Embed Size (px)
Citation preview
Makara J. Technol. 22/1 (2018), 17-27 doi: 10.7454/mst.v22i1.xxxx
17 April 2018 Vol. 22 No. 1
Prerequisites for Public Acceptance of Waste-to-Energy Plants:
Evidence from Germany and Indonesia
Uwe Lahl and Barbara Zeschmar-Lahl
1. Technische Universitat Darmstadt, Fachbereich Bauingenieurwesen und Geodaesie, Institut IWAR, Fachgebiet,
Abfalltechnik, Petersenstraβe 13, 64287 Darmstadt
2. BZL Kommunikation und Projektsteuerung GmbH, Lindenstraße 33, 28876 Oyten, Germany
*e-mail: e-mail: [email protected]
Abstract
Construction of waste incinerators often encounters resistance from the public. The minimum requirements for the ac-
ceptance of these installations include modern air pollution control (APC) technology and safe disposal of residues.
Confidence in the statements of government and government agencies as well as on those who support is an important
point of acceptance. Independent scientific bodies such as universities can help to make this happen. In the case of the
installation of waste into energy (WtE), such scientific support can be the measurement of emissions and their evalua-
tion. Many products that enter the waste stream contain heavy metals, persistent organic pollutants, and other harmful
substances. Their presence constitutes another challenge for recycling. This challenge can be solved most likely by
binding specifications for chemicals in and design for recycling of products.
Abstrak
Studi Penerimaan Publik pada Pabrik Energi Sampah: Fakta dari Jerman dan Indonesia. Pembangunan insinera-
tor sampah sering mengalami penolakan dari masyarakat. Persyaratan minimum agar instalasi insinerator dapat diterima
adalah adanya teknologi pengendalian pencemaran udara modern dan pembuangan residu yang aman. Kepercayaan
pada pemerintah dan lembaga pemerintah serta mereka yang mendukung program ini merupakan hal yang penting agar
bisa diterima di masyarakat. Institusi independen seperti Universitas dapat membantu mewujudkan hal tersebut. Dalam
kasus instalasi limbah menjadi energi (WtE), dukungan ilmiah bisa berupa pengukuran emisi buang beserta hasil eval-
uasinya. Banyak produk yang masuk ke aliran limbah mengandung logam berat, polutan organik yang persisten (POPs)
dan zat berbahaya lainnya. Kandungan bahan berbahaya tersebut menjadi tantangan tersendiri dalam proses daur ulang.
Tantangan dalam permasalahan ini dapat diatasi dengan cara mengikatkan bahan kimia di dalam spesifikasi tertentu dan
merancang daur ulang produk.
Keywords: acceptance, air pollution control, heavy metals, persistent organic pollutants (POPs), waste-to-energy
1. Introduction
The Global Waste Management Outlook (GWMO)
2015 of the United Nations Environment Programme
UNEP and the International Solid Waste Association
ISWA [1] has set five goals: by 2020, ensure universal
access to adequate, safe, affordable solid waste collec-
tion (W1); eliminate uncontrolled dumping and open
burning (W2); by 2030, ensure the sustainable and envi-
ronmentally sound management of all wastes, particu-
larly hazardous wastes (W3); substantially reduce waste
generation through prevention and the three Rs (3Rs)
(reduce, reuse, and recycle) and thereby create green jobs
(W4); halve global per-capita retail and consumer food
waste and reduce food losses in the supply chain (W5).
Midterm goals (2030) include altering people’s aware-
ness to avoid wastes and to inculcate the 3Rs in their
habits. This change entails a lengthy process. More en-
vironmentally sound technologies may reduce the de-
mand for thermal treatment of wastes in the interim, but
they do not solve the problem of dealing with hygieni-
cally problematic wastes (e.g. hospital wastes), or haz-
ardous heavy metals (mercury, cadmium) and persistent
organic pollutants (POPs) (e.g. polychlorinated biphen-
yls (PCBs), polybrominated diphenyl ethers (PBDPE),
18 Lahl, et al.
Makara J. Technol. April 2018 Vol. 22 No. 1
perfluorooctanesulfonate (PFOS), and pesticides) in
products or waste streams (e.g. wastes from electrical
and electronic equipment (WEEE), accumulators, and bat-
teries). So, long as separate collection, treatment, and
disposal of wastes containing hazardous substances
(pesticide containers, medical waste) are not widespread,
mechanical-biological treatment (MBT), composting, or
sanitary landfills merely relocate the problem.
Recycling also faces the problem of hazardous chemi-
cals in products. Although thermal treatment is present-
ly a subordinate option in the waste management hierar-
chy, it is a building block for problem solving. There-
fore, it is not surprising that projects like municipal sol-
id waste incinerators (MSWIs) combined with energy
recovery (waste-to-energy, WtE), MBT, or solid recov-
ered fuel production plants are in the stage of planning
or realization in Asia.
Unfortunately, these projects are often poorly received.
Irrespective of the technologies used, communities fear
the release of pollutants. The Government of Indonesia,
for example, was urged in 2017 to cease building WtE
plants in seven cities after the Supreme Court ruled
waste incineration illegal because the emission of haz-
ardous dioxins, furans, and heavy metals threatened the
environment and people’s health [2]. Recycling also
faces the problem of heavy metals and POPs in old
products and waste streams. Facilities that are not state-
of-the-art for recycling WEEE are the reason for some
of the world’s most polluted places.
2. Methods
This study analyzes problems with the acceptance of
waste treatment plants in Germany and the solutions
proposed or enacted.
Waste incineration in Germany has long been contro-
versial, mainly because of emissions. Requirements
limiting the emission for waste incinerators were set in
the 17th
Ordinance under the Federal Emission Control
Law (17th
BImSchV) adopted in 1991, revised in 2003,
and amended in 2013 by the European Industrial Emis-
sions Directive 2010/75/EU. Table 1 shows that the
intervals between limit and operating values for German
waste incinerators have been wide for years.
Air pollution control (APC) technology is typically built
to extreme specifications in order to maintain operating
parameters far below the legal requirements. The large
gap between the actual emissions and the stipulated
maximums indicates that the limits have not been ex-
ceeded.
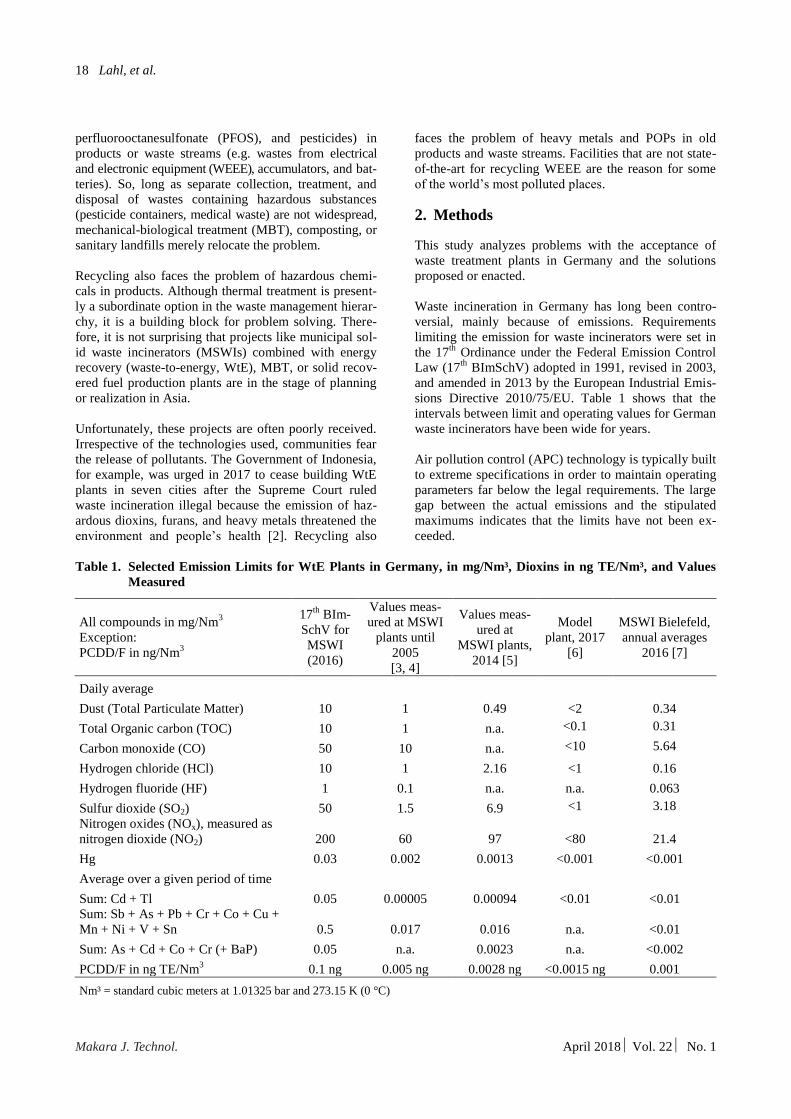
Table 1. Selected Emission Limits for WtE Plants in Germany, in mg/Nm³, Dioxins in ng TE/Nm³, and Values
Measured
All compounds in mg/Nm3
Exception:
PCDD/F in ng/Nm3
17th
BIm-
SchV for
MSWI
(2016)
Values meas-
ured at MSWI
plants until
2005
[3, 4]
Values meas-
ured at
MSWI plants,
2014 [5]
Model
plant, 2017
[6]
MSWI Bielefeld,
annual averages
2016 [7]
Daily average
Dust (Total Particulate Matter) 10 1 0.49 <2 0.34
Total Organic carbon (TOC) 10 1 n.a. <0.1 0.31
Carbon monoxide (CO) 50 10 n.a. <10 5.64
Hydrogen chloride (HCl) 10 1 2.16 <1 0.16
Hydrogen fluoride (HF) 1 0.1 n.a. n.a. 0.063
Sulfur dioxide (SO2) 50 1.5 6.9 <1 3.18
Nitrogen oxides (NOx), measured as
nitrogen dioxide (NO2) 200 60 97 <80 21.4
Hg 0.03 0.002 0.0013 <0.001 <0.001
Average over a given period of time
Sum: Cd + Tl 0.05 0.00005 0.00094 <0.01 <0.01
Sum: Sb + As + Pb + Cr + Co + Cu +
Mn + Ni + V + Sn 0.5 0.017 0.016 n.a. <0.01
Sum: As + Cd + Co + Cr (+ BaP) 0.05 n.a. 0.0023 n.a. <0.002
PCDD/F in ng TE/Nm3 0.1 ng 0.005 ng 0.0028 ng <0.0015 ng 0.001
Nm³ = standard cubic meters at 1.01325 bar and 273.15 K (0 °C)
Pollution Control at Waste-To-Energy Plants 19
Makara J. Technol. April 2018 Vol. 22 No. 1
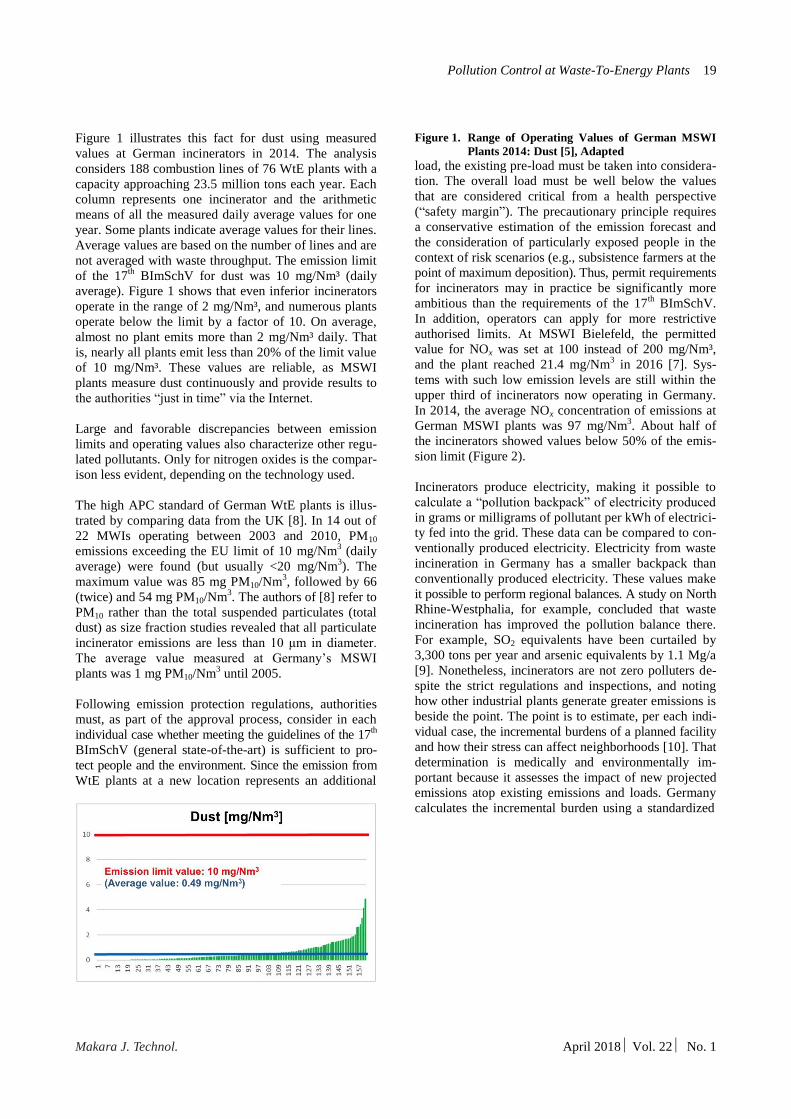
Figure 1 illustrates this fact for dust using measured
values at German incinerators in 2014. The analysis
considers 188 combustion lines of 76 WtE plants with a
capacity approaching 23.5 million tons each year. Each
column represents one incinerator and the arithmetic
means of all the measured daily average values for one
year. Some plants indicate average values for their lines.
Average values are based on the number of lines and are
not averaged with waste throughput. The emission limit
of the 17th
BImSchV for dust was 10 mg/Nm³ (daily
average). Figure 1 shows that even inferior incinerators
operate in the range of 2 mg/Nm³, and numerous plants
operate below the limit by a factor of 10. On average,
almost no plant emits more than 2 mg/Nm³ daily. That
is, nearly all plants emit less than 20% of the limit value
of 10 mg/Nm³. These values are reliable, as MSWI
plants measure dust continuously and provide results to
the authorities “just in time” via the Internet.
Large and favorable discrepancies between emission
limits and operating values also characterize other regu-
lated pollutants. Only for nitrogen oxides is the compar-
ison less evident, depending on the technology used.
The high APC standard of German WtE plants is illus-
trated by comparing data from the UK [8]. In 14 out of
22 MWIs operating between 2003 and 2010, PM10
emissions exceeding the EU limit of 10 mg/Nm3 (daily
average) were found (but usually <20 mg/Nm3). The
maximum value was 85 mg PM10/Nm3, followed by 66
(twice) and 54 mg PM10/Nm3. The authors of [8] refer to
PM10 rather than the total suspended particulates (total
dust) as size fraction studies revealed that all particulate
incinerator emissions are less than 10 μm in diameter.
The average value measured at Germany’s MSWI
plants was 1 mg PM10/Nm3 until 2005.
Following emission protection regulations, authorities
must, as part of the approval process, consider in each
individual case whether meeting the guidelines of the 17th
BImSchV (general state-of-the-art) is sufficient to pro-
tect people and the environment. Since the emission from
WtE plants at a new location represents an additional
Figure 1. Range of Operating Values of German MSWI
Plants 2014: Dust [5], Adapted
load, the existing pre-load must be taken into considera-
tion. The overall load must be well below the values
that are considered critical from a health perspective
(“safety margin”). The precautionary principle requires
a conservative estimation of the emission forecast and
the consideration of particularly exposed people in the
context of risk scenarios (e.g., subsistence farmers at the
point of maximum deposition). Thus, permit requirements
for incinerators may in practice be significantly more
ambitious than the requirements of the 17th
BImSchV.
In addition, operators can apply for more restrictive
authorised limits. At MSWI Bielefeld, the permitted
value for NOx was set at 100 instead of 200 mg/Nm³,
and the plant reached 21.4 mg/Nm3 in 2016 [7]. Sys-
tems with such low emission levels are still within the
upper third of incinerators now operating in Germany.
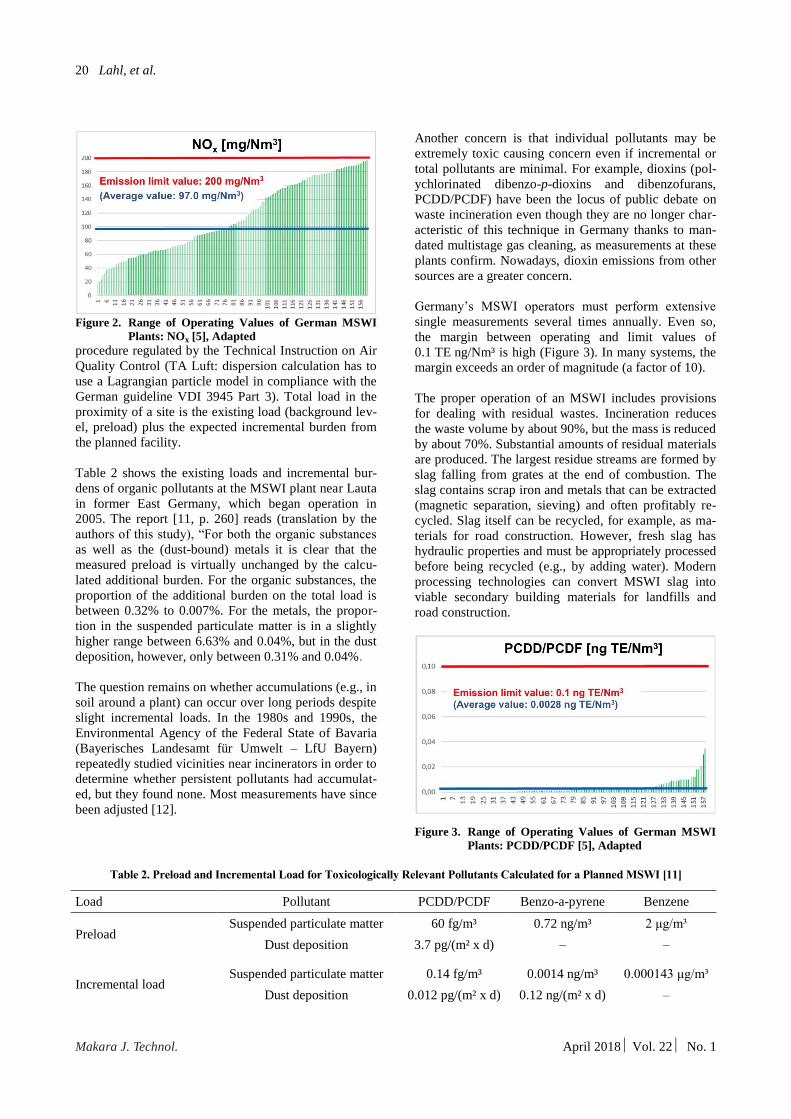
In 2014, the average NOx concentration of emissions at
German MSWI plants was 97 mg/Nm3. About half of
the incinerators showed values below 50% of the emis-
sion limit (Figure 2).
Incinerators produce electricity, making it possible to
calculate a “pollution backpack” of electricity produced
in grams or milligrams of pollutant per kWh of electrici-
ty fed into the grid. These data can be compared to con-
ventionally produced electricity. Electricity from waste
incineration in Germany has a smaller backpack than
conventionally produced electricity. These values make
it possible to perform regional balances. A study on North
Rhine-Westphalia, for example, concluded that waste
incineration has improved the pollution balance there.
For example, SO2 equivalents have been curtailed by
3,300 tons per year and arsenic equivalents by 1.1 Mg/a
[9]. Nonetheless, incinerators are not zero polluters de-
spite the strict regulations and inspections, and noting
how other industrial plants generate greater emissions is
beside the point. The point is to estimate, per each indi-
vidual case, the incremental burdens of a planned facility
and how their stress can affect neighborhoods [10]. That
determination is medically and environmentally im-
portant because it assesses the impact of new projected
emissions atop existing emissions and loads. Germany
calculates the incremental burden using a standardized
20 Lahl, et al.
Makara J. Technol. April 2018 Vol. 22 No. 1
Figure 2. Range of Operating Values of German MSWI
Plants: NOx [5], Adapted
procedure regulated by the Technical Instruction on Air
Quality Control (TA Luft: dispersion calculation has to
use a Lagrangian particle model in compliance with the
German guideline VDI 3945 Part 3). Total load in the
proximity of a site is the existing load (background lev-
el, preload) plus the expected incremental burden from
the planned facility.
Table 2 shows the existing loads and incremental bur-
dens of organic pollutants at the MSWI plant near Lauta
in former East Germany, which began operation in
2005. The report [11, p. 260] reads (translation by the
authors of this study), “For both the organic substances
as well as the (dust-bound) metals it is clear that the
measured preload is virtually unchanged by the calcu-
lated additional burden. For the organic substances, the
proportion of the additional burden on the total load is
between 0.32% to 0.007%. For the metals, the propor-
tion in the suspended particulate matter is in a slightly
higher range between 6.63% and 0.04%, but in the dust
deposition, however, only between 0.31% and 0.04%.
The question remains on whether accumulations (e.g., in
soil around a plant) can occur over long periods despite
slight incremental loads. In the 1980s and 1990s, the
Environmental Agency of the Federal State of Bavaria
(Bayerisches Landesamt für Umwelt – LfU Bayern)
repeatedly studied vicinities near incinerators in order to
determine whether persistent pollutants had accumulat-
ed, but they found none. Most measurements have since
been adjusted [12].
Another concern is that individual pollutants may be
extremely toxic causing concern even if incremental or
total pollutants are minimal. For example, dioxins (pol-
ychlorinated dibenzo-p-dioxins and dibenzofurans,
PCDD/PCDF) have been the locus of public debate on
waste incineration even though they are no longer char-
acteristic of this technique in Germany thanks to man-
dated multistage gas cleaning, as measurements at these
plants confirm. Nowadays, dioxin emissions from other
sources are a greater concern.
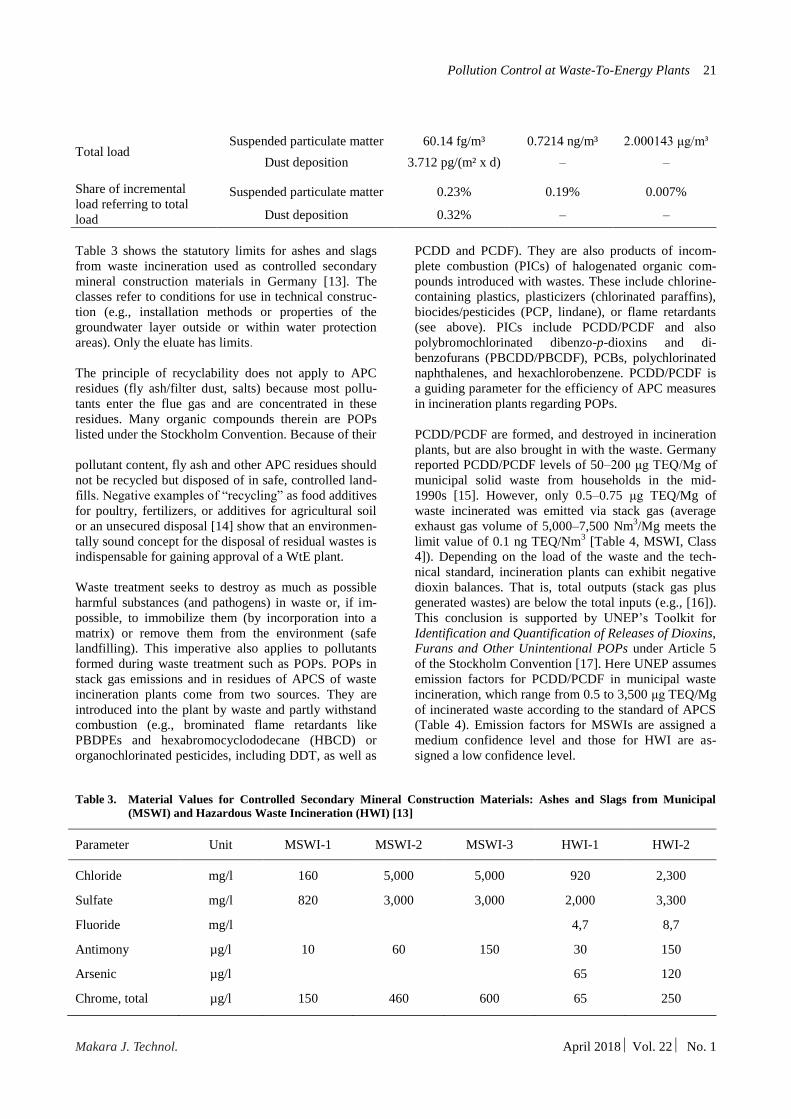
Germany’s MSWI operators must perform extensive
single measurements several times annually. Even so,
the margin between operating and limit values of
0.1 TE ng/Nm³ is high (Figure 3). In many systems, the
margin exceeds an order of magnitude (a factor of 10).
The proper operation of an MSWI includes provisions
for dealing with residual wastes. Incineration reduces
the waste volume by about 90%, but the mass is reduced
by about 70%. Substantial amounts of residual materials
are produced. The largest residue streams are formed by
slag falling from grates at the end of combustion. The
slag contains scrap iron and metals that can be extracted
(magnetic separation, sieving) and often profitably re-
cycled. Slag itself can be recycled, for example, as ma-
terials for road construction. However, fresh slag has
hydraulic properties and must be appropriately processed
before being recycled (e.g., by adding water). Modern
processing technologies can convert MSWI slag into
viable secondary building materials for landfills and
road construction.
Figure 3. Range of Operating Values of German MSWI
Plants: PCDD/PCDF [5], Adapted
Table 2. Preload and Incremental Load for Toxicologically Relevant Pollutants Calculated for a Planned MSWI [11]
Load Pollutant PCDD/PCDF Benzo-a-pyrene Benzene
Preload Suspended particulate matter 60 fg/m³ 0.72 ng/m³ 2 μg/m³
Dust deposition 3.7 pg/(m² x d) – –
Incremental load Suspended particulate matter 0.14 fg/m³ 0.0014 ng/m³ 0.000143 μg/m³
Dust deposition 0.012 pg/(m² x d) 0.12 ng/(m² x d) –
Pollution Control at Waste-To-Energy Plants 21
Makara J. Technol. April 2018 Vol. 22 No. 1
Total load Suspended particulate matter 60.14 fg/m³ 0.7214 ng/m³ 2.000143 μg/m³
Dust deposition 3.712 pg/(m² x d) – –
Share of incremental
load referring to total
load
Suspended particulate matter 0.23% 0.19% 0.007%
Dust deposition 0.32% – –
Table 3 shows the statutory limits for ashes and slags
from waste incineration used as controlled secondary
mineral construction materials in Germany [13]. The
classes refer to conditions for use in technical construc-
tion (e.g., installation methods or properties of the
groundwater layer outside or within water protection
areas). Only the eluate has limits.
The principle of recyclability does not apply to APC
residues (fly ash/filter dust, salts) because most pollu-
tants enter the flue gas and are concentrated in these
residues. Many organic compounds therein are POPs
listed under the Stockholm Convention. Because of their
pollutant content, fly ash and other APC residues should
not be recycled but disposed of in safe, controlled land-
fills. Negative examples of “recycling” as food additives
for poultry, fertilizers, or additives for agricultural soil
or an unsecured disposal [14] show that an environmen-
tally sound concept for the disposal of residual wastes is
indispensable for gaining approval of a WtE plant.
Waste treatment seeks to destroy as much as possible
harmful substances (and pathogens) in waste or, if im-
possible, to immobilize them (by incorporation into a
matrix) or remove them from the environment (safe
landfilling). This imperative also applies to pollutants
formed during waste treatment such as POPs. POPs in
stack gas emissions and in residues of APCS of waste
incineration plants come from two sources. They are
introduced into the plant by waste and partly withstand
combustion (e.g., brominated flame retardants like
PBDPEs and hexabromocyclododecane (HBCD) or
organochlorinated pesticides, including DDT, as well as
PCDD and PCDF). They are also products of incom-
plete combustion (PICs) of halogenated organic com-
pounds introduced with wastes. These include chlorine-
containing plastics, plasticizers (chlorinated paraffins),
biocides/pesticides (PCP, lindane), or flame retardants
(see above). PICs include PCDD/PCDF and also
polybromochlorinated dibenzo-p-dioxins and di-
benzofurans (PBCDD/PBCDF), PCBs, polychlorinated
naphthalenes, and hexachlorobenzene. PCDD/PCDF is
a guiding parameter for the efficiency of APC measures
in incineration plants regarding POPs.
PCDD/PCDF are formed, and destroyed in incineration
plants, but are also brought in with the waste. Germany
reported PCDD/PCDF levels of 50–200 μg TEQ/Mg of
municipal solid waste from households in the mid-
1990s [15]. However, only 0.5–0.75 μg TEQ/Mg of
waste incinerated was emitted via stack gas (average
exhaust gas volume of 5,000–7,500 Nm3/Mg meets the
limit value of 0.1 ng TEQ/Nm3 [Table 4, MSWI, Class
4]). Depending on the load of the waste and the tech-
nical standard, incineration plants can exhibit negative
dioxin balances. That is, total outputs (stack gas plus
generated wastes) are below the total inputs (e.g., [16]).
This conclusion is supported by UNEP’s Toolkit for
Identification and Quantification of Releases of Dioxins,
Furans and Other Unintentional POPs under Article 5
of the Stockholm Convention [17]. Here UNEP assumes
emission factors for PCDD/PCDF in municipal waste
incineration, which range from 0.5 to 3,500 μg TEQ/Mg
of incinerated waste according to the standard of APCS
(Table 4). Emission factors for MSWIs are assigned a
medium confidence level and those for HWI are as-
signed a low confidence level.
Table 3. Material Values for Controlled Secondary Mineral Construction Materials: Ashes and Slags from Municipal
(MSWI) and Hazardous Waste Incineration (HWI) [13]
Parameter Unit MSWI-1 MSWI-2 MSWI-3 HWI-1 HWI-2
Chloride mg/l 160 5,000 5,000 920 2,300
Sulfate mg/l 820 3,000 3,000 2,000 3,300
Fluoride mg/l 4,7 8,7
Antimony µg/l 10 60 150 30 150
Arsenic µg/l 65 120
Chrome, total µg/l 150 460 600 65 250

22 Lahl, et al.
Makara J. Technol. April 2018 Vol. 22 No. 1
Copper µg/l 110 1,000 2,000 130 500
Molybdenum µg/l 55 400 1,000 400 1,890
Vanadium µg/l 55 150 200 130 200
Table 4. PCDD/PCDF Emission Factors for the Selected Waste Incinerators (µg TEQ/Mg Waste Incinerated) [17]
Cat. Class Source categories Potential Release Route [µg TEQ/Mg]
Air Fly Ash Bottom Ash
a Municipal solid waste incineration (MSWI)
1 Low technol. combustion, no APCS
Class 1 includes MSW incinerators that are simple,
batch‐fed furnaces with no APC systems and capacities of
500 kg/h or less.
3,500 0 A
75 B
2 Controlled combustion, minimal APCS
Class 2 includes MSW incinerators that are continuously
fed, controlled combustors equipped with minimal APC
systems, such as electrostatic precipitators, multi‐cyclones
and/or simple scrubbers.
350 500 A
15 B
3 Controlled combustion, good APCS
Class 3 includes MSW incinerators that are continuously
fed, controlled combustors equipped with improved APC
systems such as a combination of electrostatic precipita-
tors and multiple scrubbers, a combination of spray‐dryers
and baghouses, or similar combinations.
30 200 A
7 B
4 High tech. combustion, sophisticated APCS
Class 4 is limited to state‐of‐the‐art MSW incinerators
equipped with sophisticated APC technologies, such as
activated carbon adsorption units or SCR DeDiox@
sys-
tems that should be capable of ensuring compliance with
a strictly enforced regulatory value for air emissions in
flue gases that is equivalent to 0.1 ng TEQ/Nm³ at
11% O2).
0.5 15 A
1.5 B
b Hazardous waste incineration (HWI)
1 Low technol. combustion, no APCS
Class 1 includes very small (< 500 kg/h) and simple fur-
naces operated in a batch‐fed mode without any APC sys-
tem for stack gases, e.g., muffle ovens, with flue gas vol-
ume flow rate of about 17,500 Nm³/Mg of hazardous
waste.
35,000 9,000
2 Controlled combustion, minimal APCS
Class 2 includes HW incinerators with controlled com-
bustion and minimal APC systems, with flue gas volume
flow rate to 15,000 Nm³/Mg of hazardous waste.
350 900
3 Controlled combustion, good APCS
Class 3 incinerators have further improved combustion
efficiencies and more efficient systems resulting in
PCDD/PCDF concentrations of about 1 ng TEQ/Nm³ (at
11% O2). Also, the specific flue gas volume flow rate is
reduced to 10,000 Nm³/Mg HW.
10 450
Pollution Control at Waste-To-Energy Plants 23
Makara J. Technol. April 2018 Vol. 22 No. 1
Cat. Class Source categories Potential Release Route [µg TEQ/Mg]
Air Fly Ash Bottom Ash
4 High tech. combustion, sophisticated APCS
Class 4 is limited to highly sophisticated hazardous waste
incineration plants that are capable of complying with a
regulatory value of 0.1 ng TEQ/Nm³ (at 11% O2), such as
legislated in the in European Union. Class 4 represents the
current state‐of‐the‐art in HW incineration and APC tech-
nology with stack gas flow rates of some 7,500 Nm³/Mg
HW.
0.75 30
A including dust from boiler and dedusting, residues from flue gas cleaning without filter dust, residues from flue gas cleaning and filter dust B including slag
3. Results and Discussion
Conflicts over techniques and locations for technical
facilities sometimes reached large proportions. Current
conflicts over the proposed sites for WtE plants in Chi-
na [18] or the decision of Indonesia’s Supreme Court
[2] show that the problem exists outside Germany and
Europe. Could these conflicts have been prevented if
more attention had been paid to public acceptance as an
aspect of technology design? Scientific approaches have
often failed because acceptance behavior is complex
and hardly predictable. Nonetheless, we must address
this difficult issue and find ways to increase acceptance
of waste management projects.
Any incinerator or waste treatment facility in Europe
must meet the emission control requirements (see
above). Any facility that does not meet this standard or
violates it during operation is unacceptable to the au-
thorities. Besides technical standards, a successfully
functioning WtE system depends on its technology and
qualified and motivated staff. Orderly workflows, clear
responsibilities, and an environmental officer assigned
to top management are essential.
But will facilities that meet or surpass the legal re-
quirements described above be accepted in the neigh-
borhood for which they are planned? Experience shows
that the expected or real emissions are major points of
conflict in proposals to construct thermal waste treatment
plants, other waste treatment facilities (e.g., MBT), and
landfills. Minimum legal requirements in Europe govern
emission control, and individual states like the Nether-
lands, Austria, and Germany impose incremental re-
quirements (e.g., for flue gas cleaning).
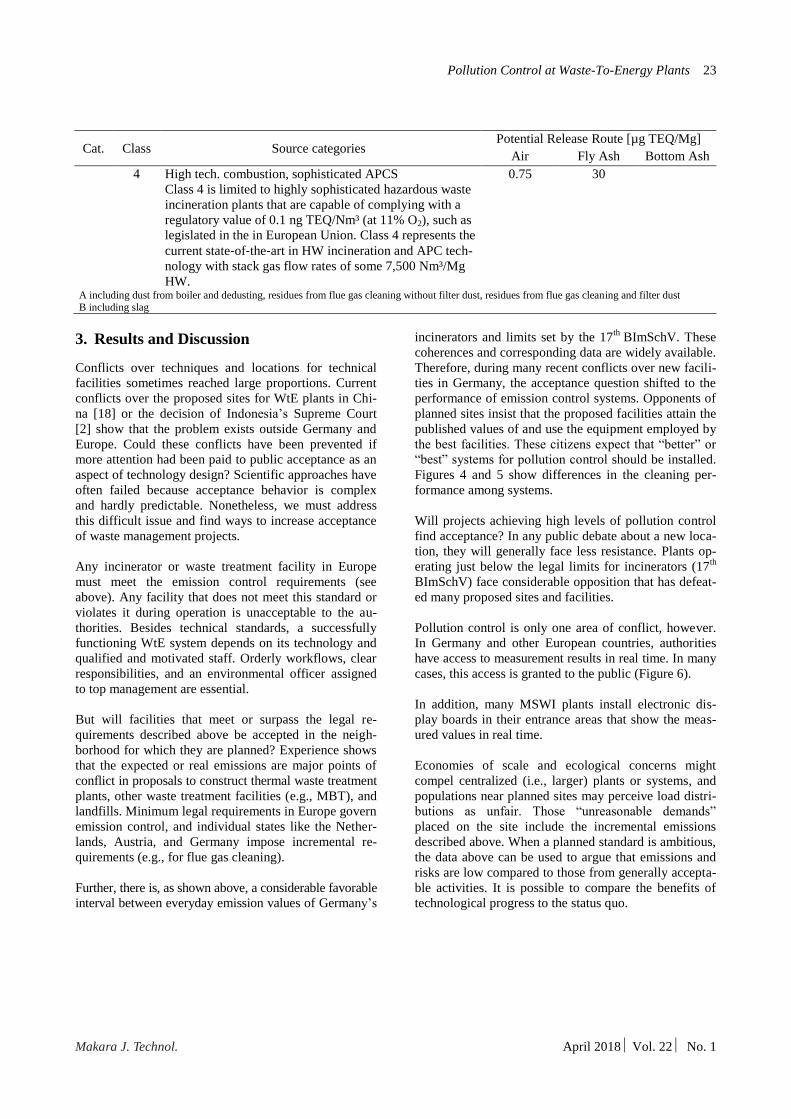
Further, there is, as shown above, a considerable favorable
interval between everyday emission values of Germany’s
incinerators and limits set by the 17th
BImSchV. These
coherences and corresponding data are widely available.
Therefore, during many recent conflicts over new facili-
ties in Germany, the acceptance question shifted to the
performance of emission control systems. Opponents of
planned sites insist that the proposed facilities attain the
published values of and use the equipment employed by
the best facilities. These citizens expect that “better” or
“best” systems for pollution control should be installed.
Figures 4 and 5 show differences in the cleaning per-
formance among systems.
Will projects achieving high levels of pollution control
find acceptance? In any public debate about a new loca-
tion, they will generally face less resistance. Plants op-
erating just below the legal limits for incinerators (17th
BImSchV) face considerable opposition that has defeat-
ed many proposed sites and facilities.
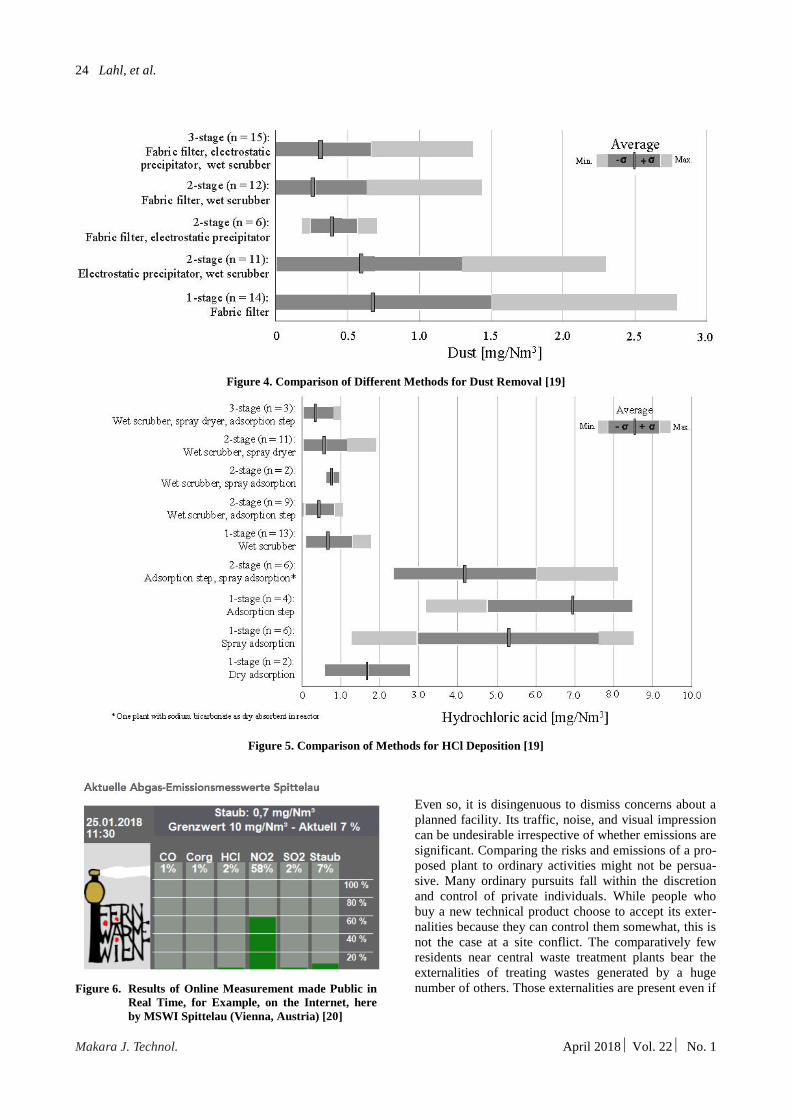
Pollution control is only one area of conflict, however.
In Germany and other European countries, authorities
have access to measurement results in real time. In many
cases, this access is granted to the public (Figure 6).
In addition, many MSWI plants install electronic dis-
play boards in their entrance areas that show the meas-
ured values in real time.
Economies of scale and ecological concerns might
compel centralized (i.e., larger) plants or systems, and
populations near planned sites may perceive load distri-
butions as unfair. Those “unreasonable demands”
placed on the site include the incremental emissions
described above. When a planned standard is ambitious,
the data above can be used to argue that emissions and
risks are low compared to those from generally accepta-
ble activities. It is possible to compare the benefits of
technological progress to the status quo.
24 Lahl, et al.
Makara J. Technol. April 2018 Vol. 22 No. 1
Figure 4. Comparison of Different Methods for Dust Removal [19]
Figure 5. Comparison of Methods for HCl Deposition [19]
Figure 6. Results of Online Measurement made Public in
Real Time, for Example, on the Internet, here
by MSWI Spittelau (Vienna, Austria) [20]
Even so, it is disingenuous to dismiss concerns about a
planned facility. Its traffic, noise, and visual impression
can be undesirable irrespective of whether emissions are
significant. Comparing the risks and emissions of a pro-
posed plant to ordinary activities might not be persua-
sive. Many ordinary pursuits fall within the discretion
and control of private individuals. While people who
buy a new technical product choose to accept its exter-
nalities because they can control them somewhat, this is
not the case at a site conflict. The comparatively few
residents near central waste treatment plants bear the
externalities of treating wastes generated by a huge
number of others. Those externalities are present even if
Pollution Control at Waste-To-Energy Plants 25
Makara J. Technol. April 2018 Vol. 22 No. 1
merely psychological, and they might depress property
prices.
Studies establish that people consciously or uncon-
sciously perform a personal risk-benefit analysis and
form judgments. A planned installation does not likely
present discernible personal benefits for inclusion in
risk-benefit accounting. Even benefits such as new jobs,
locally added value, or local sales seldom enter a per-
sonal calculation. This could change if site proposals
included direct financial compensation, but that overture
is absent in most site proposals.
The importance of pollution control systems for the
acceptance of waste treatment facilities must not be
under- or overestimated. State-of-the-art incinerators
add miniscule amounts to pollutants on site. Given the
nearly inevitable emergence of resistance, however, the
proposed plants have a chance to be accepted at the be-
ginning of the process only if they meet high APC
standards. Experience shows that it is a prerequisite that
operating values be below legally established values,
even if system manufacturers must issue warranties.
Meeting a high pollution control standard, however, will
not guarantee the acceptance of a plant. Many other
motives – fear of accidents, fugitive emissions, additional
traffic, noise, declining property values, and concern for
nature or the landscape – are equally important. Incin-
eration is an established and recognized technology in
industrialized countries, but introducing it has generated
controversy in the populace and the courts. This dispute
is now settled in Europe, because the technology proves
itself daily. As with all complex industrial plants, inde-
pendent regulatory control must preside.
As prosperity in transitioning economies rises, the calor-
ic count of waste will have rised as paper and plastics
comprise a rising share of products. E.g. in Jakarta, the
share of plastics and styrofoam on MSW composition
rose from 3.7% in 1981 to 13.3% in 2005 and of paper
from 7.8% to 20.6% during the same period [21]. Even
so, a question arises as to whether it is reasonable for
transitioning economies like Indonesia to approach the
highest waste incineration standards despite the ad-
vantages.
Social problems such as lost jobs for waste pickers
should be taken seriously. But “we should not idealize
waste picking activities and operating conditions: Issues
such as criminal activities, exploitation by middlemen,
emerged elites, child labor and high occupational health
risks need to be openly challenged…” [22].
In order to enhance social acceptability of WtE technol-
ogies and to support waste pickers, the Carbon Trust
recommends the following in its report Waste to Energy
in Indonesia [23]: “Separately, implementing WtE solu-
tions may disrupt the livelihoods of waste pickers, who
rely on established waste management practices for in-
come. To address these issues, it is recommended that
MEMR (Indonesian Ministry of Energy and Mineral
Resources): a) Continue awareness raising activities and
involve the public in developing local waste manage-
ment plans; b) Use demonstration projects with strict
environmental performance standards to show the pub-
lic that plants are not harmful to health and the envi-
ronment. These standards are likely to be required by
international donor finance (…); c) Recognize waste
pickers as an important group that needs to be consid-
ered when pursuing WtE solutions, and build capacity
and financially assist them to work on upstream recy-
cling” [23].
Following Bergecol et al., a “solution could lie in the
regulation of an appropriate juxtaposition of this infor-
mal recycling sector and the vast, centralized, technical
treatment systems in order to achieve a circularity of the
flows at its best and allow at the same time positive so-
cio-economic impacts” [24]. As one solution, Indone-
sia’s Ministry of Environment has promoted waste
banks (trash banks, garbage banks) as a program to
bridge the gap between informal and formal waste man-
agement.
Hazardous chemicals in products often cause bigger
problems for recycling than their treatment and disposal.
High levels of POPs in products (many exported from
industrial economies for reuse or recycling in develop-
ing economies) lead to site contamination because recy-
cling fails to adhere to the best available techniques
[25]. For example, “reprocessing of e-waste in parts of
East Africa and South East Asia using environmentally
damaging processes (e.g., acid leaching and open burn-
ing of wire insulation) have resulted in some of the most
polluted places on the planet and devastated the health
of entire communities” [22].
These substances are not destroyed. They re-enter the
product cycle. So, the waste hierarchy in general and the
3R programs in particular can be realized successfully
only if hazardous chemicals in products are addressed.
Chemicals in products are an emerging political issue in
international chemicals management. The Strategic Con-
cept for International Chemicals Management (SAICM)
intends to deepen in the future. For example, SAICM’s
Chemicals in Products Programme of 2015 stresses the
need for knowledge about constituent chemicals, partic-
ularly in materials intended for reuse or recycling, be-
fore disposal. The report observes the following:
41. Recyclers. Chemicals in product information is a
key component in achieving safe recycling and high
quality recycled materials. Under current conditions,
many recyclers need chemicals in products information,
and are not themselves in a position to feed it into the
manufacturing chain. Achieving effective and large-
26 Lahl, et al.
Makara J. Technol. April 2018 Vol. 22 No. 1
scale recycling is an important step on the road to
greater resource efficiency and establishing sustainable
materials use. As with numerous other overarching sus-
tainability issues, access to chemicals in products in-
formation is an important contributory element. In view
of this current status, the initial role of recyclers in the
Programme is to identify their needs for chemicals in
products information and to work with relevant stake-
holders to gain access to the information. With access to
sufficient information, recyclers could perform a role
similar to that of the chemicals suppliers or those in the
manufacturing chain described in paragraphs 38 to 40
above.1
49. Waste managers. The absence of relevant chemical
content information exchange contributes to the legacy
of improperly treated wastes and illegal trade in wastes.
The decision to treat a material or product at end of life,
by recycling or disposal, may depend on knowing its
chemical content. Having such information on chemical
content may lead to treatment choices—in particular the
choice between reuse, recycling and incineration (or
other disposal). There is a large and growing need for
improved waste management which requires chemical
information exchange systems tailored to the needs and
capacities of the waste management sector, including
the informal sector, and of government officials. The
role of waste managers in the Programme is initially to
identify their chemicals in products information needs
and to work with holders of information to achieve ac-
cess” [26].
Besides containing hazardous chemicals, many products
cannot be recycled. E.g., additives in plastics can mas-
sively hinder the recycling of large quantities of plastic
products (for example Cd stearate in PVC profiles). The
Carbon Trust points out that “it is crucial to note that
many types of plastic are not recyclable, and can only
have some value recovered in MSW incinerators. This
should guarantee a significant material flow to MSW
incineration plants downstream from recycling plants”
[23].
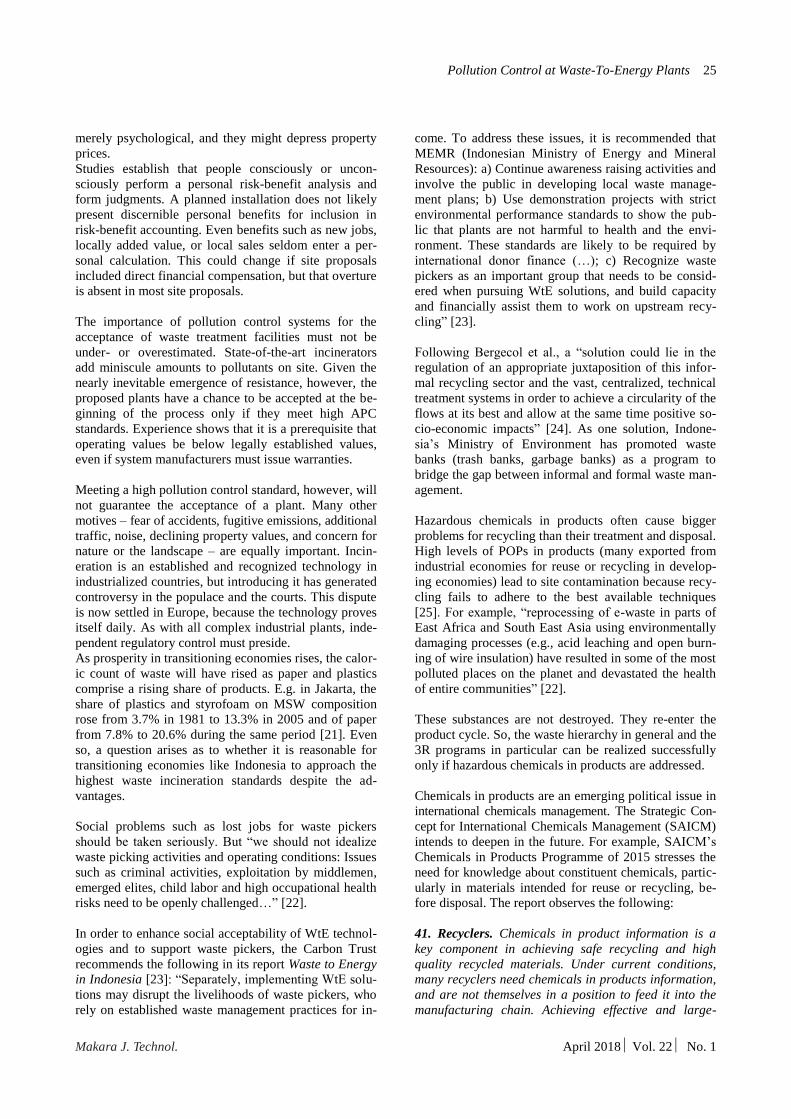
Figure 8 depicts examples from packaging, the complex
components of which need to be reconstituted to be re-
cyclable and available as (secondary) materials for new
products. Options to recycle multilayer packaging are
currently available, but have drawbacks like a limited
scope or a high expenditure of energy [27].
1Footnote 13 on page 11 in [26]: “Chemicals in products in-
formation for recyclers could be useful, as well-characterized
materials would be of higher economic value and could be
suitable alternatives to virgin materials. In both cases, chemi-
cals in products information could be used to reintroduce ma-
terials with full knowledge of the chemicals of concern that
they contain.”
International standards are needed to make “design for
recycling” or “design for recyclability” (or “design for
sustainability”) obligatory, not only for packaging, but
for other products, too. Given the globalization of the
stream of goods and wastes, it seems necessary to impose
responsibility upon manufacturers and distributors to
“recycling-friendly” products. Imposing this responsibility
on them has a regulatory basis in numerous EU direc-
tives and national regulations. However, existing regula-
tions are insufficient because they concern only selected
product groups (cars, batteries, electronic devices, and
packages) and do not apply in all markets worldwide.
This problem can be solved only on an international level,
Figure 8. Cross section of a Chip Bag from Inside to Out-
side (Own Graph, based on [28])
most likely by binding specifications for chemicals in
and design for recycling of products.
Destroying organic pollutants (and pathogens) by state-
of-the-art incineration is less problematic for human
health and the environment than getting rid of them in
unsecured landfills or in open combustion. Science is
obligated to review data regarding the emission behav-
ior of waste incineration for use in transitioning econo-
mies. A comparison of technological options for waste
management should be made available to courts and
political decision-makers.
4. Conclusions
Confidence in the statements of government and govern-
ment agencies as well as on those who support is an
important point of creating and increasing acceptance.
In the case of the installation of waste into energy (WtE),
independent scientific bodies such as universities can
contribute to this process by the measurement of emis-
sions and their evaluation. Supervision and control is
another important building block in increasing ac-
ceptance. It is important that the results of self-
Pollution Control at Waste-To-Energy Plants 27
Makara J. Technol. April 2018 Vol. 22 No. 1
monitoring and regulatory control and monitoring are
publicly available. Unfiltered access to data through the
Internet is a matter of great concern.
Many products that enter the waste stream contain heavy
metals, persistent organic pollutants, and other harmful
substances. A “circular economy” has to cope with
enormous challenges concerning the management of
pollutants contained in products or wastes. This challenge
can be solved most likely by binding specifications for
chemicals in and design for recycling of products.
References
[1] UNEP, ISWA 2015, Global Waste Management
Outlook (GWMO), 2015.
[2] R. Irfany, Govt Urged to Stop Waste-to-Energy
Projects, TEMPO.CO. https://en.tempo.co/read/news/
2017/09/20/056910854/Govt-Urged-to-Stop-Waste-
to-Energy-Projects, 2017.
[3] Bundesministerium für Umwelt (Ed.), Müll-
verbrennung – ein Gefahrenherd? (in German),
http://www.bmu.de/files/pdfs/allgemein/application
/pdf/muellverbrennung_dioxin.pdf, 2005.
[4] IFEU, Beitrag der Abfallwirtschaft zur nachhal-
tigen Entwicklung in Deutschland, Teilbericht
Siedlungsabfälle (in German),
https://www.umweltbun-
desamt.de/sites/default/files/medien/publikation/long/
2899.pdf, 2004.
[5] C. Spohn, M. Treder (ITAD), Betreiber von Ab-
fallverbrennungsanlagen im Spannungsfeld des
BVT-Merkblatts (in German), https://www.itad.de/
information/studien/BREFITADTKBerlinJan2016.
pdf, 2016.
[6] ITAD – Interessengemeinschaft der thermischen
Abfallbehandlungsanlagen in Deutschland e.V.,
Düsseldorf, Emissionen (in German), https://www.
itad.de/ITAD/emisionen, 2018.
[7] MSWI Bielefeld, Emission report 2016 (in Ger-
man), pages 1 and 6, http://www.mva-bielefeld.de/
_Downloads/Emissionsberichte/MVA _ Bielefeld__
Emissionsbericht_2016.pdf, 2017.
[8] P. Douglas, A. Freni-Sterrantino, M L. Sanchez,
D.C. Ashworth, R.E. Ghosh, D. Fecht, A. Font, M.
Blangiardo, J. Gulliver, M.B. Toledano, P. Elliott,
K. de Hoogh, G.W. Fuller, A.L. Hansell, Environ.
Sci. Technol. 51 (2017) 7511.
[9] IFEU, Ökobilanz thermischer Entsorgungssysteme
für brennbare Abfälle in Nordrhein-Westfalen (in
German), https://www.ifeu.de/abfallwirtschaft/pdf/
therm_entsorg.pdf, 2007.
[10] U. Lahl, B. Zeschmar-Lahl, in: K.J. Thomé-
Kozmiensky, L. Pelloni (Eds.): Waste Management,
2, 2011, p.363.
[11] T. Eikmann, S. Eikmann, Humantoxikologische
Bewertung von Abfallbehandlungsanlagen (in
German), http://www.itad.de/media/www.itad.de/
org/med_90034/289_eikmann2007_humantoxikolo
gischebewertung.pdf, 2007.
[12] Bayerisches Landesamt für Umwelt – LfU Bayern,
22.8.2008, cited in U. Lahl, W. Steven, Müllmagazin
4 (2008) 4-11 (in German).
[13] German Federal Government, Verordnung zur Ein-
fuhrung einer Ersatzbaustoffverordnung, zur
Neufassung der Bundes-Bodenschutz- und Alt-
lastenverordnung und zur Änderung der Depo-
nieverordnung und der Gewerbeabfallverordnung
(2017) (in German).
[14] J. Petrlik, L. Bell, Toxic ash poisons our food
chain, International POPs Elimination Network
(IPEN), April 2017.
[15] M. Wilken, B. Zeschmar-Lahl (in German), Müll-
Handbuch, Kz. 1752, 1994.
[16] E. Abad, M.A. Adrados, J. Caixach, B. Fabrellas, J.
Rivera, Chemosphere 40 (2000) 1143.
[17] UNEP: Toolkit for Identification and Quantifica-
tion of Releases of Dioxins, Furans and Other Un-
intentional POPs under Article 5 of the Stockholm
Convention, 2003.
[18] M. Standaert, YaleEnvironment360, April 20, 2017,
https://e360.yale.edu/features/as-china-pushes-waste-
to-energy-incinerators-protests-are-mounting, 2017.
[19] P. Quicker, Y. Noel, R. Daschner, M. Faulstich, U.
Raesfeld, M. Gleis, ReSource 2 (2011) 50-54 (in
German).
[20] Wien Energie, https://www.wienenergie.at/epor-tal3/
ep/channelView.do/channelId/-49106, Screenshot,
2018.
[21] E. Damanhuri, W. Handoko, T. Padmi, In: A. Paria-
tamby, M. Tanaka (Eds.), Municipal Solid Waste
Management in Asia and the Pacific Islands: Chal-
lenges and Strategic Solutions, Springer Science &
Business Media, 2013, 139-155.
[22] C. Velis, Waste pickers in Global South: Informal
recycling sector in a circular economy era, Waste
Manag. Res. 35 (2017), 329-331.
[23] Carbon Trust, Waste to energy in Indonesia. As-
sessing opportunities and barriers using insights
from the UK and beyond. CTC831, June 2014.
[24] R. de Bercegol, J. Cavé, A. Nguyen Thai Huyen,
Resour. 6 (2017) 70.
[25] L. Bell, R. Weber, B. De Borst, M.C. Paun, I.
Holoubeck, A. Watson, J. Vijgen, Assessment of
POPs contaminated sites and the need for stringent
soil standards for food and feed safety. Expert
meeting on Best Available Techniques and Best
Environmental Practices and Toolkit for Identifica-
tion and Quantification of Releases of Dioxins, Fu-
rans and Other Unintentional Persistent Organic
Pollutants under the Stockholm Convention. Brati-
slava, Slovakia, 25–27 October 2016.
[26] SAICM, Chemicals in products programme.
SAICM/ICCM.4/10, http://www.saicm.org/Por-tals/
12/Documents/EPI/CiP%20programme%20Octobe
r2015_Final.pdf, 2015.
28 Lahl, et al.
Makara J. Technol. April 2018 Vol. 22 No. 1
[27] K. Kaiser, M. Schmid, M. Schlummer, Recycling,
3/1 (2018) 1; doi:10.3390/recycling3010001.
[28] D.J. Richards, R.A. Frosch, in: D.J. Richards (Ed.):
The Industrial Green Game: Implications for Envi-
ronmental Design and Management, 1–34,
https://www.nap.edu/read/4982/chapter/2, 1997.