Embed Size (px)
Citation preview
FIELAX Gesellschaft für wissenschaftliche Datenverarbeitung mbH Schleusenstr. 14, D-27568 Bremerhaven, GERMANY Fon: +49 (0)471 30015-0, Fax: +49 (0)471 30015-22 Mail: [email protected]
Beneficiary: FIELAX GmbH | Bank account: Sparkasse Bremerhaven
IBAN: DE17 2925 0000 0004 0162 20 | BIC: BRLADE21BRS VATIN/UStID: DE221948243 | St.-Nr.: 75 570 10941, FA Bremerhaven
Comm. Reg.: HRB 3506, AG Bremerhaven | Managing director: Dr. Regina Usbeck
Das Bild kann zurzeit nicht angezeigt werden.
Processing Logbook
master track creation of RV “Heincke”
Contact:
FIELAX Gesellschaft für wissenschaftliche Datenverarbeitung mbH
Schleusenstraße 14, D-27568 Bremerhaven, GERMANY
Fon: +49 (0)471 30015-0, Fax: +49 (0)471 30015-22
Mail: [email protected]
Ref.:Processing_Logbook_RV_Heincke.pdf Vers.: 1 Date: 22/06/2015 Status: final
Page 2 of 21
Das Bild kann zurzeit nicht angezeigt werden.
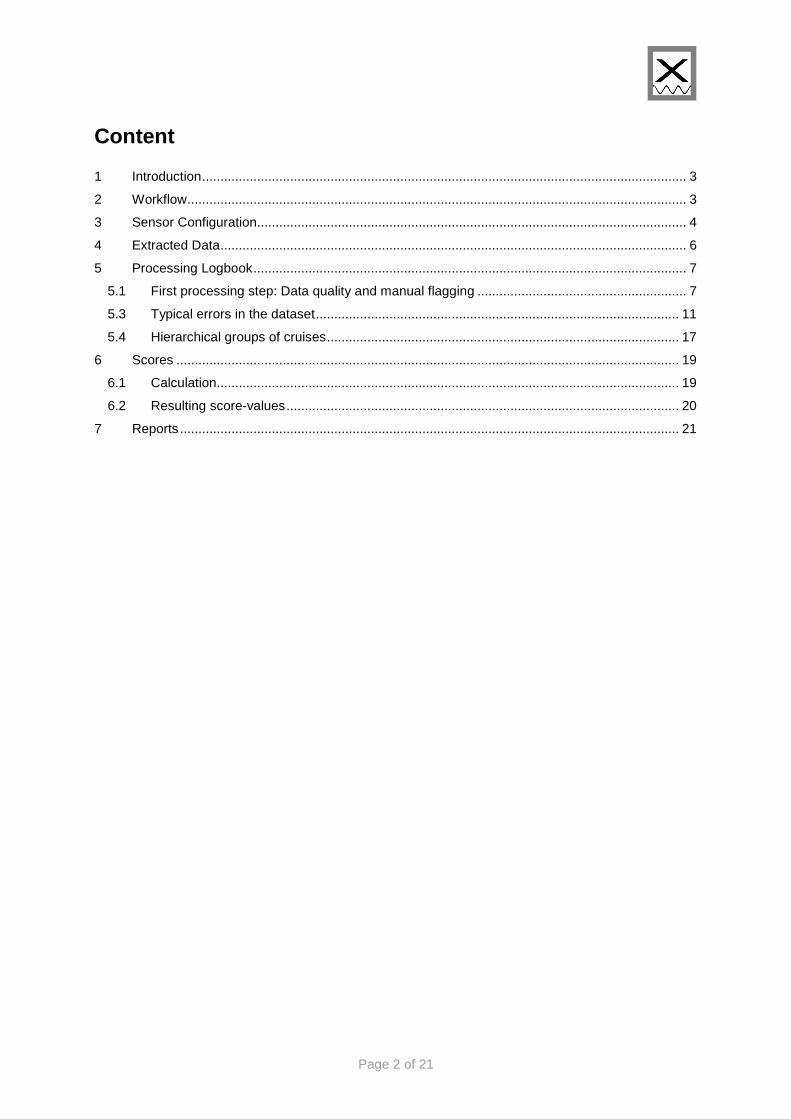
Content
1 Introduction .................................................................................................................................... 3
2 Workflow ........................................................................................................................................ 3
3 Sensor Configuration..................................................................................................................... 4
4 Extracted Data ............................................................................................................................... 6
5 Processing Logbook ...................................................................................................................... 7
5.1 First processing step: Data quality and manual flagging ......................................................... 7
5.3 Typical errors in the dataset ................................................................................................... 11
5.4 Hierarchical groups of cruises ................................................................................................ 17
6 Scores ......................................................................................................................................... 19
6.1 Calculation.............................................................................................................................. 19
6.2 Resulting score-values ........................................................................................................... 20
7 Reports ........................................................................................................................................ 21
Page 3 of 21
Das Bild kann zurzeit nicht angezeigt werden.
1 Introduction
The vessel RV Heincke is equipped with different positioning sensors which continuously record the position of the vessel during a cruise. However, these sensors vary in accuracy or they may fail completely for a certain time. Thus, all of them are compared and their accuracy is estimated to retrieve the most reliable and most probable position of the ship for each second of the cruise. This track can then be used as “master track” for the geographical positioning of further data.
2 Workflow
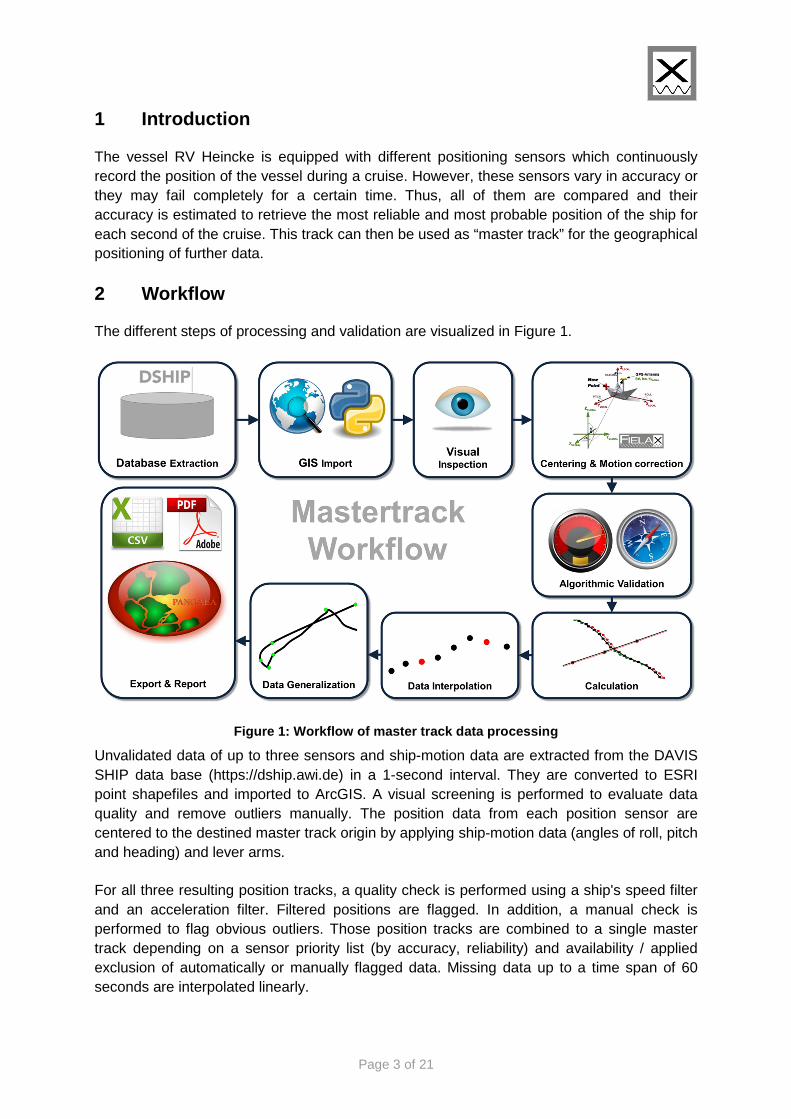
The different steps of processing and validation are visualized in Figure 1.
Figure 1: Workflow of master track data processing
Unvalidated data of up to three sensors and ship-motion data are extracted from the DAVIS SHIP data base (https://dship.awi.de) in a 1-second interval. They are converted to ESRI point shapefiles and imported to ArcGIS. A visual screening is performed to evaluate data quality and remove outliers manually. The position data from each position sensor are centered to the destined master track origin by applying ship-motion data (angles of roll, pitch and heading) and lever arms.
For all three resulting position tracks, a quality check is performed using a ship's speed filter and an acceleration filter. Filtered positions are flagged. In addition, a manual check is performed to flag obvious outliers. Those position tracks are combined to a single master track depending on a sensor priority list (by accuracy, reliability) and availability / applied exclusion of automatically or manually flagged data. Missing data up to a time span of 60 seconds are interpolated linearly.
Page 4 of 21
Das Bild kann zurzeit nicht angezeigt werden.
Finally a master position track is created by use of a regression smoothing filter. The regression estimates the position of the subsequent point and compares that to the next position of each position sensor. The point that is closest to the estimated point is assigned to the master track. To reduce the amount of points for overview maps the master track is generalized by using the Ramer-Douglas-Peucker algorithm12. This algorithm returns only the most significant points from the track. Full master track and generalized master track are written to text files and imported to PANGAEA (http://www.pangaea.de).
3 Sensor Configuration
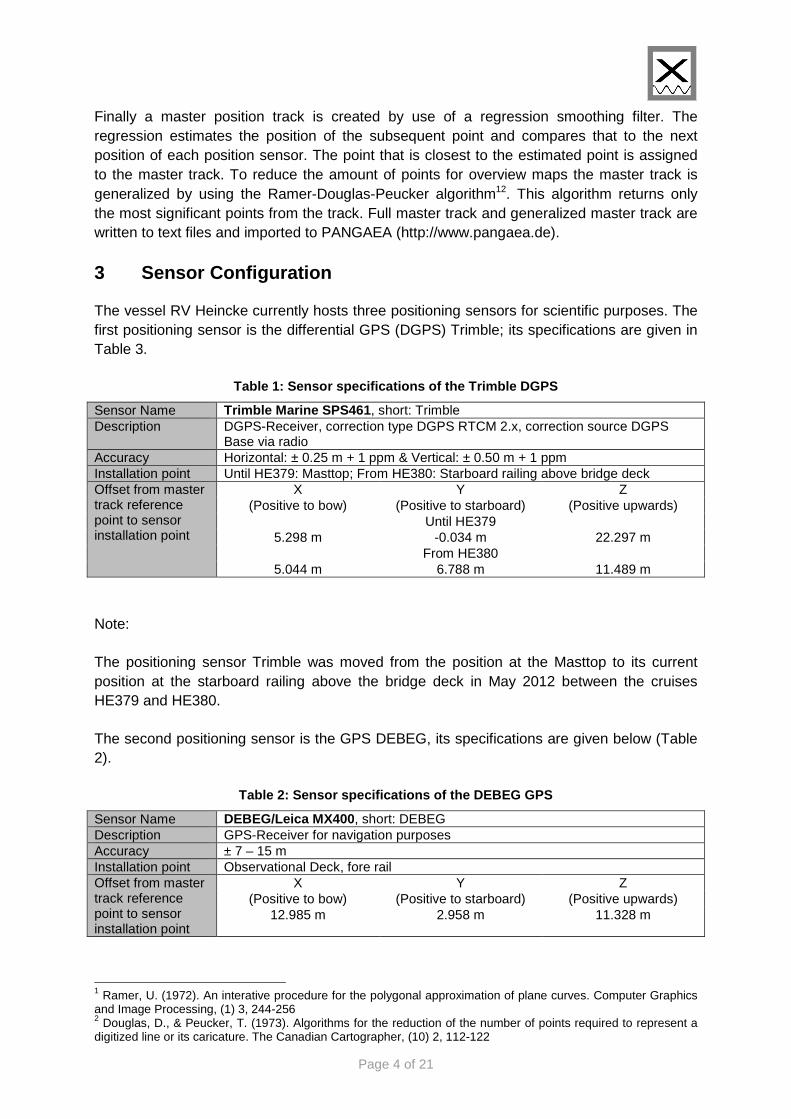
The vessel RV Heincke currently hosts three positioning sensors for scientific purposes. The first positioning sensor is the differential GPS (DGPS) Trimble; its specifications are given in Table 3.
Table 1: Sensor specifications of the Trimble DGPS
Sensor Name Trimble Marine SPS461 , short: Trimble Description DGPS-Receiver, correction type DGPS RTCM 2.x, correction source DGPS
Base via radio Accuracy Horizontal: ± 0.25 m + 1 ppm & Vertical: ± 0.50 m + 1 ppm Installation point Until HE379: Masttop; From HE380: Starboard railing above bridge deck Offset from master track reference point to sensor installation point
X Y Z (Positive to bow) (Positive to starboard) (Positive upwards)
Until HE379 5.298 m -0.034 m 22.297 m
From HE380 5.044 m 6.788 m 11.489 m
Note:
The positioning sensor Trimble was moved from the position at the Masttop to its current position at the starboard railing above the bridge deck in May 2012 between the cruises HE379 and HE380.
The second positioning sensor is the GPS DEBEG, its specifications are given below (Table 2).
Table 2: Sensor specifications of the DEBEG GPS
Sensor Name DEBEG/Leica MX400 , short: DEBEG Description GPS-Receiver for navigation purposes Accuracy ± 7 – 15 m Installation point Observational Deck, fore rail Offset from master track reference point to sensor installation point
X Y Z (Positive to bow) (Positive to starboard) (Positive upwards)
12.985 m 2.958 m 11.328 m
1 Ramer, U. (1972). An interative procedure for the polygonal approximation of plane curves. Computer Graphics and Image Processing, (1) 3, 244-256 2 Douglas, D., & Peucker, T. (1973). Algorithms for the reduction of the number of points required to represent a digitized line or its caricature. The Canadian Cartographer, (10) 2, 112-122
Page 5 of 21
Das Bild kann zurzeit nicht angezeigt werden.
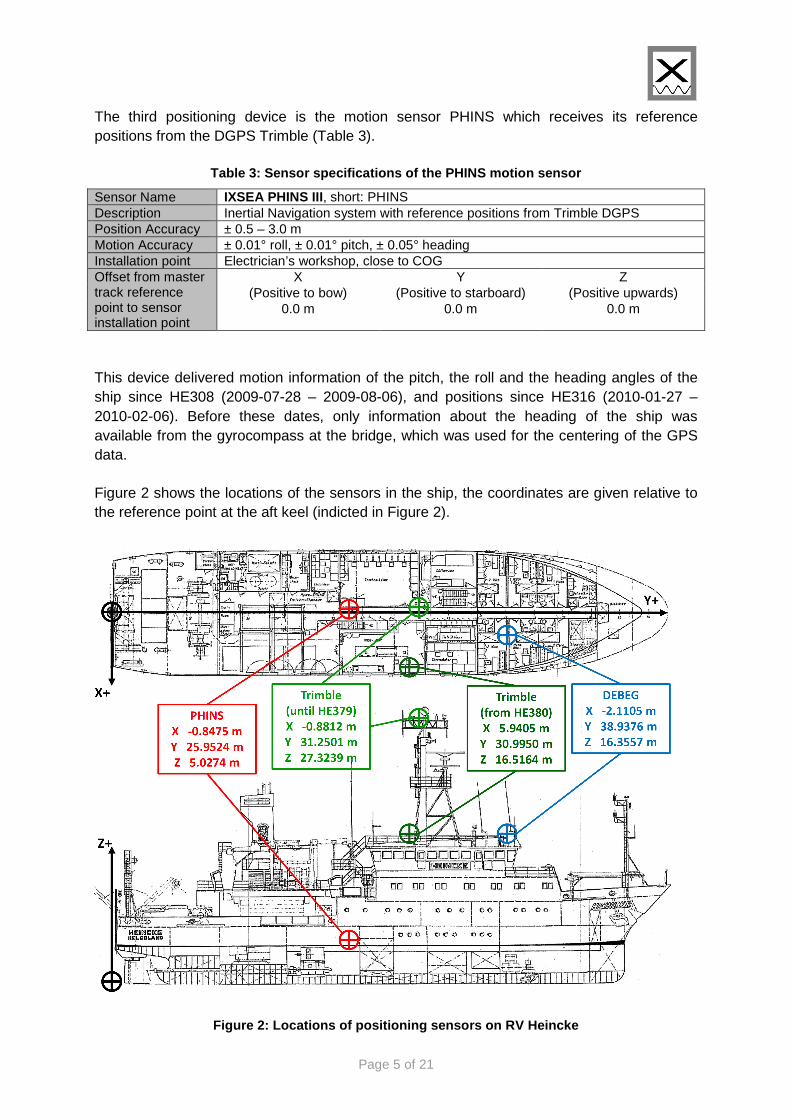
The third positioning device is the motion sensor PHINS which receives its reference positions from the DGPS Trimble (Table 3).
Table 3: Sensor specifications of the PHINS motion sensor
Sensor Name IXSEA PHINS III, short: PHINS Description Inertial Navigation system with reference positions from Trimble DGPS Position Accuracy ± 0.5 – 3.0 m Motion Accuracy ± 0.01° roll, ± 0.01° pitch, ± 0.05° heading Installation point Electrician’s workshop, close to COG Offset from master track reference point to sensor installation point
X Y Z (Positive to bow) (Positive to starboard) (Positive upwards)
0.0 m 0.0 m 0.0 m
This device delivered motion information of the pitch, the roll and the heading angles of the ship since HE308 (2009-07-28 – 2009-08-06), and positions since HE316 (2010-01-27 – 2010-02-06). Before these dates, only information about the heading of the ship was available from the gyrocompass at the bridge, which was used for the centering of the GPS data.
Figure 2 shows the locations of the sensors in the ship, the coordinates are given relative to the reference point at the aft keel (indicted in Figure 2).
Figure 2: Locations of positioning sensors on RV He incke
Page 6 of 21
Das Bild kann zurzeit nicht angezeigt werden.
4 Extracted Data
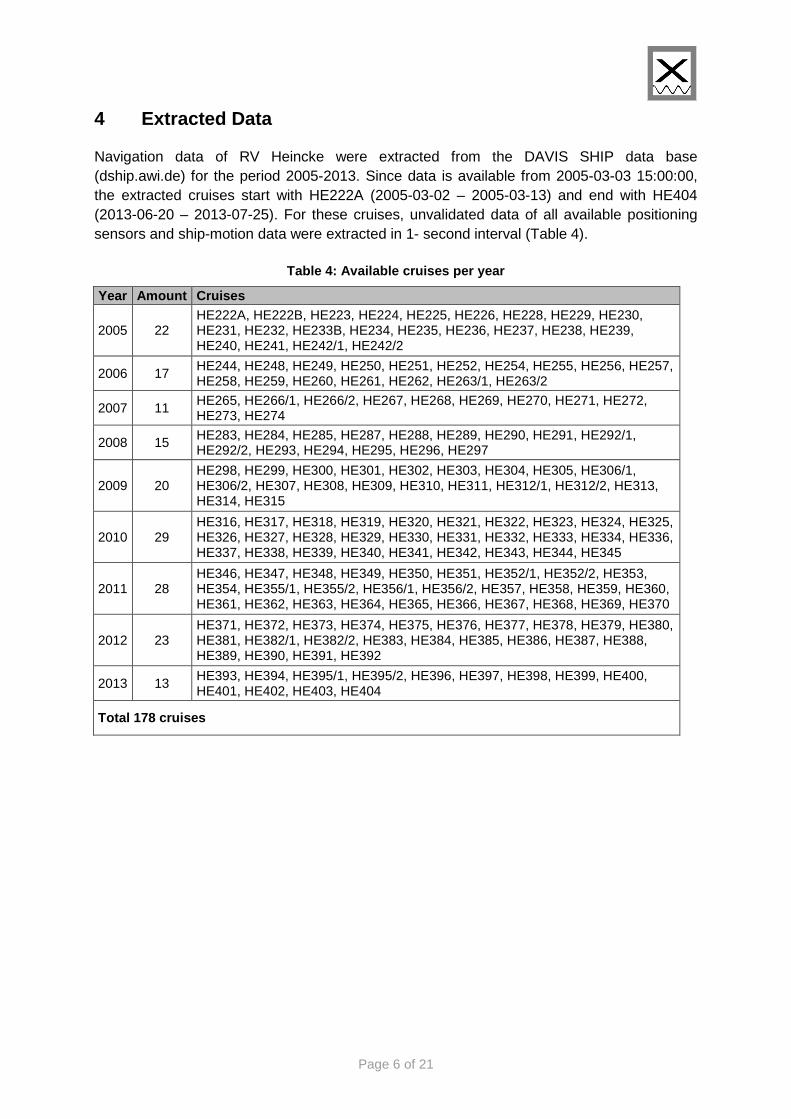
Navigation data of RV Heincke were extracted from the DAVIS SHIP data base (dship.awi.de) for the period 2005-2013. Since data is available from 2005-03-03 15:00:00, the extracted cruises start with HE222A (2005-03-02 – 2005-03-13) and end with HE404 (2013-06-20 – 2013-07-25). For these cruises, unvalidated data of all available positioning sensors and ship-motion data were extracted in 1- second interval (Table 4).
Table 4: Available cruises per year
Year Amount Cruises
2005 22 HE222A, HE222B, HE223, HE224, HE225, HE226, HE228, HE229, HE230, HE231, HE232, HE233B, HE234, HE235, HE236, HE237, HE238, HE239, HE240, HE241, HE242/1, HE242/2
2006 17 HE244, HE248, HE249, HE250, HE251, HE252, HE254, HE255, HE256, HE257, HE258, HE259, HE260, HE261, HE262, HE263/1, HE263/2
2007 11 HE265, HE266/1, HE266/2, HE267, HE268, HE269, HE270, HE271, HE272, HE273, HE274
2008 15 HE283, HE284, HE285, HE287, HE288, HE289, HE290, HE291, HE292/1, HE292/2, HE293, HE294, HE295, HE296, HE297
2009 20 HE298, HE299, HE300, HE301, HE302, HE303, HE304, HE305, HE306/1, HE306/2, HE307, HE308, HE309, HE310, HE311, HE312/1, HE312/2, HE313, HE314, HE315
2010 29 HE316, HE317, HE318, HE319, HE320, HE321, HE322, HE323, HE324, HE325, HE326, HE327, HE328, HE329, HE330, HE331, HE332, HE333, HE334, HE336, HE337, HE338, HE339, HE340, HE341, HE342, HE343, HE344, HE345
2011 28 HE346, HE347, HE348, HE349, HE350, HE351, HE352/1, HE352/2, HE353, HE354, HE355/1, HE355/2, HE356/1, HE356/2, HE357, HE358, HE359, HE360, HE361, HE362, HE363, HE364, HE365, HE366, HE367, HE368, HE369, HE370
2012 23 HE371, HE372, HE373, HE374, HE375, HE376, HE377, HE378, HE379, HE380, HE381, HE382/1, HE382/2, HE383, HE384, HE385, HE386, HE387, HE388, HE389, HE390, HE391, HE392
2013 13 HE393, HE394, HE395/1, HE395/2, HE396, HE397, HE398, HE399, HE400, HE401, HE402, HE403, HE404
Total 178 cruises
Page 7 of 21
Das Bild kann zurzeit nicht angezeigt werden.
5 Processing Logbook
5.1 First processing step: Data quality and manua l flagging
The extracted data are converted to ESRI point shapefiles and imported to a GIS. The position data from each position sensor are centered to the destined master track origin by applying ship-motion data (angles roll, pitch, and heading) and lever arms. For all position tracks, a quality check is performed using a ship’s speed filter, an acceleration filter, and a change of course-filter. Visual screening is then performed to evaluate data quality and to remove outliers manually. Filtered positions are flagged and are omitted in the master track creation.
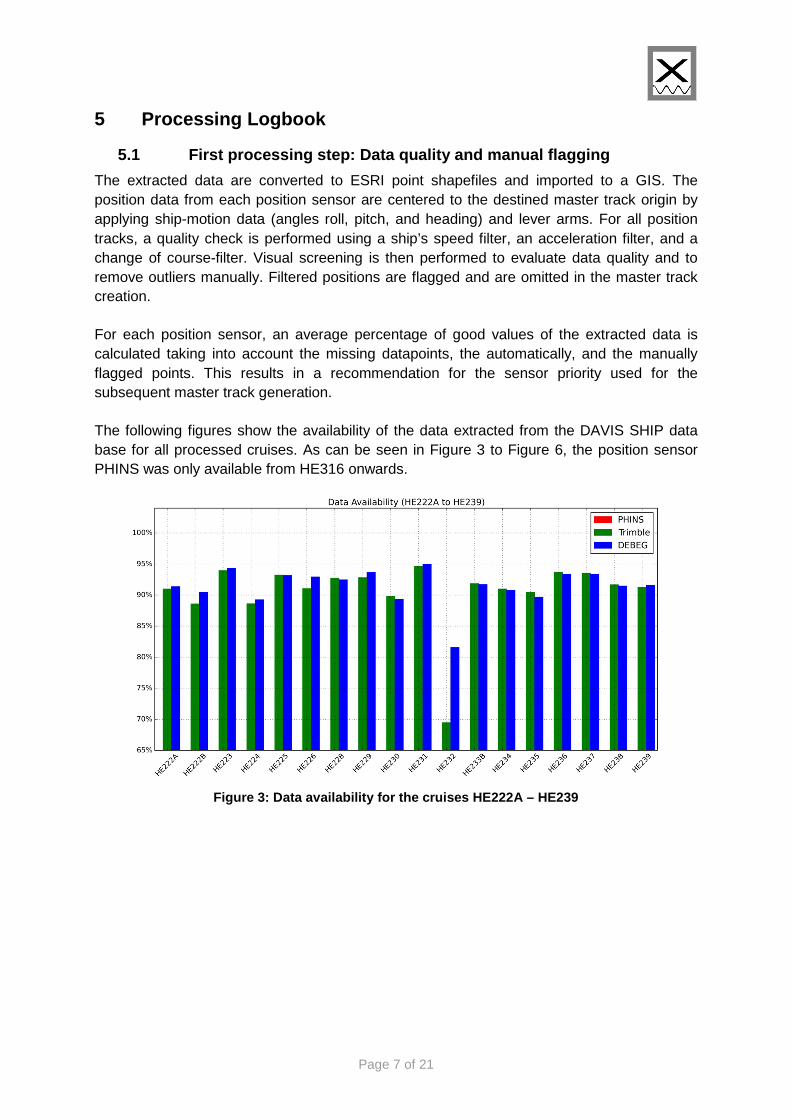
For each position sensor, an average percentage of good values of the extracted data is calculated taking into account the missing datapoints, the automatically, and the manually flagged points. This results in a recommendation for the sensor priority used for the subsequent master track generation.
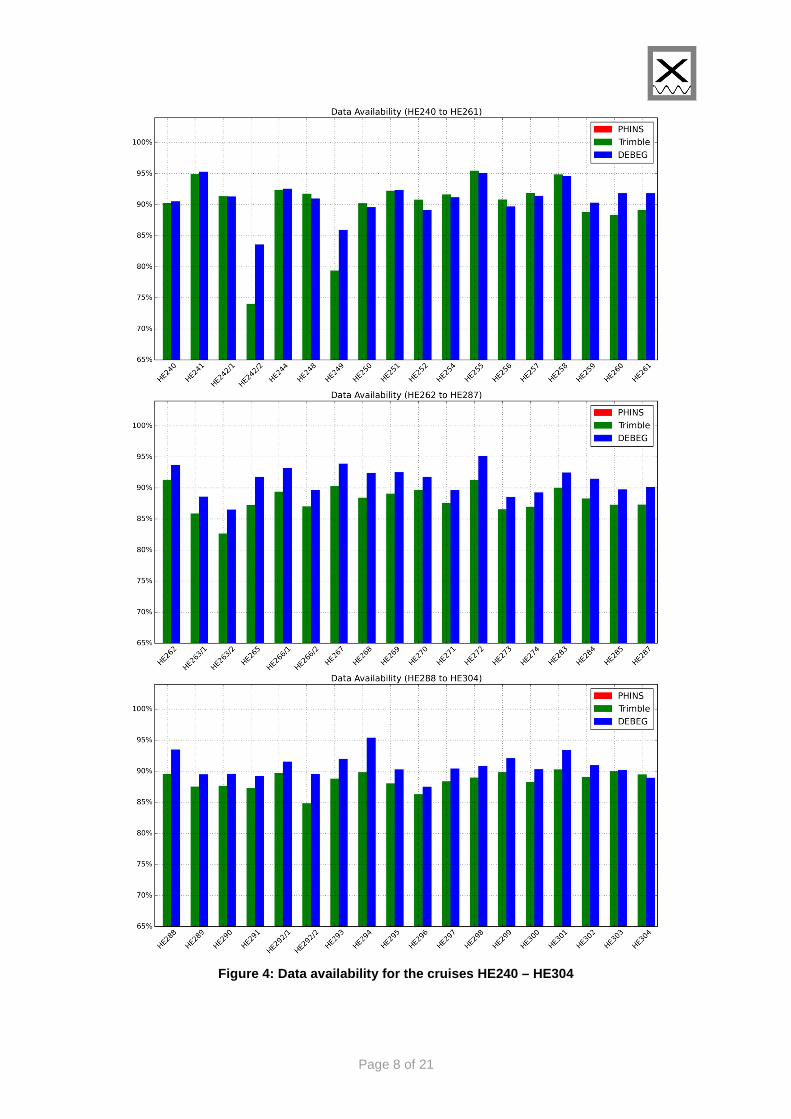
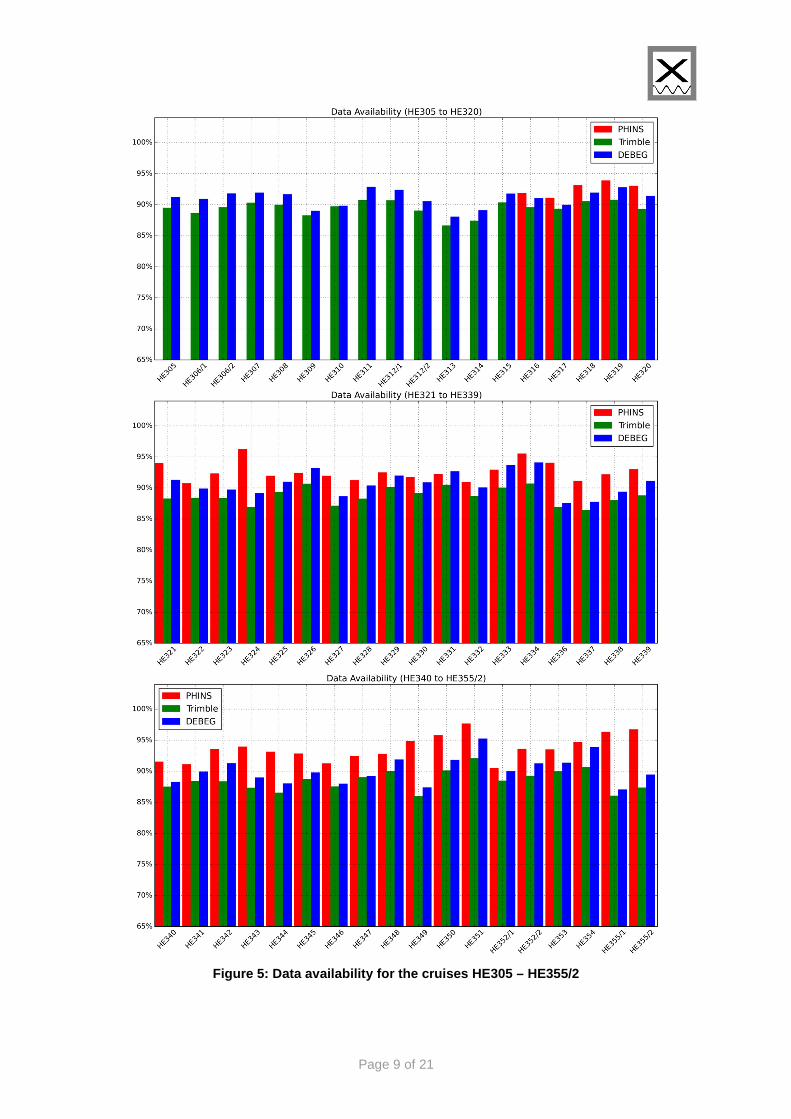
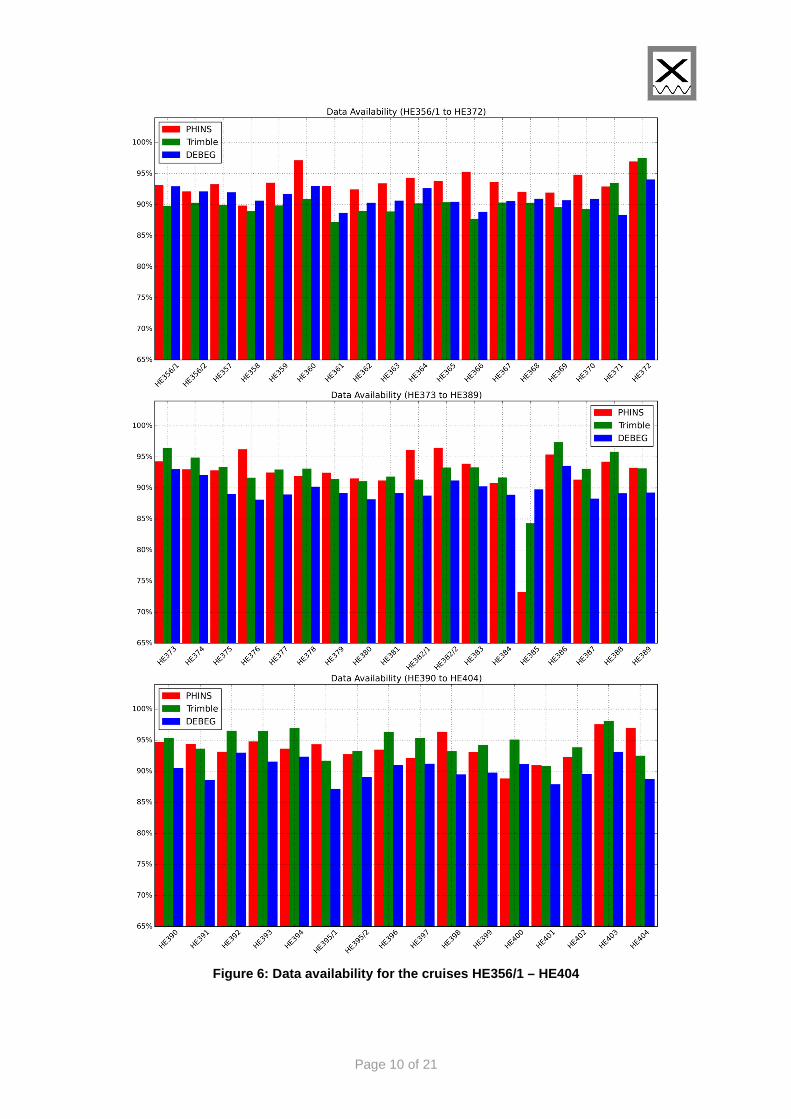
The following figures show the availability of the data extracted from the DAVIS SHIP data base for all processed cruises. As can be seen in Figure 3 to Figure 6, the position sensor PHINS was only available from HE316 onwards.
Figure 3: Data availability for the cruises HE222A – HE239
Page 8 of 21
Das Bild kann zurzeit nicht angezeigt werden.
Figure 4: Data availability for the cruises HE240 – HE304
Page 9 of 21
Das Bild kann zurzeit nicht angezeigt werden.
Figure 5: Data availability for the cruises HE305 – HE355/2
Page 10 of 21
Das Bild kann zurzeit nicht angezeigt werden.
Figure 6: Data availability for the cruises HE356/1 – HE404
Page 11 of 21
Das Bild kann zurzeit nicht angezeigt werden.
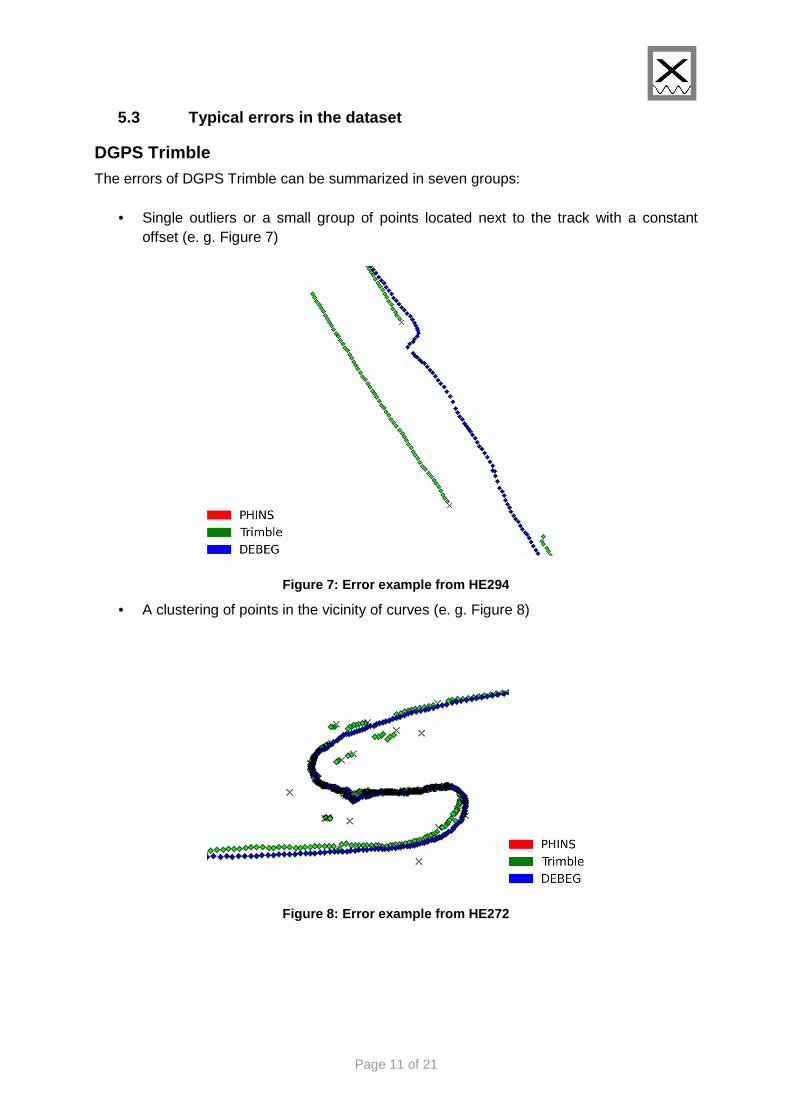
5.3 Typical errors in the dataset
DGPS Trimble The errors of DGPS Trimble can be summarized in seven groups:
• Single outliers or a small group of points located next to the track with a constant offset (e. g. Figure 7)
Figure 7: Error example from HE294
• A clustering of points in the vicinity of curves (e. g. Figure 8)
Figure 8: Error example from HE272
Page 12 of 21
Das Bild kann zurzeit nicht angezeigt werden.
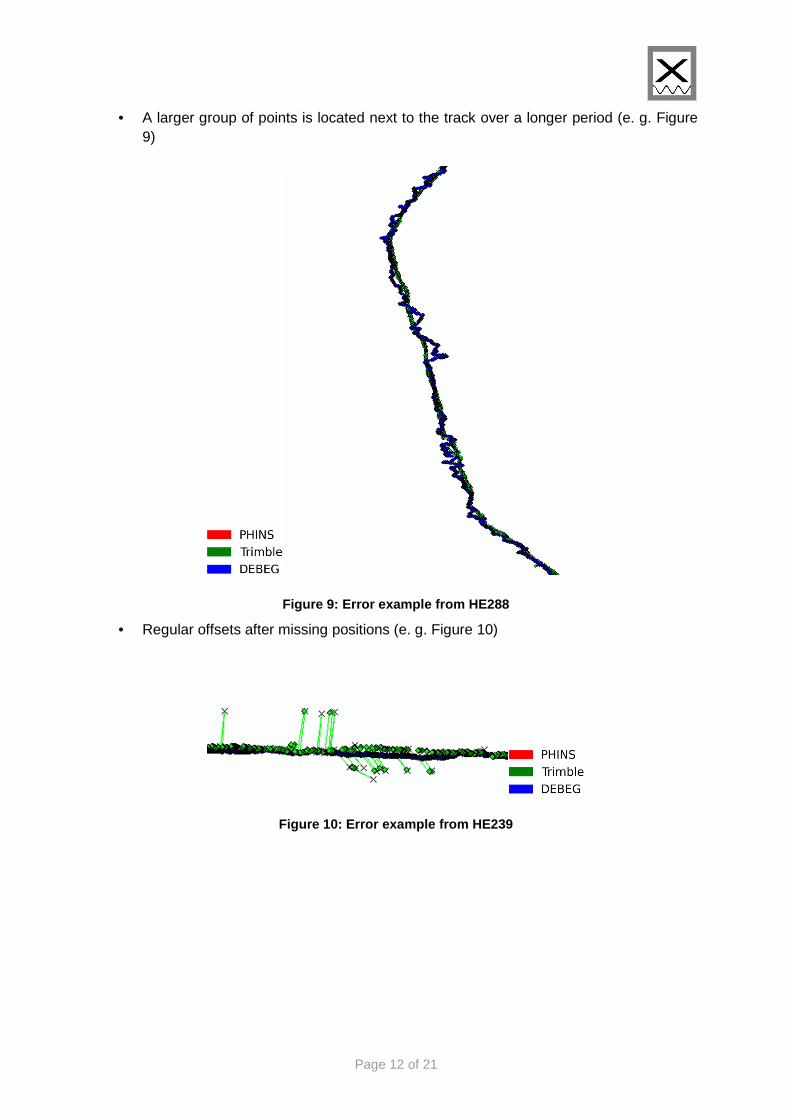
• A larger group of points is located next to the track over a longer period (e. g. Figure 9)
Figure 9: Error example from HE288
• Regular offsets after missing positions (e. g. Figure 10)
Figure 10: Error example from HE239
Page 13 of 21
Das Bild kann zurzeit nicht angezeigt werden.
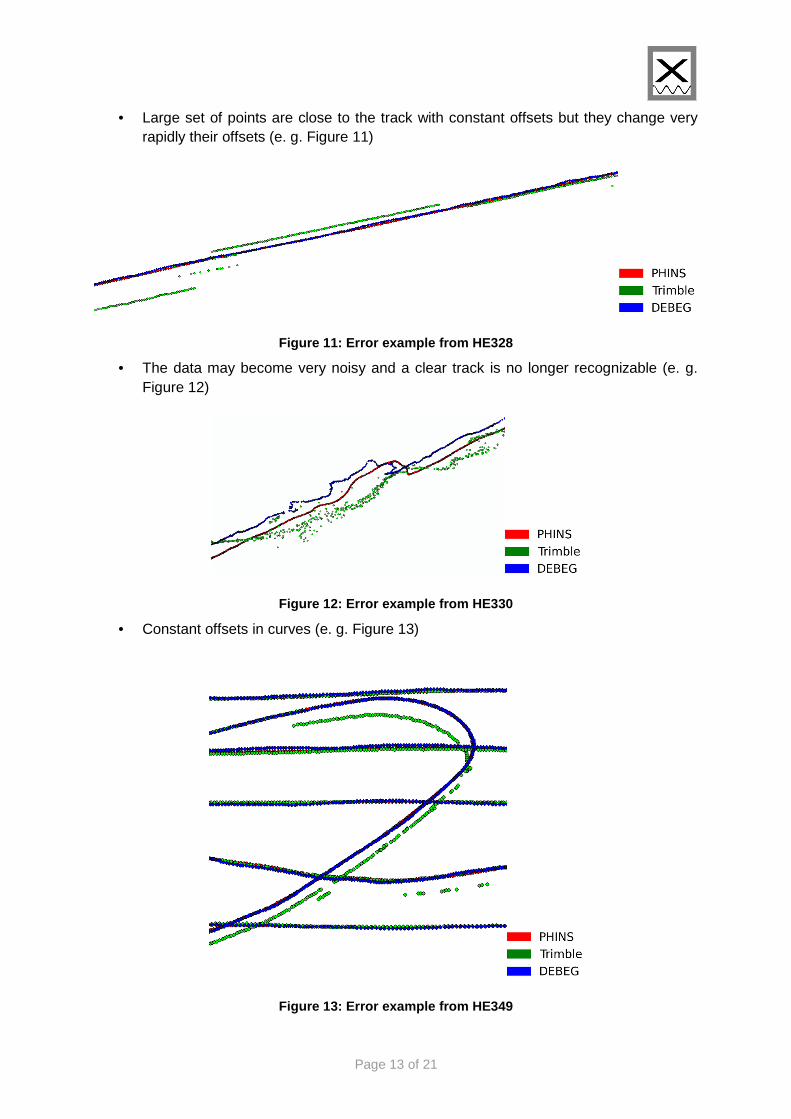
• Large set of points are close to the track with constant offsets but they change very rapidly their offsets (e. g. Figure 11)
Figure 11: Error example from HE328
• The data may become very noisy and a clear track is no longer recognizable (e. g. Figure 12)
Figure 12: Error example from HE330
• Constant offsets in curves (e. g. Figure 13)
Figure 13: Error example from HE349
Page 14 of 21
Das Bild kann zurzeit nicht angezeigt werden.
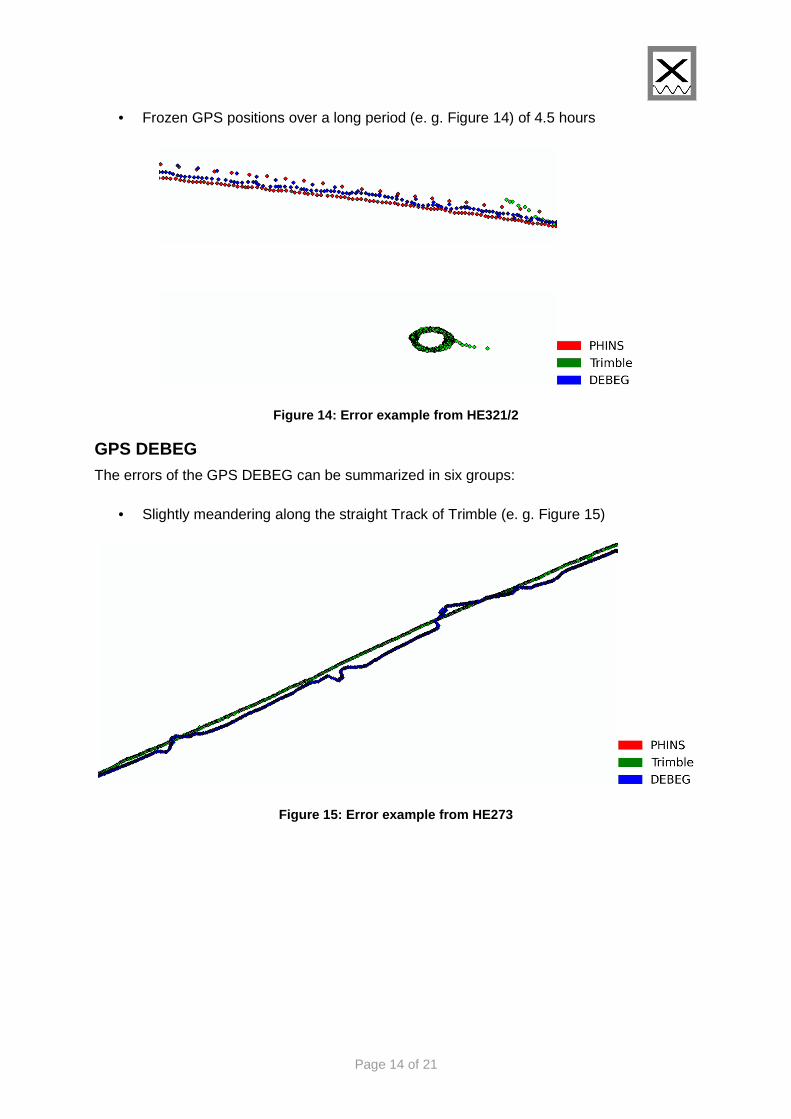
• Frozen GPS positions over a long period (e. g. Figure 14) of 4.5 hours
Figure 14: Error example from HE321/2
GPS DEBEG The errors of the GPS DEBEG can be summarized in six groups:
• Slightly meandering along the straight Track of Trimble (e. g. Figure 15)
Figure 15: Error example from HE273
Page 15 of 21
Das Bild kann zurzeit nicht angezeigt werden.
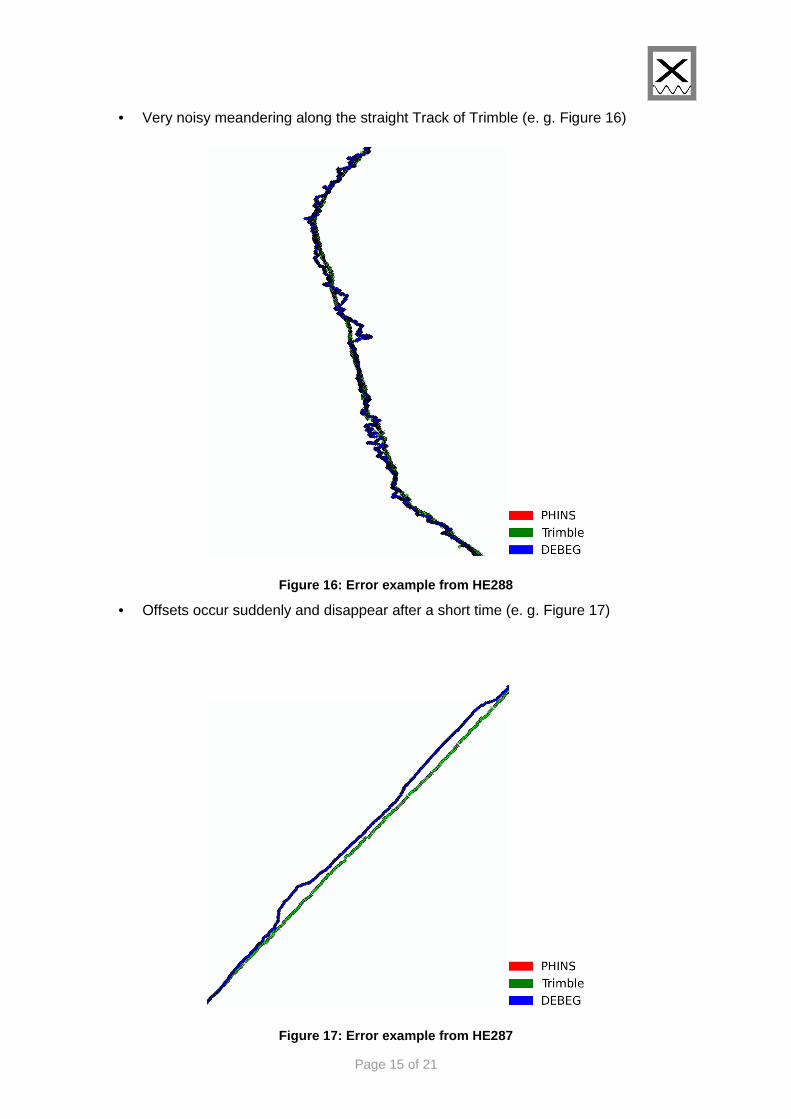
• Very noisy meandering along the straight Track of Trimble (e. g. Figure 16)
Figure 16: Error example from HE288
• Offsets occur suddenly and disappear after a short time (e. g. Figure 17)
Figure 17: Error example from HE287
Page 16 of 21
Das Bild kann zurzeit nicht angezeigt werden.
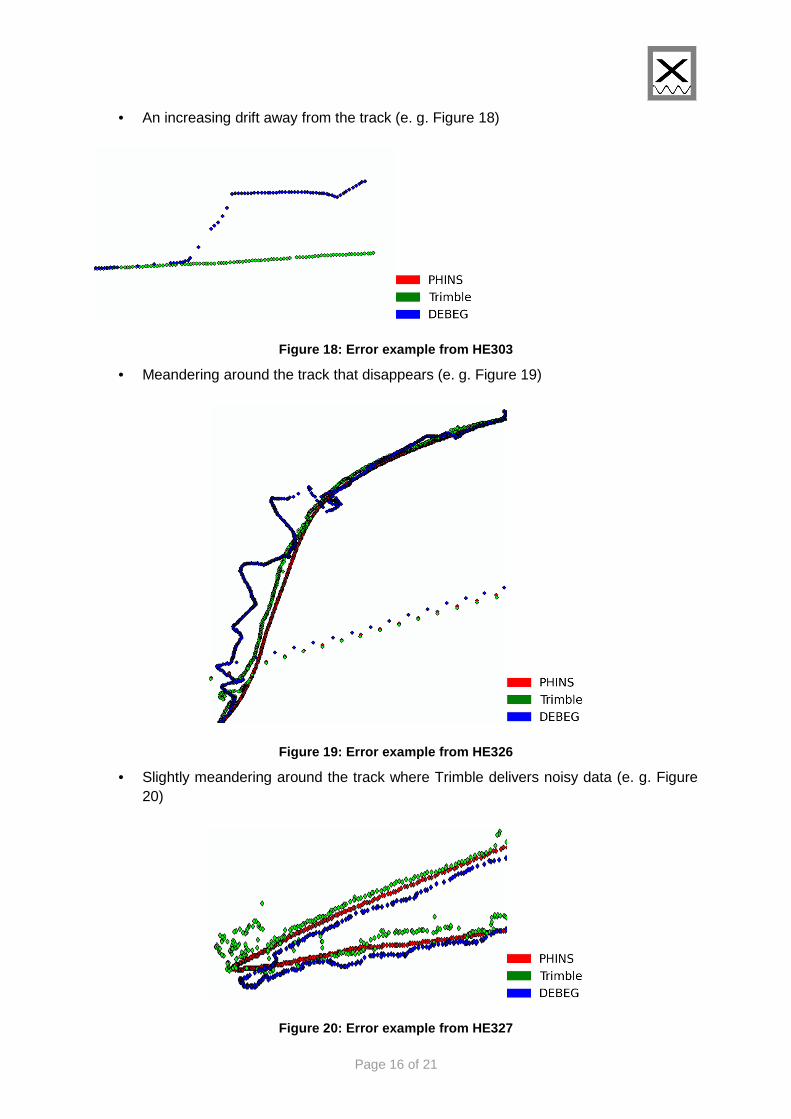
• An increasing drift away from the track (e. g. Figure 18)
Figure 18: Error example from HE303
• Meandering around the track that disappears (e. g. Figure 19)
Figure 19: Error example from HE326
• Slightly meandering around the track where Trimble delivers noisy data (e. g. Figure 20)
Figure 20: Error example from HE327

Page 17 of 21
Das Bild kann zurzeit nicht angezeigt werden.
Motion sensor PHINS The PHINS delivered positions are of very good quality, hence only isolated outliers are detected during smooth track (in HE321/2, see Figure 14)
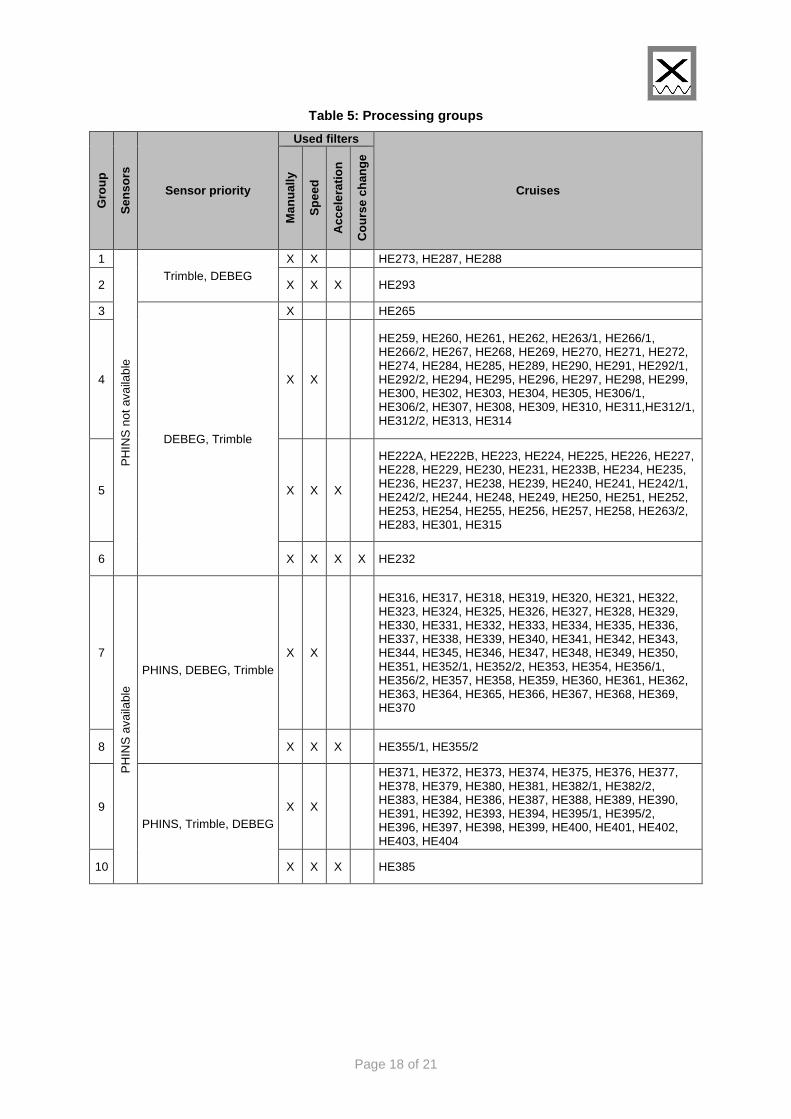
5.4 Hierarchical groups of cruises
The availability / absence of PHINS data is the primary hierarchical subdivision of the whole cruises dataset. The second subdivision relates to the sensor priority which is used for the generation of the master.
The third level refers to the applied filters. Outliers are marked manually and with automated filters. However, if too high percentages of points are flagged by the automated filters, they are not used for the master track creation. A threshold of 10% is used for the speed filter, and 5% for the acceleration- and course-change-filter, respectively. Altogether, 10 groups are defined (Table 5).
Page 18 of 21
Das Bild kann zurzeit nicht angezeigt werden.
Table 5: Processing groups G
roup
Sen
sors
Sensor priority
Used filters
Cruises
Man
ually
Spe
ed
Acc
eler
atio
n
Cou
rse
chan
ge
1
PH
INS
not
ava
ilabl
e
Trimble, DEBEG X X HE273, HE287, HE288
2 X X X HE293
3
DEBEG, Trimble
X HE265
4 X X
HE259, HE260, HE261, HE262, HE263/1, HE266/1, HE266/2, HE267, HE268, HE269, HE270, HE271, HE272, HE274, HE284, HE285, HE289, HE290, HE291, HE292/1, HE292/2, HE294, HE295, HE296, HE297, HE298, HE299, HE300, HE302, HE303, HE304, HE305, HE306/1, HE306/2, HE307, HE308, HE309, HE310, HE311,HE312/1, HE312/2, HE313, HE314
5 X X X
HE222A, HE222B, HE223, HE224, HE225, HE226, HE227, HE228, HE229, HE230, HE231, HE233B, HE234, HE235, HE236, HE237, HE238, HE239, HE240, HE241, HE242/1, HE242/2, HE244, HE248, HE249, HE250, HE251, HE252, HE253, HE254, HE255, HE256, HE257, HE258, HE263/2, HE283, HE301, HE315
6 X X X X HE232
7
PH
INS
ava
ilabl
e
PHINS, DEBEG, Trimble
X X
HE316, HE317, HE318, HE319, HE320, HE321, HE322, HE323, HE324, HE325, HE326, HE327, HE328, HE329, HE330, HE331, HE332, HE333, HE334, HE335, HE336, HE337, HE338, HE339, HE340, HE341, HE342, HE343, HE344, HE345, HE346, HE347, HE348, HE349, HE350, HE351, HE352/1, HE352/2, HE353, HE354, HE356/1, HE356/2, HE357, HE358, HE359, HE360, HE361, HE362, HE363, HE364, HE365, HE366, HE367, HE368, HE369, HE370
8 X X X HE355/1, HE355/2
9 PHINS, Trimble, DEBEG
X X
HE371, HE372, HE373, HE374, HE375, HE376, HE377, HE378, HE379, HE380, HE381, HE382/1, HE382/2, HE383, HE384, HE386, HE387, HE388, HE389, HE390, HE391, HE392, HE393, HE394, HE395/1, HE395/2, HE396, HE397, HE398, HE399, HE400, HE401, HE402, HE403, HE404
10 X X X HE385
Page 19 of 21
Das Bild kann zurzeit nicht angezeigt werden.
6 Scores
6.1 Calculation
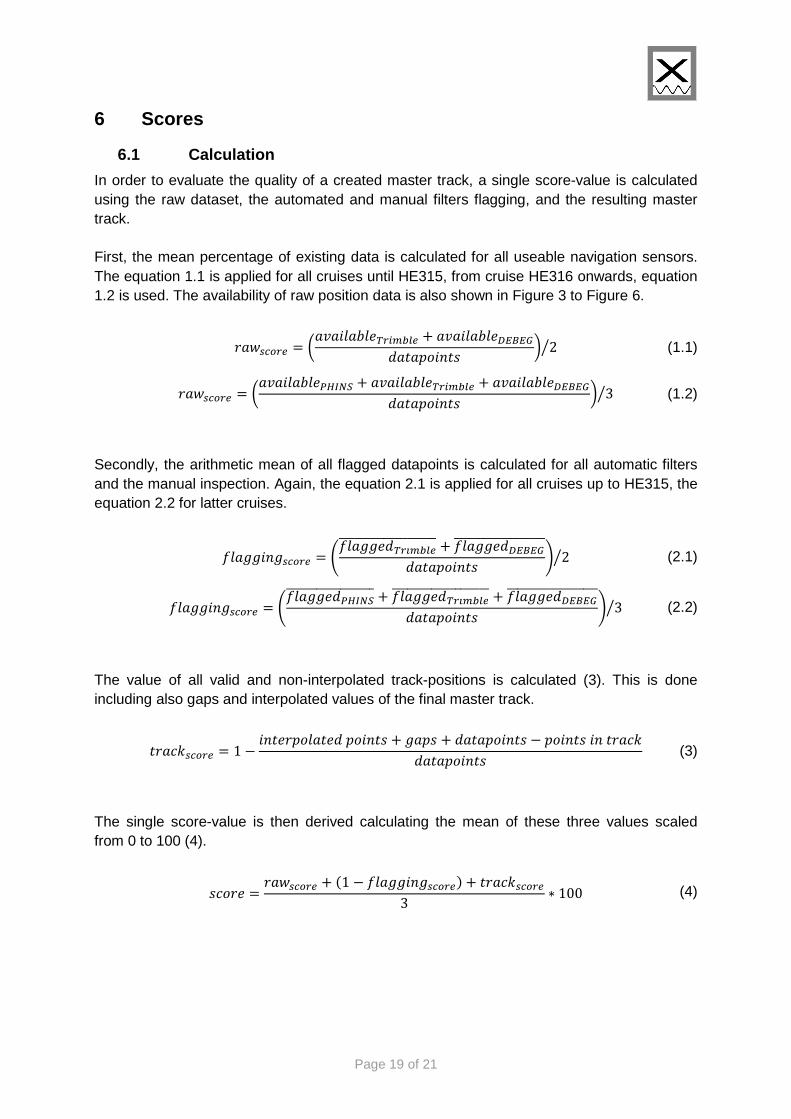
In order to evaluate the quality of a created master track, a single score-value is calculated using the raw dataset, the automated and manual filters flagging, and the resulting master track.
First, the mean percentage of existing data is calculated for all useable navigation sensors. The equation 1.1 is applied for all cruises until HE315, from cruise HE316 onwards, equation 1.2 is used. The availability of raw position data is also shown in Figure 3 to Figure 6.
�������� = ���� �� �������� + ���� �� ���������������� 2" (1.1)
�������� = ���� �� �#$%&' + ���� �� �������� + ���� �� ���������������� 3" (1.2)
Secondly, the arithmetic mean of all flagged datapoints is calculated for all automatic filters and the manual inspection. Again, the equation 2.1 is applied for all cruises up to HE315, the equation 2.2 for latter cruises.
) �**��*����� = +) �**����,����-------------------- + ) �**�������-------------------���������� . 2" (2.1)
) �**��*����� = +) �**��#$%&'------------------ + ) �**����,����-------------------- + ) �**�������-------------------���������� . 3" (2.2)
The value of all valid and non-interpolated track-positions is calculated (3). This is done including also gaps and interpolated values of the final master track.
���/0����� = 1 − ������� ���������� + *��� + ���������� − �����������/0���������� (3)
The single score-value is then derived calculating the mean of these three values scaled from 0 to 100 (4).
�/��� = �������� + 41 − ) �**��*�����5 + ���/0�����3 ∗ 100 (4)
Page 20 of 21
Das Bild kann zurzeit nicht angezeigt werden.
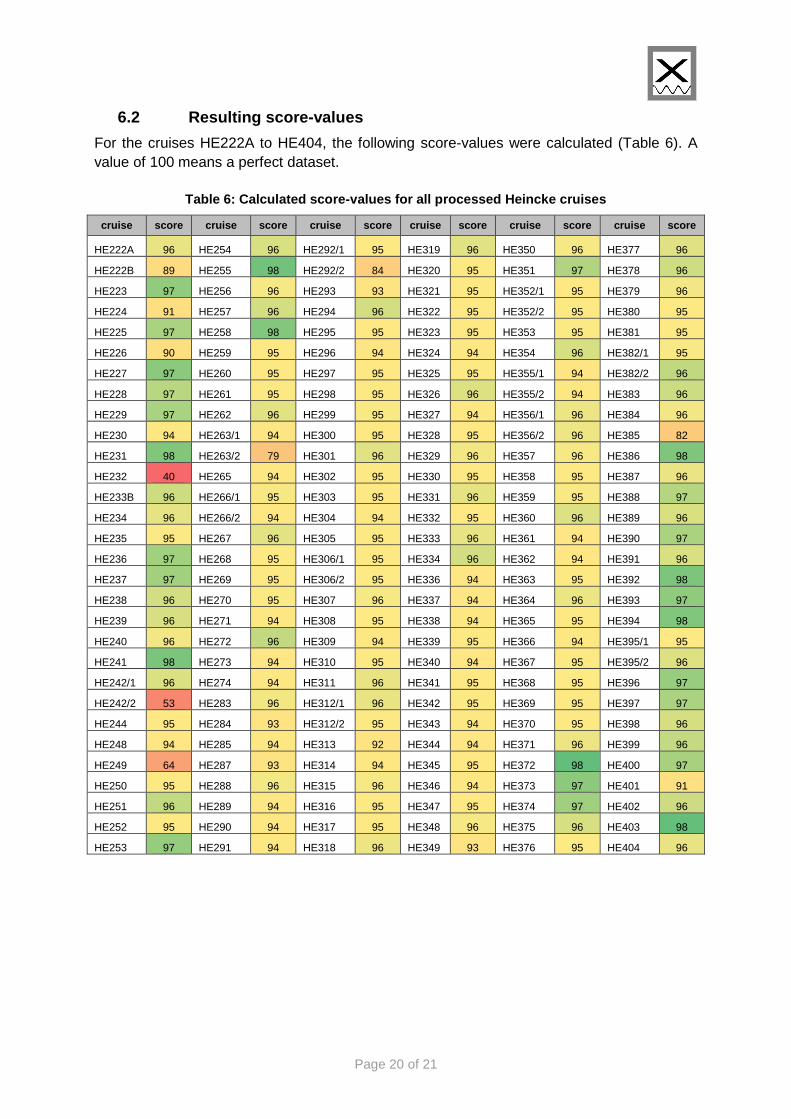
6.2 Resulting score-values
For the cruises HE222A to HE404, the following score-values were calculated (Table 6). A value of 100 means a perfect dataset.
Table 6: Calculated score-values for all processed Heincke cruises
cruise score cruise score cruise score cruise score cruise score cruise score
HE222A 96 HE254 96 HE292/1 95 HE319 96 HE350 96 HE377 96
HE222B 89 HE255 98 HE292/2 84 HE320 95 HE351 97 HE378 96
HE223 97 HE256 96 HE293 93 HE321 95 HE352/1 95 HE379 96
HE224 91 HE257 96 HE294 96 HE322 95 HE352/2 95 HE380 95
HE225 97 HE258 98 HE295 95 HE323 95 HE353 95 HE381 95
HE226 90 HE259 95 HE296 94 HE324 94 HE354 96 HE382/1 95
HE227 97 HE260 95 HE297 95 HE325 95 HE355/1 94 HE382/2 96
HE228 97 HE261 95 HE298 95 HE326 96 HE355/2 94 HE383 96
HE229 97 HE262 96 HE299 95 HE327 94 HE356/1 96 HE384 96
HE230 94 HE263/1 94 HE300 95 HE328 95 HE356/2 96 HE385 82
HE231 98 HE263/2 79 HE301 96 HE329 96 HE357 96 HE386 98
HE232 40 HE265 94 HE302 95 HE330 95 HE358 95 HE387 96
HE233B 96 HE266/1 95 HE303 95 HE331 96 HE359 95 HE388 97
HE234 96 HE266/2 94 HE304 94 HE332 95 HE360 96 HE389 96
HE235 95 HE267 96 HE305 95 HE333 96 HE361 94 HE390 97
HE236 97 HE268 95 HE306/1 95 HE334 96 HE362 94 HE391 96
HE237 97 HE269 95 HE306/2 95 HE336 94 HE363 95 HE392 98
HE238 96 HE270 95 HE307 96 HE337 94 HE364 96 HE393 97
HE239 96 HE271 94 HE308 95 HE338 94 HE365 95 HE394 98
HE240 96 HE272 96 HE309 94 HE339 95 HE366 94 HE395/1 95
HE241 98 HE273 94 HE310 95 HE340 94 HE367 95 HE395/2 96
HE242/1 96 HE274 94 HE311 96 HE341 95 HE368 95 HE396 97
HE242/2 53 HE283 96 HE312/1 96 HE342 95 HE369 95 HE397 97
HE244 95 HE284 93 HE312/2 95 HE343 94 HE370 95 HE398 96
HE248 94 HE285 94 HE313 92 HE344 94 HE371 96 HE399 96
HE249 64 HE287 93 HE314 94 HE345 95 HE372 98 HE400 97
HE250 95 HE288 96 HE315 96 HE346 94 HE373 97 HE401 91
HE251 96 HE289 94 HE316 95 HE347 95 HE374 97 HE402 96
HE252 95 HE290 94 HE317 95 HE348 96 HE375 96 HE403 98
HE253 97 HE291 94 HE318 96 HE349 93 HE376 95 HE404 96

Page 21 of 21
Das Bild kann zurzeit nicht angezeigt werden.
7 Reports
For each processed cruise, a report is created and uploaded to the electronic Publication Information Center (ePIC; http://epic.awi.de). These reports include all metadata of the cruise (duration, harbors, and start/end of extracted DSHIP-data) and all information of the used navigation sensors.
Besides this, the report gives detailed descriptions of the data quality, the result of automated and manual filtering, the settings of the master track creation (sensor priority and filters) and the composition of the created track.
Additionally, the generalized track is shown on an included map, and the calculated score value is given.