Embed Size (px)
Citation preview

Regulation der Nektarzusammensetzung bei
tag- und nachtblühenden Arten der Gattung
Nicotiana
Dissertation
zur Erlangung des Doktorgrades
der Fakultät der Mathematik und Naturwissenschaften der
Bergischen Universität Wuppertal
angefertigt in der
Arbeitsgruppe für Molekulare Pflanzenforschung/Pflanzenbiochemie (Botanik)
vorgelegt von
Kira Juliane Tiedge
Wuppertal, im Februar 2018

Referentin: Prof‘in Dr. Gertrud Lohaus, Bergische Universität Wuppertal
Co-Referentin: Prof‘in Dr. Angelika Preisfeld, Bergische Universität Wuppertal
Die Dissertation kann wie folgt zitiert werden:
urn:nbn:de:hbz:468-20180416-110816-7[http://nbn-resolving.de/urn/resolver.pl?urn=urn%3Anbn%3Ade%3Ahbz%3A468-20180416-110816-7]
Inhaltsverzeichnis i
Inhaltsverzeichnis
Inhaltsverzeichnis ................................................................................................................ i
Tabellenverzeichnis ............................................................................................................iii
Abbildungsverzeichnis .......................................................................................................iv
Abstract................................................................................................................................ v
Zusammenfassung ..............................................................................................................vi
1. Einleitung ...................................................................................................................... 1
1.1. Nektar .......................................................................................................................... 1
1.2. Nektarien ...................................................................................................................... 2
1.3. Pflanzliche Invertasen .................................................................................................. 5
1.4. Die Gattung Nicotiana .................................................................................................. 7
1.5. Bestäubungssyndrome ................................................................................................. 8
1.6. Fragestellung ..............................................................................................................11
2. Material und Methoden ................................................................................................12
2.1. Pflanzenmaterial und Anzucht .....................................................................................12
2.2. Gewinnung von Nektar ................................................................................................13
2.3. Gewinnung von Nektariengewebe ...............................................................................13
2.4. Sammeln von Blattmaterial ..........................................................................................14
2.5. Gewinnung von Phloemsaft mit der Laser-Aphiden-Technik .......................................14
2.6. Biochemische Analyse der Komponenten in Blättern, Nektarien und im Nektar ..........15
2.6.1. Chloroform-Methanol-Extraktion ...........................................................................15
2.6.2. Bestimmung von Stärke .......................................................................................15
2.6.3. Bestimmung von Protein ......................................................................................16
2.6.4. High-Performance-Liquid-Chromatography (HPLC)..............................................17
2.6.5. Proteinauftrennung mittels Polyacrylamid-Gelelektrophorese ...............................20
2.7. Bestimmung der Invertase-Aktivität .............................................................................23
2.8. Molekularbiologische Arbeiten .....................................................................................24
2.8.1. RNA-Isolierung .....................................................................................................24
2.8.2. Isolierung von Plasmid DNA (Mini-Prep) ...............................................................25
2.8.3. Bestimmung von Nukleinsäurekonzentrationen ....................................................26
2.8.4. Hydrolyse von DNA ..............................................................................................26
2.8.5. cDNA-Synthese ....................................................................................................27
2.8.6. Amplifikation von DNA-Fragmenten ......................................................................27

Inhaltsverzeichnis ii
2.8.7. DNA-Sequenzierung .............................................................................................28
2.8.8. Qualitative Echtzeit-PCR (qRT-PCR) ...................................................................29
2.8.9. Klonierung ............................................................................................................30
2.8.10. RNA- und DNA-Größenauftrennung mit Agarosegelen .........................................33
2.8.11. Screening des Nektars auf mikrobiellen Befall ......................................................34
2.9. Verwendete Oligosaccharide .......................................................................................35
2.10. Statistik .....................................................................................................................37
2.11. Bioinformatik .............................................................................................................38
3. Ergebnisse ...................................................................................................................39
3.1. Abschnitt I: Mikrobieller Befall im Nektar .....................................................................40
3.2. Abschnitt II: Nektarinhaltsstoffe bei Tabakpflanzen: Welche gibt es und wodurch
werden sie beeinflusst? ...............................................................................................42
3.3. Abschnitt III: Proteine in Nektar und Nektarien von Nicotiana ......................................84
3.4. Abschnitt IV: Regulation der Zuckerzusammensetzung in Nektar und Nektarien bei
Nicotiana .....................................................................................................................90
4. Diskussion ................................................................................................................. 124
4.1. Nektarinhaltsstoffe und ihre Anpassung an die Bestäuber ......................................... 124
4.2. Proteine im Nektar ..................................................................................................... 128
4.3. Mechanismen der Nektarzuckerproduktion bei tag- und nachtblühenden Tabakarten
129
Literatur............................................................................................................................. 133
Appendix ........................................................................................................................... 146
Danksagung ...................................................................................................................... 152
Erklärung .......................................................................................................................... 153

Tabellenverzeichnis iii
Tabellenverzeichnis
Tabelle 2.1: Liste der untersuchten Pflanzen. .......................................................................12
Tabelle 2.2: Reaktionsmedium für einen Reaktionsansatz zur Stärkebestimmung ...............15
Tabelle 2.3: Mastermix pro Reaktionsansatz zur Glucosebestimmung .................................16
Tabelle 2.4: Einstellungen für die Pulsmessungen am Amperometer ...................................17
Tabelle 2.5: Lösungen für die Aminosäure-HPLC .................................................................18
Tabelle 2.6: Pipettierschema für 2 SDS-Gele .......................................................................21
Tabelle 2.7: Puffer für die SDS-PAGE ..................................................................................21
Tabelle 2.8: Lösungen für die Coomassie-Färbung ..............................................................22
Tabelle 2.9: Lösungen für die Silberfärbung .........................................................................22
Tabelle 2.10: Puffer und Lösungen für das Invertase-Assay .................................................23
Tabelle 2.11: Puffer für die RNA-Isolierung ..........................................................................25
Tabelle 2.12: STEL-Puffer ....................................................................................................26
Tabelle 2.13 Zusammensetzung einer Standard-PCR ..........................................................28
Tabelle 2.14 Standard PCR-Programm ................................................................................28
Tabelle 2.15 Zusammensetzung einer qRT-PCR-Reaktion ..................................................29
Tabelle 2.16 Programm für die qRT-PCR .............................................................................30
Tabelle 2.17: Puffer und Medien für die Herstellung kompetenter E. coli ..............................32
Tabelle 2.18: Ansatz für 1 l LB-Medium ................................................................................33
Tabelle 2.19: Ansatz für 50x TAE Puffer ...............................................................................34
Tabelle 2.20: Ansatz für 1 l Malzextrakt-Agar .......................................................................34
Tabelle 2.21: PCR Ansatz für Hefescreening .......................................................................35
Tabelle 2.22: Verwendete Oligosaccharide für die PCR und qRT-PCR ................................36
Tabelle 2.23: Verwendete bioinformatische Software und Server .........................................38
Tabelle 3.1: Häufig vorkommende Mikroben in floralem Nektar ............................................40
Tabelle 3.2: Größe und Konzentration der Markerproteine ...................................................86
Tabelle 3.3: Proteingehalte in Nektarien und Blättern ...........................................................89

Abbildungsverzeichnis iv
Abbildungsverzeichnis
Abbildung 1.1: Blütenaufbau bei Nicotiana ............................................................................ 3
Abbildung 1.2: Modell der ekkrinen Nektarsekretion .............................................................. 5
Abbildung 1.3: Florale Nektarien bei N. tabacum ................................................................... 7
Abbildung 3.1: Mikroskopische Aufnahmen der Nektarausstriche ........................................41
Abbildung 3.2: Mit Coomassie angefärbte Proteine nach der SDS-PAGE ............................85
Abbildung 3.3: Angefärbte Proteine aus N. alata und N. sylvestris nach der SDS-PAGE .....86
Abbildung 3.4: Mit Silber angefärbte Proteine nach der SDS-PAGE .....................................87
Abbildung 3.5: Vergleich der mit Silber angefärbten Proteine innerhalb einer Art .................88
Abstract v
Abstract
To attract pollinators, tobacco plants produce nectar. Nectar is an aqueous solution with a
high sugar content and also contains amino acids, proteins, anions and cations, organic
acids and secondary metabolites. The composition of the nectar varies from species to
species, but the concentration of the components and their proportionate ratio is similar intra-
specifically. Therefore, the question arises on which factors the nectar composition depends,
for example, on the adaptation to certain pollinator groups or on the phylogeny of the
respective species. In order to test this, the nectar of 20 tobacco species was analysed for
the different components. The protein content in the nectar was similar for many species, but
the protein profile differed according to species. Statistical analyses have shown that mainly
sugar and amino acids are dependent on the pollinators, whereas for ions and the most
important organic acid malate, the influence of pollinators and phylogeny is equally high. This
gave rise to the question of how Nicotiana can regulate the nectar composition. Since only
sucrose reaches the nectar-producing tissue through phloem, the hexoses present in the
nectar have to be produced by saccharose-cleaving enzymes. The expression and activity of
cell wall invertases in day- and night-flowering tobacco was examined at different time points
simultaneously to the sugar composition in nectaries and nectar. The sugar composition of
the nectar was already predetermined before and during its secretion, as there was a high
correlation between the percentages of fructose and sucrose in nectaries and nectar and
additionally no post-secretory modification of the sugars in the nectar could be found. In case
of the night-flowering species, the sugar concentration in the nectar was even higher in
relation to the nectaries than in day-flowering species. Considering this and the sub-cellular
concentrations of sugars in the nectaries, other transport mechanisms must be involved in
the secretion in night-flowering Nicotiana species than in day-flowering species. Further
results suggest that additional enzymes besides cell wall invertases must be involved in the
production of nectar.

Zusammenfassung vi
Zusammenfassung
Tabakpflanzen produzieren Nektar, um Bestäuber anzulocken. Der Nektar ist eine wässrige
Lösung mit einem hohen Zuckeranteil und enthält außerdem Aminosäuren, Proteine,
Anionen und Kationen, organische Säuren und sekundäre Metabolite. Die
Zusammensetzung des Nektars variiert dabei von Art zu Art, die Konzentration der
Inhaltsstoffe und ihr anteiliges Verhältnis ist aber intra-spezifisch ähnlich. Daher stellt sich die
Frage, von welchen Faktoren die Nektarzusammensetzung abhängig ist, zum Beispiel von
der Anpassung an bestimmte Bestäubergruppen oder von der Phylogenese der jeweiligen
Art. Um dies zu untersuchen, wurde der Nektar von 20 verschiedenen Tabakarten auf
verschiedene Komponenten hin analysiert. Der Proteingehalt im Nektar war ähnlich bei
vielen Arten, aber das Proteinprofil unterschied sich ebenfalls je nach Art. Statistische
Analysen zeigten, dass vor allem Zucker und Aminosäuren von den Bestäuber abhängig
sind, bei Ionen und der wichtigsten organischen Säure Malat ist der Einfluss von Bestäubern
und Phylogenie gleich hoch. Daraus ergab sich die Frage, wie Nicotiana die
Nektarzusammensetzung regulieren kann. Da über das Phloem nur Saccharose zu den
Nektarien, dem Nektar-produzierenden Gewebe, gelangt, müssen die im Nektar
vorhandenen Hexosen durch Saccharose-spaltende Enzyme in den Nektarien gebildet
werden. Die Expression und Aktivität von Zellwandinvertasen wurde bei tag- und
nachtblühendem Tabak zu unterschiedlichen Zeitpunkten parallel zur
Zuckerzusammensetzung in Nektar und Nektarien untersucht. Die Zuckerzusammensetzung
des Nektars war hauptsächlich schon vor und während der Nektarsekretion vorgegeben, da
eine hohe Korrelation der prozentualen Anteile von Fructose als auch von Saccharose
zwischen Nektar und Nektarien vorhanden war und keine post-sekretionale Modifikation der
Zucker im Nektar stattfand. Bei den nachtblühenden Arten war die Zuckerkonzentration im
Nektar im Verhältnis zu den Nektarien noch stärker als bei den tagblühenden Arten erhöht.
In Anbetracht dessen und der subzellulären Konzentrationen der Zucker in den Nektarien
müssen bei nachtblühenden Nicotiana-Arten andere Transportmechanismen als bei
tagblühenden Arten an der Sekretion beteiligt sein. Weitere Ergebnisse lassen vermuten,
dass noch zusätzliche Enzyme außer Zellwandinvertasen an der Nektarproduktion beteiligt
sein müssen.

Einleitung 1
1. Einleitung
Der evolutive Erfolg der angiospermen Blütenpflanzen (Bedecktsamer) kann vor allem durch
die Symbiose mit tierischen Bestäubern erklärt werden. Die Bestäubung durch Tiere ist
weitaus zielgerichteter und somit effektiver als andere Formen der Bestäubung, weil die
Pflanze insgesamt weniger Pollen produzieren muss als beispielsweise bei der Anemophilie
(Windbestäubung), welche hauptsächlich bei Gymnospermen (Bedecktsamern) vorkommt.
Um potentielle Bestäuber anzulocken, produzieren einige Pflanzen Nektar, welcher den
Bestäubern als Nahrungsquelle dient. Die Nektarproduktion ist mit hohen Kosten für die
Pflanzen verbunden, und zwar bis zu 37% der verfügbaren Energie, ohne das Wachstum
oder die Reproduktionsfähigkeit einzuschränken (Pyke, 1991). Auf die Zusammensetzung
des Nektars und dessen Produktion in den Nektarien wird im Folgenden näher eingegangen.
1.1. Nektar
Nektar ist eine stark zuckerhaltige Lösung. Neben Zuckern enthalten Nektare auch
verschiedenen Aminosäuren, Lipide, Alkaloide und flüchtige organische Verbindungen
(Baker und Baker, 1982; La Barrera und Nobel, 2004; González-Teuber und Heil, 2009;
Lohaus und Schwerdtfeger, 2014). Durch die Produktion des süßen Nektars werden Tiere
angelockt, welche den Pollen von einer Pflanze zur nächsten transportieren können. Eine
spezielle Zusammensetzung der Inhaltsstoffe soll dabei das Spektrum der potentiellen
Bestäuber verringern. Dies geschieht beispielsweise dadurch, dass manchen
Nektarkonsumenten ein Enzym zur Saccharosespaltung fehlt und diese deshalb nur Blüten
besuchen können, deren Nektar frei von Saccharose ist (González-Teuber und Heil, 2009).
Durch die Anpassung von Nektar an den Bestäuber kann die Pflanze Nektarraub von Tieren
vermeiden, welche nicht ihrer Bestäubung dienen. Mit Hilfe der im Nektar enthaltenen
sekundären Pflanzenstoffe und der antimikrobiellen Proteine kann die Pflanze sich zusätzlich
vor Fressfeinden und Mikroorganismen schützen (Heil, 2011).
Die Zuckerkonzentration im Nektar liegt normalerweise zwischen 10% und 60% (Baker und
Baker, 1982). Abhängig ist diese Konzentration von den jeweiligen Blütenbesuchern (Baker
und Baker, 1983; Abrahamczyk et al., 2017). So ist die Zuckerkonzentration im Nektar von
Bienenblumen durchschnittlich höher als beispielsweise bei Vogelblumen, weil die Bienen
den Zucker für die Aufzucht ihrer Larven benötigen (Hess, 1987).
Einleitung 2
Mit seinem hohen Zuckergehalt und einer Wasserverfügbarkeit bietet Nektar einen optimalen
Nährboden für Mikroorganismen. Diese können durch ihre Stoffwechselprozesse die
Nektarzusammensetzung verändern (Herrera et al., 2008; Lenaerts et al., 2017). Um einem
Befall vorzubeugen, haben die Pflanzen unterschiedliche Schutzmechanismen entwickelt. So
wird beispielsweise im sogenannten Nectar-Redox-Cycle Wasserstoffperoxid gebildet,
welches einen mikrobiellen Befall verhindern kann (Carter und Thornburg, 2004a). Für
diesen Nectar-Redox-Cycle werden unterschiedliche Proteine benötigt (u.a. Nectarin I-V).
Insgesamt ist der Proteinanteil im Nektar aber verhältnismäßig gering (bei einigen Nicotiana-
Arten: 21–265 µg/ml; Kerchner et al., 2015). Womöglich machen die anorganischen Ionen
einen weiteren Teil des Nectar-Redox-Cycles aus, allerdings ist die genaue Funktionsweise
noch nicht geklärt (Carter und Thornburg, 2004a). Außerdem sind die Ionen wichtig für den
Elektrolythaushalt der Bestäuber (Calder, 1979). Von den diversen Ionen die im Nektar
vorkommen können, ist K+ das häufigste Kation und Cl- das häufigste Anion (Nicolson et al.,
2007).
Freie Aminosäuren sind im Nektar hauptsächlich als Stickstoffquelle für die Bestäuber oder
als Phagostimulantien vorhanden (Baker und Baker, 1973; Blüthgen und Fiedler, 2004).
Einzelne Aminosäuren können weitere Funktionen für die Bestäuber erfüllen: Honigbienen
(Apis mellifera) präferieren beispielsweise Prolin-reiche Nektare (Carter et al., 2006). Dies
könnte einerseits daran liegen, dass Bienen Prolin schmecken können und andererseits
auch daran, dass diese Aminosäure für die Insekten eine wichtige Rolle bei der
Fortbewegung spielt (Carter et al., 2006). Besonders für die Energieproduktion der
Flugmuskeln bei Bienen und Wespen ist Prolin essentiell (Teulier et al., 2016). Ebenfalls
essentiell für Bienen ist Phenylalanin. Bei Pflanzen der Mittelmeerregion, welche von
langzüngigen Bienen bestäubt werden, wurde diese Aminosäure in relativ großen Mengen
gefunden und wirkt stimulierend auf die Zuckerrezeptoren von Insekten (Petanidou et al.,
2006). Nicht nur die Konzentration der Aminosäuren an sich, sondern auch das Verhältnis
von Aminosäuren zu Zuckern im Nektar ist ausschlaggebend für die Anlockung bestimmter
Bestäuber. So zeigen Bienen eine Vorliebe für essentielle Aminosäuren und verzichten für
diese auf eine gewisse Menge Zucker im Nektar (Hendriksma et al., 2014).
1.2. Nektarien
Nektardrüsen werden als Nektarien bezeichnet, welche aus einem mehrschichtigen
Drüsengewebe bestehen und vom Phloem versorgt werden. Man unterscheidet Nektarien,
die sich innerhalb der Blüte befinden (florale Nektarien) von solchen, welche außerhalb der
Einleitung 3
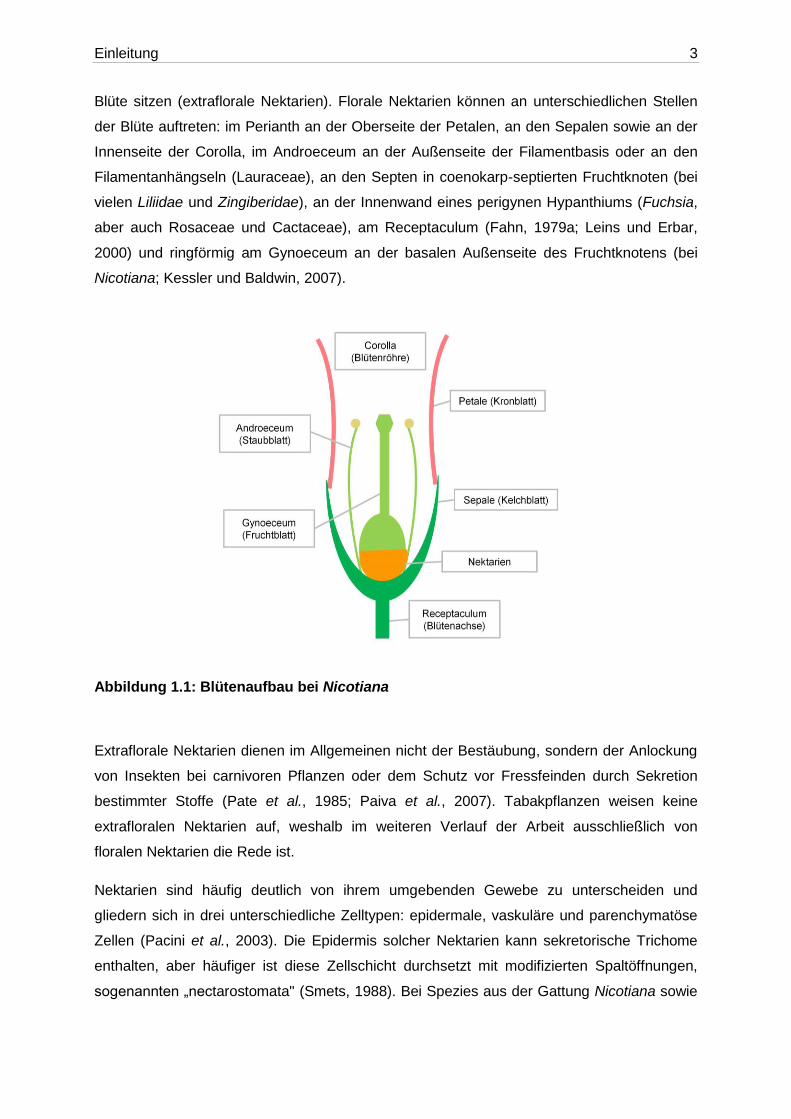
Blüte sitzen (extraflorale Nektarien). Florale Nektarien können an unterschiedlichen Stellen
der Blüte auftreten: im Perianth an der Oberseite der Petalen, an den Sepalen sowie an der
Innenseite der Corolla, im Androeceum an der Außenseite der Filamentbasis oder an den
Filamentanhängseln (Lauraceae), an den Septen in coenokarp-septierten Fruchtknoten (bei
vielen Liliidae und Zingiberidae), an der Innenwand eines perigynen Hypanthiums (Fuchsia,
aber auch Rosaceae und Cactaceae), am Receptaculum (Fahn, 1979a; Leins und Erbar,
2000) und ringförmig am Gynoeceum an der basalen Außenseite des Fruchtknotens (bei
Nicotiana; Kessler und Baldwin, 2007).
Abbildung 1.1: Blütenaufbau bei Nicotiana
Extraflorale Nektarien dienen im Allgemeinen nicht der Bestäubung, sondern der Anlockung
von Insekten bei carnivoren Pflanzen oder dem Schutz vor Fressfeinden durch Sekretion
bestimmter Stoffe (Pate et al., 1985; Paiva et al., 2007). Tabakpflanzen weisen keine
extrafloralen Nektarien auf, weshalb im weiteren Verlauf der Arbeit ausschließlich von
floralen Nektarien die Rede ist.
Nektarien sind häufig deutlich von ihrem umgebenden Gewebe zu unterscheiden und
gliedern sich in drei unterschiedliche Zelltypen: epidermale, vaskuläre und parenchymatöse
Zellen (Pacini et al., 2003). Die Epidermis solcher Nektarien kann sekretorische Trichome
enthalten, aber häufiger ist diese Zellschicht durchsetzt mit modifizierten Spaltöffnungen,
sogenannten „nectarostomata" (Smets, 1988). Bei Spezies aus der Gattung Nicotiana sowie

Einleitung 4
bei den meisten anderen Arten ist die Epidermis von einer Cuticula überzogen (Durkee,
1983; Nepi et al., 1996; Cardoso‐Gustavson und Davis, 2015). Unter der Epidermis befindet
sich das Nektarienparenchym, in welchem der sogenannte „Prä-Nektar“ modifiziert wird. Das
Parenchym ist durchsetzt von einem Gefäßsystem, welches überwiegend aus Phloem oder
seltener auch aus Xylem und Phloem bestehen kann (Frey-Wyssling, 1955; Fahn, 1979a).
Bislang ist noch nicht vollständig geklärt, wie die Inhaltsstoffe in den Nektar gelangen. Hierzu
gibt es verschiedene Theorien, welche sich auf Beobachtungen bei unterschiedlichen
Pflanzenarten stützen. Gemeinsam haben diese Modelle, dass die benötigten Metaboliten
vom Phloem zu den Nektarien geliefert werden. Da der Phloemsaft sich in seiner
Zusammensetzung sehr vom ausgeschiedenen Nektar unterscheidet (Lohaus und
Schwerdtfeger, 2014; Tiedge und Lohaus, 2017), muss eine Modifikation des Prä-Nektars im
Nektariengewebe stattfinden. Dadurch wird die Möglichkeit einer apoplastischen Sekretion
ausgeschlossen, bei welcher die vom Phloem angelieferten Metaboliten um die
Nektarienzellen herum bis an die Oberfläche der Epidermis wandern. Dieses Modell wird
zwar beschrieben (Vassilyev, 2010), kann aber nicht die Unterschiede zwischen Phloemsaft
und Nektar erklären (Kram und Carter, 2009).
Bei der merokrinen oder auch granulokrinen Sekretion werden die Metabolite des Prä-
Nektars symplastisch, also via Plasmodesmata durch die Zellen hindurch, bis zur
Nektarienoberfläche transportiert. Dort werden die Metaboliten dann in Vesikel verpackt,
welche mit der Plasmamembran verschmelzen und ihren Inhalt nach außen entleeren (Fahn,
1979b; Fahn, 1979a; Nicolson et al., 2007). Diese Theorie wird bislang lediglich von
Ultrastrukturaufnahmen gestützt. Diese zeigen beträchtliche Ansammlungen von
endoplasmatischen Retikula (ER) und Golgi-Apparaten, welche zur Bildung von Vesikeln
benötigt werden. Experimentell konnte diese Art der Sekretion bislang aber nicht bewiesen
werden.
Die ekkrine Sekretion ist das wahrscheinlichste Modell für viele Pflanzenarten (Abbildung
1.2). Dabei wird in den Nektarien gespeicherte Stärke bei der Blütenöffnung (Anthese)
abgebaut und anschließend Saccharose durch Saccharose-Phosphat-Synthase (SPS) und
andere Enzyme aus den gebildeten Zuckern resynthetisiert. Die Saccharose wird dann vom
Uniporter SWEET9, welcher in der Plasmamembran lokalisiert ist, in den Apoplasten
exportiert (Lin et al., 2014). Im extrazellulären Raum spaltet eine Zellwand-Invertase
(CWINV4) die Saccharose in die Hexose-Monomere Fructose und Glucose. Diese Spaltung
hat zwei Effekte zur Folge: Zum einen erzeugt sie einen Gradienten für den
Saccharoseexport und zum anderen erzeugt sie ein negatives Wasserpotential, sodass das

Einleitung 5
Wasser sich in Richtung der Zucker bewegt und Nektartröpfchen bildet (Ruhlmann et al.,
2010). Mutanten, bei denen SPS, SWEET9 oder CWINV4 fehlen, produzieren keinen Nektar,
während eine Überexpressionen von SWEET9 zu einer deutlichen Erhöhung des
Nektarvolumens führt (Lin et al., 2014).
Abbildung 1.2: Modell der ekkrinen Nektarsekretion
Das Modell zeigt den möglichen Transport von Zuckermolekülen vom Phloem zum Nektar;
CW-INV= cell wall invertase; SUT = sucrose transporter, HT = hexose transporter,
1.3. Pflanzliche Invertasen
Von den im Nektar vorkommenden Zuckern sind Saccharose und die Hexosen Glucose und
Fructose am weitesten verbreitet (Percival, 1961; Baker und Baker, 1983). Da Hexosen
typischerweise nicht Bestandteil des Phloemsaftes sind (Lohaus und Schwerdtfeger, 2014),
hängt der Anteil der Hexosen im Nektar von der Anwesenheit und Aktivität von Saccharose
spaltenden Enzymen ab. Die Saccharose-Spaltung in Pflanzen kann durch mindestens zwei
Arten von Enzymen katalysiert werden: entweder reversibel durch Saccharose-Synthase
(SuS; EC 2.4.1.13), eine Glycosyltransferase, oder irreversibel durch Invertasen, die die

Einleitung 6
Hydrolyse von Saccharose katalysieren (β-Fructofuranosidasen; EC 3.2.1.26). Invertasen
existieren in zahlreichen Isoformen mit unterschiedlichen subzellulären Lokalisationen und
biochemischen Eigenschaften (Roitsch und González, 2004). Sie lassen sich in drei Gruppen
einteilen: Vakuoläre Invertasen (V-INVs), extrazelluläre oder auch Zellwand-Invertasen (CW-
INVs) und neutrale Invertasen (N-INVs). Während N-INVs ein leicht alkalisches pH-Optimum
haben, sind V-INVs und CW-INVs sogenannte saure Invertasen, da sie am effizientesten bei
pH 4,5 bis pH 5,0 arbeiten. Die neutralen Invertasen sind im Cytosol lokalisiert, während sich
die vakuolären Invertasen in der Vakuole und die Zellwandinvertasen im Apoplasten
befinden (Roitsch und González, 2004). Extrazelluläre Invertasen sind ionisch an die
Zellwand gebunden (Sturm, 1999).
Es gibt verschiedene Isoformen der CW-INV, welche gemeinsame Merkmale aufweisen, wie
zum Beispiel die Aminosäuresequenzen NDPNG (βF-Motiv) nahe dem N-Terminus des
reifen Proteins und WECXDF, ein Hexapeptid näher am C-Terminus (Sturm und Chrispeels,
1990). Für einige Pflanzenarten, z.B. Karotte (Daucus carota) und Tomate (Solanum
lycopersicum), wurden verschiedene organ- und entwicklungsstadienspezifische
Expressionsmuster der sauren Invertase gezeigt (Sturm et al., 1995; Godt und Roitsch,
1997). In der Regel ist die Expressionsrate von Invertase in schnell wachsenden Geweben
mit einem hohem Bedarf an Hexosen erhöht (Weschke et al., 2003). Interessanterweise
wurde sowohl für Karotten als auch für Tomaten eine Blüten- oder Blütenknospen-
spezifische mRNA-Expression einer sauren Invertase gefunden (Lorenz et al., 1995; Godt
und Roitsch, 1997). Es wurde vermutet, dass die blütenspezifische extrazelluläre Invertase
für die männliche und weibliche Organentwicklung essentiell ist, z.B. zur Versorgung der
Antheren mit Kohlenhydraten (Dorion et al., 1996; Godt und Roitsch, 1997). In den
vergangenen Jahren konnte gezeigt werden, dass Zellwandinvertasen auch für die
Nektarsekretion bei Arabidopsis thaliana entscheidend sind (Ruhlmann et al., 2010). Die
AtCWINV4-Expression war in Nektarien von A. thaliana im Vergleich zu anderen Geweben
stark erhöht (Kram et al., 2009). Darüber hinaus sezernierten zwei unabhängige cwinv4-
Mutantenlinien mit stark reduzierter Zellwandinvertase-Aktivität keinen Nektar, obwohl die
Ultrastruktur der Nektarien dem Wildtyp sehr ähnlich war (Ruhlmann et al., 2010).

Einleitung 7
1.4. Die Gattung Nicotiana
Die Gattung Nicotiana gehört zur Familie der Nachtschattengewächse (Solanaceae). Anhand
von Plastid-DNA-Vergleichen wurden die bislang 75 bekannten Arten der Gattung Nicotiana
in 13 Sektionen aufgeteilt (Knapp et al., 2004; Clarkson et al., 2004). Viele Arten haben
durch ihr erzeugtes Nikotin einen effektiven Schutz gegen Fressfeinde entwickelt
(Goodspeed, 1954; Ippolito, 2000). Auf Grund ihres Nikotingehaltes haben sie außerdem
eine große wirtschaftliche Bedeutung für die Tabakindustrie, besonders die beiden Arten
Nicotiana sylvestris und N. tabacum (Müller-Jahncke et al., 2005). Ihre Verbreitung erstreckt
sich über Nord- und Südamerika, Australien und Afrika, wobei der Schwerpunkt mit 75% der
vorkommenden Arten deutlich auf den amerikanischen Kontinenten liegt (Goodspeed, 1954).
In Afrika wurde bislang nur eine einzige Tabakart (N. africana) entdeckt (Merxmüller und
Buttler, 1975). Viele Nicotiana-Arten sind annuell (einjährige), manche Arten sind aber auch
biennal (zweijährig) oder perennial (mehrjährig; Goodspeed, 1954). Ihre Ausprägung kann
sehr divers sein. Einige Tabakpflanzen erreichen eine Höhe von bis zu zwei Metern, und die
ovalen, lanzettlichen oder herzförmigen Blätter können eine Länge von wenigen Zentimetern
bis zu einem Meter erreichen (Goodspeed, 1954; Stehmann et al., 2002). Blüten haben oft
eine weiße, rosa oder gelb-grünliche Färbung, enthalten am Blütenboden Nektar und können
tagsüber, nachts oder in der Dämmerung erblühen (Kaczorowski, 2007). Die
Blütenmorphologie spielt eine wichtige Rolle bei der Anlockung von Bestäubern und wird
zusammen mit weiteren Merkmalen als Bestäubungssyndrom zusammengefasst.
Abbildung 1.3: Florale Nektarien bei N. tabacum
links: Eine geöffnete Blüte von N. tabacum; mittig: Das Gynoeceum befindet sich bei allen
Nicotiana Arten im unteren Bereich der Blütenröhre; rechts: Das Nektariengewebe bildet sich
ringförmig um den basalen Teil des Gynoeceums und kann mit dem Skalpell entfernt
werden.

Einleitung 8
1.5. Bestäubungssyndrome
Eine Gruppe von floralen Merkmalen wie z.B. Farbe, Morphologie, Geruch und
Nektarzusammensetzung wird als Bestäubungssyndrom (pollination syndrome) bezeichnet,
welches auf einen bestimmten Bestäubertypen hinweist. Diese Syndrome beschreiben die
evolutionäre Konvergenz zwischen Blütenmerkmalen in verschiedenen
Verwandtschaftslinien als Reaktion auf die Selektion durch ähnliche Bestäubergruppen
(Baker, 1961; van der Pijl, 1961; Stebbins, 1970). Über die oben genannten Merkmale
hinaus erfolgt die Einschätzung des Bestäubungssyndroms über die
Zuckerzusammensetzung des Nektars (Abrahamczyk et al., 2017). So produzieren
beispielsweise über Kolibris und Bienen bestäubte Pflanzen oftmals saccharosereiche
Nektare, während fledermausbestäubte Nektare überwiegend hexosedominant sind (Baker
und Baker, 1975). Allerdings konnte die tatsächliche Aussagefähigkeit der
Bestäubungssyndrome nicht endgültig belegt werden (Ollerton und Watts, 2000; Ollerton et
al., 2009) und die Festlegung auf ein Bestäubungssyndrom sollte nicht die Bestäubung durch
andere Gruppen vollständig ausschließen (Fleming et al., 2001; Mayfield et al., 2001). Im
Weiteren werden einige der für Tabakpflanzen besonders wichtigen Bestäubergruppen
sowie die entsprechenden Bestäubungssyndrome vorgestellt.
Lepidopterophilie
Das Merkmalssyndrom, welches mit der Bestäubung durch Schmetterlinge einhergeht, wird
als Lepidopterophilie bezeichnet. Generell dienen die Blumenbesuche den Schmetterlingen
zur Befriedigung des eigenen Nahrungsbedürfnisses (Hilje et al., 2015). Die
Lepidopterophilie kann weiter unterteilt werden in die Bestäubung durch Tagfalter
(Psychophilie) oder durch nachtaktive Schwärmer (Sphingophilie). Tagfalter ernähren sich
erst als erwachsene Tiere von Blütennahrung. Bei der Bestäubung durch Tagfalter wird der
Pollen beiläufig mit den Flügeln, dem Kopf oder dem Rüssel zu den nächsten Blüten
transportiert, je nachdem wo er bei der Nahrungsaufnahme hängen geblieben ist. Die Blüten
der Tagfalterblumen sind zart gebaut und stehen aufrecht. Dabei werden Stieltellerblumen
(z.B. Nelken) bevorzugt besucht. Der Aufbau dieser Blüten zeichnet sich durch eine kurze,
senkrechte Corolla (Blütenröhre) mit einer darauf sitzenden waagerechten Scheibe aus
Petalen (Kronblättern) aus, auf der die Bestäuber landen können. Der Nektar befindet sich
am Grund der maximal 40 mm tiefen Corolla. Viele dieser Blüten haben eine bunte, oft
rötliche Färbung, da Tagfalter im Gegensatz zu Bienen in der Lage sind, die Farbe Rot
wahrzunehmen. Weitere auftretende Farben sind Blau, Gelb und Weiß. Der Geruch der
Einleitung 9
Tagfalterblüten ist blumig und angenehm. Sie erblühen bzw. öffnen sich tagsüber und duften
vor allem während der Tageszeit (Kugler, 1970; Fenster et al., 2004; Hilje et al., 2015).
Nachtaktive Schmetterlinge werden als Schwärmer (Sphingidae) bezeichnet und das
entsprechende Bestäubungssyndrom als Sphingophilie. Der Rollrüssel der einheimischen
Sphingiden kann eine Länge von bis zu 80 mm erreichen. Anders als die Tagfalter saugen
die Schwärmer meistens frei schwebend. So berühren sie die Blüten nur mit dem Rüssel und
vollziehen so die Bestäubung. Angepasst an den langen Rüssel ihrer Bestäuber besitzen die
Schwärmerblumen meistens sehr schmale und längliche Kronröhren. Viele dieser Blumen
gehören dem Stieltellertyp oder auch seltener dem Pinseltyp an. Farblich überwiegen die
weißlichen, gelblichen und blass-purpurnen Töne, teilweise auch mit starker UV-Reflexion.
Nachts erblühen die Pflanzen und welken oftmals morgens bereits wieder. Die Duftemission
erfolgt primär während der Nacht (Kugler, 1970; Fenster et al., 2004; Hilje et al., 2015).
Melittophilie
Bienen und Hummeln sind zwar in Mitteleuropa mit Abstand die wichtigsten Bestäuber
(Müller et al., 2006), allerdings nicht für die überwiegend in Südamerika vorkommenden
Tabakpflanzen. Die Mundwerkzeuge der Apiden bestehen aus den Mandibeln, welche zur
Pollenzerkleinerung dienen und dem ca. 4-15 mm lange Rüssel, welcher aus den leckend-
saugenden Mundwerkzeugen gebildet wird (Haydak, 1970). Dabei unterscheidet man die
verschiedenen Bienenfamilien vor allem anhand ihrer Mundwerkzeuge. Ein wichtiges
Kriterium ist zum Beispiel die Einteilung in kurz- und langzüngige Bienen (Michener, 2000).
Der Nektar ist bei Bienenblumen in der verhältnismäßig kurzen Corolla verborgen. Nach dem
Besuch von kurzrüsseligen Hummeln finden sich oft kleine Löcher im Pflanzengewebe,
welche die Hummeln zur Nektarentnahme dort hinein gebissen haben (Leins und Erbar,
2000).
Weitere Syndrome aus der Übergruppe der Insektenbestäubung (Entomophilie) bildeten sich
aus der Bestäubung durch Käfer (Cantharophilie), Fliegen (Myiophilie), Wespen
(Sphecophilie) und Ameisen (Myrmekophilie). An dieser Stelle werden jene Syndrome nur
der Vollständigkeit halber erwähnt. Bei keiner der untersuchten Arten ist bislang eine
Bestäubung durch diese Insekten bekannt.
Ornithophilie
Vogel-bestäubte Pflanzen besitzen als gemeinsames Charakteristikum große, auffällige und
robuste Blüten oder Blütenstände mit roten, orangefarbenen oder leuchtend-gelben Farben,
ohne starken Duft und große Mengen an dünnflüssigem Nektar, welcher häufig nur eine

Einleitung 10
geringe Zuckerkonzentration vorweist. Häufig sind Blütenbecher oder Kronröhren vorhanden,
in denen der Nektar sich sammelt. Röhren-, Rachen- Glocken-, Pinsel- und Fahnenblumen
sind typische Ausbildungsformen dieses ornithophilen Syndroms. Vermutlich haben sich die
sogenannten Vogelblumen aus Bienen- und Schmetterlingsblumen entwickelt, indem sich
die Vorfahren der heutzutage vorkommenden Blütenvögel bei der Suche nach Flüssigkeiten
und Insekten den Blüten zugewandt haben (Kugler, 1970). Ornithophilie ist in vielen
Regionen Amerikas und den gemäßigten Zonen Asiens verbreitet. Eine wichtige
Bestäubergruppe für Tabakpflanzen stellen Kolibris (Trochilidae) dar (Raguso et al., 2003;
Schueller, 2004; Kessler und Baldwin, 2007). Kolibri-bestäubte Blüten unterscheiden sich
morphologisch nicht von anderen ornithophilen Blüten. Der Nektar dieser Blüten ist häufig
Saccharose-reich, ähnlich dem anderer Bestäubergruppen mit langen Mundwerkzeugen,
zum Beispiel von Schwärmern oder langzüngigen Bienen (Baker und Baker, 1983, 1990).
Nektarvögel (Nectariniidae) können als Altwelt-Gegenstück zu den in der Neuwelt
beheimateten Kolibris angesehen werden, da sie große Ähnlichkeiten sowohl in der
Morphologie als auch in der Nahrungsaufnahme aufweisen (Prinzinger et al., 1989). Deshalb
wäre zu erwarten, dass auch der konsumierte Nektar eine vergleichbare
Zuckerzusammensetzung aufweist. Dies ist aber nicht der Fall, da den Nectariniidae ein
Enzym zur Saccharosespaltung fehlt und sie deshalb auf Hexose-dominante Nektare
angewiesen sind (Marlin et al., 2016).
Chiropterophilie
Fledermausbestäubung wird als Chiropterophilie bezeichnet. Vor allem Fledermäuse der
Unterfamilie der Glossophaginae ernähren sich von Nektar. Arten dieser Unterfamilie sind in
den südlichen Vereinigten Staaten bis Brasilien beheimatet. Ihre lange Zunge ist auf die
Nektaraufnahme abgestimmt (Eisenberg und Redford, 1989). Neotropische Blüten, welche
von Fledermäusen bestäubt werden, blühen überwiegend nachts, haben eine matte
Farbgebung, einen Hexose-dominanten Nektar und einen markanten Geruch (Helversen,
1993; Muchhala, 2003). Fledermäuse können sich nicht ausschließlich von Nektar ernähren;
sie benötigen weitere Kohlenhydratquellen (Howell, 1974). Da die Chiropterophilie eine
relativ seltene Form der Bestäubung darstellt, ist sie auch weniger untersucht als viele
andere Formen.
Autogamie
Autogame Pflanzen sind selbstbestäubend. Autogamie kommt verhältnismäßig selten unter
natürlichen Umständen vor, da oft weniger keimfähige Samen gebildet werden und die
Einleitung 11
Pflanzen Schutzmechanismen (z.B. Dichogamie) gegen die Selbstbefruchtung entwickelt
haben (Routley et al., 2004). Deshalb tritt sie häufiger bei Pflanzen in Gebieten mit niedriger
Bestäuberdichte auf oder wird alternativ zur Fremdbestäubung genutzt. Autogame Blüten
sind oftmals klein, unauffällig und produzieren weniger Nektar als allogame Blüten, da sie
nicht auf die Anlockung von Bestäubern angewiesen sind (Jersáková und Johnson, 2006).
1.6. Fragestellung
Bislang ist wenig über die biochemischen und molekularen Mechanismen der
Nektarproduktion bekannt. Tabakpflanzen eignen sich besonders gut für diese
Fragestellung, da sie zum einen in den Pflanzenwissenschaften als Modellorganismen gelten
und es bereits Studien zu Nektar und Nektarien bei Tabakpflanzen gibt. Zum anderen ist die
Gattung Nicotiana sehr divers in Bezug auf ihre Bestäuber und ihre Blütenöffnungszeit.
Außerdem enthalten viele Arten verhältnismäßig große Mengen Nektar, welche für die
Analyse benötigt werden.
In der vorliegenden Arbeit wird zunächst untersucht, welche Inhaltsstoffe im Nektar von
Tabakpflanzen neben den Hauptzuckern Glucose, Fructose und Saccharose noch enthalten
sind und ob sich die Nektarzusammensetzung bei verschiedenen Nicotiana-Arten
unterscheidet. In diesem Zusammenhang werden auch Proteine untersucht, die im Nektar
vorhanden sind, und ein artenübergreifender Vergleich der Proteinmuster und
Konzentrationen angestellt. Desweiteren geht es um die Frage, ob die
Nektarzusammensetzung primär durch taxonomischen Verhältnisse oder die Anpassung an
die Bedürfnisse ihrer Bestäuber beeinflusst wird.
Darüber hinaus werden die Regulationsmechanismen, welche an der Nektarsekretion
beteiligt sind, untersucht. Dabei geht es vor allem um die Regulation der
Nektarzuckerzusammensetzung und im Speziellen um die Funktion der Zellwandinvertasen
bei diesem Prozess. Deshalb werden bei tag- und bei nachtblühenden Nicotiana-Arten unter
anderem Zuckerkonzentrationen im Nektar und den Nektarien analysiert und die
enzymatische Aktivität sowie die Expression der Zellwandinvertasen im Tagesverlauf
gemessen. Aus den Daten wird ein Modell der Nektarzuckerregulation erstellt, welches die
Regulationsmechanismen vor, während und nach der Nektarsekretion umfasst.

Material und Methoden 12
2. Material und Methoden
2.1. Pflanzenmaterial und Anzucht
Die Samen zur Anzucht der Tabakpflanzen wurden von verschiedenen Instituten zur
Verfügung gestellt (Tabelle 2.1).
Tabelle 2.1: Liste der untersuchten Pflanzen.
Art Sektion Samen von
tagblühend
N. africana Merxm. Suaveolentes Ruhr-Universität Bochum
N. attenuata Torr. ex Wat. Petunoides Max-Planck-Institut, Jena
N. glauca Graham Noctiflorae Ruhr-Universität Bochum
N. knightiana Goodsp. Paniculatae NiCoTa, Rheinstetten
N. langsdorffii Weinm. Alatae Universität Rostock
N. nudicaulis Watson Repandae Universität Rostock
N. palmeri Gray Trigonophyllae Universität Rostock
N. paniculata L. Paniculatae Ruhr-Universität Bochum
N. rustica L. Rustica Ruhr-Universität Bochum
N. tabacum L. Nicotiana NiCoTa, Rheinstetten
nachtblühend
N. acuminata Hook. Petunoides Universität Rostock
N. alata Link & Otto Alatae Ruhr-Universität Bochum
N. benthamiana Domin Suaveolentes Universität Rostock
N. longiflora Cav. Alatae NiCoTa, Rheinstetten
N. nesophila Johnston Repandae NiCoTa, Rheinstetten
N. otophora Griseb. Tomentosae NiCoTa, Rheinstetten
N. plumbaginifolia Viv. Alatae Universität Rostock
N. stocktonii Brandegee Repandae NiCoTa, Rheinstetten
N. suaveolens Lehm. Suaveolentes Ruhr-Universität Bochum
N. sylvestris Speg. & Com. Sylvestres Ruhr-Universität Bochum

Material und Methoden 13
Alle Pflanzen wurden in den Gewächshäusern der Bergischen Universität Wuppertal
angezogen. Dazu wurden die Samen auf feuchter Anzuchterde ausgesät und keimen
gelassen. Die Samen von N. attenuata mussten zuvor mit Gibberellinsäure (GA3,1mM) und
Flüssigrauch (1:50 verdünnt; The Original Australian Liquid Smoke) behandelt werden, damit
sie keimen. Sobald die Pflanzen eine Höhe von 2–3 cm erreicht hatten, wurden die
Sprösslinge pikiert und je nach Größe in passende Töpfe umgepflanzt. Die ausgewachsenen
Pflanzen wurden in 5l Töpfen gehalten und unterliegen im Gewächshaus einem
automatisierten Beleuchtungs- und Bewässerungsregime (14 Stunden Licht / 10 Stunden
Dunkel; tägliche Bewässerung). Die Temperatur betrug ganzjährig ca. 25°C am Tag und
18°C in der Nacht und die Lichtintensität lag bei ca. 300 µmol Photonen m-2 s-1.
2.2. Gewinnung von Nektar
Die Gewinnung des Nektars erfolgte auf verschiedene Arten. Für eine qualitative Analyse
des Nektars reichte es aus, den Nektar mit Filterpapierspitzen aufzusaugen und in Wasser
rückzulösen. Um für quantitative Analysen das Volumen des gewonnenen Nektars
abzuschätzen, wurde dieser entweder mit 0,5 µl Glaskapillaren oder mit der Mikropipette
direkt aus den Blütenkelchen gesammelt. Bis zur Verwendung wurde der Nektar bei -20°C
gelagert.
2.3. Gewinnung von Nektariengewebe
Um reines Nektariengewebe zu erhalten, wurden die Blüten von der Pflanze entfernt, das
Gynoeceum aus der Blüte mittels Skalpell isoliert und die Nektarien, welche deutlich an ihrer
orangen Färbung zu erkennen sind, seziert. Wenn die Nektarien später zur Isolation von
RNA verwendet werden sollten, wurden der Arbeitsplatz und die Materialien zuvor mit
Ethanol und RNase AWAY® (Carl Roth, Karlsruhe) gereinigt. Anschließend erfolgte eine
sofortige Kühlung in flüssigem Stickstoff bis zur Lagerung bei -80°C. Für weitere Analysen
wurde das Nektariengewebe unter dauerhafter Kühlung mit flüssigem Stickstoff fein
gemörsert.

Material und Methoden 14
2.4. Sammeln von Blattmaterial
Die Tabakblätter wurden parallel zum Nektariengewebe gesammelt. Es wurde darauf
geachtet, dass sich alle Blätter in einem guten Zustand befanden und dass sie ähnlichen
Lichtverhältnissen ausgesetzt waren (ca. 100 µmol Photonen m-2 s-1).
2.5. Gewinnung von Phloemsaft mit der Laser-Aphiden-
Technik
Mit der Laser-Aphiden-Technik ist es möglich, reinen Phloemsaft zu gewinnen (Barlow und
McCully, 1972; Wright und Fisher, 1980; Kawabe et al., 1980; Fisher und Frame, 1984;
Riens et al., 1991; Lohaus et al., 1995; Knop et al., 2004; Palmer et al., 2013). Dabei wird
der Stechrüssel von Blattläusen mit einem Laserstrahl abgetrennt, nachdem diese eine
Blattader angestochen hatten. Für die Versuche wurden Blattläuse verwendet, die auf den
Tabakpflanzen gefunden wurden. Als Pflanzenmaterial wurden ca. 30 cm hohe Pflanzen
verwendet. Mit einem angefeuchteten Pinsel wurden 15–20 Läuse in einem kleinen Käfig
gefangen und auf der Blattunterseite der zu untersuchenden Pflanze fixiert. Nach einer
Inkubationsphase von 2–4 h (je nach Tabakart) hatten die meisten Läuse ihre Stechrüssel in
die Siebröhren eingestochen. Der Käfig wurde entfernt und das Blatt mit den Läusen
vorsichtig in die Laser-Apparatur eingespannt. Mit einem 10x Objektiv wurde der Stechrüssel
einer Laus im Okularstrichkreuz positioniert. Für die Abtrennung des Stechrüssels wurde ein
40x Objektiv verwendet, durch dessen Strahlengang ein Laserstrahl mit einer Wellenlänge
von 1,06 µm führte (LG 760, Fa. Schott). Dessen Energie betrug 1 Joule und die
Ladespannung des Lasers war auf 1300 Volt eingestellt. Die Auslösung des Lasers erfolgte
manuell. Nachdem der Stechrüssel durchtrennt war, wurde die Aphide entfernt und eine 0,5
µl Mikrokapillare auf dem restlichen Stechrüssel positioniert. Die Kapillare verblieb so lange
auf dem Blatt, bis keine Flüssigkeit aus dem Stechrüssel mehr hinaufstieg. Um
Verdunstungen der sehr kleinen Volumina zu vermeiden, wurde dem Blatt durch einen
Luftbefeuchter kontinuierlich Wasserdampf zugeführt, sodass die Luftfeuchte etwa 90%–95%
betrug. Mithilfe eines Lineals wurde die Menge an gesammeltem Phloemsaft in der Kapillare
bestimmt, anschließend in 50 µl Wasser gelöst und bis zur weiteren Verwendung bei -20 °C
gelagert.

Material und Methoden 15
2.6. Biochemische Analyse der Komponenten in Blättern,
Nektarien und im Nektar
2.6.1. Chloroform-Methanol-Extraktion
Für die Analyse der Zucker im Pflanzengewebe wurden etwa 50 mg gemörserte Nektarien
oder 100 mg gemörserte Blätter in ein Schraubröhrchen überführt, mit 5 ml
Chloroform/Methanol-Puffer (1,5:3,5, v/v) versetzt und für 30 min auf Eis inkubiert. Die genau
abgewogene Menge wurde notiert, um später auf die per HPLC ermittelten Konzentrationen
in pro Gramm Frischgewicht (FW) umrechnen zu können. Nach der Inkubation wurden der
Lösung 3 ml H2O zugesetzt, gevortext und kurz zentrifugiert (4500 rpm). Die wässrige Phase
wurde in ein 100 ml Rundkolben überführt und die Extraktion mit 2 ml H2O wiederholt. Die
den Rest enthaltenden Zentrifugenröhrchen wurden bis zur weiteren Verwendung bei -20°C
gelagert. Nachdem die wässrigen Phasen im Rundkolben vereint wurden, folgte die
Trocknung in einem Rotationsverdampfer. Die Zucker wurden anschließend in 1 ml bei
Blättern und in 0,5 ml bei Nektarien H2O gelöst, mit einer 1 ml Spritze aufgenommen und
durch einen Spitzenfilter (Nylonmembran mit 0,2 µm Porengröße) in ein 1,5 ml
Reaktionsgefäß (RG) filtriert. Die Lagerung erfolgte bei -20 °C bis zur weiteren Verwendung.
2.6.2. Bestimmung von Stärke
Für die Stärkebestimmung wurde das Pellet aus der Chloroform-Methanol-Extraktion mit 5
ml 96% Ethanol gewaschen, zentrifugiert (5 min | 4500 rpm) und der Überstand vorsichtig
abgegossen. Dann wurde das Pellet in 2 ml 0.2 N KOH resuspendiert und im
Schüttelwasserbad inkubiert (3 h | 80°C). Anschließend wurde der pH-Wert auf 4.5–5.0
eingestellt und 10 min im Ultraschallbad homogenisiert. Zur enzymatischen Aufspaltung der
Stärke wurden je zweimal pro Probe 100 µl Probe mit 400 µl Reaktionsmedium (Tabelle 2.2)
versetzt und im Schüttelwasserbad inkubiert (4 h | 55°C).
Tabelle 2.2: Reaktionsmedium für einen Reaktionsansatz zur Stärkebestimmung
Substanz Konzentration
H20 Millipore 400 µl
Natriumacetat pH 4.8 50 mM
α-Amylase 1,98 U
Amyloglukosidase 1,38 U
Material und Methoden 16
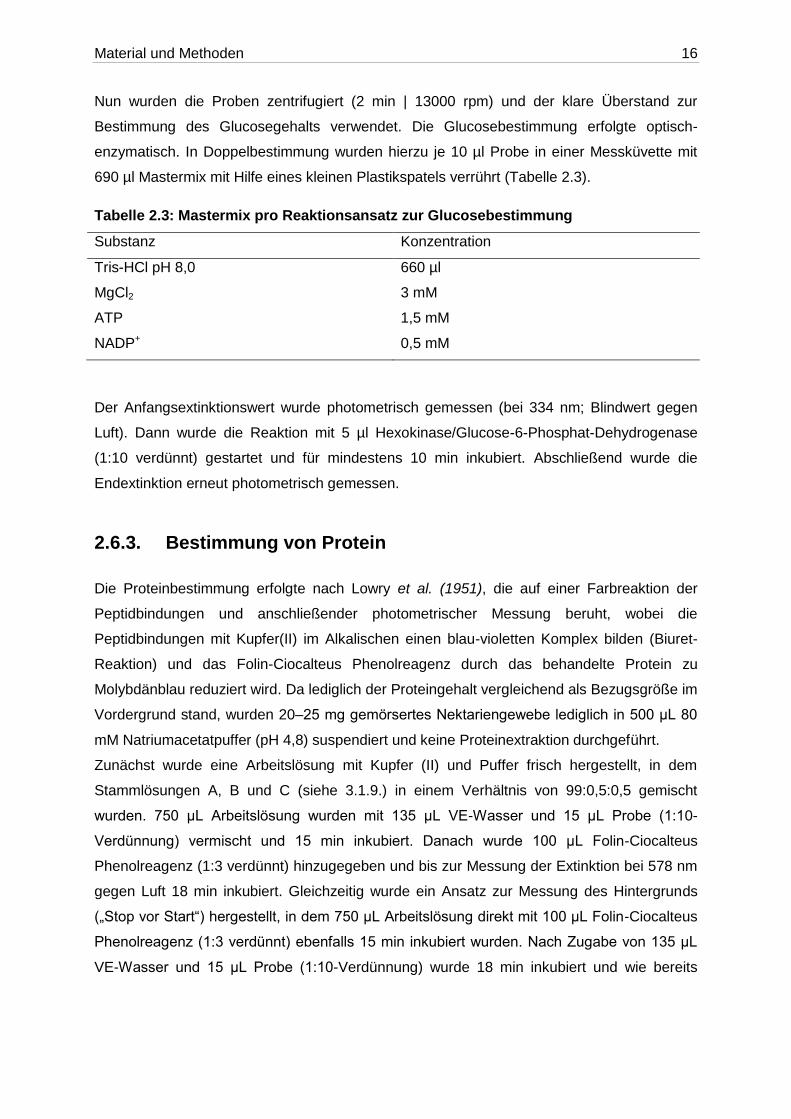
Nun wurden die Proben zentrifugiert (2 min | 13000 rpm) und der klare Überstand zur
Bestimmung des Glucosegehalts verwendet. Die Glucosebestimmung erfolgte optisch-
enzymatisch. In Doppelbestimmung wurden hierzu je 10 µl Probe in einer Messküvette mit
690 µl Mastermix mit Hilfe eines kleinen Plastikspatels verrührt (Tabelle 2.3).
Tabelle 2.3: Mastermix pro Reaktionsansatz zur Glucosebestimmung
Substanz Konzentration
Tris-HCl pH 8,0 660 µl
MgCl2 3 mM
ATP 1,5 mM
NADP+ 0,5 mM
Der Anfangsextinktionswert wurde photometrisch gemessen (bei 334 nm; Blindwert gegen
Luft). Dann wurde die Reaktion mit 5 µl Hexokinase/Glucose-6-Phosphat-Dehydrogenase
(1:10 verdünnt) gestartet und für mindestens 10 min inkubiert. Abschließend wurde die
Endextinktion erneut photometrisch gemessen.
2.6.3. Bestimmung von Protein
Die Proteinbestimmung erfolgte nach Lowry et al. (1951), die auf einer Farbreaktion der
Peptidbindungen und anschließender photometrischer Messung beruht, wobei die
Peptidbindungen mit Kupfer(II) im Alkalischen einen blau-violetten Komplex bilden (Biuret-
Reaktion) und das Folin-Ciocalteus Phenolreagenz durch das behandelte Protein zu
Molybdänblau reduziert wird. Da lediglich der Proteingehalt vergleichend als Bezugsgröße im
Vordergrund stand, wurden 20–25 mg gemörsertes Nektariengewebe lediglich in 500 μL 80
mM Natriumacetatpuffer (pH 4,8) suspendiert und keine Proteinextraktion durchgeführt.
Zunächst wurde eine Arbeitslösung mit Kupfer (II) und Puffer frisch hergestellt, in dem
Stammlösungen A, B und C (siehe 3.1.9.) in einem Verhältnis von 99:0,5:0,5 gemischt
wurden. 750 μL Arbeitslösung wurden mit 135 μL VE-Wasser und 15 μL Probe (1:10-
Verdünnung) vermischt und 15 min inkubiert. Danach wurde 100 μL Folin-Ciocalteus
Phenolreagenz (1:3 verdünnt) hinzugegeben und bis zur Messung der Extinktion bei 578 nm
gegen Luft 18 min inkubiert. Gleichzeitig wurde ein Ansatz zur Messung des Hintergrunds
(„Stop vor Start“) hergestellt, in dem 750 μL Arbeitslösung direkt mit 100 μL Folin-Ciocalteus
Phenolreagenz (1:3 verdünnt) ebenfalls 15 min inkubiert wurden. Nach Zugabe von 135 μL
VE-Wasser und 15 μL Probe (1:10-Verdünnung) wurde 18 min inkubiert und wie bereits
Material und Methoden 17
beschrieben die Extinktion (EStop vor Start) gemessen, die von der Extinktion der reagierten
Probe abgezogen werden konnte.
Zur Auswertung wurde eine externe Kalibrierung mit Rinderserumalbum (BSA) durchgeführt,
wobei statt den 135 μL VE-Wasser mit 15 μL Probe jeweils 150 μL Kalibrierlösung nach
3.1.9. zur Messung eingesetzt wurden. Mithilfe der Steigung der Kalibriergeraden konnte der
Proteingehalt berechnet werden.
𝑃𝑟𝑜𝑡𝑒𝑖𝑛𝑔𝑒ℎ𝑎𝑙𝑡 [𝑚𝑔
𝑔 𝐹𝑟𝑖𝑠𝑐ℎ𝑔𝑒𝑤𝑖𝑐ℎ𝑡] =
∆𝐸
𝑚 [𝑚𝑙𝑚𝑔]
×0,5 𝑚𝑙
𝐸𝑖𝑛𝑤𝑎𝑎𝑔𝑒 [𝑔]×
150 µ𝑙
15 µ𝑙
ΔE = E – EStop vor Start
m = Steigungsfaktor
2.6.4. High-Performance-Liquid-Chromatography (HPLC)
2.6.4.1. Analyse der Zucker
Die Bestimmung der Zucker aus Nektar, Gewebeextrakten und Phloemsaft erfolgte mithilfe
einer High-Performance-Liquid-Chromatography (HPLC) nach Nadwodnik und Lohaus
(2008). Dafür wurden die Extrakte mit Spritzenfilter (0,2 µm Porengröße, Fa. Roth) gereinigt
und mit H2O soweit verdünnt, dass die Konzentration der Zucker im linearen
Detektionsbereich (50-500µM) des Puls-Amperometrischen Detektors lag (Zelle: #5040,
Amperometer: Coulochem II, Model 5200, Fa. ESA). Die Pulseinstellungen sind in Tabelle
2.4 aufgeführt.
Tabelle 2.4: Einstellungen für die Pulsmessungen am Amperometer
Dauer Modus Spannung
500 ms Messung 50 ms
540 ms Reinigung 700 ms
540 ms Regeneration -800 ms
Die Beladung der Anionenaustauscher-Säule (Vorsäule: CarboPac PA10 Guard;
Hauptsäule: CarboPac PA10, Fa. Dionex) erfolgte über einen Autosampler (2157, Fa. LKB
Pharmacia), der die Proben über ein Ventil in die Eluenten-Zufuhr (100 mM NaOH) der Säule
einspritzte. Um die erforderliche Flussgeschwindigkeit von 0,8 ml/min bei ca. 140 bar zu

Material und Methoden 18
erreichen, wurde eine Zweikolben-Hochleistungspumpe verwendet (LC-9A; Fa. Shimadzu).
Die Auftrennung erfolgte über die Anionen-Bindekapazität der stationären Phase und der
Anzahl negativer Ladungen an den Zuckermolekülen in der mobilen Phase. Bei jedem
Probenlauf wurde eine Standardkurve zur Konzentrations-Bestimmung mit
Zuckerkonzentrationen von 50, 100, 250 und 500 µM erstellt. Die gesammelten
chromatografischen Daten wurden an einem Computer mit der Software PeakNet (Version
5.1, Fa. Dionex) analysiert.
2.6.4.2. Analyse der freien Aminosäuren
Die Analyse der freien Aminosäuren erfolgte mittels HPLC nach Riens et al. (1991) und
Lohaus et al. (2014). Für die Analyse von Aminosäuren, die eine primäre Amingruppe
enthalten, wurde eine Vorsäulenderivatisierung mit o-Phtaldialdehyd (OPA) gefolgte von
einer Auftrennung der Derivate mittels einer Umkehrphasenchromatographie-Säule (Merck,
Darmstadt, Deutschland) mit einem Acetonitril-Gradienten durchgeführt. Mit dieser Methode
konnte Prolin, eine Aminosäure, die eine sekundäre Aminogruppe enthält, nicht
nachgewiesen werden. Daher wurde für die Analyse von Prolin eine
Vorsäulenderivatisierung mit Fluorenylmethyloxycarbonylchlorid (FMOC-CL; Sigma-Aldrich,
Deutschland) anstelle von o-Phtaldialdehyd verwendet.
Die Derivate wurden mittels Fluoreszenz (bei OPA: Anregung 330 nm und Emission 408 nm;
bei FMOC-Cl: Anregung 265 nm und Emission 305 nm) detektiert. Für die externe
Kalibrierung wurden parallel dazu Aminosäure-Standards (Sigma-Aldrich, Deutschland)
gemessen. Die Auswertung der Chromatogramme erfolgte mit einem Integrationsprogramm
(Peaknet Version 5.1, Dionex).
Tabelle 2.5: Lösungen für die Aminosäure-HPLC
Lösung Substanz Konzentration
OPA-Stocklösung o-Phtaldialdehyd 5–8 mg
Methanol 1 ml
Kaliumborat (1m; pH 10,4) 125 µl
β-Mercaptoethanol 12,5 µl
OPA-Arbeitslösung Kaliumborat (1 M; pH 10,4) 1 ml
OPA-Stocklösung 0,5 ml
FMOC-Arbeitslösung FMOC-Cl 3,8 mg
Aceton 5 ml

Material und Methoden 19
HPLC-Puffer H2O (Millipore) 2,5 l
Phosphorsäure 3 ml
EDTA 1,25 g
pH 7,06- 7,1 (mit NaOH 25%
einstellen
Eluent A HPLC-Puffer 95 %
Acetonitril 5 %
Eluent B HPLC-Puffer 50 %
Acetonitril 50 %
Eluent C Acetonitril 70 %
H2O (Millipore) 30 %
2.6.4.3. Analyse der Anionen und organischen Säuren
Die Analyse der negativ geladenen Anionen mittels HPLC wurde nach Lohaus et al.
durchgeführt (2001). Eine Ionenaustauschersäule (IonPacTM AS11 4x250mm; Dionex Corp,
Sunnyvale, CA, USA) wurde mit einem Natriumhydroxid-Gradienten (4 bis 77 mM in 30 min)
zur Trennung der organischen Säuren eluiert. Ein Suppressor wurde verwendet, um die
Empfindlichkeit zu erhöhen, indem die Spitzensensitivität erhöht und das Rauschen der
Basislinie reduziert wurden (ASRS Ultra II 4mm, Dionex USA). Die Ionen wurden mit ihrer
elektronischen Leitfähigkeit (CP20 Conductivity Detector; Dionex USA) detektiert. Für die
externe Kalibrierung wurden Standards parallel gemessen. Die Auswertung der
Chromatogramme erfolgte mit einem Integrationsprogramm (Peaknet Version 5.1, Dionex).
Lösung Substanz Konzentration
Laufmittel Natriumcarbonat 1,8 mM
Natriumhydrogencarbonat 1,7 mM

Material und Methoden 20
2.6.5. Proteinauftrennung mittels Polyacrylamid-
Gelelektrophorese
Die Menge an Protein im Nektar ist im Verhältnis zum Zuckeranteil viel geringer. Deshalb ist
es sinnvoll, vor der SDS-PAGE eine Proteinfällung durchzuführen. Hierzu wird eine
modifizierte Fällung mit einer Chloroform-Methanol-Wasser-Mischung nach Wessel und
Flügge (1984) durchgeführt. Dabei wurden 200 µl Methanol zu 50 µl Nektar gegeben,
gevortext und zentrifugiert (10 sec | 9000 x g). Dann wurden 50 µl Chloroform zugegeben,
gevortext und wieder zentrifugiert (10 sec | 9000 x g). Nun wurden 150 µl H2Odest. zugegeben,
gevortext und zentrifugiert (1 min | 9000 x g). Die gebildete Oberphase wurde sorgfältig
abgenommen und verworfen. Anschließend wurden 150 µl Methanol zugegeben, gevortext
und zentrifugiert (2 min | 9000 x g). Der Überstand wurde komplett verworfen und das Pellet
bei Raumtemperatur getrocknet. Abschließend konnte das Pellet in 10 µl H2Odest. gelöst und
bis zur Verwendung bei -20°C gelagert werden.Zur Trennung und Analyse der gefällten
Proteine wurde eine Polyacrylamid-Gelelektrophorese verwendet. Hierbei wird eine
Auftrennung der Proteine anhand ihrer jeweiligen Molekülmasse durch Anlegen eines
elektrischen Feldes erreicht. Die Trennleistung eines Gels ist von seiner Porengröße
abhängig und kann durch die Totalacrylamidkonzentration T (Konzentration von Acrylamid-
und Bisacrylamid-Monomeren) und den Vernetzungsgrad C (Anteil von Bisacrylamid an der
Totalacrylamidkonzentration) bestimmt werden. Zur Anfärbung der aufgetrennten Proteine
wurden verschiedene Färbetechniken verwendet.
2.6.5.1. Natriumdodecylsulfat-Polyacrylamid-Gelelektrophorese
(SDS-PAGE)
Die SDS-PAGE nach Laemmli (1970) wurde für die standardmäßige Auftrennung von
Proteinen verwendet. Da es sich bei der Methode nach Laemmli um ein diskontinuierliches
Gelsystem handelt, bestanden die Gele aus einem feinporigen Trenn- und einem
großporigen Sammelgel mit einer Schichtdicke von 0,75 mm (Tabelle 2.6: Pipettierschema
für 2 SDS-Gele). Nach dem Gießen des Trenngels wurde dieses mit Isopropanol
überschichtet, um eine plane Oberfläche zu schaffen und den Luftsauerstoff abzuschirmen.
Nach dem Polymerisieren des Trenngels musste der verbleibende Isopropanol, vor dem
Gießen des Sammelgels, restlos entfernt werden. Die Proben wurden vor dem Auftragen 1:3
mit SDS-Probenpuffer (Tabelle 2.7) versetzt und anschließend bei einer konstanten
Spannung von 130 V aufgetrennt.

Material und Methoden 21
Tabelle 2.6: Pipettierschema für 2 SDS-Gele
Trenngel Sammelgel
T [% w/v] C [%] Acrylamid/Bisacrylamid (40 %, A/B 29:1) SDS-Gelpuffer (4x) H2Odest
SDS ( 20 % (w/v)) TEMED APS (10 % (w/v))
14 3,3 6,50 mL 3,50 mL 5,40 mL 70,0 µL 10,0 µL 100,0 µL
5 3,3 1,60 mL 2,50 mL 6,10 mL 50,0 µL 12,80 µL 84,0 µL
Tabelle 2.7: Puffer für die SDS-PAGE
Puffer Substanz Konzentration
SDS-Probenpuffer SDS-Trenngelpuffer (4x) SDS-Sammelgelpuffer (4x) SDS-Elektrophoresepuffer
SDS Na2CO3 Bromphenolblau DTT Saccharose Tris pH 8,8 (mit HCl einstellen) filtrieren Tris pH 6,8 (mit HCl einstellen) filtrieren Glycin Tris SDS pH 8,5 (stellt sich ein)
2,50 % (w/v) 23,60 mM 0,04 %(w/v) 25,0 mM 15,0 % (w/v) 1,5 M - 1 M - 383,60 mM 50,0 mM 0,1 % (w/v) -
2.6.5.2. Coomassie-Färbung nach Görg et al.
Bei der Coomassie-Färbung nach Görg et al. (1978) modifiziert nach Rexroth et al. (2003)
wurden die Proteine mit dem Farbstoff Coomassie Brilliant Blau R-250 angefärbt. Diese
Methode, mit einer Nachweisgrenze von 0,3–1 µg Protein (Wilson, 1983), bietet eine
schnelle und einfache Möglichkeit, Proteine im Gel sichtbar zu machen. Das Gel wurde nach
der Elektrophorese für 15 min in der Färbelösung inkubiert und anschließend in
Entfärbelösung A überführt. Diese Lösung wurde bei Bedarf gewechselt und das Gel
daraufhin zur endgültigen Entfärbung des Hintergrunds in Entfärbelösung B inkubiert.

Material und Methoden 22
Tabelle 2.8: Lösungen für die Coomassie-Färbung
Lösung Substanz Konzentration
Färbelösung Entfärber A Entfärber B
Essigsäure Methanol Coomassie Brilliant Blau R-250 Essigsäure Methanol Essigsäure Methanol
10,0 % (v/v) 45,0 % (v/v) 0,10 % (w/v) 10,0 % (v/v) 45,0 % (v/v) 10,0 % (v/v) 10,0 % (v/v)
2.6.5.3. Silberfärbung nach Blum et al.
Die Silberfärbung nach Blum et al. (1987) stellt mit seiner Nachweisgrenze von 5–30 ng pro
Proteinbande eine wesentlich sensitivere Methode als die Coomassie-Färbung dar. Zunächst
wurde das Gel nach der Elektrophorese zwei Mal 30 min in Fixierlösung I und dann drei Mal
20 min in Fixierlösung II inkubiert. Das Gel färbte sich milchig-weiß und schrumpfte infolge
des Wasserentzugs. Im Anschluss erfolgte eine 1-minütige Inkubation in einer Thiosulfat-
Lösung gefolgt von zwei 1-minütigen Waschschritten mit H2Odest. Danach wurde das Gel für
20 min in der Silberlösung inkubiert, mit H2Odest gespült und in eine Schale mit Entwickler
überführt. Das Gel wurde im Entwickler belassen, bis die Proteinbanden sichtbar wurden.
Daraufhin wurde die Färbung durch Zugabe von 10 % Essigsäure (v/v) abgestoppt und das
Gel nach 10 min in der Stopplösung in eine Schale mit Lagerlösung überführt.
Tabelle 2.9: Lösungen für die Silberfärbung
Lösung Substanz Konzentration
Fixierer I Fixierer II Thiosulfat-Lösung Silberlösung Entwickler Stopplösung Lagerlösung
Essigsäure Methanol Ethanol Na2S2O3 · 5 H2O AgNO3 Formaldehyd 35 % (v/v) Na2CO3 Thiosulfat-Lösung Formaldehyd 35 % (v/v) Essigsäure Essigsäure
12,0 % (v/v) 50,0 % (v/v) 50,0 % (v/v) 0,80 mM 12,0 mM 8,80 mM 566,0 mM 0,02 mM 4,80 mM 10,0 % (v/v) 1,0 % (v/v)

Material und Methoden 23
2.7. Bestimmung der Invertase-Aktivität
Zunächst wurde eine Extraktion der Proteine nach Ruhlmann et al. (2010) durchgeführt.
Hierzu wurden 25 mg Nektariengewebe in einem 1,5 ml RG mit flüssigem Stickstoff und
einem Plastikpistill möglichst fein gemörsert. Dann wurden die Proben mit 400 µl
Extraktionspuffer versetzt, 10 min auf Eis inkubiert und in einer Kühlzentrifuge zentrifugiert
(10 min | 13000 g | 4°C). Der Überstand, welcher die cytoplasmatischen und vakuolären
Invertasen enthielt, wurde in ein neues RG überführt und bei -20°C gelagert. Das Pellet
wurde in 400 µl 80 mM Natriumacetat pH 4,8 resuspendiert und auf vier Aliquote aufgeteilt.
Zwei dieser Aliquote wurden durch Erhitzen im Thermoschüttler (5 min | 100°C) gestoppt und
als Nullwert verwendet.
Das Assay zur Bestimmung der Enzymaktivität wurde nach Heineke et al. (1992)
durchgeführt. Dazu wurden zu allen Aliquoten der Proteinextraktion je 500 µl
Saccharoselösung (Tabelle 2.10) hinzugegeben. Die Proben wurden im Thermoschüttler
inkubiert (10 min | 25°C) und durch Erhitzen gestoppt (5 min | 100°C). Abschließend wurden
die Proben zentrifugiert (2 min | 5000g) und die gebildete Glucose im klaren Überstand
bestimmt. Der Glucosenachweis erfolgte optisch-enzymatisch (siehe 2.6.2 Bestimmung von
Stärke). Anhand der gemessenen Glucosekonzentration ließ sich die Aktivität der Invertase
in U/mg FG berechnen.
Tabelle 2.10: Puffer und Lösungen für das Invertase-Assay
Puffer/ Lösung Substanz Konzentration
Extraktionspuffer HEPES-NaOH pH 8.0 50 mM
MgCl2 ·6H2O 5 mM
EDTA 2 mM
MnCl2 4H2O 1 mM
CaCl2 ·2H2O 1 mM
DTT 1 mM
Natriumacetatpuffer Natriumacetat pH 4.8 80 mM
Saccharoselösung Natriumacetat pH 5.0 125 mM
Saccharose 600 mM

Material und Methoden 24
2.8. Molekularbiologische Arbeiten
2.8.1. RNA-Isolierung
RNA-Analysen geben Auskunft über den Transkriptionsstatus eines Gewebes zu einem
gegebenen Zeitpunkt und erlauben damit die Untersuchung von Expressionsmustern
bestimmter Gene. Das verwendete Protokoll ist eine Abwandlung der Vorgehensweise von
Chang et al. (1993) zur Isolierung von RNA aus Pflanzen. Alle verwendeten
Verbrauchsmaterialen wurden doppelt autoklaviert und die Arbeitsflächen wurden vor jeder
Isolierung mit RNase AWAY® abgewischt um Kontaminationen mit RNAse zu vermeiden.
Gewebeproben wurden in flüssigem Stickstoff in einer Reibschale und mit einer Pistille zu
einem feinen Pulver verrieben, wovon ca. 50 mg in ein 1,5 ml Reaktionsgefäß (RG)
abgewogen wurden. Die Proben durften nicht auftauen, weshalb sie bis zur Zugabe von
65°C warmen CTAB-Puffer in flüssigen Stickstoff gelagert wurden. Nach Zugabe von 800 µl
CTAB-Puffer wurden die Proben auf einem Thermoschüttler inkubiert (15 min | 1400 rpm).
Anschließend wurden 800 µl Chloroform/Isoamylalkohol (24:1 v/v) hinzugegeben, die Proben
30 sec gevortext und zentrifugiert (2 min | 13000 g). Die obere wässrige Phase wurde in ein
neues 2 ml RG überführt, ohne die Interphase zu berühren. Es wurden wieder 800 µl
Chloroform/Isoamylalkohol (24:1 v/v) zugefügt und wie oben beschrieben extrahiert. Die
Extraktion wurde solange wiederholt, bis keine Interphase mehr vorhanden war, mindestens
jedoch zwei Mal. Die wässrige Phase der letzten Extraktion wurde in ein 1,5 ml RG überführt
und mit dem 0,25-fachen Volumenanteil 10 M Lithiumchlorid (LiCl) versetzt und invertiert, bis
keine Schlieren mehr zu sehen waren. Die Proben wurden auf Eis über Nacht bei 4°C im
Kühlschrank für maximal 18 h inkubiert. Dieser Schritt kann auch verkürzt werden, indem die
LiCl-Fällung bei -20°C für 1–2 h durchgeführt wird, was jedoch die Ausbeute etwas reduziert.
Die Proben wurden anschließend bei 4 °C zentrifugiert (20 min | 15000 g) und der Überstand
gründlich entfernt. Das Pellet wurde in 400 µl 65°C warmen SSTE-Puffer für 10 min auf
einem Thermoschüttler (45°C, 1400 rpm) gelöst, mit 400 µl Chloroform/Isoamylalkohol (24:1
v/v) versetzt und wie oben beschrieben gevortext und zentrifugiert. Die Extraktion wurde so
lange wiederholt, bis keine Interphase mehr sichtbar war. Die wässrige Phase der letzten
Extraktion wurde mit 2-fachem Volumen Ethanol versetzt, geschüttelt und für 1 h bei -80°C
inkubiert. Nach der anschließenden Zentrifugation bei 4°C (20 min | 15000 g) wurde der
Überstand entfernt und das Pellet mit 500 µl sowie 80 µl 70%igem Ethanol gewaschen
(jeweils 1 min Zentrifugation nach jeder Waschung). Nach Entfernung des Ethanols wurde
das Pellet bei 45°C getrocknet und anschließend mit 10 µl RNase freiem DEPC-
behandeltem Wasser auf einem Thermoschüttler gelöst (10 min, 45°C, 850 rpm).
Material und Methoden 25
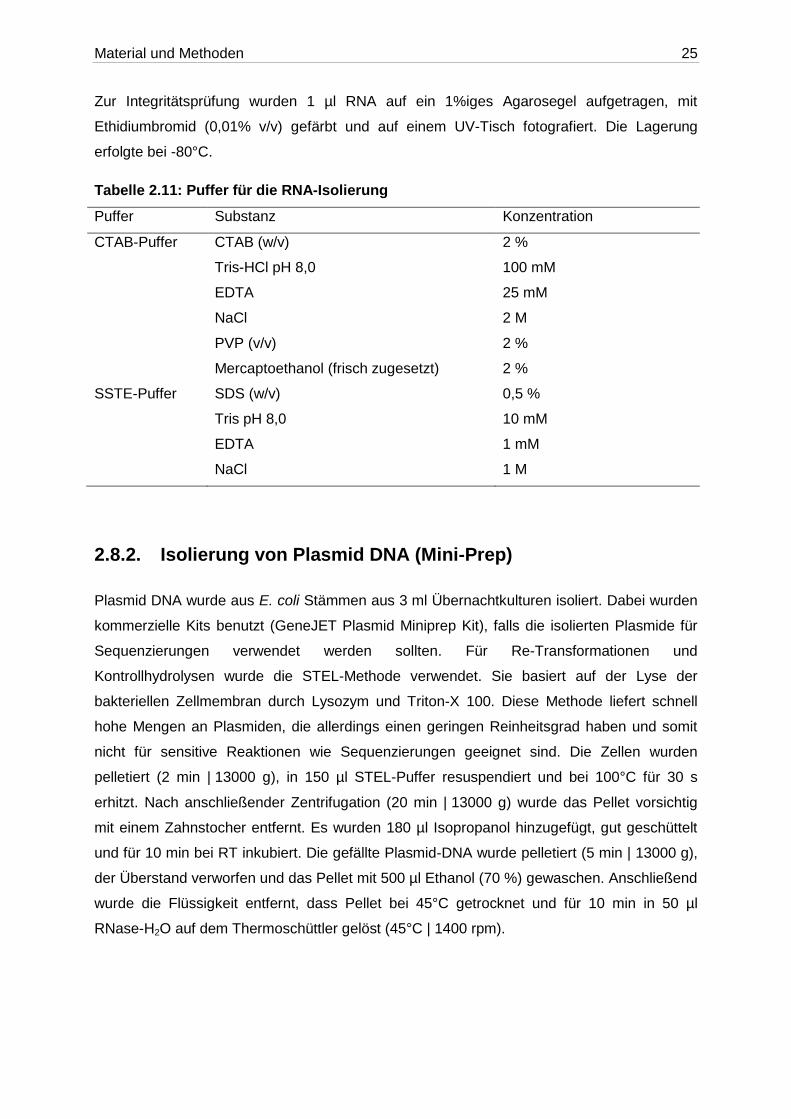
Zur Integritätsprüfung wurden 1 µl RNA auf ein 1%iges Agarosegel aufgetragen, mit
Ethidiumbromid (0,01% v/v) gefärbt und auf einem UV-Tisch fotografiert. Die Lagerung
erfolgte bei -80°C.
Tabelle 2.11: Puffer für die RNA-Isolierung
Puffer Substanz Konzentration
CTAB-Puffer CTAB (w/v) 2 %
Tris-HCl pH 8,0 100 mM
EDTA 25 mM
NaCl 2 M
PVP (v/v) 2 %
Mercaptoethanol (frisch zugesetzt) 2 %
SSTE-Puffer SDS (w/v) 0,5 %
Tris pH 8,0 10 mM
EDTA 1 mM
NaCl 1 M
2.8.2. Isolierung von Plasmid DNA (Mini-Prep)
Plasmid DNA wurde aus E. coli Stämmen aus 3 ml Übernachtkulturen isoliert. Dabei wurden
kommerzielle Kits benutzt (GeneJET Plasmid Miniprep Kit), falls die isolierten Plasmide für
Sequenzierungen verwendet werden sollten. Für Re-Transformationen und
Kontrollhydrolysen wurde die STEL-Methode verwendet. Sie basiert auf der Lyse der
bakteriellen Zellmembran durch Lysozym und Triton-X 100. Diese Methode liefert schnell
hohe Mengen an Plasmiden, die allerdings einen geringen Reinheitsgrad haben und somit
nicht für sensitive Reaktionen wie Sequenzierungen geeignet sind. Die Zellen wurden
pelletiert (2 min | 13000 g), in 150 µl STEL-Puffer resuspendiert und bei 100°C für 30 s
erhitzt. Nach anschließender Zentrifugation (20 min | 13000 g) wurde das Pellet vorsichtig
mit einem Zahnstocher entfernt. Es wurden 180 µl Isopropanol hinzugefügt, gut geschüttelt
und für 10 min bei RT inkubiert. Die gefällte Plasmid-DNA wurde pelletiert (5 min | 13000 g),
der Überstand verworfen und das Pellet mit 500 µl Ethanol (70 %) gewaschen. Anschließend
wurde die Flüssigkeit entfernt, dass Pellet bei 45°C getrocknet und für 10 min in 50 µl
RNase-H2O auf dem Thermoschüttler gelöst (45°C | 1400 rpm).
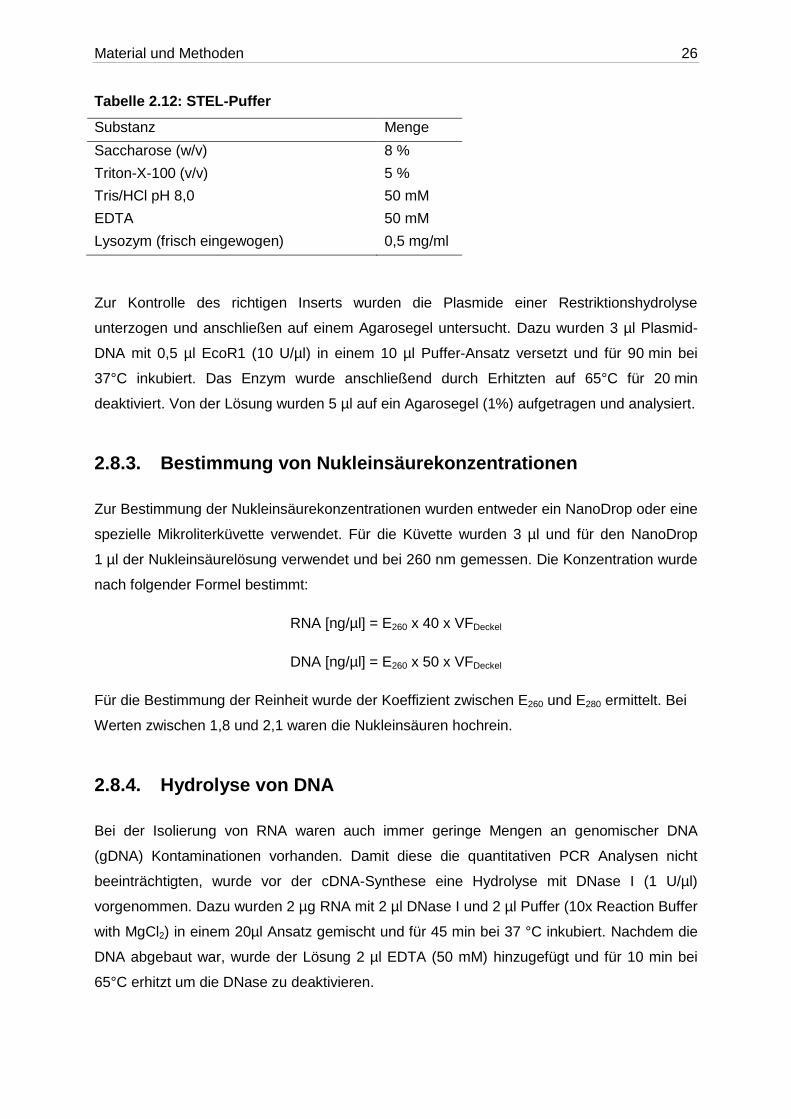
Material und Methoden 26
Tabelle 2.12: STEL-Puffer
Substanz Menge
Saccharose (w/v) 8 %
Triton-X-100 (v/v) 5 %
Tris/HCl pH 8,0 50 mM
EDTA 50 mM
Lysozym (frisch eingewogen) 0,5 mg/ml
Zur Kontrolle des richtigen Inserts wurden die Plasmide einer Restriktionshydrolyse
unterzogen und anschließen auf einem Agarosegel untersucht. Dazu wurden 3 µl Plasmid-
DNA mit 0,5 µl EcoR1 (10 U/µl) in einem 10 µl Puffer-Ansatz versetzt und für 90 min bei
37°C inkubiert. Das Enzym wurde anschließend durch Erhitzten auf 65°C für 20 min
deaktiviert. Von der Lösung wurden 5 µl auf ein Agarosegel (1%) aufgetragen und analysiert.
2.8.3. Bestimmung von Nukleinsäurekonzentrationen
Zur Bestimmung der Nukleinsäurekonzentrationen wurden entweder ein NanoDrop oder eine
spezielle Mikroliterküvette verwendet. Für die Küvette wurden 3 µl und für den NanoDrop
1 µl der Nukleinsäurelösung verwendet und bei 260 nm gemessen. Die Konzentration wurde
nach folgender Formel bestimmt:
RNA [ng/µl] = E260 x 40 x VFDeckel
DNA [ng/µl] = E260 x 50 x VFDeckel
Für die Bestimmung der Reinheit wurde der Koeffizient zwischen E260 und E280 ermittelt. Bei
Werten zwischen 1,8 und 2,1 waren die Nukleinsäuren hochrein.
2.8.4. Hydrolyse von DNA
Bei der Isolierung von RNA waren auch immer geringe Mengen an genomischer DNA
(gDNA) Kontaminationen vorhanden. Damit diese die quantitativen PCR Analysen nicht
beeinträchtigten, wurde vor der cDNA-Synthese eine Hydrolyse mit DNase I (1 U/µl)
vorgenommen. Dazu wurden 2 µg RNA mit 2 µl DNase I und 2 µl Puffer (10x Reaction Buffer
with MgCl2) in einem 20µl Ansatz gemischt und für 45 min bei 37 °C inkubiert. Nachdem die
DNA abgebaut war, wurde der Lösung 2 µl EDTA (50 mM) hinzugefügt und für 10 min bei
65°C erhitzt um die DNase zu deaktivieren.

Material und Methoden 27
2.8.5. cDNA-Synthese
1 µg RNA wurde mit 1 µl Oligo(dT)18 (100 µM) auf 12 µl mit H2O aufgefüllt und zur Auflösung
etwaiger Sekundärstrukturen für 5 min bei 65°C inkubiert und anschließend 2 min auf Eis
gekühlt. Nach Zugabe von 4 µl Puffer (5x Reaction Buffer), 1 µl RiboLock RNase Inhibitor
(20 U/µl), 2 µl dNTP Mix (10mM) und 1 µl reverser Transkriptase (200 U/µl, RevertAid M-
MuLV) wurde die Synthese bei 42°C für 60 min durchgeführt. Alle Komponenten stammen
aus dem RevertAid 1st strand cDNA Synthesis Kit. Die reverse Transkriptase wurde durch
Erhitzen für 5 min bei 70°C inaktiviert.
2.8.6. Amplifikation von DNA-Fragmenten
2.8.6.1. Primerdesign
Für das Screening auf Zellwandinvertasen im Transkriptom von Tabakarten, von denen noch
keine Sequenzen vorliegen, wurden degenerierte Primer verwendet. Diese zeichnen sich
dadurch aus, dass sie nicht artspezifisch, sondern templatespezifisch an eine Sequenz
binden, weil wobble-Basen in der Primersequenz mehrere Bindungsmöglichkeiten erlauben.
Dadurch lassen sich Sequenzen einer Genfamilie und ihre Homologen aus einer nicht
sequenzierten Art isolieren. Die Primer wurden anhand von konservierten Regionen aus
Alignments der DNA- bzw. Aminosäure-Sequenzen von bekannten Zellwandinvertasen bei
möglichst eng verwandten Arten abgeleitet. Dazu wurden die Programme PerlPrimer
(Version 1.1.21) und Geneious (Version R9) verwendet.
2.8.6.2. Polymerase-Kettenreaktion (PCR)
Die PCR ist eine Standardmethode zur Amplifizierung von spezifischen DNA-Fragmenten
(Mullis und Faloona, 1987). Das Prinzip basiert auf der zyklischen Wiederholung von
Denaturierung, Anlagerung der Primer (Annealing) und Verlängerung (Elongation) der
3‘-Enden durch eine thermostabile Polymerase, was im Idealfall zu einer exponentiellen
Vermehrung der DNA-Stücke führt.

Material und Methoden 28
Tabelle 2.13 Zusammensetzung einer Standard-PCR
Komponente Menge
10x Puffer 2,5 µl
MgCl2 25mM 2 µl
dNTPs 10 mM 0,5 µl
Forward Primer 10 µM 0,5 µl
Reverse Primer 10 µM 0,5 µl
Taq-Polymerase 5U/µl 0,3 µl
Template 1 µl
H2O ad 25 µl
Die einzelnen Parameter des PCR-Programms sowie der Reaktionsansätze wurden den
spezifischen Bedingungen angepasst, um ein optimales Ergebnis zu erzielen. Der Erfolg der
PCR wurde mithilfe der TAE-Agarosegelelektrophorese überprüft.
Tabelle 2.14 Standard PCR-Programm
Temperatur Zeit Schritt
94 °C 5 min Initialdenaturierung
94 °C 10 s Denaturierung
50 °C* 30 s Annealing
72 °C 30 s Elongation
Wiederholung des Zyklus 38-44x
72 °C finale Elongation
4 °C ∞ Lagerung
* die Annealingtemperatur ist abhängig von den verwendeten Primern
2.8.7. DNA-Sequenzierung
DNA-Fragmente wurden zur Sequenzierung in den Vektor pGEM®-T easy kloniert und
anschließend zur Firma Eurofins Genomics geschickt. Der Vektor pGEM®-T easy enthält die
Promotorsequenzen T7 und SP6, die das Insert flankieren und somit eine Sequenzierung
ermöglichen. Die Vektorkonstrukte wurden aus Übernacht-Kulturen gewonnen und 750-1500
ng Vektor in 15 µl Tris/HCl pH 8,5 wurden je Sequenzierung verschickt.

Material und Methoden 29
2.8.8. Qualitative Echtzeit-PCR (qRT-PCR)
Die Methode der quantitativen Echtzeit-PCR (qRT-PCR) erlaubt es, den relativen
Transkriptionsstatus eines gene of interest (GOI) zu einem unregulierten housekeeping gene
(HKG) zu bestimmen (Higuchi et al., 1993; Chiang et al., 1996; Gibson et al., 1996; Pfaffl,
2006). Vom Prinzip her wird eine Standard-PCR in Echtzeit „beobachtet“, indem das
Fluoreszenzsignal von SYBR Green I (Schneeberger et al., 1995) nach jedem
Amplifikationszyklus gemessen wird (Wittwer et al., 1997). Die gemessenen
Fluoreszenzwerte werden in einem XY-Diagramm gegen die Zyklenzahl aufgetragen und
aus der resultierenden sigmoidalen Kurve wird der Ct-Wert (cycle treshold) bestimmt. Dieser
Wert wird in der exponentiellen Steigungsphase gemessen, kurz nachdem die Fluoreszenz
der PCR-Reaktion das Hintergrundsignal übertrifft, da in dieser Phase die Effizienz der
Reaktion annähernd 100 % beträgt. Eine absolute Bestimmung der Ausgangskonzentration
der mRNA ist nur schwer möglich, da die Effizienz der reversen Transkriptase-Reaktion stark
schwankt, weshalb eine Normalisierung des GOI durch das HKG notwendig ist. Zur
Bestimmung der relativen Expressionsrate wird der Ct-Wert des GOI in Relation zum Ct-
Wert des HKG gesetzt wobei man annimmt, dass das HKG durch das Experiment nicht in
seiner Regulation beeinflusst wird (Schmidt und Delaney, 2010).
Zunächst wurde aus einer RNA-Isolierung mit anschließendem gDNA-Verdau cDNA
synthetisiert. Von einer cDNA wurden je 4 Ansätze für das GOI und das HKG angefertigt und
zusammen mit anderen Proben auf einer 96-Well Platte aufgetragen. Die Reaktion fand in
einem Thermocycler mit Fluoreszenzmessung statt.
Tabelle 2.15 Zusammensetzung einer qRT-PCR-Reaktion
Komponente Menge
2x qPCR MasterMix (Maxima SYBR Green, Fa. Thermo) 10 µl
ROX (5 µM) 0,08 µl
Forward Primer (10 µM) 1,2 µl
Reverse Primer (10 µM) 1,2 µl
cDNA 4 µl
H2O 3,52 µl
Ein wichtiges Maß, um die relative Expressionsrate eines Gens akkurat bestimmen zu
können, ist die Effizienz der PCR-Reaktion (Wong und Medrano, 2005; Kubista et al., 2006).
Unter optimalen Bedingungen wird die Ziel-DNA bei jedem Amplifikationsschritt verdoppelt,
was zu einer exponentiellen Vermehrung führt und einer Reaktionseffizienz von 100%
entspricht. Dieser Fall tritt allerdings selten ein, da verschiedene Faktoren die PCR-Reaktion

Material und Methoden 30
beeinflussen. Deshalb wurde für jedes Primerpaar die Effizienz experimentell bestimmt.
Dazu wurden die cDNAs aus einem Experiment gepoolt und anschließend mithilfe einer
Verdünnungsreihe von 1:2 bzw. 1:5 eine Standardkurve angefertigt. Die Steigung der
Regressionsgeraden gab die Reaktionseffizienz wieder (Pfaffl, 2001). Werte zwischen 95 %
und 105 % wurden als akkurat angenommen und für die Bestimmung der relativen
Expression verwendet. Die Berechnungen erfolgten automatisiert innerhalb der
Analysesoftware MxPro. Berücksichtigt bei der Wahl der Primer wurde auch, dass die
Dissoziationskurve nur ein spezifisches Produkt anzeigte, da sonst unspezifische Bindungen
und Primerdimere vorhanden sein können (Ririe et al., 1997).
Tabelle 2.16 Programm für die qRT-PCR
Temperatur Zeit Schritt
95 °C 10 min Initialdenaturierung und Aktivierung der
Polymerase
95 °C 15 s Denaturierung
60 °C* 30 s Annealing und Elongation
Wiederholung des Zyklus 44x
55-95 °C Dissoziationskurve
95 °C 30 s finale Denaturierung
* die Annealingtemperatur ist abhängig von den Primereigenschaften
2.8.9. Klonierung
Die Klonierung von DNA-Fragmenten wurde für Sequenzierungen und zur Herstellung von
Dauerkulturen durchgeführt. Für erfolgreiche Klonierungen ist es notwendig, dass möglichst
saubere DNA verwendet wird. Wenn im Anschluss einer PCR auf dem Kontrollgel eine
distinkte Bande der erwarteten Größe zu sehen war, so wurde das Produkt mit einem
kommerziellen Kit auf Basis von Silica-Membranen aufgereinigt (PCR-Purification Kit).
Damit eine Ligation zwischen einem Plasmidvektor und dem Insert effektiv stattfinden
konnte, wurden nach der Linearisierung die entstanden Schnittenden des Plasmids
dephosphoryliert, was eine Religation verhindert. Erst durch den Einbau des Inserts wurde
wieder eine Rezirkularisierung des Plasmidkonstruktes möglich. Für bereits linearisierte
Plasmide wie pGEM®-T easy war keine Phosphatase-Behandlung notwendig, da an den
Enden vorhandene T-Überhange eine Selbstligation verhinderten.

Material und Methoden 31
Nachdem der Vektor mit einem geeigneten Restriktionsenzym hydrolisiert wurde, erfolgte die
Dephosphorylierung. Dazu wurden 1 µg linearisierte Plasmid-DNA in einem 20 µl Ansatz mit
2 µl 10x Puffer und 1 µl Phophatase (FastAP Thermosensitive Alkaline Phospatase) versetzt
und für 10 min bei 37°C inkubiert. Anschließend wurde die Reaktion durch Erhitzen auf 75°C
für 5 min gestoppt. Das nun dephosphorylierte Plasmid konnte anschließend für die Ligation
verwendet.
Wenn bei PCR-Reaktionen Polymerasen mit Korrekturlesefunktion wie etwa Pfu-Polymerase
verwendet wurden, so entstanden Amplifikate mit glatten (blunt) Enden. Eine Ligation mit
dem Vektor p-GEM®-T easy ist hierbei schwieriger, da dieser über T-Überhänge verfügt, die
komplementär zu den durch die Taq-Polymerase an die PCR-Produkte angefügte A-
Überhänge sind. Um trotzdem eine T/A-Klonierung durchführen zu können, wurden an die
3‘-Enden der PCR-Produkte Adenosin-Reste angefügt. Dazu wurden in einem 10 µl Ansatz
6,2 µl gereinigtes PCR-Produkt mit 1 µl 10x PCR-Puffer (Puffer B, s.o), 0,8 µl MgCl2
(25 mM), 1 µl ATP (2 mM) und 1 µl Taq (5 U/µl) gemischt und für 30 min bei 72 °C inkubiert.
Von diesem Ansatz wurde 2 µl für die Ligation eingesetzt.
Für die Konstruktion von Plasmiden mit einem mittels PCR hergestelltem und durch Silica-
Membranen aufgereinigtem Insert, musste eine Ligation vorgenommen werden. Durch die
Vendung des Vektors pGEM®-T easy konnten entweder aufgereinigte Produkte einer
Taq-PCR direkt verwendet werden oder durch Pfu-PCR erzeugte Produkte nach dem
Anhängen von Adenosinbasen und ein vorheriger Restriktionsverdau und
Desphosphorylierung des Vektors waren nicht nötig. Das optimale molare Verhältnis von
Vektor zu Insert für eine hohe Transformationsrate liegt im Bereich von 3:1 und 5:1. Die
benötige Menge an Insert wurde nach folgender Formel berechnet:
𝑛𝑔 𝑉𝑒𝑘𝑡𝑜𝑟 𝑥 𝑘𝑏 𝐼𝑛𝑠𝑒𝑟𝑡𝑔𝑟öß𝑒
𝑘𝑏 𝑉𝑒𝑘𝑡𝑜𝑟𝑔𝑟öß𝑒 𝑥 𝑚𝑜𝑙𝑎𝑟𝑒𝑠 𝑉𝑒𝑟ℎä𝑙𝑡𝑛𝑖𝑠 𝑣𝑜𝑛 𝐼𝑛𝑠𝑒𝑟𝑡 𝑧𝑢 𝑉𝑒𝑘𝑡𝑜𝑟 = 𝑛𝑔 𝐼𝑛𝑠𝑒𝑟𝑡
Die berechnete Menge an Insert wurde mit 2 µl 10x Ligationspuffer, 1 µl Ligase (5 U/µl), 0,5
µl Vektor (0,5 ng/µl) versetzt und mit H2O auf 20 µl aufgefüllt. Der Ansatz wurde über Nacht
im Kühlschrank inkubiert. Alternativ wurde die Inkubation für 10 min bei Raumtemperatur
durchgeführt, was allerdings eine deutlich reduzierte Anzahl an Transformanten zur Folge
hatte.

Material und Methoden 32
2.8.9.1. Herstellung kompetenter E. coli
Die verwendete Methode basiert auf einem Protokoll von Hanahan (1983). Für die
Herstellung von kompetenten E. coli wurden in 5 ml SOC-Medium Bakterien über Nacht bei
37°C und 250 rpm auf einem Schüttler angezogen. Mit dieser Vorkultur wurden 50 ml SOC
Medium in einem 200 ml Erlenmeyer-Kolben angeimpft und bei 37°C sowie 250 rpm bis zu
einer OD600 von etwa 0,5 wachsen gelassen. Nachdem die Zelldichte hoch genug war, wurde
die Suspension auf zwei sterile 50 ml Falcon-Tubes aufgeteilt und pelletiert (5 min | 2200 g |
4°C). Die geernteten Zellen wurden anschließend in 25 ml kaltem Transformationspuffer
resuspendiert und für 30 min auf Eis inkubiert. Nach einer weiteren Zentrifugation (5 min |
2200 g | 4°C) wurden die Zellen in 5 ml Transformationspuffer und 20% Glycerin (v/v) gelöst.
200 µl Aliquote wurden auf 1,5 ml RG verteilt und bei -80°C eingelagert.
Tabelle 2.17: Puffer und Medien für die Herstellung kompetenter E. coli
Puffer/Medien Substanz Konzentration
Transformationspuffer CaCl2 100 mM
(steril filtrieren) RbCl 50 mM
MnCl2 40 mM
SOC-Medium (für 1 l) Trypton 20 g
Hefe-Extrakt 5 g
NaCl 0,5 g
KCl 0,19 g
mit NaOH auf pH 7.0 einstellen und autoklavieren
2 M MgCl2 (steril filtriert) 5 µl/ml
1 M Glucose (steril filtriert) 20 µl/ml
2.8.9.2. Transformation von E. coli
Zur Klonierung von Invertase-Fragmenten wurde der Stamm Escherichia coli DH5α
(Woodcock et al., 1989) verwendet (Genotyp: F- (ΦdlacZΔM15) recA1 end A1 gyrA96 thi-1
hsdR17 (rk-mk
+) supE44 relA1 deoR Δ (lacZYA-arfF) U169). Die bei -80°C eingelagerten
Zellen wurden auf Eis aufgetaut. Zu einem 200 µl Aliquot wurden 5–20 µl des
Ligationsansatzes hinzu pipettiert und auf Eis für 30 min inkubiert. Nach einem Hitzeschock
bei 42°C für 45 s wurden die Zellen erneut auf Eis für 2 min inkubiert. Anschließend wurden
800 µl SOC-Medium hinzugegeben, vorsichtig gemischt und bei 37°C auf einem
Thermoschüttler (200 rpm) inkubiert. Nach der Transformation wurden die Zellen auf LB-X-
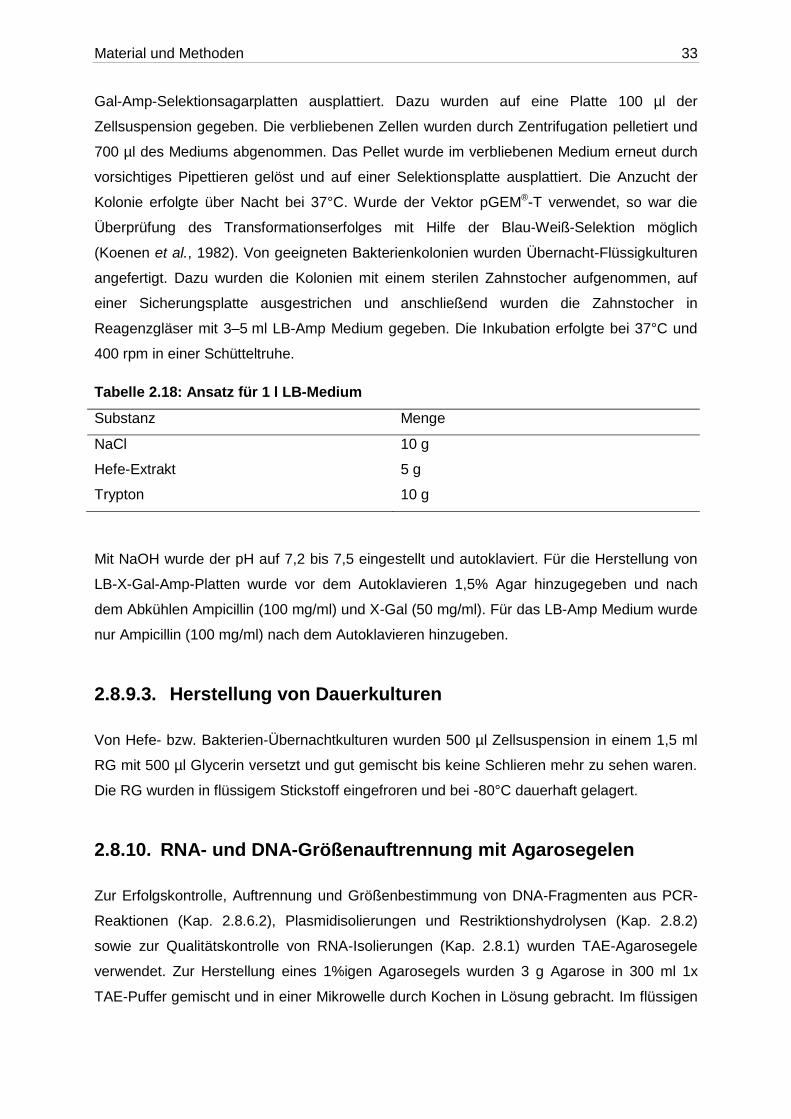
Material und Methoden 33
Gal-Amp-Selektionsagarplatten ausplattiert. Dazu wurden auf eine Platte 100 µl der
Zellsuspension gegeben. Die verbliebenen Zellen wurden durch Zentrifugation pelletiert und
700 µl des Mediums abgenommen. Das Pellet wurde im verbliebenen Medium erneut durch
vorsichtiges Pipettieren gelöst und auf einer Selektionsplatte ausplattiert. Die Anzucht der
Kolonie erfolgte über Nacht bei 37°C. Wurde der Vektor pGEM®-T verwendet, so war die
Überprüfung des Transformationserfolges mit Hilfe der Blau-Weiß-Selektion möglich
(Koenen et al., 1982). Von geeigneten Bakterienkolonien wurden Übernacht-Flüssigkulturen
angefertigt. Dazu wurden die Kolonien mit einem sterilen Zahnstocher aufgenommen, auf
einer Sicherungsplatte ausgestrichen und anschließend wurden die Zahnstocher in
Reagenzgläser mit 3–5 ml LB-Amp Medium gegeben. Die Inkubation erfolgte bei 37°C und
400 rpm in einer Schütteltruhe.
Tabelle 2.18: Ansatz für 1 l LB-Medium
Substanz Menge
NaCl 10 g
Hefe-Extrakt 5 g
Trypton 10 g
Mit NaOH wurde der pH auf 7,2 bis 7,5 eingestellt und autoklaviert. Für die Herstellung von
LB-X-Gal-Amp-Platten wurde vor dem Autoklavieren 1,5% Agar hinzugegeben und nach
dem Abkühlen Ampicillin (100 mg/ml) und X-Gal (50 mg/ml). Für das LB-Amp Medium wurde
nur Ampicillin (100 mg/ml) nach dem Autoklavieren hinzugeben.
2.8.9.3. Herstellung von Dauerkulturen
Von Hefe- bzw. Bakterien-Übernachtkulturen wurden 500 µl Zellsuspension in einem 1,5 ml
RG mit 500 µl Glycerin versetzt und gut gemischt bis keine Schlieren mehr zu sehen waren.
Die RG wurden in flüssigem Stickstoff eingefroren und bei -80°C dauerhaft gelagert.
2.8.10. RNA- und DNA-Größenauftrennung mit Agarosegelen
Zur Erfolgskontrolle, Auftrennung und Größenbestimmung von DNA-Fragmenten aus PCR-
Reaktionen (Kap. 2.8.6.2), Plasmidisolierungen und Restriktionshydrolysen (Kap. 2.8.2)
sowie zur Qualitätskontrolle von RNA-Isolierungen (Kap. 2.8.1) wurden TAE-Agarosegele
verwendet. Zur Herstellung eines 1%igen Agarosegels wurden 3 g Agarose in 300 ml 1x
TAE-Puffer gemischt und in einer Mikrowelle durch Kochen in Lösung gebracht. Im flüssigen

Material und Methoden 34
Zustand wurde das Gel in Gelkammern mit einer Dicke von etwa 0,5–1 cm aufgetragen und
zur Bildung von Beladungstaschen wurden Kämme eingesetzt. Nach dem Erkalten wurden
die Taschen mit 5 µl Probe gefüllt, die zuvor mit Gelladepuffer versetzt wurde und das Gel
wurde in 1x TAE-Puffer mit bis zu 150 mA unter Strom gesetzt. Als Größenstandard diente
der O’GeneRuler™ 1kb Plus DNA Ladder (Thermo Fisher Scientific). Nach erfolgter
Auftrennung wurde das Gel in einem Ethidiumbromid-Bad (1 µl/ml) für 20 min inkubiert und
anschließend auf einem UV-Tisch fotografiert.
Tabelle 2.19: Ansatz für 50x TAE Puffer
Substanz Menge
Tris 2 M
Acetat 1 M
EDTA pH 8,0 50 mM
2.8.11. Screening des Nektars auf mikrobiellen Befall
Um zu testen, ob die Nektarzusammensetzung durch Hefen oder Bakterien beeinflusst wird,
wurde stichprobenartig Nektar von allen untersuchten Pflanzenarten getestet. Hierzu wurden
10–50 µl Nektar auf Malzextraktplatten ausgestrichen und bis zu 7 Tage bei 25°C in den
Brutschrank gelegt.
Tabelle 2.20: Ansatz für 1 l Malzextrakt-Agar
Substanz Menge
Malzextrakt 20 g
Pepton aus Casein 3 g
Agar 22 g
pH 5,5
Wenn auf einer Malzextraktplatte ein mikrobieller Befall zu sehen war, wurde die DNA nach
einem Protokoll von Liang und Richardson (1992) isoliert. Die getrocknete DNA wurde statt
in 10 μl 0.1x TE in 10 µl Tris-HCl Puffer aufgenommen, weil dieser besser für das Gelingen
der anschließenden PCR ist.

Material und Methoden 35
Tabelle 2.21: PCR Ansatz für Hefescreening
Substanz Menge
H2O dest. 33,5 μl
10x Puffer 5 μl
25 mM MgCl2 6 μl
Primer ITS1 0,5 μl
Primer ITS4 0,5 μl
DNA 3 μl
dNTPs (20 mM) 1 μl
Taq 0,5 μl (2 units)
PCR-Programm:
0: 94°C 1min
1: 52°C 1 min
2: 72°C 1 min
Schritte 0 bis 2: 40 mal wiederholen
3: 72°C 5 min
4: 4°C
Die Proben wurden dann zur Sequenzierung geschickt und mit bekannten Sequenzen aus
Datenbanken abgeglichen (NCBI).
2.9. Verwendete Oligosaccharide
Für die verschiedenen PCR-Reaktionen wurden Primer entworfen und bei der Firma Eurofins
Genomics (Ebersberg) bestellt.

Material und Methoden 36
Tabelle 2.22: Verwendete Oligosaccharide für die PCR und qRT-PCR
Protein/Funktion Name Sequenz 5'-3'
degenerierte Invertaseprimer
Inv_for CCGGAATTCTTYTAYCARTRBAAYCC
Inv_rev CTAGTCTAGARTCRWARAANGGYTTNGAYGCRTA
degenerierte Invertaseprimer
InvTab_for ATCCTCTACACYGGWATY
InvTab_rev YACYGGRAARAAATCRAAACATTCCCA
Invertase von N. africana
NafrInv_f GTCCAAAACTACGCGATACC
NafrInv_r GATTTCTCACACTCCCAACC
Invertase von N. attenuata
NatuInv3_f GAACTCCTTCCCTTCAGC
NatuInv3_r GTTTGACACATTCCCGAC
Invertase von N. benthamiana
NbenInv2_f GGCAATGATGAAGCACGATG
NbenInv2_r ACTCCGGGATTGAATCAGG
Invertase von N. sylvestris
NsylInv_for CACAAGTCCAAAACTACGCGA
NsylInv_rev TGATTCTTCACACTCCCAACCA
Invertase von N. tabacum
NtabInvSpec_f CTGCTATGTGCTGATGGATG
NtabInvSpec_r CAGGCGCTTCACTATTCTC
Aktin HKG_Act1f GACTATGAGCAGGAACTTGAGA
HKG_Act1r TGAACCACCACTAAGAACAATG
Aktin NtActqPCR1f TGTCCTGAGGTCCTTTTCC
NtActqPCR1r ATTCTATCAGCGATACCCGG
Aktin NtActqPCR2f CCCTCCCACATGCTATTCT
NtActqPCR2r TCCTGTTCATAGTCGAGAGC
Elongation factor 1α
NtEF1αf GGCCCAACACTTCTTGATGCTC
NtEF1αr CCAACATTGTCACCAGGAAGT
Elongation factor 1α
NtEf1qPCR1f CTGCTTATTGACTCCACCAC
NtEf1qPCR1r CACCTTCCAAACCAGAGATG
Ubiquitin-conjugating enzyme E2
NtubiE2f CTGACTTCAATCCAGTCTTTGCTC
NtubiE2r GTAACAGATTAAGAGTGCGGG
Bestimmung von Mikroben
ITS1 TCCGTAGGTGAACCTGCGG
ITS4 TCCTCCGCTTATTGATATGC
Material und Methoden 37
2.10. Statistik
Um auf signifikante Unterschiede zwischen verschiedenen Gruppen zu testen wurde ein t-
Test für unabhängige Stichproben (Student's t-test) durchgeführt. Die Normalverteilung
wurde mit dem Kolmogorov-Smirnov-Test überprüft und die Homoskedastizität (Homogenität
der Varianzen) mit dem Levene-Test. Wenn diese Voraussetzungen gegeben waren wurde
gegebenenfalls eine ANOVA durchgeführt, um zu testen, ob der Mittelwert einer Gruppe
signifikant vom Gesamtmittelwert abweicht. Wenn dies zutraf, wurde der Tukey-Test
verwendet, um zu ermittelt, welcher Gruppenmittelwert von den anderen abweicht. Für nicht-
parametrische Daten wurde stattdessen der Kruskal-Wallis-Test durchgeführt.
Um die Frage zu untersuchen, ob die Nektarzusammensetzung mehr von den Bestäubern
oder phylogenetischen Verhältnissen abhängig ist, wurde eine Hauptkomponentenanalyse
(Principal Component Analysis, PCA) durchgeführt. Hierfür wurden alle Daten zunächst z-
transformiert, um ihren Mittelwert auf 0 und ihre Standardabweichung (standard deviation,
SD) auf 1 zu setzen. Dann wurden zwei Hauptkomponenten (Principal Components, PCs)
aus 33 unabhängigen Variablen, welche gemessene Konzentrationen an Zuckern,
Aminosäuren, anorganischen Anionen, Kationen und organischen Säuren repräsentieren,
extrahiert. Die daraus resultierenden Daten und die Ladungen auf die neuen
Hauptkomponenten wurden schließlich geplottet und graphische ausgewertet.
Um die graphische Auswertung mit Zahlen zu untermauern wurde eine permutational
multivariate analysis of variance (PERMANOVA) durchgeführt. Dadurch konnte der relative
Einfluss der Variablen „Bestäuber“ und „Sektionszugehörigkeit“ auf die
Nektarzusammensetzung berechnet werden. Das ‚vegan‘ Paket in R bietet hierzu eine
multivariate Analyse der Varianzen (MANOVA) unter permutierender Verwendung von
Distanzmatrizen (Anderson, 2001; Oksanen et al., 2008). Zur Berechnung wurden die
euklidische Distanz und eine Wiederholung von 999 Permutationen gewählt.
Alle statistischen Analysen wurden mit IBM SPSS Statistics 22 durchgeführt, außer die PCA
und die PERMANOVA, welche in R durchgeführt wurden.

Material und Methoden 38
2.11. Bioinformatik
Für die computergestützten Arbeiten kamen verschiedene Softwarepakete, Webserver und
Programme zum Einsatz, die in folgender Tabelle aufgeführt sind.
Tabelle 2.23: Verwendete bioinformatische Software und Server
Name Ver. Funktion Urheber
Bioedit 7.2.2 Sequenzalignment und
Analyse
www.mbio.ncsu.edu/bioedit/bioedit.html
BLAST Sequenzvergleich blast.ncbi.nlm.nih.gov/blast.cgi
ChromasPro 1.5 DNA-Sequenzierung technelysium.com.au
Geneious R9 Molekularbiologisches
Analyse Tool
www.geneious.com
MEGA 6.06 Phylogenetische Analysen www.megasoftware.net
NaDH N. attenuata Datenbank nadh.ice.mpg.de
NCBI Sequenz Datenbank www.ncbi.nlm.nih.gov
Peaknet 5.1 Chromatografie Daten
Software
Dionex
PerlPrimer 1.1.2 Primerdesign perlprimer.sourceforge.net
R 3.4.3 Statistiktool www.r-project.org
SPSS 22 Statistiktool IBM SPSS Statistics

Ergebnisse 39
3. Ergebnisse
Die Ergebnisse werden in der folgenden Struktur dargestellt:
Abschnitt I: Mikrobieller Befall in floralem Nektar
Abschnitt II: Nektarinhaltsstoffe bei Tabakpflanzen: Welche gibt es und wodurch
werden sie beeinflusst?
Diese Ergebnisse sind in dem Artikel „Nectar sugars and amino acids
in day- and night-flowering Nicotiana species are more strongly shaped
by pollinators' preferences than organic acids and inorganic ions“
(PLoS One, 2017, Vol. 5, doi: 10.1371/journal.pone.0176865)
veröffentlicht.
Abschnitt III: Proteine im Nektar von Nicotiana
Hier werden die untersuchten Arten miteinander verglichen und
mögliche Proteine identifiziert.
Abschnitt IV: Regulation der Zuckerzusammensetzung in Nektar und Nektarien bei
Nicotiana
Die Ergebnisse sind in dem Manuskript „Nectar Sugar Modulation and
Cell Wall Invertases in Nectaries of Tobacco Plants (Nicotiana)”
dargestellt und zur Veröffentlichung bei Frontiers in Plant Science
eingereicht.
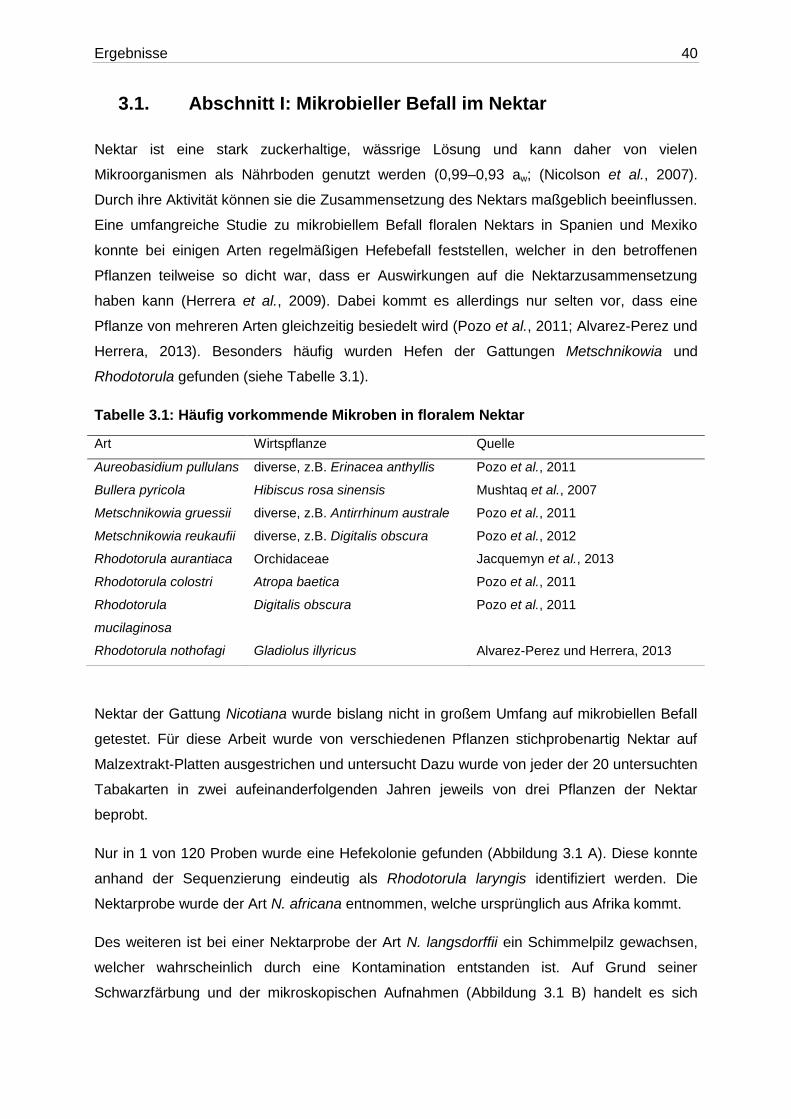
Ergebnisse 40
3.1. Abschnitt I: Mikrobieller Befall im Nektar
Nektar ist eine stark zuckerhaltige, wässrige Lösung und kann daher von vielen
Mikroorganismen als Nährboden genutzt werden (0,99–0,93 aw; (Nicolson et al., 2007).
Durch ihre Aktivität können sie die Zusammensetzung des Nektars maßgeblich beeinflussen.
Eine umfangreiche Studie zu mikrobiellem Befall floralen Nektars in Spanien und Mexiko
konnte bei einigen Arten regelmäßigen Hefebefall feststellen, welcher in den betroffenen
Pflanzen teilweise so dicht war, dass er Auswirkungen auf die Nektarzusammensetzung
haben kann (Herrera et al., 2009). Dabei kommt es allerdings nur selten vor, dass eine
Pflanze von mehreren Arten gleichzeitig besiedelt wird (Pozo et al., 2011; Alvarez-Perez und
Herrera, 2013). Besonders häufig wurden Hefen der Gattungen Metschnikowia und
Rhodotorula gefunden (siehe Tabelle 3.1).
Tabelle 3.1: Häufig vorkommende Mikroben in floralem Nektar
Nektar der Gattung Nicotiana wurde bislang nicht in großem Umfang auf mikrobiellen Befall
getestet. Für diese Arbeit wurde von verschiedenen Pflanzen stichprobenartig Nektar auf
Malzextrakt-Platten ausgestrichen und untersucht Dazu wurde von jeder der 20 untersuchten
Tabakarten in zwei aufeinanderfolgenden Jahren jeweils von drei Pflanzen der Nektar
beprobt.
Nur in 1 von 120 Proben wurde eine Hefekolonie gefunden (Abbildung 3.1 A). Diese konnte
anhand der Sequenzierung eindeutig als Rhodotorula laryngis identifiziert werden. Die
Nektarprobe wurde der Art N. africana entnommen, welche ursprünglich aus Afrika kommt.
Des weiteren ist bei einer Nektarprobe der Art N. langsdorffii ein Schimmelpilz gewachsen,
welcher wahrscheinlich durch eine Kontamination entstanden ist. Auf Grund seiner
Schwarzfärbung und der mikroskopischen Aufnahmen (Abbildung 3.1 B) handelt es sich
Art Wirtspflanze Quelle
Aureobasidium pullulans diverse, z.B. Erinacea anthyllis Pozo et al., 2011
Bullera pyricola Hibiscus rosa sinensis Mushtaq et al., 2007
Metschnikowia gruessii diverse, z.B. Antirrhinum australe Pozo et al., 2011
Metschnikowia reukaufii diverse, z.B. Digitalis obscura Pozo et al., 2012
Rhodotorula aurantiaca Orchidaceae Jacquemyn et al., 2013
Rhodotorula colostri Atropa baetica Pozo et al., 2011
Rhodotorula
mucilaginosa
Digitalis obscura Pozo et al., 2011
Rhodotorula nothofagi Gladiolus illyricus Alvarez-Perez und Herrera, 2013
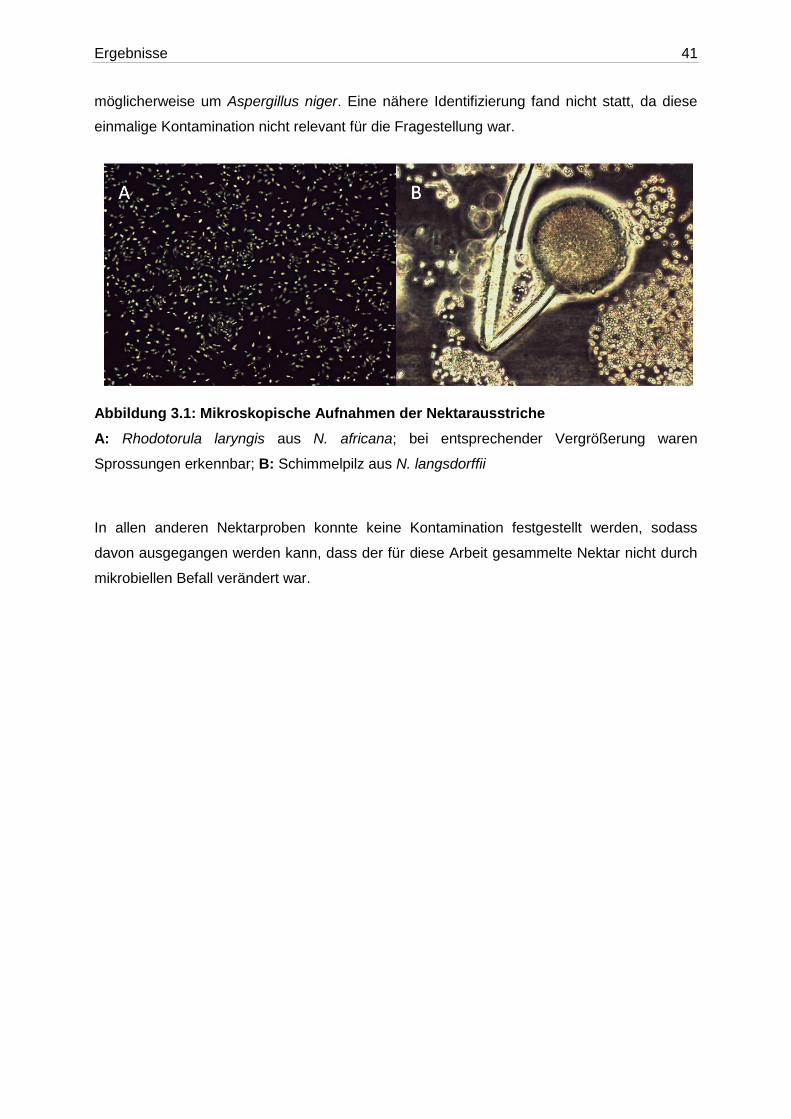
Ergebnisse 41
möglicherweise um Aspergillus niger. Eine nähere Identifizierung fand nicht statt, da diese
einmalige Kontamination nicht relevant für die Fragestellung war.
Abbildung 3.1: Mikroskopische Aufnahmen der Nektarausstriche
A: Rhodotorula laryngis aus N. africana; bei entsprechender Vergrößerung waren
Sprossungen erkennbar; B: Schimmelpilz aus N. langsdorffii
In allen anderen Nektarproben konnte keine Kontamination festgestellt werden, sodass
davon ausgegangen werden kann, dass der für diese Arbeit gesammelte Nektar nicht durch
mikrobiellen Befall verändert war.

Ergebnisse 42
3.2. Abschnitt II: Nektarinhaltsstoffe bei Tabakpflanzen:
Welche gibt es und wodurch werden sie beeinflusst?
In diesem Abschnitt sind die Ergebnisse zu den Analysen der Nektarinhaltsstoffe und ihrem
Bezug zu den jeweiligen Bestäubern einer Art zusammengefasst.
Diese Ergebnisse sind in dem Artikel „Nectar sugars and amino acids in day- and night-
flowering Nicotiana species are more strongly shaped by pollinators' preferences than
organic acids and inorganic ions“ (PLoS One, 2017, Vol. 5, doi:
10.1371/journal.pone.0176865) veröffentlicht.

Ergebnisse 43
43
Nectar Sugars and Amino Acids in Day- and Night-Flowering
Nicotiana Species are More Strongly Shaped by Pollinators’
Preferences than Organic Acids and Inorganic Ions
Authors: Kira Tiedge1, Gertrud Lohaus1*
1Molecular Plant Science/ Plant Biochemistry, University of Wuppertal, Wuppertal,
Germany
Short Title: Influential Factors on Nectar in Day- and Night-Flowering Tobacco
* Corresponding author
E-mail: [email protected]

Ergebnisse 44
44
Abstract
Floral nectar contains mainly sugars but also amino acids, organic acids, inorganic ions and
secondary compounds to attract pollinators. The genus Nicotiana exhibits great diversity
among species in floral morphology, flowering time, nectar compositions, and predominant
pollinators. We studied nectar samples of 20 Nicotiana species, composed equally of day-
and night-flowering plants and attracting different groups of pollinators (e.g. hummingbirds,
moths or bats) to investigate whether sugars, amino acids, organic acids and inorganic ions
are influenced by pollinator preferences. Glucose, fructose and sucrose were the only sugars
found in the nectar of all examined species. Sugar concentration of the nectar of day-
flowering species was 20 % higher and amino acid concentration was 2-3-fold higher
compared to the nectar of night-flowering species. The sucrose-to-hexose ratio was
significantly higher in night-flowering species and the relative share of sucrose based on the
total sugar correlated with the flower tube length in the nocturnal species. Flowers of different
tobacco species contained varying volumes of nectar which led to about 150-fold higher
amounts of total sugar per flower in bat- or sunbird-pollinated species than in bee-pollinated
or autogamous species. This difference was even higher for total amino acids per flower (up
to 1000-fold). As a consequence, some Nicotiana species invest large amounts of organic
nitrogen for certain pollinators. Higher concentrations of inorganic ions, predominantly
anions, were found in nectar of night-flowering species. Therefore, higher anion
concentrations were also associated with pollinator types active at night. Malate, the main
organic acid, was present in all nectar samples but the concentration was not correlated with
pollinator type. In conclusion, statistical analyses revealed that pollinator types have a
stronger effect on nectar composition than phylogenetic relations. In this context, nectar
sugars and amino acids are more strongly correlated with the preferences of predominant
pollinators than organic acids and inorganic ions.

Ergebnisse 45
45
Introduction
Floral nectars are aqueous, carbohydrate-rich solutions that are secreted by nectaries of
flowering plants. To a lower extent amino acids, organic acids, lipids, proteins, inorganic ions,
scents and other secondary compounds are found in nectar [1–3], too. As an interface
between the plant and its visitors, the nectar has at least two important functions: first, the
attraction of specific pollinators that facilitate sexual reproduction and second, defense
against nectar robbers, herbivores and pathogens [4–7].
Sugars dominate total nectar solutes and constitute the major energy source for visitors. The
hexoses glucose and fructose as well as the disaccharide sucrose are highly abundant in
nectar, although the ratio of sugars can differ interspecifically [1,8]. In some species there are
also smaller amounts of other sugars present [9]. Nectar sugar concentration is higher in
bee-pollinated flowers (35 % (w/v)) than in flowers pollinated by butterflies or hummingbirds
(20-25 % (w/v)) [10], because the optimal nectar concentration is higher for viscous dippers
than for suction feeders [11].
Besides sugars, nectar contains a wide range of different amino acids, which may primarily
serve as a nitrogen source for the flowers’ visitors or as a phagostimulant [12]. More recent
findings show highly variable concentrations of amino acids between different species and
smaller variations in the composition of amino acids [13]. Pollinators’ preferences have the
strongest influence on nectar composition, shown in a study about amino acid composition in
Mediterranean floral nectars [14]. This impact is even more pronounced than environmental
and taxonomical constraints. Among the measured amino acids, phenylalanine was most
strongly correlated with pollinator preferences by having a phagostimulatory effect on several
insects, especially on honey bees [14,15].
Organic acids like malic acid or citric acid play an important role in plant primary metabolism.
Under physiological pH most of the organic acids are present in the anion form. Malate is the
main soluble organic anion in several plant species and is, among others, a storage form for
fixed carbon in leaves or other plant organs. Organic acids in nectars have not been studied
in detail, despite the fact that they may play a role in nectar quality and pollinator attraction,
e.g. by adding flavours to the nectar [16]. Apart from early studies demonstrating the
presence of organic acids in various nectars [8,17], a more recent publication reported
concentrations of organic acids in two Aquilegia species [16].
In addition to organic ions nectar contains several inorganic ions, whereby K+ is the dominant
cation and Cl- the dominant anion [18]. Ion concentration in nectar has a profound influence
Ergebnisse 46
46
on the electrolyte balance of pollinators [19]. Furthermore, the ions could be part of the
nectar redox cycle, a floral defense mechanism against microbial growth [7].
Several secondary compounds, which may mediate the specialization of plant-pollinator
interaction, protect nectar from robbery or microbial activity and regulate the duration of
pollinator visits, have also been identified in the nectar of some species [6,20,21]. For
example, Kessler et al. [22] demonstrated that the occurrence of nicotine in Nicotiana
attenuata significantly decreased both frequency and length of pollinator visits. The biological
effects of secondary compounds are concentration dependent [6,20,21].
The pollination syndrome of a plant includes the floral morphology, the scent, and even the
nectar composition, which are influenced by the preferences and needs of the pollinating
animal [12]. Furthermore, shifts between pollinators has been one of the key explanations for
the radiation of angiosperms [23,24]. Flowers pollinated by hummingbirds, Old World fruit
bats, butterflies, moths, and long-tongued bees tend to secrete sucrose-rich nectar, whereas
those pollinated by perching birds, New World bats, short-tongued bees, and flies tend to
secrete hexose-rich nectar which may represent putative adaptations to dietary preferences
of the respective pollinators [8]. But in other cases it appears that this model oversimplifies
the complexity of floral evolution [25,26] and the influence of phylogenetic patterns was also
shown [27] . Nevertheless, floral traits like the corolla tube length or flower opening time can
limit the accessibility of nectar for a specific pollinator, e.g. if their mouthparts do not fit the
requirements for the nectar intake [28].
So far there exist only a few studies that investigate differences of nectar compositions in
day- and night-flowering plants. Jürgens (2004) analysed the sugar composition in nectar of
diurnal and nocturnal Conophytum species (Aizoaceae) [29]. However, in some studies
nectar sugar and/or amino acid compositions have been related to diurnal and nocturnal
pollinators [30,31]. Since these pollinators visit either day- or night-flowering species those
studies have also indirectly investigated the influence of flowering time on nectar
composition. These investigations are usually limited to sugars and in some cases to amino
acids.
The genus Nicotiana (Solanaceae) comprises 76 naturally occurring species including the
important crop plant N. tabacum [32]. Goodspeed [33] classified the taxonomy,
biogeography, and morphology present in this genus. Phylogenetic studies of the genus
Nicotiana classified 13 sections: Alatae, Nicotiana, Noctiflorae, Paniculatae, Petunoides,
Polydicliae, Repandae, Rusticae, Suaveolentes, Sylvestres, Tomentosae, Trigonophyllae
and Undulatae [32,34]. Approximately 75 % of Nicotiana species occur in South- and North-
America and 25 % in Australia; only one species has been found in Africa so far (N. africana)

Ergebnisse 47
47
[33,35,36]. The greatest diversity of species can be found in the eastern Andes (South
America), which led to the hypothesis that the genus evolved there and spread in a series of
short and long distance moves to reach its current distribution [34].
As a first step towards investigating the role of pollinators in the evolution of nectar traits,
Kaczorowski et al. [31] studied the specific Nicotiana section Alatae. In the present study the
spectrum of species was expanded to 20 species from 11 sections. Species in the genus
Nicotiana vary greatly in the time they flower (day versus night), floral morphology and in
pollinator type with six different groups of pollinators visiting members of the genus. All
different types of pollinators for tobacco plants (even the only bat-pollinated and the only
sunbird-pollinated species) are covered. Therefore, the present study questions if nectar
composition is influenced by pollinator types. Other constraints such as phylogenetic
relations or ecological conditions could also have an impact on nectar composition. For this
purpose, we investigated primary metabolites, which are involved in fundamental plant
biochemistry processes (sugars, amino acids, organic acids), and inorganic ions in the nectar
of related species with different pollinators. Such comprehensive studies about the
occurrence of amino acids and organic acids among closely related species with different
pollination types are rare, but they are necessary for a better understanding of the ecological
role of these metabolites in nectar.
Materials and methods
Plant material
20 different species of the genus Nicotiana were examined. The seeds were provided by the
University of Rostock (Germany), the Botanical Garden of the University of Bochum
(Germany), and NiCoTa (Rheinstetten, Germany). Two sets (2014 and 2015) of at least
three plants of every species were grown in a greenhouse. Each plant was potted in a single
5 L pot with compost soil. Cultivation was carried out with a 16-h-light/8-h-dark cycle, an
irradiance of about 300 µmol photons m-2 s-1 and a temperature regime of 25°C day/18°C
night. Corolla tube length and diameter were measured from six different, fully opened
flowers per plant species and compared with already existing databases [31,33].
Collection of nectar
All samples were collected on the first day of anthesis to minimize effects of flower aging on
the nectar. Nectar samples were taken either with scaled micro-capillaries or with
Ergebnisse 48
48
micropipettes for higher amounts. For longer flowers the corolla tubes had to be cut carefully
to obtain access to the bottom of the calyx where the floral nectaries (nectar secreting
glands) of Nicotiana species are located at the basal side of the gynoecium [18,37]. All
samples were stored at -80°C until analysis. From each species 10 nectar samples (with the
exception of N. nudicaulis with 8 samples) of different flowers from different plants were
taken.
Assay for microbial contamination
Yeasts or bacterial infections could alter the metabolite composition of nectar considerably
by enzyme activity. To exclude microbial contamination, nectar samples of all plants were
plated on malt extract and incubated for one week at 28° C.
Collection of leaf samples and water:chloroform:methanol extraction
To verify that differences in nectar sugars were not due to differences in overall sugar
content of the plants, sugar contents from leaf samples were analysed. From each species, 3
independent leaf samples from different individuals were collected. After shock freezing in
liquid nitrogen, leaf tissue was extracted according to Nadwodnik and Lohaus [38].
Analysis of sugars
The analysis of the nectar sugars via HPLC was performed according to Lohaus et al. [39].
An ion exchange column (CarbopacTM PA10 4x250mm; Dionex Corp, Sunnyvale, CA, USA)
was eluted isocratically with 80 mM NaOH (JT Baker Chemicals). The sugars were detected
by a pulse amperometric detector with gold electrode (ESA Model 5200, Coulochem II,
Bedford MA, USA). Pulse setting was at 50, 700 and -800 mV for 400, 540 and 540 ms
accordingly. For external calibration sugar standards (Sigma-Aldrich, Germany) were
measured in parallel. The evaluation of the chromatograms was performed with an
integration program (Peaknet version 5.1, Dionex).
Analysis of free amino acids
The analysis of free amino acids was performed via HPLC according to Riens et al. [40] and
Lohaus et al. [39]. For analysis of amino acids containing a primary amine group, precolumn
derivatization with o-phtaldialdehyde was followed by the separation of the derivates on the
reversed-phase column (Merck, Darmstadt, Germany) with an acetonitrile gradient. The
derivates were detected by fluorescence. With this method, proline, an amino acid containing
a secondary amine group, could not be detected. Therefore, for analysis of proline a
precolumn derivatization with fluorenylmethyloxycarbonyl chloride (Sigma-Aldrich, Germany)

Ergebnisse 49
49
instead of o-phtaldialdehyde was used. The derivates were detected by fluorescence
(excitation 265 nm and emission 305 nm). For external calibration amino acid standards
(Sigma-Aldrich, Germany) were measured in parallel. The evaluation of the chromatograms
was performed with an integration program (Peaknet version 5.1, Dionex).
Analysis of inorganic anions and organic acids
The analysis of anions and cations via HPLC was performed according to Lohaus et al. [41].
An anion exchange column (IonPacTM AS11 4x250mm; Dionex Corp, Sunnyvale, CA, USA)
was eluted with a sodiumhydroxid gradient (4 to 77 mM in 30 min) for separation of the
inorganic anions and organic acids. A suppressor was used to enhance the sensitivity by
increasing the peak response and reducing background levels (ASRS Ultra II 4mm, Dionex
USA). A cation exchange column (CS 12A, 4x250mm; Dionex Corp, Sunnyvale, CA, USA)
with isocratic elution (20 mM H2SO4) was used for the separation of the cations. The ions
were detected by their electronic conductivity (CP20 Conductivity Detector; Dionex USA). For
external calibration standards were measured in parallel. The evaluation of the
chromatograms was performed with an integration program (Peaknet version 5.1, Dionex).
Statistical analysis
To determine if there is a significant difference between the groups of day- or night-flowering
Nicotiana species a t-Test for independent samples (Student’s t-test) was applied. The
normal distribution of the residuals was tested with Kolmogorov-Smirnov’s and the
homoscedasticity (homogeneity of variances) was tested with Levene’s test. For samples
that fit these requirements ANOVA was performed to analyse if the mean of one of the
groups significantly distributes from the total mean of all samples. If this was the case,
Tukey’s HSD was performed to analyse which group mean deviates from the others. For
non-parametric data Independent-Samples Kruskal-Wallis test was performed for
comparison of means between the groups. To examine whether nectar composition and
floral traits were influenced by pollinator group or common ancestry, at first a Principal
Component Analysis (PCA) was performed. All data were z-transformed before conducting
the PCA to set their mean to 0 and the standard deviation (SD) to 1. Two principal
components (PCs) were extracted from 33 independent initial variables, which represent the
measurements of concentrations of all sugars, amino acids, inorganic anions, inorganic
cations, and organic acids. Rotation Method was Varimax with Kaiser Normalization.
Secondly a permutational multivariate analysis of variance (PERMANOVA) was conducted to
identify the relative importance of the variables ‘Section’ and ‘Pollinator’ on the nectar
composition. The adonis routine of the ‘vegan’ package in R was used for this purpose,

Ergebnisse 50
50
which offers a multivariate analysis of variance using distance matrices based on
permutation tests [42,43]. The Euclidean distance measure and 999 permutations were
chosen to perform the PERMANOVA. All statistical analysis was performed by the use of
IBM SPSS Statistics 22, except for the PCA and the PERMANOVA, which were performed
using R (version 3.3.2, www. r-project.org).
Results
Nicotiana classification, pollinators and floral morphology
The classification of the Nicotiana species as day- or night-flowering was mainly based on
information from the literature as well as on own observations (Table 1). The characteristics
of night-flowering species were as follows: (i) flowers opening at night, (ii) corolla white to
cream coloured and (iii) scent emission increase in the evening. The characteristics of day-
flowering species were as follows: (i) flowers stay open at day and often also at night, (ii)
corolla white, yellow, green or pink coloured and (iii) low scent intensity and no increase
during nighttime. Ten species were classified as primarily day-flowering and ten species as
night-flowering (Table 1). Corolla tube lengths of all examined tobacco species varied
between 15 mm (N. paniculata) and 97 mm (N. longiflora) (Table 1).

Ergebnisse 51
51
Table 1. Overview of all examined Nicotiana species showing some of their main features.
Species Section [32] Origin [33]
Pollinator group Flower colour
Corolla tube [mm] Corolla length/ diameter
Corresponding picture in Fig 1
length diameter
day-flowering
N. africana Merxm. Suaveolentes AF Nectariniidae [50] yellow 32 ± 1 5.0 ± 0.1 6.4 i)
N. attenuata Torr. ex Wat. Petunoides NA Trochilidae [54] white 27 ± 1 3.2 ± 0.1 9.0 g)
N. glauca Graham Noctiflorae SA Trochilidae [47] yellow 33 ± 3 4.5 ± 0.2 7.3 k)
N. knightiana Goodsp. Paniculatae SA Trochilidaea yellow 24 ± 1 4.0 ± 0.1 6.0 f)
N. langsdorffii Weinm. Alatae SA Trochilidae [25] yellow 21 ± 2 4.7 ± 0.2 4.3 e)
N. nudicaulis Watson Repandae SA Apidae [52] white 17 ± 0 3.2 ± 0.1 5.7 b)
N. palmeri Gray Trigonophyllae NA Trochilidae [48] white 21 ± 1 3.8 ± 0.2 5.5 d)
N. paniculata L. Paniculatae SA Trochilidae [26] white 15 ± 1 4.6 ± 0.2 3.3 a)
N. rustica L. Rustica NA Apidae [25] yellow 18 ± 0 6.9 ± 0.9 2.6 c)
N. tabacum L. Nicotiana SA Trochilidaea pink 43 ± 2 7.0 ± 0.2 6.1 m)
night-flowering
N. acuminata Hook. Petunoides SA Sphingidae [32] white 75 ± 1 3.0 ± 0.5 25.0 p)
N. alata Link & Otto Alatae SA Sphingidae [45] white 87 ± 5 3.5 ± 0.5 24.9 s)
N. benthamiana Domin Suaveolentes OC self pollination [55] white 31 ± 1 2.0 ± 0.3 15.5 h)
N. longiflora Cav. Alatae SA Sphingidae [49] white 97 ± 4 2.6 ± 0.1 38.8 t)
N. nesophila Johnston Repandae SA Sphingidae [52] white 43 ± 2 1.5 ± 0.1 28.7 o)
N. otophora Griseb. Tomentosae SA Glossophaginae [44] yellow 33 ± 1 5.0 ± 0.3 6.6 j)
N. plumbaginifolia Viv. Alatae SA self pollination [31] white 40 ± 2 2.0 ± 0.1 20.0 l)
N. stocktonii Brandegee Repandae NA Sphingidae [52] white 61 ± 2 2.5 ± 0.1 24.4 q)
N. suaveolens Lehm. Suaveolentes OC Sphingidae [25] white 42 ± 1 3.1 ± 0.2 14.0 n)
N. sylvestris Speg. & Com. Sylvestres SA Sphingidae [52] white 75 ± 8 3.0 ± 0.1 25.0 r) aclassified via flower morphology/ pollination syndrome Abbreviation: AF = Africa, OC = Australia, NA = North America, SA = South America

Ergebnisse 52
52
The colour (white, greenish or rosy pink) and the flower morphology of the species are
shown in Fig 1. All of the Nicotiana flowers in the upper row of Fig 1 have comparatively
short corolla tubes (< 40 mm) and belong to day-flowering species with the exception of h) N.
benthamiana and j) N. otophora (night-flowering species). The lower row represents species
with longer corolla tube length (> 40 mm) exhibiting nocturnal anthesis with the exception of
k) N. glauca and m) N. tabacum.
Fig 1. Flowers of the examined Nicotiana species. a) N. paniculata b) N. nudicaulis c) N.
rustica d) N. palmeri e) N. langsdorffii f) N. knightiana g) N. attenuata h) N. benthamiana i) N.
africana j) N. otophora k) N. glauca l) N. plumbaginifolia m) N. tabacum n) N. suaveolens o)
N. nesophila p) N. acuminata q) N. stocktonii r) N. sylvestris s) N. alata t) N. longiflora
The classification of Nicotiana species in pollination types and information on flower visitors
are shown in Table 1. In their natural environment species with longer, more slender floral
tubes and white flowers are pollinated by hawk moths (Sphingidae) as their main nocturnal
visitors, and short-tubed, coloured flowers are mainly pollinated by hummingbirds
(Trochilidae) [26,31,44–49]. The nocturnal species N. otophora is pollinated by nectar
feeding bats (Glossophaginae) [44]. In the case of N. africana sunbirds (Nectariniidae) are
the predominant pollinators and N. nudicaulis and N. rustica are basically visited by bees
(Apidae) [25,50,51,52]. N. attenuata is pollinated by both nocturnal hawk moths and diurnal
hummingbirds [53,54]. Because N. attenuata shows several floral characters which are more
attractive to hummingbirds [22,54], this species is grouped with the day-flowering species
(Table 1). N. plumbaginifolia and N. benthamiana are both described as autogamous [31,55]
Ergebnisse 53
53
whereas no flower opening was observed at all for N. plumbaginifolia. Still N. plumbaginifolia
may be classified as nocturnal due to its increased nectar secretion at night.
Concentrations of sugars in nectar
Nectar of all 20 Nicotiana species contained the three main sugars glucose, fructose and
sucrose (Table 2). No other mono-, di- or oligosaccharides were detected in appreciable
quantities. The total sugar concentrations ranged from 417 mM (10.9 % (w/v)) in N.
nesophila to 1984 mM (42.7 % (w/v)) in N. nudicaulis. The highest sucrose-to-hexose ratio of
2.0 was found in the night-flowering N. nesophila, the lowest ratios (0.1) were found in the
day-flowering species N. africana and N. attenuata.
In general, the sucrose-to-hexose ratio was significantly higher in night-flowering species (p <
0.001, df = 196, n = 198). Glucose’s fraction of total sugar content was similar for day- and
night-flowering species (Table 2), whereas the percentage of fructose was significantly
higher in day-flowering species (p < 0.001, df = 188; n = 198). At the same time the
percentage of sucrose was increased in night-flowering species; this difference was on a
significant level as well (p = 0.001, df = 195, n = 198).
When including all Nicotiana species, the percentage of total sugar content that was sucrose
positively correlated with flower tube lengths (rS = 0.451, p < 0.001). High percentages of
sucrose were found in long-tubed species, e.g. N. alata or N. longiflora. Furthermore, the
highest percentage of sucrose was found in N. nesophila with a medium-tubed flower but the
smallest diameter of the tube in relation to other species (Table 1). Most of the long-tubed
flowers belong to the night-flowering species which are pollinated by hawk moths. The
correlation between the percentage of sucrose and the flower tube length is much stronger in
night-flowering (r = 0.586, p < 0.001) than in day-flowering species, where no correlation
exists at all (r = 0.090, p < 0.001).

Ergebnisse 54
54
Table 2. Concentrations and proportions of the main three sugars in nectar of different Nicotiana species.
Species Concentration of sugars [mM]
Percentages of sugars (calc. from g/l) [%]
Sugar content in nectar (w/v)[%]
Ratio fru/ glu
Suc/ (glu+fru)
Glucose Fructose Sucrose Total Glucose Fructose Sucrose
day-flowering
N. africana 842 ± 107 820 ± 136 101 ± 41 1763 ± 260 46 ± 2 44 ± 2 10 ± 3 33 ± 5 1.0 0.12
N. attenuata 531 ± 93 644 ± 110 71 ± 27 1246 ± 212 41 ± 2 49 ± 2 10 ± 3 24 ± 4 1.2 0.11
N. glauca 49 ± 25 615 ± 155 386 ± 74 1049 ± 180 3 ± 1 44 ± 8 53 ± 8 25 ± 4 12.6 1.10
N. knightiana 165 ± 65 733 ± 116 572 ± 97 1471 ± 248 8 ± 2 37 ± 3 55 ± 2 36 ± 6 4.4 1.21
N. langsdorffii 277 ± 104 358 ± 158 405 ± 185 1039 ± 436 20 ± 2 26 ± 3 54 ± 4 25 ± 11 1.3 1.21
N. nudicaulis 667 ± 201 887 ± 205 430 ± 171 1984 ± 554 28 ± 1 39 ± 5 33 ± 4 43 ± 13 1.3 0.53
N. palmeri 456 ± 145 646 ± 294 253 ± 86 1355 ± 485 29 ± 3 40 ± 6 31 ± 6 29 ± 10 1.4 0.44
N. paniculata 409 ± 196 653 ± 204 113 ± 62 1176 ± 446 31 ± 5 53 ± 7 16 ± 4 23 ± 9 1.6 0.20
N. rustica 237 ± 115 870 ± 162 304 ± 95 1411 ± 323 13 ± 4 53 ± 7 34 ± 5 30 ± 7 3.7 0.52
N. tabacum 402 ± 29 362 ± 29 247 ± 34 1011 ± 80 33 ± 2 29 ± 1 38 ± 3 22 ± 2 0.9 0.61
mean 398 ± 106 654 ± 156 285 ± 86 1338 ± 318 25 ± 2 41 ± 4 33 ± 4 29 ± 7 2.9 0.61
night-flowering
N. acuminata 485 ± 202 539 ± 226 270 ± 82 1294 ± 564 31 ± 6 34 ± 6 35 ± 11 28 ± 8 1.1 0.50
N. alata 226 ± 73 656 ± 194 699 ± 108 1581 ± 300 10 ± 3 29 ± 4 61 ± 6 40 ± 7 2.9 1.51
N. benthamiana 585 ± 170 721 ± 185 181 ± 63 1487 ± 395 35 ± 1 44 ± 3 21 ± 4 30 ± 8 1.2 0.26
N. longiflora 311 ± 85 466 ± 91 503 ± 112 1281 ± 178 18 ± 5 27 ± 4 55 ± 7 31 ± 5 1.5 1.23
N. nesophila 44 ± 18 159 ± 45 214 ± 89 417 ± 138 7 ± 2 27 ± 4 66 ± 6 11 ± 4 3.6 2.00
N. otophora 316 ± 48 270 ± 44 169 ± 47 756 ± 88 35 ± 3 30 ± 5 35 ± 8 16 ± 2 0.9 0.55
N. plumbaginifolia 372 ± 128 421 ± 127 178 ± 103 971 ± 340 33 ± 3 38 ± 6 28 ± 6 20 ± 8 1.1 0.43
N. stocktonii 106 ± 29 300 ± 56 178 ± 36 585 ± 110 14 ± 3 40 ± 1 45 ± 4 13 ± 2 2.8 0.83
N. suaveolens 648 ± 217 677 ± 250 113 ± 53 1437 ± 496 42 ± 3 44 ± 3 14 ± 5 28 ± 9 1.0 0.16
N. sylvestris 294 ± 77 328 ± 74 455 ± 110 1077 ± 244 20 ± 3 22 ± 2 58 ± 4 27 ± 6 1.1 1.39
mean 339 ± 105 454 ± 129 296 ± 80 1089 ± 285 25 ± 3 34 ± 4 42 ± 6 24 ± 6 1.7 0.89

Ergebnisse 55
55
Significantly higher sugar concentrations of about 1720 mM (Fig 2A; Table 2) were found in
nectar of sunbird- and bee-pollinated species, which corresponds to a share of 35 % sugars
within nectar (w/v). Nectar of hummingbird-pollinated species generally has a medium
concentration with an average of about 1150 mM sugars (26 % (w/v)), similar to hawk moth-
pollinated and the autogamous species. The nectar of the bat-pollinated species N. otophora
was most diluted with about 750 mM (16 % (w/v)).

Ergebnisse 56
56
Fig 2. Boxplots of different nectar traits grouped into day- (left, white background) and
night-flowering (right, grey background) species. The data are arranged according to
their main pollinators Trochilidae, Nectariniidae, Apidae, Sphingidae, Glossophaginae and
self-pollinating species. (A) Boxplot diagram illustrating concentration of total sugars [mM].
(B) Sucrose-hexose-ratio is calculated by dividing sucrose concentration [g L-1] by the sum of
glucose and fructose [g L-1]. (C) Boxplots illustrating the concentration of total amino acids
[mM]. (D) Ratio sum of sugars-to-sum of amino acids. (E) Concentration of the amides
glutamine and asparagine [mM]. (F) Total malate concentrations [mM]. (G) Concentration of
the sum of inorganic anions (chloride, nitrate, phosphate, sulphate) [mM]. (H) Concentration
of the sum of inorganic cations (potassium, sodium, ammonium, magnesium, calcium) [mM].
Different letters designate significantly different groups determined via ANOVA, post hoc
Tukey’s HSD test and Kruskal-Wallis test for non-parametrical data (p ≤ 0.05).
The highest proportion of hexoses, particularly glucose, was found in the nectar of the
sunbird-pollinated species N. africana (Table 2). Within the hummingbird-pollinated species
the proportion of hexoses differed between 45-90 %. For hawk moth-pollinated species the
proportion of hexoses was, on average, lower than in hummingbird-pollinated species, but
also varying between 33-90 %. Therefore, the sucrose-to-hexose ratio was lowest in N.
africana (sunbird-pollinated), followed by autogamous species. A medium ratio was found in
species pollinated by hummingbirds, bees and bats, and the highest ratio was found in
species pollinated by hawk moths (Fig 2B).
To exclude the possibility that the measured differences in sugar composition are a result of
microbial activity, the samples were tested for presence of yeast. However, no
contaminations with yeast in the nectar samples from the different Nicotiana species were
found.
The overall sugar content of the leaves was analysed as well in order to disprove that the
nectar sugars are not correlated with sugar compositions in leaves. The leaves of all tobacco
species also contained glucose, fructose, and sucrose, but the composition of these sugars
in the nectar did not correlate with the composition in leaves from the same species (S1 Fig).
Concentrations of amino acids in nectar
The amino acid concentrations were much lower than the sugar concentrations and also
different between the Nicotiana species. Table 3 shows percentages of the most abundant
amino acids, the essential amino acids, and total concentrations of the 19 proteinogenic

Ergebnisse 57
57
amino acids that were detectable (alanine (ala), arginine (arg), aspartate (asp), asparagine
(asn), glycerine (gly), glutamate (glu), glutamine (gln), histidine (his), isoleucine (ile), leucine
(leu), lysine (lys), methionine (met), phenylalanine (phe), proline (pro), serine (ser), threonine
(thr), tryptophane (trp), tyrosine (tyr), valine (val)), and the non-proteinogenic amino acid γ-
aminobutyric acid (gaba).
The nectar of N. alata (night-flowering) contained the lowest concentration, whereas the
concentration in N. africana (day-flowering) was more than 30-fold higher (Table 3). Overall,
the total amino acid concentration was significantly higher in nectar of day-flowering species
than in night-flowering species (p = 0.011, df = 48; n = 98). Therefore, the ratio between sum
of sugars and sum of amino acids was about 3-fold higher in night-flowering species, mainly
due to the lower amino acid concentrations in the nectar of night-flowering species (Table 3).
The percentage of each amino acid was also different between the species (Table 3).
Glutamine, proline, and aspartate were the most abundant amino acids in nectar of Nicotiana
species. Glutamine was found in all species and contributed a substantial proportion of all
amino acids in nectar, except for the day-flowering species N. africana, N. glauca, N.
langsdorffii, N. palmeri and the night-flowering species N. suaveolens, where proline was the
dominant amino acid. The amino acid composition in the nectar did not correlate with the
composition in the leaves from the same species (S2 Fig).
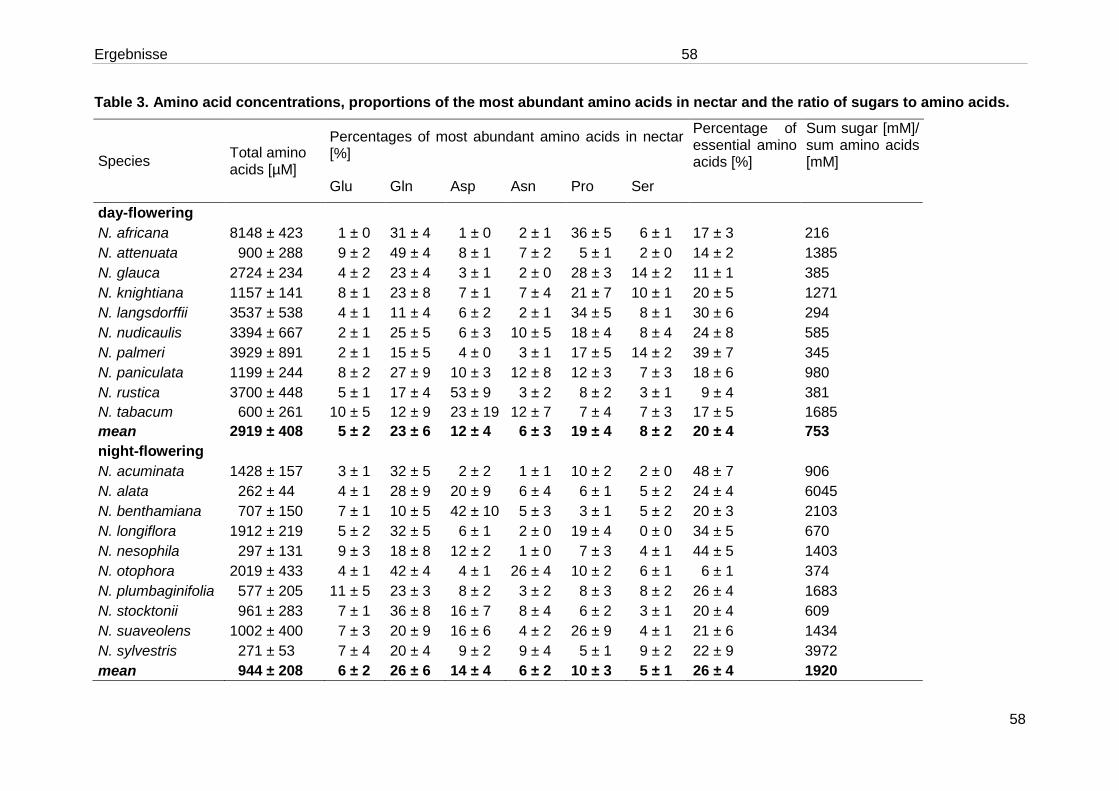
Ergebnisse 58
58
Table 3. Amino acid concentrations, proportions of the most abundant amino acids in nectar and the ratio of sugars to amino acids.
Species Total amino acids [µM]
Percentages of most abundant amino acids in nectar [%]
Percentage of essential amino acids [%]
Sum sugar [mM]/ sum amino acids [mM]
Glu Gln Asp Asn Pro Ser
day-flowering
N. africana 8148 ± 423 1 ± 0 31 ± 4 1 ± 0 2 ± 1 36 ± 5 6 ± 1 17 ± 3 216
N. attenuata 900 ± 288 9 ± 2 49 ± 4 8 ± 1 7 ± 2 5 ± 1 2 ± 0 14 ± 2 1385
N. glauca 2724 ± 234 4 ± 2 23 ± 4 3 ± 1 2 ± 0 28 ± 3 14 ± 2 11 ± 1 385
N. knightiana 1157 ± 141 8 ± 1 23 ± 8 7 ± 1 7 ± 4 21 ± 7 10 ± 1 20 ± 5 1271
N. langsdorffii 3537 ± 538 4 ± 1 11 ± 4 6 ± 2 2 ± 1 34 ± 5 8 ± 1 30 ± 6 294
N. nudicaulis 3394 ± 667 2 ± 1 25 ± 5 6 ± 3 10 ± 5 18 ± 4 8 ± 4 24 ± 8 585
N. palmeri 3929 ± 891 2 ± 1 15 ± 5 4 ± 0 3 ± 1 17 ± 5 14 ± 2 39 ± 7 345
N. paniculata 1199 ± 244 8 ± 2 27 ± 9 10 ± 3 12 ± 8 12 ± 3 7 ± 3 18 ± 6 980
N. rustica 3700 ± 448 5 ± 1 17 ± 4 53 ± 9 3 ± 2 8 ± 2 3 ± 1 9 ± 4 381
N. tabacum 600 ± 261 10 ± 5 12 ± 9 23 ± 19 12 ± 7 7 ± 4 7 ± 3 17 ± 5 1685
mean 2919 ± 408 5 ± 2 23 ± 6 12 ± 4 6 ± 3 19 ± 4 8 ± 2 20 ± 4 753
night-flowering
N. acuminata 1428 ± 157 3 ± 1 32 ± 5 2 ± 2 1 ± 1 10 ± 2 2 ± 0 48 ± 7 906
N. alata 262 ± 44 4 ± 1 28 ± 9 20 ± 9 6 ± 4 6 ± 1 5 ± 2 24 ± 4 6045
N. benthamiana 707 ± 150 7 ± 1 10 ± 5 42 ± 10 5 ± 3 3 ± 1 5 ± 2 20 ± 3 2103
N. longiflora 1912 ± 219 5 ± 2 32 ± 5 6 ± 1 2 ± 0 19 ± 4 0 ± 0 34 ± 5 670
N. nesophila 297 ± 131 9 ± 3 18 ± 8 12 ± 2 1 ± 0 7 ± 3 4 ± 1 44 ± 5 1403
N. otophora 2019 ± 433 4 ± 1 42 ± 4 4 ± 1 26 ± 4 10 ± 2 6 ± 1 6 ± 1 374
N. plumbaginifolia 577 ± 205 11 ± 5 23 ± 3 8 ± 2 3 ± 2 8 ± 3 8 ± 2 26 ± 4 1683
N. stocktonii 961 ± 283 7 ± 1 36 ± 8 16 ± 7 8 ± 4 6 ± 2 3 ± 1 20 ± 4 609
N. suaveolens 1002 ± 400 7 ± 3 20 ± 9 16 ± 6 4 ± 2 26 ± 9 4 ± 1 21 ± 6 1434
N. sylvestris 271 ± 53 7 ± 4 20 ± 4 9 ± 2 9 ± 4 5 ± 1 9 ± 2 22 ± 9 3972
mean 944 ± 208 6 ± 2 26 ± 6 14 ± 4 6 ± 2 10 ± 3 5 ± 1 26 ± 4 1920

Ergebnisse 59
59
The essential amino acids for most pollinators are arginine, histidine, isoleucine, leucine,
lysine, methionine, phenylalanine, threonine, tryptophane, and valine [18]. The percentage of
essential amino acids was between 6 % and 48 % (Table 3) and similar in day- and night
flowering species. However, the concentration of essential amino acids was significantly
higher in nectar of day-flowering species than in nectar of night-flowering species (p < .001,
df = 48; n = 98), which was also shown for the total amino acid concentration. The main
amino acids in the group of the essential amino acids were valine (in seven species),
phenylalanine and lysine (each in four species), histidine (in two species) and arginine as
well as isoleucine (each in one species). The relative share of phenylalanine was highly
variable in nectar (between less than 1 % of the total amino acid concentration in N. glauca
and up to 33 % in N. acuminata). Phenylalanine was only a minor amino acid in leaves of all
Nicotiana species (about 1-2 %; data not shown). In addition to the amino acids normally
found in proteins also some non-proteinogenic amino acids were detected in the nectar of
Nicotiana species, mainly γ-aminobutyric acid (gaba). The relative share of gaba was low (1-
2 %) with two exceptions (12 % of the total amino acid concentration in N. sylvestris and 4 %
in N. tabacum).
The amino acid concentrations in the nectar of the Nicotiana species differentiated by
pollinators are shown in Fig 2C. Nectar of the sunbird-pollinated species N. africana
contained the highest amino acid concentration (8.2 mM) of all day-flowering species,
followed by the bee-pollinated species (3.6 mM). For the night-flowering species the highest
concentration was measured in the bat-pollinated species N. otophora (2.0 mM). Therefore,
the ratio of total sugars to total amino acids was lower in these pollination types than in
hummingbird- and hawk moth-pollinated species, as well as in autogamous species (Fig 2D).
Amides (glutamine and asparagine) have a higher nitrogen-to-carbon ratio compared with
several other amino acids. The concentrations of amides were very high in the sunbird-
pollinated species (mainly glutamine) as well as in the bat-pollinated species (asparagine
and glutamine) and in bee-pollinated species (Fig 2E). For the essential amino acids no
significant differences between pollinator groups could be shown with the exception of the
sunbird-pollinated species N. africana, which has the highest concentration of essential
amino acids in nectar (data not shown). This also applies for the proline concentration (data
not shown).
Flowers of the different tobacco species contained unequal volumes of nectar, from very
small volumes in bee- or self-pollinated species (0.5-1 µL), small volumes in hummingbird-
pollinated species (1-10 µL), to high volumes in hawk moth-pollinated species (5-50 µL) and
abundant nectar volumes in species pollinated by sunbirds or bats (100-200 µL and more).
Therefore, the amount of sugars and amino acids per flower between different Nicotiana

Ergebnisse 60
60
species was also diverse. Sunbird- and bat-pollinated species provided about 150-170 µmol
sugars and 0.4-0.8 µmol amino acids per flower (Fig 3). In comparison, the amount of sugar
in the nectar per flower of autogamous species was about 100-fold lower (1-1.5 µmol) and
the amount of amino acids was even about 1000-fold lower (0.0005 µmol). On the basis of
higher nectar volumes of sphingophilous species compared to those of hummingbird-
pollinated species, the amounts of sugars and amino acids per flower were higher in hawk
moth-pollinated species (Fig 3), although the amino acid concentrations were higher in
hummingbird-pollinated species (Fig 2C).
Fig 3. Boxplots of sugar (A) and amino acid (B) amount in µmol per flower. Data were
calculated by multiplication of the sugar or amino acid concentrations (Table 2 and Table 3)
with the approximate nectar volume of each species. Results are grouped by their main
pollinators Trochilidae, Nectariniidae, Apidae, Sphingidae, Glossophaginae and self-
pollinating species. Different letters designate significantly different groups determined via
ANOVA, post hoc Tukey’s HSD test and Kruskal-Wallis test for non-parametrical data (p ≤
0.05).

Ergebnisse 61
61
Concentrations of organic acids in nectar
For the measurement of organic acids and inorganic ions by the method mentioned above,
volumes of at least 5 µL per sample are necessary. For some of the less nectar producing
species it was not possible to fulfil this requirement, so that N. nudicaulis and N. stocktonii
are excluded from the analyses. From all other species, at least three and up to five samples
could be analysed.
In nectar of Nicotiana malate was present in all analysed species, but in different amounts
(Table 4). Other organic anions like oxalate and citrate could only be detected in a few
samples and in very low concentrations. The lowest concentration of malate was found in
hummingbird-pollinated N. palmeri (0.05 mM) and the highest in N. langsdorffii (2 mM), which
is pollinated by hummingbirds as well. No significant difference between the averaged malate
concentrations in day-flowering (0.7 ± 0.2 mM) compared to night-flowering tobacco (0.6 ±
0.2 mM) was obtained.
Malate concentrations in the nectar of the Nicotiana species differentiated by pollinators are
shown in Fig 2F. With the exception of the bat-pollinated species N. otophora no significant
differences in malate concentrations were found between the pollinator groups.
Almost no correlation was found between the malate content in leaves and nectar of all
tobacco species (R2 = 0.149, p = 0.004) (S3 Fig).
Concentrations of inorganic ions in nectar
There were large differences in the total concentration of inorganic anions, that ranged from
a minimum of 0.5 ± 0.2 mM in N. glauca to a maximum of 19.2 ± 1.8 mM in N. benthamiana
(Table 4). Chloride was the most abundant anion in all analysed species and represented a
minimum share of 45 ± 7 % of the total inorganic anions in N. acuminata and a maximum
share of 98 ± 2 % in N. longiflora. Nitrate, phosphate, and sulphate were present in all
species but on a lower level. Overall, the total inorganic anion concentration was about 2-fold
higher in nectar of night-flowering species than in day-flowering species (p = 0.05, df = 9; n =
99). The total concentrations of inorganic anions differentiated by pollinators are shown in Fig
2G. Due to the higher concentration of anions in nocturnal species in general, the nocturnal
pollinator groups can also be distinguished from the pollinator groups active during daytime.
N. otophora, the only bat-pollinated plant, produces the most nitrate containing nectar. The
percentage of nitrate made up 38 % of the total anion content, whereas for the other species

Ergebnisse 62
62
the percentage of nitrate ranged from less than 1 % in sphingophilous N. nesophila to 32 %
in ornitophilous N. attenuata. Several hummingbird-pollinated species contained sulphate-
and phosphate-rich nectar. Sulphate accounts for 33 % of the measured anions in N.
knightiana and phosphate accounts for one quarter of the anions in N. palmeri. As mentioned
before the inorganic anion concentration was measured for the tobacco leaves in parallel (S4
Fig). Hardly any correlation was found between the total concentration of anions or the single
anions in nectar and leaf samples (R2 = 0.006, p < 0.001).
The total concentration of inorganic cations was similar to the concentration of inorganic
anions (Table 4). The concentration ranged from a minimum of 1 mM in N. glauca to a
maximum of 14 mM in N. suaveolens. Based on total inorganic cation concentration, the
relative amounts of potassium varied between 78 ± 1 % in N. langsdorffii and 99 ± 2 % in N.
sylvestris. The next most frequent cation was sodium. Its relative proportion was highly
variable in nectar (between less than 1 % of the total cation concentration in N. sylvestris and
up to 10 % in N. knightiana and N. langsdorffii). Ammonium, magnesium, and calcium were
present in all species but on a lower level. It was not possible to statistically differentiate
between day- and night-flowering tobacco plants on the basis of inorganic cation
concentrations, even though the mean concentration of all cations was slightly higher in
night-flowering compared to day-flowering species. The inorganic cation concentrations
differentiated by pollinators are shown in Fig 2H. Nectar of the sunbird-pollinated species N.
africana contained the highest cation concentration whereas the lowest concentration was
measured in hummingbird-pollinated species and in the bat-pollinated species N. otophora.
Overall, the concentration of both inorganic anions and cations was about 10-fold higher than
the concentration of organic acids or amino acids, whereas sugars were by far the most
dominant compounds in the nectar of all Nicotiana species (about 100-fold higher
concentrated than inorganic ions).

Ergebnisse 63
63
Table 4. Concentrations of malate, inorganic anions and cations as well as the proportions of single ions in nectar.
Species Total malate [mM]
Total anions [mM]
Percentages of anions [%] Total cations [mM]
Percentages of cations [%]
Cl- NO3- PO4
3- SO42-
K+ Na+ NH4
+ Mg2+ Ca2+
day-flowering
N. africana 0.1 ± 0.1 3.5 ± 1.4 96 ± 3 2 ± 2 1 ± 1 1 ± 1 11.5 ± 2.0 95 ± 1 3 ± 1 0 ± 0 1 ± 0 0 ± 0
N. attenuata 1.5 ± 0.6 3.6 ± 1.3 58 ± 13 29 ± 12 5 ± 2 9 ± 3 4.3 ± 1.1 85 ± 4 7 ± 2 0 ± 0 3 ± 0 5 ± 2
N. glauca 0.2 ± 0.0 0.5 ± 0.1 71 ± 4 4 ± 5 15 ± 5 10 ± 4 1.0 ± 0.5 91 ± 2 4 ± 1 3 ± 2 4 ± 1 2 ± 0
N. knightiana 1.8 ± 0.4 3.7 ± 0.7 54 ± 17 4 ± 2 9 ± 3 33 ± 16 1.5 ± 0.6 86 ± 3 10 ± 2 0 ± 0 2 ± 2 2 ± 2
N. langsdorffii 2.0 ± 0.9 3.4 ± 0.3 82 ± 7 3 ± 1 12 ± 5 3 ± 1 2.5 ± 0.2 78 ± 1 10 ± 2 0 ± 0 7 ± 2 5 ± 2
N. palmeri 0.1 ± 0.1 6.0 ± 3.2 57 ± 5 5 ± 5 22 ± 4 17 ± 7 6.7 ± 1.5 97 ± 0 2 ± 1 1 ± 1 0 ± 0 0 ± 0
N. paniculata 0.1 ± 0.1 1.7 ± 1.5 49 ± 2 12 ± 12 21 ± 10 18 ± 3 4.4 ± 2.0 95 ± 2 4 ± 1 4 ± 1 0 ± 0 0 ± 0
N. rustica 0.2 ± 0.0 1.7 ± 0.6 59 ± 8 24 ± 5 5 ± 2 12 ± 6 7.8 ± 4.0 94 ± 1 4 ± 1 4 ± 2 1 ± 0 1 ± 0
N. tabacum 0.4 ± 0.1 12.7 ± 1.9 96 ± 1 1 ± 1 1 ± 1 2 ± 1 9.3 ± 2.9 93 ± 4 5 ± 1 1 ± 0 1 ± 0 1 ± 1
mean 0.7 ± 0.2 4.9 ± 1 69 ± 7 9 ± 5 10 ± 4 12 ± 5 5.6 ± 1.7 91 ± 2 5 ± 1 2 ± 1 2 ± 1 2 ± 1
night-flowering
N. acuminata 0.4 ± 0.2 1.6 ± 0.4 46 ± 6 35 ± 5 7 ± 2 11 ± 3 6.1 ± 1.4 92 ± 1 6 ± 1 1 ± 0 1 ± 0 1 ± 0
N. alata 0.4 ± 0.1 7.9 ± 1.1 91 ± 5 1 ± 0 1 ± 1 4 ± 2 4.7 ± 0.8 95 ± 1 3 ± 1 1 ± 0 1 ± 0 1 ± 0
N. benthamiana 0.5 ± 0.2 19.2 ± 1.8 97 ± 1 1 ± 1 1 ± 1 1 ± 1 12.0 ± 1.6 91 ± 1 4 ± 1 0 ± 0 1 ± 0 4 ± 1
N. longiflora 0.1 ± 0.0 14.3 ± 2.5 98 ± 2 1 ± 1 0 ± 0 1 ± 1 12.4 ± 4.7 95 ± 2 2 ± 1 1 ± 0 2 ± 2 0 ± 0
N. nesophila 1.1 ± 0.1 17.1 ± 2.6 97 ± 0 0 ± 0 1 ± 0 2 ± 1 10.3 ± 4.4 90 ± 2 9 ± 2 3 ± 1 1 ± 0 0 ± 0
N. otophora 1.6 ± 0.6 6.1 ± 2.3 59 ± 5 39 ± 5 0 ± 0 1 ± 1 4.7 ± 0.7 97 ± 1 1 ± 0 0 ± 0 2 ± 0 0 ± 0
N. plumbaginifolia
0.2 ± 0.3 3.5 ± 4.2 93 ± 5 1 ± 1 3 ± 1 4 ± 4 1.9 ± 0.6 89 ± 2 8 ± 2 0 ± 0 1 ± 0 1 ± 1
N. suaveolens 0.3 ± 0.2 6.0 ± 1.2 84 ± 9 1 ± 1 10 ± 6 5 ± 3 14.0 ± 2.3 97 ± 0 2 ± 0 1 ± 0 1 ± 0 1 ± 0
N. sylvestris 0.4 ± 0.2 10.4 ± 1.8 94 ± 1 2 ± 1 1 ± 0 3 ± 1 9.1 ± 2.1 99 ± 0 0 ± 0 0 ± 0 1 ± 0 0 ± 0
mean 0.6 ± 0.2 10.2 ± 1.9 84 ± 4 9 ± 2 3 ± 1 4 ± 2 8.4 ± 2.2 94 ± 1 3 ± 1 1 ± 0 1 ± 0 1 ± 0

Ergebnisse 64
64
Pollinators’ preferences
To reduce the complexity of the data, a PCA was performed with independently measured
nectar features as described in the methods section. Fig 4A shows the loadings of all
measured nectar constituents on the extracted principal components. Most of the cations
load strongly negative on the first component (K+, Na+, Mg2+, Ca2+). The majority of amino
acids loads positively on the second component. The first principal component explains 24.4
% and both principal components together explain 34.7 % of the total variance. Fig 4B shows
a scatterplot of the PCA scores with focus on the distribution by pollinator groups and
sections, which are representing the phylogenetic constraints of the species. Some groups
(especially pollination types) are more distinguishable than others, for example sunbird-
pollinated plants (filled box), which cluster in the lower right quadrant and bee-pollinated
plants (filled circles), which accumulate in the upper right quadrant.
To complement the graphical evaluation, a PERMANOVA was performed on the nectar data
with pollinators and sections as categorical variables (Table 5). If all chemical classes
(sugars, amino acids, inorganic anions, inorganic cations, and malate) were taken into
account, there is a highly significant (p < 0.001) difference between the individual pollinator
groups and between the individual sections. In this model, 27 % of the data variation can be
explained by pollinators, 24 % by sections, 21 % by a combination of both variables, and 27
% by other factors. If only sugars and amino acids are taken into account, the distribution
was more different: grouping by pollinators is responsible for 66% of the variation whereas
section grouping makes up 19 % of the variation (p < 0.001 each). When the PERMANOVA
was performed solely on the measurements of inorganic anions, inorganic cations, and
malate, 26 % of the data variation could be explained by pollinators and 24 % by sections (p
< 0.001 each; 21 % pollinators × sections, 28 % residuals).

Ergebnisse 65
65
Fig 4. Loadings and scatterplot of PCA scores in rotated space. (A) Loadings of the
original variables are shown as vectors in PCA space (B) The first principal component (PC
1) accounts for 24.4 % and the second principal component (PC 2) accounts for 10.3 % of
the variation in the dataset. Eigenvalues are 2.837 for PC 1 and 1.846 for PC 2. Data (n =
99) are grouped both by main pollinators (colours) and sections (markings).
Table 5. Results of the PERMANOVA: Degrees of freedom (df), pseudo-F (F), R2, and p-
value (P).
PERMANOVA Df F R2 p
a) All components
Pollinator 5 16.12 0.27 0.001***
Section 8 8.94 0.24 0.001***
Pollinator x Section 2 31.31 0.21 0.001***
Residuals 83 0.28
Total 98 1.00
b) Sugars and amino acids
Pollinator 5 85.55 0.66 0.001***
Section 8 15.56 0.19 0.001***
Pollinator x Section 2 8.70 0.03 0.001***
Residuals 83 0.13
Total 98 1.00
c) Anions, cations, and malate
Pollinators 5 15.05 0.26 0.001***
Section 8 8.83 0.24 0.001***
Pollinator x Section 2 31.66 0.22 0.001***
Residuals 83 0.28
Total 98 1.00
Ergebnisse 66
66
Discussion
We are presenting here the first comprehensive study about the content of sugars, amino
acids, organic acids, and inorganic ions in nectars of a large set of species from one genus
comprising a wide variety of pollinators. A simplified phylogenetic tree demonstrates that the
selection of pollinators is independent from the sectional grouping of the Nicotiana plants
tested here (S5 Fig). Key factors exhibiting a significant influence on visitation of pollinators
to plants include nectar production and the composition of nectar with respect to sugars,
amino acids, organic acids, inorganic ions, and other metabolites. Correlations between
nectar sugar compositions and pollinator preferences have been demonstrated in several
previous studies [8,45,56,57]. However fewer studies investigated a relationship between
nectar amino acids and pollinators [13,14] and studies focused on organic acids or inorganic
ions and pollinator preferences are scarce.
Sucrose rich nectar correlates with corolla tube length in night-flowering species
Nectar sugar composition differed among all 20 analysed Nicotiana. Reasons for differences
in nectar composition have not been fully determined so far. Some studies proved that long-
tubed flowers with concealed nectaries tend to be associated with sucrose-dominated nectar
[1,9,27,58]. This correlation is strongly supported by our findings in night-flowering species (r
= 0.586), in contrast to day-flowering species, for which no correlation was found (r = 0.090).
The majority of the night-flowering species are long-tubed tobacco species and therefore
they are mainly pollinated by moths. They typically have a very long proboscis supporting the
hypothesis that flower shapes have co-evolved with the morphology of the mouth parts of
their pollinators [23,24]. Particularly within the group of sphingophilous tobacco plants there
exists a very high correlation between the corolla tube lengths and the proportions of sucrose
(r = 0.857). N. nesophila was however excluded due to the fact of exhibiting extreme slender
bottle-neck flowers compared to other hawk moth-pollinated flowers (Fig 1). If N. nesophila
was included, the correlation was much lower (r = 0.397). Therefore, sucrose-rich nectar in
long-tubed flowers could be an adaptation to the preference of long-tongued pollinators,
along with the fact that sucrose-rich nectar is better protected against evaporation in these
flowers [9]. Sucrose-dominated sugar solutions tend to evaporate faster than hexose-
dominated sugar solutions due to their lower osmotic potential. In addition to the longer tube,
higher humidity and lower temperatures at nights may partially prevent evaporation. One
benefit of an increased sucrose proportion is the lower viscosity of the nectar. If the viscosity
is too high, it will prevent pollinators from extracting nectar and avoid these flowers
eventually [29]. Possibly nectar viscosity is aligned with the length of the corolla tube so that

Ergebnisse 67
67
effective nectar drinking by hawk moths is possible. Moths are active suction feeders and
therefore effective drinking is ensured by nectar with lower sugar concentrations [11].
Nectar of several Nicotiana species contains more fructose than glucose
Hexose-rich nectar occurs in several Nicotiana species (N. africana, N. attenuata, N.
benthamiana, N. paniculata, N. suaveolens). Hexoses are typically not part of the phloem
sap of plants [39] and therefore the proportion of hexoses in nectar depends on the presence
and activity of cleaving enzymes in nectaries, including invertases [59].
The proportions of glucose and fructose in nectar of the different Nicotiana species were
either similar or fructose dominated (Table 2). In eight out of twenty species the fructose-to-
glucose ratio was higher than 1.5. The diurnal species N. glauca exhibited an extremely high
ratio of 12.6 followed by N. rustica with a ratio of 3.7 (Table 2). Also, higher percentages of
fructose in comparison to glucose were found in nectars of other plant families, e.g. in some
Acanthaceae [60] and Scrophulariaceae [61]. In Conophytum species (Aizoaceae) nectar of
diurnal species had significantly higher fructose-to-glucose ratios than nectar from nocturnal
species [29]. Increased sweetness of fructose rich nectars may be more rewarding for
pollinators and therefore provide a natural advantage for plants with higher fructose-to-
glucose ratios. Honey bees preferred fructose rather than glucose in artificial nectar as
demonstrated by Waller [62], which corresponds to our observation that bee-pollinated
Nicotiana species (N. nudicaulis, N. rustica) contained more fructose as glucose in their
nectar (Table 2).
Another explanation for the non-stoichiometric hexose ratio in some tobacco plants could be
the result of a yeast contamination caused by nectar probing flower visitors [63]. However,
we found no contamination with yeast in the nectar samples of the tested Nicotiana species,
which confirms the fructose-to-glucose ratio to be genuine.
Nectar amino acid composition is highly specific for pollinator groups
The presence of amino acids in nectar has been known for several decades, but their role in
nectar is still a matter of debate [14,64]. At least two possible explanations for the species-
specific differences in nectar amino acid concentration exist: (1) amino acids are leaching
from the nectaries and the nectar composition reflects the amino acid composition of the
phloem and nectaries or (2) the amino acid composition in nectar is correlated to the
preferences of different pollinators. In the latter case amino acids in nectars could present
either a potential source of amino acids in the nutrition of the pollinators or the presence of
amino acids in nectar potentially contributes to its taste [18,65].
Ergebnisse 68
68
Maximum concentrations in tobacco nectar were about 1500 mM sugars and 8 mM free
amino acids (Table 2 and 3), whereas in the phloem sap about 500 sugar (exclusively
sucrose) and 80 mM [66] are transported into the nectaries. Therefore, the carbon-to-
nitrogen ratio is clearly higher in the nectar compared to the supplying phloem sap. A
discrepancy of amino acids concentration and their composition between phloem sap and
nectar was also shown in other plants [39]. This may indicate an active regulation
mechanism in the nectaries in order to accumulate sugars and retain amino acids as well as
the selective secretion of specific amino acids into the nectar.
All ten essential amino acids for nectarivorous pollinators were present in the nectar of
Nicotiana species, but glutamine was the predominant amino acid, followed by proline,
aspartate, and serine (Table 3). Proline and glutamine were also the dominant amino acids in
the nectar of the section Alatae [31] and in most of 30 species from different plant families
[13] reported.
Studies with insect preference tests could show a preference of honey bees (Apis mellifera)
for proline-enriched artificial nectar as well as a negative response to serine [67]. The
percentage of proline in the bee-pollinated species N. rustica and N. nudicaulis was in the
middle range (8 % and 17 %, respectably, Table 3) whereas the highest percentage of
proline was found in the sunbird-pollinated species N. africana (36 %). In floral nectar of 73
Mediterranean plant species, the proportion of phenylalanine was highly variable [14]. This
corresponds to the findings in the genus Nicotiana. Nectar of N. acuminata, N. palmeri and
N. longiflora contained a high proportion of phenylalanine (up to 33 % of the total amino acid
concentration), whereas the proportion was very low for other species. We found no
correlation between phenylalanine concentration in nectar and flowering time, pollination
time, section or phenylalanine content in leaves. Further studies are therefore needed to
investigate the role of phenylalanine in nectar of certain species.
The amount of amino acids per flower in sunbird- and bat-pollinated species was about
1000-fold higher than in autogamous species and about 220-fold higher than in bee-
pollinated species (Fig 3). The concentration of amides (amino acids with a higher nitrogen-
to-carbon ratio in comparison to several other amino acids) was particularly high for sunbird-
and bat-pollinated species (Fig 2E). As a conclusion, sunbird- and bat-pollinated species
either have a large loss of organic nitrogen, or invest large amounts of organic nitrogen for
specific pollination by sunbirds or bats. In addition, pollinators could dislodge pollen into the
nectar while collecting it, which would again increase the amino acid amount [2]. Generally,
Nectariniidae are bigger than hummingbirds [68,69] and therefore might need a higher intake
of amino acids, which could provide an explanation for the lower amino acid concentration in

Ergebnisse 69
69
hummingbird-pollinated species. This dichotomy in amino acid concentrations in
ornithophilous species with lower concentrations in hummingbird-pollinated species and
higher concentrations in species pollinated by passerine birds has already been shown by
Baker and Baker [2]. In comparison, sunbird-pollinated species have nectar which is the
richest in amino acids when compared to all other day-flowering species, whereas bat-
pollinated species have the highest amino acid concentrations of all night-flowering species.
This leads to the simplified conclusion, that the bigger the pollinators are in size, the more a
plant has to invest in their amino acid nutrition.
Hawk moths lack an alternative protein source [2], which is why the low amino acid
concentration in nectar of flowers usually pollinated by these moths is surprising. A
conceivable explanation is that the collection of relatively large amounts of nectar per night
may compensate the low amino acid concentration in the nectar. This would correspond to
the higher amount of amino acids per flower in hawk moth-pollinated species in contrast to
hummingbird- or bee-pollinated species (Fig 3) as a consequence of larger nectar volumes in
hawk moth-pollinated species. All amino acids that are essential for the growth of adult
honey bees [70] were detected in nectar of melittophilous Nicotiana species except
methionine which was under the detection limit. However, bees appear to not solely rely on
nectar for their intake of nitrogen and essential amino acids. Pollen seems to represent an
additional source. As a consequence bees are not as dependent on free amino acids from
nectar as expected [70].
The function of organic acids in nectar
Organic acids in nectars have not been studied in detail, despite the fact that they may play
an important role in nectar quality and pollinator attraction, e.g. by adding flavours and
aromas to the nectar [16]. The main organic acid in nectars of all analysed Nicotiana species
was malic acid and malate respectively, followed by citrate. This result corresponds to the
composition of organic acids in the nectar of Aquilegia [16]. The concentration of malate in
nectars of Nicotiana species was between 0.1 and 2.0 mM, similar to levels found in
apoplastic fluids [41], but considerably lower than concentrations in leaves (approx. 10 µmol
g-1 FW-1 and 200 µmol g-1 FW-1 which corresponds to about 12 to 235 mM considering the
aqueous space of the leaves of about 85 %). An explanation for this concentration gradient
may be the fact that malate has no apparent benefit for the pollinators like sugars or amino
acids and therefore the plants may limit the output of this organic acid. This could also
explain why the concentration of malate in the nectar did not change significantly along with
the type of pollinator (Fig 2F), except for the bat-pollinated species N. otophora. However, it
Ergebnisse 70
70
cannot be excluded that organic acids may play a role in pollinator attraction, e.g. by adding
flavours to the nectar [16].
Inorganic ions are higher concentrated in the nectar of night-flowering species and organic
metabolites are higher concentrated in the nectar of day-flowering species
Nectar of night-flowering species is generally more dominated by inorganic ions than nectar
of day-flowering species (inorganic anions are 2-fold higher and inorganic cations are 1.5-
fold higher, Table 4). On the other hand, nectar of day-flowering species contained about 20
% more sugar (Table 2) and the total amino acid concentration was about 3-fold higher in
nectar of day-flowering species (Table 3). The reason of the lower sugar and amino acid
concentration in nectar of night-flowering species could be the lower assimilation rate of
carbon and nitrogen in the whole plant and the lower phloem translocation rate of assimilates
during the night phase [71]. The processes leading to higher concentrations of inorganic ions
in nectar of night-flowering species are still poorly explored and further analyses are
required.
The detected spectrum of inorganic ions is comparable to levels found in apoplastic fluid,
while inorganic ion concentration is usually higher in the symplast [41]. In each case chloride
and potassium were the main anion and cation, respectively. Nitrate is far less concentrated
in the nectar than in the apoplastic fluid. This might be due to a regulatory mechanism
preventing ions from being secreted into the sugary solution. Much higher potassium than
sodium concentrations in nectar are according to concentrations of these cations in the
phloem sap [72].
Ion concentration in nectar influences the electrolyte balance of nectar-feeding birds [19].
The Broad-tailed Hummingbird (Selasphorus platvcercus) for example needs to replace 14 %
of its body electrolytes each day [73]. So far, no data on electrolyte balance are available for
other pollinator groups. Hiebert and Calder found average chloride concentrations of 9.9 mM
in 19 hummingbird-pollinated species, which is close to our findings in Nicotiana (5.8 mM)
[74].
Nectar volumes and concentrations are adapted to the requirements of the pollinators
The species of Nicotiana showed variation in their phenology over the course of the day, thus
regulating the availability of nectar to pollinators. Furthermore, nectar volume and
composition of nectar are likely to be adapted to the nutritional and energetic requirements of
the pollinators [8]. We found that several nectar characteristics in tobacco corresponded to
their pollination type when pollinators are specialized to visit specific plants. Several
hummingbird-pollinated Nicotiana species secreted sucrose-rich nectar, whereas the nectar

Ergebnisse 71
71
of the sunbird-pollinated N. africana was hexose-rich (Fig 2B, Table 2). This dichotomy in
bird-pollinated species was shown by Baker and Baker [8] and it may reflect differences in
bird physiologies, e.g. different levels of sucrase activity in several nectarivorous perching
birds [75,76], and a pattern of nectar secretion, e.g. invertase activity of the nectaries [77].
These data are in agreement with findings of Martinez del Rio [75], who demonstrated an
experimental behavioural preference for sucrose over hexoses for some hummingbird
species. Napier et al. have shown that the preference is depending on the sugar
concentration and nectar feeding birds only preferred hexose solutions with low sugar
concentrations [76]. The question why nectars of hummingbird-pollinated species are often
sucrose dominated and those of sunbird-pollinated species are often hexose dominated is
still unresolved, and perhaps a combination of both bird and plant physiologies is involved
[77]. Furthermore, in other plant families the sugar composition in nectar was more linked to
the phylogeny of the species than to pollinator preferences, e.g. in 35 Asteraceae species
which were most visited by numerous insects [27].
Nectar volume is expected to correlate with the body size of the pollinators [18]. The
abundant nectar volumes of sunbird- (N. africana) and bat-pollinated species (N. otophora)
constitute a significant investment of the plants. The amount of sugars per flower was about
150-fold higher in these species than in bee-pollinated species or autogamous species. This
difference is even more pronounced for amino acids per flower (up to 1000-fold higher).
Conversely, autogamy may facilitate the evolution of reduced nectar volumes as well as
nectar concentrations, particularly that of amino acids, due to the decreased need for
pollinator attraction. Sugar and amino acid amounts were estimated for individual flowers,
rather than for the entire plant. It is possible that differences in sugar and amino acid
amounts per flower could be balanced across species by differences in the number of
flowers produced along the flowering season [31].
The PCA resulting in a dimensionality reduction allowed us to visualize the distribution of the
data. By means of different markings a pattern of the data distribution became partially
visible, which led to the conclusion, that phylogenetic constrains and particularly pollination
types are suitable to make predictions on nectars’ chemistry. These observations correlate to
findings of Petanidou et al. [78]. They demonstrated that phylogenetic affinity plays a
secondary role, if a PCA is run on the basis of nectar characteristics (nectar volume, sugar
and amino acids content) similar to those used by our group. Additionally it was shown for
the section Alatae that nectar volume and concentration tend to be more similar among
species with the same predominant pollinator compared to species with different
predominant pollinators [31].
Ergebnisse 72
72
The PERMANOVA confirmed a significant difference between both the pollination groups
and the sections (Table 5). If all measured nectar components are included, the influence of
pollinators and sections on the data variance is similar. If only sugars and amino acids are
taken into account, the influence of the pollinators becomes dominant. However, the
importance of pollinators over sections vanishes if only organic acids and inorganic ions are
considered.
It may be concluded that the composition of sugars and amino acids in nectar of Nicotiana
species is highly influenced by the main pollinator of a plant and that there is a fewer but still
significant influence on inorganic ions and malate. Nevertheless, a considerable part of the
variance cannot be explained by either of the grouping options, which raises the question if
there are further models to predict the nectar composition.
Within the genus Nicotiana highly specialized plant species have evolved, the flower
morphology and several nectar features of which are aligned to the needs of its pollinators
like the sunbird-pollinated species N. africana and the bat-pollinated species N. otophora.
This evolutionary process did not apply to all examined Nicotiana species, resulting in
generalists which are accessible to a more diverse group of pollinators. Summarizing all
data, it appears that sugar and amino acid concentrations in nectar of Nicotiana are primarily
influenced by the pollinators of the plant. Other factors such as phylogenetic relationships are
less important determinants.
Acknowledgements
We would like to thank Prof. B. Piechulla (Rostock, Germany), the Botanical Garden of
Bochum (Germany) and the Max Planck Institute for Chemical Ecology (Jena, Germany) for
the provision of seeds and R. Ritter and U. Dreses-Werringloer for critical reading of the
manuscript. Comments from the anonymous reviewers have greatly helped to improve the
previous version of the present manuscript.
Ergebnisse 73
73
References
1. Percival MS. Types of Nectar in Angiosperms. New Phytologist. 1961: 235–281.
2. Baker HG, Baker I. Chemical constituents of nectar in relation to pollination mechanisms
and phylogeny. Biochemical aspects of evolutionary biology. 1982; 131: 171.
3. Adler LS. The ecological significance of toxic nectar. Oikos. 2000; 91: 409–420.
4. Proctor M, Yeo P, Lack A. The natural history of pollination. Portland, Ohio, USA:
Timber Press; 1996.
5. Stuurman J. Dissection of Floral Pollination Syndromes in Petunia. Genetics. 2004; 168:
1585–1599.
6. Heil M. Nectar: generation, regulation and ecological functions. Trends in Plant Science.
2011; 16: 191–200.
7. Carter CJ, Thornburg RW. Is the nectar redox cycle a floral defense against microbial
attack? Trends in Plant Science. 2004; 9: 320–324.
8. Baker HG, Baker I. Floral nectar sugar constituents in relation to pollinator type.
Handbook of experimental pollination biology. 1983; 117: 141.
9. Witt T, Jürgens A, Gottsberger G. Nectar sugar composition of European
Caryophylloideae (Caryophyllaceae) in relation to flower length, pollination biology and
phylogeny. J. Evol. Biol. 2013; 26: 2244–2259.
10. Pyke GH, Waser NM. The Production of Dilute Nectars by Hummingbird and Honeyeater
Flowers. Biotropica. 1981: 260–270.
11. Kim W, Gilet T, Bush JW. Optimal concentrations in nectar feeding. Proc. Natl. Acad.
Sci. U.S.A. 2011; 108: 16618–16621.
12. Baker HG, Baker I. Amino-acids in Nectar and their Evolutionary Significance. Nature.
1973; 241: 543–545.
13. Gardener MC, Gillmann MP. Analyzing Variability in Nectar Amino Acids: Composition Is
Less Variable Than Concentration. 2001: 2545–2558.
14. Petanidou T, van Laere A, Ellis WN, Smets E. What shapes amino acid and sugar
composition in Mediterranean floral nectars. 2006: 155–169.
15. Inouye DW, Waller GD. Responses of Honey Bees (Apis Mellifera) to Amino Acid
Solutions Mimicking Floral Nectars. Ecology. 1984; 65: 618.
16. Noutsos C, Perera AM, Nikolau BJ, Seaver SMD, Ware DH. Metabolomic Profiling of
the Nectars of Aquilegia pubescens and A. canadensis. PLoS ONE. 2015; 10: e0124501.
17. Baker HG, Baker I. Studies of nectar-constitution and pollinator-plant coevolution.
Coevolution of animals and plants. 1975; 100: 591–600.
18. Nicolson SW, Nepi M, Pacini E, editors. Nectaries and Nectar. Dordrecht, The
Netherlands: Springer; 2007.

Ergebnisse 74
74
19. Calder WA. On the temperature-dependency of optimal nectar concentrations for birds.
Journal of Theoretical Biology. 1979; 78: 185–196.
20. González-Teuber M, Heil M. Nectar chemistry is tailored for both attraction of mutualists
and protection from exploiters. psb. 2014; 4: 809–813.
21. Stevenson PC, Nicolson SW, Wright GA. Plant secondary metabolites in nectar:
impacts on pollinators and ecological functions. Funct Ecol. 2017; 31: 65–75.
22. Kessler D, Bhattacharya S, Diezel C, Rothe E, Gase K, Schöttner M, et al.
Unpredictability of nectar nicotine promotes outcrossing by hummingbirds in Nicotiana
attenuata. The Plant Journal. 2012; 71: 529–538.
23. Soltis DE. Angiosperm phylogeny & evolution. New York, Basingstoke: W.H. Freeman;
2005.
24. Peter CI, Johnson SD. A pollinator shift explains floral divergence in an orchid species
complex in South Africa. Annals of Botany. 2014; 113: 277–288.
25. Raguso RA, Levin RA, Foose SE, Holmberg MW, McDade LA. Fragrance chemistry,
nocturnal rhythms and pollination “syndromes” in Nicotiana. Phytochemistry. 2003; 63:
265–284.
26. Ollerton J, Alarcón R, Waser NM, Price MV, Watts S, Cranmer L, et al. A global test of
the pollination syndrome hypothesis. Annals of Botany. 2009; 103: 1471–1480.
27. Torres C, Galetto L. Are Nectar Sugar Composition and Corolla Tube Length Related to
the Diversity of Insects that Visit Asteraceae Flowers. Plant Biol (Stuttg). 2002; 4: 360–
366.
28. Goulson D. Foraging strategies of insects for gathering nectar and pollen, and
implications for plant ecology and evolution. Perspectives in Plant Ecology, Evolution and
Systematics. 1999; 2: 185–209.
29. Jürgens A. Nectar sugar composition and floral scent compounds of diurnal and
nocturnal Conophytum species (Aizoaceae). South African Journal of Botany. 2004; 70:
191–205.
30. Krömer T, Kessler M, Lohaus G, Schmidt-Lebuhn AN. Nectar sugar composition and
concentration in relation to pollination syndromes in Bromeliaceae. Plant Biol (Stuttg).
2008; 10: 502–511.
31. Kaczorowski RL, Gardener MC, Holtsford TP. Nectar Traits in Nicotiana Section Alatae
(Solanaceae) in Relation to Floral Traits, Pollinators, and Mating System. American
Journal of Botany. 2005: 1270–1283.
32. Knapp S, Chase MW, Clarkson JJ. Nomenclatural changes and a new sectional
classification in Nicotiana (Solanaceae). Taxon. 2004: 73–82.
Ergebnisse 75
75
33. Goodspeed TH. The Genus Nicotiana. Origins, Relationships and Evolution of its
Species in the light of their Distribution, Morphology and Cytogenetics. Waltham,
Massachusetts, USA: Chronica Botanica; 1954.
34. Clarkson JJ, Knapp S, Garcia VF, Olmstead RG, Leitch AR, Chase MW. Phylogenetic
relationships in Nicotiana (Solanaceae) inferred from multiple plastid DNA regions.
Molecular Phylogenetics and Evolution. 2004; 33: 75–90.
35. Merxmüller H, Buttler KP. Nicotiana in der afrikanischen Namib - ein
pflanzengeografisches und phylogenetisches Rätsel. Mitteilungen der botanischen
Staatssammlung München. 1975: 91–104.
36. Kelly LJ, Leitch AR, Clarkson JJ, Knapp S, Chase MW. Reconstructing the complex
evolutionary origin of wild allopolylpoid Tobaccos (Nicotiana Section Suaveolentes).
Evolution. 2013; 67: 80–94.
37. Carter CJ, Healy RA, O'Tool NM, Naqvi, S M Saqlan, Ren G, et al. Tobacco nectaries
express a novel NADPH oxidase implicated in the defense of floral reproductive tissues
against microorganisms. Plant Physiology. 2007; 143: 389–399.
38. Nadwodnik J, Lohaus G. Subcellular concentrations of sugar alcohols and sugars in
relation to phloem translocation in Plantago major, Plantago maritima, Prunus persica,
and Apium graveolens. Planta. 2008; 227: 1079–1089.
39. Lohaus G, Schwerdtfeger M. Comparison of sugars, iridoid glycosides and amino acids
in nectar and phloem sap of Maurandya barclayana, Lophospermum erubescens, and
Brassica napus. PLoS ONE. 2014; 9: e87689.
40. Riens B, Lohaus G, Heineke D, Heldt H. Amino Acid and Sucrose Content Determined
in the Cytosolic, Chloroplastic, and Vacuolar Compartments and in the Phloem Sap of
Spinach Leaves. Plant Physiology. 1991: 227–233.
41. Lohaus G, Pennewiss K, Sattelmacher B, Hussmann M, Muehling KH. Is the
infiltration-centrifugation technique appropriate for the isolation of apoplastic fluid? A
critical evaluation with different plant species. Physiol Plant. 2001; 111: 457–465.
42. Anderson MJ. A new method for non-parametric multivariate analysis of variance.
Austral Ecology. 2001; 26: 32–46.
43. Oksanen J, Kindt R, Legendre P, O’Hara B, Stevens, M Henry H, et al. The vegan
package. Community ecology package. 2007; 10: 631–637.
44. Nattero J, Moré M, Sérsic AN, Cocucci AA. Possible tobacco progenitors share long-
tongued hawkmoths as pollen vectors. Plant Systematics and Evolution. 2003; 241: 47–
54.
45. Ippolito A, Fernandes GW, Holtsford TP. Pollinator Preferences for Nicotiana alata, N.
forgetiana, and their F 1 Hybrids. Evolution. 2004; 58: 2634–2644.
Ergebnisse 76
76
46. Nattero J, Cocucci AA. Geographical variation in floral traits of the tree tobacco in
relation to its hummingbird pollinator fauna. Biological Journal of the Linnean Society.
2007; 90: 657–667.
47. Schueller SK. Self-pollination in island and mainland populations of the introduced
hummingbird-pollinated plant, Nicotiana glauca (Solanaceae). American Journal of
Botany. 2004; 91: 672–681.
48. Nabhan GP. Conserving Migratory Pollinators and Nectar Corridors in Western North
America: University of Arizona Press; 2004.
49. Galetto L, Bernardello L. Nectar secretion pattern and removal effects in three species
of Solanaceae. Can. J. Bot. 1993; 71: 1394–1398.
50. Marlin D, Nicolson SW, Yusuf AA, Stevenson PC, Heyman HM, Krüger K. The only
African wild tobacco, Nicotiana africana: alkaloid content and the effect of herbivory.
PLoS ONE. 2014; 9: e102661.
51. Lotz CN, Schondube JE. Sugar Preferences in Nectar- and Fruit-Eating Birds:
Behavioral Patterns and Physiological Causes. Biotropica. 2005: 3–15.
52. Chase MW, Paun O, Fay MF. Hybridization and speciation in angiosperms: a role for
pollinator shifts. BMC Biol. 2010; 8: 45.
53. Aigner PA, Scott PE. Use and Pollination of a Hawkmoth Plant, Nicotiana attenuata, by
Migrant Hummingbirds. The Southwestern Naturalist. 2002; 47: 1.
54. Kessler D, Baldwin IT. Making sense of nectar scents: the effects of nectar secondary
metabolites on floral visitors of Nicotiana attenuata. The Plant Journal. 2007; 49: 840–
854.
55. Adler LS, Seifert MG, Wink M, Morse GE, Turlings T. Reliance on pollinators predicts
defensive chemistry across tobacco species. Ecol Lett. 2012; 15: 1140–1148.
56. Pender RJ, Morden CW, Paull RE. Investigating the pollination syndrome of the
Hawaiian lobeliad genus Clermontia (Campanulaceae) using floral nectar traits. American
Journal of Botany. 2014; 101: 201–205.
57. Torres C, Galetto L. Nectar Sugar Composition and Flower Visitors for the Naturalized
Nectar Sugar Composition and Flower Visitors for the Naturalized Exotic Lantana camara
(Verbenaceae) at Central Argentina. The International Journal of Plant Reproductive
Biology. 2014: 174–180.
58. Southwick EE, Loper GM, Sadwick SE. Nectar Production, Composition, Energetics
and Pollinator Attractiveness in Spring Flowers of Western New York. American Journal
of Botany. 1981; 68: 994.
59. Ruhlmann JM, Kram BW, Carter CJ. CELL WALL INVERTASE 4 is required for nectar
production in Arabidopsis. Journal of Experimental Botany. 2010; 61: 395–404.

Ergebnisse 77
77
60. Schmidt-Lebuhn AN, Schwerdtfeger M, Kessler M, Lohaus G. Phylogenetic
constraints vs. ecology in the nectar composition of Acanthaceae. Flora - Morphology,
Distribution, Functional Ecology of Plants. 2007; 202: 62–69.
61. Rodríguez-Riaño T, Ortega-Olivencia A, López J, Pérez-Bote JL, Navarro-Pérez ML,
Dafni A. Main sugar composition of floral nectar in three species groups of Scrophularia
(Scrophulariaceae) with different principal pollinators. Plant Biol (Stuttg). 2014: 1075–
1086.
62. Waller GD. Evaluating Responses of Honey Bees to Sugar Solutions Using an Artificial-
Flower Feeder. Annals of the Entomological Society of America. 1972; 65: 857–862.
63. Herrera CM, Vega C de, Canto A, Pozo MI. Yeasts in floral nectar: a quantitative survey.
Annals of Botany. 2009; 103: 1415–1423.
64. Baker HG, Baker I. Intraspecific constancy of floral nectar amino acid complements.
Botanical Gazette. 1977: 183–191.
65. Gardener MC, Gillman MP. The taste of nectar - a neglected area of pollination ecology.
Oikos. 2002; 98: 552–557.
66. Hocking PJ. The composition of phloem exudate and xylem sap from tree tobacco
(Nicotiana glauca Grah.). Annals of Botany. 1980; 45: 633–643.
67. Bertazzini M, Medrzycki P, Bortolotti L, Maistrello L, Forlani G. Amino acid content
and nectar choice by forager honeybees (Apis mellifera L.). Amino Acids. 2010; 39: 315–
318.
68. Krüger K, Prinzinger R, Schuchmann K. Torpor and metabolism in hummingbirds.
Comparative Biochemistry and Physiology Part A: Physiology. 1982; 73: 679–689.
69. Prinzinger R, Lübben I, Schuchmann K. Energy metabolism and body temperature in
13 sunbird species (Nectariniidae). Comparative Biochemistry and Physiology Part A:
Physiology. 1989; 92: 393–402.
70. Haydak MH. Honey bee nutrition. Annual review of Entomology. 1970; 15: 143–156.
71. Riens B, Lohaus G, Winter H, Heldt H. Production and diurnal utilization of assimilates
in leaves of spinach (Spinacia oleracea L.) and barley (Hordeum vulgare L.). Planta.
1994; 192.
72. Lohaus G, Hussmann M, Pennewiss K, Schneider H, Zhu JJ, Sattelmacher B. Solute
balance of a maize (Zea mays L.) source leaf as affected by salt treatment with special
emphasis on phloem retranslocation and ion leaching. Journal of Experimental Botany.
2000; 51: 1721–1732.
73. Calder III WA, Hiebert SM. Nectar feeding, diuresis, and electrolyte replacement of
hummingbirds. Physiological Zoology. 1983: 325–334.
74. Hiebert SM, Calder WA. Sodium, potassium, and chloride in floral nectars: energy-free
contributions to refractive index and salt balance. Ecology. 1983; 64: 399–402.

Ergebnisse 78
78
75. Martínez del Rio C. Dietary, Phylogenetic, and Ecological Correlates of Intestinal
Sucrase and Maltase Activity in Birds. Physiological Zoology. 1990; 63: 987–1011.
76. Napier KR, McWhorter TJ, Nicolson SW, Fleming PA. Sugar preferences of avian
nectarivores are correlated with intestinal sucrase activity. Physiological and Biochemical
Zoology. 2013; 86: 499–514.
77. Nicolson SW, Fleming PA. Nectar as food for birds: the physiological consequences of
drinking dilute sugar solutions. Plant Systematics and Evolution. 2003; 238: 139-153.
78. Petanidou T, Goethals V, Smets E. Nectary structure of Labiatae in relation to their
nectar secretion and characteristics in a Mediterranean shrub community - Does
flowering time matter. Plant Systematics and Evolution. 2000; 225: 103–118.
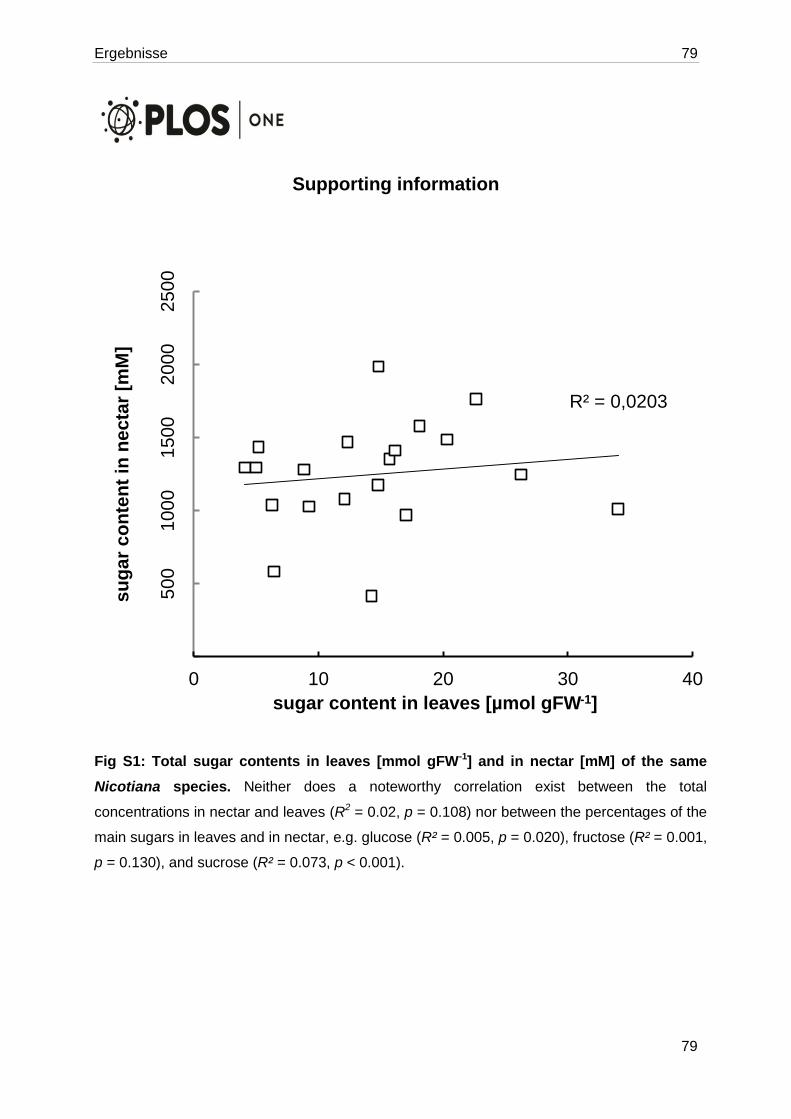
Ergebnisse 79
79
Supporting information
Fig S1: Total sugar contents in leaves [mmol gFW-1] and in nectar [mM] of the same
Nicotiana species. Neither does a noteworthy correlation exist between the total
concentrations in nectar and leaves (R2 = 0.02, p = 0.108) nor between the percentages of the
main sugars in leaves and in nectar, e.g. glucose (R² = 0.005, p = 0.020), fructose (R² = 0.001,
p = 0.130), and sucrose (R² = 0.073, p < 0.001).
R² = 0,0203
50
01000
1500
2000
2500
0 10 20 30 40
su
ga
r c
on
ten
t in
ne
cta
r [m
M]
sugar content in leaves [µmol gFW-1]

Ergebnisse 80
80
Fig S2: Total amino acid contents in leaves [µmol gFW-1] and nectar [mM] of the same
Nicotiana species. Neither does a noteworthy correlation exist between the total
concentrations in nectar and leaves (R2 = 0.035, p < 0.001) nor between the percentages of
single amino acids in leaves and nectar, e.g. glutamate (R² = 0.011, p < 0.001), glutamine (R²
= 0.053, p < 0.001), aspartate (R² = 0.015, p < 0.001) and asparagine (R² = 0.075, p = 0.211).
R² = 0,0352
0
1
2
3
4
5
6
0 5 10 15 20
am
ino
ac
id c
on
ten
t in
ne
cta
r [m
M]
amino acid content in leaves [µmol gFW-1]

Ergebnisse 81
81
Fig S3: Total concentration of malate in leaves [µmol gFW-1] and nectar [µmol L-1] of the
same Nicotiana species. There is almost no correlation between the total concentrations in
nectar and leaves (R2 = 0.149, p = 0.001).
R² = 0,1494
0,0
0,5
1,0
1,5
2,0
2,5
0 50 100 150 200 250
ma
late
co
nte
nt
in n
ec
tar
[mM
]
malate content in leaves [µmol gFW-1]

Ergebnisse 82
82
Fig S4: Total concentration of anions in leaves [mmol gFW-1] and nectar [mM] of the
same Nicotiana species. Neither does a noteworthy correlation exist between the total
concentrations in nectar and leaves (R2 = 0.006, p < 0.001) nor between the percentages of
single anions in leaves and nectar, e.g. chloride (R² = 0.221, p = 0.010), nitrate (R² = 0.208, p
= 0.023), phosphate (R² = - 0.170, p < 0.001) and sulfate (R² = 0.040, p = 0.003).
R² = 0,0056
0
5
10
15
20
25
0 200 400 600 800
an
ion
co
nte
nt
in n
ec
tar
[mM
]
anion content in leaves [µmol gFW-1]
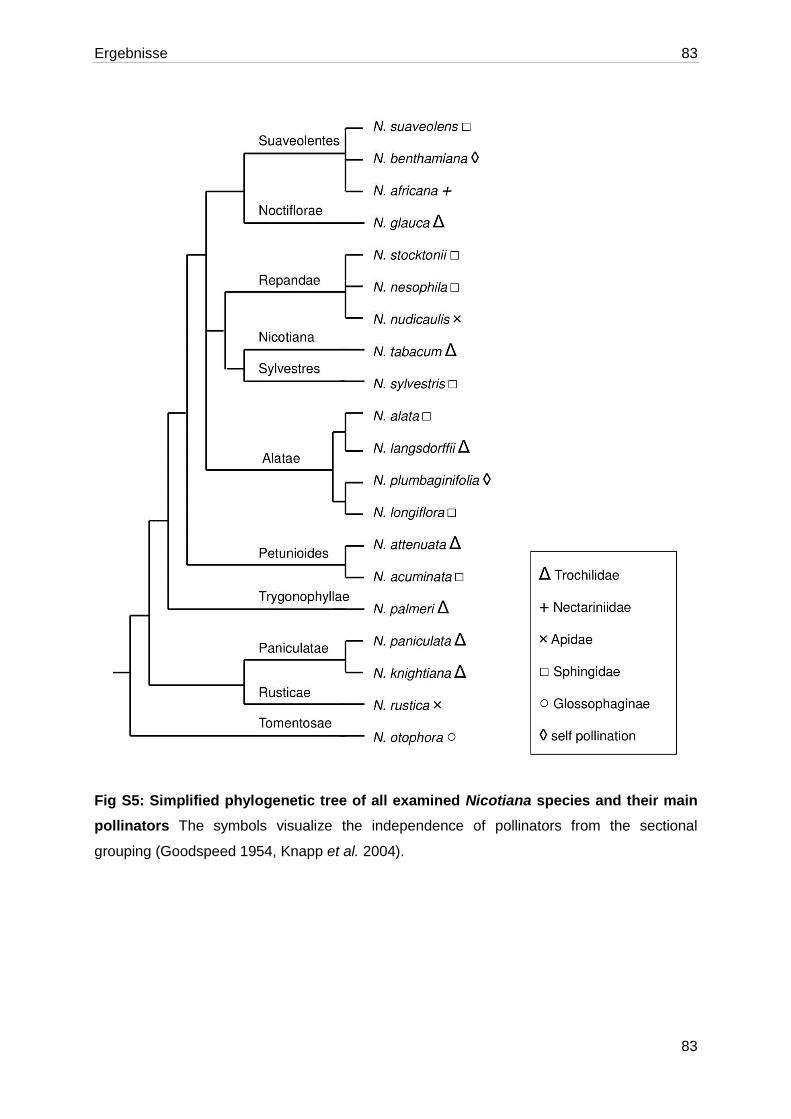
Ergebnisse 83
83
Fig S5: Simplified phylogenetic tree of all examined Nicotiana species and their main
pollinators The symbols visualize the independence of pollinators from the sectional
grouping (Goodspeed 1954, Knapp et al. 2004).

Ergebnisse 84
3.3. Abschnitt III: Proteine in Nektar und Nektarien von
Nicotiana
In floralem Nektar sind neben den immer vorhandenen Bestandteilen wie Zuckern und freien
Aminosäuren nur kleinere Mengen an Proteinen vorhanden. Deshalb musste vor der
eigentlichen SDS-PAGE eine Proteinfällung durchgeführt werden. Bei der SDS-PAGE
werden die Proteine nach ihrem Molekulargewicht aufgetrennt und anschließend im Gel
fixiert und angefärbt. Zur Anfärbung wurden zwei unterschiedliche Methoden verwendet: die
Coomassiefärbung und die Silberfärbung. Die Sensitivität liegt bei Coomassie bei 0,3–1 µg
(Wilson, 1983) und bei Silber bei 5–30 ng (Blum et al., 1987) pro Proteinbande. Nachteile der
Silberfärbung sind ihre höhere Umweltbelastung und dass eine weitere Analyse der
angefärbten Proteine schwieriger ist. Das hier verwendete Protokoll ist allerdings auch mit
massenspektrometrischen Analysen verträglich, deswegen wurden die Gele zur weiteren
Verwendung aufbewahrt.
Ergebnisse der Coomassiefärbung:
Nicht von allen Tabakarten konnte eine SDS-PAGE durchgeführt werden, da mindestens
10 µl Nektar pro Probe verwendet werden müssen und viele Arten weniger als 1 µl Nektar
produzieren. Durch die Coomassiefärbung wurden bei vielen Proben Proteinbanden in
unterschiedlicher Höhe sichtbar. Die aufgetrennten Proteine hatten eine Molekülmasse von
ca. 20–70 kDa (Abbildung 3.2). Da die durchschnittliche molekulare Masse einer Aminosäure
0,11 kDa beträgt, lässt sich anhand der folgenden Formel aus der Molekülmasse die Länge
des Proteins abschätzen:
𝐺𝑟öß𝑒 𝑑𝑒𝑠 𝑃𝑟𝑜𝑡𝑒𝑖𝑛𝑠 = 𝐴𝑛𝑧𝑎ℎ𝑙 𝑑𝑒𝑟 𝐴𝑚𝑖𝑛𝑜𝑠ä𝑢𝑟𝑒𝑛 × 0,11 𝑘𝐷𝐴
Es handelt sich also um vergleichsweise kleine Proteine mit einer geschätzten Länge von
182 – 636 Aminosäuren, welche durch DNA-Sequenzen der Länge 546 – 1908 bp codiert
werden. Bei N. tabacum konnten allerdings gar keine Proteine im Nektar gefunden werden.
Durch das kurze Erhitzen der Proben mit dem Probenpuffer konnte eine höhere Sensitivität
erreicht werden (Abbildung 3.2)

Ergebnisse 85
Abbildung 3.2: Mit Coomassie angefärbte Proteine nach der SDS-PAGE
Durch das kurze Erhitzen der Proben mit dem Probenpuffer konnten bessere Ergebnisse
erzielt werden und teilweise waren sogar mehr Banden bei der gleichen Probe auf dem Gel
zu sehen (vgl. 5 und 6).
Neben N. tabacum konnten auch bei N. sylvestris bei keiner Probe Proteine im Nektar
nachgewiesen werden (Abbildung 3.3). Als Positivkontrolle wurde der Nektar von N. alata
verwendet. Die Blüten von N. sylvestris enthielten ähnlich wie bei N. tabacum relativ große
Mengen an Nektar, sodass durch das hohe Volumen die Konzentration an Proteinen
eventuell geringer war und damit unter der Detektionsgrenze lag. Allerdings hatte N. africana
von allen untersuchten Arten das größte Nektarvolumen und enthielt dennoch sehr viel
Protein (Abbildung 3.4). Die Gesamtmenge an Protein kann mit Hilfe des Protein-
Molekulargewichtsmarkers anhand der Bandenintensität ungefähr abgeschätzt werden
(Tabelle 3.2). In N. acuminata, N. mutabilis und N. longiflora sind jeweils ca. 200 µg/ml
Protein insgesamt im Nektar vorhanden, während die Konzentration bei N. alata über
200 µg/ml beträgt.

Ergebnisse 86
Tabelle 3.2: Größe und Konzentration der Markerproteine
Protein MW (kDa)
Konzentration (mg/ml)
Myosin 212 0,2 β-Galactosidase 118 0,2 Serumalbumin 66 0,2 Ovalbumin 43 0,25 Carboanhydrase 29 0,15 Trypsin Inhibitor 20 0,2 Lysozym 14 0,2
Abbildung 3.3: Angefärbte Proteine aus N. alata und N. sylvestris nach der SDS-PAGE
Ergebnisse der Silberfärbung
Durch die Silberfärbung wurden deutlich mehr Banden pro Probe sichtbar. Während bei der
Coomassiefärbung maximal 4 Banden (davon nur 2 deutlich) zu erkennen waren, traten bei
der Silberfärbung bis zu 10 distinkte Banden pro Probe hervor. Ein Vergleich mehrerer
Proben aus unterschiedlichen Blüten der gleichen Pflanze sowie unterschiedlicher Pflanzen
der gleichen Art zeigte, dass diese Proben ein ähnliches Bandenmuster aufwiesen
(Abbildung 3.4). Demnach scheint jede Art ein spezifisches Proteinprofil im Nektar zu
entwickeln. Einige Banden waren bei unterschiedlichen Arten zu finden. So sieht man sowohl
bei N. alata als auch bei N. longiflora eine deutliche Bande bei ca. 60 kDa (Abbildung 3.2
und Abbildung 3.4). Bei N. africana, N. alata und N. longiflora bei ca. 25 kDa (Abbildung 3.4).
Bei N. africana fiel diese Bande besonders intensiv aus. Bei N. acuminata und N. mutabilis
gibt es eine gemeinsame Bande bei ca. 20 kDa (Abbildung 3.2).

Ergebnisse 87
Abbildung 3.4: Mit Silber angefärbte Proteine nach der SDS-PAGE
[1-3] Nektar aus verschiedenen Pflanzen der Art N. africana; [4-6] Nektar aus verschiedenen
Blüten einer Pflanze der Art N. africana, [5] ist leer wegen eines Fehlers bei der
Proteinfällung [7] Nektar aus N. longiflora [8] Nektar aus N. alata
Für Ziertabak (Nicotiana langsdorffii X N. sanderae) wurden bereits einige Proteine im Nektar
beschrieben und anhand ihrer molekularen Masse aufsteigend als Nectarin I (NEC1) bis
Nectarin V (NEC5) benannt. Nectarin I (NEC1) hat eine Größe von 29 kDa (Carter und
Thornburg, 2004a) und kommt im Nektar von Ziertabak in Konzentrationen von bis zu 250 µg
ml-1 vor (Carter et al., 1999). Nektarin II (NEC2) hat eine Größe von 35 kDa und Nektarin III
(NEC3) ist 40 kDa groß (Carter und Thornburg, 2004a). Die Banden von Nektarin IV (NEC4)
und Nektarin V (NEC5) sind auf dem Gel kaum voneinander zu trennen. Auf einer Höhe von
61 bis 65 kDa ist eine breite Bande zu erkennen, die bei genauer Analyse ergab, dass es
sich um zwei Isoformen von NEC4 und drei Isoformen von NEC5 handelt, welche alle eine
ähnliche Größe besitzen (Carter und Thornburg, 2004c). Demnach könnte es sich bei der
gemeinsamen Bande von N. africana, N. alata und N. longiflora bei ca. 25 kDa um NEC1
und der gemeinsamen Bande von N. alata und N. longiflora bei ca. 60 kDa um NEC4 oder
NEC5 handeln. Diese Nektarproteine spielen größtenteils eine Rolle im Nectar Redox Cycle
bei der Produktion von Wasserstoffperoxid zur Pathogenabwehr (Carter et al., 1999; Carter
und Thornburg, 2004a, 2004b; Naqvi et al., 2005).
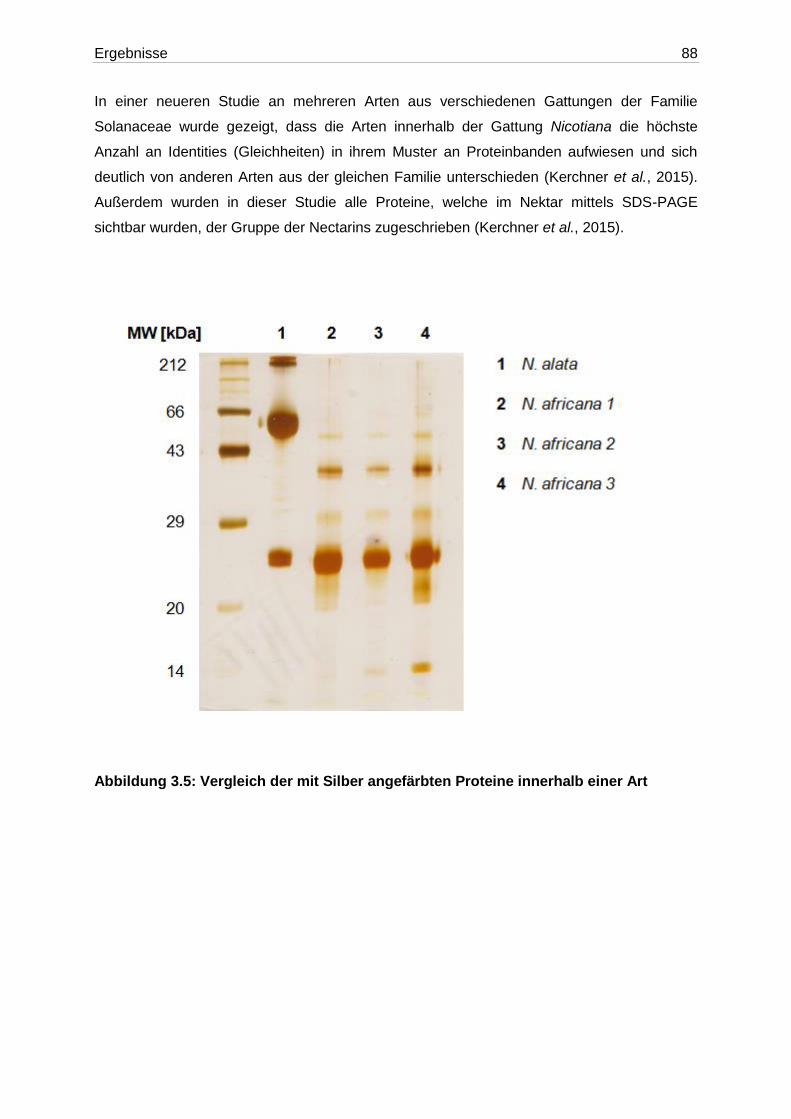
Ergebnisse 88
In einer neueren Studie an mehreren Arten aus verschiedenen Gattungen der Familie
Solanaceae wurde gezeigt, dass die Arten innerhalb der Gattung Nicotiana die höchste
Anzahl an Identities (Gleichheiten) in ihrem Muster an Proteinbanden aufwiesen und sich
deutlich von anderen Arten aus der gleichen Familie unterschieden (Kerchner et al., 2015).
Außerdem wurden in dieser Studie alle Proteine, welche im Nektar mittels SDS-PAGE
sichtbar wurden, der Gruppe der Nectarins zugeschrieben (Kerchner et al., 2015).
Abbildung 3.5: Vergleich der mit Silber angefärbten Proteine innerhalb einer Art

Ergebnisse 89
Es wurde der Gesamtproteingehalt der Nektarien bestimmt. Die Proteinbestimmung erfolgte
nach Lowry et al. (1951) und beruht auf einer Farbreaktion der Peptidbindungen mit
anschließender photometrischer Messung. Dabei wurden Werte von 4 ± 0.12 mg/g FW bis
zu 36 ± 6,5 mg/g FW in den Nektarien gemessen. Die Proteingehalte unterschieden sich
dabei eher nach Art und weniger nach Sammelzeitpunkten der Proben. Zum Vergleich
wurden auch Proteingehalte in den Blättern der Pflanzen gemessen. Diese lagen zwischen 1
± 0,2 mg/g FW und 3,5 ± 0,9 mg/g FW.
Tabelle 3.3: Proteingehalte in Nektarien und Blättern
Protein
[mg/g FW] N. africana N. attenuata N. benthamiana N. sylvestris N. tabacum
Nektarien
2 p.m. 3.9 ± 0.2 30.1 ± 2.6 34.4 ± 1.9 13.1 ± 2.4 9.7 ± 0.7
8 p.m. 4.1 ± 0.1 11.1 ± 1.2 37 ± 6.5 8 ± 2 6.2 ± 0.6
2 a.m. 4.1 ± 0.1 3.8 ± 0.1 2.7 ± 0.2 1.8 ± 0.2 1 ± 0
8 a.m. 4.1 ± 0.1 12.4 ± 0.3 24.7 ± 1.8 8.4 ± 1.2 7.4 ± 0.3
Blätter
2 p.m. 1 ± 0.2 2 ± 0.1 2.7 ± 0.1 2.2 ± 0.1 1.8 ± 0.2
8 p.m. 2 ± 0.4 1.9 ± 0.4 3.5 ± 0.9 2 ± 0.2 2.6 ± 0.9
2 a.m. 1.1 ± 0.5 2.2 ± 0.3 3.2 ± 1.1 1.6 ± 0.1 1.9 ± 0.8
8 a.m. 1.3 ± 0 1.2 ± 0.1 3.3 ± 0.9 1.9 ± 0.1 1.4 ± 0.6

Ergebnisse 90
3.4. Abschnitt IV: Regulation der Zuckerzusammensetzung in
Nektar und Nektarien bei Nicotiana
In diesem Abschnitt werden die möglichen Mechanismen hinter der Regulation des
Zuckerprofils des Nektars beleuchtet.
Die Ergebnisse sind in dem Manuskript „Nectar Sugar Modulation and Cell Wall Invertases in
Nectaries of Tobacco Plants (Nicotiana)” dargestellt und am 06.02.2018 zur Veröffentlichung
bei Frontiers in Plant Science eingereicht.
Ergebnisse 91
Nectar Sugar Modulation and Cell Wall Invertases in the
Nectaries of Day- and Night- Flowering Nicotiana
Authors: Kira Tiedge1, Gertrud Lohaus1*
1Molecular Plant Science/ Plant Biochemistry, University of Wuppertal, Wuppertal, Germany
Running title (5 words): CWINV in Tobacco Nectaries
* Correspondence:
Prof. Dr. Gertrud Lohaus
Number of words: 8256
Number of figures: 8

Ergebnisse 92
Abstract
Nectar composition varies between species, depending on flowering time and pollinator type,
among others. Various models of the biochemical and molecular mechanisms underlying
nectar production and secretion have been proposed. To gain insights into these
mechanisms, day- and night-flowering tobacco (Nicotiana) species with high or low
proportions of hexoses in the nectar were analyzed. Nectar and nectaries were
simultaneously collected, throughout the day and night. Soluble sugars and starch were
determined and the activity and expression level of cell wall invertase (CW-INVs) were
measured in nectaries.
Nectaries and nectar of the five Nicotiana species contained different amounts of sucrose,
glucose, and fructose. CW-INV activity was detected in the nectaries of all Nicotiana species
and is probably involved in the hydrolysis of sucrose in the nectary tissue and during nectar
secretion. The larger differences in the sucrose-to-hexose-ratio between nectaries and
nectar in diurnal species compared to nocturnal species can be explained by higher sucrose
cleavage within the nectaries in night-flowering species, and during secretion in day-
flowering species. However, cell wall invertase alone cannot be responsible for the
differences in sugar concentrations.
Within the nectaries of the Nicotiana species, a portion of the sugars is transiently stored as
starch. In general, night-flowering species showed higher starch contents in the nectaries
compared to day-flowering species. Moreover, in night flowering species, the starch content
decreased during the first half of the dark period, when nectar production peaks. The sucrose
concentrations in the cytoplasm of nectarial cells were extrapolated from nectary sucrose
contents. In day-flowering species, the sucrose concentration in the nectary cytoplasm was
about twice as high as in nectar, whereas in night-flowering species the situation was the
opposite, which implies different secretion mechanisms. The secreted nectar sugars
remained stable for the complete flower opening period, which indicates that post-secretory
modification is unlikely. On the basis of these results, we present an adapted model of the
mechanisms underlying the secretion of nectar sugars in day- and night-flowering Nicotiana.
Keywords (5-8): Floral nectar; nectaries; cell wall invertase; tobacco; Nicotiana; sugar
composition; diurnal/nocturnal;

Ergebnisse 93
Introduction
Nectar is a sugar-rich solution which is produced by most angiosperm plants to fulfil
extensive functions, e.g., the attraction of pollinators and protection against herbivores
(Brandenburg et al., 2009; González-Teuber und Heil, 2009; Adler et al., 2012). Nectar is
produced by and secreted from nectaries, which are highly specialized glands, and the
surrounding tissue. In Nicotiana, all floral nectaries are located at the basal side of the
gynoecium (Bernardello, 2007) and during nectary development, β-carotene is expressed,
which results in an orange colouring (Horner et al., 2007). The synthesis and secretion of
floral nectar has been the subject of several studies, and different models on the biochemical
and molecular mechanisms underlying nectar secretion have been proposed (Ge et al.,
2000; Horner et al., 2007; Kram et al., 2009; Mosti et al., 2013; Stpiczyńska et al., 2014). But
due to the enormous diversity of flowering plants, there are still several variables that warrant
further study (Roy et al., 2017). A very basic theory of nectar secretion proposes an
apoplastic movement of metabolites from the phloem to the nectary surface (Vassilyev,
2010). However, the metabolite composition differs between the phloem sap and the nectar
(Lohaus und Schwerdtfeger, 2014), which does not support the proposed apoplastic method
of nectar secretion. Other hypotheses propose that various enzymes and transport proteins
are involved in nectar production. For certain plant species, an eccrine secretion mode has
been proposed, wherein sucrose is delivered from the phloem to the nectary parenchyma
cells, and there the sucrose is transiently converted to starch or exported to the apoplast
directly. A plasma membrane-localized sucrose transporter SWEET9 is essential for this
transport (Lin et al., 2014). SWEET9 functions as a facilitated diffusion transporter for
sucrose, and mutants lacking SWEET9 do not produce nectar, e.g., in Nicotiana attenuata
(Lin et al., 2014). Once sucrose is exported from the nectary, it is then hydrolysed by an
extracellular cell wall invertase into glucose and fructose (Ruhlmann et al., 2010). In a third
proposed secretory mechanism, nectar metabolites are transported symplastically to the
outer nectary cells and then packed into vesicles, which are produced by the endoplasmatic
reticulum (ER) or the Golgi complex, to fuse with the plasma membrane and release the
nectar metabolites to the nectary surface (Fahn, 1979b; Fahn, 1979a). These three models
for nectar secretion are not necessarily mutually exclusive, and other modes of nectar
secretion can occur in different plant species.
In some plant species, starch accumulates in the nectaries and peaks approximately 24 h
before anthesis and then declines rapidly, which is the basis for the hypothesis that starch is
one source of sugars for nectar production before and during nectar secretion (Nepi et al.,
1996; Ren et al., 2007a; Ren et al., 2007b; Horner et al., 2007). Genes encoding anabolic
enzymes involved in starch synthesis were found to be more highly expressed at the early

Ergebnisse 94
stages of nectary development, and genes encoding catabolic enzymes were expressed at
later stages (Ren et al., 2007a). However, studies on lychee (Litchi chinensis) floral nectaries
have shown that the nectar sugar is composed of both phloem sap and products of starch
degradation in the nectaries (Ning et al., 2017).
Of the sugars found in nectar, the most prevalent are sucrose and the hexoses glucose and
fructose (Percival, 1961; Baker und Baker, 1983; Tiedge und Lohaus, 2017). Given that
hexoses are typically not components of the phloem sap (Lohaus und Schwerdtfeger, 2014),
the proportion of hexoses in nectar depends on the presence and activity of sucrose-cleaving
enzymes. Sucrose cleavage in plants can be catalyzed by at least two types of enzymes:
reversible sucrose cleavage is catalysed by sucrose synthase (SuS; EC 2.4.1.13), a
glycosyltransferase; and irreversible sucrose cleavage is catalysed by invertases, which
catalyse hydrolysis (β-fructofuranosidases; EC 3.2.1.26). Invertases exist in numerous
isoforms with various subcellular localizations and biochemical properties (Roitsch und
González, 2004). These enzymes can be classified into three groups: vacuolar invertases (V-
INVs), extracellular invertases (CW-INVs), and neutral invertases (N-INVs). Whereas N-INVs
have an alkaline pH-optimum, V-INVs and CW-INVs are so-called “acidic invertases”
because they work most efficiently between pH 4.5 and 5.0. Extracellular invertases are non-
soluble proteins that are ionically bound to the cell wall (Sturm, 1999). A separate gene
encodes for each of the isoforms, which have a high identity and share common features,
e.g. the pentapeptide NDPNG (βF-motif) close to the N-terminus of the mature protein, and
WECXDF, an amino acid sequence closer to the C-terminus (Sturm und Chrispeels, 1990;
Roitsch und González, 2004).
For some plant species, e.g. carrot (Daucus carota) and tomato (Solanum lycopersicum),
different organ- and development-stage-specific expression patterns of acid invertase were
shown (Sturm et al., 1995; Godt und Roitsch, 1997). Usually, invertase expression is
increased in rapidly-growing tissues with a high demand for hexoses (Weschke et al., 2003).
Interestingly, for both carrot and tomato, the mRNA expression of an acidic invertase was
found to be specific to flowers and flower buds (Lorenz et al., 1995; Godt und Roitsch, 1997).
It was assumed that this flower-specific extracellular invertase is essential for male and
female organ development, e.g., to supply the anthers with carbohydrates (Dorion et al.,
1996; Godt und Roitsch, 1997). More recently, it was shown that cell wall invertase is also
crucial for nectar secretion in Arabidopsis (Ruhlmann et al., 2010). AtCWINV4 expression
was found to be highly up regulated in nectaries of A. thaliana compared to other tissues
(Kram et al., 2009). Furthermore, two independent cwinv4-mutant lines with greatly
diminished activity of total cell wall invertase in whole Arabidopsis flowers secreted no

Ergebnisse 95
nectar, although the nectary ultrastructure appeared to be similar to that of wild-type plants
(Ruhlmann et al., 2010).
The genus Nicotiana is highly diverse in terms of flower morphology and pollination mode. In
a study involving 20 Nicotiana species, the sugar concentration in the nectar of several day-
and night flowering species was measured (Tiedge und Lohaus, 2017). The genus Nicotiana
contains species with sucrose-rich nectars as well as hexose-rich nectars, and the exact
nectar composition depends on the pollinator type, flowering time, corolla length and other
environmental factors (Tiedge und Lohaus, 2017). The sucrose-to-hexose ratio ranged from
0.1 to 2.0 and was fairly consistent within a given species.
This finding raises the question of whether the sugar composition in nectar is a result of the
sugar composition in the nectaries. Alternatively, a lower sucrose content in nectar could
reflect higher invertase activity in the nectaries and during nectar secretion. Furthermore, we
aimed to investigate potential differences in invertase expression and activity over the course
of a day, in consideration of flower opening and nectar production times. In addition to these
pre-secretory and secretory processes, post-secretory processes could also be responsible
for varying sugar composition. In such a scenario, the nectar itself must contain sugar
cleaving enzymes.
To further investigate the mechanism underlying nectar production and secretion, five
tobacco species with varying properties were examined. Two day-flowering species (N.
tabacum and N. africana) as well as two night-flowering species (N. sylvestris and N.
benthamiana) were included. Within each category (day- or night-flowering), one species
had a high sucrose content and one species had a low sucrose content (Fig. 1).

Ergebnisse 96
Figure 1: Nicotiana species arranged by flowering time and sucrose content. The
flower sizes are depicted to relative scale.
For reproduction, these species rely on pollination either by diurnal birds (N. africana:
sunbirds; N. tabacum: hummingbirds), nocturnal moths (N. sylvestris), or otherwise the
species is primarily autogamous (N. benthamiana) (Tiedge und Lohaus, 2017). Additionally,
N. attenuata was chosen, which opens its flowers at twilight both in the evening and in the
morning and is therefore less dependent on a specific pollinator (Kessler und Baldwin, 2007).
To investigate whether the nectar sugar content primarily depends on pre-secretory
processes, the secretion process, or post-secretional modification, nectar sugars were
compared to nectary sugars at multiple time points per day; additionally, the invertase activity
and expression were measured, and post-secretional activity was recorded.

Ergebnisse 97
Materials and Methods
Plant material
N. attenuata seeds were provided by the Max Planck Institute for Chemical Ecology (Jena,
Germany), N. benthamiana seeds were provided by the University of Rostock (Germany), N.
africana and N. sylvestris seeds were provided by the Botanical Garden of the University of
Bochum (Germany), and N. tabacum seeds were provided by NiCoTa (Rheinstetten,
Germany). Each plant was potted in a single 5-L pot with compost soil and grown in a
greenhouse at the University of Wuppertal. Cultivation was carried out with a 14-h-light/10-h-
dark cycle, an irradiance of approximately 300 µmol photons m-2 s-1 and a temperature
regime of 25 °C day/18 °C night.
Collection of nectaries and nectar
Each sample (~100 mg) of nectary tissue comprised 20 to 50 nectaries, depending on the
species. At each time point (2 p.m., 8 p.m., 2 a.m., 8 a.m.), three samples were taken. To
collect the nectaries, the gynoecia were extracted from the flowers, and the nectary tissue
was dissected with a scalpel and rinsed with ultrapure water to remove external sugars. All
samples were immediately frozen in liquid nitrogen and stored at -80 °C until further analysis.
The weight of a single nectary was calculated as follows:
Weight per floral nectary [mg]= 100 𝑚𝑔 number of nectaries collected per sample⁄
For each species, at least three nectar samples were taken from three plants at all four time
points. The nectar samples were collected with micropipettes and stored at -80 °C until
further analysis. The nectar samples used for post-secretional experiments were left at room
temperature for 12 h, 24 h and 48 h. The water content of the nectaries and leaves was
determined by drying and weighing those tissues. The following calculation was used:
𝑊𝑎𝑡𝑒𝑟 𝑐𝑜𝑛𝑡𝑒𝑛𝑡 = 1 − (𝑑𝑟𝑦 𝑤𝑒𝑖𝑔ℎ𝑡 [𝑚𝑔] 𝑓𝑟𝑒𝑠ℎ 𝑤𝑒𝑖𝑔ℎ𝑡⁄ [𝑚𝑔])
Analysis of sugars and starch in nectaries and nectar
For the extraction of soluble metabolites from nectary tissue, a chloroform-methanol-water
extraction was performed (Nadwodnik und Lohaus, 2008). The analysis of sugars in nectar
and nectaries via HPLC was conducted according to Lohaus and Schwerdtfeger (2014). An
ion exchange column (CarbopacTM PA10 4x250mm; Dionex Corp, Sunnyvale, CA, USA)

Ergebnisse 98
was eluted isocratically with 80 mM NaOH (JT Baker Chemicals). Sugars were detected with
a pulse amperometric detector with a gold electrode (ESA Model 5200, Coulochem II,
Bedford MA, USA). The pulse setting was 50, 700 and -800 mV for 400, 540 and 540 ms,
accordingly. For external calibration, sugar standards (Sigma-Aldrich, Germany) were
measured in parallel. The evaluation of the chromatograms was performed with an
integration program (Peaknet version 5.1, Dionex). Starch content of nectaries was
determined according to a modified protocol from Riens et al. (1994).
Expression of CWINV
RNA from approximately 50 mg of nectariferous tissue was isolated using a modified protocol
from Logemann et al. (1987). Synthesis of cDNA was performed using the RevertAidTM First
Strand cDNA Synthesis Kit (Thermo Fisher Scientific, St. Leon-Rot, Germany) with
oligo(dT)18 primers. Degenerated primers were designed to amplify cell wall invertase
sequences of the different Nicotiana species. The obtained sequences were cloned with the
pGEM®-T Easy Vector System (Promega Corporation, Madison, IW, USA) for sequencing,
and suitable specific primers for quantitative real-time polymerase-chain-reaction (qRT-PCR)
were selected. For verification of the obtained primers and sequences, amplification with
proof read polymerase (Phusion High-Fidelity DNA-Polymerase, Thermo Scientific, MA,
USA) and blasting with known sequences from NCBI (National Center for Biotechnology
Information, MD, USA) was performed. QRT-PCR analyses were performed using a Maxima
SYBR Green qPCR Master Mix (Thermo Fisher Scientific, Waltham, MA, USA) and a
Mx3005P qPCR System (Agilent Technologies Inc., Waldbronn, Germany). Efficiencies of
the PCRs were calculated with slopes of standard curves of 2-fold dilutions. For each
species two stable reference genes were used for normalization (Vandesompele et al., 2002;
Schmidt und Delaney, 2010; Liu et al., 2012). The first sample of each experiment was used
as a calibrator, which was set to one, and further samples are given as relative expression
levels to the calibrator. For each condition three biological replicates with two technical
replicates each were tested. A list of the primers used for each species can be found in the
supplementaries (Supplementary Table 1).
Enzyme Assay for CWINV
Proteins were extracted from 25 mg nectary tissue each as described by Wright et al. (1998).
Cell wall invertase activity was assayed according to Heineke et al. (1992). An aliquot of the
protein extracts was added to 0.6 M sucrose and 0.125 M sodium acetate, pH 5.0. After 10
min, the reaction was completely stopped by boiling and subsequently, the amount of
glucose released was determined by coupled optical enzyme assay. All enzyme assays were
conducted from six biological replicates with two technical replicates each.

Ergebnisse 99
Results
Sugar concentrations in nectar and nectaries during the light and dark period
The sugar content in both nectar and nectaries was primarily composed of glucose, fructose
and sucrose. Other sugars, including maltose, were not found in any of the samples. The
total sugar concentration in nectar ranged from 1042 ± 86 mM to 3183 ± 186 mM, depending
on the species and collection time (Fig. 2). The day-flowering species (N. africana and N.
tabacum) had the highest nectar sugar concentration during the day, which decreased
continuously at night. In the case of night-flowering tobacco (N. benthamiana, N. sylvestris),
the lowest sugar concentration in nectar was also found in the first half of the night period,
but the concentration increased during the second half of the night period. Day- and night-
flowering N. attenuata behaved like N. benthamiana (Fig. 2).
By measuring the sugar content in the nectaries in micromole per gram fresh weight and the
water content of the nectaries, it was also possible to determine the sugar concentration in
the nectaries. The total sugar concentration in the nectaries of all species was lower than in
the nectar, ranging from 72 ± 6 mM to 613 ± 34 mM (Fig. 2). The mean sugar concentration
in the nectar was approximately 3-5-fold higher than in the nectaries of day flowering
species, and approximately 8- to 10-fold higher in night flowering species and in N.
attenuata. In the day-flowering plants, the highest sugar concentration in nectaries occurred
either in the middle or at the end of the light period (2 p.m. or 8 p.m.). The same
phenomenon applied to the mixed-type N. attenuata. In both night-flowering plants, the sugar
concentration in nectaries increased sharply in the middle of the night at 2 a.m.

Ergebnisse 100
Figure 2: Sugar concentrations in nectaries and nectar. Mean values from all
measurements taken at one time point (n = 3) and the respective SDs were plotted;
light and dark periods are indicated by white and black bars.

Ergebnisse 101
The leaves of these tobacco species also contained primarily sucrose, glucose and fructose.
Independent of the flowering time, the sugar content in leaves was higher at the end of the
light period than at the end of the dark period (Supplementary Fig. 1). When compared to
nectaries or nectar, leaves had a significantly lower sugar concentration (10-60 mM). These
results were derived from the sugar content per gram fresh weight and the corresponding
water content (78% to 94%; data not shown).
Sugar composition in nectar and nectaries during the light and dark period
While the ratios of the three sugars within a species remained relatively constant, even
during different collection times, the sugar ratio between species varied greatly in some
cases (Fig. 3). This phenomenon was observed for both nectar and nectaries. In the nectar
of N. africana, the percentage of sucrose ranged from 3-8%, depending on the time of day.
Other species with a low sucrose–to-hexoses ratio in nectar were N. attenuata and N.
benthamiana, for which the proportion of sucrose ranged from 6-9% and 10-13%,
respectively. Higher proportions of sucrose were found in N. tabacum and N. sylvestris (16-
23% and 42-49%). In general, glucose and fructose were found to occur in similar
proportions within a species.

Ergebnisse 102
Figure 3: Sugar percentages in nectaries and nectar. All percentages were calculated
from mM; n = 3; light and dark periods are indicated by white and black bars; one pair of bars
indicates one time point of sampling, with the left bar representing nectaries and the right bar
representing nectar.

Ergebnisse 103
In nectaries, the distribution of sugars was also similar within a species during the light and
dark period. In relation to nectar, the percentage of sucrose was higher in nectaries of all
Nicotiana species, with the exception of N. sylvestris at 2 am. The percentage of sucrose
was relatively low in N. attenuata and N. benthamiana (10-28%), medium in N. africana and
N. tabacum (26-43%), and high in N. sylvestris (26-56%).
To assess whether a percentage increase of a given sugar in nectar was also reflected in the
nectaries, the sugar content in both compartments was correlated. For glucose, no bivariate
correlation was found (Pearson’s r = 0.191, p = 0.420), whereas the percentage of both
fructose and sucrose between the nectar and nectaries was correlated either highly
significantly or significantly (fructose: Pearson’s r = 0.574, p = 0.008**; sucrose: Pearson’s r
= 0.481, p = 0.032*).
However, in all species, the mean sucrose-to-hexoses ratio was higher in nectaries
compared with nectar (Table 1). In general, the difference between the sucrose-to-hexoses
ratios in nectaries and nectar was higher in light flowering species (Δ 0.37 – Δ 0.48)
compared with night flowering species (Δ 0.05 – Δ 0.15).
Table 1: Nectary- and Nectar-sugar-ratios (calc. from mM) Data were derived from Fig.
2 and 3, the values of all measuring points were averaged.
Species Nectary-sugar-
ratio [S/(G+F)]
Nectar-sugar-
ratio [S/(G+F)]
Difference
between the
ratios
N. africana 0.54 0.05 0.48
N. tabacum 0.61 0.24 0.37
N. attenuata 0.33 0.08 0.25
N. benthamiana 0.28 0.13 0.15
N. sylvestris 0.94 0.89 0.05

Ergebnisse 104
Starch content in nectaries
The starch content measured in nectaries ranged from 0.9 ± 0.1 mg g-1 FW up to 20 ± 1.5 mg
g-1 FW (measured as glucose equivalent; Fig. 4). The lowest starch contents during the light
and dark period were found in the day- flowering species, as well as in N. attenuata.
Moreover, in these species, the starch content was lower during the dark period and higher
during the light period. In the night-flowering Nicotiana species, the highest starch contents
were found both in the morning and in the evening (Fig. 4). At 2 a.m., the night flowering
species showed the lowest starch levels; thus, at the same time, the night-flowering species
presented the highest sugar concentration. Because starch in plants is synthesized from
glucose, it has been tested whether there is a correlation between the glucose and starch
content in the nectaries, but no significant correlation was found between glucose and starch
content or between fructose or sucrose and starch content.
Figure 4: Starch concentration in nectaries. Mean values from all measurements taken
at one time point (n = 3) and the respective SDs were plotted.
Starch content in leaves ranged from 0.5 ± 0.1 mg g-1 FW to 40 ± 4.8 mg g-1 FW (measured
as glucose equivalent; Supplementary Fig. 2). For all five species, the starch content in the
leaves was higher at the end of the light period compared with the end of the dark period
(Supplementary Fig. 2). The starch content of nectaries and leaves was not correlated.

Ergebnisse 105
CWINV activity in nectaries
Cell wall invertases in nectaries were active during the light as well as during the dark period.
Measured activity ranged from 0.003 ± 0.001 U mg-1 FW to 0.059 ± 0.004 U mg-1 FW (Fig. 5).
Except for N. africana, the highest activity levels in all species were found at the middle of
the light period, and then the activity decreased, regardless of when the plant opens its
flowers. The activity of cell wall invertase in nectaries did not correlate with any of the sugars
in the nectar or the nectaries.
Figure 5: Cell wall invertase activity in nectary tissue. Mean values from all
measurements taken at one time point (n = 3) and the respective SD were plotted.
The cell wall invertase activity in the leaves ranged from 0.003 ± 0.001 U mg-1 FW to 0.033 ±
0.004 U mg-1 FW (Supplementary Fig. 3). Therefore, the activity levels were similar to those
in the nectaries. Cell wall invertase activity in the leaves fluctuated only slightly between the
light and dark periods.
Ergebnisse 106
Expression levels of CWINV
The expression level of cell wall invertases in the nectaries of the five Nicotiana species was
also measured. Therefore, the expressed sequence tag (EST) of the cell wall invertase of
each species was cloned. Specific primers were designed and used for quantitative RT-PCR.
In the day-flowering and hexose-rich species, N. africana, the relative expression of cell wall
invertase was very stable throughout the light and dark periods. In the other Nicotiana
species, the expression level was slightly higher during the light period compared to the dark
period, regardless of flowing time or the percentage of hexoses in the nectar (Fig. 6). In most
Nicotiana species, the course of the expression level was consistent with the invertase
activity, especially for N. tabacum and N. sylvestris (Fig. 6). A comparison of the invertase
expression level with the nectary sugar concentration revealed a non-homogeneous pattern:
In N. attenuata, nectary sugars correlated strongly but not significantly with expression level
(glucose: Pearson’s r = 0.913, p = 0.458; fructose: Pearson’s r = 0.917, p = 0.456; sucrose:
Pearson’s r = 0.917, p = 0.455), whereas in N. benthamiana, this correlation was strongly
negative (glucose: Pearson’s r = -0.887, p = 0.469; fructose: Pearson’s r = -0.822, p = 0.497;
sucrose: Pearson’s r = -0.963, p = 0.437). For the remaining species, the correlation was
generally lower.

Ergebnisse 107
Figure 6: Invertase activity in comparison to expression level in the nectaries of
different Nicotiana species Activity and expression levels are given relative to the calibrator
(2 p.m.). Mean values from all measurements taken at one time point (n = 6 for enzyme
activity and n = 3 for expression levels) and the respective SD were plotted; light and dark
periods are indicated by white and black bars.

Ergebnisse 108
Post-secretional nectar changes
To test for changes of the nectar sugar composition after secretion, nectar of all species was
measured immediately after sampling, as well as 12 hours, 24 hours and 48 hours later. The
results showed that the sugar concentrations were not changed significantly during this
period (Fig. 7). Minor fluctuations were likely caused by the high dilution factor (1 : 2000)
used to measure nectar with the HPLC.
Figure 7: Post-secretional changes in sugar content in the nectar All samples were
analyzed immediately after collection, as well as 12 h, 24 h, and 48 h after collection; n = 3

Ergebnisse 109
Discussion
Floral nectar is synthesized and secreted by different types of floral nectaries. Nectar
composition varies between species, possibly to reward different types of pollinators. Until
now, the plant-specific differences in nectar production and nectar secretion that lead to
different nectar composition have not been fully understood.
Pre-secretory modifications of nectar sugars
The phloem supplies the nectaries with sucrose (Lohaus und Schwerdtfeger, 2014). In
contrast to phloem sap, where no hexoses are found (Knop et al., 2001; Nadwodnik und
Lohaus, 2008), the nectar of the Nicotiana species contains substantial amounts of glucose
and fructose, in addition to sucrose. Differences in the composition of nectar and phloem
may be due to either metabolic processes in the nectaries during nectar secretion or post-
secretional modification. To clarify this question, the sugar composition of the nectar and
nectaries was compared.
In the case of night-flowering tobacco, the lowest sugar concentration in nectar was
observed in the first half of the dark period (Fig. 2). This could be due to the fact that the
nectar volume in these species is highest at this time (data not shown), and, therefore, the
high water content ensures dilution. However, for day-flowering tobacco, the sugar
concentration was also found to be lower during the dark period compared with the light
period, even though the highest nectar volume is during the day, which contradicts the
previous assumption. At night, phloem transport is reduced to approximately 40% of the daily
rate (Riens et al., 1994), which means that less sucrose should arrive to the nectaries in
darkness, and this could also be a reason for the observed fluctuations in the nectar sugar
concentration. Therefore, it is generally easier for day-flowering plants to supply their nectar
with nutrients for their pollinators, because they can process their metabolites directly from
the phloem sap; in contrast, night-flowering plants, at least partially, have to store the
metabolites (Fig. 8). This finding corresponds to the differences in the starch content
observed in the nectaries of day and night flowering species. In general, the night-flowering
species had a higher starch content in the nectaries compared with the day-flowering species
(Fig. 4). Moreover, in night flowering species, the starch content decreased during the first
half of the dark period, the time with high nectar production.

Ergebnisse 110
Figure 8: Model of nectar sugar secretion in day- and night-flowering tobacco. Day-
flowering species (on the left) store less starch in their nectaries and contain more sucrose in
the cytoplasm, which could be exported by SWEET-proteins along the concentration
gradient. Night-flowering species store more starch in their nectaries and sucrose probably
cannot be exported by SWEETs, since the concentration of sucrose in the cytoplasm is lower
than in the nectar. In night-flowering species, sucrose cleavage within the nectaries accounts
for a higher proportion of the hexose provision than cleavage during secretion, which is the
opposite in day-flowering species. MSTs = monosaccharide transporters; SUTs = sucrose
transporters; CW-INV = cell wall invertases; INV = invertase; SWEETs = sucrose efflux
transporters; ? = unknown processes
Starch accumulation may function as a form of sugar storage before anthesis (Weber et al.,
1998), and starch degradation has been observed to occur before flower opening to provide
additional sugar (Nepi et al., 1996; Horner et al., 2007; Ren et al., 2007b). In potato tubers
(Solanum tuberosum), starch breakdown is triggered by decreased sucrose content
(Hajirezaei et al., 2003). In this study, no overall correlation between starch and sucrose or
hexoses in nectaries was observed, but in the case of nocturnal species, where there is a
severe decrease of starch in the middle of the night, the sugar concentration was found to be
significantly increased. Apart from that, there was no correlation between the starch content
of the nectaries and leaves, thus the starch metabolism in the nectaries appears to function
independently from the light-dependent starch metabolism of the plant.
Total nectary sugar concentration is highest at the time of flower opening, so sugar is likely
provided for nectar production (Fig. 2). There is a high correlation between the proportion of
fructose and sucrose in nectaries and nectar. This suggests that the nectar sugar
composition is already partly determined by the nectaries and is only partially adjusted during

Ergebnisse 111
secretion. For glucose, this correlation is much lower. This phenomenon may be explained
by the fact that some of the glucose is converted into starch and stored in the nectaries until
it is used (Ren et al., 2007b).
Modulation during nectar secretion
The sugar concentration in nectar was 3- to 10- fold higher than in the whole nectarial cells.
An increase in concentration due to evaporation can be neglected because the analysed
species have very long and narrow flower tubes, which protect the nectar from evaporation
(Plowright, 1987; Tiedge und Lohaus, 2017). This suggests that active sugar transport is
involved in nectar secretion, perhaps through monosaccharide transporters (MSTs) and/or
sucrose transporters (SUTs). A monosaccharide/proton symporter (AtSTP1), which only
transports glucose but not fructose, has been found in Arabidopsis flowers (Sherson et al.,
2003). SUTs have already been found in tobacco, as well, e.g., NtSUT3 in tobacco pollen
(Lemoine et al., 1999), but, so far, their occurrence and function in flowers and nectaries is
not completely understood.
A class of transporters that are clearly involved in nectar secretion are so-called SWEET
sucrose transporters. In Arabidopsis and Nicotiana, SWEET9 functions as a facilitated
diffusion transporter for sucrose (Lin et al., 2014), and there is evidence that this transporter
is more responsible for sucrose efflux from nectarial cells than for sucrose uptake. As
previously mentioned, the sugar concentration in nectar relative to nectary cells was 3- to 5-
fold higher in diurnal species and 8- to 10- fold higher in nocturnal species. Unfortunately,
until now, nothing has been reported about the subcellular distribution of sugars in the
parenchyma cells of nectaries. Assuming that the subcellular distribution of sucrose in
nectarial cells is similar to the distribution in leaves (up to 50% sucrose in the cytosol;
Nadwodnik und Lohaus, 2008) and the cytosolic compartment comprises about 20% of the
nectarial cells (Wist und Davis, 2006; Gaffal et al., 2007), the sucrose concentration in
nectarial cells can be extrapolated (Fig. 2 and 3). In day-flowering species, the maximal
sucrose concentration in the cytosol of nectarial cells was approximately 300-400 mM, and
the corresponding concentration in nectar was approximately 100-300 mM. Similar results
were obtained for N. attenuata. Therefore, it is possible that facilitated diffusion transporters
for sucrose mediate sucrose efflux from nectarial cells (Fig. 8). In night-flowering species, the
calculated concentration of sucrose in the cytosol of nectarial cells was approximately 200
mM, whereas the corresponding concentration in nectar was approximately 300-700 mM. In
the latter case, facilitated diffusion of sucrose from the nectarial cells into the nectar is not
possible. However, this does not exclude the possibility that different cell types in the
nectaries contain different sugar concentrations and that facilitated diffusion of sugars occurs
Ergebnisse 112
only in certain nectarial cells, whereas in other cells active sugar secretion may occur. This
finding is in line with findings in Arabidopsis, where SWEET9 was localized at the basal part
of the nectaries (Lin et al., 2014), and the conclusions drawn from other research in this area,
which propose a division of nectary parenchyma into functional sub-domains (Roy et al.,
2017).
Besides sugar transporters, invertases also appear to be part of the nectar metabolism. For
this work, the expression of the cell wall invertase was investigated exclusively in nectary
tissue. Not much is known about the regulation of cell wall invertase expression in nectaries,
but this enzyme has already been studied in other plant organs. Invertase expression is
regulated by multiple factors, for example, by carbohydrates (Koch, 1996), phytohormones
(Wu et al., 1993), biotic and abiotic stress-related stimuli (Roitsch et al., 2003), and
proteinaceous inhibitors (Krausgrill et al., 1996). So far, it has rarely been examined how
nectar-related invertase expression in nectaries is regulated. The invertase found in N.
attenuata is highly upregulated in parts of early corollas, such as nectaries, ovaries and
anthers. When the flowering continues to ripen, the invertase expression decreases (NaDH;
(Brockmöller et al., 2017). Most nectar is produced during early flowering, while older flowers
sometimes have no nectar at all. This fact also suggests that invertase plays a role in the
production of nectar. For other Nicotiana species, no organ-specific expression data about
cell wall invertases are available yet. Sturm and Chrispeels (1990) found that carrot cell
suspension cultures grown on either glucose, fructose, or sucrose have similar β-
fructofuranosidase mRNA content, with slightly higher levels of mRNA in cells grown on
glucose (Roitsch et al., 1995). In contrast, the expression of different β-fructofuranosidase
genes can be repressed by glucose (Kunst et al., 1974; Sarokin und Carlson, 1984; Martin et
al., 1987). For tobacco, this phenomenon may only be applicable for N. benthamiana, where
there is a strong negative correlation between the nectar sugars in general and invertase
expression levels. Furthermore, high expression levels resulting in high cell wall invertase
activity would have been expected. This seems to be true especially for N. sylvestris and N.
tabacum (Fig. 6).
The activity of CW-INV in the nectaries of different Nicotiana species (0.003 to 0.06 U mg-1
FW; Fig. 5) was similar to the activity of CW-INV measured in other hexose-rich tissues of
different plant species (Weschke et al., 2003). Moreover, an increased invertase activity
would be expected in plants with a high hexose concentration in the nectar (Ruhlmann et al.,
2010). However, for tobacco, this assumption is not confirmed by the data, regardless of
whether the species is hexose-rich or not. There seems to be other mechanisms that play a
role in the sugar composition, for example, the activity of soluble invertases, which needs to
be tested. In addition to sucrose cleaving enzymes, sugar synthesis enzymes could also be

Ergebnisse 113
involved in nectar production. It has been shown that sucrose phosphate synthase is highly
expressed in some nectaries and that its expression can be essential for nectar production
(Lin et al., 2014).
For all five Nicotiana species, the sucrose proportion of the total sugar concentration was
always lower in the nectar compared with the nectaries (Fig. 3), perhaps due to the
extracellular hydrolysis of sucrose by cell wall invertases. Differences in the sucrose-to-
hexose-ratio between the nectaries and nectar were more pronounced in diurnal species
compared with nocturnal species (Δ 0.37-0.48 vs. Δ 0.05-0.15). Therefore, the cleavage of
sucrose during secretion must be stronger in diurnal species (Fig. 8). Due to the differences
in sugar composition between nectaries and nectar, especially in day-flowering species, it
can be assumed that the sugar composition is at least partly modified during secretion, either
by the selective transport of sugars and/or the activities of sugar cleavage enzymes, like cell
wall invertases.
Post-secretory modifications
No changes in nectar sugar concentration were observed after secretion in the tobacco
species analysed in this study (Fig. 7). In acacia, a significant post-secretional modification of
extrafloral nectar by invertase has been demonstrated (Heil et al., 2005). Invertase activity in
the nectar was also measured in Cucurbita pepo, but it was too low to significantly change
the sugar profile (Nepi et al., 2012). Although other sugar-cleaving enzymes, such as
glucosidase, have been identified in the nectar of N. attenuata (Seo et al., 2013), no
invertases have been found in the tobacco nectar so far (Zha et al., 2012; Kerchner et al.,
2015). This means that the nectar sugar composition must be already determined during the
final stage of secretion, rather than undergoing post-secretory modification.
Conclusion
Nectar sugar composition must be determined by metabolic processes in nectaries as well
as during secretion (Fig. 8). Sucrose is transported to the nectaries via the phloem. Within
the nectaries, sucrose is hydrolyzed into hexoses, and a portion of the sugars is transiently
stored as starch until anthesis, especially in night-flowering species. At anthesis, starch is
converted into sucrose and hexoses. Sugars are exported out of the nectarial cells, likely by
facilitated diffusion transporters (day-flowering species) or active transporters (night-flowering
species). In the nectary tissue as well as during nectar secretion, some of the sucrose is
hydrolyzed into glucose and fructose by the activity of cell wall invertases, which explains the
higher proportion of hexoses in nectar in comparison to nectaries. Sucrose cleavage is likely
higher pre-secretional in night-flowering and during secretion in day-flowering species.
Ergebnisse 114
Furthermore, post-secretional modification of the sugar composition in nectar is not probable.
However, cell wall invertase alone cannot be responsible for the differences in hexoses
concentration, and, therefore, other enzymes seem to play important roles in determining the
nectar sugar composition.
Acknowledgements
We would like to thank the Max Planck Institute for Chemical Ecology (Jena, Germany), the
Botanical Garden of Bochum (Germany), and the Department of Biochemistry from the
University of Rostock (Germany) for the provision of seeds. In addition we would like to thank
Lisa Wiesen for critical reading of the manuscript.

Ergebnisse 115
References
Adler, L. S., Seifert, M. G., Wink, M., Morse, G. E., and Turlings, T. (2012). Reliance on
pollinators predicts defensive chemistry across tobacco species. Ecol Lett 15, 1140–
1148. doi: 10.1111/j.1461-0248.2012.01838.x
Baker, H. G., and Baker, I. (1983). Floral nectar sugar constituents in relation to pollinator
type. Handbook of experimental pollination biology 117, 141.
Bernardello, G. (2007). A systematic survey of floral nectaries. Nectaries and nectar, 19–128.
Brandenburg, A., Dell'Olivo, A., Bshary, R., and Kuhlemeier, C. (2009). The sweetest thing:
advances in nectar research. Curr. Opin. Plant Biol. 12, 486–490. doi:
10.1016/j.pbi.2009.04.002
Brockmöller, T., Ling, Z., Li, D., Gaquerel, E., Baldwin, I. T., and Xu, S. (2017). Nicotiana
attenuata Data Hub (NaDH): An integrative platform for exploring genomic, transcriptomic
and metabolomic data in wild tobacco. BMC genomics 18, 79. doi: 10.1186/s12864-016-
3465-9
Dorion, S., Lalonde, S., and Saini, H. S. (1996). Induction of Male Sterility in Wheat by
Meiotic-Stage Water Deficit Is Preceded by a Decline in Invertase Activity and Changes in
Carbohydrate Metabolism in Anthers. Plant Physiology 111, 137–145. doi:
10.1104/pp.111.1.137
Fahn, A. (1979a). Secretory tissues in plants. Academic Press.
Fahn, A. (1979b). Ultrastructure of nectaries in relation to nectar secretion. American Journal
of Botany, 977–985.
Gaffal, K. P., Friedrichs, G. J., and El-Gammal, S. (2007). Ultrastructural evidence for a dual
function of the phloem and programmed cell death in the floral nectary of Digitalis
purpurea. Annals of Botany 99, 593–607. doi: 10.1093/aob/mcm002
Ge, Y.-X., Angenent, G. C., Wittich, P. E., Peters, J., Franken, J., Busscher, M., et al. (2000).
NEC1, a novel gene, highly expressed in nectary tissue of Petunia hybrida. The Plant
Journal 24, 725–734. doi: 10.1111/j.1365-313X.2000.00926.x
Godt, D. E., and Roitsch, T. (1997). Regulation and Tissue-Specific Distribution of mRNAs
for Three Extracellular Invertase Isoenzymes of Tomato Suggests an Important Function
in Establishing and Maintaining Sink Metabolism. Plant Physiology 115, 273–282. doi:
10.1104/pp.115.1.273
González-Teuber, M., and Heil, M. (2009). Nectar chemistry is tailored for both attraction of
mutualists and protection from exploiters. Plant Signaling & Behavior 4, 809–813. doi:
10.4161/psb.4.9.9393
Hajirezaei, M.-R., Bornke, F., Peisker, M., Takahata, Y., Lerchl, J., Kirakosyan, A., et al.
(2003). Decreased sucrose content triggers starch breakdown and respiration in stored

Ergebnisse 116
potato tubers (Solanum tuberosum). Journal of Experimental Botany 54, 477–488. doi:
10.1093/jxb/erg040
Heil, M., Rattke, J., and Boland, W. (2005). Postsecretory hydrolysis of nectar sucrose and
specialization in ant/plant mutualism. Science (New York, N.Y.) 308, 560–563. doi:
10.1126/science.1107536
Heineke, D., Sonnewald, U., Büssis, D., Günter, G., Leidreiter, K., Wilke, I., et al. (1992).
Apoplastic Expression of Yeast-Derived Invertase in Potato. Plant Physiology, 301–308.
Horner, H. T., Healy, R. A., Ren, G., Fritz, D., Klyne, A., Seames, C., et al. (2007).
Amyloplast to chromoplast conversion in developing ornamental tobacco floral nectaries
provides sugar for nectar and antioxidants for protection. American Journal of Botany 94,
12–24. doi: 10.3732/ajb.94.1.12
Kerchner, A., Darok, J., Bacskay, I., Felinger, A., Jakab, G., and Farkas, A. (2015). Protein
and alkaloid patterns of the floral nectar in some solanaceous species. Acta biologica
Hungarica 66, 304–315. doi: 10.1556/018.66.2015.3.6
Kessler, D., and Baldwin, I. T. (2007). Making sense of nectar scents: the effects of nectar
secondary metabolites on floral visitors of Nicotiana attenuata. The Plant Journal 49,
840–854. doi: 10.1111/j.1365-313X.2006.02995.x
Knop, C., Voitsekhovskaja, O., and Lohaus, G. (2001). Sucrose transporters in two members
of the Scrophulariaceae with different types of transport sugar. Planta 213, 80–91. doi:
10.1007/s004250000465
Koch, K. E. (1996). Carbohydrate-Modulated Gene Expression in Plants. Annual review of
plant physiology and plant molecular biology 47, 509–540. doi:
10.1146/annurev.arplant.47.1.509
Kram, B. W., Xu, W. W., and Carter, C. J. (2009). Uncovering the Arabidopsis thaliana
nectary transcriptome: investigation of differential gene expression in floral nectariferous
tissues. BMC plant biology 9, 92. doi: 10.1186/1471-2229-9-92
Krausgrill, S., Sander, A., Greiner, S., Weil, M., and Rausch, T. (1996). Regulation of cell
wall invertase by a proteinaceous inhibitor. Journal of Experimental Botany 47 Spec No,
1193–1198. doi: 10.1093/jxb/47.Special_Issue.1193
Kunst, F., Pascal, M., Lepesant, J.-A., Walle, J., and Dedonder, R. (1974). Purification and
Some Properties of an Endocellular Sucrase from a Constitutive Mutant of Bacillus
subtilis Marburg 168. Eur J Biochem 42, 611–620. doi: 10.1111/j.1432-
1033.1974.tb03376.x
Lemoine, R., Bürkle, L., Barker, L., Sakr, S., Kühn, C., Regnacq, M., et al. (1999).
Identification of a pollen-specific sucrose transporter-like protein NtSUT3 from tobacco.
FEBS letters 454, 325–330.

Ergebnisse 117
Lin, I. W., Sosso, D., Chen, L.-Q., Gase, K., Kim, S.-G., Kessler, D., et al. (2014). Nectar
secretion requires sucrose phosphate synthases and the sugar transporter SWEET9.
Nature 508, 546–549. doi: 10.1038/nature13082
Liu, D., Shi, L., Han, C., Yu, J., Li, D., and Zhang, Y. (2012). Validation of reference genes
for gene expression studies in virus-infected Nicotiana benthamiana using quantitative
real-time PCR. PLoS ONE 7, e46451. doi: 10.1371/journal.pone.0046451
Logemann, J., Schell, J., and Willmitzer, L. (1987). Improved method for the isolation of RNA
from plant tissues. Analytical Biochemistry 163, 16–20. doi: 10.1016/0003-
2697(87)90086-8
Lohaus, G., and Schwerdtfeger, M. (2014). Comparison of sugars, iridoid glycosides and
amino acids in nectar and phloem sap of Maurandya barclayana, Lophospermum
erubescens, and Brassica napus. PLoS ONE 9, e87689. doi:
10.1371/journal.pone.0087689
Lorenz, K., Lienhard, S., and Sturm, A. (1995). Structural organization and differential
expression of carrot β-fructofuranosidase genes: identification of a gene coding for a
flower bud-specific isozyme. Plant molecular biology 28, 189–194. doi:
10.1007/BF00042049
Martin, I., Débarbouillé, M., Ferrari, E., Klier, A., and Rapoport, G. (1987). Characterization of
the levanase gene of Bacillus subtilis which shows homology to yeast invertase.
Molecular and General Genetics MGG 208, 177–184. doi: 10.1007/BF00330439
Mosti, S., Ross Friedman, C., Pacini, E., Brighigna, L., and Papini, A. (2013). Nectary
ultrastructure and secretory modes in three species of Tillandsia (Bromeliaceae) that
have different pollinators. Botany 91, 786–798. doi: 10.1139/cjb-2013-0126
Nadwodnik, J., and Lohaus, G. (2008). Subcellular concentrations of sugar alcohols and
sugars in relation to phloem translocation in Plantago major, Plantago maritima, Prunus
persica, and Apium graveolens. Planta 227, 1079–1089. doi: 10.1007/s00425-007-0682-
0
Nepi, M., Ciampolini, F., and Pacini, E. (1996). Development and Ultrastructure of Cucurbita
pepo Nectaries of Male Flowers. Annals of Botany 78, 95–104. doi:
10.1006/anbo.1996.0100
Nepi, M., Soligo, C., Nocentini, D., Abate, M., Guarnieri, M., Cai, G., et al. (2012). Amino
acids and protein profile in floral nectar: Much more than a simple reward. Flora -
Morphology, Distribution, Functional Ecology of Plants 207, 475–481. doi:
10.1016/j.flora.2012.06.002
Ning, X.-p., Tang, T.-x., and Wu, H. (2017). Relationship between the morphological
structure of floral nectaries and the formation, transport, and secretion of nectar in lychee.
Trees 31, 1–14. doi: 10.1007/s00468-016-1504-4
Ergebnisse 118
Percival, M. S. (1961). Types of Nectar in Angiosperms. New Phytologist, 235–281.
Plowright, R. C. (1987). Corolla depth and nectar concentration: An experimental study. Can.
J. Bot. 65, 1011–1013. doi: 10.1139/b87-139
Ren, G., Healy, R. A., Horner, H. T., James, M. G., and Thornburg, R. W. (2007a).
Expression of starch metabolic genes in the developing nectaries of ornamental tobacco
plants. Plant Science 173, 621–637. doi: 10.1016/j.plantsci.2007.08.012
Ren, G., Healy, R. A., Klyne, A. M., Horner, H. T., James, M. G., and Thornburg, R. W.
(2007b). Transient starch metabolism in ornamental tobacco floral nectaries regulates
nectar composition and release. Plant Science 173, 277–290. doi:
10.1016/j.plantsci.2007.05.008
Riens, B., Lohaus, G., Winter, H., and Heldt, H.-W. (1994). Production and diurnal utilization
of assimilates in leaves of spinach (Spinacia oleracea L.) and barley (Hordeum vulgare
L.). Planta 192, 497–501.
Roitsch, T., Balibrea, M. E., Hofmann, M., Proels, R., and Sinha, A. K. (2003). Extracellular
invertase: Key metabolic enzyme and PR protein. Journal of Experimental Botany 54,
513–524. doi: 10.1093/jxb/erg050
Roitsch, T., Bittner, M., and Godt, D. E. (1995). Induction of Apoplastic Invertase of
Chenopodium rubrum by D-Glucose and a Glucose Analog and Tissue-Specific
Expression Suggest a Role in Sink-Source Regulation. Plant Physiology 108, 285–294.
doi: 10.1104/pp.108.1.285
Roitsch, T., and González, M.-C. (2004). Function and regulation of plant invertases: sweet
sensations. Trends in Plant Science 9, 606–613. doi: 10.1016/j.tplants.2004.10.009
Roy, R., Schmitt, A. J., Thomas, J. B., and Carter, C. J. (2017). Review: Nectar biology: from
molecules to ecosystems. Plant Science. doi: 10.1016/j.plantsci.2017.04.012
Ruhlmann, J. M., Kram, B. W., and Carter, C. J. (2010). CELL WALL INVERTASE 4 is
required for nectar production in Arabidopsis. Journal of Experimental Botany 61, 395–
404. doi: 10.1093/jxb/erp309
Sarokin, L., and Carlson, M. (1984). Upstream region required for regulated expression of
the glucose-repressible SUC2 gene of Saccharomyces cerevisiae. Mol. Cell. Biol. 4,
2750–2757. doi: 10.1128/MCB.4.12.2750
Schmidt, G. W., and Delaney, S. K. (2010). Stable internal reference genes for normalization
of real-time RT-PCR in tobacco (Nicotiana tabacum) during development and abiotic
stress. Molecular genetics and genomics : MGG 283, 233–241. doi: 10.1007/s00438-010-
0511-1
Seo, P. J., Wielsch, N., Kessler, D., Svatos, A., Park, C.-M., Baldwin, I. T., et al. (2013).
Natural variation in floral nectar proteins of two Nicotiana attenuata accessions. BMC
Plant Biol 13, 101. doi: 10.1186/1471-2229-13-101
Ergebnisse 119
Sherson, S. M., Alford, H. L., Forbes, S. M., Wallace, G., and Smith, S. M. (2003). Roles of
cell-wall invertases and monosaccharide transporters in the growth and development of
Arabidopsis. Journal of Experimental Botany 54, 525–531. doi: 10.1093/jxb/erg055
Stpiczyńska, M., Nepi, M., and Zych, M. (2014). Nectaries and male-biased nectar
production in protandrous flowers of a perennial umbellifer Angelica sylvestris L.
(Apiaceae). Plant Syst Evol. doi: 10.1007/s00606-014-1152-3
Sturm, A. (1999). Invertases. Primary Structures, Functions, and Roles in Plant Development
and Sucrose Partitioning. Plant Physiology 121, 1–8. doi: 10.1104/pp.121.1.1
Sturm, A., and Chrispeels, M. J. (1990). cDNA cloning of carrot extracellular beta-
fructosidase and its expression in response to wounding and bacterial infection. The Plant
cell 2, 1107–1119.
Sturm, A., Šebková, V., Lorenz, K., Hardegger, M., Lienhard, S., and Unger, C. (1995).
Development- and organ-specific expression of the genes for sucrose synthase and three
isoenzymes of acid β-fructofuranosidase in carrot. Planta 195, 601–610. doi:
10.1007/BF00195721
Tiedge, K., and Lohaus, G. (2017). Nectar sugars and amino acids in day- and night-
flowering Nicotiana species are more strongly shaped by pollinators' preferences than
organic acids and inorganic ions. PLoS ONE 12, e0176865. doi:
10.1371/journal.pone.0176865
Vandesompele, J., Preter, K. de, Pattyn, F., Poppe, B., van Roy, N., Paepe, A. de, et al.
(2002). Accurate normalization of real-time quantitative RT-PCR data by geometric
averaging of multiple internal control genes. Genome Biol 3, research0034.1. doi:
10.1186/gb-2002-3-7-research0034
Vassilyev, A. E. (2010). On the mechanisms of nectar secretion: revisited. Annals of Botany
105, 349–354. doi: 10.1093/aob/mcp302
Weber, H., Heim, U., Golombek, S., Borisjuk, L., Manteuffel, R., and Wobus, U. (1998).
Expression of a yeast-derived invertase in developing cotyledons of Vicia narbonensis
alters the carbohydrate state and affects storage functions. The Plant journal : for cell and
molecular biology 16, 163–172.
Weschke, W., Panitz, R., Gubatz, S., Wang, Q., Radchuk, R., Weber, H., et al. (2003). The
role of invertases and hexose transporters in controlling sugar ratios in maternal and filial
tissues of barley caryopses during early development. The Plant Journal 33, 395–411.
Wist, T. J., and Davis, A. R. (2006). Floral nectar production and nectary anatomy and
ultrastructure of Echinacea purpurea (Asteraceae). Annals of Botany 97, 177–193.
Wright, D. P., Read, D. J., and Scholes, J. D. (1998). Mycorrhizal sink strength influences
whole plant carbon balance of Trifolium repens L. Plant, Cell & Environment, 881–891.

Ergebnisse 120
Wu, L.-L., Mitchell, J. P., Cohn, N. S., and Kaufman, P. B. (1993). Gibberellin (GA3)
Enhances Cell Wall Invertase Activity and mRNA Levels in Elongating Dwarf Pea (Pisum
sativum) Shoots. International Journal of Plant Sciences 154, 280–289. doi:
10.1086/297108
Zha, H.-G., Flowers, V. L., Yang, M., Chen, L.-Y., and Sun, H. (2012). Acidic α-galactosidase
is the most abundant nectarin in floral nectar of common tobacco (Nicotiana tabacum).
Annals of Botany 109, 735–745. doi: 10.1093/aob/mcr321
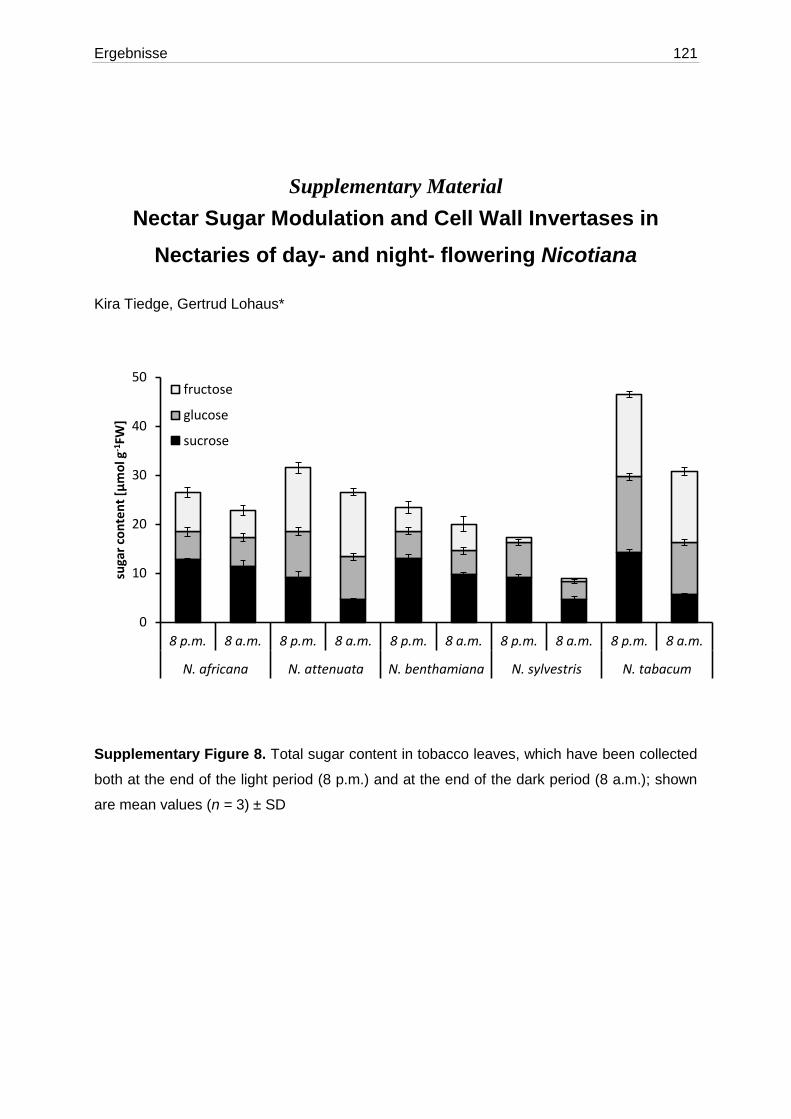
Ergebnisse 121
Supplementary Material
Nectar Sugar Modulation and Cell Wall Invertases in
Nectaries of day- and night- flowering Nicotiana
Kira Tiedge, Gertrud Lohaus*
Supplementary Figure 8. Total sugar content in tobacco leaves, which have been collected
both at the end of the light period (8 p.m.) and at the end of the dark period (8 a.m.); shown
are mean values (n = 3) ± SD
0
10
20
30
40
50
8 p.m. 8 a.m. 8 p.m. 8 a.m. 8 p.m. 8 a.m. 8 p.m. 8 a.m. 8 p.m. 8 a.m.
N. africana N. attenuata N. benthamiana N. sylvestris N. tabacum
suga
r co
nte
nt
[µm
ol g
-1FW
]
fructose
glucose
sucrose

Ergebnisse 122
Supplementary Figure 2. Starch content of tobacco leaves, which have been collected both
at the end of the light period (8 p.m.) and at the end of the dark period (8 a.m.); shown are
mean values (n = 3) ± SD
Supplementary Figure 3. Cell wall invertase activity in tobacco leaves, which have been
collected both at the end of the light period (8 p.m.) and at the end of the dark period (8
a.m.); shown are mean values (n = 6) ± SD
0
10
20
30
40
50
star
ch c
on
ten
t [m
g g-1
FW
] 8 p.m.
8 a.m.
0,000
0,005
0,010
0,015
0,020
0,025
0,030
0,035
0,040
N. africana N. tabacum N. attenuata N. benthamiana N. sylvestris
cell
wal
l in
vert
ase
acti
vity
[U
mg-1
FW
] 8 p.m.
8 a.m.

Ergebnisse 123
Supplementary Table S 1: List of primers used in this paper
Species Target gene Primer Sequence (5' - 3')
N. africana CW-INV forward GTCCAAAACTACGCGATACC
reverse GATTTCTCACACTCCCAACC
Actin forward GACTATGAGCAGGAACTTGAGA
reverse TGAACCACCACTAAGAACAATG
Elongation factor 1α forward GGCCCAACACTTCTTGATGCTC
reverse CCAACATTGTCACCAGGAAGT
N. attenuata CW-INV forward GAACTCCTTCCCTTCAGC
reverse GTTTGACACATTCCCGAC
Actin forward CCCTCCCACATGCTATTCT
reverse TCCTGTTCATAGTCGAGAGC
Ubiquitin-conjugating enzyme E2 forward CTGACTTCAATCCAGTCTTTGCTC
reverse GTAACAGATTAAGAGTGCGGG
N. benthamiana CW-INV forward GGCAATGATGAAGCACGATG
reverse ACTCCGGGATTGAATCAGG
Actin forward TGTCCTGAGGTCCTTTTCC
reverse ATTCTATCAGCGATACCCGG
Elongation factor 1α forward GGCCCAACACTTCTTGATGCTC
reverse CCAACATTGTCACCAGGAAGT
N. sylvestris CW-INV forward TGATTCTTCACACTCCCAACCA
reverse CACAAGTCCAAAACTACGCGA
Actin forward GACTATGAGCAGGAACTTGAGA
reverse TGAACCACCACTAAGAACAATG
Elongation factor 1α forward GGCCCAACACTTCTTGATGCTC
reverse CCAACATTGTCACCAGGAAGT
N. tabacum CW-INV forward CTGCTATGTGCTGATGGATG
reverse CAGGCGCTTCACTATTCTC
Actin forward CCCTCCCACATGCTATTCT
reverse TCCTGTTCATAGTCGAGAGC
Elongation factor 1α forward CTGCTTATTGACTCCACCAC
reverse CACCTTCCAAACCAGAGATG
Diskussion 124
4. Diskussion
Die Gattung Nicotiana eignet sich besonders, um die Regulation der
Nektarzusammensetzung auf unterschiedlichen Ebenen zu untersuchen. Die
Blütenmorphologie der verschiedenen Nicotiana-Arten ist sehr vielfältig, es kommen fast alle
wichtigen Bestäubergruppen vor und es gibt sowohl tag- als auch nachtblühende Arten. Auf
Grund aktueller molekularbiologischer Untersuchungen sind die Verwandtschaftsverhältnisse
der verschiedenen Arten beschrieben. In dieser Arbeit wurden daher 20 verschiedene
Tabakarten untersucht, die die verschiedenen Eigenschaften und Merkmale abbilden. Im
Folgenden werden die Ergebnisse dieser Arbeit zusammengefasst und im Hinblick auf die
Forschungsfragen diskutiert.
4.1. Nektarinhaltsstoffe und ihre Anpassung an die
Bestäuber
Bei einigen Pflanzenarten wurde in der Vergangenheit ein mikrobieller Befall des Nektars
gefunden, welche die Anteile der verschiedenen Zucker im Nektar beeinflussen könnte
(Herrera et al., 2009; Lievens et al., 2014). Für Helleborus foetidus (Ranunculaceae) konnte
zudem gezeigt werden, dass unterschiedliche Bestäuber bei der gleichen Pflanzenart eine
veränderte Nektarzuckerzusammensetzung hervorrufen können, indem sie die Blüte mit
bestimmten Hefen kontaminieren (Canto et al., 2008). Daher wurde zu Beginn der
Untersuchungen ein möglicher mikrobieller Befall der Nektarproben untersucht. Im Nektar
der getesteten Arten konnten keine Bakterien oder Hefen nachgewiesen werden, mit
Ausnahme einer Probe von der Art N. africana. Möglicherweise liegt dieses geringe
Vorkommen daran, dass die Pflanzen im Gewächshaus generell geschützter vor Befall sind,
da sie von weniger Bestäubern besucht werden, welche die Blüten mit Mikroben infizieren
könnten. Zusätzlich ist Tabaknektar durch Wasserstoffperoxid (H2O2) geschützt, welches im
sogenannten Nectar-Redox-Cycle produziert wird (Carter und Thornburg, 2004a; Carter et
al., 2007). Wasserstoffperoxid wirkt auf viele Pflanzenpathogene toxisch (Carter et al., 2007).
Der Nectar-Redox-Cycle wurde bislang nur in Nicotiana beschrieben und es ist unklar, ob er
auch bei anderen Gattungen vorkommt. Das Screening des Nektars zeigt, dass die
gefundenen Unterschiede in der Nektarzusammensetzung nicht durch mikrobielle
Kontaminationen hervorgerufen wurden. Es kann vielmehr davon ausgegangen werden,
dass andere Faktoren die Nektarzusammensetzung beeinflussen, z.B. der Bestäubertyp, der
Verwandtschaftsgrad der Nicotiana-Arten oder der Zeitpunkt der Blütenöffnung.

Diskussion 125
Anhand der morphologischen Beobachtungen der Blüten und den biochemischen
Nektaranalysen kann verglichen werden, inwiefern die Bestäubungssyndrome bei Nicotiana
zutreffend sind.
Die Bestäuber tagblühender Tabakarten sind Kolibris, Bienen und Nektarvögel, wobei die
Mehrzahl primär von Kolibris (Trochilidae) bestäubt wird. Die Blüten der Kolibri-bestäubten
Arten waren zwar tatsächlich verhältnismäßig groß und robust, aber nicht alle besaßen eine
auffällige Färbung. So war die Blütenfärbung von N. attenuata, N. palmeri und N. paniculata
weiß. N. attenuata öffnet ihre Blüten allerdings in der Dämmerung und es wurden neben
Kolibris auch Motten (Sphingidae) als Bestäuber beobachtet (Kessler und Baldwin, 2007),
welche weniger durch die Blütenfarbe sondern eher über Duftstoffe angelockt werden. Das
Saccharose-zu-Hexose-Verhältnis war ähnlich im Nektar von Kolibri- und Bienen-bestäubten
Arten höher als im Nektar von Blüten, welche durch Nektarvögel bestäubt werden (siehe 3.
Ergebnisse Abschnitt II Fig. 2B). Anhand von künstlichem Nektar konnte experimentell von
Waller (1972) gezeigt werden, dass Bienen eine Präferenz für Fructose-reichen Nektar
haben. Dies wurde auch durch einen hohen Fructoseanteil bei beiden Bienen-bestäubten
Arten N. nudicaulis und N. rustica deutlich. In Abhängigkeit von der Pflanzenart enthält
Nektar neben Zuckern auch Aminosäuren, die in unterschiedlicher Zusammensetzung und
Konzentration vorkommen können. Bienen präferieren zum einen Prolin-reichen Nektar
(Carter et al., 2006) und zum anderen Nektar, der einen erhöhten Anteil an für Bienen
essentielle Aminosäuren aufweist (Hendriksma et al., 2014). Dies spiegelte sich jedoch nicht
in der Aminosäurezusammensetzung der Bienen-bestäubten Tabakarten wider (siehe 3.
Ergebnisse Abschnitt II Tab. 3). Insgesamt ist die Präferenz von Insekten für Aminosäuren
und die Aminosäurezusammensetzung von Nektar jedoch noch nicht ausreichend
untersucht.
N. africana ist die einzige Tabakart, welche von Nektarvögeln bestäubt wird. Da
Nektarvögeln vermutlich die Enzyme zur Saccharosespaltung fehlen (Marlin et al., 2016)
sind sie auf Saccharose-arme Nektare spezialisiert. Dies zeigte sich auch im sehr niedrigen
Saccharose-zu-Hexose-Verhältnis im Nektar von N. africana, welches geringer ist als im
Nektar der anderen untersuchten Tabakarten (siehe 3. Ergebnisse Abschnitt II Fig. 2B). Die
Aminosäurekonzentration im Nektar von N. africana war höher als im Nektar aller anderen
untersuchten Tabakarten. Daher kann vermutet werden, dass Nektarvögel die Aminosäuren
als zusätzliche oder alleinige Stickstoffquelle nutzen (siehe 3. Ergebnisse Abschnitt II Fig.
2C).
Neben der Zusammensetzung unterscheidet sich auch die Menge des Nektars bei den
verschiedenen Arten in Abhängigkeit von der Bestäubergruppe. Das Nektarvolumen der

Diskussion 126
Kolibri-bestäubten Arten war größer (1-20 µl) als bei den bienenbestäubten Arten (0,5–1 µl).
Das größte Nektarvolumen von allen untersuchten Arten zeigte die einzige in Afrika
beheimatete Art N. africana. Hier wird deutlich, dass das Nektarvolumen mit der Körpergröße
und damit dem Nahrungsbedarf der Bestäuber korreliert. Bei Nektarvögeln in der
afrikanischen Namib-Wüste kommt hinzu, dass sie wahrscheinlich auf Nektar als
Flüssigkeitsquelle angewiesen sind. Pflanzen mit größeren Bestäubern müssen
entsprechend mehr Kohlenstoff- und Stickstoffverbindungen sowie Wasser für die
Nektarproduktion bereitstellen (Nicolson et al., 2007).
Von den nachtblühenden Arten wird ein Großteil von Schwärmern (Sphingidae) bestäubt. Bei
den meisten der untersuchten Schwärmer-bestäubten Arten waren die Blütenröhren so lang
und schmal, dass eine Bestäubung durch andere Tiere ausgeschlossen werden kann, da nur
Sphingiden mit ihren Rollrüsseln den tief verborgenen Nektar (bis zu 80 mm) erreichen
können (siehe 3. Ergebnisse Abschnitt II Tab. 1). Die Blütenfärbung war entsprechend des
Bestäubungssyndroms weißlich und ein starker Duft war nachts während der Blütenöffnung
vernehmbar. Besonders auffällig war der hohe Saccharose-Anteil bei Schwärmer-bestäubten
Arten (3. Ergebnisse Abschnitt II Fig. 2B), welcher stark positiv mit der Blütenröhrenlänge
korrelierte. Saccharose-reiche Nektare evaporieren auf Grund ihres niedrigeren osmotischen
Potentials schneller als Hexose-reiche Nektare mit dem gleichen Zuckergehalt Verborgen in
den langen Blütenröhren ist Saccharose-reicher Nektar jedoch weitgehend vor Verdunstung
geschützt (Witt et al., 2013). Dadurch wurde eine Koevolution zwischen langrüsseligen
Motten und langblütigen Tabakpflanzen mit Saccharose-reichen Nektaren begünstigt.
Beide überwiegend autogamen Tabakarten N. benthamiana und N. plumbaginifolia öffneten
ihre Blüten nachts. Auch ihre Blüten waren weiß, allerdings mit kürzeren Blütenröhren als die
der anderen Nachtblüher und damit auch zugänglich für ein breiteres Spektrum an
potentiellen Bestäubern. Da sie nicht auf Fremdbestäubung angewiesen sind, ist es
sozusagen effizient, dass sie nur wenig Nektar produzieren und die Zucker- und
Aminosäurekonzentration im Nektar gering ist (siehe 3. Ergebnisse Abschnitt II Fig. 3).
Die Blüten von N. otophora wiesen als einzige nachtblühende Art eine gelbliche anstelle
einer weißen Färbung auf. Mit einem Volumen von 200 µl pro Blüte produzierte diese Art mit
Abstand den meisten Nektar. Dies ist vermutlich eine Anpassung der Pflanze an ihre
speziellen Bestäuber, die relativ großen Fledermäuse. Allerdings war die
Nektarzuckerkonzentration eher gering, sodass eine Aufnahme von ausreichend Nährstoffen
allein aus Nektar nicht gewährleistet wird und der Nektar den Fledermäusen nur als
zusätzliche Futterquelle dient (Howell, 1974).

Diskussion 127
Insgesamt lässt sich sagen, dass eine Einteilung der Blütenpflanzen in
Bestäubungssyndrome auch bei Nicotiana überwiegend zutreffend ist. Dies spricht für die
Theorie des „pollinator shift“, also eine gezielte Spezialisierung der Pflanzen auf bestimmte
Bestäubergruppen (Chase et al., 2010; Peter und Johnson, 2014). Als Gegenstrategie haben
sich die sogenannten Generalisten ausgebildet, welche durch wenig Spezialisierung für
möglichst viele Bestäuber attraktiv sind (Waser und Ollerton, 2006). Bei dieser Gruppe
würde die unterschiedliche Nektarzusammensetzung bei den verschiedenen Arten eher
durch andere Faktoren bestimmt werden, z.B. durch die phylogenetischen Verhältnisse der
Arten zueinander. Um zu testen, welche der beiden Gruppierungen bei Tabakpflanzen
zutreffender ist, wurden statistische Berechnungen anhand aller gemessenen
Nektarkomponenten durchgeführt. Unter anderem wurde eine Hauptkomponentenanalyse
(Principal Component Analysis; PCA) zur Reduktion der großen Datenmenge und zur
Ermöglichung einer grafischen Darstellung angewendet. Bei der PCA zeigte sich, dass sich
die Nektarproben eher innerhalb ihrer Bestäubertypen als innerhalb ihrer Sektionen
gruppieren (siehe 3. Ergebnisse Abschnitt II Fig. 4). Ein ähnliches Ergebnis ergab auch eine
Studie von Petanidou et al. (2006) mit 73 Pflanzenarten aus dem Mittelmeerraum, bei denen
ganz ähnliche Nektarparameter erfasst wurden.
Um die grafische Auswertung mit Zahlen zu hinterlegen, wurde anschließend an die PCA
eine permutative multivariate Varianzanalyse (permutational multivariate analysis of
variance; PERMANOVA) gerechnet. Bezog man alle Stoffgruppen (Zucker, Aminosäuren,
anorganische Anionen, anorganische Kationen und organische Säuren) mit in die
Berechnung ein, erklärten die Zugehörigkeit zu einer Bestäubergruppe und die
Sektionszugehörigkeit einen ähnlich großen Anteil der Varianz der Daten (Bestäuber: 27%;
Sektionen: 24%). Sobald allerdings nur die Zucker und Aminosäuren in die Berechnung mit
einbezogen wurden, war der Einfluss der Bestäuber mehr als dreimal so hoch wie der
Einfluss der Sektionszugehörigkeit (Bestäuber: 66%; Sektionen: 19%). Betrachtete man die
verbleibenden Stoffgruppen (anorganische Anionen, anorganische Kationen und organische
Säuren), so war der Einfluss beider Gruppierungsoptionen wieder ungefähr gleich
(Bestäuber: 26%; Sektionen: 24%).
Daraus lässt sich folgern, dass Zucker und Aminosäuren eher an die Bestäuber angepasst
sind als andere Nektarkomponenten. Dies könnte zum einen daran liegen, dass diese
Inhaltsstoffe wichtiger für Anlockung und Ernährung der Bestäuber sind und von diesen in
speziellen Konzentrationen benötigt werden. Zum anderen könnte die Pflanzen die Zucker-
und Aminosäurezusammensetzung im Nektar zum Beispiel durch spezielle Transporter
gezielt regulieren, während anorganische Ionen unkontrolliert entlang eines
Konzentrationsgradienten in den Nektar diffundieren. In diesem Fall müssten entsprechende

Diskussion 128
Transportproteine für Zucker und Aminosäuren im Nektariengewebe vorhanden sein. Für
Arabidopsis thaliana, Brassica rapa und Nicotiana attenuata konnte bereits ein Transporter
aus der Familie der SWEET-Proteine in den Nektarien nachgewiesen und lokalisiert werden,
welcher für den Saccharoseexport aus den Zellen verantwortlich ist (Lin et al., 2014). Andere
Transportproteine wurden bislang nicht gezielt untersucht, obwohl deren Lokalisation und
Aktivität sehr interessant für die Nektarproduktion wäre.
4.2. Proteine im Nektar
Nektar enthält neben Zuckern, Aminosäuren, Ionen und anderen Metaboliten auch geringe
Mengen an Proteinen. Erste Untersuchungen von Baker und Baker (1975) ergaben, dass nur
bei 17% von 129 untersuchten Pflanzenarten Proteine im Nektar nachgewiesen werden
konnten. Bei Nicotiana hingegen sind bislang bei jeder untersuchten Art Nektarproteine
gefunden worden (Liu et al., 2009; Seo et al., 2013; Kerchner et al., 2015). Dieser
Unterschied könnte darauf zurückzuführen sein, dass bei aktuelleren Studien sensitivere
Nachweismethoden verwendet oder negative Ergebnisse nicht veröffentlicht wurden.
Im Rahmen dieser Arbeit wurde der Proteingehalt anhand des Protein-
Molekulargewichtsmarkers abgeschätzt. Dabei wurden Gesamtproteingehalte von ca. 200
µg/ml im Nektar der verschiedenen Tabakarten ermittelt. Carter et al. (1999) fanden ähnliche
Gesamtproteingehalte für Nektar aus Nicotiana spec. und Peumans et al. (1997) für Nektar
aus Lauch (Allium porrum).
Das Proteinprofil im Nektar war bei allen untersuchten Tabakarten unterschiedlich (siehe
Kapitel 3.3 und Kerchner et al., 2015), selbst wenn die Arten die gleichen Bestäuber hatten.
Die Identität und Funktion von Nektarproteinen ist bisher noch nicht weitreichend untersucht.
Nicht auszuschließen ist, dass manche Proteine ungezielt in den Nektar diffundieren und
dort keine spezifischen Funktionen erfüllen. Für die meisten Proteine wird jedoch postuliert,
dass sie entweder zur Anlockung von Bestäubern (z.B. Invertasen im extrafloralen Nektar
von Acacia; Heil et al., 2005), zur Abwehr von Nektarräubern (Peumans et al., 1997) oder als
Teil der Pathogenabwehr (Nectar Redox Cycle) fungieren (Park und Thornburg, 2009; Zha et
al., 2012; Kerchner et al., 2015).
Invertasen im Nektar sind von besonderem Interesse, da sie eine Spaltung von Saccharose
in Glucose und Fructose katalysieren und somit für die unterschiedliche
Zuckerzusammensetzung im Nektar eine Rolle spielen könnten. Zellwandinvertase in Tabak
hat eine Größe von 63 kDA (Weil und Rausch, 1990; Konno et al., 1993), wobei diese bisher
im Nektar nicht nachgewiesen wurde. Daher könnte zwar eine der Proteinbanden, welche

Diskussion 129
bei der SDS-PAGE im Nektar von N. alata sichtbar wurde, eine Zellwandinvertase sein,
allerdings ist wahrscheinlicher, dass es sich hierbei um die Nektarproteine Nectarin IV und
Nectarin V handelte, da diese in großen Mengen in Tabaknektar vorhanden sind und
ebenfalls eine Größe von 61–65 kDa aufweisen (Carter und Thornburg, 2004c). Zur
genaueren Identifikation der Nektarproteine sind weitere Analysen notwendig, zum Beispiel
immunochemische Nachweise mit spezifischen Antikörpern oder massenspektrometrische
Analysen (Shevchenko et al., 1996; Carter et al., 1999).
4.3. Mechanismen der Nektarzuckerproduktion bei tag- und
nachtblühenden Tabakarten
Auf Grund der vorherigen Ergebnisse stellt sich die Frage, welche Mechanismen die
unterschiedliche Zuckerzusammensetzung, insbesondere den unterschiedlichen Hexose-
Anteil im Nektar, bewirken und ob ein Zusammenhang mit dem Blütezeitpunkt besteht.
Floraler Nektar wird in Nektarien produziert. Das Phloem versorgt die Nektarien mit
Saccharose (Lohaus und Schwerdtfeger, 2014). Im Gegensatz zum Phloemsaft, welcher
keine Hexosen enthält (Knop et al., 2001; Nadwodnik und Lohaus, 2008), sind im Nektar
neben Saccharose teilweise erhebliche Mengen an Glucose und Fructose vorhanden
(Tiedge und Lohaus, 2017). Unterschiede in der Zusammensetzung von Nektar und Phloem
müssen deshalb entweder auf Stoffwechselvorgänge in den Nektaren vor oder während der
Nektarsekretion oder auf post-sekretionale Modifikationen zurückzuführen sein.
Das Phloem beliefert vermutlich sowohl die Nektarien von tag- als auch von nachtblühenden
Pflanzen mit Saccharose, jedoch ist der Phloemtransport nachts stark reduziert (Riens et al.,
1994). Dadurch müssen nachtblühende Arten einen Teil der tagsüber angelieferten Zucker in
Speicherformen überführen und können diese dann nachts wieder für die Zuckerproduktion
verwenden. Zucker werden beispielsweise transient in Form von Stärke gespeichert (Ren et
al., 2007b). Tatsächlich war der Stärkegehalt in den Nektarien bei nachtblühenden Arten
höher als bei tagblühenden und verringerte sich zu Beginn der Nektarproduktion, d.h. in der
ersten Hälfte der Nachtperiode (3. Ergebnisse Abschnitt IV Fig. 4). Gleichzeitig war die
Zuckerkonzentration in den Nektarien zu diesem Zeitpunkt am höchsten (3. Ergebnisse
Abschnitt IV Fig. 2). Es kann daher davon ausgegangen werden, dass Stärke insbesondere
bei den nachtblühenden Tabakarten in den Nektarien als Kohlenstoffspeicher für die
Bereitstellung von Nektarzuckern genutzt wird (3. Ergebnisse Abschnitt IV Fig. 8).
Da Stärke aus α-D-Glucose-Einheiten zusammengesetzt ist, wäre zu erwarten gewesen,
dass der Stärkegehalt negativ mit der Glucosekonzentration korreliert. Allerdings konnte
Diskussion 130
keine Korrelation zwischen Stärke und Glucose oder einem der anderen Zucker festgestellt
werden. Es muss davon ausgegangen werden, dass in den Nektarien Umbauprozesse der
Zucker stattfinden, z.B. die Isomerisierung von Fructose aus Glucose (Ståhlberg et al.,
2012).
Beim Vergleich der prozentualen Anteile der einzelnen Zucker im Nektar und in den
Nektarien korrelierte der prozentuale Anteil von Glucose im Nektar und den Nektarien nur
gering. Allerdings ergab sich eine hohe Korrelation sowohl bei Fructose als auch bei
Saccharose. Deshalb scheint das Zuckerprofil des Nektars teilweise schon in den Nektarien
vorgegeben zu sein. Eine weitere Modifikation der Zucker findet wahrscheinlich während der
Sekretion des Nektars statt.
Je nach Art und Uhrzeit war die Zuckerkonzentration im Nektar von tagblühenden Arten 3-
bis 5-fach und bei nachtblühenden Arten 8- bis 10-fach höher als in den Nektarien (3.
Ergebnisse Abschnitt IV Fig. 2). Über die subzelluläre Verteilung des Zuckers in den
Parenchymzellen der Nektarien ist bisher nichts bekannt. Wenn man allerdings annimmt,
dass die subzelluläre Verteilung der Saccharose in den Nektarienzellen der Verteilung in den
Blättern ähnelt (bis zu 50% Saccharose im Cytoplasma; Nadwodnik und Lohaus, 2008) und
das Cytoplasma etwa 20% der Nektarzellen ausmacht (Wist und Davis, 2006; Gaffal et al.,
2007), kann die Saccharosekonzentration im Cytoplasma der Nektarienzellen abgeschätzt
werden. Bei tagblühenden Arten lag die berechnete maximale Saccharosekonzentration im
Cytoplasma der Nektarienzellen bei ca. 300–400 mM und die entsprechende Konzentration
im Nektar bei ca. 100–300 mM. Dies bedeutet, dass die Saccharosekonzentration im Nektar
geringer ist als im Cytoplasma der Nektarien und Saccharose aus den Nektarien durch
einfache oder erleichterte Diffusion heraus transportiert werden kann. Eine Gruppe von
Zuckertransportern sind sogenannte SWEETs (kurz für: Sugars Will Eventually Be
Exported). Dies sind Transportproteine für erleichtere Diffusion und transportieren
Saccharose entlang eines Konzentrationsgradienten (Chen et al., 2015). In N. attenuata
wurde SWEET9 bereits gefunden und in Arabidopsis konnte SWEET9 in den Nektarien
lokalisiert werden (Lin et al., 2014). Daher ist es möglich, dass SWEETs auch in den
Saccharoseexport aus den Nektarienzellen bei tagblühenden Tabakarten involviert sind (3.
Ergebnisse Abschnitt IV Fig. 8).
Bei nachtblühenden Arten betrug die berechnete Saccharosekonzentration im Cytosol der
Nektarienzellen ca. 200 mM, während die entsprechende Konzentration im Nektar ca. 300–
700 mM betrug. In diesem Fall ist eine durch SWEETs erleichterte Diffusion von Saccharose
aus den Nektarien in den Nektar nicht möglich. Dieser Konzentrationsgradient kann nur
durch aktiven Transport aufgebaut werden. Eine Gruppe von Transportern, die Saccharose

Diskussion 131
gegen einen Konzentrationsgradienten transportieren können sind sogenannte SUTs
(sucrose uptake transporters). In Pollen von Tabakpflanzen wurde bereits ein SUT
identifiziert (Lemoine et al., 1999), allerdings nicht in Nektarien.
Bei Arabidopsis wurde SWEET9 nur im basalen Teil der Nektarien lokalisiert (Lin et al.,
2014). Es ist also nicht ausgeschlossen, dass es im Nektarparenchym verschiedene
funktionelle Teilbereiche gibt, welche unterschiedliche Zuckerkonzentrationen und
Sekretionsmechanismen aufweisen. Die weitere Identifizierung oder Lokalisation von
Zuckertransportern im nektarproduzierenden Gewebe von Nicotiana wäre deshalb ein
nächster Schritt zur Aufklärung der Regulation der Zuckerzusammensetzung und
Konzentration im Nektar. Weitere Erkenntnisse könnten Daten über die subzellulären
Metabolitkonzentrationen in den Nektarienzellen liefern. Die subzelluläre Fraktionierung ist in
diesem Fall allerdings schwierig, da für die bisher verwendeten Methoden größere Mengen
an Gewebe benötigt werden (Nadwodnik und Lohaus, 2008; Öner-Sieben und Lohaus, 2014;
Findling et al., 2015) und Nektariengewebe nur in sehr geringen Mengen gewonnen werden
kann.
Das Saccharose-zu-Hexose-Verhältnis in den Nektarien bzw. im Nektar ist u.a. von der
Aktivität zuckerspaltender Enzyme abhängig. Da bereits bekannt ist, dass die
Zellwandinvertase CWINV4 in Arabidopsis notwendig für die Nektarproduktion ist (Ruhlmann
et al., 2010), wurde der Fokus in dieser Arbeit auf die Expression und Aktivität der
Zellwandinvertasen in Tabaknektarien gelegt. Es konnte gezeigt werden, dass besonders bei
Arten mit einem hohen Saccharoseanteil im Nektar (N. sylvestris und N. tabacum) das
Expressionslevel mit der Enzymaktivität korrelierte (3. Ergebnisse Abschnitt IV Fig. 6).
Allerdings wurde keine erhöhte Invertaseaktivität bei Pflanzen mit einem hohen Hexoseanteil
im Nektar gefunden, wie zu erwarten gewesen wäre (Ruhlmann et al., 2010). Daher muss
davon ausgegangen werden, dass noch andere Enzyme eine Rolle bei der Bildung des
Nektarzuckerprofils spielen, zum Beispiel lösliche Invertasen oder Enzyme, welche zur
Zuckersynthese beitragen, beispielsweise die Saccharose-6-Phosphat-Synthase (SPS).
Während es über lösliche Invertasen in Nektarien noch keine Studien gibt, ist die essentielle
Funktion der SPS bei der Nektarproduktion bereits bekannt (Lin et al., 2014).
Ein weiterer Unterschied zwischen tag- und nachtblühenden Nicotiana-Arten ergab sich aus
den unterschiedlichen Saccharose-zu-Hexose-Verhältnissen in Nektar und in den Nektarien.
Zwar war bei allen Arten der Anteil an Saccharose an der Gesamtzuckerkonzentration im
Nektar niedriger als in den Nektarien, die Differenz des Saccharose-zu-Hexose-
Verhältnisses zwischen Nektar und Nektarien waren aber bei tagaktiven Arten deutlich
ausgeprägter (3. Ergebnisse Abschnitt IV Tab. 1). Daraus folgt, dass während der Sekretion
Diskussion 132
die Spaltung von Saccharose bei tagaktiven Arten vermutlich stärker ist als bei nachtaktiven
Arten, beispielsweise durch extrazelluläre Hydrolyse von Saccharose durch
Zellwandinvertasen. Diese Ergebnisse zeigen, dass die Zuckerzusammensetzung während
der Sekretion zumindest teilweise verändert wird, entweder durch den selektiven Transport
von Zuckern und/oder die Aktivität von Zucker-spaltenden Enzymen, wie z.B.
Zellwandinvertasen (3. Ergebnisse Abschnitt IV Fig. 8).
Es kann davon ausgegangen werden, dass nach der Sekretion keine weiteren post-
sekretionalen Modulationsprozesse ablaufen, da nach zwei Tagen keine Veränderung der
Zuckerzusammensetzung im Nektar der untersuchten Tabakarten nachgewiesen werden
konnte (3. Ergebnisse Abschnitt IV Fig. 7). Dieses Ergebnis wird dadurch gestützt, dass auch
bei der SDS-PAGE keine Invertasen im Nektar gefunden wurden (3. Ergebnisse Abschnitt III;
Zha et al., 2012; Kerchner et al., 2015).
Zusammenfassend lässt sich sagen, dass die Nektarzuckerzusammensetzung sowohl bei
tag- als auch bei nachtblühenden Tabakarten bereits vor oder während der Sekretion
festgelegt wird. Das Ausmaß der einzelnen Prozesse, die zur unterschiedlichen
Nektarzuckerzusammensetzung führen, unterscheidet sich jedoch bei tag- und
nachtblühenden Arten.

Literatur 133
Literatur
Abrahamczyk S, Kessler M, Hanley D et al. 2017. Pollinator adaptation and the evolution
of floral nectar sugar composition. Journal of Evolutionary Biology 30, 112–127.
Adler LS, Seifert MG, Wink M, Morse GE, Turlings T. 2012. Reliance on pollinators
predicts defensive chemistry across tobacco species. Ecology Letters 15, 1140–1148.
Alvarez-Perez S, Herrera CM. 2013. Composition, richness and nonrandom assembly of
culturable bacterial–microfungal communities in floral nectar of Mediterranean plants.
FEMS Microbiology Ecology 83, 685–699.
Anderson MJ. 2001. A new method for non‐parametric multivariate analysis of variance.
Austral ecology 26, 32–46.
Baker HG. 1961. The adaptation of flowering plants to nocturnal and crepuscular pollinators.
Quarterly Review of Biology, 64–73.
Baker HG, Baker I. 1973. Amino-acids in Nectar and their Evolutionary Significance. Nature
241, 543–545.
Baker HG, Baker I. 1975. Studies of nectar-constitution and pollinator-plant coevolution.
Coevolution of animals and plants 100, 591–600.
Baker HG, Baker I. 1982. Chemical constituents of nectar in relation to pollination
mechanisms and phylogeny. Biochemical aspects of evolutionary biology 131, 171.
Baker HG, Baker I. 1983. Floral nectar sugar constituents in relation to pollinator type.
Handbook of experimental pollination biology 117, 141.
Baker HG, Baker I. 1990. The predictive value of nectar chemistry to the recognition of
pollinator types. Israel Journal of Botany, 157–166.
Barlow CA, McCully ME. 1972. The ruby laser as an instrument for cutting the stylets of
feeding aphids. Canadian Journal of Zoology 50, 1497–1498.
Bernardello G. 2007. A systematic survey of floral nectaries. Nectaries and nectar, 19–128.
Blum H, Beier H, Gross HJ. 1987. Improved silver staining of plant proteins, RNA and DNA
in polyacrylamide gels. Electrophoresis 8, 93–99.
Blüthgen N, Fiedler K. 2004. Preferences for sugars and amino acids and their
conditionality in a diverse nectar‐feeding ant community. Journal of Animal Ecology 73,
155–166.
Brandenburg A, Dell'Olivo A, Bshary R, Kuhlemeier C. 2009. The sweetest thing:
advances in nectar research. Current opinion in plant biology 12, 486–490.
Brockmöller T, Ling Z, Li D, Gaquerel E, Baldwin IT, Xu S. 2017. Nicotiana attenuata Data
Hub (NaDH): An integrative platform for exploring genomic, transcriptomic and
metabolomic data in wild tobacco. BMC genomics 18, 79.
Literatur 134
Calder WA. 1979. On the temperature-dependency of optimal nectar concentrations for
birds. Journal of Theoretical Biology 78, 185–196.
Canto A, Herrera CM, Medrano M, Pérez R, García IM. 2008. Pollinator foraging modifies
nectar sugar composition in Helleborus foetidus (Ranunculaceae): An experimental test.
American Journal of Botany 95, 315–320.
Cardoso‐Gustavson P, Davis AR. 2015. Is nectar reabsorption restricted by the stalk cells
of floral and extrafloral nectary trichomes? Plant biology (Stuttgart, Germany) 17, 134–
146.
Carter CJ, Graham RA, Thornburg RW. 1999. Nectarin I is a novel, soluble germin-like
protein expressed in the nectar of Nicotiana sp. Plant molecular biology 41, 207–216.
Carter CJ, Healy RA, O'Tool NM et al. 2007. Tobacco nectaries express a novel NADPH
oxidase implicated in the defense of floral reproductive tissues against microorganisms.
Plant Physiology 143, 389–399.
Carter CJ, Shafir S, Yehonatan L, Palmer RG, Thornburg RW. 2006. A novel role for
proline in plant floral nectars. Die Naturwissenschaften 93, 72–79.
Carter CJ, Thornburg RW. 2004a. Is the nectar redox cycle a floral defense against
microbial attack? Trends in Plant Science 9, 320–324.
Carter CJ, Thornburg RW. 2004b. Tobacco Nectarin III is a Bifunctional Enzyme with
Monodehydroascorbate Reductase and Carbonic Anhydrase Activities. Plant molecular
biology 54, 415–425.
Carter CJ, Thornburg RW. 2004c. Tobacco Nectarin V Is a Flavin-Containing Berberine
Bridge Enzyme-Like Protein with Glucose Oxidase Activity. Plant Physiology 134, 460–
469.
Chang S, Puryear J, Cairney J. 1993. A simple and efficient method for isolating RNA from
pine trees. Plant molecular biology reporter 11, 113–116.
Chase MW, Paun O, Fay MF. 2010. Hybridization and speciation in angiosperms: a role for
pollinator shifts? BMC biology 8, 45.
Chen L-Q, Cheung LS, Feng L, Tanner W, Frommer WB. 2015. Transport of sugars.
Annual review of biochemistry 84.
Chiang P-W, Song W-J, Wu K-Y et al. 1996. Use of a fluorescent-PCR reaction to detect
genomic sequence copy number and transcriptional abundance. Genome research 6,
1013–1026.
Clarkson JJ, Knapp S, Garcia VF, Olmstead RG, Leitch AR, Chase MW. 2004.
Phylogenetic relationships in Nicotiana (Solanaceae) inferred from multiple plastid DNA
regions. Molecular Phylogenetics and Evolution 33, 75–90.

Literatur 135
Dorion S, Lalonde S, Saini HS. 1996. Induction of Male Sterility in Wheat by Meiotic-Stage
Water Deficit Is Preceded by a Decline in Invertase Activity and Changes in Carbohydrate
Metabolism in Anthers. Plant Physiology 111, 137–145.
Durkee LT. 1983. The ultrastructure of floral and extrafloral nectaries. The biology of
nectaries 1, 26.
Eisenberg JF, Redford KH. 1989. Mammals of the Neotropics, Volume 3: Ecuador, Bolivia,
Brazil: University of Chicago Press.
Fahn A. 1979a. Secretory tissues in plants: Academic Press.
Fahn A. 1979b. Ultrastructure of nectaries in relation to nectar secretion. American Journal
of Botany, 977–985.
Fenster CB, Armbruster, W. Scott, Wilson P, Dudash MR, Thomson JD. 2004.
Pollination Syndromes and Floral Specialization. Annual Review of Ecology, Evolution,
and Systematics 35, 375–403.
Findling S, Zanger K, Krueger S, Lohaus G. 2015. Subcellular distribution of raffinose
oligosaccharides and other metabolites in summer and winter leaves of Ajuga reptans
(Lamiaceae). Planta 241, 229–241.
Fisher DB, Frame JM. 1984. A guide to the use of the exuding-stylet technique in phloem
physiology. Planta 161, 385–393.
Fleming TH, Sahley CT, Holland JN, Nason JD, Hamrick JL. 2001. Sonoran Desert
columnar cacti and the evolution of generalized pollination systems. Ecological
Monographs 71, 511–530.
Frey-Wyssling A. 1955. The phloem supply to the nectaries. Acta botanica neerlandica 4,
358–369.
Gaffal KP, Friedrichs GJ, El-Gammal S. 2007. Ultrastructural evidence for a dual function
of the phloem and programmed cell death in the floral nectary of Digitalis purpurea.
Annals of Botany 99, 593–607.
Ge Y-X, Angenent GC, Wittich PE et al. 2000. NEC1, a novel gene, highly expressed in
nectary tissue of Petunia hybrida. The Plant Journal 24, 725–734.
Gibson UE, Heid CA, Williams PM. 1996. A novel method for real time quantitative RT-
PCR. Genome research 6, 995–1001.
Godt DE, Roitsch T. 1997. Regulation and Tissue-Specific Distribution of mRNAs for Three
Extracellular Invertase Isoenzymes of Tomato Suggests an Important Function in
Establishing and Maintaining Sink Metabolism. Plant Physiology 115, 273–282.
González-Teuber M, Heil M. 2009. Nectar chemistry is tailored for both attraction of
mutualists and protection from exploiters. Plant Signaling & Behavior 4, 809–813.

Literatur 136
Goodspeed TH. 1954. The Genus Nicotiana: Origins, Relationships and Evolution of its
Species in the light of their Distribution, Morphology and Cytogenetics. Waltham,
Massachusetts, USA: Chronica Botanica.
Görg A, Postel W, Westermeier R. 1978. Ultrathin-layer isoelectric focusing in
polyacrylamide gels on cellophane. Analytical Biochemistry 89, 60–70.
Hajirezaei M-R, Bornke F, Peisker M et al. 2003. Decreased sucrose content triggers
starch breakdown and respiration in stored potato tubers (Solanum tuberosum). Journal
of Experimental Botany 54, 477–488.
Hanahan D. 1983. Studies on transformation of Escherichia coli with plasmids. Journal of
molecular biology 166, 557–580.
Haydak MH. 1970. Honey bee nutrition. Annual review of Entomology 15, 143–156.
Heil M. 2011. Nectar: generation, regulation and ecological functions. Trends in Plant
Science 16, 191–200.
Heil M, Rattke J, Boland W. 2005. Postsecretory hydrolysis of nectar sucrose and
specialization in ant/plant mutualism. Science (New York, N.Y.) 308, 560–563.
Heineke D, Sonnewald U, Büssis D et al. 1992. Apoplastic Expression of Yeast-Derived
Invertase in Potato. Plant Physiology, 301–308.
Helversen O von. 1993. Adaptions of flowers to the pollination by glossophagine bats. In:
Barthlott W., ed. Animal plant interaction in tropical environments. Bonn: Museum Könnig,
41–59.
Hendriksma HP, Oxman KL, Shafir S. 2014. Amino acid and carbohydrate tradeoffs by
honey bee nectar foragers and their implications for plant–pollinator interactions. Journal
of insect physiology 69, 56–64.
Herrera CM, García IM, Pérez R. 2008. Invisible Floral Larcenies: Microbial Communities
degrade Floral Nectar of Bumble Bee-Pollinated Plants. Ecology 89, 2369–2376.
Herrera CM, Vega C de, Canto A, Pozo MI. 2009. Yeasts in floral nectar: a quantitative
survey. Annals of Botany 103, 1415–1423.
Hess D. 1987. Die Blute. Eine Einfuhrung in Struktur und Funktion, Okologie und Evolution
der Bluten. Verlag Eugen Ulmer. Review by PR Bell in New Phytol 105, 524–525.
Higuchi R, Fockler C, Dollinger G, Watson R. 1993. Kinetic PCR analysis: Real-time
monitoring of DNA amplification reactions. Nature Biotechnology 11, 1026–1030.
Hilje B, Calvo-Alvarado J, Jiménez-Rodríguez C, Sánchez-Azofeifa A. 2015. Tree
species composition, breeding systems, and pollination and dispersal syndromes in three
forest successional stages in a tropical dry forest in Mesoamerica. Tropical Conservation
Science 8, 76–94.

Literatur 137
Horner HT, Healy RA, Ren G et al. 2007. Amyloplast to chromoplast conversion in
developing ornamental tobacco floral nectaries provides sugar for nectar and antioxidants
for protection. American Journal of Botany 94, 12–24.
Howell DJ. 1974. Bats and pollen: Physiological aspects of the syndrome of chiropterophily.
Comparative Biochemistry and Physiology Part A: Physiology 48, 263–276.
Ippolito A. 2000. Systematics, floral evolution and speciation in Nicotiana. PhD. diss.
University of Missouri, Columbia, MO.
Jacquemyn H, Lenaerts M, Tyteca D, Lievens B. 2013. Microbial diversity in the floral
nectar of seven Epipactis (Orchidaceae) species. MicrobiologyOpen 2, 644–658.
Jersáková J, Johnson SD. 2006. Lack of floral nectar reduces self-pollination in a fly-
pollinated orchid. Oecologia 147, 60–68.
Kaczorowski RL. 2007. Nectar in Nicotiana: Pollinator associations, sources of variations,
and evolutionary consequences.
Kawabe S, Fukumorita T, Chino M. 1980. Collection of rice phloem sap from stylets of
homopterous insects severed by YAG laser. Plant and Cell Physiology 21, 1319–1327.
Kerchner A, Darok J, Bacskay I, Felinger A, Jakab G, Farkas A. 2015. Protein and
alkaloid patterns of the floral nectar in some solanaceous species. Acta biologica
Hungarica 66, 304–315.
Kessler D, Baldwin IT. 2007. Making sense of nectar scents: the effects of nectar
secondary metabolites on floral visitors of Nicotiana attenuata. The Plant Journal 49,
840–854.
Knapp S, Chase MW, Clarkson JJ. 2004. Nomenclatural changes and a new sectional
classification in Nicotiana (Solanaceae). Taxon, 73–82.
Knop C, Stadler R, Sauer N, Lohaus G. 2004. AmSUT1, a sucrose transporter in collection
and transport phloem of the putative symplastic phloem loader Alonsoa meridionalis.
Plant Physiology 134, 204–214.
Knop C, Voitsekhovskaja O, Lohaus G. 2001. Sucrose transporters in two members of the
Scrophulariaceae with different types of transport sugar. Planta 213, 80–91.
Koch KE. 1996. Carbohydrate-Modulated Gene Expression in Plants. Annual review of plant
physiology and plant molecular biology 47, 509–540.
Koenen M, Rüther U, Müller‐Hill B. 1982. Immunoenzymatic detection of expressed gene
fragments cloned in the lac Z gene of E. coli. The EMBO journal 1, 509–512.
Konno Y, Vedvick T, Fitzmaurice L, Mirkov TE. 1993. Purification, characterization, and
subcellular localization of soluble invertase from tomato fruit. Journal of plant physiology
141, 385–392.
Kram BW, Carter CJ. 2009. Arabidopsis thaliana as a model for functional nectary analysis.
Sexual Plant Reproduction 22, 235–246.

Literatur 138
Kram BW, Xu WW, Carter CJ. 2009. Uncovering the Arabidopsis thaliana nectary
transcriptome: investigation of differential gene expression in floral nectariferous tissues.
BMC plant biology 9, 92.
Krausgrill S, Sander A, Greiner S, Weil M, Rausch T. 1996. Regulation of cell wall
invertase by a proteinaceous inhibitor. Journal of Experimental Botany 47 Spec No,
1193–1198.
Kubista M, Andrade JM, Bengtsson M et al. 2006. The real-time polymerase chain
reaction. Molecular aspects of medicine 27, 95–125.
Kugler H. 1970. Blütenökologie. Stuttgart: Gustav Fischer.
Kunst F, Pascal M, Lepesant J-A, Walle J, Dedonder R. 1974. Purification and Some
Properties of an Endocellular Sucrase from a Constitutive Mutant of Bacillus subtilis
Marburg 168. European Journal of Biochemistry 42, 611–620.
La Barrera E de, Nobel PS. 2004. Nectar: properties, floral aspects, and speculations on
origin. Trends in Plant Science 9, 65–69.
Laemmli UK. 1970. Cleavage of Structural Proteins during the Assembly of the Head of
Bacteriophage T4. Nature 227, 680–685.
Leins P, Erbar C. 2000. Blüte und Frucht: Aspekte der Morphologie,
Entwicklungsgeschichte, Phylogenie, Funktion und Ökologie. Stuttgart: Schweizerbart.
Lemoine R, Bürkle L, Barker L et al. 1999. Identification of a pollen-specific sucrose
transporter-like protein NtSUT3 from tobacco. FEBS letters 454, 325–330.
Lenaerts M, Goelen T, Paulussen C et al. 2017. Nectar bacteria affect life history of a
generalist aphid parasitoid by altering nectar chemistry. Functional Ecology 80, 591.
Liang Q, Richardson T. 1992. A simple and rapid method for screening transformant yeast
colonies using PCR. Biotechniques 13, 730-2, 735.
Lievens B, Hallsworth JE, Pozo MI et al. 2014. Microbiology of sugar-rich environments:
diversity, ecology and system constraints. Environmental microbiology.
Lin IW, Sosso D, Chen L-Q et al. 2014. Nectar secretion requires sucrose phosphate
synthases and the sugar transporter SWEET9. Nature 508, 546–549.
Liu D, Shi L, Han C, Yu J, Li D, Zhang Y. 2012. Validation of reference genes for gene
expression studies in virus-infected Nicotiana benthamiana using quantitative real-time
PCR. PLoS ONE 7, e46451.
Liu G, Ren G, Guirgis A, Thornburg RW. 2009. The MYB305 transcription factor regulates
expression of nectarin genes in the ornamental tobacco floral nectary. The Plant cell 21,
2672–2687.
Logemann J, Schell J, Willmitzer L. 1987. Improved method for the isolation of RNA from
plant tissues. Analytical Biochemistry 163, 16–20.
Literatur 139
Lohaus G, Pennewiss K, Sattelmacher B, Hussmann M, Hermann Muehling K. 2001. Is
the infiltration-centrifugation technique appropriate for the isolation of apoplastic fluid?: A
critical evaluation with different plant species. Physiologia Plantarum 111, 457–465.
Lohaus G, Schwerdtfeger M. 2014. Comparison of sugars, iridoid glycosides and amino
acids in nectar and phloem sap of Maurandya barclayana, Lophospermum erubescens,
and Brassica napus. PLoS ONE 9, e87689.
Lohaus G, Winter H, Riens B, Heldt HW. 1995. Further studies of the phloem loading
process in leaves of barley and spinach. The comparison of metabolite concentrations in
the apoplastic compartment with those in the cytosolic compartment and in the sieve
tubes. Plant biology (Stuttgart, Germany) 108, 270–275.
Lorenz K, Lienhard S, Sturm A. 1995. Structural organization and differential expression of
carrot β-fructofuranosidase genes: identification of a gene coding for a flower bud-specific
isozyme. Plant molecular biology 28, 189–194.
Lowry OH, Rosebrough NJ, Farr AL, Randall RJ. 1951. Protein measurement with the
Folin phenol reagent. Journal of biological chemistry 193, 265–275.
Marlin D, Nicolson SW, Sampson JD, Krüger K. 2016. Insights into the pollination
requirements of the only African wild tobacco, Nicotiana africana (Solanaceae) from the
Namib Desert. Journal of Arid Environments 125, 64–67.
Martin I, Débarbouillé M, Ferrari E, Klier A, Rapoport G. 1987. Characterization of the
levanase gene of Bacillus subtilis which shows homology to yeast invertase. Molecular
and General Genetics MGG 208, 177–184.
Mayfield MM, Waser NM, Price MV. 2001. Exploring the ‘most effective pollinator
principle’with complex flowers: Bumblebees and Ipomopsis aggregata. Annals of Botany
88, 591–596.
Merxmüller H, Buttler KP. 1975. Nicotiana in der afrikanischen Namib - ein
pflanzengeografisches und phylogenetisches Rätsel. Mitteilungen der botanischen
Staatssammlung München, 91–104.
Michener CD. 2000. The bees of the world: JHU press.
Mosti S, Ross Friedman C, Pacini E, Brighigna L, Papini A. 2013. Nectary ultrastructure
and secretory modes in three species of Tillandsia (Bromeliaceae) that have different
pollinators. Botany 91, 786–798.
Muchhala N. 2003. Exploring the boundary between pollination syndromes: Bats and
hummingbirds as pollinators of Burmeistera cyclostigmata and B. tenuiflora
(Campanulaceae). Oecologia 134, 373–380.
Müller A, Diener S, Schnyder S, Stutz K, Sedivy C, Dorn S. 2006. Quantitative pollen
requirements of solitary bees: Implications for bee conservation and the evolution of bee–
flower relationships. Biological Conservation 130, 604–615.

Literatur 140
Müller-Jahncke W-D, Friedrich C, Meyer U. 2005. Arzneimittelgeschichte:
Wissenschaftliche Verlagsgesellschaft.
Mullis KB, Faloona FA. 1987. Specific synthesis of DNA in vitro via a polymerase-catalyzed
chain reaction. Methods in enzymology 155, 335–350.
Mushtaq M, Jamal A, Nahar S. 2007. Biodiversity of yeast mycoflora in nectar of Hibiscus
rosa-sinensis and Ixora coccinea flowers. Pakistan Journal of Botany 39, 1367–1376.
Nadwodnik J, Lohaus G. 2008. Subcellular concentrations of sugar alcohols and sugars in
relation to phloem translocation in Plantago major, Plantago maritima, Prunus persica,
and Apium graveolens. Planta 227, 1079–1089.
Naqvi SS, Harper A, Carter C et al. 2005. Nectarin IV, a Potent Endoglucanase Inhibitor
Secreted into the Nectar of Ornamental Tobacco Plants. Isolation, Cloning, and
Characterization. Plant Physiology 139, 1389–1400.
Nepi M, Ciampolini F, Pacini E. 1996. Development and Ultrastructure of Cucurbita pepo
Nectaries of Male Flowers. Annals of Botany 78, 95–104.
Nepi M, Soligo C, Nocentini D et al. 2012. Amino acids and protein profile in floral nectar:
Much more than a simple reward. Flora - Morphology, Distribution, Functional Ecology of
Plants 207, 475–481.
Nicolson SW, Nepi M, Pacini E. 2007. Nectaries and Nectar. Dordrecht, The Netherlands:
Springer.
Ning X-p, Tang T-x, Wu H. 2017. Relationship between the morphological structure of floral
nectaries and the formation, transport, and secretion of nectar in lychee. Trees 31, 1–14.
Oksanen J, Kindt R, Legendre P et al. 2008. The vegan package. Community ecology
package 10.
Ollerton J, Alarcón R, Waser NM et al. 2009. A global test of the pollination syndrome
hypothesis. Annals of Botany 103, 1471–1480.
Ollerton J, Watts S. 2000. Phenotype space and floral typology: Towards an objective
assessment of pollination syndromes. Det Norske Videnskaps-Akademi. I. Matematisk-
Naturvidenskapelige Klasse, Skrifter, Ny Serie 39, 149–159.
Öner-Sieben S, Lohaus G. 2014. Apoplastic and symplastic phloem loading in Quercus
robur and Fraxinus excelsior. Journal of Experimental Botany 65, 1905–1916.
Pacini E, Nepi M, Vesprini JL. 2003. Nectar biodiversity: A short review. Plant Systematics
and Evolution 238, 7–21.
Paiva ÉAS, Andrade Buono R, Neves Delgado M. 2007. Distribution and structural
aspects of extrafloral nectaries in Cedrela fissilis (Meliaceae). Flora - Morphology,
Distribution, Functional Ecology of Plants 202, 455–461.

Literatur 141
Palmer LJ, Palmer LT, Pritchard J, Graham RD, Stangoulis JCR. 2013. Improved
techniques for measurement of nanolitre volumes of phloem exudate from aphid
stylectomy. Plant methods 9, 18.
Park S, Thornburg RW. 2009. Biochemistry of Nectar Proteins. Journal of Plant Biology 52,
27–34.
Pate JS, Peoples MB, Storer PJ, Atkins CA. 1985. The extrafloral nectaries of cowpea
(Vigna unguiculata (L.) Walp.) II. Nectar composition, origin of nectar solutes, and nectary
functioning. Planta 166, 28–38.
Percival MS. 1961. Types of Nectar in Angiosperms. New Phytologist, 235–281.
Petanidou T, van Laere A, Ellis WN, Smets E. 2006. What shapes amino acid and sugar
composition in Mediterranean floral nectars?, 155–169.
Peter CI, Johnson SD. 2014. A pollinator shift explains floral divergence in an orchid
species complex in South Africa. Annals of Botany 113, 277–288.
Peumans WJ, Smeets K, van Nerum K, van Leuven F, van Damme EJM. 1997. Lectin
and alliinase are the predominant proteins in nectar from leek (Allium porrum L.) flowers.
Planta 201, 298–302.
Pfaffl MW. 2001. A new mathematical model for relative quantification in real-time RT–PCR.
Nucleic Acids Research 29, e45-e45.
Pfaffl MW. 2006. Relative quantification. Real-time PCR 63, 63–82.
Plowright RC. 1987. Corolla depth and nectar concentration: An experimental study.
Canadian Journal of Botany 65, 1011–1013.
Pozo MI, Herrera CM, Bazaga P. 2011. Species richness of yeast communities in floral
nectar of southern Spanish plants. Microbial ecology 61, 82–91.
Pozo MI, Lachance M-A, Herrera CM. 2012. Nectar yeasts of two southern Spanish plants:
The roles of immigration and physiological traits in community assembly. FEMS
Microbiology Ecology 80, 281–293.
Prinzinger R, Lübben I, Schuchmann K-L. 1989. Energy metabolism and body
temperature in 13 sunbird species (Nectariniidae). Comparative Biochemistry and
Physiology Part A: Physiology 92, 393–402.
Pyke GH. 1991. What does it cost a plant to produce floral nectar? Nature 350, 58–59.
Raguso RA, Levin RA, Foose SE, Holmberg MW, McDade LA. 2003. Fragrance
chemistry, nocturnal rhythms and pollination “syndromes” in Nicotiana. Phytochemistry
63, 265–284.
Ren G, Healy RA, Horner HT, James MG, Thornburg RW. 2007a. Expression of starch
metabolic genes in the developing nectaries of ornamental tobacco plants. Plant Science
173, 621–637.

Literatur 142
Ren G, Healy RA, Klyne AM, Horner HT, James MG, Thornburg RW. 2007b. Transient
starch metabolism in ornamental tobacco floral nectaries regulates nectar composition
and release. Plant Science 173, 277–290.
Rexroth S, Meyer zu Tittingdorf JMW, Krause F, Dencher NA, Seelert H. 2003. Thylakoid
membrane at altered metabolic state: Challenging the forgotten realms of the proteome.
Electrophoresis 24, 2814–2823.
Riens B, Lohaus G, Heineke D, Heldt H-W. 1991. Amino Acid and Sucrose Content
Determined in the Cytosolic, Chloroplastic, and Vacuolar Compartments and in the
Phloem Sap of Spinach Leaves. Plant Physiology, 227–233.
Riens B, Lohaus G, Winter H, Heldt H-W. 1994. Production and diurnal utilization of
assimilates in leaves of spinach (Spinacia oleracea L.) and barley (Hordeum vulgare L.).
Planta 192, 497–501.
Ririe KM, Rasmussen RP, Wittwer CT. 1997. Product differentiation by analysis of DNA
melting curves during the polymerase chain reaction. Analytical Biochemistry 245, 154–
160.
Roitsch T, Balibrea ME, Hofmann M, Proels R, Sinha AK. 2003. Extracellular invertase:
Key metabolic enzyme and PR protein. Journal of Experimental Botany 54, 513–524.
Roitsch T, Bittner M, Godt DE. 1995. Induction of Apoplastic Invertase of Chenopodium
rubrum by D-Glucose and a Glucose Analog and Tissue-Specific Expression Suggest a
Role in Sink-Source Regulation. Plant Physiology 108, 285–294.
Roitsch T, González M-C. 2004. Function and regulation of plant invertases: sweet
sensations. Trends in Plant Science 9, 606–613.
Routley MB, Bertin RI, Husband BC. 2004. Correlated evolution of dichogamy and self-
incompatibility: A phylogenetic perspective. International Journal of Plant Sciences 165,
983–993.
Roy R, Schmitt AJ, Thomas JB, Carter CJ. 2017. Review: Nectar biology: from molecules
to ecosystems. Plant Science.
Ruhlmann JM, Kram BW, Carter CJ. 2010. CELL WALL INVERTASE 4 is required for
nectar production in Arabidopsis. Journal of Experimental Botany 61, 395–404.
Sarokin L, Carlson M. 1984. Upstream region required for regulated expression of the
glucose-repressible SUC2 gene of Saccharomyces cerevisiae. Molecular and Cellular
Biology 4, 2750–2757.
Schmidt GW, Delaney SK. 2010. Stable internal reference genes for normalization of real-
time RT-PCR in tobacco (Nicotiana tabacum) during development and abiotic stress.
Molecular genetics and genomics MGG 283, 233–241.
Literatur 143
Schneeberger C, Speiser P, Kury F, Zeillinger R. 1995. Quantitative detection of reverse
transcriptase-PCR products by means of a novel and sensitive DNA stain. Genome
research 4, 234–238.
Schueller SK. 2004. Self-pollination in island and mainland populations of the introduced
hummingbird-pollinated plant, Nicotiana glauca (Solanaceae). American Journal of
Botany 91, 672–681.
Seo PJ, Wielsch N, Kessler D et al. 2013. Natural variation in floral nectar proteins of two
Nicotiana attenuata accessions. BMC Plant Biology 13, 101.
Sherson SM, Alford HL, Forbes SM, Wallace G, Smith SM. 2003. Roles of cell-wall
invertases and monosaccharide transporters in the growth and development of
Arabidopsis. Journal of Experimental Botany 54, 525–531.
Shevchenko A, Wilm M, Vorm O, Mann M. 1996. Mass spectrometric sequencing of
proteins from silver-stained polyacrylamide gels. Analytical chemistry 68, 850–858.
Smets E. 1988. La présence des" nectaria persistentia" chez les Magnoliophytina
(Angiospermes). The occurrence of the" nectaria persistentia" in the Magnoliophytina
(Angiospermae). Candollea 43, 709–716.
Ståhlberg T, Woodley JM, Riisager A. 2012. Enzymatic isomerization of glucose and
xylose in ionic liquids. Catalysis Science & Technology 2, 291–295.
Stebbins GL. 1970. Adaptive radiation of reproductive characteristics in angiosperms, I:
Pollination mechanisms. Annual Review of Ecology and Systematics 1, 307–326.
Stehmann JR, Semir J, Ippolito A. 2002. Nicotiana mutabilis (Solanaceae), a new species
from southern Brazil.
Stpiczyńska M, Nepi M, Zych M. 2014. Nectaries and male-biased nectar production in
protandrous flowers of a perennial umbellifer Angelica sylvestris L. (Apiaceae). Plant
Systematics and Evolution.
Sturm A. 1999. Invertases. Primary Structures, Functions, and Roles in Plant Development
and Sucrose Partitioning. Plant Physiology 121, 1–8.
Sturm A, Chrispeels MJ. 1990. cDNA cloning of carrot extracellular beta-fructosidase and
its expression in response to wounding and bacterial infection. The Plant cell 2, 1107–
1119.
Sturm A, Šebková V, Lorenz K, Hardegger M, Lienhard S, Unger C. 1995. Development-
and organ-specific expression of the genes for sucrose synthase and three isoenzymes
of acid β-fructofuranosidase in carrot. Planta 195, 601–610.
Teulier I, Weber JM, Crevier J, Darveau CA. 2016. Proline as a fuel for insect flight:
Enhancing carbohydrate oxidation in hymenopterans: The Royal Society.

Literatur 144
Tiedge K, Lohaus G. 2017. Nectar sugars and amino acids in day- and night-flowering
Nicotiana species are more strongly shaped by pollinators' preferences than organic
acids and inorganic ions. PLoS ONE 12, e0176865.
van der Pijl L. 1961. Ecological aspects of flower evolution. II. Zoophilous flower classes.
Evolution 15, 44–59.
Vandesompele J, Preter K de, Pattyn F et al. 2002. Accurate normalization of real-time
quantitative RT-PCR data by geometric averaging of multiple internal control genes.
Genome Biology 3, research0034.1.
Vassilyev AE. 2010. On the mechanisms of nectar secretion: revisited. Annals of Botany
105, 349–354.
Waller GD. 1972. Evaluating Responses of Honey Bees to Sugar Solutions Using an
Artificial-Flower Feeder. Annals of the Entomological Society of America 65, 857–862.
Waser NM, Ollerton J. 2006. Plant-pollinator interactions: From specialization to
generalization. Chicago: University of Chicago Press.
Weber H, Heim U, Golombek S, Borisjuk L, Manteuffel R, Wobus U. 1998. Expression of
a yeast-derived invertase in developing cotyledons of Vicia narbonensis alters the
carbohydrate state and affects storage functions. The Plant journal for cell and molecular
biology 16, 163–172.
Weil M, Rausch T. 1990. Cell Wall Invertase in Tobacco Crown Gall Cells: Enzyme
Properties and Regulation by Auxin. Plant Physiology 94, 1575–1581.
Weschke W, Panitz R, Gubatz S et al. 2003. The role of invertases and hexose
transporters in controlling sugar ratios in maternal and filial tissues of barley caryopses
during early development. The Plant Journal 33, 395–411.
Wessel D, Flügge UI. 1984. A method for the quantitative recovery of protein in dilute
solution in the presence of detergents and lipids. Analytical Biochemistry 138, 141–143.
Wilson CM. 1983. Staining of proteins on gels: Comparisons of dyes and procedures.
Methods in enzymology 91, 236–247.
Wist TJ, Davis AR. 2006. Floral nectar production and nectary anatomy and ultrastructure of
Echinacea purpurea (Asteraceae). Annals of Botany 97, 177–193.
Witt T, Jürgens A, Gottsberger G. 2013. Nectar sugar composition of European
Caryophylloideae (Caryophyllaceae) in relation to flower length, pollination biology and
phylogeny. Journal of Evolutionary Biology 26, 2244–2259.
Wittwer CT, Ririe KM, Andrew RV, David DA, Gundry RA, Balis UJ. 1997. The
LightCyclerTM: A microvolume multisample fluorimeter with rapid temperature control.
Biotechniques 22, 176–181.
Wong ML, Medrano JF. 2005. Real-time PCR for mRNA quantitation. Biotechniques 39,
75–88.

Literatur 145
Woodcock DM, Crowther PJ, Doherty J et al. 1989. Quantitative evaluation of Escherichia
coli host strains for tolerance to cytosine methylation in plasmid and phage recombinants.
Nucleic Acids Research 17, 3469–3478.
Wright DP, Read DJ, Scholes JD. 1998. Mycorrhizal sink strength influences whole plant
carbon balance of Trifolium repens L. Plant, Cell & Environment, 881–891.
Wright JP, Fisher DB. 1980. Direct measurement of sieve tube turgor pressure using
severed aphid stylets. Plant Physiology 65, 1133–1135.
Wu L-L, Mitchell JP, Cohn NS, Kaufman PB. 1993. Gibberellin (GA3) Enhances Cell Wall
Invertase Activity and mRNA Levels in Elongating Dwarf Pea (Pisum sativum) Shoots.
International Journal of Plant Sciences 154, 280–289.
Zha H-G, Flowers VL, Yang M, Chen L-Y, Sun H. 2012. Acidic α-galactosidase is the most
abundant nectarin in floral nectar of common tobacco (Nicotiana tabacum). Annals of
Botany 109, 735–745.

Appendix 146
Appendix
Auflistung der verwendeten Chemikalien
Chemikalie Firma
Acrylamid/Bisacrylamid (A/B 29:1) Roth
Adenosin-5´-triphosphat (ATP) Dinatriumsalz Roth
Agar-Agar Roth
Agarose Roth
Ammoniumperoxodisulfat (APS) AppliChem
Ampicillin Roth
Australian Liquid Smoke Hickory Natural Sydney & Frances
5-Brom-4-chlor-3-indoxyl-β-D-galactopyranosid (X-Gal) Roth
Bromphenolblau Sigma
Calciumchlorid (CaCl2) Roth
Cetyltrimethylammoniumbromid (CTAB) Roth
Chloroform VWR
Coomassie Briliiant Blue R250 AppliChem
Desoxynukleosidtriphosphate (dNTPs) Bio&SELL
Diethylpyrocarbonat (DEPC) Roth
Dithiothreitol (DTT) Roth
Dimethylsulfoxid (DMSO) Roth
Essigsäure Roth
Ethanol 96 % Chemsolute
Ethidiumbromid Roth
Ethylendiamintetraessigsäure (EDTA) Roth
Fluorenylmethyloxycarbonylchlorid (FMOC-Cl) Sigma
Folin-Ciocalteus Phenolreagenz Sigma-Aldrich
Formaldehyd Roth
6x Gelladepuffer (HP04.1) Roth
D(+)Glucose Merck
Glycerol Roth
Glycin Roth
Hefe-Extrakt Roth
2-(4-(2-Hydroxyethyl)-1-piperazinyl)-ethansulfonsäure Sigma
Isoamylalkohol Roth

Appendix 147
Isopropanol Roth
Kaliumchlorid Roth
Kaliumnatriumtartrat Tetrahydrat Roth
Kupfer(II)sulfat (CuSO4) Merck
Lithiumchlorid (LiCl) Roth
Magnesiumchlorid (MgCl2) Roth
Manganchlorid (MnCl2) Roth
Methanol Roth
β-Mercaptoethanol Merck
N,N,N’,N’,Tetramethylethylendiamin (TEMED) AppliChem
Natriumacetat Roth
Natriumcarbonat (Na2CO3) Roth
Natriumchlorid (NaCl) Roth
Natriumhydroxid (NaOH) Grüssing
Natriumdodecylsulfat (SDS) Roth
Natriumthiosulfat (Na2S2O3) Roth
Nicotinamidadenindinukleotidphosphat (NADP) Dinatriumsalz
Roth
Polyvinylpyrrolidon (PVP) Fluka
Reinstwasser Millipore Milli-Q® Anlage
Rinderserumalbumin (BSA) Roth
RNase AWAY® Molecular Bio-Products
Roti-Mark Proteinstandard Roth
D(+)Saccharose Roth
Salzsäure (HCl) VWR
Silbernitrat (AgNO3) Chempur
Stickstoff, flüssig Linde
Tris(hydroxymethyl)-aminomethan (Tris) Roth
Trypton Roth
Triton X-100 Fluka

Appendix 148
Auflistung der verwendeten Materialien
Material Firma
Cryovial® (T309-1A; 1,2 mL) Simport
Restriktionsenzym Eco R1 Thermo Fisher
E-Cup-Mikropistill, PP Eppendorf
Falcon Tubes (15 mL) Sarstedt
Falcon Tubes (50 mL) Roth
GeneJET Plasmid Miniprep Kit Thermo Scientific
Mikrolitermesszelle (LabelGuard) Implen
Mikroreagiergefäß (1,5 mL; 2 mL; SafeSeal) Sarstedt
Multiply®-Pro Gefäß (0,2 mL) Sarstedt
Pipettenspitzen (5 mL, 1000 μL, 200 μL, 20 μL, 10 μL) Sarstedt
pGEM-T-easy Vektor Promega
Rotilabo®-Einmal-Küvetten, PS (Halbmikro; 1,6 mL) Roth
Rührspatel, PS Roth
Skalpell (inkl. Klinge Typ 21) Roth
Spitzenfilter Nylonmembran (0,2 µm Porengröße) Roth
Auflistung der verwendeten Laborgeräte
Gerät Modell Firma
Autoklav Varioklav® Typ 400 H+P Labortechnik
Elektrophoresekammer Mini-PROTEAN® Tetra Cell
Biorad
Feinwaage PA 112 Ohaus Corporation
Geldokumentation Transilluminator, Kamera, PC, Drucker
INTAS UV-Systeme
Grobwaage PA 2102 Ohaus Corporation
Kolbenhubpipette 5 mL VWR
1000 μL VWR
200 μL Gilson Pipetman
20 μL Gilson Pipetman
10 μL VWR
Kühlzentrifuge Mikro 200R Hettich
Micro Star 17R VWR
Luftbefeuchter BH860E Honeywell
Magnetrührer RSM-10HS Phoenix Instrument

Appendix 149
Minizentrifuge T464.1 Roth
NanoDrop NanoDrop Lite Thermo Scientific
Thermocycler Mastercycler® personal Eppendorf
Mastercycler® gradient Eppendorf
pH-Meter FiveEasy Mettler Toledo
Photometer Genesys 10S UV/VIS Spectrophotometer
Thermo Scientific
NanoDrop NanoDrop Lite Thermo Scientific
qPCR System Mx3005p Stratagene
Rotationsverdampfer RV 10 VWR
Schütteltruhe G25 New Brunswick Scientific
Spannungsgeber E143 Consort
Sterilarbeitsbank Anthos LAF-Sicherheitsbank 48
Antares
Thermo-Schüttler PHMT Grant-bio
TS1 Thermoshaker biometra
Tischzentrifuge Biofuge pico Heraeus
Centrifuge 5424 Eppendorf
Micro Star 17 VWR
Trockenschrank Modell 200 Memmert
RD115 Binder
Vortex-Schüttler VV3 VWR
Wasserbad VWB2 VWR
Abkürzungsverzeichnis
Abkürzung Bedeutung
Amp Ampicillin
ATP Adenosintriphosphat
BLAST Basic Local Alignment Search Tool
bp Basenpaar
BSA Rinderserumalbumin
c konzentration
°C Grad Celsius
cDNA komplementäre DNA
CTAB Cetyltrimethylammoniumbromid
DEPC Diethylpyrocarbonat

Appendix 150
DNA Desoxyribonukleinsäure
dNTPs Desoxynukleosidtriphosphate
DTT Dithiothreitol
EDTA Ethylendiamintetraacetat
EST expressed sequence tag
F Fructose
Fig. Abbildung
FG Frischgewicht
G Glucose
g Gramm
gDNA genomische DNA
GOI gene of interest
HEPES 2-(4-(2-Hydroxyethyl)-1-piperazinyl)-ethansulfonsäure
HKG housekeeping gene
HK/G6P-DH Hexokinase/Glucose-6-Phosphat-Dehydrogenase
kb Kilobasen
kDA Kilodalton
l Liter
LB lysogeny broth (Nährmedium)
m Milli
M Molar [mol/l]
min Minute
µ Mikro
MW Molekülmasse
n Anzahl der Messungen
NADP Nicotinamidadenindinukleotidphosphat
PCR Polymerasekettenreaktion
pH negativer dekadischer Logarithmus der H+-Ionen-Aktivität
Pfu Pyrococcus furiosus
qRT-PCR quantitative Echtzeit-PCR
RNA Ribonukleinsäure
RNase Ribonuklease
rpm Umdrehungen pro Minute
RT Reverse Transkriptase, Raumtemperatur
S Saccharose

Appendix 151
SDS Natriumdodecylsulfat
SDS-PAGE SDS-Polyacrylamid-Gelelektrophorese
TAE Tris-Acetat-EDTA
Taq Thermus aquaticus
Tris Tris(hydroxymethyl)-aminomethan
U Unit (Enzymeinheit) [µmol Substrat/min]
v/v Volumenanteil
w/v Gewichtsanteil
X-Gal 5-Brom-4-chlor-3-indoxyl-β-D-galactopyranosid

Danksagung 152
Danksagung
Die vorliegende Arbeit wurde durch ein Promotionsstipendium der Konrad-Adenauer-
Stiftung gefördert.
Ganz herzlich möchte ich Frau Prof’in Dr. Gertrud Lohaus danken für die Möglichkeit
die Arbeit in ihrer Arbeitsgruppe durchzuführen, die intensive Betreuung und die
Freiheit, eigene Ideen in der Forschung umzusetzen.
Des Weiteren möchte ich Frau Prof’in Dr. Gela Preisfeld und Sabine Stratmann-
Lettner für die Möglichkeit danken, dass ich das Labor der Zoologie mitbenutzen
durfte.
Für die Bereitstellung der Tabaksamen danke ich dem Max-Planck-Institut für
Chemische Ökologie in Jena, der Universität Rostock und dem Botanischen Garten
der Ruhr-Universität Bochum.
Meiner Arbeitsgruppe danke ich für die vielen tollen gemeinsamen Stunden im Labor
und außerhalb, für die Vorschläge und Korrekturen. Auch wegen euch bin ich immer
gerne zur Arbeit gegangen. Besonders Daniel Fink möchte ich für die vielen
praktischen Tipps vom Profi danken.
Tim Kreutzer danke ich für seine vielseitige technische Assistenz und Lea van Alst
für die zusätzlichen Messungen der Invertase-Aktivität.
Mein riesiger Dank gilt Eddi Tiedge-Arnold. Ich danke dir von ganzem Herzen für
deine Hilfe und dein Verständnis. Auf jeden Fall wäre die Datenanalyse und Statistik
ohne dich wohl eine andere geworden.
Zum Abschluss möchte ich mich bei meinen Eltern bedanken, die mir immer den
Rücken freigehalten und meine Neugier erhalten haben.

Erklärung 153
Erklärung
Hiermit erkläre ich, diese Arbeit selbständig angefertigt und keine anderen als die
angegebenen Hilfsmittel und Quellen verwendet zu haben.
Ich erkläre ebenso, dass diese Dissertation keiner anderen Fakultät mit dem Ziel
vorgelegt worden ist, einen akademischen Titel zu erwerben.
_______________________
Kira Juliane Tiedge
(Wuppertal, im Februar 2018)