Embed Size (px)
Citation preview
„Im Rahmen der hochschulweiten Open-Access-Strategie für die Zweitveröffentlichung identifiziert durch die Universitätsbibliothek Ilmenau.“
“Within the academic Open Access Strategy identified for deposition by Ilmenau University Library.”
„Dieser Beitrag ist mit Zustimmung des Rechteinhabers aufgrund einer (DFG-geförderten) Allianz- bzw. Nationallizenz frei zugänglich.“
„This publication is with permission of the rights owner freely accessible due to an Alliance licence and a national licence (funded by the DFG, German Research Foundation) respectively.”
Tretsiak, Dzmitry V.; Kliauzovich, S. V.; Augsburg, Klaus; Sendler, Jan; Ivanov, Valentin G.:
Research in hydraulic brake components and operational factors influencing the hysteresis losses
URN: urn:nbn:de:gbv:ilm1-2014210297
Published OpenAccess: November 2014
Original published in: Proceedings of the Institution of Mechanical Engineers / D. - London : Sage Publ (ISSN 2041-2991). - 222 (2008) 9, S. 1633-1645. DOI: 10.1243/09544070JAUTO673 URL: http://dx.doi.org/10.1243/09544070JAUTO673 [Visited: 2014-10-14]
http://pid.sagepub.com/Engineering
Engineers, Part D: Journal of Automobile Proceedings of the Institution of Mechanical
http://pid.sagepub.com/content/222/9/1633The online version of this article can be found at:
DOI: 10.1243/09544070JAUTO673
2008 222: 1633Proceedings of the Institution of Mechanical Engineers, Part D: Journal of Automobile EngineeringD V Tretsiak, S V Kliauzovich, K Augsburg, J Sendler and V G Ivanov
Research in hydraulic brake components and operational factors influencing the hysteresis losses
Published by:
http://www.sagepublications.com
On behalf of:
Institution of Mechanical Engineers
can be found at:Proceedings of the Institution of Mechanical Engineers, Part D: Journal of Automobile EngineeringAdditional services and information for
http://pid.sagepub.com/cgi/alertsEmail Alerts:
http://pid.sagepub.com/subscriptionsSubscriptions:
http://www.sagepub.com/journalsReprints.navReprints:
http://www.sagepub.com/journalsPermissions.navPermissions:
http://pid.sagepub.com/content/222/9/1633.refs.htmlCitations:
What is This?
- Sep 1, 2008Version of Record >>
at Technische Universität Ilmenau on October 14, 2014pid.sagepub.comDownloaded from at Technische Universität Ilmenau on October 14, 2014pid.sagepub.comDownloaded from
Research in hydraulic brake components andoperational factors influencing the hysteresis lossesD V Tretsiak1*, S V Kliauzovich1, K Augsburg2, J Sendler2, and V G Ivanov2
1Automotive Engineering Department, Belarusian National Technical University, Belarus, Minsk, Belarus2Technical University of Ilmenau, Ilmenau, Germany
The manuscript was received on 9 July 2007 and was accepted after revision for publication on 19 May 2008.
DOI: 10.1243/09544070JAUTO673
Abstract: Up-to-date automotive brake systems place stringent requirements upon the per-formance, reliability, and active safety. Such advanced systems as antilock braking systems(ABS), the electronic stability programme system, and the anti-slip control system assist adriver in ensuring driving safety under many conditions. The influence of the brake compon-ents on active safety systems is mainly determined through the hysteresis loop width. Amongother negative outcomes, this parameter limits the possible frequency of cyclic braking duringABS operation.
This paper presents an experimental analysis of the factors influencing the hysteresispressure losses in a hydraulic brake system. The factors under investigations are the brakepedal stroke velocity, the gaps between the brake pads and the brake disc, and the con-figuration of the brake system. Experiments were carried out on the brake test equipment at theAutomotive Engineering Department, Faculty for Mechanical Engineering, TechnischeUniversitat Ilmenau, Germany.
Keywords: hysteresis, hydraulic system, brake, AMESim
1 INTRODUCTION
The stability of the static and dynamic characteristics
of a brake system depends in many ways on the
frictional forces arising in a master cylinder, valves,
pipelines, and other brake elements. The wear, gaps,
and slacks on the brake devices are also caused by
these inner frictional forces. Traditionally, the internal
friction is seldom considered in brake dynamics
except for evaluating the brake torque oscillations.
However, the most critical outcome of the above
influence is connected with a hysteresis phenomenon.
The hysteresis takes place by changing the sign of
the frictional forces at the brake release mode and
occurs because a pressing force on the friction
surface of the brake pad is still retained by the time
of the brake release.
A literature survey has revealed that the problems
of reduction in hysteresis losses in the brake system
components have been actively investigated in many
respects. The analysis performed shows that the
hysteresis impacts in one way or another on the
following:
(a) the operation of the brake calipers and valves
[1–3];
(b) the performance of the disc brakes, especially
for heavy vehicles [4, 5];
(c) the response speed of anti-lock braking systems
[6–8].
The presented paper describes the investigations
of hydraulic brake system components from the
point of view of the hysteresis losses and the opera-
tional factors having an influence on the hysteresis
value. The research procedures consisted of the com-
bined application of bench testing with the subseq-
uent simulation. The detailed description of the test
bench used during the investigations has been pres-
ented in reference [9]. For simulation purposes, the
model of an automotive brake system was cre-
ated using the AMESim software environment. The
general approach to the model development was
*Corresponding author: Automotive Engineering Department,
Belarusian National Technical University, Belarus, Minsk,
Belarus. email: [email protected]
1633
JAUTO673 F IMechE 2008 Proc. IMechE Vol. 222 Part D: J. Automobile Engineering
based on the methodologies discussed in refer-
ences [10] to [13].
The general idea of the presented research lies in
the definition of the share of hysteresis losses by the
main components of a typical automotive brake
system such as the master cylinder, brake gear, or
booster. This approach allows weak points in a brake
hydraulic chain to be found and recommendations
are given for the development of an advanced brake
system, in which the principal hysteresis-generating
elements may be replaced by similar mechatronic
devices.
2 TEST PROCEDURE
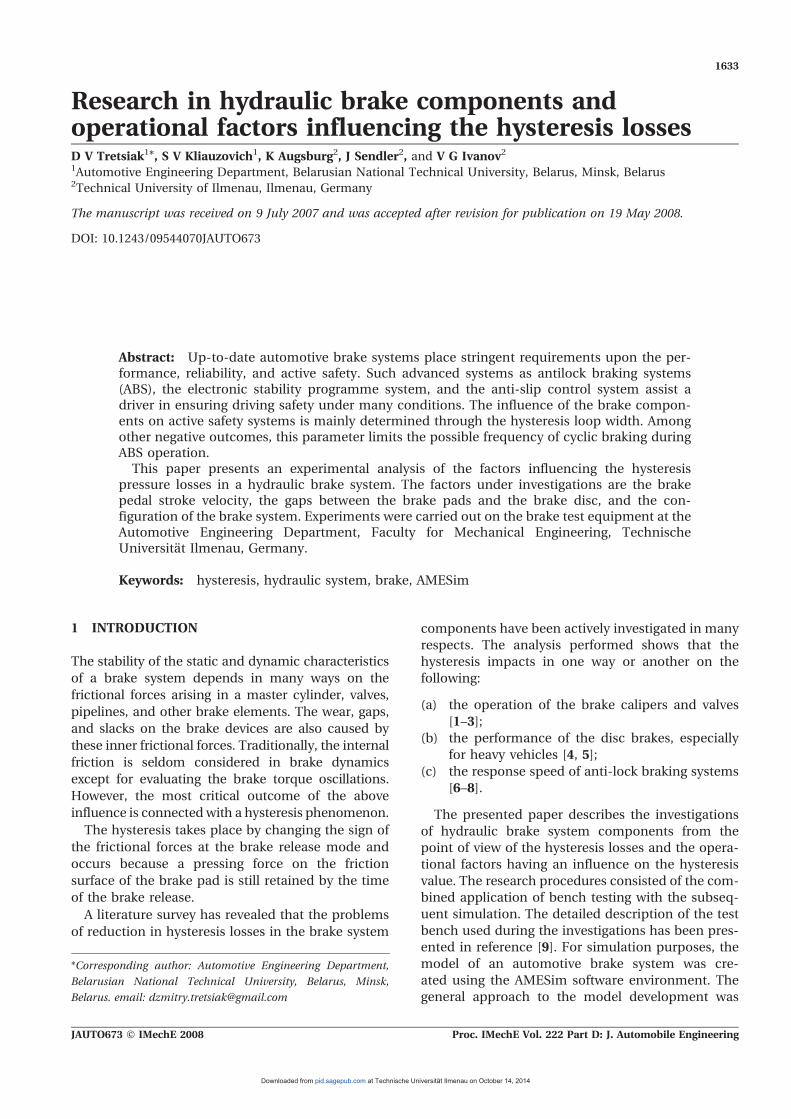
The experimental investigations of hydraulic brake
components were performed on the special test
bench configuration with a ‘brake robot’, allowing
the dynamic and precise reconstruction of the brake
pedal action. Table 1 shows the main data of the test
stand.
The following brake system components and equi-
pment were used for experiments: brake robot ac-
tuator, brake master cylinder, vacuum booster,
wheel brake, signal converter, real-time computer,
laptop with controlling software, force and pressure
sensors, hydraulic and vacuum pump, hydraulic and
vacuum tank, charging unit, storage batteries, over-
flow tank, and hydraulic and air pipes (Figs 1 and 2).
The research work consists of several stages.
1. The influence of the brake pedal stroke velocity
on hysteresis value is estimated; next the operat-
ing modes were chosen:
(a) steady state braking;
(b) service braking;
(c) emergency braking.
None of these braking modes has exact limits on
the brake pedal stroke velocity. From statistical and
practical data, the following intervals of brake pedal
stroke velocity were taken: steady state braking, 5–
15mm/s; service braking, 50–200mm/s; emergency
braking, 1000–1300mm/s [14]. Each of the velocity
intervals was divided into several parts during
experiments to obtain hysteresis characteristics for
all subintervals.
Table 1 Test bench data
Test concept ServohydraulicPedal force domain F5 0–5000NPedal velocity domain v5 0–1000mm/sMaximal frequency of sensor scanning 6 kHzTest modes Force control; stroke control; ramp-shaped control effort; oscillating control effortSafety measures Emergency switch; adjustable mechanical force limiter
Fig. 1 Structure of the component test bench forbraking systems: 1, hydraulic unit; 2, brakerobot actuator; 3, vacuum booster; 4, force anddisplacement sensors; 5, overflow tank; 6, brakemaster cylinder; 7, wheel brake with disc; 8,signal converter; 9, real-time computer; 10,laptop with suitable software; 11, vacuum unit
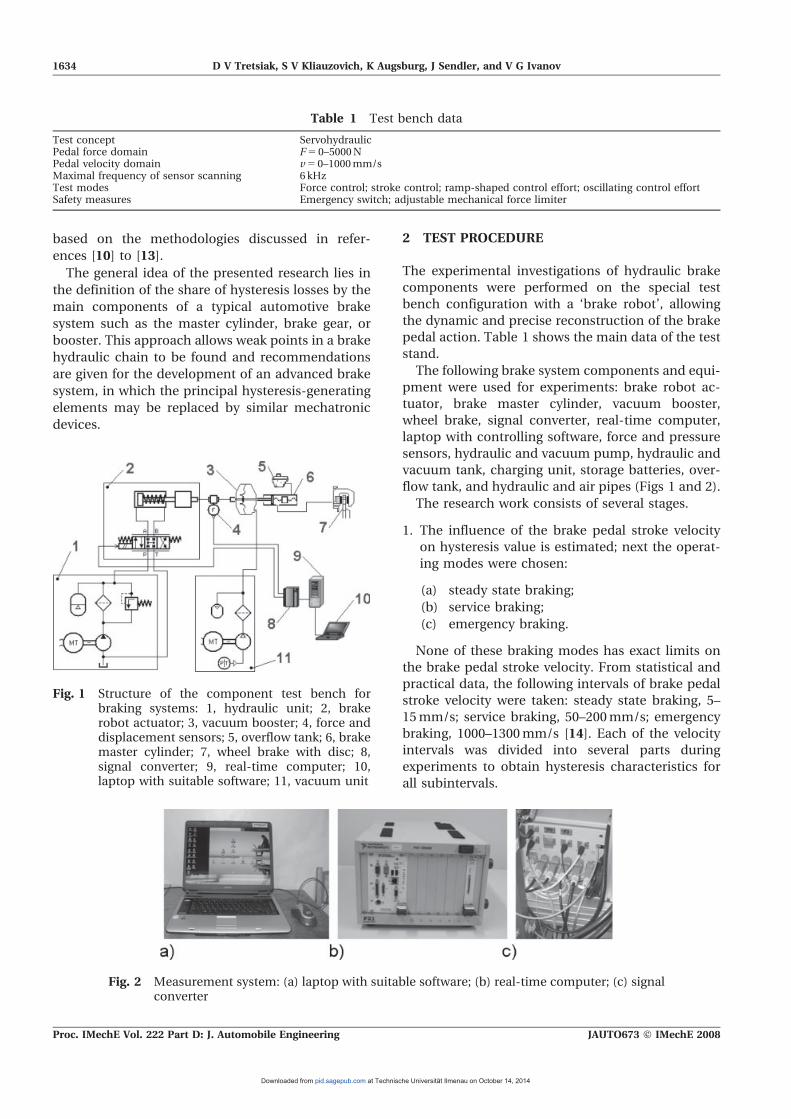
Fig. 2 Measurement system: (a) laptop with suitable software; (b) real-time computer; (c) signalconverter
1634 D V Tretsiak, S V Kliauzovich, K Augsburg, J Sendler, and V G Ivanov
Proc. IMechE Vol. 222 Part D: J. Automobile Engineering JAUTO673 F IMechE 2008
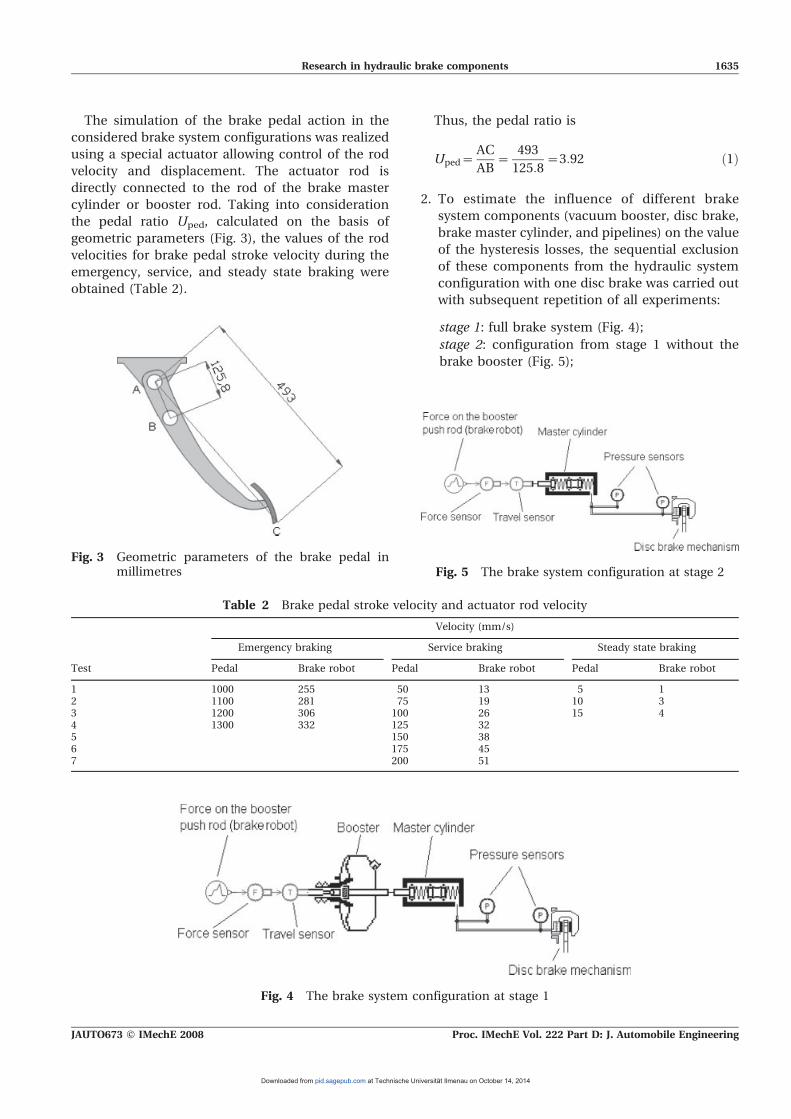
The simulation of the brake pedal action in the
considered brake system configurations was realized
using a special actuator allowing control of the rod
velocity and displacement. The actuator rod is
directly connected to the rod of the brake master
cylinder or booster rod. Taking into consideration
the pedal ratio Uped, calculated on the basis of
geometric parameters (Fig. 3), the values of the rod
velocities for brake pedal stroke velocity during the
emergency, service, and steady state braking were
obtained (Table 2).
Thus, the pedal ratio is
Uped~AC
AB~
493
125:8~3:92 ð1Þ
2. To estimate the influence of different brake
system components (vacuum booster, disc brake,
brake master cylinder, and pipelines) on the value
of the hysteresis losses, the sequential exclusion
of these components from the hydraulic system
configuration with one disc brake was carried out
with subsequent repetition of all experiments:
stage 1: full brake system (Fig. 4);
stage 2: configuration from stage 1 without the
brake booster (Fig. 5);
Fig. 3 Geometric parameters of the brake pedal inmillimetres
Table 2 Brake pedal stroke velocity and actuator rod velocity
Test
Velocity (mm/s)
Emergency braking Service braking Steady state braking
Pedal Brake robot Pedal Brake robot Pedal Brake robot
1 1000 255 50 13 5 12 1100 281 75 19 10 33 1200 306 100 26 15 44 1300 332 125 325 150 386 175 457 200 51
Fig. 4 The brake system configuration at stage 1
Fig. 5 The brake system configuration at stage 2
Research in hydraulic brake components 1635
JAUTO673 F IMechE 2008 Proc. IMechE Vol. 222 Part D: J. Automobile Engineering
stage 3: configuration from stage 2 without the
disc brake mechanism (Fig. 6);
stage 4: configuration with the hydraulic pipes
only (Fig. 7).
3 ANALYSIS OF EXPERIMENTAL RESULTS
The hysteresis, as applied to the performed brake-
testing procedures, is derived from the dependence
between the pressure actuating on the brake gear
and the brake pedal (actuator rod) displacement.
Because of the strong non-linearity of this phenom-
enon, the method of areas limited by the hysteresis
characteristic curves during the braking and brake
release and abscissa axis is used for calculation of
the hysteresis losses.
The hysteresis values were calculated from the
area inside the build-up and release curves. First, the
polynomials of quintic orders describing the experi-
mental curves have been formed using special
statistical software. Then the above-mentioned poly-
nomials have been integrated.
The pressure in the brake gear can be successfully
converted to the braking force via a reduced co-
efficient of conversion. The force integral over the
displacement gives the work done by the brake gear
to create the braking pressure; the hysteresis losses
are equivalent to the parasitic work of the brake gear.
In addition, the pressure integral over the displace-
ment gives the hysteresis work reduced to the
pressure (specific pressure hysteresis).
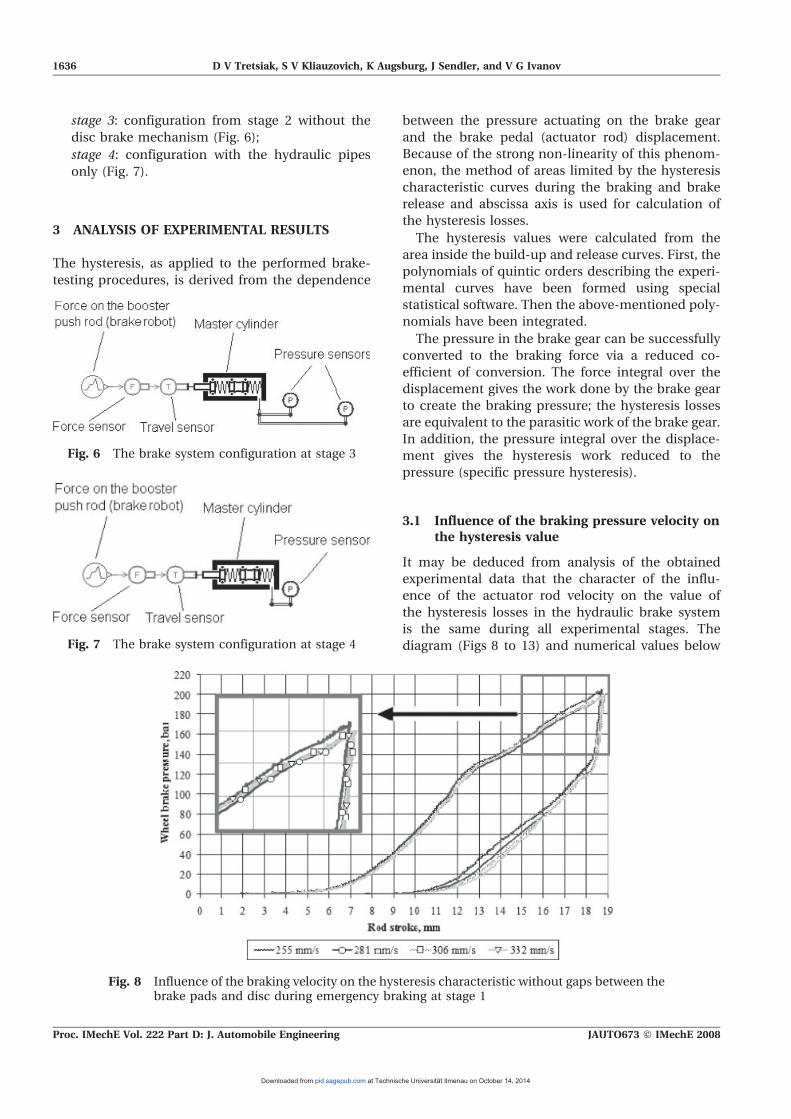
3.1 Influence of the braking pressure velocity onthe hysteresis value
It may be deduced from analysis of the obtained
experimental data that the character of the influ-
ence of the actuator rod velocity on the value of
the hysteresis losses in the hydraulic brake system
is the same during all experimental stages. The
diagram (Figs 8 to 13) and numerical values below
Fig. 6 The brake system configuration at stage 3
Fig. 7 The brake system configuration at stage 4
Fig. 8 Influence of the braking velocity on the hysteresis characteristic without gaps between thebrake pads and disc during emergency braking at stage 1
1636 D V Tretsiak, S V Kliauzovich, K Augsburg, J Sendler, and V G Ivanov
Proc. IMechE Vol. 222 Part D: J. Automobile Engineering JAUTO673 F IMechE 2008
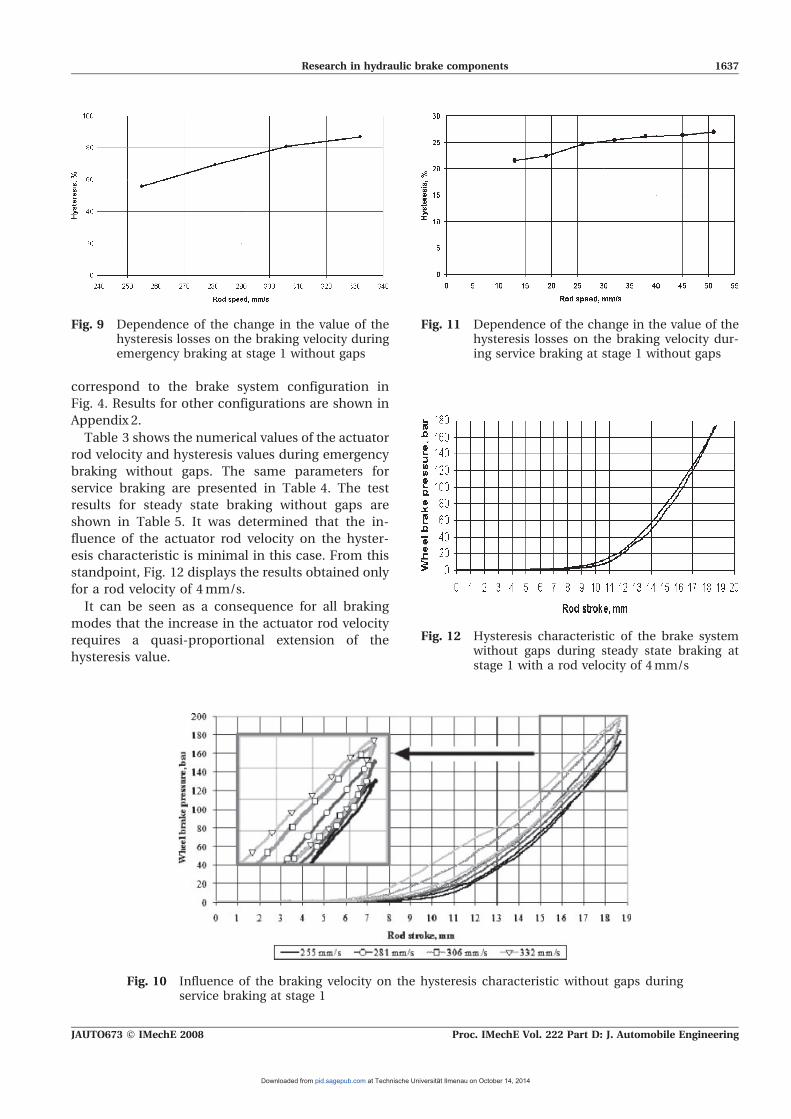
correspond to the brake system configuration in
Fig. 4. Results for other configurations are shown in
Appendix 2.
Table 3 shows the numerical values of the actuator
rod velocity and hysteresis values during emergency
braking without gaps. The same parameters for
service braking are presented in Table 4. The test
results for steady state braking without gaps are
shown in Table 5. It was determined that the in-
fluence of the actuator rod velocity on the hyster-
esis characteristic is minimal in this case. From this
standpoint, Fig. 12 displays the results obtained only
for a rod velocity of 4mm/s.
It can be seen as a consequence for all braking
modes that the increase in the actuator rod velocity
requires a quasi-proportional extension of the
hysteresis value.
Fig. 9 Dependence of the change in the value of thehysteresis losses on the braking velocity duringemergency braking at stage 1 without gaps
Fig. 10 Influence of the braking velocity on the hysteresis characteristic without gaps duringservice braking at stage 1
Fig. 11 Dependence of the change in the value of thehysteresis losses on the braking velocity dur-ing service braking at stage 1 without gaps
Fig. 12 Hysteresis characteristic of the brake systemwithout gaps during steady state braking atstage 1 with a rod velocity of 4mm/s
Research in hydraulic brake components 1637
JAUTO673 F IMechE 2008 Proc. IMechE Vol. 222 Part D: J. Automobile Engineering
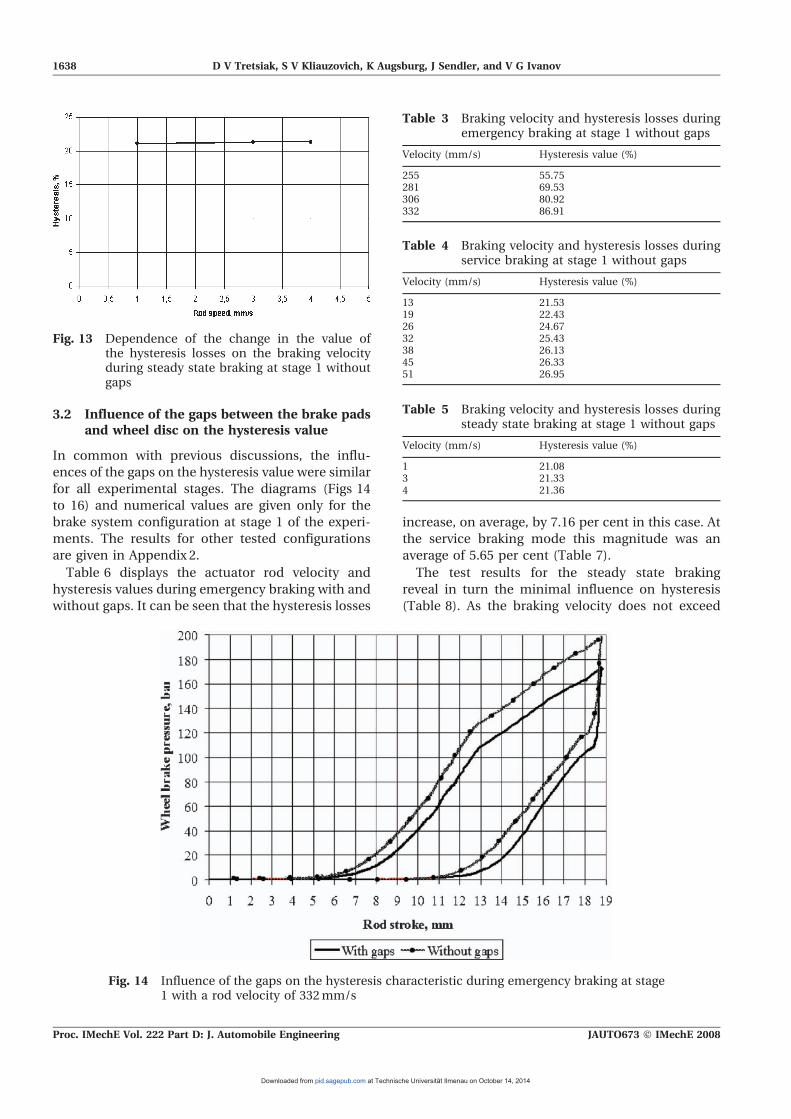
3.2 Influence of the gaps between the brake padsand wheel disc on the hysteresis value
In common with previous discussions, the influ-
ences of the gaps on the hysteresis value were similar
for all experimental stages. The diagrams (Figs 14
to 16) and numerical values are given only for the
brake system configuration at stage 1 of the experi-
ments. The results for other tested configurations
are given in Appendix 2.
Table 6 displays the actuator rod velocity and
hysteresis values during emergency braking with and
without gaps. It can be seen that the hysteresis losses
increase, on average, by 7.16 per cent in this case. At
the service braking mode this magnitude was an
average of 5.65 per cent (Table 7).
The test results for the steady state braking
reveal in turn the minimal influence on hysteresis
(Table 8). As the braking velocity does not exceed
Fig. 13 Dependence of the change in the value ofthe hysteresis losses on the braking velocityduring steady state braking at stage 1 withoutgaps
Table 3 Braking velocity and hysteresis losses duringemergency braking at stage 1 without gaps
Velocity (mm/s) Hysteresis value (%)
255 55.75281 69.53306 80.92332 86.91
Table 4 Braking velocity and hysteresis losses duringservice braking at stage 1 without gaps
Velocity (mm/s) Hysteresis value (%)
13 21.5319 22.4326 24.6732 25.4338 26.1345 26.3351 26.95
Table 5 Braking velocity and hysteresis losses duringsteady state braking at stage 1 without gaps
Velocity (mm/s) Hysteresis value (%)
1 21.083 21.334 21.36
Fig. 14 Influence of the gaps on the hysteresis characteristic during emergency braking at stage1 with a rod velocity of 332mm/s
1638 D V Tretsiak, S V Kliauzovich, K Augsburg, J Sendler, and V G Ivanov
Proc. IMechE Vol. 222 Part D: J. Automobile Engineering JAUTO673 F IMechE 2008
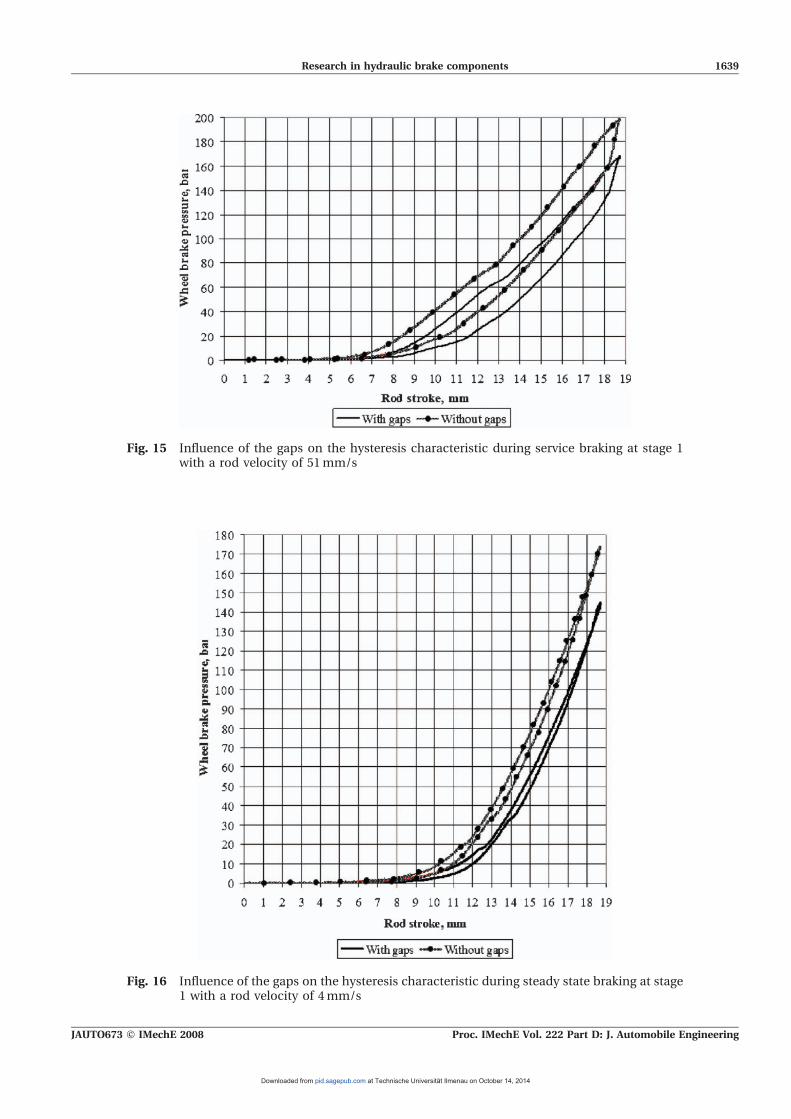
Fig. 15 Influence of the gaps on the hysteresis characteristic during service braking at stage 1with a rod velocity of 51mm/s
Fig. 16 Influence of the gaps on the hysteresis characteristic during steady state braking at stage1 with a rod velocity of 4mm/s
Research in hydraulic brake components 1639
JAUTO673 F IMechE 2008 Proc. IMechE Vol. 222 Part D: J. Automobile Engineering
4mm/s, the hysteresis value changes are not greater
than 4.8 per cent.
3.3 Theoretical justification of the pressurefluctuation in the brake pipeline at highvelocities of the brake pedal stroke
Stage 3 of the experiments (without the disc brake)
revealed the pressure fluctuation in the brake pipe-
line at emergency braking. Because of removal of the
disc brake, the hydraulic pipeline was blanked off. As
a result, the stiffness of the system rose sharply. It
was found from a literature survey that such wave
processes in pipelines have been investigated and
proved in detail in references [15] to [17]. The sharp
displacement of the actuator rod at a high velocity
causes an elastic wave in the pipeline. This elastic
wave propagates along the full length of the pipeline
and reflects from the bullnose at the end of the tube.
Then the wave reflected from the piston returns to
the beginning of the pipeline where it again reflects.
A new wave, which has then formed, approaches
the bullnose and reflects from it. By the interaction
with the bullnose, new waves eventually occur. The
described phenomenon becomes especially compli-
cated in the case of a non-uniform pipeline.
To verify the factors influencing the nature of
the apparent fluctuations in brake pressure, the
model of wave processes in pipelines has been inves-
tigated using AMESim software for the ufilized config-
uration of hydraulic brake system (a pipe diameter of
4.5mm and a wall thickness of 0.1mm). The corre-
sponding AMESim model of the pipeline is presented
in Fig. 17. The AMESim pipeline model has the
following distinctive features.
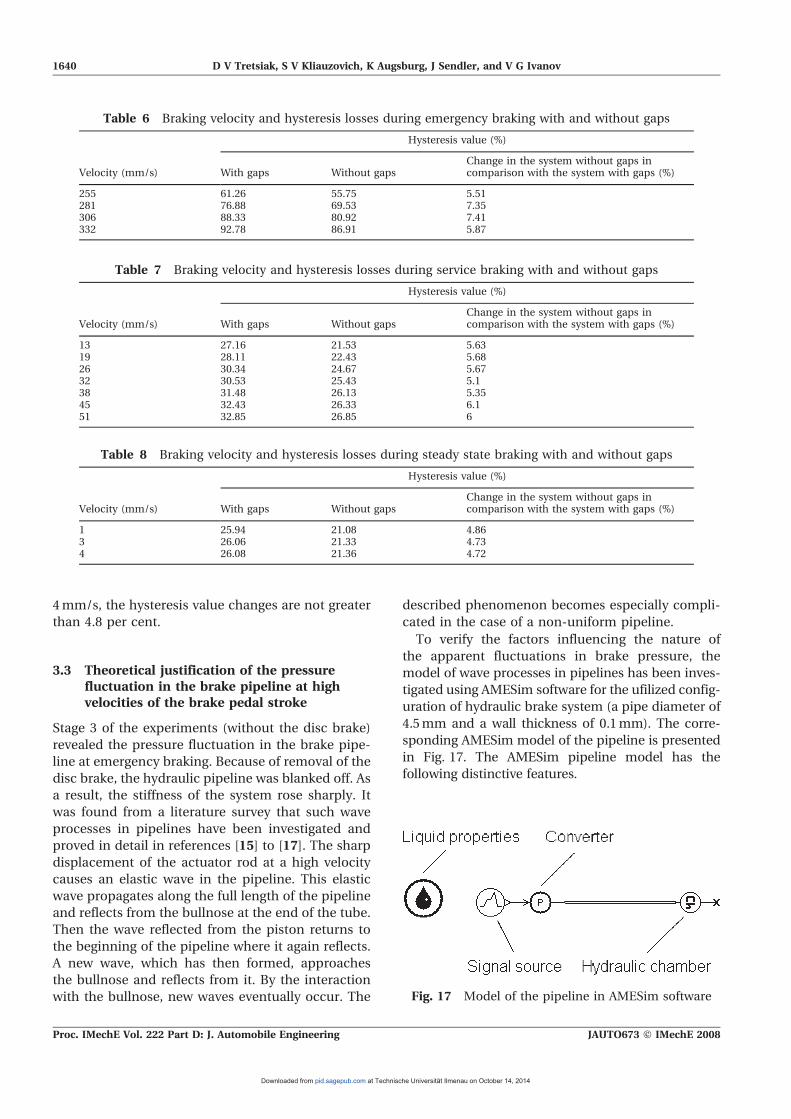
Table 6 Braking velocity and hysteresis losses during emergency braking with and without gaps
Velocity (mm/s)
Hysteresis value (%)
With gaps Without gapsChange in the system without gaps incomparison with the system with gaps (%)
255 61.26 55.75 5.51281 76.88 69.53 7.35306 88.33 80.92 7.41332 92.78 86.91 5.87
Table 7 Braking velocity and hysteresis losses during service braking with and without gaps
Velocity (mm/s)
Hysteresis value (%)
With gaps Without gapsChange in the system without gaps incomparison with the system with gaps (%)
13 27.16 21.53 5.6319 28.11 22.43 5.6826 30.34 24.67 5.6732 30.53 25.43 5.138 31.48 26.13 5.3545 32.43 26.33 6.151 32.85 26.85 6
Table 8 Braking velocity and hysteresis losses during steady state braking with and without gaps
Velocity (mm/s)
Hysteresis value (%)
With gaps Without gapsChange in the system without gaps incomparison with the system with gaps (%)
1 25.94 21.08 4.863 26.06 21.33 4.734 26.08 21.36 4.72
Fig. 17 Model of the pipeline in AMESim software
1640 D V Tretsiak, S V Kliauzovich, K Augsburg, J Sendler, and V G Ivanov
Proc. IMechE Vol. 222 Part D: J. Automobile Engineering JAUTO673 F IMechE 2008
1. Compressibility of the fluid and expansion of the
pipe wall with pressure are taken into account by
using an effective bulk modulus. This can be
calculated from the wall thickness and Young’s
modulus for the wall material.
2. Pipe friction is taken into account using a friction
factor based on the Reynolds number and relative
roughness. The value of absolute roughness for
the simulated pipeline is 1.5 mm.
3. Inertia of the fluid is taken into account and wave
dynamics equations are used.
The full system of equations describing the hyd-
raulic components in AMESim software has been
given in reference [18]. The main equations adapted
to the investigated brake hydraulic system are cited
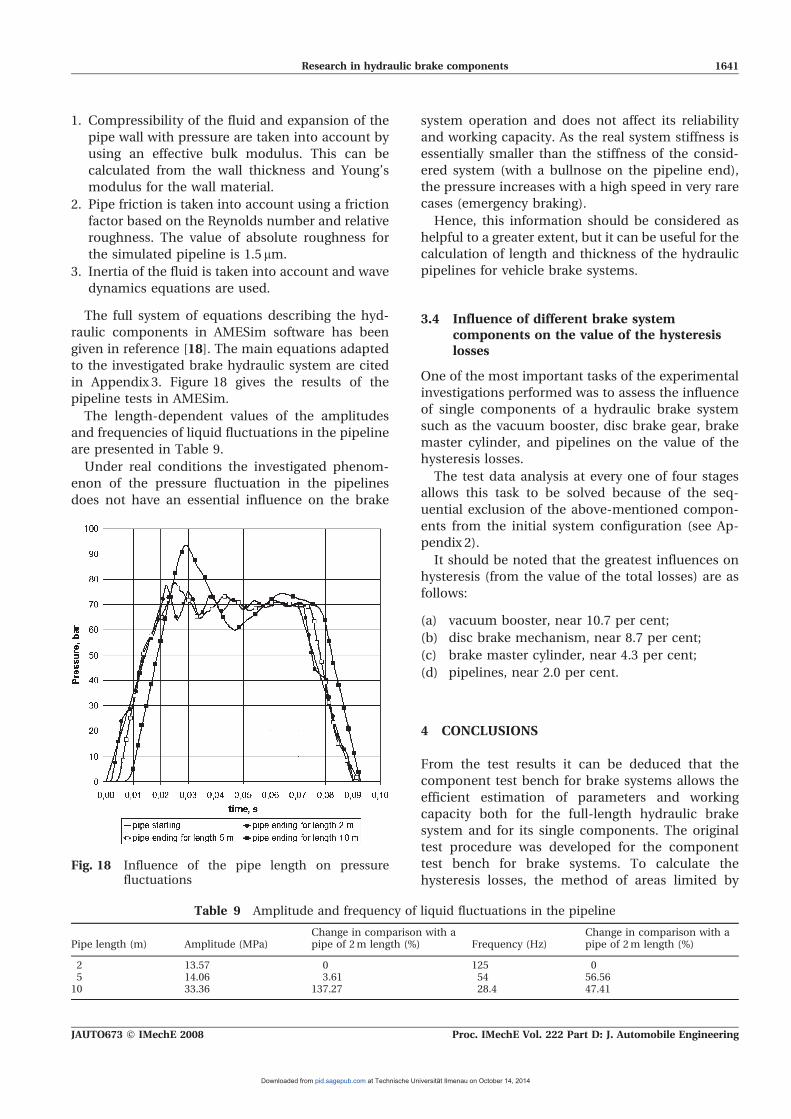
in Appendix 3. Figure 18 gives the results of the
pipeline tests in AMESim.
The length-dependent values of the amplitudes
and frequencies of liquid fluctuations in the pipeline
are presented in Table 9.
Under real conditions the investigated phenom-
enon of the pressure fluctuation in the pipelines
does not have an essential influence on the brake
system operation and does not affect its reliability
and working capacity. As the real system stiffness is
essentially smaller than the stiffness of the consid-
ered system (with a bullnose on the pipeline end),
the pressure increases with a high speed in very rare
cases (emergency braking).
Hence, this information should be considered as
helpful to a greater extent, but it can be useful for the
calculation of length and thickness of the hydraulic
pipelines for vehicle brake systems.
3.4 Influence of different brake systemcomponents on the value of the hysteresislosses
One of the most important tasks of the experimental
investigations performed was to assess the influence
of single components of a hydraulic brake system
such as the vacuum booster, disc brake gear, brake
master cylinder, and pipelines on the value of the
hysteresis losses.
The test data analysis at every one of four stages
allows this task to be solved because of the seq-
uential exclusion of the above-mentioned compon-
ents from the initial system configuration (see Ap-
pendix 2).
It should be noted that the greatest influences on
hysteresis (from the value of the total losses) are as
follows:
(a) vacuum booster, near 10.7 per cent;
(b) disc brake mechanism, near 8.7 per cent;
(c) brake master cylinder, near 4.3 per cent;
(d) pipelines, near 2.0 per cent.
4 CONCLUSIONS
From the test results it can be deduced that the
component test bench for brake systems allows the
efficient estimation of parameters and working
capacity both for the full-length hydraulic brake
system and for its single components. The original
test procedure was developed for the component
test bench for brake systems. To calculate the
hysteresis losses, the method of areas limited byFig. 18 Influence of the pipe length on pressure
fluctuations
Table 9 Amplitude and frequency of liquid fluctuations in the pipeline
Pipe length (m) Amplitude (MPa)Change in comparison with apipe of 2m length (%) Frequency (Hz)
Change in comparison with apipe of 2m length (%)
2 13.57 0 125 05 14.06 3.61 54 56.56
10 33.36 137.27 28.4 47.41
Research in hydraulic brake components 1641
JAUTO673 F IMechE 2008 Proc. IMechE Vol. 222 Part D: J. Automobile Engineering
the hysteresis characteristic curves of the brake
pressure build-up and release and by the abscissa
axis was used in this work.
The first investigated problem (stage 1) was the
influence of the brake pedal stroke velocity (actuator
rod velocity) on the hysteresis value. Regarding the
analysis of the experimental data obtained, it was
found that, when the actuator rod velocity increases
during both the service and emergency braking, the
hysteresis value increases nearly in proportion to
this velocity growth (Tables 3 to 5).
The second area of the investigation (stage 2)
covered the influence of the gaps between the brake
pads and wheel disc on the hysteresis value. It was
determined that the hysteresis losses in the hydrau-
lic brake system with gaps between the brake pads
and wheel disc increased on average by 7.16 per cent
during emergency braking and by 5.65 per cent
during service braking. During steady state braking,
the influence of the gaps was minimal.
The research stage 3, which consisted of the
experimental work (without the disc brake) together
with the AMESim simulation for emergency braking,
revealed a pressure fluctuation in the brake pipeline.
Here the correlation between the pipeline length and
the amplitude and frequency for fluctuations was
found.
The last part of the presented work (stage 4) deals
with an analysis of the influences of different braking
system components on the hysteresis value. The cor-
responding effects were evaluated for each of the
brake components.
The results obtained allow the formulation of
recommendations for the design of long-term brake
systems with reduced hysteresis losses and small
response time.
The research performedmade it possible to indicate
‘trouble spots’ in the vehicle hydraulic brake system
from the viewpoint of hysteresis losses, i.e. the brake
devices, which should be eliminated first through
their replacement by ‘brake-by-wire’ components.
ACKNOWLEDGEMENT
The authors would like to thank anonymous re-viewers for their criticism which allowed the contentof the paper to be improved.
REFERENCES
1 Tao, J. J. and Chang, H. T. A system approach tothe drag performance of disc brake caliper. SAEtechnical paper 2003-01-3300, 2003.
2 Kikovic, B. Defining the optional geometry ofproportional valve using computer simulation. InProceedings of the International Conference onThe computer as a tool (EUROCON 2005), 21–24November 2005, vol. 2, pp. 1271–1274 (IEEE, NewYork).
3 Lee, J.-C., Shin, H.-M., and Jo, H.-Y. A study ofthe effects of entrained air in a hydraulic brakeactuator. Proc. IMechE, Part D: J. Automobile Eng-ineering, 2008, 222(2), 285–292.
4 Baumgartner, H. and Theiss, A. Comparison ofpneumatic and hydraulic disk brakes for heavyduty application. SAE technical paper 902202, 1990.
5 Wang, X. D., Li, C., and Wang, X. Dynamiccharacteristics analysis of brake system for heavy-duty, off-highway vehicle. SAE technical paper2004-01-2638, 2004.
6 Galaktionov, A. M. and Poluektov, V. V. Anti-lockbraking system and operation of brake drive (inRussian). Automot. Ind., 1990, (5), 13.
7 Ren, L., Chen, H., and Wang, T. Dynamic systemidentification of Audi disc brake under anti-lockcondition. In Proceedings of the IEEE InternationalVehicle Electronics Conference (IVEC ’99), 6–9September 1999, vol. 1, pp. 78–81 (IEEE, New York).
8 Dupuis, V. Development of new drum brake. InProceedings of the 25th International m-Sympo-sium – Brake Conference, Bad Neuenahr, Germany,17–18 June 2005, pp. 95–101 (VDI Publishing,Dusseldosf).
9 Trutschel, R. Analytische und experimentelleUntersuchung der Mensch–Maschine-Schnittstellenvon Pkw-Bremsanlagen, 2007, p. 189 (Universitats-verlag Ilmenau, Ilmenau).
10 Ballinger, R. S. Disc brake corner system modelingand simulation. SAE technical paper 1999-01-3400,1999.
11 Yamada, T. Development and implementation ofsimulation tool for vehicle brake system. SAEtechnical paper 2001-01-0034, 2001.
12 Fortina, A., Velardocchia, M., and Sorniotti, A.Braking system components modelling. SAE tech-nical paper 2003-01-3335, 2003.
13 Petruccelli, L., Velardocchia, M., and Sorniotti, A.Electro-hydraulic braking system modeling andsimulation. SAE technical paper 2003-01-3336,2003.
14 Doi, S. I., Nagiri, S., and Amano, Y. Evaluation ofactive safety performance of man-vehicle system.National Highway Traffic Safety Administrationpaper 98-S2-O-05, 2003.
15 Tarko, L. M. The wave process in pipelines ofhydromechanisms (in Russian), 1963 (State Scien-tific and Technical Publishing House of Machine-Building Literature, Moscow).
16 Watton, J. Fluid power systems, 1989, pp. 244–283(Prentice-Hall, Englewood Cliffs, New Jersey).
17 Viersma, T. J. Analysis, synthesis and design ofhydraulic servosystems and pipelines, 1980, pp.129–230 (Elsevier).
1642 D V Tretsiak, S V Kliauzovich, K Augsburg, J Sendler, and V G Ivanov
Proc. IMechE Vol. 222 Part D: J. Automobile Engineering JAUTO673 F IMechE 2008
18 LMS Imagine, Lab AMESim: user’s manual, 2007(LMS, Leuven).
APPENDIX 1
Notation
E resulting elasticity modulus of the
liquid–pipeline (or cylinder) complex
p pressure of the liquid
t time
x coordinate along the pipeline axis
APPENDIX 2
The experimental results are given in Table 10.
APPENDIX 3
The used submodel of a pipeline is described by six
internal pressure state variables and five internal
flow rate state variables forming a staggered grid as
follows: — C — (R — C)5x —, where C is the
equivalent chamber volume, R is the equivalent
resistance in a pipe section; 5x indicates that a pipe
is represented in the form of five sections with
identical volume and resistance.
The following system of equations [17] was used for
hydraulic brake system simulations in the AMESim
environment. Some standard AMESim calculation
procedures have been adapted to make a compre-
hensive analysis of wave processes in brake pipelines.
1. The volumetric compliance wcomp of a pipe is
wcomp~2
E
r2ozr2ir2o{r2i
zn 1{r2i
r2ozr2i
� �� �ð2Þ
where ro is the outer radius of a pipe, ri is the
inner radius of a pipe, n5 0.3 is Poisson’s ratio, E
is Young’s modulus of the wall material of the
pipe.
2. The volume V of the pipe is
V~V0 1zwcompp� � ð3Þ
where V0 is the volume of a pipe at a pressure of 0
Pa gauge, and p is the current pressure.
3. The effective bulk modulus of the brake liquid–
pipe combination is
Beff~1
1=BLzwcompð4Þ
where BL is the bulk modulus of the brake liquid
with the density r and is given by
BL~rdp
drð5Þ
4. The derivative of pressure is
dp
dt~
BeffQ
Vð6Þ
where Q is the net flowrate into the volume.
5. The general derivative of the pressure at the
internal pressure nodes is
LpLt
~{Beff
A
LQLx
ð7Þ
where A is the cross-sectional area of the pipe.
6. The general flowrate is
LQLt
~A
r
LpLx
{9:81A sin h
{VLQLx
{fQ2 sgn Qð Þ
2dAð8Þ
where d is the diameter of the section of pipe, h is
its inclination, and f is the friction factor.
Research in hydraulic brake components 1643
JAUTO673 F IMechE 2008 Proc. IMechE Vol. 222 Part D: J. Automobile Engineering
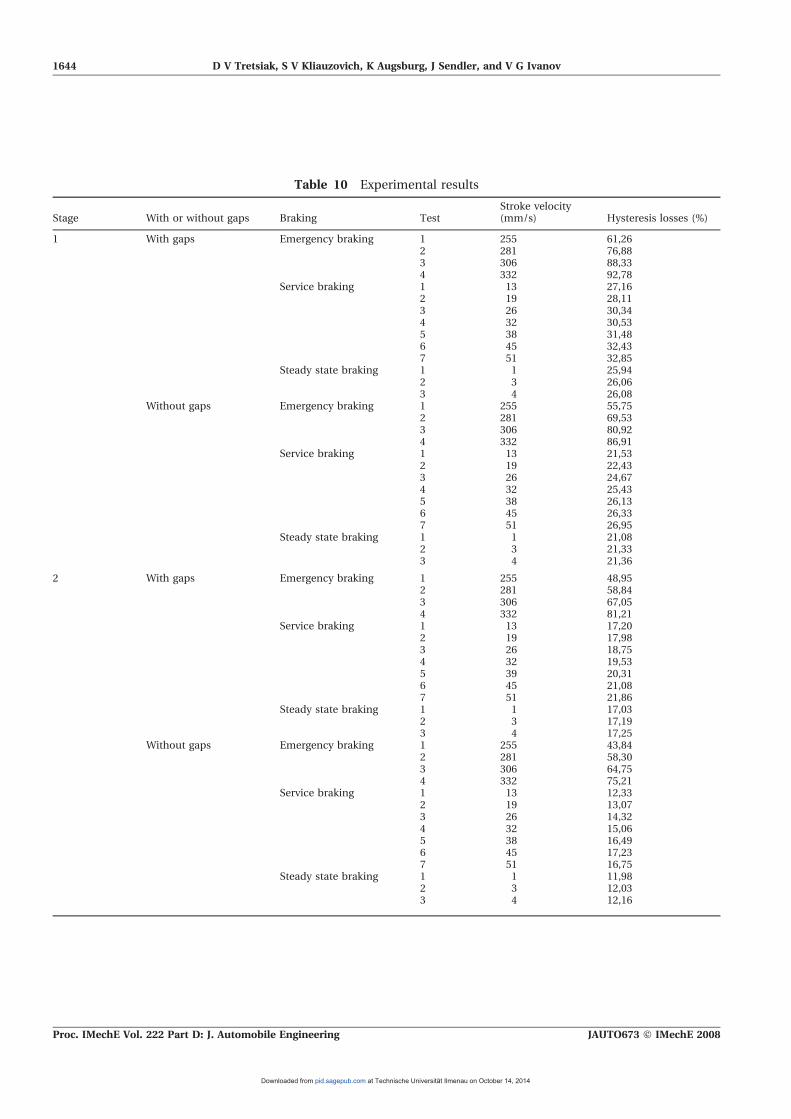
Table 10 Experimental results
Stage With or without gaps Braking TestStroke velocity(mm/s) Hysteresis losses (%)
1 With gaps Emergency braking 1 255 61,262 281 76,883 306 88,334 332 92,78
Service braking 1 13 27,162 19 28,113 26 30,344 32 30,535 38 31,486 45 32,437 51 32,85
Steady state braking 1 1 25,942 3 26,063 4 26,08
Without gaps Emergency braking 1 255 55,752 281 69,533 306 80,924 332 86,91
Service braking 1 13 21,532 19 22,433 26 24,674 32 25,435 38 26,136 45 26,337 51 26,95
Steady state braking 1 1 21,082 3 21,333 4 21,36
2 With gaps Emergency braking 1 255 48,952 281 58,843 306 67,054 332 81,21
Service braking 1 13 17,202 19 17,983 26 18,754 32 19,535 39 20,316 45 21,087 51 21,86
Steady state braking 1 1 17,032 3 17,193 4 17,25
Without gaps Emergency braking 1 255 43,842 281 58,303 306 64,754 332 75,21
Service braking 1 13 12,332 19 13,073 26 14,324 32 15,065 38 16,496 45 17,237 51 16,75
Steady state braking 1 1 11,982 3 12,033 4 12,16
1644 D V Tretsiak, S V Kliauzovich, K Augsburg, J Sendler, and V G Ivanov
Proc. IMechE Vol. 222 Part D: J. Automobile Engineering JAUTO673 F IMechE 2008
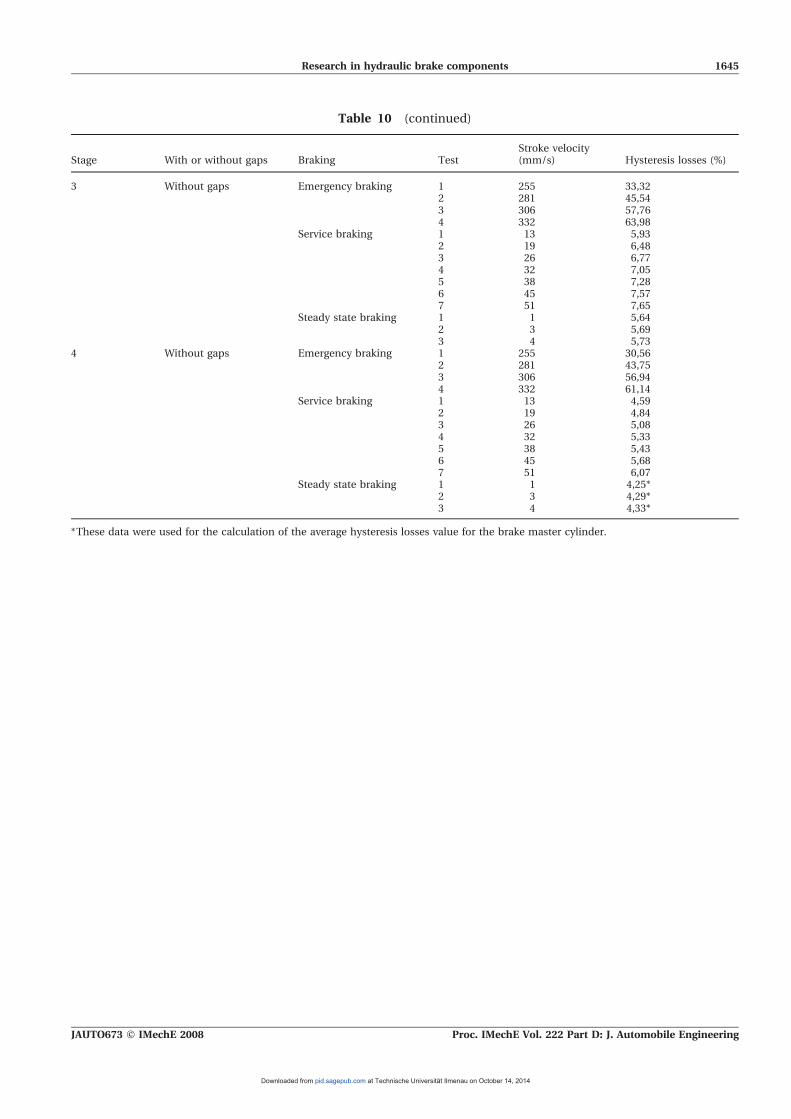
Stage With or without gaps Braking TestStroke velocity(mm/s) Hysteresis losses (%)
3 Without gaps Emergency braking 1 255 33,322 281 45,543 306 57,764 332 63,98
Service braking 1 13 5,932 19 6,483 26 6,774 32 7,055 38 7,286 45 7,577 51 7,65
Steady state braking 1 1 5,642 3 5,693 4 5,73
4 Without gaps Emergency braking 1 255 30,562 281 43,753 306 56,944 332 61,14
Service braking 1 13 4,592 19 4,843 26 5,084 32 5,335 38 5,436 45 5,687 51 6,07
Steady state braking 1 1 4,25*2 3 4,29*3 4 4,33*
*These data were used for the calculation of the average hysteresis losses value for the brake master cylinder.
Table 10 (continued)
Research in hydraulic brake components 1645
JAUTO673 F IMechE 2008 Proc. IMechE Vol. 222 Part D: J. Automobile Engineering