Embed Size (px)
Citation preview
Fakultät für Elektro- und Informationstechnik, Lehrstuhl für Kommunikationsnetze Prof. Dr.-Ing. Christian Wietfeld
technische universität dortmund
RF Mesh Systems for Smart Metering: System Architecture and Performance Evaluation
Christian Müller, Sebastian Subik, Andreas Wolff und Christian Wietfeld TU Dortmund, Communication Networks Institute (CNI)
Dortmund, Deutschland Email: {christian5.mueller, sebastian.subik, andreas.wolff, christian.wietfeld}@tu-dortmund.de
ITG FG5.2.1 Workshop: "Smart Grid" oder "Energie-Informationsnetze und Systeme“
Bremen, den 18.02.2011
IEEE SmartGridComm 2010 Beitrag in Kooperation mit Landis+Gyr: Lichtensteiger, B., Bjelajac, B., Müller, C. and Wietfeld, C., "RF Mesh Systems for Smart Metering: System Architecture and Performance" First IEEE International Conference on Smart Grid Communications (SmartGridComm 2010), Gaithersburg, Maryland, USA, IEEE, pages: 379 -384, Oct 2010.
Folie 2
Lehrstuhl für Kommunikationsnetze Prof. Dr.-Ing. C. Wietfeld
technische universität dortmund
Christian Müller RF Mesh Systems for Smart Metering:
System Architecture and Performance Evaluation
Agenda
Motivation and Problem Statement RF Mesh Systems for Smart Metering Scalability Analysis
Simulation Framework Network Model System Modules
Performance Evaluation
Models and Parameters Scenario 1: Small-scale scenario Scenario 2: Large-scale scenario
Conclusion and Outlook
Folie 3
Lehrstuhl für Kommunikationsnetze Prof. Dr.-Ing. C. Wietfeld
technische universität dortmund
Christian Müller RF Mesh Systems for Smart Metering:
System Architecture and Performance Evaluation
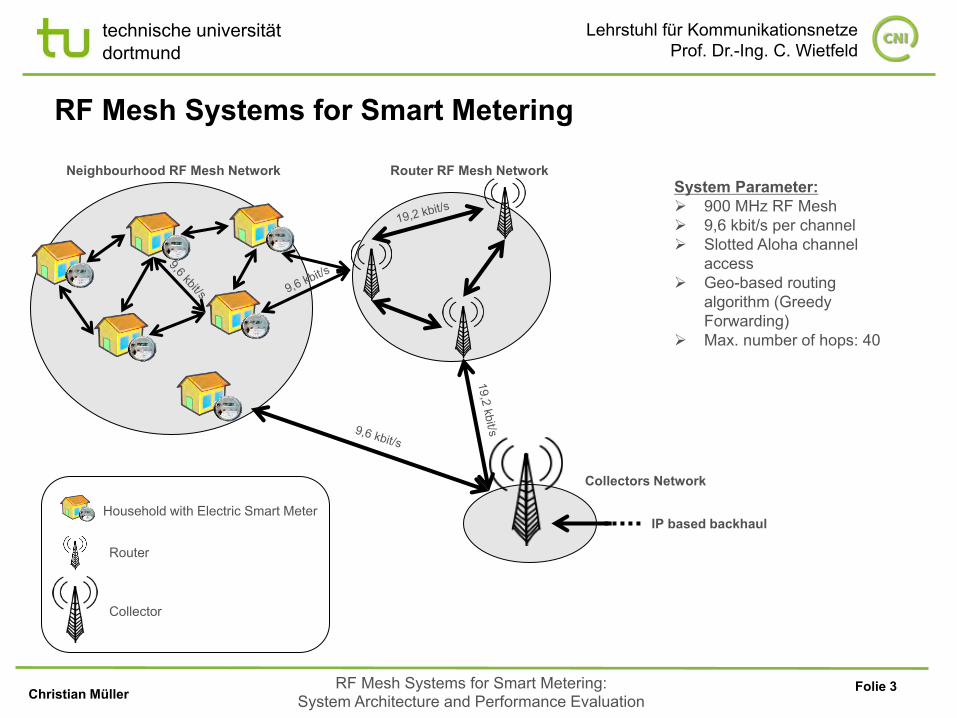
Router RF Mesh Network
RF Mesh Systems for Smart Metering
Household with Electric Smart Meter
Router
Collector
Neighbourhood RF Mesh Network
Collectors Network
IP based backhaul
System Parameter: 900 MHz RF Mesh 9,6 kbit/s per channel Slotted Aloha channel
access Geo-based routing
algorithm (Greedy Forwarding)
Max. number of hops: 40
Folie 4
Lehrstuhl für Kommunikationsnetze Prof. Dr.-Ing. C. Wietfeld
technische universität dortmund
Christian Müller RF Mesh Systems for Smart Metering:
System Architecture and Performance Evaluation
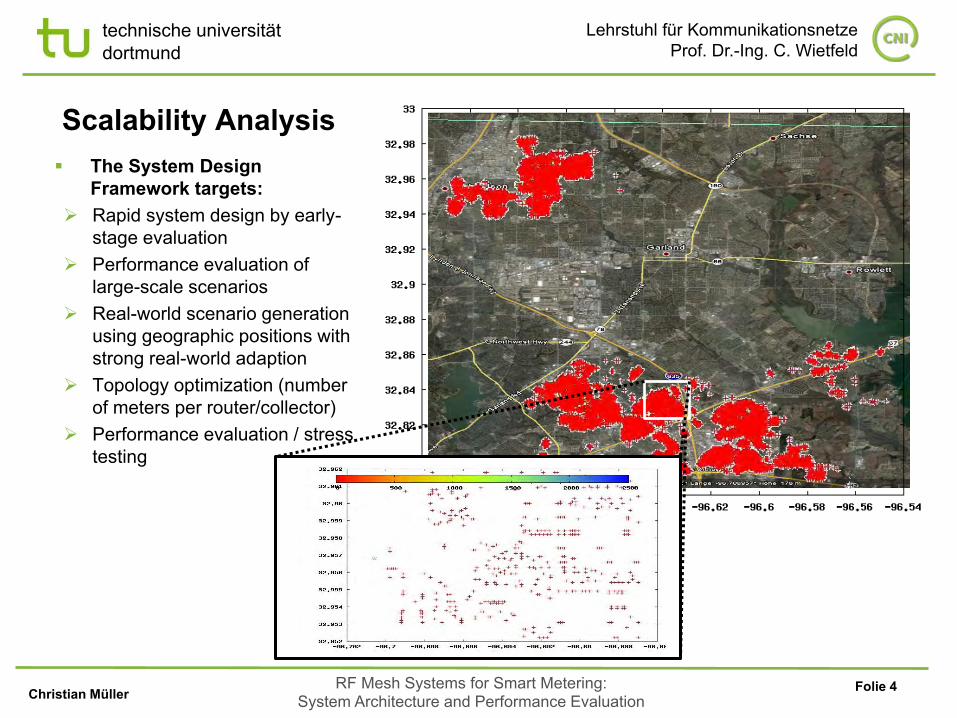
The System Design Framework targets:
Rapid system design by early-stage evaluation
Performance evaluation of large-scale scenarios
Real-world scenario generation using geographic positions with strong real-world adaption
Topology optimization (number of meters per router/collector)
Performance evaluation / stress testing
Scalability Analysis
Folie 5
Lehrstuhl für Kommunikationsnetze Prof. Dr.-Ing. C. Wietfeld
technische universität dortmund
Christian Müller RF Mesh Systems for Smart Metering:
System Architecture and Performance Evaluation
Sha
red
Cha
nnel
C
ontro
l
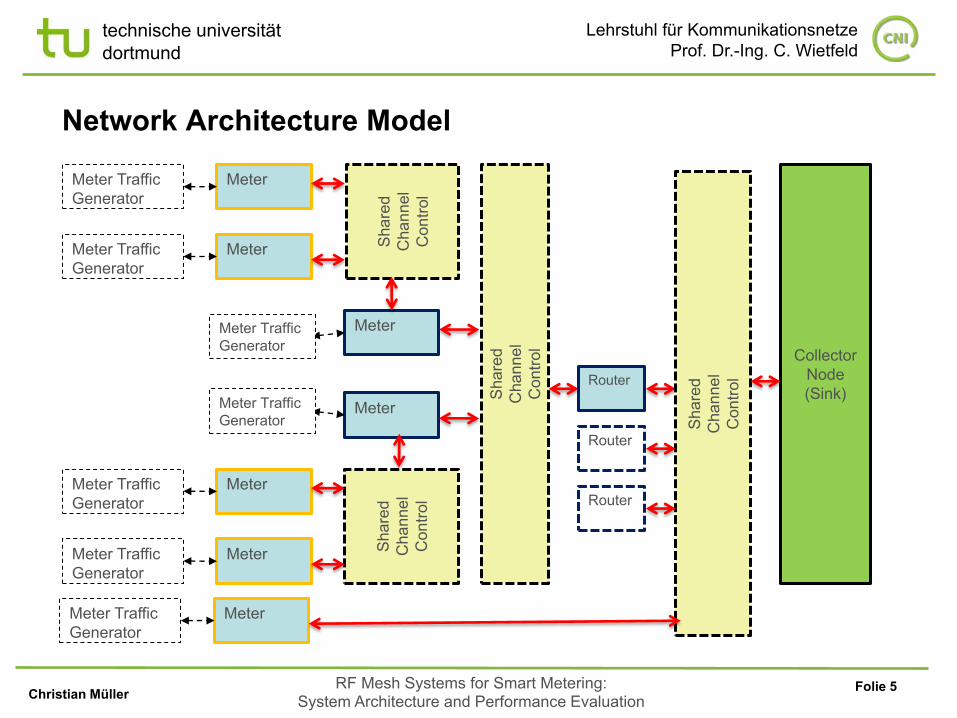
Network Architecture Model
Meter Traffic Generator
Meter
Meter Traffic Generator
Meter
Meter
Meter
Collector Node (Sink)
Meter Traffic Generator
Meter
Meter Traffic Generator
Meter
Sha
red
Cha
nnel
C
ontro
l
Sha
red
Cha
nnel
C
ontro
l
Router
Sha
red
Cha
nnel
C
ontro
l
Router
Router
Meter Traffic Generator
Meter Traffic Generator
Meter Traffic Generator
Meter
Folie 6
Lehrstuhl für Kommunikationsnetze Prof. Dr.-Ing. C. Wietfeld
technische universität dortmund
Christian Müller RF Mesh Systems for Smart Metering:
System Architecture and Performance Evaluation
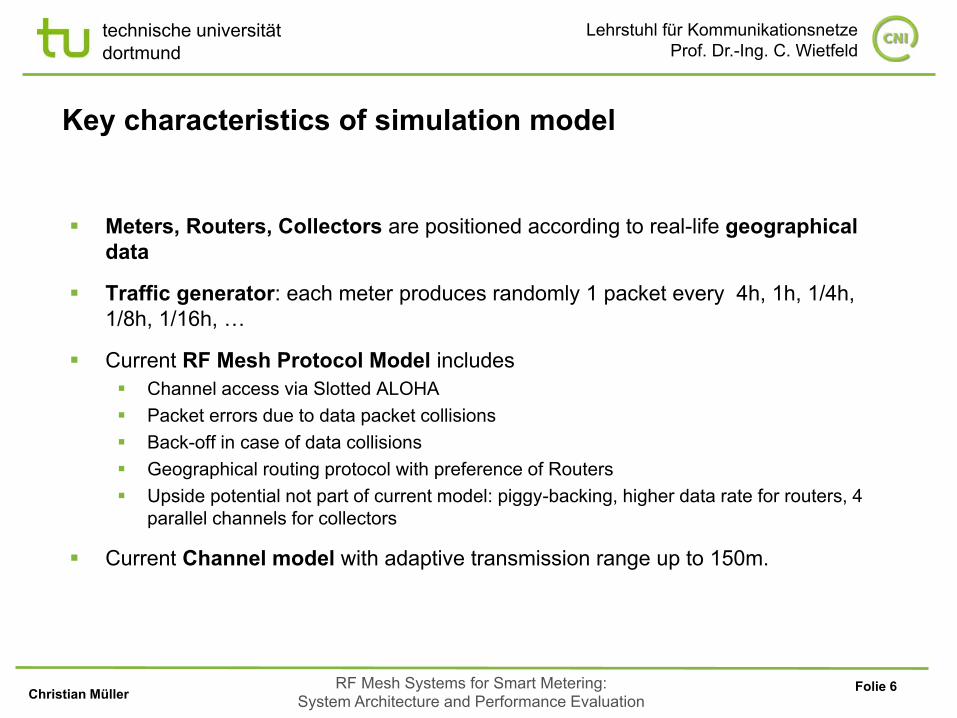
Key characteristics of simulation model
Meters, Routers, Collectors are positioned according to real-life geographical data
Traffic generator: each meter produces randomly 1 packet every 4h, 1h, 1/4h, 1/8h, 1/16h, …
Current RF Mesh Protocol Model includes Channel access via Slotted ALOHA Packet errors due to data packet collisions Back-off in case of data collisions Geographical routing protocol with preference of Routers Upside potential not part of current model: piggy-backing, higher data rate for routers, 4
parallel channels for collectors
Current Channel model with adaptive transmission range up to 150m.
Folie 7
Lehrstuhl für Kommunikationsnetze Prof. Dr.-Ing. C. Wietfeld
technische universität dortmund
Christian Müller RF Mesh Systems for Smart Metering:
System Architecture and Performance Evaluation
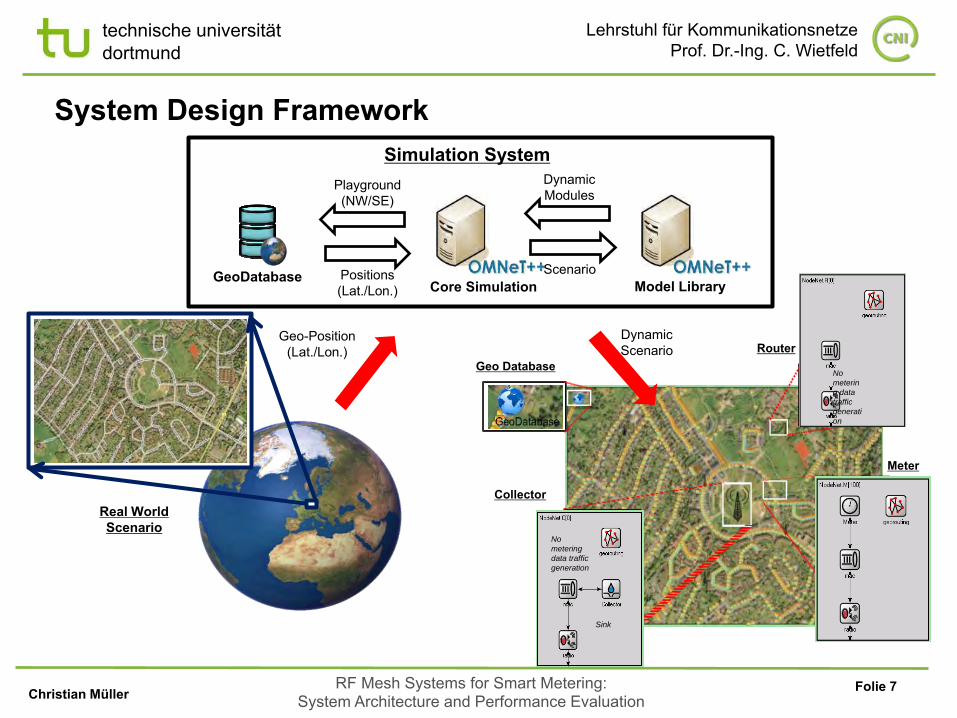
Dynamic Scenario
Geo Database Router
Meter
Collector
No
metering
data traffic
generation
Sink
No
meterin
g data
traffic
generati
on
System Design Framework
Real World Scenario
Geo-Position (Lat./Lon.)
GeoDatabase
Simulation System Playground (NW/SE)
Positions (Lat./Lon.)
Dynamic Modules
Model Library Core Simulation Scenario
Folie 8
Lehrstuhl für Kommunikationsnetze Prof. Dr.-Ing. C. Wietfeld
technische universität dortmund
Christian Müller RF Mesh Systems for Smart Metering:
System Architecture and Performance Evaluation
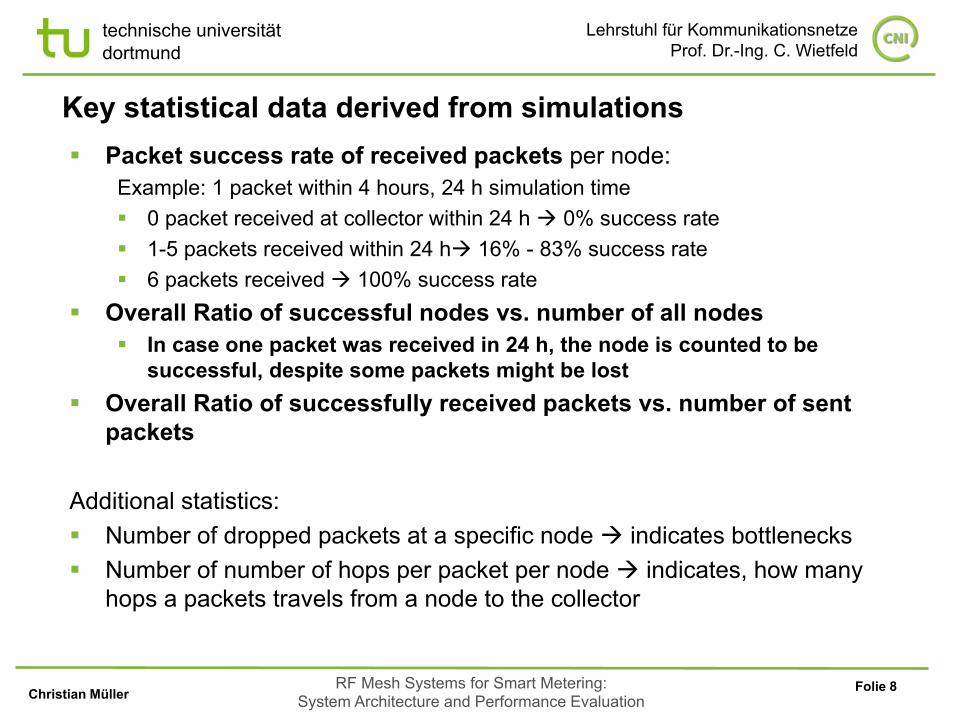
Key statistical data derived from simulations Packet success rate of received packets per node:
Example: 1 packet within 4 hours, 24 h simulation time 0 packet received at collector within 24 h 0% success rate 1-5 packets received within 24 h 16% - 83% success rate 6 packets received 100% success rate
Overall Ratio of successful nodes vs. number of all nodes In case one packet was received in 24 h, the node is counted to be
successful, despite some packets might be lost Overall Ratio of successfully received packets vs. number of sent
packets
Additional statistics: Number of dropped packets at a specific node indicates bottlenecks Number of number of hops per packet per node indicates, how many
hops a packets travels from a node to the collector
Folie 9
Lehrstuhl für Kommunikationsnetze Prof. Dr.-Ing. C. Wietfeld
technische universität dortmund
Christian Müller RF Mesh Systems for Smart Metering:
System Architecture and Performance Evaluation
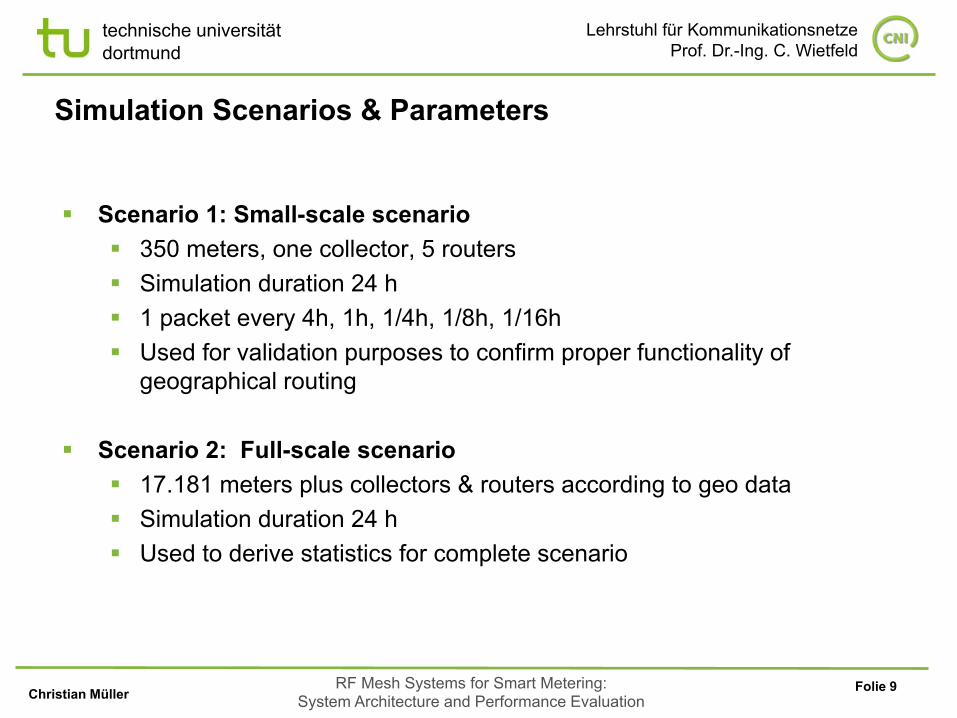
Simulation Scenarios & Parameters
Scenario 1: Small-scale scenario 350 meters, one collector, 5 routers Simulation duration 24 h 1 packet every 4h, 1h, 1/4h, 1/8h, 1/16h Used for validation purposes to confirm proper functionality of
geographical routing
Scenario 2: Full-scale scenario 17.181 meters plus collectors & routers according to geo data Simulation duration 24 h Used to derive statistics for complete scenario
Folie 10
Lehrstuhl für Kommunikationsnetze Prof. Dr.-Ing. C. Wietfeld
technische universität dortmund
Christian Müller RF Mesh Systems for Smart Metering:
System Architecture and Performance Evaluation
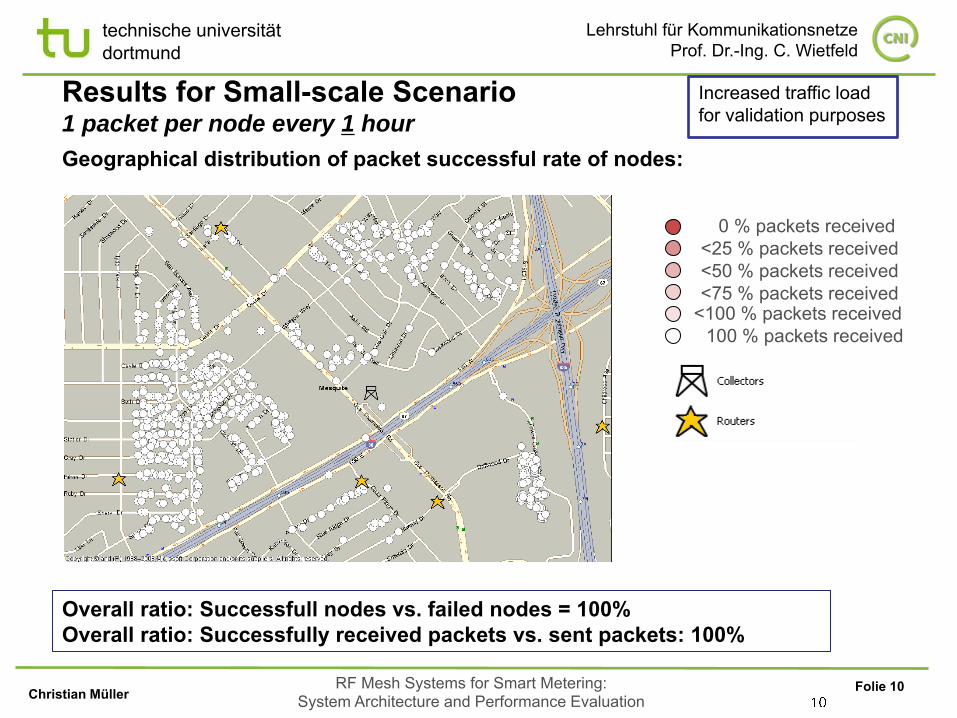
Results for Small-scale Scenario 1 packet per node every 1 hour
Geographical distribution of packet successful rate of nodes:
Overall ratio: Successfull nodes vs. failed nodes = 100% Overall ratio: Successfully received packets vs. sent packets: 100%
Increased traffic load for validation purposes
0 % packets received
<100 % packets received
<25 % packets received
<75 % packets received <50 % packets received
100 % packets received
Folie 11
Lehrstuhl für Kommunikationsnetze Prof. Dr.-Ing. C. Wietfeld
technische universität dortmund
Christian Müller RF Mesh Systems for Smart Metering:
System Architecture and Performance Evaluation
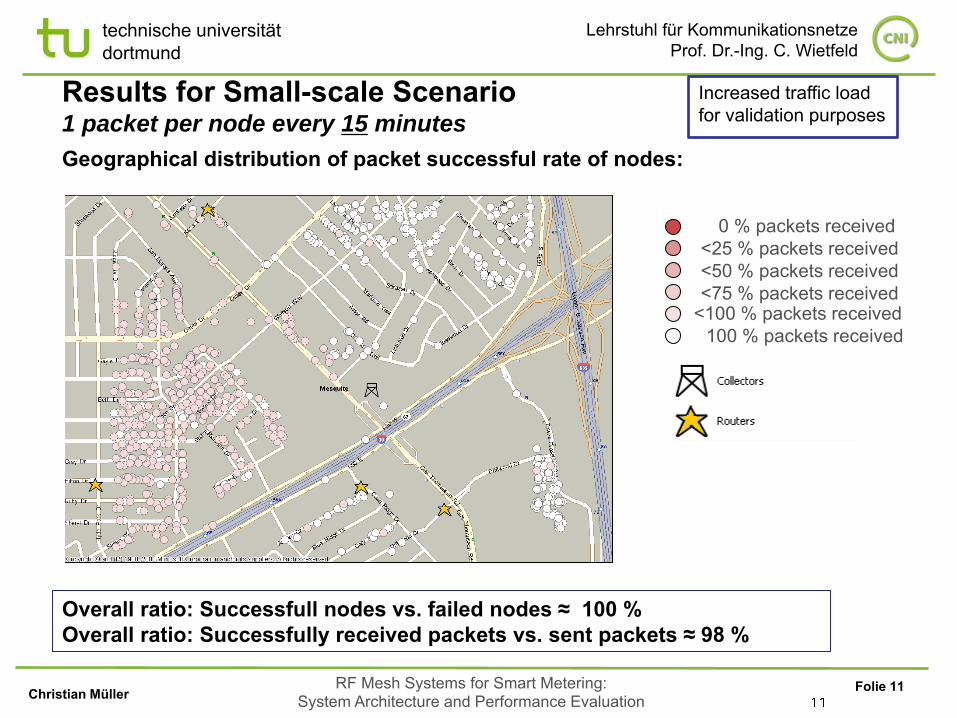
Results for Small-scale Scenario 1 packet per node every 15 minutes
Geographical distribution of packet successful rate of nodes:
Overall ratio: Successfull nodes vs. failed nodes ≈ 100 % Overall ratio: Successfully received packets vs. sent packets ≈ 98 %
0 % packets received
<100 % packets received
<25 % packets received
<75 % packets received <50 % packets received
≈
Increased traffic load for validation purposes
100 % packets received
Folie 12
Lehrstuhl für Kommunikationsnetze Prof. Dr.-Ing. C. Wietfeld
technische universität dortmund
Christian Müller RF Mesh Systems for Smart Metering:
System Architecture and Performance Evaluation
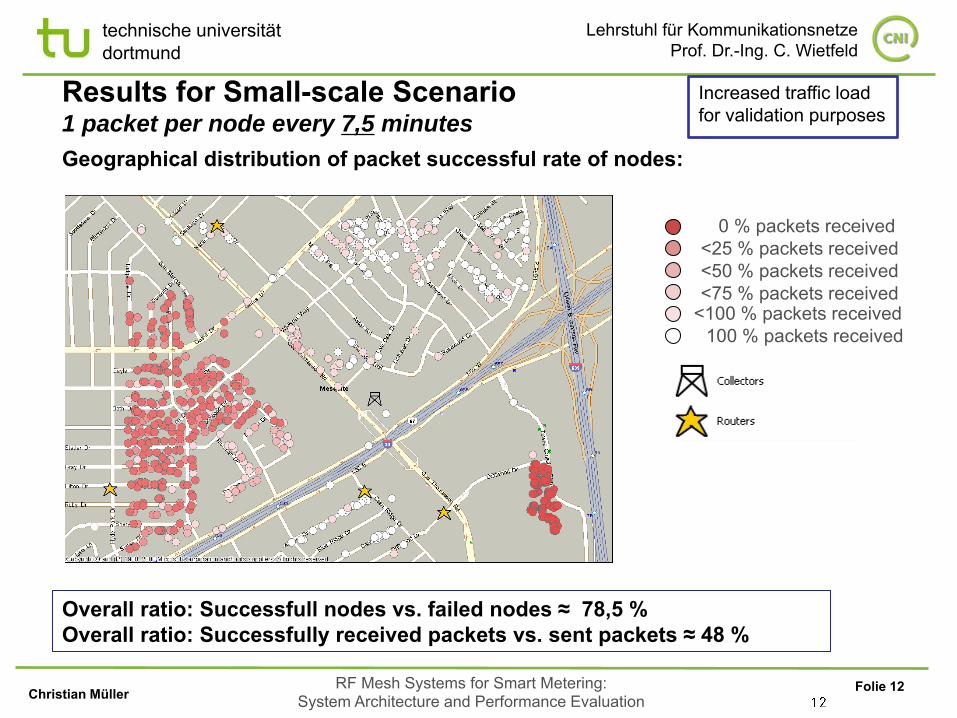
Results for Small-scale Scenario 1 packet per node every 7,5 minutes
Geographical distribution of packet successful rate of nodes:
Overall ratio: Successfull nodes vs. failed nodes ≈ 78,5 % Overall ratio: Successfully received packets vs. sent packets ≈ 48 %
Increased traffic load for validation purposes
0 % packets received
<100 % packets received
<25 % packets received
<75 % packets received <50 % packets received
100 % packets received
Folie 13
Lehrstuhl für Kommunikationsnetze Prof. Dr.-Ing. C. Wietfeld
technische universität dortmund
Christian Müller RF Mesh Systems for Smart Metering:
System Architecture and Performance Evaluation
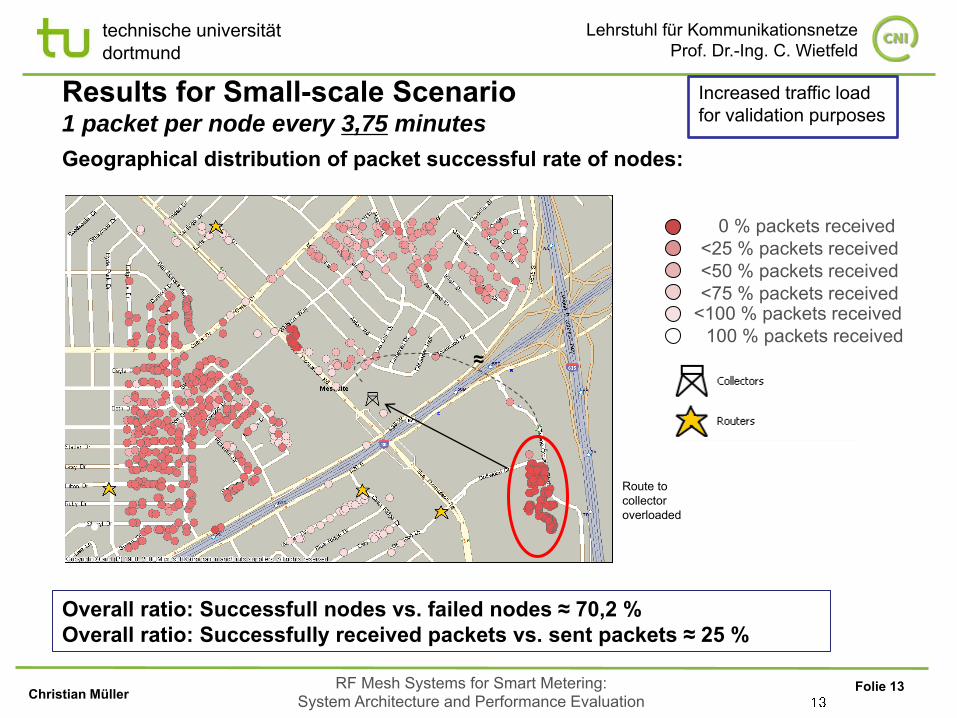
Results for Small-scale Scenario 1 packet per node every 3,75 minutes
Geographical distribution of packet successful rate of nodes:
Overall ratio: Successfull nodes vs. failed nodes ≈ 70,2 % Overall ratio: Successfully received packets vs. sent packets ≈ 25 %
≈
Increased traffic load for validation purposes
0 % packets received
<100 % packets received
<25 % packets received
<75 % packets received <50 % packets received
100 % packets received
Route to collector overloaded
Folie 14
Lehrstuhl für Kommunikationsnetze Prof. Dr.-Ing. C. Wietfeld
technische universität dortmund
Christian Müller RF Mesh Systems for Smart Metering:
System Architecture and Performance Evaluation
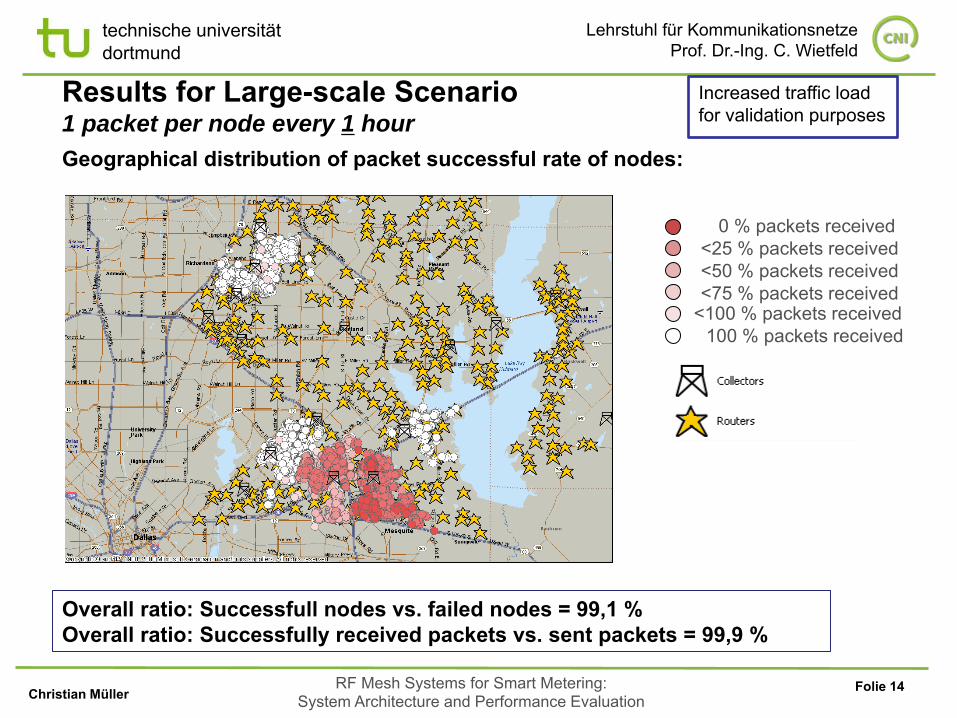
Results for Large-scale Scenario 1 packet per node every 1 hour
Geographical distribution of packet successful rate of nodes:
Overall ratio: Successfull nodes vs. failed nodes = 99,1 % Overall ratio: Successfully received packets vs. sent packets = 99,9 %
Increased traffic load for validation purposes
0 % packets received
<100 % packets received
<25 % packets received
<75 % packets received <50 % packets received
100 % packets received
Folie 15
Lehrstuhl für Kommunikationsnetze Prof. Dr.-Ing. C. Wietfeld
technische universität dortmund
Christian Müller RF Mesh Systems for Smart Metering:
System Architecture and Performance Evaluation
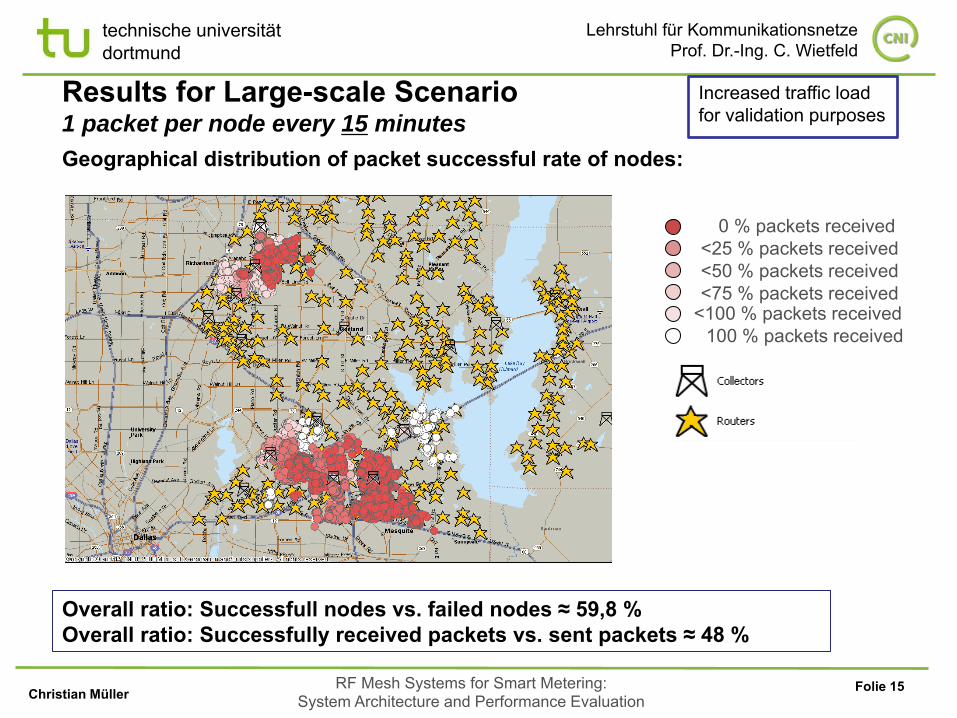
Results for Large-scale Scenario 1 packet per node every 15 minutes
Geographical distribution of packet successful rate of nodes:
Overall ratio: Successfull nodes vs. failed nodes ≈ 59,8 % Overall ratio: Successfully received packets vs. sent packets ≈ 48 %
0 % packets received
<100 % packets received
<25 % packets received
<75 % packets received <50 % packets received
≈
Increased traffic load for validation purposes
100 % packets received
Folie 16
Lehrstuhl für Kommunikationsnetze Prof. Dr.-Ing. C. Wietfeld
technische universität dortmund
Christian Müller RF Mesh Systems for Smart Metering:
System Architecture and Performance Evaluation
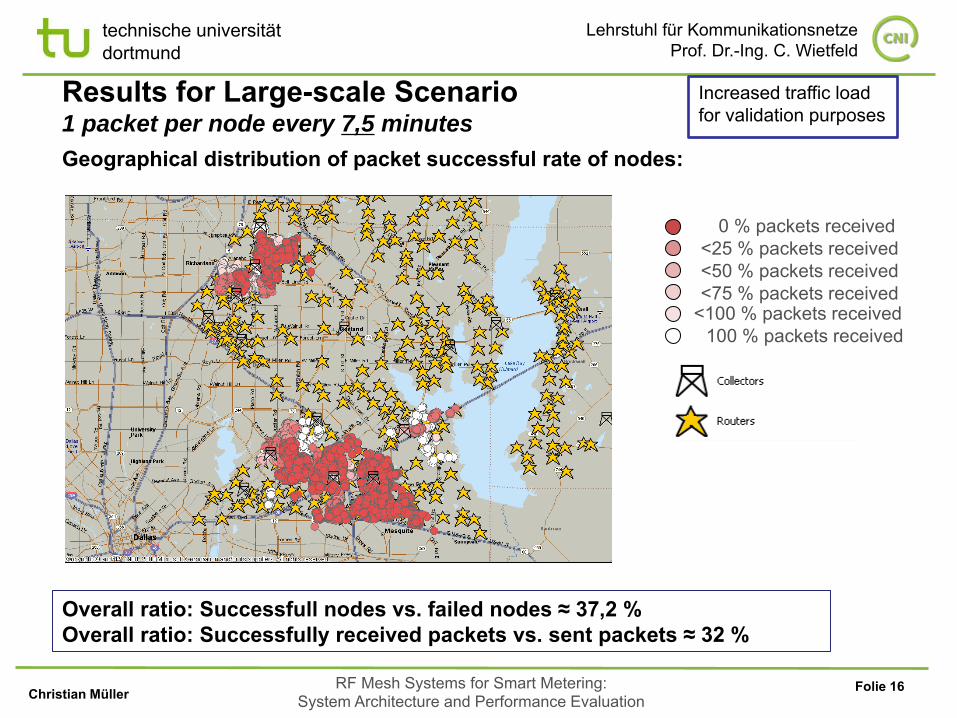
Results for Large-scale Scenario 1 packet per node every 7,5 minutes
Geographical distribution of packet successful rate of nodes:
Overall ratio: Successfull nodes vs. failed nodes ≈ 37,2 % Overall ratio: Successfully received packets vs. sent packets ≈ 32 %
Increased traffic load for validation purposes
0 % packets received
<100 % packets received
<25 % packets received
<75 % packets received <50 % packets received
100 % packets received
Folie 17
Lehrstuhl für Kommunikationsnetze Prof. Dr.-Ing. C. Wietfeld
technische universität dortmund
Christian Müller RF Mesh Systems for Smart Metering:
System Architecture and Performance Evaluation
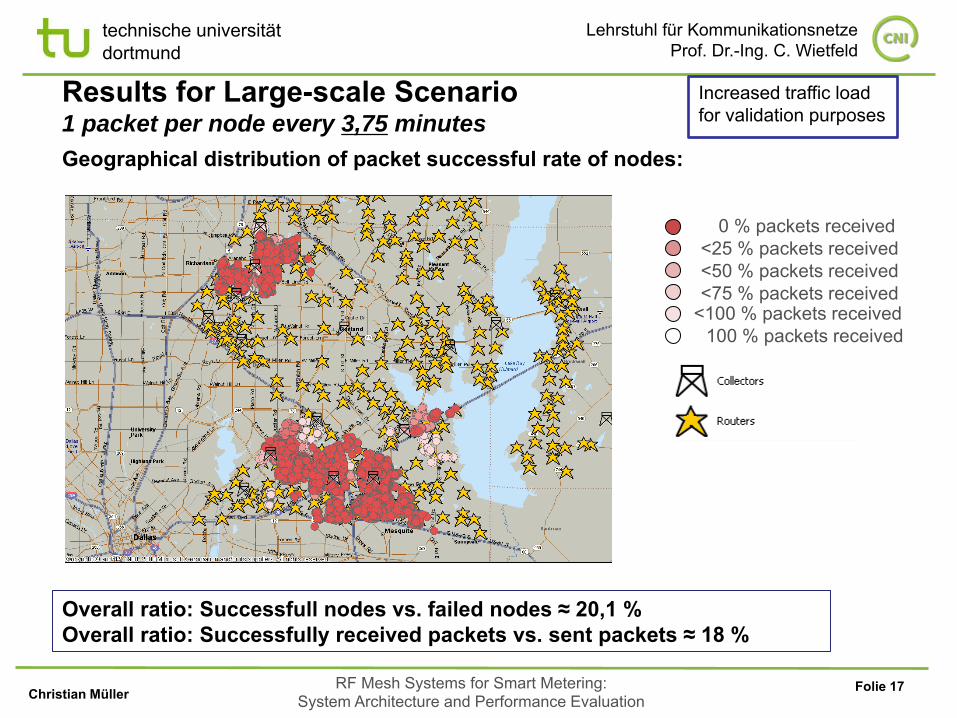
Results for Large-scale Scenario 1 packet per node every 3,75 minutes
Geographical distribution of packet successful rate of nodes:
Overall ratio: Successfull nodes vs. failed nodes ≈ 20,1 % Overall ratio: Successfully received packets vs. sent packets ≈ 18 %
Increased traffic load for validation purposes
0 % packets received
<100 % packets received
<25 % packets received
<75 % packets received <50 % packets received
100 % packets received
Folie 18
Lehrstuhl für Kommunikationsnetze Prof. Dr.-Ing. C. Wietfeld
technische universität dortmund
Christian Müller RF Mesh Systems for Smart Metering:
System Architecture and Performance Evaluation
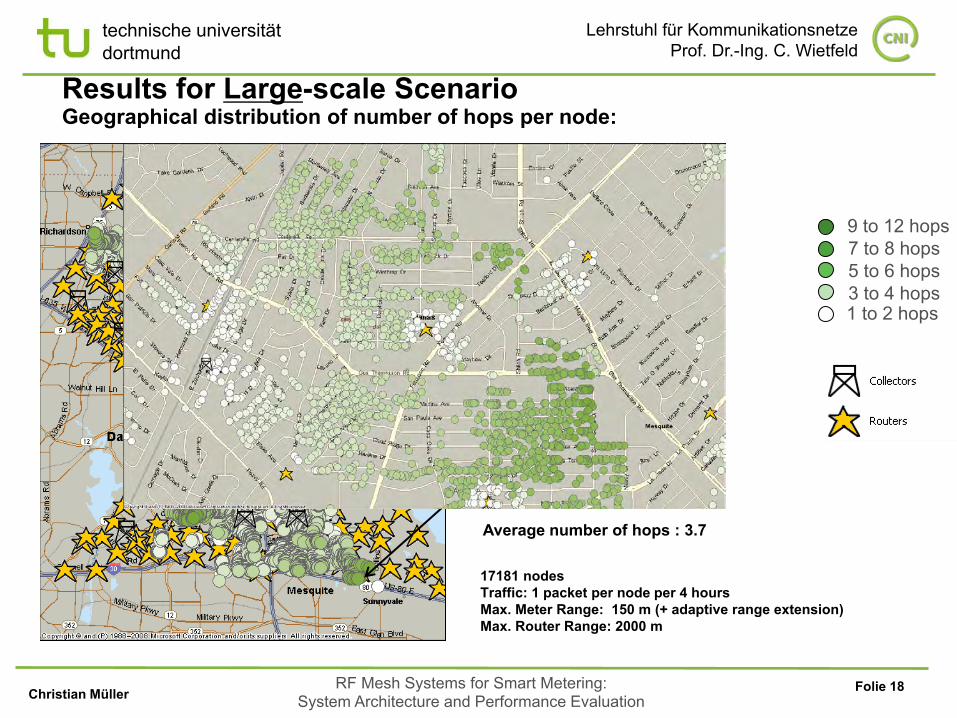
Results for Large-scale Scenario Geographical distribution of number of hops per node:
9 to 12 hops
1 to 2 hops
7 to 8 hops
3 to 4 hops 5 to 6 hops
17181 nodes Traffic: 1 packet per node per 4 hours Max. Meter Range: 150 m (+ adaptive range extension) Max. Router Range: 2000 m
Average number of hops : 3.7
1 to 3 hops to collector
9 to 12 hops to collector
Folie 19
Lehrstuhl für Kommunikationsnetze Prof. Dr.-Ing. C. Wietfeld
technische universität dortmund
Christian Müller RF Mesh Systems for Smart Metering:
System Architecture and Performance Evaluation
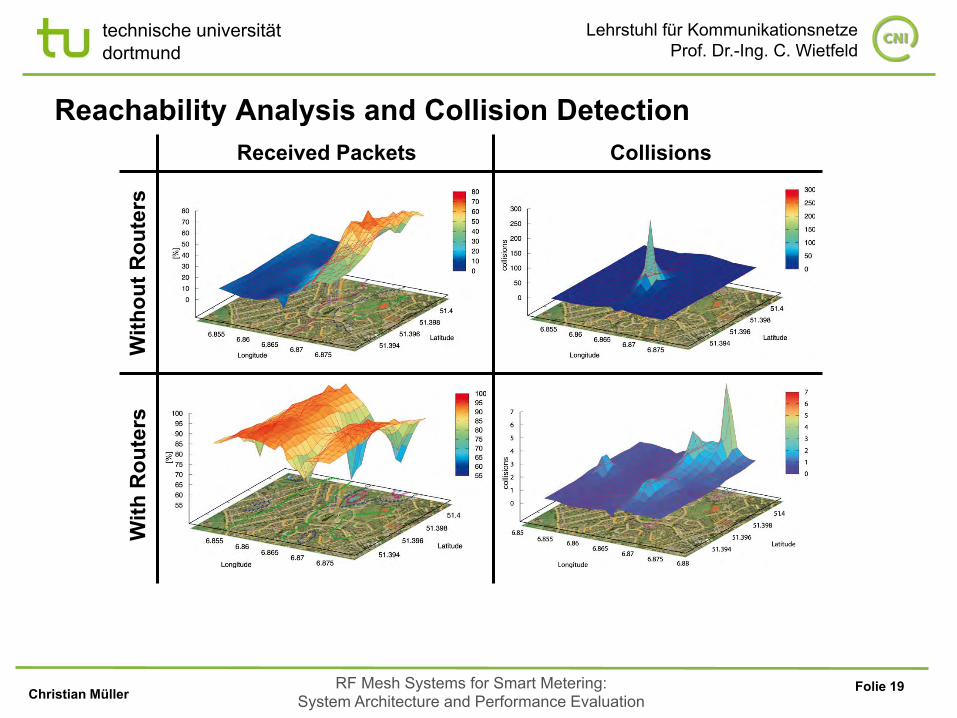
Reachability Analysis and Collision Detection Collisions Received Packets
With
out R
oute
rs
With
Rou
ters
Folie 20
Lehrstuhl für Kommunikationsnetze Prof. Dr.-Ing. C. Wietfeld
technische universität dortmund
Christian Müller RF Mesh Systems for Smart Metering:
System Architecture and Performance Evaluation
Conclusion
Simulations have confirmed, that with the given traffic of 1 packet per 4 hours, the system performs well (99,99% success rate)
Precondition: all nodes are properly meshed connectivity gaps caused by geography need to be closed with routers/range extensions
Data collisions occur, but do not lead to significant failures Detection of Point of Failure in advance to the field deployment Optimisation of location-based topology problems
Outlook BMWi E-Energy Project „E-DeMa“:
Geobased evaluation of ICT topologies with different technologies Traffic load and protocol optimization
DFG Forschergruppe „Neue Schutz- und Leitsysteme für Energiesysteme“:
Hybrid simulator for ICT and energy components
Folie 21
Lehrstuhl für Kommunikationsnetze Prof. Dr.-Ing. C. Wietfeld
technische universität dortmund
Christian Müller RF Mesh Systems for Smart Metering:
System Architecture and Performance Evaluation
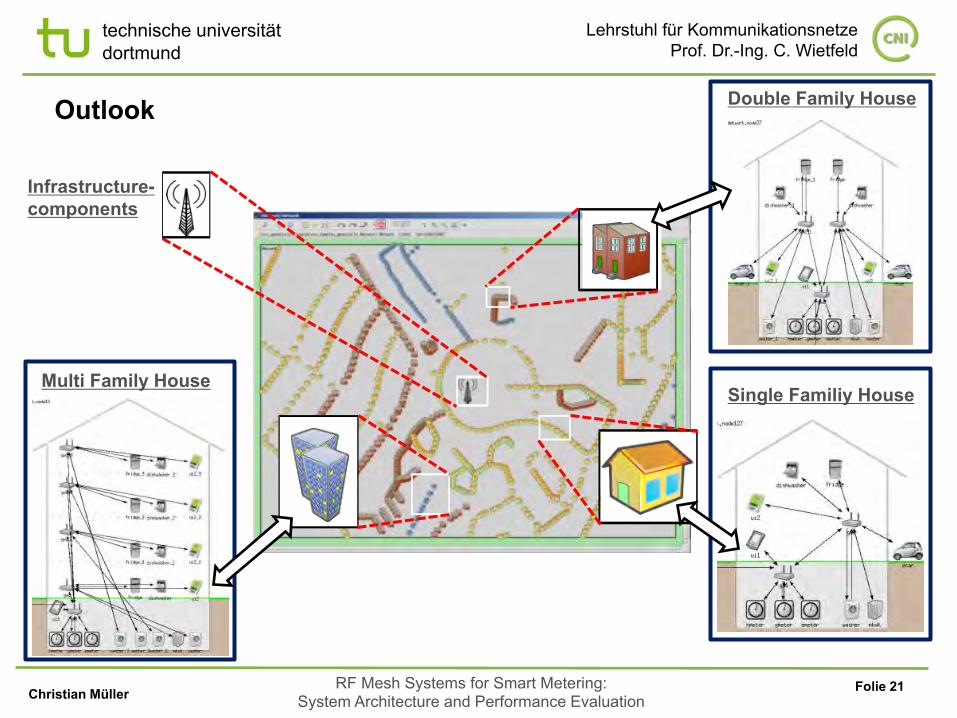
Outlook Double Family House
Single Familiy House Multi Family House
Infrastructure- components
Folie 22
Lehrstuhl für Kommunikationsnetze Prof. Dr.-Ing. C. Wietfeld
technische universität dortmund
Christian Müller RF Mesh Systems for Smart Metering:
System Architecture and Performance Evaluation
Vielen Dank für die Aufmerksamkeit!
Kontakt: Christian Müller TU Dortmund, Communication Networks Institute (CNI) Otto-Hahn-Str. 6, 44227 Dortmund Tel: +49 (0) 231-755-6140 Email: [email protected]