Embed Size (px)
Citation preview
econstor www.econstor.eu
Der Open-Access-Publikationsserver der ZBW – Leibniz-Informationszentrum WirtschaftThe Open Access Publication Server of the ZBW – Leibniz Information Centre for Economics
Standard-Nutzungsbedingungen:
Die Dokumente auf EconStor dürfen zu eigenen wissenschaftlichenZwecken und zum Privatgebrauch gespeichert und kopiert werden.
Sie dürfen die Dokumente nicht für öffentliche oder kommerzielleZwecke vervielfältigen, öffentlich ausstellen, öffentlich zugänglichmachen, vertreiben oder anderweitig nutzen.
Sofern die Verfasser die Dokumente unter Open-Content-Lizenzen(insbesondere CC-Lizenzen) zur Verfügung gestellt haben sollten,gelten abweichend von diesen Nutzungsbedingungen die in der dortgenannten Lizenz gewährten Nutzungsrechte.
Terms of use:
Documents in EconStor may be saved and copied for yourpersonal and scholarly purposes.
You are not to copy documents for public or commercialpurposes, to exhibit the documents publicly, to make thempublicly available on the internet, or to distribute or otherwiseuse the documents in public.
If the documents have been made available under an OpenContent Licence (especially Creative Commons Licences), youmay exercise further usage rights as specified in the indicatedlicence.
zbw Leibniz-Informationszentrum WirtschaftLeibniz Information Centre for Economics
Kawai, Masahiro; Zhai, Fan
Working Paper
The People's Republic of China- Japan- UnitedStates integration amid global rebalancing: Acomputable general equilibrium analysis
ADBI working paper series, No. 152
Provided in Cooperation with:Asian Development Bank Institute (ADBI), Tokyo
Suggested Citation: Kawai, Masahiro; Zhai, Fan (2009) : The People's Republic of China-Japan- United States integration amid global rebalancing: A computable general equilibriumanalysis, ADBI working paper series, No. 152
This Version is available at:http://hdl.handle.net/10419/53596
ADBI Working Paper Series
The People’s Republic of China-
Japan-United States Integration amid Global Rebalancing: A Computable General Equilibrium Analysis
Masahiro Kawai and Fan Zhai
No. 152 October 2009
Asian Development Bank Institute
Masahiro Kawai is the Dean of the Asian Development Bank Institute. Fan Zhai is a Research Fellow, Asian Development Bank Institute. The authors thank the anonymous referee, Theresa Greaney, Denise Konan, Hiro Lee, Mary Lovely and other participants of the “China, Japan, and the United States: A Deeper Integration” conferences in January and May 2009 for their comments. They are also grateful for editorial assistance from Barnard Helman.
The views expressed in this paper are the views of the authors and do not necessarily reflect the views or policies of ADBI, the Asian Development Bank (ADB), its Board of Directors, or the governments they represent. ADBI does not guarantee the accuracy of the data included in this paper and accepts no responsibility for any consequences of their use. Terminology used may not necessarily be consistent with ADB official terms.
The Working Paper series is a continuation of the formerly named Discussion Paper series; the numbering of the papers continued without interruption or change. ADBI’s working papers reflect initial ideas on a topic and are posted online for discussion. ADBI encourages readers to post their comments on the main page for each working paper (given in the citation below). Some working papers may develop into other forms of publication.
Suggested citation:
Kawai, Masahiro, and Fan Zhai. 2009. The People’s Republic of China-Japan-United States Integration amid Global Rebalancing: A Computable General Equilibrium Analysis. ADBI Working Paper 152. Tokyo: Asian Development Bank Institute. Available: http://www.adbi.org/working-paper/0/00/00/3342.gen.equilibrium.analysis.prc.japan.usa/
Asian Development Bank Institute Kasumigaseki Building 8F 3-2-5 Kasumigaseki, Chiyoda-ku Tokyo 100-6008, Japan Tel: +81-3-3593-5500 Fax: +81-3-3593-5571 URL: www.adbi.org E-mail: [email protected] © 2009 Asian Development Bank Institute
ADBI Working Paper 152 Kawai and Zhai
Abstract
Using a global general equilibrium trade model, this paper assesses the long-term implications of global rebalancing for Asian economies and explores the benefits of the People’s Republic of China-Japan-United States integration. The analysis suggests that consumption evaporation, a growth slowdown in the US, and the consequent current account correction would force the People’s Republic of China, Japan, and other East Asian economies to undergo substantial structural adjustments. A combination of domestic reform aimed at boosting service sector productivity and external liberalization aimed at fostering broader economic integration will be critical for East Asian economies to facilitate their economic rebalancing and sustained growth. Our global computable general equilibrium analysis suggests that the People’s Republic of China and Japan need to strengthen their economic ties with the United States while at the same time bringing other East Asia economies into this integration process.
JEL Classification: C68, F15
ADBI Working Paper 152 Kawai and Zhai
Contents
1. Introduction .................................................................................................................. 1
2. The CGE model ........................................................................................................... 3
2.1 Production and trade ....................................................................................... 4 2.2 Income distribution, demand, and factor markets ............................................ 4 2.3 Macro closure .................................................................................................. 5 2.4 Calibration ....................................................................................................... 5
3. Simulation scenarios ................................................................................................... 6
3.1 Simulation design ............................................................................................ 6 3.2 Effects of consumption evaporation and growth slowdown in the US ............. 8 3.3 East Asia’s structural reform to boost services sector productivity .................. 9 3.4 FTA scenario for the PRC, Japan and the US ............................................... 11
4. Conclusions ............................................................................................................... 17
References ............................................................................................................................ 18
ADBI Working Paper 152 Kawai and Zhai
1. INTRODUCTION The rapid integration of the People’s Republic of China (PRC) into the world economy has been a prominent feature of the global economic landscape over the past two decades. In 2008, the ratio of the PRC’s trade (the sum of merchandise exports and imports) to gross domestic product (GDP) reached 58.7%, nearly double the 32.6% level in 1990. Its share of world merchandise trade has also risen from a mere 1.6% to 8.0% over the same period. The PRC is now the world’s third-largest merchandise exporter after Germany and the United States (US). On the investment front, the PRC is the largest foreign direct investment (FDI) recipient in the developing world. Its share of the world stock of inward FDI rose from 1.1% in 1990 to 2.2% in 2007.1
Despite efforts to diversify its export markets in recent years, the PRC’s trade is still heavily oriented toward affluent developed economy markets, with the US, the European Union (EU), and Japan—the G3 economies—as its most important export markets. In 2008, the G3 markets accounted for 46.3% of the PRC’s total exports. The share of exports to the G2 markets—excluding Japan—was 38.2% in the same year, a significant increase from 18.7% recorded in 1990.
Underlying the increased dependence of the PRC’s exports on western markets is the changing pattern of regional production and trade in Asia. In recent two decades, rising vertical integration of production chains has been the key feature, driving the changes in trade in the PRC and other Asian economies. Underpinned by low labor costs and massive FDI inflows, the PRC has established a strong comparative advantage in the downstream stages of production processes of various products. As the final stages of production were relocated from neighboring Asian economies to the PRC, the country’s demand for intermediate parts and components from other parts of Asia has grown sharply while its exports of final goods to developed economies have also increased significantly. As a hub for regional production chains supported by trade and investment, the PRC has played a unique role as an essential assembly center for many exports from Asia to the US and EU.
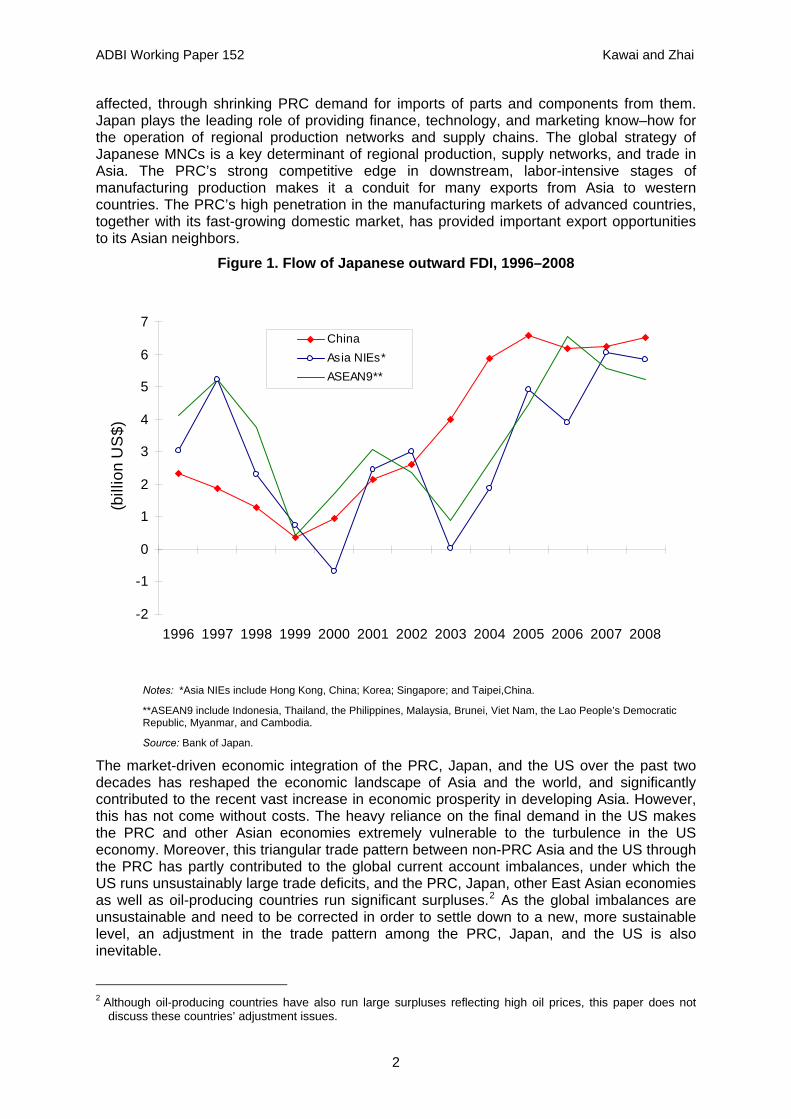
With economic growth stagnant for more than a decade in Japan, its role as a leading regional market for manufactured products has declined. During the period 1990–2008, the share of Japan in the PRC’s total exports declined from 14.7% to a mere 8.1%. However, as the largest and most advanced economy in Asia, Japan is still a very important trade partner for most East Asian economies, including the PRC. Moreover, FDI from Japan has been essential for the economic development of East Asian economies. Actually, Japanese multinational corporation (MNC) FDI in developing/emerging Asian economies, stimulated by the appreciation of the yen following the 1985 Plaza Accord, has played a vital role in shaping Asian regional production networks, especially in electrical machinery, electronics, automotive, and other machinery sectors (Kawai & Urata, 2004). In the 1990s, four Association of Southeast Asian Nations (ASEAN) economies—Indonesia, Malaysia, Thailand, and the Philippines (ASEAN4)—were the key host countries for Japanese FDI in Asia. With the Asian financial crisis hitting Southeast Asian economies in 1997–1998 and the PRC’s World Trade Organization accession in 2001, the PRC has emerged as the most favored destination of Japanese FDI among Asian countries (Figure 1). Some Japanese MNCs shifted their operations from ASEAN4 to the PRC to both tap the abundant supply of low-cost labor and to target the potentially huge domestic market.
The three giants—the US, Japan, and the PRC — play critical roles in Asian regional production networks. The US serves primarily as the final destination of a large proportion of Asia’s final output. Once the US demand for PRC exports goes down—as it did amid the recent global financial crisis—many emerging and developing Asian economies are clearly
1 See the United Nations Conference on Trade and Development (2008). China’s share in the developing world’s
FDI stock grew from 3.9% to 7.7% over the same period.
ADBI Working Paper 152 Kawai and Zhai
affected, through shrinking PRC demand for imports of parts and components from them. Japan plays the leading role of providing finance, technology, and marketing know–how for the operation of regional production networks and supply chains. The global strategy of Japanese MNCs is a key determinant of regional production, supply networks, and trade in Asia. The PRC’s strong competitive edge in downstream, labor-intensive stages of manufacturing production makes it a conduit for many exports from Asia to western countries. The PRC’s high penetration in the manufacturing markets of advanced countries, together with its fast-growing domestic market, has provided important export opportunities to its Asian neighbors.
Figure 1. Flow of Japanese outward FDI, 1996–2008
-2
-1
0
1
2
3
4
5
6
7
1996 1997 1998 1999 2000 2001 2002 2003 2004 2005 2006 2007 2008
(bill
ion
US
$)
ChinaAsia NIEs*ASEAN9**
Notes: *Asia NIEs include Hong Kong, China; Korea; Singapore; and Taipei,China.
**ASEAN9 include Indonesia, Thailand, the Philippines, Malaysia, Brunei, Viet Nam, the Lao People’s Democratic Republic, Myanmar, and Cambodia.
Source: Bank of Japan.
The market-driven economic integration of the PRC, Japan, and the US over the past two decades has reshaped the economic landscape of Asia and the world, and significantly contributed to the recent vast increase in economic prosperity in developing Asia. However, this has not come without costs. The heavy reliance on the final demand in the US makes the PRC and other Asian economies extremely vulnerable to the turbulence in the US economy. Moreover, this triangular trade pattern between non-PRC Asia and the US through the PRC has partly contributed to the global current account imbalances, under which the US runs unsustainably large trade deficits, and the PRC, Japan, other East Asian economies as well as oil-producing countries run significant surpluses.2 As the global imbalances are unsustainable and need to be corrected in order to settle down to a new, more sustainable level, an adjustment in the trade pattern among the PRC, Japan, and the US is also inevitable.
2 Although oil-producing countries have also run large surpluses reflecting high oil prices, this paper does not
discuss these countries’ adjustment issues.
2
ADBI Working Paper 152 Kawai and Zhai
With the eruption of the global financial crisis, originating from the US, a market-led, disorderly adjustment in global imbalances has already started. A sharp increase in US household savings has contributed to the significant improvement of the US current account deficit. However, this adjustment has been rapid and disorderly—despite the absence of a US dollar collapse, which was feared by many experts and policymakers before the outbreak of the financial crisis—because it has been accompanied by sharp contraction of manufacturing output, exports and imports, and rising unemployment in both the US and Asia. Given that the global imbalances were created by a number of structural features—such as the savings and investment patterns in the US and Asia, outward-oriented growth strategies in Asia, and the preference of Asian policymakers to maintain trade surpluses—the adjustment of global imbalances will be a medium- and long-term process and will likely go beyond the time horizon of the current crisis.
Against this backdrop, this paper assesses the long-term implications of global rebalancing for Asian economies and explores the benefits of PRC-Japan-US economic integration. It attempts to tackle the following three questions:
What are the impacts of a decline in export demand—due to the evaporation of US consumption—on the trade and production patterns in Asia?
What would be the long-term welfare gains of institutional economic integration—through a free trade agreement (FTA)—among China, Japan, and the US?
Should the integration process involve other emerging Asian economies, like the Asian newly industrialized economies (NIEs; i.e, Hong Kong, China; the Republic of Korea (hereafter Korea); Singapore; and Taipei,China) and ASEAN countries?
We use a multi-country, global computable general equilibrium (CGE) model to simulate different scenarios for global rebalancing and FTAs for the PRC, Japan, the US, and possibly other Asian economies. The model is static and assumes continuous full-employment, so its results should be interpreted as describing long-run equilibrium situations. 3 Our simulations suggest that the long-term decline in US consumption—accompanied by a US GDP growth slowdown—and its consequent current account correction would force the East Asian economies to undergo substantial structural adjustment. A combination of domestic reform aimed at boosting services sector productivity and external liberalization aimed at fostering broader economic integration will be critical for East Asian economies in order to facilitate their economic rebalancing and achieve sustained growth over a long period.
This paper is organized as follows. Section 2 describes the model and a set of underlying assumptions used in the analysis. Section 3 discusses the design of three types of simulation scenarios—including consumption evaporation and growth slowdown in the US, East Asia’s productivity hike in the services sector, and FTAs—and explains their results. Section 4 offers conclusions.
2. THE CGE MODEL The CGE model used in this study is a version of a global general equilibrium model developed by van der Mensbrugghe (2005) and Zhai (2008). The model has its intellectual roots in the group of multi-country, applied general equilibrium models used over the past two decades to analyze the impact of trade policy reforms (Shoven & Whalley, 1992; Hertel, 1997). A novel feature of the model is its incorporation of recent heterogeneous-firms trade theory into an empirical global CGE framework. The model features intra-industry firm heterogeneity in productivity and fixed cost of exporting, which enables us to investigate the
3 See Kawai and Zhai (2009) for a model-based analysis of the short- to medium-term dynamic adjustment of the
Asian economies in the face of the current global economic crisis.
3
ADBI Working Paper 152 Kawai and Zhai
intra-industry reallocation of resources and the exporting decision by firms, and thereby capture both the intensive and the extensive margin of trade.4 The model is calibrated to the Global Trade Analysis Project (GTAP) (version 7) global database and implemented in General Algebraic Modeling System (GAMS) programming language. It includes seventeen countries/regions and seventeen sectors. This section overviews the key features of the model, which is a revised version of the one developed by Zhai (2008).
2.1 Production and trade
The agriculture and mining sectors are assumed to have perfect competition. In each of these two sectors, there is a representative firm operated under a constant returns to scale technology. The manufacturing and service sectors are characterized by monopolistic competition, and their structure of production and trade follows Melitz (2003). Each sector with monopolistic competition consists of a continuum of firms, which are differentiated by the varieties they produce and the productivity levels. Firms face fixed production costs, resulting in increasing returns to scale. There is also a fixed cost and a variable cost associated with the exporting activities. On the demand side, the agents are assumed to have Dixit-Stiglitz preference over the continuum of varieties. As each firm is a monopolist for the variety it produces, it sets the price of its product at a constant markup over its marginal cost. A firm enters domestic or export markets if and only if the net profit generated from its domestic sales or exports in a given country is sufficiently large to cover the fixed cost. This zero cutoff profit condition defines the productivity thresholds for firm entry to domestic and export markets, and in turn determines the equilibrium distribution of non-exporting firms and exporting firms, as well as their average productivities. Usually, the combination of a fixed export cost and a variable (iceberg) export cost ensures that the exporting productivity threshold is higher than that for production for domestic market, i.e. only a small fraction of firms with high productivity engage in export markets. These firms supply both domestic and export markets.
Production technology in each sector is modeled using nested constant elasticity of substitution (CES) functions. At the top level, the output is produced as a combination of an aggregate intermediate input and an aggregate primary factor. At the second level, the aggregate intermediate input is split into each commodity input according to the Leontief technology. The aggregate primary factor is produced by a capital-land bundle and aggregate labor. Finally, at the bottom level, the capital-land bundle is decomposed into capital and land (for the agriculture sector) or natural resources (for the mining sector), and aggregate labor is decomposed into unskilled and skilled labor. At each level of production, there is a unit cost function that is dual to the CES aggregator function and demand functions for corresponding inputs. The top-level unit cost function defines the marginal cost of sectoral output.
2.2 Income distribution, demand, and factor markets
Income generated from production accrues to a single representative household in each region. A household maximizes utility using the Extended Linear Expenditure System (ELES), which is derived from maximizing the Stone-Geary utility function. The consumption/savings decision is completely static. Savings enter the utility function as a “good” and its price is set as equal to the average price of consumer goods. The reason for treating savings in this way is that savings represent a stream of future consumption from the intertemporal perspective and, hence, contribute to consumer welfare in the long run. Investment demand and government consumption are specified as a Leontief function. In
4 The extensive margin refers to the number of exporting firms and traded goods or varieties, while the intensive
margin refers to the volume of trade of existing exporting goods or firms.
4
ADBI Working Paper 152 Kawai and Zhai
each sector a composite good defined by the Dixit-Stiglitz aggregator over domestic and imported varieties is used for final and intermediate demand.
All commodity and factor markets are assumed to clear through price adjustment. There are five primary factors of production. Although agricultural land is treated as a fixed, immobile factor, both capital and two types of labor (skilled and unskilled) are fully mobile across sectors within a country or region. In the natural resource sectors of forestry, fishing, and mining, a sector-specific factor is introduced into the production function to reflect the resource constraints. These sector-specific factors are modeled using upward sloping supply curves. For other primary factors, stocks are fixed.
2.3 Macro closure
There are three macro closures in the model: the net government balance, the investment and savings balance, and the trade balance. We assume that government consumption and savings are exogenous in real terms. In our subsequent exercises, we assume no fiscal policy changes, and the government budget is automatically balanced through changes in income tax on households.
Following the GTAP model (Hertel, 1997), the savings and investment balance (or current account balance) is endogenized through the assumption of a fictitious global bank. The global bank collects savings from all regions and allocates investment to each region so as to equalize the changes in expected rates of return on capital across regions. The expected rate of return on capital in region s, Rs, is defined as follow:
σ−
⎟⎟⎠
⎞⎜⎜⎝
⎛=
s
es
Is
ss K
Kpr
R
Isp
sK esK
(1)
where rs denotes current economy-wide rate of return on capital in region s, is the
aggregate price of investment goods in region s, and are the levels of aggregate capital stock at the beginning of the period and at the end of the period, respectively, in region s. The parameter σ is an elasticity parameter determining the extent to which the expected rate of return is discounted by the increase in future stocks. With the levels of regional investment determined by the global bank, the net capital flow to each region is endogenous (subject to the constraint of the global balance) to match the changes in regional savings and investment balance.5
2.4 Calibration
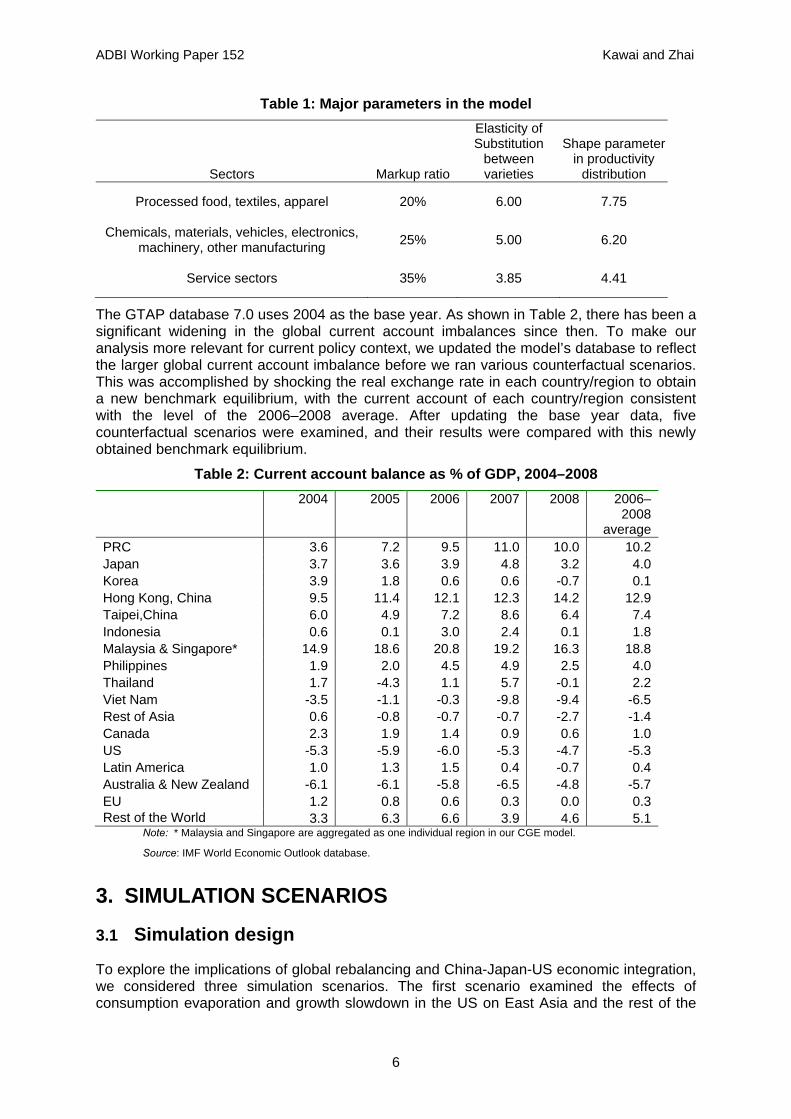
The model is calibrated to the GTAP global database (version 7.0). Some elasticity and technological parameters related to the model’s firm heterogeneity specification are not available in the GTAP database. These parameters are set mainly based on a review of the relevant literature. Table 1 reports these parameters. The markup ratios are set to 20%–25% for manufacturing sectors and 35% for services sectors. The choices of markup ratios, together with the optimal pricing rule for monopolistic firms, imply that the elasticity of substitution between varieties is 5.0–6.0 for manufacturing sectors and 3.85 for service sectors, which is consistent with the recent empirical findings of Broda and Weinstein (2006). The shape parameters of the Pareto distribution of firm productivity are calibrated to match the profit ratio in total markup, which is estimated to be 64.5% based on French firm data by Arkolakis (2006).
5 The net capital flow includes both portfolio investment and FDI, which are not distinguished in the model.
Although interesting and important, it is still difficult to explicitly model FDI in a theoretically consistent and sound way in a CGE framework. For some recent work along this direction, see Markusen, Rutherford, and Tarr (2005) and Mérette et al (2008).
5
ADBI Working Paper 152 Kawai and Zhai
Table 1: Major parameters in the model
Sectors Markup ratio
Elasticity of Substitution
between varieties
Shape parameter in productivity
distribution
Processed food, textiles, apparel 20% 6.00 7.75
Chemicals, materials, vehicles, electronics, machinery, other manufacturing 25% 5.00 6.20
Service sectors 35% 3.85 4.41
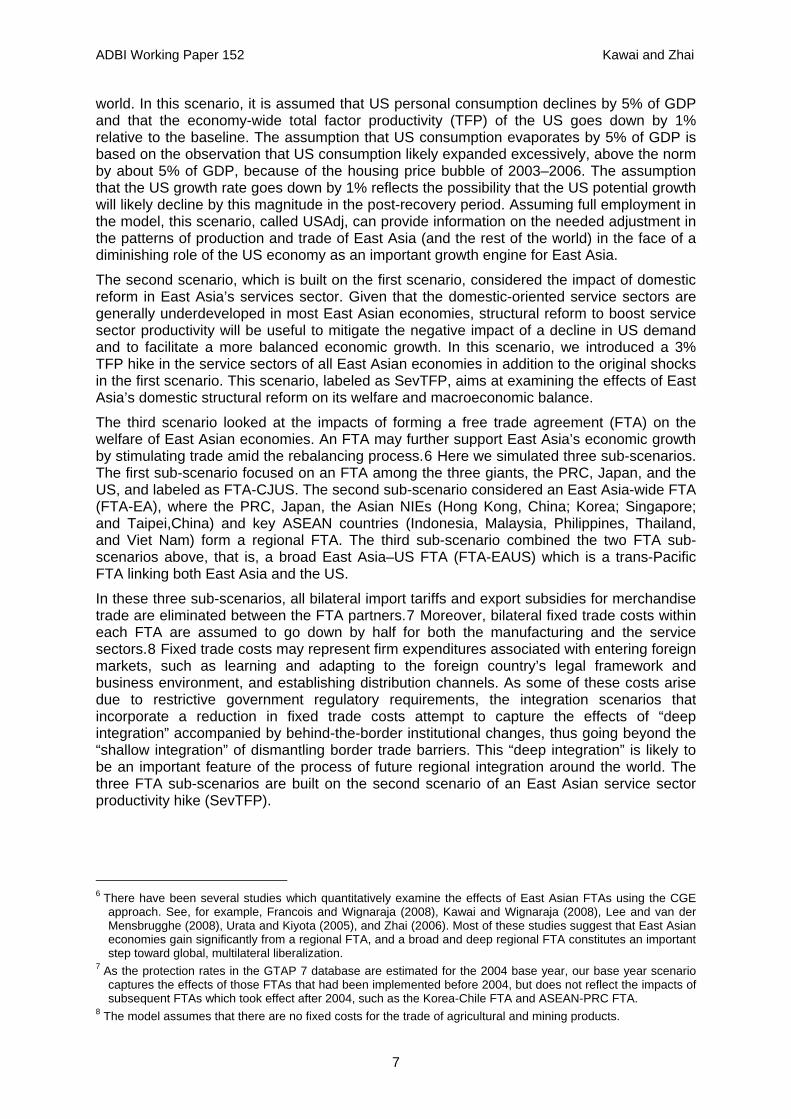
The GTAP database 7.0 uses 2004 as the base year. As shown in Table 2, there has been a significant widening in the global current account imbalances since then. To make our analysis more relevant for current policy context, we updated the model’s database to reflect the larger global current account imbalance before we ran various counterfactual scenarios. This was accomplished by shocking the real exchange rate in each country/region to obtain a new benchmark equilibrium, with the current account of each country/region consistent with the level of the 2006–2008 average. After updating the base year data, five counterfactual scenarios were examined, and their results were compared with this newly obtained benchmark equilibrium.
Table 2: Current account balance as % of GDP, 2004–2008 2004 2005 2006 2007 2008 2006–
2008 average
PRC 3.6 7.2 9.5 11.0 10.0 10.2 Japan 3.7 3.6 3.9 4.8 3.2 4.0 Korea 3.9 1.8 0.6 0.6 -0.7 0.1 Hong Kong, China 9.5 11.4 12.1 12.3 14.2 12.9 Taipei,China 6.0 4.9 7.2 8.6 6.4 7.4 Indonesia 0.6 0.1 3.0 2.4 0.1 1.8 Malaysia & Singapore* 14.9 18.6 20.8 19.2 16.3 18.8 Philippines 1.9 2.0 4.5 4.9 2.5 4.0 Thailand 1.7 -4.3 1.1 5.7 -0.1 2.2 Viet Nam -3.5 -1.1 -0.3 -9.8 -9.4 -6.5 Rest of Asia 0.6 -0.8 -0.7 -0.7 -2.7 -1.4 Canada 2.3 1.9 1.4 0.9 0.6 1.0 US -5.3 -5.9 -6.0 -5.3 -4.7 -5.3 Latin America 1.0 1.3 1.5 0.4 -0.7 0.4 Australia & New Zealand -6.1 -6.1 -5.8 -6.5 -4.8 -5.7 EU 1.2 0.8 0.6 0.3 0.0 0.3 Rest of the World 3.3 6.3 6.6 3.9 4.6 5.1
Note: * Malaysia and Singapore are aggregated as one individual region in our CGE model.
Source: IMF World Economic Outlook database.
3. SIMULATION SCENARIOS
3.1 Simulation design
To explore the implications of global rebalancing and China-Japan-US economic integration, we considered three simulation scenarios. The first scenario examined the effects of consumption evaporation and growth slowdown in the US on East Asia and the rest of the
6
ADBI Working Paper 152 Kawai and Zhai
world. In this scenario, it is assumed that US personal consumption declines by 5% of GDP and that the economy-wide total factor productivity (TFP) of the US goes down by 1% relative to the baseline. The assumption that US consumption evaporates by 5% of GDP is based on the observation that US consumption likely expanded excessively, above the norm by about 5% of GDP, because of the housing price bubble of 2003–2006. The assumption that the US growth rate goes down by 1% reflects the possibility that the US potential growth will likely decline by this magnitude in the post-recovery period. Assuming full employment in the model, this scenario, called USAdj, can provide information on the needed adjustment in the patterns of production and trade of East Asia (and the rest of the world) in the face of a diminishing role of the US economy as an important growth engine for East Asia.
The second scenario, which is built on the first scenario, considered the impact of domestic reform in East Asia’s services sector. Given that the domestic-oriented service sectors are generally underdeveloped in most East Asian economies, structural reform to boost service sector productivity will be useful to mitigate the negative impact of a decline in US demand and to facilitate a more balanced economic growth. In this scenario, we introduced a 3% TFP hike in the service sectors of all East Asian economies in addition to the original shocks in the first scenario. This scenario, labeled as SevTFP, aims at examining the effects of East Asia’s domestic structural reform on its welfare and macroeconomic balance.
The third scenario looked at the impacts of forming a free trade agreement (FTA) on the welfare of East Asian economies. An FTA may further support East Asia’s economic growth by stimulating trade amid the rebalancing process.6 Here we simulated three sub-scenarios. The first sub-scenario focused on an FTA among the three giants, the PRC, Japan, and the US, and labeled as FTA-CJUS. The second sub-scenario considered an East Asia-wide FTA (FTA-EA), where the PRC, Japan, the Asian NIEs (Hong Kong, China; Korea; Singapore; and Taipei,China) and key ASEAN countries (Indonesia, Malaysia, Philippines, Thailand, and Viet Nam) form a regional FTA. The third sub-scenario combined the two FTA sub-scenarios above, that is, a broad East Asia–US FTA (FTA-EAUS) which is a trans-Pacific FTA linking both East Asia and the US.
In these three sub-scenarios, all bilateral import tariffs and export subsidies for merchandise trade are eliminated between the FTA partners.7 Moreover, bilateral fixed trade costs within each FTA are assumed to go down by half for both the manufacturing and the service sectors.8 Fixed trade costs may represent firm expenditures associated with entering foreign markets, such as learning and adapting to the foreign country’s legal framework and business environment, and establishing distribution channels. As some of these costs arise due to restrictive government regulatory requirements, the integration scenarios that incorporate a reduction in fixed trade costs attempt to capture the effects of “deep integration” accompanied by behind-the-border institutional changes, thus going beyond the “shallow integration” of dismantling border trade barriers. This “deep integration” is likely to be an important feature of the process of future regional integration around the world. The three FTA sub-scenarios are built on the second scenario of an East Asian service sector productivity hike (SevTFP).
6 There have been several studies which quantitatively examine the effects of East Asian FTAs using the CGE
approach. See, for example, Francois and Wignaraja (2008), Kawai and Wignaraja (2008), Lee and van der Mensbrugghe (2008), Urata and Kiyota (2005), and Zhai (2006). Most of these studies suggest that East Asian economies gain significantly from a regional FTA, and a broad and deep regional FTA constitutes an important step toward global, multilateral liberalization.
7 As the protection rates in the GTAP 7 database are estimated for the 2004 base year, our base year scenario captures the effects of those FTAs that had been implemented before 2004, but does not reflect the impacts of subsequent FTAs which took effect after 2004, such as the Korea-Chile FTA and ASEAN-PRC FTA.
8 The model assumes that there are no fixed costs for the trade of agricultural and mining products.
7
ADBI Working Paper 152 Kawai and Zhai
3.2 Effects of consumption evaporation and growth slowdown in the US
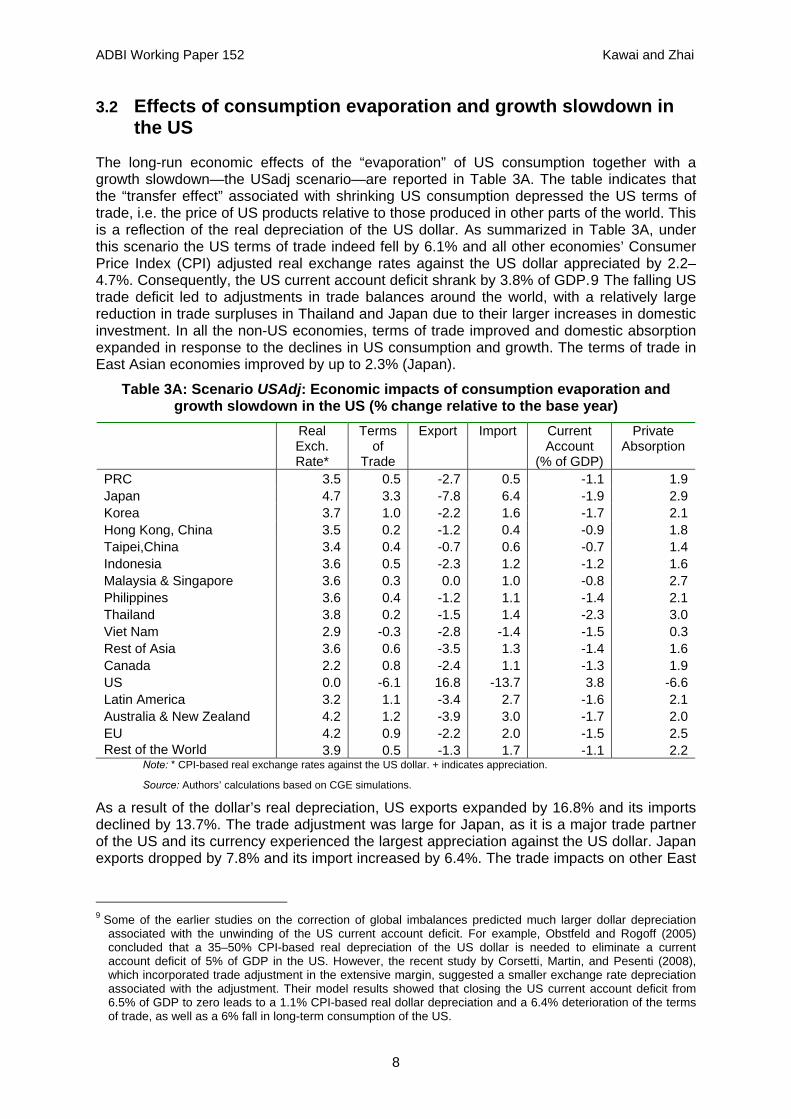
The long-run economic effects of the “evaporation” of US consumption together with a growth slowdown—the USadj scenario—are reported in Table 3A. The table indicates that the “transfer effect” associated with shrinking US consumption depressed the US terms of trade, i.e. the price of US products relative to those produced in other parts of the world. This is a reflection of the real depreciation of the US dollar. As summarized in Table 3A, under this scenario the US terms of trade indeed fell by 6.1% and all other economies’ Consumer Price Index (CPI) adjusted real exchange rates against the US dollar appreciated by 2.2–4.7%. Consequently, the US current account deficit shrank by 3.8% of GDP.9 The falling US trade deficit led to adjustments in trade balances around the world, with a relatively large reduction in trade surpluses in Thailand and Japan due to their larger increases in domestic investment. In all the non-US economies, terms of trade improved and domestic absorption expanded in response to the declines in US consumption and growth. The terms of trade in East Asian economies improved by up to 2.3% (Japan).
Table 3A: Scenario USAdj: Economic impacts of consumption evaporation and growth slowdown in the US (% change relative to the base year)
Real Exch. Rate*
Terms of
Trade
Export Import Current Account
(% of GDP)
Private Absorption
PRC 3.5 0.5 -2.7 0.5 -1.1 1.9Japan 4.7 3.3 -7.8 6.4 -1.9 2.9Korea 3.7 1.0 -2.2 1.6 -1.7 2.1Hong Kong, China 3.5 0.2 -1.2 0.4 -0.9 1.8Taipei,China 3.4 0.4 -0.7 0.6 -0.7 1.4Indonesia 3.6 0.5 -2.3 1.2 -1.2 1.6Malaysia & Singapore 3.6 0.3 0.0 1.0 -0.8 2.7Philippines 3.6 0.4 -1.2 1.1 -1.4 2.1Thailand 3.8 0.2 -1.5 1.4 -2.3 3.0Viet Nam 2.9 -0.3 -2.8 -1.4 -1.5 0.3Rest of Asia 3.6 0.6 -3.5 1.3 -1.4 1.6Canada 2.2 0.8 -2.4 1.1 -1.3 1.9US 0.0 -6.1 16.8 -13.7 3.8 -6.6Latin America 3.2 1.1 -3.4 2.7 -1.6 2.1Australia & New Zealand 4.2 1.2 -3.9 3.0 -1.7 2.0EU 4.2 0.9 -2.2 2.0 -1.5 2.5Rest of the World 3.9 0.5 -1.3 1.7 -1.1 2.2
Note: * CPI-based real exchange rates against the US dollar. + indicates appreciation.
Source: Authors’ calculations based on CGE simulations.
As a result of the dollar’s real depreciation, US exports expanded by 16.8% and its imports declined by 13.7%. The trade adjustment was large for Japan, as it is a major trade partner of the US and its currency experienced the largest appreciation against the US dollar. Japan exports dropped by 7.8% and its import increased by 6.4%. The trade impacts on other East
9 Some of the earlier studies on the correction of global imbalances predicted much larger dollar depreciation
associated with the unwinding of the US current account deficit. For example, Obstfeld and Rogoff (2005) concluded that a 35–50% CPI-based real depreciation of the US dollar is needed to eliminate a current account deficit of 5% of GDP in the US. However, the recent study by Corsetti, Martin, and Pesenti (2008), which incorporated trade adjustment in the extensive margin, suggested a smaller exchange rate depreciation associated with the adjustment. Their model results showed that closing the US current account deficit from 6.5% of GDP to zero leads to a 1.1% CPI-based real dollar depreciation and a 6.4% deterioration of the terms of trade, as well as a 6% fall in long-term consumption of the US.
8
ADBI Working Paper 152 Kawai and Zhai
Asian economies were more modest, but still notable. For most East Asian economies, their total export fell by 1.0-3.0% and their total imports increased by around 1.0%.
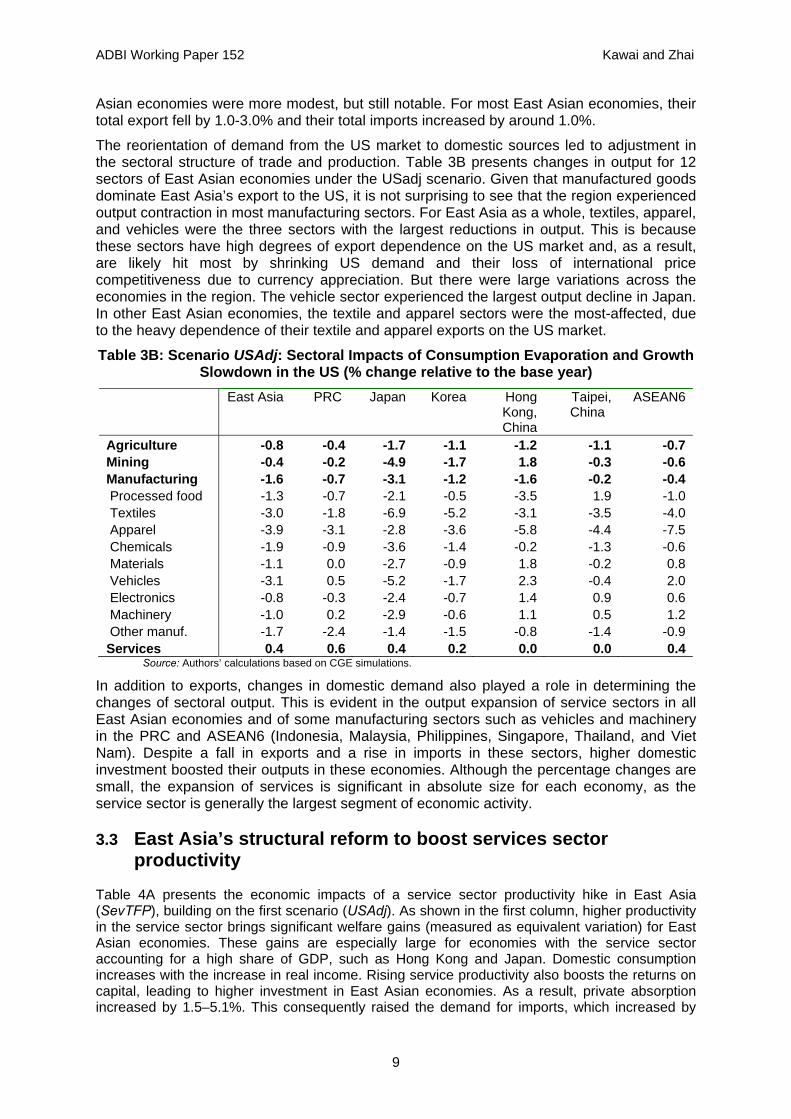
The reorientation of demand from the US market to domestic sources led to adjustment in the sectoral structure of trade and production. Table 3B presents changes in output for 12 sectors of East Asian economies under the USadj scenario. Given that manufactured goods dominate East Asia’s export to the US, it is not surprising to see that the region experienced output contraction in most manufacturing sectors. For East Asia as a whole, textiles, apparel, and vehicles were the three sectors with the largest reductions in output. This is because these sectors have high degrees of export dependence on the US market and, as a result, are likely hit most by shrinking US demand and their loss of international price competitiveness due to currency appreciation. But there were large variations across the economies in the region. The vehicle sector experienced the largest output decline in Japan. In other East Asian economies, the textile and apparel sectors were the most-affected, due to the heavy dependence of their textile and apparel exports on the US market.
Table 3B: Scenario USAdj: Sectoral Impacts of Consumption Evaporation and Growth Slowdown in the US (% change relative to the base year)
East Asia PRC Japan Korea Hong Kong, China
Taipei, China
ASEAN6
Agriculture -0.8 -0.4 -1.7 -1.1 -1.2 -1.1 -0.7Mining -0.4 -0.2 -4.9 -1.7 1.8 -0.3 -0.6Manufacturing -1.6 -0.7 -3.1 -1.2 -1.6 -0.2 -0.4 Processed food -1.3 -0.7 -2.1 -0.5 -3.5 1.9 -1.0 Textiles -3.0 -1.8 -6.9 -5.2 -3.1 -3.5 -4.0 Apparel -3.9 -3.1 -2.8 -3.6 -5.8 -4.4 -7.5 Chemicals -1.9 -0.9 -3.6 -1.4 -0.2 -1.3 -0.6 Materials -1.1 0.0 -2.7 -0.9 1.8 -0.2 0.8 Vehicles -3.1 0.5 -5.2 -1.7 2.3 -0.4 2.0 Electronics -0.8 -0.3 -2.4 -0.7 1.4 0.9 0.6 Machinery -1.0 0.2 -2.9 -0.6 1.1 0.5 1.2 Other manuf. -1.7 -2.4 -1.4 -1.5 -0.8 -1.4 -0.9Services 0.4 0.6 0.4 0.2 0.0 0.0 0.4
Source: Authors’ calculations based on CGE simulations.
In addition to exports, changes in domestic demand also played a role in determining the changes of sectoral output. This is evident in the output expansion of service sectors in all East Asian economies and of some manufacturing sectors such as vehicles and machinery in the PRC and ASEAN6 (Indonesia, Malaysia, Philippines, Singapore, Thailand, and Viet Nam). Despite a fall in exports and a rise in imports in these sectors, higher domestic investment boosted their outputs in these economies. Although the percentage changes are small, the expansion of services is significant in absolute size for each economy, as the service sector is generally the largest segment of economic activity.
3.3 East Asia’s structural reform to boost services sector productivity
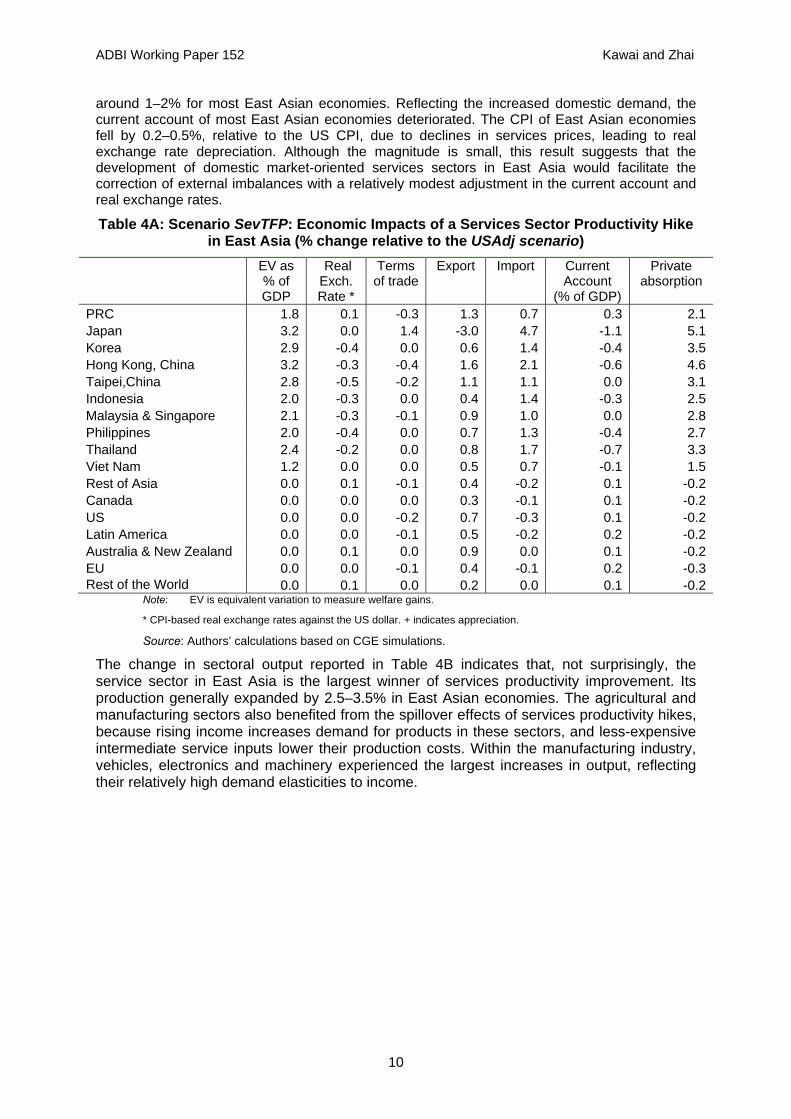
Table 4A presents the economic impacts of a service sector productivity hike in East Asia (SevTFP), building on the first scenario (USAdj). As shown in the first column, higher productivity in the service sector brings significant welfare gains (measured as equivalent variation) for East Asian economies. These gains are especially large for economies with the service sector accounting for a high share of GDP, such as Hong Kong and Japan. Domestic consumption increases with the increase in real income. Rising service productivity also boosts the returns on capital, leading to higher investment in East Asian economies. As a result, private absorption increased by 1.5–5.1%. This consequently raised the demand for imports, which increased by
9
ADBI Working Paper 152 Kawai and Zhai
around 1–2% for most East Asian economies. Reflecting the increased domestic demand, the current account of most East Asian economies deteriorated. The CPI of East Asian economies fell by 0.2–0.5%, relative to the US CPI, due to declines in services prices, leading to real exchange rate depreciation. Although the magnitude is small, this result suggests that the development of domestic market-oriented services sectors in East Asia would facilitate the correction of external imbalances with a relatively modest adjustment in the current account and real exchange rates.
Table 4A: Scenario SevTFP: Economic Impacts of a Services Sector Productivity Hike in East Asia (% change relative to the USAdj scenario)
EV as % of GDP
Real Exch. Rate *
Terms of trade
Export Import Current Account
(% of GDP)
Private absorption
PRC 1.8 0.1 -0.3 1.3 0.7 0.3 2.1Japan 3.2 0.0 1.4 -3.0 4.7 -1.1 5.1Korea 2.9 -0.4 0.0 0.6 1.4 -0.4 3.5Hong Kong, China 3.2 -0.3 -0.4 1.6 2.1 -0.6 4.6Taipei,China 2.8 -0.5 -0.2 1.1 1.1 0.0 3.1Indonesia 2.0 -0.3 0.0 0.4 1.4 -0.3 2.5Malaysia & Singapore 2.1 -0.3 -0.1 0.9 1.0 0.0 2.8Philippines 2.0 -0.4 0.0 0.7 1.3 -0.4 2.7Thailand 2.4 -0.2 0.0 0.8 1.7 -0.7 3.3Viet Nam 1.2 0.0 0.0 0.5 0.7 -0.1 1.5Rest of Asia 0.0 0.1 -0.1 0.4 -0.2 0.1 -0.2Canada 0.0 0.0 0.0 0.3 -0.1 0.1 -0.2US 0.0 0.0 -0.2 0.7 -0.3 0.1 -0.2Latin America 0.0 0.0 -0.1 0.5 -0.2 0.2 -0.2Australia & New Zealand 0.0 0.1 0.0 0.9 0.0 0.1 -0.2EU 0.0 0.0 -0.1 0.4 -0.1 0.2 -0.3Rest of the World 0.0 0.1 0.0 0.2 0.0 0.1 -0.2
Note: EV is equivalent variation to measure welfare gains.
* CPI-based real exchange rates against the US dollar. + indicates appreciation.
Source: Authors’ calculations based on CGE simulations.
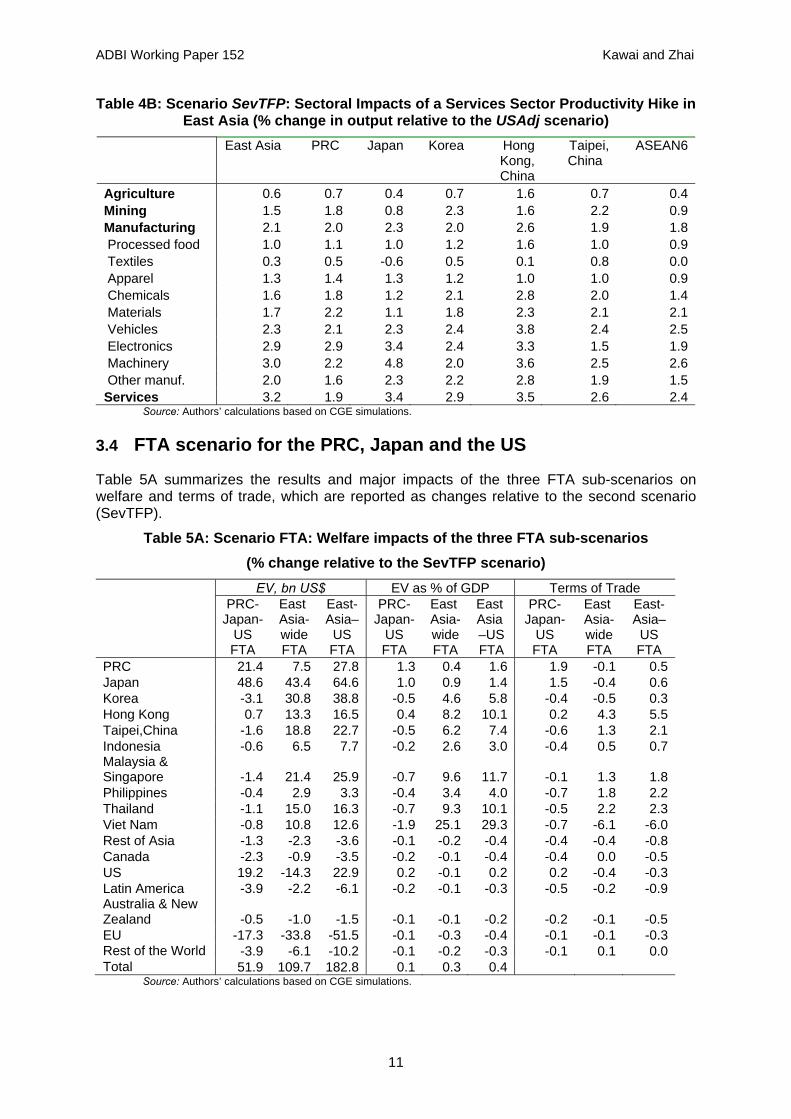
The change in sectoral output reported in Table 4B indicates that, not surprisingly, the service sector in East Asia is the largest winner of services productivity improvement. Its production generally expanded by 2.5–3.5% in East Asian economies. The agricultural and manufacturing sectors also benefited from the spillover effects of services productivity hikes, because rising income increases demand for products in these sectors, and less-expensive intermediate service inputs lower their production costs. Within the manufacturing industry, vehicles, electronics and machinery experienced the largest increases in output, reflecting their relatively high demand elasticities to income.
10
ADBI Working Paper 152 Kawai and Zhai
Table 4B: Scenario SevTFP: Sectoral Impacts of a Services Sector Productivity Hike in East Asia (% change in output relative to the USAdj scenario)
East Asia PRC Japan Korea Hong Kong, China
Taipei, China
ASEAN6
Agriculture 0.6 0.7 0.4 0.7 1.6 0.7 0.4Mining 1.5 1.8 0.8 2.3 1.6 2.2 0.9Manufacturing 2.1 2.0 2.3 2.0 2.6 1.9 1.8 Processed food 1.0 1.1 1.0 1.2 1.6 1.0 0.9 Textiles 0.3 0.5 -0.6 0.5 0.1 0.8 0.0 Apparel 1.3 1.4 1.3 1.2 1.0 1.0 0.9 Chemicals 1.6 1.8 1.2 2.1 2.8 2.0 1.4 Materials 1.7 2.2 1.1 1.8 2.3 2.1 2.1 Vehicles 2.3 2.1 2.3 2.4 3.8 2.4 2.5 Electronics 2.9 2.9 3.4 2.4 3.3 1.5 1.9 Machinery 3.0 2.2 4.8 2.0 3.6 2.5 2.6 Other manuf. 2.0 1.6 2.3 2.2 2.8 1.9 1.5Services 3.2 1.9 3.4 2.9 3.5 2.6 2.4
Source: Authors’ calculations based on CGE simulations.
3.4 FTA scenario for the PRC, Japan and the US
Table 5A summarizes the results and major impacts of the three FTA sub-scenarios on welfare and terms of trade, which are reported as changes relative to the second scenario (SevTFP).
Table 5A: Scenario FTA: Welfare impacts of the three FTA sub-scenarios (% change relative to the SevTFP scenario)
EV, bn US$ EV as % of GDP Terms of Trade
PRC-Japan-
US FTA
East Asia-wide FTA
East-Asia–
US FTA
PRC-Japan-
US FTA
East Asia-wide FTA
East Asia –US FTA
PRC-Japan-
US FTA
East Asia-wide FTA
East-Asia– US FTA
PRC 21.4 7.5 27.8 1.3 0.4 1.6 1.9 -0.1 0.5Japan 48.6 43.4 64.6 1.0 0.9 1.4 1.5 -0.4 0.6Korea -3.1 30.8 38.8 -0.5 4.6 5.8 -0.4 -0.5 0.3Hong Kong 0.7 13.3 16.5 0.4 8.2 10.1 0.2 4.3 5.5Taipei,China -1.6 18.8 22.7 -0.5 6.2 7.4 -0.6 1.3 2.1Indonesia -0.6 6.5 7.7 -0.2 2.6 3.0 -0.4 0.5 0.7Malaysia & Singapore -1.4 21.4 25.9 -0.7 9.6 11.7 -0.1 1.3 1.8Philippines -0.4 2.9 3.3 -0.4 3.4 4.0 -0.7 1.8 2.2Thailand -1.1 15.0 16.3 -0.7 9.3 10.1 -0.5 2.2 2.3Viet Nam -0.8 10.8 12.6 -1.9 25.1 29.3 -0.7 -6.1 -6.0Rest of Asia -1.3 -2.3 -3.6 -0.1 -0.2 -0.4 -0.4 -0.4 -0.8Canada -2.3 -0.9 -3.5 -0.2 -0.1 -0.4 -0.4 0.0 -0.5US 19.2 -14.3 22.9 0.2 -0.1 0.2 0.2 -0.4 -0.3Latin America -3.9 -2.2 -6.1 -0.2 -0.1 -0.3 -0.5 -0.2 -0.9Australia & New Zealand -0.5 -1.0 -1.5 -0.1 -0.1 -0.2 -0.2 -0.1 -0.5EU -17.3 -33.8 -51.5 -0.1 -0.3 -0.4 -0.1 -0.1 -0.3Rest of the World -3.9 -6.1 -10.2 -0.1 -0.2 -0.3 -0.1 0.1 0.0Total 51.9 109.7 182.8 0.1 0.3 0.4
Source: Authors’ calculations based on CGE simulations.
11
ADBI Working Paper 152 Kawai and Zhai
12
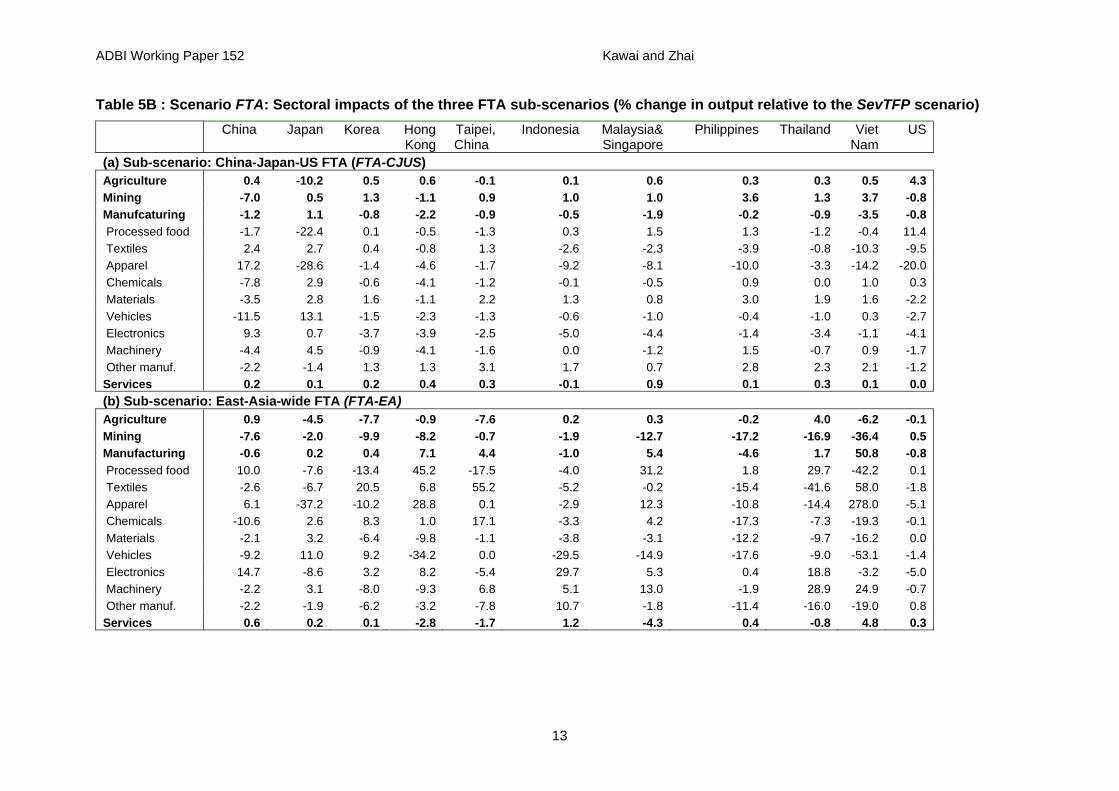
First, as shown in the first column of Table 5A, a PRC-Japan-US FTA produced a net welfare gain for the world as a whole of US$52 billion (2004 prices). This welfare gain is not distributed evenly across countries. Among the FTA partners, the welfare of the PRC and Japan rose by 1.0–1.3% of GDP, while that of the US rose by 0.2% of GDP. The gain for the US is smaller than that for Japan and the PRC, because of its large economic size, its already low tariff rates, and negative impacts on its manufacturing sector. In general, the trade dependence of larger economies on smaller economies is smaller than vice versa, hence the potential gain of a large economy—such as the US—from an FTA with a smaller economy is limited. The US is a highly open economy with generally low tariff rates—except for those on a limited number of products such as textiles, apparel, and processed food—so that its efficiency gains from the removal of distortions are small. The formation of a PRC-Japan-US FTA on the one hand expands the US agricultural sector, largely due to reduced import protection in the Japanese agriculture sector, but on the other hand reduces the manufacturing sector due to larger imports of manufactured products, thereby diverting resources out of manufacturing toward agriculture. Table 5B indeed shows that the US agricultural sector was the major beneficiary of a PRC-Japan-US FTA, with an average output expansion of 4.3%. But the manufacturing activity of the US shrank by 0.8%, with virtually no change in the service sector. Since the manufacturing sector is assumed to operate under an increasing returns to scale technology, its output contraction has negative welfare implications because of the loss of agglomeration and variety effects.
With the exception of Hong Kong, China, economies excluded from the PRC-Japan-US FTA all experienced declines in welfare, because of lower export demand and deteriorating terms of trade faced by them. Although the adverse effects on these economies were largely modest, those in East Asia suffered more than the economies outside the region, with their welfare losses generally ranging from 0.2% to 0.7% of GDP. Viet Nam experienced a very large welfare loss, equivalent to 1.9% of its GDP, mainly because of a significant contraction of its textile and apparel output. The textile and apparel sectors account for 17% of Viet Nam’s gross output and one third of its exports. Around 40% of Vietnamese textile and apparel exports go to Japan and the US. The PRC is Viet Nam’s largest competitor in these two sectors. The preferential market access under the PRC-Japan-US FTA provides a strong competitive advantage for the PRC’s textile and apparel exports, thereby reducing Viet Nam’s export of textiles and apparel to the US and Japan, and consequently its textile and apparel output. Given the high share of the textile and apparel sectors in Viet Nam’s manufacturing activity, its manufacturing output fell by 3.5%, much higher than other excluded East Asian economies. Besides the textile and apparel sectors, electronics is another key loser in most East Asian economies from the creation of a PRC-Japan-US FTA.
ADBI Working Paper 152 Kawai and Zhai
Table 5B : Scenario FTA: Sectoral impacts of the three FTA sub-scenarios (% change in output relative to the SevTFP scenario) China
Japan Korea Hong
KongTaipei, China
Indonesia Malaysia&Singapore
Philippines Thailand Viet Nam
US
(a) Sub-scenario: China-Japan-US FTA (FTA-CJUS) Agriculture 0.4 -10.2 0.5 0.6 -0.1 0.1 0.6 0.3 0.3 0.5 4.3 Mining -7.0 0.5 1.3 -1.1 0.9 1.0 1.0 3.6 1.3 3.7 -0.8 Manufcaturing -1.2 1.1 -0.8 -2.2 -0.9 -0.5 -1.9 -0.2 -0.9 -3.5 -0.8 Processed food -1.7 -22.4 0.1 -0.5 -1.3 0.3 1.5 1.3 -1.2 -0.4 11.4 Textiles 2.4 2.7 0.4 -0.8 1.3 -2.6 -2.3 -3.9 -0.8 -10.3 -9.5 Apparel 17.2 -28.6 -1.4 -4.6 -1.7 -9.2 -8.1 -10.0 -3.3 -14.2 -20.0 Chemicals -7.8 2.9 -0.6 -4.1 -1.2 -0.1 -0.5 0.9 0.0 1.0 0.3 Materials -3.5 2.8 1.6 -1.1 2.2 1.3 0.8 3.0 1.9 1.6 -2.2 Vehicles -11.5 13.1 -1.5 -2.3 -1.3 -0.6 -1.0 -0.4 -1.0 0.3 -2.7 Electronics 9.3 0.7 -3.7 -3.9 -2.5 -5.0 -4.4 -1.4 -3.4 -1.1 -4.1 Machinery -4.4 4.5 -0.9 -4.1 -1.6 0.0 -1.2 1.5 -0.7 0.9 -1.7 Other manuf. -2.2 -1.4 1.3 1.3 3.1 1.7 0.7 2.8 2.3 2.1 -1.2 Services 0.2 0.1 0.2 0.4 0.3 -0.1 0.9 0.1 0.3 0.1 0.0 (b) Sub-scenario: East-Asia-wide FTA (FTA-EA) Agriculture 0.9 -4.5 -7.7 -0.9 -7.6 0.2 0.3 -0.2 4.0 -6.2 -0.1 Mining -7.6 -2.0 -9.9 -8.2 -0.7 -1.9 -12.7 -17.2 -16.9 -36.4 0.5 Manufacturing -0.6 0.2 0.4 7.1 4.4 -1.0 5.4 -4.6 1.7 50.8 -0.8 Processed food 10.0 -7.6 -13.4 45.2 -17.5 -4.0 31.2 1.8 29.7 -42.2 0.1 Textiles -2.6 -6.7 20.5 6.8 55.2 -5.2 -0.2 -15.4 -41.6 58.0 -1.8 Apparel 6.1 -37.2 -10.2 28.8 0.1 -2.9 12.3 -10.8 -14.4 278.0 -5.1 Chemicals -10.6 2.6 8.3 1.0 17.1 -3.3 4.2 -17.3 -7.3 -19.3 -0.1 Materials -2.1 3.2 -6.4 -9.8 -1.1 -3.8 -3.1 -12.2 -9.7 -16.2 0.0 Vehicles -9.2 11.0 9.2 -34.2 0.0 -29.5 -14.9 -17.6 -9.0 -53.1 -1.4 Electronics 14.7 -8.6 3.2 8.2 -5.4 29.7 5.3 0.4 18.8 -3.2 -5.0 Machinery -2.2 3.1 -8.0 -9.3 6.8 5.1 13.0 -1.9 28.9 24.9 -0.7 Other manuf. -2.2 -1.9 -6.2 -3.2 -7.8 10.7 -1.8 -11.4 -16.0 -19.0 0.8 Services 0.6 0.2 0.1 -2.8 -1.7 1.2 -4.3 0.4 -0.8 4.8 0.3
13
ADBI Working Paper 152 Kawai and Zhai
14
(c) Sub-scenario: East-Asia–US FTA (FTA-EAUS) China
Japan Korea Hong
KongTaipei, China
Indonesia Malaysia&Singapore
Philippines Thailand Viet Nam
US
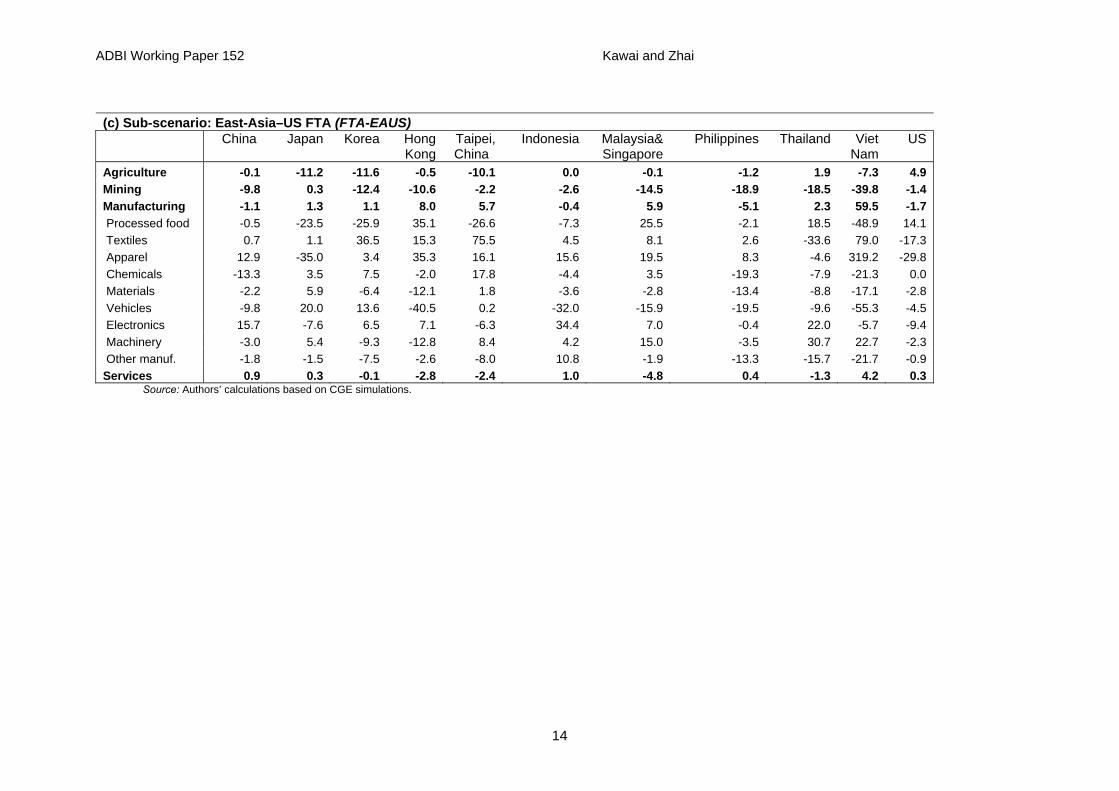
Agriculture -0.1 -11.2 -11.6 -0.5 -10.1 0.0 -0.1 -1.2 1.9 -7.3 4.9 Mining -9.8 0.3 -12.4 -10.6 -2.2 -2.6 -14.5 -18.9 -18.5 -39.8 -1.4 Manufacturing -1.1 1.3 1.1 8.0 5.7 -0.4 5.9 -5.1 2.3 59.5 -1.7 Processed food -0.5 -23.5 -25.9 35.1 -26.6 -7.3 25.5 -2.1 18.5 -48.9 14.1 Textiles 0.7 1.1 36.5 15.3 75.5 4.5 8.1 2.6 -33.6 79.0 -17.3 Apparel 12.9 -35.0 3.4 35.3 16.1 15.6 19.5 8.3 -4.6 319.2 -29.8 Chemicals -13.3 3.5 7.5 -2.0 17.8 -4.4 3.5 -19.3 -7.9 -21.3 0.0 Materials -2.2 5.9 -6.4 -12.1 1.8 -3.6 -2.8 -13.4 -8.8 -17.1 -2.8 Vehicles -9.8 20.0 13.6 -40.5 0.2 -32.0 -15.9 -19.5 -9.6 -55.3 -4.5 Electronics 15.7 -7.6 6.5 7.1 -6.3 34.4 7.0 -0.4 22.0 -5.7 -9.4 Machinery -3.0 5.4 -9.3 -12.8 8.4 4.2 15.0 -3.5 30.7 22.7 -2.3 Other manuf. -1.8 -1.5 -7.5 -2.6 -8.0 10.8 -1.9 -13.3 -15.7 -21.7 -0.9 Services 0.9 0.3 -0.1 -2.8 -2.4 1.0 -4.8 0.4 -1.3 4.2 0.3
Source: Authors’ calculations based on CGE simulations.
ADBI Working Paper 152 Kawai and Zhai
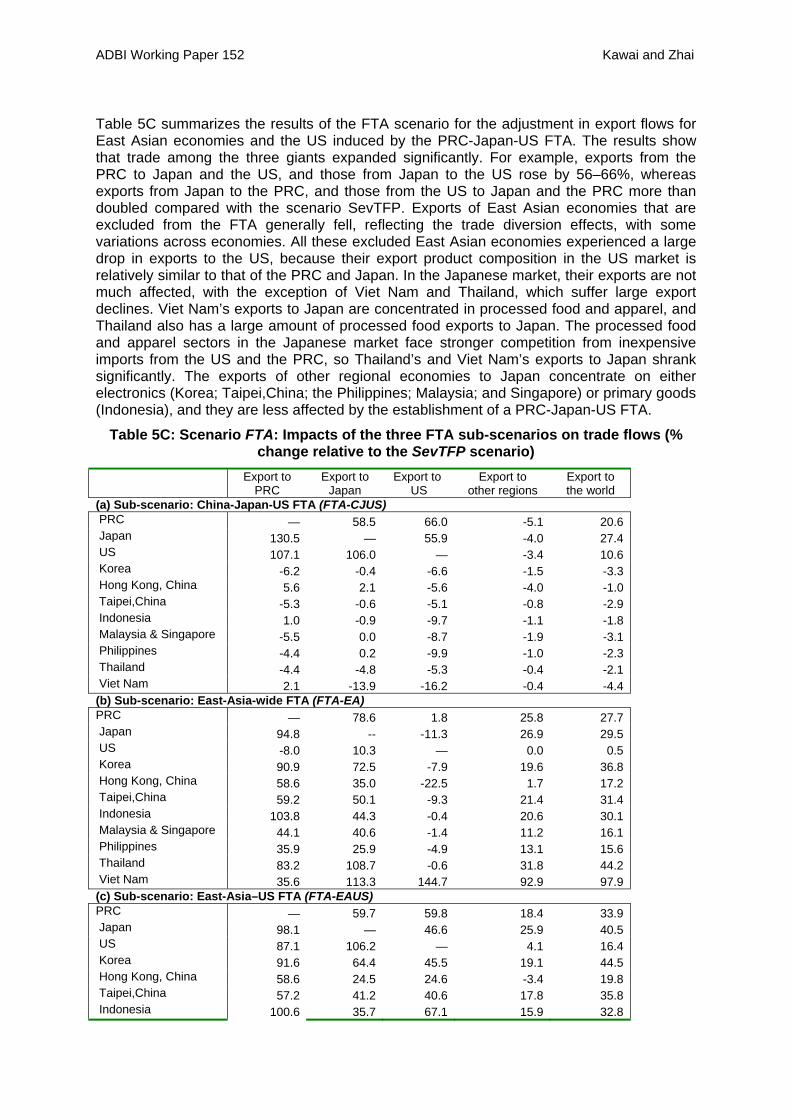
Table 5C summarizes the results of the FTA scenario for the adjustment in export flows for East Asian economies and the US induced by the PRC-Japan-US FTA. The results show that trade among the three giants expanded significantly. For example, exports from the PRC to Japan and the US, and those from Japan to the US rose by 56–66%, whereas exports from Japan to the PRC, and those from the US to Japan and the PRC more than doubled compared with the scenario SevTFP. Exports of East Asian economies that are excluded from the FTA generally fell, reflecting the trade diversion effects, with some variations across economies. All these excluded East Asian economies experienced a large drop in exports to the US, because their export product composition in the US market is relatively similar to that of the PRC and Japan. In the Japanese market, their exports are not much affected, with the exception of Viet Nam and Thailand, which suffer large export declines. Viet Nam’s exports to Japan are concentrated in processed food and apparel, and Thailand also has a large amount of processed food exports to Japan. The processed food and apparel sectors in the Japanese market face stronger competition from inexpensive imports from the US and the PRC, so Thailand’s and Viet Nam’s exports to Japan shrank significantly. The exports of other regional economies to Japan concentrate on either electronics (Korea; Taipei,China; the Philippines; Malaysia; and Singapore) or primary goods (Indonesia), and they are less affected by the establishment of a PRC-Japan-US FTA.
Table 5C: Scenario FTA: Impacts of the three FTA sub-scenarios on trade flows (% change relative to the SevTFP scenario)
Export to
PRC Export to
Japan Export to
US Export to
other regions Export to the world
(a) Sub-scenario: China-Japan-US FTA (FTA-CJUS) PRC — 58.5 66.0 -5.1 20.6 Japan 130.5 — 55.9 -4.0 27.4 US 107.1 106.0 — -3.4 10.6 Korea -6.2 -0.4 -6.6 -1.5 -3.3 Hong Kong, China 5.6 2.1 -5.6 -4.0 -1.0 Taipei,China -5.3 -0.6 -5.1 -0.8 -2.9 Indonesia 1.0 -0.9 -9.7 -1.1 -1.8 Malaysia & Singapore -5.5 0.0 -8.7 -1.9 -3.1 Philippines -4.4 0.2 -9.9 -1.0 -2.3 Thailand -4.4 -4.8 -5.3 -0.4 -2.1 Viet Nam 2.1 -13.9 -16.2 -0.4 -4.4 (b) Sub-scenario: East-Asia-wide FTA (FTA-EA) PRC — 78.6 1.8 25.8 27.7 Japan 94.8 -- -11.3 26.9 29.5 US -8.0 10.3 — 0.0 0.5 Korea 90.9 72.5 -7.9 19.6 36.8 Hong Kong, China 58.6 35.0 -22.5 1.7 17.2 Taipei,China 59.2 50.1 -9.3 21.4 31.4 Indonesia 103.8 44.3 -0.4 20.6 30.1 Malaysia & Singapore 44.1 40.6 -1.4 11.2 16.1 Philippines 35.9 25.9 -4.9 13.1 15.6 Thailand 83.2 108.7 -0.6 31.8 44.2 Viet Nam 35.6 113.3 144.7 92.9 97.9 (c) Sub-scenario: East-Asia–US FTA (FTA-EAUS) PRC — 59.7 59.8 18.4 33.9 Japan 98.1 — 46.6 25.9 40.5 US 87.1 106.2 — 4.1 16.4 Korea 91.6 64.4 45.5 19.1 44.5 Hong Kong, China 58.6 24.5 24.6 -3.4 19.8 Taipei,China 57.2 41.2 40.6 17.8 35.8 Indonesia 100.6 35.7 67.1 15.9 32.8
ADBI Working Paper 152 Kawai and Zhai
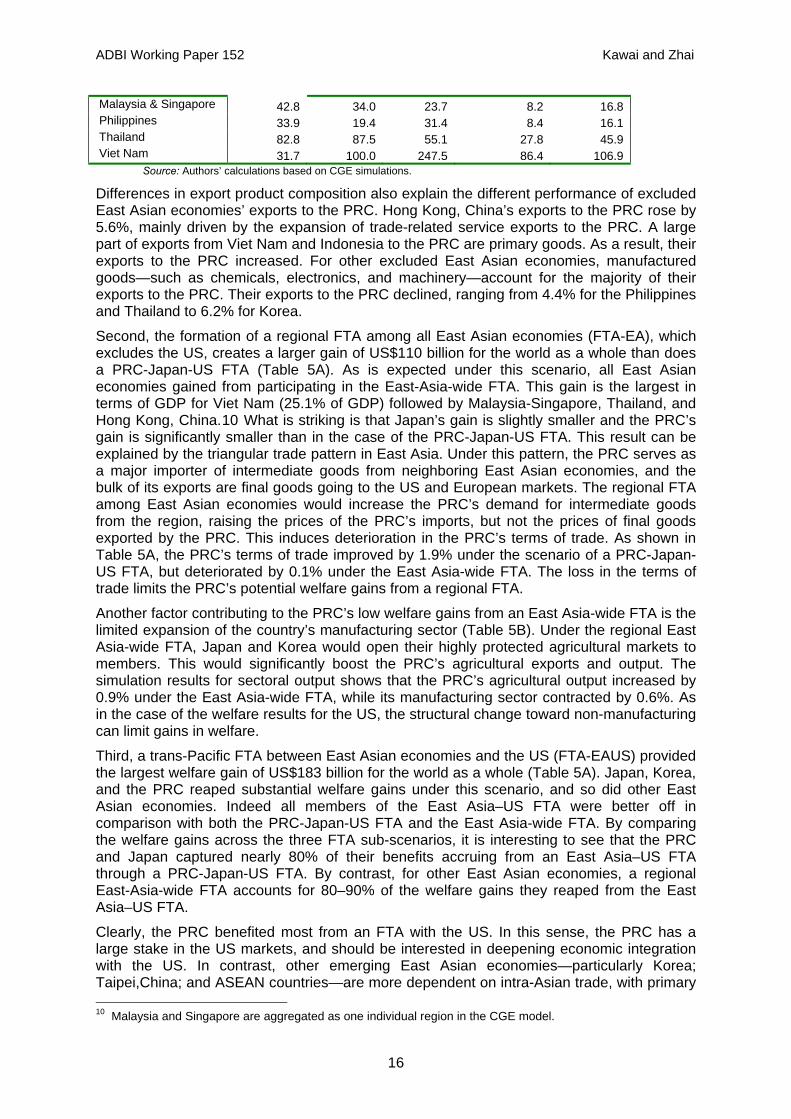
Malaysia & Singapore 42.8 34.0 23.7 8.2 16.8 Philippines 33.9 19.4 31.4 8.4 16.1 Thailand 82.8 87.5 55.1 27.8 45.9 Viet Nam 31.7 100.0 247.5 86.4 106.9
Source: Authors’ calculations based on CGE simulations.
Differences in export product composition also explain the different performance of excluded East Asian economies’ exports to the PRC. Hong Kong, China’s exports to the PRC rose by 5.6%, mainly driven by the expansion of trade-related service exports to the PRC. A large part of exports from Viet Nam and Indonesia to the PRC are primary goods. As a result, their exports to the PRC increased. For other excluded East Asian economies, manufactured goods—such as chemicals, electronics, and machinery—account for the majority of their exports to the PRC. Their exports to the PRC declined, ranging from 4.4% for the Philippines and Thailand to 6.2% for Korea.
Second, the formation of a regional FTA among all East Asian economies (FTA-EA), which excludes the US, creates a larger gain of US$110 billion for the world as a whole than does a PRC-Japan-US FTA (Table 5A). As is expected under this scenario, all East Asian economies gained from participating in the East-Asia-wide FTA. This gain is the largest in terms of GDP for Viet Nam (25.1% of GDP) followed by Malaysia-Singapore, Thailand, and Hong Kong, China.10 What is striking is that Japan’s gain is slightly smaller and the PRC’s gain is significantly smaller than in the case of the PRC-Japan-US FTA. This result can be explained by the triangular trade pattern in East Asia. Under this pattern, the PRC serves as a major importer of intermediate goods from neighboring East Asian economies, and the bulk of its exports are final goods going to the US and European markets. The regional FTA among East Asian economies would increase the PRC’s demand for intermediate goods from the region, raising the prices of the PRC’s imports, but not the prices of final goods exported by the PRC. This induces deterioration in the PRC’s terms of trade. As shown in Table 5A, the PRC’s terms of trade improved by 1.9% under the scenario of a PRC-Japan-US FTA, but deteriorated by 0.1% under the East Asia-wide FTA. The loss in the terms of trade limits the PRC’s potential welfare gains from a regional FTA.
Another factor contributing to the PRC’s low welfare gains from an East Asia-wide FTA is the limited expansion of the country’s manufacturing sector (Table 5B). Under the regional East Asia-wide FTA, Japan and Korea would open their highly protected agricultural markets to members. This would significantly boost the PRC’s agricultural exports and output. The simulation results for sectoral output shows that the PRC’s agricultural output increased by 0.9% under the East Asia-wide FTA, while its manufacturing sector contracted by 0.6%. As in the case of the welfare results for the US, the structural change toward non-manufacturing can limit gains in welfare.
Third, a trans-Pacific FTA between East Asian economies and the US (FTA-EAUS) provided the largest welfare gain of US$183 billion for the world as a whole (Table 5A). Japan, Korea, and the PRC reaped substantial welfare gains under this scenario, and so did other East Asian economies. Indeed all members of the East Asia–US FTA were better off in comparison with both the PRC-Japan-US FTA and the East Asia-wide FTA. By comparing the welfare gains across the three FTA sub-scenarios, it is interesting to see that the PRC and Japan captured nearly 80% of their benefits accruing from an East Asia–US FTA through a PRC-Japan-US FTA. By contrast, for other East Asian economies, a regional East-Asia-wide FTA accounts for 80–90% of the welfare gains they reaped from the East Asia–US FTA.
Clearly, the PRC benefited most from an FTA with the US. In this sense, the PRC has a large stake in the US markets, and should be interested in deepening economic integration with the US. In contrast, other emerging East Asian economies—particularly Korea; Taipei,China; and ASEAN countries—are more dependent on intra-Asian trade, with primary 10 Malaysia and Singapore are aggregated as one individual region in the CGE model.
16
ADBI Working Paper 152 Kawai and Zhai
interests lying in integration within Asia. Japan is somewhere in between; its gain from a PRC-Japan-US FTA was larger than that from an East-Asia-wide FTA and its gain from an East Asia–US FTA was substantially large. These results highlight the potential differences in the positions of East Asian economies toward regional integration.
4. CONCLUSIONS The future integration of three giant economies of the world— the PRC, Japan, and the US— is likely to have important impacts on the global and regional economies. This paper has examined issues related to economic integration among the PRC, Japan, and the US. Specifically, it has considered the implications both of the global economic crisis, emanating from the US, for domestic structural reforms in East Asian economies, and of the deepening economic relationship between East Asia and the US for East Asian economies. The simulation results from a global CGE model indicate that consumption evaporation in the US and its consequent decline in demand for imports would force important structural adjustments in East Asian production and trade. With the drop of the US share in East Asian exports, East Asian economies need to reorient their exportable outputs to themselves—through greater domestic demand—and to third markets. The manufacturing sectors such as vehicles, electronics and machinery are major losers in the adjustment process in East Asian economies. On the other hand, the agricultural and service sectors are likely to gain from the expanded domestic demand. For East Asian economies, structural reform to boost service sector productivity would not only bring them important welfare gains, but also facilitate their adjustment to the correction of the US current account deficit.
Given that US demand for East Asian manufactured products will remain low and US potential growth may be permanently reduced in the aftermath of the ongoing financial crisis, an important issue for the PRC and Japan is whether they should weaken or strengthen economic ties with the US. Our integration scenario suggests that, in terms of FTA strategies, the PRC and Japan should still consider strengthening economic ties with the US, but only by bringing other East Asian economies into the integration process.
In principle, the most desirable method for trade integration would be multilateral liberalization involving all countries in the world as it would bring the largest gains to all.11 However, given the uncertainties in the progress of global multilateral trade liberalization, it makes sense to consider the more feasible options of creating regional or cross-regional FTAs, such as an East Asia-wide FTA and a cross-regional FTA. The results of the three FTA sub-scenarios show that while the PRC may prefer trade integration with the US through a PRC-Japan-US FTA, other emerging East Asian economies prefer integration with the PRC and Japan. Japan may prefer to combine both intra-regional and cross-Pacific trade integration. Although an FTA among the PRC, Japan, and the US would bring important economic benefits for the PRC and Japan, it would lead to adverse welfare consequences for other East Asian economies. In contrast, a regional initiative to create an East Asia-wide FTA could produce large benefits for many East Asian economies. The PRC may wish to exercise its leadership by joining in this initiative. Ultimately all the East Asian economies should make efforts to link the region with the US, in a broad trans-Pacific FTA covering both East Asia and the US (as well as the rest of North and South America), as a promising option to reap the benefits of broader and deeper economic integration.
11 There are some exceptions to this. For example, a least developed country enjoying preferential trade access
to developed country markets could lose if the removal of such preferences were to create large losses that more than offset the gains brought about by global liberalization.
17
ADBI Working Paper 152 Kawai and Zhai
REFERENCES Arkolakis, Costas. 2006. Market access costs and the new consumers margin in
international trade. Mimeographed, University of Minnesota.
Broda, Christian, and David E. Weinstein. 2006. Globalization and the gains from variety. Quarterly Journal of Economics 121(2): 541–585.
Corsetti, Giancarlo, Philippe Martin, and Paolo Pesenti. 2008. Varieties and the transfer problem: The extensive margin of current account adjustment. NBER Working Paper 13795. Cambridge, MA: National Bureau of Economic Research.
Francois, Joseph, and Ganeshan Wignaraja. 2008. Economic implications of deeper Asian integration. CEPR Discussion Paper 6976. London: Centre for Economic Policy Research.
Hertel, Thomas W., ed. 1997. Global trade analysis: Modeling and applications. Cambridge, UK: Cambridge University Press.
Kawai, Masahiro, and Shujiro Urata. 2004. Trade and foreign direct investment in East Asia. In Exchange rate regimes in East Asia, edited by Gordon de Brouwer and Masahiro Kawai. London and New York: Routledge Curzon.
Kawai, Masahiro, and Ganeshan Wignaraja. 2008. EAFTA or CEPEA: Which way forward? ASEAN Economic Bulletin 25(2): 113–139.
Kawai, Masahiro, and Fan Zhai. 2009. Dynamic adjustment of Asian economies to the global economic crisis. Paper presented at “Conference on Global Financial Crisis: Macroeconomic Policy Issues,” Asian Development Bank Institute, Tokyo, 29 July.
Lee, Hiro, and Dominique van der Mensbrugghe. 2008. Regional integration, sectoral adjustments and natural groupings in East Asia. International Journal of Applied Economics 5(2): 57–79.
Markusen, James, Thomas Rutherford, and David Tarr. 2005. Trade and direct investment in producer services and the domestic market for expertise. Canadian Journal of Economics 38(3): 758–777.
Melitz, Marc J. 2003. The impact of trade on intra-industry reallocations and aggregate industry productivity. Econometrica 71(6): 1695–1725.
Mérette, Marcel, et al. 2008. Foreign direct investment liberalization between Canada and the USA: a CGE investigation. Atlantic Economic Journal 36(2): 195–209.
Obstfeld, Maurice, and Kenneth Rogoff. 2005. Global current account imbalances and exchange rate adjustments. Brookings Papers on Economic Activity 1 (August): 67–123.
Urata, Shujiro, and Kozo Kiyota. 2005. The impacts of an East Asia FTA on foreign trade in East Asia. In International Trade in East Asia, edited by Takatoshi Ito and Andrew Rose. Chicago: University of Chicago Press.
Shoven, John B., and John Whalley.1992. Applying general equilibrium. Cambridge,UK: Cambridge University Press.
United Nations Conference on Trade and Development. 2008. World investment report 2008: Transnational corporations and the infrastructure challenge. New York and Geneva: United Nations.
van der Mensbrugghe, Dominique. 2005. LINKAGE technical reference document: Version 6.0. Available: http://go.worldbank.org/7NP2KK1OH0.
18

ADBI Working Paper 152 Kawai and Zhai
19
Zhai, Fan. 2006. Preferential trade agreements in Asia: Alternative scenarios of “hub and spoke.” ERD Working Paper Series No. 83. Manila: Asian Development Bank.
Zhai, Fan. 2008. Armington meets Melitz: Introducing firm heterogeneity in a global CGE model of trade. Journal of Economic Integration 23(3): 575–604.