Embed Size (px)
Citation preview
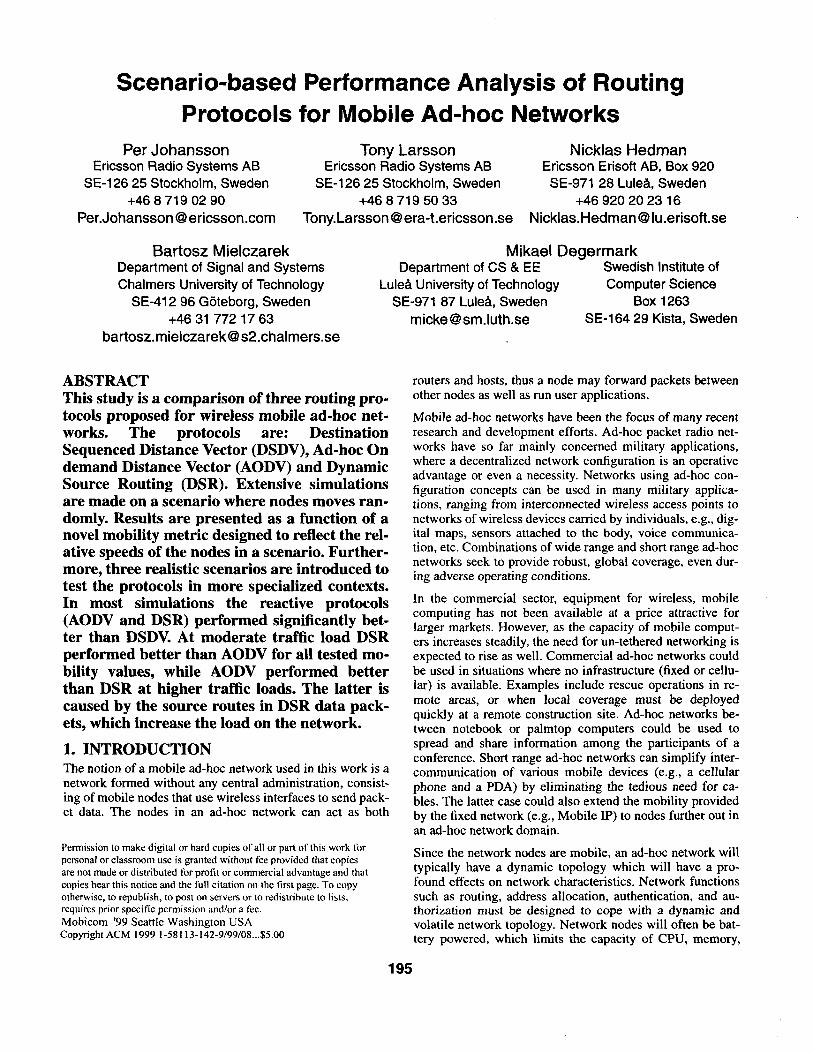
Scenario-based Performance Analysis of Routing Protocols for Mobile Ad-hoc Networks
Per Johansson Tony Larsson Nicklas Hedman Ericsson Radio Systems AB Ericsson Radio Systems AB Ericsson Erisoft AB, Box 920
SE-l 26 25 Stockholm, Sweden SE-l 26 25 Stockholm, Sweden SE-971 28 Lulea, Sweden +4687190290 +4687195033 +46 920 20 23 16
Per.JohanssonQericsson.com Tony.LarssonQera-t.ericsson.se Nicklas.HedmanQlu.erisoft.se
Bartosz Mielczarek Mikael Degermark Department of Signal and Systems Department of CS & EE Swedish Institute of Chalmers University of Technology Lulea University of Technology Computer Science
SE-41 2 96 Goteborg, Sweden SE-971 87 Lulea, Sweden Box 1263 +46 31 772 17 63 mickeQsm.luth.se
bartosz.mielczarekQs2.chalmers.se
ABSTRACT This study is a comparison of three routing pro- tocols proposed for wireless mobile ad-hoc net- works. The protocols are: Destination Sequenced Distance Vector (DSDV), Ad-hoc On demand Distance Vector (AODV) and Dynamic Source Routing (DSR). Extensive simulations are made on a scenario where nodes moves ran- domly. Results are presented as a function of a novel mobility metric designed to reflect the rel- ative speeds of the nodes in a scenario. Further- more, three realistic scenarios are introduced to test the protocols in more specialized contexts. In most simulations the reactive protocols (AODV and DSR) performed significantly bet- ter than DSDV. At moderate traffic load DSR performed better than AODV for all tested mo- bility values, while AODV performed better than DSR at higher traffic loads. The latter is caused by the source routes in DSR data pack- ets, which increase the load on the network.
routers and hosts, thus a node may forward packets between other nodes as well as run user applications.
Mobile ad-hoc networks have been the focus of many recent research and development efforts. Ad-hoc packet radio net- works have so far mainly concerned military applications, where a decentralized network configuration is an operative advantage or even a necessity. Networks using ad-hoc con- figuration concepts can be used in many military applica- tions, ranging from interconnected wireless access points to networks of wireless devices carried by individuals, e.g., dig- ital maps, sensors attached to the body, voice communica- tion, etc. Combinations of wide range and short range ad-hoc networks seek to provide robust, global coverage, even dur- ing adverse operating conditions.
1. INTRODUCTION The notion of a mobile ad-hoc network used in this work is a network formed without any central administration, consist- ing of mobile nodes that use wireless interfaces to send pack- et data. The nodes in an ad-hoc network can act as both
In the commercial sector, equipment for wireless, mobile computing has not been available at a price attractive for larger markets. However, as the capacity of mobile comput- ers increases steadily, the need for un-tethered networking is expected to rise as well. Commercial ad-hoc networks could be used in situations where no infrastructure (fixed or cellu- lar) is available. Examples include rescue operations in re- mote areas, or when local coverage must be deployed quickly at a remote construction site. Ad-hoc networks be- tween notebook or palmtop computers could be used to spread and share information among the participants of a conference. Short range ad-hoc networks can simplify inter- communication of various mobile devices (e.g., a cellular phone and a PDA) by eliminating the tedious need for ca- bles. The latter case could also extend the mobility provided by the fixed network (e.g., Mobile IP) to nodes further out in an ad-hoc network domain.
Permission to make digital or hard copies of all or part of this work for personal or classroom use is granted without fee provided that copies are not made or distributed for profit or commercial advantage and that copies bear this notice and the full citation on the tirst page. To copy otherwise, to republish, to post on servers or to redistrihute to lists. requires prior specific permission and/or a fee. Mobicom ‘99 Scattlc Washington USA Copyright ACM 1999 I-581 13-142-9/99/08...$5.00
Since the network nodes are mobile, an ad-hoc network will typically have a dynamic topology which will have a pro- found effects on network characteristics. Network functions such as routing, address allocation, authentication, and au- thorization must be designed to cope with a dynamic and volatile network topology. Network nodes will often be bat- tery powered, which limits the capacity of CPU, memory,
SE-1 64 29 Kista, Sweden
195
and bandwidth. This will require network functions that are resource effective. Furthermore, the wireless (radio) media will also affect the behavior of the network due to fluctuat- ing link bandwidths resulting from relatively high error rates.
1.1 Routing protocols for ad-hoc networks This work focuses on routing protocols for mobile ad-hoc networks. Traditional routing protocols are proactive in that they maintain routes to all nodes, including nodes to which no packets are sent. They react to topology changes, even if no traffic is affected by the change. They are based on either link-state or distance vector principles [ 181 and require peri- odic control messages to maintain routes to every node in the network. The rate at which these messages are sent must reflect the dynamics of the network in order to maintain val- id routes. Hence, the use of scarce resources, e.g., power and link bandwidth, for control traffic will increase with in- creased node mobility. An alternative approach is reactive route establishment, where routes between nodes are deter- mined only when explicitly needed to route packets,
Several routing protocols for ad-hoc networks have been proposed, for instance [l, 3, 4, 6, 8, 9, 10, 13, 15, 17, 191, but few comparisons between the different protocols have been published.
Within the Internet Engineering Task Force (IETF), a work- ing group named Mobile Ad-hoc Networks (MANET) [ 121 has the charter to standardize an IP routing protocol for mo- bile ad-hoc networks. All the routing protocols listed above (except for [ 171) have been submitted to the MANET group as internet drafts.
The work presented in [2] is the most comprehensive com- parison of ad-hoc routing protocols published so far. The study was done in the Monarch’ project at CMU and aims at a fair evaluation based on quantitative metrics. Examples of other simulation results on individual protocols are [ 1 I] and [ 141, but as these used different metrics the results are diffi- cult to compare.
Three routing protocols are studied in this work, namely Ad-hoc on Demand Distance Vector (AODV), Dynamic Source Routing (DSR), and Destination Sequenced Dis- tance Vector (DSDV). AODV and DSR were selected be- cause they show the best performance in [2], but should be compared and evaluated further using additional metrics and scenarios. As opposed to DSR and AODV, DSDV is a pro- active protocol and was included to illustrate the differences between reactive and proactive protocols.
This work has been inspired by the simulations in [2], but extends those results further by introducing a new mobility metric and new network scenarios as well as presenting re- sults on delays and byte overhead. First, a metric called mobility is introduced as a means to capture the relative mo- tion of nodes in the network. Second, throughput and delay
1. Mobile Networking ARCHitectures
are measured for the analyzed protocols with mobility and offered traffic load as variables in a random network scenar- io. Third, three network scenarios are analyzed, denoted Conference, Event Coverage, and Disaster Area, respective- ly. They are intended to model a set of usage cases believed to be more realistic than a totally random motion pattern. In addition, the simulation tools were modified to include sim- ple obstacles that shadow the coverage of nodes, which add to the realism of the latter scenarios.
The models of DSDV and DSR used in the study were part of a simulation package from CMU [20], while AODV had to be implemented independently at the time of this work. To clarify the differences to the work made in [2], a discus- sion on protocol implementations and protocol parameters are presented in conjunction with the protocol descriptions in Section 2.
In all simulations presented herein, the link layer consists of a wireless LAN using a media access control (MAC) func- tion based on the IEEE 802.11 [7] standard. This MAC function uses a random access algorithm denoted CSMA/ CA (Carrier Sense Multiple Access with Collision Avoid- ance) that essentially operates as an Ethernet in the air with- out the collision detection part. The random access concept used in this protocol makes it relatively easy to form ad-hoc networks. The technology is commercially available, and there is an implementation of this link layer in the simula- tion environment used in this study.
The paper is organized as follows. In Section 2, brief de- scriptions of the studied protocols are given. Section 3 intro- duces a mobility metric used throughout the study. In Section 4, simulation results for the random scenario are given and in Section 5 results for the three realistic scenari- os are presented and discussed. In Section 6 conclusions are drawn from the study and, finally, in Section 7 planned fur- ther work is listed.
2. PROTOCOL DESCRIPTIONS This section gives short descriptions of the three ad-hoc routing protocols studied in this work.
2.1 Destination Sequenced Distance Vector - DSDV
DSDV [17] is a hop-by-hop distance vector routing proto- col. It is proactive; each network node maintains a routing table that contains the next-hop for, and number of hops to, all reachable destinations. Periodical broadcasts of routing updates attempt to keep the routing table completely updat- ed at all times.
To guarantee loop-freedom DSDV uses a concept of se- quence numbers to indicate the freshness of a route. A route R is considered more favorable than R’ if R has a greater se- quence number or, if the routes have the same sequence number, R has lower hop-count. The sequence number for a route is set by the destination node and increased by one for every new originating route advertisement. When a node along a path detects a broken route to a destination D, it ad-
196
vertises its route to D with an infinite hop-count and a se- quence number increased by one.
Route loops can occur when incorrect routing information is present in the network after a change in the network topolo- gy, e.g., a broken link. In this context the use of sequence numbers adapts DSDV to a dynamic network topology such as in an ad-hoc network.
DSDV uses triggered route updates when the topology changes. The transmission of updates is delayed to intro- duce a damping effect when the topology is changing rapid- ly. This gives an additional adaptation of DSDV to ad-hoc networks.
The parameter values used for DSDV in the simulations are given in Table 1 and are the same as in [Z].
Table 1: DSDV Simulation parameters
Periodic route update interval 15 s
Periodic updates missed before link declared 3 broken
Route advertisement aggregation time IS
Maximum packets buffered per node per desti- 5 nation
2.2 Ad-hoc On Demand Distance vector - AODV
AODV [ 15,161 is a distance vector routing protocol, like DSDV, but it is reactive rather than proactive like DSDV. That is, AODV requests a route only when needed and does not require nodes to maintain routes to destinations that are not communicating. The process of finding routes is re- ferred to as the route acquisition henceforth. AODV uses se- quence numbers in a way similar to DSDV to avoid routing loops and to indicate the freshness of a route.
Whenever a node needs to find a route to another node it broadcasts a Route Request (RREQ) message to all its neighbors. The RREQ message is flooded through the net- work until it reaches the destination or a node with a fresh route to the destination. On its way through the network, the RREQ message initiates creation of temporary route table entries for the reverse route in the nodes it passes. If the des- tination, or a route to it, is found, the route is made available by unicasting a Route Reply (RREP) message back to the source along the temporary reverse path of the received RREQ message. On its way back to the source, the RREP message initiates creation of routing table entries for the destination in intermediate nodes. Routing table entries ex- pire after a certain time-out period.
Neighbors are detected by periodic HELLO messages (a special RREP message). If a node x does not receive HEL- LO messages from a neighbor y through which it sends traf- fic, that link is deemed broken and a link failure indication (a triggered RREP message) is sent to its active neighbors. The latter refers to the neighbors of x that were using the broken link between x and y. When the link failure messages eventually reach the affected sources, these can choose to ei-
ther stop sending data or to request a new route by sending out new RREQ messages.
The implementation of AODV made within this study com- bines HELLO messages with information from the MAC layer to detect link failures, which results in quicker failure detection. DSR uses similar methods. The HELLO interval was also increased to 1.5 seconds (1 second in [16]) since the protocol now gets additional information from the link layer. Moreover, the AODV implementation used in this study has a send buffer of 64 packets, which is not specified in [ 161. The send buffer, located in the sending node, stores outgoing packets until the route acquisition procedure ob- tains a route to their destination. The AODV specification does not require a send buffer, but it is needed to obtain a fair comparison with DSR which does specify a send buffer. The maximum time to keep packets in the send buffer was set to 8 seconds, which was a heuristically determined value based on a series of initial simulations. Some of the parame- ters used in the simulation was slightly modified compared to the ones used in [2] and the ones specified by [17]. The Route reply lifetime was set to match the Active route time- out value. The Time between retransmitted requests was set to fit the reverse route life time (3 seconds) since it should be possible to retransmit a request as soon as the reverse route has expired. To save bandwidth, the frequency of trig- gered RREP messages was limited to one every second. The parameter values used in the simulations are given in Table 2.
Table 2: Parameter values for AODV
HELLO interval 1,5 s
Active route time-out 300 s
Route reply lifetime 300 s
Allowed HELLO loss 2
Request retries 3
Time between retransmitted requests 3s
Time to hold packets awaiting routes 8s
Maximum rate for sending replies for a route l/S
2.3 Dynamic Source Routing - DSR Dynamic Source Routing (DSR) [2][10][11] is a reactive routing protocol which uses source routing to deliver data packets. Headers of data packets carry the sequence of nodes through which the packet must pass. This means that intermediate nodes only need to keep track of their immedi- ate neighbors in order to forward data packets. The source, on the other hand, needs to know the complete hop sequence to the destination.
As in AODV, the route acquisition procedure in DSR re- quests a route by flooding a Route Request packet. A node receiving a Route Request packet searches its route cache, where all its known routes are stored, for a route to the re- quested destination. If no route is found, it forwards the Route Request packet further on after having added its own address to the hop sequence stored in the Route Request packet. The Route Request packet propagates through the
197
network until it reaches either the destination or a node with a route to the destination. If a route is found, a Route Reply packet containing the proper hop sequence for reaching the destination is unicasted back to the source node. DSR does not rely on bi-directional links since the Route Reply packet is sent to the source node either according to a route already stored in the route cache of the replying node, or by being piggybacked on a Route Request packet for the source node. However, bi-directional links are assumed throughout this study. Then the reverse path in the Route Request packet can be used by the Route Reply message.
The DSR protocol has the advantage of being able to learn routes from the source routes in received packets. When A finds a route to C through B, it will in the process learn a route to B, and C will learn a route to A. When data starts flowing from A to C, B will learn a route C. However, if the reverse path from C to A passes through B, B will learn a route to C already when Route Reply message passes through B.
To avoid unnecessarily flooding the network with Route Re- quest messages, the route acquisition procedure first queries the neighboring nodes to see if a route is available in the im- mediate neighborhood. This is done by sending a first Route Request message with the hop limit set to zero, thus it will not be forwarded by the neighbors. If no response is ob- tained by this initial request, a new Route Request message is flooded over the entire network.
DSR may use the MAC layer to inform about link failures. Alternatively, it can use the Network Layer Acknowledg- ment feature as described in [3]. In this study the MAC layer feedback is used only. In case of a link failure, a route error packet is sent back to the source node, which then removes the broken link from its route cache and all routes that con- tain this hop are truncated at the point of the broken link. Furthermore, an intermediate node that forwards the route error packet may also update its route cache in a similar manner.
A DSR node is able to learn routes by overhearing packets not addressed to it (the promiscuous mode). However, this feature requires an active receiver in the nodes, which may be rather power consuming. In networks were nodes have limited power the aim is to shut down the transceiver as of- ten as possible to conserve power. In order to investigate how DSR would operate in such an environment the promis- cuous mode was not used in the DSR simulations. This de- cision was also motivated by simulation runs (not presented due to space limitations), comparing DSR with and without the promiscuous mode. In these simulations the use of the promiscuous mode did not give a significant improvement of network performance. However, more exhaustive simula- tions should be made to confirm this.
The parameter values used in the DSR simulations are taken from [2] (see Table 3).
Table 3: Parameters for DSR.
Maximum rate for sending replies for a route 1 I/s I
3. MOBILITY METRIC This section defines a mobility metric, henceforth referred to as mobility, intended to capture and quantify the kind of node motion relevant for an ad-hoc routing protocol. Ad- hoc routing protocols must take action when the relative motion of nodes causes links to break or form, and a mobili- ty metric should thus be proportional to the number of such events. The metric should also, if possible, be independent of the particular network technology used. Therefore a mo- bility metric is proposed which is geometric in the sense that the speed of a node in relation to other nodes is measured, while it is independent of any links formed between nodes in the network.
The study in [2] uses the pause time at waypoints in a ran- dom motion model as a mobility metric. This makes sense for the particular motion model used in that study but is too ad-hoc’ to be useful for generic motion models. For in- stance, the pause time metric is ill-defined when node mo- tion is continuous or when nodes use different pause times. Moreover, the speed at which nodes move between way- points is also relevant for how often links break and form.
The mobility metric proposed here describes the mobility of a scenario with a single value M which is a function of the relative motion of the nodes taking part in a scenario. If l(n,f) is the position of node II at time t, the relative velocity v(x,y, t) between nodes x and y at time t is
v(x, y, t) = -&cx, t) - ICY, 0) .
The mobility measure, Mxr between any pair (x, y) of nodes is defined as their absolute relative speed taken as an aver- age over the time, T, the mobility is measured. The formula for obtaining Mq is given below.
1 M-5 Y, r)ldr r,<rSt,+T
In order to arrive at the total mobility metric, M, for a sce- nario, the mobility measure in (2) is averaged over all node pairs, resulting in the following definition
M=&CY*Y=&)i i Kyy (3) x, Y x-l y=x+l
where lx,yl is the number of distinct node pairs (x,y) and n is
1. No pun intended.
198
the number of nodes in the scenario. (Note that the second relation in (3) assumes nodes being numbered from 1 to n.) Hence, the mobility expresses the average relative speed be- tween all nodes in the network. Consequently, the mobility for a group of nodes standing still, or moving in parallel at the same speed, is zero.
For practical reasons a discrete version of the mobility for- mula is used when computing the mobility for the network scenarios in this study. M is approximated by summing the relative speeds over small time steps, 0.1 seconds. Decreas- ing the time increment below 0.1 seconds did not improve the accuracy significantly for the scenarios under study.
The distances are measured in meters which gives the mo- bility measure in meters per second. Alternatively, the dis- tance could be normalized with the transmitting range of the nodes to compare systems with different radio coverage. However, this modification is left for evaluation in future studies.
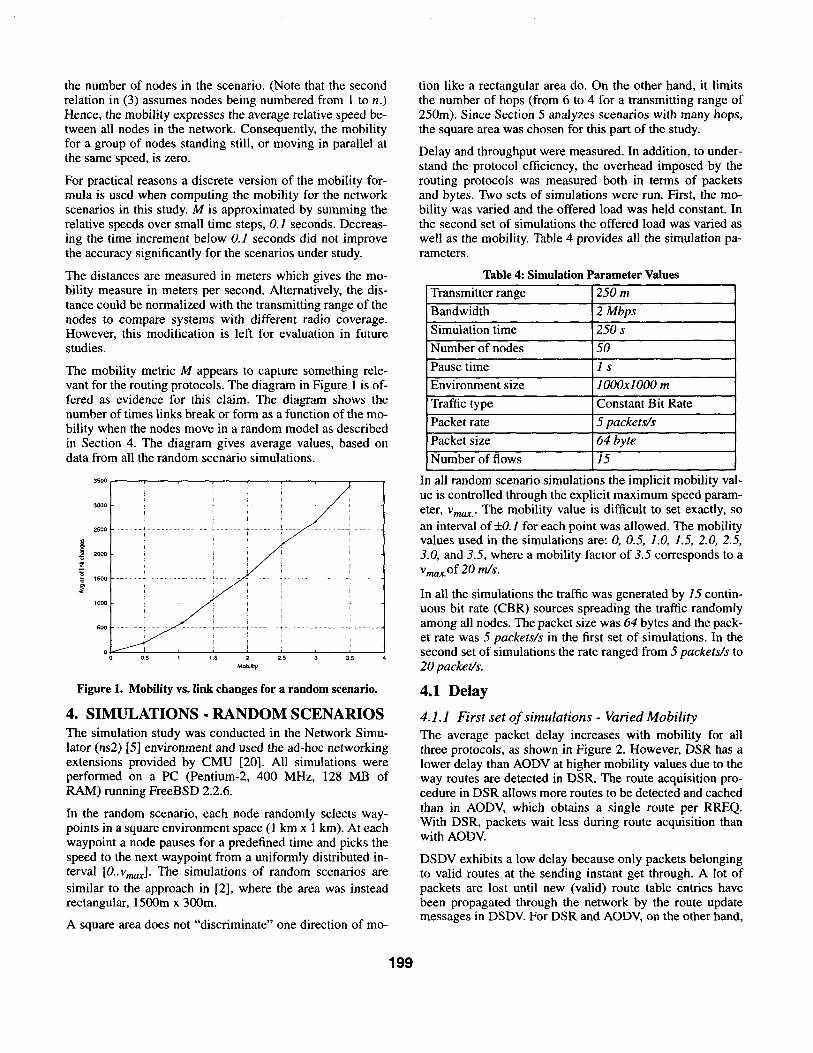
The mobility metric M appears to capture something rele- vant for the routing protocols. The diagram in Figure 1 is of- fered as evidence for this claim. The diagram shows the number of times links break or form as a function of the mo- bility when the nodes move in a random model as described in Section 4. The diagram gives average values, based on data from all the random scenario simulations.
3500
Figure 1. Mobility vs. link changes for a random scenario.
4. SIMULATIONS - RANDOM SCENARIOS The simulation study was conducted in the Network Simu- lator (ns2) [5] environment and used the ad-hoc networking extensions provided by CMU [20]. All simulations were performed on a PC (Pentium-2, 400 MHz, 128 MB of RAM) running FreeBSD 2.2.6.
In the random scenario, each node randomly selects way- points in a square environment space (1 km x 1 km). At each waypoint a node pauses for a predefined time and picks the speed to the next waypoint from a uniformly distributed in- terval [&v-l. The simulations of random scenarios are similar to the approach in [2], where the area was instead rectangular, 15OOm x 300m.
A square area does not “discriminate” one direction of mo-
tion like a rectangular area do. On the other hand, it limits the number of hops (from 6 to 4 for a transmitting range of 250m). Since Section 5 analyzes scenarios with many hops, the square area was chosen for this part of the study.
Delay and throughput were measured. In addition, to under- stand the protocol efficiency, the overhead imposed by the routing protocols was measured both in terms of packets and bytes. Two sets of simulations were run. First, the mo- bility was varied and the offered load was held constant. In the second set of simulations the offered load was varied as well as the mobility. Table 4 provides all the simulation pa- rameters.
Table 4: Simulation Parameter Values
In all random scenario simulations the implicit mobility val- ue is controlled through the explicit maximum speed param- eter, v-,. The mobility value is difficult to set exactly, so an interval of fO. I for each point was allowed. The mobility values used in the simulations are: 0, 0.5, 1.0, 1.5, 2.0, 2.5, 3.0, and 3.5, where a mobility factor of 3.5 corresponds to a v-.of 20 m/s.
In all the simulations the traffic was generated by 15 contin- uous bit rate (CBR) sources spreading the traffic randomly among all nodes. The packet size was 64 bytes and the pack- et rate was 5 packets/s in the first set of simulations. In the second set of simulations the rate ranged from 5 packets/s to 20 packet/s.
4.1 Delay
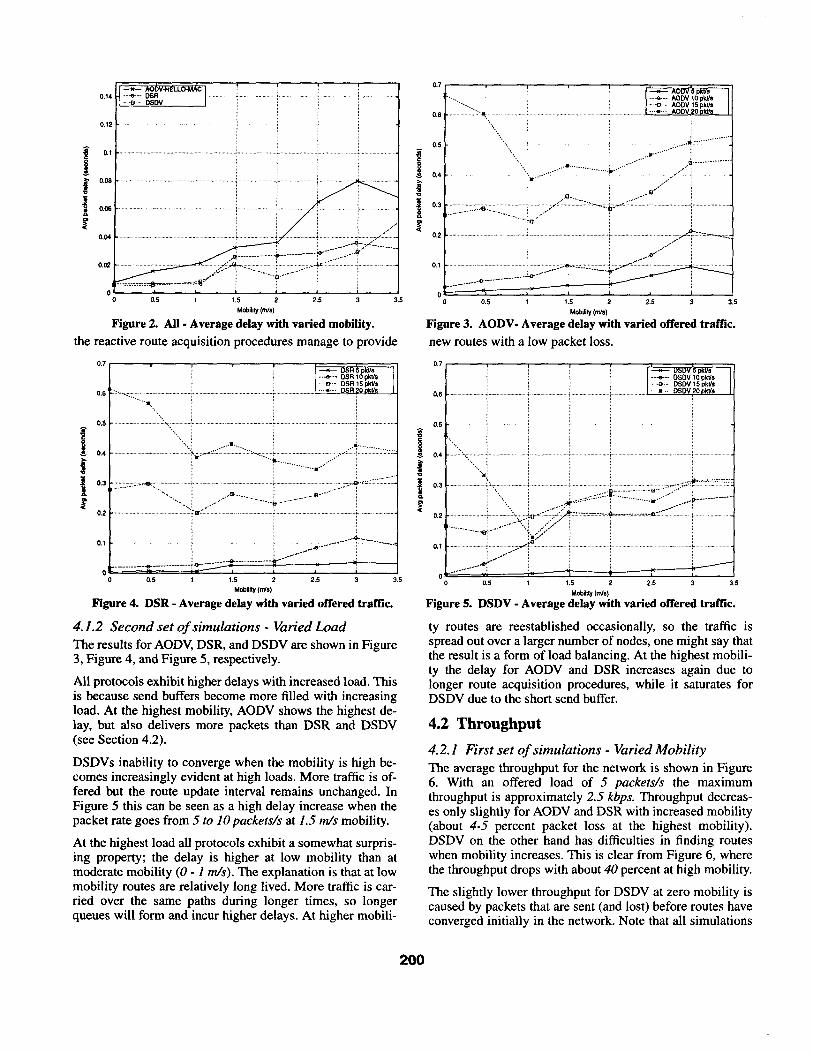
4.1.1 First set of simulations - Varied Mobility The average packet delay increases with mobility for all three protocols, as shown in Figure 2. However, DSR has a lower delay than AODV at higher mobility values due to the way routes are detected in DSR. The route acquisition pro- cedure in DSR allows more routes to be detected and cached than in AODV, which obtains a single route per RREQ. With DSR, packets wait less during route acquisition than with AODV.
DSDV exhibits a low delay because only packets belonging to valid routes at the sending instant get through. A lot of packets are lost until new (valid) route table entries have been propagated through the network by the route update messages in DSDV. For DSR and AODV, on the other hand,
199
0 0 0.5 1 1.5 2 2.5 3 3.5
M*iMy (m/s)
Figure 2. AU - Average delay with varied mobility.
the reactive route acquisition procedures manage to provide
O” R-Pyq o,6 ..:, --.=--- ................ . ............ . ......................... ........... + .... - ... DSRPJ .......
-0 0.5 1 t.5 2 2.5 3 3.5 Mdmy (In%)
Figure 4. DSR - Average delay with varied offered traffic.
4. I.2 Second set of simulations - Varied Load The results for AODV, DSR, and DSDV are shown in Figure 3, Figure 4, and Figure 5, respectively.
All protocols exhibit higher delays with increased load. This is because send buffers become more filled with increasing load. At the highest mobility, AODV shows the highest de- lay, but also delivers more packets than DSR and DSDV (see Section 4.2).
DSDVs inability to converge when the mobility is high be- comes increasingly evident at high loads. More traffic is of- fered but the route update interval remains unchanged. In Figure 5 this can be seen as a high delay increase when the packet rate goes from 5 to 10packefs/s at 1.5 m/s mobility.
At the highest load all protocols exhibit a somewhat surpris- ing property; the delay is higher at low mobility than at moderate mobility (0 - I m/s). The explanation is that at low mobility routes are relatively long lived. More traffic is car- ried over the same paths during longer times, so longer queues will form and incur higher delays. At higher mobili-
-0 0.5 1 1.5 2 2.5 3 3.5 Mobility (tdsl
Figure 3. AODV- Average delay with varied offered trafk.
new routes with a low packet loss.
0.7 I I r - DSDV 5 pk” --*-- DSOV 10 $9
o.6 ; --a.- DSDV 15 pkv,
. . . . . . . 1. + .--*-. _.. DSDV,f’hkVs
0 0.5 1 1.5 2 2.5 3 3.5 Mobuity (na)
Figure 5. DSDV -Average delay with varied offered traffic.
ty routes are reestablished occasionally, so the traffic is spread out over a larger number of nodes, one might say that the result is a form of load balancing. At the highest mobili- ty the delay for AODV and DSR increases again due to longer route acquisition procedures, while it saturates for DSDV due to the short send buffer.
4.2 Throughput
4.2.1 First set of simulations - Varied Mobility The average throughput for the network is shown in Figure 6. With an offered load of 5 packets/s the maximum throughput is approximately 2.5 kbps. Throughput decreas- es only slightly for AODV and DSR with increased mobility (about 4-5 percent packet loss at the highest mobility). DSDV on the other hand has difficulties in finding routes when mobility increases. This is clear from Figure 6, where the throughput drops with about 40 percent at high mobility.
The slightly lower throughput for DSDV at zero mobility is caused by packets that are sent (and lost) before routes have converged initially in the network. Note that all simulations
200
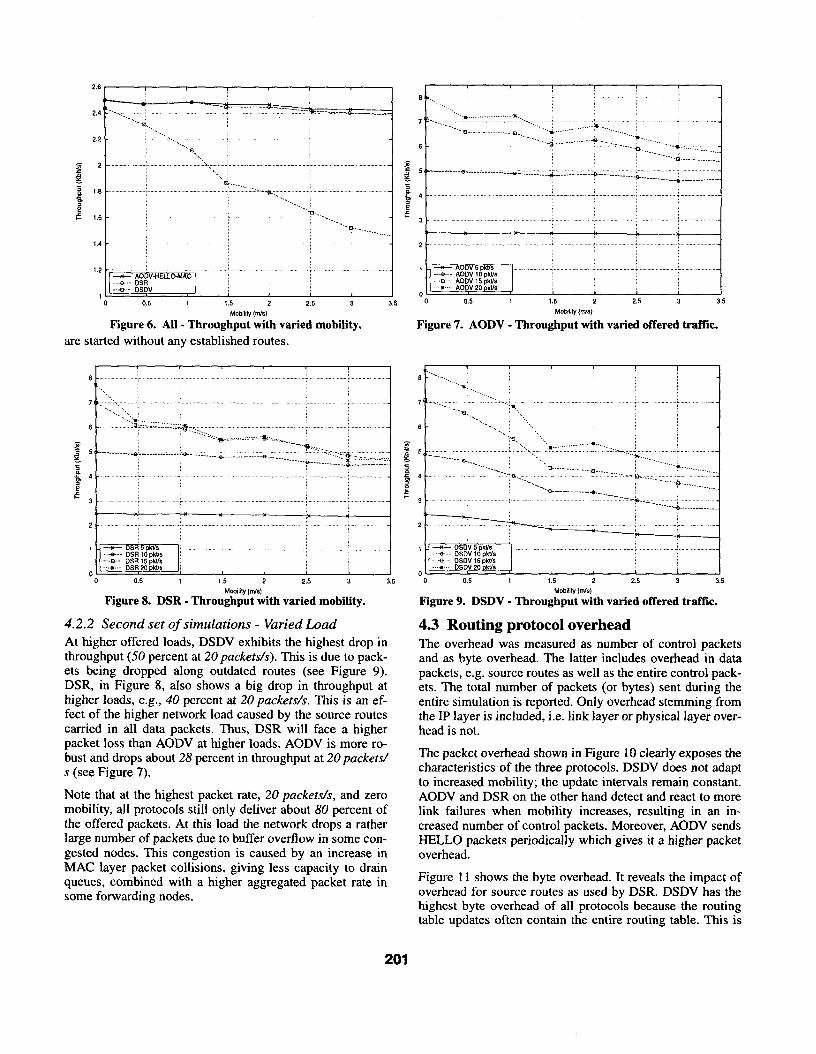
Figure 6. All - Throughput with varied mobility.
are started without any established routes.
0 0.5 1 1.5 2 2.5 3 3.5
Mabili~ (rrds)
Figure 8. DSR - Throughput with varied mobility.
4.2.2 Second set of simulations - Varied Load At higher offered loads, DSDV exhibits the highest drop in throughput (50 percent at 20 packets/s). This is due to pack- ets being dropped along outdated routes (see Figure 9). DSR, in Figure 8, also shows a big drop in throughput at higher loads, e.g., 40 percent at 20 packets/s. This is an ef- fect of the higher network load caused by the source routes carried in all data packets. Thus, DSR will face a higher packet loss than AODV at higher loads. AODV is more ro- bust and drops about 28 percent in throughput at 20 packets/ s (see Figure 7).
Note that at the highest packet rate, 20 packets/s, and zero mobility, all protocols still only deliver about 80 percent of the offered packets. At this load the network drops a rather large number of packets due to buffer overflow in some con- gested nodes. This congestion is caused by an increase in MAC layer packet collisions, giving less capacity to drain queues, combined with a higher aggregated packet rate in some forwarding nodes.
Figure 7. AODV - Throughput with varied offered traffk.
Figure 9. DSDV - Throughput with varied offered traffk.
4.3 Routing protocol overhead The overhead was measured as number of control packets and as byte overhead. The latter includes overhead in data packets, e.g. source routes as well as the entire control pack- ets. The total number of packets (or bytes) sent during the entire simulation is reported. Only overhead stemming from the IP layer is included, i.e. link layer or physical layer over- head is not.
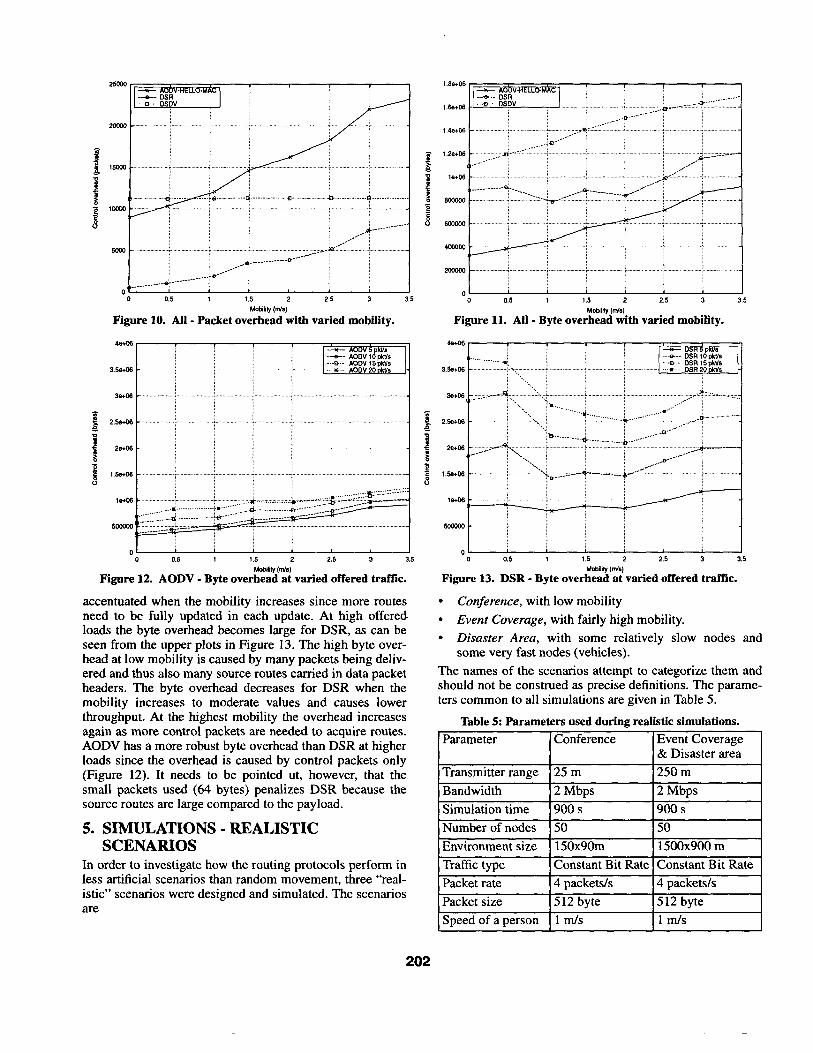
The packet overhead shown in Figure 10 clearly exposes the characteristics of the three protocols. DSDV does not adapt to increased mobility; the update intervals remain constant. AODV and DSR on the other hand detect and react to more link failures when mobility increases, resulting in an in- creased number of control packets. Moreover, AODV sends HELLO packets periodically which gives it a higher packet overhead.
Figure 11 shows the byte overhead. It reveals the impact of overhead for source routes as used by DSR. DSDV has the highest byte overhead of all protocols because the routing table updates often contain the entire routing table. This is
201
I.&+06 - AODbGW&&,AAC ---a.-- DSR
,.6e+06 -.-a.- DSDV .;
-0 0.5 1 1.5 2 2.5 3 3.5
Mobility (Ws)
Figure 10. All - Packet overhead with varied mobility.
% ;__~! 2,5e*m i.. ; ..:... .j
% t
2e+c6 -
t ,.Ej.3+06 - -. I .; . ;,. y .._.,..,. ,. . ..,,,..... .,,,
0
I 0 0.5 1 1.5 2 2.5 3 3.5
Mab6ity W4
Figure 12. AODV - Byte overhead at varied offered traffic.
accentuated when the mobility increases since more routes need to be fully updated in each update. At high offered loads the byte overhead becomes large for DSR, as can be seen from the upper plots in Figure 13. The high byte over- head at low mobility is caused by many packets being deliv- ered and thus also many source routes carried in data packet headers. The byte overhead decreases for DSR when the mobility increases to moderate values and causes lower throughput. At the highest mobility the overhead increases again as more control packets are needed to acquire routes. AODV has a more robust byte overhead than DSR at higher loads since the overhead is caused by control packets only (Figure 12). It needs to be pointed ut, however, that the small packets used (64 bytes) penalizes DSR because the source routes are large compared to the payload.
5. SIMULATIONS - REALISTIC SCENARIOS
In order to investigate how the routing protocols perform in less artificial scenarios than random movement, three “real- istic” scenarios were designed and simulated. The scenarios are
2wM)o t
. ..i... j ..:. ; ; .,. . ..f 1
01 I
0 0.5 1 1.5 2 2.5 3 3.5
MckilW (nvS)
Figure 11. AU - Byte overhead with varied mobility.
soccQO-
0 0 OS 1 1.5 2 2.5 3 3.5
Mobility (rds)
Figure 13. DSR - Byte overhead at varied offered traffhz.
. Conference, with low mobility
l Event Coverage, with fairly high mobility. l Disaster Area, with some relatively slow nodes and
some very fast nodes (vehicles).
The names of the scenarios attempt to categorize them and should not be construed as precise definitions. The parame- ters common to all simulations are given in Table 5.
Table 5: Parameters used during realistic simulations.
202
Speed of a vehicle (not used)
a. Disaster Area only
2oa t-l-h I establish routes to the speaker to try to decide, based on the retrieved information, if they should join the session or not.
Low-power radios used for indoor communication typically cannot propagate signals through walls, doors, and other ob- stacles in a building, without severe attenuation. Similar conditions may exist in an outdoor scenario, where objects in the terrain, such as buildings, cars, etc. may shadow radio transceivers. In order to get significant results in a simula- tion claiming to be realistic, obstacles to radio propagation should be modeled. Consequently, the capability to model obstacles1 was added to the simulation tool. This feature al- lows the placement of obstacles in the form of boxes among the moving nodes. If the straight line between any two nodes are crossed by an obstacle, a link between these nodes is considered broken until the nodes move out of the shad- owed area (the straight line is not crossed). A more realistic model would include radio signals penetrating some of the objects only partly absorbed as well as reflected radio sig- nals. However, this simple model is a first approximation only, which assumes fully absorbing objects.
5.1 Conference scenario
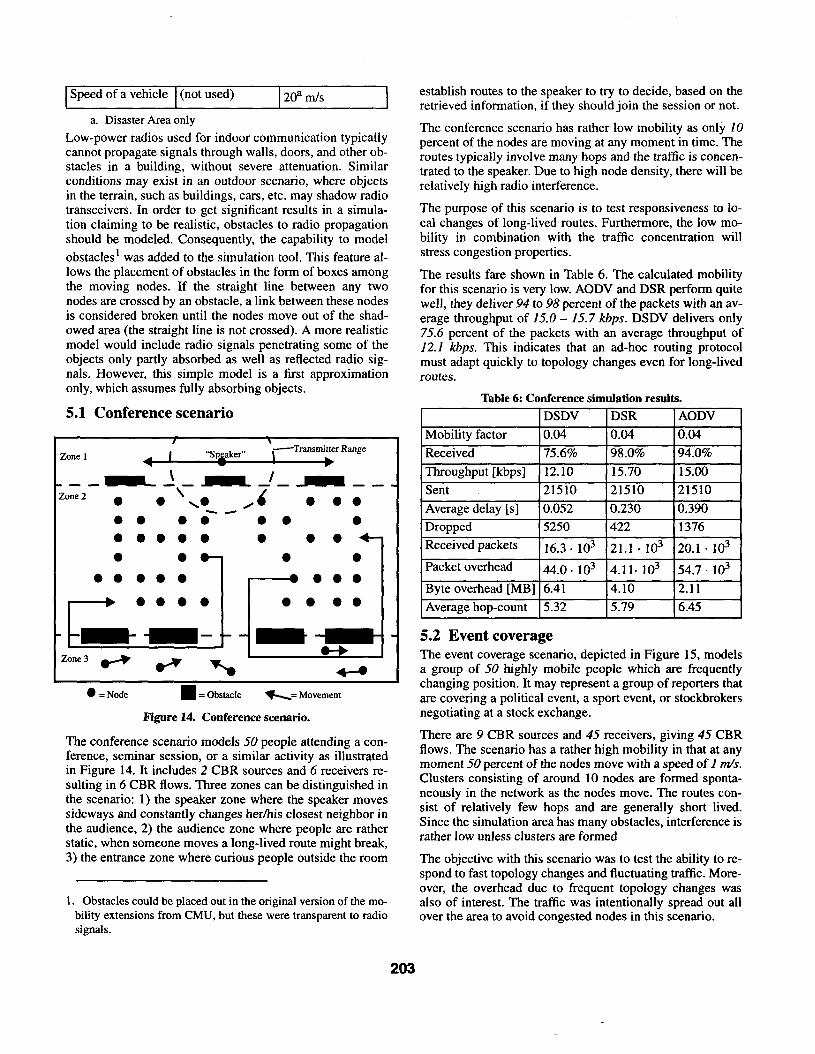
The conference scenario has rather low mobility as only 10 percent of the nodes are moving at any moment in time. The routes typically involve many hops and the traffic is concen- trated to the speaker. Due to high node density, there will be relatively high radio interference.
The purpose of this scenario is to test responsiveness to lo- cal changes of long-lived routes. Furthermore, the low mo- bility in combination with the traffic concentration will stress congestion properties.
The results fare shown in Table 6. The calculated mobility for this scenario is very low. AODV and DSR perform quite well, they deliver 94 to 98 percent of the packets with an av- erage throughput of 15.0 - 15.7 kbps. DSDV delivers only 75.6 percent of the packets with an average throughput of 12.1 kbps. This indicates that an ad-hoc routing protocol must adapt quickly to topology changes even for long-lived routes.
Table 6: Conference simulation results.
I \ Zone 1
4 ’ “Spiaker” -Transmitter Range
w *
0 00
00 00‘-00 0
0.0..
0.0. 0 0 00
5.2 Event coverage The event coverage scenario, depicted in Figure 15, models a group of 50 highly mobile people which are frequently
l = Node H= changing position. It may represent a group of reporters that
Obstacle K= Movement are covering a political event, a sport event, or stockbrokers
Figure 14. Conference scenario. negotiating at a stock exchange.
The conference scenario models 50 people attending a con- ference, seminar session, or a similar activity as illustrated in Figure 14. It includes 2 CBR sources and 6 receivers re- sulting in 6 CBR flows. Three zones can be distinguished in the scenario: 1) the speaker zone where the speaker moves sideways and constantly changes her/his closest neighbor in the audience, 2) the audience zone where people are rather static, when someone moves a long-lived route might break, 3) the entrance zone where curious people outside-the room
1. Obstacles could be placed out in the original version of the mo- bility extensions from CMU, but these were transparent to radio signals.
There are 9 CBR sources and 45 receivers, giving 45 CBR flows. The scenario has a rather high mobility in that at any moment 50 percent of the nodes move with a speed of 2 m/s. Clusters consisting of around 10 nodes are formed sponta- neously in the network as the nodes move. The routes con- sist of relatively few hops and are generally short lived. Since the simulation area has many obstacles, interference is rather low unless clusters are formed
The objective with this scenario was to test the ability to re- spond to fast topology changes and fluctuating traffic. More- over, the overhead due to frequent topology changes was also of interest. The traffic was intentionally spread out all over the area to avoid congested nodes in this scenario.
203
1 Average hop-count 1.46 hops 1 S7 hops 1,55 hops
5.3 Disaster area
. =Node I= Obstacle L= Movement
Figure 15. Event coverage scenario. I
The results from the simulations are presented in Table 7. All protocols have fairly high throughput, with DSR and AODV performing best. The event coverage scenario has a fairly low mobility (0.72) due to the low speed (I m/s) of the moving nodes. The traffic is generally traversing only a few hops (on average 1.5). The short paths result in low byte overhead for DSR since the source routes in data packets are short (160 kB overhead compared to over 4 MB for the con- ference scenario).
. Subnetwork& ’ I
AODV gives a delay almost a magnitude lower than DSR with roughly the same throughput. This is a positive effect of the HELLO message mechanism in AODV, which gives an a priori knowledge of the neighbors. It fits nicely in this scenario since the destination of a packet sent in a cluster is often a neighbor. The route acquisition procedure need not be invoked, which saves time.
An entirely proactive protocol like DSDV may have large overhead due to frequent full topology updates, which also add extra load to the network. In this scenario the offered traffic load was low so DSDV had a fairly high throughput and low delay.
Table 7: Event coverage simulation results.
a -
. l . -/
\\ ‘/
w =Node m = Obstacle k= Movement
Figure 16. Disaster area scenarios
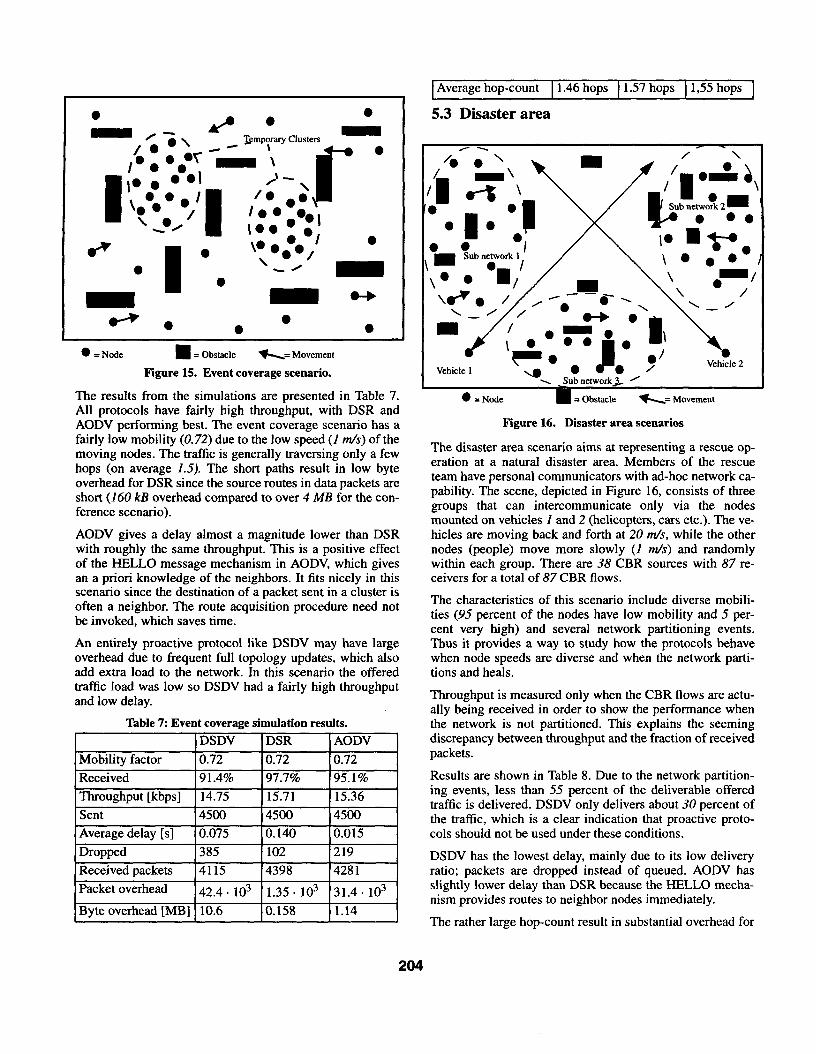
The disaster area scenario aims at representing a rescue op- eration at a natural disaster area. Members of the rescue team have personal communicators with ad-hoc network ca- pability. The scene, depicted in Figure 16, consists of three groups that can intercommunicate only via the nodes mounted on vehicles 1 and 2 (helicopters, cars etc.). The ve- hicles are moving back and forth at 20 m/s, while the other nodes (people) move more slowly (I m/s) and randomly within each group. There are 38 CBR sources with 87 re- ceivers for a total of 87 CBR flows.
The characteristics of this scenario include diverse mobili- ties (95 percent of the nodes have low mobility and 5 per- cent very high) and several network partitioning events. Thus it provides a way to study how the protocols behave when node speeds are diverse and when the network parti- tions and heals.
Throughput is measured only when the CBR flows are actu- ally being received in order to show the performance when the network is not partitioned. This explains the seeming discrepancy between throughput and the fraction of received packets.
Results are shown in Table 8. Due to the network partition- ing events, less than 55 percent of the deliverable offered traffic is delivered. DSDV only delivers about 30 percent of the traffic, which is a clear indication that proactive proto- cols should not be used under these conditions.
DSDV has the lowest delay, mainly due to its low delivery ratio; packets are dropped instead of queued. AODV has slightly lower delay than DSR because the HELLO mecha- nism provides routes to neighbor nodes immediately.
The rather large hop-count result in substantial overhead for
204
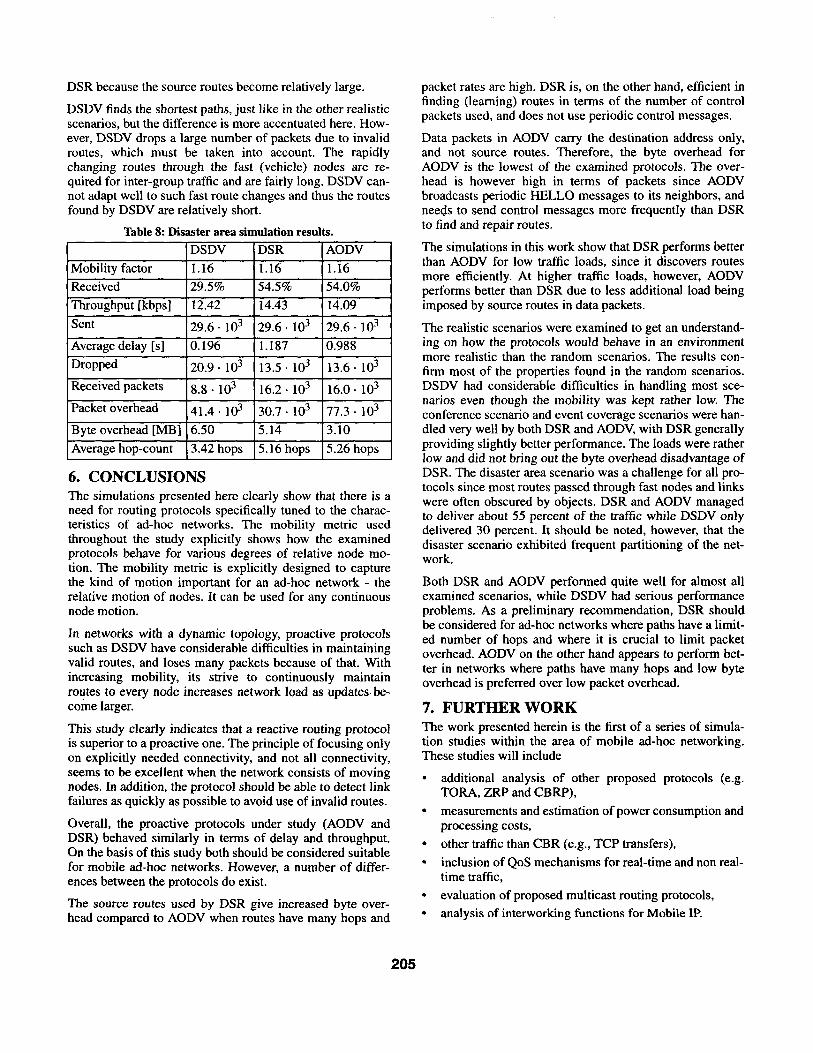
DSR because the source routes become relatively large.
DSDV finds the shortest paths, just like in the other realistic scenarios, but the difference is more accentuated here. How- ever, DSDV drops a large number of packets due to invalid routes, which must be taken into account. The rapidly changing routes through the fast (vehicle) nodes are re- quired for inter-group traffic and are fairly long. DSDV can- not adapt well to such fast route changes and thus the routes found by DSDV are relatively short.
Table 8: Disaster area sil lulation results.
DSDV
Mobility factor 1.16
Received 29.5%
Throughput [kbps] 12.42
Sent 29.6. lo3
Average delay [s ] 0.196
Dropped 20.9 . lo3
Received packets 8.8 . lo3 16.2. lo3 16.0. lo3
Packet overhead 41.4. lo3 30.7 . lo3 77.3 * lo3
Byte overhead [MB] 6.50 5.14 3.10 I I Average hop-count 3.42 hops 15.16 hops 15.26 hops
6. CONCLUSIONS The simulations presented here clearly show that there is a need for routing protocols specifically tuned to the charac- teristics of ad-hoc networks. The mobility metric used throughout the study explicitly shows how the examined protocols behave for various degrees of relative node mo- tion. The mobility metric is explicitly designed to capture the kind of motion important for an ad-hoc network - the relative motion of nodes. It can be used for any continuous node motion.
In networks with a dynamic topology, proactive protocols such as DSDV have considerable difficulties in maintaining valid routes, and loses many packets because of that. With increasing mobility, its strive to continuously maintain routes to every node increases network load as updates-be- coine larger.
This study clearly indicates that a reactive routing protocol is superior to a proactive one. The principle of focusing only on explicitly needed connectivity, and not all connectivity, seems to be excellent when the network consists of moving nodes. In addition, the protocol should be able to detect link failures as quickly as possible to avoid use of invalid routes.
Overall, the proactive protocols under study (AODV and DSR) behaved similarly in terms of delay and throughput. On the basis of this study both should be considered suitable for mobile ad-hoc networks. However, a number of differ- ences between the protocols do exist.
The source routes used by DSR give increased byte over- head compared to AODV when routes have many hops and
packet rates are high. DSR is, on the other hand, efficient in finding (learning) routes in terms of the number of control packets used, and does not use periodic control messages.
Data packets in AODV carry the destination address only, and not source routes. Therefore, the byte overhead for AODV is the lowest of the examined protocols. The over- head is however high in terms of packets since AODV broadcasts periodic HELLO messages to its neighbors, and needs to send control messages more frequently than DSR to find and repair routes.
The simulations in this work show that DSR performs better than AODV for low traffic loads, since it discovers routes more efficiently. At higher traffic loads, however, AODV performs better than DSR due to less additional load being imposed by source routes in data packets.
The realistic scenarios were examined to get an understand- ing on how the protocols would behave in an environment more realistic than the random scenarios. The results con- firm most of the properties found in the random scenarios. DSDV had considerable difficulties in handling most sce- narios even though the mobility was kept rather low. The conference scenario and event coverage scenarios were han- dled very well by both DSR and AODV, with DSR generally providing slightly better performance. The loads were rather low and did not bring out the byte overhead disadvantage of DSR. The disaster area scenario was a challenge for all pro- tocols since most routes passed through fast nodes and links were often obscured by objects. DSR and AODV managed to deliver about 55 percent of the traffic while DSDV only delivered 30 percent. It should be noted, however, that the disaster scenario exhibited frequent partitioning of the net- work.
Both DSR and AODV performed quite well for almost all examined scenarios, while DSDV had serious performance problems. As a preliminary recommendation, DSR should be considered for ad-hoc networks where paths have a limit- ed number of hops and where it is crucial to limit packet overhead. AODV on the other hand appears to perform bet- ter in networks where paths have many hops and low byte overhead is preferred over low packet overhead.
7. FURTHER WORK The work presented herein is the first of a series of simula- tion studies within the area of mobile ad-hoc networking. These studies will include
l additional analysis of other proposed protocols (e.g. TORA, ZRP and CBRP),
l measurements and estimation of power consumption and processing costs,
l other traffic than CBR (e.g., TCP transfers),
l inclusion of QoS mechanisms for real-time and non real- time traffic,
. evaluation of proposed multicast routing protocols, l analysis of interworking functions for Mobile IP.
205
8. ACKNOWLEDGEMENT The authors would like to thank the students and faculty members within the Monarch Project at CMU. Their work on the ad-hoc network extensions for the ns2 simulator has to a large extent contributed to this work.
9. 111
PI
131
[41
[51
[61
r71
PI
r91
REFERENCES Bommaiah, McAuley and Talpade. AMRoute, “Adhoc Multicast Routing Protocol”, Internet draft, draft-tal- pade-manet-amroute-OO.txt, August 1998. Work in progress.
Josh Broth, David A. Maltz, David B. Johnson, Yih- Chun Hu and Jorjeta Jetcheva, “A performance Com- parison of Multi-hop Wireless Ad Hoc Network Rout- ing Protocols”. Mobicom’98, Dallas Texas, 25-30 October 1998.
Josh Broth, David B. Johnsson, David A. Maltz, ‘The Dynamic Source Routing Protocol for Mobile Ad Hoc Networks”. Internet Draft, draft-ietf-manet-dsr-OO.txt, March 1998. Work in progress.
M.Scott Corson, S. Papademetriou, Philip Papa- dopolous, Vincent D. Park and Amir Qayyum, “An Internet MANET Encapsulation Protocol (IMEP) Spec- ification”. Internet draft, draft-ietf-manet-imep- specOl.txt, August 1998. Work in progress.
Kevin Fall and Kannan Varadhan, “ns notes and docu- mentation”. The VINT project, UC Berkeley, LBL, USC/ISI, and Xerox PARC, May 1998. Work in progress.
Zygmunt J. Haas and Marc R. Pearlman, ‘The Zone Routing Protocol (ZRP) for Ad Hoc Networks”, Inter- net draft, draft-ietf-manet-zone-zrp-01 .txt, August 1998. Work in progress. IEEE Computer Society LAN MAN Standards Com- mittee, “Wireless LAN Medium Access Control (MAC) and Physical Layer (PHY) Speci$cations”, IEEE Std 802.11-1997. The Institute of Electrical and Electronics Engineers, New York.
Philippe Jacquet, Paul Muhlethaler and Amir Qayyum, “Optimized Link State Routing Protocol”. Internet draft, draft-ietf-manet-olsr-OO.txt, November 1998. Work in progress.
Mingliang Jiang, Jinyang Li and Yong Chiang Tay, “Cluster Based Routing Protocol (CBRP) Functional specification”. Internet draft, draft-ietf-manet-cbrp- spec-OO.txt, August 1998. Work in progress.
[IO] David B. Johnson and David A.Maltz, “Dynamic source routing in ad hoc wireless networks”. In Mobile Computing, edited by Tomasz Imielinski and Hank Korth, chapter 5, pages 153- 181. Kluwer Academic Publishers, 1996.
[ 1 l] David B. Johnson and David A. Maltz, “Protocols for adaptive wireless and mobile computing”. In IEEE Per- sonal Communications, 3(l), February 1996.
[ 121 Mobile Ad-hoc Networks (MANET). URL: http:// www.ietf.org/html.charters/manet-charter.html. (1998- 1 l-29). Work in progress.
[ 131 Vincent D. Park and M. Scott Corson, “Temporally- Ordered Routing Algorithm (TORA) Version 1: Func- tional specification”. Internet draft, draft-ietf-manet- tora-spec-01 .txt, August 1998. Work in progress.
[ 141 Vincent D. Park and M. Scott Corson, “A performance comparison of the Temporally-Ordered Routing Algo- rithm and Ideal Link-state routing”. In Proceedings of IEEE Symposium on Computers and Communication ‘98, June 1998.
[ 151 Charles E. Perkins, “Ad Hoc On Demand Distance Vec- tor (AODV) Routing”. Internet draft, draft-ietf-manet- aodv-Ol.txt, August 1998. Work in progress.
[ 161 Charles E. Perkins, “Ad Hoc On Demand Distance Vec- tor (AODV) Routing”. Internet draft, draft-ietf-manet- aodv-02.txt, November 1998. Work in progress.
[ 171 Charles E. Perkins and Pravin Bhagwat, “‘Highly dynamic Destination-Sequenced Distance-Vector rout- ing (DSDV) for mobile computers”. In Proceedings of the SIGCOM ‘94 Conference on Communications Architecture, protocols and Applications, pages234- 244, August 1994. A revised version of the paper is available from http://www.cs.umd.edu/projects/mcml/ papers/Sigcomm94.ps. (1998-1 l-29)
[ 181 Larry L. Peterson and Bruce S. Davie, “Computer Net- works - A Systems Approach”. San Francisco, Morgan Kaufmann Publishers Inc. ISBN l-55860-368-9, 1996.
[ 191 Raghupathy Sivakumar, Prasun Sinha and Vaduvur Bharghavan, “Core Extraction Distributed Ad hoc Routing (CEDAR) Specification”, Internet draft, draft- ietf-manet-cedar-spec-OO.txt, October 1998. Work in progress.
[20] The CMU Monarch Project. “The CMU Monarch Projects Wireless and Mobility Extensions to ns”. URL: http://www.monarch.cs.cmu.edu/. (1998-1 l-29). Work in progress.
206


![Transfusionsindikationen bei malignen Erkrankungen · Scenario 1: number of patients Scenario 2: number of patients % of patients (mean) [46] Scenario 1: number of patients Scenario](https://img.pdfslide.org/doc/110x75/605ea3d56540f665aa09ac74/transfusionsindikationen-bei-malignen-scenario-1-number-of-patients-scenario-2.jpg)


![Simulation der ökonomischen und ökologischen Entwicklungen ... · Scenario 1: Scenario 2: Potential ecological value (30 yrs) [Points] 4765 Ecological value (after removal) [Points]](https://img.pdfslide.org/doc/110x75/5d58760088c99354598bd2ef/simulation-der-oekonomischen-und-oekologischen-entwicklungen-scenario-1.jpg)