Embed Size (px)
Citation preview
Sediment Accumulation and Diagenesis in theLate Quaternary Equatorial Atlantic Ocean: An
Environmental Magnetic and Geochemical Perspective
Dissertation
zur Erlangung des
Doktorgrades der Naturwissenschaften
am Fachbereich Geowissenschaften
der Universität Bremen
vorgelegt von
Jens A. Funk
Bremen 2004
Tag des Kolloquiums:02. Juli 2004
Gutachter:Prof. Dr. Ulrich Bleil
PD. Dr. Matthias Zabel
Prüfer:Prof. Dr. K.-U. Hinrichs
Dr. S. Kasten
Auch hier wird die Natur in neuer Herrlichkeit sichtbar,und nur der gedankenlose Menschwirft die unleserlichen, wunderlich gemischten Worte mit Verachtung weg.
Dankbar legt der Priester diese neue, erhabene Meßkunst auf den Altarzu der magnetischen Nadel, die sich nie verirrt,und zahllose Schiffe auf dem pfadlosen Ozeanzu bewohnten Küsten und den Häfen des Vaterlandes zurückführte.
Außer dem Denker giebt es aber noch andre Freunde des Wissens,die dem Hervorbringen durch Denken nicht vorzüglich zugethan,und also ohne Beruf zu dieser Kunst, lieber Schüler der Natur werden,ihre Freude im Lernen, nicht im Lehren,im Erfahren, nicht im Machen,im Empfangen, nicht im Geben finden.
Einige sind geschäftig und nehmen im Vertrauen auf die Allgegenwartund die innige Verwandtschaft der Natur,mithin auch im voraus von der Unvollständigkeitund der Continuität alles Einzelnen überzeugt,irgendeine Erscheinung mit Sorgfalt auf,und halten den in tausend Gestalten sich verwandelnden Geist derselbenmit stetem Blicke fest,und gehn dann an diesem Faden durch alle Schlupfwinkelder geheimen Werkstätte,um eine vollständige Verzeichnung dieser labyrinthischen Gängeentwerfen zu können.
Sind sie mit dieser mühseligen Arbeit fertig,so ist auch unvermerkt ein höherer Geist über sie gekommen,und es wird ihnen dann leicht, über die vorliegende Karte zu redenund jedem Suchenden seinen Weg vorzuschreiben.
Unermeßlicher Nutzen segnet ihre mühsame Arbeit,und der Grundriß ihrer Karte wird auf eine überraschende Weisemit dem Systeme des Denkers übereinstimmen,und sie werden diesem zum Trost gleichsam den lebendigen Beweisseiner abstrakten Sätze unwillkürlich geführt haben.
From VON HARDENBERG F (Novalis), 1798–1799, Die Lehrlinge zu Sais, 28. Absatz
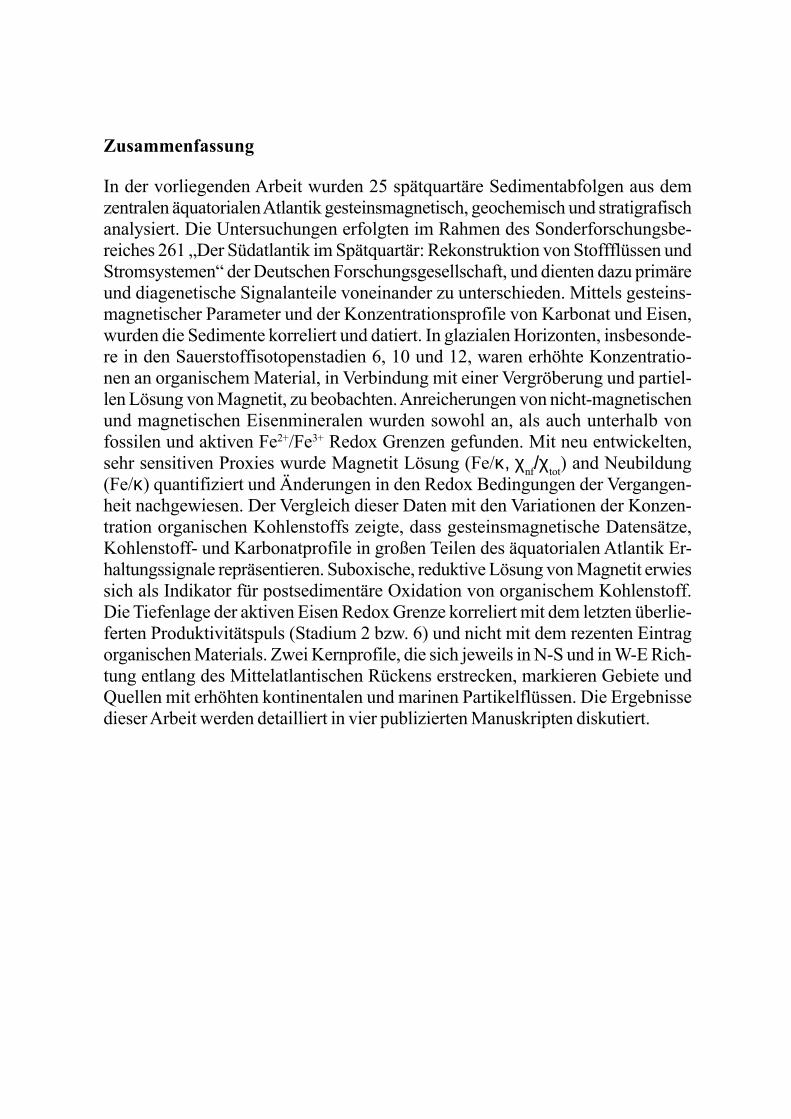
Zusammenfassung
In der vorliegenden Arbeit wurden 25 spätquartäre Sedimentabfolgen aus demzentralen äquatorialen Atlantik gesteinsmagnetisch, geochemisch und stratigrafischanalysiert. Die Untersuchungen erfolgten im Rahmen des Sonderforschungsbe-reiches 261 „Der Südatlantik im Spätquartär: Rekonstruktion von Stoffflüssen undStromsystemen“ der Deutschen Forschungsgesellschaft, und dienten dazu primäreund diagenetische Signalanteile voneinander zu unterschieden. Mittels gesteins-magnetischer Parameter und der Konzentrationsprofile von Karbonat und Eisen,wurden die Sedimente korreliert und datiert. In glazialen Horizonten, insbesonde-re in den Sauerstoffisotopenstadien 6, 10 und 12, waren erhöhte Konzentratio-nen an organischem Material, in Verbindung mit einer Vergröberung und partiel-len Lösung von Magnetit, zu beobachten. Anreicherungen von nicht-magnetischenund magnetischen Eisenmineralen wurden sowohl an, als auch unterhalb vonfossilen und aktiven Fe2+/Fe3+ Redox Grenzen gefunden. Mit neu entwickelten,sehr sensitiven Proxies wurde Magnetit Lösung (Fe/κ, χnf/χtot) and Neubildung(Fe/κ) quantifiziert und Änderungen in den Redox Bedingungen der Vergangen-heit nachgewiesen. Der Vergleich dieser Daten mit den Variationen der Konzen-tration organischen Kohlenstoffs zeigte, dass gesteinsmagnetische Datensätze,Kohlenstoff- und Karbonatprofile in großen Teilen des äquatorialen Atlantik Er-haltungssignale repräsentieren. Suboxische, reduktive Lösung von Magnetit erwiessich als Indikator für postsedimentäre Oxidation von organischem Kohlenstoff.Die Tiefenlage der aktiven Eisen Redox Grenze korreliert mit dem letzten überlie-ferten Produktivitätspuls (Stadium 2 bzw. 6) und nicht mit dem rezenten Eintragorganischen Materials. Zwei Kernprofile, die sich jeweils in N-S und in W-E Rich-tung entlang des Mittelatlantischen Rückens erstrecken, markieren Gebiete undQuellen mit erhöhten kontinentalen und marinen Partikelflüssen. Die Ergebnissedieser Arbeit werden detailliert in vier publizierten Manuskripten diskutiert.
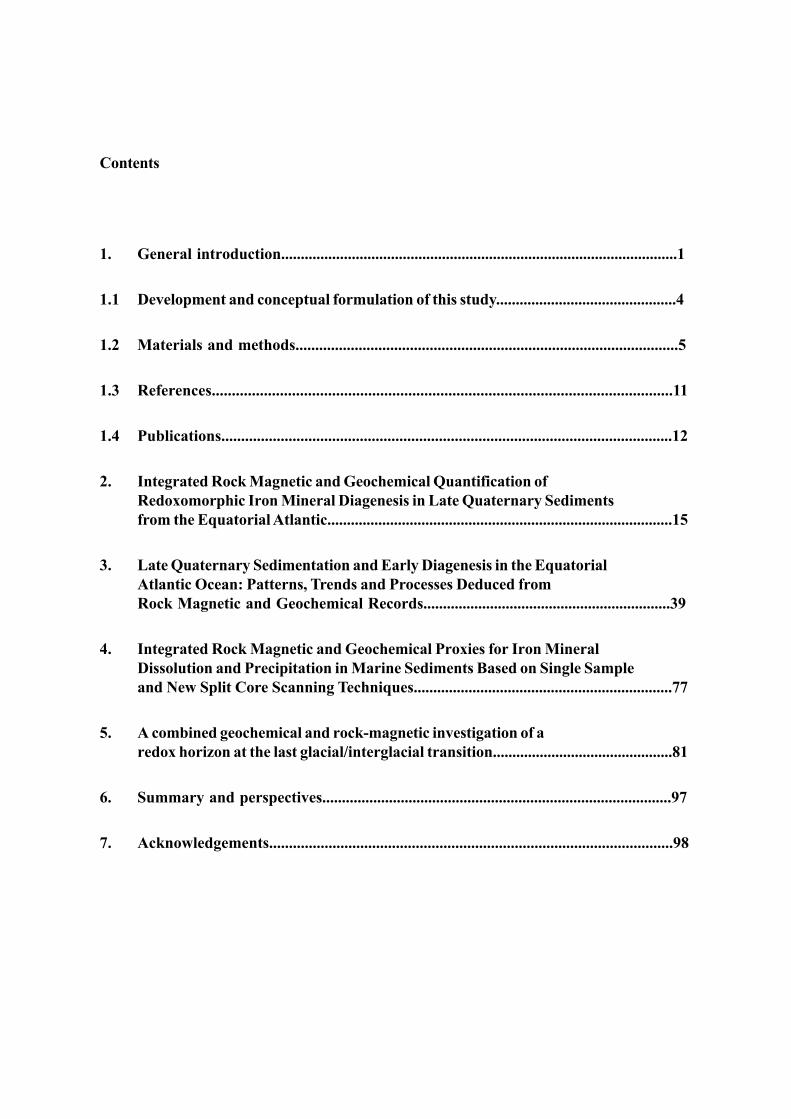
Contents
1. General introduction.....................................................................................................1
1.1 Development and conceptual formulation of this study..............................................4
1.2 Materials and methods.................................................................................................5
1.3 References...................................................................................................................11
1.4 Publications..................................................................................................................12
2. Integrated Rock Magnetic and Geochemical Quantification ofRedoxomorphic Iron Mineral Diagenesis in Late Quaternary Sedimentsfrom the Equatorial Atlantic........................................................................................15
3. Late Quaternary Sedimentation and Early Diagenesis in the EquatorialAtlantic Ocean: Patterns, Trends and Processes Deduced fromRock Magnetic and Geochemical Records...............................................................39
4. Integrated Rock Magnetic and Geochemical Proxies for Iron MineralDissolution and Precipitation in Marine Sediments Based on Single Sampleand New Split Core Scanning Techniques..................................................................77
5. A combined geochemical and rock-magnetic investigation of aredox horizon at the last glacial/interglacial transition..............................................81
6. Summary and perspectives.........................................................................................97
7. Acknowledgements......................................................................................................98
1. General IntroductionIn paleoceanography marine sediments are tradi-tionally used to reconstruct the history of earth’sclimate. Variations of data records retrieved frommeasurements performed on the solid phase of thesediments are used as proxy parameters. Theystand in for changes in oceanic and atmosphericcirculation, primary productivity or orbitally inducedvariations in solar insolation. Yet, detritus as depos-ited on the seafloor ought not to be considered as ahomogenous inert mass, because it is subject tovarious types of alterations. Under certain con-ditions particles may undergo substantial modi-
fication, already at the time of deposition and initialburial. The resulting changes in the fabric and inthe element composition alter or even destroy theprimary signal. The processes by which the originalmaterial is altered are expressed by the idea of‘diagenesis’. However, there are numerous def-initions of this term.
In general, it is used for all the physical andchemical processes that affect sediments from thetime they are initially deposited to when they showidentifiable signs of the very earliest stages oftectonic metamorphism (anchimetamorphism). In
Chapter 1
General Introduction to
Sediment Accumulation and Diagenesis in theLate Quaternary Equatorial Atlantic Ocean: An
Environmental Magnetic and Geochemical Perspective
Jens A. Funk
Universität Bremen, Fachbereich Geowissenschaften, Postfach 33 04 40,D-28334 Bremen, Germany
(e-mail): [email protected]
Abstract: This thesis investigates 25 Late Quaternary sediment records from the central EquatorialAtlantic by rock magnetic, geochemical and stratigraphical methods. The work was performed in theframework of the Collaborative Research Center 261 ‘The South Atlantic in the Late Quaternary:Reconstruction of Material Budgets and Current Systems’ funded by the Deutsche Forschungsge-meinschaft. The main objective was to analyze and distinguish terrigenous and diagenetic proxysignatures, in particular of rock magnetic parameters. All cores were correlated and dated on basis oftheir carbonate, iron and rock magnetic records. Magnetite coarsening and partial depletion wasobserved in glacial organic-rich layers, most intensely during oxygen isotope stages 6, 10 and 12.Non-magnetic and magnetic iron mineral enrichments were found below and at former and activeFe2+/Fe3+ redox boundaries. Various new proxies quantifying magnetite reduction (Fe/κ, χnf/χtot) andauthigenesis (Fe/κ) were established and found to be highly sensitive indicators of past redoxconditions. Comparing these signals with the organic carbon records, it was shown, that rockmagnetic, carbon and carbonate records in most parts of the Equatorial Atlantic are merely preservationsignals. Suboxic reductive magnetite loss can be used to identify burn-down of organic carbon. Thedepth of the active iron redox boundary correlates with the last preserved productivity pulse (stages2 or 6) and not with modern productivity. Two composite core profiles span the full WE and NSextension of the Equatorial Atlantic and mark zones and sources of enhanced continental and marineparticle fluxes. These and more conclusions of this thesis are discussed in detail within the enclosedfour published manuscripts.
2 Chapter 1
the course of time, the view of such processesbecame more differentiate.
For example Dapples (1962) identified threemain stages of diagenesis. The first one he calledredoxomorphic, after the most outstanding repre-sentative of reactions, oxidation and reduction,particularly evident during the stage of early burial,as transitions occur from loose sediment to a lithifiedaggregate. Accordingly, the redoxomorphic stageis associated with compaction and dewatering inzones that may be either oxidizing or reducing.Chamley (1989) distinguished between diagenetic(= post-sedimentary) and syngenetic (= syn-sedi-mentary, hydrogenous) effects. Accordingly, thediagenetic history of marine sediments is conven-tionally considered as starting after the deposit isburied and definitively removed from the influenceof the open ocean. In contrast, syngenetic pro-cesses are characterized by free exchanges bet-ween solid and liquid environments like sediment-water interfaces, sediments reworked by bio-turbation and highly porous sediments.
An important cause of early diagenesis is thedecomposition of organic matter related with‘redox’ reactions, which are the more intensive themore organic carbon is present. The deposition andburial of organic detritus in deep-sea sediments arecontrolled by high rates of organic matter productionin the surface waters, high sedimentation rates and/or restricted deep-water circulation which leads tooxygen-poor conditions in the bottom waters.
In their important paper, which has influencedsubsequent work on this theme, Froelich et al.(1979) considered the effects of organic matterdiagenesis on the redox equilibrium of pelagic sedi-ments. They showed that the remineralization of theburied non-oxidized organic matter is performed bymicroorganisms. After the utilization of the entiredissolved oxygen from the pore water the bacteriaresume to take benefit from secondary oxidants. Indescending order of free energy gain these secon-dary oxidants form a sequential series of terminalelectron acceptors. Nitrate and phosphate areinvolved first, followed by manganese - and ironoxides and sulfate, until the stages of fermentationand methanogenesis are finally completed. Theirstudy was carried out in the eastern EquatorialAtlantic, where organic carbon accumulation is
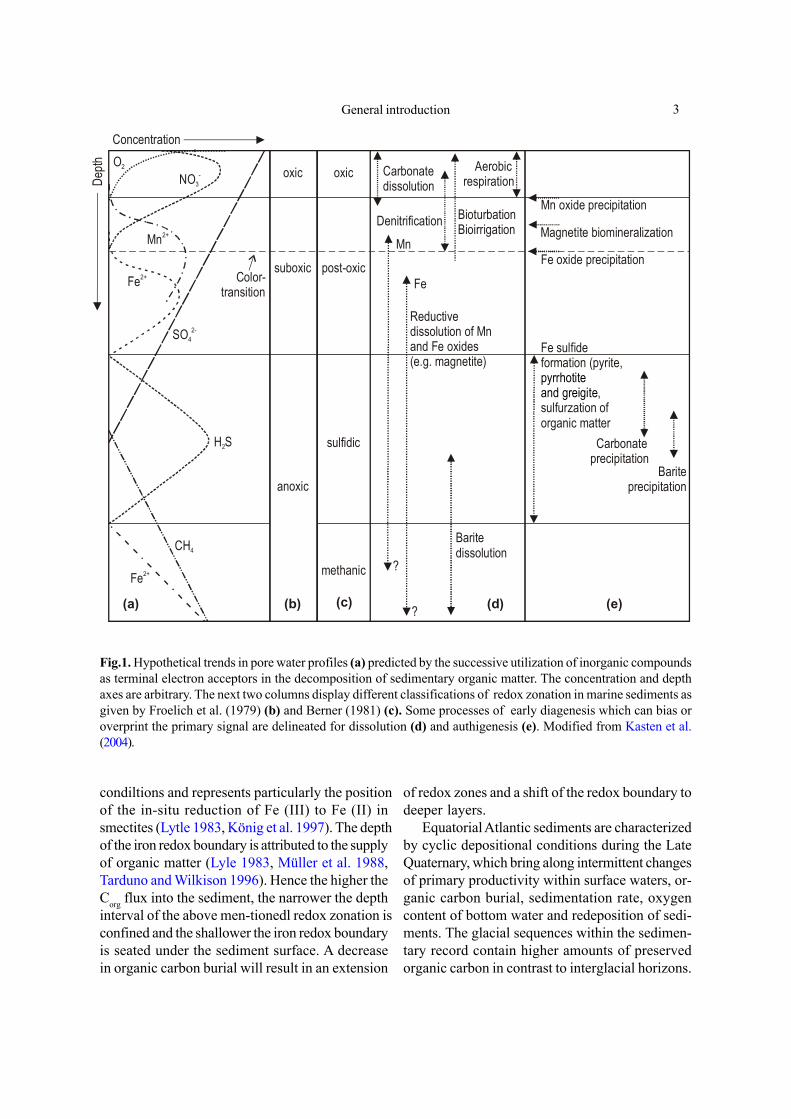
sufficiently rapid to allow suboxic and anoxic reac-tions to be active at shallow subsurface depth in thesediments. Also Berner (1981) classified differentearly diagenetic environments in marine sedimentsand separated the different terminal electron ac-ceptor processes into distinct zones. However,according to many studies this concept of redoxzonations is of model character and a simplifiedrepresentation of the true nature. According toKasten et al. (2004) some of these reactions canoccur simultaneously or the zones can even bereversed. Figure 1 displays different stages andzones of early diagenesis and some processesinvolved.
Concerning the extend of early diagenesis par-ticularly of detrital iron oxides and magnetic min-erals, the magnetic properties of the sediment arealready significantly affected in case of suboxicconditions (Bloemendal et al. 1992). Fe3+ -ions,dissociated from ferrimagnetic iron oxides are notstable under the Eh/pH conditions of the porewaters below the redox boundary and are thereforereduced to ferrous (Fe2+) ions. They diffuse up-wards along a concentrational gradient subsequentthey are entraped in the sediment column under oxicconditions.
Many detrital magnetic grains are likely to belost during prolonged diagenesis, whereas newmagnetic material can be formed in oxic conditions.Canfield and Berner (1987) demonstrated that dueto suboxic diagenesis detritic magnetite grains wereaffected by reductive dissolution being partly trans-formed into pyrite (Fig.1.e.). While fine (single-domain) magnetite grains were completely dis-solved, coarser (multi-domain) magnetite grainswere coated by a crust of pyrite, thus protecting theinner core of pristine magnetite from progressivedissolution. According to Farina et al. (1990) andMann et al. (1990) dissolved Fe(II) may react withH2S to form authigenic iron sulphide phases likepyrrhotite and greigite which are stable under re-ducing conditions (Fig.1.e.).
The active iron redox boundary can be mac-roscopically identified by a color transition, a charac-teristic feature of marine sediments (Fig.1, markedby a horizontal, dashed line). This change in colormarks the boundary between oxidizing (browncolors) and reducing (grey/green colors) redox
General introduction 3
condiltions and represents particularly the positionof the in-situ reduction of Fe (III) to Fe (II) insmectites (Lytle 1983, König et al. 1997). The depthof the iron redox boundary is attributed to the supplyof organic matter (Lyle 1983, Müller et al. 1988,Tarduno and Wilkison 1996). Hence the higher theCorg flux into the sediment, the narrower the depthinterval of the above men-tionedl redox zonation isconfined and the shallower the iron redox boundaryis seated under the sediment surface. A decreasein organic carbon burial will result in an extension
Fig.1. Hypothetical trends in pore water profiles (a) predicted by the successive utilization of inorganic compoundsas terminal electron acceptors in the decomposition of sedimentary organic matter. The concentration and depthaxes are arbitrary. The next two columns display different classifications of redox zonation in marine sediments asgiven by Froelich et al. (1979) (b) and Berner (1981) (c). Some processes of early diagenesis which can bias oroverprint the primary signal are delineated for dissolution (d) and authigenesis (e). Modified from Kasten et al.(2004).
of redox zones and a shift of the redox boundary todeeper layers.
Equatorial Atlantic sediments are characterizedby cyclic depositional conditions during the LateQuaternary, which bring along intermittent changesof primary productivity within surface waters, or-ganic carbon burial, sedimentation rate, oxygencontent of bottom water and redeposition of sedi-ments. The glacial sequences within the sedimen-tary record contain higher amounts of preservedorganic carbon in contrast to interglacial horizons.
suboxic
anoxic
oxic
post-oxic
oxic
sulfidic
methanic
O2
Mn2+
Fe2+
SO 2-4
Fe2+
CH4
H S2
NO3-
Color-transition
Carbonatedissolution
BioturbationBioirrigation
Reductivedissolution of Mnand Fe oxides(e.g. magnetite)
Baritedissolution
Mn
Fe
?
?
Fe oxide precipitation
Fe sulfideformation (pyrite,
,sulfurzation oforganic matter
pyrrhotite and greigite
Carbonateprecipitation
Bariteprecipitation
Magnetite biomineralization
Mn oxide precipitation
(a) (b) (c) (d) (e)
Depth
Concentration
Denitrification
Aerobicrespiration
4 Chapter 1
The relative abrupt changes disturb the prevailingsteady-state depositional conditions where redoxzones and redox boundaries remain at relativeconstant sediment depths. At other locations thishas been extensively investigated around sapropelsin the sedimentary record of the eastern Medi-terranean (Higgs et al. 1994; Thomson et al. 1995;van Santvoort et al. 1996; Passier et al. 1998) andturbiditic sequences from the Maderia AbyssalPlain ( Colley et al. 1984; Wilson et al. 1985;Robinson et al. 2000). Consequently, nonsteady-state diagenesis may lead to distinct authigenicenrichments of redox-sensitive elements and redoxboundaries fixed at sediment intervals with en-hanced Corg concentrations. In the Late QuaternaryEquatorial Atlantic sedimentary record the stron-gest early diagenetic overprint of the pristine sedi-ment constituents are detected along transitionalsediment intervals like terminations and withinglacial sequences.
1.1 Development and ConceptualFormulation of this Study
In a previous study which gave rise to this thesisLate Quarternary marine sediment sequences from
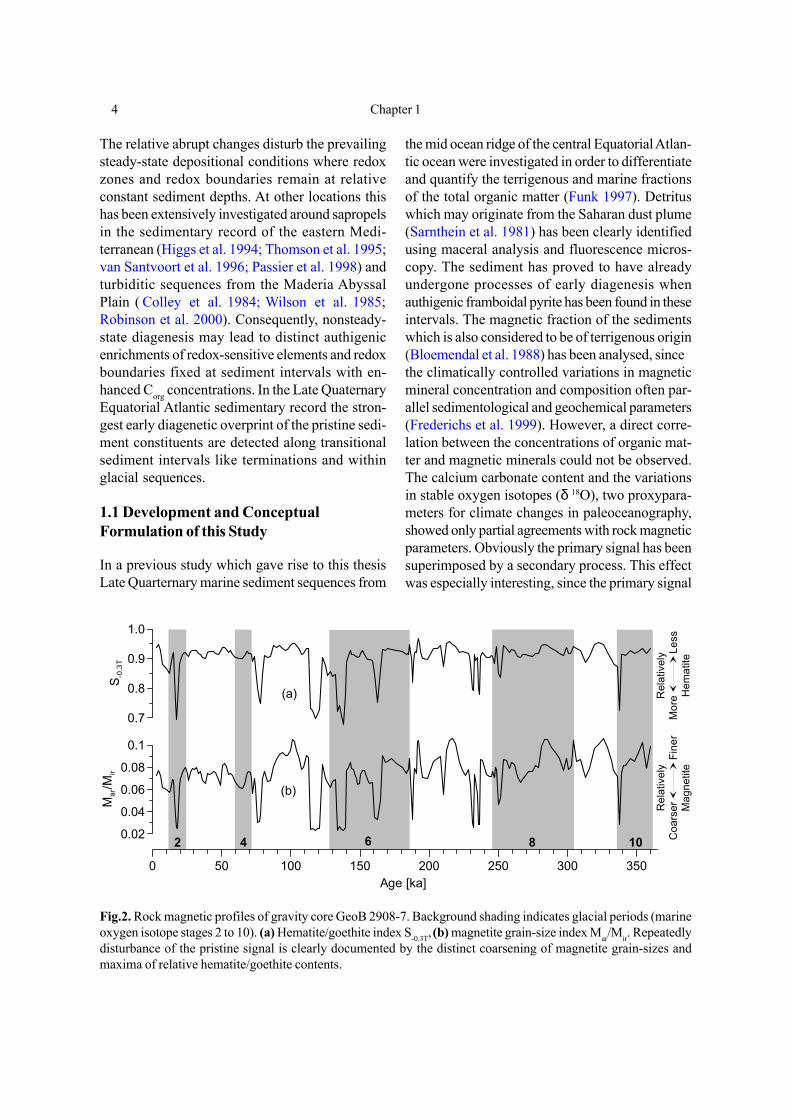
the mid ocean ridge of the central Equatorial Atlan-tic ocean were investigated in order to differentiateand quantify the terrigenous and marine fractionsof the total organic matter (Funk 1997). Detrituswhich may originate from the Saharan dust plume(Sarnthein et al. 1981) has been clearly identifiedusing maceral analysis and fluorescence micros-copy. The sediment has proved to have alreadyundergone processes of early diagenesis whenauthigenic framboidal pyrite has been found in theseintervals. The magnetic fraction of the sedimentswhich is also considered to be of terrigenous origin(Bloemendal et al. 1988) has been analysed, sincethe climatically controlled variations in magneticmineral concentration and composition often par-allel sedimentological and geochemical parameters(Frederichs et al. 1999). However, a direct corre-lation between the concentrations of organic mat-ter and magnetic minerals could not be observed.The calcium carbonate content and the variationsin stable oxygen isotopes (δ 18O), two proxypara-meters for climate changes in paleoceanography,showed only partial agreements with rock magneticparameters. Obviously the primary signal has beensuperimposed by a secondary process. This effectwas especially interesting, since the primary signal
Fig.2. Rock magnetic profiles of gravity core GeoB 2908-7. Background shading indicates glacial periods (marineoxygen isotope stages 2 to 10). (a) Hematite/goethite index S-0.3T, (b) magnetite grain-size index Mar/Mir. Repeatedlydisturbance of the pristine signal is clearly documented by the distinct coarsening of magnetite grain-sizes andmaxima of relative hematite/goethite contents.
6 8 102 4
0 50 100 150 200 250 300 350Age [ka]
0.7
0.8
0.9
1.0
S -0.
3T
0.02
0.04
0.06
0.08
0.1
Mar
/Mir
(a)
(b)
Rel
ativ
ely
Mor
e
L
ess
Hem
atite
Rel
ativ
ely
Coa
rser
Fin
erM
agne
tite
General introduction 5
1.2 Materials and Methods
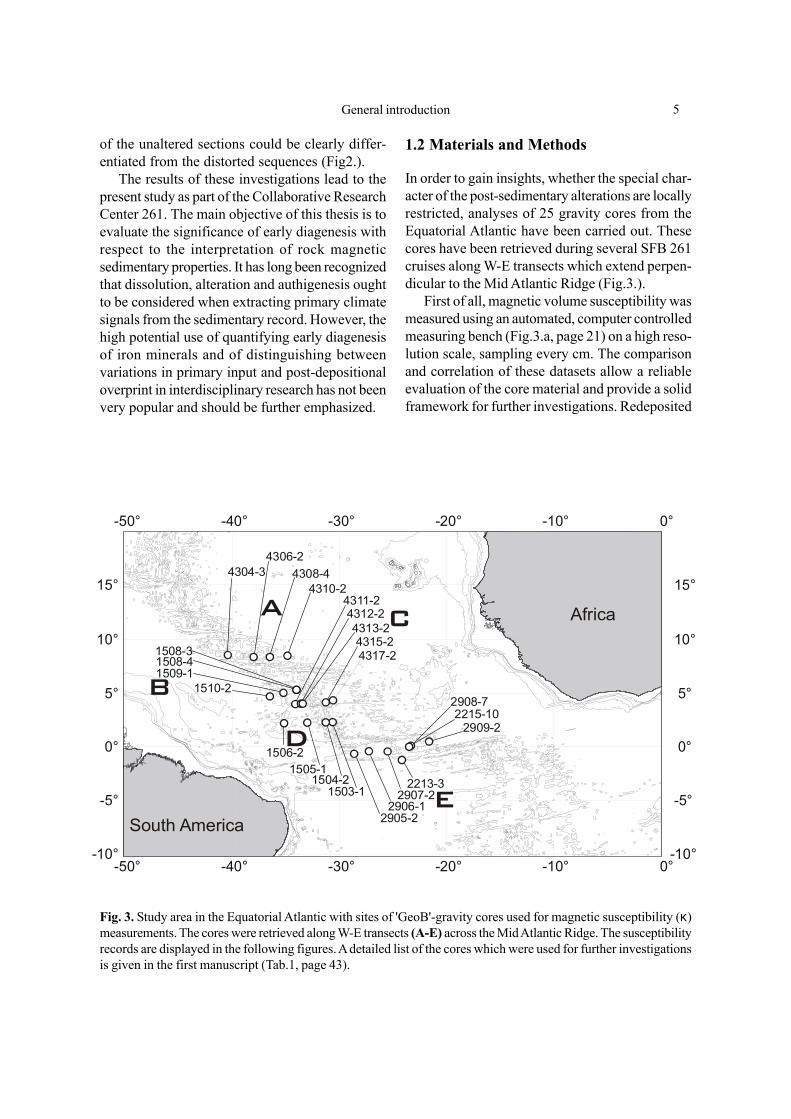
In order to gain insights, whether the special char-acter of the post-sedimentary alterations are locallyrestricted, analyses of 25 gravity cores from theEquatorial Atlantic have been carried out. Thesecores have been retrieved during several SFB 261cruises along W-E transects which extend perpen-dicular to the Mid Atlantic Ridge (Fig.3.).
First of all, magnetic volume susceptibility wasmeasured using an automated, computer controlledmeasuring bench (Fig.3.a, page 21) on a high reso-lution scale, sampling every cm. The comparisonand correlation of these datasets allow a reliableevaluation of the core material and provide a solidframework for further investigations. Redeposited
-
10° -10°
-5° -5°
0° 0°
5° 5°
10° 10°
15° 15°
-50°
-50°
-40°
-40°
-30°
-30°
-20°
-20°
-10°
-10°
0°
0°
1503-11504-2
1505-11506-2
4304-34306-2
4308-44310-2
1508-31508-41509-1
1510-2
2905-22906-1
2907-2
2908-7
2909-22215-10
4311-24312-24313-24315-24317-2
South America
Africa
2213-3
A
B
C
D
E
Fig. 3. Study area in the Equatorial Atlantic with sites of 'GeoB'-gravity cores used for magnetic susceptibility (κ)measurements. The cores were retrieved along W-E transects (A-E) across the Mid Atlantic Ridge. The susceptibilityrecords are displayed in the following figures. A detailed list of the cores which were used for further investigationsis given in the first manuscript (Tab.1, page 43).
of the unaltered sections could be clearly differ-entiated from the distorted sequences (Fig2.).
The results of these investigations lead to thepresent study as part of the Collaborative ResearchCenter 261. The main objective of this thesis is toevaluate the significance of early diagenesis withrespect to the interpretation of rock magneticsedimentary properties. It has long been recognizedthat dissolution, alteration and authigenesis oughtto be considered when extracting primary climatesignals from the sedimentary record. However, thehigh potential use of quantifying early diagenesisof iron minerals and of distinguishing betweenvariations in primary input and post-depositionaloverprint in interdisciplinary research has not beenvery popular and should be further emphasized.
6 Chapter 1
x-ray fluorescence core-scanner (Fig.3.b, page 21).This device allows high-resolution, non-destructivemeasurements of relative element concentrationslike calcium, iron, manganese and titan. By corre-lating the calcium profiles with CaCO3 records ofadjacent already dated sediment cores the requiredage models have been established. Since bothmeasuring benches, the one for determining themagnetic susceptibility and the XRF core scannerare driven by stepping motors, an exact positioningof the core segments is guaranteed. Consequently,the resulting datasets of both methods can excel-lently be compared with each other. This multi-disciplinary approach (e.g. combining the ironconcentration with the magnetic susceptibility)yields new proxy parameters which identify certainearly diagenetic processes.
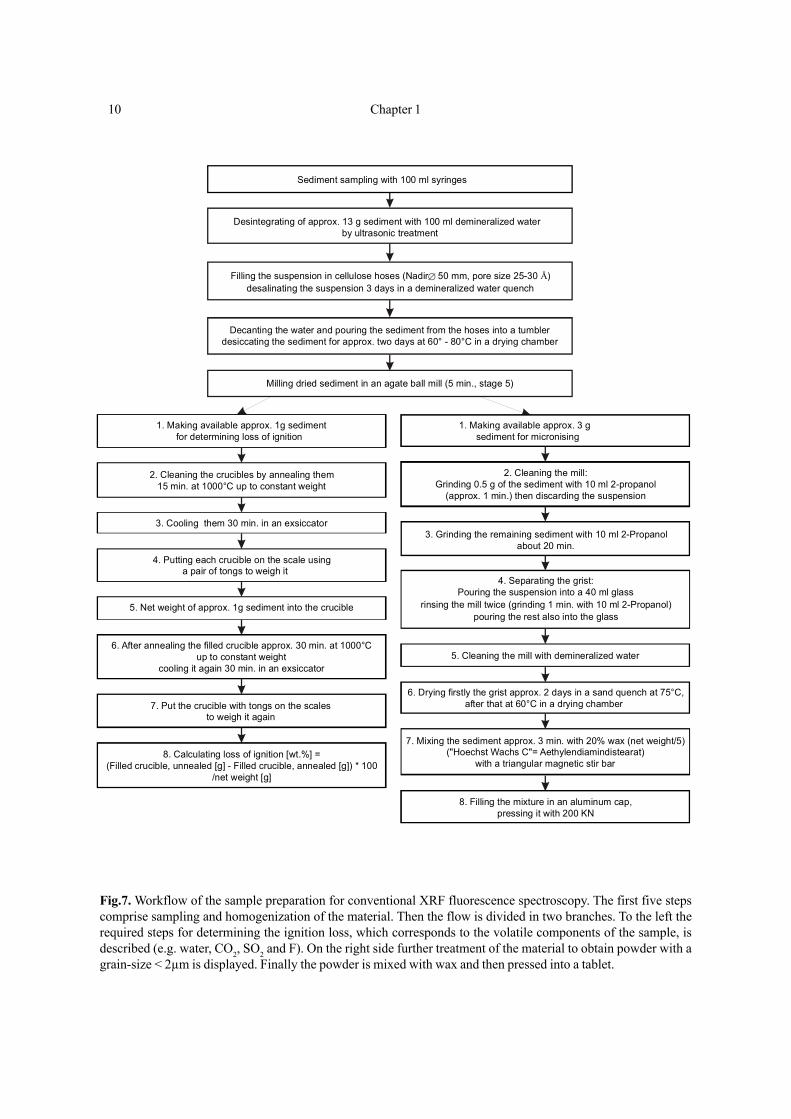
In a further step selected intervals from coresGeoB 4317-2 and GeoB 2908-7 have been ana-lyzed with a standard x-ray fluorescense spectro-meter. For this conventional method the time-consuming preparation of powder tablets is re-quired which comprises a multitude of single steps.Due to its complexity it has not been described ingreat detail in the following manuscripts. However,the workflow is displayed here in a flowchart(Fig.7.). The results have been used for a firstoverview of the geochemical processes involvedand for calibration purposes, since the XRF-corescanner did not provide quantitative results such asweight percent but qualitative element concen-trations in ‘counts per seconds’. Apart from that abroader spectrum of elements is identified by theconventional method.
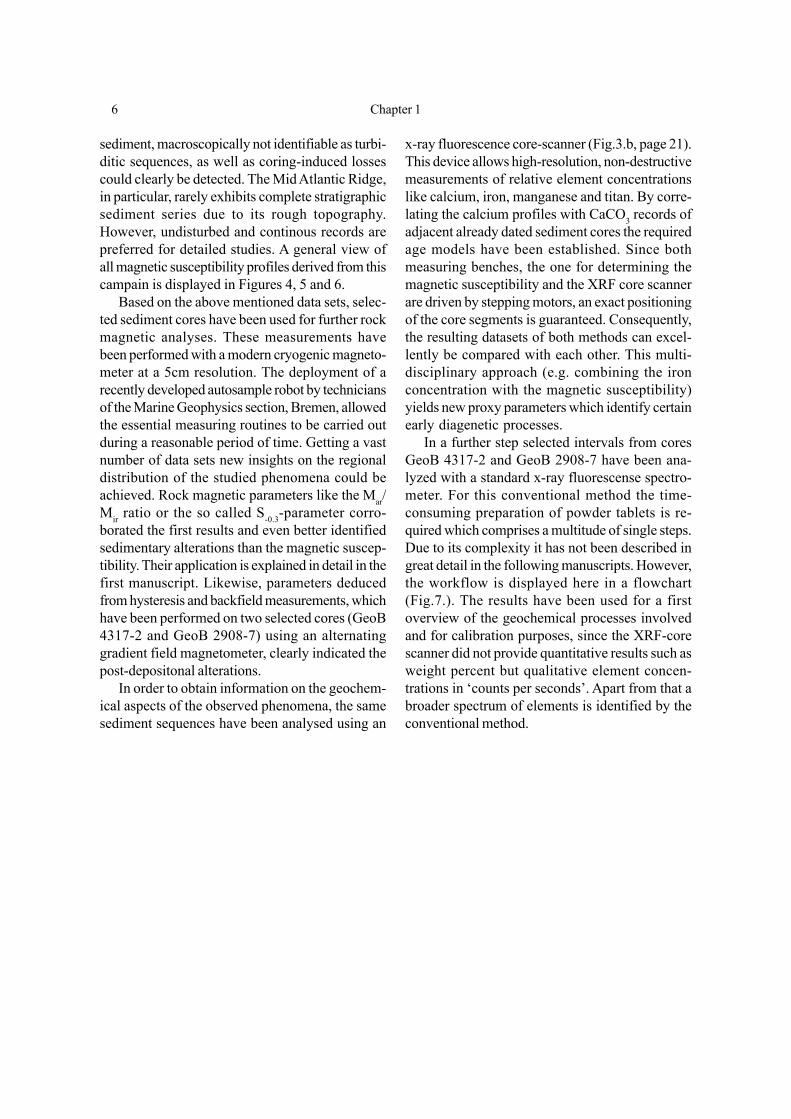
sediment, macroscopically not identifiable as turbi-ditic sequences, as well as coring-induced lossescould clearly be detected. The Mid Atlantic Ridge,in particular, rarely exhibits complete stratigraphicsediment series due to its rough topography.However, undisturbed and continous records arepreferred for detailed studies. A general view ofall magnetic susceptibility profiles derived from thiscampain is displayed in Figures 4, 5 and 6.
Based on the above mentioned data sets, selec-ted sediment cores have been used for further rockmagnetic analyses. These measurements havebeen performed with a modern cryogenic magneto-meter at a 5cm resolution. The deployment of arecently developed autosample robot by techniciansof the Marine Geophysics section, Bremen, allowedthe essential measuring routines to be carried outduring a reasonable period of time. Getting a vastnumber of data sets new insights on the regionaldistribution of the studied phenomena could beachieved. Rock magnetic parameters like the Mar/Mir ratio or the so called S-0.3-parameter corro-borated the first results and even better identifiedsedimentary alterations than the magnetic suscep-tibility. Their application is explained in detail in thefirst manuscript. Likewise, parameters deducedfrom hysteresis and backfield measurements, whichhave been performed on two selected cores (GeoB4317-2 and GeoB 2908-7) using an alternatinggradient field magnetometer, clearly indicated thepost-depositonal alterations.
In order to obtain information on the geochem-ical aspects of the observed phenomena, the samesediment sequences have been analysed using an
General introduction 7
Fig. 4. Magnetic susceptibility (κ) records of the northernmost transect at about 8°N (A) and along 5°N (B).Disturbances by redeposited sediments identified by plateau shaped signal sequences and distinct sharp minima.None of these cores were used for further investigations.
GeoB 4306-23773m
0100200300
0100200300
0100200300
0100200300
κ [1
0- 6 S
I]
GeoB 4304-3 3364m
GeoB 4308-4 4213m
GeoB 4310-24650m
0100200300
0100200300
0100200300
0100200300
0 1 2 3 4 5 6 7 8 9 10 11 12Depth [m]
05°N-Transect: 34°01,5´W - 36°30,8´W
GeoB 1509-1 4102m
GeoB 1508-33681m
GeoB 1510-24391m
GeoB 1508-43682m
08°N-Transect: 40°26,2'W - 34°52,0'WA
B
8 Chapter 1
0100200300
0100200300
0100200300
0100200300
0100200300
0100200300
04°N-Transect: 34°08,1'W - 30°36,2'W
GeoB 4311-24005m
GeoB 4313-23178m
GeoB 4312-23438m
GeoB 4317-23507m
GeoB 4315-23199m
GeoB 4314-23199m
κ [1
0- 6 S
I]
0100200300
0100200300
0100200300
0100200300
0 1 2 3 4 5 6 7 8 9 10 11 12Depth [m]
02°N-Transect: 30°38,8´W - 35°10,7´W
GeoB 1504-22981m
GeoB 1505-1 3705m
GeoB 1503-1 2306m
GeoB 1506-24268m
C
D
General introduction 9
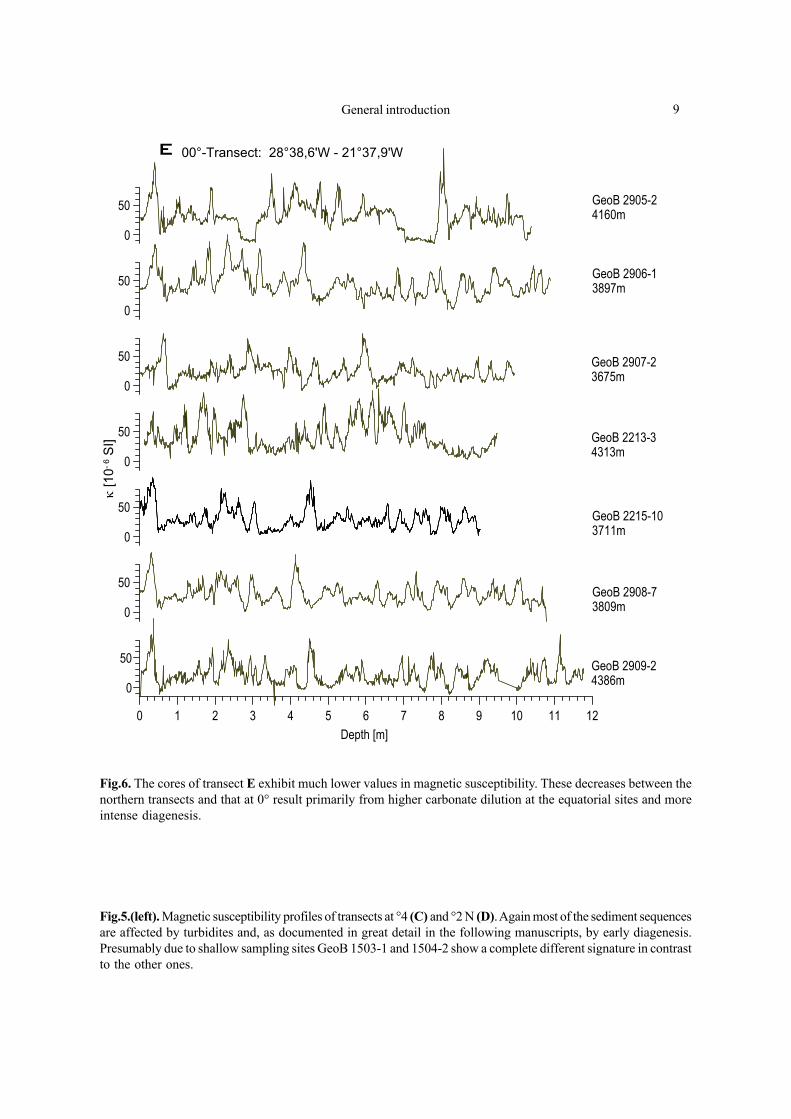
Fig.6. The cores of transect E exhibit much lower values in magnetic susceptibility. These decreases between thenorthern transects and that at 0° result primarily from higher carbonate dilution at the equatorial sites and moreintense diagenesis.
0
50
0
50
0
50
0
50
0
50
0 1 2 3 4 5 6 7 8 9 10 11 12Depth [m]
0
50
0
50
κ [1
0- 6 S
I]
00°-Transect: 28°38,6'W - 21°37,9'W
GeoB 2905-24160m
GeoB 2907-23675m
GeoB 2906-13897m
GeoB 2909-24386m
GeoB 2215-103711m
GeoB 2213-34313m
GeoB 2908-73809m
E
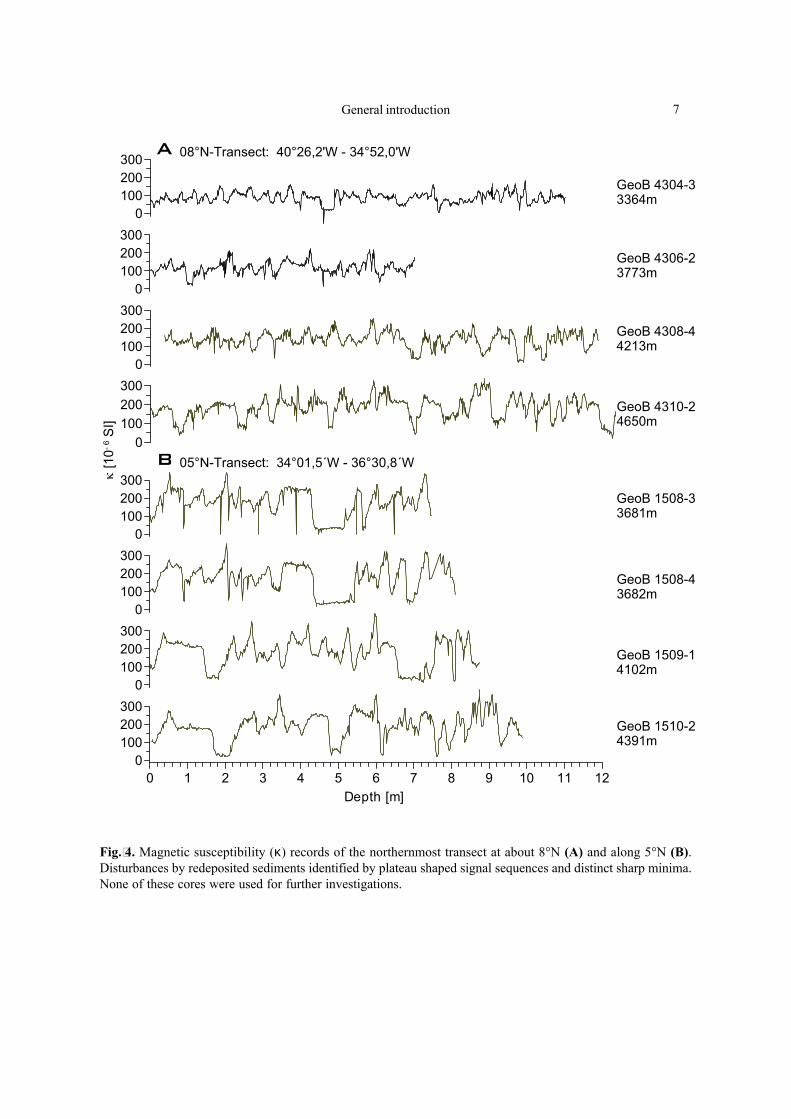
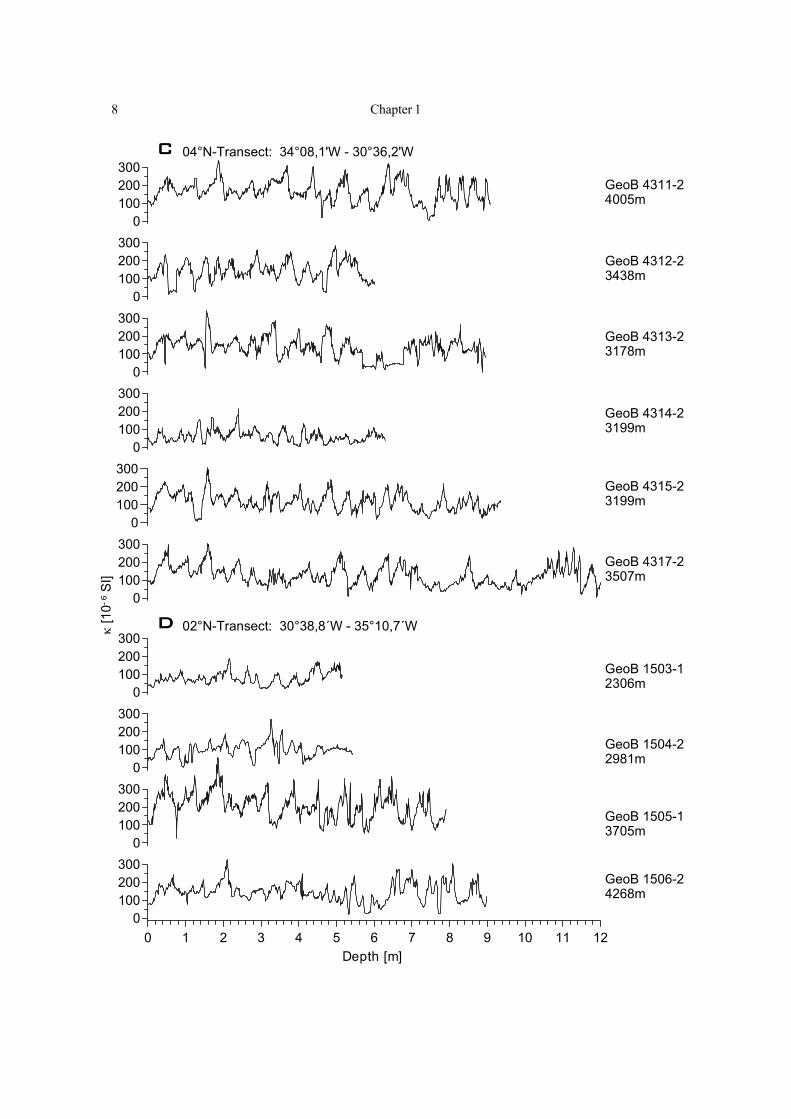
Fig.5.(left). Magnetic susceptibility profiles of transects at °4 (C) and °2 N (D). Again most of the sediment sequencesare affected by turbidites and, as documented in great detail in the following manuscripts, by early diagenesis.Presumably due to shallow sampling sites GeoB 1503-1 and 1504-2 show a complete different signature in contrastto the other ones.
10 Chapter 1
Fig.7. Workflow of the sample preparation for conventional XRF fluorescence spectroscopy. The first five stepscomprise sampling and homogenization of the material. Then the flow is divided in two branches. To the left therequired steps for determining the ignition loss, which corresponds to the volatile components of the sample, isdescribed (e.g. water, CO2, SO2 and F). On the right side further treatment of the material to obtain powder with agrain-size < 2µm is displayed. Finally the powder is mixed with wax and then pressed into a tablet.
Decanting the water and pouring the sediment from the hoses into a tumblerdesiccating the sediment for approx. two days at 60° - 80°C in a drying chamber
Filling the suspension in cellulose hoses (Nadir ∅ 50 mm, pore size 25-30 )Ådesalinating the suspension 3 days in a demineralized water quench
Desintegrating of approx. 13 g sediment with 100 ml demineralized waterby ultrasonic treatment
Sediment sampling with 100 ml syringes
Milling dried sediment in an agate ball mill (5 min., stage 5)
8. Calculating loss of ignition [wt.%] =(Filled crucible, unnealed [g] - Filled crucible, annealed [g]) * 100
/net weight [g]
7. Put the crucible with tongs on the scalesto weigh it again
6. After annealing the filled crucible approx. 30 min. at 1000°Cup to constant weight
cooling it again 30 min. in an exsiccator
5. Net weight of approx. 1g sediment into the crucible
4. Putting each crucible on the scale using weigh ita pair of tongs to
2. Cleaning the crucibles by annealing them15 min. at 1000°C up to constant weight
3. Cooling them 30 min. in an exsiccator
1. Making available approx. 1g sedimentfor determining loss of ignition
8. Filling the mixture in an aluminum cap,pressing it with 200 KN
7. Mixing the sediment approx. 3 min. with 20% wax (net weight/5)("Hoechst Wachs C"= Aethylendiamindistearat)
with a triangular magnetic stir bar
6. Drying firstly the grist approx. 2 days in a sand quench at 75°C,after that at 60°C in a drying chamber
5. Cleaning the mill with demineralized water
4. Separating the grist:Pouring the suspension into a 40 ml glass
rinsing the mill twice (grinding 1 min. with 10 ml 2-Propanol)pouring the rest also into the glass
3. Grinding the remaining sediment with 10 ml 2-Propanolabout 20 min.
2. Cleaning the mill:Grinding 0.5 g of the sediment with 10 ml 2-propanol
(approx. 1 min.) then discarding the suspension
1. Making available approx. 3 gsediment for micronising
General introduction 11
1.3 ReferencesBerner RA (1981) A new classification of sedimentary
environments. J Sed Petrol 51: 359-365Bloemendal J, Lamb B, King J (1988) Paleoenvironmental
implications of rock - magnetic properties of lateQuaternary sediment cores from the eastern equa-torial Atantic. Paleoceanography 3: 61 -87
Bloemendal J, King JW, Hall FR, Doh S-J (1992) Rockmagnetism of late Neogene and Pleistocene deep-sea sediments: Relationship to sediment source,diagenetic processes, and sediment lithology. JGeophys Res 97: 4361-4375
Canfield DE, Berner RA (1987) Dissolution and pyriti-zation of magnetite in anoxic marine sediments.Geochim Cosmochim Acta 51: 645-659
Chamley H (1989) Clay Sedimentology. Springer-VerlagNew York. 623 p
Dapples EC (1962) Stages of diagenesis in thedevelopment of sandstones. Bull Geol Soc Am 73:913-934
Colley S, Thomson J, Wilson TRS, Higgs NC (1984) Post-depositional migration of elements during diagenesisin brown clay and turbidite sequences in the NorthEast Atlantic. Geochim Cosmochim Acta 48: 1223-1235
Farina M, Esquivel DMS, Lins de Barros, HGP (1990)Magnetic iron-sulphur crystals from a magnetotacticmicroorganism. Nature 343: 256-258
Frederichs T, Bleil U, Däumler K, von Dobeneck T,Schmidt A (1999) The magnetic view on the marinepaleoenvironment: Parameters, techniques, and po-tentials of rock magnetic studies as a key to paleo-climatic and paleoceanographic changes. In: FischerG, Wefer G (eds) Use of Proxies in Paleoceanography:Examples from the South Atlantic. Springer Berlin,pp 575-599
Froelich PN, Klinkhammer GP, Bender ML, Luedtke NA,Heath GR, Cullen D, Dauphin P, Hammond D,Hartman B, Maynard V (1979) Early oxidation oforganic matter in pelagic sediments of the easternequatorial Atlantic: Suboxic diagenesis. GeochimCosmochim Acta 43: 1075-1090
Funk J (1997) Sedimentologische, organisch-geochemi-sche und geophysikalische Untersuchungen amKern 2908-7. Fachbereich Geowissenschaften,Universität Bremen (unpublished diploma thesis)
78 pHiggs HC, Thomson J, Wilson TRS, Croudace IW (1994).
Modification and complete removal of eastern Medi-terranean sapropels by postdepositional oxidation.Geology 22: 423 - 426
Kasten S, Zabel M, Heuer V, Hensen C (2004) Processesand signals of nonsteady-state diagenesis in deep-
sea sediments and their pore waters. In: Wefer G,Mulitza S and Ratmeyer V (eds) The South Atlanticin the Late Quaternary: Reconstruction of MaterialBudget and Current Systems. Springer-Verlag, pp431-459
König I, Drodt M, Suess E, Trautwein AX (1997) Ironreduction through the tan - green color transition indeep-sea sediments. Geochim Cosmochim Acta 61:1679-1683
Lyle M (1983) The brown-green color transition in marinesediments: A marker of the Fe(III)-Fe(II) redoxboundary. Limnol Oceanogr 28: 1026-1033
Mann S, Sparks NHC, Frankel RB, Bazylinski DA,Jannasch HW (1990) Biomineralization offerrimagnetic greigite (Fe3S4) and iron pyrite (FeS2)in a magnetotactic bacterium. Nature 343: 258-261
Müller PJ, Hartmann M, Suess E (1988) The chemicalenvironment of pelagic sediments. In: Halbach P,Friedrich G, von Stackelberg U (eds) The manganesenodule belt of the Pacific Ocean. Enke, Stuttgart,254 p.
Passier HF, Dekkers MJ, de Lange GJ (1998) Sedimentchemistry and magnetic properties in an anoma-lously reducing core from the eastern MediterraneanSea. Chem Geol 152: 287-306
Robinson SG, Sahota JTS, Oldfield F (2000) Early dia-genesis in North Atlantic abyssal plain sedimentscharacterized by rock magnetic and geochemicalindices. Mar Geol 163: 77-107
Sarnthein M, Tetzlaff G, Koopmann B, Wolter K,Pflaumann, U 1981. Glacial and interglacial windregimes over the eastern subtropical Atlantic andNorth-West Africa. Nature 293: 193-196
Tarduno JA, Wilkison SL (1996) Non-steady statemagnetic mineral reduction, chemical lock-in, anddelayed remanence acquisition in pelagic sediments.Earth Planet Sci Lett 144: 315-326
Thomson J, Higgs NC, Wilson TRS, Croudace IW, deLange GJ, van Santvoort, PJM (1995) Redistributionand geochemical behaviour of redox - sensitiveelements around S 1, the most recent eastern Medi-terranean sapropel. Geochim Cosmochim Acta 59:3487-3501
van Santvoort PJM, de Lange GJ, Thomson J, CussenH, Wilson TRS, Krom MD, Ströhle K (1996) Activepost-depositional oxidation of the most recent sapro-pel (S1) in sediments of the eastern MediterraneanSea. Geochim Cosmochim Acta 60: 4007-4024
Wilson TRS, Thomson J, Colley S, Hydes DJ, Higgs NC,Sorensen J (1985) Early organic diagenesis: Thesignificance of progressive subsurface oxidationfronts in pelgic sediments. Geochim CosmochimActa 49: 811-822
12 Chapter 1
1.4 Publications
This study includes four manuscripts:
· Two of them are published in the Book ‘The South Atlantic in the Late Quaternary: Reconstructionof Material Budget and Current System’ a quasi final report, which delineates and summarizes thework of the special research collaboration 261.
· The third article has been published as a result of an international symposium on fundamental rockmagnetism and environmental applications in a conference volume.
· As part of the interdisciplinary cooperation with the Geochemical Section of the Department ofGeosciences, University of Bremen, Dipl.-Geol. Anja Reitz conducted high resolution geochemical androckmagnetic measurements in the framework of her diploma-thesis, which I partly advised. The resultsare documented in the fourth paper.
J.A. Funk, T. von Dobeneck and A. Reitz (2004)Integrated Rock Magnetic and Geochemical Quantification of Redoxomorphic Iron MineralDiagenesis in Late Quaternary Sediments from the Equatorial Atlantic
In: G. Wefer, S. Mulitza and V. Ratmeyer (eds.)
The South Atlantic in the Late Quaternary: Reconstruction of Material Budget and Current Systems.Springer-Verlag Berlin Heidelberg, pp 237-260
This paper thoroughly describes the methods and parameters applied in this thesis. Particularly theinterdisciplinary geochemical/magnetic approach is outlined here, mainly the half-core-logging techniqueswhich display early diagenetic processes in high resolution records. Innovative proxy parameters arepresented, which stand for magnetite depletion, precipitation and iron relocation. It is shown that thesealterations of the pristine climate signal are paralleled by layers enriched in organic carbon. Depositedduring times of enhanced primary productivity in the surface water these ‘sapropelic layers’ itselfrepresent changes in climate and oceanic circulation. Two case studies are used to demonstrate howthe degradation of the buried organic matter was accompanied by suboxic conditions and recurrence ofreductive dissolution of magnetic minerals. By a statistical approach it is attempted to reconstruct thepristine signal.
General introduction 13
J.A. Funk, T. von Dobeneck, T. Wagner and S. Kasten (2004)Late Quaternary Sedimentation and Early Diagenesis in the Equatorial Atlantic Ocean:Patterns, Trends and Processes Deduced from Rock Magnetic and Geochemical Records
In: G. Wefer, S. Mulitza and V. Ratmeyer (eds.)
The South Atlantic in the Late Quaternary: Reconstruction of Material Budget and Current Systems.Springer-Verlag Berlin Heidelberg, pp 461-497
The article is also of multidisciplinary character with special emphasis on the post depositional alterationsof the studied records. It has a wide geographical and temporal scope, covering the sedimentary historyof the Late Quaternary and comprising data sets of 16 gravity cores retrieved in the equatorial Atlanticarea of the Mid Atlantic Ridge. Their age models and the rock magnetic properties of the sediments arepresented in order to give an overview of magnetite concentration, magnetic grain size and magneticmineralogy. A systematic use of a combination with geochemical analyzes and color datasets enables aprecise interpretation of diagenesis patterns, accumulation rates and sedimentation systems in a regio-nal context. A synthesis of the results of a long period of research in this area is integrated.
T. von Dobeneck and J. Funk (2002)Integrated Rock Magnetic and Geochemical Proxies for Iron Mineral Dissolution andPrecipitation in Marine Sediments Based on Single Sample and New Split Core ScanningTechniques
In: Leonardo Sagnotti and Andrew P. Roberts (eds.)
Fundamental RockMagnetism and Environmental ApplicationQuaderni di Geofisica, No. 26, pp 183-185
This paper gives a short overview of the new rock magnetic and environmental applications. Thegeochemical/magnetic iron diagenesis proxies Fe/knd for magnetite dissolution, Ti/knd for magnetic mineralprecipitation and Fe/Ti for iron relocation are introduced.
A. Reitz, C. Hensen, S. Kasten, J.A. Funk and G.J. deLange (in press)A combined geochemical and rock-magnetic investigation of a redox horizon at the last glacial/interglacial transition
Physics and Chemistry of the Earth
The main objective of this study is to investigate in detail a sediment section encompassing an active ironredox boundary. Conventional rock magnetic and geochemical methods were performed on a high-resolution scale in order to detect characteristic enrichments of redox-sensitive elements and the extendof magnetic mineral dissolution. A color change attributed to the iron redox boundary is observed in thevicinity of the last glacial/interglacial transition. Drastic changes in the depositional conditions during thelast deglaciation were made responsible for a change in the redox environment of the sediment causingnon-steady state diagenesis. Additionally, the development and the movement of the Fe2+/Fe3+ - redoxboundary with respect to climate change has been reconstructed.

14 Chapter 1
or eutrophication (Snowball 1993). The cited stud-ies were concerned with reconstructions of paleo-productivity and sediment accumulation, withalteration of primary minerals and diagenetic over-printing of paleo- and rock magnetic information(Dekkers et al. 1994), and with the establishmentof cyclostratigraphic age models based on orbitalrhythms (Langereis and Dekkers 1999; van Sant-voort et al. 1997).
The geochemical settings for redoxomorphicdiagenesis are alike in all mentioned situations: Bac-terially mediated oxidation of embedded organicmatter follows a declining energy yield sequenceof terminal electron acceptors from interstitial
Chapter 2
Integrated Rock Magnetic and Geochemical Quantificationof Redoxomorphic Iron Mineral Diagenesis
in Late Quaternary Sediments from the Equatorial Atlantic
J.A. Funk1*, T. von Dobeneck1,2 and A. Reitz3
1Universität Bremen, Fachbereich Geowissenschaften, Postfach 33 04 40,D-28334 Bremen, Germany
2Paleomagnetic Laboratory 'Fort Hoofddijk', Faculty of Earth SciencesUtrecht University, Budapestlaan 17, 3584 CD Utrecht, The Netherlands
3Geochemistry Department, Faculty of Earth SciencesUtrecht University, P.O. Box 80 021, 3508 TA Utrecht, The Netherlands
Abstract: Rock magnetic and geochemical data logged by fast, non-destructive X-ray fluorescenceand susceptibility half core scanning techniques have been combined to create high-resolution recordsof redoxomorphic iron mineral diagenesis in suboxic marine sediments. The great potential of thisapproach and advantage to standard single sample methods is demonstrated on two Late Quaternarysequences from the central Equatorial Atlantic (GeoB 2908-7 and 4317-2). Reductive dissolution offerric minerals, most prominently magnetite (Fe3O4) and hematite (Fe2O3), induced by organic carbondegradation is shown to represent a gradual, mineral- and grain-size selective process. Proportionalityof Fe, Ti and magnetite concentrations in the unaltered sections lead us to define proxy parametersfor magnetite depletion (Fe/κnd) below and precipitation (κnd/Ti) above the modern and numerousfossil redox boundaries, while iron relocation was detected on basis of the Fe/Ti ratio. By calibratingall three ratios internally, we reconstruct and quantify primary deposition and secondary change ofboth, magnetite and total Fe profiles. Fine-scaled Corg variations (0.1 to 0.6 %) and susceptibility losses(up to 200 · 10-6 SI) show high signal resemblance and appear to be equivalent signatures of cyclicproductivity pulses in the study area. Some minor suboxic events are still expressed in the rockmagnetic proxy signal, but are not accompanied by residual Corg enrichments.
IntroductionNumerous paleoenvironmental studies on suboxicto anoxic sediments have combined rock magneticand chemical data (e.g. Vigliotti et al. 1999) toidentify mineral alterations due to redoxomorphicdiagenesis (Dapples 1962), a “collective noun forprocesses of early diagenesis involving both re-ductive and oxidative stages” (Robinson et al.2000). Redox reactions including dissolution, de-pletion, relocation and precipitation of iron occur inand around sapropels (Passier et al. 1998), tur-biditic sequences (Robinson et al. 2000) and or-ganically enriched sediments deposited under con-ditions of upwelling (Tarduno 1994), reduced bot-tom water circulation (Calvert and Pedersen 1993)From WEFER G, MULITZA S, RATMEYER V (eds), 2004, The South Atlantic in the Late Quaternary: Reconstruction of MaterialBudget and Current Systems. Springer-Verlag Berlin Heidelberg, pp 237-260
16 Chapter 2
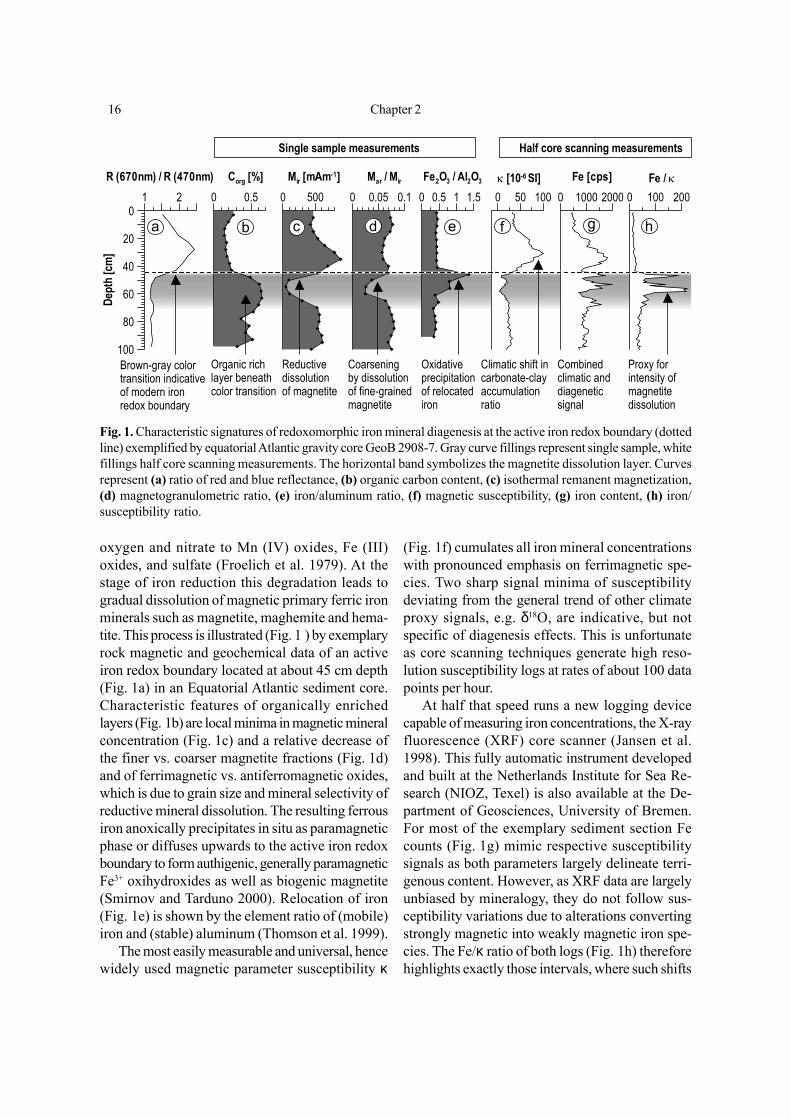
oxygen and nitrate to Mn (IV) oxides, Fe (III)oxides, and sulfate (Froelich et al. 1979). At thestage of iron reduction this degradation leads togradual dissolution of magnetic primary ferric ironminerals such as magnetite, maghemite and hema-tite. This process is illustrated (Fig. 1 ) by exemplaryrock magnetic and geochemical data of an activeiron redox boundary located at about 45 cm depth(Fig. 1a) in an Equatorial Atlantic sediment core.Characteristic features of organically enrichedlayers (Fig. 1b) are local minima in magnetic mineralconcentration (Fig. 1c) and a relative decrease ofthe finer vs. coarser magnetite fractions (Fig. 1d)and of ferrimagnetic vs. antiferromagnetic oxides,which is due to grain size and mineral selectivity ofreductive mineral dissolution. The resulting ferrousiron anoxically precipitates in situ as paramagneticphase or diffuses upwards to the active iron redoxboundary to form authigenic, generally paramagneticFe3+ oxihydroxides as well as biogenic magnetite(Smirnov and Tarduno 2000). Relocation of iron(Fig. 1e) is shown by the element ratio of (mobile)iron and (stable) aluminum (Thomson et al. 1999).
The most easily measurable and universal, hencewidely used magnetic parameter susceptibility κ
(Fig. 1f) cumulates all iron mineral concentrationswith pronounced emphasis on ferrimagnetic spe-cies. Two sharp signal minima of susceptibilitydeviating from the general trend of other climateproxy signals, e.g. δ18O, are indicative, but notspecific of diagenesis effects. This is unfortunateas core scanning techniques generate high reso-lution susceptibility logs at rates of about 100 datapoints per hour.
At half that speed runs a new logging devicecapable of measuring iron concentrations, the X-rayfluorescence (XRF) core scanner (Jansen et al.1998). This fully automatic instrument developedand built at the Netherlands Institute for Sea Re-search (NIOZ, Texel) is also available at the De-partment of Geosciences, University of Bremen.For most of the exemplary sediment section Fecounts (Fig. 1g) mimic respective susceptibilitysignals as both parameters largely delineate terri-genous content. However, as XRF data are largelyunbiased by mineralogy, they do not follow sus-ceptibility variations due to alterations convertingstrongly magnetic into weakly magnetic iron spe-cies. The Fe/κ ratio of both logs (Fig. 1h) thereforehighlights exactly those intervals, where such shifts
0 100 200Fe / κ
0 1000 2000Fe [cps]
0 50 100κ [10-6 SI]
0 0.5 1 1.5Fe2O3 / Al2O3
0 0.05 0.1Mar / Mir
0 500Mir [mAm-1]
0 0.5Corg [%]
1 2R (670nm) / R (470nm)
100
80
60
40
20
0
Dept
h [c
m]
Coarseningby dissolutionof fine-grainedmagnetite
Oxidativeprecipitationof relocatediron
Climatic shift in carbonate-clayaccumulationratio
Brown-gray colortransition indicativeof modern iron redox boundary
Organic richlayer beneathcolor transition
Reductivedissolutionof magnetite
Single sample measurements Half core scanning measurements
Proxy forintensity ofmagnetitedissolution
Combinedclimatic anddiageneticsignal
a b c d e f g h
Fig. 1. Characteristic signatures of redoxomorphic iron mineral diagenesis at the active iron redox boundary (dottedline) exemplified by equatorial Atlantic gravity core GeoB 2908-7. Gray curve fillings represent single sample, whitefillings half core scanning measurements. The horizontal band symbolizes the magnetite dissolution layer. Curvesrepresent (a) ratio of red and blue reflectance, (b) organic carbon content, (c) isothermal remanent magnetization,(d) magnetogranulometric ratio, (e) iron/aluminum ratio, (f) magnetic susceptibility, (g) iron content, (h) iron/susceptibility ratio.
Integrated Rock Magnetic and Geochemical Quantification 17
occur. The double spikes correspond primarily tothe two susceptibility minima of Fig. 1f, but partlyalso to a Fe precipitation layer at the Fe2+/Fe3+
redox zone (Fig. 1g). Both are not resolved in thesingle sample measurements of Figs. 1b-d, whichare followed by the broader underlying peak inFig. 1h. We are not aware of any preceding exam-ples where magnetic parameters were explicitlynormalized by Fe and Ti content to define quan-titative proxies for magnetic mineral diagenesis.However a good step in this direction was takenby Rosenbaum et al. (1996) by utilizing crossplotsof concentrational magnetic parameters against ironand titanium content to detect diagenetic magnetiteand hematite loss in limnic sediments .
By combining both scanning techniques in theabove depicted way, diagenetically affected sedi-ment sections can be detected at a hitherto unpre-cedented speed and precision - provided that theprimary composition of the terrigenous sedimentfraction remains fairly constant. It is the aim of thiscontribution to investigate implications and pros-pects of this new technique and to discuss its resultsin the context of established element and rockmagnetic analytics.
Materials
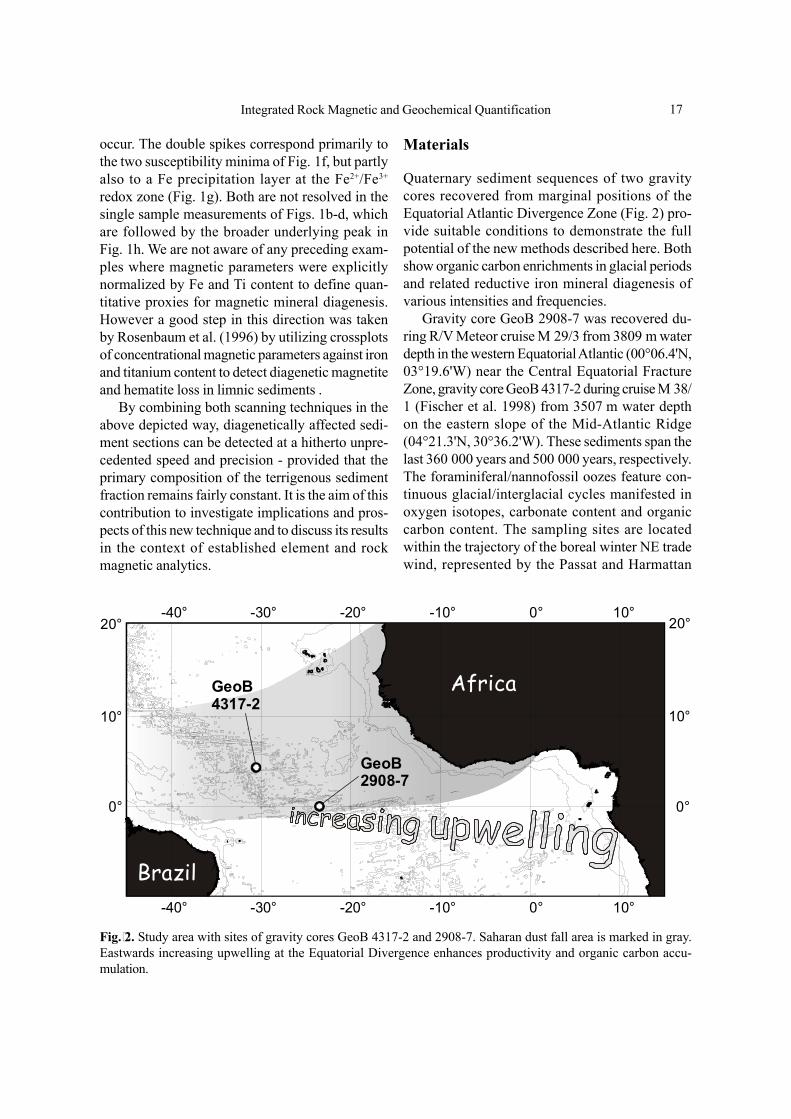
Quaternary sediment sequences of two gravitycores recovered from marginal positions of theEquatorial Atlantic Divergence Zone (Fig. 2) pro-vide suitable conditions to demonstrate the fullpotential of the new methods described here. Bothshow organic carbon enrichments in glacial periodsand related reductive iron mineral diagenesis ofvarious intensities and frequencies.
Gravity core GeoB 2908-7 was recovered du-ring R/V Meteor cruise M 29/3 from 3809 m waterdepth in the western Equatorial Atlantic (00°06.4'N,03°19.6'W) near the Central Equatorial FractureZone, gravity core GeoB 4317-2 during cruise M 38/1 (Fischer et al. 1998) from 3507 m water depthon the eastern slope of the Mid-Atlantic Ridge(04°21.3'N, 30°36.2'W). These sediments span thelast 360 000 years and 500 000 years, respectively.The foraminiferal/nannofossil oozes feature con-tinuous glacial/interglacial cycles manifested inoxygen isotopes, carbonate content and organiccarbon content. The sampling sites are locatedwithin the trajectory of the boreal winter NE tradewind, represented by the Passat and Harmattan
Fig. 2. Study area with sites of gravity cores GeoB 4317-2 and 2908-7. Saharan dust fall area is marked in gray.Eastwards increasing upwelling at the Equatorial Divergence enhances productivity and organic carbon accu-mulation.
Africa
Brazil
0° 0°
10° 10°
20° 20°
-40°
-40°
-30°
-30°
-20°
-20°
-10°
-10°
0°
0°
10°
10°
GeoB2908-7
GeoB4317-2
18 Chapter 2
wind systems. They receive huge amounts of terri-genous material from the Saharan dust plume(Ruddiman et al. 1989), which is the dominantsource of detrital iron and magnetic minerals in theEquatorial Atlantic (Bloemendal et al. 1992).Rainout within the Intertropical Convergence Zoneis the major particle removal process from theatmosphere. The surface currents in this region areequally controlled by trade winds, generating theEquatorial Divergence upwelling system, an en-hanced productivity region.
Methods
Single Sample Rock Magnetic MeasurementsThe work halves of both cores were sampled on-board at 5 cm intervals for paleo- and rock magneticmeasurements (oriented 6.2 cm3 cube samples)and later resampled at the same positions for pow-der XRF element analyses.
After paleomagnetic analysis, the cube sampleswere investigated by standard remanence-basedmeasurements carried out with the automated 2GSQUID rock magnetometer of the Marine Geo-physics Division at the Department of Geosciences,University of Bremen. Anhysteretic remanentmagnetization (Mar), a grain-size selective para-meter primarily quantifying submicron magnetite(single/pseudo-single domain size) was imparted inan alternating field decaying from 250 mT with asuperimposed constant field of 0.04 mT. Isothermalremanent magnetization (Mir), acquired in a pulsedfield of 250 mT, equally quantifies magnetite, butwith considerably less influence of particle size.The Mar/Mir ratio (Maher 1988) is therefore a well-established magnetite grain-size index. Saturationisothermal remanent magnetization (Msir) acquiredin a pulsed field of 2.5 T was subsequently over-printed by a back field of – 0.3 T to evaluate therelation of low coercive (magnetite) to high coercive(hematite, goethite) mineral concentrations, the so-called S-ratio (Bloemendal et al. 1992) defined as
)/1(5.0 3.03.0 sirTT MMS −− +⋅=
Kruiver and Passier recently demonstrated[2001] the presence of considerable internal varia-
bility and overlap within the coercivity distributionsof both magnetite and hematite, which may mo-dulate this parameter independent of actual relativemineral concentrations. The above given standardinterpretation of S-0.3 T should therefore be treatedwith caution when dealing with drastically changinggrain sizes or mineral phases of various (lithogenic,authigenic, biogenic) origin.
The viscous loss of the initial Msir in 24 hourswas termed Mvr. 'Magnetic viscosity' is due tometastable single domain magnetite particles nearthe superparamagnetic (SP) threshold grain-size ofapproximately 20 nm (Butler and Banerjee 1975).Similarly fine SP hematite particles may act in thesame sense (Banerjee 1971). The ratio Mvr/Msirtherefore quantifies the relative contribution of ferri-and antiferromagnetic particles with grain sizes nearthe SP/SSD threshold. Its general tendency com-pares to the more customary, but less sensitivefrequency-dependent susceptibility κfd%, which iscommonly used to quantify the ultra-fine magnetitefraction in environmental materials (Dearing et al.1996). Because of instrumental limitations of theused Bartington Susceptometer, the κ fd%, datameasured on the weakly magnetic material in-vestigated here were regarded as being to noisy tosupport detailed interpretation and are therfore notshown. Nevertheless, all measured κfd%, data setsare, within their error limits, in full agreement withthe Mvr/Msir ratio used here.
Single sample susceptibility (κ) data of all sam-ples are also not shown, as they coincide very wellwith scanning susceptibility data available at muchhigher resolution. They were, however, used todetermine the carbonate free dry mass suscepti-bility χcfdm. This parameter is derived from singlesample volume susceptibility measurements bymathematically eliminating the effects of porosity,pore water and carbonate dilution. It refers ex-clusively to fluctuations of magnetic mineral linkedto diagenesis or terrigenous sedimentation.
For hysteresis measurements miniature samples< 50 mg have been prepared using a techniquedescribed by von Dobeneck, (1996). Measure-ments were carried out with a PMC M2900 alter-nating gradient force magnetometer. By processingwith the HYSTEAR program (von Dobeneck1996), we derived basic hysteresis parameters such
Integrated Rock Magnetic and Geochemical Quantification 19
as the specific saturation magnetization σs andremanent magnetization σrs, the magnetogranulo-metric Mrs/Ms ratio by Day et al. (1977), the coer-cive field Bc, and the median field Brh of the rema-nent (symmetric) hysteresis component. Theequally hysteresis-based susceptibility parameterχnf quantifies contributions of paramagnetic anddiamagnetic sediment matrix constituents, whileχtot, the slope of the induced (antisymmetric) hyste-resis component at zero field, cumulates all inducedmagnetizations. The mass specific ferrimagneticsusceptibility χfer is their difference:
χfer = χtot - χnf
Single Sample Element AnalysesThe organic carbon content was determined witha LECO CS-300 infrared analyzer after removalof carbonate by 6 % HCl. Analytical accuracy waschecked using a standard every 10 to15 sample.
Element analyses of the first meter of coreGeoB 2908-7 were performed at 1 cm resolutionby Inductively Coupled Plasma Atomic EmissionSpectroscopy (ICP-AES). After total digestion of50 mg freeze-dried sediment in a mixture of 3 mlHNO3 (65% s.p.), 2 ml HF (48% s.p.) and 2 mlHCl (30% s.p.) at 200°C and evaporating thesolution, using a microwave device, the residualwas homogenized with a solution of 0.5 ml HNO3(65% s.p.) and 4.5 ml MilliQ-water, also in themicrowave. For each rank, one blank and a refe-rence standard (MAG-1, USGS; Gladney andRoelandts 1988) have been treated like the sam-ples. The resulting solutions were analyzed with aPerkin-Elmer optima 3300 RL ICP-AES system.The relative standard deviation is less than 3%.
Pressed powder tablets of selected sedimentlayers from both studied cores were also analyzedfor absolute concentrations of major and minorelements using a wavelength dispersive Philips PW1400 X-ray fluorescence spectrometer. Prior toanalysis, the samples were disintegrated by ultra-sonic treatment, dialyzed and washed to removepore water, ball-milled and pressed.
These two very precise element analytics arefar too laborious to be generally applied for highresolution studies of full sediment cores or core
collections. They were only applied in specificsections and replaced by the much faster XRFscanning for the remaining core lengths. The com-parison of absolute single sample and relaticescanning methods provides a basis for calibrationand error estimate for the latter.
In this study mainly the terrigenous elements Al,Fe and Ti are of interest. To detect relocations ofredox sensitive elements, dilution effects resultingfrom changes in biogenous accumulation must becompensated, which is commonly done by nor-malizing their concentrations to Al or Ti. Accordingto Thomson et al. (1999), this procedure implies thefollowing inherent assumptions:
Al and Ti are conservative elements which donot suffer appreciable diagenesis (Thomson et al.1998). Carbonate and opal have insignificant con-tents of redox sensitive elements. Each terrigenouselement under study is assumed to be deposited ata constant ratio relative to Al and Ti (same sourcematerial). Aluminum resides naturally in alumo-silicates associated with the silt and clay fractionof the sediment. Thus, it is considered as a surro-gate of fine-grained material (Mudroch and Azcue1995). During continental weathering Al, Ti, Fe, andMn are relatively immobile and are therefore con-sidered as refractory elements (Canfield 1997).
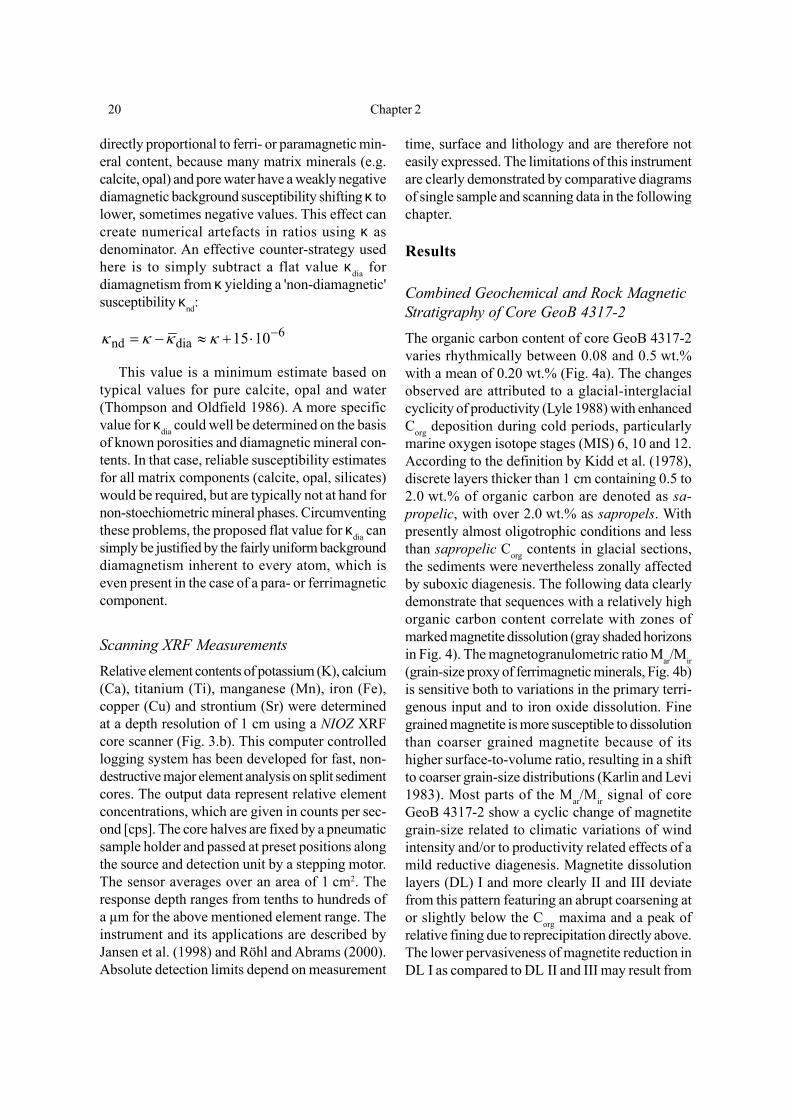
Scanning Susceptibility MeasurementsThe magnetic volume susceptibility κ was deter-mined with a custom-made, automated split-coresusceptibility scanner employing a BartingtonMS2 susceptometer with a high resolution MS2F(Ø15 mm) spot sensor (Fig. 3.a). Its lateral sensi-tivity is approximated by a Gaussian distributionwith a half width of 12 mm. Vertically, a layer of10 mm contributes over 90 % to the signal (No-waczyk and Antonow 1997; Lecoanet et al. 1999).Measurements were taken at 1 cm spacing onarchive halves in the sensitive mode. Instrumentdrift was controlled after each step by a zero mea-surements in air. The raw data were specified inSI units using an empirically derived calibrationfactor of 18.1. With a digital precision of 0.1 scaleunits, the numerical resolution is therefore in theorder of ±1·10-6 SI.
Strictly speaking, magnetic susceptibility is not
20 Chapter 2
directly proportional to ferri- or paramagnetic min-eral content, because many matrix minerals (e.g.calcite, opal) and pore water have a weakly negativediamagnetic background susceptibility shifting κ tolower, sometimes negative values. This effect cancreate numerical artefacts in ratios using κ asdenominator. An effective counter-strategy usedhere is to simply subtract a flat value κdia fordiamagnetism from κ yielding a 'non-diamagnetic'susceptibility κnd:
6diand 1015 −⋅+≈−= κκκκ
This value is a minimum estimate based ontypical values for pure calcite, opal and water(Thompson and Oldfield 1986). A more specificvalue for κdia could well be determined on the basisof known porosities and diamagnetic mineral con-tents. In that case, reliable susceptibility estimatesfor all matrix components (calcite, opal, silicates)would be required, but are typically not at hand fornon-stoechiometric mineral phases. Circumventingthese problems, the proposed flat value for κdia cansimply be justified by the fairly uniform backgrounddiamagnetism inherent to every atom, which iseven present in the case of a para- or ferrimagneticcomponent.
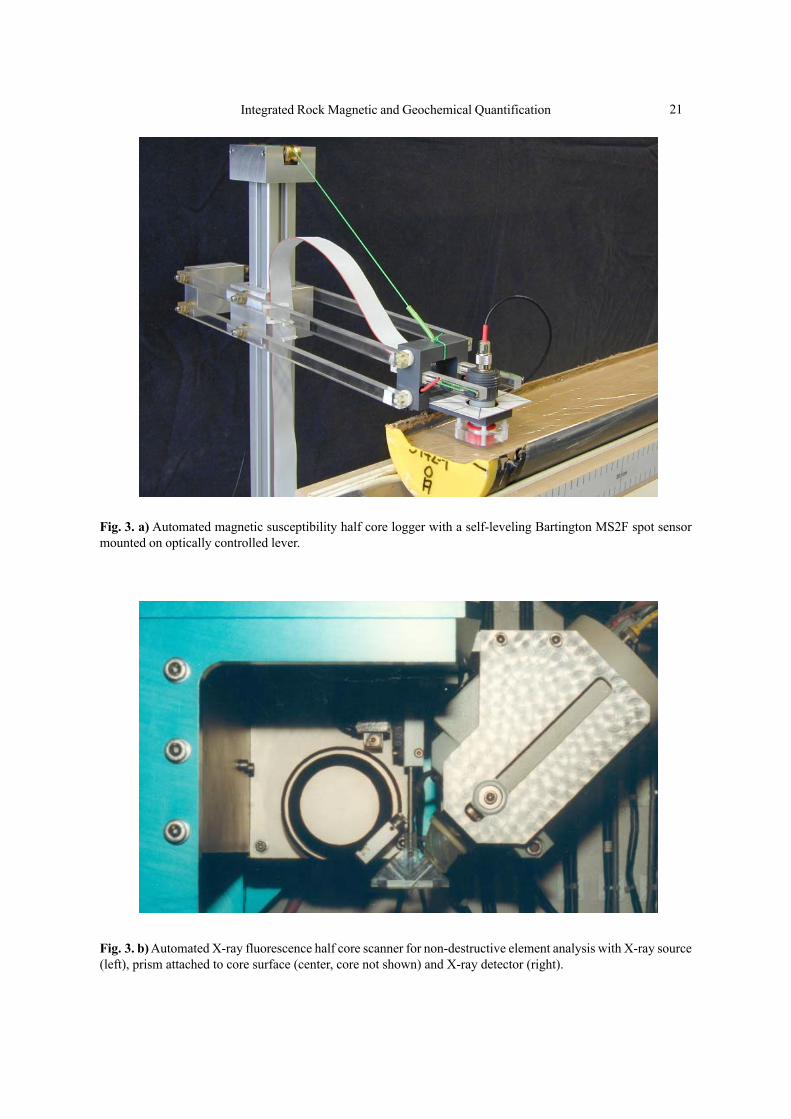
Scanning XRF MeasurementsRelative element contents of potassium (K), calcium(Ca), titanium (Ti), manganese (Mn), iron (Fe),copper (Cu) and strontium (Sr) were determinedat a depth resolution of 1 cm using a NIOZ XRFcore scanner (Fig. 3.b). This computer controlledlogging system has been developed for fast, non-destructive major element analysis on split sedimentcores. The output data represent relative elementconcentrations, which are given in counts per sec-ond [cps]. The core halves are fixed by a pneumaticsample holder and passed at preset positions alongthe source and detection unit by a stepping motor.The sensor averages over an area of 1 cm2. Theresponse depth ranges from tenths to hundreds ofa µm for the above mentioned element range. Theinstrument and its applications are described byJansen et al. (1998) and Röhl and Abrams (2000).Absolute detection limits depend on measurement
time, surface and lithology and are therefore noteasily expressed. The limitations of this instrumentare clearly demonstrated by comparative diagramsof single sample and scanning data in the followingchapter.
Results
Combined Geochemical and Rock MagneticStratigraphy of Core GeoB 4317-2The organic carbon content of core GeoB 4317-2varies rhythmically between 0.08 and 0.5 wt.%with a mean of 0.20 wt.% (Fig. 4a). The changesobserved are attributed to a glacial-interglacialcyclicity of productivity (Lyle 1988) with enhancedCorg deposition during cold periods, particularlymarine oxygen isotope stages (MIS) 6, 10 and 12.According to the definition by Kidd et al. (1978),discrete layers thicker than 1 cm containing 0.5 to2.0 wt.% of organic carbon are denoted as sa-propelic, with over 2.0 wt.% as sapropels. Withpresently almost oligotrophic conditions and lessthan sapropelic Corg contents in glacial sections,the sediments were nevertheless zonally affectedby suboxic diagenesis. The following data clearlydemonstrate that sequences with a relatively highorganic carbon content correlate with zones ofmarked magnetite dissolution (gray shaded horizonsin Fig. 4). The magnetogranulometric ratio Mar/Mir(grain-size proxy of ferrimagnetic minerals, Fig. 4b)is sensitive both to variations in the primary terri-genous input and to iron oxide dissolution. Finegrained magnetite is more susceptible to dissolutionthan coarser grained magnetite because of itshigher surface-to-volume ratio, resulting in a shiftto coarser grain-size distributions (Karlin and Levi1983). Most parts of the Mar/Mir signal of coreGeoB 4317-2 show a cyclic change of magnetitegrain-size related to climatic variations of windintensity and/or to productivity related effects of amild reductive diagenesis. Magnetite dissolutionlayers (DL) I and more clearly II and III deviatefrom this pattern featuring an abrupt coarsening ator slightly below the Corg maxima and a peak ofrelative fining due to reprecipitation directly above.The lower pervasiveness of magnetite reduction inDL I as compared to DL II and III may result from
Integrated Rock Magnetic and Geochemical Quantification 21
Fig. 3. b) Automated X-ray fluorescence half core scanner for non-destructive element analysis with X-ray source(left), prism attached to core surface (center, core not shown) and X-ray detector (right).
Fig. 3. a) Automated magnetic susceptibility half core logger with a self-leveling Bartington MS2F spot sensormounted on optically controlled lever.
22 Chapter 2
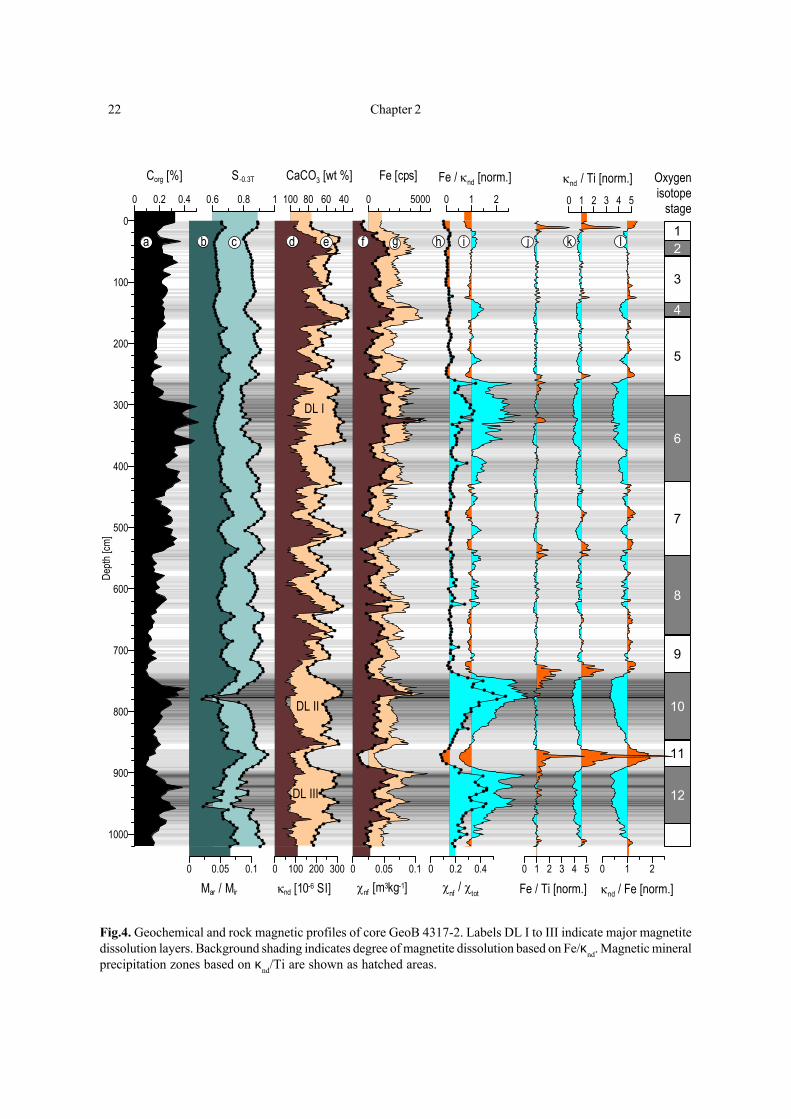
Fig.4. Geochemical and rock magnetic profiles of core GeoB 4317-2. Labels DL I to III indicate major magnetitedissolution layers. Background shading indicates degree of magnetite dissolution based on Fe/κnd. Magnetic mineralprecipitation zones based on κnd/Ti are shown as hatched areas.
0 1 2
κnd / Fe [norm.]
0 1 2 3 4 5
κnd / Ti [norm.]
0 1 2 3 4 5
Fe / Ti [norm.]
0 1 2
Fe / κnd [norm.]
0 0.2 0.4χnf / χtot
0 5000
Fe [cps]
0 0.05 0.1χnf [m3kg-1]
100 80 60 40
CaCO3 [wt %]
0 100 200 300
κnd [10-6 SI]
0.6 0.8 1
S-0.3T
0 0.05 0.1
Mar / Mir
0 0.2 0.4
Corg [%]
1000
900
800
700
600
500
400
300
200
100
0
Depth
[cm]
a b c d e gf h k lji 2
4
8
6
10
12
1
Oxygenisotope
stage
3
5
7
9
11
DL II
DL III
DL I
Integrated Rock Magnetic and Geochemical Quantification 23
the shorter duration of suboxic conditions, ie. fromthe respective burial history. Mild forms of reductionaffect primarily ultra-fine (SP) magnetic ferricminerals. They are therefore less apparent in rema-nence-based parameter records such as Mar/Mir,but still prominent in parameters derived frominduced magnetizations such as χnf /χtot (Fig. 4h)
The S-0.3T index (Fig. 4c) mirrors the ratio ofhigh- to low-coercive components, in general hema-tite and magnetite (Bloemendal et al. 1992). Thisparameter shows distinct minima, relative hematiteenrichments, in the dissolution layers, suggestingthat reductive diagenesis has a lesser effect onhematite than on magnetite. This observation willbe further substantiated and discussed at the endof this chapter.
Pronounced CaCO3 variations ranging from 35to 84 wt.% reflect mainly cycles of carbonatedissolution due to glacial emplacement of corrosiveCircumpolar Deep Water (de Menocal et al. 1993;Bickert and Wefer 1996). In absence of significantopal contents the non-carbonate sediment fraction(Fig. 4e) is largely representative of the terrigenouscontent (Schmieder et al. 2000). In most parts itmatches the magnetic susceptibility record κ ingreat detail. However, both signal clearly divergein the three major dissolution layers I, II and III,where susceptibility (Fig. 4d) is far too low forglacial conditions (Bloemendal 1988). As reductivediagenesis involves transformation of magnetic intonon-magnetic iron phases, the correlation of rockmagnetic logs to climatic cycles is strongly com-promised in these intervals. In interglacial layers,carbonate maxima resulting from much better pre-servation conditions correspond reasonably well tosusceptibility lows.
The non-ferrimagnetic susceptibility (χnf, Fig. 4f)is the slope of the linear outer branch of a satu-ration hysteresis loop (von Dobeneck 1996). Thisparameter quantifies contributions of paramagneticphases plus a small, nearly constant offset due todiamagnetic matrix minerals. Relative Fe countsmeasured with the XRF scanner (Fig. 4g) and χnfclosely mimic each other throughout the sedimentsequence implying that most iron is located inparamagnetic mineral phases like iron-bearingsilicates. The much higher level of conformity ofnon-CaCO3 with total Fe records compared to
magnetic susceptibility underlines this statement.The ratio of non-ferrimagnetic to total suscep-
tibility (χnf /χtot, Fig. 4h) delineates unequivocallywhere magnetite dissolution takes place. The pre-vailing stable baseline value (~ 0.15) represents anaverage 15 % contribution of paramagnetism tototal susceptibility, a characteristic source signature.This parameter value doubles or even triples at thepeaks of reductive dissolution implying that abouttwo thirds of the primary magnetite have vanished.The ratio Fe/κnd (Fig. 4i), based exclusively on fastlogging measurements, follows the χnf /χtot trendsin most every aspect, but provides much higherspatial resolution and detail at a fraction of mea-surement time. Both parameters image magnetitedepletion layers as distinctive, internally subdividedsawtooth patterns with upwards increasing dis-solution levels. For the three major dissolutionlayers, the diagenetic features stretch verticallyover about 100 cm. The slightly elevated Fe/κndsignals at numerous other mildly reductive layersare much narrower and also more symmetric fea-tures.
For reasons elaborated in the methods section,redox sensitive elements as Fe are often normalizedto the stable terrigenous element Al (Karlin 1990a;Karlin 1990b). As this light element is not withinthe range of the XRF scanner (K to Sr), we usehere the immobile terrigenous element Ti as norma-lizer assuming that the sedimentary iron and titaniumminerals are identical or have a common origin.From a fairly constant background level the Fe/Tiratio (Fig. 4j) shows distinct multiple enrichmentpeaks immediately above the lower two dissolutionlayers, while the effect above dissolution layer I issmaller. A sharp subsurface peak at 11 cm depth,a broader peak at 540 cm and many less developedpeaks pinpoint additional faint iron precipitationhorizons associated with underlying layers of partialmagnetite dissolution.
An alternative and related, but magnetic mineralselective Fe precipitation proxy is κnd/Ti (Fig. 4k),also derived by combining susceptibility and XRFlogs. Other than the Fe/Ti signal, κnd/Ti has nostable baseline as it also registers magnetite de-pletion (inversely to Fe/κnd). The iron residing innonmagnetic minerals is either not bioavailable,immobile or ferrous, while the ferric iron in all
24 Chapter 2
magnetic minerals is generally bioavailable (Lovleyet al. 1987). Subtle distinctions of the lower slopesof the Fe/Ti and κnd/Ti peaks, particularly at theupper boundary of magnetite dissolution layer II,probably result from cancellation effects of super-imposing magnetite depletion and subsequent pre-cipitation.
Magnetic mineral precipitation cannot be seenin susceptibilities, only the Mar/Mir and S-0.3T signalsindicate enrichment by a very fine, probably bio-genic (Karlin et al. 1987; Robinson et al. 2000;Tarduno et al. 1998) magnetite phase. Obviously,this secondary magnetite has been precipitated afterreductive dissolution of primary magnetite duringpartial burn-down of the initially broader Corgenrichment layer.
The κnd/Fe ratio (Fig. 4.l) indicates magneticmineral depletion as well as enrichment effects andis therefore a bivalent proxy. However, as magneticand total iron enrichment often go along, this para-meter may not identify precipitation correctly.Defining a baseline value for standardization is alsoless evident.
Combined Geochemical and Rock MagneticStratigraphy of Core GeoB 2908-7
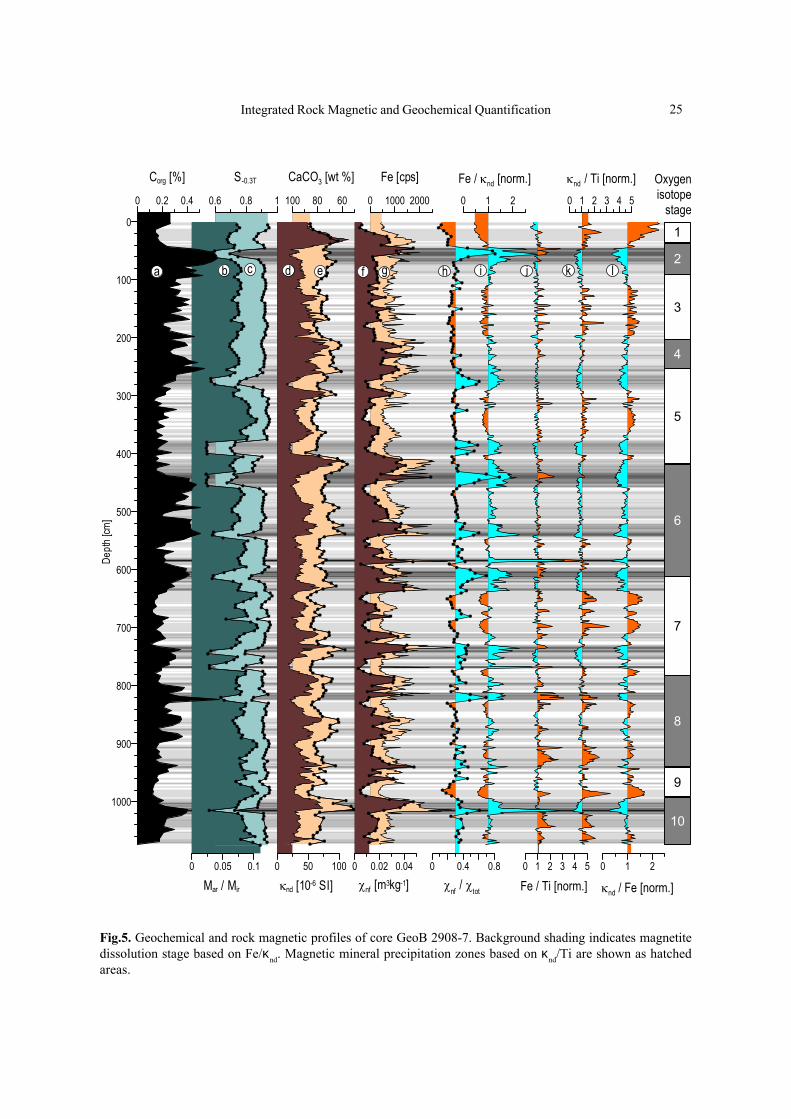
Core GeoB 2908-7, recovered about 450 km south-east of core GeoB 4317-2, has on average 35 %higher Corg contents with a mean of 0.27 wt.% andvariations between 0.1 and 0.66 wt.% (Fig. 5a).The Corg signal carries a typical equatorial Atlanticclimate signature, modulated by orbitally forcedchanges in trade wind zonality (Verardo and Mc-Intyre 1994). Productivity is more pronounced atthis site due to stronger upwelling and higher pro-ductivity towards the Equatorial Divergence Zone.More frequent productivity pulses cause highersedimentation rates and greatly increase the numberof organically enriched layers and of resultingmagnetite dissolution and precipitation horizons.While in core GeoB 4317-2 dissolution zones aremainly found at major terminations, core GeoB2908-7 carries consecutive diagenetic features alsoat stadials (Fig. 5).
The Mar/Mir ratio of core GeoB 2908-7 (Fig. 5b)also shows much stronger overprint of the primarysignal. Ten layers of intense dissolution appear as
deep, notchlike grain-size shifts (abrupt magnetitecoarsening) in the record. In combination withclimatically unexpected susceptibility minima(Fig. 5d), these peaks indicate massive loss of fine-grained magnetite, whereas high-coercive ironmineral phases (S-0.3T, Fig. 5c) are less affected. Asynopsis of Corg, dissolution and precipitation proxiessuggests that also many minor Mar/Mir and S-0.3Tshifts may be related to partial magnetite dissolutionin organically enriched horizons. It is not totally clearfrom these data, however, to what extent thesesignatures still carry traits of grain-size and mineralvariations of primary detrital iron oxides.
The wide range of susceptibilities κnd from 0.9to 100·10-6 SI documents two superimposing in-fluences: The eolian iron input from the Africancontinent is systematically lower at this more south-ern site (Ruddiman et al. 1989) and frequentlyoverprinted by reductive dissolution. The largescale variations in CaCO3 content from 51 to 90wt.% mainly reflect intensified carbonate dis-solution due to glacial advances of CircumpolarDeep Water (Bickert and Wefer 1996). This cy-clical dilution of the terrigenous (non-CaCO3) phase(Fig. 5e), is inversely correlated to magnetic sus-ceptibility.
Over most of the sediment column this initialaccumulation pattern is also conserved in the verysimilar non-ferrimagnetic susceptibility (cnf, Fig. 5f)and bulk iron (Fe Fig. 5g) records. Distinct narrowdiscrepancies from 40 to 55 cm, at 440 cm and at590 cm, all can be attributed to precipitation ofnon-magnetic iron phases. This interpretation isclearly supported by enhanced Fe/κnd ratios(Fig. 5i), indicating that this parameter does not onlyidentify dissolution of ferrimagnetics (decreasingdenominator κnd), but also precipitation of para-magnetics (increasing numerator Fe).
Fine-scaled variability is observed in the ratiosof ferrimagnetic, non-ferrimagnetic and total Fe(Fig. 5h,i,l) and respective relations to Ti (Fig. 5j,k).In spite of lower signal levels, particularly regardingTi counts, and therefore poorer signal-to-noiseratios, complex suites of alternating fine-scaledepletion and enrichment layers are recognized.Some precipitations situated within dissolution zonesare purely paramagnetic (e.g., at 445 and 820 cm)and do not appear in the κnd/Ti ratio.
Integrated Rock Magnetic and Geochemical Quantification 25
Fig.5. Geochemical and rock magnetic profiles of core GeoB 2908-7. Background shading indicates magnetitedissolution stage based on Fe/κnd. Magnetic mineral precipitation zones based on κnd/Ti are shown as hatchedareas.
0 1 2
κnd / Fe [norm.]
0 1 2 3 4 5
κnd / Ti [norm.]
0 1 2 3 4 5
Fe / Ti [norm.]
0 1 2
Fe / κnd [norm.]
0 0.4 0.8χnf / χtot
0 1000 2000
Fe [cps]
0 0.02 0.04χnf [m3kg-1]
100 80 60
CaCO3 [wt %]
0 50 100
κnd [10-6 SI]
0.6 0.8 1
S-0.3T
0 0.05 0.1
Mar / Mir
0 0.2 0.4
Corg [%]
1000
900
800
700
600
500
400
300
200
100
0
Dept
h [cm
]
a b c d e gf h k lji2
4
8
6
10
1
Oxygenisotope
stage
3
5
7
9
26 Chapter 2
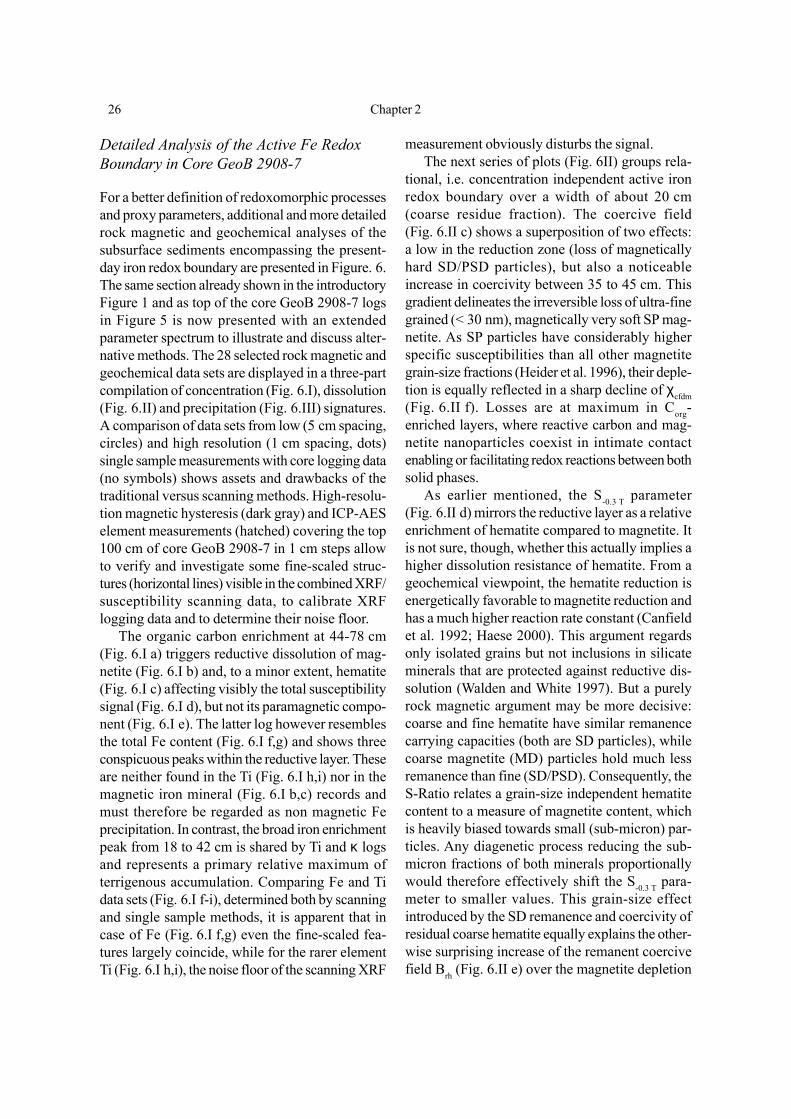
Detailed Analysis of the Active Fe RedoxBoundary in Core GeoB 2908-7
For a better definition of redoxomorphic processesand proxy parameters, additional and more detailedrock magnetic and geochemical analyses of thesubsurface sediments encompassing the present-day iron redox boundary are presented in Figure. 6.The same section already shown in the introductoryFigure 1 and as top of the core GeoB 2908-7 logsin Figure 5 is now presented with an extendedparameter spectrum to illustrate and discuss alter-native methods. The 28 selected rock magnetic andgeochemical data sets are displayed in a three-partcompilation of concentration (Fig. 6.I), dissolution(Fig. 6.II) and precipitation (Fig. 6.III) signatures.A comparison of data sets from low (5 cm spacing,circles) and high resolution (1 cm spacing, dots)single sample measurements with core logging data(no symbols) shows assets and drawbacks of thetraditional versus scanning methods. High-resolu-tion magnetic hysteresis (dark gray) and ICP-AESelement measurements (hatched) covering the top100 cm of core GeoB 2908-7 in 1 cm steps allowto verify and investigate some fine-scaled struc-tures (horizontal lines) visible in the combined XRF/susceptibility scanning data, to calibrate XRFlogging data and to determine their noise floor.
The organic carbon enrichment at 44-78 cm(Fig. 6.I a) triggers reductive dissolution of mag-netite (Fig. 6.I b) and, to a minor extent, hematite(Fig. 6.I c) affecting visibly the total susceptibilitysignal (Fig. 6.I d), but not its paramagnetic compo-nent (Fig. 6.I e). The latter log however resemblesthe total Fe content (Fig. 6.I f,g) and shows threeconspicuous peaks within the reductive layer. Theseare neither found in the Ti (Fig. 6.I h,i) nor in themagnetic iron mineral (Fig. 6.I b,c) records andmust therefore be regarded as non magnetic Feprecipitation. In contrast, the broad iron enrichmentpeak from 18 to 42 cm is shared by Ti and κ logsand represents a primary relative maximum ofterrigenous accumulation. Comparing Fe and Tidata sets (Fig. 6.I f-i), determined both by scanningand single sample methods, it is apparent that incase of Fe (Fig. 6.I f,g) even the fine-scaled fea-tures largely coincide, while for the rarer elementTi (Fig. 6.I h,i), the noise floor of the scanning XRF
measurement obviously disturbs the signal.The next series of plots (Fig. 6II) groups rela-
tional, i.e. concentration independent active ironredox boundary over a width of about 20 cm(coarse residue fraction). The coercive field(Fig. 6.II c) shows a superposition of two effects:a low in the reduction zone (loss of magneticallyhard SD/PSD particles), but also a noticeableincrease in coercivity between 35 to 45 cm. Thisgradient delineates the irreversible loss of ultra-finegrained (< 30 nm), magnetically very soft SP mag-netite. As SP particles have considerably higherspecific susceptibilities than all other magnetitegrain-size fractions (Heider et al. 1996), their deple-tion is equally reflected in a sharp decline of χcfdm(Fig. 6.II f). Losses are at maximum in Corg-enriched layers, where reactive carbon and mag-netite nanoparticles coexist in intimate contactenabling or facilitating redox reactions between bothsolid phases.
As earlier mentioned, the S-0.3 T parameter(Fig. 6.II d) mirrors the reductive layer as a relativeenrichment of hematite compared to magnetite. Itis not sure, though, whether this actually implies ahigher dissolution resistance of hematite. From ageochemical viewpoint, the hematite reduction isenergetically favorable to magnetite reduction andhas a much higher reaction rate constant (Canfieldet al. 1992; Haese 2000). This argument regardsonly isolated grains but not inclusions in silicateminerals that are protected against reductive dis-solution (Walden and White 1997). But a purelyrock magnetic argument may be more decisive:coarse and fine hematite have similar remanencecarrying capacities (both are SD particles), whilecoarse magnetite (MD) particles hold much lessremanence than fine (SD/PSD). Consequently, theS-Ratio relates a grain-size independent hematitecontent to a measure of magnetite content, whichis heavily biased towards small (sub-micron) par-ticles. Any diagenetic process reducing the sub-micron fractions of both minerals proportionallywould therefore effectively shift the S-0.3 T para-meter to smaller values. This grain-size effectintroduced by the SD remanence and coercivity ofresidual coarse hematite equally explains the other-wise surprising increase of the remanent coercivefield Brh (Fig. 6.II e) over the magnetite depletion
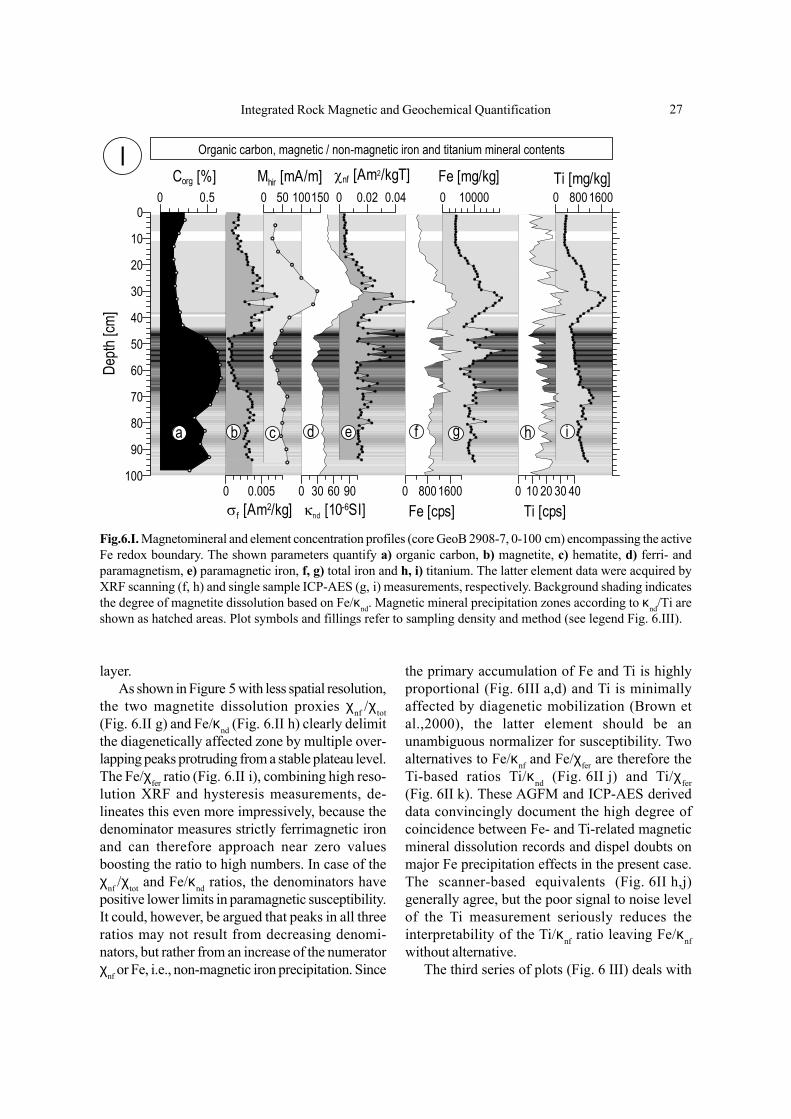
Integrated Rock Magnetic and Geochemical Quantification 27
Fig.6.I. Magnetomineral and element concentration profiles (core GeoB 2908-7, 0-100 cm) encompassing the activeFe redox boundary. The shown parameters quantify a) organic carbon, b) magnetite, c) hematite, d) ferri- andparamagnetism, e) paramagnetic iron, f, g) total iron and h, i) titanium. The latter element data were acquired byXRF scanning (f, h) and single sample ICP-AES (g, i) measurements, respectively. Background shading indicatesthe degree of magnetite dissolution based on Fe/κnd. Magnetic mineral precipitation zones according to κnd/Ti areshown as hatched areas. Plot symbols and fillings refer to sampling density and method (see legend Fig. 6.III).
layer.As shown in Figure 5 with less spatial resolution,
the two magnetite dissolution proxies χnf /χtot(Fig. 6.II g) and Fe/κnd (Fig. 6.II h) clearly delimitthe diagenetically affected zone by multiple over-lapping peaks protruding from a stable plateau level.The Fe/χfer ratio (Fig. 6.II i), combining high reso-lution XRF and hysteresis measurements, de-lineates this even more impressively, because thedenominator measures strictly ferrimagnetic ironand can therefore approach near zero valuesboosting the ratio to high numbers. In case of theχnf /χtot and Fe/κnd ratios, the denominators havepositive lower limits in paramagnetic susceptibility.It could, however, be argued that peaks in all threeratios may not result from decreasing denomi-nators, but rather from an increase of the numeratorχnf or Fe, i.e., non-magnetic iron precipitation. Since
the primary accumulation of Fe and Ti is highlyproportional (Fig. 6III a,d) and Ti is minimallyaffected by diagenetic mobilization (Brown etal.,2000), the latter element should be anunambiguous normalizer for susceptibility. Twoalternatives to Fe/κnf and Fe/χfer are therefore theTi-based ratios Ti/κnd (Fig. 6II j) and Ti/χfer(Fig. 6II k). These AGFM and ICP-AES deriveddata convincingly document the high degree ofcoincidence between Fe- and Ti-related magneticmineral dissolution records and dispel doubts onmajor Fe precipitation effects in the present case.The scanner-based equivalents (Fig. 6II h,j)generally agree, but the poor signal to noise levelof the Ti measurement seriously reduces theinterpretability of the Ti/κnf ratio leaving Fe/κnfwithout alternative.
The third series of plots (Fig. 6 III) deals with
0 800 1600Ti [mg/kg]
0 10 20 30 40Ti [cps]
0 10000Fe [mg/kg]
0 8001600Fe [cps]
0 0.02 0.04χnf [Am2/kgT]
0 30 60 90κnd [10-6SI]
0 50 100150Mhir [mA/m]
0 0.005σf [Am2/kg]
0 0.5Corg [%]
100
90
80
70
60
50
40
30
20
10
0
Depth
[cm]
I
a b c d e gf h i
Organic carbon, magnetic / non-magnetic iron and titanium mineral contents
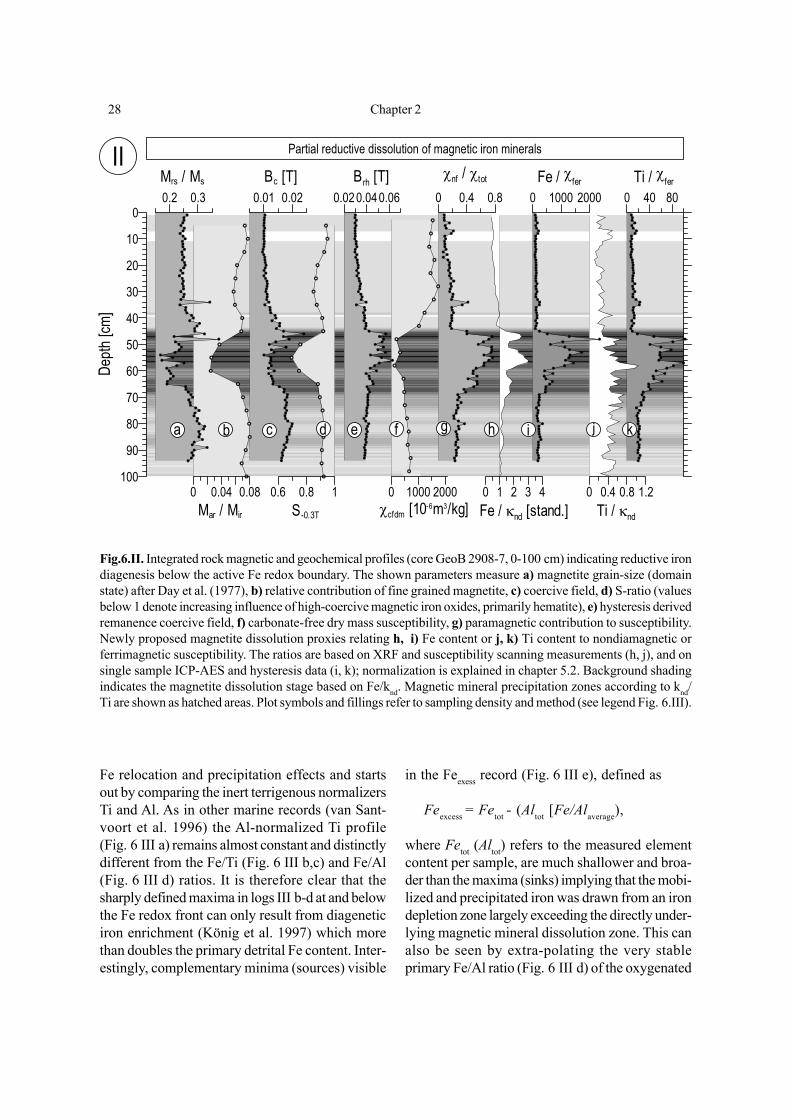
28 Chapter 2
Fe relocation and precipitation effects and startsout by comparing the inert terrigenous normalizersTi and Al. As in other marine records (van Sant-voort et al. 1996) the Al-normalized Ti profile(Fig. 6 III a) remains almost constant and distinctlydifferent from the Fe/Ti (Fig. 6 III b,c) and Fe/Al(Fig. 6 III d) ratios. It is therefore clear that thesharply defined maxima in logs III b-d at and belowthe Fe redox front can only result from diageneticiron enrichment (König et al. 1997) which morethan doubles the primary detrital Fe content. Inter-estingly, complementary minima (sources) visible
in the Feexess record (Fig. 6 III e), defined as
Feexcess = Fetot - (Altot [Fe/Alaverage),
where Fetot (Altot) refers to the measured elementcontent per sample, are much shallower and broa-der than the maxima (sinks) implying that the mobi-lized and precipitated iron was drawn from an irondepletion zone largely exceeding the directly under-lying magnetic mineral dissolution zone. This canalso be seen by extra-polating the very stableprimary Fe/Al ratio (Fig. 6 III d) of the oxygenated
0 40 80Ti / χfer
0 0.4 0.8 1.2Ti / κnd
0 1000 2000Fe / χfer
0 1 2 3 4Fe / κnd [stand.]
0 0.4 0.8
χnf / χtot
0 1000 2000χcfdm [10-6m3/kg]
0.02 0.040.06Brh [T]
0.6 0.8 1S-0.3T
0.01 0.02Bc [T]
0 0.04 0.08Mar / Mir
0.2 0.3Mrs / Ms
100
90
80
70
60
50
40
30
20
10
0
Depth
[cm]
II
a b c d e gf h kji
Partial reductive dissolution of magnetic iron minerals
Fig.6.II. Integrated rock magnetic and geochemical profiles (core GeoB 2908-7, 0-100 cm) indicating reductive irondiagenesis below the active Fe redox boundary. The shown parameters measure a) magnetite grain-size (domainstate) after Day et al. (1977), b) relative contribution of fine grained magnetite, c) coercive field, d) S-ratio (valuesbelow 1 denote increasing influence of high-coercive magnetic iron oxides, primarily hematite), e) hysteresis derivedremanence coercive field, f) carbonate-free dry mass susceptibility, g) paramagnetic contribution to susceptibility.Newly proposed magnetite dissolution proxies relating h, i) Fe content or j, k) Ti content to nondiamagnetic orferrimagnetic susceptibility. The ratios are based on XRF and susceptibility scanning measurements (h, j), and onsingle sample ICP-AES and hysteresis data (i, k); normalization is explained in chapter 5.2. Background shadingindicates the magnetite dissolution stage based on Fe/knd. Magnetic mineral precipitation zones according to knd/Ti are shown as hatched areas. Plot symbols and fillings refer to sampling density and method (see legend Fig. 6.III).
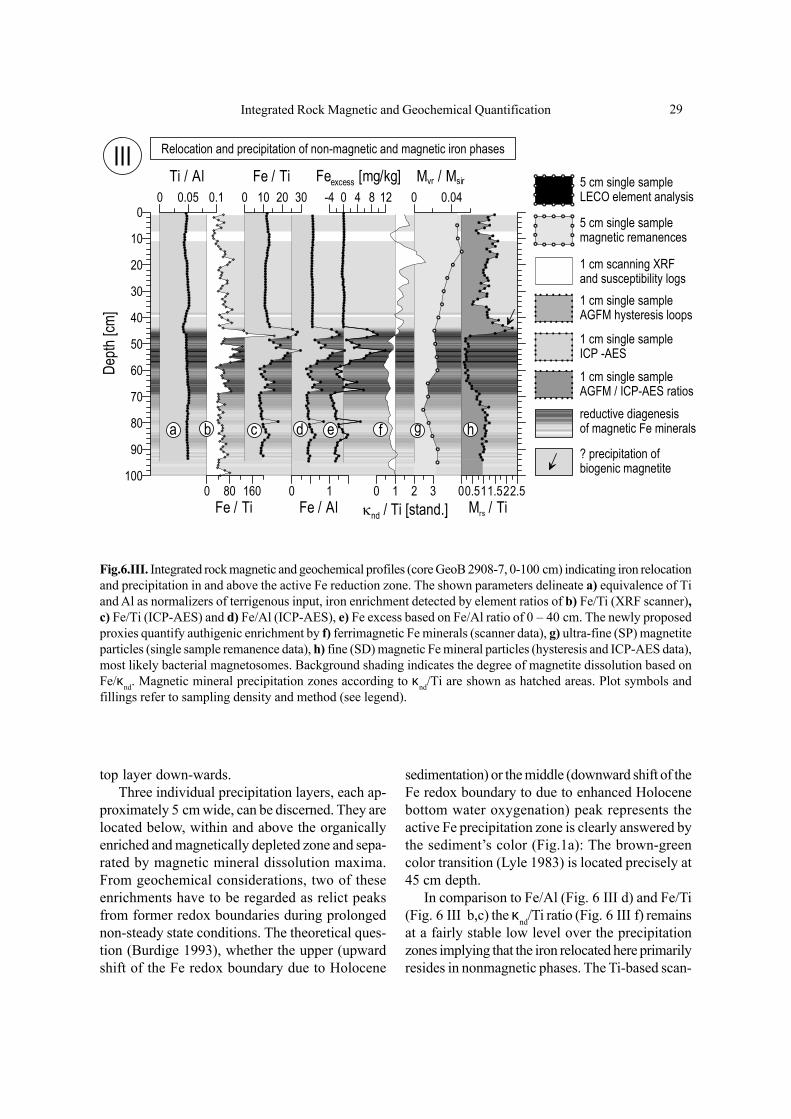
Integrated Rock Magnetic and Geochemical Quantification 29
top layer down-wards.Three individual precipitation layers, each ap-
proximately 5 cm wide, can be discerned. They arelocated below, within and above the organicallyenriched and magnetically depleted zone and sepa-rated by magnetic mineral dissolution maxima.From geochemical considerations, two of theseenrichments have to be regarded as relict peaksfrom former redox boundaries during prolongednon-steady state conditions. The theoretical ques-tion (Burdige 1993), whether the upper (upwardshift of the Fe redox boundary due to Holocene
sedimentation) or the middle (downward shift of theFe redox boundary to due to enhanced Holocenebottom water oxygenation) peak represents theactive Fe precipitation zone is clearly answered bythe sediment’s color (Fig.1a): The brown-greencolor transition (Lyle 1983) is located precisely at45 cm depth.
In comparison to Fe/Al (Fig. 6 III d) and Fe/Ti(Fig. 6 III b,c) the κnd/Ti ratio (Fig. 6 III f) remainsat a fairly stable low level over the precipitationzones implying that the iron relocated here primarilyresides in nonmagnetic phases. The Ti-based scan-
00.511.522.5Mrs / Ti
0 0.04Mvr / Msir
0 1 2 3κnd / Ti [stand.]
-4 0 4 8 12Feexcess [mg/kg]
0 1Fe / Al
0 10 20 30Fe / Ti
0 80 160Fe / Ti
0 0.05 0.1Ti / Al
100
90
80
70
60
50
40
30
20
10
0
Depth
[cm]
III Relocation and precipitation of non-magnetic and magnetic iron phases
a b c d e gf h
5 cm single sampleLECO element analysis
5 cm single samplemagnetic remanences
1 cm scanning XRF and susceptibility logs
1 cm single sampleICP -AES
1 cm single sampleAGFM hysteresis loops
1 cm single sampleAGFM / ICP-AES ratiosreductive diagenesisof magnetic Fe minerals
? precipitation of biogenic magnetite
Fig.6.III. Integrated rock magnetic and geochemical profiles (core GeoB 2908-7, 0-100 cm) indicating iron relocationand precipitation in and above the active Fe reduction zone. The shown parameters delineate a) equivalence of Tiand Al as normalizers of terrigenous input, iron enrichment detected by element ratios of b) Fe/Ti (XRF scanner),c) Fe/Ti (ICP-AES) and d) Fe/Al (ICP-AES), e) Fe excess based on Fe/Al ratio of 0 – 40 cm. The newly proposedproxies quantify authigenic enrichment by f) ferrimagnetic Fe minerals (scanner data), g) ultra-fine (SP) magnetiteparticles (single sample remanence data), h) fine (SD) magnetic Fe mineral particles (hysteresis and ICP-AES data),most likely bacterial magnetosomes. Background shading indicates the degree of magnetite dissolution based onFe/κnd. Magnetic mineral precipitation zones according to κnd/Ti are shown as hatched areas. Plot symbols andfillings refer to sampling density and method (see legend).
30 Chapter 2
ner data are again too noisy to allow an inter-pretation of minor features. However, it is obviousthat there is a marked upward increase in κnd/Tifrom the Fe redox boundary (46 cm) culminatingat a depth of 20 cm and sharply decaying above.Although no pore water data are available for thiscore, this interval is very likely to represent thenitrate zone, where magnetite biomineralization byanaerobic, nitrate respirating dissimilatory iron-reducing microorganisms (Lovley et al. 1987) andmagnetotactic bacteria (Bazylinski et al. 1988;Blakemore 1975; Petermann and Bleil 1993) wi-dely occurs. The shape of the κnd/Ti profile isparalleled by the Mvr/Msir ratio (Fig. 6 III g) sensingultra-fine, magnetically viscous magnetite particles(SP/SD transition; grain-sizes around 20 nm);(Worm and Jackson 1999). This magnetite fractioncarries a two- to threefold higher susceptibility thanall coarser fractions (Heider et al. 1996) and istherefore over-represented in susceptibility-basedparameters. Its presence throughout the nitratezone indicates a bacterially mediated reduction ofamorphous ferric iron yielding superparamagneticmagnetite as metabolic byproduct and electronacceptor. As noted above, the minute size of theseSP particles makes them a first victim of even mildreductive dissolution (Frederichs et al. 1999) andexplains for their depletion from deeper sedimentlayers.
The Mrs/Ti ratio (Fig. 6 III h) focuses mainly onrelative enrichments of slightly larger, magneticallystable magnetite particles (stable SD; grain-sizes30-100 nm) and excludes SP particles. Its profileclearly marks the magnetite dissolution zone(46-70 cm), topped by a narrow, but clearly definedpeak (40-46 cm, black arrow) just above the Feredox boundary. This is probably an enrichment offossil magnetosomes as described by Tarduno andWilkison (1996). The producers, magnetotacticbacteria, are nitrate reducers and assimilate andoxidize ferrous iron available near the Fe redoxboundary. Although potentially significant for paleo-and rock magnetic data (Tarduno et al. 1998),biogenic magnetite precipitation appears to play anegligible role in terms of absolute iron concen-trations here as it is completely absent in the Fe/Alrecord (Fig. 6 III d).
Discussion and Conclusions
Efficiency, Data Quality and Calibration ofScanning TechniquesThese studies demonstrate that combining rockmagnetic and geochemical methods is very effec-tive both in detecting redoxomorphic diagenesis ofmagnetic and nonmagnetic iron minerals and indistinguishing between variations in primary inputand secondary overprint. At the present, traditionalsingle sample methods still offer a greater variety,accuracy and selectivity of procedures and proxyparameters. The great advantage of the newlyproposed proxies based on scanning techniques istherefore the efficiency of data acquisition. Withthe now available non-destructive XRF core scan-ner combined with well established high-resolutionspot measurements of magnetic susceptibility, thedata basis can be established in a small fraction ofthe time required for conventional single samplehysteresis and element analyses.
Sample preparation and data acquisition ratesfor the two alternative methods employed here arecompiled in Table 1. Scanning methods are about20 to 50 times faster than single sample techniques.Diagenetic layers are often fine-scaled and typi-cally require centimeter spacing records for ampleresolution. Only the scanning techniques permit tostudy long and multiple sediment cores at such high-resolutions in affordable time.
The price to pay for the enormous gain in speedis a loss in sensitivity. The necessary technicalcompromises accepted by transforming XRF spec-trometry into a surface scanning technique clearlyimpair the quantification of minor elements such asTi and Mn (Fig.6 I f-i). The theoretical, but notnecessarily influential error sources of XRF ana-lyses are manifold: grain-size, surface and matrixeffects, instability of source and detector, sampleroughness, inhomogeneity and porosity, count statis-tics, not to forget the imponderables of an automa-ted algorithm transforming X-ray emission spectrainto relative element concentrations. These effectsmake it in some instances questionable to transformXRF counts into absolute concentrations. As adetailed error assessment is complicated and be-yond the scope of this paper, we simply argue on
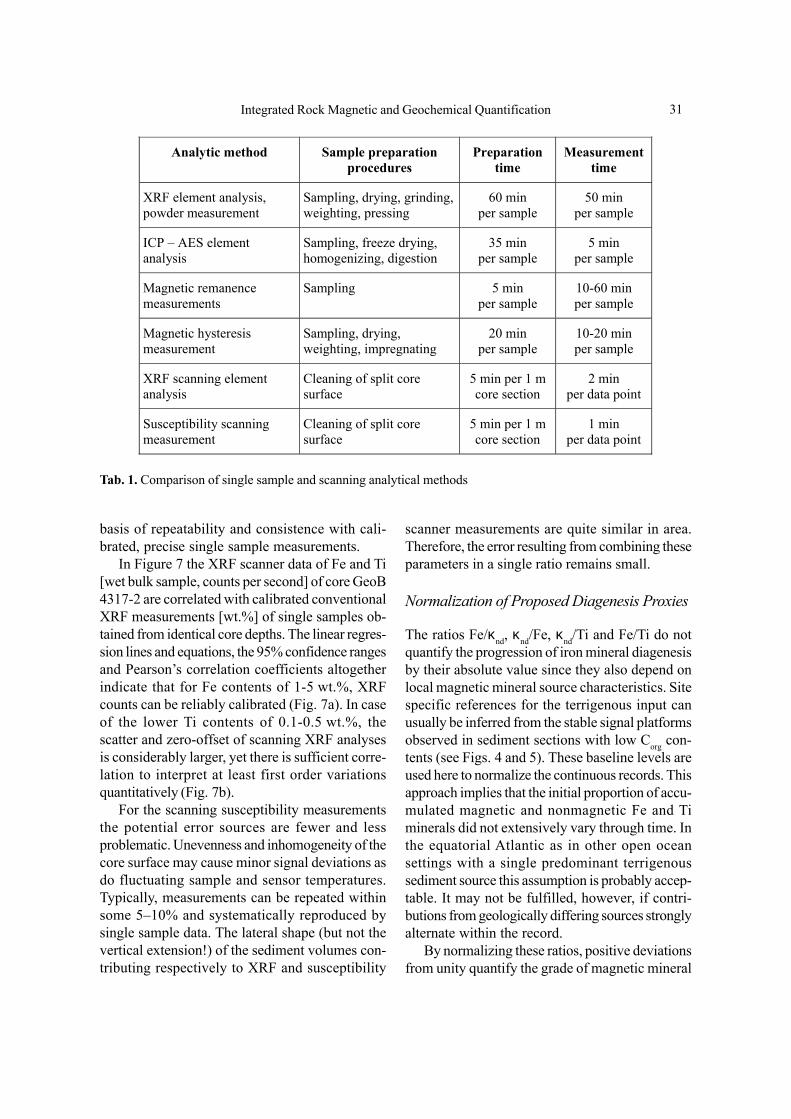
Integrated Rock Magnetic and Geochemical Quantification 31
Analytic method Sample preparationprocedures
Preparationtime
Measurementtime
XRF element analysis,powder measurement
Sampling, drying, grinding,weighting, pressing
60 minper sample
50 minper sample
ICP – AES elementanalysis
Sampling, freeze drying,homogenizing, digestion
35 minper sample
5 minper sample
Magnetic remanencemeasurements
Sampling 5 minper sample
10-60 minper sample
Magnetic hysteresismeasurement
Sampling, drying,weighting, impregnating
20 minper sample
10-20 minper sample
XRF scanning elementanalysis
Cleaning of split coresurface
5 min per 1 mcore section
2 minper data point
Susceptibility scanningmeasurement
Cleaning of split coresurface
5 min per 1 mcore section
1 minper data point
Tab. 1. Comparison of single sample and scanning analytical methods
basis of repeatability and consistence with cali-brated, precise single sample measurements.
In Figure 7 the XRF scanner data of Fe and Ti[wet bulk sample, counts per second] of core GeoB4317-2 are correlated with calibrated conventionalXRF measurements [wt.%] of single samples ob-tained from identical core depths. The linear regres-sion lines and equations, the 95% confidence rangesand Pearson’s correlation coefficients altogetherindicate that for Fe contents of 1-5 wt.%, XRFcounts can be reliably calibrated (Fig. 7a). In caseof the lower Ti contents of 0.1-0.5 wt.%, thescatter and zero-offset of scanning XRF analysesis considerably larger, yet there is sufficient corre-lation to interpret at least first order variationsquantitatively (Fig. 7b).
For the scanning susceptibility measurementsthe potential error sources are fewer and lessproblematic. Unevenness and inhomogeneity of thecore surface may cause minor signal deviations asdo fluctuating sample and sensor temperatures.Typically, measurements can be repeated withinsome 5–10% and systematically reproduced bysingle sample data. The lateral shape (but not thevertical extension!) of the sediment volumes con-tributing respectively to XRF and susceptibility
scanner measurements are quite similar in area.Therefore, the error resulting from combining theseparameters in a single ratio remains small.
Normalization of Proposed Diagenesis Proxies
The ratios Fe/κnd, κnd/Fe, κnd/Ti and Fe/Ti do notquantify the progression of iron mineral diagenesisby their absolute value since they also depend onlocal magnetic mineral source characteristics. Sitespecific references for the terrigenous input canusually be inferred from the stable signal platformsobserved in sediment sections with low Corg con-tents (see Figs. 4 and 5). These baseline levels areused here to normalize the continuous records. Thisapproach implies that the initial proportion of accu-mulated magnetic and nonmagnetic Fe and Timinerals did not extensively vary through time. Inthe equatorial Atlantic as in other open oceansettings with a single predominant terrigenoussediment source this assumption is probably accep-table. It may not be fulfilled, however, if contri-butions from geologically differing sources stronglyalternate within the record.
By normalizing these ratios, positive deviationsfrom unity quantify the grade of magnetic mineral
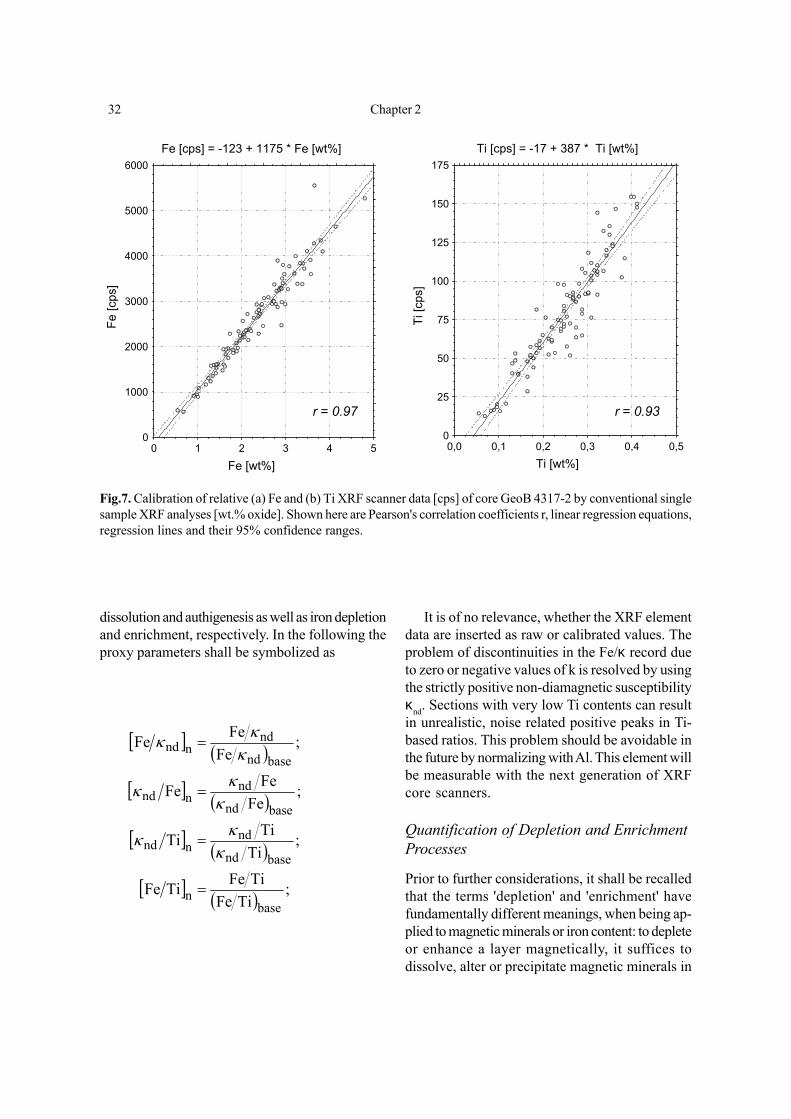
32 Chapter 2
dissolution and authigenesis as well as iron depletionand enrichment, respectively. In the following theproxy parameters shall be symbolized as
It is of no relevance, whether the XRF elementdata are inserted as raw or calibrated values. Theproblem of discontinuities in the Fe/κ record dueto zero or negative values of k is resolved by usingthe strictly positive non-diamagnetic susceptibilityκnd. Sections with very low Ti contents can resultin unrealistic, noise related positive peaks in Ti-based ratios. This problem should be avoidable inthe future by normalizing with Al. This element willbe measurable with the next generation of XRFcore scanners.
Quantification of Depletion and EnrichmentProcesses
Prior to further considerations, it shall be recalledthat the terms 'depletion' and 'enrichment' havefundamentally different meanings, when being ap-plied to magnetic minerals or iron content: to depleteor enhance a layer magnetically, it suffices todissolve, alter or precipitate magnetic minerals in
Fig.7. Calibration of relative (a) Fe and (b) Ti XRF scanner data [cps] of core GeoB 4317-2 by conventional singlesample XRF analyses [wt.% oxide]. Shown here are Pearson's correlation coefficients r, linear regression equations,regression lines and their 95% confidence ranges.
Fe [cps] = -123 + 1175 * Fe [wt%]
Fe [wt%]
Fe [c
ps]
0
1000
2000
3000
4000
5000
6000
0 1 2 3 4 5
Ti [cps] = -17 + 387 * Ti [wt%]
Ti [wt%]
Ti [c
ps]
0
25
50
75
100
125
150
175
0,0 0,1 0,2 0,3 0,4 0,5
r = 0.97 r = 0.93
[ ] ( )
[ ] ( )
[ ] ( )
[ ] ( ) ;TiFe
TiFeTiFe
;Ti
TiTi
;Fe
FeFe
;Fe
FeFe
basen
basend
ndnnd
basend
ndnnd
basend
ndnnd
=
=
=
=
κκκ
κκκ
κκκ
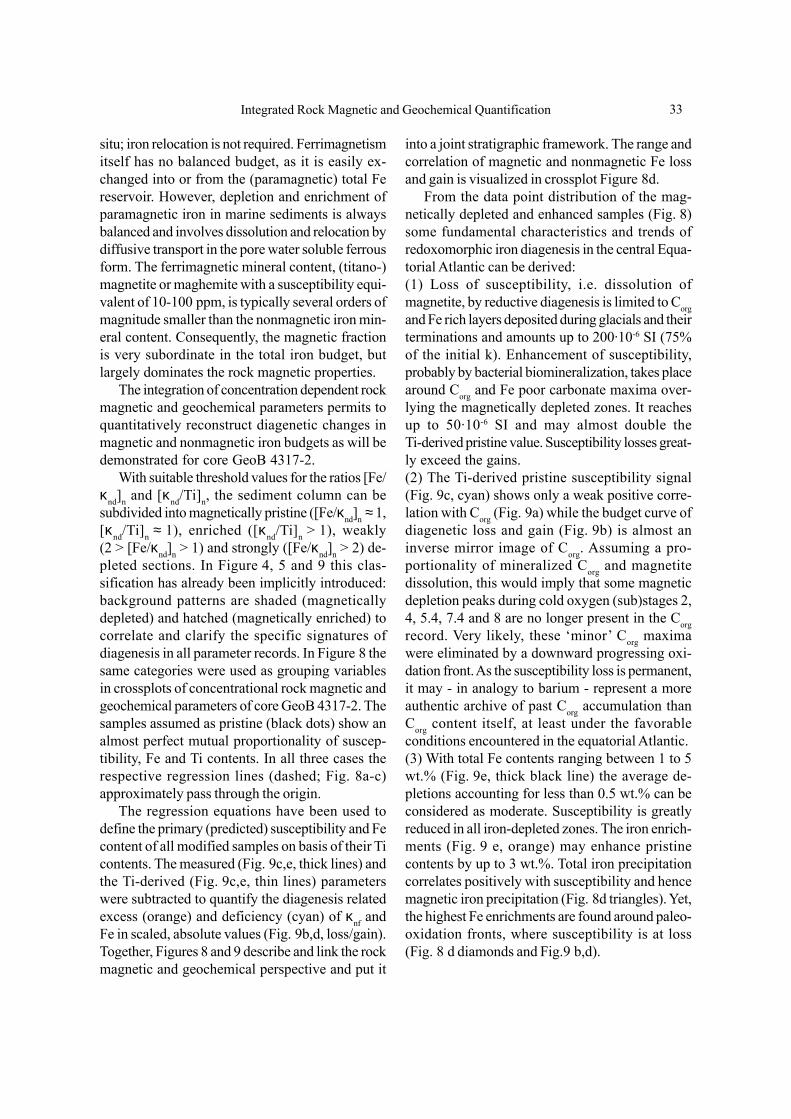
Integrated Rock Magnetic and Geochemical Quantification 33
situ; iron relocation is not required. Ferrimagnetismitself has no balanced budget, as it is easily ex-changed into or from the (paramagnetic) total Fereservoir. However, depletion and enrichment ofparamagnetic iron in marine sediments is alwaysbalanced and involves dissolution and relocation bydiffusive transport in the pore water soluble ferrousform. The ferrimagnetic mineral content, (titano-)magnetite or maghemite with a susceptibility equi-valent of 10-100 ppm, is typically several orders ofmagnitude smaller than the nonmagnetic iron min-eral content. Consequently, the magnetic fractionis very subordinate in the total iron budget, butlargely dominates the rock magnetic properties.
The integration of concentration dependent rockmagnetic and geochemical parameters permits toquantitatively reconstruct diagenetic changes inmagnetic and nonmagnetic iron budgets as will bedemonstrated for core GeoB 4317-2.
With suitable threshold values for the ratios [Fe/κnd]n and [κnd/Ti]n, the sediment column can besubdivided into magnetically pristine ([Fe/κnd]n ≈ 1,[κnd/Ti]n ≈ 1), enriched ([κnd/Ti]n > 1), weakly(2 > [Fe/κnd]n > 1) and strongly ([Fe/κnd]n > 2) de-pleted sections. In Figure 4, 5 and 9 this clas-sification has already been implicitly introduced:background patterns are shaded (magneticallydepleted) and hatched (magnetically enriched) tocorrelate and clarify the specific signatures ofdiagenesis in all parameter records. In Figure 8 thesame categories were used as grouping variablesin crossplots of concentrational rock magnetic andgeochemical parameters of core GeoB 4317-2. Thesamples assumed as pristine (black dots) show analmost perfect mutual proportionality of suscep-tibility, Fe and Ti contents. In all three cases therespective regression lines (dashed; Fig. 8a-c)approximately pass through the origin.
The regression equations have been used todefine the primary (predicted) susceptibility and Fecontent of all modified samples on basis of their Ticontents. The measured (Fig. 9c,e, thick lines) andthe Ti-derived (Fig. 9c,e, thin lines) parameterswere subtracted to quantify the diagenesis relatedexcess (orange) and deficiency (cyan) of κnf andFe in scaled, absolute values (Fig. 9b,d, loss/gain).Together, Figures 8 and 9 describe and link the rockmagnetic and geochemical perspective and put it
into a joint stratigraphic framework. The range andcorrelation of magnetic and nonmagnetic Fe lossand gain is visualized in crossplot Figure 8d.
From the data point distribution of the mag-netically depleted and enhanced samples (Fig. 8)some fundamental characteristics and trends ofredoxomorphic iron diagenesis in the central Equa-torial Atlantic can be derived:(1) Loss of susceptibility, i.e. dissolution ofmagnetite, by reductive diagenesis is limited to Corgand Fe rich layers deposited during glacials and theirterminations and amounts up to 200·10-6 SI (75%of the initial k). Enhancement of susceptibility,probably by bacterial biomineralization, takes placearound Corg and Fe poor carbonate maxima over-lying the magnetically depleted zones. It reachesup to 50·10-6 SI and may almost double theTi-derived pristine value. Susceptibility losses great-ly exceed the gains.(2) The Ti-derived pristine susceptibility signal(Fig. 9c, cyan) shows only a weak positive corre-lation with Corg (Fig. 9a) while the budget curve ofdiagenetic loss and gain (Fig. 9b) is almost aninverse mirror image of Corg. Assuming a pro-portionality of mineralized Corg and magnetitedissolution, this would imply that some magneticdepletion peaks during cold oxygen (sub)stages 2,4, 5.4, 7.4 and 8 are no longer present in the Corgrecord. Very likely, these ‘minor’ Corg maximawere eliminated by a downward progressing oxi-dation front. As the susceptibility loss is permanent,it may - in analogy to barium - represent a moreauthentic archive of past Corg accumulation thanCorg content itself, at least under the favorableconditions encountered in the equatorial Atlantic.(3) With total Fe contents ranging between 1 to 5wt.% (Fig. 9e, thick black line) the average de-pletions accounting for less than 0.5 wt.% can beconsidered as moderate. Susceptibility is greatlyreduced in all iron-depleted zones. The iron enrich-ments (Fig. 9 e, orange) may enhance pristinecontents by up to 3 wt.%. Total iron precipitationcorrelates positively with susceptibility and hencemagnetic iron precipitation (Fig. 8d triangles). Yet,the highest Fe enrichments are found around paleo-oxidation fronts, where susceptibility is at loss(Fig. 8 d diamonds and Fig.9 b,d).
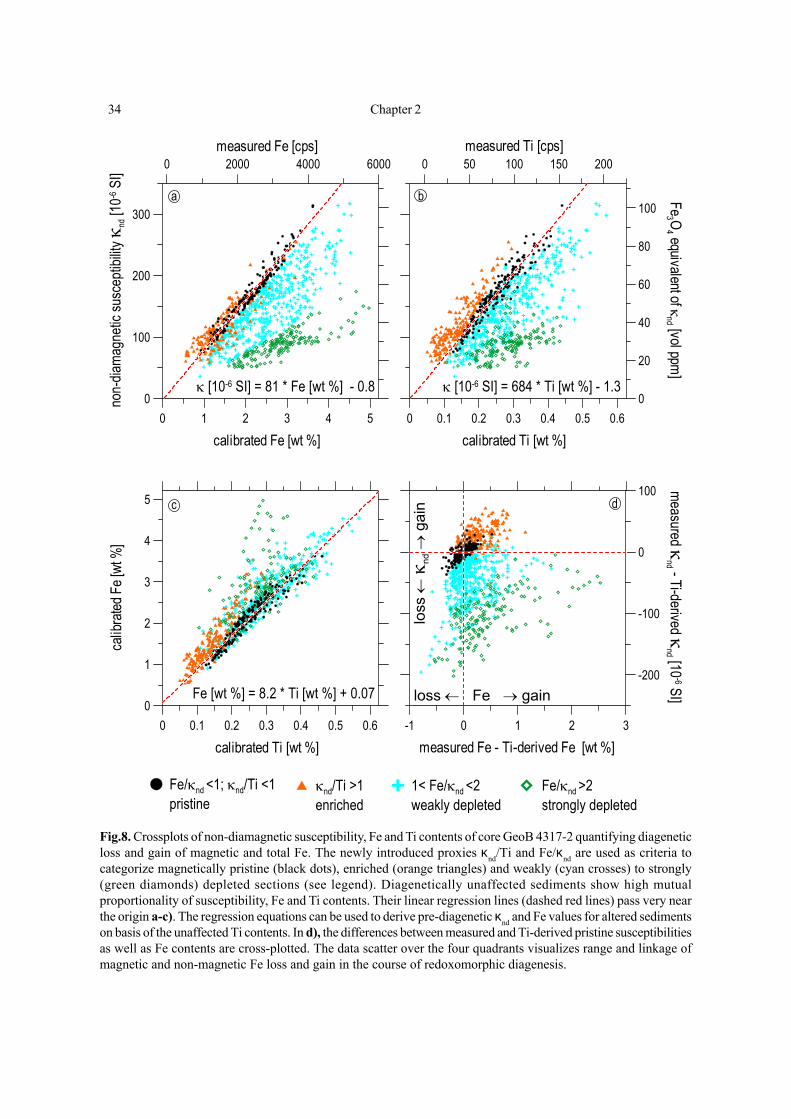
34 Chapter 2
Fig.8. Crossplots of non-diamagnetic susceptibility, Fe and Ti contents of core GeoB 4317-2 quantifying diageneticloss and gain of magnetic and total Fe. The newly introduced proxies κnd/Ti and Fe/κnd are used as criteria tocategorize magnetically pristine (black dots), enriched (orange triangles) and weakly (cyan crosses) to strongly(green diamonds) depleted sections (see legend). Diagenetically unaffected sediments show high mutualproportionality of susceptibility, Fe and Ti contents. Their linear regression lines (dashed red lines) pass very nearthe origin a-c). The regression equations can be used to derive pre-diagenetic κnd and Fe values for altered sedimentson basis of the unaffected Ti contents. In d), the differences between measured and Ti-derived pristine susceptibilitiesas well as Fe contents are cross-plotted. The data scatter over the four quadrants visualizes range and linkage ofmagnetic and non-magnetic Fe loss and gain in the course of redoxomorphic diagenesis.
-1 0 1 2 3measured Fe - Ti-derived Fe [wt %]
-200
-100
0
100 measured κnd - Ti-derived κ
nd [10-6 SI]
0
1
2
3
4
5
calib
rated
Fe [
wt %
]
0 0.1 0.2 0.3 0.4 0.5 0.6
calibrated Ti [wt %]
0
20
40
60
80
100
Fe3 O
4 equivalent of κnd [vol ppm
]
0 0.1 0.2 0.3 0.4 0.5 0.6
calibrated Ti [wt %]
0 50 100 150 200measured Ti [cps]
0
100
200
300
non-
diama
gneti
c sus
cepti
bility
κnd
[10-6
SI]
0 1 2 3 4 5
calibrated Fe [wt %]
0 2000 4000 6000measured Fe [cps]
κ [10-6 SI] = 684 * Ti [wt %] - 1.3κ [10-6 SI] = 81 * Fe [wt %] - 0.8
Fe [wt %] = 8.2 * Ti [wt %] + 0.07 loss ← Fe → gain
loss
← κ
nd →
gai
n
a b
c d
Fe/κnd <1; κnd/Ti <1pristine
κnd/Ti >1enriched
1< Fe/κnd <2weakly depleted
Fe/κnd >2strongly depleted
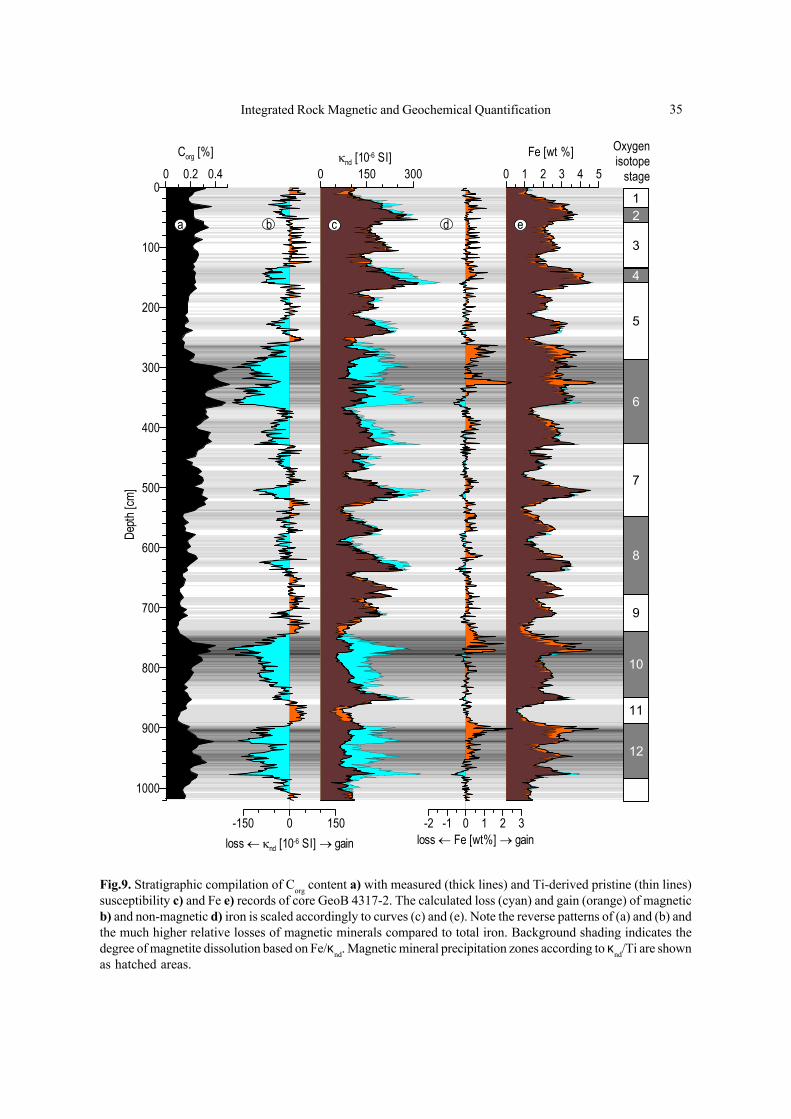
Integrated Rock Magnetic and Geochemical Quantification 35
0 1 2 3 4 5Fe [wt %]
-2 -1 0 1 2 3loss ← Fe [wt%] → gain
0 150 300κnd [10-6 SI]
-150 0 150loss ← κnd [10-6 SI] → gain
0 0.2 0.4Corg [%]
1000
900
800
700
600
500
400
300
200
100
0
Depth
[cm]
2
4
8
6
10
12
1
Oxygenisotope
stage
3
5
7
9
11
a b c d e
Fig.9. Stratigraphic compilation of Corg content a) with measured (thick lines) and Ti-derived pristine (thin lines)susceptibility c) and Fe e) records of core GeoB 4317-2. The calculated loss (cyan) and gain (orange) of magneticb) and non-magnetic d) iron is scaled accordingly to curves (c) and (e). Note the reverse patterns of (a) and (b) andthe much higher relative losses of magnetic minerals compared to total iron. Background shading indicates thedegree of magnetite dissolution based on Fe/κnd. Magnetic mineral precipitation zones according to κnd/Ti are shownas hatched areas.
36 Chapter 2
ReferencesBanerjee SK (1971) Decay of marine magnetic anomalies
by ferrous ion diffusion. Nature: Physical Science229: 181–183
Bazylinski DA, Frankel RB, Jannasch HW (1988) An-aerobic magnetite production by a marine, mag-netotactic bacterium. Nature 334: 518–519
Bickert T and Wefer G (1996) Late Quaternary deep watercirculation in the South Atlantic: Reconstructionfrom carbonate dissolution and benthic stable iso-topes. In: Wefer G, Berger WH, Siedler G, Webb DJ(eds) The South Atlantic: Present and Past Circu-lation. Springer, Berlin, pp 599-620
Blakemore RP (1975) Magnetotactic bacteria. Science190: 377-379
Bloemendal J, Lamb B, King J (1988) Paleoenvironmentalimplications of rock - magnetic properties of LateQuaternary sediment cores from the eastern Equa-torial Atantic. Paleoceanography 3: 61-87
Bloemendal J, King JW, Hall FR, Doh S-J (1992) Rockmagnetism of late Neogene and Pleistocene deep-sea sediments: Relationship to sediment source,diagenetic processes, and sediment lithology.J Geophys Res 97: 4361-4375
Brown ET, Le Callonnec L, German CR (2000) Geo-chemical cycling of redox-sensitive metals in sedi-ments from Lake Malawi: A diagnostic paleotracer
for episodic changes in mixing depth. Geochim Cos-mochim Acta 64: 3515-3523
Burdige DJ (1993) The biochemistry of manganese andiron reduction in marine sediments. Earth Sci Rev 35:249-284
Butler RF and Banerjee SK (1975) Theoretical single-domain grain size range in magnetite and titano-magnetite. J Geophys Res 80: 4049–4058
Calvert SE and Pedersen TF (1993) Geochemistry ofrecent oxic and anoxic marine sediments: Impli-cations for the geological record. Mar Geol 113: 67-88
Canfield DE, Raiswell R, Bottrell S (1992) The reactivityof sedimentary iron minerals toward sulfide. Amer Jof Sci 292: 659-683
Canfield DE (1997) The geochemistry of river particlesfrom the continental USA: Major elements. GeochimCosmochim Acta 61: 3349 - 3365
Dapples EC (1962) Stages of diagenesis in the develop-ment of sandstones. Bull Geol Soc Am 73: 913-934
Day R, Fuller M, Schmidt VA (1977) Hysteresis proper-ties of titanomagnetites: Grain-size and composi-tional dependence. Phys Earth Planet Inter 13: 260-267
Dearing JA, Dann RJL, Hay K, Lees JA, Loveland PJ,Maher BA, O'Grady K (1996) Frequency dependentsusceptibility measurements of environmental ma-terials. Geophys J Int 124: 228-240
Dekkers MJ, Langereis CG, Vriend SP, van SantvoortPJM, de Lange GJ (1994) Fuzzy c-means clusteranalysis of early diagenetic effects on natural rema-nent magnetisation acquisition in a 1.1 Myr pistoncore from the Central Mediterranean. Phys EarthPlanet Inter 85: 155-171
deMenocal PB, Ruddiman WF, Pokras EM (1993) In-fluences of high- and low- latitude processes onAfrican terrestrial climate: Pleistocene eolian recordsfrom equatorial Atlantic ocean drilling program Site663. Paleoceanography 8: 209-242
Fischer G and cruise participants (1998) Report andpreliminary results of Meteor cruise M38/1. BerFachber Geowiss Univ Bremen 94, pp 1-178
Frederichs T, Bleil U, Däumler K, von Dobeneck T,Schmidt A (1999) The magnetic view on the marinepaleoenvironment: Parameters, techniques, and po-tentials of rock magnetic studies as a key to paleo-climatic and paleoceanographic changes. In: FischerG and Wefer G (eds) Use of Proxies in Paleocean-ography: Examples from the South Atlantic, Springer,Berlin, pp 575-599
Froelich PN, Klinkhammer GP, Bender ML, Luedtke NA,Heath GR, Cullen D, Dauphin P, Hammond D,Hartman B, Maynard V (1979) Early oxidation of
AcknowledgementsWe thank officers and crews of RV Meteor fortheir efficient support during cruises M 29/3 andM 38/1. Arguments and constructive criticismraised by U. Bleil and the two peer reviewers,M. Dekkers and S. Banerjee, have greatly im-proved this manuscript and are gratefully acknow-ledged. T. Wagner provided Corg data of coreGeoB 4317-2. U. Röhl made the XRF scannermeasurements possible and was very helpful. Thisstudy was funded by the Deutsche Forschungs-gemeinschaft (Sonderforschungsbereich 261 atBremen University, contribution No. 385). J.A.Funk was supported by the Deutsche Forschungs-gemeinschaft in the framework of Graduierten-kolleg 221. T. von Dobeneck is a visiting researchfellow at Utrecht University supported by the Neth-erlands Research Center for Integrated Solid EarthScience (ISES). Data are available under www.pangaea.de/Projects/SFB261.
Integrated Rock Magnetic and Geochemical Quantification 37
organic matter in pelagic sediments of the easternequatorial Atlantic: Suboxic diagenesis. GeochimCosmochim Acta 43: 1075-1090
Gladney ES and Roelandts I (1988) 1987 compilation ofelemental concentration data for USGS BHVO-1,MAG-1, QLO-1, RGM-1, SCO-1, SDC-1, SGR-1 andSTM-1. Geostandards Newsletters 12: 253-362
Haese, RR (2000) The reactivity of iron. In: Schulz HDand Zabel M (eds), Marine Geochemistry. Springer,Berlin, pp 233-262
Heider F, Zitzelsberger A, Fabian F (1996) Magneticsusceptibility and remanent coercive force in grownmagnetite crystals from 0.1 µm to 6 mm. Phys EarthPlanet Inter 93: 239-256
Jansen JHF, Van der Gaast SJ, Koster AJ (1998) CORTEX,a shipboard XRF-scanner for element analyses insplit sediment cores. Mar Geol 151: 143-153
Karlin R (1990a) Magnetic mineral diagenesis in suboxicsediments at Bettis Site W-N, NE Pacific Ocean. JGeophys Res 95: 4421-4436
Karlin R (1990b) Magnetite diagenesis in marine sedi-ments from the Oregon continental margin. JGeophys Res 95: 4405-4419
Karlin R and Levi S (1983) Diagenesis of magneticminerals in recent haemipelagic sediments. Nature303: 327-330
Karlin R, Lyle M, Heath GR (1987) Authigenic magneticformation in suboxic marine sediments. Nature 326:490-493
Kidd RB, Cita MB, Ryan WBF (1978) Stratigraphy ofeastern Mediterranean sapropel sequences reco-vered during DSDP Leg 42A and their paleoen-vironmental significance. In: Hsü KJ and MontadertL et al. (eds), Initial Reports of the Deep Sea DrillingProject 42A, U.S. Government Printing Office, Wash-ington: pp 421-443
Kruiver PP and Passier HF (2001) Coercivity analysis ofmagnetic phases in sapropel S1 related to variationsin redox conditions, including an investigation of theS ratio. Geochemistry Geophysics Geosystems 14December: 1-21
König I, Drodt M, Suess E, Trautwein AX (1997) Ironreduction through the tan - green color transition indeep-sea sediments. Geochim Cosmochim Acta 61:1679-1683
Langereis CG and Dekkers MJ (1999) Magnetic cyclo-stratigraphy: High resolution dating in and beyondthe Quaternary and analysis of periodic changes indiagenesis and sedimentary magnetism. In: MaherB and Thompson R (eds) Quaternary Climates, En-vironments and Magnetism. Cambridge UniversityPress, pp 352-382
Lecoanet H, Lévêque F, Segura S (1999) Magnetic sus-
ceptibility in environmental applications: Compari-son of field probes. Phys Earth Planet Inter 115: 191-204
Lovley DR, Stolz JF, Nord GL Jr, and Phillips EJP (1987)Anaerobic production of magnetite by a dissimi-latory iron-reducing microorganism. Nature 330: 252–254
Lyle M (1983) The brown-green color transition in marinesediments: A marker of the Fe(III)-Fe(II) redox boun-dary. Limnol Oceanogr 28: 1026-1033
Lyle M (1988) Climatically forced organic carbon burialin equatorial Atlantic and Pacific Oceans. Nature 335:529-532
Maher BA (1988) Magnetic properties of some syntheticsubmicron magnetites. Geophys J 94: 83–96
Mudroch A and Azcue JM (1995) Manual of aquaticsediment sampling. Lewis Publishers, Boca Raton,219 p
Nowaczyk NR and Antonow M (1997) High-resolutionmagnetostratigraphy of four sediment cores from theGreenland Sea I. Identification of the Mono Lakeexcursion, Laschamp and Biwa I / Jamaica geo-magnetic polarity events. Geophys J Int 131: 310-324
Passier HF, Dekkers MJ, de Lange GJ (1998) Sedimentchemistry and magnetic properties in an anoma-lously reducing core from the eastern MediterraneanSea. Chem Geol 152: 287-306
Petermann H and Bleil U (1993) Detection of live mag-netotactic bacteria in South Atlantic deep-sea sedi-ments. Earth Planet Sci Lett 117: 223-228
Robinson SG, Sahota JTS, Oldfield F (2000) Early dia-genesis in North Atlantic abyssal plain sedimentscharacterized by rock magnetic and geochemicalindices. Mar Geol 163: 77-107
Röhl U and Abrams LJ (2000) High-resolution downholeand nondestructive core measurements from Sites999 and 1001 in the Caribbean Sea: Application tothe Late Paleocene thermal maximum. In: Leckie RM,Sigurdsson H, Acton GD, Draper G (eds) Proc ODPSci Results 165. College Station, TX, pp 191-203
Rosenbaum JG, Reynolds RL, Adam DP, Drexler J, Sarna-Wojcicki AM, Whitney GC, (1996) Record of middlePleistocene climate change from Buck Lake, CascadeRange, southern Oregon - evidence from sedimentmagnetism, trace-element geochemistry, and pollen.Bull Geol Soc Am 108: 1328-1341
Ruddiman WF and Janecek TR (1989) Pliocene-Pleisto-cene biogenic and terrigenous fluxes at equatorialAtlantic Sites 662, 663, and 664. In: Ruddiman W andSarnthein M (eds) Proc ODP Sci Results 108. CollegeStation, TX, pp 211-240
Schmieder F, von Dobeneck T, Bleil U (2000) The Mid-Pleistocene climate transition as documented in the
38 Chapter 2
deep South Atlantic Ocean: Initiation, interim stateand terminal event. Earth Planet Sci Lett 179: 539-549
Smirnov AV and Tarduno JA (2000) Low-temperaturemagnetic properties of pelagic sediments (OceanDrilling Program Site 805C): Tracers of maghemiti-zation and magnetic mineral reduction. J GeophysRes 105: 16,457-16,471
Snowball IF (1993) Geochemical control of magnetitedissolution in subarctic lake sediments and the impli-cations for environmental magnetism. J Quater Sci8: 339-346
Tarduno JA (1994) Temporal trends of magnetic disso-lution in the pelagic realm: Gauging paleoproduc-tivity? Earth Planet Sci Lett 123: 39-48
Tarduno JA, Tian W, Wilkison S (1998) Biogeochemicalremanent magnetization in pelagic sediments of thewestern equatorial Pacific Ocean. Geophys Res Lett25: 3987-3990
Tarduno JA and Wilkison SL (1996) Non-steady statemagnetic mineral reduction, chemical lock-in, anddelayed remanence acquisition in pelagic sediments.Earth Planet Sci Lett 144: 315-326
Thompson R and Oldfield F (1986) Environmental Mag-netism. Allen & Unwin, London, UK, 227 pp
Thomson J, Jarvis I, Green DRH, Green D (1998) Oxidationfronts in Madeira abyssal plain turbidites: Persis-tence of early diagenetic trace-element enrichmentsduring burial, Site 950. In: Weaver PPE, SchminckeH-U, Firth JV, Duffield W (eds) Proc ODP Sci Results157. College Station, TX, pp 559-571
Thomson J, Mercone D, de Lange GJ, van Santvoort PJM(1999) Review of recent advances in the interpre-tation of eastern Mediterranean sapropel S1 from
geochemical evidence. Mar Geol 153: 77-89van Santvoort PJM, de Lange GJ, Langereis CG, Dekkers
MJ, Paterne M (1997) Geochemical and paleomag-netic evidence for the occurence of 'missing' sapro-pels in eastern Mediterranean sediments. Paleocean-ography 12: 773-786
van Santvoort PJM, de Lange GJ, Thomson J, CussenH, Wilson TRS, Krom MD, Ströhle K (1996) Activepost-depositional oxidation of the most recent sapro-pel (S1) in sediments of the eastern MediterraneanSea. Geochim Cosmochim Acta 60: 4007-4024
Verardo DJ and McIntyre A (1994) Production and des-truction: Control of biogenous sedimentation in thetropical Atlantic 0-300,000 years B.P. Paleocean-ography 9: 63-86
Vigliotti L, Capotondi L, Torii M (1999) Magnetic pro-perties of sediments deposited in suboxic - anoxicenvironments: Relationships with biological andgeochemical proxies. In: Tarling DH and Turner P(eds), Paleomagnetism and Diagenesis in Sediments.Geol Soc Spec Publ London, 151: pp 71-83
von Dobeneck T (1996) A sytematic analysis of naturalmagnetic mineral assemblages based on modellinghysteresis loops with coercivity-related hyberbolicbasis functions. Geophys J Int 124: 675-694
Walden J and White K (1997) Investigation of the con-trols on dune colour in the Namib Sand Sea usingmineral magnetic analyses. Earth Planet Sci Lett 152:187-201
Worm H-U and Jackson M (1999) The superparamag-netism of Yucca Mountain Tuff. J Geophys Res B:Solid Earth 104: 25,415-25,425
From WEFER G, MULITZA S, RATMEYER V (eds), 2004, The South Atlantic in the Late Quaternary: Reconstruction of MaterialBudget and Current Systems. Springer-Verlag Berlin Heidelberg, pp 461-497
Abstract: This is an interdisciplinary and synoptic study of Equatorial Atlantic sediment formationin the Late Quaternary aimed at untangling the interlaced signatures of terrigenous and biogenousdeposition and early diagenesis. It is based on a stratigraphic network of 16 gravity core recordsarranged along one meridional and three zonal transects (4°N, 0° and 4°S) crossing the Amazon andSahara plumes as well as the Equatorial Divergence high productivity region. All newly introducedsediment sequences are collectively dated by their coherent CaCO3 content profiles and two availableδ18O age models. To infer proxy records indicative of individual fluxes and processes, we analyzeenvironmental magnetic parameters describing magnetite concentration, magnetic grain sizes andmagnetic mineralogy along with CaCO3, Corg, Fe, Mn, Ba and color data. Diagenetically affectedlayers are identified by a newly introduced Fe/κ index. Reach and climatic variability of the majorregional sedimentation systems is delimited from lithological patterns and glacial/interglacialaccumulation rate averages. The most prominent regional trends are the N-S decrease in terrigenousaccumulation and the Equatorial Divergence high in glacial Corg accumulation, which decays muchfaster south- than northwards. Glacial enrichments in Corg and proportional depletions in CaCO3content appear to reflect sedimentary carbonate diagenesis more than lysoclinal oscillations anddominate temporal lithology changes. Suboxic iron mineral reduction is low at Ceará Rise and SierraLeone Rise, but more intense on both flanks of the Mid-Atlantic ridge, where it occurs within organicrich layers deposited during oxygen isotope stages 6, 10 and 12, in particular at the terminations. Tothe equator, these zones reflect a full precessional rhythm with individual diagenesis peaks merginginto broader magnetite-depleted zones. Rock magnetic and geochemical data show, that the depthsof the Fe3+/Fe2+ redox boundary in the Equatorial Atlantic are not indicative of average productivityand were frequently shifted in the past. They are now located just above the topmost preservedproductivity pulse. At 4°N, this organically enriched layer coincides with glacial stage 6, at 0° withglacial stage 2. Subsequent oxic and suboxic degradation of organic material entails stratigraphicallycoincident carbonate and magnetite losses opening new analytical perspectives.
Chapter 3
Late Quaternary Sedimentation and Early Diagenesis in the EquatorialAtlantic Ocean: Patterns, Trends and Processes
Deduced from Rock Magnetic and Geochemical Records
J.A. Funk1*, T. von Dobeneck1,2, T. Wagner3 and S. Kasten1
1Universität Bremen, Fachbereich Geowissenschaften, Postfach 33 04 40,D-28334 Bremen, Germany
2Paleomagnetic Laboratory 'Fort Hoofddijk', Faculty of Earth SciencesUtrecht University, Budapestlaan 17, 3584 CD Utrecht, The Netherlands
3Woods Hole Oceanographic Institution, Marine Chemistry and Geochemistry Dept.,Fye Laboratory (MS#4), 360 Woods Hole Rd, Woods Hole, MA 02543-1543, USA
* corresponding author (e-mail): [email protected]
IntroductionThe Equatorial Atlantic is an interesting and wellestablished research area for the general discussionof marine sedimentation, land-ocean linkage andearly diagenesis through Quaternary climates. Itsmodel character results from pronounced west-east
asymmetries with regard to transport pathways andflux rates of terrigenous matter, which has bothlithogenic (e.g. Ratmeyer et al. 1999a,b) and or-ganic (e.g. Wagner 2000, Dupont et al. 2000)components.
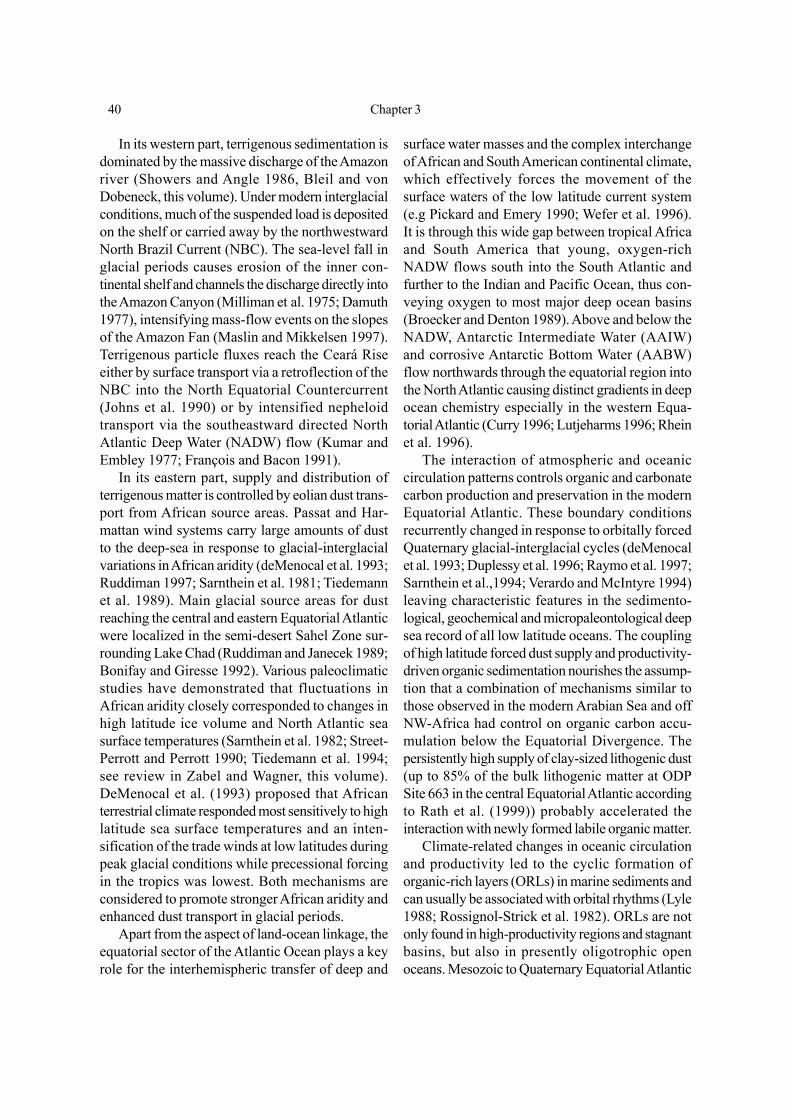
40 Chapter 3
In its western part, terrigenous sedimentation isdominated by the massive discharge of the Amazonriver (Showers and Angle 1986, Bleil and vonDobeneck, this volume). Under modern interglacialconditions, much of the suspended load is depositedon the shelf or carried away by the northwestwardNorth Brazil Current (NBC). The sea-level fall inglacial periods causes erosion of the inner con-tinental shelf and channels the discharge directly intothe Amazon Canyon (Milliman et al. 1975; Damuth1977), intensifying mass-flow events on the slopesof the Amazon Fan (Maslin and Mikkelsen 1997).Terrigenous particle fluxes reach the Ceará Riseeither by surface transport via a retroflection of theNBC into the North Equatorial Countercurrent(Johns et al. 1990) or by intensified nepheloidtransport via the southeastward directed NorthAtlantic Deep Water (NADW) flow (Kumar andEmbley 1977; François and Bacon 1991).
In its eastern part, supply and distribution ofterrigenous matter is controlled by eolian dust trans-port from African source areas. Passat and Har-mattan wind systems carry large amounts of dustto the deep-sea in response to glacial-interglacialvariations in African aridity (deMenocal et al. 1993;Ruddiman 1997; Sarnthein et al. 1981; Tiedemannet al. 1989). Main glacial source areas for dustreaching the central and eastern Equatorial Atlanticwere localized in the semi-desert Sahel Zone sur-rounding Lake Chad (Ruddiman and Janecek 1989;Bonifay and Giresse 1992). Various paleoclimaticstudies have demonstrated that fluctuations inAfrican aridity closely corresponded to changes inhigh latitude ice volume and North Atlantic seasurface temperatures (Sarnthein et al. 1982; Street-Perrott and Perrott 1990; Tiedemann et al. 1994;see review in Zabel and Wagner, this volume).DeMenocal et al. (1993) proposed that Africanterrestrial climate responded most sensitively to highlatitude sea surface temperatures and an inten-sification of the trade winds at low latitudes duringpeak glacial conditions while precessional forcingin the tropics was lowest. Both mechanisms areconsidered to promote stronger African aridity andenhanced dust transport in glacial periods.
Apart from the aspect of land-ocean linkage, theequatorial sector of the Atlantic Ocean plays a keyrole for the interhemispheric transfer of deep and
surface water masses and the complex interchangeof African and South American continental climate,which effectively forces the movement of thesurface waters of the low latitude current system(e.g Pickard and Emery 1990; Wefer et al. 1996).It is through this wide gap between tropical Africaand South America that young, oxygen-richNADW flows south into the South Atlantic andfurther to the Indian and Pacific Ocean, thus con-veying oxygen to most major deep ocean basins(Broecker and Denton 1989). Above and below theNADW, Antarctic Intermediate Water (AAIW)and corrosive Antarctic Bottom Water (AABW)flow northwards through the equatorial region intothe North Atlantic causing distinct gradients in deepocean chemistry especially in the western Equa-torial Atlantic (Curry 1996; Lutjeharms 1996; Rheinet al. 1996).
The interaction of atmospheric and oceaniccirculation patterns controls organic and carbonatecarbon production and preservation in the modernEquatorial Atlantic. These boundary conditionsrecurrently changed in response to orbitally forcedQuaternary glacial-interglacial cycles (deMenocalet al. 1993; Duplessy et al. 1996; Raymo et al. 1997;Sarnthein et al.,1994; Verardo and McIntyre 1994)leaving characteristic features in the sedimento-logical, geochemical and micropaleontological deepsea record of all low latitude oceans. The couplingof high latitude forced dust supply and productivity-driven organic sedimentation nourishes the assump-tion that a combination of mechanisms similar tothose observed in the modern Arabian Sea and offNW-Africa had control on organic carbon accu-mulation below the Equatorial Divergence. Thepersistently high supply of clay-sized lithogenic dust(up to 85% of the bulk lithogenic matter at ODPSite 663 in the central Equatorial Atlantic accordingto Rath et al. (1999)) probably accelerated theinteraction with newly formed labile organic matter.
Climate-related changes in oceanic circulationand productivity led to the cyclic formation oforganic-rich layers (ORLs) in marine sediments andcan usually be associated with orbital rhythms (Lyle1988; Rossignol-Strick et al. 1982). ORLs are notonly found in high-productivity regions and stagnantbasins, but also in presently oligotrophic openoceans. Mesozoic to Quaternary Equatorial Atlantic
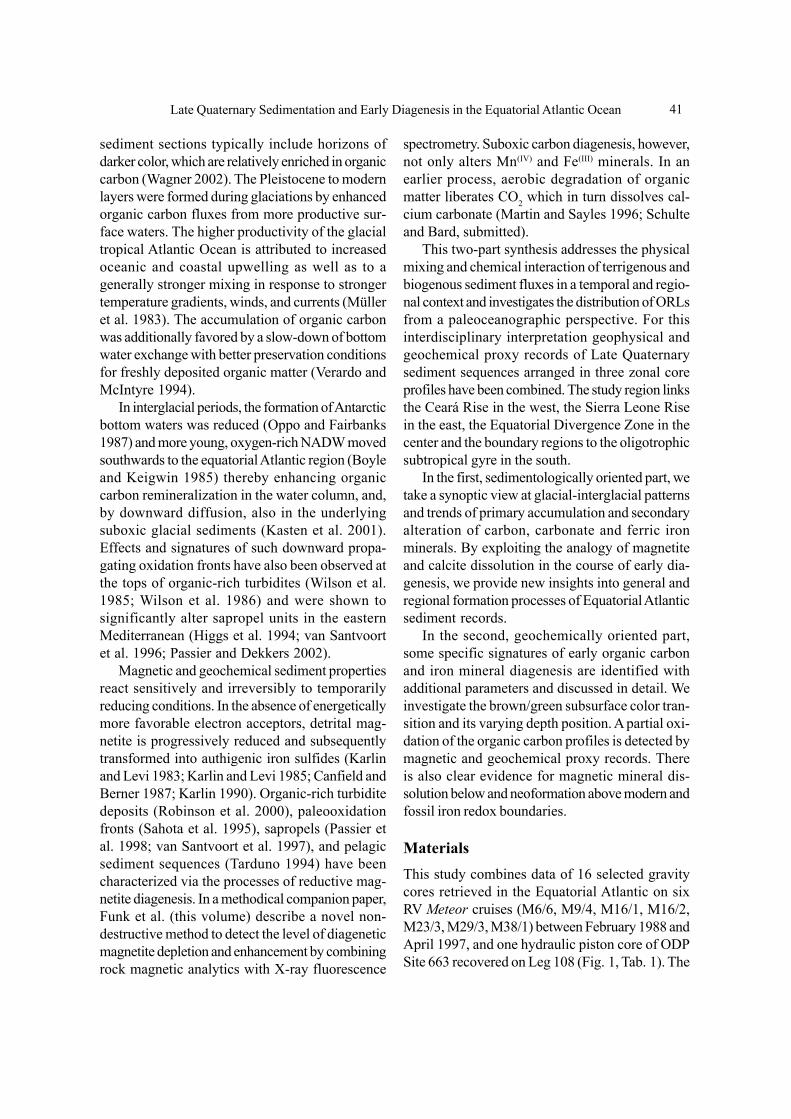
Late Quaternary Sedimentation and Early Diagenesis in the Equatorial Atlantic Ocean 41
sediment sections typically include horizons ofdarker color, which are relatively enriched in organiccarbon (Wagner 2002). The Pleistocene to modernlayers were formed during glaciations by enhancedorganic carbon fluxes from more productive sur-face waters. The higher productivity of the glacialtropical Atlantic Ocean is attributed to increasedoceanic and coastal upwelling as well as to agenerally stronger mixing in response to strongertemperature gradients, winds, and currents (Mülleret al. 1983). The accumulation of organic carbonwas additionally favored by a slow-down of bottomwater exchange with better preservation conditionsfor freshly deposited organic matter (Verardo andMcIntyre 1994).
In interglacial periods, the formation of Antarcticbottom waters was reduced (Oppo and Fairbanks1987) and more young, oxygen-rich NADW movedsouthwards to the equatorial Atlantic region (Boyleand Keigwin 1985) thereby enhancing organiccarbon remineralization in the water column, and,by downward diffusion, also in the underlyingsuboxic glacial sediments (Kasten et al. 2001).Effects and signatures of such downward propa-gating oxidation fronts have also been observed atthe tops of organic-rich turbidites (Wilson et al.1985; Wilson et al. 1986) and were shown tosignificantly alter sapropel units in the easternMediterranean (Higgs et al. 1994; van Santvoortet al. 1996; Passier and Dekkers 2002).
Magnetic and geochemical sediment propertiesreact sensitively and irreversibly to temporarilyreducing conditions. In the absence of energeticallymore favorable electron acceptors, detrital mag-netite is progressively reduced and subsequentlytransformed into authigenic iron sulfides (Karlinand Levi 1983; Karlin and Levi 1985; Canfield andBerner 1987; Karlin 1990). Organic-rich turbiditedeposits (Robinson et al. 2000), paleooxidationfronts (Sahota et al. 1995), sapropels (Passier etal. 1998; van Santvoort et al. 1997), and pelagicsediment sequences (Tarduno 1994) have beencharacterized via the processes of reductive mag-netite diagenesis. In a methodical companion paper,Funk et al. (this volume) describe a novel non-destructive method to detect the level of diageneticmagnetite depletion and enhancement by combiningrock magnetic analytics with X-ray fluorescence
spectrometry. Suboxic carbon diagenesis, however,not only alters Mn(IV) and Fe(III) minerals. In anearlier process, aerobic degradation of organicmatter liberates CO2 which in turn dissolves cal-cium carbonate (Martin and Sayles 1996; Schulteand Bard, submitted).
This two-part synthesis addresses the physicalmixing and chemical interaction of terrigenous andbiogenous sediment fluxes in a temporal and regio-nal context and investigates the distribution of ORLsfrom a paleoceanographic perspective. For thisinterdisciplinary interpretation geophysical andgeochemical proxy records of Late Quaternarysediment sequences arranged in three zonal coreprofiles have been combined. The study region linksthe Ceará Rise in the west, the Sierra Leone Risein the east, the Equatorial Divergence Zone in thecenter and the boundary regions to the oligotrophicsubtropical gyre in the south.
In the first, sedimentologically oriented part, wetake a synoptic view at glacial-interglacial patternsand trends of primary accumulation and secondaryalteration of carbon, carbonate and ferric ironminerals. By exploiting the analogy of magnetiteand calcite dissolution in the course of early dia-genesis, we provide new insights into general andregional formation processes of Equatorial Atlanticsediment records.
In the second, geochemically oriented part,some specific signatures of early organic carbonand iron mineral diagenesis are identified withadditional parameters and discussed in detail. Weinvestigate the brown/green subsurface color tran-sition and its varying depth position. A partial oxi-dation of the organic carbon profiles is detected bymagnetic and geochemical proxy records. Thereis also clear evidence for magnetic mineral dis-solution below and neoformation above modern andfossil iron redox boundaries.
MaterialsThis study combines data of 16 selected gravitycores retrieved in the Equatorial Atlantic on sixRV Meteor cruises (M6/6, M9/4, M16/1, M16/2,M23/3, M29/3, M38/1) between February 1988 andApril 1997, and one hydraulic piston core of ODPSite 663 recovered on Leg 108 (Fig. 1, Tab. 1). The
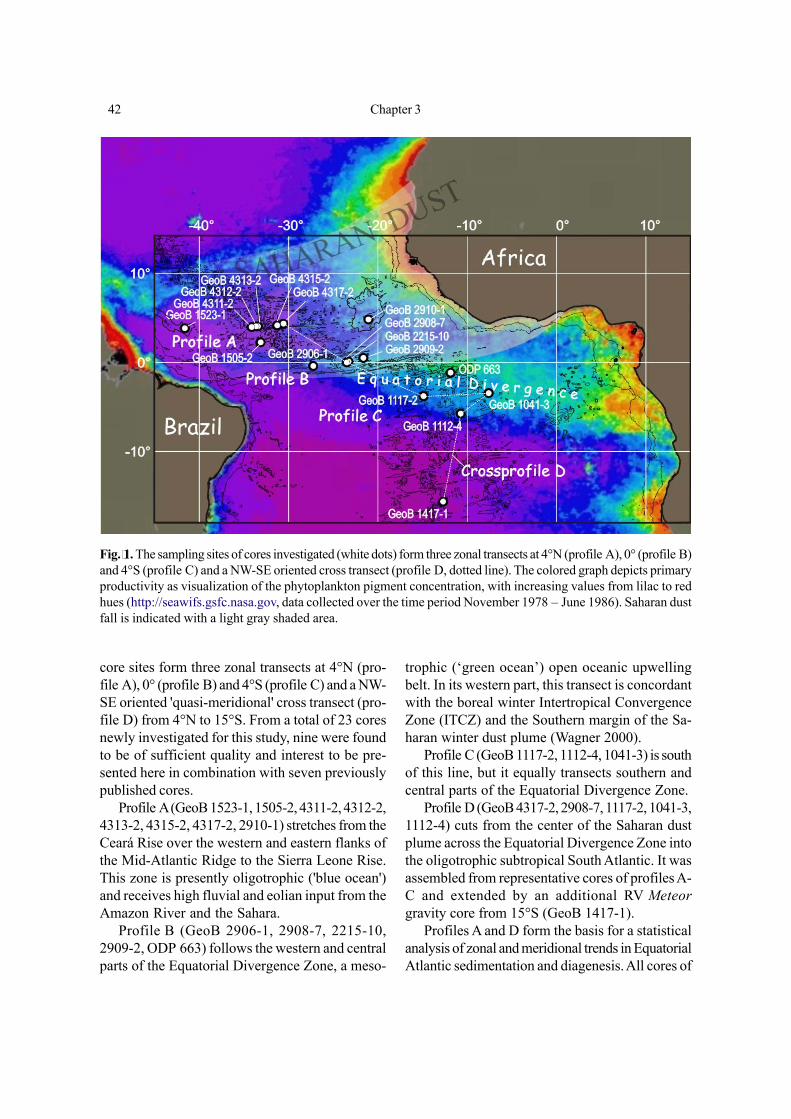
42 Chapter 3
core sites form three zonal transects at 4°N (pro-file A), 0° (profile B) and 4°S (profile C) and a NW-SE oriented 'quasi-meridional' cross transect (pro-file D) from 4°N to 15°S. From a total of 23 coresnewly investigated for this study, nine were foundto be of sufficient quality and interest to be pre-sented here in combination with seven previouslypublished cores.
Profile A (GeoB 1523-1, 1505-2, 4311-2, 4312-2,4313-2, 4315-2, 4317-2, 2910-1) stretches from theCeará Rise over the western and eastern flanks ofthe Mid-Atlantic Ridge to the Sierra Leone Rise.This zone is presently oligotrophic ('blue ocean')and receives high fluvial and eolian input from theAmazon River and the Sahara.
Profile B (GeoB 2906-1, 2908-7, 2215-10,2909-2, ODP 663) follows the western and centralparts of the Equatorial Divergence Zone, a meso-
trophic (‘green ocean’) open oceanic upwellingbelt. In its western part, this transect is concordantwith the boreal winter Intertropical ConvergenceZone (ITCZ) and the Southern margin of the Sa-haran winter dust plume (Wagner 2000).
Profile C (GeoB 1117-2, 1112-4, 1041-3) is southof this line, but it equally transects southern andcentral parts of the Equatorial Divergence Zone.
Profile D (GeoB 4317-2, 2908-7, 1117-2, 1041-3,1112-4) cuts from the center of the Saharan dustplume across the Equatorial Divergence Zone intothe oligotrophic subtropical South Atlantic. It wasassembled from representative cores of profiles A-C and extended by an additional RV Meteorgravity core from 15°S (GeoB 1417-1).
Profiles A and D form the basis for a statisticalanalysis of zonal and meridional trends in EquatorialAtlantic sedimentation and diagenesis. All cores of
Fig. 1. The sampling sites of cores investigated (white dots) form three zonal transects at 4°N (profile A), 0° (profile B)and 4°S (profile C) and a NW-SE oriented cross transect (profile D, dotted line). The colored graph depicts primaryproductivity as visualization of the phytoplankton pigment concentration, with increasing values from lilac to redhues (http://seawifs.gsfc.nasa.gov, data collected over the time period November 1978 – June 1986). Saharan dustfall is indicated with a light gray shaded area.
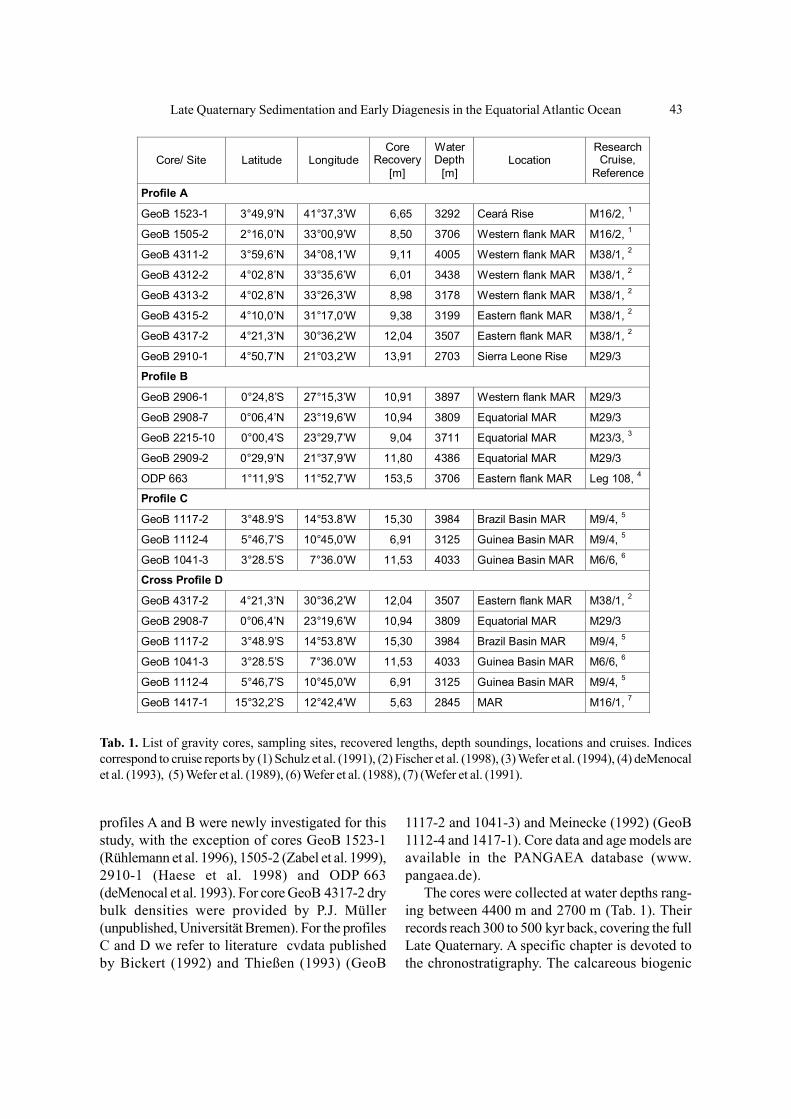
Late Quaternary Sedimentation and Early Diagenesis in the Equatorial Atlantic Ocean 43
Tab. 1. List of gravity cores, sampling sites, recovered lengths, depth soundings, locations and cruises. Indicescorrespond to cruise reports by (1) Schulz et al. (1991), (2) Fischer et al. (1998), (3) Wefer et al. (1994), (4) deMenocalet al. (1993), (5) Wefer et al. (1989), (6) Wefer et al. (1988), (7) (Wefer et al. (1991).
profiles A and B were newly investigated for thisstudy, with the exception of cores GeoB 1523-1(Rühlemann et al. 1996), 1505-2 (Zabel et al. 1999),2910-1 (Haese et al. 1998) and ODP 663(deMenocal et al. 1993). For core GeoB 4317-2 drybulk densities were provided by P.J. Müller(unpublished, Universität Bremen). For the profilesC and D we refer to literature cvdata publishedby Bickert (1992) and Thießen (1993) (GeoB
1117-2 and 1041-3) and Meinecke (1992) (GeoB1112-4 and 1417-1). Core data and age models areavailable in the PANGAEA database (www.pangaea.de).
The cores were collected at water depths rang-ing between 4400 m and 2700 m (Tab. 1). Theirrecords reach 300 to 500 kyr back, covering the fullLate Quaternary. A specific chapter is devoted tothe chronostratigraphy. The calcareous biogenic
Core/ Site
Latitude
Longitude
Core Recovery
[m]
Water Depth
[m]
Location
Research Cruise,
Reference
Profile A
GeoB 1523-1 3°49,9’N 41°37,3’W 6,65 3292 Ceará Rise M16/2, 1
GeoB 1505-2 2°16,0’N 33°00,9’W 8,50 3706 Western flank MAR M16/2, 1
GeoB 4311-2 3°59,6’N 34°08,1’W 9,11 4005 Western flank MAR M38/1, 2
GeoB 4312-2 4°02,8’N 33°35,6’W 6,01 3438 Western flank MAR M38/1, 2
GeoB 4313-2 4°02,8’N 33°26,3’W 8,98 3178 Western flank MAR M38/1, 2
GeoB 4315-2 4°10,0’N 31°17,0‘W 9,38 3199 Eastern flank MAR M38/1, 2
GeoB 4317-2 4°21,3’N 30°36,2’W 12,04 3507 Eastern flank MAR M38/1, 2
GeoB 2910-1 4°50,7’N 21°03,2’W 13,91 2703 Sierra Leone Rise M29/3
Profile B
GeoB 2906-1 0°24,8’S 27°15,3’W 10,91 3897 Western flank MAR M29/3
GeoB 2908-7 0°06,4’N 23°19,6’W 10,94 3809 Equatorial MAR M29/3
GeoB 2215-10 0°00,4’S 23°29,7’W 9,04 3711 Equatorial MAR M23/3, 3
GeoB 2909-2 0°29,9’N 21°37,9’W 11,80 4386 Equatorial MAR M29/3
ODP 663 1°11,9’S 11°52,7’W 153,5 3706 Eastern flank MAR Leg 108, 4
Profile C
GeoB 1117-2 3°48.9’S 14°53.8’W 15,30 3984 Brazil Basin MAR M9/4, 5
GeoB 1112-4 5°46,7’S 10°45,0’W 6,91 3125 Guinea Basin MAR M9/4, 5
GeoB 1041-3 3°28.5’S 7°36.0’W 11,53 4033 Guinea Basin MAR M6/6, 6
Cross Profile D
GeoB 4317-2 4°21,3’N 30°36,2’W 12,04 3507 Eastern flank MAR M38/1, 2
GeoB 2908-7 0°06,4’N 23°19,6’W 10,94 3809 Equatorial MAR M29/3
GeoB 1117-2 3°48.9’S 14°53.8’W 15,30 3984 Brazil Basin MAR M9/4, 5
GeoB 1041-3 3°28.5’S 7°36.0’W 11,53 4033 Guinea Basin MAR M6/6, 6
GeoB 1112-4 5°46,7’S 10°45,0’W 6,91 3125 Guinea Basin MAR M9/4, 5
GeoB 1417-1 15°32,2’S 12°42,4’W 5,63 2845 MAR M16/1, 7
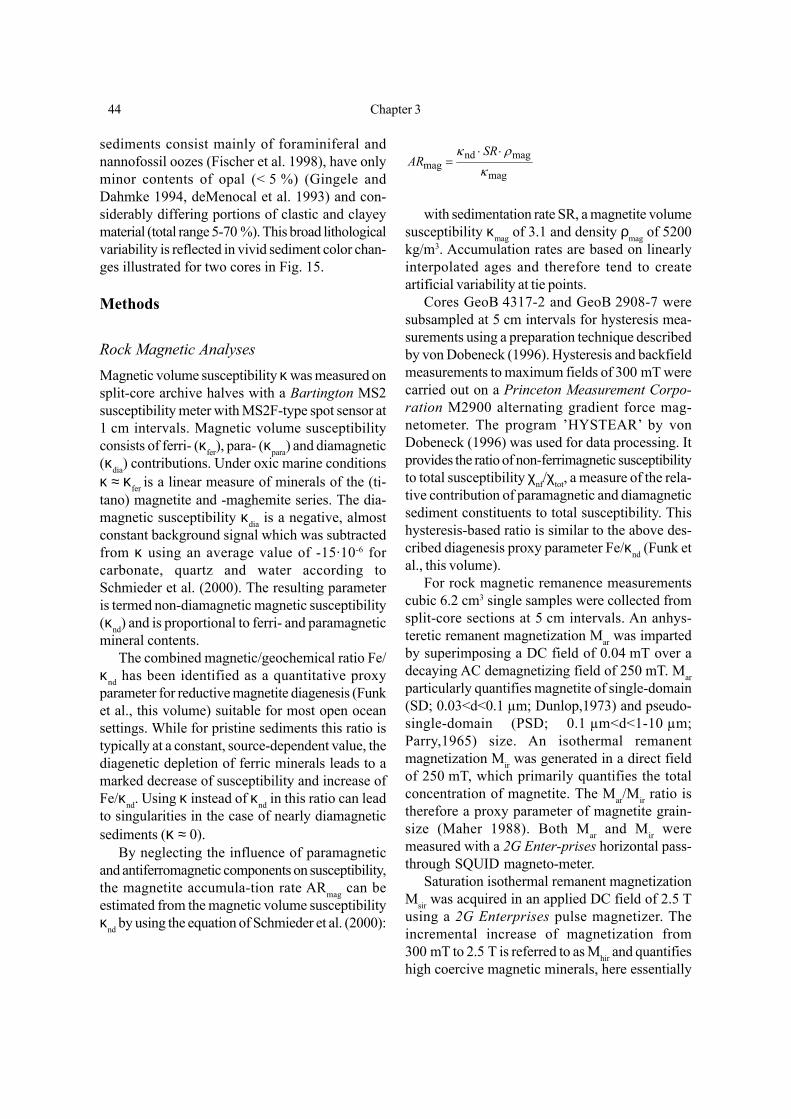
44 Chapter 3
sediments consist mainly of foraminiferal andnannofossil oozes (Fischer et al. 1998), have onlyminor contents of opal (< 5 %) (Gingele andDahmke 1994, deMenocal et al. 1993) and con-siderably differing portions of clastic and clayeymaterial (total range 5-70 %). This broad lithologicalvariability is reflected in vivid sediment color chan-ges illustrated for two cores in Fig. 15.
Methods
Rock Magnetic AnalysesMagnetic volume susceptibility κ was measured onsplit-core archive halves with a Bartington MS2susceptibility meter with MS2F-type spot sensor at1 cm intervals. Magnetic volume susceptibilityconsists of ferri- (κfer), para- (κpara) and diamagnetic(κdia) contributions. Under oxic marine conditionsκ ≈ κfer is a linear measure of minerals of the (ti-tano) magnetite and -maghemite series. The dia-magnetic susceptibility κdia is a negative, almostconstant background signal which was subtractedfrom κ using an average value of -15·10-6 forcarbonate, quartz and water according toSchmieder et al. (2000). The resulting parameteris termed non-diamagnetic magnetic susceptibility(κnd) and is proportional to ferri- and paramagneticmineral contents.
The combined magnetic/geochemical ratio Fe/κnd has been identified as a quantitative proxyparameter for reductive magnetite diagenesis (Funket al., this volume) suitable for most open oceansettings. While for pristine sediments this ratio istypically at a constant, source-dependent value, thediagenetic depletion of ferric minerals leads to amarked decrease of susceptibility and increase ofFe/κnd. Using κ instead of κnd in this ratio can leadto singularities in the case of nearly diamagneticsediments (κ ≈ 0).
By neglecting the influence of paramagneticand antiferromagnetic components on susceptibility,the magnetite accumula-tion rate ARmag can beestimated from the magnetic volume susceptibilityκnd by using the equation of Schmieder et al. (2000):
mag
magndmag κ
ρκ ⋅⋅=
SRAR
with sedimentation rate SR, a magnetite volumesusceptibility κmag of 3.1 and density ρmag of 5200kg/m3. Accumulation rates are based on linearlyinterpolated ages and therefore tend to createartificial variability at tie points.
Cores GeoB 4317-2 and GeoB 2908-7 weresubsampled at 5 cm intervals for hysteresis mea-surements using a preparation technique describedby von Dobeneck (1996). Hysteresis and backfieldmeasurements to maximum fields of 300 mT werecarried out on a Princeton Measurement Corpo-ration M2900 alternating gradient force mag-netometer. The program ’HYSTEAR’ by vonDobeneck (1996) was used for data processing. Itprovides the ratio of non-ferrimagnetic susceptibilityto total susceptibility χnf/χtot, a measure of the rela-tive contribution of paramagnetic and diamagneticsediment constituents to total susceptibility. Thishysteresis-based ratio is similar to the above des-cribed diagenesis proxy parameter Fe/κnd (Funk etal., this volume).
For rock magnetic remanence measurementscubic 6.2 cm3 single samples were collected fromsplit-core sections at 5 cm intervals. An anhys-teretic remanent magnetization Mar was impartedby superimposing a DC field of 0.04 mT over adecaying AC demagnetizing field of 250 mT. Marparticularly quantifies magnetite of single-domain(SD; 0.03<d<0.1 µm; Dunlop,1973) and pseudo-single-domain (PSD; 0.1 µm<d<1-10 µm;Parry,1965) size. An isothermal remanentmagnetization Mir was generated in a direct fieldof 250 mT, which primarily quantifies the totalconcentration of magnetite. The Mar/Mir ratio istherefore a proxy parameter of magnetite grain-size (Maher 1988). Both Mar and Mir weremeasured with a 2G Enter-prises horizontal pass-through SQUID magneto-meter.
Saturation isothermal remanent magnetizationMsir was acquired in an applied DC field of 2.5 Tusing a 2G Enterprises pulse magnetizer. Theincremental increase of magnetization from300 mT to 2.5 T is referred to as Mhir and quantifieshigh coercive magnetic minerals, here essentially
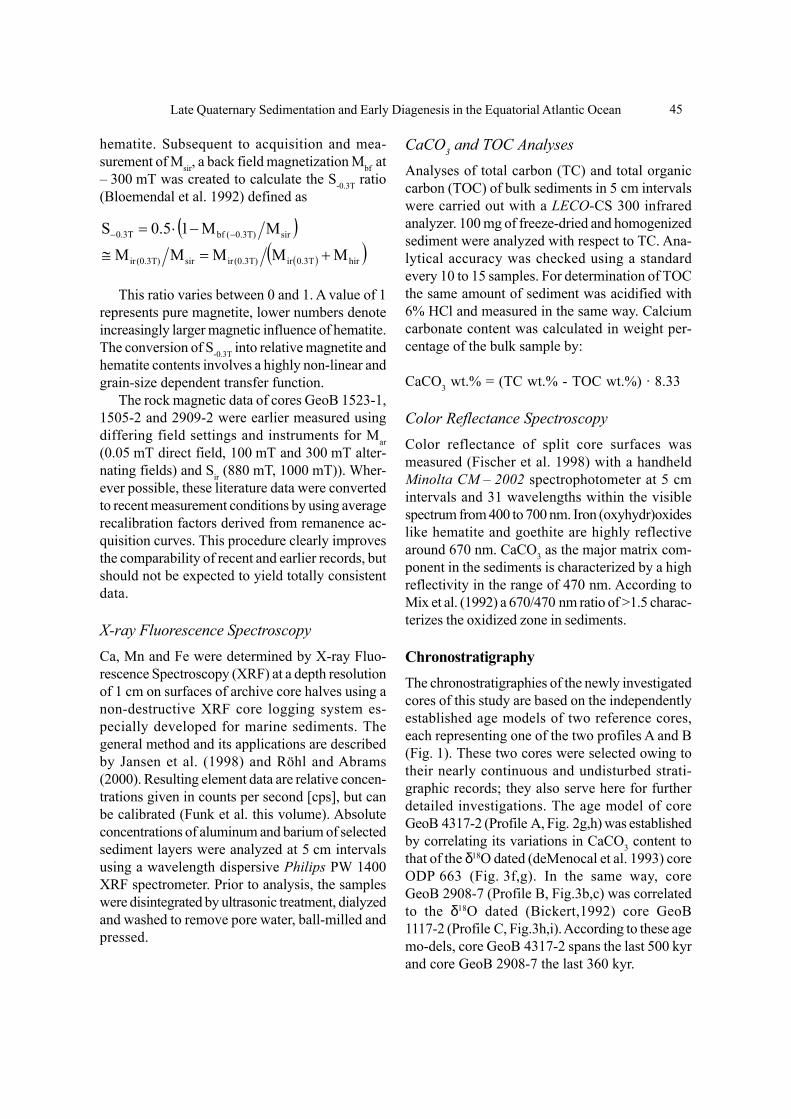
Late Quaternary Sedimentation and Early Diagenesis in the Equatorial Atlantic Ocean 45
hematite. Subsequent to acquisition and mea-surement of Msir, a back field magnetization Mbf at– 300 mT was created to calculate the S-0.3T ratio(Bloemendal et al. 1992) defined as
This ratio varies between 0 and 1. A value of 1represents pure magnetite, lower numbers denoteincreasingly larger magnetic influence of hematite.The conversion of S-0.3T into relative magnetite andhematite contents involves a highly non-linear andgrain-size dependent transfer function.
The rock magnetic data of cores GeoB 1523-1,1505-2 and 2909-2 were earlier measured usingdiffering field settings and instruments for Mar(0.05 mT direct field, 100 mT and 300 mT alter-nating fields) and Sir (880 mT, 1000 mT)). Wher-ever possible, these literature data were convertedto recent measurement conditions by using averagerecalibration factors derived from remanence ac-quisition curves. This procedure clearly improvesthe comparability of recent and earlier records, butshould not be expected to yield totally consistentdata.
X-ray Fluorescence SpectroscopyCa, Mn and Fe were determined by X-ray Fluo-rescence Spectroscopy (XRF) at a depth resolutionof 1 cm on surfaces of archive core halves using anon-destructive XRF core logging system es-pecially developed for marine sediments. Thegeneral method and its applications are describedby Jansen et al. (1998) and Röhl and Abrams(2000). Resulting element data are relative concen-trations given in counts per second [cps], but canbe calibrated (Funk et al. this volume). Absoluteconcentrations of aluminum and barium of selectedsediment layers were analyzed at 5 cm intervalsusing a wavelength dispersive Philips PW 1400XRF spectrometer. Prior to analysis, the sampleswere disintegrated by ultrasonic treatment, dialyzedand washed to remove pore water, ball-milled andpressed.
CaCO3 and TOC AnalysesAnalyses of total carbon (TC) and total organiccarbon (TOC) of bulk sediments in 5 cm intervalswere carried out with a LECO-CS 300 infraredanalyzer. 100 mg of freeze-dried and homogenizedsediment were analyzed with respect to TC. Ana-lytical accuracy was checked using a standardevery 10 to 15 samples. For determination of TOCthe same amount of sediment was acidified with6% HCl and measured in the same way. Calciumcarbonate content was calculated in weight per-centage of the bulk sample by:
CaCO3 wt.% = (TC wt.% - TOC wt.%) · 8.33
Color Reflectance SpectroscopyColor reflectance of split core surfaces wasmeasured (Fischer et al. 1998) with a handheldMinolta CM – 2002 spectrophotometer at 5 cmintervals and 31 wavelengths within the visiblespectrum from 400 to 700 nm. Iron (oxyhydr)oxideslike hematite and goethite are highly reflectivearound 670 nm. CaCO3 as the major matrix com-ponent in the sediments is characterized by a highreflectivity in the range of 470 nm. According toMix et al. (1992) a 670/470 nm ratio of >1.5 charac-terizes the oxidized zone in sediments.
ChronostratigraphyThe chronostratigraphies of the newly investigatedcores of this study are based on the independentlyestablished age models of two reference cores,each representing one of the two profiles A and B(Fig. 1). These two cores were selected owing totheir nearly continuous and undisturbed strati-graphic records; they also serve here for furtherdetailed investigations. The age model of coreGeoB 4317-2 (Profile A, Fig. 2g,h) was establishedby correlating its variations in CaCO3 content tothat of the δ18O dated (deMenocal et al. 1993) coreODP 663 (Fig. 3f,g). In the same way, coreGeoB 2908-7 (Profile B, Fig.3b,c) was correlatedto the δ18O dated (Bickert,1992) core GeoB1117-2 (Profile C, Fig.3h,i). According to these agemo-dels, core GeoB 4317-2 spans the last 500 kyrand core GeoB 2908-7 the last 360 kyr.
( )( )( )hir0.3Tir(0.3T)irsir(0.3T)ir
sir0.3T)(bf0.3T
MMMMM
MM10.5S
+=≅
−⋅= −−
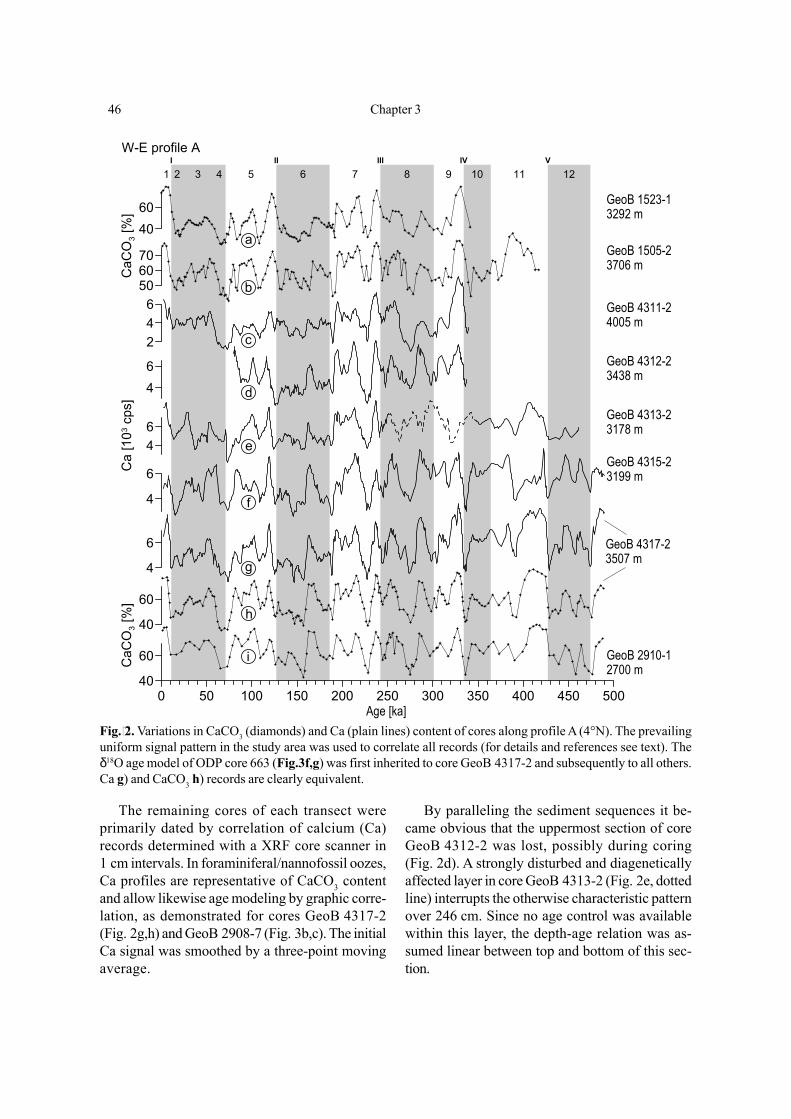
46 Chapter 3
Fig. 2. Variations in CaCO3 (diamonds) and Ca (plain lines) content of cores along profile A (4°N). The prevailinguniform signal pattern in the study area was used to correlate all records (for details and references see text). Theδ18O age model of ODP core 663 (Fig.3f,g) was first inherited to core GeoB 4317-2 and subsequently to all others.Ca g) and CaCO3 h) records are clearly equivalent.
The remaining cores of each transect wereprimarily dated by correlation of calcium (Ca)records determined with a XRF core scanner in1 cm intervals. In foraminiferal/nannofossil oozes,Ca profiles are representative of CaCO3 contentand allow likewise age modeling by graphic corre-lation, as demonstrated for cores GeoB 4317-2(Fig. 2g,h) and GeoB 2908-7 (Fig. 3b,c). The initialCa signal was smoothed by a three-point movingaverage.
By paralleling the sediment sequences it be-came obvious that the uppermost section of coreGeoB 4312-2 was lost, possibly during coring(Fig. 2d). A strongly disturbed and diageneticallyaffected layer in core GeoB 4313-2 (Fig. 2e, dottedline) interrupts the otherwise characteristic patternover 246 cm. Since no age control was availablewithin this layer, the depth-age relation was as-sumed linear between top and bottom of this sec-tion.
I II III IV V
1 2 3 4 5 6 7 8 9 10 11 12
0 50 100 150 200 250 300 350 400 450 500Age [ka]
40
60
4
6
40
60
46
4
6
46
246
506070
4060
CaC
O3 [
%]
W-E profile AC
a [1
03 cps
]C
aCO
3 [%
]
GeoB 1523-13292 m
GeoB 1505-23706 m
GeoB 4311-24005 m
GeoB 4312-23438 m
GeoB 4313-23178 m
GeoB 4315-23199 m
GeoB 4317-23507 m
GeoB 2910-12700 m
a
b
c
d
e
f
g
h
i
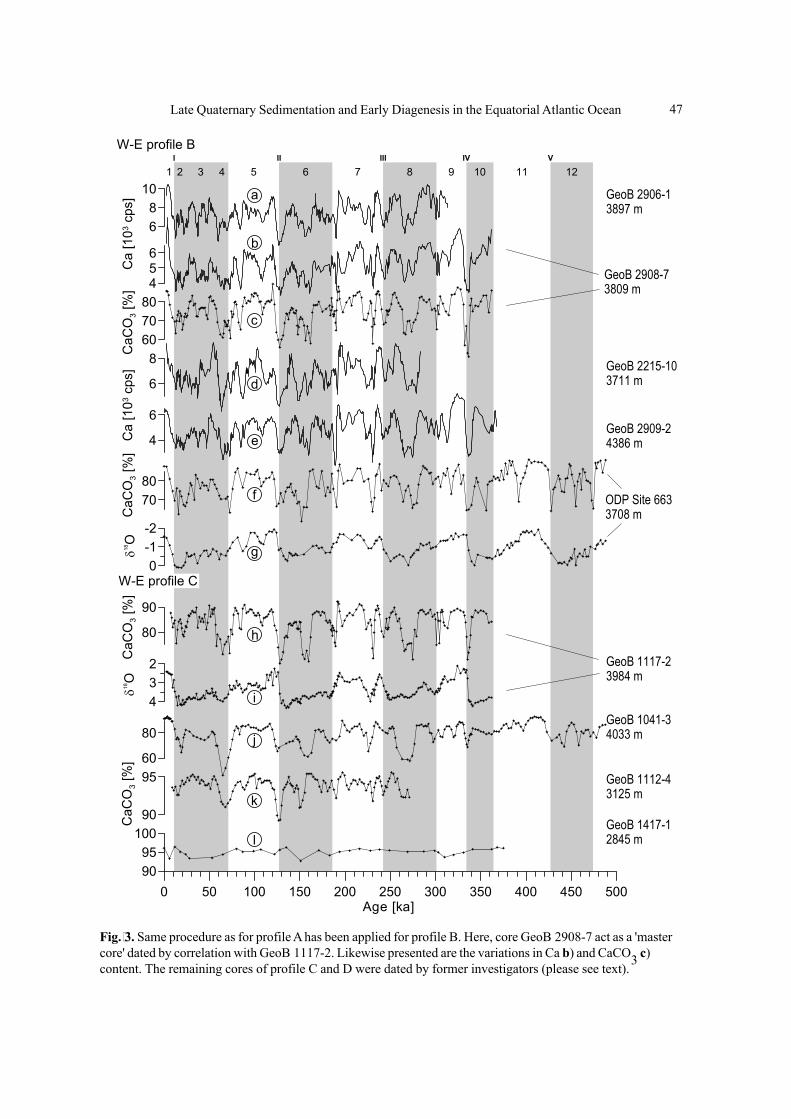
Late Quaternary Sedimentation and Early Diagenesis in the Equatorial Atlantic Ocean 47
Fig. 3. Same procedure as for profile A has been applied for profile B. Here, core GeoB 2908-7 act as a 'mastercore' dated by correlation with GeoB 1117-2. Likewise presented are the variations in Ca b) and CaCO3 c)content. The remaining cores of profile C and D were dated by former investigators (please see text).
I II III IV V
1 2 3 4 5 6 7 8 9 10 11 12
δ18O
CaC
O3 [
%]
CaC
O3 [
%]
0-1-2
7080
4
6
6
8607080
456
68
10
W-E profile BC
a [1
03 cps
]C
a [1
03 cps
]
ODP Site 6633708 m
GeoB 2906-13897 m
GeoB 2908-73809 m
GeoB 2215-103711 m
GeoB 2909-24386 m
0 50 100 150 200 250 300 350 400 450 500Age [ka]
9095
10090
9560
80
432
80
90
CaC
O3 [
%]
δ18O
CaC
O3 [
%]
GeoB 1117-23984 m
GeoB 1041-34033 m
GeoB 1112-43125 m
GeoB 1417-12845 m
a
b
c
d
e
f
g
h
i
j
k
l
W-E profile C
48 Chapter 3
The variations in CaCO3 and Ca contents werecompared with earlier dated carbonate recordsfrom the Equatorial Atlantic (GeoB 1523-1, 1505-2,2910-1, 1041-3, 1112-4 and 1417-1, see Figs. 2, 3).The close match of the signal patterns down to finestdetails is striking. The good comparability of indi-vidual signal features within a large set of recordsmade a convincing case for a minor readjustmentof the earlier age model of core GeoB 2910-1(Zabel et al. 1999), which resulted in an appre-ciablesmoothing of the sedimentation rate in MIS 9. Thenow existing carbonate based stratigraphic networkof the Late Quaternary Equatorial Atlantic Oceanforms a solid fundament for future work.
While the obvious similarities of the shownCaCO3 signals are primordial for chronostrati-graphic purposes, their equally obvious dissimi-larities form a promising basis to analyze signalformation mechanisms in a regional and temporalframework. The potential and most likely contri-buting factors are:
1. Variations in primary productivity due tochanging nutrient supply to the photic zone. Theglacial weakening of the northwesterly NorthAfrican summer monsoons strengthens the south-westerly trade winds (Kutzbach 1981) causing arise of the Equatorial Atlantic thermo- and nutriclinein the east and a synchronous fall in the west,together with more vigorous mixing and upwelling(Müller et al. 1983).
2. Variations in terrigenous dilution of carbonateby enhanced glacial dust flux from the Sahara andSahel Zone. This material is eroded under con-ditions of greater aridity and carried by strongerglacial NE trade winds into the eastern EquatorialAtlantic (Sarnthein et al. 1982; deMenocal et al.1993).
3. Variations in terrigenous dilution of carbonateby an enhanced discharge of Amazon detritus intothe western Equatorial Atlantic during glacial sealevel falls and low stands. At high stands, Ama-zonian sediments are mainly deposited on the con-tinental shelf (Damuth 1977; François et al. 1990;Bleil and von Dobeneck, this volume).
4. Variations in carbonate preservation in thewater column due to weaker overturning of glacialNADW resulting in a vertical expansion of AABWentailing a rise of the calcite lysocline by several
hundred meters (Gardner and Burkle 1975; Boyleand Keigwin 1982; Raymo et al. 1990; Bickert andWefer 1996). Curry and Lohmann (1986, 1990)demonstrated, that Quaternary carbonates de-posited at the Sierra Leone Rise above 3750 m aregenerally well preserved, while Rühlemann et al.(1996) associate fractionation of foraminifera at3300 m depth during extreme glacial stages withinfluence of southern-source deep water.
5. Variations in carbonate preservation due tocarbonate dissolution by metabolic acids releasedin the course of aerobic OM decomposition in near-surface sediment layers (Martin and Sayles 1996;Pfeifer et al. 2002; Hensen et al., this volume). Thisprocess is particularly active in times of enhancedocean fertility with enhanced Corg/CaCO3 rainratios. According to Martin and Sayles (1996), themodern sedimentary calcite dissolution rate at thepresently oligotrophic and supralysoclinal CearáRise amounts to as much as 40-60% of the initiallydeposited CaCO3, although this estimate should behandled with care (see review on carbonate dis-solution in the South Atlantic by Henrich et al., thisvolume).
Patterns, Trends and Formation Processesof Sedimentary Records
Organic Carbon and Carbonate RecordsWe approach the multi-factorial problem of sedi-mentary signal formation in the Equatorial Atlanticby investigating and comparing the patterns andtrends of various lithostratigraphic parameters,starting out with the relation of carbonate andorganic carbon content.
A compilation of organic carbon and calciumcarbonate contents along the meridional crossprofile D exhibits very pronounced temporal pat-terns, regional trends and asymmetries (Fig. 4).Both parameters show pronounced climate cycli-city with large contrasts in organic carbon burialat a glacial/interglacial and substage rhythm.
Glacial Corg maxima vary widely between0.25% and 2%, while interglacial Corg minimaremain at the same low level of about 0.125%throughout the entire Equatorial Atlantic. This
Late Quaternary Sedimentation and Early Diagenesis in the Equatorial Atlantic Ocean 49
uniformity of recent sedimentary TOC levels con-trasts with large modern productivity gradientsalong profile D indicated by Coastal Zone ColorScanner (CZCS) images (compare to November1978 – June 1986 chlorophyll pigment concen-tration in Figure 1). Wagner and Dupont (1999)already observed, that modern, enhanced marineorganic carbon fluxes are largely remineralized andtherefore not recorded in surface sediments. Thissituation appears to be a general feature of inter-glacial conditions. Apparently, only in glacial periodsregional productivity pulses have been preservedin the sedimentary archive.
The northernmost core GeoB 4317-2 (4°N,Fig. 4a) is scarcely influenced by the EquatorialDivergence and presently under oligotrophic con-ditions. On the basis of preserved TOC, there isno evidence for enhanced glacial productivity aftertermination II. The youngest organic-rich layer(ORL) dates back to MIS 6 reaching the highestobserved concentrations of about 0.5% TOC.Similar saw-tooth shaped TOC patterns precedein glacial stages 10 and 12, while MIS 8 comparesto the low values encountered in MIS 2 and 4. Itwill be argued below, that these 'missing ORLs' (inanalogy to the term 'missing sapropels' by vanSantvoort 1997) may rather be due to a lack oforganic carbon preservation than to a lack ofdeposition. In greater vicinity of the EquatorialDivergence as in core GeoB 2908-7, glacial TOCcontents are increasingly higher (Fig. 4b) and fullydeveloped in every glacial stage. A well-definedglacial/interglacial pattern (Lyle 1988) with steeplyincreasing values is even more evident in coresGeoB 1117-2 and 1041-3 (Bickert 1992) whereindividual precessional ORLs merge to broaderbands covering entire glacial periods, however, withstill clearly separated subpeaks.
In core GeoB 1041-3 these carbon enrichmentsreach TOC concentrations of sapropelic layersaccording to the definition by Kidd et al. (1978),since they are 'discrete, greater than 1 cm inthickness, set in open marine pelagic sedimentsand containing between 0.5% and 2.0% or-ganic carbon by weight'. Our data are consistentwith findings of Verardo and McIntyre (1994) whodescribe a fourfold increase in TOC contents duringMIS 2 from the margins to the center of the Equa-
torial Divergence upwelling. The two southernmostrecords GeoB 1112-4 and 1417-1 (Fig. 4e,f) showconstantly high carbonate contents and accordinglylow TOC and terrigenous contents. As shown bythe enlarged carbonate record of GeoB 1112-4 inFig. 3k, a faint climate signature at largely reducedamplitude remains.
It is a general feature of all investigated cores,that Corg and CaCO3 records are in a broad senseclearly antisymmetric and anticorrelated. Thisnegative correlation is at maximum at the EquatorialDivergence (r = -0.72), still relatively high in theadjacent northern regions (r = -0.46 to -0.36) andgoes down to r = -0.17 in the oligotrophic sub-tropical gyre (Fig. 5a). This negative correlation iseven more pronounced, if sediment sections nextto terminations are excluded which obviously havebeen carbon-depleted by burn-down due to a down-ward progressing postglacial oxidation front (noteirregularity in record asymmetry in particular a-round Termination II).
The inverse pattern of preserved CaCO3 andTOC clearly prohibits the concept of assessingpaleoproductivity from carbonate accumulation,which is generally based on the observation, thatorganic carbon and carbonate fluxes are globallywell-correlated in deep-moored sediment traps(Brummer and Van Eijden 1992; Milliman 1993)throughout different oceanic productivity regimes(van Kreveld et al. 1996). Since fluctuations ofdeep water stratification are not sufficient forexplaining the observed effects over the broadrange of included core depths, we interpret theobserved anticorrelation of CaCO3 and TOC alongthe lines of Archer and Maier-Reimer (1994) andMartin and Sayles (1996) as an effect of enhancedglacial Corg/CaCO3 rain rates entailing calcite dis-solution by metabolic CO2 release in the course ofaerobic organic carbon degradation (Wilson andThomson 1998; Schneider et al. 2000):
While from the stoichiometry of the Redfieldratio, the molar loss relationship of organic carbonand carbonate should not exceed 106:124 (= 1:1.17),ratios above 1:4 were observed in the oxic zones
(CH2O)106(NH3)16(H3PO4) + 138 O2 + 124 CaCO3 →230 HCO3
- + 16 NO3- + HPO4
2- + 124 Ca2+ + 16 H2O
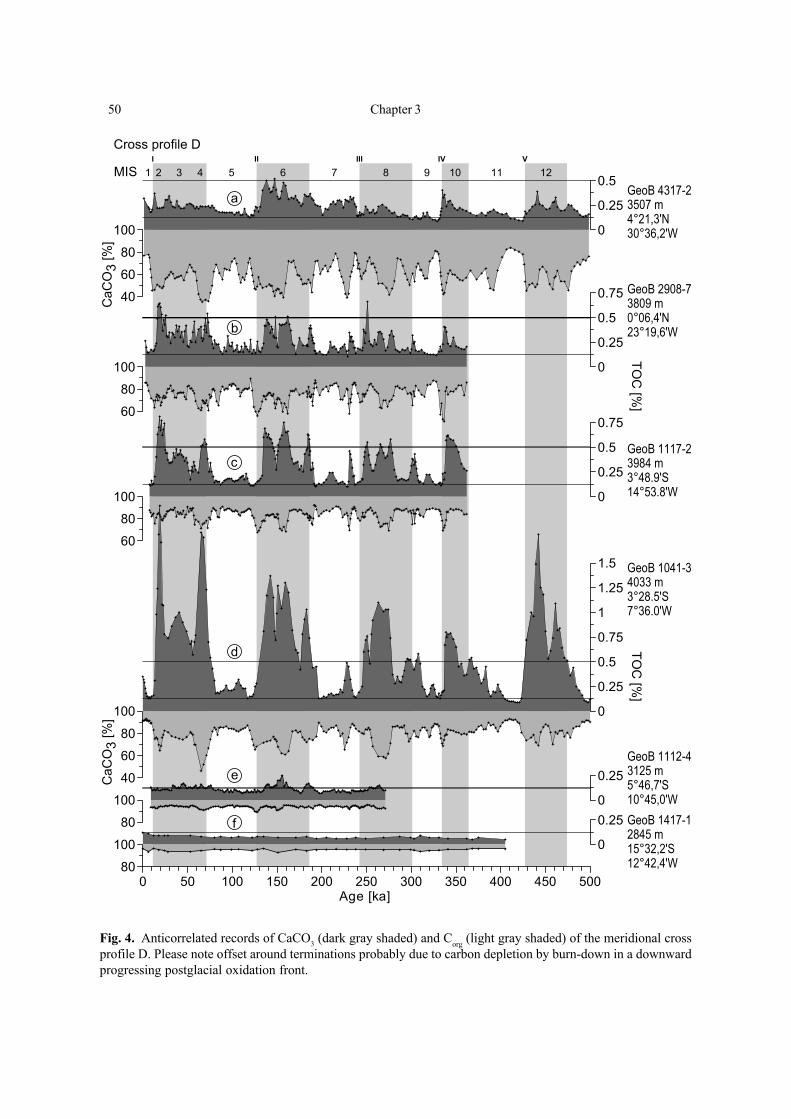
50 Chapter 3
Fig. 4. Anticorrelated records of CaCO3 (dark gray shaded) and Corg (light gray shaded) of the meridional crossprofile D. Please note offset around terminations probably due to carbon depletion by burn-down in a downwardprogressing postglacial oxidation front.
I II III IV V
1 2 3 4 5 6 7 8 9 10 11 12
60
80
100
0 50 100 150 200 250 300 350 400 450 500Age [ka]
60
80
100
0
0.25
0.5
0.75
1
1.25
1.5
0
0.25
0.5
0.75
0
0.25
0.5
0
0.2580
100 0
0.2540
60
80
100
0
0.25
0.5
0.75
80
100
40
60
80
100
CaC
O3
[%]
Cross profile D
MISTO
C [%
]
GeoB 4317-23507 m4°21,3'N30°36,2'W
GeoB 2908-73809 m0°06,4'N23°19,6'W
GeoB 1117-23984 m3°48.9'S14°53.8'W
GeoB 1041-34033 m3°28.5'S7°36.0'W
GeoB 1112-43125 m5°46,7'S10°45,0'WGeoB 1417-12845 m15°32,2'S12°42,4'W
a
b
c
d
e
f
CaC
O3
[%]
TOC
[%]
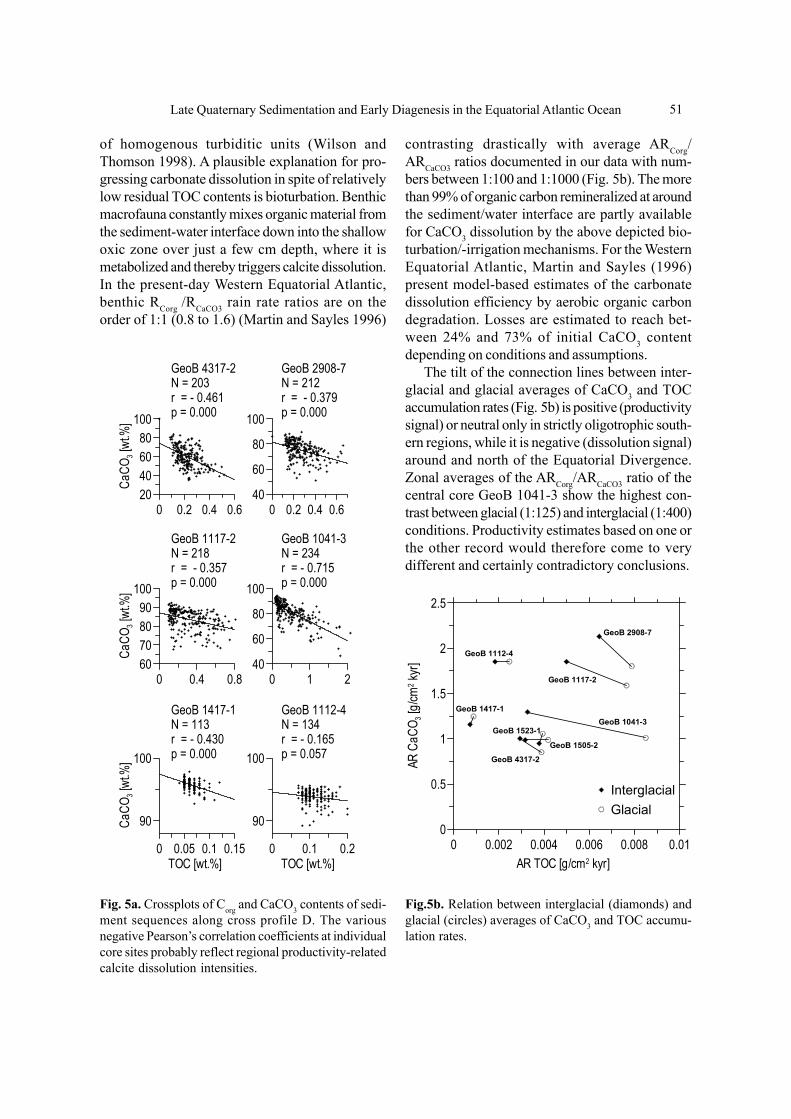
Late Quaternary Sedimentation and Early Diagenesis in the Equatorial Atlantic Ocean 51
of homogenous turbiditic units (Wilson andThomson 1998). A plausible explanation for pro-gressing carbonate dissolution in spite of relativelylow residual TOC contents is bioturbation. Benthicmacrofauna constantly mixes organic material fromthe sediment-water interface down into the shallowoxic zone over just a few cm depth, where it ismetabolized and thereby triggers calcite dissolution.In the present-day Western Equatorial Atlantic,benthic RCorg /RCaCO3 rain rate ratios are on theorder of 1:1 (0.8 to 1.6) (Martin and Sayles 1996)
contrasting drastically with average ARCorg/ARCaCO3 ratios documented in our data with num-bers between 1:100 and 1:1000 (Fig. 5b). The morethan 99% of organic carbon remineralized at aroundthe sediment/water interface are partly availablefor CaCO3 dissolution by the above depicted bio-turbation/-irrigation mechanisms. For the WesternEquatorial Atlantic, Martin and Sayles (1996)present model-based estimates of the carbonatedissolution efficiency by aerobic organic carbondegradation. Losses are estimated to reach bet-ween 24% and 73% of initial CaCO3 contentdepending on conditions and assumptions.
The tilt of the connection lines between inter-glacial and glacial averages of CaCO3 and TOCaccumulation rates (Fig. 5b) is positive (productivitysignal) or neutral only in strictly oligotrophic south-ern regions, while it is negative (dissolution signal)around and north of the Equatorial Divergence.Zonal averages of the ARCorg/ARCaCO3 ratio of thecentral core GeoB 1041-3 show the highest con-trast between glacial (1:125) and interglacial (1:400)conditions. Productivity estimates based on one orthe other record would therefore come to verydifferent and certainly contradictory conclusions.
Fig.5b. Relation between interglacial (diamonds) andglacial (circles) averages of CaCO3 and TOC accumu-lation rates.
0 0.002 0.004 0.006 0.008 0.01AR TOC [g/cm2 kyr]
0
0.5
1
1.5
2
2.5
AR C
aCO 3 [
g/cm
2 kyr
]
GeoB 1041-3
GeoB 2908-7
GeoB 1117-2
GeoB 1112-4
GeoB 1417-1
GeoB 4317-2
GeoB 1505-2
GeoB 1523-1
GlacialInterglacial
0 0.2 0.4 0.620406080
100
CaCO
3 [wt
.%]
40
60
80
100
0 0.2 0.4 0.6
0 0.4 0.860708090
100
CaCO
3 [wt
.%]
0 1 240
60
80
100
0 0.1 0.2TOC [wt.%]
90
100
0 0.05 0.1 0.15TOC [wt.%]
90
100
CaCO
3 [wt
.%]
GeoB 1112-4N = 134r = - 0.165p = 0.057
GeoB 1041-3N = 234r = - 0.715p = 0.000
GeoB 2908-7N = 212r = - 0.379p = 0.000
GeoB 4317-2N = 203r = - 0.461p = 0.000
GeoB 1117-2N = 218r = - 0.357p = 0.000
GeoB 1417-1N = 113r = - 0.430p = 0.000
Fig. 5a. Crossplots of Corg and CaCO3 contents of sedi-ment sequences along cross profile D. The variousnegative Pearson’s correlation coefficients at individualcore sites probably reflect regional productivity-relatedcalcite dissolution intensities.
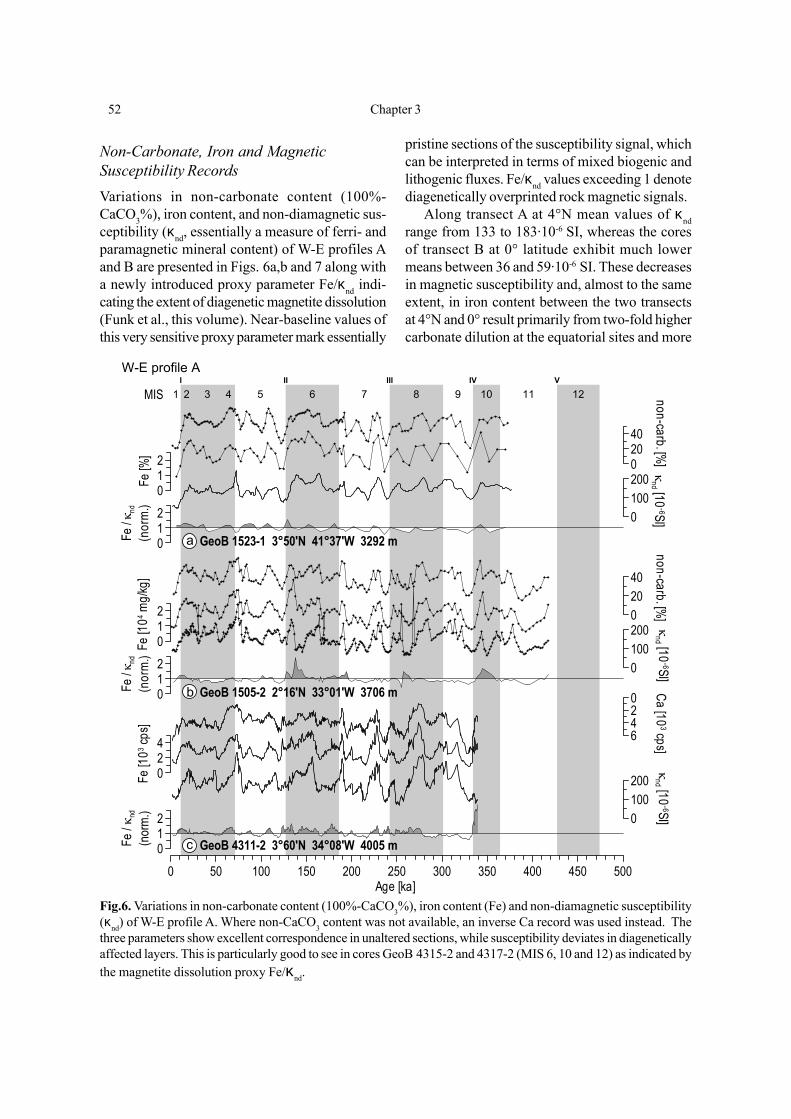
52 Chapter 3
Non-Carbonate, Iron and MagneticSusceptibility RecordsVariations in non-carbonate content (100%-CaCO3%), iron content, and non-diamagnetic sus-ceptibility (κnd, essentially a measure of ferri- andparamagnetic mineral content) of W-E profiles Aand B are presented in Figs. 6a,b and 7 along witha newly introduced proxy parameter Fe/κnd indi-cating the extent of diagenetic magnetite dissolution(Funk et al., this volume). Near-baseline values ofthis very sensitive proxy parameter mark essentially
pristine sections of the susceptibility signal, whichcan be interpreted in terms of mixed biogenic andlithogenic fluxes. Fe/κnd values exceeding 1 denotediagenetically overprinted rock magnetic signals.
Along transect A at 4°N mean values of κndrange from 133 to 183·10-6 SI, whereas the coresof transect B at 0° latitude exhibit much lowermeans between 36 and 59·10-6 SI. These decreasesin magnetic susceptibility and, almost to the sameextent, in iron content between the two transectsat 4°N and 0° result primarily from two-fold highercarbonate dilution at the equatorial sites and more
Fig.6. Variations in non-carbonate content (100%-CaCO3%), iron content (Fe) and non-diamagnetic susceptibility(κnd) of W-E profile A. Where non-CaCO3 content was not available, an inverse Ca record was used instead. Thethree parameters show excellent correspondence in unaltered sections, while susceptibility deviates in diageneticallyaffected layers. This is particularly good to see in cores GeoB 4315-2 and 4317-2 (MIS 6, 10 and 12) as indicated bythe magnetite dissolution proxy Fe/κnd.
1 2 3 4 5 6 7 8 9 10 11 12I II III IV V
012
Fe [%
]
0 50 100 150 200 250 300 350 400 450 500Age [ka]
02040
non-carb. [%]
0100200
κnd [10
-6SI]
024
Fe [1
03 cps
]
012
Fe / κ
nd
(nor
m.)
6420 Ca [10
3 cps]
0100200 κ
nd [10-6SI]
012
Fe [1
04 mg/
kg]
02040
non-carb. [%]
012
Fe / κ
nd
(nor
m.)
012
Fe / κ
nd
(nor
m.)
0100200 κ
nd [10-6SI]
MIS
W-E profile A
GeoB 1523-1 3°50'N 41°37'W 3292 m
GeoB 1505-2 2°16'N 33°01'W 3706 m
GeoB 4311-2 3°60'N 34°08'W 4005 m
a
b
c
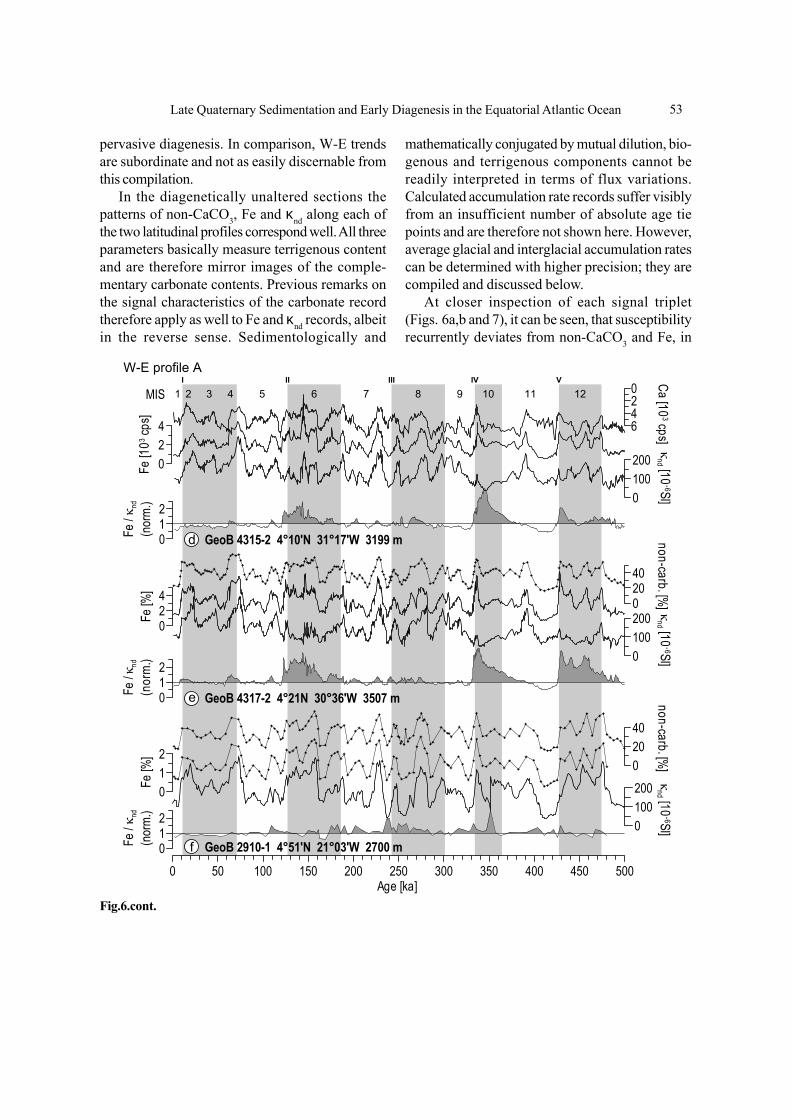
Late Quaternary Sedimentation and Early Diagenesis in the Equatorial Atlantic Ocean 53
pervasive diagenesis. In comparison, W-E trendsare subordinate and not as easily discernable fromthis compilation.
In the diagenetically unaltered sections thepatterns of non-CaCO3, Fe and κnd along each ofthe two latitudinal profiles correspond well. All threeparameters basically measure terrigenous contentand are therefore mirror images of the comple-mentary carbonate contents. Previous remarks onthe signal characteristics of the carbonate recordtherefore apply as well to Fe and κnd records, albeitin the reverse sense. Sedimentologically and
mathematically conjugated by mutual dilution, bio-genous and terrigenous components cannot bereadily interpreted in terms of flux variations.Calculated accumulation rate records suffer visiblyfrom an insufficient number of absolute age tiepoints and are therefore not shown here. However,average glacial and interglacial accumulation ratescan be determined with higher precision; they arecompiled and discussed below.
At closer inspection of each signal triplet(Figs. 6a,b and 7), it can be seen, that susceptibilityrecurrently deviates from non-CaCO3 and Fe, in
Fig.6.cont.
1 2 3 4 5 6 7 8 9 10 11 12I II III IV V
024
Fe [%
]
0 50 100 150 200 250 300 350 400 450 500Age [ka]
024
Fe [1
03 cps
]
0100200 κ
nd [10-6SI]
0100200
κnd [10
-6SI]
012
Fe / κ
nd
(nor
m.)
02040
non-carb. [%]
6420 Ca [10
3 cps]
012
Fe / κ
nd
(nor
m.)
0100200 κ
nd [10-6SI]
012
Fe [%
]
012
Fe / κ
nd
(nor
m.)
02040
non-carb. [%]
MIS
W-E profile A
GeoB 4315-2 4°10'N 31°17'W 3199 m
GeoB 4317-2 4°21N 30°36'W 3507 m
GeoB 2910-1 4°51'N 21°03'W 2700 m
d
e
f

54 Chapter 3
particular at glacial terminations and within glacials(e.g. MIS 6, 10 and 12). In general, these offsetsin the susceptibility signal show lower and lessmodulated values and occur almost simultaneouslyin every core of each transect. The Fe/κnd ratioclearly pinpoints this behavior as magnetic mineraldissolution layers. Although dissolution layers inprofiles A and B are basically synchronous, they
occur more frequently at 0° than at 4° N.Along the northern profile A situated at 4° N in
a recently oligotrophic area (Fig. 6b) a fairly con-stant baseline value alternates with elevated Fe/κndvalues (gray shaded sections) around major climatetransitions, in particular after MIS 6, 10, and 12.These sections coincide well with TOC enrichmentsshown in Fig. 4. Especially in cores GeoB 4317-2
Fig.7. Variations in non-carbonate content (100%-CaCO3%), iron content (Fe) and non-diamagnetic susceptibility(κnd) of W-E profile B. Differences of the two profiles A and B are explained in detail in the text.
1 2 3 4 5 6 7 8 9 10 11 12I II III IV V
012
Fe [1
03 cps
]
0
50
κnd [10
-6SI]
012
Fe [1
03 cps
]
0
50
κnd [10
-6SI]
0
50
κnd [10
-6SI]
012
Fe [1
03 cps
]
20
40
non-carb. [%]
0
20
non-carb. [%]
642
Ca [103 cps]
012
Fe / κ
nd
(nor
m.)
012
Fe / κ
nd
(nor
m.)
0 50 100 150 200 250 300 350 400 450 500Age [ka]
012
Fe / κ
nd
(nor
m.)
MIS
GeoB 2906-1 0°25'S 27°15'W 3897 m
GeoB 2908-7 0°06'N 23°20'W 3809 m
GeoB 2909-2 0°23'N 21°38'W 4386 m
W-E profile B
a
b
c
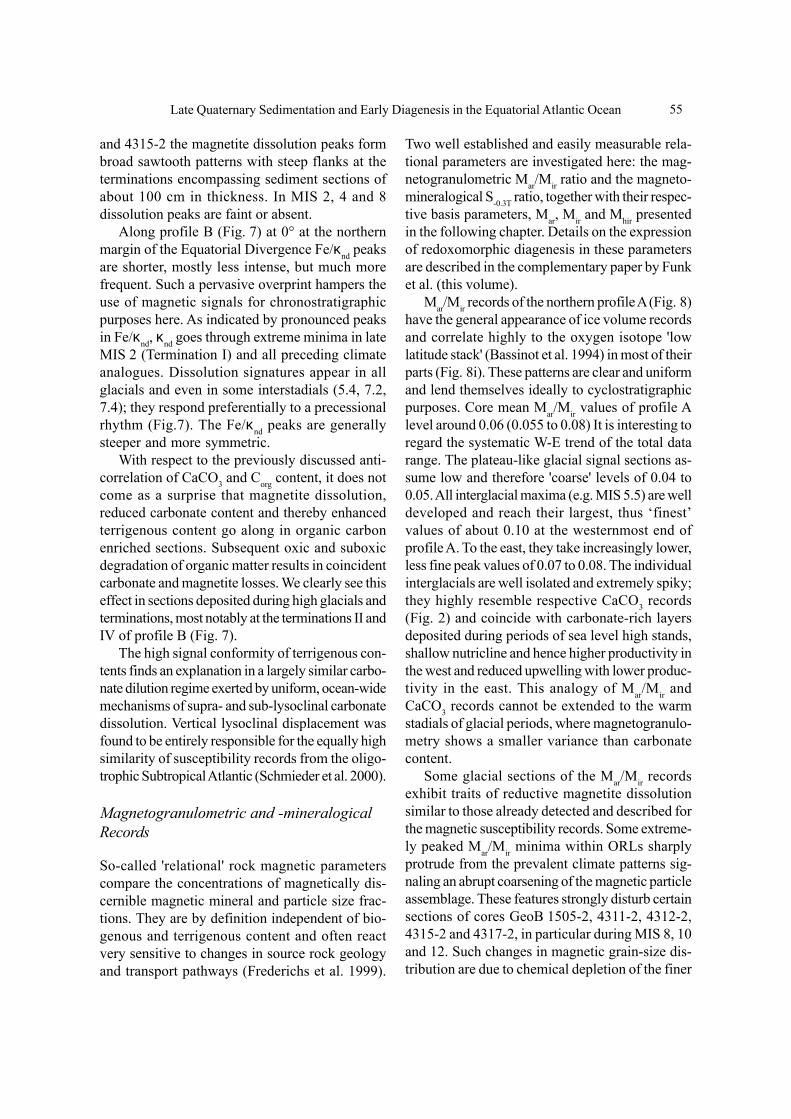
Late Quaternary Sedimentation and Early Diagenesis in the Equatorial Atlantic Ocean 55
and 4315-2 the magnetite dissolution peaks formbroad sawtooth patterns with steep flanks at theterminations encompassing sediment sections ofabout 100 cm in thickness. In MIS 2, 4 and 8dissolution peaks are faint or absent.
Along profile B (Fig. 7) at 0° at the northernmargin of the Equatorial Divergence Fe/κnd peaksare shorter, mostly less intense, but much morefrequent. Such a pervasive overprint hampers theuse of magnetic signals for chronostratigraphicpurposes here. As indicated by pronounced peaksin Fe/κnd, κnd goes through extreme minima in lateMIS 2 (Termination I) and all preceding climateanalogues. Dissolution signatures appear in allglacials and even in some interstadials (5.4, 7.2,7.4); they respond preferentially to a precessionalrhythm (Fig.7). The Fe/κnd peaks are generallysteeper and more symmetric.
With respect to the previously discussed anti-correlation of CaCO3 and Corg content, it does notcome as a surprise that magnetite dissolution,reduced carbonate content and thereby enhancedterrigenous content go along in organic carbonenriched sections. Subsequent oxic and suboxicdegradation of organic matter results in coincidentcarbonate and magnetite losses. We clearly see thiseffect in sections deposited during high glacials andterminations, most notably at the terminations II andIV of profile B (Fig. 7).
The high signal conformity of terrigenous con-tents finds an explanation in a largely similar carbo-nate dilution regime exerted by uniform, ocean-widemechanisms of supra- and sub-lysoclinal carbonatedissolution. Vertical lysoclinal displacement wasfound to be entirely responsible for the equally highsimilarity of susceptibility records from the oligo-trophic Subtropical Atlantic (Schmieder et al. 2000).
Magnetogranulometric and -mineralogicalRecords
So-called 'relational' rock magnetic parameterscompare the concentrations of magnetically dis-cernible magnetic mineral and particle size frac-tions. They are by definition independent of bio-genous and terrigenous content and often reactvery sensitive to changes in source rock geologyand transport pathways (Frederichs et al. 1999).
Two well established and easily measurable rela-tional parameters are investigated here: the mag-netogranulometric Mar/Mir ratio and the magneto-mineralogical S-0.3T ratio, together with their respec-tive basis parameters, Mar, Mir and Mhir presentedin the following chapter. Details on the expressionof redoxomorphic diagenesis in these parametersare described in the complementary paper by Funket al. (this volume).
Mar/Mir records of the northern profile A (Fig. 8)have the general appearance of ice volume recordsand correlate highly to the oxygen isotope 'lowlatitude stack' (Bassinot et al. 1994) in most of theirparts (Fig. 8i). These patterns are clear and uniformand lend themselves ideally to cyclostratigraphicpurposes. Core mean Mar/Mir values of profile Alevel around 0.06 (0.055 to 0.08) It is interesting toregard the systematic W-E trend of the total datarange. The plateau-like glacial signal sections as-sume low and therefore 'coarse' levels of 0.04 to0.05. All interglacial maxima (e.g. MIS 5.5) are welldeveloped and reach their largest, thus ‘finest’values of about 0.10 at the westernmost end ofprofile A. To the east, they take increasingly lower,less fine peak values of 0.07 to 0.08. The individualinterglacials are well isolated and extremely spiky;they highly resemble respective CaCO3 records(Fig. 2) and coincide with carbonate-rich layersdeposited during periods of sea level high stands,shallow nutricline and hence higher productivity inthe west and reduced upwelling with lower produc-tivity in the east. This analogy of Mar/Mir andCaCO3 records cannot be extended to the warmstadials of glacial periods, where magnetogranulo-metry shows a smaller variance than carbonatecontent.
Some glacial sections of the Mar/Mir recordsexhibit traits of reductive magnetite dissolutionsimilar to those already detected and described forthe magnetic susceptibility records. Some extreme-ly peaked Mar/Mir minima within ORLs sharplyprotrude from the prevalent climate patterns sig-naling an abrupt coarsening of the magnetic particleassemblage. These features strongly disturb certainsections of cores GeoB 1505-2, 4311-2, 4312-2,4315-2 and 4317-2, in particular during MIS 8, 10and 12. Such changes in magnetic grain-size dis-tribution are due to chemical depletion of the finer
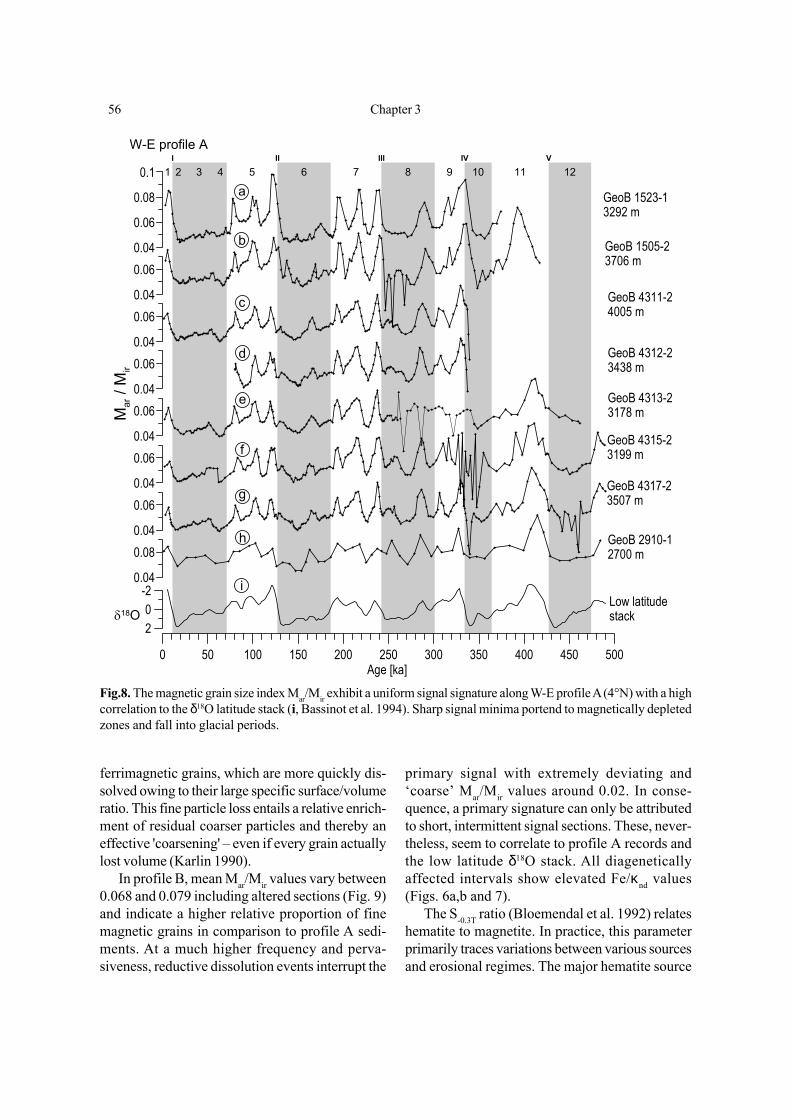
56 Chapter 3
ferrimagnetic grains, which are more quickly dis-solved owing to their large specific surface/volumeratio. This fine particle loss entails a relative enrich-ment of residual coarser particles and thereby aneffective 'coarsening' – even if every grain actuallylost volume (Karlin 1990).
In profile B, mean Mar/Mir values vary between0.068 and 0.079 including altered sections (Fig. 9)and indicate a higher relative proportion of finemagnetic grains in comparison to profile A sedi-ments. At a much higher frequency and perva-siveness, reductive dissolution events interrupt the
primary signal with extremely deviating and‘coarse’ Mar/Mir values around 0.02. In conse-quence, a primary signature can only be attributedto short, intermittent signal sections. These, never-theless, seem to correlate to profile A records andthe low latitude δ18O stack. All diageneticallyaffected intervals show elevated Fe/κnd values(Figs. 6a,b and 7).
The S-0.3T ratio (Bloemendal et al. 1992) relateshematite to magnetite. In practice, this parameterprimarily traces variations between various sourcesand erosional regimes. The major hematite source
Fig.8. The magnetic grain size index Mar/Mir exhibit a uniform signal signature along W-E profile A (4°N) with a highcorrelation to the δ18O latitude stack (i, Bassinot et al. 1994). Sharp signal minima portend to magnetically depletedzones and fall into glacial periods.
1 2 3 4 5 6 7 8 9 10 11 12I II III IV V
0 50 100 150 200 250 300 350 400 450 500Age [ka]
0.04
0.060.04
0.06
0.04
0.06
0.04
0.06
0.04
0.06
20
-2
0.04
0.06
0.04
0.08
0.04
0.06
0.08
0.1
δ18O
Mar /
Mir
Low latitudestack
W-E profile A
GeoB 4311-24005 m
GeoB 4312-23438 m
GeoB 4313-23178 m
GeoB 4315-23199 m
GeoB 4317-23507 m
GeoB 1505-23706 m
GeoB 2910-12700 m
GeoB 1523-13292 m
a
b
c
d
e
f
g
h
i
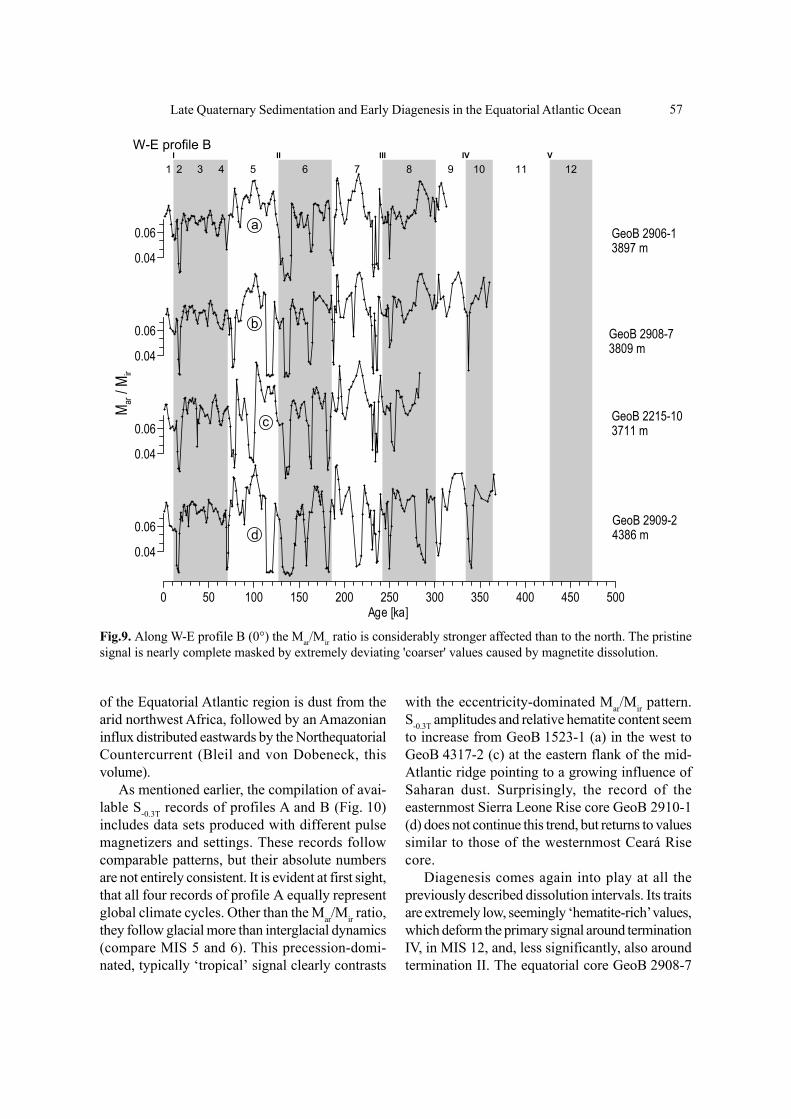
Late Quaternary Sedimentation and Early Diagenesis in the Equatorial Atlantic Ocean 57
of the Equatorial Atlantic region is dust from thearid northwest Africa, followed by an Amazonianinflux distributed eastwards by the NorthequatorialCountercurrent (Bleil and von Dobeneck, thisvolume).
As mentioned earlier, the compilation of avai-lable S-0.3T records of profiles A and B (Fig. 10)includes data sets produced with different pulsemagnetizers and settings. These records followcomparable patterns, but their absolute numbersare not entirely consistent. It is evident at first sight,that all four records of profile A equally representglobal climate cycles. Other than the Mar/Mir ratio,they follow glacial more than interglacial dynamics(compare MIS 5 and 6). This precession-domi-nated, typically ‘tropical’ signal clearly contrasts
with the eccentricity-dominated Mar/Mir pattern.S-0.3T amplitudes and relative hematite content seemto increase from GeoB 1523-1 (a) in the west toGeoB 4317-2 (c) at the eastern flank of the mid-Atlantic ridge pointing to a growing influence ofSaharan dust. Surprisingly, the record of theeasternmost Sierra Leone Rise core GeoB 2910-1(d) does not continue this trend, but returns to valuessimilar to those of the westernmost Ceará Risecore.
Diagenesis comes again into play at all thepreviously described dissolution intervals. Its traitsare extremely low, seemingly ‘hematite-rich’ values,which deform the primary signal around terminationIV, in MIS 12, and, less significantly, also aroundtermination II. The equatorial core GeoB 2908-7
Fig.9. Along W-E profile B (0°) the Mar/Mir ratio is considerably stronger affected than to the north. The pristinesignal is nearly complete masked by extremely deviating 'coarser' values caused by magnetite dissolution.
1 2 3 4 5 6 7 8 9 10 11 12I II III IV V
0 50 100 150 200 250 300 350 400 450 500Age [ka]
0.04
0.06
0.04
0.06
0.04
0.06
0.04
0.06
M ar / M
ir
GeoB 2906-13897 m
GeoB 2908-73809 m
GeoB 2215-103711 m
GeoB 2909-24386 m
a
b
c
d
W-E profile B
58 Chapter 3
(e) shows again stronger and more frequent over-printing in all the numerous ORLs at terminationsI, II, III and IV as well as in MIS 4 and 6. Thischange in magnetic composition is primarily relatedto magnetite depletion by reductive dissolution,leaving the more reduction-resistant, probably alsocoarser hematite phases behind as a relict mineral.
Selective Rock Magnetic Records
In order to resolve the climatic controls responsiblefor the signal characteristics of the two rock mag-netic proxies Mar/Mir and S-0.3T, it is necessary totake a look at their three defining curves Mar, Mirand Mhir, tracking fine-particle (SD) magnetite, totalmagnetite and hematite content, respectively. Theco-compilation of these three parameters (Fig. 11)raises evidence for a regional interpretation.
A detailed inspection of all curves shows, that
their patterns are essentially quite similar. However,their dynamics and signal levels vary considerably.These properties are most easily compared on basisof some statistical quantities compiled in Table 2,comprising arithmetic means, relative standarddeviations and interparametric Pearson’s correla-tion coefficients. Signal sections severely affectedby diagenesis were excluded from this calculation.Three main trends can be observed:
1. Comparing relative standard deviations of allparameters and sites, we find that hematite vari-ance systematically exceeds coarse magnetitevariance and nearly doubles fine magnetite vari-ance. We also note, that all these variances increasefrom west to east.
2. Correlation coefficients between hematiteand coarse magnetite records are always higherthan those between fine and coarse magnetiterecords. Correlations improve from west to east,
Fig.10. Compilation of S-0.3T records of profiles A and B. For explanation see text.
1 2 3 4 5 6 7 8 9 10 11 12I II III IV V
0 50 100 150 200 250 300 350 400 450 500Age [ka]
0.850.9
0.95
0.850.9
0.95
0.850.9
0.95S-3.0T
0.850.9
0.95
0.850.9
0.95
W-E profile A-B
a
b
c
d
e
GeoB 1505-23706 m
GeoB 1523-13292 m
GeoB 4317-23507 m
GeoB 2910-12700 m
GeoB 2908-73809 m
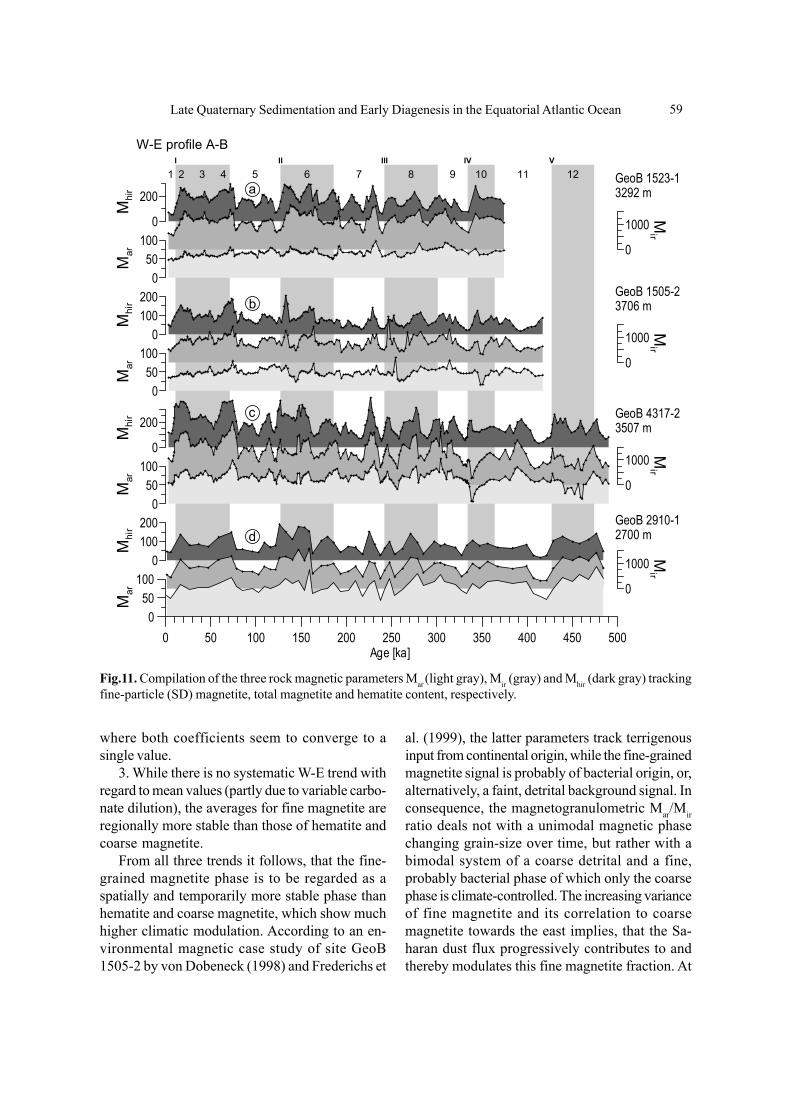
Late Quaternary Sedimentation and Early Diagenesis in the Equatorial Atlantic Ocean 59
where both coefficients seem to converge to asingle value.
3. While there is no systematic W-E trend withregard to mean values (partly due to variable carbo-nate dilution), the averages for fine magnetite areregionally more stable than those of hematite andcoarse magnetite.
From all three trends it follows, that the fine-grained magnetite phase is to be regarded as aspatially and temporarily more stable phase thanhematite and coarse magnetite, which show muchhigher climatic modulation. According to an en-vironmental magnetic case study of site GeoB1505-2 by von Dobeneck (1998) and Frederichs et
al. (1999), the latter parameters track terrigenousinput from continental origin, while the fine-grainedmagnetite signal is probably of bacterial origin, or,alternatively, a faint, detrital background signal. Inconsequence, the magnetogranulometric Mar/Mirratio deals not with a unimodal magnetic phasechanging grain-size over time, but rather with abimodal system of a coarse detrital and a fine,probably bacterial phase of which only the coarsephase is climate-controlled. The increasing varianceof fine magnetite and its correlation to coarsemagnetite towards the east implies, that the Sa-haran dust flux progressively contributes to andthereby modulates this fine magnetite fraction. At
Fig.11. Compilation of the three rock magnetic parameters Mar (light gray), Mir (gray) and Mhir (dark gray) trackingfine-particle (SD) magnetite, total magnetite and hematite content, respectively.
1 2 3 4 5 6 7 8 9 10 11 12I II III IV V
0100200
Mhi
r
0
1000 Mir
050
100
Mar
0100200
Mhi
r
0
1000 Mir
0
200
Mhi
r
0
1000 Mir
050
100
Mar
050
100
Mar
0
200
Mhi
r
0
1000 Mir
050
100
Mar
0 50 100 150 200 250 300 350 400 450 500Age [ka]
W-E profile A-B
GeoB 4317-23507 m
GeoB 1505-23706 m
GeoB 2910-12700 m
GeoB 1523-13292 ma
b
c
d
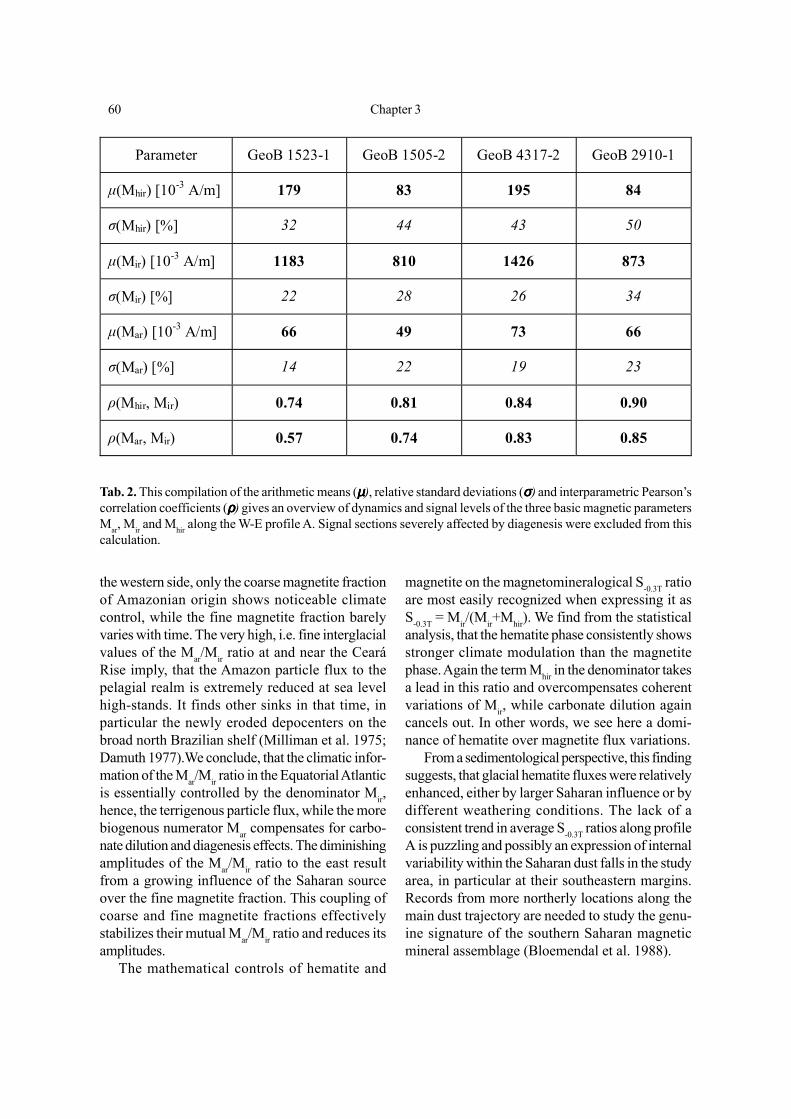
60 Chapter 3
the western side, only the coarse magnetite fractionof Amazonian origin shows noticeable climatecontrol, while the fine magnetite fraction barelyvaries with time. The very high, i.e. fine interglacialvalues of the Mar/Mir ratio at and near the CearáRise imply, that the Amazon particle flux to thepelagial realm is extremely reduced at sea levelhigh-stands. It finds other sinks in that time, inparticular the newly eroded depocenters on thebroad north Brazilian shelf (Milliman et al. 1975;Damuth 1977).We conclude, that the climatic infor-mation of the Mar/Mir ratio in the Equatorial Atlanticis essentially controlled by the denominator Mir,hence, the terrigenous particle flux, while the morebiogenous numerator Mar compensates for carbo-nate dilution and diagenesis effects. The diminishingamplitudes of the Mar/Mir ratio to the east resultfrom a growing influence of the Saharan sourceover the fine magnetite fraction. This coupling ofcoarse and fine magnetite fractions effectivelystabilizes their mutual Mar/Mir ratio and reduces itsamplitudes.
The mathematical controls of hematite and
magnetite on the magnetomineralogical S-0.3T ratioare most easily recognized when expressing it asS-0.3T = Mir/(Mir+Mhir). We find from the statisticalanalysis, that the hematite phase consistently showsstronger climate modulation than the magnetitephase. Again the term Mhir in the denominator takesa lead in this ratio and overcompensates coherentvariations of Mir, while carbonate dilution againcancels out. In other words, we see here a domi-nance of hematite over magnetite flux variations.
From a sedimentological perspective, this findingsuggests, that glacial hematite fluxes were relativelyenhanced, either by larger Saharan influence or bydifferent weathering conditions. The lack of aconsistent trend in average S-0.3T ratios along profileA is puzzling and possibly an expression of internalvariability within the Saharan dust falls in the studyarea, in particular at their southeastern margins.Records from more northerly locations along themain dust trajectory are needed to study the genu-ine signature of the southern Saharan magneticmineral assemblage (Bloemendal et al. 1988).
Tab. 2. This compilation of the arithmetic means (µµµµµ), relative standard deviations (σσσσσ) and interparametric Pearson’scorrelation coefficients (ρρρρρ) gives an overview of dynamics and signal levels of the three basic magnetic parametersMar, Mir and Mhir along the W-E profile A. Signal sections severely affected by diagenesis were excluded from thiscalculation.
Parameter GeoB 1523-1 GeoB 1505-2 GeoB 4317-2 GeoB 2910-1
µ(Mhir) [10-3 A/m] 179 83 195 84
σ(Mhir) [%] 32 44 43 50
µ(Mir) [10-3 A/m] 1183 810 1426 873
σ(Mir) [%] 22 28 26 34
µ(Mar) [10-3 A/m] 66 49 73 66
σ(Mar) [%] 14 22 19 23
ρ(Mhir, Mir) 0.74 0.81 0.84 0.90
ρ(Mar, Mir) 0.57 0.74 0.83 0.85
Late Quaternary Sedimentation and Early Diagenesis in the Equatorial Atlantic Ocean 61
Synopsis of Glacial/InterglacialAccumulation Rate Averages
For paleoclimate research we need to know indi-vidual material fluxes and budgets, which can onlybe resumed from accumulation rates (AR).Inawareness of the known difficulties involved inestimating accumulation rates from records withcyclostratigraphic, i.e. relative age models wedecided to follow the approach of Ruddimann(1997) and Wagner (2000), who limited AR errorsresulting from dating uncertainties by averagingover larger time intervals. Here we determinedARs over extended glacial (MIS 2+3+4, 6) andinterglacial (MIS 1, 5, 7) periods of the 100 kyrcycle. That this approach largely cancels out pre-cessional variations. An additional problem wasencountered with the two western cores of profileA, which suffer from noticeable coring inducedcompression in their lower parts. This problem isoften encountered when coring porous, clay-richand therefore easily deformable sediments. A mod-est compression has little effect on concentrationrecords if these have been correctly transposedinto the time domain. However, the deformation ofaccumulation records is by far more problematicand not tolerable, when it comes to compare ab-solute AR values. As a conservative but firmapproach, all AR averages of profile A were there-fore exclusively derived from the last 200 kyr,where compression (Bleil and von Dobeneck, thisvolume) and early diagenesis seem to have donelittle damage. Each region is represented by a singlesediment core.
For most of the W-E profile (Fig. 12), totalsedimentation rates (a) amount to some 2.5 cm/kyrand show little or no consistent glacial/interglacialvariability. As sole exception, the Sierra Leone Riserecord GeoB 2910-1 has a 40% lower sedimen-tation rate of about 1.4 cm/kyr. In terms of bio-genous (d) and terrigenous (f) content, the latterdecreases from about 55% in the west to around35% in the east. Since AR averages of CaCO3 (e)of roughly 1 g/cm2 kyr do not show large zonal ortemporal gradients, the glacial/interglacial shifts innon-CaCO3 AR averages (g) are largely respon-sible for lithological variability. We notice a W-Edecrease from 1.2 over 0.78 and 0.75 down to
0.35 g/cm2 kyr. This trend is obviously inverse tothe trade wind direction and, unless we take at-mospheric focusing of the Saharan dust fall intoconsideration, also to existing opinions on Saharanprevalence in the central Equatorial Atlantic.
In particular the very low eastern detrital ARsare astonishing and raise some suspect that win-nowing may have come into play at this topographicheight of the Sierra Leone Rise. On the other hand,we find also the largest, i.e. finest average Mar/Mirratios at this eastern site (Fig. 9). Magnetic 'fining',however, is contradictive to elevated bottom currentvelocities. Furthermore, we find also the highestand most climate dependent susceptibilities (h) atthis site, in spite of the lower terrigenous contents.
The governing W-E trend from lower to highercarbonate-free susceptibilities is only interrupted byGeoB 4317-2, the only core with relatively lowersusceptibility and magnetite AR during glacials (i).This is clearly an effect of the large magnetite lossesduring glacial MIS 6 as suggested by highest glacialTOC averages (0.30%) among all cores of profileA (b).
Comparing TOC contents (b) and ARs (c), wefind, that some subtle shifts towards higher glacialTOC contents observed in the three western coresare at least partly due to carbonate dilution. Inreality, TOC accumulation at the Ceará Rise evendrops slightly during glacials as to be expected fromthe shear wind driven seesaw mechanism, whichdisequilibrates glacial Equatorial Atlantic produc-tivity by lifting the eastern and lowering the westernnutricline. Indeed, glacial Corg burial rates weresome 19% higher on the western and 36% higheron the eastern flanks of the MAR, most likely dueto larger W-E gradients in ocean productivity.
AR averages of glacial/interglacial Corg andCaCO3 shift inversely like the earlier shown signalpatterns. GeoB 4317-2, the core with the highestglacial TOC increase and magnetite loss, alsofeatures the largest drop to glacial CaCO3 accu-mulation rates. This drop in carbonate sedimentationis also seen at the shallow Ceará Rise core GeoB1523-1 (2845 m) whereas the deepest core GeoB1505-2 (3706 m) shows nearly balanced glacial/interglacial CaCO3 contents and ARs. This againis strong evidence for a lead of sedimentary dia-genesis over CCD oscillation in controlling supra-
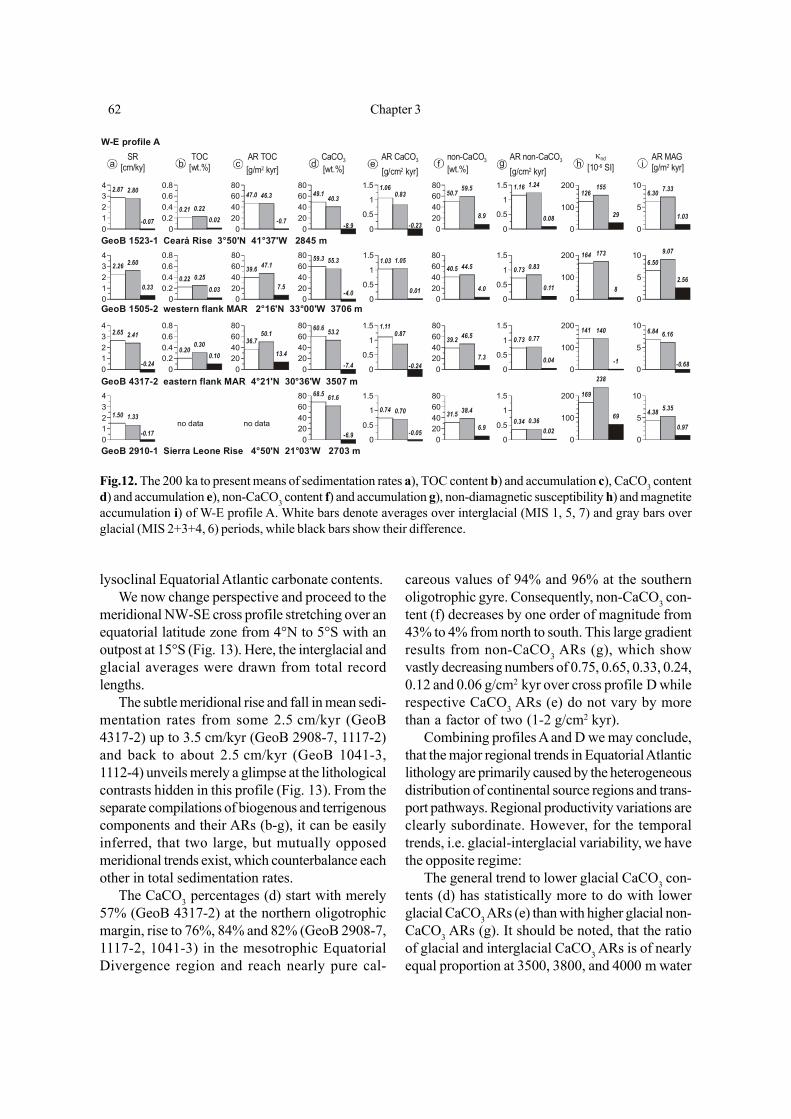
62 Chapter 3
lysoclinal Equatorial Atlantic carbonate contents.We now change perspective and proceed to the
meridional NW-SE cross profile stretching over anequatorial latitude zone from 4°N to 5°S with anoutpost at 15°S (Fig. 13). Here, the interglacial andglacial averages were drawn from total recordlengths.
The subtle meridional rise and fall in mean sedi-mentation rates from some 2.5 cm/kyr (GeoB4317-2) up to 3.5 cm/kyr (GeoB 2908-7, 1117-2)and back to about 2.5 cm/kyr (GeoB 1041-3,1112-4) unveils merely a glimpse at the lithologicalcontrasts hidden in this profile (Fig. 13). From theseparate compilations of biogenous and terrigenouscomponents and their ARs (b-g), it can be easilyinferred, that two large, but mutually opposedmeridional trends exist, which counterbalance eachother in total sedimentation rates.
The CaCO3 percentages (d) start with merely57% (GeoB 4317-2) at the northern oligotrophicmargin, rise to 76%, 84% and 82% (GeoB 2908-7,1117-2, 1041-3) in the mesotrophic EquatorialDivergence region and reach nearly pure cal-
careous values of 94% and 96% at the southernoligotrophic gyre. Consequently, non-CaCO3 con-tent (f) decreases by one order of magnitude from43% to 4% from north to south. This large gradientresults from non-CaCO3 ARs (g), which showvastly decreasing numbers of 0.75, 0.65, 0.33, 0.24,0.12 and 0.06 g/cm2 kyr over cross profile D whilerespective CaCO3 ARs (e) do not vary by morethan a factor of two (1-2 g/cm2 kyr).
Combining profiles A and D we may conclude,that the major regional trends in Equatorial Atlanticlithology are primarily caused by the heterogeneousdistribution of continental source regions and trans-port pathways. Regional productivity variations areclearly subordinate. However, for the temporaltrends, i.e. glacial-interglacial variability, we havethe opposite regime:
The general trend to lower glacial CaCO3 con-tents (d) has statistically more to do with lowerglacial CaCO3 ARs (e) than with higher glacial non-CaCO3 ARs (g). It should be noted, that the ratioof glacial and interglacial CaCO3 ARs is of nearlyequal proportion at 3500, 3800, and 4000 m water
Fig.12. The 200 ka to present means of sedimentation rates a), TOC content b) and accumulation c), CaCO3 contentd) and accumulation e), non-CaCO3 content f) and accumulation g), non-diamagnetic susceptibility h) and magnetiteaccumulation i) of W-E profile A. White bars denote averages over interglacial (MIS 1, 5, 7) and gray bars overglacial (MIS 2+3+4, 6) periods, while black bars show their difference.
00.20.40.60.8
0.200.30
0.10
020406080
36.750.1
13.4
020406080 60.6 53.2
-7.4 0
0.5
1
1.5 1.110.87
-0.24 0
100
200 141 140
-10
5
106.84 6.16
-0.6801234
2.65 2.41
-0.240
0.5
1
1.5
0.73 0.77
0.040
20406080
39.2 46.5
7.3
00.20.40.60.8
0.22 0.250.03
020406080
39.6 47.1
7.5
020406080 59.3 55.3
-4.00
0.5
1
1.51.03 1.05
0.010
100
200 164 173
80
5
106.50
9.07
2.56
01234
2.26 2.60
0.330
0.5
1
1.5
0.73 0.83
0.110
20406080
40.5 44.5
4.0
0
5
106.30 7.33
1.03
0
100
200126
155
29
0
0.5
1
1.5 1.16 1.24
0.080
20406080
50.7 59.5
8.9
0
0.5
1
1.5 1.060.83
-0.23020406080
49.140.3
-8.9020406080
47.0 46.3
-0.70
0.20.40.60.8
0.21 0.220.02
01234 2.87 2.80
-0.07
020406080 68.5 61.6
-6.9 0
0.5
1
1.5
0.74 0.70
-0.050
100
200 169
238
69
0
5
10
4.38 5.35
0.97
01234
1.50 1.33
-0.170
0.5
1
1.5
0.34 0.360.02
020406080
31.5 38.4
6.9no data no data
AR TOC[g/m2 kyr]
TOC[wt.%]
SR[cm/ky]
CaCO3
[wt.%]AR CaCO3
[g/cm2 kyr]non-CaCO3
[wt.%]AR non-CaCO3
[g/cm2 kyr]
κnd
[10-6 SI]AR MAG[g/m2 kyr]cba d e f g h i
GeoB 2910-1 Sierra Leone Rise 4°50'N 21°03'W 2703 m
GeoB 4317-2 eastern flank MAR 4°21'N 30°36'W 3507 m
GeoB 1505-2 western flank MAR 2°16'N 33°00'W 3706 m
GeoB 1523-1 Ceará Rise 3°50'N 41°37'W 2845 m
W-E profile A
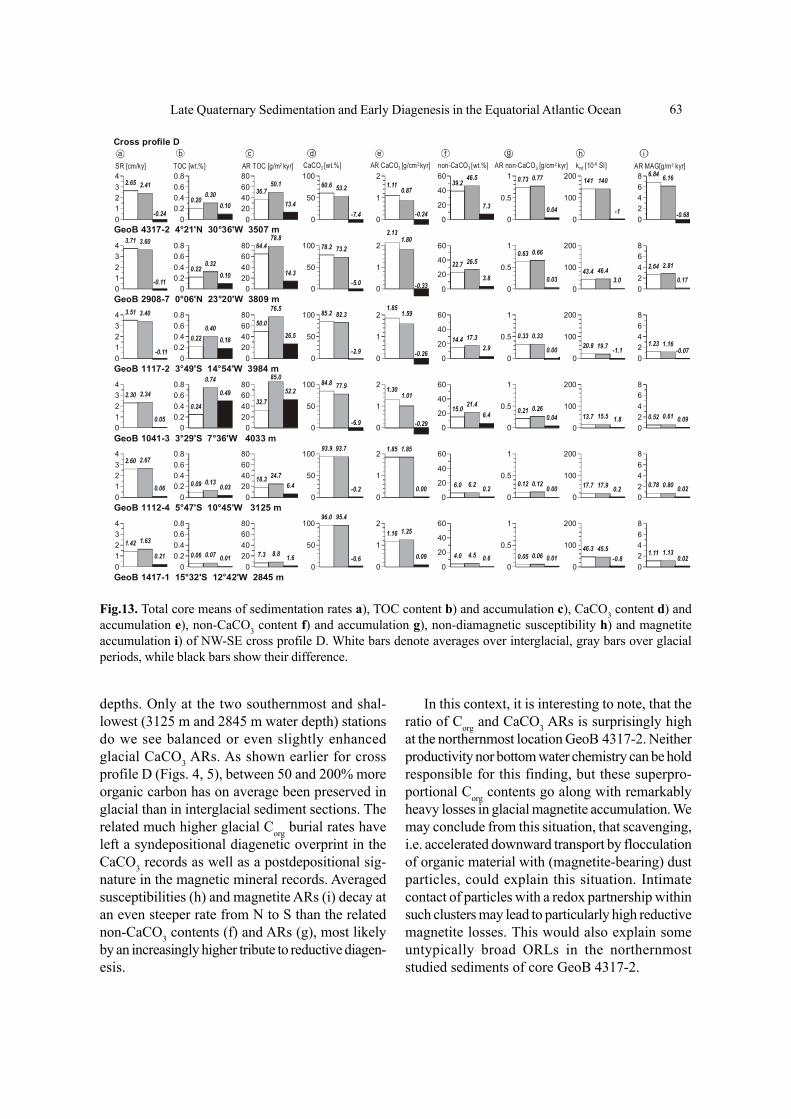
Late Quaternary Sedimentation and Early Diagenesis in the Equatorial Atlantic Ocean 63
depths. Only at the two southernmost and shal-lowest (3125 m and 2845 m water depth) stationsdo we see balanced or even slightly enhancedglacial CaCO3 ARs. As shown earlier for crossprofile D (Figs. 4, 5), between 50 and 200% moreorganic carbon has on average been preserved inglacial than in interglacial sediment sections. Therelated much higher glacial Corg burial rates haveleft a syndepositional diagenetic overprint in theCaCO3 records as well as a postdepositional sig-nature in the magnetic mineral records. Averagedsusceptibilities (h) and magnetite ARs (i) decay atan even steeper rate from N to S than the relatednon-CaCO3 contents (f) and ARs (g), most likelyby an increasingly higher tribute to reductive diagen-esis.
In this context, it is interesting to note, that theratio of Corg and CaCO3 ARs is surprisingly highat the northernmost location GeoB 4317-2. Neitherproductivity nor bottom water chemistry can be holdresponsible for this finding, but these superpro-portional Corg contents go along with remarkablyheavy losses in glacial magnetite accumulation. Wemay conclude from this situation, that scavenging,i.e. accelerated downward transport by flocculationof organic material with (magnetite-bearing) dustparticles, could explain this situation. Intimatecontact of particles with a redox partnership withinsuch clusters may lead to particularly high reductivemagnetite losses. This would also explain someuntypically broad ORLs in the northernmoststudied sediments of core GeoB 4317-2.
Fig.13. Total core means of sedimentation rates a), TOC content b) and accumulation c), CaCO3 content d) andaccumulation e), non-CaCO3 content f) and accumulation g), non-diamagnetic susceptibility h) and magnetiteaccumulation i) of NW-SE cross profile D. White bars denote averages over interglacial, gray bars over glacialperiods, while black bars show their difference.
TOC [wt.%] AR TOC [g/m2 kyr] CaCO3 [wt.%] AR CaCO3 [g/cm2 kyr] knd [10-6 SI] AR MAG[g/m2 kyr]SR [cm/ky] AR non-CaCO3 [g/cm2 kyr]non-CaCO3 [wt.%]
02468
1.11 1.130.02
0
100
200
46.3 45.5-0.8
0
1
21.16 1.25
0.090
50
10096.0 95.4
-0.6020406080
7.3 8.8 1.60
0.20.40.60.8
0.06 0.07 0.0101234
1.42 1.63
0.210
20
40
60
4.0 4.5 0.60
0.5
1
0.05 0.06 0.01
02468
0.78 0.80 0.020
100
200
17.7 17.9 0.20
1
2 1.85 1.85
0.000
50
10093.9 93.7
-0.2020406080
18.3 24.76.4
00.20.40.60.8
0.09 0.13 0.03012342.60 2.67
0.060
20
40
60
6.0 6.2 0.20
0.5
1
0.12 0.120.00
02468
0.52 0.61 0.090
100
200
13.7 15.5 1.80
1
2 1.301.01
-0.290
50
100 84.8 77.9
-6.9020406080
32.7
85.0
52.2
00.20.40.60.8
0.24
0.74
0.49
012342.30 2.34
0.050
20
40
60
15.0 21.46.4
0
0.5
1
0.21 0.260.04
00.20.40.60.8
0.220.40
0.18
020406080
50.0
76.5
26.5
0
50
100 85.2 82.3
-2.90
1
21.85
1.59
-0.26 0
100
200
20.8 19.7 -1.102468
1.23 1.16-0.07
01234 3.51 3.40
-0.110
20
40
60
14.4 17.32.9
0
0.5
1
0.33 0.33
0.00
00.20.40.60.8
0.220.32
0.10
020406080 64.4
78.8
14.3
0
50
100 78.2 73.2
-5.00
1
2
2.131.80
-0.33 0
100
200
43.4 46.43.0
02468
2.64 2.81
0.17012343.71 3.60
-0.110
20
40
60
22.7 26.5
3.80
0.5
10.63 0.66
0.03
00.20.40.60.8
0.200.30
0.10
020406080
36.750.1
13.4
0
50
10060.6 53.2
-7.40
1
21.11
0.87
-0.240
100
200 141 140
-102468 6.84 6.16
-0.68012342.65 2.41
-0.240
0.5
1 0.73 0.77
0.040
20
40
6039.2
46.5
7.3
a b c d e f g h i
GeoB 1041-3 3°29'S 7°36'W 4033 m
GeoB 1117-2 3°49'S 14°54'W 3984 m
GeoB 2908-7 0°06'N 23°20'W 3809 m
GeoB 4317-2 4°21'N 30°36'W 3507 m
Cross profile D
GeoB 1112-4 5°47'S 10°45'W 3125 m
GeoB 1417-1 15°32'S 12°42'W 2845 m
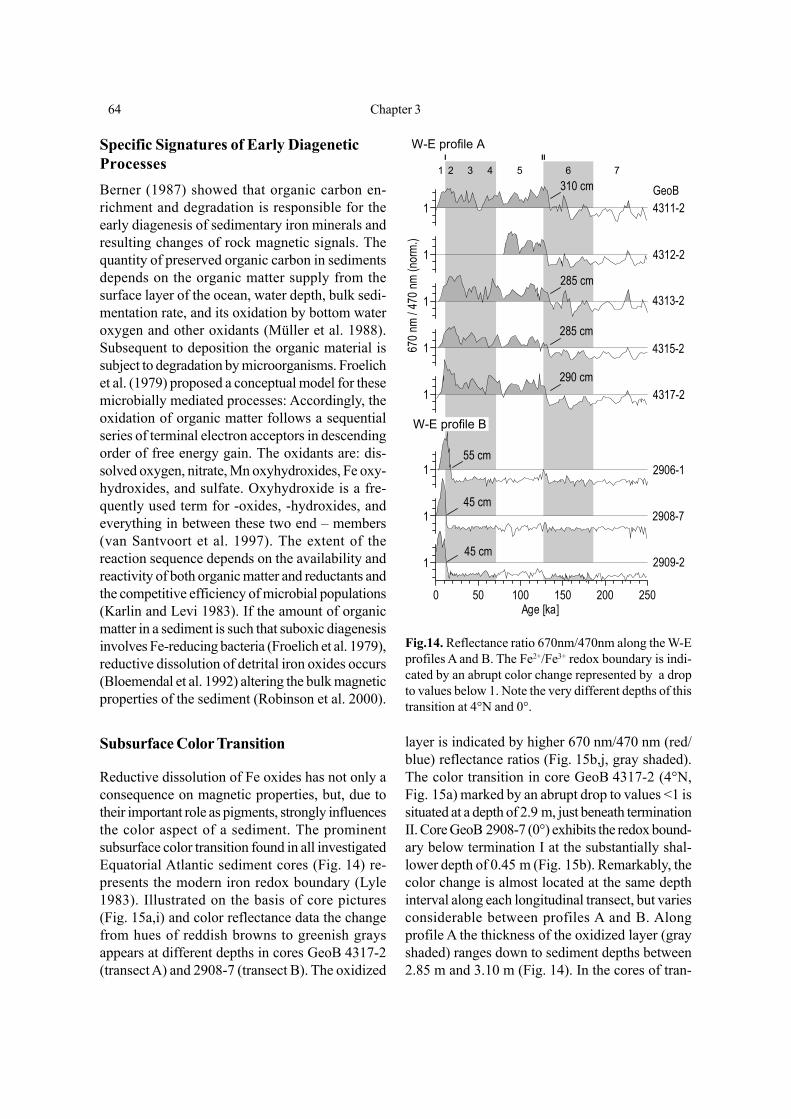
64 Chapter 3
Specific Signatures of Early DiageneticProcessesBerner (1987) showed that organic carbon en-richment and degradation is responsible for theearly diagenesis of sedimentary iron minerals andresulting changes of rock magnetic signals. Thequantity of preserved organic carbon in sedimentsdepends on the organic matter supply from thesurface layer of the ocean, water depth, bulk sedi-mentation rate, and its oxidation by bottom wateroxygen and other oxidants (Müller et al. 1988).Subsequent to deposition the organic material issubject to degradation by microorganisms. Froelichet al. (1979) proposed a conceptual model for thesemicrobially mediated processes: Accordingly, theoxidation of organic matter follows a sequentialseries of terminal electron acceptors in descendingorder of free energy gain. The oxidants are: dis-solved oxygen, nitrate, Mn oxyhydroxides, Fe oxy-hydroxides, and sulfate. Oxyhydroxide is a fre-quently used term for -oxides, -hydroxides, andeverything in between these two end – members(van Santvoort et al. 1997). The extent of thereaction sequence depends on the availability andreactivity of both organic matter and reductants andthe competitive efficiency of microbial populations(Karlin and Levi 1983). If the amount of organicmatter in a sediment is such that suboxic diagenesisinvolves Fe-reducing bacteria (Froelich et al. 1979),reductive dissolution of detrital iron oxides occurs(Bloemendal et al. 1992) altering the bulk magneticproperties of the sediment (Robinson et al. 2000).
Subsurface Color Transition
Reductive dissolution of Fe oxides has not only aconsequence on magnetic properties, but, due totheir important role as pigments, strongly influencesthe color aspect of a sediment. The prominentsubsurface color transition found in all investigatedEquatorial Atlantic sediment cores (Fig. 14) re-presents the modern iron redox boundary (Lyle1983). Illustrated on the basis of core pictures(Fig. 15a,i) and color reflectance data the changefrom hues of reddish browns to greenish graysappears at different depths in cores GeoB 4317-2(transect A) and 2908-7 (transect B). The oxidized
layer is indicated by higher 670 nm/470 nm (red/blue) reflectance ratios (Fig. 15b,j, gray shaded).The color transition in core GeoB 4317-2 (4°N,Fig. 15a) marked by an abrupt drop to values <1 issituated at a depth of 2.9 m, just beneath terminationII. Core GeoB 2908-7 (0°) exhibits the redox bound-ary below termination I at the substantially shal-lower depth of 0.45 m (Fig. 15b). Remarkably, thecolor change is almost located at the same depthinterval along each longitudinal transect, but variesconsiderable between profiles A and B. Alongprofile A the thickness of the oxidized layer (grayshaded) ranges down to sediment depths between2.85 m and 3.10 m (Fig. 14). In the cores of tran-
Fig.14. Reflectance ratio 670nm/470nm along the W-Eprofiles A and B. The Fe2+/Fe3+ redox boundary is indi-cated by an abrupt color change represented by a dropto values below 1. Note the very different depths of thistransition at 4°N and 0°.
I II
1 2 3 4 5 6 7
1
1
1
1
1
0 50 100 150 200 250Age [ka]
1
1
1
310 cm
45 cm
55 cm
45 cm
290 cm
285 cm
285 cm
4311-2
4312-2
4313-2
4315-2
4317-2
2906-1
2908-7
2909-2
GeoB
670 n
m / 4
70 nm
(nor
m.)
W-E profile A
W-E profile B
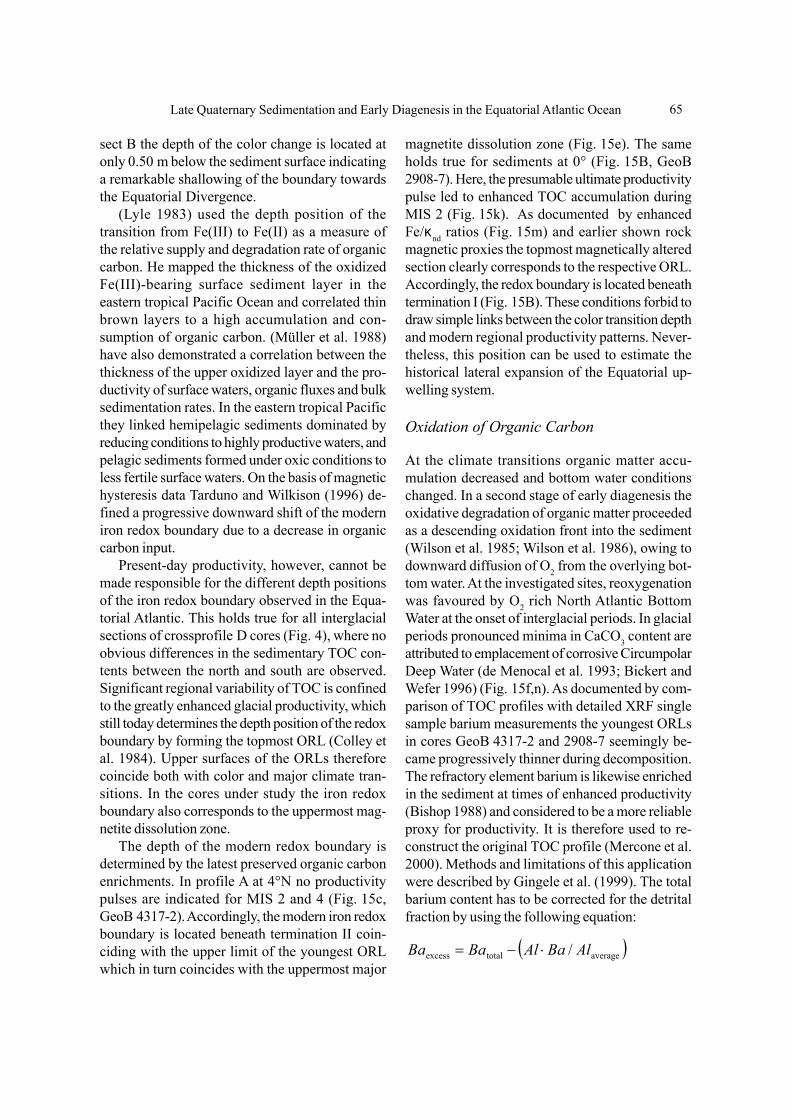
Late Quaternary Sedimentation and Early Diagenesis in the Equatorial Atlantic Ocean 65
sect B the depth of the color change is located atonly 0.50 m below the sediment surface indicatinga remarkable shallowing of the boundary towardsthe Equatorial Divergence.
(Lyle 1983) used the depth position of thetransition from Fe(III) to Fe(II) as a measure ofthe relative supply and degradation rate of organiccarbon. He mapped the thickness of the oxidizedFe(III)-bearing surface sediment layer in theeastern tropical Pacific Ocean and correlated thinbrown layers to a high accumulation and con-sumption of organic carbon. (Müller et al. 1988)have also demonstrated a correlation between thethickness of the upper oxidized layer and the pro-ductivity of surface waters, organic fluxes and bulksedimentation rates. In the eastern tropical Pacificthey linked hemipelagic sediments dominated byreducing conditions to highly productive waters, andpelagic sediments formed under oxic conditions toless fertile surface waters. On the basis of magnetichysteresis data Tarduno and Wilkison (1996) de-fined a progressive downward shift of the moderniron redox boundary due to a decrease in organiccarbon input.
Present-day productivity, however, cannot bemade responsible for the different depth positionsof the iron redox boundary observed in the Equa-torial Atlantic. This holds true for all interglacialsections of crossprofile D cores (Fig. 4), where noobvious differences in the sedimentary TOC con-tents between the north and south are observed.Significant regional variability of TOC is confinedto the greatly enhanced glacial productivity, whichstill today determines the depth position of the redoxboundary by forming the topmost ORL (Colley etal. 1984). Upper surfaces of the ORLs thereforecoincide both with color and major climate tran-sitions. In the cores under study the iron redoxboundary also corresponds to the uppermost mag-netite dissolution zone.
The depth of the modern redox boundary isdetermined by the latest preserved organic carbonenrichments. In profile A at 4°N no productivitypulses are indicated for MIS 2 and 4 (Fig. 15c,GeoB 4317-2). Accordingly, the modern iron redoxboundary is located beneath termination II coin-ciding with the upper limit of the youngest ORLwhich in turn coincides with the uppermost major
magnetite dissolution zone (Fig. 15e). The sameholds true for sediments at 0° (Fig. 15B, GeoB2908-7). Here, the presumable ultimate productivitypulse led to enhanced TOC accumulation duringMIS 2 (Fig. 15k). As documented by enhancedFe/κnd ratios (Fig. 15m) and earlier shown rockmagnetic proxies the topmost magnetically alteredsection clearly corresponds to the respective ORL.Accordingly, the redox boundary is located beneathtermination I (Fig. 15B). These conditions forbid todraw simple links between the color transition depthand modern regional productivity patterns. Never-theless, this position can be used to estimate thehistorical lateral expansion of the Equatorial up-welling system.
Oxidation of Organic Carbon
At the climate transitions organic matter accu-mulation decreased and bottom water conditionschanged. In a second stage of early diagenesis theoxidative degradation of organic matter proceededas a descending oxidation front into the sediment(Wilson et al. 1985; Wilson et al. 1986), owing todownward diffusion of O2 from the overlying bot-tom water. At the investigated sites, reoxygenationwas favoured by O2 rich North Atlantic BottomWater at the onset of interglacial periods. In glacialperiods pronounced minima in CaCO3 content areattributed to emplacement of corrosive CircumpolarDeep Water (de Menocal et al. 1993; Bickert andWefer 1996) (Fig. 15f,n). As documented by com-parison of TOC profiles with detailed XRF singlesample barium measurements the youngest ORLsin cores GeoB 4317-2 and 2908-7 seemingly be-came progressively thinner during decomposition.The refractory element barium is likewise enrichedin the sediment at times of enhanced productivity(Bishop 1988) and considered to be a more reliableproxy for productivity. It is therefore used to re-construct the original TOC profile (Mercone et al.2000). Methods and limitations of this applicationwere described by Gingele et al. (1999). The totalbarium content has to be corrected for the detritalfraction by using the following equation:
( )averagetotalexcess / AlBaAlBaBa ⋅−=
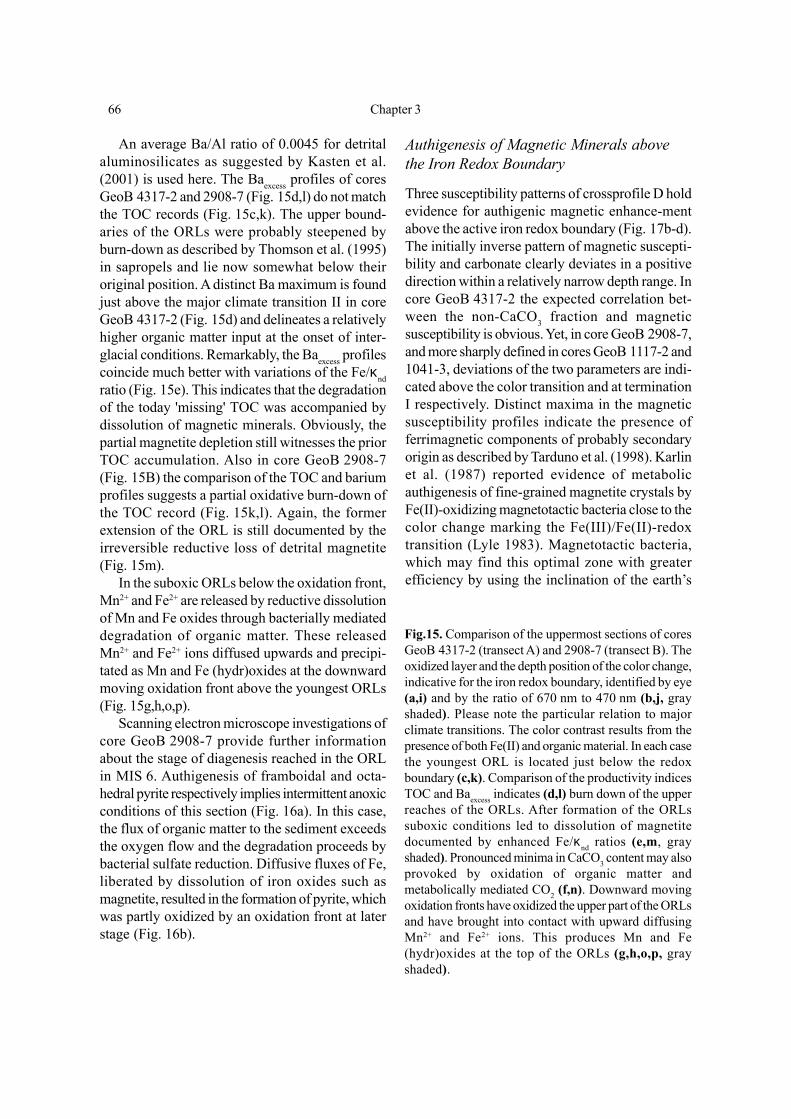
66 Chapter 3
An average Ba/Al ratio of 0.0045 for detritalaluminosilicates as suggested by Kasten et al.(2001) is used here. The Baexcess profiles of coresGeoB 4317-2 and 2908-7 (Fig. 15d,l) do not matchthe TOC records (Fig. 15c,k). The upper bound-aries of the ORLs were probably steepened byburn-down as described by Thomson et al. (1995)in sapropels and lie now somewhat below theiroriginal position. A distinct Ba maximum is foundjust above the major climate transition II in coreGeoB 4317-2 (Fig. 15d) and delineates a relativelyhigher organic matter input at the onset of inter-glacial conditions. Remarkably, the Baexcess profilescoincide much better with variations of the Fe/κndratio (Fig. 15e). This indicates that the degradationof the today 'missing' TOC was accompanied bydissolution of magnetic minerals. Obviously, thepartial magnetite depletion still witnesses the priorTOC accumulation. Also in core GeoB 2908-7(Fig. 15B) the comparison of the TOC and bariumprofiles suggests a partial oxidative burn-down ofthe TOC record (Fig. 15k,l). Again, the formerextension of the ORL is still documented by theirreversible reductive loss of detrital magnetite(Fig. 15m).
In the suboxic ORLs below the oxidation front,Mn2+ and Fe2+ are released by reductive dissolutionof Mn and Fe oxides through bacterially mediateddegradation of organic matter. These releasedMn2+ and Fe2+ ions diffused upwards and precipi-tated as Mn and Fe (hydr)oxides at the downwardmoving oxidation front above the youngest ORLs(Fig. 15g,h,o,p).
Scanning electron microscope investigations ofcore GeoB 2908-7 provide further informationabout the stage of diagenesis reached in the ORLin MIS 6. Authigenesis of framboidal and octa-hedral pyrite respectively implies intermittent anoxicconditions of this section (Fig. 16a). In this case,the flux of organic matter to the sediment exceedsthe oxygen flow and the degradation proceeds bybacterial sulfate reduction. Diffusive fluxes of Fe,liberated by dissolution of iron oxides such asmagnetite, resulted in the formation of pyrite, whichwas partly oxidized by an oxidation front at laterstage (Fig. 16b).
Fig.15. Comparison of the uppermost sections of coresGeoB 4317-2 (transect A) and 2908-7 (transect B). Theoxidized layer and the depth position of the color change,indicative for the iron redox boundary, identified by eye(a,i) and by the ratio of 670 nm to 470 nm (b,j, grayshaded). Please note the particular relation to majorclimate transitions. The color contrast results from thepresence of both Fe(II) and organic material. In each casethe youngest ORL is located just below the redoxboundary (c,k). Comparison of the productivity indicesTOC and Baexcess indicates (d,l) burn down of the upperreaches of the ORLs. After formation of the ORLssuboxic conditions led to dissolution of magnetitedocumented by enhanced Fe/κnd ratios (e,m, grayshaded). Pronounced minima in CaCO3 content may alsoprovoked by oxidation of organic matter andmetabolically mediated CO2 (f,n). Downward movingoxidation fronts have oxidized the upper part of the ORLsand have brought into contact with upward diffusingMn2+ and Fe2+ ions. This produces Mn and Fe(hydr)oxides at the top of the ORLs (g,h,o,p, grayshaded).
Authigenesis of Magnetic Minerals abovethe Iron Redox Boundary
Three susceptibility patterns of crossprofile D holdevidence for authigenic magnetic enhance-mentabove the active iron redox boundary (Fig. 17b-d).The initially inverse pattern of magnetic suscepti-bility and carbonate clearly deviates in a positivedirection within a relatively narrow depth range. Incore GeoB 4317-2 the expected correlation bet-ween the non-CaCO3 fraction and magneticsusceptibility is obvious. Yet, in core GeoB 2908-7,and more sharply defined in cores GeoB 1117-2 and1041-3, deviations of the two parameters are indi-cated above the color transition and at terminationI respectively. Distinct maxima in the magneticsusceptibility profiles indicate the presence offerrimagnetic components of probably secondaryorigin as described by Tarduno et al. (1998). Karlinet al. (1987) reported evidence of metabolicauthigenesis of fine-grained magnetite crystals byFe(II)-oxidizing magnetotactic bacteria close to thecolor change marking the Fe(III)/Fe(II)-redoxtransition (Lyle 1983). Magnetotactic bacteria,which may find this optimal zone with greaterefficiency by using the inclination of the earth’s
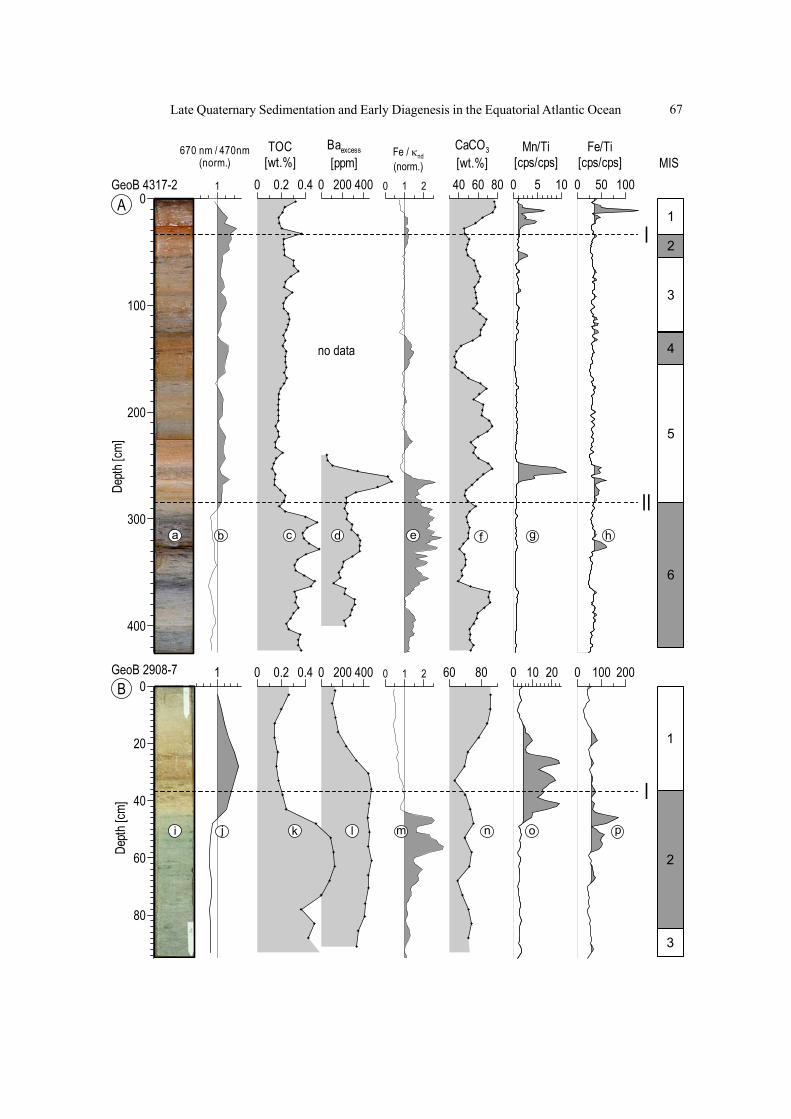
Late Quaternary Sedimentation and Early Diagenesis in the Equatorial Atlantic Ocean 67
0 200 400
Baexcess
[ppm]40 60 80
CaCO3
[wt.%]0 50 100
Fe/Ti[cps/cps]
1
670 nm / 470nm(norm.)
0 1 2
Fe / κnd
(norm.)0 5 10
Mn/Ti[cps/cps]
0 0.2 0.4
TOC[wt.%]
80
60
40
20
0
Depth
[cm]
400
300
200
100
0
Depth
[cm]
0 200 400 60 80 0 100 2000 1 2 0 10 200 0.2 0.41
GeoB 4317-2A
BGeoB 2908-7
I
II
2
4
6
1
3
5
MIS
2
1
3
no data
lkji m n o p
I
hgfedcba
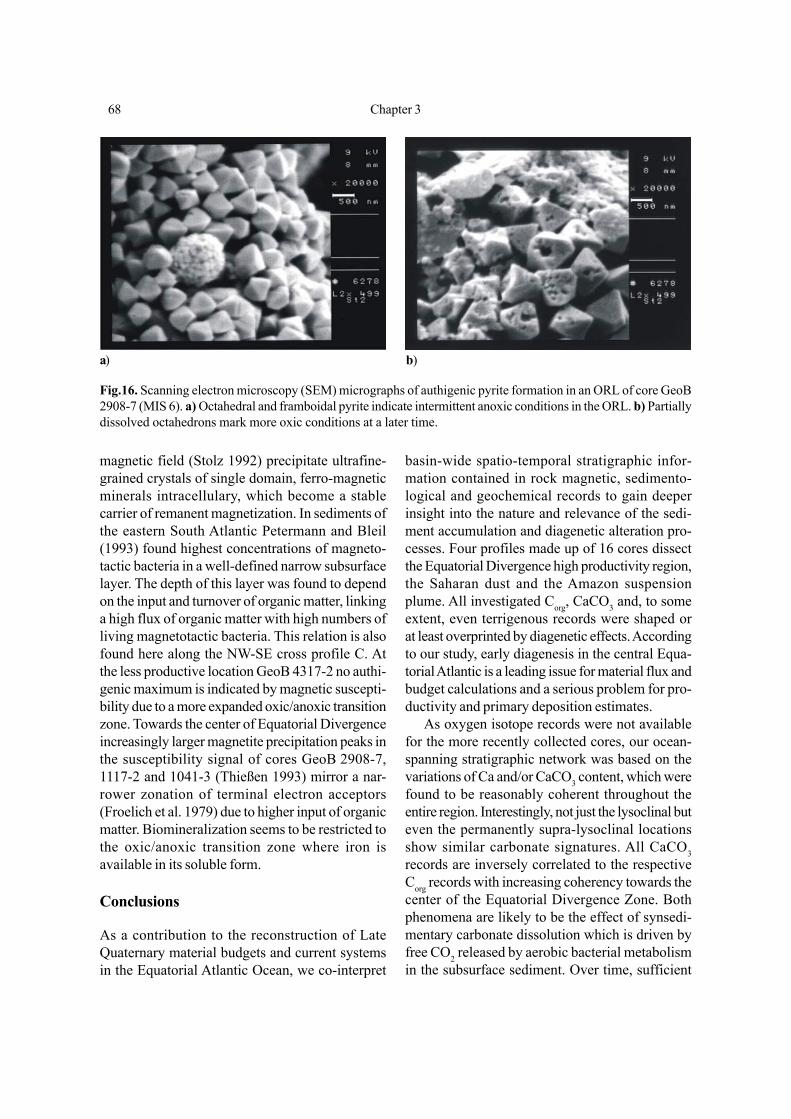
68 Chapter 3
magnetic field (Stolz 1992) precipitate ultrafine-grained crystals of single domain, ferro-magneticminerals intracellulary, which become a stablecarrier of remanent magnetization. In sediments ofthe eastern South Atlantic Petermann and Bleil(1993) found highest concentrations of magneto-tactic bacteria in a well-defined narrow subsurfacelayer. The depth of this layer was found to dependon the input and turnover of organic matter, linkinga high flux of organic matter with high numbers ofliving magnetotactic bacteria. This relation is alsofound here along the NW-SE cross profile C. Atthe less productive location GeoB 4317-2 no authi-genic maximum is indicated by magnetic suscepti-bility due to a more expanded oxic/anoxic transitionzone. Towards the center of Equatorial Divergenceincreasingly larger magnetite precipitation peaks inthe susceptibility signal of cores GeoB 2908-7,1117-2 and 1041-3 (Thießen 1993) mirror a nar-rower zonation of terminal electron acceptors(Froelich et al. 1979) due to higher input of organicmatter. Biomineralization seems to be restricted tothe oxic/anoxic transition zone where iron isavailable in its soluble form.
Conclusions
As a contribution to the reconstruction of LateQuaternary material budgets and current systemsin the Equatorial Atlantic Ocean, we co-interpret
basin-wide spatio-temporal stratigraphic infor-mation contained in rock magnetic, sedimento-logical and geochemical records to gain deeperinsight into the nature and relevance of the sedi-ment accumulation and diagenetic alteration pro-cesses. Four profiles made up of 16 cores dissectthe Equatorial Divergence high productivity region,the Saharan dust and the Amazon suspensionplume. All investigated Corg, CaCO3 and, to someextent, even terrigenous records were shaped orat least overprinted by diagenetic effects. Accordingto our study, early diagenesis in the central Equa-torial Atlantic is a leading issue for material flux andbudget calculations and a serious problem for pro-ductivity and primary deposition estimates.
As oxygen isotope records were not availablefor the more recently collected cores, our ocean-spanning stratigraphic network was based on thevariations of Ca and/or CaCO3 content, which werefound to be reasonably coherent throughout theentire region. Interestingly, not just the lysoclinal buteven the permanently supra-lysoclinal locationsshow similar carbonate signatures. All CaCO3records are inversely correlated to the respectiveCorg records with increasing coherency towards thecenter of the Equatorial Divergence Zone. Bothphenomena are likely to be the effect of synsedi-mentary carbonate dissolution which is driven byfree CO2 released by aerobic bacterial metabolismin the subsurface sediment. Over time, sufficient
a) b)
Fig.16. Scanning electron microscopy (SEM) micrographs of authigenic pyrite formation in an ORL of core GeoB2908-7 (MIS 6). a) Octahedral and framboidal pyrite indicate intermittent anoxic conditions in the ORL. b) Partiallydissolved octahedrons mark more oxic conditions at a later time.
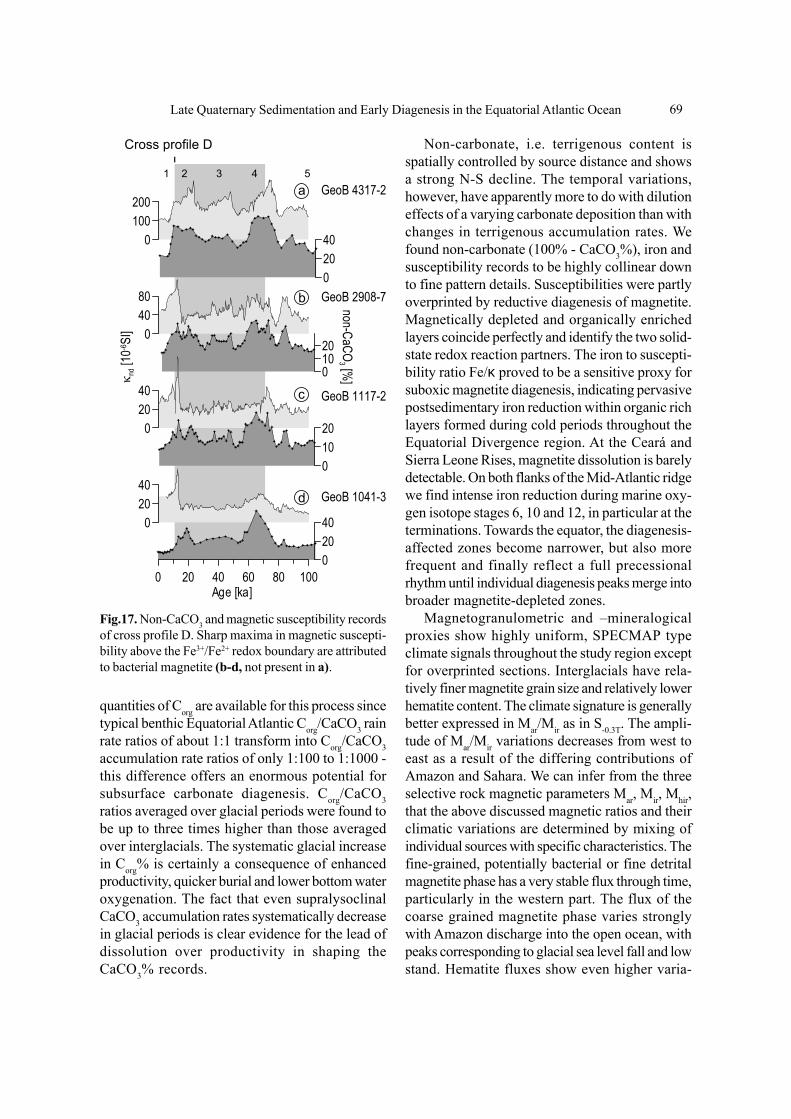
Late Quaternary Sedimentation and Early Diagenesis in the Equatorial Atlantic Ocean 69
quantities of Corg are available for this process sincetypical benthic Equatorial Atlantic Corg/CaCO3 rainrate ratios of about 1:1 transform into Corg/CaCO3accumulation rate ratios of only 1:100 to 1:1000 -this difference offers an enormous potential forsubsurface carbonate diagenesis. Corg/CaCO3ratios averaged over glacial periods were found tobe up to three times higher than those averagedover interglacials. The systematic glacial increasein Corg% is certainly a consequence of enhancedproductivity, quicker burial and lower bottom wateroxygenation. The fact that even supralysoclinalCaCO3 accumulation rates systematically decreasein glacial periods is clear evidence for the lead ofdissolution over productivity in shaping theCaCO3% records.
I
1 2 3 4 5
04080
0100200
02040
02040
01020
02040
02040
0 20 40 60 80 100Age [ka]
01020
κ nd [
10-6SI
]
GeoB 1041-3
GeoB 1117-2
GeoB 2908-7
GeoB 4317-2
non-CaCO3 [%
]
Cross profile D
a
b
c
d
Fig.17. Non-CaCO3 and magnetic susceptibility recordsof cross profile D. Sharp maxima in magnetic suscepti-bility above the Fe3+/Fe2+ redox boundary are attributedto bacterial magnetite (b-d, not present in a).
Non-carbonate, i.e. terrigenous content isspatially controlled by source distance and showsa strong N-S decline. The temporal variations,however, have apparently more to do with dilutioneffects of a varying carbonate deposition than withchanges in terrigenous accumulation rates. Wefound non-carbonate (100% - CaCO3%), iron andsusceptibility records to be highly collinear downto fine pattern details. Susceptibilities were partlyoverprinted by reductive diagenesis of magnetite.Magnetically depleted and organically enrichedlayers coincide perfectly and identify the two solid-state redox reaction partners. The iron to suscepti-bility ratio Fe/κ proved to be a sensitive proxy forsuboxic magnetite diagenesis, indicating pervasivepostsedimentary iron reduction within organic richlayers formed during cold periods throughout theEquatorial Divergence region. At the Ceará andSierra Leone Rises, magnetite dissolution is barelydetectable. On both flanks of the Mid-Atlantic ridgewe find intense iron reduction during marine oxy-gen isotope stages 6, 10 and 12, in particular at theterminations. Towards the equator, the diagenesis-affected zones become narrower, but also morefrequent and finally reflect a full precessionalrhythm until individual diagenesis peaks merge intobroader magnetite-depleted zones.
Magnetogranulometric and –mineralogicalproxies show highly uniform, SPECMAP typeclimate signals throughout the study region exceptfor overprinted sections. Interglacials have rela-tively finer magnetite grain size and relatively lowerhematite content. The climate signature is generallybetter expressed in Mar/Mir as in S-0.3T. The ampli-tude of Mar/Mir variations decreases from west toeast as a result of the differing contributions ofAmazon and Sahara. We can infer from the threeselective rock magnetic parameters Mar, Mir, Mhir,that the above discussed magnetic ratios and theirclimatic variations are determined by mixing ofindividual sources with specific characteristics. Thefine-grained, potentially bacterial or fine detritalmagnetite phase has a very stable flux through time,particularly in the western part. The flux of thecoarse grained magnetite phase varies stronglywith Amazon discharge into the open ocean, withpeaks corresponding to glacial sea level fall and lowstand. Hematite fluxes show even higher varia-
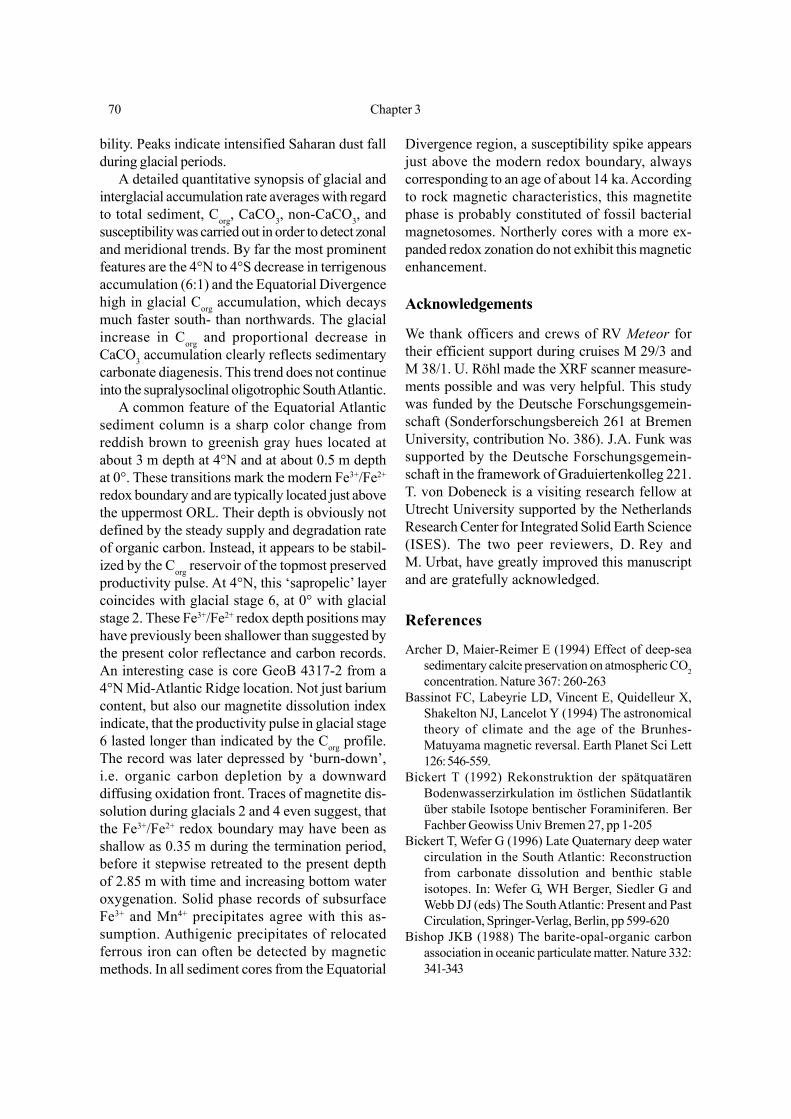
70 Chapter 3
Divergence region, a susceptibility spike appearsjust above the modern redox boundary, alwayscorresponding to an age of about 14 ka. Accordingto rock magnetic characteristics, this magnetitephase is probably constituted of fossil bacterialmagnetosomes. Northerly cores with a more ex-panded redox zonation do not exhibit this magneticenhancement.
Acknowledgements
We thank officers and crews of RV Meteor fortheir efficient support during cruises M 29/3 andM 38/1. U. Röhl made the XRF scanner measure-ments possible and was very helpful. This studywas funded by the Deutsche Forschungsgemein-schaft (Sonderforschungsbereich 261 at BremenUniversity, contribution No. 386). J.A. Funk wassupported by the Deutsche Forschungsgemein-schaft in the framework of Graduiertenkolleg 221.T. von Dobeneck is a visiting research fellow atUtrecht University supported by the NetherlandsResearch Center for Integrated Solid Earth Science(ISES). The two peer reviewers, D. Rey andM. Urbat, have greatly improved this manuscriptand are gratefully acknowledged.
References
Archer D, Maier-Reimer E (1994) Effect of deep-seasedimentary calcite preservation on atmospheric CO2concentration. Nature 367: 260-263
Bassinot FC, Labeyrie LD, Vincent E, Quidelleur X,Shakelton NJ, Lancelot Y (1994) The astronomicaltheory of climate and the age of the Brunhes-Matuyama magnetic reversal. Earth Planet Sci Lett126: 546-559.
Bickert T (1992) Rekonstruktion der spätquatärenBodenwasserzirkulation im östlichen Südatlantiküber stabile Isotope bentischer Foraminiferen. BerFachber Geowiss Univ Bremen 27, pp 1-205
Bickert T, Wefer G (1996) Late Quaternary deep watercirculation in the South Atlantic: Reconstructionfrom carbonate dissolution and benthic stableisotopes. In: Wefer G, WH Berger, Siedler G andWebb DJ (eds) The South Atlantic: Present and PastCirculation, Springer-Verlag, Berlin, pp 599-620
Bishop JKB (1988) The barite-opal-organic carbonassociation in oceanic particulate matter. Nature 332:341-343
bility. Peaks indicate intensified Saharan dust fallduring glacial periods.
A detailed quantitative synopsis of glacial andinterglacial accumulation rate averages with regardto total sediment, Corg, CaCO3, non-CaCO3, andsusceptibility was carried out in order to detect zonaland meridional trends. By far the most prominentfeatures are the 4°N to 4°S decrease in terrigenousaccumulation (6:1) and the Equatorial Divergencehigh in glacial Corg accumulation, which decaysmuch faster south- than northwards. The glacialincrease in Corg and proportional decrease inCaCO3 accumulation clearly reflects sedimentarycarbonate diagenesis. This trend does not continueinto the supralysoclinal oligotrophic South Atlantic.
A common feature of the Equatorial Atlanticsediment column is a sharp color change fromreddish brown to greenish gray hues located atabout 3 m depth at 4°N and at about 0.5 m depthat 0°. These transitions mark the modern Fe3+/Fe2+
redox boundary and are typically located just abovethe uppermost ORL. Their depth is obviously notdefined by the steady supply and degradation rateof organic carbon. Instead, it appears to be stabil-ized by the Corg reservoir of the topmost preservedproductivity pulse. At 4°N, this ‘sapropelic’ layercoincides with glacial stage 6, at 0° with glacialstage 2. These Fe3+/Fe2+ redox depth positions mayhave previously been shallower than suggested bythe present color reflectance and carbon records.An interesting case is core GeoB 4317-2 from a4°N Mid-Atlantic Ridge location. Not just bariumcontent, but also our magnetite dissolution indexindicate, that the productivity pulse in glacial stage6 lasted longer than indicated by the Corg profile.The record was later depressed by ‘burn-down’,i.e. organic carbon depletion by a downwarddiffusing oxidation front. Traces of magnetite dis-solution during glacials 2 and 4 even suggest, thatthe Fe3+/Fe2+ redox boundary may have been asshallow as 0.35 m during the termination period,before it stepwise retreated to the present depthof 2.85 m with time and increasing bottom wateroxygenation. Solid phase records of subsurfaceFe3+ and Mn4+ precipitates agree with this as-sumption. Authigenic precipitates of relocatedferrous iron can often be detected by magneticmethods. In all sediment cores from the Equatorial
Late Quaternary Sedimentation and Early Diagenesis in the Equatorial Atlantic Ocean 71
663. Paleoceanography 8: 209-242Dunlop DJ (1973) Superparamagnetic and single-domain
threshold sizes in magnetite. J Geophys Res 78:1780–1793
Duplessy J C, Labeyrie L, Paterne M, Hovine S, FichefetT, Duprat J, Labracherie M (1996) High latitude deepwater sources during the Last Glacial Maximum andthe intensity of the global oceanic circulation. In:Wefer G, Berger WH, Siedler G, Webb D. (eds) TheSouth Atlantic: Present and Past Circulation. Sprin-ger, Berlin, pp 445-460
Dupont LM, Jahns S, Marret F, Ning S (2000) Vegetationchange in equatorial West Africa: Time-slices for thelast 150 ka. Palaeogeogr Palaeoclimatol Palaeoecol155: 95-122
Fischer G and participants (1998) Report and preliminaryresults of METEOR cruise M38/1, Las Palmas - Recife,25.1.-1.3.1997. Ber Fachber Geowiss Univ Bremen 94,pp 1-178
François R, Bacon MP (1991) Variations in terrigenousinput into the deep Equatorial Atlantic during the past24,000 years. Science 251: 1473-1475
François R, Bacon MP, Suman DO (1990) Thorium 230profiling in deep-sea sediments: High-resolutionrecords of flux and dissolution of carbonate in theequatorial Atlantic during the last 24000 years. Pale-oceanography 5: 761–787
Frederichs T, Bleil U, Däumler K, von Dobeneck T,Schmidt A (1999) The magnetic view on the marinepaleoenvironment: Parameters, techniques, and po-tentials of rock magnetic studies as a key to paleo-climatic and paleoceanographic changes. In: FischerG, Wefer G (eds) Use of Proxies in Paleoceanography:Examples from the South Atlantic. Springer Berlin,pp 575-599
Froelich PN, Klinkhammer GP, Bender ML, Luedtke NA,Heath GR, Cullen D, Dauphin P, Hammond D,Hartman B, Maynard V (1979) Early oxidation oforganic matter in pelagic sediments of the easternequatorial Atlantic: Suboxic diagenesis. GeochimCosmochim Acta 43: 1075-1090
Gardner JV, Burkle LH (1975) Upper Pleistocene Eth-modiscus rex from the eastern equatorial Atlantic.Micropaleontology 21: 236-242
Gingele F, Dahmke A (1994) Discrete barite particles andbarium as tracers of paleoproductivity in SouthAtlantic sediments. Paleoceanography 9: 151-168
Gingele FX, Zabel M, Kasten S, Bonn WJ, Nürnberg CC(1999) Biogenic barium as a proxy for paleopro-ductivity: Methods and limitations of application. In:Fischer G, Wefer G (eds) Use of proxies in pale-oceanography: Examples from the South Atlantic.
Bloemendal J, King JW, Hall FR, Doh S-J (1992) Rockmagnetism of late Neogene and Pleistocene deep-sea sediments: Relationship to sediment source,diagenetic processes, and sediment lithology. JGeophys Res 97: 4361-4375
Bloemendal J, Lamb B, King J (1988) Paleoenvironmentalimplications of rock - magnetic properties of lateQuaternary sediment cores from the eastern equa-torial Atantic. Paleoceanography 3: 61 -87
Bonifay D, Giresse P (1992) Middle to Late Quaternarysediment flux and post- depositional processes bet-ween the continental slope off Gabon and the Mid-Guinean margin. Mar Geol 106: 107-129
Boyle EA, Keigwin LD (1982) Deep circulation of theNorth Atlantic over the last 200,000 years: Geo-chemical evidence. Science 218: 784-787
Boyle EA, Keigwin LD (1985) Comparison of Atlanticand Pacific paleochemical records for the last 215,000years: Changes in deep ocean circulation and chemi-cal inventories. Earth Planet Sci Lett 76: 135-140
Broecker WS, Denton GH (1989) The role of ocean-atmosphere reorganisations in glacial cycles. Geo-chim Cosmochim Acta 53: 2465-2501
Brummer GJA, Van Eijden AJM (1992) 'Blue-ocean'paleoproductivity estimates from pelagic carbonatemass accumulation rates. Mar Micropaleontol 19: 99-117
Canfield DE, Berner RA (1987) Dissolution and pyriti-zation of magnetite in anoxic marine sediments.Geochim Cosmochim Acta 51: 645-659
Colley S, Thomson J, Wilson TRS, Higgs NC (1984) Post-depositional migration of elements during diagenesisin brown clay and turbidite sequences in the NorthEast Atlantic. Geochim Cosmochim Acta 48: 1223-1235
Curry WB, Lohmann GP (1986) Late Quaternary sedi-mentation at the Sierra Leone Rise (eastern equa-torial Atlantic Ocean). Mar Geol 70: 223-250
Curry WB, Lohmann GP (1990) Reconstructing pastparticle fluxes in the tropical Atlantic Ocean. Pale-oceanography 5: 487-506
Curry WB (1996) Late Quaternary deep circulation in thewestern Equatorial Atlantic. In: Wefer G, Berger WH,Siedler G, Webb D (eds) The South Atlantic: Presentand Past Circulation. Springer, Berlin, pp 577-598
Damuth JE (1977) Late Quaternary sedimentation in thewestern equatorial Atlantic. Geol Soc Amer Bull 88:695-710
deMenocal PB, Ruddiman WF, Pokras EM (1993) In-fluences of high- and low- latitude processes onAfrican terrestrial climate: Pleistocene eolian recordsfrom equatorial Atlantic ocean drilling program Site
72 Chapter 3
Springer, Berlin, pp 345-364Haese RR, Petermann H, Dittert L, Schulz HD (1998) The
early diagenesis of iron in pelagic sediments: Amultidisciplinary approach. Earth Planet Sci Lett 157:233-248.
Higgs HC, Thomson J, Wilson TRS, Croudace IW (1994).Modification and complete removal of eastern Medi-terranean sapropels by postdepositional oxidation.Geology 22: 423 - 426
Jansen JHF, Van der Gaast SJ, Koster AJ (1998) CORTEX,a shipboard XRF-scanner for element analyses insplit sediment cores. Mar Geol 151: 143-153
Johns WE, Schott FA, Zantopp RJ, Evans RH (1990) TheNorth Brazil Current retroflection: Seasonal structureand eddy variability, J Geophys Res 95: 22103-22120
Karlin R, Levi S (1983) Diagenesis of magnetic mineralsin recent haemipelagic sediments. Nature 303: 327-330
Karlin R, Levi S (1985) Geochemical and sedimentologi-cal control of the magnetic properties of hemipelagicsediments. J Geophys Res 90: 10,373-10,392
Karlin R, Lyle M, Heath GR (1987) Authigenic magneticformation in suboxic marine sediments. Nature 326:490-493
Karlin R (1990) Magnetite diagenesis in marinesediments from the Oregon continental margin. JGeophys Res 95: 4405-4419
Kasten S, Haese RR, Zabel M, Rühlemann C, Schulz HD(2001) Barium peaks at glacial terminations insediments of the equatorial Atlantic Ocean - relictsof deglacial productivity pulses? Chemical Geology175: 635-651
Kidd RB, Cita MB, Ryan WBF (1978) Stratigraphy ofeastern Mediterranean sapropel sequences recov-ered during DSDP Leg 42A and their paleoenviron-mental significance. In: Hsü KJ et al. (eds) InitialReports of the Deep Sea Drilling Project. USGovernment Printing Office, Washington: pp 421-443
Kumar N, Embley RW (1977) Evolution and origin ofCeará Rise: An aseismic rise in the western equatorialAtlantic. Geol Soc Amer Bull 88: 683-694
Kutzbach JE (1981) Monsoon climate of the early Holo-cene: Climatic experiment with the Earth's orbitalparameters for 9000 years ago. Science 214: 59-61
Lutjeharms JRE (1996) The exchange of water betweenthe South Indian and South Atlantic Oceans. In:Wefer G, Berger WH, Siedler G, Webb D (eds) TheSouth Atlantic: Present and Past Circulation.Springer, Berlin, pp 125-162
Lyle M (1983) The brown-green color transition in marinesediments: A marker of the Fe(III)-Fe(II) redoxboundary. Limnol Oceanogr 28: 1026-1033
Lyle M (1988) Climatically forced organic carbon burialin equatorial Atlantic and Pacific Oceans. Nature 335:529-532
Maher BA (1988) Magnetic properties of some syntheticsubmicron magnetites. Geophys J 94: 83-96
Martin WR, Sayles FL (1996) CaCO3 dissolution insediments of the Ceara Rise, western equatorialAtlantic. Geochim Cosmochim Acta 60: 243-263
Maslin M, Mikkelsen N (1997) Amazon fan mass-transport deposits and underlying interglacialdeposits: Age estimates and fan dynamics. ProcODP Sci Results 155: 353-365
Meinecke G (1992) Spätquartäre Oberflächenwasser-temperaturen im östlichen äquatorialen Atlantik. BerFachber Geowiss Univ Bremen 29, pp 1-181
Mercone D, Thomson J, Croudace IW, Siani G, PaterneM, Troelsta S (2000) Duration of S1, the most recentsapropel in the eastern Mediterranean Sea, as indi-cated by accelerator mass spectrometry radiocarbonand geochemical evidence. Paleoceanography 15:336 - 347
Milliman JD, Summerhayes CP, Barretto HT (1975) Qua-ternary sedimentation on the Amazon continentalmargin: A model. Geol Soc Amer Bull 86: 610-614
Milliman JD (1993) Production and accumulation ofcalcium carbonate in the ocean: Budget of a non-steady. Glob Biochem Cycl 7: 927-957
Mix AC, Rugh W, Pisias N G, Veirs S (1992) Color reflec-tance spectroscopy: A tool for rapid charakterizationof deep-sea sediments. Proc ODP, Initial Reports 138:67-77
Müller PJ, Erlenkeuser H, v Grafenstein R (1983) Glacial- interglacial cycles in oceanic productivity inferredfrom organic carbon contents in eastern northAtlantic sediment cores. In: Thiede J, Suess E (eds)Coastal Upwelling Part B. Plenum Press, New York,USA: pp 365 - 398
Müller PJ, Hartmann M, Suess E (1988) The chemicalenvironment of pelagic sediments. In: Halbach P,Friedrich G, von Stackelberg U (eds) The manganesenodule belt of the Pacific Ocean. Enke, Stuttgart, 254p.
Oppo DW, Fairbanks RG (1987) Variability in the deepand intermediate water circulation of the AtlanticOcean during the past 25,000 years: Northern Hemis-phere modulation of the Southern Ocean. EarthPlanet Sci Lett 86: 1-15
Parry LG (1965) Magnetic properties of dispersed mag-netite powders. Philosophical Magazine 11: 303–312
Passier HF, Dekkers MJ, de Lange GJ (1998) Sedimentchemistry and magnetic properties in an anoma-lously reducing core from the eastern Mediterranean
Late Quaternary Sedimentation and Early Diagenesis in the Equatorial Atlantic Ocean 73
Sea. Chem Geol 152: 287-306Passier HF, Dekkers MJ (2002) Assessment of the for-
mation of iron oxides in the active oxidation frontabove sapropel S l in the eastern Mediterranean Seaby low- temperature magnetic properties. GeophysJ Int, In press
Petermann H, Bleil U (1993) Detection of live magneto-tactic bacteria in South Atlantic deep-sea sediments.Earth Planet Sci Lett 117: 223-228
Pfeifer K, Hensen C, Adler M, Wenzhöfer F, Weber B,Schulz HD (2002) Modeling of subsurface calcitedissolution - including the respiration and re-oxi-dation processes of marine sediments in the regionof the equatorial upwelling off Gabon. GeochimCosmochim Acta 66: 4247-4259
Pickard GL, Emery WJ (1990) Descriptive PhysicalOceanography. Pergamon Press Oxford UK, 320 p
Rath S, Wagner T, Henrich S (1999) PleistozäneSchwankungen im Staubeintrag und in der Karbo-naterhaltung im äquatorialen Atlantik (ODP Site 663)zwischen 480 und 390 Ka: Hinweise aus Korngrößen-analysen. Zentralblatt Geologie-Paläontologie Teil IH 7-10: 1-19
Ratmeyer V, Balzer W, Bergametti G, Chiapello I, FischerG, Wyputta U (1999a) Seasonal impact of mineral duston deep-ocean particle flux in the eastern subtropicalAtlantic Ocean. Mar Geol 159: 241-252
Ratmeyer V, Fischer G, Wefer G (1999b) Lithogenicparticle fluxes and grain size distributions in the deepocean off northwest Africa: Implications for seasonalchanges of aeolian dust input and downward trans-port. Deep Sea Research 46: 1289-1337
Raymo ME, Ruddiman WF, Shakleton NJ, Oppo DW(1990) Evolution of Atlantic - Pacific δ13C gradientsover the last 2.5 m.y. Earth Planet Sci Lett 97: 353-368
Raymo ME, Oppo DW, Curry W (1997) The mid-Pleistocene climate transition: A deep-sea carbonisotopic perspective. Paleoceanography 12: 546-559
Rhein M, Schott F, Fischer J, Send U, Stramma L (1996)The deep water regime in the Equatorial Atlantic. In:Wefer G, Berger WH, Siedler G, Webb D (eds) TheSouth Atlantic: Present and Past Circulation,Springer Berlin: pp 261-271
Robinson SG, Sahota JTS, Oldfield F (2000) Early dia-genesis in North Atlantic abyssal plain sedimentscharacterized by rock magnetic and geochemicalindices. Mar Geol 163: 77-107
Röhl U, Abrams LJ (2000) High-resolution, downhole,and nondestructive core measurements from Sites999 and 1001 in the Caribbean Sea: Application tothe Late Paleocene thermal maximum. In: Leckie RM,
Sigurdsson H, Acton GD, Draper G (eds) Proc ODPSci Results. College Station Texas, pp 191-203
Rossignol-Strick M, Nesteroff W, Olive P, Vergnaud-Grazzini C (1982) After the deluge: Mediterraneanstagnation and sapropel formation. Nature 295: 105-110
Ruddiman WF (1997) Tropical Atlantic terrigenousfluxes since 25,000 yrs B.P. Mar Geol 136: 189-207
Ruddiman WF, Janecek TR (1989) Pliocene-Pleistocenebiogenic and terrigenous fluxes at equatorial AtlanticSites 662, 663, and 664. In: Ruddiman W, SarntheinM (eds) Proc ODP Sci Results. College Station, Texaspp 211-240
Rühlemann C, Frank M, Hale W, Mangini A, Mulitza S,Müller PJ, Wefer G (1996) Late Quaternaryproductivity changes in the western equatorialAtlantic: Evidence from 230Th-normalized carbonateand organic carbon accumulation rates. Mar Geol135: 127-152
Sahota JTS, Robinson SG, Oldfield F (1995) Magneticmeasurements used to identify paleoxidation frontsfrom the Madeira abyssal plain. Geophys Res Lett22: 1961-1964
Sarnthein M, Tetzlaff G, Koopmann B, Wolter K,Pflaumann, U 1981. Glacial and interglacial windregimes over the eastern subtropical Atlantic andNorth-West Africa. Nature 293: 193-196
Sarnthein M, Thiede J, Pflaumann U, Erlenkeuser H,Fütterer D, Koopmann B, Lange H, Seibold E (1982)Atmospheric and oceanic circulation patterns offNorthwest Africa during the past 25 million years.In: von Rad U, Hinz K et al. (eds) Geology of theNorthwest African Continental Margin. Springer-Verlag Berlin: pp 545-604
Sarnthein M, Winn K, Jung SJA, Duplessy J-C, LabeyrieL, Erlenkeuser H, Ganssen G (1994) Changes in eastAtlantic deepwater circulation over the last 30,000years: Eight time slice reconstructions.Paleoceanography 9: 209-267
Schmieder F, von Dobeneck T, Bleil U (2000) The Mid-Pleistocene climate transition as documented in thedeep South Atlantic Ocean: Initiation, interim stateand terminal event. Earth Planet Sci Lett 179: 539-549
Schneider RR, Schulz HD, Hensen C (2000) Marinecarbonates: Their formation and destruction. In:Schulz HD, Zabel M (eds) Marine Geochemistry.Springer, Berlin, pp 283-307
Schulte S, Bard E (2003) Past changes of biologicallymediated dissolution of calcite above the chemycallysocline documented in Indian Ocean sediments.Quater Sci Rev 22 (15-17), 1757-1770
Schulz, HD and participants (1991) Report and
74 Chapter 3
preliminary results of Meteor cruise M16/2, Recife -Belem, 28.4.-20.5.1991. Ber Fachber Geowiss UnivBremen 19, pp 1-149
Showers WJ, Angle DG (1986) Stable isotopiccharacterization of organic carbon accumulation onthe Amazon continental shelf. Continent Shelf Res6: 227-244
Stolz JF (1992) Magnetotactic Bacteria: Biominerali-zation, Ecology, Sediment Magnetism, Environ-mental Indicator. In: Skinner HGW, Fitzpatrick RW(eds) Biomineralization processes of iron andmanganese. Catena-Verl Cremlingen-Destedt, pp 133-145
Street-Perrott FA, Perrott RA (1990) Abrupt climatefluctuations in the tropics: The influence of AtlanticOcean circulation. Nature 343: 607-612
Tarduno JA (1994) Temporal trends of magnetic dissolu-tion in the pelagic realm: Gauging paleoproductivity?Earth Planet Sci Lett 123: 39-48
Tarduno JA, Tian W, Wilkison S (1998) Biogeochemicalremanent magnetization in pelagic sediments of thewestern equatorial Pacific Ocean. Geophys Res Lett25: 3987-3990
Tarduno JA, Wilkison SL (1996) Non-steady statemagnetic mineral reduction, chemical lock-in, anddelayed remanence acquisition in pelagic sediments.Earth Planet Sci Lett 144: 315-326
Thießen W (1993) Magnetische Eigenschaften vonSedimenten des östlichen Südatlantiks und ihrepaläozeanographische Relevanz. Ber FachberGeowiss Univ Bremen 4, pp 1-170
Thomson J, Higgs NC, Wilson TRS, Croudace IW, deLange GJ, van Santvoort, PJM (1995) Redistributionand geochemical behaviour of redox - sensitiveelements around S 1, the most recent eastern Medi-terranean sapropel. Geochim Cosmochim Acta 59:3487-3501
Tiedemann R, Sarnthein M, Shackleton NJ (1994)Astronomic timescale for the Pliocene Atlantic δ18Oand dust flux records of Ocean Drilling Program Site659. Paleoceanography 9: 619-638
Tiedemann R, Sarnthein M, Stein R (1989) Climaticchanges in the western Sahara: Aeolo-marinesediment record of the last 8 million years (Sites 657-661) In: Ruddimann W, Sarnthein M et al. (eds) ProcODP Sci Results. Vol 108, pp 241-277
van Kreveld SA, Knappertsbusch M, Ottens J, GanssenGM, van Hinte JE (1996) Biogenic carbonate and ice-rafted debris (Heinrich layer) accumulation in deep-sea sediments from a Northeast Atlantic piston core.Mar Geol 131: 21-46
van Santvoort PJM, de Lange GJ, Thomson J, CussenH, Wilson TRS, Krom MD, Ströhle K (1996) Active
post-depositional oxidation of the most recent sapro-pel (S1) in sediments of the eastern MediterraneanSea. Geochim Cosmochim Acta 60: 4007-4024
van Santvoort PJM, de Lange GJ, Langereis CG, DekkersMJ, Paterne M (1997) Geochemical and paleomag-netic evidence for the occurence of 'missing'sapropels in eastern Mediterranean sediments.Paleoceanography 12: 773-786
Verardo DJ, McIntyre A (1994) Production anddestruction: Control of biogenous sedimentation inthe tropical Atlantic 0-300,000 years BP.Paleoceanography 9: 63-86
von Dobeneck T (1996) A sytematic analysis of naturalmagnetic mineral assemblages based on modellinghysteresis loops with coercivity-related hyberbolicbasis functions. Geophys J Int 124: 675-694
von Dobeneck T (1998) The concept of 'partialsusceptibilities'. Geologica Carpathica 49: 228-229
von Dobeneck T, Schmieder F (1999) Using rock mag-netic proxy records for orbital tuning and extentedtime series analyses into the Super- and Sub-Milankovitch bands. In: Fischer G, Wefer G (eds) Useof Proxies in Paleoceanography: Examples from theSouth Atlantic. Springer; Berlin, pp 601-633
Wagner T (2002) Organic sedimentation in the EquatorialAtlantic: Evolution from Cretaceous to early Qua-ternary depositional environments. PalaeogeogrPalaeoclimatol Palaeoecol 179: 113-147
Wagner T (2000) Control of organic carbon accumula-tion in the late Quaternary equatorial Atlantic (OceanDrilling Program sites 664 and 663): Productivityversus terrigenous supply. Paleoceanography 15:181-199
Wagner T, Dupont LM (1999) Terrestrial organic matterin marine sediments: Analytical approaches andeolian-marine records in the Central EquatorialAtlantic. In: Fischer G, Wefer G (eds) Use of Proxiesin Paleoceanography: Examples from the SouthAtlantic. Springer, Berlin, pp 547-574
Wefer G, Berger W H, Bickert T, Donner B, Fischer G,Kemle-von Mücke S, Meinecke G, Müller P J, MulitzaS, Niebler H-S, Pätzold J, Schmidt H, Schneider R R,Segl M (1996) Late Quaternary surface circulationin the South Atlantic: The stable isotope record andimplications for heat transport and productivity. In:Wefer G, Berger WH, Siedler G, Webb D (eds) TheSouth Atlantic: Present and Past Circulation,Springer Berlin: pp 461-502
Wefer G and participants (1988) Report and preliminaryresults of Meteor cruise M6/6, Libreville - Las Palmas,18.2.-23.3.1988. Ber Fachber Geowiss Univ Bremen3, pp 1-97
Wefer G and participants (1989) Report and preliminary
Late Quaternary Sedimentation and Early Diagenesis in the Equatorial Atlantic Ocean 75
results of Meteor cruise M9/4, Dakar - Santa Cruz,19.2.-16.3.1989. Ber Fachber Geowiss Univ Bremen7, pp 1-103
Wefer G and participants (1991) Report and preliminaryresults of Meteor cruise M16/1, Pointe Noir - Recife,27.3.-25.4.1991. Ber Fachber Geowiss Univ Bremen18, pp 1-120
Wefer G and participants (1994) Report and preliminaryresults of Meteor cruise M23/3, Recife - Las Palmas,21.3.-12.4.1993. Ber Fachber Geowiss Univ Bremen44, pp 1-71
Wilson TRS, Thomson J, Colley S, Hydes DJ, Higgs NC,Sorensen J (1985) Early organic diagenesis: Thesignificance of progressive subsurface oxidationfronts in pelgic sediments. Geochim Cosmochim
Acta 49: 811-822Wilson TRS, Thomson J, Hydes DJ, Colley S, Culkin F,
Sörensen J (1986) Oxidation fronts in pelagic sedi-ments: Diagenetic formation of metal-rich layers.Science 232: 972-975
Wilson TRS, Thomson J (1998) Calcite dissolutionaccompanying early diagenesis in turbiditic deepocean sediments. Geochim Cosmochim Acta 62:2087-2096
Zabel M, Bickert T, Dittert L, Haese RR (1999)Significance of the sedimentary Al:Ti ratio as anindicator for variations in the circulation patterns ofthe equatorial North Atlantic. Paleoceanography 14:789-799

76 Chapter 3
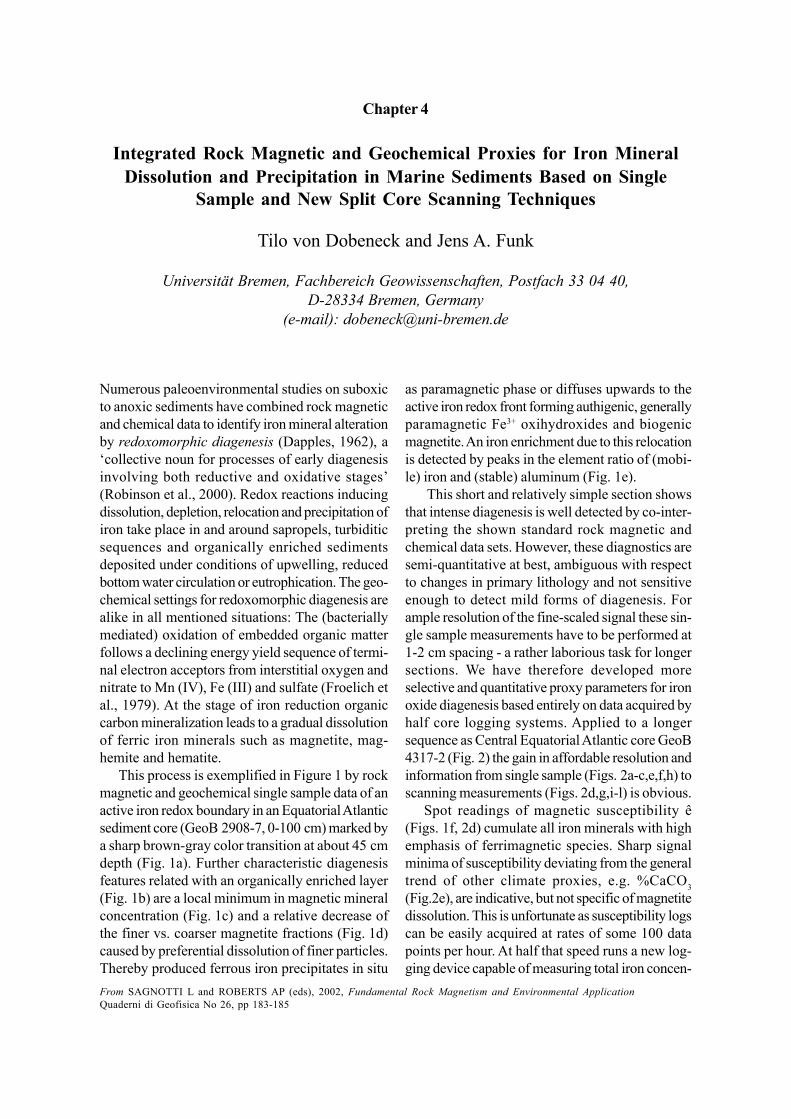
Numerous paleoenvironmental studies on suboxicto anoxic sediments have combined rock magneticand chemical data to identify iron mineral alterationby redoxomorphic diagenesis (Dapples, 1962), a‘collective noun for processes of early diagenesisinvolving both reductive and oxidative stages’(Robinson et al., 2000). Redox reactions inducingdissolution, depletion, relocation and precipitation ofiron take place in and around sapropels, turbiditicsequences and organically enriched sedimentsdeposited under conditions of upwelling, reducedbottom water circulation or eutrophication. The geo-chemical settings for redoxomorphic diagenesis arealike in all mentioned situations: The (bacteriallymediated) oxidation of embedded organic matterfollows a declining energy yield sequence of termi-nal electron acceptors from interstitial oxygen andnitrate to Mn (IV), Fe (III) and sulfate (Froelich etal., 1979). At the stage of iron reduction organiccarbon mineralization leads to a gradual dissolutionof ferric iron minerals such as magnetite, mag-hemite and hematite.
This process is exemplified in Figure 1 by rockmagnetic and geochemical single sample data of anactive iron redox boundary in an Equatorial Atlanticsediment core (GeoB 2908-7, 0-100 cm) marked bya sharp brown-gray color transition at about 45 cmdepth (Fig. 1a). Further characteristic diagenesisfeatures related with an organically enriched layer(Fig. 1b) are a local minimum in magnetic mineralconcentration (Fig. 1c) and a relative decrease ofthe finer vs. coarser magnetite fractions (Fig. 1d)caused by preferential dissolution of finer particles.Thereby produced ferrous iron precipitates in situ
as paramagnetic phase or diffuses upwards to theactive iron redox front forming authigenic, generallyparamagnetic Fe3+ oxihydroxides and biogenicmagnetite. An iron enrichment due to this relocationis detected by peaks in the element ratio of (mobi-le) iron and (stable) aluminum (Fig. 1e).
This short and relatively simple section showsthat intense diagenesis is well detected by co-inter-preting the shown standard rock magnetic andchemical data sets. However, these diagnostics aresemi-quantitative at best, ambiguous with respectto changes in primary lithology and not sensitiveenough to detect mild forms of diagenesis. Forample resolution of the fine-scaled signal these sin-gle sample measurements have to be performed at1-2 cm spacing - a rather laborious task for longersections. We have therefore developed moreselective and quantitative proxy parameters for ironoxide diagenesis based entirely on data acquired byhalf core logging systems. Applied to a longersequence as Central Equatorial Atlantic core GeoB4317-2 (Fig. 2) the gain in affordable resolution andinformation from single sample (Figs. 2a-c,e,f,h) toscanning measurements (Figs. 2d,g,i-l) is obvious.
Spot readings of magnetic susceptibility ê(Figs. 1f, 2d) cumulate all iron minerals with highemphasis of ferrimagnetic species. Sharp signalminima of susceptibility deviating from the generaltrend of other climate proxies, e.g. %CaCO3(Fig.2e), are indicative, but not specific of magnetitedissolution. This is unfortunate as susceptibility logscan be easily acquired at rates of some 100 datapoints per hour. At half that speed runs a new log-ging device capable of measuring total iron concen-
Chapter 4
Integrated Rock Magnetic and Geochemical Proxies for Iron MineralDissolution and Precipitation in Marine Sediments Based on Single
Sample and New Split Core Scanning Techniques
Tilo von Dobeneck and Jens A. Funk
Universität Bremen, Fachbereich Geowissenschaften, Postfach 33 04 40,D-28334 Bremen, Germany
(e-mail): [email protected]
From SAGNOTTI L and ROBERTS AP (eds), 2002, Fundamental Rock Magnetism and Environmental ApplicationQuaderni di Geofisica No 26, pp 183-185
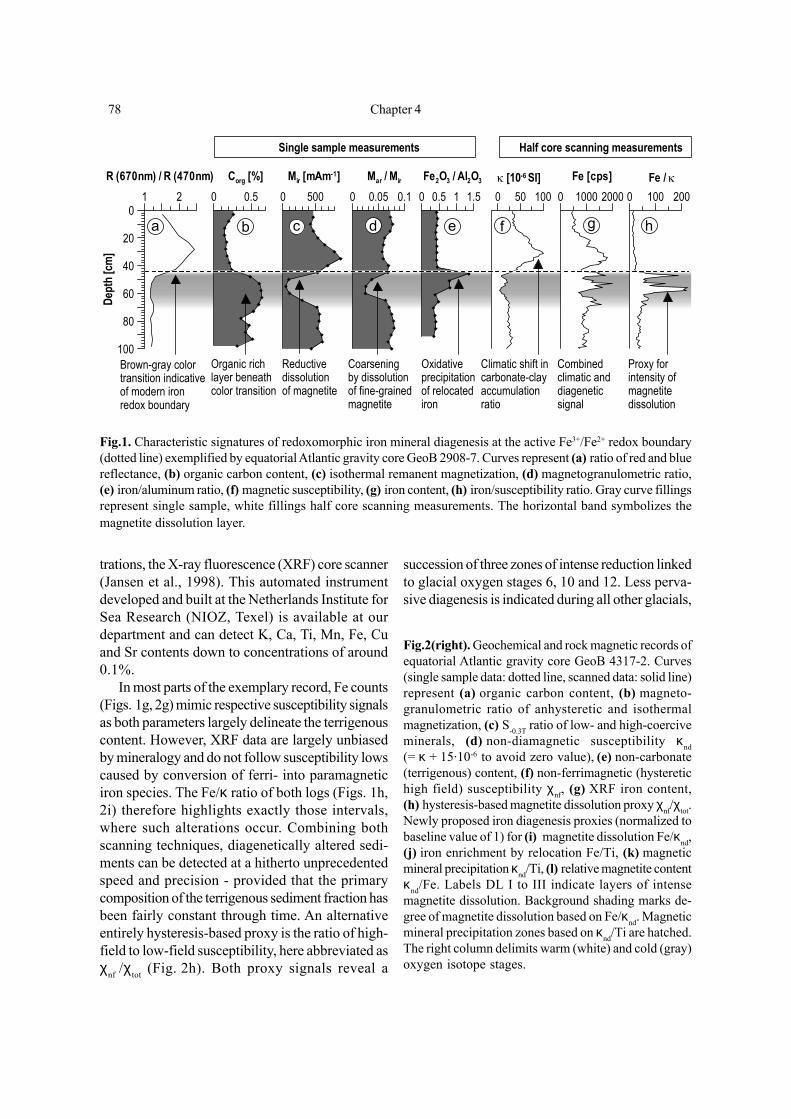
78 Chapter 4
trations, the X-ray fluorescence (XRF) core scanner(Jansen et al., 1998). This automated instrumentdeveloped and built at the Netherlands Institute forSea Research (NIOZ, Texel) is available at ourdepartment and can detect K, Ca, Ti, Mn, Fe, Cuand Sr contents down to concentrations of around0.1%.
In most parts of the exemplary record, Fe counts(Figs. 1g, 2g) mimic respective susceptibility signalsas both parameters largely delineate the terrigenouscontent. However, XRF data are largely unbiasedby mineralogy and do not follow susceptibility lowscaused by conversion of ferri- into paramagneticiron species. The Fe/κ ratio of both logs (Figs. 1h,2i) therefore highlights exactly those intervals,where such alterations occur. Combining bothscanning techniques, diagenetically altered sedi-ments can be detected at a hitherto unprecedentedspeed and precision - provided that the primarycomposition of the terrigenous sediment fraction hasbeen fairly constant through time. An alternativeentirely hysteresis-based proxy is the ratio of high-field to low-field susceptibility, here abbreviated asχnf /χtot (Fig. 2h). Both proxy signals reveal a
succession of three zones of intense reduction linkedto glacial oxygen stages 6, 10 and 12. Less perva-sive diagenesis is indicated during all other glacials,
Fig.1. Characteristic signatures of redoxomorphic iron mineral diagenesis at the active Fe3+/Fe2+ redox boundary(dotted line) exemplified by equatorial Atlantic gravity core GeoB 2908-7. Curves represent (a) ratio of red and bluereflectance, (b) organic carbon content, (c) isothermal remanent magnetization, (d) magnetogranulometric ratio,(e) iron/aluminum ratio, (f) magnetic susceptibility, (g) iron content, (h) iron/susceptibility ratio. Gray curve fillingsrepresent single sample, white fillings half core scanning measurements. The horizontal band symbolizes themagnetite dissolution layer.
0 100 200Fe / κ
0 1000 2000Fe [cps]
0 50 100κ [10-6 SI]
0 0.5 1 1.5Fe2O3 / Al2O3
0 0.05 0.1Mar / Mir
0 500Mir [mAm-1]
0 0.5Corg [%]
1 2R (670nm) / R (470nm)
100
80
60
40
20
0
Dept
h [c
m]
Coarseningby dissolutionof fine-grainedmagnetite
Oxidativeprecipitationof relocatediron
Climatic shift in carbonate-clayaccumulationratio
Brown-gray colortransition indicativeof modern iron redox boundary
Organic richlayer beneathcolor transition
Reductivedissolutionof magnetite
Single sample measurements Half core scanning measurements
Proxy forintensity ofmagnetitedissolution
Combinedclimatic anddiageneticsignal
a b c d e f g h
Fig.2(right). Geochemical and rock magnetic records ofequatorial Atlantic gravity core GeoB 4317-2. Curves(single sample data: dotted line, scanned data: solid line)represent (a) organic carbon content, (b) magneto-granulometric ratio of anhysteretic and isothermalmagnetization, (c) S-0.3T ratio of low- and high-coerciveminerals, (d) non-diamagnetic susceptibility κnd(= κ + 15·10-6 to avoid zero value), (e) non-carbonate(terrigenous) content, (f) non-ferrimagnetic (hysteretichigh field) susceptibility χnf, (g) XRF iron content,(h) hysteresis-based magnetite dissolution proxy χnf/χtot.Newly proposed iron diagenesis proxies (normalized tobaseline value of 1) for (i) magnetite dissolution Fe/κnd,(j) iron enrichment by relocation Fe/Ti, (k) magneticmineral precipitation κnd/Ti, (l) relative magnetite contentκnd/Fe. Labels DL I to III indicate layers of intensemagnetite dissolution. Background shading marks de-gree of magnetite dissolution based on Fe/κnd. Magneticmineral precipitation zones based on κnd/Ti are hatched.The right column delimits warm (white) and cold (gray)oxygen isotope stages.
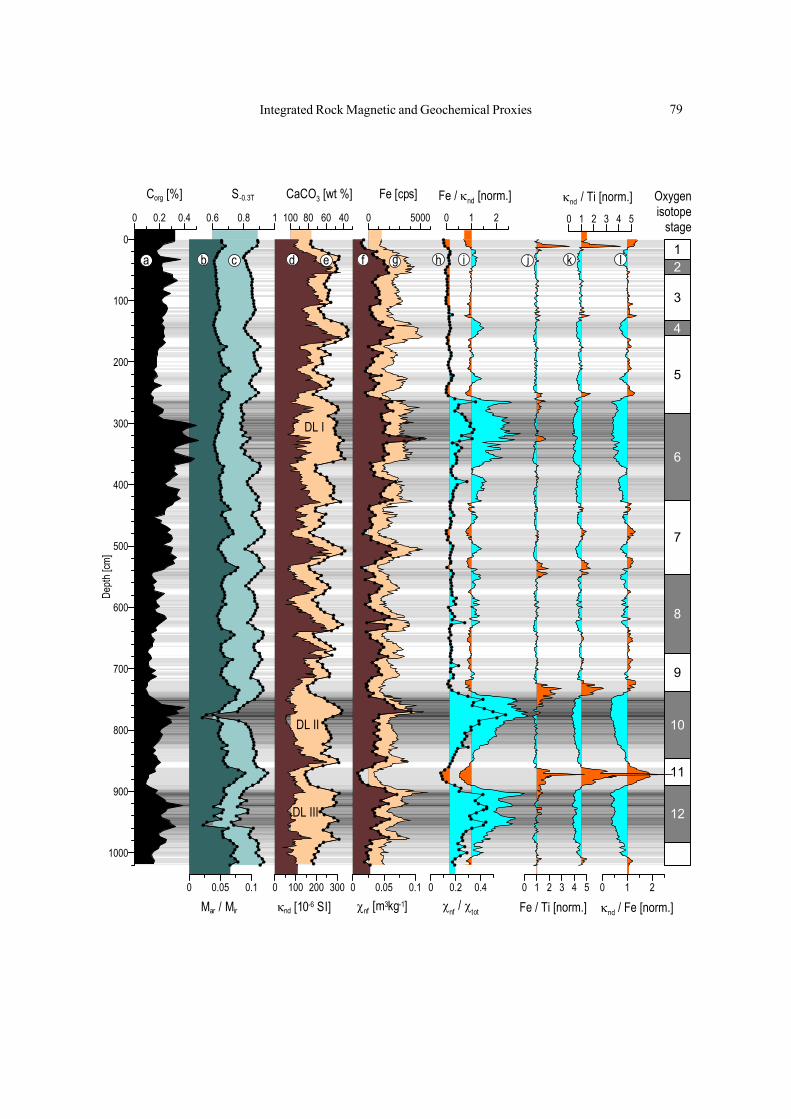
Integrated Rock Magnetic and Geochemical Proxies 79
0 1 2
κnd / Fe [norm.]
0 1 2 3 4 5
κnd / Ti [norm.]
0 1 2 3 4 5
Fe / Ti [norm.]
0 1 2
Fe / κnd [norm.]
0 0.2 0.4χnf / χtot
0 5000
Fe [cps]
0 0.05 0.1χnf [m3kg-1]
100 80 60 40
CaCO3 [wt %]
0 100 200 300
κnd [10-6 SI]
0.6 0.8 1
S-0.3T
0 0.05 0.1
Mar / Mir
0 0.2 0.4
Corg [%]
1000
900
800
700
600
500
400
300
200
100
0
Depth
[cm]
a b c d e gf h k lji 2
4
8
6
10
12
1
Oxygenisotope
stage
3
5
7
9
11
DL II
DL III
DL I
80 Chapter 4
in spite that the corresponding Corg contents(Fig. 2a) are not always elevated. It is very likely,that the Corg concentrations in these layers wereoriginally larger and have been later diminished byprograding oxidation. The reductive loss of mag-netite is therefore a useful indicator of formersuboxic events.
Sedimentary Ti4+ is like Al3+ an inert and insol-uble, hence conservative ion of terrigenous origin.Primary titanium accumulation is mostly highlycorrelated with that of iron. XRF-based Ti logs cantherefore be used as normalizers for κ and Fe logs.This yields two additional proxy ratios for ferri-magnetic iron precipitation (κnd/Ti, Fig. 2k) and to-tal iron enrichment (Fe/Ti, Fig. 2j).
In total, the mutual proportionalities of Fe, Ti andmagnetite concentrations in unaltered sedimentsections enable us to define quantitative proxyparameters for magnetite depletion (Fe/κnd) belowand precipitation (κnd/Ti) above the modern andnumerous fossil redox boundaries, while iron re-location is detected on basis of the Fe/Ti ratio. Allthree ratios were calibrated internally by setting thebaseline value to 1. It is possible to reconstruct andquantify primary deposition and secondary change
of magnetite as well as total Fe by using linear Ti-based transfer functions derived in pristine coresections. All necessary raw data sets can bemeasured by combining non-destructive split coresurface scanning techniques with a cumulativedata acquisition time of less than two minutes persample.
ReferencesDapples, EC (1962) Stages of diagenesis in the
development of sandstones. Geological Society ofAmerica Bulletin, 73, 913-934
Froelich, PN, Klinkhammer GP, Bender ML, Luedtke NA,Heath GR, Cullen D, Dauphin P, Hammond D,Hartman B, Maynard V (1979) Early oxidation oforganic matter in pelagic sediments of the easternequatorial Atlantic: suboxic diagenesis. Geochimicaet Cosmochimica Acta, 43, 1075-1090.
Jansen JHF, Van der Gaast SJ and Koster AJ (1998)CORTEX, a shipboard XRF-scanner for elementanalyses in split sediment cores. Marine Geology,151,143-153.
Robinson SG, Sahota JTS and Oldfield F (2000) Earlydiagenesis in North Atlantic abyssal plain sedimentscharacterized by rock magnetic and geochemicalindices. Marine Geology, 163, 77-107.
Abstract: A high-resolution study of an active Fe2+/Fe3+ redox horizon has been carried out onsediments of the central equatorial Atlantic. The multidisciplinary approach combining geochemicaland rock-magnetic parameters gives evidence of the interrelation of the redox horizon with the lastchange from glacial to interglacial conditions (T1). Distinct enrichments of redox-sensitive elements(Mn, Fe, V, and U) reveal a characteristic depth-sequence, indicating non-steady-state diageneticconditions caused by a decrease in productivity and an increase in oxygen content in the bottomwater during T1 and a reversal during the Holocene. Thus, the redox boundaries first moved downinto the sediment and subsequently upwards. The movement of the redox boundaries led to thedevelopment of conspicuous double peaks for Fe and Mn. The reconstruction based on geochemicaldata is supported by susceptibility and magnetization measurements of the sediments displayingwell-defined anomalies in the vicinity of active and paleo redox boundaries. The combination ofgeochemical and rock-magnetic parameters, like the ferrimagnetic susceptibility, and total Feconcentration (χf/Fe) are suitable for characterizing distinct zones of dissolution and precipitation offerromagnetic mineral phases (e.g. magnetite). Moreover, the small scale movement of the Fe2+/Fe3+redox-boundary, could be traced in detail by overlaying the peak-shape pattern of V/Al and ofχf/χtot.
Keywords: Equatorial Atlantic Ocean, high resolution investigation, geochemistry,rock-magnetics, non-steady state diagenesis, Fe2+/Fe3+ redox-boundary
Chapter 5
A combined geochemical and rock-magnetic investigation of a redoxhorizon at the last glacial/interglacial transition
A. Reitz1*, C. Hensen2, S. Kasten3, J.A. Funk3 and G.J. deLange1
1Geochemistry Department, Faculty of Earth Sciences,Utrecht University, P.O. Box 80021, 3508 TA Utrecht, The Netherlands
2GEOMAR � Research Centre for Marine Geosciences, Marine Environmental GeologyWischhofstr. 1-3, D-24148 Kiel, Germany
3Universität Bremen, Fachbereich Geowissenschaften, Postfach 33 04 40, D-28334 Bremen, Germany
* corresponding author (e-mail): [email protected]
geochemical and rock-magnetic investigations ofmarine sediments can give useful information onlong-term variation of a number of climate-drivenprocesses (e.g. accumulation of organic carbon,oxygen content in bottom water etc.).
Abrupt changes of organic matter input and/orthe oxygen level in the bottom water are shown togenerate transient conditions of early diageneticprocesses (Wilson et al., 1985). Diagenetic pro-cesses may not only overprint primary sedimentarysignals, but can also generate secondary diagenetic
1. IntroductionDuring the Quaternary the interaction of atmos-pheric and oceanic circulation patterns, whichcontrols the productivity and preservation of or-ganic matter, changed repeatedly in response toorbitally forced glacial/interglacial cycles (Wagner,1999; Berger et al., 1994; Imbrie and PalmerImbrie, 1998). Deep-ocean sediments are archivesfor such climate variations, which can be revealedby the analysis of various properties determined bygeochemical, geophysical or sedimentologicalmethods (cf. Fischer & Wefer, 1999). In particular,Physics and Chemistry of the Earth (in press)
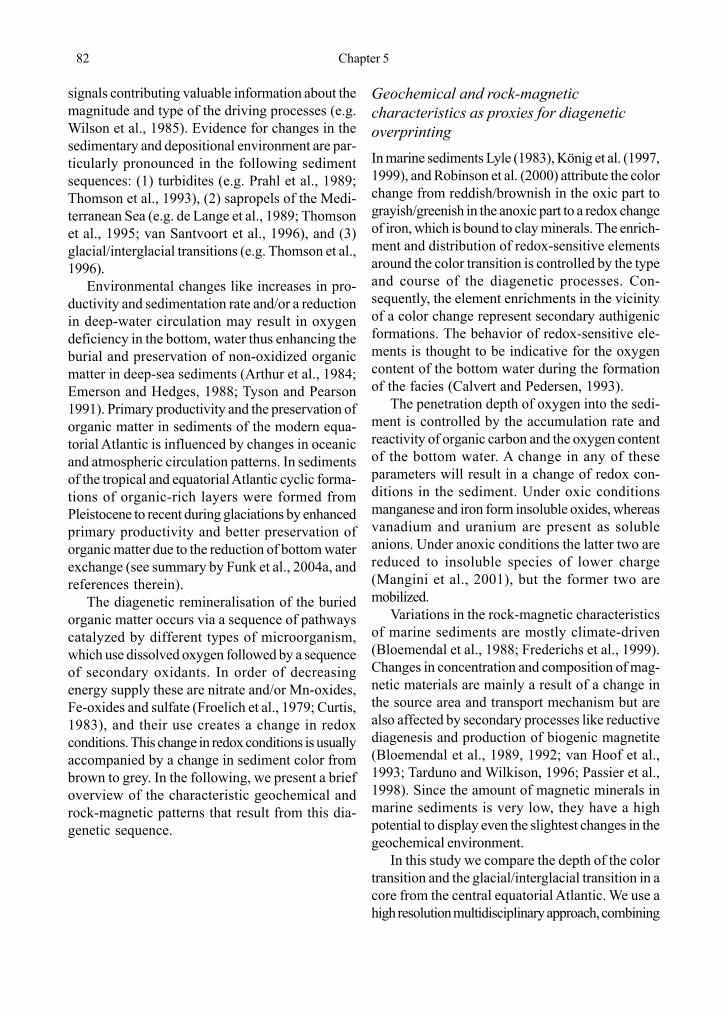
82 Chapter 5
Geochemical and rock-magneticcharacteristics as proxies for diageneticoverprintingIn marine sediments Lyle (1983), König et al. (1997,1999), and Robinson et al. (2000) attribute the colorchange from reddish/brownish in the oxic part tograyish/greenish in the anoxic part to a redox changeof iron, which is bound to clay minerals. The enrich-ment and distribution of redox-sensitive elementsaround the color transition is controlled by the typeand course of the diagenetic processes. Con-sequently, the element enrichments in the vicinityof a color change represent secondary authigenicformations. The behavior of redox-sensitive ele-ments is thought to be indicative for the oxygencontent of the bottom water during the formationof the facies (Calvert and Pedersen, 1993).
The penetration depth of oxygen into the sedi-ment is controlled by the accumulation rate andreactivity of organic carbon and the oxygen contentof the bottom water. A change in any of theseparameters will result in a change of redox con-ditions in the sediment. Under oxic conditionsmanganese and iron form insoluble oxides, whereasvanadium and uranium are present as solubleanions. Under anoxic conditions the latter two arereduced to insoluble species of lower charge(Mangini et al., 2001), but the former two aremobilized.
Variations in the rock-magnetic characteristicsof marine sediments are mostly climate-driven(Bloemendal et al., 1988; Frederichs et al., 1999).Changes in concentration and composition of mag-netic materials are mainly a result of a change inthe source area and transport mechanism but arealso affected by secondary processes like reductivediagenesis and production of biogenic magnetite(Bloemendal et al., 1989, 1992; van Hoof et al.,1993; Tarduno and Wilkison, 1996; Passier et al.,1998). Since the amount of magnetic minerals inmarine sediments is very low, they have a highpotential to display even the slightest changes in thegeochemical environment.
In this study we compare the depth of the colortransition and the glacial/interglacial transition in acore from the central equatorial Atlantic. We use ahigh resolution multidisciplinary approach, combining
signals contributing valuable information about themagnitude and type of the driving processes (e.g.Wilson et al., 1985). Evidence for changes in thesedimentary and depositional environment are par-ticularly pronounced in the following sedimentsequences: (1) turbidites (e.g. Prahl et al., 1989;Thomson et al., 1993), (2) sapropels of the Medi-terranean Sea (e.g. de Lange et al., 1989; Thomsonet al., 1995; van Santvoort et al., 1996), and (3)glacial/interglacial transitions (e.g. Thomson et al.,1996).
Environmental changes like increases in pro-ductivity and sedimentation rate and/or a reductionin deep-water circulation may result in oxygendeficiency in the bottom, water thus enhancing theburial and preservation of non-oxidized organicmatter in deep-sea sediments (Arthur et al., 1984;Emerson and Hedges, 1988; Tyson and Pearson1991). Primary productivity and the preservation oforganic matter in sediments of the modern equa-torial Atlantic is influenced by changes in oceanicand atmospheric circulation patterns. In sedimentsof the tropical and equatorial Atlantic cyclic forma-tions of organic-rich layers were formed fromPleistocene to recent during glaciations by enhancedprimary productivity and better preservation oforganic matter due to the reduction of bottom waterexchange (see summary by Funk et al., 2004a, andreferences therein).
The diagenetic remineralisation of the buriedorganic matter occurs via a sequence of pathwayscatalyzed by different types of microorganism,which use dissolved oxygen followed by a sequenceof secondary oxidants. In order of decreasingenergy supply these are nitrate and/or Mn-oxides,Fe-oxides and sulfate (Froelich et al., 1979; Curtis,1983), and their use creates a change in redoxconditions. This change in redox conditions is usuallyaccompanied by a change in sediment color frombrown to grey. In the following, we present a briefoverview of the characteristic geochemical androck-magnetic patterns that result from this dia-genetic sequence.
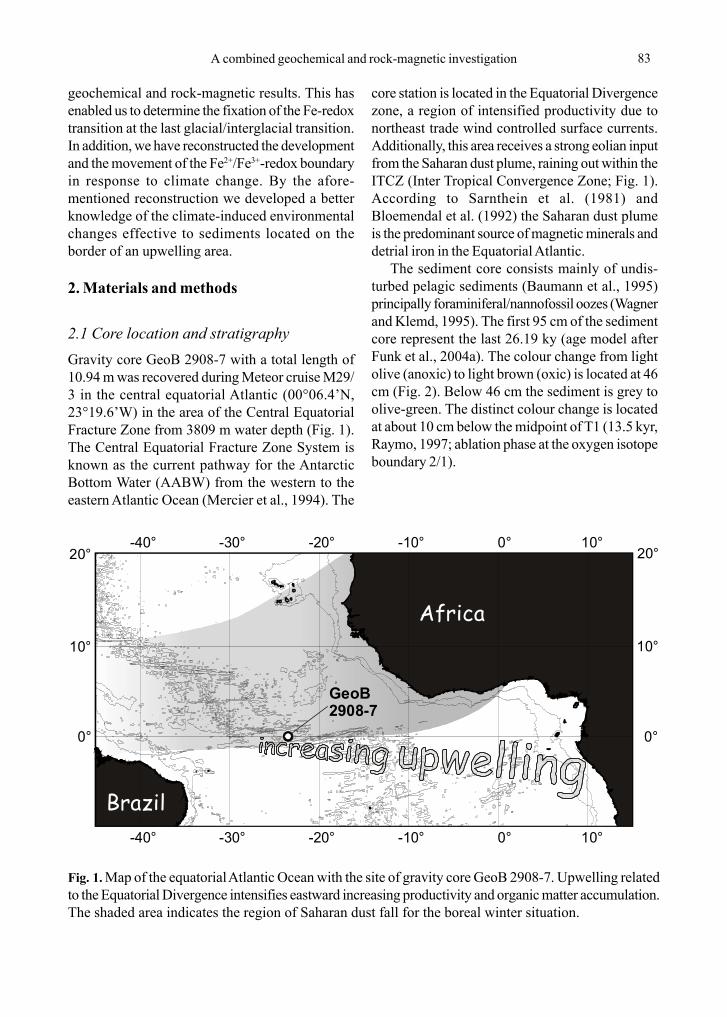
A combined geochemical and rock-magnetic investigation 83
geochemical and rock-magnetic results. This hasenabled us to determine the fixation of the Fe-redoxtransition at the last glacial/interglacial transition.In addition, we have reconstructed the developmentand the movement of the Fe2+/Fe3+-redox boundaryin response to climate change. By the afore-mentioned reconstruction we developed a betterknowledge of the climate-induced environmentalchanges effective to sediments located on theborder of an upwelling area.
2. Materials and methods
2.1 Core location and stratigraphyGravity core GeoB 2908-7 with a total length of10.94 m was recovered during Meteor cruise M29/3 in the central equatorial Atlantic (00°06.4�N,23°19.6�W) in the area of the Central EquatorialFracture Zone from 3809 m water depth (Fig. 1).The Central Equatorial Fracture Zone System isknown as the current pathway for the AntarcticBottom Water (AABW) from the western to theeastern Atlantic Ocean (Mercier et al., 1994). The
core station is located in the Equatorial Divergencezone, a region of intensified productivity due tonortheast trade wind controlled surface currents.Additionally, this area receives a strong eolian inputfrom the Saharan dust plume, raining out within theITCZ (Inter Tropical Convergence Zone; Fig. 1).According to Sarnthein et al. (1981) andBloemendal et al. (1992) the Saharan dust plumeis the predominant source of magnetic minerals anddetrial iron in the Equatorial Atlantic.
The sediment core consists mainly of undis-turbed pelagic sediments (Baumann et al., 1995)principally foraminiferal/nannofossil oozes (Wagnerand Klemd, 1995). The first 95 cm of the sedimentcore represent the last 26.19 ky (age model afterFunk et al., 2004a). The colour change from lightolive (anoxic) to light brown (oxic) is located at 46cm (Fig. 2). Below 46 cm the sediment is grey toolive-green. The distinct colour change is locatedat about 10 cm below the midpoint of T1 (13.5 kyr,Raymo, 1997; ablation phase at the oxygen isotopeboundary 2/1).
Fig. 1. Map of the equatorial Atlantic Ocean with the site of gravity core GeoB 2908-7. Upwelling relatedto the Equatorial Divergence intensifies eastward increasing productivity and organic matter accumulation.The shaded area indicates the region of Saharan dust fall for the boreal winter situation.
Africa
Brazil
0° 0°
10° 10°
20° 20°
-40°
-40°
-30°
-30°
-20°
-20°
-10°
-10°
0°
0°
10°
10°
GeoB2908-7
84 Chapter 5
2.2 Geochemical analysisBulk element analyses of the sediment sequence0-95 cm were performed by Inductively CoupledPlasma-Atomic Emission Spectrometry (Perkin-Elmer optima 3300 RL ICP-AES) and InductivelyCoupled Plasma-Mass Spectrometry (FinniganSola ICP-MS) in 1 cm resolution after a 3-step totaldigestion in a microwave device (Ethos 1600 andMega 2, MLS). (1) Digestion of 50 mg of freeze-dried sediment in a mixture of 3 mL HNO3 (65%s.p.), 2 mL HF (48% s.p.) and 2 mL HCl (30% s.p.)at 200°C; (2) evaporation of the solution close todryness; (3) dissolution and homogenisation of theresidual in a solution of 0.5 mL HNO3 (65% s.p.)and 4.5 mL MilliQ-water, finally the solution wasfilled up to 50 mL with MilliQ-water. To each batchof 10 samples, one blank and a reference standard(MAG-1, USGS; Gladney and Roelandts, 1988)have been added and treated in the same way asthe sediments. Each sample solution was analyzedin 3 replicates, and a deviation of less than 3% wasaccepted for ICP-AES and less than 10% for ICP-MS.
Dissolution effects (e.g. calcium carbonate)should be minimized by normalizing the measuredelements to aluminum (Al). It is assumed that Al isexclusively bound to the alumosilicate phase(Calvert and Petersen, 1993) and behaves as aconservative element with respect to diageneticoverprinting (Thomson et al., 1998). Hence thistechnique emphasizes the effects of diageneticelement mobilization (Brown et al., 2000).
2.3 Rock-magnetic analysisHysteresis measurements were carried out at a 1cm resolution with a PMC M2900 alternatinggradient force magnetometer (AGM). For themeasurements < 50 mg miniature samples asdescribed by von Dobeneck (1996) have beenprepared. The 3 step hysteresis analysis started withthe determination of the minor loop applying amaximum field strength of 300 mT and a fieldincrement of 2 mT. In the second step the backfieldcurve was determined by first magnetizing thesample and subsequently magnetizing it in theopposite direction. Finally, the major loop wasdetermined applying a maximum field strength of
1000 mT and a field increment of 5 mT in the thirdstep. The hysteresis measurements were processedwith the program HYSTEAR (von Dobeneck,1996) to acquire the basic hysteresis parameters,which are (1) the saturation magnetization Ms, (2)the remanent saturation magnetization Mrs, (3) thecoercivity Bc, and (4) the remanent coercivity Bcr.Accordingly, the magnetization (i.e. magneto-granulometric Mrs/Ms ratio by Day et al., 1977), andmagnetic stability of a sample can be derived. Thehysteresis based total susceptibility χtot (per massunit) integrates all induced magnetization signals;the non-ferromagnetic susceptibility χnf representsexclusively the paramagnetic (iron-bearing silicatesand clays) and the diamagnetic (biogenic carbonateand opal) sediment matrix. The difference betweenthem is given by the ferromagnetic susceptibility χf,which is a quantitative measure of the abundanceof ferromagnetic and antiferromagnetic minerals.
3. Results
3.1 Geochemical characteristicsDown-core variations of element/Al-ratios areplotted in Figure 2. A conspicuous depth sequenceof redox-sensitive element enrichments around thecolor transition is distinctively visible. The sequencestarts with a broad Mn/Al double-peak above thecolor change that is followed downward by an Fe/Al double-peak of which the upper one is locateddirectly at the color change. Just below the upperFe/Al peak, increasing values of V/Al occur,followed in turn by increasing values of U/Al.
The productivity-related Ba/Al ratio showsincreasing values below the glacial to interglacialtransition (TI). These increased values form abroad peak extending over at least 30 cm; inaddition, there is a slight but distinct increase fromabout 5 to 15 cm depth. The Sr/Al plot displayshigher values from about 0 to 15 cm depth followedby a distinct broad depletion between 15 and about40 cm. Below that depth mean values prevail.
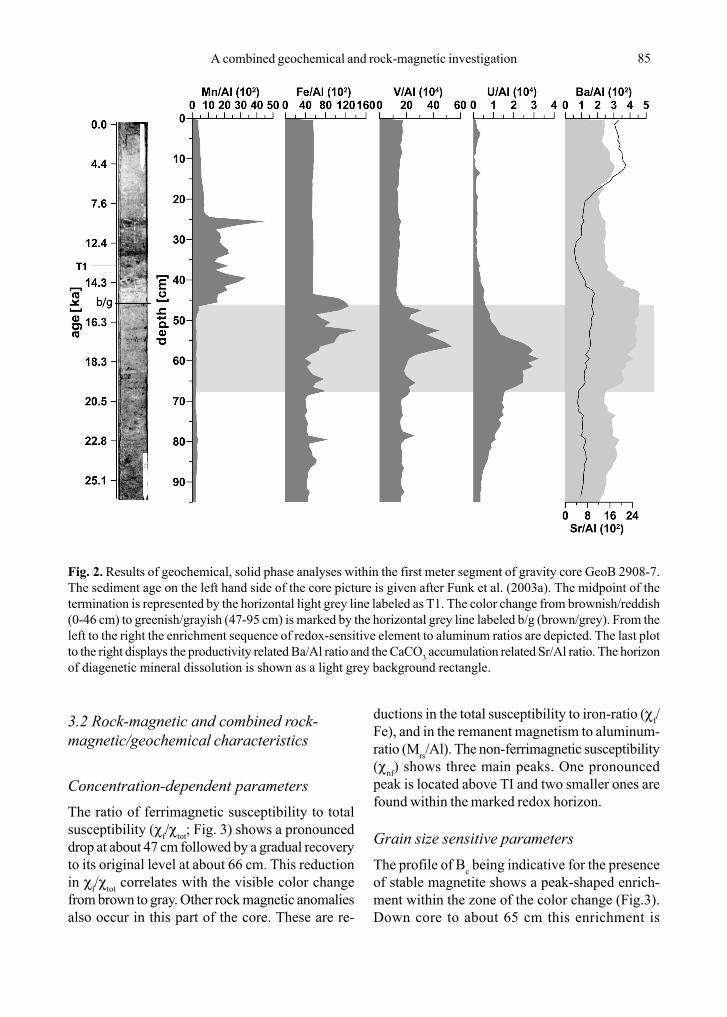
A combined geochemical and rock-magnetic investigation 85
3.2 Rock-magnetic and combined rock-magnetic/geochemical characteristics
Concentration-dependent parametersThe ratio of ferrimagnetic susceptibility to totalsusceptibility (χf/χtot; Fig. 3) shows a pronounceddrop at about 47 cm followed by a gradual recoveryto its original level at about 66 cm. This reductionin χf/χtot correlates with the visible color changefrom brown to gray. Other rock magnetic anomaliesalso occur in this part of the core. These are re-
ductions in the total susceptibility to iron-ratio (χf/Fe), and in the remanent magnetism to aluminum-ratio (Mrs/Al). The non-ferrimagnetic susceptibility(χnf) shows three main peaks. One pronouncedpeak is located above TI and two smaller ones arefound within the marked redox horizon.
Grain size sensitive parametersThe profile of Bc being indicative for the presenceof stable magnetite shows a peak-shaped enrich-ment within the zone of the color change (Fig.3).Down core to about 65 cm this enrichment is
Fig. 2. Results of geochemical, solid phase analyses within the first meter segment of gravity core GeoB 2908-7.The sediment age on the left hand side of the core picture is given after Funk et al. (2003a). The midpoint of thetermination is represented by the horizontal light grey line labeled as T1. The color change from brownish/reddish(0-46 cm) to greenish/grayish (47-95 cm) is marked by the horizontal grey line labeled b/g (brown/grey). From theleft to the right the enrichment sequence of redox-sensitive element to aluminum ratios are depicted. The last plotto the right displays the productivity related Ba/Al ratio and the CaCO3 accumulation related Sr/Al ratio. The horizonof diagenetic mineral dissolution is shown as a light grey background rectangle.
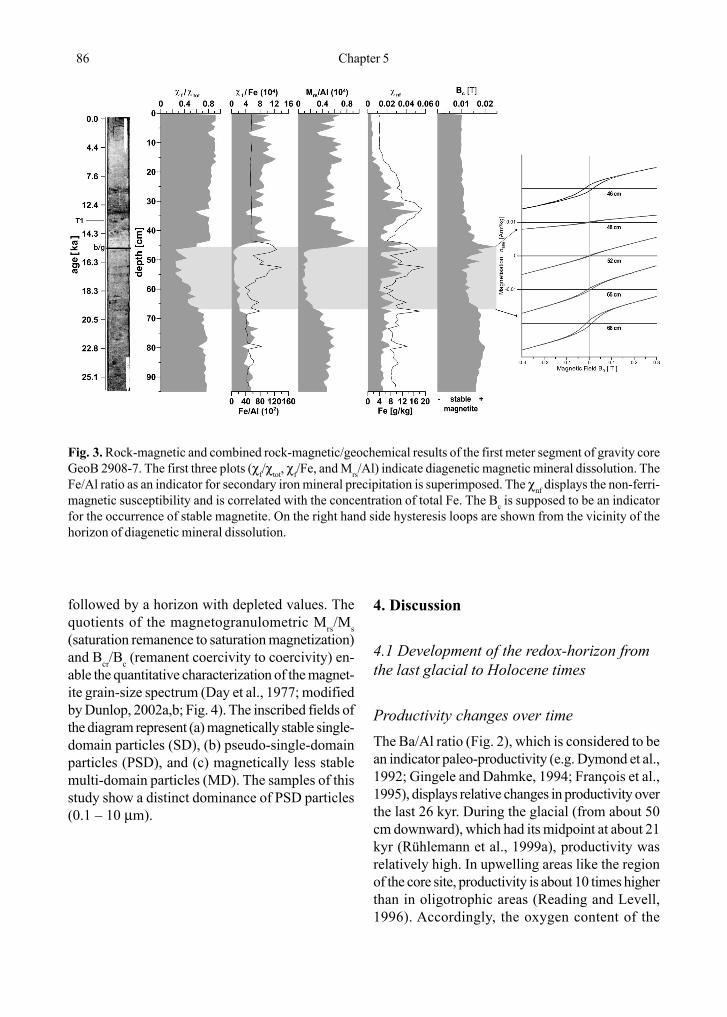
86 Chapter 5
followed by a horizon with depleted values. Thequotients of the magnetogranulometric Mrs/Ms(saturation remanence to saturation magnetization)and Bcr/Bc (remanent coercivity to coercivity) en-able the quantitative characterization of the magnet-ite grain-size spectrum (Day et al., 1977; modifiedby Dunlop, 2002a,b; Fig. 4). The inscribed fields ofthe diagram represent (a) magnetically stable single-domain particles (SD), (b) pseudo-single-domainparticles (PSD), and (c) magnetically less stablemulti-domain particles (MD). The samples of thisstudy show a distinct dominance of PSD particles(0.1 � 10 µm).
4. Discussion
4.1 Development of the redox-horizon fromthe last glacial to Holocene times
Productivity changes over timeThe Ba/Al ratio (Fig. 2), which is considered to bean indicator paleo-productivity (e.g. Dymond et al.,1992; Gingele and Dahmke, 1994; François et al.,1995), displays relative changes in productivity overthe last 26 kyr. During the glacial (from about 50cm downward), which had its midpoint at about 21kyr (Rühlemann et al., 1999a), productivity wasrelatively high. In upwelling areas like the regionof the core site, productivity is about 10 times higherthan in oligotrophic areas (Reading and Levell,1996). Accordingly, the oxygen content of the
Fig. 3. Rock-magnetic and combined rock-magnetic/geochemical results of the first meter segment of gravity coreGeoB 2908-7. The first three plots (χf/χtot, χf/Fe, and Mrs/Al) indicate diagenetic magnetic mineral dissolution. TheFe/Al ratio as an indicator for secondary iron mineral precipitation is superimposed. The χnf displays the non-ferri-magnetic susceptibility and is correlated with the concentration of total Fe. The Bc is supposed to be an indicatorfor the occurrence of stable magnetite. On the right hand side hysteresis loops are shown from the vicinity of thehorizon of diagenetic mineral dissolution.
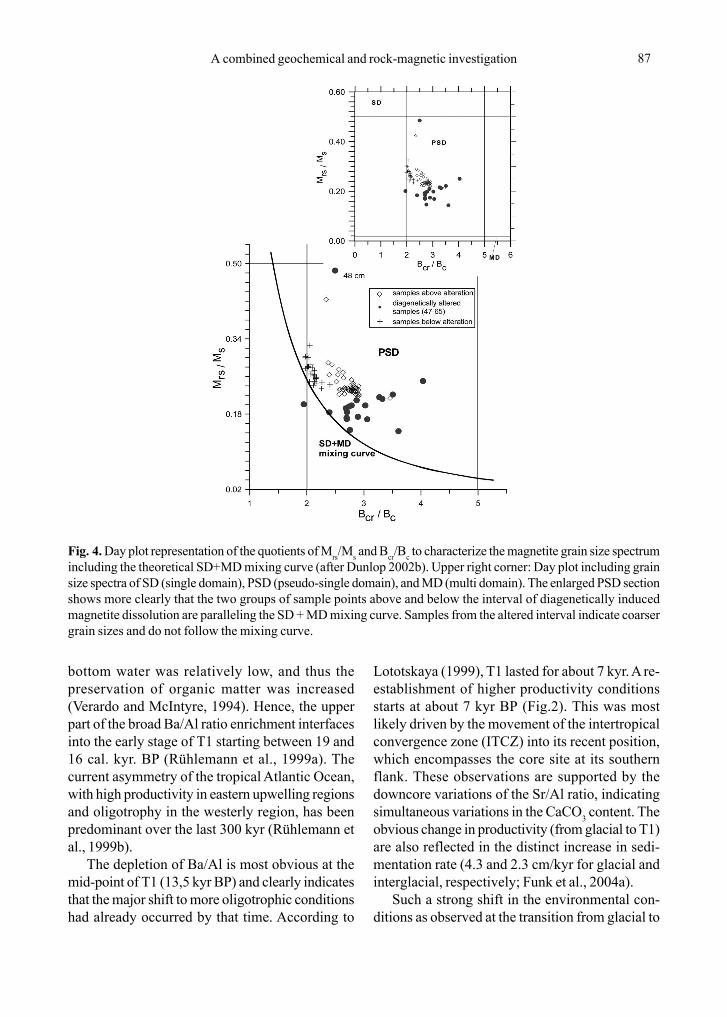
A combined geochemical and rock-magnetic investigation 87
bottom water was relatively low, and thus thepreservation of organic matter was increased(Verardo and McIntyre, 1994). Hence, the upperpart of the broad Ba/Al ratio enrichment interfacesinto the early stage of T1 starting between 19 and16 cal. kyr. BP (Rühlemann et al., 1999a). Thecurrent asymmetry of the tropical Atlantic Ocean,with high productivity in eastern upwelling regionsand oligotrophy in the westerly region, has beenpredominant over the last 300 kyr (Rühlemann etal., 1999b).
The depletion of Ba/Al is most obvious at themid-point of T1 (13,5 kyr BP) and clearly indicatesthat the major shift to more oligotrophic conditionshad already occurred by that time. According to
Lototskaya (1999), T1 lasted for about 7 kyr. A re-establishment of higher productivity conditionsstarts at about 7 kyr BP (Fig.2). This was mostlikely driven by the movement of the intertropicalconvergence zone (ITCZ) into its recent position,which encompasses the core site at its southernflank. These observations are supported by thedowncore variations of the Sr/Al ratio, indicatingsimultaneous variations in the CaCO3 content. Theobvious change in productivity (from glacial to T1)are also reflected in the distinct increase in sedi-mentation rate (4.3 and 2.3 cm/kyr for glacial andinterglacial, respectively; Funk et al., 2004a).
Such a strong shift in the environmental con-ditions as observed at the transition from glacial to
Fig. 4. Day plot representation of the quotients of Mrs/Ms and Bcr/Bc to characterize the magnetite grain size spectrumincluding the theoretical SD+MD mixing curve (after Dunlop 2002b). Upper right corner: Day plot including grainsize spectra of SD (single domain), PSD (pseudo-single domain), and MD (multi domain). The enlarged PSD sectionshows more clearly that the two groups of sample points above and below the interval of diagenetically inducedmagnetite dissolution are paralleling the SD + MD mixing curve. Samples from the altered interval indicate coarsergrain sizes and do not follow the mixing curve.
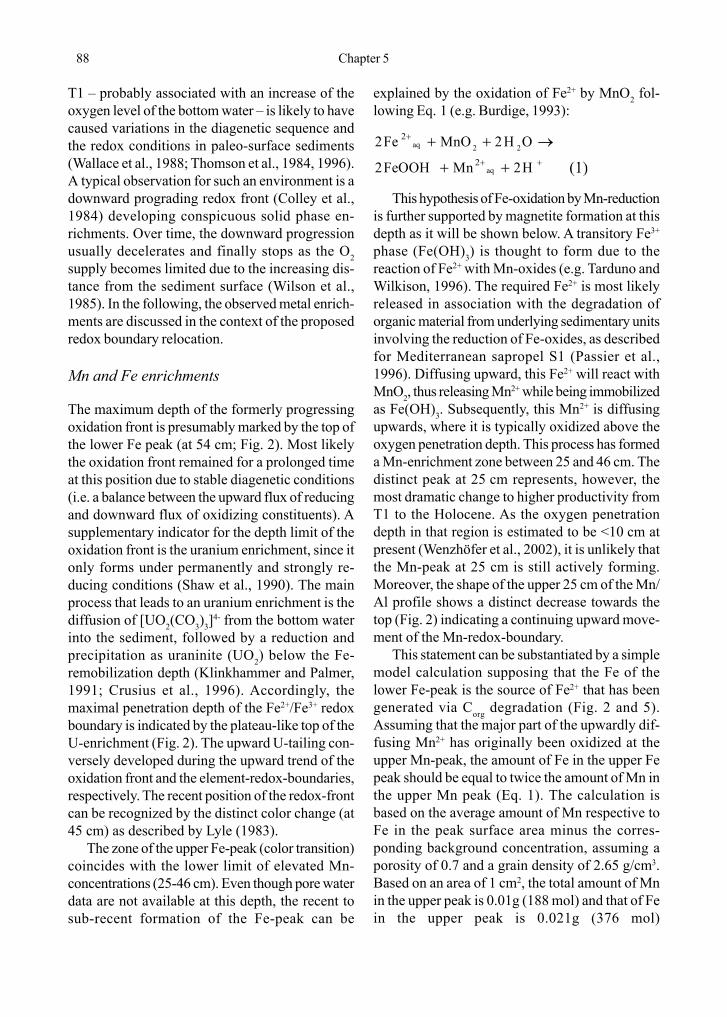
88 Chapter 5
T1 � probably associated with an increase of theoxygen level of the bottom water � is likely to havecaused variations in the diagenetic sequence andthe redox conditions in paleo-surface sediments(Wallace et al., 1988; Thomson et al., 1984, 1996).A typical observation for such an environment is adownward prograding redox front (Colley et al.,1984) developing conspicuous solid phase en-richments. Over time, the downward progressionusually decelerates and finally stops as the O2supply becomes limited due to the increasing dis-tance from the sediment surface (Wilson et al.,1985). In the following, the observed metal enrich-ments are discussed in the context of the proposedredox boundary relocation.
Mn and Fe enrichments
The maximum depth of the formerly progressingoxidation front is presumably marked by the top ofthe lower Fe peak (at 54 cm; Fig. 2). Most likelythe oxidation front remained for a prolonged timeat this position due to stable diagenetic conditions(i.e. a balance between the upward flux of reducingand downward flux of oxidizing constituents). Asupplementary indicator for the depth limit of theoxidation front is the uranium enrichment, since itonly forms under permanently and strongly re-ducing conditions (Shaw et al., 1990). The mainprocess that leads to an uranium enrichment is thediffusion of [UO2(CO3)3]
4- from the bottom waterinto the sediment, followed by a reduction andprecipitation as uraninite (UO2) below the Fe-remobilization depth (Klinkhammer and Palmer,1991; Crusius et al., 1996). Accordingly, themaximal penetration depth of the Fe2+/Fe3+ redoxboundary is indicated by the plateau-like top of theU-enrichment (Fig. 2). The upward U-tailing con-versely developed during the upward trend of theoxidation front and the element-redox-boundaries,respectively. The recent position of the redox-frontcan be recognized by the distinct color change (at45 cm) as described by Lyle (1983).
The zone of the upper Fe-peak (color transition)coincides with the lower limit of elevated Mn-concentrations (25-46 cm). Even though pore waterdata are not available at this depth, the recent tosub-recent formation of the Fe-peak can be
explained by the oxidation of Fe2+ by MnO2 fol-lowing Eq. 1 (e.g. Burdige, 1993):
This hypothesis of Fe-oxidation by Mn-reductionis further supported by magnetite formation at thisdepth as it will be shown below. A transitory Fe3+
phase (Fe(OH)3) is thought to form due to thereaction of Fe2+ with Mn-oxides (e.g. Tarduno andWilkison, 1996). The required Fe2+ is most likelyreleased in association with the degradation oforganic material from underlying sedimentary unitsinvolving the reduction of Fe-oxides, as describedfor Mediterranean sapropel S1 (Passier et al.,1996). Diffusing upward, this Fe2+ will react withMnO2, thus releasing Mn2+ while being immobilizedas Fe(OH)3. Subsequently, this Mn2+ is diffusingupwards, where it is typically oxidized above theoxygen penetration depth. This process has formeda Mn-enrichment zone between 25 and 46 cm. Thedistinct peak at 25 cm represents, however, themost dramatic change to higher productivity fromT1 to the Holocene. As the oxygen penetrationdepth in that region is estimated to be <10 cm atpresent (Wenzhöfer et al., 2002), it is unlikely thatthe Mn-peak at 25 cm is still actively forming.Moreover, the shape of the upper 25 cm of the Mn/Al profile shows a distinct decrease towards thetop (Fig. 2) indicating a continuing upward move-ment of the Mn-redox-boundary.
This statement can be substantiated by a simplemodel calculation supposing that the Fe of thelower Fe-peak is the source of Fe2+ that has beengenerated via Corg degradation (Fig. 2 and 5).Assuming that the major part of the upwardly dif-fusing Mn2+ has originally been oxidized at theupper Mn-peak, the amount of Fe in the upper Fepeak should be equal to twice the amount of Mn inthe upper Mn peak (Eq. 1). The calculation isbased on the average amount of Mn respective toFe in the peak surface area minus the corres-ponding background concentration, assuming aporosity of 0.7 and a grain density of 2.65 g/cm3.Based on an area of 1 cm2, the total amount of Mnin the upper peak is 0.01g (188 mol) and that of Fein the upper peak is 0.021g (376 mol)
22
222
222
++
+
++
→++
HMnFeOOH
OHMnOFe
aq
aq
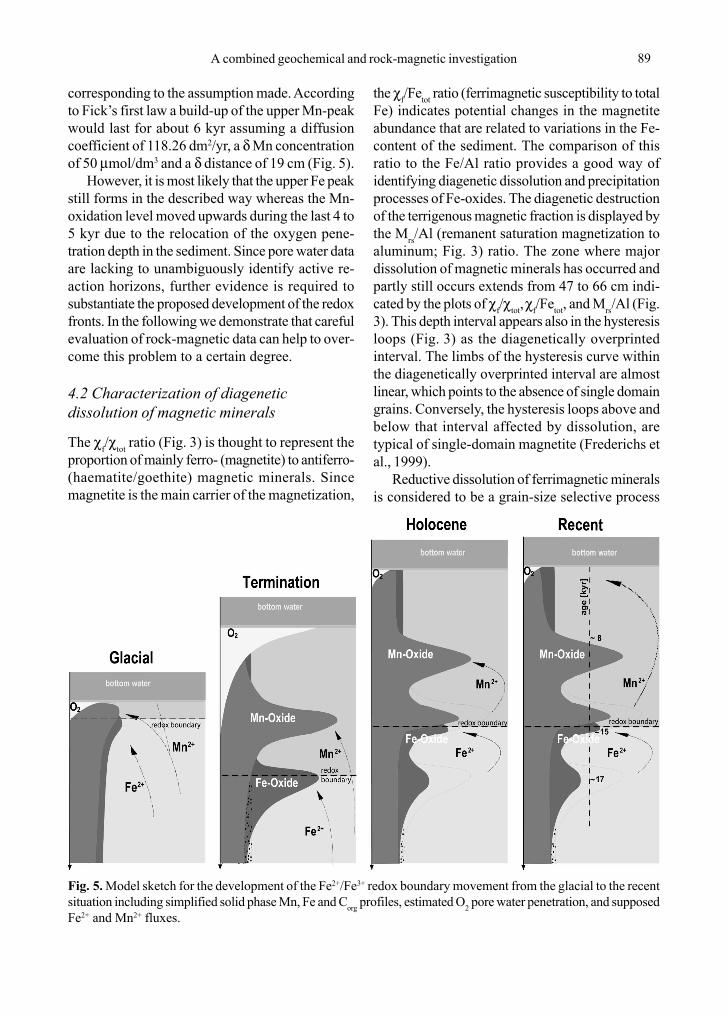
A combined geochemical and rock-magnetic investigation 89
corresponding to the assumption made. Accordingto Fick�s first law a build-up of the upper Mn-peakwould last for about 6 kyr assuming a diffusioncoefficient of 118.26 dm2/yr, a δ Mn concentrationof 50 µmol/dm3 and a δ distance of 19 cm (Fig. 5).
However, it is most likely that the upper Fe peakstill forms in the described way whereas the Mn-oxidation level moved upwards during the last 4 to5 kyr due to the relocation of the oxygen pene-tration depth in the sediment. Since pore water dataare lacking to unambiguously identify active re-action horizons, further evidence is required tosubstantiate the proposed development of the redoxfronts. In the following we demonstrate that carefulevaluation of rock-magnetic data can help to over-come this problem to a certain degree.
4.2 Characterization of diageneticdissolution of magnetic minerals
The χf/χtot ratio (Fig. 3) is thought to represent theproportion of mainly ferro- (magnetite) to antiferro-(haematite/goethite) magnetic minerals. Sincemagnetite is the main carrier of the magnetization,
the χf/Fetot ratio (ferrimagnetic susceptibility to totalFe) indicates potential changes in the magnetiteabundance that are related to variations in the Fe-content of the sediment. The comparison of thisratio to the Fe/Al ratio provides a good way ofidentifying diagenetic dissolution and precipitationprocesses of Fe-oxides. The diagenetic destructionof the terrigenous magnetic fraction is displayed bythe Mrs/Al (remanent saturation magnetization toaluminum; Fig. 3) ratio. The zone where majordissolution of magnetic minerals has occurred andpartly still occurs extends from 47 to 66 cm indi-cated by the plots of χf/χtot, χf/Fetot, and Mrs/Al (Fig.3). This depth interval appears also in the hysteresisloops (Fig. 3) as the diagenetically overprintedinterval. The limbs of the hysteresis curve withinthe diagenetically overprinted interval are almostlinear, which points to the absence of single domaingrains. Conversely, the hysteresis loops above andbelow that interval affected by dissolution, aretypical of single-domain magnetite (Frederichs etal., 1999).
Reductive dissolution of ferrimagnetic mineralsis considered to be a grain-size selective process
Fig. 5. Model sketch for the development of the Fe2+/Fe3+ redox boundary movement from the glacial to the recentsituation including simplified solid phase Mn, Fe and Corg profiles, estimated O2 pore water penetration, and supposedFe2+ and Mn2+ fluxes.
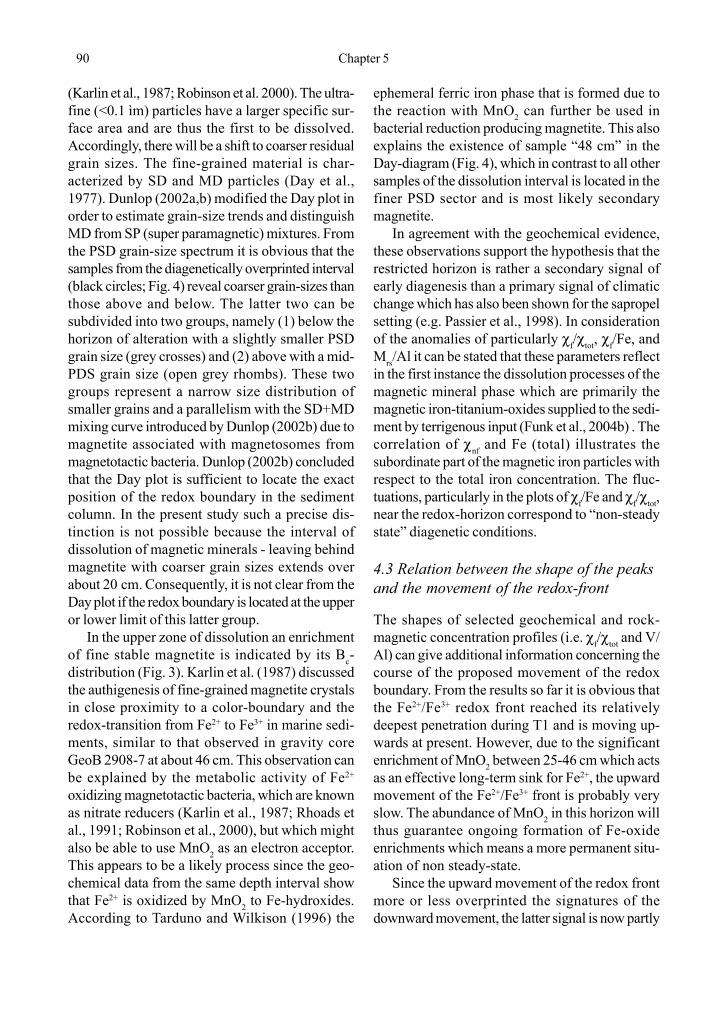
90 Chapter 5
ephemeral ferric iron phase that is formed due tothe reaction with MnO2 can further be used inbacterial reduction producing magnetite. This alsoexplains the existence of sample �48 cm� in theDay-diagram (Fig. 4), which in contrast to all othersamples of the dissolution interval is located in thefiner PSD sector and is most likely secondarymagnetite.
In agreement with the geochemical evidence,these observations support the hypothesis that therestricted horizon is rather a secondary signal ofearly diagenesis than a primary signal of climaticchange which has also been shown for the sapropelsetting (e.g. Passier et al., 1998). In considerationof the anomalies of particularly χf/χtot, χf/Fe, andMrs/Al it can be stated that these parameters reflectin the first instance the dissolution processes of themagnetic mineral phase which are primarily themagnetic iron-titanium-oxides supplied to the sedi-ment by terrigenous input (Funk et al., 2004b) . Thecorrelation of χnf and Fe (total) illustrates thesubordinate part of the magnetic iron particles withrespect to the total iron concentration. The fluc-tuations, particularly in the plots of χf/Fe and χf/χtot,near the redox-horizon correspond to �non-steadystate� diagenetic conditions.
4.3 Relation between the shape of the peaksand the movement of the redox-front
The shapes of selected geochemical and rock-magnetic concentration profiles (i.e. χf/χtot and V/Al) can give additional information concerning thecourse of the proposed movement of the redoxboundary. From the results so far it is obvious thatthe Fe2+/Fe3+ redox front reached its relativelydeepest penetration during T1 and is moving up-wards at present. However, due to the significantenrichment of MnO2 between 25-46 cm which actsas an effective long-term sink for Fe2+, the upwardmovement of the Fe2+/Fe3+ front is probably veryslow. The abundance of MnO2 in this horizon willthus guarantee ongoing formation of Fe-oxideenrichments which means a more permanent situ-ation of non steady-state.
Since the upward movement of the redox frontmore or less overprinted the signatures of thedownward movement, the latter signal is now partly
(Karlin et al., 1987; Robinson et al. 2000). The ultra-fine (<0.1 ìm) particles have a larger specific sur-face area and are thus the first to be dissolved.Accordingly, there will be a shift to coarser residualgrain sizes. The fine-grained material is char-acterized by SD and MD particles (Day et al.,1977). Dunlop (2002a,b) modified the Day plot inorder to estimate grain-size trends and distinguishMD from SP (super paramagnetic) mixtures. Fromthe PSD grain-size spectrum it is obvious that thesamples from the diagenetically overprinted interval(black circles; Fig. 4) reveal coarser grain-sizes thanthose above and below. The latter two can besubdivided into two groups, namely (1) below thehorizon of alteration with a slightly smaller PSDgrain size (grey crosses) and (2) above with a mid-PDS grain size (open grey rhombs). These twogroups represent a narrow size distribution ofsmaller grains and a parallelism with the SD+MDmixing curve introduced by Dunlop (2002b) due tomagnetite associated with magnetosomes frommagnetotactic bacteria. Dunlop (2002b) concludedthat the Day plot is sufficient to locate the exactposition of the redox boundary in the sedimentcolumn. In the present study such a precise dis-tinction is not possible because the interval ofdissolution of magnetic minerals - leaving behindmagnetite with coarser grain sizes extends overabout 20 cm. Consequently, it is not clear from theDay plot if the redox boundary is located at the upperor lower limit of this latter group.
In the upper zone of dissolution an enrichmentof fine stable magnetite is indicated by its Bc-distribution (Fig. 3). Karlin et al. (1987) discussedthe authigenesis of fine-grained magnetite crystalsin close proximity to a color-boundary and theredox-transition from Fe2+ to Fe3+ in marine sedi-ments, similar to that observed in gravity coreGeoB 2908-7 at about 46 cm. This observation canbe explained by the metabolic activity of Fe2+
oxidizing magnetotactic bacteria, which are knownas nitrate reducers (Karlin et al., 1987; Rhoads etal., 1991; Robinson et al., 2000), but which mightalso be able to use MnO2 as an electron acceptor.This appears to be a likely process since the geo-chemical data from the same depth interval showthat Fe2+ is oxidized by MnO2 to Fe-hydroxides.According to Tarduno and Wilkison (1996) the
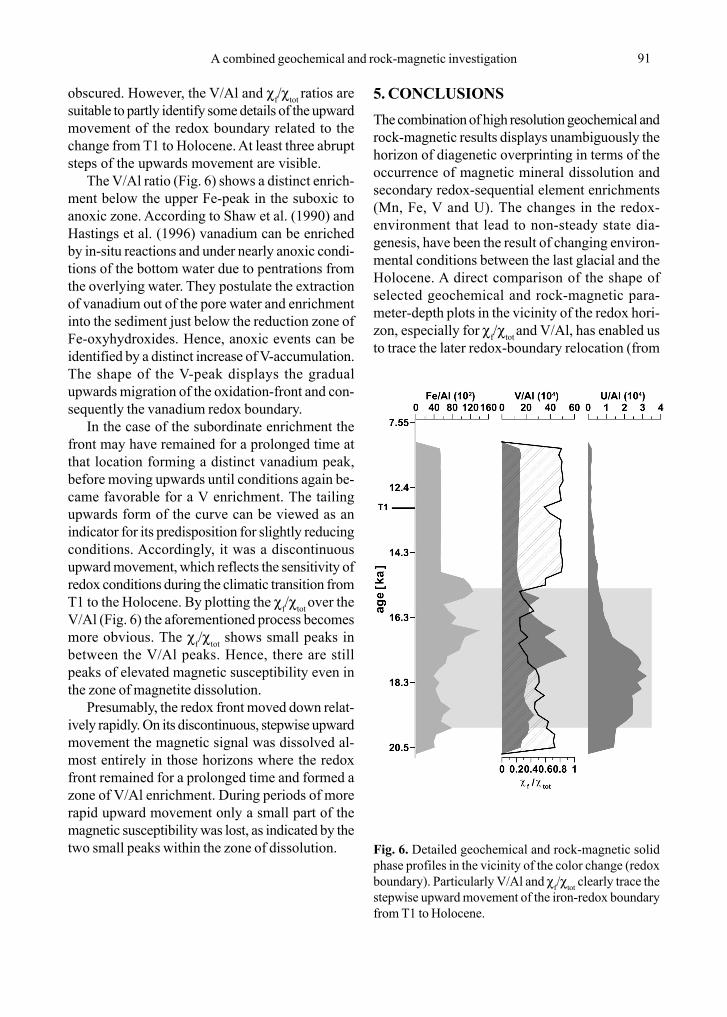
A combined geochemical and rock-magnetic investigation 91
obscured. However, the V/Al and χf/χtot ratios aresuitable to partly identify some details of the upwardmovement of the redox boundary related to thechange from T1 to Holocene. At least three abruptsteps of the upwards movement are visible.
The V/Al ratio (Fig. 6) shows a distinct enrich-ment below the upper Fe-peak in the suboxic toanoxic zone. According to Shaw et al. (1990) andHastings et al. (1996) vanadium can be enrichedby in-situ reactions and under nearly anoxic condi-tions of the bottom water due to pentrations fromthe overlying water. They postulate the extractionof vanadium out of the pore water and enrichmentinto the sediment just below the reduction zone ofFe-oxyhydroxides. Hence, anoxic events can beidentified by a distinct increase of V-accumulation.The shape of the V-peak displays the gradualupwards migration of the oxidation-front and con-sequently the vanadium redox boundary.
In the case of the subordinate enrichment thefront may have remained for a prolonged time atthat location forming a distinct vanadium peak,before moving upwards until conditions again be-came favorable for a V enrichment. The tailingupwards form of the curve can be viewed as anindicator for its predisposition for slightly reducingconditions. Accordingly, it was a discontinuousupward movement, which reflects the sensitivity ofredox conditions during the climatic transition fromT1 to the Holocene. By plotting the χf/χtot over theV/Al (Fig. 6) the aforementioned process becomesmore obvious. The χf/χtot shows small peaks inbetween the V/Al peaks. Hence, there are stillpeaks of elevated magnetic susceptibility even inthe zone of magnetite dissolution.
Presumably, the redox front moved down relat-ively rapidly. On its discontinuous, stepwise upwardmovement the magnetic signal was dissolved al-most entirely in those horizons where the redoxfront remained for a prolonged time and formed azone of V/Al enrichment. During periods of morerapid upward movement only a small part of themagnetic susceptibility was lost, as indicated by thetwo small peaks within the zone of dissolution.
5. CONCLUSIONSThe combination of high resolution geochemical androck-magnetic results displays unambiguously thehorizon of diagenetic overprinting in terms of theoccurrence of magnetic mineral dissolution andsecondary redox-sequential element enrichments(Mn, Fe, V and U). The changes in the redox-environment that lead to non-steady state dia-genesis, have been the result of changing environ-mental conditions between the last glacial and theHolocene. A direct comparison of the shape ofselected geochemical and rock-magnetic para-meter-depth plots in the vicinity of the redox hori-zon, especially for χf/χtot and V/Al, has enabled usto trace the later redox-boundary relocation (from
Fig. 6. Detailed geochemical and rock-magnetic solidphase profiles in the vicinity of the color change (redoxboundary). Particularly V/Al and χf/χtot clearly trace thestepwise upward movement of the iron-redox boundaryfrom T1 to Holocene.
92 Chapter 5
T1 to Holocene) in detail.This study has shown that a multidisciplinary
high resolution analysis of diagenetically over-printed sediments is required to record the exactshape of characteristic geochemical and rock-magnetic enrichments and dissolution, respectively.By means of these records it is possible to tracethe relocation of element redox boundaries. More-over, the combination of geochemical and rock-magnetic methods appears to be a promising toolto identify and trace the processes of early dia-genesis, which are particularly effective to sedi-ments located on the boundary of high productivityareas that have been subject to climate-inducedgeochemical changes. On the other hand our resultsshow, that the use of rock-magnetic parameters asa climatic indicator in sediments with strong dia-genetic overprinting might be limited.
Acknowledgments � We greatly thank MarkDekkers for extensive revision of an earlier versionof the manuscript. Jan Bloemendal and ananonymous reviewer are thanked for their criticaland constructive suggestions. We thank MarcusSchmidt and Anke Dreizehner for their contribu-tion to the sample preparation. This work wasfounded by NWO/ALW (Aard- en Levens-wetenschappen) via the project SAPS (NSGcontribution No. 2004.03.02), and by Deutsche For-schungsgemeinschaft � Research Centre OceanMargins (contribution No. RCOM0126).
ReferencesArthur, M.A., Dean, W.E., Stow, D.A.V., 1984. Models
for the deposition of Mesozoic-Cenozoic fine-grained, organic-carbon-rich, sediment in the deep-sea. In: Stow, D.A.V., Piper, D.J.W. (Eds.), Fine-Grained Sediments: Deep-water Processes andFacies. Geol. Soc. London, Spec. Publ. 15, 527-560.
Baumann, K.-H., Henning, R., Meggers, H., 1995.Carbonate Contents. In: Schulz, H., Bleil, U., Henrich,R., Segl, M. (Eds.). Geo Bremen SOUTH ATLANTIC1994, Cruise No. 29, 17 Juni � 5 September 1994.METEOR-Berichte, Universität Hamburg, pp. 248-252.
Berger, W.H., Herguera, J.C., Lange C.B., Schneider, R.,1994. Paleoproductivity: Flux proxies versus nutrientproxies and other problems concerning theQuaternary productivity record. In: Zahn, R.,Pedersen T.F., Kaminski M.A., Labeyrie, L. (Eds.),Carbon Cycling in the Glacial Ocean: Constraints onthe Ocean�s Role in Global Change. NATO ASISeries 17, Springer, Berlin, Heidelberg, pp. 385-412.
Bloemendal, J., Lamb, B., King, J.W., 1988.Palaeoenvironmental implications of rock-magneticproperties of late Quaternary sediment cores fromthe eastern equatorial Atlantic. Paleoceanography3, 61-87.
Bloemendal, J., King, J.W., Tauxe, L., Valet, J.P., 1989.Rock magnetic stratigraphy of Leg 108 (easterntropical Atlantic) Sites 658, 659, 661 and 665. Proc.ODP, Sci. Results 108, 415-428.
Bloemendal, J., King, J.W., Hall, F.R., Doh, S.-J., 1992.Rock magnetism of late Neogene and Pleistocenedeep-sea sediments: relationship to sediment source,diagenetic processes, and sediment lithology. J.Geophys. Res. 97, 4361-4375.
Brown, E.T., Callonnec, L.L., German, C.R., 2000.Geochemical cycling of redox-sensitive metals insediments from Lake Malawi: A diagnosticpaleotracer for episodic changes in mixing depth.Geochim. Cosmochim. Acta 64, 3515-3523.
Burdige, D.J., 1993. The biogeochemistry of Mn and Fereduction in marine sediments. Earth Sci. Rev. 35, 249-284.
Calvert, S.E., Pedersen, T.F., 1993. Geochemistry ofRecent oxic and anoxic marine sediments:Implications for the geological record. Mar. Geol. 113:67-88.
Colley, S., Thomson J., Wilson, T.R.S., Higgs, N.C., 1984.Post-depositional migration of elements duringdiagenesis in brown clay and turbidite sequencesin the North East Atlantic. Geochem. Cosmochim.
A combined geochemical and rock-magnetic investigation 93
Acta 48, 1223-1235.Crusius, J., Calvert, S., Pedersen, T., Sage, D., 1996.
Rhenium and molybdenum enrichments in sedimentsas indicators of oxic, suboxic and sulfidic conditionsof deposition. Earth. Planet. Sci. Lett. 145, 65-78.
Curtis, C., 1983. Microorganisms and diagenesis ofsediments. In: Krumbein, W.E. (Ed.), MicrobialGeochemistry. Blackwell, Oxford, pp. 263-286.
Day, R., Fuller, M., Schmidt, V.A., 1977. HysteresisProperties of Titanomagnetites: Grain-Size andCompositional Dependence. Physics of the Earthand Planetary Interiors 13, 260-267.
de Lange, G.J., Middelburg, J.J., Pruysers, P.A., 1989.Discussion: Middle and Late Quaternarydepositional sequences and cycles in the EasternMediterranean. Sedimentology 36, 151-158.
Dunlop, D.J., 2002a. Theory and application of the Dayplot (Mrs/Ms versus Hcr/Hc) 1. Theoretical curves andtests using titanomagnetite data. J. Geophys. Res.107, 10.1029/2001JB000486.
Dunlop, D.J., 2002b. Theory and application of the Dayplot (Mrs/Ms versus Hcr/Hc) 2. Application to data forrocks, sediments, and soils. J. Geophys. Res. 107,10.1029/2001JB000487.
Dymond, J., Suess, E., Lyle, M., 1992. Barium in deep-sea sediments: a geochemical proxy forpaleoproductivity. Paleoceanography 7, 163-181.
Emerson, S., Hedges, J.I., 1988. Processes controlling theorganic carbon content of open ocean sediments.Paleoceanography 3, 621-634.
Fischer, G., Wefer. G. (Eds.), 1999. Use of Proxis inPaleoceanography: Examples from the SouthAtlantic. Springer-Verlag, Berlin, Heidelberg, 735 pp.
François, R., Honjo, S., Manganini, S.J., Ravizza, G.E.,1995. Biogenic barium fluxes to the deep sea:implications for paleoproductivity reconstruction.Global Biogeochem. Cycles 9, 289-303.
Frederichs, T., Bleil, U., Däumler, K., von Dobeneck, T.,Schmidt, A.M., 1999. The Magnetic View on theMarine Paleoenvironment: Parameters, Techniquesand Potentials of Rock Magnetic Studies as a Keyto Paleoclimatic and Paleoceanographic Changes. In:Fischer, G., Wefer, G. (Eds.), Use of Proxies inPaleoceanography: Examples from the SouthAtlantic. Springer-Verlag, Berlin, Heidelberg, pp. 575-599.
Froelich, P.N., Klinkhammer, G.P., Bender, M.L., Luedtke,N.A., Heath, G.R., Cullen, D., Dauphin, P., Hammond,D., Hartman, B., Maynard, V., 1979. Early oxidationof organic matter in pelagic sediments of the easternequatorial Atlantic: suboxic diagenesis. Geochim.Cosmochim. Acta 43, 1075-1090.
Funk, J.A., von Dobeneck, T., Wagner, T., Kasten, S.,2004a. Late Quaternary Sedimentation and EarlyDiagenesis in the Equatorial Atlantic Ocean: Patterns,Trends and Processes Deduced from Rock Magneticand Geochemical Records. In: Wefer, G., Mulitza, S.,Ratmeyer, V. (Eds.), The South Atlantic in the LateQuaternary: Reconstruction of Material Budget andCurrent Systems. Springer-Verlag, Berlin, pp 461-497.
Funk, J.A., von Dobeneck, T., Reitz, A., 2004b. IntegratedRock Magnetic and Geochemical Quantification ofRedoxomorphic Iron Mineral Diagenesis in LateQuaternary Sediments from the Equatorial Atlantic.In: Wefer, G., Mulitza, S., Ratmeyer, V. (Eds.), TheSouth Atlantic in the Late Quaternary:Reconstruction of Material Budget and CurrentSystems. Springer-Verlag, Berlin, pp 237-260.
Gingele, F., Dahmke A., 1994. Discrete barite particlesand barium as tracers of paleoproductivity in SouthAtlantic sediments. Paleoceanography 9, 151-168.
Gladney, E.S., Roelandts, I., 1988. 1987 compilation ofelemental concentration data for USGS BHVO-1,MAG-1, QLO-1, RGM-1, SCO-1, SDC-1, SGR-1 andSTM-1. Geostandards Newsletters 12, 253-362.
Hastings, D., Emerson, S., Mix, A., 1996. Vanadium inforaminiferal calcite as a tracer for changes in the arealextent of reducing sediments. Paleoceanography 11,665-678.
Imbrie, J., Palmer Imbrie, K., 1998. Ice Ages: Solving theMystery. Seventh printing. Harvard UniversityPress, Cambridge Massachusetts London, 224 pp.
Karlin, R., Lyle, M., Heath, G.R., 1987. Authigenicmagnetite formation in suboxic marine sediments.Nature 326, 490-493.
Klinkhammer, G.P., Palmer, M.R., 1991. Uranium in theoceans: where it goes and why. Geochim.Cosmochim. Acta 55, 1799-1806.
König, I., Drodt, M., Suess, E., Trautwein, A.X., 1997.Iron reduction through the tan-green color transitionin deep-sea sediments. Geochim. Cosmochim. Acta,61, 1679-1683.
König, I., Haeckel, M., Drodt, M., Suess, E., Trautwein,A.X., 1999. Reactive Fe(II) layers in deep-seasediments. Geochim. Cosmochim. Acta 63: 1517-1526.
Lototskaya, A.A., 1999. Mid-latitude North Atlanticclimate between 150,000 and 100,000 years BP.Amsterdam University, PhD thesis, 171 pp.
Lyle, M., 1983. The brown-green colour transition inmarine sediments: a marker for the Fe(III)-Fe(II) redoxboundary. Limnol. Oceanogr. 28, 1026-1033.
Mangini, A., Jung, M., Laukenmann, S., 2001. What dowe learn from peaks of uranium and of manganesein deep sea sediments? In: Kasten, S. and Hensen,
94 Chapter 5
C. (Eds.), Mar. Geol. 177, 63-78.Mercier, H., Speer, K.G., Honnorez, J., 1994. Flow
pathways of bottom water through the Romancheand Chain Fracture Zones. Deep-Sea Res. I 41,1457-1477.
Passier, H.F., Middelburg, J.J., van Os, B.J.H., deLange, G.J., 1996. Diagenetic pyritisation undereastern Mediterranean sapropels caused bydownward sulphide diffusion. Geochim.Cosmochim. Acta 60, 751-763.
Passier, H.F., Dekkers, M.J., de Lange, G.J., 1998.Sediment chemistry and magnetic properties inan anomalously reducing core from the easternMediterranean Sea. Chem. Geol. 152, 287-306.
Prahl, F.G., de Lange, G.J., Lyle, M., Sparrow, M.A.,1989. Post-depositional stability of long-chainalkenones under oxic and suboxic conditions.Nature 341, 434-437.
Raymo, M.E., 1997. The timing of major climateterminations. Paleoceanography 12, 577-585.
Reading, H.G., Levell, B.K., 1996. Controls on thesedimentary rock record. In: Reading, H.G. (Ed.),Sedimentary Environments: Processes, Faciesand Stratigraphy. Third edition. BlackwellScience, Oxford, London, pp. 5-36.
Rhoads, D.C., Mulsow, S.G., Gutschick, R., Baldwin,C.T., Stolz, J.F., 1991. The dysaerobic zonerevisited: a magnetic facies? In: Tyson, R.V.,Pearson, T.H. (Eds.), Modern and AncientContinental Shelf Anoxia. Geol. Soc. London,Spec. Publ. 58, 187-199.
Robinson, S.G., Sahota, J.T.S., Oldfield, F., 2000. Earlydiagenesis in North Atlantic abyssal plainsediments characterized by rock-magnetic andgeochemical indices. Mar. Geol. 163, 77-107.
Rühlemann, C., Mulitza, S., Müller, P.J., Wefer, G.,Zahn, R., 1999a. Warming of the tropical AtlanticOcean and slowdown of thermohaline circulationduring the last deglaciation. Nature 402, 511-514.
Rühlemann, C., Müller, P.J., Schneider, R.R., 1999b.Organic Carbon and Carbonate asPaleoproductivity Proxies: Examples from Highand Low Productivity Areas of the TropicalAtlantic. In: Fischer, G., Wefer. G. (Eds.), Use ofProxies in Paleoceanography: Examples from theSouth Atlantic. Springer-Verlag, Berlin,Heidelberg, pp. 315-344.
Sarnthein, M., Tetzlaff, G., Koopmann, B., Wolter, K.,Pflaumann, U., 1981. Glacial and interglacial windregimes over the eastern subtropical Atlantic andNorth-West Africa. Nature 293, 193-196.
Shaw, T.J., Gieskes, J.M., Jahnke, R.A., 1990. Early
diagenesis in differing depositional environments:The response of transition metals in porewater.Geochim. Cosmochim. Acta 54, 1233-1246.
Tarduno, J.A., Wilkison, S.L., 1996. Non-steady statemagnetic mineral reduction, chemical lock-in, anddelayed remanence acquisition in pelagic sediments.Earth Planet. Sci. Lett. 144, 315-326.
Thomson, J., Wilson, T.R.S., Culkin, F., Hydes, D.J., 1984.Non-steady state diagenetic record in easternequatorial Atlantic sediments. Earth Planet. Sci. Lett.71, 23-30.
Thomson, J., Higgs, N.C., Croudace, I.W., Colley, S.,Hydes, D.J., 1993. Redox zonation of elements at anoxic / post-oxic boundary in deep-sea sediments.Geochim. Cosmochim. Acta 57, 579-595.
Thomson, J., Higgs, N.C., Clayton, T., 1995. Ageochemical criterion for the recognition of Heinrichevents and estimations of their depositional fluxesby the (230Th excess)0 profiling method. Earth Planet.Sci. Lett. 135, 41-56.
Thomson, J., Higgs, N.C., Colley, S., 1996. Diageneticredistributions of redox-sensitive elements innortheast Atlantic glacial/interglacial transitionsediments. Earth Planet. Sci. Lett. 139, 365-377.
Thomson, J., Jarvis, I., Green, D.R.H., Green, D.A.,Clayton, T., 1998. Mobility and immobility of redox-sensitive elements in deep-sea turbidites duringshallow burial. Geochim. Cosmochim. Acta 62, 643-656.
Tyson, R.V., Pearson, T.H., 1991. Modern and ancientcontinental shelf anoxia: an overview. In: Tyson, R.V.,Pearson, T.H. (Ed.), Modern and Ancient ContinentalShelf Anoxia. Geol. Soc. London, Spec. Publ. 58, 1-24.
van Hoof, A.A.M., van Os, B.J.H., Rademakers, J.G.,Langereis, C.G., de Lange, G.J., 1993. A paleomagneticand geochemical record of the upper Cochiti reversaland two subsequent precessional cycles fromSouthern Sicily (Italy). Earth Planet. Sci. Lett. 117,235-250.
van Santvoort, P.J.M., de Lange, G.J., Thomson, J.,Cussen, H., Wilson, T.R.S., Krom, M.D., Ströhle, K.,1996. Active post-depositional oxidation of the mostrecent sapropel (S1) in sediments of the easternMediterranean Sea. Geochim. Cosmochim. Acta 60(21), 4007-4027.
Verardo, D.J., McIntyre, A., 1994. Production anddestruction: control of biogenous sedimentation inthe tropical Atlantic 0-300,000 years B.P.Paleoceanography 9, 63-86.
von Dobeneck, T., 1996. A systematic analysis of naturalmagnetic mineral assemblages based on modelling
A combined geochemical and rock-magnetic investigation 95
hysteresis loops with coercivity-related hyperbolicbasis functions. Geophys. J. Int. 124, 675-694.
Wagner, T., Klemd, R., 1995. Core Descriptions andSmears Slide Analysis. In: Schulz, H., Bleil, U.,Henrich, R., Segl, M. (Eds.), Geo Bremen SOUTHATLANTIC 1994, Cruise No. 29, 17 Juni � 5September 1994. METEOR-Berichte, UniversitätHamburg, pp. 233-248.
Wagner, T., 1999. Petrology of organic matter in modernand late Quaternary deposits of the EquatorialAtlantic: climatic and oceanographic links. Int. J. ofCoal Geology 39, 155-184.
Wallace, H.E., Thomson, J., Wilson, T.R.S., Weaver,
P.P.E., Higgs, N.C., Hydes, D.J., 1988. Activediagenetic formation of metal-rich layers in N. E.Atlantic sediments. Geochim. Cosmochim. Acta 52,1557-1569.
Wenzhöfer, F., Glud, R.N., 2002. Benthic carbonmineralization in the Atlantic: a synthesis based onin situ data from the last decade. Deep-Sea Res. I 49,1255-1279.
Wilson, T.R.S., Thomson, J., Colley, S., Hydes, D.J.,Higgs, N.C., Sørensen, J., 1985. Early organicdiagenesis: The significance of progressivesubsurface oxidation fronts in pelagic sediments.Geochim. Cosmochim. Acta 49, 811-822.

96 Chapter 5
Summary and perspectives
This study is a substantial contribution to the inter-pretation of the marine sedimentary record and tothe reconstruction of Late Quaternary materialbudgets and current systems. It delineates the highpotential of rock magnetic properties for under-standing the marine geochemical cycles of iron andcarbon. Responding very susceptible to diageneticprocesses the techniques of ‘Environmental Mag-netism’ are powerful tools in developing new proxyparameters for diagenetically induced alterations inmarine sedimentary deposits. In this context themultidisciplinary approach of combining rock mag-netics with geochemical analytical methods is animportant aspect because it provides unique in-formation. Both disciplines make use of loggingtechniques which excellently complete one anotherand which enable the fast recording of the requireddata sets.
Beside the technical progress in analytics thisapproach provides new insights in paleoceano-graphy and helps to reveal biases or overprints onthe primary signal. Thus a stratigraphic network ofthe Late Quaternary Equatorial Atlantic could beestablished and new information about the regio-nal distribution of the diagenetic alterations underinvestigation were achieved. The strategy for com-bining proxies allowed derivation of new indiceswhich stand in for magnetite depletion, precipitationand iron relocation. For example the ratio of the ironconcentration and the magnetic susceptibility, bothdetected by logging techniques, display magnetite
dissolution in a quick and easy manner. Further-more it exemplifies how multiproxy studies andscanning techniques represent very successful toolsfor developing new fields in marine geology.
The results identify sediment sequences de-posited during cold climates and during transitionsfrom glacial to interglacial conditions as by far themost diagenetically affected. This confirms thesignificance of these time periods with regard todrastic changes in oceanographic, climatic anddepositional conditions. Primary productivity duringthe glacial intervals must have been a manyfold ofwhat is called ‘enhanced productivity’ in the mo-dern central Equatorial Atlantic. Significantly moreorganic carbon was pumped down into the deepocean during glaciations than today, leaving surfacewaters with reduced CO2 levels in comparison withthe present. More fine scale events of post de-positional alterations during interglacials are alsodetected by the high resolution records. Thesehorizons are not paralleled by higher concentrationsof preserved organic carbon. Possibly rock mag-netic parameters may be used in further researchas tracers which allow to reconstruct small suboxicor anoxic events in the sediment resulting fromshort-termed productivity pulses not preserved inorganic carbon records. Early diagenesis may notonly overprint the pristine sedimentary signal, butcan also provide valuable information on kind andorigin of the changing processes which in turn arerelated to climate changes. The study confirms thatnearly all proxy parameters are influenced by postdepositional alterations and elucidates the need fora better understanding of these processes.
Chapter 6 97
98 Chapter 7
Acknowledgements
I thank Professor Dr. Ulrich Bleil for supervisingand supporting my Ph.D. thesis. Also Professor Dr.Tilo von Dobeneck was very helpful and had a lotof good advice. Their arguments and constructivecriticism have greatly improved my work, my talks,my posters and the manuscripts. I have to mentionDr. Frank Schmieder who spent several years withme in our office, there is nothing more to say aboutthat. A perpetually perfect running magnetic labwas enabled by Christian Hilgenfeldt and ThomasFrederichs. Also Andreas Steinbach, Liane Brückand Heike Piero were very helpful.
Many thanks to Dr. Sabine Kasten, Dr. MartinKölling, Dipl.-Geol. Anja Reitz and Dr. ThomasWagner for many fruitful discussions, valuableinformation and true interdisciplinary cooperation.
I thank Dr. Ulla Röhl for XRF instructions andAlexius Wülbers and Walter Hale from the ODPcore repository for a very friendly and helpfulsupport during my weeks in the XRF container. Ialso thank Prof. Dr. Olaf Brockamp, Dr. MichaelZuther and Mr. Stefan Sopke for good advice onsample preparation of powder tablets and theirsupport in the XRF lab. Sincere thanks are givento PD Dr. Matthias Zabel for his second opinion.Many other people of the Geosciences Departmentand last but not least Babette and Lennart supportedme during my work.
I participated in four Meteor cruises, accord-ingly I have to thank officers and crews for pro-fessional help and support.
This study was funded by the German ScienceFoundation in the framework of the special re-search collaboration 261 and Graduiertenkolleg 221at the University of Bremen.


![Seesedimente als Phosphor-Senke und Ansatzpunkt für ... · Diagenese [Jahr] Sediment Diagenese [Jahr] Sediment Belüftung Nitratzugabe Fällung Abdeckung Beeinflussung der Phosphor-Retention](https://img.pdfslide.org/doc/110x75/5e1306caf09abd4e6b30309b/seesedimente-als-phosphor-senke-und-ansatzpunkt-fr-diagenese-jahr-sediment.jpg)