Embed Size (px)
Citation preview
Smelting of Iron Oxides Using Hydrogen Based Plasmas
An der Montanuniversität Leoben eingereichte Dissertation zur
Erlangung des akademischen Grades eines Doktors der Montanistischen Wissenschaften
Verfasser: Karim Badr, B.Sc., M.Sc. Leoben, November 2007

Eidesstattliche Erklärung Ich erkläre an Eides Statt, dass ich die gegenständliche Dissertation selbstständig und ohne
fremde Hilfe verfasst, andere als die angegebenen Quellen und Hilfsmittel nicht benutzt und
die den benutzten Quellen wörtlich und inhaltlich entnommen Stellen als solche kenntlich
gemacht habe.
Karim Badr
Acknowledgments
I would like to thank: Prof. Dr.mont. Wilfried Krieger for his full support in helping to carry out the present work at
the Chair of Metallurgy and his confidence in my work within ULCOS project.
Prof. Dr. techn. Harald Raupenstrauch, Chair of Thermal Processes, for his readiness to
assess my work and his helpful suggestions.
Em O.Prof. Dr. mont. Herbert Hiebler, Chair of Metallurgy, for his continued support and
advices during my research work.
Dipl.-Ing. Dr.mont. Eduard Bäck, In-House Consultant, for the fruitful discussions and the
detailed review of my work.
Dipl.-Ing. Thomas Bürgler, voestalpine Stahl Linz, for his financial support during the first
period of my work.
Dipl.-Ing. Dr.mont. Axel Sormann, voestalpine Stahl Donawitz, for his assistance in
suppling the required raw materials and carring out the needed metal and slag chemical
analysis (free of charge) within the company.
The technicians of the chair for their assistance in executing the experimental work.
My wife Ingy Abou Elkhair for her complete support during the completion of the research
work.
Finally, I would like to thank the European Community for their financial support under
contract no. 515960 within the framework of the European research project (ULCOS).
Schmelzreduktion von Eisenoxiden mit auf Wasserstoff basierendem Plasma
Kurzfassung
Wasserstoff-Plasma-Schmelzreduktion wurde als eine der möglichen innovativen
Stahlerzeugungsrouten am Lehrstuhl für Metallurgie an der Montanuniversität
Leoben seit nunmehr fast zwei Jahrzehnten untersucht. Es zeigte sich das Potenzial
der Vermeidung direkter CO2-Emissionen als Folge der Substitution fossiler
Brennstoffe durch eine kohlenstofffreie Quelle (H2-Plasma). Die vorliegende Arbeit
zielt auf den Nachweis des Potenzials von H2 - bzw. CH4-haltigen Reduktionsmitteln
in einem up-scaled Prozess als Alternative zu fossilen Reduktionsmitteln in
konventionellen Prozessen ab. Einige Versuche wurden durchgeführt, um den
Einfluss von Gasen wie CO, CO2 und H2O auf den Reduktionsprozess mit
wasserstoffhaltigem Plasma zu untersuchen. Die kontinuierliche Feinerzzufuhr durch
die Hohlelektrode wurde in einer Versuchsserie durchgeführt um den Einfluss auf die
Plasmastabilität und die Reduktionskinetik zu beurteilen. Der Prozess wurde in
Bezug auf die Thermodynamik und die Kinetik charakterisiert und in der vorliegenden
Arbeit auch diskutiert.
Smelting of Iron Oxides Using Hydrogen Based Plasmas
Abstract
As one of the possible innovative steelmaking technologies, hydrogen plasma
smelting reduction, HPSR, has been examined over almost two decades at the chair
of metallurgy, University of Leoben. HPSR showed a potential due to its defining
characteristic of no direct CO2 emissions as a result of replacing fossil fuels by
carbon free source (H2-Plasma). The present work aimed at showing the potential of
H2/CH4 in an up-scaled process as an alternative to fossil fuel in the conventional
processes. Some experiments were done to investigate the influence of gases like
CO, CO2 and H2O on the reduction behaviour of hydrogen plasma. Continuous
feeding of fines ore through the hollow electrode was also conducted in a series of
experiments to assess its influence on the plasma arc stability and the reduction
kinetics. The characteristics of the process in terms of thermodynamics and kinetics
was also examined and discussed within the thesis.
Table of contents 1
Table of contents 1 Introduction 5 1.1 Background 5 1.2 Objective of the present work 6 1.3 Structure of the present work 8 2 Thermodynamical principles of iron oxide reduction 10 2.1 Thermodynamics at low temperatures 10 2.2 Thermodynamics at plasma temperatures 11
2.2.1 Fundamentals 11 2.2.2 Influence of the melt polarity on thermodynamics 13
3 Kinetics of molten iron oxide reduction 17 3.1 Reduction rate of molten iron oxide by hydrogen 17
3.1.1 Reduction rate by hydrogen at low temperatures 17 3.1.2 Reduction rate by hydrogen at plasma temperatures 20
3.2 Reduction rate of molten iron oxide by CO at low temperatures 22 3.3 Reduction rate of molten iron oxide by carbon at low temperatures 23
3.3.1 Reduction rate by solid carbon 23 3.3.2 Reduction rate by carbon dissolved in liquid iron 24
4 Characteristics of plasma 26 4.1 Definition of plasma 26 4.2 Diagnostics of plasma 26
4.2.1 Properties of plasma gas 27 4.2.2 Influence of gas properties on plasma 27 4.2.3 Plasma velocity 29 4.2.4 Classification of arcs 30 4.2.5 Striking behaviour of arcs 30
4.3 Plasma heat transfer 31 4.3.1 Mechanisms of heat transfer 31 4.3.2 Distribution of the heat transfer 33 4.3.3 Effect of gas composition on the heat transfer 34 4.3.4 Effect of metal vapours on the heat transfer 35
4.4 Melt plasma interactions 36 4.4.1 Circulating flows in the melt 36 4.4.2 Melt depression 38
5 Solubility of hydrogen in liquid iron and slag 39 5.1 Hydrogen solubility in liquid iron 39
Table of contents 2
5.1.1 Solubility of molecular hydrogen 39 5.1.2 Solubility of hydrogen in the plasma state 40
5.1.2.1 Mechanism of hydrogen absorption 40 5.1.2.2 Equilibrium of atomic hydrogen with liquid iron 42
5.2 Hydrogen solubility in slag 44 5.3 Phase boundary reactions in hydrogen plasma smelting reduction process 48 6 Implementation of thermodynamical calculations 49 6.1 Thermodynamic equilibrium of iron oxide and reducing /oxidising agents 49
6.1.1 FeO-H2 49 6.1.2 FeO-CH4 50 6.1.3 FeO-CO 51 6.1.4 FeO-H2-CO2 52 6.1.5 FeO-H2-H2O 53 6.1.6 FeO-C 54
6.2 Thermodynamic calculation of slag diagrams at various % CaO 56 7 Experimental work 59 7.1 Experimental program 59 7.2 Setup of the laboratory furnace system 62
7.2.1 Basic setup of the hydrogen plasma facility 62 7.2.2 Lateral supply of hydrogen via a ceramic lance 62 7.2.3 Steam addition to the existing Ar-H2 supply facility 63 7.2.4 Fines ore continuous feeding system 64
7.3 Experimental procedures 66 7.3.1 Preparation of fines ore 66 7.3.2 Preparation and execution of experiments 67 7.3.3 Evaluation of experiments 68
7.3.3.1 Ar-H2 reduction experiments 69 7.3.3.2 CH4-Ar reduction experiments 72 7.3.3.3 CO-H2-Ar and CO-Ar reduction experiments 73 7.3.3.4 CO2-H2-Ar reduction experiments 73 7.3.3.5 H2O-H2-Ar reduction experiments 73 7.3.3.6 H2-Ar reduction with coke additions 74 7.3.3.7 Continuous feeding of ore during reduction 74
7.4 Results of experiments 75 7.4.1 Reduction by H2 plasma, graphite versus tungsten electrodes 75
7.4.1.1 H2-Ar reduction using graphite electrode 75 7.4.1.2 H2-Ar reduction using tungsten electrode 80
Table of contents 3
7.4.2 Impact of lateral H2 supply on the reduction behaviour 83 7.4.3 CH4 – Ar reduction 85
7.4.3.1 Reduction rate 85 7.4.3.2 Metal analysis 88
7.4.4 Reduction at various basicities 88 7.4.4.1 Reduction behaviour 88 7.4.4.2 Phosphorous behaviour 89
7.4.5 Reduction of magnetite 91 7.4.6 Reduction of pre-reduced ore 93 7.4.7 Reduction with CO-H2-Ar mixture 95 7.4.8 Reduction with CO-Ar mixture 97 7.4.9 Reduction with CO2-H2-Ar mixture 100 7.4.10 Reduction with H2O-H2-Ar mixtures 102 7.4.11 H2 - Ar reduction with coke additions 104
7.4.11.1 Coke additions – batch wise 104 7.4.11.2 Coke additions – continuous feeding 106
7.4.12 H2 - Ar reduction of continuous fed ore 109 7.5 Discussion 114
7.5.1 Reduction by H2-Ar plasma 114 7.5.1.1 Reduction using graphite electrode 115 7.5.1.2 Reduction using tungsten electrode 115
7.5.2 Impact of lateral H2 supply on the reduction behaviour 118 7.5.3 CH4 – Ar reduction 118 7.5.4 Reduction at various basicities 119 7.5.5 Reduction of magnetite 120 7.5.6 Reduction of pre-reduced ore 120 7.5.7 Reduction with CO-H2-Ar mixture and CO-Ar mixture 120 7.5.8 Reduction with CO2-H2-Ar mixture 122 7.5.9 Reduction with H2O-H2-Ar mixtures 123 7.5.10 H2 - Ar reduction with coke additions 124 7.5.11 H2 - Ar reduction of continuous fed ore 126 7.5.12 Experimental results overview 126
8 Up-scaling of the H2/CH4 plasma process 129 8.1 Introduction 129 8.2 Process flow-sheet 129
8.2.1 Iron ore pre-heater 130 8.2.2 Smelting reactor 130
Table of contents 4
8.2.3 Electrical energy 130 8.2.4 Feeding of fines ore 131 8.2.5 Reducing gas 131 8.2.6 Products 131
8.3 Process description 132 8.3.1 Operation parameters 132 8.3.2 Flow-sheet 133 8.3.3 Process parameters 136 8.3.4 Methane plasma 138
8.4 SWOT analysis 140 9 Conclusion and future work 141 9.1 Conclusion 141 9.2 Future work 145
List of figures 146 List of tables 150 List of literature 151 10 Appendix 157 A. Thermodynamic calculations of slag diagrams at various % CaO 159
B. Experimental work 160
C. CH4 heat and mass balance, IRMA model 167
D. Numerical simulation of pure hydrogen arc with FLUENT program 168
Introduction 5
1 Introduction
1.1 Background
Climate change has become a dominating problem around the globe, and as a result has
been a priority in the agendas of many industrial countries in the last decade. This global
problem requires a global solution and policies to encourage improved energy efficiency and
reduced CO2 emissions in all fields. In that sense, the Kyoto protocol proved its potential due
to the commitment of the participating countries to reduce CO2 and five other greenhouse
gases, or engage in emissions trading if they maintain or increase emissions of these gases.
However, such policies of imposing extra taxes and charges on the Kyoto-countries merely
results in a switch of production to other parts of the world. This is likely to increase, rather
than reduce, global greenhouse gas concentrations. A competitive global industry, such as
the steel industry requires new and imaginative approaches in the post-Kyoto period.
The steel industry has made significant reductions in its CO2 emissions mainly within the EU
since 1990. The iron and steel industry produces now just over 3 % of global green house
gases (GHG) emissions, mainly CO2, and is still committed to taking positive actions to
achieve further reductions in its own CO2 emissions. Moreover, the steel industry believes
that the new policies should accommodate the production growth required to provide the
world with the steel it needs. These policies became even more important with the increasing
steel production in developing countries such as China and India, where a booming in the
world production up to 1.24 billion tonnes of steel was achieved in 2006, [1].
Most CO2 gases generated by the steel industry is produced from the reduction of iron ore by
carbon in the blast furnace, i.e. 75 % of the total CO2 emissions of the blast furnace-oxygen
converter route (BF-BOF), [2]. However, it should be mentioned that the maturity and
efficiency of the BF-BOF, as a conventional technology, means that in the most advanced
facilities, the iron-reduction process operates close to thermodynamic limits. Therefore, by
using conventional technologies, making substantial further reductions in CO2 emissions will
be almost impossible. Awareness of the need of breakthrough technologies for CO2
mitigation recently arose on an international level.
Introduction 6
1.2 Objective of the present work
Research and development for new technology solutions to radically reduce the level of CO2
emissions into the atmosphere for each ton of steel produced has been recently undertaken
by an EU project called ULCOS. ULCOS (Ultra Low CO2 Steelmaking) is a "concept
development" program that explored, fairly extensively, a wide array of steelmaking routes
with a high potential for CO2 mitigation. The technologies called for breakthrough innovation
within the steel industry, as they will need extensive research & development to mature into
commercial processes. The target is to develop new solutions, before the end of the 2010's,
with 50 % less specific CO2 emissions compared to the modern blast furnace. These
solutions should be in a position to be rolled out into production plants 15 to 20 years from
now. A second and third step should thus lead to the deployment of the ULCOS technologies
in the post-Kyoto period, [3].
In the first phase of the project (2004-2006), many technologies have passed a first pre-
screening. The technologies were mainly classified to the following sub-projects: (1) new
carbon-based reduction concepts, making use of the shaft furnace but also (2) new smelting
reduction processes with less common reactors; (3) natural gas based pre-reduction reactors
(4) hydrogen-based reduction using hydrogen from CO2 lean technologies; (5) direct
production of steel by electrolysis, and (6) the use of biomass, which circulates carbon
rapidly in the atmosphere. (7) CO2 capture and storage will be included in the design, [4].
The contribution of the University of Leoben, chair of metallurgy was within the second sub-
project, where introducing new smelting reduction processes was required. The priorities of
the new processes were innovation in design, optimization of energy and the use of carbon-
lean or renewable resources.
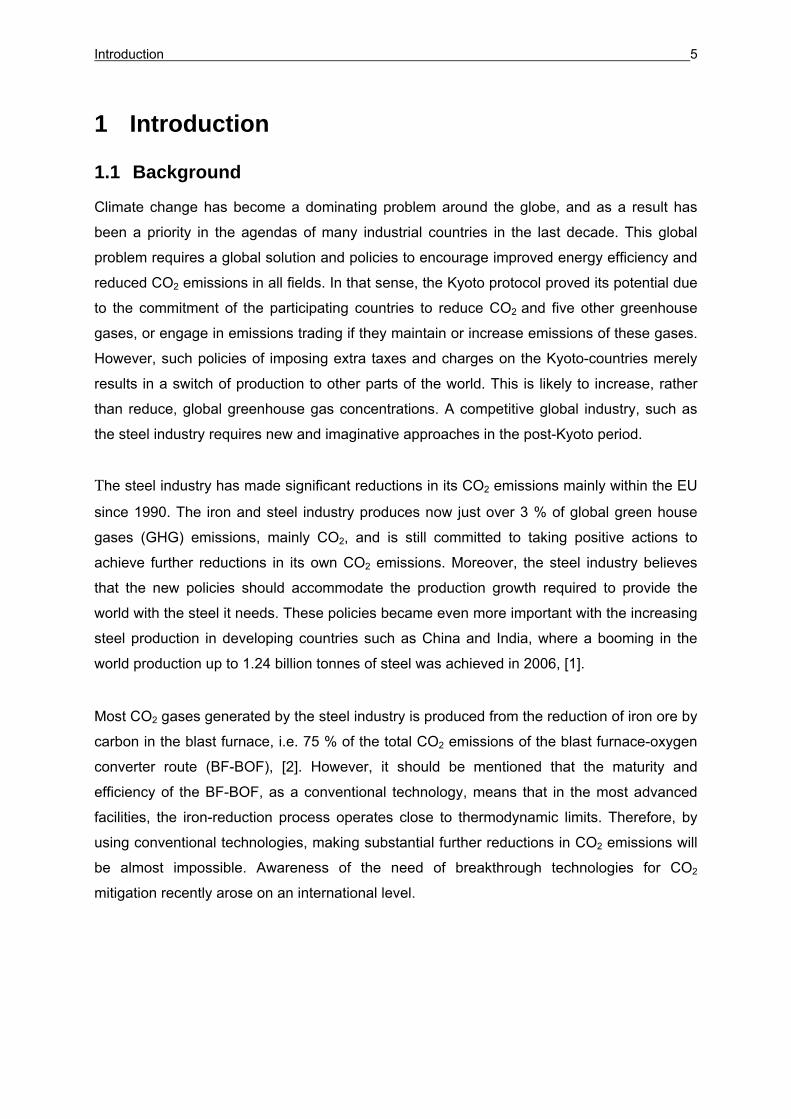
A smelting reduction process is generally a two stage process, followed by a refining stage to
produce liquid steel. These two stages include a first pre-reduction/pre-heating stage,
followed by a final stage, which takes place in a bath of liquid iron and slag, figure 1. In the
case of carbon based processes, oxygen is also injected with the reductant. This second
stage is the so called bath smelter, electric arc or hydrogen plasma reactor. Using fines ore,
rather than pellets, lumps and sinter is a main advantage of the process, where raw materials
pre-treatment and coking (in the case of carbon usage as a reductant) are ruled out.
Introduction 7
Fig. 1. Schematic diagram of a two stage smelting reduction process, [5]
The participation of the chair of metallurgy in the second sub-project was due to their
experience in the field of hydrogen plasma smelting reduction, HPSR. It is should be noted
that the development of HPSR, on a lab scale basis, has started within the chair of
metallurgy since 1990, [6,7]. The objective of this participation was to show the potential of
H2/CH4 as an alternative to fossil fuel, which is indispensable in the conventional processes
both as heat source and reducing agent. The characteristics of the process in terms of
thermodynamics, kinetics, and up-scalability potential were investigated and explained in
details within the project.
Introduction 8
1.3 Structure of the present work
The present work is classified into theoretical part and experimental part. In the theoretical
part, a literature review to the relevant published work was carried out. Main topics covered
are in the field of thermodynamical basics of iron ore reduction, kinetics results, and
characteristics of direct current plasma. In the experimental part, the results of reduction
experiments conducted in a plasma furnace are presented, discussed and compared with the
previous conducted work.
In chapter 2, the thermodynamic principles of iron ore reduction are discussed.
Fundamentals of ore reduction under plasma application and influence of the melt’s electric
charge on the thermodynamics behaviour are covered.
In chapter 3, a focus on the reduction kinetics of molten iron oxide by various reducing
agents is discussed. Published work in the reduction rate of iron oxide by hydrogen at
temperatures just above the melting temperature of FeO and at higher temperatures, using
plasma facility, are presented. The published reduction rates of iron oxide by CO at
temperatures just above the melting temperature of FeO are also included. In the end of that
chapter, the reduction rate of molten iron oxide by solid carbon against that reduced by
carbon dissolved in liquid iron are presented.
In chapter 4, the principles of a DC plasma is introduced. After defining briefly the meaning of
plasma, published work is presented on the diagnostics of the plasma, i.e. plasma gas
properties, velocity and arc classification. Moreover, mechanisms of heat transfer, effect of
gas composition and metal vapours on the heat transfer are covered. Finally, the influence of
plasma on the melt in terms of circulating flows in the melt and the depression pattern are
discussed.
In chapter 5, the mechanism of H2/H2O solubility in liquid iron and slag is discussed. The
importance of this subject is the susceptibility of liquid iron in the adopted process, hydrogen
plasma, to relatively high hydrogen diffusion. This phenomenon is emphasized due to
working with H2 based gases plus dissociating atmosphere that is caused by arc / plasma.
Before starting the experimental part, thermodynamic calculations by FactSage 5.5, chapter
6, are carried out for better understanding of the thermodynamic characteristics of the
reducing agents and oxidizing gases that were used in the experimental work. The influence
of CaO additions and slag temperature on the liquidus temperature of the calculated phase
diagrams are also investigated.
Introduction 9
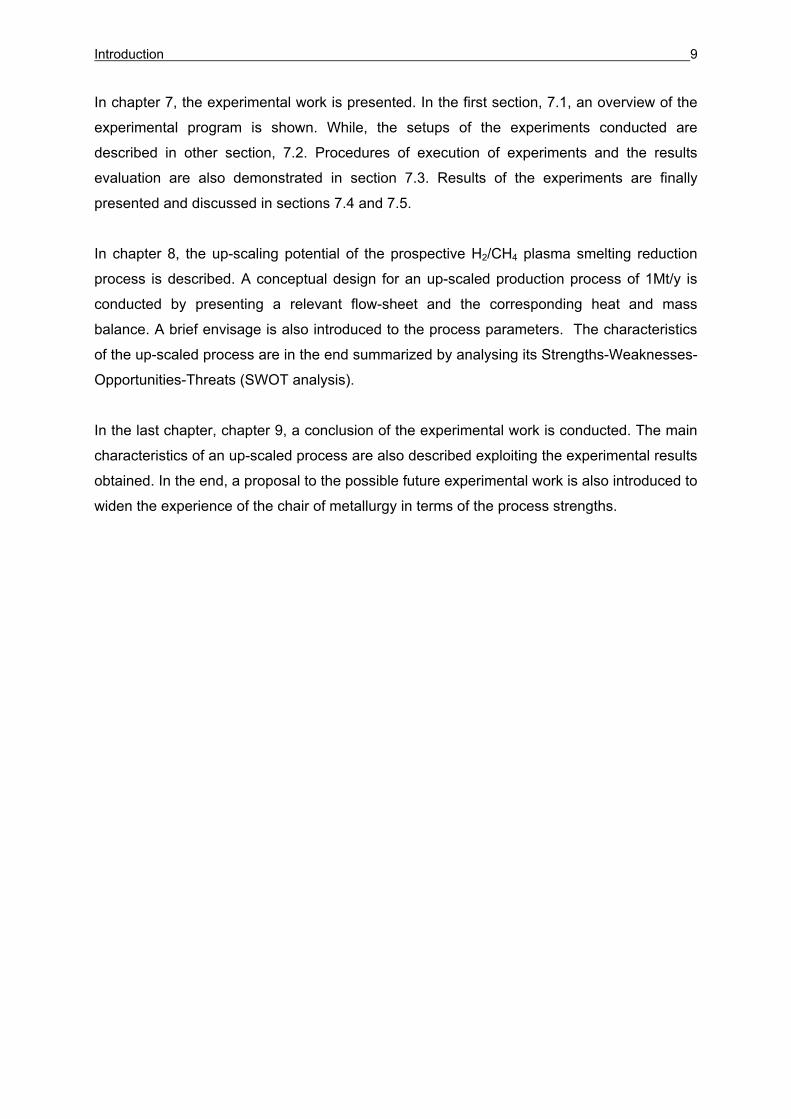
In chapter 7, the experimental work is presented. In the first section, 7.1, an overview of the
experimental program is shown. While, the setups of the experiments conducted are
described in other section, 7.2. Procedures of execution of experiments and the results
evaluation are also demonstrated in section 7.3. Results of the experiments are finally
presented and discussed in sections 7.4 and 7.5.
In chapter 8, the up-scaling potential of the prospective H2/CH4 plasma smelting reduction
process is described. A conceptual design for an up-scaled production process of 1Mt/y is
conducted by presenting a relevant flow-sheet and the corresponding heat and mass
balance. A brief envisage is also introduced to the process parameters. The characteristics
of the up-scaled process are in the end summarized by analysing its Strengths-Weaknesses-
Opportunities-Threats (SWOT analysis).
In the last chapter, chapter 9, a conclusion of the experimental work is conducted. The main
characteristics of an up-scaled process are also described exploiting the experimental results
obtained. In the end, a proposal to the possible future experimental work is also introduced to
widen the experience of the chair of metallurgy in terms of the process strengths.
Literature review – Metallurgical background 10
2 Thermodynamical principles of iron oxide reduction
2.1 Thermodynamics at low temperatures
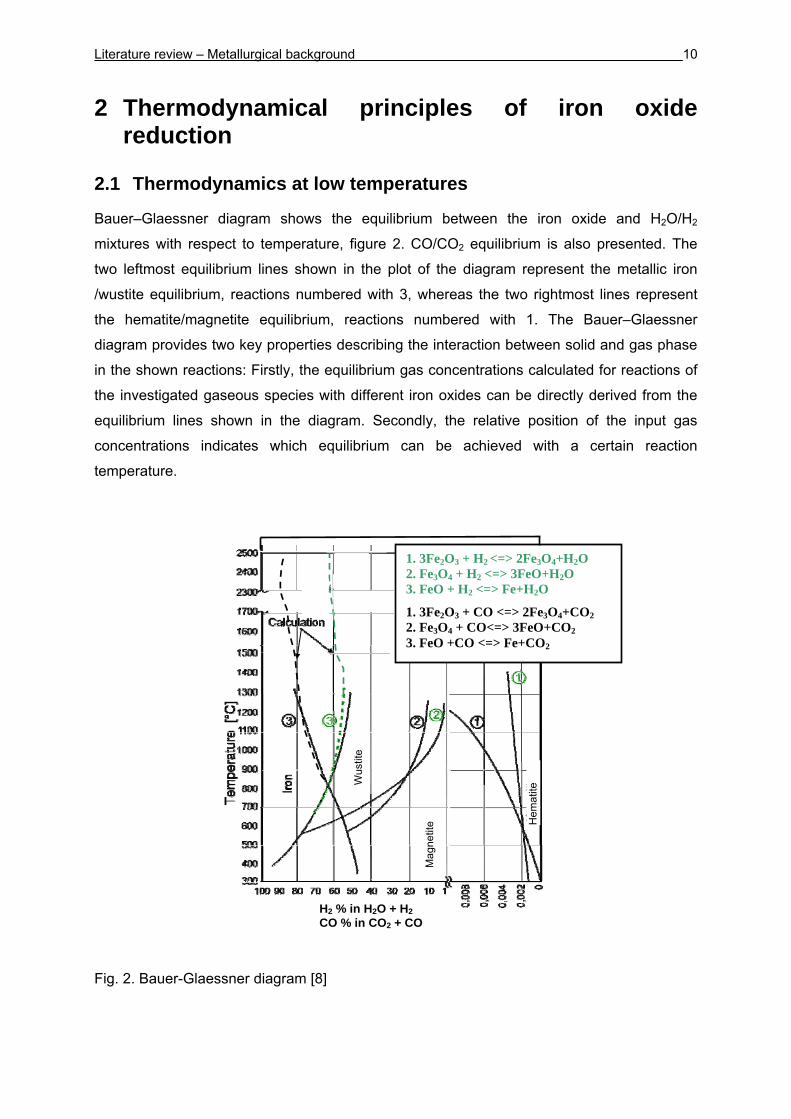
Bauer–Glaessner diagram shows the equilibrium between the iron oxide and H2O/H2
mixtures with respect to temperature, figure 2. CO/CO2 equilibrium is also presented. The
two leftmost equilibrium lines shown in the plot of the diagram represent the metallic iron
/wustite equilibrium, reactions numbered with 3, whereas the two rightmost lines represent
the hematite/magnetite equilibrium, reactions numbered with 1. The Bauer–Glaessner
diagram provides two key properties describing the interaction between solid and gas phase
in the shown reactions: Firstly, the equilibrium gas concentrations calculated for reactions of
the investigated gaseous species with different iron oxides can be directly derived from the
equilibrium lines shown in the diagram. Secondly, the relative position of the input gas
concentrations indicates which equilibrium can be achieved with a certain reaction
temperature.
Fig. 2. Bauer-Glaessner diagram [8]
1. 3Fe2O3 + H2 <=> 2Fe3O4+H2O 2. Fe3O4 + H2 <=> 3FeO+H2O 3. FeO + H2 <=> Fe+H2O
1. 3Fe2O3 + CO <=> 2Fe3O4+CO2 2. Fe3O4 + CO<=> 3FeO+CO2 3. FeO +CO <=> Fe+CO2
Mag
netit
e Hem
atite
Wus
tite
H2 % in H2O + H2CO % in CO2 + CO
Literature review – Metallurgical background 11
For instance at a temperature of 1300 °C, the equilibrium gas concentrations achieved with a
reduction from wustite to iron would be 52 % H2 / 48 % H2O, and 82 % CO / 18 % CO2,
respectively. In other words, gas yields (degrees of gas utilisation) of input hydrogen and
input CO of 48 % and 18 % are respectively obtained and an input gas having a H2/H2O ratio
less than 52/48 and a CO/CO2 ratio less than 82/18 will therefore not reduce wustite.
Extrapolating the equilibrium lines of FeO and H2 / CO in figure 2 at higher temperatures
(with molten phases) via calculations using FactSage program [9], indicates a constant
degree of utilisation of H2 of approximately 40 % up to 2500 oC. Moreover a slight variation
between 10 and 15 % in the case of CO utilisation degree was found. It should be mentioned
that above 2500 oC, further extrapolation of the equilibrium lines was not possible due to the
significant evaporation of Fe and FeO. By conducting, however, equilibrium calculations of
FeO and H2 at higher temperatures (2600 oC - 2900 oC), an evolution of higher amounts of
H2O with respect to equilibrium at lower temperatures is obtained. It should be noted that this
increase in H2O amounts is not attributed to a change in the hydrogen reduction behaviour
but to the shift of FeO from the liquid to the gas phase and its subsequent reaction with the
existing molecular hydrogen to produce H2O and gaseous Fe.
2.2 Thermodynamics at plasma temperatures
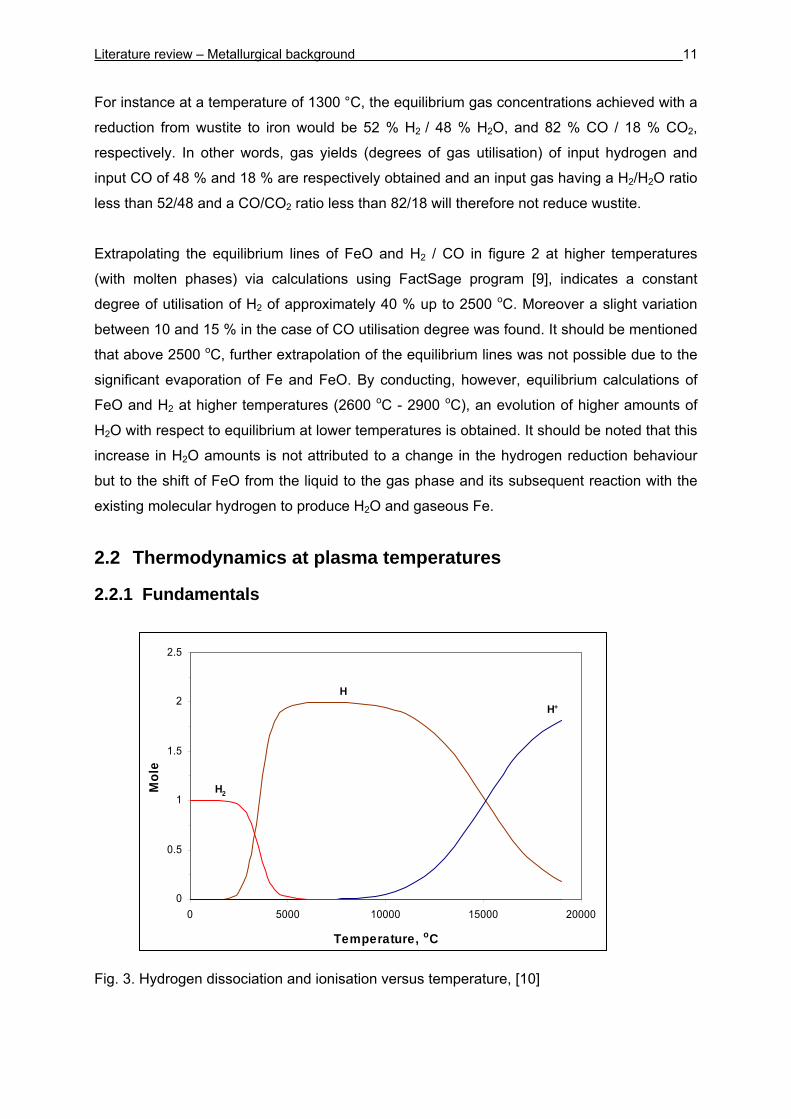
2.2.1 Fundamentals
Fig. 3. Hydrogen dissociation and ionisation versus temperature, [10]
HH+
H2
0
0.5
1
1.5
2
2.5
0 5000 10000 15000 20000
Temperature, oC
Mol
e
Literature review – Metallurgical background 12
In plasma metallurgy, hydrogen can be chosen as a reducing gas for ore reduction purposes.
Hydrogen under ambient temperature exists only in its molecular form, H2, where the
covalent bond between the two atoms is secured by a shared electron pair. At higher
temperatures, H2 starts to dissociate, as shown in figure 3, where the amount of H exceeds
that of H2 at approximately 3500 oC. Increasing the temperature furthermore leads to the
ionisation of H into H+. H+ exceeds H at a temperature of 15500 oC.
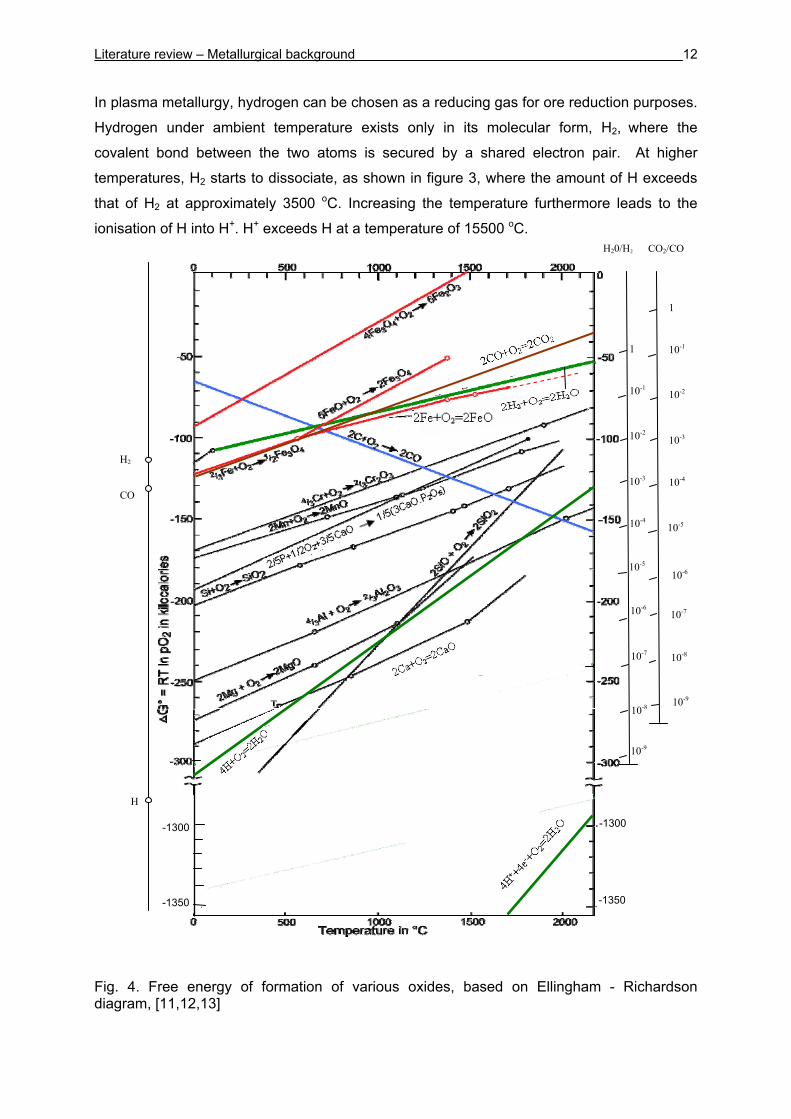
Fig. 4. Free energy of formation of various oxides, based on Ellingham - Richardson diagram, [11,12,13]
H2
H
H20/H2
-1300
-1350
1
10-3
10-4
10-1
10-2
-1300
-1350
10-7
10-8
10-6
10-9
-1300
-1350
CO
1
10-3
10-4
10-1
10-2
10-7
10-8
10-6
10-5
CO2/CO
10-9
10-5
Literature review – Metallurgical background 13
The Ellingham-Richardson diagram was explained in details in previous work [10,14].
However, a brief review of the diagram has been described in this work, where H and H+
equilibrium calculations were corrected using FactSage program [14], with respect to the
published calculations done by Dembovsky [15]. FeO-CO equilibrium line was also included.
The importance of the Ellingham-Richardson diagram, figure 4, in any set of compounds,
such as oxides, is the possibility to readily determine the thermodynamics of all possible
reactions. Important reactions and equilibriums can therefore be separated from those which
are not important. Furthermore, the diagram can be used to quantitatively estimate how
changes in temperature, pressure and composition affect the relevant chemical equilibrium.
The standard free energies of formation of various metal oxides, ΔGo, are represented in
figure 4 as a function of temperature. For temperatures at which the H2/H2O, CO/CO2, C/CO
equilibrium lines lie below the oxide lines, the corresponding reducing agent can reduce the
oxides to their sub-oxides or elements. Furthermore, the ratios of H2O/H2 and CO2/CO in
equilibrium with any of the metal-metal oxide systems are easily determined using the right
hand side scales shown in the diagram.
At higher temperatures, up to 20000 oC in the case of plasma application, where the
existence of H2, H and H+ is possible, a potential reduction of extremely stable oxides, from
the thermodynamical point of view, is obtained. In other words, the use of plasma shifts the
ΔGo values further towards the negative domain. This is evident from the shown free
energies of formation of H2O by means of H and H+ with respect to H2, [16]. However,
practically speaking, in plasma metallurgy, homogeneous reactions (single phase) could not
be guaranteed unless the processed material converts to a plasma state as well.
2H2(g) + O2(g) ↔ 2H2O(g) 0
298GΔ = -474.38 [kJ⋅mol-1] (1)
4H(g) + O2(g) ↔ 2H2O(g) 0298GΔ = -1287.55 [kJ⋅mol-1] (2)
4H+(g) + O2(g) +4e- ↔ 2H2O(g) 0
298GΔ = -6512.24 [kJ⋅mol-1] (3)
2.2.2 Influence of the melt polarity on thermodynamics
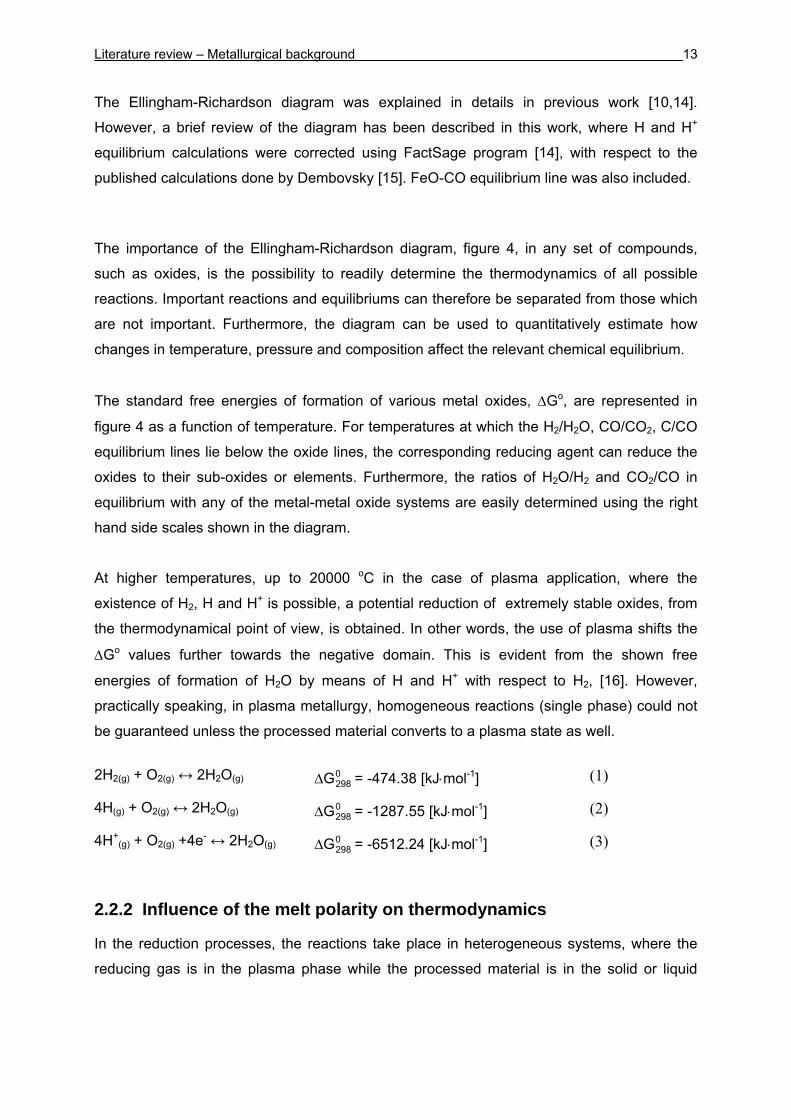
In the reduction processes, the reactions take place in heterogeneous systems, where the
reducing gas is in the plasma phase while the processed material is in the solid or liquid
Literature review – Metallurgical background 14
phase. A scheme of such a system, as shown in figure 5, showing the transport of active
particles from the plasma to the surface of the material was presented by Dembovsky, [17].
Fig. 5. Transport of active particles to the reacting surface, in the absence of an external
electric field, : molecule, : atom, [17]
At the interface between the relatively cool charge material and the plasma, there will always
be a boundary layer marked by an abrupt temperature gradient. In this layer atomic and
electrically charged particles will tend to recombine. Recombination will reduce the
concentration of the atomic and ionic particles, while increasing the concentration of
electrically neutral or already recombined particles. Therefore, the zone adjacent to the cool
surface will also be a region of concentration gradients, where the declining concentration of
active particles causes ions and electrons to diffuse towards the reacting surface. As the
coefficient of diffusion for electrons is much higher than that of ions, this might seem to imply
that the electron flow will exceed the ion flow, but the electrically insulated surface of the
charge material will not allow such development. A negative potential is formed which repels
electrons and attracts positive ions until the flows are balanced. This process is localized in a
narrow layer known as the plasma sheath, where the plasma is deprived of its electrically
quasi neutral character as the positive and negative components no longer cancel each
other.
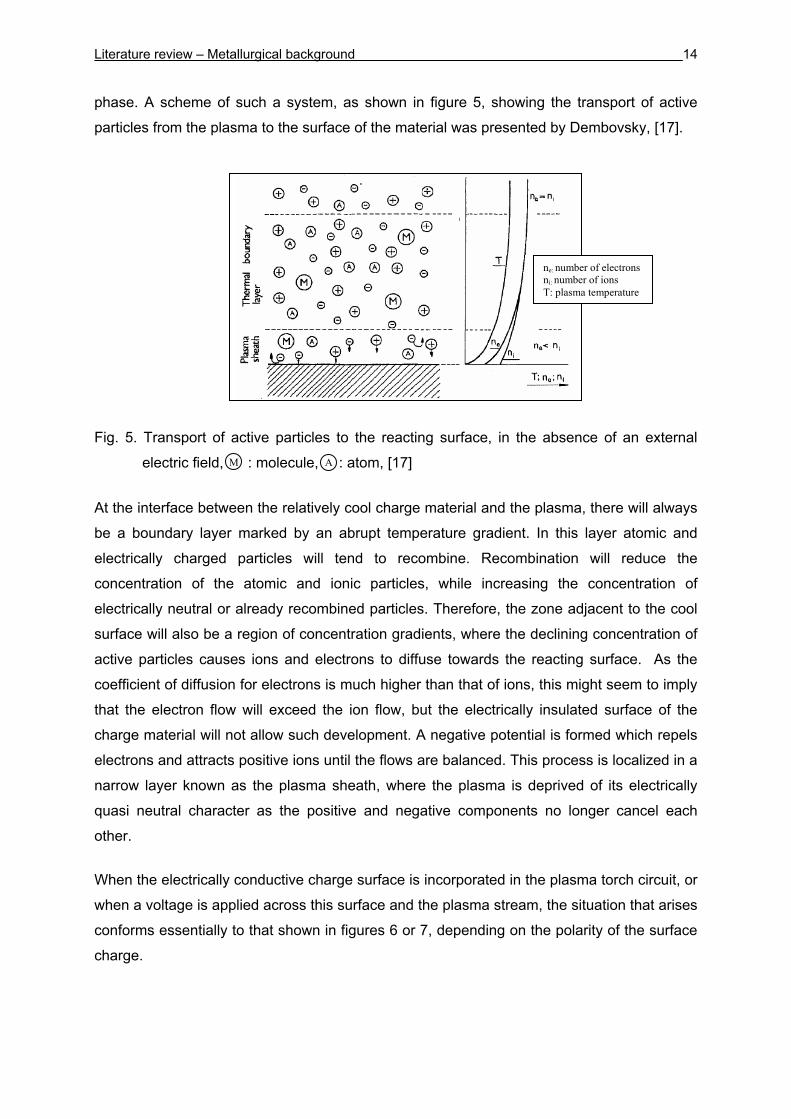
When the electrically conductive charge surface is incorporated in the plasma torch circuit, or
when a voltage is applied across this surface and the plasma stream, the situation that arises
conforms essentially to that shown in figures 6 or 7, depending on the polarity of the surface
charge.
M A
ne: number of electrons ni: number of ions T: plasma temperature
Literature review – Metallurgical background 15
Fig. 6. Transport of active particles to the reacting surface with positive polarity, [17]
Fig. 7. Transport of active particles to the reacting surface with negative polarity, [17]
When the surface charge has a positive polarity, the current density, j, is delivered via the
electrons, while the opposite takes place when the polarity is negative, i.e. the current
density is transferred to the surface via the flow of ions.
Dembovsky [17] has examined the situation arising in the absence and the existence of an
external applied electric field. The resultant electric field is found to accelerate particles with
a polarity opposite to that of the surface, so that in effect the charge material attracts
particles of the opposite polarity and repels particles which share its own polarity. A positively
charged surface will attract electrons, but repel positive ions; consequently, the particles
reacting with that surface will be neutral atoms and molecules. Conversely, a negatively
charged surface will repel electrons and will therefore react only with positive ions and
electrically neutral atoms and molecules.
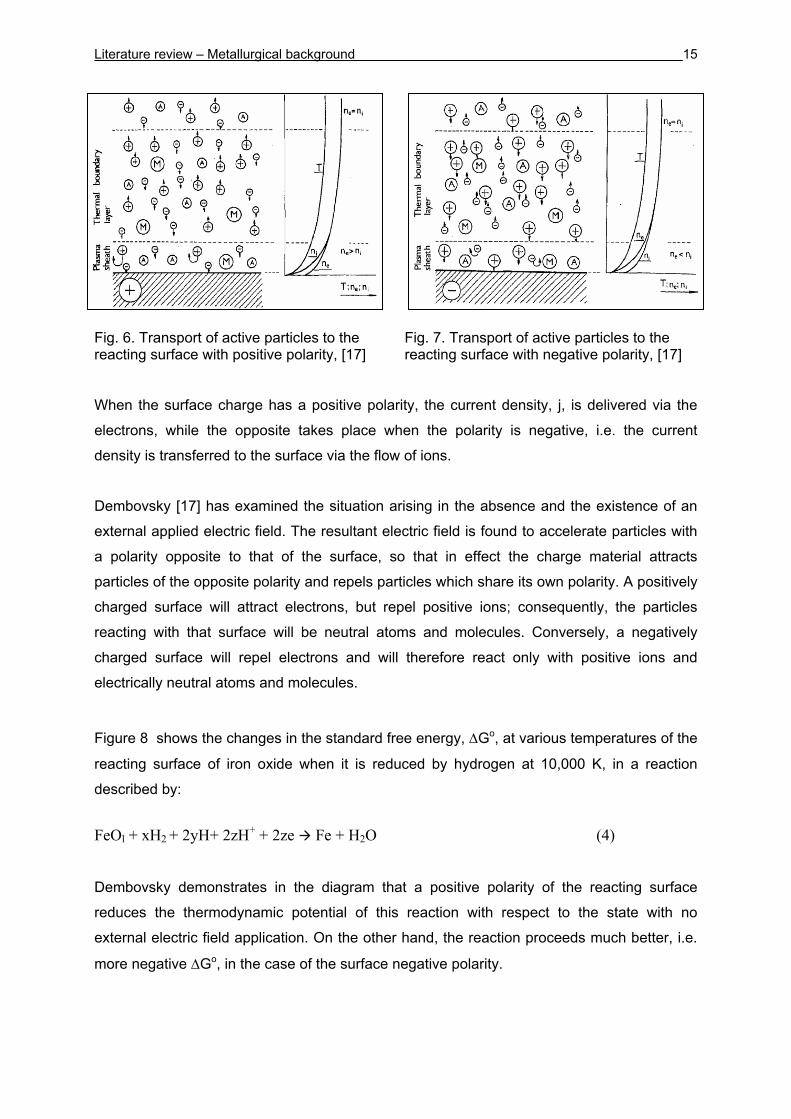
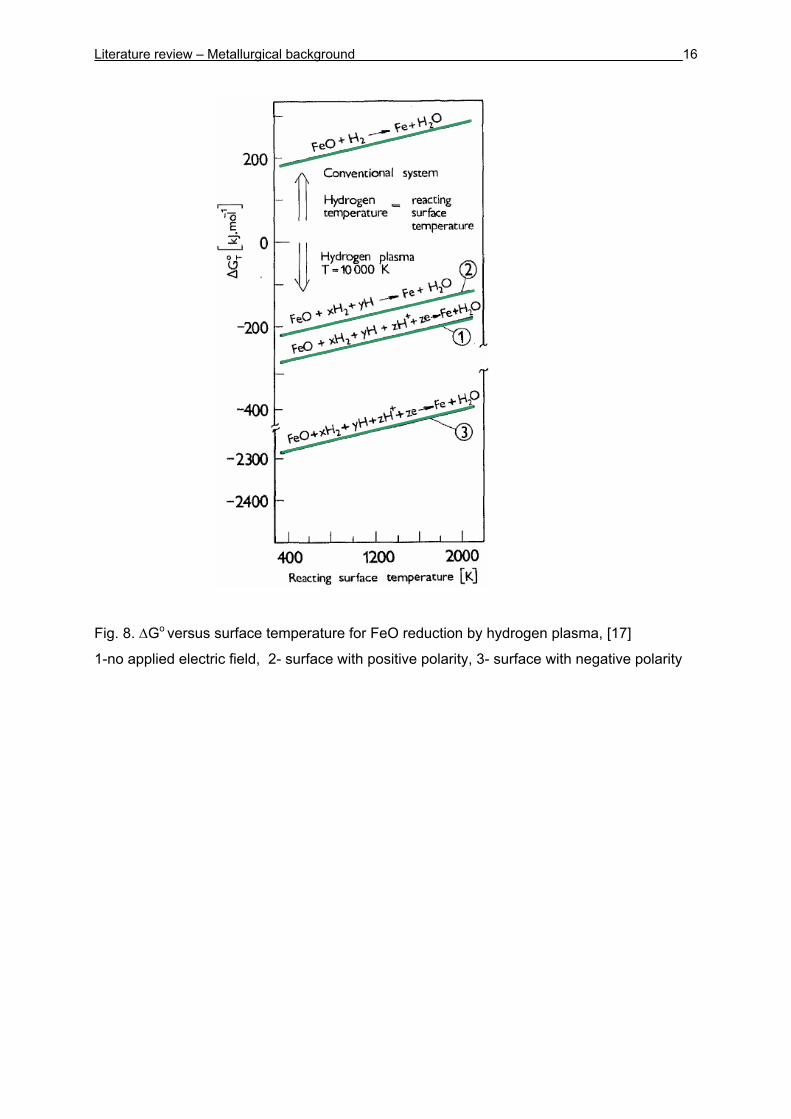
Figure 8 shows the changes in the standard free energy, ΔGo, at various temperatures of the
reacting surface of iron oxide when it is reduced by hydrogen at 10,000 K, in a reaction
described by:
FeOl + xH2 + 2yH+ 2zH+ + 2ze Fe + H2O (4)
Dembovsky demonstrates in the diagram that a positive polarity of the reacting surface
reduces the thermodynamic potential of this reaction with respect to the state with no
external electric field application. On the other hand, the reaction proceeds much better, i.e.
more negative ΔGo, in the case of the surface negative polarity.
Literature review – Metallurgical background 16
Fig. 8. ΔGo versus surface temperature for FeO reduction by hydrogen plasma, [17]
1-no applied electric field, 2- surface with positive polarity, 3- surface with negative polarity
Literature review – Metallurgical background 17
3 Kinetics of molten iron oxide reduction For a chemical reaction to occur, the reacting particles must first collide, i.e. come into
physical contact with one another with enough kinetic energy to climb the activation energy
barrier. As the temperature of the system increases, the number of molecules that carry
enough energy, to react when they collide, also increases. However, mutual contact is not all
that is needed. Many reactions are restricted to rates far lower than the limit imposed by the
frequency of collisions. By varying the concentrations of some of the reagents, we can not
only influence the reaction rate, but also identify the slowest event in the mechanism, that
restricts the overall reaction rate.
Mechanisms of the reduction in heterogeneous gas liquid system for iron oxide reduction by
hydrogen plasma are governed by the following steps as summarized by Kamiya et al, [18]:
1. Mass transfer of hydrogen through a gas film from the bulk phase to the reaction
interface between plasma gas and molten iron oxide or FeO bearing slag.
2. Mass transfer of oxygen through a liquid film from molten iron oxide or molten FeO
bearing slag bulk to the reaction interface.
3. Adsorption of the molecular or atomic hydrogen at the reaction interface.
4. Adsorption with dissociation of FeO at the reaction interface.
5. Chemical reaction at the reaction interface.
6. Desorption of H2O from the reaction interface.
7. Mass transfer of H2O through a gas film from the reaction interface to the bulk phase.
3.1 Reduction rate of molten iron oxide by hydrogen
3.1.1 Reduction rate by hydrogen at low temperatures
A lot of studies have been made on the kinetics of the reduction of solid iron ores for the
understanding of the conventional iron making processes. However, fundamental research
on the kinetics of the reduction of molten iron oxide using hydrogen is still insufficient. A
study, done by Ban-Ya et al.[19] was conducted to investigate the kinetics of hydrogen
reduction in molten iron oxide contained in an iron crucible. The experimental work was
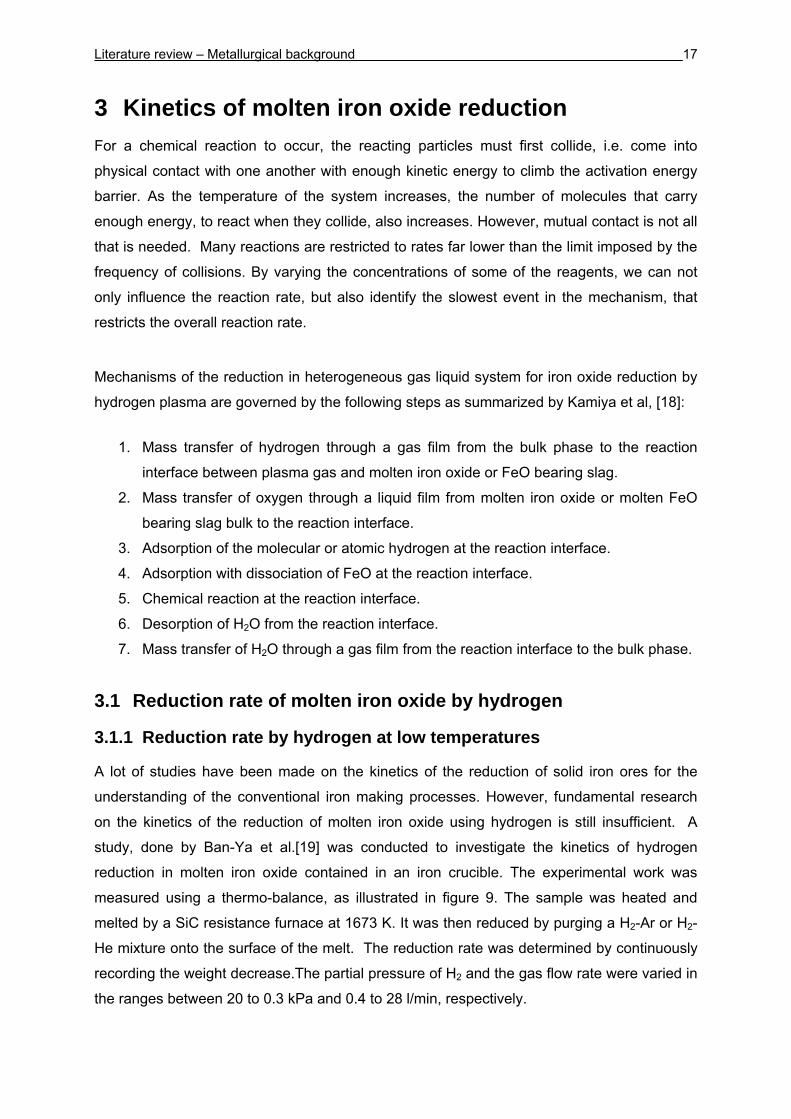
measured using a thermo-balance, as illustrated in figure 9. The sample was heated and
melted by a SiC resistance furnace at 1673 K. It was then reduced by purging a H2-Ar or H2-
He mixture onto the surface of the melt. The reduction rate was determined by continuously
recording the weight decrease.The partial pressure of H2 and the gas flow rate were varied in
the ranges between 20 to 0.3 kPa and 0.4 to 28 l/min, respectively.
Literature review – Metallurgical background 18
Fig. 9. Schematic diagram of the experimental setup, [19]
Throughout the experimental runs, the reduction rate was directly proportional to the partial
pressure of H2 in the H2-Ar and H2-He gaseous mixtures. It was expressed as follows:
2Hp].H[kr 2a= (kg-oxygen/m2s) (5)
where r is the specific reduction rate
ka[H2] is the apparent rate constant for hydrogen reduction (kg-oxygen/m2s Pa)
2Hp is the H2 partial pressure
The apparent rate constant obtained, ka[H2], was found to be 1.6 x 10⁻⁶ (kg-oxygen/m2s Pa) at
1673 K when the reduction rate was governed by the chemical reaction rate. The specific
reduction rate, r, was accordingly determined to be 1.6 x 10⁻¹ (kg-oxygen/m2s) by using pure
hydrogen.
Other work by Hayashi et al.[20] has measured the chemical reaction rate of hydrogen
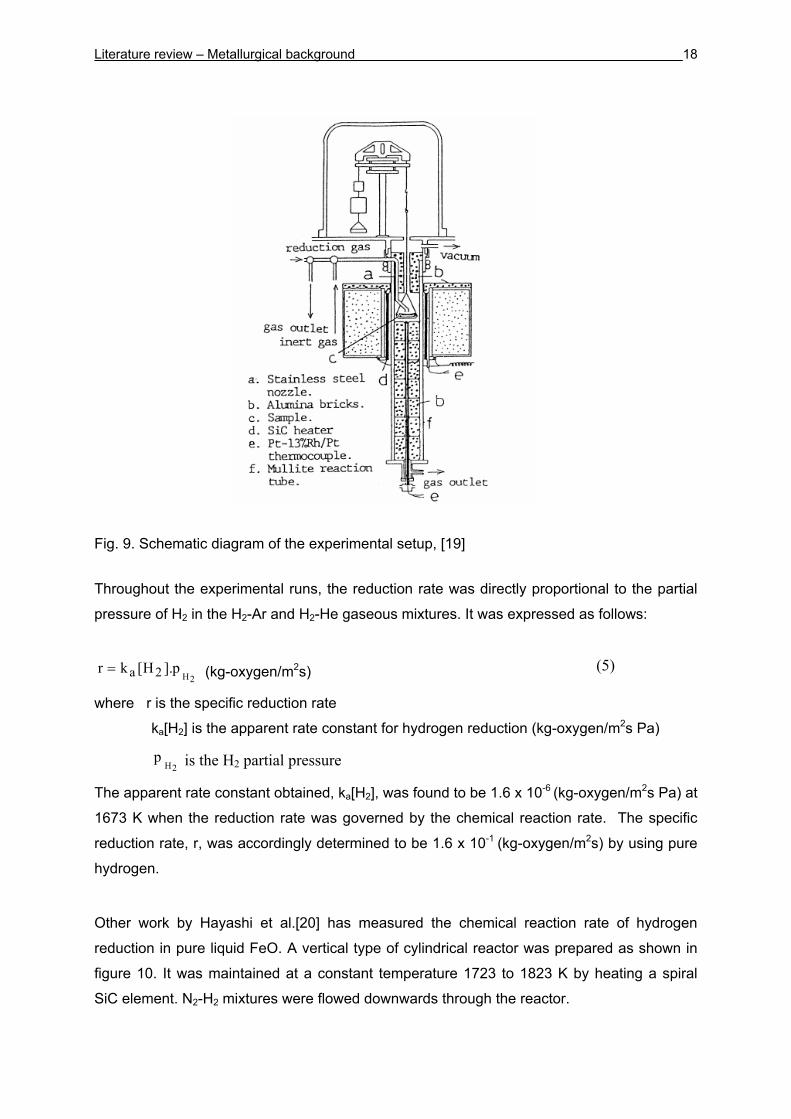
reduction in pure liquid FeO. A vertical type of cylindrical reactor was prepared as shown in
figure 10. It was maintained at a constant temperature 1723 to 1823 K by heating a spiral
SiC element. N2-H2 mixtures were flowed downwards through the reactor.
Literature review – Metallurgical background 19
Fig. 10. Schematic diagram of the cylindrical reactor, [20]
A batch of pure spherical wustite particles (average diameter 58 μm) was fed into the upper
part of the reactor at a small constant rate by means of a screw feeder. The feed ratio of
particles to hydrogen was selected to be between 0.035 ~ 0.25 g/Nl, which allowed an
extremely dilute particle-gas conveyance system to be realized. During the falling of these
particles, they are melted, reduced, solidified and finally collected in a cold trap. The
residence time of particles in the isothermal zone and the overall reduction rate can be
controlled by shifting both flow rate and hydrogen content of gas mixtures in the range of Q =
0.6 ~ 3.0 Nl/min and 5 ~ 30 % H2, respectively.
Results were obtained at 5 % H2 where the chemical reaction should limit the overall
reduction rates. It was found that the reaction rate constant decreased at higher % H2 due to
the increase of the diffusion resistance within the liquid phase. The results showed a specific
reduction rate of 1.58 x 10⁻¹ (kg-oxygen/m2s) at 1773 K. The results obtained were slightly at
elevated temperatures but showed good agreement with the previous shown work of Ban-Ya
,[19].
Literature review – Metallurgical background 20
3.1.2 Reduction rate by hydrogen at plasma temperatures
Utilisation of plasma technology in the smelting of ores has been investigated since the late
1970’s [21-33] and was summarized in a previous work [13]. However, the studies concerned
with the reduction kinetics of molten FeO with hydrogen plasma are briefly reviewed in this
section.
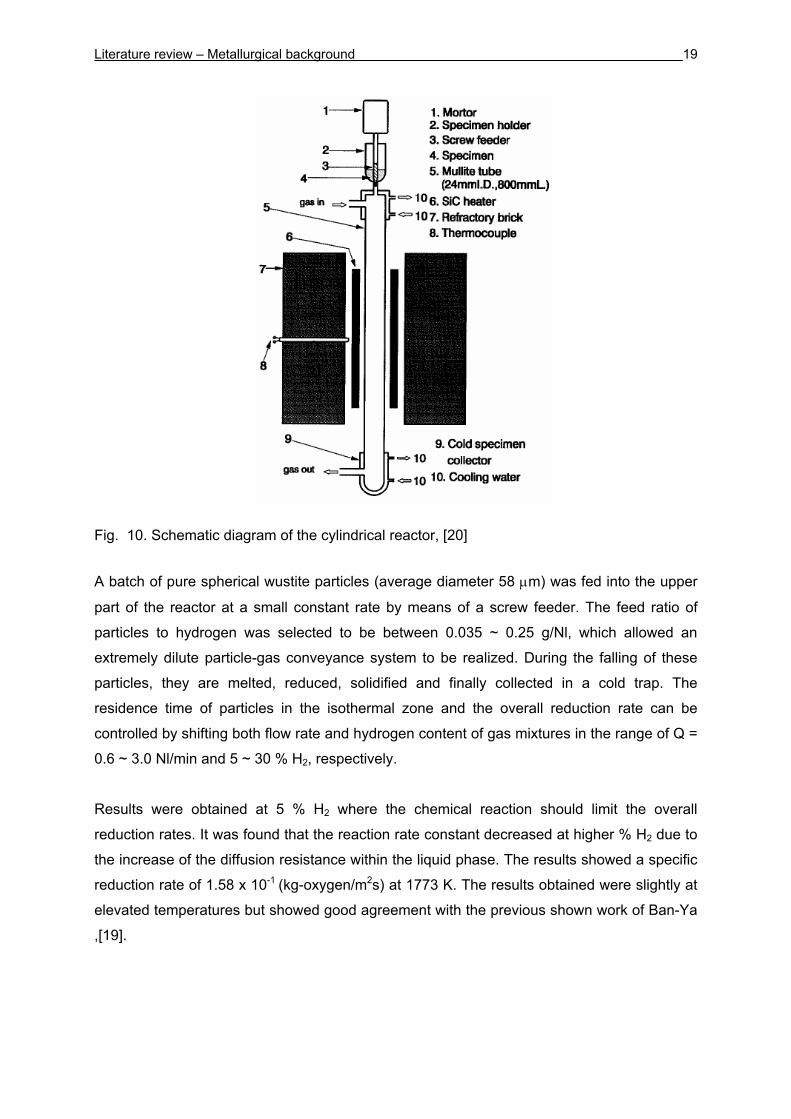
Kamiya et al. [18] have prepared a simple experimental apparatus for the study of iron ore
reduction rate, figure 11. It is composed of a DC plasma torch with thoriated tungsten
electrode, water cooled copper anode and water cooled copper crucible. The ore was
partially melted by non transferred Ar plasma and then melted down by a transferred Ar
plasma. The plasma gas was then switched to a H2-Ar mixture. The ore varied between 25 to
75 g, the flow rate of the mixture was 20 Nl/min and the input DC power 8.3 kW.
Fig. 11. Schematic diagram of the experimental apparatus, [18]
The results obtained showed a degree of hydrogen utilisation of approximately 44 %. This
conforms to the reduction of FeO by molecular H2 from the equilibrium point of view. The
specific reduction rate of FeO, r, was also determined to be 0.3 kg-oxygen/m2s. On the other
hand, higher degree of hydrogen utilisation (60 – 70 %) at low concentrations of inlet H2, less
Literature review – Metallurgical background 21
than 20 % H2 in Ar-H2 mixtures was found. This phenomenon of having a higher degree of
hydrogen utilisation at low % H2 was also found in the work of Nakamura [29]. Nakamura
attributed this in part to the dissociated hydrogen presented in the plasma. Moreover, he
presumed that the separation of the oxide melt from the reduced iron might improve the
reduction behaviour, i.e. iron oxide alone reacts with hydrogen. Lemperle [21] reported that
the novel effect of atomic hydrogen, i.e. higher utilisation degree, might appear at low
concentrations of H2 but then disappears when the rate of recombination of atomic hydrogen
increases (at higher concentrations of H2).
The studies conducted by Nakamura et al. [29] and Lemperle [21], using principally a
symmetric experimental setup like that shown in figure 11, showed specific reduction rates, r,
of about 0.3 and 0.28 kg-oxygen/m2s respectively, as was reported by Lemperle. These
results are in good agreement with that of Kamiya [18]. However, a slight deviation in the
results obtained should be expected due to the approximation of the reaction area (the arc
melt interface) in the works conducted.
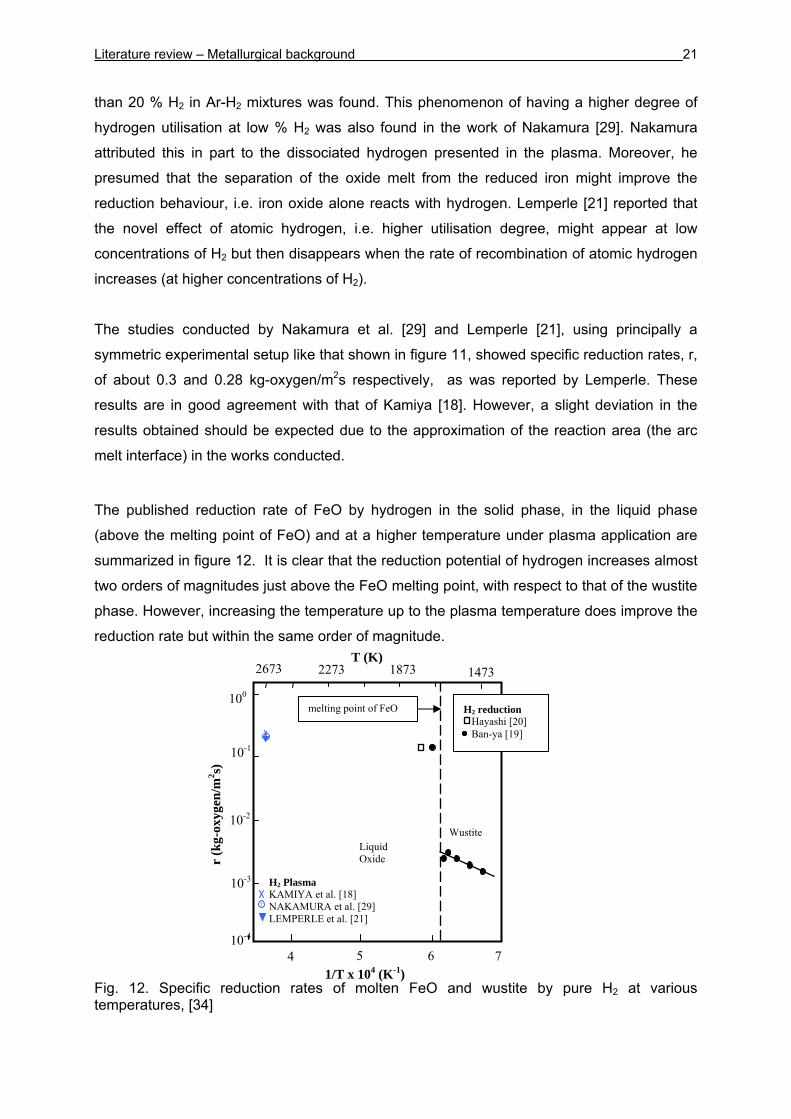
The published reduction rate of FeO by hydrogen in the solid phase, in the liquid phase
(above the melting point of FeO) and at a higher temperature under plasma application are
summarized in figure 12. It is clear that the reduction potential of hydrogen increases almost
two orders of magnitudes just above the FeO melting point, with respect to that of the wustite
phase. However, increasing the temperature up to the plasma temperature does improve the
reduction rate but within the same order of magnitude.
Fig. 12. Specific reduction rates of molten FeO and wustite by pure H2 at various temperatures, [34]
1/T x 104 (K-1)
melting point of FeO
Wustite
T (K)
10-1
100
10-2
10-3
76 54
r (k
g-ox
ygen
/m2 s)
H2 Plasma KAMIYA et al. [18] NAKAMURA et al. [29] LEMPERLE et al. [21]
14732273 1873 2673
10-4
Liquid Oxide
H2 reduction Hayashi [20]
Ban-ya [19]
Literature review – Metallurgical background 22
3.2 Reduction rate of molten iron oxide by CO at low temperatures
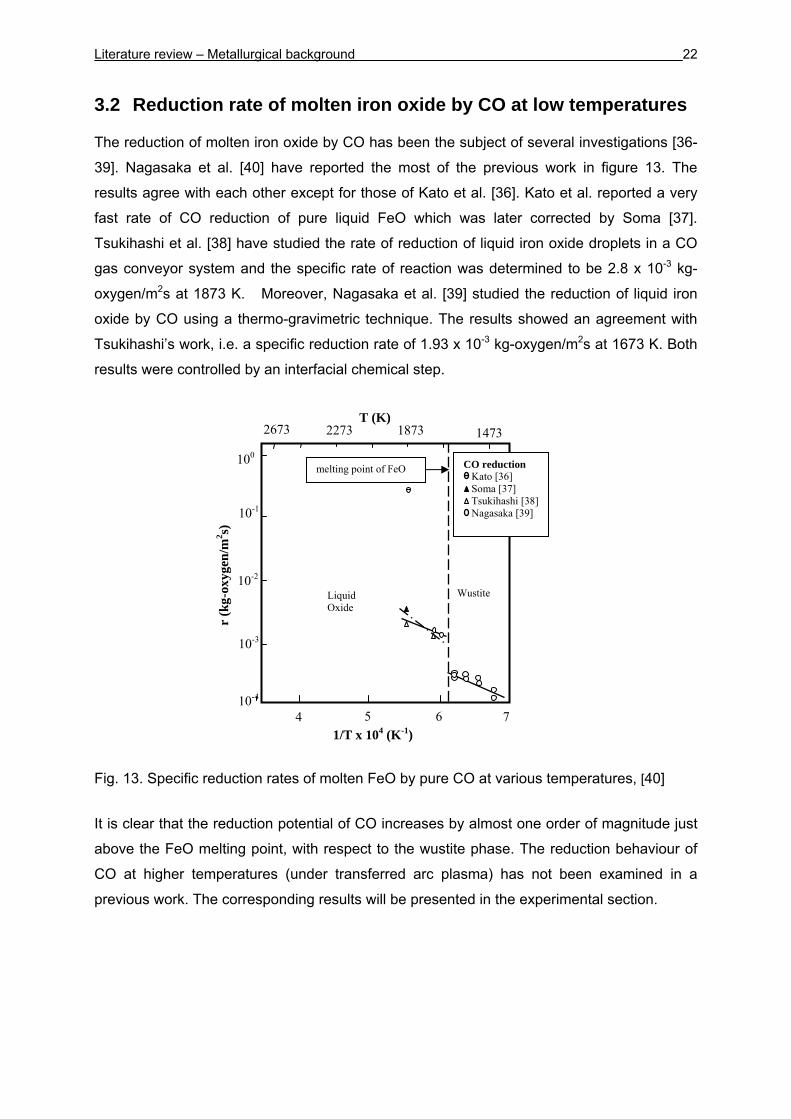
The reduction of molten iron oxide by CO has been the subject of several investigations [36-
39]. Nagasaka et al. [40] have reported the most of the previous work in figure 13. The
results agree with each other except for those of Kato et al. [36]. Kato et al. reported a very
fast rate of CO reduction of pure liquid FeO which was later corrected by Soma [37].
Tsukihashi et al. [38] have studied the rate of reduction of liquid iron oxide droplets in a CO
gas conveyor system and the specific rate of reaction was determined to be 2.8 x 10⁻³ kg-
oxygen/m2s at 1873 K. Moreover, Nagasaka et al. [39] studied the reduction of liquid iron
oxide by CO using a thermo-gravimetric technique. The results showed an agreement with
Tsukihashi’s work, i.e. a specific reduction rate of 1.93 x 10⁻³ kg-oxygen/m2s at 1673 K. Both
results were controlled by an interfacial chemical step.
Fig. 13. Specific reduction rates of molten FeO by pure CO at various temperatures, [40]
It is clear that the reduction potential of CO increases by almost one order of magnitude just
above the FeO melting point, with respect to the wustite phase. The reduction behaviour of
CO at higher temperatures (under transferred arc plasma) has not been examined in a
previous work. The corresponding results will be presented in the experimental section.
melting point of FeO
Wustite
T (K)
1/T x 104 (K-1)
10-1
100
10-2
10-3
76 54
r (k
g-ox
ygen
/m2 s)
14732273 1873 2673
10-4
Liquid Oxide
CO reduction Kato [36] Soma [37] Tsukihashi [38] Nagasaka [39]
Literature review – Metallurgical background 23
3.3 Reduction rate of molten iron oxide by carbon at low temperatures
3.3.1 Reduction rate by solid carbon
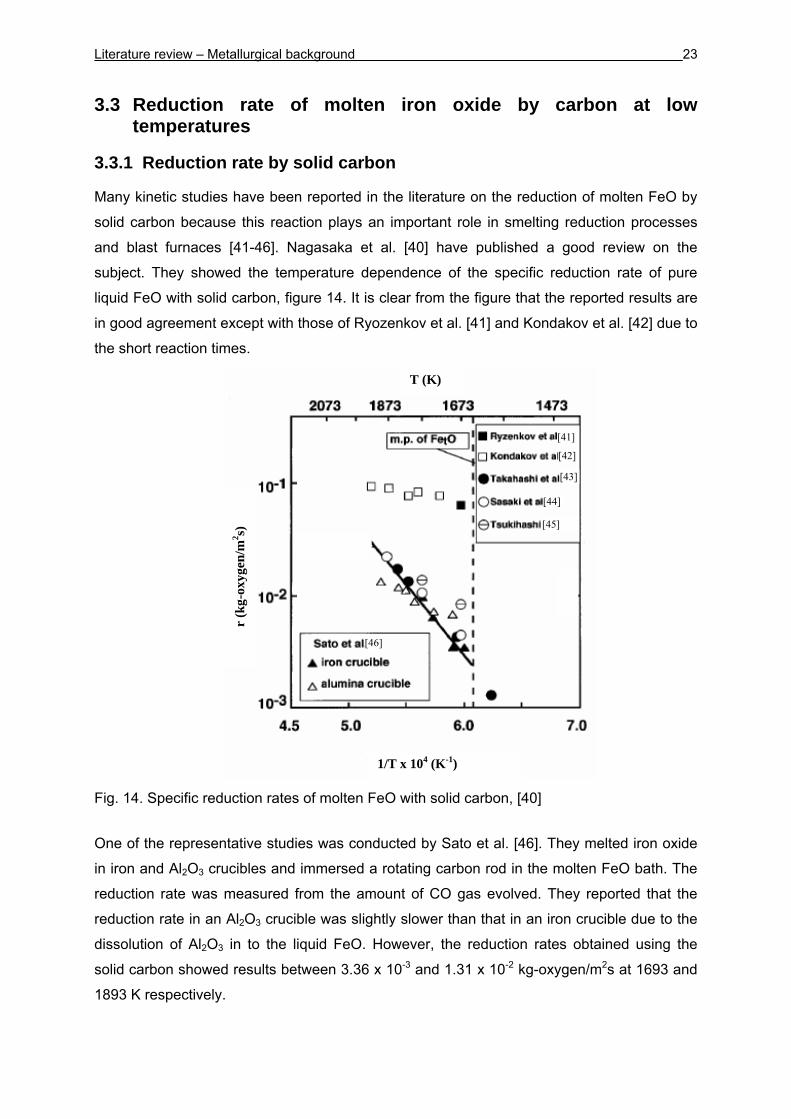
Many kinetic studies have been reported in the literature on the reduction of molten FeO by
solid carbon because this reaction plays an important role in smelting reduction processes
and blast furnaces [41-46]. Nagasaka et al. [40] have published a good review on the
subject. They showed the temperature dependence of the specific reduction rate of pure
liquid FeO with solid carbon, figure 14. It is clear from the figure that the reported results are
in good agreement except with those of Ryozenkov et al. [41] and Kondakov et al. [42] due to
the short reaction times.
Fig. 14. Specific reduction rates of molten FeO with solid carbon, [40]
One of the representative studies was conducted by Sato et al. [46]. They melted iron oxide
in iron and Al2O3 crucibles and immersed a rotating carbon rod in the molten FeO bath. The
reduction rate was measured from the amount of CO gas evolved. They reported that the
reduction rate in an Al2O3 crucible was slightly slower than that in an iron crucible due to the
dissolution of Al2O3 in to the liquid FeO. However, the reduction rates obtained using the
solid carbon showed results between 3.36 x 10⁻³ and 1.31 x 10⁻² kg-oxygen/m2s at 1693 and
1893 K respectively.
1/T x 104 (K-1)
[45]
[44]
[43]
[42]
[41]
[46]
r (k
g-ox
ygen
/m2 s)
T (K)
Literature review – Metallurgical background 24
3.3.2 Reduction rate by carbon dissolved in liquid iron
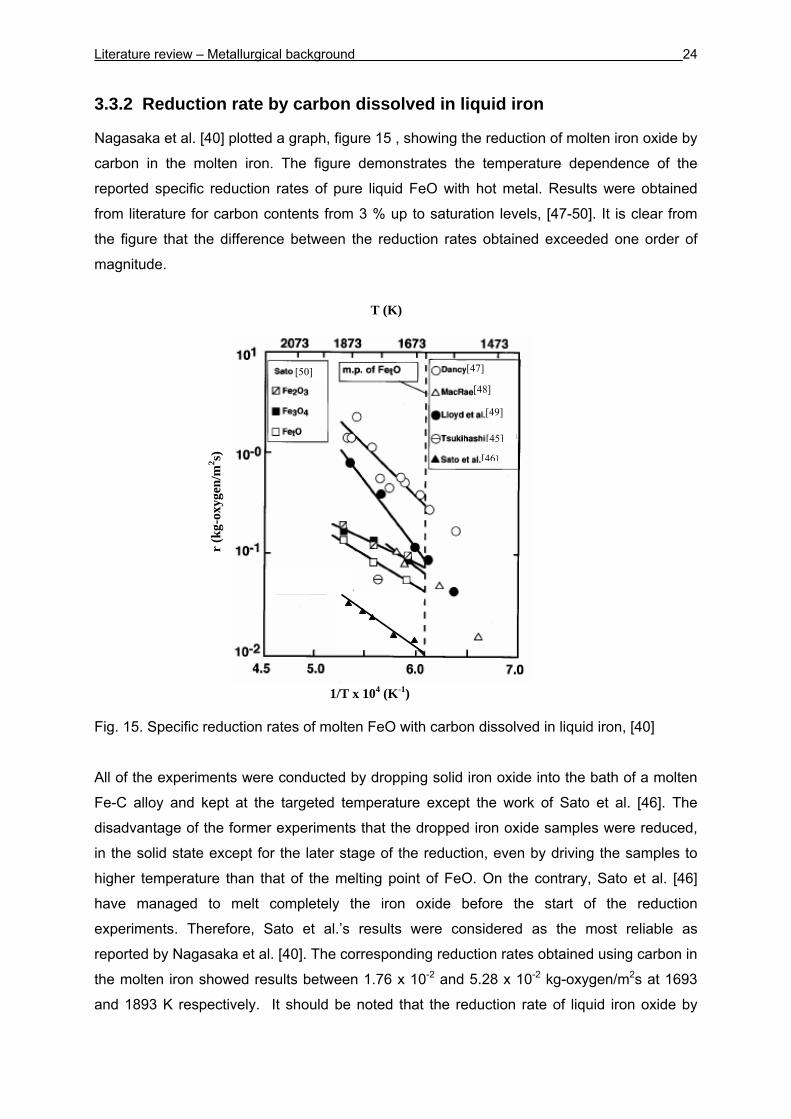
Nagasaka et al. [40] plotted a graph, figure 15 , showing the reduction of molten iron oxide by
carbon in the molten iron. The figure demonstrates the temperature dependence of the
reported specific reduction rates of pure liquid FeO with hot metal. Results were obtained
from literature for carbon contents from 3 % up to saturation levels, [47-50]. It is clear from
the figure that the difference between the reduction rates obtained exceeded one order of
magnitude.
Fig. 15. Specific reduction rates of molten FeO with carbon dissolved in liquid iron, [40] All of the experiments were conducted by dropping solid iron oxide into the bath of a molten
Fe-C alloy and kept at the targeted temperature except the work of Sato et al. [46]. The
disadvantage of the former experiments that the dropped iron oxide samples were reduced,
in the solid state except for the later stage of the reduction, even by driving the samples to
higher temperature than that of the melting point of FeO. On the contrary, Sato et al. [46]
have managed to melt completely the iron oxide before the start of the reduction
experiments. Therefore, Sato et al.’s results were considered as the most reliable as
reported by Nagasaka et al. [40]. The corresponding reduction rates obtained using carbon in
the molten iron showed results between 1.76 x 10⁻² and 5.28 x 10⁻² kg-oxygen/m2s at 1693
and 1893 K respectively. It should be noted that the reduction rate of liquid iron oxide by
1/T x 104 (K-1)
[50]
r (k
g-ox
ygen
/m2 s)
T (K)
[47]
[48]
[49]
[45]
[46]

Literature review – Metallurgical background 25
Fe-C is higher than that of solid carbon up to 1893 K. The reduction behaviour of carbon at
higher temperatures (under plasma application) has not been examined in previous work.
The corresponding results will be presented in the experimental section.
Literature review - Characteristics of plasma 26
4 Characteristics of plasma
4.1 Definition of plasma
Plasmas are mainly generated by passing an electric current through a gas. While a gas at
room temperature is an excellent insulator, a small percentage of charge carriers, ions and
electrons, can be sufficient to make the gas electrically conducting. Plasma gas comprises
molecules, atoms, ions, electrons and photons. However, overall, it is electrically neutral.
Plasma is principally divided into two types. The first type is the cold or non equilibrium
plasma. It is characterised by high electron temperatures and low temperatures of heavy
particles. The second type is the thermal or equilibrium plasma. In contrast to the cold
plasma, it is characterised by an approximate equality between heavy particle (neutrals and
ions) and electron temperatures, i.e. the thermodynamic state of the plasma approaches
equilibrium, or more precisely, local thermal equilibrium (LTE).
The thermal plasma, which is adopted in the current research work, is chosen to provide high
energy fluxes to the system. It is characterised by relatively high pressure (above 0.1 bar).
As a result of the high pressure (high gas density), the collision frequency between the
electrons and the heavy ions is high and an equilibrium state is attained (Te = Th). Typical
temperatures and ionisation degrees of thermal plasma are in the range between 5 x 10³ -
50 x 103 K and 5 -100 % respectively.
Maintaining an arc requires at least two electrodes to complete the path of the charge
carriers (electrons and ions) into and out of the gas space of the arc [51]. At any given time,
one electrode is the anode (electrons enter the electrode from the arc) while the second is
the cathode (electrons leave the electrode). In a direct current (DC) arc, the function of the
anode or cathode is maintained. In the alternating current (AC) arc, an electrode is
successively anode and cathode at the frequency of power supply. If one electrode is
tubular, from which gas emerges, and the other electrode is the material to be heated and
melted, the plasma arc is said to be of the transferred type. Otherwise, a plasma torch is
used, without heating the material, and the arc is called non transferred in that case.
4.2 Diagnostics of plasma
In plasma metallurgy, Ar, with low ionisation potential, is widely employed for stabilizing the
arc discharges from plasma torches and electrodes. On the other hand, H2 is used mainly for
reduction purposes, but its physical properties make it also an excellent medium for
Literature review - Characteristics of plasma 27
increasing the heat content of plasma. In the DC plasma arc, the properties of the gas used
influence to a great extent the temperature, momentum and the heat transfer to the system.
4.2.1 Properties of plasma gas
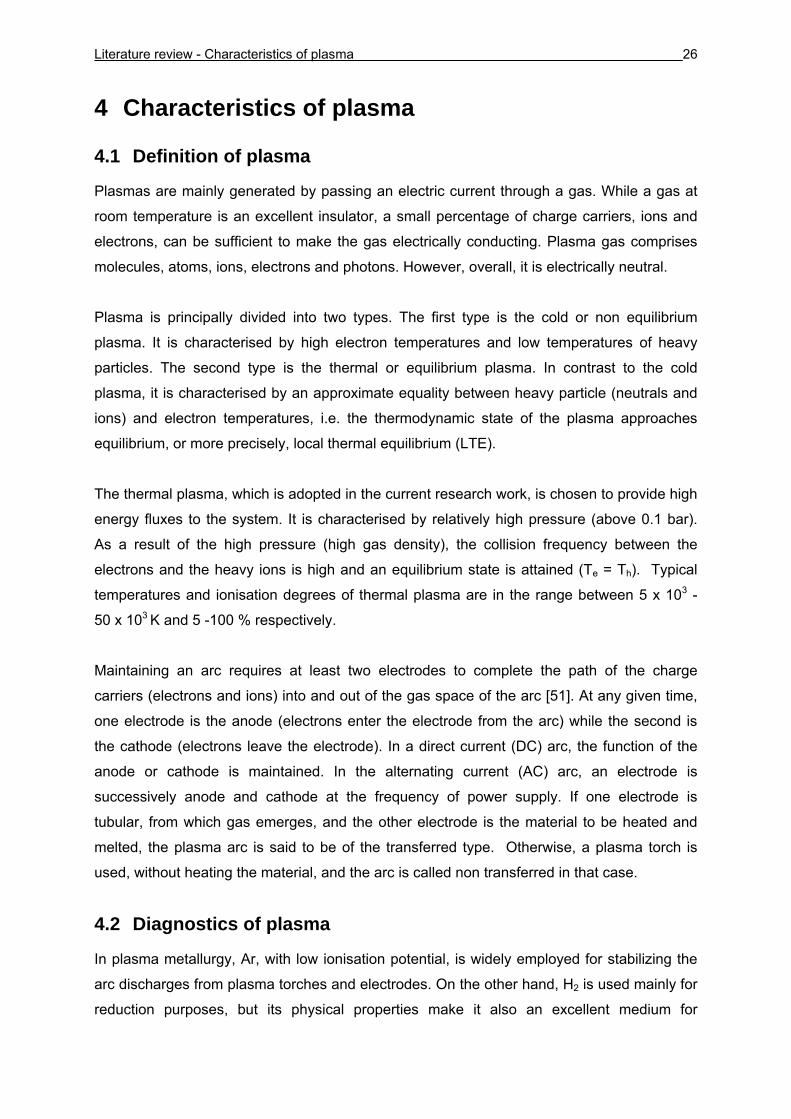
Figure 16 shows the specific heat (calculated by FactSage [9]), viscosity, thermal
conductivity and electrical conductivity of Ar, H2 and CH4*, [52, 53]. It is clear that Ar has the
lowest specific heat and thermal conductivity of all these gases. The specific heat of CH4,
averaged throughout the temperature range presented, is approximately 2.5 times that of H2.
H2 has the lowest viscosity, with some increase in the case of CH4, and a much larger
increase in the case of Ar. All gases have almost similar electrical conductivity.
*: CH4 transport properties are calculated by Murphy using the same methods [52, 53] but not published yet
Fig. 16. Specific heat, [9], viscosity, thermal conductivity and electrical conductivity of Ar, H2 and CH4 [52, 53]
4.2.2 Influence of gas properties on plasma
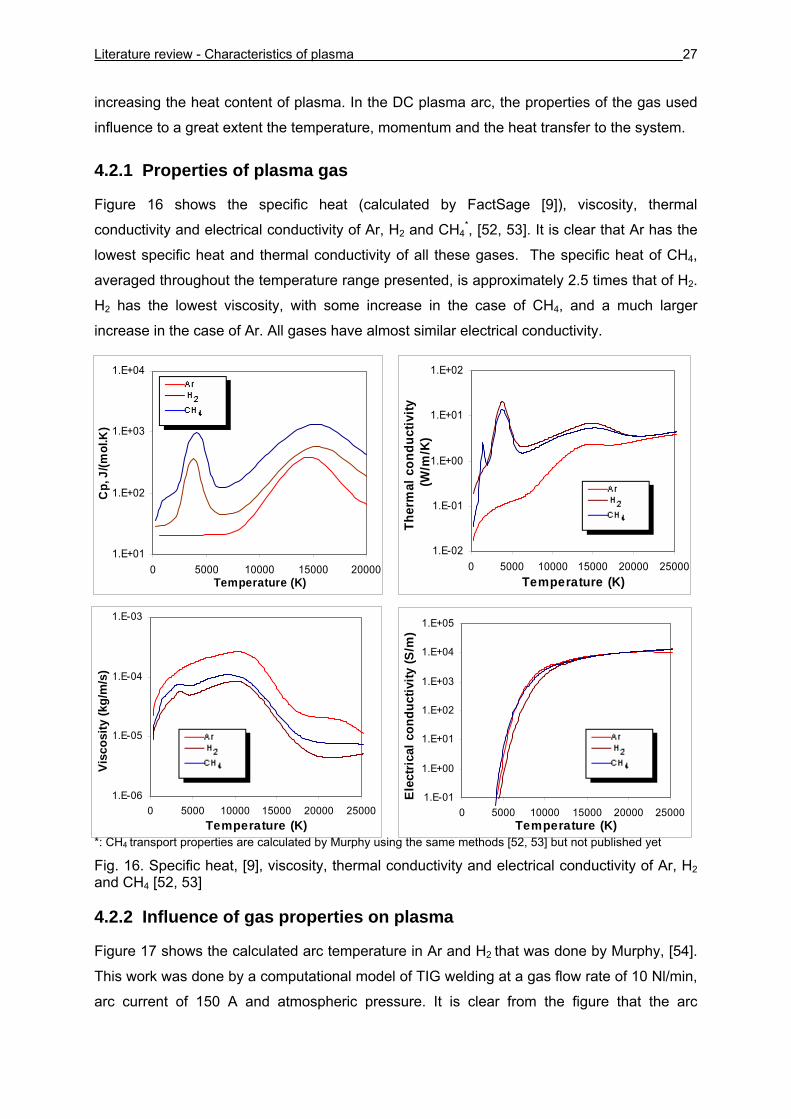
Figure 17 shows the calculated arc temperature in Ar and H2 that was done by Murphy, [54].
This work was done by a computational model of TIG welding at a gas flow rate of 10 Nl/min,
arc current of 150 A and atmospheric pressure. It is clear from the figure that the arc
1.E+01
1.E+02
1.E+03
1.E+04
0 5000 10000 15000 20000Temperature (K)
Cp,
J/(m
ol.K
)
1.E-06
1.E-05
1.E-04
1.E-03
0 5000 10000 15000 20000 25000Temperature (K)
Vis
cosi
ty (K
g/m
/s)
1.E-01
1.E+00
1.E+01
1.E+02
1.E+03
1.E+04
1.E+05
0 5000 10000 15000 20000 25000Temperature (K)
Ele
ctric
al c
ondu
ctiv
ity (S
/m)
1.E-02
1.E-01
1.E+00
1.E+01
1.E+02
0 5000 10000 15000 20000 25000Temperature (K)
Ther
mal
con
duct
ivity
(W
/m/K
)
Visc
osity
(kg/
m/s
)
Literature review - Characteristics of plasma 28
properties are strongly dependent on the properties of the gases, where an increase in the
arc temperature and the arc constriction was obtained by switching from Ar to H2. This study
was aimed at determining the main gas properties that are responsible for the changes in the
arc behaviour. This has been done by modelling arcs with artificial thermodynamic and
transport properties. In each case, all the properties of argon were used but only one
property was replaced by an equivalent property of He like specific heat, thermal
conductivity, electrical conductivity, etc.
Fig. 17. Temperature fields for arcs in Ar and H2, [54] It was found that a higher specific heat leads to an increased constriction of the arc and a
consequent increase in the maximum arc temperature. The mechanism by which increasing
the specific heat constricts the arc has been discussed by Tanaka and Lowke, [55]. They
argued that at any axial position, the total enthalpy of the plasma flowing towards the melt
can be approximated by the product of the arc current I, and the potential difference V
between the cathode and the plasma at the axial position. This neglects the low heat losses
in case of the encountered small arc gap. Tanaka and Lowke then used the formula:
A.v.h.IV ρ≈ (6 )
,where ρ , h and v are respectively density, enthalpy and velocity averaged over the arc
cross-sectional area A.
They claimed that the term v.h.ρ increases by switching from Ar to H2. This is attributed
mainly to the increase of the enthalpy delivered by H2, by approximately a factor of 10, and to
the approximate neutral effect of the term v.ρ . Therefore, for almost 3 times higher voltage,
Ar : 150 A, 10.8 V
0 2 4 6 8 10 0 2 4 6 8 10
H2 : 150 A, 35.5 V
Radial distance (mm) Radial distance (mm)
Axi
al d
ista
nce
(mm
)
Axi
al d
ista
nce
(mm
)
Literature review - Characteristics of plasma 29
in the case of H2, arc voltage = 35.5 V, a decrease in cross sectional area, A, is expected to
balance the formula, and hence create a more constricted arc.
Back to the work of Murphy [54], he also found that the lower electrical conductivity, but to a
lesser extent with respect to the specific heat effect, leads to an increased arc constriction.
This was due to the restriction of the area through which the current flows, i.e. increasing
current density, j, near the arc axis. By examining the influence of a higher thermal
conductivity, an opposite effect by modelling was obtained (broadening of the arc). This is
contrary to the previous arguments [56] that stated that increasing the thermal conductivity
will increase the current density, j, near the arc axis and accordingly increase the arc
constriction.
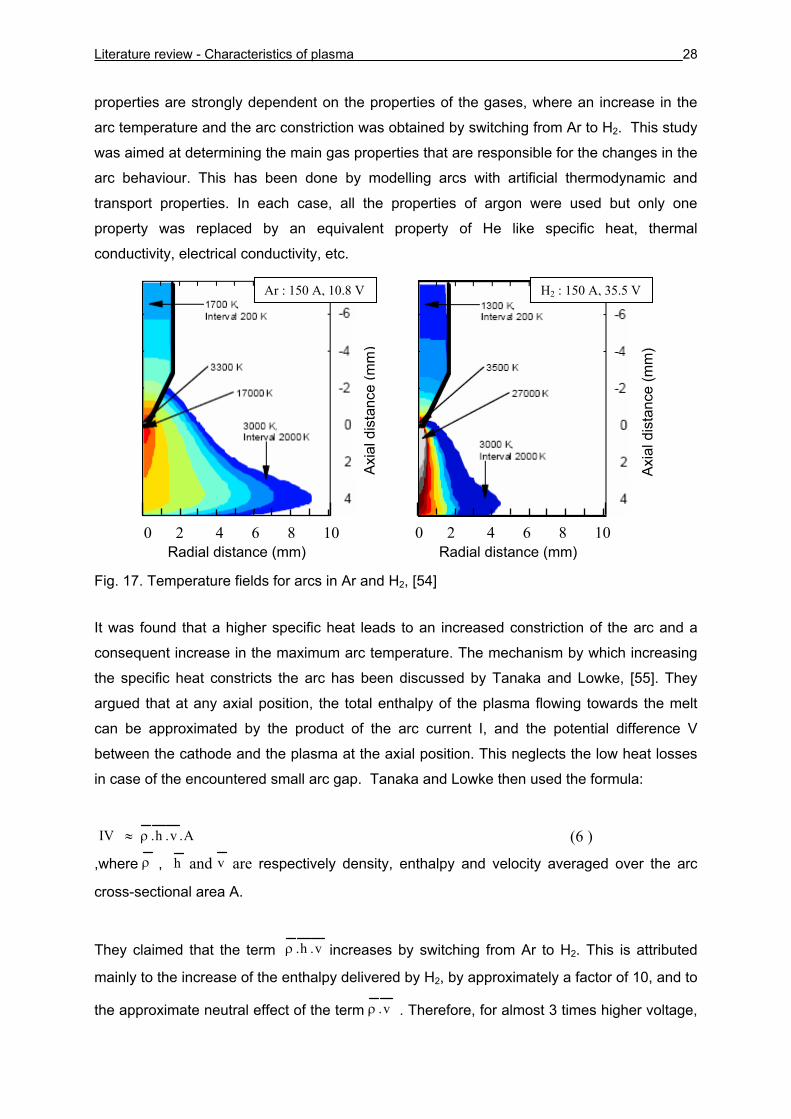
4.2.3 Plasma velocity
Fig. 18. Velocity fields for arcs in Ar and H2, [54] Figure 18 shows the calculated plasma axial velocity in Ar and H2, [54]. It is clear that the
increase in the axial velocity of H2 is dramatic. As clarified in section 4.2.2, the delivery of H2
decreases the arc cross sectional area compared to Ar. This constriction leads to the
increase of current density near the cathode and consequently to an increase in the j x B
force or Lorentz force, where j is the current density in the arc and B is applied magnetic
field. The Lorentz force tends to squeeze the arc and increase the pressure on the arc axis.
This pressure is the driving mechanism for the convective flow in the arc as it causes a
strong axial flow away from the electrode towards the melt (pinch effect), [55].
H2 : 150 A, 35.5 V Ar : 150 A, 10.8 V
Radial distance (mm) Radial distance (mm)
Axi
al d
ista
nce
(mm
)
Axi
al d
ista
nce
(mm
)
Literature review - Characteristics of plasma 30
4.2.4 Classification of arcs
In view of arc applications, a classification in terms of stabilization of the arc column appears
to be useful. There is a direct link between the method of stabilizing the arc column and the
options available for the design of arc devices [51]. Most electric arcs require some kind of
stabilizing mechanism, which must be either provided externally or which may be produced
by the arc itself. Here the term stabilization refers to a particular mechanism that keeps the
arc column in a given, stable position. Existing stabilization mechanisms like wall stabilized
arcs, vortex stabilised arcs, self stabilized arcs and forced convection stabilized arcs are
common examples for the arc stabilizing mechanisms.
In free burning arcs [51], a classical type of arc, no external stabilizing mechanism is
imposed on the arc. However, this does not exclude that the arc generates its own stabilizing
mechanism. Although high intensity arcs may be operated in the free burning mode, they are
frequently classified as self stabilized arcs. Stability can also be achieved by superimposing
an axial flow to unstable arc as in the case of the forced convection stabilized arcs. The
temperature is then reduced by the convective heat transfer from the arc to the cold gas
shroud surrounding the arc. As a result, the electrical conductivity is dropped at this location
and the arc in short will be forced to return to the equilibrium position towards the arc axis.
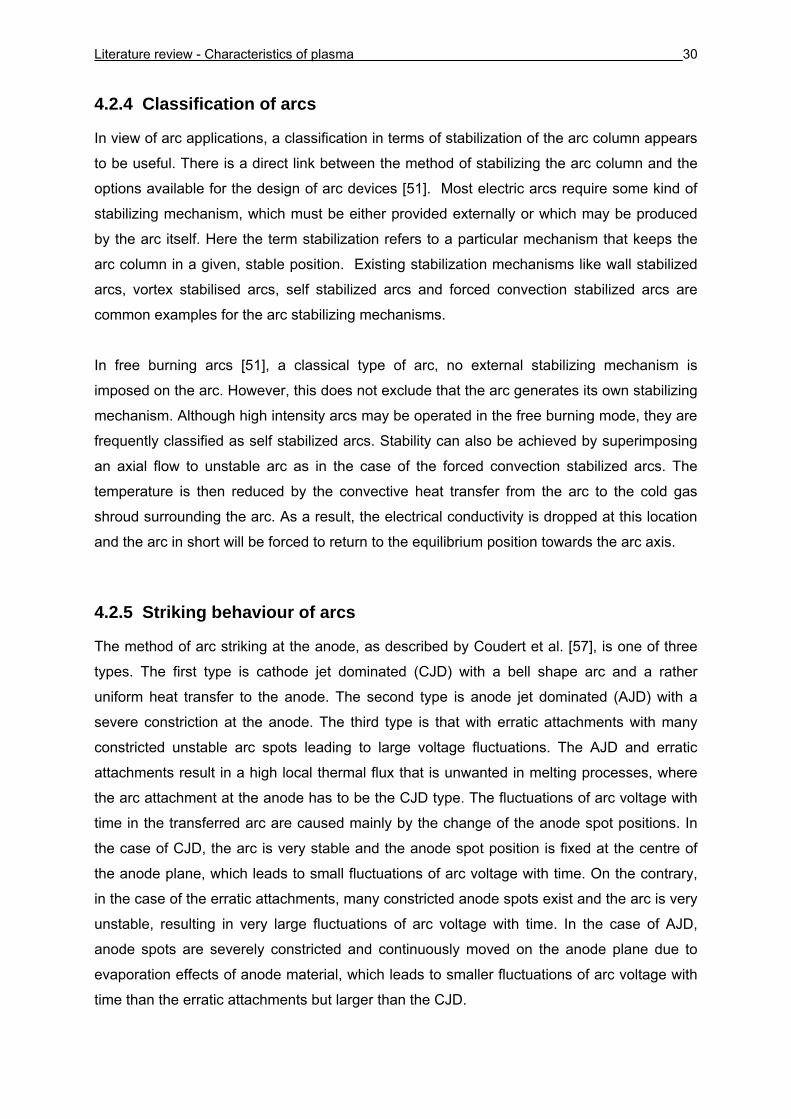
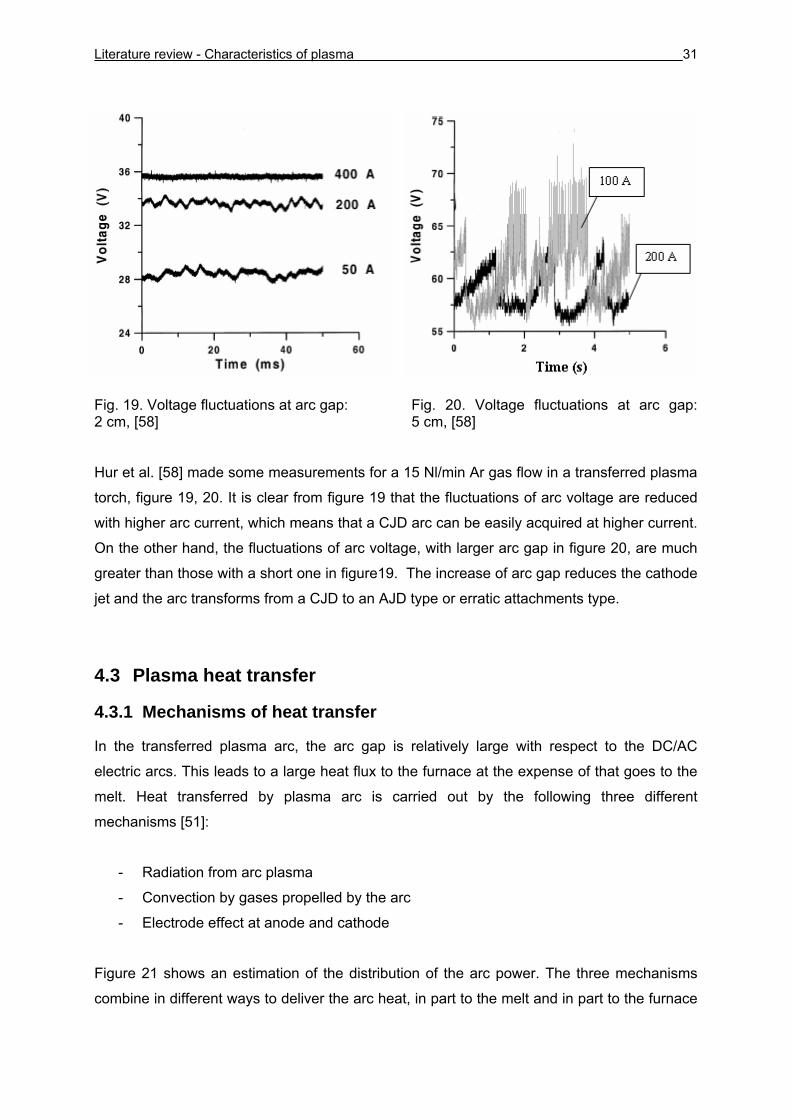
4.2.5 Striking behaviour of arcs
The method of arc striking at the anode, as described by Coudert et al. [57], is one of three
types. The first type is cathode jet dominated (CJD) with a bell shape arc and a rather
uniform heat transfer to the anode. The second type is anode jet dominated (AJD) with a
severe constriction at the anode. The third type is that with erratic attachments with many
constricted unstable arc spots leading to large voltage fluctuations. The AJD and erratic
attachments result in a high local thermal flux that is unwanted in melting processes, where
the arc attachment at the anode has to be the CJD type. The fluctuations of arc voltage with
time in the transferred arc are caused mainly by the change of the anode spot positions. In
the case of CJD, the arc is very stable and the anode spot position is fixed at the centre of
the anode plane, which leads to small fluctuations of arc voltage with time. On the contrary,
in the case of the erratic attachments, many constricted anode spots exist and the arc is very
unstable, resulting in very large fluctuations of arc voltage with time. In the case of AJD,
anode spots are severely constricted and continuously moved on the anode plane due to
evaporation effects of anode material, which leads to smaller fluctuations of arc voltage with
time than the erratic attachments but larger than the CJD.
Literature review - Characteristics of plasma 31
Fig. 19. Voltage fluctuations at arc gap: 2 cm, [58]
Fig. 20. Voltage fluctuations at arc gap: 5 cm, [58]
Hur et al. [58] made some measurements for a 15 Nl/min Ar gas flow in a transferred plasma
torch, figure 19, 20. It is clear from figure 19 that the fluctuations of arc voltage are reduced
with higher arc current, which means that a CJD arc can be easily acquired at higher current.
On the other hand, the fluctuations of arc voltage, with larger arc gap in figure 20, are much
greater than those with a short one in figure19. The increase of arc gap reduces the cathode
jet and the arc transforms from a CJD to an AJD type or erratic attachments type.
4.3 Plasma heat transfer
4.3.1 Mechanisms of heat transfer
In the transferred plasma arc, the arc gap is relatively large with respect to the DC/AC
electric arcs. This leads to a large heat flux to the furnace at the expense of that goes to the
melt. Heat transferred by plasma arc is carried out by the following three different
mechanisms [51]:
- Radiation from arc plasma
- Convection by gases propelled by the arc
- Electrode effect at anode and cathode
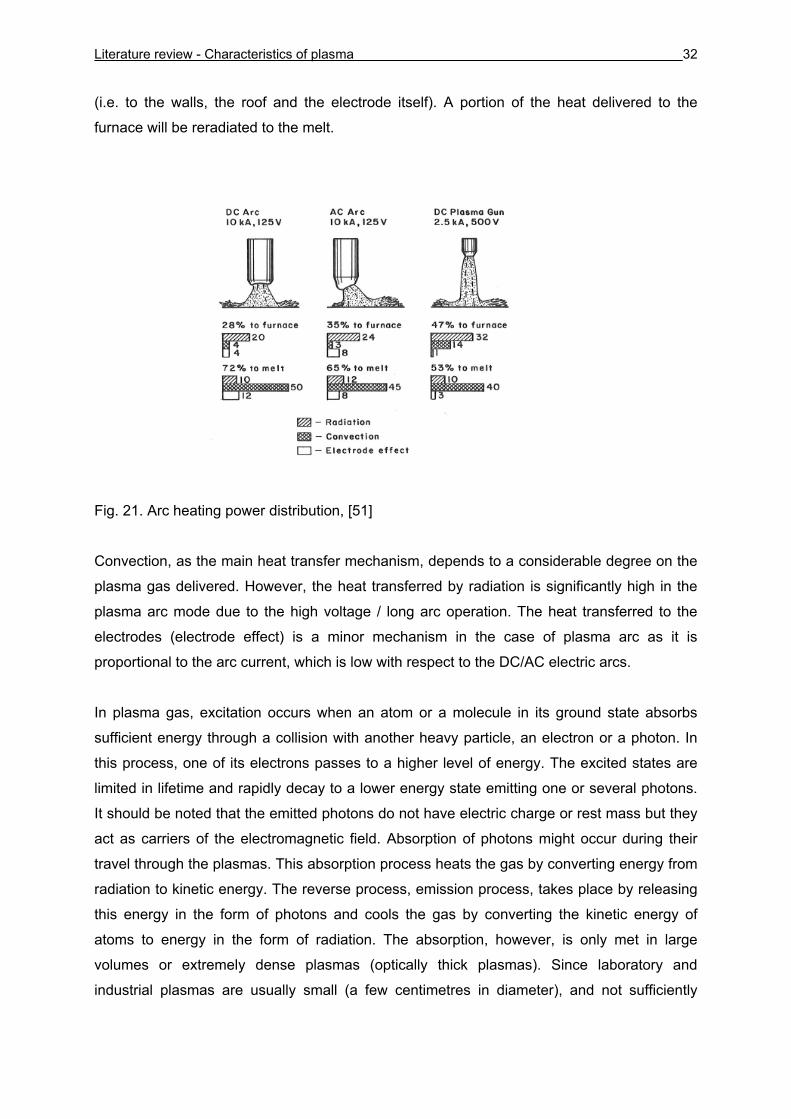
Figure 21 shows an estimation of the distribution of the arc power. The three mechanisms
combine in different ways to deliver the arc heat, in part to the melt and in part to the furnace
Literature review - Characteristics of plasma 32
(i.e. to the walls, the roof and the electrode itself). A portion of the heat delivered to the
furnace will be reradiated to the melt.
Fig. 21. Arc heating power distribution, [51]
Convection, as the main heat transfer mechanism, depends to a considerable degree on the
plasma gas delivered. However, the heat transferred by radiation is significantly high in the
plasma arc mode due to the high voltage / long arc operation. The heat transferred to the
electrodes (electrode effect) is a minor mechanism in the case of plasma arc as it is
proportional to the arc current, which is low with respect to the DC/AC electric arcs.
In plasma gas, excitation occurs when an atom or a molecule in its ground state absorbs
sufficient energy through a collision with another heavy particle, an electron or a photon. In
this process, one of its electrons passes to a higher level of energy. The excited states are
limited in lifetime and rapidly decay to a lower energy state emitting one or several photons.
It should be noted that the emitted photons do not have electric charge or rest mass but they
act as carriers of the electromagnetic field. Absorption of photons might occur during their
travel through the plasmas. This absorption process heats the gas by converting energy from
radiation to kinetic energy. The reverse process, emission process, takes place by releasing
this energy in the form of photons and cools the gas by converting the kinetic energy of
atoms to energy in the form of radiation. The absorption, however, is only met in large
volumes or extremely dense plasmas (optically thick plasmas). Since laboratory and
industrial plasmas are usually small (a few centimetres in diameter), and not sufficiently
Literature review - Characteristics of plasma 33
dense, therefore the emitted radiation intensity is generally significant, i.e. most of the
photons are not reabsorbed in the plasma (optically thin plasma), [51, 59].
As an arc efficiency determinant, it should be noted that the radiation mechanism is a
complicated process due to the interaction behaviour of the matter with radiated energy
made up by photons. Photons energy, as a quantum of energy of electromagnetic radiation,
is the product of Planck's constant and the frequency of the electromagnetic field. It ranges
from high-energy gamma rays and X rays to low-energy infrared and radio waves, though all
travel at the same speed, the speed of light, [59].
4.3.2 Distribution of the heat transfer
No modelling so far has been carried out for a transferred arc using pure H2 gas for the
reduction of iron ore. All published modelling works have handled other applications like
metal melting, plasma welding, and plasma spraying. Theses publications were conducted
either under pure Ar or a mixture of Ar and other gases like H2 and He. However, to get a
better understanding of the plasma characteristics in terms of heat transfer, it was decided to
review the previous work.
An important study that examined the heat transfer by transferred Ar arc was conducted by
Holt [60]. The heat transfer of 300 kW graphite lined plasma reactor with three 45 o tilted and
120 mm long arcs was used. A current and Ar flow rate of 500 A and 30 Nl/min were
respectively used to melt silicon metal fines. A cold model that was equipped with the same
torches, as the real hot reactor, was adopted to measure the heat flux distribution
calorimetrically. A numerical simulation of the reactor heat transfer, including a thermal lining,
was also done. Radiation from the arcs to the surrounding surfaces (including the melt) was
calculated to be 31 % of the electric power input. It was stressed that the radiation transfer to
the melt is likely to be better with tilted arcs than with one single axisymmetrically positioned
arc. This is attributed to the increase of the view factors from the hot cathode end of the arc,
which makes the net radiation flux to the melt less dependant on the wall to melt radiation. It
was also stated that a better arc configuration could be obtained by an optimization between
an efficient convective heat transfer obtained with a vertical arc and a possibly higher
radiation to the melt by tilted arcs. In that sense, Esser [61] claimed that the higher heat
transfer efficiency to the melt by the tilted arcs with respect to the vertical arc is attributed to
their better convective heat transport in the melt. However, it was agreed in both studies that
the tilted arc orientation is better than the axial arc in terms of heat transfer efficiency to the
melt. Another experimental setup for calorimetric measurement was carried out by Bini et al.
Literature review - Characteristics of plasma 34
[62] to assess the energy distribution in an Ar transferred arc for welding applications. The
arc is developed between a thoriated tungsten electrode and copper anode. A maximum
power of almost 3 kW and maximum Ar flow of 12 Nl/min was adopted. The results
measured showed an arc efficiency of 75 % at 10 mm arc gap, which dropped to 64 % by
increasing the power to almost 4 kW and the arc gap to 20 mm. This was attributed to a
significant increase in radiation heat losses to the chamber walls.
A third energy balance was carried out for an experimental setup, for welding applications,
with an arc current of 150 A, arc voltage of 10.4 V, and arc gap of 5 mm by Tanaka and
Lowke, [55]. A water cooled copper anode at atmospheric pressure in Ar was used. The arc
efficiency has been experimentally measured and also modelled to show a value of 82 %. It
is obvious in that case that the arc efficiency is relatively high due to the small arc gap
adopted in this experimental setup.
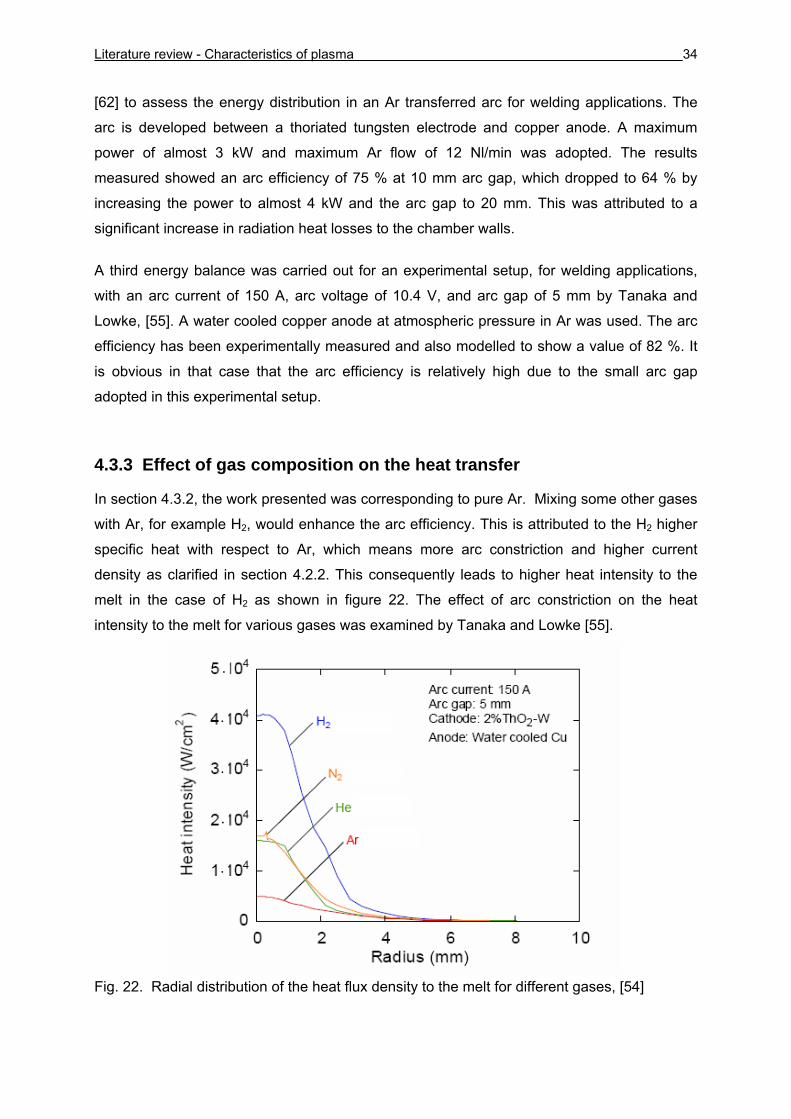
4.3.3 Effect of gas composition on the heat transfer
In section 4.3.2, the work presented was corresponding to pure Ar. Mixing some other gases
with Ar, for example H2, would enhance the arc efficiency. This is attributed to the H2 higher
specific heat with respect to Ar, which means more arc constriction and higher current
density as clarified in section 4.2.2. This consequently leads to higher heat intensity to the
melt in the case of H2 as shown in figure 22. The effect of arc constriction on the heat
intensity to the melt for various gases was examined by Tanaka and Lowke [55].
Fig. 22. Radial distribution of the heat flux density to the melt for different gases, [54]
.
.
.
.
.
Literature review - Characteristics of plasma 35
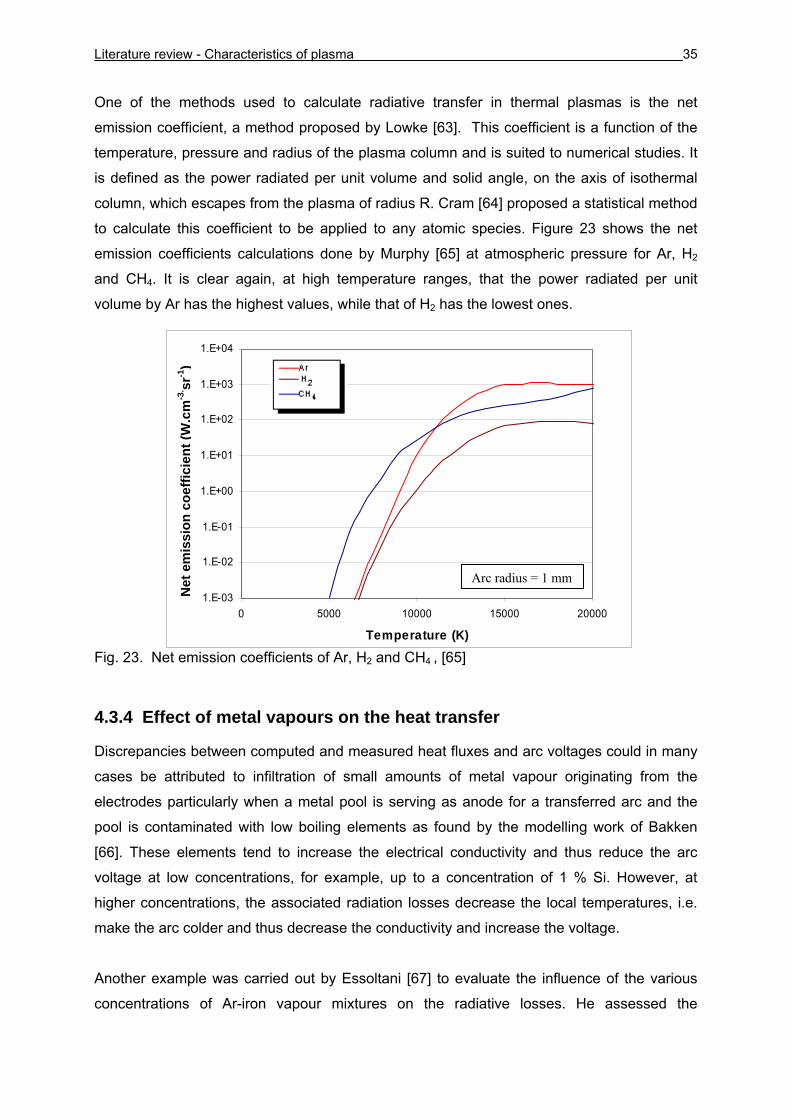
One of the methods used to calculate radiative transfer in thermal plasmas is the net
emission coefficient, a method proposed by Lowke [63]. This coefficient is a function of the
temperature, pressure and radius of the plasma column and is suited to numerical studies. It
is defined as the power radiated per unit volume and solid angle, on the axis of isothermal
column, which escapes from the plasma of radius R. Cram [64] proposed a statistical method
to calculate this coefficient to be applied to any atomic species. Figure 23 shows the net
emission coefficients calculations done by Murphy [65] at atmospheric pressure for Ar, H2
and CH4. It is clear again, at high temperature ranges, that the power radiated per unit
volume by Ar has the highest values, while that of H2 has the lowest ones.
Fig. 23. Net emission coefficients of Ar, H2 and CH4 , [65]
4.3.4 Effect of metal vapours on the heat transfer
Discrepancies between computed and measured heat fluxes and arc voltages could in many
cases be attributed to infiltration of small amounts of metal vapour originating from the
electrodes particularly when a metal pool is serving as anode for a transferred arc and the
pool is contaminated with low boiling elements as found by the modelling work of Bakken
[66]. These elements tend to increase the electrical conductivity and thus reduce the arc
voltage at low concentrations, for example, up to a concentration of 1 % Si. However, at
higher concentrations, the associated radiation losses decrease the local temperatures, i.e.
make the arc colder and thus decrease the conductivity and increase the voltage.
Another example was carried out by Essoltani [67] to evaluate the influence of the various
concentrations of Ar-iron vapour mixtures on the radiative losses. He assessed the
1.E-03
1.E-02
1.E-01
1.E+00
1.E+01
1.E+02
1.E+03
1.E+04
0 5000 10000 15000 20000
Temperature (K)
Net
em
issi
on c
oeffi
cien
t (W
.cm
-3. sr
-1)
Net
em
issi
on c
oeffi
cien
t (W
.cm
-3. sr
-1)
Arc radius = 1 mm
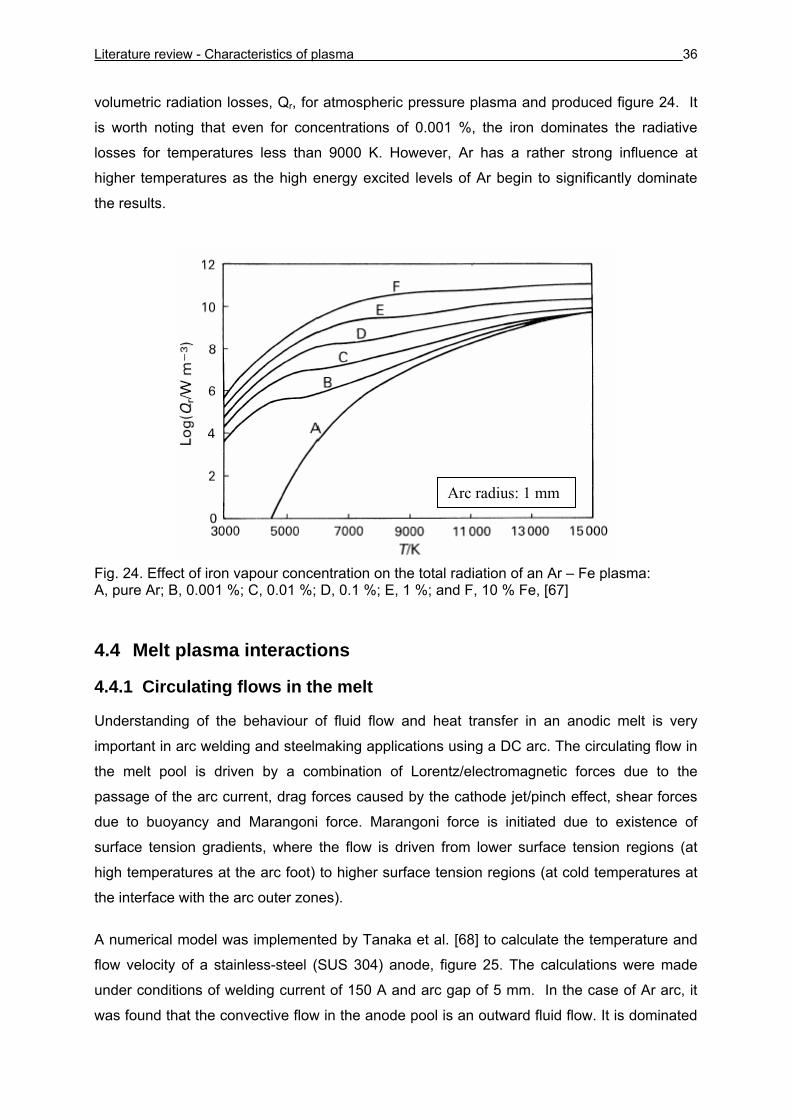
Literature review - Characteristics of plasma 36
volumetric radiation losses, Qr, for atmospheric pressure plasma and produced figure 24. It
is worth noting that even for concentrations of 0.001 %, the iron dominates the radiative
losses for temperatures less than 9000 K. However, Ar has a rather strong influence at
higher temperatures as the high energy excited levels of Ar begin to significantly dominate
the results.
Fig. 24. Effect of iron vapour concentration on the total radiation of an Ar – Fe plasma: A, pure Ar; B, 0.001 %; C, 0.01 %; D, 0.1 %; E, 1 %; and F, 10 % Fe, [67]
4.4 Melt plasma interactions
4.4.1 Circulating flows in the melt
Understanding of the behaviour of fluid flow and heat transfer in an anodic melt is very
important in arc welding and steelmaking applications using a DC arc. The circulating flow in
the melt pool is driven by a combination of Lorentz/electromagnetic forces due to the
passage of the arc current, drag forces caused by the cathode jet/pinch effect, shear forces
due to buoyancy and Marangoni force. Marangoni force is initiated due to existence of
surface tension gradients, where the flow is driven from lower surface tension regions (at
high temperatures at the arc foot) to higher surface tension regions (at cold temperatures at
the interface with the arc outer zones).
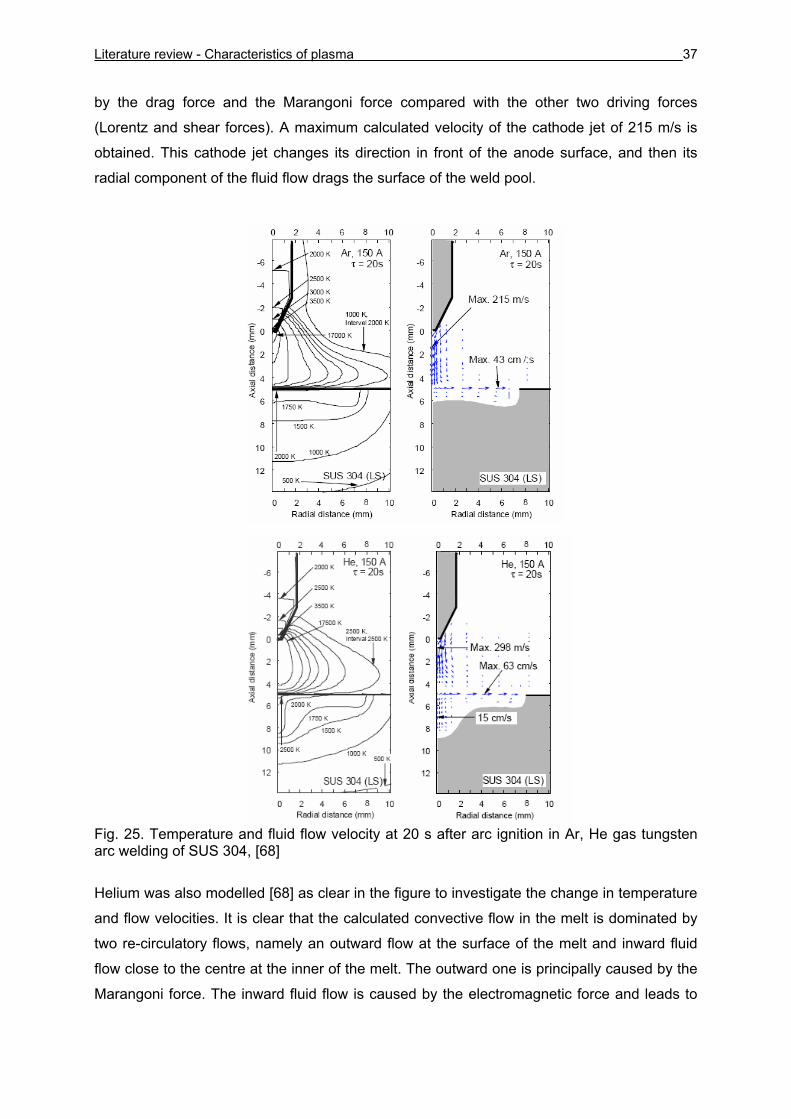
A numerical model was implemented by Tanaka et al. [68] to calculate the temperature and
flow velocity of a stainless-steel (SUS 304) anode, figure 25. The calculations were made
under conditions of welding current of 150 A and arc gap of 5 mm. In the case of Ar arc, it
was found that the convective flow in the anode pool is an outward fluid flow. It is dominated
Arc radius: 1 mm
Literature review - Characteristics of plasma 37
by the drag force and the Marangoni force compared with the other two driving forces
(Lorentz and shear forces). A maximum calculated velocity of the cathode jet of 215 m/s is
obtained. This cathode jet changes its direction in front of the anode surface, and then its
radial component of the fluid flow drags the surface of the weld pool.
Fig. 25. Temperature and fluid flow velocity at 20 s after arc ignition in Ar, He gas tungsten arc welding of SUS 304, [68]
Helium was also modelled [68] as clear in the figure to investigate the change in temperature
and flow velocities. It is clear that the calculated convective flow in the melt is dominated by
two re-circulatory flows, namely an outward flow at the surface of the melt and inward fluid
flow close to the centre at the inner of the melt. The outward one is principally caused by the
Marangoni force. The inward fluid flow is caused by the electromagnetic force and leads to
Literature review - Characteristics of plasma 38
the obvious melt penetration geometry obtained in the figure. The significant
electromagnetic force was attributed to the smaller electrical conductivity of He with respect
to Ar at low plasma temperatures. This consequently leads to a constriction of helium arc
close to the anode surface and an increase in its current density. It is obvious from the work
done that the balance of the driving forces could change the direction of the re-circulatory
flow in the melt and changes the melt penetration geometry.
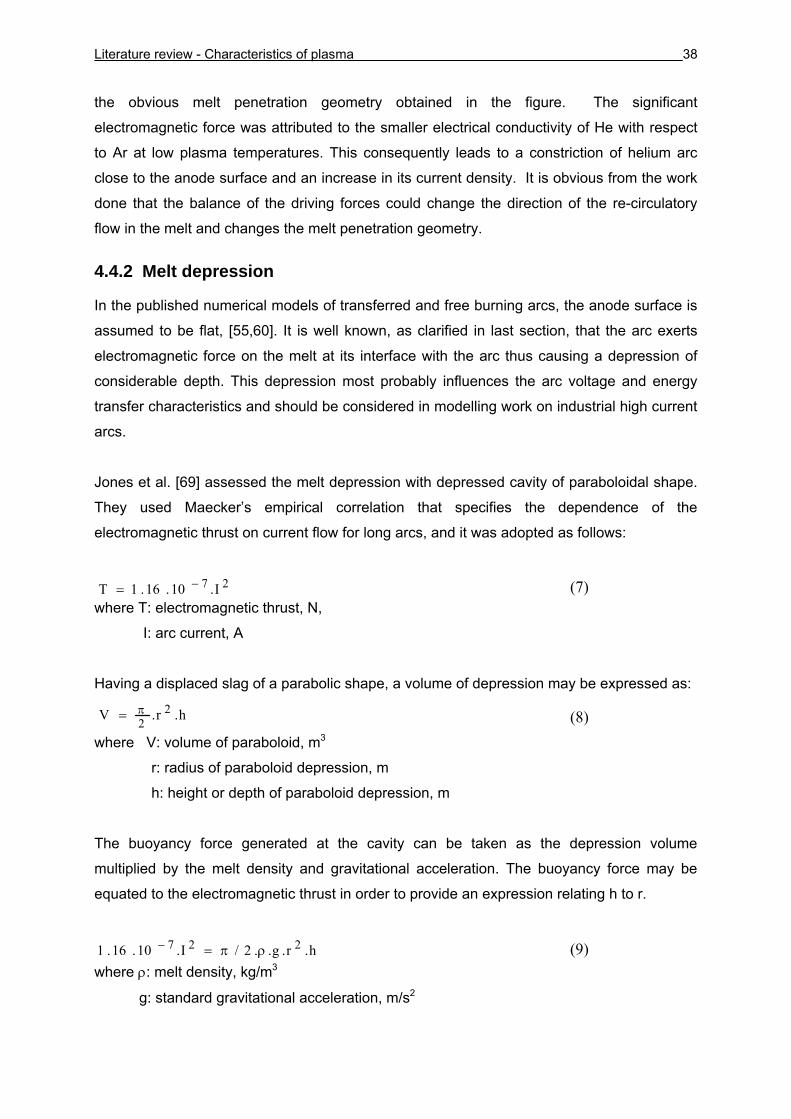
4.4.2 Melt depression
In the published numerical models of transferred and free burning arcs, the anode surface is
assumed to be flat, [55,60]. It is well known, as clarified in last section, that the arc exerts
electromagnetic force on the melt at its interface with the arc thus causing a depression of
considerable depth. This depression most probably influences the arc voltage and energy
transfer characteristics and should be considered in modelling work on industrial high current
arcs.
Jones et al. [69] assessed the melt depression with depressed cavity of paraboloidal shape.
They used Maecker’s empirical correlation that specifies the dependence of the
electromagnetic thrust on current flow for long arcs, and it was adopted as follows:
27 I.10.16.1T −= (7) where T: electromagnetic thrust, N,
I: arc current, A
Having a displaced slag of a parabolic shape, a volume of depression may be expressed as:
h.r.V 22π= (8)
where V: volume of paraboloid, m3
r: radius of paraboloid depression, m
h: height or depth of paraboloid depression, m
The buoyancy force generated at the cavity can be taken as the depression volume
multiplied by the melt density and gravitational acceleration. The buoyancy force may be
equated to the electromagnetic thrust in order to provide an expression relating h to r.
h.r.g..2/I.10.16.1 227 ρπ=− (9) where ρ: melt density, kg/m3
g: standard gravitational acceleration, m/s2
Literature review – Solubility of hydrogen in liquid iron and slag 39
5 Solubility of hydrogen in liquid iron and slag The control of hydrogen content in liquid steel is an important task for steelmakers because
of its generally detrimental effects on processing characteristics and service performance of
steel products. Just a few parts per million of hydrogen dissolved in iron can cause hairline
cracks (flakes), hydrogen embrittlement, and loss of tensile ductility. Understanding the
mechanism of hydrogen solubility in liquid iron and slag is sensible especially in the
hydrogen based processes like that discussed in the present work, i.e. hydrogen plasma
smelting reduction.
5.1 Hydrogen solubility in liquid iron
5.1.1 Solubility of molecular hydrogen
Diatomic gases such as H2, N2 and O2 dissolve in liquid metals in the atomic form as follows:
[X] (g)X 1/2 2 = (ppm) in liquid metal (10)
The concentration of X, for example hydrogen, is directly proportional to the square root of
the equilibrium gas partial pressure; this is known as Sievert’s law, [70]:
2/1
H 2H2p.K]H[% = (11)
Where 2HK and 2H
p are the equilibrium constant and the hydrogen partial pressure
respectively.
For the solute content in ppm (by mass) and the gas pressure in atm, the temperature
dependence (in K) of the equilibrium constant for H2 solubility in liquid iron has been given by
Turkodogan [71]:
423.2T
1900)p(
]ppmH[log 2/1H2
+−= (12)
Literature review – Solubility of hydrogen in liquid iron and slag 40
5.1.2 Solubility of hydrogen in the plasma state
5.1.2.1 Mechanism of hydrogen absorption
Theoretical and experimental studies have been conducted to examine the solubilities of
gases in liquid iron subjected to a plasma [72-74]. The studies stated that higher values than
the equilibrium solubilities are attainable for the same gases. This means that a portion of the
gas will enter the melt in a dissociated or ionised state due to the plasma application. In that
case, the use of Sievert’s law (based on equilibrium absorption of diatomic gas) is then
invalid.
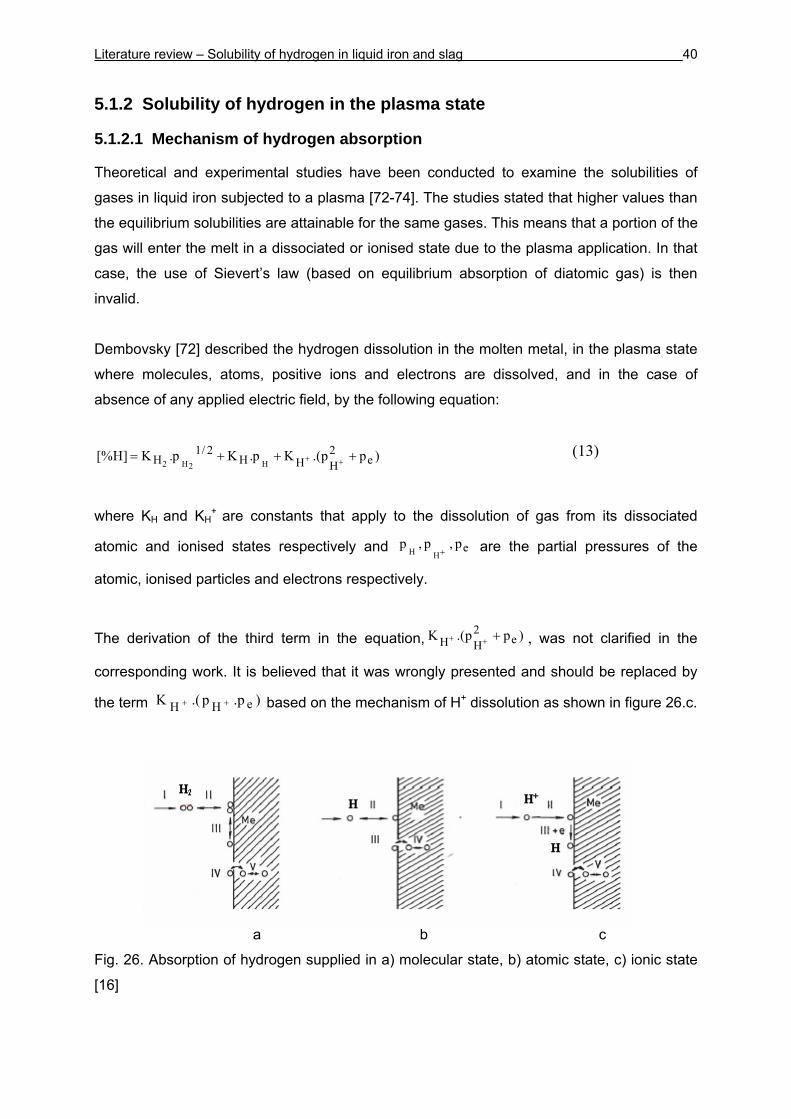
Dembovsky [72] described the hydrogen dissolution in the molten metal, in the plasma state
where molecules, atoms, positive ions and electrons are dissolved, and in the case of
absence of any applied electric field, by the following equation:
)pp.(Kp.Kp.K]H[% e2HHH
2/1H H2H2
+++= ++ (13)
where KH and KH+
are constants that apply to the dissolution of gas from its dissociated
atomic and ionised states respectively and ep,p,pHH + are the partial pressures of the
atomic, ionised particles and electrons respectively.
The derivation of the third term in the equation, )pp.(K e2HH +++ , was not clarified in the
corresponding work. It is believed that it was wrongly presented and should be replaced by
the term )p.p.(K eHH ++ based on the mechanism of H+ dissolution as shown in figure 26.c.
a b c
Fig. 26. Absorption of hydrogen supplied in a) molecular state, b) atomic state, c) ionic state
[16]
Literature review – Solubility of hydrogen in liquid iron and slag 41
Figure 26 shows the mechanism of hydrogen absorption into the melt. The schemes indicate
the stages of hydrogen dissolution in the molecular, atomic and ionic states. In the molecular
state, hydrogen is dissolved as described previously in equation (10). This reaction involves
the following stages:
I. Diffusion of H2, H2 is free gas molecule
II. H2 H2 (ads), H2 (ads) is adsorbed gas molecule III. H2 2H (ads), H (ads) is adsorbed gas atom
IV. H (ads) [H] [H] is dissolved gas atom
V. Diffusion of [H]
The mechanism of absorption of atomic hydrogen is different compared to that of molecular
hydrogen, figure 26.b. The atoms are adsorbed directly. Therefore, stage III in the above
mechanism is omitted and the mechanism then comprises the following stages:
I. Diffusion of H III. H (ads) [H]
II. H H (ads) IV. Diffusion of [H]
When the hydrogen atoms are ionised, H+, their dissolution differs from that of electrically
neutral gas particles by an extra side reaction, which is the recombination of ions adsorbed
at the metal surface. As clear from figure 26.c, the mechanism changes again to:
I. Diffusion of H+ IV. H (ads) [H]
II. H+ H+ (ads) V. Diffusion of [H]
III. H+ (ads) + e H (ads), where e is a negative charge (electron)
Dembovsky [72] concluded that the dissociated gases in their atomic or ionised state have
low activation energies for dissolution, which should make it possible to accelerate their
dissolution in the liquid iron. It is therefore quite important to take into account the
participation of active particles when examining the reactions involved in the dissolution of
gases in their plasma state. On the other hand, it should be noted that the absorption of gas
by molten metal, in the presence of an electric field, is governed not only by the partial
pressure of the gas but also by the degree of its ionisation, by polarity of the metal surface
and by the intensity of current that transports ions to the metal surface.
Literature review – Solubility of hydrogen in liquid iron and slag 42
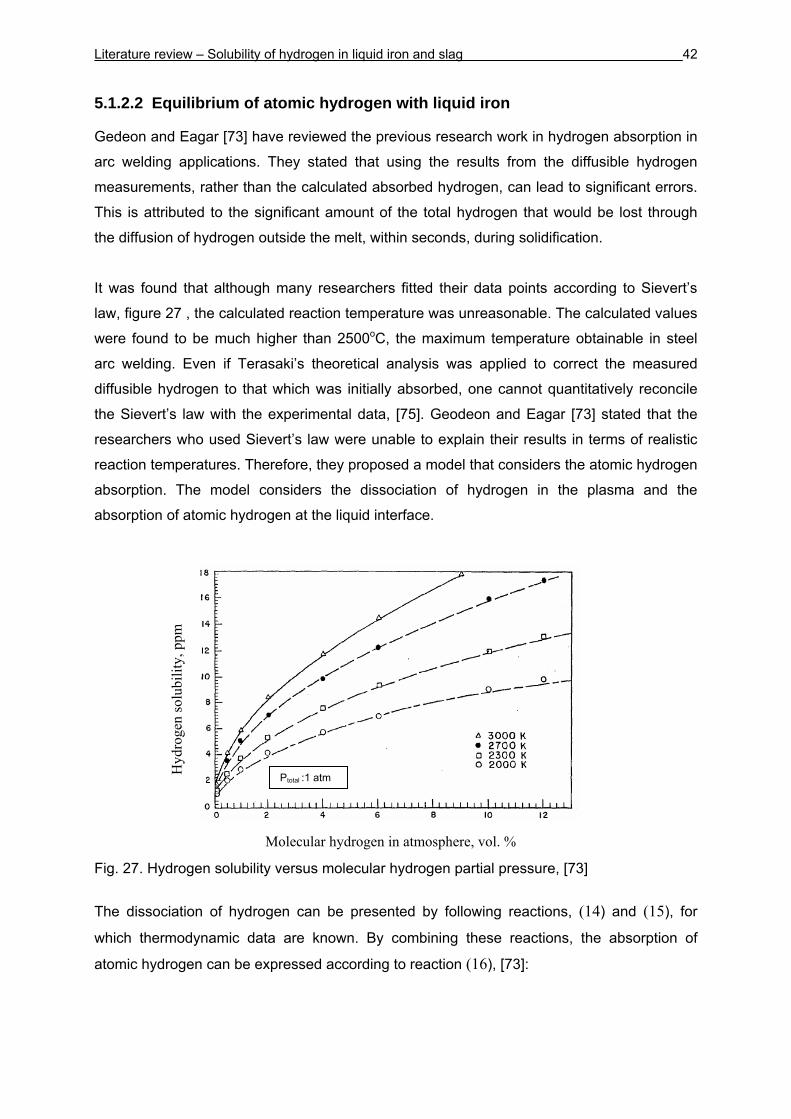
5.1.2.2 Equilibrium of atomic hydrogen with liquid iron
Gedeon and Eagar [73] have reviewed the previous research work in hydrogen absorption in
arc welding applications. They stated that using the results from the diffusible hydrogen
measurements, rather than the calculated absorbed hydrogen, can lead to significant errors.
This is attributed to the significant amount of the total hydrogen that would be lost through
the diffusion of hydrogen outside the melt, within seconds, during solidification.
It was found that although many researchers fitted their data points according to Sievert’s
law, figure 27 , the calculated reaction temperature was unreasonable. The calculated values
were found to be much higher than 2500oC, the maximum temperature obtainable in steel
arc welding. Even if Terasaki’s theoretical analysis was applied to correct the measured
diffusible hydrogen to that which was initially absorbed, one cannot quantitatively reconcile
the Sievert’s law with the experimental data, [75]. Geodeon and Eagar [73] stated that the
researchers who used Sievert’s law were unable to explain their results in terms of realistic
reaction temperatures. Therefore, they proposed a model that considers the atomic hydrogen
absorption. The model considers the dissociation of hydrogen in the plasma and the
absorption of atomic hydrogen at the liquid interface.
Fig. 27. Hydrogen solubility versus molecular hydrogen partial pressure, [73]
The dissociation of hydrogen can be presented by following reactions, (14) and (15), for
which thermodynamic data are known. By combining these reactions, the absorption of
atomic hydrogen can be expressed according to reaction (16), [73]:
Molecular hydrogen in atmosphere, vol. %
Hyd
roge
n so
lubi
lity,
ppm
Ptotal :1 atm
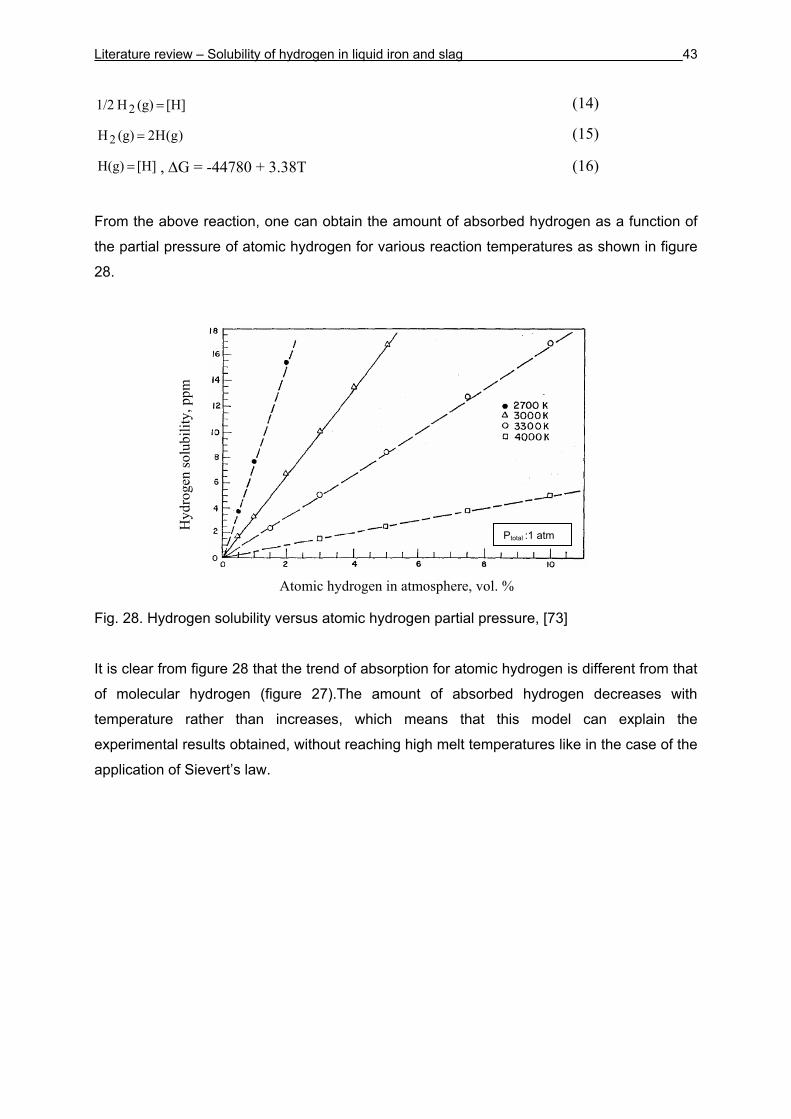
Literature review – Solubility of hydrogen in liquid iron and slag 43
[H] (g)H 1/2 2 = (14)
)g(H2 (g)H2 = (15)
[H] H(g) = , ΔG = -44780 + 3.38T (16)
From the above reaction, one can obtain the amount of absorbed hydrogen as a function of
the partial pressure of atomic hydrogen for various reaction temperatures as shown in figure
28.
Fig. 28. Hydrogen solubility versus atomic hydrogen partial pressure, [73] It is clear from figure 28 that the trend of absorption for atomic hydrogen is different from that
of molecular hydrogen (figure 27).The amount of absorbed hydrogen decreases with
temperature rather than increases, which means that this model can explain the
experimental results obtained, without reaching high melt temperatures like in the case of the
application of Sievert’s law.
Atomic hydrogen in atmosphere, vol. %
Hyd
roge
n so
lubi
lity,
ppm
Ptotal :1 atm
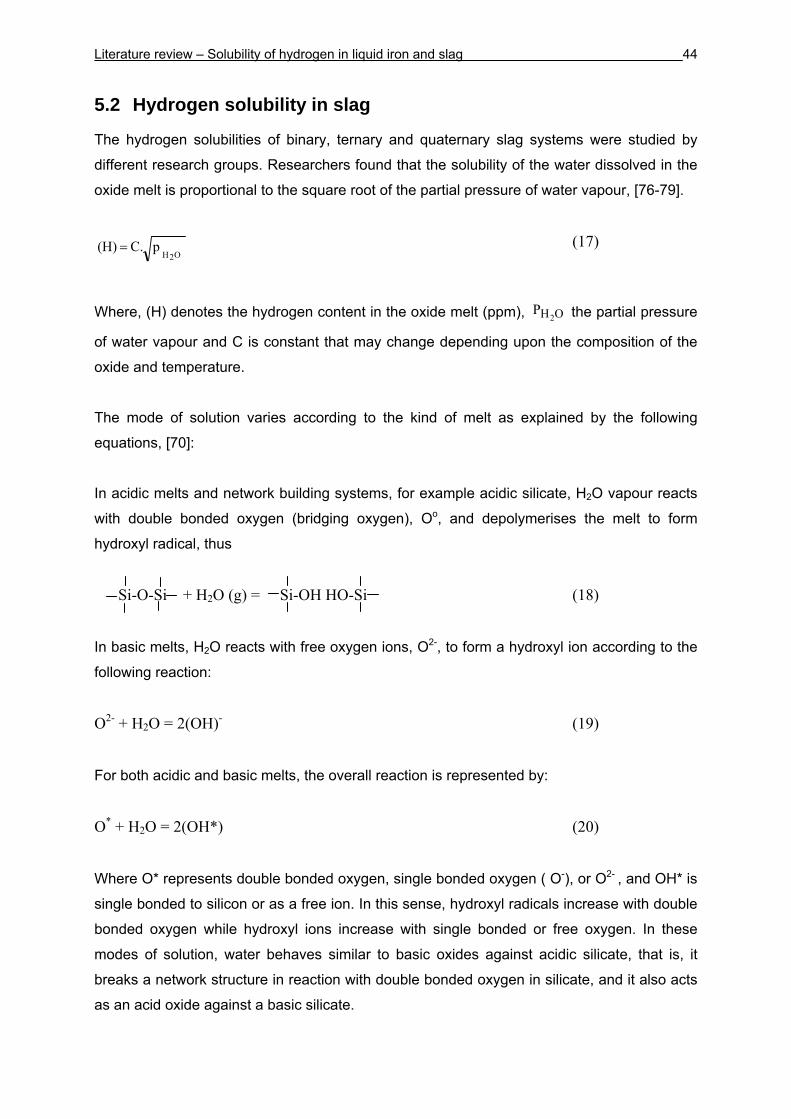
Literature review – Solubility of hydrogen in liquid iron and slag 44
5.2 Hydrogen solubility in slag
The hydrogen solubilities of binary, ternary and quaternary slag systems were studied by
different research groups. Researchers found that the solubility of the water dissolved in the
oxide melt is proportional to the square root of the partial pressure of water vapour, [76-79].
O2HpC. (H) = (17)
Where, (H) denotes the hydrogen content in the oxide melt (ppm), OH2P the partial pressure
of water vapour and C is constant that may change depending upon the composition of the
oxide and temperature.
The mode of solution varies according to the kind of melt as explained by the following
equations, [70]:
In acidic melts and network building systems, for example acidic silicate, H2O vapour reacts
with double bonded oxygen (bridging oxygen), Oo, and depolymerises the melt to form
hydroxyl radical, thus
Si-O-Si + H2O (g) = Si-OH HO-Si (18)
In basic melts, H2O reacts with free oxygen ions, O2-, to form a hydroxyl ion according to the
following reaction:
O2- + H2O = 2(OH)- (19)
For both acidic and basic melts, the overall reaction is represented by:
O* + H2O = 2(OH*) (20)
Where O* represents double bonded oxygen, single bonded oxygen ( O-), or O2- , and OH* is
single bonded to silicon or as a free ion. In this sense, hydroxyl radicals increase with double
bonded oxygen while hydroxyl ions increase with single bonded or free oxygen. In these
modes of solution, water behaves similar to basic oxides against acidic silicate, that is, it
breaks a network structure in reaction with double bonded oxygen in silicate, and it also acts
as an acid oxide against a basic silicate.
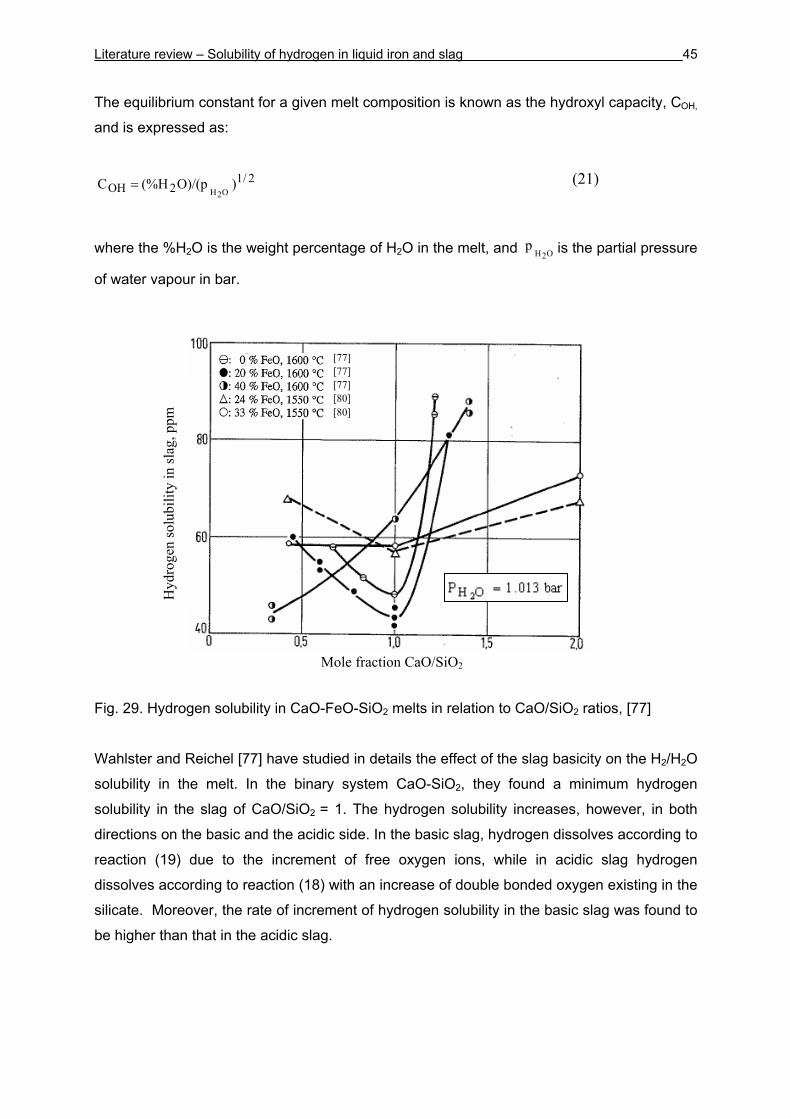
Literature review – Solubility of hydrogen in liquid iron and slag 45
The equilibrium constant for a given melt composition is known as the hydroxyl capacity, COH,
and is expressed as:
2/12OH )O)/(p(%H C
O2H= (21)
where the %H2O is the weight percentage of H2O in the melt, and O2Hp is the partial pressure
of water vapour in bar.
Fig. 29. Hydrogen solubility in CaO-FeO-SiO2 melts in relation to CaO/SiO2 ratios, [77]
Wahlster and Reichel [77] have studied in details the effect of the slag basicity on the H2/H2O
solubility in the melt. In the binary system CaO-SiO2, they found a minimum hydrogen
solubility in the slag of CaO/SiO2 = 1. The hydrogen solubility increases, however, in both
directions on the basic and the acidic side. In the basic slag, hydrogen dissolves according to
reaction (19) due to the increment of free oxygen ions, while in acidic slag hydrogen
dissolves according to reaction (18) with an increase of double bonded oxygen existing in the
silicate. Moreover, the rate of increment of hydrogen solubility in the basic slag was found to
be higher than that in the acidic slag.
Mole fraction CaO/SiO2
Hyd
roge
n so
lubi
lity
in sl
ag, p
pm
[77] [77] [77] [80] [80]
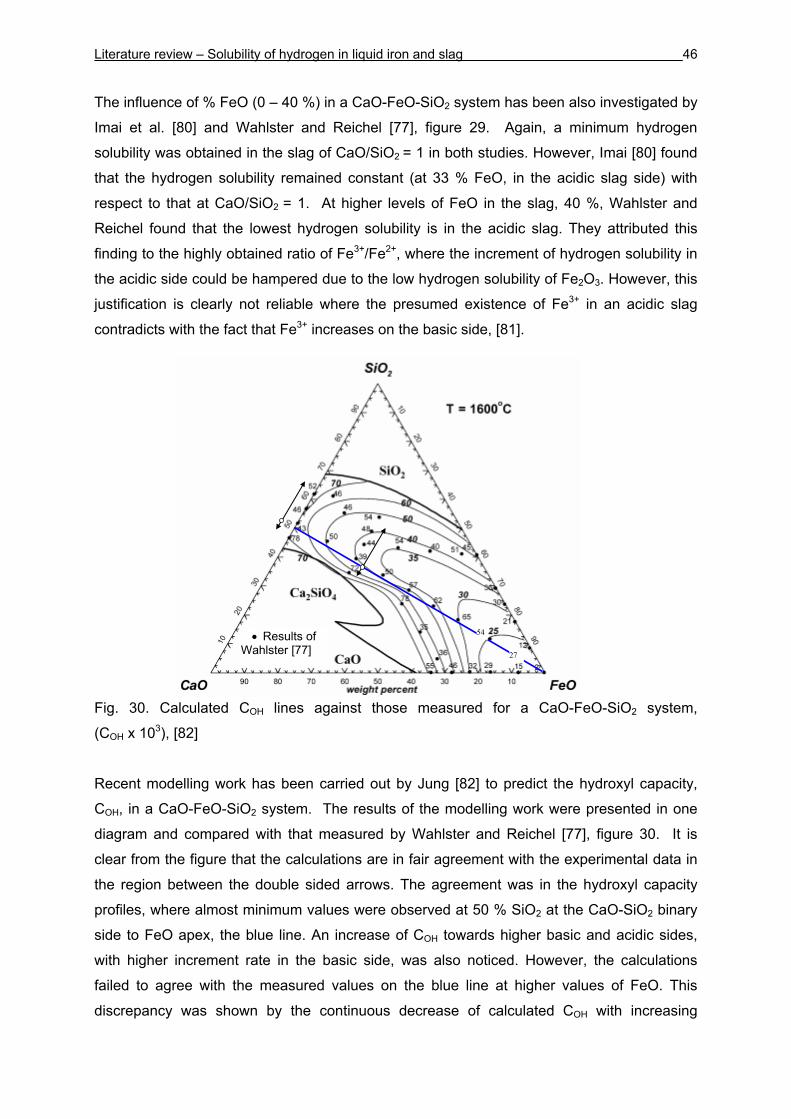
Literature review – Solubility of hydrogen in liquid iron and slag 46
The influence of % FeO (0 – 40 %) in a CaO-FeO-SiO2 system has been also investigated by
Imai et al. [80] and Wahlster and Reichel [77], figure 29. Again, a minimum hydrogen
solubility was obtained in the slag of CaO/SiO2 = 1 in both studies. However, Imai [80] found
that the hydrogen solubility remained constant (at 33 % FeO, in the acidic slag side) with
respect to that at CaO/SiO2 = 1. At higher levels of FeO in the slag, 40 %, Wahlster and
Reichel found that the lowest hydrogen solubility is in the acidic slag. They attributed this
finding to the highly obtained ratio of Fe3+/Fe2+, where the increment of hydrogen solubility in
the acidic side could be hampered due to the low hydrogen solubility of Fe2O3. However, this
justification is clearly not reliable where the presumed existence of Fe3+ in an acidic slag
contradicts with the fact that Fe3+ increases on the basic side, [81].
Fig. 30. Calculated COH lines against those measured for a CaO-FeO-SiO2 system,
(COH x 103), [82]
Recent modelling work has been carried out by Jung [82] to predict the hydroxyl capacity,
COH, in a CaO-FeO-SiO2 system. The results of the modelling work were presented in one
diagram and compared with that measured by Wahlster and Reichel [77], figure 30. It is
clear from the figure that the calculations are in fair agreement with the experimental data in
the region between the double sided arrows. The agreement was in the hydroxyl capacity
profiles, where almost minimum values were observed at 50 % SiO2 at the CaO-SiO2 binary
side to FeO apex, the blue line. An increase of COH towards higher basic and acidic sides,
with higher increment rate in the basic side, was also noticed. However, the calculations
failed to agree with the measured values on the blue line at higher values of FeO. This
discrepancy was shown by the continuous decrease of calculated COH with increasing
54
27
• Results of Wahlster [77]
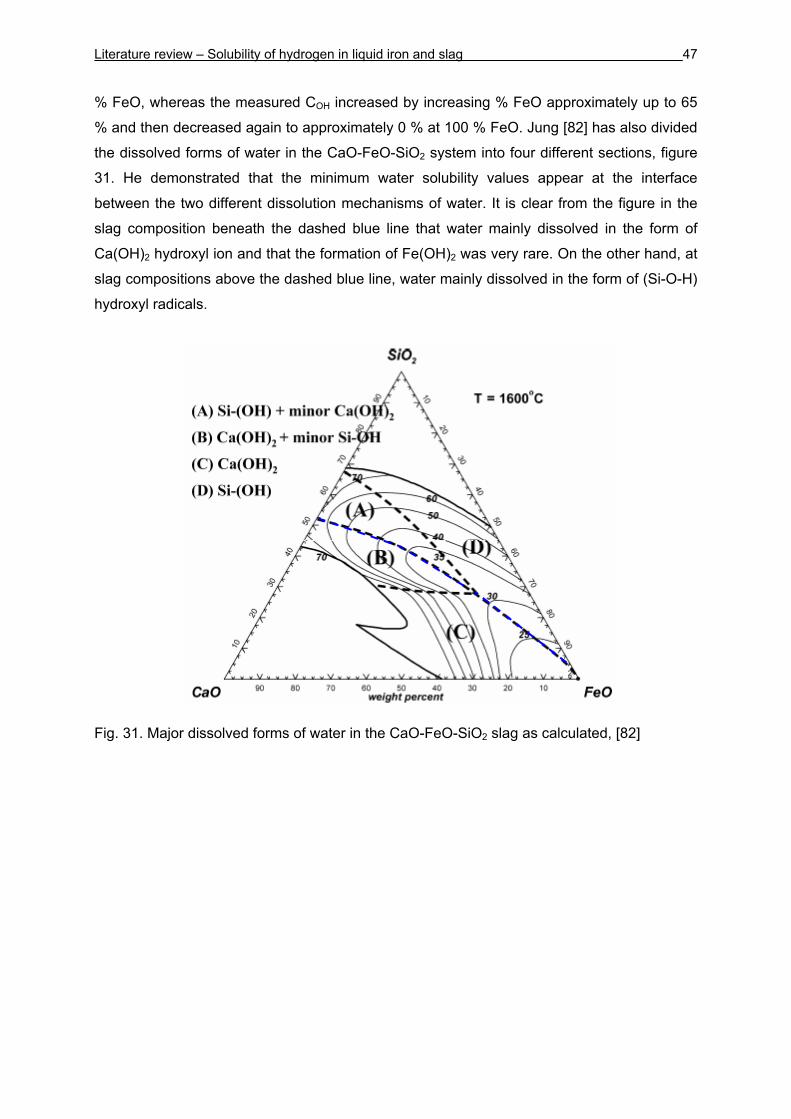
Literature review – Solubility of hydrogen in liquid iron and slag 47
% FeO, whereas the measured COH increased by increasing % FeO approximately up to 65
% and then decreased again to approximately 0 % at 100 % FeO. Jung [82] has also divided
the dissolved forms of water in the CaO-FeO-SiO2 system into four different sections, figure
31. He demonstrated that the minimum water solubility values appear at the interface
between the two different dissolution mechanisms of water. It is clear from the figure in the
slag composition beneath the dashed blue line that water mainly dissolved in the form of
Ca(OH)2 hydroxyl ion and that the formation of Fe(OH)2 was very rare. On the other hand, at
slag compositions above the dashed blue line, water mainly dissolved in the form of (Si-O-H)
hydroxyl radicals.
Fig. 31. Major dissolved forms of water in the CaO-FeO-SiO2 slag as calculated, [82]
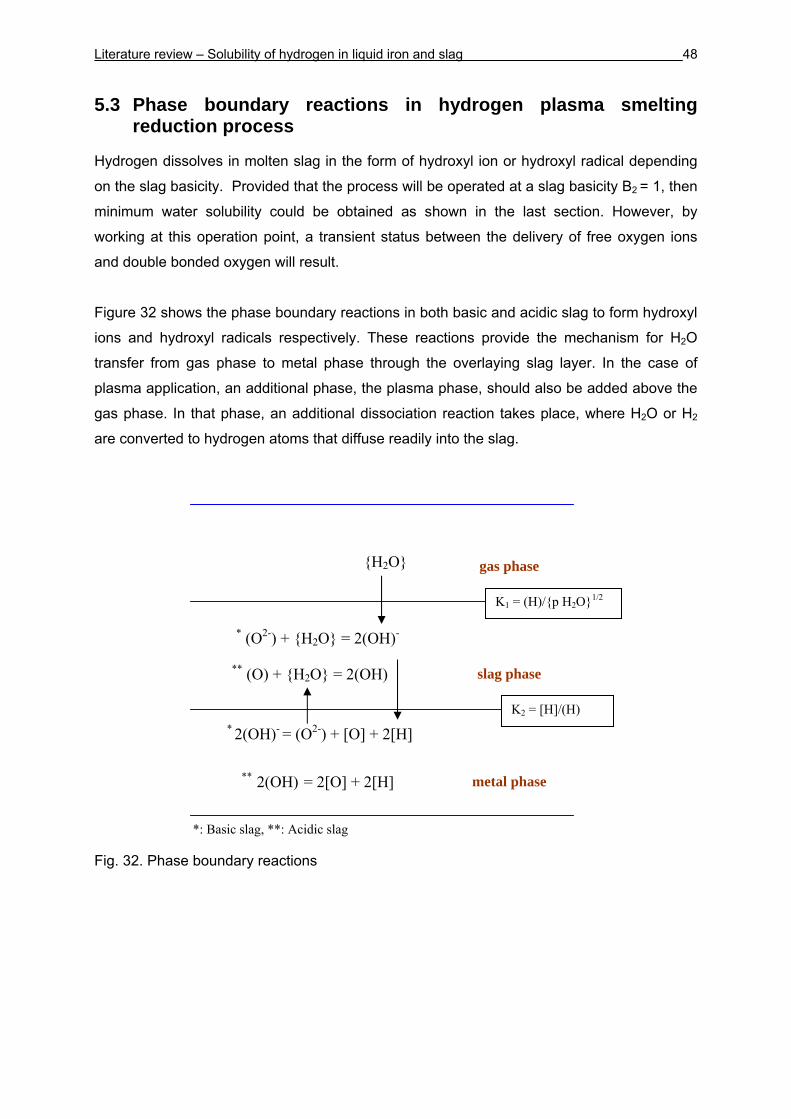
Literature review – Solubility of hydrogen in liquid iron and slag 48
5.3 Phase boundary reactions in hydrogen plasma smelting reduction process
Hydrogen dissolves in molten slag in the form of hydroxyl ion or hydroxyl radical depending
on the slag basicity. Provided that the process will be operated at a slag basicity B2 = 1, then
minimum water solubility could be obtained as shown in the last section. However, by
working at this operation point, a transient status between the delivery of free oxygen ions
and double bonded oxygen will result.
Figure 32 shows the phase boundary reactions in both basic and acidic slag to form hydroxyl
ions and hydroxyl radicals respectively. These reactions provide the mechanism for H2O
transfer from gas phase to metal phase through the overlaying slag layer. In the case of
plasma application, an additional phase, the plasma phase, should also be added above the
gas phase. In that phase, an additional dissociation reaction takes place, where H2O or H2
are converted to hydrogen atoms that diffuse readily into the slag.
*: Basic slag, **: Acidic slag
Fig. 32. Phase boundary reactions
{H2O} gas phase
slag phase
metal phase
* (O2-) + {H2O} = 2(OH)-
** (O) + {H2O} = 2(OH)
* 2(OH)- = (O2-) + [O] + 2[H]
** 2(OH) = 2[O] + 2[H]
K1 = (H)/{p H2O}1/2
K2 = [H]/(H)
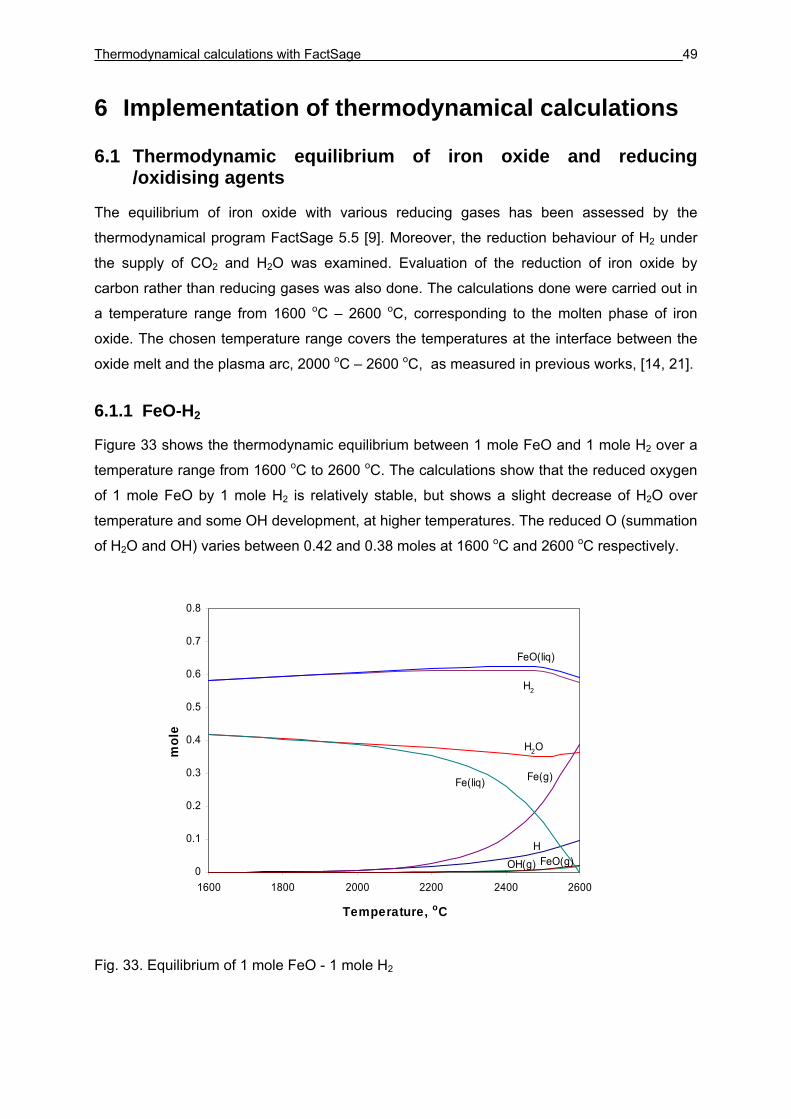
Thermodynamical calculations with FactSage 49
6 Implementation of thermodynamical calculations
6.1 Thermodynamic equilibrium of iron oxide and reducing /oxidising agents
The equilibrium of iron oxide with various reducing gases has been assessed by the
thermodynamical program FactSage 5.5 [9]. Moreover, the reduction behaviour of H2 under
the supply of CO2 and H2O was examined. Evaluation of the reduction of iron oxide by
carbon rather than reducing gases was also done. The calculations done were carried out in
a temperature range from 1600 oC – 2600 oC, corresponding to the molten phase of iron
oxide. The chosen temperature range covers the temperatures at the interface between the
oxide melt and the plasma arc, 2000 oC – 2600 oC, as measured in previous works, [14, 21].
6.1.1 FeO-H2
Figure 33 shows the thermodynamic equilibrium between 1 mole FeO and 1 mole H2 over a
temperature range from 1600 oC to 2600 oC. The calculations show that the reduced oxygen
of 1 mole FeO by 1 mole H2 is relatively stable, but shows a slight decrease of H2O over
temperature and some OH development, at higher temperatures. The reduced O (summation
of H2O and OH) varies between 0.42 and 0.38 moles at 1600 oC and 2600 oC respectively.
Fig. 33. Equilibrium of 1 mole FeO - 1 mole H2
H
H2
OH(g)
H2O
Fe(g)
FeO(g)
Fe(liq)
FeO(liq)
0
0.1
0.2
0.3
0.4
0.5
0.6
0.7
0.8
1600 1800 2000 2200 2400 2600
Temperature, oC
mol
e
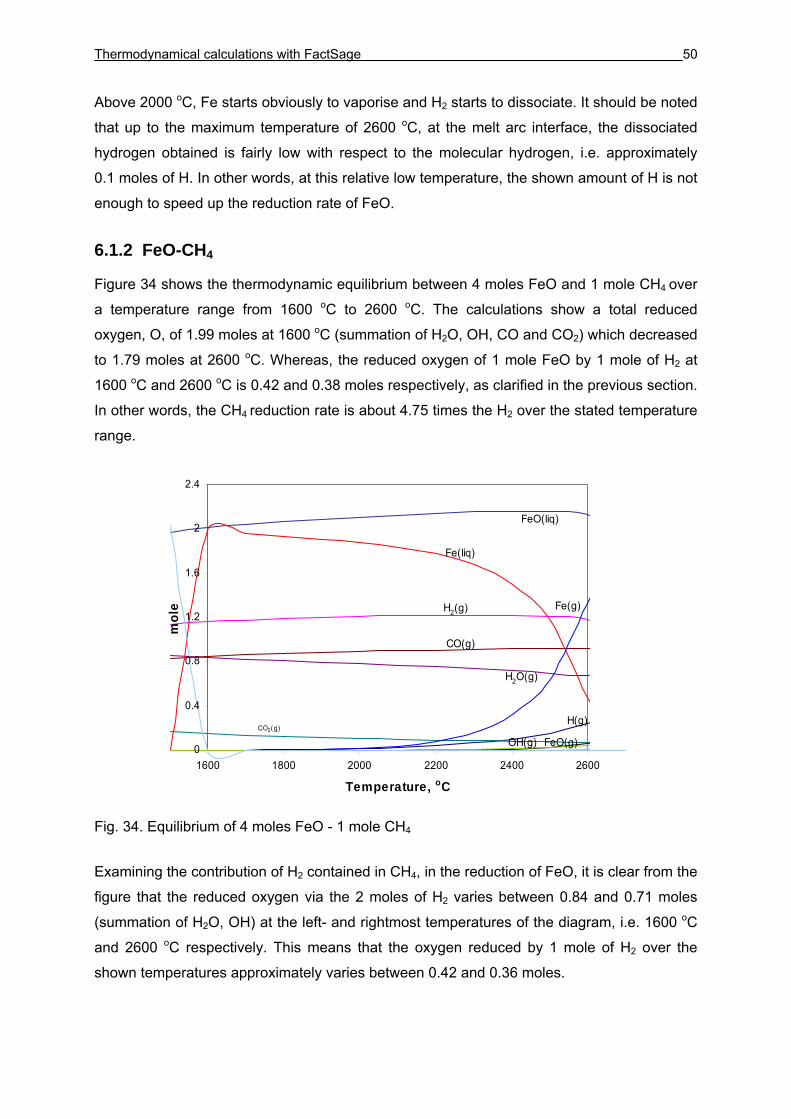
Thermodynamical calculations with FactSage 50
Above 2000 oC, Fe starts obviously to vaporise and H2 starts to dissociate. It should be noted
that up to the maximum temperature of 2600 oC, at the melt arc interface, the dissociated
hydrogen obtained is fairly low with respect to the molecular hydrogen, i.e. approximately
0.1 moles of H. In other words, at this relative low temperature, the shown amount of H is not
enough to speed up the reduction rate of FeO.
6.1.2 FeO-CH4
Figure 34 shows the thermodynamic equilibrium between 4 moles FeO and 1 mole CH4 over
a temperature range from 1600 oC to 2600 oC. The calculations show a total reduced
oxygen, O, of 1.99 moles at 1600 oC (summation of H2O, OH, CO and CO2) which decreased
to 1.79 moles at 2600 oC. Whereas, the reduced oxygen of 1 mole FeO by 1 mole of H2 at
1600 oC and 2600 oC is 0.42 and 0.38 moles respectively, as clarified in the previous section.
In other words, the CH4 reduction rate is about 4.75 times the H2 over the stated temperature
range.
Fig. 34. Equilibrium of 4 moles FeO - 1 mole CH4
Examining the contribution of H2 contained in CH4, in the reduction of FeO, it is clear from the
figure that the reduced oxygen via the 2 moles of H2 varies between 0.84 and 0.71 moles
(summation of H2O, OH) at the left- and rightmost temperatures of the diagram, i.e. 1600 oC
and 2600 oC respectively. This means that the oxygen reduced by 1 mole of H2 over the
shown temperatures approximately varies between 0.42 and 0.36 moles.
H(g)
H2(g)
H2O(g)
CO(g)
CO2(g)
Fe(g)
FeO(g)
Fe(liq)
FeO(liq)
OH(g)0
0.4
0.8
1.2
1.6
2
2.4
1600 1800 2000 2200 2400 2600
Temperature, oC
mol
e
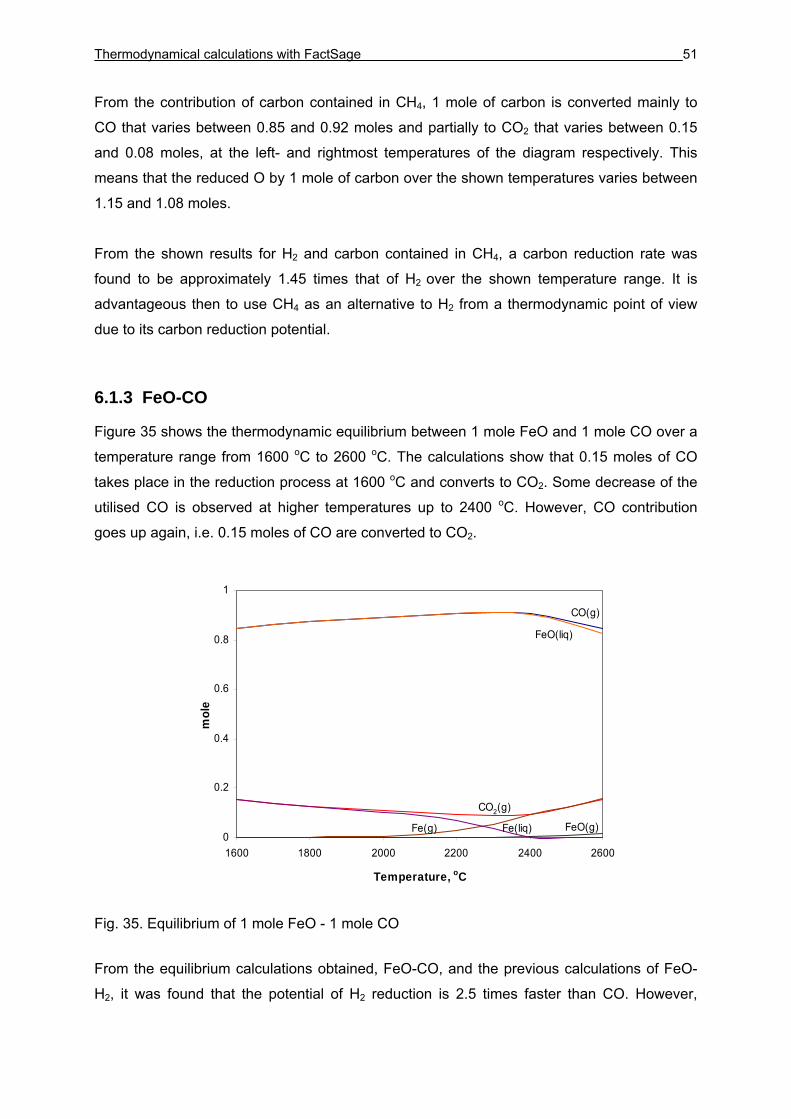
Thermodynamical calculations with FactSage 51
From the contribution of carbon contained in CH4, 1 mole of carbon is converted mainly to
CO that varies between 0.85 and 0.92 moles and partially to CO2 that varies between 0.15
and 0.08 moles, at the left- and rightmost temperatures of the diagram respectively. This
means that the reduced O by 1 mole of carbon over the shown temperatures varies between
1.15 and 1.08 moles.
From the shown results for H2 and carbon contained in CH4, a carbon reduction rate was
found to be approximately 1.45 times that of H2 over the shown temperature range. It is
advantageous then to use CH4 as an alternative to H2 from a thermodynamic point of view
due to its carbon reduction potential.
6.1.3 FeO-CO
Figure 35 shows the thermodynamic equilibrium between 1 mole FeO and 1 mole CO over a
temperature range from 1600 oC to 2600 oC. The calculations show that 0.15 moles of CO
takes place in the reduction process at 1600 oC and converts to CO2. Some decrease of the
utilised CO is observed at higher temperatures up to 2400 oC. However, CO contribution
goes up again, i.e. 0.15 moles of CO are converted to CO2.
Fig. 35. Equilibrium of 1 mole FeO - 1 mole CO
From the equilibrium calculations obtained, FeO-CO, and the previous calculations of FeO-
H2, it was found that the potential of H2 reduction is 2.5 times faster than CO. However,
CO(g)
CO2(g)
Fe(g) FeO(g)Fe(liq)
FeO(liq)
0
0.2
0.4
0.6
0.8
1
1600 1800 2000 2200 2400 2600
Temperature, oC
mol
e
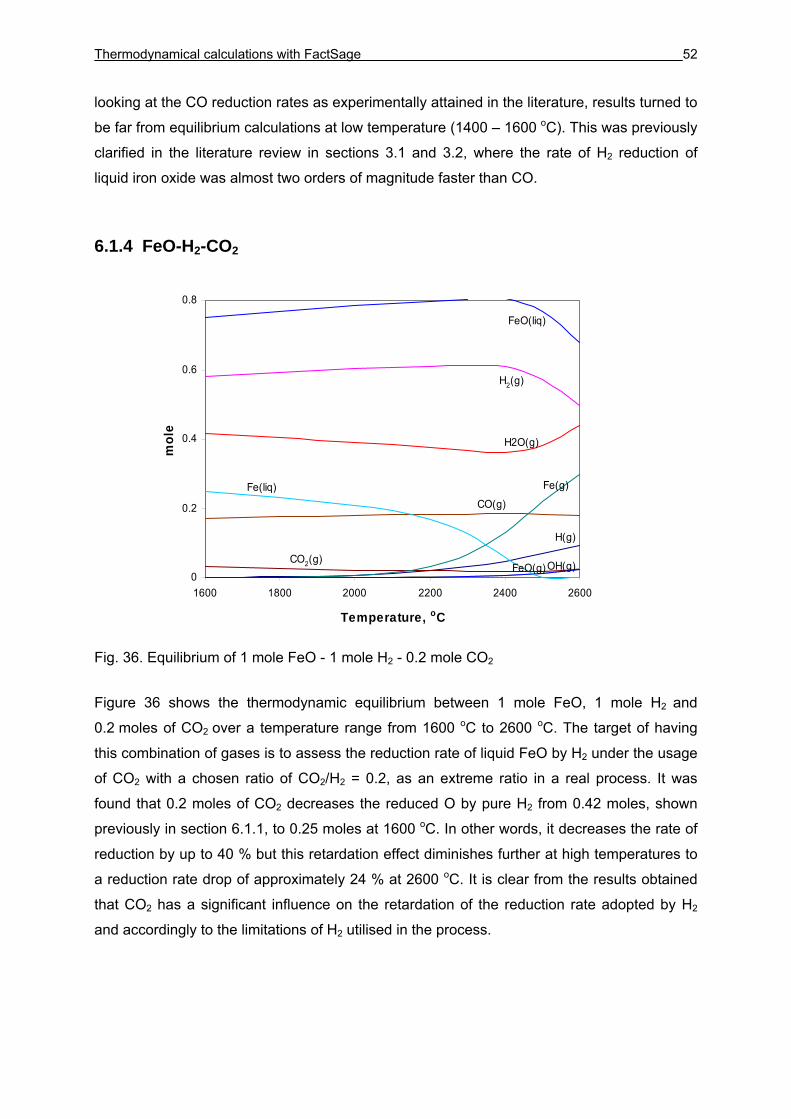
Thermodynamical calculations with FactSage 52
looking at the CO reduction rates as experimentally attained in the literature, results turned to
be far from equilibrium calculations at low temperature (1400 – 1600 oC). This was previously
clarified in the literature review in sections 3.1 and 3.2, where the rate of H2 reduction of
liquid iron oxide was almost two orders of magnitude faster than CO.
6.1.4 FeO-H2-CO2
Fig. 36. Equilibrium of 1 mole FeO - 1 mole H2 - 0.2 mole CO2
Figure 36 shows the thermodynamic equilibrium between 1 mole FeO, 1 mole H2 and
0.2 moles of CO2 over a temperature range from 1600 oC to 2600 oC. The target of having
this combination of gases is to assess the reduction rate of liquid FeO by H2 under the usage
of CO2 with a chosen ratio of CO2/H2 = 0.2, as an extreme ratio in a real process. It was
found that 0.2 moles of CO2 decreases the reduced O by pure H2 from 0.42 moles, shown
previously in section 6.1.1, to 0.25 moles at 1600 oC. In other words, it decreases the rate of
reduction by up to 40 % but this retardation effect diminishes further at high temperatures to
a reduction rate drop of approximately 24 % at 2600 oC. It is clear from the results obtained
that CO2 has a significant influence on the retardation of the reduction rate adopted by H2
and accordingly to the limitations of H2 utilised in the process.
H(g)
H2(g)
OH(g)
H2O(g)
CO(g)
CO2(g)
Fe(g)
FeO(g)
Fe(liq)
FeO(liq)
0
0.2
0.4
0.6
0.8
1600 1800 2000 2200 2400 2600
Temperature, oC
mol
e
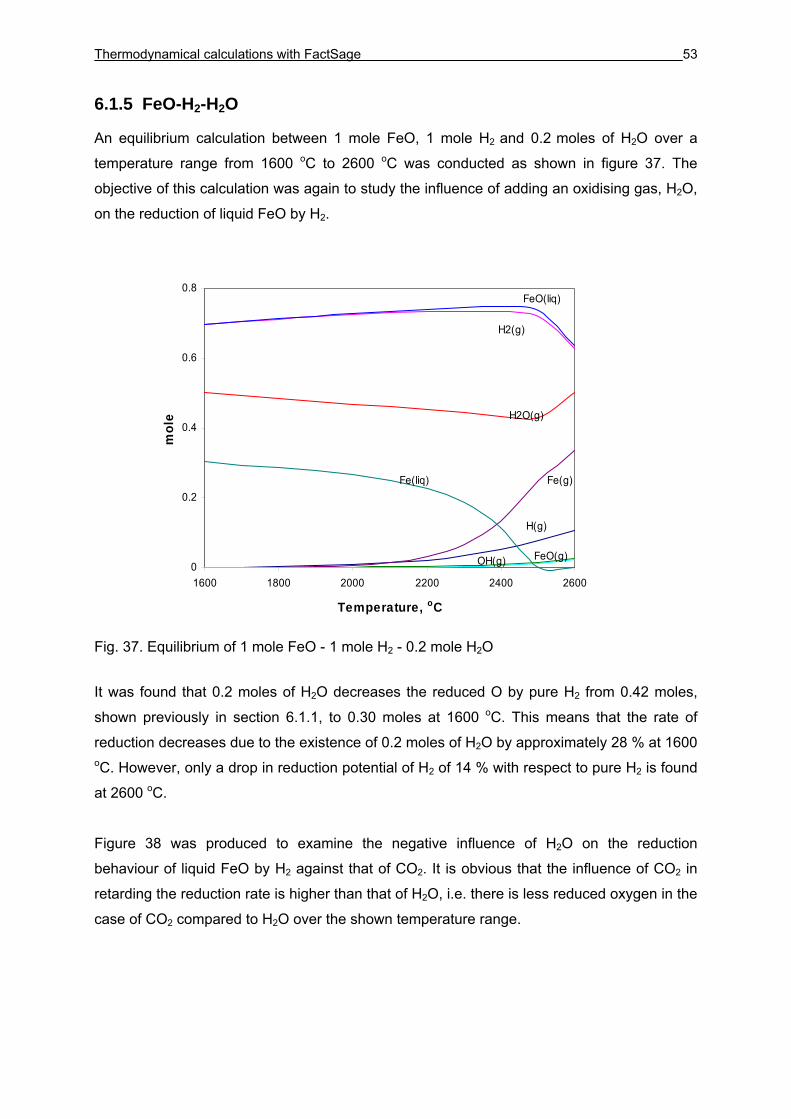
Thermodynamical calculations with FactSage 53
6.1.5 FeO-H2-H2O
An equilibrium calculation between 1 mole FeO, 1 mole H2 and 0.2 moles of H2O over a
temperature range from 1600 oC to 2600 oC was conducted as shown in figure 37. The
objective of this calculation was again to study the influence of adding an oxidising gas, H2O,
on the reduction of liquid FeO by H2.
Fig. 37. Equilibrium of 1 mole FeO - 1 mole H2 - 0.2 mole H2O
It was found that 0.2 moles of H2O decreases the reduced O by pure H2 from 0.42 moles,
shown previously in section 6.1.1, to 0.30 moles at 1600 oC. This means that the rate of
reduction decreases due to the existence of 0.2 moles of H2O by approximately 28 % at 1600 oC. However, only a drop in reduction potential of H2 of 14 % with respect to pure H2 is found
at 2600 oC.
Figure 38 was produced to examine the negative influence of H2O on the reduction
behaviour of liquid FeO by H2 against that of CO2. It is obvious that the influence of CO2 in
retarding the reduction rate is higher than that of H2O, i.e. there is less reduced oxygen in the
case of CO2 compared to H2O over the shown temperature range.
H(g)
H2(g)
H2O(g)
Fe(g)
OH(g) FeO(g)
Fe(liq)
FeO(liq)
0
0.2
0.4
0.6
0.8
1600 1800 2000 2200 2400 2600
Temperature, oC
mol
e
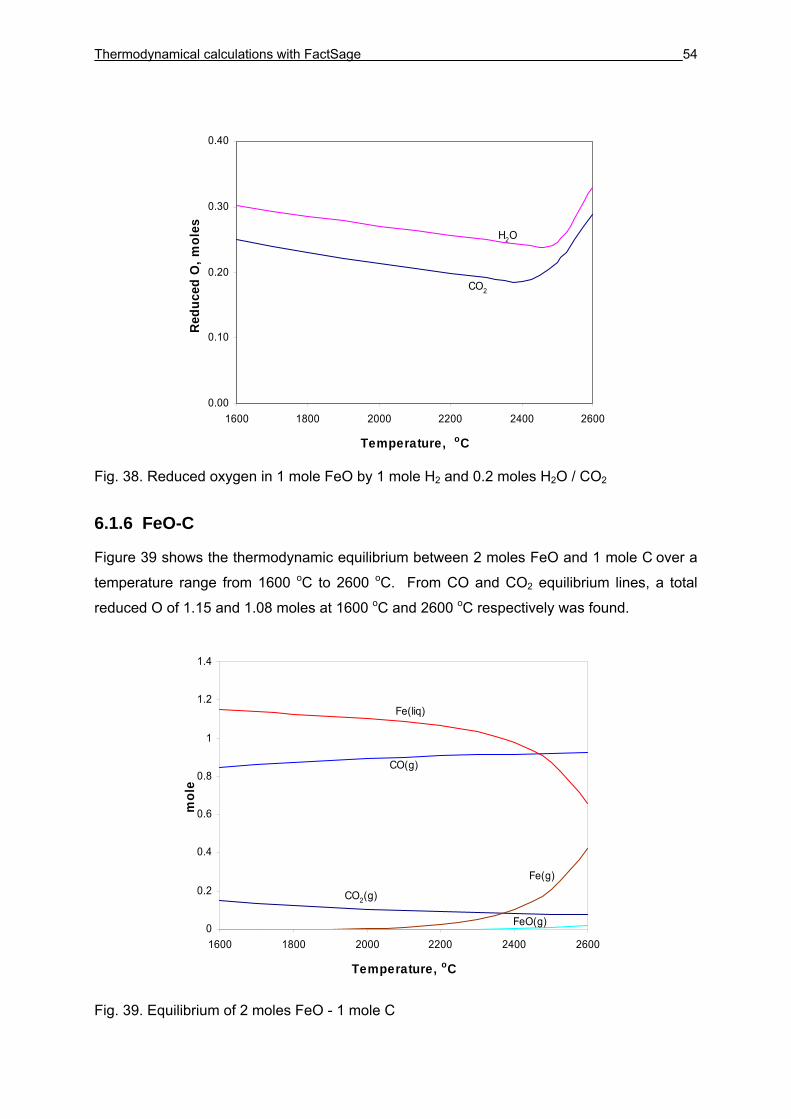
Thermodynamical calculations with FactSage 54
Fig. 38. Reduced oxygen in 1 mole FeO by 1 mole H2 and 0.2 moles H2O / CO2
6.1.6 FeO-C
Figure 39 shows the thermodynamic equilibrium between 2 moles FeO and 1 mole C over a
temperature range from 1600 oC to 2600 oC. From CO and CO2 equilibrium lines, a total
reduced O of 1.15 and 1.08 moles at 1600 oC and 2600 oC respectively was found.
Fig. 39. Equilibrium of 2 moles FeO - 1 mole C
CO(g)
CO2(g)
Fe(g)
FeO(g)
Fe(liq)
0
0.2
0.4
0.6
0.8
1
1.2
1.4
1600 1800 2000 2200 2400 2600
Temperature, oC
mol
e
CO2
H2O
0.00
0.10
0.20
0.30
0.40
1600 1800 2000 2200 2400 2600
Temperature, oC
Red
uced
O, m
oles

Thermodynamical calculations with FactSage 55
From the shown results and the results of FeO-H2 in section 6.1.1, the carbon reduction rate
was found approximately to be 2.85 times that of H2 over the shown temperature range.
Therefore, it is clear again that the carbon has a significant role compared to H2 in the
reduction process.
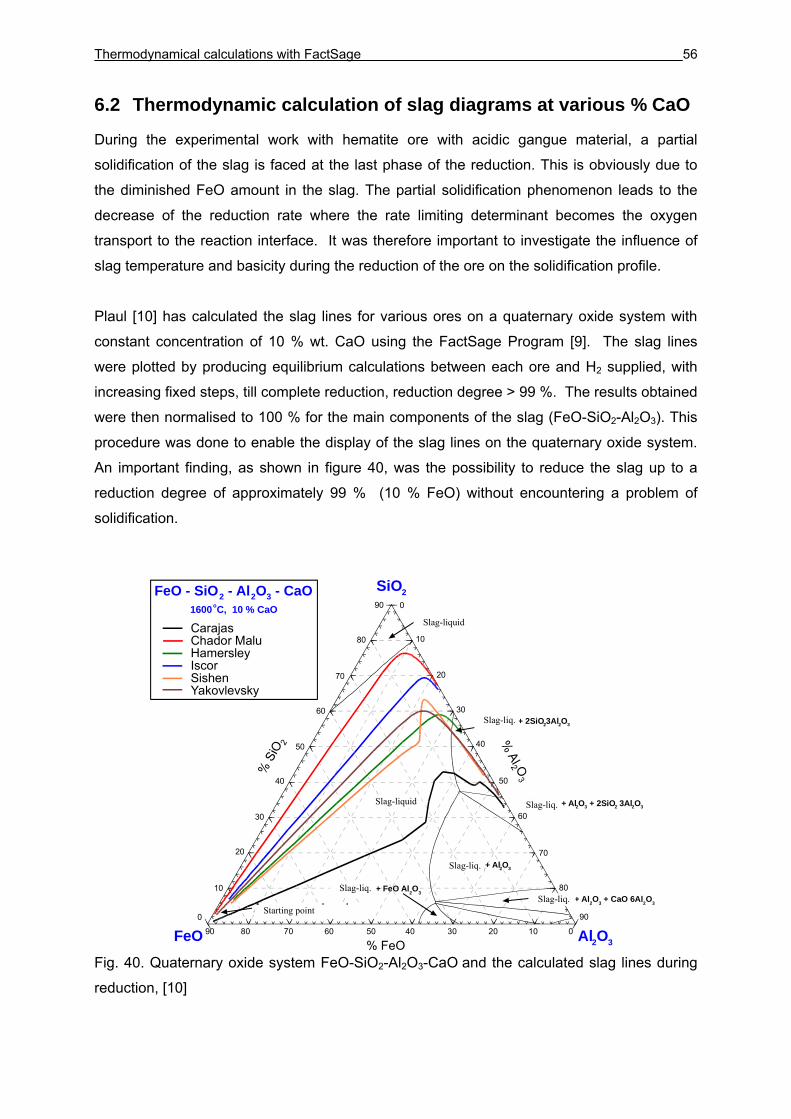
Thermodynamical calculations with FactSage 56
6.2 Thermodynamic calculation of slag diagrams at various % CaO
During the experimental work with hematite ore with acidic gangue material, a partial
solidification of the slag is faced at the last phase of the reduction. This is obviously due to
the diminished FeO amount in the slag. The partial solidification phenomenon leads to the
decrease of the reduction rate where the rate limiting determinant becomes the oxygen
transport to the reaction interface. It was therefore important to investigate the influence of
slag temperature and basicity during the reduction of the ore on the solidification profile.
Plaul [10] has calculated the slag lines for various ores on a quaternary oxide system with
constant concentration of 10 % wt. CaO using the FactSage Program [9]. The slag lines
were plotted by producing equilibrium calculations between each ore and H2 supplied, with
increasing fixed steps, till complete reduction, reduction degree > 99 %. The results obtained
were then normalised to 100 % for the main components of the slag (FeO-SiO2-Al2O3). This
procedure was done to enable the display of the slag lines on the quaternary oxide system.
An important finding, as shown in figure 40, was the possibility to reduce the slag up to a
reduction degree of approximately 99 % (10 % FeO) without encountering a problem of
solidification.
Fig. 40. Quaternary oxide system FeO-SiO2-Al2O3-CaO and the calculated slag lines during
reduction, [10]
SiO2
FeO Al2O3
2 2FeO - SiO - Al O3 - CaO1600oC, 10 % CaO
% FeO90 80 70 60 50 40 30 20 10 0
90
80
70
60
50
40
30
20
10
090
80
70
60
50
40
30
20
10
0Ausgangsschmelzen
Schlackeliq
+ Al2O3Schlackeliq
2 2 + 2SiO 3Al O3Schlackeliq
2 3 2 2 3 + Al O + 2SiO 3Al OSchlackeliq
Schlackeliq + Al2O3 + CaO 6Al2O3
Schlackeliq + FeO Al2O3
A Schlackeliq + B SchlackeliqCarajasChador MaluHamersleyIscorSishenYakovlevsky
Slag-liquid
Slag-liq.
Slag-liq.
Slag-liq.
Slag-liquid
Slag-liq.
Starting point
Slag-liq.
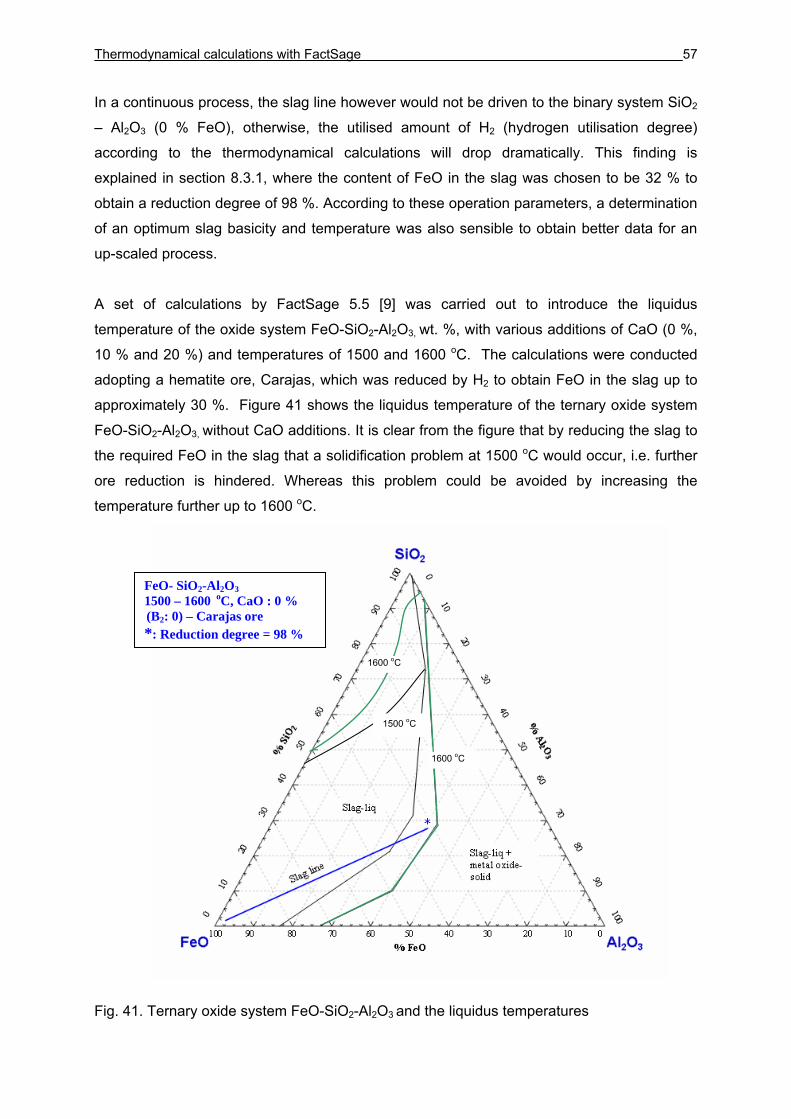
Thermodynamical calculations with FactSage 57
In a continuous process, the slag line however would not be driven to the binary system SiO2
– Al2O3 (0 % FeO), otherwise, the utilised amount of H2 (hydrogen utilisation degree)
according to the thermodynamical calculations will drop dramatically. This finding is
explained in section 8.3.1, where the content of FeO in the slag was chosen to be 32 % to
obtain a reduction degree of 98 %. According to these operation parameters, a determination
of an optimum slag basicity and temperature was also sensible to obtain better data for an
up-scaled process.
A set of calculations by FactSage 5.5 [9] was carried out to introduce the liquidus
temperature of the oxide system FeO-SiO2-Al2O3, wt. %, with various additions of CaO (0 %,
10 % and 20 %) and temperatures of 1500 and 1600 oC. The calculations were conducted
adopting a hematite ore, Carajas, which was reduced by H2 to obtain FeO in the slag up to
approximately 30 %. Figure 41 shows the liquidus temperature of the ternary oxide system
FeO-SiO2-Al2O3, without CaO additions. It is clear from the figure that by reducing the slag to
the required FeO in the slag that a solidification problem at 1500 oC would occur, i.e. further
ore reduction is hindered. Whereas this problem could be avoided by increasing the
temperature further up to 1600 oC.
Fig. 41. Ternary oxide system FeO-SiO2-Al2O3 and the liquidus temperatures
FeO- SiO2-Al2O3 1500 – 1600 oC, CaO : 0 % (B2: 0) – Carajas ore *: Reduction degree = 98 %
1500 oC
1600 oC
1600 oC
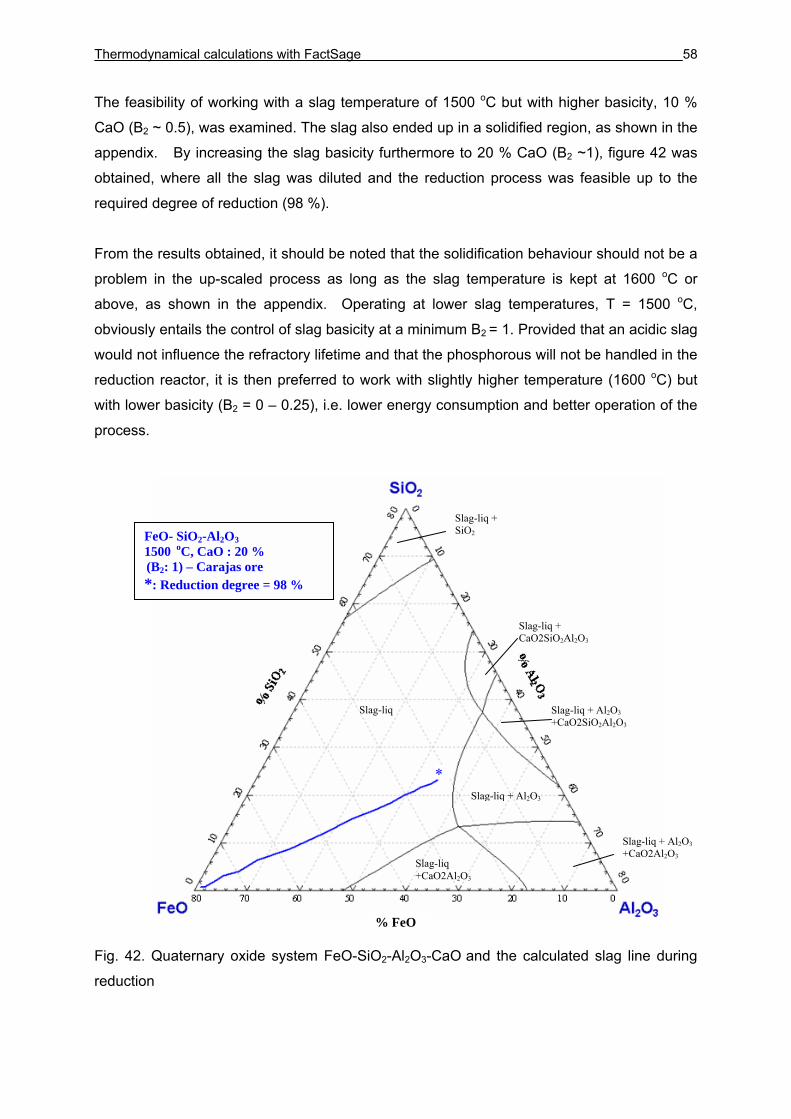
Thermodynamical calculations with FactSage 58
The feasibility of working with a slag temperature of 1500 oC but with higher basicity, 10 %
CaO (B2 ~ 0.5), was examined. The slag also ended up in a solidified region, as shown in the
appendix. By increasing the slag basicity furthermore to 20 % CaO (B2 ~1), figure 42 was
obtained, where all the slag was diluted and the reduction process was feasible up to the
required degree of reduction (98 %).
From the results obtained, it should be noted that the solidification behaviour should not be a
problem in the up-scaled process as long as the slag temperature is kept at 1600 oC or
above, as shown in the appendix. Operating at lower slag temperatures, T = 1500 oC,
obviously entails the control of slag basicity at a minimum B2 = 1. Provided that an acidic slag
would not influence the refractory lifetime and that the phosphorous will not be handled in the
reduction reactor, it is then preferred to work with slightly higher temperature (1600 oC) but
with lower basicity (B2 = 0 – 0.25), i.e. lower energy consumption and better operation of the
process.
Fig. 42. Quaternary oxide system FeO-SiO2-Al2O3-CaO and the calculated slag line during
reduction
*
Slag-liq + SiO2
Slag-liq
Slag-liq + CaO2SiO2Al2O3
Slag-liq + Al2O3 +CaO2SiO2Al2O3
Slag-liq + Al2O3
Slag-liq +CaO2Al2O3
Slag-liq + Al2O3 +CaO2Al2O3
*
% FeO
FeO- SiO2-Al2O3 1500 oC, CaO : 20 % (B2: 1) – Carajas ore *: Reduction degree = 98 %
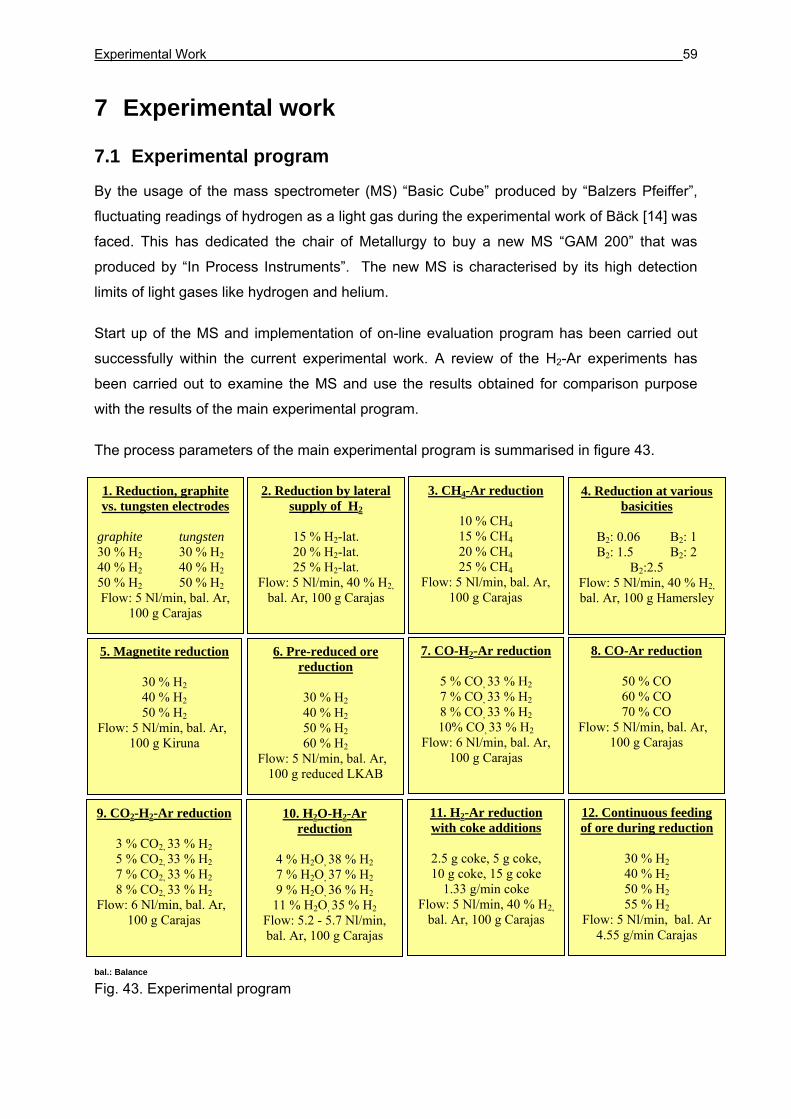
Experimental Work 59
7 Experimental work
7.1 Experimental program
By the usage of the mass spectrometer (MS) “Basic Cube” produced by “Balzers Pfeiffer”,
fluctuating readings of hydrogen as a light gas during the experimental work of Bäck [14] was
faced. This has dedicated the chair of Metallurgy to buy a new MS “GAM 200” that was
produced by “In Process Instruments”. The new MS is characterised by its high detection
limits of light gases like hydrogen and helium.
Start up of the MS and implementation of on-line evaluation program has been carried out
successfully within the current experimental work. A review of the H2-Ar experiments has
been carried out to examine the MS and use the results obtained for comparison purpose
with the results of the main experimental program.
The process parameters of the main experimental program is summarised in figure 43.
bal.: Balance
Fig. 43. Experimental program
1. Reduction, graphite vs. tungsten electrodes
graphite tungsten 30 % H2 30 % H2 40 % H2 40 % H2 50 % H2 50 % H2 Flow: 5 Nl/min, bal. Ar,
100 g Carajas
7. CO-H2-Ar reduction
5 % CO, 33 % H2 7 % CO, 33 % H2 8 % CO, 33 % H2 10% CO, 33 % H2
Flow: 6 Nl/min, bal. Ar, 100 g Carajas
9. CO2-H2-Ar reduction
3 % CO2, 33 % H2 5 % CO2, 33 % H2 7 % CO2, 33 % H2 8 % CO2, 33 % H2
Flow: 6 Nl/min, bal. Ar, 100 g Carajas
10. H2O-H2-Ar reduction
4 % H2O, 38 % H2 7 % H2O, 37 % H2 9 % H2O, 36 % H2 11 % H2O, 35 % H2
Flow: 5.2 - 5.7 Nl/min, bal. Ar, 100 g Carajas
5. Magnetite reduction
30 % H2 40 % H2 50 % H2
Flow: 5 Nl/min, bal. Ar, 100 g Kiruna
6. Pre-reduced ore reduction
30 % H2 40 % H2 50 % H2 60 % H2
Flow: 5 Nl/min, bal. Ar, 100 g reduced LKAB
4. Reduction at various basicities
B2: 0.06 B2: 1 B2: 1.5 B2: 2
B2:2.5 Flow: 5 Nl/min, 40 % H2, bal. Ar, 100 g Hamersley
2. Reduction by lateral supply of H2
15 % H2-lat. 20 % H2-lat. 25 % H2-lat.
Flow: 5 Nl/min, 40 % H2, bal. Ar, 100 g Carajas
3. CH4-Ar reduction
10 % CH4 15 % CH4 20 % CH4 25 % CH4
Flow: 5 Nl/min, bal. Ar, 100 g Carajas
8. CO-Ar reduction
50 % CO 60 % CO 70 % CO
Flow: 5 Nl/min, bal. Ar, 100 g Carajas
11. H2-Ar reduction with coke additions
2.5 g coke, 5 g coke, 10 g coke, 15 g coke
1.33 g/min coke Flow: 5 Nl/min, 40 % H2,
bal. Ar, 100 g Carajas
12. Continuous feeding of ore during reduction
30 % H2 40 % H2 50 % H2 55 % H2
Flow: 5 Nl/min, bal. Ar 4.55 g/min Carajas
Experimental Work 60
Carajas fines ore was used in most of the conducted experiments. Hamersley, Kiruna and
pre-reduced LKAB were also used as shown below in some series of experiments.
Reference experiments were conducted first using a graphite electrode. After that,
experiments with a tungsten electrode with the same process parameters were done. The
objective of these experiments was to assess the hydrogen utilisation degree with carbon
contribution predominating from the graphite electrode against the actual hydrogen utilisation
degree without carbon contribution by the usage of a tungsten electrode.
Lateral supply of hydrogen through a ceramic pipe, rather than being supplied through a
hollow electrode were conducted in a second series of experiments. The objective of these
experiments was to investigate the hydrogen reduction behaviour at reaction zones with
lower temperature ranges (non plasma zone) where absence of dissociated hydrogen is
quite obvious.
Methane has been used instead of hydrogen as an alternative reducing gas in a series of
experiments. The advantage of methane with respect to hydrogen is firstly saving a H2
production unit in the case of up-scaling. Secondly is the utilisation of the existing carbon in
the methane as a superior reductant in the process. Experiments at various concentrations of
methane have been conducted and compared with the results of hydrogen experiments at
the same amount of supplied H2.
Basicity of the ore has been controlled by varying CaO amount in a set of reduction
experiments. The target was to evaluate the reduction behaviour with CaO additions and
investigate the behaviour of phosphorous in the process up to the di-calcium silicate phase of
the slag.
Magnetite ore has been adopted in a set of experiments (rather than hematite). The same
process parameters were kept to compare the influence of the ore characteristics on the
reduction behaviour.
LKAB ore has been reduced almost to a divalent iron phase with the assistance of the LKAB
company to carry out experiments using pre-reduced ore. It has been charged in a set of
experiments under various concentrations of hydrogen to investigate the influence of the ore
pre-reduction on the reduction behaviour.
Experimental Work 61
All the following series of experiments were planned to deepen the perception of an up-
scaled process as a main task within our contribution part in an EU project (ULCOS).
In up-scaled processes, where graphite electrode reactions, calcination products from the
used additives and products from the reduction process take place, accompanying gases like
CO, CO2 and H2O would exist in the system. Some experiments have been carried out as
shown in the following four series of experiments to investigate the effect of these gases on
the reduction behaviour:
1. CO was varied in Ar-H2 mixture to evaluate the influence of CO on hydrogen
reduction behaviour.
2. Absolute reduction rate of CO at various concentrations was evaluated in another
series of experiments. Higher concentrations of CO without the usage of hydrogen
were used in these experiments to assess precisely the CO reduction kinetics under
plasma application.
3. CO2 was varied in Ar-H2 mixture to evaluate the influence of CO2 on the retardation of
hydrogen reduction rate.
4. H2O was varied in Ar-H2 mixture to evaluate the influence of H2O on the retardation of
hydrogen reduction rate.
In the study phase of up-scaled process, a hybrid application of coke and hydrogen plasma
was used as an option. Coke has been mixed with the ore and placed in the crucible in a
series of experiments to evaluate the influence of coke on the reduction behaviour of
hydrogen plasma. Additionally, the development of slag foaming via coke additions was a
phenomenon to be observed. In the end, in order to have representative results and longer
time of evaluation to the coke reduction behaviour, continuous feeding of coke by a screw
conveyor through the hollow electrode was conducted.
In the last series of experiments, continuous feeding of fines ore, instead of charging it in the
crucible before the experiments, was carried out. The objective of this series of experiments
was to investigate the plasma stability and the reduction behaviour under continuous feeding
of ore. The necessity of these experiments was to study the feasibility of the continuous
feeding of ore via the electrodes in an up-scaled process as this option might have a positive
effect on the in-flight reduction or the arc heat load to the furnace walls.
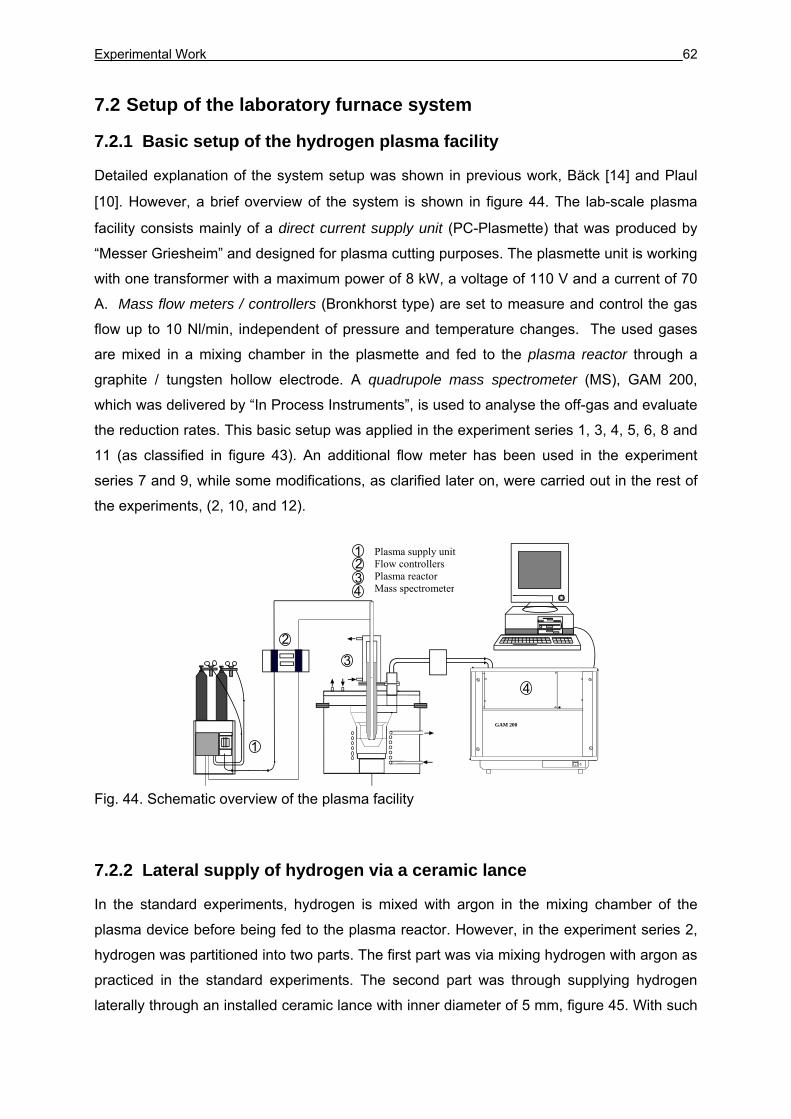
Experimental Work 62
7.2 Setup of the laboratory furnace system
7.2.1 Basic setup of the hydrogen plasma facility
Detailed explanation of the system setup was shown in previous work, Bäck [14] and Plaul
[10]. However, a brief overview of the system is shown in figure 44. The lab-scale plasma
facility consists mainly of a direct current supply unit (PC-Plasmette) that was produced by
“Messer Griesheim” and designed for plasma cutting purposes. The plasmette unit is working
with one transformer with a maximum power of 8 kW, a voltage of 110 V and a current of 70
A. Mass flow meters / controllers (Bronkhorst type) are set to measure and control the gas
flow up to 10 Nl/min, independent of pressure and temperature changes. The used gases
are mixed in a mixing chamber in the plasmette and fed to the plasma reactor through a
graphite / tungsten hollow electrode. A quadrupole mass spectrometer (MS), GAM 200,
which was delivered by “In Process Instruments”, is used to analyse the off-gas and evaluate
the reduction rates. This basic setup was applied in the experiment series 1, 3, 4, 5, 6, 8 and
11 (as classified in figure 43). An additional flow meter has been used in the experiment
series 7 and 9, while some modifications, as clarified later on, were carried out in the rest of
the experiments, (2, 10, and 12).
AutoCube
Balzers MSC 200
1
32
PlasmetteDurchflussregelungPlasmaofenMassenspektrometer
1234
4
Fig. 44. Schematic overview of the plasma facility
7.2.2 Lateral supply of hydrogen via a ceramic lance
In the standard experiments, hydrogen is mixed with argon in the mixing chamber of the
plasma device before being fed to the plasma reactor. However, in the experiment series 2,
hydrogen was partitioned into two parts. The first part was via mixing hydrogen with argon as
practiced in the standard experiments. The second part was through supplying hydrogen
laterally through an installed ceramic lance with inner diameter of 5 mm, figure 45. With such
Plasma supply unit Flow controllers Plasma reactor Mass spectrometer
GAM 200
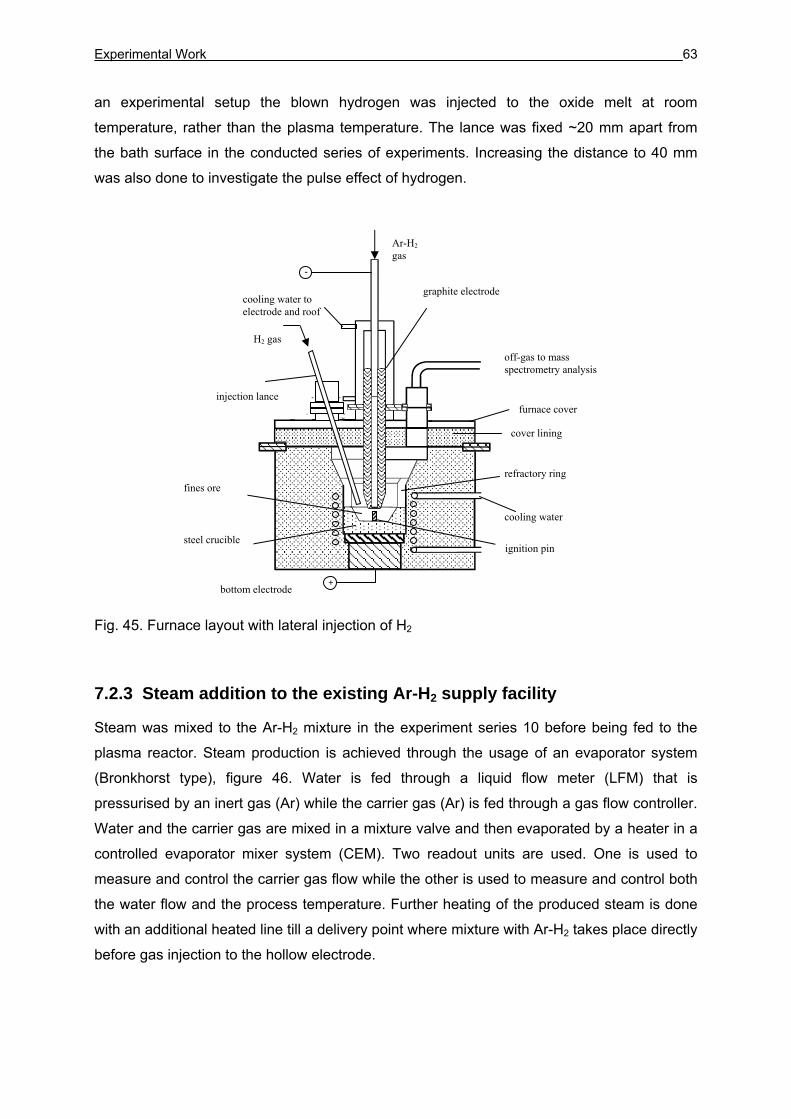
Experimental Work 63
an experimental setup the blown hydrogen was injected to the oxide melt at room
temperature, rather than the plasma temperature. The lance was fixed ~20 mm apart from
the bath surface in the conducted series of experiments. Increasing the distance to 40 mm
was also done to investigate the pulse effect of hydrogen.
Fig. 45. Furnace layout with lateral injection of H2
7.2.3 Steam addition to the existing Ar-H2 supply facility
Steam was mixed to the Ar-H2 mixture in the experiment series 10 before being fed to the
plasma reactor. Steam production is achieved through the usage of an evaporator system
(Bronkhorst type), figure 46. Water is fed through a liquid flow meter (LFM) that is
pressurised by an inert gas (Ar) while the carrier gas (Ar) is fed through a gas flow controller.
Water and the carrier gas are mixed in a mixture valve and then evaporated by a heater in a
controlled evaporator mixer system (CEM). Two readout units are used. One is used to
measure and control the carrier gas flow while the other is used to measure and control both
the water flow and the process temperature. Further heating of the produced steam is done
with an additional heated line till a delivery point where mixture with Ar-H2 takes place directly
before gas injection to the hollow electrode.
+
-
cooling water
off-gas to mass spectrometry analysis
refractory ring
Ar-H2 gas
cooling water to electrode and roof
bottom electrode
graphite electrode
ignition pin
fines ore
steel crucible
injection lance
H2 gas
furnace cover
cover lining
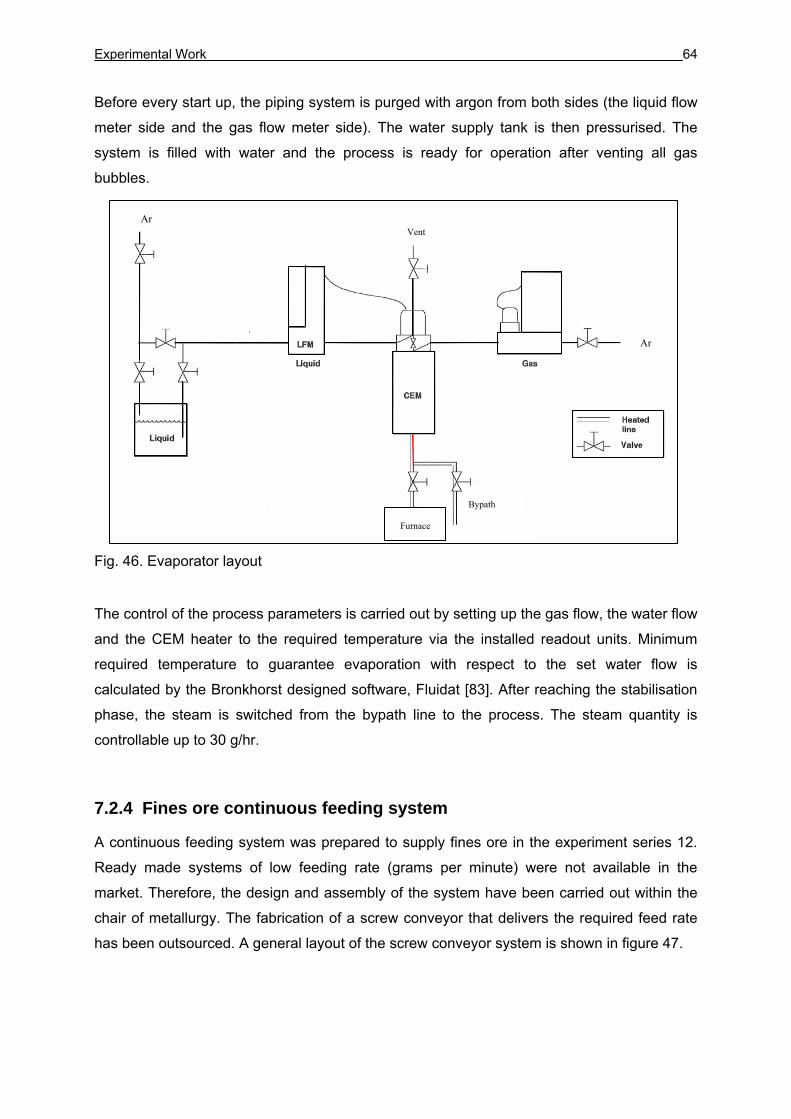
Experimental Work 64
Before every start up, the piping system is purged with argon from both sides (the liquid flow
meter side and the gas flow meter side). The water supply tank is then pressurised. The
system is filled with water and the process is ready for operation after venting all gas
bubbles.
Fig. 46. Evaporator layout
The control of the process parameters is carried out by setting up the gas flow, the water flow
and the CEM heater to the required temperature via the installed readout units. Minimum
required temperature to guarantee evaporation with respect to the set water flow is
calculated by the Bronkhorst designed software, Fluidat [83]. After reaching the stabilisation
phase, the steam is switched from the bypath line to the process. The steam quantity is
controllable up to 30 g/hr.
7.2.4 Fines ore continuous feeding system
A continuous feeding system was prepared to supply fines ore in the experiment series 12.
Ready made systems of low feeding rate (grams per minute) were not available in the
market. Therefore, the design and assembly of the system have been carried out within the
chair of metallurgy. The fabrication of a screw conveyor that delivers the required feed rate
has been outsourced. A general layout of the screw conveyor system is shown in figure 47.
Vent
Bypath
Ar
Ar
Furnace
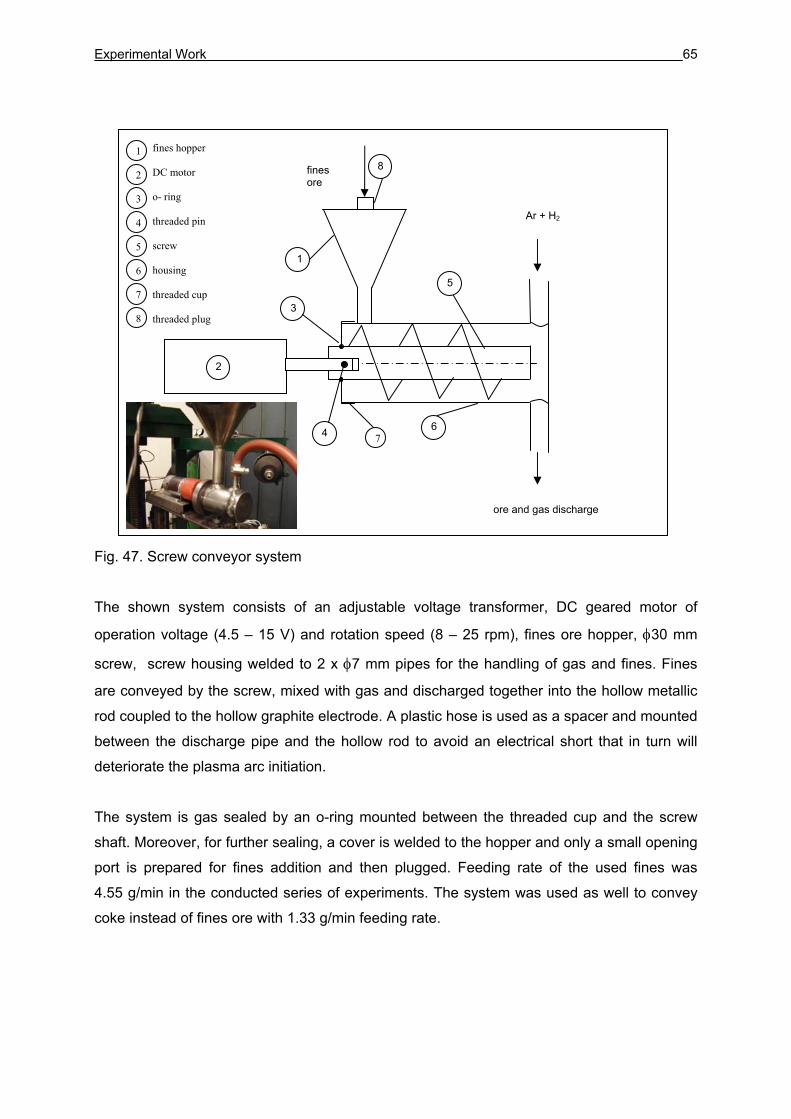
Experimental Work 65
Fig. 47. Screw conveyor system
The shown system consists of an adjustable voltage transformer, DC geared motor of
operation voltage (4.5 – 15 V) and rotation speed (8 – 25 rpm), fines ore hopper, φ30 mm
screw, screw housing welded to 2 x φ7 mm pipes for the handling of gas and fines. Fines
are conveyed by the screw, mixed with gas and discharged together into the hollow metallic
rod coupled to the hollow graphite electrode. A plastic hose is used as a spacer and mounted
between the discharge pipe and the hollow rod to avoid an electrical short that in turn will
deteriorate the plasma arc initiation.
The system is gas sealed by an o-ring mounted between the threaded cup and the screw
shaft. Moreover, for further sealing, a cover is welded to the hopper and only a small opening
port is prepared for fines addition and then plugged. Feeding rate of the used fines was
4.55 g/min in the conducted series of experiments. The system was used as well to convey
coke instead of fines ore with 1.33 g/min feeding rate.
ore and gas discharge
Ar + H2
fines ore
1
2
5
4
3
6
fines hopper DC motor o- ring threaded pin screw housing threaded cup threaded plug
1
2
3
4
5
6
8
7
8
7
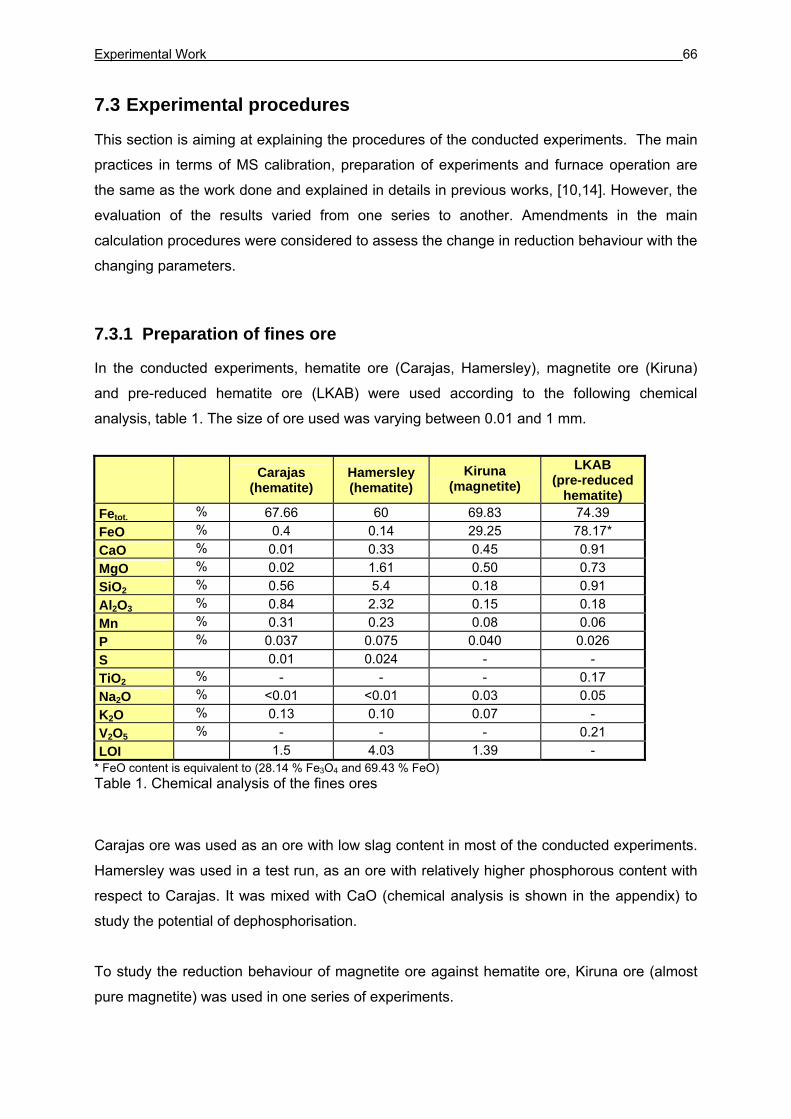
Experimental Work 66
7.3 Experimental procedures
This section is aiming at explaining the procedures of the conducted experiments. The main
practices in terms of MS calibration, preparation of experiments and furnace operation are
the same as the work done and explained in details in previous works, [10,14]. However, the
evaluation of the results varied from one series to another. Amendments in the main
calculation procedures were considered to assess the change in reduction behaviour with the
changing parameters.
7.3.1 Preparation of fines ore
In the conducted experiments, hematite ore (Carajas, Hamersley), magnetite ore (Kiruna)
and pre-reduced hematite ore (LKAB) were used according to the following chemical
analysis, table 1. The size of ore used was varying between 0.01 and 1 mm.
Carajas (hematite)
Hamersley (hematite)
Kiruna (magnetite)
LKAB (pre-reduced
hematite) Fetot. % 67.66 60 69.83 74.39 FeO % 0.4 0.14 29.25 78.17* CaO % 0.01 0.33 0.45 0.91 MgO % 0.02 1.61 0.50 0.73 SiO2 % 0.56 5.4 0.18 0.91 Al2O3 % 0.84 2.32 0.15 0.18 Mn % 0.31 0.23 0.08 0.06 P % 0.037 0.075 0.040 0.026 S 0.01 0.024 - - TiO2 % - - - 0.17 Na2O % <0.01 <0.01 0.03 0.05 K2O % 0.13 0.10 0.07 - V2O5 % - - - 0.21 LOI 1.5 4.03 1.39 -
* FeO content is equivalent to (28.14 % Fe3O4 and 69.43 % FeO) Table 1. Chemical analysis of the fines ores
Carajas ore was used as an ore with low slag content in most of the conducted experiments.
Hamersley was used in a test run, as an ore with relatively higher phosphorous content with
respect to Carajas. It was mixed with CaO (chemical analysis is shown in the appendix) to
study the potential of dephosphorisation.
To study the reduction behaviour of magnetite ore against hematite ore, Kiruna ore (almost
pure magnetite) was used in one series of experiments.
Experimental Work 67
Wustite equivalent pre-reduced ore has been prepared at LKAB laboratory to carry out
reduction experiments of Fe2+ containing ore. Hematite pellets were prepared, reduced
mainly to wustite and then crushed to fines. The reducing gases were set at 830 oC and at
vol. composition of 40/20/15/25 % - H2/CO/CO2/H2O respectively. Reduction has been run
until no weight loss of the sample was observed.
7.3.2 Preparation and execution of experiments
Before each experiment, fines ore, a steel crucible and a refractory ring (made of MgO) are
weighted for a mass balance and then set in the furnace. The furnace cover is fitted to the
furnace housing by a lifting crane and fastened by latch clamps. The electrode is manually
derived downwards till being contacted to the ignition pin. Subsequently electric resistance is
measured between the electrode and the furnace bottom part. The electric resistance is
confirmed in each experiment to be less than 5 Ohm. The lifting arm of the electrode is then
fixed to the electrode to control the movement mechanism of the electrode via a lifting
spindle during the experiment. As a final stage in the furnace preparation, the MS heated
capillary hose is coupled to the furnace off-gas duct.
In order to start furnace purging, the electromagnetic operated valves are switched on by
starting the main switch button of the plasma device. Ar flow is then controlled up to 3 Nl/min
and gas analysis is monitored till N2 decreases to ppm range and Ar increases to more than
98 %. Cooling water is delivered to the furnace housing, roof, bottom part and the electrode
jacket.
Before starting the experiment, contact between the electrode and the ignition pin has to be
confirmed. The process parameters are set in an evaluation program for the sake of on-line
monitoring of the reduction progress. The current supply is then switched on, electrode is
lifted up, arc initiates and melting starts. After a melting phase of approximately 3 minutes, H2
is supplied to the furnace according to the set process parameters. Meanwhile, the
evaluation program is started. Current and voltage (across the arc) are monitored throughout
the experiment. On-line measurements for voltage and current are carried out in some
experiments for a better monitoring of the plasma stability in terms of voltage/current
fluctuations. MS is used throughout the experiment to analyse the off-gas and calculate the
reduction behaviour in terms of reduction degree and H2 utilisation degree using the
designated evaluation program.
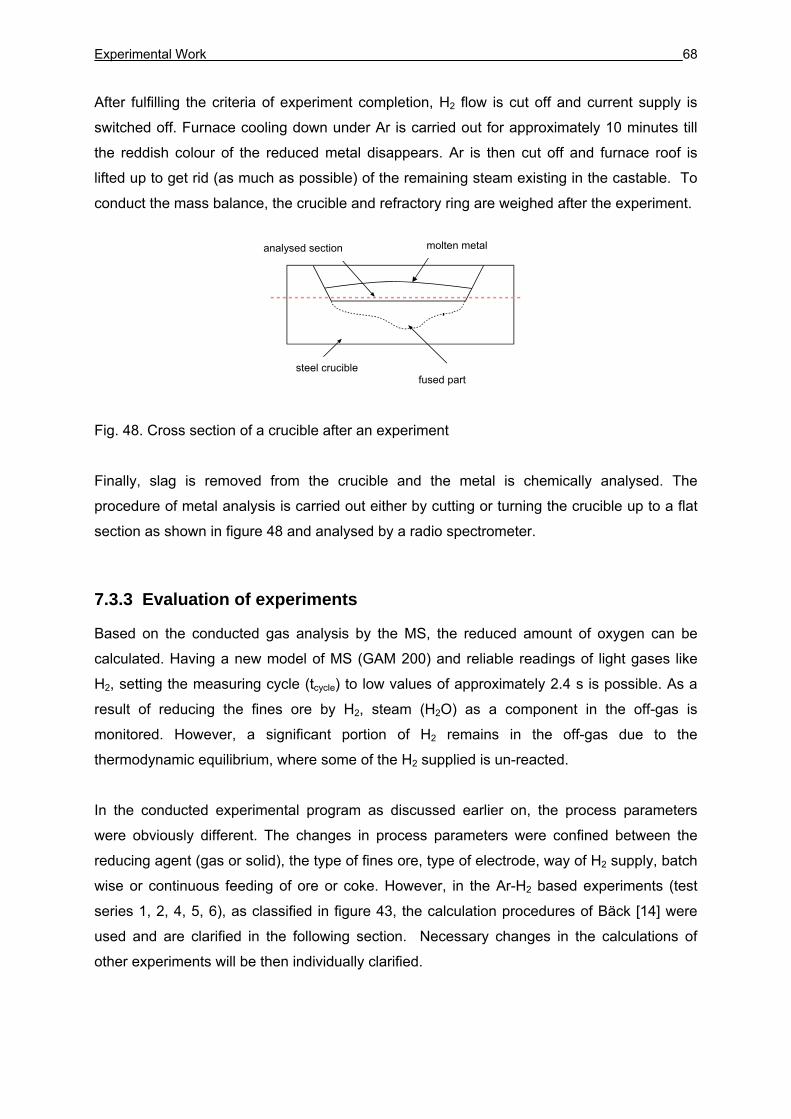
Experimental Work 68
After fulfilling the criteria of experiment completion, H2 flow is cut off and current supply is
switched off. Furnace cooling down under Ar is carried out for approximately 10 minutes till
the reddish colour of the reduced metal disappears. Ar is then cut off and furnace roof is
lifted up to get rid (as much as possible) of the remaining steam existing in the castable. To
conduct the mass balance, the crucible and refractory ring are weighed after the experiment.
Fig. 48. Cross section of a crucible after an experiment
Finally, slag is removed from the crucible and the metal is chemically analysed. The
procedure of metal analysis is carried out either by cutting or turning the crucible up to a flat
section as shown in figure 48 and analysed by a radio spectrometer.
7.3.3 Evaluation of experiments
Based on the conducted gas analysis by the MS, the reduced amount of oxygen can be
calculated. Having a new model of MS (GAM 200) and reliable readings of light gases like
H2, setting the measuring cycle (tcycle) to low values of approximately 2.4 s is possible. As a
result of reducing the fines ore by H2, steam (H2O) as a component in the off-gas is
monitored. However, a significant portion of H2 remains in the off-gas due to the
thermodynamic equilibrium, where some of the H2 supplied is un-reacted.
In the conducted experimental program as discussed earlier on, the process parameters
were obviously different. The changes in process parameters were confined between the
reducing agent (gas or solid), the type of fines ore, type of electrode, way of H2 supply, batch
wise or continuous feeding of ore or coke. However, in the Ar-H2 based experiments (test
series 1, 2, 4, 5, 6), as classified in figure 43, the calculation procedures of Bäck [14] were
used and are clarified in the following section. Necessary changes in the calculations of
other experiments will be then individually clarified.
steel crucible fused part
molten metal analysed section
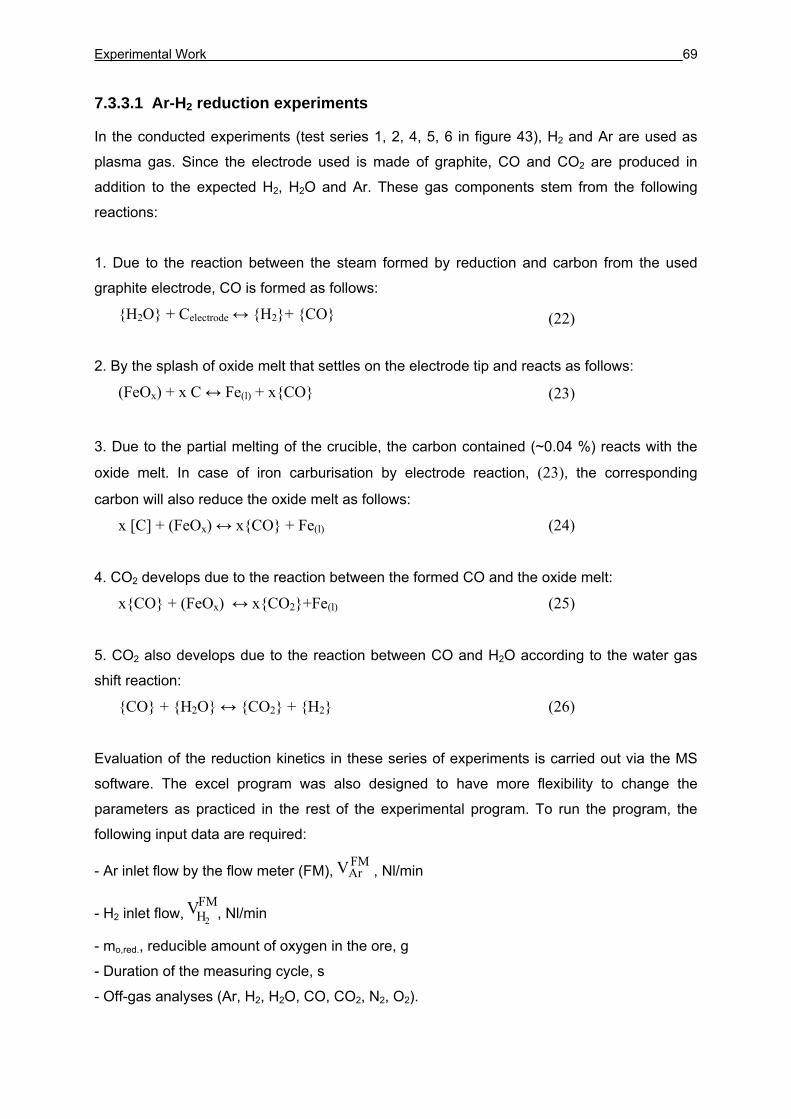
Experimental Work 69
7.3.3.1 Ar-H2 reduction experiments
In the conducted experiments (test series 1, 2, 4, 5, 6 in figure 43), H2 and Ar are used as
plasma gas. Since the electrode used is made of graphite, CO and CO2 are produced in
addition to the expected H2, H2O and Ar. These gas components stem from the following
reactions:
1. Due to the reaction between the steam formed by reduction and carbon from the used
graphite electrode, CO is formed as follows:
{H2O} + Celectrode ↔ {H2}+ {CO} (22)
2. By the splash of oxide melt that settles on the electrode tip and reacts as follows:
(FeOx) + x C ↔ Fe(l) + x{CO} (23)
3. Due to the partial melting of the crucible, the carbon contained (~0.04 %) reacts with the
oxide melt. In case of iron carburisation by electrode reaction, (23), the corresponding
carbon will also reduce the oxide melt as follows:
x [C] + (FeOx) ↔ x{CO} + Fe(l) (24)
4. CO2 develops due to the reaction between the formed CO and the oxide melt:
x{CO} + (FeOx) ↔ x{CO2}+Fe(l) (25)
5. CO2 also develops due to the reaction between CO and H2O according to the water gas
shift reaction:
{CO} + {H2O} ↔ {CO2} + {H2} (26)
Evaluation of the reduction kinetics in these series of experiments is carried out via the MS
software. The excel program was also designed to have more flexibility to change the
parameters as practiced in the rest of the experimental program. To run the program, the
following input data are required:
- Ar inlet flow by the flow meter (FM),FMArV , Nl/min
- H2 inlet flow,FMH2
V , Nl/min
- mo,red., reducible amount of oxygen in the ore, g
- Duration of the measuring cycle, s
- Off-gas analyses (Ar, H2, H2O, CO, CO2, N2, O2).
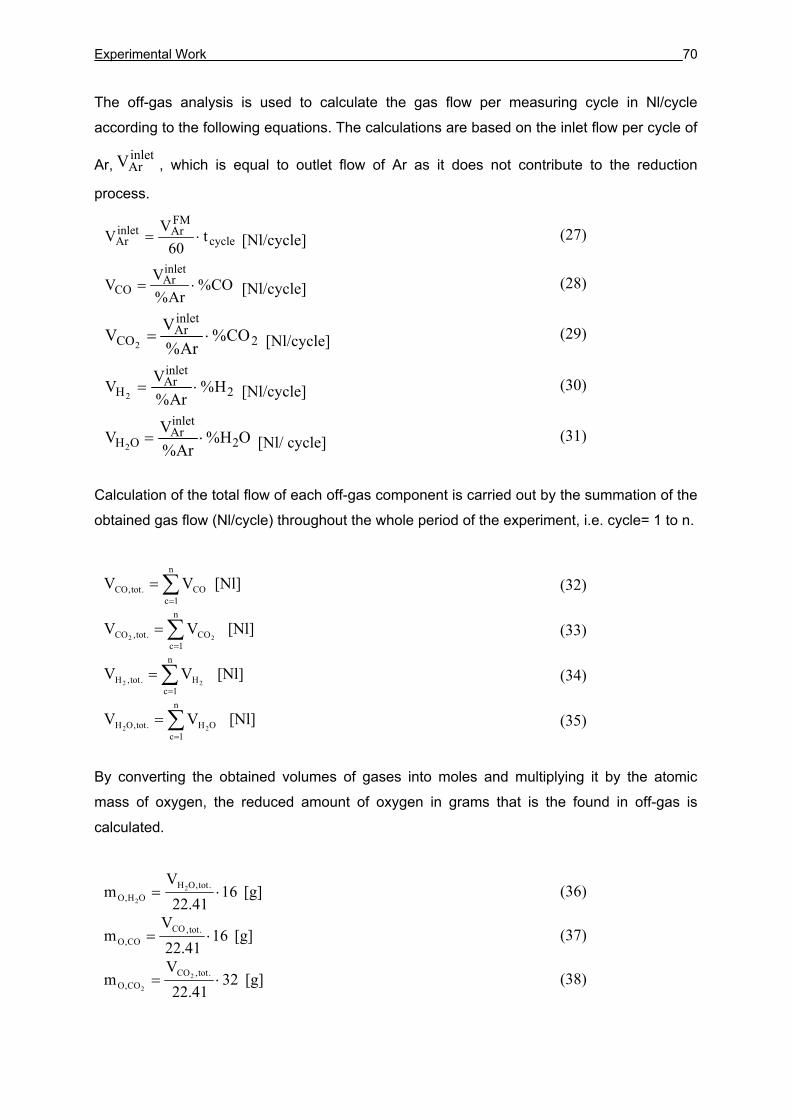
Experimental Work 70
The off-gas analysis is used to calculate the gas flow per measuring cycle in Nl/cycle
according to the following equations. The calculations are based on the inlet flow per cycle of
Ar,inletArV , which is equal to outlet flow of Ar as it does not contribute to the reduction
process.
cycle
FMArinlet
Ar t60
VV ⋅= [Nl/cycle] (27)
CO%Ar%
VVinletAr
CO ⋅= [Nl/cycle] (28)
2
inletAr
CO CO%Ar%
VV2
⋅= [Nl/cycle] (29)
2
inletAr
H H%Ar%
VV2
⋅= [Nl/cycle] (30)
OH%Ar%
VV 2
inletAr
OH2⋅= [Nl/ cycle] (31)
Calculation of the total flow of each off-gas component is carried out by the summation of the
obtained gas flow (Nl/cycle) throughout the whole period of the experiment, i.e. cycle= 1 to n.
∑=
=n
1cCO.tot,CO VV [Nl] (32)
∑=
=n
1cCO.tot,CO 22
VV [Nl] (33)
∑=
=n
1cH.tot,H 22
VV [Nl] (34)
∑=
=n
1cOH.tot,OH 22
VV [Nl] (35)
By converting the obtained volumes of gases into moles and multiplying it by the atomic
mass of oxygen, the reduced amount of oxygen in grams that is the found in off-gas is
calculated.
1641.22
Vm .tot,OH
OH,O2
2⋅= [g] (36)
1641.22
Vm .tot,CO
CO,O ⋅= [g] (37)
3241.22
Vm .tot,CO
CO,O2
2⋅= [g] (38)
Experimental Work 71
By conducting a H2 balance during the beginning of the experiment, a H2 deficit is noticed.
Whereas some time later a H2 surplus is found. This is due to the relative low temperature of
the furnace lining and the high steam partial pressure at the beginning of the experiment.
This developing steam diffuses in the pores of the lining. Later, at higher lining temperature,
steam gets out of the lining and shows up in the off-gas. To handle this error in the actual
emitted steam, a correction term via the H2 balance is calculated. This correction term
(mO,H2O, corr.) is positive at the beginning of the experiment but becomes negative at later
stages of the experiment.
2222 HOHinletH.corr,OH VVVV −−= [Nl/cycle] (39)
∑=
=n
1c.corr,OH.tot.,corr,OH 22
VV [Nl] (40)
41.2216.Vm .tot.,corr,OH.corr,OH,O 22
= [g] (41)
222 CO,OCO,O.corr,OH,OOH,O.tot,O mmmmm +++= [g], (42)
where inletH2
V is the inlet H2 (Nl/cycle) and mO,tot. is the total amount of reduced oxygen.
The apparent contribution of H2 and CO in the reduction is the reduced oxygen in g found in
H2O, CO and CO2 divided by the reducible oxygen existing in the ore, mO,red. and assessed
as individual reduction degrees in %.
100m
mmRD
.red,o
corr,OH,OOH,OOH
222
⋅+
=Δ [%] (43)
100mm
RD.red,O
CO,OCO ⋅=Δ [%] (44)
100mm
RD.red,O
CO,OCO
22
⋅=Δ [%] (45)
The total reduction degree is then calculated as follows:
22 COCOOHtot RDRDRDRD Δ+Δ+Δ=Δ [%] (46)
To examine the thermodynamics equilibrium of the process, the degree of utilisation of H2
)(2Hη and the total utilisation degree of H2 )( .totη per cycle are evaluated. Moreover, the
rate of reduced oxygen dmo,red./dt (g/cycle) is calculated to assess the reduction kinetics. The
mentioned parameters are monitored via the evaluation program and defined as follows:
Experimental Work 72
100V
VVinletH
corr,OHOHH
2
22
2⋅
+=η [%] (47)
The H2 utilisation degree )(2Hη per cycle is the measure of the H2O produced in the off-gas
from the H2 supplied inletH2
V throughout a measuring cycle of the MS. The steam produced is
the summation of the steam found in the off-gas OH2V and the steam received/produced by
the furnace lining corr,OH2V and calculated via the H2 balance.
The total utilisation degree of H2 )( .totη per cycle is calculated as follows:
100V
V2VVVinletH
COCOcorr,OHOH.tot
2
222 ⋅⋅+++
=η [%] (48)
In the analysed off-gas, oxygen is found mainly in H2O. However, it is found in CO and CO2
as well. It should be mentioned that some of the oxygen witnessed in CO and CO2 stems
from reactions (22) and (26) while the rest is produced by the reduction potential of CO
according to the reaction (25). Therefore, the actual H2 utilisation degree is some value
between the H2 utilisation degree and the total utilisation degree.
Finally, the reduction rate of oxygen dmo,red./dt (g/cycle) is calculated as follows:
41.2216).V.2VVV(dt/dm
222 COCOcorr,OHOH.red,O +++= [g/cycle] (49)
7.3.3.2 CH4-Ar reduction experiments
CH4 decomposes mainly to solid carbon and hydrogen molecules at the arc-melt interface
according to the following reaction:
{CH4} C(s) + 2 {H2}
(50)
Evaluation of the Ar-CH4 experiments, experiment series 3, entails the input of inlet flow of
CH4 (Nl/cycle) and the same input data that was shown in the previous section. However, the
previous calculations of mO,H2O,corr and the utilisation degrees are amended as follows:
2242 HOHinletCH.corr,OH VVV.2V −−= [Nl/cycle] (51)
Experimental Work 73
100V.2VV
inletCH
.corr,OHOHH
4
22
2⋅
+=η [%] (52)
100V
VV.5.0inletCH
COCOC
4
2 ⋅+
=η [%] (53)
7.3.3.3 CO-H2-Ar and CO-Ar reduction experiments
Inlet flow of CO ( inletCO
V ), Nl/cycle is set within the input data in experiment series 7, 8.
However, the previous calculations of mO,tot. and dt/dm .red,O are changed as shown below.
Moreover, the total utilisation degree of H2 is substituted by CO utilisation degree.
∑=
=n
1c
inletCO.COinlet,O 41.22
16.Vm [g] (54)
COinlet,OCO,OCO,Ocorr,OH,OOH,O.tot,O mmmmmm222
−+++= [g] (55)
100VV
inletCO
COCO
2 ⋅=η [%] (56)
41.2216).VV.2VVV(dt/dm inlet
COCOCOcorr,OHOH.red,O 222−+++= [g/cycle] (57)
7.3.3.4 CO2-H2-Ar reduction experiments
Inlet flow of CO2 ( inlet2CO
V ), Nl/cycle is set within the input data in experiment series 9.
Monitoring of the gas utilisation degree is conducted by the calculation of H2 utilisation
degree. The amount of inlet oxygen via supplied CO2, the amount of reduced oxygen and the
reduction rate are evaluated through the following equations:
∑=
=n
1c
inletCO.inletCO,O 41.22
32.Vm22
[g] (58)
inletCO,OCO,OCO,Ocorr,OH,OOH,O.tot,O 2222mmmmmm −+++= [g] (59)
41.2216).V.2V.2VVV(dt/dm inlet
COCOCOcorr,OHOH.red,O 2222−+++= [g/cycle] (60)
7.3.3.5 H2O-H2-Ar reduction experiments
Inlet flow of H2O ( inletO2H
V ), Nl/cycle is set within the input data in experiment series 10. The following changes in the equations were carried out:
Experimental Work 74
22222 HOHinlet
OHinletH.corr,OH VVVVV −−+= [Nl/cycle] (61)
∑=
=n
1c
inletOH.OinletH,O 41.22
16.Vm22
[g] (62)
OinletH,OCO,OCO,Ocorr,OH,OOH,O.tot,O 2222mmmmmm −+++= [g] (63)
41.2216).VV.2VVV(dt/dm inlet
OHCOCOcorr,OHOH.red,O 2222−+++= [g/cycle] (64)
7.3.3.6 H2-Ar reduction with coke additions
Inlet amount of coke, g or g/min are set within the input data in experiment series 11. There
is no change in the calculation procedures. However, carbon utilisation degree is defined as
follows:
100inlet,coke
VV.5.02COCO
C ⋅+
=η [%], (65)
where2COCO V,V and coke inlet are in moles/cycle.
7.3.3.7 Continuous feeding of ore during reduction
The dosage rate of ore, r, g/cycle and the percentage of reducible oxygen in the ore, p, %,
are additionally set to the input data in experiment series 12. The total reducible oxygen is
not constant in these experiments but increases over the time of the experiment due to the
continuous feeding of the ore. Therefore, the reducible oxygen is the summation of the
oxygen content in the ore existing in the crucible before further feeding of ore, mO,red.,batch and
that fed continuously, mO,red.,cont..
=.cont.,red,Om (r. p)/100 [g/cycle] (66)
∑=
=n
1c.cont.,red,O.tot.,cont.,red,O mm [g] (67)
.tot.,cont.,red,Obatch.,red,O.red,O mmm += [g] (68)
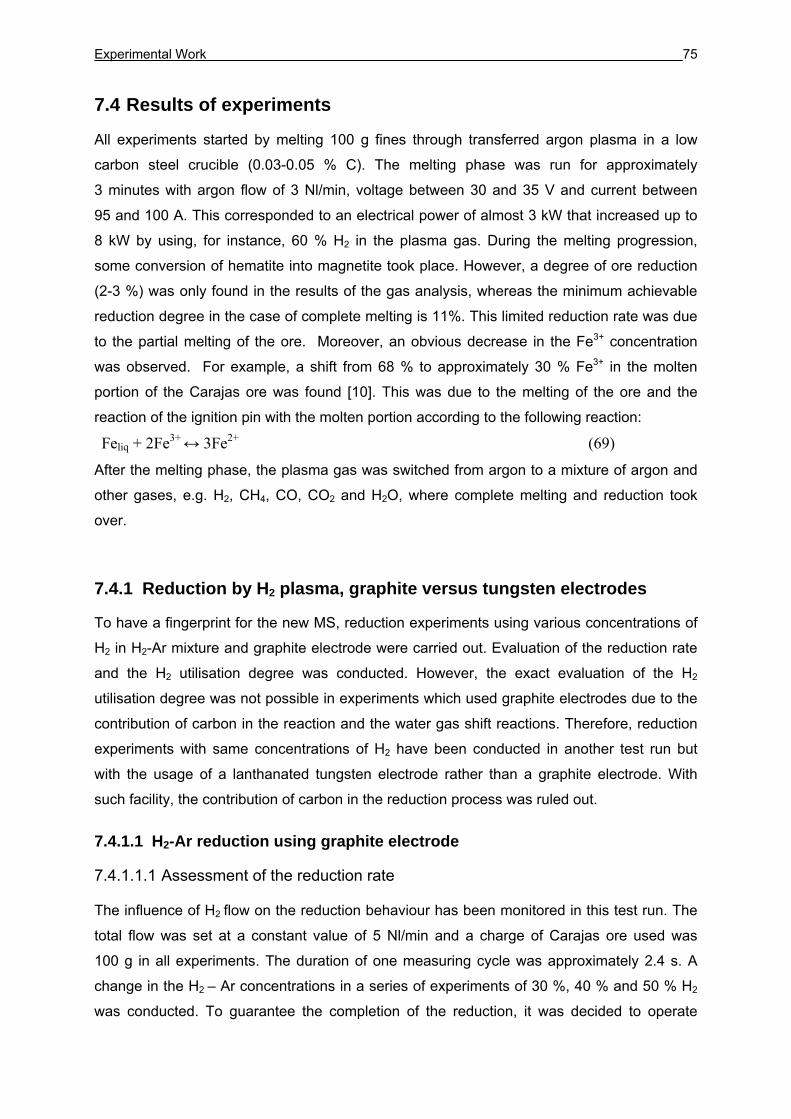
Experimental Work 75
7.4 Results of experiments
All experiments started by melting 100 g fines through transferred argon plasma in a low
carbon steel crucible (0.03-0.05 % C). The melting phase was run for approximately
3 minutes with argon flow of 3 Nl/min, voltage between 30 and 35 V and current between
95 and 100 A. This corresponded to an electrical power of almost 3 kW that increased up to
8 kW by using, for instance, 60 % H2 in the plasma gas. During the melting progression,
some conversion of hematite into magnetite took place. However, a degree of ore reduction
(2-3 %) was only found in the results of the gas analysis, whereas the minimum achievable
reduction degree in the case of complete melting is 11%. This limited reduction rate was due
to the partial melting of the ore. Moreover, an obvious decrease in the Fe3+ concentration
was observed. For example, a shift from 68 % to approximately 30 % Fe3+ in the molten
portion of the Carajas ore was found [10]. This was due to the melting of the ore and the
reaction of the ignition pin with the molten portion according to the following reaction:
Feliq + 2Fe3+ ↔ 3Fe2+ (69)
After the melting phase, the plasma gas was switched from argon to a mixture of argon and
other gases, e.g. H2, CH4, CO, CO2 and H2O, where complete melting and reduction took
over.
7.4.1 Reduction by H2 plasma, graphite versus tungsten electrodes
To have a fingerprint for the new MS, reduction experiments using various concentrations of
H2 in H2-Ar mixture and graphite electrode were carried out. Evaluation of the reduction rate
and the H2 utilisation degree was conducted. However, the exact evaluation of the H2
utilisation degree was not possible in experiments which used graphite electrodes due to the
contribution of carbon in the reaction and the water gas shift reactions. Therefore, reduction
experiments with same concentrations of H2 have been conducted in another test run but
with the usage of a lanthanated tungsten electrode rather than a graphite electrode. With
such facility, the contribution of carbon in the reduction process was ruled out.
7.4.1.1 H2-Ar reduction using graphite electrode
7.4.1.1.1 Assessment of the reduction rate
The influence of H2 flow on the reduction behaviour has been monitored in this test run. The
total flow was set at a constant value of 5 Nl/min and a charge of Carajas ore used was
100 g in all experiments. The duration of one measuring cycle was approximately 2.4 s. A
change in the H2 – Ar concentrations in a series of experiments of 30 %, 40 % and 50 % H2
was conducted. To guarantee the completion of the reduction, it was decided to operate
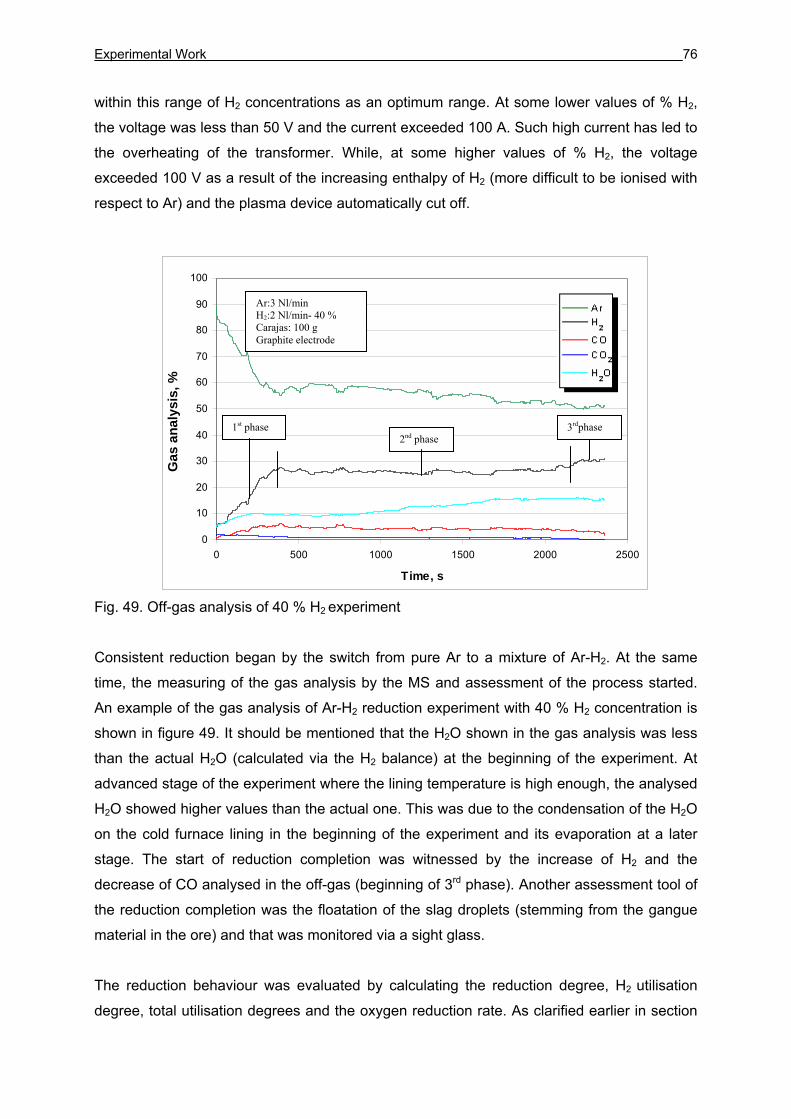
Experimental Work 76
within this range of H2 concentrations as an optimum range. At some lower values of % H2,
the voltage was less than 50 V and the current exceeded 100 A. Such high current has led to
the overheating of the transformer. While, at some higher values of % H2, the voltage
exceeded 100 V as a result of the increasing enthalpy of H2 (more difficult to be ionised with
respect to Ar) and the plasma device automatically cut off.
Fig. 49. Off-gas analysis of 40 % H2 experiment
Consistent reduction began by the switch from pure Ar to a mixture of Ar-H2. At the same
time, the measuring of the gas analysis by the MS and assessment of the process started.
An example of the gas analysis of Ar-H2 reduction experiment with 40 % H2 concentration is
shown in figure 49. It should be mentioned that the H2O shown in the gas analysis was less
than the actual H2O (calculated via the H2 balance) at the beginning of the experiment. At
advanced stage of the experiment where the lining temperature is high enough, the analysed
H2O showed higher values than the actual one. This was due to the condensation of the H2O
on the cold furnace lining in the beginning of the experiment and its evaporation at a later
stage. The start of reduction completion was witnessed by the increase of H2 and the
decrease of CO analysed in the off-gas (beginning of 3rd phase). Another assessment tool of
the reduction completion was the floatation of the slag droplets (stemming from the gangue
material in the ore) and that was monitored via a sight glass.
The reduction behaviour was evaluated by calculating the reduction degree, H2 utilisation
degree, total utilisation degrees and the oxygen reduction rate. As clarified earlier in section
0
10
20
30
40
50
60
70
80
90
100
0 500 1000 1500 2000 2500
Time, s
gas
anal
ysis
, %
Ar:3 Nl/min H2:2 Nl/min- 40 % Carajas: 100 g Graphite electrode
Gas
ana
lysi
s, %
1st phase 2nd phase
3rdphase
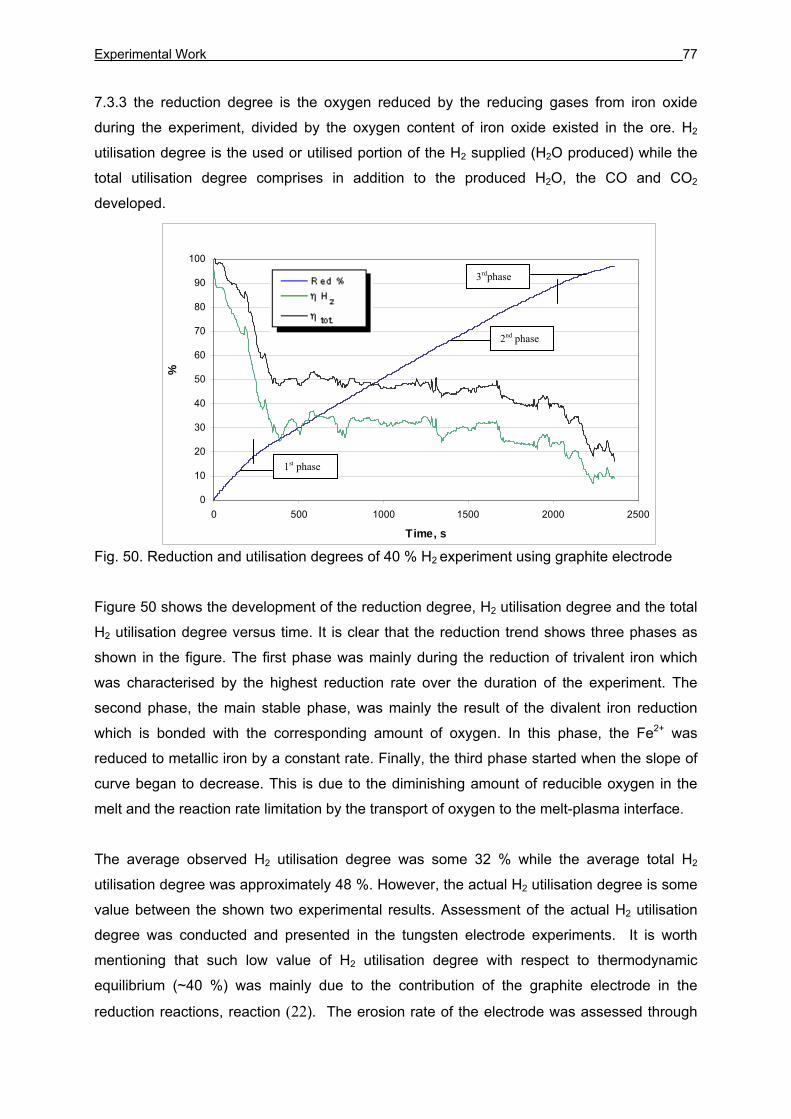
Experimental Work 77
7.3.3 the reduction degree is the oxygen reduced by the reducing gases from iron oxide
during the experiment, divided by the oxygen content of iron oxide existed in the ore. H2
utilisation degree is the used or utilised portion of the H2 supplied (H2O produced) while the
total utilisation degree comprises in addition to the produced H2O, the CO and CO2
developed.
Fig. 50. Reduction and utilisation degrees of 40 % H2 experiment using graphite electrode
Figure 50 shows the development of the reduction degree, H2 utilisation degree and the total
H2 utilisation degree versus time. It is clear that the reduction trend shows three phases as
shown in the figure. The first phase was mainly during the reduction of trivalent iron which
was characterised by the highest reduction rate over the duration of the experiment. The
second phase, the main stable phase, was mainly the result of the divalent iron reduction
which is bonded with the corresponding amount of oxygen. In this phase, the Fe2+ was
reduced to metallic iron by a constant rate. Finally, the third phase started when the slope of
curve began to decrease. This is due to the diminishing amount of reducible oxygen in the
melt and the reaction rate limitation by the transport of oxygen to the melt-plasma interface.
The average observed H2 utilisation degree was some 32 % while the average total H2
utilisation degree was approximately 48 %. However, the actual H2 utilisation degree is some
value between the shown two experimental results. Assessment of the actual H2 utilisation
degree was conducted and presented in the tungsten electrode experiments. It is worth
mentioning that such low value of H2 utilisation degree with respect to thermodynamic
equilibrium (~40 %) was mainly due to the contribution of the graphite electrode in the
reduction reactions, reaction (22). The erosion rate of the electrode was assessed through
0
10
20
30
40
50
60
70
80
90
100
0 500 1000 1500 2000 2500
Time, s
%
1st phase
2nd phase
3rdphase
Experimental Work 78
the gas analysis and found to be 0.15 g/min. Considering this, it should be noted that by the
conduction of carbon balance to the electrode used in some of the experiments, it was found
that the measured erosion was ~7 % higher than the weighted erosion. This deviation was
mainly due to the slag droplets splashed on the electrode during the experiment and could
not be ruled out during the weighing of the electrode.
Fig. 51. Reduction rate of 40 % H2 experiment using graphite electrode
Figure 51 shows the total reduction rate (dmO / dt) including the oxygen carried by CO and
CO2. Moreover, the apparent reduction rate obtained by H2 ( dt/dm OH,O 2) is also plotted. It
was found that the reduction contribution by H2 is some 65 % of the total reduction rate.
Averaging the total reduction rate during the 2nd phase, mainly iron (II) oxide reduction
phase, 0.7 g O /min was obtained. Combining this result with those obtained from the
experiments with other H2 concentrations (30 and 50 %), figure 52 is plotted. Results of the
other Ar-H2 experiments are attached in the appendix. It is clear from figure 52 that the
reduction rate increases with increasing H2 flow rate on a first order relationship basis.
However, exact passage of the trend line through the origin could not be obtained due to two
factors. The first factor is the contribution of carbon (stemming from the graphite electrode) in
the reduction process. The second factor that could not be ruled out is the possible error of
measurement caused by the MS and the gas flow controllers.
0.0
0.2
0.4
0.6
0.8
1.0
1.2
1.4
1.6
0 500 1000 1500 2000 2500
time, s
redu
ctio
n ra
te, g
O/m
inR
educ
tion
rate
, g O
/min
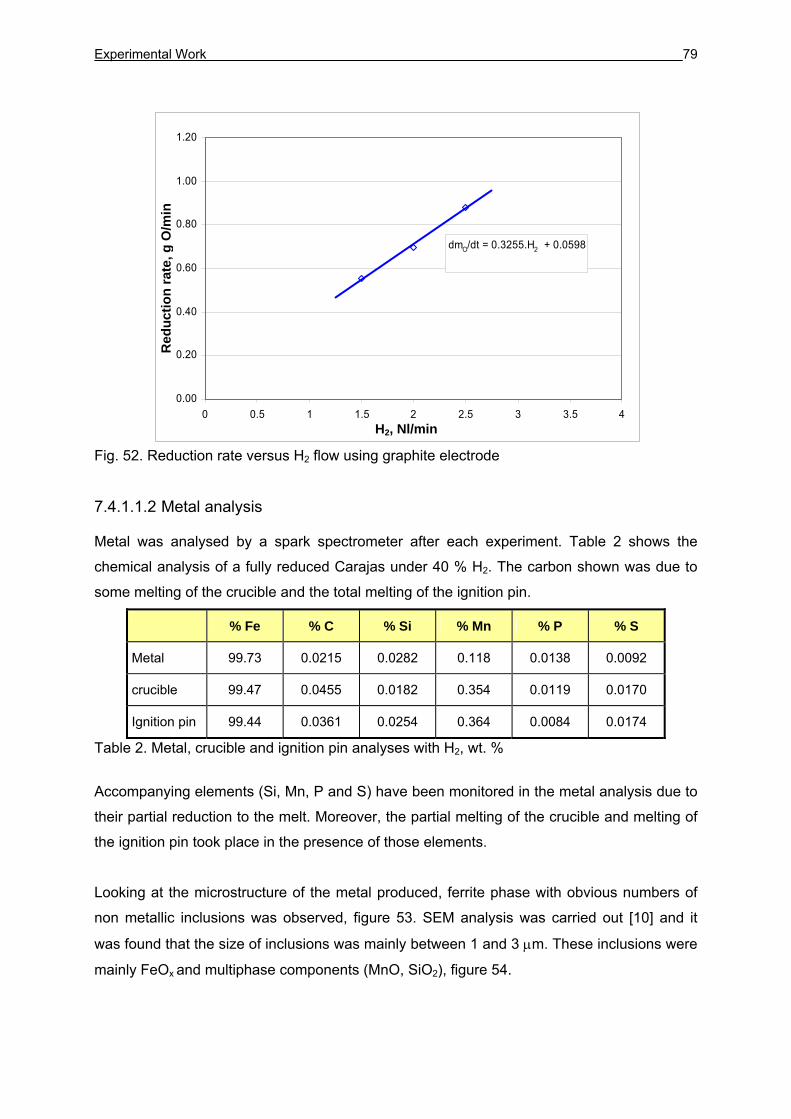
Experimental Work 79
Fig. 52. Reduction rate versus H2 flow using graphite electrode
7.4.1.1.2 Metal analysis
Metal was analysed by a spark spectrometer after each experiment. Table 2 shows the
chemical analysis of a fully reduced Carajas under 40 % H2. The carbon shown was due to
some melting of the crucible and the total melting of the ignition pin.
% Fe % C % Si % Mn % P % S
Metal 99.73 0.0215 0.0282 0.118 0.0138 0.0092
crucible 99.47 0.0455 0.0182 0.354 0.0119 0.0170
Ignition pin 99.44 0.0361 0.0254 0.364 0.0084 0.0174
Table 2. Metal, crucible and ignition pin analyses with H2, wt. %
Accompanying elements (Si, Mn, P and S) have been monitored in the metal analysis due to
their partial reduction to the melt. Moreover, the partial melting of the crucible and melting of
the ignition pin took place in the presence of those elements.
Looking at the microstructure of the metal produced, ferrite phase with obvious numbers of
non metallic inclusions was observed, figure 53. SEM analysis was carried out [10] and it
was found that the size of inclusions was mainly between 1 and 3 μm. These inclusions were
mainly FeOx and multiphase components (MnO, SiO2), figure 54.
dmO/dt = 0.3255.H2 + 0.0598
0.00
0.20
0.40
0.60
0.80
1.00
1.20
0 0.5 1 1.5 2 2.5 3 3.5 4H2, lit/min
redu
ctio
n ra
te g
O /m
inR
educ
tion
rate
, g O
/min
H2, Nl/min
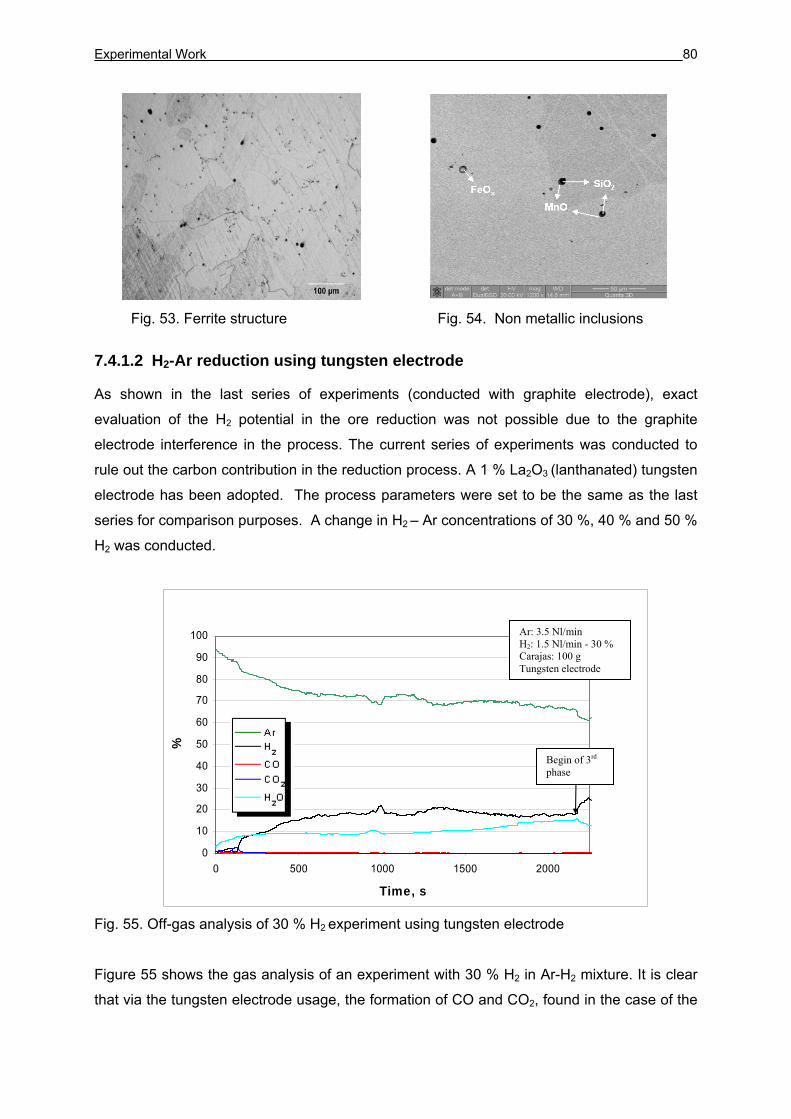
Experimental Work 80
Fig. 53. Ferrite structure Fig. 54. Non metallic inclusions
7.4.1.2 H2-Ar reduction using tungsten electrode
As shown in the last series of experiments (conducted with graphite electrode), exact
evaluation of the H2 potential in the ore reduction was not possible due to the graphite
electrode interference in the process. The current series of experiments was conducted to
rule out the carbon contribution in the reduction process. A 1 % La2O3 (lanthanated) tungsten
electrode has been adopted. The process parameters were set to be the same as the last
series for comparison purposes. A change in H2 – Ar concentrations of 30 %, 40 % and 50 %
H2 was conducted.
Fig. 55. Off-gas analysis of 30 % H2 experiment using tungsten electrode
Figure 55 shows the gas analysis of an experiment with 30 % H2 in Ar-H2 mixture. It is clear
that via the tungsten electrode usage, the formation of CO and CO2, found in the case of the
0
10
20
30
40
50
60
70
80
90
100
0 500 1000 1500 2000
Time, s
%
Ar: 3.5 Nl/min H2: 1.5 Nl/min - 30 % Carajas: 100 g Tungsten electrode
Begin of 3rd
phase
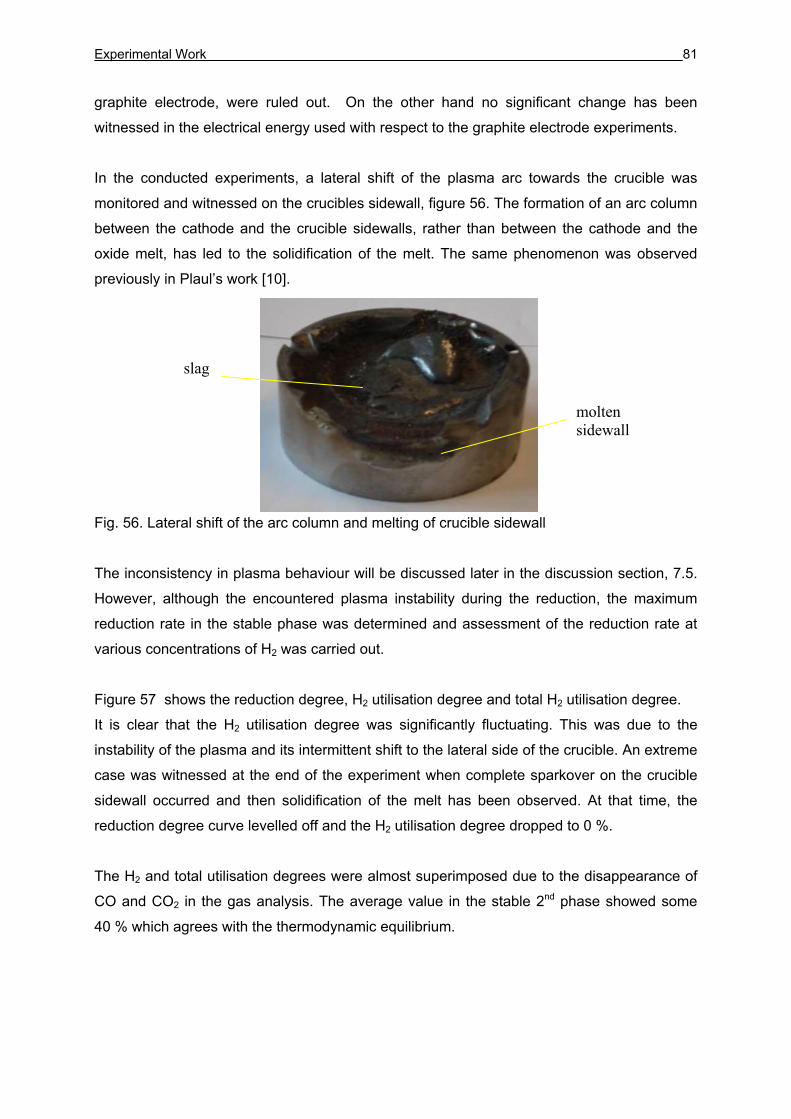
Experimental Work 81
graphite electrode, were ruled out. On the other hand no significant change has been
witnessed in the electrical energy used with respect to the graphite electrode experiments.
In the conducted experiments, a lateral shift of the plasma arc towards the crucible was
monitored and witnessed on the crucibles sidewall, figure 56. The formation of an arc column
between the cathode and the crucible sidewalls, rather than between the cathode and the
oxide melt, has led to the solidification of the melt. The same phenomenon was observed
previously in Plaul’s work [10].
Fig. 56. Lateral shift of the arc column and melting of crucible sidewall The inconsistency in plasma behaviour will be discussed later in the discussion section, 7.5.
However, although the encountered plasma instability during the reduction, the maximum
reduction rate in the stable phase was determined and assessment of the reduction rate at
various concentrations of H2 was carried out.
Figure 57 shows the reduction degree, H2 utilisation degree and total H2 utilisation degree.
It is clear that the H2 utilisation degree was significantly fluctuating. This was due to the
instability of the plasma and its intermittent shift to the lateral side of the crucible. An extreme
case was witnessed at the end of the experiment when complete sparkover on the crucible
sidewall occurred and then solidification of the melt has been observed. At that time, the
reduction degree curve levelled off and the H2 utilisation degree dropped to 0 %.
The H2 and total utilisation degrees were almost superimposed due to the disappearance of
CO and CO2 in the gas analysis. The average value in the stable 2nd phase showed some
40 % which agrees with the thermodynamic equilibrium.
molten sidewall
slag
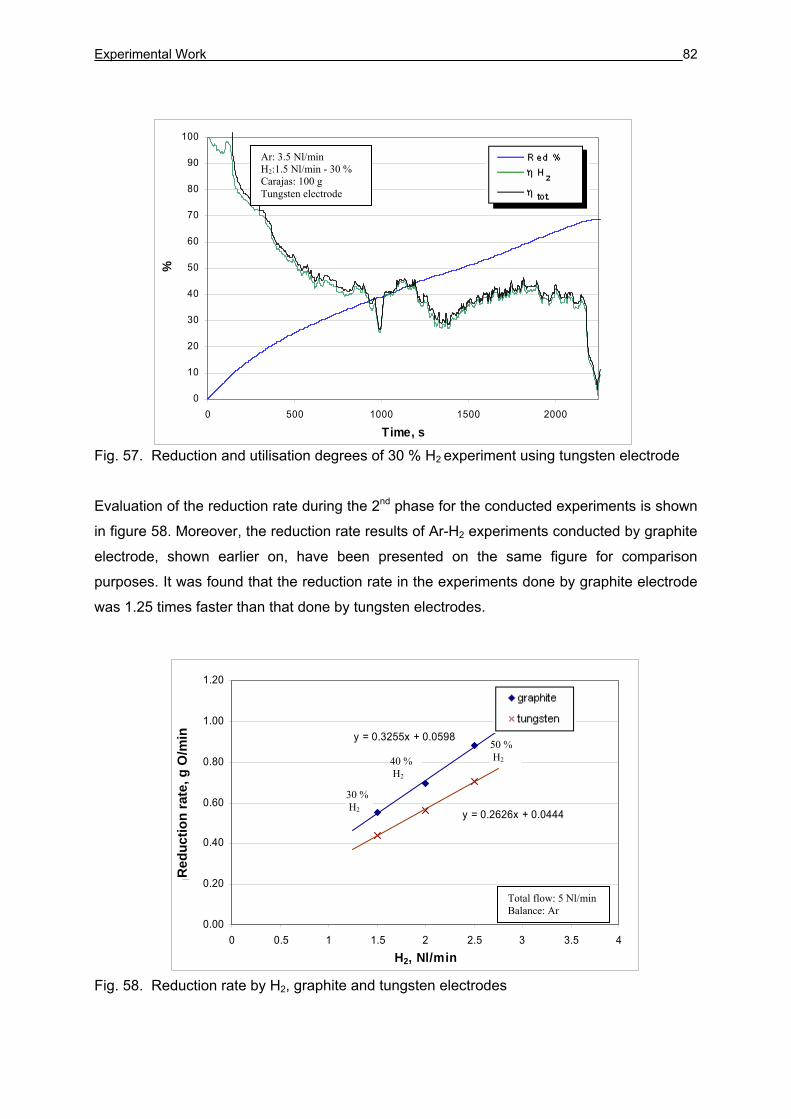
Experimental Work 82
Fig. 57. Reduction and utilisation degrees of 30 % H2 experiment using tungsten electrode
Evaluation of the reduction rate during the 2nd phase for the conducted experiments is shown
in figure 58. Moreover, the reduction rate results of Ar-H2 experiments conducted by graphite
electrode, shown earlier on, have been presented on the same figure for comparison
purposes. It was found that the reduction rate in the experiments done by graphite electrode
was 1.25 times faster than that done by tungsten electrodes.
Fig. 58. Reduction rate by H2, graphite and tungsten electrodes
0
10
20
30
40
50
60
70
80
90
100
0 500 1000 1500 2000
Time, s
%Ar: 3.5 Nl/min H2:1.5 Nl/min - 30 % Carajas: 100 g Tungsten electrode
y = 0.2626x + 0.0444
y = 0.3255x + 0.0598
0.00
0.20
0.40
0.60
0.80
1.00
1.20
0 0.5 1 1.5 2 2.5 3 3.5 4H2, Nl/min
redu
ctio
n ra
te, g
O /m
inR
educ
tion
rate
, g O
/min
30 % H2
40 % H2
50 % H2
Total flow: 5 Nl/min Balance: Ar
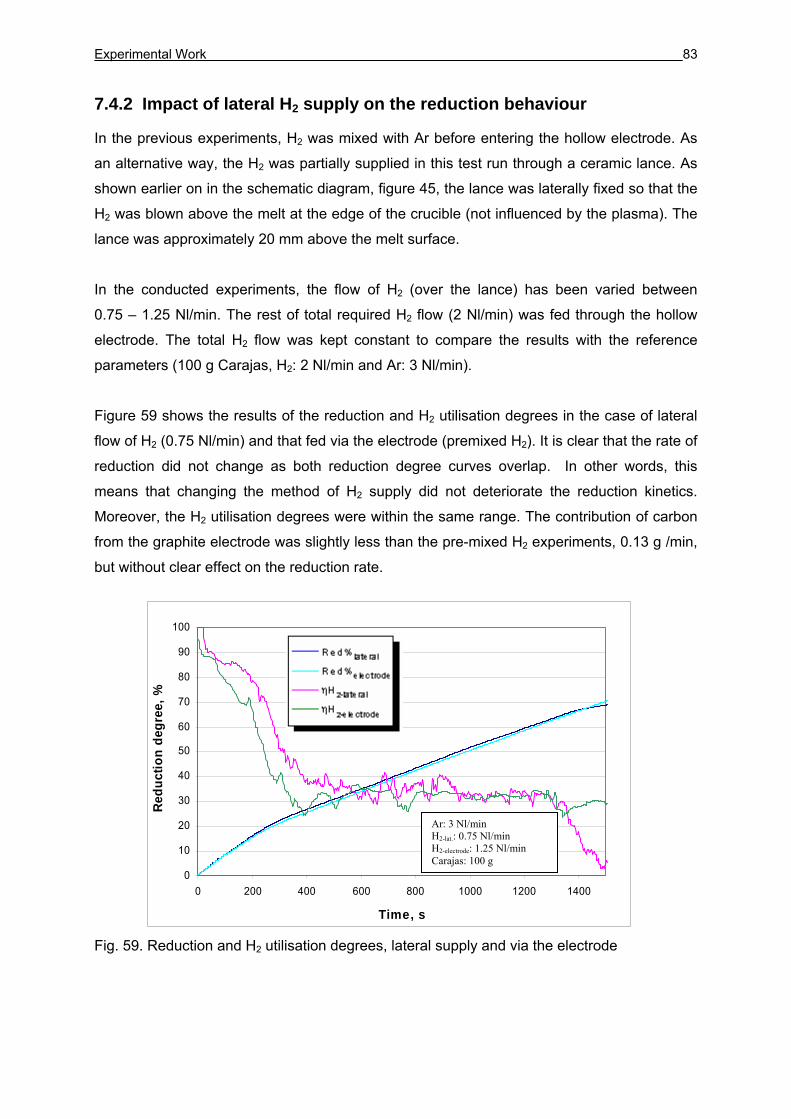
Experimental Work 83
0
10
20
30
40
50
60
70
80
90
100
0 200 400 600 800 1000 1200 1400
Time, s
Redu
ctio
n de
gree
, %
7.4.2 Impact of lateral H2 supply on the reduction behaviour
In the previous experiments, H2 was mixed with Ar before entering the hollow electrode. As
an alternative way, the H2 was partially supplied in this test run through a ceramic lance. As
shown earlier on in the schematic diagram, figure 45, the lance was laterally fixed so that the
H2 was blown above the melt at the edge of the crucible (not influenced by the plasma). The
lance was approximately 20 mm above the melt surface.
In the conducted experiments, the flow of H2 (over the lance) has been varied between
0.75 – 1.25 Nl/min. The rest of total required H2 flow (2 Nl/min) was fed through the hollow
electrode. The total H2 flow was kept constant to compare the results with the reference
parameters (100 g Carajas, H2: 2 Nl/min and Ar: 3 Nl/min).
Figure 59 shows the results of the reduction and H2 utilisation degrees in the case of lateral
flow of H2 (0.75 Nl/min) and that fed via the electrode (premixed H2). It is clear that the rate of
reduction did not change as both reduction degree curves overlap. In other words, this
means that changing the method of H2 supply did not deteriorate the reduction kinetics.
Moreover, the H2 utilisation degrees were within the same range. The contribution of carbon
from the graphite electrode was slightly less than the pre-mixed H2 experiments, 0.13 g /min,
but without clear effect on the reduction rate.
Fig. 59. Reduction and H2 utilisation degrees, lateral supply and via the electrode
Ar: 3 Nl/min H2-lat.: 0.75 Nl/min H2-electrode: 1.25 Nl/min Carajas: 100 g
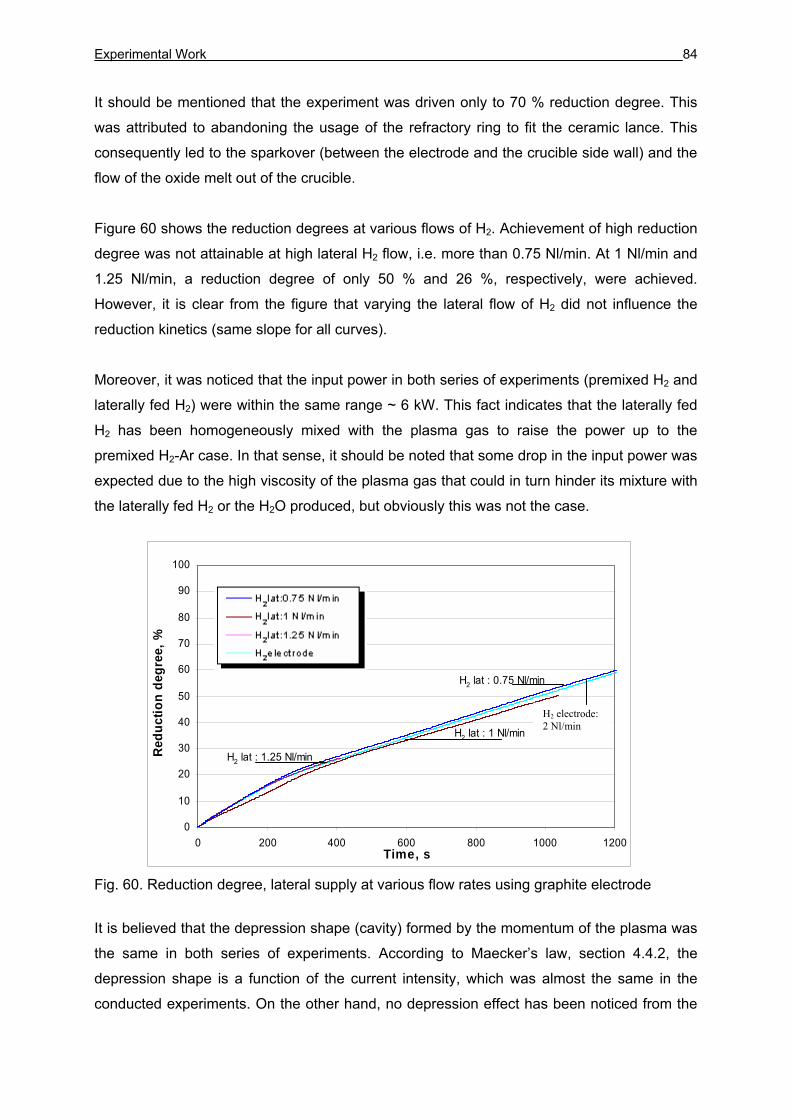
Experimental Work 84
H2 electrode
H2 lat : 1.25 Nl/min
H2 lat : 1 Nl/min
H2 lat : 0.75 Nl/min
0
10
20
30
40
50
60
70
80
90
100
0 200 400 600 800 1000 1200Time, s
Red
uctio
n de
gree
, %
It should be mentioned that the experiment was driven only to 70 % reduction degree. This
was attributed to abandoning the usage of the refractory ring to fit the ceramic lance. This
consequently led to the sparkover (between the electrode and the crucible side wall) and the
flow of the oxide melt out of the crucible.
Figure 60 shows the reduction degrees at various flows of H2. Achievement of high reduction
degree was not attainable at high lateral H2 flow, i.e. more than 0.75 Nl/min. At 1 Nl/min and
1.25 Nl/min, a reduction degree of only 50 % and 26 %, respectively, were achieved.
However, it is clear from the figure that varying the lateral flow of H2 did not influence the
reduction kinetics (same slope for all curves).
Moreover, it was noticed that the input power in both series of experiments (premixed H2 and
laterally fed H2) were within the same range ~ 6 kW. This fact indicates that the laterally fed
H2 has been homogeneously mixed with the plasma gas to raise the power up to the
premixed H2-Ar case. In that sense, it should be noted that some drop in the input power was
expected due to the high viscosity of the plasma gas that could in turn hinder its mixture with
the laterally fed H2 or the H2O produced, but obviously this was not the case.
Fig. 60. Reduction degree, lateral supply at various flow rates using graphite electrode
It is believed that the depression shape (cavity) formed by the momentum of the plasma was
the same in both series of experiments. According to Maecker’s law, section 4.4.2, the
depression shape is a function of the current intensity, which was almost the same in the
conducted experiments. On the other hand, no depression effect has been noticed from the
H2 electrode: 2 Nl/min
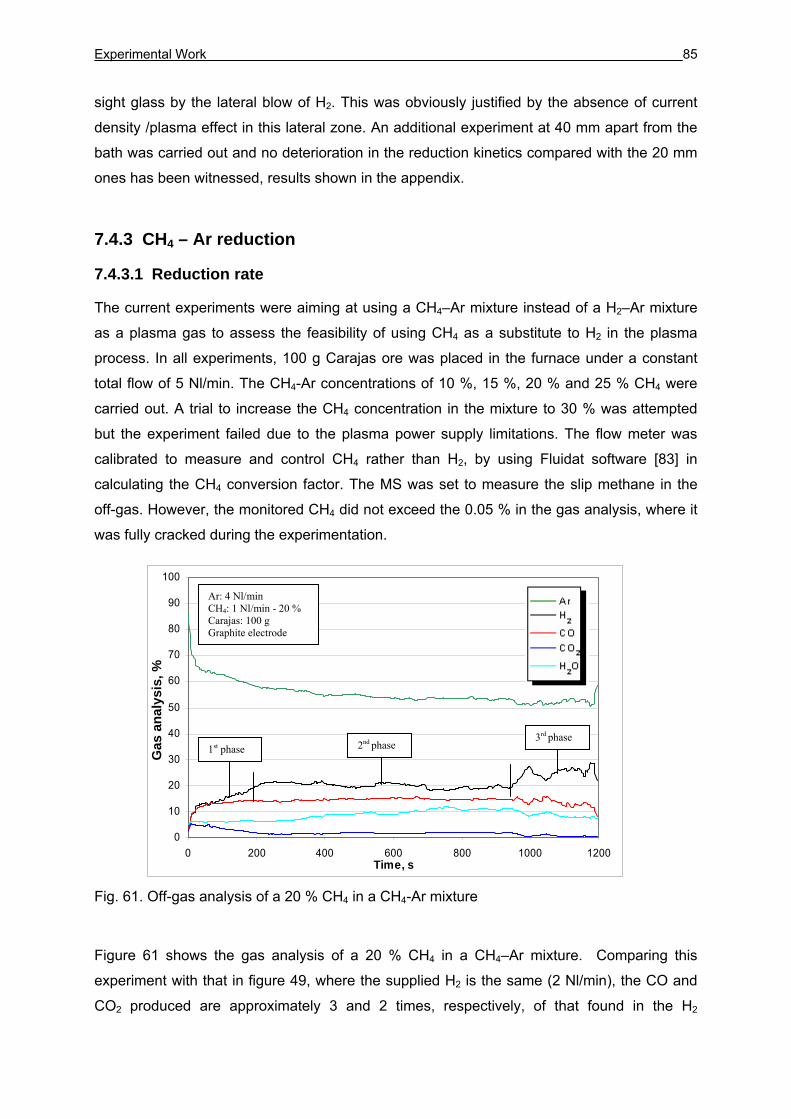
Experimental Work 85
sight glass by the lateral blow of H2. This was obviously justified by the absence of current
density /plasma effect in this lateral zone. An additional experiment at 40 mm apart from the
bath was carried out and no deterioration in the reduction kinetics compared with the 20 mm
ones has been witnessed, results shown in the appendix.
7.4.3 CH4 – Ar reduction
7.4.3.1 Reduction rate
The current experiments were aiming at using a CH4–Ar mixture instead of a H2–Ar mixture
as a plasma gas to assess the feasibility of using CH4 as a substitute to H2 in the plasma
process. In all experiments, 100 g Carajas ore was placed in the furnace under a constant
total flow of 5 Nl/min. The CH4-Ar concentrations of 10 %, 15 %, 20 % and 25 % CH4 were
carried out. A trial to increase the CH4 concentration in the mixture to 30 % was attempted
but the experiment failed due to the plasma power supply limitations. The flow meter was
calibrated to measure and control CH4 rather than H2, by using Fluidat software [83] in
calculating the CH4 conversion factor. The MS was set to measure the slip methane in the
off-gas. However, the monitored CH4 did not exceed the 0.05 % in the gas analysis, where it
was fully cracked during the experimentation.
Fig. 61. Off-gas analysis of a 20 % CH4 in a CH4-Ar mixture
Figure 61 shows the gas analysis of a 20 % CH4 in a CH4–Ar mixture. Comparing this
experiment with that in figure 49, where the supplied H2 is the same (2 Nl/min), the CO and
CO2 produced are approximately 3 and 2 times, respectively, of that found in the H2
0
10
20
30
40
50
60
70
80
90
100
0 200 400 600 800 1000 1200Time, s
%
Ar: 4 Nl/min CH4: 1 Nl/min - 20 % Carajas: 100 g Graphite electrode
1st phase 2nd phase 3rd phase
Gas
ana
lysi
s, %
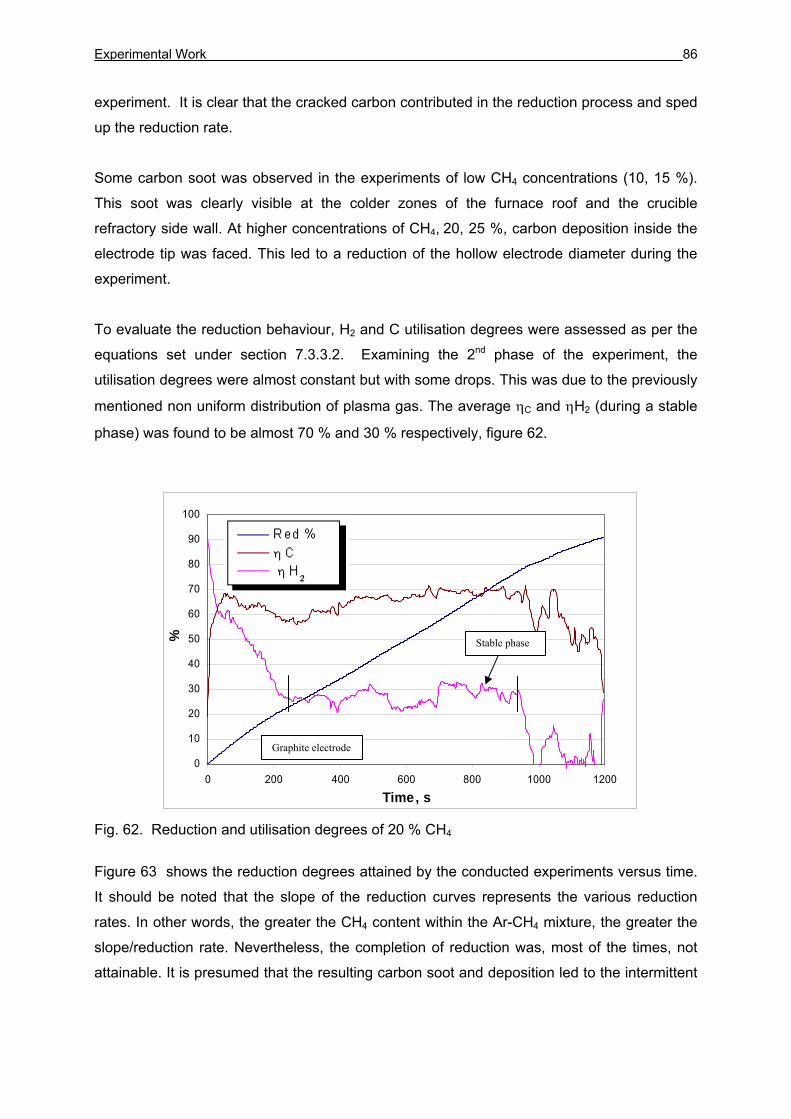
Experimental Work 86
experiment. It is clear that the cracked carbon contributed in the reduction process and sped
up the reduction rate.
Some carbon soot was observed in the experiments of low CH4 concentrations (10, 15 %).
This soot was clearly visible at the colder zones of the furnace roof and the crucible
refractory side wall. At higher concentrations of CH4, 20, 25 %, carbon deposition inside the
electrode tip was faced. This led to a reduction of the hollow electrode diameter during the
experiment.
To evaluate the reduction behaviour, H2 and C utilisation degrees were assessed as per the
equations set under section 7.3.3.2. Examining the 2nd phase of the experiment, the
utilisation degrees were almost constant but with some drops. This was due to the previously
mentioned non uniform distribution of plasma gas. The average ηC and ηH2 (during a stable
phase) was found to be almost 70 % and 30 % respectively, figure 62.
Fig. 62. Reduction and utilisation degrees of 20 % CH4
Figure 63 shows the reduction degrees attained by the conducted experiments versus time.
It should be noted that the slope of the reduction curves represents the various reduction
rates. In other words, the greater the CH4 content within the Ar-CH4 mixture, the greater the
slope/reduction rate. Nevertheless, the completion of reduction was, most of the times, not
attainable. It is presumed that the resulting carbon soot and deposition led to the intermittent
0
10
20
30
40
50
60
70
80
90
100
0 200 400 600 800 1000 1200
Time, s
% Stable phase
Graphite electrode
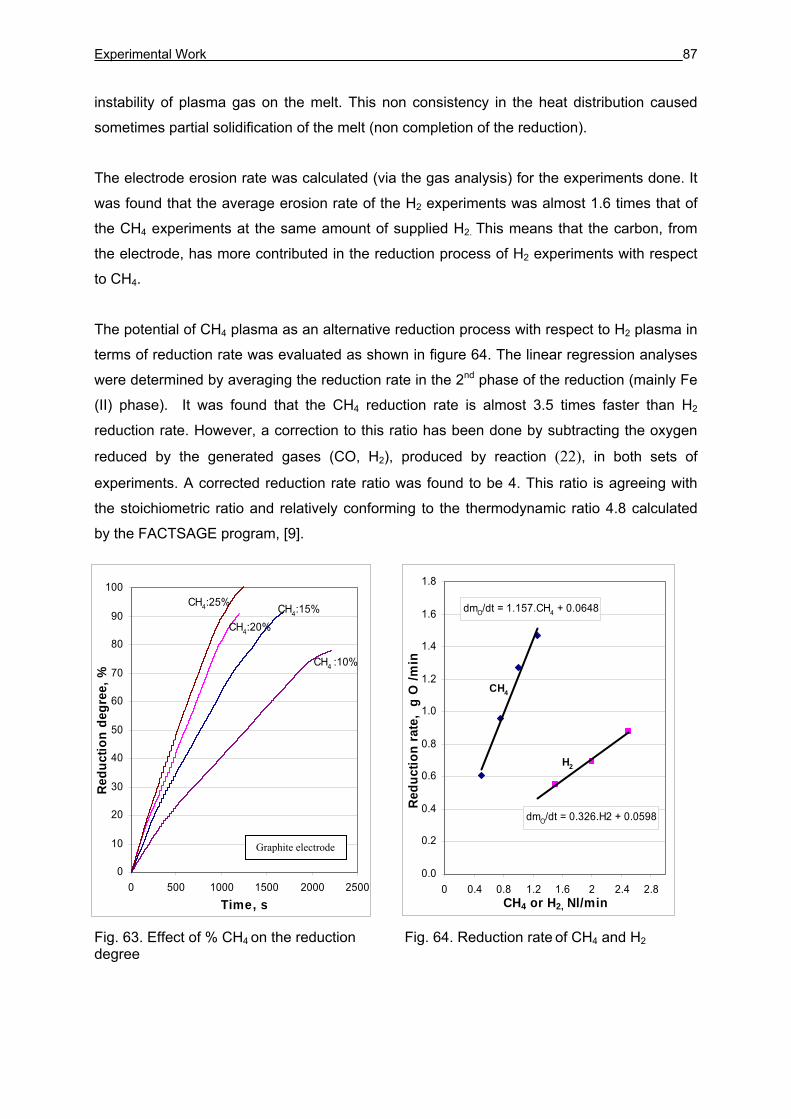
Experimental Work 87
instability of plasma gas on the melt. This non consistency in the heat distribution caused
sometimes partial solidification of the melt (non completion of the reduction).
The electrode erosion rate was calculated (via the gas analysis) for the experiments done. It
was found that the average erosion rate of the H2 experiments was almost 1.6 times that of
the CH4 experiments at the same amount of supplied H2. This means that the carbon, from
the electrode, has more contributed in the reduction process of H2 experiments with respect
to CH4.
The potential of CH4 plasma as an alternative reduction process with respect to H2 plasma in
terms of reduction rate was evaluated as shown in figure 64. The linear regression analyses
were determined by averaging the reduction rate in the 2nd phase of the reduction (mainly Fe
(II) phase). It was found that the CH4 reduction rate is almost 3.5 times faster than H2
reduction rate. However, a correction to this ratio has been done by subtracting the oxygen
reduced by the generated gases (CO, H2), produced by reaction (22), in both sets of
experiments. A corrected reduction rate ratio was found to be 4. This ratio is agreeing with
the stoichiometric ratio and relatively conforming to the thermodynamic ratio 4.8 calculated
by the FACTSAGE program, [9].
Fig. 63. Effect of % CH4 on the reduction Fig. 64. Reduction rate of CH4 and H2 degree
CH4 :10%
CH4:15%CH4:20%
CH4:25%
0
10
20
30
40
50
60
70
80
90
100
0 500 1000 1500 2000 2500Time, s
Redu
ctio
n de
gree
, %
H2
CH4
dmO/dt = 0.326.H2 + 0.0598
dmO/dt = 1.157.CH4 + 0.0648
0.0
0.2
0.4
0.6
0.8
1.0
1.2
1.4
1.6
1.8
0 0.4 0.8 1.2 1.6 2 2.4 2.8CH4 or H2, Nl/min
Red
uctio
n ra
te,
g O
/min
Graphite electrode
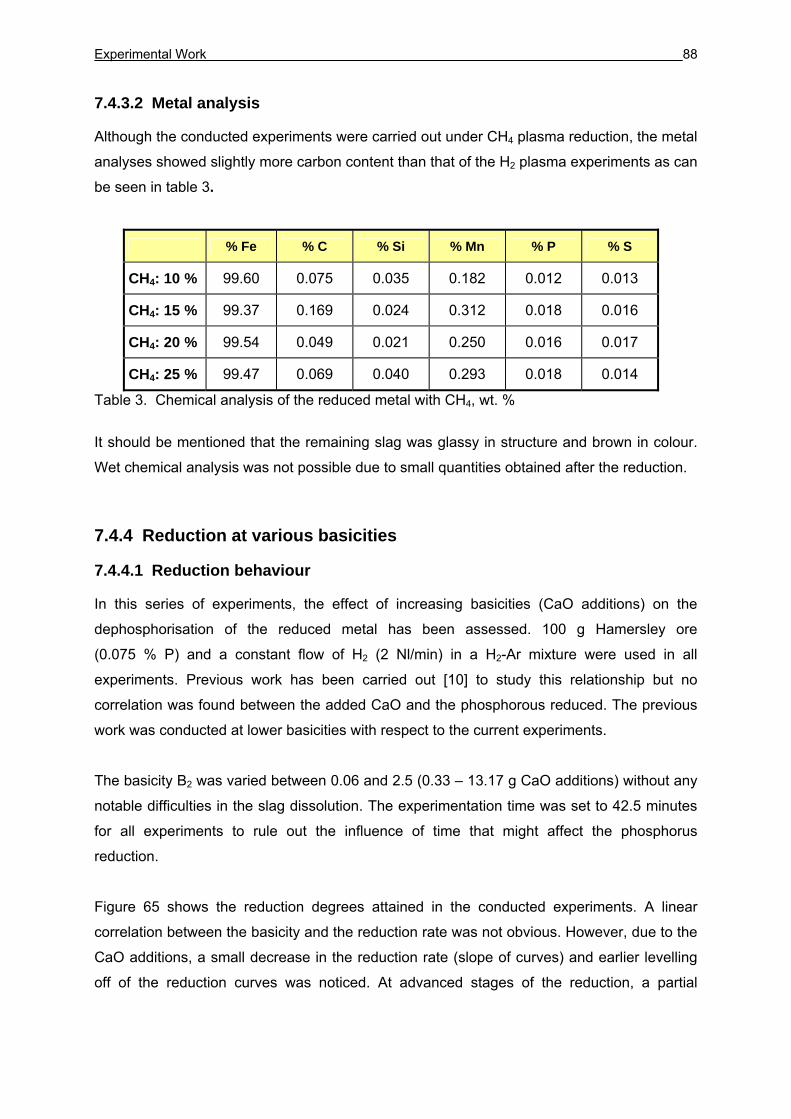
Experimental Work 88
7.4.3.2 Metal analysis
Although the conducted experiments were carried out under CH4 plasma reduction, the metal
analyses showed slightly more carbon content than that of the H2 plasma experiments as can
be seen in table 3.
% Fe % C % Si % Mn % P % S
CH4: 10 % 99.60 0.075 0.035 0.182 0.012 0.013
CH4: 15 % 99.37 0.169 0.024 0.312 0.018 0.016
CH4: 20 % 99.54 0.049 0.021 0.250 0.016 0.017
CH4: 25 % 99.47 0.069 0.040 0.293 0.018 0.014
Table 3. Chemical analysis of the reduced metal with CH4, wt. %
It should be mentioned that the remaining slag was glassy in structure and brown in colour.
Wet chemical analysis was not possible due to small quantities obtained after the reduction.
7.4.4 Reduction at various basicities
7.4.4.1 Reduction behaviour
In this series of experiments, the effect of increasing basicities (CaO additions) on the
dephosphorisation of the reduced metal has been assessed. 100 g Hamersley ore
(0.075 % P) and a constant flow of H2 (2 Nl/min) in a H2-Ar mixture were used in all
experiments. Previous work has been carried out [10] to study this relationship but no
correlation was found between the added CaO and the phosphorous reduced. The previous
work was conducted at lower basicities with respect to the current experiments.
The basicity B2 was varied between 0.06 and 2.5 (0.33 – 13.17 g CaO additions) without any
notable difficulties in the slag dissolution. The experimentation time was set to 42.5 minutes
for all experiments to rule out the influence of time that might affect the phosphorus
reduction.
Figure 65 shows the reduction degrees attained in the conducted experiments. A linear
correlation between the basicity and the reduction rate was not obvious. However, due to the
CaO additions, a small decrease in the reduction rate (slope of curves) and earlier levelling
off of the reduction curves was noticed. At advanced stages of the reduction, a partial
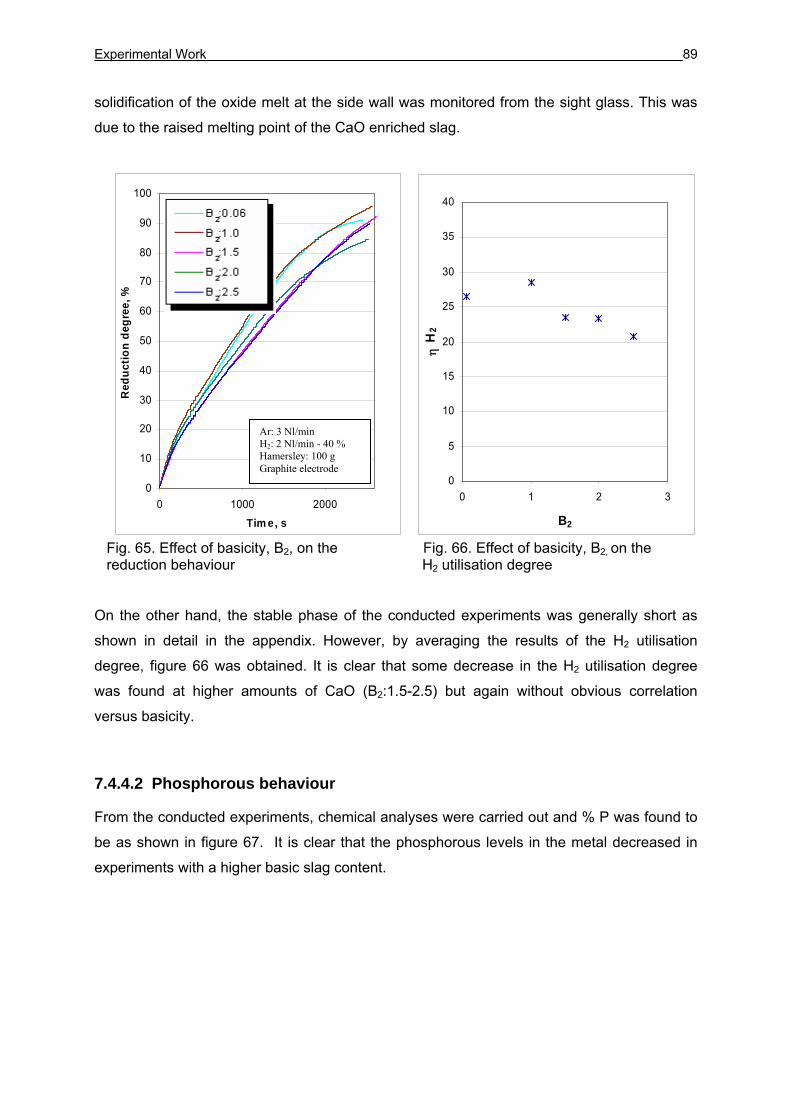
Experimental Work 89
0
10
20
30
40
50
60
70
80
90
100
0 1000 2000
Tim e, s
Red
uctio
n de
gree
, %
solidification of the oxide melt at the side wall was monitored from the sight glass. This was
due to the raised melting point of the CaO enriched slag.
Fig. 65. Effect of basicity, B2, on the Fig. 66. Effect of basicity, B2, on the reduction behaviour H2 utilisation degree On the other hand, the stable phase of the conducted experiments was generally short as
shown in detail in the appendix. However, by averaging the results of the H2 utilisation
degree, figure 66 was obtained. It is clear that some decrease in the H2 utilisation degree
was found at higher amounts of CaO (B2:1.5-2.5) but again without obvious correlation
versus basicity.
7.4.4.2 Phosphorous behaviour
From the conducted experiments, chemical analyses were carried out and % P was found to
be as shown in figure 67. It is clear that the phosphorous levels in the metal decreased in
experiments with a higher basic slag content.
Ar: 3 Nl/min H2: 2 Nl/min - 40 % Hamersley: 100 g Graphite electrode
0
5
10
15
20
25
30
35
40
0 1 2 3
B2
η H
2
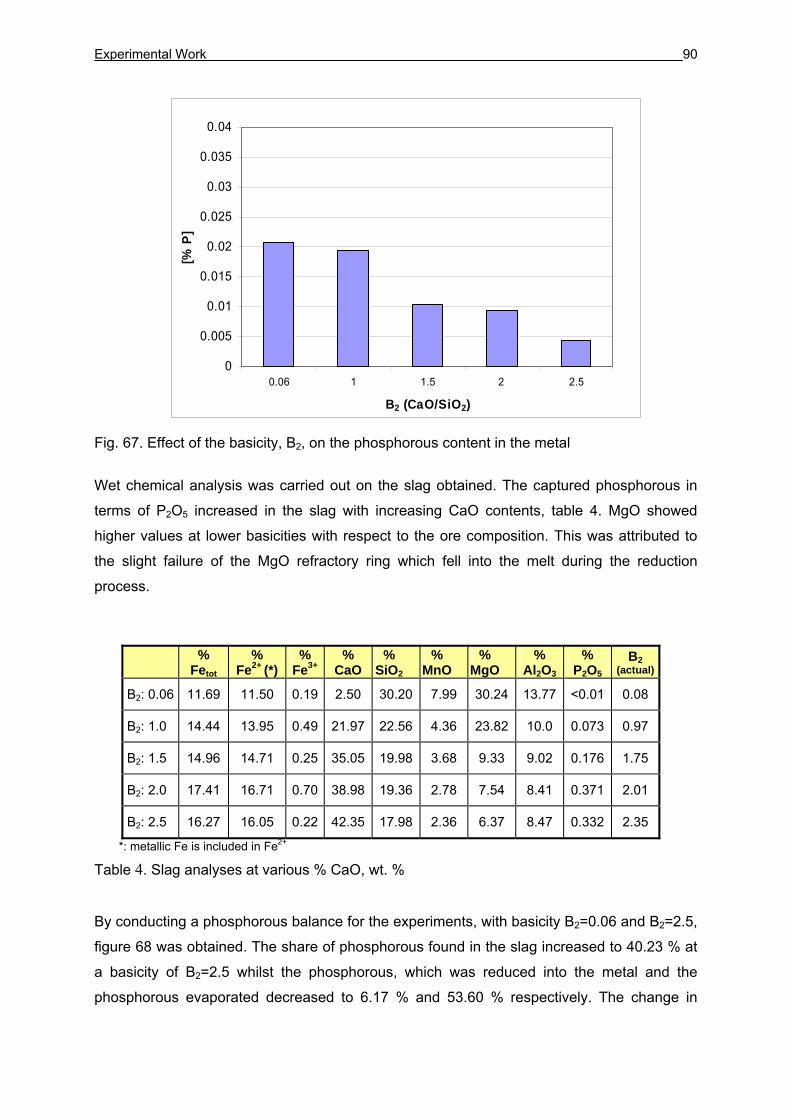
Experimental Work 90
Fig. 67. Effect of the basicity, B2, on the phosphorous content in the metal
Wet chemical analysis was carried out on the slag obtained. The captured phosphorous in
terms of P2O5 increased in the slag with increasing CaO contents, table 4. MgO showed
higher values at lower basicities with respect to the ore composition. This was attributed to
the slight failure of the MgO refractory ring which fell into the melt during the reduction
process.
%
Fetot %
Fe2+ (*) %
Fe3+ %
CaO %
SiO2 %
MnO %
MgO %
Al2O3
% P2O5
B2 (actual)
B2: 0.06 11.69 11.50 0.19 2.50 30.20 7.99 30.24 13.77 <0.01 0.08
B2: 1.0 14.44 13.95 0.49 21.97 22.56 4.36 23.82 10.0 0.073 0.97
B2: 1.5 14.96 14.71 0.25 35.05 19.98 3.68 9.33 9.02 0.176 1.75
B2: 2.0 17.41 16.71 0.70 38.98 19.36 2.78 7.54 8.41 0.371 2.01
B2: 2.5 16.27 16.05 0.22 42.35 17.98 2.36 6.37 8.47 0.332 2.35
*: metallic Fe is included in Fe2+
Table 4. Slag analyses at various % CaO, wt. %
By conducting a phosphorous balance for the experiments, with basicity B2=0.06 and B2=2.5,
figure 68 was obtained. The share of phosphorous found in the slag increased to 40.23 % at
a basicity of B2=2.5 whilst the phosphorous, which was reduced into the metal and the
phosphorous evaporated decreased to 6.17 % and 53.60 % respectively. The change in
0
0.005
0.01
0.015
0.02
0.025
0.03
0.035
0.04
0.06 1 1.5 2 2.5
B2 (CaO/SiO2)
[% P
]
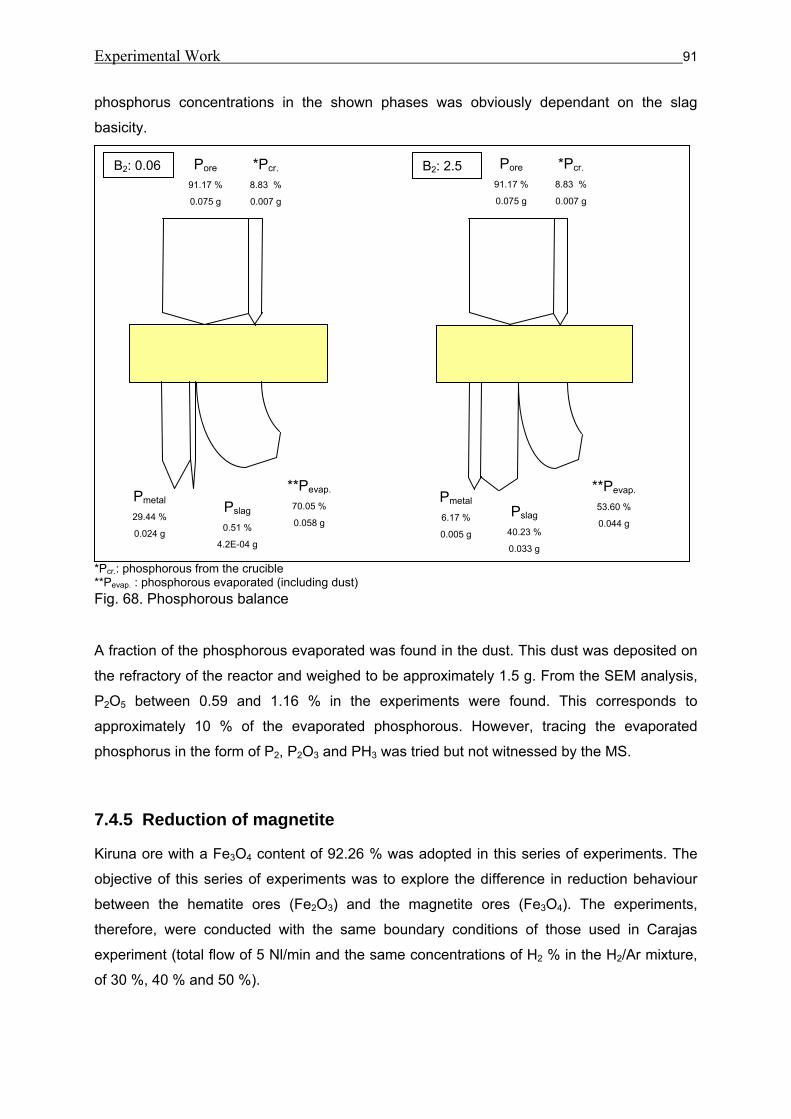
Experimental Work 91
phosphorus concentrations in the shown phases was obviously dependant on the slag
basicity.
*Pcr.: phosphorous from the crucible **Pevap. : phosphorous evaporated (including dust) Fig. 68. Phosphorous balance
A fraction of the phosphorous evaporated was found in the dust. This dust was deposited on
the refractory of the reactor and weighed to be approximately 1.5 g. From the SEM analysis,
P2O5 between 0.59 and 1.16 % in the experiments were found. This corresponds to
approximately 10 % of the evaporated phosphorous. However, tracing the evaporated
phosphorus in the form of P2, P2O3 and PH3 was tried but not witnessed by the MS.
7.4.5 Reduction of magnetite
Kiruna ore with a Fe3O4 content of 92.26 % was adopted in this series of experiments. The
objective of this series of experiments was to explore the difference in reduction behaviour
between the hematite ores (Fe2O3) and the magnetite ores (Fe3O4). The experiments,
therefore, were conducted with the same boundary conditions of those used in Carajas
experiment (total flow of 5 Nl/min and the same concentrations of H2 % in the H2/Ar mixture,
of 30 %, 40 % and 50 %).
Pore
91.17 %
0.075 g
*Pcr.
8.83 %
0.007 g
Pmetal
29.44 %
0.024 g
Pslag
0.51 %
4.2E-04 g
**Pevap.
70.05 %
0.058 g
Pore
91.17 %
0.075 g
*Pcr.
8.83 %
0.007 g
Pmetal
6.17 %
0.005 g
Pslag
40.23 %
0.033 g
**Pevap.
53.60 %
0.044 g
B2: 0.06 B2: 2.5
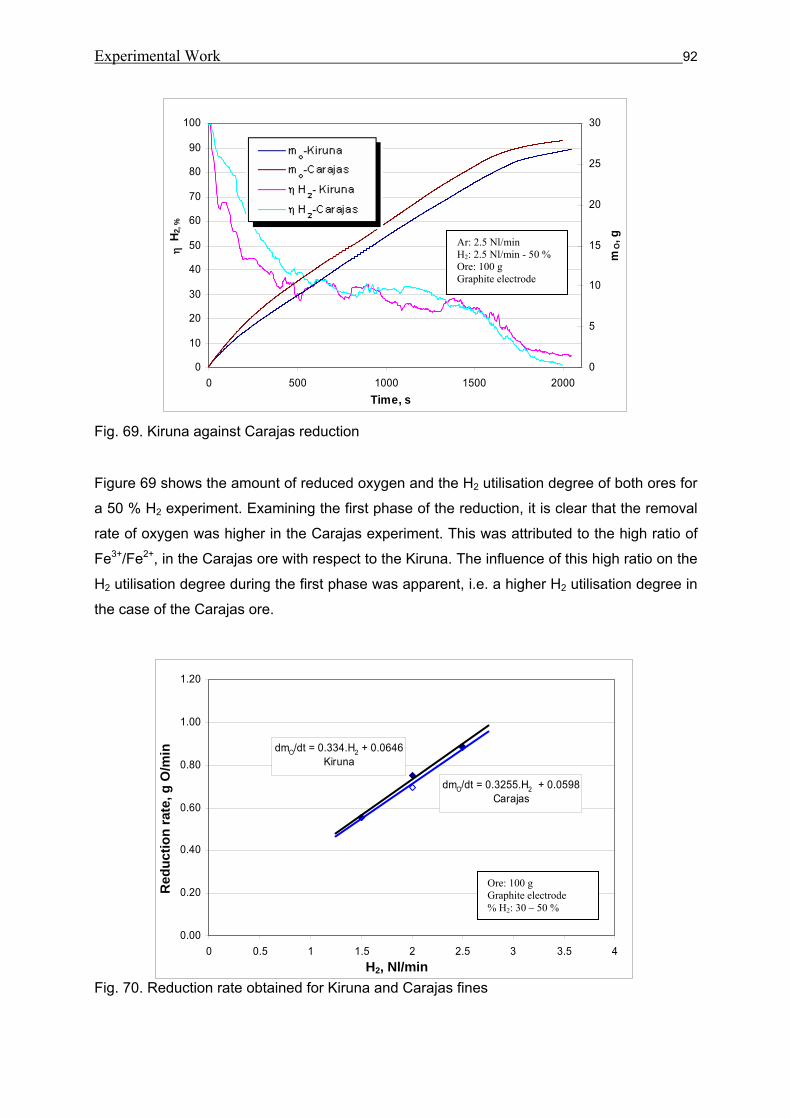
Experimental Work 92
0
10
20
30
40
50
60
70
80
90
100
0 500 1000 1500 2000Time, s
η H
2, %
0
5
10
15
20
25
30
mO, g
Fig. 69. Kiruna against Carajas reduction
Figure 69 shows the amount of reduced oxygen and the H2 utilisation degree of both ores for
a 50 % H2 experiment. Examining the first phase of the reduction, it is clear that the removal
rate of oxygen was higher in the Carajas experiment. This was attributed to the high ratio of
Fe3+/Fe2+, in the Carajas ore with respect to the Kiruna. The influence of this high ratio on the
H2 utilisation degree during the first phase was apparent, i.e. a higher H2 utilisation degree in
the case of the Carajas ore.
Fig. 70. Reduction rate obtained for Kiruna and Carajas fines
Ar: 2.5 Nl/min H2: 2.5 Nl/min - 50 % Ore: 100 g Graphite electrode
dmO/dt = 0.3255.H2 + 0.0598Carajas
dmO/dt = 0.334.H2 + 0.0646Kiruna
0.00
0.20
0.40
0.60
0.80
1.00
1.20
0 0.5 1 1.5 2 2.5 3 3.5 4H2, lit/min
redu
ctio
n ra
te g
O /m
inR
educ
tion
rate
, g O
/min
H2, Nl/min
Ore: 100 g Graphite electrode % H2: 30 – 50 %
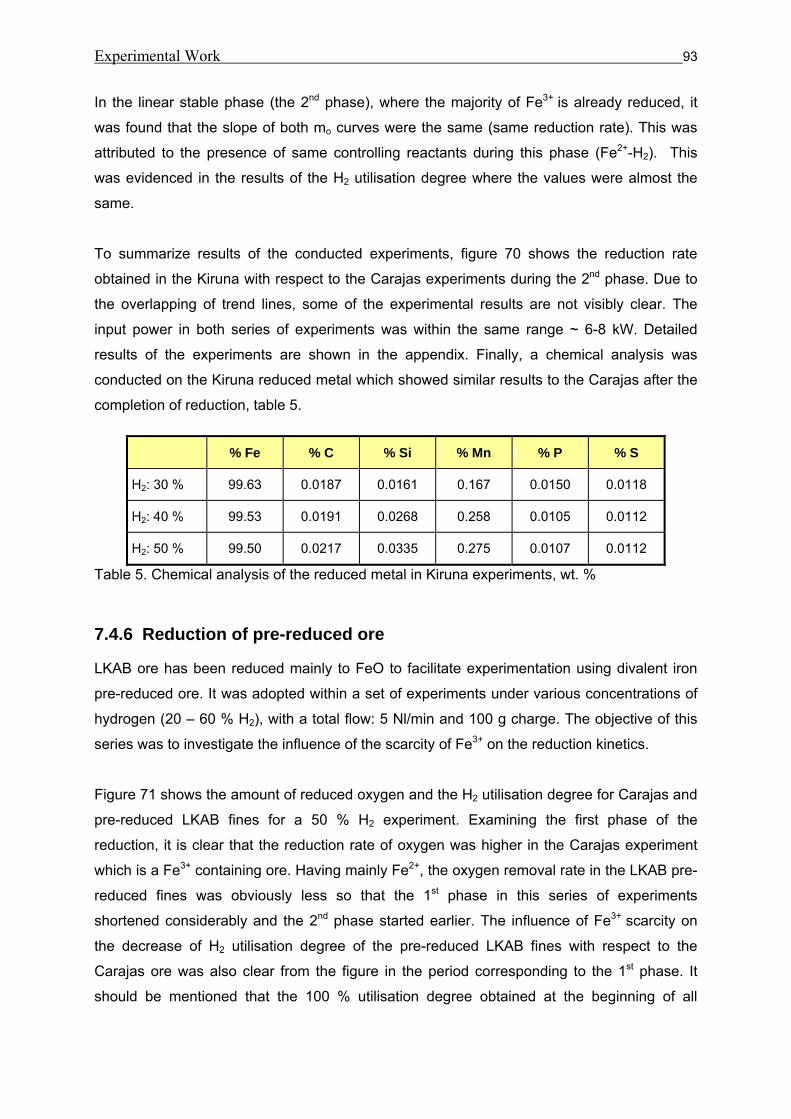
Experimental Work 93
In the linear stable phase (the 2nd phase), where the majority of Fe3+ is already reduced, it
was found that the slope of both mo curves were the same (same reduction rate). This was
attributed to the presence of same controlling reactants during this phase (Fe2+-H2). This
was evidenced in the results of the H2 utilisation degree where the values were almost the
same.
To summarize results of the conducted experiments, figure 70 shows the reduction rate
obtained in the Kiruna with respect to the Carajas experiments during the 2nd phase. Due to
the overlapping of trend lines, some of the experimental results are not visibly clear. The
input power in both series of experiments was within the same range ~ 6-8 kW. Detailed
results of the experiments are shown in the appendix. Finally, a chemical analysis was
conducted on the Kiruna reduced metal which showed similar results to the Carajas after the
completion of reduction, table 5.
Table 5. Chemical analysis of the reduced metal in Kiruna experiments, wt. %
7.4.6 Reduction of pre-reduced ore
LKAB ore has been reduced mainly to FeO to facilitate experimentation using divalent iron
pre-reduced ore. It was adopted within a set of experiments under various concentrations of
hydrogen (20 – 60 % H2), with a total flow: 5 Nl/min and 100 g charge. The objective of this
series was to investigate the influence of the scarcity of Fe3+ on the reduction kinetics.
Figure 71 shows the amount of reduced oxygen and the H2 utilisation degree for Carajas and
pre-reduced LKAB fines for a 50 % H2 experiment. Examining the first phase of the
reduction, it is clear that the reduction rate of oxygen was higher in the Carajas experiment
which is a Fe3+ containing ore. Having mainly Fe2+, the oxygen removal rate in the LKAB pre-
reduced fines was obviously less so that the 1st phase in this series of experiments
shortened considerably and the 2nd phase started earlier. The influence of Fe3+ scarcity on
the decrease of H2 utilisation degree of the pre-reduced LKAB fines with respect to the
Carajas ore was also clear from the figure in the period corresponding to the 1st phase. It
should be mentioned that the 100 % utilisation degree obtained at the beginning of all
% Fe % C % Si % Mn % P % S
H2: 30 % 99.63 0.0187 0.0161 0.167 0.0150 0.0118
H2: 40 % 99.53 0.0191 0.0268 0.258 0.0105 0.0112
H2: 50 % 99.50 0.0217 0.0335 0.275 0.0107 0.0112
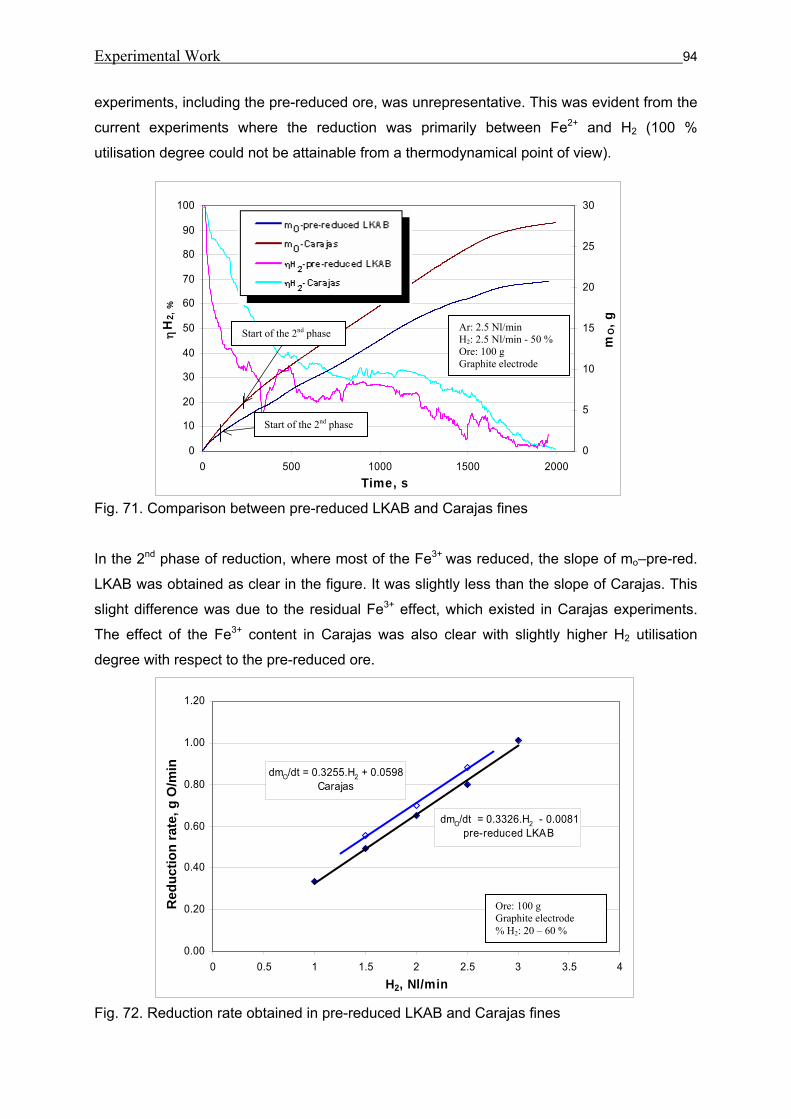
Experimental Work 94
0
10
20
30
40
50
60
70
80
90
100
0 500 1000 1500 2000Time, s
ηH
2, %
0
5
10
15
20
25
30
mO
, g
experiments, including the pre-reduced ore, was unrepresentative. This was evident from the
current experiments where the reduction was primarily between Fe2+ and H2 (100 %
utilisation degree could not be attainable from a thermodynamical point of view).
Fig. 71. Comparison between pre-reduced LKAB and Carajas fines
In the 2nd phase of reduction, where most of the Fe3+ was reduced, the slope of mo–pre-red.
LKAB was obtained as clear in the figure. It was slightly less than the slope of Carajas. This
slight difference was due to the residual Fe3+ effect, which existed in Carajas experiments.
The effect of the Fe3+ content in Carajas was also clear with slightly higher H2 utilisation
degree with respect to the pre-reduced ore.
Fig. 72. Reduction rate obtained in pre-reduced LKAB and Carajas fines
Ar: 2.5 Nl/min H2: 2.5 Nl/min - 50 % Ore: 100 g Graphite electrode
Start of the 2nd phase
Start of the 2nd phase
dmO/dt = 0.3255.H2 + 0.0598Carajas
dmO/dt = 0.3326.H2 - 0.0081pre-reduced LKAB
0.00
0.20
0.40
0.60
0.80
1.00
1.20
0 0.5 1 1.5 2 2.5 3 3.5 4H2, Nl/min
redu
ctio
n ra
te, g
O /m
inR
educ
tion
rate
, g O
/min
Ore: 100 g Graphite electrode % H2: 20 – 60 %
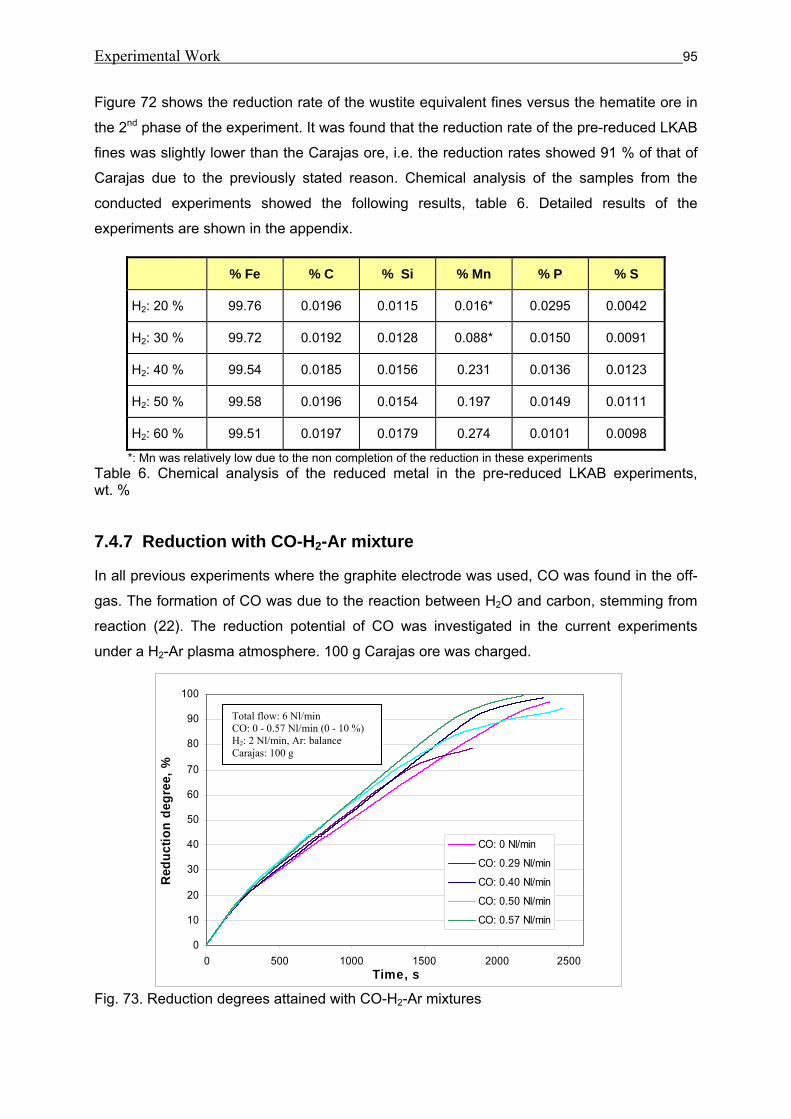
Experimental Work 95
0
10
20
30
40
50
60
70
80
90
100
0 500 1000 1500 2000 2500Time, s
Red
uctio
n de
gree
, %
CO: 0 Nl/min
CO: 0.29 Nl/min
CO: 0.40 Nl/min
CO: 0.50 Nl/min
CO: 0.57 Nl/min
Figure 72 shows the reduction rate of the wustite equivalent fines versus the hematite ore in
the 2nd phase of the experiment. It was found that the reduction rate of the pre-reduced LKAB
fines was slightly lower than the Carajas ore, i.e. the reduction rates showed 91 % of that of
Carajas due to the previously stated reason. Chemical analysis of the samples from the
conducted experiments showed the following results, table 6. Detailed results of the
experiments are shown in the appendix.
*: Mn was relatively low due to the non completion of the reduction in these experiments Table 6. Chemical analysis of the reduced metal in the pre-reduced LKAB experiments, wt. %
7.4.7 Reduction with CO-H2-Ar mixture
In all previous experiments where the graphite electrode was used, CO was found in the off-
gas. The formation of CO was due to the reaction between H2O and carbon, stemming from
reaction (22). The reduction potential of CO was investigated in the current experiments
under a H2-Ar plasma atmosphere. 100 g Carajas ore was charged.
Fig. 73. Reduction degrees attained with CO-H2-Ar mixtures
% Fe % C % Si % Mn % P % S
H2: 20 % 99.76 0.0196 0.0115 0.016* 0.0295 0.0042
H2: 30 % 99.72 0.0192 0.0128 0.088* 0.0150 0.0091
H2: 40 % 99.54 0.0185 0.0156 0.231 0.0136 0.0123
H2: 50 % 99.58 0.0196 0.0154 0.197 0.0149 0.0111
H2: 60 % 99.51 0.0197 0.0179 0.274 0.0101 0.0098
Total flow: 6 Nl/min CO: 0 - 0.57 Nl/min (0 - 10 %) H2: 2 Nl/min, Ar: balance Carajas: 100 g
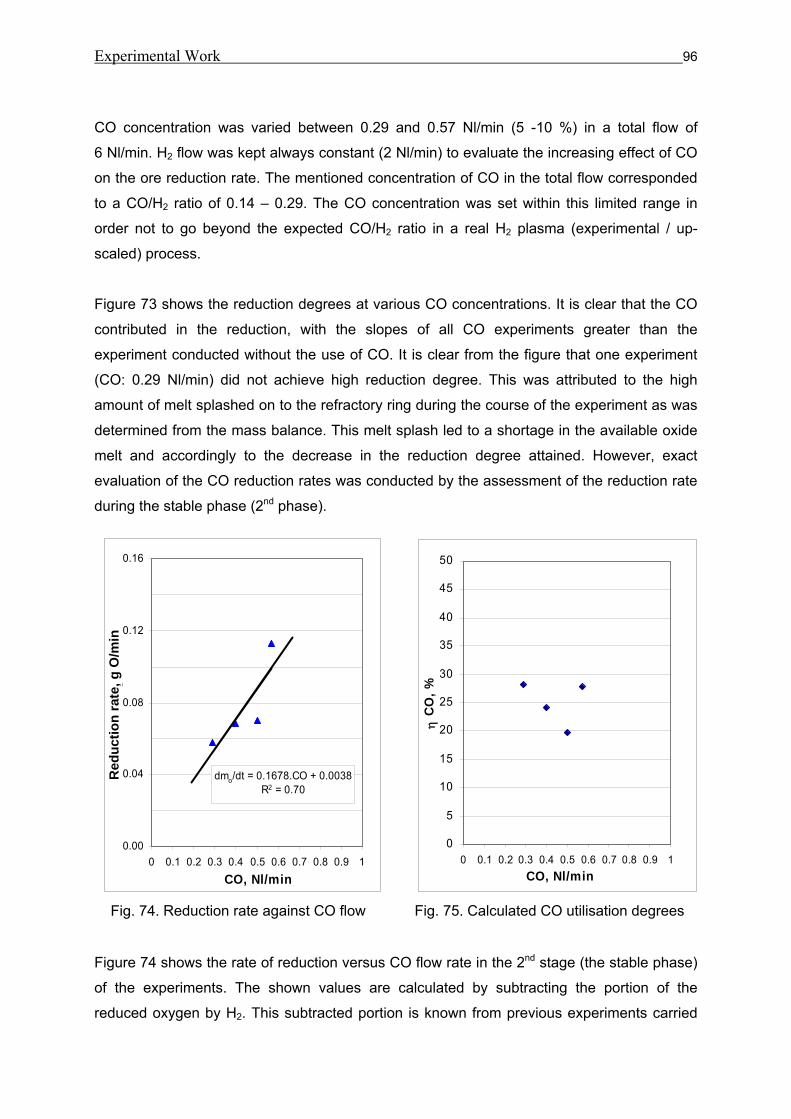
Experimental Work 96
CO concentration was varied between 0.29 and 0.57 Nl/min (5 -10 %) in a total flow of
6 Nl/min. H2 flow was kept always constant (2 Nl/min) to evaluate the increasing effect of CO
on the ore reduction rate. The mentioned concentration of CO in the total flow corresponded
to a CO/H2 ratio of 0.14 – 0.29. The CO concentration was set within this limited range in
order not to go beyond the expected CO/H2 ratio in a real H2 plasma (experimental / up-
scaled) process.
Figure 73 shows the reduction degrees at various CO concentrations. It is clear that the CO
contributed in the reduction, with the slopes of all CO experiments greater than the
experiment conducted without the use of CO. It is clear from the figure that one experiment
(CO: 0.29 Nl/min) did not achieve high reduction degree. This was attributed to the high
amount of melt splashed on to the refractory ring during the course of the experiment as was
determined from the mass balance. This melt splash led to a shortage in the available oxide
melt and accordingly to the decrease in the reduction degree attained. However, exact
evaluation of the CO reduction rates was conducted by the assessment of the reduction rate
during the stable phase (2nd phase).
Fig. 74. Reduction rate against CO flow Fig. 75. Calculated CO utilisation degrees
Figure 74 shows the rate of reduction versus CO flow rate in the 2nd stage (the stable phase)
of the experiments. The shown values are calculated by subtracting the portion of the
reduced oxygen by H2. This subtracted portion is known from previous experiments carried
dmo/dt = 0.1678.CO + 0.0038R2 = 0.70
0.00
0.04
0.08
0.12
0.16
0 0.1 0.2 0.3 0.4 0.5 0.6 0.7 0.8 0.9 1CO, Nl/min
redu
ctio
n ra
te, g
O /m
inR
educ
tion
rate
, g O
/min
0
5
10
15
20
25
30
35
40
45
50
0 0.1 0.2 0.3 0.4 0.5 0.6 0.7 0.8 0.9 1CO, Nl/min
η C
O, %
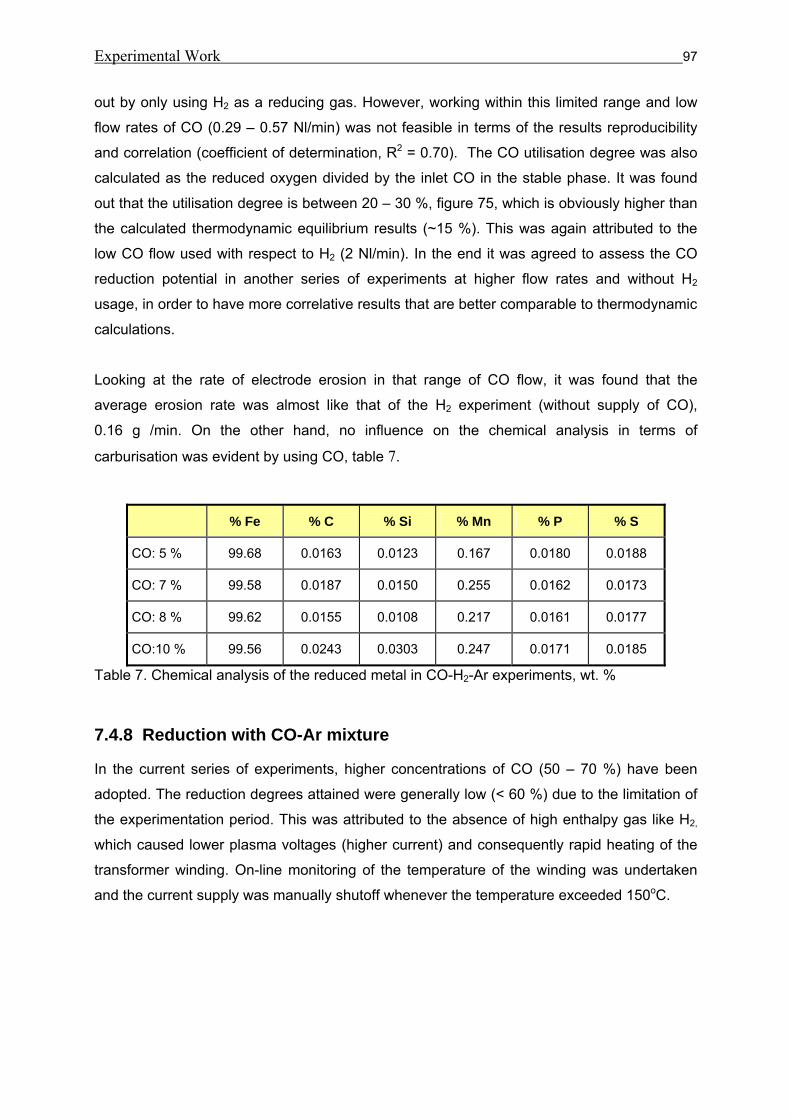
Experimental Work 97
out by only using H2 as a reducing gas. However, working within this limited range and low
flow rates of CO (0.29 – 0.57 Nl/min) was not feasible in terms of the results reproducibility
and correlation (coefficient of determination, R2 = 0.70). The CO utilisation degree was also
calculated as the reduced oxygen divided by the inlet CO in the stable phase. It was found
out that the utilisation degree is between 20 – 30 %, figure 75, which is obviously higher than
the calculated thermodynamic equilibrium results (~15 %). This was again attributed to the
low CO flow used with respect to H2 (2 Nl/min). In the end it was agreed to assess the CO
reduction potential in another series of experiments at higher flow rates and without H2
usage, in order to have more correlative results that are better comparable to thermodynamic
calculations.
Looking at the rate of electrode erosion in that range of CO flow, it was found that the
average erosion rate was almost like that of the H2 experiment (without supply of CO),
0.16 g /min. On the other hand, no influence on the chemical analysis in terms of
carburisation was evident by using CO, table 7.
Table 7. Chemical analysis of the reduced metal in CO-H2-Ar experiments, wt. %
7.4.8 Reduction with CO-Ar mixture
In the current series of experiments, higher concentrations of CO (50 – 70 %) have been
adopted. The reduction degrees attained were generally low (< 60 %) due to the limitation of
the experimentation period. This was attributed to the absence of high enthalpy gas like H2,
which caused lower plasma voltages (higher current) and consequently rapid heating of the
transformer winding. On-line monitoring of the temperature of the winding was undertaken
and the current supply was manually shutoff whenever the temperature exceeded 150oC.
% Fe % C % Si % Mn % P % S
CO: 5 % 99.68 0.0163 0.0123 0.167 0.0180 0.0188
CO: 7 % 99.58 0.0187 0.0150 0.255 0.0162 0.0173
CO: 8 % 99.62 0.0155 0.0108 0.217 0.0161 0.0177
CO:10 % 99.56 0.0243 0.0303 0.247 0.0171 0.0185
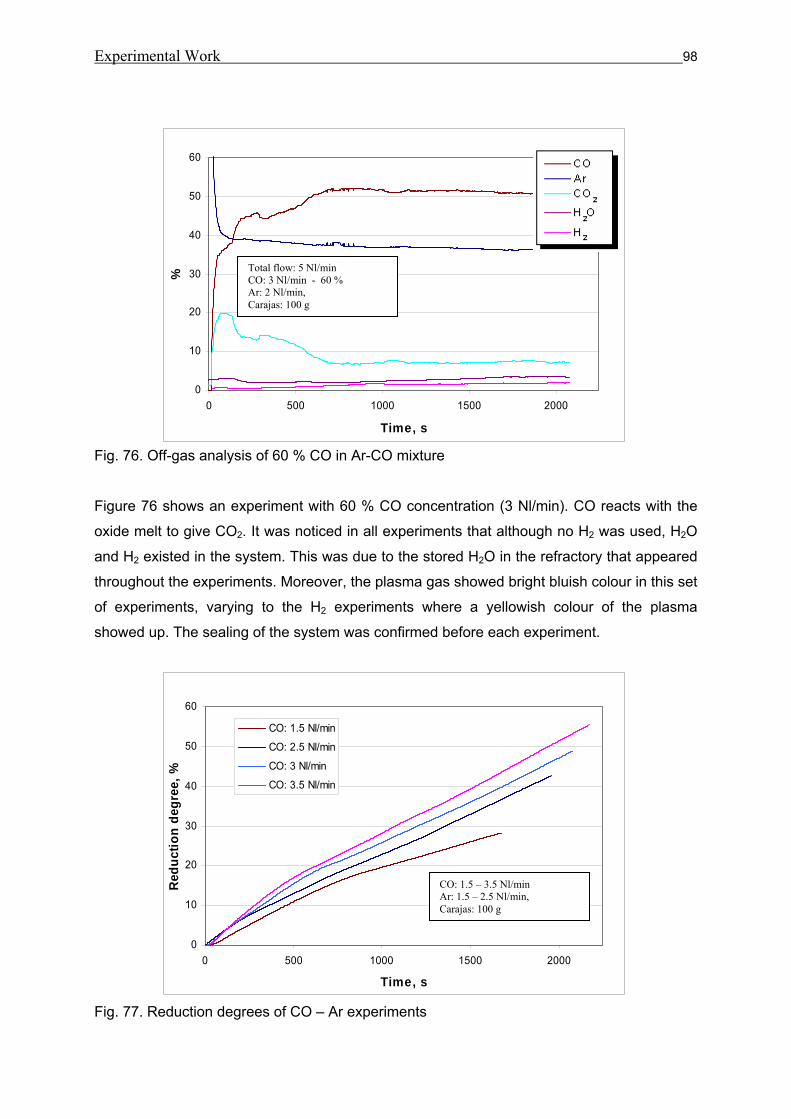
Experimental Work 98
0
10
20
30
40
50
60
0 500 1000 1500 2000
Time, s
Red
uctio
n de
gree
, %
CO: 1.5 Nl/min
CO: 2.5 Nl/min
CO: 3 Nl/min
CO: 3.5 Nl/min
Fig. 76. Off-gas analysis of 60 % CO in Ar-CO mixture
Figure 76 shows an experiment with 60 % CO concentration (3 Nl/min). CO reacts with the
oxide melt to give CO2. It was noticed in all experiments that although no H2 was used, H2O
and H2 existed in the system. This was due to the stored H2O in the refractory that appeared
throughout the experiments. Moreover, the plasma gas showed bright bluish colour in this set
of experiments, varying to the H2 experiments where a yellowish colour of the plasma
showed up. The sealing of the system was confirmed before each experiment.
Fig. 77. Reduction degrees of CO – Ar experiments
0
10
20
30
40
50
60
0 500 1000 1500 2000
Time, s
% Total flow: 5 Nl/min CO: 3 Nl/min - 60 % Ar: 2 Nl/min, Carajas: 100 g
CO: 1.5 – 3.5 Nl/min Ar: 1.5 – 2.5 Nl/min, Carajas: 100 g
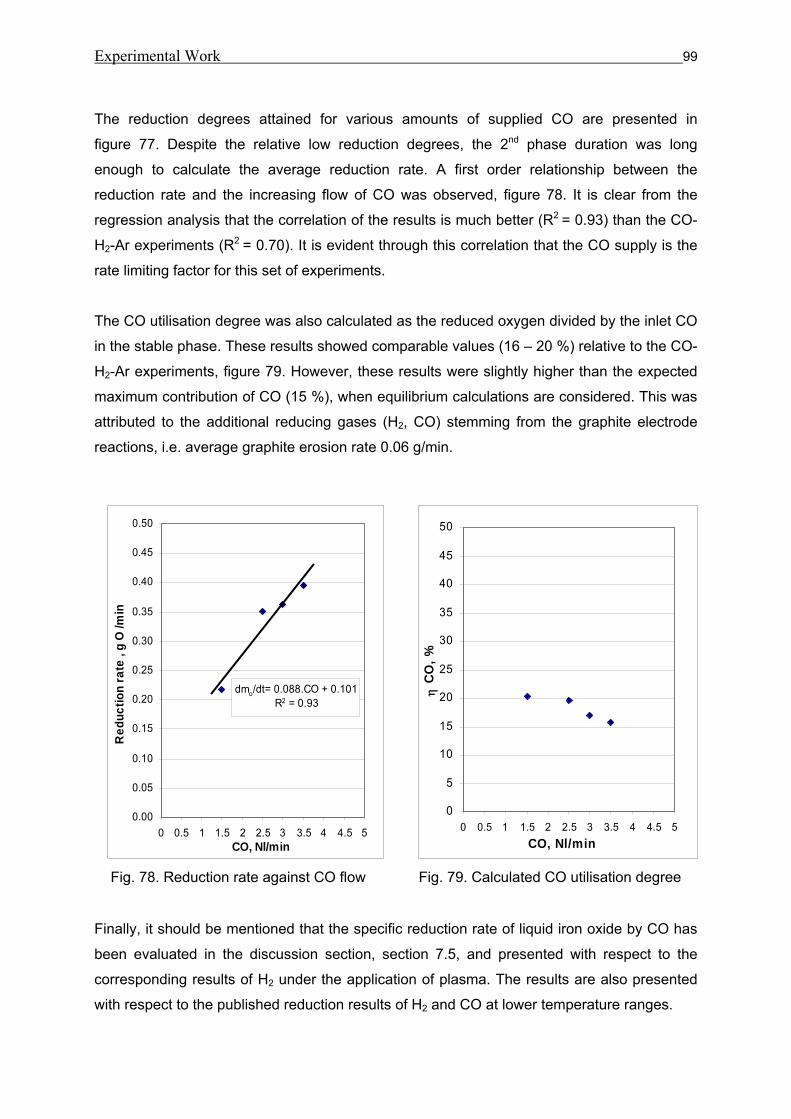
Experimental Work 99
The reduction degrees attained for various amounts of supplied CO are presented in
figure 77. Despite the relative low reduction degrees, the 2nd phase duration was long
enough to calculate the average reduction rate. A first order relationship between the
reduction rate and the increasing flow of CO was observed, figure 78. It is clear from the
regression analysis that the correlation of the results is much better (R2 = 0.93) than the CO-
H2-Ar experiments (R2 = 0.70). It is evident through this correlation that the CO supply is the
rate limiting factor for this set of experiments.
The CO utilisation degree was also calculated as the reduced oxygen divided by the inlet CO
in the stable phase. These results showed comparable values (16 – 20 %) relative to the CO-
H2-Ar experiments, figure 79. However, these results were slightly higher than the expected
maximum contribution of CO (15 %), when equilibrium calculations are considered. This was
attributed to the additional reducing gases (H2, CO) stemming from the graphite electrode
reactions, i.e. average graphite erosion rate 0.06 g/min.
Fig. 78. Reduction rate against CO flow Fig. 79. Calculated CO utilisation degree
Finally, it should be mentioned that the specific reduction rate of liquid iron oxide by CO has
been evaluated in the discussion section, section 7.5, and presented with respect to the
corresponding results of H2 under the application of plasma. The results are also presented
with respect to the published reduction results of H2 and CO at lower temperature ranges.
Red
uctio
n ra
te, g
O/m
in
0
5
10
15
20
25
30
35
40
45
50
0 0.5 1 1.5 2 2.5 3 3.5 4 4.5 5CO, Nl/min
η C
O, %
dmo/dt= 0.088.CO + 0.101R2 = 0.93
0.00
0.05
0.10
0.15
0.20
0.25
0.30
0.35
0.40
0.45
0.50
0 0.5 1 1.5 2 2.5 3 3.5 4 4.5 5CO, Nl/min
Red
uctio
n ra
te ,
g O
/min
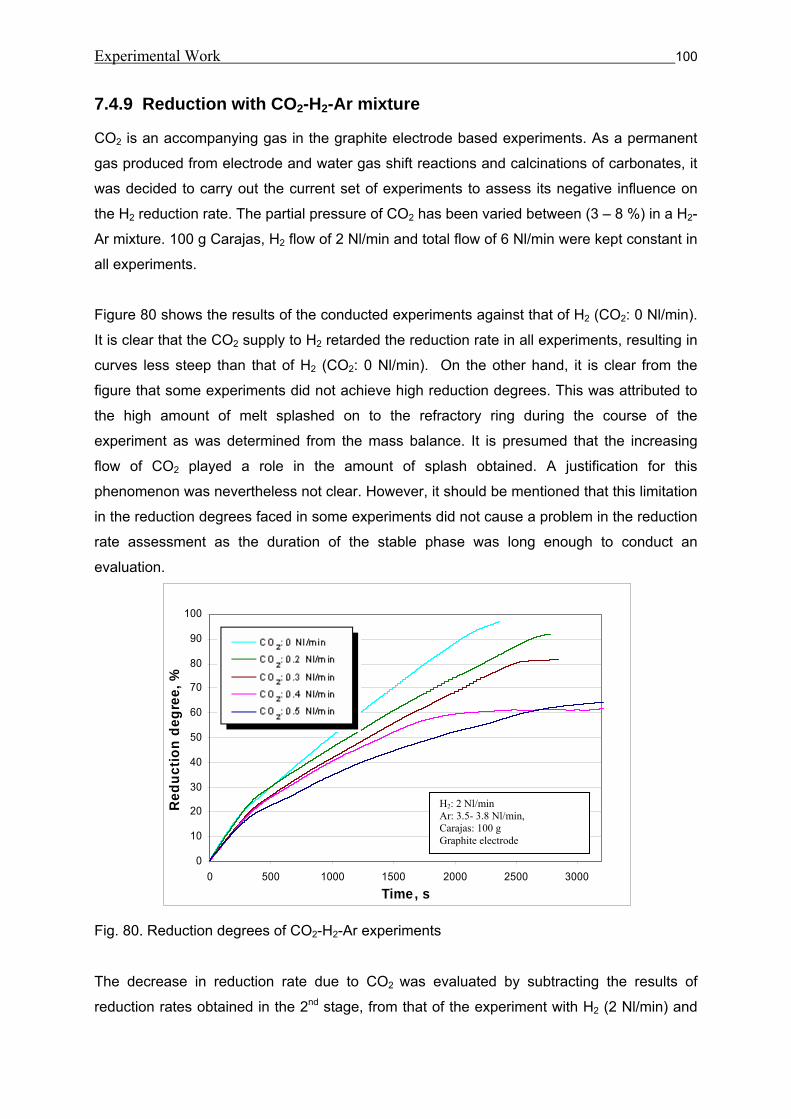
Experimental Work 100
Red
uctio
n de
gree
, %
0
10
20
30
40
50
60
70
80
90
100
0 500 1000 1500 2000 2500 3000Time, s
Red
uctio
n de
gree
, %
7.4.9 Reduction with CO2-H2-Ar mixture
CO2 is an accompanying gas in the graphite electrode based experiments. As a permanent
gas produced from electrode and water gas shift reactions and calcinations of carbonates, it
was decided to carry out the current set of experiments to assess its negative influence on
the H2 reduction rate. The partial pressure of CO2 has been varied between (3 – 8 %) in a H2-
Ar mixture. 100 g Carajas, H2 flow of 2 Nl/min and total flow of 6 Nl/min were kept constant in
all experiments.
Figure 80 shows the results of the conducted experiments against that of H2 (CO2: 0 Nl/min).
It is clear that the CO2 supply to H2 retarded the reduction rate in all experiments, resulting in
curves less steep than that of H2 (CO2: 0 Nl/min). On the other hand, it is clear from the
figure that some experiments did not achieve high reduction degrees. This was attributed to
the high amount of melt splashed on to the refractory ring during the course of the
experiment as was determined from the mass balance. It is presumed that the increasing
flow of CO2 played a role in the amount of splash obtained. A justification for this
phenomenon was nevertheless not clear. However, it should be mentioned that this limitation
in the reduction degrees faced in some experiments did not cause a problem in the reduction
rate assessment as the duration of the stable phase was long enough to conduct an
evaluation.
Fig. 80. Reduction degrees of CO2-H2-Ar experiments The decrease in reduction rate due to CO2 was evaluated by subtracting the results of
reduction rates obtained in the 2nd stage, from that of the experiment with H2 (2 Nl/min) and
H2: 2 Nl/min Ar: 3.5- 3.8 Nl/min, Carajas: 100 g Graphite electrode
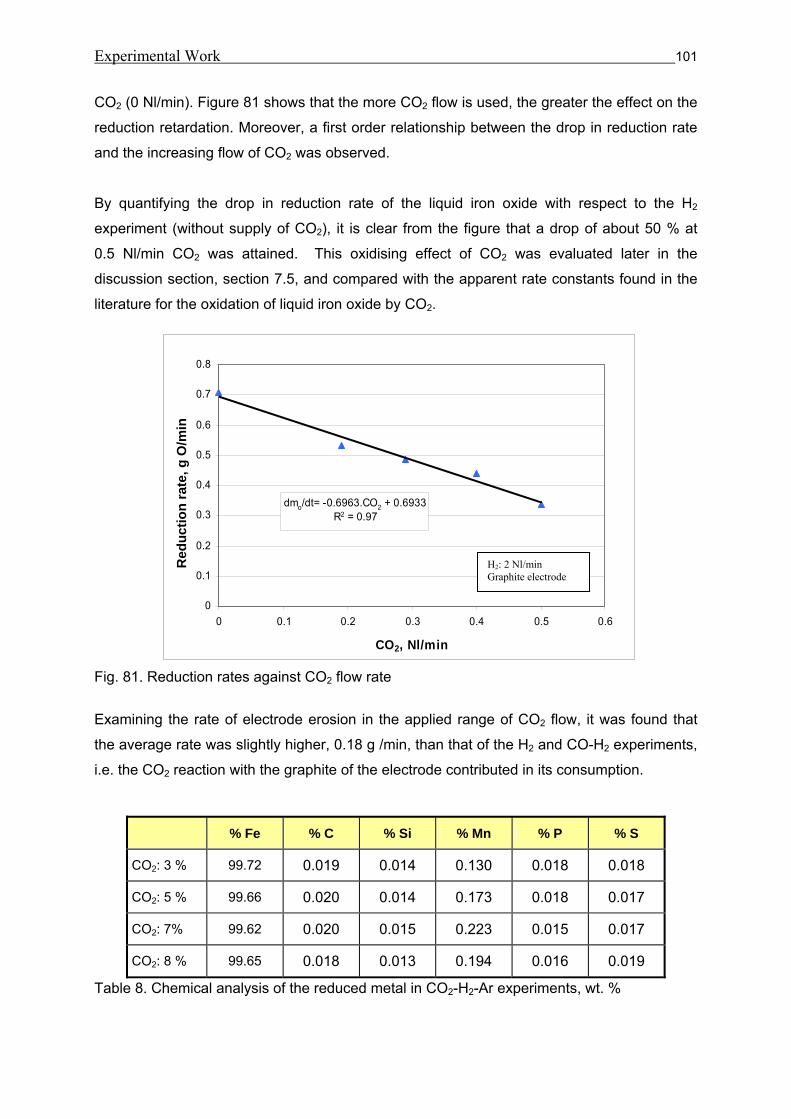
Experimental Work 101
CO2 (0 Nl/min). Figure 81 shows that the more CO2 flow is used, the greater the effect on the
reduction retardation. Moreover, a first order relationship between the drop in reduction rate
and the increasing flow of CO2 was observed.
By quantifying the drop in reduction rate of the liquid iron oxide with respect to the H2
experiment (without supply of CO2), it is clear from the figure that a drop of about 50 % at
0.5 Nl/min CO2 was attained. This oxidising effect of CO2 was evaluated later in the
discussion section, section 7.5, and compared with the apparent rate constants found in the
literature for the oxidation of liquid iron oxide by CO2.
Fig. 81. Reduction rates against CO2 flow rate
Examining the rate of electrode erosion in the applied range of CO2 flow, it was found that
the average rate was slightly higher, 0.18 g /min, than that of the H2 and CO-H2 experiments,
i.e. the CO2 reaction with the graphite of the electrode contributed in its consumption.
Table 8. Chemical analysis of the reduced metal in CO2-H2-Ar experiments, wt. %
% Fe % C % Si % Mn % P % S
CO2: 3 % 99.72 0.019 0.014 0.130 0.018 0.018
CO2: 5 % 99.66 0.020 0.014 0.173 0.018 0.017
CO2: 7% 99.62 0.020 0.015 0.223 0.015 0.017
CO2: 8 % 99.65 0.018 0.013 0.194 0.016 0.019
dmo/dt= -0.6963.CO2 + 0.6933R2 = 0.97
0
0.1
0.2
0.3
0.4
0.5
0.6
0.7
0.8
0 0.1 0.2 0.3 0.4 0.5 0.6
CO2, Nl/min
redu
ctio
n ra
te, g
O /m
in
H2: 2 Nl/min Graphite electrode
Red
uctio
n ra
te, g
O/m
in
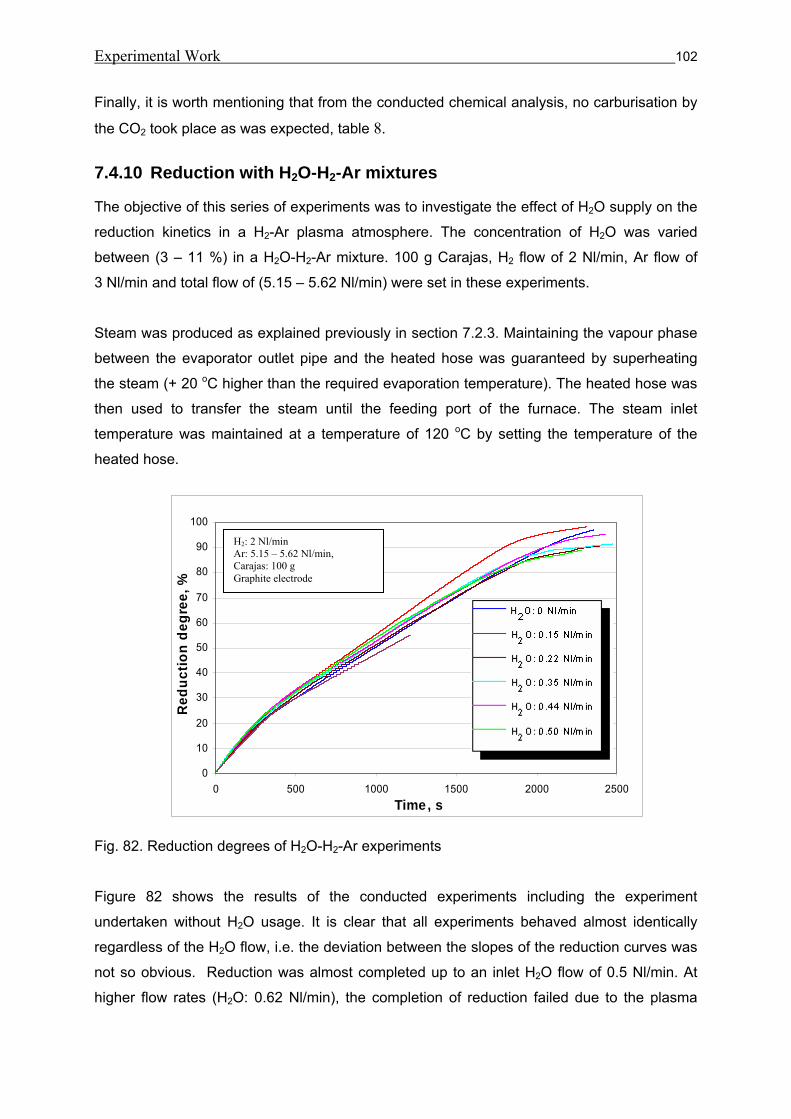
Experimental Work 102
0
10
20
30
40
50
60
70
80
90
100
0 500 1000 1500 2000 2500Time, s
Red
uctio
n de
gree
, %
Finally, it is worth mentioning that from the conducted chemical analysis, no carburisation by
the CO2 took place as was expected, table 8.
7.4.10 Reduction with H2O-H2-Ar mixtures
The objective of this series of experiments was to investigate the effect of H2O supply on the
reduction kinetics in a H2-Ar plasma atmosphere. The concentration of H2O was varied
between (3 – 11 %) in a H2O-H2-Ar mixture. 100 g Carajas, H2 flow of 2 Nl/min, Ar flow of
3 Nl/min and total flow of (5.15 – 5.62 Nl/min) were set in these experiments.
Steam was produced as explained previously in section 7.2.3. Maintaining the vapour phase
between the evaporator outlet pipe and the heated hose was guaranteed by superheating
the steam (+ 20 oC higher than the required evaporation temperature). The heated hose was
then used to transfer the steam until the feeding port of the furnace. The steam inlet
temperature was maintained at a temperature of 120 oC by setting the temperature of the
heated hose.
Fig. 82. Reduction degrees of H2O-H2-Ar experiments Figure 82 shows the results of the conducted experiments including the experiment
undertaken without H2O usage. It is clear that all experiments behaved almost identically
regardless of the H2O flow, i.e. the deviation between the slopes of the reduction curves was
not so obvious. Reduction was almost completed up to an inlet H2O flow of 0.5 Nl/min. At
higher flow rates (H2O: 0.62 Nl/min), the completion of reduction failed due to the plasma
H2: 2 Nl/min Ar: 5.15 – 5.62 Nl/min, Carajas: 100 g Graphite electrode
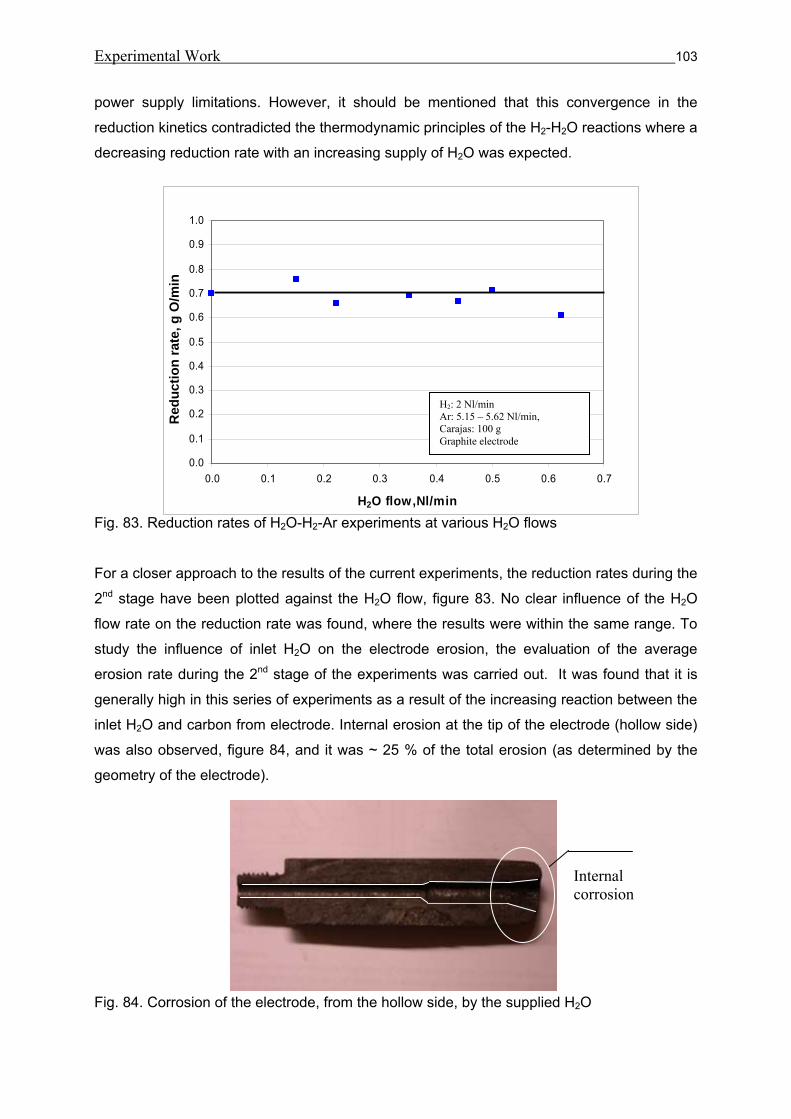
Experimental Work 103
power supply limitations. However, it should be mentioned that this convergence in the
reduction kinetics contradicted the thermodynamic principles of the H2-H2O reactions where a
decreasing reduction rate with an increasing supply of H2O was expected.
Fig. 83. Reduction rates of H2O-H2-Ar experiments at various H2O flows For a closer approach to the results of the current experiments, the reduction rates during the
2nd stage have been plotted against the H2O flow, figure 83. No clear influence of the H2O
flow rate on the reduction rate was found, where the results were within the same range. To
study the influence of inlet H2O on the electrode erosion, the evaluation of the average
erosion rate during the 2nd stage of the experiments was carried out. It was found that it is
generally high in this series of experiments as a result of the increasing reaction between the
inlet H2O and carbon from electrode. Internal erosion at the tip of the electrode (hollow side)
was also observed, figure 84, and it was ~ 25 % of the total erosion (as determined by the
geometry of the electrode).
Fig. 84. Corrosion of the electrode, from the hollow side, by the supplied H2O
Internal corrosion
0.0
0.1
0.2
0.3
0.4
0.5
0.6
0.7
0.8
0.9
1.0
0.0 0.1 0.2 0.3 0.4 0.5 0.6 0.7
H2O flow,Nl/min
redu
ctio
n ra
te, g
O /
min
Red
uctio
n ra
te, g
O/m
in
H2: 2 Nl/min Ar: 5.15 – 5.62 Nl/min, Carajas: 100 g Graphite electrode
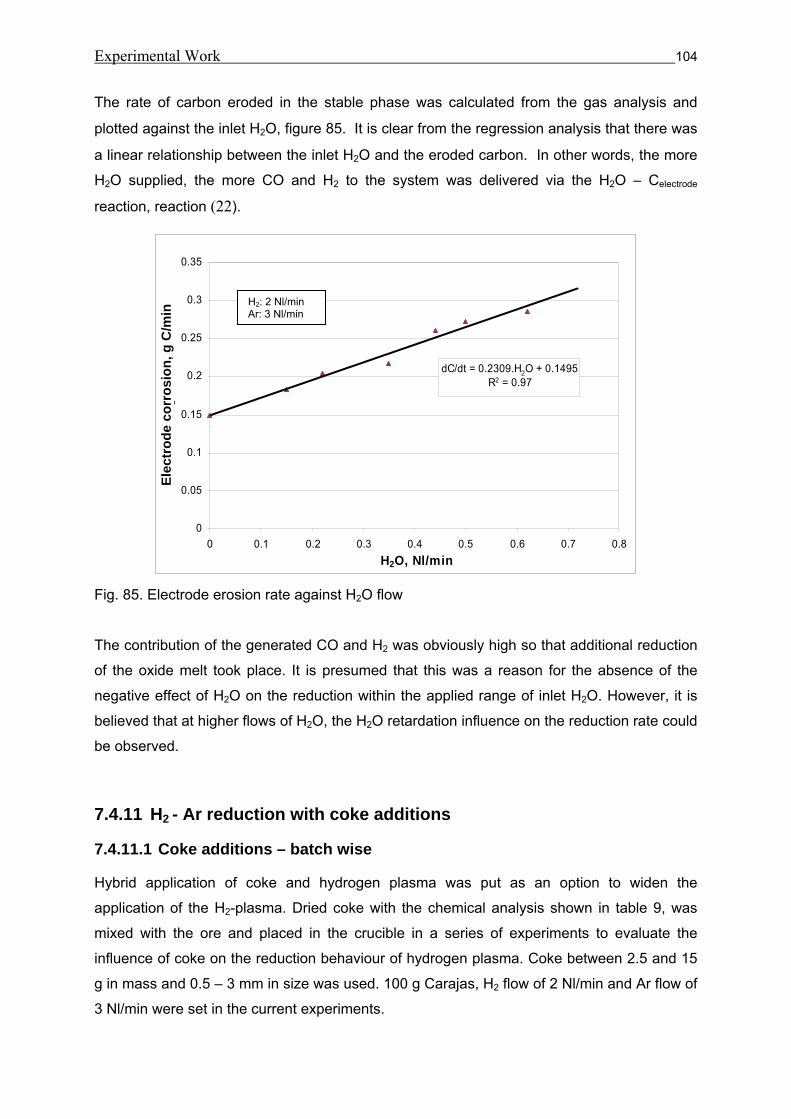
Experimental Work 104
dC/dt = 0.2309.H2O + 0.1495R2 = 0.97
0
0.05
0.1
0.15
0.2
0.25
0.3
0.35
0 0.1 0.2 0.3 0.4 0.5 0.6 0.7 0.8 H2O, Nl/min
C, g
/min
The rate of carbon eroded in the stable phase was calculated from the gas analysis and
plotted against the inlet H2O, figure 85. It is clear from the regression analysis that there was
a linear relationship between the inlet H2O and the eroded carbon. In other words, the more
H2O supplied, the more CO and H2 to the system was delivered via the H2O – Celectrode
reaction, reaction (22).
Fig. 85. Electrode erosion rate against H2O flow The contribution of the generated CO and H2 was obviously high so that additional reduction
of the oxide melt took place. It is presumed that this was a reason for the absence of the
negative effect of H2O on the reduction within the applied range of inlet H2O. However, it is
believed that at higher flows of H2O, the H2O retardation influence on the reduction rate could
be observed.
7.4.11 H2 - Ar reduction with coke additions
7.4.11.1 Coke additions – batch wise
Hybrid application of coke and hydrogen plasma was put as an option to widen the
application of the H2-plasma. Dried coke with the chemical analysis shown in table 9, was
mixed with the ore and placed in the crucible in a series of experiments to evaluate the
influence of coke on the reduction behaviour of hydrogen plasma. Coke between 2.5 and 15
g in mass and 0.5 – 3 mm in size was used. 100 g Carajas, H2 flow of 2 Nl/min and Ar flow of
3 Nl/min were set in the current experiments.
H2: 2 Nl/min Ar: 3 Nl/min
Elec
trod
e co
rros
ion,
g C
/min
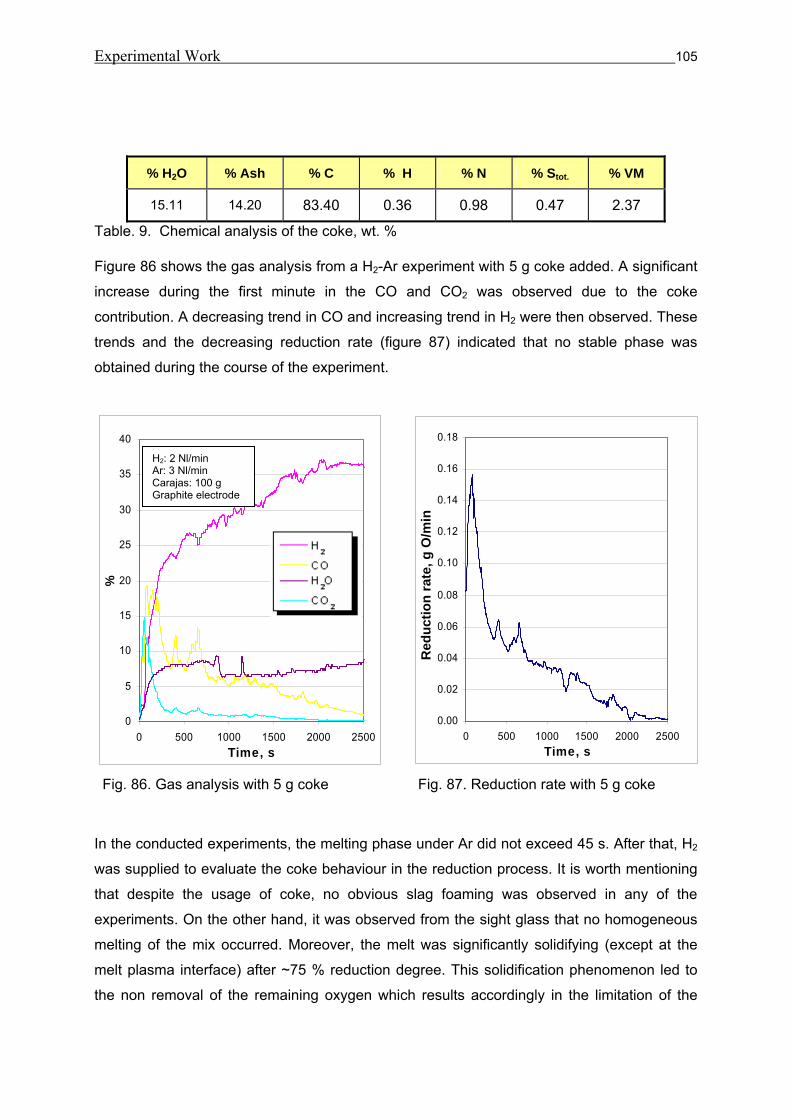
Experimental Work 105
Table. 9. Chemical analysis of the coke, wt. % Figure 86 shows the gas analysis from a H2-Ar experiment with 5 g coke added. A significant
increase during the first minute in the CO and CO2 was observed due to the coke
contribution. A decreasing trend in CO and increasing trend in H2 were then observed. These
trends and the decreasing reduction rate (figure 87) indicated that no stable phase was
obtained during the course of the experiment.
Fig. 86. Gas analysis with 5 g coke Fig. 87. Reduction rate with 5 g coke
In the conducted experiments, the melting phase under Ar did not exceed 45 s. After that, H2
was supplied to evaluate the coke behaviour in the reduction process. It is worth mentioning
that despite the usage of coke, no obvious slag foaming was observed in any of the
experiments. On the other hand, it was observed from the sight glass that no homogeneous
melting of the mix occurred. Moreover, the melt was significantly solidifying (except at the
melt plasma interface) after ~75 % reduction degree. This solidification phenomenon led to
the non removal of the remaining oxygen which results accordingly in the limitation of the
% H2O % Ash % C % H % N % Stot. % VM
15.11 14.20 83.40 0.36 0.98 0.47 2.37
0
5
10
15
20
25
30
35
40
0 500 1000 1500 2000 2500Time, s
%
0.00
0.02
0.04
0.06
0.08
0.10
0.12
0.14
0.16
0.18
0 500 1000 1500 2000 2500Time, s
redu
ctio
n ra
te, g
O /
min
H2: 2 Nl/min Ar: 3 Nl/min Carajas: 100 g Graphite electrode
Red
uctio
n ra
te, g
O/m
in
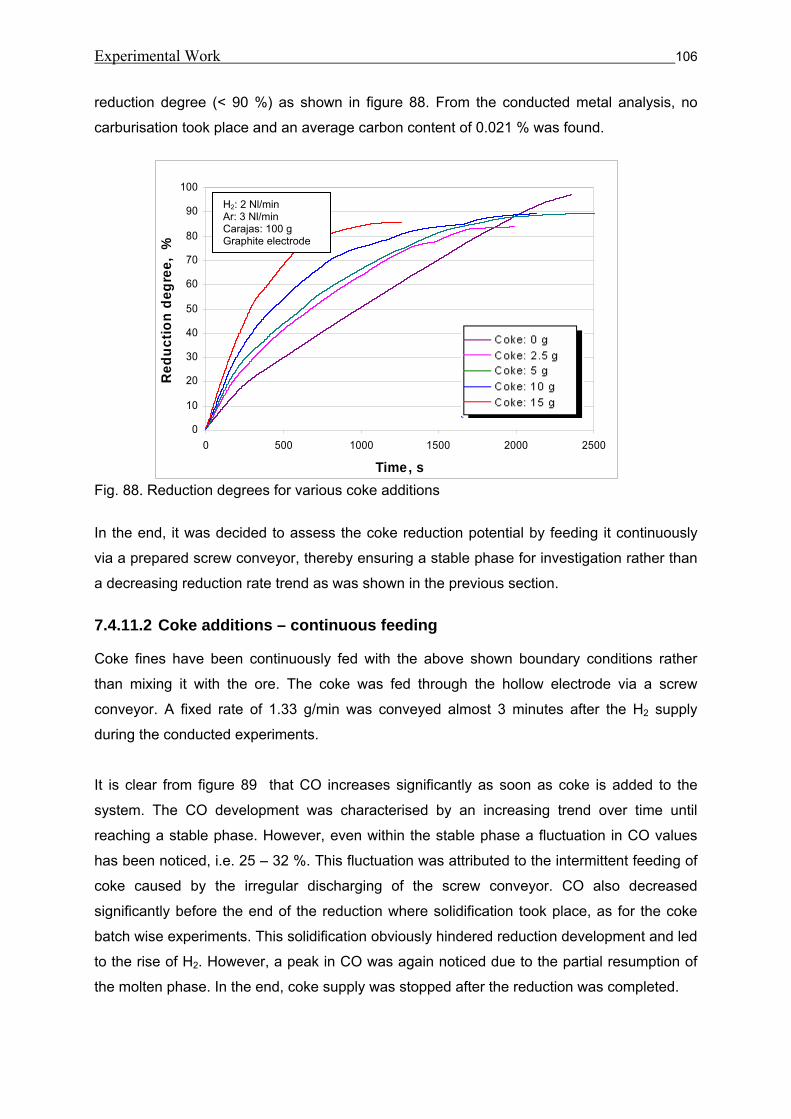
Experimental Work 106
0
10
20
30
40
50
60
70
80
90
100
0 500 1000 1500 2000 2500
Time, s
Red
uctio
n de
gree
, %
reduction degree (< 90 %) as shown in figure 88. From the conducted metal analysis, no
carburisation took place and an average carbon content of 0.021 % was found.
Fig. 88. Reduction degrees for various coke additions
In the end, it was decided to assess the coke reduction potential by feeding it continuously
via a prepared screw conveyor, thereby ensuring a stable phase for investigation rather than
a decreasing reduction rate trend as was shown in the previous section.
7.4.11.2 Coke additions – continuous feeding
Coke fines have been continuously fed with the above shown boundary conditions rather
than mixing it with the ore. The coke was fed through the hollow electrode via a screw
conveyor. A fixed rate of 1.33 g/min was conveyed almost 3 minutes after the H2 supply
during the conducted experiments.
It is clear from figure 89 that CO increases significantly as soon as coke is added to the
system. The CO development was characterised by an increasing trend over time until
reaching a stable phase. However, even within the stable phase a fluctuation in CO values
has been noticed, i.e. 25 – 32 %. This fluctuation was attributed to the intermittent feeding of
coke caused by the irregular discharging of the screw conveyor. CO also decreased
significantly before the end of the reduction where solidification took place, as for the coke
batch wise experiments. This solidification obviously hindered reduction development and led
to the rise of H2. However, a peak in CO was again noticed due to the partial resumption of
the molten phase. In the end, coke supply was stopped after the reduction was completed.
H2: 2 Nl/min Ar: 3 Nl/min Carajas: 100 g Graphite electrode
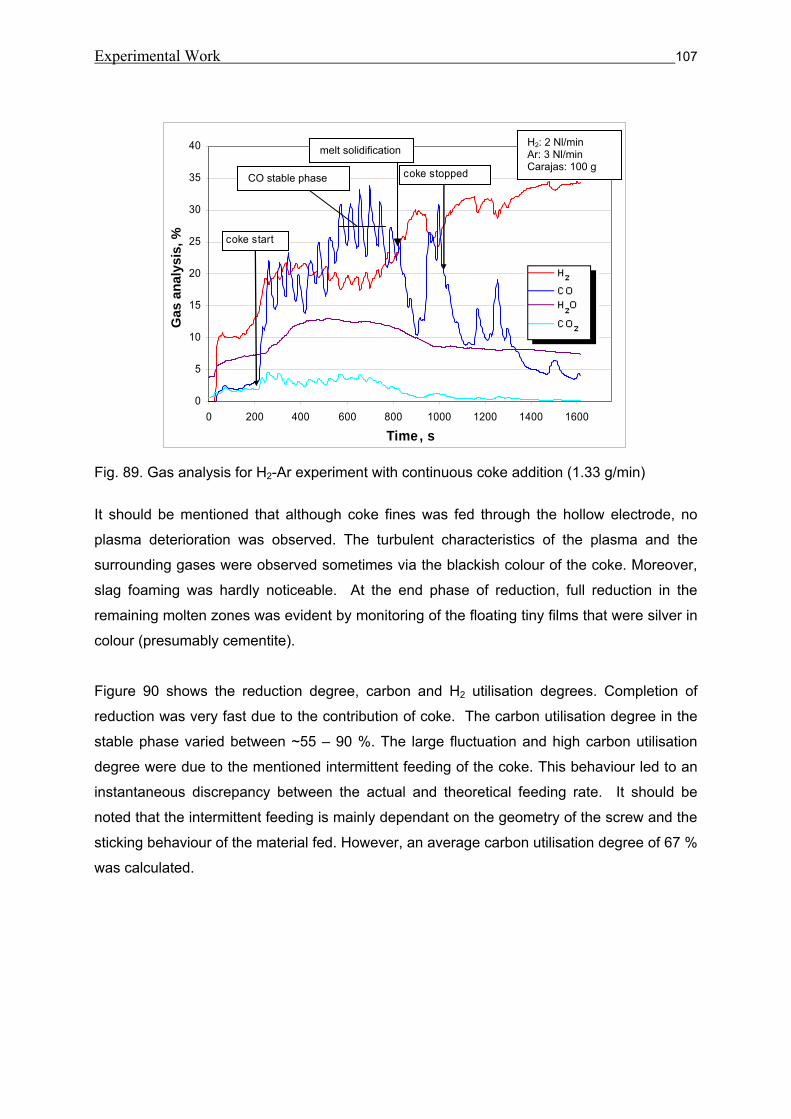
Experimental Work 107
Fig. 89. Gas analysis for H2-Ar experiment with continuous coke addition (1.33 g/min)
It should be mentioned that although coke fines was fed through the hollow electrode, no
plasma deterioration was observed. The turbulent characteristics of the plasma and the
surrounding gases were observed sometimes via the blackish colour of the coke. Moreover,
slag foaming was hardly noticeable. At the end phase of reduction, full reduction in the
remaining molten zones was evident by monitoring of the floating tiny films that were silver in
colour (presumably cementite).
Figure 90 shows the reduction degree, carbon and H2 utilisation degrees. Completion of
reduction was very fast due to the contribution of coke. The carbon utilisation degree in the
stable phase varied between ~55 – 90 %. The large fluctuation and high carbon utilisation
degree were due to the mentioned intermittent feeding of the coke. This behaviour led to an
instantaneous discrepancy between the actual and theoretical feeding rate. It should be
noted that the intermittent feeding is mainly dependant on the geometry of the screw and the
sticking behaviour of the material fed. However, an average carbon utilisation degree of 67 %
was calculated.
0
5
10
15
20
25
30
35
40
0 200 400 600 800 1000 1200 1400 1600
Time, s
%coke stopped
coke start
CO stable phase
H2: 2 Nl/min Ar: 3 Nl/min Carajas: 100 g
melt solidification
Gas
ana
lysi
s, %
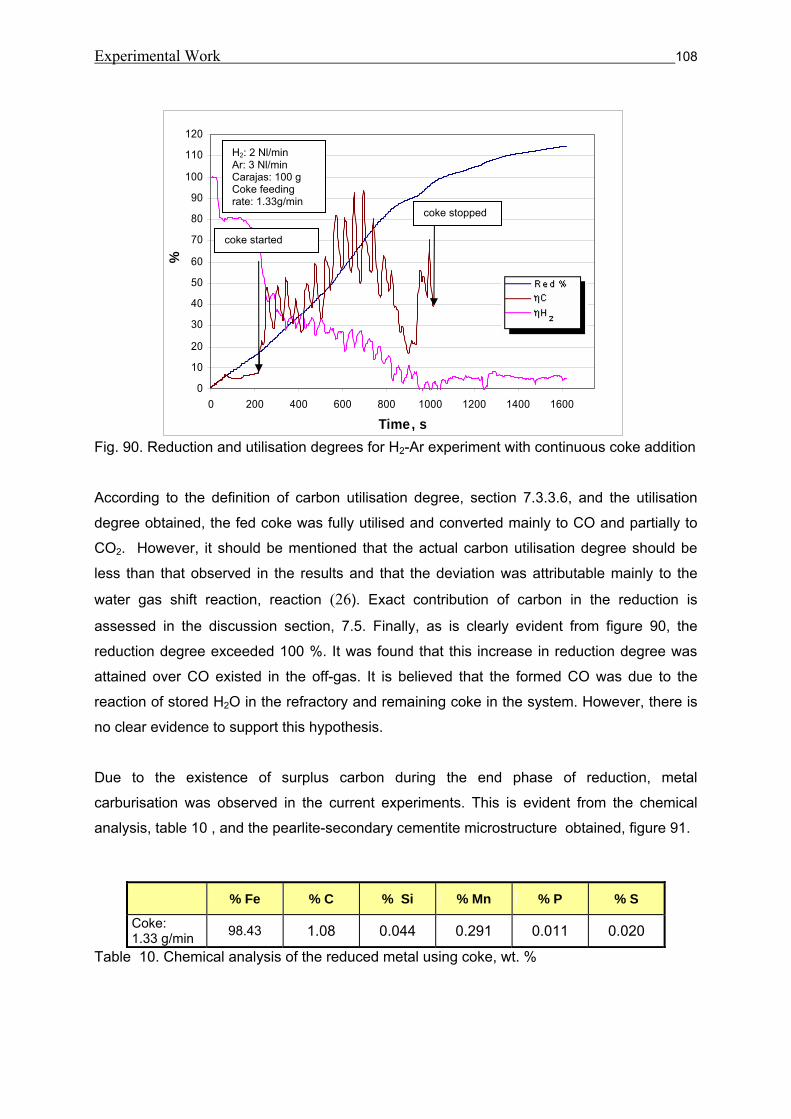
Experimental Work 108
0
10
20
30
40
50
60
70
80
90
100
110
120
0 200 400 600 800 1000 1200 1400 1600
Time, s
%
Fig. 90. Reduction and utilisation degrees for H2-Ar experiment with continuous coke addition According to the definition of carbon utilisation degree, section 7.3.3.6, and the utilisation
degree obtained, the fed coke was fully utilised and converted mainly to CO and partially to
CO2. However, it should be mentioned that the actual carbon utilisation degree should be
less than that observed in the results and that the deviation was attributable mainly to the
water gas shift reaction, reaction (26). Exact contribution of carbon in the reduction is
assessed in the discussion section, 7.5. Finally, as is clearly evident from figure 90, the
reduction degree exceeded 100 %. It was found that this increase in reduction degree was
attained over CO existed in the off-gas. It is believed that the formed CO was due to the
reaction of stored H2O in the refractory and remaining coke in the system. However, there is
no clear evidence to support this hypothesis.
Due to the existence of surplus carbon during the end phase of reduction, metal
carburisation was observed in the current experiments. This is evident from the chemical
analysis, table 10 , and the pearlite-secondary cementite microstructure obtained, figure 91.
Table 10. Chemical analysis of the reduced metal using coke, wt. %
% Fe % C % Si % Mn % P % S
Coke: 1.33 g/min 98.43 1.08 0.044 0.291 0.011 0.020
H2: 2 Nl/min Ar: 3 Nl/min Carajas: 100 g Coke feeding rate: 1.33g/min
coke stopped
coke started
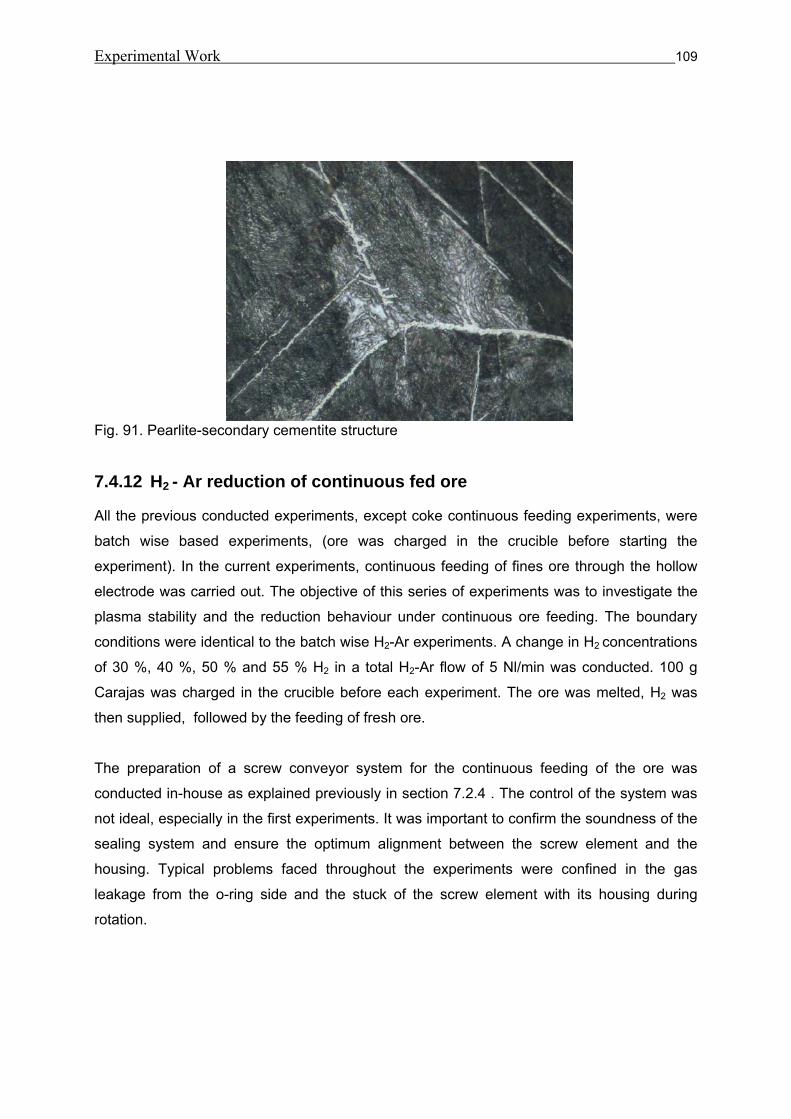
Experimental Work 109
Fig. 91. Pearlite-secondary cementite structure
7.4.12 H2 - Ar reduction of continuous fed ore
All the previous conducted experiments, except coke continuous feeding experiments, were
batch wise based experiments, (ore was charged in the crucible before starting the
experiment). In the current experiments, continuous feeding of fines ore through the hollow
electrode was carried out. The objective of this series of experiments was to investigate the
plasma stability and the reduction behaviour under continuous ore feeding. The boundary
conditions were identical to the batch wise H2-Ar experiments. A change in H2 concentrations
of 30 %, 40 %, 50 % and 55 % H2 in a total H2-Ar flow of 5 Nl/min was conducted. 100 g
Carajas was charged in the crucible before each experiment. The ore was melted, H2 was
then supplied, followed by the feeding of fresh ore.
The preparation of a screw conveyor system for the continuous feeding of the ore was
conducted in-house as explained previously in section 7.2.4 . The control of the system was
not ideal, especially in the first experiments. It was important to confirm the soundness of the
sealing system and ensure the optimum alignment between the screw element and the
housing. Typical problems faced throughout the experiments were confined in the gas
leakage from the o-ring side and the stuck of the screw element with its housing during
rotation.
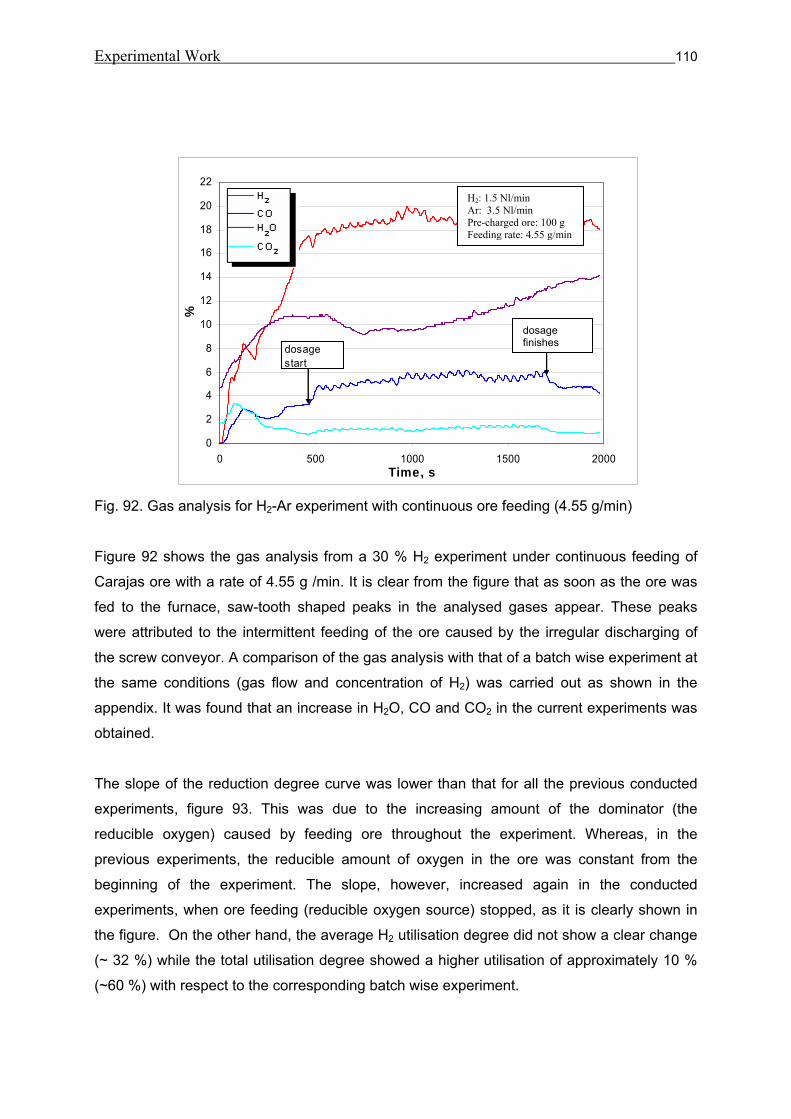
Experimental Work 110
0
2
4
6
8
10
12
14
16
18
20
22
0 500 1000 1500 2000Time, s
%
dosage start
dosage f inishes
Fig. 92. Gas analysis for H2-Ar experiment with continuous ore feeding (4.55 g/min) Figure 92 shows the gas analysis from a 30 % H2 experiment under continuous feeding of
Carajas ore with a rate of 4.55 g /min. It is clear from the figure that as soon as the ore was
fed to the furnace, saw-tooth shaped peaks in the analysed gases appear. These peaks
were attributed to the intermittent feeding of the ore caused by the irregular discharging of
the screw conveyor. A comparison of the gas analysis with that of a batch wise experiment at
the same conditions (gas flow and concentration of H2) was carried out as shown in the
appendix. It was found that an increase in H2O, CO and CO2 in the current experiments was
obtained.
The slope of the reduction degree curve was lower than that for all the previous conducted
experiments, figure 93. This was due to the increasing amount of the dominator (the
reducible oxygen) caused by feeding ore throughout the experiment. Whereas, in the
previous experiments, the reducible amount of oxygen in the ore was constant from the
beginning of the experiment. The slope, however, increased again in the conducted
experiments, when ore feeding (reducible oxygen source) stopped, as it is clearly shown in
the figure. On the other hand, the average H2 utilisation degree did not show a clear change
(~ 32 %) while the total utilisation degree showed a higher utilisation of approximately 10 %
(~60 %) with respect to the corresponding batch wise experiment.
H2: 1.5 Nl/min Ar: 3.5 Nl/min Pre-charged ore: 100 g Feeding rate: 4.55 g/min
dosage finishes
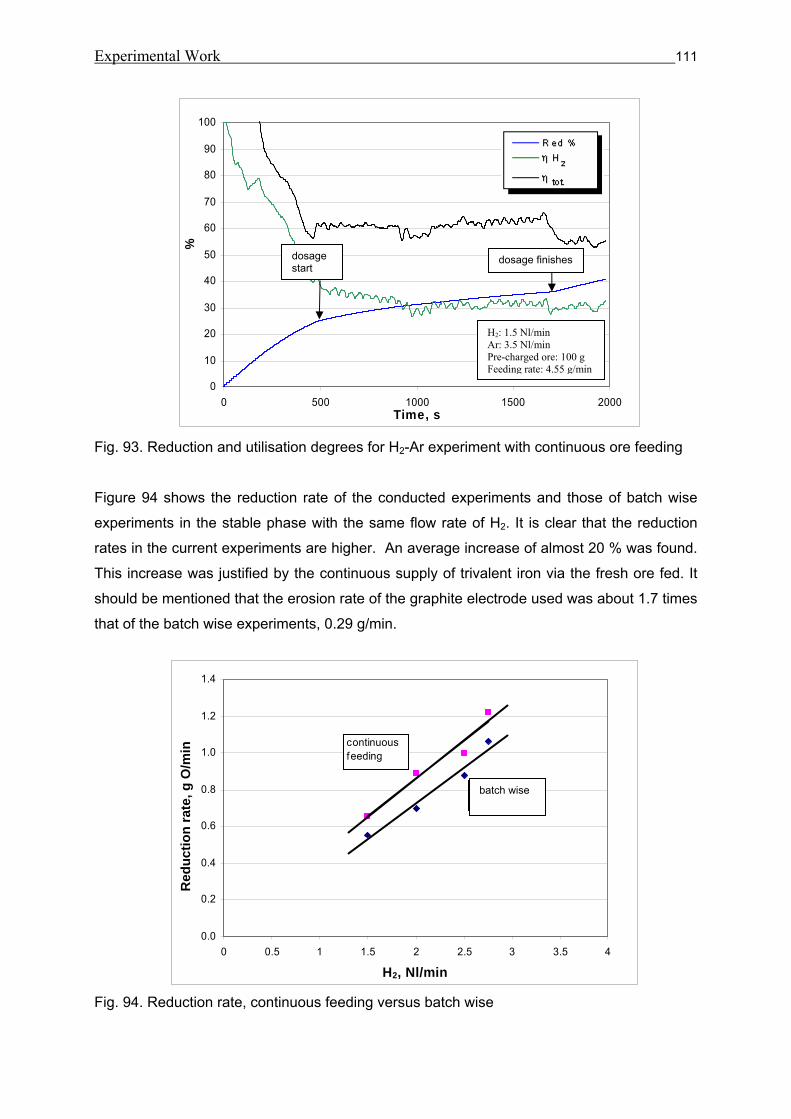
Experimental Work 111
Fig. 93. Reduction and utilisation degrees for H2-Ar experiment with continuous ore feeding Figure 94 shows the reduction rate of the conducted experiments and those of batch wise
experiments in the stable phase with the same flow rate of H2. It is clear that the reduction
rates in the current experiments are higher. An average increase of almost 20 % was found.
This increase was justified by the continuous supply of trivalent iron via the fresh ore fed. It
should be mentioned that the erosion rate of the graphite electrode used was about 1.7 times
that of the batch wise experiments, 0.29 g/min.
Fig. 94. Reduction rate, continuous feeding versus batch wise
0
10
20
30
40
50
60
70
80
90
100
0 500 1000 1500 2000Time, s
%
H2: 1.5 Nl/min Ar: 3.5 Nl/min Pre-charged ore: 100 g Feeding rate: 4.55 g/min
0.0
0.2
0.4
0.6
0.8
1.0
1.2
1.4
0 0.5 1 1.5 2 2.5 3 3.5 4
H2, Nl/min
redu
ctio
n ra
te, g
O /m
in
batch w ise
continuous feeding
dosage finishes dosage start
Red
uctio
n ra
te, g
O/m
in
batch wise
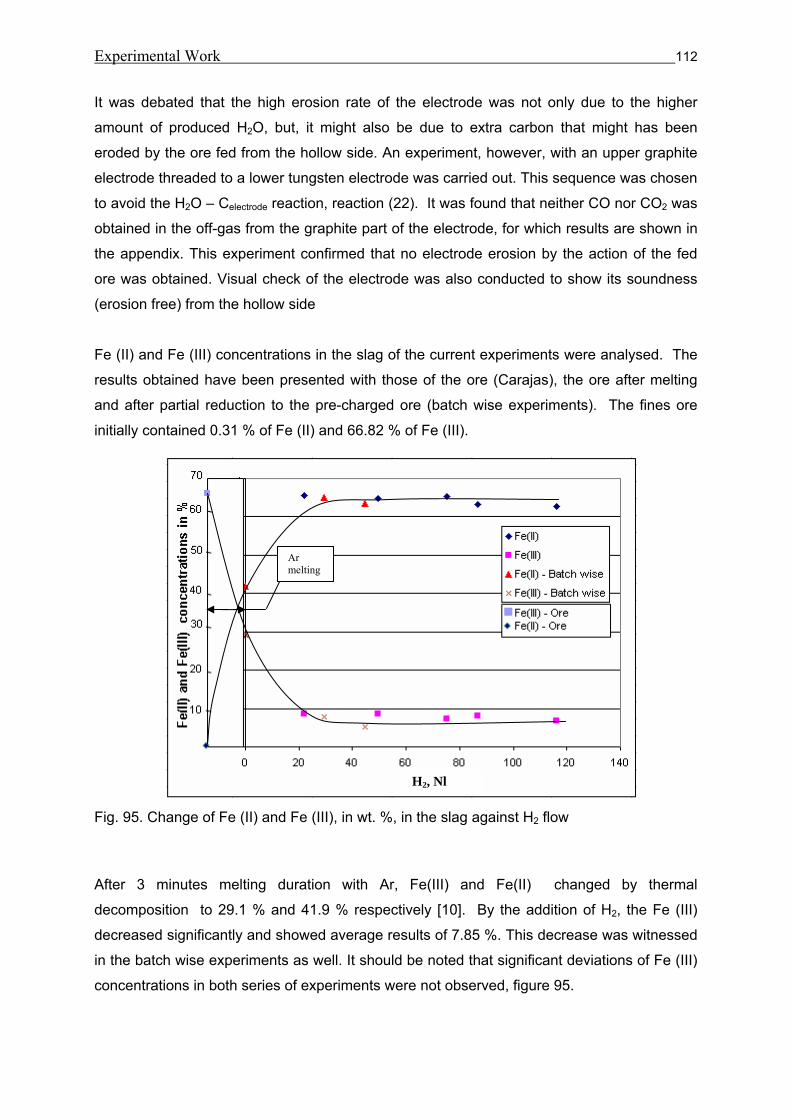
Experimental Work 112
It was debated that the high erosion rate of the electrode was not only due to the higher
amount of produced H2O, but, it might also be due to extra carbon that might has been
eroded by the ore fed from the hollow side. An experiment, however, with an upper graphite
electrode threaded to a lower tungsten electrode was carried out. This sequence was chosen
to avoid the H2O – Celectrode reaction, reaction (22). It was found that neither CO nor CO2 was
obtained in the off-gas from the graphite part of the electrode, for which results are shown in
the appendix. This experiment confirmed that no electrode erosion by the action of the fed
ore was obtained. Visual check of the electrode was also conducted to show its soundness
(erosion free) from the hollow side
Fe (II) and Fe (III) concentrations in the slag of the current experiments were analysed. The
results obtained have been presented with those of the ore (Carajas), the ore after melting
and after partial reduction to the pre-charged ore (batch wise experiments). The fines ore
initially contained 0.31 % of Fe (II) and 66.82 % of Fe (III).
Fig. 95. Change of Fe (II) and Fe (III), in wt. %, in the slag against H2 flow
After 3 minutes melting duration with Ar, Fe(III) and Fe(II) changed by thermal
decomposition to 29.1 % and 41.9 % respectively [10]. By the addition of H2, the Fe (III)
decreased significantly and showed average results of 7.85 %. This decrease was witnessed
in the batch wise experiments as well. It should be noted that significant deviations of Fe (III)
concentrations in both series of experiments were not observed, figure 95.
H2, Nl
Ar melting
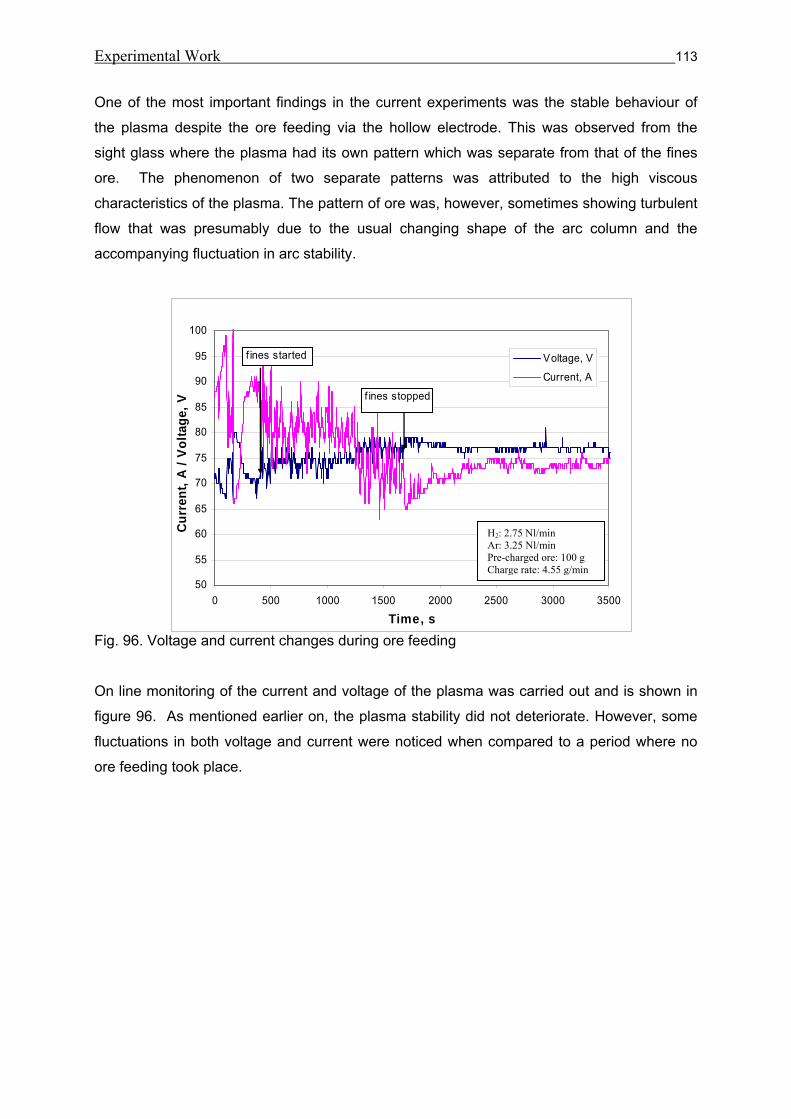
Experimental Work 113
50
55
60
65
70
75
80
85
90
95
100
0 500 1000 1500 2000 2500 3000 3500
Time, s
Curr
ent,
A / V
olta
ge, V
Voltage, V
Current, A
f ines stopped
f ines started
One of the most important findings in the current experiments was the stable behaviour of
the plasma despite the ore feeding via the hollow electrode. This was observed from the
sight glass where the plasma had its own pattern which was separate from that of the fines
ore. The phenomenon of two separate patterns was attributed to the high viscous
characteristics of the plasma. The pattern of ore was, however, sometimes showing turbulent
flow that was presumably due to the usual changing shape of the arc column and the
accompanying fluctuation in arc stability.
Fig. 96. Voltage and current changes during ore feeding On line monitoring of the current and voltage of the plasma was carried out and is shown in
figure 96. As mentioned earlier on, the plasma stability did not deteriorate. However, some
fluctuations in both voltage and current were noticed when compared to a period where no
ore feeding took place.
H2: 2.75 Nl/min Ar: 3.25 Nl/min Pre-charged ore: 100 g Charge rate: 4.55 g/min
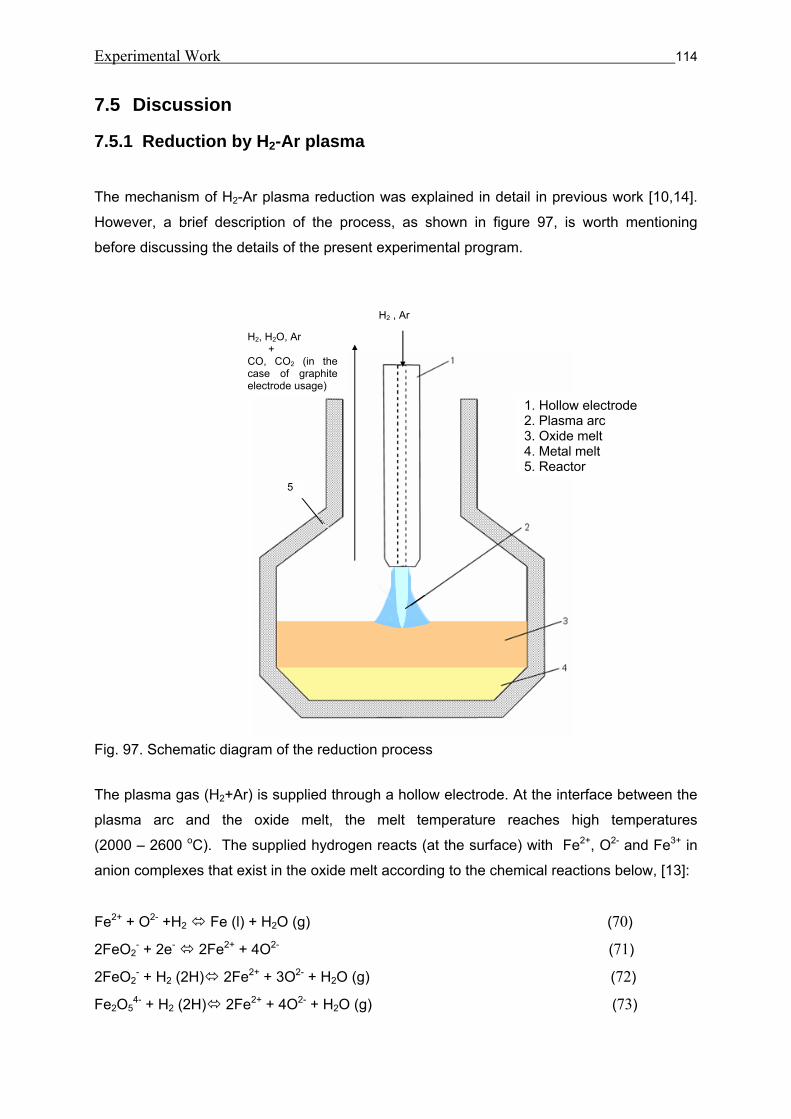
Experimental Work 114
7.5 Discussion
7.5.1 Reduction by H2-Ar plasma
The mechanism of H2-Ar plasma reduction was explained in detail in previous work [10,14].
However, a brief description of the process, as shown in figure 97, is worth mentioning
before discussing the details of the present experimental program.
Fig. 97. Schematic diagram of the reduction process
The plasma gas (H2+Ar) is supplied through a hollow electrode. At the interface between the
plasma arc and the oxide melt, the melt temperature reaches high temperatures
(2000 – 2600 oC). The supplied hydrogen reacts (at the surface) with Fe2+, O2- and Fe3+ in
anion complexes that exist in the oxide melt according to the chemical reactions below, [13]:
Fe2+ + O2- +H2 Fe (l) + H2O (g) (70)
2FeO2- + 2e- 2Fe2+ + 4O2- (71)
2FeO2- + H2 (2H) 2Fe2+ + 3O2- + H2O (g) (72)
Fe2O54- + H2 (2H) 2Fe2+ + 4O2- + H2O (g) (73)
H2, H2O, Ar + CO, CO2 (in the case of graphite electrode usage)
H2 , Ar
1. Hollow electrode 2. Plasma arc 3. Oxide melt 4. Metal melt 5. Reactor
5
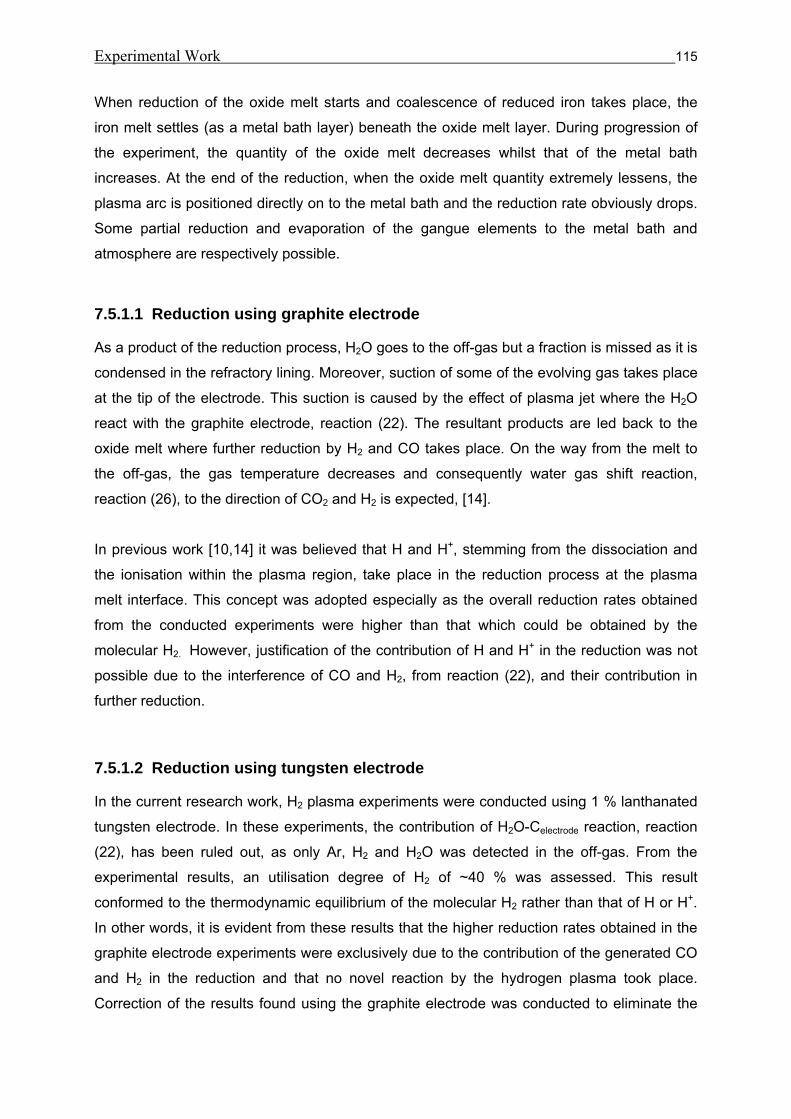
Experimental Work 115
When reduction of the oxide melt starts and coalescence of reduced iron takes place, the
iron melt settles (as a metal bath layer) beneath the oxide melt layer. During progression of
the experiment, the quantity of the oxide melt decreases whilst that of the metal bath
increases. At the end of the reduction, when the oxide melt quantity extremely lessens, the
plasma arc is positioned directly on to the metal bath and the reduction rate obviously drops.
Some partial reduction and evaporation of the gangue elements to the metal bath and
atmosphere are respectively possible.
7.5.1.1 Reduction using graphite electrode
As a product of the reduction process, H2O goes to the off-gas but a fraction is missed as it is
condensed in the refractory lining. Moreover, suction of some of the evolving gas takes place
at the tip of the electrode. This suction is caused by the effect of plasma jet where the H2O
react with the graphite electrode, reaction (22). The resultant products are led back to the
oxide melt where further reduction by H2 and CO takes place. On the way from the melt to
the off-gas, the gas temperature decreases and consequently water gas shift reaction,
reaction (26), to the direction of CO2 and H2 is expected, [14].
In previous work [10,14] it was believed that H and H+, stemming from the dissociation and
the ionisation within the plasma region, take place in the reduction process at the plasma
melt interface. This concept was adopted especially as the overall reduction rates obtained
from the conducted experiments were higher than that which could be obtained by the
molecular H2. However, justification of the contribution of H and H+ in the reduction was not
possible due to the interference of CO and H2, from reaction (22), and their contribution in
further reduction.
7.5.1.2 Reduction using tungsten electrode
In the current research work, H2 plasma experiments were conducted using 1 % lanthanated
tungsten electrode. In these experiments, the contribution of H2O-Celectrode reaction, reaction
(22), has been ruled out, as only Ar, H2 and H2O was detected in the off-gas. From the
experimental results, an utilisation degree of H2 of ~40 % was assessed. This result
conformed to the thermodynamic equilibrium of the molecular H2 rather than that of H or H+.
In other words, it is evident from these results that the higher reduction rates obtained in the
graphite electrode experiments were exclusively due to the contribution of the generated CO
and H2 in the reduction and that no novel reaction by the hydrogen plasma took place.
Correction of the results found using the graphite electrode was conducted to eliminate the
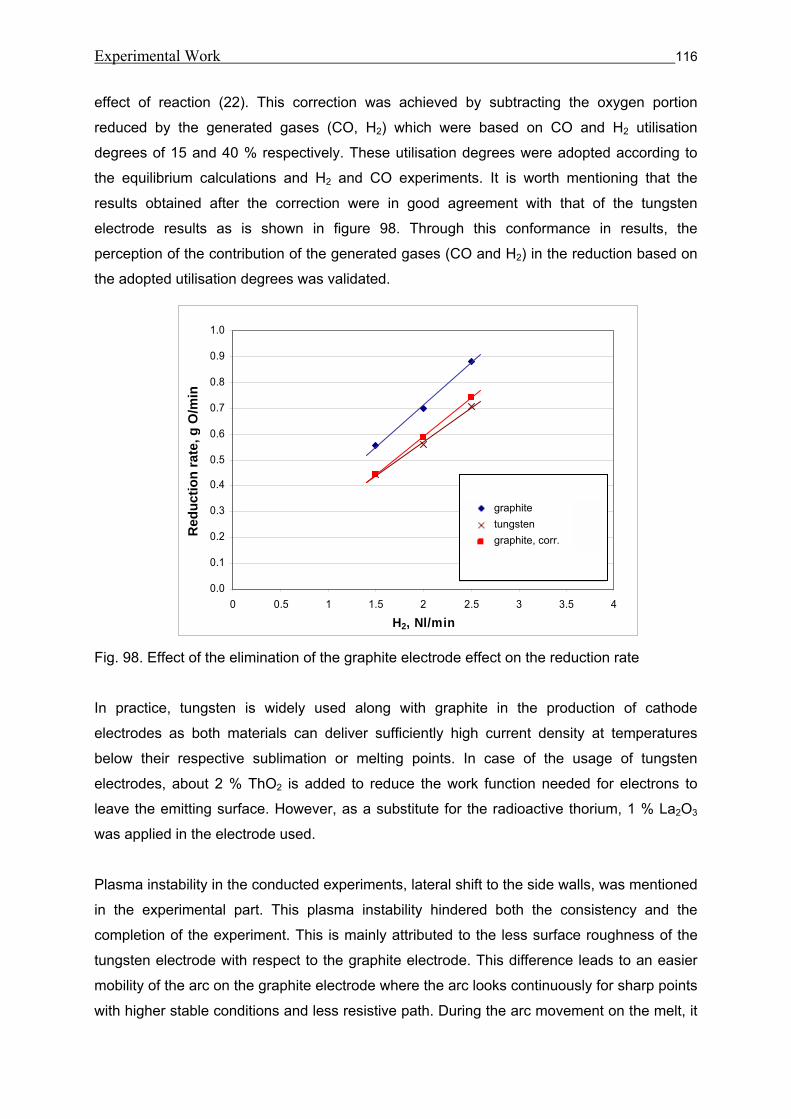
Experimental Work 116
effect of reaction (22). This correction was achieved by subtracting the oxygen portion
reduced by the generated gases (CO, H2) which were based on CO and H2 utilisation
degrees of 15 and 40 % respectively. These utilisation degrees were adopted according to
the equilibrium calculations and H2 and CO experiments. It is worth mentioning that the
results obtained after the correction were in good agreement with that of the tungsten
electrode results as is shown in figure 98. Through this conformance in results, the
perception of the contribution of the generated gases (CO and H2) in the reduction based on
the adopted utilisation degrees was validated.
Fig. 98. Effect of the elimination of the graphite electrode effect on the reduction rate
In practice, tungsten is widely used along with graphite in the production of cathode
electrodes as both materials can deliver sufficiently high current density at temperatures
below their respective sublimation or melting points. In case of the usage of tungsten
electrodes, about 2 % ThO2 is added to reduce the work function needed for electrons to
leave the emitting surface. However, as a substitute for the radioactive thorium, 1 % La2O3
was applied in the electrode used.
Plasma instability in the conducted experiments, lateral shift to the side walls, was mentioned
in the experimental part. This plasma instability hindered both the consistency and the
completion of the experiment. This is mainly attributed to the less surface roughness of the
tungsten electrode with respect to the graphite electrode. This difference leads to an easier
mobility of the arc on the graphite electrode where the arc looks continuously for sharp points
with higher stable conditions and less resistive path. During the arc movement on the melt, it
0.0
0.1
0.2
0.3
0.4
0.5
0.6
0.7
0.8
0.9
1.0
0 0.5 1 1.5 2 2.5 3 3.5 4
H2, Nl/min
redu
ctio
n ra
te, g
O /m
in
graphiteTungsten graphite, corrLinear (graphite)Linear (Tungsten )Linear (graphite, corr)
Red
uctio
n ra
te, g
O/m
in
graphite
tungsten graphite, corr.
Experimental Work 117
sparks over sometimes to the metal crucible. In case of the graphite electrode, the easy
mobility of the arc renders its contact to the melt while it is not the case in the tungsten
electrode. In other words, the less mobility of the arc on the tungsten electrode leads to the
relative stagnation of the arc at the crucible and the found stagnant lateral shift of the arc.
Fig. 99. Reduction rate of wustite and liquid oxide by H2 as a function of temperature Finally, the specific reduction rates of both sets of experiments were calculated based on a
reaction area of 1 cm2. This area corresponds to the plasma melt interface and was visually
estimated during the experimentation. The calculations from the experiments using graphite
and tungsten electrodes showed 30 x 10-2 and 25 x 10-2 kg-oxygen/m2s respectively. Having
the results obtained, the average results of the published H2 plasma smelting (using tungsten
electrode), [18,21,29], and the work of Ban-Ya [19] for a H2 reduction rate at 1400 oC, a
straight line is plotted, figure 99. It should be noted that, according to Arrhenius equation [84],
the slope of the plotted straight line is defined as (- Ea/R) where,
Ea: the activation energy for the reaction in Joules
R: the ideal gas constant in J/mol K
The activation energy was calculated to be 23 kJ/mol and from a regression analysis, the
following empirical equation was obtained:
ln r = - 0.15 - 2811 / T (kg-oxygen/m2s) (74)
Where r is the specific reduction rate and T is the temperature in K.
T (oC)
1/T x 104 (K-1)
melting point of FeO
Wustite
10-1
100
10-2
10-3
76 54
r (kg
-oxy
gen/
m2 s)
H2 Plasma KAMIYA et al. [18] NAKAMURA et al. [29] LEMPERLE et al. [ 21] Present work
1200 2000 1600 2400
10-4
Liquid Oxide
H2 reduction Hayashi [20] Ban-ya [19]
Experimental Work 118
7.5.2 Impact of lateral H2 supply on the reduction behaviour
As an alternative way to premixing the plasma gases, H2 was partially fed via a ceramic
lance. The lance was positioned above the melt and slightly towards the edge of the crucible.
The objective of this positioning was to keep the blown gas at approximately the room
temperature before the reaction takes place. In other words, this was done to rule out the
influence of plasma on the blown gas, and accordingly the dissociation and ionisation of H2.
Completion of experiments with high lateral hydrogen flow rate (more than 0.75 Nl/min) was
not possible as mentioned in the experimental section. This was due to the abrupt
fluctuations of voltage found during the experiments, which caused break up of the power
supply. However, the results were generally satisfying and obviously agreed with the
premixed hydrogen argon experiments. This means that no contribution of H and H+ in the
hydrogen plasma experiments take place, as previously proved in section 7.5.1.2. On the
other hand, it should be noted that the possibility of feeding H2 through separate lances
rather than hollow electrodes could be utilized as an option when a scaled-up process is
considered. By having such a possibility, the amount of H2 (plasma gas) fed via the hollow
electrode could be decreased.
7.5.3 CH4 – Ar reduction
The objective of this series of experiments was to assess the CH4 reduction behaviour with
respect to H2. Through the application of plasma, CH4 is fully cracked to solid carbon and
hydrogen molecules according to the reaction (50). From a stoichiometric point of view, it is
clear that the products of 1 mole of CH4 can reduce 4 atoms of oxygen (CO2, 2H2O) while
1 mole of H2 can only reduce 1 mole of oxygen (H2O). Therefore, the usage of CH4 in
comparison to H2 will result in a higher reduction rate (i.e. 4 times higher reduction rate).
However, this value should increase to 4.8 when thermodynamics is considered, as clarified
in section 6.1.2.
From the experimental results, the average erosion rate of the H2 experiments was more
than that of CH4 experiments at the same amount of supplied H2. It is presumed that this was
attributed to the increasing amounts of CO, produced from CH4, which increased the rate of
water gas shift reaction, reaction (26), towards more CO2 and less H2O. This subsequently
decreased the rate of H2O-Celectrode reaction, reaction (22), i.e. less erosion rate of the
electrode.
Experimental Work 119
The methane reduction rate was found to be 4 times that of the hydrogen reduction rate. This
reduction rate ratio was calculated by using a correction term as conducted in the H2
experiments, section 7.5.1.2, to eliminate the contributing carbon (from reaction (22)) in the
reduction results. From the calculated ratio, it is apparent that the reduction rate of 1 mole of
carbon was equivalent to that of 2 moles of H2. Moreover, it is clear that this ratio conforms
relatively to the thermodynamical ratio of 4.8. However, this deviation might be due to the
non full contribution of carbon from the CH4 in the reduction. This was evident from the
deposited carbon inside the hollow electrode and the carbon soot formation. It should be
stressed that the encountered carbon deposition inside the hollow electrode has led to non
uniform distribution of the plasma gas over the melt. This consequently led to a partial
solidification of the melt and an inconsistency in reduction, with some zones fully reduced
whilst other zones were not. However, it is believed that the hollow electrode susceptibility to
the carbon deposition was significantly high due to the limitations of the hollow diameter
(8 mm), whereas such a phenomenon is not expected to occur in larger diameters in the up-
scaled process.
From the chemical analysis results, a slight carburisation has been found. This was due to
carbon pick-up by excessive CH4. However, for an up-scaled process with continuous
operation no carburisation is expected due to the existence of the protecting slag layer with
high oxygen potential.
Finally, it should be mentioned that CH4 is a potential alternative to H2 when up-scaling is
considered. On one hand, saving the investment and running cost of H2 production is a great
advantage by applying CH4-plasma. On the other hand, the gas volume in the prospective
flow-sheet will be decreased with respect to H2-plasma due to the higher reduction potential
of the existing carbon in the CH4.
7.5.4 Reduction at various basicities
This set of experiments was carried out to study the effect of CaO addition on the
phosphorous behaviour. CaO additions slightly influenced the reduction rate but have
captured to a great extent the phosphorous in the slag. This was evident from the
experimental results where the phosphorous in the slag obviously increased at higher
basicities whilst the phosphorous reduced into the melt and that evaporated decreased. The
evaporated phosphorus was obviously high in the conducted experiments. This shows the
potential of the H2-plasma in terms of phosphorous evaporation up to a basicity of B2 = 2.5.
Experimental Work 120
7.5.5 Reduction of magnetite
Kiruna ore with a Fe3O4 content of 92.26 % was reduced in this set of experiments by H2 to
assess its reduction behaviour with respect to Carajas ore. It was found that after first phase
of the reduction process, where most of the Fe3+ in the melt was reduced, the reduction rate
of both charges exhibited identical results. This was attributed to the reduction characteristics
of the 2nd phase where the Fe2+ reduction is the rate limiting factor. This identical behaviour
of magnetite with respect to hematite showed the potential of bath smelting process with
respect to solid phase reduction process. In other words, the characteristics of low reduction
rate in the case of magnetite, as a solid phase, disappeared in the molten phase process by
the usage of the H2 plasma. This obviously widens the range of ore selection when up-
scaling process is considered.
7.5.6 Reduction of pre-reduced ore
A 69.43 % FeO and 28.14 % Fe3O4 pre-reduced ore was reduced in this set of experiments
by H2 to assess its reduction behaviour with respect to the Carajas ore. In the main phase of
the conducted experiments, slight decreases in the reduction rates of ~7 % with respect to
the Carajas ore were found. This slight deviation was attributed to the full conversion of Fe3+
to Fe2+ in the first phase of reduction (contrary to the hematite and magnetite experiments).
On the other hand, it was evident that the starting H2 utilisation degree of 100 % was an
unrepresentative result from a thermodynamic point of view. It is believed that this high value
was due to the highly estimated .corr,OH 2V , equation (39).
7.5.7 Reduction with CO-H2-Ar mixture and CO-Ar mixture
The objective of the CO experimental work was to assess the reduction rate of liquid iron
oxide by CO under an Ar plasma atmosphere. The reduction rate was evaluated in the
stable phase of the experimentation. This phase was characterised as the reaction between
the CO and the divalent iron Fe2+ existing in the oxide melt. A first trial to derive experiments
at low flow rates of CO up to 0.57 Nl/min in an Ar-H2 mixture was carried out. H2 was used as
high enthalpy gas to sustain the current of the plasma at low values. However, due to the low
CO supplied, the exact reduction contribution of CO against H2 was not possible for reliable
evaluation; higher reduction rates by CO in the experimental results were found in
comparison to the equilibrium calculations. Another set of experiments at higher flow rates of
Experimental Work 121
CO up to 3.5 Nl/min in an Ar-CO mixture was carried out and better results with respect to
the equilibrium calculations were obtained.
Based on the experimental results, a specific reduction rate in the conducted experiments
was calculated to be 1.09 x 10⁻¹ kg-oxygen/m2s. However, this reduction rate was
corresponding to the results presented in section 7.4.8 where the calculated CO utilisation
degree was slightly higher than the equilibrium one. This was attributed to the contribution of
H2O-Celectrode, reaction (22), in the reduction process. A correction to these additional
reactions has been made to rule out the effect of the additional oxygen due to the reduction
of H2 and CO. This correction was approximated by subtracting the contribution from the
gases based on their utilisation degree as conducted in the H2 experiments. A corrected
reduction rate for the conducted experiments was calculated to be 0.89 x 10⁻¹ kg-oxygen/m2s.
The deviation, however, between both results was not so significant. Combining the work of
Soma [37] for a CO reduction rate at 1600 oC with the current work at an average
temperature of 2400 oC, an activation energy of 150 kJ/mol was calculated and a regression
analysis of both works gave the following empirical equation:
ln r = 4.34 - 18059 / T (kg-oxygen/m2s) (75)
Where r is the specific reduction rate and T is the temperature in K.
By dividing the presented reduction rate results from H2 with respect to those from the CO in
the plasma region, a factor of 3.4 was obtained. This convergence in the reduction potential
of both gases at high temperatures of the plasma is justified by the increasing diffusion
coefficient versus temperature, where the influence of molecules mass is diminishing. A
summary of these results with respect to the results of H2 and CO at lower temperatures is
given in figure 100.
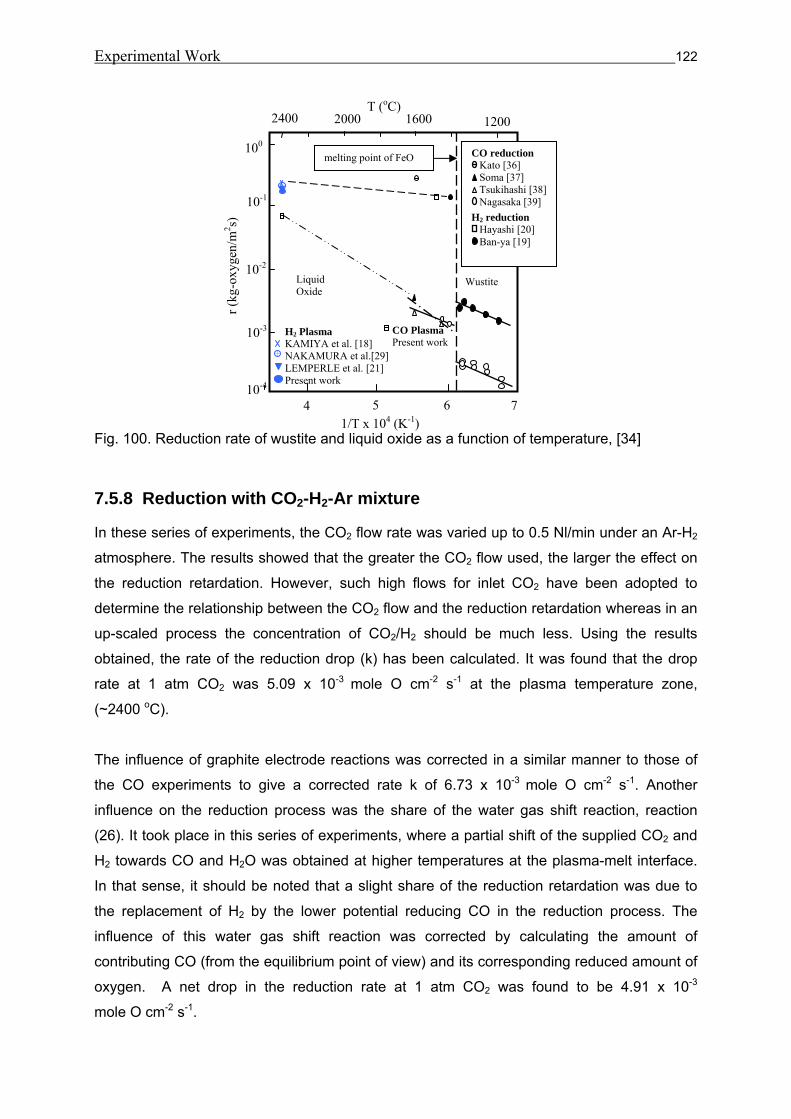
Experimental Work 122
Fig. 100. Reduction rate of wustite and liquid oxide as a function of temperature, [34]
7.5.8 Reduction with CO2-H2-Ar mixture
In these series of experiments, the CO2 flow rate was varied up to 0.5 Nl/min under an Ar-H2
atmosphere. The results showed that the greater the CO2 flow used, the larger the effect on
the reduction retardation. However, such high flows for inlet CO2 have been adopted to
determine the relationship between the CO2 flow and the reduction retardation whereas in an
up-scaled process the concentration of CO2/H2 should be much less. Using the results
obtained, the rate of the reduction drop (k) has been calculated. It was found that the drop
rate at 1 atm CO2 was 5.09 x 10⁻³ mole O cm-2 s-1 at the plasma temperature zone,
(~2400 oC).
The influence of graphite electrode reactions was corrected in a similar manner to those of
the CO experiments to give a corrected rate k of 6.73 x 10⁻³ mole O cm-2 s-1. Another
influence on the reduction process was the share of the water gas shift reaction, reaction
(26). It took place in this series of experiments, where a partial shift of the supplied CO2 and
H2 towards CO and H2O was obtained at higher temperatures at the plasma-melt interface.
In that sense, it should be noted that a slight share of the reduction retardation was due to
the replacement of H2 by the lower potential reducing CO in the reduction process. The
influence of this water gas shift reaction was corrected by calculating the amount of
contributing CO (from the equilibrium point of view) and its corresponding reduced amount of
oxygen. A net drop in the reduction rate at 1 atm CO2 was found to be 4.91 x 10⁻³
mole O cm-2 s-1.
1/T x 104 (K-1)
melting point of FeO
Wustite
T (oC)
10-1
100
10-2
10-3
76 54
r (kg
-oxy
gen/
m2 s)
H2 Plasma KAMIYA et al. [18] NAKAMURA et al.[29] LEMPERLE et al. [21] Present work
CO Plasma Present work
12002000 1600 2400
10-4
Liquid Oxide
CO reduction Kato [36] Soma [37] Tsukihashi [38] Nagasaka [39]
H2 reduction Hayashi [20] Ban-ya [19]
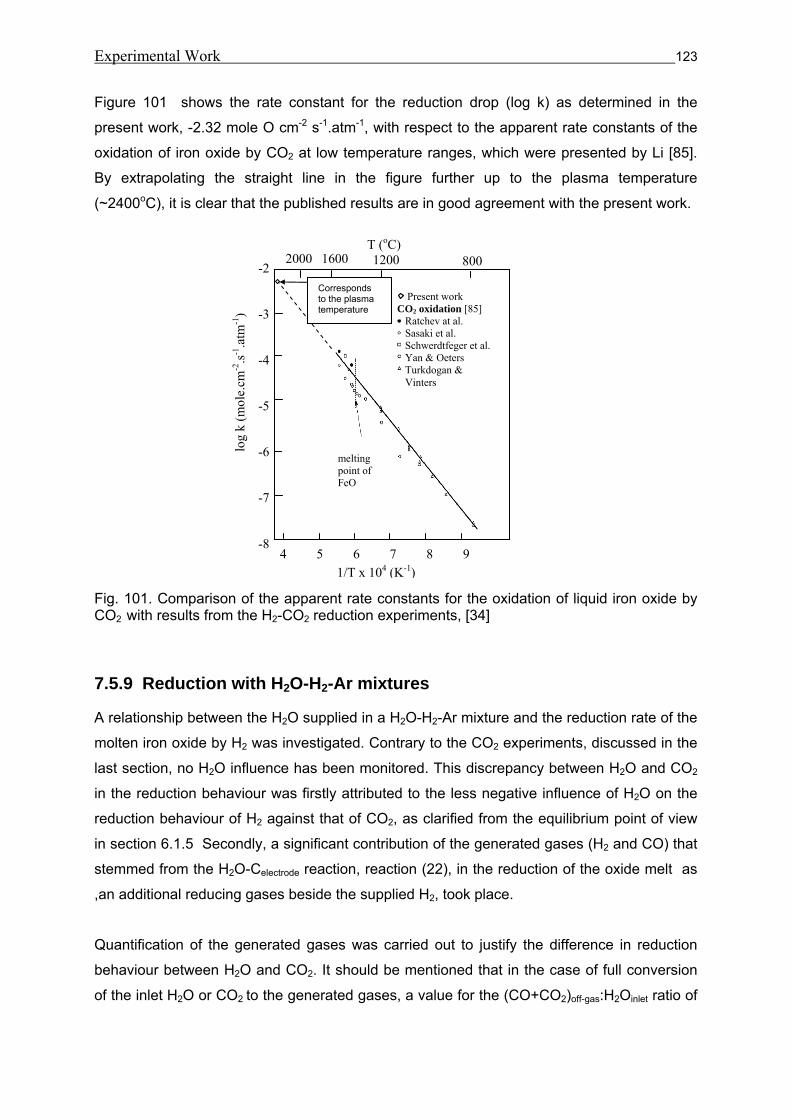
Experimental Work 123
Figure 101 shows the rate constant for the reduction drop (log k) as determined in the
present work, -2.32 mole O cm-2 s-1.atm-1, with respect to the apparent rate constants of the
oxidation of iron oxide by CO2 at low temperature ranges, which were presented by Li [85].
By extrapolating the straight line in the figure further up to the plasma temperature
(~2400oC), it is clear that the published results are in good agreement with the present work.
Fig. 101. Comparison of the apparent rate constants for the oxidation of liquid iron oxide by CO2 with results from the H2-CO2 reduction experiments, [34]
7.5.9 Reduction with H2O-H2-Ar mixtures
A relationship between the H2O supplied in a H2O-H2-Ar mixture and the reduction rate of the
molten iron oxide by H2 was investigated. Contrary to the CO2 experiments, discussed in the
last section, no H2O influence has been monitored. This discrepancy between H2O and CO2
in the reduction behaviour was firstly attributed to the less negative influence of H2O on the
reduction behaviour of H2 against that of CO2, as clarified from the equilibrium point of view
in section 6.1.5 Secondly, a significant contribution of the generated gases (H2 and CO) that
stemmed from the H2O-Celectrode reaction, reaction (22), in the reduction of the oxide melt as
,an additional reducing gases beside the supplied H2, took place.
Quantification of the generated gases was carried out to justify the difference in reduction
behaviour between H2O and CO2. It should be mentioned that in the case of full conversion
of the inlet H2O or CO2 to the generated gases, a value for the (CO+CO2)off-gas:H2Oinlet ratio of
-2
-3
-4
-5
-6
-7
-8
log
k (m
ole.
cm-2
.s-1.a
tm-1
)
1/T x 104 (K-1)
Present work CO2 oxidation [85]
Ratchev at al. Sasaki et al. Schwerdtfeger et al. Yan & Oeters Turkdogan & Vinters
4 5 6 7 8 9
melting point of FeO
8001600 12002000 T (oC)
Corresponds to the plasma temperature
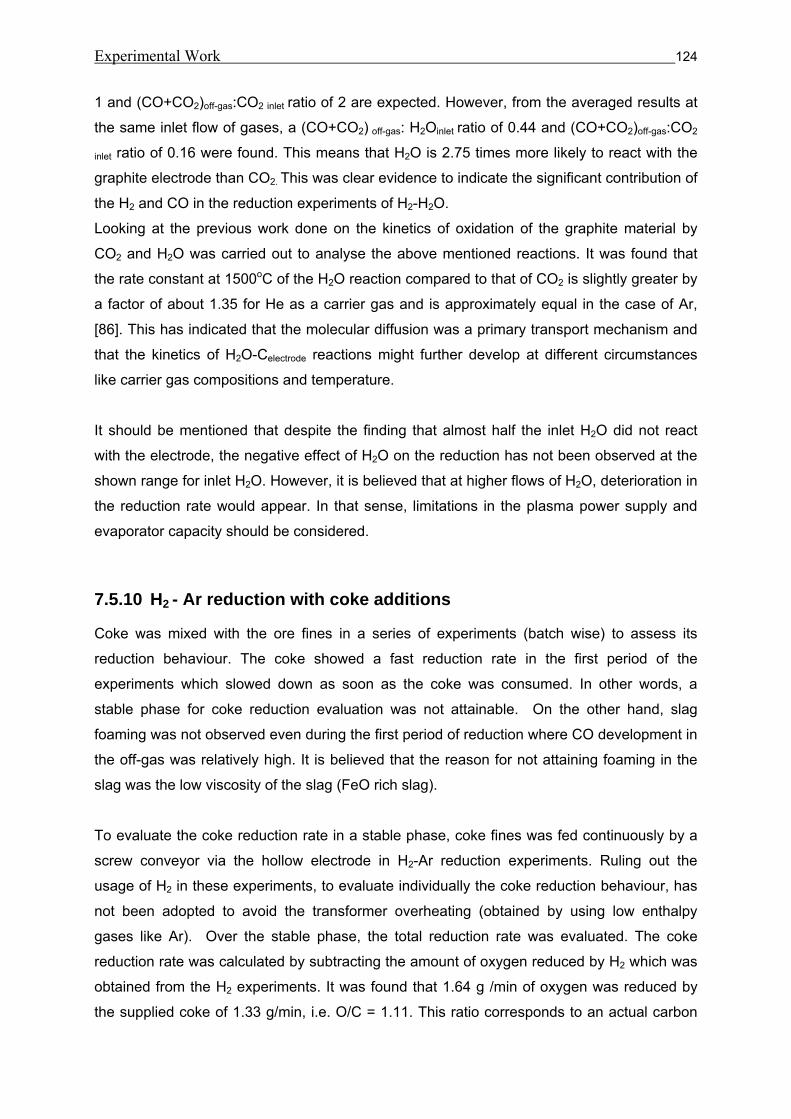
Experimental Work 124
1 and (CO+CO2)off-gas:CO2 inlet ratio of 2 are expected. However, from the averaged results at
the same inlet flow of gases, a (CO+CO2) off-gas: H2Oinlet ratio of 0.44 and (CO+CO2)off-gas:CO2
inlet ratio of 0.16 were found. This means that H2O is 2.75 times more likely to react with the
graphite electrode than CO2. This was clear evidence to indicate the significant contribution of
the H2 and CO in the reduction experiments of H2-H2O.
Looking at the previous work done on the kinetics of oxidation of the graphite material by
CO2 and H2O was carried out to analyse the above mentioned reactions. It was found that
the rate constant at 1500oC of the H2O reaction compared to that of CO2 is slightly greater by
a factor of about 1.35 for He as a carrier gas and is approximately equal in the case of Ar,
[86]. This has indicated that the molecular diffusion was a primary transport mechanism and
that the kinetics of H2O-Celectrode reactions might further develop at different circumstances
like carrier gas compositions and temperature.
It should be mentioned that despite the finding that almost half the inlet H2O did not react
with the electrode, the negative effect of H2O on the reduction has not been observed at the
shown range for inlet H2O. However, it is believed that at higher flows of H2O, deterioration in
the reduction rate would appear. In that sense, limitations in the plasma power supply and
evaporator capacity should be considered.
7.5.10 H2 - Ar reduction with coke additions
Coke was mixed with the ore fines in a series of experiments (batch wise) to assess its
reduction behaviour. The coke showed a fast reduction rate in the first period of the
experiments which slowed down as soon as the coke was consumed. In other words, a
stable phase for coke reduction evaluation was not attainable. On the other hand, slag
foaming was not observed even during the first period of reduction where CO development in
the off-gas was relatively high. It is believed that the reason for not attaining foaming in the
slag was the low viscosity of the slag (FeO rich slag).
To evaluate the coke reduction rate in a stable phase, coke fines was fed continuously by a
screw conveyor via the hollow electrode in H2-Ar reduction experiments. Ruling out the
usage of H2 in these experiments, to evaluate individually the coke reduction behaviour, has
not been adopted to avoid the transformer overheating (obtained by using low enthalpy
gases like Ar). Over the stable phase, the total reduction rate was evaluated. The coke
reduction rate was calculated by subtracting the amount of oxygen reduced by H2 which was
obtained from the H2 experiments. It was found that 1.64 g /min of oxygen was reduced by
the supplied coke of 1.33 g/min, i.e. O/C = 1.11. This ratio corresponds to an actual carbon
Experimental Work 125
utilisation degree of ~ 55 %. It should be mentioned that using coarser grains of coke could
decrease the reduction rate, where the interface area between the coke and the oxide melt
might be a rate limiting factor.
Based on the experimental results, a specific reduction rate of the conducted experiments
was calculated to be 9.19 x 10⁻¹ (kg-oxygen/m2s). By dividing this reduction rate result by that
of H2 in the plasma region, a factor of ~ 3 has been obtained.
Fig. 102. Comparison of the reduction rates for coke plasma with respect to C melt and solid carbon By extrapolating the published reduction rates at lower temperatures [46] to higher
temperatures, some agreement with the present experimental result is observed, as shown
in figure 102. However, it should be mentioned that the evaluated experimental result is not
completely reliable. This is due to the rough assumption that the reaction took place at the
plasma-melt interface, where the exact reaction area between the coke and oxide melt could
not be figured out. A lower operating temperature of 2000 oC with respect to that of H2
plasma (~2400 oC) was selected in the figure. This is due to the fact that the coke can react
at lower temperatures within the whole bulk of the oxide melt. In summary, coke has a good
reduction potential with respect to H2 at higher temperatures. Furthermore, no plasma
deterioration was witnessed during coke continuous feeding.
1/T x 104 (K-1)
10-1
100
10-2
10-3
10-4
melting point of FeO
Wustite
T (oC)
76 54
r (kg
-oxy
gen/
m2 s)
H2 Plasma KAMIYA et al. [18] NAKAMURA et al. [29] LEMPERLE et al. [21] Present work
12002000 1600 2400
Liquid Oxide
Coke plasma Present work
Sato [46] Fe-C melt Solid carbon
(Iron crucible) Solid carbon
(Alumina crucible)
Experimental Work 126
7.5.11 H2 - Ar reduction of continuous fed ore
In the current series of experiments, the continuous feeding of fines ore instead of charging it
in the crucible before the experiments was carried out. One of the most important findings in
the current experiments was the plasma stability despite the ore feeding via the hollow
electrode, where the plasma gas had its own pattern which was separate from that of the
fines ore. The phenomenon of two separate patterns was attributed to the high viscous
characteristics of the plasma. A greater reduction rate with respect to the batch wise
experiments was also observed due to the continuous feeding of the ore which led to a
higher Fe3+/Fe2+ ratio in the oxide melt. Examining the slag analysis, the concentration of
Fe3+ in the continuous feeding experiments was almost identical to that of the batch wise.
This was against the expectations of higher Fe3+ in the slag in the case of the continuous
feeding of ore. However, this was attributed to the H2 potential in reducing most of the Fe3+ in
the ore fed at the given ore feeding rate.
From the results obtained, an increase in the reduction rate of approximately 20 % was
found. However, the larger quantities of H2O produced obviously led to a higher reaction rate
of the H2O – Celectrode and consequently to more generated gases (CO, H2) as was observed
in section 7.4.12. By ruling out the generated gases contribution via a correction term, as
practiced in section 7.5.1, an increase in the reduction rate of almost 10 % was calculated.
7.5.12 Experimental results overview
The conducted experimental program was characterised by comprising wide range of
process parameters, i.e. fines ores, reducing agents, reducing gas injection port, batch wise /
continuous feeding. As main outcomes of the experiments, the specific reduction rates, the
reduction potential of each test run with respect to the standard H2 experiment and the gas
utilisation degrees were summarized in table 11. Examining CH4, CO and coke, it was worth
finding that their reduction potentials with respect to H2 are 3.5, 0.35 and 2.97 respectively.
On the other hand, the oxidation effect of CO2 was evident from the experimental results and
the gas utilisation degrees whilst this effect did not appear in H2O experiments. A summary
of the specific reduction rates of the conducted experiments is also plotted in figure 103.
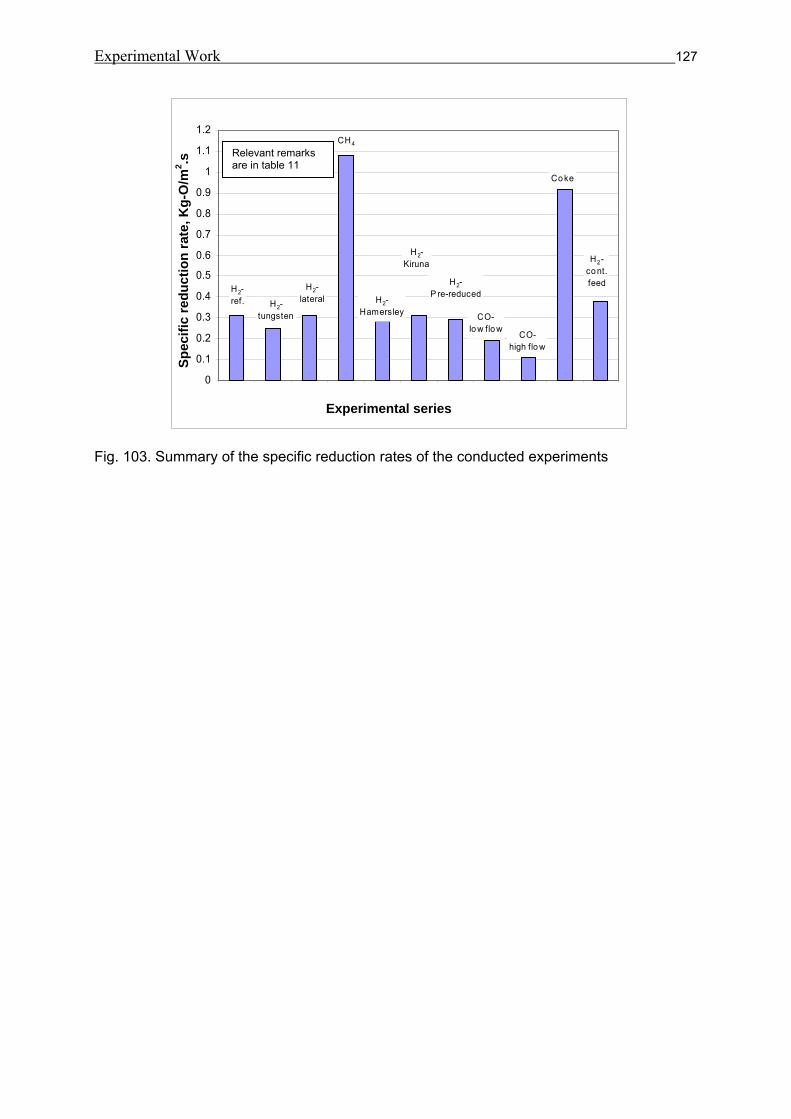
Experimental Work 127
Fig. 103. Summary of the specific reduction rates of the conducted experiments
H2 -co nt. feed
Co ke
CO-high flo w
CO-lo w flo w
H2-P re-reduced
H2-Kiruna
H2-Hamersley
CH4
H2-lateralH2-
tungsten
H2-ref.
0
0.1
0.2
0.3
0.4
0.5
0.6
0.7
0.8
0.9
1
1.1
1.2
Experiment Series
Spe
cific
redu
ctio
n ra
te, k
g-O
/m2 .s Relevant remarks
are in table 11
Experimental series
Spec
ific
redu
ctio
n ra
te, K
g-O
/m2 .s
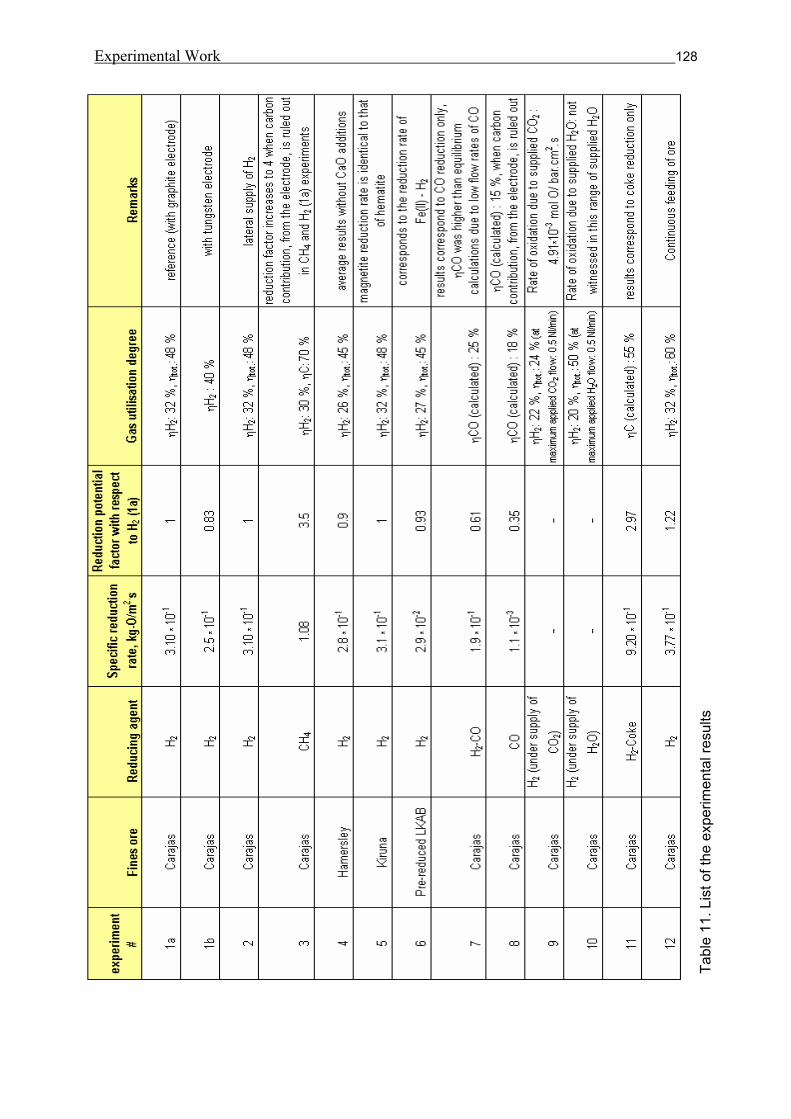
Experimental Work 128
Tabl
e 11
. Lis
t of t
he e
xper
imen
tal r
esul
ts
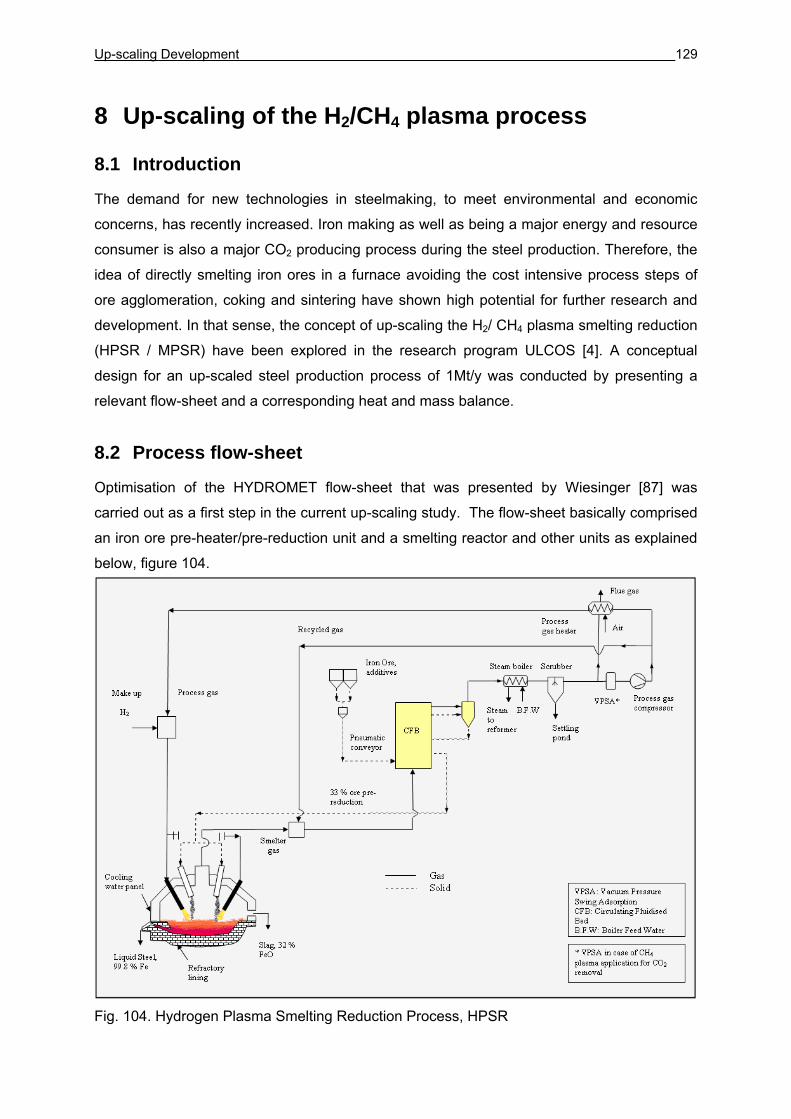
Up-scaling Development 129
8 Up-scaling of the H2/CH4 plasma process
8.1 Introduction
The demand for new technologies in steelmaking, to meet environmental and economic
concerns, has recently increased. Iron making as well as being a major energy and resource
consumer is also a major CO2 producing process during the steel production. Therefore, the
idea of directly smelting iron ores in a furnace avoiding the cost intensive process steps of
ore agglomeration, coking and sintering have shown high potential for further research and
development. In that sense, the concept of up-scaling the H2/ CH4 plasma smelting reduction
(HPSR / MPSR) have been explored in the research program ULCOS [4]. A conceptual
design for an up-scaled steel production process of 1Mt/y was conducted by presenting a
relevant flow-sheet and a corresponding heat and mass balance.
8.2 Process flow-sheet
Optimisation of the HYDROMET flow-sheet that was presented by Wiesinger [87] was
carried out as a first step in the current up-scaling study. The flow-sheet basically comprised
an iron ore pre-heater/pre-reduction unit and a smelting reactor and other units as explained
below, figure 104.
Fig. 104. Hydrogen Plasma Smelting Reduction Process, HPSR
Up-scaling Development 130
8.2.1 Iron ore pre-heater
An iron ore fines pre-heater has been adopted despite the whole reduction process could be
conducted at higher reduction rate at the molten phase in the smelter. However, the strength
of choosing a pre-heater is to utilise the significant sensible heat of the smelter off-gas and
minimise the energy input to the system.
According to the flow-sheet, iron ore fines are preheated prior to feeding them into the
smelting reactor. The selection of the CFB principle is adopted as it showed successful
operation on a semi-commercial basis, [88]. The circulating fluidised bed (CFB) system
consists of a reactor, a recycle cyclone and two stage venturi pre-heater with the necessary
gas/solids separation cyclones. The pre-heating will take place in the circulating fluidised bed
reactor to dry and calcine the material, and pre-reduce the ore fed. The highly possible
achieved pre-reduction degree (33 % in the current case) within this type of fluidised bed
(CFB) is due to the high slip velocity attained (difference between the gas and particles
velocity). This high slip velocity renders great heat and mass transfer rates which is much
higher than that showed in a bubbling fluidised bed and transport reactor.
8.2.2 Smelting reactor
The reactor is chosen with a refractory lining within the hearth and a water cooled free board.
The refractory hearth contains a metal bath and above it a layer of slag. Envisaging an
approximate diameter for the reactor, the relationship between the electrode diameter,
minimum pitch circle diameter and the applied current of the AC-EAF has been adopted in
the diameter calculations. The limiting factor in that sense is the irregular interference
between the arcs electromagnetic forces. A diameter of 6 - 7 m and an overall height of
3.3 m are found relevant for the process. No stirring facility is planned in the flow-sheet due
to the satisfactory effect of the plasma impulse. However, a closer investigation of the
implementation of a stirring facility might be useful. The advantage of stirring in that sense is
to increase the amount of splashed slag on the water cooled free board and accordingly
utilise it as a self liner.
8.2.3 Electrical energy
Electrical energy is supplied by separate DC power supply units over non-cooled hollow
graphite electrodes. The advantage of the graphite electrodes is the characteristic high
power capacity in comparison to the water cooled plasma torches. The DC plasma is
Up-scaling Development 131
maintained under transferred arc mode and connected to the bottom anode via the melt. The
electrodes, cathodes, are side positioned (inclined) to increase the view factors from the
plasma arc and accordingly improve the net heat flux via radiation to the bath. However, due
to the immaturity of the current plasma technologies with graphite electrodes, maximum
permissible energy transferred per electrode could not be defined. Nonetheless, a figure
between 3 and 6 electrodes (based on the permissible energy) is adopted.
8.2.4 Feeding of fines ore
Feeding of the pre-reduced ore is conducted through feeding pipes that are distributed
evenly across the roof. In the case of a vertical oriented electrode, the feeding process can
be carried out through the hollow of the electrode as proven by the experimental work or
through fixing a plasma jacket around the electrode and feeding the pre-reduced ore through
the annular space between them. The advantage of feeding the pre-reduced ore through the
electrode or around it is the possibility to deliver it to the hottest areas, possible in-flight
reduction and the decrease of the heat load to the furnace walls.
8.2.5 Reducing gas
H2 rich gas is supplied to the smelter via the hollow electrodes. H2 will be produced by a
steam reformer due to its advanced state of the art in terms of cost effectiveness and
production capacity compared with the other existing alternatives like oil partial oxidation and
coal gasification. In that sense, H2 temperature has been accordingly set at 760 oC.
However, it should be mentioned that CH4 has great potential to be used as an alternative to
H2 as a reducing gas. The strengths of CH4 against H2 will be described later in this chapter.
8.2.6 Products
The carbon free liquid iron produced by the process is batch tapped approximately every
1 hour while the slag is tapped every 5 hours due to the low quantity of generated slag. The
steel produced can be post treated in the secondary metallurgy to remove dissolved
hydrogen and oxygen to the required limits. The slag as an FeO containing product can also
be used as a valuable material (without free CaO) in road construction work.
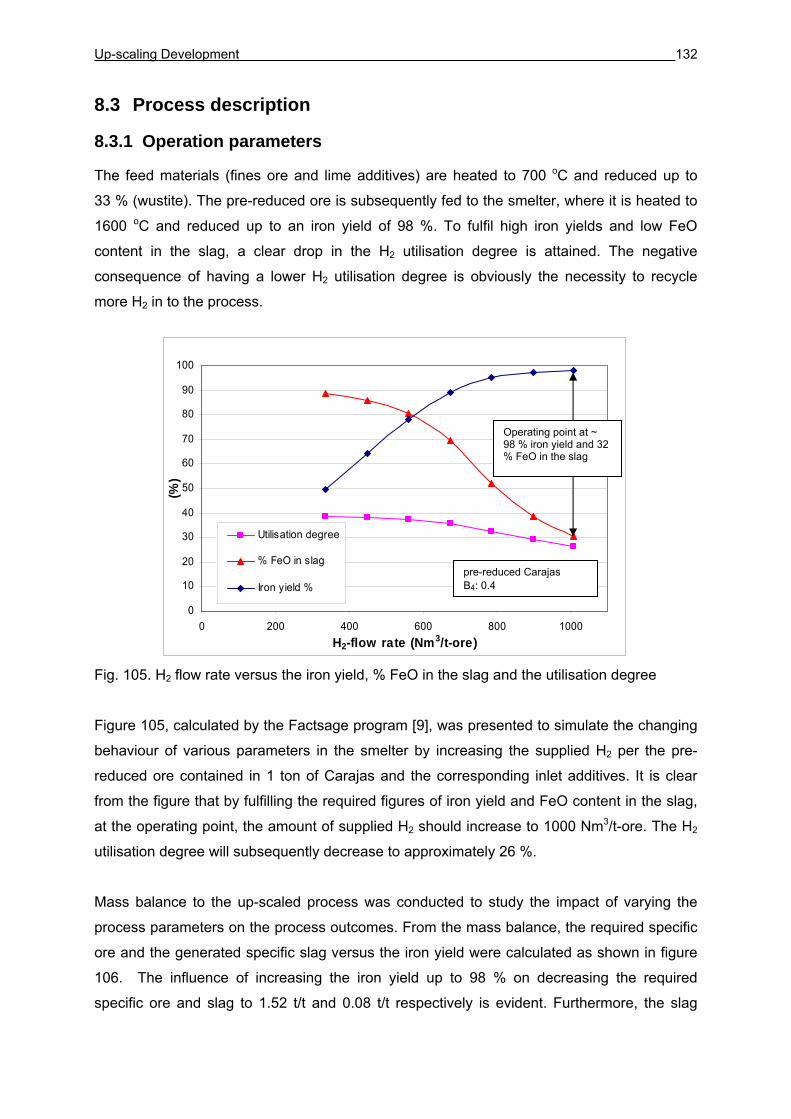
Up-scaling Development 132
8.3 Process description
8.3.1 Operation parameters
The feed materials (fines ore and lime additives) are heated to 700 oC and reduced up to
33 % (wustite). The pre-reduced ore is subsequently fed to the smelter, where it is heated to
1600 oC and reduced up to an iron yield of 98 %. To fulfil high iron yields and low FeO
content in the slag, a clear drop in the H2 utilisation degree is attained. The negative
consequence of having a lower H2 utilisation degree is obviously the necessity to recycle
more H2 in to the process.
Fig. 105. H2 flow rate versus the iron yield, % FeO in the slag and the utilisation degree
Figure 105, calculated by the Factsage program [9], was presented to simulate the changing
behaviour of various parameters in the smelter by increasing the supplied H2 per the pre-
reduced ore contained in 1 ton of Carajas and the corresponding inlet additives. It is clear
from the figure that by fulfilling the required figures of iron yield and FeO content in the slag,
at the operating point, the amount of supplied H2 should increase to 1000 Nm3/t-ore. The H2
utilisation degree will subsequently decrease to approximately 26 %.
Mass balance to the up-scaled process was conducted to study the impact of varying the
process parameters on the process outcomes. From the mass balance, the required specific
ore and the generated specific slag versus the iron yield were calculated as shown in figure
106. The influence of increasing the iron yield up to 98 % on decreasing the required
specific ore and slag to 1.52 t/t and 0.08 t/t respectively is evident. Furthermore, the slag
0
10
20
30
40
50
60
70
80
90
100
0 200 400 600 800 1000H2-flow rate (Nm3/t-ore)
(%)
Utilisation degree
% FeO in slag
Iron yield %pre-reduced Carajas B4: 0.4
Operating point at ~ 98 % iron yield and 32 % FeO in the slag
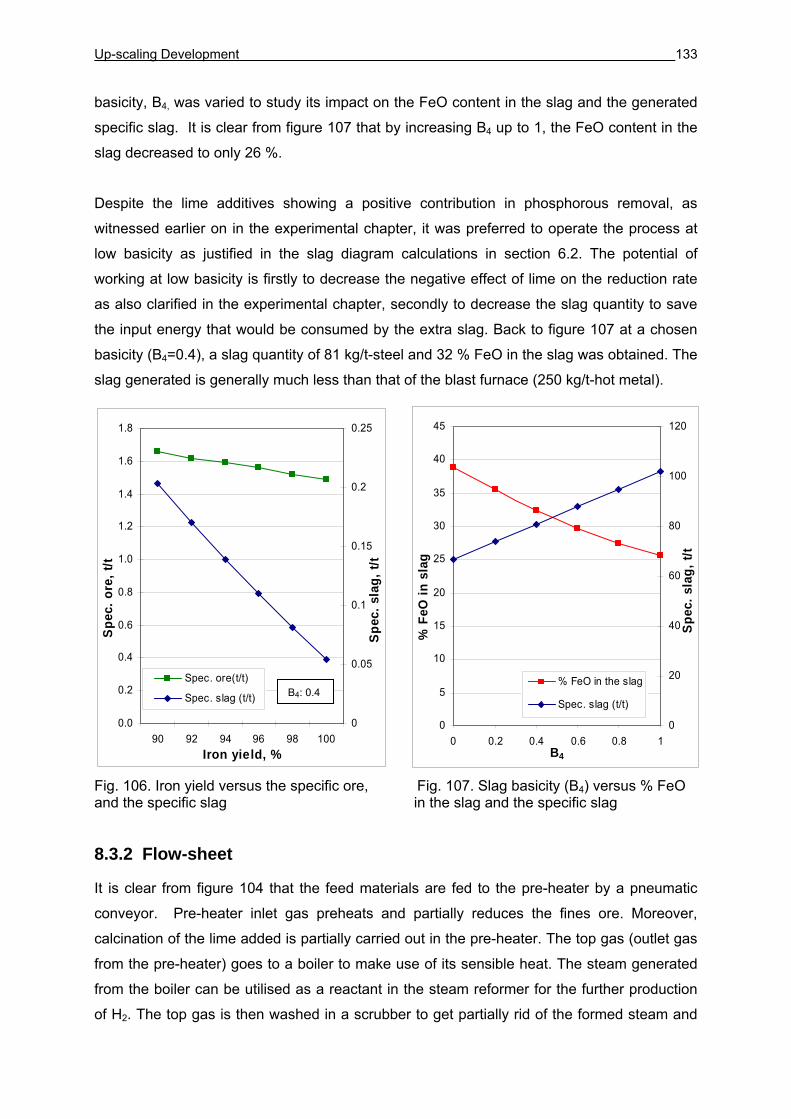
Up-scaling Development 133
0.0
0.2
0.4
0.6
0.8
1.0
1.2
1.4
1.6
1.8
90 92 94 96 98 100Iron yield, %
Spe
c. o
re, t
/t
0
0.05
0.1
0.15
0.2
0.25
Spec
. sla
g, t/
t
Spec. ore(t/t)
Spec. slag (t/t)
basicity, B4, was varied to study its impact on the FeO content in the slag and the generated
specific slag. It is clear from figure 107 that by increasing B4 up to 1, the FeO content in the
slag decreased to only 26 %.
Despite the lime additives showing a positive contribution in phosphorous removal, as
witnessed earlier on in the experimental chapter, it was preferred to operate the process at
low basicity as justified in the slag diagram calculations in section 6.2. The potential of
working at low basicity is firstly to decrease the negative effect of lime on the reduction rate
as also clarified in the experimental chapter, secondly to decrease the slag quantity to save
the input energy that would be consumed by the extra slag. Back to figure 107 at a chosen
basicity (B4=0.4), a slag quantity of 81 kg/t-steel and 32 % FeO in the slag was obtained. The
slag generated is generally much less than that of the blast furnace (250 kg/t-hot metal).
Fig. 106. Iron yield versus the specific ore, Fig. 107. Slag basicity (B4) versus % FeO and the specific slag in the slag and the specific slag
8.3.2 Flow-sheet
It is clear from figure 104 that the feed materials are fed to the pre-heater by a pneumatic
conveyor. Pre-heater inlet gas preheats and partially reduces the fines ore. Moreover,
calcination of the lime added is partially carried out in the pre-heater. The top gas (outlet gas
from the pre-heater) goes to a boiler to make use of its sensible heat. The steam generated
from the boiler can be utilised as a reactant in the steam reformer for the further production
of H2. The top gas is then washed in a scrubber to get partially rid of the formed steam and
B4: 0.4
0
5
10
15
20
25
30
35
40
45
0 0.2 0.4 0.6 0.8 1B4
% F
eO in
sla
g
0
20
40
60
80
100
120
Spec
. sla
g, t/
t% FeO in the slag
Spec. slag (t/t)
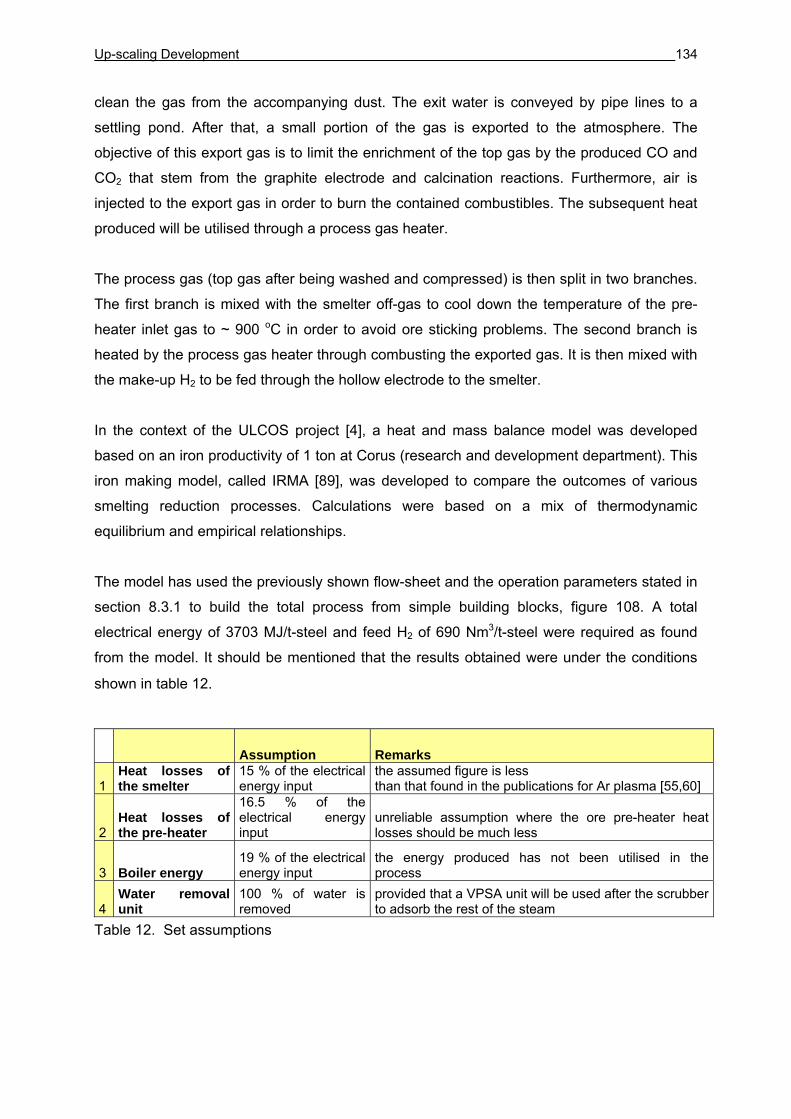
Up-scaling Development 134
clean the gas from the accompanying dust. The exit water is conveyed by pipe lines to a
settling pond. After that, a small portion of the gas is exported to the atmosphere. The
objective of this export gas is to limit the enrichment of the top gas by the produced CO and
CO2 that stem from the graphite electrode and calcination reactions. Furthermore, air is
injected to the export gas in order to burn the contained combustibles. The subsequent heat
produced will be utilised through a process gas heater.
The process gas (top gas after being washed and compressed) is then split in two branches.
The first branch is mixed with the smelter off-gas to cool down the temperature of the pre-
heater inlet gas to ~ 900 oC in order to avoid ore sticking problems. The second branch is
heated by the process gas heater through combusting the exported gas. It is then mixed with
the make-up H2 to be fed through the hollow electrode to the smelter.
In the context of the ULCOS project [4], a heat and mass balance model was developed
based on an iron productivity of 1 ton at Corus (research and development department). This
iron making model, called IRMA [89], was developed to compare the outcomes of various
smelting reduction processes. Calculations were based on a mix of thermodynamic
equilibrium and empirical relationships.
The model has used the previously shown flow-sheet and the operation parameters stated in
section 8.3.1 to build the total process from simple building blocks, figure 108. A total
electrical energy of 3703 MJ/t-steel and feed H2 of 690 Nm3/t-steel were required as found
from the model. It should be mentioned that the results obtained were under the conditions
shown in table 12.
Table 12. Set assumptions
Assumption Remarks
1 Heat losses of the smelter
15 % of the electrical energy input
the assumed figure is less than that found in the publications for Ar plasma [55,60]
2 Heat losses of the pre-heater
16.5 % of the electrical energy input
unreliable assumption where the ore pre-heater heat losses should be much less
3 Boiler energy 19 % of the electrical energy input
the energy produced has not been utilised in the process
4 Water removal unit
100 % of water is removed
provided that a VPSA unit will be used after the scrubber to adsorb the rest of the steam
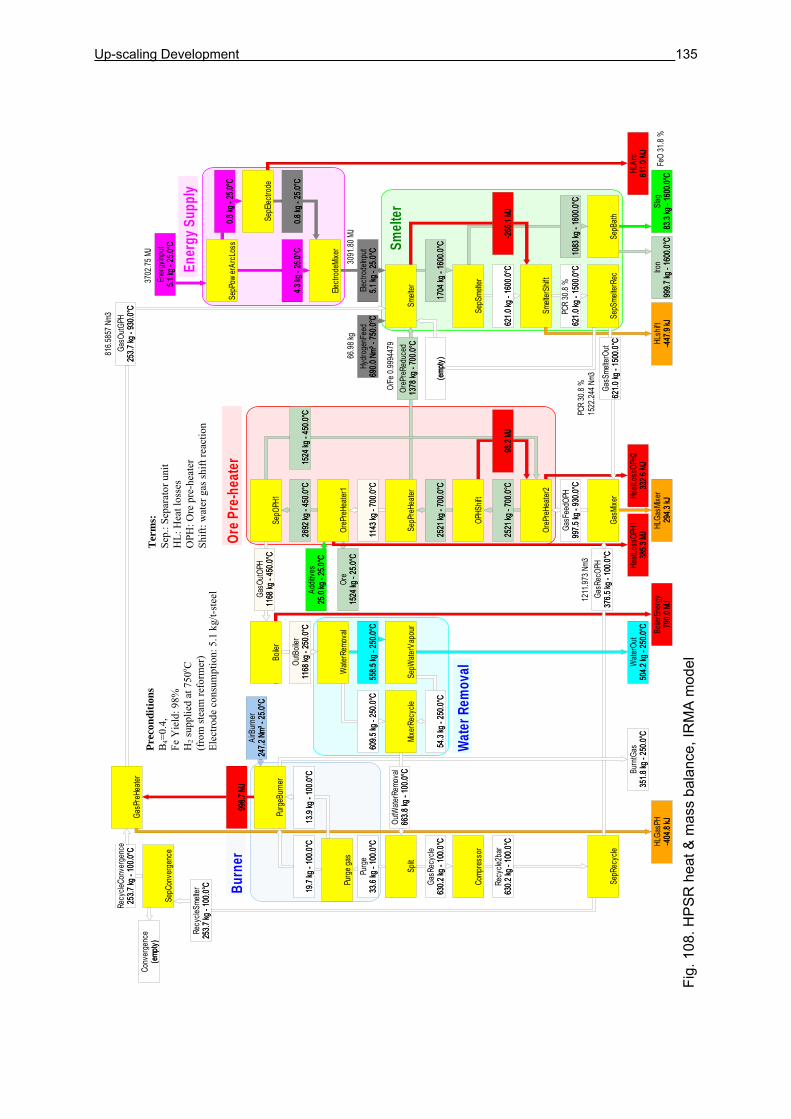
Up-scaling Development 135
Ore P
re-h
eate
rBu
rner
Wat
er R
emov
al
Ene
rgy S
uppl
y
Sm
elter
Ener
gyInp
ut5.1
kg -
25.0°
C5.1
kg -
25.0°
C
Iron
999.7
kg -
1600
.0°C
999.7
kg -
1600
.0°C
Slag
83.3
kg -
1600
.0°C
83.3
kg -
1600
.0°C
SepP
ower
ArcL
oss
0.8 kg
- 25
.0°C
0.8 kg
- 25
.0°C
4.3 kg
- 25
.0°C
4.3 kg
- 25
.0°C
HLAr
c61
1.0 M
J61
1.0 M
J
Electr
odeM
ixer
Electr
odeIn
put
5.1 kg
- 25
.0°C
5.1 kg
- 25
.0°C
SepE
lectro
de
0.8 kg
- 25
.0°C
0.8 kg
- 25
.0°C
SepS
melte
r
621.0
kg -
1600
.0°C
621.0
kg -
1600
.0°C
1083
kg -
1600
.0°C
1083
kg -
1600
.0°C
SepB
ath
SepP
reHe
ater
OreP
reRe
duce
d13
78 kg
- 70
0.0°C
1378
kg -
700.0
°C
1143
kg -
700.0
°C11
43 kg
- 70
0.0°C
GasM
ixer
GasF
eedO
PH99
7.5 kg
- 93
0.0°C
997.5
kg -
930.0
°C
HLGa
sMixe
r29
4.3 kJ
294.3
kJ
OreP
reHe
ater2
2521
kg -
700.0
°C25
21 kg
- 70
0.0°C
HeatL
ossO
PH2
332.6
MJ
332.6
MJ
Addit
ives
25.0
kg -
25.0°
C25
.0 kg
- 25
.0°C
Ore
1524
kg -
25.0°
C15
24 kg
- 25
.0°C
-266
.1 MJ
-266
.1 MJ
HLsh
ift-4
47.9
kJ-4
47.9
kJ
OPHS
hift
2521
kg -
700.0
°C25
21 kg
- 70
0.0°C
98.2
MJ98
.2 MJ
GasP
reHe
ater
Hydr
ogen
Feed
690.0
Nm³
- 75
0.0°C
690.0
Nm³
- 75
0.0°C
HLGa
sPH
-404
.8 kJ
-404
.8 kJ
SepR
ecyc
le
Recy
cle2b
ar63
0.2 kg
- 10
0.0°C
630.2
kg -
100.0
°C
Boile
r
OutB
oiler
1168
kg -
250.0
°C11
68 kg
- 25
0.0°C Bo
ilerE
nerg
y79
0.0 M
J79
0.0 M
J
Smelt
erSh
ift
621.0
kg -
1500
.0°C
621.0
kg -
1500
.0°C
66.98
kg
GasO
utGPH
253.7
kg -
930.0
°C25
3.7 kg
- 93
0.0°C
FeO
31.8
%
SepS
melte
rRec
(emp
ty)(e
mpty)
GasS
melte
rOut
621.0
kg -
1500
.0°C
621.0
kg -
1500
.0°C
PCR
30.8
%
PCR
30.8
%15
22.24
4 Nm3
O/Fe
0.99
9447
9
1211
.973 N
m3
3702
.75 M
J
3091
.80 M
J
1704
kg -
1600
.0°C
1704
kg -
1600
.0°C
OreP
reHe
ater1
2692
kg -
450.0
°C26
92 kg
- 45
0.0°C
HeatL
ossO
PH1
385.3
MJ
385.3
MJ
SepO
PH1
GasO
utOPH
1168
kg -
450.0
°C11
68 kg
- 45
0.0°C
1524
kg -
450.0
°C15
24 kg
- 45
0.0°C
GasR
ecOP
H37
6.5 kg
- 10
0.0°C
376.5
kg -
100.0
°C
Split
Purg
e33
.6 kg
- 10
0.0°C
33.6
kg -
100.0
°C
SepW
aterV
apou
r
Wate
rOut
504.2
kg -
250.0
°C50
4.2 kg
- 25
0.0°C
Purg
eBur
ner
Burn
tGas
351.8
kg -
250.0
°C35
1.8 kg
- 25
0.0°C
998.7
MJ
998.7
MJ
AirB
urne
r24
7.2 N
m³ -
25.0°
C24
7.2 N
m³ -
25.0°
C
Mixe
rRec
ycle
54.3
kg -
250.0
°C54
.3 kg
- 25
0.0°C
Wate
rRem
oval
558.5
kg -
250.0
°C55
8.5 kg
- 25
0.0°C
609.5
kg -
250.0
°C60
9.5 kg
- 25
0.0°C
Purg
e gas
19.7
kg -
100.0
°C19
.7 kg
- 10
0.0°C
13.9
kg -
100.0
°C13
.9 kg
- 10
0.0°C
816.5
857 N
m3
Comp
ress
or
OutW
aterR
emov
al66
3.8 kg
- 10
0.0°C
663.8
kg -
100.0
°C
GasR
ecyc
le63
0.2 kg
- 10
0.0°C
630.2
kg -
100.0
°C
Recy
cleSm
elter
253.7
kg -
100.0
°C25
3.7 kg
- 10
0.0°C
Smelt
er
SepC
onve
rgen
ce
Recy
cleCo
nver
genc
e25
3.7 kg
- 10
0.0°C
253.7
kg -
100.0
°CCo
nver
genc
e(e
mpty)
(emp
ty)
Fig.
108
. HP
SR
hea
t & m
ass
bala
nce,
IRM
A m
odel
Prec
ondi
tions
B
4=0.
4,
Fe Y
ield
: 98%
H
2 sup
plie
d at
750
o C
(fro
m st
eam
refo
rmer
) El
ectro
de c
onsu
mpt
ion:
5.1
kg/
t-ste
el
Ter
ms:
Se
p.: S
epar
ator
uni
t H
L: H
eat l
osse
s O
PH: O
re p
re-h
eate
r Sh
ift: w
ater
gas
shift
reac
tion
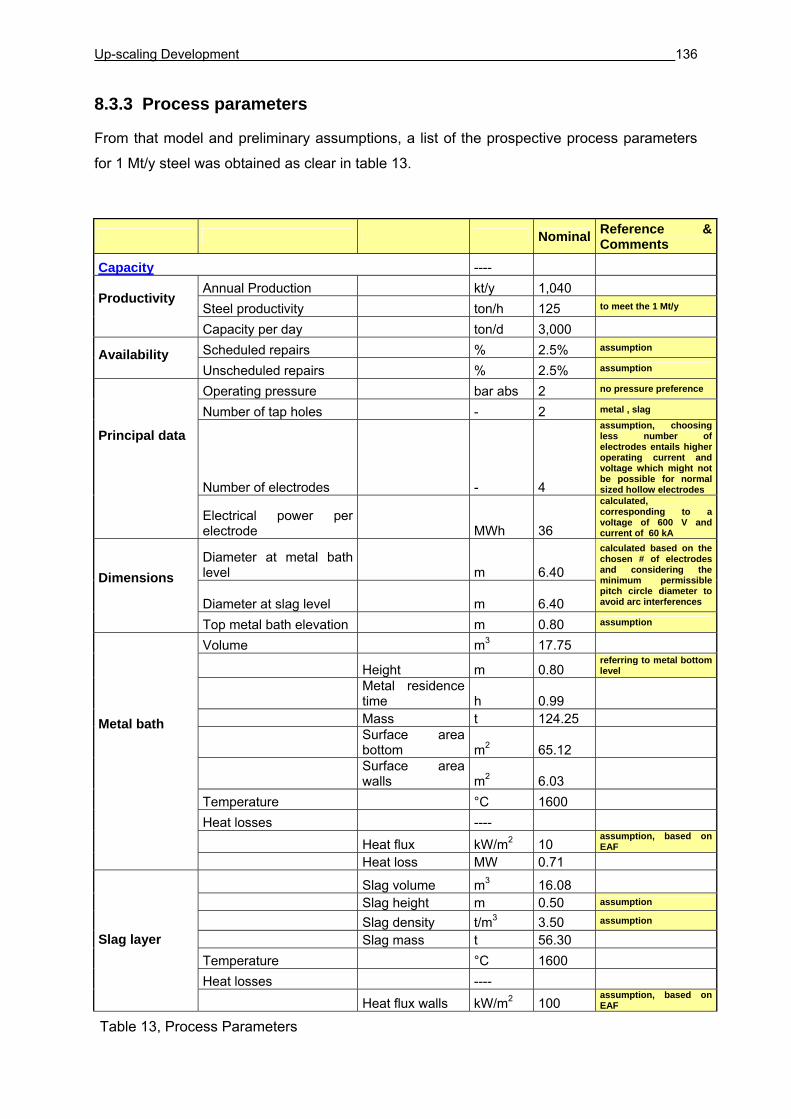
Up-scaling Development 136
8.3.3 Process parameters
From that model and preliminary assumptions, a list of the prospective process parameters
for 1 Mt/y steel was obtained as clear in table 13.
Nominal Reference & Comments
Capacity ----
Annual Production kt/y 1,040
Steel productivity ton/h 125 to meet the 1 Mt/y Productivity Capacity per day ton/d 3,000
Scheduled repairs % 2.5% assumption Availability Unscheduled repairs % 2.5% assumption
Operating pressure bar abs 2 no pressure preference
Number of tap holes - 2 metal , slag
Number of electrodes - 4
assumption, choosing less number of electrodes entails higher operating current and voltage which might not be possible for normal sized hollow electrodes
Principal data
Electrical power per electrode MWh 36
calculated, corresponding to a voltage of 600 V and current of 60 kA
Diameter at metal bath level m 6.40
Diameter at slag level m 6.40
calculated based on the chosen # of electrodes and considering the minimum permissible pitch circle diameter to avoid arc interferences
Dimensions
Top metal bath elevation m 0.80 assumption
Volume m3 17.75
Height m 0.80 referring to metal bottom level
Metal residence time h 0.99
Mass t 124.25
Surface area bottom m2 65.12
Surface area walls m2 6.03
Temperature °C 1600
Heat losses ----
Heat flux kW/m2 10 assumption, based on EAF
Metal bath Heat loss MW 0.71
Slag volume m3 16.08
Slag height m 0.50 assumption
Slag density t/m3 3.50 assumption
Slag mass t 56.30
Temperature °C 1600
Heat losses ----
Slag layer
Heat flux walls kW/m2 100 assumption, based on EAF
Table 13, Process Parameters
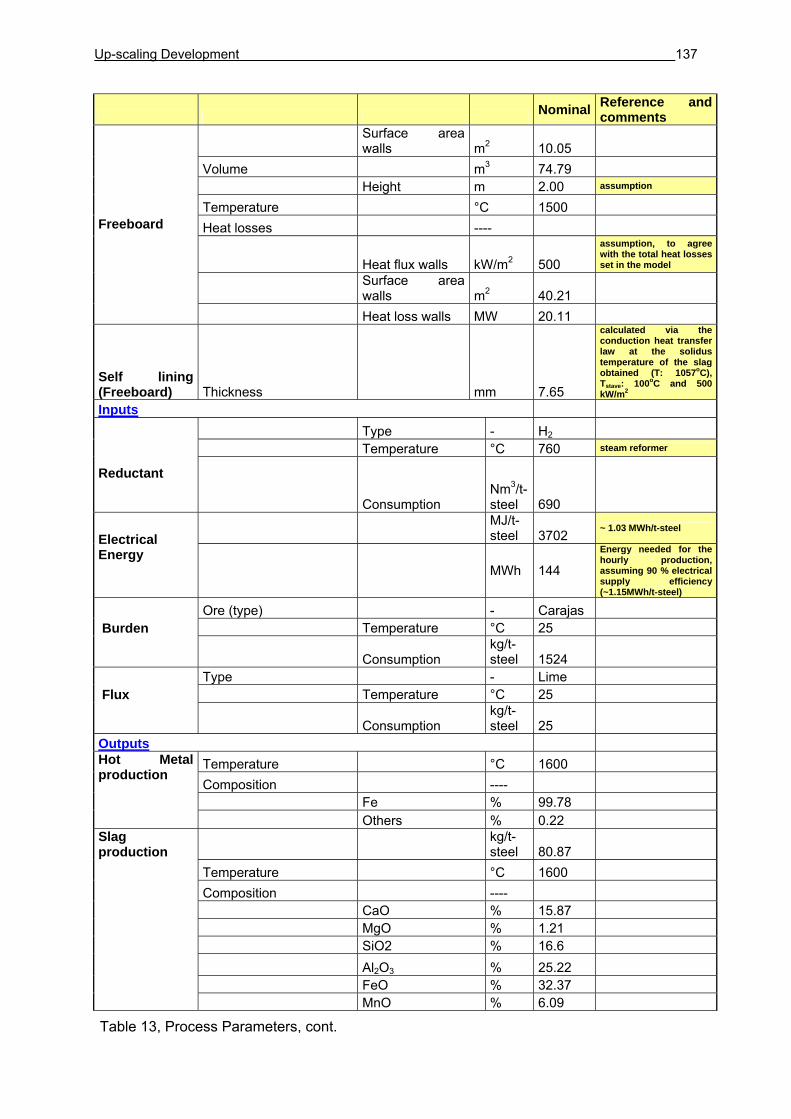
Up-scaling Development 137
Nominal Reference and comments
Surface area walls m2 10.05
Volume m3 74.79
Height m 2.00 assumption
Temperature °C 1500
Heat losses ----
Heat flux walls kW/m2 500
assumption, to agree with the total heat losses set in the model
Surface area walls m2 40.21
Freeboard Heat loss walls MW 20.11
Self lining (Freeboard) Thickness mm 7.65
calculated via the conduction heat transfer law at the solidus temperature of the slag obtained (T: 1057oC), Tstave: 100oC and 500 kW/m2
Inputs
Type - H2
Temperature °C 760 steam reformer
Reductant Consumption
Nm3/t-steel 690
MJ/t-steel 3702
~ 1.03 MWh/t-steel Electrical Energy MWh 144
Energy needed for the hourly production, assuming 90 % electrical supply efficiency (~1.15MWh/t-steel)
Ore (type) - Carajas
Temperature °C 25 Burden Consumption
kg/t-steel 1524
Type - Lime
Temperature °C 25 Flux Consumption
kg/t-steel 25
Outputs
Temperature °C 1600
Composition ----
Fe % 99.78
Hot Metal production Others % 0.22
kg/t-steel 80.87
Temperature °C 1600
Composition ----
CaO % 15.87
MgO % 1.21
SiO2 % 16.6
Al2O3 % 25.22
FeO % 32.37
Slag production
MnO % 6.09
Table 13, Process Parameters, cont.
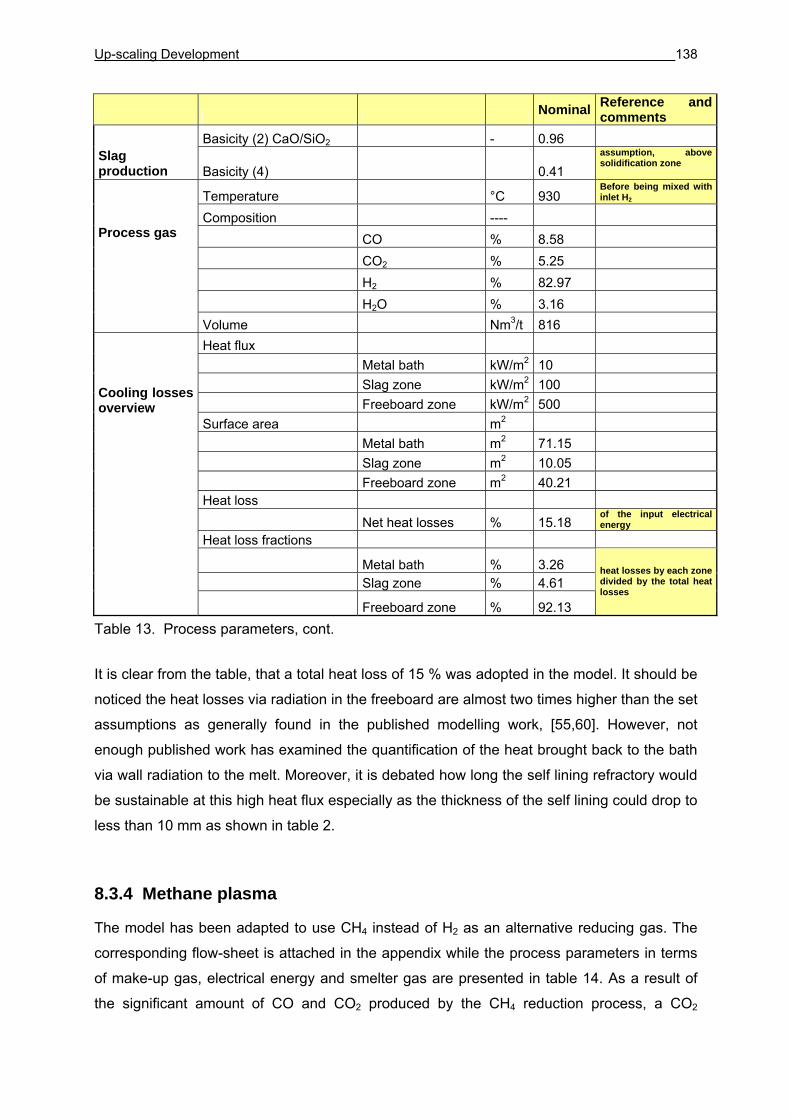
Up-scaling Development 138
Nominal Reference and comments
Basicity (2) CaO/SiO2 - 0.96
Slag production Basicity (4) 0.41
assumption, above solidification zone
Temperature °C 930 Before being mixed with inlet H2
Composition ----
CO % 8.58
CO2 % 5.25
H2 % 82.97
H2O % 3.16
Process gas Volume Nm3/t 816
Heat flux
Metal bath kW/m2 10
Slag zone kW/m2 100
Freeboard zone kW/m2 500
Surface area m2
Metal bath m2 71.15
Slag zone m2 10.05
Freeboard zone m2 40.21
Heat loss
Net heat losses % 15.18 of the input electrical energy
Heat loss fractions
Metal bath % 3.26 Slag zone % 4.61
Cooling losses overview Freeboard zone % 92.13
heat losses by each zone divided by the total heat losses
Table 13. Process parameters, cont.
It is clear from the table, that a total heat loss of 15 % was adopted in the model. It should be
noticed the heat losses via radiation in the freeboard are almost two times higher than the set
assumptions as generally found in the published modelling work, [55,60]. However, not
enough published work has examined the quantification of the heat brought back to the bath
via wall radiation to the melt. Moreover, it is debated how long the self lining refractory would
be sustainable at this high heat flux especially as the thickness of the self lining could drop to
less than 10 mm as shown in table 2.
8.3.4 Methane plasma
The model has been adapted to use CH4 instead of H2 as an alternative reducing gas. The
corresponding flow-sheet is attached in the appendix while the process parameters in terms
of make-up gas, electrical energy and smelter gas are presented in table 14. As a result of
the significant amount of CO and CO2 produced by the CH4 reduction process, a CO2
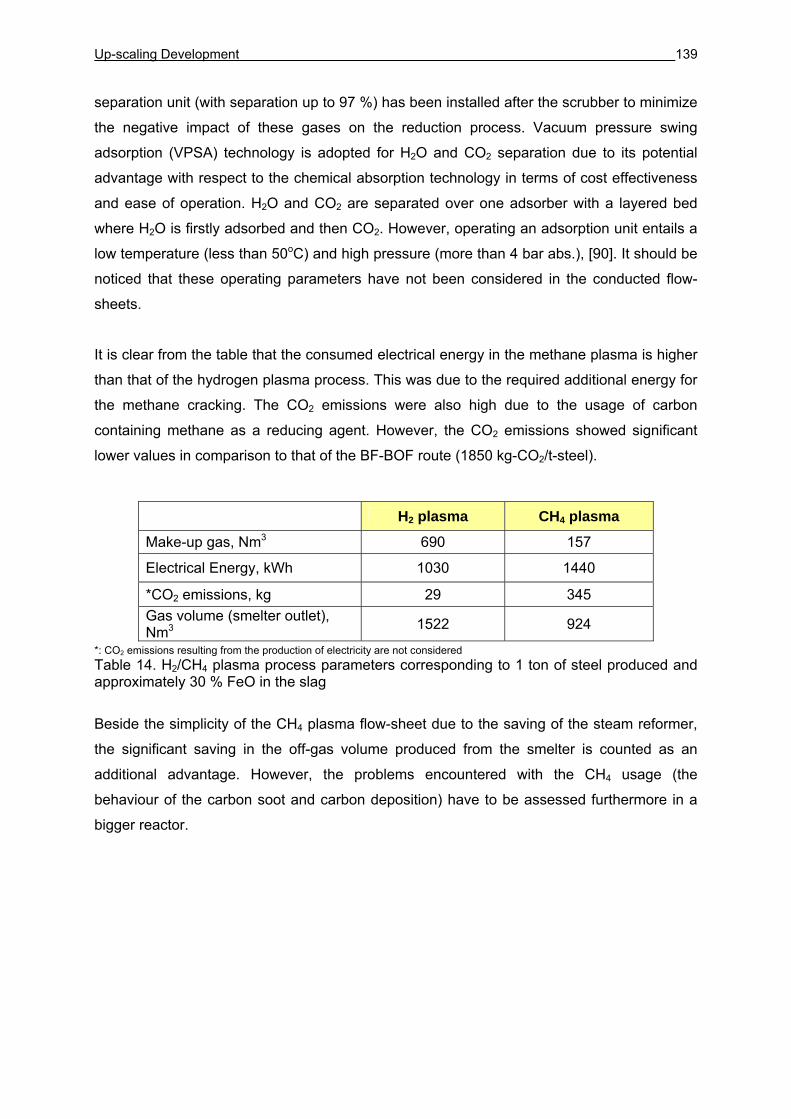
Up-scaling Development 139
separation unit (with separation up to 97 %) has been installed after the scrubber to minimize
the negative impact of these gases on the reduction process. Vacuum pressure swing
adsorption (VPSA) technology is adopted for H2O and CO2 separation due to its potential
advantage with respect to the chemical absorption technology in terms of cost effectiveness
and ease of operation. H2O and CO2 are separated over one adsorber with a layered bed
where H2O is firstly adsorbed and then CO2. However, operating an adsorption unit entails a
low temperature (less than 50oC) and high pressure (more than 4 bar abs.), [90]. It should be
noticed that these operating parameters have not been considered in the conducted flow-
sheets.
It is clear from the table that the consumed electrical energy in the methane plasma is higher
than that of the hydrogen plasma process. This was due to the required additional energy for
the methane cracking. The CO2 emissions were also high due to the usage of carbon
containing methane as a reducing agent. However, the CO2 emissions showed significant
lower values in comparison to that of the BF-BOF route (1850 kg-CO2/t-steel).
*: CO2 emissions resulting from the production of electricity are not considered Table 14. H2/CH4 plasma process parameters corresponding to 1 ton of steel produced and approximately 30 % FeO in the slag
Beside the simplicity of the CH4 plasma flow-sheet due to the saving of the steam reformer,
the significant saving in the off-gas volume produced from the smelter is counted as an
additional advantage. However, the problems encountered with the CH4 usage (the
behaviour of the carbon soot and carbon deposition) have to be assessed furthermore in a
bigger reactor.
H2 plasma CH4 plasma
Make-up gas, Nm3 690 157
Electrical Energy, kWh 1030 1440
*CO2 emissions, kg 29 345 Gas volume (smelter outlet), Nm3 1522 924
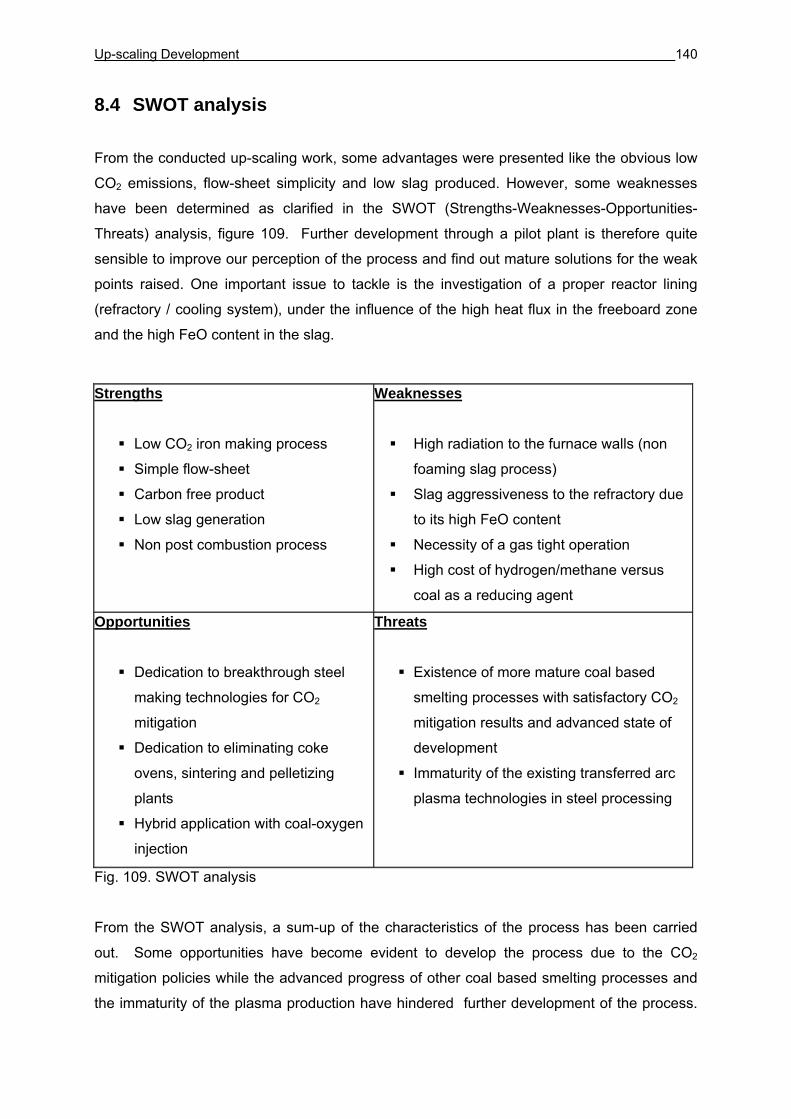
Up-scaling Development 140
8.4 SWOT analysis
From the conducted up-scaling work, some advantages were presented like the obvious low
CO2 emissions, flow-sheet simplicity and low slag produced. However, some weaknesses
have been determined as clarified in the SWOT (Strengths-Weaknesses-Opportunities-
Threats) analysis, figure 109. Further development through a pilot plant is therefore quite
sensible to improve our perception of the process and find out mature solutions for the weak
points raised. One important issue to tackle is the investigation of a proper reactor lining
(refractory / cooling system), under the influence of the high heat flux in the freeboard zone
and the high FeO content in the slag.
Strengths
Low CO2 iron making process
Simple flow-sheet
Carbon free product
Low slag generation
Non post combustion process
Weaknesses
High radiation to the furnace walls (non
foaming slag process)
Slag aggressiveness to the refractory due
to its high FeO content
Necessity of a gas tight operation
High cost of hydrogen/methane versus
coal as a reducing agent
Opportunities
Dedication to breakthrough steel
making technologies for CO2
mitigation
Dedication to eliminating coke
ovens, sintering and pelletizing
plants
Hybrid application with coal-oxygen
injection
Threats
Existence of more mature coal based
smelting processes with satisfactory CO2
mitigation results and advanced state of
development
Immaturity of the existing transferred arc
plasma technologies in steel processing
Fig. 109. SWOT analysis
From the SWOT analysis, a sum-up of the characteristics of the process has been carried
out. Some opportunities have become evident to develop the process due to the CO2
mitigation policies while the advanced progress of other coal based smelting processes and
the immaturity of the plasma production have hindered further development of the process.
Conclusion and future work 141
9 Conclusion and future work
9.1 Conclusion
The objective of the present work was to introduce a fair concept of the characteristics of
hydrogen based smelting process using plasma technology. Better understanding of the
process characteristics (thermodynamics and kinetics) was obtained by a series of
experiments adopting various reducing agents like H2, CH4, CO and coke for the reduction of
mainly hematite fines ore (Carajas). Moreover, CO2 and H2O gases were used in a mixture of
H2-Ar to study their influence on the ore reduction rate. An investigation of the plasma
stability under the continuous feeding of ore through a hollow electrode was also carried out.
A conclusion of the work conducted is summarized as following:
Reduction experiments of Carajas ore by H2 with a tungsten electrode were
conducted and showed less reduction rate with respect to those experiments done
using graphite electrode, i.e. approximately 20 % less reduction rate. The obtained
40 % utilisation degree of hydrogen, in the case of the tungsten electrode
experiments, conforms to the FeO-H2 equilibrium calculations rather than that of FeO-
H or FeO-H+.
An empirical equation was derived statistically for the work published on the reduction
rates of molten iron oxide using H2 at low temperatures (just above the melting point
of FeO) and that done by hydrogen plasma (~ 2400 oC) to show:
ln r = - 0.15 - 2811 / T (kg-oxygen/m2s)
Where r is the specific reduction rate and T is the temperature in K.
Hydrogen was partially fed via a ceramic lance, rather than through the hollow
electrode, in a series of experiments to decrease the amount of hydrogen dissociated
via the plasma and examine the reduction potential of molecular hydrogen. The
results agreed completely with those experiments supplying hydrogen only through
the electrode. This finding confirms the first conclusion: H and H+ do not influence the
reduction process. Secondly, these experiments show the possibility to partially feed
the reducing gases in separate pipes rather than being totally fed through the hollow
electrodes. This possibility would be important in the case that the reacting area
(melt-plasma interface) turned to be a rate limiting factor.
Conclusion and future work 142
CH4 showed, in general, high reduction rate of the iron ore with respect to H2,
i.e. 3.5 – 4 times that of H2. Although there was deposited carbon observed inside the
hollow electrode and carbon soot formation, it is believed that these phenomena will
be diminished when the up-scaling process is considered. In that sense, CH4 will be a
potential alternative to H2 where the burden of H2 production will be ruled out and less
gas volume compared to that in the case of hydrogen process will be handled.
The positive influence of CaO additions to the ore on the phosphorus stability in the
slag was proven in a series of experiments. A minimum phosphorous content of
0.004 % in the metal was found at a slag basicity of B2 = 2.5. However, further
investigation has to be done to study the feasibility of the phosphorous removal in the
plasma reactor, rather than in a separate reactor. An obvious importance of the CaO
additions (except for phosphorous removal) is not observed, where fluxing the slag
with high amounts of CaO is not as meaningful as found in section 6.2.
Magnetite ore (Kiruna) and pre-reduced ore (reduced almost to FeO at “LKAB”) were
used in two series of experiments for comparison purposes with the used hematite
ore (Carajas). In the pre-reduced LKAB experiments, an agreement with the results of
Carajas experiments, but with slight less reduction rates, was observed. This slight
difference was due to the effect of the retained Fe3+ that existed in the stable phase of
Carajas experiments. In the case of Kiruna experiments, the influence of
morphology, as expected, did not take place. This is a significant advantage, when
up-scaling process is considered, where wider range of ore can be selected.
To study the up-scaling potential of the hydrogen based smelting reduction process
within ULCOS project; the details of the proposed flow-sheet were described.
Moreover, a heat and mass balance, based on 1 ton liquid steel, using Corus
designed model was carried out. Expected low CO2 emissions in both H2 and CH4
plasma process were found. However, complete removal of CO, CO2 and H2O in the
system could not be achieved. Moreover, FeO content in the slag, even at a set high
iron yield of 98 %, will be relatively high, i.e. ~ 30 % FeO.
The experimental results obtained in the reduction of Carajas ore by CO under Ar
plasma atmosphere showed values that are in the same order of magnitude with that
of H2 plasma, i.e. reduction rate by H2 plasma is approximately 3 times that of CO
plasma. While the reduction rate of liquid iron oxide using H2 at lower temperatures
Conclusion and future work 143
(above the melting point of FeO) is almost two orders of magnitude faster than CO,
as found in the literature. This means that the increase of the reduction rate using H2
is less compared to CO with increasing temperatures. This convergence in the
reduction potential of both gases at higher temperatures is due the higher rate of
increase of CO diffusion coefficient with respect to that of H2.
An empirical equation was derived statistically for the work published on the reduction
rates of molten iron oxide using CO at low temperatures (above the melting point of
FeO) and that done by CO plasma (~ 2400 oC) to show:
ln r = 4.34 - 18059 / T (kg-oxygen/m2s)
Where r is the specific reduction rate and T is the temperature in K
The reduction rates of Carajas using a mixture of H2-CO2-Ar were evaluated through
a series of experiments. Reduction retardation was obtained due to the supply of
CO2. Using the results obtained, the rate of the reduction drop has been calculated. It
was found that the drop rate at 1 atm CO2 was 4.91 x 10⁻³ mole O cm-2 s-1 at the
plasma temperature zone, (~ 2400 oC). This result was found to be in a good
agreement with the extrapolation of the published work at lower temperatures. In
other words, the plasma application did not show, via CO2 dissociation, an increase in
the reduction rate drop with respect to the published work.
H2O was supplied to H2-Ar mixture in a series of experiments to investigate its
influence on the reduction rate of Carajas ore. Contrary to the CO2 experiments, no
influence on the reduction was monitored. This was attributed to the less negative
influence of H2O against that of CO2 on the reduction behaviour of H2 from the
equilibrium point of view. Moreover, the contribution CO and H2 (generated from the
reaction of graphite electrode with the produced H2O) played an obvious role in
further ore reduction and the disappearance of H2O influence on H2 reduction
behaviour.
Reduction of Carajas ore in H2/Ar plasma atmosphere using continuously fed coke
was also evaluated. From the experimental results, a specific reduction rate of iron
oxide via coke was found to be 9.19 x 10⁻¹ (kg-oxygen/m2s). This means that the
reduction potential of coke compared to that of H2 is approximately a factor of 3 at
high temperatures of the plasma application. An important advantage of coke usage
Conclusion and future work 144
in H2 plasma up-scaled process is the possibility to suppress FeO content in the slag
such that the problem of slag aggressiveness to the refractory lining (due to high
FeO) could be ruled out.
Continuous feeding of Carajas fines ore throughout the experiment, rather than
conducting batch-wise experiments, was examined in a series of experiments. It was
concluded that ore feeding through the hollow electrode does neither deteriorate the
plasma arc stability nor the behaviour of ore reduction.
A SWOT (Strengths-Weaknesses-Opportunities-Threats) analysis was presented
during the study of the up-scaling potential of the process. Some advantages were
emphasized like the obvious low CO2 emissions, flow-sheet simplicity and low slag
produced. However, some weaknesses were introduced. Two important points that
have to be deeply investigated in future work are the influence of the high heat flux
via radiation in the freeboard zone on the total heat losses of the process and
determination of a proper reactor lining in the slag zone (refractory / self lining).
However, the option of self lining by water cooling system could be ruled out in the
case of coke usage as a control tool for % FeO reduction in the slag. In that case, the
refractory is a sensible option for the reactor lining.
In conclusion, it should be noted that despite that H2/CH4 plasma smelting reduction process
shows a potential advantage, from the environmental point of view, the economics of plasma
metallurgy processes do not yet show a significant advantage over other comparable
techniques. Therefore the development of the plasma in the field of ore reduction is unlikely
to happen unless electricity becomes much cheaper. A second scenario could be the
growing shortage of fossil fuels and the increasing burden of reducing CO2 emissions, which
might force the steelmakers, at some time, to abandon the conventional steelmaking
processes. A third scenario is the development of plasma technology one day so that the
contribution of radicals (H and H+) would exist, improving dramatically the reduction kinetics
and driving the process to a novel economics standard.
Conclusion and future work 145
9.2 Future work
Plasma processing, in general, has a high potential even at the present status. More work
has to be done to find the strengths of the plasma metallurgy. During the execution of the
present work, the following topics were found to be valuable for further work:
During the last two decades, much work [91-93] has been done to develop processes
based on plasma technology for recovering valuable metals from waste dusts and
slag. However, all projects conducted have adopted only carbonaceous reducing
agent for waste treatment. In that sense, it is believed that plasma application using
hydrogen and coke (supplied by the existing screw conveyor facility) could be a
potential alternative for the reduction of solid wastes, i.e. electric arc furnace (EAF)
dust and EAF stainless steel dust.
Continuous feeding of coke (using the screw conveyor facility) can be carried out in
another series of experiments. In this work, a partial reduction of the oxide melt by H2
plasma could be conducted. A switch to the reduction by coke is then proposed to
investigate the coke behaviour (as a single reducing agent) and the possible
carburisation in the remaining period of the experiment.
The variation of the degree of reduction of iron oxide could be experimentally
controlled in a series of experiments. The objective of these experiments is to
investigate the reduction behaviour of the accompanying elements like phosphorous
at various reduction degrees.
Modelling work in the field of hydrogen plasma smelting reduction has not yet been
conducted. The present status is still immature in the fundamentals of the technology
like plasma arc heat distribution, melt temperature and heat losses. Some modelling
work on the plasma arc, however, has recently started in conjunction with the chair of
modelling and simulation of metallurgical processes (CMSMP). A primary validation
to the simulation program with respect to the published work was conducted (shown
in the appendix). The validation of the model with respect to the experimental results
is planned as a next step.
List of figures 146
List of figures Fig. 1. Schematic diagram of a two stage smelting reduction process 7 Fig. 2. Bauer-Glaessner diagram 10 Fig. 3. Hydrogen dissociation and ionisation versus temperature 11 Fig. 4. Free energy of formation of various oxides, based on Ellingham - Richardson
diagram 12 Fig. 5. Transport of active particles to the reacting surface, in the absence of an external
electric field 14 Fig. 6. Transport of active particles to the reacting surface with positive polarity 15 Fig. 7. Transport of active particles to the reacting surface with negative polarity 15 Fig. 8. ΔGo versus surface temperature for FeO reduction by hydrogen plasma 16 Fig. 9. Schematic diagram of the experimental setup 18 Fig. 10. Schematic diagram of the cylindrical reactor 19 Fig. 11. Schematic diagram of the experimental apparatus 20 Fig. 12. Specific reduction rates of molten FeO and wustite by pure H2 at various
temperatures 21 Fig. 13. Specific reduction rates of molten FeO by pure CO at various temperatures 22 Fig. 14. Specific reduction rates of molten FeO with solid carbon 23 Fig. 15. Specific reduction rates of molten FeO with carbon dissolved in liquid iron 24 Fig. 16. Specific heat, viscosity, thermal conductivity and electrical conductivity of Ar, H2
and CH4 27 Fig. 17. Temperature fields for arcs in Ar and H2 28 Fig. 18. Velocity fields for arcs in Ar and H2 29 Fig. 19. Voltage fluctuations at arc gap: 2 cm 31 Fig. 20. Voltage fluctuations at arc gap: 5 cm 31 Fig. 21. Arc heating power distribution 32 Fig. 22. Radial distribution of the heat flux density to the melt for different gases 34 Fig. 23. Net emission coefficients of Ar, H2 and CH4 35 Fig. 24. Effect of iron vapour concentration on the total radiation of an Ar – Fe plasma 36 Fig. 25. Temperature and fluid flow velocity at 20 s after arc ignition in Ar, He gas tungsten
arc welding of SUS 304 37 Fig. 26. Absorption of hydrogen supplied in a) molecular state, b) atomic state,
c) ionic state 40 Fig. 27. Hydrogen solubility versus molecular hydrogen partial pressure 42 Fig. 28. Hydrogen solubility versus atomic hydrogen partial pressure 43 Fig. 29. Hydrogen solubility in CaO-FeO-SiO2 melts in relation to CaO/SiO2 ratios 45
List of figures 147
Fig. 30. Calculated COH lines against those measured for a CaO-FeO-SiO2 system 46 Fig. 31. Major dissolved forms of water in the CaO-FeO-SiO2 slag as calculated 47 Fig. 32. Phase boundary reactions 48 Fig. 33. Equilibrium of 1 mole FeO - 1 mole H2 49 Fig. 34. Equilibrium of 4 mole FeO - 1 mole CH4 50 Fig. 35. Equilibrium of 1 mole FeO - 1 mole CO 51 Fig. 36. Equilibrium of 1 mole FeO - 1 mole H2 - 0.2 mole CO2 52 Fig. 37. Equilibrium of 1 mole FeO - 1 mole H2 - 0.2 moleH2O 53 Fig. 38. Reduced oxygen in 1 mole FeO by 1 mole H2 and 0.2 moles H2O / CO2 54 Fig. 39. Equilibrium of 2 mole FeO - 1 mole C 54 Fig. 40. Quaternary oxide system FeO-SiO2-Al2O3-CaO and the calculated slag lines during
reduction 56 Fig. 41. Ternary oxide system FeO-SiO2-Al2O3 and the liquidus temperatures 57 Fig. 42. Quaternary oxide system FeO-SiO2-Al2O3-CaO and the calculated slag line during
reduction 58 Fig. 43. Experimental program 59 Fig. 44. Schematic overview of the plasma facility 62 Fig. 45. Furnace layout with lateral injection of H2 63 Fig. 46. Evaporator layout 64 Fig. 47. Screw conveyor system 65 Fig. 48. Cross section of a crucible after an experiment 68 Fig. 49. Off-gas analysis of 40 % H2 experiment 76 Fig. 50. Reduction and utilisation degrees of 40 % H2 experiment using graphite electrode 77 Fig. 51. Reduction rate of 40 % H2 experiment using graphite electrode 78 Fig. 52. Reduction rate versus H2 flow using graphite electrode 79 Fig. 53. Ferrite structure 80
Fig. 54. Non metallic inclusions 80 Fig. 55. Off-gas analysis of 30 % H2 experiment using tungsten electrode 80 Fig. 56. Lateral shift of the arc column and melting of crucible sidewall 81 Fig. 57. Reduction and utilisation degrees of 30 % H2 experiment using tungsten electrode 82 Fig. 58. Reduction rate by H2, graphite and tungsten electrodes 82 Fig. 59. Reduction and H2 utilisation degrees, lateral supply and via the electrode 83 Fig. 60. Reduction degree, lateral supply at various flow rates using graphite electrode 84 Fig. 61. Off-gas analysis of a 20 % CH4 in Ar-CH4 mixture 85 Fig. 62. Reduction and utilisation degrees of 20 % CH4 86 Fig. 63. Effect of % CH4 on the reduction degree 87 Fig. 64. Reduction rate of CH4 and H2 87
List of figures 148
Fig. 65. Effect of basicity, B2, on the reduction behaviour 89
Fig. 66. Effect of basicity, B2, on the H2 utilisation degree 89 Fig. 67. Effect of the basicity, B2, on the phosphorous content in the metal 90 Fig. 68. Phosphorous balance 91 Fig. 69. Kiruna against Carajas reduction 92 Fig. 70. Reduction rate obtained for Kiruna and Carajas fines 92 Fig. 71. Comparison between pre-reduced LKAB and Carajas fines 94 Fig. 72. Reduction rate obtained in pre-reduced LKAB and Carajas fines 94 Fig. 73. Reduction degrees attained with CO-H2-Ar mixtures 95 Fig. 74. Reduction rate against CO flow 96
Fig. 75. Calculated CO utilisation degrees 96 Fig. 76. Off-gas analysis of 60 % CO in Ar-CO mixture 98 Fig. 77. Reduction degrees of CO – Ar experiments 98 Fig. 78. Reduction rate against CO flow 99
Fig. 79. Calculated CO utilisation degree 99
Fig. 80. Reduction degrees of CO2-H2-Ar experiments 100 Fig. 80. Reduction degrees of CO2-H2-Ar experiments 100 Fig. 81. Reduction rates against CO2 flow rate 101 Fig. 82. Reduction degrees of H2O-H2-Ar experiments 102 Fig. 83. Reduction rates of H2O-H2-Ar experiments at various H2O flows 103 Fig. 84. Erosion of the electrode, from the hollow side, by the supplied H2O 103 Fig. 85. Electrode erosion rate against H2O flow 104 Fig. 86. Gas analysis with 5 g coke 105
Fig. 87. Reduction rate with 5 g coke 105 Fig. 88. Reduction degrees for various coke additions 106 Fig. 89. Gas analysis for H2-Ar experiment with continuous coke addition (1.33 g/min) 107 Fig. 90. Reduction and utilisation degrees for H2-Ar experiment with continuous
coke addition 108 Fig. 91. Pearlite-secondary cementite structure 109 Fig. 92. Gas analysis for H2-Ar experiment with continuous ore feeding (4.55 g/min) 110 Fig. 93. Reduction and utilisation degrees for H2-Ar experiment with continuous
ore feeding 111 Fig. 94. Reduction rate, continuous feeding versus batch-wise 111 Fig. 95. Change of Fe (II) and Fe (III), in wt. %, in the slag against H2 flow 112 Fig. 96. Voltage and current changes during ore feeding 113 Fig. 97. Schematic diagram of the reduction process 114 Fig. 98. Effect of the elimination of the graphite electrode effect on the reduction rate 116
List of figures 149
Fig. 99. Reduction rate of wustite and liquid oxide by H2 as a function of temperature 117 Fig. 100. Reduction rate of wustite and liquid oxide as a function of temperature 122 Fig. 101. Comparison of the apparent rate constants for the oxidation of liquid iron oxide by
CO2 with results from the H2-CO2 reduction experiments 123 Fig. 102. Comparison of the reduction rates for coke plasma with respect to C melt and solid
carbon 125 Fig. 103. Summary of the specific reduction rates of the conducted experiments 127 Fig. 104. Hydrogen Plasma Smelting Reduction Process, HPSR 129 Fig. 105. H2 flow rate versus the iron yield, % FeO in the slag and the utilisation degree 132 Fig. 106. Iron yield versus the specific ore 133
Fig. 107. Slag basicity (B4) versus % FeO 133
Fig. 108. HPSR heat & mass balance, IRMA model 133 Fig. 109. SWOT analysis 140
List of tables 150
List of tables Table 1. Chemical analysis of the fines ores 66 Table 2. Metal, crucible and ignition pin analyses, wt. % 79 Table 3. Chemical analysis of the reduced metal with CH4, wt. % 88 Table 4. Slag analyses at various % CaO, wt. % 90 Table 5. Chemical analysis of the reduced metal in Kiruna experiments, wt. % 93 Table 6. Chemical analysis of the reduced metal in the pre-reduced LKAB experiments,
wt. % 95 Table 7. Chemical analysis of the reduced metal in CO-H2-Ar experiments, wt. % 97 Table 8. Chemical analysis of the reduced metal in CO2-H2-Ar experiments, wt. % 101 Table 9. Chemical analysis of the coke, wt. % 105 Table 10. Chemical analysis of the reduced metal using coke, wt. % 108 Table 11. List of the experimental results 128 Table 12. Set assumptions 134 Table 13. Process parameters 138 Table 14. H2/CH4 plasma process parameters corresponding to 1 ton of steel produced and
approximately 30 % FeO in the slag 139
List of literature 151
List of literature [1] International Iron and Steel Institute (IISI): Steel in figures, http://www.worldsteel.org/index.php
[2] Still, G., ThyssenKrupp Steel: Practical solutions for steel to national allocations plans, 5. June 2003, www.ceps.be/files/TF/SchulzeThyssenkrupp.ppt [3] Birat, J. P., Arcelor Research: Overview of the results & conclusions of ULCOS program's phase I and of the scientific & technical program for phase II, second year-confidential report, August 2006.
[4] Sixth Framework Programme (FP6) Home Page: http://cordis.europa.eu/fp6/projects.htm, ULCOS.
[5] Boon, W. and Denys, M.: New smelting reduction, ULCOS 1st annual conference, Bilbao 11-12 February 2004.
[6] Sormann, A.: Doctoral thesis, Untersuchungen zur Schmelzreduktion von Eisenoxiden mit Wasserstoff als Reduktionsmittel. Montanuniversität Leoben, 1992. [7] Sormann, A.; Hiebler, H.; Presslinger, H.: Smelting reduction of iron oxide by hydrogen. In: International Conference on New Smelting Reduction and Near Net Shape Casting Technologies for Steel. Vol. 1: pp.57-74, 1990. [8] Hatarascu, O.: Besonderheiten der Thermodynamik und Kinetik der Eisenoxidreduktion mit Kohlenmonoxid und Wasserstoff: Archiv für das Eisenhüttenwesen. Vol. 51, Nr. 11: pp. 445-448, 1980. [9] C.Bale, W.Pelton, K. Hack et al.: www.factsage.com, © Thermfact 1976-2007, GTT-Technologies. [10] Plaul, J.F.: Doctoral thesis, Schmelzreduktion von hämatitischen Feinerzen im Wasserstoff-Argon-Pasma, Montanuniversität Leoben, 2005. [11] Milner, D. R.: A survey of the scientific principles related to wetting and spreading, British welding journal, vol.5, no.3, pp. 90-105, 1958 [12] Coudurier, L.; Hopkins, D. W.; Wilkomirsky, I.: Fundamentals of metallurgical processes, Oxford, New York, Toronto, Sydney, Paris, Frankfurt: Pergamon Press, 1978. [13] Robino, C.V., Representation of mixed reactive gases on free energy (Ellingham-Richardson) diagrams, Metallurgical and Materials Transaction B, vol 27B, pp 65-69, 1996. [14] Bäck, E.: Doctoral thesis, Schmelzreduktion von Eisenoxiden mit Argon-Wasserstoff- Plasma, Montanuniversität Leoben, 1998. [15] Dembovsky, V.: Zu Fragen der Thermodynamik und Reaktionskinetik in der Plasmametallurgie, Neue Hütte. Vol. 32: pp. 214-219, 1987. [16] Dembovsky, V.: Plasma Metallurgy -The Principles, Materials Science Monographs, 23, Elsevier Science Ltd, 1985.
List of literature 152
[17] Dembovsky, V.: How the polarity of a surface reacting with a low temperature plasma affects the thermodynamic variables in metallurgical reactions, acta phys. slov. 34, No.1, 1984.
[18] Kamiya, K.; Kitahara, N.: Reduction of molten iron oxide and FeO bearing slags by H2-Ar plasma, Transactions ISIJ. Vol. 24: pp. 7-16, 1984.
[19] Ban-ya, S.; Iguchi, Y.; Nagasaka, T.: Rate of reduction of liquid iron oxide with hydrogen, Transactions ISIJ, Vol. 23, pp. 197, 1983. [20] Hayashi, S.; Yoshiaki, I.: Hydrogen reduction of liquid iron oxide fines in gas-conveyed systems, ISIJ International, Vol. 34, No. 7, pp.555-561, 1994.
[21] Lemperle, M.; Weigel, A.: On the smelting reduction of iron ores with hydrogen argon plasma. steel research, Vol. 56, No. 9: pp. 465-469,1985 [22] Müller, H.: Doctoral thesis, Entwicklung von induktiven und Lichtbogen-Plasmaanlagen und ihre experimentelle Erprobung bei der Reduktion von Eisenerz. Aachen, RWTH-Aachen, 1982. [23] Müller, H.; Weigel, A.; Wilhelmi, H.: Verfahrenstechnische Grundlagen der Plasma-Schmelzreduktion, Arch. Eisenhüttenwesen 54, No. 12, pp. 481-486, 1983. [24] Plaul, J. F.; Krieger, W.: Wasserstoff-Plasma-Schmelzreduktion: Ein alternativer Weg zur Stahlerzeugung, BHM. Vol. 194, No. 7: pp. 235-239, 2004. [25] Plaul, J. F.; Krieger, W.; Bäck, E.: Reduction of fine ores in argon-hydrogen plasma, steel research international. Vol. 76, No. 8: pp. 548-554, 2005. [26] Bäck, E.; Schneider, R.; Hiebler, H.: Vergleich der Schmelzreduktionsverfahren, BHM. Vol. 142, No. 5: pp. 195-203, 1997. [27] Bäck, E., Hiebler, H. (1998): Schmelzreduktion von Eisenoxid mit Wasserstoff in einem Plasmaofen, BHM. Vol. 143, No. 5: pp. 153-158, 1998. [28] Bäck, E.,Sormann A.: Stand der Schmelzreduktion von Eisenoxid mit Wasserstoff als Reduktionsmittel, BHM. Vol. 145, Nr. 1: pp. 14-21, 2000. [29] Nakamura, T.; Shibata, K.; Takeda, K.: Reduction and dephosphorisation of molten iron oxide with hydrogen-argon plasma, Plasma Chemistry and Plasma Processing. Vol. 1: pp. 149-160, 1981. [30] Gilles, H. L.; Clump, C. W.: Reduction of iron ore with hydrogen in direct current plasma jet.: Ind. Eng. Chem. Process Des. Dev. Vol. 9: pp. 194-207, 1970. [31] Gold, R. G.; Sandall; W. R., Cheplick P. G.: Plasma reduction of iron oxide with hydrogen and natural gas at 100 kw and 1 MW, Ironmaking and Steelmaking, No.1, pp. 10-14, 1977. [32] Pateyron, B.; Aubreton, J.; Kassabji F.; Fauchais P.: New design of reduction plasma furnaces including the electrical transfer to the bath and the falling film, ISPC5, Edinburgh, pp. 167-177, 1981.
List of literature 153
[33] Akashi, K.; Ishizuka, R.; Mutobe, T.: Reduction of metal oxide in a direct current plasma arc. Proceedings of the 4th International Conference on Vacuum Metallurgy, Vol. 3: pp. 165-169, 1974. [34] Badr, K.; Bäck, E.; Krieger, W.: Reduction of iron ore by a mixture of Ar-H2 with CO and CO2 under plasma application; 18th International Symposium on Plasma Chemistry, August 26-31, Kyoto, Japan, 2007. [35] Badr, K.; Bäck, E.; Krieger, W.: Plasma Reduction of Iron Oxide by Methane Gas and its Process Up-scaling; steel research int., 78, No. 4, pp. 275-280, 2007. [36] Kato, K.; Sasaki, Y.; Soma, T.: Reduction of molten iron oxide with carbon monoxide gas, Trans. Iron Steel Inst. Jpn., Vol. 17, pp. 532-33, 1977. [37] Soma, T.: Molten state reduction of iron ore, Bull. Jpn. Inst. Met., vol. 21, pp. 620-25, 1982. [38] Tsukihashi, F.; Kato, K.; Ohtsuka, K.; Soma, T.: Reduction of molten iron ore with carbon Trans, Iron Steel Inst. Jpn., Vol. 22, pp. 688-95, 1982. [39] Nagasaka, T; Iguchi, Y.; Ban-ya, S.: 5th Int. Iron and Steel Congr.: Process Technology Proc., ISS, Washington, DC, Vol. 6, pp.669-78, 1986. [40] Nagasaka, T; Mitsutaka, H.; Ban-ya, S.: Interfacial kinetics of hydrogen with liquid slag containing iron oxide, Metall. Mater.Trans.B, Vol. 31B, pp.945-55, 2000. [41] Ryzenkov, D.I.; Golenko, D.M.; Chelyadunov, L.M.: Izv. VUZ Chern. Met., No. 4, pp. 19-22, 1960. [42] Kondakov, V.V. ; Ryzenkov, D.I. ; Golenko, D.M.: Izv. VUZ Chern. Met., No. 4, pp. 23-28, 1960. [43] Takahashi, K.; Amatatsu, M.; Soma, T.: Reduction of molten iron ores with solid carbon, Tetsu-to-Hagane, vol. 61, pp. 2525-30, 1975. [44] Sasaki, Y.; Okamoto, K.; Soma, T.: Tetsu-to-Hagane, Vol. 64, pp. 367-75, 1978. [45] Tsukihashi, F.; Amatatsu, M.; Soma, T.: Reduction of molten iron ore with carbon, Tetsu-to-Hagane, Vol. 68, pp. 1880-88, 1982. [46] Sato, A.; Aragane, G.; Kamihira, K.,; Yoshimatsu, S.: Reduction rate of molten iron oxide by the solid carbon or the carbon in molten iron, Tetsu-to-Hagane, 1987, Vol. 73, pp. 812-19. [47] Dancy, T.E.: The kinetics of the reduction of iron oxide above 1400°, J. Iron Steel Inst., Vol. 169, pp. 17-24, 1951. [48] Mac Rae; Donald, R.: Kinetics and mechanism of the reduction of solid iron oxides in iron-carbon melts from 1200 to 1500°, J. Met., Vol. 17, pp. 1391-95, 1965. [49] Lloyd, G.W.; Young, D.R.; Baker, L.A.: Reaction of iron oxide with iron-carbon melts, Ironmaking and Steelmaking, Vol. 2, pp. 49-55, 1975. [50] Sato, A.; Nakagawa, R.; Yoshimatsu, S.; Fukuzawa, A.; Ozak, F.: Melting rate of iron oxide pellets into iron melt, Tetsu-to-Hagane, Vol. 67, pp. 303-12, 1981.
List of literature 154
[51] Feinman, J.: Plasma Technology in Metallurgical Processing, Iron and Steel Society, Chapter 3, 4, 7, ISBN 0-932897-12-6,1987. [52] Murphy, A.B.; Arundell, C.J.: Transport coefficients of argon, nitrogen, oxygen, argon-nitrogen, and argon-oxygen Plasmas, Plasma Chem. Plasma Process, 14, pp. 451-490, 1994.
[53] Murphy, A.B.: Transport coefficients of hydrogen and argon-hydrogen plasmas, Plasma Chem. Plasma Process, 20, pp. 279-297, 2000.
[54] Murphy, A.B.; Tanaka, M.; Tashiro, S.; Satoh, T.; Lowke, J.J.: Modelling of the influence of welding gas composition on arc properties and weld depth in TIG welding, 18th International Symposium on Plasma Chemistry, August 26-31, Kyoto, Japan, 2007.
[55] Tanaka, M.; Lowke, J.J.: Predictions of weld pool profiles using plasma physics, J. Phys. D: Appl.. Phys. 40, pp.1-23, 2007. [56] Murphy, A.B.: Demixing in free-beurning arcs, Physical Review E, Vol. 55, 6, pp. 7473, 1997.
[57] Coudert, J.F.; Delalondre, C.; Roumilhac, P., Simonin, O.; Fauchais, P.: Modeling and experimental study of a transferred arc stabilized with argon and flowing in a controlled-atmosphere chamber filled with argon at atmospheric pressure, Plasma Chem and Plasma Process, 13, pp. 399, 1993.
[58] Hur, M.; Hwang, T.H..; Ju, W. T.; Lee C. M.; Hong, S.H.: Numerical analysis and experiments on transferred plasma torches for finding appropriate operating conditions and electrode configuration for a waste melting process, Thin Solid Films, Vol. 390, pp. 186-191, 2001. [59] Sci-Tech Encyclopedia, McGraw-Hill Encyclopedia of Science and Technology, 5th edition, McGraw-Hill Companies, Inc., Principles of radiation transfer, www.Answers.com. [60] Holt, N. J.; Bakken, J. A.: Transferred argon arc reactor with emphasis on radiation heat transfer, 1993 Electric furnace conference proceedings, pp.177-86, 1993. [61] Esser, F.; Fiedler, H.; Lachner, W.: On the theory of remelting solid metallic charges in plasma torch furnaces, Proceedings 4th ICVM, pp.145-48, 1968.
[62] Bini, R.; Boulos, M.I.: Energy distribution in argon transferred arcs, 18th International Symposium on Plasma Chemistry, August 26-31, Kyoto, Japan, 2007. [63] Lowke, J. J.: Prediction of arc temperature profiles using approximate emission coefficients for radiation losses, J. Quant. Spectrosc. Radiat. Transfer, 14, 111, 1974. [64] Cram, L. E.: Statistical evaluation of radiative power losses from thermal plasmas due to spectral lines, J. Phys. D: Appl. Phys. vol. 18, pp. 401, 1985. [65] Murphy, A.B.: Net emission coefficients tables using Cram method, not published yet.
List of literature 155
[66] Bakken, J. A., Modelling of fluid flow, heat transfer and diffusion in arcs, High Temp. Chem. Processes 3, pp. 677-688, 1994. [67] Essoltani, A.; Proulx, P.; Boulos, M.I.: Radiation and self absorption in argon – iron plasmas at atmospheric pressure, J. of Analytical Atomic Spectrometry, Vol. 5, pp. 543-546, 1990. [68] Tanaka, M.; Ushio, M.; Lowke, J.J.: Numerical study of gas tungsten arc plasma with anode melting, Vacuum 73, pp. 381-389, 2004. [69] Jones, R.T.; Reynolds, Q.G.; Alport, M.J.: DC arc photography and modelling, Minerals Engineering, V. 15, pp. 985-991, 2002.
[70] Fruehan R., The making, Shaping and Treating of Steel, 11th Edition, Steelmaking and Refining Volume, ISBN: 0-930767-02-0, pp. 61, 89, 1998. [71] Turkdogan, E.T.: Fundamentals of Steelmaking, The Institute of Materials, London, 1996. [72] Dembovsky, V.: Thermodynamics of dissolution and liberation of gases in the atomization of molten metals by plasma-induced expansion, J of Mat. Proc. Tech. 64, pp. 65-74, 1997. [73] Gedeon, S. A; Eagar, T.W.: Thermochemical Analysis of Hydrogen Absorption in Welding, Welding Research Supplement, pp.264-271, 1990. [74] Grigorian, V. A. et al.: Research on interaction of nitrogen with liquid iron in electric arc heating, Interactions of gases with metals (in Russian), pp. 146, 1973. [75] Suh, D.; Eagar, T.W.: Mechanistic understanding of hydrogen in steel welds, Proceedings of international workshop conference on hydrogen management for welding applications, Ontario, Canada, pp.105-10, 6-8 Oct. 1998. [76] Iguchi, Y.; Ban-ya, S.; Fuwa, T.: The solubility of water in liquid CaO-SiO2 with Al2O3, TiO2, and FeO at 1550oC, Transactions ISIJ, Vol. 9, pp. 189-95, 1969.
[77] Wahlster, M.; Reichel, H.: Die Wasserstofflöslichkeit von Schlacken des Systems CaO-FeO-SiO2, Archiv für das Eisenhüttenwesen, Heft 1, 1969. [78] Ban-ya, S.; Hino, M.; Nagasaka, T: Estimation of water vapour solubility in molten silicates by quadratic formalism based on the regular solution model, ISIJ International, Vol. 33, pp. 12-19, 1993. [79] Sung-Koo, J.; Seon-Hyo, K.: The solubility of water vapour in CaO- SiO2-Al2O3-MgO slag system, steel research 71, pp. 15-21, 2000. [80] Imai, M.; Ooi., H.; Emi, T.: Tetsu to Hagane 48, pp.111/17, 1962. [81] Larson, H.: Chipman, J.: Oxygen activity in iron oxide slags, Journal of Metals, pp. 1089-96, 1953. [82] Jung, In-Ho: Thermodynamic modelling of gas solubility in molten slags (II)-water, ISIJ International, Vol. 46, No.11, pp. 1587-93, 2006.
List of literature 156
[83] Bronkhorst High-Tech B.V.: Bronkhorst software for physical properties and flow calculations of liquids and gases, http://www.fluidat.com. [84] Purdue University, College of Science: Review of the activation energy of chemical reactions, http://chemed.chem.purdue.edu/genchem/topicreview/
[85] LI, Y.; Ratchev, I. P.; Belton, G.R.; et al.: Rate of interfacial reaction between liquid iron oxide and CO-CO2, Metall. and Mater.Trans.B, Vol. 31B, pp. 1049-1057, October 2000.
[86] Story, S.R.; Fruehan, R.J.: Kinetics of oxidation of carbonaceous materials by CO2 and H2O between 1300oC and 1500oC, Metall. and Mater.Trans.B, Vol. 31B, pp. 43-54, February 2000.
[87] Wiesinger, H.: Doctoral thesis: Bewertung der Wasserstoffschmelzreduktion zur Stahlherstellung, Montanuniveristät Leoben, 2000. [88] Elmquist, S.; Weber, P; Eichberger, H: Operational results of the Circored fine ore direct reduction plant in Trinidad, stahl und eisen 122, No.2 , 2002. [89] R. Speets: Iron Making Model User Manual – IRMA version 1.1, Corus Research, Development & Technology, Confidential within ULCOS Project, 2005. [90] Vincent, G.: Vacuum and Pressure Swing Adsorption by AIR LIQUIDE, Confidential presentation within ULCOS Project, September 2006. [91] Herlitz, H.G.: Plasma technology for metal recovery from oxidic waste, Vacuum Metallurgy Conference on Special Metals Melting and Processing, Pittsburgh, PA, June 1984. [92] Page, D.C.; Heanley, C.P.: Non ferrous metals extraction using Tetatronics Plasma Systems with particular emphasis on Zinc and Lead, Mintek 50, International conference on Plasma in Extractive Metallurgy, Sandton, South Africa, March1984. [93] Denton, G.M.; Barcza, N.A.; Scott. P.D.; Fulton, T.: EAF stainless steel dust processing, John Floyd International Symposium on Sustainable Developments in Metals Processing, Melbourne, Australia, pp. 273-283July 2005.
Appendix 157
Smelting of Iron Oxides Using Hydrogen Based Plasmas
Appendix
Appendix 158
10 Appendix A. Thermodynamic calculations of slag diagrams at various % CaO 159
B. Experimental work 160
B.1 Lime chemical analysis 160
B.2 Experimental results 161
C. CH4 heat and mass balance, IRMA model 167
D. Numerical simulation of pure hydrogen arc with FLUENT program 168
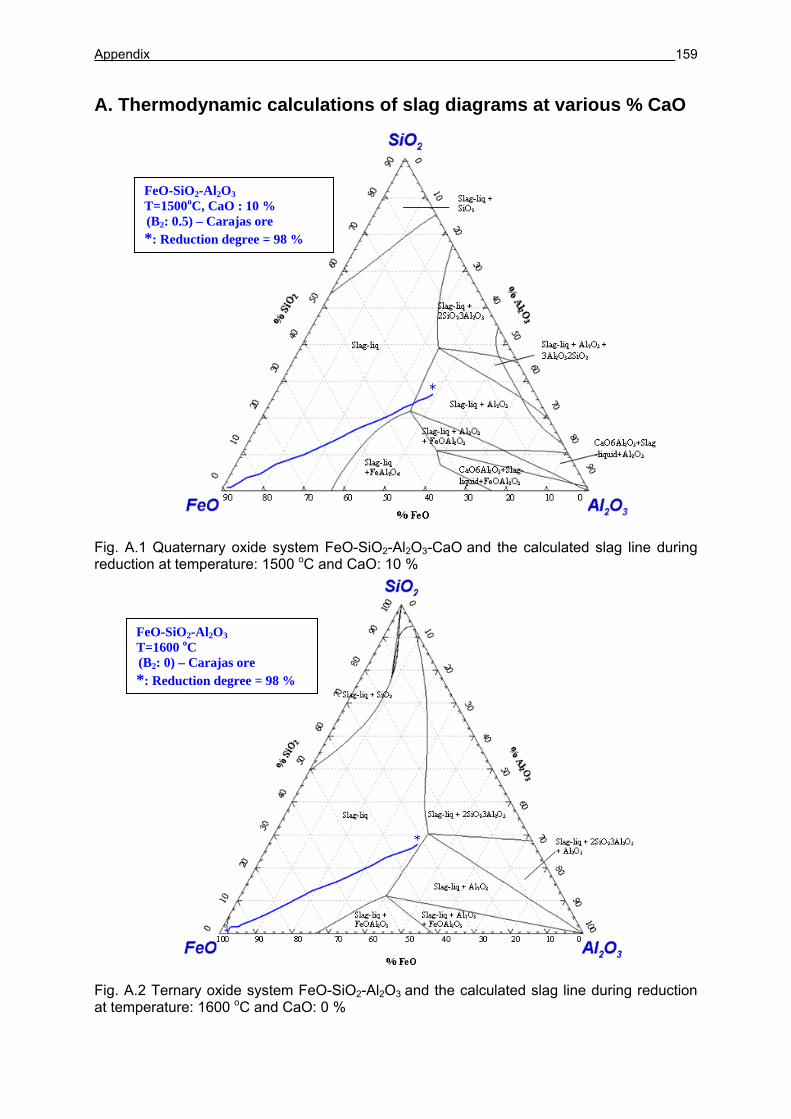
Appendix 159
A. Thermodynamic calculations of slag diagrams at various % CaO
Fig. A.1 Quaternary oxide system FeO-SiO2-Al2O3-CaO and the calculated slag line during reduction at temperature: 1500 oC and CaO: 10 %
Fig. A.2 Ternary oxide system FeO-SiO2-Al2O3 and the calculated slag line during reduction at temperature: 1600 oC and CaO: 0 %
FeO-SiO2-Al2O3 T=1500oC, CaO : 10 % (B2: 0.5) – Carajas ore *: Reduction degree = 98 %
FeO-SiO2-Al2O3 T=1600 oC (B2: 0) – Carajas ore *: Reduction degree = 98 %
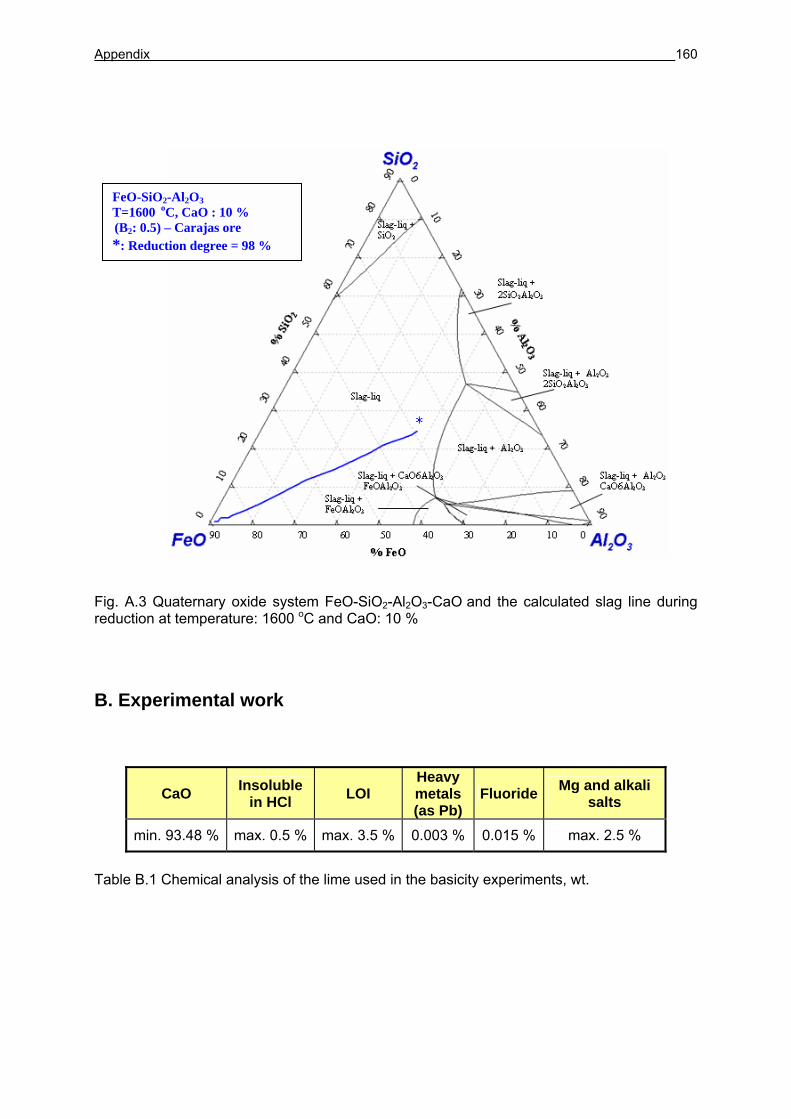
Appendix 160
Fig. A.3 Quaternary oxide system FeO-SiO2-Al2O3-CaO and the calculated slag line during reduction at temperature: 1600 oC and CaO: 10 %
B. Experimental work
Table B.1 Chemical analysis of the lime used in the basicity experiments, wt.
CaO Insoluble in HCl LOI
Heavy metals (as Pb)
Fluoride Mg and alkali salts
min. 93.48 % max. 0.5 % max. 3.5 % 0.003 % 0.015 % max. 2.5 %
FeO-SiO2-Al2O3 T=1600 oC, CaO : 10 % (B2: 0.5) – Carajas ore *: Reduction degree = 98 %
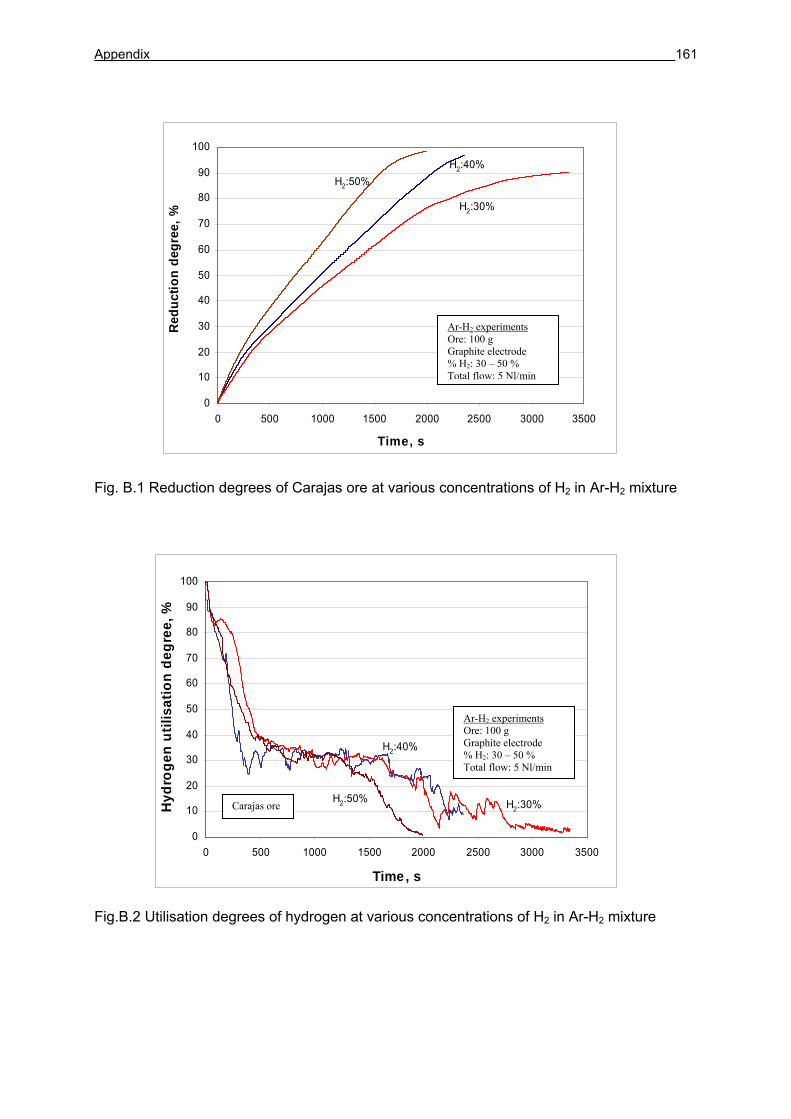
Appendix 161
Fig. B.1 Reduction degrees of Carajas ore at various concentrations of H2 in Ar-H2 mixture
Fig.B.2 Utilisation degrees of hydrogen at various concentrations of H2 in Ar-H2 mixture
H2:40%
H2:30%
H2:50%
0
10
20
30
40
50
60
70
80
90
100
0 500 1000 1500 2000 2500 3000 3500
Time, s
Redu
ctio
n de
gree
, %
Ar-H2 experiments Ore: 100 g Graphite electrode % H2: 30 – 50 % Total flow: 5 Nl/min
H2:40%
H2:30%H2:50%
0
10
20
30
40
50
60
70
80
90
100
0 500 1000 1500 2000 2500 3000 3500
Time, s
Hyd
roge
n ut
ilisa
tion
degr
ee, %
Ar-H2 experiments Ore: 100 g Graphite electrode % H2: 30 – 50 % Total flow: 5 Nl/min
Carajas ore
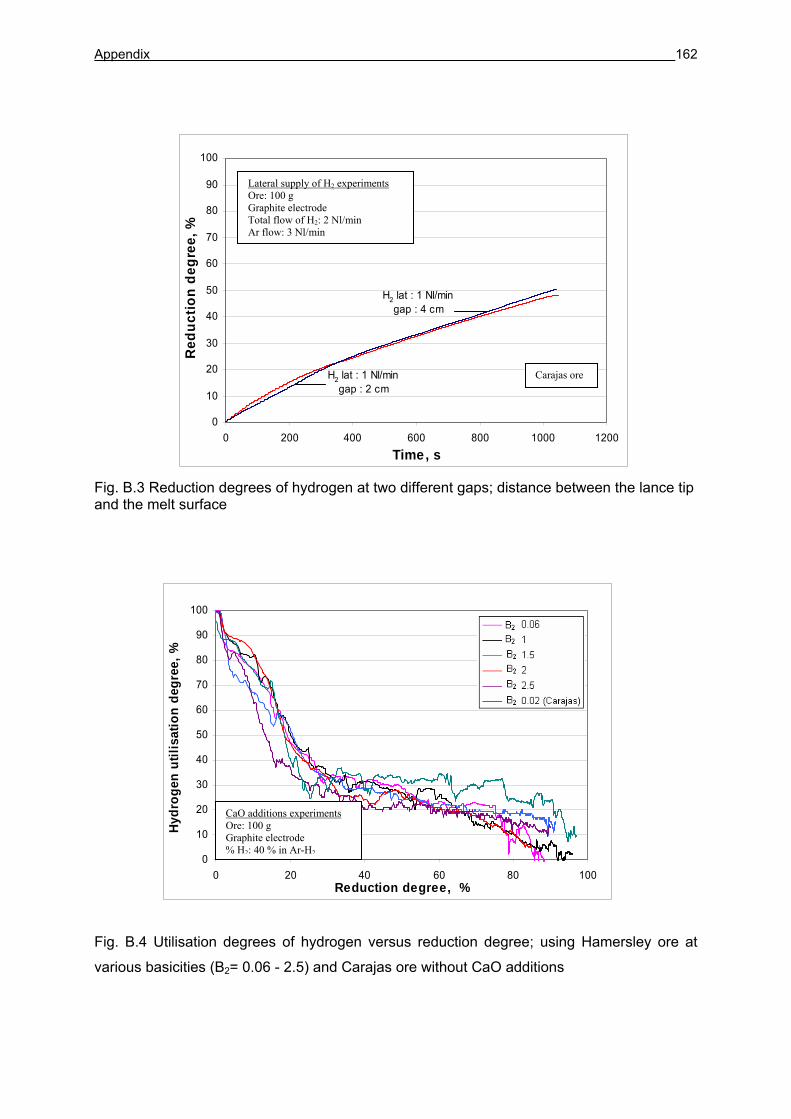
Appendix 162
Fig. B.3 Reduction degrees of hydrogen at two different gaps; distance between the lance tip and the melt surface Fig. B.4 Utilisation degrees of hydrogen versus reduction degree; using Hamersley ore at
various basicities (B2= 0.06 - 2.5) and Carajas ore without CaO additions
H2 lat : 1 Nl/mingap : 4 cm
H2 lat : 1 Nl/mingap : 2 cm
0
10
20
30
40
50
60
70
80
90
100
0 200 400 600 800 1000 1200Time, s
Red
uctio
n de
gree
, %Lateral supply of H2 experiments Ore: 100 g Graphite electrode Total flow of H2: 2 Nl/min Ar flow: 3 Nl/min
0
10
20
30
40
50
60
70
80
90
100
0 20 40 60 80 100Reduction degree, %
Hydr
ogen
util
isat
ion
degr
ee, %
CaO additions experiments Ore: 100 g Graphite electrode % H2: 40 % in Ar-H2
Carajas ore
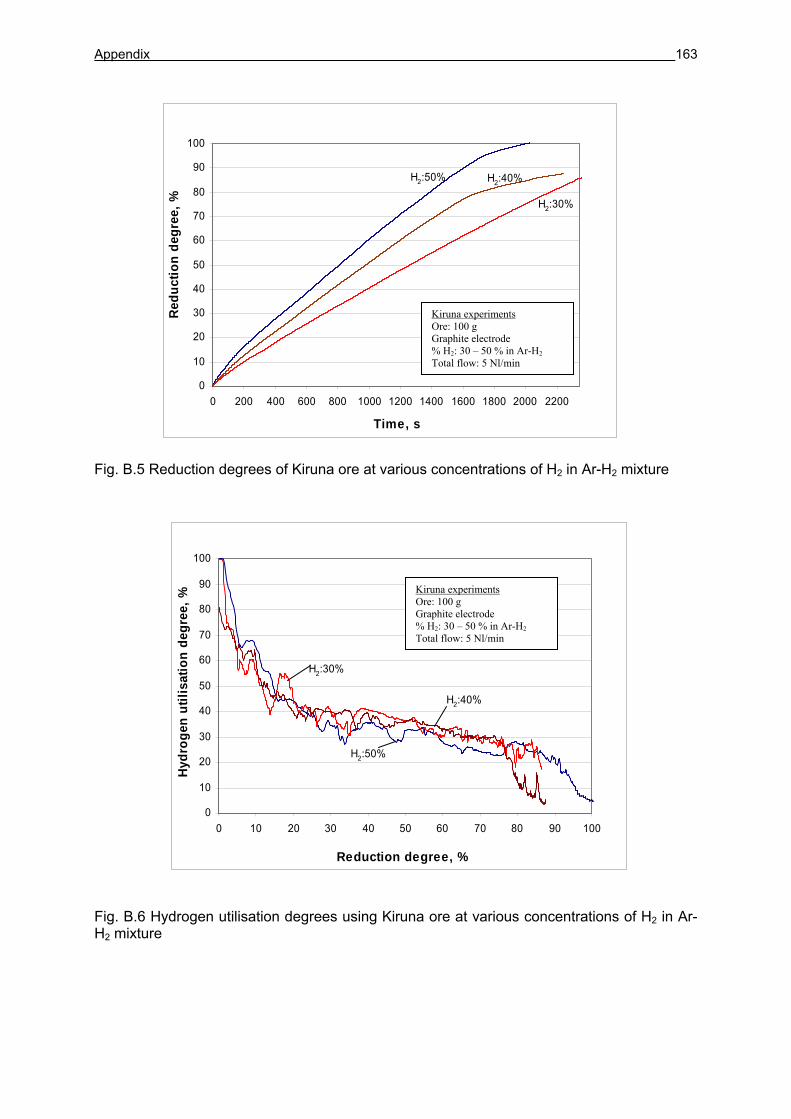
Appendix 163
H2:50%
H2:30%
H2:40%
0
10
20
30
40
50
60
70
80
90
100
0 200 400 600 800 1000 1200 1400 1600 1800 2000 2200
Time, s
Redu
ctio
n de
gree
, %
H2:50%
H2:30%
H2:40%
0
10
20
30
40
50
60
70
80
90
100
0 10 20 30 40 50 60 70 80 90 100
Reduction degree, %
Hydr
ogen
util
isat
ion
degr
ee, %
Fig. B.5 Reduction degrees of Kiruna ore at various concentrations of H2 in Ar-H2 mixture
Fig. B.6 Hydrogen utilisation degrees using Kiruna ore at various concentrations of H2 in Ar-H2 mixture
Kiruna experiments Ore: 100 g Graphite electrode % H2: 30 – 50 % in Ar-H2 Total flow: 5 Nl/min
Kiruna experiments Ore: 100 g Graphite electrode % H2: 30 – 50 % in Ar-H2 Total flow: 5 Nl/min
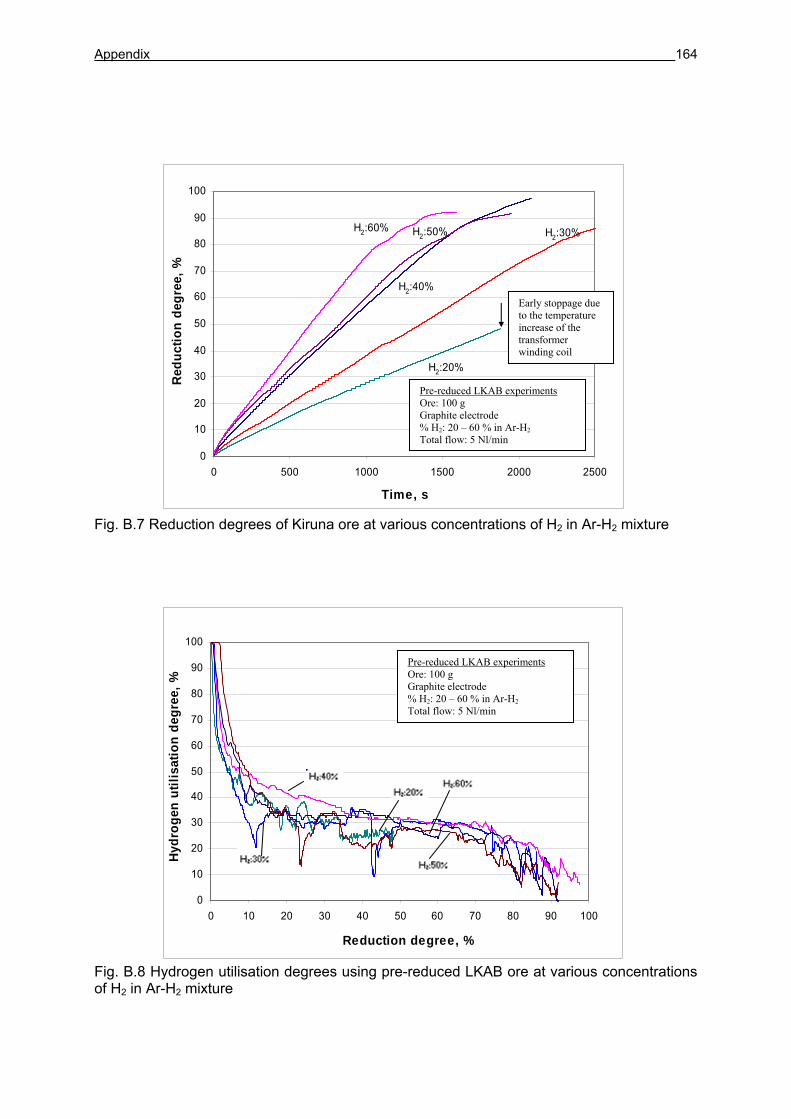
Appendix 164
H2:20%
H2:30%
H2:40%
H2:50%H2:60%
0
10
20
30
40
50
60
70
80
90
100
0 500 1000 1500 2000 2500
Time, s
Red
uctio
n de
gree
, %
0
10
20
30
40
50
60
70
80
90
100
0 10 20 30 40 50 60 70 80 90 100
Reduction degree, %
Hydr
ogen
util
isat
ion
degr
ee, %
Fig. B.7 Reduction degrees of Kiruna ore at various concentrations of H2 in Ar-H2 mixture
Fig. B.8 Hydrogen utilisation degrees using pre-reduced LKAB ore at various concentrations of H2 in Ar-H2 mixture
Pre-reduced LKAB experiments Ore: 100 g Graphite electrode % H2: 20 – 60 % in Ar-H2 Total flow: 5 Nl/min
Early stoppage due to the temperature increase of the transformer winding coil
Pre-reduced LKAB experiments Ore: 100 g Graphite electrode % H2: 20 – 60 % in Ar-H2 Total flow: 5 Nl/min
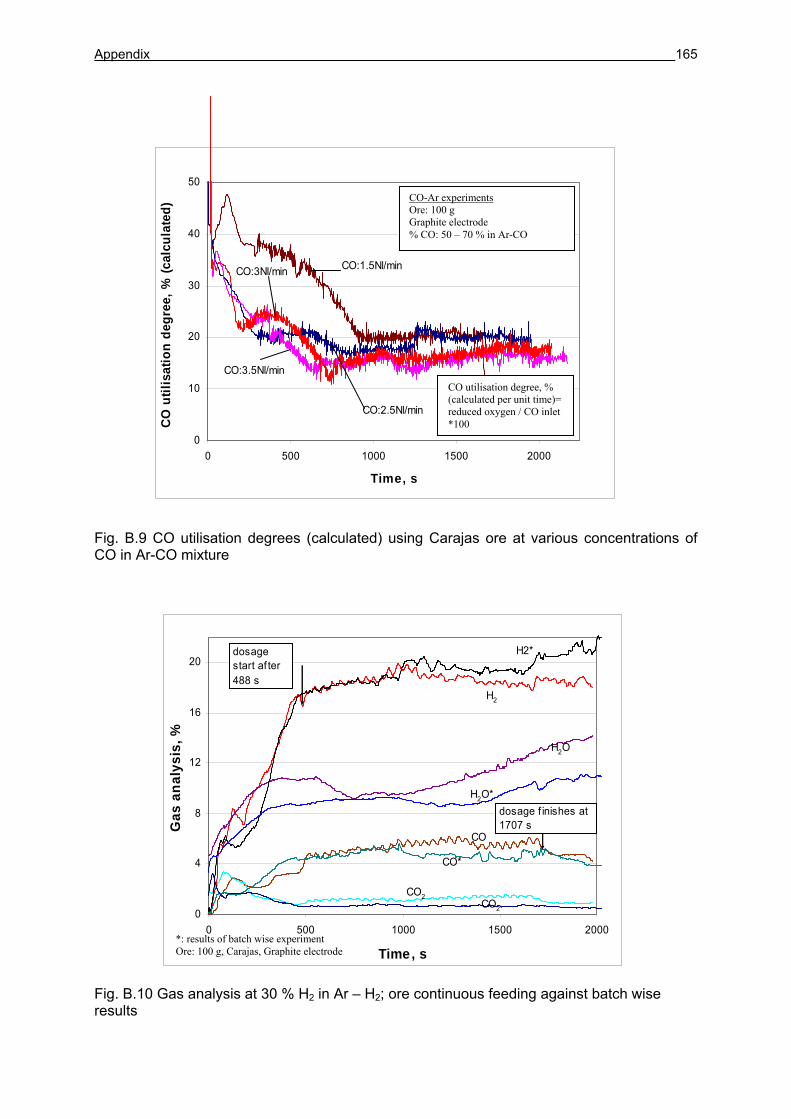
Appendix 165
CO:1.5Nl/min
CO:3.5Nl/min
CO:2.5Nl/min
CO:3Nl/min
0
10
20
30
40
50
0 500 1000 1500 2000
Time, s
CO u
tilis
atio
n de
gree
, % (c
alcu
late
d)
H2
CO
CO2
H2O
H2*
CO*
H2O*
CO2*0
4
8
12
16
20
0 500 1000 1500 2000
Time, s
Gas
ana
lysi
s, %
dosage start af ter 488 s
dosage f inishes at 1707 s
Fig. B.9 CO utilisation degrees (calculated) using Carajas ore at various concentrations of CO in Ar-CO mixture
Fig. B.10 Gas analysis at 30 % H2 in Ar – H2; ore continuous feeding against batch wise results
CO-Ar experiments Ore: 100 g Graphite electrode % CO: 50 – 70 % in Ar-CO
CO utilisation degree, % (calculated per unit time)= reduced oxygen / CO inlet *100
*: results of batch wise experiment Ore: 100 g, Carajas, Graphite electrode
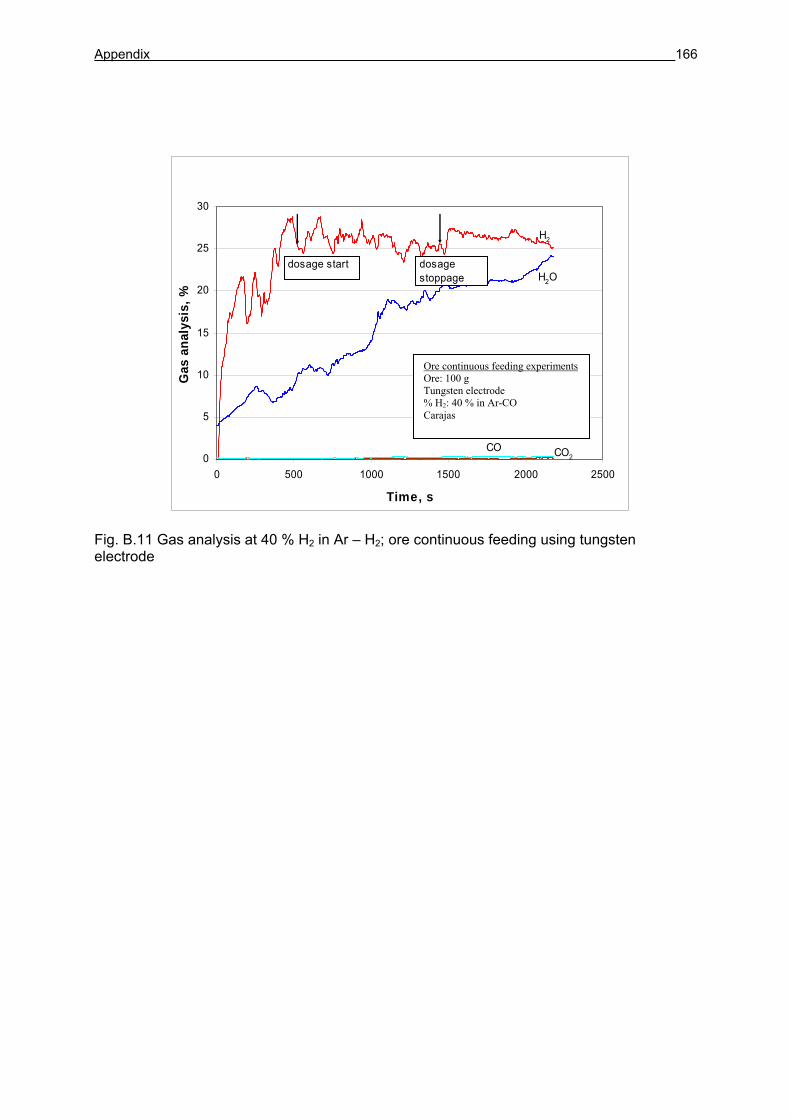
Appendix 166
H2
CO2CO
H2O
0
5
10
15
20
25
30
0 500 1000 1500 2000 2500
Time, s
Gas
ana
lysi
s, %
dosage start dosage stoppage
Fig. B.11 Gas analysis at 40 % H2 in Ar – H2; ore continuous feeding using tungsten electrode
Ore continuous feeding experiments Ore: 100 g Tungsten electrode % H2: 40 % in Ar-CO Carajas
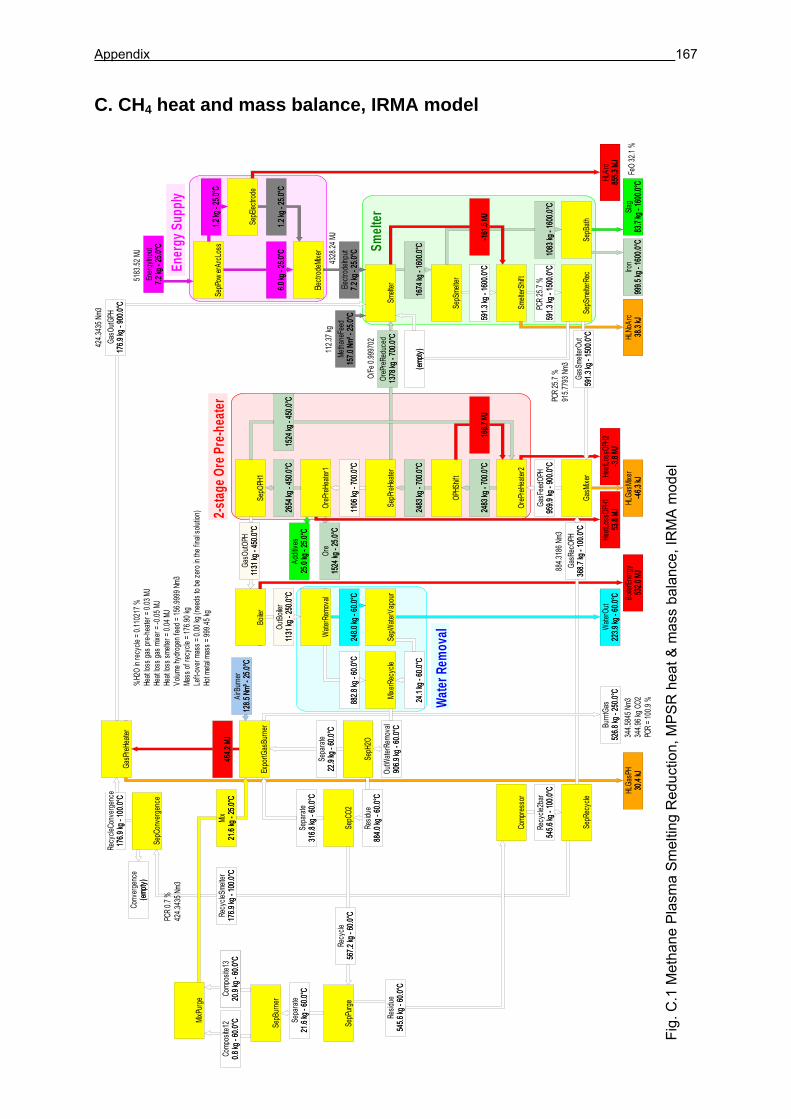
Appendix 167
C. CH4 heat and mass balance, IRMA model
2-stag
e Ore
Pre
-hea
ter
Water
Rem
oval
Ene
rgy S
upply
Sme
lter
Ener
gyInp
ut7.2
kg -
25.0°
C7.2
kg -
25.0°
C
Iron
999.5
kg -
1600
.0°C
999.5
kg -
1600
.0°C
Slag
83.7
kg -
1600
.0°C
83.7
kg -
1600
.0°C
SepP
ower
ArcL
oss
1.2 kg
- 25
.0°C
1.2 kg
- 25
.0°C
6.0 kg
- 25
.0°C
6.0 kg
- 25
.0°C
HLAr
c85
5.3 M
J85
5.3 M
J
Electr
odeM
ixer
Electr
odeIn
put
7.2 kg
- 25
.0°C
7.2 kg
- 25
.0°C
SepE
lectro
de
1.2 kg
- 25
.0°C
1.2 kg
- 25
.0°C
SepS
melte
r
591.3
kg -
1600
.0°C
591.3
kg -
1600
.0°C
1083
kg -
1600
.0°C
1083
kg -
1600
.0°C
SepB
ath
SepP
reHe
ater
OreP
reRe
duce
d13
78 kg
- 70
0.0°C
1378
kg -
700.0
°C
1106
kg -
700.0
°C11
06 kg
- 70
0.0°C
GasM
ixer
GasF
eedO
PH95
9.9 kg
- 90
0.0°C
959.9
kg -
900.0
°C
HLGa
sMixe
r-4
6.3 kJ
-46.3
kJ
OreP
reHe
ater2
2483
kg -
700.0
°C24
83 kg
- 70
0.0°C
HeatL
ossO
PH2
-3.8
MJ-3
.8 MJ
Addit
ives
25.0
kg -
25.0°
C25
.0 kg
- 25
.0°C
Ore
1524
kg -
25.0°
C15
24 kg
- 25
.0°C
-161
.5 MJ
-161
.5 MJ
HLNo
Arc
38.3
kJ38
.3 kJ
OPHS
hift
2483
kg -
700.0
°C24
83 kg
- 70
0.0°C
166.7
MJ
166.7
MJ
GasP
reHe
ater
Metha
neFe
ed15
7.0 N
m³ -
25.0°
C15
7.0 N
m³ -
25.0°
C
HLGa
sPH
30.4
kJ30
.4 kJ
SepR
ecyc
le
Recy
cle2b
ar54
5.6 kg
- 10
0.0°C
545.6
kg -
100.0
°C
Boile
r
OutB
oiler
1131
kg -
250.0
°C11
31 kg
- 25
0.0°C Bo
ilerE
nerg
y53
2.0 M
J53
2.0 M
J
Smelt
erSh
ift
591.3
kg -
1500
.0°C
591.3
kg -
1500
.0°C
112.3
7 kg
GasO
utGPH
176.9
kg -
900.0
°C17
6.9 kg
- 90
0.0°C
FeO
32.1
%
SepS
melte
rRec
(emp
ty)(e
mpty)
GasS
melte
rOut
591.3
kg -
1500
.0°C
591.3
kg -
1500
.0°C
PCR
25.7
%
PCR
25.7
%91
5.779
3 Nm3
O/Fe
0.99
9702
884.3
186 N
m3
5183
.52 M
J
4328
.24 M
J
PCR
0.7 %
424.3
435 N
m3
1674
kg -
1600
.0°C
1674
kg -
1600
.0°C
OreP
reHe
ater1
2654
kg -
450.0
°C26
54 kg
- 45
0.0°C
HeatL
ossO
PH1
53.8
MJ53
.8 MJ
SepO
PH1
GasO
utOPH
1131
kg -
450.0
°C11
31 kg
- 45
0.0°C
1524
kg -
450.0
°C15
24 kg
- 45
0.0°C
GasR
ecOP
H36
8.7 kg
- 10
0.0°C
368.7
kg -
100.0
°C
SepW
aterV
apou
r
Wate
rOut
223.9
kg -
60.0°
C22
3.9 kg
- 60
.0°C
Expo
rtGas
Burn
er Burn
tGas
526.8
kg -
250.0
°C52
6.8 kg
- 25
0.0°C
464.2
MJ
464.2
MJ
AirB
urne
r12
8.5 N
m³ -
25.0°
C12
8.5 N
m³ -
25.0°
C
Mixe
rRec
ycle
24.1
kg -
60.0°
C24
.1 kg
- 60
.0°C
Wate
rRem
oval
248.0
kg -
60.0°
C24
8.0 kg
- 60
.0°C
882.8
kg -
60.0°
C88
2.8 kg
- 60
.0°C
344.5
845 N
m334
4.96 k
g CO2
PCR
= 100
.9 %
424.3
435 N
m3
Comp
ress
or
OutW
aterR
emov
al90
6.9 kg
- 60
.0°C
906.9
kg -
60.0°
C
Recy
cleSm
elter
176.9
kg -
100.0
°C17
6.9 kg
- 10
0.0°C
Smelt
er
SepC
onve
rgen
ce
Recy
cleCo
nver
genc
e17
6.9 kg
- 10
0.0°C
176.9
kg -
100.0
°CCo
nver
genc
e(e
mpty)
(emp
ty)%
H2O
in re
cycle
= 0.1
1021
7 %He
at los
s gas
pre-
heate
r = 0.
03 M
JHe
at los
s gas
mixe
r = -0
.05 M
JHe
at los
s sme
lter =
0.04
MJ
Volum
e hyd
roge
n fee
d = 15
6.999
9 Nm3
Mass
of re
cycle
= 17
6.90 k
gLe
ft-ov
er m
ass =
0.00
kg (n
eeds
to be
zero
in th
e fina
l solu
tion)
Hot m
etal m
ass =
999.4
5 kg
SepH
2O
Sepa
rate
22.9
kg -
60.0°
C22
.9 kg
- 60
.0°C
Resid
ue88
4.0 kg
- 60
.0°C
884.0
kg -
60.0°
C
SepC
O2
Sepa
rate
316.8
kg -
60.0°
C31
6.8 kg
- 60
.0°C
Recy
cle56
7.2 kg
- 60
.0°C
567.2
kg -
60.0°
C
Sepa
rate
21.6
kg -
60.0°
C21
.6 kg
- 60
.0°C
Resid
ue54
5.6 kg
- 60
.0°C
545.6
kg -
60.0°
C
MixP
urge
Mix
21.6
kg -
25.0°
C21
.6 kg
- 25
.0°C
SepP
urge
SepB
urne
r
Comp
osite
120.8
kg -
60.0°
C0.8
kg -
60.0°
CCo
mpos
ite13
20.9
kg -
60.0°
C20
.9 kg
- 60
.0°C
Comp
osite
1320
.9 kg
- 60
.0°C
20.9
kg -
60.0°
C
Fig.
C.1
Met
hane
Pla
sma
Sm
eltin
g R
educ
tion,
MP
SR
hea
t & m
ass
bala
nce,
IRM
A m
odel
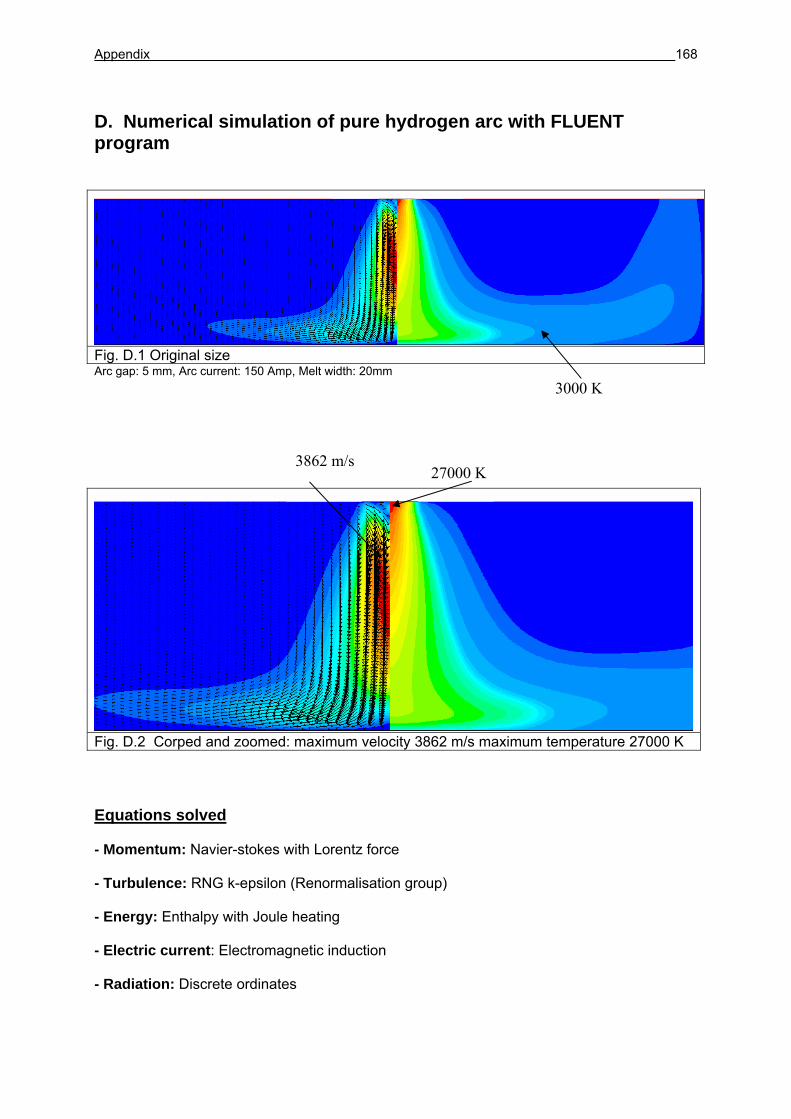
Appendix 168
D. Numerical simulation of pure hydrogen arc with FLUENT program
Fig. D.1 Original size Arc gap: 5 mm, Arc current: 150 Amp, Melt width: 20mm
Fig. D.2 Corped and zoomed: maximum velocity 3862 m/s maximum temperature 27000 K Equations solved - Momentum: Navier-stokes with Lorentz force - Turbulence: RNG k-epsilon (Renormalisation group) - Energy: Enthalpy with Joule heating - Electric current: Electromagnetic induction - Radiation: Discrete ordinates
27000 K 3862 m/s
3000 K
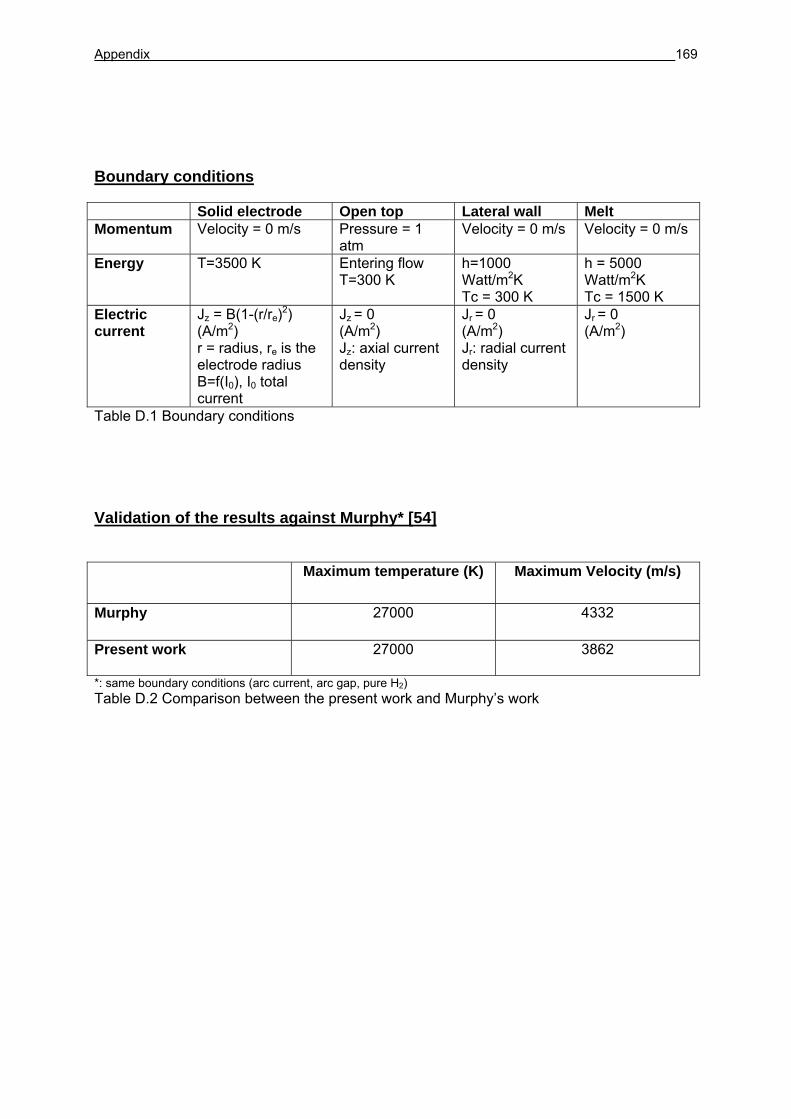
Appendix 169
Boundary conditions Solid electrode Open top Lateral wall Melt Momentum Velocity = 0 m/s Pressure = 1
atm Velocity = 0 m/s Velocity = 0 m/s
Energy T=3500 K Entering flow T=300 K
h=1000 Watt/m2K Tc = 300 K
h = 5000 Watt/m2K Tc = 1500 K
Electric current
Jz = B(1-(r/re)2) (A/m2) r = radius, re is the electrode radius B=f(I0), I0 total current
Jz = 0 (A/m2) Jz: axial current density
Jr = 0 (A/m2) Jr: radial current density
Jr = 0 (A/m2)
Table D.1 Boundary conditions Validation of the results against Murphy* [54] Maximum temperature (K) Maximum Velocity (m/s)
Murphy 27000 4332
Present work 27000 3862
*: same boundary conditions (arc current, arc gap, pure H2) Table D.2 Comparison between the present work and Murphy’s work