Embed Size (px)
Citation preview
VISUAL ANALYTICSS. Fabrikant, C. Gabathuler, A. Skupin: Web-based Self-Organizing Maps
S. Fabrikant, C. Gabathuler, A. Skupin: Web-based Self-Organizing Maps VISUAL ANALYTICS
der Nutzer vorbei? Aufgrund der geringen Anzahl der Testteilnehmer kann sicher kein umfassendes Bild der Kartennutzer in Bezug auf Punktkarten gezeichnet werden. Die Notwendigkeit zur Lieferung eines Werkzeugs zur Anpassung der Karte an individuelle Vorstellungen kann jedoch als bestätigt angesehen werden.
Fazit: Wer über Grundkenntnisse in der Gestaltung von Karten verfügt und bereits mit Geo-Informationssystemen gearbeitet hat, wird den entwickelten Algorithmus gut nutzen können, um die Entwurfsarbeit für Punktdarstellungen in Punktkarten zu beschleunigen. Die graphische Bedienober-fläche des Programms hat Potential für Optimierungen.
Danksagung
Die Autorin dankt allen Testteilnehmerin-nen und -teilnehmern, insbesondere den Rostocker Studenten und den Mitarbei-tern des Instituts für Kartographie der ETH Zürich für ihre Mitwirkung.
Literatur
Aschenbrenner, J., 1989: Die EDV-unterstützte Herstel-lung von Punktstreuungskarten auf der Basis kleinster Bezugseinheiten. Wien.
Hey, A., 2012: Untersuchungen zur automatisierten Visualisierung statistischer Geodaten mittels Punktmethode. Dissertation. Universität Rostock. http://rosdok.uni-rostock.de/resolve? urn=urn:nbn:de:gbv:28-diss2012-0093-7&pdf
Hey, A., 2013: Gestaltungsspielraum bei der automati-schen Generierung von Punktkarten. In: gis.SCIENCE 1 2013, S. 15 – 25.
Hey, A., Bill, R., 2014: Placing dots in dot maps. In: Inter-national Journal of Geographical Information Science, S. 1 – 19.
Kimerling, A.J., 2009: Dotting the Dot Map, Revisited. In: Cartography and Geographic Information Science, Vol.36 No.2, S.165 – 182.
Koch, W.G., Stams, W., 2002: Punktmethode. In: J. Bollmann, W.G. Koch (Hrsg.): Lexikon der Kartographie und Geomatik. Heidelberg/Berlin, S. 242 – 243.
Koch, W.G., 2002: Minimaldimensionen von Karten-zeichen. In: J. Bollmann, W.G. Koch (Hrsg.): Lexikon der Kartographie und Geomatik. Heidelberg/Berlin, S. 152ff.
Über die Verfasserin
Dr.-Ing. Annette Hey hat an der TU Dresden Kartogra-phie (Diplom) studiert und an der Universität Rostock im Bereich Geoinformatik promoviert. Sie arbeitet dort als Wissenschaftliche Mitarbeiterin an der Professur für Geodäsie und Geoinformatik. E-mail: [email protected]
Manuskript eingereicht am 3.2.2015, nach Review angenommen am 3.3.2015
81
KN2/2015
SOMViz: Web-based Self-Organizing MapsSOMViz: Web-basierte Self-Organizing Maps
Sara Irina Fabrikant, Cedric Gabathuler, Zürich (Switzerland) and André Skupin, San Diego (USA)
The self-organizing map (SOM) method has become popular in various discip-lines for visual exploration of large, complex, multivariate databases. Despite the increasing popularity of this powerful, but computationally intensive, neural network approach, web applications involving SOM construction and visualization are still rare. We introduce SOMViz, a simple, interactive, web-based prototype system, accessible online through a simple graphical user interface, allowing users without programming knowledge to generate SOMs from multivariate geographic datasets, and visually explore them in combina-tion with thematic maps. At the heart of our contribution lies a proof-of-con-cept based on an open architecture, including open source technology. We first outline and evaluate design decisions of the proof-of-concept system already com-pleted in 2009 in the context of current state-of-the-art web technology, and then present implementation details and respective functionality of the SOMViz prototype applied to a case study with Swiss population census data as an example. With this contribution, we hope on the one hand to facilitate access to the powerful SOM analysis method for non-specialists, based on generic and open web technology. On the other hand, we offer this solution as a starting point to apply long-standing cartographic design principles and approaches to emerging non-geographic mapping technologies and methods.n Schlüsselwörter: Self-organizing maps, web interface, open architecture, census data
Die Self-Organizing Map (SOM)-Methode ist in diversen Disziplinen ein belieb- tes Mittel, um sehr große, komplexe, multivariate Datenbanken visuell zu erkunden. Trotz der zunehmenden Beliebtheit dieses mächtigen, aber rechen-intensiven, neuronalen Netzwerkansatzes, sind Web-basierte Lösungen, die SOM Konstruktion und Visualisierung erlauben, noch selten. Wir stellen SOM-Viz vor, ein einfaches, interaktives, web-basiertes System, das es erlaubt, ohne Programmierkenntnisse aus multivariaten geographischen Datensätzen SOMs zu generieren, und diese visuell in Kombination mit thematischen Karten er- kunden zu können. Dies geschieht über eine einfache grafische Benutzerober-fläche. Im Mittelpunkt unseres Beitrags steht ein System als Proof-of-Concept, das auf einer offenen Architektur und Open Source-Technologie basiert. Im ersten Teil des Beitrags diskutieren wir Designentscheidungen des Proof-of-Concept-System das bereits 2009 entwickelt wurde, im Rahmen aktueller Webtechnologien und -Ansätze und erläutern in einem zweiten Schritt Imple- mentierungsdetails sowie die entsprechende Funktionalität des SOMViz Proto-typs anhand einer Fallstudie mit Schweizer Volkszählungsdaten. Mit diesem Beitrag hoffen wir zum einen, die Einstiegsschwelle zu leistungsstarken SOM Analysen auch für Interessierte ohne Programmierkenntnisse zu verringern und zum anderen, bieten wir mit dieser Web-Lösung als Ausgangspunkt, ein neues Betätigungsfeld für Kartographinnen und Kartographen, um bestehen-de, etablierte kartographische Darstellungsmethoden auch auf nicht-geogra-fische Datenvisualisierungsansätze und -technologien anwenden zu können.n Keywords: Self-organizing Maps, Web-Interface, offene Architektur, Zensus Daten
VISUAL ANALYTICS S. Fabrikant, C. Gabathuler, A. Skupin: Web-based Self-Organizing Maps
from a SOM, but over the process of SOM creation itself, including modifying various parameters of neural network training. Finally, a web-based system should allow creation and visualization of SOMs from realistic data sets involving potentially thousands of multivariate input objects that are stored in standard database formats.
Based on the contention that web-based systems have the potential for making SOM functionality more accessible and usable for an audience interested in data exploration, but not in advanced programming, this project set out to deve-lop a prototype implementation based on open-source technology. The aim is to allow exploration of structured geographic datasets with SOMs in combination with thematic maps. This paper describes a feasibility case study in which this system is applied to Swiss population census data as one input data example. While the technology has somewhat changed since completion of the project six years ago, there have not been any further successful attempts to provide SOM computation, visualization, and exploration for a non-expert audience over the Web.
2 Related Work
SOMs have been applied to a variety of practical problems, such as speech re-cognition, robot control, industrial process control, optimization problems, including the analysis of semantic information (Lin et al., 1991). With the rise of available data in digital form SOM have also been rediscovered for exploratory data analysis, for example, with financial and economic data, for information management and retrieval, and for load forecasting in infor-mation systems (Kohonen, 2001). Interes-tingly, in the early days of the World Wide Web Girardin (1995) and Lin et al. (1991) already presented SOMs on the web that had been constructed from the content of text-based online web document archives, allowing users to browse visually through this semantic space with interac-
discovering unexpected relationships in a dataset, and assessing the contributions of individual variables to the composite pattern (Koua et al., 2006). Given the inherently multivariate nature of socio-demographic information–just consider the number of variables captured in population census data–it is not surprising that the SOM method has been seen as an attractive option for visual exploration and knowledge construction on the basis of such data. In addition to applications involving well-structured, quantitative data, the method has also been success-fully applied to a variety of other data types that may be less structured and more of qualitative nature, such as text documents (Skupin et al., 2013).
A variety of software packages have provided SOM functionality since the method’s inception in the early 1980s (Kohonen, 1982), including the popular SOM_PAK1 implementation (Kohonen et al., 1996). The SOM method can be accessed in modular form, such as with the statistics toolkit R (2015; Spielman and Folch, 2015) and the SOM Toolbox for Matlab (Vesanto et al., 1999), as well as in stand-alone form, like the data mining suite Viscovery SOMine (2015). Meanwhile, GeoVISTA Studio (Gahegan et al., 2002), CommonGIS (Andrienko et al., 2010), and SOM Analyst2 (Lacayo and Skupin, 2007) are examples for coupling of SOM components with geographic visualization. Despite the growing list of SOM implementations and applications, including in the GIScience domain (Agar-wal and Skupin, 2008), there is a notable absence of easy-to-use web-based SOM tools that would provide practical SOM functionality to a non-specialist audience without requiring familiarization with a set of new and complex tools. This contri-bution is aimed at providing a stepping-stone towards further minimizing this research gap.
Web-based SOM implementations should have the advantage of being plat-form independent and ubiquitous, with access through standard web browsers and with easy-to-use graphical interfaces, without the need of installing additional software. Such software must allow con-trol not just over the visualizations derived
1 Introduction
Geographic datasets including socio-eco-nomic information are continuing to grow in volume, in levels of detail, availability, and accessibility. A majority of this data is inherently multivariate, and becoming increasingly difficult to analyze, without sophisticated data mining, and exploratory spatial data analysis techniques. Analyzing very large datasets with traditional statis-tics can become inadequate, as the data may be bound by a-priori assumptions (Spielman and Thill, 2008). Frequently, data dimensionality reduction techniques (i. e., factor analysis, multidimensional scaling, principal component analysis, etc.) are employed in exploratory multiva-riate analysis to make sense of complex high-dimensional datasets. While many of the traditional multivariate statistics approaches seem to break down when faced with very large datasets, the SOM technique has shown to scale up very well for databases containing even millions of observations, and/or variables (Skupin and Hagelman, 2003). That is one major rea-son for the growing popularity of SOMs, or the Kohonen (1982) map method, when the aim is to visually explore lower-dimensional representations of ever growing multivariate databases.
SOM, a type of artificial neural network, effectively combines computational and visual methods for knowledge discovery in large non-geographic and geographic datasets (Skupin and Agarwal, 2008). It is a computationally intensive method that allows generating a single lower-dimensional representation comprising a multitude of input variables, but also supports investigations of the various patterns among individual attributes contributing to the overall model, jointly in one display. Agarwal and Skupin’s (2008) edited volume provides an in-depth introduction to the inner workings of this powerful dimensionality reduction tech-nique, and reviews a range of applications to solve geographical problems. Spielman and Folch (2015) provide a very accessible primer and tutorial to SOMs using census data with the statistical R package. SOMs have been shown to be very effective for tasks like visual comparison of variables, confirming expected relationships and
1 Available for download on the Web at: http://www.cis.hut.fi/research/som_lvq_pak.shtml
2 Available for download on the Web at: http://githup.com/mlacayoemery/somanalyst
82
KN2/2015
S. Fabrikant, C. Gabathuler, A. Skupin: Web-based Self-Organizing Maps VISUAL ANALYTICS
of existing SOM tools, the ability to work with large data sets, and finally, the difficulty of maintaining fine control over graphic outputs (as compared to modern GIS software) (Spielman and Folch, 2015). There is a need to put the ability into the hands of users, to not only examine SOMs that someone else computed and visua-lized, but also to have direct control over a large number of essential parameters for SOM creation, including the selection of input objects and variables from existing geographic databases.
4 SOMViz Architecture
The overall goal of this research was to develop a simple, web-based prototype for people not versed in programming to apply the SOM method to population census data and then explore the resul-ting SOM in combination with typical geographic displays, i. e., choropleth maps. We were not invested in making the front-end graphically sophisticated at the outset, but strived first and foremost for technical feasibility, while maintaining clarity by means of visual simplicity. We set out to accomplish these goals while using non-proprietary, easily available open source architecture, relying on open source technology as much as possible available at the time of the project, which was completed in 2009. Today, all employed open source components are still in ongoing development and used globally. By open source architecture, we refer to non-restricted access to source code, without making a priori assump-tions about standards and reusability as such. In other words, we not only wanted to minimize conceptual barriers to SOMs, but also technological ones. Our architec-ture should therefore be able to read and process data from a range of proprietary and open formats. Open architecture also intends to minimize financial barriers to implementation, by combining software components that are free and open source (Dunfey et al., 2006).
The proposed architecture includes open source components to store, translate, analyze, and visualize spatial and non-spatial data through a web-based interface. Another advantage of
Another early example of exploratory data visualization and analysis with SOM for population data is Kaski and Kohonen’s (1996) approach to explore socio-demo-graphic relationships between countries using thirty-nine welfare indicators.
These first SOM applications and respective outputs were typically of a com-pletely static nature. In contrast, Li (1998) presented the interactive potential of data brushing in attribute space and geogra-phic space by linking SOMs with cartogra-phic maps in a multi-window approach using ESRI’s ArcView. This made it possible to interactively explore spatial association, identify spatial outliers, and generally assist in space-time pattern recognition by selecting neurons in the SOM, and exploring the respective patterns highligh-ted in a linked geographically referenced map.
There has been a growing interest among GIScientists in highly computatio-nal tools for analyzing geographic data in attribute space, including use of the SOM method (Agarwal and Skupin, 2008). Some efforts have advanced the under-lying algorithmic tool set (Baçao et al., 2008). Others have pushed forward with the application of common SOM tools – like SOM_PAK – to large geographic data sets containing several hundred thousand objects and their multivariate attributes (Skupin, 2007; Skupin and Esperbé, 2008). Skupin and Hagelman (2003) introduced additional, more explicit, representations of temporality and change in order to understand population dynamics, by overlaying the lifelines of socio-economic units as they traverse high-dimensional space over time. Another direction is the projection of actual space-time paths, such as cap-tured using GPS, onto a fine-grained SOM trained with population attributes of geographic objects (Skupin, 2007). There have also been efforts towards improved symbolization of SOM, such as the coloring of neurons to show cluster memberships in attribute and geographic space (Guo et al., 2005).
Despite those more recent advances, barriers to effective use of the SOM method remain quite high, from prepro-cessing of input data to the complexity
tive browser interfaces. However, despite a growing literature describing various SOM applications and a diversification of SOM architectures-including a number of significant modifications to Kohonen’s original algorithm-there is today still a lack of advanced web-based applications involving the creation and visualization of SOMs for realistically sized data sets. In fact, the strict separation of SOM creation and SOM visualization observed in early web examples continues to be the status quo still today, with the single rare exceptional example by Herrero et al. (2003) for a very specialized case of microarray gene expression profile analysis in the life sciences. However, there is no web-based SOM computation and visualization system, to our knowledge, that deals with geographic data sets directly online.
3 SOM Applications involving geographic data
Spatio-temporal population datasets, such as census data, were already spatialized offline using SOM by the early 1990s, with the efforts by Winter and Hewitson (1994) as a prime example. They applied the SOM method to socio-demographic data containing over 100,000 records gathered from the 1991 South African Census, in order to investigate unusual structural population groupings and respective spatial distribution. Acknow-ledging the geographic nature of their data, they also reference a subset of the SOM results in a choropleth map of cen-sus districts of the Western Cape region. In doing so, they demonstrated that spa-tial autocorrelation of ethnicity in attribute space (via the SOM output) bared a strong relationship to spatial autocorrelation of the ethnic clusters in geographic space. In the same volume edited by Hewitson and Crane (1994), Openshaw (1994) makes a case for a quantitative geography by means of a neural net architecture. He employs the SOM method towards spatial data classification problems, specifically for census data. His comparative studies demonstrate the benefits of that approach to classification over more traditional approaches (i. e., k-means among others).
83
KN2/2015
VISUAL ANALYTICS S. Fabrikant, C. Gabathuler, A. Skupin: Web-based Self-Organizing Maps
user interface (i. e., data selection and query), and to handle the maps delivered by the server.
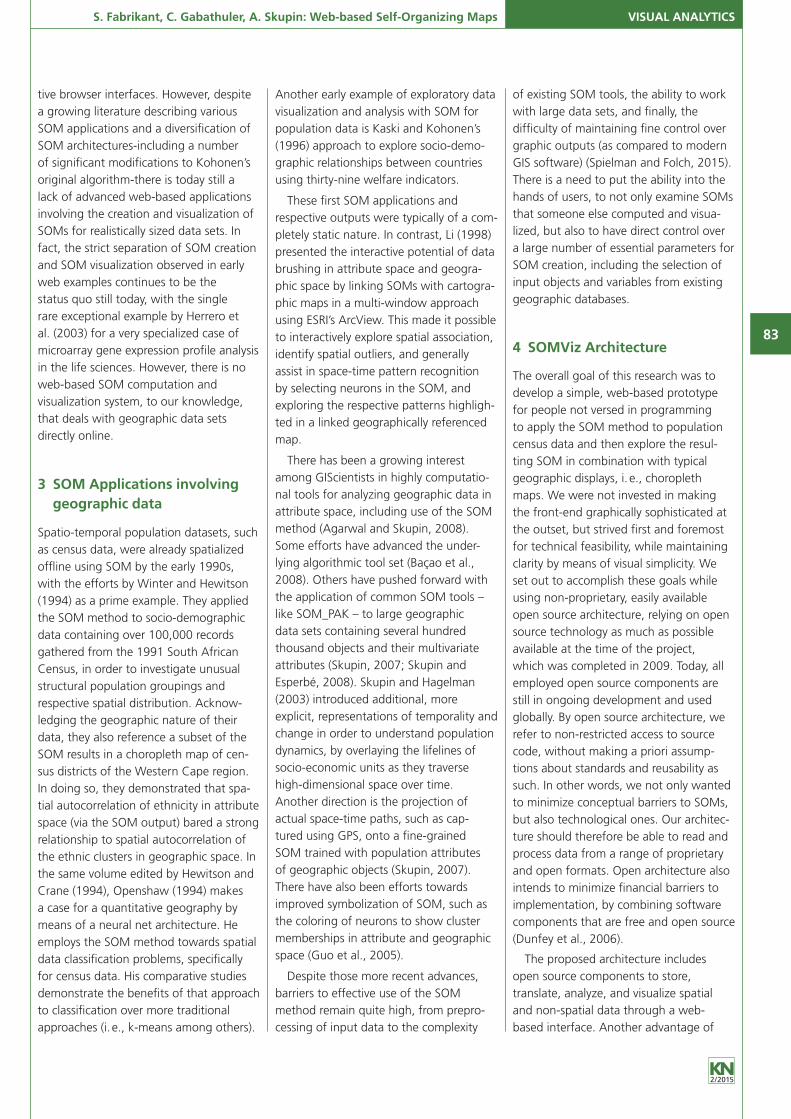
A user can interactively select census data attributes through a standard web browser interface. These data subsets are then transformed and standardized before they enter the training process with SOM_PAK on the server. Java applets are emplo-yed to depict the trained self-organizing map data delivered from the server to the web-based client. An overview of the SOMViz architecture is provided in Figure 1. Since the implementation of our system by the end of 2009, the open technology has developed rapidly, but employed com-ponents (i. e., SOM_PAK, Java, Apache servers, etc.) are still widely used today, and no new significant open SOM tools have appeared, that allow web-based, online SOM construction and visualiza-tion, particularly for geographic datasets. Today, one would probably opt for Web 2.0 savvy frameworks for implementation that would allow for more flexible user interaction beyond what Java Applets or Java Server Pages might have offered, and avoid potential security restriction issues. Still, conceptually, our overall open source component approach is flexible and extendable, so that new technology solutions can be easily integrated. In the next sections we describe and evaluate the chosen architecture in more detail.
For reasons of stability and security, we chose the open development environment Linux CentOS 5.2 (CentOS, 2015) as the operating system. SOM_PAK 3.1 (CIS, 2015) was compiled for this platform. We chose the open source and object-rela-tional PostGIS 1.3.3 database, based on PostgreSQL (2015), to store and query the census attribute data, and handle respec-tive geometry. This database is connected to an Apache Tomcat 6.0.16 (2015) web server, with a JDBC connection. This open source web server supports Java servlet and Java server pages technology. GeoServer (2015) technology is an open source, Java-based web application that we installed on Apache Tomcat. Web map services (WMS) and web feature services (WFS) are employed to deliver the geometry stored in our PostGIS database. Finally, SOMViz relies on JavaScript-based
tasks (Chang and Park, 2006; Yao and Zou, 2008).
Based on Chang and Park (2006)’s evaluation of client and server side approaches for distributed GIS solutions, we decided to follow a hybrid approach, relying on both advantages of server and client side technologies. In our approach, resource intensive data processing and computation is fully implemented on the server. In the context of current state-of-the-art “big data” analytics, this choice seems still the most desirable. Server-side geoprocessing still outperforms clients, despite their ongoing increase in proces-sing power. Hamilton (2014) found that current implementation of web browsers are limited in their ability to execute JavaScript geoprocessing, and are not yet prepared to process data sizes larger than about 7.000 to 10.000 vertices. The generation of the SOM and the thematic map is also performed server-side, while all other system functionality, like the gra-phical user interface, user interactivity, etc. is performed on the client side. This setup was chosen as to deliver only a small data volume over the network to the client, and to be able to remain platform inde-pendent on the client-side. In doing so, the system can be accessed with any kind of standard web browser, and running on any operating system. Assessing the strength and weaknesses of server and cli-ent side open architecture technology, as suggested by Chang and Park (2006), we chose the open source database PostGIS (2015), running the open source Apache Tomcat (2015) software including the Java Servlet and JavaServer Pages technology, and the open-source SOM_PAK (CIS, 2015) package for SOM generation. This solution offers the strength of minimum client usage requirements, and straightfor-ward output delivery to any standard web browser, relying on standard and open Java libraries. For the server-side techno-logy, Java servlets and Java server pages were employed to maximize performance and functionality. Java can access the compiled binaries through the runtime environment, in our case Linux. On the client-side, JavaScript and Java applets are utilized. JavaScript is used for handling simple user interactions in the web-based
relying on open source components is that a developer can examine and test the employed algorithms that would other-wise be typically hidden in proprietary software. An open-source developer can therefore have greater confidence in the quality of the data processing, as he/she can customize, refine, or even change the algorithms directly, if needed (Dunfey et al., 2006).
Our use of the standard SOM_PAK package (Kohonen et al., 1996) as the core component for neural network training addresses several key concerns. SOM_PAK was the first public-domain SOM software package released in 1990 by Kohonen and colleagues (CIS, 2009), and now available in version 3.1 (CIS, 2009). Written in ANSI C, it was designed for large and computationally heavy tasks and has over the years proven more flexible, portable, and scalable than popular alternatives (like the SOM Toolbox for Matlab), especially when it comes to truly large data sets. On the downside, SOM_PAK definitely is not easy-to-use, with its command line user interface and range of input options (Kohonen, 2001). The package is, however, free to use for academic purposes, while it cannot be used in commercial software without per-mission by its producer (Kohonen et al., 1995). This ease-of-access, cross-platform portability, and proven performance of SOM_PAK (e.g., compared to Java or macro language-based SOM implemen-tations) were key considerations for its adoption in our system, in addition to not requiring any re-implementation of core SOM software.
With the rise of open architectures, new development models for dynamic and interoperable Internet GIS applica-tion have appeared (Chang and Park, 2006; Yao and Zou, 2008). Various data-handling approaches and respective technologies are readily available for web-based applications, including distributed GIS solutions (i. e., server-side, client-side, and hybrid). Each approach has its specific advantages and disadvantages with res-pect to scalability, data manipulation and management, user interactivity and user collaboration options, and the distribution (of server-side or client-side) data handling
84
KN2/2015
S. Fabrikant, C. Gabathuler, A. Skupin: Web-based Self-Organizing Maps VISUAL ANALYTICS
the SOM (number of neurons in x and y), neighborhood function, and initialization type. The self-organizing map is then ini-tialized. With further training parameters then chosen by the user, neural network training itself is started, with SOM_PAK as its core. The SOM processing actions handled by SOM_PAK include:1. initialize the neural network with a
user-defined topology and linear or random neuron weights,
2. train the neural network, including iterative adjustment of neuron weights over multiple training cycles,
3. evaluate the quantization error,4. and finally, store results in a file.
7 Server-side processing
SOM processing results in a trained SOM codebook file located server-side, with two-dimensional coordinates of neurons and associated neuron weights stored in the database. At this stage, labels for the best matching units (BMU) are
ween 0.5 and 1.3 seconds, and depends on the complexity of the query request.
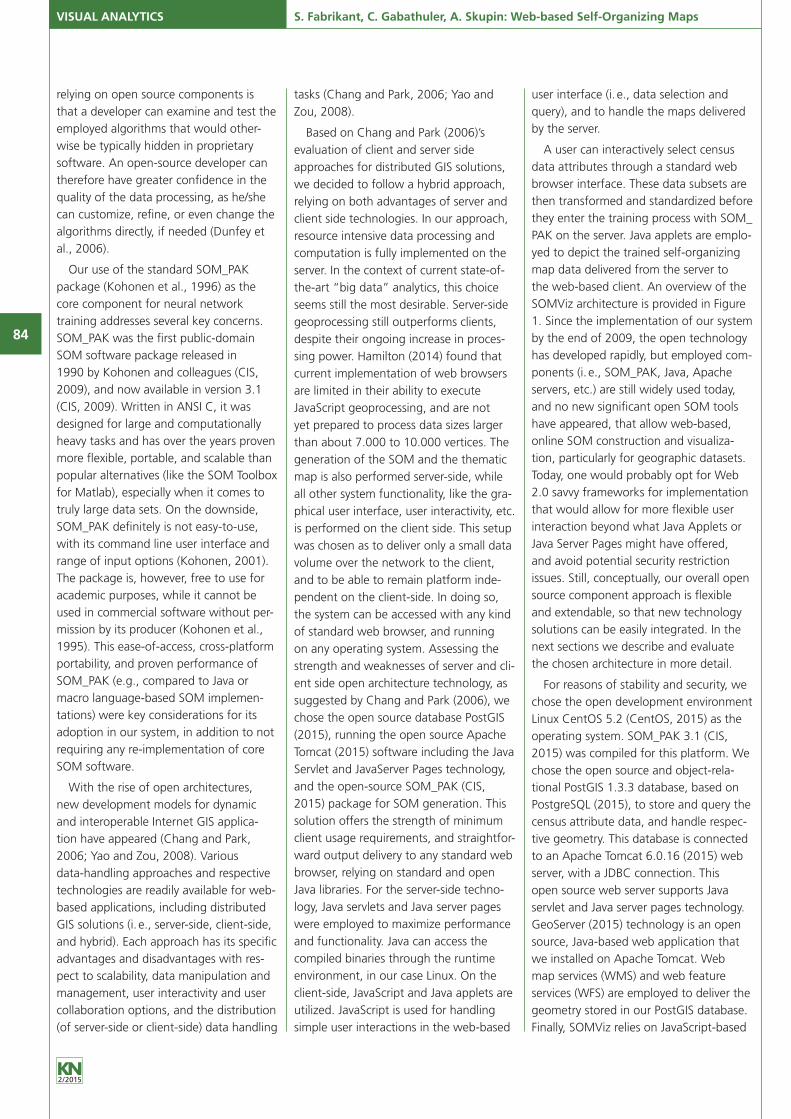
After pressing the “Create Input Data” button at the bottom of the form in Figure 2, a data matrix with selected variables including labels for the enume-ration units is generated on the server, ready to be further processed by SOM_PAK. SOMViz offers a couple of data normalization options for data pre-processing. For a sensible SOM spatializa-tion, it is important to consider whether data normalization, such as z-score, log transformation, or range scaling of values is necessary, especially with heterogene-ous value ranges (Skupin and Fabrikant, 2007). Without normalization, attributes with larger variance would have more influence during the SOM training phase, than attributes with smaller ranges. Currently, SOMViz offers z-score and histogram equalization.
Following the data selection step, the user can specify a number of SOM para-meters, including topology type, size of
OpenLayers technology to handle WFS service requests, and to query the geogra-phic attribute data. WMS service requests depict the choropleth maps in the web browser.
5 Data Selection and Management
The test data set chosen to demonst-rate the unique features of the SOMViz proof-of-concept system was obtained from the Swiss Federal Statistical Office (SFSO, 2015). The attribute data includes Swiss census data from four decades (1970 – 2000), harmonized and aggrega-ted by 2896 municipalities for the year 2001. We downloaded ESRI Shape files of boundaries for Cantons and municipalities from the Swiss Federal Statistical Office Web site (SFSO, 2015). For simplicity, we only used a subset of ten census themes for SOMViz, including their associated 41 variables. The ESRI shape files including Swiss Canton and municipality borders were ingested into our PostGIS database. The executable “shp2pgsql” included with the PostGIS database installation was used for this step, and a spatial index was then created in PostGIS. While this data is currently implemented in the system, it can of course be substituted with other similarly structured census data and boundary files.
6 Online Creation of Self-organizing Maps
The SOMViz web-based tool includes a point-and-click SOM creation wizard (see Figure 2) to go through the standard sequence of steps for the creation of SOMs. As shown in a subset of the web form in Figure 2, a user has selected a series of variables and the respective geographic units (i. e., Cantons) as input for the SOM. After the user presses the “Create Input Data” button at the bottom of Figure 2, a query request is sent to the database on the server where respective variables are selected and normalized, if necessary. This data selection step takes less than five seconds on an Intel single core machine with 2.16 GHz and 1GB Ram. The average time for selection is bet-
Fig. 1: Open Architecture of SOMViz
Fig. 2: Web-based form “wizard” to select source data for SOM creation
85
KN2/2015
VISUAL ANALYTICS S. Fabrikant, C. Gabathuler, A. Skupin: Web-based Self-Organizing Maps
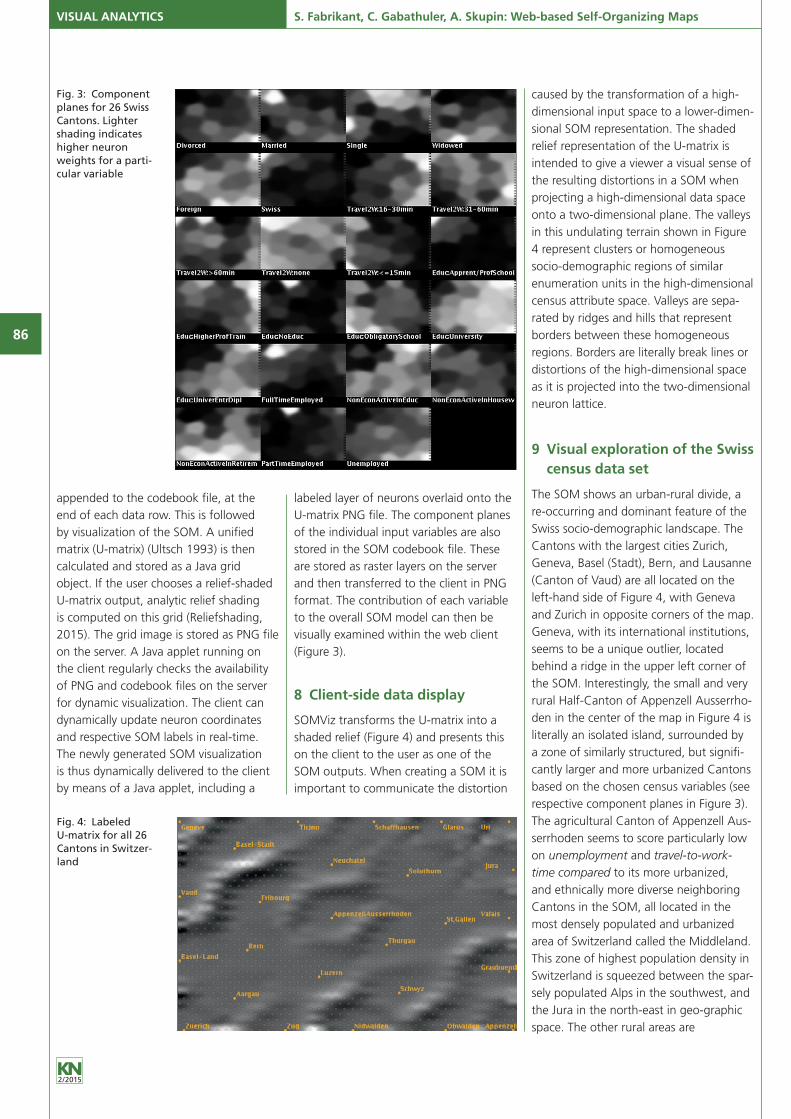
caused by the transformation of a high-dimensional input space to a lower-dimen-sional SOM representation. The shaded relief representation of the U-matrix is intended to give a viewer a visual sense of the resulting distortions in a SOM when projecting a high-dimensional data space onto a two-dimensional plane. The valleys in this undulating terrain shown in Figure 4 represent clusters or homogeneous socio-demographic regions of similar enumeration units in the high-dimensional census attribute space. Valleys are sepa-rated by ridges and hills that represent borders between these homogeneous regions. Borders are literally break lines or distortions of the high-dimensional space as it is projected into the two-dimensional neuron lattice.
9 Visual exploration of the Swiss census data set
The SOM shows an urban-rural divide, a re-occurring and dominant feature of the Swiss socio-demographic landscape. The Cantons with the largest cities Zurich, Geneva, Basel (Stadt), Bern, and Lausanne (Canton of Vaud) are all located on the left-hand side of Figure 4, with Geneva and Zurich in opposite corners of the map. Geneva, with its international institutions, seems to be a unique outlier, located behind a ridge in the upper left corner of the SOM. Interestingly, the small and very rural Half-Canton of Appenzell Ausserrho-den in the center of the map in Figure 4 is literally an isolated island, surrounded by a zone of similarly structured, but signifi-cantly larger and more urbanized Cantons based on the chosen census variables (see respective component planes in Figure 3). The agricultural Canton of Appenzell Aus-serrhoden seems to score particularly low on unemployment and travel-to-work-time compared to its more urbanized, and ethnically more diverse neighboring Cantons in the SOM, all located in the most densely populated and urbanized area of Switzerland called the Middleland. This zone of highest population density in Switzerland is squeezed between the spar-sely populated Alps in the southwest, and the Jura in the north-east in geo-graphic space. The other rural areas are
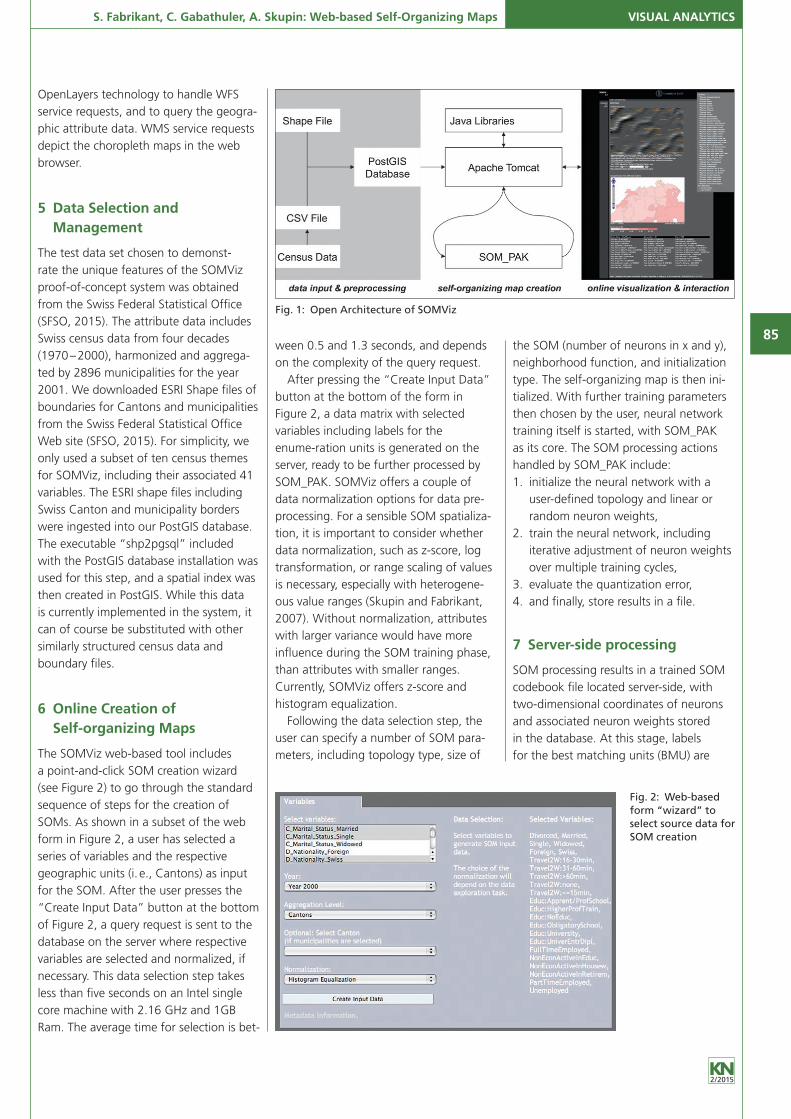
labeled layer of neurons overlaid onto the U-matrix PNG file. The component planes of the individual input variables are also stored in the SOM codebook file. These are stored as raster layers on the server and then transferred to the client in PNG format. The contribution of each variable to the overall SOM model can then be visually examined within the web client (Figure 3).
8 Client-side data display
SOMViz transforms the U-matrix into a shaded relief (Figure 4) and presents this on the client to the user as one of the SOM outputs. When creating a SOM it is important to communicate the distortion
appended to the codebook file, at the end of each data row. This is followed by visualization of the SOM. A unified matrix (U-matrix) (Ultsch 1993) is then calculated and stored as a Java grid object. If the user chooses a relief-shaded U-matrix output, analytic relief shading is computed on this grid (Reliefshading, 2015). The grid image is stored as PNG file on the server. A Java applet running on the client regularly checks the availability of PNG and codebook files on the server for dynamic visualization. The client can dynamically update neuron coordinates and respective SOM labels in real-time. The newly generated SOM visualization is thus dynamically delivered to the client by means of a Java applet, including a
Fig. 3: Component planes for 26 Swiss Cantons. Lighter shading indicates higher neuron weights for a parti-cular variable
Fig. 4: Labeled U-matrix for all 26 Cantons in Switzer-land
86
KN2/2015
S. Fabrikant, C. Gabathuler, A. Skupin: Web-based Self-Organizing Maps VISUAL ANALYTICS
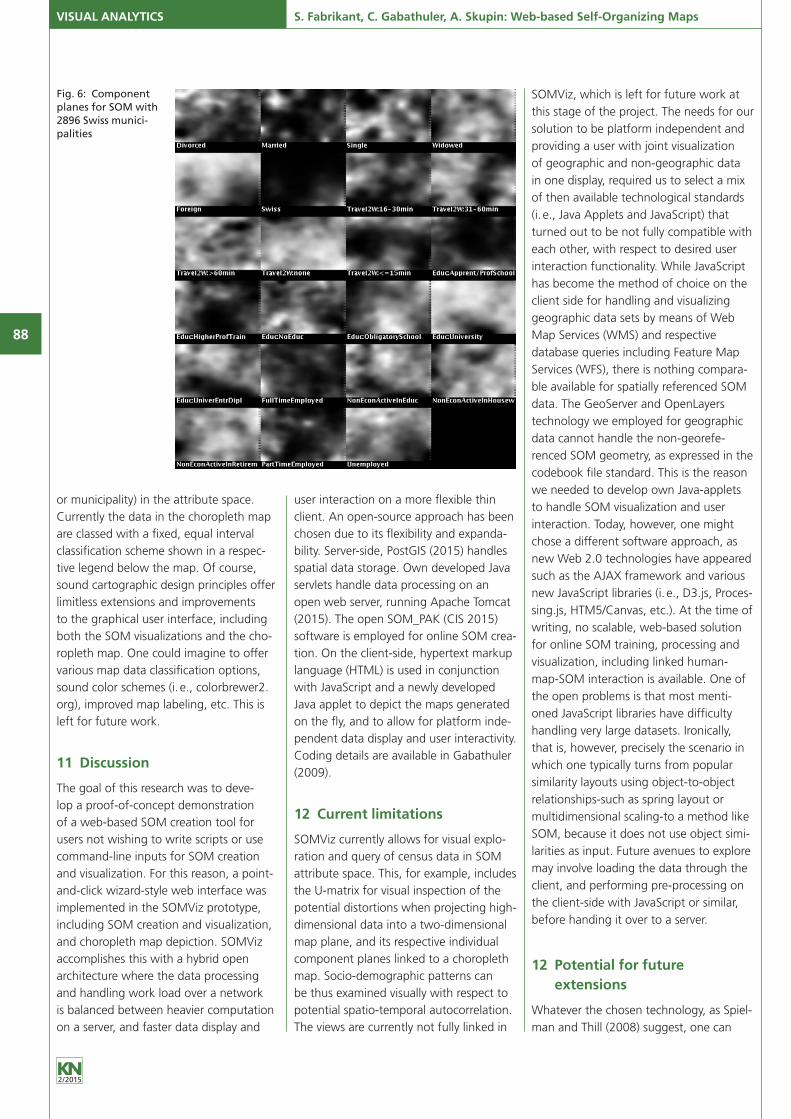
The interpretation of the municipalities pattern is more complex, and would require much more background on Swiss socio-demographics that would go beyond the scope of this paper. Figure 6 simply illustrates that our system can indeed process data consisting of several thousand high-dimensional input vectors.
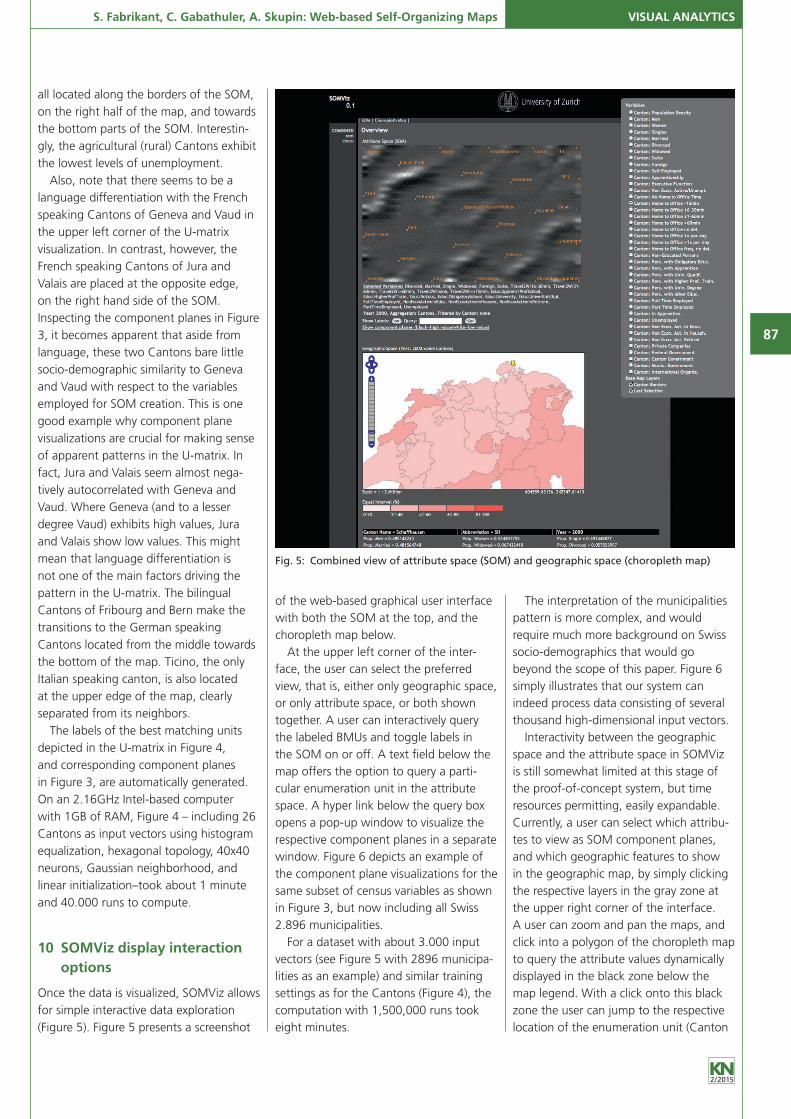
Interactivity between the geographic space and the attribute space in SOMViz is still somewhat limited at this stage of the proof-of-concept system, but time resources permitting, easily expandable. Currently, a user can select which attribu-tes to view as SOM component planes, and which geographic features to show in the geographic map, by simply clicking the respective layers in the gray zone at the upper right corner of the interface. A user can zoom and pan the maps, and click into a polygon of the choropleth map to query the attribute values dynamically displayed in the black zone below the map legend. With a click onto this black zone the user can jump to the respective location of the enumeration unit (Canton
of the web-based graphical user interface with both the SOM at the top, and the choropleth map below.
At the upper left corner of the inter-face, the user can select the preferred view, that is, either only geographic space, or only attribute space, or both shown together. A user can interactively query the labeled BMUs and toggle labels in the SOM on or off. A text field below the map offers the option to query a parti-cular enumeration unit in the attribute space. A hyper link below the query box opens a pop-up window to visualize the respective component planes in a separate window. Figure 6 depicts an example of the component plane visualizations for the same subset of census variables as shown in Figure 3, but now including all Swiss 2.896 municipalities.
For a dataset with about 3.000 input vectors (see Figure 5 with 2896 municipa-lities as an example) and similar training settings as for the Cantons (Figure 4), the computation with 1,500,000 runs took eight minutes.
all located along the borders of the SOM, on the right half of the map, and towards the bottom parts of the SOM. Interestin-gly, the agricultural (rural) Cantons exhibit the lowest levels of unemployment.
Also, note that there seems to be a language differentiation with the French speaking Cantons of Geneva and Vaud in the upper left corner of the U-matrix visualization. In contrast, however, the French speaking Cantons of Jura and Valais are placed at the opposite edge, on the right hand side of the SOM. Inspecting the component planes in Figure 3, it becomes apparent that aside from language, these two Cantons bare little socio-demographic similarity to Geneva and Vaud with respect to the variables employed for SOM creation. This is one good example why component plane visualizations are crucial for making sense of apparent patterns in the U-matrix. In fact, Jura and Valais seem almost nega-tively autocorrelated with Geneva and Vaud. Where Geneva (and to a lesser degree Vaud) exhibits high values, Jura and Valais show low values. This might mean that language differentiation is not one of the main factors driving the pattern in the U-matrix. The bilingual Cantons of Fribourg and Bern make the transitions to the German speaking Cantons located from the middle towards the bottom of the map. Ticino, the only Italian speaking canton, is also located at the upper edge of the map, clearly separated from its neighbors.
The labels of the best matching units depicted in the U-matrix in Figure 4, and corresponding component planes in Figure 3, are automatically generated. On an 2.16GHz Intel-based computer with 1GB of RAM, Figure 4 – including 26 Cantons as input vectors using histogram equalization, hexagonal topology, 40x40 neurons, Gaussian neighborhood, and linear initialization–took about 1 minute and 40.000 runs to compute.
10 SOMViz display interaction options
Once the data is visualized, SOMViz allows for simple interactive data exploration (Figure 5). Figure 5 presents a screenshot
Fig. 5: Combined view of attribute space (SOM) and geographic space (choropleth map)
87
KN2/2015
VISUAL ANALYTICS S. Fabrikant, C. Gabathuler, A. Skupin: Web-based Self-Organizing Maps
SOMViz, which is left for future work at this stage of the project. The needs for our solution to be platform independent and providing a user with joint visualization of geographic and non-geographic data in one display, required us to select a mix of then available technological standards (i. e., Java Applets and JavaScript) that turned out to be not fully compatible with each other, with respect to desired user interaction functionality. While JavaScript has become the method of choice on the client side for handling and visualizing geographic data sets by means of Web Map Services (WMS) and respective database queries including Feature Map Services (WFS), there is nothing compara-ble available for spatially referenced SOM data. The GeoServer and OpenLayers technology we employed for geographic data cannot handle the non-georefe-renced SOM geometry, as expressed in the codebook file standard. This is the reason we needed to develop own Java-applets to handle SOM visualization and user interaction. Today, however, one might chose a different software approach, as new Web 2.0 technologies have appeared such as the AJAX framework and various new JavaScript libraries (i. e., D3.js, Proces-sing.js, HTM5/Canvas, etc.). At the time of writing, no scalable, web-based solution for online SOM training, processing and visualization, including linked human-map-SOM interaction is available. One of the open problems is that most menti-oned JavaScript libraries have difficulty handling very large datasets. Ironically, that is, however, precisely the scenario in which one typically turns from popular similarity layouts using object-to-object relationships-such as spring layout or multidimensional scaling-to a method like SOM, because it does not use object simi-larities as input. Future avenues to explore may involve loading the data through the client, and performing pre-processing on the client-side with JavaScript or similar, before handing it over to a server.
12 Potential for future extensions
Whatever the chosen technology, as Spiel-man and Thill (2008) suggest, one can
user interaction on a more flexible thin client. An open-source approach has been chosen due to its flexibility and expanda-bility. Server-side, PostGIS (2015) handles spatial data storage. Own developed Java servlets handle data processing on an open web server, running Apache Tomcat (2015). The open SOM_PAK (CIS 2015) software is employed for online SOM crea-tion. On the client-side, hypertext markup language (HTML) is used in conjunction with JavaScript and a newly developed Java applet to depict the maps generated on the fly, and to allow for platform inde-pendent data display and user interactivity. Coding details are available in Gabathuler (2009).
12 Current limitations
SOMViz currently allows for visual explo-ration and query of census data in SOM attribute space. This, for example, includes the U-matrix for visual inspection of the potential distortions when projecting high-dimensional data into a two-dimensional map plane, and its respective individual component planes linked to a choropleth map. Socio-demographic patterns can be thus examined visually with respect to potential spatio-temporal autocorrelation. The views are currently not fully linked in
or municipality) in the attribute space. Currently the data in the choropleth map are classed with a fixed, equal interval classification scheme shown in a respec-tive legend below the map. Of course, sound cartographic design principles offer limitless extensions and improvements to the graphical user interface, including both the SOM visualizations and the cho-ropleth map. One could imagine to offer various map data classification options, sound color schemes (i. e., colorbrewer2.org), improved map labeling, etc. This is left for future work.
11 Discussion
The goal of this research was to deve-lop a proof-of-concept demonstration of a web-based SOM creation tool for users not wishing to write scripts or use command-line inputs for SOM creation and visualization. For this reason, a point-and-click wizard-style web interface was implemented in the SOMViz prototype, including SOM creation and visualization, and choropleth map depiction. SOMViz accomplishes this with a hybrid open architecture where the data processing and handling work load over a network is balanced between heavier computation on a server, and faster data display and
Fig. 6: Component planes for SOM with 2896 Swiss munici-palities
88
KN2/2015
S. Fabrikant, C. Gabathuler, A. Skupin: Web-based Self-Organizing Maps VISUAL ANALYTICS
demographic data. As such additional features are implemented, key advantages of the overall web-centric approach and this particular client-server configuration can be exploited. Similar to SOM training, other compute-intensive operations-like clustering of neurons-could be performed server-side, and the respective results deli-vered to fairly thin clients, including even mobile platforms such as smart phones.
To evaluate the usability of a tool like SOMViz one could analyze the effective-ness and efficiency of the tool with users through traditional empirical success metrics, such as error rate and task com-pletion time. Such studies should be done not necessarily with a large number of users, but professionals that might want to use the tool to analyze complex data. For example, population specialists would be observed they apply SOMViz towards the analysis of census data. Evaluation of a tool must also include an explicit validation of the method, that is, whether it indeed helps to uncover the types of patterns it is supposed to uncover. One means of validating methods is to check them against benchmark data sets, where the data patterns are known in advance (Andrienko et al. 2008).
13 Summary and Outlook
We presented SOMViz, a proof-of-concept implementation of a web-based, open source SOM generation tool aimed at spa-tializing multivariate census data. Key con-tributions introduced in this web-based SOM prototype include the following:
• web-based, database-driven data selec-tion and query
• web-based SOM training with levera-ging of a standard SOM tool set capable of dealing with very large input data sets and large numbers of neurons
• web-based post-processing of trained SOM, including analytical hill shading of the U-matrix,
• web-based SOM visualization including U-matrix and component plane displays in combination with a geographic choropleth map
Technology has and will certainly change over time, and provide additional and/or different opportunities for creating SOMs
yet been fully implemented. As mentioned earlier, this limitation can be overcome, once more mature technology will be available that includes advanced graphical user interaction functionality for “big data” analytics, as well as a range of advanced web-based services that can handle geographic as well as non-geogra-phic spatial attribute data effectively and efficiently. Once this is available, one could imagine many additional cartographic visualization options. For example, the choropleth map could be complemented with graduated symbols, and animations, showcasing the temporal component of the data. Trajectory visualization, as pro-posed by Skupin and Hagelman (2003), would also be possible in this context.
Due to their inherent spatio-temporal nature, census data often exhibit explicit patterns of spatial heterogeneity, and often include autocorrelation in time and space (Andrienko et al. 2008). Conse-quently, interactive spatial autocorrelation tools (i. e., Moran’s I, etc.), for both, the attribute and geographic space, would be an interesting avenue to develop further (Brunsdon and Dykes, 2007). Also, additional tools to explore the modifia-ble areal unit problem (MAUP) could be envisaged. Meanwhile, efforts by Baçao et al. (2008) point towards possible modifications to the SOM algorithm itself, with specific incorporation of geographic location.
In comparison with common GIS approaches, where visual and computatio-nal overlays of various thematic layers are done on the basis of a standard coordi-nate system, one could similarly overlay various clustering solutions onto the same neuron geometry (Skupin 2004) and/or onto the geometry of the geographic space. Intelligent coordination of sym-bology for side-by-side geographic and attribute space depictions are a crucial concern of course, with the approach of Guo et al. (2005) providing a good starting point.
These and many additional features are feasible in this open and modular SOMViz prototype. The system is understood as an expandable research platform, thus a first stepping-stone for future like-minded work, related to web-based SOM of socio-
imagine various ways of linked interaction. For example, users could select an area or areas of interest in the geographic map and explore the highlighted patterns in the SOM. The reverse approach would be to select a best matching unit or an area of interest in the SOM, and highlight the respective patterns in the geographic map. Thirdly, a user could select a specific attribute value range from the database, and visualize the pattern in the SOM and the geographic map (Spielman and Thill, 2008). Another interesting option could be to project new data that were not initially trained with the SOM into the existing attribute space, for example, by placing it with its best matching unit in the SOM. One could thus compare various datasets across space and time. However, for providing this kind of advanced user interaction, while maintaining platform independence, it is probably best to rely on one technology for implementation on either client or server. For example, one could imagine to store SOM data together with geographic data in the same spatial database on the server, instead of having the SOM data separately stored in the common codebook file format. Likewise, one can foresee in the near future availa-ble technology on the client specifically targeted to high-quality graphics and user interaction.
Whatever the technology choice, the combination of attribute and geographic space for census data exploration seems very promising. Koua et al. (2006) showed in an empirical study with participants exploring population census variables for 150 countries, that maps were more effective for visual tasks such as locate, and distinguish, but seemed less effective for tasks involving comparison and corre-lation of the studied variables. A disad-vantage for a thematic map is that it can only show a limited number of attributes, which conflicts with the high-dimensional nature of census data. Meanwhile, Koua et al. (2006) found that the SOM component planes can help users view data relationships by comparing patterns among variables.
In the current version of SOMViz, multiple-window functionality, including synchronized data highlighting, has not
89
KN2/2015
VISUAL ANALYTICS S. Fabrikant, C. Gabathuler, A. Skupin: Web-based Self-Organizing Maps
Hamilton, E. (2014). Client-side versus server-side geo-processing. Benchmarking the performance of web-browsers processing geospatial data using common GIS operations. Unpublished MSc Thesis, Department of Geography, University of Wisconsin-Madison, USA.
Herrero, J., Al-Shahrour, F., Diaz-Uriarte, R., Mateos, A., Vaquerizas, J. M., Santoyo, J., and Dopazo, J. (2003). GEPAS: a web-based resource for microarray gene expression data analysis. Nucleic Acids Research, 31(13): 3461– 3467.
Hewitson, B. C. and Crane, R. G., (eds.). (1994). Neural Nets: Applications in Geography, Kluwer Academic Publishers, Dordrecht, NL.
Kaski, S. and Kohonen, T. (1996). Exploratory data analy-sis by self-organizing map. Structures of welfare and poverty in the world. In: Refenes, A.N., Abu-Mostafa, Y., Moody, J., and Weigend, A., (eds.), Neural Networks in Financial Engineering, World Scientific, Singapore: 498 – 507.
Kohonen, T. 1982. Self-organized formation of topologi-cally correct feature maps. Biological Cybernetics 43: 59 – 69.
Kohonen, T. 2001. Self-organizing maps. third edition. Springer Series in Information Sciences. Berlin, Germany: Springer Verlag.
Kohonen, T., Hynninen, J., Kangas, J., and Laaksonen, J. (1996). SOM_PAK: The Self-Organizing Map Program Package. Technical Report A30, Helsinki University of Technology, Laboratory of Computer and Information Science, Espoo, Finland.
Koua, E. L., MacEachren, A. M., and Kraak, M. J. 2006. Evaluating the usability of visualization methods in an exploratory geovisualization environment. Internatio-nal Journal of Geographical Information Science 20(4): 425 – 48.
Lacayo, M. and Skupin, A. 2007. A GIS-based Visualization Module for Self-Organizing Maps. Proceedings, 23rd International Cartographic Conference (ICC2007), Moscow, Russia, Aug. 4 –10, 2007 (CD-ROM).
Li, B. 1998. Exploring spatial patterns with self-organi-zing maps. Proceedings, GIS/LIS ‚98, Fort Worth (TX), USA, (CD-ROM).
Lin, X., Soergel, D., and Marchionini, G. 1991. A self organizing semantic map for information retrieval. Proceedings, SIGIR’91: 262 – 269.
Matlab. 2015. The MathWorks Deutschland, MATLAB and Simulink for technical computing. [http://www.mathworks.com; accessed February 2015].
Openshaw, S. (1994). Neuroclassification of Spatial Data. In: Hewitson, B. C., and Crane, R. G., (eds.), Neural Nets: Applications in Geography, Kluwer Academic Publishers, Dordrecht, NL: 53 –70.
PostGIS. 2015. PostGIS. [http://www.postgis.org; accessed February 2015].
PostgreSQL. 2010. PostgreSQL, The world‘s most advan-ced open source database. [http://www.postgresql.org; accessed February 2015].
R project for statistical computing (R). 2015. [http://www.r-project.org; accessed February 2015].
Reliefshading. 2010. Relief shading. [http://www.reliefs-hading.com; accessed February 2015].
SFSO. 2010. Swiss Federal Statistic Office, Swiss sta-tistics. [http://www.bfs.admin.ch; accessed February 2015].
Skupin, A. (2002). A cartographic approach to visualizing conference abstracts. IEEE Computer Graphics and Application 22(1). pp. 50 – 58.
References
Agarwal, P. & A. Skupin. 2008. Self-organising Maps : Applications in Geographic Information Science. Chichester, England ; Hoboken, NJ: Wiley.
Andrienko, G., Andrienko, N., Bremm, S. , Schreck, T., von Landesberger, T., Bak, P., Keim, D., (2010) Space-in-Time and Time-in-Space. Self-Organizing Maps for Ex-ploring Spatiotemporal Patterns. Computer Graphics Forum, 29(3): 913–922.
Andrienko, G. L., N. V. Andrienko, J. Dykes, S. I. Fabrikant, and M. Wachowicz. 2008. Geovisualization of dyna-mics, movement and change: Key issues and develo-ping approaches in visualization research. Information Visualization 7(3): 173– 80.
Apache Tomcat. 2015. Apache Tomcat. [http://tomcat.apache.org; accessed February 2015].
Baçao, F., Lobo, V. and Painho, M. (2008): Applications of different self-organizing maps variants to geogra-phical information science problems, in: Agarwal, P.; Skupin, A. (eds): Self-Organising Maps. Applications in Geographic Information Science,Wiley: Chichester, UK, pp. 21– 44.
Brunsdon, C. and Dykes, J. (2007). Geographically weighted visualization – interactive graphics for scale-varying exploratory analysis. Proceedings, GISRUK, NUI Maynooth, Ireland, Apr. 11–13, 2007.
Card, S. K., Mackinlay, J. D., and Shneiderman B. 1999. Readings in information visualization, Using vision to think. San Francisco (CA), USA:Morgan Kaufmann Publishers.
CentOS. 2015. The community enterprise operating system. [http://www.centos.org; accessed February 2015].
Chang, Y. S., and Park, H. D. 2006. XML web service-based development model for internet GIS applica-tions. International Journal of Geographical Informa-tion Science 20(4): 371– 99.
CIS. 2015. Laboratory of computer and information science. Department of computer science and enginee-ring. Hesinki University of Technology. [http://www.cis.hut.fi/research/som-research/nnrc-programs.shtml; accessed February 2015].
Dunfey, R. I., Gittings, B. M., and Batcheller, J. K. 2006. Towards an open architecture for vector GIS. Compu-ters & Geosciences, 32: 1720 – 32.
Gabathuler, C. (2009). Web-based Self-Organizing Maps for Exploration of Swiss Census Data. Unpublished Masters Thesis, Department of Geography, University of Zurich, Switzerland.
Gahegan, M., Takatsuka, M., Wheeler, M., and Hardisty, F. 2002. Introducing GeoVISTA Studio, An integrated suite of visualization and computational methods for exploration and knowledge construction in geograph. Computers, Environment and Urban Systems 26: 267– 92.
Girardin, L. (1995). Mapping the Virtual Geography of the World Wide Web. Proceedings, Fifth International World Wide Web Conference, Paris, France, May, 6 –10.
GeoServer. 2010. GeoServer. [http://geoserver.org; accessed February 2015].
Guo D., Gahegan M., MacEachren A. M., Zhou, B. (2005) Multivariate analysis and geovisualization with an integrated geographic knowledge discovery approach. Cartography and Geographic Information Science, 32:113 –132.
online in the future. This in turn might
affect the design and implementation of
a web-based system, and will offer new
ways to apply SOMs to socio-economic
data, and for social science research
questions. Our approach is intended as a
first step to demonstrate that online SOM
creation is feasible, and thus also poten-
tially more accessible for an audience
not versed in programming. SOMViz is
an open and flexible research prototype
with opportunities and challenges for
extension. For example, user interactivity
could be improved with linked, multiple
windows, allowing synchronized selec-
tion and highlighting. Additional SOM
creation options could be included, such
as logarithmic normalization for potential
data skewness reduction, and descriptive
statistics measures for data selection, to
support users in their data normalization
choices. Additionally, statistical indicators
to explore spatial autocorrelation could
be provided in attribute and geographic
space. Certainly, questions of how SOM-
Viz can amplify cognition for socio-demo-
graphic visual data analytics still remain to
be addressed. These research questions
could be tackled with systematic user
studies and expert evaluations, to assess
the usefulness of this prototype for census
data exploration and analysis. Another
topic for future work is to provide space-
time trajectories to visualize the temporal
dimension of the geographic census
datasets. Finally, a critical advantage of
SOM over other dimensionality reduction
techniques is the ability to map new data
items onto the trained SOM, without
having to recompute the underlying
base map. This makes the SOM method
a prime candidate for generating base
maps of attribute space that can then
routinely appear side-by-side with familiar
depictions of geographic space, allowing
in-depth comparative studies of geogra-
phic phenomena that may be distributed
across geographic space, attribute space,
or time.
Acknowledgments
We thank the Swiss Federal Statistic Office
for their permission to use Swiss popula-
tion census data for our case study.
90
KN2/2015
FACHBERICHTET. Gloor: Laser Airborne Scanning revolutioniert die Herstellung
T. Gloor: Laser Airborne Scanning revolutioniert die Herstellung FACHBERICHTE
Fax: +41 44 635-6848 ) is a Professor of Geography and currently the elected chair of the ICA Cognitive Visualization Commission. She has research interests in geovisual analytics, GIScience and cognition, and dynamic cartography. She is the appointed Head of the Geography Department at the University of Zürich (UZH) where she also heads the Geographic Information Visualization and Analysis Group at the GIScience Center. Email: [email protected]
Cedric Gabathuler is an independent scholar working in the finance sector. He holds both a M.Sc. in Geography with specialization in Geographic Information Science, and a M.A.S. in Finance from the University of Zurich. He has research interests in data analysis, geovisual analytics, GIScience and information technology. Email: [email protected]
Dr. André Skupin (San Diego State University, Center for Information Convergence and Strategy, Department of Geography, San Diego, CA 92182-4493, USA. Tel: +1 619 594-6946; Fax: +1 619 594-4938) is a Professor of Geography and founder and Co-Director of the Center for Information Convergence and Strategy (CICS) at San Diego State University. His research interests revolve around information visuali- zation, visual data mining, text mining, and knowledge analytics. He is an Associate Director of the Center for Entrepreneurship and Innovation at the University of Dubai as well as co-founder of a start-up company in the knowledge management domain. He currently serves on the Board of Directors of the University Consortium for Geographic Information Science (UCGIS). Email: [email protected]
Manuskript eingereicht am 20.2.2015, nach Review angenommen am 13.3.2015
Skupin, A., and Esperbé, A. 2008. Towards high resolu-tion self-organizing maps of geographic features. In: Dodge, M., Turner, M., and Derby, M. (eds). Geographic Visualization: Concepts, Tools and Applications. Chichester, United Kingdom:Wiley. pp. 159 – 81.
Spielman, S. E., and Folch, D. C. (2015). Social Area Analysis and Self-Organizing Maps. In: Brundson, C. and Singleton, A. (eds.). Geocomputation: A Practical Primer, Sage, Los Angeles, USA: 152 – 168.
Spielman, S. E., and Thill, J. C. 2008. Social area analysis, data mining, and GIS. Computers, Environment and Urban Systems 32: 110 – 22.
Ultsch, A. (1993). Self-organizing neural networks for visualization and classification. In: Opitz, O., Lausen, B., and Klar, R., (eds.), Information and Classification: Concepts, Methods, and Applications, Springer, Berlin, Germany: 307– 313.
Vesanto, J., Himberg, J., Alhoniemi, E., and Parhankangas, J. 1999. Self-organizing map in Matlab. The SOM Toolbox. Proceedings, Matlab DSP Conference 1999, Espoo, Finnland, Nov. 16 –17, 1999: 35 – 40.
Viscovery SOMine. 2015. Viscovery SOMine 6 [http://www.viscovery.net; accessed February 2015].
Winter, K., and Hewitson, B. C. 1994. Self-organizing maps, Applications to census data. In: Hewitson, B. C., and Crane, R.G. (eds). Neural Nets, Applications in Geography. GeoJournal Library, Vol. 29. Dordrecht, Netherland: Kluwer Academic Publishers. pp. 71– 77.
Yao, X., and L. Zou. 2008. Interoperable internet mapping: An open source approach. Cartography and Geographic Information Science 35(4): 279 – 93.
About the authors
Dr. Sara Irina Fabrikant (University of Zurich, Department of Geography, Winterthurerstrasse 190, 8057 Zurich, Switzerland. Tel: +41 44 635-5151;
Skupin, A. (2004). The world of geography, Visualizing a knowledge domain with cartographic means. In: Proceedings of the National Academy of Sciences of the United States of America 101 (Suppl. 1). pp. 5274 –78.
Skupin, A. (2007). Where do you want to go today [in attribute space]? In: Miller, H., (ed.), Societies and Cities in the Age of Instant Access, Springer, Berlin, Germany: 133 –149.
Skupin, A. 2008. Visualizing human movement in attribute space. In: Agarwal, P., and Skupin, A. (eds). Self-Organising Maps, Applications in Geographic Information Science. Chichester, United Kingdom: Wiley. pp. 121– 35.
Skupin, A., and Agarwal, P. 2008. Introduction, What is a self-organizing map?. In: Agarwal, P., and A. Skupin (eds). Self-Organising Maps, Applications in Geographic Information Science. Chichester, United Kingdom: Wiley. pp. 1–20.
Skupin, A. and Biberstine, J. R., Börner, K. (2013). Visualizing the Topical Structure of the Medical Sciences: A Self-Organizing Map Approach. PLoS ONE 8(3): e58779. doi:10.1371/journal.pone.0058779.
Skupin, A., and Fabrikant, S.I. 2007. Spatialization. In: Wilson, J., and Fotheringham, A.S. (eds). Handbook of Geographic Information Science. Oxford, United Kingdom: Blackwell Publishers. pp. 61–79.
Skupin, A., and Fabrikant, S.I. 2003. Spatialization methods, A cartographic research agenda for non-geographic information visualization. Cartography and Geographic Information Science 30(2): 95 –115.
Skupin, A., and Hagelman, R. 2003. Attribute space visualization of demographic change. In: Proceedings of the 11th ACM International Symposium on Advances in Geographic Information Systems, New Orleans (LA), USA. pp. 56 – 62.
KN2/2015
91
Fachberichte
Laser Airborne Scanning revolutioniert die Herstellung von Orien-tierungslauf-Karten.
Thomas Gloor
Es sind noch keine 10 Jahre her als Orientierungslauf-Karten mit ungenauen, archaischen Vermes-sungsmethoden hergestellt wurden: Schrittmass und Kompasspeilung waren damals das Rüstzeug jedes OL-Kartenaufnehmers. Heute gehört dies der Vergangenheit an. Airborne Laser Scanning (LiDAR)
hat die Herstellung von OL-Karten revolutioniert und so auch deren Genauigkeit stark erhöht.
n Schlüsselwörter: ???????
Sportart mit Köpfchen
Beim Orientierungslauf geht es da-
rum, die auf einer Karte eingezeich-
nete Reihenfolge von Kontrollposten
– im Gelände sind sie mit rot-weissen
Flaggen markiert – anzulaufen und
mit einem elektronischen Stempel
zu quittieren. Derjenige einer jeder
Alterskategorie, der die Kontrollpos-
ten in korrekter Reihenfolge und in
kürzester Zeit zurücklegt, gewinnt
den Wettkampf. Die Herausforderung
in dieser Sportart liegt also darin,
unter physischer Belastung schnell
Routenwahlentscheide zwischen den
zwei Kontrollposten zu fällen und sie
anschliessenden im Gelände – meist
ist im Wald – ohne Navigationsfehler
umzusetzen.
Hierzu ist eine Spezialkarte
notwendig. Sie enthält weit mehr
Details als amtliche Übersichtspläne
oder topografische Karten. So werden
darin beispielsweise kleine Mulden,
Senken oder Hügel sowie grosse
Steine oder Felsblöcke dargestellt.
Am Augenfälligsten unterscheidet
sich eine OL-Karte dadurch, dass die
Laufbehinderung der Bodenvegeta-
tion in 3 Grünstufen dargestellt sowie
Wiesen und Felder in der Farbe Gelb
repräsentiert werden. Charakteristisch
ist weiter, dass das Höhenkurvenbild
meist in einer Aequidistanz von
5 Metern abgebildet wird und der
Kartenmassstab 1:15.000 oder
1:10.000 ist. Die Gesamtheit aller
auf einer OL-Karte darzustellenden
Objekte sind in den Internationa-
len Darstellungsvorschriften für
OL-Karten (ISOM: International
Specification for Orienteering Maps)
definiert. Es sind insgesamt etwas
über 100 Kartensymbole.
Die Grundlage zur Erstellung
einer OL-Karte ist eine möglichst
detaillierte, bestehende topografische
Karte, beispielsweise ein amtlicher
Übersichtsplan im Massstab 1:10.000
mit einer Aequidistanz von 10 Metern,
welche durch die in den Darstellungs-
vorschriften definierten Kartenobjekte
ergänzt wird. Das Höhenkurvenbild


![Brief Review of Self-Organizing Maps · Finish Professor Teuvo Kohonen in the 1980s, [1,2]. Self-organizing map (SOM), sometimes also called a Kohonen map use unsupervised, competitive](https://img.pdfslide.org/doc/110x75/5e70404037ccd828040770c4/brief-review-of-self-organizing-maps-finish-professor-teuvo-kohonen-in-the-1980s.jpg)