Embed Size (px)
Citation preview

SPEED WINSIMPLEMENTING SPEED TRAINING INTO RETURN TO PLAY STRATEGIES & ON-FIELD PERFORMANCE
Cameron Josse, MS CSCSAthletic Performance Coach, Indiana University Football

SPECIAL THANKS TO THOSE WHO TEACH ME EVERY DAY!
Aaron Wellman
Chris Allen
Justin Collett
Jacob Laverman
Pete Remmes

Dr. Ken ClarkDr. JB Morin
INFLUENCERS OF MY SPEED EDUCATION
AND MANY, MANY MORE!
Charlie FrancisStu McMillan Dan Pfaff
Boo Schexnayder Henk Kraaijenhof Derek Hansen Jonas Dodoo Frans Bosch

SPRINT PROFILING FOR INDIVIDUALIZED LOADING
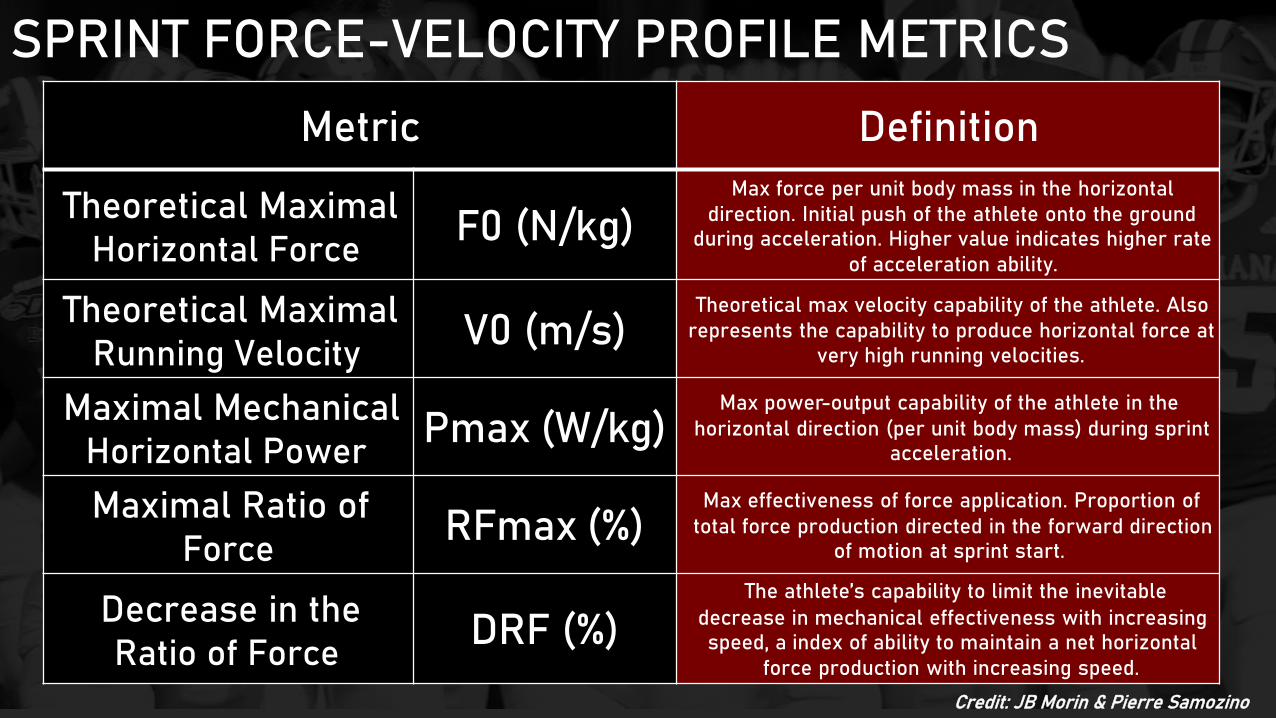
SPRINT FORCE-VELOCITY PROFILE METRICS
Metric Definition
Theoretical Maximal Horizontal Force F0 (N/kg)
Max force per unit body mass in the horizontal direction. Initial push of the athlete onto the ground
during acceleration. Higher value indicates higher rate of acceleration ability.
Theoretical Maximal Running Velocity V0 (m/s)
Theoretical max velocity capability of the athlete. Also represents the capability to produce horizontal force at
very high running velocities.
Maximal Mechanical Horizontal Power Pmax (W/kg)
Max power-output capability of the athlete in the horizontal direction (per unit body mass) during sprint
acceleration.
Maximal Ratio of Force RFmax (%)
Max effectiveness of force application. Proportion of total force production directed in the forward direction
of motion at sprint start.
Decrease in the Ratio of Force DRF (%)
The athlete’s capability to limit the inevitable decrease in mechanical effectiveness with increasing speed, a index of ability to maintain a net horizontal
force production with increasing speed.
Credit: JB Morin & Pierre Samozino
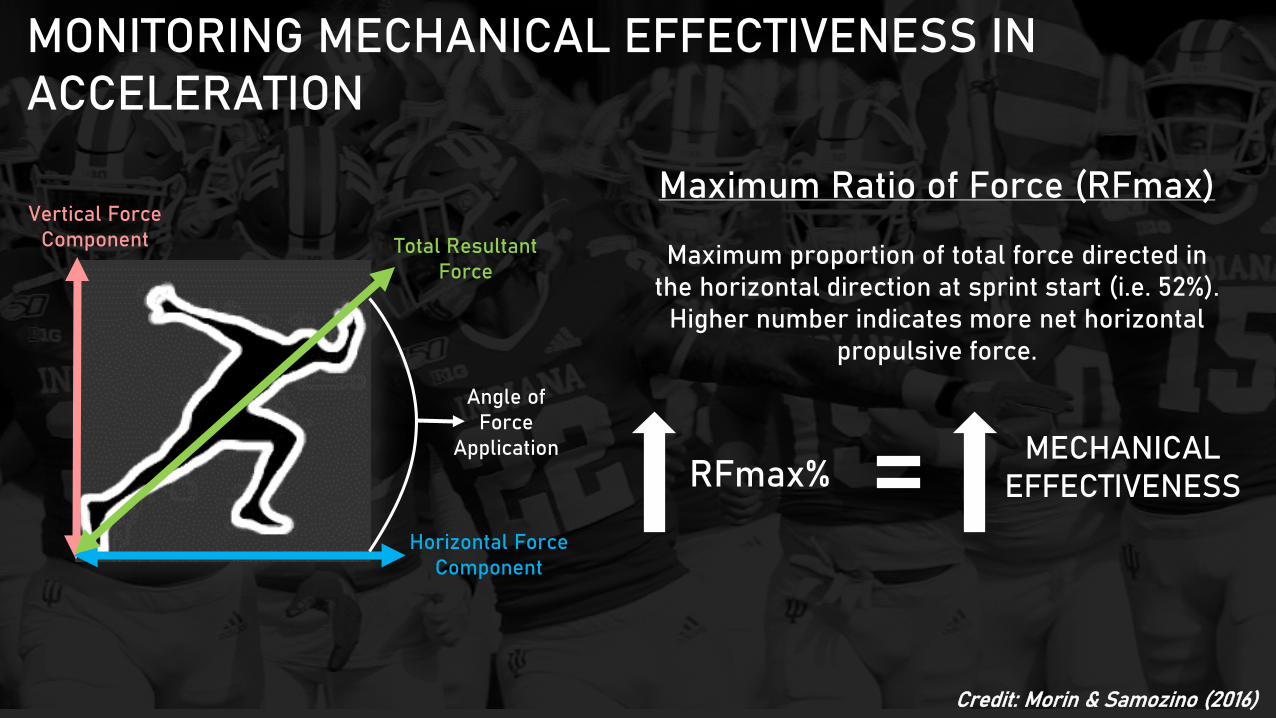
MONITORING MECHANICAL EFFECTIVENESS IN ACCELERATION
Vertical Force Component
Horizontal Force Component
Total Resultant Force
Angle of Force
Application
Maximum Ratio of Force (RFmax)
Maximum proportion of total force directed in the horizontal direction at sprint start (i.e. 52%).
Higher number indicates more net horizontal propulsive force.
Credit: Morin & Samozino (2016)
RFmax%MECHANICAL
EFFECTIVENESS
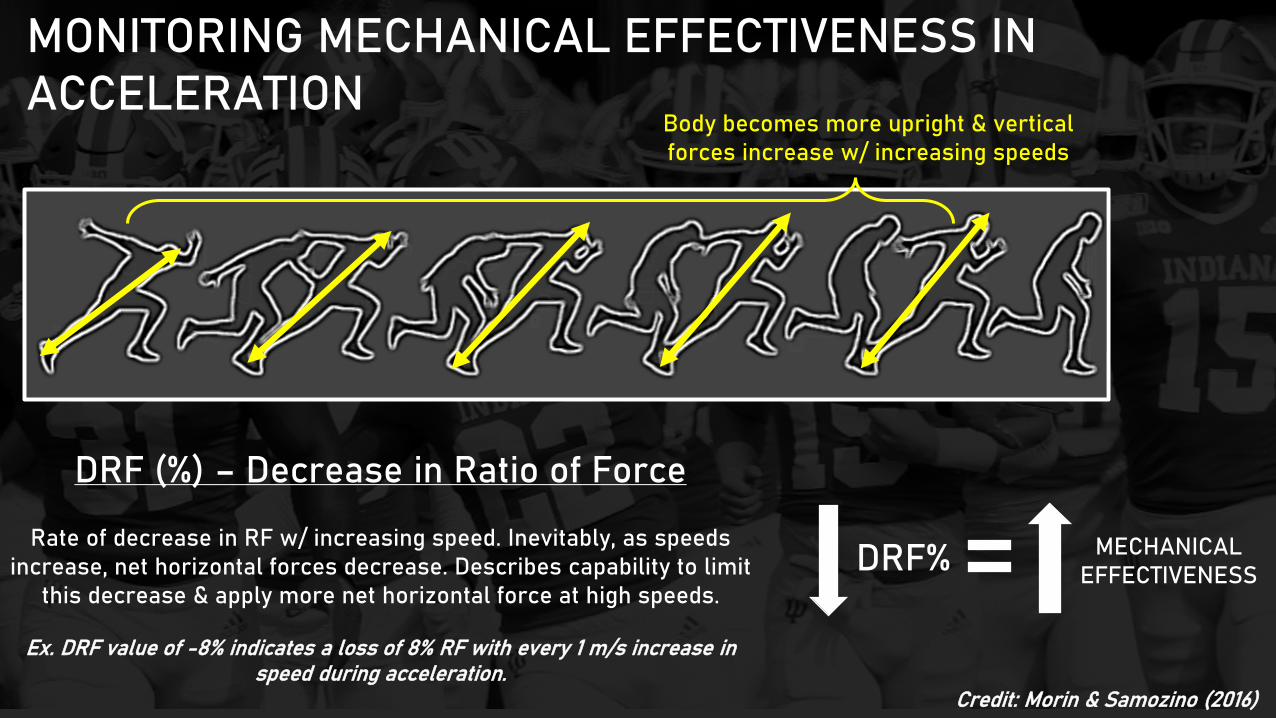
MONITORING MECHANICAL EFFECTIVENESS IN ACCELERATION
Body becomes more upright & vertical forces increase w/ increasing speeds
DRF (%) – Decrease in Ratio of Force
Rate of decrease in RF w/ increasing speed. Inevitably, as speeds increase, net horizontal forces decrease. Describes capability to limit
this decrease & apply more net horizontal force at high speeds.
Ex. DRF value of -8% indicates a loss of 8% RF with every 1 m/s increase in speed during acceleration.
DRF% MECHANICAL EFFECTIVENESS
Credit: Morin & Samozino (2016)
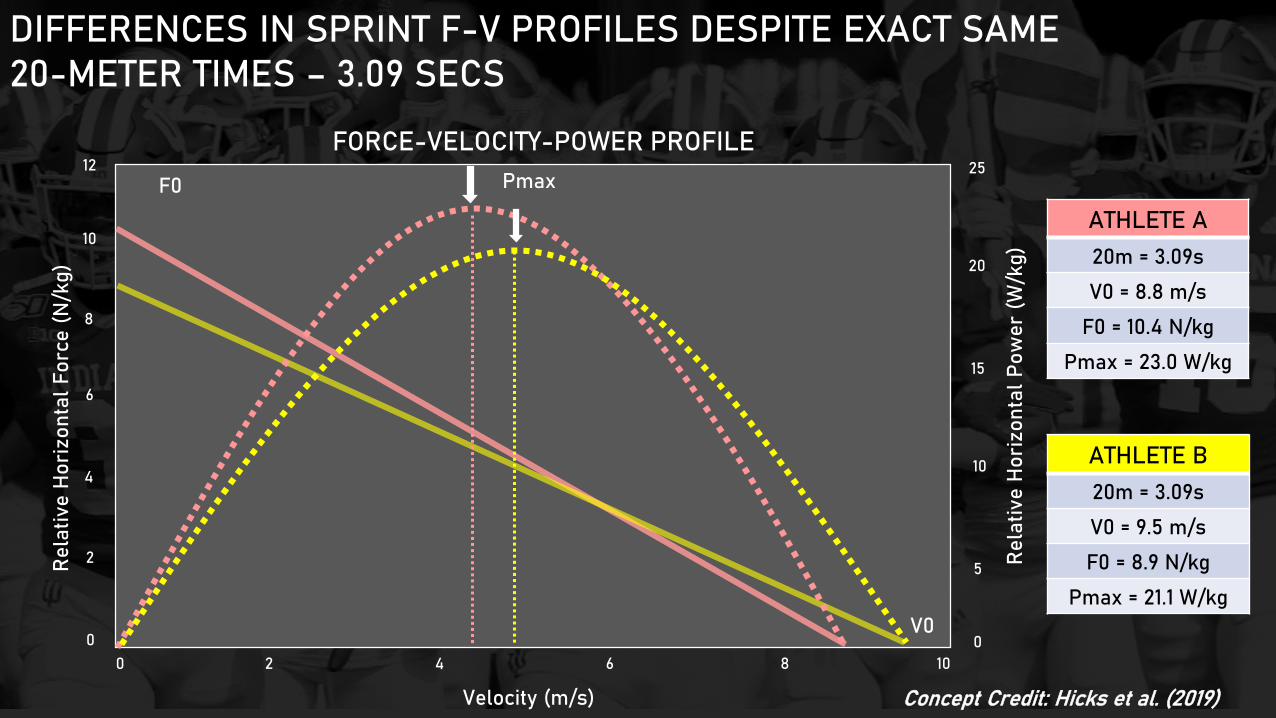
DIFFERENCES IN SPRINT F-V PROFILES DESPITE EXACT SAME 20-METER TIMES – 3.09 SECS
12
10
6
4
2
0
25
10
0
15
5
20
0 2 4 6 8 10
FORCE-VELOCITY-POWER PROFILE
Velocity (m/s)
Rel
ativ
e H
oriz
onta
l For
ce (
N/k
g)
Rel
ativ
e H
oriz
onta
l Pow
er (W
/kg)
ATHLETE A20m = 3.09s
V0 = 8.8 m/s
F0 = 10.4 N/kg
Pmax = 23.0 W/kg
ATHLETE B20m = 3.09s
V0 = 9.5 m/s
F0 = 8.9 N/kg
Pmax = 21.1 W/kg
Concept Credit: Hicks et al. (2019)
PmaxF0
V0
8
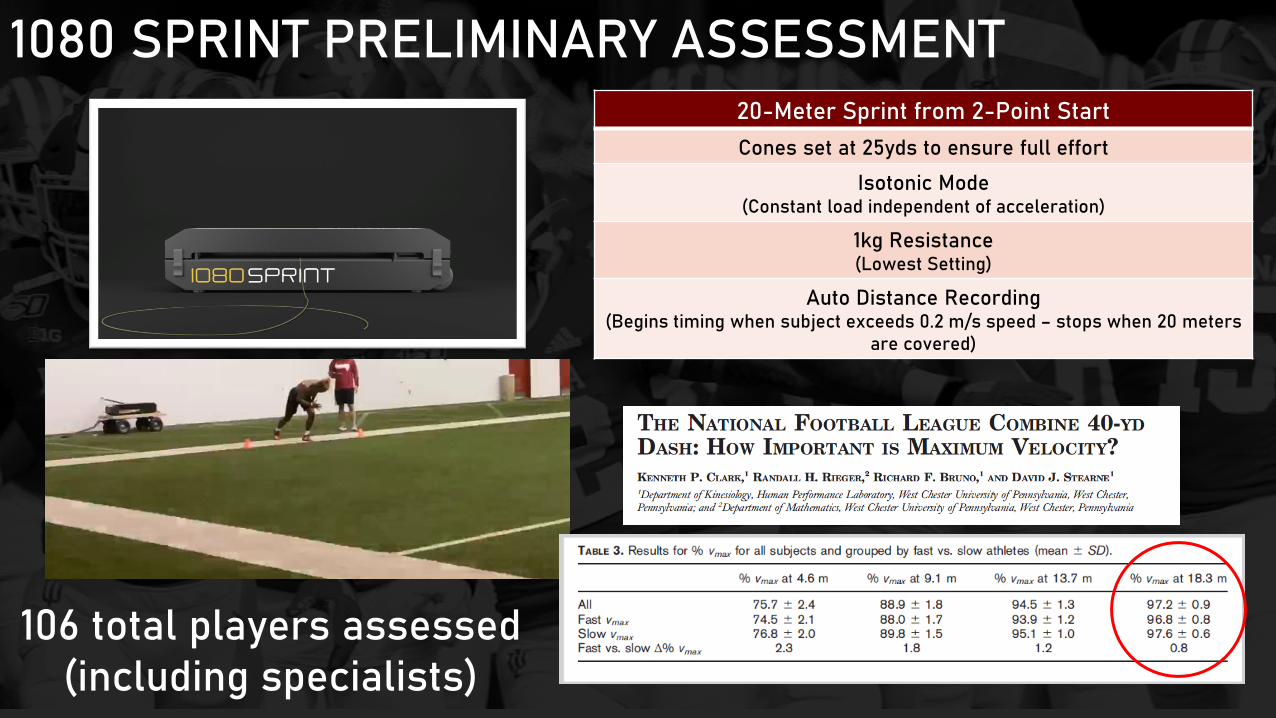
1080 SPRINT PRELIMINARY ASSESSMENT 20-Meter Sprint from 2-Point StartCones set at 25yds to ensure full effort
Isotonic Mode(Constant load independent of acceleration)
1kg Resistance(Lowest Setting)
Auto Distance Recording(Begins timing when subject exceeds 0.2 m/s speed – stops when 20 meters
are covered)
106 total players assessed(including specialists)
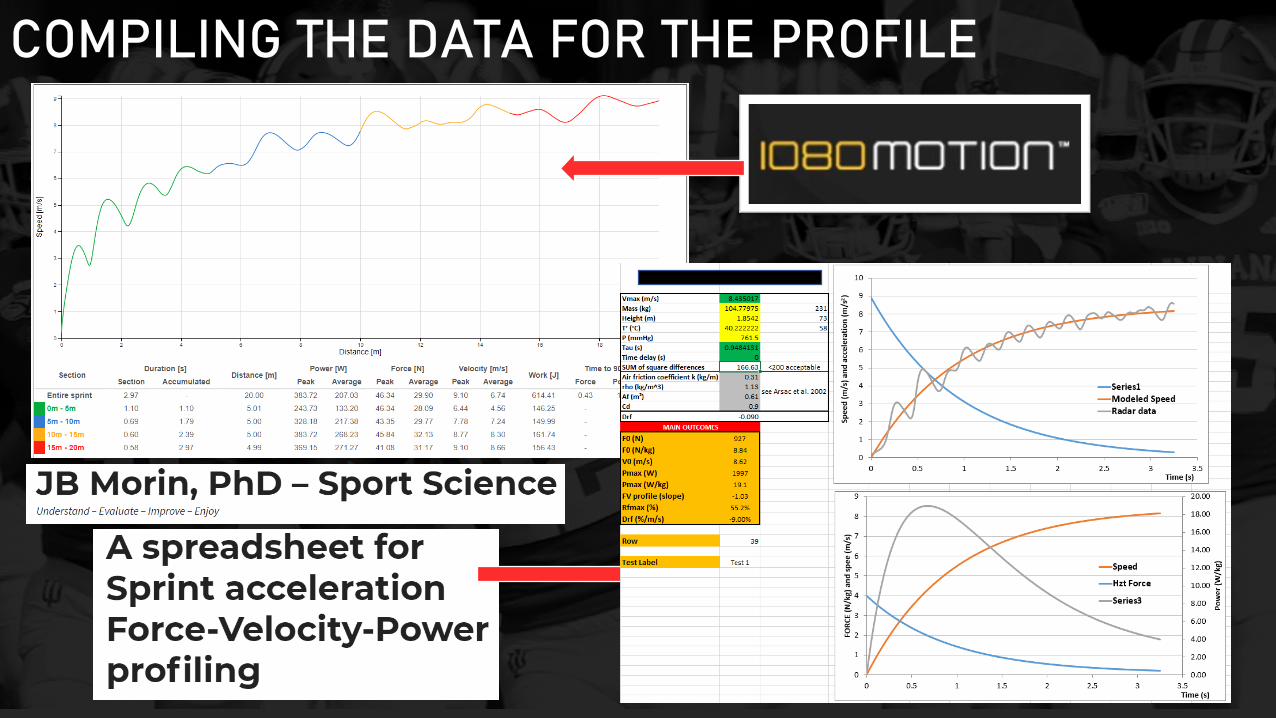
COMPILING THE DATA FOR THE PROFILE
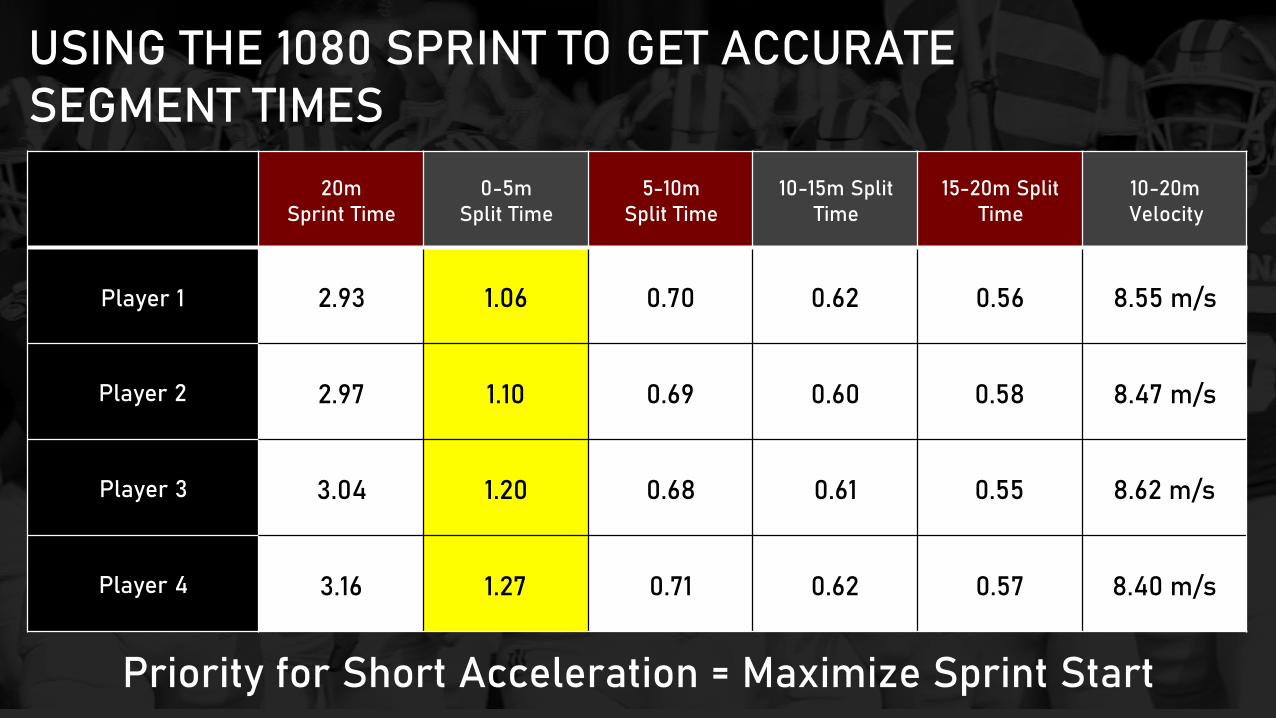
USING THE 1080 SPRINT TO GET ACCURATE SEGMENT TIMES
Priority for Short Acceleration = Maximize Sprint Start
20mSprint Time
0-5mSplit Time
5-10mSplit Time
10-15m Split Time
15-20m Split Time
10-20m Velocity
Player 1 2.93 1.06 0.70 0.62 0.56 8.55 m/s
Player 2 2.97 1.10 0.69 0.60 0.58 8.47 m/s
Player 3 3.04 1.20 0.68 0.61 0.55 8.62 m/s
Player 4 3.16 1.27 0.71 0.62 0.57 8.40 m/s
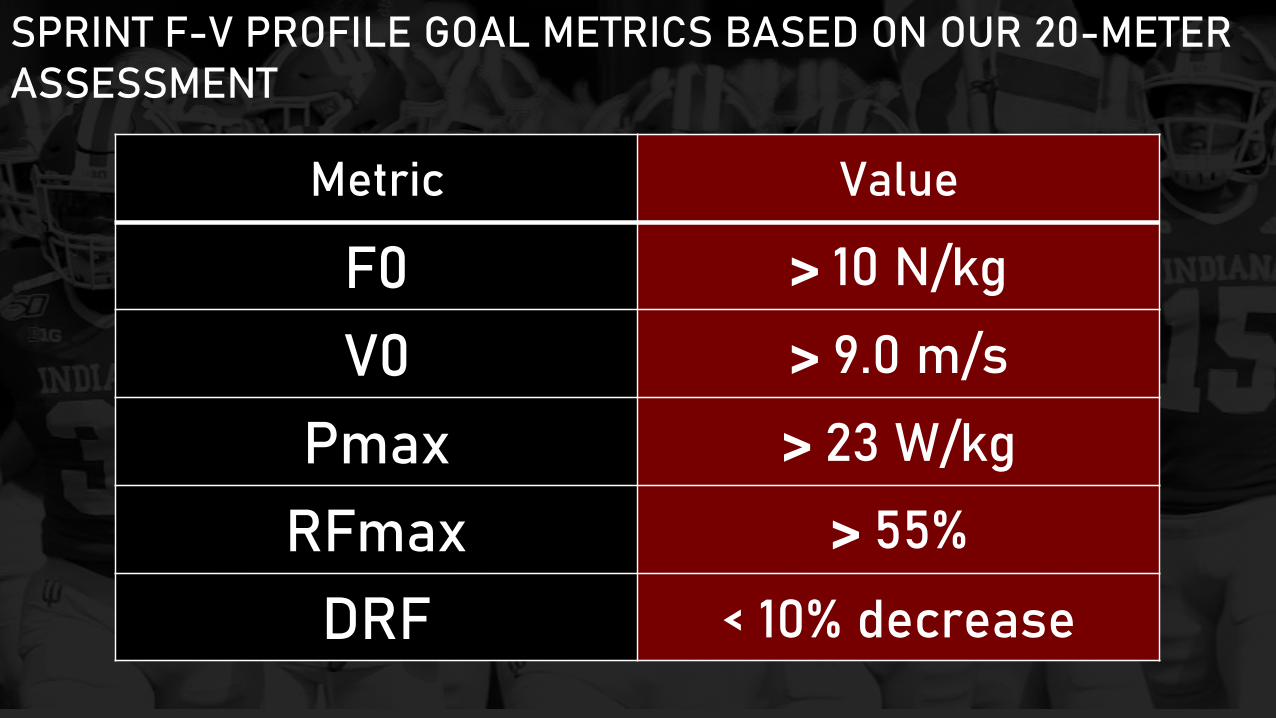
SPRINT F-V PROFILE GOAL METRICS BASED ON OUR 20-METER ASSESSMENT
Metric Value
F0 > 10 N/kg
V0 > 9.0 m/s
Pmax > 23 W/kg
RFmax > 55%
DRF < 10% decrease
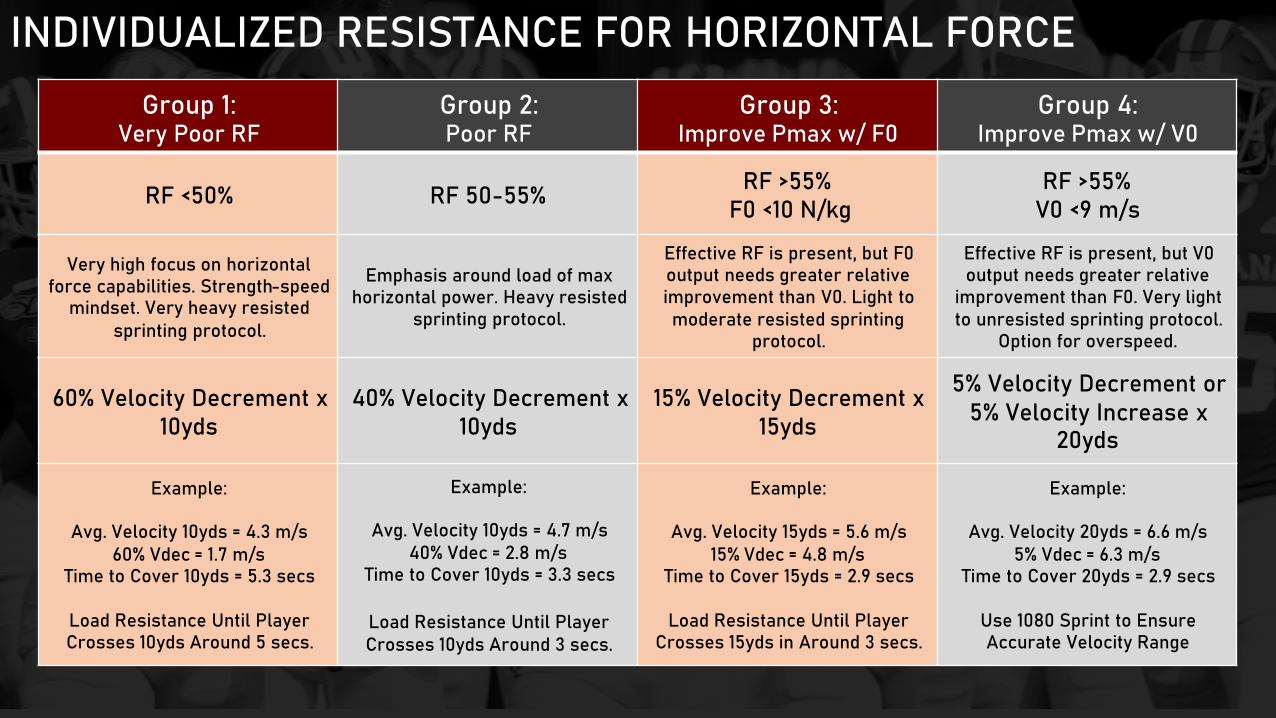
INDIVIDUALIZED RESISTANCE FOR HORIZONTAL FORCE
Group 1:Very Poor RF
Group 2:Poor RF
Group 3:Improve Pmax w/ F0
Group 4:Improve Pmax w/ V0
RF <50% RF 50-55% RF >55%F0 <10 N/kg
RF >55%V0 <9 m/s
Very high focus on horizontal force capabilities. Strength-speed
mindset. Very heavy resisted sprinting protocol.
Emphasis around load of max horizontal power. Heavy resisted
sprinting protocol.
Effective RF is present, but F0 output needs greater relative improvement than V0. Light to moderate resisted sprinting
protocol.
Effective RF is present, but V0 output needs greater relative
improvement than F0. Very light to unresisted sprinting protocol.
Option for overspeed.
60% Velocity Decrement x 10yds
40% Velocity Decrement x 10yds
15% Velocity Decrement x 15yds
5% Velocity Decrement or 5% Velocity Increase x
20yds
Example:
Avg. Velocity 10yds = 4.3 m/s60% Vdec = 1.7 m/s
Time to Cover 10yds = 5.3 secs
Load Resistance Until Player Crosses 10yds Around 5 secs.
Example:
Avg. Velocity 10yds = 4.7 m/s40% Vdec = 2.8 m/s
Time to Cover 10yds = 3.3 secs
Load Resistance Until Player Crosses 10yds Around 3 secs.
Example:
Avg. Velocity 15yds = 5.6 m/s15% Vdec = 4.8 m/s
Time to Cover 15yds = 2.9 secs
Load Resistance Until Player Crosses 15yds in Around 3 secs.
Example:
Avg. Velocity 20yds = 6.6 m/s5% Vdec = 6.3 m/s
Time to Cover 20yds = 2.9 secs
Use 1080 Sprint to Ensure Accurate Velocity Range

KINEMATIC VIDEO ANALYSIS
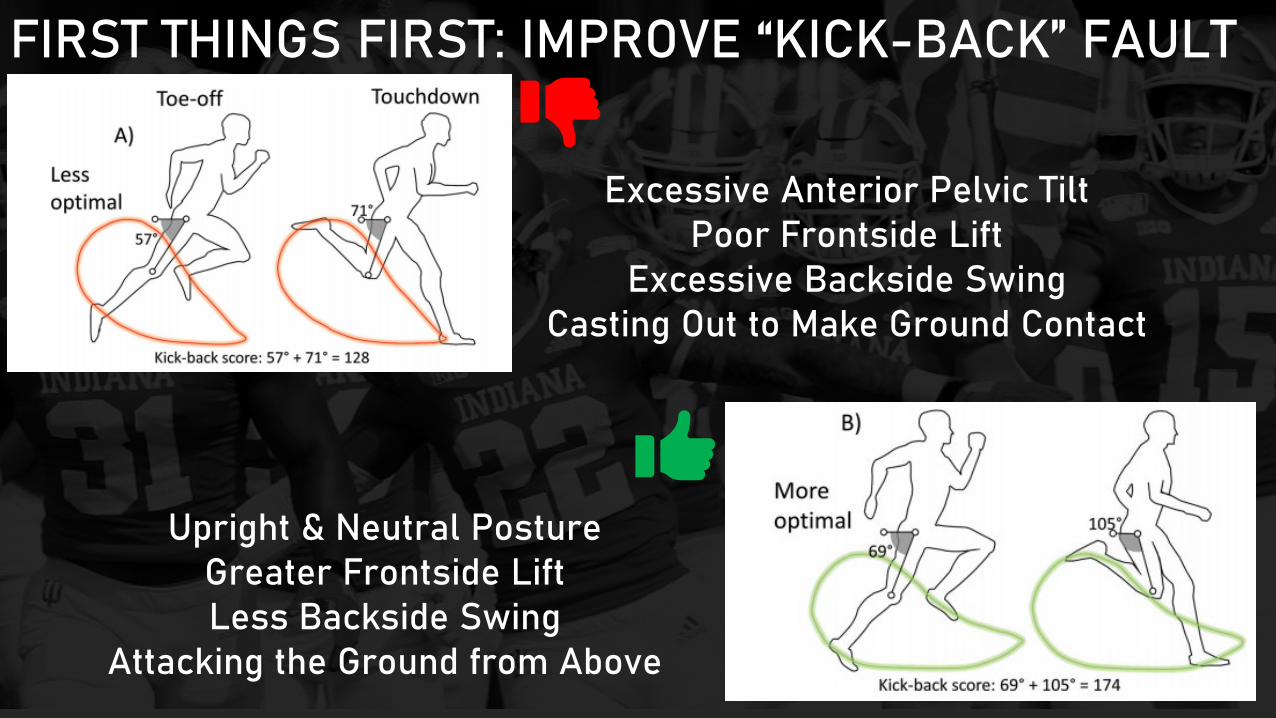
FIRST THINGS FIRST: IMPROVE “KICK-BACK” FAULT
Excessive Anterior Pelvic TiltPoor Frontside Lift
Excessive Backside SwingCasting Out to Make Ground Contact
Upright & Neutral PostureGreater Frontside LiftLess Backside Swing
Attacking the Ground from Above
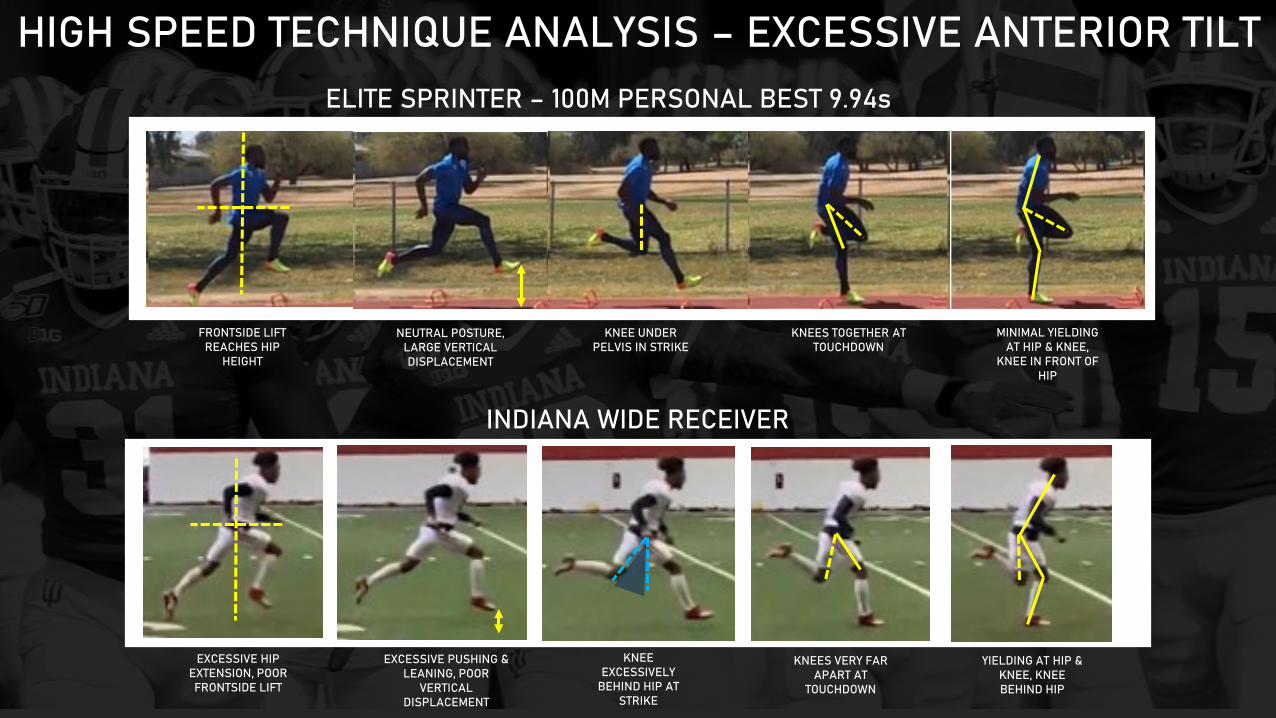
ELITE SPRINTER – 100M PERSONAL BEST 9.94s
INDIANA WIDE RECEIVER
NEUTRAL POSTURE, LARGE VERTICAL DISPLACEMENT
KNEES TOGETHER AT TOUCHDOWN
MINIMAL YIELDING AT HIP & KNEE,
KNEE IN FRONT OF HIP
FRONTSIDE LIFT REACHES HIP
HEIGHT
KNEE UNDER PELVIS IN STRIKE
HIGH SPEED TECHNIQUE ANALYSIS – EXCESSIVE ANTERIOR TILT
EXCESSIVE PUSHING & LEANING, POOR
VERTICAL DISPLACEMENT
KNEES VERY FAR APART AT
TOUCHDOWN
EXCESSIVE HIP EXTENSION, POOR FRONTSIDE LIFT
KNEE EXCESSIVELY
BEHIND HIP AT STRIKE
YIELDING AT HIP & KNEE, KNEE BEHIND HIP
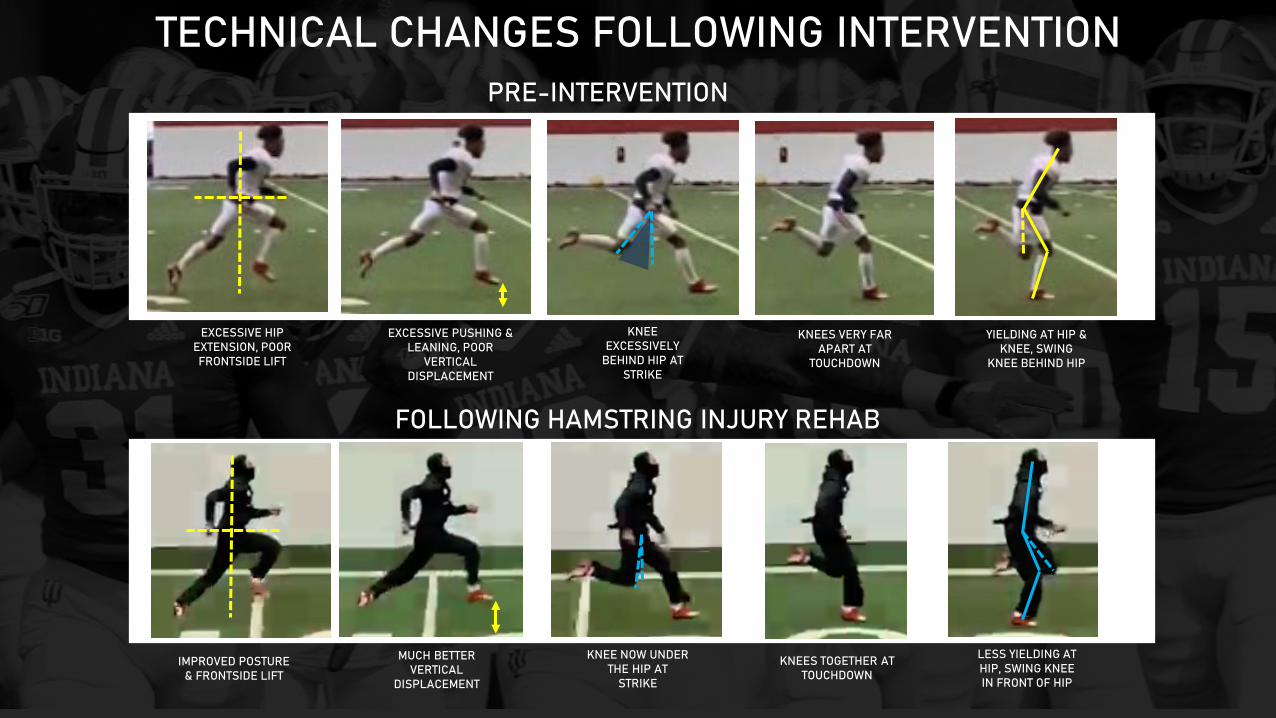
PRE-INTERVENTION
FOLLOWING HAMSTRING INJURY REHAB
TECHNICAL CHANGES FOLLOWING INTERVENTION
IMPROVED POSTURE & FRONTSIDE LIFT
MUCH BETTER VERTICAL
DISPLACEMENT
KNEE NOW UNDER THE HIP AT
STRIKE
KNEES TOGETHER AT TOUCHDOWN
LESS YIELDING AT HIP, SWING KNEE IN FRONT OF HIP
EXCESSIVE PUSHING & LEANING, POOR
VERTICAL DISPLACEMENT
KNEES VERY FAR APART AT
TOUCHDOWN
EXCESSIVE HIP EXTENSION, POOR FRONTSIDE LIFT
KNEE EXCESSIVELY
BEHIND HIP AT STRIKE
YIELDING AT HIP & KNEE, SWING
KNEE BEHIND HIP
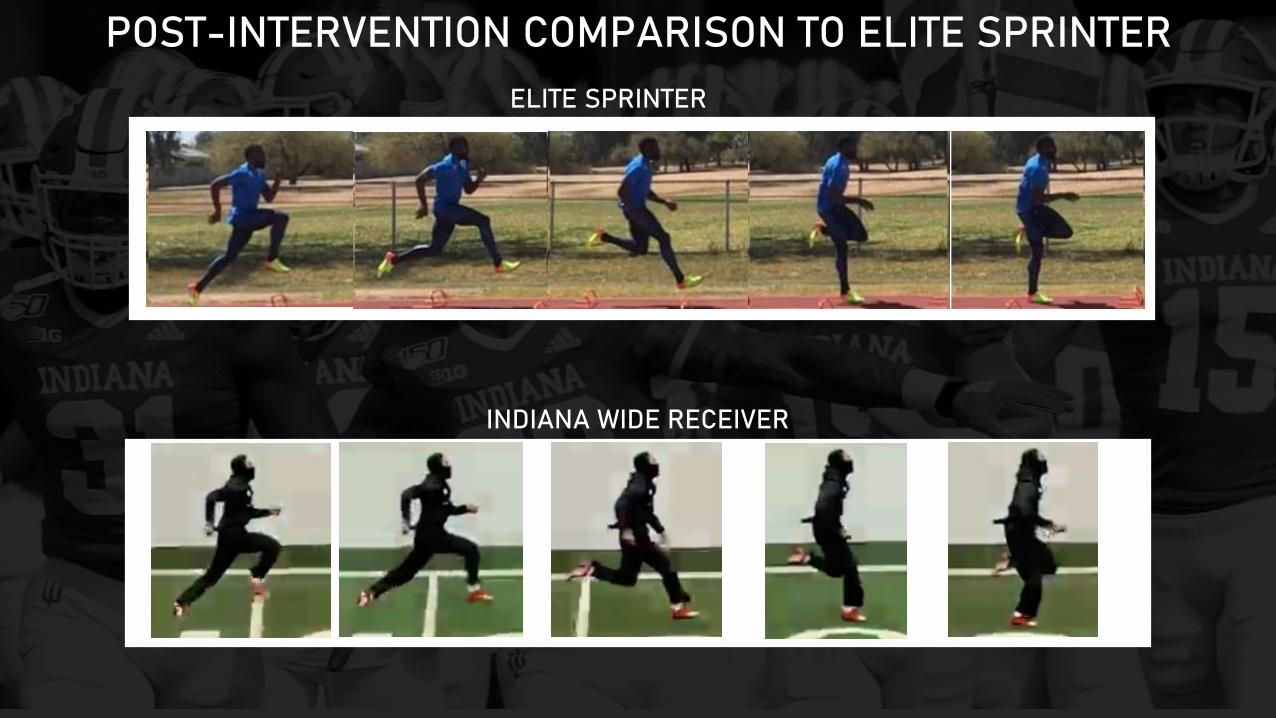
ELITE SPRINTER
INDIANA WIDE RECEIVER
POST-INTERVENTION COMPARISON TO ELITE SPRINTER

USING FORCE-VELOCITY PROFILES FOR RETURN-TO-PLAY
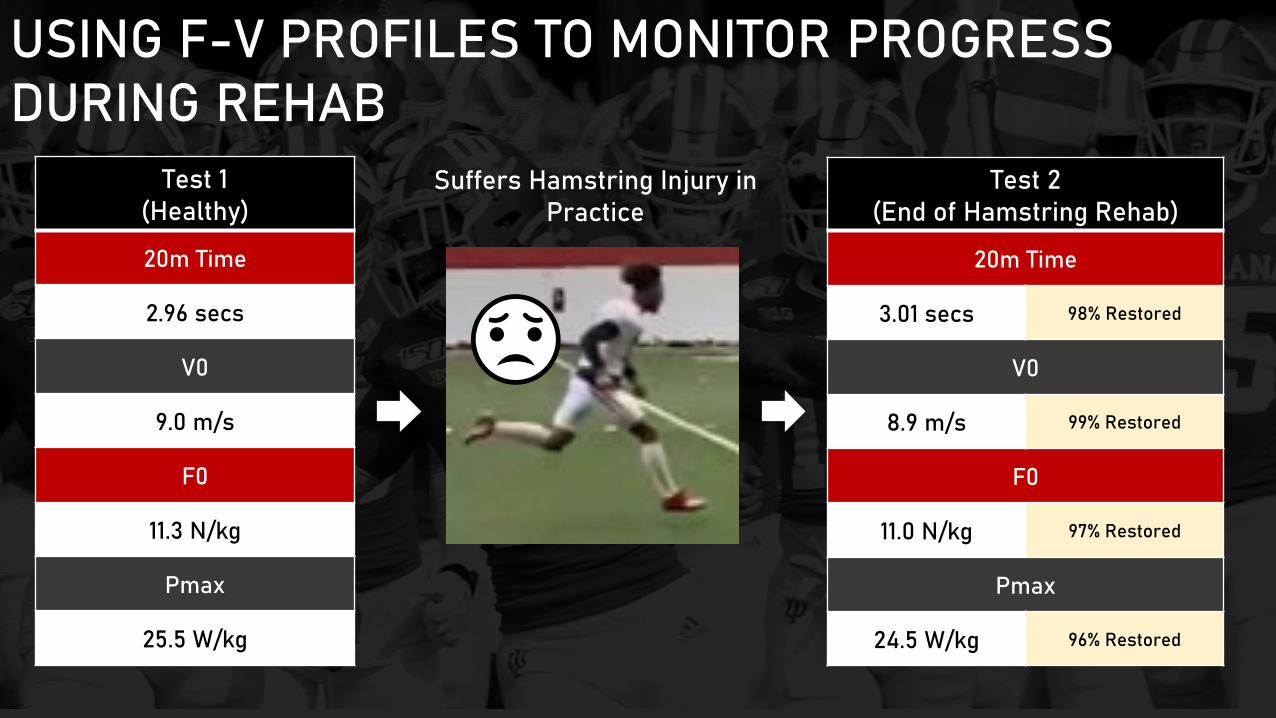
USING F-V PROFILES TO MONITOR PROGRESS DURING REHAB
Test 1(Healthy)
20m Time
2.96 secs
V0
9.0 m/s
F0
11.3 N/kg
Pmax
25.5 W/kg
Test 2(End of Hamstring Rehab)
20m Time
3.01 secs 98% Restored
V0
8.9 m/s 99% Restored
F0
11.0 N/kg 97% Restored
Pmax
24.5 W/kg 96% Restored
Suffers Hamstring Injury in Practice

1080 SPRINT SPECIALIZED LOADING FOR RETURN-TO-PLAY
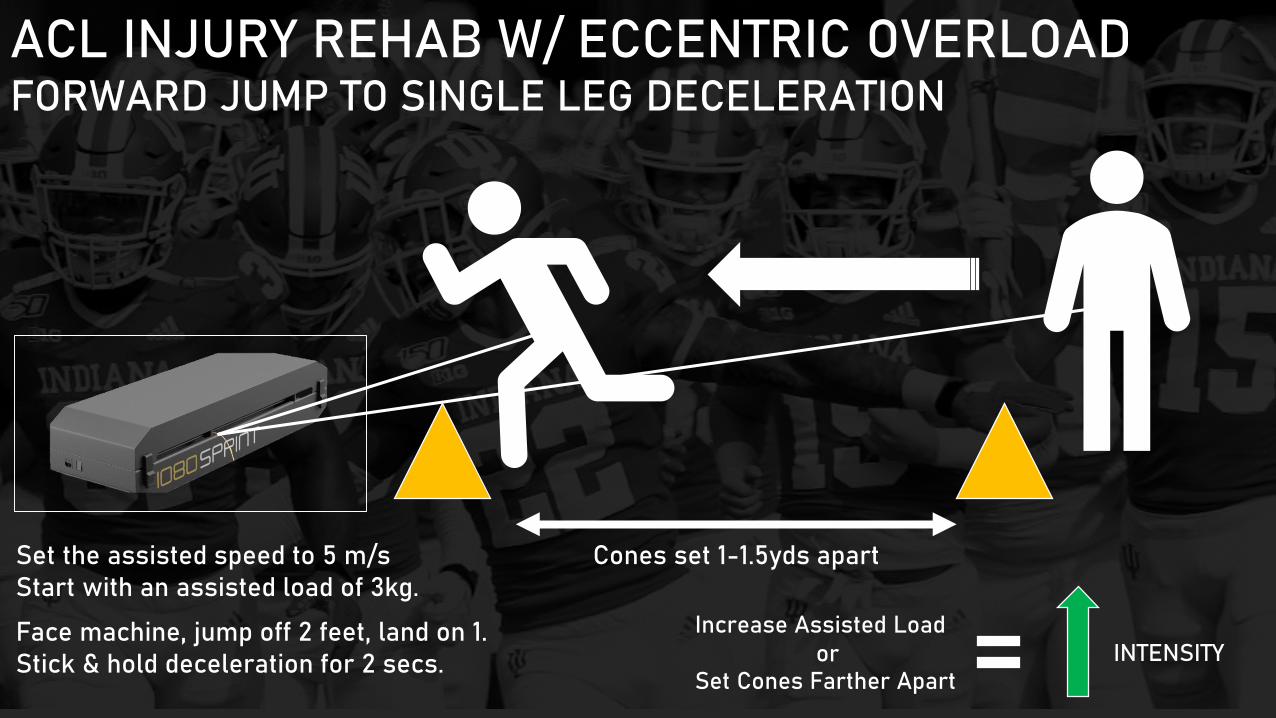
ACL INJURY REHAB W/ ECCENTRIC OVERLOADFORWARD JUMP TO SINGLE LEG DECELERATION
Cones set 1-1.5yds apartSet the assisted speed to 5 m/sStart with an assisted load of 3kg.
Face machine, jump off 2 feet, land on 1.Stick & hold deceleration for 2 secs.
Increase Assisted Loador
Set Cones Farther ApartINTENSITY
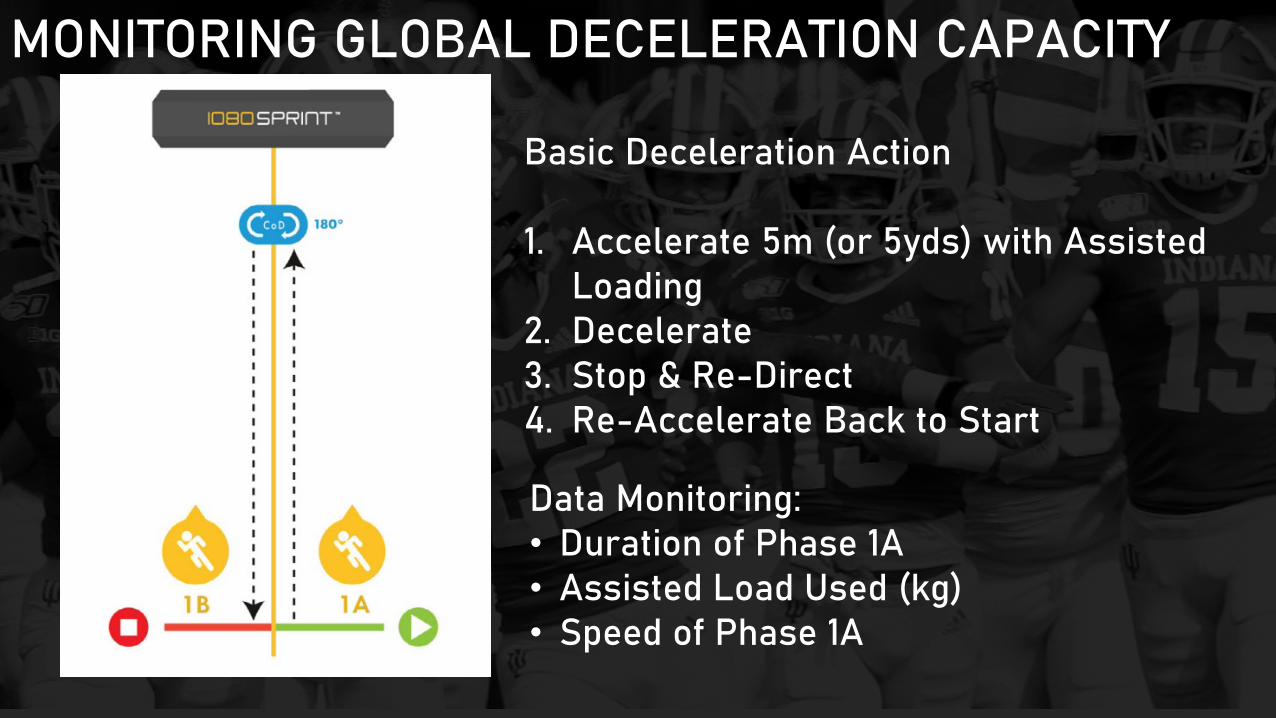
MONITORING GLOBAL DECELERATION CAPACITY
Basic Deceleration Action
1. Accelerate 5m (or 5yds) with Assisted Loading
2. Decelerate3. Stop & Re-Direct4. Re-Accelerate Back to Start
Data Monitoring:• Duration of Phase 1A• Assisted Load Used (kg)• Speed of Phase 1A
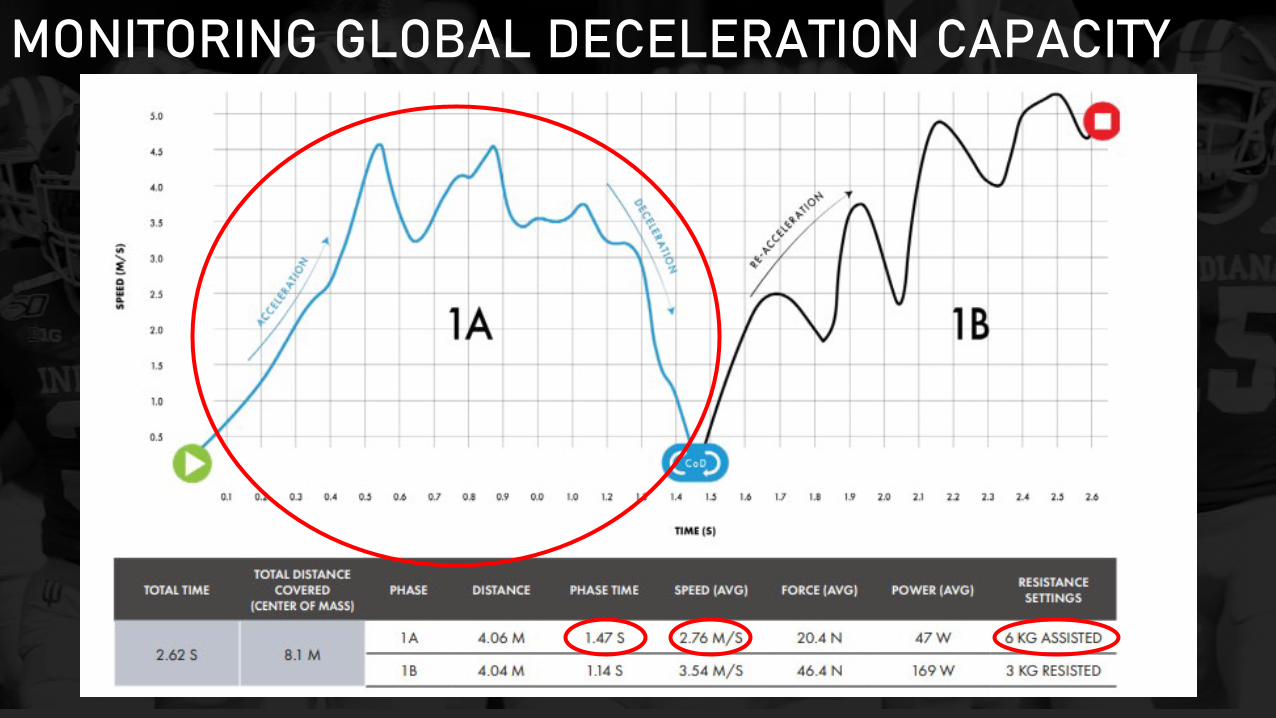
MONITORING GLOBAL DECELERATION CAPACITY

THANK YOU!
@IUCoachJosse


![NX Motion Simulator[1]](https://img.pdfslide.org/doc/110x75/55cf948f550346f57ba2cb28/nx-motion-simulator1.jpg)