Embed Size (px)
Citation preview
Spheronization Process - Particle Kinematics
and Pellet Formation Mechanisms
Inaugural-Dissertation
zur Erlangung des Doktorgrades
der Mathematisch-Naturwissenschaftlichen Fakultät
der Heinrich-Heine-Universität Düsseldorf
vorgelegt von
Martin David Köster
aus Mönchengladbach
Düsseldorf, Juni 2012
aus dem Institut für pharmazeutische Technologie und Biopharmazie
der Heinrich-Heine-Universität Düsseldorf
Gedruckt mit der Genemigung der
Mathematisch-Naturwissenschaftlichen Fakultät der
Heinrich-Heine-Universität Düsseldorf
Referent: Prof. Dr. Peter Kleinebudde
Koreferent: Prof. Dr. Jörg Breitkreutz
Tag der mündlichen Prüfung: 04. Juli 2012
Table of Contents
I
Table of Contents
Table of Contents ................................................................................................................................... I
List of Abbreviations ........................................................................................................................ VII
1 CHAPTER 1 - INTRODUCTION ....................................................................... - 1 -
1.1 Multiparticular Dosage Forms ........................................................................... - 1 -
1.2 Pellets ..................................................................................................................... - 2 -
1.3 Pellet Manufacturing ........................................................................................... - 2 -
1.4 Extrusion/Spheronization ................................................................................... - 3 -
1.4.1 Process ................................................................................................................... - 3 -
1.4.2 Pelletization Aids ................................................................................................. - 3 -
1.4.3 Mechanisms .......................................................................................................... - 5 -
1.5 Particle Image Velocimetry................................................................................. - 7 -
1.6 Simulation ............................................................................................................. - 9 -
1.6.1 Background ........................................................................................................... - 9 -
1.6.2 Contact Models................................................................................................... - 10 -
1.6.3 DEM Applications ............................................................................................. - 11 -
1.6.4 LIGGGHTS .......................................................................................................... - 12 -
1.7 Aims of the Thesis .............................................................................................. - 13 -
1.8 Outline of the Thesis .......................................................................................... - 14 -
1.9 References ........................................................................................................... - 16 -
2 CHAPTER 2 - New insights into the pelletization mechanism by
extrusion/spheronization .................................................................................. - 22 -
2.1 Pretext .................................................................................................................. - 22 -
2.2 Abstract ............................................................................................................... - 23 -
2.3 Introduction ........................................................................................................ - 24 -
2.4 Materials .............................................................................................................. - 25 -
II
2.5 Methods ...............................................................................................................- 25 -
2.5.1 Experimental plan ..............................................................................................- 25 -
2.5.2 Powder Blending ................................................................................................- 25 -
2.5.3 Extrusion..............................................................................................................- 26 -
2.5.4 Spheronization ....................................................................................................- 26 -
2.5.5 Imaging ................................................................................................................- 26 -
2.6 Results and Discussion ......................................................................................- 27 -
2.6.1 Concept of Mass Transfer in Spheronization .................................................- 27 -
2.6.2 Mechanism of Mass Transfer ............................................................................- 28 -
2.6.3 Water content and Mass Transfer ....................................................................- 29 -
2.7 Conclusion ...........................................................................................................- 30 -
2.8 References ............................................................................................................- 30 -
3 CHAPTER 3 - Quantification of Mass Transfer during Spheronization.....- 32 -
3.1 Pretext ..................................................................................................................- 32 -
3.2 Abstract ................................................................................................................- 33 -
3.3 Introduction ........................................................................................................- 34 -
3.4 Materials and Methods ......................................................................................- 35 -
3.4.1 Materials ..............................................................................................................- 35 -
3.4.2 Methods ...............................................................................................................- 36 -
3.5 Results and Discussion ......................................................................................- 37 -
3.5.1 Pellet Shape and Size .........................................................................................- 38 -
3.5.2 Mass Transfer ......................................................................................................- 39 -
3.5.3 Mass Transfer Fraction (MTF) ..........................................................................- 40 -
3.6 Conclusion ...........................................................................................................- 42 -
3.7 Acknowledgements ...........................................................................................- 42 -
3.8 References ............................................................................................................- 42 -
Table of Contents
III
4 CHAPTER 4 - Systematic Evaluations Regarding Interparticular Mass
Transfer in Spheronization ............................................................................... - 45 -
4.1 Pretext .................................................................................................................. - 45 -
4.2 Abstract ............................................................................................................... - 46 -
4.3 Introduction ........................................................................................................ - 47 -
4.4 Materials and Methods ..................................................................................... - 48 -
4.4.1 Materials .............................................................................................................. - 48 -
4.4.2 Experimental Plan .............................................................................................. - 48 -
4.4.3 Pellet Manufacturing ......................................................................................... - 50 -
4.4.4 Analytics .............................................................................................................. - 51 -
4.5 Results and Discussion ...................................................................................... - 53 -
4.5.1 Preliminary Studies ........................................................................................... - 53 -
4.5.2 Influence of Storage Time ................................................................................. - 54 -
4.5.3 Mass Transfer over Time .................................................................................. - 55 -
4.6 Conclusion .......................................................................................................... - 61 -
4.7 References ........................................................................................................... - 61 -
5 CHAPTER 5 - Analysis of Particle Kinematics in Spheronisation via Particle
Image Velocimetry ............................................................................................. - 64 -
5.1 Pretext .................................................................................................................. - 64 -
5.2 Abstract ............................................................................................................... - 65 -
5.3 Introduction ........................................................................................................ - 66 -
5.4 Materials .............................................................................................................. - 68 -
5.5 Methods ............................................................................................................... - 68 -
5.5.1 Extrusion/Spheronization ................................................................................. - 68 -
5.5.2 High Speed Imaging .......................................................................................... - 68 -
5.5.3 Particle Image Velocimetry Analysis .............................................................. - 69 -
5.5.4 PIV Validation .................................................................................................... - 69 -
IV
5.5.5 Design of experiments .......................................................................................- 70 -
5.6 Results and Discussion ......................................................................................- 72 -
5.6.1 Calibration ...........................................................................................................- 72 -
5.6.2 Visualization of the Velocity Distribution ......................................................- 73 -
5.6.3 Evaluation of the Spheronization Parameters ................................................- 75 -
5.7 Conclusion ...........................................................................................................- 81 -
5.8 Acknowledgements ...........................................................................................- 81 -
5.9 References ............................................................................................................- 81 -
6 CHAPTER 6 - Attrition, Agglomeration, and Stagnation in the
Spheronization of Pharmaceutical Materials .................................................- 83 -
6.1 Pretext ..................................................................................................................- 83 -
6.2 Abstract ................................................................................................................- 84 -
6.3 Introduction ........................................................................................................- 85 -
6.3.1 Background .........................................................................................................- 85 -
6.3.2 Objectives ............................................................................................................- 86 -
6.4 Materials and Methods ......................................................................................- 86 -
6.4.1 Exerimental Setup (PIV) ....................................................................................- 86 -
6.4.2 Numerical Setup .................................................................................................- 87 -
6.4.3 Particle Properties ..............................................................................................- 88 -
6.5 Results and Discussion ......................................................................................- 89 -
6.6 Summary and Conclusions ...............................................................................- 96 -
6.7 Acknowledgements ...........................................................................................- 97 -
6.8 References ............................................................................................................- 97 -
7 CONCLUSION AND OUTLOOK .................................................................. - 100 -
7.1 Spheronization Mechanisms ........................................................................... - 100 -
7.2 Particle Kinematics ........................................................................................... - 101 -
7.3 DEM Simulation ............................................................................................... - 102 -
Table of Contents
V
7.4 Summary ........................................................................................................... - 103 -
7.5 Zusammenfassung ........................................................................................... - 104 -
8 LIST OF PUBLISHED ORIGINAL PUBLICATIONS .................................. - 105 -
9 CONTRIBUTIONS TO INTERNATIONAL CONFERENCES .................. - 106 -
9.1 Poster Presentations ......................................................................................... - 106 -
9.2 Talks ................................................................................................................... - 106 -
10 ERKLÄRUNG ................................................................................................... - 107 -
11 DANKSAGUNG ............................................................................................... - 108 -

VI
List of Abbreviations
VII
List of Abbreviations
Abbreviation Name
ACE acetaminophen
API active pharmaceutical ingredient
AR aspect ratio
CAR κ-carrageenan
CFD computational fluid dynamics
DEM discrete element method
DMT Derjaguin-Muller-Toporov model
DoE design of experiment
DUR duration of a spheronizer run
εp porosity
E Young's modulus
ES extrusion / spheronization
FEM finite element method
(H)PIV (high speed) particle image velocimetry
IBU ibuprofen
ICH International Conference on Harmonisation of Technical
Requirements for Registration of Pharmaceuticals for
Human Use
JKR Johnson-Kendall-Roberts model
LAMMPS large-scale atomic molecular massively parallel simulator
LDV laser doppler velocimetry
LED light emitting diode
LIGGGHTS LAMMPS improved for general granular and granular
heat transfer simulations
VIII
LOA loading of the spheronizer
LoQ limit of quantification
MCC (I and II) microcrystalline cellulose (type 1 and type 2)
MD molecular dynamics
MTF mass transfer fraction
P-value lack of fit parameter
PEPT positron emitting particle tracking
Q² coefficient of prediction
R coefficient of determination
RP repeatability
SPE rotation speed of the spheronizer
WAT water content
USP united states pharmacopeia
ν Poisson's ratio
x25, x50, x75 quartiles
CHAPTER 1 - INTRODUCTION
1 CHAPTER 1 - INTRODUCTION
1.1 Multiparticular Dosage Forms
The dosage form is essential for the compliance and effect of an active pharmaceutical
ingredient (API). Multiparticular dosage forms consist either out of multiple small particles
or disintegrate fastly into multiple small particles. Whereas the actual number of particles
per dosage is not defined, the maximum size of each particle is defined as lower than 2.0 mm
(Bauer et al., 2006). In clinical studies multi particular dosage forms showed several
important benefits compared to monolithical oral dosage forms. Due to their smaller size,
they are easier to swallow. Especially elder people and children suffer from swallowing
issues, that reduce the compliance and cause distress upon taking monolithical dosage forms
(e.g. tablets) (Breitkreutz and Boos, 2007). Recently a study showed promising results for the
oral application of mini tablets even for children (Spomer et al., 2012, Thomson et al., 2009).
Multiparticular dosage forms show less irritation to the gastro intestinal tract and have a
leveling effect on the intra-individual as well as inter-individual variation of the plasma
concentration of the API. The risk of dose dumping, due to a defect in a functional coating
layer is reduced as well (Bechgaard and Nielsen, 1978). Bechgaard explained these effects by
the different behavior of monolithical and multiparticular dosage forms inside the gastro
intestinal tract (1976). Multiple particles have different, separate passage times and thereby
the average passage time shows less variability than of monolithical dosage forms (Follonier
and Doelker, 1992). With multiparticular dosage forms it is possible to combine APIs with
pysico-chemical interactions or particles with different release kinetics in one dosage form
(Ishida et al., 2008). The combination of different APIs is of high importance for the treatment
of elderly patients, because it can reduce the number of different takings per day. The
possibility of an individually changeable dose might offer new chances for approaches of
personal medicine regimes (Wening and Breitkreutz, 2011).
Drawbacks of multiparticular dosage forms are their considerable higher manufacturing
costs and the more complex process steps compared to monolithical dosage forms. In
addition they show a higher specific surface, that must be considered in relation to stability
and their coating performance (Kleinebudde, 1996). The amount of coating material has to be
increased compared to monolithical dosage forms, what leads to higher manufacturing costs
and times.
- 2 -
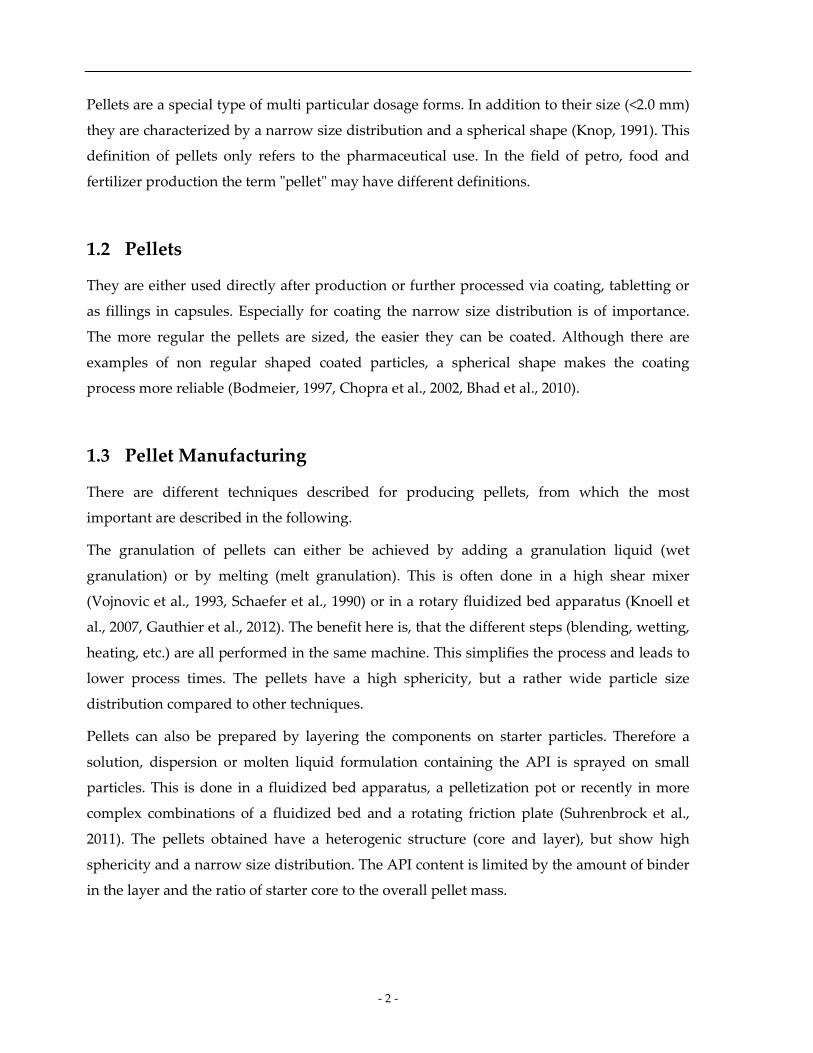
Pellets are a special type of multi particular dosage forms. In addition to their size (<2.0 mm)
they are characterized by a narrow size distribution and a spherical shape (Knop, 1991). This
definition of pellets only refers to the pharmaceutical use. In the field of petro, food and
fertilizer production the term "pellet" may have different definitions.
1.2 Pellets
They are either used directly after production or further processed via coating, tabletting or
as fillings in capsules. Especially for coating the narrow size distribution is of importance.
The more regular the pellets are sized, the easier they can be coated. Although there are
examples of non regular shaped coated particles, a spherical shape makes the coating
process more reliable (Bodmeier, 1997, Chopra et al., 2002, Bhad et al., 2010).
1.3 Pellet Manufacturing
There are different techniques described for producing pellets, from which the most
important are described in the following.
The granulation of pellets can either be achieved by adding a granulation liquid (wet
granulation) or by melting (melt granulation). This is often done in a high shear mixer
(Vojnovic et al., 1993, Schaefer et al., 1990) or in a rotary fluidized bed apparatus (Knoell et
al., 2007, Gauthier et al., 2012). The benefit here is, that the different steps (blending, wetting,
heating, etc.) are all performed in the same machine. This simplifies the process and leads to
lower process times. The pellets have a high sphericity, but a rather wide particle size
distribution compared to other techniques.
Pellets can also be prepared by layering the components on starter particles. Therefore a
solution, dispersion or molten liquid formulation containing the API is sprayed on small
particles. This is done in a fluidized bed apparatus, a pelletization pot or recently in more
complex combinations of a fluidized bed and a rotating friction plate (Suhrenbrock et al.,
2011). The pellets obtained have a heterogenic structure (core and layer), but show high
sphericity and a narrow size distribution. The API content is limited by the amount of binder
in the layer and the ratio of starter core to the overall pellet mass.
CHAPTER 1 - INTRODUCTION
- 3 -
1.4 Extrusion/Spheronization
1.4.1 Process
Extrusion/spheronization (ES) is another common technique to manufacture pellets. In ES a
plastically deformable mass is pressed through a die into spaghetti like, oblong cylindrical
particles. The mass can either be made deformable by adding a granulation liquid (Erkoboni,
2003) or by heating it up (Reitz and Kleinebudde, 2007), depending on the used excipient.
These extrudates are then transferred into the spheronizer and rounded to spherical particles
by the energy of a rotating friction plate at the bottom of the spheronizer.
Several machine types can be chosen for forming the extrudates. Some of them combine the
wetting and extrusion step (twin screw extruders) while others (ring die press, piston
extruder, single screw extruder) extrude a pre-wetted mass (Basit et al., 1999, Flament et al.,
2004, Ghanam and Kleinebudde, 2011). All have in common, that a deformable mass is
pressed through a die with one up to several thousand cylindrical holes. The size, number
and orientation of the holes varies between the extruder types. In the pharmaceutical field
the twin screw extruder is of high interest, because it combines mixing, wetting and
extruding the material in one machine.
After extrusion the cylindrical particles are transferred into the spheronizer. A rotating plate
on the bottom of the spheronizer transfers energy into the particle bed and thereby helps
forming spherical particles. The wet mass must have several distinguished characteristics for
resulting in pellets with the desired product qualities. For the extrusion step the mass has to
be plastically deformable to be squeezed into the cylindrical shape, but has to be strong
enough to keep this shape long enough to be transferred into the spheronizer (Erkoboni,
2003). In the spheronizer the long, cylindrical extrudates have to be brittle to break into
smaller particles, but rigid enough to not being destroyed by the rotating plate. They have to
be cohesive to form spherical particles, but must not stick on each other or at surfaces. The
plastic deformation must be in a range of the forces involved during spheronization. All of
the characteristics above leave only few suitable spheronization excipients.
1.4.2 Pelletization Aids
In addition to the requirements to the pelletization aids given by the needed characteristics
of the wet mass (1.4.1) the pelletization aids have to meet further requirements (Dukić-Ott et
al., 2009). The maximal API content in the dosage should be high to reduce the amount that
- 4 -
has to be swallowed. Therefore the possible drug load of the pellets should be as high as
possible, at least 80 % are favorable. The pellet shape should be spherical, the surface
smooth, the abrasion low and the yield strength high. In addition to these mechanical
properties, the dissolution profile must be reproducible and the spheronization aid should
not show interactions with possible APIs. Water as granulation liquid is preferred, because
in contrast to organic solvents it has no toxicity and is non flammable. To achieve a robust
and controllable production process the span of formulation parameters resulting in pellets
should be as high as possible.
Microcrystalline cellulose (MCC) was the first substance able to form these pellets of suitable
characteristics and high API contents in the formulation (Reynolds, 1970, Conine and
Hadley, 1970). Pellets made with the incorporation of MCC have a low tendency to abrasion
and a high yield strength (Erkoboni and Parikh, 1997). Even though these pellets are still the
gold standard (Gupta and Khan, 2011), they have some drawbacks as well. It is known for
some API to be absorbed at the MCC (Rivera and Ghodbane, 1994), what might interfere
with their absorption in the body. Another problem of MCC based pellets is their lack of
disintegration. Even for pellets with a high drug load, the MCC acts as a matrix and the
pellet structure stays intact after the API is dissolved (O'Connor et al., 1984, Kleinebudde,
1994). To overcome this issue several disintegrants were added to MCC formulations
(Schröder and Kleinebudde, 1995). None of these lead to the desired fast disintegrating
pellets. Therefore further spheronization aids with different characteristics are of high
interest.
Many substances were screened in order to find more excipients for the spheronization
process during the last decades. The results for the most relevant ones are given in a review
paper by (Dukić-Ott et al., 2009).
κ-Carrageenan is a polysaccharide that is extracted from red seaweeds. It is commonly used
as gel forming agent in the pharmaceutical as well as food industry (Trono and Lluisma,
1992). Similar to MCC an API content of 95 % can be realized in the resulting pellets. The
pellets have adequate characteristics with respect to size and shape, but show some
differences in contrast to MCC based pellets: The porosity is higher because the κ-
carrageenan does not shrink during drying. In water the pellets dissolve within minutes and
show a faster drug release than MCC pellets. The water content and the span of possible
water contents resulting in pellets with adequate size and shape is higher than for MCC
(Bornhöft et al., 2005). Thommes (2006) explains this by the different chemical structure of
CHAPTER 1 - INTRODUCTION
- 5 -
MCC and κ-carrageenan. Whereas MCC is non water soluble and forms a crumbling paste
during extrusion, the κ-carrageenan acts as a gel builder and has an increased water binding
capacity. The pellets tensile strength is lower compared to MCC, but still sufficient for
further handling. One challenge of κ-carrageenan is the ionic structure, which can cause
interactions with the API or other components of the formulations. The high costs for κ-
carrageenan are a possible drawback for industrial scale production of pellets.
Recently a different polymorph of MCC, called MCC Type 2, was characterized as
spheronization aid by Krueger (2010). It was known as disintegrant in tabletting (Kumar et
al., 2002), but just recently got into focus for the use in ES because of its disintegration
behavior in compacts. Even though microcrystalline cellulose type 2 (MCCII) can be
characterized as "microcrystalline cellulose" according to the USP, it has different properties
after ES than MCCI. Most important, pellets made of MCCII via ES disintegrate within
seconds after contact with water (Krueger et al., 2010). A drawback of the MCCII is the
higher sensitivity of the spheronization process to changes of the water content. Whether the
new research about MCCII leads to innovative market products cannot be said at the time
given, but due to the interesting spheronization behavior it is nevertheless included in this
work.
Even though the results for other excipients like starch (O'Connor et al., 1984), chitosan
(Agrawal et al., 2004), pectinic acid (Tho et al., 2002) and HPMC (Chatlapalli and Rohera,
1998) were promising, these substances are of minor impact in the field of pellet production
via ES in the pharmaceutical industry.
1.4.3 Mechanisms
The mechanism of spheronization is discussed in literature since the first paper published by
Reynolds (1970). He described a "rolling motion" of the extrudates induced by the friction
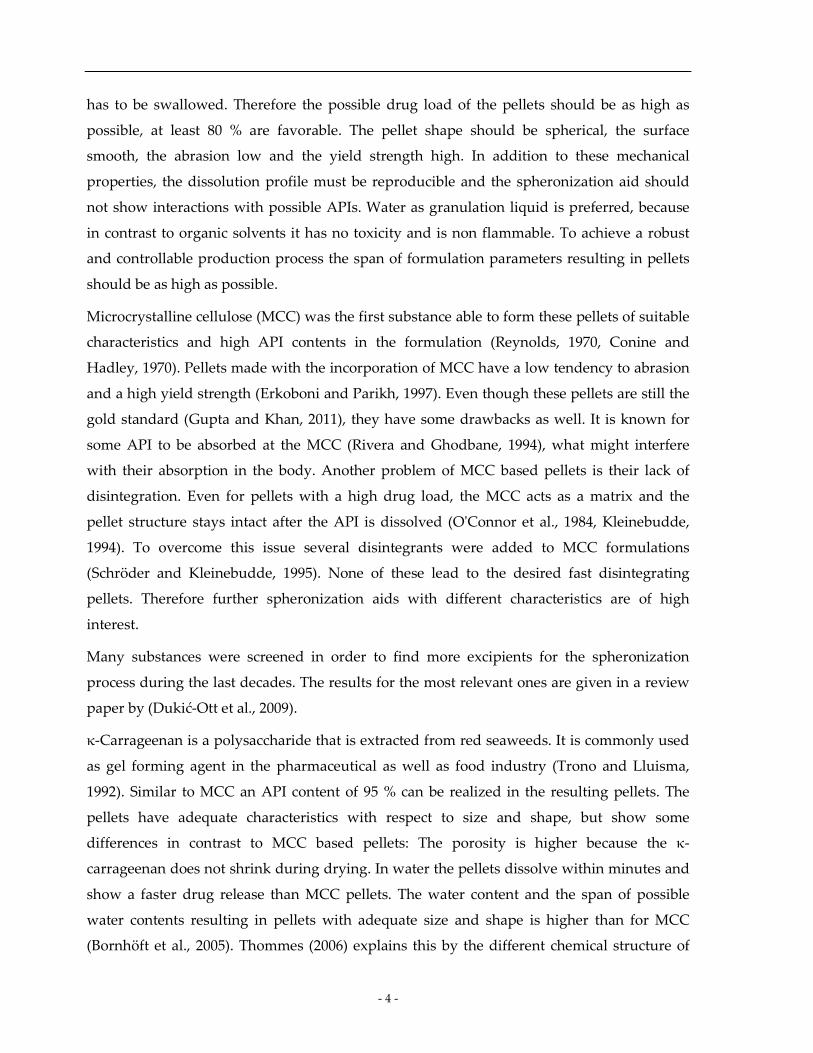
plate, that leads to round particles. In 1985 Rowe described 5 steps of deformation (Rowe,
1985), that transform the cylindrical extrudate into a spherical pellet (figure 1a). At the
beginning the long, cylindrical extrudates break into oblong pieces (I). The friction plate
induces impacts of these pieces against the spheronizer wall and against other pieces. These
impacts result in a deformation of the pieces, that deform the exposed parts of the pieces the
most; the edges get rounded (II). As this process continues the piece gets deformed further
and starts to form first a dumb-bell structure (III) and then an ellipsoid pellet (IV). In the last
step this ellipsoid gets deformed into a spherical particle (V) and the spheronization is
- 6 -
complete. This mechanism is solely based on the initial breakage of the long extrudates and a
deformation of the resulting pieces and does not include the building of a fine fraction
occurring during spheronization.
Figure 1: Spheronization mechanism according to Rowe (1985, upper row) and Baert (1993, lower row)
In 1993 Baert proposed another possible mechanism (Baert et al., 1993) that includes a second
breakage step (IV). The initial breakage of the extrudates is described similar to Rowe, but
the deformation differs after the dumb-bell stage (III). In Baert's mechanism the dumb-bell is
twisted and breaks in two in the center at its weakest point (IV) and the two parts are
rounded into spheres afterwards.
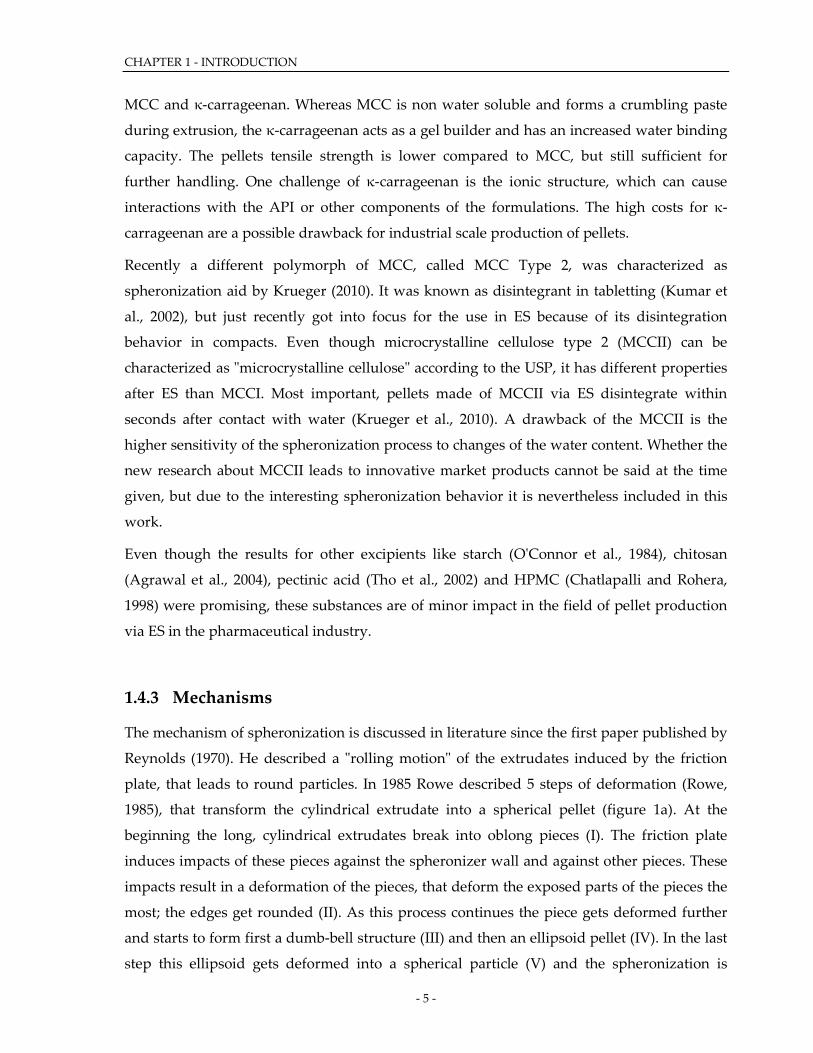
Recently, Liew (2007) compared the pellet formation in a rotary processor to the
spheronization step. She describes a third mechanism, in which the agglomeration of fine
particles is considered. The extrudates break into particles of a length to diameter ratio of 1
(i). In addition to the deformation, small particles from the previous breakage step get
attached to the pellets surface and form a more spherical pellet (ii - iv).
Figure 2: Spheronization mechanism according to Liew [2007]
CHAPTER 1 - INTRODUCTION
- 7 -
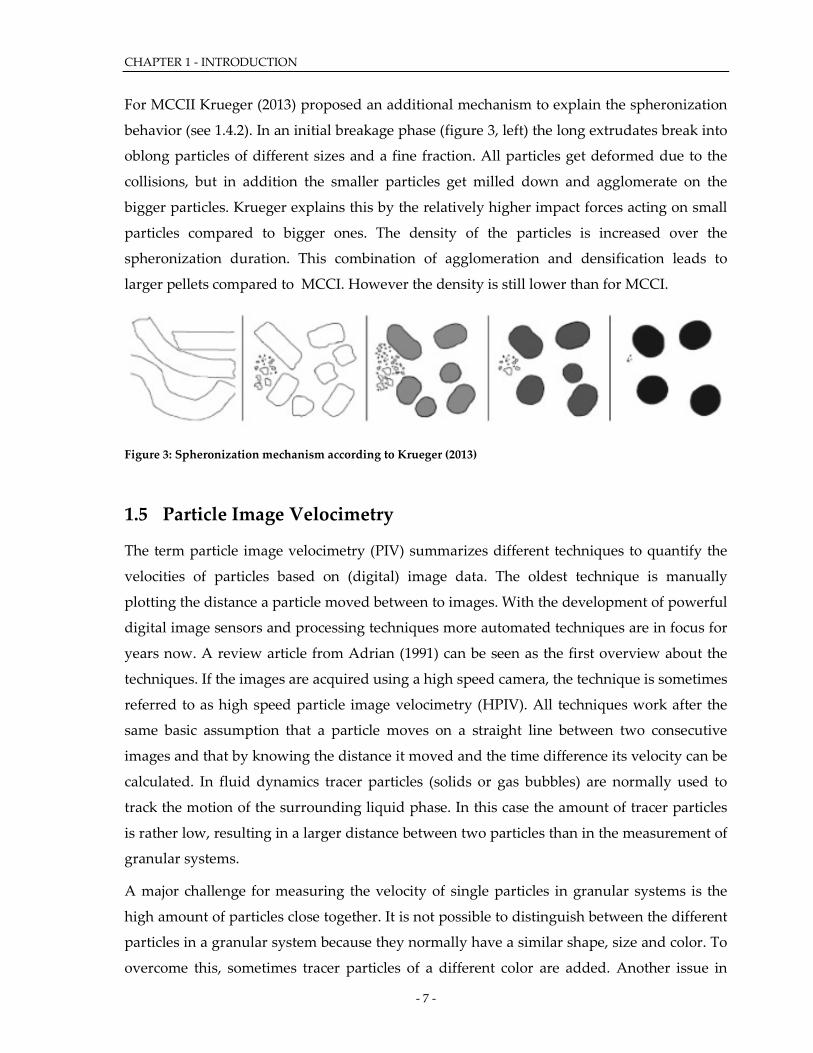
For MCCII Krueger (2013) proposed an additional mechanism to explain the spheronization
behavior (see 1.4.2). In an initial breakage phase (figure 3, left) the long extrudates break into
oblong particles of different sizes and a fine fraction. All particles get deformed due to the
collisions, but in addition the smaller particles get milled down and agglomerate on the
bigger particles. Krueger explains this by the relatively higher impact forces acting on small
particles compared to bigger ones. The density of the particles is increased over the
spheronization duration. This combination of agglomeration and densification leads to
larger pellets compared to MCCI. However the density is still lower than for MCCI.
Figure 3: Spheronization mechanism according to Krueger (2013)
1.5 Particle Image Velocimetry
The term particle image velocimetry (PIV) summarizes different techniques to quantify the
velocities of particles based on (digital) image data. The oldest technique is manually
plotting the distance a particle moved between to images. With the development of powerful
digital image sensors and processing techniques more automated techniques are in focus for
years now. A review article from Adrian (1991) can be seen as the first overview about the
techniques. If the images are acquired using a high speed camera, the technique is sometimes
referred to as high speed particle image velocimetry (HPIV). All techniques work after the
same basic assumption that a particle moves on a straight line between two consecutive
images and that by knowing the distance it moved and the time difference its velocity can be
calculated. In fluid dynamics tracer particles (solids or gas bubbles) are normally used to
track the motion of the surrounding liquid phase. In this case the amount of tracer particles
is rather low, resulting in a larger distance between two particles than in the measurement of
granular systems.
A major challenge for measuring the velocity of single particles in granular systems is the
high amount of particles close together. It is not possible to distinguish between the different
particles in a granular system because they normally have a similar shape, size and color. To
overcome this, sometimes tracer particles of a different color are added. Another issue in
- 8 -
granular systems is the visibility of the particles. If the particle number per volume increases,
the maximum deepness visible decreases up to a system where only the surface of the
particle bed is visible. In this case the tracer particles can move to more inner regions of the
bed and make it impossible to track them.
Keane (1992) proposed another technique for these cases. Instead of tracking single particles
the velocity of an area of particles is calculated with a cross correlation approach. The images
are separated in different quadratic areas of interest. Then the quality of the overlap of these
areas of interest with the image from the next time step is calculated for each pixel of the
image. To reduce the calculation time a maximum movement range can be included in the
calculations. The distance between the original center of the area of interest and the best
possible overlap is used to calculate the velocity at this point. This approach is further
improved by rotating the area of interest around its center to increase the quality of overlap.
For PIV several different illumination techniques are used. The system can be illuminated by
a plane of laser light. This generates cuts through the particle stream and thereby only
measures the particles on this plane. On the one hand this can be an advantage, because it is
possible to measure the 3D flow inside the zone of interest but on the other hand there are
challenges connected. The particle stream must have an optical density, that allows the laser
to illuminate different depths into the particle bed. If too many particles are present, the laser
cannot reach through the particle stream. In this case a light source is used to illuminate the
surface of the particle stream. A drawback in this case is the missing information about
particle movement in the depth of the stream. The light source can be of a steady type or can
be pulsed. A pulsed light source has the benefit that the luminous intensity can be higher
compared to steady illumination, because issues in cooling the light source are avoided. A
benefit of an increased illumination intensity is the possibility to decrease the shutter time,
resulting in sharper images. For the spheronization process a combination of a pulsed LED
light source and the cross correlation approach seems reasonable.
PIV has to be distinguished from another technique for the same purpose. Laser Doppler
velocimetry (LDV) uses the frequency shift of the Doppler effect to analyze the velocity of
the surface hit by a laser. Another possibility to track the movement of particles is the
positron emission particle tracking (PEPT) (Stewart et al., 2001). A positron emitting element
(i.e. 22Na or 18F) is encapsuled in tracer particles. The position of the particle at the moment
of a positron emitting event can be located with a Birmingham positron camera (Parker et al.,
1993).
CHAPTER 1 - INTRODUCTION
- 9 -
1.6 Simulation
1.6.1 Background
Numerical simulations of processes in the field of engineering science have developed a
higher interest, due to the increased data calculation capacities of computers in the last
decades. In general a computer simulation is a computer program capable of finding an
analytical or numerical solution to a problem and by this being able to predict the behavior
of the system under varied starting conditions (Hartmann, 2009). Numerical simulations can
be divided into continuous and discrete simulations. In the case of the continuous finite
element simulations (FEM) the system is transferred in a grid (Weaver and Gere, 1990), often
consiting out of triangles (2D) or tetraeders (3D). The size of the triangles depends on the
desired resolution and can be made infinitely small. This method is commonly used for the
simulation of solid structures. For granular systems the discrete element method (DEM) is
more common (Zhou et al., 1999, Ball and Melrose, 1997, Rajamani et al., 2000, Walton and
Braun, 1985): Here, the particles are represented by solid bodies and their interactions with
each other are calculated after previously defined time steps according to Newton's laws of
motion. The particles are treated as indestructible and are usually in the micrometer scale or
above. It is closely connected to molecular dynamics (MD), where molecules are simulated
on the atomic level. The main difference between MD and DEM are the considered
interactions between the particles/atoms. In MD coulomb forces, electrostatic attraction,
Pauli repulsion and van-der-Waals-forces are dominant, whereas for DEM the gravitational
force, contact elasticity and friction are of interest (Balbuena and Seminario, 1999). In general
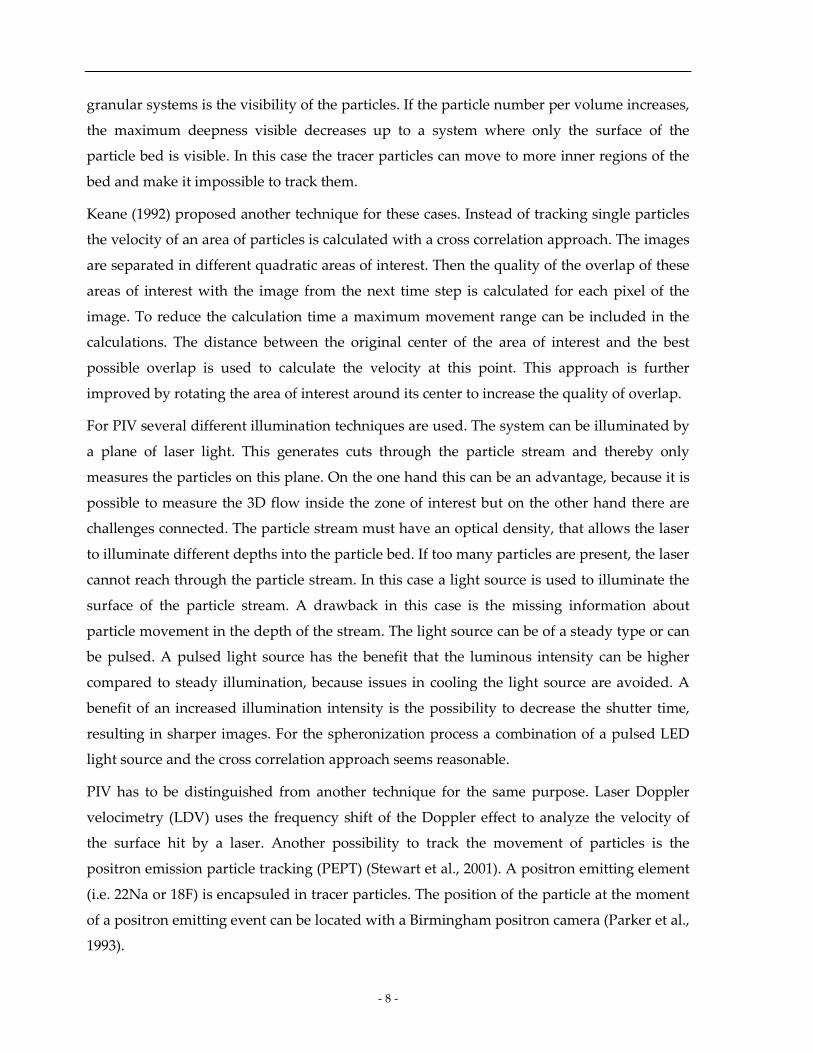
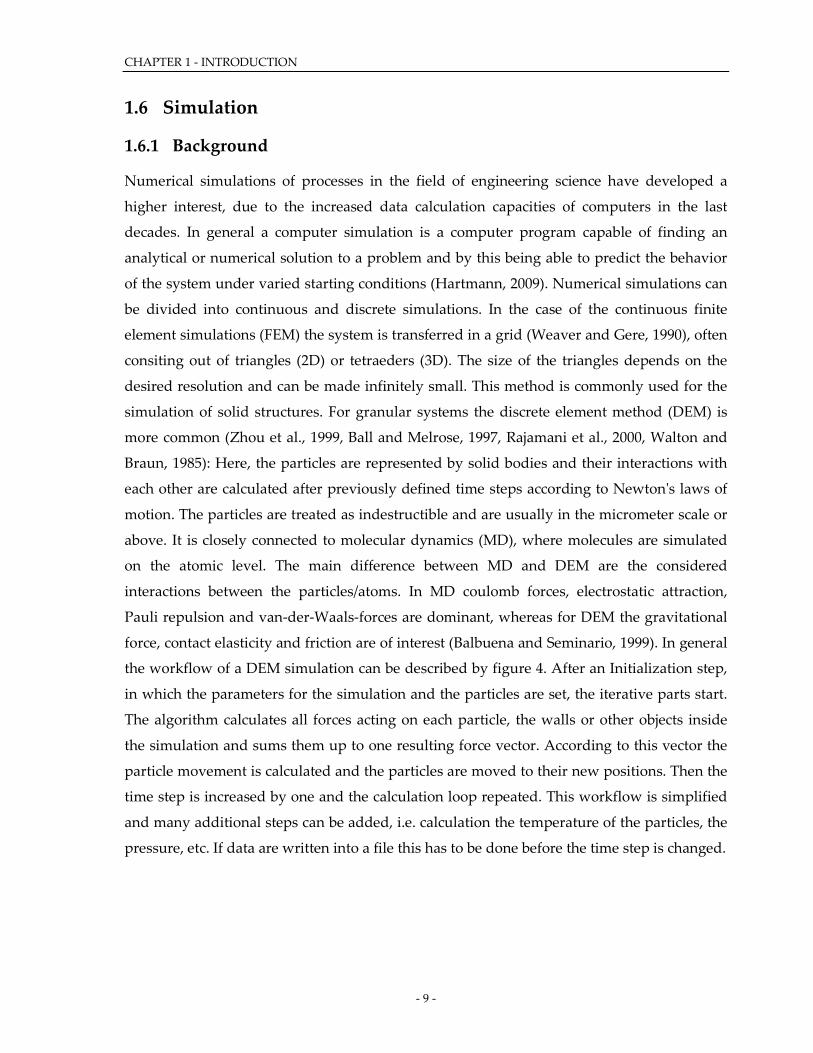
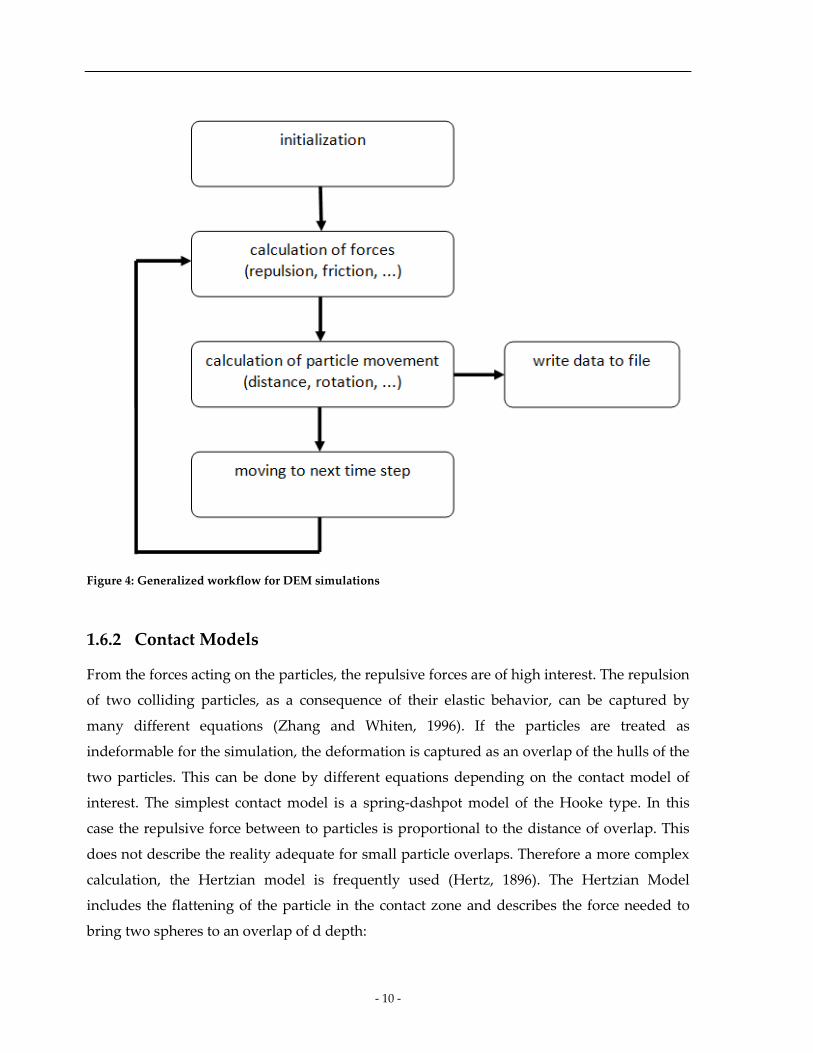
the workflow of a DEM simulation can be described by figure 4. After an Initialization step,
in which the parameters for the simulation and the particles are set, the iterative parts start.
The algorithm calculates all forces acting on each particle, the walls or other objects inside
the simulation and sums them up to one resulting force vector. According to this vector the
particle movement is calculated and the particles are moved to their new positions. Then the
time step is increased by one and the calculation loop repeated. This workflow is simplified
and many additional steps can be added, i.e. calculation the temperature of the particles, the
pressure, etc. If data are written into a file this has to be done before the time step is changed.
- 10 -
Figure 4: Generalized workflow for DEM simulations
1.6.2 Contact Models
From the forces acting on the particles, the repulsive forces are of high interest. The repulsion
of two colliding particles, as a consequence of their elastic behavior, can be captured by
many different equations (Zhang and Whiten, 1996). If the particles are treated as
indeformable for the simulation, the deformation is captured as an overlap of the hulls of the
two particles. This can be done by different equations depending on the contact model of
interest. The simplest contact model is a spring-dashpot model of the Hooke type. In this
case the repulsive force between to particles is proportional to the distance of overlap. This
does not describe the reality adequate for small particle overlaps. Therefore a more complex
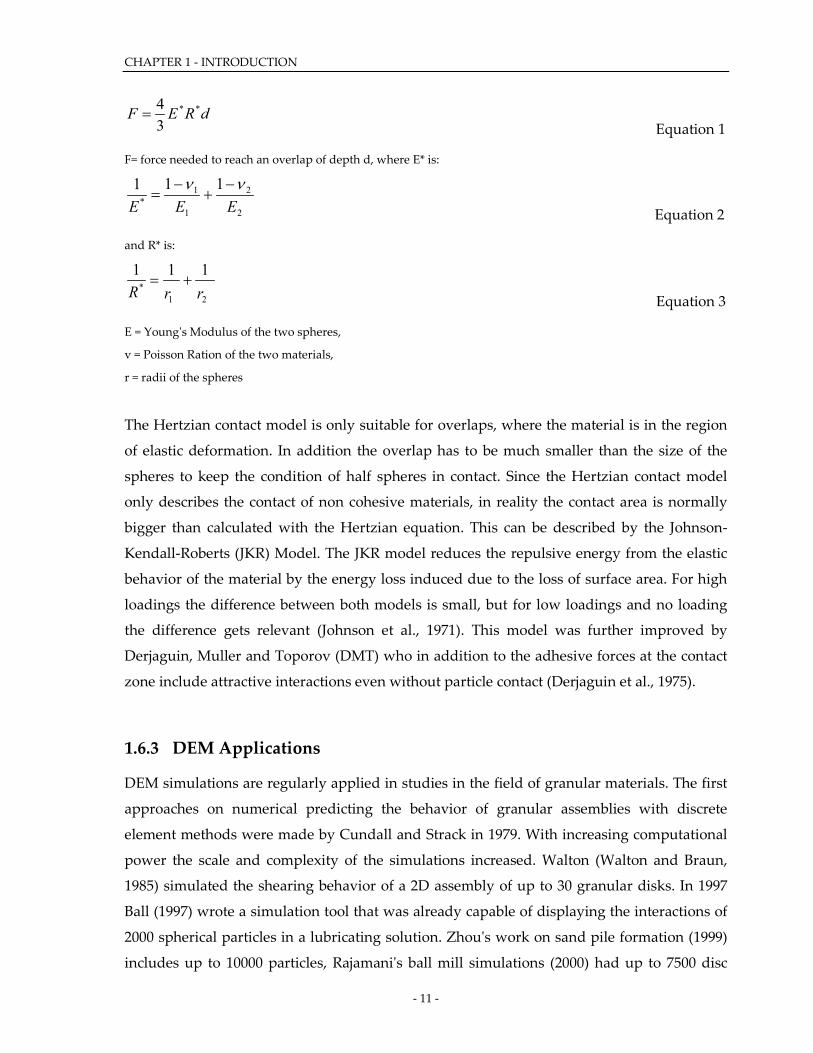
calculation, the Hertzian model is frequently used (Hertz, 1896). The Hertzian Model
includes the flattening of the particle in the contact zone and describes the force needed to
bring two spheres to an overlap of d depth:
CHAPTER 1 - INTRODUCTION
- 11 -
dREF **
34
= Equation 1
F= force needed to reach an overlap of depth d, where E* is:
2
2
1
1*
111EEE
νν −+
−=
Equation 2
and R* is:
21*
111rrR
+= Equation 3
E = Young's Modulus of the two spheres,
v = Poisson Ration of the two materials,
r = radii of the spheres
The Hertzian contact model is only suitable for overlaps, where the material is in the region
of elastic deformation. In addition the overlap has to be much smaller than the size of the
spheres to keep the condition of half spheres in contact. Since the Hertzian contact model
only describes the contact of non cohesive materials, in reality the contact area is normally
bigger than calculated with the Hertzian equation. This can be described by the Johnson-
Kendall-Roberts (JKR) Model. The JKR model reduces the repulsive energy from the elastic
behavior of the material by the energy loss induced due to the loss of surface area. For high
loadings the difference between both models is small, but for low loadings and no loading
the difference gets relevant (Johnson et al., 1971). This model was further improved by
Derjaguin, Muller and Toporov (DMT) who in addition to the adhesive forces at the contact
zone include attractive interactions even without particle contact (Derjaguin et al., 1975).
1.6.3 DEM Applications
DEM simulations are regularly applied in studies in the field of granular materials. The first
approaches on numerical predicting the behavior of granular assemblies with discrete
element methods were made by Cundall and Strack in 1979. With increasing computational
power the scale and complexity of the simulations increased. Walton (Walton and Braun,
1985) simulated the shearing behavior of a 2D assembly of up to 30 granular disks. In 1997
Ball (1997) wrote a simulation tool that was already capable of displaying the interactions of
2000 spherical particles in a lubricating solution. Zhou's work on sand pile formation (1999)
includes up to 10000 particles, Rajamani's ball mill simulations (2000) had up to 7500 disc
- 12 -
shaped particles. Recently the DEM simulation is coupled with fluid dynamic simulations to
calculate both, the movement of the granular particles and the stream of air or liquid
surrounding them. Fries et al. (2011) simulated the probability of an particle to get in contact
with the sprayed liquid during fluidized bed granulation.
1.6.4 LIGGGHTS
There are several software applications on the market for DEM simulations. Most of the
DEM simulations have their origins in the field of molecular dynamics (LAMMPS) and
therefore include algorithms closely connected to the molecular scale. Most of the
programmed applications of use in industrial environments (e.g. EDEM) are proprietary
software and were therefore not considered in this project. An open source solution was
prefered, because of the ability to look into the code and change it according to the preferred
methods.
The focus of the software used in this thesis should nevertheless be in the simulation of
granular materials with a simulated number of particles above 100.000. With respect to the
hardware, which could be used inhouse, the simulation software should be able to run on an
open source operating system (e.g. Ubuntu, Debian,...) and should not depend on
proprietary software for post-processing of the data.
With LIGGGHTS (LAMMPS improved for general granular and granular heat transfer
simulations) a software capable of the matters discussed was found, that included most of
the geneerally used contact models (see 1.6.2). LIGGGHTS (Version 1.50,
nf.nci.org.au/facilities/software/LIGGGHTS/doc/Manual.html) is capable of parallel
processing of the simulation, reducing the calculation time substancially.
The output of the simulations is stored in datafiles with a defined data structure (.vtk), which
can be visualized and analyzed by many open source software packages. In this thesis, the
post production was performed by paraview (kitware inc., Clifton Park, NY , USA).
CHAPTER 1 - INTRODUCTION
- 13 -
1.7 Aims of the Thesis
The aims of this thesis were on the one hand to characterize the spheronization process in
detail and on the other hand to use this knowledge to implement a spheronization
simulation based on DEM models.
More specifically the aims were:
- Investigating the origin of fine fraction during spheronization, its whereabouts during
spheronization and analyzing the effect this fine fraction as on the pellet formation
- Analyzing whether the pellet formation for different pelletisation aids all follow the same
mechanism or if there are quantitative differences
- Investigating the pellet kinematics during spheronization and linking them to relevant
process parameters
- Setting up a DEM simulation of the spheronization process with realistic scale regarding
particle numbers and spheronizer size
- Validating this simulation with lab experiments
- 14 -
1.8 Outline of the Thesis
The simulation of industrial processes is a common technique in many fields (aeronautics,
automotive engineering, etc.), but in the field of pharmaceutics it is only used frequently.
The rapid development of computational power and the increased usability of simulation
software made the implementation in new fields of scientific research possible. Therefore
this work will deal with the implementation of a spheronizer simulation and its validation
against lab experiments.
Prior to these simulation studies, the mechanisms of spheronization had to be investigated in
detail, because the commonly used mechanistic models do not explain the processes
involved on a sufficient level to transfer the process directly into a simulation. Rowe and
Baert did not include the fine fraction at all and Liew's work did not mention a deformation
into dumb-bell shaped intermediate stages during spheronization. Therefore chapter 2 deals
with new methods to characterize the interactions during spheronization on a particle scale
and their influence on forming spherical pellets on a qualitative level. The experiments
showed, that the proposed mechanisms all contributed to spheronization, but could not
describe these contributions quantitatively.
A novel analytical method to quantify these contributions to the spheronization mechanism
is given in chapter 3. The mass transfer fraction describes the ratio of pellet mass coming
from agglomeration to the part coming from the original extrudate itself. The chapter will
show the influence of API and water content on the MTF for two different pelletization aids.
The influences of fine fraction and mass transfer to pellet formation over time are given in
chapter 4. The experiments were performed for MCCI and κ-carrageenan as used in chapter
and MCCII was added due to the work of Krueger. The differences between these three
pelletization aids with a focus on the deformation and agglomeration tendencies are
discussed in this chapter and a more generalized spheronization mechanism could be
proposed.
In a next step an overview simulation should be established, in which the particles are
treated as non deforming, indestructible spheres in order to gain insights into the particle
movement during spheronization. Before this could be realized more detailed insights into
the particle movement during spheronization had to be gained, because relevant parameters
for the correlation of simulation data to lab experiments are a crucial step in validation of
simulation models. Particle image velocimetry (PIV) should be used as a possible tool to
characterize the particle kinematics during spheronization. In a second step their use as
CHAPTER 1 - INTRODUCTION
- 15 -
descriptive parameters for validation of the simulation should be applied. In chapter 5 , PIV
is used to analyze the influence of critical process parameters on the particle kinematics in
spheronization, to get a better understanding of the nature of particle-particle interactions
during spheronization.
A DEM based simulation approach is applied to spheronization in chapter 6. The process is
simulated with a realistic number of spherical particles and validated against experiments
carried out with non cohesive model particles. Up to this point an implementation of
cohesion to the model is possible, but was not performed so far.
Finally the work is summarized in chapter 7 to give a coherent conclusion about all
published papers.
- 16 -
1.9 References
ADRIAN, R. J. 1991. Particle-imaging techniques for experimental fluid mechanics. Annual
Review of Fluid Mechanics, 23, 261-304.
AGRAWAL, A. M., HOWARD, M. A. & NEAU, S. H. 2004. Extruded and spheronized beads
containing no microcrystalline cellulose: influence of formulation and process variables.
Pharmaceutical Development and Technology, 9, 197-217.
BAERT, L., VERMEERSCH, H., REMON, J. P., SMEYERS-VERBEKE, J. & MASSART, D.
1993. Study of parameters important in the spheronisation process. International Journal of
Pharmaceutics, 96, 225-229.
BALBUENA, P. & SEMINARIO, J. M. 1999. Molecular Dynamics: From Classical to Quantum
Methods, Amsterdam, The Netherlands, Elsevier Science.
BALL, R. C. & MELROSE, J. R. 1997. A simulation technique for many spheres in quasi-static
motion under frame-invariant pair drag and Brownian forces. Physica A: Statistical and
Theoretical Physics, 247, 444-472.
BASIT, A. W., NEWTON, J. M. & LACEY, L. F. 1999. Formulation of ranitidine pellets by
extrusion-spheronization with little or no microcrystalline cellulose. Pharmaceutical
Development and Technology, 4, 499-505.
BAUER, K. H., EGERMANN, H., FRÖMMING, K. H., LIPPOLD, B. C. & FÜHRER, C. 2006.
Lehrbuch der Pharmazeutischen Technologie: mit einer Einführung in die Biopharmazie ; mit 95
Tabellen, Stuttgart, Wissenschaftliche Verlagsgesellschaft.
BECHGAARD, H. & NIELSEN, G. H. 1976. There's slow release and slow release. British
Medical Journal, 2, 1197.
BECHGAARD, H. & NIELSEN, G. H. 1978. Controlled-Release Multiple-Units and Single-
Unit Doses a Literature Review. Drug Development and Industrial Pharmacy, 4, 53-67.
BHAD, M. E., ABDUL, S., JAISWAL, S. B., CHANDEWAR, A. V., JAIN, J. M. & SAKARKAR,
D. M. 2010. MUPS Tablets–A Brief Review. International Journal of Pharm. Tech. Research, 2(1),
847-855.
BODMEIER, R. 1997. Tableting of coated pellets. European Journal of Pharmaceutics and
Biopharmaceutics, 43, 1-8.
CHAPTER 1 - INTRODUCTION
- 17 -
BORNHÖFT, M., THOMMES, M. & KLEINEBUDDE, P. 2005. Preliminary assessment of
carrageenan as excipient for extrusion/spheronisation. European Journal of Pharmaceutics and
Biopharmaceutics, 59, 127-131.
BREITKREUTZ, J. & BOOS, J. 2007. Paediatric and geriatric drug delivery. Expert Opinion on
Drug Delivery, 4, 37-45.
CHATLAPALLI, R. & ROHERA, B. D. 1998. Physical characterization of HPMC and HEC
and investigation of their use as pelletization aids. International Journal of Pharmaceutics, 161,
179-193.
CHOPRA, R., PODCZECK, F., NEWTON, J. M. & ALDERBORN, G. 2002. The influence of
pellet shape and film coating on the filling of pellets into hard shell capsules. European
Journal of Pharmaceutics and Biopharmaceutics, 53, 327-333.
CONINE, J. & HADLEY, H. 1970. Preparation of small solid pharmaceutical spheres. Drug
Cosmet. Ind, 106, 38-41.
DERJAGUIN, B. V., MULLER, V. M. & TOPOROV, Y. P. 1975. Effect of contact deformations
on the adhesion of particles. Journal of Colloid and Interface Science, 53, 314-326.
DUKIĆ-OTT, A., THOMMES, M., REMON, J. P., KLEINEBUDDE, P. & VERVAET, C. 2009.
Production of pellets via extrusion–spheronisation without the incorporation of
microcrystalline cellulose: a critical review. European Journal of Pharmaceutics and
Biopharmaceutics, 71, 38-46.
ERKOBONI, D. F. 2003. Extrusion/Spheronization. In: GHEBRE-SELLASSIE, I. & MARTIN,
C. Pharmaceutical Extrusion Technology. New York: Marcel Dekker Incorporated, 249-290.
ERKOBONI, D. F. & PARIKH, D. 1997. Extrusion-spheronization as a granulation technique.
Drugs and the Pharmaceutical Sciences, 81, 333-368.
FLAMENT, M., DUPONT, G., LETERME, P., FARAH, N. & GAYOT, A. 2004. Development
of 400 um Pellets by Extrusion-Spheronization Application with Gelucire 50/02 to Produce a
“Sprinkle” Form. Drug Development and Industrial Pharmacy, 30, 43-51.
FOLLONIER, N. & DOELKER, E. 1992. Biopharmaceutical comparison of oral multiple-unit
and single-unit sustained-release dosage forms.S.T.P. Pharma Science, 2(2), 141-158.
FRIES, L., ANTONYUK, S., HEINRICH, S. & PALZER, S. 2011. DEM–CFD modeling of a
fluidized bed spray granulator. Chemical Engineering Science, 66, 2340-2355.
- 18 -
GAUTHIER, P., CARDOT, J.-M., BEYSSAC, E. & AIACHE, J.-M. 2012. Single process for
manufacturing spheres with a lipid base (HCO). Pharmaceutical Development and Technology,
17, 303-314.
GHANAM, D. & KLEINEBUDDE, P. 2011. Suitability of a flat die press for the manufacture
of pharmaceutical pellets by extrusion/spheronization. Drug Development and Industrial
Pharmacy, 37, 456-464.
GUPTA, N. & KHAN, S. 2011. Formulation and evaluation of olanzapine matrix pellets for
controlled release. DARU Journal of Pharmaceutical Sciences, 19(4), 249-256.
HARTMANN, A. K. 2009. Practical Guide To Computer Simulations, Singapore ,World
Scientific Publishing Company Incorporated.
HERTZ, H. 1896. Über die Berührung Fester Elastischer Körper (on the contact of elastic
solids). J Reine und Angewandte Mathematik 92: 156. Miscellaneous papers H. Hertz.
Macmillan, London.
ISHIDA, M., ABE, K., HASHIZUME, M. & KAWAMURA, M. 2008. A novel approach to
sustained pseudoephedrine release: Differentially coated mini-tablets in HPMC capsules.
International Journal of Pharmaceutics, 359, 46-52.
JOHNSON, K. L., KENDALL, K. & ROBERTS, A. D. 1971. Surface Energy and the Contact of
Elastic Solids. Proceedings of the Royal Society of London. A. Mathematical and Physical Sciences,
324, 301-313.
KEANE, R. & ADRIAN, R. 1992. Theory of cross-correlation analysis of PIV images. Applied
Scientific Research, 49, 191-215.
KLEINEBUDDE, P. 1994. Shrinking and swelling properties of pellets containing
microcrystalline cellulose and low substituted hydroxypropylcellulose: I. Shrinking
properties. International Journal of Pharmaceutics, 109, 209-219.
KLEINEBUDDE, P. 1996. Pharmazeutische Pellets durch Extrudieren, Sphäronisieren: Herstellung,
Eigenschaften, Modifizierung, Habilitationsschrift, Universität Kiel.
KNOELL, M., LIZIO, R., PETEREIT, H.-U. & LANGGUTH, P. 2007. Rotary agglomeration: A
process for wet spheronization of bioadhesive micropellets. Pharmazeutische Industrie, 69,
1194-1201.
KNOP, K. 1991. Pellets. Hagers Handbuch der pharmazeutischen Praxis. Nürnberg: Surmann,
CHAPTER 1 - INTRODUCTION
- 19 -
KRUEGER, C., THOMMES, M. & KLEINEBUDDE, P. 2010. “MCC SANAQ®burst”—A New
Type of Cellulose and its Suitability to Prepare Fast Disintegrating Pellets. Journal of
Pharmaceutical Innovation, 5, 45-57.
KRUEGER, C., THOMMES, M. & KLEINEBUDDE, P. 2013. Spheronisation mechanism of
MCC II-based pellets. Powder Technology, 238, 176-187.
KUMAR, V., DE LA LUZ REUS-MEDINA, M. & YANG, D. 2002. Preparation,
characterization, and tabletting properties of a new cellulose-based pharmaceutical aid.
International Journal of Pharmaceutics, 235, 129-140.
LIEW, C. V., CHUA, S. M. & HENG, P. W. 2007. Elucidation of spheroid formation with and
without the extrusion step. AAPS PharmSciTech, 8, E70-E81.
O'CONNOR, R., HOLINEJ, J. & SCHWARTZ, J. 1984. Spheronization I: Processing and
evaluation of spheres prepared from commercially available excipients. Am. J. Pharm, 156,
80-87.
PARKER, D. J., BROADBENT, C. J., FOWLES, P., HAWKESWORTH, M. R. & MCNEIL, P.
1993. Positron emission particle tracking - a technique for studying flow within engineering
equipment. Nuclear Instruments and Methods in Physics Research Section A: Accelerators,
Spectrometers, Detectors and Associated Equipment, 326, 592-607.
RAJAMANI, R. K., MISHRA, B. K., VENUGOPAL, R. & DATTA, A. 2000a. Discrete element
analysis of tumbling mills. Powder Technology, 109, 105-112.
RAJAMANI, R. K., MISHRA, B. K., VENUGOPAL, R. & DATTA, A. 2000b. Discrete element
analysis of tumbling mills. Powder Technology, 109, 105-112.
REITZ, C. & KLEINEBUDDE, P. 2007. Solid lipid extrusion of sustained release dosage
forms. European Journal of Pharmaceutics and Biopharmaceutics, 67, 440-448.
REYNOLDS, A. 1970. A new technique for the production of spherical particles. Manuf.
Chem, 41, 40-43.
RIVERA, S. L. & GHODBANE, S. 1994. In vitro adsorption-desorption of famotidine on
microcrystalline cellulose. International Journal of Pharmaceutics, 108, 31-38.
ROWE, R. 1985. Spheronization: a novel pill-making process. Pharm. Int, 6, 119-123.
SCHAEFER, T., HOLM, P. & KRISTENSEN, H. G. 1990. Melt Granulation in A Laboratory
Scale High Shear Mixer. Drug Development and Industrial Pharmacy, 16, 1249-1277.
- 20 -
SCHRÖDER, M. & KLEINEBUDDE, P. 1995. Development of Disintegrating Pellets Obtained
from Extrusion/Spheronization. Pharmacy and Pharmacology Communications, 1, 415-418.
SPOMER, N., KLINGMANN, V., STOLTENBERG, I., LERCH, C., MEISSNER, T. &
BREITKREUTZ, J. 2012. Acceptance of uncoated mini-tablets in young children: results from
a prospective exploratory cross-over study. Archives of Disease in Childhood, 97, 283-286.
STEWART, R. L., BRIDGWATER, J. & PARKER, D. J. 2001. Granular flow over a flat-bladed
stirrer. Chemical Engineering Science, 56, 4257-4271.
SUHRENBROCK, L., RADTKE, G., KNOP, K. & KLEINEBUDDE, P. 2011. Suspension pellet
layering using PVA–PEG graft copolymer as a new binder. International Journal of
Pharmaceutics, 412, 28-36.
THO, I., SANDE, S. A. & KLEINEBUDDE, P. 2002. Pectinic acid, a novel excipient for
production of pellets by extrusion/spheronisation: preliminary studies. European Journal of
Pharmaceutics and Biopharmaceutics, 54, 95-99.
THOMMES, M. & KLEINEBUDDE, P. 2006. Use of κ-carrageenan as alternative pelletisation
aid to microcrystalline cellulose in extrusion/spheronisation. I. Influence of type and fraction
of filler. European Journal of Pharmaceutics and Biopharmaceutics, 63, 59-67.
THOMSON, S., TULEU, C., WONG, I., KEADY, S., PITT, K. & SUTCLIFF, A. 2009. Assessing
the acceptability of mini-tablets for use in children aged 2–6 years old. Pediatrics, 123, e235-
e238.
TRONO, G., JR. & LLUISMA, A. 1992. Differences in biomass production and carrageenan
yields among four strains of farmed carrageenophytes in Northern Bohol, Philippines.
Hydrobiologia, 247, 223-227.
VOJNOVIC, D., RUPENA, P., MONEGHINI, M., RUBESSA, F. & COSLOVICH, S. 1993.
Experimental research methodology applied to wet pelletization in a high-shear mixer. I, STP Pharma
Sciences, Vol. 3 (2), 130-135.
WALTON, O. R. & BRAUN, R. L. 1985. VISCOSITY, Granular-Temperature and Stress
Calculations for Shearing Assemblies of Inelastic, Frictional Disks. Journal of Rheology, 30,
949-980.
WEAVER, W. & GERE, J. M. 1990. Matrix Analysis Of Framed Structures, Springer.
WENING, K. & BREITKREUTZ, J. 2011. Oral drug delivery in personalized medicine: Unmet
needs and novel approaches. International Journal of Pharmaceutics, 404, 1-9.
CHAPTER 1 - INTRODUCTION
- 21 -
ZHANG, D. & WHITEN, W. 1996. The calculation of contact forces between particles using
spring and damping models. Powder technology, 88, 59-64.
ZHOU, Y., WRIGHT, B., YANG, R., XU, B. & YU, A. 1999. Rolling friction in the dynamic
simulation of sandpile formation. Physica A: Statistical Mechanics and its Applications, 269, 536-
553.
- 22 -
2 CHAPTER 2 - New insights into the pelletization mechanism
by extrusion/spheronization
2.1 Pretext
The following work was published in November 2010 in the AAPS PharmSciTech Journal
(impact factor 2010: 1.211). It was submitted as a rapid communication, because preliminary
experiments showed an agglomeration of fine particles during spheronization. While the
existence of fine particles was described in literature before, their agglomeration on the
pellets was not adequately described in literature so far.
The first author of this paper, Martin Koester, is responsible for the concept of the
expriments as well as their evaluation and writing of the manuscript. Dr. Markus Thommes,
listed as senior author, is responsible for concept, ideas and revision of the manuscript.
Submitted 12 July 2010
Accepted 13 October 2010
Published online 2 November 2010
Cite as: Volume 11, Issue 4, Pages 1549-1551, DOI: 10.1208/s12249-010-9532-7
CHAPTER 2 - New insights into the pelletization mechanism by extrusion/spheronization
- 23 -
2.2 Abstract
Pellet manufacturing by extrusion/spheronization is quite common in the pharmaceutical
field because the obtained product is characterized by a high sphericity as well as a narrow
particle size distribution. The established mechanisms only consider deformation of the
initially fractured particles but do not account for mass transfer between the particles as a
factor in achieving spherical particles.
This study dealt with the visualization of mass transfer during spheronization. Therefore,
two common pelletization aids, microcrystalline cellulose and kappa-carrageenan, were used
alone as well as in combination with lactose as a filler.
This study proves that mass transfer between particles must be considered in addition to
plastic deformation in order to capture the spheronization mechanism. Moreover, it is
evident there are regional distinctions in the amount of mass transfer at the particle surface.
Therefore, the commonly espoused pelletization mechanisms need to be extended to account
for material transfer between pellet particles, which has not been considered before.
- 24 -
2.3 Introduction
Since extrusion/spheronization was suggested by Conine and Reynolds in 1970 [1, 2], it has
been developed as common technology in bead manufacturing in the pharmaceutical area.
In the last few years several efforts were made to analyze and characterize the
spheronization process. However, most studies focus on an empirical description of the
spheronization process [3, 4, 5]. Consequently, there has been a lack of fundamental
understanding of the spheronization process until now.
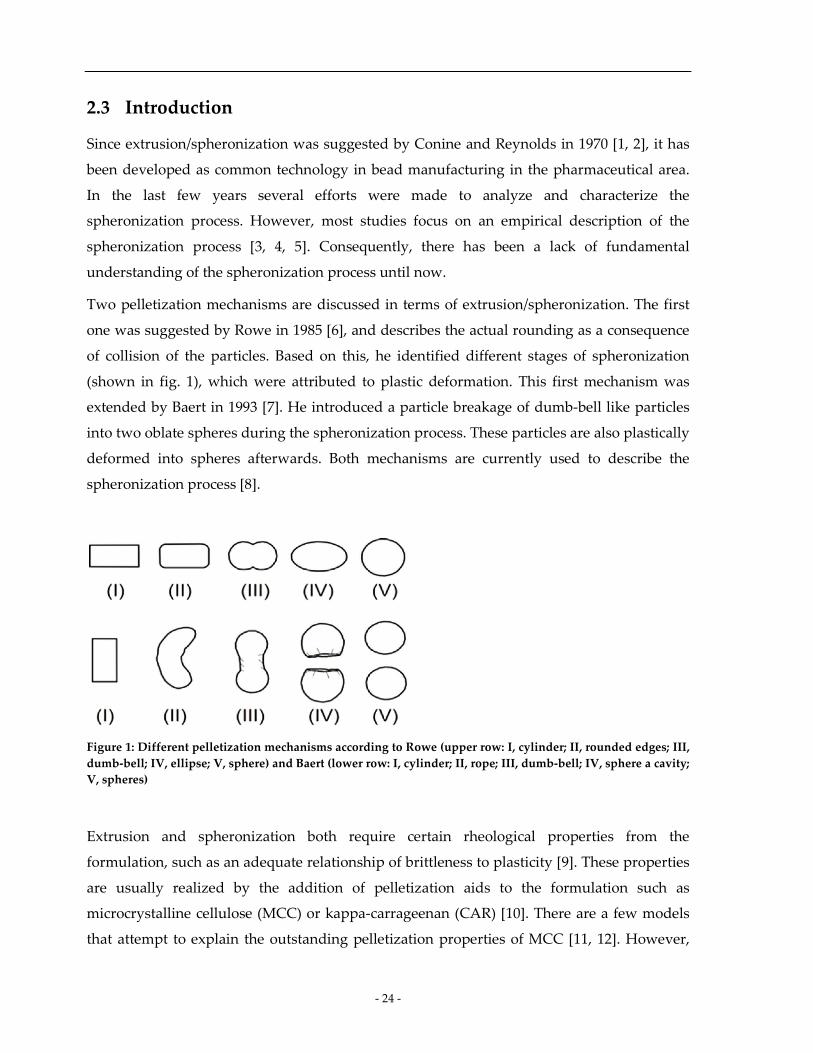
Two pelletization mechanisms are discussed in terms of extrusion/spheronization. The first
one was suggested by Rowe in 1985 [6], and describes the actual rounding as a consequence
of collision of the particles. Based on this, he identified different stages of spheronization
(shown in fig. 1), which were attributed to plastic deformation. This first mechanism was
extended by Baert in 1993 [7]. He introduced a particle breakage of dumb-bell like particles
into two oblate spheres during the spheronization process. These particles are also plastically
deformed into spheres afterwards. Both mechanisms are currently used to describe the
spheronization process [8].
Figure 1: Different pelletization mechanisms according to Rowe (upper row: I, cylinder; II, rounded edges; III, dumb-bell; IV, ellipse; V, sphere) and Baert (lower row: I, cylinder; II, rope; III, dumb-bell; IV, sphere a cavity; V, spheres)
Extrusion and spheronization both require certain rheological properties from the
formulation, such as an adequate relationship of brittleness to plasticity [9]. These properties
are usually realized by the addition of pelletization aids to the formulation such as
microcrystalline cellulose (MCC) or kappa-carrageenan (CAR) [10]. There are a few models
that attempt to explain the outstanding pelletization properties of MCC [11, 12]. However,
CHAPTER 2 - New insights into the pelletization mechanism by extrusion/spheronization
- 25 -
this study focused on the macroscopic scale of the particle interaction. Therefore, these
models were not considered.
2.4 Materials
The following materials were used as received: kappa-carrageenan (Gelcarin® GP 911 NF,
FMC, Philadelphia, PA, USA), lactose (Granulac 200, Meggle, Wasserburg, Germany), MCC
102 (Pharmatrans Sanaq, Basel, Switzerland), Sicovit red (BASF, Ludwigshafen, Germany),
Sicovit green (BASF, Ludwigshafen, Germany) and titanium dioxide (Gruessing GmbH,
Filsum, Germany).
2.5 Methods
2.5.1 Experimental plan
In this study, two common pelletization aids (MCC and kappa-carrageenan) were used.
Additionally, the powder formulation was varied using lactose as filler. Each powder
formulation was colored using one of three different pigments (Sicovit red, green and
titanium dioxide, tab. 1). The water content in the extrusion was optimized for each
formulation in preliminary investigations and fixed in extrusion at certain levels, which are
given in the manuscript. Differently colored extrudates (3x100 g) were spheronized
simultaneously and a color change occurred which was visually observed. The color change
of the extrudate was attributed to mass transfer since insoluble pigments were used for
coloring. It was assumed that the influence of the pigments on the pelletization behavior was
negligible.
2.5.2 Powder Blending
A pelletization aid and a filler (1500 g) were weighed and blended for 15 min in a laboratory
scale blender (LM40, Bohle, Ennigerloh, Germany) at 25 rpm. Afterward, the powder was
divided into three equal parts and blended again (15 min) with one of three different
pigments (Sicovit red, green and titanium dioxide).
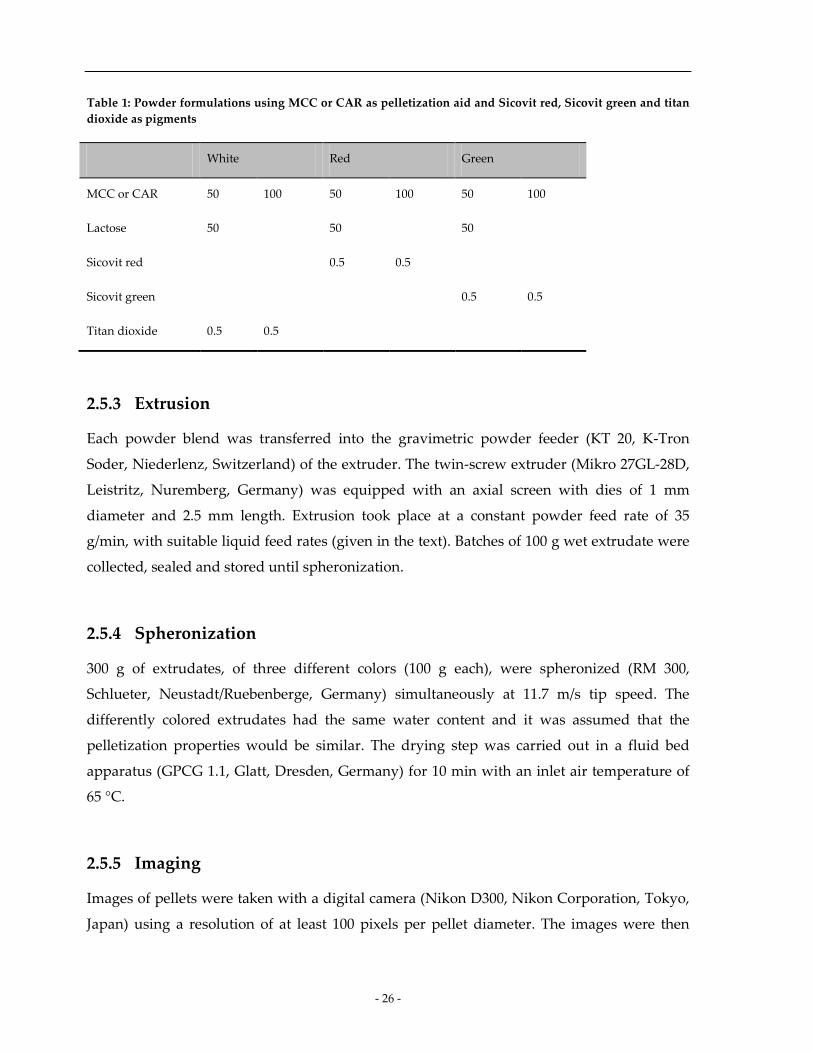
- 26 -
Table 1: Powder formulations using MCC or CAR as pelletization aid and Sicovit red, Sicovit green and titan dioxide as pigments
White Red Green
MCC or CAR 50 100 50 100 50 100
Lactose 50 50 50
Sicovit red 0.5 0.5
Sicovit green 0.5 0.5
Titan dioxide 0.5 0.5
2.5.3 Extrusion
Each powder blend was transferred into the gravimetric powder feeder (KT 20, K-Tron
Soder, Niederlenz, Switzerland) of the extruder. The twin-screw extruder (Mikro 27GL-28D,
Leistritz, Nuremberg, Germany) was equipped with an axial screen with dies of 1 mm
diameter and 2.5 mm length. Extrusion took place at a constant powder feed rate of 35
g/min, with suitable liquid feed rates (given in the text). Batches of 100 g wet extrudate were
collected, sealed and stored until spheronization.
2.5.4 Spheronization
300 g of extrudates, of three different colors (100 g each), were spheronized (RM 300,
Schlueter, Neustadt/Ruebenberge, Germany) simultaneously at 11.7 m/s tip speed. The
differently colored extrudates had the same water content and it was assumed that the
pelletization properties would be similar. The drying step was carried out in a fluid bed
apparatus (GPCG 1.1, Glatt, Dresden, Germany) for 10 min with an inlet air temperature of
65 °C.
2.5.5 Imaging
Images of pellets were taken with a digital camera (Nikon D300, Nikon Corporation, Tokyo,
Japan) using a resolution of at least 100 pixels per pellet diameter. The images were then
CHAPTER 2 - New insights into the pelletization mechanism by extrusion/spheronization
- 27 -
post-processed to reduce brightness variability and to adjust the contrast of the image in
relation to the background.
2.6 Results and Discussion
2.6.1 Concept of Mass Transfer in Spheronization
All four tested formulations (tab. 1) showed an adequate pelletization behavior [9]. Pellets of
a spherical shape and a narrow size distribution were obtained regardless of the pelletization
aid and amount of filler. The size and shape of pellets of one formulation and one color was
similar to the size and shape of pellets formed by the other colors and formulations (fig. 2
and 3). Therefore, images from representative single particles are given throughout the
manuscript.
It is remarkable that the aspect ratio of the particles increases from the green, to the red, to
the white particles. This is related to the storage time between extrusion and spheronization
because the differently colored formulations were extruded one after the other. The storage
resulted in different rheological properties, affecting the pellet shape. This might be
attributed to a drying of the extrudates. The differences in particle size of the differently
colored pellets were also attributed to this effect.
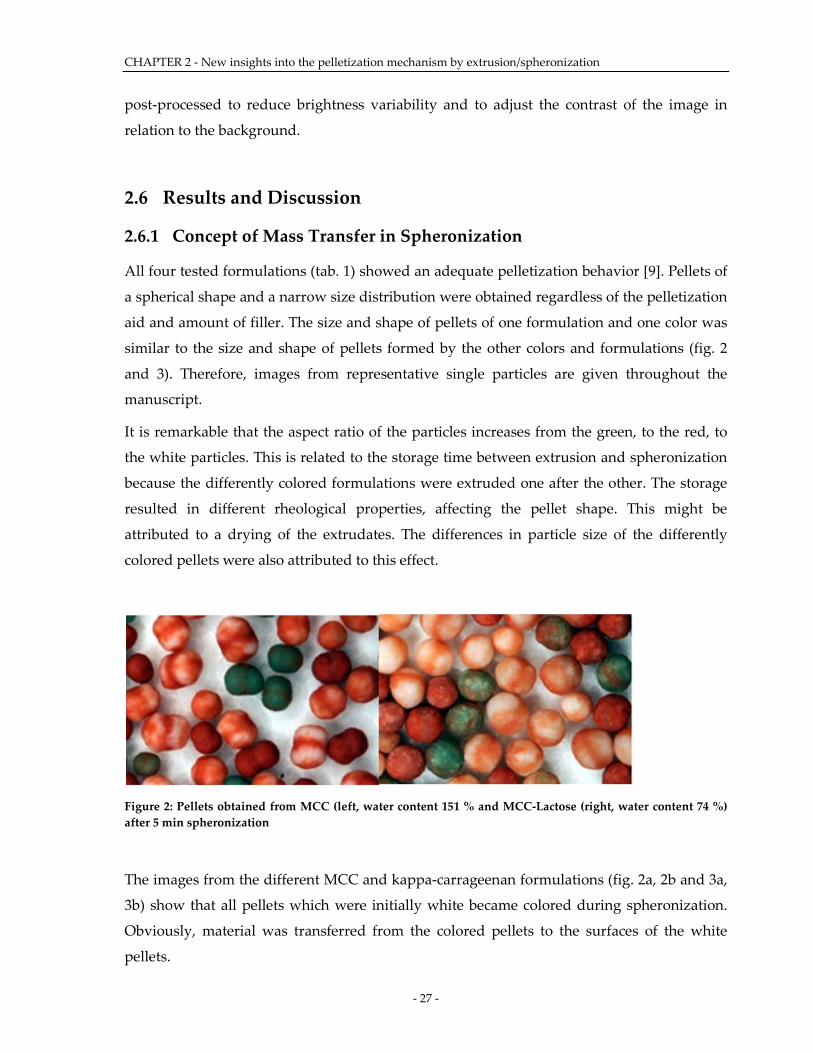
Figure 2: Pellets obtained from MCC (left, water content 151 % and MCC-Lactose (right, water content 74 %) after 5 min spheronization
The images from the different MCC and kappa-carrageenan formulations (fig. 2a, 2b and 3a,
3b) show that all pellets which were initially white became colored during spheronization.
Obviously, material was transferred from the colored pellets to the surfaces of the white
pellets.
- 28 -
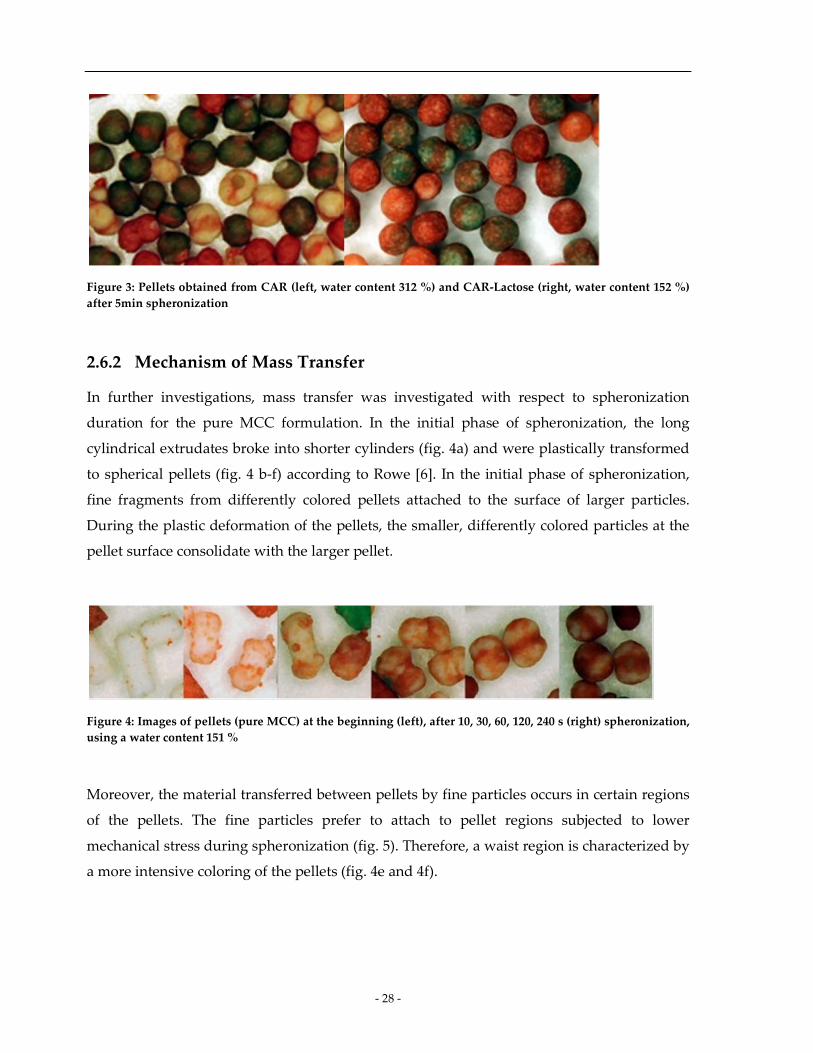
Figure 3: Pellets obtained from CAR (left, water content 312 %) and CAR-Lactose (right, water content 152 %) after 5min spheronization
2.6.2 Mechanism of Mass Transfer
In further investigations, mass transfer was investigated with respect to spheronization
duration for the pure MCC formulation. In the initial phase of spheronization, the long
cylindrical extrudates broke into shorter cylinders (fig. 4a) and were plastically transformed
to spherical pellets (fig. 4 b-f) according to Rowe [6]. In the initial phase of spheronization,
fine fragments from differently colored pellets attached to the surface of larger particles.
During the plastic deformation of the pellets, the smaller, differently colored particles at the
pellet surface consolidate with the larger pellet.
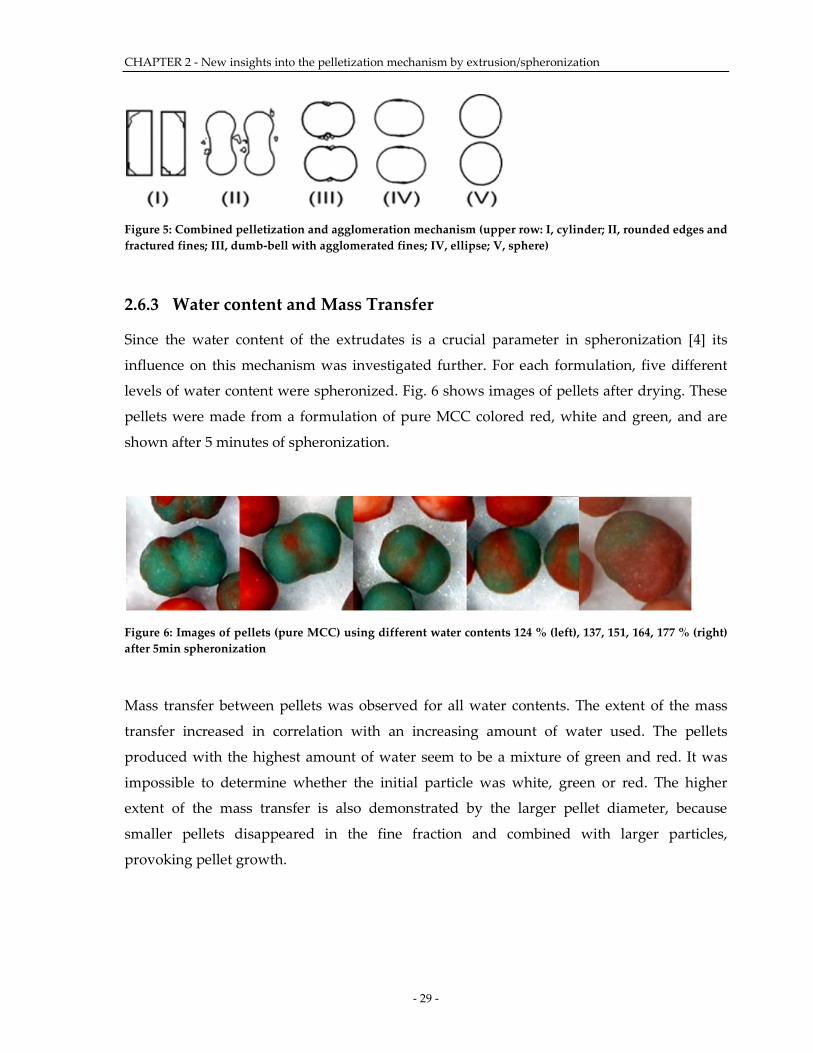
Figure 4: Images of pellets (pure MCC) at the beginning (left), after 10, 30, 60, 120, 240 s (right) spheronization, using a water content 151 %
Moreover, the material transferred between pellets by fine particles occurs in certain regions
of the pellets. The fine particles prefer to attach to pellet regions subjected to lower
mechanical stress during spheronization (fig. 5). Therefore, a waist region is characterized by
a more intensive coloring of the pellets (fig. 4e and 4f).
CHAPTER 2 - New insights into the pelletization mechanism by extrusion/spheronization
- 29 -
Figure 5: Combined pelletization and agglomeration mechanism (upper row: I, cylinder; II, rounded edges and fractured fines; III, dumb-bell with agglomerated fines; IV, ellipse; V, sphere)
2.6.3 Water content and Mass Transfer
Since the water content of the extrudates is a crucial parameter in spheronization [4] its
influence on this mechanism was investigated further. For each formulation, five different
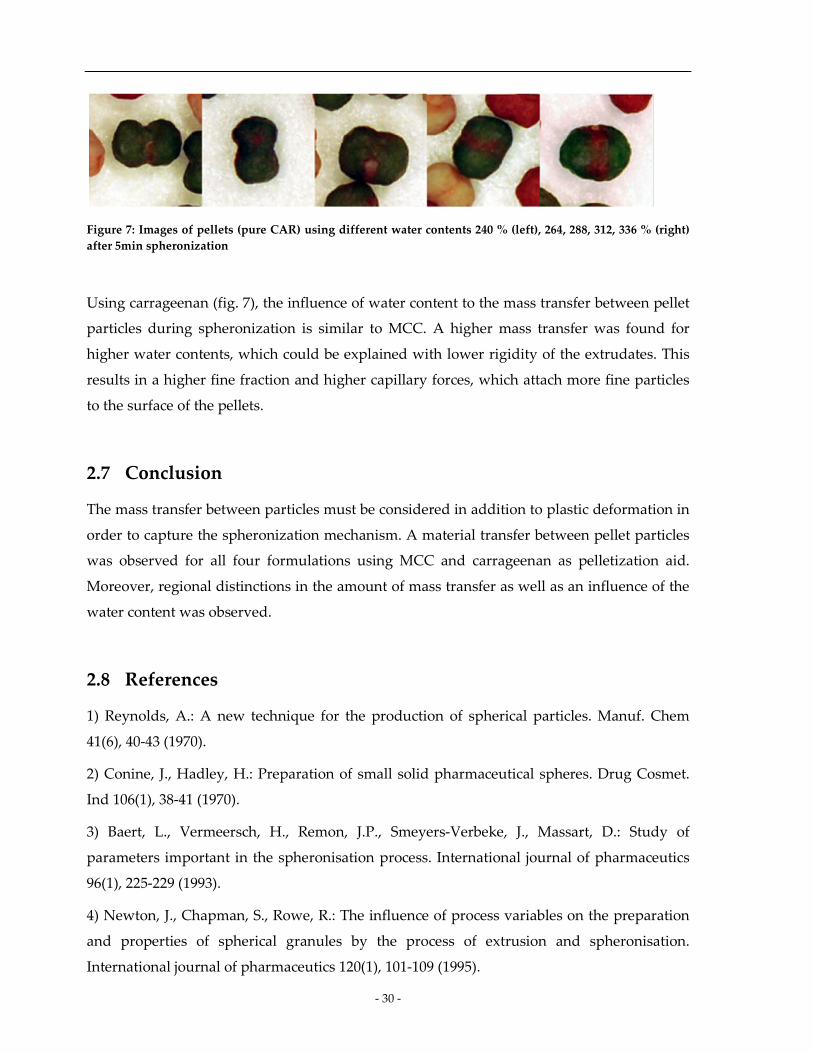
levels of water content were spheronized. Fig. 6 shows images of pellets after drying. These
pellets were made from a formulation of pure MCC colored red, white and green, and are
shown after 5 minutes of spheronization.
Figure 6: Images of pellets (pure MCC) using different water contents 124 % (left), 137, 151, 164, 177 % (right) after 5min spheronization
Mass transfer between pellets was observed for all water contents. The extent of the mass
transfer increased in correlation with an increasing amount of water used. The pellets
produced with the highest amount of water seem to be a mixture of green and red. It was
impossible to determine whether the initial particle was white, green or red. The higher
extent of the mass transfer is also demonstrated by the larger pellet diameter, because
smaller pellets disappeared in the fine fraction and combined with larger particles,
provoking pellet growth.
- 30 -
Figure 7: Images of pellets (pure CAR) using different water contents 240 % (left), 264, 288, 312, 336 % (right) after 5min spheronization
Using carrageenan (fig. 7), the influence of water content to the mass transfer between pellet
particles during spheronization is similar to MCC. A higher mass transfer was found for
higher water contents, which could be explained with lower rigidity of the extrudates. This
results in a higher fine fraction and higher capillary forces, which attach more fine particles
to the surface of the pellets.
2.7 Conclusion
The mass transfer between particles must be considered in addition to plastic deformation in
order to capture the spheronization mechanism. A material transfer between pellet particles
was observed for all four formulations using MCC and carrageenan as pelletization aid.
Moreover, regional distinctions in the amount of mass transfer as well as an influence of the
water content was observed.
2.8 References
1) Reynolds, A.: A new technique for the production of spherical particles. Manuf. Chem
41(6), 40-43 (1970).
2) Conine, J., Hadley, H.: Preparation of small solid pharmaceutical spheres. Drug Cosmet.
Ind 106(1), 38-41 (1970).
3) Baert, L., Vermeersch, H., Remon, J.P., Smeyers-Verbeke, J., Massart, D.: Study of
parameters important in the spheronisation process. International journal of pharmaceutics
96(1), 225-229 (1993).
4) Newton, J., Chapman, S., Rowe, R.: The influence of process variables on the preparation
and properties of spherical granules by the process of extrusion and spheronisation.
International journal of pharmaceutics 120(1), 101-109 (1995).
CHAPTER 2 - New insights into the pelletization mechanism by extrusion/spheronization
- 31 -
5) Wan, L.S., Heng, P.W., Liew, C.V.: Spheronization conditions on spheroid shape and size.
International Journal of Pharmaceutics 96(1), 59-65 (1993).
6) Rowe, R.: Spheronization: a novel pill-making process. Pharm. Int 6, 119-123 (1985).
7) Vervaet, C., Baert, L., Remon, J.P.: Extrusion-spheronisation A literature review.
International Journal of Pharmaceutics 116(2), 131-146 (1995).
8) Erkoboni, DF.: Extrusion-Spheronization as a Granulation Technique. In: Parikh, DM.,
Handbook of pharmaceutical granulation technology. New York: Marcel Dekker Inc;. 334-
365 (1997)
9) Erkoboni, DF.: Extrusion/Spheronization. In: Ghebre-Sellassie, I., Martin, C.
Pharmaceutical extrusion technology. New York: Marcel Dekker Inc;. 277-318 (2003)
10) Dukić-Ott, A., Thommes, M., Remon, J.P., Kleinebudde, P., Vervaet, C.: Production of
pellets via extrusion–spheronisation without the incorporation of microcrystalline cellulose:
a critical review. European Journal of Pharmaceutics and Biopharmaceutics 71(1), 38-46
(2009).
11) Fielden, K., Newton, J.M., O'BRIEN, P., Rowe, R.C.: Thermal studies on the interaction of
water and microcrystalline cellulose. Journal of pharmacy and pharmacology 40(10), 674-678
(1988).
12) Kleinebudde, P.: The crystallite-gel-model for microcrystalline cellulose in wet-
granulation, extrusion, and spheronization. Pharmaceutical research 14(6), 804-809 (1997).
- 32 -
3 CHAPTER 3 - Quantification of Mass Transfer during
Spheronization
3.1 Pretext
The following work was submitted in November 2011 to the AAPS PharmSciTech Journal
(impact factor 2010: 1.211). It is a follow up to the previously published paper, dealing with
the quantification of the mass transfer during spheronization. For the further studies it was
essential to quantify the effect of mass transfer during spheronization. Therefore, a mass
transfer fraction (MTF) was defined and a method to calculate it from the drug content of
single pellets was established. The paper describes the effect of API solubility, water content
of the formulation and type of pelletisation aid on the MTF.
The first author of this paper, Martin Koester, is responsible for the concept of the
expriments as well as their evaluation and writing of the manuscript. Dr. Markus Thommes,
listed as senior author, is responsible for concept, ideas and revision of the manuscript.
Submitted 7 November 2011
Accepted 28 February 2012
Cite as: DOI: 10.1208/s12249-012-9770-y
CHAPTER 3 - Quantification of Mass Transfer during Spheronization
- 33 -
3.2 Abstract
Spherical granules (pellets) are quite useful in many pharmaceutical applications. The
extrusion spheronisation technique is well established as a method of producing pellets of a
spherical shape and narrow size distribution. After extrusion, the cylindrical extrudates are
transformed to spherical pellets by spheronisation. The frequently used models consider
deformation and breakage during this process. However, the adhesion of fine particles has
been neglected as a mechanism in spheronisation for many years.
This study quantifies the mass transfer between pellets during spheronisation. During the
investigation the pelletisation aid (microcrystalline cellulose, kappa-carrageenan), the drug
(acetaminophen, ibuprofen) and water content were varied systematically. A novel
parameter, namely the "mass transfer fraction" (MTF), was defined to quantify the mass
transfer between the pellets.
All four investigated formulations had a MTF between 0.10 and 0.52 - that implies that up to
50 % of the final pellet weight was involved in mass transfer. Both pelletisation aids showed
a similar MTF, independent of the drug used. Furthermore an increase of the MTF, with
respect to an increase of the water content, was found for MCC formulations.
In conclusion, the mass transfer between pellets has to be considered as a mechanism for
spheronisation.
- 34 -
3.3 Introduction
Spherical agglomerates (pellets) are widely used in pharmaceutics, because their distinctive
properties (i.e. spherical shape and narrow size distribution) make them particularly useful
for processes like coating and encapsulation. Furthermore pellets have a low risk of
intoxication and fewer side effects related to local irritations [1]. Pellets are often prepared by
extrusion spheronization as introduced by Conine and Reynolds in 1970 [2, 3].
Extrusion spheronization is a two-step process: During the extrusion step, the wet mass is
pressed through circular dies, and cylindrical extrudates are obtained. These are transferred
to a spheronizer consisting of a cylindrical bin and a rotating bottom plate. The
spheronization process transforms the cylindrical extrudates into spherical pellets [4]. This
process requires particular properties of the wet mass: To form cylindrical extrudates, the
mass must be cohesive and rigid, but it must also be brittle and plastically deformable to
form spheres [5]. These requirements are usually met by addition of pelletization aids to the
formulation [6]. Several pelletization aids have been suggested in the last few years [7-10].
Other investigations deal with the influence of various process variables on the pellet
properties [11-15]. Until now there have been just a few suggestions regarding the pellet
formation mechanism: In 1985 Rowe [16] attributed spheronization to breakage and collision.
In the initial phase of spheronization, the cylindrical extrudates break in shorter cylinders,
which are plastically deformed by collision with each other as well as the spheronizer. This
leads to different interim stages of deformation (fig. 1a). Baert [17] extended this mechanism
by an additional breakage in 1993. The dumb-bell shaped particles break in two and are
rounded into spherical particles afterwards (fig. 1b). Both mechanisms share their focus on
the plastic deformation as a driving force in pellet formation. In 2007 Liew [18] described a
third mechanism, whereby fine particles break off the extrudates and agglomerate randomly
on the larger particles.
Recently, Liew’s approach was refined because an agglomeration of fines in distinctive
regions of the pellets was found (fig. 1c) [19]. Due to the lower mechanical stress at the
central band of the pellets, the fine particles tend to accumulate in this pellet region.
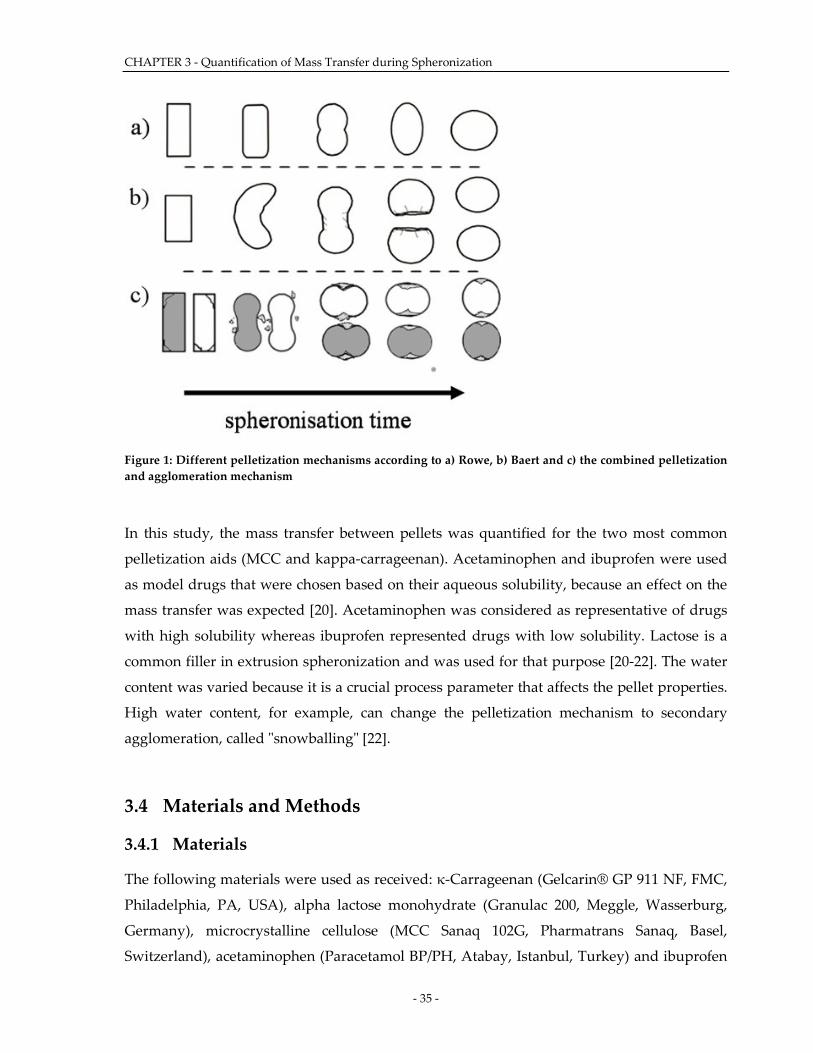
CHAPTER 3 - Quantification of Mass Transfer during Spheronization
- 35 -
Figure 1: Different pelletization mechanisms according to a) Rowe, b) Baert and c) the combined pelletization and agglomeration mechanism
In this study, the mass transfer between pellets was quantified for the two most common
pelletization aids (MCC and kappa-carrageenan). Acetaminophen and ibuprofen were used
as model drugs that were chosen based on their aqueous solubility, because an effect on the
mass transfer was expected [20]. Acetaminophen was considered as representative of drugs
with high solubility whereas ibuprofen represented drugs with low solubility. Lactose is a
common filler in extrusion spheronization and was used for that purpose [20-22]. The water
content was varied because it is a crucial process parameter that affects the pellet properties.
High water content, for example, can change the pelletization mechanism to secondary
agglomeration, called "snowballing" [22].
3.4 Materials and Methods
3.4.1 Materials
The following materials were used as received: κ-Carrageenan (Gelcarin® GP 911 NF, FMC,
Philadelphia, PA, USA), alpha lactose monohydrate (Granulac 200, Meggle, Wasserburg,
Germany), microcrystalline cellulose (MCC Sanaq 102G, Pharmatrans Sanaq, Basel,
Switzerland), acetaminophen (Paracetamol BP/PH, Atabay, Istanbul, Turkey) and ibuprofen
- 36 -
(Ibuprofen 50 FF, Losan Pharma GmbH, Neuenburg, Germany). All substances were
pharmaceutical grades, according to the pharmacopoeias.
3.4.2 Methods
3.4.2.1 Powder blending
The powder substances were weighed and blended for 15 min in a laboratory scale blender
(LM40, Bohle, Ennigerloh, Germany) at 25 rpm and transferred into the gravimetric powder
feeder (KT 20, K-Tron Soder, Niederlenz, Switzerland) of the extruder.
3.4.2.2 Extrusion/Spheronization
The twin-screw extruder (Mikro 27GL-28D, Leistritz, Nuremberg, Germany) was equipped
with an axial screen with 23 dies of 1 mm diameter and 2.5 mm length. The extrusion took
place at a constant powder feed rate of 30 g/min, with suitable liquid feed rate. 250 g of wet
extrudate were collected, sealed, and stored until spheronization. 250 g of extrudate with
and without drug (500 g total) were combined and spheronized (RM 300, Schlueter,
Neustadt/Ruebenberge, Germany) at 11.7 m/s tip speed for 5 min. Afterwards, the drying
step was carried out in a fluid bed apparatus (GPCG 1.1, Glatt, Dresden, Germany) for 10
min with an inlet air temperature of 55 °C.
3.4.2.3 Loss on Drying
Samples of 1 g were taken to analyse the water content. The samples were dried at 65 °C
under vacuum (<20 mbar) for 7 days [23] (Heraeus Vacutherm, Kendo, Hanau, Germany).
The water content was calculated with respect to the dry mass of the extrudates. The
determination was done in triplicate.
3.4.2.4 Image Analysis
The pellets were sieved with sieves of 0.8 mm and 2 mm apertures respectively. Statistically
representative samples were obtained from the yield fraction using a rotary cone sample
divider (Retschmuele PT, Retsch, Haan, Germany). Image analysis software (Qwin, Leica,
Cambridge, UK) was used to analyze images which were obtained using a system consisting
of a stereo microscope (Leica MZ 75, Cambridge, UK), a ring light with cold light source
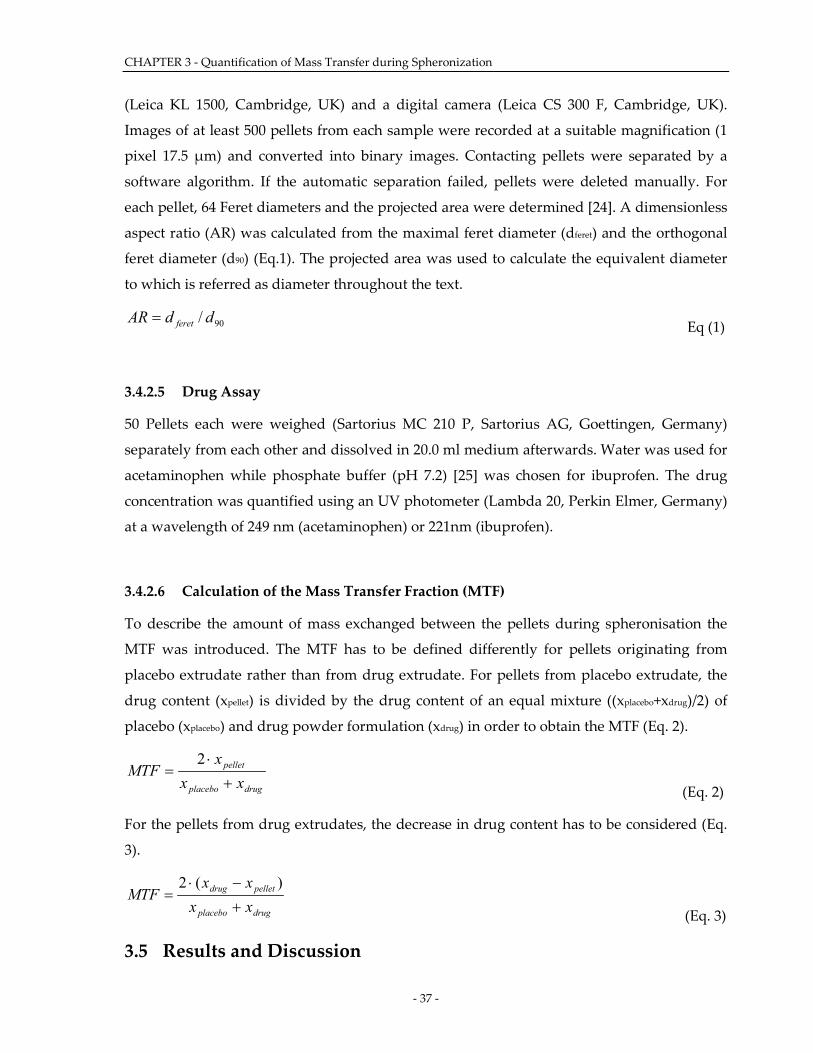
CHAPTER 3 - Quantification of Mass Transfer during Spheronization
- 37 -
(Leica KL 1500, Cambridge, UK) and a digital camera (Leica CS 300 F, Cambridge, UK).
Images of at least 500 pellets from each sample were recorded at a suitable magnification (1
pixel 17.5 µm) and converted into binary images. Contacting pellets were separated by a
software algorithm. If the automatic separation failed, pellets were deleted manually. For
each pellet, 64 Feret diameters and the projected area were determined [24]. A dimensionless
aspect ratio (AR) was calculated from the maximal feret diameter (dferet) and the orthogonal
feret diameter (d90) (Eq.1). The projected area was used to calculate the equivalent diameter
to which is referred as diameter throughout the text.
90/ ddAR feret= Eq (1)
3.4.2.5 Drug Assay
50 Pellets each were weighed (Sartorius MC 210 P, Sartorius AG, Goettingen, Germany)
separately from each other and dissolved in 20.0 ml medium afterwards. Water was used for
acetaminophen while phosphate buffer (pH 7.2) [25] was chosen for ibuprofen. The drug
concentration was quantified using an UV photometer (Lambda 20, Perkin Elmer, Germany)
at a wavelength of 249 nm (acetaminophen) or 221nm (ibuprofen).
3.4.2.6 Calculation of the Mass Transfer Fraction (MTF)
To describe the amount of mass exchanged between the pellets during spheronisation the
MTF was introduced. The MTF has to be defined differently for pellets originating from
placebo extrudate rather than from drug extrudate. For pellets from placebo extrudate, the
drug content (xpellet) is divided by the drug content of an equal mixture ((xplacebo+xdrug)/2) of
placebo (xplacebo) and drug powder formulation (xdrug) in order to obtain the MTF (Eq. 2).
drugplacebo
pellet
xxx
MTF+
⋅=
2
(Eq. 2)
For the pellets from drug extrudates, the decrease in drug content has to be considered (Eq.
3).
drugplacebo
pelletdrug
xxxx
MTF+−⋅
=)(2
(Eq. 3)
3.5 Results and Discussion
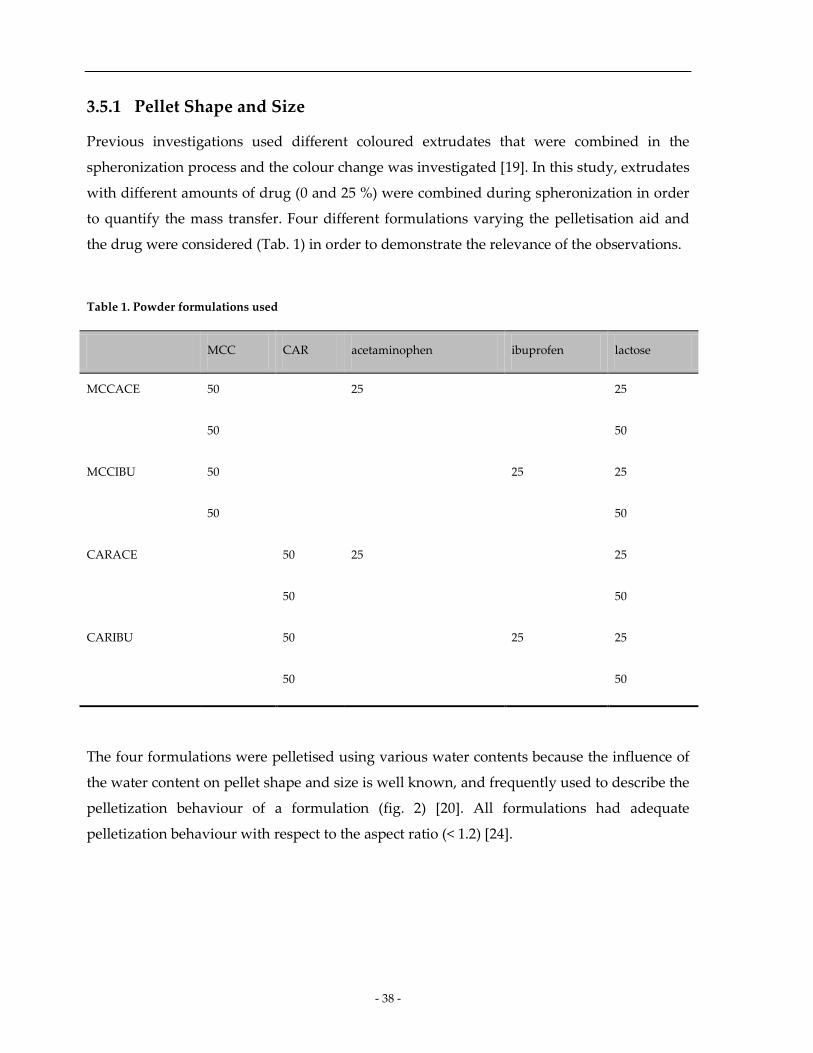
- 38 -
3.5.1 Pellet Shape and Size
Previous investigations used different coloured extrudates that were combined in the
spheronization process and the colour change was investigated [19]. In this study, extrudates
with different amounts of drug (0 and 25 %) were combined during spheronization in order
to quantify the mass transfer. Four different formulations varying the pelletisation aid and
the drug were considered (Tab. 1) in order to demonstrate the relevance of the observations.
Table 1. Powder formulations used
MCC CAR acetaminophen ibuprofen lactose
MCCACE 50 25 25
50 50
MCCIBU 50 25 25
50 50
CARACE 50 25 25
50 50
CARIBU 50 25 25
50 50
The four formulations were pelletised using various water contents because the influence of
the water content on pellet shape and size is well known, and frequently used to describe the
pelletization behaviour of a formulation (fig. 2) [20]. All formulations had adequate
pelletization behaviour with respect to the aspect ratio (< 1.2) [24].
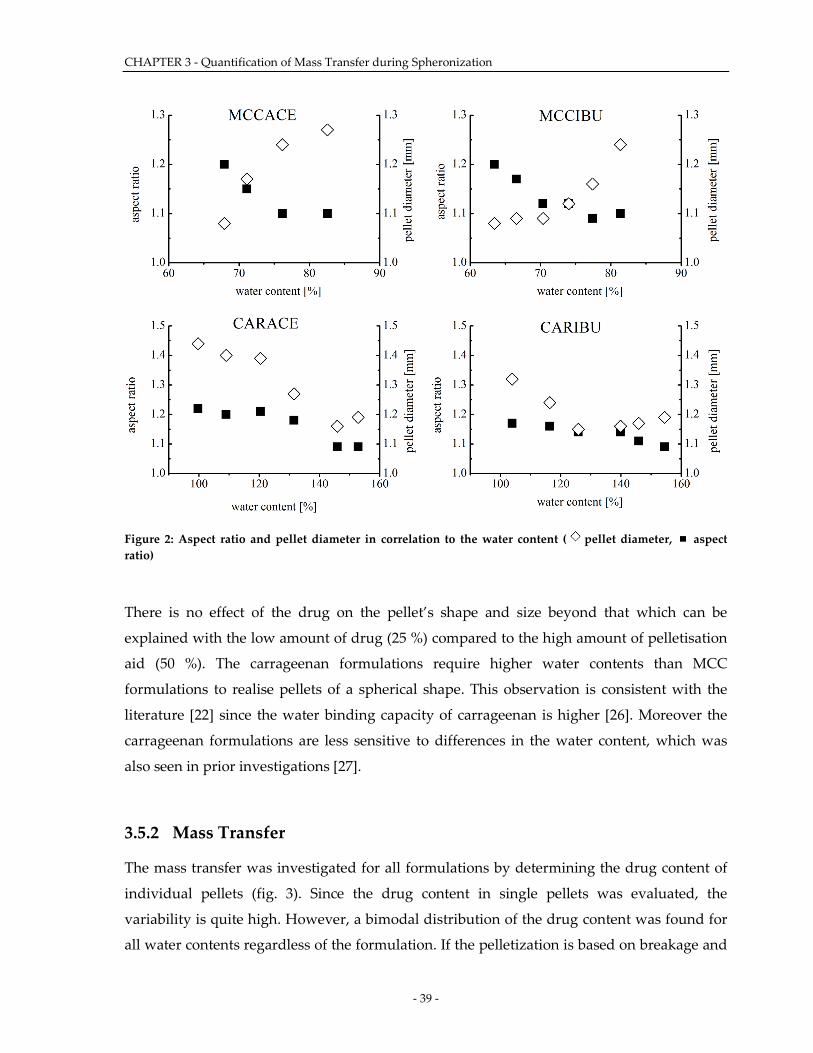
CHAPTER 3 - Quantification of Mass Transfer during Spheronization
- 39 -
Figure 2: Aspect ratio and pellet diameter in correlation to the water content ( pellet diameter, aspect ratio)
There is no effect of the drug on the pellet’s shape and size beyond that which can be
explained with the low amount of drug (25 %) compared to the high amount of pelletisation
aid (50 %). The carrageenan formulations require higher water contents than MCC
formulations to realise pellets of a spherical shape. This observation is consistent with the
literature [22] since the water binding capacity of carrageenan is higher [26]. Moreover the
carrageenan formulations are less sensitive to differences in the water content, which was
also seen in prior investigations [27].
3.5.2 Mass Transfer
The mass transfer was investigated for all formulations by determining the drug content of
individual pellets (fig. 3). Since the drug content in single pellets was evaluated, the
variability is quite high. However, a bimodal distribution of the drug content was found for
all water contents regardless of the formulation. If the pelletization is based on breakage and
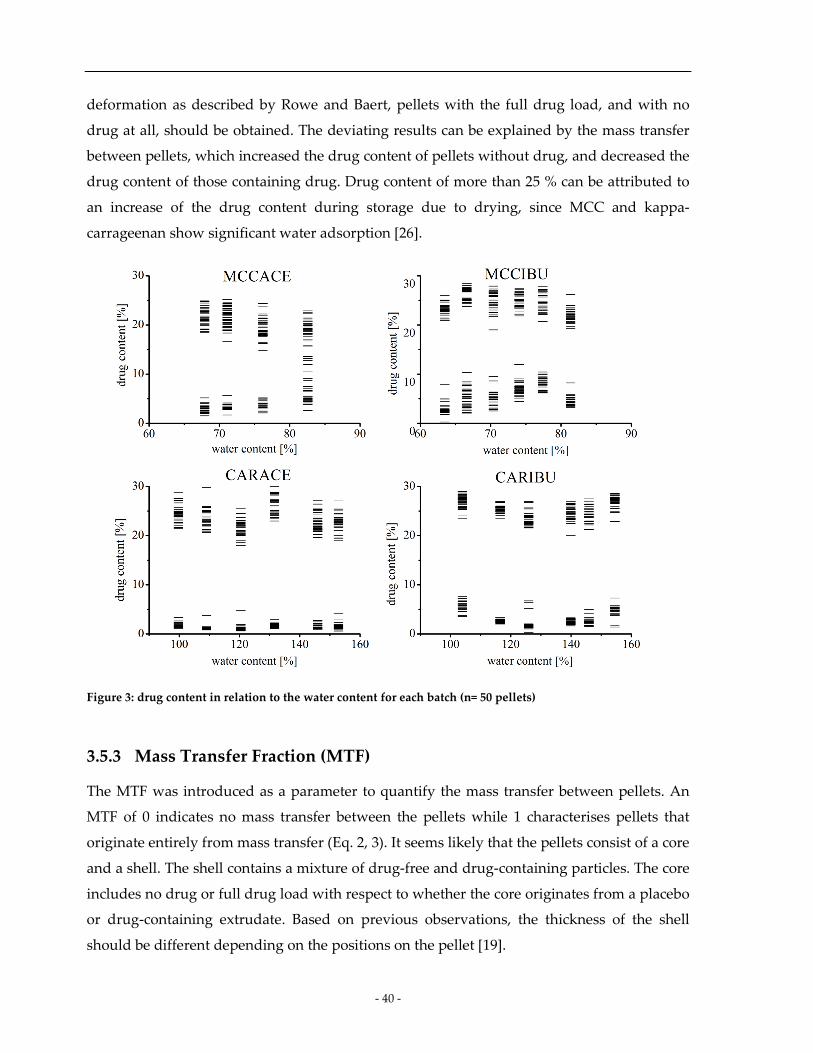
- 40 -
deformation as described by Rowe and Baert, pellets with the full drug load, and with no
drug at all, should be obtained. The deviating results can be explained by the mass transfer
between pellets, which increased the drug content of pellets without drug, and decreased the
drug content of those containing drug. Drug content of more than 25 % can be attributed to
an increase of the drug content during storage due to drying, since MCC and kappa-
carrageenan show significant water adsorption [26].
Figure 3: drug content in relation to the water content for each batch (n= 50 pellets)
3.5.3 Mass Transfer Fraction (MTF)
The MTF was introduced as a parameter to quantify the mass transfer between pellets. An
MTF of 0 indicates no mass transfer between the pellets while 1 characterises pellets that
originate entirely from mass transfer (Eq. 2, 3). It seems likely that the pellets consist of a core
and a shell. The shell contains a mixture of drug-free and drug-containing particles. The core
includes no drug or full drug load with respect to whether the core originates from a placebo
or drug-containing extrudate. Based on previous observations, the thickness of the shell
should be different depending on the positions on the pellet [19].
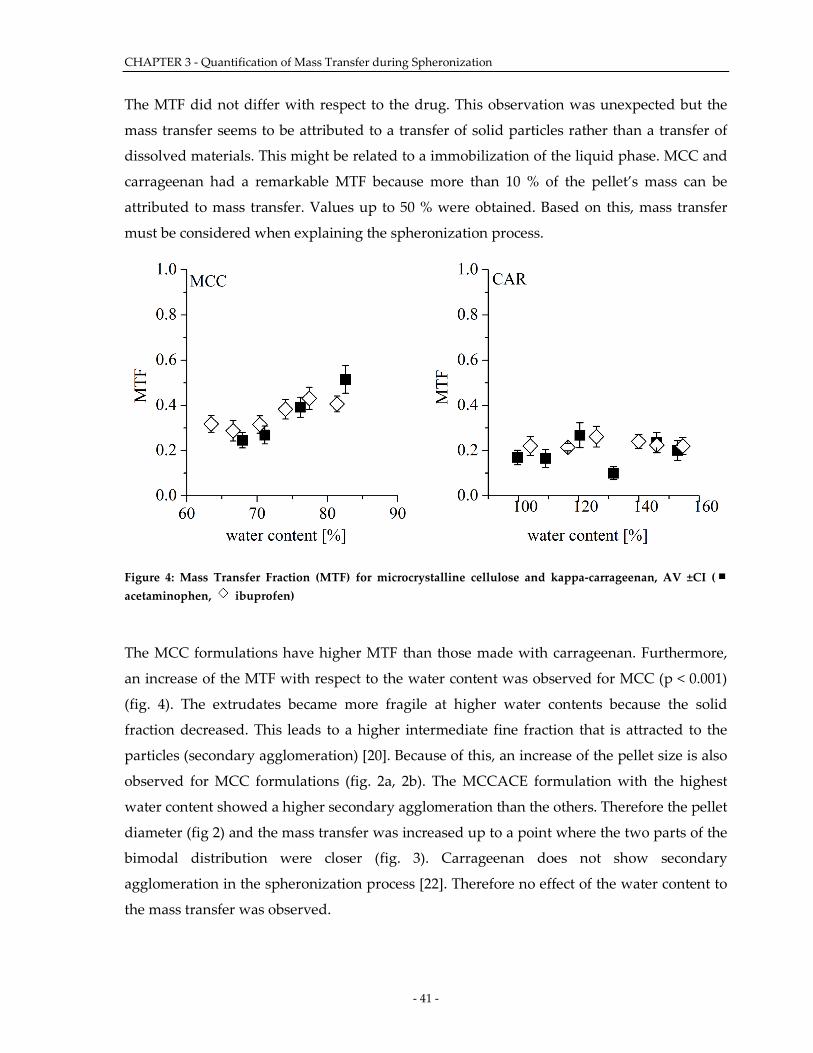
CHAPTER 3 - Quantification of Mass Transfer during Spheronization
- 41 -
The MTF did not differ with respect to the drug. This observation was unexpected but the
mass transfer seems to be attributed to a transfer of solid particles rather than a transfer of
dissolved materials. This might be related to a immobilization of the liquid phase. MCC and
carrageenan had a remarkable MTF because more than 10 % of the pellet’s mass can be
attributed to mass transfer. Values up to 50 % were obtained. Based on this, mass transfer
must be considered when explaining the spheronization process.
Figure 4: Mass Transfer Fraction (MTF) for microcrystalline cellulose and kappa-carrageenan, AV ±CI ( acetaminophen, ibuprofen)
The MCC formulations have higher MTF than those made with carrageenan. Furthermore,
an increase of the MTF with respect to the water content was observed for MCC (p < 0.001)
(fig. 4). The extrudates became more fragile at higher water contents because the solid
fraction decreased. This leads to a higher intermediate fine fraction that is attracted to the
particles (secondary agglomeration) [20]. Because of this, an increase of the pellet size is also
observed for MCC formulations (fig. 2a, 2b). The MCCACE formulation with the highest
water content showed a higher secondary agglomeration than the others. Therefore the pellet
diameter (fig 2) and the mass transfer was increased up to a point where the two parts of the
bimodal distribution were closer (fig. 3). Carrageenan does not show secondary
agglomeration in the spheronization process [22]. Therefore no effect of the water content to
the mass transfer was observed.
- 42 -
3.6 Conclusion
The mass transfer between pellets was investigated in this study using different formulations
and various water contents. The Mass Transfer Fraction (MTF) was introduced as a novel
parameter for quantification. All formulations had a significant MTF that ranged from 10 %
to 52 %. Due to this fact, it is indispensable to consider mass transfer as one major
pelletization mechanism. A correlation between the water content and the amount of mass
transferred could be observed for microcrystalline cellulose, which was attributed to
secondary agglomeration
3.7 Acknowledgements
We gratefully acknowledge Meggle (Wasserburg, Germany) and Pharmatrans SANAQ
(Basel, Switzerland) for donating materials, and the assistance of Elizabeth Ely (EIES,
Lafayette IN, USA) in preparing the manuscript.
3.8 References
1) Ghebre Sellassie I. Pellets: a general overview. In: Ghebre Sellassie I. Pharmaceutical
Pelletization Technology. New York: Marcel Dekker Inc; 1989. pp.1-14
2) Conine JW Hadley H. Preparation of small solid pharmaceutical spheres. Drug Cosmed
Ind. 1970;106:38-40
3) Reynolds AD. A New technique for the production of spherical particles. Mfg Chem.
Aerosol News.1970;41:40-43
4) Erkoboni DF. Extrusion-Spheronisation as a granulation Technique. In: Parikh, DM.
Handbook of pharmaceutical granulation technology. New York: Marcel Dekker Inc.;1997.
pp. 334-365
5) Erkoboni DF. Extrusion/Spheronization. In: Ghebre Sellassie I, Martin C. Pharmaceutical
Extrusion Technology. New York: Marcel Dekker Inc.;2003. pp. 277-318
6) Dukic-Ott A. Thommes M. Remon JP. Kleinebudde P. Vervaet C. Production of pellets via
extrusion-spheronisation without the incorporation of microcrystalline cellulose: A critical
review. European Journal of Pharmaceutics and Biopharmaceutics. 2009;71:38-46
CHAPTER 3 - Quantification of Mass Transfer during Spheronization
- 43 -
7) Lindner H. Kleinebudde P. Use of powdered cellulose for the production of pellets by
extrusion/spheronisation. J. Pharm. Pharmacol. 1994;46:2-7
8) O'Connor RE. Holinej J. Schwartz JB. Spheronization I: processing and evaluation of
spheres prepared of commercially available excipients. Am. J. 1984;156:80-87
9) Agrawal AM. Howard AM. Neau SH. Extruded and spheronized beads containing no
microcrystalline cellulose: influence of formulation and process variables. Pharm. Dev. Tech.
2004;9:197–217
10) Chatlapalli R. Rohera BD. Physical characterization of HPMC and HEC and investigation
of their use as pelletization aids. Int. J. Pharm. 1998;161:179-193
11) Baert L. Vermeersch H. Remon JP. Smeyers-Verbeke J. Massart DL. Study of parameters
important in the spheronisation process. International Journal of Pharmaceutics. 1996;96:225-
229
12) Schmidt C. Kleinebudde P. Comparison between a twin-screw extruder and a rotary ring
die press. Part II: influence of process variables. European Journal of Pharmaceutics and
Biopharmaceutics. 1998;45:173-179
13) Schröder M. Kleinebudde P. Development of disintegrating pellets obtained from
extrusion/spheronisation. Pharm. Sci. 1995:415-418
14) Wan LSC. Heng PWS. Liew VC. Spheronisation conditions on spheroid shape and size.
International Journal of Pharmaceutics.1993;96:59-65
15) Newton JM. Chapman SR. Rowe RC. The influence of process variables on the
preparation and properties of spherical granules by the process of extrusion and
spheronisation. International Journal of Pharmaceutics. 1995;120:101-109
16) Rowe RC. Spheronisation: a new pill-making process?. Pharm. Int. 1985;6:119-123
17) Baert L. Vervaet C. Remon JP. Extrusion-spheronisation A literature review. International
Journal of Pharmaceutics. 1995;116:131-146
18) Liew VC. Chua SM. Heng, PWS. Elucidation of Spheroid Formation With and Without
the Extrusion Step. AAPS PharmSciTech. 2007;8
19) Koester M. Thommes M. New Insights into the Pelletization Mechanism by
Extrusion/Spheronization. AAPS PharmSciTech. 2010;11:1549-1551
- 44 -
20) Lustig-Gustafsson C. Kaur Johal H. Podczeck F. Newton JM. The influence of water
content and drug solubility on the formulation of pellets by extrusion and spheronisation.
European Journal of Pharmaceutical Sciences. 1999;8:147-152
21) Thommes M. Kleinebudde P. Use of k-carrageenan as alternative pelletisation aid to
microcrystalline cellulose in extrusion/spheronisation. II. Influence of drug and filler type.
European Journal of Pharmaceutics and Biopharmaceutics. 2005;63:68-75
22) Bornhöft M. Thommes M. Kleinebudde P. Preliminary assessment of carrageenan as
excipient for extrusion/spheronisation. European Journal of Pharmaceutics and
Biopharmaceutics. 2005;59:127-131
23) Thommes M. Kleinebudde P. Properties of Pellets Manufactured by Wet Extrusion
Spheronization Process Using κ-Carrageenan: Effect of Process Parameters. AAPS
PharmSciTech. 2007;8:95
24) Lindner H. Kleinebudde P. Characterization of pellets by means of autonomic image
analysis. Pharmazeutische Industrie. 1993;55: 694-701
25) The United States Pharmacopeial Convention. Buffer Solutions. In: The United States
Pharmacopeia. Rockville. 2008. pp. 813.
26) Thommes M. Ely DR. Kleinebudde P. The water binding behavior of kappa-Carrageenan
determined by three different methods. Pharmaceutical Development an Technology.
2009;14:249-258
27) Thommes M. Kleinebudde P. The behavior of different carrageenans in pelletization by
extrusion/spheronization. Pharmaceutical Development and Technology. 2008;13:27-35
CHAPTER 4 - Systematic Evaluations Regarding Interparticular Mass Transfer in Spheronization
- 45 -
4 CHAPTER 4 - Systematic Evaluations Regarding
Interparticular Mass Transfer in Spheronization
4.1 Pretext
The following work was published in April 2012 in the International Journal of
Pharmaceutics (impact factor 2010: 3.607). The concept of mass transfer discussed in the
previous papers was investigated for three different pelletization aids and multiple time
steps in order to gain new knowledge about the time dependent processes during
spheronization. In addition to the time dependence of the spheronization, the storage
conditions for wet extrudates were investigated to check for possible influences on the
product quality.
The first author of this paper, Martin Koester, is responsible for the concept of the
expriments as well as their evaluation and writing of the manuscript. Emilie Willemsen is
responsible for the experiments, as a part of a master thesis at the Laboratory of
Pharmaceutical Technology (Ghent, Belgium). Dr. Cornelia Krueger is responsible for a part
of the concept of the manuscript and Dr. Markus Thommes, listed as senior author, is
responsible for concept, ideas and revision of the manuscript.
Submitted 2 February 2012
Revised 29 March 2012
Accepted 16 April 2012
Published online 23 April 2012
Cite as: Volume 11, Issue 4, Pages 1549-1551, DOI: 10.1208/s12249-010-9532-7
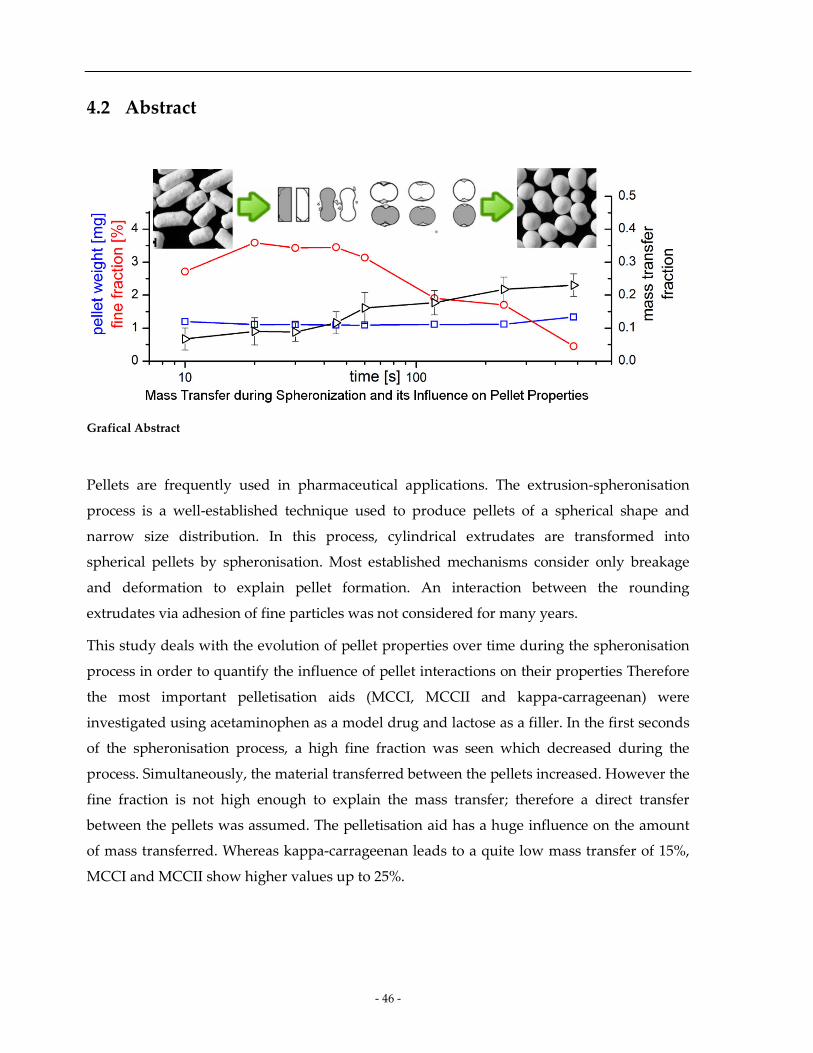
- 46 -
4.2 Abstract
Grafical Abstract
Pellets are frequently used in pharmaceutical applications. The extrusion-spheronisation
process is a well-established technique used to produce pellets of a spherical shape and
narrow size distribution. In this process, cylindrical extrudates are transformed into
spherical pellets by spheronisation. Most established mechanisms consider only breakage
and deformation to explain pellet formation. An interaction between the rounding
extrudates via adhesion of fine particles was not considered for many years.
This study deals with the evolution of pellet properties over time during the spheronisation
process in order to quantify the influence of pellet interactions on their properties Therefore
the most important pelletisation aids (MCCI, MCCII and kappa-carrageenan) were
investigated using acetaminophen as a model drug and lactose as a filler. In the first seconds
of the spheronisation process, a high fine fraction was seen which decreased during the
process. Simultaneously, the material transferred between the pellets increased. However the
fine fraction is not high enough to explain the mass transfer; therefore a direct transfer
between the pellets was assumed. The pelletisation aid has a huge influence on the amount
of mass transferred. Whereas kappa-carrageenan leads to a quite low mass transfer of 15%,
MCCI and MCCII show higher values up to 25%.
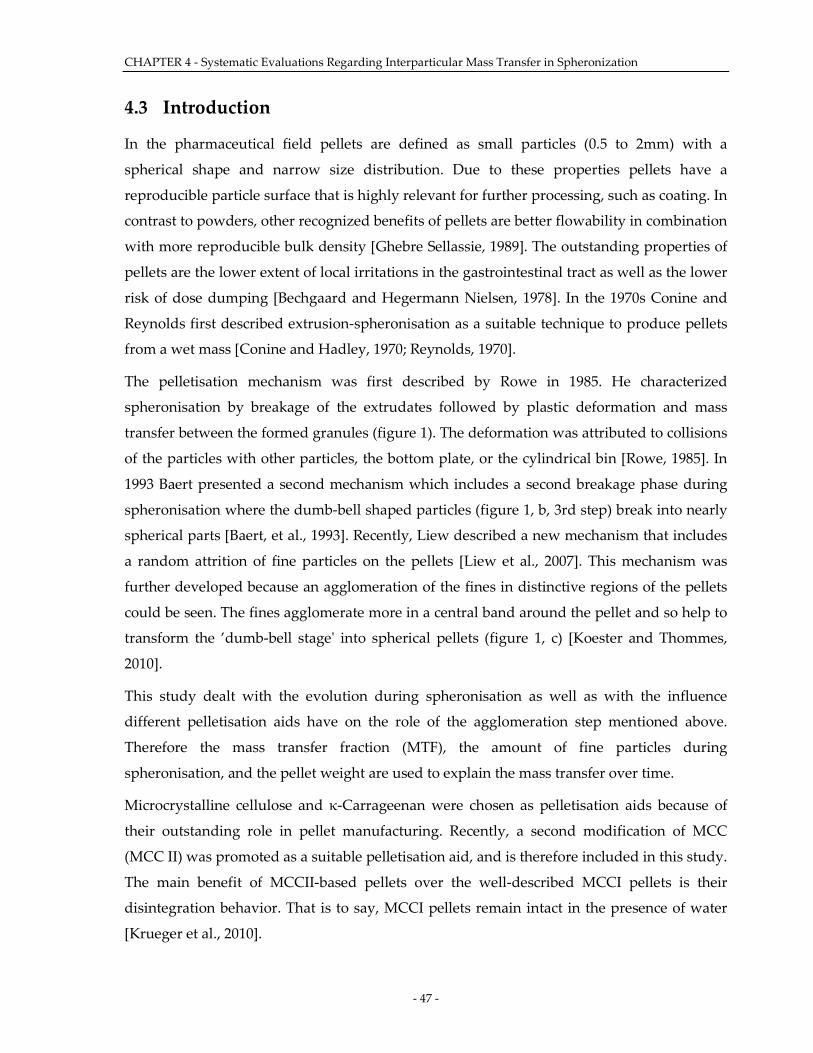
CHAPTER 4 - Systematic Evaluations Regarding Interparticular Mass Transfer in Spheronization
- 47 -
4.3 Introduction
In the pharmaceutical field pellets are defined as small particles (0.5 to 2mm) with a
spherical shape and narrow size distribution. Due to these properties pellets have a
reproducible particle surface that is highly relevant for further processing, such as coating. In
contrast to powders, other recognized benefits of pellets are better flowability in combination
with more reproducible bulk density [Ghebre Sellassie, 1989]. The outstanding properties of
pellets are the lower extent of local irritations in the gastrointestinal tract as well as the lower
risk of dose dumping [Bechgaard and Hegermann Nielsen, 1978]. In the 1970s Conine and
Reynolds first described extrusion-spheronisation as a suitable technique to produce pellets
from a wet mass [Conine and Hadley, 1970; Reynolds, 1970].
The pelletisation mechanism was first described by Rowe in 1985. He characterized
spheronisation by breakage of the extrudates followed by plastic deformation and mass
transfer between the formed granules (figure 1). The deformation was attributed to collisions
of the particles with other particles, the bottom plate, or the cylindrical bin [Rowe, 1985]. In
1993 Baert presented a second mechanism which includes a second breakage phase during
spheronisation where the dumb-bell shaped particles (figure 1, b, 3rd step) break into nearly
spherical parts [Baert, et al., 1993]. Recently, Liew described a new mechanism that includes
a random attrition of fine particles on the pellets [Liew et al., 2007]. This mechanism was
further developed because an agglomeration of the fines in distinctive regions of the pellets
could be seen. The fines agglomerate more in a central band around the pellet and so help to
transform the ’dumb-bell stage' into spherical pellets (figure 1, c) [Koester and Thommes,
2010].
This study dealt with the evolution during spheronisation as well as with the influence
different pelletisation aids have on the role of the agglomeration step mentioned above.
Therefore the mass transfer fraction (MTF), the amount of fine particles during
spheronisation, and the pellet weight are used to explain the mass transfer over time.
Microcrystalline cellulose and κ-Carrageenan were chosen as pelletisation aids because of
their outstanding role in pellet manufacturing. Recently, a second modification of MCC
(MCC II) was promoted as a suitable pelletisation aid, and is therefore included in this study.
The main benefit of MCCII-based pellets over the well-described MCCI pellets is their
disintegration behavior. That is to say, MCCI pellets remain intact in the presence of water
[Krueger et al., 2010].
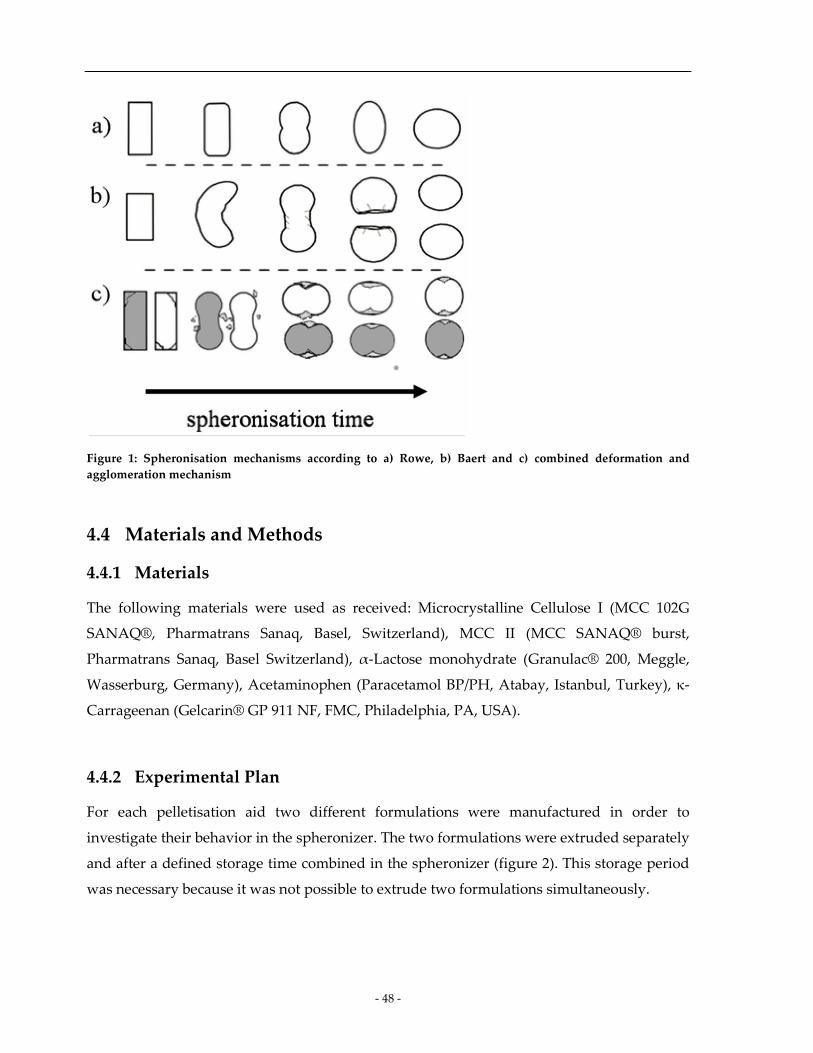
- 48 -
Figure 1: Spheronisation mechanisms according to a) Rowe, b) Baert and c) combined deformation and agglomeration mechanism
4.4 Materials and Methods
4.4.1 Materials
The following materials were used as received: Microcrystalline Cellulose I (MCC 102G
SANAQ®, Pharmatrans Sanaq, Basel, Switzerland), MCC II (MCC SANAQ® burst,
Pharmatrans Sanaq, Basel Switzerland), α-Lactose monohydrate (Granulac® 200, Meggle,
Wasserburg, Germany), Acetaminophen (Paracetamol BP/PH, Atabay, Istanbul, Turkey), κ-
Carrageenan (Gelcarin® GP 911 NF, FMC, Philadelphia, PA, USA).
4.4.2 Experimental Plan
For each pelletisation aid two different formulations were manufactured in order to
investigate their behavior in the spheronizer. The two formulations were extruded separately
and after a defined storage time combined in the spheronizer (figure 2). This storage period
was necessary because it was not possible to extrude two formulations simultaneously.
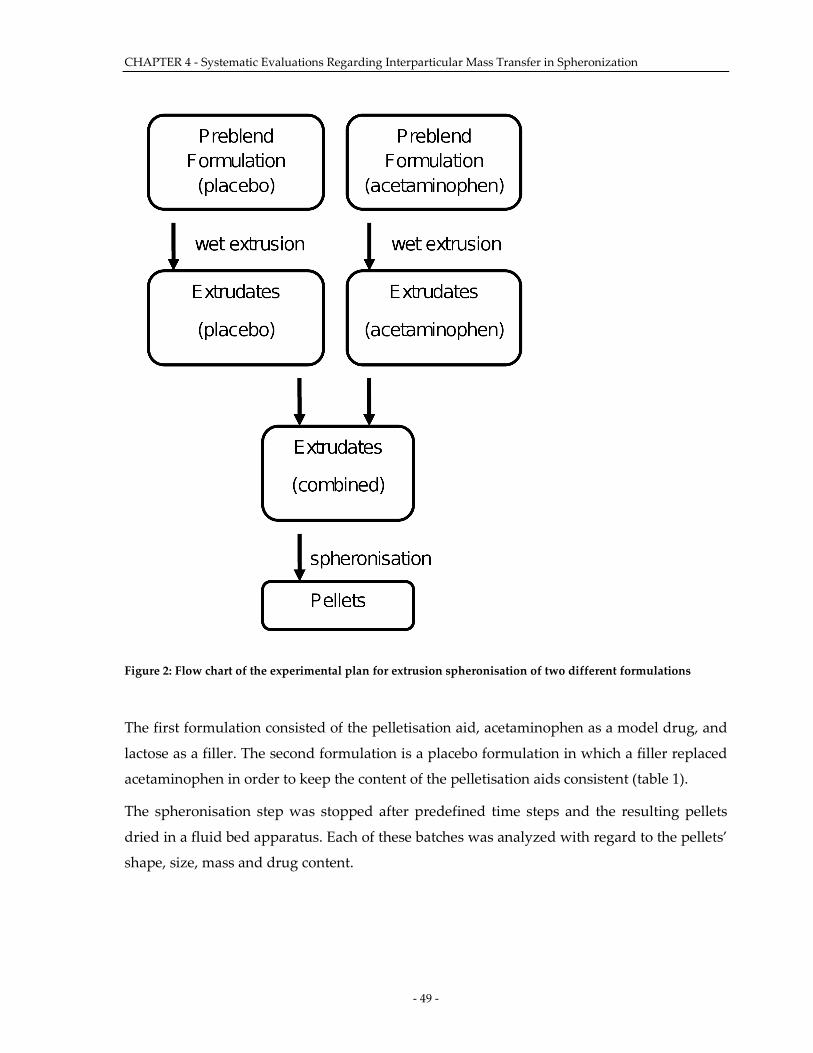
CHAPTER 4 - Systematic Evaluations Regarding Interparticular Mass Transfer in Spheronization
- 49 -
Figure 2: Flow chart of the experimental plan for extrusion spheronisation of two different formulations
The first formulation consisted of the pelletisation aid, acetaminophen as a model drug, and
lactose as a filler. The second formulation is a placebo formulation in which a filler replaced
acetaminophen in order to keep the content of the pelletisation aids consistent (table 1).
The spheronisation step was stopped after predefined time steps and the resulting pellets
dried in a fluid bed apparatus. Each of these batches was analyzed with regard to the pellets’
shape, size, mass and drug content.
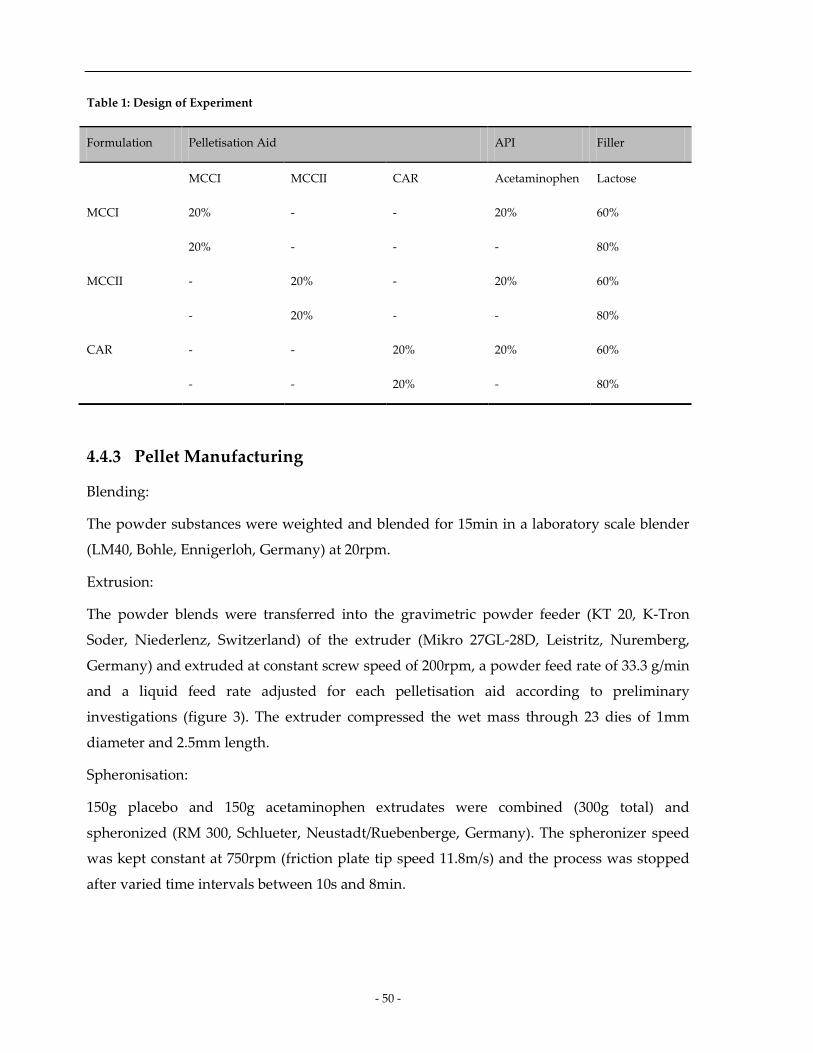
- 50 -
Table 1: Design of Experiment
Formulation Pelletisation Aid API Filler
MCCI MCCII CAR Acetaminophen Lactose
MCCI 20% - - 20% 60%
20% - - - 80%
MCCII - 20% - 20% 60%
- 20% - - 80%
CAR - - 20% 20% 60%
- - 20% - 80%
4.4.3 Pellet Manufacturing
Blending:
The powder substances were weighted and blended for 15min in a laboratory scale blender
(LM40, Bohle, Ennigerloh, Germany) at 20rpm.
Extrusion:
The powder blends were transferred into the gravimetric powder feeder (KT 20, K-Tron
Soder, Niederlenz, Switzerland) of the extruder (Mikro 27GL-28D, Leistritz, Nuremberg,
Germany) and extruded at constant screw speed of 200rpm, a powder feed rate of 33.3 g/min
and a liquid feed rate adjusted for each pelletisation aid according to preliminary
investigations (figure 3). The extruder compressed the wet mass through 23 dies of 1mm
diameter and 2.5mm length.
Spheronisation:
150g placebo and 150g acetaminophen extrudates were combined (300g total) and
spheronized (RM 300, Schlueter, Neustadt/Ruebenberge, Germany). The spheronizer speed
was kept constant at 750rpm (friction plate tip speed 11.8m/s) and the process was stopped
after varied time intervals between 10s and 8min.
CHAPTER 4 - Systematic Evaluations Regarding Interparticular Mass Transfer in Spheronization
- 51 -
Drying:
After spheronisation the pellets were dried in a fluid bed dryer (GPCG 1.1, Glatt, Dresden,
Germany). The inlet air temperature was 70°C and pellets were dried up to a product
temperature of 45°C. To reach this a drying time of 10min was needed.
4.4.4 Analytics
4.4.4.1 Loss on Drying
Samples of approx. 1g were taken during extrusion to analyze the water content. These
samples were dried at 65 °C under vacuum (<20 mbar) for 7 days [Thommes and
Kleinebudde, 2007] (Heraeus Vacutherm, Kendo, Hanau, Germany). The water content was
calculated as the amount of water (mwet - mdry) with respect to the dry mass (mdry) of the
extrudates (equation 1). The determination was done in triplicate.
drydrywet mmmcontentwater /)( −= Equation 1
4.4.4.2 Grading
The dried pellets were classified using sieve cuts. The class below 630µm is referred to as
fine fraction, the class above 2000µm as secondary agglomerates, and the range in between
as yield fraction. This yield fraction was divided into multiple samples using a rotary cone
sample divider (Retschmuele PT, Retsch, Haan, Germany). Samples of approximately 500
pellets were used for further analysis.
4.4.4.3 Image Analysis
Aspect ratio:
Each of these 500 pellet samples was photographed using a stereo microscope (Leica MZ 75,
Cambridge, UK), a ring light with cold light source (Leica KL 1500, Cambridge, UK) and a
digital camera (Leica CS 300 F, Cambridge, UK). These images were processed with image
analysis software (Qwin, Leica, Cambridge, UK) that calculated 64 feret diameters and the
projected area for each pellet. The aspect ratio was calculated from the maximum feret
diameter (dferet_max) and the diameter orthogonal (d90) to it (equation 2).
- 52 -
90max_ / ddAR feret= Equation 2
Equivalent diameter:
The equivalent diameter is determined as the diameter of a circle with the same area as the
pellets 2d projection taken from the image analysis.
10% Interval:
A 10% Interval was defined to characterize the homogeneity in particle size. It describes the
fraction of pellets within the interval 90% to 110% of the dimensionless diameter [Thommes
and Kleinebudde, 2005a].
Pellet weight:
The average weight was determined by weighting 20g of pellets of each batch and the
counting them with a Camsizer® (Retsch, Haan, Germany).
4.4.4.4 Porosity
The helium density (ρHe) was determined using a helium pycnometer (AccuPyc,
Micrometrics, Moenchengladbach, Germany). The apparent density (ρHg) was determined
with a mercury porosimeter (Pascal140, Thermo Fisher, Milan, Italy) at a pressure of 0.1
MPa. The porosity (εp) was calculated using equation 3.
εp = (1 - ρHg / ρHe ) 100% Equation 3
4.4.4.5 Content Uniformity
To determine content uniformity, 50 pellets of each batch were weighed separately (Sartorius
MC 210 P, Sartorius AG, Goettingen, Germany) and dissolved in 20.0 ml of water. After 24
hours, the acetaminophen concentration was determined using a UV photometer (Lambda
20, Perkin Elmer, Germany) at a wavelength of 249 nm [USP, 2008].
4.4.4.6 Mass Transfer Fraction
A mass transfer fraction (MTF) was calculated [Koester, 2011]. For pellets from the placebo
extrudate, the drug content (xpellet) was divided by the drug content of an equal mixture of
placebo (xplacebo) and drug powder formulation (xdrug) in order to obtain the MTF (equation 4).
MTF = 2 xpellet / (xplacebo + xdrug) Equation 4
CHAPTER 4 - Systematic Evaluations Regarding Interparticular Mass Transfer in Spheronization
- 53 -
For the pellets from drug extrudates, the decrease in drug content must be considered
(equation 5).
MTF = 2 (xdrug – xpellet ) / (xplacebo + xdrug) Equation 5
4.5 Results and Discussion
4.5.1 Preliminary Studies
The water content of the extruded mass is a crucial parameter affecting the pellet shape and
size [Erkoboni, 2003]. Therefore an optimal water content was determined, resulting in
pellets with the lowest aspect ratio (figure 3). The MCCI formulation shows a decrease of the
aspect ratio with an increase of the water content up to 42%. Above this water content, an
increase of the aspect ratio as well as a remarkable increase in particle size was observed.
According to the literature [Erkoboni, 2003] this can be explained by the characteristic
properties of the wetted MCCI mass. At low water contents the mass breaks, but is then too
dry to be plastically deformed in the spheronizer, resulting in short sticks or dumb-bell-
shaped particles. Coming closer to the optimal water content, the mass is more easily
deformable, and fines can agglomerate on the wet extrudates. Increasing the water content
more and exceeding the optimal range causes the particles to get stickier. Because of this,
fines not only agglomerate on the particles, but multiple particles coalesce into larger particle
agglomerates. This can be seen by the increase of the pellets’ equivalent diameter, as well as
an increase in the aspect ratio.
The MCCII-based formulation undergoes the same principle when increasing the water
content. If under-wetted, the extrudates are too rigid to spheronize, but remain in a dumb-
bell shape. If over-wetted, the mass is too sticky and starts forming secondary agglomerates
of larger size and reduced roundness. In contrast to MCCI, the optimal water content is
reached at lower values (35%) and the powder formulation reacts less robust to changes in
the water content. This effect was already described by Krueger [Krueger et al., 2011].
The k-carrageenan-based formulation shows a trend similar to the MCC formulations, but at
higher water contents. The aspect ratio decreases when increasing the water content. At high
water contents (above 50%) k-carrageenan behaved differently from the MCC formulations:
the aspect ratio and the mean pellet diameter did not increase with an increase in water
content. This indicates a missing second agglomeration phase as shown for the MCC
formulations. It can be concluded, in agreement with the literature, that k-carrageenan has a
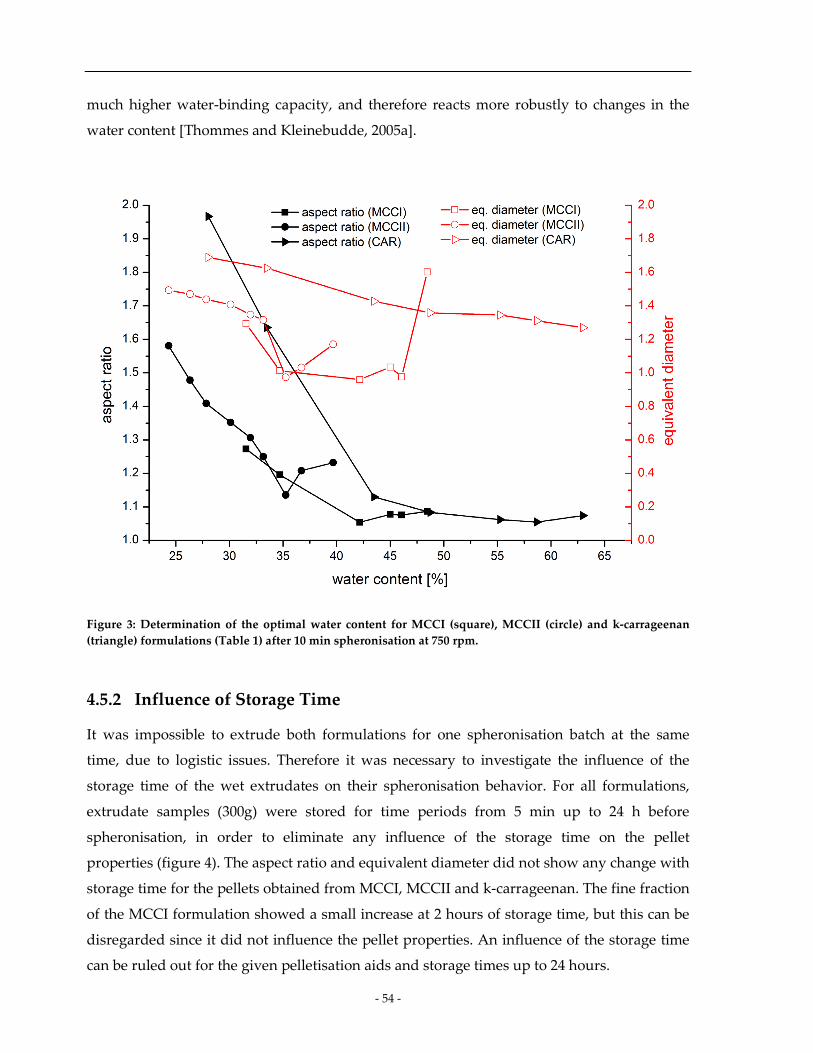
- 54 -
much higher water-binding capacity, and therefore reacts more robustly to changes in the
water content [Thommes and Kleinebudde, 2005a].
Figure 3: Determination of the optimal water content for MCCI (square), MCCII (circle) and k-carrageenan (triangle) formulations (Table 1) after 10 min spheronisation at 750 rpm.
4.5.2 Influence of Storage Time
It was impossible to extrude both formulations for one spheronisation batch at the same
time, due to logistic issues. Therefore it was necessary to investigate the influence of the
storage time of the wet extrudates on their spheronisation behavior. For all formulations,
extrudate samples (300g) were stored for time periods from 5 min up to 24 h before
spheronisation, in order to eliminate any influence of the storage time on the pellet
properties (figure 4). The aspect ratio and equivalent diameter did not show any change with
storage time for the pellets obtained from MCCI, MCCII and k-carrageenan. The fine fraction
of the MCCI formulation showed a small increase at 2 hours of storage time, but this can be
disregarded since it did not influence the pellet properties. An influence of the storage time
can be ruled out for the given pelletisation aids and storage times up to 24 hours.
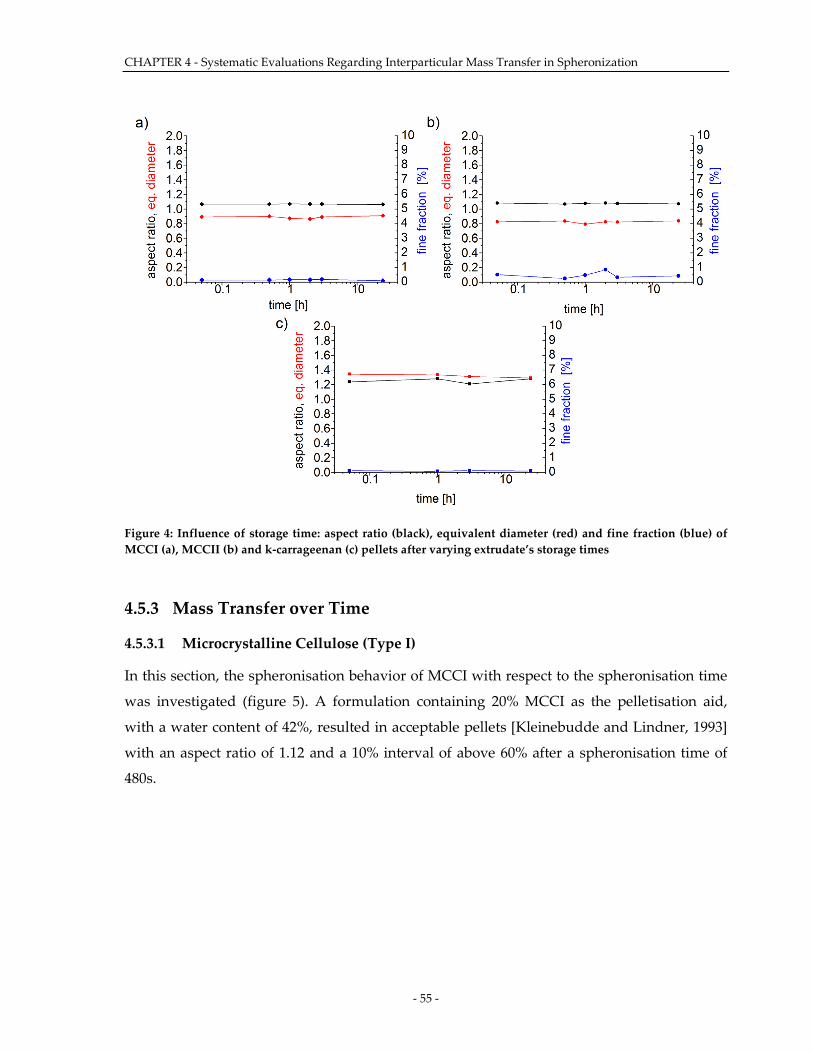
CHAPTER 4 - Systematic Evaluations Regarding Interparticular Mass Transfer in Spheronization
- 55 -
Figure 4: Influence of storage time: aspect ratio (black), equivalent diameter (red) and fine fraction (blue) of MCCI (a), MCCII (b) and k-carrageenan (c) pellets after varying extrudate’s storage times
4.5.3 Mass Transfer over Time
4.5.3.1 Microcrystalline Cellulose (Type I)
In this section, the spheronisation behavior of MCCI with respect to the spheronisation time
was investigated (figure 5). A formulation containing 20% MCCI as the pelletisation aid,
with a water content of 42%, resulted in acceptable pellets [Kleinebudde and Lindner, 1993]
with an aspect ratio of 1.12 and a 10% interval of above 60% after a spheronisation time of
480s.
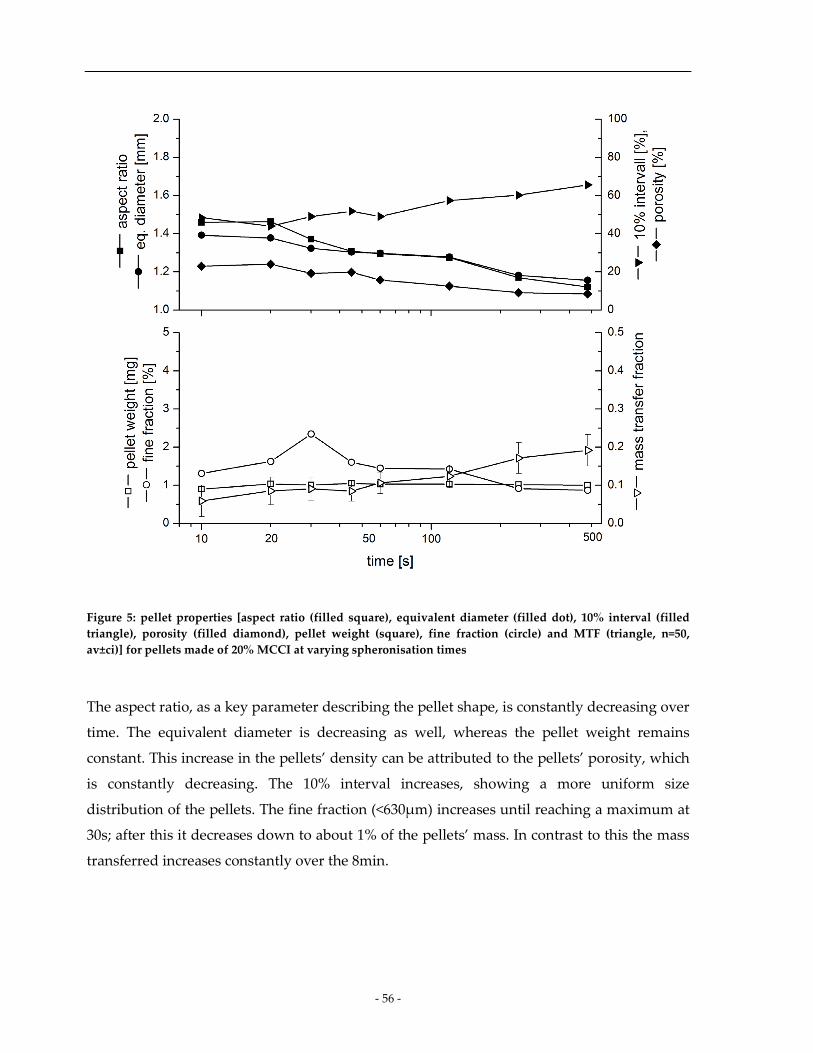
- 56 -
Figure 5: pellet properties [aspect ratio (filled square), equivalent diameter (filled dot), 10% interval (filled triangle), porosity (filled diamond), pellet weight (square), fine fraction (circle) and MTF (triangle, n=50, av±ci)] for pellets made of 20% MCCI at varying spheronisation times
The aspect ratio, as a key parameter describing the pellet shape, is constantly decreasing over
time. The equivalent diameter is decreasing as well, whereas the pellet weight remains
constant. This increase in the pellets’ density can be attributed to the pellets’ porosity, which
is constantly decreasing. The 10% interval increases, showing a more uniform size
distribution of the pellets. The fine fraction (<630µm) increases until reaching a maximum at
30s; after this it decreases down to about 1% of the pellets’ mass. In contrast to this the mass
transferred increases constantly over the 8min.
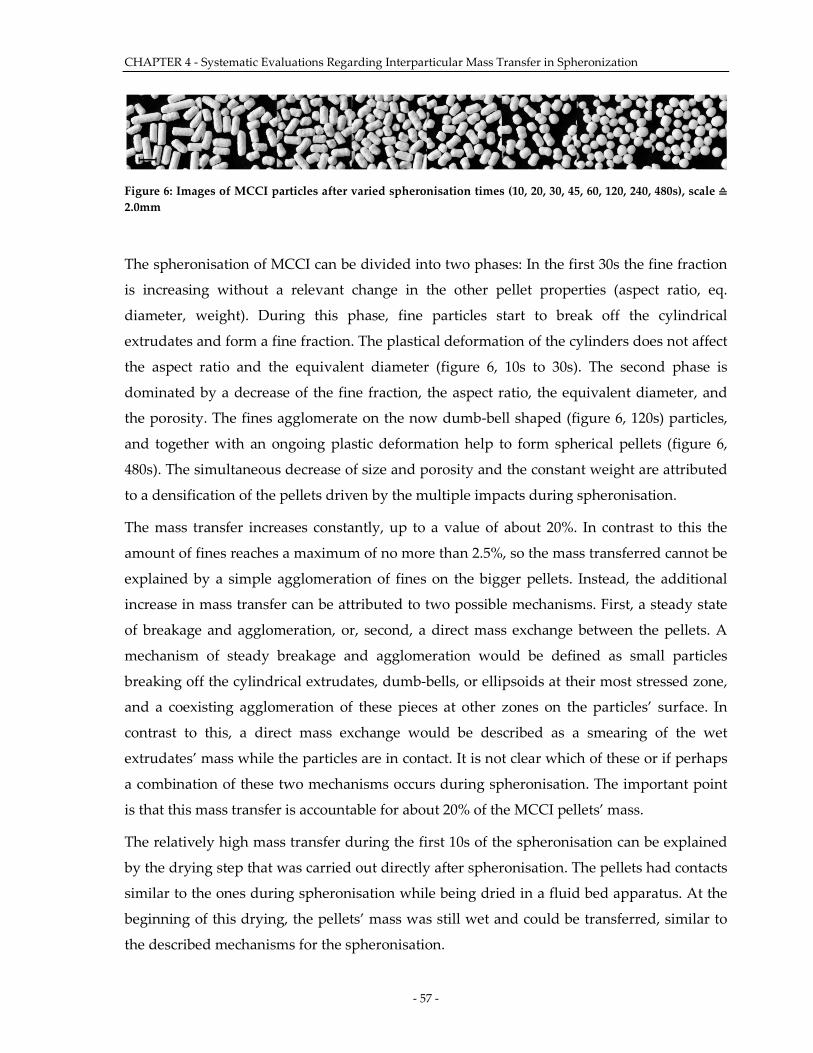
CHAPTER 4 - Systematic Evaluations Regarding Interparticular Mass Transfer in Spheronization
- 57 -
Figure 6: Images of MCCI particles after varied spheronisation times (10, 20, 30, 45, 60, 120, 240, 480s), scale ≙ 2.0mm
The spheronisation of MCCI can be divided into two phases: In the first 30s the fine fraction
is increasing without a relevant change in the other pellet properties (aspect ratio, eq.
diameter, weight). During this phase, fine particles start to break off the cylindrical
extrudates and form a fine fraction. The plastical deformation of the cylinders does not affect
the aspect ratio and the equivalent diameter (figure 6, 10s to 30s). The second phase is
dominated by a decrease of the fine fraction, the aspect ratio, the equivalent diameter, and
the porosity. The fines agglomerate on the now dumb-bell shaped (figure 6, 120s) particles,
and together with an ongoing plastic deformation help to form spherical pellets (figure 6,
480s). The simultaneous decrease of size and porosity and the constant weight are attributed
to a densification of the pellets driven by the multiple impacts during spheronisation.
The mass transfer increases constantly, up to a value of about 20%. In contrast to this the
amount of fines reaches a maximum of no more than 2.5%, so the mass transferred cannot be
explained by a simple agglomeration of fines on the bigger pellets. Instead, the additional
increase in mass transfer can be attributed to two possible mechanisms. First, a steady state
of breakage and agglomeration, or, second, a direct mass exchange between the pellets. A
mechanism of steady breakage and agglomeration would be defined as small particles
breaking off the cylindrical extrudates, dumb-bells, or ellipsoids at their most stressed zone,
and a coexisting agglomeration of these pieces at other zones on the particles’ surface. In
contrast to this, a direct mass exchange would be described as a smearing of the wet
extrudates’ mass while the particles are in contact. It is not clear which of these or if perhaps
a combination of these two mechanisms occurs during spheronisation. The important point
is that this mass transfer is accountable for about 20% of the MCCI pellets’ mass.
The relatively high mass transfer during the first 10s of the spheronisation can be explained
by the drying step that was carried out directly after spheronisation. The pellets had contacts
similar to the ones during spheronisation while being dried in a fluid bed apparatus. At the
beginning of this drying, the pellets’ mass was still wet and could be transferred, similar to
the described mechanisms for the spheronisation.
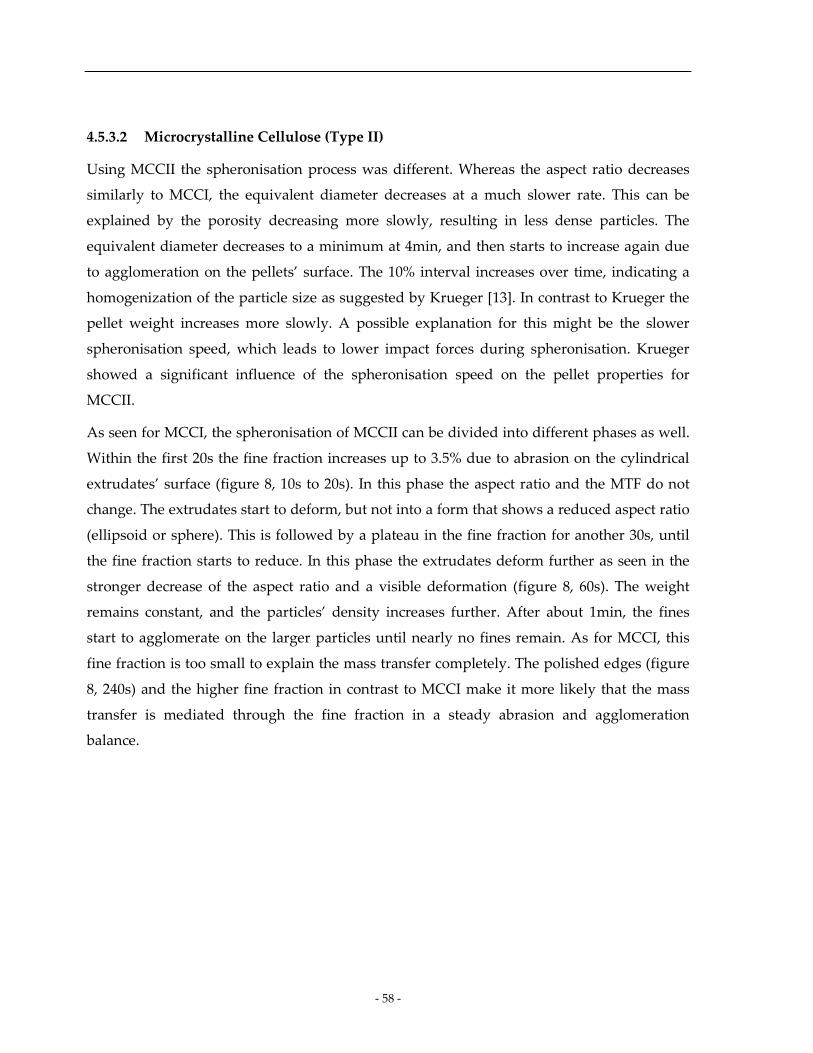
- 58 -
4.5.3.2 Microcrystalline Cellulose (Type II)
Using MCCII the spheronisation process was different. Whereas the aspect ratio decreases
similarly to MCCI, the equivalent diameter decreases at a much slower rate. This can be
explained by the porosity decreasing more slowly, resulting in less dense particles. The
equivalent diameter decreases to a minimum at 4min, and then starts to increase again due
to agglomeration on the pellets’ surface. The 10% interval increases over time, indicating a
homogenization of the particle size as suggested by Krueger [13]. In contrast to Krueger the
pellet weight increases more slowly. A possible explanation for this might be the slower
spheronisation speed, which leads to lower impact forces during spheronisation. Krueger
showed a significant influence of the spheronisation speed on the pellet properties for
MCCII.
As seen for MCCI, the spheronisation of MCCII can be divided into different phases as well.
Within the first 20s the fine fraction increases up to 3.5% due to abrasion on the cylindrical
extrudates’ surface (figure 8, 10s to 20s). In this phase the aspect ratio and the MTF do not
change. The extrudates start to deform, but not into a form that shows a reduced aspect ratio
(ellipsoid or sphere). This is followed by a plateau in the fine fraction for another 30s, until
the fine fraction starts to reduce. In this phase the extrudates deform further as seen in the
stronger decrease of the aspect ratio and a visible deformation (figure 8, 60s). The weight
remains constant, and the particles’ density increases further. After about 1min, the fines
start to agglomerate on the larger particles until nearly no fines remain. As for MCCI, this
fine fraction is too small to explain the mass transfer completely. The polished edges (figure
8, 240s) and the higher fine fraction in contrast to MCCI make it more likely that the mass
transfer is mediated through the fine fraction in a steady abrasion and agglomeration
balance.
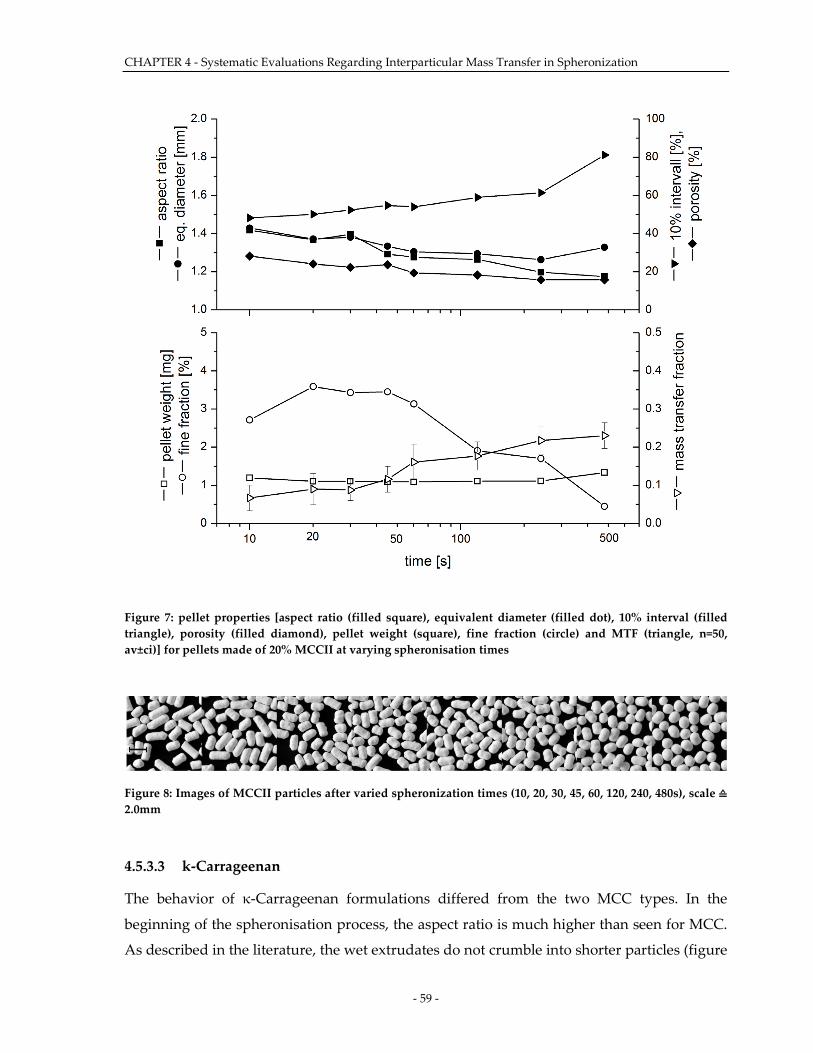
CHAPTER 4 - Systematic Evaluations Regarding Interparticular Mass Transfer in Spheronization
- 59 -
Figure 7: pellet properties [aspect ratio (filled square), equivalent diameter (filled dot), 10% interval (filled triangle), porosity (filled diamond), pellet weight (square), fine fraction (circle) and MTF (triangle, n=50, av±ci)] for pellets made of 20% MCCII at varying spheronisation times
Figure 8: Images of MCCII particles after varied spheronization times (10, 20, 30, 45, 60, 120, 240, 480s), scale ≙ 2.0mm
4.5.3.3 k-Carrageenan
The behavior of κ-Carrageenan formulations differed from the two MCC types. In the
beginning of the spheronisation process, the aspect ratio is much higher than seen for MCC.
As described in the literature, the wet extrudates do not crumble into shorter particles (figure
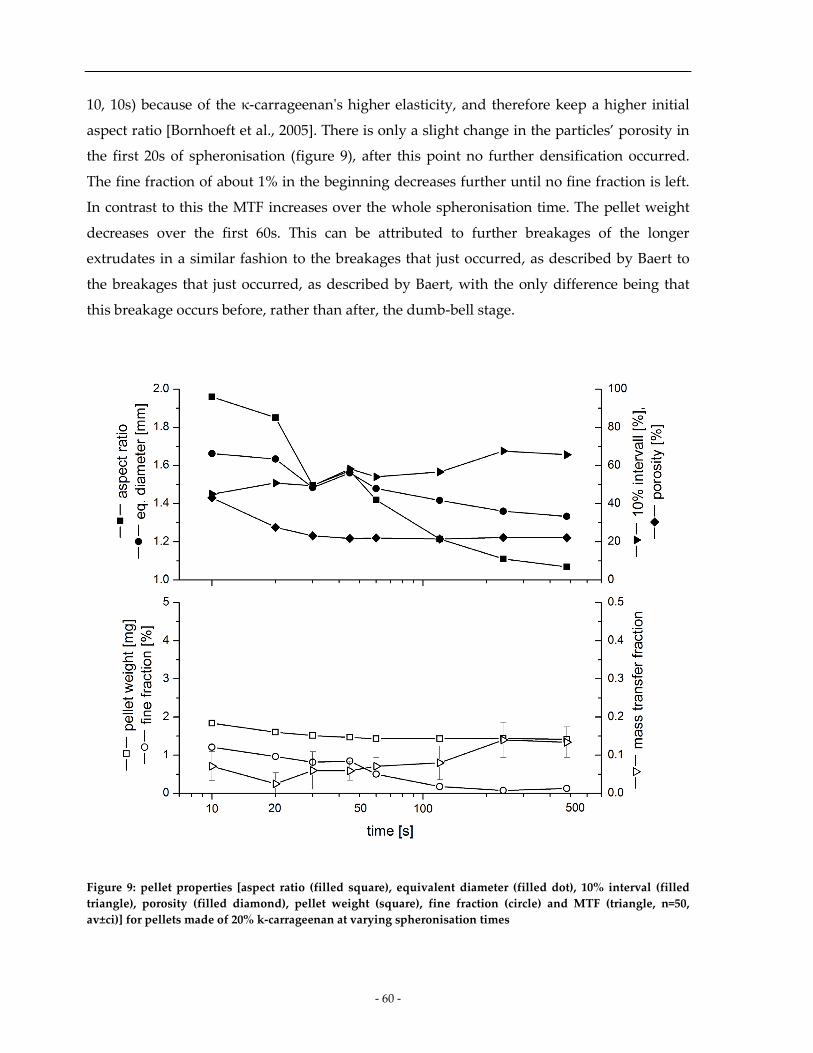
- 60 -
10, 10s) because of the κ-carrageenan's higher elasticity, and therefore keep a higher initial
aspect ratio [Bornhoeft et al., 2005]. There is only a slight change in the particles’ porosity in
the first 20s of spheronisation (figure 9), after this point no further densification occurred.
The fine fraction of about 1% in the beginning decreases further until no fine fraction is left.
In contrast to this the MTF increases over the whole spheronisation time. The pellet weight
decreases over the first 60s. This can be attributed to further breakages of the longer
extrudates in a similar fashion to the breakages that just occurred, as described by Baert to
the breakages that just occurred, as described by Baert, with the only difference being that
this breakage occurs before, rather than after, the dumb-bell stage.
Figure 9: pellet properties [aspect ratio (filled square), equivalent diameter (filled dot), 10% interval (filled triangle), porosity (filled diamond), pellet weight (square), fine fraction (circle) and MTF (triangle, n=50, av±ci)] for pellets made of 20% k-carrageenan at varying spheronisation times
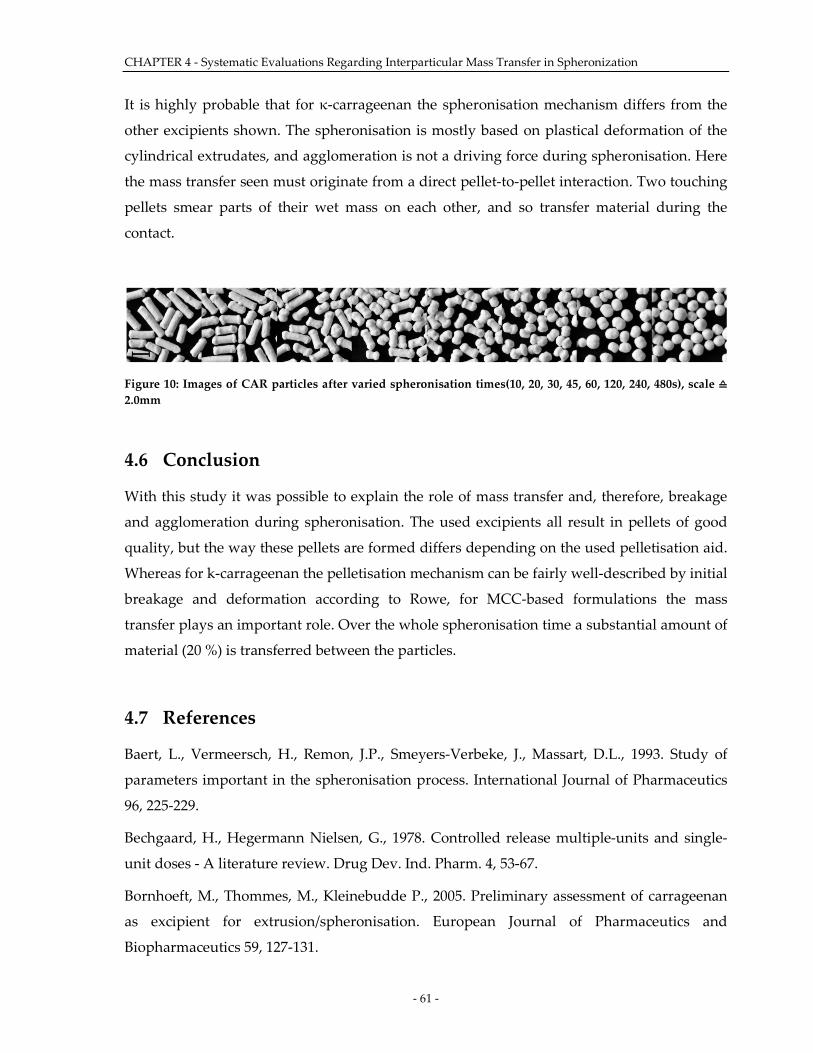
CHAPTER 4 - Systematic Evaluations Regarding Interparticular Mass Transfer in Spheronization
- 61 -
It is highly probable that for κ-carrageenan the spheronisation mechanism differs from the
other excipients shown. The spheronisation is mostly based on plastical deformation of the
cylindrical extrudates, and agglomeration is not a driving force during spheronisation. Here
the mass transfer seen must originate from a direct pellet-to-pellet interaction. Two touching
pellets smear parts of their wet mass on each other, and so transfer material during the
contact.
Figure 10: Images of CAR particles after varied spheronisation times(10, 20, 30, 45, 60, 120, 240, 480s), scale ≙ 2.0mm
4.6 Conclusion
With this study it was possible to explain the role of mass transfer and, therefore, breakage
and agglomeration during spheronisation. The used excipients all result in pellets of good
quality, but the way these pellets are formed differs depending on the used pelletisation aid.
Whereas for k-carrageenan the pelletisation mechanism can be fairly well-described by initial
breakage and deformation according to Rowe, for MCC-based formulations the mass
transfer plays an important role. Over the whole spheronisation time a substantial amount of
material (20 %) is transferred between the particles.
4.7 References
Baert, L., Vermeersch, H., Remon, J.P., Smeyers-Verbeke, J., Massart, D.L., 1993. Study of
parameters important in the spheronisation process. International Journal of Pharmaceutics
96, 225-229.
Bechgaard, H., Hegermann Nielsen, G., 1978. Controlled release multiple-units and single-
unit doses - A literature review. Drug Dev. Ind. Pharm. 4, 53-67.
Bornhoeft, M., Thommes, M., Kleinebudde P., 2005. Preliminary assessment of carrageenan
as excipient for extrusion/spheronisation. European Journal of Pharmaceutics and
Biopharmaceutics 59, 127-131.
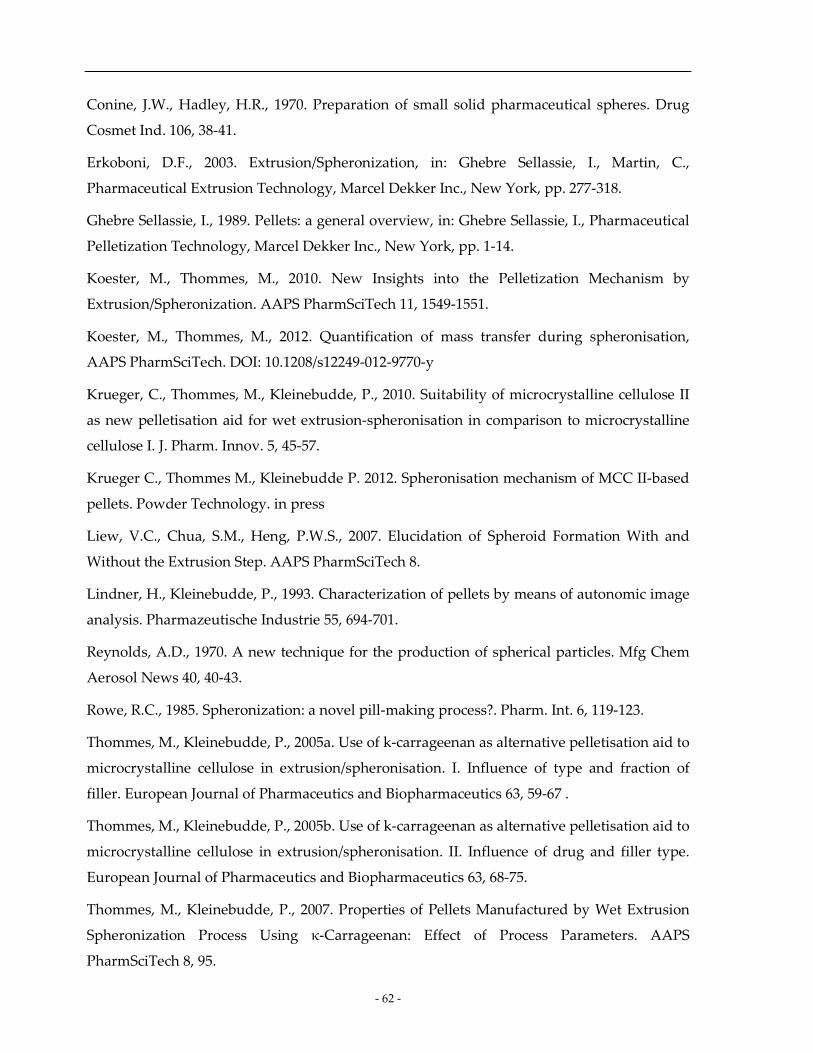
- 62 -
Conine, J.W., Hadley, H.R., 1970. Preparation of small solid pharmaceutical spheres. Drug
Cosmet Ind. 106, 38-41.
Erkoboni, D.F., 2003. Extrusion/Spheronization, in: Ghebre Sellassie, I., Martin, C.,
Pharmaceutical Extrusion Technology, Marcel Dekker Inc., New York, pp. 277-318.
Ghebre Sellassie, I., 1989. Pellets: a general overview, in: Ghebre Sellassie, I., Pharmaceutical
Pelletization Technology, Marcel Dekker Inc., New York, pp. 1-14.
Koester, M., Thommes, M., 2010. New Insights into the Pelletization Mechanism by
Extrusion/Spheronization. AAPS PharmSciTech 11, 1549-1551.
Koester, M., Thommes, M., 2012. Quantification of mass transfer during spheronisation,
AAPS PharmSciTech. DOI: 10.1208/s12249-012-9770-y
Krueger, C., Thommes, M., Kleinebudde, P., 2010. Suitability of microcrystalline cellulose II
as new pelletisation aid for wet extrusion-spheronisation in comparison to microcrystalline
cellulose I. J. Pharm. Innov. 5, 45-57.
Krueger C., Thommes M., Kleinebudde P. 2012. Spheronisation mechanism of MCC II-based
pellets. Powder Technology. in press
Liew, V.C., Chua, S.M., Heng, P.W.S., 2007. Elucidation of Spheroid Formation With and
Without the Extrusion Step. AAPS PharmSciTech 8.
Lindner, H., Kleinebudde, P., 1993. Characterization of pellets by means of autonomic image
analysis. Pharmazeutische Industrie 55, 694-701.
Reynolds, A.D., 1970. A new technique for the production of spherical particles. Mfg Chem
Aerosol News 40, 40-43.
Rowe, R.C., 1985. Spheronization: a novel pill-making process?. Pharm. Int. 6, 119-123.
Thommes, M., Kleinebudde, P., 2005a. Use of k-carrageenan as alternative pelletisation aid to
microcrystalline cellulose in extrusion/spheronisation. I. Influence of type and fraction of
filler. European Journal of Pharmaceutics and Biopharmaceutics 63, 59-67 .
Thommes, M., Kleinebudde, P., 2005b. Use of k-carrageenan as alternative pelletisation aid to
microcrystalline cellulose in extrusion/spheronisation. II. Influence of drug and filler type.
European Journal of Pharmaceutics and Biopharmaceutics 63, 68-75.
Thommes, M., Kleinebudde, P., 2007. Properties of Pellets Manufactured by Wet Extrusion
Spheronization Process Using κ-Carrageenan: Effect of Process Parameters. AAPS
PharmSciTech 8, 95.
CHAPTER 4 - Systematic Evaluations Regarding Interparticular Mass Transfer in Spheronization
- 63 -
The United States Pharmacopeial Convention, 2008. Buffer Solutions, in: The United States
Pharmacopeia, Rockville, USA, pp. 813.
- 64 -
5 CHAPTER 5 - Analysis of Particle Kinematics in
Spheronisation via Particle Image Velocimetry
5.1 Pretext
The following work was published in February 2013 to the European Journal of
Pharmaceutics and Biopharmaceutics (impact factor 2010: 4.304). The kinematics during
spheronization might be a possibility to link the previously proposed mechanisms of
spheronization to the process parameters. This link is of high importance to rationalize the
spheronization process. In this work the influence of various process parameters on the
particle kinematics during spheronization were investigated. Previously to this
investigations the particle image velocimetry (PIV) method was validated for its use in
spheronization.
The first author of this paper, Martin Koester, is responsible for the concept of the
expriments as well as their evaluation and writing of the manuscript. Dr. Markus Thommes,
listed as senior author, is responsible for concept, ideas and revision of the manuscript.
Submitted 10 May 2012
Published February 2013
Cite as: Volume 183, Issue 2, Pages 307–314, DOI: 10.1016/j.ejpb.2012.08.013
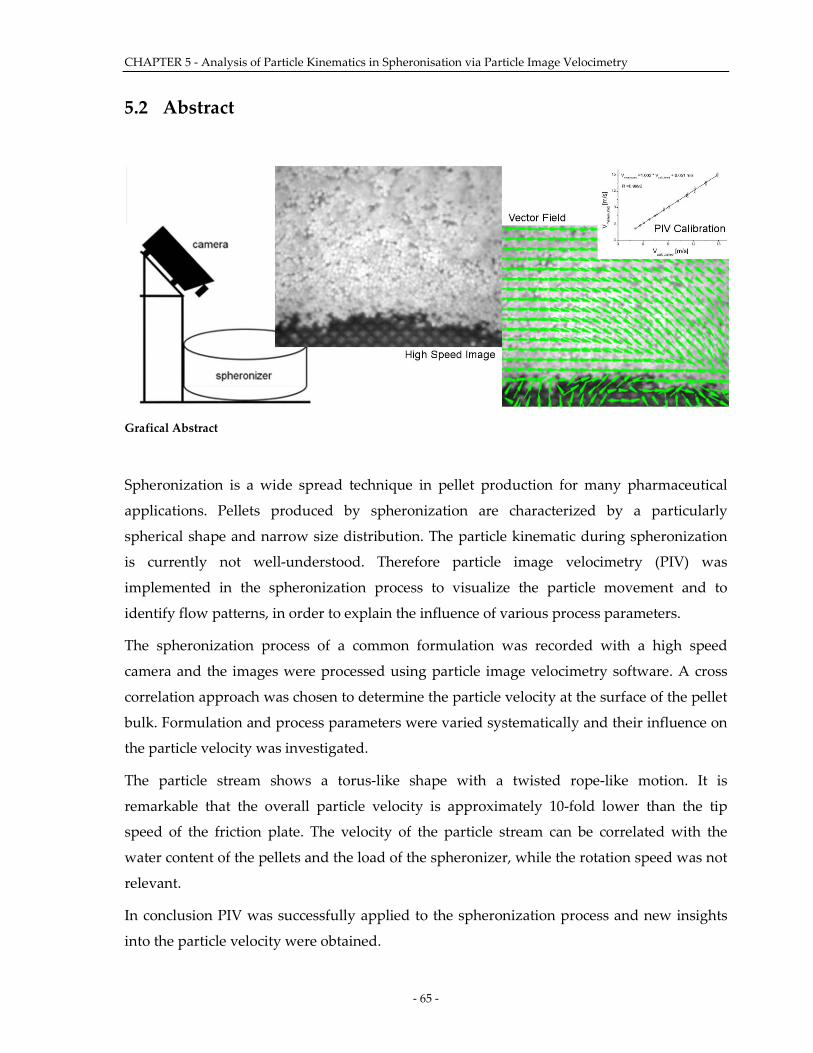
CHAPTER 5 - Analysis of Particle Kinematics in Spheronisation via Particle Image Velocimetry
- 65 -
5.2 Abstract
Grafical Abstract
Spheronization is a wide spread technique in pellet production for many pharmaceutical
applications. Pellets produced by spheronization are characterized by a particularly
spherical shape and narrow size distribution. The particle kinematic during spheronization
is currently not well-understood. Therefore particle image velocimetry (PIV) was
implemented in the spheronization process to visualize the particle movement and to
identify flow patterns, in order to explain the influence of various process parameters.
The spheronization process of a common formulation was recorded with a high speed
camera and the images were processed using particle image velocimetry software. A cross
correlation approach was chosen to determine the particle velocity at the surface of the pellet
bulk. Formulation and process parameters were varied systematically and their influence on
the particle velocity was investigated.
The particle stream shows a torus-like shape with a twisted rope-like motion. It is
remarkable that the overall particle velocity is approximately 10-fold lower than the tip
speed of the friction plate. The velocity of the particle stream can be correlated with the
water content of the pellets and the load of the spheronizer, while the rotation speed was not
relevant.
In conclusion PIV was successfully applied to the spheronization process and new insights
into the particle velocity were obtained.
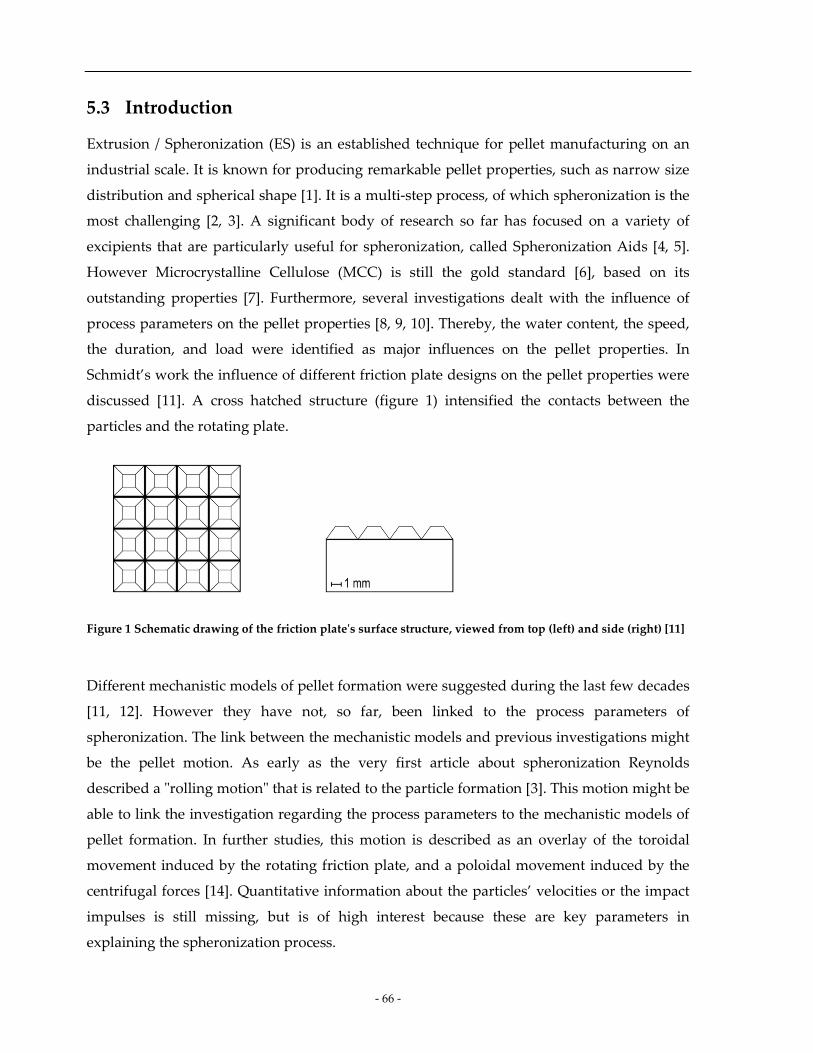
- 66 -
5.3 Introduction
Extrusion / Spheronization (ES) is an established technique for pellet manufacturing on an
industrial scale. It is known for producing remarkable pellet properties, such as narrow size
distribution and spherical shape [1]. It is a multi-step process, of which spheronization is the
most challenging [2, 3]. A significant body of research so far has focused on a variety of
excipients that are particularly useful for spheronization, called Spheronization Aids [4, 5].
However Microcrystalline Cellulose (MCC) is still the gold standard [6], based on its
outstanding properties [7]. Furthermore, several investigations dealt with the influence of
process parameters on the pellet properties [8, 9, 10]. Thereby, the water content, the speed,
the duration, and load were identified as major influences on the pellet properties. In
Schmidt’s work the influence of different friction plate designs on the pellet properties were
discussed [11]. A cross hatched structure (figure 1) intensified the contacts between the
particles and the rotating plate.
Figure 1 Schematic drawing of the friction plate's surface structure, viewed from top (left) and side (right) [11]
Different mechanistic models of pellet formation were suggested during the last few decades
[11, 12]. However they have not, so far, been linked to the process parameters of
spheronization. The link between the mechanistic models and previous investigations might
be the pellet motion. As early as the very first article about spheronization Reynolds
described a "rolling motion" that is related to the particle formation [3]. This motion might be
able to link the investigation regarding the process parameters to the mechanistic models of
pellet formation. In further studies, this motion is described as an overlay of the toroidal
movement induced by the rotating friction plate, and a poloidal movement induced by the
centrifugal forces [14]. Quantitative information about the particles’ velocities or the impact
impulses is still missing, but is of high interest because these are key parameters in
explaining the spheronization process.
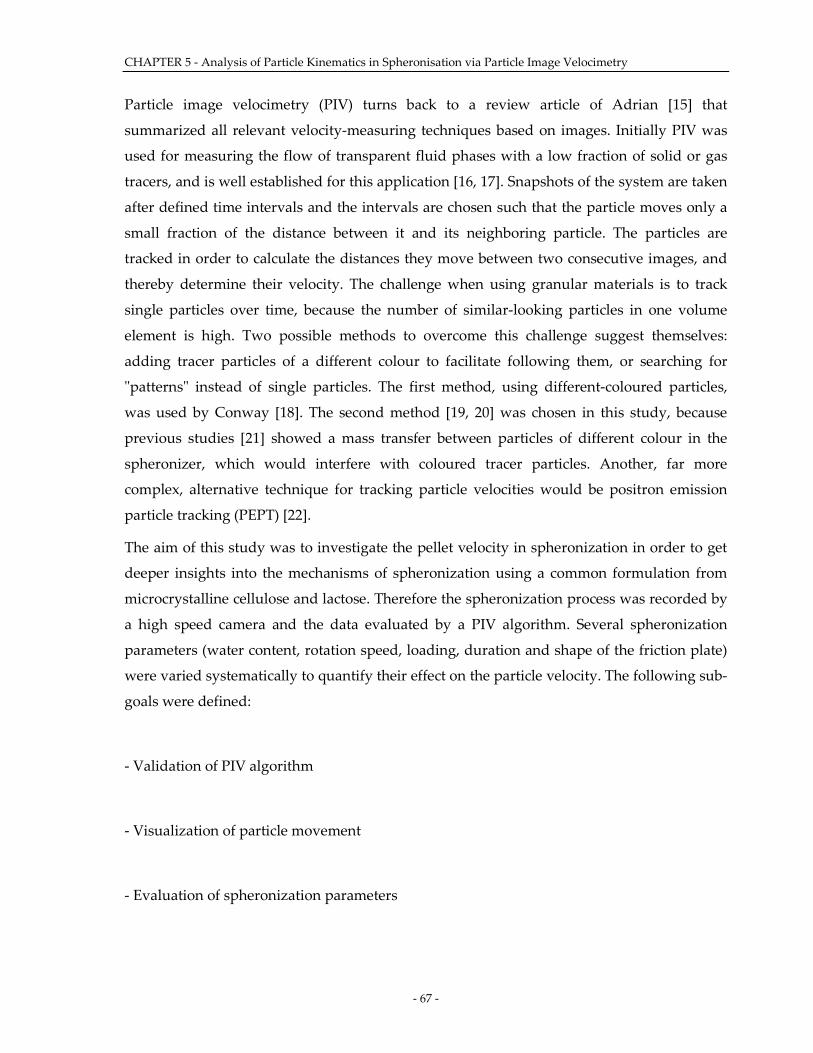
CHAPTER 5 - Analysis of Particle Kinematics in Spheronisation via Particle Image Velocimetry
- 67 -
Particle image velocimetry (PIV) turns back to a review article of Adrian [15] that
summarized all relevant velocity-measuring techniques based on images. Initially PIV was
used for measuring the flow of transparent fluid phases with a low fraction of solid or gas
tracers, and is well established for this application [16, 17]. Snapshots of the system are taken
after defined time intervals and the intervals are chosen such that the particle moves only a
small fraction of the distance between it and its neighboring particle. The particles are
tracked in order to calculate the distances they move between two consecutive images, and
thereby determine their velocity. The challenge when using granular materials is to track
single particles over time, because the number of similar-looking particles in one volume
element is high. Two possible methods to overcome this challenge suggest themselves:
adding tracer particles of a different colour to facilitate following them, or searching for
"patterns" instead of single particles. The first method, using different-coloured particles,
was used by Conway [18]. The second method [19, 20] was chosen in this study, because
previous studies [21] showed a mass transfer between particles of different colour in the
spheronizer, which would interfere with coloured tracer particles. Another, far more
complex, alternative technique for tracking particle velocities would be positron emission
particle tracking (PEPT) [22].
The aim of this study was to investigate the pellet velocity in spheronization in order to get
deeper insights into the mechanisms of spheronization using a common formulation from
microcrystalline cellulose and lactose. Therefore the spheronization process was recorded by
a high speed camera and the data evaluated by a PIV algorithm. Several spheronization
parameters (water content, rotation speed, loading, duration and shape of the friction plate)
were varied systematically to quantify their effect on the particle velocity. The following sub-
goals were defined:
- Validation of PIV algorithm
- Visualization of particle movement
- Evaluation of spheronization parameters
- 68 -
5.4 Materials
Microcrystalline Cellulose (MCC 102G SANAQ®, Pharmatrans Sanaq, Basel, Switzerland)
and α-Lactose monohydrate (Granulac® 200, Meggle, Wasserburg, Germany) were used in a
20:80 ratio, and deionized water was added as the granulation liquid (table 1).
5.5 Methods
5.5.1 Extrusion/Spheronization
Powder blending
A formulation containing microcrystalline cellulose and α-lactose monohydrate was blended
for 15 min at 20 rpm (LM40, Bohle, Ennigerloh, Germany) and loaded into the gravimetric
powder feeder (KT 20, K-Tron Soder, Niederlenz, Switzerland) of the extruder (Mikro 27GL-
28D, Leistritz, Nuremberg, Germany).
Extrusion
The formulation was extruded at a screw speed of 100 rpm and a powder feed rate of 33
g/min. The liquid feed was adjusted to obtain a water content from 26 to 38 % (w/w, based
on dry mass) as shown in table 1. The extruder compressed the wet mass through 23 dies of
1 mm diameter and 2.5 mm length.
Spheronization
Batches of 300 to 1500 g of extrudates were transferred into the spheronizer (RM 300,
Schlueter, Neustadt/Ruebenberge, Germany) and spheronized for 10 s and 300 s with
varying rotation speeds from 500 to 1000 rpm.
5.5.2 High Speed Imaging
The spheronization process was recorded with a high-speed camera (Fastcam SA4, Photron,
San Diego, USA) from two different positions. One camera was positioned to record the top
of the torus (figure 2, left) and the second was positioned to record at the bottom through a
transparent side window in the spheronizer jacket (figure 2, right). The particle stream was
illuminated using a single high power LED in synchronized pulse mode (High Power LED
illumination set, Ila GmbH, Juelich, Germany). For each accumulation, greyscale images
(8bit) of 1024x1024 pixels were taken at a frequency of 2000 fps (4000 fps for the side view).
CHAPTER 5 - Analysis of Particle Kinematics in Spheronisation via Particle Image Velocimetry
- 69 -
Figure 2 Camera position from above the pellet stream (left) and through a side window (right)
5.5.3 Particle Image Velocimetry Analysis
PIV-software (VidPIV4.7, Ila GmbH, Juelich, Germany) was used for the calculation of
velocity vector fields. For each evaluation, 101 images were imported without any changes in
brightness, contrast, or tonal value. An area of interest was defined that included only the
parts of the picture that contained any pellets (i.e. not the spheronizer wall or the friction
plate). This area was divided into interrogation spots of 80x80 pixels, and the movement of
each spot was calculated using the 'adaptive cross correlation' method [23]. In this method
each spot at time step tn is moved in the x and y direction (up to a maximum of 16 pixels)
and simultaneously rotated around its centre. The distance between the starting point and
the point of highest probability of overlap with the image data of time step tn+1 is taken as a
velocity vector. In this way a velocity vector map is acquired for all time steps (t0 to t100).
The average of all 100 time steps is further referred to as pixel velocity. The size of the
interrogation spots (80 pixels) and the maximum movement (16 pixels in each direction) was
chosen according to preliminary experiments. In addition, the standard deviation of the
velocity at each point between all time steps is taken to describe the fluctuation in the
velocity, referred to as the granular temperature [24].
5.5.4 PIV Validation
Several single pellets were fixed in different positions and angles on the friction plate,
representing the pellet bed. The plate was rotated at various speeds and the theoretical
- 70 -
velocity of the particles calculated according to equation 1 (v = velocity [m/s], r distance of
the particle from the centre [m] and f = rotational frequency [1/s]) and compared with PIV
data (see 3.3)
frv ⋅⋅⋅= π2 Equation 1
5.5.5 Design of experiments
Based on previous investigations of spheronization parameters (see introduction) the
loading, rotation speed, water content, duration, and plate design were identified as relevant
parameters for spheronization. Including the camera positions, six independent factors
should be evaluated (table 1). Since nonlinear effects for loading, rotation speed, and water
content were likely, 3x designs were favourable. However it did not seem wise to perform a
36 design, based on the high number of experiments. Therefore the water content (WAT) and
the rotation speed (SPE) were evaluated in a 3² design that was extended by a second 3²
design evaluating the speed (SPE) and the loading (LOA) (figure 3). Two repetitions were
performed at the centre point of the first DoE to estimate the repetition error. Therefore 17
experiments were performed for both DoE. The effect of spheronization duration (DUR) was
evaluated one after another in each experiment. All investigations were done for both
camera positions and for both friction plates. In total 68 experiments were performed while
the two PIV measurement per experiment were done to evaluate the effect of duration - 136
datasets were investigated.
The first 3² design considered the water content (WAT) and the speed (SPE) while the second
3² design dealt with the loading (LOA) and the speed (SPE) (figure 3). The evaluation of both
DoEs included the spheronization duration (DUR) and the effects on the response (y) can be
described with the following coefficient (β) equation:
DURWATDURSPEWATSPE
WATSPEDURWATSPE
xxxxxxxxxxxy
876
25
244210
βββ
ββββββ
+++
+++++= Equation 2
In a backward regression this equation can be simplified by reducing insignificant terms:
DURWATSPEWATSPEDURWAT xxxxxxxy 652
43210 βββββββ ++++++= Equation 3
The second design evaluated the loading (LOA), the rotation speed (SPE) and the duration
(DUR); the simplified equation is given below:
DURLOALOADURLOA xxxxxy 42
3210 βββββ ++++= Equation 4
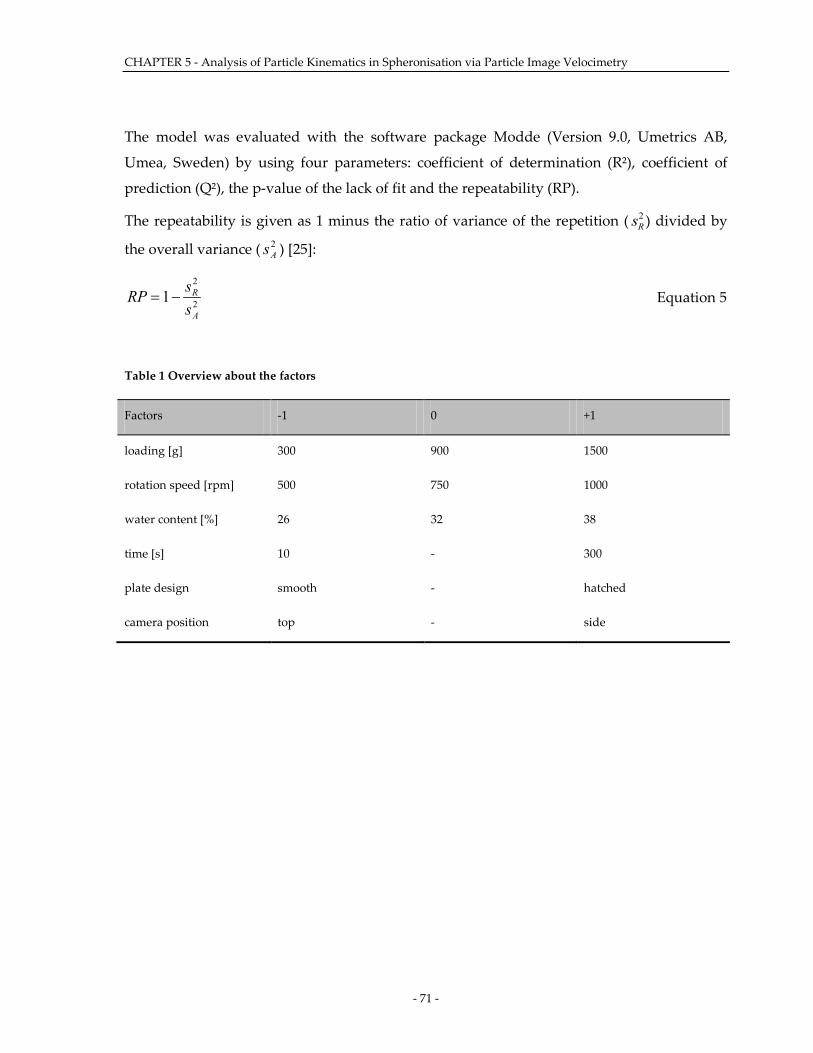
CHAPTER 5 - Analysis of Particle Kinematics in Spheronisation via Particle Image Velocimetry
- 71 -
The model was evaluated with the software package Modde (Version 9.0, Umetrics AB,
Umea, Sweden) by using four parameters: coefficient of determination (R²), coefficient of
prediction (Q²), the p-value of the lack of fit and the repeatability (RP).
The repeatability is given as 1 minus the ratio of variance of the repetition (
sR2 ) divided by
the overall variance ( 2As ) [25]:
2
2
1A
R
ssRP −= Equation 5
Table 1 Overview about the factors
Factors -1 0 +1
loading [g] 300 900 1500
rotation speed [rpm] 500 750 1000
water content [%] 26 32 38
time [s] 10 - 300
plate design smooth - hatched
camera position top - side
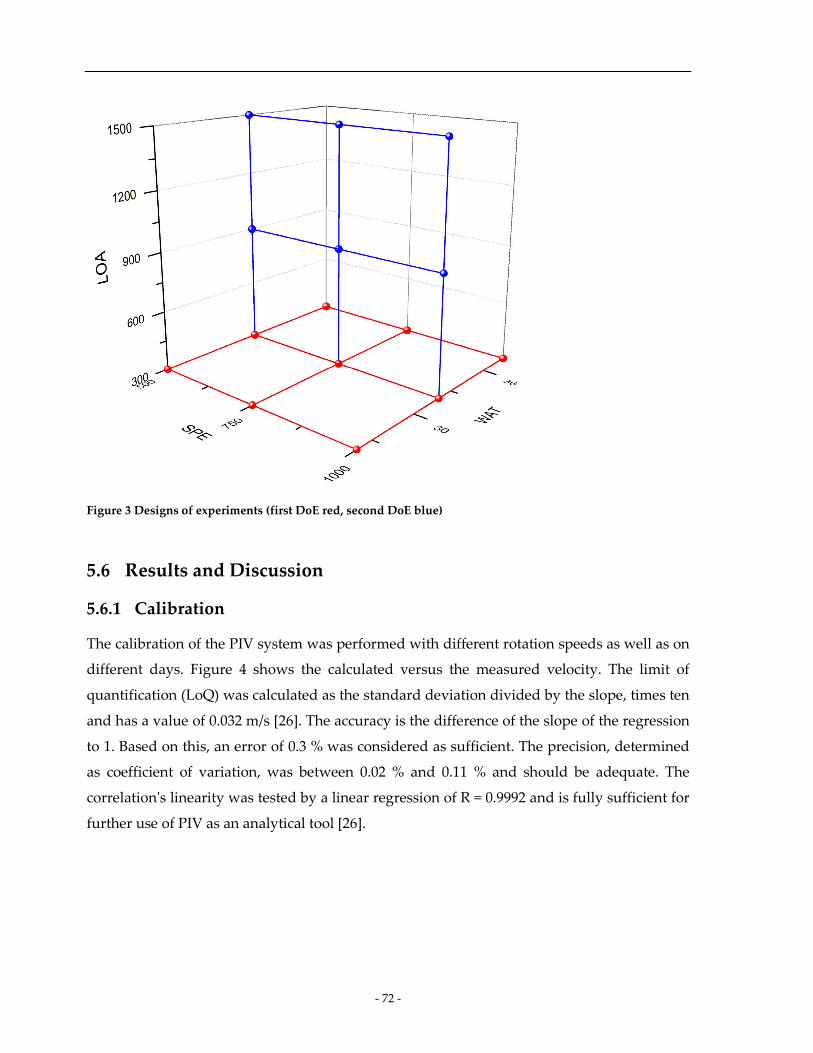
- 72 -
Figure 3 Designs of experiments (first DoE red, second DoE blue)
5.6 Results and Discussion
5.6.1 Calibration
The calibration of the PIV system was performed with different rotation speeds as well as on
different days. Figure 4 shows the calculated versus the measured velocity. The limit of
quantification (LoQ) was calculated as the standard deviation divided by the slope, times ten
and has a value of 0.032 m/s [26]. The accuracy is the difference of the slope of the regression
to 1. Based on this, an error of 0.3 % was considered as sufficient. The precision, determined
as coefficient of variation, was between 0.02 % and 0.11 % and should be adequate. The
correlation's linearity was tested by a linear regression of R = 0.9992 and is fully sufficient for
further use of PIV as an analytical tool [26].
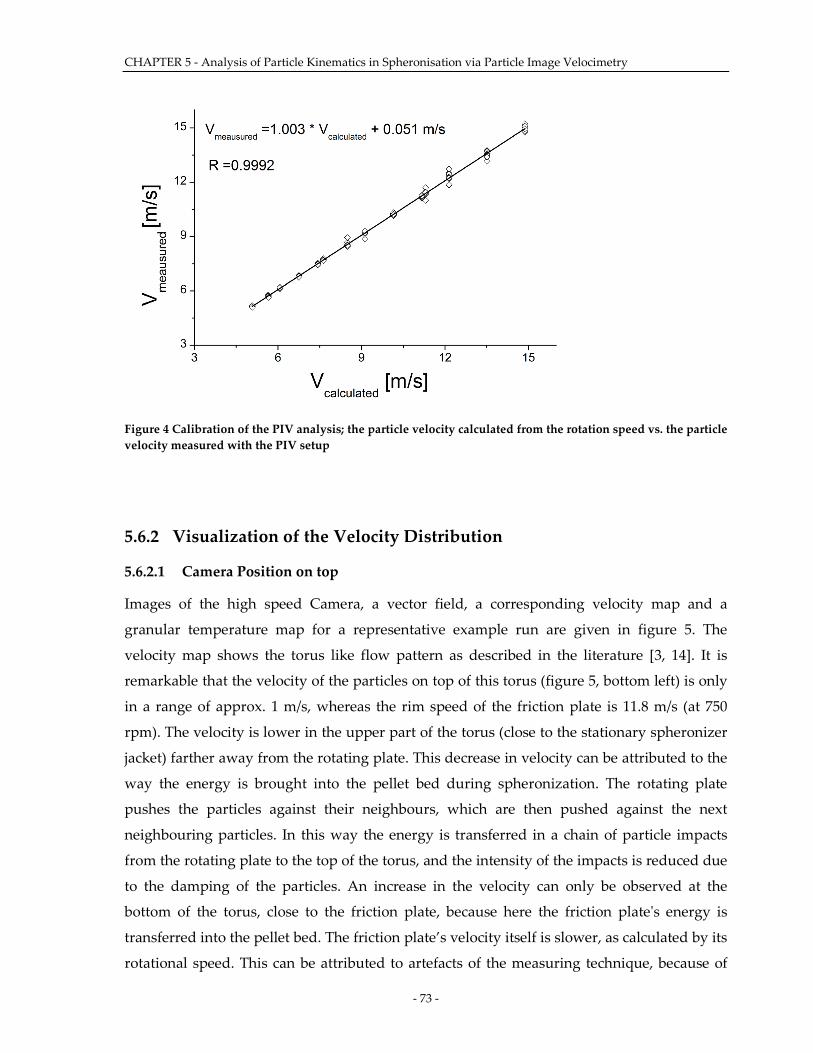
CHAPTER 5 - Analysis of Particle Kinematics in Spheronisation via Particle Image Velocimetry
- 73 -
Figure 4 Calibration of the PIV analysis; the particle velocity calculated from the rotation speed vs. the particle velocity measured with the PIV setup
5.6.2 Visualization of the Velocity Distribution
5.6.2.1 Camera Position on top
Images of the high speed Camera, a vector field, a corresponding velocity map and a
granular temperature map for a representative example run are given in figure 5. The
velocity map shows the torus like flow pattern as described in the literature [3, 14]. It is
remarkable that the velocity of the particles on top of this torus (figure 5, bottom left) is only
in a range of approx. 1 m/s, whereas the rim speed of the friction plate is 11.8 m/s (at 750
rpm). The velocity is lower in the upper part of the torus (close to the stationary spheronizer
jacket) farther away from the rotating plate. This decrease in velocity can be attributed to the
way the energy is brought into the pellet bed during spheronization. The rotating plate
pushes the particles against their neighbours, which are then pushed against the next
neighbouring particles. In this way the energy is transferred in a chain of particle impacts
from the rotating plate to the top of the torus, and the intensity of the impacts is reduced due
to the damping of the particles. An increase in the velocity can only be observed at the
bottom of the torus, close to the friction plate, because here the friction plate's energy is
transferred into the pellet bed. The friction plate’s velocity itself is slower, as calculated by its
rotational speed. This can be attributed to artefacts of the measuring technique, because of
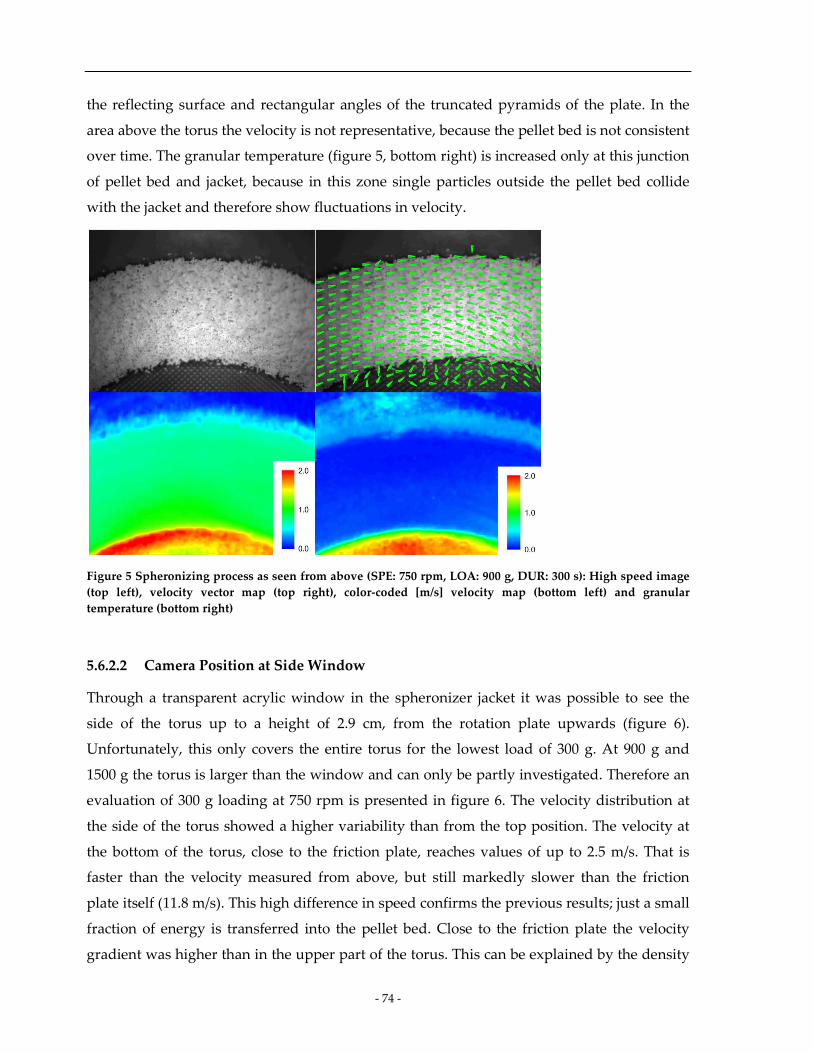
- 74 -
the reflecting surface and rectangular angles of the truncated pyramids of the plate. In the
area above the torus the velocity is not representative, because the pellet bed is not consistent
over time. The granular temperature (figure 5, bottom right) is increased only at this junction
of pellet bed and jacket, because in this zone single particles outside the pellet bed collide
with the jacket and therefore show fluctuations in velocity.
Figure 5 Spheronizing process as seen from above (SPE: 750 rpm, LOA: 900 g, DUR: 300 s): High speed image (top left), velocity vector map (top right), color-coded [m/s] velocity map (bottom left) and granular temperature (bottom right)
5.6.2.2 Camera Position at Side Window
Through a transparent acrylic window in the spheronizer jacket it was possible to see the
side of the torus up to a height of 2.9 cm, from the rotation plate upwards (figure 6).
Unfortunately, this only covers the entire torus for the lowest load of 300 g. At 900 g and
1500 g the torus is larger than the window and can only be partly investigated. Therefore an
evaluation of 300 g loading at 750 rpm is presented in figure 6. The velocity distribution at
the side of the torus showed a higher variability than from the top position. The velocity at
the bottom of the torus, close to the friction plate, reaches values of up to 2.5 m/s. That is
faster than the velocity measured from above, but still markedly slower than the friction
plate itself (11.8 m/s). This high difference in speed confirms the previous results; just a small
fraction of energy is transferred into the pellet bed. Close to the friction plate the velocity
gradient was higher than in the upper part of the torus. This can be explained by the density
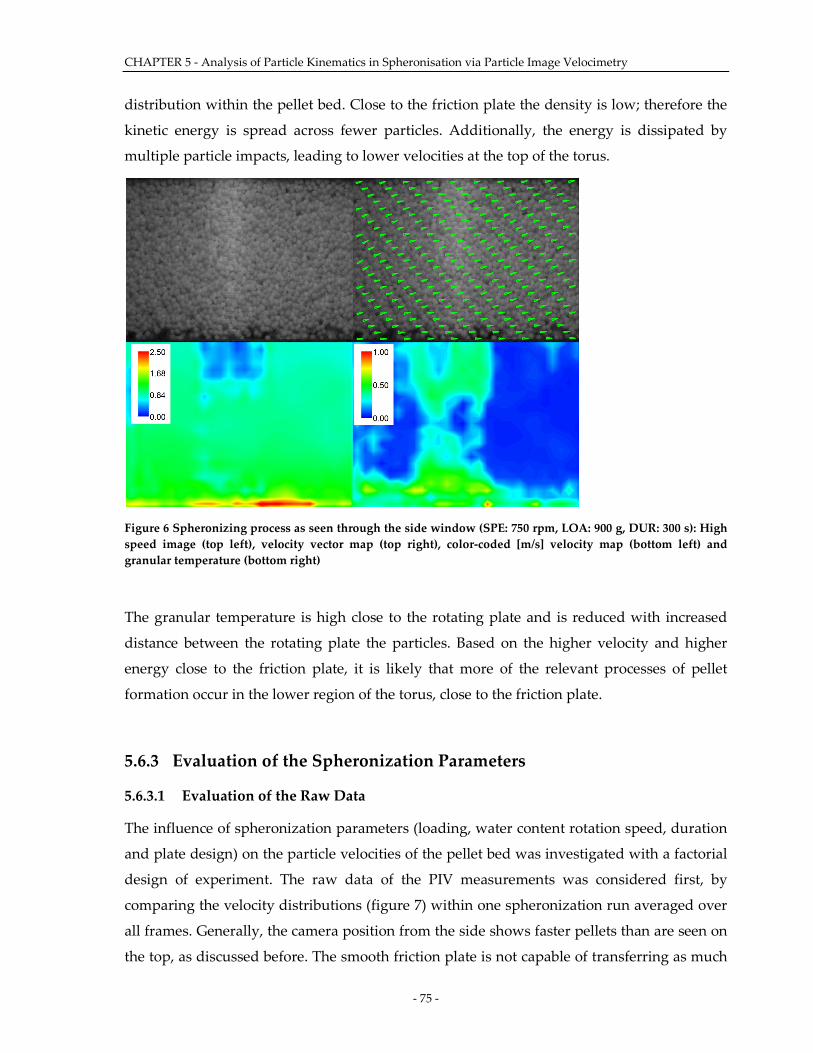
CHAPTER 5 - Analysis of Particle Kinematics in Spheronisation via Particle Image Velocimetry
- 75 -
distribution within the pellet bed. Close to the friction plate the density is low; therefore the
kinetic energy is spread across fewer particles. Additionally, the energy is dissipated by
multiple particle impacts, leading to lower velocities at the top of the torus.
Figure 6 Spheronizing process as seen through the side window (SPE: 750 rpm, LOA: 900 g, DUR: 300 s): High speed image (top left), velocity vector map (top right), color-coded [m/s] velocity map (bottom left) and granular temperature (bottom right)
The granular temperature is high close to the rotating plate and is reduced with increased
distance between the rotating plate the particles. Based on the higher velocity and higher
energy close to the friction plate, it is likely that more of the relevant processes of pellet
formation occur in the lower region of the torus, close to the friction plate.
5.6.3 Evaluation of the Spheronization Parameters
5.6.3.1 Evaluation of the Raw Data
The influence of spheronization parameters (loading, water content rotation speed, duration
and plate design) on the particle velocities of the pellet bed was investigated with a factorial
design of experiment. The raw data of the PIV measurements was considered first, by
comparing the velocity distributions (figure 7) within one spheronization run averaged over
all frames. Generally, the camera position from the side shows faster pellets than are seen on
the top, as discussed before. The smooth friction plate is not capable of transferring as much
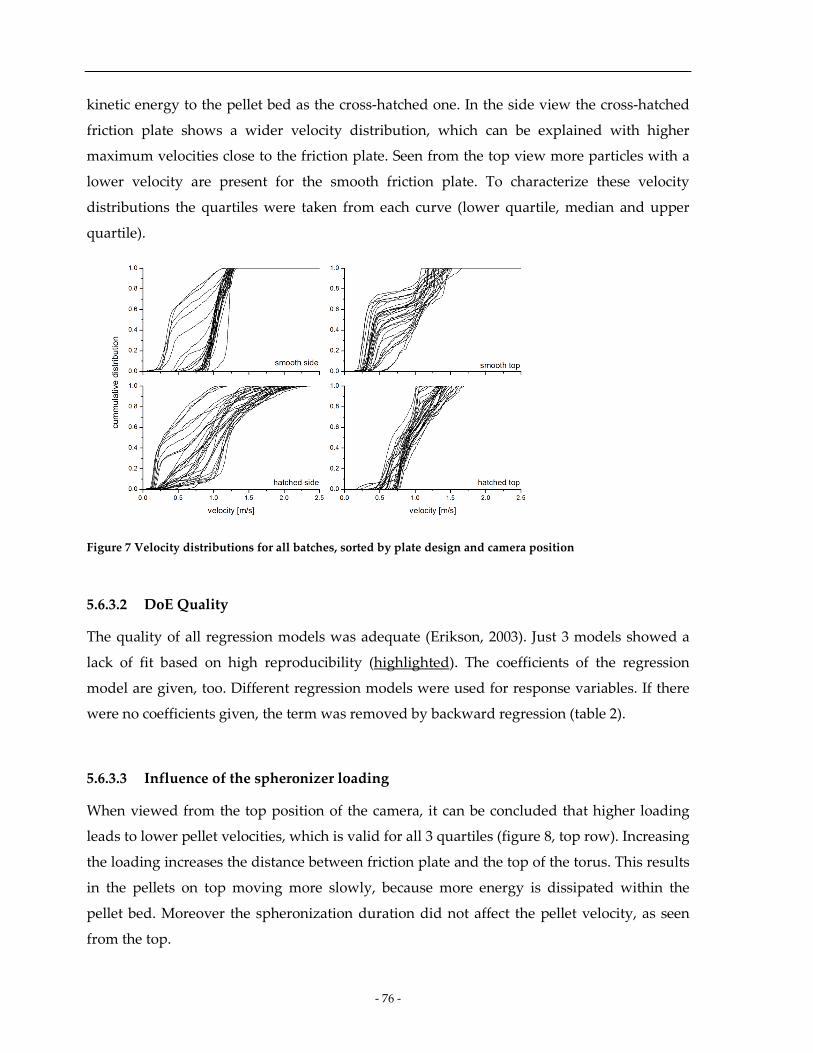
- 76 -
kinetic energy to the pellet bed as the cross-hatched one. In the side view the cross-hatched
friction plate shows a wider velocity distribution, which can be explained with higher
maximum velocities close to the friction plate. Seen from the top view more particles with a
lower velocity are present for the smooth friction plate. To characterize these velocity
distributions the quartiles were taken from each curve (lower quartile, median and upper
quartile).
Figure 7 Velocity distributions for all batches, sorted by plate design and camera position
5.6.3.2 DoE Quality
The quality of all regression models was adequate (Erikson, 2003). Just 3 models showed a
lack of fit based on high reproducibility (highlighted). The coefficients of the regression
model are given, too. Different regression models were used for response variables. If there
were no coefficients given, the term was removed by backward regression (table 2).
5.6.3.3 Influence of the spheronizer loading
When viewed from the top position of the camera, it can be concluded that higher loading
leads to lower pellet velocities, which is valid for all 3 quartiles (figure 8, top row). Increasing
the loading increases the distance between friction plate and the top of the torus. This results
in the pellets on top moving more slowly, because more energy is dissipated within the
pellet bed. Moreover the spheronization duration did not affect the pellet velocity, as seen
from the top.
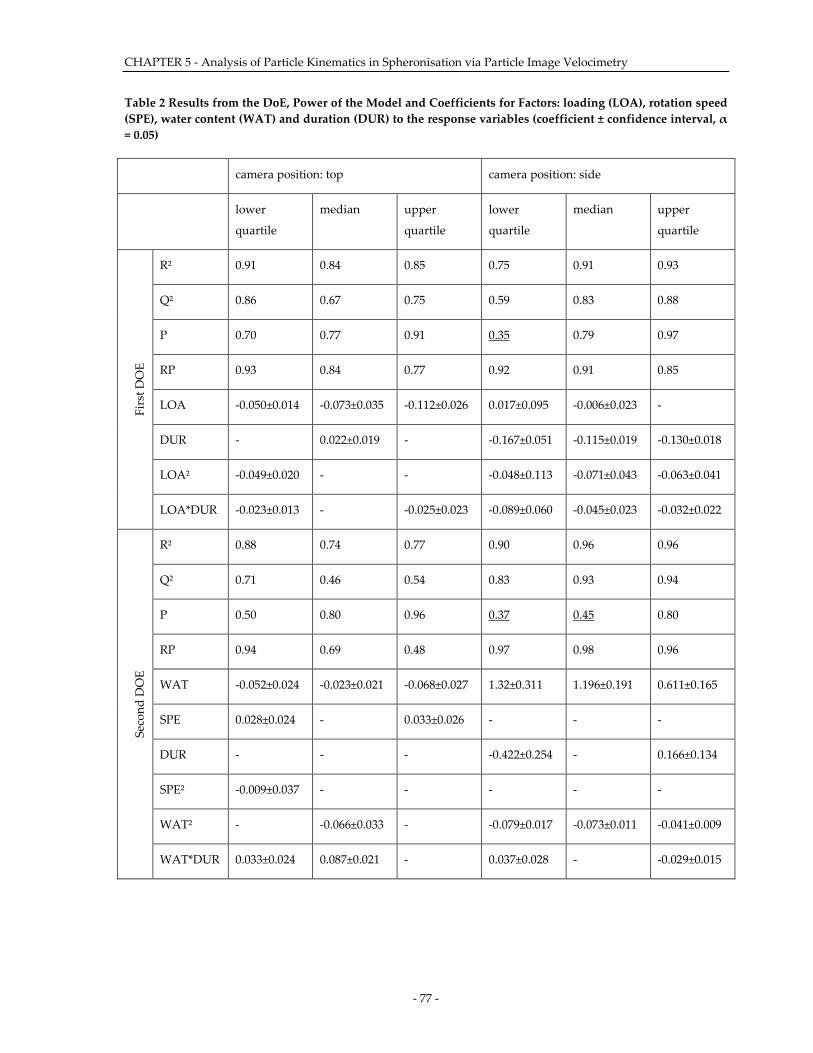
CHAPTER 5 - Analysis of Particle Kinematics in Spheronisation via Particle Image Velocimetry
- 77 -
Table 2 Results from the DoE, Power of the Model and Coefficients for Factors: loading (LOA), rotation speed (SPE), water content (WAT) and duration (DUR) to the response variables (coefficient ± confidence interval, α = 0.05)
camera position: top camera position: side
lower
quartile
median upper
quartile
lower
quartile
median upper
quartile
Firs
t DO
E
R² 0.91 0.84 0.85 0.75 0.91 0.93
Q² 0.86 0.67 0.75 0.59 0.83 0.88
P 0.70 0.77 0.91 0.35 0.79 0.97
RP 0.93 0.84 0.77 0.92 0.91 0.85
LOA -0.050±0.014 -0.073±0.035 -0.112±0.026 0.017±0.095 -0.006±0.023 -
DUR - 0.022±0.019 - -0.167±0.051 -0.115±0.019 -0.130±0.018
LOA² -0.049±0.020 - - -0.048±0.113 -0.071±0.043 -0.063±0.041
LOA*DUR -0.023±0.013 - -0.025±0.023 -0.089±0.060 -0.045±0.023 -0.032±0.022
Seco
nd D
OE
R² 0.88 0.74 0.77 0.90 0.96 0.96
Q² 0.71 0.46 0.54 0.83 0.93 0.94
P 0.50 0.80 0.96 0.37 0.45 0.80
RP 0.94 0.69 0.48 0.97 0.98 0.96
WAT -0.052±0.024 -0.023±0.021 -0.068±0.027 1.32±0.311 1.196±0.191 0.611±0.165
SPE 0.028±0.024 - 0.033±0.026 - - -
DUR - - - -0.422±0.254 - 0.166±0.134
SPE² -0.009±0.037 - - - - -
WAT² - -0.066±0.033 - -0.079±0.017 -0.073±0.011 -0.041±0.009
WAT*DUR 0.033±0.024 0.087±0.021 - 0.037±0.028 - -0.029±0.015
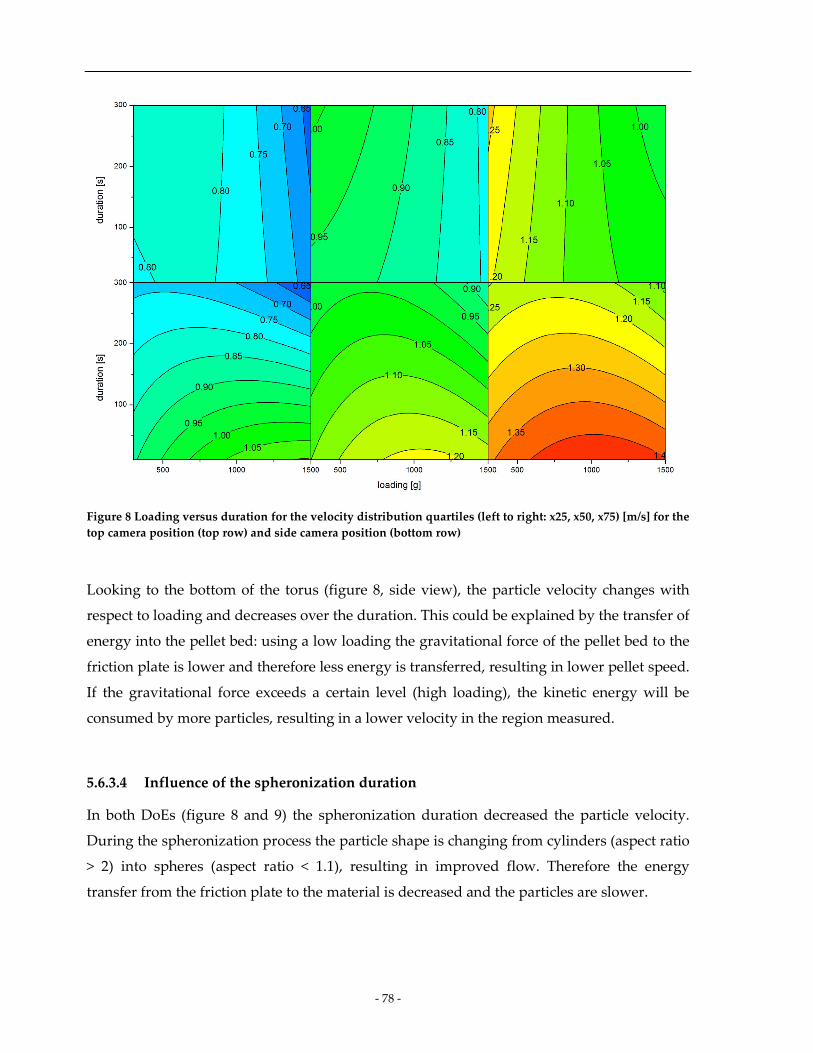
- 78 -
Figure 8 Loading versus duration for the velocity distribution quartiles (left to right: x25, x50, x75) [m/s] for the top camera position (top row) and side camera position (bottom row)
Looking to the bottom of the torus (figure 8, side view), the particle velocity changes with
respect to loading and decreases over the duration. This could be explained by the transfer of
energy into the pellet bed: using a low loading the gravitational force of the pellet bed to the
friction plate is lower and therefore less energy is transferred, resulting in lower pellet speed.
If the gravitational force exceeds a certain level (high loading), the kinetic energy will be
consumed by more particles, resulting in a lower velocity in the region measured.
5.6.3.4 Influence of the spheronization duration
In both DoEs (figure 8 and 9) the spheronization duration decreased the particle velocity.
During the spheronization process the particle shape is changing from cylinders (aspect ratio
> 2) into spheres (aspect ratio < 1.1), resulting in improved flow. Therefore the energy
transfer from the friction plate to the material is decreased and the particles are slower.
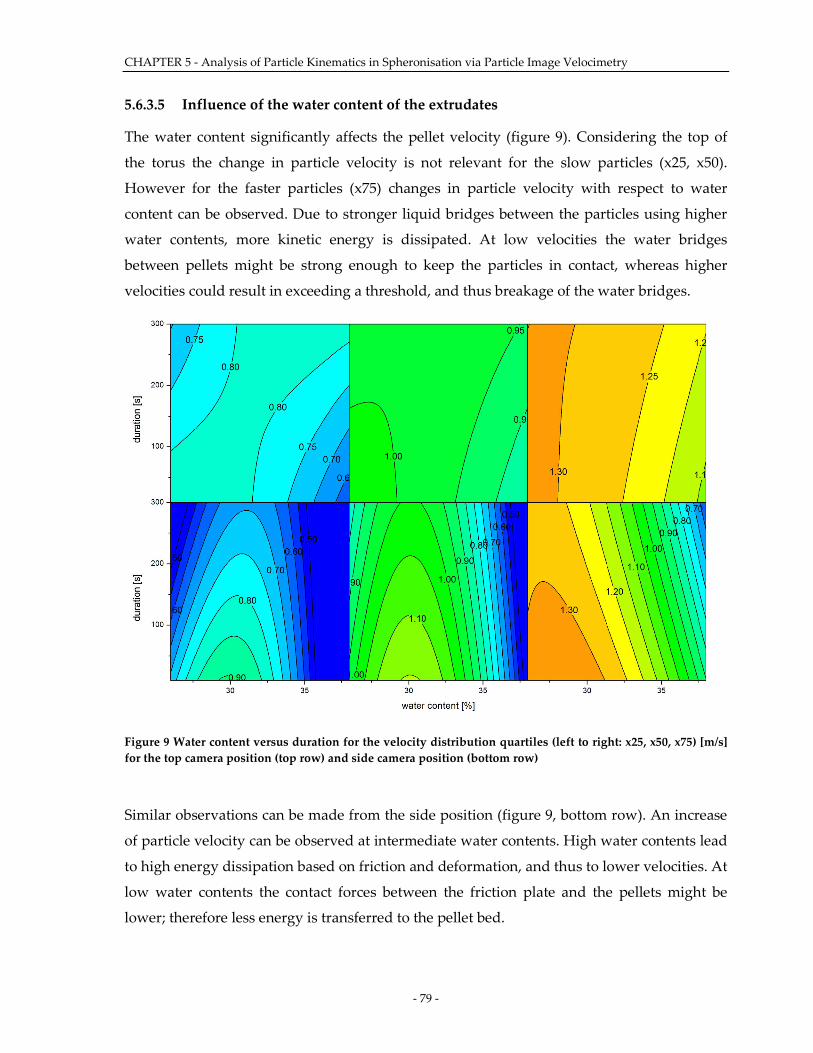
CHAPTER 5 - Analysis of Particle Kinematics in Spheronisation via Particle Image Velocimetry
- 79 -
5.6.3.5 Influence of the water content of the extrudates
The water content significantly affects the pellet velocity (figure 9). Considering the top of
the torus the change in particle velocity is not relevant for the slow particles (x25, x50).
However for the faster particles (x75) changes in particle velocity with respect to water
content can be observed. Due to stronger liquid bridges between the particles using higher
water contents, more kinetic energy is dissipated. At low velocities the water bridges
between pellets might be strong enough to keep the particles in contact, whereas higher
velocities could result in exceeding a threshold, and thus breakage of the water bridges.
Figure 9 Water content versus duration for the velocity distribution quartiles (left to right: x25, x50, x75) [m/s] for the top camera position (top row) and side camera position (bottom row)
Similar observations can be made from the side position (figure 9, bottom row). An increase
of particle velocity can be observed at intermediate water contents. High water contents lead
to high energy dissipation based on friction and deformation, and thus to lower velocities. At
low water contents the contact forces between the friction plate and the pellets might be
lower; therefore less energy is transferred to the pellet bed.
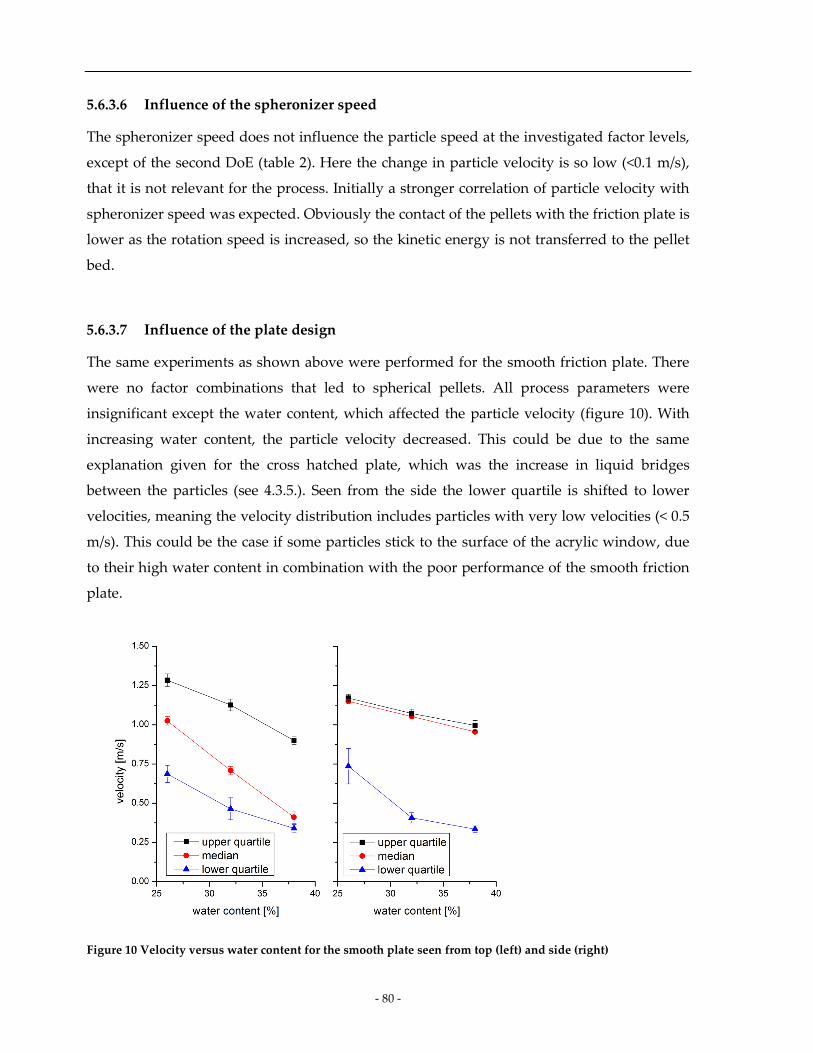
- 80 -
5.6.3.6 Influence of the spheronizer speed
The spheronizer speed does not influence the particle speed at the investigated factor levels,
except of the second DoE (table 2). Here the change in particle velocity is so low (<0.1 m/s),
that it is not relevant for the process. Initially a stronger correlation of particle velocity with
spheronizer speed was expected. Obviously the contact of the pellets with the friction plate is
lower as the rotation speed is increased, so the kinetic energy is not transferred to the pellet
bed.
5.6.3.7 Influence of the plate design
The same experiments as shown above were performed for the smooth friction plate. There
were no factor combinations that led to spherical pellets. All process parameters were
insignificant except the water content, which affected the particle velocity (figure 10). With
increasing water content, the particle velocity decreased. This could be due to the same
explanation given for the cross hatched plate, which was the increase in liquid bridges
between the particles (see 4.3.5.). Seen from the side the lower quartile is shifted to lower
velocities, meaning the velocity distribution includes particles with very low velocities (< 0.5
m/s). This could be the case if some particles stick to the surface of the acrylic window, due
to their high water content in combination with the poor performance of the smooth friction
plate.
Figure 10 Velocity versus water content for the smooth plate seen from top (left) and side (right)
CHAPTER 5 - Analysis of Particle Kinematics in Spheronisation via Particle Image Velocimetry
- 81 -
5.7 Conclusion
Particle image velocimetry (PIV) is a valuable tool to characterize the particle kinematics in
spheronization. The PIV-setup was validated for the spheronization process in accordance to
ICH Q2 guideline. It was possible to analyze the movement of the particle stream inside the
spheronizer, and this data could be used to characterize the influences of different process
parameters on the velocity distribution. The water content, spheronization duration, and
spheronizer loading have a dominant influence on the particle kinematics, whereas the
rotation speed does not influence the kinematics relevantly. Overall, the particle velocities
were much slower than expected in relation to the rotation speed of the spheronizer.
5.8 Acknowledgements
The authors thank the Schlueter GmbH (Neustadt/Ruebenberge, Germany) for lending the
second friction plate to them and Elizabeth Ely (EIES, Lafayette IN, USA) for assistance in
preparing the manuscript.
5.9 References
[1] I. Ghebre Sellassie, Pharmaceutical Pelletization Technology, Marcel Dekker, New York, 1989.
[2] J.-W. Conine, H.R. Hadley, Preparation of small solid pharmaceutical spheres, Drug Cosmet. Ind. 106 (1970) 38-41.
[3] A.-D. Reynolds, A new technique for the production of spherical particles, Manuf Chem Aerosol News 40 (1970) 40-43.
[4] A. Dukic-Ott, M. Thommes, J. P. Remon, P. Kleinebudde, C. Vervaet, Production of pellets via extrusion-spheronisation without the incorporation of microcrystalline cellulose: A critical review, Eur J Pharm Biopharm 71(2009) 38-46.
[5] C. Krueger, M. Thommes, P. Kleinebudde, “MCC SANAQ® burst”—A New Type of Cellulose and its Suitability to Prepare Fast Disintegrating Pellets, J Pharm Innov 5 (2010) 45-57.
[6] N. Vishal, Formulation and evaluation of olanzapine matrix pellets for controlled release, Daru 19 (2011) 249-256.
[7] D.F. Erkoboni, Extrusion/Spheronization, in: I. Ghebre-Sellassie, C. Martin, Pharmaceutical Extrusion Technology, Marcel Dekker, New York, 2003, pp. 277-322.
[8] L.S.C. Wan, P.W.S. Heng, C.V. Liew, Spheronization conditions on spheroid shape and size, Int J Pharm 96 (1993) 59-65.
- 82 -
[9] C. Vervaet, L. Baert, J.P. Remon, Extrusion-spheronisation A literature review, Int J Pharm 116 (1995) 131-146.
[10] A.M. Agrawal, M.A. Howard, S.H. Neau, Extruded and spheronized beads containing no microcrystalline cellulose: Influence of formulation and process variables, Pharm Dev Technol 9 (2004) 197-217.
[11] C. Schmidt, P. Kleinebudde, Comparison between a twin-screw extruder and a rotary ring die press. Part II: influence of process variables, Eur J Pharm Biopharm 45 (1997) 173-9.
[12] R.C. Rowe, Spheronization: a novel pill-making process?, Pharm. Int. 6 (1985) 119-123.
[13] L. Baert, H. Vermeersch, J.P. Remon, J. Smeyers-Verbeke, D.L. Massart, Study of parameters important in the spheronisation process, Int J Pharm 96 (1993) 225-229.
[14] P. Kleinebudde, Pharmazeutische Pellets durch Extrudieren/Sphäronisieren - Herstellung, Eigenschaften, Modifizierung, Habilitationsschrift (1997), Kiel
[15] R.J. Adrian, Particle-imaging techniques for experimental fluid mechanics, Annual review of fluid mechanics 23 (1991) 261-304.
[16] C.E. Willert, M. Gharib, Digital particle image velocimetry, Exp Fluids 10 (1991) 181-193.
[17] A. Melling, Tracer particles and seeding for particle image velocimetry, Meas Sci Technol 8 (1999) 1406-1416.
[18] S.L. Conway, A. Lekhal, J.G. Khinast, B.J. Glasser, Granular flow and segregation in a four-bladed mixer, Chem Eng Sci 60 (2005) 7091-7107.
[19] R.D. Keane, R.J. Adrian, Theory of cross-correlation analysis of PIV images, Applied Scientific Research 49 (1992) 191-215.
[20] M. Boerner, M. Peglow, E. Tsotsas, Particle Residence Times in Fluidized Bed Granulation Equipments, Chemical Engineering & Technology 34 (2011) 1116-1122.
[21] M. Koester, M. Thommes, New Insights into the Pelletization Mechanism by Extrusion/Spheronization, AAPS PharmSciTech 11 (2010) 1549-1551.
[22] R.L. Steward, J. Bridgewater, Y.C. Zhou, A.B. Yu, Simulated and measured flow of granules in a bladed mixer- A detailed comparison, Chem Eng Sci 56 (2001) 5457-5471.
[23] J. Soria, Multigrid approach to cross-correlation digital PIV and HPIV analysis, 13th Australian fluid dynamics conference, 1998
[24] D.J. Holland, C.R. Müller, J.S. Dennis, L.F. Gladden, A.J. Sederman, Spatially resolved measurement of anisotropic granular temperature in gas-fluidized beds, Powder Technology 182 (2008) 171-181.
[25] L. Eriksson, Design of Experiments - Principles and Applications, MKS Umetrics AB, Umea (Sweden), 2003.
[26] International Conference on Harmonisation of Technical Requirements for Registration of Pharmaceuticals for Human Use, 2005. Validation of Analytical Procedures: Text and Methology Q2(R11)
CHAPTER 6 - Attrition, Agglomeration, and Stagnation in the Spheronization of Pharmaceutical Materials
- 83 -
6 CHAPTER 6 - Attrition, Agglomeration, and Stagnation in the
Spheronization of Pharmaceutical Materials
6.1 Pretext
The following work will be submitted in June 2013 to Granular Matter (impact factor 2010:
1.22). In this paper a discrete element method simulation for the dynamic movement of
mono-disperse particles inside the spheronizer is compared to experiments in order to
validate the simulation. The particle velocities were chosen as relevant output parameter for
the simulation as well as the experiments because of the results presented in chapter five and
five characteristic zones controlling the spheronization process could be identified.
The first author of this paper, Martin Koester, is responsible for the concept of the
expriments and the simulation as well as their evaluation and writing of the manuscript.
Associate Professor R. Edwin García, listed as second author, is responsible for revision of
the manuscript. Dr. Markus Thommes, listed as senior author, is responsible for ideas and
revision of the manuscript.
Submission June 2013
- 84 -
6.2 Abstract
Spheronization is an important pharmaceutical manufacturing technique to fabricate
spherical agglomerates whose size ranges between 0.5 and 2 mm (pellets). The product is
characterized by a narrow size distribution and a well-defined spherical shape. During the
spheronization process, the extrudate starting material break up in short cylinders and
evolve from a cylindrical to a spherical state through deformation and
attrition/agglomeration mechanisms. In this paper, by using the discrete element method, an
integrated modeling-experimental framework is presented that captures the particle motion
during the spheronization process. Simulations were directly compared and validated
against particle image velocimetry (PIV) experiments with monodisperse spherical and dry
γ-Al2O3 particles.
Results demonstrate a characteristic torus like flow pattern, with particle velocities about
three times slower than the rotation speed of the friction plate. Five characteristic zones
controlling the spheronization process are identified: Zone I, where particles undergo shear
forces that favor attrition and contributes material to the agglomeration process; Zone II,
where the static wall contributes to the mass exchange between particles; Zone III, where
gravitational forces combined with particle motion induce particles to collide with the
moving plate and re-enter Zone I; Zone IV, where a subpopulation of particles are ejected
into the air when in contact with the friction plate structure; and Zone V where the low
poloidal velocity favors a stagnant particle population and is entirely controlled by the batch
size.
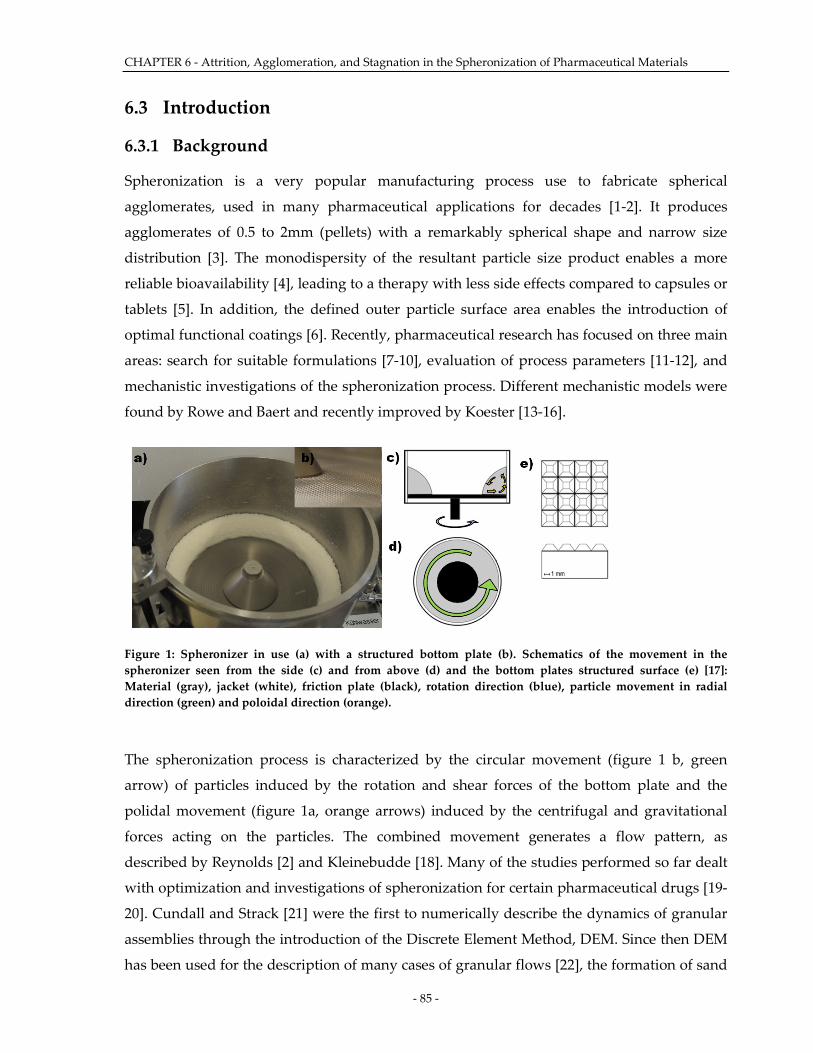
CHAPTER 6 - Attrition, Agglomeration, and Stagnation in the Spheronization of Pharmaceutical Materials
- 85 -
6.3 Introduction
6.3.1 Background
Spheronization is a very popular manufacturing process use to fabricate spherical
agglomerates, used in many pharmaceutical applications for decades [1-2]. It produces
agglomerates of 0.5 to 2mm (pellets) with a remarkably spherical shape and narrow size
distribution [3]. The monodispersity of the resultant particle size product enables a more
reliable bioavailability [4], leading to a therapy with less side effects compared to capsules or
tablets [5]. In addition, the defined outer particle surface area enables the introduction of
optimal functional coatings [6]. Recently, pharmaceutical research has focused on three main
areas: search for suitable formulations [7-10], evaluation of process parameters [11-12], and
mechanistic investigations of the spheronization process. Different mechanistic models were
found by Rowe and Baert and recently improved by Koester [13-16].
Figure 1: Spheronizer in use (a) with a structured bottom plate (b). Schematics of the movement in the spheronizer seen from the side (c) and from above (d) and the bottom plates structured surface (e) [17]: Material (gray), jacket (white), friction plate (black), rotation direction (blue), particle movement in radial direction (green) and poloidal direction (orange).
The spheronization process is characterized by the circular movement (figure 1 b, green
arrow) of particles induced by the rotation and shear forces of the bottom plate and the
polidal movement (figure 1a, orange arrows) induced by the centrifugal and gravitational
forces acting on the particles. The combined movement generates a flow pattern, as
described by Reynolds [2] and Kleinebudde [18]. Many of the studies performed so far dealt
with optimization and investigations of spheronization for certain pharmaceutical drugs [19-
20]. Cundall and Strack [21] were the first to numerically describe the dynamics of granular
assemblies through the introduction of the Discrete Element Method, DEM. Since then DEM
has been used for the description of many cases of granular flows [22], the formation of sand
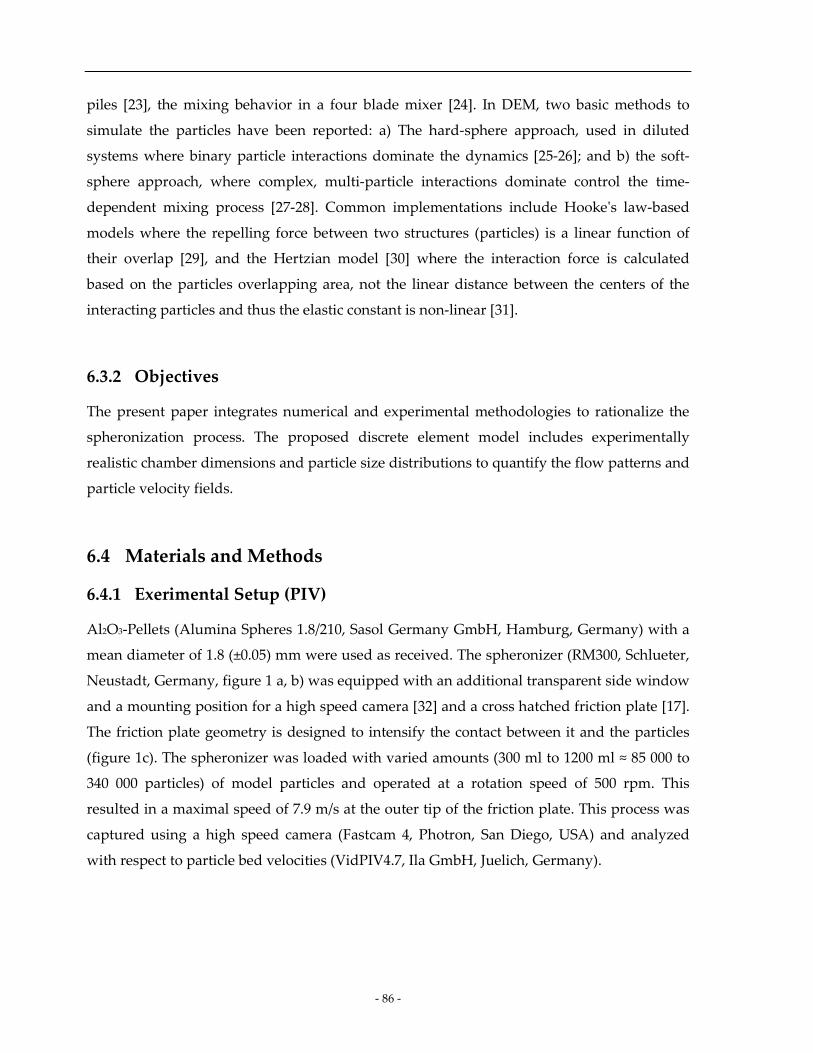
- 86 -
piles [23], the mixing behavior in a four blade mixer [24]. In DEM, two basic methods to
simulate the particles have been reported: a) The hard-sphere approach, used in diluted
systems where binary particle interactions dominate the dynamics [25-26]; and b) the soft-
sphere approach, where complex, multi-particle interactions dominate control the time-
dependent mixing process [27-28]. Common implementations include Hooke's law-based
models where the repelling force between two structures (particles) is a linear function of
their overlap [29], and the Hertzian model [30] where the interaction force is calculated
based on the particles overlapping area, not the linear distance between the centers of the
interacting particles and thus the elastic constant is non-linear [31].
6.3.2 Objectives
The present paper integrates numerical and experimental methodologies to rationalize the
spheronization process. The proposed discrete element model includes experimentally
realistic chamber dimensions and particle size distributions to quantify the flow patterns and
particle velocity fields.
6.4 Materials and Methods
6.4.1 Exerimental Setup (PIV)
Al2O3-Pellets (Alumina Spheres 1.8/210, Sasol Germany GmbH, Hamburg, Germany) with a
mean diameter of 1.8 (±0.05) mm were used as received. The spheronizer (RM300, Schlueter,
Neustadt, Germany, figure 1 a, b) was equipped with an additional transparent side window
and a mounting position for a high speed camera [32] and a cross hatched friction plate [17].
The friction plate geometry is designed to intensify the contact between it and the particles
(figure 1c). The spheronizer was loaded with varied amounts (300 ml to 1200 ml ≈ 85 000 to
340 000 particles) of model particles and operated at a rotation speed of 500 rpm. This
resulted in a maximal speed of 7.9 m/s at the outer tip of the friction plate. This process was
captured using a high speed camera (Fastcam 4, Photron, San Diego, USA) and analyzed
with respect to particle bed velocities (VidPIV4.7, Ila GmbH, Juelich, Germany).
CHAPTER 6 - Attrition, Agglomeration, and Stagnation in the Spheronization of Pharmaceutical Materials
- 87 -
6.4.2 Numerical Setup
LIGGGHTS (Version 1.50, nf.nci.org.au/facilities/software/LIGGGHTS/doc/ Manual.html), an
open source software package, adapted from LAMMPS, to simulate granular systems was
used to simulate the spheronization process. An existing Hertzian contact model, expanded
by Mindlin and Deresiewicz was used as implemented in LIGGGHTS to represent the
interactions between the simulated particles [35]:
)()( ijtijtijnijn vttkvnnkF γδγδ −+−= Equation 2
The elastic (k) and viscoelastic (γ) damping constants of this model were defined from the
material properties [36] of the model particles given in table 1 according to the calculations
described in detail by Kloss et al [35]. For each simulated instant (t) each contribution to the
total force (normal and tangential) per particle is calculated from elastic and viscoelastic
damping constants (k and γ) and the current relative velocity (v) of the interacting particles
(i and j). This model was used, because the γ-Al2O3-Spheres showed no adhesion between
each other or to the surfaces of the spheronizer. The spheronizer geometry was defined in
terms of two triangular mesh components [37]: a) A cylindrical jacket, as defined by the
RM300 spheronizer used in the performed experiments, a static triangular mesh; and b) A
rotating friction plate, as described by Schmidt [17] in terms of approx. 8000 truncated
pyramids. Each pyramidal structure had a 3x3 mm base and 1.75 mm height (see figure 1c).
85 000 to 340 000 particles, a typical spheronization load, was imported into the simulation
domain and initialized to be devoided of particle-particle contact to minimize extraneous
interactions. The applied gravitational force points in direction of the friction plate. The
particle properties are listed in table 1. The time step of the simulation was set to dt = 10-6 s.
The spheronization simulation consists of two parts: a transient phase, where the particles
fall on the friction plate and are accelerated by the rotating friction plate, and a steady state
phase, where the actual spheronization process takes place. Only the steady state data was
used in the analysis described herein. Data associated to the particle dynamics was captured
every 400 steps, including the mesh geometry and the location, velocity, acceleration and
rotation of every individual particle. The data was visualized using paraview 3.10 (kitware
inc., Clifton Park, NY , USA). Generated images were then processed using the same PIV
software to visualize the particle flow inside the simulated spheronizer. Cross-section
visualizations were generated and color coded by using their tangential and normal velocity.
- 88 -
6.4.3 Particle Properties
The coefficient of restitution (CoR), the rate at which energy is dissipated when particles
bounce on a surface, was experimentally determined by dropping particles on a steel block
and measuring their starting and rebound height using a high speed camera (Fastcam 4,
Photron, San Diego, USA). The CoR was calculated by equation1:
rebound
impact
heightheight
CoR = Equation 1
The coefficient of friction (CoF), the rate at which particles dissipate energy when sliding
tangentially on a surface, was determined using a ring shear cell (RST01, Schulze
Schuettgutmesstechnik, Wolfenbuettel, Germany). The cell was rotated with increasing
normal forces [33] at a constant shear velocity. After filling the cell with the Al2O3-Pellets the
normal pressure was increased from 250 to 2000 Pa and the normal force and shear force was
measured over a range of 100 mm shearing distance. The ratio of normal force to shear force
was used as coefficient of friction.
The apparent density was determined with a mercury porosimeter (Pascal140, Thermo
Fisher, Milan, Italy) at a pressure of 0.1 MPa.
The median equivalent diameter was used for the simulation. 500 particles were
photographed using a stereo microscope (Leica MZ 75, Cambridge, UK), a ring light with
cold light source (Leica KL 1500, Cambridge, UK) and a digital camera (Leica CS 300 F,
Cambridge, UK). Images were recorded at a suitable magnification (1 pixel = 17.5 µm) and
converted into binary images. Contacting pellets were separated by a software algorithm
[34]. If the automatic separation failed, pellets were deleted manually.
The poisson ratio of each particle was set to 0.5, in order to enforce pellet incompressibility.
Properties are summarized in Table 1.
CHAPTER 6 - Attrition, Agglomeration, and Stagnation in the Spheronization of Pharmaceutical Materials
- 89 -
Table 1: Particle Properties
Parameter Symbol Unit measured
(av ± s, n)
used
simulation
Size d mm 1.8 ± 0.05, 500 1.8 mm
Density ρ g/cm³ 0.38 g/cm³
Young's Modulus* E GPa - 15 GPa
Poisson Ratio ν - - 0.5
Coefficient of Restitution CoR - 0.90 ± 0.02, 10 0.90
Coefficient of Friction CoF - 0.39 ± 0.01, 8 0.39
(* literature values taken from [38])
6.5 Results and Discussion
Figure 2 shows a visual comparison between the DEM results and experimental data.
Results demonstrate a torus like movement for the particle bed (figure 2, left), in excellent
agreement with each other [2,18]. Here, the friction of the rotating plate induces a toroidal
movement and a poloidal movement is favored by the centrifugal forces acting on the
particles. The majority of the particles is in contact with each other and assembles a
consistent particle flow. A subpopulation of particles flows on the surface of the bulk of the
particle bed at higher velocities as a result of the ejecting rotating friction and transfer of
momentum induced by the rotating plate. This subpopulation is about 1.6 % of the entirety
of the particles, for those simulations initialized with the smallest loads. For the rest of the
simulations this subpopulation constitutes less than 0.5 % of the particles. Images show a
qualitative agreement with these observations.
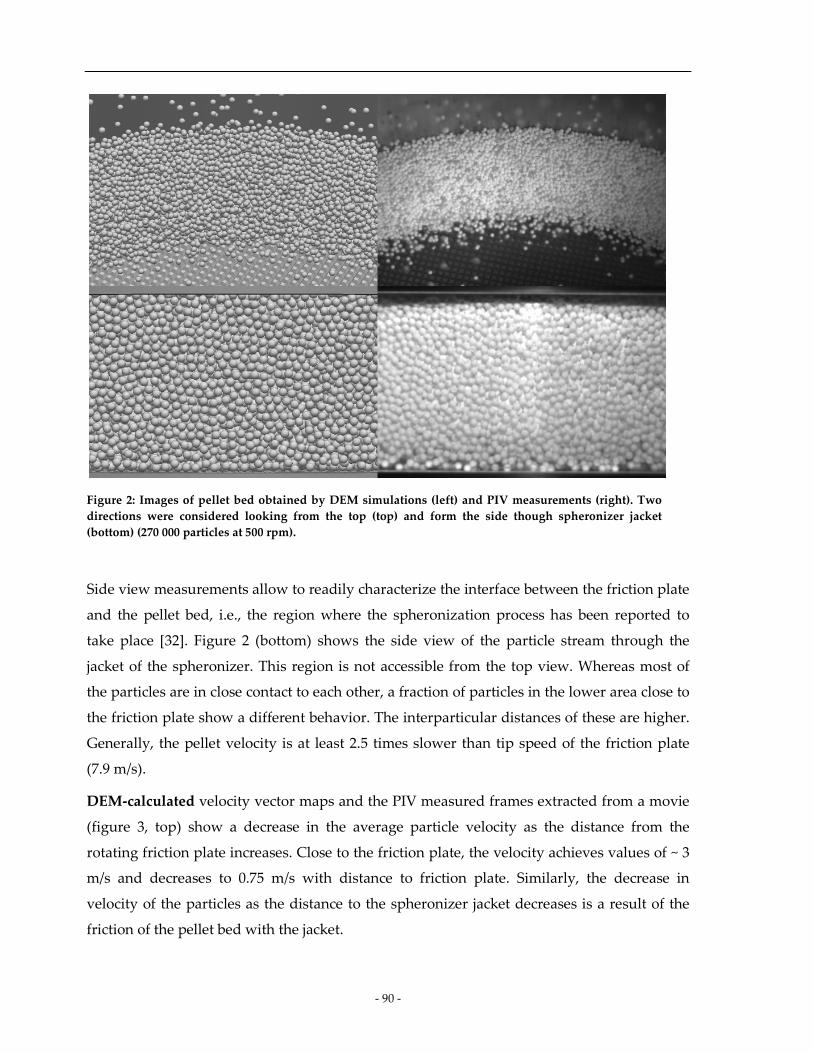
- 90 -
Figure 2: Images of pellet bed obtained by DEM simulations (left) and PIV measurements (right). Two directions were considered looking from the top (top) and form the side though spheronizer jacket (bottom) (270 000 particles at 500 rpm).
Side view measurements allow to readily characterize the interface between the friction plate
and the pellet bed, i.e., the region where the spheronization process has been reported to
take place [32]. Figure 2 (bottom) shows the side view of the particle stream through the
jacket of the spheronizer. This region is not accessible from the top view. Whereas most of
the particles are in close contact to each other, a fraction of particles in the lower area close to
the friction plate show a different behavior. The interparticular distances of these are higher.
Generally, the pellet velocity is at least 2.5 times slower than tip speed of the friction plate
(7.9 m/s).
DEM-calculated velocity vector maps and the PIV measured frames extracted from a movie
(figure 3, top) show a decrease in the average particle velocity as the distance from the
rotating friction plate increases. Close to the friction plate, the velocity achieves values of ~ 3
m/s and decreases to 0.75 m/s with distance to friction plate. Similarly, the decrease in
velocity of the particles as the distance to the spheronizer jacket decreases is a result of the
friction of the pellet bed with the jacket.
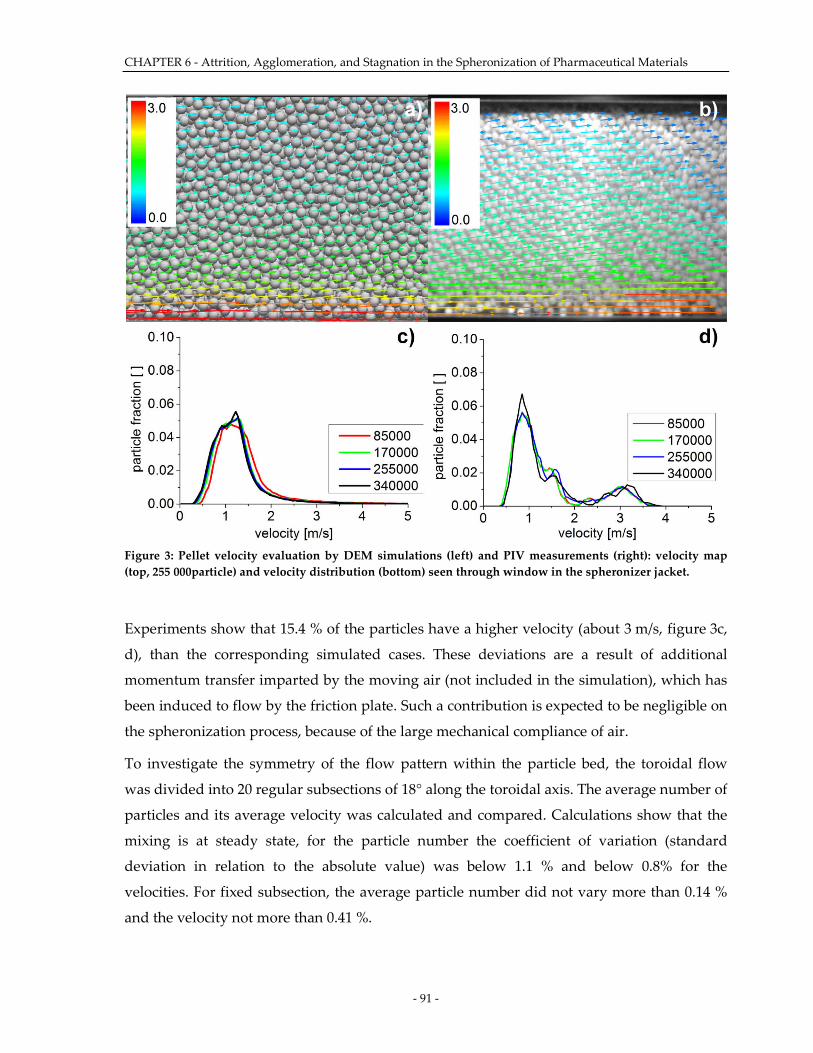
CHAPTER 6 - Attrition, Agglomeration, and Stagnation in the Spheronization of Pharmaceutical Materials
- 91 -
Figure 3: Pellet velocity evaluation by DEM simulations (left) and PIV measurements (right): velocity map (top, 255 000particle) and velocity distribution (bottom) seen through window in the spheronizer jacket.
Experiments show that 15.4 % of the particles have a higher velocity (about 3 m/s, figure 3c,
d), than the corresponding simulated cases. These deviations are a result of additional
momentum transfer imparted by the moving air (not included in the simulation), which has
been induced to flow by the friction plate. Such a contribution is expected to be negligible on
the spheronization process, because of the large mechanical compliance of air.
To investigate the symmetry of the flow pattern within the particle bed, the toroidal flow
was divided into 20 regular subsections of 18° along the toroidal axis. The average number of
particles and its average velocity was calculated and compared. Calculations show that the
mixing is at steady state, for the particle number the coefficient of variation (standard
deviation in relation to the absolute value) was below 1.1 % and below 0.8% for the
velocities. For fixed subsection, the average particle number did not vary more than 0.14 %
and the velocity not more than 0.41 %.
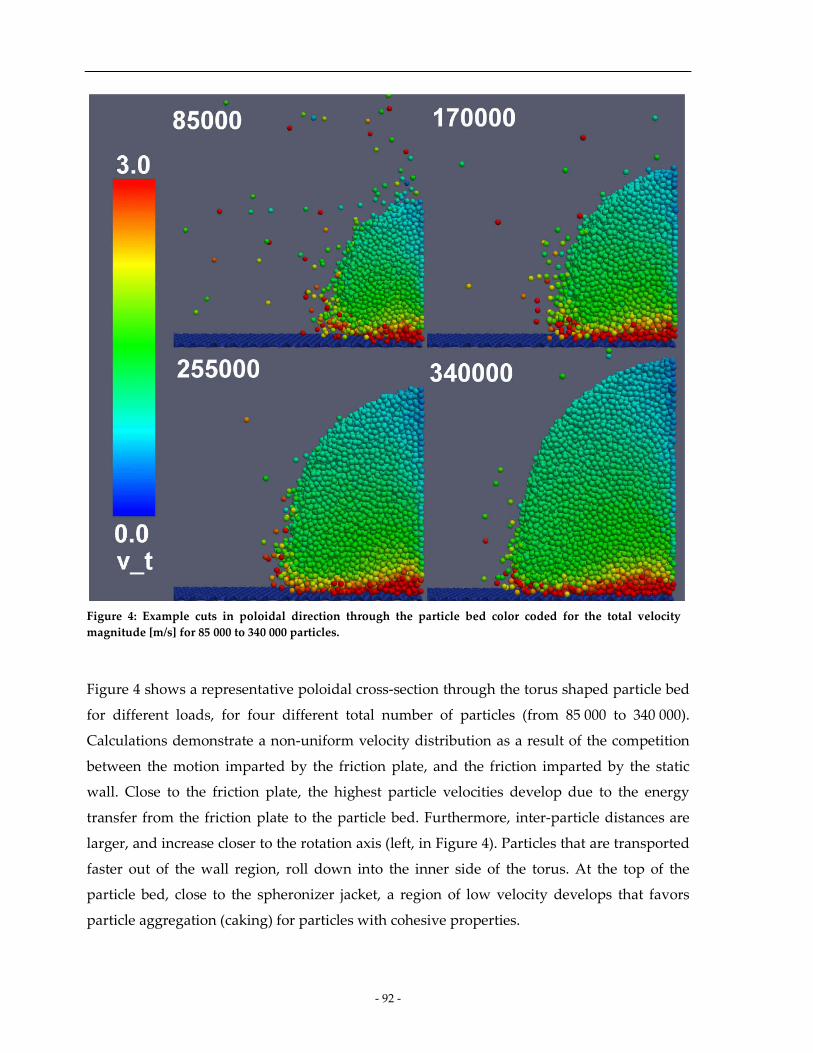
- 92 -
Figure 4: Example cuts in poloidal direction through the particle bed color coded for the total velocity magnitude [m/s] for 85 000 to 340 000 particles.
Figure 4 shows a representative poloidal cross-section through the torus shaped particle bed
for different loads, for four different total number of particles (from 85 000 to 340 000).
Calculations demonstrate a non-uniform velocity distribution as a result of the competition
between the motion imparted by the friction plate, and the friction imparted by the static
wall. Close to the friction plate, the highest particle velocities develop due to the energy
transfer from the friction plate to the particle bed. Furthermore, inter-particle distances are
larger, and increase closer to the rotation axis (left, in Figure 4). Particles that are transported
faster out of the wall region, roll down into the inner side of the torus. At the top of the
particle bed, close to the spheronizer jacket, a region of low velocity develops that favors
particle aggregation (caking) for particles with cohesive properties.
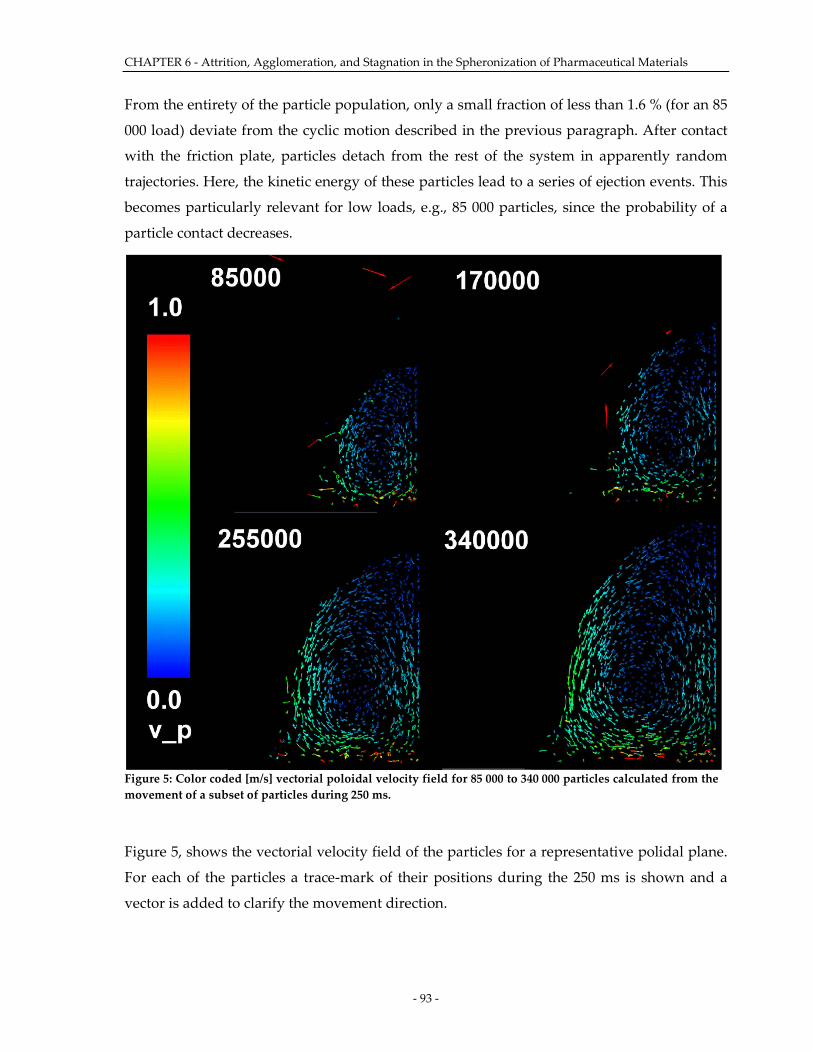
CHAPTER 6 - Attrition, Agglomeration, and Stagnation in the Spheronization of Pharmaceutical Materials
- 93 -
From the entirety of the particle population, only a small fraction of less than 1.6 % (for an 85
000 load) deviate from the cyclic motion described in the previous paragraph. After contact
with the friction plate, particles detach from the rest of the system in apparently random
trajectories. Here, the kinetic energy of these particles lead to a series of ejection events. This
becomes particularly relevant for low loads, e.g., 85 000 particles, since the probability of a
particle contact decreases.
Figure 5: Color coded [m/s] vectorial poloidal velocity field for 85 000 to 340 000 particles calculated from the movement of a subset of particles during 250 ms.
Figure 5, shows the vectorial velocity field of the particles for a representative polidal plane.
For each of the particles a trace-mark of their positions during the 250 ms is shown and a
vector is added to clarify the movement direction.
- 94 -
Figure 6 summarizes the (circular) motion zones (see figure 5):
Zone I: (or attrition regime) In this regime, when in contact with the friction plate, particles are
accelerated and forced to flow underneath the particle bed. Here, particles undergo a great
deal of shear forces that favors attrition and contributes material to the agglomeration
process.
Zone II: (or mixing regime) In the vicinity of the static wall of the spheronizer, particles are
pushed upwards by the incoming particles that are exiting zone I. Here, while the static wall
does not impart any additional force to the agglomerates, the imposed flow continuity
further contributes to the mass exchange between particles.
Zone III: (or reentry regime) when particles slide down to the inner section of the torus. Here,
gravitational forces combined with particle motion induce particles to collide with the
moving plate and re-enter Zone I.
Zone IV: (or transition regime) when reaching the rotating friction plate, the particle density is
reduced due to the acceleration of the particles. Here, a subpopulation of particles are ejected
into the air when in contact with the friction plate structure.
Zone V: (or stagnation regime) where a lower poloidal velocity, develops. Here, due to the low
velocity in the poloidal plane, the particles do not participate in the particle interactions with
the plate and is entirely controlled by the particle-particle attrition/agglomeration
interactions. The extent of zone V is a function of the total load, thus, becoming more
pronounced as the batch size increases.
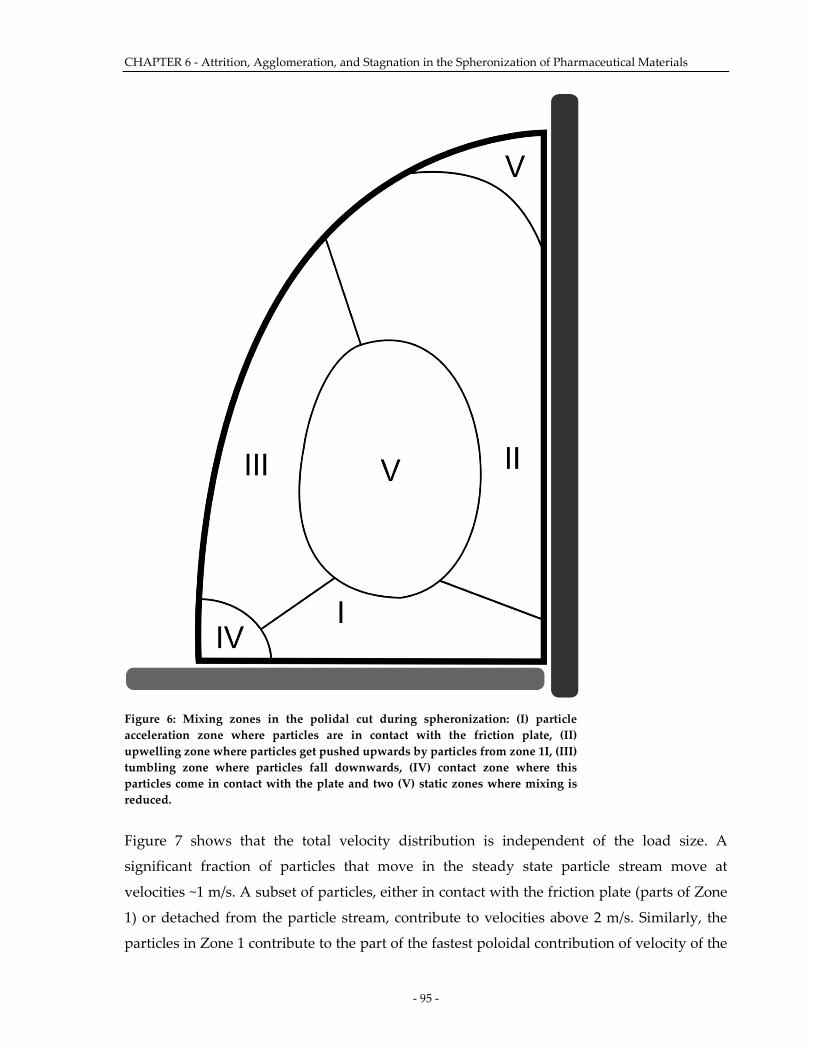
CHAPTER 6 - Attrition, Agglomeration, and Stagnation in the Spheronization of Pharmaceutical Materials
- 95 -
Figure 6: Mixing zones in the polidal cut during spheronization: (I) particle acceleration zone where particles are in contact with the friction plate, (II) upwelling zone where particles get pushed upwards by particles from zone 1I, (III) tumbling zone where particles fall downwards, (IV) contact zone where this particles come in contact with the plate and two (V) static zones where mixing is reduced.
Figure 7 shows that the total velocity distribution is independent of the load size. A
significant fraction of particles that move in the steady state particle stream move at
velocities ~1 m/s. A subset of particles, either in contact with the friction plate (parts of Zone
1) or detached from the particle stream, contribute to velocities above 2 m/s. Similarly, the
particles in Zone 1 contribute to the part of the fastest poloidal contribution of velocity of the
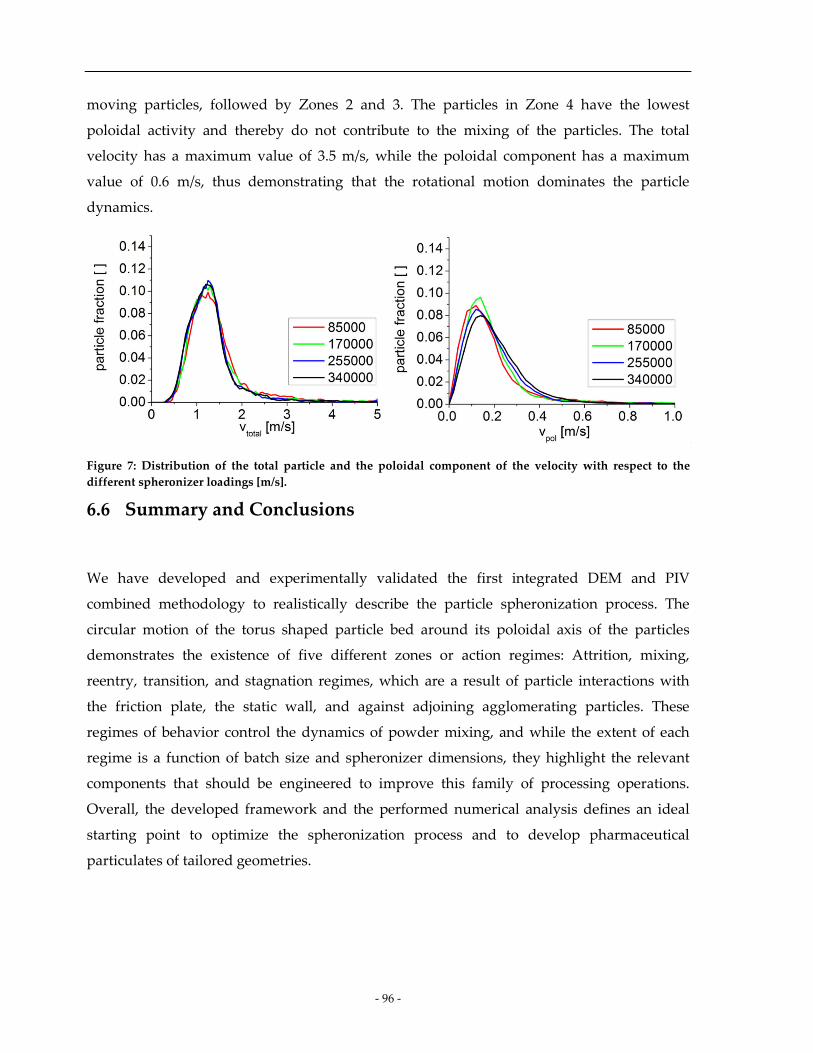
- 96 -
moving particles, followed by Zones 2 and 3. The particles in Zone 4 have the lowest
poloidal activity and thereby do not contribute to the mixing of the particles. The total
velocity has a maximum value of 3.5 m/s, while the poloidal component has a maximum
value of 0.6 m/s, thus demonstrating that the rotational motion dominates the particle
dynamics.
Figure 7: Distribution of the total particle and the poloidal component of the velocity with respect to the different spheronizer loadings [m/s].
6.6 Summary and Conclusions
We have developed and experimentally validated the first integrated DEM and PIV
combined methodology to realistically describe the particle spheronization process. The
circular motion of the torus shaped particle bed around its poloidal axis of the particles
demonstrates the existence of five different zones or action regimes: Attrition, mixing,
reentry, transition, and stagnation regimes, which are a result of particle interactions with
the friction plate, the static wall, and against adjoining agglomerating particles. These
regimes of behavior control the dynamics of powder mixing, and while the extent of each
regime is a function of batch size and spheronizer dimensions, they highlight the relevant
components that should be engineered to improve this family of processing operations.
Overall, the developed framework and the performed numerical analysis defines an ideal
starting point to optimize the spheronization process and to develop pharmaceutical
particulates of tailored geometries.
CHAPTER 6 - Attrition, Agglomeration, and Stagnation in the Spheronization of Pharmaceutical Materials
- 97 -
6.7 Acknowledgements
Martin Koester and Markus Thommes are grateful for the donation of the test particles by
Sasol (Sasol Germany GmbH, Hamburg, Germany) and R. Edwin García thanks the partial
support from NSF CMMI 0856491.
6.8 References
1. Conine, J., Hadley, H.: Preparation of small solid pharmaceutical spheres. Drug Cosmet. Ind 106(1), 38-41 (1970).
2. Reynolds, A.: A new technique for the production of spherical particles. Manuf. Chem 41(6), 40-43 (1970).
3. Erkoboni, D.F., Parikh, D.: Extrusion-spheronization as a granulation technique. Drugs and the pharmaceutical sciences 81, 333-368 (1997).
4. Bechgaard, H., Nielsen, G.H.: Controlled-Release Multiple-Units and Single-Unit Doses a Literature Review. Drug Development and Industrial Pharmacy 4(1), 53-67 (1978). doi:doi:10.3109/03639047809055639
5. Follonier, N., Doelker, E.: Biopharmaceutical comparison of oral multiple-unit and single-unit sustained-release dosage forms. STP Pharma sciences 2(2), 141-158 (1992).
6. Chopra, R., Podczeck, F., Newton, J.M., Alderborn, G.: The influence of pellet shape and film coating on the filling of pellets into hard shell capsules. European journal of pharmaceutics and biopharmaceutics 53(3), 327-333 (2002).
7. O'Connor, R., Holinej, J., Schwartz, J.: Spheronization I: Processing and evaluation of spheres prepared from commercially available excipients. Am. J. Pharm 156, 80-87 (1984).
8. Agrawal, A.M., Howard, M.A., Neau, S.H.: Extruded and spheronized beads containing no microcrystalline cellulose: influence of formulation and process variables. Pharmaceutical development and technology 9(2), 197-217 (2004).
9. Chatlapalli, R., Rohera, B.D.: Physical characterization of HPMC and HEC and investigation of their use as pelletization aids. International journal of pharmaceutics 161(2), 179-193 (1998).
10. Lindner, H., Kleinebudde, P.: Use of powdered cellulose for the production of pellets by extrusion/spheronization. Journal of pharmacy and pharmacology 46(1), 2-7 (1994).
11. Newton, J., Chapman, S., Rowe, R.: The influence of process variables on the preparation and properties of spherical granules by the process of extrusion and spheronisation. International journal of pharmaceutics 120(1), 101-109 (1995).
12. Baert, L., Vermeersch, H., Remon, J.P., Smeyers-Verbeke, J., Massart, D.: Study of parameters important in the spheronisation process. International journal of pharmaceutics 96(1), 225-229 (1993).
- 98 -
13. Rowe, R.: Spheronization: a novel pill-making process. Pharm. Int 6, 119-123 (1985).
14. Baert, L., Remon, J.P.: Influence of amount of granulation liquid on the drug release rate from pellets made by extrusion spheronisation. International journal of pharmaceutics 95(1), 135-141 (1993).
15. Liew, C.V., Chua, S.M., Heng, P.W.: Elucidation of spheroid formation with and without the extrusion step. AAPS PharmSciTech 8(1), E70-E81 (2007).
16. Koester, M., Thommes, M.: New insights into the pelletization mechanism by extrusion/spheronization. AAPS PharmSciTech 11(4), 1549-1551 (2010).
17. Schmidt, C., Kleinebudde, P.: Comparison between a twin-screw extruder and a rotary ring die press. Part II: influence of process variables. European journal of pharmaceutics and biopharmaceutics 45(2), 173-179 (1998).
18. Kleinebudde, P.: Pharmazeutische Pellets durch Extrudieren, Sphäronisieren: Herstellung, Eigenschaften, Modifizierung. (1996)
19. Basit, A.W., Newton, J.M., Lacey, L.F.: Formulation of ranitidine pellets by extrusion-spheronization with little or no microcrystalline cellulose. Pharmaceutical development and technology 4(4), 499-505 (1999).
20. Gupta, N., Khan, S.: Formulation and evaluation of olanzapine matrix pellets for controlled release. DARU Journal of Pharmaceutical Sciences 19(4) (2011).
21. Cundall, P.A., Strack, O.D.: A discrete numerical model for granular assemblies. Geotechnique 29(1), 47-65 (1979).
22. Cleary, P.W., Sawley, M.L.: DEM modelling of industrial granular flows: 3D case studies and the effect of particle shape on hopper discharge. Applied Mathematical Modelling 26(2), 89-111 (2002).
23. Zhou, Y., Wright, B., Yang, R., Xu, B., Yu, A.: Rolling friction in the dynamic simulation of sandpile formation. Physica A: Statistical Mechanics and its Applications 269(2), 536-553 (1999).
24. Remy, B., Glasser, B.J., Khinast, J.G.: The effect of mixer properties and fill level on granular flow in a bladed mixer. AIChE Journal 56(2), 336-353 (2010).
25. Xu, B., Yu, A.: Numerical simulation of the gas-solid flow in a fluidized bed by combining discrete particle method with computational fluid dynamics. Chemical Engineering Science 52(16), 2785-2809 (1997).
26. Li, J., Kuipers, J.: Gas-particle interactions in dense gas-fluidized beds. Chemical Engineering Science 58(3), 711-718 (2003).
27. Hanes, D.M., Walton, O.R.: Simulations and physical measurements of glass spheres flowing down a bumpy incline. Powder technology 109(1), 133-144 (2000).
28. Cleary, P.W., Metcalfe, G., Liffman, K.: How well do discrete element granular flow models capture the essentials of mixing processes? Applied Mathematical Modelling 22(12), 995-1008 (1998).
CHAPTER 6 - Attrition, Agglomeration, and Stagnation in the Spheronization of Pharmaceutical Materials
- 99 -
29. Silbert, L.E., Ertaş, D., Grest, G.S., Halsey, T.C., Levine, D., Plimpton, S.J.: Granular flow down an inclined plane: Bagnold scaling and rheology. Physical Review E 64(5), 051302 (2001).
30. Hertz, H.: Über die Berührung Fester Elastischer Körper (on the contact of elastic solids). J Reine und Angewandte Mathematik 92: 156. Miscellaneous papers H. Hertz. Macmillan, London (1896).
31. Zhang, H., Makse, H.: Jamming transition in emulsions and granular materials. Physical Review E 72(1), 011301 (2005).
32. Koester, M., Thommes, M.: Analysis of particle kinematics in spheronization via particle image velocimetry. European journal of pharmaceutics and biopharmaceutics 83(2), 307-314 (2013). doi:http://dx.doi.org/10.1016/j.ejpb.2012.08.013
33. Schwedes, J., Schulze, D.: Measurement of flow properties of bulk solids. Powder technology 61(1), 59-68 (1990).
34. Lindner, H., Kleinebudde, P.: Characterization of pellets by means of automatic image analysis. Pharm. Ind 55(7), 694-701 (1993).
35. Kloss, C., Goniva, C.: LIGGGHTS–Open Source Discrete Element Simulations of Granular Materials Based on Lammps. Supplemental Proceedings: Materials Fabrication, Properties, Characterization, and Modeling, Volume 2, 781-788 (2011).
36. Di Renzo, A., Di Maio, F.P.: Comparison of contact-force models for the simulation of collisions in DEM-based granular flow codes. Chemical Engineering Science 59(3), 525-541 (2004).
37. Kremmer, M., Favier, J.F.: A method for representing boundaries in discrete element modelling—part I: Geometry and contact detection. International Journal for Numerical Methods in Engineering 51(12), 1407-1421 (2001). doi:10.1002/nme.184
38. Antonyuk, S., Heinrich, S., Tomas, J., Deen, N.G., van Buijtenen, M.S., Kuipers, J.: Energy absorption during compression and impact of dry elastic-plastic spherical granules. Granular Matter 12(1), 15-47 (2010).
- 100 -
7 CONCLUSION AND OUTLOOK
7.1 Spheronization Mechanisms
The spheronization mechanisms are discussed in this work in detail. As an outcome of this
work, the processes involved in spheronization are now characterized on a qualitative and
quantitative level. It is evident, that spheronization of pharmaceutical excipients is not solely
based on deformation as stated by Rowe and Baert. The breakage of the extrudates forms a
fine fraction and the further development of this fine fraction has an influence of the
properties of the resulting pellets. On a qualitative level the agglomeration of the fine
fraction to distinct zones of the pellets was found and explained. The extrudates are
deformed to a dumb-bell state, where a zone in the center of the extrudates has the highest
probability of fine particles to agglomerate. This equatorial ring around the pellet is less
likely to be hit by other particles and so the tendency to agglomerate here is increased.
The amount of material transferred between the pellets was investigated by developing a
concept of mass transfer. The mass transfer fraction (MTF) can be seen as an index describing
the ratio between deformation and agglomeration in spheronization. Values of 15 to 50 %
indicate the importance of mass transfer in pellet formation via extrusion / spheronization.
This concept was investigated for different pelletization aids and APIs. Whereas the
solubility of the API seems not to influence the mass transfer, the type of pelletization aid
does. It was possible to characterize three pelletization aids (MCCI, MCCII and κ-
carrageenan) in respect to their spheronization behavior, whether the deformation or
agglomeration are relevant for the process. In the case of the two MCC polymorphs the
agglomeration is of higher importance and crucial for pellet formation. The κ-carrageenan
formulations are better plastically deformable and less brittle and therefore show a more
deformation driven spheronization.
In future studies a link of these spheronization mechanisms to the rheological properties of
the wet masses might be possible. In this case predictions about the spheronization
performance of formulations could be made by analyzing data from rheological tests (e.g. a
triaxial compression test)
CONCLUSION AND OUTLOOK
- 101 -
7.2 Particle Kinematics
The forces acting on single particles are of high interest in explaining deformation and
agglomeration described in this thesis. Due to the size and physical properties of the single
particles it is not possible to measure these forces directly inside the spheronizer. Instead of
measuring the forces it is nevertheless possible to analyze the kinematics of particle
movement and use these data instead. The spheronizer was equipped with mountings for a
high speed camera at two different positions. From these positions the surface of the moving
particle stream was recorded and processed with a particle image velocimetry (PIV)
software.
In a first step the PIV system was validated for an application in spheronization in order to
ensure the reliability of the data. This validation showed excellent results with regard to
particle velocity even for clusters of several particles in close contact.
The movement pattern of the particles during spheronization was already outlined in
literature, but PIV made detailed, quantitative assumptions possible. The particles move in a
torus like motion, driven by the rotational movement of the friction plate on the poloidal axis
and by centrifugal and gravitational forces on the toroidal axis. This movement pattern
ensures the contact of all particles with the friction plate in regular time intervals and
thereby a uniform spheronization of all particles. The average velocity of the particles was
lower than expected from the velocity of the friction plate.
In a design of experiment the influence of relevant process parameters on the particle
kinematics was analyzed. The water content of the extrudates, spheronization duration,
loading of the spheronizer, rotation speed and structure of the friction plate were considered
as relevant parameters. The influence of water content, spheronization duration and loading
on the particle velocity is dominating. For the rotation speed of the spheronizer a more
pronounced influence would have been expected, as well as higher average velocities of the
particles.
- 102 -
7.3 DEM Simulation
With the data from the PIV experiments a simulation of the spheronization process could be
validated. The simulation included a realistic number of spherical particles as well as a
complex wall geometry of identical shape and size as for the spheronizer. LIGGGHTS as
DEM software showed good calculation performances on the computers available. The
simulation ran in multi core mode for about 72h per spheronization experiment and the post
processing could be realized at the same system. A limitation of the current simulation is the
use of non deformable particles without surface cohesion. For a more complex simulation the
deformation of particles as well as the simulation of a sticky particle surface would be of
interest, but at this stage of the simulation these factors were neglected to reduce the number
of parameters included in the simulation.
The simulation data showed a torus shaped particle bed with densely packed particles
similar to the spheronization experiments. Whereas the validation showed a good
correlation of velocities for most of the particles, the fastest particles had an increased
velocity in the spheronization experiments. A possible source for this difference might be the
air drag, which was not simulated so far. The faster the particles get, the bigger would be the
difference between a static surrounding air compartment and the moving air in the
experiment. To increase the accuracy of the DEM simulation a coupling with a CFD-
simulation might be the next best thing to do. Nevertheless the simulation can be used for
making some assumptions about the particle actions inside the particle bed.
Virtual cuts through the pellet bed showed a very unsteady velocity distribution. The
particles close to the friction plate had velocities of approximately two times higher values,
than the particles in the upper part of the pellet bed. Along with these increased velocities
the particle movement is less even, resulting in more particle-particle collisions of higher
impacts close to the friction plate. To increase the spheronization performance an increase of
average particle velocity as well as an increase of particle impacts would be favorable. A
DEM simulation could be used to investigate changes to the spheronizer geometry before
actually building them.
CONCLUSION AND OUTLOOK
- 103 -
7.4 Summary
The first part of thesis dealt with the influence of fine fraction to the spheronization process.
It was possible to visualize the agglomeration of these fine particles during spheronization
with respect to spheronization duration and location on the pellets surface.
To quantify these agglomeration experiments were performed with different pelletisation
aids, different active pharmaceutical ingredients and under varied process parameters. A
new method for describing the amount of mass transferred via fine fraction, the mass
transfer fraction, was defined.
The influence of this mass transfer to spheronization was systematically evaluated for three
different spheronization aids and for varied spheronization durations. Whereas the
spheronization resulted in spherical pellets for all three substances, the actual role of
agglomeration differed from microcrystalline cellulose (type 2), to microcrystalline cellulose
(type 1) to κ-carrageenan.
The particle kinematics during spheronization could be analyzed with respect to six process
parameters in a factorial design of experiment. The results showed an influence of water
content, spheronizer loading and spheronizing duration on the particle velocity, whereas the
general torus like shape of the particle bed was visible for all parameter combinations.
A DEM simulation could be designed with realistic numbers of particles and wall
geometries. In a second step this simulation was validated against spheronization
experiments with cohesionless model particles. The movement patters did match the
experiments very well, but the velocity as quantitative parameter showed a difference for the
fastest 10 % of the particles. Nevertheless this simulation could be used to analyze the
spheronization process.
- 104 -
7.5 Zusammenfassung
Ziel dieser Arbeit war die Simulation des Sphäronisationsprozesses und die Untersuchung
der Interaktionen zwischen einzelnen Partikeln während der Ausrundung. Die Arbeit
gliedert sich in 3 Teile, neben der Simulation der Partikelbewegungen im Spheronizer wurde
der Einfluss des Feinanteils auf den Sphäronisationsprozess und die Partikelbewegungen im
Spheronizer untersucht. Hierbei war es möglich, den Verbleib dieser feinen Partikel sowohl
zeitlich, als auch räumlich betrachtet sichtbar zu machen und seine Auswirkungen auf den
Sphäronisationsprozess zu erklären.
Zur Quantifizierung dieses Effekts wurden Experimente mit unterschiedlichen Arznei-,
sowie Hilfsstoffen und mit variierten Prozessparametern durchgeführt. Eine neuartige
Methode zur Quantifizierung des Verbleibs des Feinanteils während der Sphäronisierung
wurde entwickelt und getestet. Der Einfluss dieses Massetransfers auf das
Sphäronisationsverhalten wurde für unterschiedliche Hilfsstoffe und über den zeitlichen
Verlauf der Sphäronisation gezeigt. Der Effekt dieses Massetransfers zeigte eine
unterschiedlich große Rolle beim Ausrunden der Partikel für unterschiedliche
Pelletierhilfsstoffe und nimmt ausgehend von mikrokristalliner Cellulose (Typ2), über
mikrokristalline Cellulose (Typ1), bis hin zu κ-Carrageenan ab.
Die Partikelbewegungen während des Sphäronisationsprozesses wurden unter
Berücksichtigung von sechs Prozessparametern mittels Particle Image Velocimetry (PIV)
untersucht. Die PIV wurde hierzu validiert und zeichnete sich durch eine hohe Genauigkeit
aus. Bei der Analyse der Prozessparameter zeigten sich ausgeprägte Effekte für die
Extrudatfeuchte, die Beladung und die Sphäronisationszeit. Diese Parameter hatten Einfluss
auf die Partikelgeschwindigkeit, nicht jedoch auf die Torusform des Partikelbettes an sich.
Eine DEM Simulation mit realistischer Teilchenzahl und Gerätegeometrie konnte erstellt
werden. Trotz der Ergebnisse zum Massentransfer während der Sphäronisation wurden in
dieser Simulation nur nicht deformierbare Partikel ohne Oberflächenhaftung untersucht, um
eine Simulation der Sphäronisation zu ermöglichen. Diese Simulation wurde gegen
Laborexperimente mit Modelpartikeln getestet und die Bewegungsmuster der Partikel
analysiert. Die Ergebnisse von Simulation und Experiment stimmten gut überein, jedoch
zeigte ein kleiner Teil der Partikel eine erhöhte Geschwindigkeit im Vergleich zur
Simulation. Die Simulation erlaubte es erstmalig Aussagen über die Bewegungen innerhalb
des Partikelstroms zu treffen.
LIST OF PUBLISHED ORIGINAL PUBLICATIONS
- 105 -
8 LIST OF PUBLISHED ORIGINAL PUBLICATIONS
• Koester, M., Thommes, M.: New insights into the pelletization mechanism by
extrusion/spheronization. AAPS PharmSciTech 11(4), 1549-1551 (2010). DOI:
10.1208/s12249-010-9532-7
• Koester, M., Thommes, M.: Quantification of Mass Transfer During Spheronisation.
AAPS PharmSciTech 13(2), 493-497 (2012). DOI: 10.1208/s12249-012-9770-y
• Koester, M., Willemsen, E., Krueger, C., Thommes, M.: Systematic evaluations
regarding interparticular mass transfer in spheronization. International Journal of
Pharmaceutics (2012). DOI: 10.1208/s12249-010-9532-7
• Koester, M., Thommes, M.: Analysis of particle kinematics in spheronization via
particle image velocimetry. European Journal of Pharmaceutics and Biopharmaceutics
83(2), 307-314 (2013). DOI: 10.1016/j.ejpb.2012.08.013
- 106 -
9 CONTRIBUTIONS TO INTERNATIONAL CONFERENCES
9.1 Poster Presentations
• M. Köster, M. Thommes. New insights into the pelletization mechanism by
extrusion/spheronization. 8th Central European Symposium on Pharmaceutical
Technology, Graz 2010
• M. Köster, M. Thommes. Hot-Melt Extrusion - A new production technique for oral
applicable films. DPhG Jahrestagung 2010
• M. Köster, M. Thommes. Determination of the Coefficient of Restitution for small
particles. Polish-German-Symposium 2011
• M. Köster, M. Thommes. Quantification of Mass Transfer during Spheronization. 5th
International Granulation Workshop, Lausanne 2011
• M. Köster, M. Thommes. Particle Image Velocimetry Analysis of a Spheronisation
Process. 5th International Congress on Pharmaceutical Engineering, Graz 2011
• M. Köster, M. Thommes. DEM Simulation of the Spheronization Process. AAPS
Annual Meeting 2011, Washington
• M. Koester, E. Willemsen, C. Krueger, M. Thommes. Time Depending Mass Transfer
during Spheronization. AAPS Annual Meeting 2011, Washington
• M. Koester, R. Edwin García, M. Thommes, The Spheronization Process: PIV-Analysis
and DEM Simulation Feasibility Study, 8th World Meeting on Pharmaceutics,
Biopharmaceutics and Pharmaceutical Technology, 2012, Istanbul
• M. Koester, M. Thommes, Particle Image Velocimetry Analyse des Sphäronisations-
prozesses, Jahrestreffen der ProcessNet-Fachgruppen Agglomerations- und Schüttgut-
technik, 2012, Lutherstadt Wittenberg
9.2 Talks
• M. Koester, M.Thommes. Process monitoring via inline dynamic torque measurement
in extrusion. PSSRC Annual Meeting, Copenhagen 2009
• M. Köster, M.Thommes. Interparticlar mass exchange during spheronisation. PSSRC
Annual Meeting, Cambridge 2010
• M. Köster, M.Thommes. The Spheronization Process Investigated by Particle Image
Velocimetry. PSSRC Annual Meeting, Helsinki 2011
ERKLÄRUNG
- 107 -
10 ERKLÄRUNG
Hiermit versichere ich, dass ich die vorliegende Arbeit selbstständig und ohne unerlaubte
fremde Hilfe angefertigt habe. Ich nutzte dabei ausschließlich die angegebenen
Literaturquellen und Hilfsmittel.
Düsseldorf, den 01.06.2013
- 108 -
11 DANKSAGUNG
Vielen Menschen, die ich während dieser Zeit habe kennenlernen dürfen, gilt mein Dank für
die konstruktiven Gespräche und einzigartigen Sichtweisen. Besonders hervorheben möchte
ich jedoch meinen Dank an...
…Professor Dr. P. Kleinebudde. Neben den oft kritischen aber (fast) immer hilfreichen
Kommentaren und Denkanstößen rund um diese Arbeit, für die lehrreichen Erfahrungen im
Bereich der universitären Forschung.
…Dr. M. Thommes. Sein unermüdlicher Einsatz für die gemeinsame Forschung und sein
Ideenreichtum in Theorie und Praxis haben maßgeblich zum Gelingen dieser Arbeit
beigetragen. Auch der Hinweis darauf, dass eine Promotion aus mehr als einer Dissertation
besteht war stets ein guter Rat.
...Prof. Dr. J. Breitkreutz für die Übernahme des Koreferats und seine Hilfestellung bei
konkreten Fragen.
...Associate Professor R. Edwin García. I am grateful for the time in his work group at the
School of Materials Engineering in Purdue. It was a very interesting stay and undoubtfully a
chance to get insights into the scientific work at the institute as well as in the life at an US
university.
...Emilie Willemsen for the enthusiasm and effort she had for the research during her time as
a master student.
…G. Büttgenbach und der gesamten Feinmechanik für die schnelle Anfertigung einer stetig
wachsenden Anzahl an Sonderwünschen.
...to all members of the Pharmaceutical Solid State Research Cluster (PSSRC). It was a
pleasure to meet them at various conferences, to exchange thoughts about the work and get
valuable feedback.
...Christan Mühlenfeld und Julian Quodbach. Beide haben mit ihrem Humor wesentlich
dazu beigetragen die Zeit im Institut sehr kurzweilig zu gestalten und nur sehr selten eine
getrübte Stimmung aufkommen zu lassen.
... Eva Hoffmann und Martina Smikalla. Die Taxikosten wären enorm gewesen.
…allen Mitarbeitern des Instituts für Pharmazeutische Technologie und Biopharmazie für
die gute Zusammenarbeit und die gemeinsamen Unternehmungen und Erlebnisse während
und nach der Arbeitszeit.

![Assessing particle kinematics via template matching algorithms · the time evolution of the particles can be recorded by an optical device to estimate the kinemat-ics [2,3], independent](https://img.pdfslide.org/doc/110x75/5fd8a806fa107c76e0604455/assessing-particle-kinematics-via-template-matching-algorithms-the-time-evolution.jpg)