Embed Size (px)
Citation preview
Structural and biophysical characterization of
selected proteins associated with cyclically
transmitted parasitic diseases
Dissertation
zur Erlangung des naturwissenschaftlichen Doktorgrades (Dr. rer. nat.)
am Fachbereich Chemie der Fakultät für Mathematik,
Informatik und Naturwissenschaften,
Universität Hamburg
vorgelegt von
Svetlana Kapis
Hamburg, Dezember 2017


Die vorliegende Arbeit wurde im Zeitraum von März 2014 bis Mai 2017 in der
Arbeitsgruppe von Prof. Christian Betzel im Laboratorium für Strukturbiologie von
Infektion und Entzündung und am Institut für Biochemie und Molekularbiologie des
Fachbereichs Chemie der Universität Hamburg durchgeführt.
1. Gutachter: Prof. Ch. Betzel
2. Gutachter: Prof. A. Torda
Datum der Disputation und der Druckfreigabe: 02.02.2018


i
Inhalt
List of figures ........................................................................................................................................................................................................................ vi
List of tables .......................................................................................................................................................................................................................... ix
List of abbreviations ............................................................................................................................................................................................................ x
List of publications ............................................................................................................................................................................................................. ix
Summary .................................................................................................................................................................................................................................. 1
Zusammenfassung ............................................................................................................................................................................................................... 2
1. Introduction .............................................................................................................................................................................................................. 3
1.1. Cyclically transmitted parasitic diseases ................................................................................................................................... 3
1.1.1. Malaria .................................................................................................................................................................................................. 3
1.1.1.1. Epidemiology .............................................................................................................................................................................. 3
1.1.1.2. Life cycle of P. falciparum ...................................................................................................................................................... 4
1.1.1.3. Genomic features of P. falciparum .................................................................................................................................... 5
1.1.1.4. Nutrient uptake in P. falciparum trophozoite stage ................................................................................................. 6
1.1.1.5. Kinases and their druggability ........................................................................................................................................... 7
1.1.1.6. Distinct features of plasmodial protein kinases ......................................................................................................... 8
1.1.1.6.1. P. falciparum Serine-Threonine kinase PfSTK: PFPK9/PF13_0085 ORF ................................................. 8
1.1.1.6.2. P. falciparum 5-(2-hydroxy-ethyl)-4-methylthiazole (THZ) kinase PfThiM .......................................... 9
1.1.2. Lymphatic filariasis ..................................................................................................................................................................... 11
1.1.2.1. Epidemiology ........................................................................................................................................................................... 11
1.1.2.2. Wuchereria bancrofti and its life cycle ......................................................................................................................... 11
1.1.2.3. Thioredoxins ............................................................................................................................................................................ 12
1.1.2.3.1. Thioredoxin from Wuchereria bancrofti ............................................................................................................... 13
1.2. Towards serial and time-resolved crystallography ........................................................................................................... 16
1.2.1. Serial Synchrotron Radiation crystallography using specific radiation damage with millisecond
temporal resolution............................................................................................................................................................................................ 17
1.2.2. Applications of protein micro-crystallography for serial Synchrotron Radiation experiments at room
temperature ........................................................................................................................................................................................................... 19
1.2.3. Applications of microfluidic devices for use in serial and time-resolved crystallography ...................... 19
1.3. Outline and aims of the thesis ...................................................................................................................................................... 21
2. Results....................................................................................................................................................................................................................... 22
2.1. PfSTK ........................................................................................................................................................................................................ 22
ii
2.1.1. Initial expression and purification experiments ........................................................................................................... 22
2.1.2. Initial biophysical characterization ..................................................................................................................................... 24
2.1.3. ADP colorimetric assay ............................................................................................................................................................. 26
2.1.4. Sequence analysis for construct optimization ............................................................................................................... 27
2.1.5. Expression and purification of His6-GST-tagged Pf13_085 constructs PfSTK(1-367) and PfSTK(79-
367) after codon optimization ...................................................................................................................................................................... 28
2.1.6. Sequence analysis of PfSTK to identify additional suitable truncation variants ........................................... 32
2.1.7. Homology modelling analysis of PfSTK ............................................................................................................................. 36
2.1.8. Cloning, expression and purification of truncation variants PfSTK(97-367) and PfSTK(107-361) .... 39
2.1.9. Solubility studies of PfSTK truncation variants ............................................................................................................. 40
2.1.9.1. Purification of PfSTK(97-367)GST and PfSTK(107-361)GST ........................................................................... 41
2.1.10. Biophysical characterization of PfSTK(107-361)GST using DLS .................................................................... 42
2.1.11. Baculoviral expression and in vivo crystallization of PfSTK ............................................................................. 43
2.2. PfThiM ...................................................................................................................................................................................................... 45
2.2.1. Initial expression experiments .............................................................................................................................................. 45
2.2.2. Initial biophysical characterization ..................................................................................................................................... 47
2.2.3. Sequence analysis and homology modelling of PfThiM............................................................................................. 49
2.3. WbTrx ...................................................................................................................................................................................................... 53
2.3.1. Adaptation and optimization of expression and purification ................................................................................. 53
2.3.2. Biophysical characterization .................................................................................................................................................. 54
2.3.2.1. Analysis of folding integrity and secondary structure elements using CD spectroscopy ................... 54
2.3.2.2. DLS measurements ............................................................................................................................................................... 55
2.3.2.3. Molecular weight verification of WbTrx using ESI-MS ........................................................................................ 56
2.3.2.4. Structure validation by SAXS analysis ......................................................................................................................... 57
2.3.3. Applicability of WbTrx sample for nanocrystal production .................................................................................... 60
2.3.4. Production of microcrystals .................................................................................................................................................... 62
2.3.5. In situ crystallization and room temperature X-ray diffraction ............................................................................ 64
2.3.5.1. In situ X-ray crystallography using microfluidic chips ........................................................................................ 64
2.3.5.1.1. Diffraction data collection ........................................................................................................................................... 67
2.3.5.1.2. Data quality and statistics ............................................................................................................................................ 67
2.3.5.2. In situ X-ray crystallography using Kapton® foil sandwich approach .......................................................... 70
2.3.5.2.1.1. Diffraction data collection ........................................................................................................................................... 71
2.3.5.3. Data quality and statistics .................................................................................................................................................. 72
2.3.5.4. Crystal orientations .............................................................................................................................................................. 78
iii
2.3.6. Preparation of WbTrx crystals using the batch crystallization method ............................................................ 79
3. Discussion ............................................................................................................................................................................................................... 80
3.1. Kinases from Plasmodium falciparum ...................................................................................................................................... 80
3.1.1. Prokaryotically expressed PfSTK ......................................................................................................................................... 80
3.1.1.1. PfSTK-Strep ............................................................................................................................................................................... 80
3.1.1.2. Codon-optimized PfSTK variants ................................................................................................................................... 82
3.1.1.3. In vivo crystallization of PfSTK ....................................................................................................................................... 87
3.1.2. Expression and purification of PfThiM .............................................................................................................................. 89
3.2. WbTrx ...................................................................................................................................................................................................... 90
3.2.1. WbTrx production and characterization .......................................................................................................................... 91
3.2.2. Detection of WbTrx sub-microcrystals during crystallization using DDLS ..................................................... 91
3.2.3. In situ crystallization and room-temperature X-ray diffraction approaches for serial and time-
resolved crystallography ................................................................................................................................................................................. 92
4. Material and Methods........................................................................................................................................................................................ 96
4.1. Materials ................................................................................................................................................................................................. 96
4.1.1. Chemicals ......................................................................................................................................................................................... 96
4.1.2. Consumables .................................................................................................................................................................................. 96
4.1.3. Molecular-weight size markers ............................................................................................................................................. 96
4.1.4. Commercial kits and enzymes ............................................................................................................................................... 97
4.1.5. Bacterial strains ............................................................................................................................................................................ 97
4.1.6. Vectors systems ............................................................................................................................................................................ 98
4.1.7. Oligonucleotides ........................................................................................................................................................................... 99
4.1.8. Buffers, solutions and media .................................................................................................................................................. 99
4.1.9. Instrumentation .......................................................................................................................................................................... 104
4.2. Methods ................................................................................................................................................................................................ 105
4.2.1. Molecular biology and biochemical methods ............................................................................................................... 105
4.2.1.1. Polymerase Chain Reaction (PCR) ............................................................................................................................... 105
4.2.1.2. Agarose gel electrophoresis ............................................................................................................................................ 106
4.2.1.3. Clean-up of PCR products ................................................................................................................................................ 106
4.2.1.4. Restriction endonuclease digestion ............................................................................................................................ 107
4.2.1.5. Determination of DNA concentration ........................................................................................................................ 107
4.2.1.6. Sticky end ligation ............................................................................................................................................................... 107
4.2.1.7. Preparation of chemically competent E. coli cells ................................................................................................ 107
4.2.1.8. Transformation of competent E. coli cells ................................................................................................................ 108

iv
4.2.1.9. Preparation of bacterial plasmid DNA ....................................................................................................................... 108
4.2.1.10. DNA sequencing .................................................................................................................................................................... 108
4.2.1.11. Recombinant gene expression ....................................................................................................................................... 109
4.2.1.12. SDS polyacrylamide gel electrophoresis (SDS-PAGE) ........................................................................................ 109
4.2.1.13. Preparation of cleared E. coli lysates .......................................................................................................................... 110
4.2.1.14. Solubility screening............................................................................................................................................................. 111
4.2.1.15. Strep-Tactin® affinity chromatography .................................................................................................................... 111
4.2.1.16. Ni-NTA affinity chromatography .................................................................................................................................. 112
4.2.1.17. Glutathione affinity chromatography......................................................................................................................... 112
4.2.1.18. TEV-protease cleavage reaction ................................................................................................................................... 112
4.2.1.19. PreScission protease cleavage reaction .................................................................................................................... 113
4.2.1.20. WbTrx purification using Q-Sepharose Fast Flow ............................................................................................... 113
4.2.1.21. Protein quantification ........................................................................................................................................................ 113
4.2.1.22. Technique for concentrating protein solutions ..................................................................................................... 114
4.2.1.23. Size exclusion chromatography (SEC) ....................................................................................................................... 114
4.2.2. Biophysical methods ................................................................................................................................................................ 115
4.2.2.1. Dynamic light scattering (DLS) ..................................................................................................................................... 115
4.2.2.2. Circular dichroism (CD) spectroscopy....................................................................................................................... 115
4.2.2.3. Kinase assay ............................................................................................................................................................................ 116
4.2.2.4. MALDI mass spectrometry .............................................................................................................................................. 116
4.2.2.5. Native mass spectrometry ............................................................................................................................................... 117
4.2.2.6. Small angle X-ray scattering (SAXS) ........................................................................................................................... 118
4.2.3. Protein crystallization ............................................................................................................................................................. 119
4.2.3.1. Screening for crystallization conditions ................................................................................................................... 119
4.2.3.2. Optimization of crystallization conditions and up-scaling .............................................................................. 119
4.2.3.3. Batch crystallization of WbTrx ...................................................................................................................................... 119
4.2.4. Diffraction data collection and evaluation ..................................................................................................................... 120
4.2.4.1. Multiple crystal diffraction data collection using the Kapton® foil sandwich approach ................... 120
4.2.4.2. X-ray crystallographic data evaluation ..................................................................................................................... 120
4.2.4.3. Detection of radiation-induced changes at disulfide bonds ............................................................................ 121
4.2.4.4. Calculation of crystal orientations ............................................................................................................................... 121
4.2.5. Microfluidic chip fabrication ................................................................................................................................................ 121
4.2.5.1. Mask design ............................................................................................................................................................................ 122
4.2.5.3. PDMS mold preparation ................................................................................................................................................... 123

v
4.2.5.4. In situ chip fabrication ....................................................................................................................................................... 123
4.2.5.5. Access ports for fluid delivery ....................................................................................................................................... 124
4.2.5.6. Surface treatment ................................................................................................................................................................ 124
4.2.6. Insect cell culture and in vivo crystallization ................................................................................................................ 124
4.2.6.1. Transfection of Sf9 cells with Bacmid-DNA ............................................................................................................. 125
4.2.6.2. Amplification of viral particles ...................................................................................................................................... 125
4.2.6.3. Insect cell infection for gene expression and generation of in vivo crystals ........................................... 125
4.2.6.4. Isolation of in vivo crystals .............................................................................................................................................. 125
References ............................................................................................................................................................................................................. 127
Amino acid sequences ..................................................................................................................................................................................... 142
GHS and risk symbols ...................................................................................................................................................................................... 144
List of GHS Hazard statements .................................................................................................................................................................... 144
GHS Precautionary Statements ................................................................................................................................................................... 145
Acknowledgements .......................................................................................................................................................................................... 151
Eidesstattliche Versicherung ....................................................................................................................................................................... 152
vi
List of figures
Figure 1: Schematic representation of the Plasmodium falciparum life cycle. ............................................................. 4
Figure 2: Simplified schematic of catabolic processes of erythrocytes infected by Plasmodium. ....................... 6
Figure 3: Schematic representation of the Thiamine phosphate biosynthesis pathway. .................................... 10
Figure 4: Schematic representation of the reversible thiol-disulfide exchange as catalytic mechanism in
thioredoxins. ........................................................................................................................................................................................... 12
Figure 5: Structural model of Thioredoxin from Wuchereria bancrofti (PDB-ID: 4FYU). .................................... 13
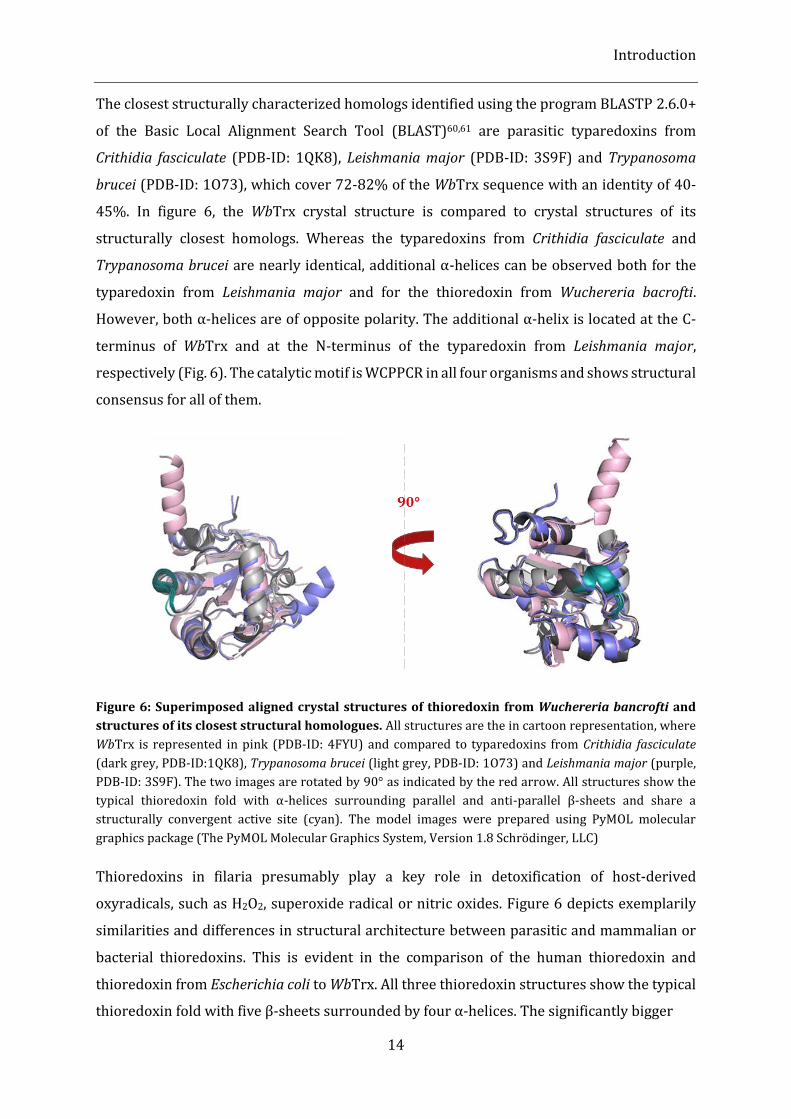
Figure 6: Superimposed aligned crystal structures of thioredoxin from Wuchereria bancrofti and structures
of its closest structural homologues. ........................................................................................................................................... 14
Figure 7: Superimposed aligned crystal structures of thioredoxins from Wuchereria bancrofti (green),
Escherichia coli (blue) and Homo sapiens (purple) in the cartoon representation. ................................................ 15
Figure 8: Comparison of the active sites of human and Wuchereria bancrofti thioredoxins. ............................ 15
Figure 9: Initial expression and purification trials of PfSTK. ............................................................................................ 23
Figure 10: Purification of PfSTK via size exclusion chromatography (SEC). ............................................................. 24
Figure 11: CD-spectroscopic analysis of the SEC purified PfSTK. ................................................................................... 25
Figure 12: Dynamic Light scattering (DLS) of the purified PfSTK-Strep. .................................................................... 26
Figure 13: ADP calorimetric kinase assay for PfSTK and the peptide substrate PfSAP-C10-SAP. ..................... 27
Figure 14: SDS-PAGE analysis of the expression and purification of codon-optimized GST-tagged constructs
PfSTK(1-367)His6-GST and PfSTK(79-367)His6-GST. .......................................................................................................... 29
Figure 15: TEV cleavage and SEC purification of PfSTK(79-367). .................................................................................. 31
Figure 16: Dynamic light scattering analysis (DLS) of PfSTK(79-367)His6-GST. .................................................... 32
Figure 17: Multiple sequence alignment of the PfSTK amino acid sequence with its closest structurally
known homologs using PRALINE138,139. ..................................................................................................................................... 33
Figure 18: Multiple sequence alignment of PfSTK amino acid sequence with its phylogenetically closest
structurally known homologues. .................................................................................................................................................. 34
Figure 19: Graphical representations of the PfSTK homology models. ....................................................................... 36
Figure 20: Comparison of PfSTK homology models. ............................................................................................................ 37
Figure 21: Homology modelling using Protein Homology/analogY Recognition Engine V 2.0 web-based
services PHYRE2135 for structure prediction for different PfSTK truncation variants. ........................................ 38
Figure 22: Solvent exposed area of the PfSTK homology model. .................................................................................... 38
Figure 23: Cloning and initial expression of PfSTK truncation variants PfSTK(97-367) and PfSTK(107-361).
Figure 24: SDS-PAGE analysis of the fractions from solubility tests of PfSTK variants. ....................................... 40
vii
Figure 25: SDS-PAGE analysis of the affinity purification profile of PfSTK(97-367)GST and PfSTK(107-
361)GST. ................................................................................................................................................................................................... 41
Figure 26: SEC purification of PfSTK(107-361)GST. ............................................................................................................ 42
Figure 27: Dynamic light scattering analysis (DLS) of PfSTK(107-361)GST. ............................................................ 43
Figure 28: Electrophoretic analysis verifying presence of Bacmids carrying PfSTK inserts after PCR. ........ 44
Figure 29: In vivo grown crystals of PfSTK. .............................................................................................................................. 45
Figure 30: Expression and purification profiles of PfThiM. .............................................................................................. 46
Figure 31: SEC purification chromatogram of PfThiM......................................................................................................... 47
Figure 32: Dynamic light scattering of putative PfThiM after dialysis in different buffer systems. ................ 48
Figure 33: Multiple sequence alignment of PfThiM with its closest structurally known homologues. ......... 50
Figure 34: Graphical representations of the PfThiM homology models. ..................................................................... 51
Figure 35: Comparison of PfThiM homology models. .......................................................................................................... 51
Figure 36: Surface charge destribution of SaThiM and PfThiM. ...................................................................................... 52
Figure 37: Expression and purification profiles of WbTrx. ............................................................................................... 53
Figure 38: CD spectroscopic analysis of WbTrx. .................................................................................................................... 55
Figure 39: Dynamic light scattering analysis (DLS) of WbTrx. ........................................................................................ 56
Figure 40: ESI-MS spectrum of WbTrx after buffer exchange into 0.5 M Sodium acetate, pH 8.0. .................. 57
Figure 41: WbTrx SAXS data analysis using PRIMUS164. ..................................................................................................... 58
Figure 42: Ab initio model of WbTrx calculated using DAMMIF165................................................................................ 59
Figure 43: Superposition of averaged ab initio models of WbTrx obtained from DAMAVER166. ..................... 59
Figure 44: DDLS analysis of WbTrx crystallization process and sample verification with complementary
methods. ................................................................................................................................................................................................... 61
Figure 45: Crystallization of WbTrx and its optimization to obtain a high number of microcrystals. ........... 63
Figure 46: WbTrx crystals grown on a COC sealed PDMS microfluidic chips. .......................................................... 65
Figure 47: Microfluidic chip used for in situ crystallization and X-ray diffraction experiments with
recombinant WbTrx. ........................................................................................................................................................................... 66
Figure 48: In situ X-ray diffraction at a synchrotron beamline. ....................................................................................... 67
Figure 49: Schematic representation of the crystallization set-up using Kapton® foil and the assembly of the
sandwich for synthrotron diffraction data collection. ......................................................................................................... 70
Figure 50: WbTrx crystals grown on a Kapton® foil in a vapour diffusion experiment. ...................................... 71
Figure 51: Diffraction data collection using multiple WbTrx crystals in a Kapton® foil sandwich at a
synchrotron radiation X-ray beamline. ...................................................................................................................................... 71

viii
Figure 52: Data statistics from the room-temperature data collection on WbTrx microcrystals using the
Kapton foil sandwich approach. .................................................................................................................................................... 75
Figure 53: WbTrx disulfide bond at two different time points with a calculated structure-factor amplitude
Fourier difference maps (Fo-Fo). .................................................................................................................................................... 76
Figure 54: Indication of dose-dependent disulfide bond destabilization. .................................................................. 77
Figure 55: Distribution of orientations of exposed WbTrx crystals in the Kapton foil sandwich with respect
to the laboratory coordinate system. .......................................................................................................................................... 78
Figure 56: Crystals of WbTrx grown in a batch experiment under a light microscope. ....................................... 79
Figure 57: Schematic representation of the microfluidic chip assembly. ................................................................. 122
Figure 58: Schematic representation of the flow geometry of a microfluidic chip. .............................................. 122
Figure 59: GHS pictograms ............................................................................................................................................................ 144

ix
List of tables
Table 1: Summary of parameters obtained from SAXS analysis of WbTrx in solution ......................................... 58
Table 2: Data collection and refinement statistics. ............................................................................................................... 69
Table 3: Data collection and refinement statistics for different doses of the low-dose run. .............................. 73
Table 4: Data collection parameters and statistics for different doses of the high-dose run. ............................ 74
Table 5: Overview of PfSTK secondary structure elements predicted experimentally or in silico based. ... 82
Table 6: Overview on protein engineering, prokaryotic expression, purification and initial biophysical
characterization of different codon-optimized PfSTK truncation variants. ............................................................... 83
Table 7: Overview of theoretical protein features, predicted disorder and surface features for the four PfSTK
truncation variants .............................................................................................................................................................................. 85
Table 8: Overview of consumables. .............................................................................................................................................. 96
Table 9: Overview of commercial kits and enzymes. ........................................................................................................... 97
Table 10: Bacterial E. coli strains. ................................................................................................................................................. 97
Table 11: Vector systems. ................................................................................................................................................................. 98
Table 12: Overview of oligonucleotides. .................................................................................................................................... 99
Table 13: Growth media used for E. coli cultures. ................................................................................................................. 99
Table 14: Overview of antibiotic used for selection. .......................................................................................................... 100
Table 15: Overview of general buffers and solutions. ....................................................................................................... 100
Table 16: Buffer used for Solubility Screening ...................................................................................................................... 102
Table 17: Instrumentation and corresponding manufacturer ....................................................................................... 104
Table 18: PCR reaction set-up ...................................................................................................................................................... 105
Table 19: Parameters for applied PCR programs ................................................................................................................ 106
Table 20: Composition of SDS-PAGE gels ................................................................................................................................ 110
Table 21: Overview of different protein constructs with the corresponding molecular weight and extinction
coefficient. ............................................................................................................................................................................................. 114
Table 22: List of chemicals (alphabetic order) ..................................................................................................................... 147
Table 23: H- and P-statements of the crystallization screens used ............................................................................. 149
Table 24: List of CMR substances ................................................................................................................................................ 150

x
List of abbreviations
Å Angstrom
AHT Anhydrotetracycline
AIEX Anion exchange chromatography
approx. approximately
APS Ammonium persulfate
ATP Adenosine triphosphate
Bis-tris 2-[Bis(2-hydroxyethyl)amino]-2-(hydroxymethyl)propane-1,3-diol
bp Base pair
BSA Bovine serum albumin
CD circular dichroism
Da Dalton
ddH2O Double-distilled water
DLS Dynamic light scattering
Dmax Maximum particle diameter
DNA Deoxyribonucleic acid
DPBS Dulbecco’s Phosphate-Buffered Saline
DTT Dithiothreitol
EDTA Ethylenediaminetetraacetic acid
ESI Electrospray ionization
FEL Free-electron laser
GST Glutathione-S-Transferase
IPTG Isopropyl β-D-1-thiogalactopyranoside
kb Kilobases
kDa Kilodalton
LB Lysogeny broth
LCP Lipidic cubic phase
MALDI Matrix-assisted laser desorption/ionization
Mb Megabases
MCS Multiple cloning site
MS Mass spectrometry
MW Molecular weight
MWCO Molecular weight cut-off
NaCl Sodium chloride
xi
NMR Nuclear magnetic resonance
Ni-NTA Nitrilotriacetic acid with immobilized nickel
OD Optical density
P. Plasmodium
PAGE Polyacrylamide gel electrophoresis
PBS Phosphate-buffered saline
PCR Polymerase chain reaction
PDB Protein Data Bank
PDMS Polydimethylsiloxane
PEG Polyethylene glycol
PMSF Phenylmethanesulfonyl fluoride
Rg Radius of gyration
Rh Hydrodynamic radius
RMSD Root-mean-square deviation
rpm Rounds per minute
RT Room temperature
SAXS Small angle X-ray scattering
SDS Sodium dodecyl sulfate
SEC Size-exclusion chromatography
SEM Scanning electron microscopy
SHG Second harmonic generation
SR Synchrotron radiation
SPG Succinic acid, Sodium phosphate monobasic monohydrate, Glycine
TEMED N,N,N′,N′-Tetramethylethane-1,2-diamine
TEV Tobacco etch virus
TOF Time of flight
Tris Tris(hydroxymethyl)aminomethane
tRNA Transfer ribonucleic acid
UV Ultraviolet
UV-TPEF Ultraviolet two-photon exited fluorescence
WHO World Health Organization

xii
List of publications
Robin Schubert, Svetlana Kapis, Yannig Giquel, Gleb Bourenkov, Thomas Schneider, Michael
Heymann, Christian Betzel, Markus Perbandt, A multicrystal data collection approach for
studying structural dynamics with millisecond temporal resolution. IUCrJ (2016) 3, 393-401
Robin Schubert, Arne Meyer, Karsten Dierks, Svetlana Kapis, Rudolph Reimer, Howard
Einspahr, Markus Perbandt and Christian Betzel, Reliably distinguishing protein nanocrystals
from amorphous precipitate by means of depolarized dynamic light scattering, Journal of
Applied Crystallography (2015) 48, 1476–1484
Svetlana Kapis, Michael Heymann, Markus Perbandt, Guoqing Chang, Franz Kärtner,
Christian Betzel, Application of on-chip room-temperature protein crystallography to visualize
the dynamics of structural changes, Poster presentation, ECM29, Rovinj, Croatia
Summary
1
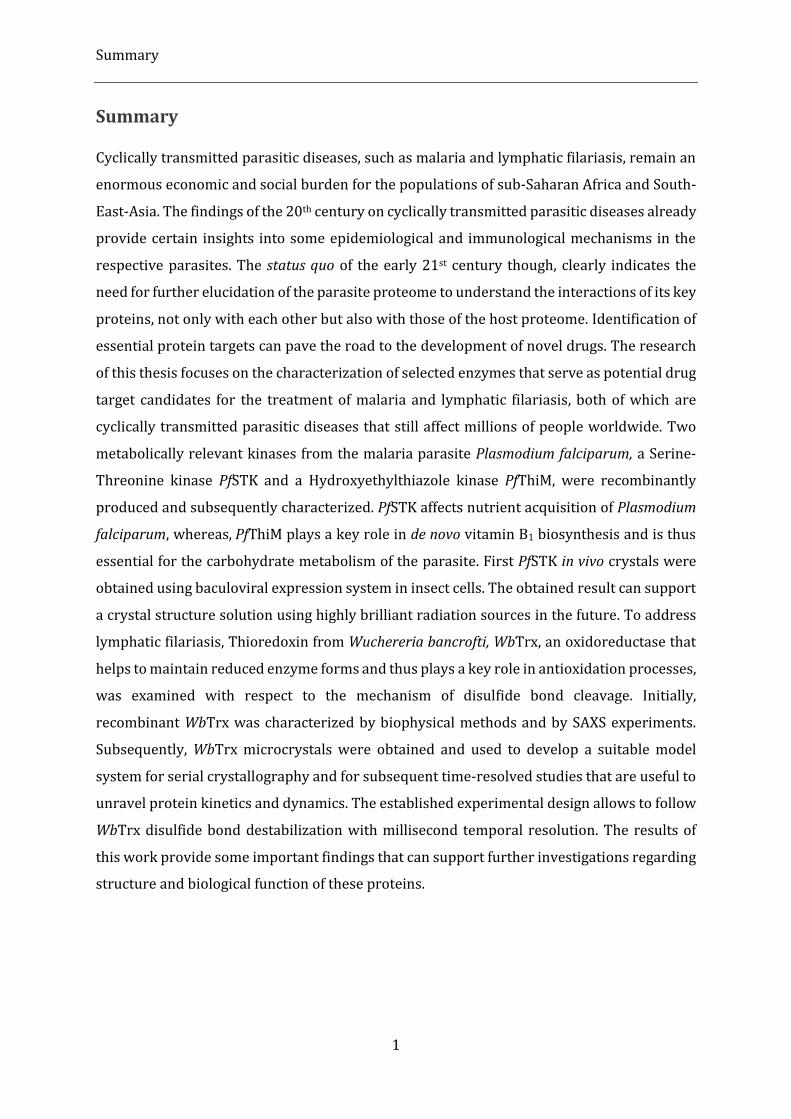
Summary
Cyclically transmitted parasitic diseases, such as malaria and lymphatic filariasis, remain an
enormous economic and social burden for the populations of sub-Saharan Africa and South-
East-Asia. The findings of the 20th century on cyclically transmitted parasitic diseases already
provide certain insights into some epidemiological and immunological mechanisms in the
respective parasites. The status quo of the early 21st century though, clearly indicates the
need for further elucidation of the parasite proteome to understand the interactions of its key
proteins, not only with each other but also with those of the host proteome. Identification of
essential protein targets can pave the road to the development of novel drugs. The research
of this thesis focuses on the characterization of selected enzymes that serve as potential drug
target candidates for the treatment of malaria and lymphatic filariasis, both of which are
cyclically transmitted parasitic diseases that still affect millions of people worldwide. Two
metabolically relevant kinases from the malaria parasite Plasmodium falciparum, a Serine-
Threonine kinase PfSTK and a Hydroxyethylthiazole kinase PfThiM, were recombinantly
produced and subsequently characterized. PfSTK affects nutrient acquisition of Plasmodium
falciparum, whereas, PfThiM plays a key role in de novo vitamin B1 biosynthesis and is thus
essential for the carbohydrate metabolism of the parasite. First PfSTK in vivo crystals were
obtained using baculoviral expression system in insect cells. The obtained result can support
a crystal structure solution using highly brilliant radiation sources in the future. To address
lymphatic filariasis, Thioredoxin from Wuchereria bancrofti, WbTrx, an oxidoreductase that
helps to maintain reduced enzyme forms and thus plays a key role in antioxidation processes,
was examined with respect to the mechanism of disulfide bond cleavage. Initially,
recombinant WbTrx was characterized by biophysical methods and by SAXS experiments.
Subsequently, WbTrx microcrystals were obtained and used to develop a suitable model
system for serial crystallography and for subsequent time-resolved studies that are useful to
unravel protein kinetics and dynamics. The established experimental design allows to follow
WbTrx disulfide bond destabilization with millisecond temporal resolution. The results of
this work provide some important findings that can support further investigations regarding
structure and biological function of these proteins.
Zusammenfassung
2
Zusammenfassung
Zyklische Parasitosen, Erkrankungen zu denen Malaria und lymphatische Filariose zählen,
stellen nach wie vor eine enorme sozioökonomische Belastung für die Bevölkerung in Afrika
südlich der Sahara und Südostasien dar. Die Erkenntnisse des 20. Jahrhunderts über
zyklische Parasitosen geben bereits Einblicke in einige epidemiologisch und immunologisch
relevante Mechanismen dieser Parasiten. Der Status quo des frühen 21. Jahrhunderts zeigt
jedoch deutlich die Notwendigkeit einer tiefergehenden Erforschung des Parasitenproteoms,
um die Wechselwirkungen seiner Schlüsselproteine untereinander, aber auch mit den
Proteinen des Wirtsproteoms, zu verstehen. Die Identifizierung von essentiellen Protein-
zielstrukturen soll den Weg zur Entwicklung neuartiger Medikamente ebnen. Der Fokus
dieser Arbeit liegt auf der Charakterisierung ausgewählter Enzyme, die als potentielle
Wirkstoffkandidaten für die Behandlung von Malaria und lymphatischer Filariose dienen
können. Dazu wurden zwei metabolisch relevante Kinasen aus dem Malariaparasiten
Plasmodium falciparum, eine Serin-Threonin-Kinase, PfSTK, sowie eine Hydroxyethylthiazol-
Kinase, PfThiM, rekombinant hergestellt und charakterisiert. Während PfSTK den
Nährstoffbezug von Plasmodium falciparum beeinflusst, spielt PfThiM eine Schlüsselrolle in
der de novo Biosynthese von Vitamin B1 und ist somit für den Kohlenhydratstoffwechsel des
Parasiten essentiell. Zudem wurden erste in vivo Kristalle von PfSTK im Baculovirus-
Expressionssystem in Insektenzellen erhalten. Dieses Ergebnis kann in Zukunft die
Aufklärung der Kristallstruktur von PfSTK unter Verwendung von hochbrillianter Strahlung
ermöglichen. Als Zielstruktur aus dem für lymphatische Filariose verantwortlichen Parasiten
Wuchereria bancrofti wurde Thioredoxin, WbTrx, ausgewählt. Dieses Enzym ist eine
Oxidoreduktase, die dabei hilft reduzierte Enzymspezies aufrechtzuerhalten und damit eine
Schlüsselrolle bei Antioxidationsprozessen spielt. WbTrx wurde in Bezug auf den
Mechanismus der Spaltung der Disulfidbrückenbindung untersucht, da über dieses Target
bereits erste strukturelle Informationen vorliegen. Rekombinantes WbTrx wurde zunächst
durch biophysikalische Methoden sowie durch SAXS-Experimente charakterisiert.
Anschließend wurde mit diesem Protein ein geeignetes Modellsystem für serielle
Kristallographie sowie für zeitaufgelöste Studien, die der Entschlüsselung der Proteinkinetik
dienen, entwickelt. Das etablierte experimentelle Design ermöglicht es, Destabilisierungen
von Disulfidbrücken mit einer zeitlichen Auflösung im Millisekundenbereich zu verfolgen.
Diese Arbeit liefert einige wichtige Erkenntnisse, die weitere Untersuchungen der Struktur
und der biologischen Funktion der ausgewählten Proteine vermitteln können.
Introduction
3
1. Introduction
1.1. Cyclically transmitted parasitic diseases
Cyclically transmitted parasitic diseases like malaria and lymphatic filariasis are of enormous
global medical importance, with millions of people affected worldwide. These vector-borne
diseases particularly burdensome for developing countries where they consistently cause
high mortality or are responsible for the persistent physical and mental impairment of
patients. These types of infections are difficult to treat because of the cyclic transmission
mode, which makes it possible for the parasite to survive and to replicate within its host for
a long period of time without being detected. For parasites, such as Plasmodium falciparum
and Wuchereria bancrofti, several parasitic stages are known, as well a large number of
evasion mechanisms that allow the parasites to escape from human immune response.
Furthermore, the existing treatment options are limited due to rapidly evolving drug
resistances. Taken together, these facts indicate a clear need for further investigations to
identify new strategies to treat malaria and lymphatic filariasis.
1.1.1. Malaria
1.1.1.1. Epidemiology
Malaria is considered to be one of the most lethal infectious diseases worldwide. Although
the number of de novo infections decreased from 262 million cases in 2000 to 216 million
cases in 2016, the fact that 90% of the malaria cases reported in 2016 affect African countries
reveals the necessity to pursue this problem1. There are a particularly high number of deaths
among children under 5 years. In sub-Saharan Africa, on average, a child dies every 5 minutes
as a result of malaria manifestation. Most people at risk live in highly endemic indigent
regions with insufficient infrastructure and are consequently affected by under-resourced
medical care2. In 2016, 91 countries and regions were reported to have been confronted with
perpetual malaria transmission3. Today, several antimalarial prevention options, which
include chemoprevention and vector control, are available. But the recurring resistance to
antimalarial drugs as well as the under-organized supply of endemic regions with insecticide-
treated mosquito nets remains a problem of the 21st century. Over the last decades,
immunological research targeting the malaria parasite as well as malaria vaccine
Introduction
4
development has been a focus of intense effort. Still, as for any other parasite, there is
currently no licensed antimalarial vaccines available3.
The transmission of malaria is caused by unicellular eukaryotic organisms, the so-called
protozoa, which belong to the genus Plasmodium. The five human infecting Plasmodium
species known so far are: P. falciparum, P. vivax, P. ovale, P. malariae and P. knowlesi.
P. falciparum is the causative agent of malaria tropica, the most lethal malaria form, and is
therefore of particular clinical interest4.
1.1.1.2. Life cycle of P. falciparum
Plasmodia are transmitted by female mosquitos of the genus Anopheles, which take blood
meals from infected humans. The life cycle of the malaria parasite can be subdivided into an
asexual phase (schizogony), which takes place in the human body and the sexual
reproduction (sporogony) which takes place in the mosquito organism (Fig. 1)5,6.
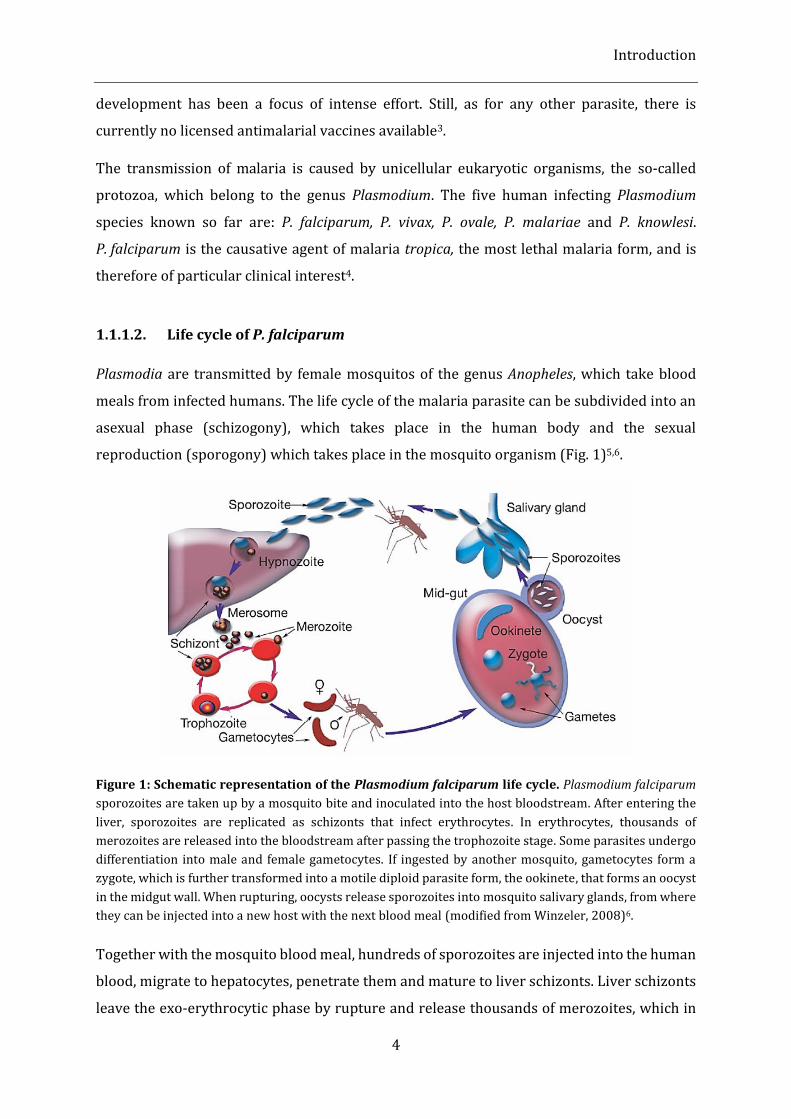
Figure 1: Schematic representation of the Plasmodium falciparum life cycle. Plasmodium falciparum
sporozoites are taken up by a mosquito bite and inoculated into the host bloodstream. After entering the
liver, sporozoites are replicated as schizonts that infect erythrocytes. In erythrocytes, thousands of
merozoites are released into the bloodstream after passing the trophozoite stage. Some parasites undergo
differentiation into male and female gametocytes. If ingested by another mosquito, gametocytes form a
zygote, which is further transformed into a motile diploid parasite form, the ookinete, that forms an oocyst
in the midgut wall. When rupturing, oocysts release sporozoites into mosquito salivary glands, from where
they can be injected into a new host with the next blood meal (modified from Winzeler, 2008)6.
Together with the mosquito blood meal, hundreds of sporozoites are injected into the human
blood, migrate to hepatocytes, penetrate them and mature to liver schizonts. Liver schizonts
leave the exo-erythrocytic phase by rupture and release thousands of merozoites, which in
Introduction
5
turn enter the erythrocytic cycle by infecting red blood cells. During this cycle, Plasmodia
undergo several morphological and transcriptional differentiation stages. In the ring stage,
merozoites transform to trophozoites, which in turn mature into schizonts and rupture
erythrocytes, thus releasing merozoites into the blood stream. At this point, the intra-
erythrocytic cycle is closed and new erythrocytes can be infected. Some of the Plasmodia
differentiate into gametocytes, which represent the sexual stage within the life cycle of the
parasite. The female gametocytes are called macrogametocyte, whereas the male forms are
called microgametocytes. Male and female gametocytes, if ingested by a female Anopheles
mosquito during its blood meal, form a zygote which matures to oocysts in the midgut wall
of the mosquito. Oocysts rupture and release thousands of sporozoites, which migrate to the
salivary glands of the mosquito, from where they can be injected into a new human host.
Thus, the sporogonic cycle within the mosquito is closed. This replication cycle is strictly
temperature-dependent and requires ambient temperatures of above 15 °C 4,7.
1.1.1.3. Genomic features of P. falciparum
The genome sequence of Plasmodium falciparum 3D7 was published by Gardner et al. in
20028. The genome is distributed across 14 chromosomes and has a length of 28.8 Mb.
Approximately 5300 protein-coding genes were identified, which reveals a calculated gene
density of roughly 4.3 bp per gene. Considering a predicted intron content of 54%, an average
length of a protein-coding gene in P. falciparum is 2.4 kb. The genome of the parasite has one
the most strikingly AT-rich sequences known so far, showing an 80.6% content of adenine-
and thymine-bases. P. falciparum exhibits minimum redundancy of tRNA with an unusually
high number of tRNA coding regions of 43, which implies a significantly different codon usage
to that in human or bacteria8,9. Less than half of the predicted protein-coding genes in P.
falciparum are well characterized to present date. In addition, there is a highly-conserved
stage-specific gene expression. For example, 49% of the proteins expressed in the sporozoite
stage are only present in this specific stage. The same applies to the merozoite-, trophozoite-
and gametocyte-stages showing 20-30% of stage-specific protein expression for each of these
phases, which is still a remarkably high percentage10. Only about 6% of all proteins known in
P. falciparum could be detected throughout all developmental phases, most of which are
housekeeping proteins exhibiting a ribosomal, transcriptional or metabolic function. This
untypical genome and proteome organization of P. falciparum must be considered when
identifying and defining potential drug target candidates9-13.
Introduction
6
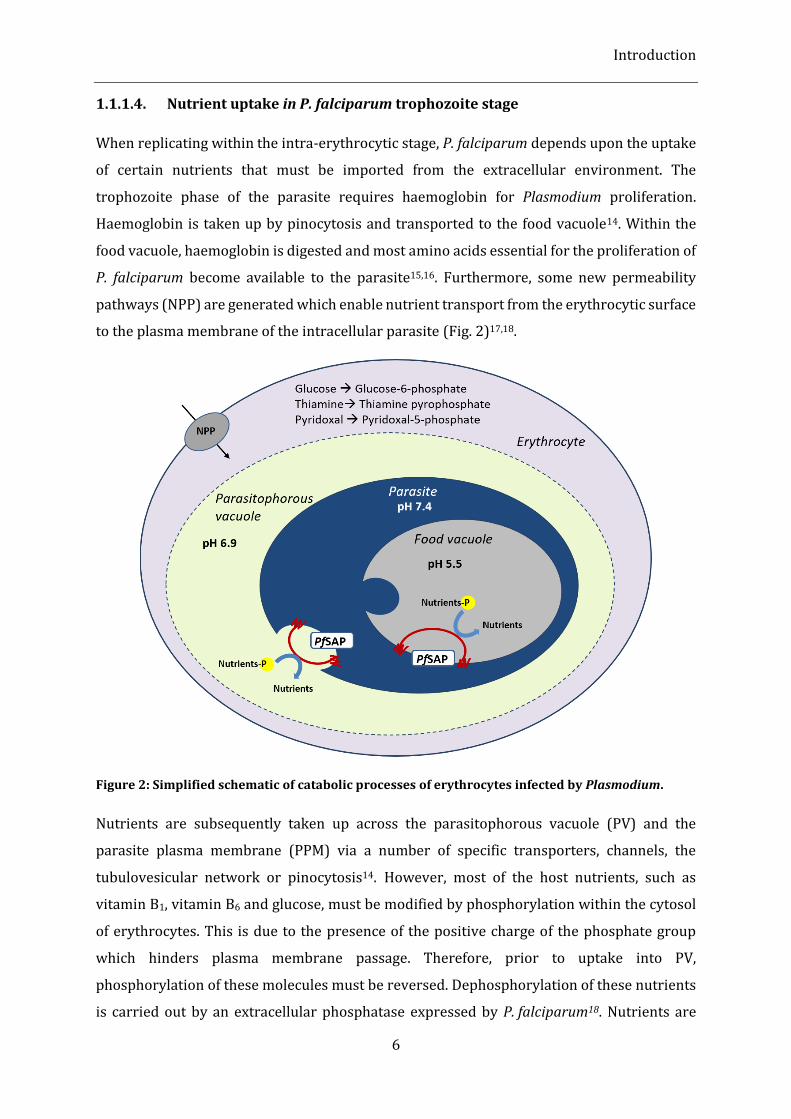
1.1.1.4. Nutrient uptake in P. falciparum trophozoite stage
When replicating within the intra-erythrocytic stage, P. falciparum depends upon the uptake
of certain nutrients that must be imported from the extracellular environment. The
trophozoite phase of the parasite requires haemoglobin for Plasmodium proliferation.
Haemoglobin is taken up by pinocytosis and transported to the food vacuole14. Within the
food vacuole, haemoglobin is digested and most amino acids essential for the proliferation of
P. falciparum become available to the parasite15,16. Furthermore, some new permeability
pathways (NPP) are generated which enable nutrient transport from the erythrocytic surface
to the plasma membrane of the intracellular parasite (Fig. 2)17,18.
Figure 2: Simplified schematic of catabolic processes of erythrocytes infected by Plasmodium.
Nutrients are subsequently taken up across the parasitophorous vacuole (PV) and the
parasite plasma membrane (PPM) via a number of specific transporters, channels, the
tubulovesicular network or pinocytosis14. However, most of the host nutrients, such as
vitamin B1, vitamin B6 and glucose, must be modified by phosphorylation within the cytosol
of erythrocytes. This is due to the presence of the positive charge of the phosphate group
which hinders plasma membrane passage. Therefore, prior to uptake into PV,
phosphorylation of these molecules must be reversed. Dephosphorylation of these nutrients
is carried out by an extracellular phosphatase expressed by P. falciparum18. Nutrients are
Introduction
7
phosphorylated back again within the parasite and can be subsequently transported to the
food vacuole (FV) via lysosome-like vesicles, where they are digested under acidic conditions
(Fig. 2)14,19. A secreted acidic phosphatase (PfSAP) with a pH optimum of 5-7 has been
identified, which is not only found to be secreted to the cell surface but also to be localized in
the food vacuole throughout the intra-erythrocytic developmental stages of P. falciparum.
The C-terminal part of the phosphatase is supposed to contain a signal sequence which is
presumably responsible for the transport of the PfSAP18. The secretion pathway in P.
falciparum is well characterized, however, there is not much known about its endo- and
lysosomal transport route. In yeast, it was already shown that lysosomal targeting is initiated
by the short cytoplasmic C-terminal sequence of a lysosomal acid phosphatases (LAPs). Thus,
it is likely that the secreted acidic phosphatase in P. falciparum is also activated by kinase
phosphorylation, which in turn induces endocytic processes.
1.1.1.5. Kinases and their druggability
Phosphorylation is one of the key protein modifications that plays an important role in a
variety of cellular signalling processes, such as cell differentiation, proliferation or
apoptosis20. Phosphorylation is carried out by kinases and can be reversed by phosphatases.
The process of phosphorylation involves γ-phosphate transfer from nucleoside phosphates
to amino acid residues of substrate proteins, which typically results in a change in
conformation leading to an altered specificity of the phosphorylated molecules and thus
induces a certain function, substrate association or translocation. Kinases can be subdivided
into three main groups according to their substrate specificity: Serine/Threonine kinases,
Tyrosine kinases and dual specificity kinases21. Known from genetic and structural analysis,
highly conserved catalytic domains are present in protein kinases that show an overall
evolutionary conservation in both eukaryotes and prokaryotes. Many high-throughput-based
studies are currently focussing on targeting protein kinases as potential drug targets to find
suitable selective kinase inhibitors22,23.
Eukaryotic kinases have a highly conserved catalytic core and a number of conserved regions
within the catalytic domain21,24,25. In the N-terminal part of the kinase domain there is a
glycine-rich region GxGGxG in the proximity of a lysine. This forms a hairpin and has been
shown to be responsible for ATP binding20,21,26. The middle part of the kinase domain amino
acid sequence contains a conserved aspartic acid residue, which mediates the catalytic
activity of the enzyme20,21,25.
Introduction
8
1.1.1.6. Distinct features of plasmodial protein kinases
There are certain aberrant characteristics regarding protein kinases of the malaria parasite
Plasmodium compared to the metazoan kinome. First of all, there is a lower number with only
85-100 kinase-related enzymes found in Plasmodium falciparum in contrast to over
500 kinase-like proteins present in the human genome26-28. Secondly, orphan kinases that do
not have a distinct orthologue in mammals with multiple specificity are present. Meaning that
kinases which belong to this group are atypical members of the protein kinase group and do
not cluster with any other phylogenetically classified kinases26,29,30. These two major aspects
are important to consider when identifying potential antimalarial drug targets. Plasmodial
mechanisms which are involved in development of drug resistance can be addressed by
targeting multiple structurally related kinases rather than specifically targeting the ATP-
binding site. Thus, identification of putative regulatory domains as well as studies on
allosteric inhibitors that can interfere with the active conformation formation clearly will
increase the chance of achieving parasiticidal effects26,31-33. Targeting orphan kinases in
general can be beneficial as potential inhibitory molecules are less likely to interfere with the
human homologs, which will lead to a reduced potential toxicity.
1.1.1.6.1. P. falciparum Serine-Threonine kinase PfSTK: PFPK9/PF13_0085 ORF
A lysosomal transport initiated by the C-terminal part of the PfSAP (amino acid sequence
NC: ASSFLSKNMK) to the food vacuole has been suggested. An orphan plasmodial Serine-
Threonine kinase PfSTK has been found through systematic screening (unpublished data by
Lindner et al., group of Prof. Carsten Wrenger, University of Sao Paulo, Brazil) that putatively
phosphorylates the C-terminus of the PfSAP, thus enabling the formation of lysosomal
vesicles for further transport to the food vacuole of the parasite19.
This kinase is the Plasmodium falciparum kinase PfPK9/PF13_0085 ORF and will further be
assigned as PfSTK in this thesis to keep the nomenclature as simple as possible. This protein
shares up to 39% sequence identity with other eukaryotic kinases within the region of its
kinase domain. This makes up approx. only 11% of the overall sequence identity. The absence
of significant structural similarity for the N-terminal part, which is outside the conserved
kinase domain, is striking and was also observed in just a few other protein kinases in
Plasmodium falciparum, like PfPK7 and in the group of so called FIKK kinases27,33,34.
Introduction
9
PfSTK was shown to autophosphorylate at three distinct threonine residues: T082, T265 and
T269, as derived from phosphopeptide mapping studies35. Similar studies suggest its
localization to the parasitophorous vacuole as well as to the cytosol. Furthermore, an
endogenous substrate of PfSTK was identified, which is a protein showing high homology to
the E2 ubiquitin-conjugating enzyme 13 (UBC13). One of the so far identified exogenous
substrates is Histone H127,35. Other specific targets and functional mechanisms are still
unknown and phosphorylation of PfSAP could complement the knowledge about the PfSTK
specificity and its role in host nutrient acquisition.
Since kinases are attractive potential drug targets for many human diseases, the orphan
kinase PfSTK is a valuable antimalarial drug target because it has a high divergence to human
proteins and can possibly be targeted in a multiple approach along with other kinases (see
chapter 1.1.1.6).
1.1.1.6.2. P. falciparum 5-(2-hydroxy-ethyl)-4-methylthiazole (THZ) kinase PfThiM
Another metabolically relevant kinase from Plasmodium falciparum is the 5-(2-hydroxy-
ethyl)-4-methylthiazole (THZ) kinase PfThiM. Its expression throughout developmental
erythrocytic stages crucially affects carbohydrate and amino acid metabolism. An essential
co-factor for enzymes that metabolize carbohydrates is vitamin B1, also known as thiamine.
Compared to mammals that rely on exogenic vitamin B1 uptake, in Plasmodium this vitamin
can be synthesized de novo. This is owing to the presence of a thiamine phosphate
biosynthesis pathway. This pathway was also originally found in bacteria and was confirmed
to be also present in plants and fungi36-39. The plasmodial thiamine phosphate pathway
consists of two branches, the thiazole and the pyrimidine branch, that independently produce
the two moieties that are subsequently fused to the activated thiazole phosphate40,41 (Fig. 3).
The pyrimidine branch has the 4-amino-5-hydroxymethyl-2-methylpyrimidine (HMP) as a
precursor molecule, which is phosphorylated by the HMP/HMP-P kinase (ThiD) in a two-step
reaction. Alternatively, in Plasmodia, the first phosphorylation of HMP can also be
accomplished by the pyridoxine kinase (PdxK)41,42. In the pyrimidine branch, THZ is
phosphorylated by ThiM to 4-methyl-5-(2-phospho-ethyl)-thiazole (THZ-P). Finally, HMP-PP
and THZ-P are combined to form thiamine phosphate (Thi-P) in a reaction catalysed by
thiamine phosphate synthase (ThiE)42. Thiamine phosphate is further processed to the final
product thiamine (Vitamin B1) by a GTPase43.
Introduction
10
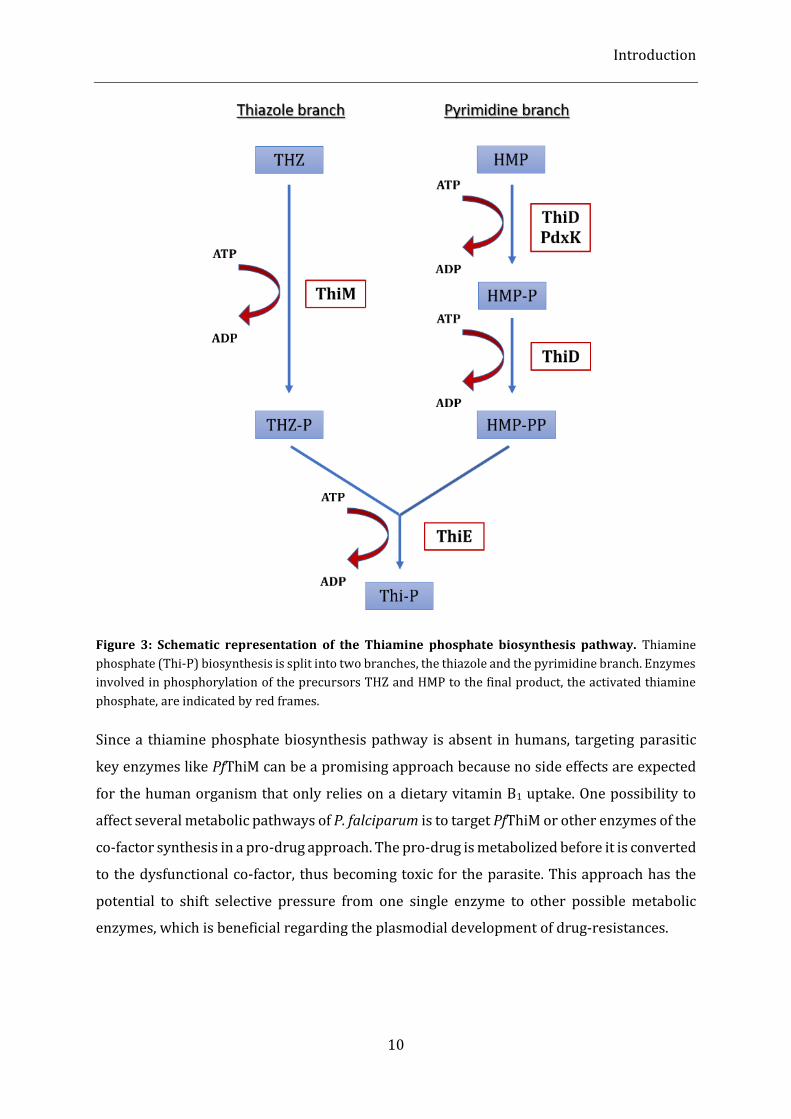
Figure 3: Schematic representation of the Thiamine phosphate biosynthesis pathway. Thiamine
phosphate (Thi-P) biosynthesis is split into two branches, the thiazole and the pyrimidine branch. Enzymes
involved in phosphorylation of the precursors THZ and HMP to the final product, the activated thiamine
phosphate, are indicated by red frames.
Since a thiamine phosphate biosynthesis pathway is absent in humans, targeting parasitic
key enzymes like PfThiM can be a promising approach because no side effects are expected
for the human organism that only relies on a dietary vitamin B1 uptake. One possibility to
affect several metabolic pathways of P. falciparum is to target PfThiM or other enzymes of the
co-factor synthesis in a pro-drug approach. The pro-drug is metabolized before it is converted
to the dysfunctional co-factor, thus becoming toxic for the parasite. This approach has the
potential to shift selective pressure from one single enzyme to other possible metabolic
enzymes, which is beneficial regarding the plasmodial development of drug-resistances.
Introduction
11
1.1.2. Lymphatic filariasis
1.1.2.1. Epidemiology
Lymphatic filariasis (LF) is a cyclically transmitted parasitic disease that affects over
120 million people worldwide. The disease is known to be the second most common vector-
borne parasitic disease after malaria44,45. The disease is also known as “elephantids’”, because
it is responsible for swelling of extremities and genitals in patients46,47. Around 40 million
humans are currently suffering from LF, showing severe disfigurements and incapacitation.
According to WHO statistics, lymphatic filariasis is ranked second from most common causes
of long-term mental and physical illness44. In total, there are 73 countries located in tropical
and sub-tropical areas of predominantly Africa and Southeast Asia with an estimated number
of 1.4 billion people living at risk of becoming infected. From those infected by the LF parasite
approximately one-third lives in India, one-third in Africa and the remainder is residential to
the Americas, the Pacific Islands, Papua New Guinea and other Southeast Asian countries. The
disease not only causes physical and mental suffering in patients but is also an enormous
social and economic burden for the endemic countries48. Individuals infected with the LF
parasite are more susceptible to HIV/AIDS, tuberculosis and malaria49. Moreover, lymphatic
filariasis can be counted to the one of the most debilitating neglected tropical diseases
worldwide46,50.
1.1.2.2. Wuchereria bancrofti and its life cycle
Lymphatic filariasis can be transmitted from human to human by a mosquito bite. The LF
parasite in 90% of the cases is Wuchereria bancrofti, a nematode that is typically ingested by
the mosquito during their blood meals taken from an infected human. The mosquito vectors
are of the genus Culex, Anopheles, Mansonia or Aedes 51. At this stage, W. bancrofti is persisting
in the microfilaria stage. Microfilariae then mature to larvae which can infect humans by
entering the skin with the next mosquito bite. In the human body, larvae circulate in the blood
for 6-12 months and mature to adult worms that lodge in the lymphatics. The presence of
adult worms in the lymphatic system can cause severe impairment of the immune system
and is responsible for the manifestation of chronic filarial lymphoedema46. The nematodes
can survive for approximately 6–8 years, which results in sexual reproduction between male
and female worms. This event leads to the production of millions of sheathed microfilariae
that circulate in the blood or migrate into lymph during their lifetime. The parasite is taken
Introduction
12
up by another mosquito where microfilariae shed their sheaths and enter the midgut of the
transmission vector. After migration to thoracic muscles, the parasite passes several
maturation stages to larvae, which then migrate to the head and the proboscis of the
mosquito52.
1.1.2.3. Thioredoxins
The Wuchereria bancrofti target protein, which was selected in the terms of the thesis
research activities, belongs to the group of thioredoxins (Trx). This chapter describes general
features of this protein group, before focusing specifically on the thioredoxin from
Wuchereria bancrofti (WbTrx) in chapter 1.1.2.4. Thioredoxins are ubiquitous proteins that
belong to the enzyme class of oxidoreductases. They are found in all regna of living organisms
and play an important role in a variety of cell processes, like transcription regulation,
proliferation, inhibition of apoptosis and the defence of oxidative stress by maintaining
reduced forms of various enzymes. The enzymatic mechanism of thioredoxins is based on
reversible thiol-disulfide exchange via electron transporter molecules53-56. Figure 4 depicts
such a reaction cycle. The reduced form of thioredoxin reduces the oxidized protein
substrate. Thus, thioredoxin is converted into its oxidized form with a disulfide bond formed
within the active site. Thioredoxin reductase (TrxR), in turn, catalyses the thioredoxin
reduction driven by the electron transport via the reduced form of Nicotinamide Adenine
Dinucleotide Phosphate (NADPH). NADPH is then oxidized to NADP+.
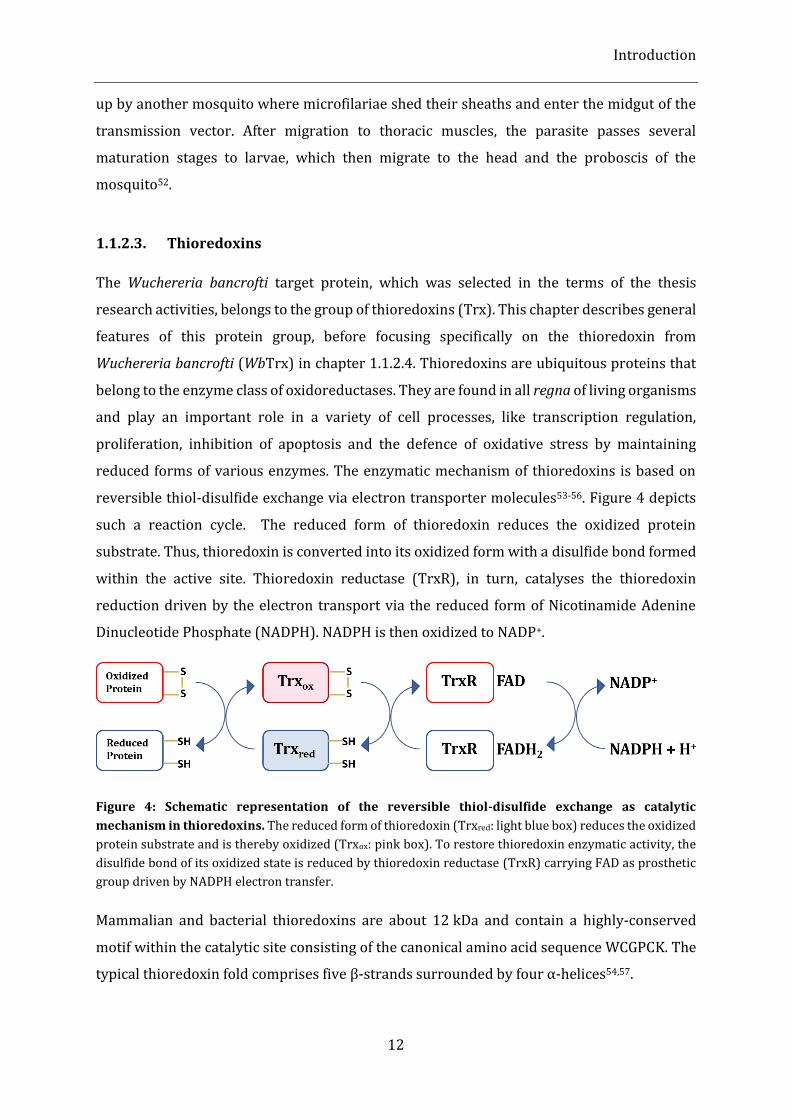
Figure 4: Schematic representation of the reversible thiol-disulfide exchange as catalytic
mechanism in thioredoxins. The reduced form of thioredoxin (Trxred: light blue box) reduces the oxidized
protein substrate and is thereby oxidized (Trxox: pink box). To restore thioredoxin enzymatic activity, the
disulfide bond of its oxidized state is reduced by thioredoxin reductase (TrxR) carrying FAD as prosthetic
group driven by NADPH electron transfer.
Mammalian and bacterial thioredoxins are about 12 kDa and contain a highly-conserved
motif within the catalytic site consisting of the canonical amino acid sequence WCGPCK. The
typical thioredoxin fold comprises five β-strands surrounded by four α-helices54,57.
Introduction
13
A class of nematodal thioredoxins has been defined that features some variations in size and
within the active site58. In the course of these studies, thioredoxins from Wuchereria
bancrofti, Brugia malayi and Caenorhabditis elegans have been identified and characterized58.
The 16-kDa thioredoxins from nematodes are significantly larger than the majority of
thioredoxins characterized to date and the active site sequence is WCPPCR and thus differs
from the motif found in mammals and bacteria. However, from the comparison of all known
thioredoxins the consensus sequence WCXXCK/R can be derived. This sequence is
responsible for the overall similar catalytic function regarding to the thiol-disulfide exchange
mechanism.
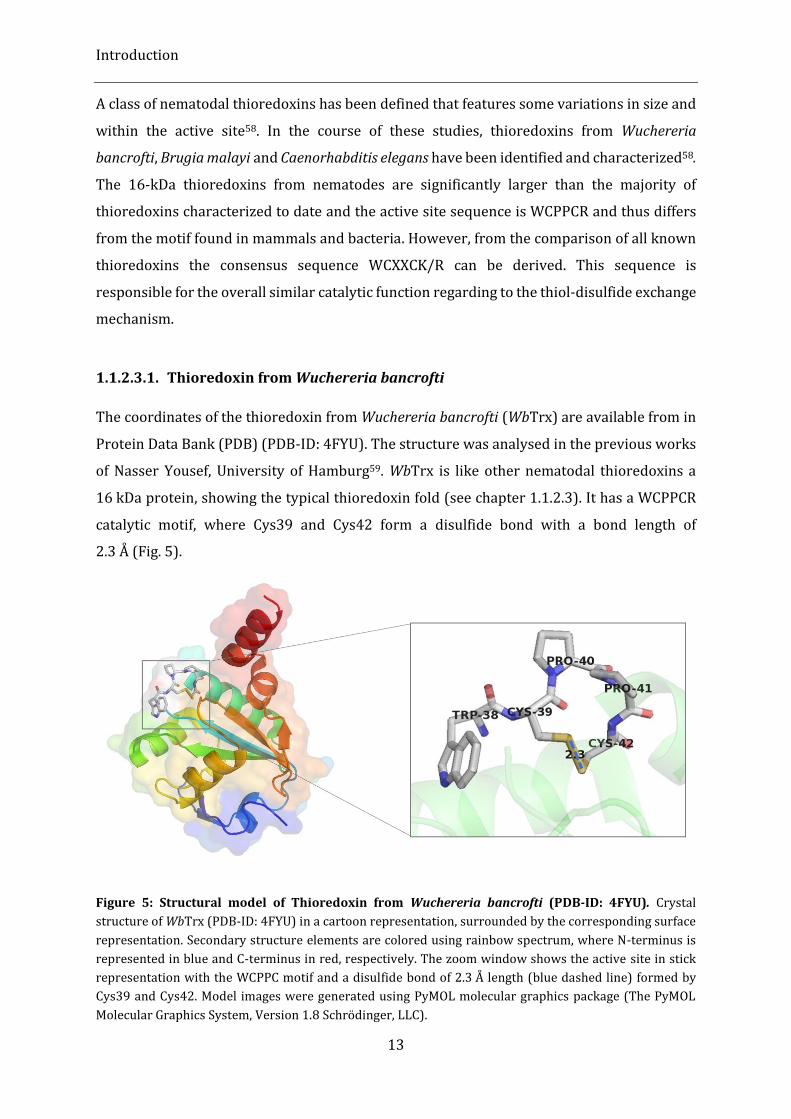
1.1.2.3.1. Thioredoxin from Wuchereria bancrofti
The coordinates of the thioredoxin from Wuchereria bancrofti (WbTrx) are available from in
Protein Data Bank (PDB) (PDB-ID: 4FYU). The structure was analysed in the previous works
of Nasser Yousef, University of Hamburg59. WbTrx is like other nematodal thioredoxins a
16 kDa protein, showing the typical thioredoxin fold (see chapter 1.1.2.3). It has a WCPPCR
catalytic motif, where Cys39 and Cys42 form a disulfide bond with a bond length of
2.3 Å (Fig. 5).
Figure 5: Structural model of Thioredoxin from Wuchereria bancrofti (PDB-ID: 4FYU). Crystal
structure of WbTrx (PDB-ID: 4FYU) in a cartoon representation, surrounded by the corresponding surface
representation. Secondary structure elements are colored using rainbow spectrum, where N-terminus is
represented in blue and C-terminus in red, respectively. The zoom window shows the active site in stick
representation with the WCPPC motif and a disulfide bond of 2.3 Å length (blue dashed line) formed by
Cys39 and Cys42. Model images were generated using PyMOL molecular graphics package (The PyMOL
Molecular Graphics System, Version 1.8 Schrödinger, LLC).
Introduction
14
The closest structurally characterized homologs identified using the program BLASTP 2.6.0+
of the Basic Local Alignment Search Tool (BLAST)60,61 are parasitic typaredoxins from
Crithidia fasciculate (PDB-ID: 1QK8), Leishmania major (PDB-ID: 3S9F) and Trypanosoma
brucei (PDB-ID: 1O73), which cover 72-82% of the WbTrx sequence with an identity of 40-
45%. In figure 6, the WbTrx crystal structure is compared to crystal structures of its
structurally closest homologs. Whereas the typaredoxins from Crithidia fasciculate and
Trypanosoma brucei are nearly identical, additional α-helices can be observed both for the
typaredoxin from Leishmania major and for the thioredoxin from Wuchereria bacrofti.
However, both α-helices are of opposite polarity. The additional α-helix is located at the C-
terminus of WbTrx and at the N-terminus of the typaredoxin from Leishmania major,
respectively (Fig. 6). The catalytic motif is WCPPCR in all four organisms and shows structural
consensus for all of them.
Figure 6: Superimposed aligned crystal structures of thioredoxin from Wuchereria bancrofti and
structures of its closest structural homologues. All structures are the in cartoon representation, where
WbTrx is represented in pink (PDB-ID: 4FYU) and compared to typaredoxins from Crithidia fasciculate
(dark grey, PDB-ID:1QK8), Trypanosoma brucei (light grey, PDB-ID: 1O73) and Leishmania major (purple,
PDB-ID: 3S9F). The two images are rotated by 90° as indicated by the red arrow. All structures show the
typical thioredoxin fold with α-helices surrounding parallel and anti-parallel β-sheets and share a
structurally convergent active site (cyan). The model images were prepared using PyMOL molecular
graphics package (The PyMOL Molecular Graphics System, Version 1.8 Schrödinger, LLC)
Thioredoxins in filaria presumably play a key role in detoxification of host-derived
oxyradicals, such as H2O2, superoxide radical or nitric oxides. Figure 6 depicts exemplarily
similarities and differences in structural architecture between parasitic and mammalian or
bacterial thioredoxins. This is evident in the comparison of the human thioredoxin and
thioredoxin from Escherichia coli to WbTrx. All three thioredoxin structures show the typical
thioredoxin fold with five β-sheets surrounded by four α-helices. The significantly bigger
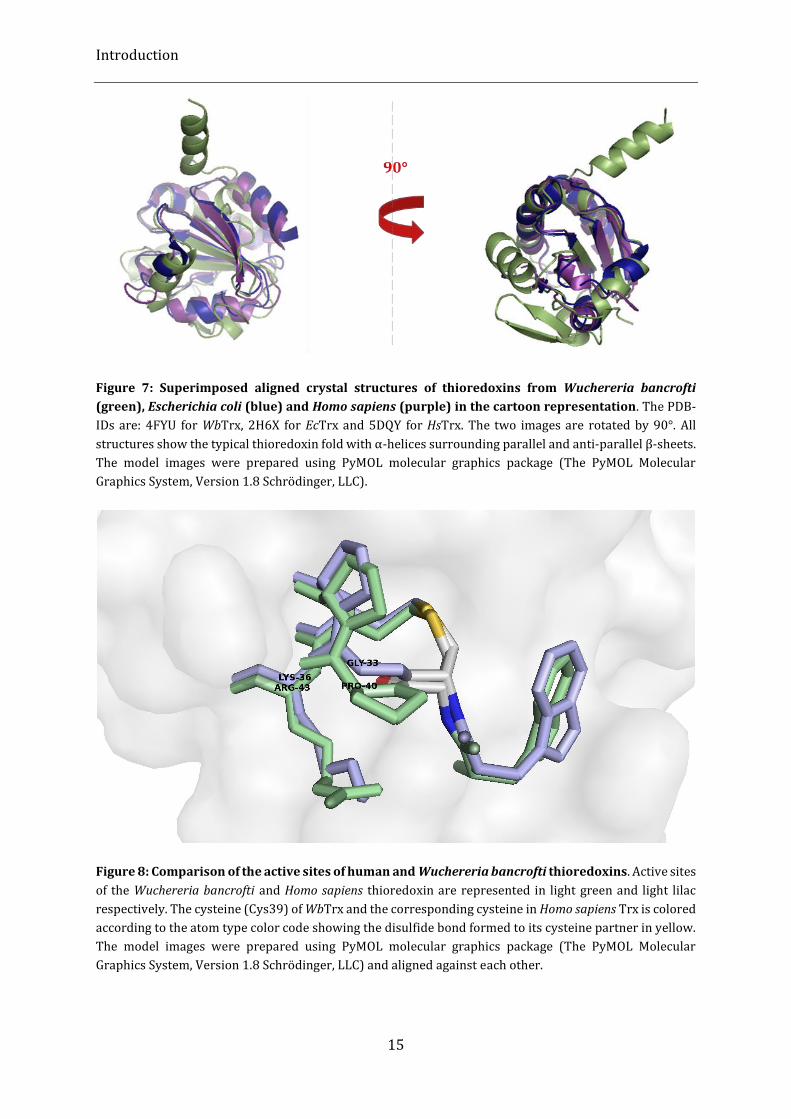
Introduction
15
Figure 7: Superimposed aligned crystal structures of thioredoxins from Wuchereria bancrofti
(green), Escherichia coli (blue) and Homo sapiens (purple) in the cartoon representation. The PDB-
IDs are: 4FYU for WbTrx, 2H6X for EcTrx and 5DQY for HsTrx. The two images are rotated by 90°. All
structures show the typical thioredoxin fold with α-helices surrounding parallel and anti-parallel β-sheets.
The model images were prepared using PyMOL molecular graphics package (The PyMOL Molecular
Graphics System, Version 1.8 Schrödinger, LLC).
Figure 8: Comparison of the active sites of human and Wuchereria bancrofti thioredoxins. Active sites
of the Wuchereria bancrofti and Homo sapiens thioredoxin are represented in light green and light lilac
respectively. The cysteine (Cys39) of WbTrx and the corresponding cysteine in Homo sapiens Trx is colored
according to the atom type color code showing the disulfide bond formed to its cysteine partner in yellow.
The model images were prepared using PyMOL molecular graphics package (The PyMOL Molecular
Graphics System, Version 1.8 Schrödinger, LLC) and aligned against each other.
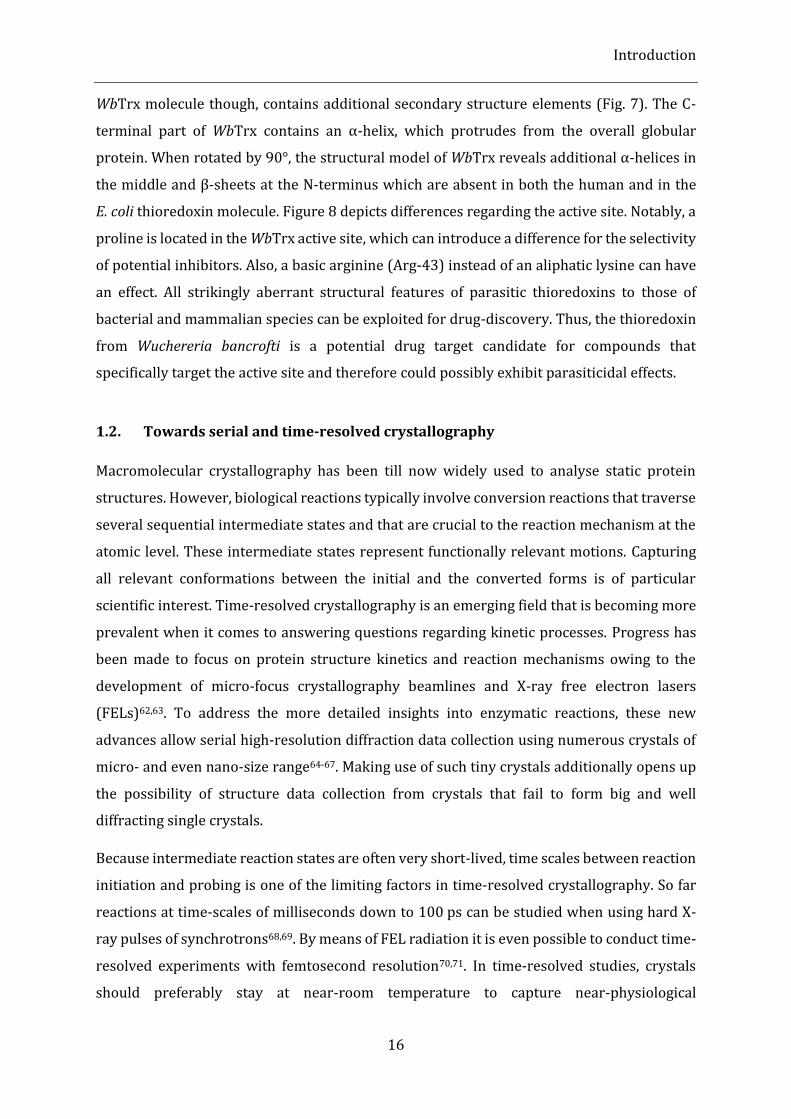
Introduction
16
WbTrx molecule though, contains additional secondary structure elements (Fig. 7). The C-
terminal part of WbTrx contains an α-helix, which protrudes from the overall globular
protein. When rotated by 90°, the structural model of WbTrx reveals additional α-helices in
the middle and β-sheets at the N-terminus which are absent in both the human and in the
E. coli thioredoxin molecule. Figure 8 depicts differences regarding the active site. Notably, a
proline is located in the WbTrx active site, which can introduce a difference for the selectivity
of potential inhibitors. Also, a basic arginine (Arg-43) instead of an aliphatic lysine can have
an effect. All strikingly aberrant structural features of parasitic thioredoxins to those of
bacterial and mammalian species can be exploited for drug-discovery. Thus, the thioredoxin
from Wuchereria bancrofti is a potential drug target candidate for compounds that
specifically target the active site and therefore could possibly exhibit parasiticidal effects.
1.2. Towards serial and time-resolved crystallography
Macromolecular crystallography has been till now widely used to analyse static protein
structures. However, biological reactions typically involve conversion reactions that traverse
several sequential intermediate states and that are crucial to the reaction mechanism at the
atomic level. These intermediate states represent functionally relevant motions. Capturing
all relevant conformations between the initial and the converted forms is of particular
scientific interest. Time-resolved crystallography is an emerging field that is becoming more
prevalent when it comes to answering questions regarding kinetic processes. Progress has
been made to focus on protein structure kinetics and reaction mechanisms owing to the
development of micro-focus crystallography beamlines and X-ray free electron lasers
(FELs)62,63. To address the more detailed insights into enzymatic reactions, these new
advances allow serial high-resolution diffraction data collection using numerous crystals of
micro- and even nano-size range64-67. Making use of such tiny crystals additionally opens up
the possibility of structure data collection from crystals that fail to form big and well
diffracting single crystals.
Because intermediate reaction states are often very short-lived, time scales between reaction
initiation and probing is one of the limiting factors in time-resolved crystallography. So far
reactions at time-scales of milliseconds down to 100 ps can be studied when using hard X-
ray pulses of synchrotrons68,69. By means of FEL radiation it is even possible to conduct time-
resolved experiments with femtosecond resolution70,71. In time-resolved studies, crystals
should preferably stay at near-room temperature to capture near-physiological
Introduction
17
conformations72,73. Another advantage of serial time-resolved crystallography is that data
collection can be easily carried out at room-temperature. This is possible because only a few
or even just one image per crystal is recorded, and numerous individual images are merged
to a complete data set afterwards. Thus, the effect of radiation damage can be outrun74,75.
A major aspect of time-resolved crystallography is the reaction initiation. On the one hand, it
needs to be guaranteed that there is a sufficient number of molecules that build up a crystal
lattice to obtain a significantly strong signal. On the other hand, crystals must be small enough
to allow rapid and uniform reaction initiation over the entire crystal. There are different ways
to induce a specific reaction within a crystalline sample. Possible mechanisms are for
example temperature or pressure jump, diffusion of a reactant into the crystal, light-
activation or bond cleavage by X-ray irradiation68,76-78. The most in-depth studied protein
targets remain so far photosensitive systems, like photoactive yellow protein (PYP),
photosystem II or myoglobin68,69,72,79,80.
Before the field of serial crystallography was developed, these kinds of experiments were
carried out using stable and very large single crystals which were subjected to many
sequential pump-probe cycles that were used for reversible reactions68,81-83. The progressive
development of serial crystallography now allows time-resolved studies using very small
crystals, which are sub-micrometer sized or sometimes even smaller down to nanometer
range. The high number of isomorph crystals enables structural analysis of radiation-
sensitive targets, even with reactions that are irreversible because of potential disintegrity of
the crystal lattice71,84,85.
1.2.1. Serial Synchrotron Radiation crystallography using specific radiation damage with millisecond temporal resolution
Room-temperature data collection using multiple crystals can be realized by means of high-
brilliance synchrotron radiation and can be used to investigate specific radiation-damage
effects in the millisecond regime. Diffraction data analysis using this new method indicates a
dose-dependent destabilization of disulfide bonds86. This was successfully shown for the
well-studied protein thaumatin from Thaumatococcus daniellii. The eight intramolecular
disulfide bonds within the thaumatin molecule are known to be extremely sensitive to
radiation damage86-88.
When applying imaging methods to achieve molecular resolution, use of ionizing radiation is
made and consequently sample matter can suffer from damage or degradation. This also
Introduction
18
applies for protein crystals in X-ray crystallography. To avoid structural bias or wasting
useful crystalline sample, the extent of radiation damage should ideally be assessable. The
tolerable dose for diffraction data collection at cryogenic temperatures was already
calculated in 1990 and defined as the aptly named Henderson limit of 30 MGy88-91. In X-ray
crystallography, radiation damage, for decades, could be successfully reduced by recording
diffraction data from well-ordered protein crystals with volumes of a (sub)-millimeter range
at a temperature of 100 K. However, growing large well-ordered crystals is not always
possible. In general, the occurrence of a high number of small crystals is more probable, as
evident from most initial crystallization trials, where high-throughput screens were used. In
initial hits, microcrystalline matter is often found, and it would be worthwhile to find a way
to make use of smaller crystals for structure determination. For small crystals, however, the
effect of radiation damage is much higher and thus, several isomorphic crystals are required
to record a complete diffraction data set92. Considering that at cryogenic temperatures the
diffusion of released free radicals is slowed, it is self-evident that at room temperature, the
extent of radiation damage is dramatically higher. This leads to the conclusion that to be able
to make use of small crystals for structure determination, the total absorbed dose must be
put to a minimum. There are several ways to address this problem. When working with
synchrotron radiation (SR), the crystal size should ideally match the beam dimensions. In the
case of microfocus beamlines, the beam also needs to be attenuated to avoid too high photon
fluxes. Typical microfocus SR-beamline fluxes are about 5 x 10¹² photons per second, which
result from energies in the range of 12 keV and are focused onto an area of only a few μm2.
Therefore, it is important to correlate the total absorbed dose to the experimental parameters
like crystal size, filter transmission, exposure time as well as the number of images recorded
from one crystal92. Deriving from these considerations, the required number of crystals to be
exposed can be roughly estimated to obtain complete and highly redundant data sets.
Depending on the presence and configuration of radiation sensitive groups or atoms within
a molecule, the occurring radiation damage can be either global or specific89,93,94. Global
radiation damage typically results in overall decrease of diffraction intensity, especially for
higher resolution shells, in higher B-factors, in an increased unit cell volume and in the
variations of other relevant experimental values95. In contrast, specific radiation damage
causes distinct structural changes within the macromolecular conformation. This
particularly involves elongation and cleavage of disulfide bonds, decarboxylation of
aspartates and glutamates, dehydroxylation of tyrosines, and the breakage of bonds between
carbons and sulfurs in methionines96,97. In contrast to global radiation damage, specific
Introduction
19
structural damage cannot be assessed during diffraction data collection, as the above
mentioned structural changes only become visible after refinement and are typically not
associated with significant loss of diffraction intensities during the experiment.
1.2.2. Applications of protein micro-crystallography for serial Synchrotron Radiation experiments at room temperature
Despite the advances made during the last five years regarding SFX data collection at FELs,
beamtime at synchrotron radiation (SR) beamlines remains still more readily accessible and
thus, SR serial crystallography is being continuously implemented and improved98-104.
Advances have been made regarding sample automation to make data collection at many SR
beamlines more efficient. However, when using sample mounting robotics, crystals are
extracted from their natural environment, which can result in several problems that impair
crystal quality and consequently their diffraction properties, typically caused by mechanical
stress, dehydration or temperature changes. The extent of this impairment generally
correlates with crystal size and is higher the smaller the crystals are105. To overcome the
negative effects of sample manipulation, in situ diffraction techniques on so-called fixed-
targets have been developed106, like low X-ray absorbing 96-well plates107,108 microfluidic
chips109-112, capillaries103, and others113,114. Another factor which can lead to diminished
crystal quality and reduced diffraction is cryo-cooling. Depending on crystal packing and
solvent content, the search for a suitable cryo-protectant can be problematic and time-
consuming. The presence of a sub-optimal cryo-protectant in some cases can drastically
reduce crystal quality and thus the diffraction power of the crystal107. Moreover, cryo-
protection in general can restrict the diversity of possible conformations or result in biased
conformations compared to those at room temperature115-119. More so, sometimes a higher
mosaic spread of reflections is detected for cryocooled crystals120.
1.2.3. Applications of microfluidic devices for use in serial and time-resolved crystallography
Microfluidic devices complement several, so far limited, possibilities for in situ crystallization
and diffraction and at the same time bear the potential in respect to a more rationally
controlled crystallization reaction environment. In this chapter, the benefit of the use of
microfluidic devices for addressing the problems regarding crystal growth and sample
manipulation for applications in serial and time-resolved crystallography is discussed.
Introduction
20
Microfluidic chips possess micro- to nanolitre-sized crystallization compartments connected
via micro-channels, a configuration that not only reduces sample consumption to a minimum
but also allows for high-throughput screening of crystallization conditions108,121,122. Once
crystals are formed within a microfluidic chamber, diffraction data can be collected without
the need for additional sample handling and manipulation of the crystal environment, which
eliminates mechanical stress or dehydration of the crystalline matter. Microfluidic devices
can be also used to overcome the problem of cryo-cooling. Most chips are designed in a way
that hundreds to thousands of crystals can be exposed on the same device. Thus, by shooting
only the first few images per crystal, diffraction data collection becomes feasible at room
temperature. Furthermore, most chip designs are at regular intervals, which allows for each
crystal to be targeted individually. This not only results in a high hit rate and less sample
wastage but also offers the possibility of data collection automation. Finally, fabrication of
microfluidic chips is rather inexpensive and the devices can be produced in high quantities.
Fabrication of microfluidic devices can be realized by utilizing rapid prototyping with soft
lithography in chemically inert polymer polydimethylsiloxane (PDMS). Thus, a patterned
polymer can be sandwiched between two polymer foil layers. The pattern is obtained by
combining soft lithography prototyping, casting and molding. First of all, a photomask is
required to transfer the desired pattern into a photoresist on a silicon wafer. To obtain more
sophisticated profiles within the microfluidic chip, several different layers with different
patterns and heights can be combined. The pattern is subsequently casted into the PDMS and
sealed with chemically inert Kapton® polyimide film or Cyclic Olefin Copolymer (COC). This
step is based on coupling chemistry and the plasma activation of the surface and is required
to achieve proper bonding. After plasma activation, the surface is functionalized with epoxy
and amine109,110,112. Materials like Kapton® foil have several features that make diffraction
data collection possible. They are not only chemically inert, thermally stable and insensitive
to X-ray radiation, but also highly transmissible and cause little background scattering.
Outline and aim of the thesis
21
1.3. Outline and aims of the thesis
Malaria and lymphatic filariasis are tropical diseases of enormous medical relevance and
affect hundreds of millions of people, predominantly in under-resourced developing
countries. Although both diseases affect their patients in a different way, both malaria and
lymphatic filariasis are classified as cyclically transmitted parasitic diseases. This thesis’
research activities are aimed at the characterization of selected parasitic enzymes, that could
be potential drug targets.
One of the objectives of the presented work was the recombinant expression, purification of
two metabolically relevant protein kinases of the malaria parasite Plasmodium falciparum
and their biophysical and biochemical characterization, applying complementary biophysical
techniques. These two kinases were the Serine/Threonine kinase PfSTK and the
Hydroxyethylthiazole kinase PfThiM. PfSTK presumably plays a role in host nutrient
acquisition, whereas PfThiM is a key enzyme within the vitamin B1 de novo biosynthesis
pathway.
Another objective of this work was to establish the production of microcrystals from highly
pure recombinant Thioredoxin from Wuchereria bancrofti (WbTrx) and to prove the
applicability of the microcrystalline sample for serial crystallography and time-resolved
studies. WbTrx is an oxidoreductase from the lymphatic filariasis parasite Wuchereria
bancrofti, which has several functions throughout the life cycle of the nematode. It maintains
parasitic cell functions at different developmental stages by catalysing a reaction, which
keeps up the level and the supply of reducing equivalents. Since WbTrx contains a disulfide
bond within its active site, attempts were made to detect the disulfide bond cleavage with a
millisecond temporal resolution by means of specific radiation damage. This can be
addressed by methods that focus on capturing reaction intermediates, thus complementing
the knowledge on structural aspects regarding kinetics and dynamics of catalytic processes.
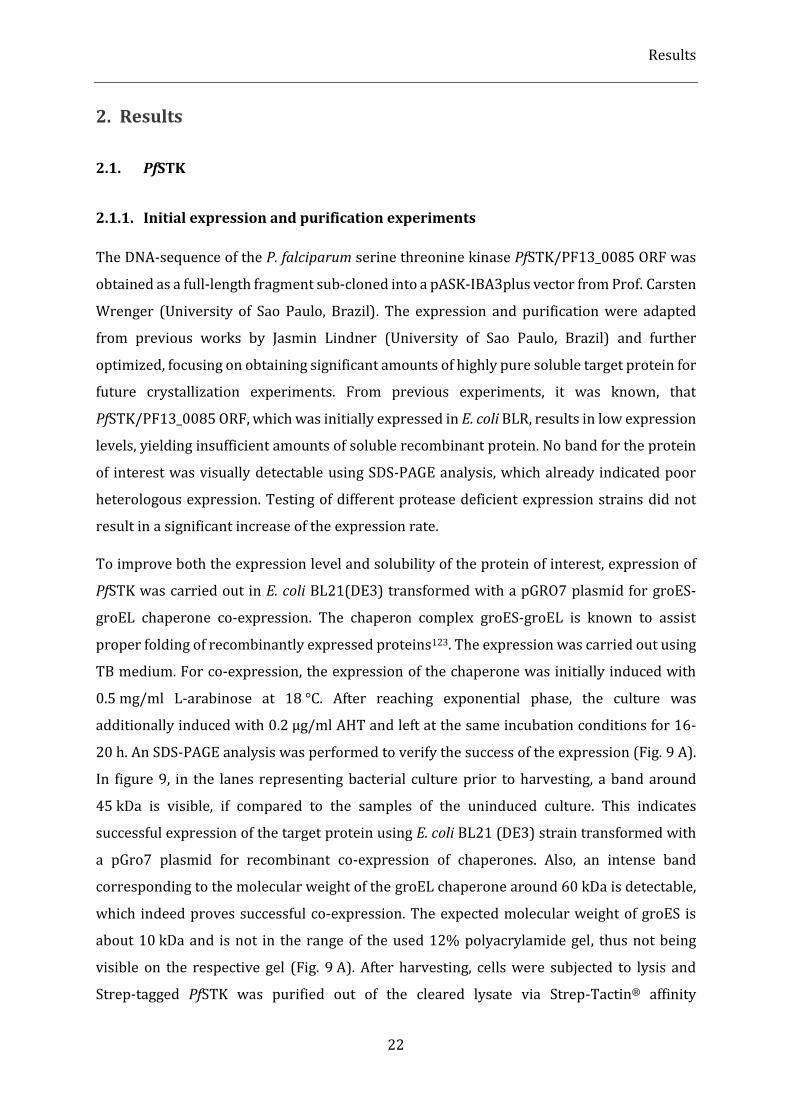
Results
22
2. Results
2.1. PfSTK
2.1.1. Initial expression and purification experiments
The DNA-sequence of the P. falciparum serine threonine kinase PfSTK/PF13_0085 ORF was
obtained as a full-length fragment sub-cloned into a pASK-IBA3plus vector from Prof. Carsten
Wrenger (University of Sao Paulo, Brazil). The expression and purification were adapted
from previous works by Jasmin Lindner (University of Sao Paulo, Brazil) and further
optimized, focusing on obtaining significant amounts of highly pure soluble target protein for
future crystallization experiments. From previous experiments, it was known, that
PfSTK/PF13_0085 ORF, which was initially expressed in E. coli BLR, results in low expression
levels, yielding insufficient amounts of soluble recombinant protein. No band for the protein
of interest was visually detectable using SDS-PAGE analysis, which already indicated poor
heterologous expression. Testing of different protease deficient expression strains did not
result in a significant increase of the expression rate.
To improve both the expression level and solubility of the protein of interest, expression of
PfSTK was carried out in E. coli BL21(DE3) transformed with a pGRO7 plasmid for groES-
groEL chaperone co-expression. The chaperon complex groES-groEL is known to assist
proper folding of recombinantly expressed proteins123. The expression was carried out using
TB medium. For co-expression, the expression of the chaperone was initially induced with
0.5 mg/ml L-arabinose at 18 °C. After reaching exponential phase, the culture was
additionally induced with 0.2 µg/ml AHT and left at the same incubation conditions for 16-
20 h. An SDS-PAGE analysis was performed to verify the success of the expression (Fig. 9 A).
In figure 9, in the lanes representing bacterial culture prior to harvesting, a band around
45 kDa is visible, if compared to the samples of the uninduced culture. This indicates
successful expression of the target protein using E. coli BL21 (DE3) strain transformed with
a pGro7 plasmid for recombinant co-expression of chaperones. Also, an intense band
corresponding to the molecular weight of the groEL chaperone around 60 kDa is detectable,
which indeed proves successful co-expression. The expected molecular weight of groES is
about 10 kDa and is not in the range of the used 12% polyacrylamide gel, thus not being
visible on the respective gel (Fig. 9 A). After harvesting, cells were subjected to lysis and
Strep-tagged PfSTK was purified out of the cleared lysate via Strep-Tactin® affinity
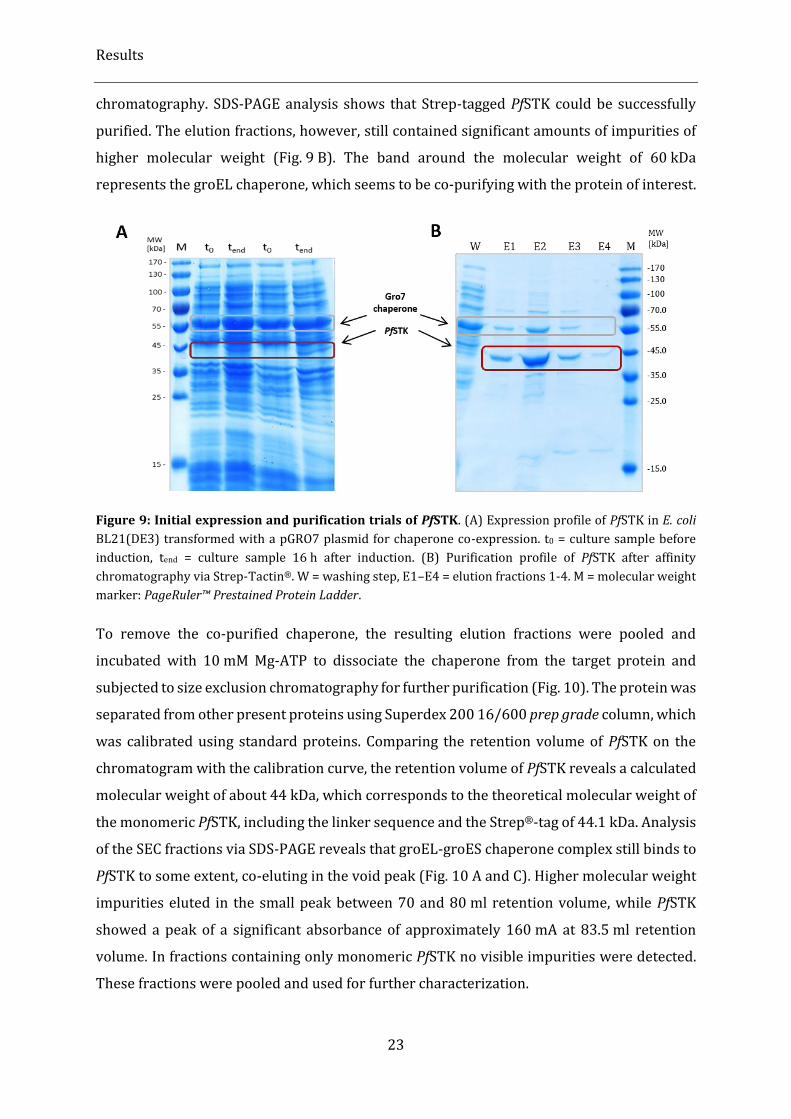
Results
23
chromatography. SDS-PAGE analysis shows that Strep-tagged PfSTK could be successfully
purified. The elution fractions, however, still contained significant amounts of impurities of
higher molecular weight (Fig. 9 B). The band around the molecular weight of 60 kDa
represents the groEL chaperone, which seems to be co-purifying with the protein of interest.
Figure 9: Initial expression and purification trials of PfSTK. (A) Expression profile of PfSTK in E. coli
BL21(DE3) transformed with a pGRO7 plasmid for chaperone co-expression. t0 = culture sample before
induction, tend = culture sample 16 h after induction. (B) Purification profile of PfSTK after affinity
chromatography via Strep-Tactin®. W = washing step, E1–E4 = elution fractions 1-4. M = molecular weight
marker: PageRuler™ Prestained Protein Ladder.
To remove the co-purified chaperone, the resulting elution fractions were pooled and
incubated with 10 mM Mg-ATP to dissociate the chaperone from the target protein and
subjected to size exclusion chromatography for further purification (Fig. 10). The protein was
separated from other present proteins using Superdex 200 16/600 prep grade column, which
was calibrated using standard proteins. Comparing the retention volume of PfSTK on the
chromatogram with the calibration curve, the retention volume of PfSTK reveals a calculated
molecular weight of about 44 kDa, which corresponds to the theoretical molecular weight of
the monomeric PfSTK, including the linker sequence and the Strep®-tag of 44.1 kDa. Analysis
of the SEC fractions via SDS-PAGE reveals that groEL-groES chaperone complex still binds to
PfSTK to some extent, co-eluting in the void peak (Fig. 10 A and C). Higher molecular weight
impurities eluted in the small peak between 70 and 80 ml retention volume, while PfSTK
showed a peak of a significant absorbance of approximately 160 mA at 83.5 ml retention
volume. In fractions containing only monomeric PfSTK no visible impurities were detected.
These fractions were pooled and used for further characterization.
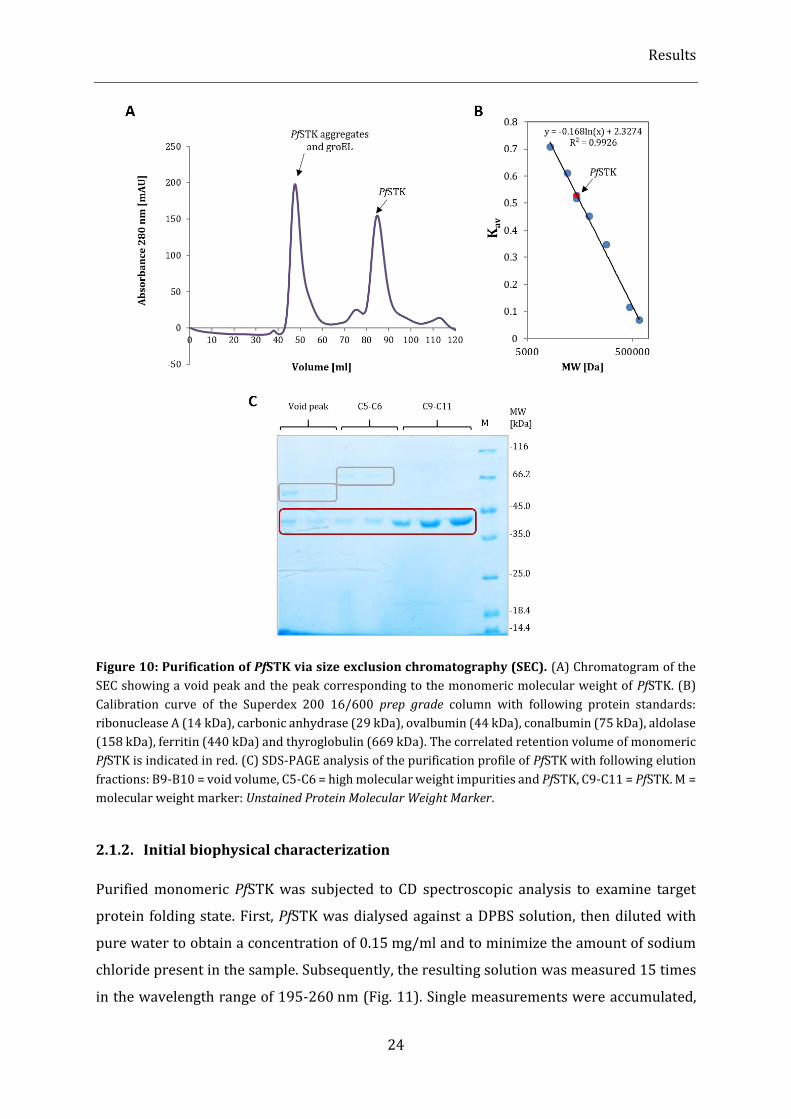
Results
24
Figure 10: Purification of PfSTK via size exclusion chromatography (SEC). (A) Chromatogram of the
SEC showing a void peak and the peak corresponding to the monomeric molecular weight of PfSTK. (B)
Calibration curve of the Superdex 200 16/600 prep grade column with following protein standards:
ribonuclease A (14 kDa), carbonic anhydrase (29 kDa), ovalbumin (44 kDa), conalbumin (75 kDa), aldolase
(158 kDa), ferritin (440 kDa) and thyroglobulin (669 kDa). The correlated retention volume of monomeric
PfSTK is indicated in red. (C) SDS-PAGE analysis of the purification profile of PfSTK with following elution
fractions: B9-B10 = void volume, C5-C6 = high molecular weight impurities and PfSTK, C9-C11 = PfSTK. M =
molecular weight marker: Unstained Protein Molecular Weight Marker.
2.1.2. Initial biophysical characterization
Purified monomeric PfSTK was subjected to CD spectroscopic analysis to examine target
protein folding state. First, PfSTK was dialysed against a DPBS solution, then diluted with
pure water to obtain a concentration of 0.15 mg/ml and to minimize the amount of sodium
chloride present in the sample. Subsequently, the resulting solution was measured 15 times
in the wavelength range of 195-260 nm (Fig. 11). Single measurements were accumulated,
Results
25
and the buffer signal was subtracted. The resulting curve allowed a secondary structure
prediction using an algorithm of Yang et al.124. Derived from its minima and its zero-crossing,
the algorithm revealed that PfSTK adopted a folding, showing approx. 23% α-helical and 45%
β-sheet structures under the chosen conditions. Also, the presence of almost 30% of random
structural contents within the protein chain were detected. The RMS value for the
measurements performed was calculated to be 8%, which corresponds to a reliable
prediction.
Figure 11: CD-spectroscopic analysis of the SEC purified PfSTK. (A) Mean molar residue ellipticity
plotted against the wavelength. The course of the shape reveals folded protein in solution and allows a
secondary structure prediction. (B) Reference spectra for far-UV CD secondary structure elements. Solid
line: α-helix, long dashed line: β-sheet, short dashed line: random coil. Modified from Kelly et al., 2005125.
Although purified folded PfSTK could be obtained, the resulting protein yield was only
approximately 0.5 mg from 1 l of E. coli culture and further attempts to concentrate PfSTK for
subsequent characterization and crystallization set-ups failed due to aggregation at
concentrations higher than 0.6 mg/ml. To further characterize the solution with respect to
particle distribution, the resulting protein solution was centrifuged for 1 h at 16100 x g and
measured applying dynamic light scattering (DLS) technique (Fig. 12). The hydrodynamic
radius of the protein in solution was estimated to be 11.4 ± 1.6 nm, which corresponds to a
calculated molecular weight of approx. 875 kDa, assuming globular protein shape. The DLS
result confirmed the formation of ordered aggregates. Samples containing more than
0.6 mg/ml PfSTK-Strep resulted in detection of amorphous aggregates with inhomogeneous
particle distribution, which even could not be steadily measured by DLS. The obtained
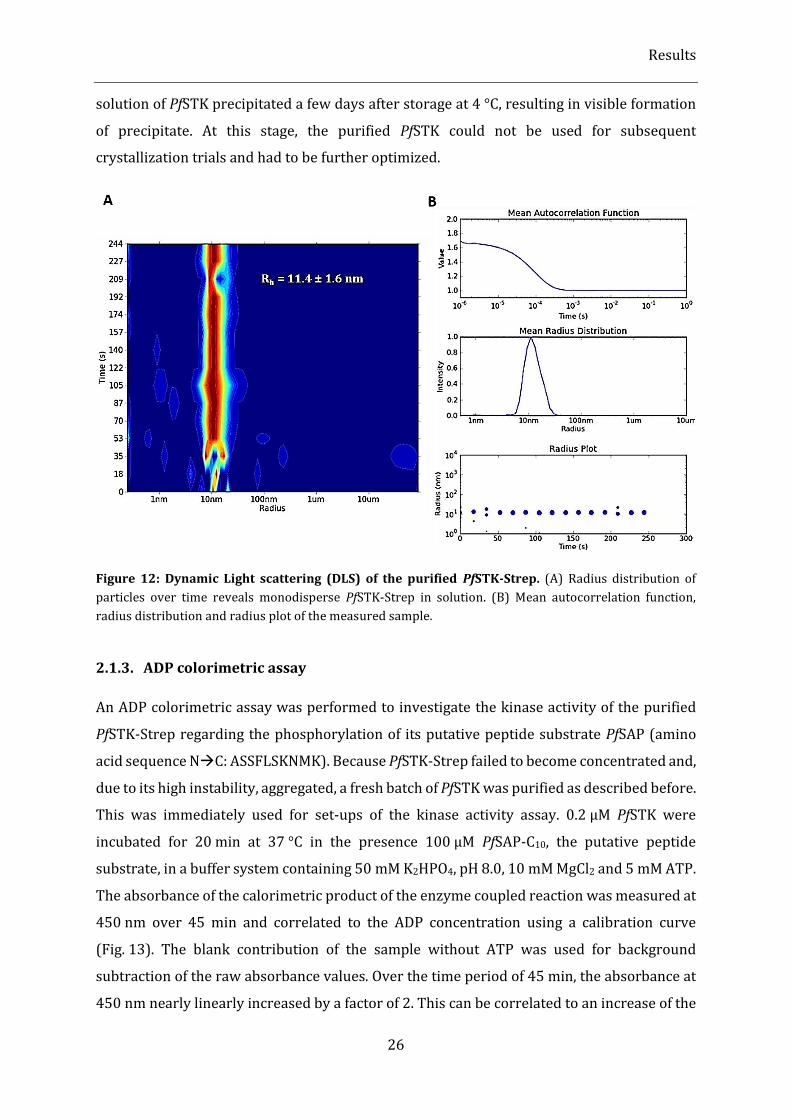
Results
26
solution of PfSTK precipitated a few days after storage at 4 °C, resulting in visible formation
of precipitate. At this stage, the purified PfSTK could not be used for subsequent
crystallization trials and had to be further optimized.
Figure 12: Dynamic Light scattering (DLS) of the purified PfSTK-Strep. (A) Radius distribution of
particles over time reveals monodisperse PfSTK-Strep in solution. (B) Mean autocorrelation function,
radius distribution and radius plot of the measured sample.
2.1.3. ADP colorimetric assay
An ADP colorimetric assay was performed to investigate the kinase activity of the purified
PfSTK-Strep regarding the phosphorylation of its putative peptide substrate PfSAP (amino
acid sequence NC: ASSFLSKNMK). Because PfSTK-Strep failed to become concentrated and,
due to its high instability, aggregated, a fresh batch of PfSTK was purified as described before.
This was immediately used for set-ups of the kinase activity assay. 0.2 µM PfSTK were
incubated for 20 min at 37 °C in the presence 100 µM PfSAP-C10, the putative peptide
substrate, in a buffer system containing 50 mM K2HPO4, pH 8.0, 10 mM MgCl2 and 5 mM ATP.
The absorbance of the calorimetric product of the enzyme coupled reaction was measured at
450 nm over 45 min and correlated to the ADP concentration using a calibration curve
(Fig. 13). The blank contribution of the sample without ATP was used for background
subtraction of the raw absorbance values. Over the time period of 45 min, the absorbance at
450 nm nearly linearly increased by a factor of 2. This can be correlated to an increase of the
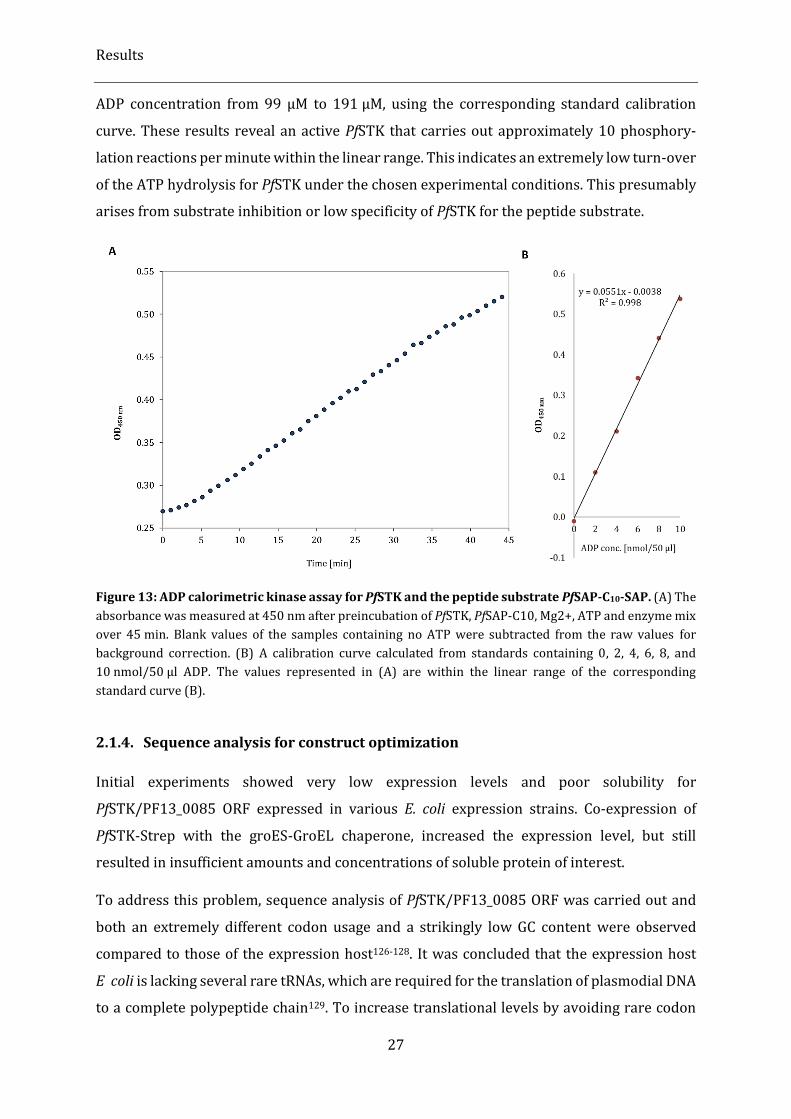
Results
27
ADP concentration from 99 µM to 191 µM, using the corresponding standard calibration
curve. These results reveal an active PfSTK that carries out approximately 10 phosphory-
lation reactions per minute within the linear range. This indicates an extremely low turn-over
of the ATP hydrolysis for PfSTK under the chosen experimental conditions. This presumably
arises from substrate inhibition or low specificity of PfSTK for the peptide substrate.
Figure 13: ADP calorimetric kinase assay for PfSTK and the peptide substrate PfSAP-C10-SAP. (A) The
absorbance was measured at 450 nm after preincubation of PfSTK, PfSAP-C10, Mg2+, ATP and enzyme mix
over 45 min. Blank values of the samples containing no ATP were subtracted from the raw values for
background correction. (B) A calibration curve calculated from standards containing 0, 2, 4, 6, 8, and
10 nmol/50 µl ADP. The values represented in (A) are within the linear range of the corresponding
standard curve (B).
2.1.4. Sequence analysis for construct optimization
Initial experiments showed very low expression levels and poor solubility for
PfSTK/PF13_0085 ORF expressed in various E. coli expression strains. Co-expression of
PfSTK-Strep with the groES-GroEL chaperone, increased the expression level, but still
resulted in insufficient amounts and concentrations of soluble protein of interest.
To address this problem, sequence analysis of PfSTK/PF13_0085 ORF was carried out and
both an extremely different codon usage and a strikingly low GC content were observed
compared to those of the expression host126-128. It was concluded that the expression host
E coli is lacking several rare tRNAs, which are required for the translation of plasmodial DNA
to a complete polypeptide chain129. To increase translational levels by avoiding rare codon
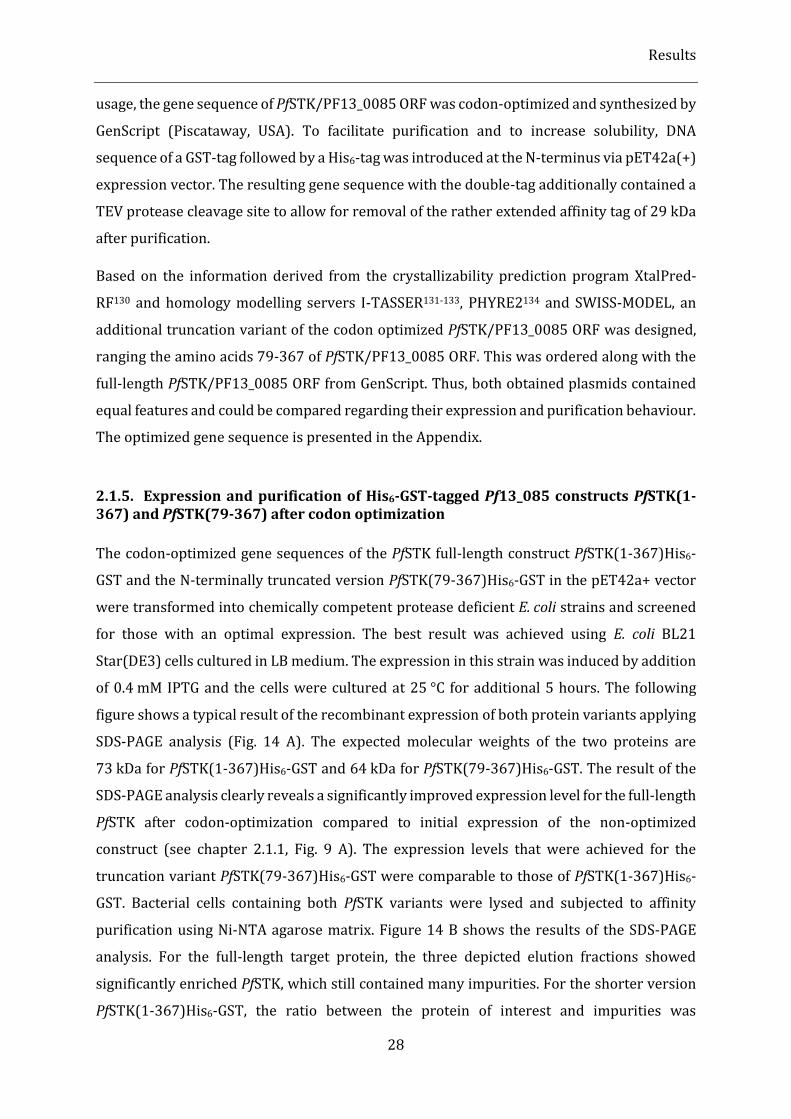
Results
28
usage, the gene sequence of PfSTK/PF13_0085 ORF was codon-optimized and synthesized by
GenScript (Piscataway, USA). To facilitate purification and to increase solubility, DNA
sequence of a GST-tag followed by a His6-tag was introduced at the N-terminus via pET42a(+)
expression vector. The resulting gene sequence with the double-tag additionally contained a
TEV protease cleavage site to allow for removal of the rather extended affinity tag of 29 kDa
after purification.
Based on the information derived from the crystallizability prediction program XtalPred-
RF130 and homology modelling servers I-TASSER131-133, PHYRE2134 and SWISS-MODEL, an
additional truncation variant of the codon optimized PfSTK/PF13_0085 ORF was designed,
ranging the amino acids 79-367 of PfSTK/PF13_0085 ORF. This was ordered along with the
full-length PfSTK/PF13_0085 ORF from GenScript. Thus, both obtained plasmids contained
equal features and could be compared regarding their expression and purification behaviour.
The optimized gene sequence is presented in the Appendix.
2.1.5. Expression and purification of His6-GST-tagged Pf13_085 constructs PfSTK(1-367) and PfSTK(79-367) after codon optimization
The codon-optimized gene sequences of the PfSTK full-length construct PfSTK(1-367)His6-
GST and the N-terminally truncated version PfSTK(79-367)His6-GST in the pET42a+ vector
were transformed into chemically competent protease deficient E. coli strains and screened
for those with an optimal expression. The best result was achieved using E. coli BL21
Star(DE3) cells cultured in LB medium. The expression in this strain was induced by addition
of 0.4 mM IPTG and the cells were cultured at 25 °C for additional 5 hours. The following
figure shows a typical result of the recombinant expression of both protein variants applying
SDS-PAGE analysis (Fig. 14 A). The expected molecular weights of the two proteins are
73 kDa for PfSTK(1-367)His6-GST and 64 kDa for PfSTK(79-367)His6-GST. The result of the
SDS-PAGE analysis clearly reveals a significantly improved expression level for the full-length
PfSTK after codon-optimization compared to initial expression of the non-optimized
construct (see chapter 2.1.1, Fig. 9 A). The expression levels that were achieved for the
truncation variant PfSTK(79-367)His6-GST were comparable to those of PfSTK(1-367)His6-
GST. Bacterial cells containing both PfSTK variants were lysed and subjected to affinity
purification using Ni-NTA agarose matrix. Figure 14 B shows the results of the SDS-PAGE
analysis. For the full-length target protein, the three depicted elution fractions showed
significantly enriched PfSTK, which still contained many impurities. For the shorter version
PfSTK(1-367)His6-GST, the ratio between the protein of interest and impurities was
Results
29
significantly higher, with PfSTK(1-367)His6-GST being by far the most prominent band on the
gel (Fig. 14 B).
Figure 14: SDS-PAGE analysis of the expression and purification of codon-optimized GST-tagged
constructs PfSTK(1-367)His6-GST and PfSTK(79-367)His6-GST. A 12% polyacrylamide gel was used to
electrophoretically separate the proteins. (A) Both proteins were expressed in E.coli BL21star (DE3). t = 0:
culture sample before induction, t = 1 h and t = 3 h: culture samples 1 h or 3 h after induction with 0.4 mM
IPTG. Left from the marker: expression profile of PfSTK(1-367)His6-GST. Right from the marker: expression
profile and PfSTK(79-367)His6-GST. (B) Fraction from Ni-NTA affinity purification. W = wash fraction, FT =
flow-through, E = elution fraction. Left from the marker: fractions from purification of PfSTK(1-367)His6-
GST; right from the marker: fractions from purification of PfSTK(79-367)His6-GST. M = molecular weight
marker: Unstained Protein Molecular Weight Marker.
In order to verify the identity of the proteins of interest, the bands of the putative PfSTK(1-
367)His6-GST and PfSTK(79-367)His6-GST were excised from the acrylamide gel and
extracted for further subjection to MALDI-MS. MLDI-MS-results confirmed the target protein
identity for both samples. For PfSTK(1-367) 62% of the expected protein sequence could be
covered by the identified peptides, whereas this value was 63% for PfSTK(79-367). For the
sample containing PfSTK(1-367), along with 33 peptides of the target protein, also 61
peptides that belong to an E. coli chaperone Hsp90 HtpG as well 25 peptides of bifunctional
E. coli polymyxin resistance protein ArnA were detected. These expression host-derived
house-keeping proteins have a monomeric molecular weight of 71.4 kDa or 74.4 kDa,
respectively, and seem to appear as one big band at the same height on the 12%
polyacrylamide gel as the tagged protein of interest PfSTK(1-367)His6-GST, which has an
expected molecular weight of 75.9 kDa.
The elution fractions from the Ni-NTA purification were dialysed against imidazole-free
buffer, pooled and concentrated for subjection to subsequent TEV protease cleavage and size
exclusion chromatography. Whereas PfSTK(1-367)His6-GST showed concentration-
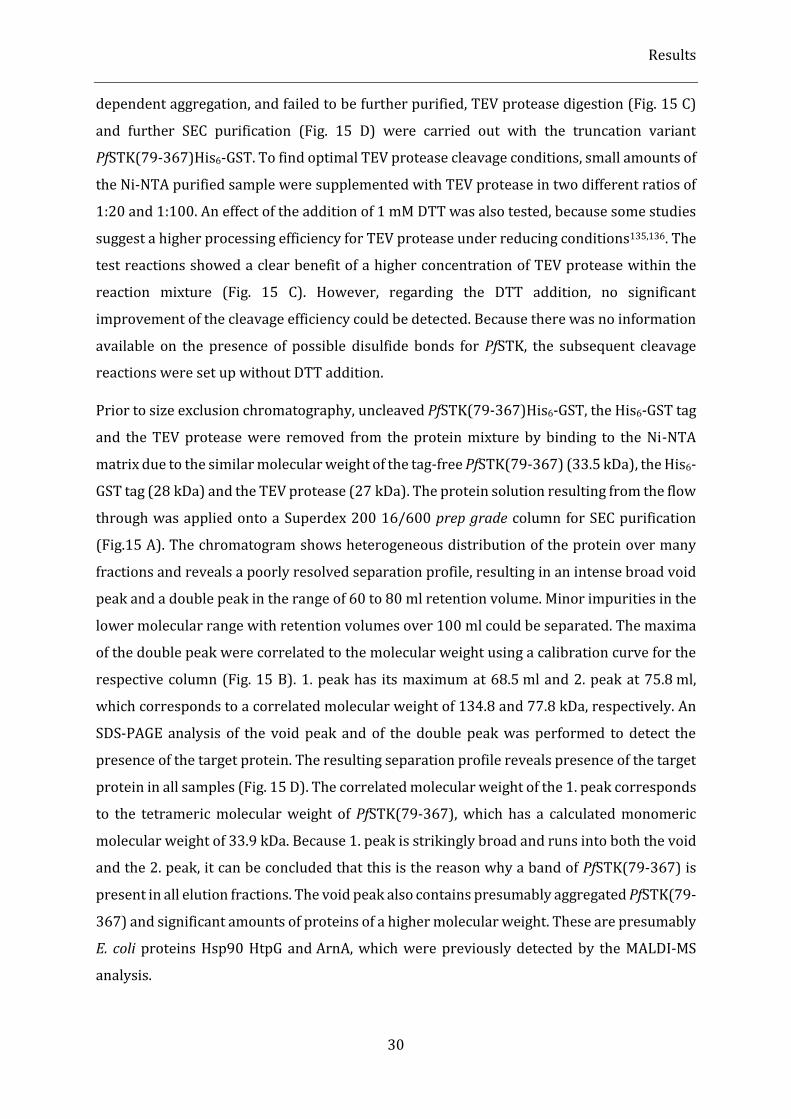
Results
30
dependent aggregation, and failed to be further purified, TEV protease digestion (Fig. 15 C)
and further SEC purification (Fig. 15 D) were carried out with the truncation variant
PfSTK(79-367)His6-GST. To find optimal TEV protease cleavage conditions, small amounts of
the Ni-NTA purified sample were supplemented with TEV protease in two different ratios of
1:20 and 1:100. An effect of the addition of 1 mM DTT was also tested, because some studies
suggest a higher processing efficiency for TEV protease under reducing conditions135,136. The
test reactions showed a clear benefit of a higher concentration of TEV protease within the
reaction mixture (Fig. 15 C). However, regarding the DTT addition, no significant
improvement of the cleavage efficiency could be detected. Because there was no information
available on the presence of possible disulfide bonds for PfSTK, the subsequent cleavage
reactions were set up without DTT addition.
Prior to size exclusion chromatography, uncleaved PfSTK(79-367)His6-GST, the His6-GST tag
and the TEV protease were removed from the protein mixture by binding to the Ni-NTA
matrix due to the similar molecular weight of the tag-free PfSTK(79-367) (33.5 kDa), the His6-
GST tag (28 kDa) and the TEV protease (27 kDa). The protein solution resulting from the flow
through was applied onto a Superdex 200 16/600 prep grade column for SEC purification
(Fig.15 A). The chromatogram shows heterogeneous distribution of the protein over many
fractions and reveals a poorly resolved separation profile, resulting in an intense broad void
peak and a double peak in the range of 60 to 80 ml retention volume. Minor impurities in the
lower molecular range with retention volumes over 100 ml could be separated. The maxima
of the double peak were correlated to the molecular weight using a calibration curve for the
respective column (Fig. 15 B). 1. peak has its maximum at 68.5 ml and 2. peak at 75.8 ml,
which corresponds to a correlated molecular weight of 134.8 and 77.8 kDa, respectively. An
SDS-PAGE analysis of the void peak and of the double peak was performed to detect the
presence of the target protein. The resulting separation profile reveals presence of the target
protein in all samples (Fig. 15 D). The correlated molecular weight of the 1. peak corresponds
to the tetrameric molecular weight of PfSTK(79-367), which has a calculated monomeric
molecular weight of 33.9 kDa. Because 1. peak is strikingly broad and runs into both the void
and the 2. peak, it can be concluded that this is the reason why a band of PfSTK(79-367) is
present in all elution fractions. The void peak also contains presumably aggregated PfSTK(79-
367) and significant amounts of proteins of a higher molecular weight. These are presumably
E. coli proteins Hsp90 HtpG and ArnA, which were previously detected by the MALDI-MS
analysis.
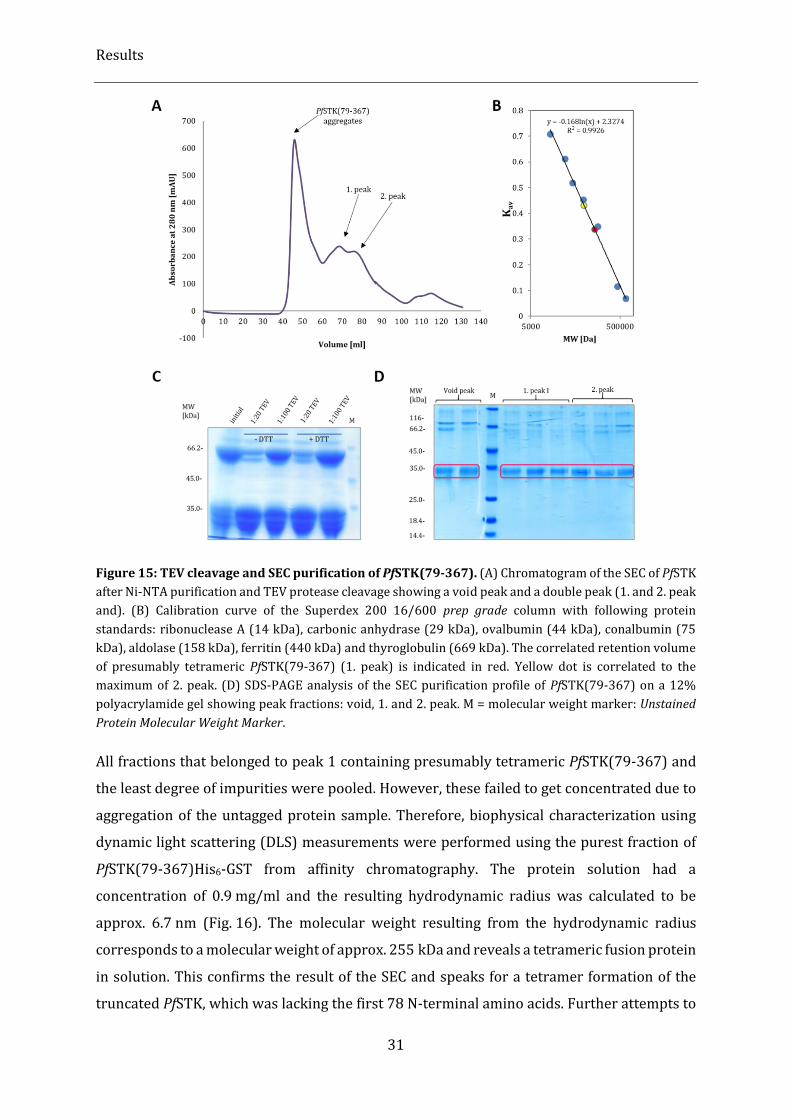
Results
31
Figure 15: TEV cleavage and SEC purification of PfSTK(79-367). (A) Chromatogram of the SEC of PfSTK
after Ni-NTA purification and TEV protease cleavage showing a void peak and a double peak (1. and 2. peak
and). (B) Calibration curve of the Superdex 200 16/600 prep grade column with following protein
standards: ribonuclease A (14 kDa), carbonic anhydrase (29 kDa), ovalbumin (44 kDa), conalbumin (75
kDa), aldolase (158 kDa), ferritin (440 kDa) and thyroglobulin (669 kDa). The correlated retention volume
of presumably tetrameric PfSTK(79-367) (1. peak) is indicated in red. Yellow dot is correlated to the
maximum of 2. peak. (D) SDS-PAGE analysis of the SEC purification profile of PfSTK(79-367) on a 12%
polyacrylamide gel showing peak fractions: void, 1. and 2. peak. M = molecular weight marker: Unstained
Protein Molecular Weight Marker.
All fractions that belonged to peak 1 containing presumably tetrameric PfSTK(79-367) and
the least degree of impurities were pooled. However, these failed to get concentrated due to
aggregation of the untagged protein sample. Therefore, biophysical characterization using
dynamic light scattering (DLS) measurements were performed using the purest fraction of
PfSTK(79-367)His6-GST from affinity chromatography. The protein solution had a
concentration of 0.9 mg/ml and the resulting hydrodynamic radius was calculated to be
approx. 6.7 nm (Fig. 16). The molecular weight resulting from the hydrodynamic radius
corresponds to a molecular weight of approx. 255 kDa and reveals a tetrameric fusion protein
in solution. This confirms the result of the SEC and speaks for a tetramer formation of the
truncated PfSTK, which was lacking the first 78 N-terminal amino acids. Further attempts to
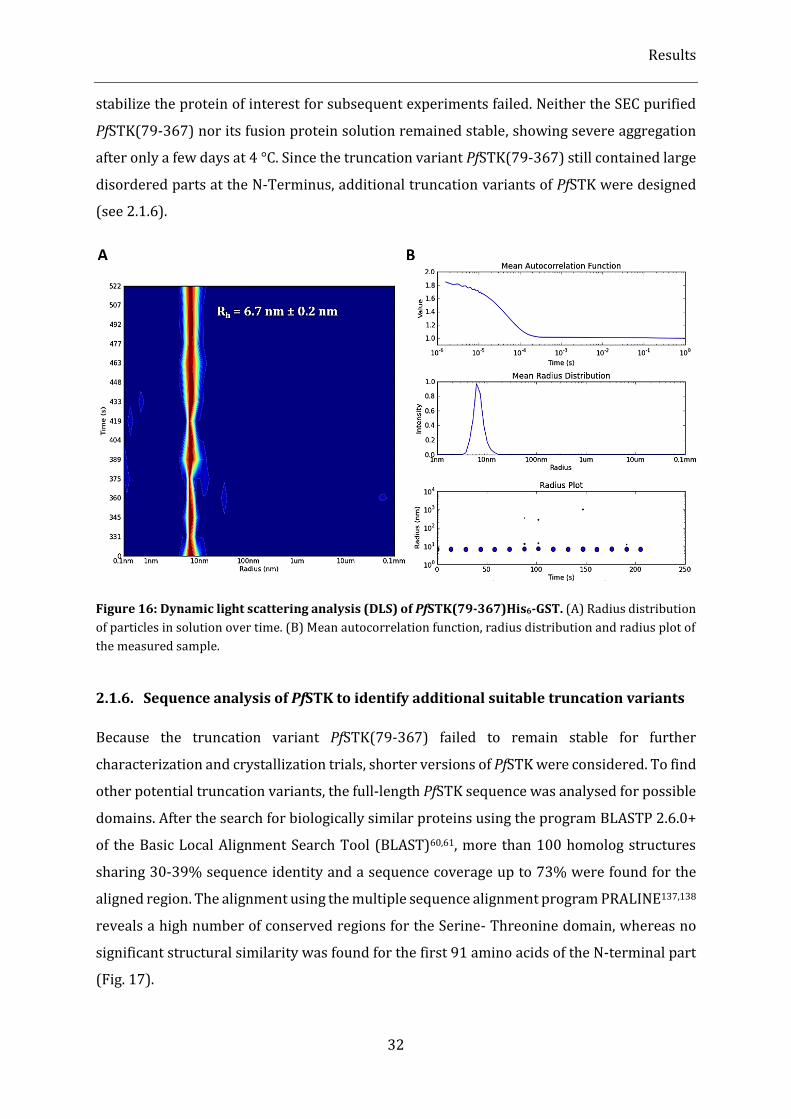
Results
32
stabilize the protein of interest for subsequent experiments failed. Neither the SEC purified
PfSTK(79-367) nor its fusion protein solution remained stable, showing severe aggregation
after only a few days at 4 °C. Since the truncation variant PfSTK(79-367) still contained large
disordered parts at the N-Terminus, additional truncation variants of PfSTK were designed
(see 2.1.6).
Figure 16: Dynamic light scattering analysis (DLS) of PfSTK(79-367)His6-GST. (A) Radius distribution
of particles in solution over time. (B) Mean autocorrelation function, radius distribution and radius plot of
the measured sample.
2.1.6. Sequence analysis of PfSTK to identify additional suitable truncation variants
Because the truncation variant PfSTK(79-367) failed to remain stable for further
characterization and crystallization trials, shorter versions of PfSTK were considered. To find
other potential truncation variants, the full-length PfSTK sequence was analysed for possible
domains. After the search for biologically similar proteins using the program BLASTP 2.6.0+
of the Basic Local Alignment Search Tool (BLAST)60,61, more than 100 homolog structures
sharing 30-39% sequence identity and a sequence coverage up to 73% were found for the
aligned region. The alignment using the multiple sequence alignment program PRALINE137,138
reveals a high number of conserved regions for the Serine- Threonine domain, whereas no
significant structural similarity was found for the first 91 amino acids of the N-terminal part
(Fig. 17).
Results
33
Figure 17: Multiple sequence alignment of the PfSTK amino acid sequence with its closest
structurally known homologs using PRALINE137,138. (A) The alignment reveals a highly conserved
Serine-Threonine kinase domain. (B) Color code for ranking of the predicted sequence conservation shown
in a color gradient: blue (0) unconserved to red (10) highly conserved.
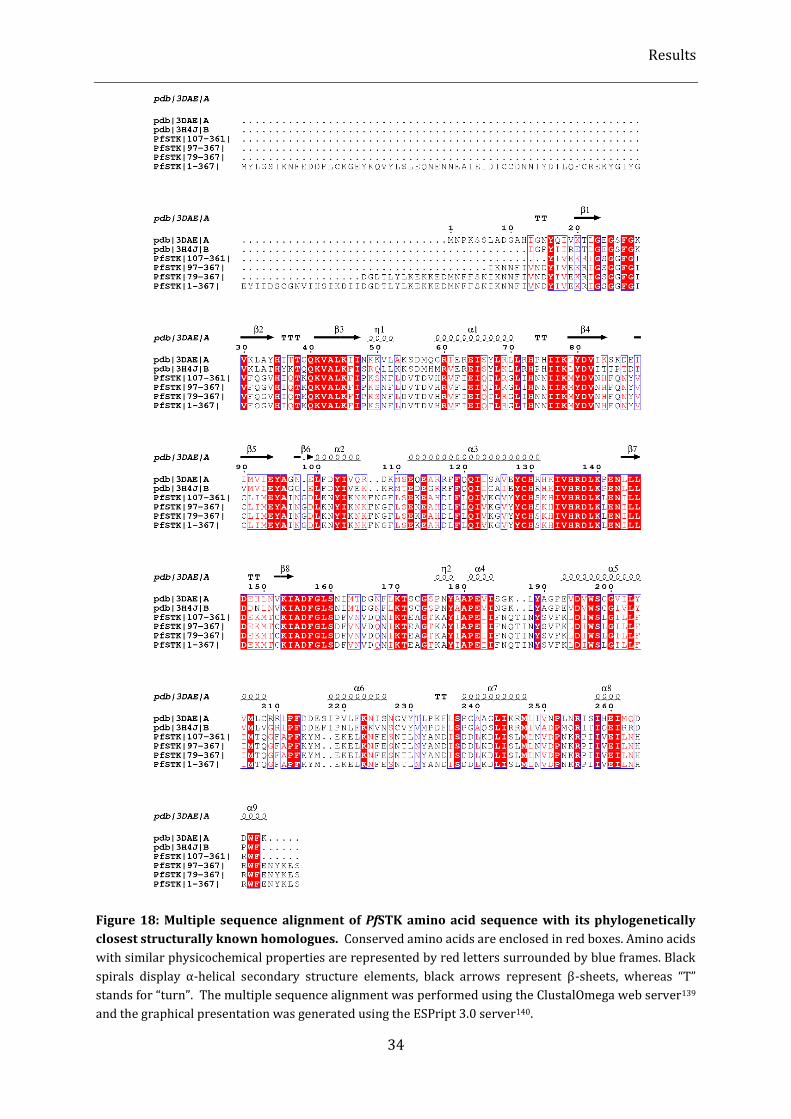
Results
34
Figure 18: Multiple sequence alignment of PfSTK amino acid sequence with its phylogenetically
closest structurally known homologues. Conserved amino acids are enclosed in red boxes. Amino acids
with similar physicochemical properties are represented by red letters surrounded by blue frames. Black
spirals display α-helical secondary structure elements, black arrows represent β-sheets, whereas “T”
stands for “turn”. The multiple sequence alignment was performed using the ClustalOmega web server139
and the graphical presentation was generated using the ESPript 3.0 server140.
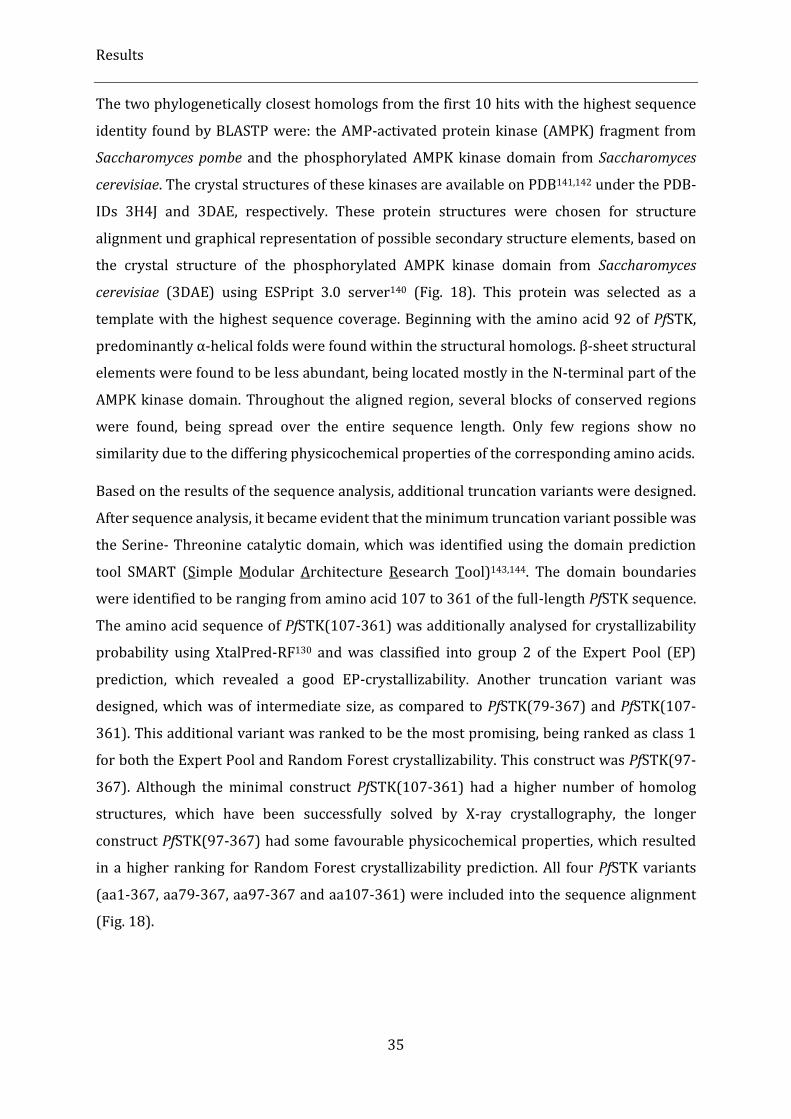
Results
35
The two phylogenetically closest homologs from the first 10 hits with the highest sequence
identity found by BLASTP were: the AMP-activated protein kinase (AMPK) fragment from
Saccharomyces pombe and the phosphorylated AMPK kinase domain from Saccharomyces
cerevisiae. The crystal structures of these kinases are available on PDB141,142 under the PDB-
IDs 3H4J and 3DAE, respectively. These protein structures were chosen for structure
alignment und graphical representation of possible secondary structure elements, based on
the crystal structure of the phosphorylated AMPK kinase domain from Saccharomyces
cerevisiae (3DAE) using ESPript 3.0 server140 (Fig. 18). This protein was selected as a
template with the highest sequence coverage. Beginning with the amino acid 92 of PfSTK,
predominantly α-helical folds were found within the structural homologs. β-sheet structural
elements were found to be less abundant, being located mostly in the N-terminal part of the
AMPK kinase domain. Throughout the aligned region, several blocks of conserved regions
were found, being spread over the entire sequence length. Only few regions show no
similarity due to the differing physicochemical properties of the corresponding amino acids.
Based on the results of the sequence analysis, additional truncation variants were designed.
After sequence analysis, it became evident that the minimum truncation variant possible was
the Serine- Threonine catalytic domain, which was identified using the domain prediction
tool SMART (Simple Modular Architecture Research Tool)143,144. The domain boundaries
were identified to be ranging from amino acid 107 to 361 of the full-length PfSTK sequence.
The amino acid sequence of PfSTK(107-361) was additionally analysed for crystallizability
probability using XtalPred-RF130 and was classified into group 2 of the Expert Pool (EP)
prediction, which revealed a good EP-crystallizability. Another truncation variant was
designed, which was of intermediate size, as compared to PfSTK(79-367) and PfSTK(107-
361). This additional variant was ranked to be the most promising, being ranked as class 1
for both the Expert Pool and Random Forest crystallizability. This construct was PfSTK(97-
367). Although the minimal construct PfSTK(107-361) had a higher number of homolog
structures, which have been successfully solved by X-ray crystallography, the longer
construct PfSTK(97-367) had some favourable physicochemical properties, which resulted
in a higher ranking for Random Forest crystallizability prediction. All four PfSTK variants
(aa1-367, aa79-367, aa97-367 and aa107-361) were included into the sequence alignment
(Fig. 18).
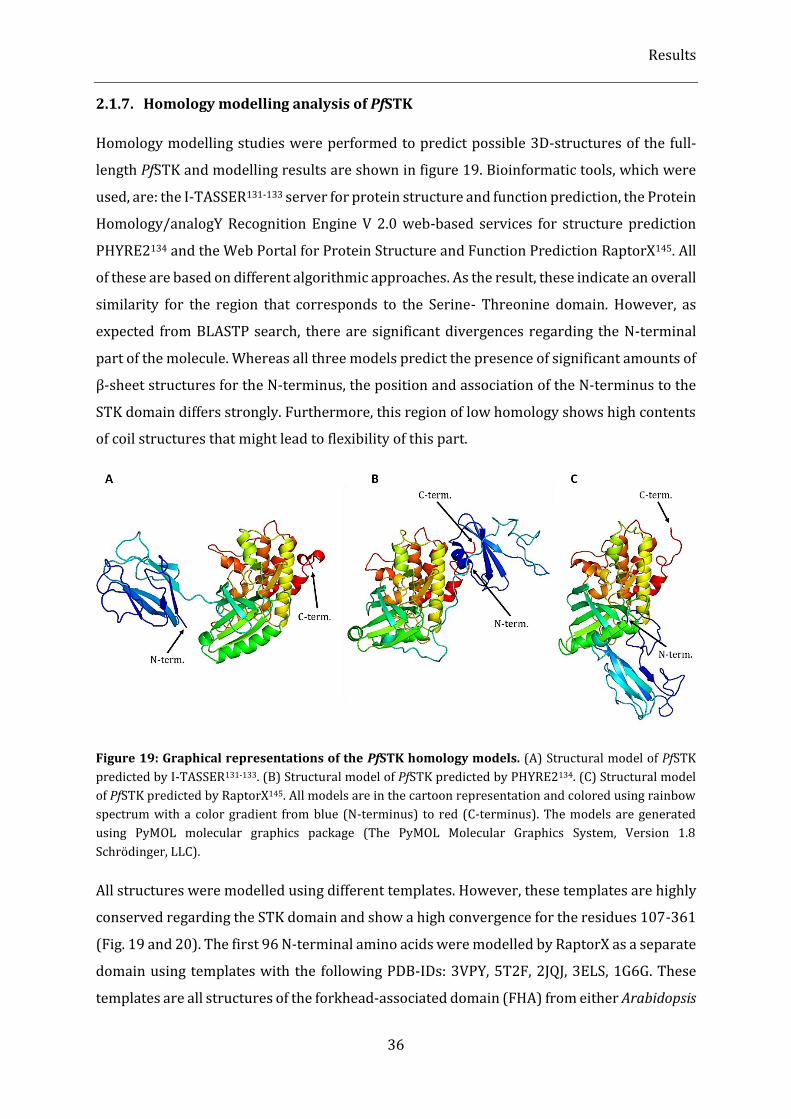
Results
36
2.1.7. Homology modelling analysis of PfSTK
Homology modelling studies were performed to predict possible 3D-structures of the full-
length PfSTK and modelling results are shown in figure 19. Bioinformatic tools, which were
used, are: the I-TASSER131-133 server for protein structure and function prediction, the Protein
Homology/analogY Recognition Engine V 2.0 web-based services for structure prediction
PHYRE2134 and the Web Portal for Protein Structure and Function Prediction RaptorX145. All
of these are based on different algorithmic approaches. As the result, these indicate an overall
similarity for the region that corresponds to the Serine- Threonine domain. However, as
expected from BLASTP search, there are significant divergences regarding the N-terminal
part of the molecule. Whereas all three models predict the presence of significant amounts of
β-sheet structures for the N-terminus, the position and association of the N-terminus to the
STK domain differs strongly. Furthermore, this region of low homology shows high contents
of coil structures that might lead to flexibility of this part.
Figure 19: Graphical representations of the PfSTK homology models. (A) Structural model of PfSTK
predicted by I-TASSER131-133. (B) Structural model of PfSTK predicted by PHYRE2134. (C) Structural model
of PfSTK predicted by RaptorX145. All models are in the cartoon representation and colored using rainbow
spectrum with a color gradient from blue (N-terminus) to red (C-terminus). The models are generated
using PyMOL molecular graphics package (The PyMOL Molecular Graphics System, Version 1.8
Schrödinger, LLC).
All structures were modelled using different templates. However, these templates are highly
conserved regarding the STK domain and show a high convergence for the residues 107-361
(Fig. 19 and 20). The first 96 N-terminal amino acids were modelled by RaptorX as a separate
domain using templates with the following PDB-IDs: 3VPY, 5T2F, 2JQJ, 3ELS, 1G6G. These
templates are all structures of the forkhead-associated domain (FHA) from either Arabidopsis
Results
37
thaliana or Saccharomyces cerevisiae. In eukaryotes, FHA domain containing proteins are
mostly involved in processes regulated by reversible protein phosphorylation of its
interaction partners146,147. Despite the low sequence identity and the low modelling
confidence of the N-terminus, it can be assumed that this part forms a distinct domain, which
has functions like the FHA domain. Several cellular pathways were identified where the FHA
domain plays a key role: signal transduction, vesicular transport and protein
degradation146,147. Regarding previous studies by Philip et al. (2007)35 and Müller et al.
(2011)19, both its role in the vesicular transport and protein degradation is conceivable.
As far as the secondary structure composition and content are concerned, the model
generated by RaptorX contains 23% α-helical, 22% β-sheet and 54% coiled structures. This
does not comply with the secondary structure prediction obtained from CD measurements
(chapter 2.1.2).
Figure 20: Comparison of PfSTK homology models. The models were calculated by I-TASSER131-133,
PHYRE2134 and RaptorX145.The models are in cartoon representation generated using PyMOL molecular
graphics package (The PyMOL Molecular Graphics System, Version 1.8 Schrödinger, LLC) and aligned to
each other in respect to their functional STK domain, which shows an overall similarity. Red dashed frames
indicate N-terminal parts that differ significantly between the three models. Blue: I-TASSER model, purple:
RaptorX model, lime green: PHYRE2 model.
Figure 21 shows 3D models generated by PHYRE2 for all four variants of PfSTK in comparison
to each other. From left to right, gradually more regions of low homology are removed until
only the STK domain is present in the PfSTK(107-361) construct (Fig. 21). Although some
potentially relevant parts of the PfSTK are not present for the minimal construct, it is due to
its smaller size and its compact nature with a higher secondary structure content that it is
more likely to result in folded soluble protein.
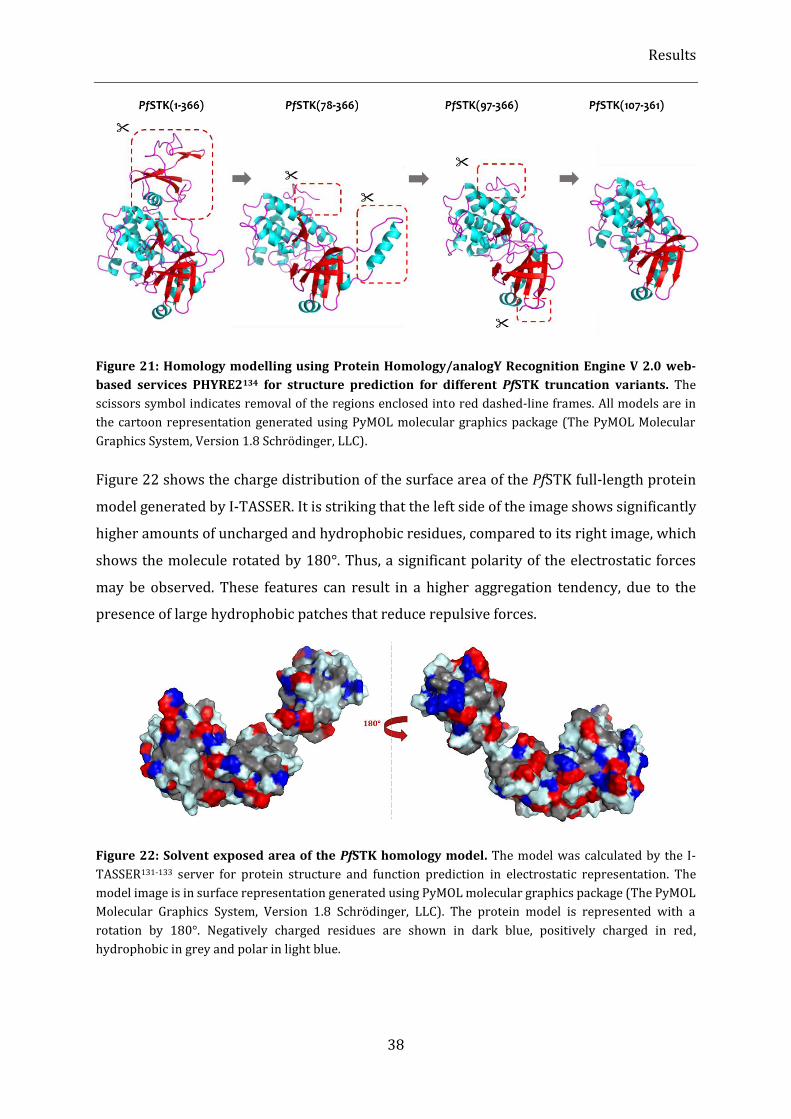
Results
38
Figure 21: Homology modelling using Protein Homology/analogY Recognition Engine V 2.0 web-
based services PHYRE2134 for structure prediction for different PfSTK truncation variants. The
scissors symbol indicates removal of the regions enclosed into red dashed-line frames. All models are in
the cartoon representation generated using PyMOL molecular graphics package (The PyMOL Molecular
Graphics System, Version 1.8 Schrödinger, LLC).
Figure 22 shows the charge distribution of the surface area of the PfSTK full-length protein
model generated by I-TASSER. It is striking that the left side of the image shows significantly
higher amounts of uncharged and hydrophobic residues, compared to its right image, which
shows the molecule rotated by 180°. Thus, a significant polarity of the electrostatic forces
may be observed. These features can result in a higher aggregation tendency, due to the
presence of large hydrophobic patches that reduce repulsive forces.
Figure 22: Solvent exposed area of the PfSTK homology model. The model was calculated by the I-
TASSER131-133 server for protein structure and function prediction in electrostatic representation. The
model image is in surface representation generated using PyMOL molecular graphics package (The PyMOL
Molecular Graphics System, Version 1.8 Schrödinger, LLC). The protein model is represented with a
rotation by 180°. Negatively charged residues are shown in dark blue, positively charged in red,
hydrophobic in grey and polar in light blue.
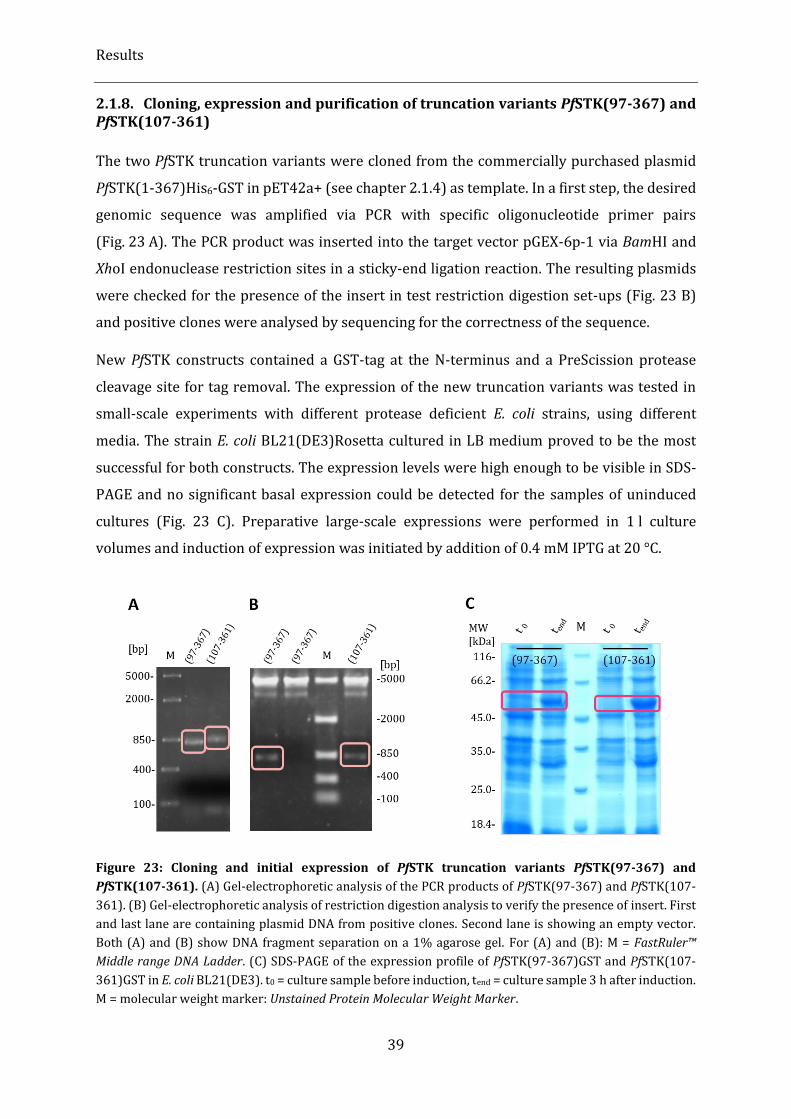
Results
39
2.1.8. Cloning, expression and purification of truncation variants PfSTK(97-367) and PfSTK(107-361)
The two PfSTK truncation variants were cloned from the commercially purchased plasmid
PfSTK(1-367)His6-GST in pET42a+ (see chapter 2.1.4) as template. In a first step, the desired
genomic sequence was amplified via PCR with specific oligonucleotide primer pairs
(Fig. 23 A). The PCR product was inserted into the target vector pGEX-6p-1 via BamHI and
XhoI endonuclease restriction sites in a sticky-end ligation reaction. The resulting plasmids
were checked for the presence of the insert in test restriction digestion set-ups (Fig. 23 B)
and positive clones were analysed by sequencing for the correctness of the sequence.
New PfSTK constructs contained a GST-tag at the N-terminus and a PreScission protease
cleavage site for tag removal. The expression of the new truncation variants was tested in
small-scale experiments with different protease deficient E. coli strains, using different
media. The strain E. coli BL21(DE3)Rosetta cultured in LB medium proved to be the most
successful for both constructs. The expression levels were high enough to be visible in SDS-
PAGE and no significant basal expression could be detected for the samples of uninduced
cultures (Fig. 23 C). Preparative large-scale expressions were performed in 1 l culture
volumes and induction of expression was initiated by addition of 0.4 mM IPTG at 20 °C.
Figure 23: Cloning and initial expression of PfSTK truncation variants PfSTK(97-367) and
PfSTK(107-361). (A) Gel-electrophoretic analysis of the PCR products of PfSTK(97-367) and PfSTK(107-
361). (B) Gel-electrophoretic analysis of restriction digestion analysis to verify the presence of insert. First
and last lane are containing plasmid DNA from positive clones. Second lane is showing an empty vector.
Both (A) and (B) show DNA fragment separation on a 1% agarose gel. For (A) and (B): M = FastRuler™
Middle range DNA Ladder. (C) SDS-PAGE of the expression profile of PfSTK(97-367)GST and PfSTK(107-
361)GST in E. coli BL21(DE3). t0 = culture sample before induction, tend = culture sample 3 h after induction.
M = molecular weight marker: Unstained Protein Molecular Weight Marker.
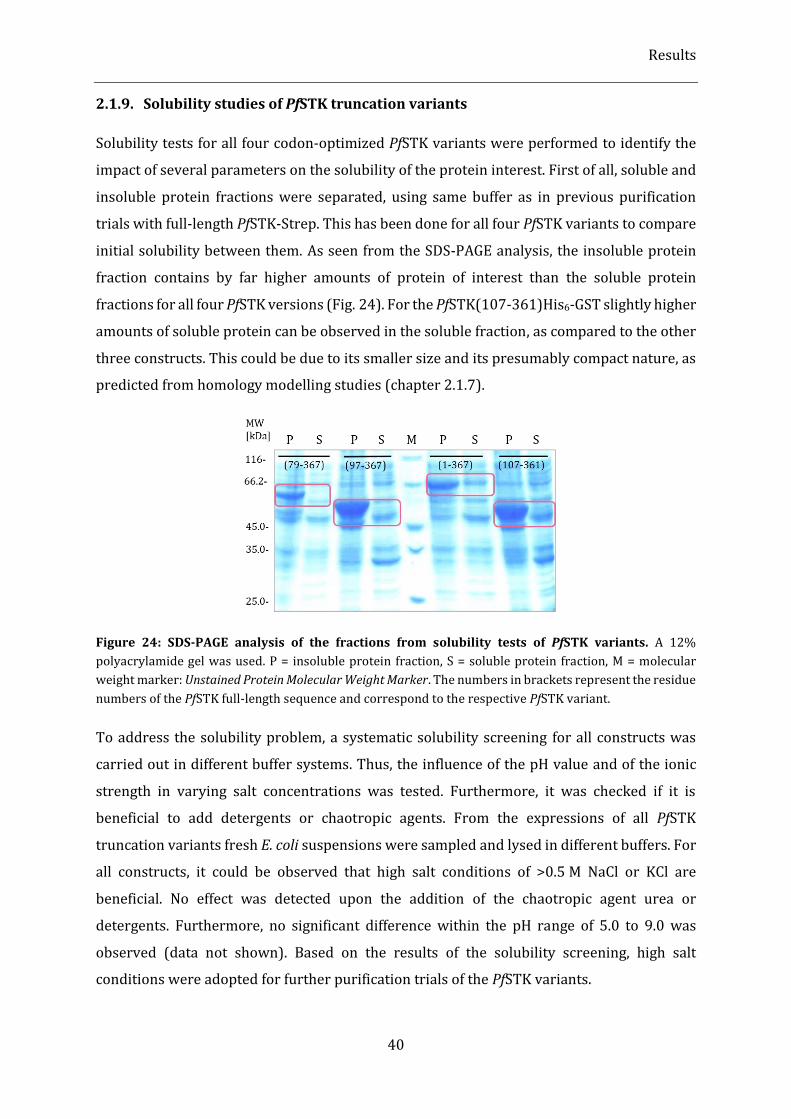
Results
40
2.1.9. Solubility studies of PfSTK truncation variants
Solubility tests for all four codon-optimized PfSTK variants were performed to identify the
impact of several parameters on the solubility of the protein interest. First of all, soluble and
insoluble protein fractions were separated, using same buffer as in previous purification
trials with full-length PfSTK-Strep. This has been done for all four PfSTK variants to compare
initial solubility between them. As seen from the SDS-PAGE analysis, the insoluble protein
fraction contains by far higher amounts of protein of interest than the soluble protein
fractions for all four PfSTK versions (Fig. 24). For the PfSTK(107-361)His6-GST slightly higher
amounts of soluble protein can be observed in the soluble fraction, as compared to the other
three constructs. This could be due to its smaller size and its presumably compact nature, as
predicted from homology modelling studies (chapter 2.1.7).
Figure 24: SDS-PAGE analysis of the fractions from solubility tests of PfSTK variants. A 12%
polyacrylamide gel was used. P = insoluble protein fraction, S = soluble protein fraction, M = molecular
weight marker: Unstained Protein Molecular Weight Marker. The numbers in brackets represent the residue
numbers of the PfSTK full-length sequence and correspond to the respective PfSTK variant.
To address the solubility problem, a systematic solubility screening for all constructs was
carried out in different buffer systems. Thus, the influence of the pH value and of the ionic
strength in varying salt concentrations was tested. Furthermore, it was checked if it is
beneficial to add detergents or chaotropic agents. From the expressions of all PfSTK
truncation variants fresh E. coli suspensions were sampled and lysed in different buffers. For
all constructs, it could be observed that high salt conditions of >0.5 M NaCl or KCl are
beneficial. No effect was detected upon the addition of the chaotropic agent urea or
detergents. Furthermore, no significant difference within the pH range of 5.0 to 9.0 was
observed (data not shown). Based on the results of the solubility screening, high salt
conditions were adopted for further purification trials of the PfSTK variants.
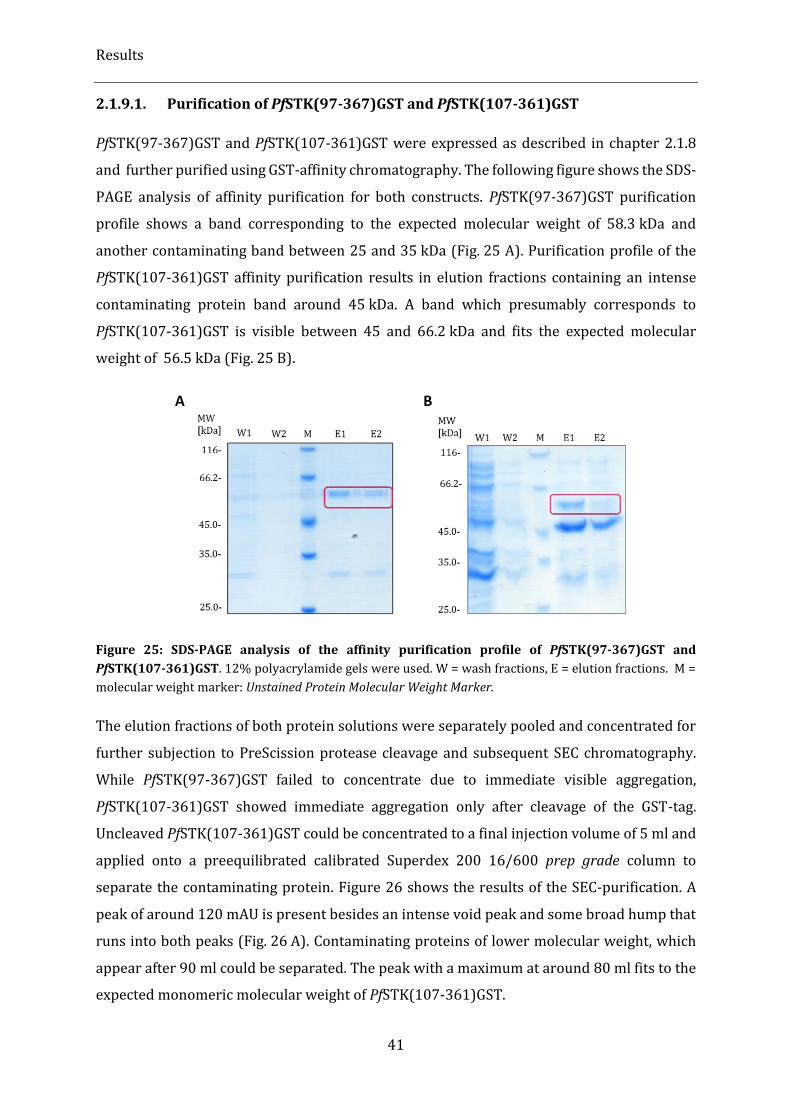
Results
41
2.1.9.1. Purification of PfSTK(97-367)GST and PfSTK(107-361)GST
PfSTK(97-367)GST and PfSTK(107-361)GST were expressed as described in chapter 2.1.8
and further purified using GST-affinity chromatography. The following figure shows the SDS-
PAGE analysis of affinity purification for both constructs. PfSTK(97-367)GST purification
profile shows a band corresponding to the expected molecular weight of 58.3 kDa and
another contaminating band between 25 and 35 kDa (Fig. 25 A). Purification profile of the
PfSTK(107-361)GST affinity purification results in elution fractions containing an intense
contaminating protein band around 45 kDa. A band which presumably corresponds to
PfSTK(107-361)GST is visible between 45 and 66.2 kDa and fits the expected molecular
weight of 56.5 kDa (Fig. 25 B).
Figure 25: SDS-PAGE analysis of the affinity purification profile of PfSTK(97-367)GST and
PfSTK(107-361)GST. 12% polyacrylamide gels were used. W = wash fractions, E = elution fractions. M =
molecular weight marker: Unstained Protein Molecular Weight Marker.
The elution fractions of both protein solutions were separately pooled and concentrated for
further subjection to PreScission protease cleavage and subsequent SEC chromatography.
While PfSTK(97-367)GST failed to concentrate due to immediate visible aggregation,
PfSTK(107-361)GST showed immediate aggregation only after cleavage of the GST-tag.
Uncleaved PfSTK(107-361)GST could be concentrated to a final injection volume of 5 ml and
applied onto a preequilibrated calibrated Superdex 200 16/600 prep grade column to
separate the contaminating protein. Figure 26 shows the results of the SEC-purification. A
peak of around 120 mAU is present besides an intense void peak and some broad hump that
runs into both peaks (Fig. 26 A). Contaminating proteins of lower molecular weight, which
appear after 90 ml could be separated. The peak with a maximum at around 80 ml fits to the
expected monomeric molecular weight of PfSTK(107-361)GST.
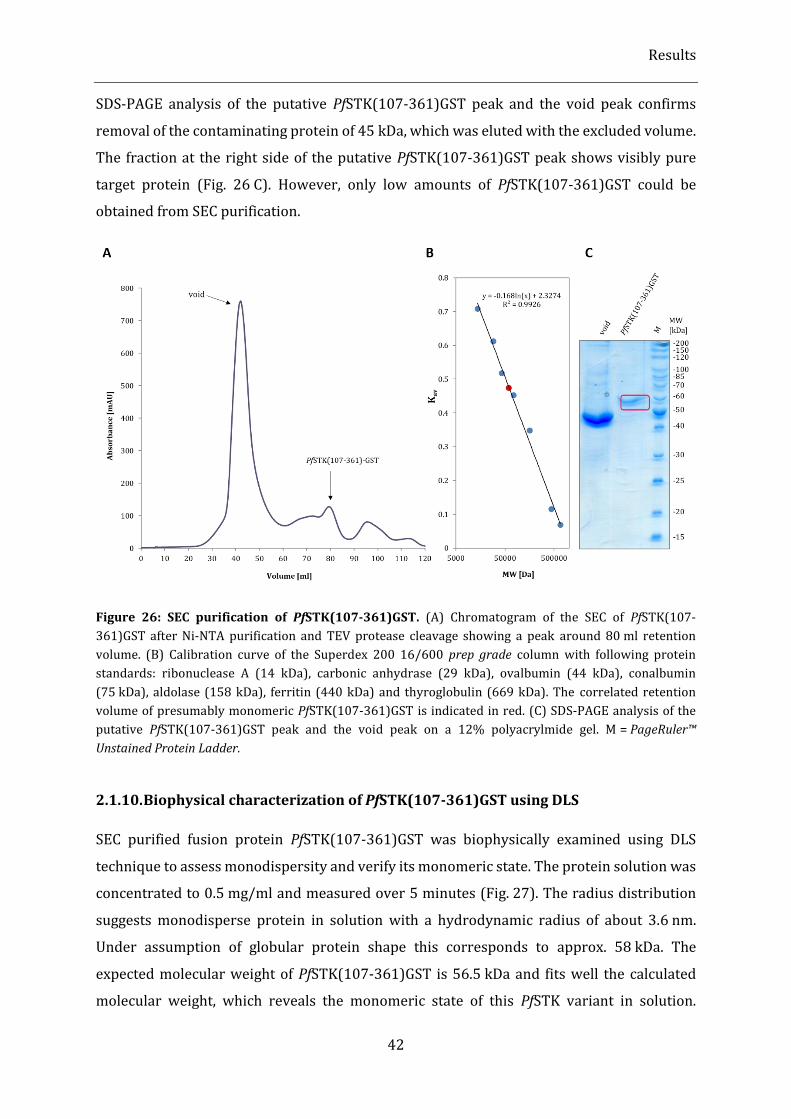
Results
42
SDS-PAGE analysis of the putative PfSTK(107-361)GST peak and the void peak confirms
removal of the contaminating protein of 45 kDa, which was eluted with the excluded volume.
The fraction at the right side of the putative PfSTK(107-361)GST peak shows visibly pure
target protein (Fig. 26 C). However, only low amounts of PfSTK(107-361)GST could be
obtained from SEC purification.
Figure 26: SEC purification of PfSTK(107-361)GST. (A) Chromatogram of the SEC of PfSTK(107-
361)GST after Ni-NTA purification and TEV protease cleavage showing a peak around 80 ml retention
volume. (B) Calibration curve of the Superdex 200 16/600 prep grade column with following protein
standards: ribonuclease A (14 kDa), carbonic anhydrase (29 kDa), ovalbumin (44 kDa), conalbumin
(75 kDa), aldolase (158 kDa), ferritin (440 kDa) and thyroglobulin (669 kDa). The correlated retention
volume of presumably monomeric PfSTK(107-361)GST is indicated in red. (C) SDS-PAGE analysis of the
putative PfSTK(107-361)GST peak and the void peak on a 12% polyacrylmide gel. M = PageRuler™
Unstained Protein Ladder.
2.1.10. Biophysical characterization of PfSTK(107-361)GST using DLS
SEC purified fusion protein PfSTK(107-361)GST was biophysically examined using DLS
technique to assess monodispersity and verify its monomeric state. The protein solution was
concentrated to 0.5 mg/ml and measured over 5 minutes (Fig. 27). The radius distribution
suggests monodisperse protein in solution with a hydrodynamic radius of about 3.6 nm.
Under assumption of globular protein shape this corresponds to approx. 58 kDa. The
expected molecular weight of PfSTK(107-361)GST is 56.5 kDa and fits well the calculated
molecular weight, which reveals the monomeric state of this PfSTK variant in solution.
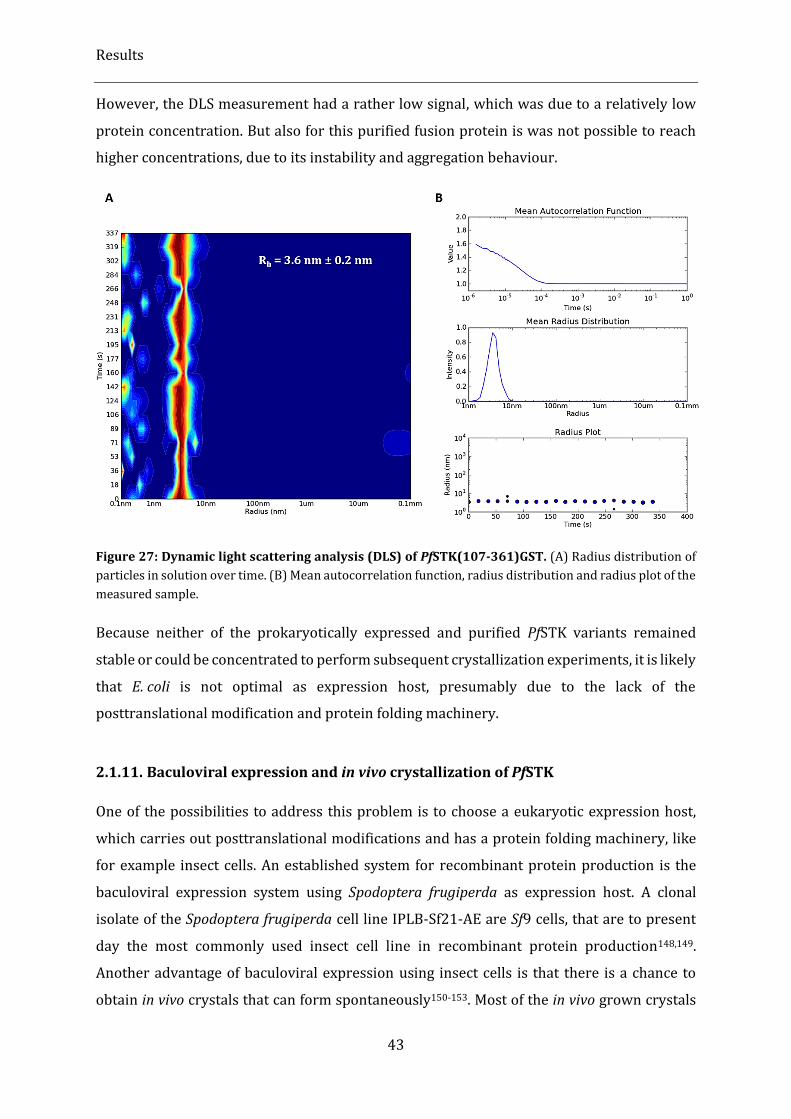
Results
43
However, the DLS measurement had a rather low signal, which was due to a relatively low
protein concentration. But also for this purified fusion protein is was not possible to reach
higher concentrations, due to its instability and aggregation behaviour.
Figure 27: Dynamic light scattering analysis (DLS) of PfSTK(107-361)GST. (A) Radius distribution of
particles in solution over time. (B) Mean autocorrelation function, radius distribution and radius plot of the
measured sample.
Because neither of the prokaryotically expressed and purified PfSTK variants remained
stable or could be concentrated to perform subsequent crystallization experiments, it is likely
that E. coli is not optimal as expression host, presumably due to the lack of the
posttranslational modification and protein folding machinery.
2.1.11. Baculoviral expression and in vivo crystallization of PfSTK
One of the possibilities to address this problem is to choose a eukaryotic expression host,
which carries out posttranslational modifications and has a protein folding machinery, like
for example insect cells. An established system for recombinant protein production is the
baculoviral expression system using Spodoptera frugiperda as expression host. A clonal
isolate of the Spodoptera frugiperda cell line IPLB-Sf21-AE are Sf9 cells, that are to present
day the most commonly used insect cell line in recombinant protein production148,149.
Another advantage of baculoviral expression using insect cells is that there is a chance to
obtain in vivo crystals that can form spontaneously150-153. Most of the in vivo grown crystals
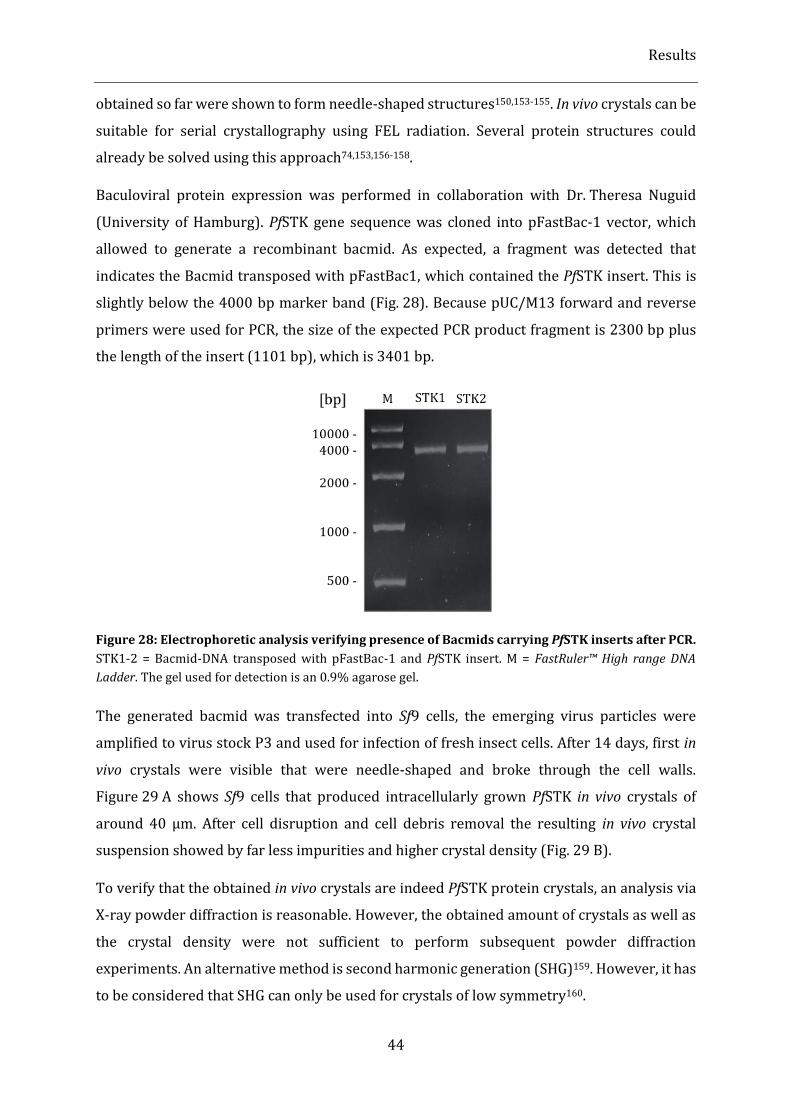
Results
44
obtained so far were shown to form needle-shaped structures150,153-155. In vivo crystals can be
suitable for serial crystallography using FEL radiation. Several protein structures could
already be solved using this approach74,153,156-158.
Baculoviral protein expression was performed in collaboration with Dr. Theresa Nuguid
(University of Hamburg). PfSTK gene sequence was cloned into pFastBac-1 vector, which
allowed to generate a recombinant bacmid. As expected, a fragment was detected that
indicates the Bacmid transposed with pFastBac1, which contained the PfSTK insert. This is
slightly below the 4000 bp marker band (Fig. 28). Because pUC/M13 forward and reverse
primers were used for PCR, the size of the expected PCR product fragment is 2300 bp plus
the length of the insert (1101 bp), which is 3401 bp.
Figure 28: Electrophoretic analysis verifying presence of Bacmids carrying PfSTK inserts after PCR.
STK1-2 = Bacmid-DNA transposed with pFastBac-1 and PfSTK insert. M = FastRuler™ High range DNA
Ladder. The gel used for detection is an 0.9% agarose gel.
The generated bacmid was transfected into Sf9 cells, the emerging virus particles were
amplified to virus stock P3 and used for infection of fresh insect cells. After 14 days, first in
vivo crystals were visible that were needle-shaped and broke through the cell walls.
Figure 29 A shows Sf9 cells that produced intracellularly grown PfSTK in vivo crystals of
around 40 µm. After cell disruption and cell debris removal the resulting in vivo crystal
suspension showed by far less impurities and higher crystal density (Fig. 29 B).
To verify that the obtained in vivo crystals are indeed PfSTK protein crystals, an analysis via
X-ray powder diffraction is reasonable. However, the obtained amount of crystals as well as
the crystal density were not sufficient to perform subsequent powder diffraction
experiments. An alternative method is second harmonic generation (SHG)159. However, it has
to be considered that SHG can only be used for crystals of low symmetry160.
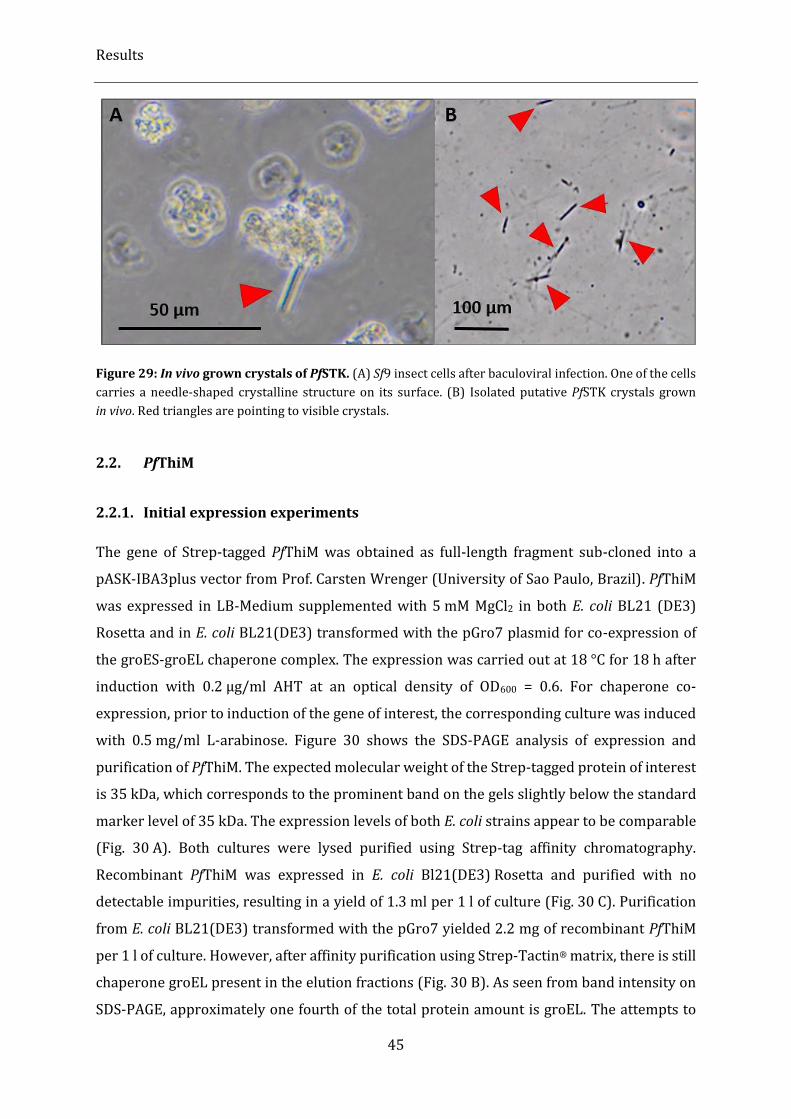
Results
45
Figure 29: In vivo grown crystals of PfSTK. (A) Sf9 insect cells after baculoviral infection. One of the cells
carries a needle-shaped crystalline structure on its surface. (B) Isolated putative PfSTK crystals grown
in vivo. Red triangles are pointing to visible crystals.
2.2. PfThiM
2.2.1. Initial expression experiments
The gene of Strep-tagged PfThiM was obtained as full-length fragment sub-cloned into a
pASK-IBA3plus vector from Prof. Carsten Wrenger (University of Sao Paulo, Brazil). PfThiM
was expressed in LB-Medium supplemented with 5 mM MgCl2 in both E. coli BL21 (DE3)
Rosetta and in E. coli BL21(DE3) transformed with the pGro7 plasmid for co-expression of
the groES-groEL chaperone complex. The expression was carried out at 18 °C for 18 h after
induction with 0.2 µg/ml AHT at an optical density of OD600 = 0.6. For chaperone co-
expression, prior to induction of the gene of interest, the corresponding culture was induced
with 0.5 mg/ml L-arabinose. Figure 30 shows the SDS-PAGE analysis of expression and
purification of PfThiM. The expected molecular weight of the Strep-tagged protein of interest
is 35 kDa, which corresponds to the prominent band on the gels slightly below the standard
marker level of 35 kDa. The expression levels of both E. coli strains appear to be comparable
(Fig. 30 A). Both cultures were lysed purified using Strep-tag affinity chromatography.
Recombinant PfThiM was expressed in E. coli Bl21(DE3) Rosetta and purified with no
detectable impurities, resulting in a yield of 1.3 ml per 1 l of culture (Fig. 30 C). Purification
from E. coli BL21(DE3) transformed with the pGro7 yielded 2.2 mg of recombinant PfThiM
per 1 l of culture. However, after affinity purification using Strep-Tactin® matrix, there is still
chaperone groEL present in the elution fractions (Fig. 30 B). As seen from band intensity on
SDS-PAGE, approximately one fourth of the total protein amount is groEL. The attempts to
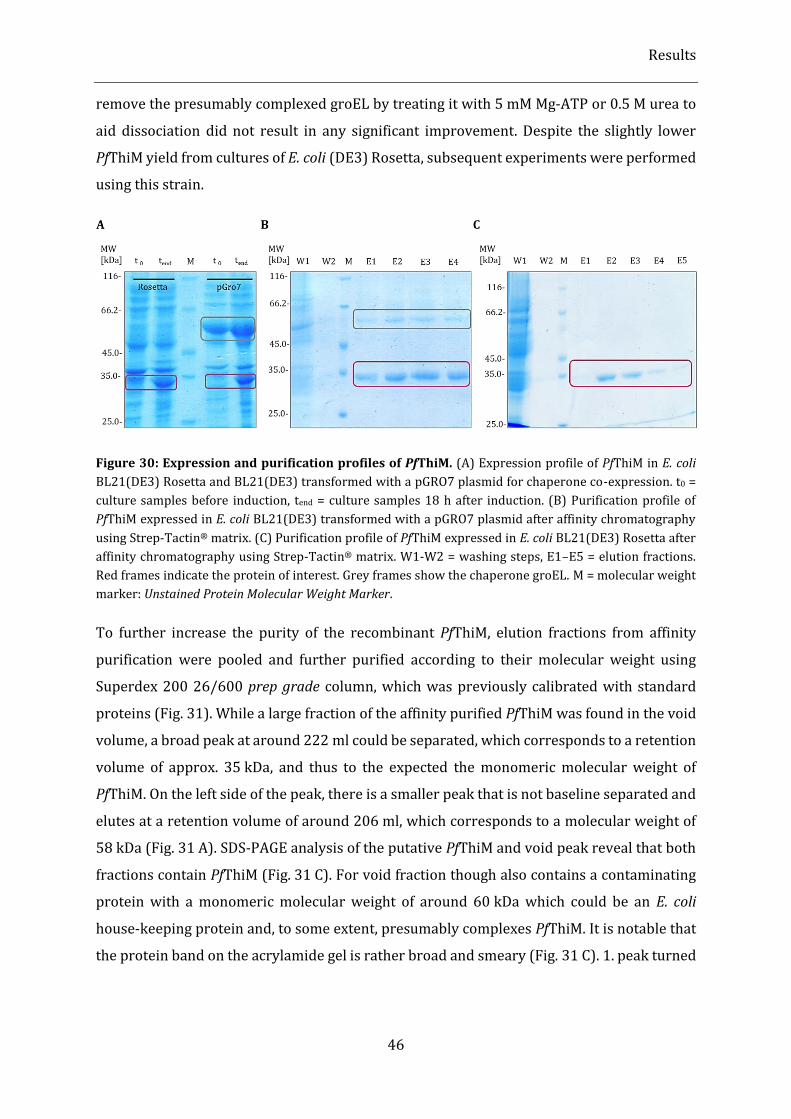
Results
46
remove the presumably complexed groEL by treating it with 5 mM Mg-ATP or 0.5 M urea to
aid dissociation did not result in any significant improvement. Despite the slightly lower
PfThiM yield from cultures of E. coli (DE3) Rosetta, subsequent experiments were performed
using this strain.
Figure 30: Expression and purification profiles of PfThiM. (A) Expression profile of PfThiM in E. coli
BL21(DE3) Rosetta and BL21(DE3) transformed with a pGRO7 plasmid for chaperone co-expression. t0 =
culture samples before induction, tend = culture samples 18 h after induction. (B) Purification profile of
PfThiM expressed in E. coli BL21(DE3) transformed with a pGRO7 plasmid after affinity chromatography
using Strep-Tactin® matrix. (C) Purification profile of PfThiM expressed in E. coli BL21(DE3) Rosetta after
affinity chromatography using Strep-Tactin® matrix. W1-W2 = washing steps, E1–E5 = elution fractions.
Red frames indicate the protein of interest. Grey frames show the chaperone groEL. M = molecular weight
marker: Unstained Protein Molecular Weight Marker.
To further increase the purity of the recombinant PfThiM, elution fractions from affinity
purification were pooled and further purified according to their molecular weight using
Superdex 200 26/600 prep grade column, which was previously calibrated with standard
proteins (Fig. 31). While a large fraction of the affinity purified PfThiM was found in the void
volume, a broad peak at around 222 ml could be separated, which corresponds to a retention
volume of approx. 35 kDa, and thus to the expected the monomeric molecular weight of
PfThiM. On the left side of the peak, there is a smaller peak that is not baseline separated and
elutes at a retention volume of around 206 ml, which corresponds to a molecular weight of
58 kDa (Fig. 31 A). SDS-PAGE analysis of the putative PfThiM and void peak reveal that both
fractions contain PfThiM (Fig. 31 C). For void fraction though also contains a contaminating
protein with a monomeric molecular weight of around 60 kDa which could be an E. coli
house-keeping protein and, to some extent, presumably complexes PfThiM. It is notable that
the protein band on the acrylamide gel is rather broad and smeary (Fig. 31 C). 1. peak turned
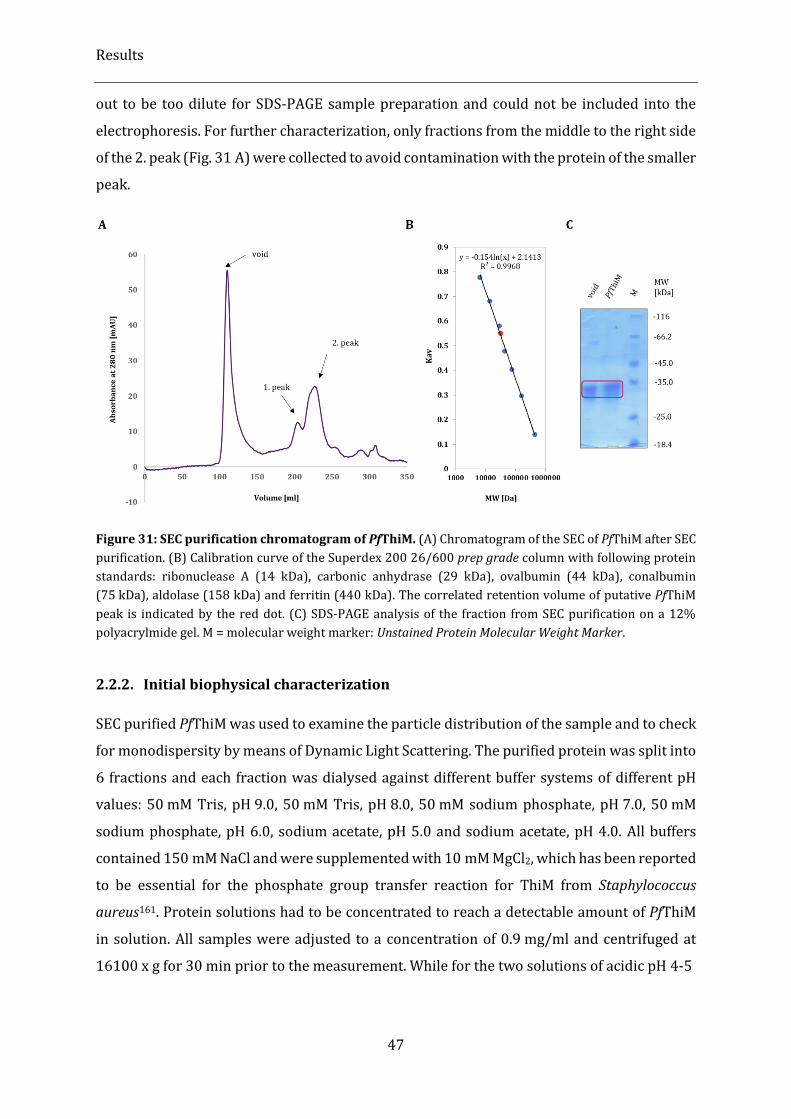
Results
47
out to be too dilute for SDS-PAGE sample preparation and could not be included into the
electrophoresis. For further characterization, only fractions from the middle to the right side
of the 2. peak (Fig. 31 A) were collected to avoid contamination with the protein of the smaller
peak.
Figure 31: SEC purification chromatogram of PfThiM. (A) Chromatogram of the SEC of PfThiM after SEC
purification. (B) Calibration curve of the Superdex 200 26/600 prep grade column with following protein
standards: ribonuclease A (14 kDa), carbonic anhydrase (29 kDa), ovalbumin (44 kDa), conalbumin
(75 kDa), aldolase (158 kDa) and ferritin (440 kDa). The correlated retention volume of putative PfThiM
peak is indicated by the red dot. (C) SDS-PAGE analysis of the fraction from SEC purification on a 12%
polyacrylmide gel. M = molecular weight marker: Unstained Protein Molecular Weight Marker.
2.2.2. Initial biophysical characterization
SEC purified PfThiM was used to examine the particle distribution of the sample and to check
for monodispersity by means of Dynamic Light Scattering. The purified protein was split into
6 fractions and each fraction was dialysed against different buffer systems of different pH
values: 50 mM Tris, pH 9.0, 50 mM Tris, pH 8.0, 50 mM sodium phosphate, pH 7.0, 50 mM
sodium phosphate, pH 6.0, sodium acetate, pH 5.0 and sodium acetate, pH 4.0. All buffers
contained 150 mM NaCl and were supplemented with 10 mM MgCl2, which has been reported
to be essential for the phosphate group transfer reaction for ThiM from Staphylococcus
aureus161. Protein solutions had to be concentrated to reach a detectable amount of PfThiM
in solution. All samples were adjusted to a concentration of 0.9 mg/ml and centrifuged at
16100 x g for 30 min prior to the measurement. While for the two solutions of acidic pH 4-5
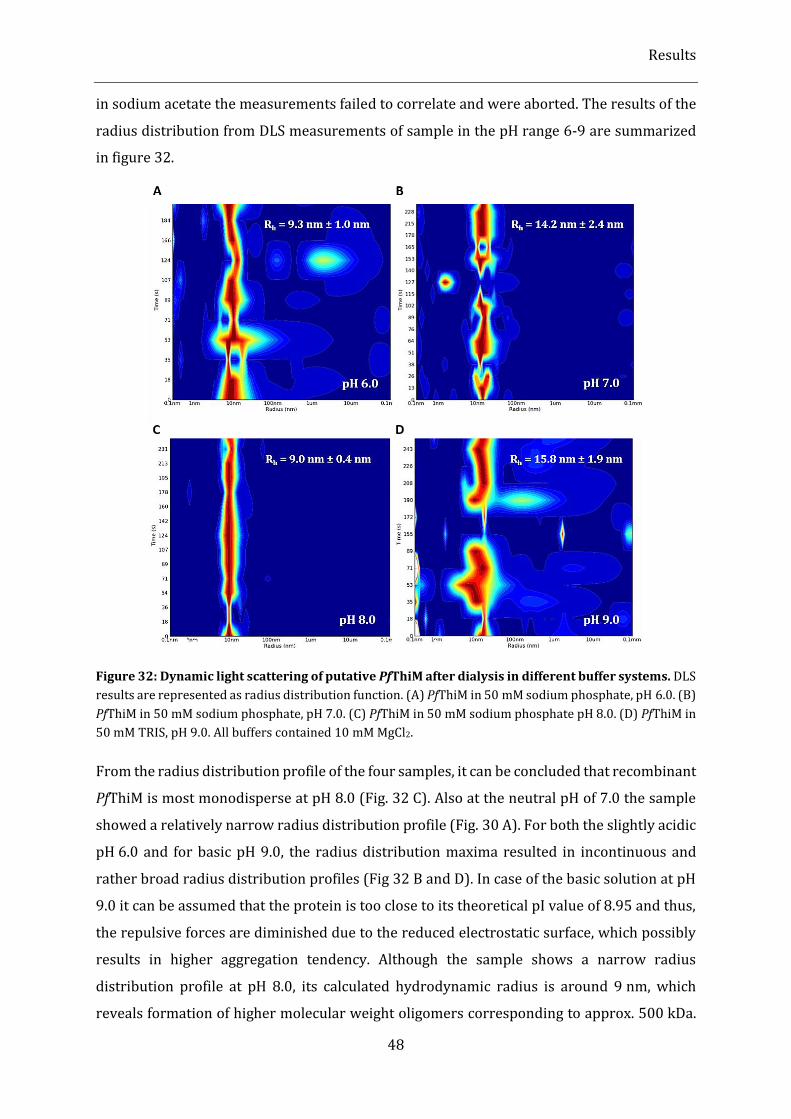
Results
48
in sodium acetate the measurements failed to correlate and were aborted. The results of the
radius distribution from DLS measurements of sample in the pH range 6-9 are summarized
in figure 32.
Figure 32: Dynamic light scattering of putative PfThiM after dialysis in different buffer systems. DLS
results are represented as radius distribution function. (A) PfThiM in 50 mM sodium phosphate, pH 6.0. (B)
PfThiM in 50 mM sodium phosphate, pH 7.0. (C) PfThiM in 50 mM sodium phosphate pH 8.0. (D) PfThiM in
50 mM TRIS, pH 9.0. All buffers contained 10 mM MgCl2.
From the radius distribution profile of the four samples, it can be concluded that recombinant
PfThiM is most monodisperse at pH 8.0 (Fig. 32 C). Also at the neutral pH of 7.0 the sample
showed a relatively narrow radius distribution profile (Fig. 30 A). For both the slightly acidic
pH 6.0 and for basic pH 9.0, the radius distribution maxima resulted in incontinuous and
rather broad radius distribution profiles (Fig 32 B and D). In case of the basic solution at pH
9.0 it can be assumed that the protein is too close to its theoretical pI value of 8.95 and thus,
the repulsive forces are diminished due to the reduced electrostatic surface, which possibly
results in higher aggregation tendency. Although the sample shows a narrow radius
distribution profile at pH 8.0, its calculated hydrodynamic radius is around 9 nm, which
reveals formation of higher molecular weight oligomers corresponding to approx. 500 kDa.
Results
49
Whereas the hydrodynamic radius is also around 9 nm for PfThiM in pH 6.0, it is significantly
higher for the buffer system with pH 7.0 and pH 9.0 of 14-16 nm with rather high standard
deviations. Although it is not surprising for the sample of pH 9.0 because of the PfThiM pI
value, it is cumbersome that the difference is so high between pH 7.0 and the pH values 6.0
and 8.0.
2.2.3. Sequence analysis and homology modelling of PfThiM
In the course of the search for biologically similar proteins using the program BLASTP 2.6.0+
of the Basic Local Alignment Search Tool (BLAST)60,61, five structurally characterized
homologs of PfThiM sharing 30-39% sequence identity and a sequence coverage up to 87%
for the aligned region could be identified. These proteins are: 4-methyl-5-beta-
hydroxyethylthiazole kinase from Bacillus subtilis (PDB-ID: 1EKK), hydroxyethylthiazole
kinase ThiM from Staphylococcus aureus (PDB-ID: 5CGA), 4-methyl-5-(beta-hydroxyethyl)-
thiazole kinase from Enterococcus faecalis (PDB-ID: 3DZV), hydroxyethylthiazole kinase from
Pyrococcus horikoshii (PDB-ID: 3HPD) and 4-methyl-5-beta-hydroxyethylthiazole kinase
from Bacillus subtilis in the monoclinic form (PDB-ID: 1C3Q). These five sequences were
chosen for structure alignment und graphical representation of possible secondary structure
elements based on their crystal structures using ESPript 3.0 server140 (Fig. 33). Ranging
amino acids from 29 to 290 of PfThiM sequence, tens of highly conserved amino acids were
found spread between amino acids 40 and 253 of PfThiM. These were either paired or single.
No blocks of conserved amino acids were found, like in the case if PfSTK (see chapter 2.1.6).
Based on crystal structure of ThiM from Staphylococcus aureus (PDB-ID: 5CGA),
predominantly α-helical folds were suggested as secondary structure elements for the
aligned region.
To predict possible 3D-structures of the full-length PfThiM, homology modelling studies were
performed. Modelling results are shown in figure 34. Bioinformatic tools used were the I-
TASSER131-133 server for protein structure and function prediction, the Protein
Homology/analogY Recognition Engine V 2.0 web-based services for structure prediction
PHYRE2134, the Web Portal for Protein Structure and Function Prediction RaptorX145. These
homology modelling tools are based on different algorithmic approaches. The results reveal
that all of these bioinformatic tools suggest structural models with on overall similarity
regarding the aligned region. This means that the N-Terminal part of PfThiM up to amino acid
28 could not be reliably predicted. All three models predict predominance of α-helical
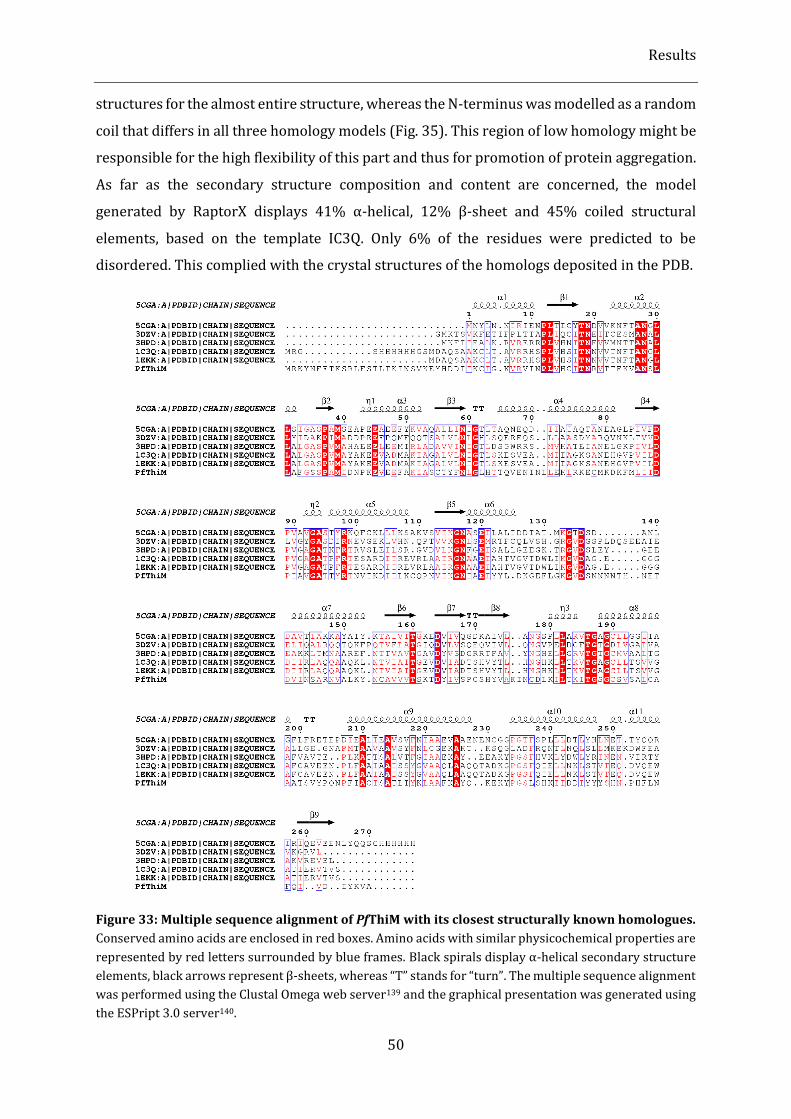
Results
50
structures for the almost entire structure, whereas the N-terminus was modelled as a random
coil that differs in all three homology models (Fig. 35). This region of low homology might be
responsible for the high flexibility of this part and thus for promotion of protein aggregation.
As far as the secondary structure composition and content are concerned, the model
generated by RaptorX displays 41% α-helical, 12% β-sheet and 45% coiled structural
elements, based on the template IC3Q. Only 6% of the residues were predicted to be
disordered. This complied with the crystal structures of the homologs deposited in the PDB.
Figure 33: Multiple sequence alignment of PfThiM with its closest structurally known homologues.
Conserved amino acids are enclosed in red boxes. Amino acids with similar physicochemical properties are
represented by red letters surrounded by blue frames. Black spirals display α-helical secondary structure
elements, black arrows represent β-sheets, whereas “T” stands for “turn”. The multiple sequence alignment
was performed using the Clustal Omega web server139 and the graphical presentation was generated using
the ESPript 3.0 server140.
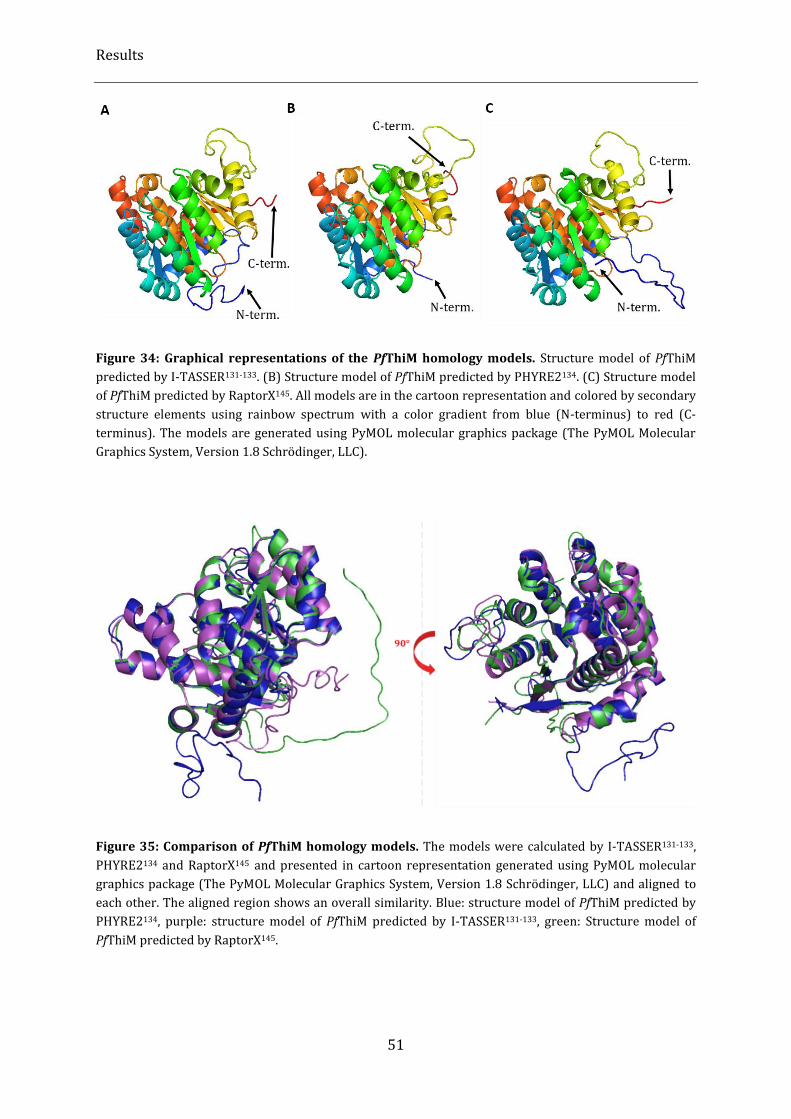
Results
51
Figure 34: Graphical representations of the PfThiM homology models. Structure model of PfThiM
predicted by I-TASSER131-133. (B) Structure model of PfThiM predicted by PHYRE2134. (C) Structure model
of PfThiM predicted by RaptorX145. All models are in the cartoon representation and colored by secondary
structure elements using rainbow spectrum with a color gradient from blue (N-terminus) to red (C-
terminus). The models are generated using PyMOL molecular graphics package (The PyMOL Molecular
Graphics System, Version 1.8 Schrödinger, LLC).
Figure 35: Comparison of PfThiM homology models. The models were calculated by I-TASSER131-133,
PHYRE2134 and RaptorX145 and presented in cartoon representation generated using PyMOL molecular
graphics package (The PyMOL Molecular Graphics System, Version 1.8 Schrödinger, LLC) and aligned to
each other. The aligned region shows an overall similarity. Blue: structure model of PfThiM predicted by
PHYRE2134, purple: structure model of PfThiM predicted by I-TASSER131-133, green: Structure model of
PfThiM predicted by RaptorX145.
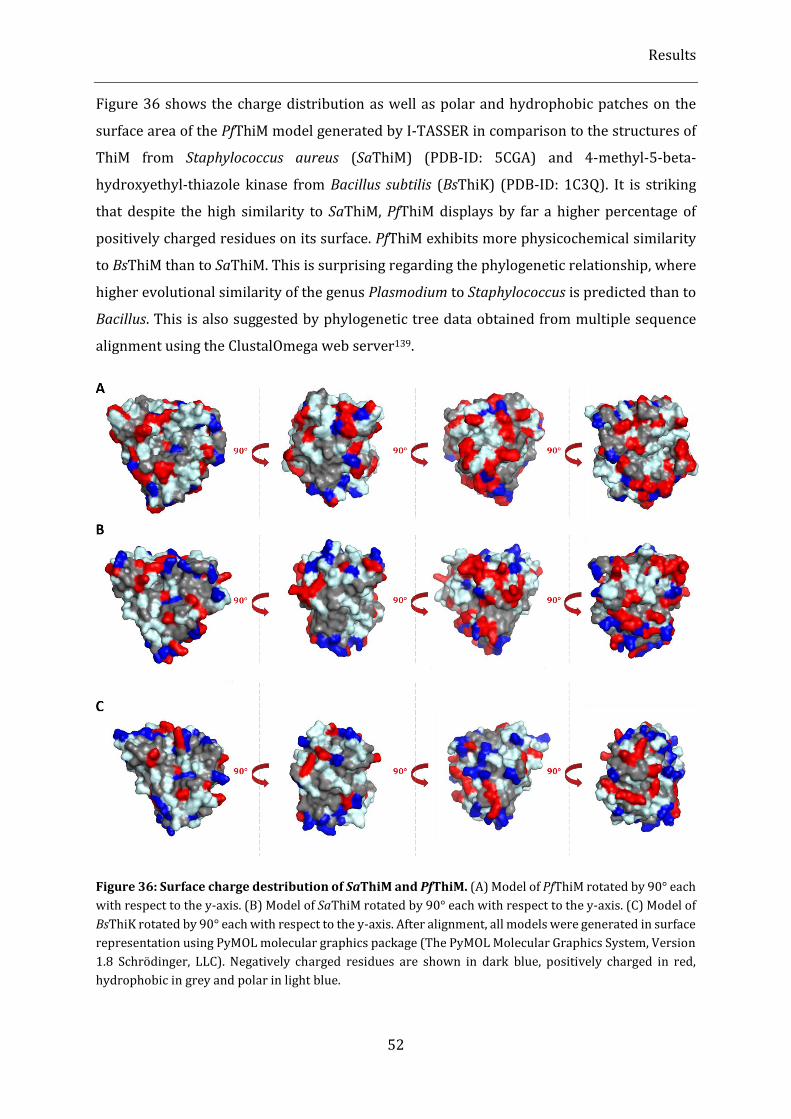
Results
52
Figure 36 shows the charge distribution as well as polar and hydrophobic patches on the
surface area of the PfThiM model generated by I-TASSER in comparison to the structures of
ThiM from Staphylococcus aureus (SaThiM) (PDB-ID: 5CGA) and 4-methyl-5-beta-
hydroxyethyl-thiazole kinase from Bacillus subtilis (BsThiK) (PDB-ID: 1C3Q). It is striking
that despite the high similarity to SaThiM, PfThiM displays by far a higher percentage of
positively charged residues on its surface. PfThiM exhibits more physicochemical similarity
to BsThiM than to SaThiM. This is surprising regarding the phylogenetic relationship, where
higher evolutional similarity of the genus Plasmodium to Staphylococcus is predicted than to
Bacillus. This is also suggested by phylogenetic tree data obtained from multiple sequence
alignment using the ClustalOmega web server139.
Figure 36: Surface charge destribution of SaThiM and PfThiM. (A) Model of PfThiM rotated by 90° each
with respect to the y-axis. (B) Model of SaThiM rotated by 90° each with respect to the y-axis. (C) Model of
BsThiK rotated by 90° each with respect to the y-axis. After alignment, all models were generated in surface
representation using PyMOL molecular graphics package (The PyMOL Molecular Graphics System, Version
1.8 Schrödinger, LLC). Negatively charged residues are shown in dark blue, positively charged in red,
hydrophobic in grey and polar in light blue.
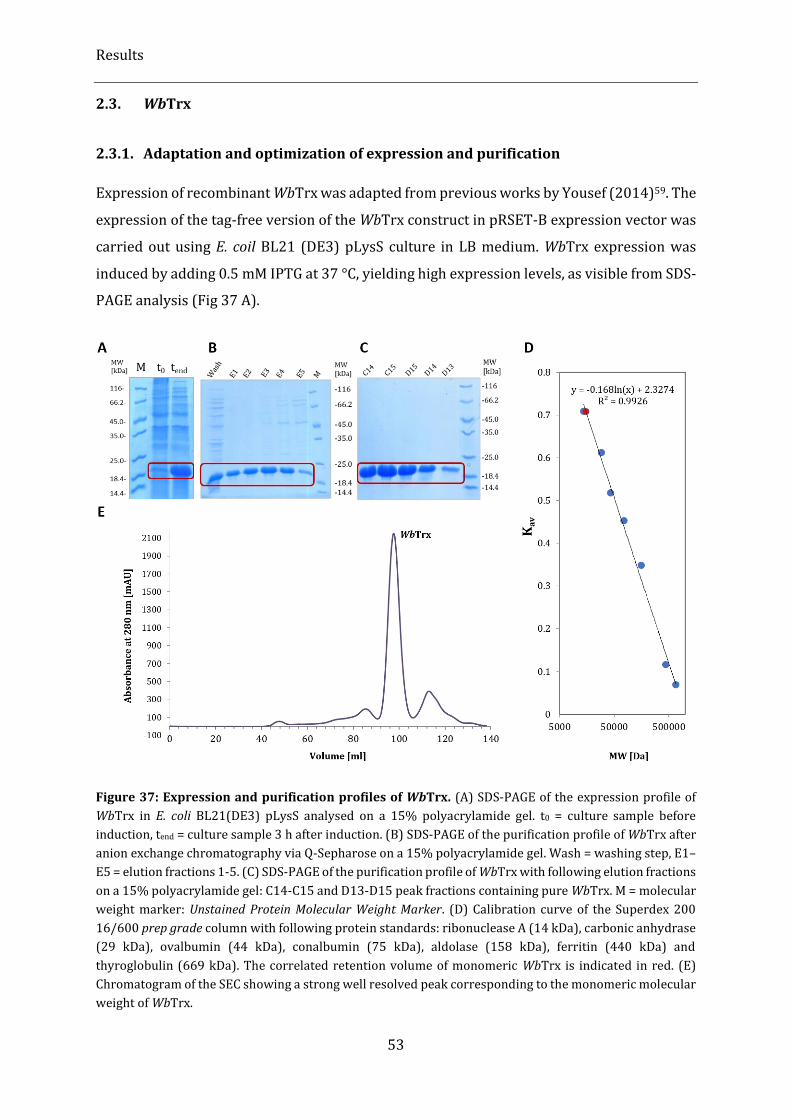
Results
53
2.3. WbTrx
2.3.1. Adaptation and optimization of expression and purification
Expression of recombinant WbTrx was adapted from previous works by Yousef (2014)59. The
expression of the tag-free version of the WbTrx construct in pRSET-B expression vector was
carried out using E. coil BL21 (DE3) pLysS culture in LB medium. WbTrx expression was
induced by adding 0.5 mM IPTG at 37 °C, yielding high expression levels, as visible from SDS-
PAGE analysis (Fig 37 A).
Figure 37: Expression and purification profiles of WbTrx. (A) SDS-PAGE of the expression profile of
WbTrx in E. coli BL21(DE3) pLysS analysed on a 15% polyacrylamide gel. t0 = culture sample before
induction, tend = culture sample 3 h after induction. (B) SDS-PAGE of the purification profile of WbTrx after
anion exchange chromatography via Q-Sepharose on a 15% polyacrylamide gel. Wash = washing step, E1–
E5 = elution fractions 1-5. (C) SDS-PAGE of the purification profile of WbTrx with following elution fractions
on a 15% polyacrylamide gel: C14-C15 and D13-D15 peak fractions containing pure WbTrx. M = molecular
weight marker: Unstained Protein Molecular Weight Marker. (D) Calibration curve of the Superdex 200
16/600 prep grade column with following protein standards: ribonuclease A (14 kDa), carbonic anhydrase
(29 kDa), ovalbumin (44 kDa), conalbumin (75 kDa), aldolase (158 kDa), ferritin (440 kDa) and
thyroglobulin (669 kDa). The correlated retention volume of monomeric WbTrx is indicated in red. (E)
Chromatogram of the SEC showing a strong well resolved peak corresponding to the monomeric molecular
weight of WbTrx.
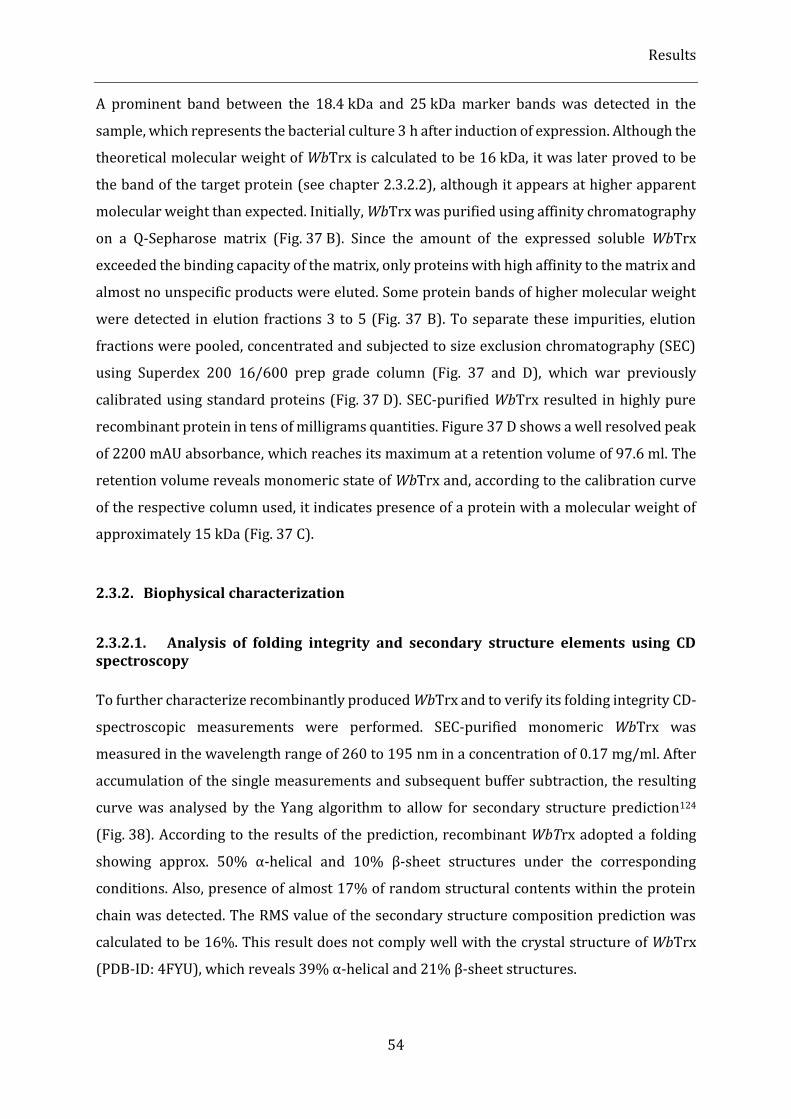
Results
54
A prominent band between the 18.4 kDa and 25 kDa marker bands was detected in the
sample, which represents the bacterial culture 3 h after induction of expression. Although the
theoretical molecular weight of WbTrx is calculated to be 16 kDa, it was later proved to be
the band of the target protein (see chapter 2.3.2.2), although it appears at higher apparent
molecular weight than expected. Initially, WbTrx was purified using affinity chromatography
on a Q-Sepharose matrix (Fig. 37 B). Since the amount of the expressed soluble WbTrx
exceeded the binding capacity of the matrix, only proteins with high affinity to the matrix and
almost no unspecific products were eluted. Some protein bands of higher molecular weight
were detected in elution fractions 3 to 5 (Fig. 37 B). To separate these impurities, elution
fractions were pooled, concentrated and subjected to size exclusion chromatography (SEC)
using Superdex 200 16/600 prep grade column (Fig. 37 and D), which war previously
calibrated using standard proteins (Fig. 37 D). SEC-purified WbTrx resulted in highly pure
recombinant protein in tens of milligrams quantities. Figure 37 D shows a well resolved peak
of 2200 mAU absorbance, which reaches its maximum at a retention volume of 97.6 ml. The
retention volume reveals monomeric state of WbTrx and, according to the calibration curve
of the respective column used, it indicates presence of a protein with a molecular weight of
approximately 15 kDa (Fig. 37 C).
2.3.2. Biophysical characterization
2.3.2.1. Analysis of folding integrity and secondary structure elements using CD spectroscopy
To further characterize recombinantly produced WbTrx and to verify its folding integrity CD-
spectroscopic measurements were performed. SEC-purified monomeric WbTrx was
measured in the wavelength range of 260 to 195 nm in a concentration of 0.17 mg/ml. After
accumulation of the single measurements and subsequent buffer subtraction, the resulting
curve was analysed by the Yang algorithm to allow for secondary structure prediction124
(Fig. 38). According to the results of the prediction, recombinant WbTrx adopted a folding
showing approx. 50% α-helical and 10% β-sheet structures under the corresponding
conditions. Also, presence of almost 17% of random structural contents within the protein
chain was detected. The RMS value of the secondary structure composition prediction was
calculated to be 16%. This result does not comply well with the crystal structure of WbTrx
(PDB-ID: 4FYU), which reveals 39% α-helical and 21% β-sheet structures.
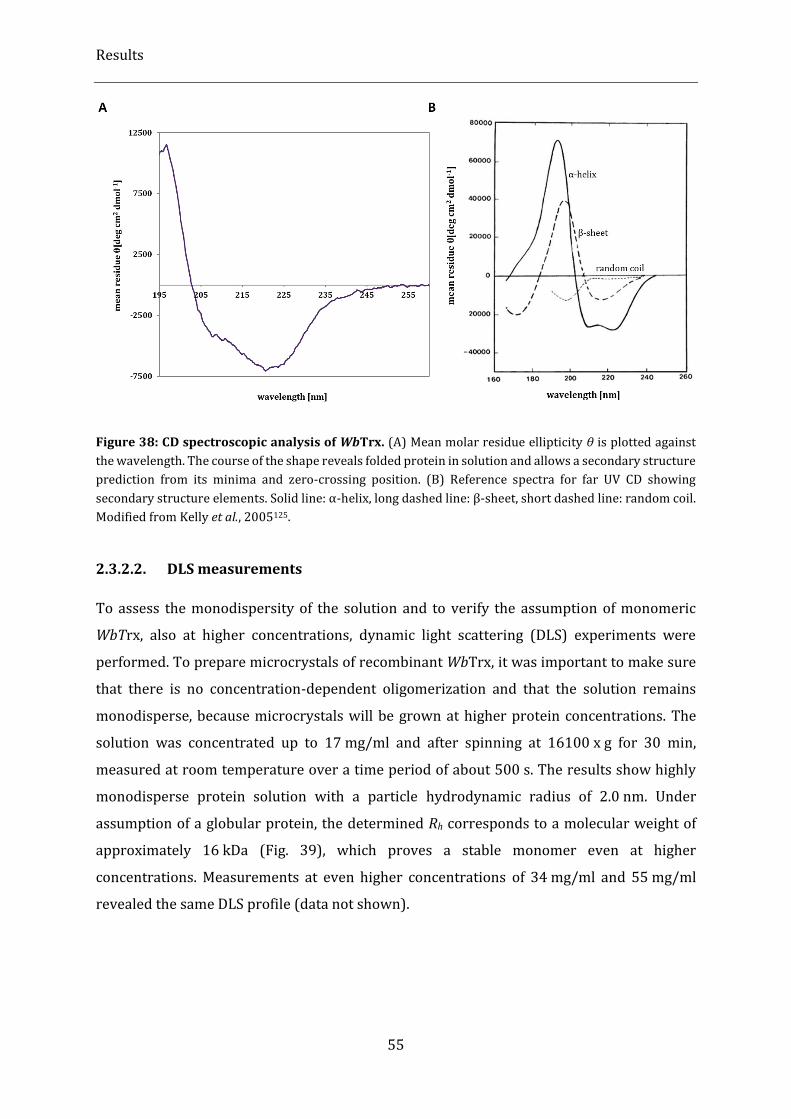
Results
55
Figure 38: CD spectroscopic analysis of WbTrx. (A) Mean molar residue ellipticity θ is plotted against
the wavelength. The course of the shape reveals folded protein in solution and allows a secondary structure
prediction from its minima and zero-crossing position. (B) Reference spectra for far UV CD showing
secondary structure elements. Solid line: α-helix, long dashed line: β-sheet, short dashed line: random coil.
Modified from Kelly et al., 2005125.
2.3.2.2. DLS measurements
To assess the monodispersity of the solution and to verify the assumption of monomeric
WbTrx, also at higher concentrations, dynamic light scattering (DLS) experiments were
performed. To prepare microcrystals of recombinant WbTrx, it was important to make sure
that there is no concentration-dependent oligomerization and that the solution remains
monodisperse, because microcrystals will be grown at higher protein concentrations. The
solution was concentrated up to 17 mg/ml and after spinning at 16100 x g for 30 min,
measured at room temperature over a time period of about 500 s. The results show highly
monodisperse protein solution with a particle hydrodynamic radius of 2.0 nm. Under
assumption of a globular protein, the determined Rh corresponds to a molecular weight of
approximately 16 kDa (Fig. 39), which proves a stable monomer even at higher
concentrations. Measurements at even higher concentrations of 34 mg/ml and 55 mg/ml
revealed the same DLS profile (data not shown).
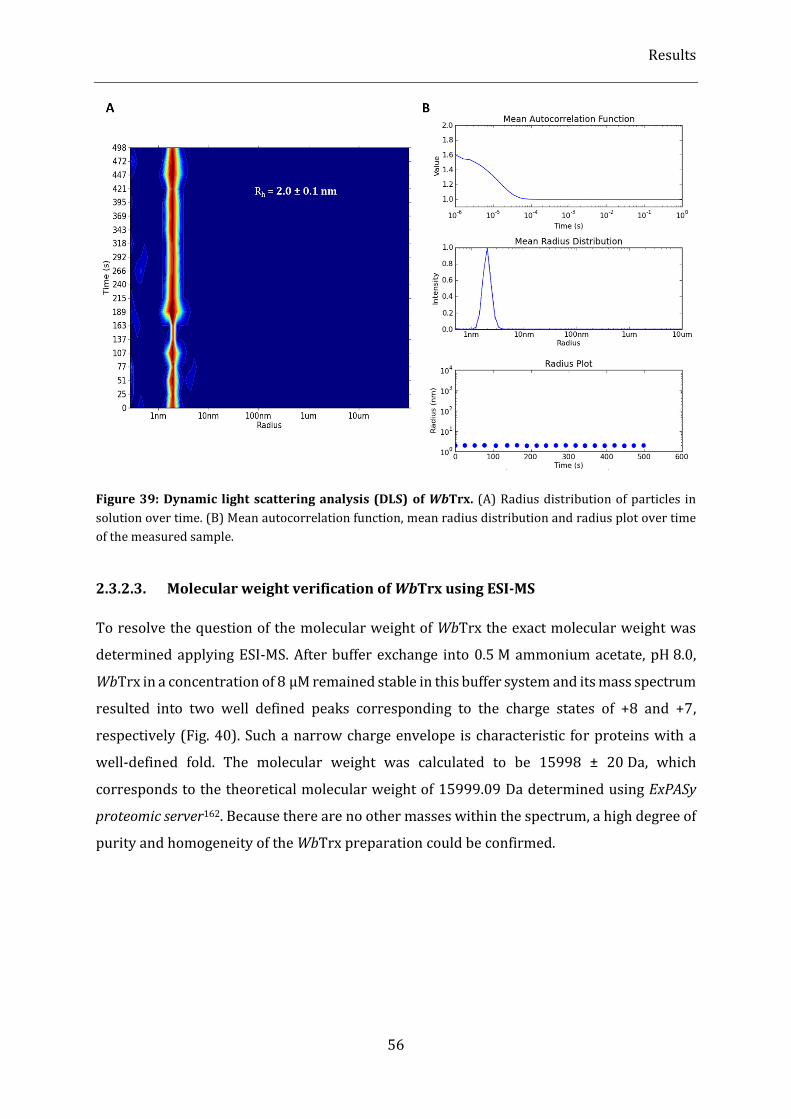
Results
56
Figure 39: Dynamic light scattering analysis (DLS) of WbTrx. (A) Radius distribution of particles in
solution over time. (B) Mean autocorrelation function, mean radius distribution and radius plot over time
of the measured sample.
2.3.2.3. Molecular weight verification of WbTrx using ESI-MS
To resolve the question of the molecular weight of WbTrx the exact molecular weight was
determined applying ESI-MS. After buffer exchange into 0.5 M ammonium acetate, pH 8.0,
WbTrx in a concentration of 8 µM remained stable in this buffer system and its mass spectrum
resulted into two well defined peaks corresponding to the charge states of +8 and +7,
respectively (Fig. 40). Such a narrow charge envelope is characteristic for proteins with a
well-defined fold. The molecular weight was calculated to be 15998 ± 20 Da, which
corresponds to the theoretical molecular weight of 15999.09 Da determined using ExPASy
proteomic server162. Because there are no other masses within the spectrum, a high degree of
purity and homogeneity of the WbTrx preparation could be confirmed.
Results
57
Figure 40: ESI-MS spectrum of WbTrx after buffer exchange into 0.5 M Sodium acetate, pH 8.0.
Relative intensity is plotted over the mass-to-charge ratio. Two distinct peaks corresponding to the charge
states +8 and +7 reveal a well-folded monomeric protein of interest with a calculated molecular weight of
15998 Da.
2.3.2.4. Structure validation by SAXS analysis
Prior to SAXS analysis, WbTrx was purified as described in chapter 2.3.1. The purified
monomeric WbTrx from SEC was concentrated to two different concentrations: 6.7 mg/ml
and 10.5 mg/ml. Protein solutions of both concentrations were centrifuged at 21000 x g for
60 min and examined using DLS to verify monodispersity of the particles in solution. Using
30 µl of the corresponding protein solution, SAXS data were recorded at the P12 EMBL-
beamline of the PETRA III synchrotron, DESY, Hamburg. Samples were exposed for 45 ms
each and, before and after each exposure, buffer contribution to the overall signal was
subtracted from the signal measured. PRIMUS was used to average the data and to
extrapolate them to concentration-independent scattering intensity curves (Fig. 41 A)163. The
resulting Guinier plot showed strong linearity (Fig. 41 B) and the radius of gyration Rg was
calculated to be 1.52 ± 0.13 nm. This value allowed to determine the distance distribution
function p(r) (Fig. 41 C), which revealed the maximum diameter of the particle Dmax of 4.8 nm
as well as a Porod volume VPorod of 21.3 nm3. The corresponding molecular weight MWPorod
was calculated to be 14.7 kDa, which approximately fits the monomeric molecular weight of
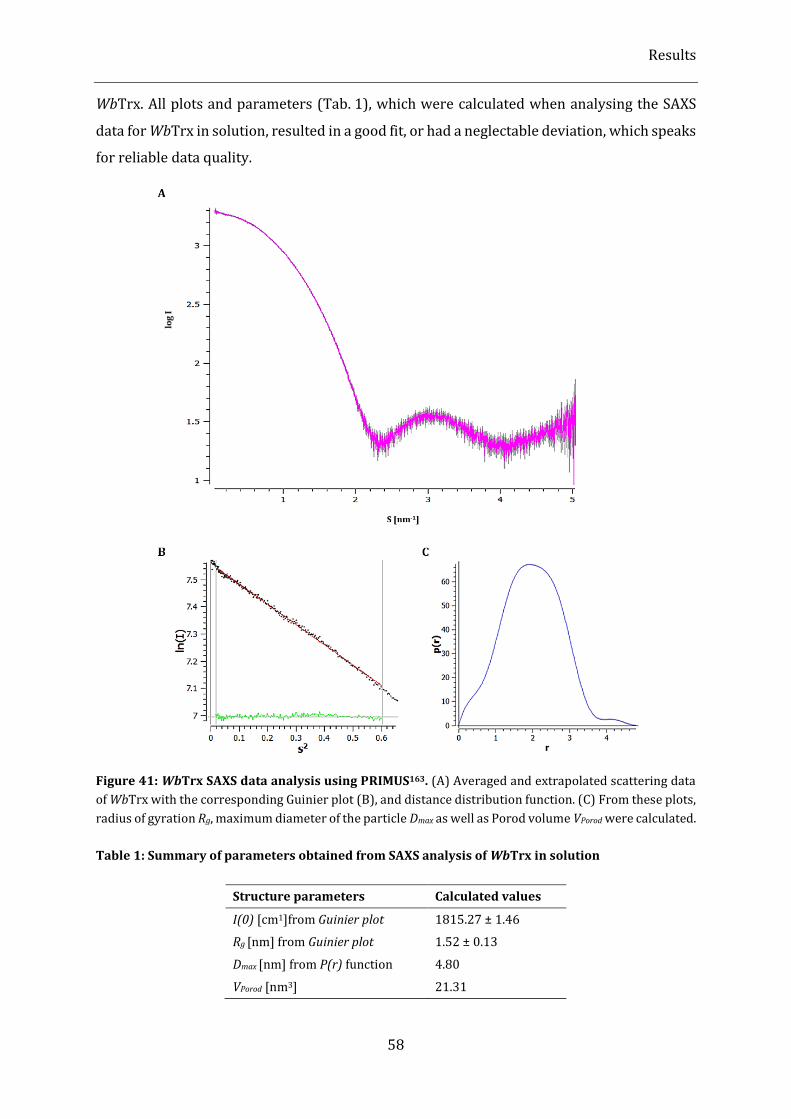
Results
58
WbTrx. All plots and parameters (Tab. 1), which were calculated when analysing the SAXS
data for WbTrx in solution, resulted in a good fit, or had a neglectable deviation, which speaks
for reliable data quality.
Figure 41: WbTrx SAXS data analysis using PRIMUS163. (A) Averaged and extrapolated scattering data
of WbTrx with the corresponding Guinier plot (B), and distance distribution function. (C) From these plots,
radius of gyration Rg, maximum diameter of the particle Dmax as well as Porod volume VPorod were calculated.
Table 1: Summary of parameters obtained from SAXS analysis of WbTrx in solution
Structure parameters Calculated values
I(0) [cm1]from Guinier plot 1815.27 ± 1.46
Rg [nm] from Guinier plot 1.52 ± 0.13
Dmax [nm] from P(r) function 4.80
VPorod [nm3] 21.31
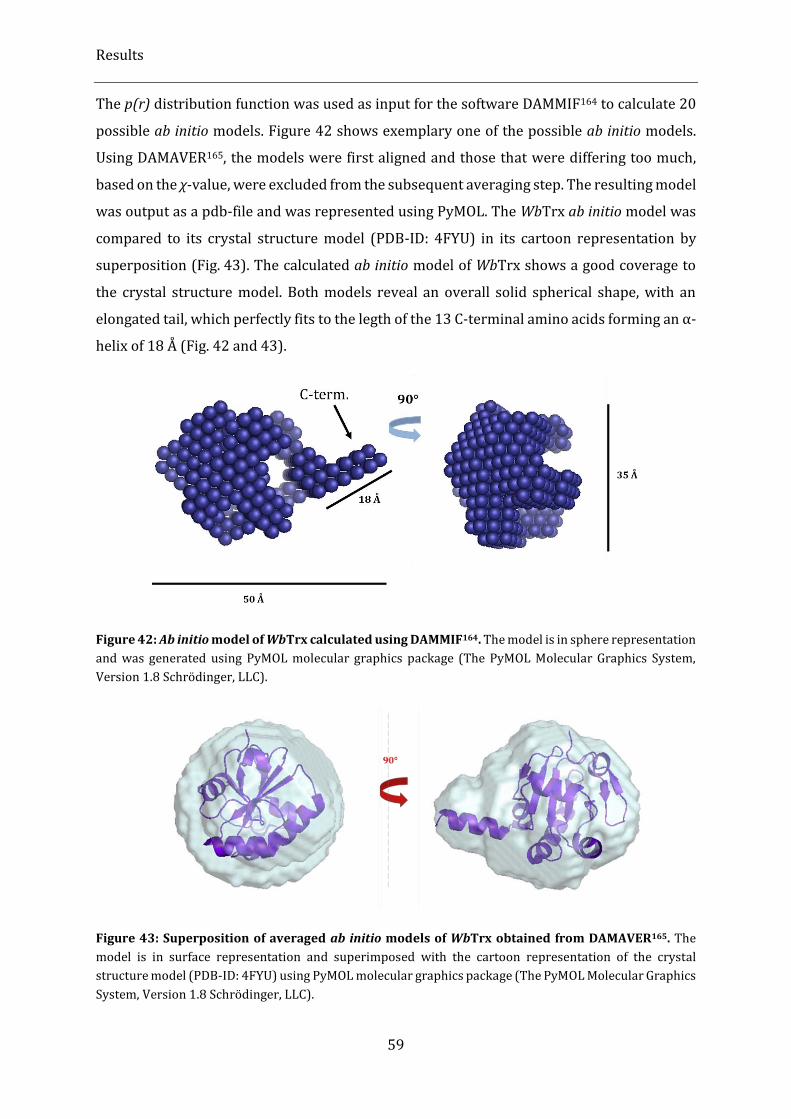
Results
59
The p(r) distribution function was used as input for the software DAMMIF164 to calculate 20
possible ab initio models. Figure 42 shows exemplary one of the possible ab initio models.
Using DAMAVER165, the models were first aligned and those that were differing too much,
based on the χ-value, were excluded from the subsequent averaging step. The resulting model
was output as a pdb-file and was represented using PyMOL. The WbTrx ab initio model was
compared to its crystal structure model (PDB-ID: 4FYU) in its cartoon representation by
superposition (Fig. 43). The calculated ab initio model of WbTrx shows a good coverage to
the crystal structure model. Both models reveal an overall solid spherical shape, with an
elongated tail, which perfectly fits to the legth of the 13 C-terminal amino acids forming an α-
helix of 18 Å (Fig. 42 and 43).
Figure 42: Ab initio model of WbTrx calculated using DAMMIF164. The model is in sphere representation
and was generated using PyMOL molecular graphics package (The PyMOL Molecular Graphics System,
Version 1.8 Schrödinger, LLC).
Figure 43: Superposition of averaged ab initio models of WbTrx obtained from DAMAVER165. The
model is in surface representation and superimposed with the cartoon representation of the crystal
structure model (PDB-ID: 4FYU) using PyMOL molecular graphics package (The PyMOL Molecular Graphics
System, Version 1.8 Schrödinger, LLC).
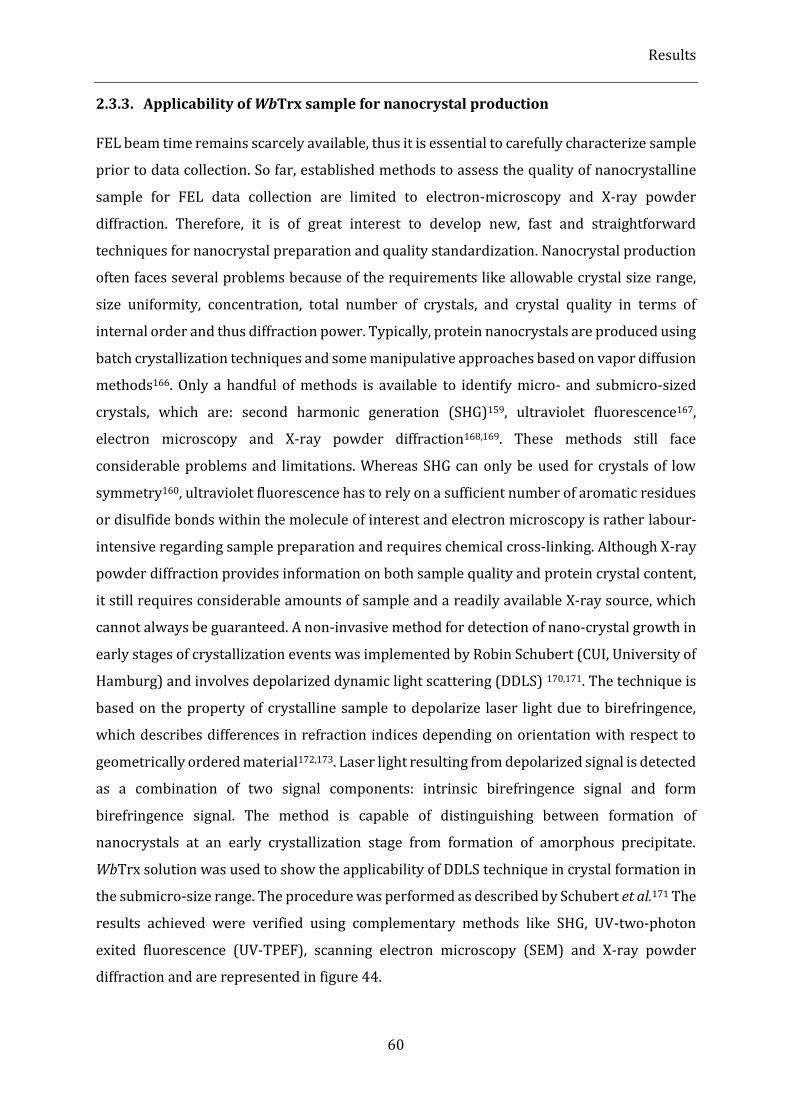
Results
60
2.3.3. Applicability of WbTrx sample for nanocrystal production
FEL beam time remains scarcely available, thus it is essential to carefully characterize sample
prior to data collection. So far, established methods to assess the quality of nanocrystalline
sample for FEL data collection are limited to electron-microscopy and X-ray powder
diffraction. Therefore, it is of great interest to develop new, fast and straightforward
techniques for nanocrystal preparation and quality standardization. Nanocrystal production
often faces several problems because of the requirements like allowable crystal size range,
size uniformity, concentration, total number of crystals, and crystal quality in terms of
internal order and thus diffraction power. Typically, protein nanocrystals are produced using
batch crystallization techniques and some manipulative approaches based on vapor diffusion
methods166. Only a handful of methods is available to identify micro- and submicro-sized
crystals, which are: second harmonic generation (SHG)159, ultraviolet fluorescence167,
electron microscopy and X-ray powder diffraction168,169. These methods still face
considerable problems and limitations. Whereas SHG can only be used for crystals of low
symmetry160, ultraviolet fluorescence has to rely on a sufficient number of aromatic residues
or disulfide bonds within the molecule of interest and electron microscopy is rather labour-
intensive regarding sample preparation and requires chemical cross-linking. Although X-ray
powder diffraction provides information on both sample quality and protein crystal content,
it still requires considerable amounts of sample and a readily available X-ray source, which
cannot always be guaranteed. A non-invasive method for detection of nano-crystal growth in
early stages of crystallization events was implemented by Robin Schubert (CUI, University of
Hamburg) and involves depolarized dynamic light scattering (DDLS) 170,171. The technique is
based on the property of crystalline sample to depolarize laser light due to birefringence,
which describes differences in refraction indices depending on orientation with respect to
geometrically ordered material172,173. Laser light resulting from depolarized signal is detected
as a combination of two signal components: intrinsic birefringence signal and form
birefringence signal. The method is capable of distinguishing between formation of
nanocrystals at an early crystallization stage from formation of amorphous precipitate.
WbTrx solution was used to show the applicability of DDLS technique in crystal formation in
the submicro-size range. The procedure was performed as described by Schubert et al.171 The
results achieved were verified using complementary methods like SHG, UV-two-photon
exited fluorescence (UV-TPEF), scanning electron microscopy (SEM) and X-ray powder
diffraction and are represented in figure 44.
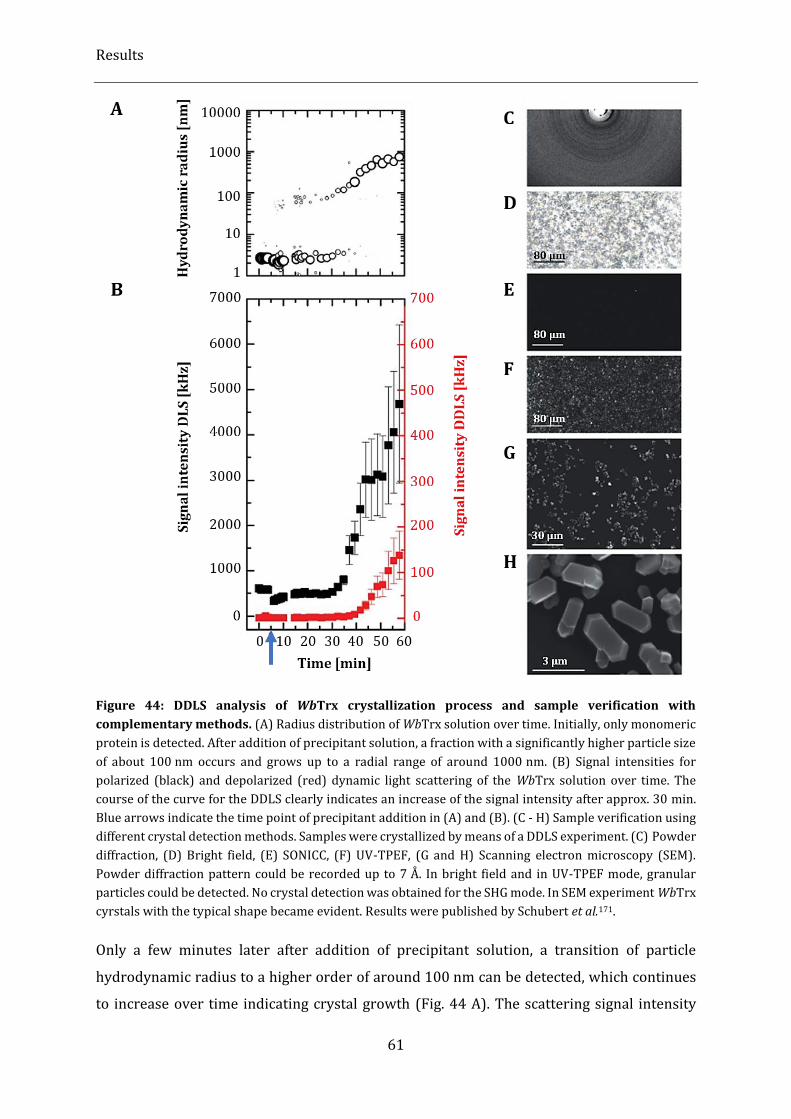
Results
61
Figure 44: DDLS analysis of WbTrx crystallization process and sample verification with
complementary methods. (A) Radius distribution of WbTrx solution over time. Initially, only monomeric
protein is detected. After addition of precipitant solution, a fraction with a significantly higher particle size
of about 100 nm occurs and grows up to a radial range of around 1000 nm. (B) Signal intensities for
polarized (black) and depolarized (red) dynamic light scattering of the WbTrx solution over time. The
course of the curve for the DDLS clearly indicates an increase of the signal intensity after approx. 30 min.
Blue arrows indicate the time point of precipitant addition in (A) and (B). (C - H) Sample verification using
different crystal detection methods. Samples were crystallized by means of a DDLS experiment. (C) Powder
diffraction, (D) Bright field, (E) SONICC, (F) UV-TPEF, (G and H) Scanning electron microscopy (SEM).
Powder diffraction pattern could be recorded up to 7 Å. In bright field and in UV-TPEF mode, granular
particles could be detected. No crystal detection was obtained for the SHG mode. In SEM experiment WbTrx
cyrstals with the typical shape became evident. Results were published by Schubert et al.171.
Only a few minutes later after addition of precipitant solution, a transition of particle
hydrodynamic radius to a higher order of around 100 nm can be detected, which continues
to increase over time indicating crystal growth (Fig. 44 A). The scattering signal intensity
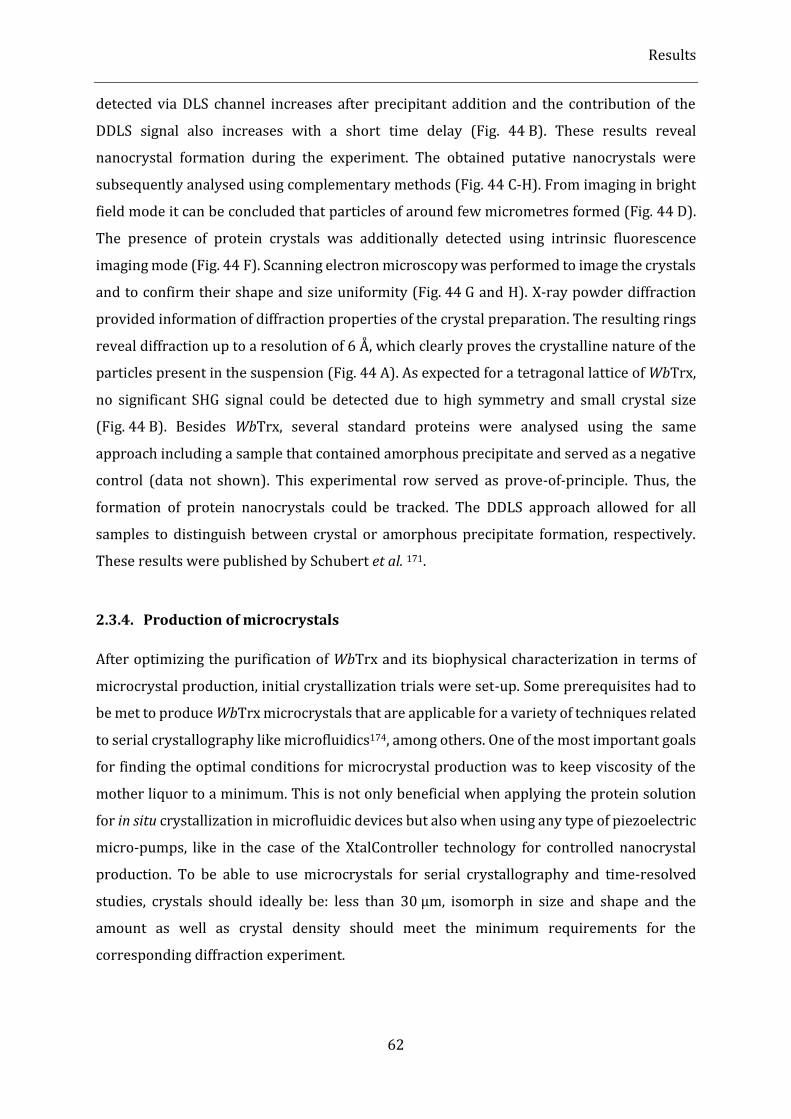
Results
62
detected via DLS channel increases after precipitant addition and the contribution of the
DDLS signal also increases with a short time delay (Fig. 44 B). These results reveal
nanocrystal formation during the experiment. The obtained putative nanocrystals were
subsequently analysed using complementary methods (Fig. 44 C-H). From imaging in bright
field mode it can be concluded that particles of around few micrometres formed (Fig. 44 D).
The presence of protein crystals was additionally detected using intrinsic fluorescence
imaging mode (Fig. 44 F). Scanning electron microscopy was performed to image the crystals
and to confirm their shape and size uniformity (Fig. 44 G and H). X-ray powder diffraction
provided information of diffraction properties of the crystal preparation. The resulting rings
reveal diffraction up to a resolution of 6 Å, which clearly proves the crystalline nature of the
particles present in the suspension (Fig. 44 A). As expected for a tetragonal lattice of WbTrx,
no significant SHG signal could be detected due to high symmetry and small crystal size
(Fig. 44 B). Besides WbTrx, several standard proteins were analysed using the same
approach including a sample that contained amorphous precipitate and served as a negative
control (data not shown). This experimental row served as prove-of-principle. Thus, the
formation of protein nanocrystals could be tracked. The DDLS approach allowed for all
samples to distinguish between crystal or amorphous precipitate formation, respectively.
These results were published by Schubert et al. 171.
2.3.4. Production of microcrystals
After optimizing the purification of WbTrx and its biophysical characterization in terms of
microcrystal production, initial crystallization trials were set-up. Some prerequisites had to
be met to produce WbTrx microcrystals that are applicable for a variety of techniques related
to serial crystallography like microfluidics174, among others. One of the most important goals
for finding the optimal conditions for microcrystal production was to keep viscosity of the
mother liquor to a minimum. This is not only beneficial when applying the protein solution
for in situ crystallization in microfluidic devices but also when using any type of piezoelectric
micro-pumps, like in the case of the XtalController technology for controlled nanocrystal
production. To be able to use microcrystals for serial crystallography and time-resolved
studies, crystals should ideally be: less than 30 µm, isomorph in size and shape and the
amount as well as crystal density should meet the minimum requirements for the
corresponding diffraction experiment.
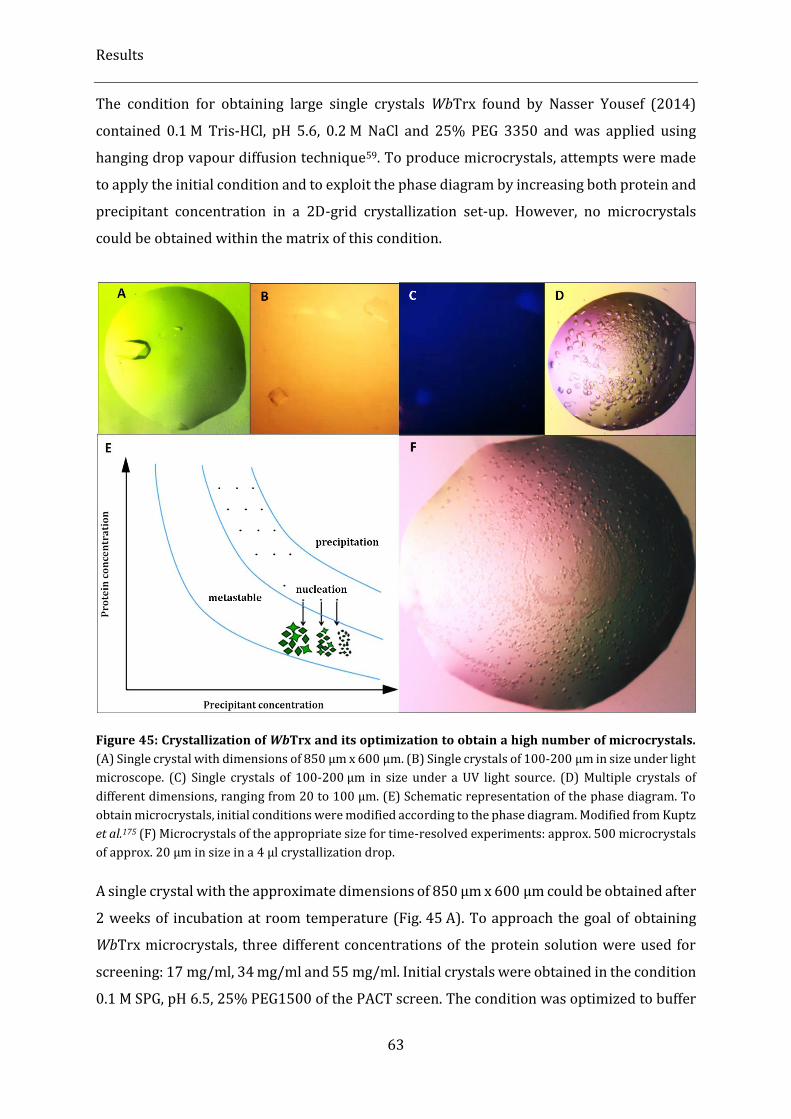
Results
63
The condition for obtaining large single crystals WbTrx found by Nasser Yousef (2014)
contained 0.1 M Tris-HCl, pH 5.6, 0.2 M NaCl and 25% PEG 3350 and was applied using
hanging drop vapour diffusion technique59. To produce microcrystals, attempts were made
to apply the initial condition and to exploit the phase diagram by increasing both protein and
precipitant concentration in a 2D-grid crystallization set-up. However, no microcrystals
could be obtained within the matrix of this condition.
Figure 45: Crystallization of WbTrx and its optimization to obtain a high number of microcrystals.
(A) Single crystal with dimensions of 850 µm x 600 µm. (B) Single crystals of 100-200 µm in size under light
microscope. (C) Single crystals of 100-200 µm in size under a UV light source. (D) Multiple crystals of
different dimensions, ranging from 20 to 100 µm. (E) Schematic representation of the phase diagram. To
obtain microcrystals, initial conditions were modified according to the phase diagram. Modified from Kuptz
et al.175 (F) Microcrystals of the appropriate size for time-resolved experiments: approx. 500 microcrystals
of approx. 20 µm in size in a 4 µl crystallization drop.
A single crystal with the approximate dimensions of 850 µm x 600 µm could be obtained after
2 weeks of incubation at room temperature (Fig. 45 A). To approach the goal of obtaining
WbTrx microcrystals, three different concentrations of the protein solution were used for
screening: 17 mg/ml, 34 mg/ml and 55 mg/ml. Initial crystals were obtained in the condition
0.1 M SPG, pH 6.5, 25% PEG1500 of the PACT screen. The condition was optimized to buffer
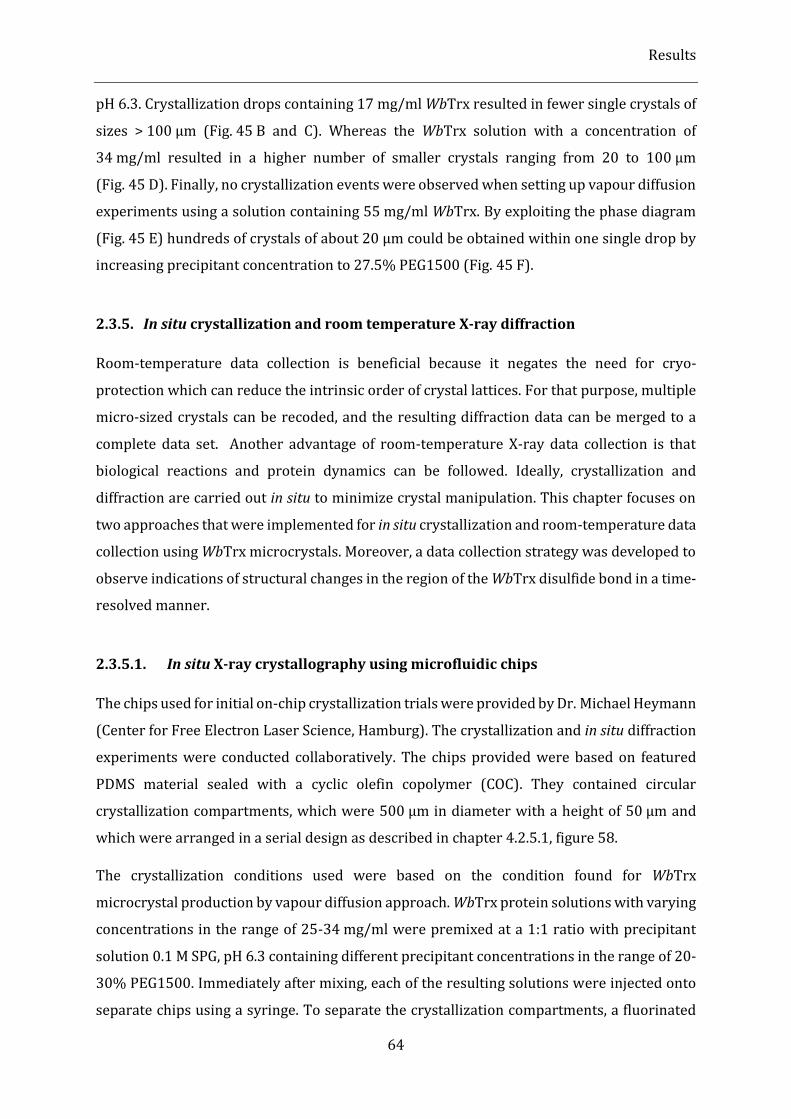
Results
64
pH 6.3. Crystallization drops containing 17 mg/ml WbTrx resulted in fewer single crystals of
sizes > 100 µm (Fig. 45 B and C). Whereas the WbTrx solution with a concentration of
34 mg/ml resulted in a higher number of smaller crystals ranging from 20 to 100 µm
(Fig. 45 D). Finally, no crystallization events were observed when setting up vapour diffusion
experiments using a solution containing 55 mg/ml WbTrx. By exploiting the phase diagram
(Fig. 45 E) hundreds of crystals of about 20 µm could be obtained within one single drop by
increasing precipitant concentration to 27.5% PEG1500 (Fig. 45 F).
2.3.5. In situ crystallization and room temperature X-ray diffraction
Room-temperature data collection is beneficial because it negates the need for cryo-
protection which can reduce the intrinsic order of crystal lattices. For that purpose, multiple
micro-sized crystals can be recoded, and the resulting diffraction data can be merged to a
complete data set. Another advantage of room-temperature X-ray data collection is that
biological reactions and protein dynamics can be followed. Ideally, crystallization and
diffraction are carried out in situ to minimize crystal manipulation. This chapter focuses on
two approaches that were implemented for in situ crystallization and room-temperature data
collection using WbTrx microcrystals. Moreover, a data collection strategy was developed to
observe indications of structural changes in the region of the WbTrx disulfide bond in a time-
resolved manner.
2.3.5.1. In situ X-ray crystallography using microfluidic chips
The chips used for initial on-chip crystallization trials were provided by Dr. Michael Heymann
(Center for Free Electron Laser Science, Hamburg). The crystallization and in situ diffraction
experiments were conducted collaboratively. The chips provided were based on featured
PDMS material sealed with a cyclic olefin copolymer (COC). They contained circular
crystallization compartments, which were 500 µm in diameter with a height of 50 µm and
which were arranged in a serial design as described in chapter 4.2.5.1, figure 58.
The crystallization conditions used were based on the condition found for WbTrx
microcrystal production by vapour diffusion approach. WbTrx protein solutions with varying
concentrations in the range of 25-34 mg/ml were premixed at a 1:1 ratio with precipitant
solution 0.1 M SPG, pH 6.3 containing different precipitant concentrations in the range of 20-
30% PEG1500. Immediately after mixing, each of the resulting solutions were injected onto
separate chips using a syringe. To separate the crystallization compartments, a fluorinated
Results
65
oil (HFE-7500, 3M, USA) was injected to eliminate protein solution from the channels. In the
process, not every well of the chip array was filled and some of the wells only resulted in
partially filled crystallization drops. To simulate a vapor diffusion experiment, the chips were
exposed to air, accelerating evaporation, thus reaching the nucleation phase. Once
microscopically detectable crystals appeared, the chips were stored in humid chambers to
decrease the evaporation rate and to allow for crystal growth. On-chip crystallization of
WbTrx was successful and detectable after 18 h. PEG1500 concentrations of 22.5-27.5% in
combination with 28-30 mg/ml WbTrx lead to well-shaped crystals. As expected, higher
concentration of precipitant and protein lead to a higher number of smaller crystals. Crystals
of different sizes within the range of 20-100 µm could be obtained using the on-chip
crystallization technique. (Fig. 46). However, on-chip crystallization did not result in a
complete chip array filled with crystals. From the wells that could successfully be filled with
crystallization mixture, only a small fraction produced crystals, implying that the chip loading
procedure requires further optimization.
Figure 46: WbTrx crystals grown on a COC sealed PDMS microfluidic chips. Using slight variations of
the initial vapour diffusion conditions, according to the phase diagram, crystals ranging from 20 µm to
approx. 100 µm in size could be obtained. Red arrows indicate typical WbTrx crytsls.
In previous studies and in unpublished consecutive experiments by Heymann et al., it was
shown that due to the layer thickness of PDMS and the resulting background scattering,
diffraction patterns recorded using PDMS chips showed a rather low signal-to-noise ratio
110,174. To address this problem and to maximize the signal-to-noise ratio, chips with
improved properties were designed and fabricated collaboratively with Michael Heymann
and colleagues (CFEL, Hamburg). The objective was to produce chips with minimal layer
thickness, which lead to the decision to use commercially available Kapton® foil as the
material of choice to seal the chips. Kapton® foil is available with a thickness of only 7.5 µm,
which is significantly less than the size of the initially used PDMS chips with COC as sealing
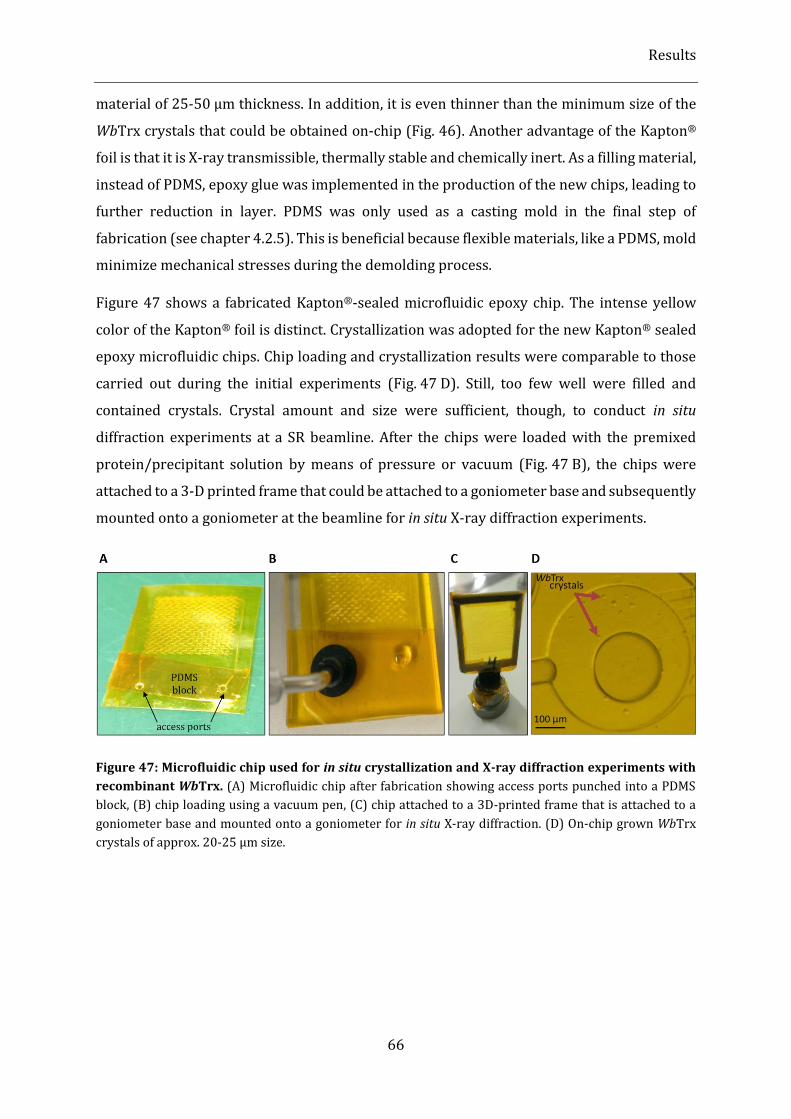
Results
66
material of 25-50 µm thickness. In addition, it is even thinner than the minimum size of the
WbTrx crystals that could be obtained on-chip (Fig. 46). Another advantage of the Kapton®
foil is that it is X-ray transmissible, thermally stable and chemically inert. As a filling material,
instead of PDMS, epoxy glue was implemented in the production of the new chips, leading to
further reduction in layer. PDMS was only used as a casting mold in the final step of
fabrication (see chapter 4.2.5). This is beneficial because flexible materials, like a PDMS, mold
minimize mechanical stresses during the demolding process.
Figure 47 shows a fabricated Kapton®-sealed microfluidic epoxy chip. The intense yellow
color of the Kapton® foil is distinct. Crystallization was adopted for the new Kapton® sealed
epoxy microfluidic chips. Chip loading and crystallization results were comparable to those
carried out during the initial experiments (Fig. 47 D). Still, too few well were filled and
contained crystals. Crystal amount and size were sufficient, though, to conduct in situ
diffraction experiments at a SR beamline. After the chips were loaded with the premixed
protein/precipitant solution by means of pressure or vacuum (Fig. 47 B), the chips were
attached to a 3-D printed frame that could be attached to a goniometer base and subsequently
mounted onto a goniometer at the beamline for in situ X-ray diffraction experiments.
Figure 47: Microfluidic chip used for in situ crystallization and X-ray diffraction experiments with
recombinant WbTrx. (A) Microfluidic chip after fabrication showing access ports punched into a PDMS
block, (B) chip loading using a vacuum pen, (C) chip attached to a 3D-printed frame that is attached to a
goniometer base and mounted onto a goniometer for in situ X-ray diffraction. (D) On-chip grown WbTrx
crystals of approx. 20-25 µm size.
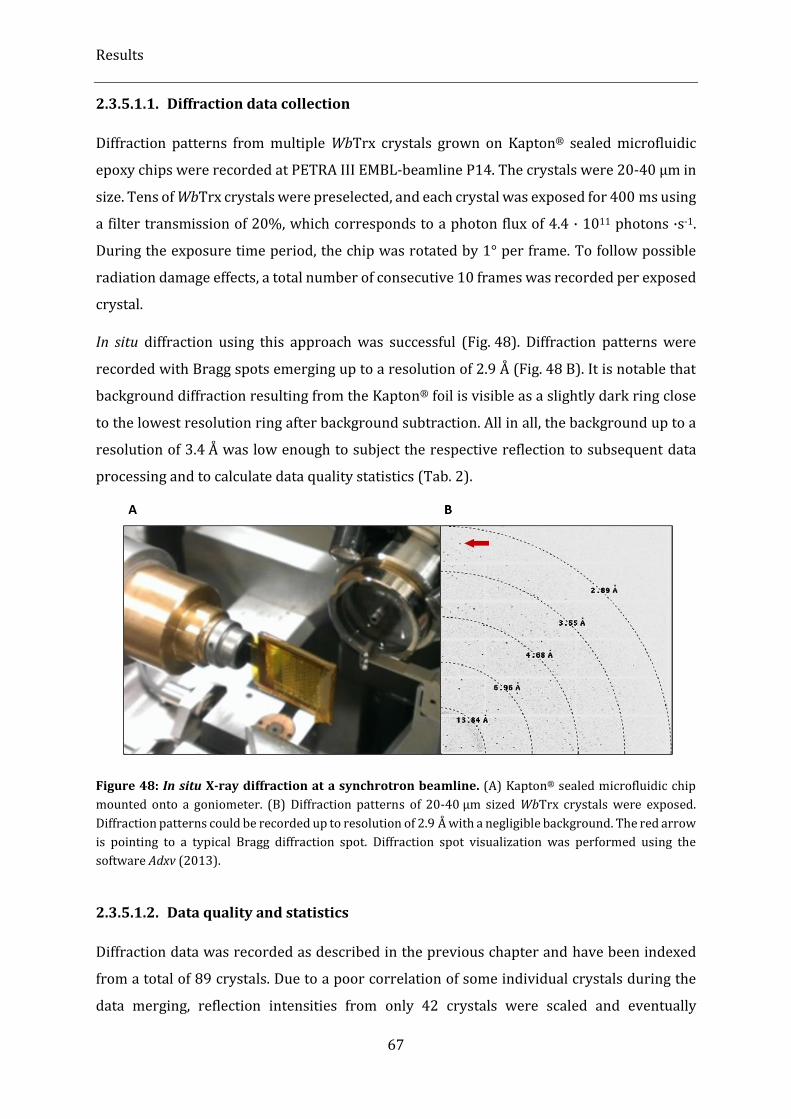
Results
67
2.3.5.1.1. Diffraction data collection
Diffraction patterns from multiple WbTrx crystals grown on Kapton® sealed microfluidic
epoxy chips were recorded at PETRA III EMBL-beamline P14. The crystals were 20-40 µm in
size. Tens of WbTrx crystals were preselected, and each crystal was exposed for 400 ms using
a filter transmission of 20%, which corresponds to a photon flux of 4.4 · 1011 photons ·s-1.
During the exposure time period, the chip was rotated by 1° per frame. To follow possible
radiation damage effects, a total number of consecutive 10 frames was recorded per exposed
crystal.
In situ diffraction using this approach was successful (Fig. 48). Diffraction patterns were
recorded with Bragg spots emerging up to a resolution of 2.9 Å (Fig. 48 B). It is notable that
background diffraction resulting from the Kapton® foil is visible as a slightly dark ring close
to the lowest resolution ring after background subtraction. All in all, the background up to a
resolution of 3.4 Å was low enough to subject the respective reflection to subsequent data
processing and to calculate data quality statistics (Tab. 2).
Figure 48: In situ X-ray diffraction at a synchrotron beamline. (A) Kapton® sealed microfluidic chip
mounted onto a goniometer. (B) Diffraction patterns of 20-40 µm sized WbTrx crystals were exposed.
Diffraction patterns could be recorded up to resolution of 2.9 Å with a negligible background. The red arrow
is pointing to a typical Bragg diffraction spot. Diffraction spot visualization was performed using the
software Adxv (2013).
2.3.5.1.2. Data quality and statistics
Diffraction data was recorded as described in the previous chapter and have been indexed
from a total of 89 crystals. Due to a poor correlation of some individual crystals during the
data merging, reflection intensities from only 42 crystals were scaled and eventually
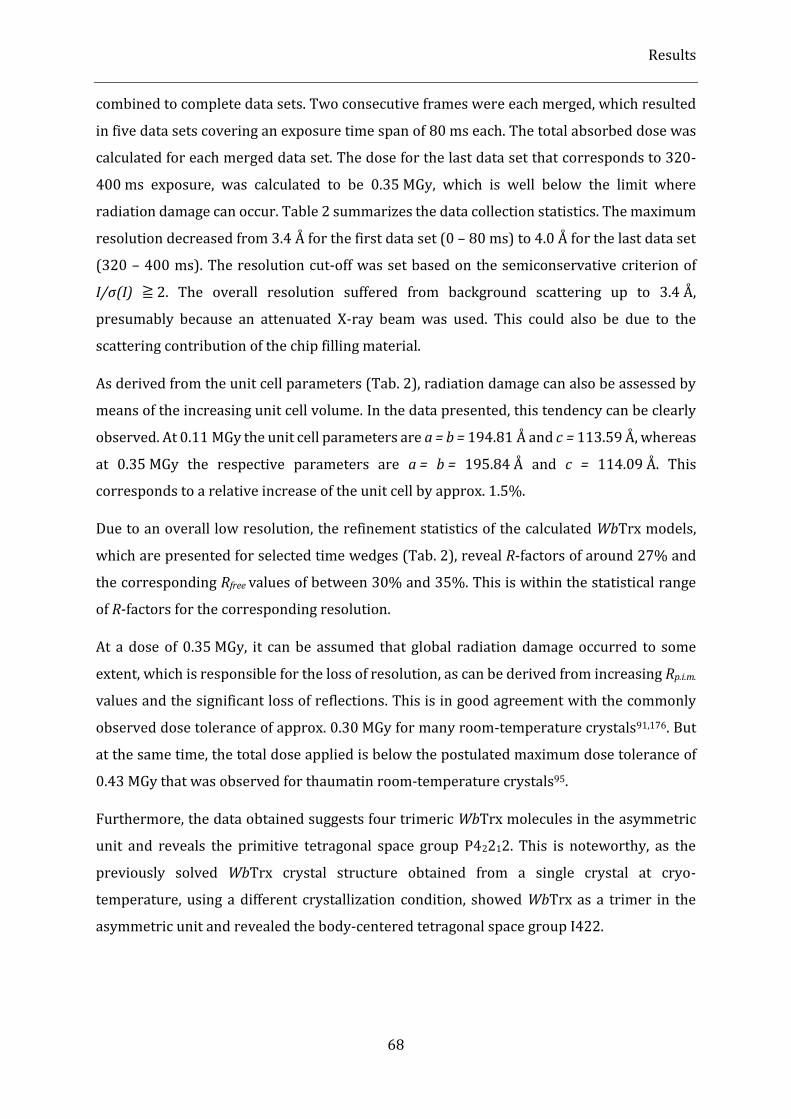
Results
68
combined to complete data sets. Two consecutive frames were each merged, which resulted
in five data sets covering an exposure time span of 80 ms each. The total absorbed dose was
calculated for each merged data set. The dose for the last data set that corresponds to 320-
400 ms exposure, was calculated to be 0.35 MGy, which is well below the limit where
radiation damage can occur. Table 2 summarizes the data collection statistics. The maximum
resolution decreased from 3.4 Å for the first data set (0 – 80 ms) to 4.0 Å for the last data set
(320 – 400 ms). The resolution cut-off was set based on the semiconservative criterion of
I/σ(I) ≧ 2. The overall resolution suffered from background scattering up to 3.4 Å,
presumably because an attenuated X-ray beam was used. This could also be due to the
scattering contribution of the chip filling material.
As derived from the unit cell parameters (Tab. 2), radiation damage can also be assessed by
means of the increasing unit cell volume. In the data presented, this tendency can be clearly
observed. At 0.11 MGy the unit cell parameters are a = b = 194.81 Å and c = 113.59 Å, whereas
at 0.35 MGy the respective parameters are a = b = 195.84 Å and c = 114.09 Å. This
corresponds to a relative increase of the unit cell by approx. 1.5%.
Due to an overall low resolution, the refinement statistics of the calculated WbTrx models,
which are presented for selected time wedges (Tab. 2), reveal R-factors of around 27% and
the corresponding Rfree values of between 30% and 35%. This is within the statistical range
of R-factors for the corresponding resolution.
At a dose of 0.35 MGy, it can be assumed that global radiation damage occurred to some
extent, which is responsible for the loss of resolution, as can be derived from increasing Rp.i.m.
values and the significant loss of reflections. This is in good agreement with the commonly
observed dose tolerance of approx. 0.30 MGy for many room-temperature crystals91,176. But
at the same time, the total dose applied is below the postulated maximum dose tolerance of
0.43 MGy that was observed for thaumatin room-temperature crystals95.
Furthermore, the data obtained suggests four trimeric WbTrx molecules in the asymmetric
unit and reveals the primitive tetragonal space group P42212. This is noteworthy, as the
previously solved WbTrx crystal structure obtained from a single crystal at cryo-
temperature, using a different crystallization condition, showed WbTrx as a trimer in the
asymmetric unit and revealed the body-centered tetragonal space group I422.
Results
69
Table 2: Data collection and refinement statistics. Values in parenthesis correspond for the highest
resolution shell. Rp.i.m. =∑hkl {1/(N(hkl)-1)}1/2∑i |Ii(hkl)-⟨I(hkl)⟩|/ ∑hkl ∑i Ii(hkl), where ⟨I (hkl)⟩ is the mean
intensity of the reflections hkl, ∑hkl is the sum over all reflections, and ∑i is the sum over i measurements of
reflection hkl.
Data collection statistics
4.4 ∙ 1011 photons/s
No. of crystals: 42
0-80 ms
0.11 MGy
160-240 ms
0.24 MGy
320-400 ms
0.35 MGy
Beamline P14 P14 P14
Wavelength [Å] 0.96863 0.96863 0.96863
Temperature [K] 296 296 296
Space group P42212 P42212 P42212
Molecules in asymmetric unit 12 12 12
Unit cell: a = b, c [Å] 194.81, 113.59 195.23, 113.76 195.84, 114.09
Resolution [Å] for I/σ(I) ≧ 2 50-3.40
(3.40-3.48)
50-3.60
(3.60-3.68)
50-4.00
(4.00-4.09)
Average I/σ(I) 3.3 (2.2) 3.0 (2.0) 2.5 (2.0)
Completeness [%] 98.4 (99) 95.4 (96) 87.9 (89)
Rp.i.m [%] 18.6 (28.9) 21.1 (34.9) 25.5 (38.0)
Measured reflections 173466 96591 44328
Unique reflections 28825 23553 15755
CC1/2 [%] 93.4 (78) 94.6 (77) 93.3 (75)
Multiplicity 6.0 4.1 2.8
Refinement statistics
Resolution range 50-3.40 50-3.60 50-4.00
R/Rfree [%] 27.0/32.8 27.4/30.8 28.1/33.7
Protein atoms 13536 13536 13536
Water molecules 288 181 84
R. m. s. deviations
Bond lengths [Å] 0.009 0.008 0.008
Bond angles [°] 1.22 1.18 1.13
B-factors [Å2]: protein 28.9 37.9 53.1
B-factors [Å2]: water 5.9 11.3 22.2
Ramachandran plot analysis
Most favoured regions [%] 97.30 97.12 96.48
Allowed regions [%] 2.70 2.88 3.46
Generously allowed regions [%] 0.00 0.00 0.06
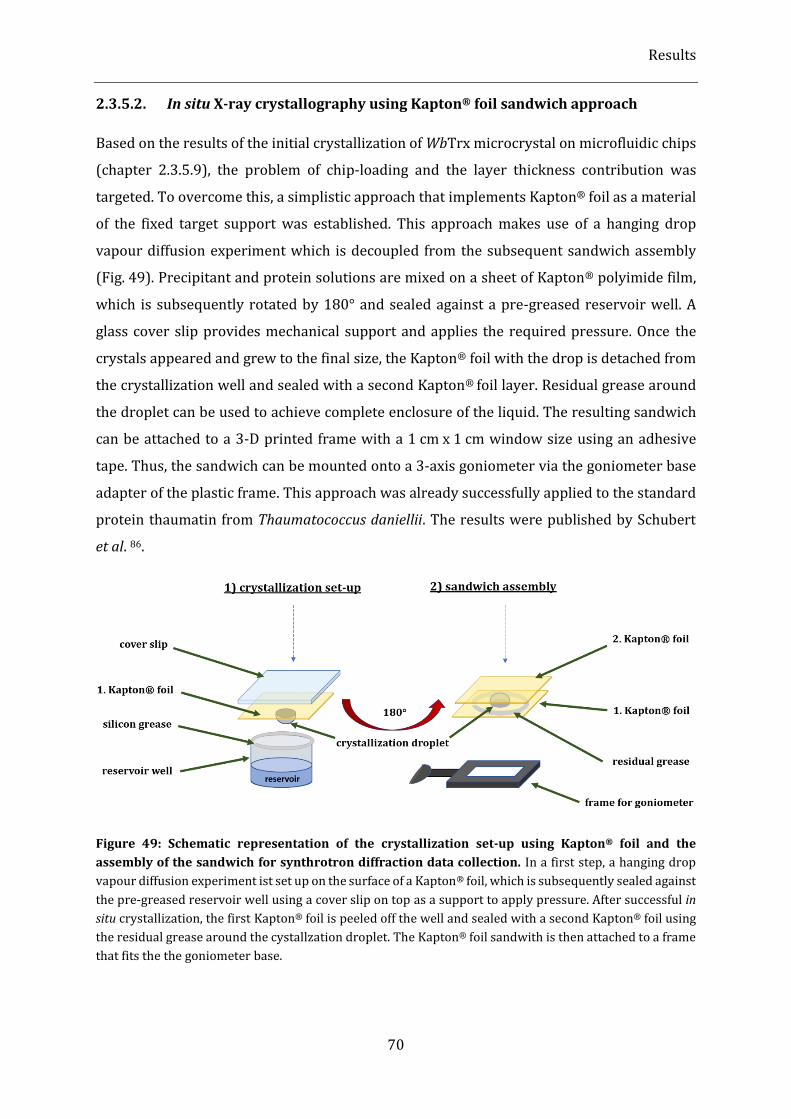
Results
70
2.3.5.2. In situ X-ray crystallography using Kapton® foil sandwich approach
Based on the results of the initial crystallization of WbTrx microcrystal on microfluidic chips
(chapter 2.3.5.9), the problem of chip-loading and the layer thickness contribution was
targeted. To overcome this, a simplistic approach that implements Kapton® foil as a material
of the fixed target support was established. This approach makes use of a hanging drop
vapour diffusion experiment which is decoupled from the subsequent sandwich assembly
(Fig. 49). Precipitant and protein solutions are mixed on a sheet of Kapton® polyimide film,
which is subsequently rotated by 180° and sealed against a pre-greased reservoir well. A
glass cover slip provides mechanical support and applies the required pressure. Once the
crystals appeared and grew to the final size, the Kapton® foil with the drop is detached from
the crystallization well and sealed with a second Kapton® foil layer. Residual grease around
the droplet can be used to achieve complete enclosure of the liquid. The resulting sandwich
can be attached to a 3-D printed frame with a 1 cm x 1 cm window size using an adhesive
tape. Thus, the sandwich can be mounted onto a 3-axis goniometer via the goniometer base
adapter of the plastic frame. This approach was already successfully applied to the standard
protein thaumatin from Thaumatococcus daniellii. The results were published by Schubert
et al. 86.
Figure 49: Schematic representation of the crystallization set-up using Kapton® foil and the
assembly of the sandwich for synthrotron diffraction data collection. In a first step, a hanging drop
vapour diffusion experiment ist set up on the surface of a Kapton® foil, which is subsequently sealed against
the pre-greased reservoir well using a cover slip on top as a support to apply pressure. After successful in
situ crystallization, the first Kapton® foil is peeled off the well and sealed with a second Kapton® foil using
the residual grease around the cystallzation droplet. The Kapton® foil sandwith is then attached to a frame
that fits the the goniometer base.
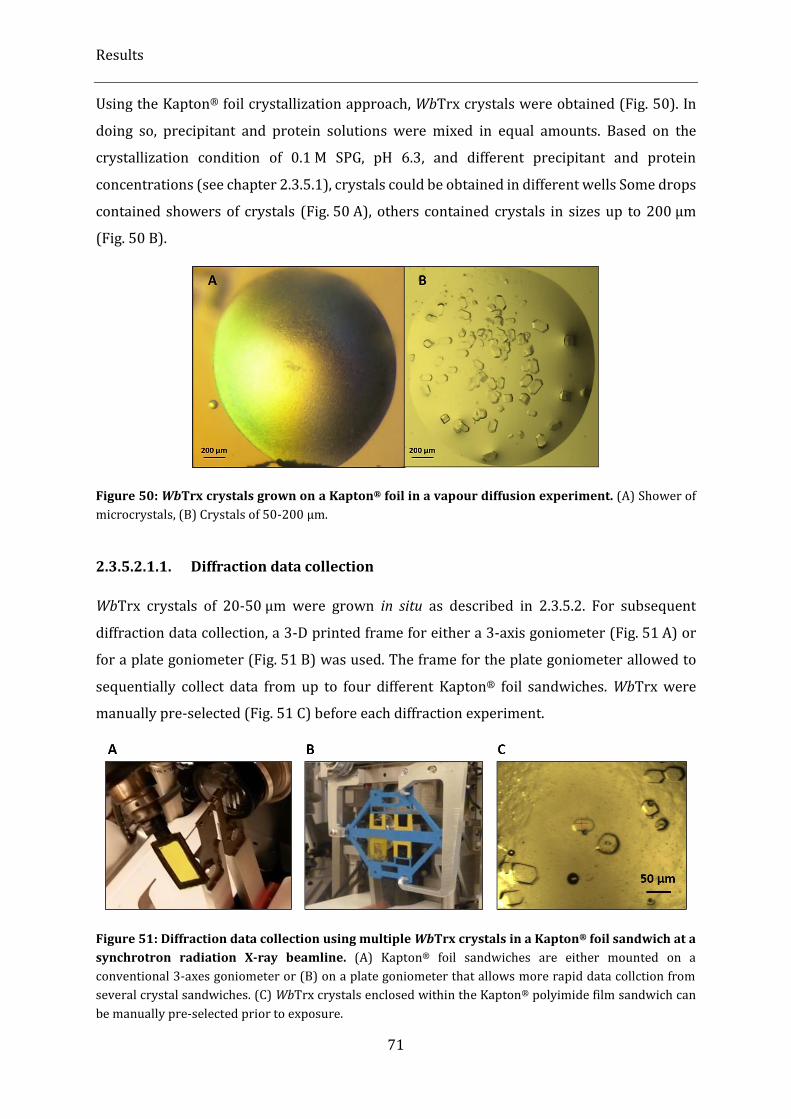
Results
71
Using the Kapton® foil crystallization approach, WbTrx crystals were obtained (Fig. 50). In
doing so, precipitant and protein solutions were mixed in equal amounts. Based on the
crystallization condition of 0.1 M SPG, pH 6.3, and different precipitant and protein
concentrations (see chapter 2.3.5.1), crystals could be obtained in different wells Some drops
contained showers of crystals (Fig. 50 A), others contained crystals in sizes up to 200 µm
(Fig. 50 B).
Figure 50: WbTrx crystals grown on a Kapton® foil in a vapour diffusion experiment. (A) Shower of
microcrystals, (B) Crystals of 50-200 µm.
2.3.5.2.1.1. Diffraction data collection
WbTrx crystals of 20-50 µm were grown in situ as described in 2.3.5.2. For subsequent
diffraction data collection, a 3-D printed frame for either a 3-axis goniometer (Fig. 51 A) or
for a plate goniometer (Fig. 51 B) was used. The frame for the plate goniometer allowed to
sequentially collect data from up to four different Kapton® foil sandwiches. WbTrx were
manually pre-selected (Fig. 51 C) before each diffraction experiment.
Figure 51: Diffraction data collection using multiple WbTrx crystals in a Kapton® foil sandwich at a
synchrotron radiation X-ray beamline. (A) Kapton® foil sandwiches are either mounted on a
conventional 3-axes goniometer or (B) on a plate goniometer that allows more rapid data collction from
several crystal sandwiches. (C) WbTrx crystals enclosed within the Kapton® polyimide film sandwich can
be manually pre-selected prior to exposure.
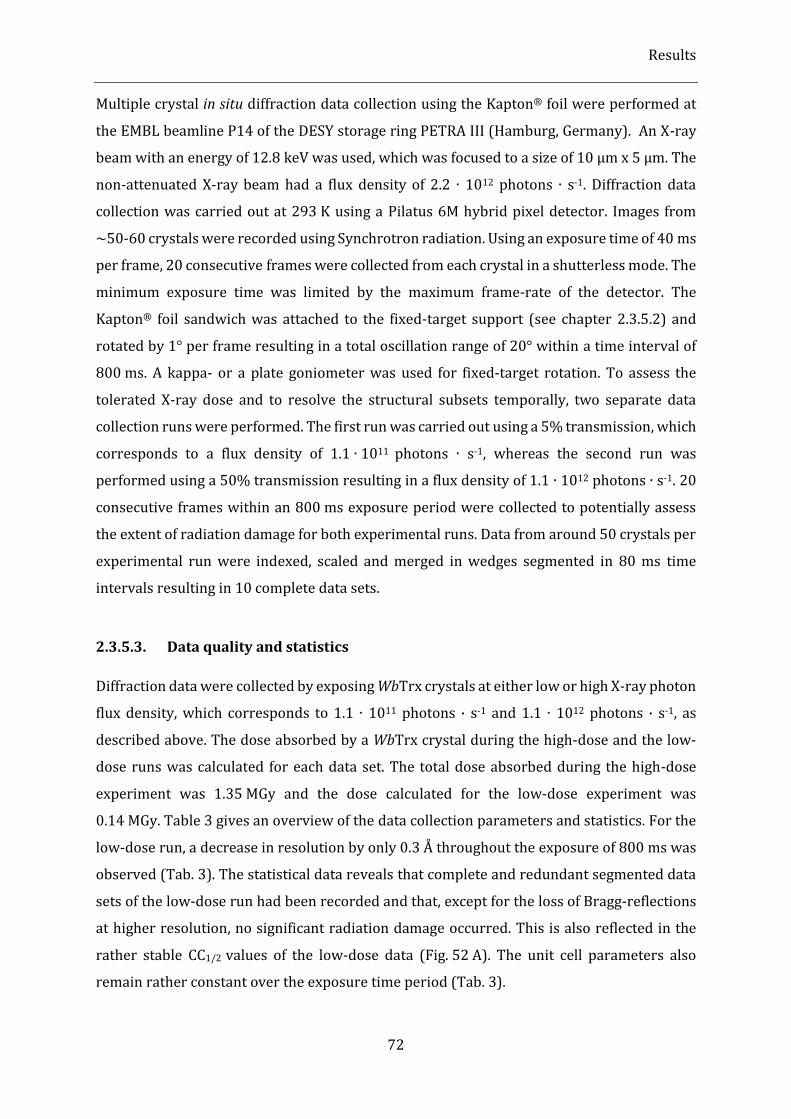
Results
72
Multiple crystal in situ diffraction data collection using the Kapton® foil were performed at
the EMBL beamline P14 of the DESY storage ring PETRA III (Hamburg, Germany). An X-ray
beam with an energy of 12.8 keV was used, which was focused to a size of 10 µm x 5 μm. The
non-attenuated X-ray beam had a flux density of 2.2 ∙ 1012 photons ∙ s-1. Diffraction data
collection was carried out at 293 K using a Pilatus 6M hybrid pixel detector. Images from
~50-60 crystals were recorded using Synchrotron radiation. Using an exposure time of 40 ms
per frame, 20 consecutive frames were collected from each crystal in a shutterless mode. The
minimum exposure time was limited by the maximum frame-rate of the detector. The
Kapton® foil sandwich was attached to the fixed-target support (see chapter 2.3.5.2) and
rotated by 1° per frame resulting in a total oscillation range of 20° within a time interval of
800 ms. A kappa- or a plate goniometer was used for fixed-target rotation. To assess the
tolerated X-ray dose and to resolve the structural subsets temporally, two separate data
collection runs were performed. The first run was carried out using a 5% transmission, which
corresponds to a flux density of 1.1 ∙ 1011 photons ∙ s-1, whereas the second run was
performed using a 50% transmission resulting in a flux density of 1.1 ∙ 1012 photons ∙ s-1. 20
consecutive frames within an 800 ms exposure period were collected to potentially assess
the extent of radiation damage for both experimental runs. Data from around 50 crystals per
experimental run were indexed, scaled and merged in wedges segmented in 80 ms time
intervals resulting in 10 complete data sets.
2.3.5.3. Data quality and statistics
Diffraction data were collected by exposing WbTrx crystals at either low or high X-ray photon
flux density, which corresponds to 1.1 ∙ 1011 photons · s-1 and 1.1 ∙ 1012 photons · s-1, as
described above. The dose absorbed by a WbTrx crystal during the high-dose and the low-
dose runs was calculated for each data set. The total dose absorbed during the high-dose
experiment was 1.35 MGy and the dose calculated for the low-dose experiment was
0.14 MGy. Table 3 gives an overview of the data collection parameters and statistics. For the
low-dose run, a decrease in resolution by only 0.3 Å throughout the exposure of 800 ms was
observed (Tab. 3). The statistical data reveals that complete and redundant segmented data
sets of the low-dose run had been recorded and that, except for the loss of Bragg-reflections
at higher resolution, no significant radiation damage occurred. This is also reflected in the
rather stable CC1/2 values of the low-dose data (Fig. 52 A). The unit cell parameters also
remain rather constant over the exposure time period (Tab. 3).
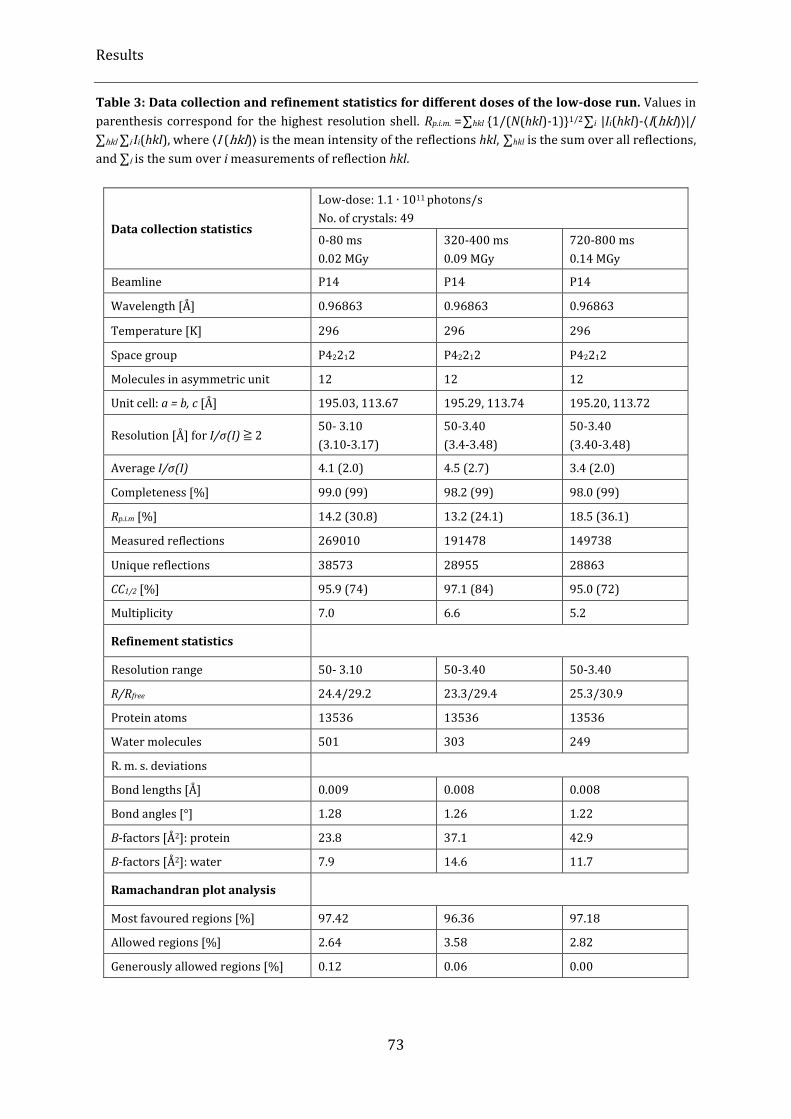
Results
73
Table 3: Data collection and refinement statistics for different doses of the low-dose run. Values in
parenthesis correspond for the highest resolution shell. Rp.i.m. =∑hkl {1/(N(hkl)-1)}1/2∑i |Ii(hkl)-⟨I(hkl)⟩|/
∑hkl ∑i Ii(hkl), where ⟨I (hkl)⟩ is the mean intensity of the reflections hkl, ∑hkl is the sum over all reflections,
and ∑i is the sum over i measurements of reflection hkl.
Data collection statistics
Low-dose: 1.1 ∙ 1011 photons/s
No. of crystals: 49
0-80 ms
0.02 MGy
320-400 ms
0.09 MGy
720-800 ms
0.14 MGy
Beamline P14 P14 P14
Wavelength [Å] 0.96863 0.96863 0.96863
Temperature [K] 296 296 296
Space group P42212 P42212 P42212
Molecules in asymmetric unit 12 12 12
Unit cell: a = b, c [Å] 195.03, 113.67 195.29, 113.74 195.20, 113.72
Resolution [Å] for I/σ(I) ≧ 2 50- 3.10
(3.10-3.17)
50-3.40
(3.4-3.48)
50-3.40
(3.40-3.48)
Average I/σ(I) 4.1 (2.0) 4.5 (2.7) 3.4 (2.0)
Completeness [%] 99.0 (99) 98.2 (99) 98.0 (99)
Rp.i.m [%] 14.2 (30.8) 13.2 (24.1) 18.5 (36.1)
Measured reflections 269010 191478 149738
Unique reflections 38573 28955 28863
CC1/2 [%] 95.9 (74) 97.1 (84) 95.0 (72)
Multiplicity 7.0 6.6 5.2
Refinement statistics
Resolution range 50- 3.10 50-3.40 50-3.40
R/Rfree 24.4/29.2 23.3/29.4 25.3/30.9
Protein atoms 13536 13536 13536
Water molecules 501 303 249
R. m. s. deviations
Bond lengths [Å] 0.009 0.008 0.008
Bond angles [°] 1.28 1.26 1.22
B-factors [Å2]: protein 23.8 37.1 42.9
B-factors [Å2]: water 7.9 14.6 11.7
Ramachandran plot analysis
Most favoured regions [%] 97.42 96.36 97.18
Allowed regions [%] 2.64 3.58 2.82
Generously allowed regions [%] 0.12 0.06 0.00
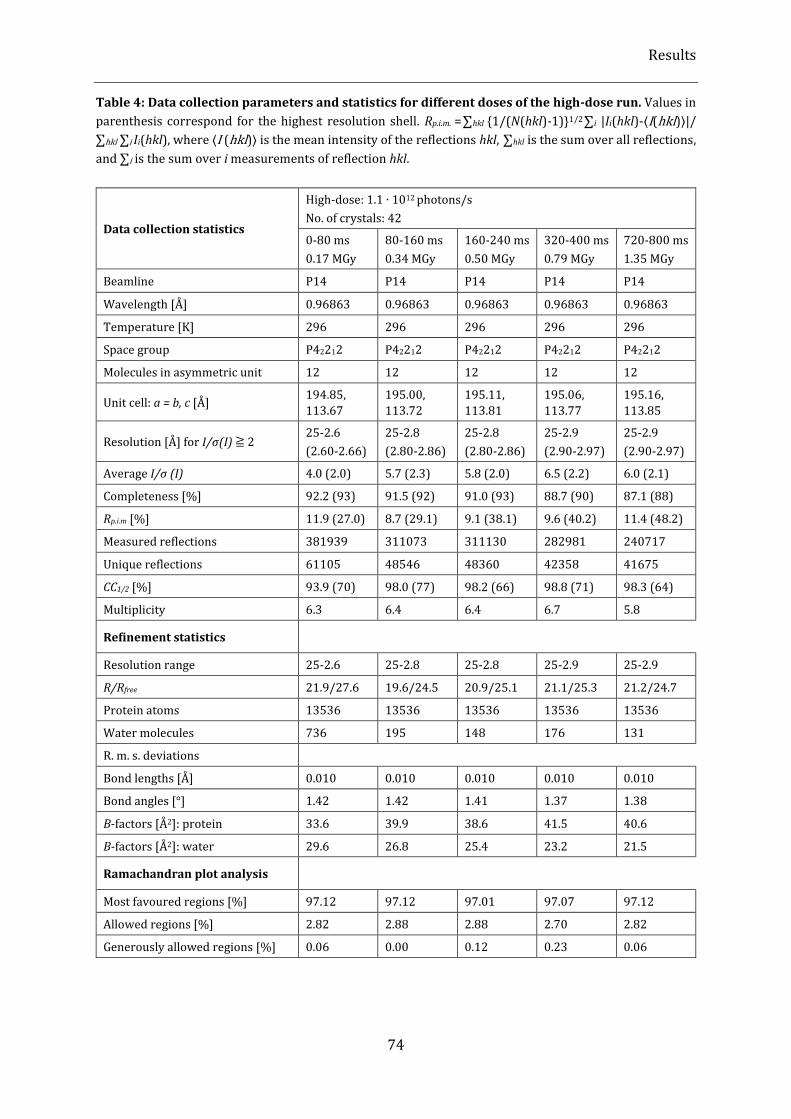
Results
74
Table 4: Data collection parameters and statistics for different doses of the high-dose run. Values in
parenthesis correspond for the highest resolution shell. Rp.i.m. =∑hkl {1/(N(hkl)-1)}1/2∑i |Ii(hkl)-⟨I(hkl)⟩|/
∑hkl ∑i Ii(hkl), where ⟨I (hkl)⟩ is the mean intensity of the reflections hkl, ∑hkl is the sum over all reflections,
and ∑i is the sum over i measurements of reflection hkl.
Data collection statistics
High-dose: 1.1 ∙ 1012 photons/s
No. of crystals: 42
0-80 ms
0.17 MGy
80-160 ms
0.34 MGy
160-240 ms
0.50 MGy
320-400 ms
0.79 MGy
720-800 ms
1.35 MGy
Beamline P14 P14 P14 P14 P14
Wavelength [Å] 0.96863 0.96863 0.96863 0.96863 0.96863
Temperature [K] 296 296 296 296 296
Space group P42212 P42212 P42212 P42212 P42212
Molecules in asymmetric unit 12 12 12 12 12
Unit cell: a = b, c [Å] 194.85,
113.67
195.00,
113.72
195.11,
113.81
195.06,
113.77
195.16,
113.85
Resolution [Å] for I/σ(I) ≧ 2 25-2.6
(2.60-2.66)
25-2.8
(2.80-2.86)
25-2.8
(2.80-2.86)
25-2.9
(2.90-2.97)
25-2.9
(2.90-2.97)
Average I/σ (I) 4.0 (2.0) 5.7 (2.3) 5.8 (2.0) 6.5 (2.2) 6.0 (2.1)
Completeness [%] 92.2 (93) 91.5 (92) 91.0 (93) 88.7 (90) 87.1 (88)
Rp.i.m [%] 11.9 (27.0) 8.7 (29.1) 9.1 (38.1) 9.6 (40.2) 11.4 (48.2)
Measured reflections 381939 311073 311130 282981 240717
Unique reflections 61105 48546 48360 42358 41675
CC1/2 [%] 93.9 (70) 98.0 (77) 98.2 (66) 98.8 (71) 98.3 (64)
Multiplicity 6.3 6.4 6.4 6.7 5.8
Refinement statistics
Resolution range 25-2.6 25-2.8 25-2.8 25-2.9 25-2.9
R/Rfree 21.9/27.6 19.6/24.5 20.9/25.1 21.1/25.3 21.2/24.7
Protein atoms 13536 13536 13536 13536 13536
Water molecules 736 195 148 176 131
R. m. s. deviations
Bond lengths [Å] 0.010 0.010 0.010 0.010 0.010
Bond angles [°] 1.42 1.42 1.41 1.37 1.38
B-factors [Å2]: protein 33.6 39.9 38.6 41.5 40.6
B-factors [Å2]: water 29.6 26.8 25.4 23.2 21.5
Ramachandran plot analysis
Most favoured regions [%] 97.12 97.12 97.01 97.07 97.12
Allowed regions [%] 2.82 2.88 2.88 2.70 2.82
Generously allowed regions [%] 0.06 0.00 0.12 0.23 0.06
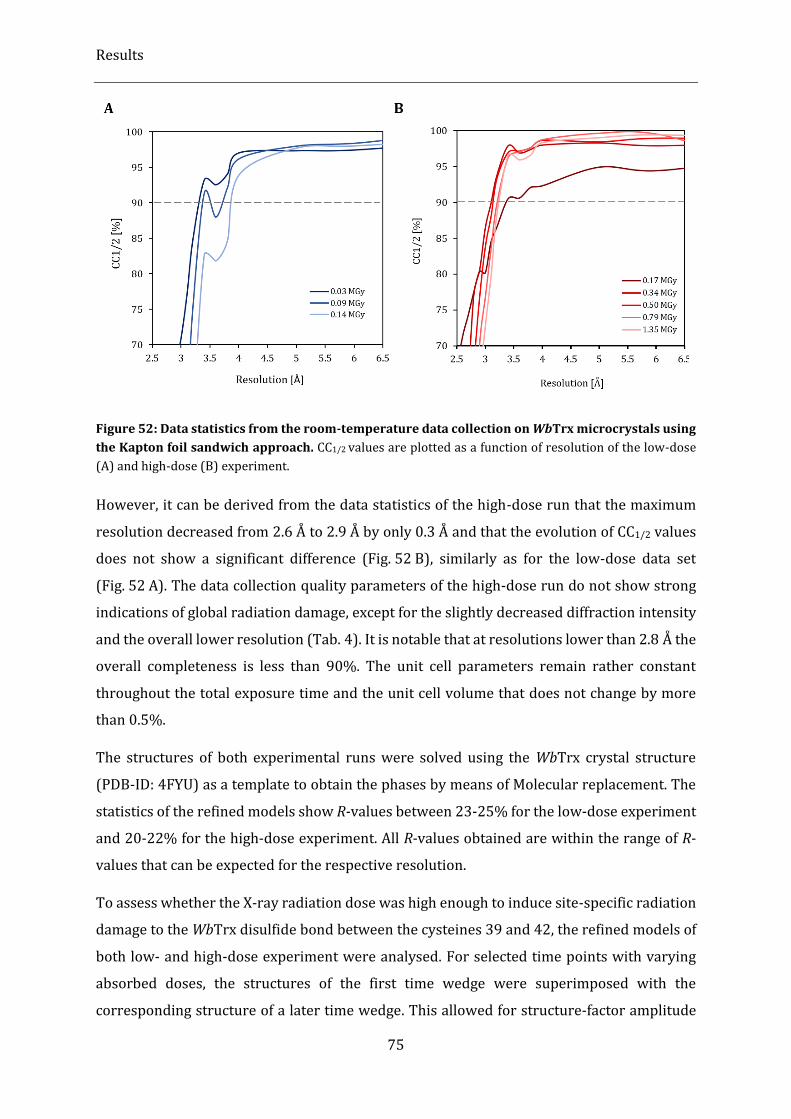
Results
75
Figure 52: Data statistics from the room-temperature data collection on WbTrx microcrystals using
the Kapton foil sandwich approach. CC1/2 values are plotted as a function of resolution of the low-dose
(A) and high-dose (B) experiment.
However, it can be derived from the data statistics of the high-dose run that the maximum
resolution decreased from 2.6 Å to 2.9 Å by only 0.3 Å and that the evolution of CC1/2 values
does not show a significant difference (Fig. 52 B), similarly as for the low-dose data set
(Fig. 52 A). The data collection quality parameters of the high-dose run do not show strong
indications of global radiation damage, except for the slightly decreased diffraction intensity
and the overall lower resolution (Tab. 4). It is notable that at resolutions lower than 2.8 Å the
overall completeness is less than 90%. The unit cell parameters remain rather constant
throughout the total exposure time and the unit cell volume that does not change by more
than 0.5%.
The structures of both experimental runs were solved using the WbTrx crystal structure
(PDB-ID: 4FYU) as a template to obtain the phases by means of Molecular replacement. The
statistics of the refined models show R-values between 23-25% for the low-dose experiment
and 20-22% for the high-dose experiment. All R-values obtained are within the range of R-
values that can be expected for the respective resolution.
To assess whether the X-ray radiation dose was high enough to induce site-specific radiation
damage to the WbTrx disulfide bond between the cysteines 39 and 42, the refined models of
both low- and high-dose experiment were analysed. For selected time points with varying
absorbed doses, the structures of the first time wedge were superimposed with the
corresponding structure of a later time wedge. This allowed for structure-factor amplitude
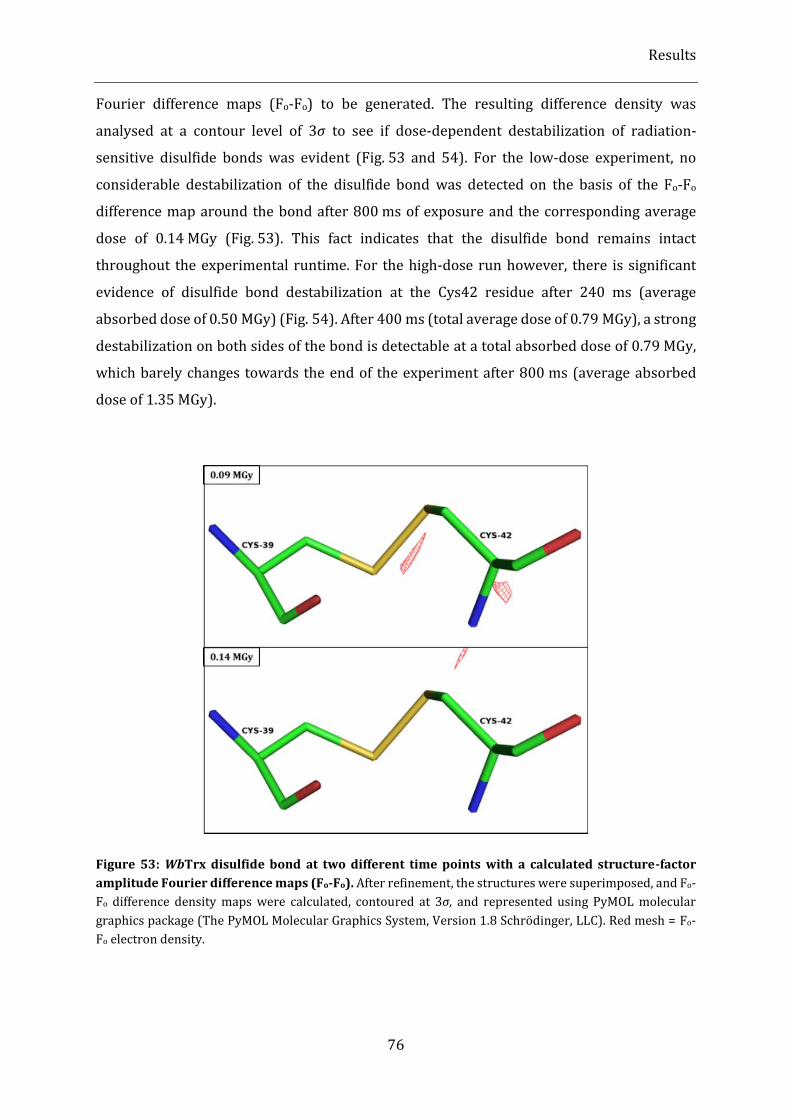
Results
76
Fourier difference maps (Fo-Fo) to be generated. The resulting difference density was
analysed at a contour level of 3σ to see if dose-dependent destabilization of radiation-
sensitive disulfide bonds was evident (Fig. 53 and 54). For the low-dose experiment, no
considerable destabilization of the disulfide bond was detected on the basis of the Fo-Fo
difference map around the bond after 800 ms of exposure and the corresponding average
dose of 0.14 MGy (Fig. 53). This fact indicates that the disulfide bond remains intact
throughout the experimental runtime. For the high-dose run however, there is significant
evidence of disulfide bond destabilization at the Cys42 residue after 240 ms (average
absorbed dose of 0.50 MGy) (Fig. 54). After 400 ms (total average dose of 0.79 MGy), a strong
destabilization on both sides of the bond is detectable at a total absorbed dose of 0.79 MGy,
which barely changes towards the end of the experiment after 800 ms (average absorbed
dose of 1.35 MGy).
Figure 53: WbTrx disulfide bond at two different time points with a calculated structure-factor
amplitude Fourier difference maps (Fo-Fo). After refinement, the structures were superimposed, and Fo-
Fo difference density maps were calculated, contoured at 3σ, and represented using PyMOL molecular
graphics package (The PyMOL Molecular Graphics System, Version 1.8 Schrödinger, LLC). Red mesh = Fo-
Fo electron density.
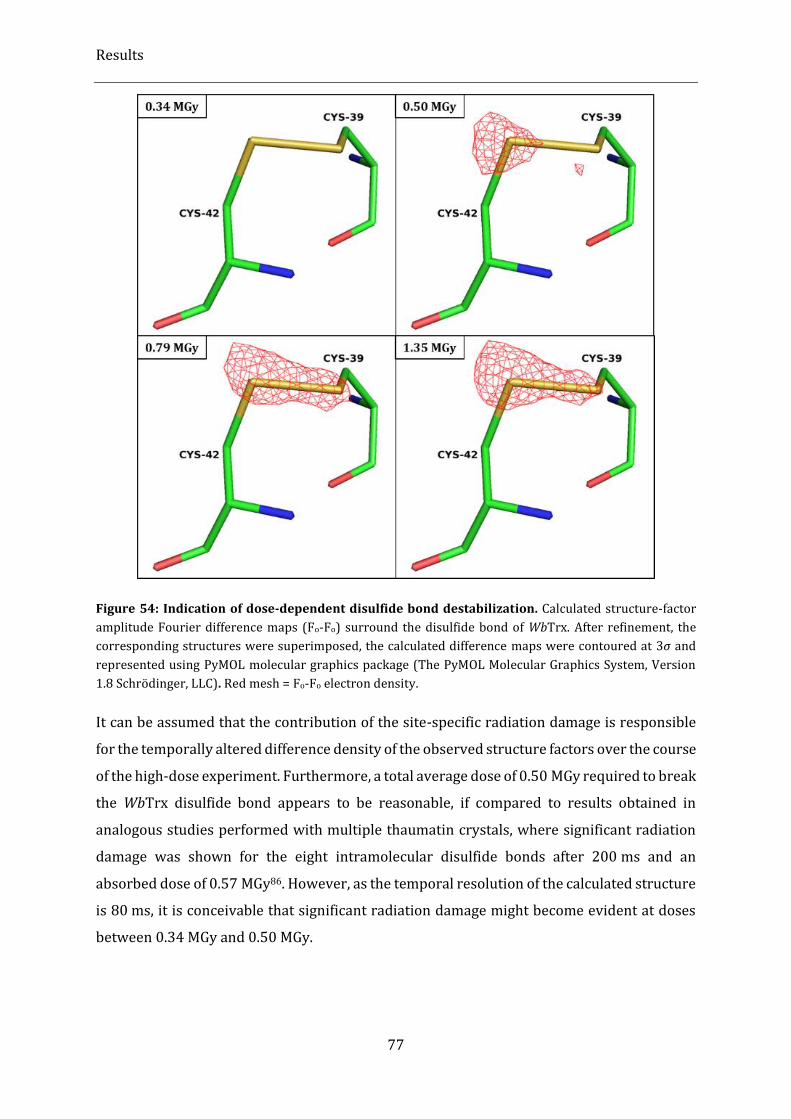
Results
77
Figure 54: Indication of dose-dependent disulfide bond destabilization. Calculated structure-factor
amplitude Fourier difference maps (Fo-Fo) surround the disulfide bond of WbTrx. After refinement, the
corresponding structures were superimposed, the calculated difference maps were contoured at 3σ and
represented using PyMOL molecular graphics package (The PyMOL Molecular Graphics System, Version
1.8 Schrödinger, LLC). Red mesh = Fo-Fo electron density.
It can be assumed that the contribution of the site-specific radiation damage is responsible
for the temporally altered difference density of the observed structure factors over the course
of the high-dose experiment. Furthermore, a total average dose of 0.50 MGy required to break
the WbTrx disulfide bond appears to be reasonable, if compared to results obtained in
analogous studies performed with multiple thaumatin crystals, where significant radiation
damage was shown for the eight intramolecular disulfide bonds after 200 ms and an
absorbed dose of 0.57 MGy86. However, as the temporal resolution of the calculated structure
is 80 ms, it is conceivable that significant radiation damage might become evident at doses
between 0.34 MGy and 0.50 MGy.
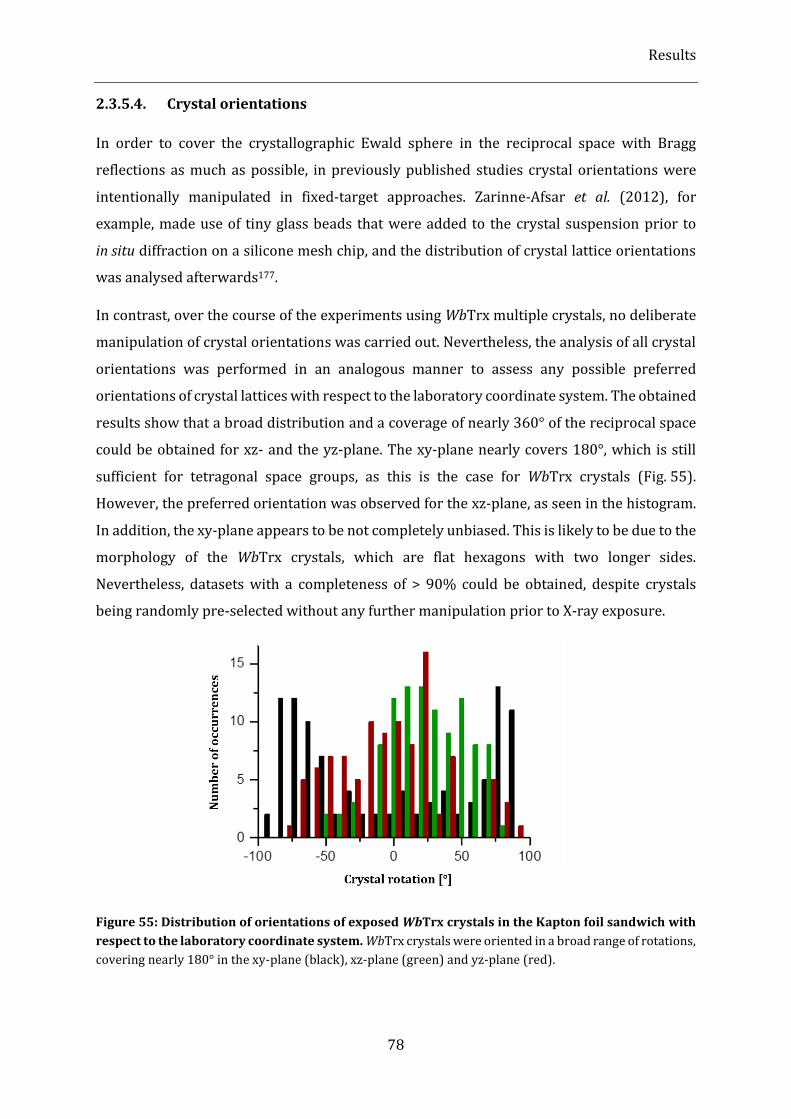
Results
78
2.3.5.4. Crystal orientations
In order to cover the crystallographic Ewald sphere in the reciprocal space with Bragg
reflections as much as possible, in previously published studies crystal orientations were
intentionally manipulated in fixed-target approaches. Zarinne-Afsar et al. (2012), for
example, made use of tiny glass beads that were added to the crystal suspension prior to
in situ diffraction on a silicone mesh chip, and the distribution of crystal lattice orientations
was analysed afterwards177.
In contrast, over the course of the experiments using WbTrx multiple crystals, no deliberate
manipulation of crystal orientations was carried out. Nevertheless, the analysis of all crystal
orientations was performed in an analogous manner to assess any possible preferred
orientations of crystal lattices with respect to the laboratory coordinate system. The obtained
results show that a broad distribution and a coverage of nearly 360° of the reciprocal space
could be obtained for xz- and the yz-plane. The xy-plane nearly covers 180°, which is still
sufficient for tetragonal space groups, as this is the case for WbTrx crystals (Fig. 55).
However, the preferred orientation was observed for the xz-plane, as seen in the histogram.
In addition, the xy-plane appears to be not completely unbiased. This is likely to be due to the
morphology of the WbTrx crystals, which are flat hexagons with two longer sides.
Nevertheless, datasets with a completeness of > 90% could be obtained, despite crystals
being randomly pre-selected without any further manipulation prior to X-ray exposure.
Figure 55: Distribution of orientations of exposed WbTrx crystals in the Kapton foil sandwich with
respect to the laboratory coordinate system. WbTrx crystals were oriented in a broad range of rotations,
covering nearly 180° in the xy-plane (black), xz-plane (green) and yz-plane (red).
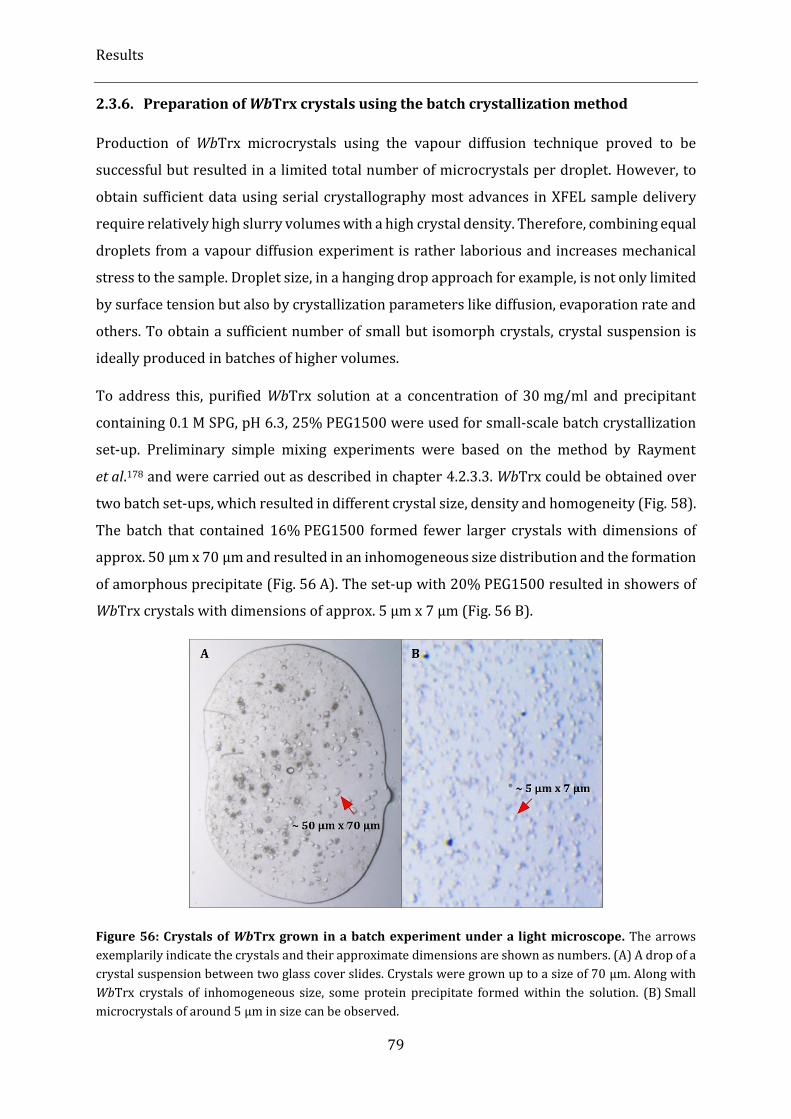
Results
79
2.3.6. Preparation of WbTrx crystals using the batch crystallization method
Production of WbTrx microcrystals using the vapour diffusion technique proved to be
successful but resulted in a limited total number of microcrystals per droplet. However, to
obtain sufficient data using serial crystallography most advances in XFEL sample delivery
require relatively high slurry volumes with a high crystal density. Therefore, combining equal
droplets from a vapour diffusion experiment is rather laborious and increases mechanical
stress to the sample. Droplet size, in a hanging drop approach for example, is not only limited
by surface tension but also by crystallization parameters like diffusion, evaporation rate and
others. To obtain a sufficient number of small but isomorph crystals, crystal suspension is
ideally produced in batches of higher volumes.
To address this, purified WbTrx solution at a concentration of 30 mg/ml and precipitant
containing 0.1 M SPG, pH 6.3, 25% PEG1500 were used for small-scale batch crystallization
set-up. Preliminary simple mixing experiments were based on the method by Rayment
et al.178 and were carried out as described in chapter 4.2.3.3. WbTrx could be obtained over
two batch set-ups, which resulted in different crystal size, density and homogeneity (Fig. 58).
The batch that contained 16% PEG1500 formed fewer larger crystals with dimensions of
approx. 50 µm x 70 µm and resulted in an inhomogeneous size distribution and the formation
of amorphous precipitate (Fig. 56 A). The set-up with 20% PEG1500 resulted in showers of
WbTrx crystals with dimensions of approx. 5 µm x 7 µm (Fig. 56 B).
Figure 56: Crystals of WbTrx grown in a batch experiment under a light microscope. The arrows
exemplarily indicate the crystals and their approximate dimensions are shown as numbers. (A) A drop of a
crystal suspension between two glass cover slides. Crystals were grown up to a size of 70 µm. Along with
WbTrx crystals of inhomogeneous size, some protein precipitate formed within the solution. (B) Small
microcrystals of around 5 µm in size can be observed.
Discussion
80
3. Discussion
3.1. Kinases from Plasmodium falciparum
Malaria is a parasitic disease, which results annually in approximately 200 million deaths
worldwide. For the affected populations, the disease is a significant economic and social
burden. Although many research groups worldwide focus on targeting the malaria parasite,
there is still no commercially available malaria vaccine. Plasmodial kinases are recognized as
promising drug targets. In the course of this thesis two different kinases from the most lethal
malaria parasite, Plasmodium falciparum, were recombinantly produced and characterized.
Serine Threonine kinase (PfSTK) from the most lethal malaria parasite Plasmodium
falciparum is found to be involved in parasite nutrient acquisition. Another kinase from P.
falciparum is the Hydroxyethylthiazole kinase PfThiM, which is essential for the de novo
synthesis of vitamin B1 and consequently the carbohydrate metabolism of the parasite. In
addition to the characterization of the prokaryotically produced PfSTK, first PfSTK in vivo
crystals were obtained using a baculoviral expression system. This result can possibly pave
the road to obtain structural information or even a high-resolution structure by means of
serial crystallography in the future. These results will be discussed in the following chapters.
3.1.1. Prokaryotically expressed PfSTK
3.1.1.1. PfSTK-Strep
The expression of the full-length PfSTK-Strep was performed using chaperone co-expression.
A two-step purification was established to isolate soluble protein of interest by Strep-tag
affinity chromatography. This was followed by size exclusion chromatography. Expression
and purification unfortunately yielded only 0.5 mg of pure monomeric PfSTK from 1 l of
bacterial culture. Also, the resulting protein could not be concentrated to concentrations
higher than 0.6 mg/ml due to aggregation events. Dynamic light scattering measurements
were performed to check the dispersity and to assess the particle size of the PfSTK solution
at 0.6 mg/ml. The solution was monodisperse and showed a hydrodynamic radius of approx.
11.4 nm. Assuming a globular protein particle shape, a molecular weight of approx. 875 kDa
was calculated. This molecular weight would either fit an oligomer with 20 unites or could
result from formation of ordered aggregates, which is more likely. Besides this observation,
Discussion
81
the generated protein solution also showed a rather low stability at 4 °C extending for only
2 days and showing visible aggregation thereafter.
To analyse folding integrity of purified PfSTK, a far UV spectrum was recorded using circular
dichroism spectroscopy. Thus, presence of folded protein could be confirmed and the
spectrum was further analysed for possible secondary structure elements124. According to
the prediction, β-sheet content was predominant with almost 45%, whereas nearly one third
of the protein was predicted to be unfolded. α-helical structural elements were found to be
only around 23%. The result of the CD measurement does not correspond well to the
secondary structure prediction that was made for PfSTK homology models.
Homology modelling using different servers was carried out and information obtained from
the generated models was compared with the result of the CD measurements. All structural
homology models generated showed a high convergence concerning the Serine-/Threonine
kinase domain (STK-domain). The N-terminus that contained a very low similarity to other
structurally known proteins showed for all three models presence of mainly β-sheet
structures. However, the overall content of β-sheets was predicted to be only half of the
percentage calculated by the Yang algorithm after CD spectroscopy (Tab. 5). Thus, the CD
spectroscopy result is rather questionable. Although the RMS value of approx. 8% is rather
low and implies a good correlation, it has to be taken into account that the far-UV region had
to be cut to 195 nm because of too high absorbance. The short wavelength far-UV region is
particularly dispositive to accurate secondary structure prediction but is at the same time
extremely sensitive to absorbance125. Lower wavelengths could not be reached due to a
minimum amount of salt, which had to be maintained to keep the sample stable. This could
also not be realized by further buffer exchange attempts.
Table 5 shows secondary structure prediction of the CD experiment, compared to the
homology modelling result obtained using RaptorX145 and sequence analysis using the
PSIPRED tool, which is based on position-specific scoring matrices179,180. Here, the homology
modelling result is more similar to the sequence-base prediction, especially in terms of the
β-sheet and random coil content. It is supposable that about 50% of the PfSTK amino acid
chain does not adopt any of the classical secondary structure, which can in turn lead to chain
flexibility and increased aggregation tendency.
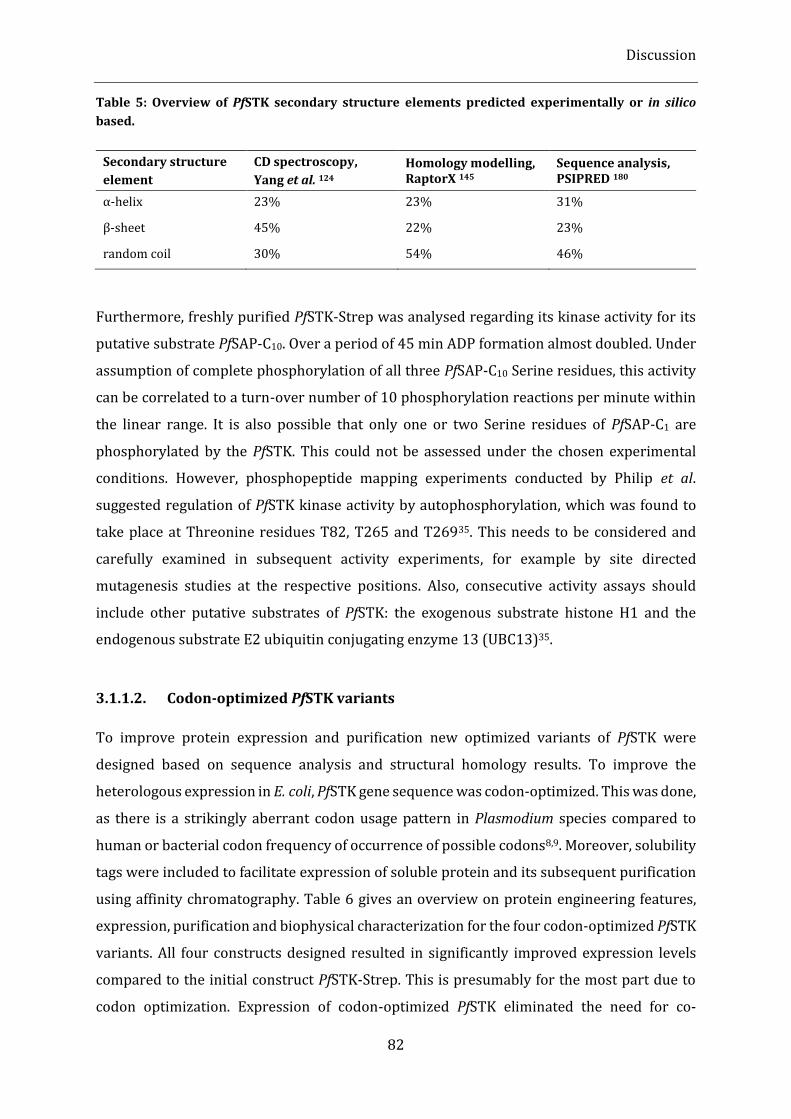
Discussion
82
Table 5: Overview of PfSTK secondary structure elements predicted experimentally or in silico
based.
Secondary structure
element
CD spectroscopy,
Yang et al. 124
Homology modelling, RaptorX 145
Sequence analysis, PSIPRED 180
α-helix 23% 23% 31%
β-sheet 45% 22% 23%
random coil 30% 54% 46%
Furthermore, freshly purified PfSTK-Strep was analysed regarding its kinase activity for its
putative substrate PfSAP-C10. Over a period of 45 min ADP formation almost doubled. Under
assumption of complete phosphorylation of all three PfSAP-C10 Serine residues, this activity
can be correlated to a turn-over number of 10 phosphorylation reactions per minute within
the linear range. It is also possible that only one or two Serine residues of PfSAP-C1 are
phosphorylated by the PfSTK. This could not be assessed under the chosen experimental
conditions. However, phosphopeptide mapping experiments conducted by Philip et al.
suggested regulation of PfSTK kinase activity by autophosphorylation, which was found to
take place at Threonine residues T82, T265 and T26935. This needs to be considered and
carefully examined in subsequent activity experiments, for example by site directed
mutagenesis studies at the respective positions. Also, consecutive activity assays should
include other putative substrates of PfSTK: the exogenous substrate histone H1 and the
endogenous substrate E2 ubiquitin conjugating enzyme 13 (UBC13)35.
3.1.1.2. Codon-optimized PfSTK variants
To improve protein expression and purification new optimized variants of PfSTK were
designed based on sequence analysis and structural homology results. To improve the
heterologous expression in E. coli, PfSTK gene sequence was codon-optimized. This was done,
as there is a strikingly aberrant codon usage pattern in Plasmodium species compared to
human or bacterial codon frequency of occurrence of possible codons8,9. Moreover, solubility
tags were included to facilitate expression of soluble protein and its subsequent purification
using affinity chromatography. Table 6 gives an overview on protein engineering features,
expression, purification and biophysical characterization for the four codon-optimized PfSTK
variants. All four constructs designed resulted in significantly improved expression levels
compared to the initial construct PfSTK-Strep. This is presumably for the most part due to
codon optimization. Expression of codon-optimized PfSTK eliminated the need for co-
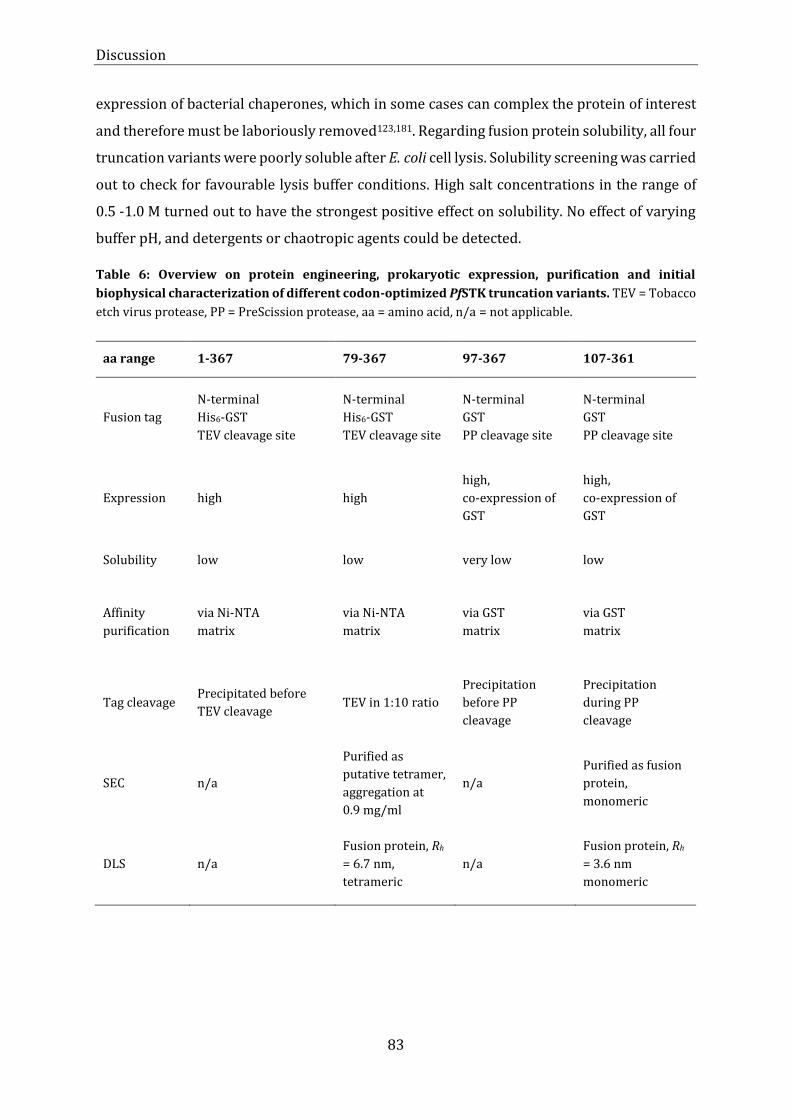
Discussion
83
expression of bacterial chaperones, which in some cases can complex the protein of interest
and therefore must be laboriously removed123,181. Regarding fusion protein solubility, all four
truncation variants were poorly soluble after E. coli cell lysis. Solubility screening was carried
out to check for favourable lysis buffer conditions. High salt concentrations in the range of
0.5 -1.0 M turned out to have the strongest positive effect on solubility. No effect of varying
buffer pH, and detergents or chaotropic agents could be detected.
Table 6: Overview on protein engineering, prokaryotic expression, purification and initial
biophysical characterization of different codon-optimized PfSTK truncation variants. TEV = Tobacco
etch virus protease, PP = PreScission protease, aa = amino acid, n/a = not applicable.
aa range 1-367 79-367 97-367 107-361
Fusion tag
N-terminal
His6-GST
TEV cleavage site
N-terminal
His6-GST
TEV cleavage site
N-terminal
GST
PP cleavage site
N-terminal
GST
PP cleavage site
Expression high high
high,
co-expression of
GST
high,
co-expression of
GST
Solubility low low very low low
Affinity
purification
via Ni-NTA
matrix
via Ni-NTA
matrix
via GST
matrix
via GST
matrix
Tag cleavage Precipitated before
TEV cleavage TEV in 1:10 ratio
Precipitation
before PP
cleavage
Precipitation
during PP
cleavage
SEC n/a
Purified as
putative tetramer,
aggregation at
0.9 mg/ml
n/a
Purified as fusion
protein,
monomeric
DLS n/a
Fusion protein, Rh
= 6.7 nm,
tetrameric
n/a
Fusion protein, Rh
= 3.6 nm
monomeric
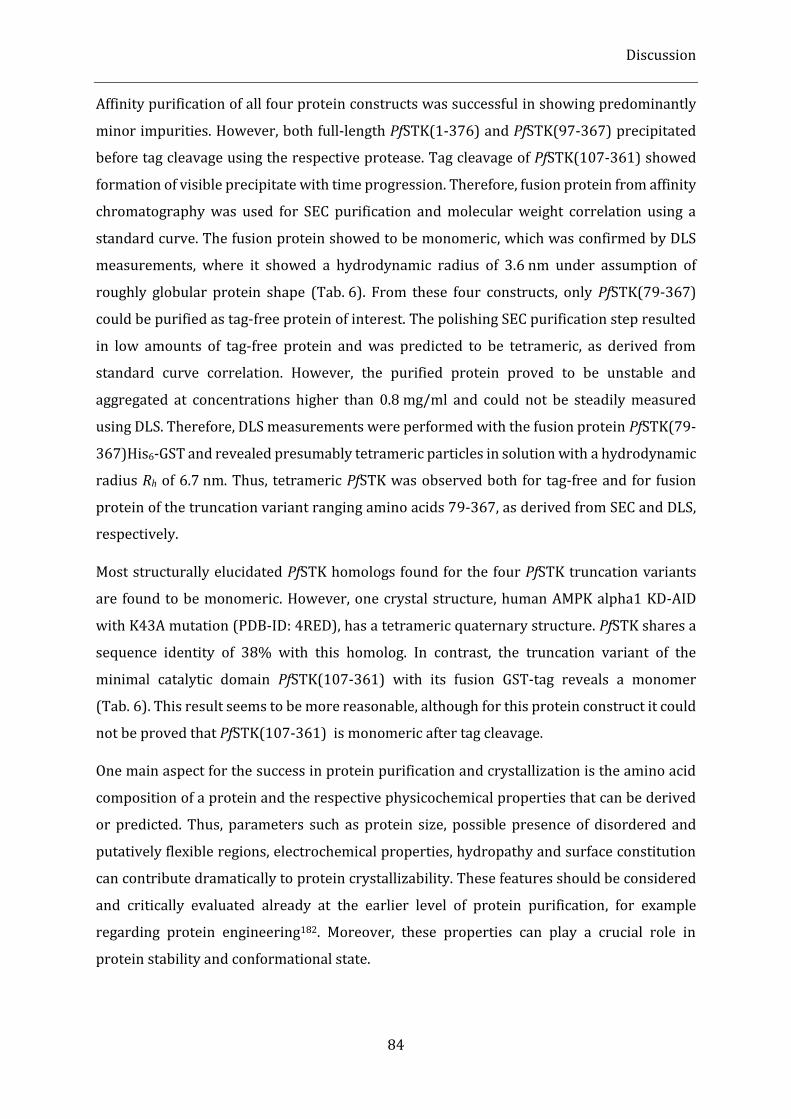
Discussion
84
Affinity purification of all four protein constructs was successful in showing predominantly
minor impurities. However, both full-length PfSTK(1-376) and PfSTK(97-367) precipitated
before tag cleavage using the respective protease. Tag cleavage of PfSTK(107-361) showed
formation of visible precipitate with time progression. Therefore, fusion protein from affinity
chromatography was used for SEC purification and molecular weight correlation using a
standard curve. The fusion protein showed to be monomeric, which was confirmed by DLS
measurements, where it showed a hydrodynamic radius of 3.6 nm under assumption of
roughly globular protein shape (Tab. 6). From these four constructs, only PfSTK(79-367)
could be purified as tag-free protein of interest. The polishing SEC purification step resulted
in low amounts of tag-free protein and was predicted to be tetrameric, as derived from
standard curve correlation. However, the purified protein proved to be unstable and
aggregated at concentrations higher than 0.8 mg/ml and could not be steadily measured
using DLS. Therefore, DLS measurements were performed with the fusion protein PfSTK(79-
367)His6-GST and revealed presumably tetrameric particles in solution with a hydrodynamic
radius Rh of 6.7 nm. Thus, tetrameric PfSTK was observed both for tag-free and for fusion
protein of the truncation variant ranging amino acids 79-367, as derived from SEC and DLS,
respectively.
Most structurally elucidated PfSTK homologs found for the four PfSTK truncation variants
are found to be monomeric. However, one crystal structure, human AMPK alpha1 KD-AID
with K43A mutation (PDB-ID: 4RED), has a tetrameric quaternary structure. PfSTK shares a
sequence identity of 38% with this homolog. In contrast, the truncation variant of the
minimal catalytic domain PfSTK(107-361) with its fusion GST-tag reveals a monomer
(Tab. 6). This result seems to be more reasonable, although for this protein construct it could
not be proved that PfSTK(107-361) is monomeric after tag cleavage.
One main aspect for the success in protein purification and crystallization is the amino acid
composition of a protein and the respective physicochemical properties that can be derived
or predicted. Thus, parameters such as protein size, possible presence of disordered and
putatively flexible regions, electrochemical properties, hydropathy and surface constitution
can contribute dramatically to protein crystallizability. These features should be considered
and critically evaluated already at the earlier level of protein purification, for example
regarding protein engineering182. Moreover, these properties can play a crucial role in
protein stability and conformational state.
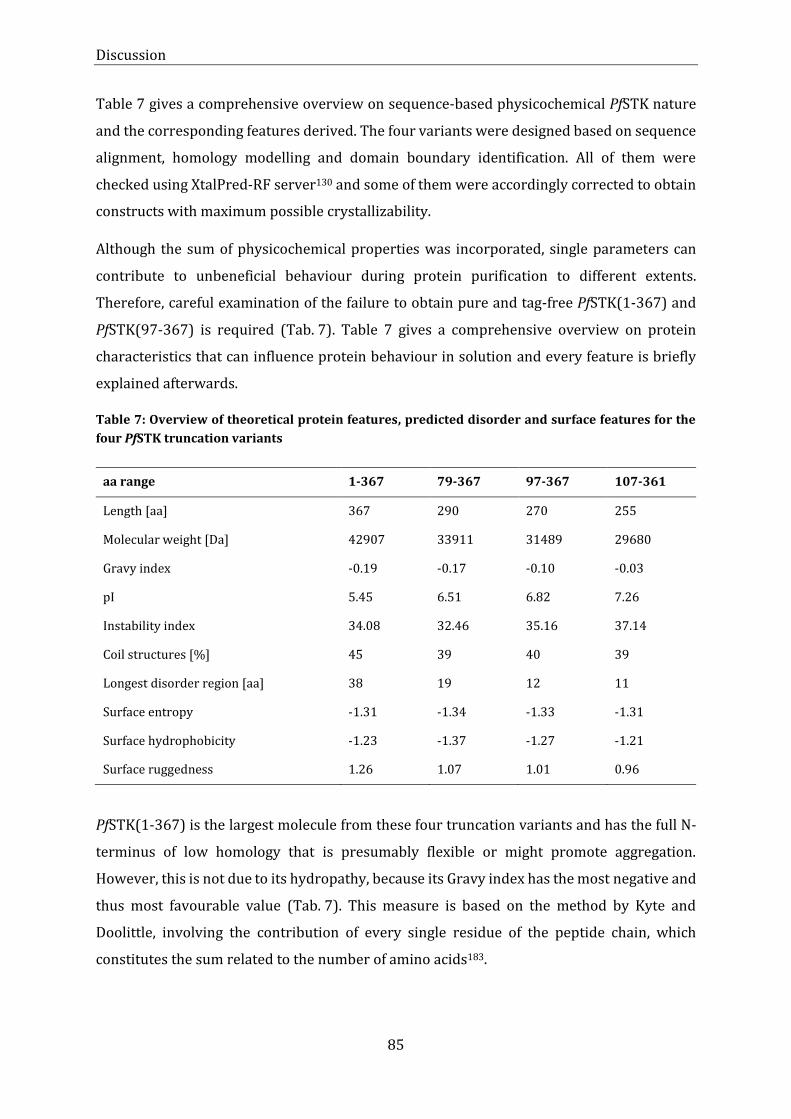
Discussion
85
Table 7 gives a comprehensive overview on sequence-based physicochemical PfSTK nature
and the corresponding features derived. The four variants were designed based on sequence
alignment, homology modelling and domain boundary identification. All of them were
checked using XtalPred-RF server130 and some of them were accordingly corrected to obtain
constructs with maximum possible crystallizability.
Although the sum of physicochemical properties was incorporated, single parameters can
contribute to unbeneficial behaviour during protein purification to different extents.
Therefore, careful examination of the failure to obtain pure and tag-free PfSTK(1-367) and
PfSTK(97-367) is required (Tab. 7). Table 7 gives a comprehensive overview on protein
characteristics that can influence protein behaviour in solution and every feature is briefly
explained afterwards.
Table 7: Overview of theoretical protein features, predicted disorder and surface features for the
four PfSTK truncation variants
aa range 1-367 79-367 97-367 107-361
Length [aa] 367 290 270 255
Molecular weight [Da] 42907 33911 31489 29680
Gravy index -0.19 -0.17 -0.10 -0.03
pI 5.45 6.51 6.82 7.26
Instability index 34.08 32.46 35.16 37.14
Coil structures [%] 45 39 40 39
Longest disorder region [aa] 38 19 12 11
Surface entropy -1.31 -1.34 -1.33 -1.31
Surface hydrophobicity -1.23 -1.37 -1.27 -1.21
Surface ruggedness 1.26 1.07 1.01 0.96
PfSTK(1-367) is the largest molecule from these four truncation variants and has the full N-
terminus of low homology that is presumably flexible or might promote aggregation.
However, this is not due to its hydropathy, because its Gravy index has the most negative and
thus most favourable value (Tab. 7). This measure is based on the method by Kyte and
Doolittle, involving the contribution of every single residue of the peptide chain, which
constitutes the sum related to the number of amino acids183.
Discussion
86
The isoelectric point is a parameter of great importance both for protein purification and the
subsequent crystallization. However, at both levels one must guarantee good protein
solubility in the working buffer system. When using slightly basic condition, as for the
purification and cleavage of most GST- and His6-tagged proteins, the pI should not be too
close to the buffer pH to avoid aggregation. However, great attention was paid to the pH value.
The instability index is a parameter based in the statistical occurrence of particular
dipeptides, which were found either in very stable or very unstable proteins184. According to
this value the minimal truncation variant PfSTK(107-361) is the least stable (Tab. 7). This
effect was observed while removing the fusion tag, showing visible protein aggregation
during the PreScission protease cleavage.
Another aspect of protein solubility and stability is protein order at the secondary structure
level. Thus, the presence of possible coil structure and putatively disordered regions must be
considered. Regarding this, full-length PfSTK has the least favourable predicted properties
(Tab. 7). As discussed above, it displays nearly 50% coil structures, as predicted by the
program COILS185, and a sequence of 38 amino acid that possibly constitute the longest
disorder region, as predicted by DISOPRED3 186. This makes up to 10% of the protein peptide
chain. However, such a relatively high fraction of intrinsically disordered regions is typical
for many eukaryotic proteins that can act in unstructured conformation or undergo
transitions between folded and unfolded state.
Besides the primary and secondary structure composition, the estimated tertiary structure
and the resulting surface constitution plays an important role and can promote aggregation
or lead to protein instability. In terms of surface entropy and surface hydrophobicity no
significant disparities were found for the four PfSTK versions (Tab. 7). The surface
ruggedness considers the number of protrusions and cavities on the protein surface and was
predicted by NetSurfP server187. Here it correlates well to the protein size and is lowest, and
therefore most beneficial, for PfSTK(107-361) (Tab. 7). This parameter is defined as a ratio
between the surface area and the total accessible area, which is expected for a protein of a
given molecular weight188. The surface area is calculated as the sum of solvent accessibilities
of every single residue. However, surface ruggedness has a higher impact on protein
crystallizability than on solubility.
For the full-length PfSTK lack of protein stability and solubility is probably due its
conformational properties like molecular weight, presence of coil structures and long
disorder regions and the resulting surface ruggedness. After removing the first 77 amino
Discussion
87
acids the protein shows by far most beneficial properties. In case of PfSTK(97-367), however,
its strong aggregation tendency cannot be derived from the mere sequence derived predicted
parameters.
A stable protein is a prerequisite not only at the level of protein purification but also for the
subsequent crystallization trials. In approaching the structural elucidation of prokaryotically
produced recombinant proteins, there are several classical methods available. One of them is
intensive buffer screening using the ThermoFluor assay189,190. With up to 96 buffer conditions
that can be examined concurrently, for example when using commercially available RUBIC
screens191. However, this method requires either a reproducibly stable protein sample or
immediate screening after purification which could not be realized in the course of this study.
The instability of PfSTK also hindered complementary approaches, which could be applied to
obtain structural information like Small Angle X-Ray Scattering SAXS163, or Nuclear Magnetic
Resonance (NMR)192.
One of most promising strategies in the case of PfSTK is to change the expression system to a
eukaryotic host expression system, which can lead to an increased chance of obtaining a
correctly folded functional protein. Expression in established yeasts strains like for example
Pichia pastoris or Saccharomyces cerevisiae can lead to a stable recombinant protein due to
the presence of eukaryotic protein folding and glycosylation machinery. One practical
disadvantage is that yeast cells are difficult to disrupt. Other problems might occur because
expression using yeast is less applicable to cytoplasmatically expressed protein. Additionally,
inhomogeneous posttranslational glycosylations can sometimes interfere with subsequent
protein crystallization193.
A more expensive and contamination-sensitive expression system is baculoviral expression
using insect cells. However, baculoviral expression allows for translational modifications that
are required for structural integrity. Moreover it was shown to be successful also for some
challenging membrane proteins194. In the course of the thesis’ research activities, first
attempts were made to make use of baculoviral expression system to overexpress PfSTK,
which is described in the following chapter.
3.1.1.3. In vivo crystallization of PfSTK
In some cases, formation of intracellular protein crystals was observed when Sf9 insect cells
or other eukaryotic cell lines were used for expression of the protein of interest74,151,195,196.
The high-resolution structure of natively inhibiting CatB from Trypanosoma brucei (TbCatB)
Discussion
88
was solved as a first protein target using the approach of in vivo crystallography in
combination with an FEL radiation source74. Successful in vivo crystallization was observed
for a number of other protein targets, which suggests that formation of crystals within the
cell is not a random phenomenon99,156,158. In the case of TbCatB for example, needle-shaped
crystals are formed within the cell that are very stable regarding both chemical and
mechanical factors of influence74.
In the course of the experimental part of this thesis, attempts were made to express the PfSTK
gene in Sf9 cells using baculoviral expression system. After successful cloning and generation
of a recombinant bacmid, cells were infected with the previously amplified viral stock P3.
This infection resulted in formation of rod-shaped crystalline structures within the cells that
partially led to cell rupture by reaching their maximum length. A protocol established by
Dr. Theresa Nuguid (University of Hamburg) was adapted for the isolation of in vivo grown
crystals. The first trials resulted in rather low amounts of pure crystals, requiring further
optimization. Isolation and crystal purification strategies are not always straight forward. For
the Luciferase from Photinus pyralis for example, crystal degradation was observed during
cell lysis195.
Because diffraction beamtime at FELs is till now only rarely available, sample verification
prior to diffraction experiment is indispensable. Thus, it must be confirmed that the crystals
that are formed within the cells are not salt but protein crystals. This can for example be
achieved by means of the X-ray powder diffraction technique. In contrast to diffraction on
well-ordered single crystals, the powder diffraction technique is suitable for analysis of sub-
microcrystalline matter197. However, the amount of crystals obtained by the applied isolation
strategy was not sufficient to perform a powder diffraction experiment using conventional X-
ray source. Alternative methods to verify presence of protein crystals could be: ultraviolet
fluorescence167, electron microscopy169 or second harmonic generation (SHG)159. Ultraviolet
fluorescence, however, is only applicable for well-shaped and pure crystals. Since the in vivo
crystal sample obtained contained tiny needle-shaped crystals and the solution was not
highly pure, it is likely that the UV fluorescence signal will not be strong enough and most
likely be covered by background. Furthermore, for UV detection of proteins it is assumed that
the higher the extinction coefficient of a protein is, due to the presence of aromatic residues,
the better the signal to noise ratio. In the PfSTK amino acid sequence there are only two
tryptophan residues present, which are the strongest UV absorbers. For a 367 bp long
sequence it has a rather low tryptophan content. Therefore, even for a well-shaped crystal,
like cubic or hexagonal or tetragonal crystal, a strong UV signal cannot be expected. Crystal
Discussion
89
detection via Electron Microscopy (EM) typically requires cross-linking of the sample. The in
vivo crystalline sample obtained from recombinant PfSTK did not meet the minimum
requirements to perform crystal preparation for subsequent EM experiments. Second
harmonic generation faces the same problems as UV fluorescence detection. In addition, the
method fails to verify crystals of higher symmetry. For crystals with unknown symmetry it is
therefore not the first method of choice.
The first in vivo grown crystals from PfSTK need to get reproduced. Additionally, further
optimization of the isolation strategy is needed to obtain higher yields of crystals with a
higher crystal density. In the case of positive verification, protein crystals can be used for
serial femtosecond X-ray crystallography (SFX) using FEL radiation75 to solve the structure
of PfSTK. Baculoviral expression in Sf9 cells also offers the possibility to establish large-scale
expression and purification of PfSTK. This approach could support the production of stable
soluble functional PfSTK, which in turn would allow conventional in vitro crystallization
experiments.
3.1.2. Expression and purification of PfThiM
Recombinant PfThiM-Strep was produced in E. coil BL21 (DE3) and initially co-expressed
with groES-groEL chaperones to increase the possibility of proper intracellular folding. The
heterologous expression resulted in high expression levels. However, during the purification
step, it was not possible to remove the chaperones due to target protein complexing.
Therefore, PfThiM expression was established in E. coli BL21 Rosetta, an E. coli mutant that
is capable to produce rare tRNAs. Rare tRNAs promote expression of recombinant proteins
that have a strongly aberrant codon-usage compared to the host codon-usage.
Although the expression levels using this strategy were significantly lower than when using
co-expressed chaperones, the first purification step using Strep-Tactin® affinity
chromatography already resulted in much purer PfThiM. A further purification step was a
size exclusion chromatography (SEC) step. However, this polishing step resulted in a loss of
significant quantities of protein. As an SDS-PAGE analysis revealed, PfThiM presumably
aggregated and therefore was predominantly found in the void volume fractions. Moreover,
the chromatogram displayed an overall low absorbance signal and showed poor peaks that
were not baseline-separated. The bands that correspond to PfThiM on denaturing acrylamide
gels, appeared to be smeared, which could be a sign for inhomogeneous sample. Possible
reasons for mearing could be protein degradation, premature translation stop or possible,
Discussion
90
however relatively unstudied, post-translational modifications carried out by E. coli that have
been recently discovered under certain conditions198. All these events can lead to
inhomogeneous protein folding and consequently to sample aggregation. The protein
obtained after SEC was found to be monomeric according to the calibration curve. This result
did not conform with the expectations, as other Hydroxyethylthiazole kinases and its closest
homologs, which have been structurally characterized, displayed uniformly a trimeric state,
like for example Hydroxyethylthiazole kinase from Staphylococcus aureus (SaThiM)199. This
homolog that shares an approx. 35% sequence identity was purified and crystallized in the
same laboratory. First attempts to adopt the purification strategy from that of SaThiM failed.
This could be due to a significantly different surface charge distribution, which was observed
in homology modelling studies.
Purified PfThiM was dialysed into different buffer systems with different pH values and was
found to be most monodisperse in 50 mM Phosphate buffer, pH 8.0, where it displayed its
lowest Rh of approx. 9 nm. Assuming globular particles, this value corresponds to approx.
500 kDa, which is too high and reveals formation of ordered aggregates. Acidic pH of 4-5
showed to promote aggregation to a higher extent. Because PfThiM failed to remain stable, it
can be suggested that further protein engineering is required to optimize the recombinant
construct. As can be derived from the homology modelling results, the first 29 N-terminal
amino acids are of low homology and are predicted to be slightly disordered and flexible. The
presence of disordered or flexible regions tends to lead to protein aggregation. An alternative
approach could be construct optimization using limited proteolysis200 or site-directed
mutagenesis201 of problematic residues. Possibly, using baculoviral expression in insect cells
is more constructive, because many eukaryotic proteins require distinct posttranslational
modifications. Similar as for the Serine- Threonine Kinase from P. falciparum (PfSTK), there
is a good chance to obtain intracellularly grown in vivo crystals.
3.2. WbTrx
Lymphatic filariasis, the second common vector-borne disease after malaria, affects around
120 million people worldwide. Its parasite Wuchereria bancrofti infects the human lymphatic
system, which typically leads to severe disfigurement of legs or genitals. Patients not only
suffer from physical pain but also from social stigma. Because most patients live in countries
that are also highly endemic to other infectious diseases, the affected populations bear an
additionally high economic burden. In this work, Thioredoxin from Wuchereria bancrofti
Discussion
91
WbTrx was under investigation. WbTrx form a particular disulfide bond and its mode of
action is via disulfide-thiol exchange. One focus of this work was the preparation of
recombinant WbTrx for serial crystallographic approaches. The disulfide bond cleavage is of
particular interest and can possibly be studied in a time-resolved mode using FEL radiation
in the future. Microcrystals and sub-microcrystals were obtained from recombinant WbTrx
and first experiments using a micro-focus SR beamline and different fixed-target approaches
were performed, particularly with a focus towards time-resolved studies.
3.2.1. WbTrx production and characterization
Expression and purification of recombinant WbTrx were optimized, leading to high yields of
highly purified protein being obtained. This is essential because both high yields and high
purity are prerequisite for microcrystal production. Prior to micro-crystal production,
biophysical characterization of WbTrx was carried out. The exact molecular weight of WbTrx
was determined using ESI-MS analysis and calculated to be 15998 Da which corresponds to
the theoretical monomeric molecular weight. The recorded spectrum revealed a well-defined
fold and a high-degree of purity. Moreover, further biophysical characterization was
performed by DLS and CD spectroscopy to prove monodispersity of the protein solution at
high concentrations and to verify the folding integrity of WbTrx in solution. DLS
measurements showed a narrow radius distribution profile, even at high concentrations. The
calculated hydrodynamic radius Rh was around 2.0 nm, which corresponds well to the
previously observed Rh at low concentrations59. No changes in the DLS profile and thus no
concentration dependent aggregation was observed up to 55 mg/ml. SAXS experiments were
performed to analyse the WbTrx particle shape in solution. The calculated ab initio model fits
well to the WbTrx crystal structure (PDB-ID: 4FYU)59. It showed an overall compact globular
shape of the particle and a region that sticks out of the surface. This region covers well the
last 13 C-terminal residues of the WbTrx amino acid sequence that form an α-helix which is
extended to a length of 18 Å.
3.2.2. Detection of WbTrx sub-microcrystals during crystallization using DDLS
Crystal growth detection at early stages of crystallization can be realized by means of
depolarized dynamic light scattering (DDLS) technique. Highly purified WbTrx solution was
used for a proof of principle, along with several standard proteins171. A considerable increase
of the scattering signal intensity of both polarized and depolarized signal was detected after
Discussion
92
precipitant addition, thereby indicating an increase of hydrodynamic particle sizes up to a
range of 100-1000 nm. Thus, it has been successfully shown that WbTrx sub-microcrystals
formed, which could be reliably distinguished from amorphous precipitate. A negative
control that contained a sample with amorphous precipitate in contrast did not result in a
significant increase of the depolarized scattering signal. This result also suggests, that high
numbers of nanometer sized WbTrx crystals can be obtained and detected, which might
constitute a valuable sample for possible ongoing serial femtosecond studies using highly
brilliant coherent X-ray radiation sources in the future.
3.2.3. In situ crystallization and room-temperature X-ray diffraction approaches for serial and time-resolved crystallography
After its characterization, recombinant WbTrx solution was extensively screened for further
crystallization conditions that were suitable for establishing (sub-)microcrystal production
and detection. The condition hit with the lowest viscosity was selected to avoid possible
interference with the operation mode of piezoelectric micro-pumps and microfluidic devices.
This condition was further optimized and resulted in generation of hundreds of microcrystals
within a hinging drop of only a few µl. To assess the suitability of the obtained microcrystals
for subsequent serial and time-resolved experiments, WbTrx crystallization was adapted for
two different in situ crystallization and room-temperature X-ray diffraction approaches. Both
approaches were fixed-target approaches, allowing for rapid exposure of multiple WbTrx
crystals at room temperature using a microfocus SR beamline and minimizing sample
manipulation.
The first multiple crystal approach performed using multiple WbTrx crystals was based on
microfluidics, where crystallization was carried out in situ in nanoliter-sized compartments
that were arranged on a chip array in a serial design110,174. Initial on-chip crystallization was
performed with PDMS chips sealed with COC, which resulted in appearance of well-shaped
WbTrx crystals of 20-100 µm after 18 h. However, many wells of the chip did not get filled
with the crystallization mixture during the loading procedure and from those wells that were
successfully filled, only a small fraction contained crystals. Thus, chip loading of a microfluidic
chip in a serial design must be further improved to approach the goal of efficient and semi-
automatic crystal probing. First on-chip diffraction experiments were performed using a
collaboratively fabricated Kapton®-sealed epoxy chips, that showed advantageous signal-to-
noise ratios, due to a reduced overall layer thickness and high physical and chemical stability.
Chip loading and crystallization resulted in similar yields compared to the COC-sealed PDMS
Discussion
93
chips. This implies that not only the loading procedure but also the chip design might require
some further optimization. The diffraction data collection strategy was set to obtain 10
consecutive images per crystal recorded in 1° oscillation increments each. Crystals were pre-
selected and data collection was carried out automatically in a shutterless mode. Crystals
diffracted up to a resolution of 2.9 Å. However, the signal-to-noise ratio was appropriate, with
I/σ(I) ≧ 2, only up to a resolution of 3.4 Å. Such a low diffraction power could also originate
from the contribution of the chip layer thickness.
The data sets were segmented to 80 ms wedges. The corresponding wedges were scaled and
merged to nearly complete data sets from only 42 crystals. Data analysis revealed that
resolution decreased from 3.4 Å after 80 ms to 4.0 Å after 400 ms exposure, according to the
semi-conservative criterion I/σ(I) ≧ 2. Such a significant loss of resolution presumably
originates from radiation damage and can also be observed when monitoring unit cell
parameters. In this experiment, unit cell parameters increased towards the end of exposure
by 1.5%. A striking decrease in data quality can be observed for data sets that correspond to
absorbed doses above 0.35 MGy. This corresponds with the minimum dose tolerance that
was postulated for several other protein crystals91,176. This is, however, lower than the
assumed dose tolerance of 0.43 MGy for thaumatin crystals, which contain eight
intramolecular disulfide bonds95.
Because the coordinates for the WbTrx crystal structure were already available in the PDB
databank, Molecular Replacement was carried out to solve the phase problem. The unit cell
volume revealed four trimeric WbTrx molecules within the asymmetric unit and the primitive
space group P42212. In contrast, the WbTrx structure solved before is found to be one trimer
within the asymmetric unit. Furthermore, this structure corresponds to the body-centered
space group I422. This significant difference regarding these crystallographic parameters can
be due to different crystallization conditions.
The subsequent refinement of the structures resulted in R-values between approx. 27% and
28%. The electron density was too poor to observe possible specific radiation damage.
Nevertheless, possible dose-dependent point of radiation damage occurrence was identified
based on the diffraction data quality which corresponded to approx. 0.35 MGy. However, it is
unlikely that this breaking point is due to specific radiation damage because the overall
diffraction quality is impaired. Overall, the resolution was too poor to observe site-specific
radiation damage effects, which reveal disulfide bond cleavage.
Discussion
94
To overcome the problem of chip loading and background contribution resulting from the
chip layer thickness, a simplistic in situ crystallization and X-ray diffraction approach based
on a hanging drop experiment was established collaboratively86. As a result, multiple crystals
within a Kapton® film sandwich can be analysed rapidly after a manual pre-selection. Two
separate WbTrx crystal sandwiches were subjected to two separate exposure experiments
that only differed in photon flux by a factor of 10, which resulted in different total absorbed
doses. The data collection strategy was applied to collect 20 consecutive images within
800 ms of exposure with an oscillation of 1° per frame. Finally, segmented data sets of 80 ms
wedges were generated for both experiments. Data from less than 50 crystals of the
corresponding data sets were scaled and merged to nearly complete data sets and the data
quality was analysed. Only a few µm of sample were used to obtain the resulting data.
For the experiment with the lower total absorbed dose, ranging from 0.02 MGy after 80 ms
to 0.14 MGy after 800 ms, the maximum resolution decreased from 3.2 Å to 3.4 Å, based on
the semi-conservative criterion was I/σ(I) ≧ 2. As far as unit cell parameters are concerned,
only a minor increase of these parameters was observed, making it likely that no considerable
global radiation damage occurred. This result reveals that for serial room-temperature data
collection considerable radiation damage can be avoided when using an attenuated X-ray
beam and not exposing crystals to doses higher than 0.3 MGy. The high-dose data set analysis
reveals a decrease in resolution by only 0.3 Å for the I/σ(I) ≧ 2criterion after 800 ms
exposure and an absorbed dose of 1.35 MGy. Also, the unit cell parameters only marginally
increased. It can also be assumed that the effect of global radiation damage is relatively low
for the high-dose experimental run, with a photon flux being 10 times higher than for the low-
dose run.
To prove if the effect of the specific radiation damage component becomes evident with
progressing time and increasing X-ray radiation dose, Fo- Fo difference maps which compare
the first wedge with a data wedge of a later time point were calculated for both low- and high-
dose data. The resulting difference density was analysed to see if there were indications of
WbTrx disulfide bond destabilization. For the low-dose data, no considerable specific
radiation damage was visible in the proximity of the WbTrx disulfide bond after 800 ms and
a total absorbed dose of 0.14 MGy. For the high-dose data, however, there is evidence to
significant site-specific radiation damage starting to become visible after 240 ms of exposure
and an average dose of 0.50 MGy. After 400 ms and an absorbed dose of 0.79 MGy, the
complete bond is extremely destabilized, as concluded from the significantly increased
electron density difference. These findings correspond to analogous studies performed using
Discussion
95
thaumatin, where strong indications of specific radiation damage to the eight intramolecular
disulfide bonds were detected at doses higher than 0.57 MGy86. For insulin crystals, however,
no occurrence of significant radiation damage up to an absorbed dose of 0.57 MGy was
reported by another research group102. The conclusion of this experiments was that disulfide
bond cleavage generally occurs at higher doses and that global radiation damage is the
dominating component for room-temperature crystals.
Because the time resolution of the performed experiments is only 80 ms, it can be assumed
that the actual point of disulfide bond destabilization is in-between the time points that could
be assessed. To further improve resolution, higher numbers of frames need to be recorded to
obtain complete data sets with a temporal resolution of 40 ms, which for the presented
experimental set-up was limited by the detector readout rate. A combination of the presented
method with the Hadamard transform, which is based on X-ray probe-pulse sequences, can
possibly further increase the temporal resolution to the low millisecond range87.
A principal problem of this experimental design was that the crystal sizes and quality were
not completely identical. Therefore, images of certain crystals had to be traced based on
reduced correlation coefficients and consequently omitted during data processing. This
resulted in a significantly reduced total amount of data, which partially impaired the overall
completeness. Another important aspect could be crystal density within the chip well or
Kapton foil sandwich, respectively. The closer the pre-selected crystals are to each other, the
higher is the spread of free radicals throughout the exposed area, which can dramatically
increase the extent of the radiation damage.
To sum up, the recombinant WbTrx could successfully be established as a non-standard
protein sample, not only for (sub)-microcrystal production and detection, but also as a model
system to perform serial and time-resolved experiments. The results of this work can
contribute to continuative studies, which are aimed at assessing structural changes with
higher temporal resolution in the future.
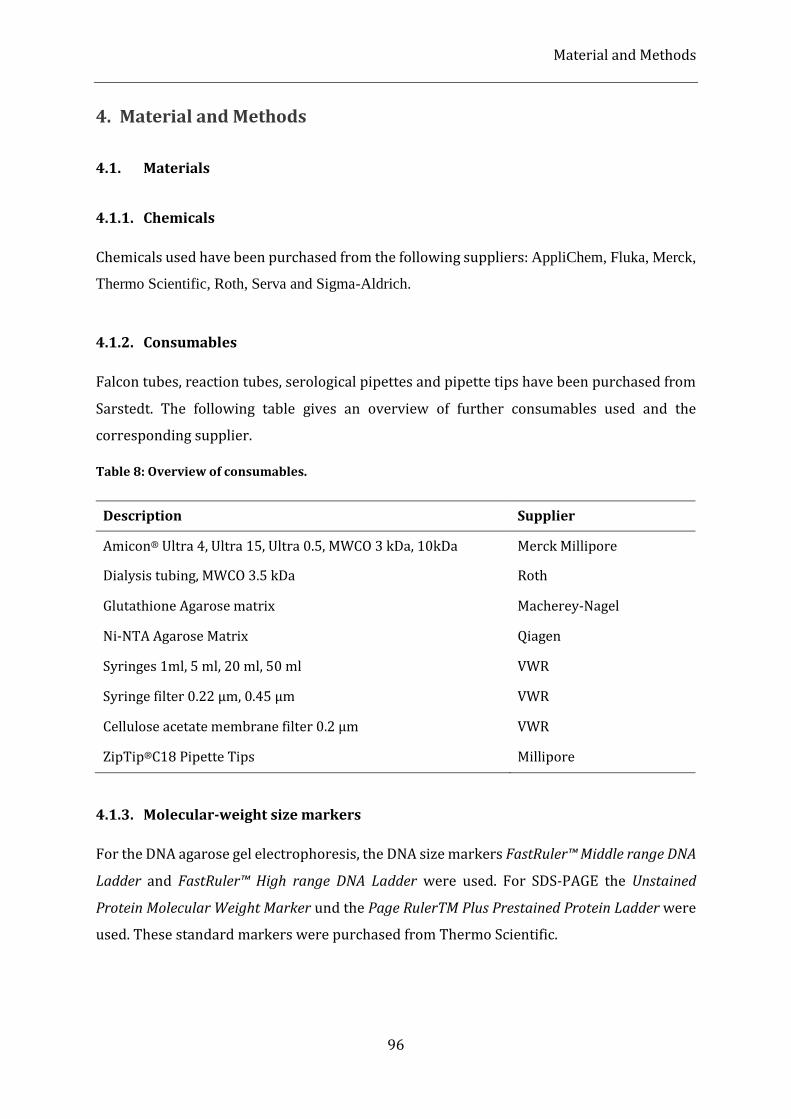
Material and Methods
96
4. Material and Methods
4.1. Materials
4.1.1. Chemicals
Chemicals used have been purchased from the following suppliers: AppliChem, Fluka, Merck,
Thermo Scientific, Roth, Serva and Sigma-Aldrich.
4.1.2. Consumables
Falcon tubes, reaction tubes, serological pipettes and pipette tips have been purchased from
Sarstedt. The following table gives an overview of further consumables used and the
corresponding supplier.
Table 8: Overview of consumables.
Description Supplier
Amicon® Ultra 4, Ultra 15, Ultra 0.5, MWCO 3 kDa, 10kDa Merck Millipore
Dialysis tubing, MWCO 3.5 kDa Roth
Glutathione Agarose matrix Macherey-Nagel
Ni-NTA Agarose Matrix Qiagen
Syringes 1ml, 5 ml, 20 ml, 50 ml VWR
Syringe filter 0.22 µm, 0.45 µm VWR
Cellulose acetate membrane filter 0.2 µm VWR
ZipTip®C18 Pipette Tips Millipore
4.1.3. Molecular-weight size markers
For the DNA agarose gel electrophoresis, the DNA size markers FastRuler™ Middle range DNA
Ladder and FastRuler™ High range DNA Ladder were used. For SDS-PAGE the Unstained
Protein Molecular Weight Marker und the Page RulerTM Plus Prestained Protein Ladder were
used. These standard markers were purchased from Thermo Scientific.
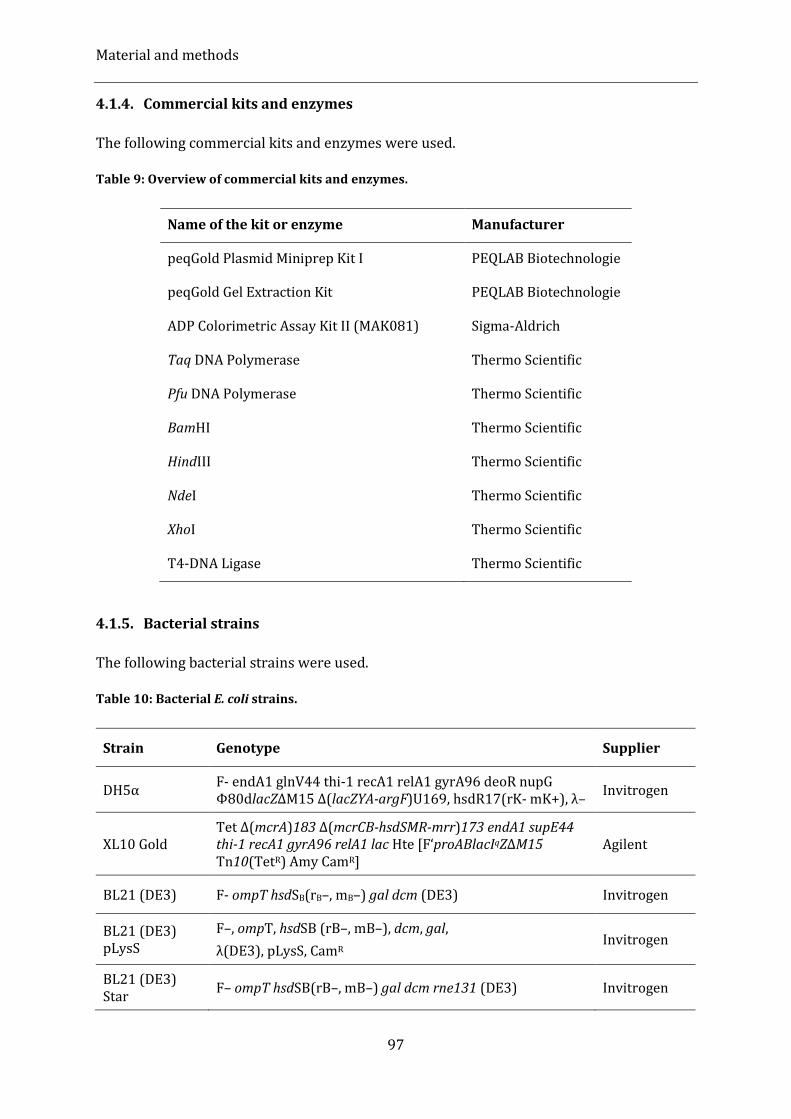
Material and methods
97
4.1.4. Commercial kits and enzymes
The following commercial kits and enzymes were used.
Table 9: Overview of commercial kits and enzymes.
Name of the kit or enzyme Manufacturer
peqGold Plasmid Miniprep Kit I PEQLAB Biotechnologie
peqGold Gel Extraction Kit PEQLAB Biotechnologie
ADP Colorimetric Assay Kit II (MAK081) Sigma-Aldrich
Taq DNA Polymerase Thermo Scientific
Pfu DNA Polymerase Thermo Scientific
BamHI Thermo Scientific
HindIII Thermo Scientific
NdeI Thermo Scientific
XhoI Thermo Scientific
T4-DNA Ligase Thermo Scientific
4.1.5. Bacterial strains
The following bacterial strains were used.
Table 10: Bacterial E. coli strains.
Strain Genotype Supplier
DH5α F- endA1 glnV44 thi-1 recA1 relA1 gyrA96 deoR nupG Φ80dlacZΔM15 Δ(lacZYA-argF)U169, hsdR17(rK- mK+), λ–
Invitrogen
XL10 Gold Tet Δ(mcrA)183 Δ(mcrCB-hsdSMR-mrr)173 endA1 supE44 thi-1 recA1 gyrA96 relA1 lac Hte [F‘proABlacIqZΔM15 Tn10(TetR) Amy CamR]
Agilent
BL21 (DE3) F- ompT hsdSB(rB–, mB–) gal dcm (DE3) Invitrogen
BL21 (DE3) pLysS
F–, ompT, hsdSB (rB–, mB–), dcm, gal,
λ(DE3), pLysS, CamR Invitrogen
BL21 (DE3) Star
F– ompT hsdSB(rB–, mB–) gal dcm rne131 (DE3) Invitrogen
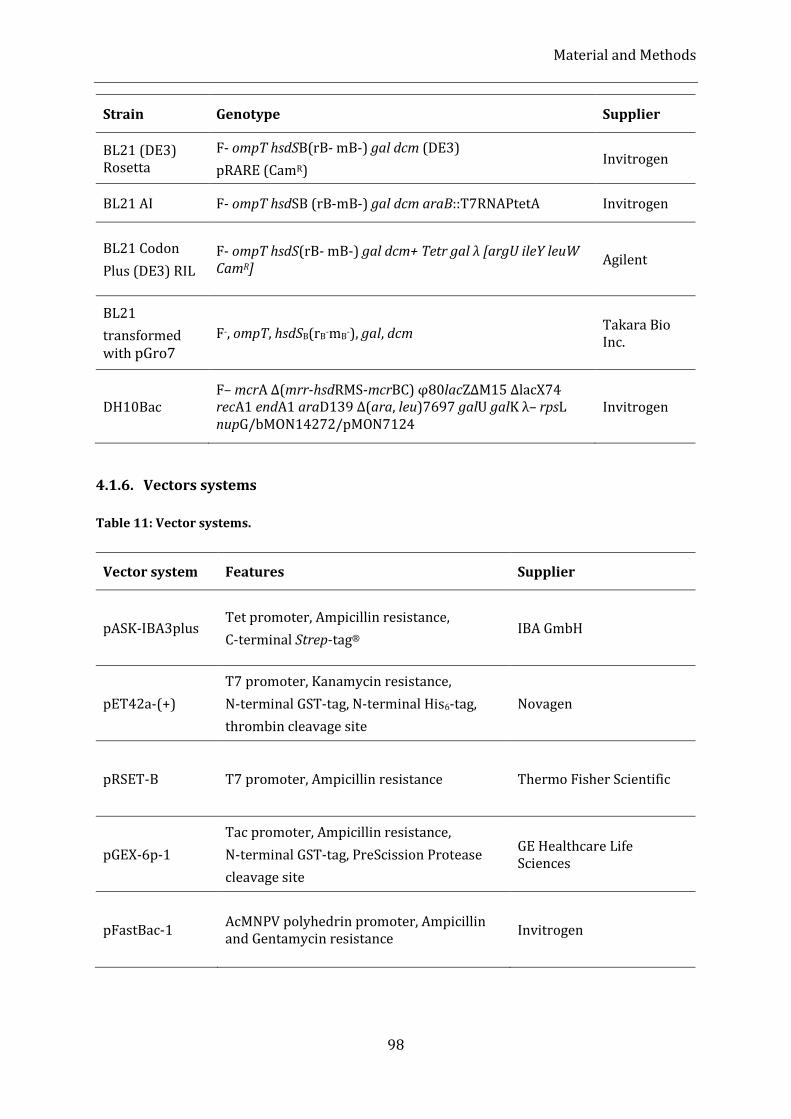
Material and Methods
98
Strain Genotype Supplier
BL21 (DE3) Rosetta
F- ompT hsdSB(rB- mB-) gal dcm (DE3)
pRARE (CamR) Invitrogen
BL21 AI F- ompT hsdSB (rB-mB-) gal dcm araB::T7RNAPtetA Invitrogen
BL21 Codon
Plus (DE3) RIL
F- ompT hsdS(rB- mB-) gal dcm+ Tetr gal λ [argU ileY leuW CamR]
Agilent
BL21
transformed with pGro7
F-, ompT, hsdSB(rB-mB
-), gal, dcm Takara Bio Inc.
DH10Bac F– mcrA Δ(mrr-hsdRMS-mcrBC) φ80lacZΔM15 ΔlacX74 recA1 endA1 araD139 Δ(ara, leu)7697 galU galK λ– rpsL nupG/bMON14272/pMON7124
Invitrogen
4.1.6. Vectors systems
Table 11: Vector systems.
Vector system Features Supplier
pASK-IBA3plus Tet promoter, Ampicillin resistance,
C-terminal Strep-tag® IBA GmbH
pET42a-(+)
T7 promoter, Kanamycin resistance,
N-terminal GST-tag, N-terminal His6-tag,
thrombin cleavage site
Novagen
pRSET-B T7 promoter, Ampicillin resistance Thermo Fisher Scientific
pGEX-6p-1
Tac promoter, Ampicillin resistance,
N-terminal GST-tag, PreScission Protease
cleavage site
GE Healthcare Life Sciences
pFastBac-1 AcMNPV polyhedrin promoter, Ampicillin and Gentamycin resistance
Invitrogen
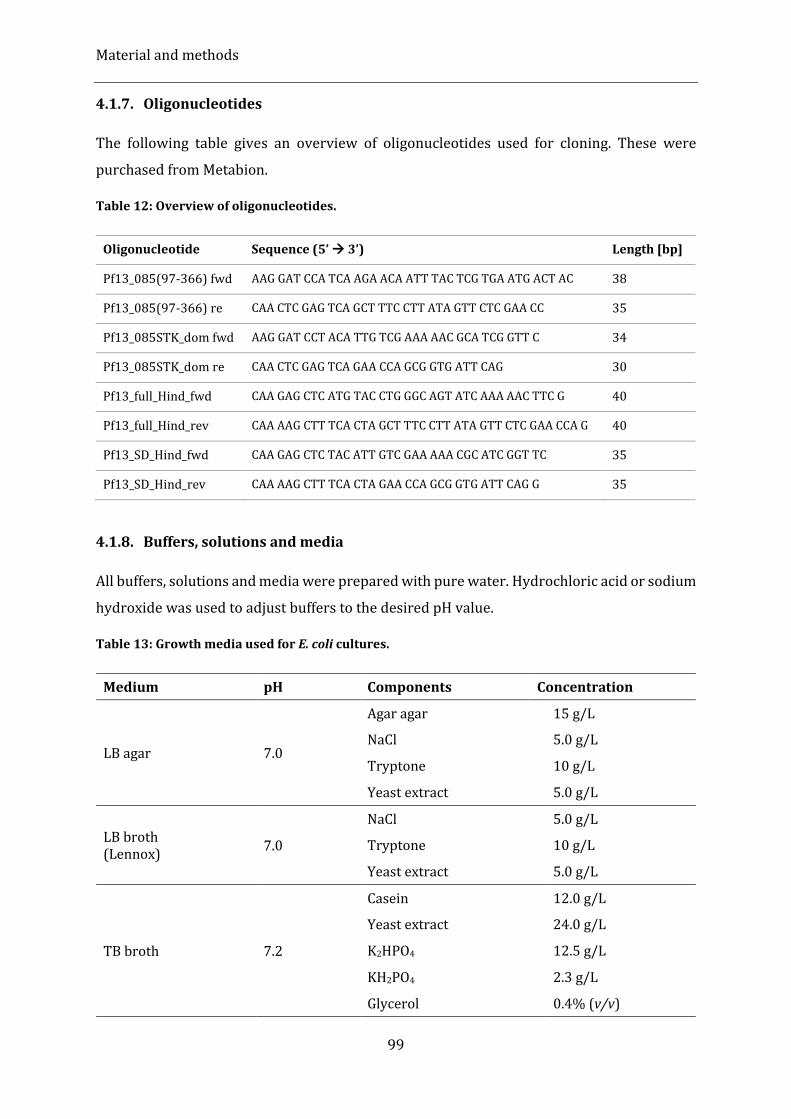
Material and methods
99
4.1.7. Oligonucleotides
The following table gives an overview of oligonucleotides used for cloning. These were
purchased from Metabion.
Table 12: Overview of oligonucleotides.
Oligonucleotide Sequence (5’ 3’) Length [bp]
Pf13_085(97-366) fwd AAG GAT CCA TCA AGA ACA ATT TAC TCG TGA ATG ACT AC 38
Pf13_085(97-366) re CAA CTC GAG TCA GCT TTC CTT ATA GTT CTC GAA CC 35
Pf13_085STK_dom fwd AAG GAT CCT ACA TTG TCG AAA AAC GCA TCG GTT C 34
Pf13_085STK_dom re CAA CTC GAG TCA GAA CCA GCG GTG ATT CAG 30
Pf13_full_Hind_fwd CAA GAG CTC ATG TAC CTG GGC AGT ATC AAA AAC TTC G 40
Pf13_full_Hind_rev CAA AAG CTT TCA CTA GCT TTC CTT ATA GTT CTC GAA CCA G 40
Pf13_SD_Hind_fwd CAA GAG CTC TAC ATT GTC GAA AAA CGC ATC GGT TC 35
Pf13_SD_Hind_rev CAA AAG CTT TCA CTA GAA CCA GCG GTG ATT CAG G 35
4.1.8. Buffers, solutions and media
All buffers, solutions and media were prepared with pure water. Hydrochloric acid or sodium
hydroxide was used to adjust buffers to the desired pH value.
Table 13: Growth media used for E. coli cultures.
Medium pH Components Concentration
LB agar 7.0
Agar agar 15 g/L
NaCl 5.0 g/L
Tryptone 10 g/L
Yeast extract 5.0 g/L
LB broth (Lennox)
7.0
NaCl 5.0 g/L
Tryptone 10 g/L
Yeast extract 5.0 g/L
TB broth 7.2
Casein 12.0 g/L
Yeast extract 24.0 g/L
K2HPO4 12.5 g/L
KH2PO4 2.3 g/L
Glycerol 0.4% (v/v)
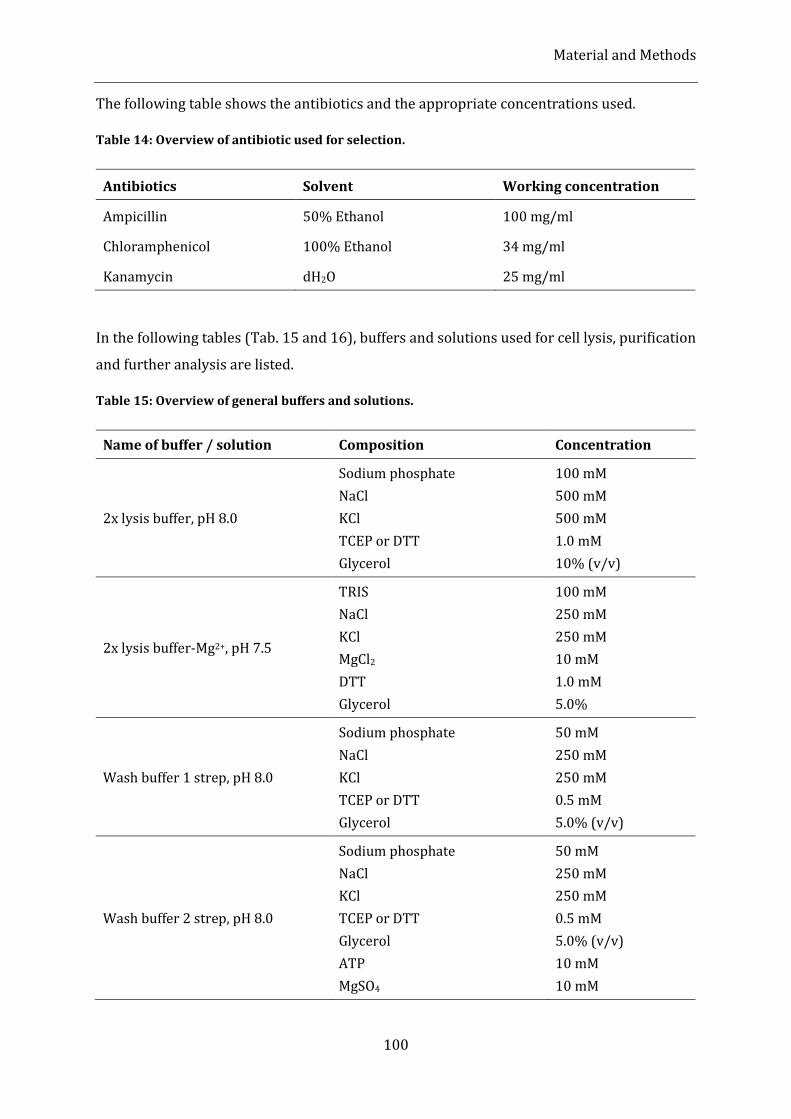
Material and Methods
100
The following table shows the antibiotics and the appropriate concentrations used.
Table 14: Overview of antibiotic used for selection.
Antibiotics Solvent Working concentration
Ampicillin 50% Ethanol 100 mg/ml
Chloramphenicol 100% Ethanol 34 mg/ml
Kanamycin dH2O 25 mg/ml
In the following tables (Tab. 15 and 16), buffers and solutions used for cell lysis, purification
and further analysis are listed.
Table 15: Overview of general buffers and solutions.
Name of buffer / solution Composition Concentration
2x lysis buffer, pH 8.0
Sodium phosphate
NaCl
KCl
TCEP or DTT
Glycerol
100 mM
500 mM
500 mM
1.0 mM
10% (v/v)
2x lysis buffer-Mg2+, pH 7.5
TRIS
NaCl
KCl
MgCl2
DTT
Glycerol
100 mM
250 mM
250 mM
10 mM
1.0 mM
5.0%
Wash buffer 1 strep, pH 8.0
Sodium phosphate
NaCl
KCl
TCEP or DTT
Glycerol
50 mM
250 mM
250 mM
0.5 mM
5.0% (v/v)
Wash buffer 2 strep, pH 8.0
Sodium phosphate
NaCl
KCl
TCEP or DTT
Glycerol
ATP
MgSO4
50 mM
250 mM
250 mM
0.5 mM
5.0% (v/v)
10 mM
10 mM
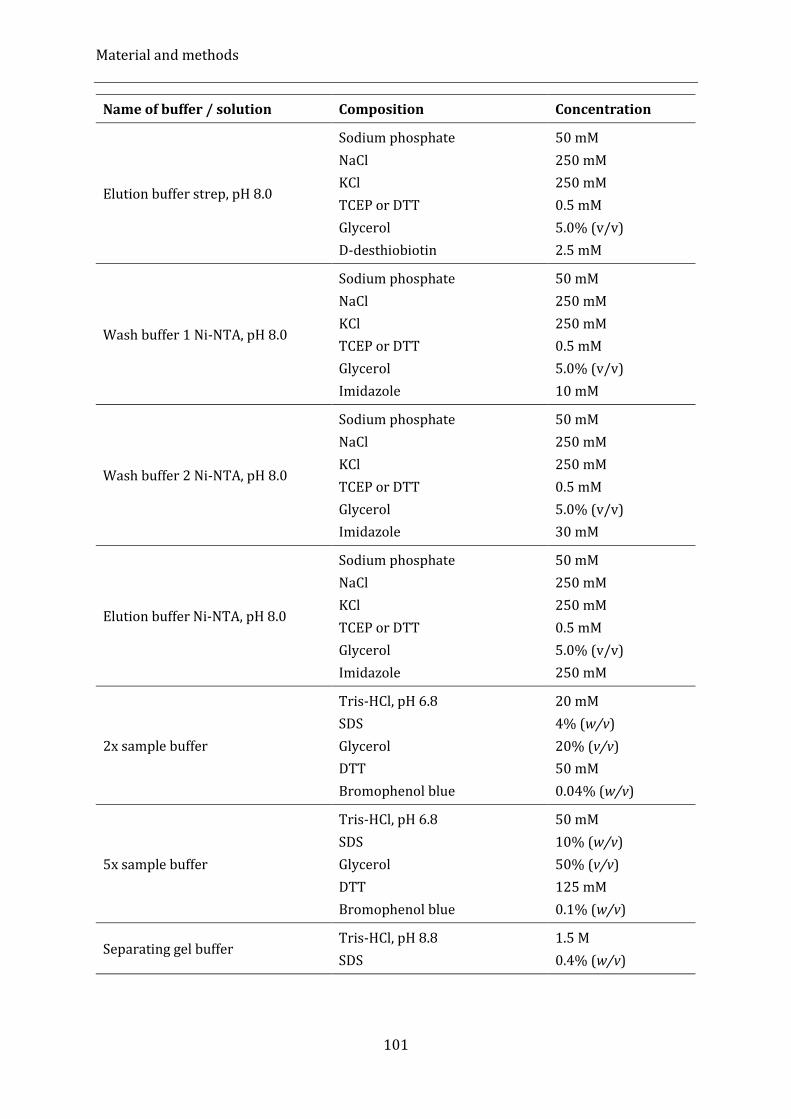
Material and methods
101
Name of buffer / solution Composition Concentration
Elution buffer strep, pH 8.0
Sodium phosphate
NaCl
KCl
TCEP or DTT
Glycerol
D-desthiobiotin
50 mM
250 mM
250 mM
0.5 mM
5.0% (v/v)
2.5 mM
Wash buffer 1 Ni-NTA, pH 8.0
Sodium phosphate
NaCl
KCl
TCEP or DTT
Glycerol
Imidazole
50 mM
250 mM
250 mM
0.5 mM
5.0% (v/v)
10 mM
Wash buffer 2 Ni-NTA, pH 8.0
Sodium phosphate
NaCl
KCl
TCEP or DTT
Glycerol
Imidazole
50 mM
250 mM
250 mM
0.5 mM
5.0% (v/v)
30 mM
Elution buffer Ni-NTA, pH 8.0
Sodium phosphate
NaCl
KCl
TCEP or DTT
Glycerol
Imidazole
50 mM
250 mM
250 mM
0.5 mM
5.0% (v/v)
250 mM
2x sample buffer
Tris-HCl, pH 6.8
SDS
Glycerol
DTT
Bromophenol blue
20 mM
4% (w/v)
20% (v/v)
50 mM
0.04% (w/v)
5x sample buffer
Tris-HCl, pH 6.8
SDS
Glycerol
DTT
Bromophenol blue
50 mM
10% (w/v)
50% (v/v)
125 mM
0.1% (w/v)
Separating gel buffer Tris-HCl, pH 8.8
SDS
1.5 M
0.4% (w/v)
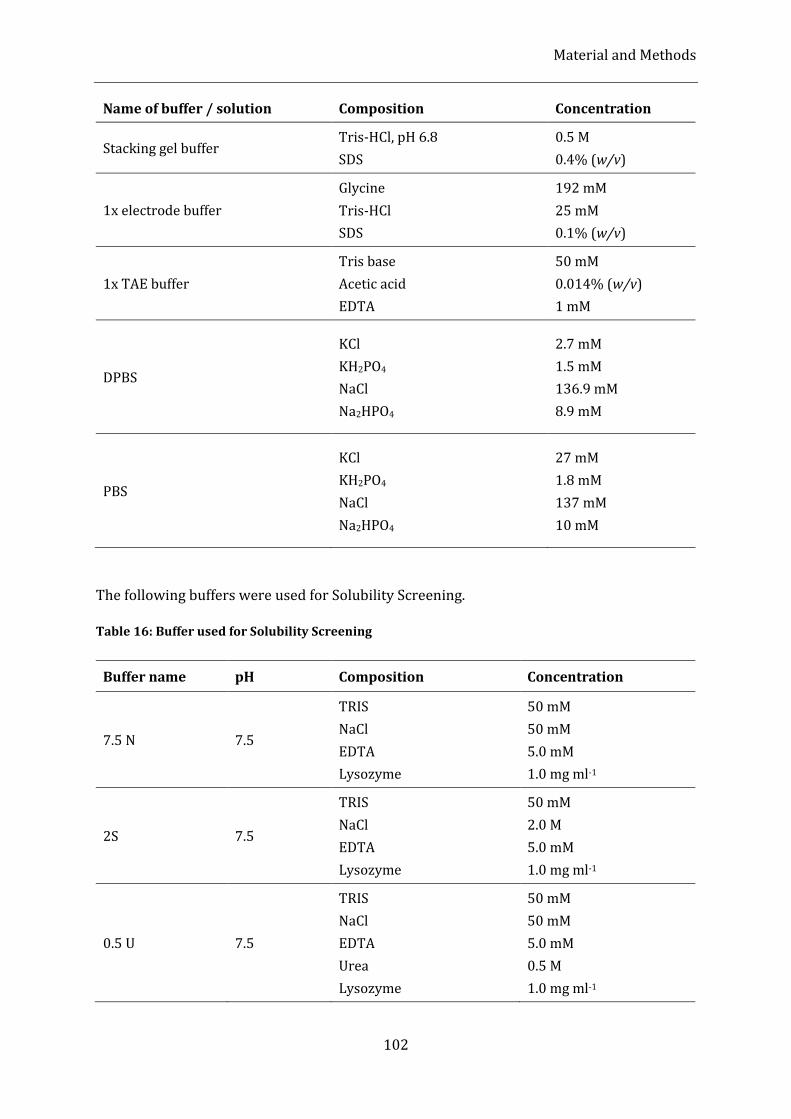
Material and Methods
102
Name of buffer / solution Composition Concentration
Stacking gel buffer Tris-HCl, pH 6.8
SDS
0.5 M
0.4% (w/v)
1x electrode buffer
Glycine
Tris-HCl
SDS
192 mM
25 mM
0.1% (w/v)
1x TAE buffer
Tris base
Acetic acid
EDTA
50 mM
0.014% (w/v)
1 mM
DPBS
KCl
KH2PO4
NaCl
Na2HPO4
2.7 mM
1.5 mM
136.9 mM
8.9 mM
PBS
KCl
KH2PO4
NaCl
Na2HPO4
27 mM
1.8 mM
137 mM
10 mM
The following buffers were used for Solubility Screening.
Table 16: Buffer used for Solubility Screening
Buffer name pH Composition Concentration
7.5 N 7.5
TRIS
NaCl
EDTA
Lysozyme
50 mM
50 mM
5.0 mM
1.0 mg ml-1
2S 7.5
TRIS
NaCl
EDTA
Lysozyme
50 mM
2.0 M
5.0 mM
1.0 mg ml-1
0.5 U 7.5
TRIS
NaCl
EDTA
Urea
Lysozyme
50 mM
50 mM
5.0 mM
0.5 M
1.0 mg ml-1
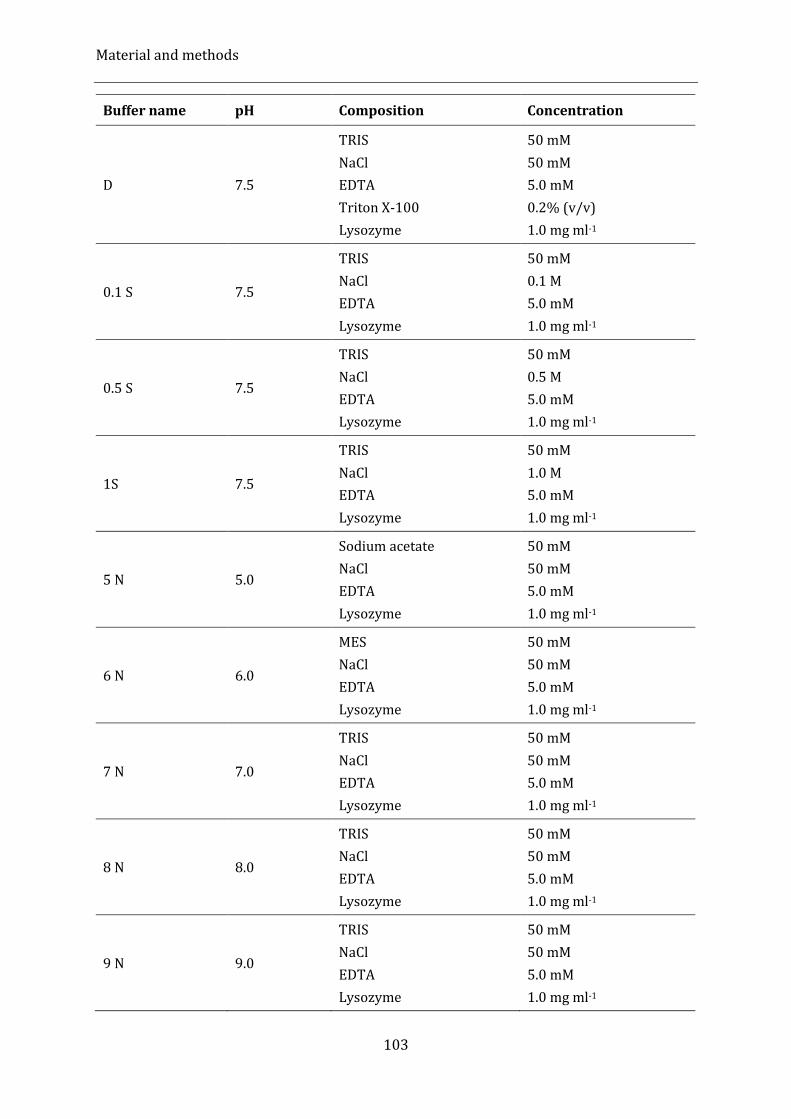
Material and methods
103
Buffer name pH Composition Concentration
D 7.5
TRIS
NaCl
EDTA
Triton X-100
Lysozyme
50 mM
50 mM
5.0 mM
0.2% (v/v)
1.0 mg ml-1
0.1 S 7.5
TRIS
NaCl
EDTA
Lysozyme
50 mM
0.1 M
5.0 mM
1.0 mg ml-1
0.5 S 7.5
TRIS
NaCl
EDTA
Lysozyme
50 mM
0.5 M
5.0 mM
1.0 mg ml-1
1S 7.5
TRIS
NaCl
EDTA
Lysozyme
50 mM
1.0 M
5.0 mM
1.0 mg ml-1
5 N 5.0
Sodium acetate
NaCl
EDTA
Lysozyme
50 mM
50 mM
5.0 mM
1.0 mg ml-1
6 N 6.0
MES
NaCl
EDTA
Lysozyme
50 mM
50 mM
5.0 mM
1.0 mg ml-1
7 N 7.0
TRIS
NaCl
EDTA
Lysozyme
50 mM
50 mM
5.0 mM
1.0 mg ml-1
8 N 8.0
TRIS
NaCl
EDTA
Lysozyme
50 mM
50 mM
5.0 mM
1.0 mg ml-1
9 N 9.0
TRIS
NaCl
EDTA
Lysozyme
50 mM
50 mM
5.0 mM
1.0 mg ml-1
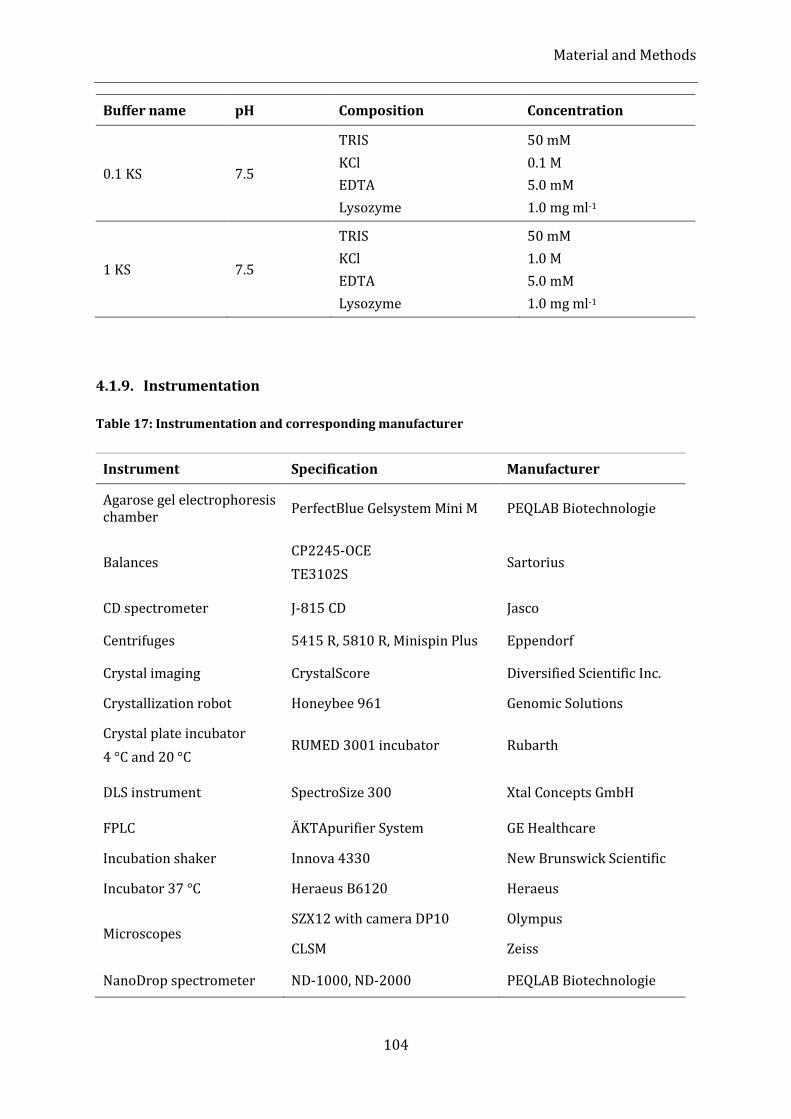
Material and Methods
104
Buffer name pH Composition Concentration
0.1 KS 7.5
TRIS
KCl
EDTA
Lysozyme
50 mM
0.1 M
5.0 mM
1.0 mg ml-1
1 KS 7.5
TRIS
KCl
EDTA
Lysozyme
50 mM
1.0 M
5.0 mM
1.0 mg ml-1
4.1.9. Instrumentation
Table 17: Instrumentation and corresponding manufacturer
Instrument Specification Manufacturer
Agarose gel electrophoresis chamber
PerfectBlue Gelsystem Mini M PEQLAB Biotechnologie
Balances CP2245-OCE
TE3102S Sartorius
CD spectrometer J-815 CD Jasco
Centrifuges 5415 R, 5810 R, Minispin Plus Eppendorf
Crystal imaging CrystalScore Diversified Scientific Inc.
Crystallization robot Honeybee 961 Genomic Solutions
Crystal plate incubator
4 °C and 20 °C RUMED 3001 incubator Rubarth
DLS instrument SpectroSize 300 Xtal Concepts GmbH
FPLC ÄKTApurifier System GE Healthcare
Incubation shaker Innova 4330 New Brunswick Scientific
Incubator 37 °C Heraeus B6120 Heraeus
Microscopes SZX12 with camera DP10 Olympus
CLSM Zeiss
NanoDrop spectrometer ND-1000, ND-2000 PEQLAB Biotechnologie
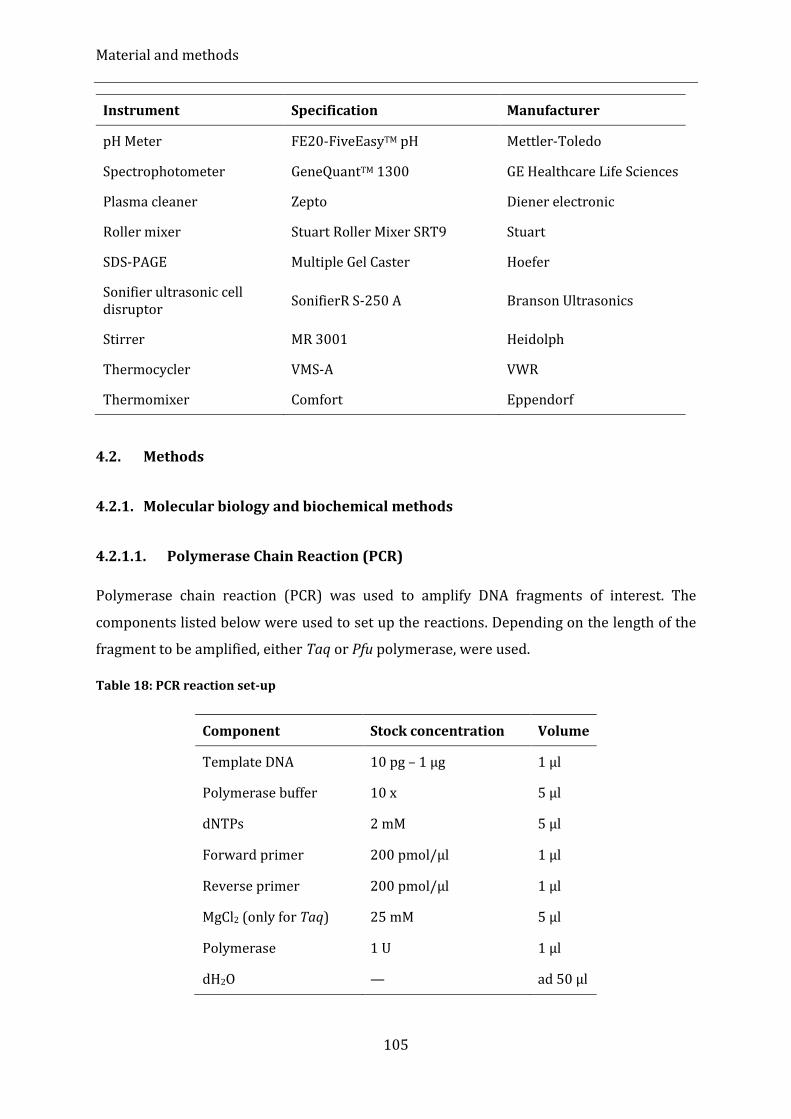
Material and methods
105
Instrument Specification Manufacturer
pH Meter FE20-FiveEasyTM pH Mettler-Toledo
Spectrophotometer GeneQuantTM 1300 GE Healthcare Life Sciences
Plasma cleaner Zepto Diener electronic
Roller mixer Stuart Roller Mixer SRT9 Stuart
SDS-PAGE Multiple Gel Caster Hoefer
Sonifier ultrasonic cell disruptor
SonifierR S-250 A Branson Ultrasonics
Stirrer MR 3001 Heidolph
Thermocycler VMS-A VWR
Thermomixer Comfort Eppendorf
4.2. Methods
4.2.1. Molecular biology and biochemical methods
4.2.1.1. Polymerase Chain Reaction (PCR)
Polymerase chain reaction (PCR) was used to amplify DNA fragments of interest. The
components listed below were used to set up the reactions. Depending on the length of the
fragment to be amplified, either Taq or Pfu polymerase, were used.
Table 18: PCR reaction set-up
Component Stock concentration Volume
Template DNA 10 pg – 1 µg 1 µl
Polymerase buffer 10 x 5 µl
dNTPs 2 mM 5 µl
Forward primer 200 pmol/µl 1 µl
Reverse primer 200 pmol/µl 1 µl
MgCl2 (only for Taq) 25 mM 5 µl
Polymerase 1 U 1 µl
dH2O — ad 50 µl
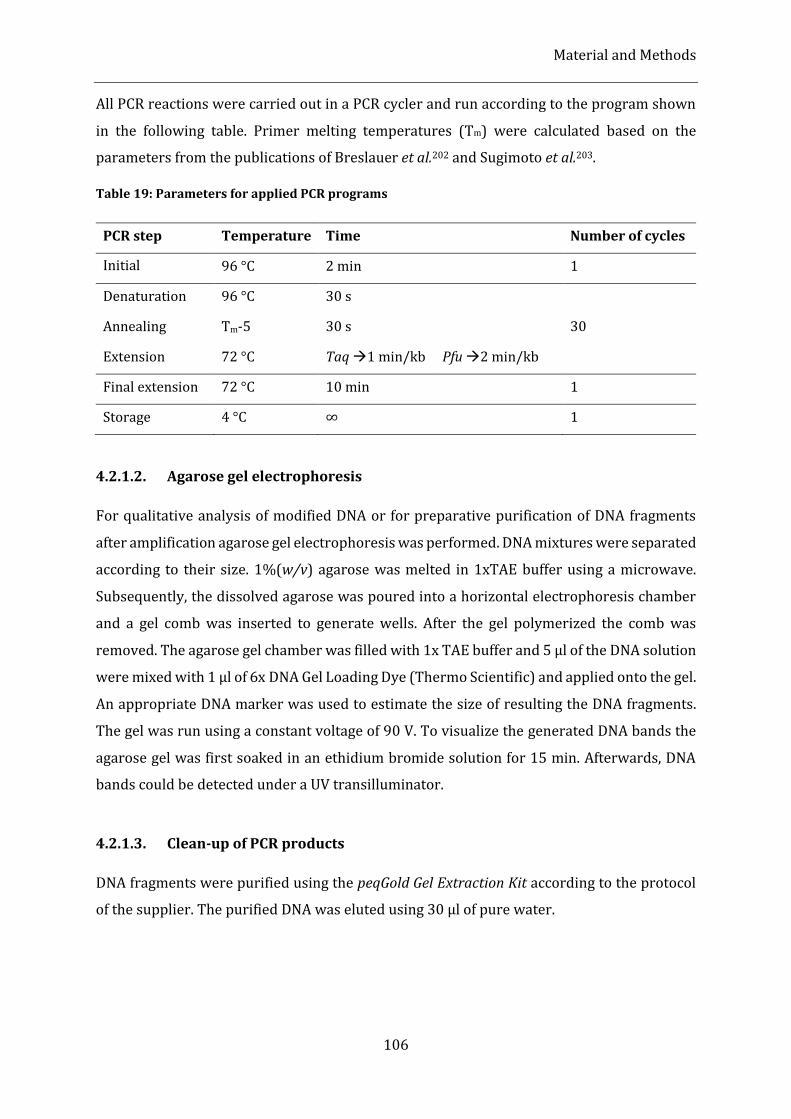
Material and Methods
106
All PCR reactions were carried out in a PCR cycler and run according to the program shown
in the following table. Primer melting temperatures (Tm) were calculated based on the
parameters from the publications of Breslauer et al.202 and Sugimoto et al.203.
Table 19: Parameters for applied PCR programs
PCR step Temperature Time Number of cycles
Initial
denaturation
96 °C 2 min 1
Denaturation 96 °C 30 s
30 Annealing Tm-5 30 s
Extension 72 °C Taq 1 min/kb Pfu 2 min/kb
Final extension 72 °C 10 min 1
Storage 4 °C ∞ 1
4.2.1.2. Agarose gel electrophoresis
For qualitative analysis of modified DNA or for preparative purification of DNA fragments
after amplification agarose gel electrophoresis was performed. DNA mixtures were separated
according to their size. 1%(w/v) agarose was melted in 1xTAE buffer using a microwave.
Subsequently, the dissolved agarose was poured into a horizontal electrophoresis chamber
and a gel comb was inserted to generate wells. After the gel polymerized the comb was
removed. The agarose gel chamber was filled with 1x TAE buffer and 5 µl of the DNA solution
were mixed with 1 µl of 6x DNA Gel Loading Dye (Thermo Scientific) and applied onto the gel.
An appropriate DNA marker was used to estimate the size of resulting the DNA fragments.
The gel was run using a constant voltage of 90 V. To visualize the generated DNA bands the
agarose gel was first soaked in an ethidium bromide solution for 15 min. Afterwards, DNA
bands could be detected under a UV transilluminator.
4.2.1.3. Clean-up of PCR products
DNA fragments were purified using the peqGold Gel Extraction Kit according to the protocol
of the supplier. The purified DNA was eluted using 30 µl of pure water.
Material and methods
107
4.2.1.4. Restriction endonuclease digestion
Purified DNA fragments as well as target expression vectors were subjected to restriction
endonuclease digestion. Reactions were set up according to the protocol of the endonuclease
supplier using recommended buffers that also were purchased from the respective company.
The reaction volume was adjusted to 40 µl for preparative restriction digestion or to 10 µl for
qualitative verification tests, respectively. After an incubation step of 2-3 h at 37 °C the DNA
was either further purified using the peqGold Gel Extraction Kit as described above for
subsequent cloning steps or analysed by agarose gel electrophoresis.
4.2.1.5. Determination of DNA concentration
DNA concentrations were determined photometrically using a NonoDrop spectrometer. The
measurement is based on the absorbance of double stranded DNA at a wavelength of 260 nm
where it has its maximum. 1 µl of DNA solution were applied onto the pedestal of the
photometric device and the absorbance of the sample was determined both at 260 nm and at
280 nm.
4.2.1.6. Sticky end ligation
DNA fragments treated with appropriate endonucleases and purified as described above
were ligated into the target expression vector using the enzyme T4 DAN Ligase. A typical
ligation reaction was set up by mixing 60-70 ng of linearized vector DNA with its three- to
five-fold molar ratio of insert DNA, 0.5 µl of T4 DNA Ligase (1 U) and 2 µl of 10x T4 DNA
Ligase buffer. The volume was adjusted to 20 µl with nuclease-free water. Ligation reaction
was performed for 1 h at room temperature. 5 µl of the ligation reaction mixture were used
for transformation of competent E. coli cells.
4.2.1.7. Preparation of chemically competent E. coli cells
5 ml of LB medium containing appropriate antibiotics were inoculated from a glycerol stock
of the corresponding E. coli strain and grown overnight in a shaker incubator at 37 °C and
200 rpm. 1 ml of this culture were used to inoculate 100 ml of LB medium that contained the
appropriate antibiotics. The rest of the overnight culture was used to prepare new glycerol
stocks by mixing 800 µl of the cell suspension with 600 µl of sterile glycerol. The mixture was
subsequently shock-frozen in liquid nitrogen and stored at -80 °C. The cells were cultured at
Material and Methods
108
37 °C and 220 rpm until an optical density at 600 nm (OD600) of 0.6-0.8 was reached. Then,
the cell suspension was cooled on ice for 10 min and centrifuged at 800 x g for 15 min. After
the supernatant was discarded, the resulting cell pellet was resuspended in 10 ml ice-cold
buffer containing 0.1 M CaCl2 and 10% (v/v) glycerol. Afterwards, the cells were incubated
on ice for 30 min and centrifuged at 800 x g for 15 min. The supernatant was discarded again,
and the pellet was resuspended in 1 ml ice-cold buffer (0.1 M CaCl2 and 10% (v/v) glycerol).
The resulting suspension of chemically competent cells was used to prepare 50 µl aliquots in
pre-chilled 1.5 µl reaction tubes, which were shock-frozen in liquid nitrogen and stored at
-80 °C.
4.2.1.8. Transformation of competent E. coli cells
For transformation, to each 50 µl aliquot of competent E. coli cells thawed on ice 20-70 ng of
DNA in a total volume of 1-5 µl were added. The mixture was incubated on ice for 15 min.
Afterwards, the cells were heat-shocked at 42 °C for 45 s and incubated on ice for another
2 min. After adding 450 µl of antibiotic-free LB medium to the cells, these were shaken at
300 rpm and 37 °C for 1 h. Subsequently, the cells were plated on LB agar containing
appropriate antibiotics for selection and incubated at 37 °C overnight.
4.2.1.9. Preparation of bacterial plasmid DNA
To isolate bacterial plasmid DNA, transformation colonies grown on agar plates were picked
with a sterile pipette tip and used to inoculate 5 ml of LB medium containing appropriate
antibiotics for selection. The cultures were shaken at 220 rpm and 37 °C overnight and
afterwards pelleted at room temperature at 5000 x g using a microcentrifuge. Plasmid DNA
was extracted using the commercially purchased kit peqGold Plasmid Miniprep following the
manufacturers protocol. 60 µl of pure water were used for the elution step. The isolated plasmid
solution was stored at -20 °C.
4.2.1.10. DNA sequencing
DNA sequencing was performed to verify the cloning success. For this purpose, 5 µl of
plasmid DNA in a concentration of 80-120 ng/µl were mixed with 5 µl of the appropriate
primer solution. The sequencing reaction and analysis were performed by the company GATC
Biotech using the LIGHTrun sequencing method.
Material and methods
109
4.2.1.11. Recombinant gene expression
To express a gene of interest, a fresh transformation was performed as described above. An
initial bacterial culture was prepared by inoculating a single colony picked from the
transformation agar plate into 200 ml of LB medium that contained the appropriate
antibiotics. The initial culture was shaken at 30 °C and 220 rpm overnight, or at 37 °C until
an OD600 of approximately 1 was reached. The resulting culture was used in a ratio of 1:25 to
inoculate LB or TB medium, which contained antibiotics required for selection. The resulting
expression culture was incubated at 37 °C and 200 rpm until the desired OD600 value,
typically between 0.5 and 0.8, was reached. Depending of the induction temperature required
for the expression of the specific protein, cells were either immediately induced with the
appropriate inducer and cultured using the same parameters for another 3 hours, or the
temperature of the shaker incubator was first adjusted to the desired value prior to induction.
When expression was performed at 18-20 °C, the cells were cultured for up to 20 h after
induction. Subsequently, E. coli cell suspensions were harvested using a centrifuge run at
4122 x g and 4 °C for 45 min. The resulting supernatant was discarded, and the cell pellets
were resuspended in the corresponding lysis buffer and stored at -20 °C. To check if the
expression was successful, 1 ml of sample, both before induction and prior to harvesting,
were collected. Subsequently, each sample was pelleted and an appropriate volume of 2x
sample buffer was added. Afterwards, the samples were heated at 96 °C for 5-10 min, spun
using a microcentrifuge and, after cooling down, subjected to SDS-PAGE analysis.
4.2.1.12. SDS polyacrylamide gel electrophoresis (SDS-PAGE)
SDS-PAGE was used to separate protein mixtures according to the protein molecular weight.
Denaturing polyacrylamide gels were prepared according to the recipe listed in table 20.
Thereby, the separating gel of the desired acrylamide concentration was prepared first,
followed by the preparation of a 4% stacking gel. Dilute protein solutions were mixed with
5x sample buffer, whereas concentrated protein samples or bacterial pellets were mixed with
2x sample buffer. To denature the proteins, samples were heated at 96 °C for 5-10 min. 20 µl
of the sample were applied onto the appropriate acrylamide gel. Additionally, 5 µl of a protein
marker were loaded to estimate the apparent molecular weight. The electrophoresis was
performed in 1x electrode buffer at a constant current of 25 mA per gel. After the run, protein
bands on the gel were visualized by Coomassie staining. For this purpose, gels were incubated
in a Coomassie brilliant blue solution (25% (v/v) isopropanol, 10% (v/v) acetic acid and 0.1%
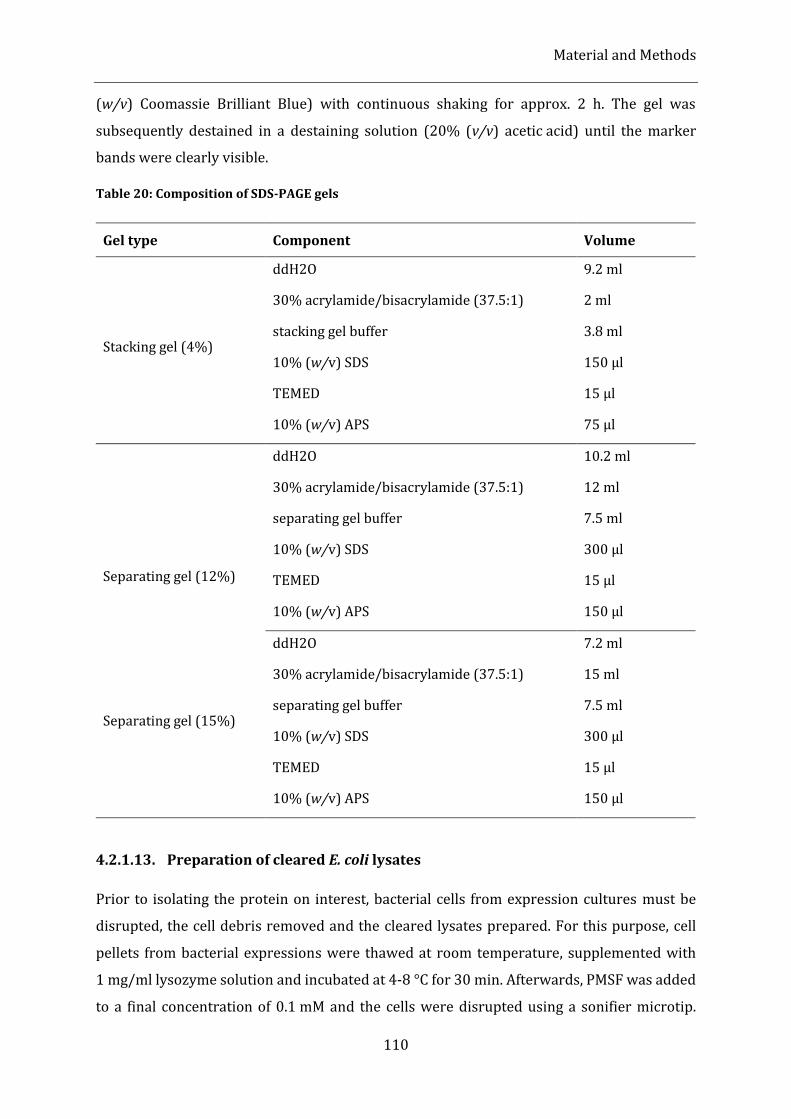
Material and Methods
110
(w/v) Coomassie Brilliant Blue) with continuous shaking for approx. 2 h. The gel was
subsequently destained in a destaining solution (20% (v/v) acetic acid) until the marker
bands were clearly visible.
Table 20: Composition of SDS-PAGE gels
Gel type Component Volume
Stacking gel (4%)
ddH2O 9.2 ml
30% acrylamide/bisacrylamide (37.5:1) 2 ml
stacking gel buffer 3.8 ml
10% (w/v) SDS 150 µl
TEMED 15 µl
10% (w/v) APS 75 µl
Separating gel (12%)
ddH2O 10.2 ml
30% acrylamide/bisacrylamide (37.5:1) 12 ml
separating gel buffer 7.5 ml
10% (w/v) SDS 300 µl
TEMED 15 µl
10% (w/v) APS 150 µl
Separating gel (15%)
ddH2O 7.2 ml
30% acrylamide/bisacrylamide (37.5:1) 15 ml
separating gel buffer 7.5 ml
10% (w/v) SDS 300 µl
TEMED 15 µl
10% (w/v) APS 150 µl
4.2.1.13. Preparation of cleared E. coli lysates
Prior to isolating the protein on interest, bacterial cells from expression cultures must be
disrupted, the cell debris removed and the cleared lysates prepared. For this purpose, cell
pellets from bacterial expressions were thawed at room temperature, supplemented with
1 mg/ml lysozyme solution and incubated at 4-8 °C for 30 min. Afterwards, PMSF was added
to a final concentration of 0.1 mM and the cells were disrupted using a sonifier microtip.
Material and methods
111
Sonication was performed on ice 3-6 times for 30-60 s each. Between each cycle 30 s pauses
were included. A duty cycle of 30 and an output control of 2-3 were used. After the lysis,
bacterial lysates were centrifuged at 16000 x g and 4 °C for 30 min. The resulting supernatant
was used to purify soluble protein of interest, whereas the pellet was discarded.
4.2.1.14. Solubility screening
A systematic solubility screening is helpful when identifying suitable conditions for cell lysis
and the subsequent purification of recombinant proteins, which tend to form insoluble
inclusion bodies. Thereby, different buffer systems can be tested at varying pH values and
ionic strengths in small-scale set-ups. The benefits of adding detergents or chaotropic agents
can be additionally analysed. Prior to harvesting, 50 µl aliquots were prepared from E. coli
expression cultures. The suspensions were centrifuged at 6000 x g for 5 min and the
supernatant was discarded. The resulting cell pellets were resuspended in 100 µl of the
respective buffer (see table 16, chapter 4.1.8). Cell disruption and lysis were performed using
a four-cycle procedure of freezing and thawing. Thus, the cell suspensions were first frozen
in dry ice for 3 min and afterwards thawed for 2 min at 42 °C using a thermomixer. Between
each cycle, each suspension was vortexed. After the cell lysis, cell debris was separated by
centrifugation at 16000 x g for 10 min. The cell pellet contained insoluble protein fraction
and was stored at -20 °C until needed. The supernatant was treated with 1 ml of ice-cold
acetone and incubated on ice for 15 min. The precipitated proteins were sedimented during
a 5 min centrifugation step at 16000 x g. After acetone was discarded, the pellets, which
represented the soluble protein fraction, were dried at 37 °C and stored at -20 °C. Soluble and
insoluble protein fractions were compared using SDS-PAGE analysis.
4.2.1.15. Strep-Tactin® affinity chromatography
Target proteins, which contained a Strep-tag® II sequence, were initially purified using
affinity chromatography. For that purpose, Strep-Tactin® matrix was equilibrated in a glass
column body with at least 2 column volumes (CV) of buffer used for cell lysis. Afterwards,
cleared E. coli lysates of Strep-tagged proteins were loaded onto the matrix and incubated for
30 min at 4-8 °C on a roller mixer. The column was subsequently mounted vertically, its outlet
opened, and the flow-through was collected. The matrix was washed 3 times with 10 CV of
the corresponding lysis buffer. The same buffer system was used for elution, which was
Material and Methods
112
additionally supplemented with 2.5 mM D-Desthiobiotin. Strep-tagged proteins were eluted
5-10 times in 1 CV fractions. The success of the purification was analysed via SDS-PAGE.
4.2.1.16. Ni-NTA affinity chromatography
Ni-NTA affinity purification was performed to purify soluble His6-tagged proteins of interest.
Initially, Ni-NTA matrix war equilibrated with 2 CV in a glass column body and the
supernatant from the cell lysis was applied. After 30 min of incubation at 4-8 °C on a roller
mixer, the column was mounted vertically and the flow-through was collected. The matrix
was washed 2 times with 10 CV of the corresponding lysis buffer supplemented with 20 mM
imidazole. Subsequently, elution was performed stepwise using 5 CV fractions, starting with
lysis buffer supplemented with 75 mM imidazole, then with 150 mM imidazole, followed by
a final elution step with 300 mM imidazole. The fractions of interest were analysed using SDS-
PAGE.
4.2.1.17. Glutathione affinity chromatography
Cleared lysates from expressions of GST-tagged target proteins were loaded onto previously
equilibrated glutathione agarose matrix placed in a glass column body. The solution and the
matrix were incubated for 30-60 min at 4-8 °C. Afterwards, the column was mounted
vertically and the flow-through was collected. The matrix was subsequently washed 3 times
with 10 CV of the appropriate purification buffer and eluted 6 times with 1 CV of the
corresponding buffer supplemented with 20 mM reduced L-Glutathione.
4.2.1.18. TEV-protease cleavage reaction
Before cleavage, eluted protein was dialysed against 2 L of TEV-cleavage buffer (50 mM Tris-
HCl, pH 8.0, 0.5 mM EDTA) at 4-8 °C. Afterwards, TEV protease was added to the dialysate in
a molar ratio of 1:25 to 1:50 and incubated at 4-8 °C overnight. Cleaved target protein was
further purified using size exclusion chromatography (SEC). For on-column cleavage, buffer
used for washing was replaced by 5 CV TEV-cleavage buffer. Subsequently, TEV protease was
added to the matrix in a ratio of 1:25 to 1:50 and incubated overnight at 4-8 °C. The cleaved
protein of interest was obtained by collecting the flow-through. The uncleaved protein as well
as the His6-tagged TEV-protease were eluted using appropriate buffer as describe above.
Material and methods
113
4.2.1.19. PreScission protease cleavage reaction
Cleavage of the purified GST-tagged protein was performed using PreScission protease.
Firstly, eluted protein was dialysed against 2 L of the PreScission-cleavage buffer (50 mM.
Tris-HCl, 150 mM NaCl, 1 mM EDTA, 1 mM DTT, pH 7.0) at 4-8 °C to remove glutathione.
Subsequently, the dialysate was supplemented with the PreScission protease to a final ratio
of 1:25 and incubated overnight on a roller mixer at 4-8 °C. After cleavage, cleaved protein
was separated by means of size exclusion chromatography (SEC).
4.2.1.20. WbTrx purification using Q-Sepharose Fast Flow
Cell pellets containing recombinant WbTrx were resuspended in lysis buffer (20 mM Tris-
HCl, pH 8.0, 5 mM EDTA), disrupted by sonication and clarified by centrifugation at 16000 x g
for 30 min. The resulting supernatant was applied onto Q-Sepharose fast flow (GE Healthcare
Life Sciences, Freiburg, Germany) equilibrated with lysis buffer and incubated at 4 °C for 1 h.
The matrix was initially washed with 2 CV lysis buffer to remove unbound protein.
Afterwards, it was washed (20 mM Tris–HCl pH 8.0, 5 mM EDTA, 20 mM NaCl) and
recombinant WbTrx was eluted stepwise using elution buffer (20 mM Tris–HCl pH 8.0, 5 mM
EDTA, 150 mM NaCl). The resulting elution fractions were analysed using SDS-PAGE and
further purified by size exclusion chromatography (SEC) using the elution buffer.
4.2.1.21. Protein quantification
Protein concentration was determined using a NanoDrop spectrometer by measuring the
absorbance of aromatic amino acids at 280 nm. 2 µl of the protein solution were applied onto
the pedestal of the device, where the absorbance was determined. Every measurement was
repeated to verify its stability. Applying Lambert-Beer’s law, the protein concentration was
calculated according to the following equation.
𝑪 = 𝑨𝟐𝟖𝟎
𝜺 ∙ 𝒅∙ 𝑴𝑾
Equation 1: Protein concentration calculation based on absorbance measurements using NanoDrop.
C = protein concentration, A280 = measured absorbance at 280 nm, MW = molecular weight, ε = extinction
coefficient at 280 nm, d = layer thickness.
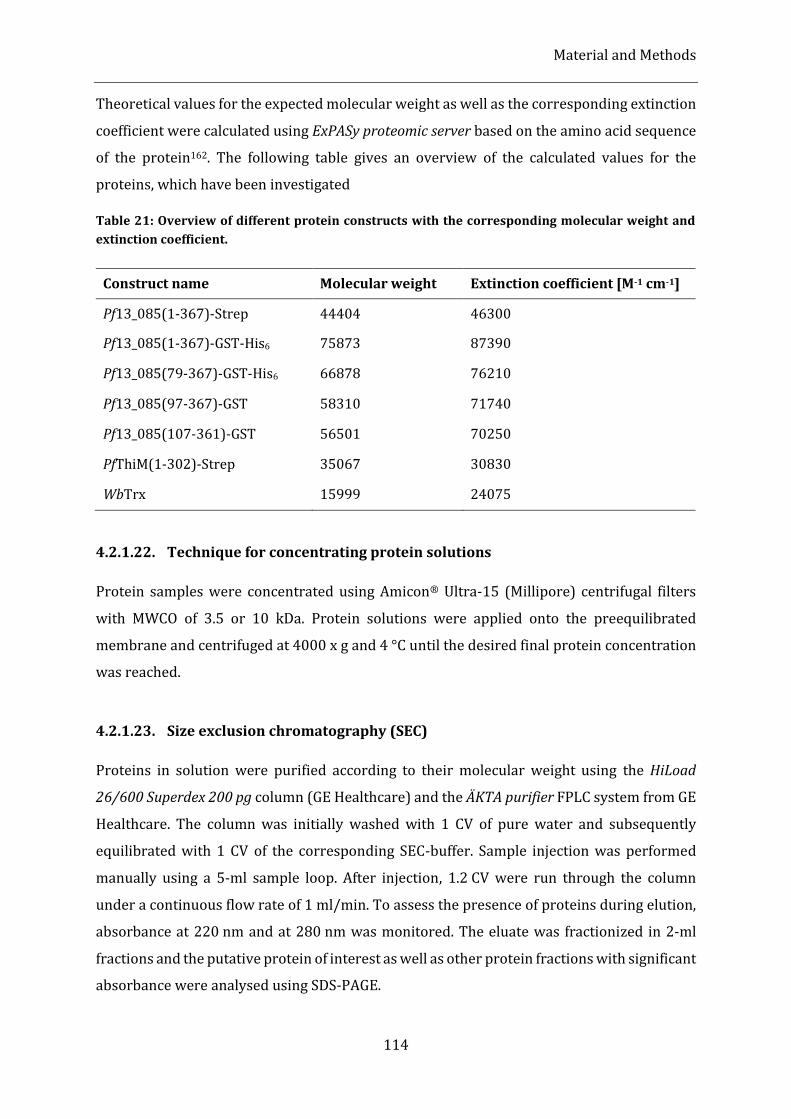
Material and Methods
114
Theoretical values for the expected molecular weight as well as the corresponding extinction
coefficient were calculated using ExPASy proteomic server based on the amino acid sequence
of the protein162. The following table gives an overview of the calculated values for the
proteins, which have been investigated
Table 21: Overview of different protein constructs with the corresponding molecular weight and
extinction coefficient.
Construct name Molecular weight
[Da]
Extinction coefficient [M-1 cm-1]
Pf13_085(1-367)-Strep 44404 46300
Pf13_085(1-367)-GST-His6 75873 87390
Pf13_085(79-367)-GST-His6 66878 76210
Pf13_085(97-367)-GST 58310 71740
Pf13_085(107-361)-GST 56501 70250
PfThiM(1-302)-Strep 35067 30830
WbTrx 15999 24075
4.2.1.22. Technique for concentrating protein solutions
Protein samples were concentrated using Amicon® Ultra-15 (Millipore) centrifugal filters
with MWCO of 3.5 or 10 kDa. Protein solutions were applied onto the preequilibrated
membrane and centrifuged at 4000 x g and 4 °C until the desired final protein concentration
was reached.
4.2.1.23. Size exclusion chromatography (SEC)
Proteins in solution were purified according to their molecular weight using the HiLoad
26/600 Superdex 200 pg column (GE Healthcare) and the ÄKTA purifier FPLC system from GE
Healthcare. The column was initially washed with 1 CV of pure water and subsequently
equilibrated with 1 CV of the corresponding SEC-buffer. Sample injection was performed
manually using a 5-ml sample loop. After injection, 1.2 CV were run through the column
under a continuous flow rate of 1 ml/min. To assess the presence of proteins during elution,
absorbance at 220 nm and at 280 nm was monitored. The eluate was fractionized in 2-ml
fractions and the putative protein of interest as well as other protein fractions with significant
absorbance were analysed using SDS-PAGE.
Material and methods
115
4.2.2. Biophysical methods
4.2.2.1. Dynamic light scattering (DLS)
To obtain information about the distribution of hydrodynamic radii in solution, dynamic light
scattering (DLS) was performed. The hydrodynamic radius Rh can be calculated using the
Stokes-Einstein equation, considering the viscosity of the protein solution η.
𝑅ℎ = 𝜅𝑇
6 𝜋 𝜂 𝐷
Equation 2: Calculation of the hydrodynamic radius Rh. κ = Boltzmann constant [J/K], T =
temperature [K], η = dynamic viscosity [N s m-2].
Prior to DLS measurements, all samples were spun at 16100 x g and 4 °C for 30-60 min.
Afterwards, 12 µl of the sample were pipetted into a quartz cuvette and measured using the
DLS device SpectroSize-300 (XtalConcepts, Hamburg, Germany) at a constant temperature of
20 °C.
4.2.2.2. Circular dichroism (CD) spectroscopy
Circular dichroism spectroscopy (CD) was applied to examine secondary structure content
and the protein folding integrity in solution. Absorbance was measured over a specific
wavelength range and, depending on the position of the arising minima, maxima and the zero-
crossing, presence of specific secondary structures was predicted125.
CD spectroscopic measurements were performed using a J-185 (Jasco) device. 100 µl of the
sample were applied into a quartz cuvette with a path length of 1 mm and measured 15 times
over a wavelength range of 260 nm to 190 nm at a constant temperature of 20 °C. The
measurements were averaged to obtain a resulting CD spectrum. Before each protein sample
measurement, a blank measurement was performed to assess buffer contribution to the
overall signal, which was subsequently subtracted from the sample spectrum. The measured
ellipticity was converted into the unit mean molar residue ellipticity [θ], which can be
expressed in deg ∙ cm2 ∙ dmol-1.
[𝜃] = 𝜃 𝑀
10 𝑐 𝑙 𝑛
Equation 3: Calculation of the mean residue ellipticity [θ]. θ = measured ellipticity [mdeg], M =
molecular mass [g mol-1], c = protein concentration [g mol-1], l = cuvette path length [cm], n = number of
peptide bonds within the amino acid chain.
Material and Methods
116
4.2.2.3. Kinase assay
The ADP colorimetric kinase assay kit was purchased from Sigma-Aldirch and the assay was
performed according to the manufacturer’s protocol. All samples and standards were run as
duplicates. The kinase assay is based on an enzyme-coupled reaction. In the process, the ADP
concentration is correlated to the absorbance of the colorimetric product at 450 nm. The
amount of target protein per well was in the range of 2-10 nmol/50 µl, whereas the amount
of the substrate was 100 µmol/50 µl.
4.2.2.4. MALDI mass spectrometry
To verify the identity of a putative protein of interest protein samples were initially analysed
by SDS-PAGE and subsequently subjected to MALDI mass spectrometric analysis. After SDS-
PAGE and Coomassie staining, polyacrylamide gels were post-treated to isolate proteins out
of the gel. The MALDI analysis was performed externally at the Institute of Organic Chemistry,
University of Hamburg.
Firstly, the sample was extracted and subjected to tryptic digestion. For this purpose, protein
bands of interest were cut out with a sterile scalpel blade. The following section describes the
procedure of gel extraction and tryptic protein digestion. The gel slices were chopped and
mixed with 100 µl 25 mM NH4HCO3 in 50% acetonitrile in a 1.5 ml reaction tube. The samples
were shaken at 1400 rpm at RT using a thermomixer. After spinning, the supernatant
solution was removed using gel-loading pipette tips and the shaking and centrifugation steps
were repeated until the gel slices were completely destained. Afterwards, the gel slices were
dried using a SpeedVac. To reduce the potentially present disulfide bonds, gel slices were
incubated at 56 °C in 30 µl of the reduction solution (25 mM NH4HCO3, 10 mM DTT). The
solution was subsequently removed using gel-loading pipette tips and discarded. Afterwards,
the gel slices were dissolved in 25 µl of a solution containing 55 mM iodoacetamide and
25 mM NH4HCO3 and incubated for 45 min under shaded conditions. This step was essential
to prevent potential reoxidation of carboxymethylated cysteines. After another removal of
the solution, gel slices were washed in 100 µl of a 25 mM NH4HCO3 solution in a thermomixer
at 1400 rpm and RT. After the washing solution was discarded, gel slices were dehydrated by
applying 100 µl of 25 mM NH4HCO3 in 50% acetonitrile and this procedure was performed
while shaking at 1400 rpm and RT in a thermomixer. Before the gel slices were dried using a
SpeedVac for 30 min, the dehydration step was repeated. The actual tryptic digestion
followed the procedure described above. For this purpose, 20 µl of the trypsin solution were
Material and methods
117
added to the gel slices and the mixture was rehydrated on ice for 10 min. Subsequently, the
reaction mixture was overlaid with 20 µl of a 25 mM NH4HCO3 solution and incubated for
16 h at 37 °C. Afterwards, the solution was transferred into a fresh LoBind Eppendorf tube
and mixed with 20 µl of a solution containing 5% formic acid and 50% acetonitrile, then
shaken at 1400 rpm for 30 min. The reaction was subsequently subjected to a 30-min
sonication step using an ultrasonic bath. The resulting solution was transferred into a fresh
LoBind Eppendorf tube and the remaining gel slice was mixed again with 20 µl of a solution
containing 5% formic acid and 50% acetonitrile, then treated as described above. The extract
was combined with the solution from the first extraction step and reduced up to a volume of
10-20 µl using a SpeedVac. To avoid any potential interferences with salts during the MALDI
analysis, the samples were purified using 10 µl ZipTip® pipette tips (Millipore) according to
the manufacturer’s protocol. Prior to MALDI mass spectrometric analysis, the samples were
stored at -20 °C.
4.2.2.5. Native mass spectrometry
The Native-MS experiment was performed in collaboration with the junior research group
Dynamics of Viral Structures led by Dr. Charlotte Uetrecht from the Heinrich-Pette-Institute
(HPI), Hamburg, Germany. Native mass spectrometry can be used to study macromolecular
interactions, protein processing and topology of protein complexes up to a size of Mega-
Daltons. Typically, electrospray ionization (ESI) mass spectrometers are used to vaporize the
protein solution, because it is a gentle ionization method that keeps proteins intact in their
“native” state. Because higher amounts of salts present in buffers after recombinant protein
purification can negatively impair the ionization process, samples need to be transferred into
a volatility-compatible buffer system. Buffers containing ammonium acetate in the
concentration range of 5 mM to 1 M with a neutral pH have proved to be suitable for this
purpose204.
Depending on the electrostatic nature of the exposed surface area in solution, a single protein
can generate several ionic states with multiple charges in a native MS-experiment. Thus, well
folded compact macromolecules that possess a smaller surface area will result in a lower
charge compared to unfolded proteins. The mass can be derived from the mass-to-charge
ratio (m/z) of two adjacent peaks, 1 and 2, and the corresponding charge, which differs by 1.
Material and Methods
118
𝑀𝑊 = 𝑛 ∙ (𝑚
𝑧)
1 and 𝑀𝑊 = (𝑛 − 1) ∙ (
𝑚
𝑧)
2
Equation 4: Calculation of the molecular weight. MW = molecular weight, m = mass, z = charge, n =
number.
Initially, a buffer exchange of the protein solution into 500 mM ammonium acetate, pH 8.0,
was performed at 4 °C using Vivaspin® 500 filtration units with a MWCO of 5000 (Sartorius)
according to the protocol of the manufacturer. 5-10 μL of the sample were inserted into a
gold-coated glass capillary and subjected to ESI-MS.
The mass spectrometer used was an LCT Premier mass spectrometer (Waters/Micromass,
UK) modified for high masses (MS Vision, NL). A nano-ESI source was applied for sample
ionization and a time-of-flight (ToF) instrument for mass analysis before multi-channel plate
(MCP) detection. MS control and sample analysis were carried out by the program MassLynx
4.1 (Waters, UK) using the positive ion mode. The capillary voltage applied was 1300 V and
1400 V. At the sample cone, the voltage was varied in the range 130 -150 V.
4.2.2.6. Small angle X-ray scattering (SAXS)
The method of small angle X-ray scattering (SAXS) was applied to obtain structural
information of the proteins in solution, like for example their shape, the oligomeric state as
well as the particle size. This approach makes use of elastic X-ray scattering for scattering
events captured at small angles in the range of 0.1°-10°.
Prior to SAXS analysis, solutions containing purified protein of interest were centrifuged at
16100 x g for 30 – 60 min and analysed via DLS as described above to verify their
monodispersity. For every protein of interest at least three different protein concentrations
were measured. All measurements were performed at the P12 EMBL-beamline of the
PETRA III storage ring (DESY, Hamburg). The sample volume was 20 µl, the wavelength and
the detector distance were 1.24 Å and 3 m, respectively. To eliminate background noise
contribution, the exact same buffer was measured before and after each measurement. The
buffer scattering signal was subsequently subtracted from the sample scattering signal using
an implemented beamline pipeline software.
Data processing was performed using the software PRIMUS163 and GNOM205 of the ATSAS206
package. By means of these programs, the Guinier approximation, the Kratky plot, as well as
the distance distribution function were calculated, which allowed to derive the radius of
gyration Rg and the maximum diameter of the particle Dmax164.
Material and methods
119
To calculate ab initio models, the following software from the ATSAS206 online server was
used: DAMMIF164 for generating up to 20 models and DAMAVER165 for averaging. For the
representation of the models, the software CRYSOL207 was used.
4.2.3. Protein crystallization
4.2.3.1. Screening for crystallization conditions
Commercially available high-throughput screens were employed to screen for crystallization
conditions using a Honeybee 961 robotic device (Genomic Solutions). The set-ups were
realized applying the sitting drop method and using MRC2 crystallization plates. For this
purpose, 0.5 µl of the protein solution was typically mixed with an equal volume of the
precipitant solution and equilibrated against 50 µl of reservoir solution after sealing the plate
with a transparent sealing foil. Crystallization plates were subsequently stored at 20 °C. The
plates were routinely checked using a light microscope. Following crystallization screens
were used for robotic screening: JCSG-plus, PACT premier, Morpheus, Structure, SturaFootprint
& Macrosol from Molecular Dimensions, UK, as well as AmSO4-Suite, ComPAS Suite, Classics Suite
and Classics Suite from Qiagen, Germany.
4.2.3.2. Optimization of crystallization conditions and up-scaling
To optimize initial crystallization conditions the hanging drop crystallization approach using
Linbro plates was applied. The volume of the crystallization drop was typically 2 – 6 µl and
the reservoir volume 500 – 1000 µl. Linbro plates were sealed with silicone grease covered
by a siliconized coverslip. The composition of the set-up was depending on the initial
crystallization condition. To optimize the crystal size and quality, parameters like buffer-pH
and precipitant concentration were varied.
4.2.3.3. Batch crystallization of WbTrx
Preliminary small-scale batch crystallization set-ups were carried out in accordance with
considerations published by Rayment et al.178. WbTrx in a concentration of 34 mg/ml was
mixed with varying precipitant solutions containing 0.06-0.08 M SPG, pH 6.5 and 15-20%
PEG1500 in a 10 µl volume. The crystallization success was examined by eye and additionally
using a light microscope. Batch conditions which led to WbTrx crystal formation were
successfully up-scaled to a total volume of 20 µl.
Material and Methods
120
4.2.4. Diffraction data collection and evaluation
4.2.4.1. Multiple crystal diffraction data collection using the Kapton® foil sandwich approach
Multiple crystal diffraction data collection using the Kapton® foil crystallization and in situ
diffraction approach (chapter 2.3.5.2) was performed at the EMBL beamline P14 of the DESY
storage ring PETRA III (Hamburg, Germany). An X-ray beam with an energy of 12.8 keV was
used and was focused onto a size of 10 µm x 5 μm (FWHM of Gaussian profile). The non-
attenuated X-ray beam had a flux density of 2.2 ∙ 1012 photons ∙ s-1. Diffraction data collection
was carried out at 293 K using a Pilatus 6M hybrid pixel detector. Either a kappa-, or a plate
goniometer was used for the fixed-target rotation. Using an exposure time of 40 ms per frame,
20 frames were collected in a shutterless operation from each crystal. Thus, images were
recorded from a total number of ~50-100 crystals. The Kapton® foil sandwich or the chip,
respectively, attached to the fixed-target support was rotated by 1° per exposure cycle
resulting in a total oscillation range of 20° within 800 ms. To assess the tolerated X-ray dose,
two separate data collection runs were performed in the described manner. The first run was
carried out using a 5% transmission which corresponds to 1.1 ∙ 1011 photons ∙ s-1 and the
second using a 50% transmission resulting in a flux of 1.1 ∙ 1012 photons ∙ s-1.
4.2.4.2. X-ray crystallographic data evaluation
XDS208 was used to process each recorded diffraction pattern individually. Diffraction images
that belonged to a specific time wedge were processed and scaled together over all crystals
using the program XSCALE of the XDS package. Data processing automation was facilitated
by bash scripts written by Robin Schubert, University of Hamburg, Germany. Molecular
Replacement was performed to derive the phase information based on the 3D coordinates of
the WbTrx crystal structure with the PDB entry 4FYU. For this purpose, the program
MOLREP209 of the CCP4 suite210 was used. Structure refinement was performed using
Refmac5211, while manual modifications in real space were carried out using COOT212. Both
refinement programs were used in a successive manner to build and obtain the final model.
The conservative criterion I/σ(I) ≧ 2 was applied to define the highest resolution shell.
Solvent molecules were automatically and were subsequently checked for the chemical
plausibility. The resulting models were inspected for possible Ramachandran outliers. To
evaluate the progression of the radiation damage over the different time wedges the program
RADDOSE-3D213 was used to assess the radiation dose absorbed by a crystal.
Material and methods
121
4.2.4.3. Detection of radiation-induced changes at disulfide bonds
To assess possible effects of the site-specific component of the radiation damage, structure-
factor amplitude Fourier difference maps Fo - Fo of electron density maps that had to be
compared to each other have been calculated. Firstly, the corresponding refined models were
superimposed using the Python-based Hierarchical ENvironment for Integrated Xtallography
(PHENIX)214. The corresponding difference maps Fo - Fo were subsequently calculated using
COOT212 and analysed at a contour level of 3σ.
4.2.4.4. Calculation of crystal orientations
To analyse if possible preferred crystal orientations were present, crystal orientation
distribution with respect to the laboratory coordinate system was determined. For this
purpose, using the XDS output file XPARM.XDS Euler angles from the orientation matrix were
calculated using MATLAB (MATLAB and Statistics Toolbox Release 2007a, The MathWorks
Inc., Natick, Massachusetts, United States) according to the procedure previously described
by Zarrine-Afsar et al.177. The obtained angles were plotted for all three rotation planes in a
histogram.
4.2.5. Microfluidic chip fabrication
Microfluidic chips were used for in situ crystallization and diffraction experiments.
Microfluidic chip fabrication is a procedure that involves four main steps: mask design,
fabrication of SU-8 masters, patterning of PDMS mold, epoxy cast preparation and chip
assembly and sealing (Fig. 57). Microfluidic chip fabrication was performed collaboratively
with the team of Dr. Michael Heymann (Center for Free Electron Laser Science, Hamburg).
The first steps of the chip preparation were carried out in a dust-free room.
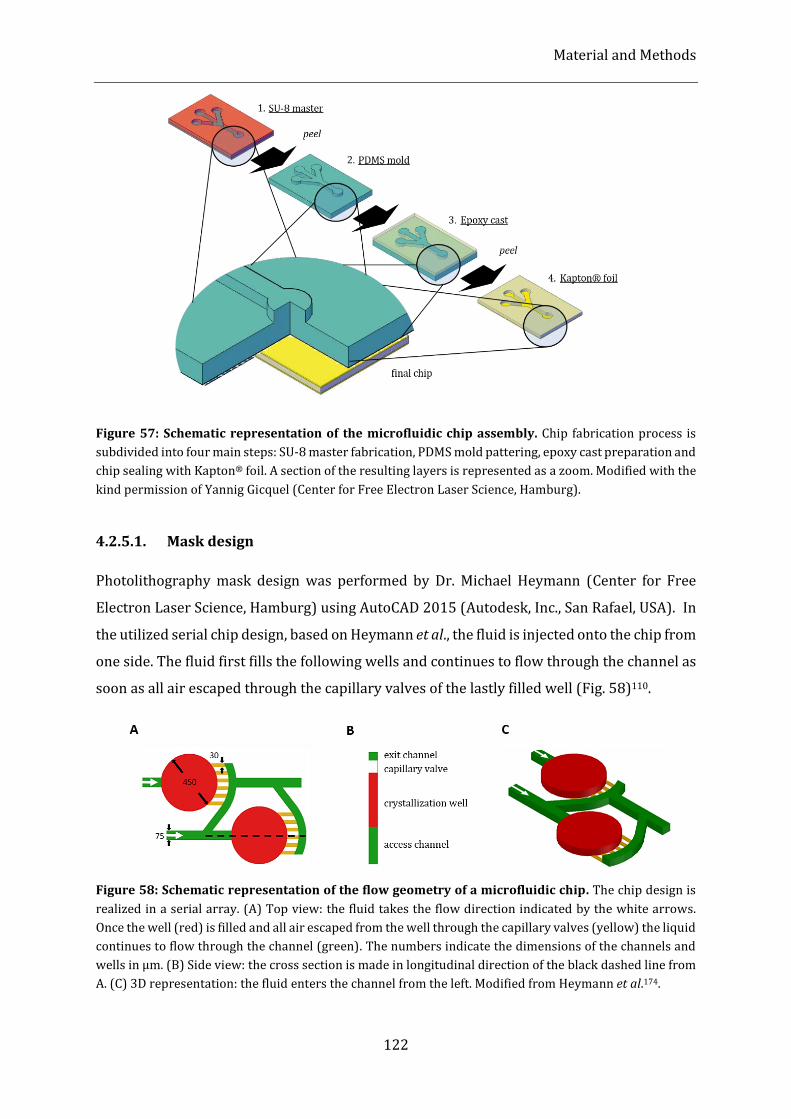
Material and Methods
122
Figure 57: Schematic representation of the microfluidic chip assembly. Chip fabrication process is
subdivided into four main steps: SU-8 master fabrication, PDMS mold pattering, epoxy cast preparation and
chip sealing with Kapton® foil. A section of the resulting layers is represented as a zoom. Modified with the
kind permission of Yannig Gicquel (Center for Free Electron Laser Science, Hamburg).
4.2.5.1. Mask design
Photolithography mask design was performed by Dr. Michael Heymann (Center for Free
Electron Laser Science, Hamburg) using AutoCAD 2015 (Autodesk, Inc., San Rafael, USA). In
the utilized serial chip design, based on Heymann et al., the fluid is injected onto the chip from
one side. The fluid first fills the following wells and continues to flow through the channel as
soon as all air escaped through the capillary valves of the lastly filled well (Fig. 58)110.
Figure 58: Schematic representation of the flow geometry of a microfluidic chip. The chip design is
realized in a serial array. (A) Top view: the fluid takes the flow direction indicated by the white arrows.
Once the well (red) is filled and all air escaped from the well through the capillary valves (yellow) the liquid
continues to flow through the channel (green). The numbers indicate the dimensions of the channels and
wells in μm. (B) Side view: the cross section is made in longitudinal direction of the black dashed line from
A. (C) 3D representation: the fluid enters the channel from the left. Modified from Heymann et al.174.
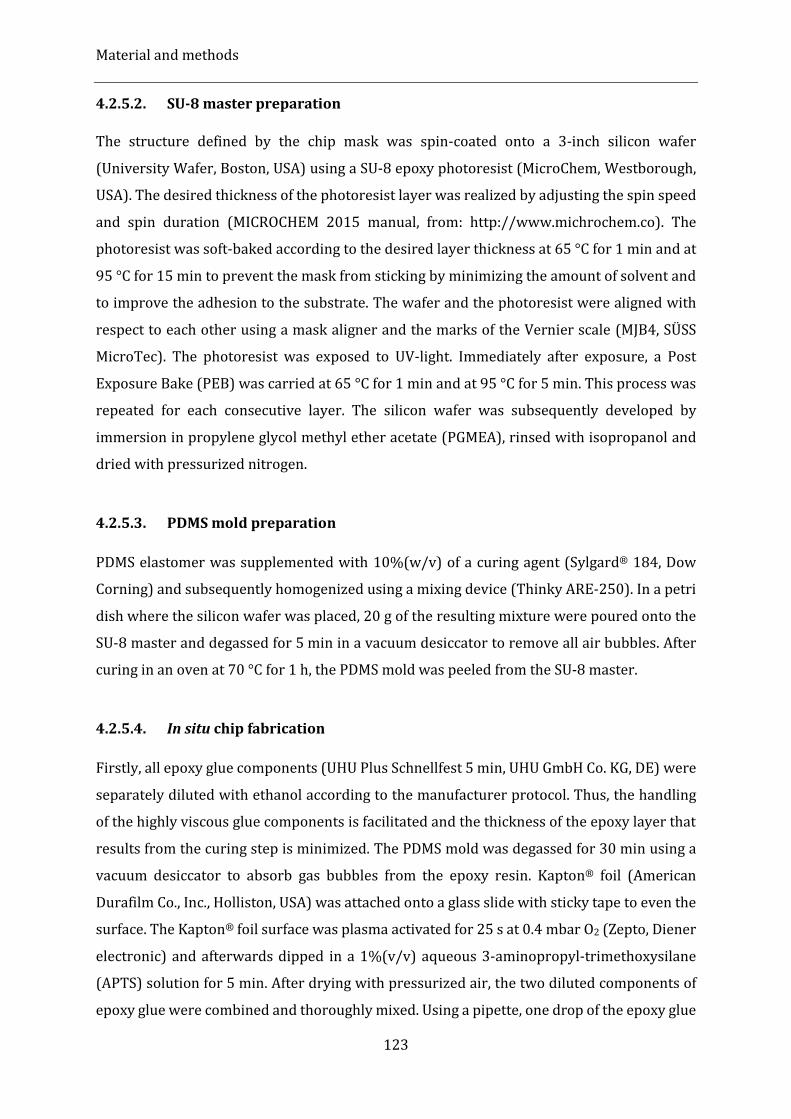
Material and methods
123
4.2.5.2. SU-8 master preparation
The structure defined by the chip mask was spin-coated onto a 3-inch silicon wafer
(University Wafer, Boston, USA) using a SU-8 epoxy photoresist (MicroChem, Westborough,
USA). The desired thickness of the photoresist layer was realized by adjusting the spin speed
and spin duration (MICROCHEM 2015 manual, from: http://www.michrochem.co). The
photoresist was soft-baked according to the desired layer thickness at 65 °C for 1 min and at
95 °C for 15 min to prevent the mask from sticking by minimizing the amount of solvent and
to improve the adhesion to the substrate. The wafer and the photoresist were aligned with
respect to each other using a mask aligner and the marks of the Vernier scale (MJB4, SÜSS
MicroTec). The photoresist was exposed to UV-light. Immediately after exposure, a Post
Exposure Bake (PEB) was carried at 65 °C for 1 min and at 95 °C for 5 min. This process was
repeated for each consecutive layer. The silicon wafer was subsequently developed by
immersion in propylene glycol methyl ether acetate (PGMEA), rinsed with isopropanol and
dried with pressurized nitrogen.
4.2.5.3. PDMS mold preparation
PDMS elastomer was supplemented with 10%(w/v) of a curing agent (Sylgard® 184, Dow
Corning) and subsequently homogenized using a mixing device (Thinky ARE-250). In a petri
dish where the silicon wafer was placed, 20 g of the resulting mixture were poured onto the
SU-8 master and degassed for 5 min in a vacuum desiccator to remove all air bubbles. After
curing in an oven at 70 °C for 1 h, the PDMS mold was peeled from the SU-8 master.
4.2.5.4. In situ chip fabrication
Firstly, all epoxy glue components (UHU Plus Schnellfest 5 min, UHU GmbH Co. KG, DE) were
separately diluted with ethanol according to the manufacturer protocol. Thus, the handling
of the highly viscous glue components is facilitated and the thickness of the epoxy layer that
results from the curing step is minimized. The PDMS mold was degassed for 30 min using a
vacuum desiccator to absorb gas bubbles from the epoxy resin. Kapton® foil (American
Durafilm Co., Inc., Holliston, USA) was attached onto a glass slide with sticky tape to even the
surface. The Kapton® foil surface was plasma activated for 25 s at 0.4 mbar O2 (Zepto, Diener
electronic) and afterwards dipped in a 1%(v/v) aqueous 3-aminopropyl-trimethoxysilane
(APTS) solution for 5 min. After drying with pressurized air, the two diluted components of
epoxy glue were combined and thoroughly mixed. Using a pipette, one drop of the epoxy glue
Material and Methods
124
mixture was applied onto each chip feature of the PDMS mold. The surface of the activated
Kapton® foil attached to the glass slide was put onto the PDMS mold with the glue drops and
pressed down as strongly as possible to minimize the layer thickness of the resulting epoxy
film. During the curing process, pressure was applied for 1 h using metal weights. The
Kapton® foil with the patterned epoxy resin was subsequently released from the glass slide
and from the PDMS mold. After plasma activation at 0.4 mbar O2 for 20 min, the foil was
dipped in a 1%(v/v) aqueous 3-aminopropyl-trimethoxysilane (APTS) solution for 5 min.
Another equal peace of Kapton® foil was activated in the same way and dipped in a 1%(v/v)
aqueous 3-glycidoxypropyl-trimethoxysilane (GPTS) solution for 5 min. Both foils were dried
separately using pressurized air. The foil with the epoxy resin was positioned on a flat surface
with the resin being face up and subsequently sealed with the other activated Kapton® foil
sheet.
4.2.5.5. Access ports for fluid delivery
An oblong PDMS block was prepared that fitted the length of the chip side to enable the
interface for the access of the fluid delivery. The chips and the PDMS block were plasma
activated for 20 min at 0.4 mbar O2, dipped for 5 min into a 1%(v/v) aqueous APTS or GPTS
solution, respectively, and finally dried with pressurized air. After pressing the block against
the corresponding chip surface, fluid access port holes were punched using a 0.75 mm biopsy
punch and the back part of the chip was sealed with sticky tape. The diameter of the holes
determines the outer diameter of the tubing that can be used for sample injection.
4.2.5.6. Surface treatment
To minimize possible interactions of the protein solution with the surface of the chip channel
system, a 9%(w/v) CTX-109AE (AGC Chemicals, Exton, USA) in CT-Solv 100 (AGC Chemicals,
USA) solution was injected into the chip using a syringe. The solution applied acted as a
hydrophobic coating. The solvent was removed by placing the treated chip onto a 190 °C hot
plate for 5 min.
4.2.6. Insect cell culture and in vivo crystallization
Cloning into the pFastBac-1 vector and generation of the recombinant Bacmid were carried
out according to the instructions of the “Bac-to-Bac Baculovirus Expression System” manual
Material and methods
125
(Invitrogen) version from 2015. All insect culture steps were adopted from this manual, as
well. The following chapters focus on all aberrant steps. Insect cell culture was performed
collaboratively with Dr. Theresa Nuguid (University of Hamburg).
4.2.6.1. Transfection of Sf9 cells with Bacmid-DNA
Sf9 cells that were in logarithmic phase with approx. 2.5 · 106 cells per ml were plated into 6-
well dishes and incubated for 1 h at RT. After cell adhesion, ExCell 420 medium containing
Penicillin-Streptomycin was replaced by fresh unsupplemented medium. Subsequently, 2 μg
of isolated Bacmid-DNA and 4 μl of the ESCORT IV transfection reagent (Sigma) were
separately diluted with the culture medium to a volume of 100 μl. Afterwards, both reactions
were combined and incubated for 20 min. This mixture was then given drop-by-drop into a
6-well plate and incubated for 4 h at 27 °C. Then, the medium was exchanged against fresh
antibiotic containing medium and incubated at 27 °C for 3 days. Cell cultures were examined
for first sign of viral infection. In case of obvious viral infection, the virus containing
supernatant was cleared at 4500 x g for 5 min and transferred into a fresh vial that was
subsequently kept under shaded conditions at 4 °C (P1 stock).
4.2.6.2. Amplification of viral particles
8 · 105 Sf9 cells were plated and infected with 200 ml of the P1 stock and incubated as
describe in previous chapter. After 3 days, the supernatant (P2 stock) was collected and
stored in dark at 4 °C. To produce a stock with a higher virus titer, the procedure was
repeated (P3 stock).
4.2.6.3. Insect cell infection for gene expression and generation of in vivo crystals
Using T-175 cell culture flasks, 8 · 105 Sf9 cells/ml were plated in in 20 ml ExCell 420 medium
containing Pen/Strep and infected with the P3 virus stock in a 1:500 ratio. The cells were
incubated at 27 °C for 5 days during which they were carefully examined using a microscope
to allow for detection of in vivo crystal formation.
4.2.6.4. Isolation of in vivo crystals
Infected Sf9 cells were detached from the flask bottom using a cell scraper, transferred into
50 ml falcon tubes and centrifuged at 3200 x g for 5 min. The resulting supernatant that

Material and Methods
126
contained crystals was subsequently transferred into 2 ml reaction tubes and centrifuged at
12000 x g for 5 min. The supernatant was discarded, the pelleted crystals were washed in
RIPA buffer (Thermo Scientific) and centrifuged at 12000 x g. The resulting crystal pellet was
resuspended in PBS buffer.
Appendix
127
References
1 World Health Organization, World Malaria Report 2016, Geneva (2017, April).
2 Snow, R. W., Craig, M. & Deichmann, U. Estimating mortality, morbidity and disability due to malaria among Africa's non-pregnant population. Bulletin of the World Health Organization (1999).
3 World Helath Organization, Malaria Report 2016. Geneva (2016).
4 Center for Disease Control and Prevention, About Malaria. (2017, March 28).
5 Josling, G. A. & Llinás, M. Sexual development in Plasmodium parasites: knowing when it's time to commit. Nature Reviews Microbiology 13, 573-587, doi:10.1038/nrmicro3519 (2015).
6 Winzeler, E. A. Malaria research in the post-genomic era. Nature (2008).
7 Beck-Johnson, L. M., Nelson, W. A. & Paaijmans, K. P. The effect of temperature on Anopheles mosquito population dynamics and the potential for malaria transmission. PLoS ONE, doi:10.1371/journal.pone.0079276 (2013).
8 Gardner, M. J. et al. Genome sequence of the human malaria parasite Plasmodium falciparum. Nature 419 (2002).
9 Kirchner, S., Power, J. B. & Waters, A. P. Recent advances in malaria genomics and epigenomics. Genome Medicine 8, doi:10.1186/s13073-016-0343-7 (2016).
10 Florens, L., Washburn, M. P., Raine, J. D. & Anthony, R. M. A proteomic view of the Plasmodium falciparum life cycle. Nature, doi:10.1038/nature01107 (2002).
11 Bautista, J. M., Marín-García, P., Diez, A. & Azcárate, I. G. Malaria proteomics: insights into the parasite–host interactions in the pathogenic space. Journal of Proteomics (2014).
12 Duffy, M. F., Selvarajah, S. A. & Josling, G. A. Epigenetic regulation of the Plasmodium falciparum genome. Briefings in functional Genomics, doi:10.1093/bfgp/elt047 (2013).
13 Hall, N., Karras, M., Raine, J. D. & Carlton, J. M. A comprehensive survey of the Plasmodium life cycle by genomic, transcriptomic, and proteomic analyses. Science, doi:10.1126/science.1103717 (2005).
14 Kirk, K. & Saliba, K. J. Targeting nutrient uptake mechanisms in Plasmodium. Current drug targets 8, 75-88, doi:10.2174/138945007779315560 (2007).
15 Aikawa, M. The fine structure of the erythrocytic stages of three avian malarial parasites, Plasmodium fallax, P. lophurae, and P. cathemerium. American journal of tropical medicine and hygiene (1966).
16 Rudzinska, M. A. & Trager, W. Pinocytotic uptake and the digestion of hemoglobin in malaria parasites. The Journal of Protozoology, doi:10.1111/j.1550-7408.1965.tb03256.x (1965).
Appendix
128
17 Ginsburg, H., Krugliak, M., Eidelman, O. & Cabantchik, I. Z. New permeability pathways induced in membranes of Plasmodium falciparum infected erythrocytes. Molecular and biochemical parasitology 8, 177-190 (1983).
18 Saliba, K. J., Horner, H. A. & Kirk, K. Transport and Metabolism of the Essential Vitamin Pantothenic Acid in Human Erythrocytes Infected with the Malaria Parasite Plasmodium falciparum. Journal of Biological Chemistry, doi:10.1074/jbc.273.17.10190 (1998).
19 Müller, I. B. et al. Secretion of an acid phosphatase provides a possible mechanism to acquire host nutrients by Plasmodium falciparum. Cellular Microbiology 12, 677-691, doi:10.1111/j.1462-5822.2010.01426.x (2010).
20 Francis, S. E. & Jr, S. D. J. Hemoglobin metabolism in the malaria parasite Plasmodium falciparum. Annual Reviews in Microbiology (1997).
21 Manning, G., Plowman, G. D., Hunter, T. & Sudarsanam, S. Evolution of protein kinase signaling from yeast to man. Trends in Biochemical Sciences 27, 514-520, doi:10.1016/S0968-0004(02)02179-5 (2002).
22 Hanks, S. K., Quinn, A. M. & Hunter, T. The protein kinase family: conserved features and deduced phylogeny of the catalytic domains. Science (1988).
23 Stout, T. J., Foster, P. G. & Matthews, D. J. High-throughput structural biology in drug discovery: protein kinases. Current pharmaceutical design, doi:10.2174/1381612043452695 (2004).
24 Hanks, S. K. & Quinn, A. M. Protein kinase catalytic domain sequence database: Identification of conserved features of primary structure and classification of family members. Methods in enzymology (1991).
25 Li, B., Liu, Y., Uno, T. & Gray, N. Creating chemical diversity to target protein kinases. Combinatorial chemistry & high throughput screening, doi:10.2174/1386207043328580 (2004).
26 Hunter, T. [1] Protein kinase classification. Methods in enzymology 200, 3-37 (1991).
27 Doerig, C. et al. Protein kinases of malaria parasites: an update. Trends in parasitology 24, 570-577 (2008).
28 Srinivasan, N. & Krupa, A. A genomic perspective of protein kinases in Plasmodium falciparum. Proteins: Structure, doi:10.1002/prot.20278 (2005).
29 Hanks, S. K. Genomic analysis of the eukaryotic protein kinase superfamily: a perspective. Genome biology (2003).
30 Kostich, M., English, J. & Madison, V. Human members of the eukaryotic protein kinase family. Genome Biology (2002).
31 Bain, J., Plater, L., Elliott, M., Shpiro, N. & Hastie, C. J. The selectivity of protein kinase inhibitors: a further update. Biochemical Journal (2007).
32 Fedorov, O., Marsden, B. & Pogacic, V. A systematic interaction map of validated kinase inhibitors with Ser/Thr kinases. Proceedings of the National Academy of Sciences, doi:10.1073/pnas.0708800104 (2007).
Appendix
129
33 Ward, P., Equinet, L., Packer, J. & Doerig, C. Protein kinases of the human malaria parasite Plasmodium falciparum: the kinome of a divergent eukaryote. BMC genomics 5, 79 (2004).
34 Schneider, A. G. & Mercereau-Puijalon, O. A new Apicomplexa-specific protein kinase family: multiple members in Plasmodium falciparum, all with an export signature. BMC genomics 6, 30, doi:10.1186/1471-2164-6-30 (2005).
35 Philip, N. & Haystead, T. A. Characterization of a UBC13 kinase in Plasmodium falciparum. Proceedings of the National Academy of Sciences of the United States of America 104, 7845-7850, doi:10.1073/pnas.0611601104 (2007).
36 Begley, T. P. et al. Thiamin biosynthesis in prokaryotes. Archives of microbiology 171, 293-300 (1999).
37 Begley, T. P., Ealick, S. E. & McLafferty, F. W. Thiamin biosynthesis: still yielding fascinating biological chemistry. Biochemical Society transactions 40, 555-560, doi:10.1042/BST20120084 (2012).
38 Gerdes, S. et al. Plant B vitamin pathways and their compartmentation: a guide for the perplexed. Journal of experimental botany 63, 5379-5395, doi:10.1093/ jxb/ers208 (2012).
39 Jurgenson, C. T., Begley, T. P. & Ealick, S. E. The structural and biochemical foundations of thiamin biosynthesis. Annual review of biochemistry 78, 569-603, doi:10.1146/annurev.biochem.78.072407.102340 (2009).
40 Wrenger, C., Eschbach, M.-L., Müller, I. B., Warnecke, D. & Walter, R. D. Analysis of the vitamin B6 biosynthesis pathway in the human malaria parasite Plasmodium falciparum. Journal of Biological Chemistry 280, 5242-5248 (2005).
41 Wrenger, C. et al. Vitamin B1 de novo synthesis in the human malaria parasite Plasmodium falciparum depends on external provision of 4-amino-5-hydroxymethyl-2-methylpyrimidine. Biological chemistry 387, 41-51, doi: 10.1515/BC.2006.007 (2006).
42 Taylor, S. V. et al. Thiamin biosynthesis in Escherichia coli. Identification of ThiS thiocarboxylate as the immediate sulfur donor in the thiazole formation. Journal of Biological Chemistry 273, 16555-16560, doi:10.1074/jbc.273.26.16555 (1998).
43 Müller, I. B., Bergmann, B., Groves, M. R., Couto, I. & Amaral, L. The vitamin B1 metabolism of Staphylococcus aureus is controlled at enzymatic and transcriptional levels. PLoS ONE, doi:10.1371/journal.pone.0007656 (2009).
44 Wynd, S., Melrose, W. D., Durrheim, D. N., Carron, J. & Gyapong, M. Understanding the community impact of lymphatic filariasis: a review of the sociocultural literature. Bulletin of the World Health Organization 85, 493-498, doi: 10.1590/S0042-96862007000600017 (2007).
45 Ottesen, E. A. Editorial: the global programme to eliminate lymphatic filariasis. Tropical Medicine & International Health, doi:10.1046/j.1365-3156.2000.00620.x (2000).
Appendix
130
46 Chandy, A., Thakur, A., Singh, M. & Manigauha, A. A review of neglected tropical diseases: filariasis. Asian Pacific journal of tropical medicine, 581-586, doi:10.1016/s1995-7645(11)60150-8 (2011).
47 Molyneux, D. H. & Taylor, M. J. Current status and future prospects of the Global Lymphatic Filariasis Programme. Current opinion in infectious diseases (2001).
48 Evans, D. B., Gelband, H. & Vlassoff, C. Social and economic factors and the control of lymphatic filariasis: a review. Acta tropica 53, 1-26 (1993).
49 Organization, W. H. Neglected tropical diseases, hidden successes, emerging opportunities. Geneva (2009).
50 Ottesen, E. A., Hooper, P. J. & Bradley, M. The global programme to eliminate lymphatic filariasis: health impact after 8 years. PLoS Negl Trop Dis, doi: 10.1371/journal.pntd.0000317 (2008).
51 World Health Organization, Lymphatic filariasis, Geneva (2017, 06).
52 Center for Disease Control and Prevention, Biology - Life Cycle of Wuchereria bancrofti. (2010, 11).
53 Arnér, E. S. J. & Holmgren, A. Physiological functions of thioredoxin and thioredoxin reductase. European Journal of Biochemistry, doi:10.1046/j.1432-1327.2000.01701.x (2000).
54 Collet, J. F. & Messens, J. Structure, function, and mechanism of thioredoxin proteins. Antioxidants & redox signaling, doi:10.1089/ars.2010.3114 (2010).
55 Powis, G. & Montfort, W. R. Properties and biological activities of thioredoxins. Annual Review of Pharmacology and Toxicology, doi:10.1146/annurev.pharmtox. 41.1.261 (2001).
56 Watson, W. H., Yang, X., Choi, Y. E. & Jones, D. P. Thioredoxin and its role in toxicology. Toxicological Sciences, doi:10.1093/toxsci/kfh050 (2004).
57 Holmgren, A., Söderberg, B. O., Eklund, H. & Brändén, C. I. Three-dimensional structure of Escherichia coli thioredoxin-S2 to 2.8 A resolution. Proceedings of the National Academy of Sciences 72, 2305-2309 (1975).
58 Kunchithapautham, K. & Padmavathi, B. Thioredoxin from Brugia malayi: defining a 16-kilodalton class of thioredoxins from nematodes. Infection and …, doi:10.1128/IAI.71.7.4119-4126.2003 (2003).
59 Yousef, N. Structure function analysis of thioredoxin from Wuchereria bancrofti, a drug target for human lymphatic filariasis. Dissertation (2014).
60 Altschul, S. F. et al. Gapped BLAST and PSI-BLAST: a new generation of protein database search programs. Nucleic acids research 25, 3389-3402 (1997).
61 Altschul, S. F., Wootton, J. C. & Gertz, E. M. Protein database searches using compositionally adjusted substitution matrices. The FEBS Journal, doi: 10.1111/j.1742-4658.2005.04945.x (2005).
Appendix
131
62 Martin-Garcia, J. M., Conrad, C. E., Coe, J., Roy-Chowdhury, S. & Fromme, P. Serial femtosecond crystallography: A revolution in structural biology. Archives of Biochemistry and Biophysics, 32-47, doi:10.1016/j.abb.2016.03.036 (2016).
63 Schlichting, I. Serial femtosecond crystallography: the first five years. IUCrJ, doi:10.1107/S205225251402702X (2015).
64 Boutet, S. High-Resolution Protein Structure Determination by Serial Femto- second Crystallography (CXIDB ID 17). Science (2012).
65 Gruner, S. M. & Lattman, E. E. Biostructural Science Inspired by Next-Generation X-Ray Sources. Annual review of biophysics 44, 33-51, doi:10.1146/annurev-biophys-060414-033813 (2015).
66 Moukhametzianov, R. et al. Protein crystallography with a micrometre-sized synchrotron-radiation beam. Acta crystallographica. Section D, Biological crystallography 64, 158-166, doi:10.1107/S090744490705812X (2008).
67 Riekel, C., García Gutiérrez, M. C., Gourrier, A. & Roth, S. Recent synchrotron radiation microdiffraction experiments on polymer and biopolymer fibers. Analytical and bioanalytical chemistry 376, 594-601, doi:10.1007/s00216-003-1976-0 (2003).
68 Jung, Y. O. et al. Volume-conserving trans–cis isomerization pathways in photoactive yellow protein visualized by picosecond X-ray crystallography. Nature Chemistry 5, 212, doi:10.1038/nchem.1565 (2013).
69 Genick, U. K. et al. Structure of a Protein Photocycle Intermediate by Millisecond Time-Resolved Crystallography. Science 275, 1471-1475, doi:10.1126/science. 275.5305.1471 (1997).
70 Bourgeois, D. & Royant, A. Advances in kinetic protein crystallography. Current Opinion in Structural Biology 15, 538-547, doi:10.1016/j.sbi.2005.08.002 (2005).
71 Moffat, K. Time-resolved crystallography and protein design: signalling photoreceptors and optogenetics. Philosophical transactions of the Royal Society of London. Series B, Biological sciences 369, 20130568, doi:10.1098/rstb.2013.0568 (2014).
72 Ihee, H., Wulff, M., Kim, J. & Adachi, S.-i. Ultrafast X-ray scattering: structural dynamics from diatomic to protein molecules. International Reviews in Physical Chemistry 29, 453-520, doi:10.1080/0144235X.2010.498938 (2010).
73 Moffat, K. Time-Resolved Biochemical Crystallography: A Mechanistic Perspective. Chemical Reviews 101, 1569-1582, doi:10.1021/cr990039q (2001).
74 Redecke, L., Nass, K., DePonte, D. P. & White, T. A. Natively inhibited Trypanosoma brucei cathepsin B structure determined by using an X-ray laser. Science (2013).
75 Chapman, H. N., Fromme, P., Barty, A., White, T. A. & Kirian, R. A. Femtosecond X-ray protein nanocrystallography. Nature (2011).
76 Lu, C., Bucher, G. & Sander, W. Steady-State and Time-Resolved Studies on Photoinduced Disulfide Bond Cleavage Using Aniline as an Electron Donor. ChemPhysChem 5, 399-402, doi:10.1002/cphc.200300759 (2004).
Appendix
132
77 Weik, M. et al. Specific chemical and structural damage to proteins produced by synchrotron radiation. Proceedings of the National Academy of Sciences of the United States of America 97, 623-628 (2000).
78 Calvey, G. D., Katz, A. M., Schaffer, C. B. & Pollack, L. Mixing injector enables time-resolved crystallography with high hit rate at X-ray free electron lasers. Structural Dynamics 3, 054301, doi:10.1063/1.4961971 (2016).
79 Brunori, M., Bourgeois, D. & Vallone, B. in Methods in Enzymology Vol. 437 (ed Robert K. Poole) 397-416 (Academic Press, 2008).
80 Kupitz, C. et al. Serial time-resolved crystallography of photosystem II using a femtosecond X-ray laser. Nature 513, 261-265, doi:10.1038/nature13453 (2014).
81 Neutze, R. & Moffat, K. Time-resolved structural studies at synchrotrons and X-ray free electron lasers: opportunities and challenges. Current Opinion in Structural Biology 22, 651-659, doi:10.1016/j.sbi.2012.08.006 (2012).
82 Schotte, F. et al. Watching a Protein as it Functions with 150-ps Time-Resolved X-ray Crystallography. Science 300, 1944-1947, doi:10.1126/science.1078797 (2003).
83 Ren, Z. et al. Laue crystallography: coming of age. Journal of Synchrotron Radiation 6, 891-917, doi:10.1107/S0909049599006366 (1999).
84 Graber, T. et al. BioCARS: a synchrotron resource for time-resolved X-ray science. Journal of Synchrotron Radiation 18, 658-670, doi:10.1107/S0909049511009423 (2011).
85 Miller, R. J. D. Femtosecond Crystallography with Ultrabright Electrons and X-rays: Capturing Chemistry in Action. Science 343, 1108 (2014).
86 Schubert, R. et al. A multicrystal diffraction data-collection approach for studying structural dynamics with millisecond temporal resolution. IUCrJ 3, 393-401 (2016).
87 Yorke, B. A., Beddard, G. S., Owen, R. L. & Pearson, A. R. Time-resolved crystallography using the Hadamard Transform. Nature methods 11, 1131-1134, doi:10.1038/nmeth.3139 (2014).
88 Garman, E. F. Radiation damage in macromolecular crystallography: what is it and why should we care? Acta Crystallographica Section D: Biological Crystallography (2010).
89 Garman, E. F. & Owen, R. L. Cryocooling and radiation damage in macromolecular crystallography. Acta Crystallographica Section D: Biological Crystallography, doi:10.1107/S0907444905034207 (2006).
90 Henderson, R. Cryo-Protection of Protein Crystals against Radiation Damage in Electron and X-Ray Diffraction. Proceedings of the Royal Society of London B: Biological Sciences, doi:10.2307/76720 (1990).
91 Owen, R., Rudiño-Piñera, E. & Garman, E. F. Experimental determination of the radiation dose limit for cryocooled protein crystals. Proceedings of the National
Appendix
133
Academy of Sciences of the United States of America 103, 4912-4917, doi:10.1073/pnas.0600973103 (2006).
92 Holton, J. M. & Frankel, K. A. The minimum crystal size needed for a complete diffraction data set. Acta Crystallographica Section D: Biological Crystallography 66, 393-408 (2010).
93 Burmeister, W. P. Structural changes in a cryo-cooled protein crystal owing to radiation damage. Acta Crystallographica Section D: Biological Crystallography (2000).
94 Holton, J. M. A beginner's guide to radiation damage. Journal of synchrotron radiation 16, 133-142, doi:10.1107/S0909049509004361 (2009).
95 Leal, R., Bourenkov, G., Russi, S. & Popov, A. N. A survey of global radiation damage to 15 different protein crystal types at room temperature: a new decay model. Journal of synchrotron radiation 20, 14-22, doi:10.1107/S0909049512049114 (2013).
96 Ravelli, R. B. G. & McSweeney, S. M. The fingerprint that X-rays can leave on structures. Structure 8, 315-328 (2000).
97 Weik, M., Berges, J., Raves, M. L. & Gros, P. Evidence for the formation of disulfide radicals in protein crystals upon X-ray irradiation. Journal of synchrotron … (2002).
98 Botha, S. et al. Room-temperature serial crystallography at synchrotron X-ray sources using slowly flowing free-standing high-viscosity microstreams. Acta Crystallographica Section D: Biological Crystallography 71, 387-397, doi:10.1107/S1399004714026327 (2015).
99 Gati, C. et al. Serial crystallography on in vivo grown microcrystals using synchrotron radiation. IUCrJ 1, 87-94, doi:10.1107/S2052252513033939 (2014).
100 Nogly, P. et al. Lipidic cubic phase serial millisecond crystallography using synchrotron radiation. IUCrJ, doi:10.1107/S2052252514026487 (2015).
101 Roedig, P. et al. Room-temperature macromolecular crystallography using a micro-patterned silicon chip with minimal background scattering. Journal of applied crystallography 49, 968-975, doi:10.1107/S1600576716006348 (2016).
102 Roedig, P. et al. A micro-patterned silicon chip as sample holder for macromolecular crystallography experiments with minimal background scattering. Scientific reports 5, 10451, doi:10.1038/srep10451 (2015).
103 Stellato, F. et al. Room-temperature macromolecular serial crystallography using synchrotron radiation. IUCrJ 1, 204-212, doi:10.1107/S2052252514010070 (2014).
104 Zander, U. et al. MeshAndCollect: an automated multi-crystal data-collection workflow for synchrotron macromolecular crystallography beamlines. Acta crystallographica. Section D, Biological crystallography 71, 2328-2343, doi:10.1107/S1399004715017927 (2015).
Appendix
134
105 Cipriani, F. et al. CrystalDirect: a new method for automated crystal harvesting based on laser-induced photoablation of thin films. Acta crystallographica. Section D, Biological crystallography 68, 1393-1399, doi:10.1107/s0907444912031459 (2012).
106 McPherson, A. In situ X-ray crystallography. Journal of applied crystallography 33, 397-400 (2000).
107 Axford, D., Owen, R. L., Aishima, J. & Foadi, J. In situ macromolecular crystallography using microbeams. Acta Crystalographica. Section D: Biological Crystallography, doi:10.1107/S0907444912006749 (2012).
108 Kisselman, G., Qiu, W. & Romanov, V. X-CHIP: an integrated platform for high-throughput protein crystallization and on-the-chip X-ray diffraction data collection. Acta Crystallographica Section D: Biological Crystallography, doi:10.1107/S0907444911011589 (2011).
109 Guha, S., Perry, S. L., Pawate, A. S. & Kenis, P. J. A. Fabrication of X-ray compatible microfluidic platforms for protein crystallization. Fabrication of X-ray compatible microfluidic platforms for protein crystallization, doi:10.1021/cg301757g (2012).
110 Heymann, M. et al. Room-temperature serial crystallography using a kinetically optimized microfluidic device for protein crystallization and on-chip X-ray diffraction. IUCrJ 1, 349-360, doi:10.1107/s2052252514016960 (2014).
111 Mueller, C. et al. Fixed target matrix for femtosecond time-resolved and in situ serial micro-crystallography. Structural dynamics (Melville, N.Y.) 2, 54302, doi:10.1063/1.4928706 (2015).
112 Perry, S. L. et al. In situ serial Laue diffraction on a microfluidic crystallization device. Journal of applied crystallography 47, 1975-1982, doi:10.1107/ S1600576714023322 (2014).
113 Coquelle, N. et al. Raster-scanning serial protein crystallography using micro- and nano-focused synchrotron beams. Acta Crystallographica Section D: Biological Crystallography 71, 1184-1196, doi:10.1107/s1399004715004514 (2015).
114 Huang, C. Y. et al. In meso in situ serial X-ray crystallography of soluble and membrane proteins. Acta crystallographica. Section D, Biological crystallography 71, 1238-1256, doi:10.1107/S1399004715005210 (2015).
115 Fraser, J. S. et al. Hidden alternative structures of proline isomerase essential for catalysis. Nature 462, 669-673, doi:10.1038/nature08615 (2009).
116 Fraser, J. S. & van den Bedem, H. Accessing protein conformational ensembles using room-temperature X-ray crystallography. Proceedings of the National Academy of Sciences, doi:10.1073/pnas.1111325108 (2011).
117 Jr, T. R. F., Dewan, J. C. & Petsko, G. A. Effects of temperature on protein structure and dynamics: X-ray crystallographic studies of the protein ribonuclease-A at nine different temperatures from 98 to 320 K. Biochemistry (1992).
118 Juers, D. H. & Matthews, B. W. The role of solvent transport in cryo-annealing of macromolecular crystals. Acta crystallographica. Section D, Biological crystallography 60, 412-421, doi:10.1107/S0907444903027938 (2004).
Appendix
135
119 Rasmussen, B. F., Stock, A. M., Ringe, D. & Petsko, G. A. Crystalline ribonuclease A loses function below the dynamical transition at 220 K. Nature 357, 423-424, doi:10.1038/357423a0 (1992).
120 Lovelace, J. J., Murphy, C. R., Pahl, R., Brister, K. & Borgstahl, G. E. O. Tracking reflections through cryogenic cooling with topography. Journal of applied crystallography 39, 425-432 (2006).
121 Li, L. & Ismagilov, R. F. Protein crystallization using microfluidic technologies based on valves, droplets, and SlipChip. Annual review of biophysics, doi:10.1146/annurev.biophys.050708.133630 (2010).
122 Zheng, B., Roach, S. L. & Ismagilov, R. F. Screening of Protein Crystallization Conditions on a Microfluidic Chip Using Nanoliter-Size Droplets. Journal of the American Chemical Society 125, 11170-11171, doi:10.1021/ja037166v (2003).
123 Nishihara, K., Kanemori, M., Kitagawa, M., Yanagi, H. & Yura, T. Chaperone coexpression plasmids: Differential and synergistic roles of DnaK-DnaJ-GrpE and GroEL-GroES in assisting folding of an allergen of Japanese cedar pollen, Cryj2, inEscherichia coli. Applied and Environmental Microbiology 64, 1694-1699 (1998).
124 Yang, J. T., Wu, C. S. C. & Martinez, H. M. Calculation of protein conformation from circular dichroism. Methods in enzymology (1986).
125 Kelly, S. M., Jess, T. J. & Price, N. C. How to study proteins by circular dichroism. Biochimica et Biophysica Acta (BBA)-Proteins and Proteomics 1751, 119-139 (2005).
126 Bibb, M. J., Findlay, P. R. & Johnson, M. W. The relationship between base composition and codon usage in bacterial genes and its use for the simple and reliable identification of protein-coding sequences. Gene (1984).
127 Grosjean, H. & Fiers, W. Preferential codon usage in prokaryotic genes: the optimal codon-anticodon interaction energy and the selective codon usage in efficiently expressed genes. Gene (1982).
128 Saul, A. & Battistutta, D. Codon usage in Plasmodium falciparum. Molecular and biochemical parasitology 27, 35-42 (1988).
129 Kane, J. F. Effects of rare codon clusters on high-level expression of heterologous proteins in Escherichia coli. Current Opinion in Biotechnology 6, 494-500, doi:10.1016/0958-1669(95)80082-4 (1995).
130 Slabinski, L., Jaroszewski, L. & Rychlewski, L. XtalPred: a web server for prediction of protein crystallizability. Bioinformatics, doi:10.1093/bioinformatics/btm477 (2007).
131 Roy, A., Kucukural, A. & Zhang, Y. I-TASSER: a unified platform for automated protein structure and function prediction. Nature protocols (2010).
132 Yang, J. et al. The I-TASSER Suite: protein structure and function prediction. Nature methods (2015).
133 Zhang, Y. I-TASSER server for protein 3D structure prediction. BMC bioinformatics (2008).
Appendix
136
134 Kelley, L. A., Mezulis, S., Yates, C. M. & Wass, M. N. The Phyre2 web portal for protein modeling, prediction and analysis. Nature protocols, doi:10.1038/ nprot.2015.053 (2015).
135 Nallamsetty, S., Kapust, R. B., Tözsér, J. & Cherry, S. Efficient site-specific processing of fusion proteins by tobacco vein mottling virus protease in vivo and in vitro. Protein Expression and Purification (2004).
136 Waugh, D. S. An overview of enzymatic reagents for the removal of affinity tags. Protein Expression and Purification 80, 283-293, doi:10.1016/j.pep.2011.08.005 (2011).
137 Simossis, V. A. & Heringa, J. The PRALINE online server: optimising progressive multiple alignment on the web. Computational biology and chemistry (2003).
138 Simossis, V. A. & Heringa, J. PRALINE: a multiple sequence alignment toolbox that integrates homology-extended and secondary structure information. Nucleic acids research 33, doi:10.1093/nar/gki390 (2005).
139 Sievers, F. et al. Fast, scalable generation of high quality protein multiple sequence alignments using Clustal Omega. Molecular systems biology 7, 539, doi:10.1038/ msb.2011.75 (2011).
140 Robert, X. & Gouet, P. Deciphering key features in protein structures with the new ENDscript server. Nucleic acids research (2014).
141 Berman, H. M., Battistuz, T., Bhat, T. N. & Bluhm, W. F. The protein data bank. Acta Crystallographica Section D: Biological Crystallography (2002).
142 Berman, H. M., Westbrook, J. & Feng, Z. The protein data bank. Nucleic Acids Research (2000).
143 Letunic, I., Doerks, T. & Bork, P. SMART: recent updates, new developments and status in 2015. Nucleic acids research 43, 60, doi:10.1093/nar/gku949 (2015).
144 Schultz, J., Milpetz, F., Bork, P. & Ponting, C. P. SMART, a simple modular architecture research tool: identification of signaling domains. Proceedings of the National Academy of Sciences of the United States of America 95, 5857-5864 (1998).
145 Peng, J. & Xu, J. RaptorX: exploiting structure information for protein alignment by statistical inference. Proteins: Structure, Function, and Bioinformatics 79, 161-171, doi:10.1002/prot.23175 (2011).
146 Durocher, D. & Jackson, S. P. The FHA domain. FEBS letters, doi:10.1016/S0014-5793(01)03294-X (2002).
147 Hofmann, K. & Bucher, P. The FHA domain: a putative nuclear signalling domain found in protein kinases and transcription factors. Trends in biochemical sciences 20, 347-349 (1995).
148 Vaughn, J. L., Goodwin, R. H., Tompkins, G. J. & McCawley, P. The establishment of two cell lines from the insect Spodoptera frugiperda (Lepidoptera; Noctuidae). In Vitro Cellular & Developmental Biology-Plant 13, 213-217 (1977).
Appendix
137
149 Pasumarthy, M. K. & Murhammer, D. W. Clonal Variation in the Spodoptera frugiperda IPLB-SF21-AE Insect Cell Population. Biotechnology Progress 10, 314-319, doi:10.1021/bp00027a012 (1994).
150 Duszenko, M. et al. In vivo protein crystallization in combination with highly brilliant radiation sources offers novel opportunities for the structural analysis of post-translationally modified eukaryotic proteins. Acta crystallographica. Section F, Structural biology communications 71, 929-937, doi:10.1107/s2053230 x15011450 (2015).
151 Doye, J. P. K. & Poon, W. C. K. Protein crystallization in vivo. Current Opinion in Colloid & Interface Science 11, 40-46, doi:10.1016/j.cocis.2005.10.002 (2006).
152 Fan, G. Y. et al. In vivo calcineurin crystals formed using the baculovirus expression system. Microscopy research and technique 34, 77-86, doi:10.1002/(sici)1097-0029(19960501)34:1 (1996).
153 Axford, D., Ji, X., Stuart, D. I. & Sutton, G. In cellulo structure determination of a novel cypovirus polyhedrin. Acta Crystallographica Section D: Biological Crystallography 70, 1435-1441, doi:10.1107/S1399004714004714 (2014).
154 Coulibaly, F., Chiu, E., Ikeda, K., Gutmann, S. & Haebel, P. W. The molecular organization of cypovirus polyhedra. Nature (2007).
155 Baskaran, Y. et al. An in cellulo-derived structure of PAK4 in complex with its inhibitor Inka1. Nature communications 6, 8681, doi:10.1038/ncomms9681 (2015).
156 Koopmann, R., Cupelli, K., Redecke, L. & Nass, K. In vivo protein crystallization opens new routes in structural biology. Nature methods (2012).
157 Gati, C. et al. Atomic structure of granulin determined from native nanocrystalline granulovirus using an X-ray free-electron laser. Proceedings of the National Academy of Sciences 114, 2247-2252, doi:10.1073/pnas.1609243114 (2017).
158 Banerjee, S. et al. Structure of a heterogeneous, glycosylated, lipid-bound, in vivo-grown protein crystal at atomic resolution from the viviparous cockroach Diploptera punctata. IUCrJ 3, 282-293, doi:10.1107/s2052252516008903 (2016).
159 Wampler, R. D., Kissick, D. J. & Dehen, C. J. Selective detection of protein crystals by second harmonic microscopy. Journal of the American Chemical Society, doi:10.1021/ja805983b (2008).
160 Kissick, D. J. & Wanapun, D. Second-order nonlinear optical imaging of chiral crystals. Annual Review of Analyticla Chemistry (2011).
161 Drebes, J., Künz, M., Windshügel, B. & Kikhney, A. G. Structure of ThiM from Vitamin B1 biosynthetic pathway of Staphylococcus aureus–Insights into a novel pro-drug approach addressing MRSA infections. Scientific reports (2016).
162 Gasteiger, E., Hoogland, C., Gattiker, A. & Duvaud, S. Protein identification and analysis tools on the ExPASy server. Protein identification and analysis tools on the ExPASy server (2005).
Appendix
138
163 Konarev, P. V., Volkov, V. V. & Sokolova, A. V. PRIMUS: a Windows PC-based system for small-angle scattering data analysis. Journal of Applied Crystallography (2003).
164 Franke, D. & Svergun, D. I. DAMMIF, a program for rapid ab-initio shape determination in small-angle scattering. Journal of applied crystallography, doi:10.1107/S0021889809000338 (2009).
165 Volkov, V. V. & Svergun, D. I. Uniqueness of ab initio shape determination in small-angle scattering. Journal of applied crystallography (2003).
166 Meyer, A., Dierks, K., Hilterhaus, D. & Klupsch, T. Single-drop optimization of protein crystallization. Acta Crystallographica. Section F: Structural Biology and crystallization communications (2012).
167 Dierks, K., Meyer, A., Oberthür, D. & Rapp, G. Efficient UV detection of protein crystals enabled by fluorescence excitation at wavelengths longer than 300 nm. Acta Crystallographica. Section F: Structural Biology and crystallization communications (2010).
168 Falkner, J. C., Al-Somali, A. M. & Jamison, J. A. Generation of size-controlled, submicrometer protein crystals. Chemistry of Materials, doi:10.1021/cm047924w (2005).
169 Stevenson, H. P., Makhov, A. M. & Calero, M. Use of transmission electron microscopy to identify nanocrystals of challenging protein targets. Proceedings of the National Academy of Sciences, doi:10.1073/pnas.1400240111 (2014).
170 Chayen, N., Dieckmann, M. & Dierks, K. Size and shape determination of proteins in solution by a noninvasive depolarized dynamic light scattering instrument. Annals of the New York Academiy of Sciences, doi:10.1196/annals.1324.003 (2004).
171 Schubert, R. et al. Reliably distinguishing protein nanocrystals from amorphous precipitate by means of depolarized dynamic light scattering. Journal of Applied Crystallography 48, 1476-1484 (2015).
172 Oldenbourg, R. & Ruiz, T. Birefringence of macromolecules. Wiener's theory revisited, with applications to DNA and tobacco mosaic virus. Biophysical journal (1989).
173 Bragg, W. L. & Pippard, A. B. The form birefringence of macromolecules. Acta Crystallographica (1953).
174 Heymann, M. Microfluidic Tools to Investigate Protein Crystallization. Microfluidic Tools to Investigate Protein Crystallization (2014).
175 Kupitz, C. et al. Microcrystallization techniques for serial femtosecond crystallography using photosystem II from Thermosynechococcus elongatus as a model system. Philosophical Transactions of the Royal Society B: Biological Sciences 369, doi:10.1098/rstb.2013.0316 (2014).
176 Nave, C. & Garman, E. F. Towards an understanding of radiation damage in cryocooled macromolecular crystals. Journal of Synchrotron Radiation 12, 257-260, doi:doi:10.1107/S0909049505007132 (2005).
Appendix
139
177 Zarrine-Afsar, A. et al. Crystallography on a chip. Acta crystallographica. Section D, Biological crystallography 68, 321-323, doi:10.1107/S0907444911055296 (2012).
178 Rayment, I. Small-Scale Batch Crystallization of Proteins Revisited. Structure 10, 147-151, doi:10.1016/S0969-2126(02)00711-6.
179 Jones, D. T. Protein secondary structure prediction based on position-specific scoring matrices11Edited by G. Von Heijne. Journal of Molecular Biology 292, 195-202, doi:10.1006/jmbi.1999.3091 (1999).
180 Buchan, D. W., Minneci, F., Nugent, T. C., Bryson, K. & Jones, D. T. Scalable web services for the PSIPRED Protein Analysis Workbench. Nucleic acids research 41, 57, doi:10.1093/nar/gkt381 (2013).
181 Zylicz, M. & Georgopoulos, C. Purification and properties of the Escherichia coli dnaK replication protein. The Journal of biological chemistry 259, 8820-8825 (1984).
182 Derewenda, Z. S. The use of recombinant methods and molecular engineering in protein crystallization. Methods 34, 354-363, doi:10.1016/j.ymeth.2004.03.024 (2004).
183 Kyte, J. & Doolittle, R. F. A simple method for displaying the hydropathic character of a protein. J Mol Biol 157, 105-132 (1982).
184 Guruprasad, K., Reddy, B. V. & Pandit, M. W. Correlation between stability of a protein and its dipeptide composition: a novel approach for predicting in vivo stability of a protein from its primary sequence. Protein engineering 4, 155-161 (1990).
185 Lupas, A., Van Dyke, M. & Stock, J. Predicting coiled coils from protein sequences. Science 252, 1162-1164, doi:10.1126/science.252.5009.1162 (1991).
186 Jones, D. T. & Cozzetto, D. DISOPRED3: precise disordered region predictions with annotated protein-binding activity. Bioinformatics 31, 857-863, doi:10.1093/bioinformatics/btu744 (2015).
187 Petersen, B., Petersen, T. N., Andersen, P., Nielsen, M. & Lundegaard, C. A generic method for assignment of reliability scores applied to solvent accessibility predictions. BMC Structural Biology 9, 51, doi:10.1186/1472-6807-9-51 (2009).
188 Miller, S., Janin, J., Lesk, A. M. & Chothia, C. Interior and surface of monomeric proteins. Journal of Molecular Biology 196, 641-656, doi:10.1016/0022-2836(87)90038-6 (1987).
189 Nettleship, J. E., Brown, J., Groves, M. R. & Geerlof, A. in Structural Proteomics: High-Throughput Methods 299-318 (2008).
190 Ericsson, U. B., Hallberg, B. M., DeTitta, G. T., Dekker, N. & Nordlund, P. Thermofluor-based high-throughput stability optimization of proteins for structural studies. Analytical Biochemistry 357, 289-298, doi:10.1016/j.ab.2006.07.027 (2006).
Appendix
140
191 Boivin, S., Kozak, S. & Meijers, R. Optimization of protein purification and characterization using Thermofluor screens. Protein Expression and Purification 91, 192-206, doi:10.1016/j.pep.2013.08.002 (2013).
192 Nabuurs, S. B., Spronk, C. A. E. M., Vuister, G. W. & Vriend, G. Traditional Biomolecular Structure Determination by NMR Spectroscopy Allows for Major Errors. PLOS Computational Biology 2, e9, doi:10.1371/journal.pcbi.0020009 (2006).
193 Prinz, B. et al. Establishing a versatile fermentation and purification procedure for human proteins expressed in the yeasts Saccharomyces cerevisiae and Pichia pastoris for structural genomics. Journal of Structural and Functional Genomics 5, 29-44, doi:10.1023/B:JSFG.0000029207.13959.90 (2004).
194 Madden, D. R. & Safferling, M. in Macromolecular Crystallography Protocols: Volume 1, Preparation and Crystallization of Macromolecules (eds John M. Walker & Sylvie Doublié) 39-57 (Humana Press, 2007).
195 Schönherr, R. et al. Real-time investigation of dynamic protein crystallization in living cells. Structural Dynamics 2, 041712, doi:10.1063/1.4921591 (2015).
196 Hasegawa, H. et al. In vivo crystallization of human IgG in the endoplasmic reticulum of engineered Chinese hamster ovary (CHO) cells. The Journal of biological chemistry 286, 19917-19931, doi:10.1074/jbc.M110.204362 (2011).
197 Klug, H. P. & Alexander, L. E. X-ray diffraction procedures. Vol. 2.
198 Brown, C. W. et al. Large-scale analysis of post-translational modifications in E. coli under glucose-limiting conditions. BMC Genomics 18, 301, doi:10.1186/s12864-017-3676-8 (2017).
199 Drebes, J. et al. Structure of ThiM from Vitamin B1 biosynthetic pathway of Staphylococcus aureus – Insights into a novel pro-drug approach addressing MRSA infections. 6, 22871, doi:10.1038/srep22871 (2016).
200 Fontana, A. et al. Probing protein structure by limited proteolysis. Acta biochimica Polonica 51, 299-321, doi:035001299 (2004).
201 Ho, S. N., Hunt, H. D., Horton, R. M., Pullen, J. K. & Pease, L. R. Site-directed mutagenesis by overlap extension using the polymerase chain reaction. Gene 77, 51-59 (1989).
202 Breslauer, K. J., Frank, R., Blöcker, H. & Marky, L. A. Predicting DNA duplex stability from the base sequence. Proceedings of the National Academy of Sciences 83, 3746-3750 (1986).
203 Sugimoto, N., Nakano, S. & Yoneyama, M. Improved thermodynamic parameters and helix initiation factor to predict stability of DNA duplexes. Nucleic acids … (1996).
204 Heck, A. J. Native mass spectrometry: a bridge between interactomics and structural biology. Nature methods 5, 927-933, doi:10.1038/nmeth.1265 (2008).
205 Svergun, D. I. Determination of the regularization parameter in indirect-transform methods using perceptual criteria. Journal of applied crystallography (1992).
Appendix
141
206 Petoukhov, M. V., Franke, D. & Shkumatov, A. V. New developments in the ATSAS program package for small-angle scattering data analysis. Journal of Applied Crystallography, doi:10.1107/S0021889812007662 (2012).
207 Svergun, D., Barberato, C. & Koch, M. H. J. CRYSOL–a program to evaluate X-ray solution scattering of biological macromolecules from atomic coordinates. Journal of Applied Crystallography (1995).
208 Kabsch, W. Xds. Acta Crystallographica Section D: Biological Crystallography, doi:10.1107/S0907444909047337 (2010).
209 Vagin, A. & Teplyakov, A. MOLREP: an automated program for molecular replacement. Journal of applied crystallography (1997).
210 Winn, M. D., Ballard, C. C. & Cowtan, K. D. Overview of the CCP4 suite and current developments. Acta Crystallographica Section D: Biological Crystallography (2011).
211 Murshudov, G. N., Skubák, P. & Lebedev, A. A. REFMAC5 for the refinement of macromolecular crystal structures. Acta Crystallographica Section D: Biological Crystallography, doi:10.1107/S0907444911001314 (2011).
212 Emsley, P., Lohkamp, B. & Scott, W. G. Features and development of Coot. Acta Crystallographica Section D: Biological Crystallography, doi:10.1107/S0907444910007493 (2010).
213 Zeldin, O. B., Gerstel, M. & Garman, E. F. RADDOSE-3D: time-and space-resolved modelling of dose in macromolecular crystallography. Journal of applied crystallography (2013).
214 Adams, P. D. et al. PHENIX: a comprehensive Python-based system for macromolecular structure solution. Acta Crystallographica Section D: Biological Crystallography 66, 213-221, doi:10.1107/S0907444909052925 (2010).
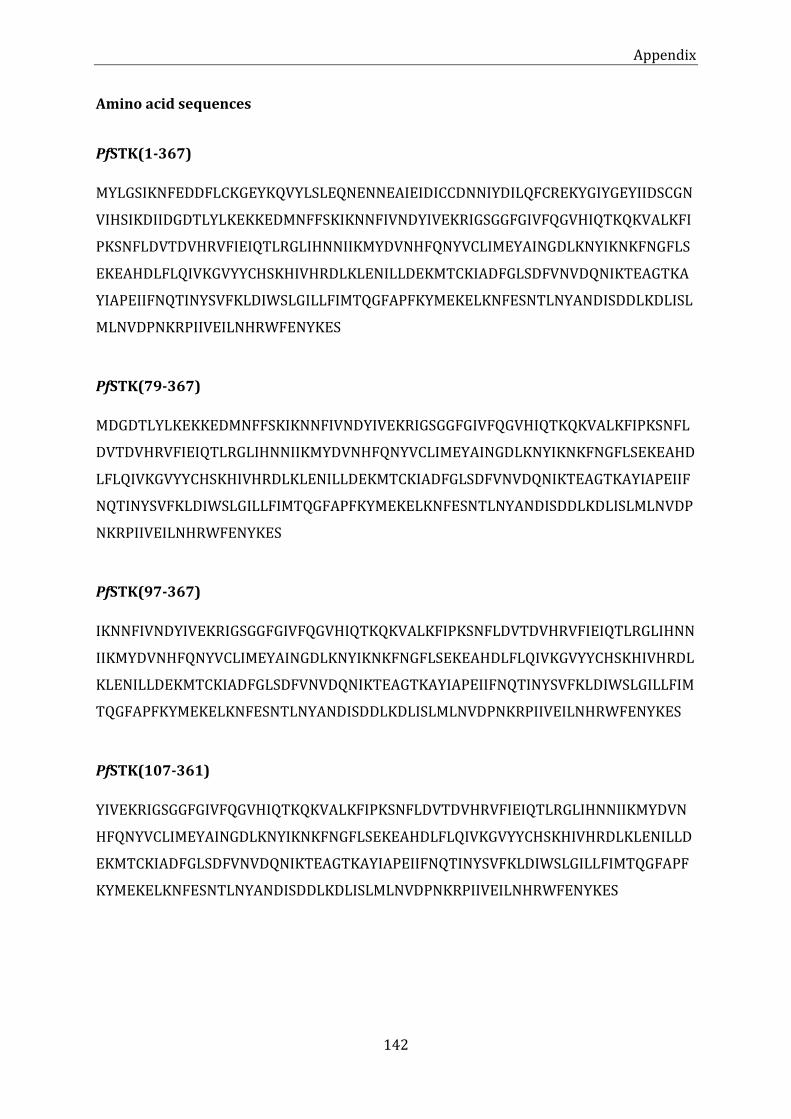
Appendix
142
Amino acid sequences
PfSTK(1-367)
MYLGSIKNFEDDFLCKGEYKQVYLSLEQNENNEAIEIDICCDNNIYDILQFCREKYGIYGEYIIDSCGN
VIHSIKDIIDGDTLYLKEKKEDMNFFSKIKNNFIVNDYIVEKRIGSGGFGIVFQGVHIQTKQKVALKFI
PKSNFLDVTDVHRVFIEIQTLRGLIHNNIIKMYDVNHFQNYVCLIMEYAINGDLKNYIKNKFNGFLS
EKEAHDLFLQIVKGVYYCHSKHIVHRDLKLENILLDEKMTCKIADFGLSDFVNVDQNIKTEAGTKA
YIAPEIIFNQTINYSVFKLDIWSLGILLFIMTQGFAPFKYMEKELKNFESNTLNYANDISDDLKDLISL
MLNVDPNKRPIIVEILNHRWFENYKES
PfSTK(79-367)
MDGDTLYLKEKKEDMNFFSKIKNNFIVNDYIVEKRIGSGGFGIVFQGVHIQTKQKVALKFIPKSNFL
DVTDVHRVFIEIQTLRGLIHNNIIKMYDVNHFQNYVCLIMEYAINGDLKNYIKNKFNGFLSEKEAHD
LFLQIVKGVYYCHSKHIVHRDLKLENILLDEKMTCKIADFGLSDFVNVDQNIKTEAGTKAYIAPEIIF
NQTINYSVFKLDIWSLGILLFIMTQGFAPFKYMEKELKNFESNTLNYANDISDDLKDLISLMLNVDP
NKRPIIVEILNHRWFENYKES
PfSTK(97-367)
IKNNFIVNDYIVEKRIGSGGFGIVFQGVHIQTKQKVALKFIPKSNFLDVTDVHRVFIEIQTLRGLIHNN
IIKMYDVNHFQNYVCLIMEYAINGDLKNYIKNKFNGFLSEKEAHDLFLQIVKGVYYCHSKHIVHRDL
KLENILLDEKMTCKIADFGLSDFVNVDQNIKTEAGTKAYIAPEIIFNQTINYSVFKLDIWSLGILLFIM
TQGFAPFKYMEKELKNFESNTLNYANDISDDLKDLISLMLNVDPNKRPIIVEILNHRWFENYKES
PfSTK(107-361)
YIVEKRIGSGGFGIVFQGVHIQTKQKVALKFIPKSNFLDVTDVHRVFIEIQTLRGLIHNNIIKMYDVN
HFQNYVCLIMEYAINGDLKNYIKNKFNGFLSEKEAHDLFLQIVKGVYYCHSKHIVHRDLKLENILLD
EKMTCKIADFGLSDFVNVDQNIKTEAGTKAYIAPEIIFNQTINYSVFKLDIWSLGILLFIMTQGFAPF
KYMEKELKNFESNTLNYANDISDDLKDLISLMLNVDPNKRPIIVEILNHRWFENYKES
Appendix
143
PfThiM
MRKYNFFTKSRLFSTLTKINSVKEYHDDIIKCIGKVRVINPLVHCITNRVTTEKVANSLLAFGSSPAM
IDNPKEVEEFAKIASCTYFNLGLHTTQVENINLLEKLRKECMKDKFMLIIDPIAVGATTYRTNVIKDI
ILKCQPNVIKGNIAEIYYLDKGEFLGKGVDSNNNNTHNETDVINSARNVALKYNCAVVVTSKTDYIV
SPCSHYVAKINCDLKILTKITGSGCSVSALCAAATSVYPQNPFIACISATLIYKLAAFKAYQKEKYPGS
LSHKIIDDIYYYSHNPHFLNFQIVDIYKVA
WbTrx
ADLLANIDLKKADGTVKKGSDALANKKVVALYFSAHWCPPCRQFTPILKEFYEEVDDDQFEIVFVS
LDHSEEDLNNYVKESHGDWYHVPFGSSEIEKLKNKYEVAGIPMLIVIKSDGNVITKNGRADVSGKA
PPQTLSSWLAAA
Codon-optimized gene sequence of full-length PfSTK
ATGTACCTGGGCAGTATCAAAAACTTCGAAGACGATTTTCTGTGCAAGGGCGAGTATAAACAGGT
GTACCTGTCGCTGGAACAGAACGAGAACAATGAAGCGATCGAGATTGACATCTGCTGTGATAACA
ACATCTACGATATCCTGCAATTCTGCCGTGAAAAGTACGGTATCTATGGCGAGTACATCATTGAT
AGCTGTGGCAACGTCATTCATTCCATCAAAGACATCATTGACGGTGATACCCTGTATCTGAAGGA
AAAGAAAGAGGATATGAACTTCTTTTCTAAGATCAAGAACAATTTCATCGTGAATGACTACATT
GTCGAAAAACGCATCGGTTCAGGTGGCTTCGGCATTGTCTTTCAGGGTGTTCATATCCAGACCAA
GCAGAAAGTGGCTCTGAAGTTCATCCCGAAAAGCAACTTTCTGGACGTTACCGATGTGCACCGTG
TCTTCATTGAAATCCAGACCCTGCGCGGCCTGATCCATAACAACATCATCAAGATGTACGATGTT
AACCACTTCCAGAACTACGTGTGTCTGATTATGGAGTACGCGATCAATGGCGACCTGAAGAACTA
CATCAAGAACAAGTTCAACGGTTTTCTGAGCGAAAAAGAAGCTCACGACCTGTTCCTGCAAATTG
TTAAGGGTGTGTACTATTGCCACTCCAAACATATTGTGCACCGTGATCTGAAGCTGGAAAACATC
CTGCTGGACGAGAAGATGACCTGTAAAATTGCGGACTTCGGCCTGTCTGATTTTGTGAATGTGGA
CCAGAACATCAAGACCGAAGCAGGTACCAAAGCCTATATTGCTCCCGAGATCATTTTCAATCAGA
CCATTAACTACTCTGTGTTTAAACTGGATATCTGGTCACTGGGCATTCTGCTGTTCATCATGACC
CAGGGTTTCGCCCCATTCAAGTACATGGAAAAGGAGCTGAAGAACTTTGAATCAAACACCCTGAA
TTACGCTAACGATATTAGTGACGATCTGAAAGACCTGATCTCGCTGATGCTGAATGTGGACCCGA
ACAAGCGTCCTATCATTGTTGAAATCCTGAATCACCGCTGGTTCGAGAACTATAAGGAAAGCTG
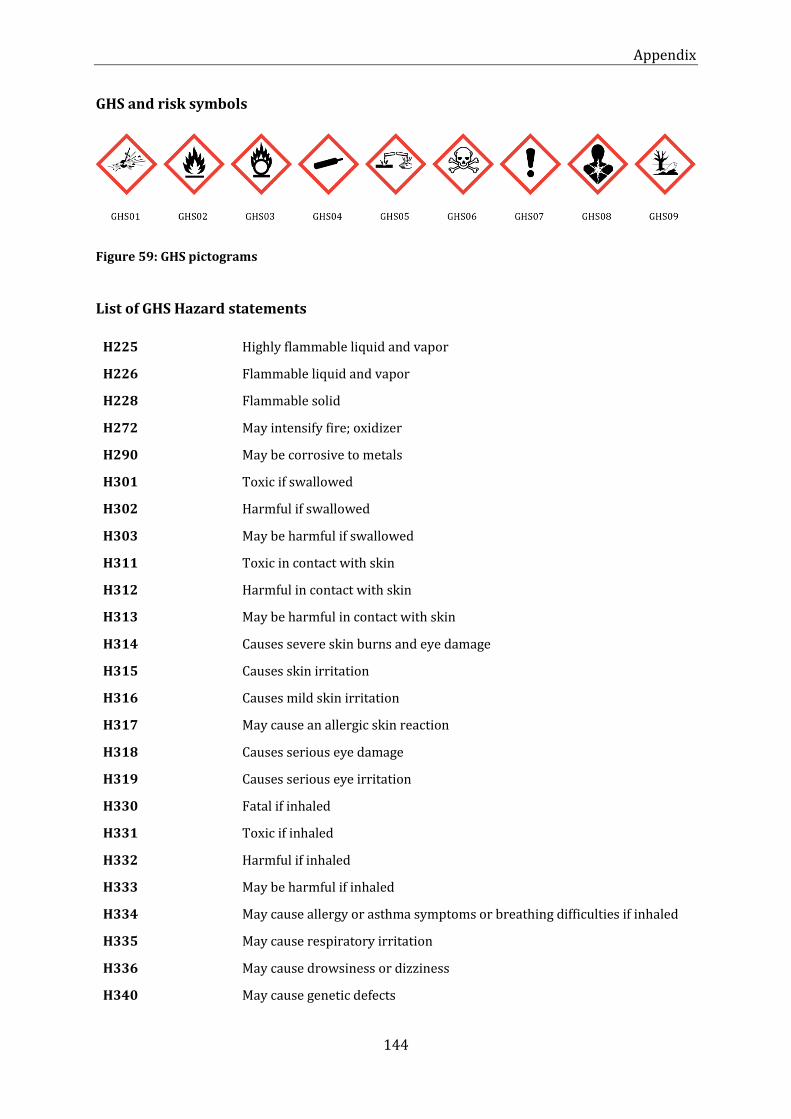
Appendix
144
GHS and risk symbols
Figure 59: GHS pictograms
List of GHS Hazard statements
H225 Highly flammable liquid and vapor
H226 Flammable liquid and vapor
H228 Flammable solid
H272 May intensify fire; oxidizer
H290 May be corrosive to metals
H301 Toxic if swallowed
H302 Harmful if swallowed
H303 May be harmful if swallowed
H311 Toxic in contact with skin
H312 Harmful in contact with skin
H313 May be harmful in contact with skin
H314 Causes severe skin burns and eye damage
H315 Causes skin irritation
H316 Causes mild skin irritation
H317 May cause an allergic skin reaction
H318 Causes serious eye damage
H319 Causes serious eye irritation
H330 Fatal if inhaled
H331 Toxic if inhaled
H332 Harmful if inhaled
H333 May be harmful if inhaled
H334 May cause allergy or asthma symptoms or breathing difficulties if inhaled
H335 May cause respiratory irritation
H336 May cause drowsiness or dizziness
H340 May cause genetic defects

Appendix
145
H341 Suspected of causing genetic defects
H350 May cause cancer
H350i May cause cancer by inhalation
H360 May damage fertility or the unborn child
H360D May damage the unborn child
H360F May damage fertility
H360Fd May damage fertility. Suspected of damaging the unborn child
H360FD May damage fertility. May damage the unborn child
H361 Suspected of damaging fertility or the unborn child
H361d Suspected of damaging the unborn child.
H361f Suspected of damaging fertility
H370 Cause damage to organs
H372 Causes damage to organs through prolonged or repeated exposure
H373 May cause damage to organs through prolonged or repeated exposure.
H400 Very toxic to aquatic life with long-lasting effects
H410 Very toxic to aquatic life with long lasting effects
H411 Toxic to aquatic life with long lasting effects
H412 Harmful to aquatic life with long lasting effects.
EUH032 Contact with acids liberates very toxic gas
EUH066 Repeated exposure may cause skin dryness or cracking
GHS Precautionary Statements
P101 If medical advice is needed, have product container or label at hand
P201 Obtain special instructions before use
P210 Keep away from heat/sparks/open flames/hot surfaces – No smoking
P233 Keep container tightly closed
P260 Do not breathe dust/fume/gas/mist/vapors/spray
P261 Avoid breathing dust/fume/gas/mist/vapors/spray
P264 Wash thoroughly after handling
P270 Do not eat, drink or smoke when using this product
P273 Avoid release to the environment
P281 Use personal protective equipment as required
P280 Wear protective gloves/protective clothing/eye protection/face protection
Appendix
146
P284 Wear respiratory protection
P309 IF exposed or you feel unwell
P310 Immediately call a POISON CENTER or doctor/physician
P311 Call a POISON CENTER or doctor/physician
P312 Call a POISON CENTER or doctor/physician if you feel unwell
P321 Specific treatment (see respective MSDS)
P330 Rinse mouth
P362 Take off contaminated clothing and wash before reuse
P391 Collect spillage.
P405 Store locked up
P501 Dispose of contents/container in accordance with local/regional/national/ international regulations
P301+P310 IF SWALLOWED: Immediately call a POISON CENTER or doctor/physician
P301+P312 IF SWALLOWED: Call a POISON CENTER or doctor/physician if you feel unwell
P301+P330+P331 IF SWALLOWED: Rinse mouth. Do NOT induce vomiting
P302+P352 IF ON SKIN: Wash with soap and water
P303+P361+P353 IF ON SKIN (or hair): Remove/Take off immediately all contaminated clothing. Rinse skin with water/shower
P304+P341 IF INHALED: lf breathing is difficult, remove victim to fresh air and keep at rest in a position comfortable for breathing
P305+P351+P338 IF IN EYES: Rinse cautiously with water for several minutes. Remove contact lenses if present and easy to do - continue rinsing
P308+P313 If exposed or concerned: Get medical advice/attention
P309+P311 IF exposed or you feel unwell: Call a POISON CENTER or doctor/physician
P332+P313 lf skin irritation occurs: Get medical advice/attention
P333+P313 If skin irritation or rash occurs: Get medical advice/attention
P337+P313 If eye irritation persists: Get medical advice/attention.
P342+P311 Call a POISON CENTER or doctor/physician
P370+P378 In case of fire: Use for extinction: Alcohol resistant foam.
P370+P378 In case of fire: Use for extinction: Fire-extinguishing powder.
P370+P378 In case of fire: Use for extinction: Carbon dioxide.
P403+P233 Store in a well-ventilated place. Keep container tightly closed
P403+P235 Store in a well-ventilated place. Keep cool
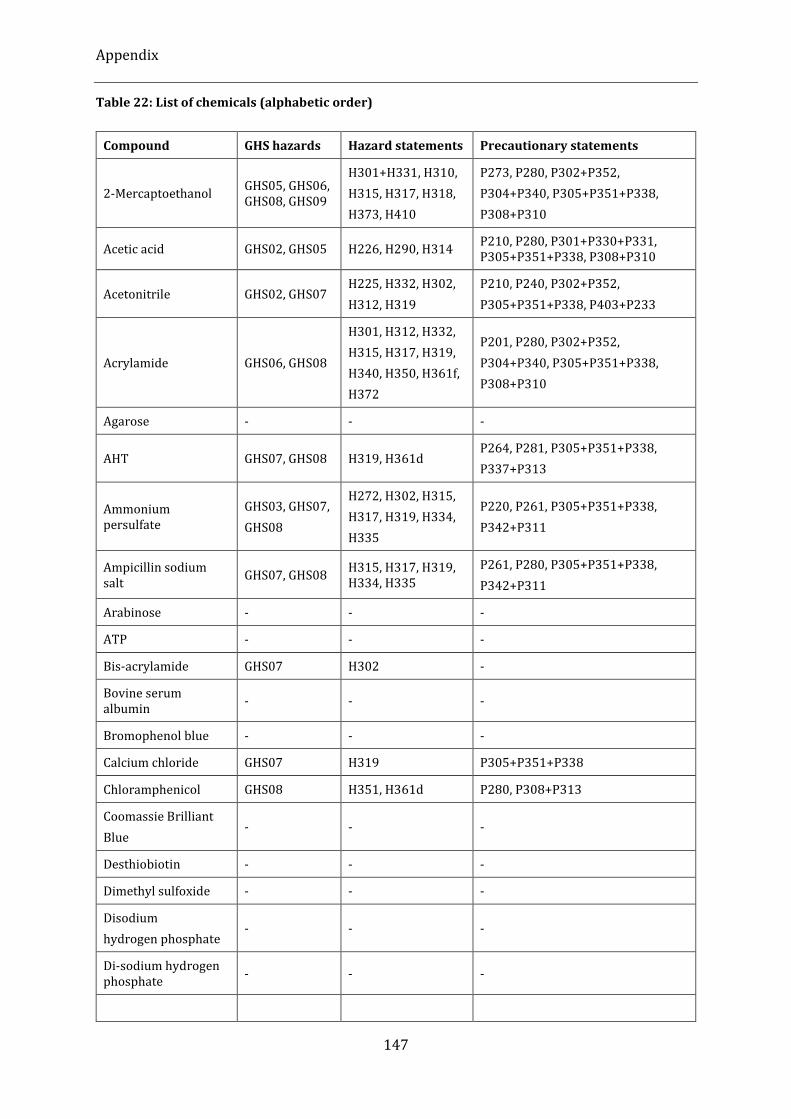
Appendix
147
Table 22: List of chemicals (alphabetic order)
Compound GHS hazards Hazard statements Precautionary statements
2-Mercaptoethanol GHS05, GHS06, GHS08, GHS09
H301+H331, H310,
H315, H317, H318,
H373, H410
P273, P280, P302+P352,
P304+P340, P305+P351+P338,
P308+P310
Acetic acid GHS02, GHS05 H226, H290, H314 P210, P280, P301+P330+P331, P305+P351+P338, P308+P310
Acetonitrile GHS02, GHS07 H225, H332, H302,
H312, H319
P210, P240, P302+P352,
P305+P351+P338, P403+P233
Acrylamide GHS06, GHS08
H301, H312, H332,
H315, H317, H319,
H340, H350, H361f,
H372
P201, P280, P302+P352,
P304+P340, P305+P351+P338,
P308+P310
Agarose - - -
AHT GHS07, GHS08 H319, H361d P264, P281, P305+P351+P338,
P337+P313
Ammonium persulfate
GHS03, GHS07,
GHS08
H272, H302, H315,
H317, H319, H334,
H335
P220, P261, P305+P351+P338,
P342+P311
Ampicillin sodium salt
GHS07, GHS08 H315, H317, H319, H334, H335
P261, P280, P305+P351+P338,
P342+P311
Arabinose - - -
ATP - - -
Bis-acrylamide GHS07 H302 -
Bovine serum albumin
- - -
Bromophenol blue - - -
Calcium chloride GHS07 H319 P305+P351+P338
Chloramphenicol GHS08 H351, H361d P280, P308+P313
Coomassie Brilliant
Blue - - -
Desthiobiotin - - -
Dimethyl sulfoxide - - -
Disodium
hydrogen phosphate - - -
Di-sodium hydrogen phosphate
- - -
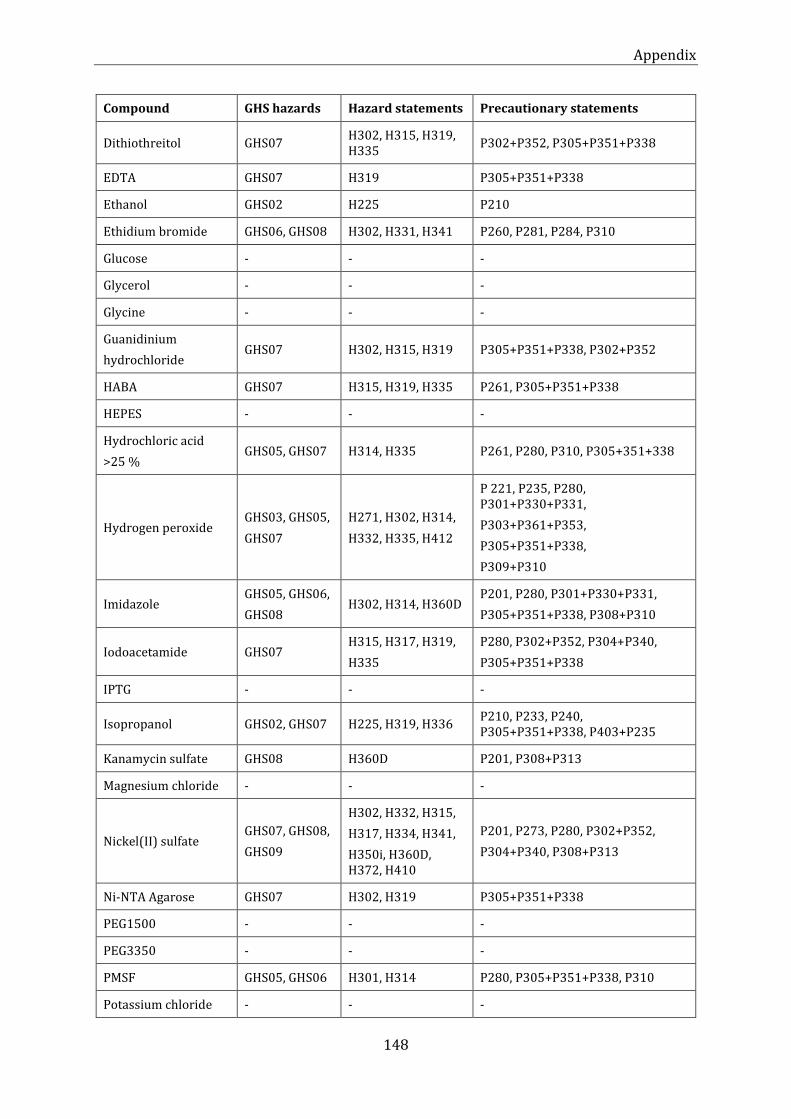
Appendix
148
Compound GHS hazards Hazard statements Precautionary statements
Dithiothreitol GHS07 H302, H315, H319, H335
P302+P352, P305+P351+P338
EDTA GHS07 H319 P305+P351+P338
Ethanol GHS02 H225 P210
Ethidium bromide GHS06, GHS08 H302, H331, H341 P260, P281, P284, P310
Glucose - - -
Glycerol - - -
Glycine - - -
Guanidinium
hydrochloride GHS07 H302, H315, H319 P305+P351+P338, P302+P352
HABA GHS07 H315, H319, H335 P261, P305+P351+P338
HEPES - - -
Hydrochloric acid
>25 % GHS05, GHS07 H314, H335 P261, P280, P310, P305+351+338
Hydrogen peroxide GHS03, GHS05,
GHS07
H271, H302, H314,
H332, H335, H412
P 221, P235, P280, P301+P330+P331,
P303+P361+P353,
P305+P351+P338,
P309+P310
Imidazole GHS05, GHS06,
GHS08 H302, H314, H360D
P201, P280, P301+P330+P331,
P305+P351+P338, P308+P310
Iodoacetamide GHS07 H315, H317, H319,
H335
P280, P302+P352, P304+P340,
P305+P351+P338
IPTG - - -
Isopropanol GHS02, GHS07 H225, H319, H336 P210, P233, P240, P305+P351+P338, P403+P235
Kanamycin sulfate GHS08 H360D P201, P308+P313
Magnesium chloride - - -
Nickel(II) sulfate GHS07, GHS08,
GHS09
H302, H332, H315,
H317, H334, H341,
H350i, H360D, H372, H410
P201, P273, P280, P302+P352,
P304+P340, P308+P313
Ni-NTA Agarose GHS07 H302, H319 P305+P351+P338
PEG1500 - - -
PEG3350 - - -
PMSF GHS05, GHS06 H301, H314 P280, P305+P351+P338, P310
Potassium chloride - - -
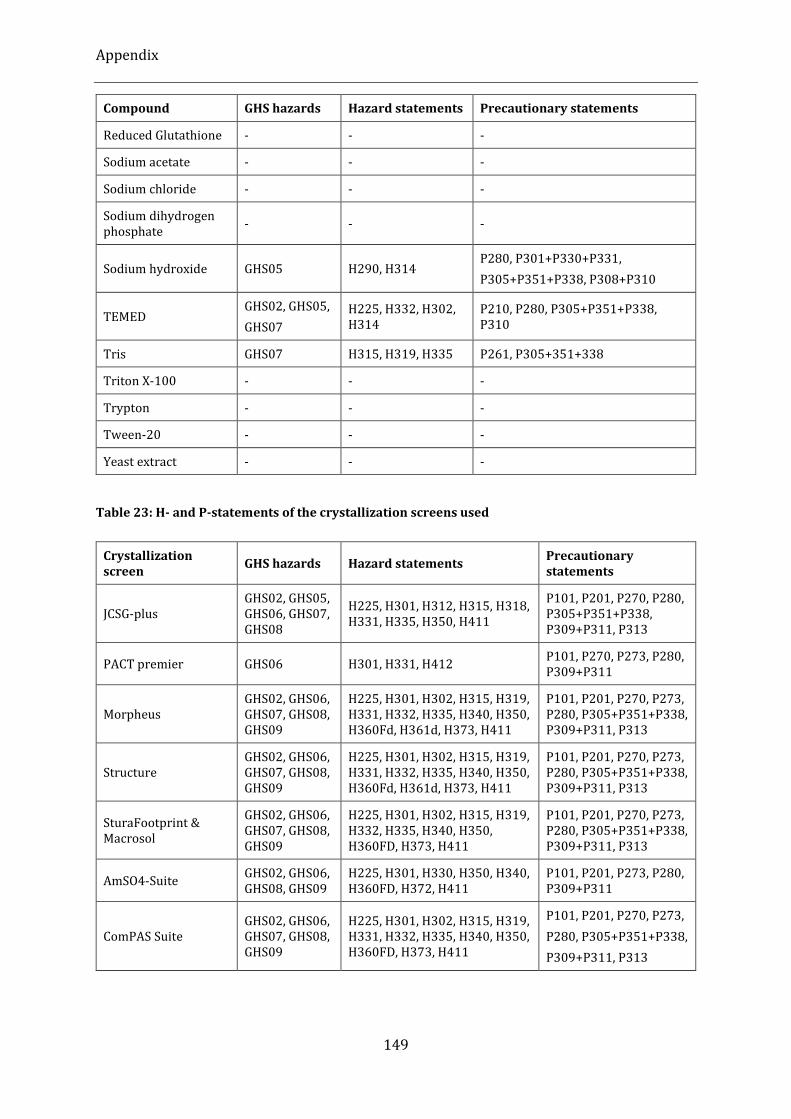
Appendix
149
Compound GHS hazards Hazard statements Precautionary statements
Reduced Glutathione - - -
Sodium acetate - - -
Sodium chloride - - -
Sodium dihydrogen phosphate
- - -
Sodium hydroxide GHS05 H290, H314 P280, P301+P330+P331,
P305+P351+P338, P308+P310
TEMED GHS02, GHS05,
GHS07
H225, H332, H302, H314
P210, P280, P305+P351+P338, P310
Tris GHS07 H315, H319, H335 P261, P305+351+338
Triton X-100 - - -
Trypton - - -
Tween-20 - - -
Yeast extract - - -
Table 23: H- and P-statements of the crystallization screens used
Crystallization screen
GHS hazards Hazard statements Precautionary statements
JCSG-plus GHS02, GHS05, GHS06, GHS07, GHS08
H225, H301, H312, H315, H318, H331, H335, H350, H411
P101, P201, P270, P280, P305+P351+P338, P309+P311, P313
PACT premier GHS06 H301, H331, H412 P101, P270, P273, P280, P309+P311
Morpheus GHS02, GHS06, GHS07, GHS08, GHS09
H225, H301, H302, H315, H319, H331, H332, H335, H340, H350, H360Fd, H361d, H373, H411
P101, P201, P270, P273, P280, P305+P351+P338, P309+P311, P313
Structure GHS02, GHS06, GHS07, GHS08, GHS09
H225, H301, H302, H315, H319, H331, H332, H335, H340, H350, H360Fd, H361d, H373, H411
P101, P201, P270, P273, P280, P305+P351+P338, P309+P311, P313
SturaFootprint & Macrosol
GHS02, GHS06, GHS07, GHS08, GHS09
H225, H301, H302, H315, H319, H332, H335, H340, H350, H360FD, H373, H411
P101, P201, P270, P273, P280, P305+P351+P338, P309+P311, P313
AmSO4-Suite GHS02, GHS06, GHS08, GHS09
H225, H301, H330, H350, H340, H360FD, H372, H411
P101, P201, P273, P280, P309+P311
ComPAS Suite GHS02, GHS06, GHS07, GHS08, GHS09
H225, H301, H302, H315, H319, H331, H332, H335, H340, H350, H360FD, H373, H411
P101, P201, P270, P273,
P280, P305+P351+P338,
P309+P311, P313

Appendix
150
Table 24: List of CMR substances
Compound CAS
number Supplier Method and concentration used
CMR
category
Acrylamide 79-06-1 Sigma-Aldrich SDS-PAGE C: 1B
M: 1B
Nickel(II) sulfate 7786-81-4 Sigma-Aldrich Regeneration der Ni-NTA
agarose (100mM in solution)
C: 1A
M: 2
R: 1B
Imidazole 288-32-4 Sigma-Aldrich Buffer compound (< 250 mM) R: 1B

Acknowledgements
151
Acknowledgements
Ich möchte mich herzlich bei Prof. Christian Betzel für die Betreuung und Begutachtung
meiner Arbeit sowie für die mir gegebenen Möglichkeiten an Forschungsreisen im Ausland
und an Konferenzen teilzunehmen bedanken. Danke für diese lehrreiche Zeit.
Meinem Zweitbetreuer PD Dr. Markus Perbandt danke ich herzlich für seine Unterstützung
sowie für seine immerwährende Diskussionsbereitschaft.
Meinem Co-Betreuer Prof. Carsten Wrenger danke ich nicht nur für seinen Beitrag zu dem
Thema der Arbeit, sondern auch für seine Betreuung und Unterstützung während meiner Zeit
in Sao Paulo, die ich sehr bereichernd fand.
Prof. Andrew Torda möchte ich für die Übernahme des Zweitgutachtens danken. Außerdem
danke ich Prof. Ralph Holl und Dr. Thomas Hackl für die Begutachtung meiner Disputation.
Dr. Michael Heymann und Yannig Gicquel danke ich für die großartige Zusammenarbeit an
gemeinsamen Projekten sowie für die mir gegebenen Einblicke auf dem Gebiet der
Microfluidics.
Dr. Carolin Seuring danke ich für die Möglichkeit an einem spannenden Kollaborations-
projekt mitwirken zu können sowie für ihr großes Engagement.
Prof. Iqbal Choudhary danke ich für seine Gastfreundschaft, für sein stets offenes Ohr und
den frischgebrühten Kaffee sowie für die Einblicke in den akademischen Alltag in Karatschi,
Pakistan. Ich habe den Aufenthalt sehr genossen.
Robin Schubert danke ich für seine stets zielorientierte Hilfe auf diversen Gebieten und
möchte ihn dabei als einen tollen Begleiter, nicht nur in Stanford und San Francisco, sondern
auch bei diversen Strahlzeiten und auch bei Aktivitäten außerhalb der Uni hervorheben.
Boris Krichel danke ich für seinen Beitrag zu den Nativ-MS-Messungen. Aber auch einfach
dafür, dass ich ihn kenne, und dass sich viele Sachen durch unsere Freundschaft gefügt haben.
Sabine Botha und Christina Schmidt danke ich dafür, dass sie da waren. Ohne Euch wäre
wirklich vieles anders, oder erst gar nicht möglich, gewesen. You know it. Theresa Nuguid
möchte ich an dieser Stelle hervorheben, weil sie die ganze Zeit mich unterstützt und mit mir
Vieles gemeinsam durchgestanden hat. Ich werde die Momente, die uns verbinden, nicht
vergessen. Danke für alles!

Eidesstattliche Versicherung
Hiermit erkläre ich an Eides statt, dass ich die vorliegende Dissertationsschrift selbst verfasst
und keine anderen als die angegebenen Quellen und Hilfsmittel benutzt habe. Ich versichere,
dass diese Dissertation nicht in einem früheren Promotionsverfahren eingereicht wurde.
Hamburg, 15.12.2017
___________________
Svetlana Kapis