Embed Size (px)
Citation preview
Structure – Property Relationships in Polyolefins
Von der Fakultät für Mathematik, Informatik und Naturwissenschaften der Rheinisch-
Westfälischen Technischen Hochschule Aachen zur Erlangung des akademischen Grades
eines Doktors der Naturwissenschaften genehmigte Dissertation
vorgelegt von
M. Sc. Cristian Eugen Hedesiu
aus Iclod, Romania
Berichter: Universitätsprofessor Dr. Dr. h.c. Bernhard Blümich
Universitätsprofessor Dr. -Ing. Edmund Haberstroh
Tag der mündlichen Prüfung: 12 December 2007
Diese Dissertation ist auf den Internetseiten der Hochschulbibliothek online verfügbar.

Contents
Contents 1 INTRODUCTION AND MOTIVATION 1
2 POLYETHYLENE AND POLYPROPYLENE MORPHOLOGY 5 2.1 Polyethylene 5
2.1.1 History 5
2.1.2 Properties and economic relevance 5
2.1.3 Morphology of polyethylene 5
2.2 Polypropylene 7
2.2.1 History 7
2.2.2 Properties and economic relevance 8
2.2.3 Morphology of isotactic polypropylene 8
3 EXPERIMENTAL METHODS 13 3.1 Introduction 13
3.2 Transmission electron microscopy 13
3.3 Scanning electron microscopy 13
3.4 Atomic force microscopy 14
3.5 Differential scanning calorimetry 14
3.6 Small-angle X-ray scattering 14
3.7 Wide angle X-ray diffraction 15
3.8 Infrared spectroscopy 15
3.9 Mechanical tests 16
3.10 Nuclear magnetic resonance 17
3.10.1 Proton wide-line NMR spectroscopy 17
3.10.2 Proton transverse magnetization relaxation 18
3.10.3 Spin-diffusion NMR experiments with dipolar filters 19
4 HIGH DENSITY POLYETHYLENE 27 4.1 Introduction and motivation 27
4.2 Materials 30
4.3 Morphology of HDPE by TEM 30
4.4 Crystallinity and morphology by SAXS 31
Contents
4.5 Temperature dependence of the phase composition and chain mobilities
of HDPE by NMR 32
4.6 The effect of annealing on chain mobility and the phase composition by
NMR 35
4.7 The thickness of domains in HDPE 36
4.8 The effect of annealing on the thickness of domains and chain mobility 39
4.9 Conclusions 40
5 ISOTACTIC POLYPROPYLENE 43 5.1 Introduction and motivation 43
5.2 Materials 44
5.3 Crystallinity by DSC 44
5.4 Morphology of iPP by TEM 47
5.5 Crystallinity and Morphology by SAXS 48
5.6 Solid-state NMR study of phase composition, chain mobility, and domain
thickness 51
5.6.1 Temperature dependence of phase composition and chain mobility 51
5.6.2 The effect of annealing temperature and annealing time on the
phase composition and chain mobility 53
5.6.3 Comparison of the amounts of the rigid fraction/crystallinity
obtained by NMR, SAXS, and DSC 55
5.6.4 Comparison of the domain thicknesses measured by DQ and
Goldman-Shen dipolar filters in spin-diffusion experiments 55
5.6.5 Temperature dependence of the domain thickness 57
5.6.6 The effect of annealing temperature and annealing time on the
domain thickness of iPP sample 58
5.6.7 Thickening of crystalline domains during annealing 59
5.6.8 Correlation between the 1H transverse magnetization rate and
the domain thickness of the crystalline domains 61
5.7 Conclusions 63
6 AGING ON ISOTACTIC POLYPROPYLENE 65 6.1 Introduction and motivation 65
6.2 Materials 66
Contents
6.3 NMR data processing 67
6.4 Mechanical results 67
6.5 X-ray results 69
6.6 DSC results 69
6.7 Changes induced by aging at 28° C in the phase composition and chain
mobility of homopolymeric iPP samples 73
6.8 Changes induced by aging at 70-130° C in the phase composition and
chain mobility of homopolymeric iPP samples 75
6.9 Discussion: physical ageing in homopolymeric iPP samples by NMR
and mechanical analysis 79
6.10 Conclusions 80
7 UNIAXIALLY DEFORMED ISOTACTIC POLYPROPYLENE 83 7.1 Introduction and motivation 83
7.2 Materials 85
7.3 Stress-strain characteristics 85
7.4 Crystallinity by IR 86
7.5 Phase content and chain mobility by NMR at 70° C 87
7.6 Effect of drawing ratio on the phase composition and chain mobility 89
7.7 Effect of drawing rate on the phase composition and chain mobility 90
7.8 Effect of drawing temperature on the phase composition and chain
mobility 91
7.9 Effect of draw ratio and drawing temperature on the domain sizes of iPP 93
7.10 Correlation between the amount of the rigid fraction and the thickness of
the rigid domains 95
7.11 Correlation between the long period and the drawing temperatures 96
7.12 Correlation between the H transverse relaxation rate and the domain
thickness of the rigid domains 98
7.13 Conclusions 99
8 IMPACT MODIFIED ISOTACTIC POLYPROPYLENE 103 8.1 Introduction and motivation 103
8.2 Materials 104
8.3 Morphology by TEM and AFM 105
Contents
8.4 Crystallization temperature and heat of fusion by DSC 108
8.5 Tensile and flexural tests 109
8.6 Phase content and chain mobility by NMR at 70° C 111
8.7 Aging in impact modified PP copolymer at 70 ° C by NMR 112
8.8 Phase content and chain mobility by NMR at 0° C 114
8.9 Conclusions 118
9 GENERAL CONCLUSIONS 119
REFERENCES 123
Abbreviations and Symbols
Abbreviations and Symbols
NMR nuclear magnetic resonance
AFM atomic force microscopy
a, b, c dimensions of unit cell
cp heat capacity
C1, C2 WLF coefficients
CLTE coefficient of linear thermal expansion
da thickness of the amorphous fraction
di thickness of the intermediate fraction
dr, dc thickness of the rigid fraction
DSC differential scanning calorimetry
Da diffusion coefficient amorphous fraction
Di diffusion coefficient intermediate fraction
Dr diffusion coefficient rigid fraction
DQ double quantum
FID free induction decay
GS Goldman – Shen filter
H enthalpy
HDPE high density polyethylene
HEPS Hahn echo pulse sequence
LDPE low density polyethylene
I scattering intensity
ICP impact copolymer
IR infrared spectroscopy
Lp long period
LLDPE linear low density polyethylene
M2 second van Vleck moment
Mn number averaged molar mass
Mw weight averaged molar mass
PE polyethylene
PP isotactic polypropylene
q scattering vector
Abbreviations and Symbols
SAXS small angle X-ray scattering
SEM scanning electron microscopy
SEPS solid echo pulse sequence
SPE single pulse excitation
ta aging time
td mixing time
T1 longitudinal relaxation time
T2 transverse relaxation time
Tg glass transition temperature
Tm0 equilibrium melting point
TEM transmission electron microscopy
XRD X-ray diffraction
W crystallinity by DSC
WAXD wide angle X-ray diffraction
WAXS wide angle X-ray scattering
WLF William – Landel – Ferry equation
wt% weight percent
Δν1/2 full line width at half height
ρ proton density
γ correlation function
λ draw ratio
Chapter 1. Introduction and Motivation
1
Chapter 1 Introduction and Motivation The extensive and still increasing usage of polymeric materials stems from their unique
physical and mechanical properties. Combined with economic advantages in terms of price
and market availability polymeric materials became a logical choice for a wide range of
applications. For many purposes, their performance is much better than that of conventional
materials such as metals, ceramics or wood. Among the polymeric materials, polyolefins hold
an important role, becoming more and more an indispensable part of our daily life. We can
identify so many products around us ranging from our basic necessities such as tooth brushes,
clothing, storage bottles, and carry bags to special applications like gas and water pipelines,
automotive applications, and biomedical implants all made from polyolefins.
The macroscopic properties of polyolefin materials are not only determined by the size
and construction of the application but to a great extend also to the morphology of the
polyolefin used. Polyolefins show a very complex morphology in which various levels of
hierarchy are distinguished. Four levels of morphology can be identified: chain characteristic
(primary level), crystal unit-cell (secondary level), lamellae structure (tertiary level), and
crystal aggregates or super-molecular structure (quaternary level).
A wide range of material properties are achieved depending on the chain
characteristics, type of polyolefin monomers, e.g. homo- or co-polymer, their architecture,
e.g. linear, branched, microstructure, e.g. tacticity, amount and distribution of region- and/or
stereo defects and molecular weight and molecular weight distribution. By incorporation of α-
olefin comonomers macroscopic properties such as toughness and environmental crack
resistance can be influenced.
The morphology of the polyolefin on the tertiary and quaternary levels not only is
influenced by the chain characteristics but to a large extend also by the processing conditions,
storage conditions, and influence of additives. Due to this variety of possibilities in
morphology and with that in the properties, the study of the structure - properties relationships
in polyolefins has become an exciting field of research in recent decades.
Different NMR methods applied to polyolefins can provide structural and dynamical
information about their morphology that subsequently can be correlated with the macroscopic
properties. The potential and the wide range of applicability of 1H solid - state NMR is
emphasized in this work, which focuses on the applications of NMR in polyolefins
Chapter 1. Introduction and Motivation
2
characterization. Classical and advanced solid-state NMR methods were successfully applied
for the investigation of a broad range of systems such as, high-density polyethylene (HDPE),
isotactic polypropylene (iPP) and PP impact modified copolymers (ICP). A good
understanding of their microscopic structure and dynamics as well as morphology is
necessary in order to manufacture materials with improved macroscopic properties.
The primary aim of this work is to investigate the changes in the morphology, e.g.
phase composition, chain mobility, and domain sizes of polyethylene and polypropylene
samples as a function of composition, (comonomer incorporation, chain structure etc.),
storage time, temperature at storage, speed of cooling down from the melt, and behaviour
under loading conditions. Another aim relates to investigations of the structure – property
relationship in polyethylenes and polypropylenes. For these purposes, several experimental
methods and methods of data analysis were used, as detailed in Chapter 3 wherein a
comprehensive description of the 1H solid – state NMR methods utilized in this work is
given.
The changes in the morphology, phase content, chain mobility, and domain sizes of
HDPE samples as a function of annealing temperatures and storage time are presented in
Chapter 4. In this chapter, we established the temperature range for which the largest
differences are observed in molecular mobility in rigid, semi-rigid, and soft fractions
allowing accurate determination of the phase composition and the thickness of these
domains. The domain thickness, which was determined by NMR, is in good agreement with
those measured by small-angle X-ray scattering (SAXS) and transmission electron
microscopy (TEM). It is shown that annealing is accompanied by structural reorganizations
in the amorphous layer adjacent to the lamella surface causing a continuous shift of the
interface towards the inner part of the amorphous regions and thus reducing the thickness of
the amorphous layer. The temperature dependence of the spin diffusivities is reported for the
three phases of HDPE. The spin-diffusion experiments performed by time-domain low-field
NMR and frequency-domain high-field NMR are compared.
Chapter 5 focuses on the combination of different experimental techniques, e.g. DSC,
SAXS, WAXD, 1H time-domain, and frequency domain NMR measurements, for
determination of the amount of rigid / crystalline, semi-rigid, and soft fractions of isotactic
polypropylene (iPP). Changes in the rigid, semi-rigid, and soft fractions of iPP were
investigated as a function of annealing time and annealing temperature. The most probable
iPP morphology was established by TEM in combination with results from1H spin-diffusion
data compared to data from multidimensional solutions of the spin-diffusion equations. The
Chapter 1. Introduction and Motivation
3
temperature dependence of spin diffusivities was taken into account, and a semiquantitative
theory is presented for this dependence in the case of the amorphous domains. A
combination of 1H spin-diffusion, NMR and SAXS was used to estimate the lamellar
thicknesses for non-annealed and annealed iPP samples. Annealing at temperatures above
110o C causes increases in the lamellar thickness and the crystallinity, and a decrease in the
chain mobility of the rigid and semi-rigid fractions. The quantities of the different phases and
the chain dynamics are reported for three annealing temperatures 134° C, 143° C, and 153° C,
and annealing times in the range from 15 minutes to 30 hours.
Chapter 6 focuses on the changes in the phase composition and chain mobility in
injection moulded, melt-crystallized and quenched homopolymeric iPP samples, associated
with aging at temperatures well above Tg for 150 and 1000 hours. Those changes are studied
with high sensitivity using low field 1H solid-state NMR and X-ray diffraction (XRD). By
NMR the aging effect at 28° C was monitored each hour during 1000 hours for all iPP
samples. Aging in the temperature range from 70o C to 130o C was studied each hour during
150 hours for melt-crystallized homopolymer iPP samples. The aging effects of the
morphology of the homopolymer iPP are rationalized in terms of increased restrictions of the
chain mobility in the semi-rigid and soft fractions. All sample exhibit physical aging when
raised to elevated temperatures, and the physical aging kinetics was observed to depend on
the morphology of the homopolymeric iPP and aging temperatures. A significant increase in
the tensile modulus with time was observed for injection molded homopolymeric iPP
samples. The observed property changes induced by aging are attributed to micro – structural
changes within the semi-rigid and amorphous phases. This is consistent with a reduction in
chain mobility of the semi-rigid and soft fractions.
In chapter 7 changes in the amount of the rigid, semi-rigid, and soft fractions, molecular
mobility, and domain thickness of uniaxially stretched isotactic polypropylene (iPP) were
investigated as a function of temperature, draw ratio, drawing temperature, and drawing rate,
using 1H solid - state NMR at low field. The amount of the rigid fraction determined by
NMR, is in good agreement with crystallinity measured by IR. The study largely focuses on
strain-induced changes in the soft phase that have not been analyzed previously in detail. The
effect of drawing temperature on the studied molecular parameters shows an important effect
of the rate of molecular motions on the strain - induced transformation of the spherulitic
morphology of iPP to the fibrillar one.
Chapter 8 presents the influence of the rubber content and nucleating agents on the
morphology, phase content, chain mobility, and mechanical properties of impact
Chapter 1. Introduction and Motivation
4
copolymeric PP samples. Changes in the morphology, phase content, and chain mobility
were studied using a combination of different techniques like NMR, X-Ray, TEM, SEM,
AFM, and DSC. Structure-property relationships for impact modified copolymeric PP’s are
also presented in this chapter.
Chapter 2. Polyethylene and Polypropylene Morphology
5
Chapter 2 Polyethylene and Polypropylene Morphology 2.1 Polyethylene 2.1.1 History In 1953 Karl Ziegler discovered heterogeneous catalyst based on titanium halides (TiCl3·1/3
AlCl3) that produced HDPE upon activation with an organoaluminium cocatalysit such as
Al(C2H5)2Cl by coordination polymerization at low temperature and pressure [Nat1955].
Later, Natta independently produced stereoregular polymers such as propylene, butane - 1 and
styrene by the same principle [Nat1955]. The subsequent discovery of a MgCl2 supported
TiCl4 catalyst system resulted in a two fold increase in the activity [Nat1955, Nat1956,
Nat1964].
2.1.2 Properties and economic relevance Polyethylene is now one of the most common plastics in the word. It is used to make grocery
bags, bottles, children’s toys, and a host of other everyday items. Polyethylene is of great
industrial importance, and is produced in millions of tones each year. Its versatility combined
with the physical and chemical properties makes it an attractive commodity to produce.
Polyethylene is prepared either via free radical polymerization or via coordination
polymerization using a catalyst. The type of polymerization, reaction conditions such as
temperature, pressure, type of catalyst, cocatalyst, and comonomer can considerably influence
the composition, molecular weight and degree of branching in the polymer and hence the final
architecture.
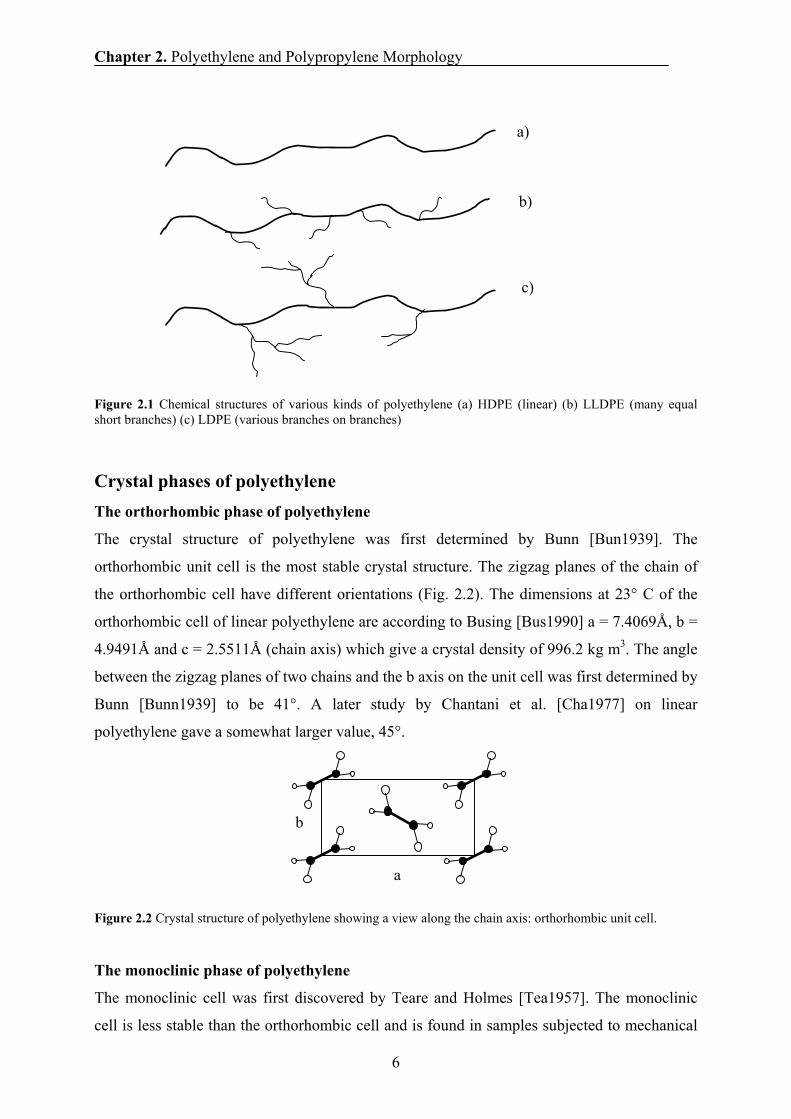
2.1.3 Morphology of polyethylene Molecular characteristics Based on the polymer architecture and the resulting density of packing, polyethylene’s are
classified into high density polyethylene (HDPE; few short or no chain branches), linear low
density polyethylene (LLDPE; many equal short branches) and low density polyethylene
(LDPE; various branches).
Chapter 2. Polyethylene and Polypropylene Morphology
6
Figure 2.1 Chemical structures of various kinds of polyethylene (a) HDPE (linear) (b) LLDPE (many equal short branches) (c) LDPE (various branches on branches)
Crystal phases of polyethylene The orthorhombic phase of polyethylene
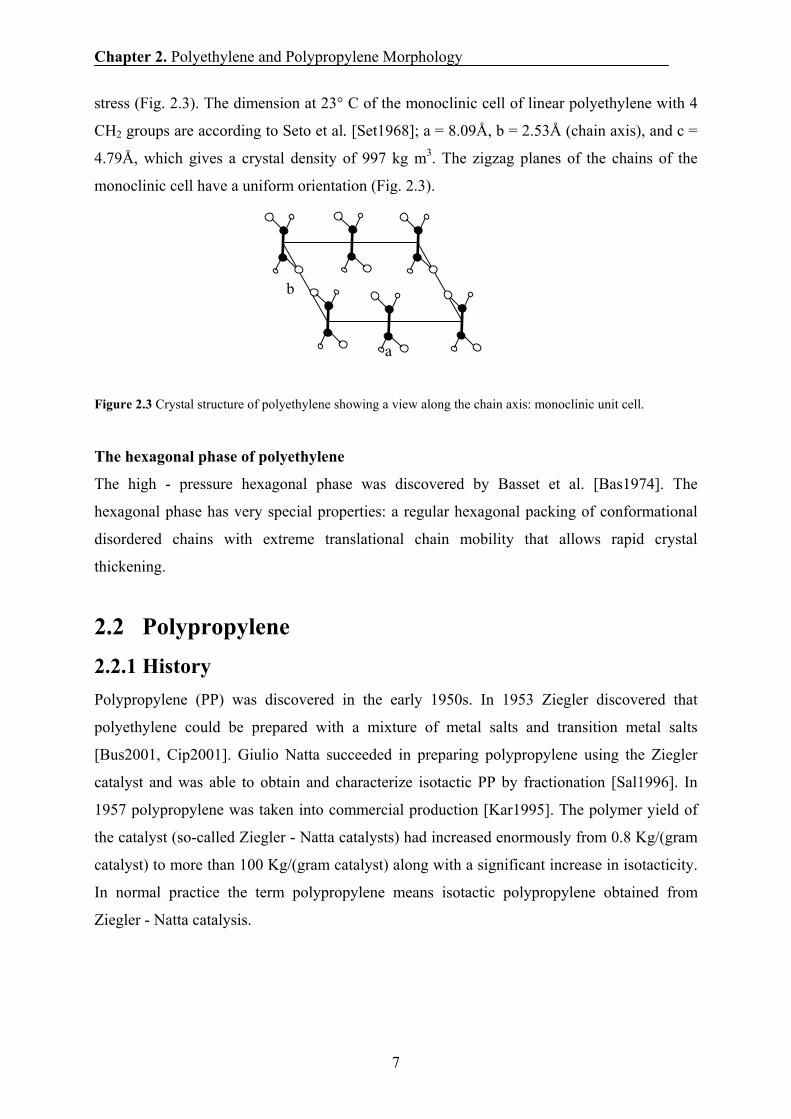
The crystal structure of polyethylene was first determined by Bunn [Bun1939]. The
orthorhombic unit cell is the most stable crystal structure. The zigzag planes of the chain of
the orthorhombic cell have different orientations (Fig. 2.2). The dimensions at 23° C of the
orthorhombic cell of linear polyethylene are according to Busing [Bus1990] a = 7.4069Å, b =
4.9491Å and c = 2.5511Å (chain axis) which give a crystal density of 996.2 kg m3. The angle
between the zigzag planes of two chains and the b axis on the unit cell was first determined by
Bunn [Bunn1939] to be 41°. A later study by Chantani et al. [Cha1977] on linear
polyethylene gave a somewhat larger value, 45°.
Figure 2.2 Crystal structure of polyethylene showing a view along the chain axis: orthorhombic unit cell.
The monoclinic phase of polyethylene
The monoclinic cell was first discovered by Teare and Holmes [Tea1957]. The monoclinic
cell is less stable than the orthorhombic cell and is found in samples subjected to mechanical
a)
b)
c)
a
b
Chapter 2. Polyethylene and Polypropylene Morphology
7
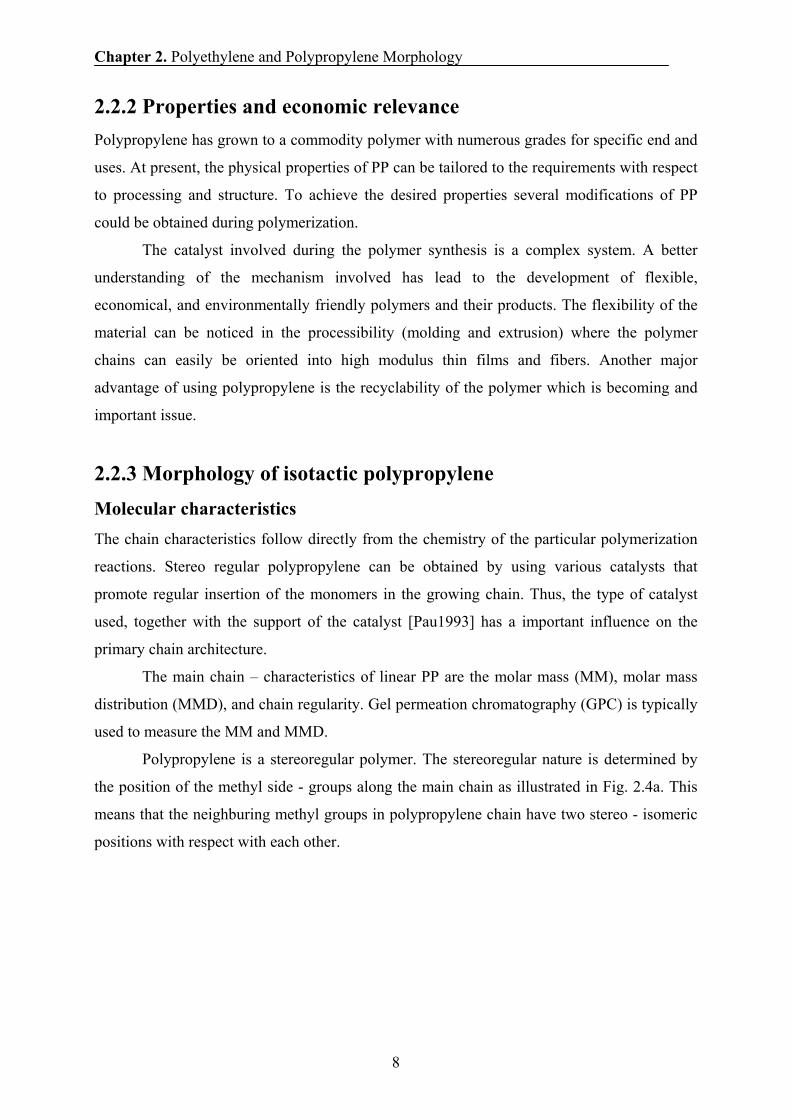
stress (Fig. 2.3). The dimension at 23° C of the monoclinic cell of linear polyethylene with 4
CH2 groups are according to Seto et al. [Set1968]; a = 8.09Å, b = 2.53Å (chain axis), and c =
4.79Å, which gives a crystal density of 997 kg m3. The zigzag planes of the chains of the
monoclinic cell have a uniform orientation (Fig. 2.3).
Figure 2.3 Crystal structure of polyethylene showing a view along the chain axis: monoclinic unit cell.
The hexagonal phase of polyethylene
The high - pressure hexagonal phase was discovered by Basset et al. [Bas1974]. The
hexagonal phase has very special properties: a regular hexagonal packing of conformational
disordered chains with extreme translational chain mobility that allows rapid crystal
thickening.
2.2 Polypropylene 2.2.1 History Polypropylene (PP) was discovered in the early 1950s. In 1953 Ziegler discovered that
polyethylene could be prepared with a mixture of metal salts and transition metal salts
[Bus2001, Cip2001]. Giulio Natta succeeded in preparing polypropylene using the Ziegler
catalyst and was able to obtain and characterize isotactic PP by fractionation [Sal1996]. In
1957 polypropylene was taken into commercial production [Kar1995]. The polymer yield of
the catalyst (so-called Ziegler - Natta catalysts) had increased enormously from 0.8 Kg/(gram
catalyst) to more than 100 Kg/(gram catalyst) along with a significant increase in isotacticity.
In normal practice the term polypropylene means isotactic polypropylene obtained from
Ziegler - Natta catalysis.
a
b
Chapter 2. Polyethylene and Polypropylene Morphology
8
2.2.2 Properties and economic relevance Polypropylene has grown to a commodity polymer with numerous grades for specific end and
uses. At present, the physical properties of PP can be tailored to the requirements with respect
to processing and structure. To achieve the desired properties several modifications of PP
could be obtained during polymerization.
The catalyst involved during the polymer synthesis is a complex system. A better
understanding of the mechanism involved has lead to the development of flexible,
economical, and environmentally friendly polymers and their products. The flexibility of the
material can be noticed in the processibility (molding and extrusion) where the polymer
chains can easily be oriented into high modulus thin films and fibers. Another major
advantage of using polypropylene is the recyclability of the polymer which is becoming and
important issue.
2.2.3 Morphology of isotactic polypropylene Molecular characteristics The chain characteristics follow directly from the chemistry of the particular polymerization
reactions. Stereo regular polypropylene can be obtained by using various catalysts that
promote regular insertion of the monomers in the growing chain. Thus, the type of catalyst
used, together with the support of the catalyst [Pau1993] has a important influence on the
primary chain architecture.
The main chain – characteristics of linear PP are the molar mass (MM), molar mass
distribution (MMD), and chain regularity. Gel permeation chromatography (GPC) is typically
used to measure the MM and MMD.
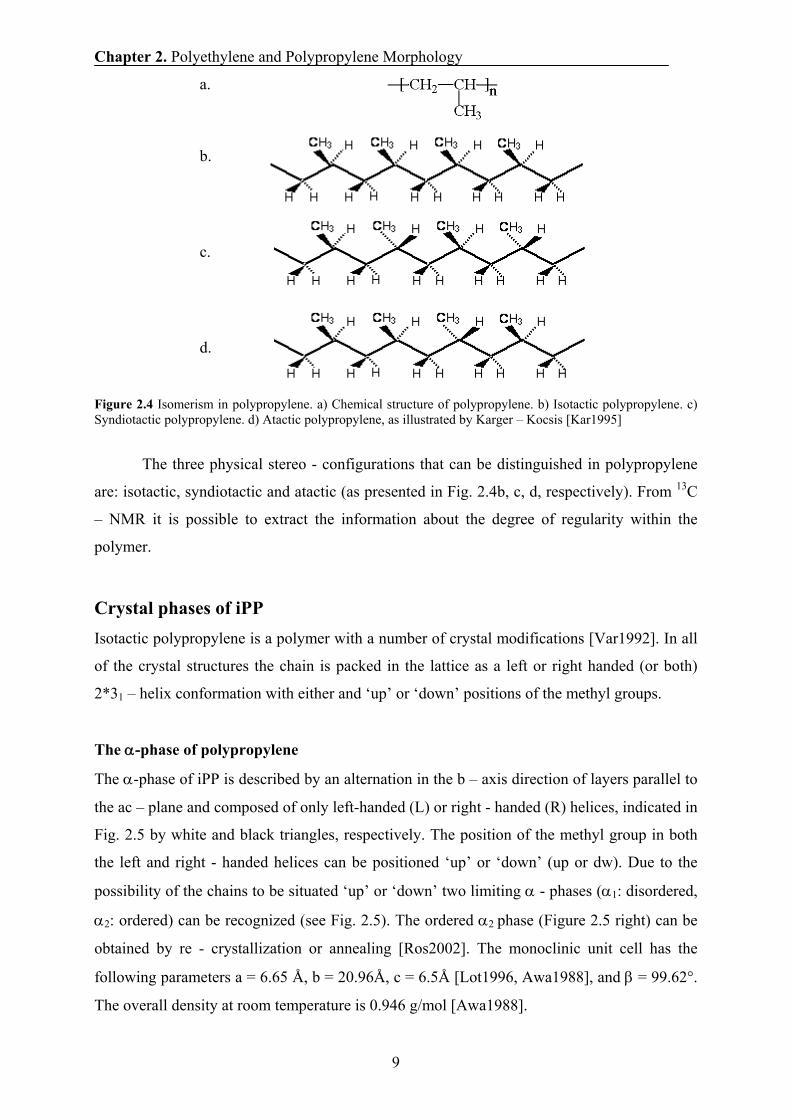
Polypropylene is a stereoregular polymer. The stereoregular nature is determined by
the position of the methyl side - groups along the main chain as illustrated in Fig. 2.4a. This
means that the neighburing methyl groups in polypropylene chain have two stereo - isomeric
positions with respect with each other.
Chapter 2. Polyethylene and Polypropylene Morphology
9
Figure 2.4 Isomerism in polypropylene. a) Chemical structure of polypropylene. b) Isotactic polypropylene. c) Syndiotactic polypropylene. d) Atactic polypropylene, as illustrated by Karger – Kocsis [Kar1995]
The three physical stereo - configurations that can be distinguished in polypropylene
are: isotactic, syndiotactic and atactic (as presented in Fig. 2.4b, c, d, respectively). From 13C
– NMR it is possible to extract the information about the degree of regularity within the
polymer.
Crystal phases of iPP
Isotactic polypropylene is a polymer with a number of crystal modifications [Var1992]. In all
of the crystal structures the chain is packed in the lattice as a left or right handed (or both)
2*31 – helix conformation with either and ‘up’ or ‘down’ positions of the methyl groups.
The α-phase of polypropylene
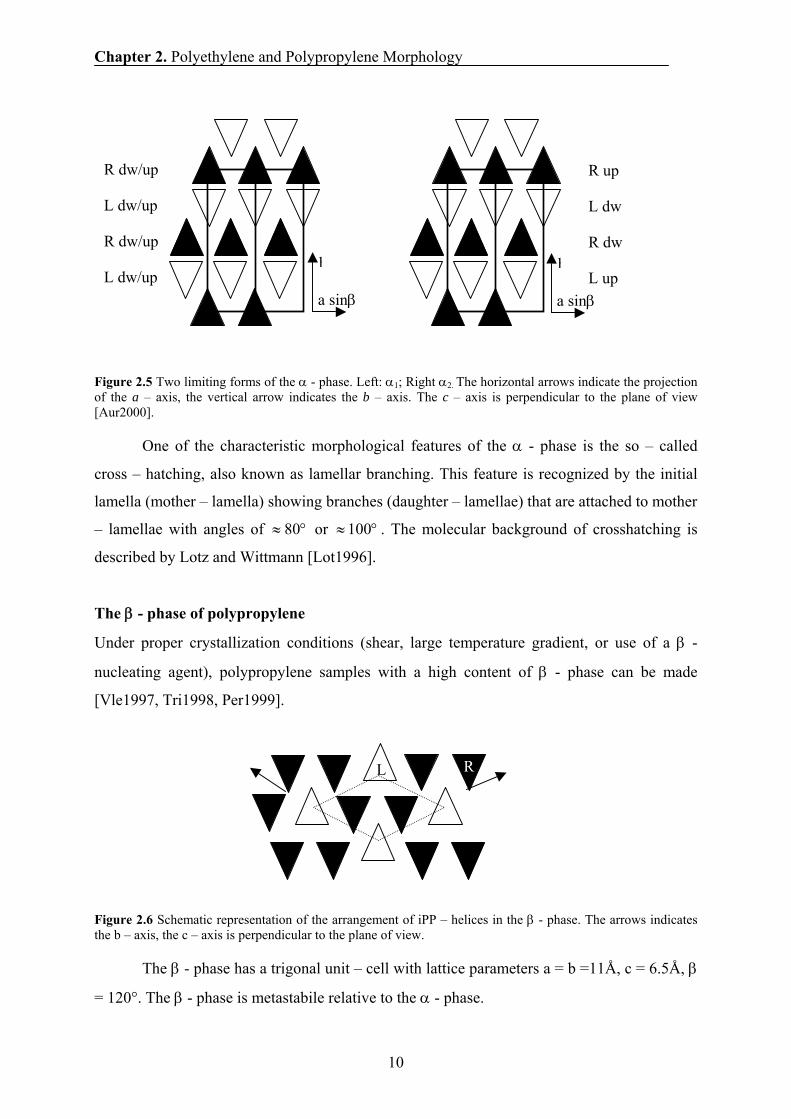
The α-phase of iPP is described by an alternation in the b – axis direction of layers parallel to
the ac – plane and composed of only left-handed (L) or right - handed (R) helices, indicated in
Fig. 2.5 by white and black triangles, respectively. The position of the methyl group in both
the left and right - handed helices can be positioned ‘up’ or ‘down’ (up or dw). Due to the
possibility of the chains to be situated ‘up’ or ‘down’ two limiting α - phases (α1: disordered,
α2: ordered) can be recognized (see Fig. 2.5). The ordered α2 phase (Figure 2.5 right) can be
obtained by re - crystallization or annealing [Ros2002]. The monoclinic unit cell has the
following parameters a = 6.65 Å, b = 20.96Å, c = 6.5Å [Lot1996, Awa1988], and β = 99.62°.
The overall density at room temperature is 0.946 g/mol [Awa1988].
a.
b.
c.
d.
Chapter 2. Polyethylene and Polypropylene Morphology
10
Figure 2.5 Two limiting forms of the α - phase. Left: α1; Right α2. The horizontal arrows indicate the projection of the a – axis, the vertical arrow indicates the b – axis. The c – axis is perpendicular to the plane of view [Aur2000].
One of the characteristic morphological features of the α - phase is the so – called
cross – hatching, also known as lamellar branching. This feature is recognized by the initial
lamella (mother – lamella) showing branches (daughter – lamellae) that are attached to mother
– lamellae with angles of °≈ 80 or °≈100 . The molecular background of crosshatching is
described by Lotz and Wittmann [Lot1996].
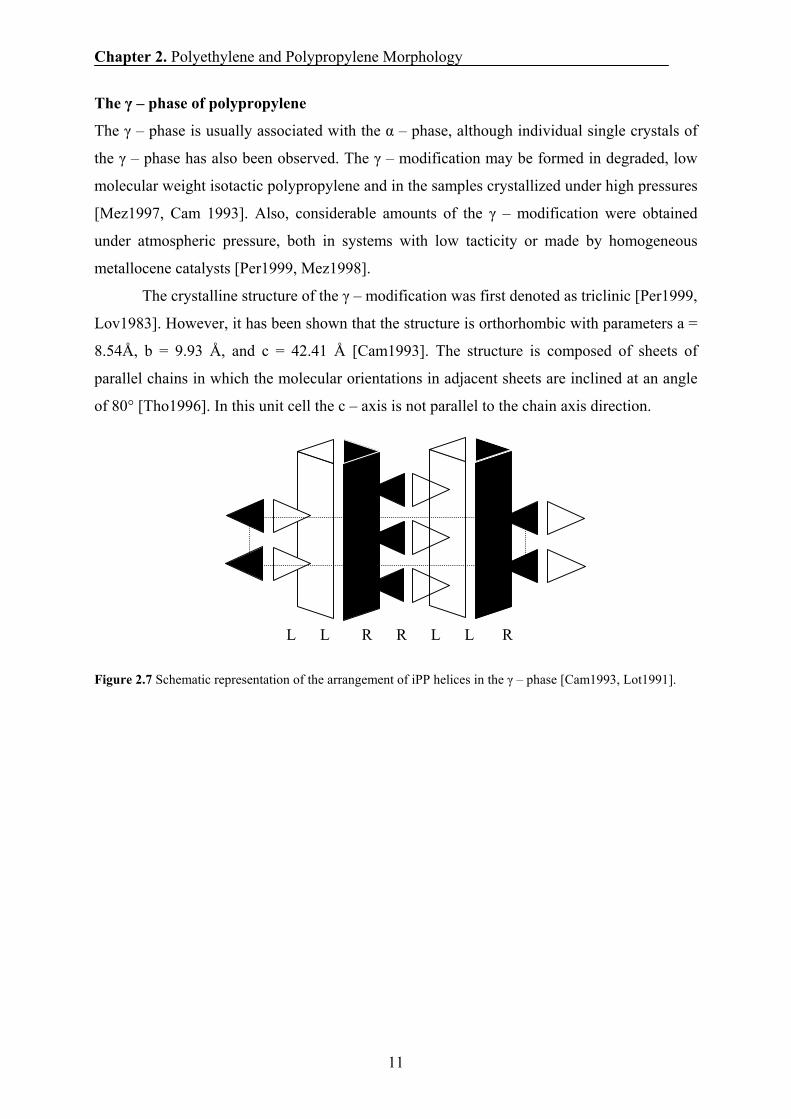
The β - phase of polypropylene
Under proper crystallization conditions (shear, large temperature gradient, or use of a β -
nucleating agent), polypropylene samples with a high content of β - phase can be made
[Vle1997, Tri1998, Per1999].
Figure 2.6 Schematic representation of the arrangement of iPP – helices in the β - phase. The arrows indicates the b – axis, the c – axis is perpendicular to the plane of view.
The β - phase has a trigonal unit – cell with lattice parameters a = b =11Å, c = 6.5Å, β
= 120°. The β - phase is metastabile relative to the α - phase.
R dw/up
L dw/up
R dw/up
L dw/up
R up
L dw
R dw
L up b
a sinβ
b
a sinβ
R
L
R L
Chapter 2. Polyethylene and Polypropylene Morphology
11
The γ – phase of polypropylene
The γ – phase is usually associated with the α – phase, although individual single crystals of
the γ – phase has also been observed. The γ – modification may be formed in degraded, low
molecular weight isotactic polypropylene and in the samples crystallized under high pressures
[Mez1997, Cam 1993]. Also, considerable amounts of the γ – modification were obtained
under atmospheric pressure, both in systems with low tacticity or made by homogeneous
metallocene catalysts [Per1999, Mez1998].
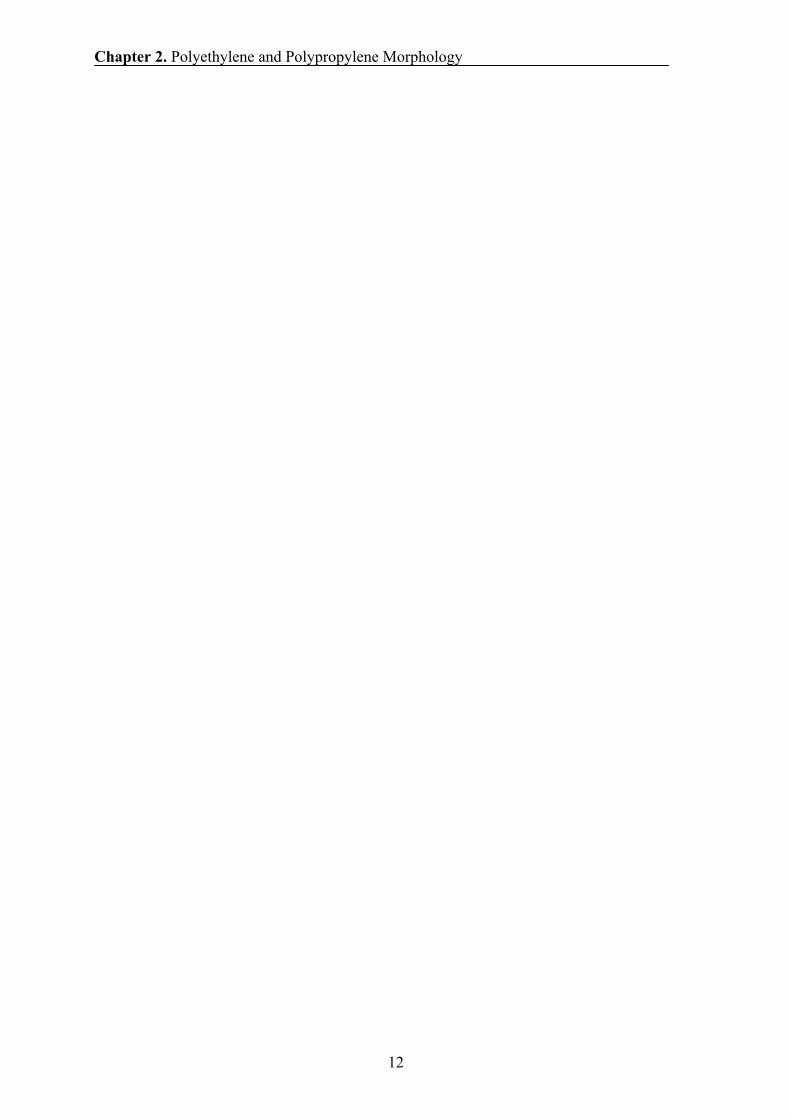
The crystalline structure of the γ – modification was first denoted as triclinic [Per1999,
Lov1983]. However, it has been shown that the structure is orthorhombic with parameters a =
8.54Å, b = 9.93 Å, and c = 42.41 Å [Cam1993]. The structure is composed of sheets of
parallel chains in which the molecular orientations in adjacent sheets are inclined at an angle
of 80° [Tho1996]. In this unit cell the c – axis is not parallel to the chain axis direction.
Figure 2.7 Schematic representation of the arrangement of iPP helices in the γ – phase [Cam1993, Lot1991].
L L R R L L R
Chapter 2. Polyethylene and Polypropylene Morphology
12
Chapter 3. Experimental Methods
13
Chapter 3
Experimental Methods
3.1 Introduction In this thesis PE and PP samples are investigated using transmission electron microscopy
(TEM), atomic force microscopy (AFM), scanning electron microscopy (SEM), differential
scanning calorimetry (DSC), X-Ray diffraction (XRD) and nuclear magnetic resonance
(NMR). All these experimental methods and the associated experimental issues are described
in brief in this chapter.
3.2 Transmission electron microscopy (TEM) TEM has been utilized to probe the morphology and structure properties including lamella
thickness and the nature of crosshatching. Transmission electron microscopy (TEM) has been
performed using Philips CM200 equipment at an acceleration voltage of 120 kV. The
polyethylene and polypropylene samples were trimmed at temperature of -120° C and stained
for 24 hours in a RuO4 solution. Sections of 70 nm thick were obtained by slicing the sample
with an ultramicrotrome at -120° C.
3.3 Scanning electron microscopy (SEM) In order to obtain information about the microstructure of impact modified copolymeric PP,
scanning electron microscopy was performed. The Scanning Electron Microscope (SEM) is
an electron microscope capable of producing high-resolution images of a sample surface. Due
to the manner in which the image is created, SEM images have a characteristic three-
dimensional appearance and are useful for judging the surface structure of the sample. The
SEM has a large field of depth, which allows a large amount of the sample to be in focus at
one time. Preparation of the samples is relatively easy since most SEMs only require the
sample to be conductive. The combination of higher magnification, larger depth of focus,
greater resolution, and ease of sample observation makes the SEM one of the most popular
research instruments today.
Chapter 3. Experimental Methods
14
3.4 Atomic force microscopy (AFM) AFM experiments were performed to investigate the morphology of impact modified
copolymeric PP. The atomic force microscope (AFM) is a high-resolution type of scanning
probe microscope, with demonstrated resolution in the range of fractions of a nanometer, i.e.
more than 1000 times better than the optical diffraction limit.
The AFM can be operated in a number of modes, depending on the application. In
general, possible imaging modes are dived into static (also called contact) mode and a variety
of dynamic modes. AFM provides a three-dimensional surface profile and does not require
any special sample treatments that would irreversibly change or damage the sample
[Mag1996].
3.5 Differential scanning calorimetry (DSC) DSC experiments were performed using a Perkin Elmer DSC-7 at a heating rate of 10° C/min.
In these experiments, a negative heat flow is defined as an exothermal process and positive
heat flow as an endothermal one. Small amounts of polymer (typically 2 – 3 mg) were put
into pans. After a first quick melting and recrystallization of the sample, specific treatments
were applied. The melting- and crystallization temperatures were determined from the
maximum of the melting endotherm and the minimum of the crystallization exotherm,
respectively.
Various cooling rates were applied from the melt while recording the heat flow during
cooling (crystallization) and heating (melting). For most samples, heating experiments were
performed immediately after crystallization by controlled cooling.
3.6 Small-angle X-ray scattering (SAXS) The small angle X-ray scattering (SAXS) experiments were performed with a modified
Kratky setup in order to study the structure of polyethylene and polypropylene samples in
terms of average lamellae sizes. The method is accurate, non-destructive and requires only a
minimum of sample preparation. Conceptually, SAXS experiment is simple: the sample is
exposed to X-rays and a detector registers the scattering radiation. The analysis of the X-ray
scattering curve (intensity versus scattering angle) provides estimates of the thickness of the
rigid domains and long period in polyethylene and polypropylene.
Chapter 3. Experimental Methods
15
3.7 Wide angle X-ray diffraction (WAXD) Wide angle X-ray diffraction (WAXD) is an X-ray diffraction technique that is used to
determinate the crystalline structures of polyethylene and polypropylene. Moreover, with
WAXS it is possible to obtain information about the unit cell orientation in the material.
In a X-ray experiment the monochromatic X-ray beam (with a wavelength λ) is
scattered (diffracted) by the material at a specific angle θ [Ale1969], due to the presence of
regular (crystal) planes in the material separated a distance ( d ). The scattering angle ( θ2 ) is
related to the inter-planar distance ( d ) by the Bragg equation,
θλ
sin2 nd = ,
where n is an integer. The equation indicates a reciprocal relationship between the
characteristic length d and θsin .
3.8 Infrared spectroscopy (IR) Infrared measurements are suitable for the determination of the orientation of individual
components or phases (crystalline or amorphous domains in semi-crystalline polymers or an
average of the two domains). The method is based on the principle of selective absorption of
polarized IR radiation parallel and perpendicular to a certain reference direction.
IR experiments were performed on a Perkin Elmer AutoImage FTIR microscope. IR
spectra (4000-6000 cm-1) were acquired at a spectral resolution of 4 cm-1, using 200
accumulations. Three spectra were acquired for every spectrum, namely without polarisation,
with IR light polarised parallel to the stretching direction of the polymer, and with the IR light
polarised perpendicular to the stretching direction of the polymer. Dichroic analyses were
carried out using a wire grid polariser. The sample was rotated rather than the polariser, as it
is known that the exciting beam of the spectrometer used is partly polarised. The data
processing procedure follows the method provided by Kissin [Kis1983]. The method is used
as provided, i.e. without renewed validation, and the results should be considered indicative
rather than a fully validated.
Chapter 3. Experimental Methods
16
3.9 Mechanical tests Impact testing method: A single point Izod test was used to measures the resistance of the
investigated material to impact. Izod impact strength is defined as the strength at which the
specimen breaks when hit with a pointed hammer having a set kinetic energy. The specimen
is notched to prevent its deformation upon impact.
The tests were performed with a Zwick Type 5110 testing machine according to ASTM D256
on 65 x 12.7 x 3.2 mm specimens and with a striking speed of the hammer of 3.5 m/s. The
given value of the impact strength is an average of five tests.
The impact strength aiN, expressed in kJ/m2 was calculated from the following equation:
310×⋅
=N
ciN bh
Ea ,
where: Ec is the corrected energy, in joules, absorbed by breaking the specimen
h is the thickness of the specimen in mm
bN is the width at the notch in mm
Two hammers were used having a kinetic energy of 2.75 J and 5.5 J, respectively. If after
carrying out the test with the lighter hammer, the specimen did not fully brake, the specimen
was discarded without recording the impact strength and the heavier hammer was used.
Flexural testing method: The principle of this test is to bend or flex the specimen in the
middle at a constant bending rate until the specimen fractures or until the deformation reaches
some predetermined value. During the test the force applied to the specimen is measured.
Flexural modulus was computed and used as an indication of the material’s stiffness when
flexed.
The tests were carried out with a Zwick tensile machine according to ASTM D790.
The dimensions of the specimen were 65 x 12 x 3.2 mm. The values of flexural modulus are
an average values of five tests.
Tensile testing method: Is used to investigate the tensile behaviour of the specimens and for
determining the tensile strength and tensile modulus. The tests were carried out with a Zwick
Z050 tensile machine according to ISO 37-II. The tests were performed at 25° C with a
deformation rate of 50 mm/min.
The aim of the tensile tests were to determine the effect of the rubber content and the
addition of the nucleating agents on the yield point of the specimens under investigation.
Chapter 3. Experimental Methods
17
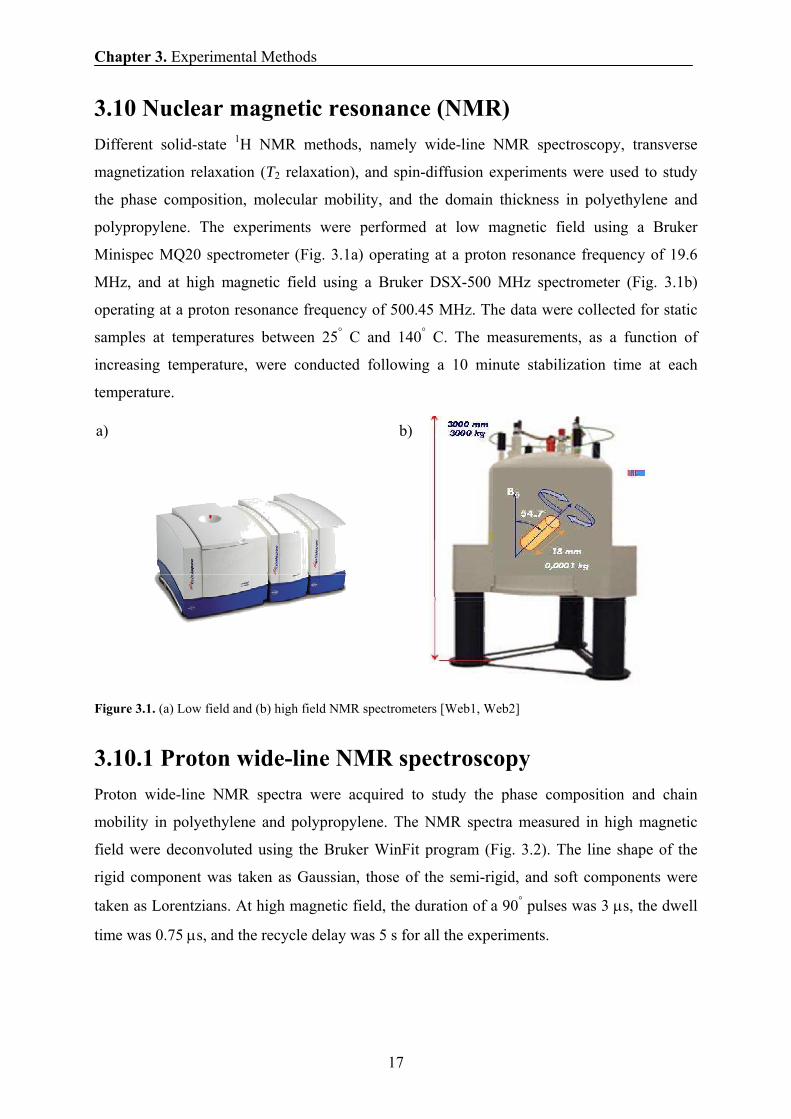
3.10 Nuclear magnetic resonance (NMR) Different solid-state 1H NMR methods, namely wide-line NMR spectroscopy, transverse
magnetization relaxation (T2 relaxation), and spin-diffusion experiments were used to study
the phase composition, molecular mobility, and the domain thickness in polyethylene and
polypropylene. The experiments were performed at low magnetic field using a Bruker
Minispec MQ20 spectrometer (Fig. 3.1a) operating at a proton resonance frequency of 19.6
MHz, and at high magnetic field using a Bruker DSX-500 MHz spectrometer (Fig. 3.1b)
operating at a proton resonance frequency of 500.45 MHz. The data were collected for static
samples at temperatures between 25° C and 140° C. The measurements, as a function of
increasing temperature, were conducted following a 10 minute stabilization time at each
temperature.
Figure 3.1. (a) Low field and (b) high field NMR spectrometers [Web1, Web2]
3.10.1 Proton wide-line NMR spectroscopy
Proton wide-line NMR spectra were acquired to study the phase composition and chain
mobility in polyethylene and polypropylene. The NMR spectra measured in high magnetic
field were deconvoluted using the Bruker WinFit program (Fig. 3.2). The line shape of the
rigid component was taken as Gaussian, those of the semi-rigid, and soft components were
taken as Lorentzians. At high magnetic field, the duration of a 90° pulses was 3 μs, the dwell
time was 0.75 μs, and the recycle delay was 5 s for all the experiments.
a) b)
Chapter 3. Experimental Methods
18
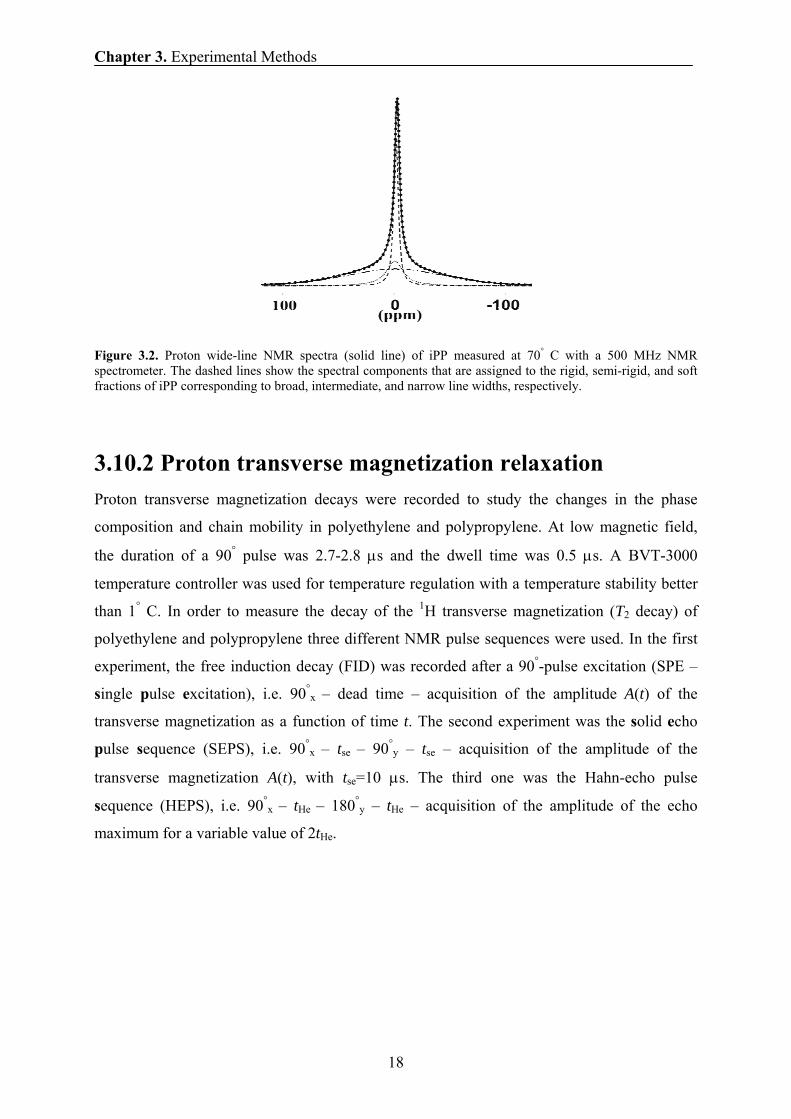
Figure 3.2. Proton wide-line NMR spectra (solid line) of iPP measured at 70° C with a 500 MHz NMR spectrometer. The dashed lines show the spectral components that are assigned to the rigid, semi-rigid, and soft fractions of iPP corresponding to broad, intermediate, and narrow line widths, respectively.
3.10.2 Proton transverse magnetization relaxation Proton transverse magnetization decays were recorded to study the changes in the phase
composition and chain mobility in polyethylene and polypropylene. At low magnetic field,
the duration of a 90° pulse was 2.7-2.8 μs and the dwell time was 0.5 μs. A BVT-3000
temperature controller was used for temperature regulation with a temperature stability better
than 1° C. In order to measure the decay of the 1H transverse magnetization (T2 decay) of
polyethylene and polypropylene three different NMR pulse sequences were used. In the first
experiment, the free induction decay (FID) was recorded after a 90°-pulse excitation (SPE –
single pulse excitation), i.e. 90°x – dead time – acquisition of the amplitude A(t) of the
transverse magnetization as a function of time t. The second experiment was the solid echo
pulse sequence (SEPS), i.e. 90°x – tse – 90°
y – tse – acquisition of the amplitude of the
transverse magnetization A(t), with tse=10 μs. The third one was the Hahn-echo pulse
sequence (HEPS), i.e. 90°x – tHe – 180°
y – tHe – acquisition of the amplitude of the echo
maximum for a variable value of 2tHe.
Chapter 3. Experimental Methods
19
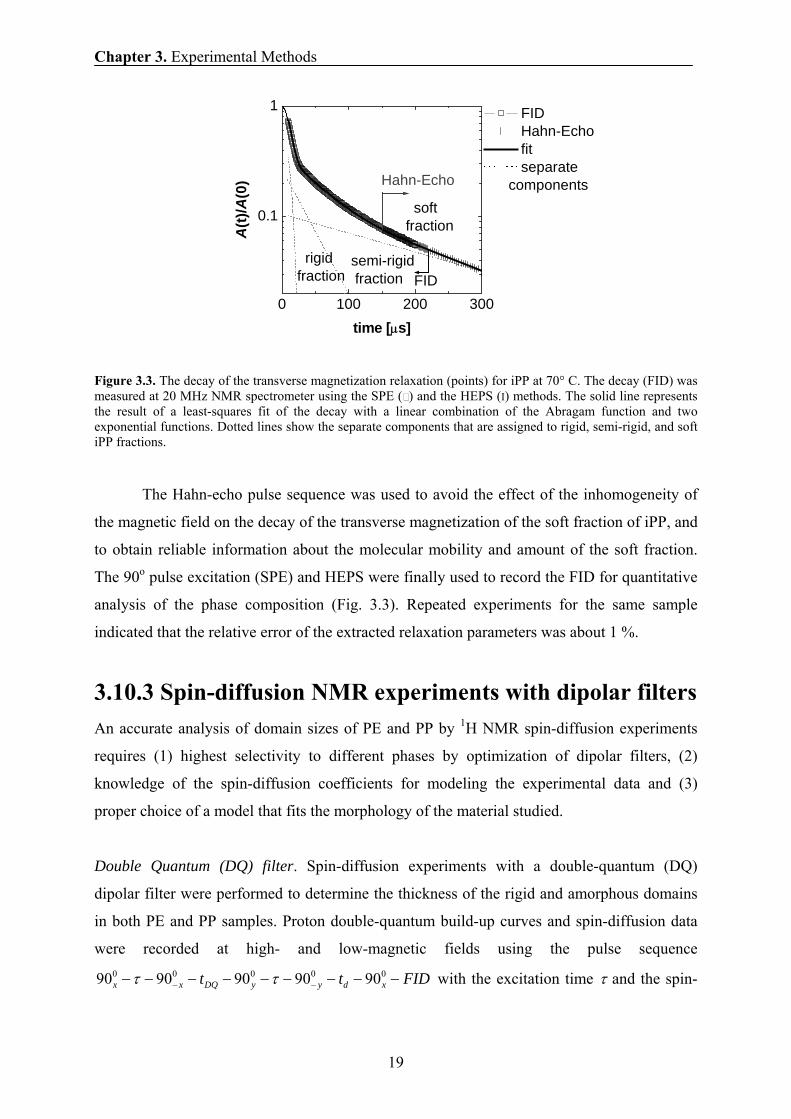
Figure 3.3. The decay of the transverse magnetization relaxation (points) for iPP at 70° C. The decay (FID) was measured at 20 MHz NMR spectrometer using the SPE ( ) and the HEPS (I) methods. The solid line represents the result of a least-squares fit of the decay with a linear combination of the Abragam function and two exponential functions. Dotted lines show the separate components that are assigned to rigid, semi-rigid, and soft iPP fractions.
The Hahn-echo pulse sequence was used to avoid the effect of the inhomogeneity of
the magnetic field on the decay of the transverse magnetization of the soft fraction of iPP, and
to obtain reliable information about the molecular mobility and amount of the soft fraction.
The 90o pulse excitation (SPE) and HEPS were finally used to record the FID for quantitative
analysis of the phase composition (Fig. 3.3). Repeated experiments for the same sample
indicated that the relative error of the extracted relaxation parameters was about 1 %.
3.10.3 Spin-diffusion NMR experiments with dipolar filters An accurate analysis of domain sizes of PE and PP by 1H NMR spin-diffusion experiments
requires (1) highest selectivity to different phases by optimization of dipolar filters, (2)
knowledge of the spin-diffusion coefficients for modeling the experimental data and (3)
proper choice of a model that fits the morphology of the material studied.
Double Quantum (DQ) filter. Spin-diffusion experiments with a double-quantum (DQ)
dipolar filter were performed to determine the thickness of the rigid and amorphous domains
in both PE and PP samples. Proton double-quantum build-up curves and spin-diffusion data
were recorded at high- and low-magnetic fields using the pulse sequence
FIDtt xdyyDQxx −−−−−−−−− −−00000 9090909090 ττ with the excitation time τ and the spin-
0 100 200 300
0.1
1
Hahn-Echo
FID
softfraction
semi-rigid fraction
rigid fraction
A(t)
/A(0
)
time [μs]
FID Hahn-Echo fit separate
components
Chapter 3. Experimental Methods
20
diffusion time dt . The evolution time of the DQ coherences is DQt which was taken as 5 μs in
all experiments.
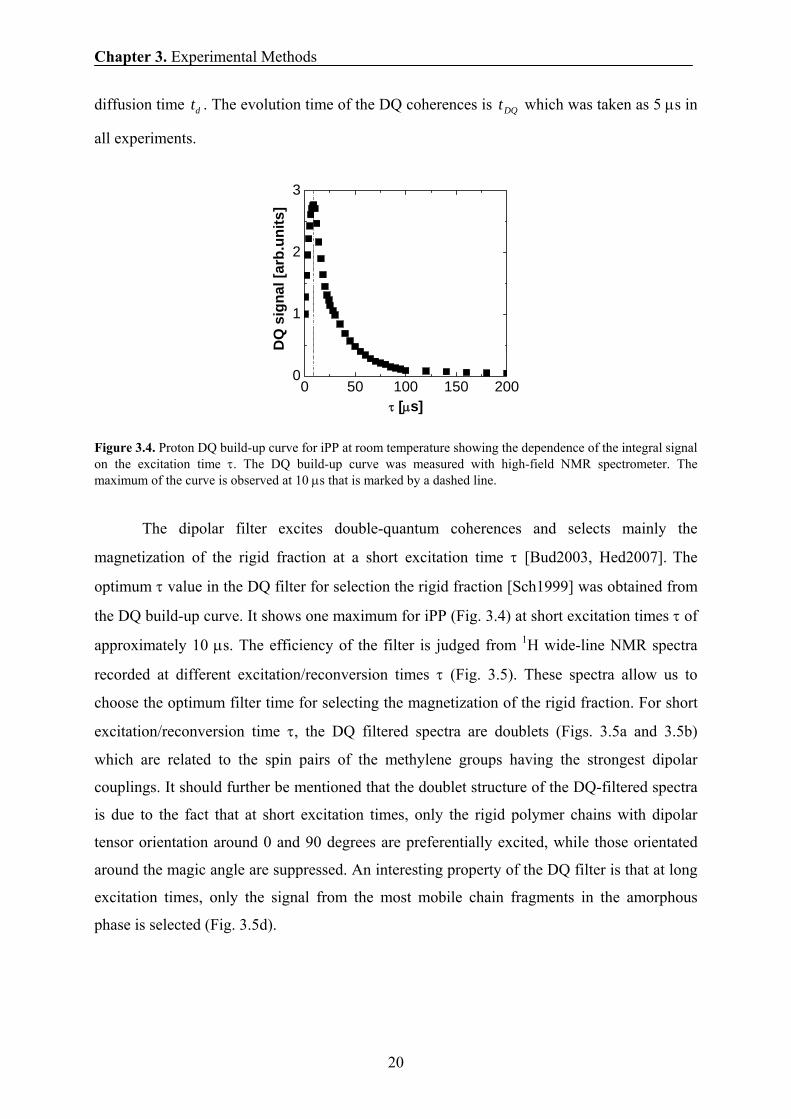
Figure 3.4. Proton DQ build-up curve for iPP at room temperature showing the dependence of the integral signal on the excitation time τ. The DQ build-up curve was measured with high-field NMR spectrometer. The maximum of the curve is observed at 10 μs that is marked by a dashed line.
The dipolar filter excites double-quantum coherences and selects mainly the
magnetization of the rigid fraction at a short excitation time τ [Bud2003, Hed2007]. The
optimum τ value in the DQ filter for selection the rigid fraction [Sch1999] was obtained from
the DQ build-up curve. It shows one maximum for iPP (Fig. 3.4) at short excitation times τ of
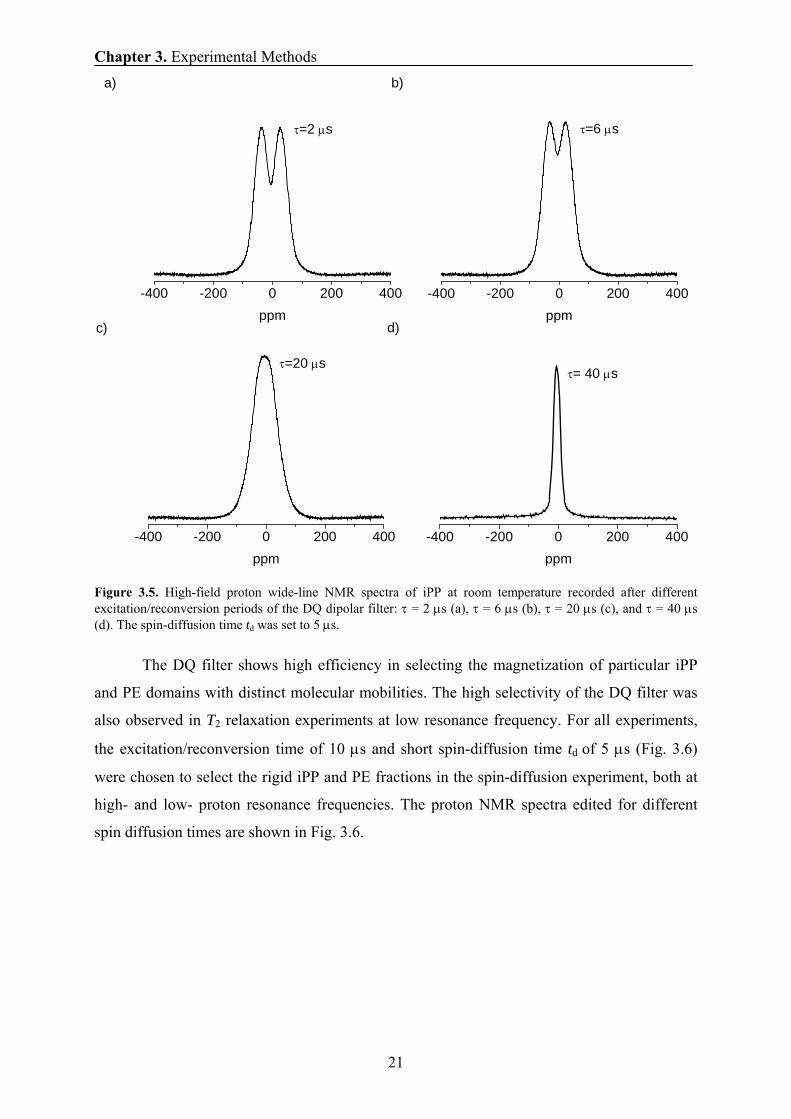
approximately 10 μs. The efficiency of the filter is judged from 1H wide-line NMR spectra
recorded at different excitation/reconversion times τ (Fig. 3.5). These spectra allow us to
choose the optimum filter time for selecting the magnetization of the rigid fraction. For short
excitation/reconversion time τ, the DQ filtered spectra are doublets (Figs. 3.5a and 3.5b)
which are related to the spin pairs of the methylene groups having the strongest dipolar
couplings. It should further be mentioned that the doublet structure of the DQ-filtered spectra
is due to the fact that at short excitation times, only the rigid polymer chains with dipolar
tensor orientation around 0 and 90 degrees are preferentially excited, while those orientated
around the magic angle are suppressed. An interesting property of the DQ filter is that at long
excitation times, only the signal from the most mobile chain fragments in the amorphous
phase is selected (Fig. 3.5d).
0 50 100 150 2000
1
2
3
DQ
sig
nal [
arb.
units
]
τ [μs]
Chapter 3. Experimental Methods
21
Figure 3.5. High-field proton wide-line NMR spectra of iPP at room temperature recorded after different excitation/reconversion periods of the DQ dipolar filter: τ = 2 μs (a), τ = 6 μs (b), τ = 20 μs (c), and τ = 40 μs (d). The spin-diffusion time td was set to 5 μs.
The DQ filter shows high efficiency in selecting the magnetization of particular iPP
and PE domains with distinct molecular mobilities. The high selectivity of the DQ filter was
also observed in T2 relaxation experiments at low resonance frequency. For all experiments,
the excitation/reconversion time of 10 μs and short spin-diffusion time td of 5 μs (Fig. 3.6)
were chosen to select the rigid iPP and PE fractions in the spin-diffusion experiment, both at
high- and low- proton resonance frequencies. The proton NMR spectra edited for different
spin diffusion times are shown in Fig. 3.6.
-400 -200 0 200 400
a)
ppm
τ=2 μs
-400 -200 0 200 400
b)
ppm
τ=6 μs
-400 -200 0 200 400
c)
ppm
τ=20 μs
-400 -200 0 200 400
d)
ppm
τ= 40 μs
Chapter 3. Experimental Methods
22
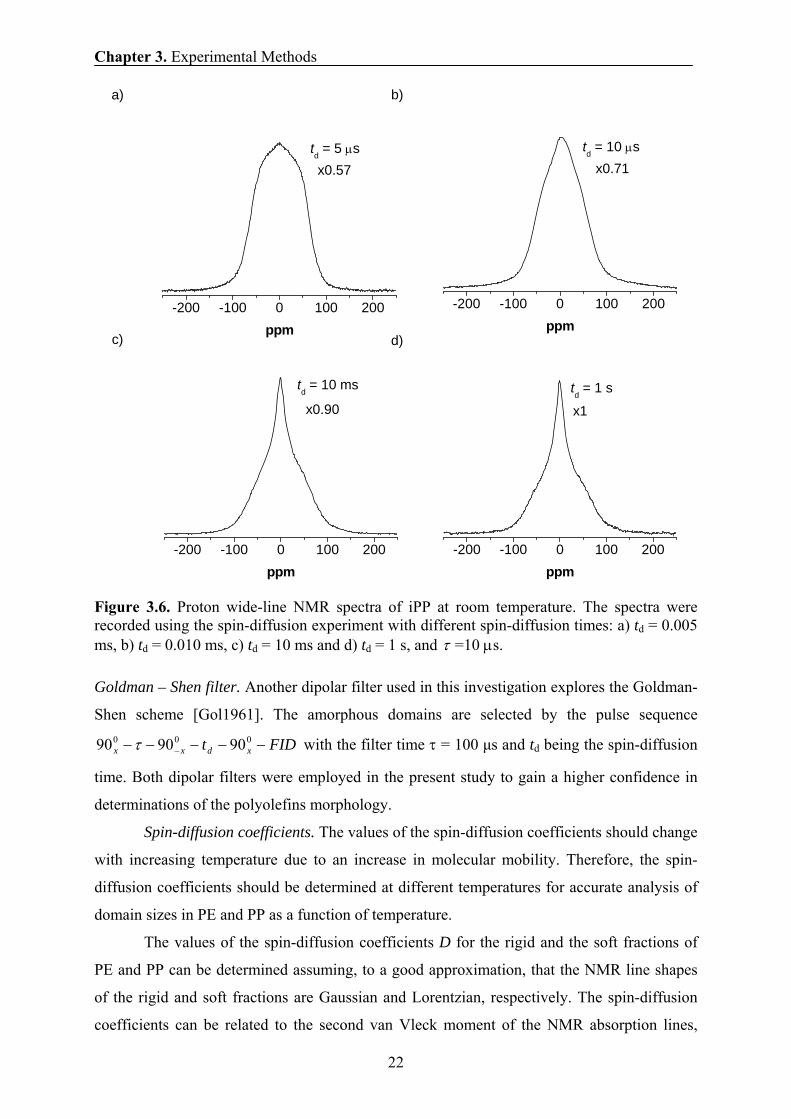
Figure 3.6. Proton wide-line NMR spectra of iPP at room temperature. The spectra were recorded using the spin-diffusion experiment with different spin-diffusion times: a) td = 0.005 ms, b) td = 0.010 ms, c) td = 10 ms and d) td = 1 s, and τ =10 μs.
Goldman – Shen filter. Another dipolar filter used in this investigation explores the Goldman-
Shen scheme [Gol1961]. The amorphous domains are selected by the pulse sequence
FIDt xdxx −−−−− −000 909090 τ with the filter time τ = 100 μs and td being the spin-diffusion
time. Both dipolar filters were employed in the present study to gain a higher confidence in
determinations of the polyolefins morphology.
Spin-diffusion coefficients. The values of the spin-diffusion coefficients should change
with increasing temperature due to an increase in molecular mobility. Therefore, the spin-
diffusion coefficients should be determined at different temperatures for accurate analysis of
domain sizes in PE and PP as a function of temperature.
The values of the spin-diffusion coefficients D for the rigid and the soft fractions of
PE and PP can be determined assuming, to a good approximation, that the NMR line shapes
of the rigid and soft fractions are Gaussian and Lorentzian, respectively. The spin-diffusion
coefficients can be related to the second van Vleck moment of the NMR absorption lines,
-200 -100 0 100 200
a)
ppm
td = 5 μsx0.57
-200 -100 0 100 200
b)
ppm
td = 10 μsx0.71
-200 -100 0 100 200
c)
ppm
td = 10 ms
x0.90
-200 -100 0 100 200
d)
ppm
td = 1 s
x1
Chapter 3. Experimental Methods
23
which, in turn, is related to the full line width Δν1/2 at half height. Hence, the spin diffusivity
for the rigid (Dr) and soft (Da) fractions is as follows [Dem1995]:
2/12
2ln2121 νπ
Δ≈ rDr , (3.1)
and
[ ] 2/12/1
2
61 ναΔ≈ rDa , (3.2)
where 2r is the mean square distance between the nearest spins, and α is a cut-off parameter
for the Lorentzian line shape [Dem1995]. The temperature dependence of Δν1/2 is determined
at each temperature by spectral deconvolution as shown at one temperature in Fig. 3.2. For
calculating 2r the Discover program (version 2004.1) was used. The estimated weighted
mean square of these distances 2r equal approximately 0.0484 nm2 for PE and 0.08 nm2 for
PP, respectively.
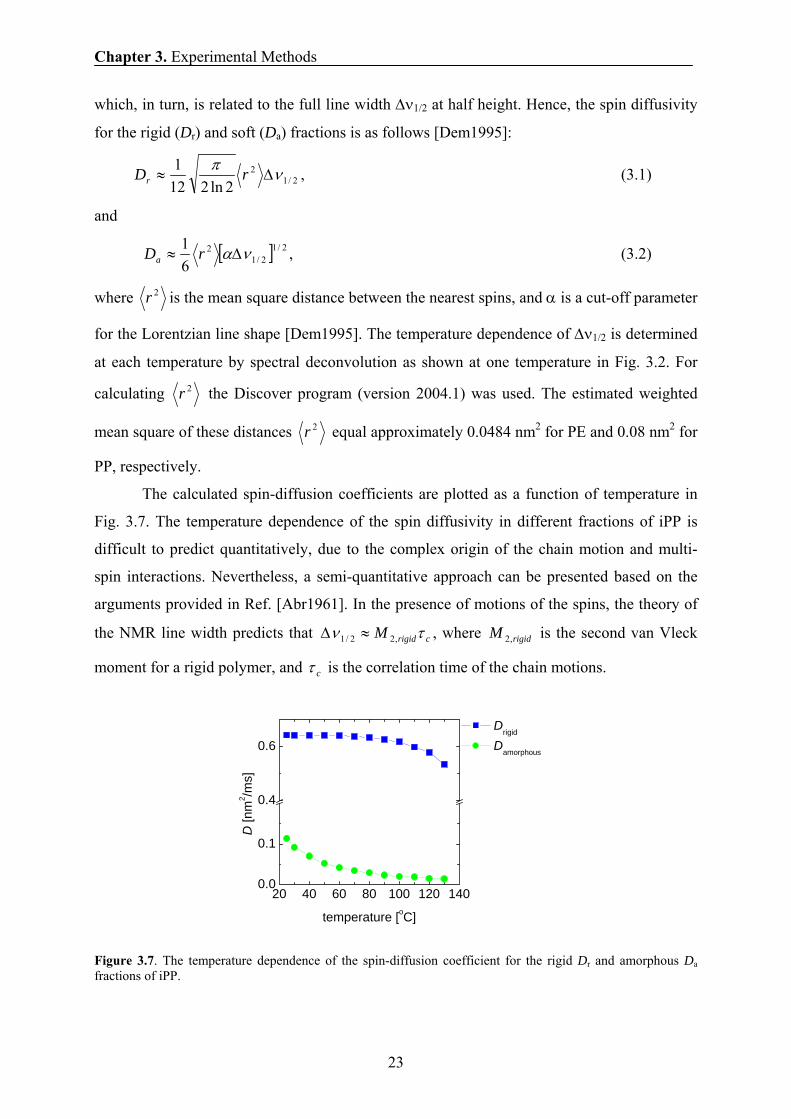
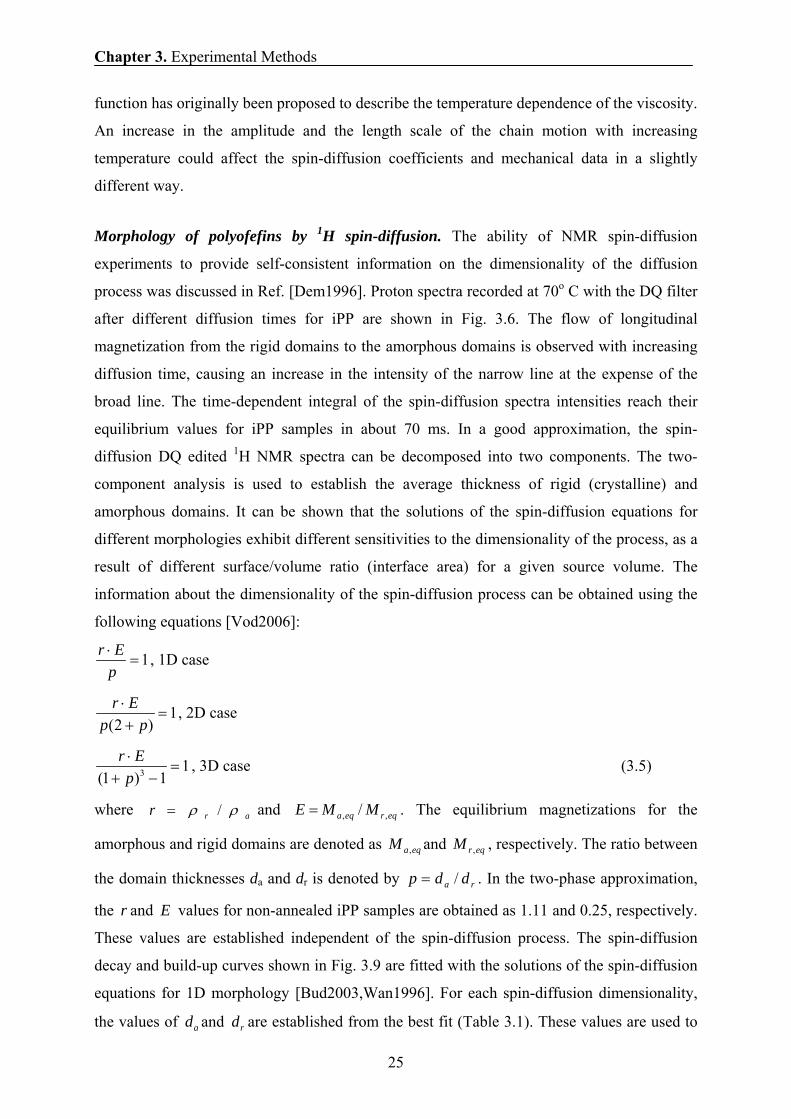
The calculated spin-diffusion coefficients are plotted as a function of temperature in
Fig. 3.7. The temperature dependence of the spin diffusivity in different fractions of iPP is
difficult to predict quantitatively, due to the complex origin of the chain motion and multi-
spin interactions. Nevertheless, a semi-quantitative approach can be presented based on the
arguments provided in Ref. [Abr1961]. In the presence of motions of the spins, the theory of
the NMR line width predicts that crigidM τν ,22/1 ≈Δ , where rigidM ,2 is the second van Vleck
moment for a rigid polymer, and cτ is the correlation time of the chain motions.
Figure 3.7. The temperature dependence of the spin-diffusion coefficient for the rigid Dr and amorphous Da fractions of iPP.
20 40 60 80 100 120 1400.0
0.1
0.4
0.6
D [n
m2 /m
s]
temperature [oC]
Drigid
Damorphous
Chapter 3. Experimental Methods
24
From Equation 3.2 and the above relationship, one obtains: ( ) 2/1caD τ∝ . The temperature
dependence of the correlation time in amorphous polymers can be approximated by the
Williams-Landel-Ferry (WLF) equation (see Ref. [Sch1994]), i.e.,
( ) ( ) ( )( )⎥⎥⎦
⎤
⎢⎢⎣
⎡
−−
−−=
2
1expCTTTTC
TTg
ggcc ττ , (3.3)
where gT is the glass transition temperature and 1C and 2C are the WLF coefficients.
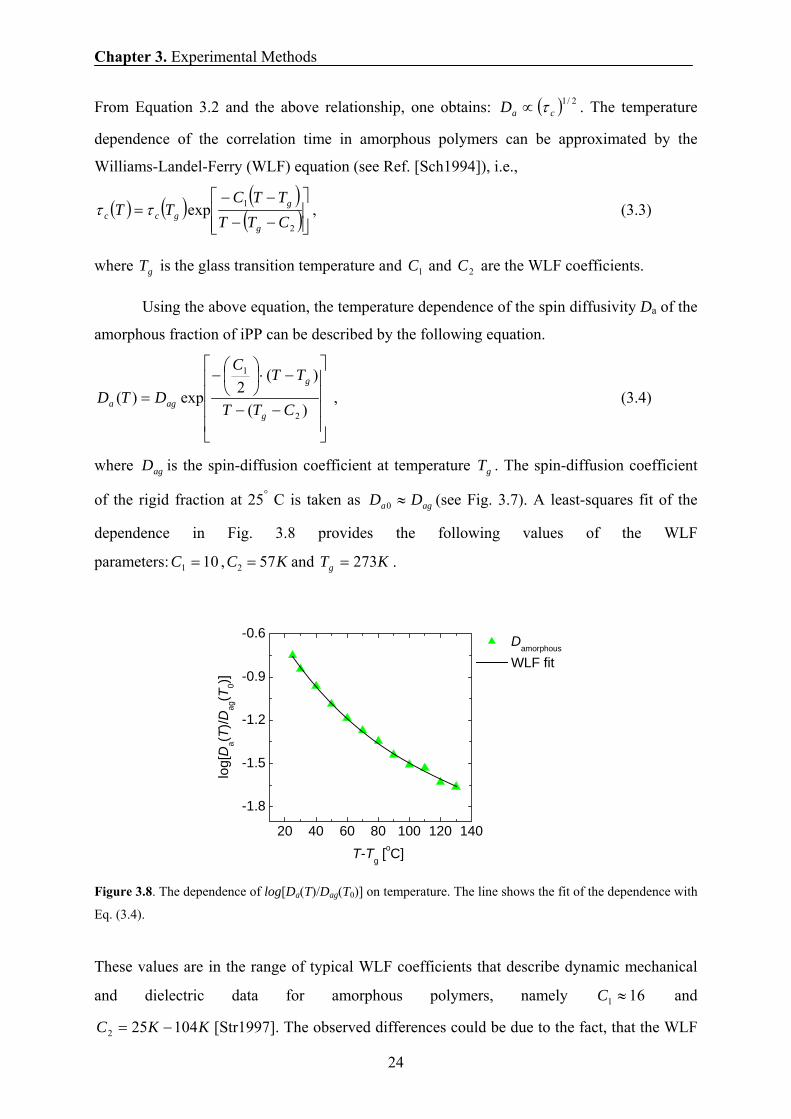
Using the above equation, the temperature dependence of the spin diffusivity Da of the
amorphous fraction of iPP can be described by the following equation.
⎥⎥⎥⎥
⎦
⎤
⎢⎢⎢⎢
⎣
⎡
−−
−⋅⎟⎠⎞
⎜⎝⎛−
=)(
)(2exp)(
2
1
CTT
TTC
DTDg
g
aga , (3.4)
where agD is the spin-diffusion coefficient at temperature gT . The spin-diffusion coefficient
of the rigid fraction at 25° C is taken as aga DD ≈0 (see Fig. 3.7). A least-squares fit of the
dependence in Fig. 3.8 provides the following values of the WLF
parameters: 101 =C , KC 572 = and KTg 273= .
Figure 3.8. The dependence of log[Da(T)/Dag(T0)] on temperature. The line shows the fit of the dependence with
Eq. (3.4).
These values are in the range of typical WLF coefficients that describe dynamic mechanical
and dielectric data for amorphous polymers, namely 161 ≈C and
KKC 104252 −= [Str1997]. The observed differences could be due to the fact, that the WLF
20 40 60 80 100 120 140
-1.8
-1.5
-1.2
-0.9
-0.6
log[
Da(T
)/Dag
(T0)]
T-Tg [oC]
Damorphous
WLF fit
Chapter 3. Experimental Methods
25
function has originally been proposed to describe the temperature dependence of the viscosity.
An increase in the amplitude and the length scale of the chain motion with increasing
temperature could affect the spin-diffusion coefficients and mechanical data in a slightly
different way.
Morphology of polyofefins by 1H spin-diffusion. The ability of NMR spin-diffusion
experiments to provide self-consistent information on the dimensionality of the diffusion
process was discussed in Ref. [Dem1996]. Proton spectra recorded at 70o C with the DQ filter
after different diffusion times for iPP are shown in Fig. 3.6. The flow of longitudinal
magnetization from the rigid domains to the amorphous domains is observed with increasing
diffusion time, causing an increase in the intensity of the narrow line at the expense of the
broad line. The time-dependent integral of the spin-diffusion spectra intensities reach their
equilibrium values for iPP samples in about 70 ms. In a good approximation, the spin-
diffusion DQ edited 1H NMR spectra can be decomposed into two components. The two-
component analysis is used to establish the average thickness of rigid (crystalline) and
amorphous domains. It can be shown that the solutions of the spin-diffusion equations for
different morphologies exhibit different sensitivities to the dimensionality of the process, as a
result of different surface/volume ratio (interface area) for a given source volume. The
information about the dimensionality of the spin-diffusion process can be obtained using the
following equations [Vod2006]:
1=⋅pEr , 1D case
1)2(=
+⋅
ppEr , 2D case
11)1( 3 =
−+⋅p
Er , 3D case (3.5)
where arr ρρ /= and eqreqa MME ,, /= . The equilibrium magnetizations for the
amorphous and rigid domains are denoted as eqaM , and eqrM , , respectively. The ratio between
the domain thicknesses da and dr is denoted by ra ddp /= . In the two-phase approximation,
the r and E values for non-annealed iPP samples are obtained as 1.11 and 0.25, respectively.
These values are established independent of the spin-diffusion process. The spin-diffusion
decay and build-up curves shown in Fig. 3.9 are fitted with the solutions of the spin-diffusion
equations for 1D morphology [Bud2003,Wan1996]. For each spin-diffusion dimensionality,
the values of ad and rd are established from the best fit (Table 3.1). These values are used to
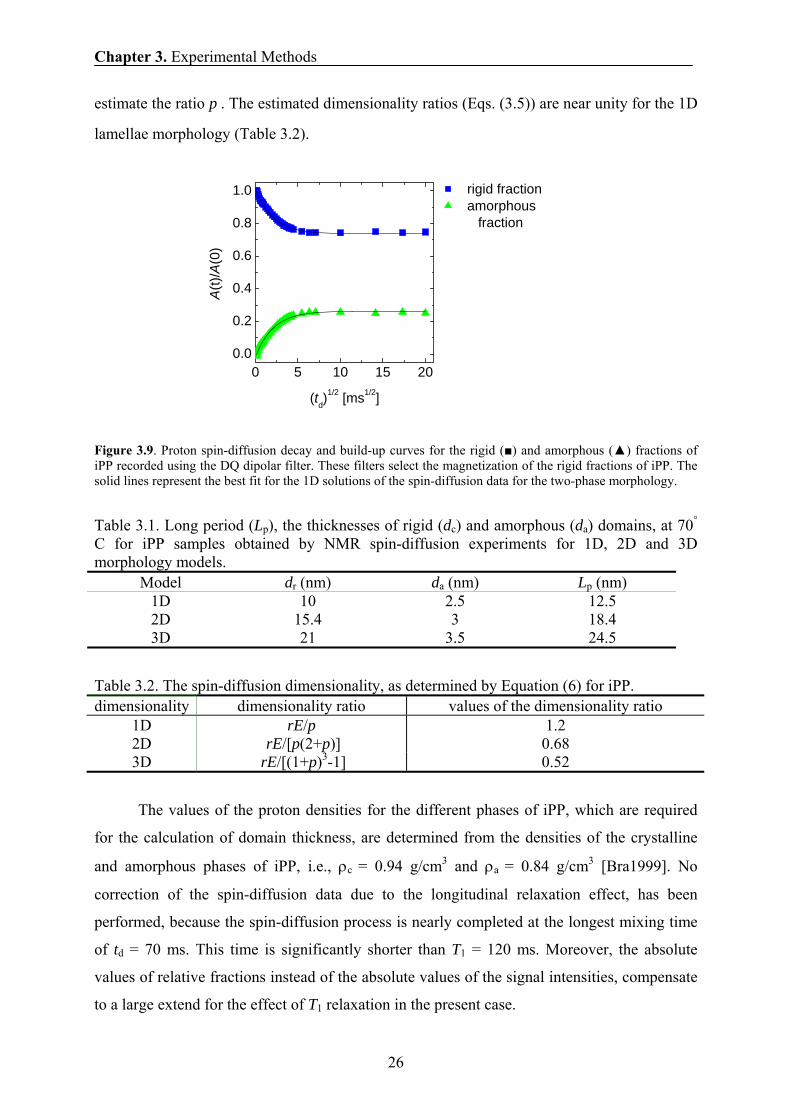
Chapter 3. Experimental Methods
26
estimate the ratio p . The estimated dimensionality ratios (Eqs. (3.5)) are near unity for the 1D
lamellae morphology (Table 3.2).
Figure 3.9. Proton spin-diffusion decay and build-up curves for the rigid (■) and amorphous (▲) fractions of iPP recorded using the DQ dipolar filter. These filters select the magnetization of the rigid fractions of iPP. The solid lines represent the best fit for the 1D solutions of the spin-diffusion data for the two-phase morphology.
Table 3.1. Long period (Lp), the thicknesses of rigid (dc) and amorphous (da) domains, at 70° C for iPP samples obtained by NMR spin-diffusion experiments for 1D, 2D and 3D morphology models.
Model dr (nm) da (nm) Lp (nm) 1D 10 2.5 12.5 2D 15.4 3 18.4 3D 21 3.5 24.5
Table 3.2. The spin-diffusion dimensionality, as determined by Equation (6) for iPP. dimensionality dimensionality ratio values of the dimensionality ratio
1D rE/p 1.2 2D rE/[p(2+p)] 0.68 3D rE/[(1+p)3-1] 0.52
The values of the proton densities for the different phases of iPP, which are required
for the calculation of domain thickness, are determined from the densities of the crystalline
and amorphous phases of iPP, i.e., ρc = 0.94 g/cm3 and ρa = 0.84 g/cm3 [Bra1999]. No
correction of the spin-diffusion data due to the longitudinal relaxation effect, has been
performed, because the spin-diffusion process is nearly completed at the longest mixing time
of td = 70 ms. This time is significantly shorter than T1 = 120 ms. Moreover, the absolute
values of relative fractions instead of the absolute values of the signal intensities, compensate
to a large extend for the effect of T1 relaxation in the present case.
0 5 10 15 200.0
0.2
0.4
0.6
0.8
1.0
A(t)
/A(0
)
(td)1/2 [ms1/2]
rigid fraction amorphous
fraction
Chapter 4. High Density Polyethylene
27
Chapter 4
High Density Polyethylene (HDPE) 4.1 Introduction and motivation The morphology of semi-crystalline polymers has important effects on the materials properties
including the mechanical performance [Pop1987, Man1988]. A quantitative characterization of
the phase composition and molecular mobility in semi-crystalline polymers is therefore of
great importance to advance our understanding of their properties. In this respect, the phase
composition is probably one of the most important morphological parameters, mainly because
the amorphous and crystalline phases exhibit vastly different behavior and their relative
contributions to the material properties should be accurately known. Traditionally, a two-phase
model is used to describe the morphology of undeformed, melt-crystallized polyethylene (PE)
and other semi-crystalline polymers [Flo1978, Man1990]. The most common methods for
crystallinity determination are X-ray diffraction, density measurement and differential
scanning calorimetry. In general, different methods for crystallinity determination do not
always yield the same results on exactly the same sample [Isa1999, Hir1990] because of the
following reasons: (1) The complex morphology of semi-crystalline polymers requires
different sets of assumptions for the analysis of the data recorded by different techniques. (2)
The discrimination of the crystalline and amorphous phases is made on the basis of different
characteristics, such as the enthalpy of melting (DSC), long range periodicity (WAXD) and the
specific volume (density analysis). (3) The two-phase model is a simplified for description of
semi-crystalline polymers due to the presence of a crystal-amorphous interface, which can be
detected either as crystalline or amorphous fraction depending on the method used [Isa1999].
Various experimental methods, such as neutron scattering, dielectric relaxation, calorimetry
and solid-state NMR, show that a thin layer separates crystalline and amorphous phases, and
the properties of this layer are intermediate between those for crystalline and amorphous
phases [Man1988, Man1990, Iwa2002, His1999]. Therefore, the term “phase composition” is
perhaps more appropriate than simply “crystallinity” to emphasize the multi-phase nature of
semi-crystalline polymers.
Solid-state NMR is one of the most informative techniques for characterization of
molecular mobility and molecular scale heterogeneity in materials [Sch1994]. During the
years, different solid-state NMR methods have been used for investigations of morphology
Chapter 4. High Density Polyethylene
28
and molecular mobility in PE. At temperatures well above Tg of the amorphous phase, the T2-
relaxation decay and wide-line NMR spectra for PE can usually be decomposed into three
components, which originate from a crystalline phase, a semi-rigid crystalline-amorphous
interphase, and a soft fraction of the amorphous phase. The intermediate phase has distinct
dynamic properties and may not be considered as a true thermodynamic phase. Apparently,
the definition of an interface or a semi-rigid fraction of the amorphous phase is more
appropriate for this phase. 13C NMR spectroscopy has provided more detailed information
about molecular mobility in the different phases of PE, than 1H NMR because of the high
phase selectivity of 13C NMR exploring differences in the chemical shift for crystalline and
amorphous phases [Lit2002, Kit1994, Hil1998, Che1994, Sch1991, Kle2002, Kuw2000].
Most of the 13C NMR studies support the three-phase model of semi-crystalline PE. However,
other studies suggested four types of structures with distinctly different molecular mobilities
[Hil1998, Hu2000]: two types of crystalline environments, both with an all trans chain
conformation - a more perfect one and one with “twist” defects, and two types of chain
fragments in the amorphous phase - less mobile chain units mainly in the trans conformation
rotating around the trans chain axis, and more mobile chain fragments whose mobility
approaches isotropic tumbling. Detailed information about the nature of the molecular
mobility in linear PE has been obtained by two-dimensional (2D) 13C exchange NMR and 2H
wide-line NMR [Sch1991, Hen1984].
Despite numerous studies, the morphological origin of PE regions with different
molecular mobilities is still a matter of discussion. Therefore, the determination of the
thickness of domains with distinctly different molecular mobility is of a substantial interest
for a better understanding of the morphology and relaxation properties of PE. Domain sizes in
heterogeneous polymers [Bri1993, Pac1984] and polymer fibers [Hu2000, Bud2003,
Bud2004, Van1996] have been determined by proton NMR spin-diffusion experiments.
Previous 1H NMR spin-diffusion experiments have shown that the lamellae thickness of melt-
crystallized PE and PE fibers varies in a wide range depending on the degree of the branching
and the thermal history of the sample [Eck1997, Pac1984]. It should be mentioned that the
thickness of the rigid fraction in semi-crystalline polymers could differ from the lamellae
thickness since some fraction of the amorphous phase adjacent to the lamellae surface can be
largely immobilized and cause an apparent increase in the lamellae thickness. The estimated
thickness of the mobile amorphous fraction in PE ranges from 1 nm to 5 nm [Eck1997,
Hu2000, Pac1984]. The morphology and phase characteristics of HDPE were also
investigated by 13C edited 1H spin-diffusion using a dipolar filter for filtering out the
Chapter 4. High Density Polyethylene
29
magnetization from the rigid phase [Van1996]. The dimensions of 6.5 nm, 0.8 - 1.3 nm, and 5
nm were determined for the crystalline, intermediate, and amorphous phases, respectively. 13C
solid-state NMR methods offer certain advantages for the analysis of domain sizes in PE due
to high phase selectivity [Axe1983, Kit1986].
The high sensitivity of proton NMR makes this method very attractive for
characterization of crystallization kinetics [Kri2000], premelting behaviour [Tan1995], and
quality control [Bud2003]. The main disadvantage of 1H NMR for a phase analysis in PE is a
lack of high selectivity regarding the crystalline and amorphous phases, if the experiments
are performed at room temperature. A discrimination of these phases by proton NMR is
made on the basis of differences in molecular mobility. Despite numerous 1H NMR studies
of PE, it is still not well known how annealing at elevated temperatures affects the phase
composition and the thickness of the domains. To the best of our knowledge neither the
temperature dependence of the domain thickness was studied by NMR so far, as well as the
effect of annealing on the domain thickness.
Based on the above considerations, we aim to establish a reliable method for the
analysis of the phase composition and domain sizes in HDPE using high-field proton wide-
line NMR and low-field 1H NMR transverse magnetization relaxation methods. By
comparing the results of these two methods the performance of low-field NMR
measurements for characterization of the domain sizes in semi-crystalline polymers can be
validated. Furthermore, the effects of measurement temperature and annealing at elevated
temperatures on the polymer morphology are studied in detail, as temperature may play a
decisive role in the outcome of the measurements. Knowledge of the temperature effect will
help to identity the temperature range for which the largest NMR difference between the
different phases can be obtained, while ensuring high accuracy of the method by avoiding
annealing. A recently developed NMR spin-diffusion experiment is applied for measuring
the domains sizes [Bud2003, Bud2004]. This method explores a double-quantum dipolar
filter [Bud2003, Bud2004, Ba1998, Che2005], provides higher differences, and consequently
a more accurate analysis is possible. In order to evaluate the reliability of the NMR method,
the results are compared to crystallinity and domain sizes determined for the same sample by
SAXS and TEM.
Chapter 4. High Density Polyethylene
30
4.2 Materials High-density polyethylene (HDPE) samples were obtained from SABIC Europe BV. The
molar mass and molar mass distribution, as determined by size exclusion chromatography in
1,2,4-three chlorobenzene, were characterized by: Mn = 15.103 g/mol, Mw = 78.103 g/mol, and
Mw/Mn = 5.2. Four millimetre thick compression moulded plates were prepared by melting
HDPE in a mould first under atmospheric pressure at 180° C with a subsequent pressure
increase to 500 kPa. To create a homogeneous melt, the HDPE sample was kept in the mould
for 15 minutes. Afterwards, the mould was cooled with cold water and the HDPE plates were
annealed at 100° C in an oven for one hour followed by slow cooling to room temperature.
For the annealing study, the sample was further annealed at different temperatures inside the
NMR probe for 100 hours.
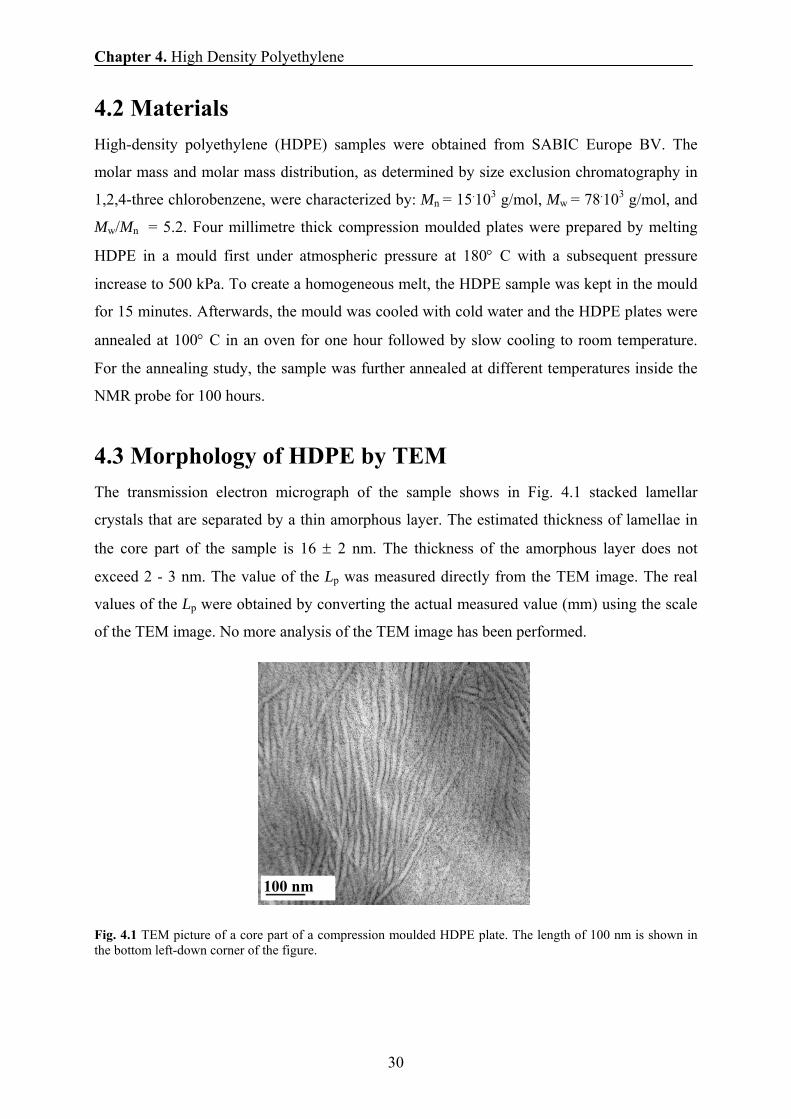
4.3 Morphology of HDPE by TEM The transmission electron micrograph of the sample shows in Fig. 4.1 stacked lamellar
crystals that are separated by a thin amorphous layer. The estimated thickness of lamellae in
the core part of the sample is 16 ± 2 nm. The thickness of the amorphous layer does not
exceed 2 - 3 nm. The value of the Lp was measured directly from the TEM image. The real
values of the Lp were obtained by converting the actual measured value (mm) using the scale
of the TEM image. No more analysis of the TEM image has been performed.
Fig. 4.1 TEM picture of a core part of a compression moulded HDPE plate. The length of 100 nm is shown in the bottom left-down corner of the figure.
100 nm
Chapter 4. High Density Polyethylene
31
4.4 Crystallinity and morphology by SAXS The SAXS patterns reveal a maximum due to the long period (Fig. 4.2a), which is a typical
feature of semi-crystalline polymers. For HDPE, this can be interpreted in terms of a quasi-
periodic, lamellar morphology as outlined in more detail above. The analysis of the one-
dimensional electron density correlation function assumes the two-phase model, which cannot
be strictly valid due to the presence of the interfacial layer, as shown below by NMR
experiments.
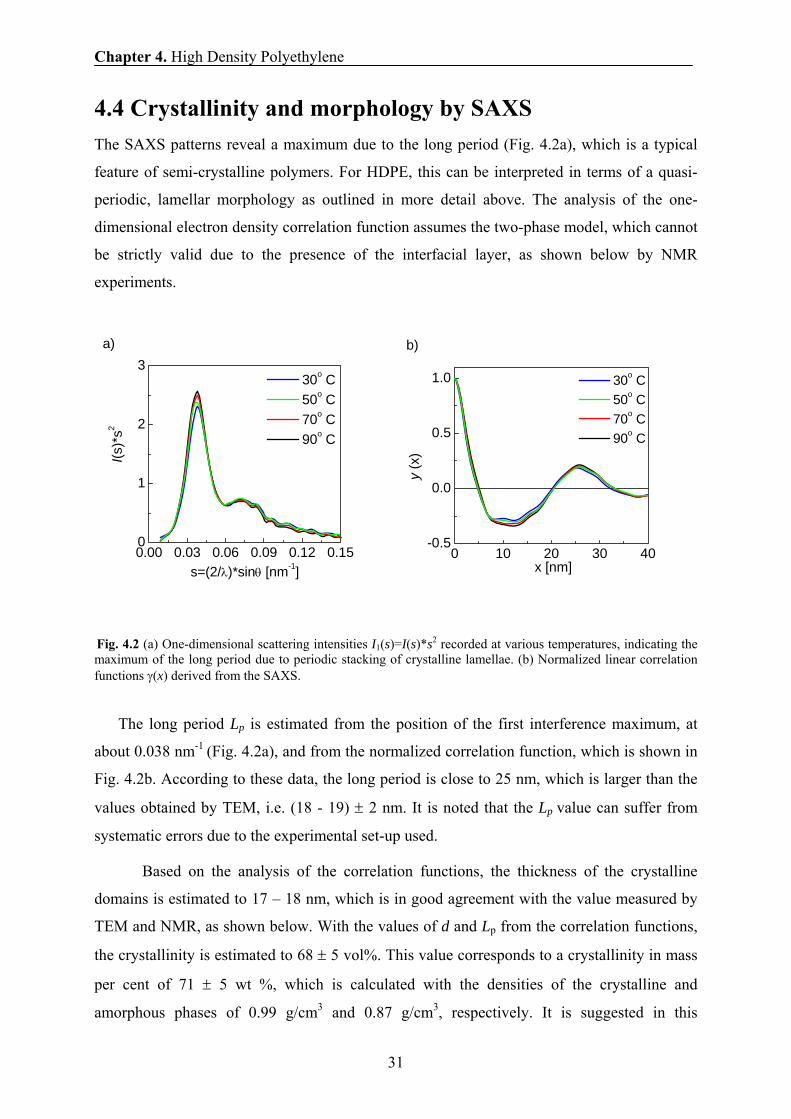
Fig. 4.2 (a) One-dimensional scattering intensities I1(s)=I(s)*s2 recorded at various temperatures, indicating the maximum of the long period due to periodic stacking of crystalline lamellae. (b) Normalized linear correlation functions γ(x) derived from the SAXS.
The long period Lp is estimated from the position of the first interference maximum, at
about 0.038 nm-1 (Fig. 4.2a), and from the normalized correlation function, which is shown in
Fig. 4.2b. According to these data, the long period is close to 25 nm, which is larger than the
values obtained by TEM, i.e. (18 - 19) ± 2 nm. It is noted that the Lp value can suffer from
systematic errors due to the experimental set-up used.
Based on the analysis of the correlation functions, the thickness of the crystalline
domains is estimated to 17 – 18 nm, which is in good agreement with the value measured by
TEM and NMR, as shown below. With the values of d and Lp from the correlation functions,
the crystallinity is estimated to 68 ± 5 vol%. This value corresponds to a crystallinity in mass
per cent of 71 ± 5 wt %, which is calculated with the densities of the crystalline and
amorphous phases of 0.99 g/cm3 and 0.87 g/cm3, respectively. It is suggested in this
0.00 0.03 0.06 0.09 0.12 0.150
1
2
3
I(s)*
s2
s=(2/λ)*sinθ [nm-1]
30o C 50o C 70o C 90o C
a)
0 10 20 30 40-0.5
0.0
0.5
1.0 30o C 50o C 70o C 90o C
y (x
)
x [nm]
b)
Chapter 4. High Density Polyethylene
32
calculation that the density of an interfacial layer is given by the mean value of the densities
for the crystalline and amorphous phases. SAXS experiments at different temperatures reveal
almost the same long period, lamella thickness, and crystallinity in the temperature range
from 30° C to 90° C.
4.5 Temperature dependence of the phase composition
and chain mobility of HDPE by NMR The existence of three fractions with different molecular mobilities is revealed by 1H NMR
spectra, and the proton NMR free induction decay (FID) was measured for HDPE at 100° C.
The relaxation components are assigned to three fractions with different molecular mobilities,
the rigid - T2rigid, semi-rigid - T2
semi-rigid, and soft -T2soft fractions, respectively [Ber1978,
Fed1985, Han1998, Lit2004]. Like the FID, the spectra can be deconvoluted into three
components (example Fig.3.3 and Fig. 3.4). Broad, intermediate and narrow lines originate
from rigid, semi-rigid and soft fractions of HDPE, respectively. However, the quantitative
analysis of FID and wide-line NMR spectra in terms of crystalline phase, crystal-amorphous
interface and soft fraction of the amorphous phase can be complicated due to the following
reasons: (1) To observe distinct differences in molecular mobility of the crystalline and
amorphous phases, and consequently in the T2 relaxation and the line width, the temperature
of the sample should substantially exceed the dynamic glass transition temperature at the time
scale of the NMR experiment, i.e. in the range of 10-4 - 10-5 sec. The Tg of the HDPE sample
that was determined by a high performance DSC equals –57o C. The NMR Tg should be
observed in the temperature range from –30o C to –10o C. Therefore, a proper choice of the
temperature of the NMR experiment is required. (2) Since the T2-relaxation experiments
should be performed at temperatures well above Tg, the sample exposure to elevated
temperatures can cause irreversible changes in the phase composition and thus in the
molecular mobility. Therefore, the temperature for the experiments should not be too high to
prevent annealing of the sample during the NMR experiment. In order to find the optimum
temperature for determination of the phase composition by NMR, we recorded the
temperature dependence of the T2 relaxation and the wide-line spectra (Fig. 4.3).
At room temperature, a significant fraction of the amorphous phase is rigid on the time
scale of the NMR experiments and this amorphous fraction contributes to the intensity of the
broad line of the NMR spectra and the short T2-relaxation component of the FID, as can be
concluded by comparing the amount of the rigid fraction with the crystallinity determined by
Chapter 4. High Density Polyethylene
33
SAXS, i.e 71 ± 5 wt%. Upon increasing temperature, the amount of the rigid fraction, which is
composed of the crystalline phase and the rigid fraction of the amorphous phase, gradually
decreases, whereas the amount of the semi-rigid and soft fractions increases. These changes are
caused by an increase in molecular mobility of the less constrained chain fragments in the
amorphous phase, and possibly by melting of thin lamellae, which are inserted into the primary
stack of crystallites upon cooling of HDPE which was crystallized at elevated temperatures
[Mat1994].
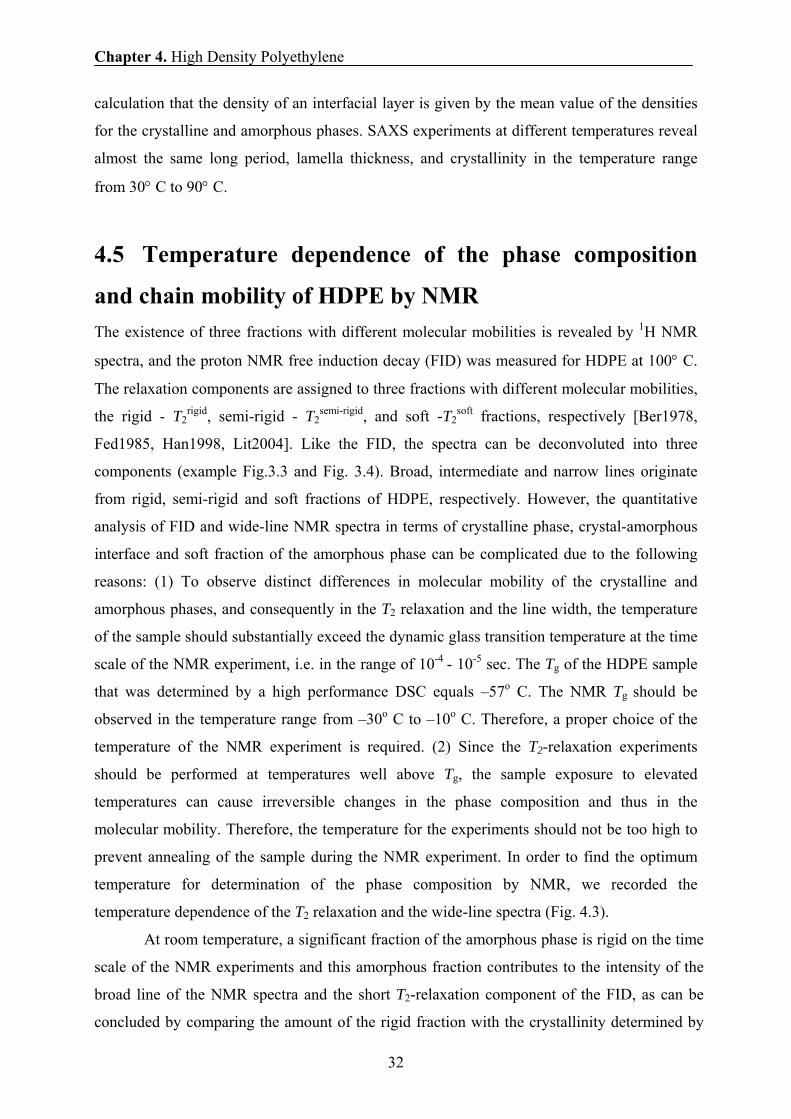
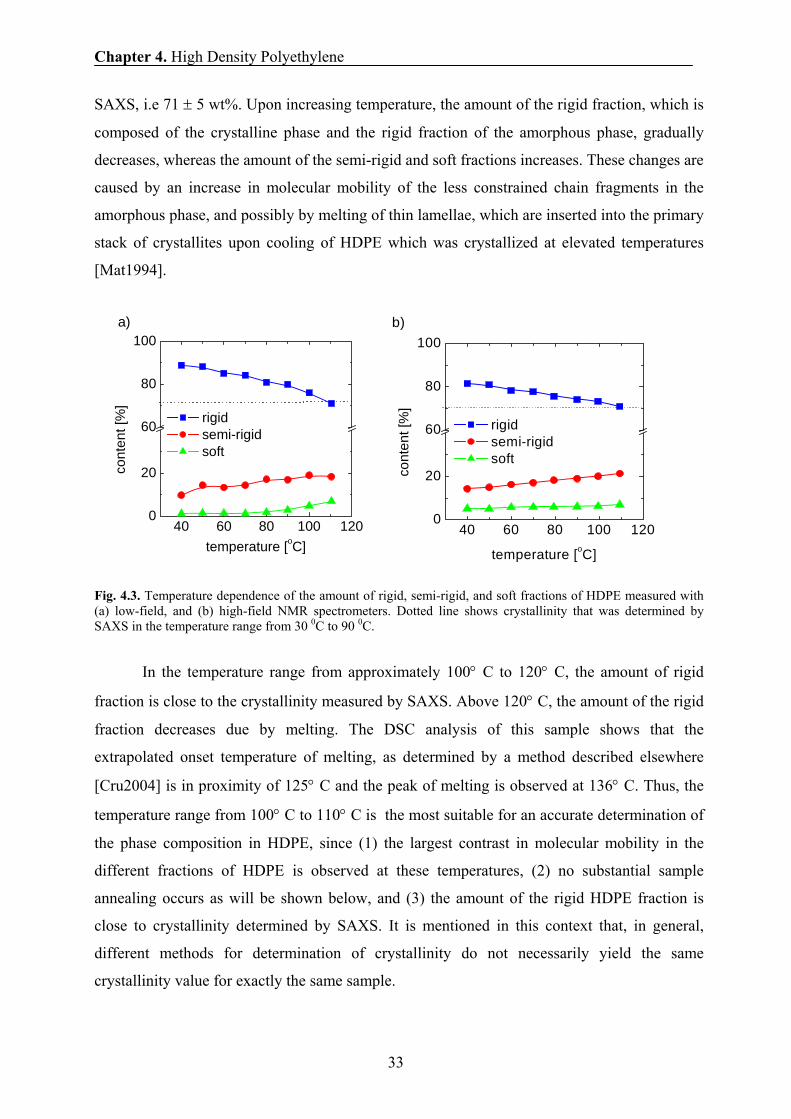
Fig. 4.3. Temperature dependence of the amount of rigid, semi-rigid, and soft fractions of HDPE measured with (a) low-field, and (b) high-field NMR spectrometers. Dotted line shows crystallinity that was determined by SAXS in the temperature range from 30 0C to 90 0C.
In the temperature range from approximately 100° C to 120° C, the amount of rigid
fraction is close to the crystallinity measured by SAXS. Above 120° C, the amount of the rigid
fraction decreases due by melting. The DSC analysis of this sample shows that the
extrapolated onset temperature of melting, as determined by a method described elsewhere
[Cru2004] is in proximity of 125° C and the peak of melting is observed at 136° C. Thus, the
temperature range from 100° C to 110° C is the most suitable for an accurate determination of
the phase composition in HDPE, since (1) the largest contrast in molecular mobility in the
different fractions of HDPE is observed at these temperatures, (2) no substantial sample
annealing occurs as will be shown below, and (3) the amount of the rigid HDPE fraction is
close to crystallinity determined by SAXS. It is mentioned in this context that, in general,
different methods for determination of crystallinity do not necessarily yield the same
crystallinity value for exactly the same sample.
40 60 80 100 1200
20
60
80
100a)
rigid semi-rigid soft
cont
ent [
%]
temperature [oC]40 60 80 100 120
0
20
60
80
100b)
rigid semi-rigid soft
cont
ent [
%]
temperature [oC]
Chapter 4. High Density Polyethylene
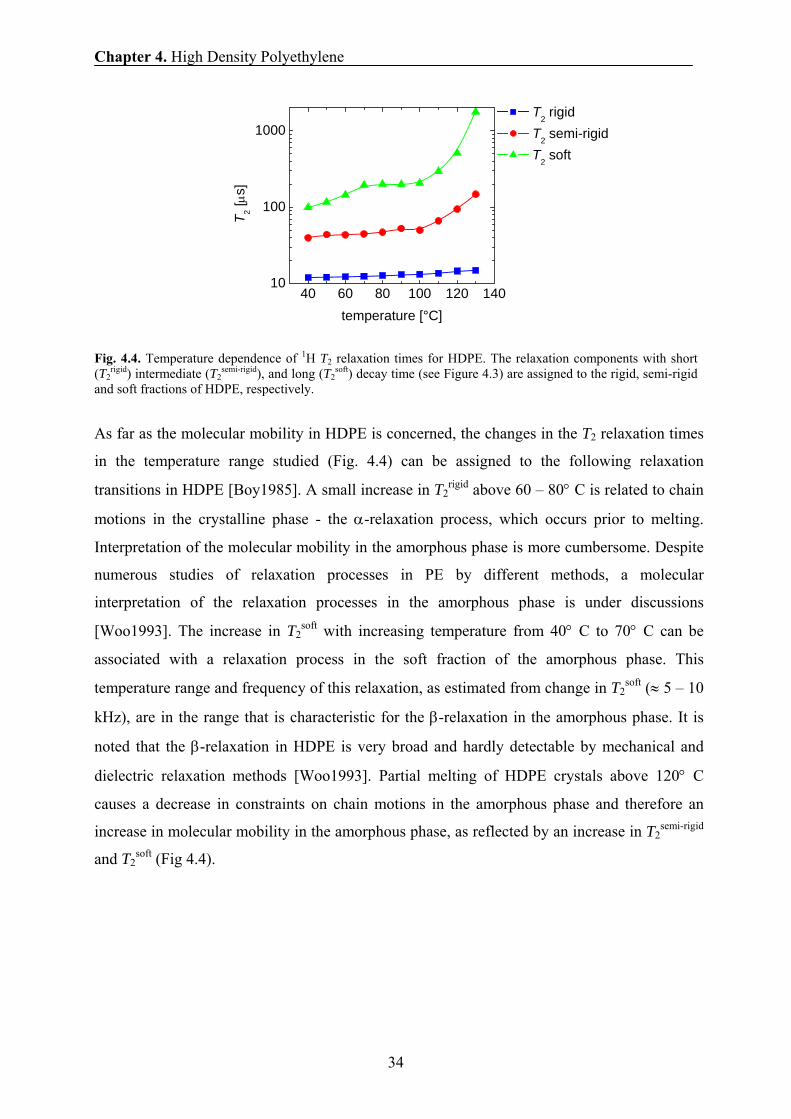
34
Fig. 4.4. Temperature dependence of 1H T2 relaxation times for HDPE. The relaxation components with short (T2
rigid) intermediate (T2semi-rigid), and long (T2
soft) decay time (see Figure 4.3) are assigned to the rigid, semi-rigid and soft fractions of HDPE, respectively.
As far as the molecular mobility in HDPE is concerned, the changes in the T2 relaxation times
in the temperature range studied (Fig. 4.4) can be assigned to the following relaxation
transitions in HDPE [Boy1985]. A small increase in T2rigid above 60 – 80° C is related to chain
motions in the crystalline phase - the α-relaxation process, which occurs prior to melting.
Interpretation of the molecular mobility in the amorphous phase is more cumbersome. Despite
numerous studies of relaxation processes in PE by different methods, a molecular
interpretation of the relaxation processes in the amorphous phase is under discussions
[Woo1993]. The increase in T2soft with increasing temperature from 40° C to 70° C can be
associated with a relaxation process in the soft fraction of the amorphous phase. This
temperature range and frequency of this relaxation, as estimated from change in T2soft (≈ 5 – 10
kHz), are in the range that is characteristic for the β-relaxation in the amorphous phase. It is
noted that the β-relaxation in HDPE is very broad and hardly detectable by mechanical and
dielectric relaxation methods [Woo1993]. Partial melting of HDPE crystals above 120° C
causes a decrease in constraints on chain motions in the amorphous phase and therefore an
increase in molecular mobility in the amorphous phase, as reflected by an increase in T2semi-rigid
and T2soft (Fig 4.4).
40 60 80 100 120 14010
100
1000 T2 rigid T2 semi-rigid T2 soft
T 2 [μs]
temperature [°C]
Chapter 4. High Density Polyethylene
35
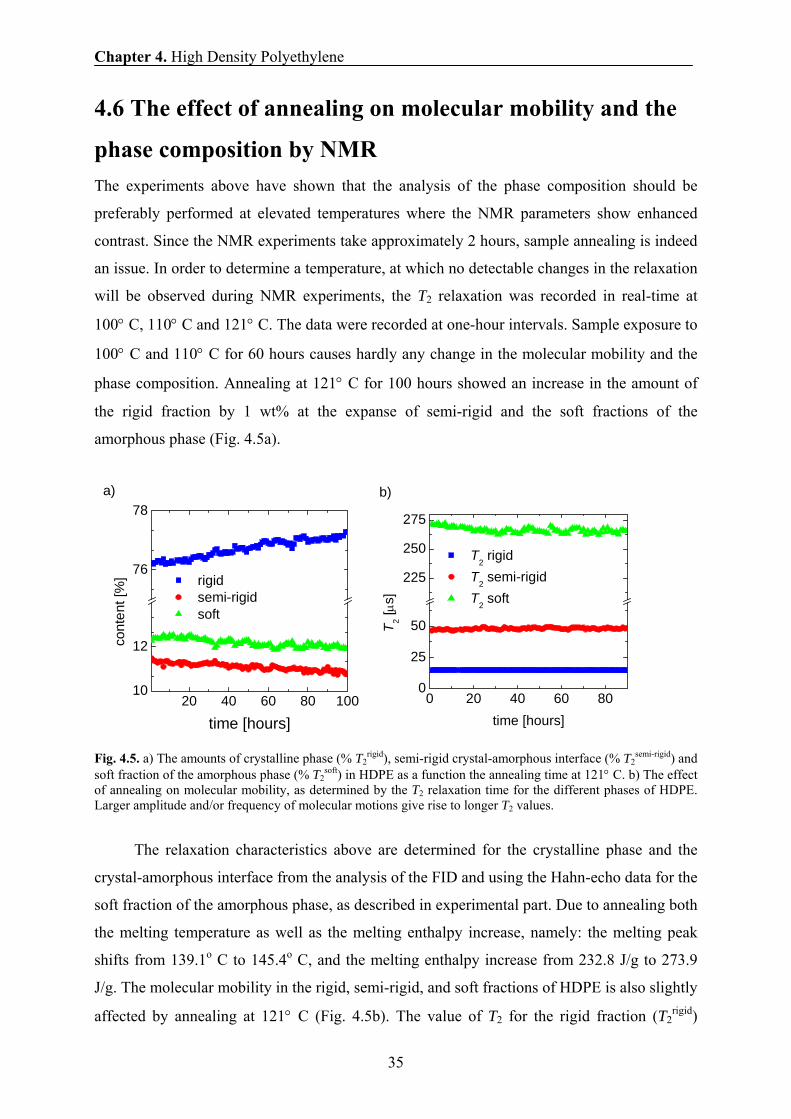
4.6 The effect of annealing on molecular mobility and the
phase composition by NMR The experiments above have shown that the analysis of the phase composition should be
preferably performed at elevated temperatures where the NMR parameters show enhanced
contrast. Since the NMR experiments take approximately 2 hours, sample annealing is indeed
an issue. In order to determine a temperature, at which no detectable changes in the relaxation
will be observed during NMR experiments, the T2 relaxation was recorded in real-time at
100° C, 110° C and 121° C. The data were recorded at one-hour intervals. Sample exposure to
100° C and 110° C for 60 hours causes hardly any change in the molecular mobility and the
phase composition. Annealing at 121° C for 100 hours showed an increase in the amount of
the rigid fraction by 1 wt% at the expanse of semi-rigid and the soft fractions of the
amorphous phase (Fig. 4.5a).
Fig. 4.5. a) The amounts of crystalline phase (% T2rigid), semi-rigid crystal-amorphous interface (% T2
semi-rigid) and soft fraction of the amorphous phase (% T2
soft) in HDPE as a function the annealing time at 121° C. b) The effect of annealing on molecular mobility, as determined by the T2 relaxation time for the different phases of HDPE. Larger amplitude and/or frequency of molecular motions give rise to longer T2 values.
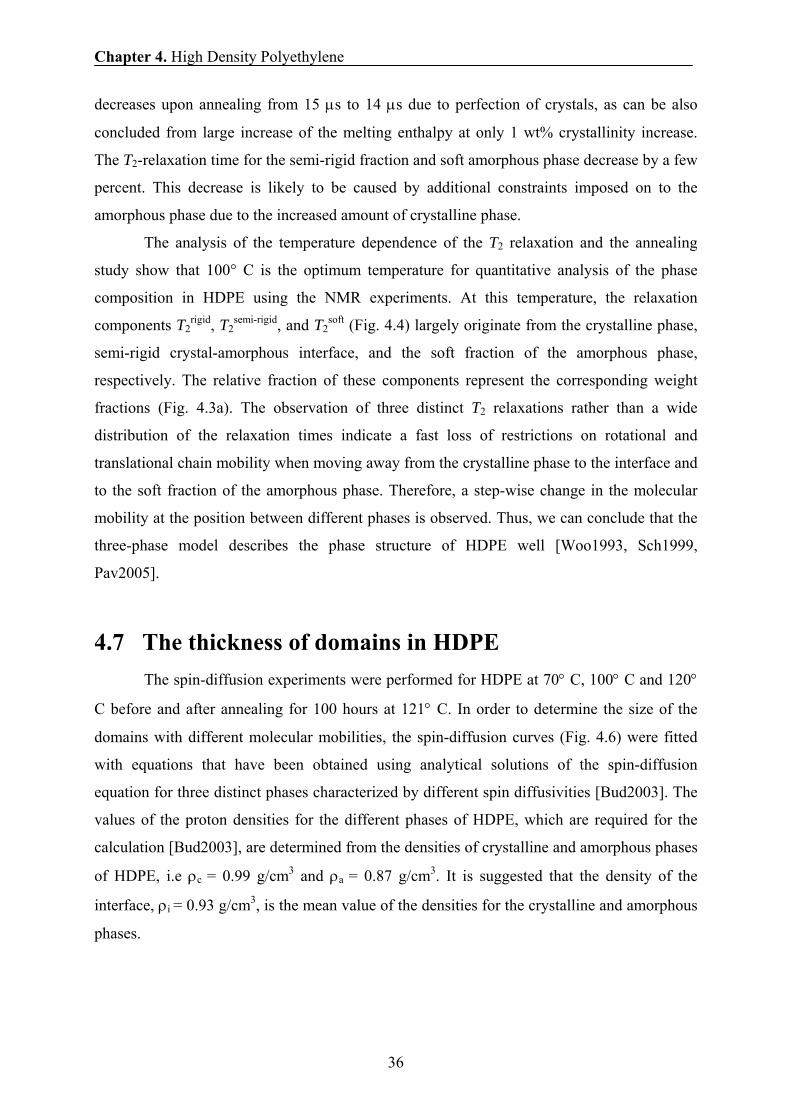
The relaxation characteristics above are determined for the crystalline phase and the
crystal-amorphous interface from the analysis of the FID and using the Hahn-echo data for the
soft fraction of the amorphous phase, as described in experimental part. Due to annealing both
the melting temperature as well as the melting enthalpy increase, namely: the melting peak
shifts from 139.1o C to 145.4o C, and the melting enthalpy increase from 232.8 J/g to 273.9
J/g. The molecular mobility in the rigid, semi-rigid, and soft fractions of HDPE is also slightly
affected by annealing at 121° C (Fig. 4.5b). The value of T2 for the rigid fraction (T2rigid)
20 40 60 80 10010
12
76
78a)
cont
ent [
%]
time [hours]
rigid semi-rigid soft
0 20 40 60 800
25
50
225
250
275
b)
T 2 [μs]
time [hours]
T2 rigid T2 semi-rigid T2 soft
Chapter 4. High Density Polyethylene
36
decreases upon annealing from 15 μs to 14 μs due to perfection of crystals, as can be also
concluded from large increase of the melting enthalpy at only 1 wt% crystallinity increase.
The T2-relaxation time for the semi-rigid fraction and soft amorphous phase decrease by a few
percent. This decrease is likely to be caused by additional constraints imposed on to the
amorphous phase due to the increased amount of crystalline phase.
The analysis of the temperature dependence of the T2 relaxation and the annealing
study show that 100° C is the optimum temperature for quantitative analysis of the phase
composition in HDPE using the NMR experiments. At this temperature, the relaxation
components T2rigid, T2
semi-rigid, and T2soft (Fig. 4.4) largely originate from the crystalline phase,
semi-rigid crystal-amorphous interface, and the soft fraction of the amorphous phase,
respectively. The relative fraction of these components represent the corresponding weight
fractions (Fig. 4.3a). The observation of three distinct T2 relaxations rather than a wide
distribution of the relaxation times indicate a fast loss of restrictions on rotational and
translational chain mobility when moving away from the crystalline phase to the interface and
to the soft fraction of the amorphous phase. Therefore, a step-wise change in the molecular
mobility at the position between different phases is observed. Thus, we can conclude that the
three-phase model describes the phase structure of HDPE well [Woo1993, Sch1999,
Pav2005].
4.7 The thickness of domains in HDPE The spin-diffusion experiments were performed for HDPE at 70° C, 100° C and 120°
C before and after annealing for 100 hours at 121° C. In order to determine the size of the
domains with different molecular mobilities, the spin-diffusion curves (Fig. 4.6) were fitted
with equations that have been obtained using analytical solutions of the spin-diffusion
equation for three distinct phases characterized by different spin diffusivities [Bud2003]. The
values of the proton densities for the different phases of HDPE, which are required for the
calculation [Bud2003], are determined from the densities of crystalline and amorphous phases
of HDPE, i.e ρc = 0.99 g/cm3 and ρa = 0.87 g/cm3. It is suggested that the density of the
interface, ρi = 0.93 g/cm3, is the mean value of the densities for the crystalline and amorphous
phases.
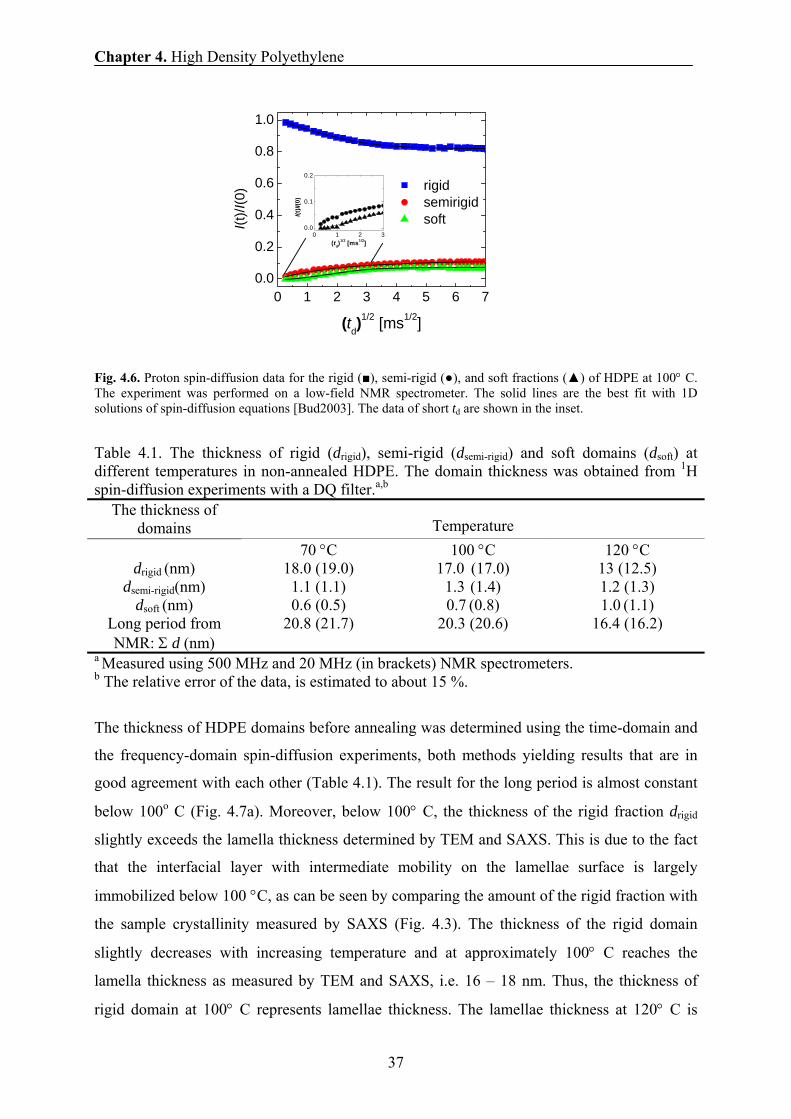
Chapter 4. High Density Polyethylene
37
Fig. 4.6. Proton spin-diffusion data for the rigid (■), semi-rigid (●), and soft fractions (▲) of HDPE at 100° C. The experiment was performed on a low-field NMR spectrometer. The solid lines are the best fit with 1D solutions of spin-diffusion equations [Bud2003]. The data of short td are shown in the inset.
Table 4.1. The thickness of rigid (drigid), semi-rigid (dsemi-rigid) and soft domains (dsoft) at different temperatures in non-annealed HDPE. The domain thickness was obtained from 1H spin-diffusion experiments with a DQ filter.a,b
The thickness of domains Temperature
70 °C 100 °C 120 °C drigid (nm) 18.0 (19.0) 17.0 (17.0) 13 (12.5)
dsemi-rigid(nm) 1.1 (1.1) 1.3 (1.4) 1.2 (1.3) dsoft (nm) 0.6 (0.5) 0.7 (0.8) 1.0 (1.1)
Long period from NMR: Σ d (nm)
20.8 (21.7) 20.3 (20.6) 16.4 (16.2)
a Measured using 500 MHz and 20 MHz (in brackets) NMR spectrometers. b The relative error of the data, is estimated to about 15 %.
The thickness of HDPE domains before annealing was determined using the time-domain and
the frequency-domain spin-diffusion experiments, both methods yielding results that are in
good agreement with each other (Table 4.1). The result for the long period is almost constant
below 100o C (Fig. 4.7a). Moreover, below 100° C, the thickness of the rigid fraction drigid
slightly exceeds the lamella thickness determined by TEM and SAXS. This is due to the fact
that the interfacial layer with intermediate mobility on the lamellae surface is largely
immobilized below 100 °C, as can be seen by comparing the amount of the rigid fraction with
the sample crystallinity measured by SAXS (Fig. 4.3). The thickness of the rigid domain
slightly decreases with increasing temperature and at approximately 100° C reaches the
lamella thickness as measured by TEM and SAXS, i.e. 16 – 18 nm. Thus, the thickness of
rigid domain at 100° C represents lamellae thickness. The lamellae thickness at 120° C is
0 1 2 3 4 5 6 70.0
0.2
0.4
0.6
0.8
1.0
0 1 2 30.0
0.1
0.2
I(t)/I
(0)
(td)1/2 [ms1/2]
I(t)/I
(0)
(td)1/2 [ms1/2]
rigid semirigid soft
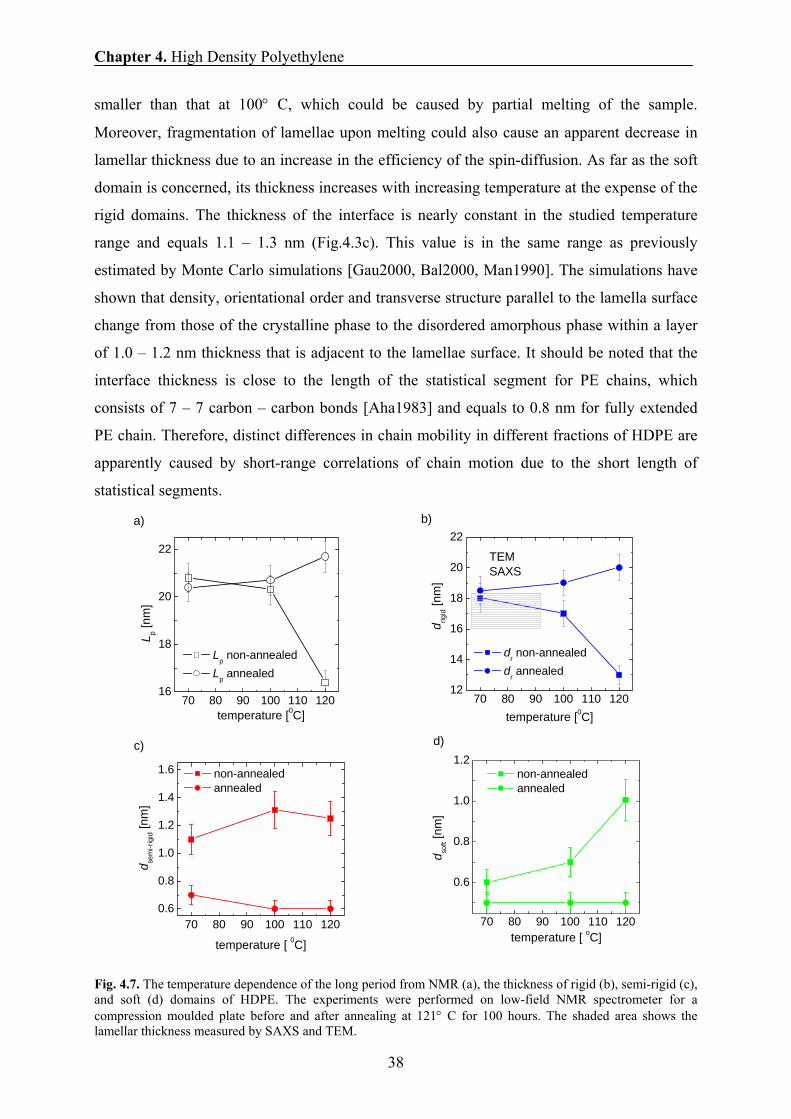
Chapter 4. High Density Polyethylene
38
smaller than that at 100° C, which could be caused by partial melting of the sample.
Moreover, fragmentation of lamellae upon melting could also cause an apparent decrease in
lamellar thickness due to an increase in the efficiency of the spin-diffusion. As far as the soft
domain is concerned, its thickness increases with increasing temperature at the expense of the
rigid domains. The thickness of the interface is nearly constant in the studied temperature
range and equals 1.1 – 1.3 nm (Fig.4.3c). This value is in the same range as previously
estimated by Monte Carlo simulations [Gau2000, Bal2000, Man1990]. The simulations have
shown that density, orientational order and transverse structure parallel to the lamella surface
change from those of the crystalline phase to the disordered amorphous phase within a layer
of 1.0 – 1.2 nm thickness that is adjacent to the lamellae surface. It should be noted that the
interface thickness is close to the length of the statistical segment for PE chains, which
consists of 7 – 7 carbon – carbon bonds [Aha1983] and equals to 0.8 nm for fully extended
PE chain. Therefore, distinct differences in chain mobility in different fractions of HDPE are
apparently caused by short-range correlations of chain motion due to the short length of
statistical segments.
Fig. 4.7. The temperature dependence of the long period from NMR (a), the thickness of rigid (b), semi-rigid (c), and soft (d) domains of HDPE. The experiments were performed on low-field NMR spectrometer for a compression moulded plate before and after annealing at 121° C for 100 hours. The shaded area shows the lamellar thickness measured by SAXS and TEM.
70 80 90 100 110 12016
18
20
22
a)
L p [nm
]
temperature [0C]
Lp non-annealed Lp annealed
70 80 90 100 110 12012
14
16
18
20
22b)
TEM SAXS
d rigid [n
m]
temperature [0C]
dr non-annealed dr annealed
70 80 90 100 110 1200.6
0.8
1.0
1.2
1.4
1.6
c)
d sem
i-rig
id [n
m]
temperature [ 0C]
non-annealed annealed
70 80 90 100 110 120
0.6
0.8
1.0
1.2d)
d soft [n
m]
temperature [ oC]
non-annealed annealed
Chapter 4. High Density Polyethylene
39
4.8 The effect of annealing on the thickness of domains
and molecular mobility In order to determine the effect of annealing on the thickness of the rigid, semi-rigid, and soft
domains, a compression moulded HDPE plate was annealed at 121° C for 100 hours. The
thickness of domains was determined at 70° C, 100° C and 120° C and the results for the
annealed sample are compared to those of the sample not annealed (Fig. 4.7). Annealing
causes a significant decrease in the thickness of the interfacial layer and the soft amorphous
phase, and an increase in the lamellar thickness, which can clearly be seen for the results
measured at 120° C. The annealing causes only minor changes in molecular mobility (Fig.
4.5b).
The annealing study suggests the following mechanism of morphological changes due
to annealing at elevated temperatures. Upon approaching the melting temperature, the
molecular mobility increases both in the amorphous regions, the crystal-amorphous interface,
and in the crystalline phase (α-relaxation) (Fig. 4.4). Previous 13C NMR studies have
suggested two types of crystalline environments with distinctly different molecular mobilities:
a more perfect one and one with defects [Hil1998, Hu2000]. It might be suggested that chain
mobility increases at elevated temperatures in the less ordered, surface layer of lamellae, as
follows from a decrease in the lamella thickness above 100° C for the non-annealed sample
(Fig. 4.7b). An increase in the molecular mobility is accompanied by partial melting of small
crystals and less ordered fragments of the lamellae. An increased mobility in the amorphous
phase and chain diffusion in- and out of the crystals (α - relaxation) [Sch1991] facilitate to
some extent morphological changes towards a more thermodynamically stable, better-ordered
crystalline structure and thicker lamellae. It should be mentioned in this respect that the root-
mean-square displacement of chains in PE lamellae amounts to more than 10 nm at 100o C
within 100 seconds [Sch1991]. Chain rearrangements upon prolonged annealing at 121° C for
100 hours result in a decrease in molecular mobility in the crystalline phase, as follows from a
slight decrease of T2rigid during annealing and large increase in the melting enthalpy (from
232.8 J/g to 273.9 J/g) at only 1 wt% increase in the crystallinity (Fig. 4.5b). This might
suggest perfection of the crystalline order. Lamellae thickening and a slight increase in the
crystallinity would cause additional slippage of chain entanglements towards the inner part of
inter-lamellar amorphous regions causing additional immobilization of the soft fraction of the
Chapter 4. High Density Polyethylene
40
amorphous phases, as can be concluded from the decrease of the thickness of this layer (Fig.
4.7c) and the decrease in T2l (Fig. 4.5b). Thus, our observations reveal that annealing is
accompanied by a continuous shift of the crystal-amorphous interface towards the inner part
of the amorphous regions and a reduction of the thickness of the amorphous layer [Che1994,
Mat2001, Bas1973, Str1997 ].
4.9 Conclusions The effects of temperature and annealing on the following molecular and morphological
characteristics of HDPE were studied by time- and frequency- domain proton solid-state
NMR: (i) the amount of rigid, semi-rigid, and soft fractions of HDPE, (ii) the thickness of the
domains with different molecular mobilities, and (iii) the molecular mobility in these
domains.
This study focused on two areas, namely (1) the improvement of low-field solid-state
NMR methods for determining the thickness of domains in heterogeneous polymers, and (2) a
better understanding of the phenomena that occur upon annealing of HDPE. (1) The novel
spin-diffusion experiments that are based on the double-quantum dipolar filter provided
reliable information about the thickness of lamellae, crystal-amorphous interface and soft
fraction of the amorphous phase. The applied method allows a better discrimination between
the HDPE phases and, therefore, a more accurate analysis of the thickness of the domains. In
order to improve the accuracy of the method, the temperature dependence of the spin
diffusivities in all three phases was determined, which allowed us to obtain reliable
information about changes in the domain thickness as a function of temperature. The lamellae
thickness and the long period determined by NMR, are in good agreement with the results of
classical methods, i.e. TEM and SAXS, which proves the reliability of the NMR method. This
study has also showed that spin-diffusion experiments with advanced dipolar filters can be
performed with a low cost, low-field NMR spectrometer, which broadens the range of
applications of this equipment.
(2) This study shows that the three-phase model is the most appropriate description of the
phase composition in HDPE at least as revealed by 1H NMR data. The spin-diffusion
experiments show that rigid and soft fractions of HDPE are separated by a thin layer with
intermediate molecular mobility. The thickness of this interface is nearly constant in the
temperature range from 70° C to 120° C and its value is comparable to the length of the
statistical segment of the PE chains. This suggests that the interfacial layer largely originates
Chapter 4. High Density Polyethylene
41
from constraints on rotational and translational motions of chain fragments adjacent to the
lamellae surface.
The crystalline phase, the semi-rigid crystalline-amorphous interface, and the soft
fraction of the amorphous phase exhibit a larger contrast in molecular mobility at
temperatures above 90° C. Upon increasing the temperature, the molecular mobility begins to
increase in the inner/softer part of the amorphous phase towards the lamellae surface.
Annealing causes a significant decrease in the thickness of the interfacial layer and the soft
amorphous phase, and an increase in the lamellar thickness. It is suggested that annealing is
accompanied by structural reorganizations at the frontier between the crystalline and
amorphous phases, and these reorganizations are largely influenced by the chain dynamics in
the crystalline and amorphous phases. Annealing leads to improving perfections of the
crystalline order (presumably in a layer close to the lamellae surface), and a continuous shift
of the interface towards the inner part of the amorphous regions reducing the thickness of the
soft amorphous layer. These observations are in agreement with a previously proposed
mechanism of partial melting and surface crystallization upon annealing of HDPE at
premelting temperatures [Str1997].

Chapter 4. High Density Polyethylene
42
Chapter 5. Isotactic Polypropylene
43
Chapter 5
Isotactic Polypropylene (iPP) 5.1 Introduction and motivation The physical and mechanical properties of semi-crystalline polymers (like isotactic
polypropylene), and their practical lifetime, are significantly influenced by both the changes
in the degree of crystallinity [Pop1987, Hal1972, Boy1979, Boy1983,Boy1984, Boy1985,
Str1980, Man1964, Man1985, Neg1992, Wor1996], and the orientation distribution of the
crystalline volume portion [Bel1993, Gos1996]. Both quantities typically change when the
sample is exposed to temperatures well above the glass transition due to annealing [Hik1997,
Alo1999, Aki1999, Mar2000, Iij2000, Mai2000, Weg2000, Ali2001, Lab2001]. This means
that the degree of the crystallinity and the orientation distribution depend on processing
conditions, crystallization, annealing, and thermal history in such materials. It is known that
annealing of semi-crystalline polymers after fabrication causes changes in the structure and
properties of the materials. This process has been employed to improve the final properties of
polymers via healing of defects and diminishing residual stress and strain. In addition,
lamellae thickening and rearrangement of the chain during heating also occur upon annealing.
For establishing structure-property relationships of semi-crystalline polymers, the
characterization of lamellar thickness in bulk materials is a necessity, because their thermal
and physical properties depend largely on the characteristic of the lamellae. Traditionally,
transmission electron micrograph (TEM) and small-angle X-ray scattering (SAXS) are two
major techniques used to determine the lamellar thickness. The former offers the advantage of
direct access to the morphology. SAXS is a well-developed method to quantitatively
determine the thicknesses of alternating layers of the crystalline and amorphous regions that
are formed in semi-crystalline polymers. The morphological parameters can be deduced from
SAXS data based on a model calculation. Although an indirect approach is applied, SAXS
provides volume average characteristic.
Proton NMR spin-diffusion experiments have been used to provide information about
the thickness of domains with different molecular mobility in polymers [Bri1993, Pac1984]
[Hu2000, Bud2003, Bud2004, Van1996].
The main aim of this chapter is to study the change in the rigid fraction/crystallinity,
semi-rigid, and soft fractions, and lamellae thicknesses for both annealed and non-annealed
Chapter 5. Isotactic Polypropylene
44
iPP samples. This was done using a combination of DSC, SAXS, WAXD, TEM, and 1H
solid-state NMR, including spin-diffusion NMR. The 1H NMR spin-diffusion methods, which
explore both double-quantum (DQ) dipolar filter [Bud2003, Ba1998, Che2005] and the
Goldman-Shen (GS) filter [Gol1961, Dem1996], were used for the first time to provide a
more accurate analysis of the domain thickness of iPP. It is thought that TEM, SAXS, and
NMR are complementary techniques, providing morphological evidence on the nanometer
scale. The most probable morphology was established by comparing the 1H spin-diffusion
data with the multidimensional evaluation of the magnetization by spin-diffusion. The results
are compared under the given conditions, which include the annealing time and annealing
temperature. A simple model of crystal thickening as a function of the annealing time is
discussed. The correlation between transverse relaxation rates and thickness of the rigid
domain is presented, i.e., microscopic and mesoscopic properties.
5.2 Materials Isotactic polypropylene homopolymer was obtained from SABIC Europe BV and used in our
experiments. The material was injected in an Engel 45A machine. The melt temperature was
set to 235° C, the holding pressure to 40 MPa, the holding time to 20 s, the cooling time to 20
s, and the overall cycle time to 49.5 s. For the annealing study, the sample was further
annealed in the NMR probe at 134° C, 143° C and 153 °C, for several times between 15
minutes and 30 hours.
5.3 Crystallinity by DSC Quantities like the enthalpy, derived from heat capacity measurements, can provide important
information about the physical state of the material. The heat capacities of iPP annealed for 10
hours at 143° C and iPP annealed for 10 hours at 153° C, are presented in Fig.5.1 as a function
of temperature. Parts a and c of Figure 5.1 show the heat capacity cp and crystallinity W data
for the first heating curve and the second heating/cooling curve, respectively. The observed
differences between the first heating curves for non-annealed and iPP annealed for 10 hours at
143° C and 153° C (Figure 5.1a) are due to the thermal treatment (thermal history) of the
sample. For completion, heat capacity measurements of the cooling and second heating curve
are presented as well in order to verify whether or not the thermal treatment modifies the
polymer material. The thermal history of iPP is erased after the first heating scan and by
keeping the polymer for 5 minutes in the molten state (200° C) (Fig. 5.1d).
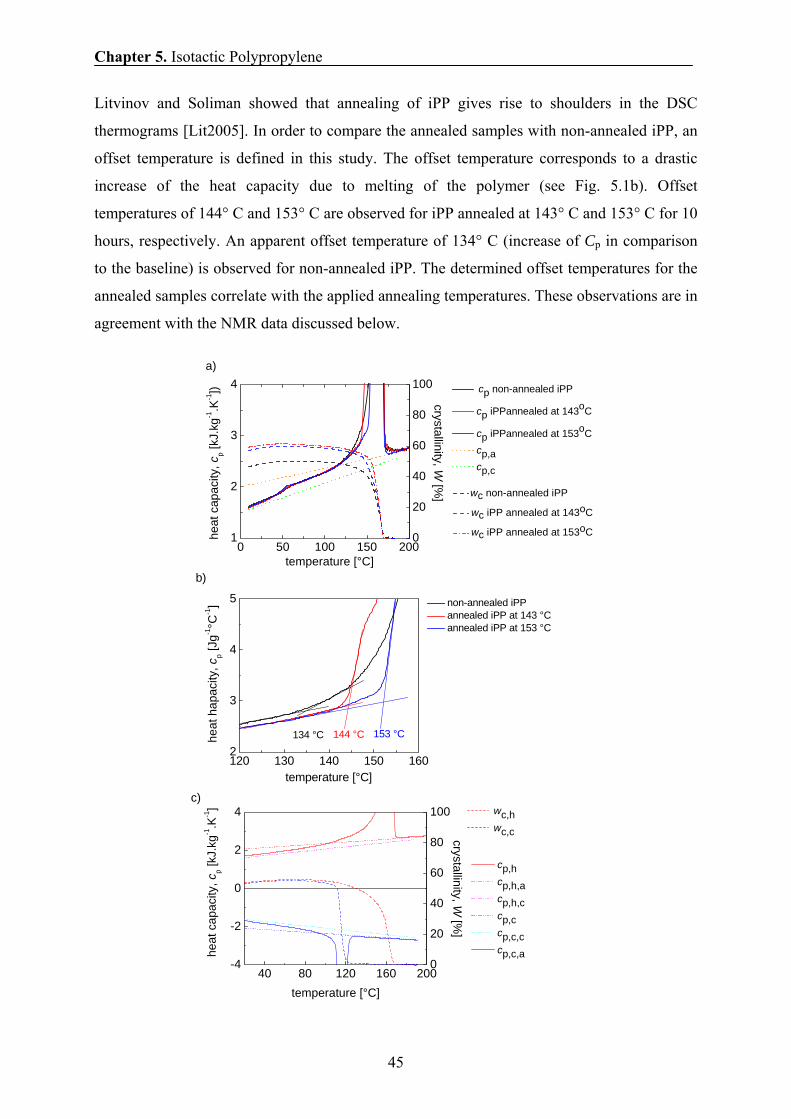
Chapter 5. Isotactic Polypropylene
45
Litvinov and Soliman showed that annealing of iPP gives rise to shoulders in the DSC
thermograms [Lit2005]. In order to compare the annealed samples with non-annealed iPP, an
offset temperature is defined in this study. The offset temperature corresponds to a drastic
increase of the heat capacity due to melting of the polymer (see Fig. 5.1b). Offset
temperatures of 144° C and 153° C are observed for iPP annealed at 143° C and 153° C for 10
hours, respectively. An apparent offset temperature of 134° C (increase of Cp in comparison
to the baseline) is observed for non-annealed iPP. The determined offset temperatures for the
annealed samples correlate with the applied annealing temperatures. These observations are in
agreement with the NMR data discussed below.
120 130 140 150 1602
3
4
5 non-annealed iPP annealed iPP at 143 °C annealed iPP at 153 °C
b)
heat
hap
acity
, cp [
Jg-1°C
-1]
temperature [°C]
134 °C 144 °C 153 °C
40 80 120 160 200-4
-2
0
2
4
0
20
40
60
80
100
cp,h cp,h,a cp,h,c cp,c cp,c,c cp,c,ahe
at c
apac
ity, c
p [kJ.
kg-1.K
-1]
temperature [°C]
c) wc,h wc,c
crystallinity, W [%
]
0 50 100 150 2001
2
3
4
0
20
40
60
80
100
cp non-annealed iPP
cp iPPannealed at 143oC
cp iPPannealed at 153oC cp,a cp,c
heat
cap
acity
, cp [k
J.kg
-1.K
-1])
temperature [°C]
wc non-annealed iPP
wc iPP annealed at 143oC
wc iPP annealed at 153oC
crystallinity, W [%
]a)
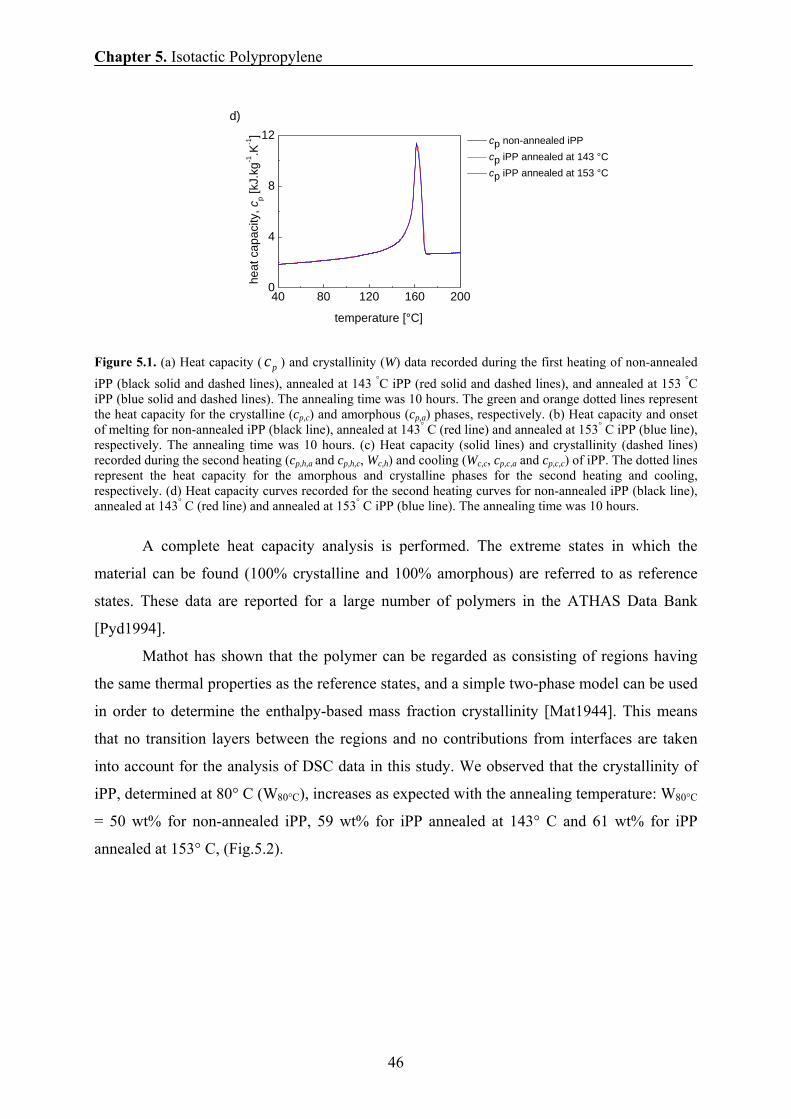
Chapter 5. Isotactic Polypropylene
46
Figure 5.1. (a) Heat capacity ( pc ) and crystallinity (W) data recorded during the first heating of non-annealed iPP (black solid and dashed lines), annealed at 143 °C iPP (red solid and dashed lines), and annealed at 153 °C iPP (blue solid and dashed lines). The annealing time was 10 hours. The green and orange dotted lines represent the heat capacity for the crystalline (cp,c) and amorphous (cp,a) phases, respectively. (b) Heat capacity and onset of melting for non-annealed iPP (black line), annealed at 143° C (red line) and annealed at 153° C iPP (blue line), respectively. The annealing time was 10 hours. (c) Heat capacity (solid lines) and crystallinity (dashed lines) recorded during the second heating (cp,h,a and cp,h,c, Wc,h) and cooling (Wc,c, cp,c,a and cp,c,c) of iPP. The dotted lines represent the heat capacity for the amorphous and crystalline phases for the second heating and cooling, respectively. (d) Heat capacity curves recorded for the second heating curves for non-annealed iPP (black line), annealed at 143° C (red line) and annealed at 153° C iPP (blue line). The annealing time was 10 hours.
A complete heat capacity analysis is performed. The extreme states in which the
material can be found (100% crystalline and 100% amorphous) are referred to as reference
states. These data are reported for a large number of polymers in the ATHAS Data Bank
[Pyd1994].
Mathot has shown that the polymer can be regarded as consisting of regions having
the same thermal properties as the reference states, and a simple two-phase model can be used
in order to determine the enthalpy-based mass fraction crystallinity [Mat1944]. This means
that no transition layers between the regions and no contributions from interfaces are taken
into account for the analysis of DSC data in this study. We observed that the crystallinity of
iPP, determined at 80° C (W80°C), increases as expected with the annealing temperature: W80°C
= 50 wt% for non-annealed iPP, 59 wt% for iPP annealed at 143° C and 61 wt% for iPP
annealed at 153° C, (Fig.5.2).
40 80 120 160 2000
4
8
12
temperature [°C]
cp non-annealed iPP cp iPP annealed at 143 °C cp iPP annealed at 153 °C
d)
heat
cap
acity
, cp [k
J.kg
-1.K
-1]
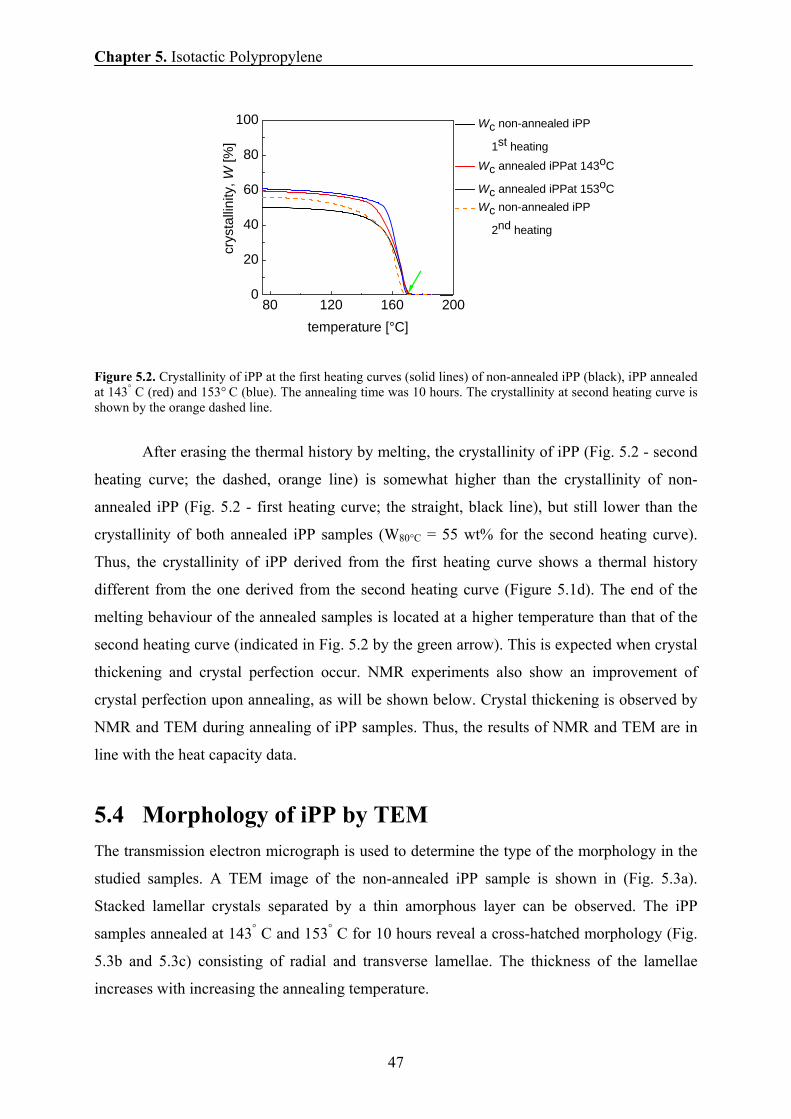
Chapter 5. Isotactic Polypropylene
47
Figure 5.2. Crystallinity of iPP at the first heating curves (solid lines) of non-annealed iPP (black), iPP annealed at 143° C (red) and 153° C (blue). The annealing time was 10 hours. The crystallinity at second heating curve is shown by the orange dashed line.
After erasing the thermal history by melting, the crystallinity of iPP (Fig. 5.2 - second
heating curve; the dashed, orange line) is somewhat higher than the crystallinity of non-
annealed iPP (Fig. 5.2 - first heating curve; the straight, black line), but still lower than the
crystallinity of both annealed iPP samples (W80°C = 55 wt% for the second heating curve).
Thus, the crystallinity of iPP derived from the first heating curve shows a thermal history
different from the one derived from the second heating curve (Figure 5.1d). The end of the
melting behaviour of the annealed samples is located at a higher temperature than that of the
second heating curve (indicated in Fig. 5.2 by the green arrow). This is expected when crystal
thickening and crystal perfection occur. NMR experiments also show an improvement of
crystal perfection upon annealing, as will be shown below. Crystal thickening is observed by
NMR and TEM during annealing of iPP samples. Thus, the results of NMR and TEM are in
line with the heat capacity data.
5.4 Morphology of iPP by TEM The transmission electron micrograph is used to determine the type of the morphology in the
studied samples. A TEM image of the non-annealed iPP sample is shown in (Fig. 5.3a).
Stacked lamellar crystals separated by a thin amorphous layer can be observed. The iPP
samples annealed at 143° C and 153° C for 10 hours reveal a cross-hatched morphology (Fig.
5.3b and 5.3c) consisting of radial and transverse lamellae. The thickness of the lamellae
increases with increasing the annealing temperature.
80 120 160 2000
20
40
60
80
100 Wc non-annealed iPP
1st heating Wc annealed iPPat 143oC
Wc annealed iPPat 153oC Wc non-annealed iPP
2nd heatingcr
ysta
llini
ty, W
[%]
temperature [°C]
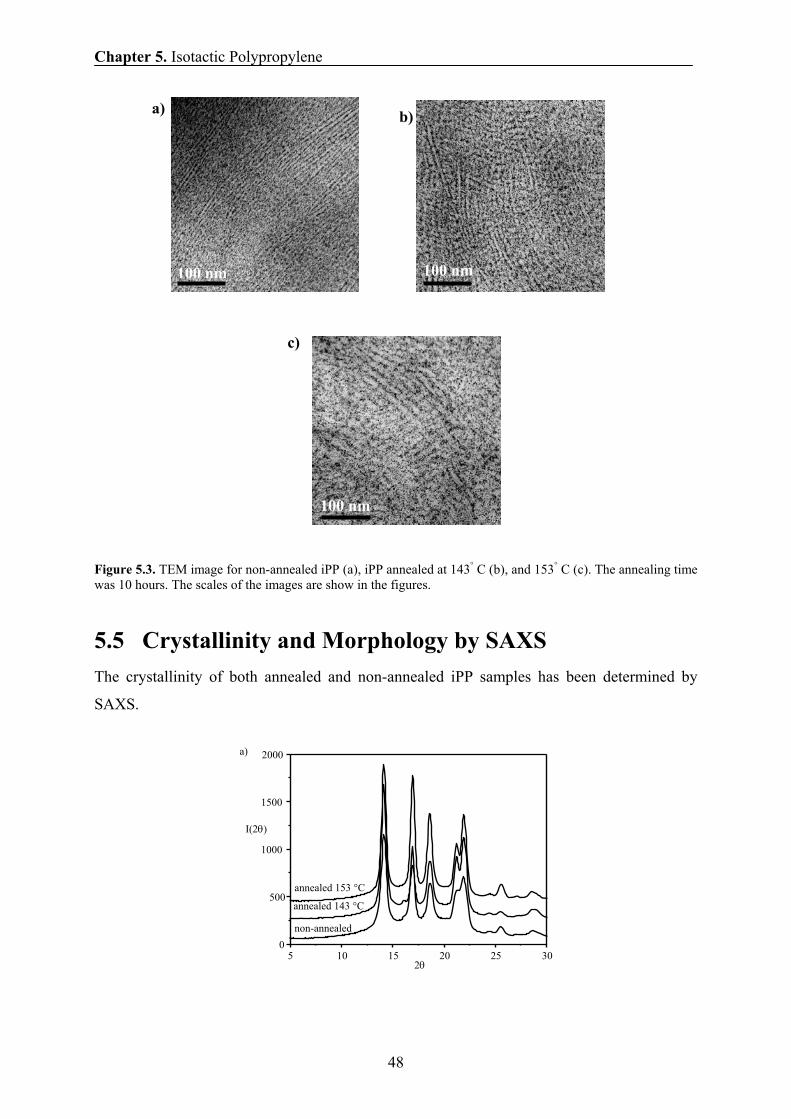
Chapter 5. Isotactic Polypropylene
48
Figure 5.3. TEM image for non-annealed iPP (a), iPP annealed at 143° C (b), and 153° C (c). The annealing time was 10 hours. The scales of the images are show in the figures. 5.5 Crystallinity and Morphology by SAXS The crystallinity of both annealed and non-annealed iPP samples has been determined by
SAXS.
100 nm
a)
100 nm
b)
100 nm
c)
5 10 15 20 25 300
500
1000
1500
2000
annealed 153 °C
annealed 143 °C
non-annealed
I(2θ)
2θ
a)
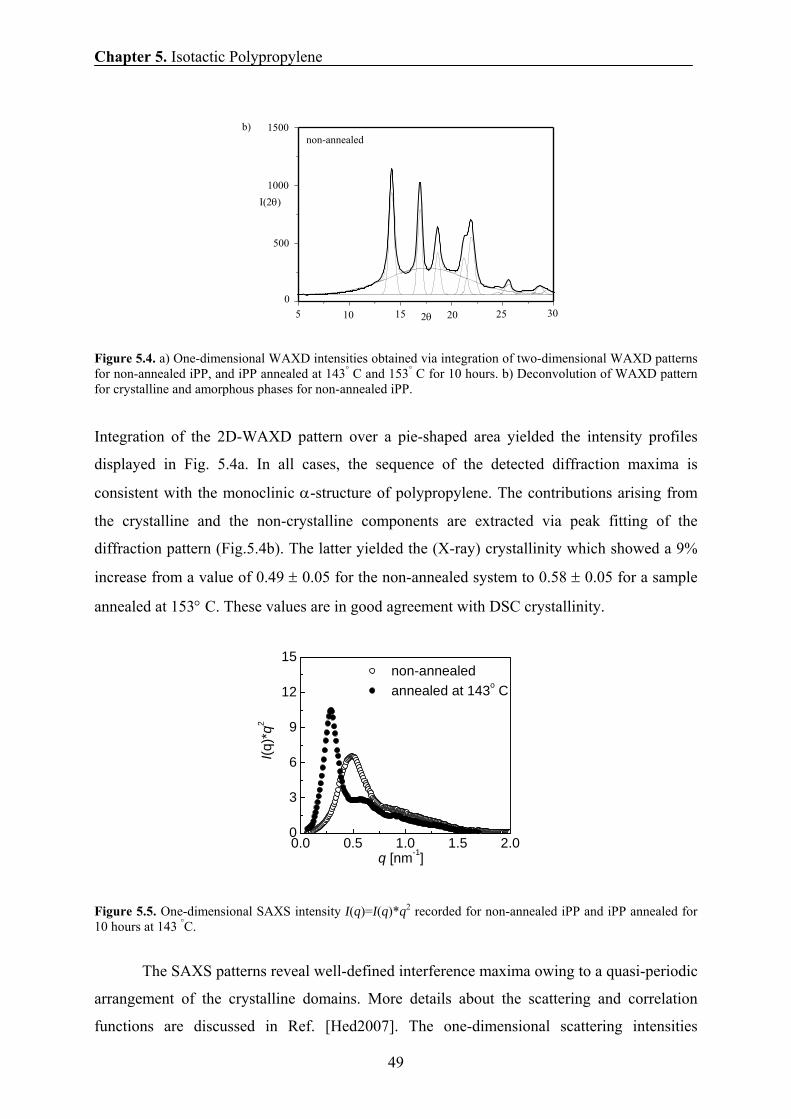
Chapter 5. Isotactic Polypropylene
49
Figure 5.4. a) One-dimensional WAXD intensities obtained via integration of two-dimensional WAXD patterns for non-annealed iPP, and iPP annealed at 143° C and 153° C for 10 hours. b) Deconvolution of WAXD pattern for crystalline and amorphous phases for non-annealed iPP. Integration of the 2D-WAXD pattern over a pie-shaped area yielded the intensity profiles
displayed in Fig. 5.4a. In all cases, the sequence of the detected diffraction maxima is
consistent with the monoclinic α-structure of polypropylene. The contributions arising from
the crystalline and the non-crystalline components are extracted via peak fitting of the
diffraction pattern (Fig.5.4b). The latter yielded the (X-ray) crystallinity which showed a 9%
increase from a value of 0.49 ± 0.05 for the non-annealed system to 0.58 ± 0.05 for a sample
annealed at 153° C. These values are in good agreement with DSC crystallinity.
Figure 5.5. One-dimensional SAXS intensity I(q)=I(q)*q2 recorded for non-annealed iPP and iPP annealed for 10 hours at 143 °C.
The SAXS patterns reveal well-defined interference maxima owing to a quasi-periodic
arrangement of the crystalline domains. More details about the scattering and correlation
functions are discussed in Ref. [Hed2007]. The one-dimensional scattering intensities
2θ
500
1000
1500
0 5 10 15 20 25 30
I(2θ)
non-annealed b)
0.0 0.5 1.0 1.5 2.00
3
6
9
12
15 non-annealed annealed at 143o C
I(q)*
q2
q [nm-1]
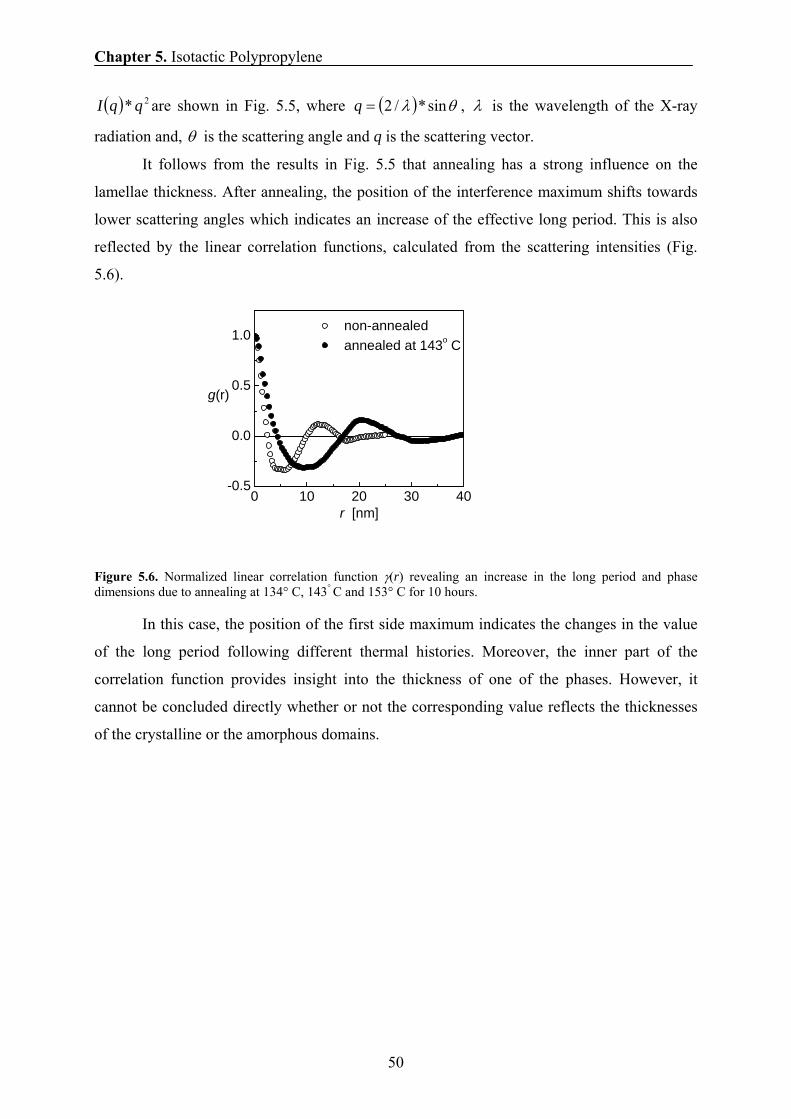
Chapter 5. Isotactic Polypropylene
50
( ) 2* qqI are shown in Fig. 5.5, where ( ) θλ sin*/2=q , λ is the wavelength of the X-ray
radiation and, θ is the scattering angle and q is the scattering vector.
It follows from the results in Fig. 5.5 that annealing has a strong influence on the
lamellae thickness. After annealing, the position of the interference maximum shifts towards
lower scattering angles which indicates an increase of the effective long period. This is also
reflected by the linear correlation functions, calculated from the scattering intensities (Fig.
5.6).
Figure 5.6. Normalized linear correlation function γ(r) revealing an increase in the long period and phase dimensions due to annealing at 134° C, 143° C and 153° C for 10 hours.
In this case, the position of the first side maximum indicates the changes in the value
of the long period following different thermal histories. Moreover, the inner part of the
correlation function provides insight into the thickness of one of the phases. However, it
cannot be concluded directly whether or not the corresponding value reflects the thicknesses
of the crystalline or the amorphous domains.
0 10 20 30 40-0.5
0.0
0.5
1.0
g(r)
r [nm]
non-annealed annealed at 143o C
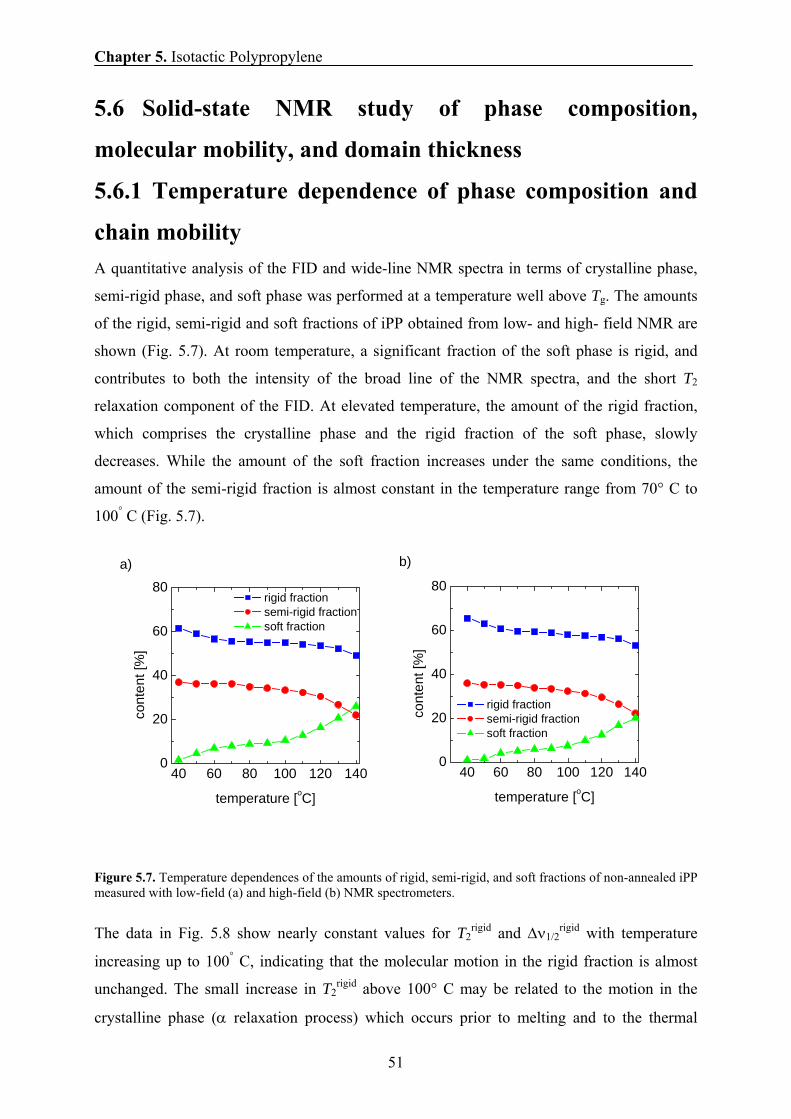
Chapter 5. Isotactic Polypropylene
51
5.6 Solid-state NMR study of phase composition,
molecular mobility, and domain thickness
5.6.1 Temperature dependence of phase composition and
chain mobility A quantitative analysis of the FID and wide-line NMR spectra in terms of crystalline phase,
semi-rigid phase, and soft phase was performed at a temperature well above Tg. The amounts
of the rigid, semi-rigid and soft fractions of iPP obtained from low- and high- field NMR are
shown (Fig. 5.7). At room temperature, a significant fraction of the soft phase is rigid, and
contributes to both the intensity of the broad line of the NMR spectra, and the short T2
relaxation component of the FID. At elevated temperature, the amount of the rigid fraction,
which comprises the crystalline phase and the rigid fraction of the soft phase, slowly
decreases. While the amount of the soft fraction increases under the same conditions, the
amount of the semi-rigid fraction is almost constant in the temperature range from 70° C to
100° C (Fig. 5.7).
Figure 5.7. Temperature dependences of the amounts of rigid, semi-rigid, and soft fractions of non-annealed iPP measured with low-field (a) and high-field (b) NMR spectrometers. The data in Fig. 5.8 show nearly constant values for T2
rigid and Δν1/2rigid with temperature
increasing up to 100° C, indicating that the molecular motion in the rigid fraction is almost
unchanged. The small increase in T2rigid above 100° C may be related to the motion in the
crystalline phase (α relaxation process) which occurs prior to melting and to the thermal
40 60 80 100 120 1400
20
40
60
80a)
rigid fraction semi-rigid fraction soft fraction
cont
ent [
%]
temperature [oC]
40 60 80 100 120 1400
20
40
60
80
b)
rigid fraction semi-rigid fraction soft fraction
cont
ent [
%]
temperature [oC]
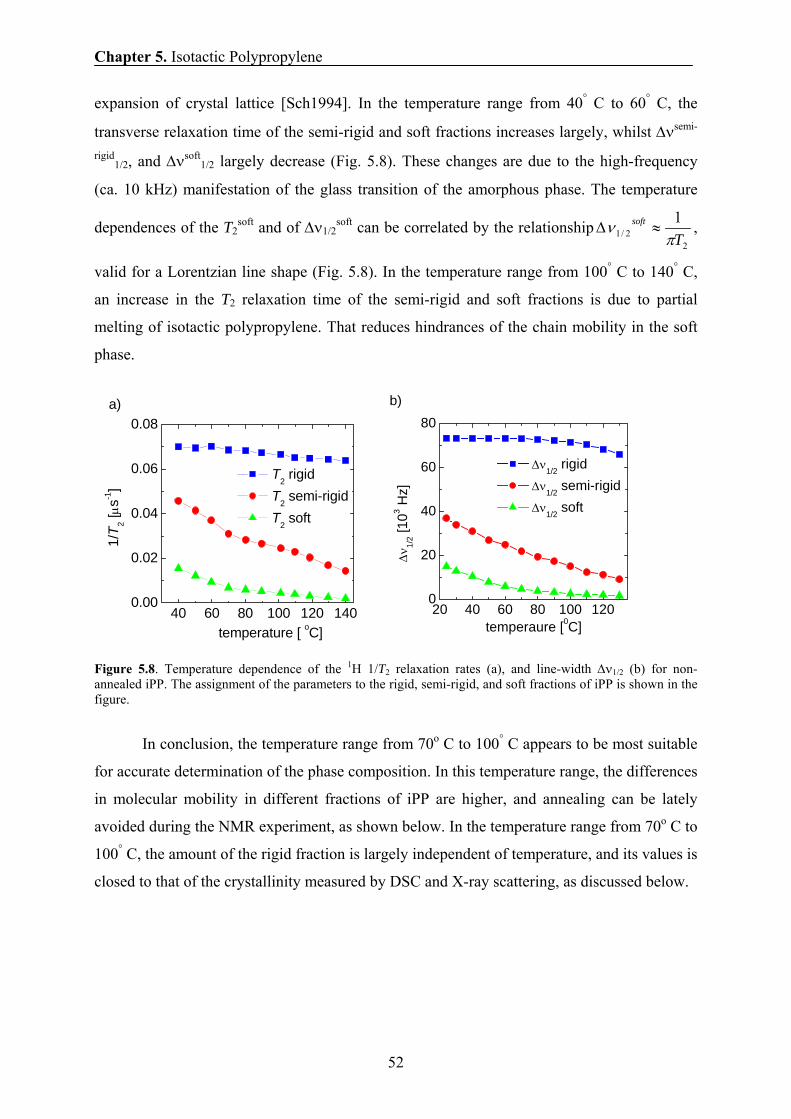
Chapter 5. Isotactic Polypropylene
52
expansion of crystal lattice [Sch1994]. In the temperature range from 40° C to 60° C, the
transverse relaxation time of the semi-rigid and soft fractions increases largely, whilst Δνsemi-
rigid1/2, and Δνsoft
1/2 largely decrease (Fig. 5.8). These changes are due to the high-frequency
(ca. 10 kHz) manifestation of the glass transition of the amorphous phase. The temperature
dependences of the T2soft and of Δν1/2
soft can be correlated by the relationship2
2/11T
soft
πν ≈Δ ,
valid for a Lorentzian line shape (Fig. 5.8). In the temperature range from 100° C to 140° C,
an increase in the T2 relaxation time of the semi-rigid and soft fractions is due to partial
melting of isotactic polypropylene. That reduces hindrances of the chain mobility in the soft
phase.
Figure 5.8. Temperature dependence of the 1H 1/T2 relaxation rates (a), and line-width Δν1/2 (b) for non-annealed iPP. The assignment of the parameters to the rigid, semi-rigid, and soft fractions of iPP is shown in the figure.
In conclusion, the temperature range from 70o C to 100° C appears to be most suitable
for accurate determination of the phase composition. In this temperature range, the differences
in molecular mobility in different fractions of iPP are higher, and annealing can be lately
avoided during the NMR experiment, as shown below. In the temperature range from 70o C to
100° C, the amount of the rigid fraction is largely independent of temperature, and its values is
closed to that of the crystallinity measured by DSC and X-ray scattering, as discussed below.
40 60 80 100 120 1400.00
0.02
0.04
0.06
0.08
T2 rigid T2 semi-rigid T2 soft
1/T 2 [
μs-1]
temperature [ oC]
a)
20 40 60 80 100 1200
20
40
60
80b)
Δν
1/2 [1
03 Hz]
temperaure [0C]
Δν1/2 rigid Δν1/2 semi-rigid Δν1/2 soft
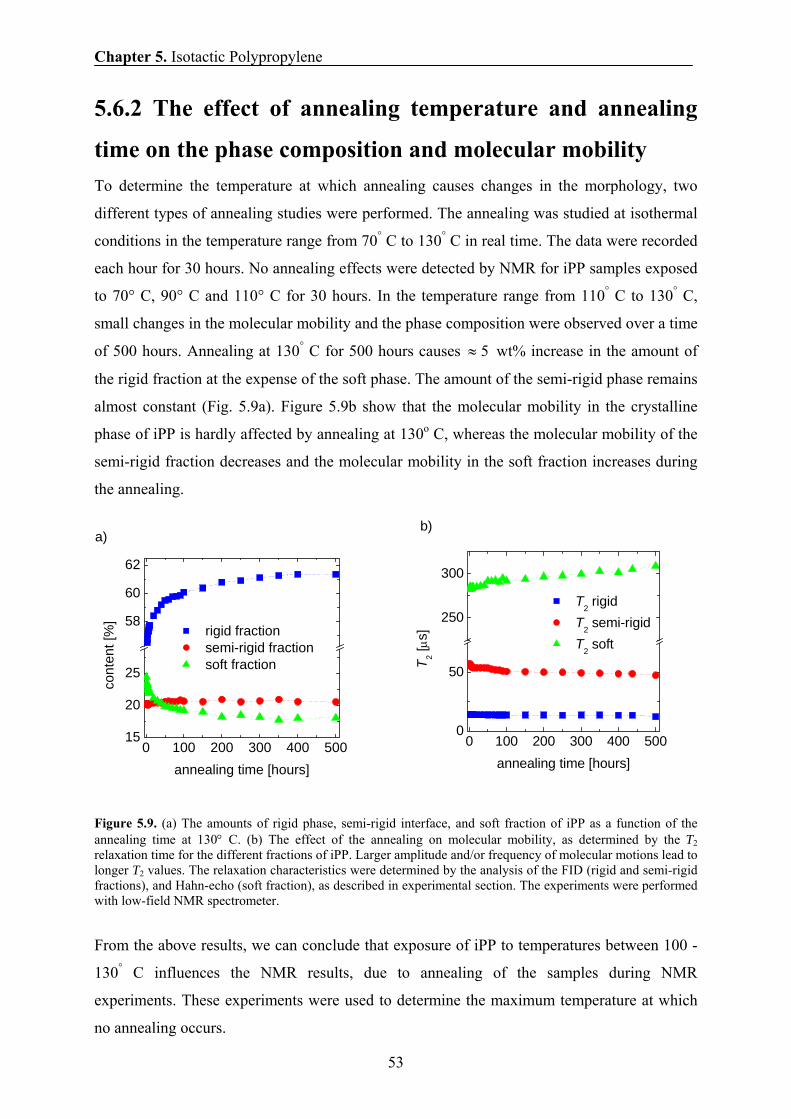
Chapter 5. Isotactic Polypropylene
53
5.6.2 The effect of annealing temperature and annealing
time on the phase composition and molecular mobility To determine the temperature at which annealing causes changes in the morphology, two
different types of annealing studies were performed. The annealing was studied at isothermal
conditions in the temperature range from 70° C to 130° C in real time. The data were recorded
each hour for 30 hours. No annealing effects were detected by NMR for iPP samples exposed
to 70° C, 90° C and 110° C for 30 hours. In the temperature range from 110° C to 130° C,
small changes in the molecular mobility and the phase composition were observed over a time
of 500 hours. Annealing at 130° C for 500 hours causes 5≈ wt% increase in the amount of
the rigid fraction at the expense of the soft phase. The amount of the semi-rigid phase remains
almost constant (Fig. 5.9a). Figure 5.9b show that the molecular mobility in the crystalline
phase of iPP is hardly affected by annealing at 130o C, whereas the molecular mobility of the
semi-rigid fraction decreases and the molecular mobility in the soft fraction increases during
the annealing.
Figure 5.9. (a) The amounts of rigid phase, semi-rigid interface, and soft fraction of iPP as a function of the annealing time at 130° C. (b) The effect of the annealing on molecular mobility, as determined by the T2 relaxation time for the different fractions of iPP. Larger amplitude and/or frequency of molecular motions lead to longer T2 values. The relaxation characteristics were determined by the analysis of the FID (rigid and semi-rigid fractions), and Hahn-echo (soft fraction), as described in experimental section. The experiments were performed with low-field NMR spectrometer.
From the above results, we can conclude that exposure of iPP to temperatures between 100 -
130° C influences the NMR results, due to annealing of the samples during NMR
experiments. These experiments were used to determine the maximum temperature at which
no annealing occurs.
0 100 200 300 400 5000
50
250
300
b)
T 2 [μs]
annealing time [hours]
T2 rigid T2 semi-rigid T2 soft
0 100 200 300 400 50015
20
25
58
60
62
a)
cont
ent [
%]
annealing time [hours]
rigid fraction semi-rigid fraction soft fraction
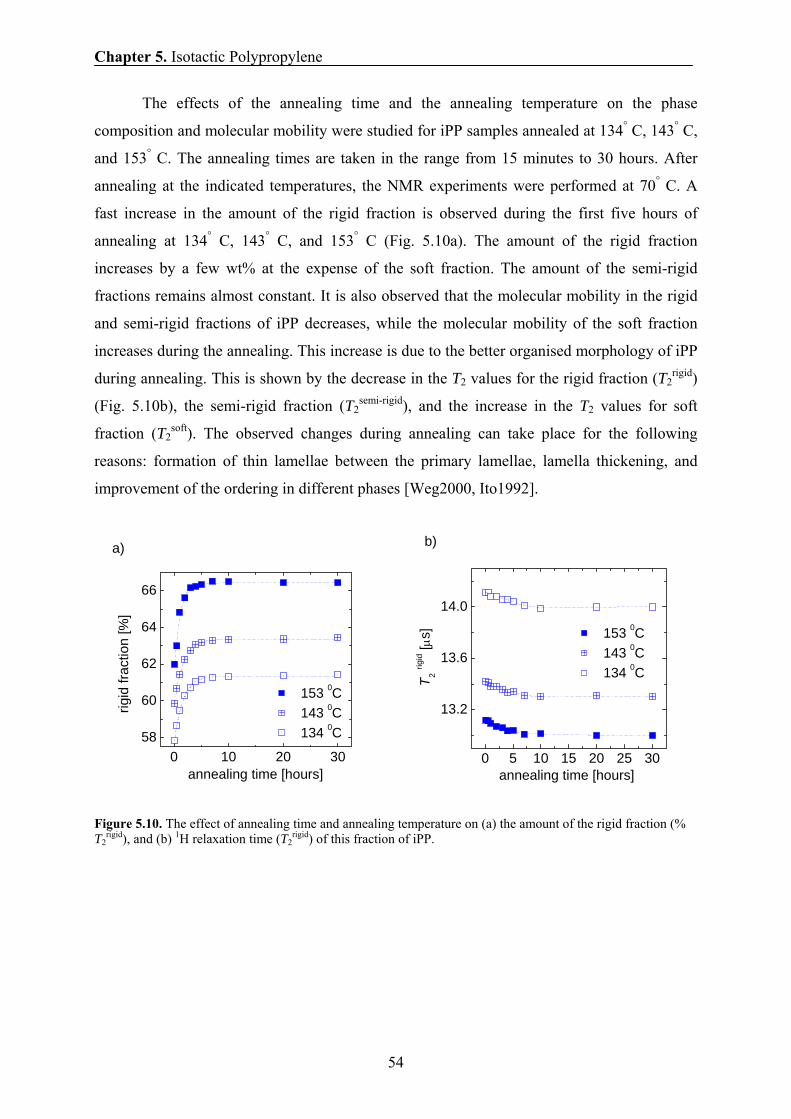
Chapter 5. Isotactic Polypropylene
54
The effects of the annealing time and the annealing temperature on the phase
composition and molecular mobility were studied for iPP samples annealed at 134° C, 143° C,
and 153° C. The annealing times are taken in the range from 15 minutes to 30 hours. After
annealing at the indicated temperatures, the NMR experiments were performed at 70° C. A
fast increase in the amount of the rigid fraction is observed during the first five hours of
annealing at 134° C, 143° C, and 153° C (Fig. 5.10a). The amount of the rigid fraction
increases by a few wt% at the expense of the soft fraction. The amount of the semi-rigid
fractions remains almost constant. It is also observed that the molecular mobility in the rigid
and semi-rigid fractions of iPP decreases, while the molecular mobility of the soft fraction
increases during the annealing. This increase is due to the better organised morphology of iPP
during annealing. This is shown by the decrease in the T2 values for the rigid fraction (T2rigid)
(Fig. 5.10b), the semi-rigid fraction (T2semi-rigid), and the increase in the T2 values for soft
fraction (T2soft). The observed changes during annealing can take place for the following
reasons: formation of thin lamellae between the primary lamellae, lamella thickening, and
improvement of the ordering in different phases [Weg2000, Ito1992].
Figure 5.10. The effect of annealing time and annealing temperature on (a) the amount of the rigid fraction (% T2
rigid), and (b) 1H relaxation time (T2rigid) of this fraction of iPP.
0 10 20 3058
60
62
64
66
153 0C 143 0C 134 0C
rigid
frac
tion
[%]
annealing time [hours]
a)
0 5 10 15 20 25 30
13.2
13.6
14.0
b)
annealing time [hours]
153 0C 143 0C 134 0CT 2 rig
id [μ
s]
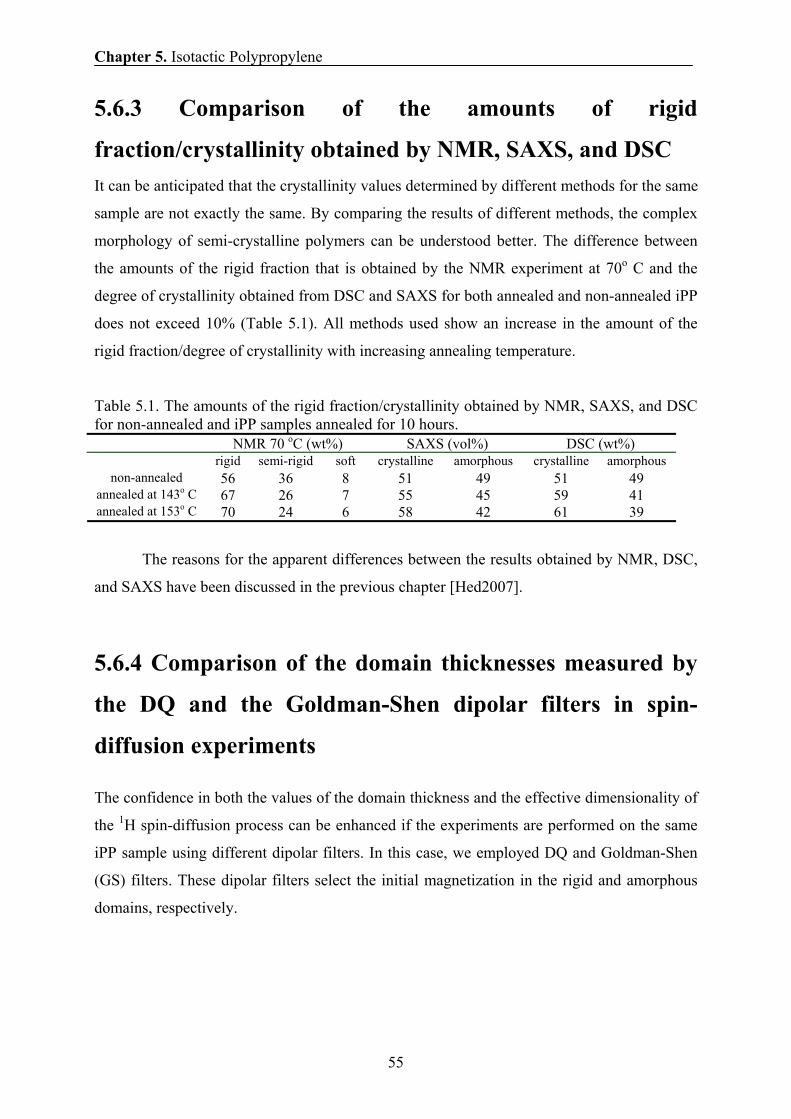
Chapter 5. Isotactic Polypropylene
55
5.6.3 Comparison of the amounts of rigid
fraction/crystallinity obtained by NMR, SAXS, and DSC It can be anticipated that the crystallinity values determined by different methods for the same
sample are not exactly the same. By comparing the results of different methods, the complex
morphology of semi-crystalline polymers can be understood better. The difference between
the amounts of the rigid fraction that is obtained by the NMR experiment at 70o C and the
degree of crystallinity obtained from DSC and SAXS for both annealed and non-annealed iPP
does not exceed 10% (Table 5.1). All methods used show an increase in the amount of the
rigid fraction/degree of crystallinity with increasing annealing temperature.
Table 5.1. The amounts of the rigid fraction/crystallinity obtained by NMR, SAXS, and DSC for non-annealed and iPP samples annealed for 10 hours.
NMR 70 oC (wt%) SAXS (vol%) DSC (wt%) rigid semi-rigid soft crystalline amorphous crystalline amorphous
non-annealed 56 36 8 51 49 51 49 annealed at 143o C 67 26 7 55 45 59 41 annealed at 153o C 70 24 6 58 42 61 39
The reasons for the apparent differences between the results obtained by NMR, DSC,
and SAXS have been discussed in the previous chapter [Hed2007].
5.6.4 Comparison of the domain thicknesses measured by
the DQ and the Goldman-Shen dipolar filters in spin-
diffusion experiments
The confidence in both the values of the domain thickness and the effective dimensionality of
the 1H spin-diffusion process can be enhanced if the experiments are performed on the same
iPP sample using different dipolar filters. In this case, we employed DQ and Goldman-Shen
(GS) filters. These dipolar filters select the initial magnetization in the rigid and amorphous
domains, respectively.
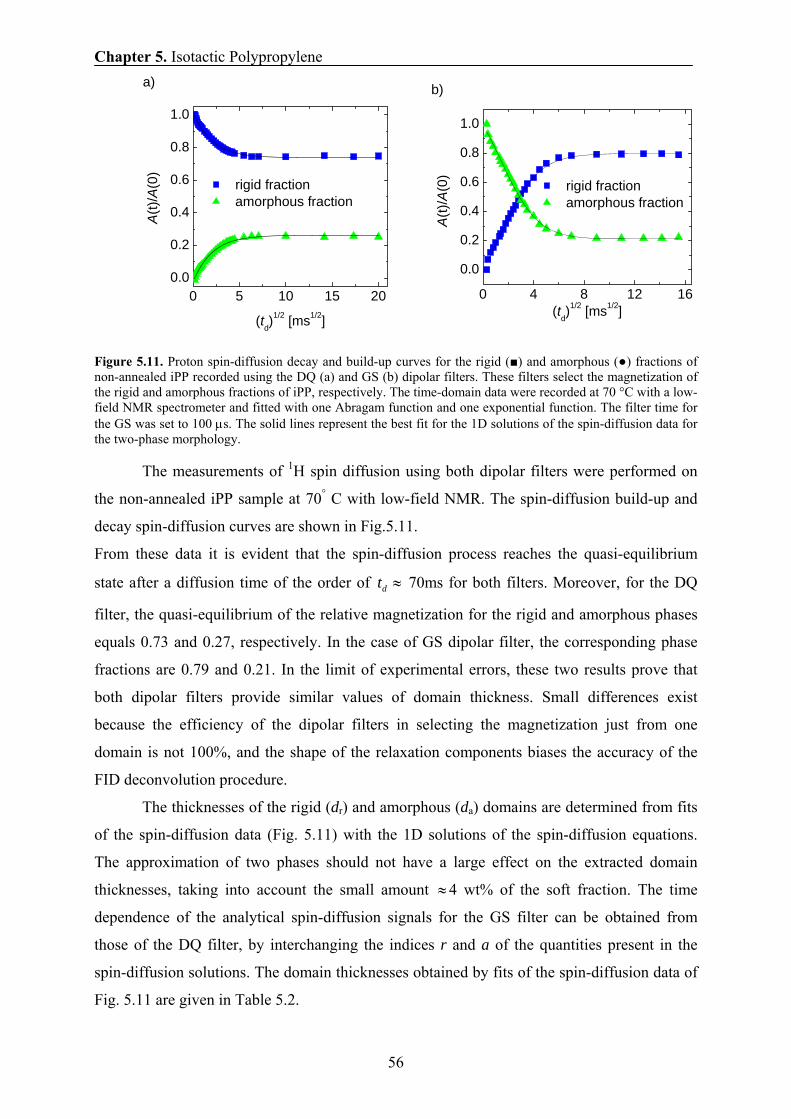
Chapter 5. Isotactic Polypropylene
56
Figure 5.11. Proton spin-diffusion decay and build-up curves for the rigid (■) and amorphous (●) fractions of non-annealed iPP recorded using the DQ (a) and GS (b) dipolar filters. These filters select the magnetization of the rigid and amorphous fractions of iPP, respectively. The time-domain data were recorded at 70 °C with a low-field NMR spectrometer and fitted with one Abragam function and one exponential function. The filter time for the GS was set to 100 μs. The solid lines represent the best fit for the 1D solutions of the spin-diffusion data for the two-phase morphology.
The measurements of 1H spin diffusion using both dipolar filters were performed on
the non-annealed iPP sample at 70° C with low-field NMR. The spin-diffusion build-up and
decay spin-diffusion curves are shown in Fig.5.11.
From these data it is evident that the spin-diffusion process reaches the quasi-equilibrium
state after a diffusion time of the order of ≈dt 70ms for both filters. Moreover, for the DQ
filter, the quasi-equilibrium of the relative magnetization for the rigid and amorphous phases
equals 0.73 and 0.27, respectively. In the case of GS dipolar filter, the corresponding phase
fractions are 0.79 and 0.21. In the limit of experimental errors, these two results prove that
both dipolar filters provide similar values of domain thickness. Small differences exist
because the efficiency of the dipolar filters in selecting the magnetization just from one
domain is not 100%, and the shape of the relaxation components biases the accuracy of the
FID deconvolution procedure.
The thicknesses of the rigid (dr) and amorphous (da) domains are determined from fits
of the spin-diffusion data (Fig. 5.11) with the 1D solutions of the spin-diffusion equations.
The approximation of two phases should not have a large effect on the extracted domain
thicknesses, taking into account the small amount ≈4 wt% of the soft fraction. The time
dependence of the analytical spin-diffusion signals for the GS filter can be obtained from
those of the DQ filter, by interchanging the indices r and a of the quantities present in the
spin-diffusion solutions. The domain thicknesses obtained by fits of the spin-diffusion data of
Fig. 5.11 are given in Table 5.2.
0 5 10 15 200.0
0.2
0.4
0.6
0.8
1.0
a)
A(t)
/A(0
)
(td)1/2 [ms1/2]
rigid fraction amorphous fraction
0 4 8 12 16
0.0
0.2
0.4
0.6
0.8
1.0
rigid fraction amorphous fraction
A(t)
/A(0
)
(td)1/2 [ms1/2]
b)
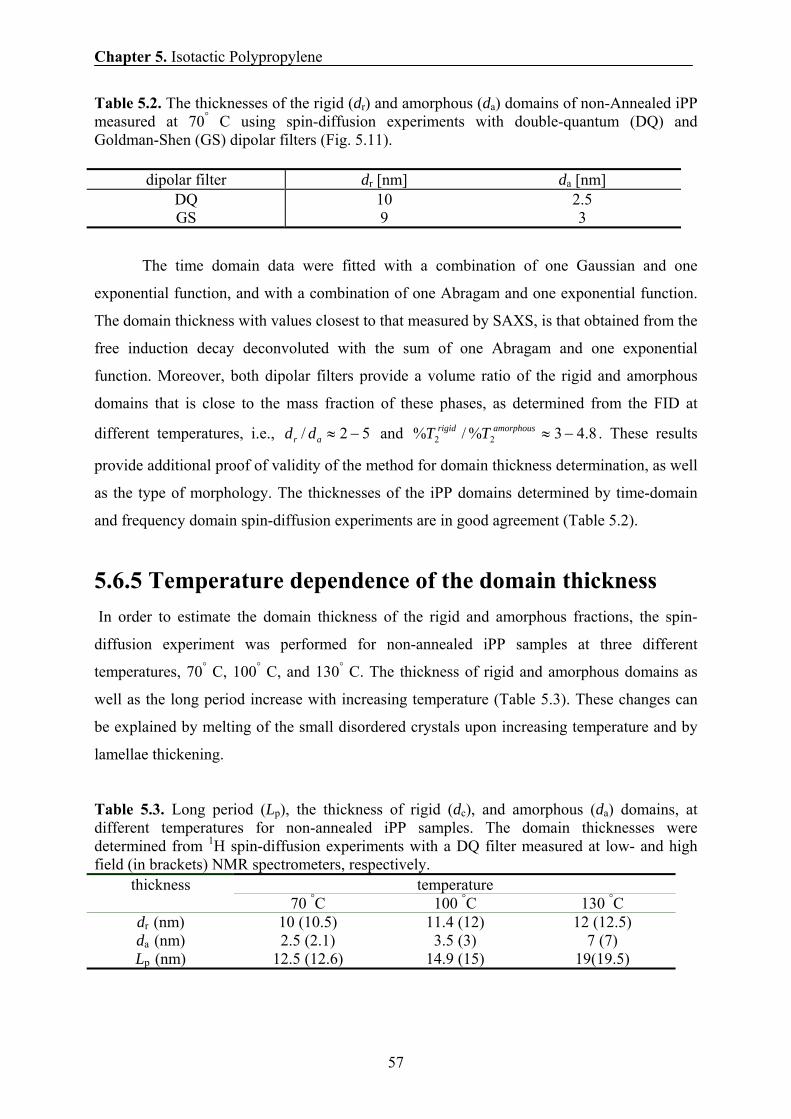
Chapter 5. Isotactic Polypropylene
57
Table 5.2. The thicknesses of the rigid (dr) and amorphous (da) domains of non-Annealed iPP measured at 70° C using spin-diffusion experiments with double-quantum (DQ) and Goldman-Shen (GS) dipolar filters (Fig. 5.11).
The time domain data were fitted with a combination of one Gaussian and one
exponential function, and with a combination of one Abragam and one exponential function.
The domain thickness with values closest to that measured by SAXS, is that obtained from the
free induction decay deconvoluted with the sum of one Abragam and one exponential
function. Moreover, both dipolar filters provide a volume ratio of the rigid and amorphous
domains that is close to the mass fraction of these phases, as determined from the FID at
different temperatures, i.e., 52/ −≈ar dd and 8.43%/% 22 −≈amorphousrigid TT . These results
provide additional proof of validity of the method for domain thickness determination, as well
as the type of morphology. The thicknesses of the iPP domains determined by time-domain
and frequency domain spin-diffusion experiments are in good agreement (Table 5.2).
5.6.5 Temperature dependence of the domain thickness In order to estimate the domain thickness of the rigid and amorphous fractions, the spin-
diffusion experiment was performed for non-annealed iPP samples at three different
temperatures, 70° C, 100° C, and 130° C. The thickness of rigid and amorphous domains as
well as the long period increase with increasing temperature (Table 5.3). These changes can
be explained by melting of the small disordered crystals upon increasing temperature and by
lamellae thickening.
Table 5.3. Long period (Lp), the thickness of rigid (dc), and amorphous (da) domains, at different temperatures for non-annealed iPP samples. The domain thicknesses were determined from 1H spin-diffusion experiments with a DQ filter measured at low- and high field (in brackets) NMR spectrometers, respectively.
temperature thickness 70 °C 100 °C 130 °C
dr (nm) 10 (10.5) 11.4 (12) 12 (12.5) da (nm) 2.5 (2.1) 3.5 (3) 7 (7) Lp (nm) 12.5 (12.6) 14.9 (15) 19(19.5)
dipolar filter dr [nm] da [nm] DQ 10 2.5 GS 9 3
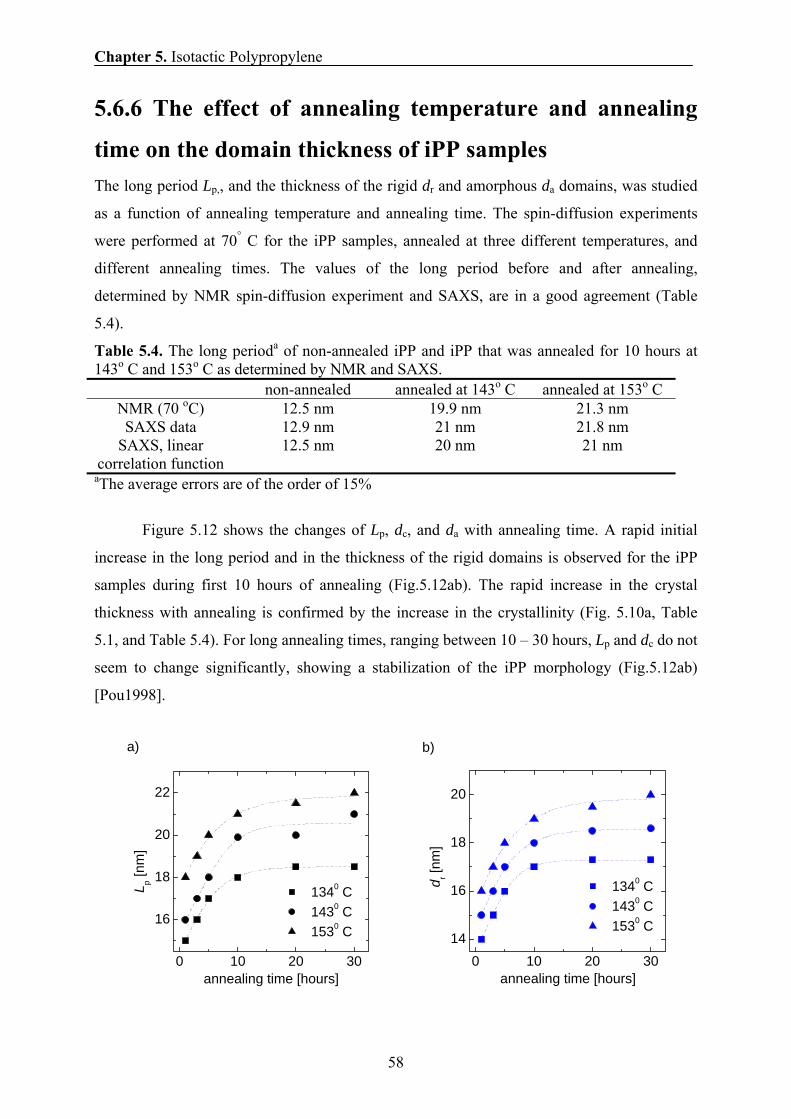
Chapter 5. Isotactic Polypropylene
58
5.6.6 The effect of annealing temperature and annealing
time on the domain thickness of iPP samples The long period Lp,, and the thickness of the rigid dr and amorphous da domains, was studied
as a function of annealing temperature and annealing time. The spin-diffusion experiments
were performed at 70° C for the iPP samples, annealed at three different temperatures, and
different annealing times. The values of the long period before and after annealing,
determined by NMR spin-diffusion experiment and SAXS, are in a good agreement (Table
5.4).
Table 5.4. The long perioda of non-annealed iPP and iPP that was annealed for 10 hours at 143o C and 153o C as determined by NMR and SAXS. non-annealed annealed at 143o C annealed at 153o C
NMR (70 oC) 12.5 nm 19.9 nm 21.3 nm SAXS data 12.9 nm 21 nm 21.8 nm
SAXS, linear correlation function
12.5 nm 20 nm 21 nm
aThe average errors are of the order of 15%
Figure 5.12 shows the changes of Lp, dc, and da with annealing time. A rapid initial
increase in the long period and in the thickness of the rigid domains is observed for the iPP
samples during first 10 hours of annealing (Fig.5.12ab). The rapid increase in the crystal
thickness with annealing is confirmed by the increase in the crystallinity (Fig. 5.10a, Table
5.1, and Table 5.4). For long annealing times, ranging between 10 – 30 hours, Lp and dc do not
seem to change significantly, showing a stabilization of the iPP morphology (Fig.5.12ab)
[Pou1998].
0 10 20 30
16
18
20
22
a)
L p [nm
]
annealing time [hours]
1340 C 1430 C 1530 C
0 10 20 3014
16
18
20
b)
annealing time [hours]
1340 C 1430 C 1530 C
d r [nm
]
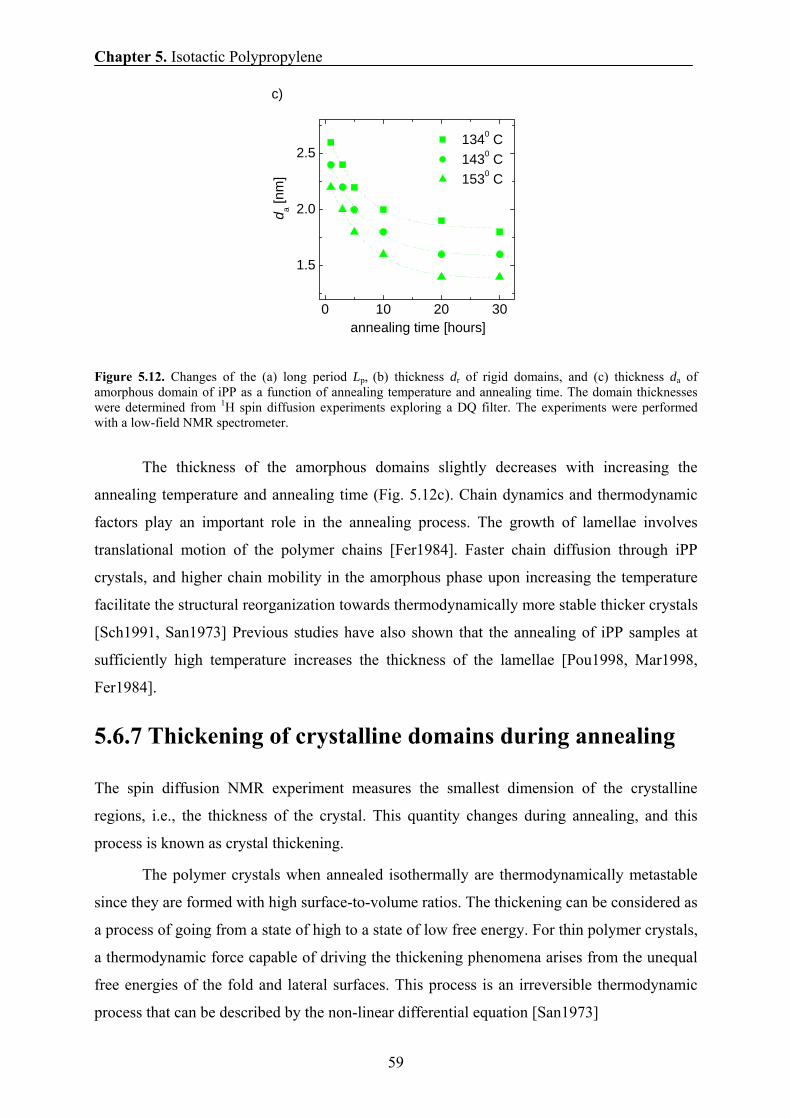
Chapter 5. Isotactic Polypropylene
59
Figure 5.12. Changes of the (a) long period Lp, (b) thickness dr of rigid domains, and (c) thickness da of amorphous domain of iPP as a function of annealing temperature and annealing time. The domain thicknesses were determined from 1H spin diffusion experiments exploring a DQ filter. The experiments were performed with a low-field NMR spectrometer.
The thickness of the amorphous domains slightly decreases with increasing the
annealing temperature and annealing time (Fig. 5.12c). Chain dynamics and thermodynamic
factors play an important role in the annealing process. The growth of lamellae involves
translational motion of the polymer chains [Fer1984]. Faster chain diffusion through iPP
crystals, and higher chain mobility in the amorphous phase upon increasing the temperature
facilitate the structural reorganization towards thermodynamically more stable thicker crystals
[Sch1991, San1973] Previous studies have also shown that the annealing of iPP samples at
sufficiently high temperature increases the thickness of the lamellae [Pou1998, Mar1998,
Fer1984].
5.6.7 Thickening of crystalline domains during annealing
The spin diffusion NMR experiment measures the smallest dimension of the crystalline
regions, i.e., the thickness of the crystal. This quantity changes during annealing, and this
process is known as crystal thickening.
The polymer crystals when annealed isothermally are thermodynamically metastable
since they are formed with high surface-to-volume ratios. The thickening can be considered as
a process of going from a state of high to a state of low free energy. For thin polymer crystals,
a thermodynamic force capable of driving the thickening phenomena arises from the unequal
free energies of the fold and lateral surfaces. This process is an irreversible thermodynamic
process that can be described by the non-linear differential equation [San1973]
0 10 20 30
1.5
2.0
2.5
c)
1340 C 1430 C 1530 C
annealing time [hours]
d a [nm
]
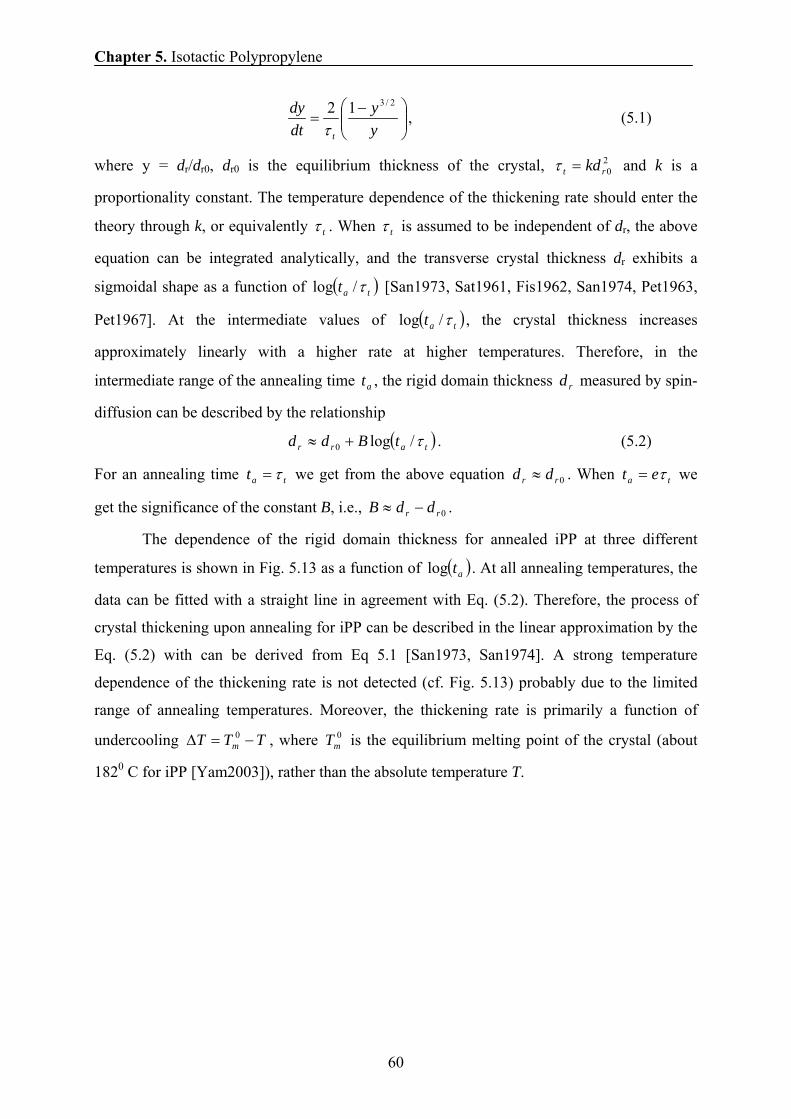
Chapter 5. Isotactic Polypropylene
60
⎟⎟⎠
⎞⎜⎜⎝
⎛ −=
yy
dtdy
t
2/312τ
, (5.1)
where y = dr/dr0, dr0 is the equilibrium thickness of the crystal, 20rt kd=τ and k is a
proportionality constant. The temperature dependence of the thickening rate should enter the
theory through k, or equivalently tτ . When tτ is assumed to be independent of dr, the above
equation can be integrated analytically, and the transverse crystal thickness dr exhibits a
sigmoidal shape as a function of ( )tat τ/log [San1973, Sat1961, Fis1962, San1974, Pet1963,
Pet1967]. At the intermediate values of ( )tat τ/log , the crystal thickness increases
approximately linearly with a higher rate at higher temperatures. Therefore, in the
intermediate range of the annealing time at , the rigid domain thickness rd measured by spin-
diffusion can be described by the relationship
( )tarr tBdd τ/log0 +≈ . (5.2)
For an annealing time tat τ= we get from the above equation 0rr dd ≈ . When ta et τ= we
get the significance of the constant B, i.e., 0rr ddB −≈ .
The dependence of the rigid domain thickness for annealed iPP at three different
temperatures is shown in Fig. 5.13 as a function of ( )atlog . At all annealing temperatures, the
data can be fitted with a straight line in agreement with Eq. (5.2). Therefore, the process of
crystal thickening upon annealing for iPP can be described in the linear approximation by the
Eq. (5.2) with can be derived from Eq 5.1 [San1973, San1974]. A strong temperature
dependence of the thickening rate is not detected (cf. Fig. 5.13) probably due to the limited
range of annealing temperatures. Moreover, the thickening rate is primarily a function of
undercooling TTT m −=Δ 0 , where 0mT is the equilibrium melting point of the crystal (about
1820 C for iPP [Yam2003]), rather than the absolute temperature T.
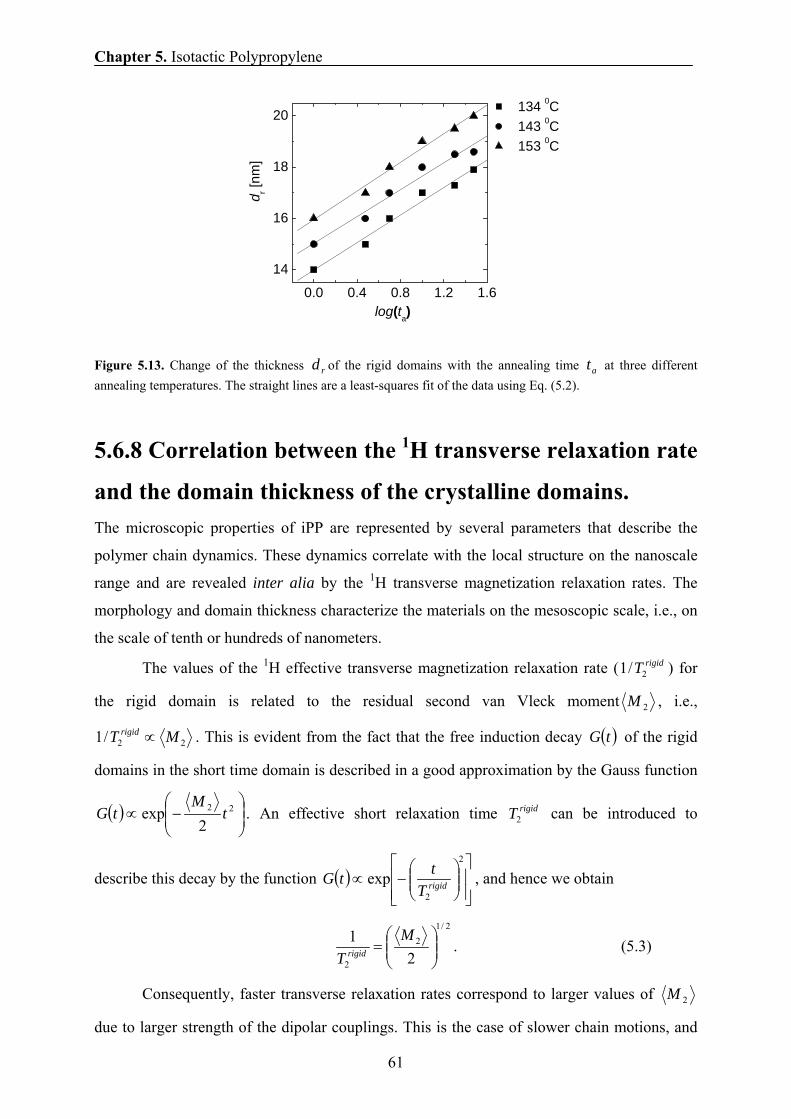
Chapter 5. Isotactic Polypropylene
61
Figure 5.13. Change of the thickness rd of the rigid domains with the annealing time at at three different annealing temperatures. The straight lines are a least-squares fit of the data using Eq. (5.2).
5.6.8 Correlation between the 1H transverse relaxation rate
and the domain thickness of the crystalline domains. The microscopic properties of iPP are represented by several parameters that describe the
polymer chain dynamics. These dynamics correlate with the local structure on the nanoscale
range and are revealed inter alia by the 1H transverse magnetization relaxation rates. The
morphology and domain thickness characterize the materials on the mesoscopic scale, i.e., on
the scale of tenth or hundreds of nanometers.
The values of the 1H effective transverse magnetization relaxation rate ( rigidT2/1 ) for
the rigid domain is related to the residual second van Vleck moment 2M , i.e.,
22/1 MT rigid ∝ . This is evident from the fact that the free induction decay ( )tG of the rigid
domains in the short time domain is described in a good approximation by the Gauss function
( ) ⎟⎟⎠
⎞⎜⎜⎝
⎛−∝ 22
2exp t
MtG . An effective short relaxation time rigidT2 can be introduced to
describe this decay by the function ( )⎥⎥⎦
⎤
⎢⎢⎣
⎡⎟⎟⎠
⎞⎜⎜⎝
⎛−∝
2
2
exp rigidTttG , and hence we obtain
2/1
2
2 21
⎟⎟⎠
⎞⎜⎜⎝
⎛=
MT rigid . (5.3)
Consequently, faster transverse relaxation rates correspond to larger values of 2M
due to larger strength of the dipolar couplings. This is the case of slower chain motions, and
0.0 0.4 0.8 1.2 1.6
14
16
18
20 134 0C 143 0C 153 0C
d r [nm
]
log(ta)
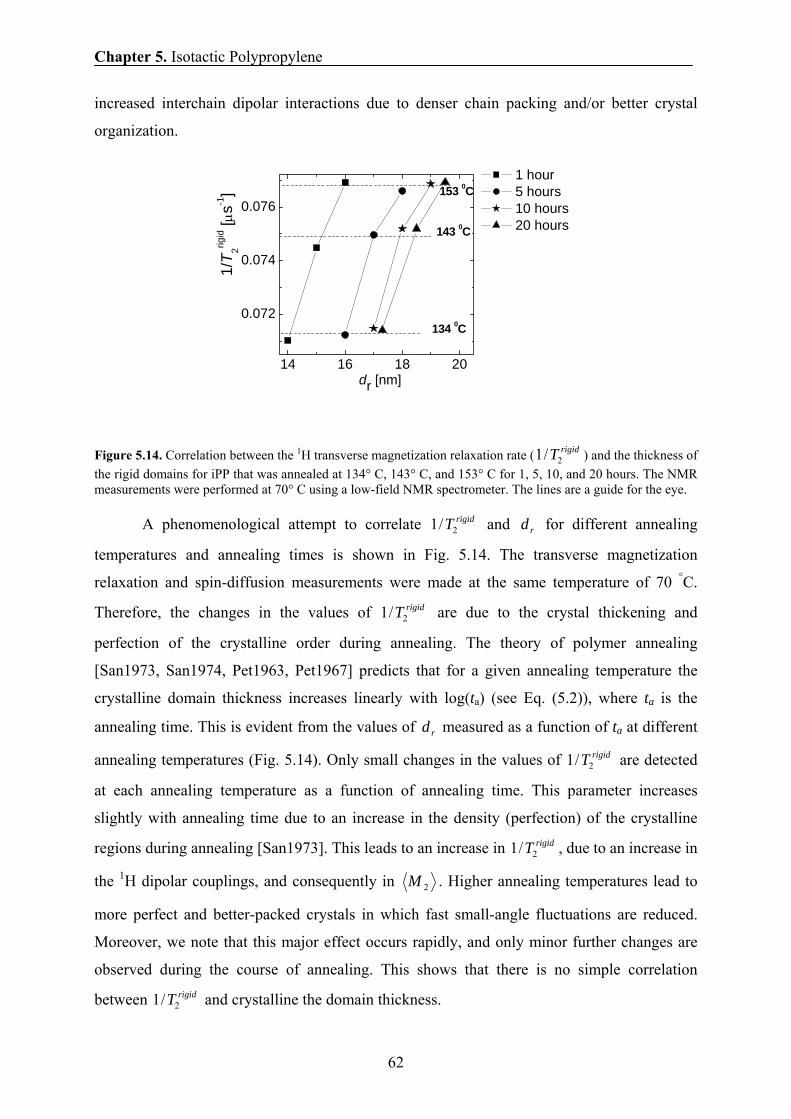
Chapter 5. Isotactic Polypropylene
62
increased interchain dipolar interactions due to denser chain packing and/or better crystal
organization.
Figure 5.14. Correlation between the 1H transverse magnetization relaxation rate ( rigidT2/1 ) and the thickness of the rigid domains for iPP that was annealed at 134° C, 143° C, and 153° C for 1, 5, 10, and 20 hours. The NMR measurements were performed at 70° C using a low-field NMR spectrometer. The lines are a guide for the eye.
A phenomenological attempt to correlate rigidT2/1 and rd for different annealing
temperatures and annealing times is shown in Fig. 5.14. The transverse magnetization
relaxation and spin-diffusion measurements were made at the same temperature of 70 °C.
Therefore, the changes in the values of rigidT2/1 are due to the crystal thickening and
perfection of the crystalline order during annealing. The theory of polymer annealing
[San1973, San1974, Pet1963, Pet1967] predicts that for a given annealing temperature the
crystalline domain thickness increases linearly with log(ta) (see Eq. (5.2)), where ta is the
annealing time. This is evident from the values of rd measured as a function of ta at different
annealing temperatures (Fig. 5.14). Only small changes in the values of rigidT2/1 are detected
at each annealing temperature as a function of annealing time. This parameter increases
slightly with annealing time due to an increase in the density (perfection) of the crystalline
regions during annealing [San1973]. This leads to an increase in rigidT2/1 , due to an increase in
the 1H dipolar couplings, and consequently in 2M . Higher annealing temperatures lead to
more perfect and better-packed crystals in which fast small-angle fluctuations are reduced.
Moreover, we note that this major effect occurs rapidly, and only minor further changes are
observed during the course of annealing. This shows that there is no simple correlation
between rigidT2/1 and crystalline the domain thickness.
14 16 18 20
0.072
0.074
0.076
134 0C
153 0C
143 0C
1 hour 5 hours 10 hours 20 hours
dr [nm]
1/T 2rig
id [μ
s-1]
Chapter 5. Isotactic Polypropylene
63
5.7 Conclusions Changes in phase composition (namely the amounts of rigid fraction/crystallinity, semi-rigid,
and soft fractions), molecular mobility and domain thickness of both annealed and non-
annealed iPP samples were investigated by 1H NMR, SAXS, and DSC at different
temperatures and different annealing times. The amounts of the rigid fraction as determined
by NMR, exceeds by 5-10% the crystallinity from DSC and SAXS. This difference can
quantitatively be explained by the effect of the interface, which is not taken into account in
the analysis of the DSC and SAXS data.
According to TEM, the morphology of non-annealed iPP is mainly lamellar. For iPP
samples that have been annealed at different temperatures and different times, the cross-
hatching morphology can be observed. However, the predominant morphology remains
lamellar. This is confirmed by the comparison of the phase composition with the domain
thickness ratio that is determined by simulation of the results of the spin-diffusion data using
1D, 2D, and 3D solutions of the spin-diffusion equations. In an approximation of the two-
phase model, the long periods obtained by NMR and SAXS are in good agreement with each
other.
An important feature of the spin-diffusion experiments reported in this investigation is
the temperature dependence of the proton spin diffusivities, which decrease with increasing
temperature. The temperature dependence of the spin diffusivity of the amorphous phase was
derived from the spectral line width. In the approximation of a single correlation time
described by the Williams-Landel-Ferry (WLF) equation, the temperature dependence of the
spin diffusivities was established, and the obtained WLF coefficients are in the range that is
typical for the amorphous phase in semi-crystalline polymers and amorphous polymers.
The thicknesses of the rigid domains for iPP that has been annealed at different
temperatures and different times has been discussed as a function of the logarithm of the
annealing time. A linear relationship holds for all cases in good agreement between theory
and the experimental results for other polymers [San1973, San1974].
The existence of a phenomenological correlation between microscopic and
mesoscopic properties of iPP is reported. Microscopic properties are described by 1H
transverse relaxation rates or second van Vleck moment characterizing mainly the proton
dipolar network. The morphology and domain thickness characterize the polymer on the
mesoscopic scale. The correlation is complex and explained by the improvement of the
crystalline order during the crystal thickening.
Chapter 5. Isotactic Polypropylene
64
Chapter 6. Aging in Isotactic Polypropylene
65
Chapter 6
Aging on Isotactic Polypropylene 6.1 Introduction and motivation Physical aging of semi-crystalline polymers, which has been studied extensively in the past
[Cru1984, Cha1980, Tom1996, Uzo1997, Ibh1996, Hel1997] from many aspects, refers to the
evolution towards an equilibrium state and the associated changes in the morphological
organization and physical properties. Above the glass transition the physical aging at different
temperatures and different times involves the densification of the amorphous fraction
(reduction in free volume) [Son1987], constraints in the chain mobility [Aga1981], lamellar
perfection or densification, lamellar thickening, crystallization of constrained polymer chains
forming small crystals or fringed micelles, and melting-recrystallization. The exact origin of
the changes in iPP samples (and in other semi-crystalline polymers) with aging time and
aging temperature is still under dispute [Cru1984, Cha1980, Tom1996, Uzo1997, Ibh1996,
Hel1997, Son1987, Aga1981]. One reason of the dispute lies in the limitations of different
techniques used to probe the structure of these materials and the discrepancies between their
results.
Differential scanning calorimetry (DSC) rarely provides similar values for crystallinity
as other techniques [Isa1999, Zho1997]; wide-angle X-ray diffraction (WAXD) requires an
estimation of the amorphous fraction and the lattice imperfection factor [Rul1961]; and small-
angle X-Ray diffraction (SAXS) is extremely model dependent [Bal1989]. It should be noted
that the problems with SAXS analyses are enhanced in the case of iPP due to the crosshatched
lamellar morphology [Oll1989].
One feature that is generally agreed upon by most researchers as important for aging
behaviour is whether the annealing temperatures are above or below the crystalline dielectric
relaxation αc. The crystalline relaxation αc is associated with the rotational-translational
motion travelling along the crystal stem [Boy1985, Boy1985, Spi1991, Hu1999] that can
grow from the soft fraction in a crystal thickening process. The responsible mechanism for
crystallinity increase due to aging is the secondary crystallization by which the new lamellae
are inserted between those formed during the primary crystallization. This mechanism occurs
since the regions remaining amorphous still have the potential to partially crystallize. The
Chapter 6. Aging in Isotactic Polypropylene
66
newly formed lamellae are constrained by those formed during primary crystallization. They
are thicker as they are formed at higher temperatures. Because an additional driving force is
needed, the newly formed lamellae at lower temperature upon further non-isothermal cooling
are thinner. They may thicken if a low temperature active process is plausible. It is not only a
matter of aging temperature, with respect to the glass transition temperatures of the crystalline
and amorphous phases, for the new formed lamella, but also depends on the initial iPP
morphology.
The first aim of this chapter is to study in detail the effects of aging temperature and
aging time on the phase composition, crystallinity, melting and crystallization temperatures,
chain mobility and mechanical properties of injection molded, crystallized from the melt, and
quenched homopolymeric iPP by 1H low field solid state NMR, DSC and X-ray. The second
goal of this chapter is to show that the 1H low-field solid-state NMR technique is capable of
detecting the small changes in the phase composition and chain mobility due to aging at
different times and different temperatures. Moreover, a correlation between the changes in the
NMR, and DSC parameters due to aging and mechanical data is presented and discussed.
6.2 Materials Three homopolymeric isotactic polypropylene (iPP) samples were used in our investigations.
All the samples are commercial Ziegler-Natta-catalyzed PP manufactured by SABIC Europe
BV. The first sample is an injection molded homopolymeric iPP. The materials were injected
in an Engel 45A machine. The melt temperature was set to 235° C, the holding pressure to 40
MPa, the holding time to 20 s, the cooling time to 20 s, and the overall cycle time to 49.5 s.
The second sample is melt-crystallized homopolymer iPP. The injection molded plates were
melted at 230° C for 30 minutes in an oven under nitrogen flow, in order to avoid the
oxidation of the samples, and finally crystallized at a slow cooling rate. The third sample is a
quenched homopolymeric iPP sample. The sample has been brought to 250° C, kept 30
minutes at that temperature and than quenched from the melt at -195° C between two metal
plates.
For the aging study at 28° C, all the homopolymeric iPP samples were further
annealed in the NMR probe, for times between 10 minutes and 1000 hours after preparation.
For the aging study at different temperatures the iPP samples crystallized from the melt was
annealed in the NMR probe for the temperature range from 70° C to 130° C, for times
between 10 minutes and 150 hours after preparation. The temperature of the NMR
experiments coincides with the annealing temperature. All NMR measurements were repeated
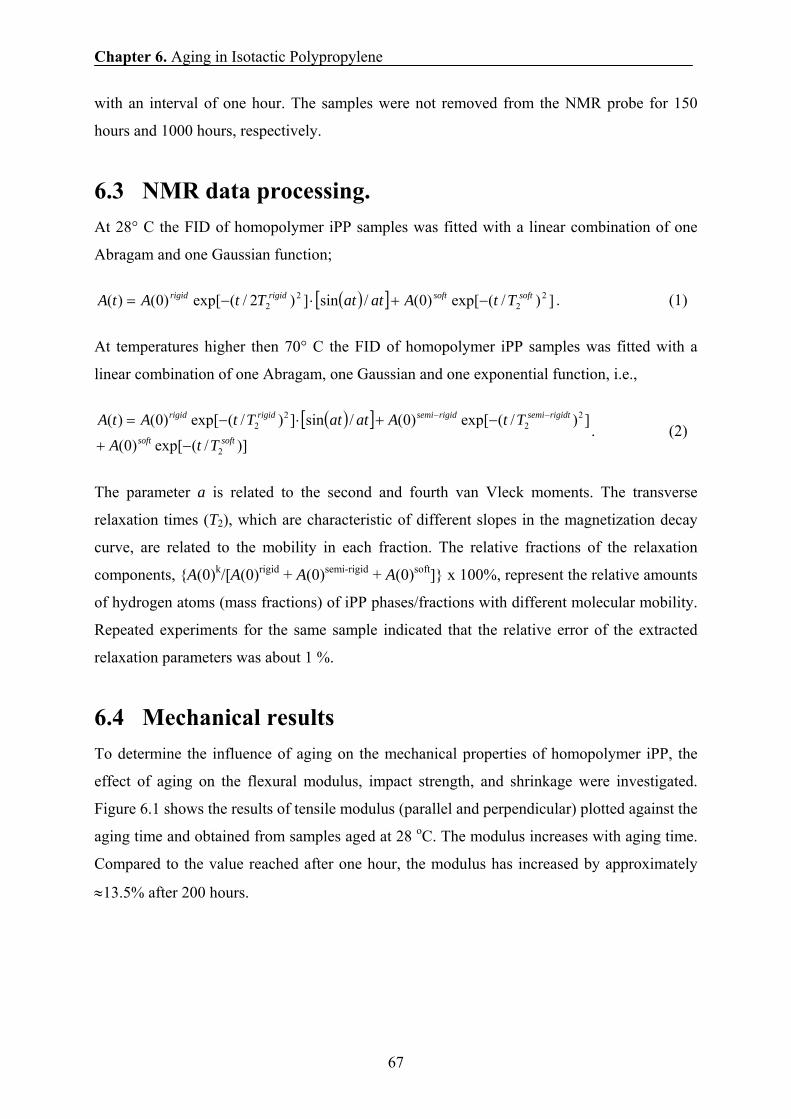
Chapter 6. Aging in Isotactic Polypropylene
67
with an interval of one hour. The samples were not removed from the NMR probe for 150
hours and 1000 hours, respectively.
6.3 NMR data processing. At 28° C the FID of homopolymer iPP samples was fitted with a linear combination of one
Abragam and one Gaussian function;
( )[ ] ])/(exp[)0(/sin])2/(exp[)0()( 22
22
softsoftrigidrigid TtAatatTtAtA −+⋅−= . (1)
At temperatures higher then 70° C the FID of homopolymer iPP samples was fitted with a
linear combination of one Abragam, one Gaussian and one exponential function, i.e.,
( )[ ])]/(exp[)0(
])/(exp[)0(/sin])/(exp[)0()(
2
22
22
softsoft
rigidtsemirigidsemirigidrigid
TtA
TtAatatTtAtA
−+
−+⋅−= −−
. (2)
The parameter a is related to the second and fourth van Vleck moments. The transverse
relaxation times (T2), which are characteristic of different slopes in the magnetization decay
curve, are related to the mobility in each fraction. The relative fractions of the relaxation
components, {A(0)k/[A(0)rigid + A(0)semi-rigid + A(0)soft]} x 100%, represent the relative amounts
of hydrogen atoms (mass fractions) of iPP phases/fractions with different molecular mobility.
Repeated experiments for the same sample indicated that the relative error of the extracted
relaxation parameters was about 1 %.
6.4 Mechanical results To determine the influence of aging on the mechanical properties of homopolymer iPP, the
effect of aging on the flexural modulus, impact strength, and shrinkage were investigated.
Figure 6.1 shows the results of tensile modulus (parallel and perpendicular) plotted against the
aging time and obtained from samples aged at 28 oC. The modulus increases with aging time.
Compared to the value reached after one hour, the modulus has increased by approximately
≈13.5% after 200 hours.
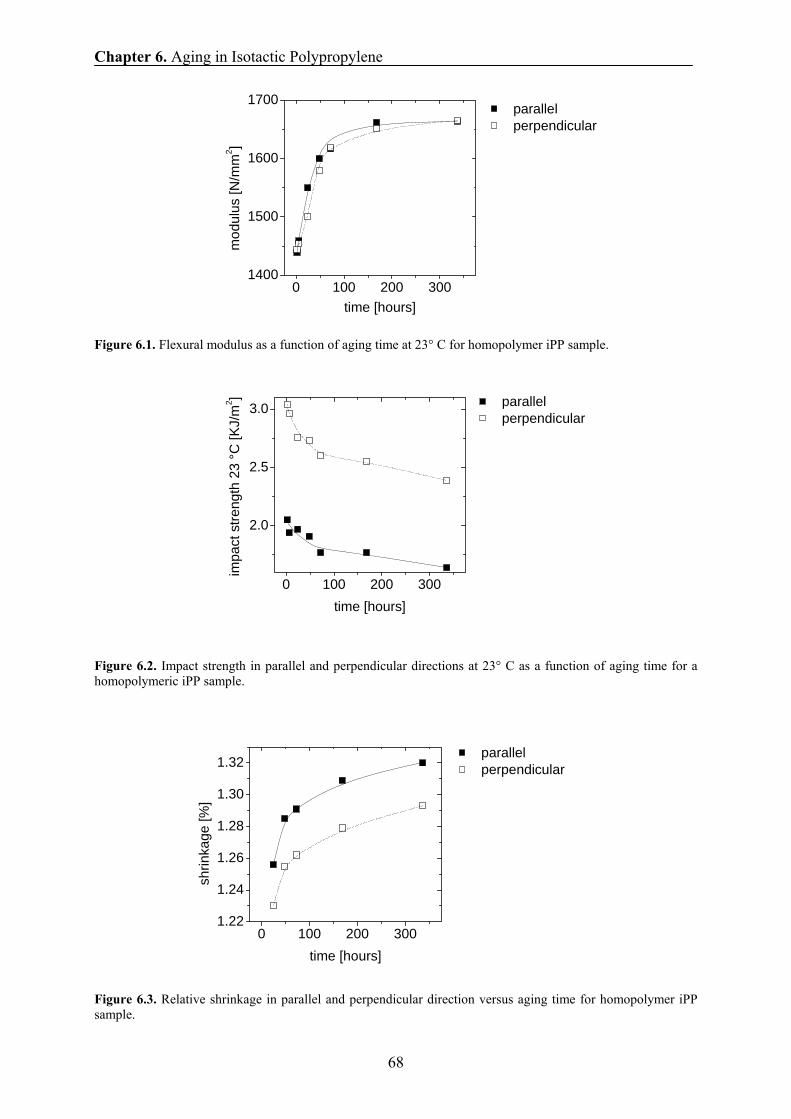
Chapter 6. Aging in Isotactic Polypropylene
68
Figure 6.1. Flexural modulus as a function of aging time at 23° C for homopolymer iPP sample.
Figure 6.2. Impact strength in parallel and perpendicular directions at 23° C as a function of aging time for a homopolymeric iPP sample.
Figure 6.3. Relative shrinkage in parallel and perpendicular direction versus aging time for homopolymer iPP sample.
0 100 200 3001.22
1.24
1.26
1.28
1.30
1.32
shrin
kage
[%]
time [hours]
parallel perpendicular
0 100 200 3001400
1500
1600
1700
mod
ulus
[N/m
m2 ]
time [hours]
parallel perpendicular
0 100 200 300
2.0
2.5
3.0
impa
ct s
treng
th 2
3 °C
[KJ/
m2 ]
time [hours]
parallel perpendicular
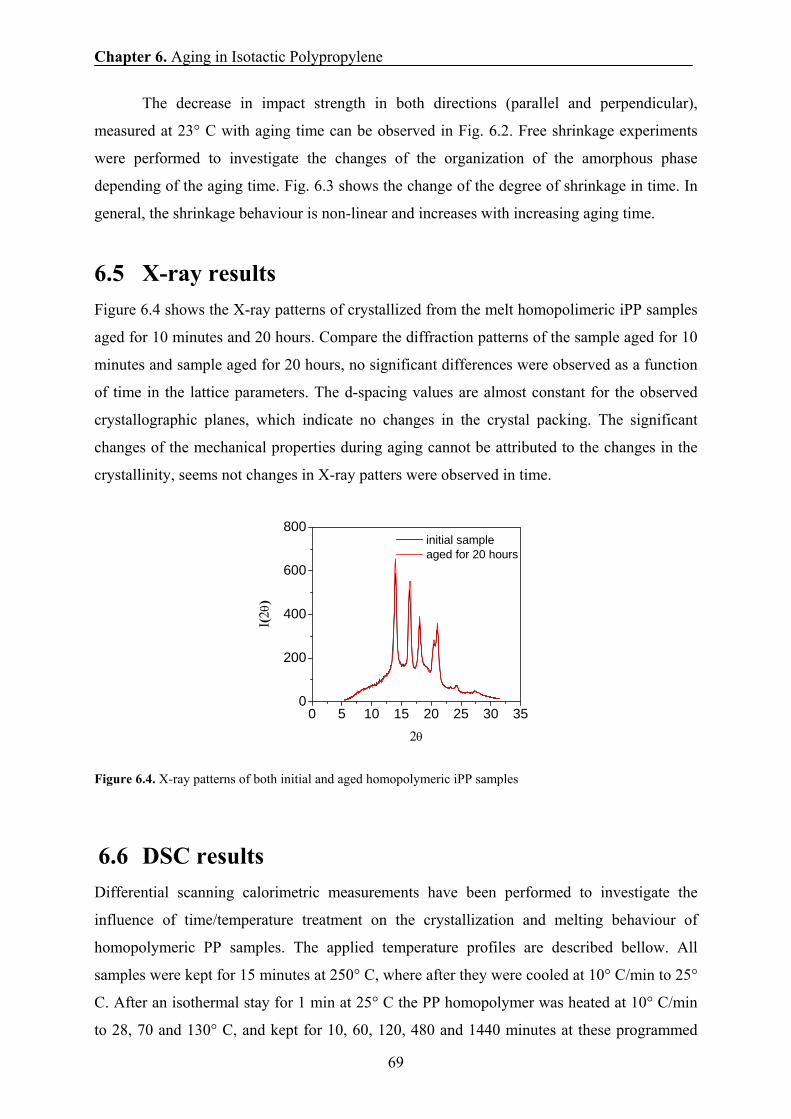
Chapter 6. Aging in Isotactic Polypropylene
69
The decrease in impact strength in both directions (parallel and perpendicular),
measured at 23° C with aging time can be observed in Fig. 6.2. Free shrinkage experiments
were performed to investigate the changes of the organization of the amorphous phase
depending of the aging time. Fig. 6.3 shows the change of the degree of shrinkage in time. In
general, the shrinkage behaviour is non-linear and increases with increasing aging time.
6.5 X-ray results Figure 6.4 shows the X-ray patterns of crystallized from the melt homopolimeric iPP samples
aged for 10 minutes and 20 hours. Compare the diffraction patterns of the sample aged for 10
minutes and sample aged for 20 hours, no significant differences were observed as a function
of time in the lattice parameters. The d-spacing values are almost constant for the observed
crystallographic planes, which indicate no changes in the crystal packing. The significant
changes of the mechanical properties during aging cannot be attributed to the changes in the
crystallinity, seems not changes in X-ray patters were observed in time.
Figure 6.4. X-ray patterns of both initial and aged homopolymeric iPP samples
6.6 DSC results
Differential scanning calorimetric measurements have been performed to investigate the
influence of time/temperature treatment on the crystallization and melting behaviour of
homopolymeric PP samples. The applied temperature profiles are described bellow. All
samples were kept for 15 minutes at 250° C, where after they were cooled at 10° C/min to 25°
C. After an isothermal stay for 1 min at 25° C the PP homopolymer was heated at 10° C/min
to 28, 70 and 130° C, and kept for 10, 60, 120, 480 and 1440 minutes at these programmed
0 5 10 15 20 25 30 350
200
400
600
800 initial sample aged for 20 hours
I(2θ
)
2θ
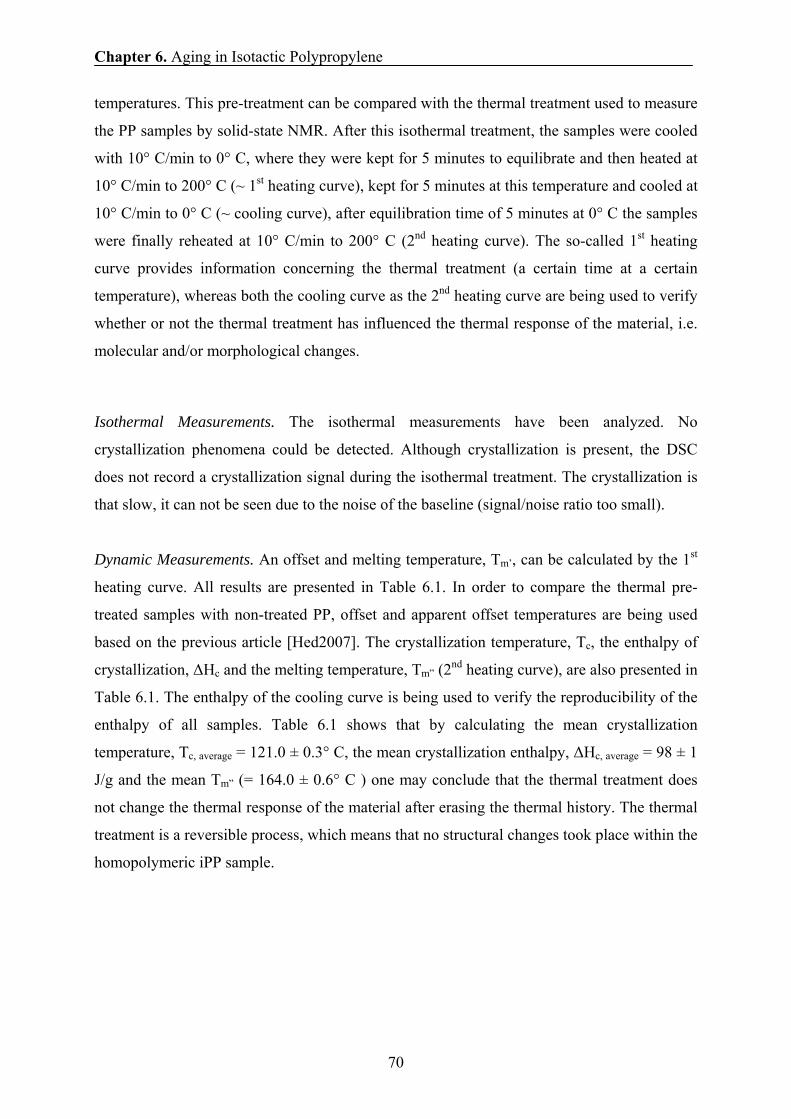
Chapter 6. Aging in Isotactic Polypropylene
70
temperatures. This pre-treatment can be compared with the thermal treatment used to measure
the PP samples by solid-state NMR. After this isothermal treatment, the samples were cooled
with 10° C/min to 0° C, where they were kept for 5 minutes to equilibrate and then heated at
10° C/min to 200° C (~ 1st heating curve), kept for 5 minutes at this temperature and cooled at
10° C/min to 0° C (~ cooling curve), after equilibration time of 5 minutes at 0° C the samples
were finally reheated at 10° C/min to 200° C (2nd heating curve). The so-called 1st heating
curve provides information concerning the thermal treatment (a certain time at a certain
temperature), whereas both the cooling curve as the 2nd heating curve are being used to verify
whether or not the thermal treatment has influenced the thermal response of the material, i.e.
molecular and/or morphological changes.
Isothermal Measurements. The isothermal measurements have been analyzed. No
crystallization phenomena could be detected. Although crystallization is present, the DSC
does not record a crystallization signal during the isothermal treatment. The crystallization is
that slow, it can not be seen due to the noise of the baseline (signal/noise ratio too small).
Dynamic Measurements. An offset and melting temperature, Tm’, can be calculated by the 1st
heating curve. All results are presented in Table 6.1. In order to compare the thermal pre-
treated samples with non-treated PP, offset and apparent offset temperatures are being used
based on the previous article [Hed2007]. The crystallization temperature, Tc, the enthalpy of
crystallization, ΔHc and the melting temperature, Tm” (2nd heating curve), are also presented in
Table 6.1. The enthalpy of the cooling curve is being used to verify the reproducibility of the
enthalpy of all samples. Table 6.1 shows that by calculating the mean crystallization
temperature, Tc, average = 121.0 ± 0.3° C, the mean crystallization enthalpy, ΔHc, average = 98 ± 1
J/g and the mean Tm” (= 164.0 ± 0.6° C ) one may conclude that the thermal treatment does
not change the thermal response of the material after erasing the thermal history. The thermal
treatment is a reversible process, which means that no structural changes took place within the
homopolymeric iPP sample.
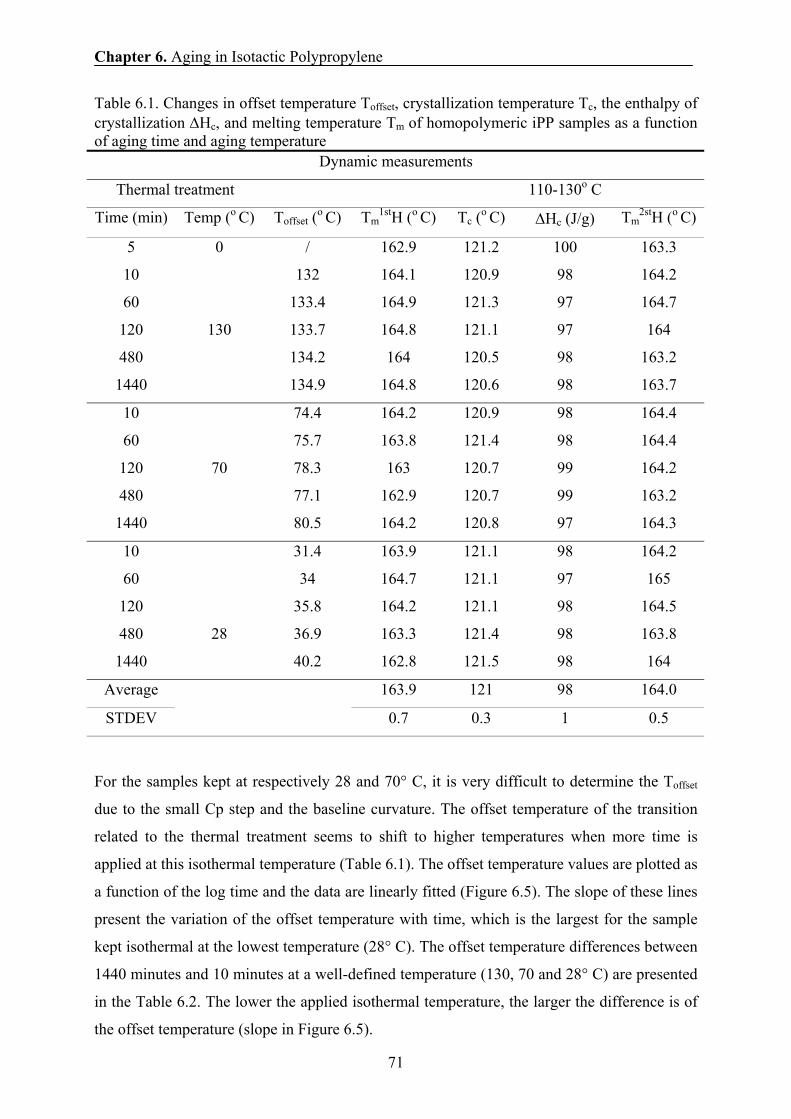
Chapter 6. Aging in Isotactic Polypropylene
71
Table 6.1. Changes in offset temperature Toffset, crystallization temperature Tc, the enthalpy of crystallization ΔHc, and melting temperature Tm of homopolymeric iPP samples as a function of aging time and aging temperature
Dynamic measurements
Thermal treatment 110-130o C
Time (min) Temp (o C) Toffset (o C) Tm1stH (o C) Tc (o C) ΔHc (J/g) Tm
2stH (o C)
5 0 / 162.9 121.2 100 163.3
10 132 164.1 120.9 98 164.2
60 133.4 164.9 121.3 97 164.7
120 133.7 164.8 121.1 97 164
480 134.2 164 120.5 98 163.2
1440
130
134.9 164.8 120.6 98 163.7
10 74.4 164.2 120.9 98 164.4
60 75.7 163.8 121.4 98 164.4
120 78.3 163 120.7 99 164.2
480 77.1 162.9 120.7 99 163.2
1440
70
80.5 164.2 120.8 97 164.3
10 31.4 163.9 121.1 98 164.2
60 34 164.7 121.1 97 165
120 35.8 164.2 121.1 98 164.5
480 36.9 163.3 121.4 98 163.8
1440
28
40.2 162.8 121.5 98 164
Average 163.9 121 98 164.0
STDEV
0.7 0.3 1 0.5
For the samples kept at respectively 28 and 70° C, it is very difficult to determine the Toffset
due to the small Cp step and the baseline curvature. The offset temperature of the transition
related to the thermal treatment seems to shift to higher temperatures when more time is
applied at this isothermal temperature (Table 6.1). The offset temperature values are plotted as
a function of the log time and the data are linearly fitted (Figure 6.5). The slope of these lines
present the variation of the offset temperature with time, which is the largest for the sample
kept isothermal at the lowest temperature (28° C). The offset temperature differences between
1440 minutes and 10 minutes at a well-defined temperature (130, 70 and 28° C) are presented
in the Table 6.2. The lower the applied isothermal temperature, the larger the difference is of
the offset temperature (slope in Figure 6.5).
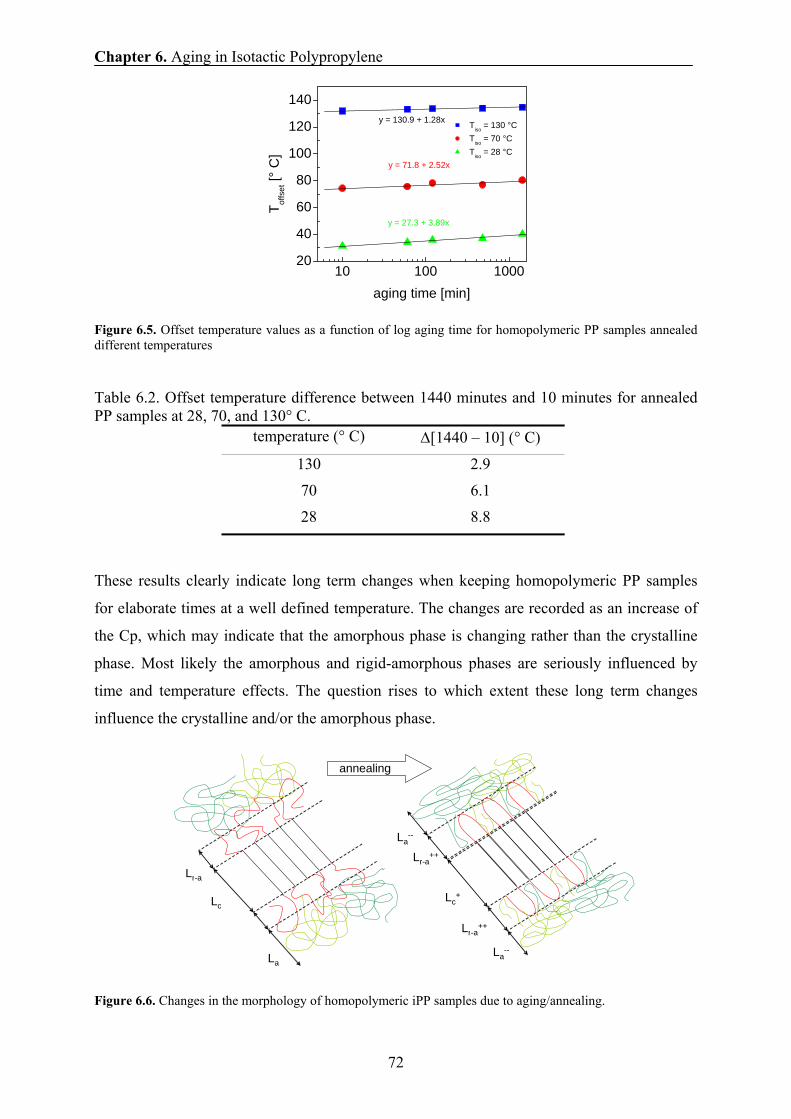
Chapter 6. Aging in Isotactic Polypropylene
72
Figure 6.5. Offset temperature values as a function of log aging time for homopolymeric PP samples annealed different temperatures
Table 6.2. Offset temperature difference between 1440 minutes and 10 minutes for annealed PP samples at 28, 70, and 130° C.
temperature (° C) Δ[1440 – 10] (° C)
130 2.9
70 6.1
28 8.8
These results clearly indicate long term changes when keeping homopolymeric PP samples
for elaborate times at a well defined temperature. The changes are recorded as an increase of
the Cp, which may indicate that the amorphous phase is changing rather than the crystalline
phase. Most likely the amorphous and rigid-amorphous phases are seriously influenced by
time and temperature effects. The question rises to which extent these long term changes
influence the crystalline and/or the amorphous phase.
Figure 6.6. Changes in the morphology of homopolymeric iPP samples due to aging/annealing.
10 100 100020
40
60
80
100
120
140
Tiso = 130 °C Tiso = 70 °C Tiso = 28 °C
y = 27.3 + 3.89x
y = 71.8 + 2.52x
T offs
et [°
C]
aging time [min]
y = 130.9 + 1.28x
annealing
Lc
La
L r-aLc
+
La--
Lr-a++
La--
Lr-a++
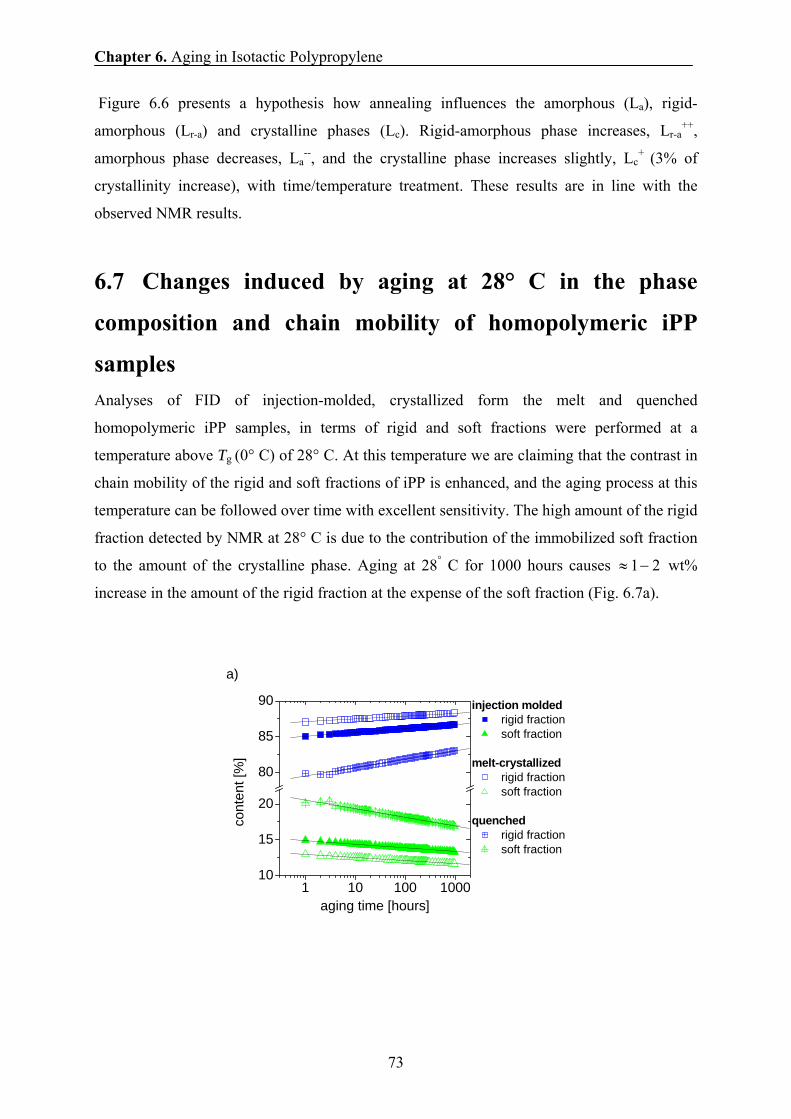
Chapter 6. Aging in Isotactic Polypropylene
73
Figure 6.6 presents a hypothesis how annealing influences the amorphous (La), rigid-
amorphous (Lr-a) and crystalline phases (Lc). Rigid-amorphous phase increases, Lr-a++,
amorphous phase decreases, La--, and the crystalline phase increases slightly, Lc
+ (3% of
crystallinity increase), with time/temperature treatment. These results are in line with the
observed NMR results.
6.7 Changes induced by aging at 28° C in the phase
composition and chain mobility of homopolymeric iPP
samples Analyses of FID of injection-molded, crystallized form the melt and quenched
homopolymeric iPP samples, in terms of rigid and soft fractions were performed at a
temperature above Tg (0° C) of 28° C. At this temperature we are claiming that the contrast in
chain mobility of the rigid and soft fractions of iPP is enhanced, and the aging process at this
temperature can be followed over time with excellent sensitivity. The high amount of the rigid
fraction detected by NMR at 28° C is due to the contribution of the immobilized soft fraction
to the amount of the crystalline phase. Aging at 28° C for 1000 hours causes 21−≈ wt%
increase in the amount of the rigid fraction at the expense of the soft fraction (Fig. 6.7a).
1 10 100 100010
15
20
80
85
90 injection molded rigid fraction soft fraction
melt-crystallized rigid fraction soft fraction
quenched rigid fraction soft fraction
cont
ent [
%]
aging time [hours]
a)
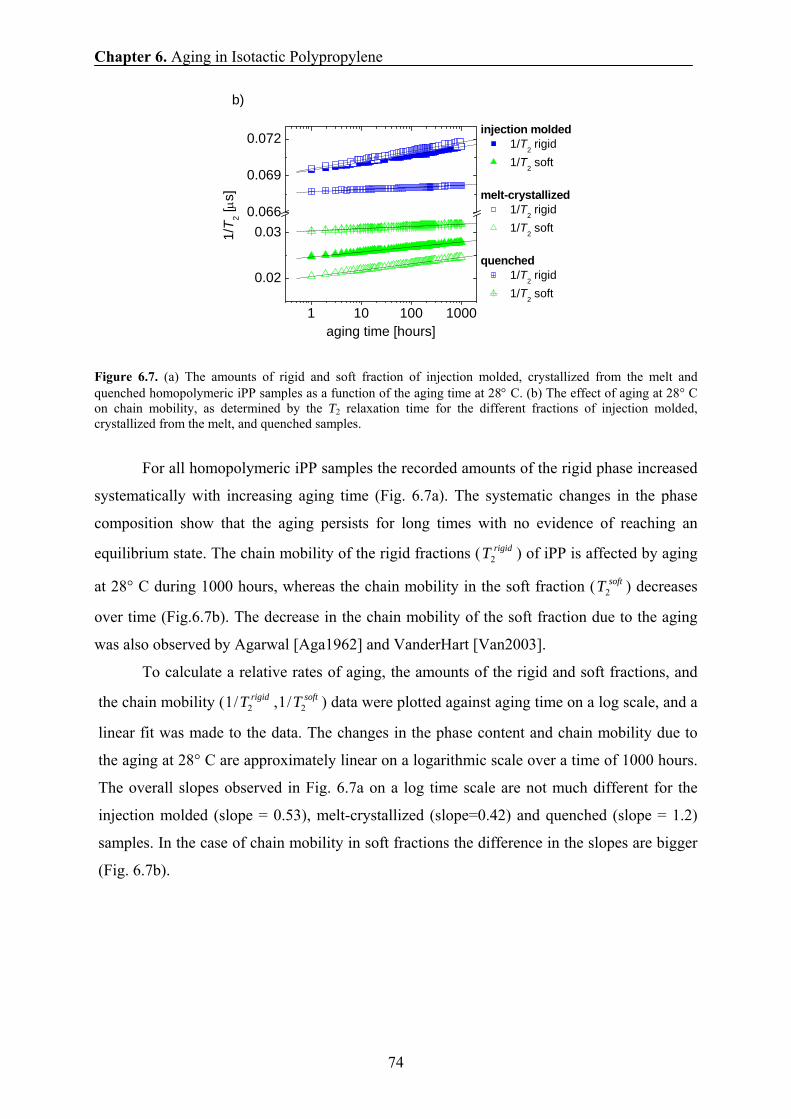
Chapter 6. Aging in Isotactic Polypropylene
74
Figure 6.7. (a) The amounts of rigid and soft fraction of injection molded, crystallized from the melt and quenched homopolymeric iPP samples as a function of the aging time at 28° C. (b) The effect of aging at 28° C on chain mobility, as determined by the T2 relaxation time for the different fractions of injection molded, crystallized from the melt, and quenched samples.
For all homopolymeric iPP samples the recorded amounts of the rigid phase increased
systematically with increasing aging time (Fig. 6.7a). The systematic changes in the phase
composition show that the aging persists for long times with no evidence of reaching an
equilibrium state. The chain mobility of the rigid fractions ( rigidT2 ) of iPP is affected by aging
at 28° C during 1000 hours, whereas the chain mobility in the soft fraction ( softT2 ) decreases
over time (Fig.6.7b). The decrease in the chain mobility of the soft fraction due to the aging
was also observed by Agarwal [Aga1962] and VanderHart [Van2003].
To calculate a relative rates of aging, the amounts of the rigid and soft fractions, and
the chain mobility ( rigidT2/1 , softT2/1 ) data were plotted against aging time on a log scale, and a
linear fit was made to the data. The changes in the phase content and chain mobility due to
the aging at 28° C are approximately linear on a logarithmic scale over a time of 1000 hours.
The overall slopes observed in Fig. 6.7a on a log time scale are not much different for the
injection molded (slope = 0.53), melt-crystallized (slope=0.42) and quenched (slope = 1.2)
samples. In the case of chain mobility in soft fractions the difference in the slopes are bigger
(Fig. 6.7b).
1 10 100 1000
0.02
0.030.066
0.069
0.072injection molded
1/T2 rigid 1/T2 soft
melt-crystallized 1/T2 rigid 1/T2 soft
quenched 1/T2 rigid 1/T2 soft
1/T 2 [μ
s]
aging time [hours]
b)
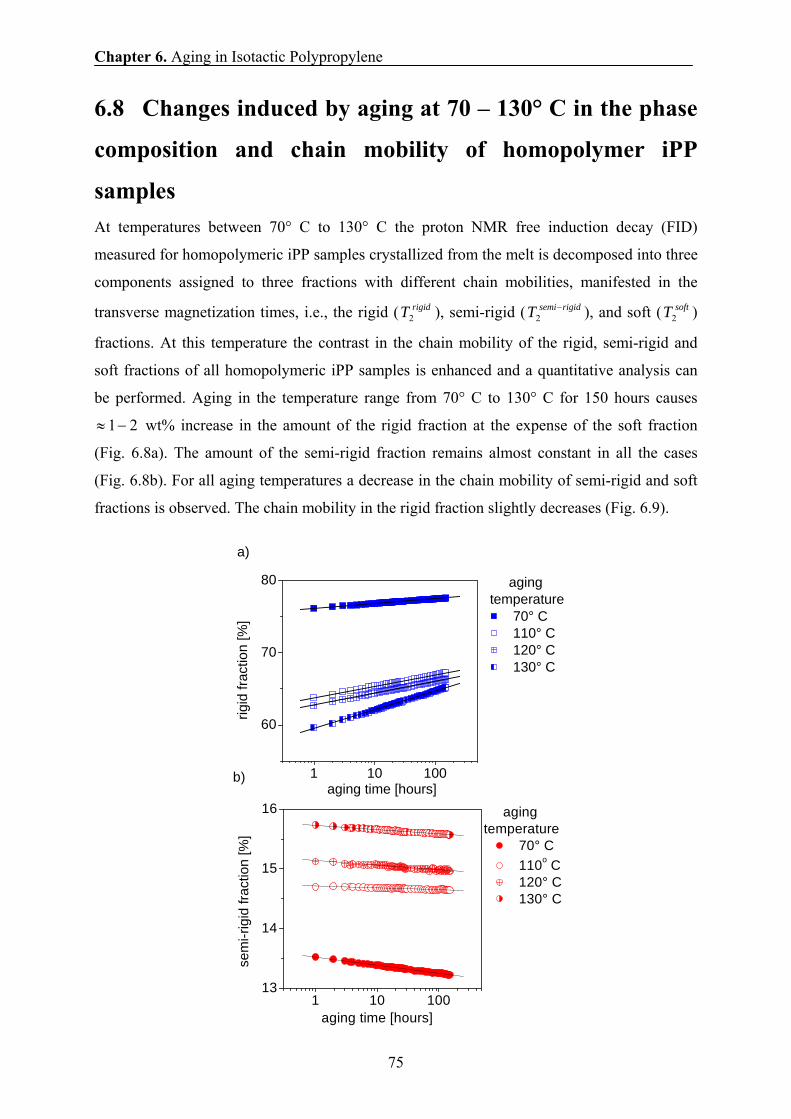
Chapter 6. Aging in Isotactic Polypropylene
75
6.8 Changes induced by aging at 70 – 130° C in the phase
composition and chain mobility of homopolymer iPP
samples At temperatures between 70° C to 130° C the proton NMR free induction decay (FID)
measured for homopolymeric iPP samples crystallized from the melt is decomposed into three
components assigned to three fractions with different chain mobilities, manifested in the
transverse magnetization times, i.e., the rigid ( rigidT2 ), semi-rigid ( rigidsemiT −2 ), and soft ( softT2 )
fractions. At this temperature the contrast in the chain mobility of the rigid, semi-rigid and
soft fractions of all homopolymeric iPP samples is enhanced and a quantitative analysis can
be performed. Aging in the temperature range from 70° C to 130° C for 150 hours causes
21−≈ wt% increase in the amount of the rigid fraction at the expense of the soft fraction
(Fig. 6.8a). The amount of the semi-rigid fraction remains almost constant in all the cases
(Fig. 6.8b). For all aging temperatures a decrease in the chain mobility of semi-rigid and soft
fractions is observed. The chain mobility in the rigid fraction slightly decreases (Fig. 6.9).
1 10 100
60
70
80 aging temperature
70° C 110° C 120° C 130° C
rigid
frac
tion
[%]
aging time [hours]
a)
1 10 10013
14
15
16 aging temperature
70° C 110o C 120° C 130° C
sem
i-rig
id fr
actio
n [%
]
aging time [hours]
b)
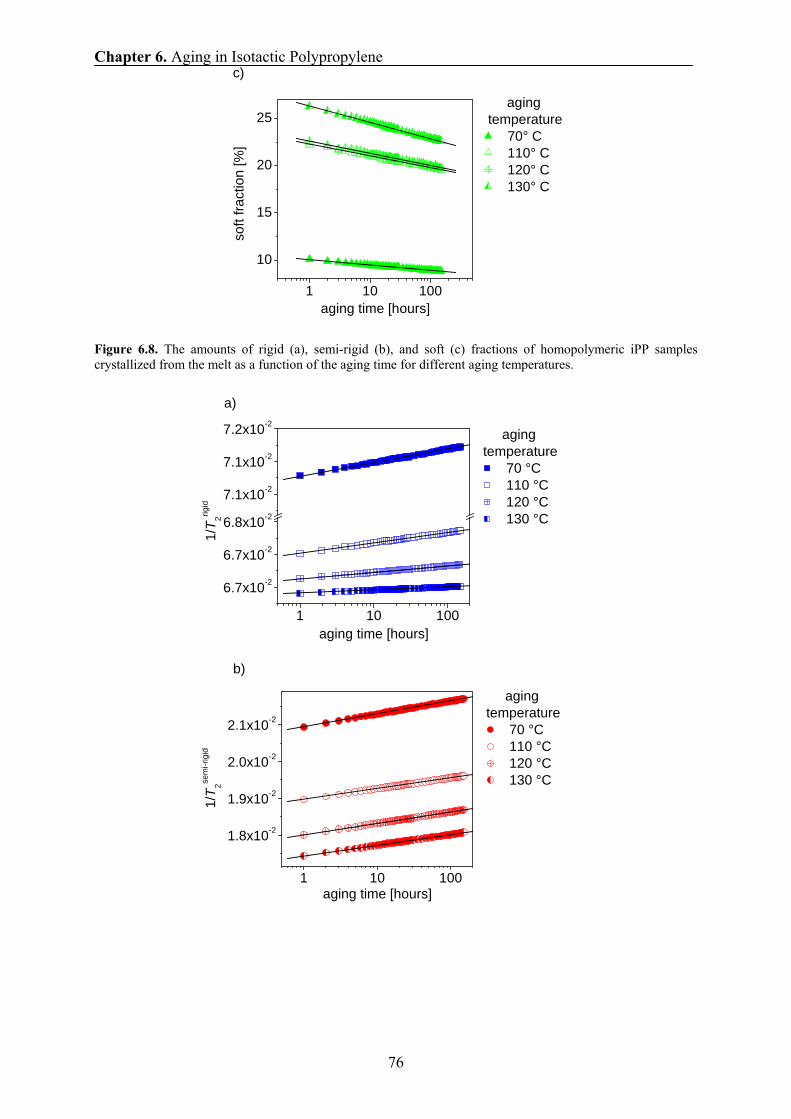
Chapter 6. Aging in Isotactic Polypropylene
76
Figure 6.8. The amounts of rigid (a), semi-rigid (b), and soft (c) fractions of homopolymeric iPP samples crystallized from the melt as a function of the aging time for different aging temperatures.
1 10 100
10
15
20
25 aging temperature
70° C 110° C 120° C 130° C
soft
fract
ion
[%]
aging time [hours]
c)
1 10 100
6.7x10⁻²
6.7x10⁻²
6.8x10⁻²
7.1x10⁻²
7.1x10⁻²
7.2x10⁻² aging temperature
70 °C 110 °C 120 °C 130 °C
1/T 2rig
id
aging time [hours]
a)
1 10 100
1.8x10⁻²
1.9x10⁻²
2.0x10⁻²
2.1x10⁻²
aging temperature
70 °C 110 °C 120 °C 130 °C
1/T 2se
mi-r
igid
aging time [hours]
b)
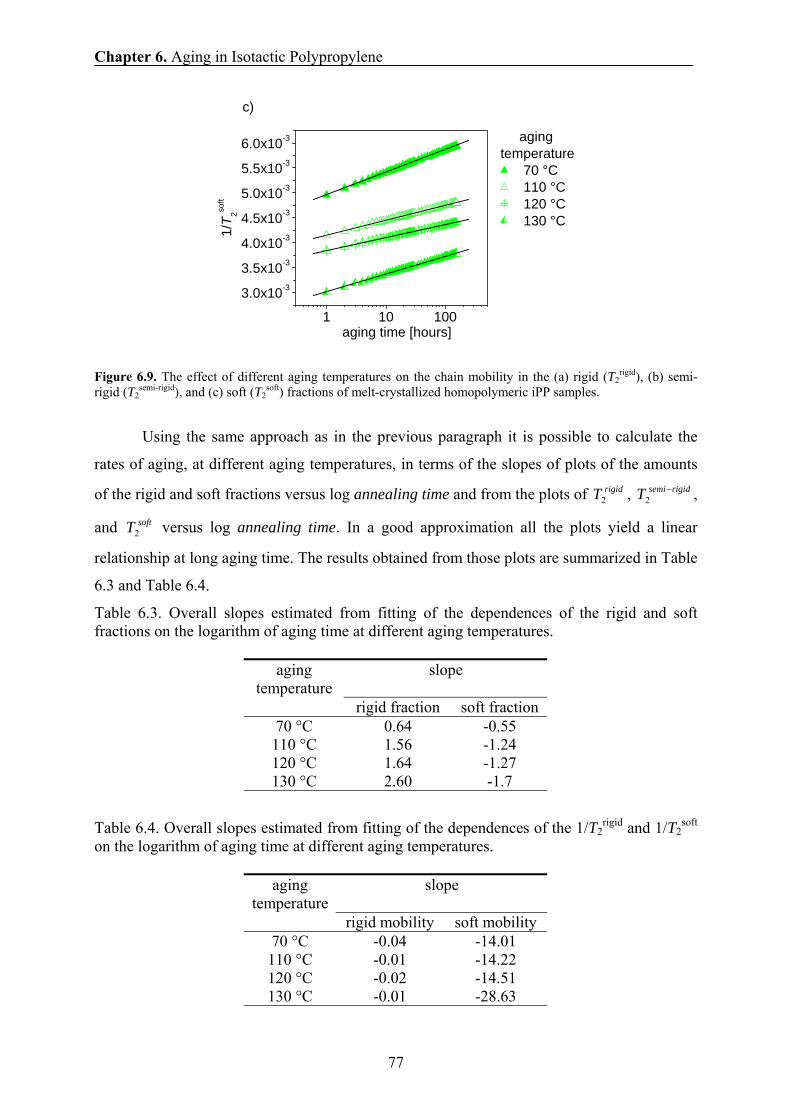
Chapter 6. Aging in Isotactic Polypropylene
77
Figure 6.9. The effect of different aging temperatures on the chain mobility in the (a) rigid (T2
rigid), (b) semi-rigid (T2
semi-rigid), and (c) soft (T2soft) fractions of melt-crystallized homopolymeric iPP samples.
Using the same approach as in the previous paragraph it is possible to calculate the
rates of aging, at different aging temperatures, in terms of the slopes of plots of the amounts
of the rigid and soft fractions versus log annealing time and from the plots of rigidT2 , rigidsemiT −2 ,
and softT2 versus log annealing time. In a good approximation all the plots yield a linear
relationship at long aging time. The results obtained from those plots are summarized in Table
6.3 and Table 6.4.
Table 6.3. Overall slopes estimated from fitting of the dependences of the rigid and soft fractions on the logarithm of aging time at different aging temperatures.
aging temperature
slope
rigid fraction soft fraction 70 °C 0.64 -0.55 110 °C 1.56 -1.24 120 °C 1.64 -1.27 130 °C 2.60 -1.7
Table 6.4. Overall slopes estimated from fitting of the dependences of the 1/T2rigid and 1/T2
soft on the logarithm of aging time at different aging temperatures.
aging temperature
slope
rigid mobility soft mobility 70 °C -0.04 -14.01 110 °C -0.01 -14.22 120 °C -0.02 -14.51 130 °C -0.01 -28.63
1 10 100
3.0x10⁻³
3.5x10⁻³
4.0x10⁻³
4.5x10⁻³
5.0x10⁻³
5.5x10⁻³
6.0x10⁻³ aging temperature
70 °C 110 °C 120 °C 130 °C
1/T 2so
ft
aging time [hours]
c)
Chapter 6. Aging in Isotactic Polypropylene
78
6.9 Discussion: physical aging in homopolymeric iPP
samples by NMR and mechanical analysis [Hed2007] has reported that the morphology of isotactic polypropylene at temperatures well
above the glass transition can be described by a three phases model of rigid, semi-rigid and
soft phases. At temperatures close to 25° C the morphology of iPP can be described by a two-
phase model of rigid and soft fractions. The amounts and chain mobility of each fraction are
important parameters regarding the physical and mechanical properties of iPP. Those
quantities typically change when the sample is exposed to temperatures well above the glass
transition due to aging and annealing [Hik1997, Ala1999, Aki1999, Mar2000, Iji2000,
Mai2000, Weg2000, Ali2001, Lab2001]. It is known that the aging of iPP samples after the
fabrication causes changes in the structure and properties of the materials. This process has
been employed to improve the final properties of the polymers via healing of defects and
relaxing residual stress and strain. The observed changes in the mechanical properties (Fig.
6.1, 6.2, 6.3) with the aging time indicate that micro-structural reorganization take place
within the material. An increase in elastic modulus has been observed (Fig. 6.1), while the
impact strength decreases (Fig. 6.2) with increasing aging time. The decrease in the impact
strength is associated with an increasing the amount of the rigid fraction during aging.
Property changes occurring upon aging are generally attributed to the relaxation process in the
amorphous phase, leading to a reduction in free volume (Fig. 6.3), which will be recovered at
higher temperatures, implying that aging is a fully thermoreversible process. The mechanical
data imply that aging restricts the motion of the polymer chains, and a good way of probing
such changes is to study isothermally the changes in the NMR signal for a long period of
time.
In order to follow with high sensitivity the changes in the structure at 28° C the
amounts and the chain mobility of the rigid and soft fractions are plotted versus log annealing
time. When the sample is exposed at temperature of 28° C for 1000 hours after preparation the
amount of the rigid fraction gradually increase in time at the expense of the soft fraction (Fig.
6.7ab). In contrast to the characteristic values describing the mechanical behaviour, the
increase in the amount of the rigid fraction is not very pronounced and is not sufficient to
attribute the significant enhancement of mechanical properties during aging just to the
secondary crystallization. The chain mobility of the rigid fraction remains almost constant and
the chain mobility of the soft fraction decreases with time.
Chapter 6. Aging in Isotactic Polypropylene
79
Based on information from Fig. 6.7b, it is plausible to conclude that the aging at 28o C
influences mainly the soft fraction of all homopolymer iPP samples, and the soft fraction
becomes more restricted possibly due to molecular ordering. Our observations are in line with
Struik’s model [Str1987]. The information provided by Fig. 6.7(a) and (b), with the available
level of resolution, indicates that the aging rate is higher in the case of injection moulded and
quenched homopolymeric iPP compared to the material crystallized from the melt. From these
results we can conclude that important factors determining aging are the morphology of the
sample, and a relationship between the physical aging kinetics and the relative amount of the
soft fraction. At 28 °C we cannot conclude about the changes in the semi-rigid fraction due to
aging, because at this temperature the NMR signal can be decomposed into only two
components.
In order to study the changes in the semi-rigid fraction due to aging, the temperature
of the aging and NMR experiment was set within 70° C to 130° C. Increasing the aging
temperature from 28° C to 70 - 130° C allows molecular motions to occur, which may lead to
structural rearrangements and the observation of the phenomenon of physical aging.
According to the results shown in Figure 6.5, Figure 6.8 and Figure 6.9, it is plausible to
conclude that in homopolymeric iPP samples crystallized from the melt physical aging
influences both the semi-rigid and soft fractions. These changes can be due to the small
crystals formed by secondary-crystallization, which hinder the mobility of the soft fraction.
The NMR data are consistent with the possibility of the formation of the small crystals, but do
not prove this type of structure. Based on the chain mobility considerations, the formation of
the new crystals, due to the secondary crystallization, takes place mainly in the semi-rigid and
soft fractions, where the chain mobility decreases with increasing the aging time. No evidence
of formation of thinner lamellae growing between the primary one due to aging is pointed out
by X-ray data (Figure 6.4) Based on the results summarized in Table 6.3 and Table 6.4 the
aging rates increase with increasing aging temperature.
The combination of results from NMR, DSC, X-ray and mechanical properties as a
function of the age of the polymer on the basis of the current understanding of the dependence
of those parameters on the polymer structure suggest an explicit interpretation of the changes
in the structure, which accounts for the variation of the properties during aging. The structural
changes are considered to be associated with a molecular rearrangement generally similar to
secondary crystallization accompanied by a decrease in segmental chain mobility of the
amorphous chains involved in the diffusion process. A decrease in the segmental chain
mobility, by increasing the structural packing density in the amorphous or intercrystalline
Chapter 6. Aging in Isotactic Polypropylene
80
regions due to the aging, results in an increase in the elastic modulus (see Fig. 6.1.). Tobolsky
[Tob1965] states that for polypropylene and another semi-crystalline polymers, the crystalline
regions act in part like crosslinks, thereby tending to increase the modulus by increasing the
resiliency contributions of the amorphous or semi-rigid regions. The effect of the formations
of small crystals due to secondary crystallization may therefore be viewed as effectively
increasing the modulus.
6.10 Conclusions In this chapter, we have investigated the influence of morphology, aging time, and aging
temperature on the physical aging behaviour of homopolymeric iPP samples. We
characterized the morphology in terms of the two- and three-phase model comprising rigid
and soft phases, and rigid, semi-rigid and soft phases, respectively. Injection molded,
crystallized from the melt, and quenched homopolymeric iPP samples provided us with
specimens of widely differing morphologies. Crystallization from the melt resulted in a
relatively lower amount of the soft fraction. This is consistent with a lower degree of
constraints imposed by the crystallites on the mobility of the noncrystalline chain segments
when crystallization occurs under conditions of high segmental mobility.
The extent and kinetics of physical aging in these samples were characterized
following the changing in the phase content and chain mobility with time. These changes in
the amounts of the rigid, semi-rigid, and soft fractions, and chain mobility in each fraction
( rigidT2/1 , rigidsemiT −2/1 and softT2/1 ) displayed a linear dependence on log(aging time). The
changes in the phase content and chain mobility with time indicated that the extent of physical
aging in semi-crystalline homopolymer iPP samples is significant and easily quantifiable. As
a result, physical aging must be considered as an important factor when semi-crystalline iPP
samples are designed for use in applications that involve prolonged exposure to above-
ambient temperatures.
We have observed that the chain relaxation rate in semi-crystalline homopolymeric
iPP is sensitive to the relative amounts of the semi-rigid and soft factions. Specifically, for a
given aging history, the chain relaxation rate was observed to increase in the samples with a
more stable thermodynamic morphology. This observation raises the possibility that the aging
takes place primarily in regions of highest mobility that are more distant from the fold surface
of the primary crystallites. The observation reported here also suggests that the
conformational entropic state of the semi-rigid and soft fractions is more relevant to physical
Chapter 6. Aging in Isotactic Polypropylene
81
aging in semi-crystalline polymers than the proximity of the aging temperature to their
respective glass transition temperatures.
Chapter 6. Aging in Isotactic Polypropylene
82
Chapter 7. Uniaxially Deformed Isotactic Polypropylene
83
Chapter 7
Uniaxially Deformed Isotactic Polypropylene 7.1 Introduction and motivation The mechanical properties of semi-crystalline polymers are strongly affected by changes in
the degree of crystallinity due to variations in the molecular structure, different processing
conditions and loading conditions [Pop1987, Hal1972, Boy1979, Boy1983, Str1980,
Man1964, Man1985, Neg1992, Wor1996, Boy1984, Boy1985]. Loading conditions include
the drawing temperature, draw ratio, and the strain rate [Bel1993, Gos1996, Sil1998]. The
deformation process of semi-crystalline polymers has been extensively investigated for many
years using a variety of methods [Fis1962, Pet1967, Hay1965, Pet1967, Pet1969, Fis1969,
Ste1969]. When semi-crystalline polymers are highly drawn, the shear forces destroy the
spherulites. This is followed by the reorganization of the spherulitic morphology to another
type of morphology depending on the material drawn and the drawing conditions. Several
modes of deformation above glass transition temperature have been identified in semi-
crystalline polymers. According to Flory and Yoon [Flo1978], the plastic deformation occurs
by partial melting and re-crystallization of the crystalline phase. However, according to
Peterlin [Pet1973] the plastic deformation during the application of stress occurs in three
stages. In the first stage, the plastic deformation of the original spherulitic structure occurs.
The deformation occurs by strain of the interlamellar soft regions with a combination of
interlamellar separation, lamellae stack rotation, interlamellar shear deformation and
cavitation [Li1999, Lin1974, Zha2000]. In the second stage, the discontinuous transformation
of the spherulitic structure to a fibrillar morphology takes place. During this stage, the
lamellae in micronecks are fragmented and the broken crystal blocks are incorporated into
newly formed microfibrils. In uniaxial drawing, the blocks are not only oriented into the
drawing direction, but also in the direction perpendicular to it [Bra1986]. The chains
connecting the broken crystal blocks in the lamellae serve as intramicrofibrillar tie molecules.
In the third stage, the plastic deformation of the fibrilar structure occurs. The drawing of the
microfibrillar structure [Pet1973] is completely different from the initial plastic deformation
that transforms the lamellae into the microfibrillar morphology. The thickness of the fibrils
changes almost proportionally to the draw ratio, as a consequence of the much smaller shear
Chapter 7. Uniaxially Deformed Isotactic Polypropylene
84
displacement of the constituting microfibrils, caused by the shear stress on the fibrils [Pet
1987].
Crystallinity, molecular mobility, lamellar thickness and structural orientation in both
soft and crystalline phases are important parameters regarding the physical and mechanical
properties of stretched and non-stretched iPP. There are several methods for the structural
characterization of the soft and crystalline phases of the polymers. One of the methods - solid-
state NMR - is capable of characterizing the crystallinity, the molecular mobility, domain
thickness and specifically the orientation distribution function of semi-crystalline polymers
[Sch1994, Sch1991, Gun1992, Kiv1986, Bud2003, Ba1998, Che2005, Gol1961, Dem1996].
Another method is IR spectroscopy, widely used to determine the degree of crystallinity of
iPP [Hei1959, Sam1981, Kis1983]. Knowledge of strain-induced order in the crystalline and
soft phases of stretched iPP under various conditions is valuable information for
understanding the structure reorganization mechanisms, and their relation to the mechanical
properties of iPP.
Wide-angle X-ray diffraction (WAXD) provides information about the crystal lattice
order, strain-induced changes in orientation of crystalline domains, and highly oriented
crystalline structures in the fibrilar morphology generated in the neck part of uniaxially
stretched polymers [Men2003]. Very little information about strain-induced changes in the
soft component can be obtained from WAXD. Small angle X-ray scattering (SAXS) provides
information about lamellae packing, orientation, and long period [Zhu2004, Wen1993,
Zhu2005, Mez1994, Aur2001].
The spectroscopic evidence from infrared (IR) and NMR for structural reorganization
during deformation is rather indirect as far as morphology is concerned. Transmission
electron microscopy (TEM) yields direct access to the details of the lamellar morphology
[Yam1998, Zho2005]. It is thought that IR and NMR are complementary techniques
providing morphological evidence on nanometer scale phenomena for stretched iPP, the phase
composition, molecular mobility and the orientation. In a recent investigation on iPP by
NMR, SAXS, WAXD, DSC and TEM [Hed2007] the phase composition, chain mobility, and
domain thicknesses were correlated.
The focus of this chapter is to study the change in the phase composition/crystallinity,
molecular mobility, and lamellae thicknesses in iPP upon uniaxial drawing at different
drawing temperatures and rates. Two complementary methods, 1H solid-state NMR and IR,
are used. The study largely focuses on strain-induced changes in the soft phase that have not
been analyzed previously in detail.
Chapter 7. Uniaxially Deformed Isotactic Polypropylene
85
7.2 Materials The isotactic polypropylene (iPP-PP575P) homopolymer samples that were used for the
present study were manufactured by SABIC Europe BV. The material is characterized by a
melt flow index of 10g/10 min. It was injected moulded into plates of 12 cm x12 cm and 4
mm thickness using an Engel 45A machine. The melt temperature was set to 235° C, the
holding pressure, the holding time, the cooling time and the overall cycle time were 40 MPa,
20 s, 20 s and 49.5 s, respectively.
Dog - bone shaped tensile bars with a length of 70 mm, thickness of 4 mm and gauge
dimensions of 20 mm length were cut from the injection moulded iPP plates. The samples
were uniaxially stretched at different temperatures (25° C, 80° C, and 110° C) and different
rates (1, 10, 50, 100 mm/min) to draw ratios in the range of λ = 7 – 16 using a Zwick Z050
tensile machine. Based on the literature information [Pet1971] we assume that in this
deformation range the spherulitic structure is transformed into fibrillar structure. Since no
homogeneous neck formation was observed at λ = 1 – 6, samples in this range of strain were
not studied. All the NMR and IR experiments in this study were performed on the neck part of
stretched samples after 2 hours of strain recovery. New tensile bars were used for each NMR
experiment as a function of temperature, strain and deformation rate.
7.3 Stress-strain characteristics Figure 7.1a shows the stress-strain curves for iPP samples that were uniaxially stretched at a
deformation rate of 10 mm/min in a temperature range between 25° C and 110° C. It can be
observed that the deformation behavior of iPP is strongly affected by the temperature. For a
drawing temperature range between 25° C and 110° C typical ductile deformation behavior
with a yield point, neck formation, and propagation, and strain hardening is found. In the low
temperature region a pronounced yield point occurs, which is related to necking and the
inhomogeneous deformation of the iPP samples. At a microscopic scale this corresponds to
the beginning of the transformation of the initial spherulitic morphology into fibrillar
morphology. The higher values of the yield stress at low drawing temperatures can be
explained with increasingly important contributions from the soft phase to strain-induced
changes in the crystalline phase due to the low chain mobility in the soft phase. With
increasing drawing temperature, the yield stress and strain hardening decrease. The strain-
hardening region also becomes less well defined and the yield point becomes diffuse. At high
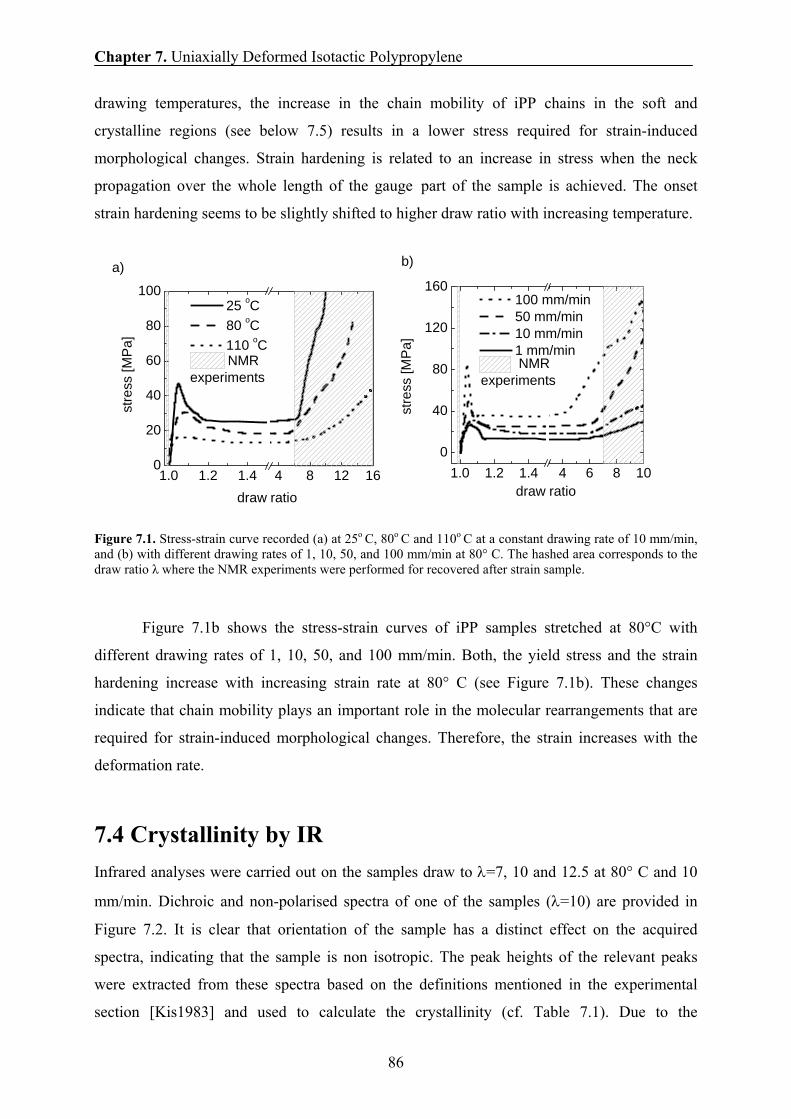
Chapter 7. Uniaxially Deformed Isotactic Polypropylene
86
drawing temperatures, the increase in the chain mobility of iPP chains in the soft and
crystalline regions (see below 7.5) results in a lower stress required for strain-induced
morphological changes. Strain hardening is related to an increase in stress when the neck
propagation over the whole length of the gauge part of the sample is achieved. The onset
strain hardening seems to be slightly shifted to higher draw ratio with increasing temperature.
Figure 7.1. Stress-strain curve recorded (a) at 25o C, 80o C and 110o C at a constant drawing rate of 10 mm/min, and (b) with different drawing rates of 1, 10, 50, and 100 mm/min at 80° C. The hashed area corresponds to the draw ratio λ where the NMR experiments were performed for recovered after strain sample.
Figure 7.1b shows the stress-strain curves of iPP samples stretched at 80°C with
different drawing rates of 1, 10, 50, and 100 mm/min. Both, the yield stress and the strain
hardening increase with increasing strain rate at 80° C (see Figure 7.1b). These changes
indicate that chain mobility plays an important role in the molecular rearrangements that are
required for strain-induced morphological changes. Therefore, the strain increases with the
deformation rate.
7.4 Crystallinity by IR Infrared analyses were carried out on the samples draw to λ=7, 10 and 12.5 at 80° C and 10
mm/min. Dichroic and non-polarised spectra of one of the samples (λ=10) are provided in
Figure 7.2. It is clear that orientation of the sample has a distinct effect on the acquired
spectra, indicating that the sample is non isotropic. The peak heights of the relevant peaks
were extracted from these spectra based on the definitions mentioned in the experimental
section [Kis1983] and used to calculate the crystallinity (cf. Table 7.1). Due to the
1.0 1.2 1.4 4 8 12 160
20
40
60
80
100
stre
ss [M
Pa]
draw ratio
25 oC 80 oC 110 oC
NMRexperiments
a)
1.0 1.2 1.4 4 6 8 100
40
80
120
160
NMRexperiments
stre
ss [M
Pa]
draw ratio
100 mm/min 50 mm/min 10 mm/min 1 mm/min
b)
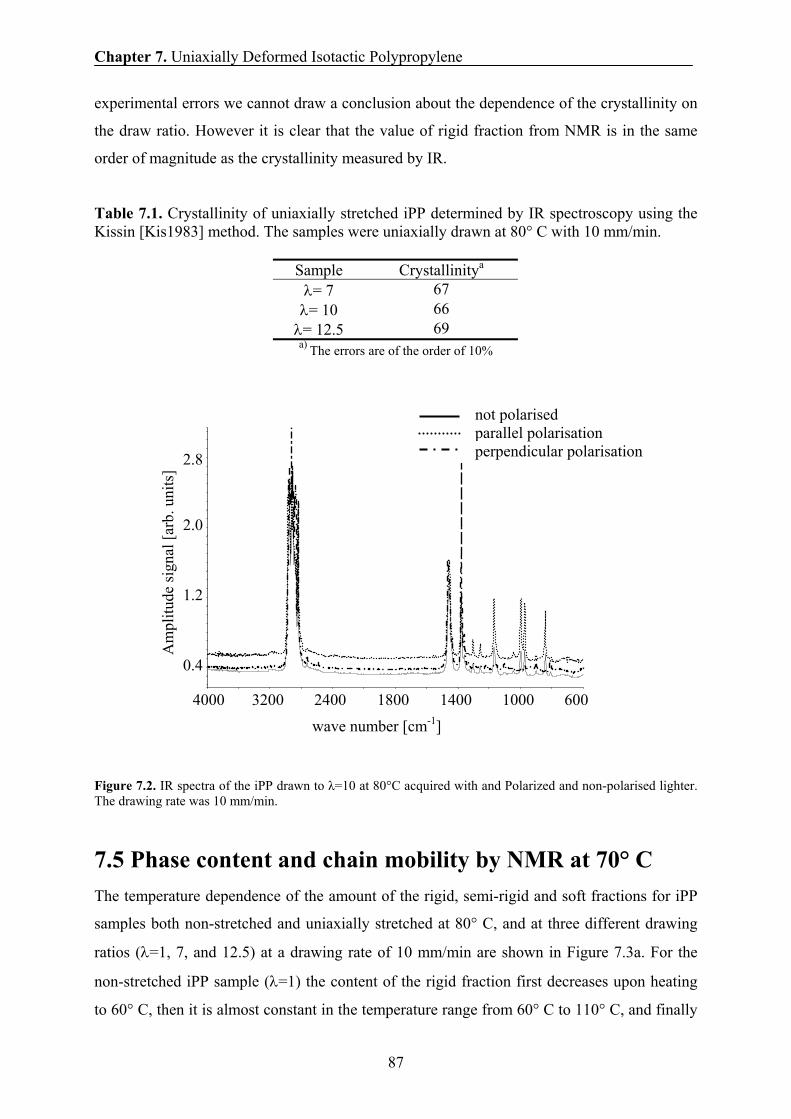
Chapter 7. Uniaxially Deformed Isotactic Polypropylene
87
4000 3200 2400 1800 1400 1000 600
0.4
1.2
2.0
2.8
Am
plitu
de si
gnal
[arb
. uni
ts]
wave number [cm-1]
not polarised parallel polarisation perpendicular polarisation
experimental errors we cannot draw a conclusion about the dependence of the crystallinity on
the draw ratio. However it is clear that the value of rigid fraction from NMR is in the same
order of magnitude as the crystallinity measured by IR.
Table 7.1. Crystallinity of uniaxially stretched iPP determined by IR spectroscopy using the Kissin [Kis1983] method. The samples were uniaxially drawn at 80° C with 10 mm/min.
Sample Crystallinitya
λ= 7 67 λ= 10 66 λ= 12.5 69 a) The errors are of the order of 10%
Figure 7.2. IR spectra of the iPP drawn to λ=10 at 80°C acquired with and Polarized and non-polarised lighter. The drawing rate was 10 mm/min.
7.5 Phase content and chain mobility by NMR at 70° C The temperature dependence of the amount of the rigid, semi-rigid and soft fractions for iPP
samples both non-stretched and uniaxially stretched at 80° C, and at three different drawing
ratios (λ=1, 7, and 12.5) at a drawing rate of 10 mm/min are shown in Figure 7.3a. For the
non-stretched iPP sample (λ=1) the content of the rigid fraction first decreases upon heating
to 60° C, then it is almost constant in the temperature range from 60° C to 110° C, and finally
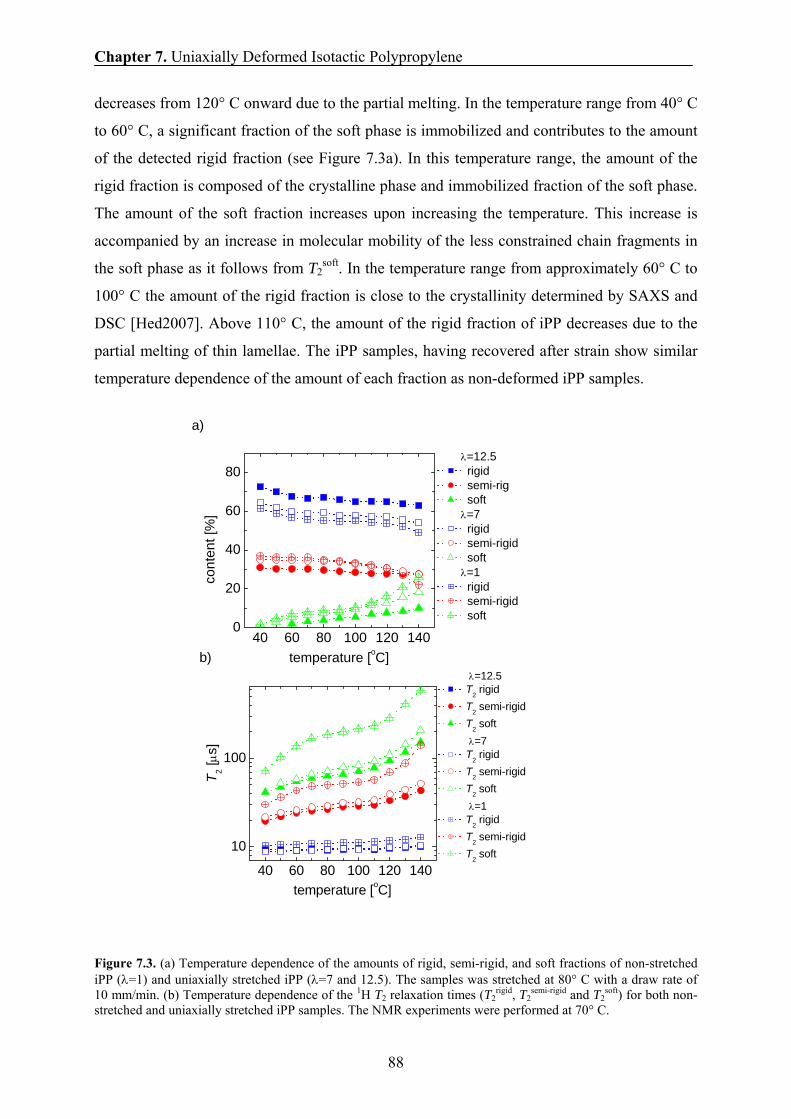
Chapter 7. Uniaxially Deformed Isotactic Polypropylene
88
decreases from 120° C onward due to the partial melting. In the temperature range from 40° C
to 60° C, a significant fraction of the soft phase is immobilized and contributes to the amount
of the detected rigid fraction (see Figure 7.3a). In this temperature range, the amount of the
rigid fraction is composed of the crystalline phase and immobilized fraction of the soft phase.
The amount of the soft fraction increases upon increasing the temperature. This increase is
accompanied by an increase in molecular mobility of the less constrained chain fragments in
the soft phase as it follows from T2soft. In the temperature range from approximately 60° C to
100° C the amount of the rigid fraction is close to the crystallinity determined by SAXS and
DSC [Hed2007]. Above 110° C, the amount of the rigid fraction of iPP decreases due to the
partial melting of thin lamellae. The iPP samples, having recovered after strain show similar
temperature dependence of the amount of each fraction as non-deformed iPP samples.
Figure 7.3. (a) Temperature dependence of the amounts of rigid, semi-rigid, and soft fractions of non-stretched iPP (λ=1) and uniaxially stretched iPP (λ=7 and 12.5). The samples was stretched at 80° C with a draw rate of 10 mm/min. (b) Temperature dependence of the 1H T2 relaxation times (T2
rigid, T2semi-rigid and T2
soft) for both non-stretched and uniaxially stretched iPP samples. The NMR experiments were performed at 70° C.
40 60 80 100 120 1400
20
40
60
80
a)
λ=12.5 rigid semi-rig soft
λ=7 rigid semi-rigid soft
λ=1 rigid semi-rigid soft
cont
ent [
%]
temperature [oC]
40 60 80 100 120 140
10
100
b)
temperature [oC]
T 2 [μs
]
λ=12.5 T2 rigid T2 semi-rigid T2 soft
λ=7 T2 rigid T2 semi-rigid T2 soft
λ=1 T2 rigid T2 semi-rigid T2 soft

Chapter 7. Uniaxially Deformed Isotactic Polypropylene
89
Thus, above 40° C, three different fractions (Figure 7.3a) with different mobilities
(Figure 7.3b) are detected. The characteristic decay time T2 is related to the chain mobility in
different fractions. The relaxation time (T2rigid) of the rigid fraction increases slightly with
temperature in all the samples. The small increases in T2rigid with increasing temperature could
be related to αc relaxation process [Sch1991]. The intermediate T2semi-rigid relaxation time
increases with increasing temperature, but its value essentially does not exceed T2rigid for the
same sample at a given temperature. This indicates that the segmental motion responsible for
T2semi-rigid is largely restricted. A significant difference in temperature dependence for the
sample with different draw ratios is observed for the relaxation time T2soft of the soft fraction
(Figure 7.3b). With increasing draw ratio the constraints on the segmental mobility in both
soft and semi-rigid component increases. This leads to a decrease of T2semi-rigid and T2
soft, is
especially in the strain-hardening region (λ ∼ 7) of the samples.
7.6 Effect of drawing ratio on the phase composition and
chain mobility In order to study the structural changes caused by drawing, the amounts of rigid, semi-rigid,
and soft fractions that was measured at 70° C is plotted as a function of the draw ratio for iPP
samples which were uniaxially stretched at 80° C, with a drawing rate of 10 mm/min (Figure
7.4a). Drawing to λ = 7 cause a small increase in the amount of the rigid fraction, which
indicates the presence of highly strained tie molecules. With the draw ratio increasing to 10 –
16, a further increase in the amount of the rigid fraction is observed. This increase can be
attributed to strain-induced crystallization due to high straining of chains in the soft
component and/or large immobilization of chains in the soft phase due to their elongation. In
the deformation range from λ=7 to λ=12.5 the amount of the rigid fraction is in good
correspondence with the degree of crystallinity obtained by IR (see Figure 7.4a). Thus, the
increase in the amount of the rigid fraction is mainly due to strain – induced crystallization.
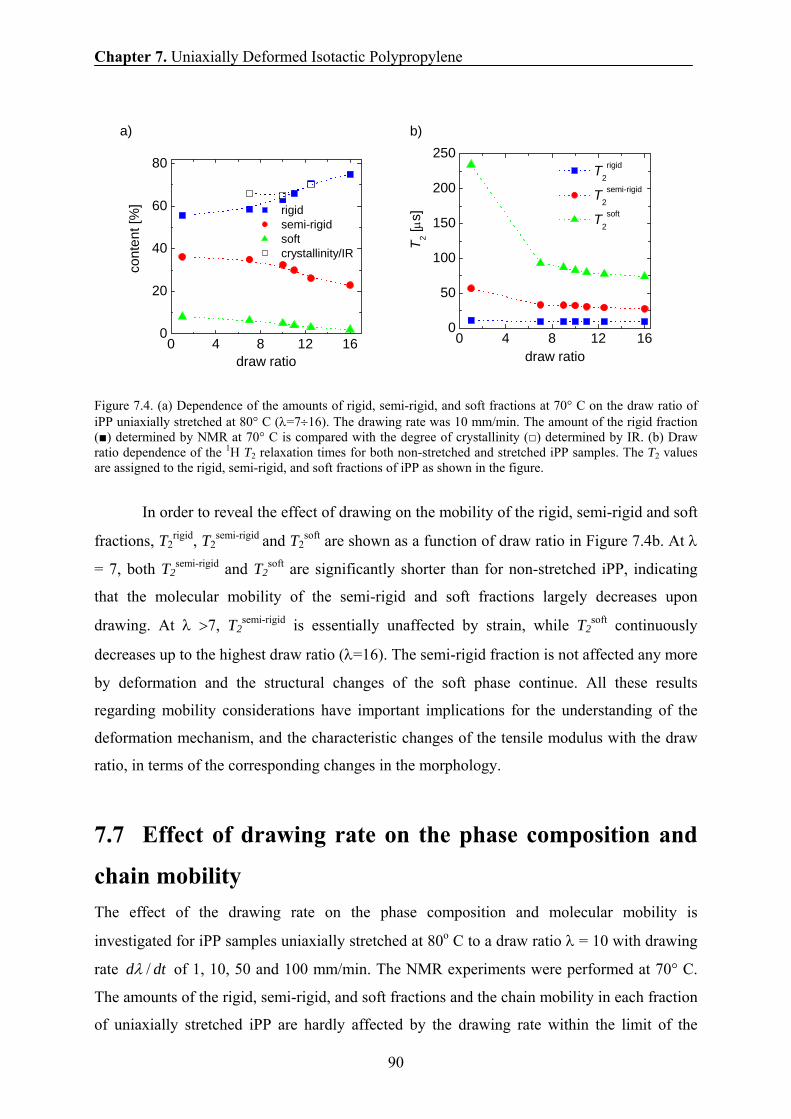
Chapter 7. Uniaxially Deformed Isotactic Polypropylene
90
Figure 7.4. (a) Dependence of the amounts of rigid, semi-rigid, and soft fractions at 70° C on the draw ratio of iPP uniaxially stretched at 80° C (λ=7÷16). The drawing rate was 10 mm/min. The amount of the rigid fraction (■) determined by NMR at 70° C is compared with the degree of crystallinity (□) determined by IR. (b) Draw ratio dependence of the 1H T2 relaxation times for both non-stretched and stretched iPP samples. The T2 values are assigned to the rigid, semi-rigid, and soft fractions of iPP as shown in the figure.
In order to reveal the effect of drawing on the mobility of the rigid, semi-rigid and soft
fractions, T2rigid, T2
semi-rigid and T2soft are shown as a function of draw ratio in Figure 7.4b. At λ
= 7, both T2semi-rigid and T2
soft are significantly shorter than for non-stretched iPP, indicating
that the molecular mobility of the semi-rigid and soft fractions largely decreases upon
drawing. At λ >7, T2semi-rigid is essentially unaffected by strain, while T2
soft continuously
decreases up to the highest draw ratio (λ=16). The semi-rigid fraction is not affected any more
by deformation and the structural changes of the soft phase continue. All these results
regarding mobility considerations have important implications for the understanding of the
deformation mechanism, and the characteristic changes of the tensile modulus with the draw
ratio, in terms of the corresponding changes in the morphology.
7.7 Effect of drawing rate on the phase composition and
chain mobility The effect of the drawing rate on the phase composition and molecular mobility is
investigated for iPP samples uniaxially stretched at 80o C to a draw ratio λ = 10 with drawing
rate dtd /λ of 1, 10, 50 and 100 mm/min. The NMR experiments were performed at 70° C.
The amounts of the rigid, semi-rigid, and soft fractions and the chain mobility in each fraction
of uniaxially stretched iPP are hardly affected by the drawing rate within the limit of the
0 4 8 12 160
20
40
60
80
a)
co
nten
t [%
]
draw ratio
rigid semi-rigid soft crystallinity/IR
0 4 8 12 160
50
100
150
200
250b)
T 2 [μs]
draw ratio
T2rigid
T2semi-rigid
T2soft
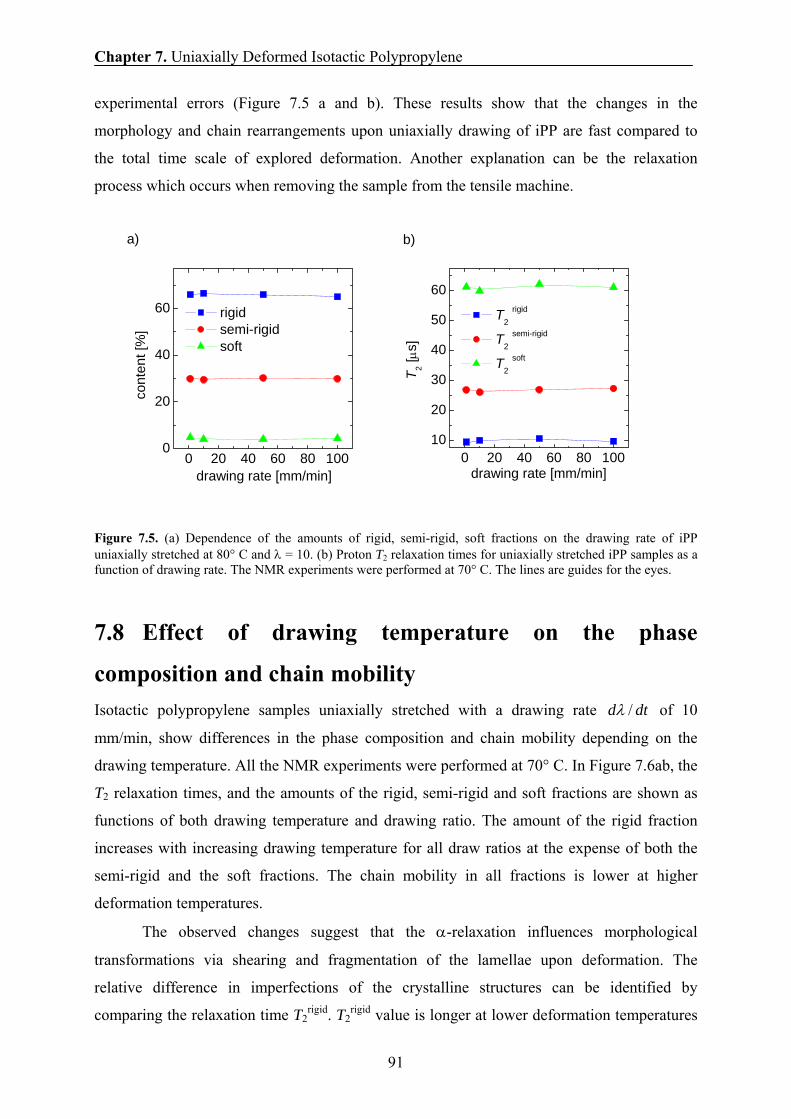
Chapter 7. Uniaxially Deformed Isotactic Polypropylene
91
experimental errors (Figure 7.5 a and b). These results show that the changes in the
morphology and chain rearrangements upon uniaxially drawing of iPP are fast compared to
the total time scale of explored deformation. Another explanation can be the relaxation
process which occurs when removing the sample from the tensile machine.
Figure 7.5. (a) Dependence of the amounts of rigid, semi-rigid, soft fractions on the drawing rate of iPP uniaxially stretched at 80° C and λ = 10. (b) Proton T2 relaxation times for uniaxially stretched iPP samples as a function of drawing rate. The NMR experiments were performed at 70° C. The lines are guides for the eyes.
7.8 Effect of drawing temperature on the phase
composition and chain mobility Isotactic polypropylene samples uniaxially stretched with a drawing rate dtd /λ of 10
mm/min, show differences in the phase composition and chain mobility depending on the
drawing temperature. All the NMR experiments were performed at 70° C. In Figure 7.6ab, the
T2 relaxation times, and the amounts of the rigid, semi-rigid and soft fractions are shown as
functions of both drawing temperature and drawing ratio. The amount of the rigid fraction
increases with increasing drawing temperature for all draw ratios at the expense of both the
semi-rigid and the soft fractions. The chain mobility in all fractions is lower at higher
deformation temperatures.
The observed changes suggest that the α-relaxation influences morphological
transformations via shearing and fragmentation of the lamellae upon deformation. The
relative difference in imperfections of the crystalline structures can be identified by
comparing the relaxation time T2rigid. T2
rigid value is longer at lower deformation temperatures
0 20 40 60 80 1000
20
40
60
a)
drawing rate [mm/min]
cont
ent [
%]
rigid semi-rigid soft
0 20 40 60 80 10010
20
30
40
50
60
b)
drawing rate [mm/min]
T 2 [μs]
T2 rigid
T2 semi-rigid
T2 soft
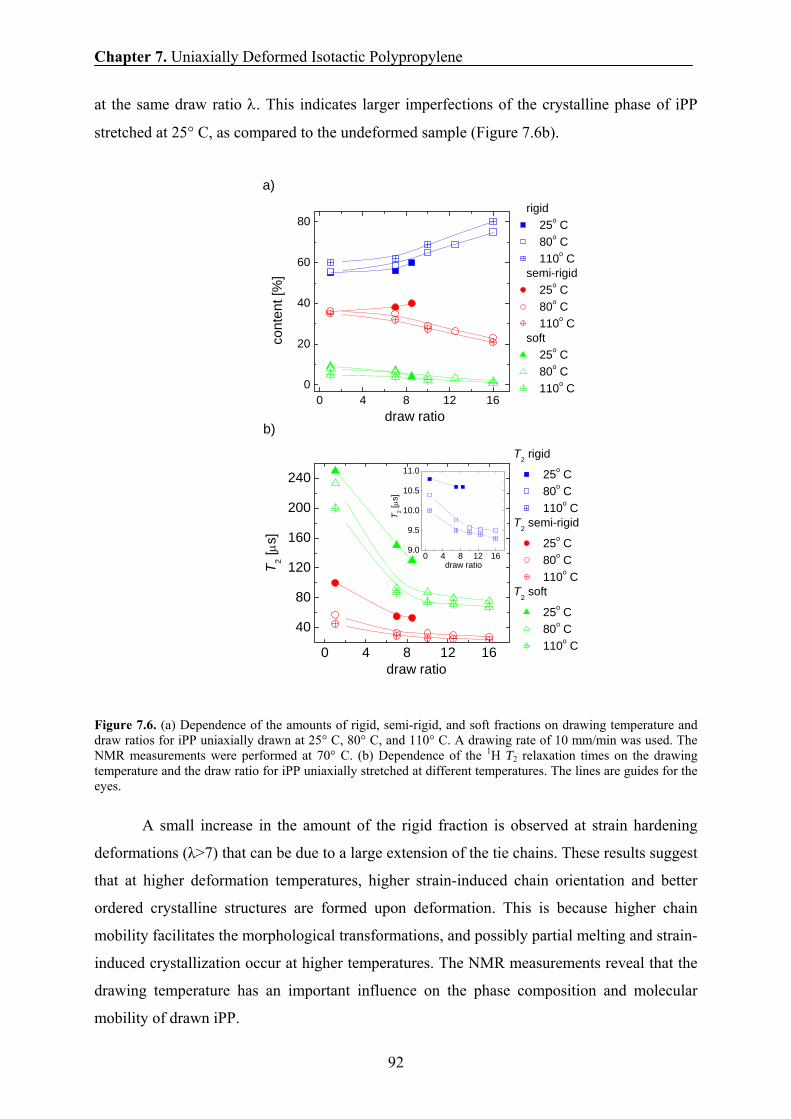
Chapter 7. Uniaxially Deformed Isotactic Polypropylene
92
at the same draw ratio λ. This indicates larger imperfections of the crystalline phase of iPP
stretched at 25° C, as compared to the undeformed sample (Figure 7.6b).
Figure 7.6. (a) Dependence of the amounts of rigid, semi-rigid, and soft fractions on drawing temperature and draw ratios for iPP uniaxially drawn at 25° C, 80° C, and 110° C. A drawing rate of 10 mm/min was used. The NMR measurements were performed at 70° C. (b) Dependence of the 1H T2 relaxation times on the drawing temperature and the draw ratio for iPP uniaxially stretched at different temperatures. The lines are guides for the eyes.
A small increase in the amount of the rigid fraction is observed at strain hardening
deformations (λ>7) that can be due to a large extension of the tie chains. These results suggest
that at higher deformation temperatures, higher strain-induced chain orientation and better
ordered crystalline structures are formed upon deformation. This is because higher chain
mobility facilitates the morphological transformations, and possibly partial melting and strain-
induced crystallization occur at higher temperatures. The NMR measurements reveal that the
drawing temperature has an important influence on the phase composition and molecular
mobility of drawn iPP.
0 4 8 12 16
40
80
120
160
200
240
0 4 8 12 169.0
9.5
10.0
10.5
11.0
T 2 [μs
]
draw ratio
b)
T2 rigid
25o C 80o C 110o C
T2 semi-rigid
25o C 80o C 110o C
T2 soft
25o C 80o C 110o C
T 2 [μs]
draw ratio
0 4 8 12 160
20
40
60
80
a)
cont
ent [
%]
draw ratio
rigid 25o C 80o C 110o C
semi-rigid 25o C 80o C 110o C
soft 25o C 80o C 110o C
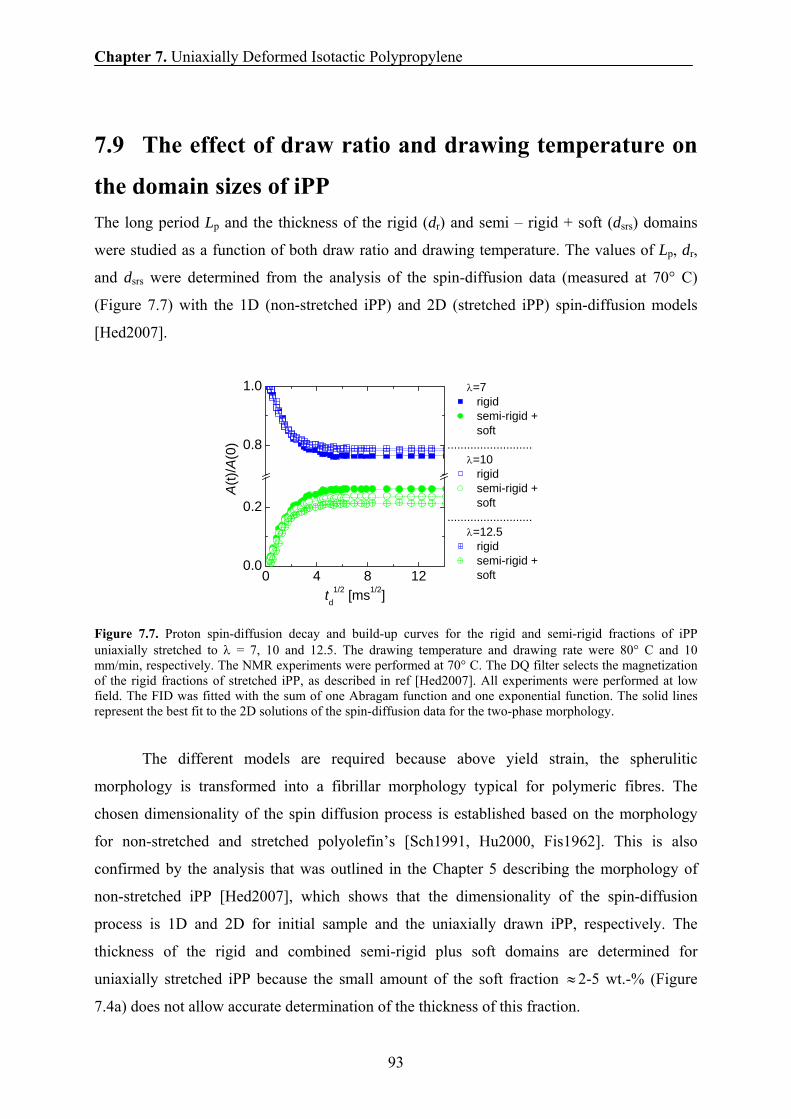
Chapter 7. Uniaxially Deformed Isotactic Polypropylene
93
7.9 The effect of draw ratio and drawing temperature on
the domain sizes of iPP The long period Lp and the thickness of the rigid (dr) and semi – rigid + soft (dsrs) domains
were studied as a function of both draw ratio and drawing temperature. The values of Lp, dr,
and dsrs were determined from the analysis of the spin-diffusion data (measured at 70° C)
(Figure 7.7) with the 1D (non-stretched iPP) and 2D (stretched iPP) spin-diffusion models
[Hed2007].
Figure 7.7. Proton spin-diffusion decay and build-up curves for the rigid and semi-rigid fractions of iPP uniaxially stretched to λ = 7, 10 and 12.5. The drawing temperature and drawing rate were 80° C and 10 mm/min, respectively. The NMR experiments were performed at 70° C. The DQ filter selects the magnetization of the rigid fractions of stretched iPP, as described in ref [Hed2007]. All experiments were performed at low field. The FID was fitted with the sum of one Abragam function and one exponential function. The solid lines represent the best fit to the 2D solutions of the spin-diffusion data for the two-phase morphology.
The different models are required because above yield strain, the spherulitic
morphology is transformed into a fibrillar morphology typical for polymeric fibres. The
chosen dimensionality of the spin diffusion process is established based on the morphology
for non-stretched and stretched polyolefin’s [Sch1991, Hu2000, Fis1962]. This is also
confirmed by the analysis that was outlined in the Chapter 5 describing the morphology of
non-stretched iPP [Hed2007], which shows that the dimensionality of the spin-diffusion
process is 1D and 2D for initial sample and the uniaxially drawn iPP, respectively. The
thickness of the rigid and combined semi-rigid plus soft domains are determined for
uniaxially stretched iPP because the small amount of the soft fraction ≈2-5 wt.-% (Figure
7.4a) does not allow accurate determination of the thickness of this fraction.
0 4 8 120.0
0.2
0.8
1.0
A(t)
/A(0
)
td1/2 [ms1/2]
λ=7 rigid semi-rigid +
soft.......................... λ=10
rigid semi-rigid +
soft.......................... λ=12.5
rigid semi-rigid +
soft
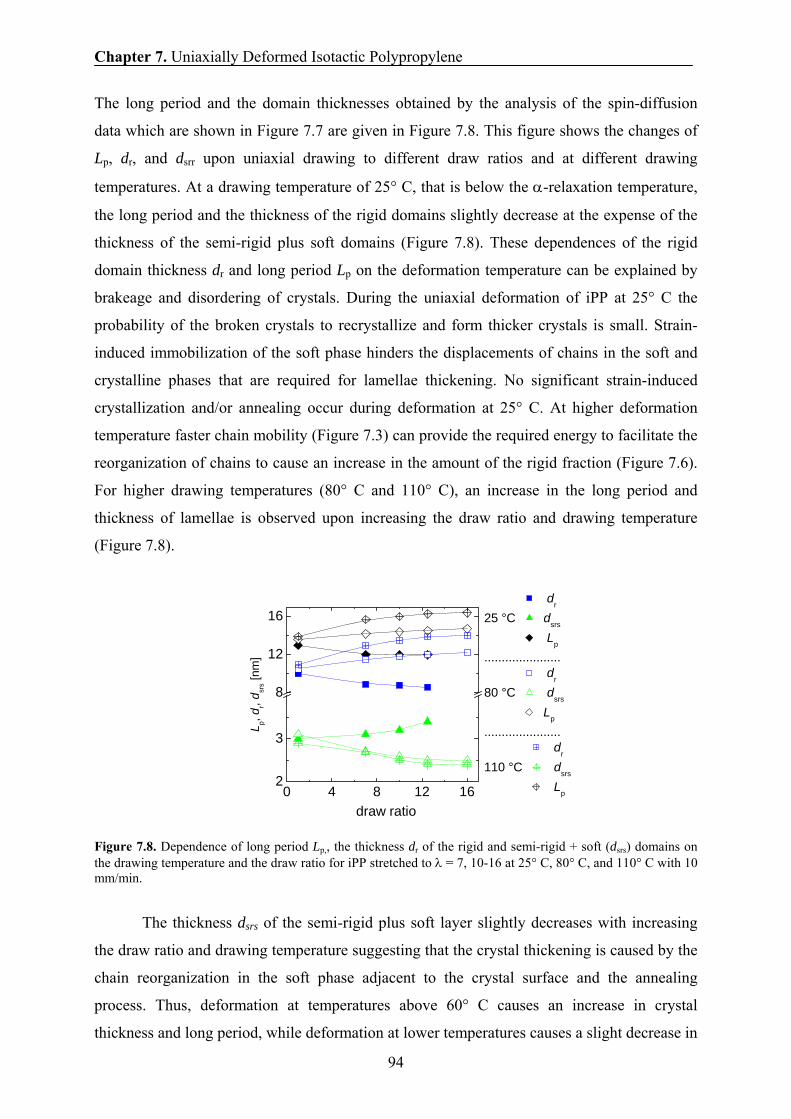
Chapter 7. Uniaxially Deformed Isotactic Polypropylene
94
The long period and the domain thicknesses obtained by the analysis of the spin-diffusion
data which are shown in Figure 7.7 are given in Figure 7.8. This figure shows the changes of
Lp, dr, and dsrr upon uniaxial drawing to different draw ratios and at different drawing
temperatures. At a drawing temperature of 25° C, that is below the α-relaxation temperature,
the long period and the thickness of the rigid domains slightly decrease at the expense of the
thickness of the semi-rigid plus soft domains (Figure 7.8). These dependences of the rigid
domain thickness dr and long period Lp on the deformation temperature can be explained by
brakeage and disordering of crystals. During the uniaxial deformation of iPP at 25° C the
probability of the broken crystals to recrystallize and form thicker crystals is small. Strain-
induced immobilization of the soft phase hinders the displacements of chains in the soft and
crystalline phases that are required for lamellae thickening. No significant strain-induced
crystallization and/or annealing occur during deformation at 25° C. At higher deformation
temperature faster chain mobility (Figure 7.3) can provide the required energy to facilitate the
reorganization of chains to cause an increase in the amount of the rigid fraction (Figure 7.6).
For higher drawing temperatures (80° C and 110° C), an increase in the long period and
thickness of lamellae is observed upon increasing the draw ratio and drawing temperature
(Figure 7.8).
Figure 7.8. Dependence of long period Lp,, the thickness dr of the rigid and semi-rigid + soft (dsrs) domains on the drawing temperature and the draw ratio for iPP stretched to λ = 7, 10-16 at 25° C, 80° C, and 110° C with 10 mm/min.
The thickness dsrs of the semi-rigid plus soft layer slightly decreases with increasing
the draw ratio and drawing temperature suggesting that the crystal thickening is caused by the
chain reorganization in the soft phase adjacent to the crystal surface and the annealing
process. Thus, deformation at temperatures above 60° C causes an increase in crystal
thickness and long period, while deformation at lower temperatures causes a slight decrease in
0 4 8 12 162
3
8
12
16
L p, dr, d
srs [n
m]
draw ratio
dr
25 °C dsrs
Lp
...................... dr
80 °C dsrs Lp
...................... dr
110 °C dsrs Lp
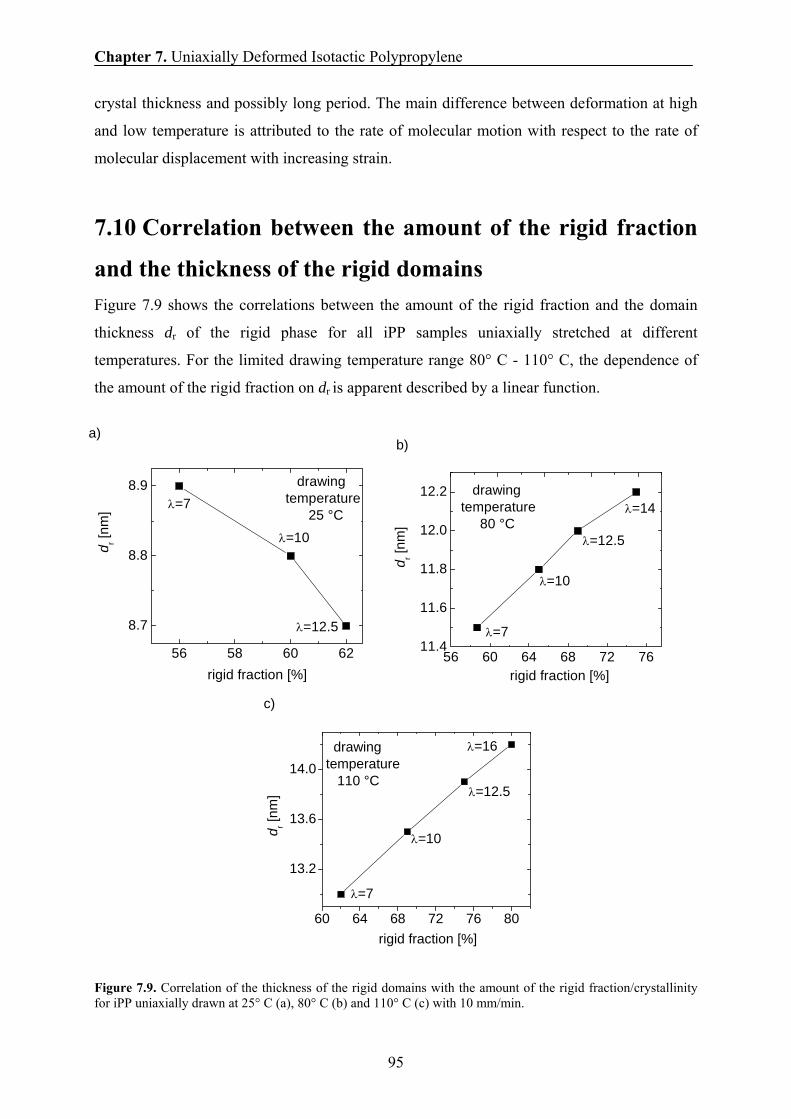
Chapter 7. Uniaxially Deformed Isotactic Polypropylene
95
crystal thickness and possibly long period. The main difference between deformation at high
and low temperature is attributed to the rate of molecular motion with respect to the rate of
molecular displacement with increasing strain.
7.10 Correlation between the amount of the rigid fraction
and the thickness of the rigid domains Figure 7.9 shows the correlations between the amount of the rigid fraction and the domain
thickness dr of the rigid phase for all iPP samples uniaxially stretched at different
temperatures. For the limited drawing temperature range 80° C - 110° C, the dependence of
the amount of the rigid fraction on dr is apparent described by a linear function.
Figure 7.9. Correlation of the thickness of the rigid domains with the amount of the rigid fraction/crystallinity for iPP uniaxially drawn at 25° C (a), 80° C (b) and 110° C (c) with 10 mm/min.
13.2
13.6
14.0
60 64 68 72 76 80
λ=16
λ=12.5
λ=7
λ=10d r [nm
]
rigid fraction [%]
drawingtemperature 110 °C
c)
11.4
11.6
11.8
12.0
12.2
56 60 64 68 72 76
λ=14
λ=12.5
λ=7
λ=10
drawingtemperature 80 °C
rigid fraction [%]
d r [nm
]
b)
8.7
8.8
8.9
56 58 60 62
λ=12.5
λ=10
d r [n
m]
rigid fraction [%]
drawingtemperature 25 °C
λ=7
a)
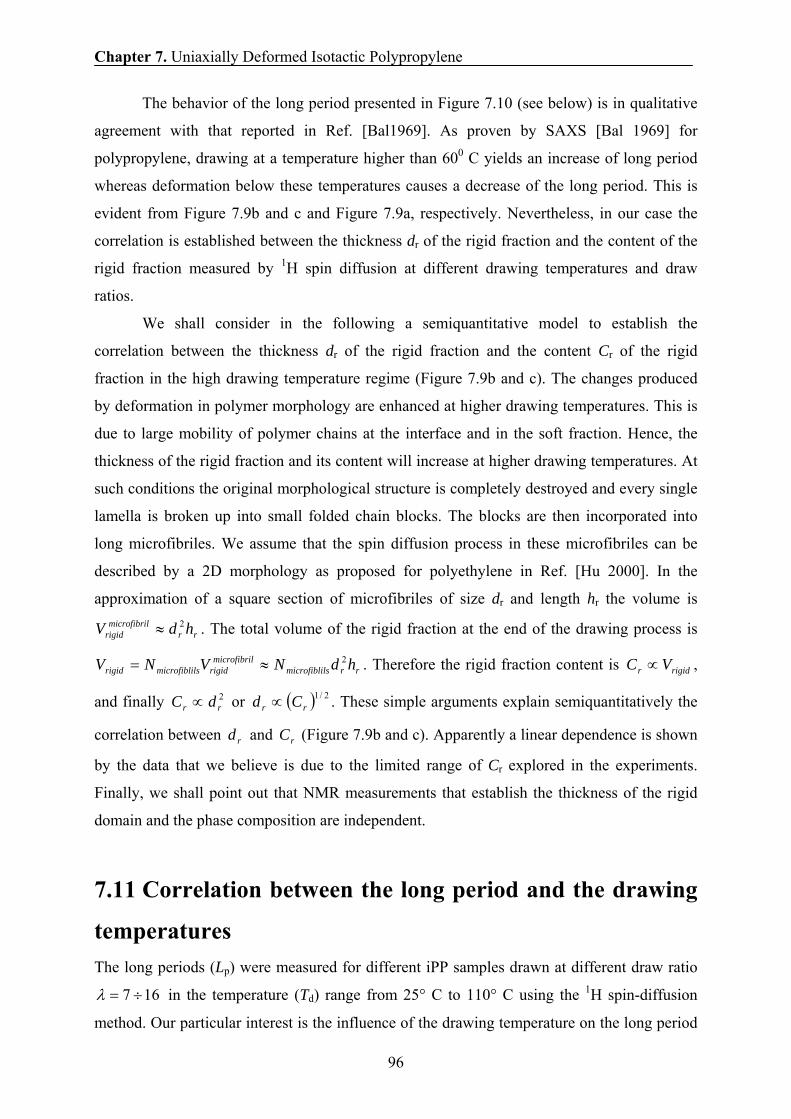
Chapter 7. Uniaxially Deformed Isotactic Polypropylene
96
The behavior of the long period presented in Figure 7.10 (see below) is in qualitative
agreement with that reported in Ref. [Bal1969]. As proven by SAXS [Bal 1969] for
polypropylene, drawing at a temperature higher than 600 C yields an increase of long period
whereas deformation below these temperatures causes a decrease of the long period. This is
evident from Figure 7.9b and c and Figure 7.9a, respectively. Nevertheless, in our case the
correlation is established between the thickness dr of the rigid fraction and the content of the
rigid fraction measured by 1H spin diffusion at different drawing temperatures and draw
ratios.
We shall consider in the following a semiquantitative model to establish the
correlation between the thickness dr of the rigid fraction and the content Cr of the rigid
fraction in the high drawing temperature regime (Figure 7.9b and c). The changes produced
by deformation in polymer morphology are enhanced at higher drawing temperatures. This is
due to large mobility of polymer chains at the interface and in the soft fraction. Hence, the
thickness of the rigid fraction and its content will increase at higher drawing temperatures. At
such conditions the original morphological structure is completely destroyed and every single
lamella is broken up into small folded chain blocks. The blocks are then incorporated into
long microfibriles. We assume that the spin diffusion process in these microfibriles can be
described by a 2D morphology as proposed for polyethylene in Ref. [Hu 2000]. In the
approximation of a square section of microfibriles of size dr and length hr the volume is
rrlmicrofibri
rigid hdV 2≈ . The total volume of the rigid fraction at the end of the drawing process is
rrlsmicrofiblilmicrofibri
rigidlsmicrofiblirigid hdNVNV 2≈= . Therefore the rigid fraction content is rigidr VC ∝ ,
and finally 2rr dC ∝ or ( ) 2/1
rr Cd ∝ . These simple arguments explain semiquantitatively the
correlation between rd and rC (Figure 7.9b and c). Apparently a linear dependence is shown
by the data that we believe is due to the limited range of Cr explored in the experiments.
Finally, we shall point out that NMR measurements that establish the thickness of the rigid
domain and the phase composition are independent.
7.11 Correlation between the long period and the drawing
temperatures The long periods (Lp) were measured for different iPP samples drawn at different draw ratio
167 ÷=λ in the temperature (Td) range from 25° C to 110° C using the 1H spin-diffusion
method. Our particular interest is the influence of the drawing temperature on the long period
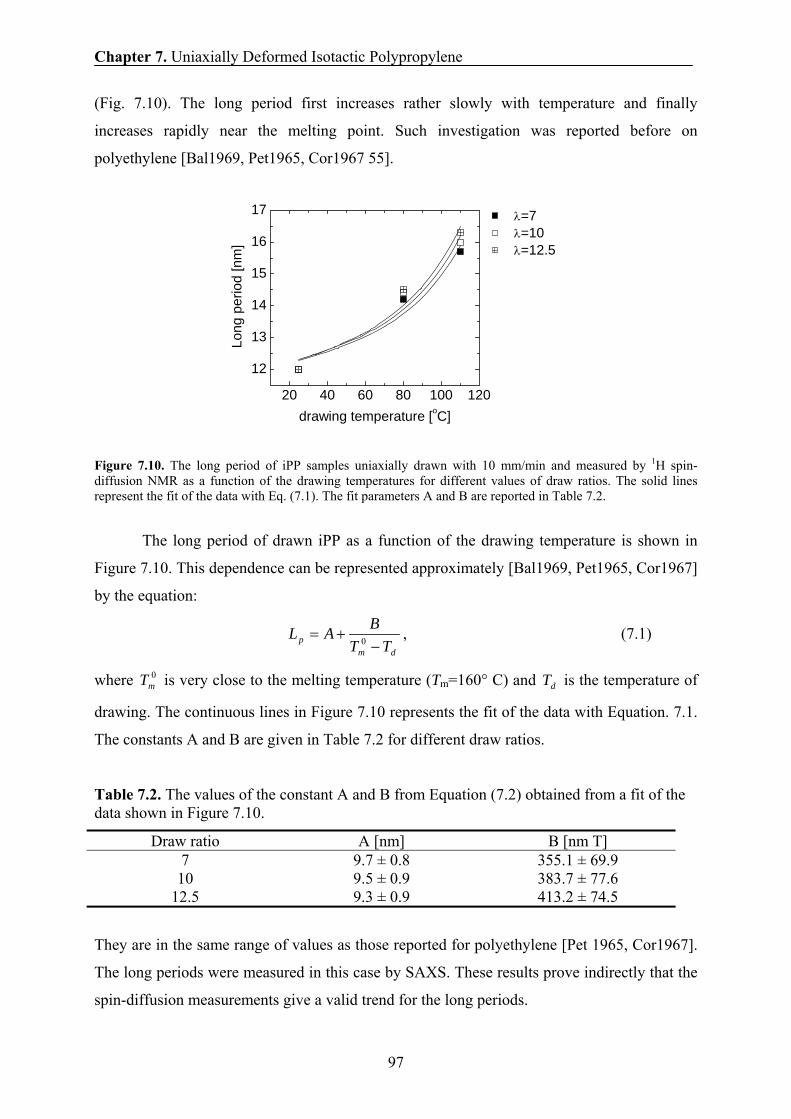
Chapter 7. Uniaxially Deformed Isotactic Polypropylene
97
(Fig. 7.10). The long period first increases rather slowly with temperature and finally
increases rapidly near the melting point. Such investigation was reported before on
polyethylene [Bal1969, Pet1965, Cor1967 55].
Figure 7.10. The long period of iPP samples uniaxially drawn with 10 mm/min and measured by 1H spin-diffusion NMR as a function of the drawing temperatures for different values of draw ratios. The solid lines represent the fit of the data with Eq. (7.1). The fit parameters A and B are reported in Table 7.2.
The long period of drawn iPP as a function of the drawing temperature is shown in
Figure 7.10. This dependence can be represented approximately [Bal1969, Pet1965, Cor1967]
by the equation:
dm
p TTBAL−
+= 0 , (7.1)
where 0mT is very close to the melting temperature (Tm=160° C) and dT is the temperature of
drawing. The continuous lines in Figure 7.10 represents the fit of the data with Equation. 7.1.
The constants A and B are given in Table 7.2 for different draw ratios.
Table 7.2. The values of the constant A and B from Equation (7.2) obtained from a fit of the data shown in Figure 7.10.
Draw ratio A [nm] B [nm T] 7 9.7 ± 0.8 355.1 ± 69.9 10 9.5 ± 0.9 383.7 ± 77.6
12.5 9.3 ± 0.9 413.2 ± 74.5
They are in the same range of values as those reported for polyethylene [Pet 1965, Cor1967].
The long periods were measured in this case by SAXS. These results prove indirectly that the
spin-diffusion measurements give a valid trend for the long periods.
20 40 60 80 100 120
12
13
14
15
16
17 λ=7 λ=10 λ=12.5
Long
per
iod
[nm
]
drawing temperature [oC]
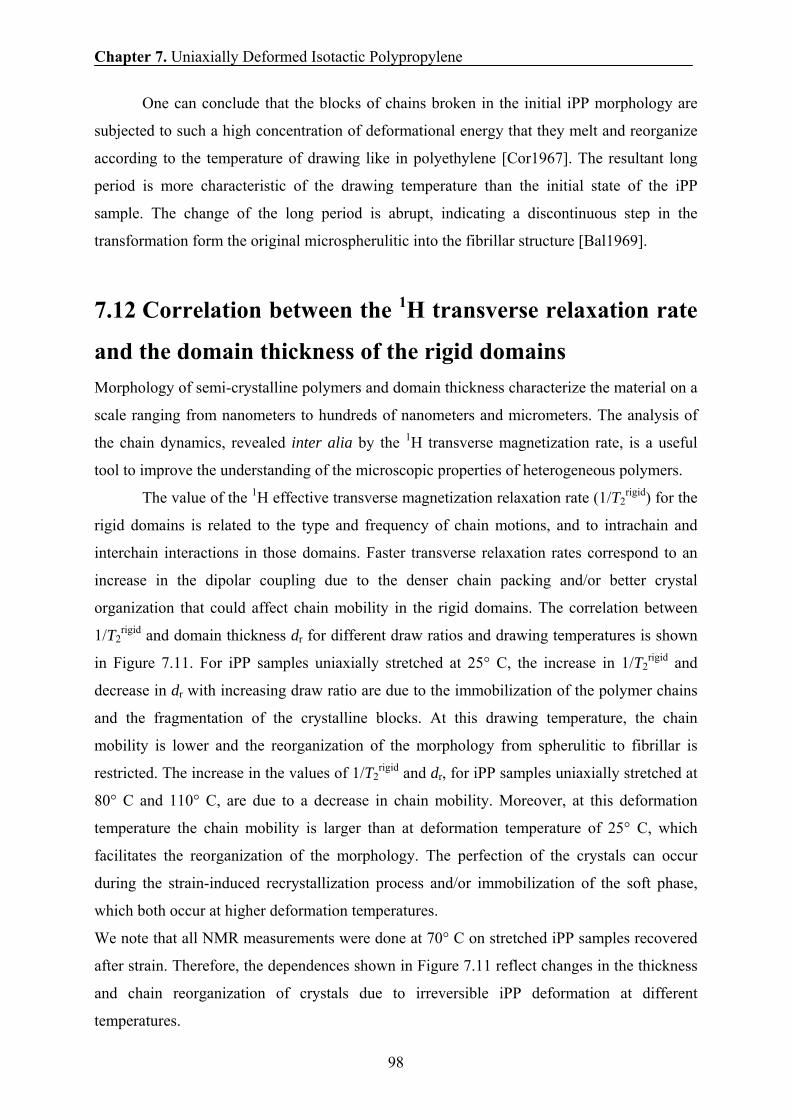
Chapter 7. Uniaxially Deformed Isotactic Polypropylene
98
One can conclude that the blocks of chains broken in the initial iPP morphology are
subjected to such a high concentration of deformational energy that they melt and reorganize
according to the temperature of drawing like in polyethylene [Cor1967]. The resultant long
period is more characteristic of the drawing temperature than the initial state of the iPP
sample. The change of the long period is abrupt, indicating a discontinuous step in the
transformation form the original microspherulitic into the fibrillar structure [Bal1969].
7.12 Correlation between the 1H transverse relaxation rate
and the domain thickness of the rigid domains Morphology of semi-crystalline polymers and domain thickness characterize the material on a
scale ranging from nanometers to hundreds of nanometers and micrometers. The analysis of
the chain dynamics, revealed inter alia by the 1H transverse magnetization rate, is a useful
tool to improve the understanding of the microscopic properties of heterogeneous polymers.
The value of the 1H effective transverse magnetization relaxation rate (1/T2rigid) for the
rigid domains is related to the type and frequency of chain motions, and to intrachain and
interchain interactions in those domains. Faster transverse relaxation rates correspond to an
increase in the dipolar coupling due to the denser chain packing and/or better crystal
organization that could affect chain mobility in the rigid domains. The correlation between
1/T2rigid and domain thickness dr for different draw ratios and drawing temperatures is shown
in Figure 7.11. For iPP samples uniaxially stretched at 25° C, the increase in 1/T2rigid and
decrease in dr with increasing draw ratio are due to the immobilization of the polymer chains
and the fragmentation of the crystalline blocks. At this drawing temperature, the chain
mobility is lower and the reorganization of the morphology from spherulitic to fibrillar is
restricted. The increase in the values of 1/T2rigid and dr, for iPP samples uniaxially stretched at
80° C and 110° C, are due to a decrease in chain mobility. Moreover, at this deformation
temperature the chain mobility is larger than at deformation temperature of 25° C, which
facilitates the reorganization of the morphology. The perfection of the crystals can occur
during the strain-induced recrystallization process and/or immobilization of the soft phase,
which both occur at higher deformation temperatures.
We note that all NMR measurements were done at 70° C on stretched iPP samples recovered
after strain. Therefore, the dependences shown in Figure 7.11 reflect changes in the thickness
and chain reorganization of crystals due to irreversible iPP deformation at different
temperatures.
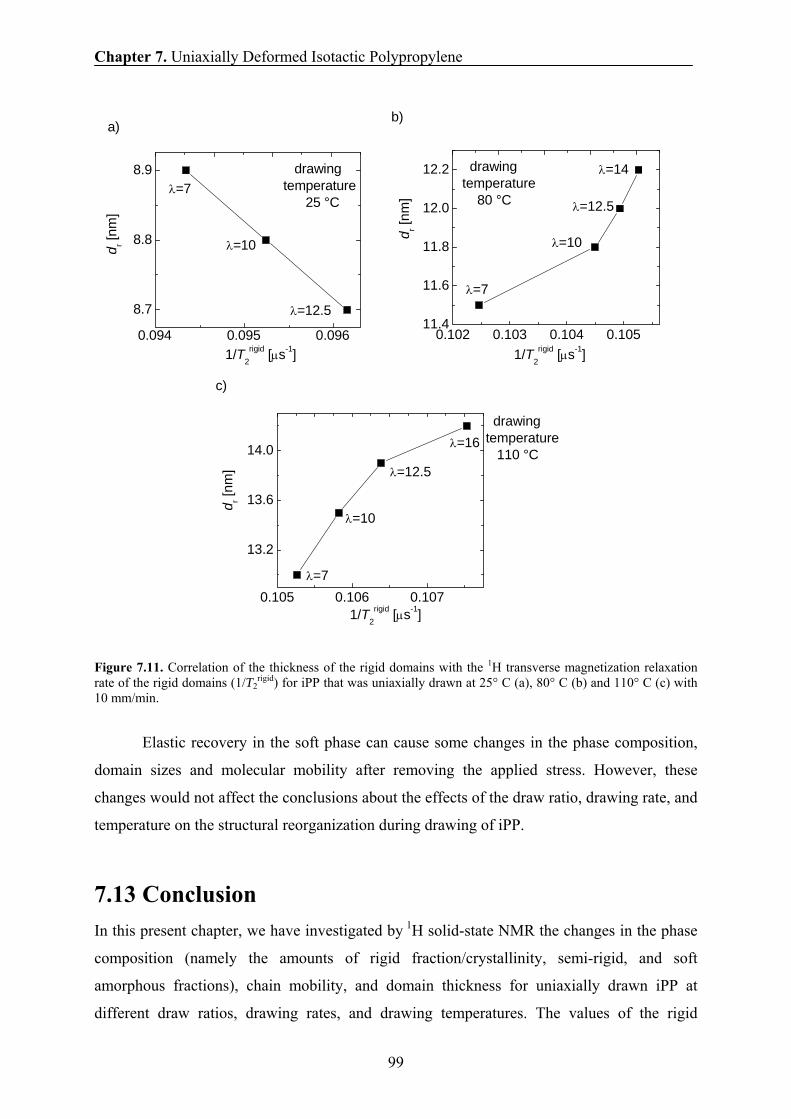
Chapter 7. Uniaxially Deformed Isotactic Polypropylene
99
Figure 7.11. Correlation of the thickness of the rigid domains with the 1H transverse magnetization relaxation rate of the rigid domains (1/T2
rigid) for iPP that was uniaxially drawn at 25° C (a), 80° C (b) and 110° C (c) with 10 mm/min.
Elastic recovery in the soft phase can cause some changes in the phase composition,
domain sizes and molecular mobility after removing the applied stress. However, these
changes would not affect the conclusions about the effects of the draw ratio, drawing rate, and
temperature on the structural reorganization during drawing of iPP.
7.13 Conclusion In this present chapter, we have investigated by 1H solid-state NMR the changes in the phase
composition (namely the amounts of rigid fraction/crystallinity, semi-rigid, and soft
amorphous fractions), chain mobility, and domain thickness for uniaxially drawn iPP at
different draw ratios, drawing rates, and drawing temperatures. The values of the rigid
8.7
8.8
8.9
0.094 0.095 0.096
λ=12.5
λ=10
λ=7
d r [nm
]
1/T2rigid [μs-1]
drawingtemperature 25 °C
a)
11.4
11.6
11.8
12.0
12.2
0.102 0.103 0.104 0.105
λ=14
λ=12.5
λ=10
λ=7
drawingtemperature 80 °C
1/T2rigid [μs-1]
d r [nm
]
b)
13.2
13.6
14.0
0.105 0.106 0.107
λ=16
λ=12.5
λ=7
λ=10
1/T2rigid [μs-1]
d r [nm
]
drawing temperature 110 °C
c)
Chapter 7. Uniaxially Deformed Isotactic Polypropylene
100
fraction/degree of crystallinity obtained by NMR and IR coincide within a few percent. The
small difference can be explained by the analysis of NMR and IR data using three- and two-
phase model, respectively. An increase in the drawing rate from 1 mm/min to 100 mm/min
does not affect the phase composition and chain mobility for iPP stretched at 80o C. The
drawing temperature was shown to have a significant effect on the phase composition, chain
mobility, long period, and lamellar thickness. The results show that the amount of the rigid
fraction/crystallinity increases as the draw ratio and drawing temperature increase for the
entire range of draw ratios (λ = 1, 7 - 16). For example, the amount of the rigid fraction in
non-drawn iPP is 55 wt.-% at 70o C. Its value at the same temperature increases up to 65 wt.-
% for iPP stretched to λ=12.5. Higher draw ratio and drawing temperatures above 80 °C
resulted in an increase of the thickness of the lamellae from 11 nm to 16.5 nm that can be
explained by partial melting and recrystallization as well as immobilization of the soft phase.
We can conclude that the phase composition, chain mobility and the thickness of domains
largely depend on the deformation conditions, namely the draw ratio and the drawing
temperature.
Correlations between the following molecular parameters were established: (1) the
amount of the rigid domains and their thickness; (2) the chain mobility in the rigid domains
and the thickness of these domains. A semiquantitative model was developed to describe the
correlation between the amount of the rigid fraction and the thickness of the crystalline
domain in the range of high drawing temperatures. Moreover, the correlation between the
long period and the drawing temperature was analysed based on a phenomenological law
applied before on polyethylene [Cor1967]. These relationships differ for iPP uniaxially drawn
at 25° C and at higher deformation temperatures ≥ 80° C. The results reveal the important role
of chain mobility during strain-induced transformation of the spherulitic morphology to a
fibrillar one. At 25° C, the rate of molecular motion is not high enough to follow molecular
displacements that are caused by macroscopic strain. This is conformed by the fact that the
stress-strain dependence at 25° C largely depends on the deformation rate. High local forces
that cause crystal slip damage crystalline structures as can be concluded from a small decrease
in the lamellae thickness. At the same time the amount of the rigid fraction increases due to
the immobilization of highly strained chain fragments in the soft phase. Deformation at
temperatures of 80° C and higher, is not accompanied by high local forces due to more
intensive chain motion. Moreover, a heat release during drawing causes partial melting
followed by recrystallization. This results in thicker crystals and larger long periods. As far as
the chain mobility is concerned, it decreases with increasing draw ratio both in the rigid and
Chapter 7. Uniaxially Deformed Isotactic Polypropylene
101
soft phases. The decrease is more pronounced at higher deformation temperatures, which
points out a more perfect structure reorganization due to partial melting followed by
recrystallization at higher deformation temperatures.

Chapter 7. Uniaxially Deformed Isotactic Polypropylene
102
Chapter 8. Impact Copolymer Polypropylene
103
Chapter 8
Impact Modified Copolymer Polypropylene 8.1 Introduction and motivation Polypropylene (PP) is one of the most important commercial polymers available because of
its extremely broad spectrum of applications. Homopolymeric PP however is too brittle for
applications such as automotive components that require a polymer with high or medium
impact resistance. The most widely used method to improve the impact properties of PP is
through copolymerization with another α-olefin in a multi-stage reactor system or blending
with ethylene propylene rubber (EPR), resulting in a system with dispersed ethylene
propylene rubber particles (EPR) in a PP matrix [Ros1992, Kar1999]. The impact properties
depend on the EPR rubber dispersion, composition and particle sizes and on the matrix
crystallinity [Jan1993, Jan1994, Pre2000, Jan1996]. However, such modifications to improve
the impact properties are often detrimental to other desired properties. The development of
new systems that show an improved balance between properties represent therefore one of the
major challenges to the PP industry. For instance, an improved balance between impact
strength and stiffness, impact strength and transparency and impact strength and stress
whitening is desired and are areas of continuous research. To partially compensate the
decrease in stiffness due to the addition of EPR, addition of nucleating agents such as talc and
ADK STAB NA-11 is recommended. Addition of nucleating agents increases the temperature
of crystallization resulting in a decrease in cycle for injection moulding [Fil1994]. Nucleating
agents increase the number of crystallization sites in polymers and reduce the spherulite size.
They cause simultaneous growth and thus evenly sized crystals. Smaller evenly sized crystals
improve the physical properties of the polymer like transparency and flexural modulus. A
detailed knowledge of the phase morphology is a key parameter for improving the mechanical
and optical properties, and for obtaining a proper balance between these properties for
different applications.
A wide range of characterization methods has been applied to study the PP
copolymers. A number of these techniques are suited to give information on the morphology
of PP copolymers where the EPR domains typically extend form a few hundred nanometers to
a few micrometers in size. Scanning electron microscopy (SEM) has been applied to study the
EPR distribution in PP copolymers [Gre2002, Goi1992, Goi1993, Poe2000, Kim1998,
Chapter 8. Impact Copolymer Polypropylene
104
Cha2002, Cha2002, Cop1987, Pet1996, Bro1997, Kar1979, Ora2001, Bed2000, Yam1999,
Ora1982]. TEM is another technique that has been widely applied to study the morphology in
PP copolymers [Gre2002, Kim1998, Nor1995, Yok1997, Nys1999, Sta1998, San1986,
Bed2002, Tom2000, Kim1996]. The prepared TEM samples show clear contrast between
matrix and rubber inclusions. This technique has the advantage that the lamellae structure of
the PP matrix as well as the rubber part can be studied [Poe2000, Ora2001, Sta1998,
San1986].
Atomic force microscopy (AFM) is a convenient method compared to SEM and TEM
in the sense that less sample preparation could be necessary and several investigations have
employed AFM for morphology studies of rubber-modified PP [Cha2002, Cha2002,
Nys1999, Bed2002, Nys1995, Swa2000,]. AFM directly reveals the presence of the rubber
inclusions on the surface.
Nuclear magnetic resonance (NMR) relaxation provides an excellent microscopic
probe of molecular or segmental motion in PP copolymer systems [Dou1979]. Sensitive
indicators of molecular mobility in different fractions are the nuclear spin-lattice relaxation
time T1 and spin-spin relaxation time T2. Previously, solid-state NMR relaxation has been
used to study the changes in the phase content and the chain mobility in different fractions of
polyethylene and polypropylene [Hed2007].
The first purpose of this chapter is to study the morphological features of impact
modified PP copolymer by transmission electron microscopy (TEM), scanning electron
microscopy (SEM) and atomic force microscopy (AFM). The second purpose is to study the
changes in the phase content and chain mobility due to the change in the rubber content and
the addition of nucleating agents (talc and ADK STAB NA-11). The third propose is to
establish a correlation between the NMR parameters, DSC results, and mechanical data.
8.2 Materials The impact modified copolymer polypropylene samples used in our experiments were
manufactured by SABIC Europe BV. The material was first compounded at temperature
between 244 - 262° C in a ZSK3033 extruder than injected in an Angel 45A machine. The
melt temperature was set to 235° C, the holding pressure was 40 MPa, the holding time 20 s,
the cooling time 20 s, and the overall cycle time 49.5 s. The mold chosen provides an
injection molding plate (65 x 65 x3.2 mm) and a tensile bar (dumbbell shape). Three series of
five samples were prepared with different rubber contents (from 0% to 33%) and different
nucleating agents (Table 8.1).
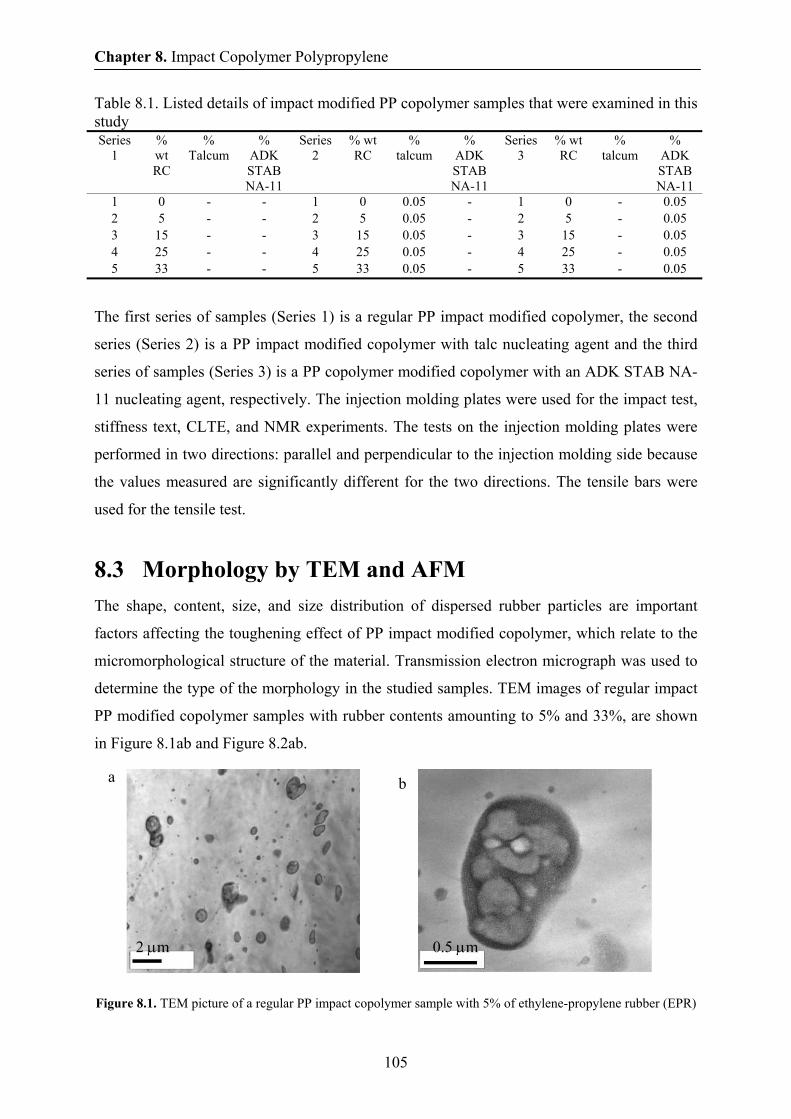
Chapter 8. Impact Copolymer Polypropylene
105
Table 8.1. Listed details of impact modified PP copolymer samples that were examined in this study Series
1 % wt RC
% Talcum
% ADK STAB NA-11
Series 2
% wt RC
% talcum
% ADK STAB NA-11
Series 3
% wt RC
% talcum
% ADK STAB NA-11
1 0 - - 1 0 0.05 - 1 0 - 0.05 2 5 - - 2 5 0.05 - 2 5 - 0.05 3 15 - - 3 15 0.05 - 3 15 - 0.05 4 25 - - 4 25 0.05 - 4 25 - 0.05 5 33 - - 5 33 0.05 - 5 33 - 0.05
The first series of samples (Series 1) is a regular PP impact modified copolymer, the second
series (Series 2) is a PP impact modified copolymer with talc nucleating agent and the third
series of samples (Series 3) is a PP copolymer modified copolymer with an ADK STAB NA-
11 nucleating agent, respectively. The injection molding plates were used for the impact test,
stiffness text, CLTE, and NMR experiments. The tests on the injection molding plates were
performed in two directions: parallel and perpendicular to the injection molding side because
the values measured are significantly different for the two directions. The tensile bars were
used for the tensile test.
8.3 Morphology by TEM and AFM The shape, content, size, and size distribution of dispersed rubber particles are important
factors affecting the toughening effect of PP impact modified copolymer, which relate to the
micromorphological structure of the material. Transmission electron micrograph was used to
determine the type of the morphology in the studied samples. TEM images of regular impact
PP modified copolymer samples with rubber contents amounting to 5% and 33%, are shown
in Figure 8.1ab and Figure 8.2ab.
Figure 8.1. TEM picture of a regular PP impact copolymer sample with 5% of ethylene-propylene rubber (EPR)
a
2 μm
b
0.5 μm
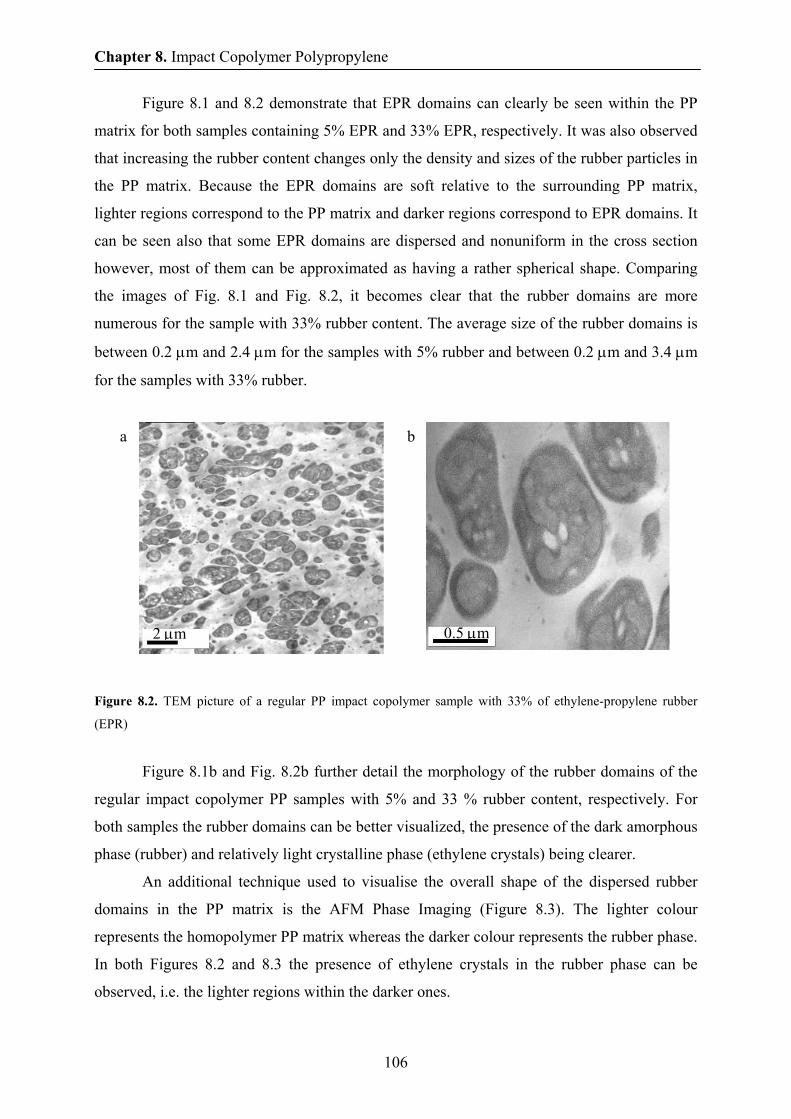
Chapter 8. Impact Copolymer Polypropylene
106
Figure 8.1 and 8.2 demonstrate that EPR domains can clearly be seen within the PP
matrix for both samples containing 5% EPR and 33% EPR, respectively. It was also observed
that increasing the rubber content changes only the density and sizes of the rubber particles in
the PP matrix. Because the EPR domains are soft relative to the surrounding PP matrix,
lighter regions correspond to the PP matrix and darker regions correspond to EPR domains. It
can be seen also that some EPR domains are dispersed and nonuniform in the cross section
however, most of them can be approximated as having a rather spherical shape. Comparing
the images of Fig. 8.1 and Fig. 8.2, it becomes clear that the rubber domains are more
numerous for the sample with 33% rubber content. The average size of the rubber domains is
between 0.2 μm and 2.4 μm for the samples with 5% rubber and between 0.2 μm and 3.4 μm
for the samples with 33% rubber.
Figure 8.2. TEM picture of a regular PP impact copolymer sample with 33% of ethylene-propylene rubber
(EPR)
Figure 8.1b and Fig. 8.2b further detail the morphology of the rubber domains of the
regular impact copolymer PP samples with 5% and 33 % rubber content, respectively. For
both samples the rubber domains can be better visualized, the presence of the dark amorphous
phase (rubber) and relatively light crystalline phase (ethylene crystals) being clearer.
An additional technique used to visualise the overall shape of the dispersed rubber
domains in the PP matrix is the AFM Phase Imaging (Figure 8.3). The lighter colour
represents the homopolymer PP matrix whereas the darker colour represents the rubber phase.
In both Figures 8.2 and 8.3 the presence of ethylene crystals in the rubber phase can be
observed, i.e. the lighter regions within the darker ones.
a
2 μm 0.5 μm
b
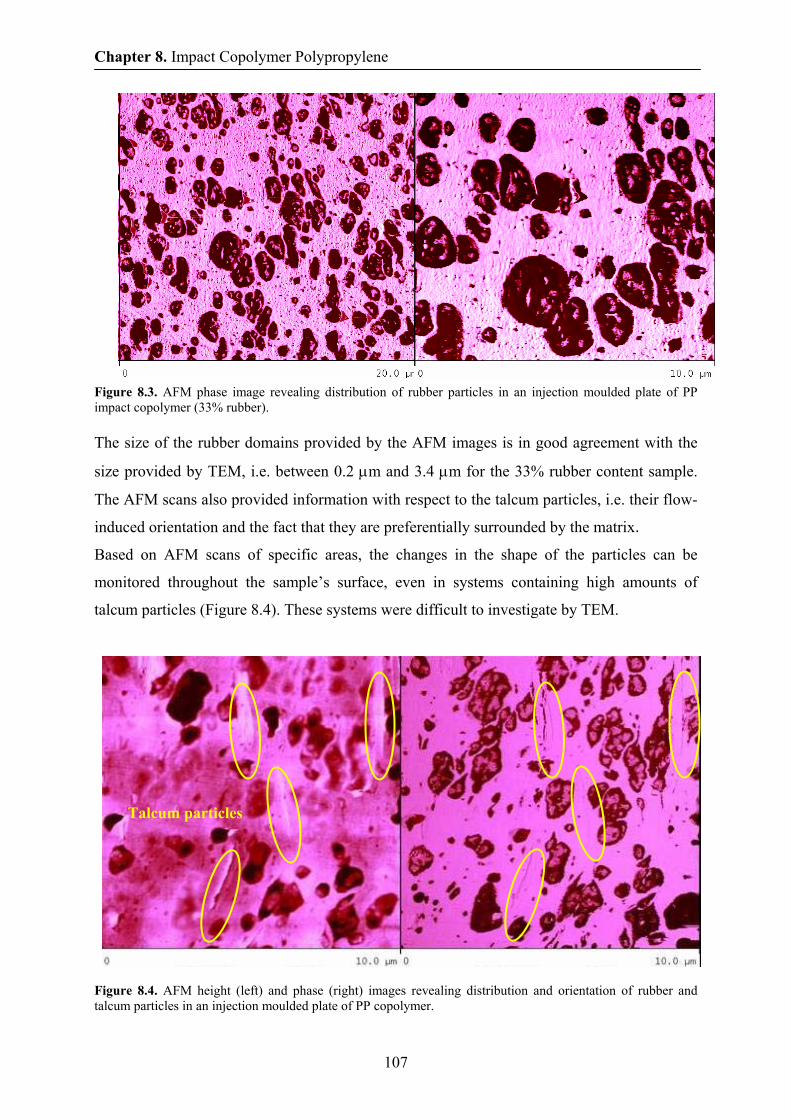
Chapter 8. Impact Copolymer Polypropylene
107
Figure 8.3. AFM phase image revealing distribution of rubber particles in an injection moulded plate of PP impact copolymer (33% rubber). The size of the rubber domains provided by the AFM images is in good agreement with the
size provided by TEM, i.e. between 0.2 μm and 3.4 μm for the 33% rubber content sample.
The AFM scans also provided information with respect to the talcum particles, i.e. their flow-
induced orientation and the fact that they are preferentially surrounded by the matrix.
Based on AFM scans of specific areas, the changes in the shape of the particles can be
monitored throughout the sample’s surface, even in systems containing high amounts of
talcum particles (Figure 8.4). These systems were difficult to investigate by TEM.
Figure 8.4. AFM height (left) and phase (right) images revealing distribution and orientation of rubber and talcum particles in an injection moulded plate of PP copolymer.
Talcum particles
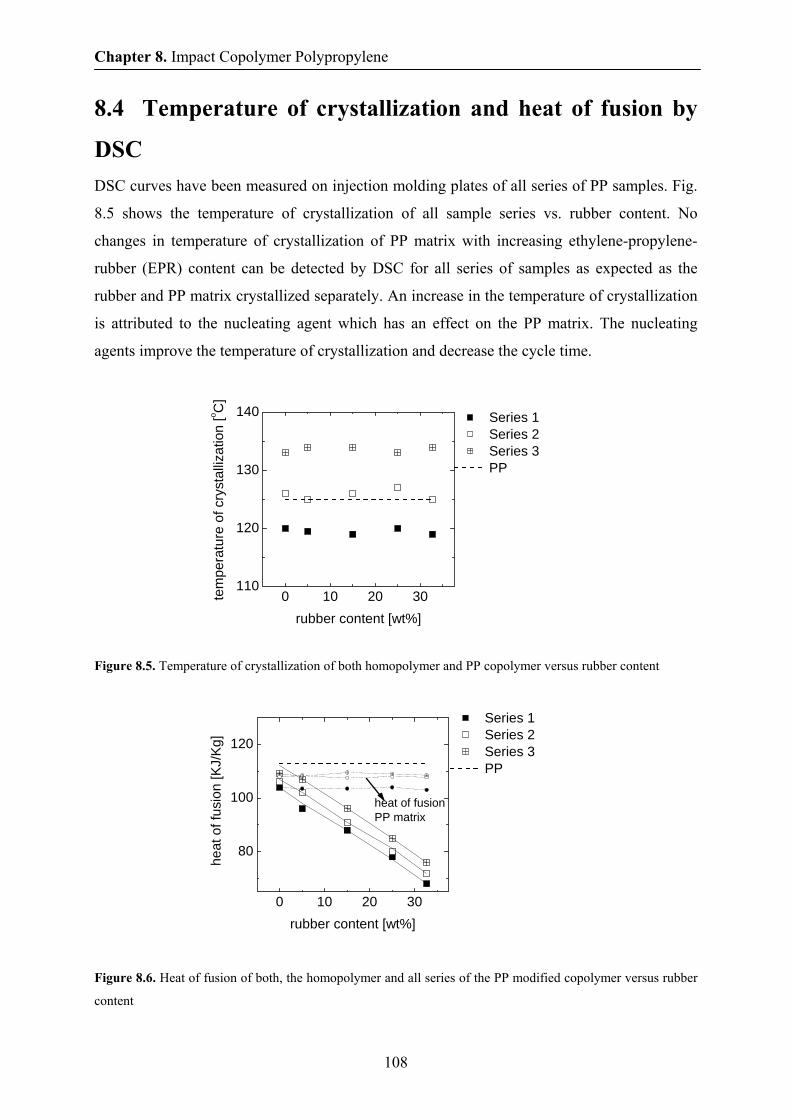
Chapter 8. Impact Copolymer Polypropylene
108
8.4 Temperature of crystallization and heat of fusion by
DSC DSC curves have been measured on injection molding plates of all series of PP samples. Fig.
8.5 shows the temperature of crystallization of all sample series vs. rubber content. No
changes in temperature of crystallization of PP matrix with increasing ethylene-propylene-
rubber (EPR) content can be detected by DSC for all series of samples as expected as the
rubber and PP matrix crystallized separately. An increase in the temperature of crystallization
is attributed to the nucleating agent which has an effect on the PP matrix. The nucleating
agents improve the temperature of crystallization and decrease the cycle time.
Figure 8.5. Temperature of crystallization of both homopolymer and PP copolymer versus rubber content
Figure 8.6. Heat of fusion of both, the homopolymer and all series of the PP modified copolymer versus rubber
content
0 10 20 30
80
100
120
heat
of f
usio
n [K
J/K
g]
rubber content [wt%]
Series 1 Series 2 Series 3 PP
heat of fusionPP matrix
0 10 20 30110
120
130
140
tem
pera
ture
of c
ryst
alliz
atio
n [o C
]
rubber content [wt%]
Series 1 Series 2 Series 3 PP
Chapter 8. Impact Copolymer Polypropylene
109
Figure 8.6 represents the heat of fusion of the second heating curve versus the rubber content.
A decrease in the heat of fusion for all series impact copolymer PP samples can be observed
with increasing rubber content. The heat of fusion of PP matrix is constant and independent of
the rubber content. An increase in the heat of fusion is observed due to the presence of
nucleating agent.
8.5 Mechanical properties The improvement in toughness (impact strength) when EPR is added to PP matrix normally
implies in a reduction of its stiffness, which is usually related to a decrease in flexural
modulus, yield stress and an increase in the yield strain. A balance between toughness and
stiffness is always required for optimum performance of the rubber-toughened polymer. The
aim of tensile and flexural tests is to study the effect of rubber content and the addition of
nucleating agents to the yield point and flexural modulus. The yield point is defined as the
first point on the stress-strain curve at which an increase in strain occurs without a stress
increase. A soft but tough material shows a low modulus and a low yield stress. We expect
that the addition of rubber would decrease the yield stress whereas the addition of nucleating
agents would increase the yield stress.
Figure 8.7 shows the dependences of yield stress on the rubber content. The yield
stress decreases with the rubber content indicating that the softness increases. The impact
modified copolymers tend to have lower stiffness and lower yield stress than the
homopolymer as the presence of the ethylene reduces the crystallinity and stress level to
produce shear yielding [Mes1995]. The addition of nucleating agents produce a finer
spherulitic structure in the nucleated impact modified PP copolymers sample, which tend to
give higher yield stress values in relation to non-nucleated sample. All the nucleating agents
have almost the same effects.
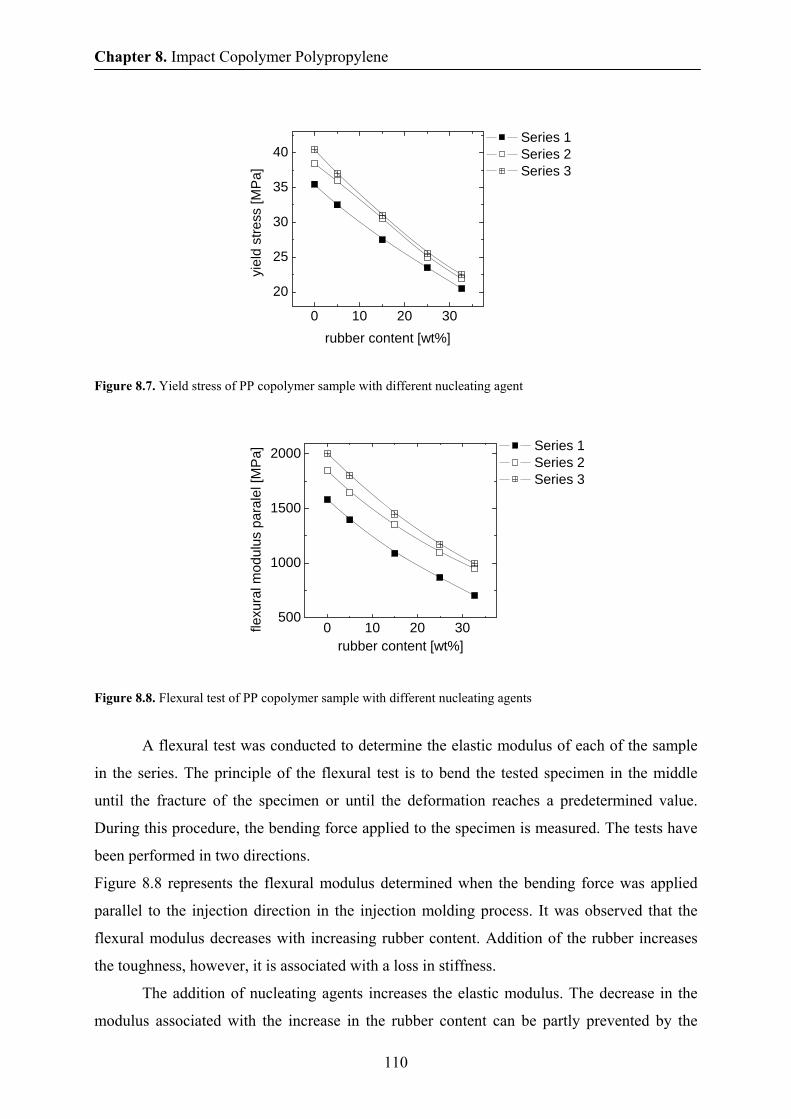
Chapter 8. Impact Copolymer Polypropylene
110
Figure 8.7. Yield stress of PP copolymer sample with different nucleating agent
Figure 8.8. Flexural test of PP copolymer sample with different nucleating agents
A flexural test was conducted to determine the elastic modulus of each of the sample
in the series. The principle of the flexural test is to bend the tested specimen in the middle
until the fracture of the specimen or until the deformation reaches a predetermined value.
During this procedure, the bending force applied to the specimen is measured. The tests have
been performed in two directions.
Figure 8.8 represents the flexural modulus determined when the bending force was applied
parallel to the injection direction in the injection molding process. It was observed that the
flexural modulus decreases with increasing rubber content. Addition of the rubber increases
the toughness, however, it is associated with a loss in stiffness.
The addition of nucleating agents increases the elastic modulus. The decrease in the
modulus associated with the increase in the rubber content can be partly prevented by the
0 10 20 30
20
25
30
35
40
yiel
d st
ress
[MP
a]
rubber content [wt%]
Series 1 Series 2 Series 3
0 10 20 30500
1000
1500
2000
flexu
ral m
odul
us p
aral
el [M
Pa]
rubber content [wt%]
Series 1 Series 2 Series 3
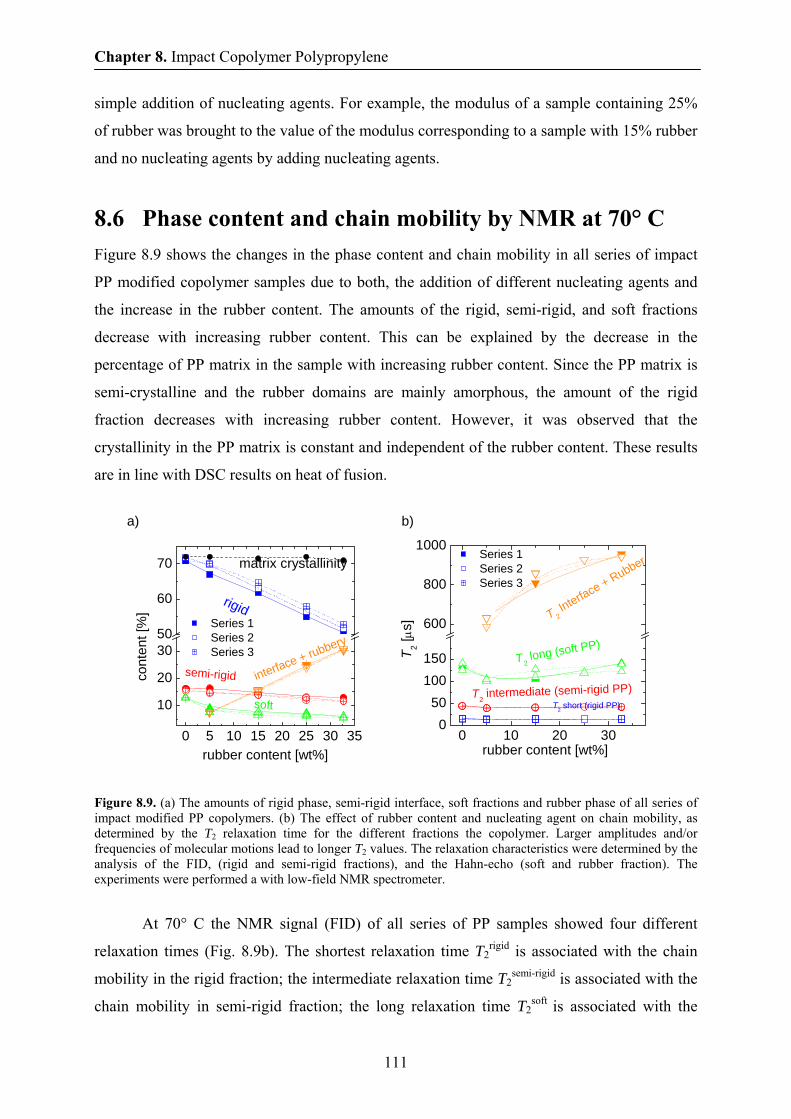
Chapter 8. Impact Copolymer Polypropylene
111
simple addition of nucleating agents. For example, the modulus of a sample containing 25%
of rubber was brought to the value of the modulus corresponding to a sample with 15% rubber
and no nucleating agents by adding nucleating agents.
8.6 Phase content and chain mobility by NMR at 70° C Figure 8.9 shows the changes in the phase content and chain mobility in all series of impact
PP modified copolymer samples due to both, the addition of different nucleating agents and
the increase in the rubber content. The amounts of the rigid, semi-rigid, and soft fractions
decrease with increasing rubber content. This can be explained by the decrease in the
percentage of PP matrix in the sample with increasing rubber content. Since the PP matrix is
semi-crystalline and the rubber domains are mainly amorphous, the amount of the rigid
fraction decreases with increasing rubber content. However, it was observed that the
crystallinity in the PP matrix is constant and independent of the rubber content. These results
are in line with DSC results on heat of fusion.
Figure 8.9. (a) The amounts of rigid phase, semi-rigid interface, soft fractions and rubber phase of all series of impact modified PP copolymers. (b) The effect of rubber content and nucleating agent on chain mobility, as determined by the T2 relaxation time for the different fractions the copolymer. Larger amplitudes and/or frequencies of molecular motions lead to longer T2 values. The relaxation characteristics were determined by the analysis of the FID, (rigid and semi-rigid fractions), and the Hahn-echo (soft and rubber fraction). The experiments were performed a with low-field NMR spectrometer.
At 70° C the NMR signal (FID) of all series of PP samples showed four different
relaxation times (Fig. 8.9b). The shortest relaxation time T2rigid is associated with the chain
mobility in the rigid fraction; the intermediate relaxation time T2semi-rigid is associated with the
chain mobility in semi-rigid fraction; the long relaxation time T2soft is associated with the
0 5 10 15 20 25 30 35
10
20
3050
60
70
interface + rubbery
soft
semi-rigid
rigid
cont
ent [
%]
rubber content [wt%]
Series 1 Series 2 Series 3
matrix crystallinity
a)
0 10 20 300
50100150
600
800
1000
T2 short (rigid PP)T2
intermediate (semi-rigid PP)
T2 long (soft PP)
T 2 Interface + Rubber Series 1
Series 2 Series 3
rubber content [wt%]
T 2 [μs]
b)
Chapter 8. Impact Copolymer Polypropylene
112
chain mobility in soft fraction, and the longest relaxation T2rubber time is associated with the
interface and rubber fraction.
The chain mobility of the rigid (T2rigid) and semi-rigid (T2
semi-rigid) fractions was found
unaffected by increasing the rubber content. This shows that the ethylene-propylene rubber is
well separated from the rigid and semi-rigid fractions, and cannot be present in those
fractions. Similarly, the increase in the chain mobility of the soft fraction (T2soft) of the
copolymer was explained by the presence of ethylene-propylene rubber mainly in the more
mobile core part of the soft phase.
The longest relaxation time (T2rubber) related to the mobility of the rubber fraction was
found to increase with increasing the ethylene-propylene rubber content. This is believed to
be related to the average size and size distribution of ethylene-propylene rubber domains and
the presence of small ethylene crystals in the rubber domains. In small rubber domains the
chain mobility of the rubber molecules is more restricted due to the attachment of a large
percentage of these molecules to the fraction of the PP chains in the amorphous phase. In
larger rubber domains the percentage of the attached rubber molecules is lower and therefore
the chain mobility is less restricted. Another explanation for increase in T2rubber with
increasing the rubber content can be the better phase separation between the rubber domains
and the amorphous PP phase for the sample with the highest amount of rubber. The large
difference in the molecular mobility between PP matrix and rubber matrix is due to Tg much
lower for ethylene-propylene rubber than for the PP homopolymer.
No significant changes in the phase content and chain mobility were detected by NMR
for any of the series of impact modified PP copolymer samples upon addition of nucleating
agents. The amount of rubber estimated by low-field NMR was found to be in good
agreement with the results obtained from liquid-state NMR and the calculated chemical
composition.
8.7 Aging in impact modified PP copolymer at 70° C by
NMR In the chapter 6 we reported that aging at 70° C causes changes in the morphology and chain
mobility of homopolymeric PP. The observed changes in the phase content and chain mobility
with aging time indicate that a micro-structural reorganization takes place within the material.
In order to follow the micro-structural reorganization at 70° C in the structure of the impact
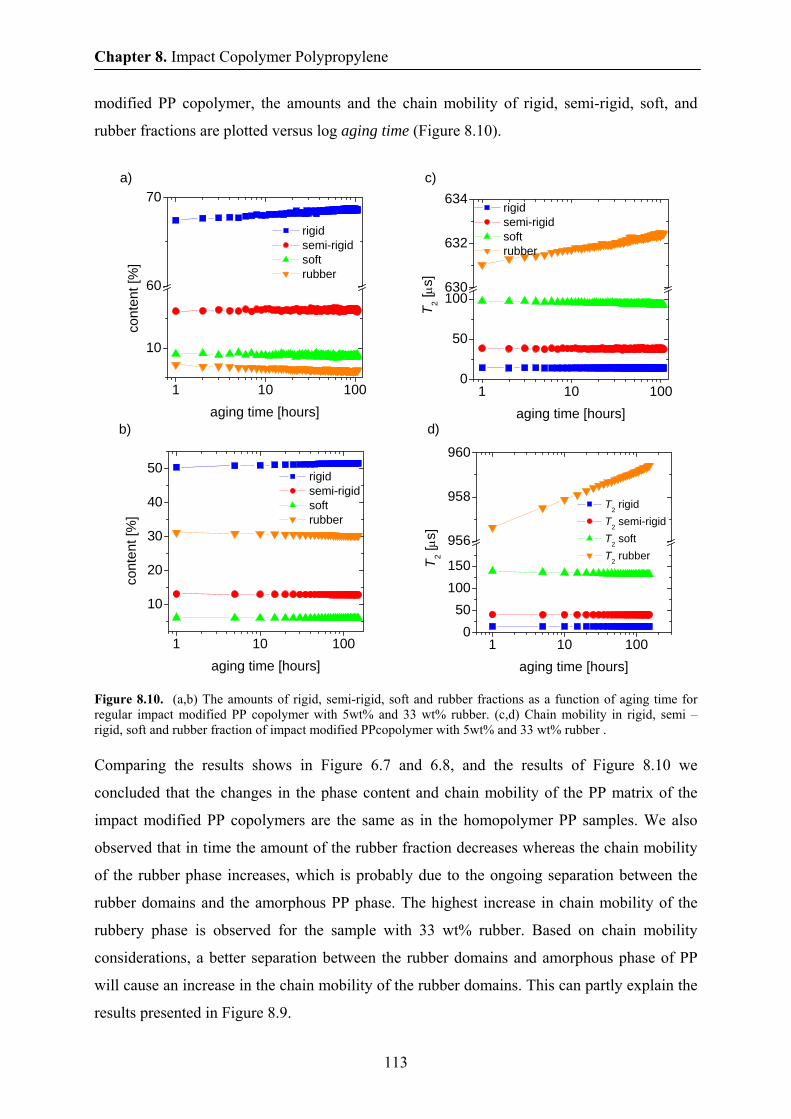
Chapter 8. Impact Copolymer Polypropylene
113
modified PP copolymer, the amounts and the chain mobility of rigid, semi-rigid, soft, and
rubber fractions are plotted versus log aging time (Figure 8.10).
Figure 8.10. (a,b) The amounts of rigid, semi-rigid, soft and rubber fractions as a function of aging time for regular impact modified PP copolymer with 5wt% and 33 wt% rubber. (c,d) Chain mobility in rigid, semi – rigid, soft and rubber fraction of impact modified PPcopolymer with 5wt% and 33 wt% rubber . Comparing the results shows in Figure 6.7 and 6.8, and the results of Figure 8.10 we
concluded that the changes in the phase content and chain mobility of the PP matrix of the
impact modified PP copolymers are the same as in the homopolymer PP samples. We also
observed that in time the amount of the rubber fraction decreases whereas the chain mobility
of the rubber phase increases, which is probably due to the ongoing separation between the
rubber domains and the amorphous PP phase. The highest increase in chain mobility of the
rubbery phase is observed for the sample with 33 wt% rubber. Based on chain mobility
considerations, a better separation between the rubber domains and amorphous phase of PP
will cause an increase in the chain mobility of the rubber domains. This can partly explain the
results presented in Figure 8.9.
1 10 100
10
20
30
40
50
cont
ent [
%]
aging time [hours]
rigid semi-rigid soft rubber
b)
1 10 1000
50100150
956
958
960
T 2 [μ
s]
aging time [hours]
T2 rigid T2 semi-rigid T2 soft T2 rubber
d)
1 10 100
10
60
70
cont
ent [
%]
aging time [hours]
rigid semi-rigid soft rubber
a)
1 10 1000
50
100630
632
634 rigid semi-rigid soft rubber
T 2 [μs]
aging time [hours]
c)
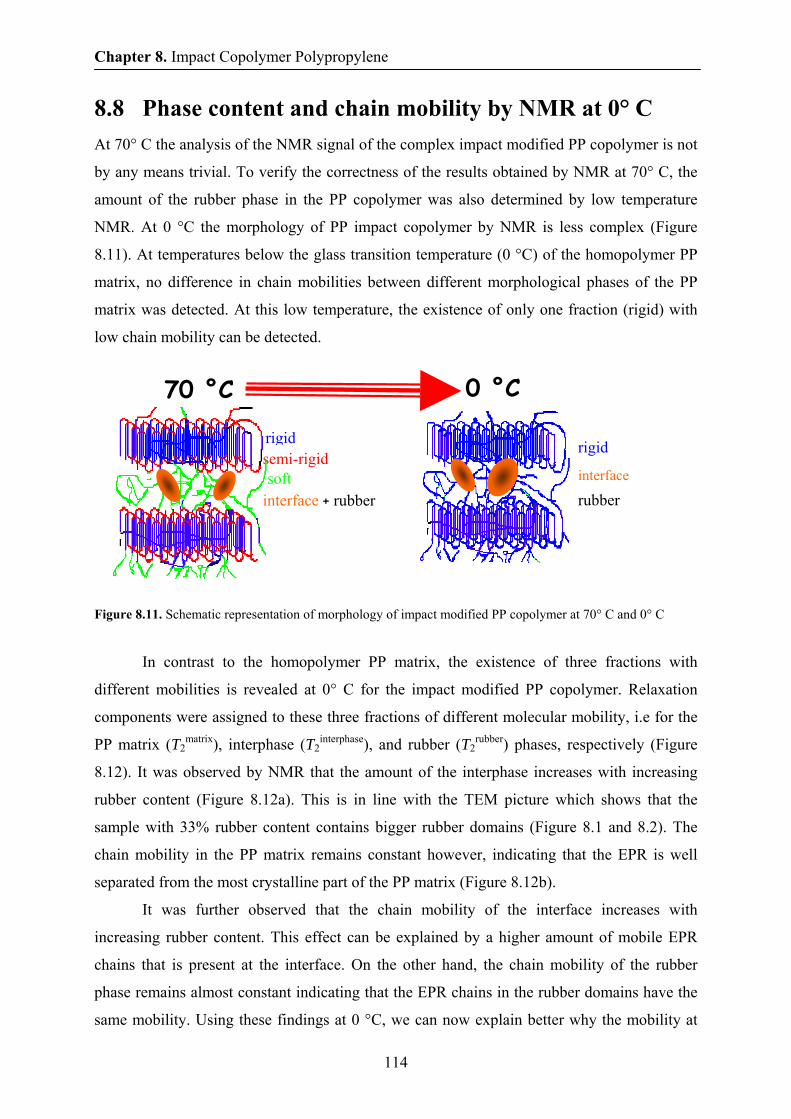
Chapter 8. Impact Copolymer Polypropylene
114
8.8 Phase content and chain mobility by NMR at 0° C At 70° C the analysis of the NMR signal of the complex impact modified PP copolymer is not
by any means trivial. To verify the correctness of the results obtained by NMR at 70° C, the
amount of the rubber phase in the PP copolymer was also determined by low temperature
NMR. At 0 °C the morphology of PP impact copolymer by NMR is less complex (Figure
8.11). At temperatures below the glass transition temperature (0 °C) of the homopolymer PP
matrix, no difference in chain mobilities between different morphological phases of the PP
matrix was detected. At this low temperature, the existence of only one fraction (rigid) with
low chain mobility can be detected.
Figure 8.11. Schematic representation of morphology of impact modified PP copolymer at 70° C and 0° C
In contrast to the homopolymer PP matrix, the existence of three fractions with
different mobilities is revealed at 0° C for the impact modified PP copolymer. Relaxation
components were assigned to these three fractions of different molecular mobility, i.e for the
PP matrix (T2matrix), interphase (T2
interphase), and rubber (T2rubber) phases, respectively (Figure
8.12). It was observed by NMR that the amount of the interphase increases with increasing
rubber content (Figure 8.12a). This is in line with the TEM picture which shows that the
sample with 33% rubber content contains bigger rubber domains (Figure 8.1 and 8.2). The
chain mobility in the PP matrix remains constant however, indicating that the EPR is well
separated from the most crystalline part of the PP matrix (Figure 8.12b).
It was further observed that the chain mobility of the interface increases with
increasing rubber content. This effect can be explained by a higher amount of mobile EPR
chains that is present at the interface. On the other hand, the chain mobility of the rubber
phase remains almost constant indicating that the EPR chains in the rubber domains have the
same mobility. Using these findings at 0 °C, we can now explain better why the mobility at
0 °C
rigid
rubber interface
interface + rubber
semi-rigid rigid
soft
70 °C
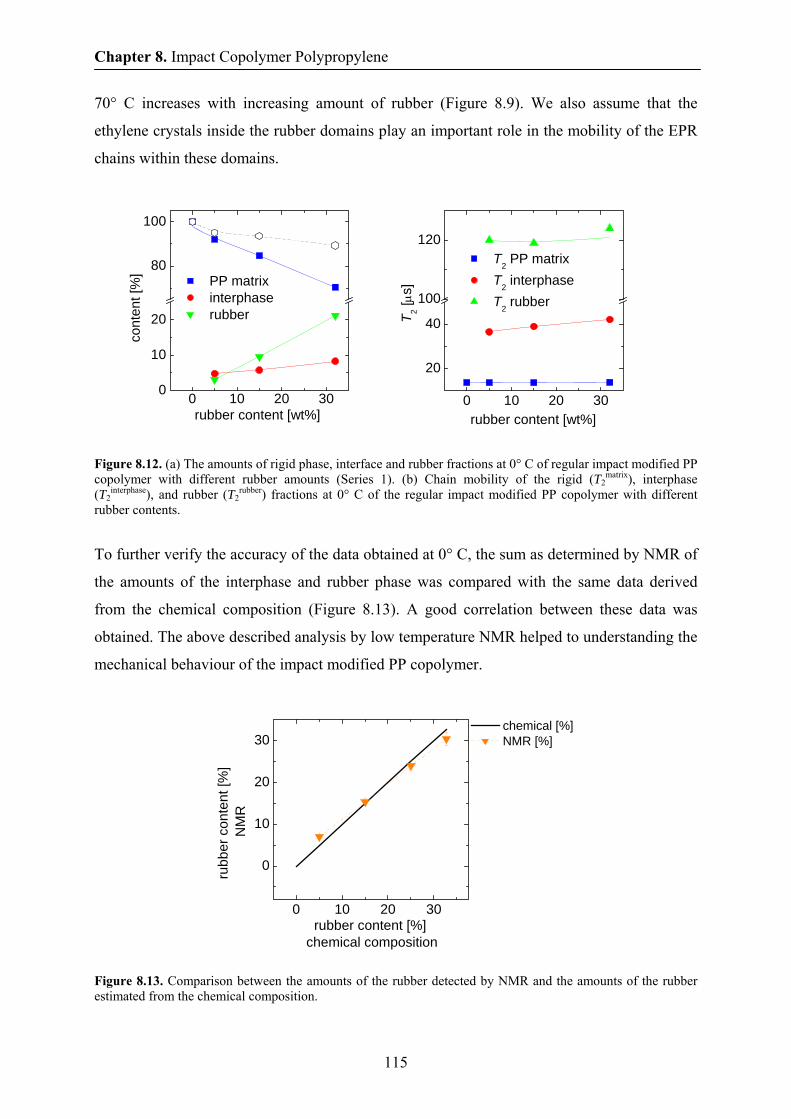
Chapter 8. Impact Copolymer Polypropylene
115
70° C increases with increasing amount of rubber (Figure 8.9). We also assume that the
ethylene crystals inside the rubber domains play an important role in the mobility of the EPR
chains within these domains.
Figure 8.12. (a) The amounts of rigid phase, interface and rubber fractions at 0° C of regular impact modified PP copolymer with different rubber amounts (Series 1). (b) Chain mobility of the rigid (T2
matrix), interphase (T2
interphase), and rubber (T2rubber) fractions at 0° C of the regular impact modified PP copolymer with different
rubber contents.
To further verify the accuracy of the data obtained at 0° C, the sum as determined by NMR of
the amounts of the interphase and rubber phase was compared with the same data derived
from the chemical composition (Figure 8.13). A good correlation between these data was
obtained. The above described analysis by low temperature NMR helped to understanding the
mechanical behaviour of the impact modified PP copolymer.
Figure 8.13. Comparison between the amounts of the rubber detected by NMR and the amounts of the rubber estimated from the chemical composition.
0 10 20 30
0
10
20
30
rubber content [%] chemical composition
rubb
er c
onte
nt [%
] N
MR
chemical [%] NMR [%]
0 10 20 300
10
20
80
100
cont
ent [
%]
rubber content [wt%]
PP matrix interphase rubber
0 10 20 30
20
40
100
120 T2 PP matrix T2 interphase T2 rubber
rubber content [wt%]
T 2 [μs]

Chapter 8. Impact Copolymer Polypropylene
116
One of the disadvantages of known PP copolymers is their low impact strength at low
temperatures. A method to improve the impact strength is to blend the PP with rubber, also
known as rubber toughening. Figure 8.14 represent the impact strength versus temperature for
regular impact modified PP copolymer with 5 wt% rubber. The letters indicate the different
classifications given to the sample. A brittle sample (B) means that the sample break rapidly,
whereas a tough sample (T) yields above a certain value of the applied force. In the transition
regime, there are brittle-tough samples (B-T) and tough-brittle (T-B) samples. The sample is
called brittle-tough when for the five sample tested there are more brittle than tough samples
and the other way around for the tough-brittle samples.
Figure 8.14. Impact strength of regular PP impact copolymer with 5 wt% rubber at different temperature
The impact strength at low temperatures depends on the behaviour of the rubber at
those low temperatures. To study in detail the rubber behaviour with temperature in impact
modified PP copolymer samples with 5 wt% rubber content, the NMR experiments were
performed from -40° C and up to 70° C. In the temperature range from -40° C to -20° C
(regime I in Figure 8.15ab) the NMR signal can be decomposed in two components with
different chain mobility, i.e. a rigid component with low chain mobility and a soft component
with higher chain mobility.
20 40 60 80 1000
10
20
30T
T
T-B
B-TB
B
impa
ct s
treng
th [K
J/m
2 ]
temperature [°C]
B
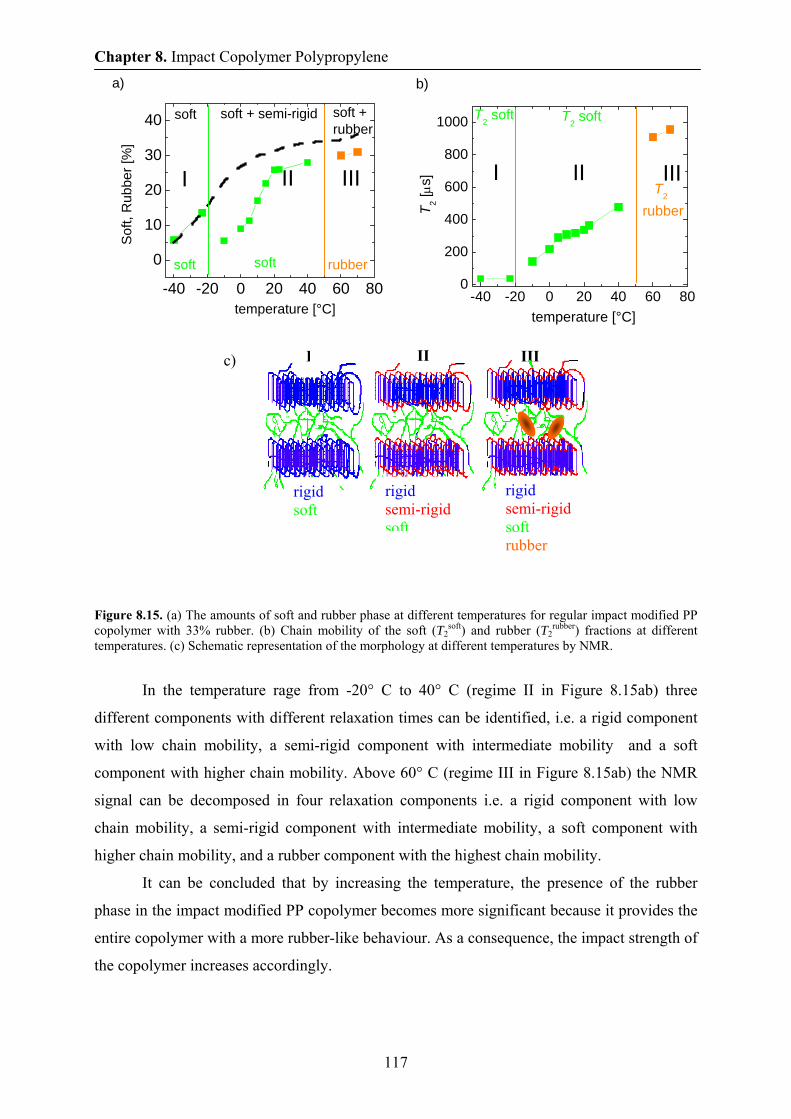
Chapter 8. Impact Copolymer Polypropylene
117
Figure 8.15. (a) The amounts of soft and rubber phase at different temperatures for regular impact modified PP copolymer with 33% rubber. (b) Chain mobility of the soft (T2
soft) and rubber (T2rubber) fractions at different
temperatures. (c) Schematic representation of the morphology at different temperatures by NMR.
In the temperature rage from -20° C to 40° C (regime II in Figure 8.15ab) three
different components with different relaxation times can be identified, i.e. a rigid component
with low chain mobility, a semi-rigid component with intermediate mobility and a soft
component with higher chain mobility. Above 60° C (regime III in Figure 8.15ab) the NMR
signal can be decomposed in four relaxation components i.e. a rigid component with low
chain mobility, a semi-rigid component with intermediate mobility, a soft component with
higher chain mobility, and a rubber component with the highest chain mobility.
It can be concluded that by increasing the temperature, the presence of the rubber
phase in the impact modified PP copolymer becomes more significant because it provides the
entire copolymer with a more rubber-like behaviour. As a consequence, the impact strength of
the copolymer increases accordingly.
-40 -20 0 20 40 60 80
0
10
20
30
40 soft +rubber
soft + semi-rigidsoft
rubbersoft
IIIII
Sof
t, R
ubbe
r [%
]
temperature [°C]
I
soft
a)
-40 -20 0 20 40 60 800
200
400
600
800
1000
T2
rubber
T2 soft
IIIII
temperature [°C]
T2 [μ
s] I
T2 soft
b)
III I II
rigid soft
rigid semi-rigidsoft
rigid semi-rigid soft rubber
c)
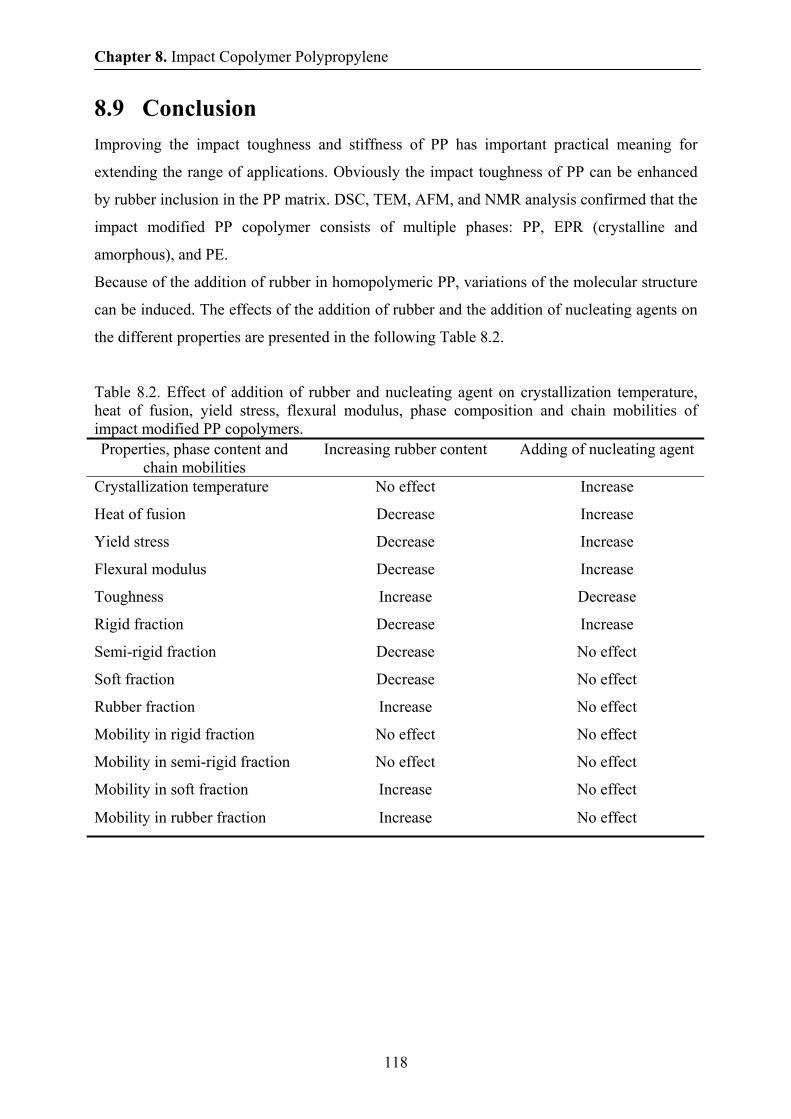
Chapter 8. Impact Copolymer Polypropylene
118
8.9 Conclusion Improving the impact toughness and stiffness of PP has important practical meaning for
extending the range of applications. Obviously the impact toughness of PP can be enhanced
by rubber inclusion in the PP matrix. DSC, TEM, AFM, and NMR analysis confirmed that the
impact modified PP copolymer consists of multiple phases: PP, EPR (crystalline and
amorphous), and PE.
Because of the addition of rubber in homopolymeric PP, variations of the molecular structure
can be induced. The effects of the addition of rubber and the addition of nucleating agents on
the different properties are presented in the following Table 8.2.
Table 8.2. Effect of addition of rubber and nucleating agent on crystallization temperature, heat of fusion, yield stress, flexural modulus, phase composition and chain mobilities of impact modified PP copolymers. Properties, phase content and
chain mobilities Increasing rubber content Adding of nucleating agent
Crystallization temperature No effect Increase
Heat of fusion Decrease Increase
Yield stress Decrease Increase
Flexural modulus
Toughness
Decrease
Increase
Increase
Decrease
Rigid fraction Decrease Increase
Semi-rigid fraction Decrease No effect
Soft fraction Decrease No effect
Rubber fraction Increase No effect
Mobility in rigid fraction No effect No effect
Mobility in semi-rigid fraction No effect No effect
Mobility in soft fraction Increase No effect
Mobility in rubber fraction Increase No effect
Chapter 9. General conclusions
119
Chapter 9 General Conclusions Solid state Nuclear Magnetic Resonance has successfully been applied for the characterization
of high-density polyethylene, isotactic polypropylene, and impact modified polypropylene
copolymers. For the first time, NMR experiments on polyolefin materials have been
performed at both low and high field. These NMR methods alone and in combination with
DSC, X-ray, IR, TEM, and AFM were used to obtain information about the changes in the
structure, molecular dynamics, and domain thickness of the investigated systems. These
changes were caused by stretching and exposure of the sample at elevated temperature for a
certain time, and addition of rubber and nucleating agents. The main conclusions of this work
results are as follows:
1. The most appropriate description of the morphology of both homopolymer HDPE
and iPP by NMR is a three-phase model (rigid, semi-rigid, and soft fractions). The
amounts of the rigid, semi-rigid and soft fraction, and chain dynamics in each fraction
of polyethylene and isotactic polypropylene have been investigated by 1H solid state
NMR as a function of temperature. The domain thicknesses as determined by NMR
were compared with those measured by small-angle X-ray scattering (SAXS) and
transmission electron microscopy (TEM) and are in a good agreement. This proves the
reliability of the low-field NMR methods for the determination of domain thicknesses
in heterogeneous polymers like those enumerated above. Annealing at higher
temperatures causes an increase in the lamellae thickness and crystallinity and a
decrease in the chain mobility in all fractions. It was shown that the thickening of the
crystalline domains during annealing of iPP can be described by a model based on
irreversible thermodynamics. A phenomenological correlation was established
between the relaxation rate of 1H transverse magnetization characteristic to the rigid
fraction of iPP and the annealing temperatures.
2. The effects of deformation ratio, deformation rate, and deformation temperatures on
the phase content, chain mobility, and domain thickness of homopolymeric iPP has
been investigated using low-field solid state NMR. The amount of the rigid
Chapter 9. General conclusions
120
fraction/degree of crystallinity obtained by NMR coincided within few percent with
that obtained by IR. A decrease in the chain mobility has been observed in all fractions
with increasing the drawing rate, draw ratio, and drawing temperature. The increase in
the thickness of the lamellae with increasing draw ratio and drawing temperature can
be explained by partial melting and recrystallization, as well as immobilization of the
amorphous phase. We established correlations between the thicknesses of the rigid
domains and the amount of the rigid fraction of unaxially stretched iPP, as well as
between the thickness of the rigid domains and the chain mobility in the rigid fraction.
3. The effect of aging temperature and aging time on the phase composition, chain
mobility and mechanical properties of iPP homopolymer has been studied in detail by 1H low-field solid state NMR. The samples were obtained by a process involving
injection molding, crystallization from the melt, and quenching. The aging effect on
different morphologies of homopolymeric iPP samples was rationalized in terms of
increased restrictions of the chain mobility in the semi-rigid and soft fractions. All
samples exhibited physical aging at elevated temperatures and furthermore, it was
observed that the physical aging kinetics depends by the morphology of the iPP and
the aging temperature. The structural changes due to aging are considered to be
associated with a molecular rearrangement generally similar to a secondary
crystallization which is accompanied by a decrease in segmental chain mobility of the
diffusing amorphous chains.
4. Changes in the morphology, phase content, chain mobility, and mechanical data of
impact modified polypropylene copolymer have been investigated using a
combination of different techniques such as NMR, X-Ray, TEM, AFM, and DSC.
These changes were caused by the ethylene-propylene rubber and nucleating agents
added to improve the impact strength and modulus of the polymer. A decrease in the
heat of fusion, yield stress, flexural modulus has been observed with increasing rubber
content. The addition of nucleating agents however, caused an increase in the
crystallization temperature, heat of fusion, yield stress, flexural modulus, and rigid
fraction.
Based on the above results, we can conclude that low and high field proton NMR can be
successfully used to obtain information about the structure, molecular dynamics, and domain
Chapter 9. General conclusions
121
thickness in the investigated homopolymers of HDPE, iPP, and copolymeric PP. However,
the potential of these NMR techniques can be easily extended to other polymeric systems.
Corroborating the NMR results with data obtained from other measurement techniques as
those enumerated above, helped in gaining further insights in the microscopic properties of
the materials under investigation. Therefore, the authors hopes that this thesis brings the
reader a step closer to understanding at least part of the known multiple possibilities of NMR
investigations and sets a solid base for those that are yet to be discovered.
Chapter 9. General conclusions
122
References
123
References
[Abr1961] A. Abragam, “Principles of Nuclear Magnetism”, Oxford University Press,
Oxford, 1961.
[Aga1962] M. K.Agarwal, K. E. Helf, Kolloid Z. 180, 114-118 (1962).
[Aga1981] M. Agarwal, J. M. Schultz, Polym. Eng. Sci. 21, 776 – 781 (1981).
[Aha1983] S. M. Aharoni, Macromolecules 16, 1722-1728 (1983).
[Aki1999] A. Akizadeh, L. Richardson, J. Xu, S. McCartney, H. Marand, Y. W. Cheung,
S. Chum, Macromolecules 32, 6221 (1999).
[Ala1999] R. G. Alamo, G. M. Brown, L. Mandelkern, A. Lehtinen, R. Paukkerri,
Polymer 40, 3933 (1999).
[Ale1969] L. E. Alexander, Diffraction Methods in Polymer Science, John Wiley & Sons,
Inc.: New York, 1969.
[Ali2001] A. Alizahedh, S. Sohn, J. Quinn, H. Marand, L. C. Shank, H. D. Iler,
Macromolecules 34, 4066 (2001).
[Ass1978] R. A. Assink, Macromolecules 11, 1233 (1978).
[Ath1994] ATHAS Data Bank. http://web.utk.edu/~athas/databank/ Ed. M. Pyda, 1994.
[Aur2000] F. Auriemma, O.R. Ballesteros, C. De Rosa, P. Corradini, Macromolecules 33,
8764, (2000).
[Aur2001] F. Auriemma, C. De Rosa, T. Boscato, P. Corradini, Macromolecules 34, 4815
(2001).
[Awa1998] H. Awaya, Polymer 26, 591, (1988).
[Axe1983] D. E. Axelson, L. Mandelkern, R. Popli, P.J. Mathieu, Polym. Sci.:
Polym.Phys. 2, 2319 (1983).
[Ba1998] Y. Ba, J. A. Ripmesster, J. Chem. Phys. 108, 8589-8594 (1998).
[Bas1974] D. C. Bassett, S. Block, G. J. Piermarini, J. Appl. Phys. 45, 4146, (1974)
[Bal1989] F. J. Balta-Calleja, C. G. Vonk, „X-ray Scattering of Synthetic Polymers“
Elsevier, New York, 1989.
[Bal2000] S. Balijepalli, G. C. Rutledge, Comp. And Theoretical Pol. Sci. 10, 103-113
(2000).
[Bas1973] D. C. Bassett, D. R. Carder, Polymer 24, 387 (1973).
[Bed2000] E.L. Bedia, N. Astrini, A. Sudarisman, F. Sumera and Y. Kashiro. J Appl
References
124
Polym Sci 78, 1200 (2000).
[Bed2002] E.L. Bedia, S. Murakami, K. Senoo and S. Kohjiya. Polymer 43, 749 (2002).
[Bell1993] A. Bellare, R. E. Cohen, A. S. Argon, Polymer 34, 1393 (1993).
[Ber1967] K.Bergmann, K. Nawotki, Z-Z Polym 219, 132 (1967).
[Ber1978] K. Bergmann, J.Polym.Sci., Polym. Phys. 16, 1611 (1978).
[Boy1979] R.H. Boyd, Polym. Engng. Sci. 19, 1010 (1979).
[Boy1983] R.H. Boyd, J. Polym. Sci. Polym. Phys. 21, 493 (1983).
[Boy1984] R. H. Boyd, Macromolecules 17, 903 (1984).
[Boy1985] R. H. Boyd, Polymer 26, 323 (1985).
[Bra1986] J. M. Brady, E. L. Thomas, Polymer Prep. 27, 1 (1986).
[Bra1999] J. Brandrup, E. H. Immergut, E. A. Grulke, „Polymer Handbook“ 1999.
[Bri1993] J. V. McBrierty, K. J. Paker, “Nuclear Magnetic Resonance in Solid Polymers”
Cambridge Univ. Press, Cambridge, 1993.
[Bro1997] G.M. Brown and J.H. Butler. Polymer 38, 3937 (1997).
[Bud2003] A. Buda, D. E. Demco, M. Bertmer, B. Blümich, V. M. Litvinov, J. P.
Penning, J. Phys. Chem. B 107 5357 (2003).
[Bud2003] A. Buda, D. E. Demco, M. Bertmer, B. Blümich, B. Reining, H. Keul, H.
Höcker, Solid State Nucl. Magn. Reson. 24, 39 2003.
[Bud2004] A. Buda, D. E. Demco, B. Blümich, V. M. Litvinov, J. P. Penning,
ChemPhysChem 5, 876-883 (2004).
[Bun1939] C. W. Bunn, Trans. Farad. Soc. 35, 482, (1954).
[Bus1990] W. R. Busing, Macromolecules 23, 4608, (1990).
[Cam1993] R. A. Campbell, P. J. Philips, Polymer 34, 4809, (1939).
[Cla1993] J. Clauss, K. Schmidt-Rohr, H. W. Spiess, Acta Polym. 44, 1-17 (1993).
[Cha1977] Y. Chantani, Y. Ueda, H. Tadokoro, Annual meeting of the Society of Polymer
Science, Japan, Tokyo, Preprint, p 1326, (1977).
[Cha1980] C. K. Chai, N. G. McCrum, Polymer 21, 706 (1980).
[Cha2002] A.C. Chang, L. Tau, A. Hiltner and E. Baer. Polymer 43, 4923 (2002).
[Cha2002] A.C. Chang, S.P. Chum, A. Hiltner and E. Baer. J Appl Polym Sci 86, 3625
(2002).
[Che1994] J. Cheng, M. Fone, V. N. Reddy, K. B. Schwartz, H. P. Fisher, B. Wunderlich
J.Polym.Sci.: Part B: Polym.Phys. 32, 2683 (1994).
[Che2006] B. R. Cherry, C. H. Fujimoto, C. J. Cornelius, T. M. Alam, Macromolecules
38, 1201-1206 (2005).
References
125
[Cho1988] J.C. Chou, K. Vijayan, D. Kirby, A. Hiltner, E. Baer, J. Mater. Sci. 23, 2521
(1988).
[Chi1961] R. Chiang, P.J. Flory, J. Am. Chem. Soc. 83, 2857 (1961).
[Cop1987] F. Coppola, R. Greco, E. Martucelli, H.W. Kammer and C. Kummerlowe.
Polymer 28, 47 (1987).
[Cru1984] N. G. McCrum, Polymer 25, 299 (1984).
[Cru2004] N. G. McCrum, B. E. Read, G. Williams, “Anelastic and Dielectric Effects in
Polymeric Solids”, Wiley, New York, 2004.
[Dad1994] D. Dadayli, R. K. Harris, A. M. Kenwright, B. J. Say, M. M. Sunnetcioglu,
IRC Polym. and Tech. 35, 4083 (1994).
[Dem1995] D. E. Demco, A. Johansson, J. Tegenfeldt, Solid State Nucl. Magn. Reson. 4,
13-38 (1995).
[Dou1979] D.C. Douglass.; V.J. McBrierty, Polym. Eng. Sci. 19, 1054, (1979) and
references therein.
[Ear1979] W. Earl, D. L. VanderHart, Macromolecules 12, 762 (1979).
[Eck1997] R. R. Eckman, P. M. Henrichs, A. J. Peacock, Macromolecules 30, 2474
(1997).
[Ern1987] R. R. Ernst, G. Bodenhausen, A. Wokaun “Principles of Nuclear Magnetic
Resonance in One and Two Dimensions”, Oxford University Press, Clarendon,
1987.
[Fed1985] V. D. Fedotov, N. A. Abdrashitiva. Polym. Sci. USSR 27, 287 (1985).
[Fer1984] A. Ferrero, E. Ferracini, R. Hosemann, Polymer 25, 1747 (1984).
[Fil1994] B. Fillon, A. Thierry, B. Lotz, J. Wittman, J. Therm. Analys. 42, 721 (1994)
[Fis1962] E. W. Fischer, G. F. Z. Schmidt, Angew. Chem. 1, 488 (1962).
[Fis1969] E. W. Fischer, M. Goddar, J. Polymer Sci. C16, 4405 (1969).
[Flo1978] P. J. Flory, D. Y. Yoon, Nature 272, 226-229 (1978).
[Fuj1991] M. Fujiyama, T. Walino, J. Appl. Polym. Sci. 42, 2739 (1991).
[Gau2000] S. Gautman, S. Balijepalli, G. C. Rutledge, Macromolecules 33, 9136-9145
(2000).
[Ghe1994] J. Gheng, M. Fone, N. V. Reddy, B. K. Schwartz, P. H. Fisher, B. Wunderlich,
J. Polym. Sci.: Polym. Phys. 32, 2683-2693 (1994).
[Goi1992] G. Goizueta, T. Chiba and T. Inoue, Polymer 33, 886 (1992).
[Goi1993] G. Goizueta, T. Chiba and T. Inoue, Polymer 34, 253 (1993).
[Gol1961] M. Goldman, L. Shen, Phys. Rev. 144, 321 (1961).
References
126
[Gos1996] U. Goschel, K. Deutscher, V. Abetz, Polymer 37, 1 (1996).
[Gre2002] C. Grein, C.J.G. Plummer, H.-H. Kausch, Y. Germain and P. Beguelin.
Polymer 43, 3279 (2002).
[Hai1965] I. L. Hay, A. Keller, Kolloid-Z. & Z. Polymere 204, 43 (1965).
[Hal1972] J. C. Halpin, J. L. Kardos, J Appl. Phys. 43, 2235 (1972).
[Han1974] J. M. Hannon, J. Appl. Poly. Sci. 18, 3761, (1974).
[Han1998] E. W. Hansen, P. E. Kristiansen , B. Pedersen, J.Phys..Chem. B 102, 5444
(1998).
[Hed2007] C. Hedesiu, D. E. Demco, R. Kleppinger, A. A. Buda, B. Blumich, K.
Remerie, V. M. Litvinov, Polymer 48, 763 (2007).
[Hed2007] C. Hedesiu, D. E. Demco, R. Kleppinger, G. Vanden Poel, W. Gijsbers, B.
Blümich, K. Remerie, V. M. Litvinov, Macromolecules, 40, 3977-3989 (2007).
[Hei1959] W. Heinsen, Journal of Polymer Science 38, 134 1959.
[Hel1997] S. Hellinckx , Colloid Polym. Sci. 275, 116 (1997)
[Hen1984] D. Hentschel, H. Sillescu, H. W. Spiess, Polymer 25, 1078 (1984).
[Hik1997] M. Hikosaka, K. Amano, S. Rastogi, A. Keller, Macromolecules 30, 2067
(1997).
[Hill1998] L. Hillebrand, A. Schmidt, A. Bolz, M. Hess, W. Veeman, R. J. Meier, G. Van
der Velden, Macromolecules 31, 5010 (1998).
[Hir1990] J. Hirschinger, H. Miura, A. D. English, Macromolecules 23, 2153 (1990).
[His1999] R. Hiss, S. Hobeika, C. Lynn, G. Strobl, Macromolecules 32, 4390 (1999).
[Hu1999] W. G. Hu, C. Boeffel, K. Schmidt-Rohr, Macromolecules 32, 1611-1619
(1999).
[Hu2000] W.-G. Hu, K. Schmidt-Rohr, Polymer 41, 2979 (2000).
[Hu2000] J. Z. Hu, W. Wang, S. Bai, R. J. Pugmire, G. M..V. Taylor, D. M. Grant,
Macromolecules 33, 3359 (2000).
[Ibh1996] A. O. Ibhadon, J. Appl. Polym. Sci. 62, 1843 (1996).
[Idi1996] D. S. H. Idiyatullin, E. V. Khozina, V. S. Smirnov, Solid State Nucl. Magn.
Reson. 7, 17 (1996).
[Iij2000] M. Iijima, G. Strobl, Macromolecules 33, 5204 (2000).
[Isa1999] J. R. L. Isasi, M. J. Mandelkern, R. G. Galante Alamo, J. Polym. Sci., Polym.
Phys. 37, 323 (1999).
[Ito1981] M. Ito, T. Kanamoto, K. Tanaka, Macromolecules 14, 1779 (1981).
[Ito1992] J. Ito, K. Mitani, Y. Mizutani, J. Appl. Polym. Sci. 46, 1221 (1992).
References
127
[Iwa2002] Iwata K. Polymer 43, 6609 (2002).
[Jan1993] J. Jancar, A. T. J. Dibenedetto, J. Kucera, Polymer 34, 1684 (1993).
[Jan1994] J. Jancar, A. T. J. Dibenedetto, J.Matter. Sci. 29, 4651 (1994).
[Jan1996] J. Jancar, J.Matter. Sci. 31, 3983 (1996).
[Kak1985] T. Kakudate, M. Kakizaki , T. Hideshima, J.Polym.Sci.: Polym.Phys. 23, 787
(1985).
[Kar1979] J. Karger-Kocsis, A. Kallo, A. Szafner, G. Bodar and Z. Senyei. Polymer 20,
37 (1979).
[Kar1995] J. Karger – Kocsis, Polypropylene; structure, blends and composites; Vol. 1,
Champman and hall, London, (1995).
[Kar1999] H. G. Karian, Handbook of Polypropylene and Polypropylene Composites;
Marcel Dekker: New York, 1999.
[Kav1971] S. Kavesh, J.M. Schultz, J. Polym. Sci. Part A-2 9, 85 (1971).
[Kha1996] A. Khare, A. Mitra, J. Mater. Sci. 31, 5691 (1996).
[Kim1996] G.-M. Kim, G.H. Michler, M. Gahleitner and J. Fiebig. J Appl Polym Sci 60,
1391 (1996).
[Kim1998] G.-M. Kim and G.-H. Michler. Polymer 39, 5689 (1998).
[Kis1983] Y. V. Kissin, J. of Polym. Sci.: Polym. Phys. Edit. 31, 2085 (1983).
[Kit1977] R. Kitamaru, F. Horii, F. Hyon, J Polym Sci Polym Phys 15, 821 (1977).
[Kit1978] R. Kitamaru, F. Horii, Adv Polym. Sci. 26, 139 (1978).
[Kit1986] R. Kitamaru, F. Horii, K. Murayama, Macromolecules 19, 636 (1986).
[Kit1994] R. Kitamaru, F. Horii, Q. Zhu, D. C. Bassett, R. H. Olley, Polymer 35, 1171
(1994).
[Kiv1986] A. Kivinen, M. Ovaska, K. Soljamo, Chemical Physics Letters 128, 4 (1986).
[Kle2002] P. G. Klein, M. A. N. Driver, Macromolecules 35, 6598 (2002).
[Kri1999] P. E. Kristiansen, E. W. Hansen, B. Pedersen, J.Phys..Chem. B: 103, 3552
(1999).
[Kri2000] P. E. Kristiansen, E. W. Hansen, B. Pedersen, Polymer 41, 311 (2000).
[Kuw2000] K. Kuwabara, H. Kaji, M. Tsuji , F. Horii, Macromolecules 33, 7093 (2000).
[Lab2001] T. Labour, C. Gauthier, R. Seguela, G. Vigier, Y. Bomal, G. Orange, Polymer
42, 7127 (2001).
[Li1999] J. X. Li, W. L. Cheung, C. M. Chan, Polymer 40, 2089 (1999).
[Lin1974] L. Lin, A. S. Argon, J. Mater. Sci. 9, 2034 (1974).
[Lit2002] V.M. Litvinov, V. B. F. Mathot, Solid State Nuclear Mag. Res. 22, 218
References
128
(2002).
[Lit2004] V.M. Litvinov, J. P. Penning, Macromol. Chem. Phys. 205, 172 (2004).
[Lit2005] V. M. Litvinov, M. Soliman, Polymer 46, 3077 (2005).
[Lot1991] B. Lotz, S. Graff, C. Staupe, J. C. Wittman, Polymer 32, 2903, (1991).
[Lot1996] B. Lotz, J. C. Wittmann, Polymer 37, 4979, (1996).
[Lov1983] A. J. Lovinger, J. Polm. Phys. 21, 97, (1983).
[Mag1996] S. N. Magonov, Surface analysis with STM and AFM, VCH Publisher, New
York, 1996
[Mai2000] P. Maiti, M. Hikosaka, K. Yamada, A. Toda, F. Gu, Macromolecules 33, 9069
(2000).
[Man1964] L. Mandelkern, “Crystallization of polymers”, McGraw-Hill, New York, 1964.
[Man1968] L. Mandelkern, A. L. Allou, M. Gopalan, J. Phys. Chem. 72, 309 (1968).
[Man1985] L. Mandelkern, Polymer J. 17, 337 (1985).
[Man1988] L. Mandelkern, A. J. Peacock, Stud. Phys. Theor. Chem. 54, 201-217 (1988).
[Man1990] L. Mandelkeren, R. G. Aloma, M. A. Kennedy, Macromolecules 23, 4721-
4723 (1990).
[Man1990] L. Mandelkern, Acc. Chem. Res. 23, 380-394, (1990).
[Mar2000] H. Marand, A. Alizadeh, R. Farmer, R. Desai, V. Velikov, Macromolecules
33, 3392 (2000).
[Mar1998] A. Martorana, S. Piccarolo, D. Sapoundjieva, Macromolec. Chem. Phys. 3, 531
(1998).
[Mat1994] V. B. F. Mathot, “Calorimetry and Thermal Analysis of Polymers” Hanser
Publishers: Munich, Germany, Vienna, and New York, 1994.
[Mat2000] H. Matsuda, T. Aoike, H. Uehara, T. Yamanobe, T. Komoto, Polymer 42,
5013-5021 (2000).
[Men2003] R. Mendoza, G. Regnifer, W. Seiler, J. L. Lebrun, Polymer 44, 3363 (2003).
[Mez1994] K. Mezghani, R. A. Cambell, P. J. Phillips, Macromolecules 27, 997 (1994).
[Mez1997] K. Mezghani, P. J. Phillips, Polymer 38, 5725, (1997)
[Mes1995] P. B. Messersmith, E. P. Giannelis, J. Polym. Sci. Part A: Polym. Chem. 33,
1047 (1995).
[Mun1987] M. Munowitz, A. Pines, Adv. Chem. Phys. 66, 1-152 (1987).
[Nat1955] G. Natta, P. Pino, P. Corrandini, F. Danusso, E. Mantica, G. Mazzanti, G.
Moragilo, J. Am. Chem. Soc. 77, 1708, (1955).
[Nat1956] G. Natta, Angew. Chem. 68, 541, (1956).
References
129
[Nat1964] G. Natta, Angew. Chem. 76, 553, (1964).
[Neg1992] M. Negahban, A. S. Wineman, Int. J. Engng. Sci. 30, 819 (1992).
[Nor1995] T. Normura, T. Nishio, T. Fujii, J. Sakai, M. Yamamoto, A. Uemura, M.
Kakugo. Polym Engng Sci. 35, 1261, 1995.
[Nys1995] B. Nysten, R. Legras and J.-L. Costa. J. Appl. Phys. 78, 5953 (1995).
[Nys1999] B. Nysten, A. Ghanem, J.-L. Costa and R. Legras. Polym. Int. 48, 334 (1999).
[Oll1989] R. H. Olley, D. C. Bassett, Polymer 30, 399-409 (1989).
[Ora1982] L. D'Orazio, N. Greco, C. Mancarella, E. Martuscelli, G. Nagosta and C.
Silvereste. Polym Engng Sci 22, 536 (1982).
[Ora2001] L. D'Orazio and G. Cecchin. Polymer 42, 2675 (2001).
[Pac1984] K. J. Packer, J. M. Pope, R. R. Yeung, J. Polym. Sci.: Polym. Phys. 22, 589-
616 (1984).
[Pau1993] R. Paukkeri, T. Vaananen, A. Lehtinen, Polymer 34, 2488, (1993).
[Pav2005] S. Pavel, T. Hashimoto, S. Kenji, G. Arkadiusz, Polymer 46, 513-521, (2005).
[Pea1990] A. Peacock, L. Mandelkern, J. Polym. Sci., Polym. Phys. Ed. 28, 1917, (1990).
[Per1999] E. Perez, D. Zucchi, M. C. Sacchi, F. Forlini, A. Bello, Polymer 40, 675,
(1999)
[Pet1963] A. Peterlin, J. Polym. Sci. B1 B1, 279 (1963).
[Pet1967] A. Peterlin, Polymer 6, 25 (1967).
[Pet1971] A. Peterlin, J. Mater. Sci. 6, 490 (1971).
[Pet1973] A. Peterlin, Appl. Polym. Symp. 20, 269 (1973).
[Pet1987] A. Peterlin, Colloid&Polymer Sci. 265, 357 (1987).
[Pet1996] F. Coppola, R. Greco, E. Martucelli, H.W. Kammer and C. Kummerlowe.
Polymer 28, 47 (1987).
[Poe2003] P. Poelt, E. Ingolic, M. Gahleitner, K. Bernreitner and W. Geymayer. J Appl
Polym Sci 78, 1152 (2000).
[Pop1987] R. Popli, L. Mandelkern, J. Polym. Sci. , Polym. Phys. 25, 441-449, (1987).
[Pou1998] L. Poussin, Y. A. Bertin, J. Parisot, C. Brassy, Polymer 39, 4261 (1998).
[Pre2000] R. Premphet, P. Horanont, J. Appl. Polym. Sci. 76, 1929 (2000).
[Ros1992] S. Rostami, I. S. Miles, “Multicomponent Polymer Systems” Wiley: New York,
1992.
[Ros2002] C. De Rosa, F. Auriemma, T. Circelli, R. M. Waymouth, Macromolecules 35,
3622, (2002).
[Rul1961] W. Ruland, Acta Crystallogr. 14, 1180 (1961).
References
130
[Rul1964] W. Ruland, Polymer 5, 89 (1964).
[Sam1981] R. J. Samuels, Makromol. Chem. 4, 241 (1981).
[San1973] I. C. Sanchez, J. P. Colson , R. K. Egy, J. Appl. Phys. 44, 4332 (1973).
[San1974] I. C. Sanchez, A. Peterlin, R. K. Egy, F. L. McCrackin, J. Appl. Phys. 45,
4216 (1974).
[San1986] H. Sano, T. Usami and H. Nakagawa, Polymer 27, 1497 (1986).
[Set1968] T. Seto, T. Hara, K. Tanaka, Japanese J. Phys. 48, 282, (1968)
[Son1987] H. H. Song, R. J. Roe, Macromolecules 20, 2723 (1987).
[Sch1994] K. Schmidt-Rohr, H. W. Spiess, „Multidimensional Solid-State NMR and
Polymers” , Academic Press, London, 1994.
[Sch1991] K. Schmidt-Rohr, H. W. Spiess, Macromolecules 24, 5288 (1991).
[Sch1999] M. Schneider, L. Gasper, D. E. Demco, B. Blümich, J. Chem. Phys. 111, 402
(1999).
[Sch1999] S. Schreurs, J. P. Francois, P. Adriaenens, J. Gelan, J.Phys.Chem. B 103, 1393
(1999).
[Sil1998] R. Silvestry, P. Sgarzi, Polymer 39, 5871 (1998).
[Sta1961] W. C. Statton, J. Appl. Phys. 32, 2332 (1961).
[Sta1998] J.U. Starke, G.U. Michler, W. Grellmann, S. Seidler, M. Gahleitner, J. Fiebig
and E. Nezbedova. Polymer 39, 75 (1998).
[Ste1969] R. S. Stein, Polymer Eng. Sci. 9, 320 (1969).
[Str1980] G. R. Strobl, M. J. Schneider, I. G. Voigt-Martin, J.Polym.Sci. 18, 1361
(1980).
[Str1997] G. R. Strobl, “The Physics of Polymers”, Springer-Verlag, Berlin 1997.
[Str1987] L. C. E. Struik, Polymer 28, 1521 (1987).
[Swa1998] K. Swaminathan and D.W.M. Maw. J Appl Polym Sci 78, 452 (2000).
[Tan1989] H. Tanaka, F. Kohrogi, K. Suzuki, Eur. Polym. J. 25, 449 (1989).
[Tan1993] H. Tanaka, Y. Inoue, Polymer International 31, 9 (1993).
[Tea1957] P. W. Teare, D. R. Holmes, J. Polym. Sci. 24, 496, (1957).
[Tho1996] R. Thomann, C. Wang, J. Kressler, Macromolecules 29, 8425, (1996).
[Tom1996] P. E. Tomlins, Polymer 37, 3907 (1996).
[Tom1998] P. E. Tomlins, B. E. Read, Polymer 39, 355 (1998).
[Tom1998] E. Tomasetti, B. Nysten and R. Legras. Nanotechnology 9, 305 (1998).
[Tom2000] E. Tomasetti, R. Legras, B. Henri-Mazeaud and B. Nysten. Polymer 41, 6597
(2000).
References
131
[Tri1998] D. Trifonova, J. Varga, G.J. Vancso, Polm. Bull. 41, 341, (1998).
[Ueh2000] H. Uehara, T. Yamanobe, T. Komoto, Macromolecules 33, 4861-4870
(2000).
[Uzo1997] T. C. Uzomah, S. C. O Ugbolue, J Appl Polym. Sci. 65, 625 (1997).
[Van1996] D. L. VanderHart, G. B. McFadden, Solid State Nucl. Magn. Reson. 7, 45-66
(1996).
[Van2003] D.L.VanderHart, C. R. Snyder, Macrololecules 36, 4813-4826 (2003).
[Var1992] J. Varga, J. Mat. Sci. 27, 2557, (1992).
[Vle1997] S. Vleeshouwers, Polymer 38, 3213, (1997)
[Vod2006] A. M. Voda, D. E. Demco, A. Voda, T. M. SchauberAdler, T. Dabisch, A.
Adams, M. Baias, B. Blümich, Macromolecules, 39, 4802 (2006).
[Von1971] C. G. Vonk, J.Appl.Crystallogr 4, 340 (1971).
[Von1973] C. G. Vonk, J.Appl.Crystallogr 6, 149 (1973).
[Vor1996] F. J. Wortmann, K.V. Schulz, Polymer 37, 819 (1996).
[Wan1996] J. Wang, J.Chem.Phys. 104, 48 (1996).
[Web1] www.yellow-design.de
[Web2] www.imc.cas.cz
[Weg2000] W. P. Weglarz, H. Peemoeller, A. Rudin, J Polym Sci, B: Polym Phys. 38,
2487 (2000).
[Wen1993] W. Wenig, F. Herzog, J. App. Polym. Sci. 50, 2163 (1993).
[Woo1993] R. P. Wool, Macromolecules 26, 1564 (1993).
[Wun2005] B. Wunderlich, “Thermal analysis of polymeric materials”, Springer, 2005.
[Yam1998] K. Yamada, S. Matsumoto, K. Tagashira, M. Hikosaka Polymer 39, 5327
(1998).
[Yam1999] M. Yamaguchi and K.H. Nitta. Polym Engng Sci 39, 833 (1999).
[Yam2003] K. Yamada, M. Hikosaka, A. Toda, S. Yamazaki, K. Tagashira
Macromolecules 36, 4790 (2003).
[Yok1997] Y. Yokoyama and T. Ricco. J Appl Polym Sci 66, 1007, (1997).
[Zie1955] K. Ziegler, E. Holzkamp, H. Briel, H. Martin, Angew. Chem. 67, 426, (1955).
[Zha2000] X. C. Zhang, M. F. Butler, R. E. Cameron, Polymer 41, 3797 (2000).
[Zha2002] M. Zhang, Y. Liu, X. Zhang, J. Gao, F. Huang, Z. Song, G. Wei and J. Qiao.
Polymer 43, 5133 (2002).
[Zho2005] J. J. Zhou, J. G. Liu, S. K. Yan, J. Y. Dong, L. Li, C. M. Chan, J. Schultz,
Polymer 46, 4077 (2005).
References
132
[Zhu2004] P. Zhu, E. Graham, Polymer 45, 2603 (2004).
[Zhu2005] P. Zhu, J. Tung, G. Edward, Polymer 46, 10960 (2005).
Acknowledgements
133
Acknowledgements At the end of this thesis I would like to express my gratitude to everyone who directly or
indirectly contributed to this work and its completion.
First and foremost I must single out my promoter Prof. Dr. Dr. h. c. Bernhard Blümich who
gave me the opportunity to perform my PhD in his group. It was a pleasure and a privilege for
me to be part of his team.
Many thanks to Prof. Dan Demco for his permanent advices and help related to any NMR
problem.
I would kindly like to thanks Dr. Klaas Remerie, Dr. Rieky Steenbakkers, Dr Maria
Soliman from SABIC Europe, for many hours of useful discussions, for the support and
understanding during these years. Thank you for being around anytime I needed.
Many thanks are addressed to Dr. Victor Litvinov, Dr. Ralf Kleppinger, Dr. Rudy Debliek
from DSM Research Resolve for their support and interesting discussions we had.
I would like to thank my colleagues and friends from RWTH Aachen Dr. Alina Adams, Dr.
Adrian Voda, Lavinia Utiu, Maria Baias, Isa Fonseca, Elena Talnishnikh, Claudiu
Melian for good advices and nice time we had together.
I would like to thank my colleagues and friends from DSM Research and SABIC Europe Dr.
Mihai Morariu, Dr. Elena Trezza, Harrie Linssen, Gerda Kolfschoten and Dr. Aurora
Bastinas for the nice moments we have shared together during the coffee breaks and for the
friendly environment.
For sure I do not forget all my friends from the five stars hotel AMVJ Geleen where I had
very nice time during my PhD thesis.
At the end I want to say the biggest thanks for my mother Valeria and my father Virgil who
gave me the power to go on. I am also deeply thankful to my sister Ioana and my brother
Nicu.
Curriculum Vitae
134
Curriculum Vitae Cristian Eugen Hedesiu Birth date and place: 08 April 1980, Iclod, Romania
E-mail: [email protected]
Nationality: Romanian
Education 2007 December Defence for the Doctoral Degree in natural science Thesis: „Structure – Property Relationship in Semi - Crystalline
Polymers (Polyethylene and Polypropylene)” 04. 2004 – 2006 PhD Student, RWTH Aachen, Germany and SABIC – Europe
B.V., The Netherlands 09.2002 – 08.2003 Master of science (Biophysics and Medical Physics), “Babes-
Bolyai” University, Cluj-Napoca, Romania, in collaboration with RWTH, Aachen, Germany
Dissertation: “Investigation of Nylon6 fibers by Solid State NMR”
09.1998 – 07.2002 Dip. Phys., Faculty of Physics, Babes-Bolyai University, Cluj-Napoca, Romania
Dipolma: “Application of gamma rays in cardiology”
Professional Experience 2004 – 2007 SABIC Research Campus, Geleen, The Netherlands;
DSM Resolve Research Campus, Geleen, The Netherlands; IIT Research Institute, New Delhi, India. DAAD Program;
2003 Erasmus – Socrates Scholarship at the Institute for Technical and Macromolecular Chemistry, RWTH Aachen, Germany; Lecturer at “Emil Racovita” High-school, Cluj, Romania;
2002 “N.S. Stancioiu” Heart Institute, Cluj-Napoca, Romania Nuclear Cardiology Department;
Publications
1. C. Hedesiu, D. E. Demco, R. Kleppinger, A. A. Buda, B. Blümich, K. Remerie, V. Litvinov, The effect of temperature and annealing on the phase composition, molecular mobility and the thickness of domains in high-density polyethylene, Polymer, 48 (2007) 763-777
2. C. Hedesiu, D. E. Demco, R. Kleppinger, G. Vanden Poel, W. Gijsbers, B. Blümich, K.
Remerie, V. Litvinov, The effect of temperature and annealing on the phase composition, molecular mobility and the thickness of domains in isotactic
Curriculum Vitae
135
polypropylene studied by proton solid-state NMR, SAXS and DSC, Macromolecules, 40 (2007) 3977 – 3989.
3. C. Hedesiu, D. E. Demco, B. Blümich, K. Remerie, V.M Litvinov, Study of uniaxially
deformed isotactic polypropylene by 1H solid state NMR and IR spectroscopy. Accepted to Macromolecular Chemistry and Physics
4. C. Hedesiu, D. E. Demco, R. Steenbakkers, R. Kleppinger, G. Vanden Poel, B.
Blümich, K. Remerie, V.M Litvinov, Aging Study on Polypropylene by 1H solid state NMR, X-ray, and DSC. In preparation
5. C. Hedesiu, D. E. Demco, R. Steenbakkers, B. Blümich, K. Remerie, V.M Litvinov,
Study of PP impact polypropylene by 1H solid state NMR, SAXS, TEM and SEM. In preparation


![Structure of Cd-Ga Melts Part 2: X-Ray Small-Angle Scatteringzfn.mpdl.mpg.de/data/Reihe_A/35/ZNA-1980-35a-0938.pdf · Li-Na [9] by X-ray scattering. In the present work the Cd-Ga](https://img.pdfslide.org/doc/110x75/5f763bbf76e87738ae6f036d/structure-of-cd-ga-melts-part-2-x-ray-small-angle-li-na-9-by-x-ray-scattering.jpg)


![Bachelorarbeit GPU-basiertes Volumen Ray Casting am ... · Das Ray Casting ist eine Abwandlung des Ray Tracing, und wurde zuerst 1988 von Marc Levoy [6] beschrieben. Da das Ray Casting](https://img.pdfslide.org/doc/110x75/6059c1cf786b3a31dd586a30/bachelorarbeit-gpu-basiertes-volumen-ray-casting-am-das-ray-casting-ist-eine.jpg)