Embed Size (px)
Citation preview
TECHNISCHE UNIVERSITÄT MÜNCHEN
Lehrstuhl für Experimentelle Genetik
Development of an osteoblast cell culture system for functional characterization and comparative analyses of mouse models
with bone phenotypes and systemic investigation of an Osteogenesis imperfecta disease model
Frank Thiele
Vollständiger Abdruck der von der Fakultät Wissenschaftszentrum Weihenstephan
für Ernährung, Landnutzung und Umwelt der Technischen Universität München zur
Erlangung des akademischen Grades eines
Doktors der Naturwissenschaften
genehmigten Dissertation.
Vorsitzender: Univ.-Prof. Dr. A. Gierl
Prüfer der Dissertation:
1. Univ.-Prof. Dr. M. Hrabé de Angelis
2. apl. Prof. Dr. J. Adamski
Die Dissertation wurde am 24.07.2009 bei der Technischen Universität München eingereicht und
durch die Fakultät Wissenschaftszentrum Weihenstephan für Ernährung, Landnutzung und Umwelt
am 26.10.2009 angenommen.

Für
Käte und Erich,
Gudrun, Peter, Monique und Alexander
- I -
I. Table of contents
I. TABLE OF CONTENTS............................................................................................ I
II. FIGURES AND TABLES ....................................................................................... IV
III. ABBREVIATION LIST........................................................................................... VI
IV. PUBLICATIONS................................................................................................... IX
V. CURRICULUM VITAE........................................................................................... XI
VI. AFFIRMATION.................................................................................................... XII
VII. ACKNOWLEDGMENT ...................................................................................... XIII
1. INTRODUCTION .................................................................................................... 1
1.1. Bone function ................................................................................................................................. 1
1.2. Classification of bones .................................................................................................................. 1
1.3. Composition and structure of bone ............................................................................................. 3
1.4. Bone cells........................................................................................................................................ 5
1.5. ECM and mineralization of bone................................................................................................... 8
1.6. Development and formation of bone.......................................................................................... 10
1.7. Bone modeling and homeostasis ............................................................................................... 13
1.8. Bone diseases .............................................................................................................................. 15
1.9. Osteogenesis imperfecta – the “brittle bone disease”............................................................. 17
1.10. Mouse models for human diseases.......................................................................................... 19
1.11. Mouse models for skeletal disorders....................................................................................... 20
1.12. Aga2 - a mouse model for Osteogenesis imperfecta ............................................................. 21
1.13. The German Mouse Clinic ......................................................................................................... 21
1.14. In vitro cell culture...................................................................................................................... 22
1.15. Goal.............................................................................................................................................. 24 I. In vitro analysis of osteoblasts................................................................................................... 24 II. Heart and lung investigation in the Aga2 OI mouse model .................................................... 24
- II -
2. MATERIAL AND METHODS ............................................................................... 25
2.1. In vitro analysis of osteoblasts................................................................................................... 25 2.1.1. General remarks .................................................................................................................... 25
2.1.1.1. Workflow......................................................................................................................... 25 2.1.1.2. Scheme of analysis, mating of mice and genotyping ................................................ 25 2.1.1.3. Measurement days and assay analysis....................................................................... 27 2.1.1.4. Cell preparation and cultivation ................................................................................... 28 2.1.1.5. Important considerations.............................................................................................. 30 2.1.1.6. Statistical analysis......................................................................................................... 31
2.1.2. Material and methods ........................................................................................................... 32 2.1.2.1. Cell preparation and cultivation ................................................................................... 32 2.1.2.2. Proliferation / Metabolic activity / Protein content / ALP activity (A1) ..................... 34 2.1.2.3. Collagen secretion / Collagen deposition (A2) ........................................................... 40 2.1.2.4. Matrix mineralization (A3) ............................................................................................. 45 2.1.2.5. Nodule quantification (A4) ............................................................................................ 48 2.1.2.6. Gene expression (A5).................................................................................................... 50
2.2. Heart and lung investigation in the Aga2 OI mouse model ..................................................... 55 2.2.1. Animal keeping and handling .............................................................................................. 55 2.2.2. Genotyping ............................................................................................................................ 55 2.2.3. Cardiovascular phenotyping ............................................................................................... 55 2.2.4. pO2 measurement.................................................................................................................. 57 2.2.5. Histology and SEM................................................................................................................ 57 2.2.6. In vitro cell culture and TEM ................................................................................................ 59 2.2.7. RNA Isolation......................................................................................................................... 61 2.2.8. Expression profiling ............................................................................................................. 62 2.2.9. qRT-PCR................................................................................................................................. 64 2.2.10. Statistical analysis .............................................................................................................. 65
3. RESULTS............................................................................................................. 66
3.1. In vitro analysis of osteoblasts................................................................................................... 66 3.1.1. Establishment of the cell culture system ........................................................................... 66
3.1.1.1. Growth and differentiation of the osteoblasts............................................................ 66 3.1.1.2. Proliferation / Metabolic activity / Protein content / ALP activity (A1) ..................... 68 3.1.1.3. Collagen secretion / Collagen deposition (A2) ........................................................... 72 3.1.1.4. Matrix mineralization (A3) ............................................................................................. 73 3.1.1.5. Nodule quantification (A4) ............................................................................................ 73 3.1.1.6. Gene expression (A5).................................................................................................... 74
3.1.2. Validation of the cell culture system................................................................................... 75 3.1.2.1. Selection of suitable mouse mutants with bone phenotype ..................................... 75 3.1.2.2. Analysis of Aga2 and ABE2 within the cell culture system ...................................... 78
- III -
3.2. Heart and lung investigation in the Aga2 OI mouse model ..................................................... 82 3.2.1. Phenotypic classification of heterozygous Aga2 .............................................................. 82 3.2.2. Cardiovascular phenotyping ............................................................................................... 83 3.2.3. Histology ................................................................................................................................ 84 3.2.4. In vitro cell culture analysis of heart and lung fibroblasts ............................................... 88 3.2.5. Expression profiling ............................................................................................................. 91 3.2.6. pO2 measurement.................................................................................................................. 93 3.2.7. Onset of Col1a1 down regulation and analysis of allele specific Col1a1 expression in
heart ....................................................................................................................................... 94
4. DISCUSSION ....................................................................................................... 97
4.1. In vitro analysis of osteoblasts................................................................................................... 97 4.1.1. Establishment of the cell culture system ........................................................................... 97
4.1.1.1. Growth and differentiation of the osteoblasts............................................................ 97 4.1.1.2. Cellular assays for the characterization of the osteoblast phenotype .................... 99 4.1.1.3. Validation of the cell culture system ......................................................................... 104 4.1.1.4. Concluding remarks and further directions.............................................................. 109
4.2. Heart and lung investigation in the Aga2 OI mouse model ................................................... 111 4.2.1. Downregulation of cardiac type I collagen in Aga2......................................................... 111 4.2.2. Structural alterations and dysfunction of the heart in Aga2 .......................................... 113 4.2.3. Hemorrhagic lungs and impaired pulmonary function in Aga2 ..................................... 114 4.2.4. Pulmonary ECM in Aga2..................................................................................................... 116 4.2.5. Pathological linkage between heart and lung dysfunction in Aga2 .............................. 117 4.2.6. Origin and molecular onset of the cardiopulmonary disorder in Aga2......................... 117 4.2.7. Concluding remarks ........................................................................................................... 119
5. SUPPLEMENT ....................................................................................................121
6. REFERENCES ....................................................................................................126
7. SUMMARY..........................................................................................................134
7.1. In vitro analysis of osteoblasts................................................................................................. 134
7.2. Heart and lung investigation in the Aga2 OI mouse model ................................................... 135
8. ZUSAMMENFASSUNG ......................................................................................136
8.1. In vitro Analyse von Osteoblasten ........................................................................................... 136
8.2. Herz- und Lungenuntersuchung beim Aga2 OI Mausmodell................................................. 137
- IV -
II. Figures and tables
II.I. Figures
Figure 1. Classification of bones. ........................................................................................................ 2 Figure 2. Structural organization of long bones. ............................................................................... 4 Figure 3. Topographic relationships among bone cells.................................................................... 5 Figure 4. Osteoblast differentiation from mesenchymal progenitor cells....................................... 6 Figure 5. Osteoclast differentiation from haematopoietic stem cells.............................................. 7 Figure 6. ALP activity for hydroxyapatite formation.......................................................................... 9 Figure 7. Schematic representation of intramembranous and endochondral bone formation... 11 Figure 8. Skeletal homeostasis.......................................................................................................... 13 Figure 9. Osteoblasts and osteoclasts during bone remodeling. .................................................. 15 Figure 10. Whole body DXA images of OI patients.......................................................................... 17 Figure 11. Workflow of the cell culture system................................................................................ 25 Figure 12. Primary calvarial cells after isolation.............................................................................. 66 Figure 13. Nodule formation in primary calvarial cell cultures....................................................... 67 Figure 14. Influence of culture condition on nodule formation. ..................................................... 68 Figure 15. Validation of the Proliferation assay. .............................................................................. 69 Figure 16. Validation of the Metabolic activity assay. ..................................................................... 70 Figure 17. Validation of the Protein quantification assay. .............................................................. 70 Figure 18. Validation of the ALP activity assay................................................................................ 71 Figure 19. Validation of the Collagen secretion and deposition assay. ........................................ 72 Figure 20. Validation of the Matrix mineralization assay. ............................................................... 73 Figure 21. Nodule quantification assay............................................................................................. 74 Figure 22. pQCT scan of Aga2 femur. ............................................................................................... 76 Figure 23. pQCT scan of ABE2 femur. .............................................................................................. 77 Figure 24. Appearance of heterozygous Aga2 mutants. ................................................................. 82 Figure 25. Quantitative analysis of heart function via ultrasound imaging. ................................. 84 Figure 26. Morphological appearance of heart tissue. .................................................................... 85 Figure 27. Histological investigation of heart tissue. ...................................................................... 86 Figure 28. Morphological appearance of lung tissue. ..................................................................... 87 Figure 29. Vasculature in lung tissue................................................................................................ 88 Figure 30. ICC for type I collagen of in vitro cultivated heart and lung fibroblasts...................... 89 Figure 31. Col1a1 expression in cultivated heart and lung fibroblasts (qRT-PCR)...................... 90 Figure 32. Col1a1 expression in heart and lung tissue (qRT-PCR)................................................ 92 Figure 33. Quantitative analysis of blood gas parameters. ............................................................ 93 Figure 34. Col1a1 expression in perinatal development of heterozygous Aga2 (qRT-PCR)....... 94 Figure 35. Allele specific Col1a1 expression in perinatal development of heterozygous Aga2. 95 Figure 36. Allele specific Col1a1 expression in Aga2mild and Aga2severe (qRT-PCR). ................... 96 Figure 37. The pathological mechanisms in heart, lung and bone tissue of Aga2severe. ............ 120
- V -
II.II. Supplemental Figures Figure S 1. B-mode pictures from the ultrasound analysis of Aga2severe. ................................... 121
Figure S2. TEM analysis of in vitro cultivated heart and lung fibroblasts. ................................. 121
Figure S3. Expression profiling of heart tissue.............................................................................. 122
Figure S4. Expression profiling of lung tissue (1). ........................................................................ 123
Figure S5. Expression profiling of lung tissue (2). ........................................................................ 124
II.III. Tables Table 1. Osteogenesis imperfecta - Nosology. ................................................................................ 18 Table 2. Analysis and mating scheme of the cell culture system. ................................................. 26 Table 3. Assays and measurement scheme of the cell culture system......................................... 27 Table 4. Overview about culture ware for the cell culture system. ................................................ 29 Table 5. Preparation of a standard curve for the Matrix mineralization assay. ............................ 46 Table 6. qRT-PCR primer for the cell culture system. ..................................................................... 50 Table 7. qRT-PCR primer for heart and lung investigation in Aga2. .............................................. 65 Table 8. Efficiency of the qRT-PCR primers for the cell culture system and expression
differences between biological replicates. ........................................................................ 75 Table 9. DXA analysis of Aga2. .......................................................................................................... 76 Table 10. DXA analysis of ABE2. ....................................................................................................... 77 Table 11. Expression analysis of Aga2 osteoblasts within the cell culture system..................... 81 Table 12. Expression analysis of ABE2 osteoblasts within the cell culture system.................... 81 Table 13. ECG analysis of Aga2mild within the primary cardiovascular screen of the GMC. ....... 83
II.IV. Supplemental Tables Table S1. GO-Term analysis of differentially expressed genes in hearts of Aga2severe.............. 125
Table S2. GO-Term analysis of differentially expressed genes in lungs of Aga2severe. .............. 125
- VI -
III. Abbreviation list
Aga2 Abnormal gait 2 (mouse mutant with Col1a1 mutation)
Aga2mild Aga2 mutant with mild phenotype
Aga2severe Aga2 mutant with severe phenotype
ABE2 Abnormal behavior 2 (mouse mutant with Jag1 mutation)
ALP Alkaline phosphatase
α-MEM Minimal essential medium alpha
AMP Adenosine monophosphate
ANOVA Analysis of variance
ATP Adenosine triphosphate
AVF Augmented vector foot
AVL Augmented vector left
AVR Augmented vector right
BMC Bone mineral content
BMD Bone mineral density
BMU Basic multicellular unit (bone multicellular / metabolic unit)
bp Base pairs
BSA Bovine serum albumin
CMCM CellyticM reagent with Complete Mini Protease Inhibitor
Col1a1Aga2 Mutated Col1a1 allele
Col1a1WT Wild type Col1a1 allele
CQBM CellQuanti-Blue reagent with culture medium A
CRTAP Cartilage associated protein
Ct Crossing point (cycle threshold)
DAB 3,3’-Diaminobenzidine
DAPI 4’6-diamidino-2’-phenylindole
DMEM Dulbecco’s modified eagle medium
DPD Deoxypyridinoline
DXA Dual energy X-ray absorptiometry
ECG Electrocardiography
ECM Extracellular matrix
EDTA Ethylene diamine tetraacetic acid
EF Ejaction fraction
- VII -
EGF Epidermal growth factor
ENU N-ethyl-N-nitrosourea
ER Endoplasmic reticulum
FCS Fetal calf serum
FDR False discovery rate
FGF Fibroblast growth factor
FS Fractional shortening
GAGs Glycosaminoglycans
GEO Gene Expression Omnibus
GMC German Mouse Clinic
GO Gene ontology
HBSS Hank’s balanced salt solution
H&E Haematoxylin and eosin
HSC Haematopoietic stem cells
HTC Hypertrophic chondrocytes
ICC Immunocytochemistry
IGF Insulin-like growth factor
IHC Immunohistochemistry
ILD Interstitial lung disease
LEPRE1 Leprecan
LVEDD Left ventricular end-diastolic internal diameter
LVESD Left ventricular end-systolic internal diameter
M-CSF Macrophage colony-stimulating factor
µCT Micro computed tomography
MGI Mouse Genome Informatics
MSC Mesenchymal stem cells
MV Matrix vesicle
NCP Non-collagenous proteins
NTPPPH Nucleoside triphosphate pyrophosphohydrolase
NTPs Nucleoside triphosphates
OA Osteoarthritis
OD Optical density
OI Osteogenesis imperfecta
pBMD Partial BMD (excluding skull)
- VIII -
PBS Phosphate buffered saline
PCR Polymerase Chain Reaction
PFA Paraformaldehyde
Pi Orthophosphate
PNPP 4-Nitrophenylphosphate
pO2 Oxygen partial pressure
PPi Pyrophosphate
pQCT Peripheral quantitative computed tomography
PTH Parathyroid hormone
qRT-PCR Quantitative Reverse Transcriptase Polymerase Chain Reaction
RA Rheumatoid Arthritis
RANKL Receptor Activator for Nuclear Factor kappaB Ligand
RFU Raw fluorescence value
RGD Amino acid sequence Arg-Gly-Asp
rpm Rounds per minute
RT Room temperature
sBMD Specific BMD (BMD related to body weight)
SD Standard deviation
SDS Sodium dodecyl sulfate
SEM Scanning electron microscopy
SEM Standard error of the mean
SNP Single nucleotide polymorphism
SOP Standard operating procedure
SSC Standard saline citrate
TEM Transmission electron microscopy
TGF-β Transforming growth factor beta
TRAP Tartrate resistant acid phosphatase
Tris Tris (hydroxymethyl) aminomethane
VEGF Vascular endothelial growth factor
WS Working solution
Introduction
- 1 -
1. Introduction
Although characterized by a hard and rigid nature, bone is a living organ that,
together with cartilage, builds up the vertebrate endoskeleton that is supplemented
by ligaments, tendons and muscles. In adult humans, the skeleton consists of 206
bones making up about 12% of total body weight.
1.1. Bone function
Bone is a versatile organ possessing multiple mechanical and metabolic functions
[1]. Based on its stiffness and strength, bones hold up the body, provide mechanical
integrity for locomotion and serves for attachment of muscles, ligaments and
tendons. It protects internal organs (brain, spinal cord, heart and lung as well as
pelvic viscera) and is furthermore important to support breathing and for the
mechanical aspect of hearing - sound transduction. Due to its composition, bone
supports haematopoiesis and regulates mineral homeostasis as it contains 99% of
body calcium, 88% of body phosphate and 40-60% total body sodium and
magnesium. By serving as a reservoir for these ions, the inorganic matrix helps to
maintain their extracellular fluid concentrations within the ranges necessary for
physiologic functions, including nerve conduction and muscle contractions as well as
important biochemical reactions. Bone furthermore stores fat, regulates acid-base
balance by absorbing or releasing alkaline mineral salts and influences detoxification
by storing heavy metals and other foreign elements after their removal from the
blood.
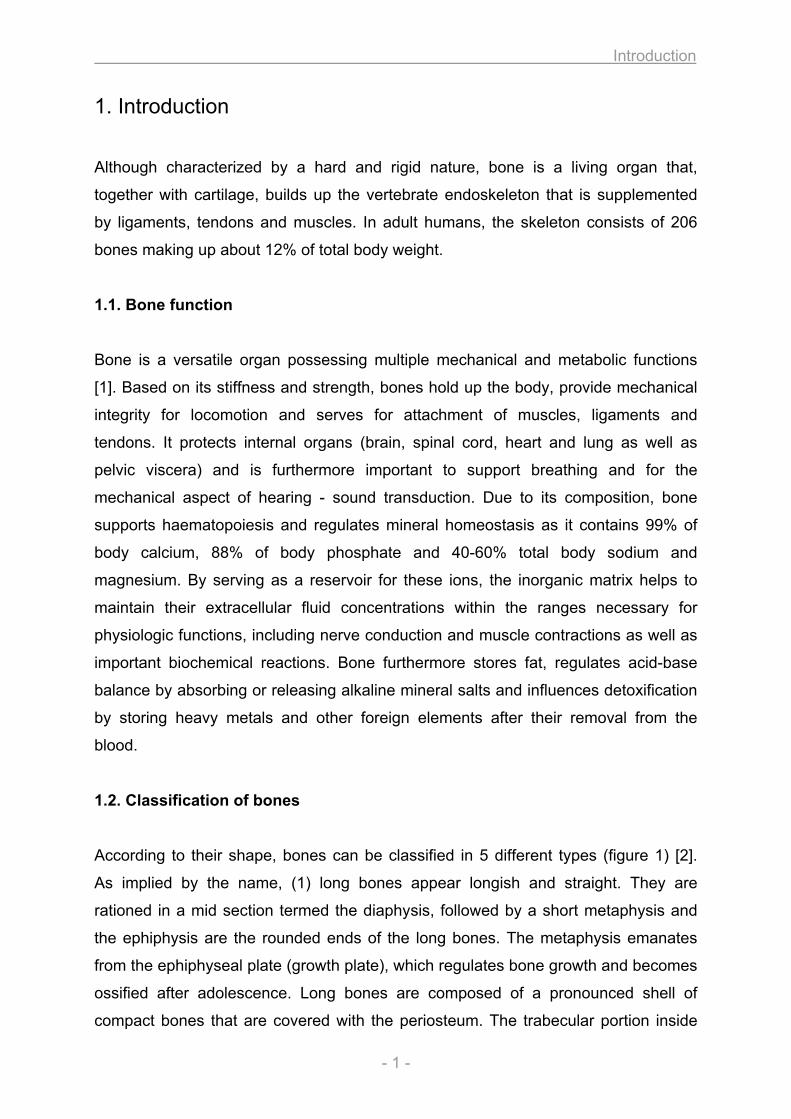
1.2. Classification of bones
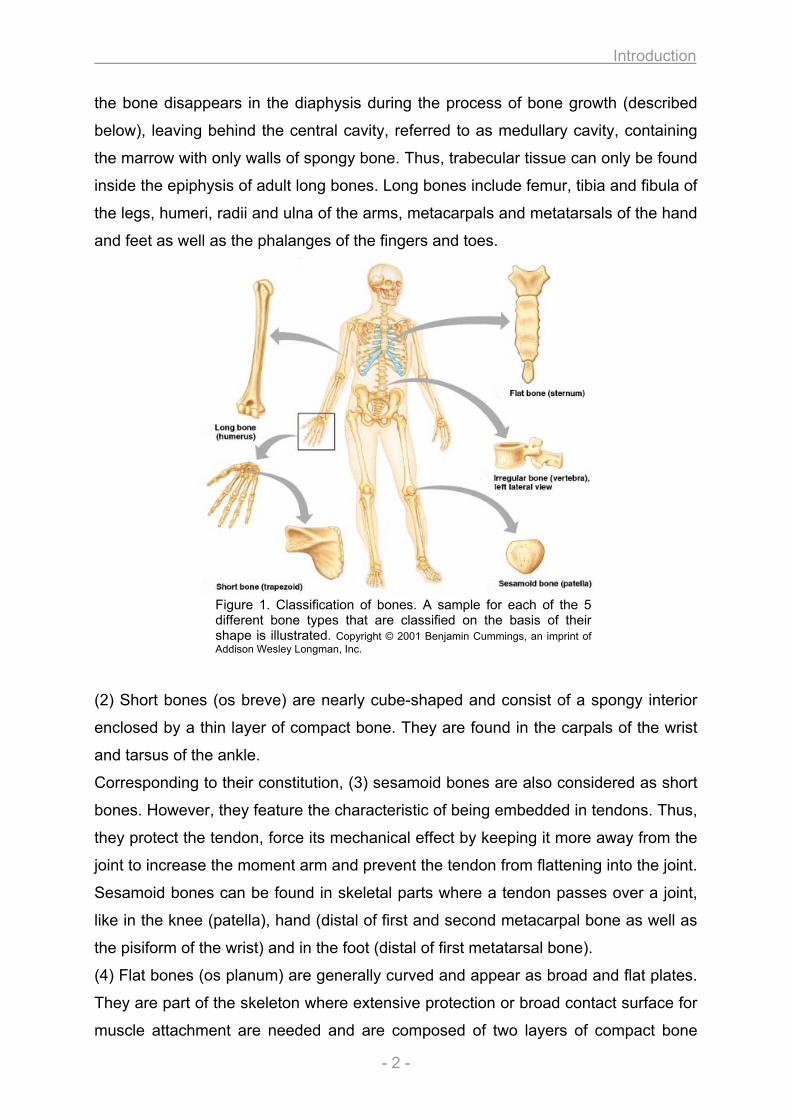
According to their shape, bones can be classified in 5 different types (figure 1) [2].
As implied by the name, (1) long bones appear longish and straight. They are
rationed in a mid section termed the diaphysis, followed by a short metaphysis and
the ephiphysis are the rounded ends of the long bones. The metaphysis emanates
from the ephiphyseal plate (growth plate), which regulates bone growth and becomes
ossified after adolescence. Long bones are composed of a pronounced shell of
compact bones that are covered with the periosteum. The trabecular portion inside
Introduction
- 2 -
the bone disappears in the diaphysis during the process of bone growth (described
below), leaving behind the central cavity, referred to as medullary cavity, containing
the marrow with only walls of spongy bone. Thus, trabecular tissue can only be found
inside the epiphysis of adult long bones. Long bones include femur, tibia and fibula of
the legs, humeri, radii and ulna of the arms, metacarpals and metatarsals of the hand
and feet as well as the phalanges of the fingers and toes.
Figure 1. Classification of bones. A sample for each of the 5 different bone types that are classified on the basis of their shape is illustrated. Copyright © 2001 Benjamin Cummings, an imprint of Addison Wesley Longman, Inc.
(2) Short bones (os breve) are nearly cube-shaped and consist of a spongy interior
enclosed by a thin layer of compact bone. They are found in the carpals of the wrist
and tarsus of the ankle.
Corresponding to their constitution, (3) sesamoid bones are also considered as short
bones. However, they feature the characteristic of being embedded in tendons. Thus,
they protect the tendon, force its mechanical effect by keeping it more away from the
joint to increase the moment arm and prevent the tendon from flattening into the joint.
Sesamoid bones can be found in skeletal parts where a tendon passes over a joint,
like in the knee (patella), hand (distal of first and second metacarpal bone as well as
the pisiform of the wrist) and in the foot (distal of first metatarsal bone).
(4) Flat bones (os planum) are generally curved and appear as broad and flat plates.
They are part of the skeleton where extensive protection or broad contact surface for
muscle attachment are needed and are composed of two layers of compact bone
Introduction
- 3 -
tissue enclosing the trabecular portion with the marrow (red bone marrow). Flat
bones are the occipital, parietal, frontal, nasal, lacrimal and vomer bones of the skull
as well as the hip bone of the pelvis, scapula, sternum and ribs. In the flat bones of
the skull, the outer layer of compact bone is thick and robust while the inner layer is
thin and more brittle. Moreover, the intervening trabecular bone becomes absorbed,
similar to the medullary cavity in long bones.
(5) Irregular bones have a complicated, peculiar shape and can not be grouped into
the categories mentioned above. Vertebrae, sacrum and coccyx of the pelvis as well
as some bones of the skull (temporal, sphenoid, ethmoid, zygomatic, maxilla,
mandible, palatine, inferior nasal concha and hyoid) are classified as irregular bones.
They consist of trabecular tissue enclosed with a thin layer of compact bone and fulfil
various functions such as protection of the spinal cord (vertebrae) or enable multiple
anchor points for skeletal muscle attachment (sacrum).
1.3. Composition and structure of bone
A major part of the bone organ is the mineralized extracellular matrix, termed
osseous tissue. Further components are the periosteum and endosteum as well as
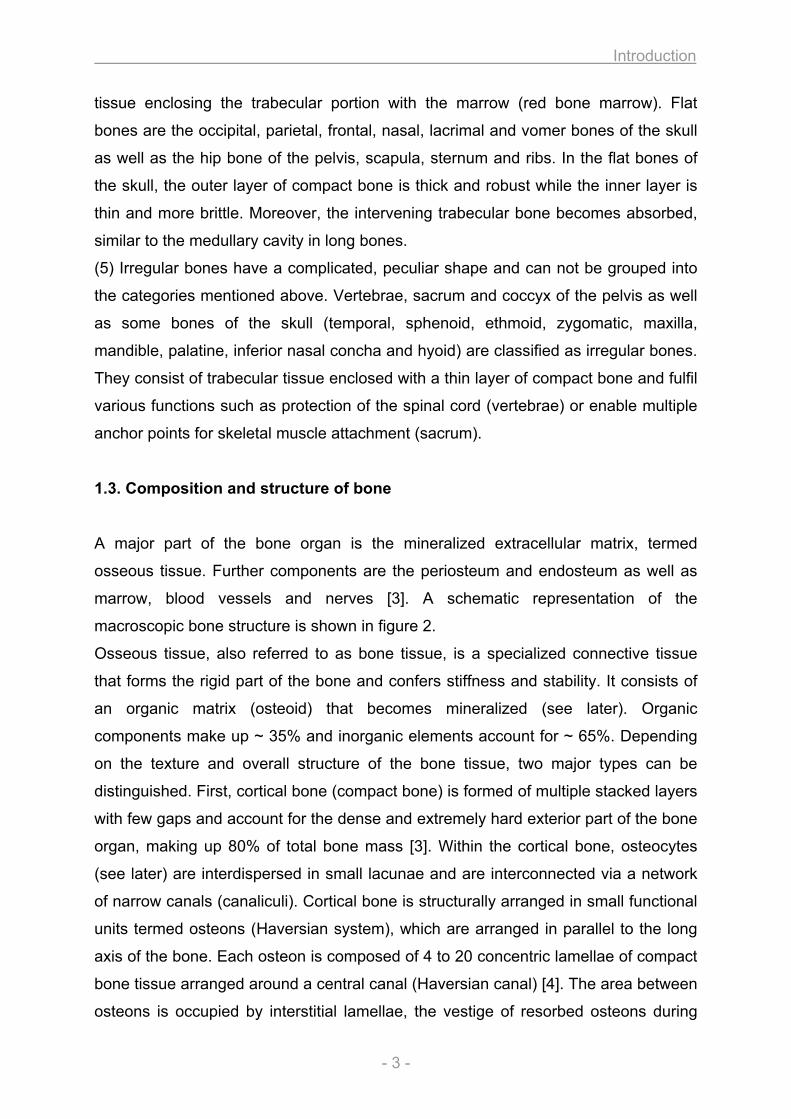
marrow, blood vessels and nerves [3]. A schematic representation of the
macroscopic bone structure is shown in figure 2.
Osseous tissue, also referred to as bone tissue, is a specialized connective tissue
that forms the rigid part of the bone and confers stiffness and stability. It consists of
an organic matrix (osteoid) that becomes mineralized (see later). Organic
components make up ~ 35% and inorganic elements account for ~ 65%. Depending
on the texture and overall structure of the bone tissue, two major types can be
distinguished. First, cortical bone (compact bone) is formed of multiple stacked layers
with few gaps and account for the dense and extremely hard exterior part of the bone
organ, making up 80% of total bone mass [3]. Within the cortical bone, osteocytes
(see later) are interdispersed in small lacunae and are interconnected via a network
of narrow canals (canaliculi). Cortical bone is structurally arranged in small functional
units termed osteons (Haversian system), which are arranged in parallel to the long
axis of the bone. Each osteon is composed of 4 to 20 concentric lamellae of compact
bone tissue arranged around a central canal (Haversian canal) [4]. The area between
osteons is occupied by interstitial lamellae, the vestige of resorbed osteons during
Introduction
- 4 -
bone remodeling. Interconnection of the osteons among each other (between
Haversian canals) and with the periosteum is permitted by so called Volkmann’s
canals, which are perpendicular arranged to the osteons and by canaliculi, which
further provide communication between the Haversian canals and the osteocytes [4].
The second type of bone tissue, trabecular bone (cancellous bone or substantia
spongiosa), is composed of a network of rod- and plate-like elements and possesses
low density and strength but a high surface area. Given the low density, the inner
part of the bone forms a central cavity with only walls of spongy bone, thus providing
space for blood vessels and marrow. It fills the interior of the bone organ, accounting
for the remaining 20% of total bone mass [3].
Figure 2. Structural organization of long bones. The cortical part is composed of dense and parallel arranged osteon providing the hard exterior part of the bone. The trabecular area consistes of rod- and plate like elements with low density and strength but high surface area harboring the marrow cavity inside the bone. Osteocytes reside in small lacunae in the bone tissue. The bone is pervaded with blood vessels and nerves. Taken from http://people.uleth.ca/~s.simard/knes2110/Fuzzyimages/osteon%202.jpg.
The bone marrow is stored in between the central cavity of the trabecular portion. It
can be classified into (1) red marrow containing the myeloid tissue with
haematopoietic stem cells (HSC), (2) yellow marrow mainly consisting of fat and (3)
marrow stroma with fibroblasts as well as mesenchymal stem cells (MSC) including
developing bone cells.
Introduction
- 5 -
The outer surface of bones is covered with a vascular membrane termed periosteum,
except at joint surfaces, where it is covered with cartilage. Periosteum consists of
dense irregular connective tissue divided into an outer fibrous layer containing
fibroblasts and an inner cambium layer (osteogenic layer) with progenitor cells
developing in bone cells [5]. Similar in morphology and function to the periosteum,
the medullary cavity inside the bone is lined with the endosteum. The bone is
innervated with nerves and pervaded with blood vessels running in the medullary
cavity (trabecular bone) as well as the Haversian canals (Haversian capillaries) and
Volkmann’s canals in the cortical bone [6].
1.4. Bone cells
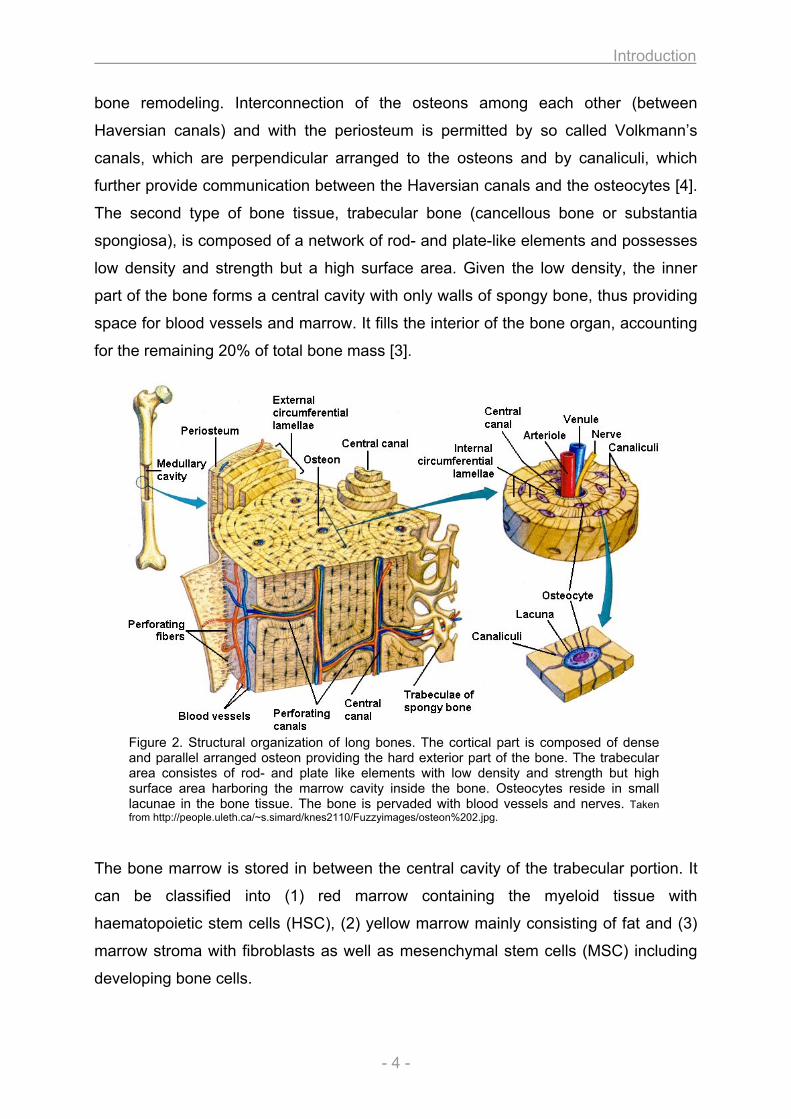
There are four different cell types constituting the bone (figure 3). (1) Osteoblasts, (2)
osteocytes and (3) bone lining cells account for bone formation. They originate in a
linear sequence from mesenchymal stem cells (MSC) via osteoprogenitor and
preosteoblast stage to mature osteoblasts, bone lining cells and osteocytes. In
contrast, (4) osteoclasts are responsible for bone resorption and descend from
haematopoietic stem cells. Development, stimulation and maturation of these bone
cells are regulated by cell-cell and cell-matrix interactions, cytokines and growth
factors (figure 4 and 5).
Figure 3. Topographic relationships among bone cells. The bone surface is covered with different cell types. Osteoblasts are responsible for new matrix formation. Bone lining cells are quiescent osteoblasts and osteoclasts are the bone resorbing cells. Inside the mineralized matrix reside osteocytes in small lacune. Taken from [7].
Introduction
- 6 -
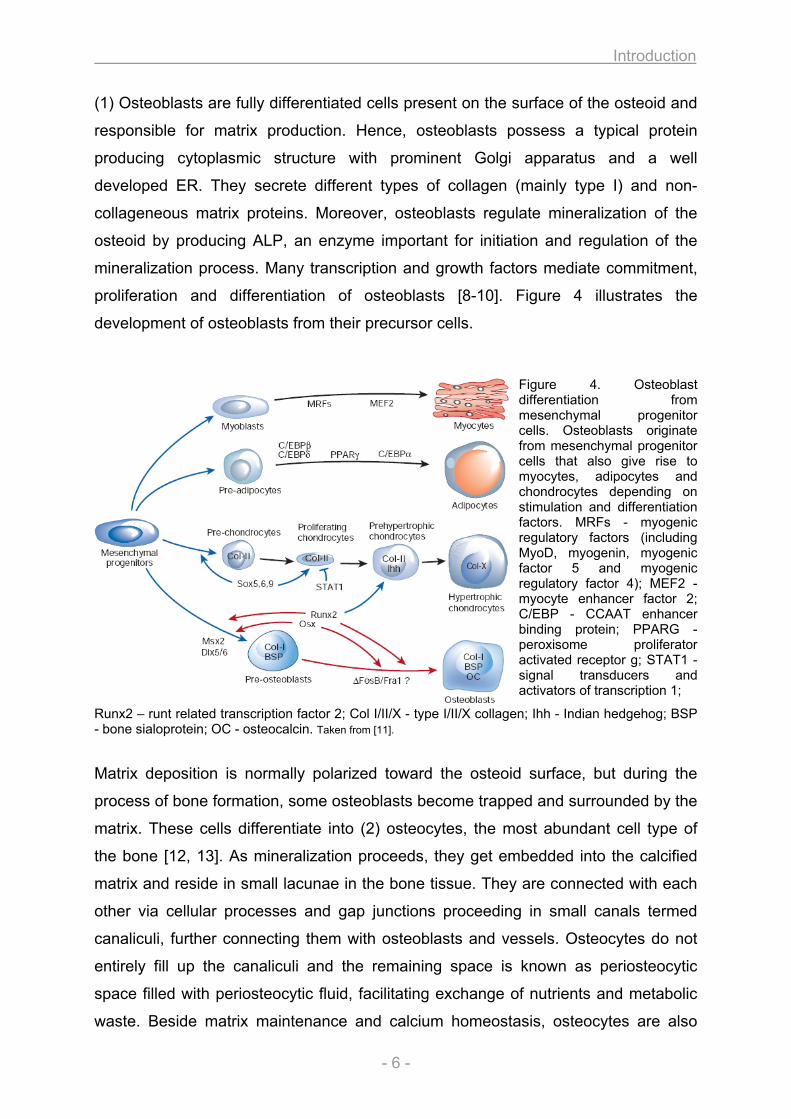
(1) Osteoblasts are fully differentiated cells present on the surface of the osteoid and
responsible for matrix production. Hence, osteoblasts possess a typical protein
producing cytoplasmic structure with prominent Golgi apparatus and a well
developed ER. They secrete different types of collagen (mainly type I) and non-
collageneous matrix proteins. Moreover, osteoblasts regulate mineralization of the
osteoid by producing ALP, an enzyme important for initiation and regulation of the
mineralization process. Many transcription and growth factors mediate commitment,
proliferation and differentiation of osteoblasts [8-10]. Figure 4 illustrates the
development of osteoblasts from their precursor cells.
Figure 4. Osteoblast differentiation from mesenchymal progenitor cells. Osteoblasts originate from mesenchymal progenitor cells that also give rise to myocytes, adipocytes and chondrocytes depending on stimulation and differentiation factors. MRFs - myogenic regulatory factors (including MyoD, myogenin, myogenic factor 5 and myogenic regulatory factor 4); MEF2 - myocyte enhancer factor 2; C/EBP - CCAAT enhancer binding protein; PPARG - peroxisome proliferator activated receptor g; STAT1 - signal transducers and activators of transcription 1;
Runx2 – runt related transcription factor 2; Col I/II/X - type I/II/X collagen; Ihh - Indian hedgehog; BSP - bone sialoprotein; OC - osteocalcin. Taken from [11].
Matrix deposition is normally polarized toward the osteoid surface, but during the
process of bone formation, some osteoblasts become trapped and surrounded by the
matrix. These cells differentiate into (2) osteocytes, the most abundant cell type of
the bone [12, 13]. As mineralization proceeds, they get embedded into the calcified
matrix and reside in small lacunae in the bone tissue. They are connected with each
other via cellular processes and gap junctions proceeding in small canals termed
canaliculi, further connecting them with osteoblasts and vessels. Osteocytes do not
entirely fill up the canaliculi and the remaining space is known as periosteocytic
space filled with periosteocytic fluid, facilitating exchange of nutrients and metabolic
waste. Beside matrix maintenance and calcium homeostasis, osteocytes are also
Introduction
- 7 -
important for mechanosensing and mechanotransduction, i.e. regulating the
response to stress and mechanical load to the bone.
Bone surfaces that undergo neither formation nor resorption are covered with (3)
bone lining cells. Considered as inactive osteoblasts, these cells appear flat and
elongated with few cytoplasmic organelles. They separate the bone fluids from the
interstitial fluids and function as barrier for certain ions [14]. They are thought to
regulate the movement of calcium and phosphate into and out of the bone. There is
evidence that bone lining cells are precursors for osteoblasts and furthermore, their
retraction is a mandatory step in starting osteoclastic bone resorption.
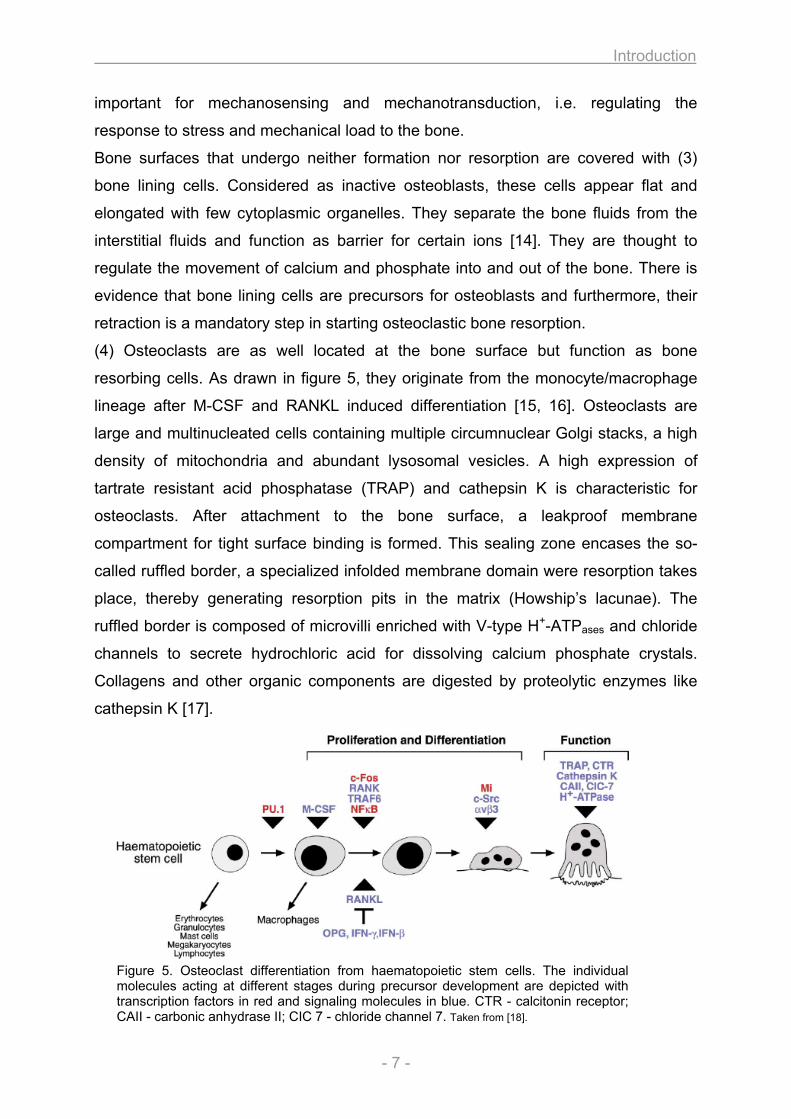
(4) Osteoclasts are as well located at the bone surface but function as bone
resorbing cells. As drawn in figure 5, they originate from the monocyte/macrophage
lineage after M-CSF and RANKL induced differentiation [15, 16]. Osteoclasts are
large and multinucleated cells containing multiple circumnuclear Golgi stacks, a high
density of mitochondria and abundant lysosomal vesicles. A high expression of
tartrate resistant acid phosphatase (TRAP) and cathepsin K is characteristic for
osteoclasts. After attachment to the bone surface, a leakproof membrane
compartment for tight surface binding is formed. This sealing zone encases the so-
called ruffled border, a specialized infolded membrane domain were resorption takes
place, thereby generating resorption pits in the matrix (Howship’s lacunae). The
ruffled border is composed of microvilli enriched with V-type H+-ATPases and chloride
channels to secrete hydrochloric acid for dissolving calcium phosphate crystals.
Collagens and other organic components are digested by proteolytic enzymes like
cathepsin K [17].
Figure 5. Osteoclast differentiation from haematopoietic stem cells. The individual molecules acting at different stages during precursor development are depicted with transcription factors in red and signaling molecules in blue. CTR - calcitonin receptor; CAII - carbonic anhydrase II; CIC 7 - chloride channel 7. Taken from [18].
Introduction
- 8 -
1.5. ECM and mineralization of bone
The organic matrix of the bone (osteoid) is composed predominantly of type I
collagen (90%) as well as a small amount of non-collagenous proteins (NCP) to
about 10% [3]. Type I collagen is essential for bone strength and serves as scaffold
for binding other proteins that nucleate hydroxyapatite deposition (mineralization).
Non-collagenous proteins can be classified according to their structural basis [19,
20]. (1) Proteoglycans are a special class of glycoproteins consisting of a core
protein with covalently attached polysaccharide side chains (glycosaminoglycans –
GAGs) that are in most cases sulphated [6]. Four subclasses of proteoglycans are
characterized by the nature of the protein core and the GAG side chain. (1a)
Chondroitin sulphate side chains are found in biglycan, decorin and versican. (1b)
Keratan sulphate side chains occur in fibromodulin and (1c) heparin sulphate side
chains in membrane associated proteoglycans like the receptors for TGF-β and
FGFs. The (1d) glycosaminoglycan hyaluron belongs to the fourth subclass and is
neither sulphated nor attached to a protein core. (2) Gamma carboxy glutamate
containing proteins are also major constituents of bone matrix like osteocalcin, matrix
Gla protein or protein S. (3) Glycoproteins are posttranslationally modified proteins
containing either N- or O-linked oligosaccharides like alkaline phosphatase (ALP),
osteonectin or tetranectin. Some of them possess the amino acid sequence Arg-Gly-
Asp (RGD) and are therefore termed RGD-containing glycoproteins like
thrombospondin, fibronectin, vitronectin, fibrillin or sialoproteins (containing sialic acid
like osteopontin (SPP1 / BSP-I), bone sialoprotein (IBSP / BSP-II) or BAG-75). The
RGD sequence confers the ability to bind to integrin cell surface receptors, the basis
for cell-matrix interactions. (4) Finally, several other NCPs can be found in variable
amounts in the bone matrix including serum proteins (e.g. albumin, α-2HS
glycoprotein, immunoglobulins), cytokines, chemokines, growth factors, proteolipids
as well as enzymes and their inhibitors. The non-collagenous proteins adhere to the
matrix and regulate cell attachment, cell proliferation, collagen fibrillogenesis and
bone resorption, function as calcium binding proteins and initiate and mediate
mineralization [19, 20].
Incorporation of calcium phosphate as hydroxyapatite Ca10(PO4)6(OH)2 into the
organic matrix lead to mineralization of the osteoid. The crystals are spindle or
platelet shaped up to 200 nm in length. Because of the small crystal size and
Introduction
- 9 -
therefore large surface per weight ratio (10 m2/g bone), a high proportion of the
mineral particles can be exchanged and react with other ions similar in size and
charge to Ca2+, PO43-, OH-. Thus, bone has the ability to incorporate ions as Mg2+,
Sr2+ or replace OH- with F-, Cl- or CO32-. Indeed, many investigators refer to
hydroxyapatite as carbonate-apatite, since carbonate is the most prevalent bone
mineral constituent [21]. Other components include calcium carbonate, calcium
fluoride and magnesium fluoride. The process of mineralization takes place in distinct
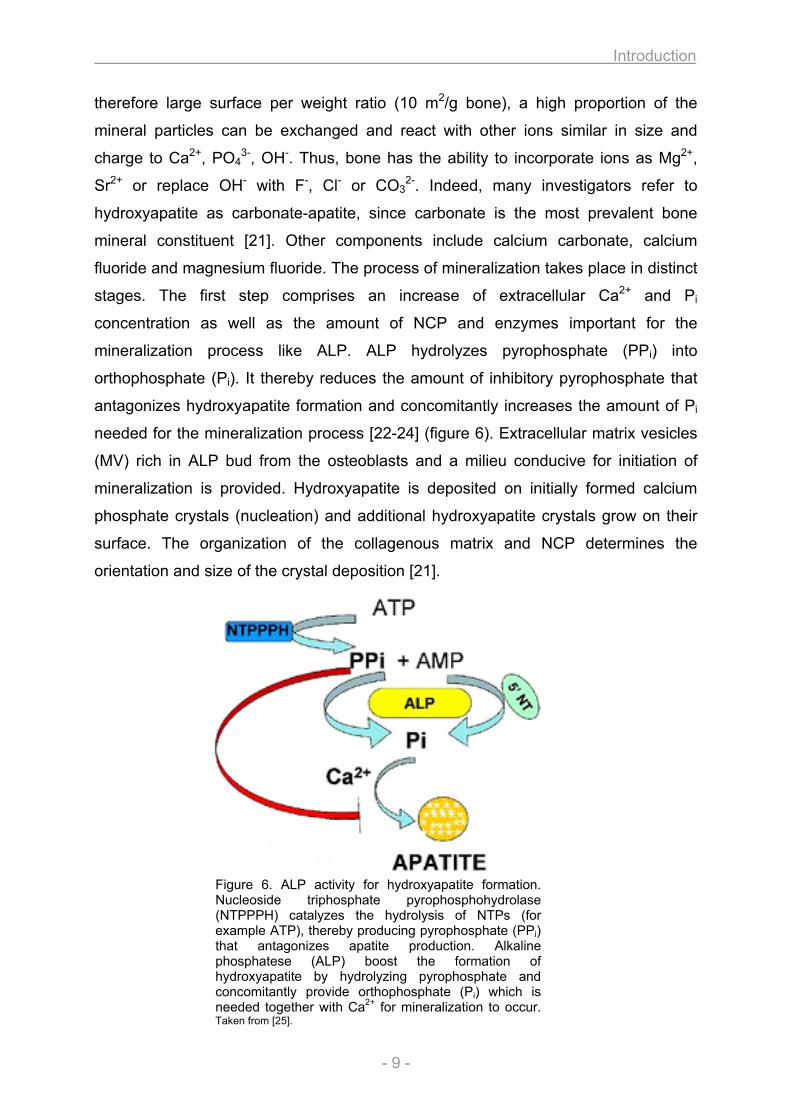
stages. The first step comprises an increase of extracellular Ca2+ and Pi
concentration as well as the amount of NCP and enzymes important for the
mineralization process like ALP. ALP hydrolyzes pyrophosphate (PPi) into
orthophosphate (Pi). It thereby reduces the amount of inhibitory pyrophosphate that
antagonizes hydroxyapatite formation and concomitantly increases the amount of Pi
needed for the mineralization process [22-24] (figure 6). Extracellular matrix vesicles
(MV) rich in ALP bud from the osteoblasts and a milieu conducive for initiation of
mineralization is provided. Hydroxyapatite is deposited on initially formed calcium
phosphate crystals (nucleation) and additional hydroxyapatite crystals grow on their
surface. The organization of the collagenous matrix and NCP determines the
orientation and size of the crystal deposition [21].
Figure 6. ALP activity for hydroxyapatite formation. Nucleoside triphosphate pyrophosphohydrolase (NTPPPH) catalyzes the hydrolysis of NTPs (for example ATP), thereby producing pyrophosphate (PPi) that antagonizes apatite production. Alkaline phosphatese (ALP) boost the formation of hydroxyapatite by hydrolyzing pyrophosphate and concomitantly provide orthophosphate (Pi) which is needed together with Ca2+ for mineralization to occur. Taken from [25].
Introduction
- 10 -
According to the structural organisation of the collagen fibres and the osteocyte ratio,
bone matrix can be distinguished as either woven or lamellar [26]. Woven bone is
initially laid down during osteogenesis and afterwards gradually replaced by the
lamellar structure. Therefore, lamellar organisation occurs in both trabecular and
cortical bone. Woven bone (primary, immature bone tissue) forms quickly, but
contains a high proportion of osteocytes and a disorganized structure with few
randomly oriented collagen fibres making it weak. It is observed in fetal skeleton and
in pathological situations like fractures in adults. Lamellar bone (secondary bone
tissue) is stronger, possesses a low proportion of osteocytes and is highly organized
in osteons containing many parallel arranged collagen fibres. Almost all bones in
adults are of lamellar structure, except few places like the sutures of flat bones of the
skull.
1.6. Development and formation of bone
Development and formation of bone (ossification) results by either a direct
(intramembranous) or indirect (endochondral) process (figure 7). Intramembraneous
ossification is characterized by the direct transformation of mesenchymal cells into
osteoblasts without prior formation of cartilage [26, 27]. It occurs during fetal
development of the skeleton and is also essential during formation of the skull
(calvaria, some facial bones and parts of mandible and clavicle) and the initial phase
of fracture healing. It leads to the deposition of woven bone, which is later replaced
by lamellar bone. Intramembraneous ossification is initiated by replication of MSC
that derive from the mesenchyme (embryonal bone formation) or medullary cavity
(fracture healing) and aggregate into nodule-like structures (mesenchymal
condensation). Once a nodule has been formed, MSCs stop replicating and develop
into osteoprogenitor cells with changes in morphology, enlargement of the cell body
and increasing amounts of Golgi and ER. The cells begin to synthesize the ECM
consisting mainly of type I collagen (osteoid). At this stage, they are referred to as
osteoblasts and continue to produce the matrix at the periphery of the nodules or
develop into osteocytes when they become incorporated into the osteoid.
Mineralization of the growing nodules leads to formation of rudimentary bone tissue
that aggregates to build up bone spicules. Bone growth proceeds at the surface of
Introduction
- 11 -
A
B
the spicule by ECM secreting osteoblasts and as the size of the spicule increases,
they fuse with each other and become trabeculae.
Interconnection of increasing trabeculae lead to formation of woven bone (primary
spongiosa) and the periosteum is formed by differentiating MSCs around the
trabeculae. As woven bone is weaker, it can be replaced by lamellar bone at the
primary center of ossification between the periosteum and the primary spongiosa,
where osteogenic cells increase appositional growth and a bone collar is formed.
When the bone collar is mineralized, lamellar bone arise.
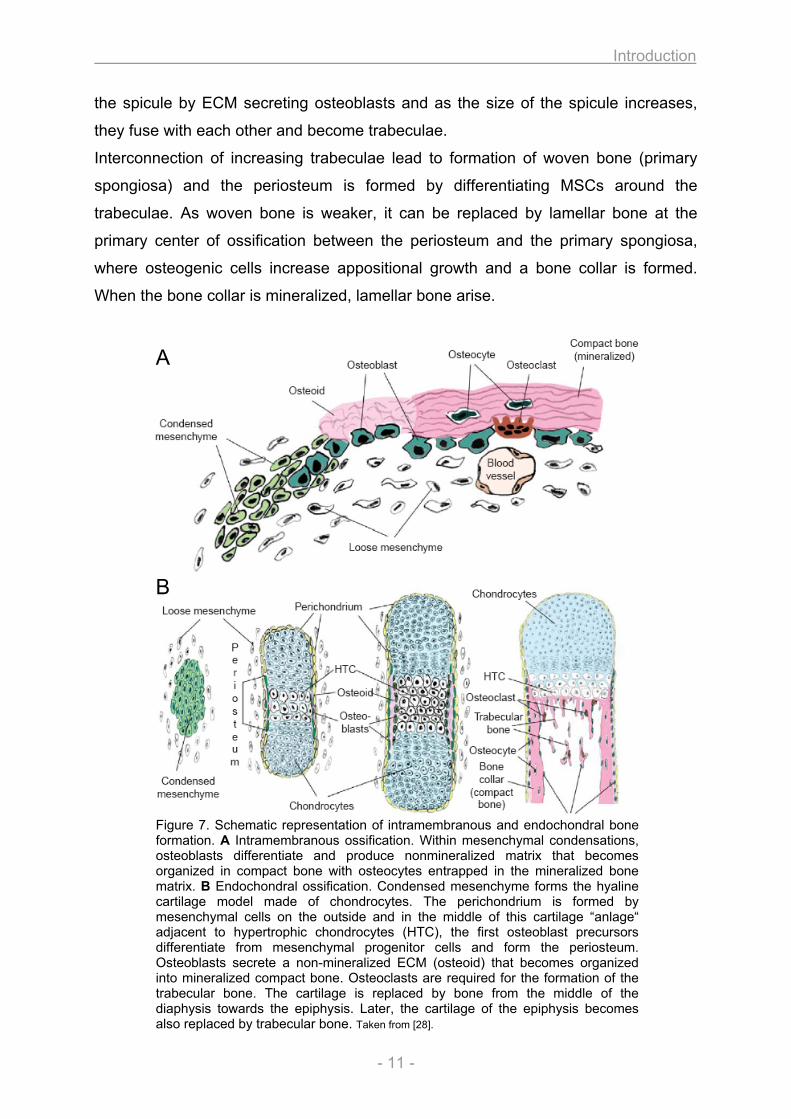
Figure 7. Schematic representation of intramembranous and endochondral bone formation. A Intramembranous ossification. Within mesenchymal condensations, osteoblasts differentiate and produce nonmineralized matrix that becomes organized in compact bone with osteocytes entrapped in the mineralized bone matrix. B Endochondral ossification. Condensed mesenchyme forms the hyaline cartilage model made of chondrocytes. The perichondrium is formed by mesenchymal cells on the outside and in the middle of this cartilage “anlage“ adjacent to hypertrophic chondrocytes (HTC), the first osteoblast precursors differentiate from mesenchymal progenitor cells and form the periosteum. Osteoblasts secrete a non-mineralized ECM (osteoid) that becomes organized into mineralized compact bone. Osteoclasts are required for the formation of the trabecular bone. The cartilage is replaced by bone from the middle of the diaphysis towards the epiphysis. Later, the cartilage of the epiphysis becomes also replaced by trabecular bone. Taken from [28].
Introduction
- 12 -
During the second type of ossification (endochondral), bone is formed through a
cartilage intermediate [26, 27, 29, 30]. It occurs during fetal development of diaphysis
from long bones, short bones and irregular bones (primary ossification) and after
birth for epiphysis of long bones (secondary ossification). Furthermore, it is important
for the replacement of woven bone in the process of fracture healing. As with
intramembranous ossification, woven bone is first laid down and replaced by lamellar
bone. The initial step is the development of a hyaline cartilage “model” from
mesenchymal condensation, which grows in length by replication of chondrocytes,
accompanied by secretion of cartilage ECM (interstitial growth). Appositional growth
in thickness occurs with development of new chondroblasts from the perichondrium
surrounding the cartilage and further deposition of ECM on the periphery.
Ossification of the cartilage model occurs in the middle of the cartilage shaft (later
diaphysis), the primary ossification center. On the outside, the perichondrium
becomes vascularized and develops into the periosteum, containing osteoprogenitor
cells that turn into osteoblasts to secrete the osteoid against the shaft of the cartilage
model. This appositional growth forms a bone collar which gives rise to cortical bone
that is first laid down as woven bone and later replaced by lamellar structure. Inside
the primary ossification center, chondrocytes begin to grow (hypertrophic
chondrocytes) and secrete ALP, an enzyme essential for matrix mineralization, as
well as VEGF (vascular endothelial growth factor), important for vessel formation.
After onset of calcification, the hypertrophic chondrocytes undergo apoptosis. Blood
vessels sprout out from the perichondrium and invade the cavity left by apoptotic
chondrocytes, thereby carrying haematopoietic and mesenchymal stem cells inside
the cavity to later form the bone marrow. Migrating osteoprogenitor cells develop to
osteoblasts, which use the calcified cartilage as scaffold to secrete osteoid, thereby
forming the bone trabecula as woven bone, which becomes later replaced by
lamellar structure. Concomitantly, osteoclasts proteolyse the cartilage matrix and
degrade the spongy bone to form the medullary cavity. During the progression of the
endochondral ossification, the cartilage is replaced by bone from the middle of the
diaphysis towards the epiphysis. When the secondary ossification center is formed in
the epiphysis, the cartilage - according to the process of primary ossification - is
replaced by bone, with spongy bone surrounded by a thin layer of articular cartilage.
In contrast to the diaphysis, the spongy bone inside is not degraded but completely
fills the epiphysis. Remaining cartilage stays between diaphysis and epiphysis in the
Introduction
- 13 -
so-called epiphyseal plate (growth plate, growth zone), where growth in length takes
place. After the growth period, when skeletal maturity has been completed,
proliferation of hypertrophic chondrocytes in the epiphyseal plate also stops and the
continuous replacement with bone results in the obliteration of the epiphyseal plate,
the closure of the epiphysis. Growth in diameter occurs by deposition of bone
beneath the periosteum while osteoclasts in the interior cavity resorb bone until its
ultimate thickness is obtained.
1.7. Bone modeling and homeostasis
Once bone has been made, it is not a rigid structure but rebuilt throughout the life,
where old bone is removed and replaced with new bone. The factors and parameters
determining bone formation and resorption are illustrated in figure 8.
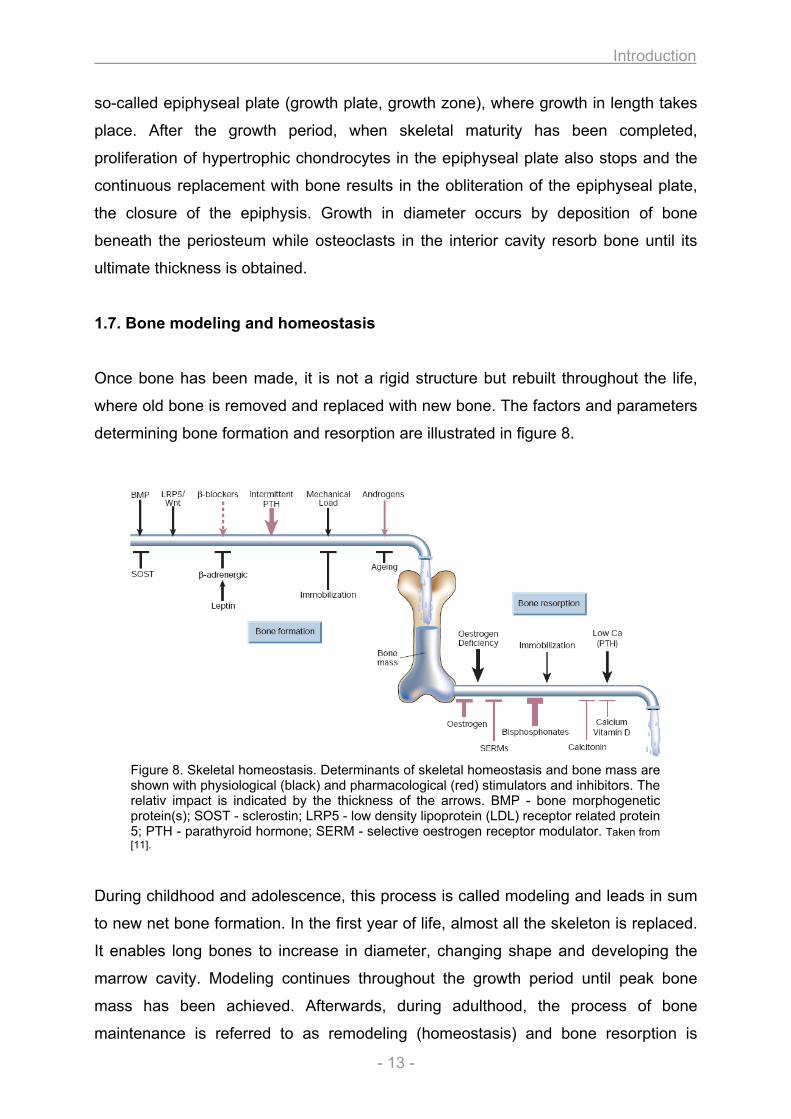
Figure 8. Skeletal homeostasis. Determinants of skeletal homeostasis and bone mass are shown with physiological (black) and pharmacological (red) stimulators and inhibitors. The relativ impact is indicated by the thickness of the arrows. BMP - bone morphogenetic protein(s); SOST - sclerostin; LRP5 - low density lipoprotein (LDL) receptor related protein 5; PTH - parathyroid hormone; SERM - selective oestrogen receptor modulator. Taken from [11].
During childhood and adolescence, this process is called modeling and leads in sum
to new net bone formation. In the first year of life, almost all the skeleton is replaced.
It enables long bones to increase in diameter, changing shape and developing the
marrow cavity. Modeling continues throughout the growth period until peak bone
mass has been achieved. Afterwards, during adulthood, the process of bone
maintenance is referred to as remodeling (homeostasis) and bone resorption is
Introduction
- 14 -
equally and optimally balanced by bone formation in healthy skeleton. Approximately
0.7% of human skeleton is resorbed daily and replaced by new bone [31]. It is
important for regulation of calcium homeostasis and mineral metabolism, repair of
microdamaged bones, replacement and reshaping of bone after injuries and
response to functional demands and muscle attachment. Imbalances in regulation of
the remodeling process result in many metabolic bone diseases such as
osteoporosis. Bone remodeling has important genetic determinants and is
furthermore influenced by other factors like hormones, nutritional intake, mechanical
forces and diseases. For example, the influence of mechanical load on remodeling is
explained by Wolff’s law, which states that bone will adapt to increasing load with
remodeling to become stronger and more resistant [32]. In the process of bone
homeostasis, bone cells are functionally linked via complex regulatory networks in a
“basic multicellular unit” (BMU – also termed “bone multicellular unit” or “bone
metabolic units”) [33, 34]. The skeleton contains millions of these units, which are not
permanent structures but forms after stimulation and always undergo the same
sequence of function. (1) BMU formation is triggered by mechanical stress or injury
and originate in response to hormones and cytokines including PTH, 1,25-dihydroxy-
vitamin D, interleukin 6 and 11, estrogens, androgens and prostaglandins. (2) As a
single BMU can exist for months but the lifespan of individual cells in between a BMU
is much shorter, new cells must be continuously recruited and activated, a process
that occurs at the edge of the BMU. The signals come from existing BMU cells,
although bone lining cells and osteocytes may participate. (3) Resorption takes place
after bone lining cells change their shape and secrete collagenase to expose the
collagen matrix and the bone mineral. Thereafter, they attract pre-osteoclasts which
fuse into multinucleated osteoclasts and resorb bone. During resorption, bone-
derived growth factors that were deposited into the matrix by previous generation of
osteoblasts are released like TGF-β, IGF and FGF. These factors recruit osteoblasts
which are responsible for (4) new bone formation. Osteoblasts converge at the
bottom of the cavity and form the osteoid which becomes (5) mineralized. The
osteoblasts continue to form and mineralize osteoid until the cavity is filled and
thereafter begin to flatten and cover the surface as quiescent lining cells or
differentiate to osteocytes if remaining in the matrix. Figure 9 depicts schematically
the process of bone remodeling.
Introduction
- 15 -
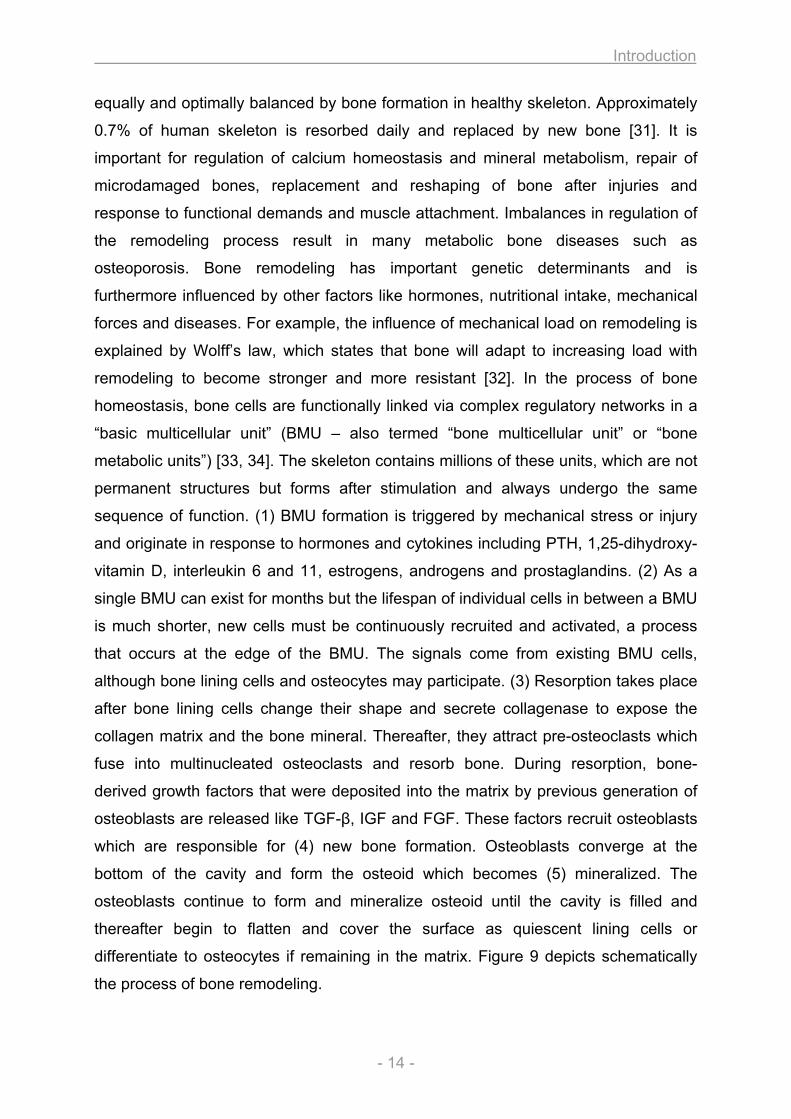
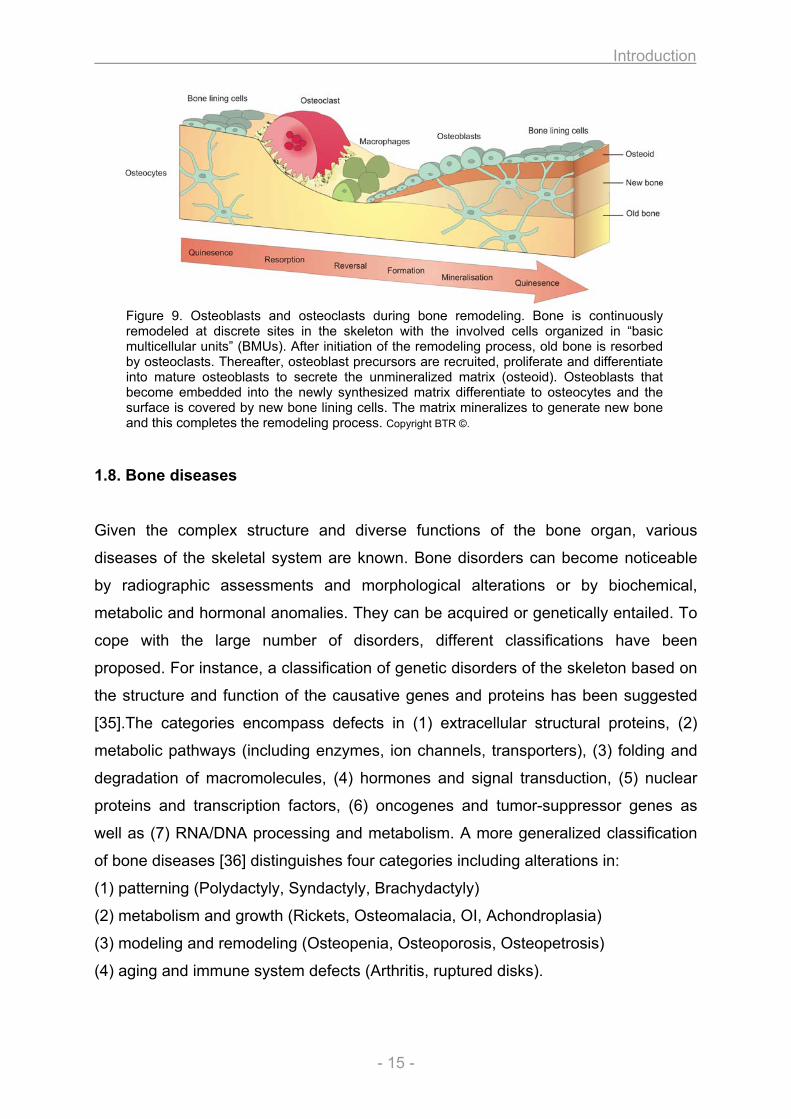
Figure 9. Osteoblasts and osteoclasts during bone remodeling. Bone is continuously remodeled at discrete sites in the skeleton with the involved cells organized in “basic multicellular units” (BMUs). After initiation of the remodeling process, old bone is resorbed by osteoclasts. Thereafter, osteoblast precursors are recruited, proliferate and differentiate into mature osteoblasts to secrete the unmineralized matrix (osteoid). Osteoblasts that become embedded into the newly synthesized matrix differentiate to osteocytes and the surface is covered by new bone lining cells. The matrix mineralizes to generate new bone and this completes the remodeling process. Copyright BTR ©.
1.8. Bone diseases
Given the complex structure and diverse functions of the bone organ, various
diseases of the skeletal system are known. Bone disorders can become noticeable
by radiographic assessments and morphological alterations or by biochemical,
metabolic and hormonal anomalies. They can be acquired or genetically entailed. To
cope with the large number of disorders, different classifications have been
proposed. For instance, a classification of genetic disorders of the skeleton based on
the structure and function of the causative genes and proteins has been suggested
[35].The categories encompass defects in (1) extracellular structural proteins, (2)
metabolic pathways (including enzymes, ion channels, transporters), (3) folding and
degradation of macromolecules, (4) hormones and signal transduction, (5) nuclear
proteins and transcription factors, (6) oncogenes and tumor-suppressor genes as
well as (7) RNA/DNA processing and metabolism. A more generalized classification
of bone diseases [36] distinguishes four categories including alterations in:
(1) patterning (Polydactyly, Syndactyly, Brachydactyly)
(2) metabolism and growth (Rickets, Osteomalacia, OI, Achondroplasia)
(3) modeling and remodeling (Osteopenia, Osteoporosis, Osteopetrosis)
(4) aging and immune system defects (Arthritis, ruptured disks).
Introduction
- 16 -
(1) Defects in developmental patterning entail malformations of the fingers or toes
with supernumerary digits in polydactyly, fusion of digits in syndactyly or shortness of
digits in brachydactyly. (2) Alterations in metabolism and growth / mineralization
result in growth retardation and bending or fractures of bone. Softening of bone
tissue due to defective mineralization is characteristic for patients with a lack of
vitamin D or its metabolism and occurs in rickets (childhood) and osteomalacia (adult
age). Abnormal collagen metabolism accounts for increased fracture rate and bone
deformities in Osteogenesis imperfecta (OI), and bone growth anomalies with defects
in the growth plate causes Achondrodysplasia, a major cause of dwarfism. (3)
Imbalance in bone modeling / remodeling processes causes alterations in bone mass
and bone mineral density (BMD), respectively. The bone mineral density T score
relates the BMD of a patient to the mean value of healthy control. A decrease of the
BMD with a score between -1.0 and -2.5 (SD to control) is considered as osteopenia
and a further decrease with scores below -2.5 characterizes osteoporosis. Reduced
BMD is either caused by decreased bone formation or increased resorption, leading
to a less stable skeleton with pronounced fracture risk. Osteopetrosis is also a bone
disease with a dysfunction of the remodeling process, but contrariwise, it is
characterized by higher BMD due to functional impairment of osteoclasts with
decreased bone resorption. (4) Inflammatory processes that affect the bone are seen
in Osteoarthritis (OA) and Rheumatoid Arthritis (RA), the most frequent joint diseases
in the world with prevalence of 50% in people over 65 years. OA is a degenerative
disease affecting the articular cartilage and subchondral bone, leading to
degeneration of the synovium and cartilage in joints of mostly hip and knee, which
results in joint pain, tenderness, stiffness and inflammation amongst other symptoms.
RA is a chronic, systemic inflammatory disorder affecting many organs but primarily
targets multiple joints of hands, feet, wrists, elbows, ankles, shoulders and knees. It
results in inflammation of the synovial membrane (synovitis) that often leads to
destruction of the articular cartilage and ankylosis of the joints. Cartilage destruction,
bone erosion, joint deformity and loss of joint function are common features in RA.
Many skeletal diseases cause long term complications and as the population ages,
the economic toll of medical treatment is predicted to increase in the future.
Therefore, bone diseases gain importance in research and medicine and a raise of
awareness for musculo-skeletal disorders in the society has to be achieved.
Introduction
- 17 -
1.9. Osteogenesis imperfecta – the “brittle bone disease”
Osteogenesis imperfecta is a group of inherited connective tissue disorders also
referred to as “brittle bone disease”. Skeletal symptoms comprise bone deformities,
brittle bones, fractures, low bone mass and osteoporosis (figure 10).
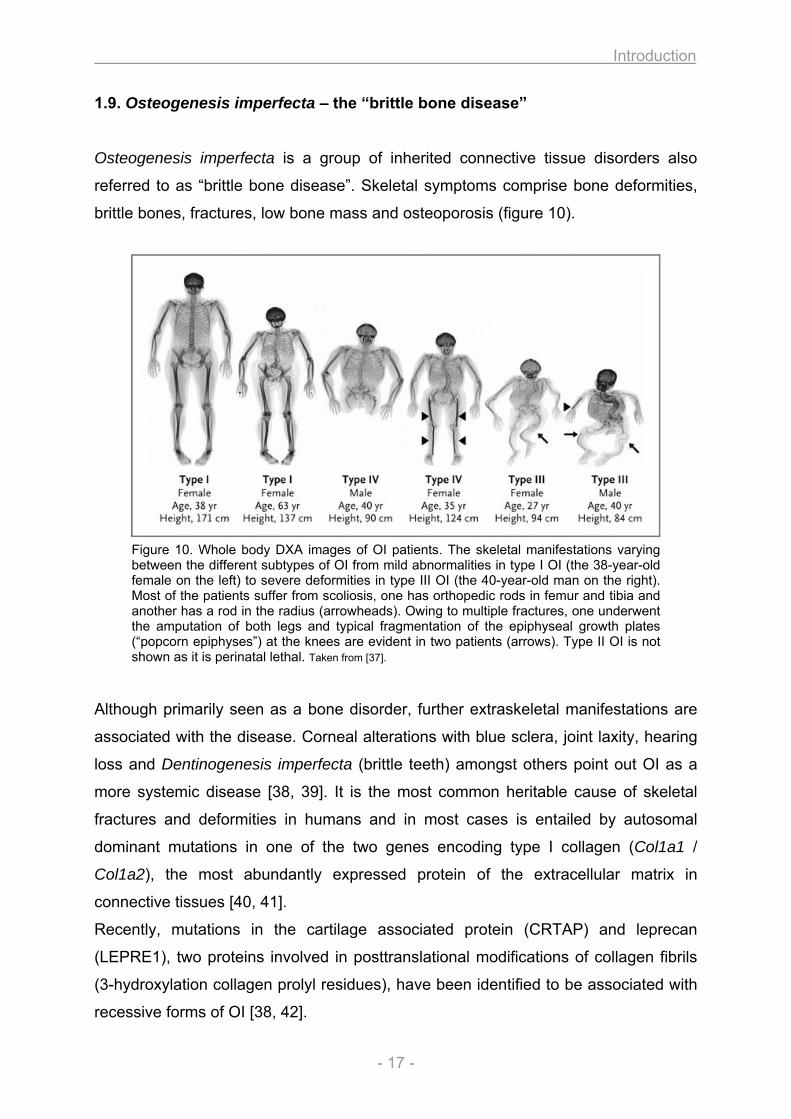
Figure 10. Whole body DXA images of OI patients. The skeletal manifestations varying between the different subtypes of OI from mild abnormalities in type I OI (the 38-year-old female on the left) to severe deformities in type III OI (the 40-year-old man on the right). Most of the patients suffer from scoliosis, one has orthopedic rods in femur and tibia and another has a rod in the radius (arrowheads). Owing to multiple fractures, one underwent the amputation of both legs and typical fragmentation of the epiphyseal growth plates (“popcorn epiphyses”) at the knees are evident in two patients (arrows). Type II OI is not shown as it is perinatal lethal. Taken from [37].
Although primarily seen as a bone disorder, further extraskeletal manifestations are
associated with the disease. Corneal alterations with blue sclera, joint laxity, hearing
loss and Dentinogenesis imperfecta (brittle teeth) amongst others point out OI as a
more systemic disease [38, 39]. It is the most common heritable cause of skeletal
fractures and deformities in humans and in most cases is entailed by autosomal
dominant mutations in one of the two genes encoding type I collagen (Col1a1 /
Col1a2), the most abundantly expressed protein of the extracellular matrix in
connective tissues [40, 41].
Recently, mutations in the cartilage associated protein (CRTAP) and leprecan
(LEPRE1), two proteins involved in posttranslational modifications of collagen fibrils
(3-hydroxylation collagen prolyl residues), have been identified to be associated with
recessive forms of OI [38, 42].
Introduction
- 18 -
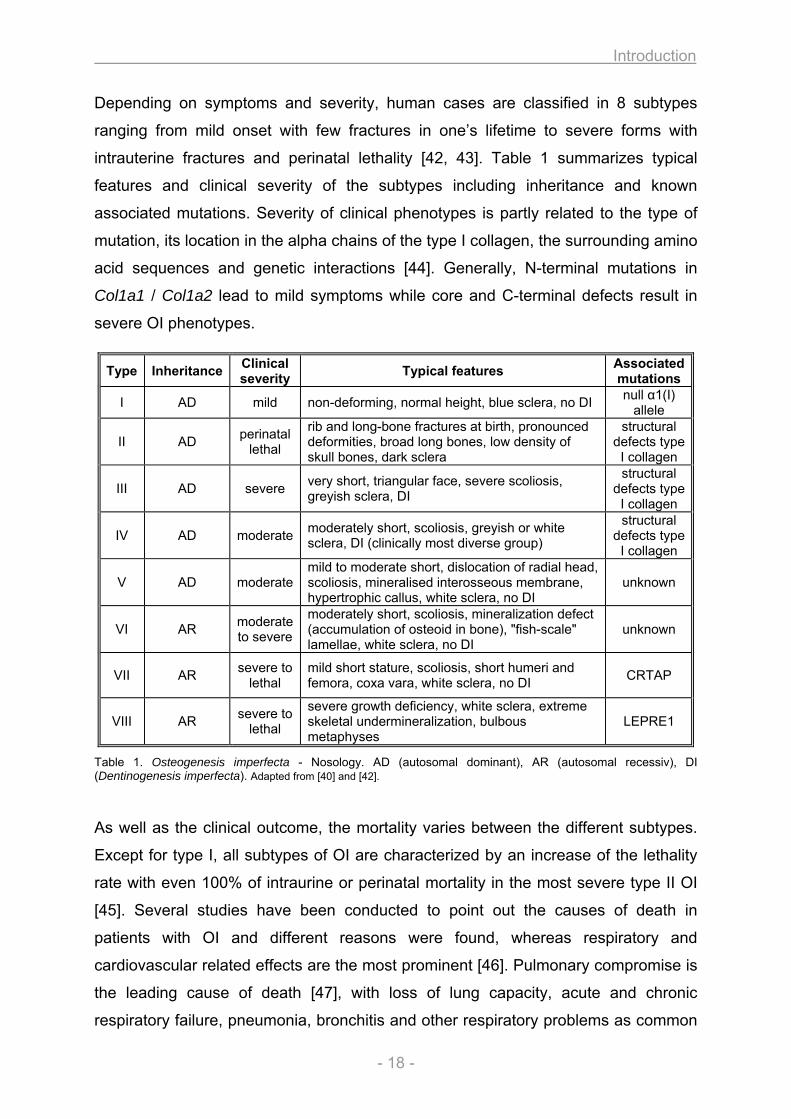
Depending on symptoms and severity, human cases are classified in 8 subtypes
ranging from mild onset with few fractures in one’s lifetime to severe forms with
intrauterine fractures and perinatal lethality [42, 43]. Table 1 summarizes typical
features and clinical severity of the subtypes including inheritance and known
associated mutations. Severity of clinical phenotypes is partly related to the type of
mutation, its location in the alpha chains of the type I collagen, the surrounding amino
acid sequences and genetic interactions [44]. Generally, N-terminal mutations in
Col1a1 / Col1a2 lead to mild symptoms while core and C-terminal defects result in
severe OI phenotypes.
Table 1. Osteogenesis imperfecta - Nosology. AD (autosomal dominant), AR (autosomal recessiv), DI (Dentinogenesis imperfecta). Adapted from [40] and [42].
As well as the clinical outcome, the mortality varies between the different subtypes.
Except for type I, all subtypes of OI are characterized by an increase of the lethality
rate with even 100% of intraurine or perinatal mortality in the most severe type II OI
[45]. Several studies have been conducted to point out the causes of death in
patients with OI and different reasons were found, whereas respiratory and
cardiovascular related effects are the most prominent [46]. Pulmonary compromise is
the leading cause of death [47], with loss of lung capacity, acute and chronic
respiratory failure, pneumonia, bronchitis and other respiratory problems as common
Type Inheritance Clinical severity Typical features Associated
mutations
I AD mild non-deforming, normal height, blue sclera, no DI null α1(I) allele
II AD perinatal lethal
rib and long-bone fractures at birth, pronounced deformities, broad long bones, low density of skull bones, dark sclera
structural defects type I collagen
III AD severe very short, triangular face, severe scoliosis, greyish sclera, DI
structural defects type I collagen
IV AD moderate moderately short, scoliosis, greyish or white sclera, DI (clinically most diverse group)
structural defects type I collagen
V AD moderate mild to moderate short, dislocation of radial head, scoliosis, mineralised interosseous membrane, hypertrophic callus, white sclera, no DI
unknown
VI AR moderate to severe
moderately short, scoliosis, mineralization defect (accumulation of osteoid in bone), "fish-scale" lamellae, white sclera, no DI
unknown
VII AR severe to lethal
mild short stature, scoliosis, short humeri and femora, coxa vara, white sclera, no DI CRTAP
VIII AR severe to lethal
severe growth deficiency, white sclera, extreme skeletal undermineralization, bulbous metaphyses
LEPRE1
Introduction
- 19 -
features in patients with OI. Although type I collagen is one of the major collagens in
lung and abnormal lung collagen has been thought to provoke respiratory problems,
large studies concerning this matter are missing and its involvement is poorly
understood. So far, lung problems are considered as secondary effects due to rib
fractures and scoliosis [40, 46, 47]. One study suggested effects of abnormal
collagen on the lung function in OI, but primary dermal fibroblasts were used for the
investigation of the type I collagen synthesis and the lung has not been studied
systematically [48].
Also cardiovascular disorders are known complications associated with OI and
clinical studies refer to pathological alterations such as aortic root dilatation, valvular
insufficiency and atrial septal defects. However, an explanation about the onset of
heart failure in patients with OI is wanting or, comparable to lung problems,
cardiovascular alterations are thought to be side effects due to skeletal abnormalities
like Kyphoscoliosis [46]. Type I collagen alterations in heart were previously
described in an OI mouse model and type II OI affected fetuses respectively [49, 50],
but an association of the encountered collagen defects with the development of heart
failure and the higher mortality in OI is missing.
To date, although substantial findings concerning lethality in OI were made, defects
in heart and lung are not directly linked to the underlying collagen mutation. Moreover
it is important to mention that the causes of death – if described – are considered as
asymptomatic and secondary, mostly due to an abnormity of the skeletal phenotype.
1.10. Mouse models for human diseases
Model organisms are widely used to study human diseases and reveal insight into
complex genetic traits. Possessing a long history in research, the mouse represents
the premier genetic model organism for the study of human diseases and
development [51]. One reason favouring the mouse as model organism for studies of
human disease is the developmental differences of mammalians compared to lower
organisms such as D.melanogaster or C.elegans. The murine system is
characterized by a short generation time (10 weeks) with large litter size and
importantly, the mouse genome has been completely sequenced showing a high
similarity with 95% homology to the human genome. The genome size is roughly
equivalent to the human genome (3x10⁹bp) and nearly all human genes have an
Introduction
- 20 -
orthologue in the mouse. Furthermore, large segments of synteny occur in the
genome of both species, harboring hundreds of genes in the same order and with
similar intergenic distances. In the mouse, forward and reverse genetic approaches
are readily available and our knowledge regarding polymorphic markers
(microsatellites, SNPs), exon-intron structure, restriction enzyme sites and other
functional and structural features of the mouse genome increases daily. Therefore,
the combination of genetics and genomics in the mouse provides access to
molecular mechanisms of complex biological questions [36].
1.11. Mouse models for skeletal disorders
Bone disorders raise complex biological questions and as the skeleton was acquired
late during evolution and lower model organisms such as D.melanogaster possesses
unequal exoskeletal systems, it is necessary to develop disease models using
vertebrate organisms such as the mouse. Therefore, beside its relatively unique
applicability to genetic studies of immunology, cancer, behavior and mammalian
development, the mouse is a valuable model organism for investigation of bone
biology, allowing detailed molecular, functional and pathological studies as well as
predicting candidate genes for human skeletal disorders [52]. As mutants represent
one of the most effective ways to acquire information to a gene’s function, various
mutant lines with skeletal defects have been developed using either spontaneous or
targeted mutagenesis and to date, nearly 3000 genotypes with over 10000
annotations have been listed in the Mouse Genome Informatics (MGI) database for
skeletal phenotypes (www.informatics.jax.org). Large scale mouse mutagenesis
screens have been conducted to further increase the number of mouse models for
human diseases. Reverse genetic approaches have produced mice with gain of
function (transgenic) and loss of function (knockout) alleles possessing abnormalities
in patterning, bone remodeling and joints [35]. Among forward genetic approaches,
ENU mutagenesis is the most powerful method creating mutants [53]. In the Munich
ENU mutagenesis screen [54], various mouse mutants have been isolated as models
for human diseases, including mice with different bone phenotypes. Among the
mutants possessing skeletal abnormalities, phenotypes have been identified
resembling Polydactylism, Syndactylism, Osteogenesis imperfecta, Achondroplasia,
Osteoporosis and Rheumatoid Arthritis amongst others (unpuplished data).
Introduction
- 21 -
1.12. Aga2 - a mouse model for Osteogenesis imperfecta
A new mouse model for OI has recently been identified in the Munich ENU
mutagenesis screen [55]. Due to the first observed phenotype it was referred to as
Aga2 (abnormal gait). A point mutation with a T to A transversion in the intron 50 of
the Col1a1 gene generated a novel cryptic 3’ splice acceptor site. The alternative
splice transcript possesses a 16 bp elongation with a frameshift of the endogenous
stop, predicting 89 new amino acids beyond the original termination position and
leading to structural alterations of the mutated type I collagen protein. Given the
dominant negative mutation, homozygous animals are embryonic lethal.
Heterozygous animals (Col1a1Aga2/Col1a1+) display hallmarks of OI symptoms
including multiple fractures in long bone, pelvis and rib cage, scoliosis, reduced body
size and an overall decrease in bone mass and density. Furthermore and
comparable to clinical heterogeneity in man (see above), heterozygous Aga2 mice
varying in the severity of disease and two different phenotypes can be distinguished.
Mildly affected Col1a1Aga2/Col1a1+ mice possess a moderate phenotype and survive
to adulthood (herein after referred to as Aga2mild). In contrast, severely affected
Col1a1Aga2/Col1a1+ animals feature a strong disease pattern and succumb to
postnatal lethality (herein after referred to as Aga2severe) [55]. In depth analysis of this
mouse line has proven Aga2 to be a good murine model for OI and furthermore, a
new pathological mechanism with the involvement of ER stress related apoptosis in
the bone tissue was shown [55]. But according to the human situation, the reasons
for lethality in the severely affected mice have not been identified so far and are still
speculative.
1.13. The German Mouse Clinic
Once a mouse mutant has been established as model system for human diseases or
for developmental studies, a comprehensive analysis of the phenotype is as
important as the mutagenesis itself to unravel the molecular and pathological
alterations that emerge from the genetic modification. The German Mouse Clinic
(GMC) offers large scale phenotyping for standardized and comprehensive analysis
of mouse mutant lines. Phenotypic investigation is performed in 14 different clinical
screens covering allergy, clinical chemistry, cardiovascular analyses, dysmorphology,
Introduction
- 22 -
immunology, lung function and molecular phenotyping amongst others [56]. The mice
are non-invasively analyzed within the primary screen for more than 320 parameters
in the various fields and if required, secondary and tertiary tests can be performed in
addition for a more detailed characterization of the mutant mice.
The Dysmorphology screen comprises the phenotypic analysis of bone and cartilage
[57]. Alterations in skeletal development, growth and mineralization, modeling and
remodeling as well as aging and immune system effects can be detected. Anatomical
observations together with X-ray analysis and DXA measurements are performed
within the primary screen. In case of significant differences between mutant mice and
wild type controls, more sophisticated investigations can be done in the secondary
screen including µCT and pQCT analysis, three-point bending tests or determination
of biochemical markers for bone formation and resorption like Osteocalcin (Bglap1 /
OC), Alkaline Phosphatase (ALP), Tartrate-resistent acid phosphatase (TRAP) or
deoxypyridinoline (DPD). Thus, the Dysmorphology screen of the GMC provides a
comprehensive picture of morphological, structural and clinic chemical alterations of
the skeletal system in mutant mice. However, as the deployed methods are of a more
descriptive nature, they cannot unravel the cellular and molecular causes of the
observed bone alterations as they can either be due to direct alterations of the bone
cells (primary effect) or evoked by systemic influences on the bone in terms of
hormonal / metabolic dysregulations (secondary effect). Therefore, in vitro cell culture
studies with osteoblasts might provide a closer look to the cellular phenotype, thus
assessing the nature of the bone alteration.
1.14. In vitro cell culture
To study the behavior, biochemical pathways and molecular mechanisms at the
cellular level independently from systemic influences, the application of tissue culture
is the method of choice. At the beginning of the last century, tissue culture came into
being with the work of Harrison and Carrel [58, 59] and enabled the investigation of
cellular parameters free of variations due to normal homeostasis and / or stress
conditions in the animal. Since then, vast progress has been made in developing
tissue culture methods and today they are widely distributed and closely related to
basic and medical research as well as pharmaceutical drug development and
production. Tissue culture is applied in virology, immunology, radiation biology,
Introduction
- 23 -
cancer research and almost all fields in life science. It is of great importance in
clinical diagnostics and biotechnological production of agents for prophylaxis and
therapy as well as vaccines and drugs. Furthermore, with the latest developments in
stem cell research and tissue engineering, tissue culture will become more and more
relevant in regenerative medicine.
Tissue culture generally refers to the growth of eukaryotic cells separate from the
organism in vitro [60]. It comprises (1) organ culture with in vitro cultivation of whole
organs to maintain the architecture of the composing structures, (2) explant cultures
with in vitro cultivation of tissue pieces to either investigate cells left in their
surrounding matrix or to isolate them as they outgrow from the explant and (3) cell
culture for in vitro cultivation of dispersed cells as permanent cell lines or primary
cells. Permanent cell lines have originated from eukaryotic tissues and have
spontaneously acquired or were treated to exhibit the capacity to perpetually re-
divide and are therefore sometimes referred to as immortalized or established cell
lines. In contrast, primary cells possess a delimited proliferation capacity and mitotic
potential after isolation from the tissue and senescence occurs after few passages in
vitro. For various research purposes, primary cells are more appropriate than
permanent cell lines, as their phenotype matches the in vivo situation or is at least
closer to that. Cell cultures can be used to assess intracellular activity, gene
expression, protein synthesis, energy metabolism, ligand-receptor interactions and
signal transduction processes, cell-cell / cell-matrix and cell-environment interactions,
differentiation capacity and morphogenesis as well as various other parameters [60].
The uncoupling and disengagement from systemic effects of the whole organism and
the possibility to define, control and influence the cultivation conditions are the major
advantage of using tissue culture. Thus, biological samples can be kept under
identical and well known conditions. Using primary cells from different animals (e.g.
mutant and wild type control), their in vitro investigation can provide insights into
possible cellular and molecular differences of the analyzed cells between both animal
groups.
Introduction
- 24 -
1.15. Goal
I. In vitro analysis of osteoblasts
To broaden the phentoyping options of the GMC Dysmorphology Screen and to
extend the analysis to the cellular level, a primary cell culture system for osteoblasts
should be established. The development and implementation of quantitative assays
for various bone relevant parameter should allow for a comprehensive investigation
of the cellular phenotype. Thus, the comparison of cells from bone diseased mice
and wild type littermates should provide hints for possible cellular and molecular
reasons of the bone alteration in the mutants. As the cells are thereby cultivated and
investigated identical and uncoupled from systemic influences, one can determine
whether cell autonomous (primary) or systemic (secondary) effects are responsible
for the bone disease. An SOP for the “In vitro analysis of osteoblast” has been
developed and is described in detail in Material and Method part 2.1.
II. Heart and lung investigation in the Aga2 OI mouse model
Osteogenesis imperfecta (OI) is associated with an increased mortality and lung as
well as heart alterations have been found to be the main causes of death. However,
the cardiopulmonary defects are considered as asymptomatic and secondary due to
an alteration of the skeletal phenotype. Aga2 has recently been described as a new
mouse model for OI. Comparable to human cases, mutant mice varying in the
aetiopathology with a high mortality in severely affected mutants (Aga2severe). To
explain the postnatal lethality in Aga2severe and to elucidate the pathological and
molecular reasons for it, comprehensive and in depth analysis of Aga2 should be
conducted. Given the precognition of cardiac and pulmonary complications in human,
heart and lung have been chosen as the most relevant and reasonable organs to be
related with the lethality. Thus, investigations on the functional, morphological and
molecular level should be performed with heart and lung of Aga2severe mice in vivo
and in vitro.
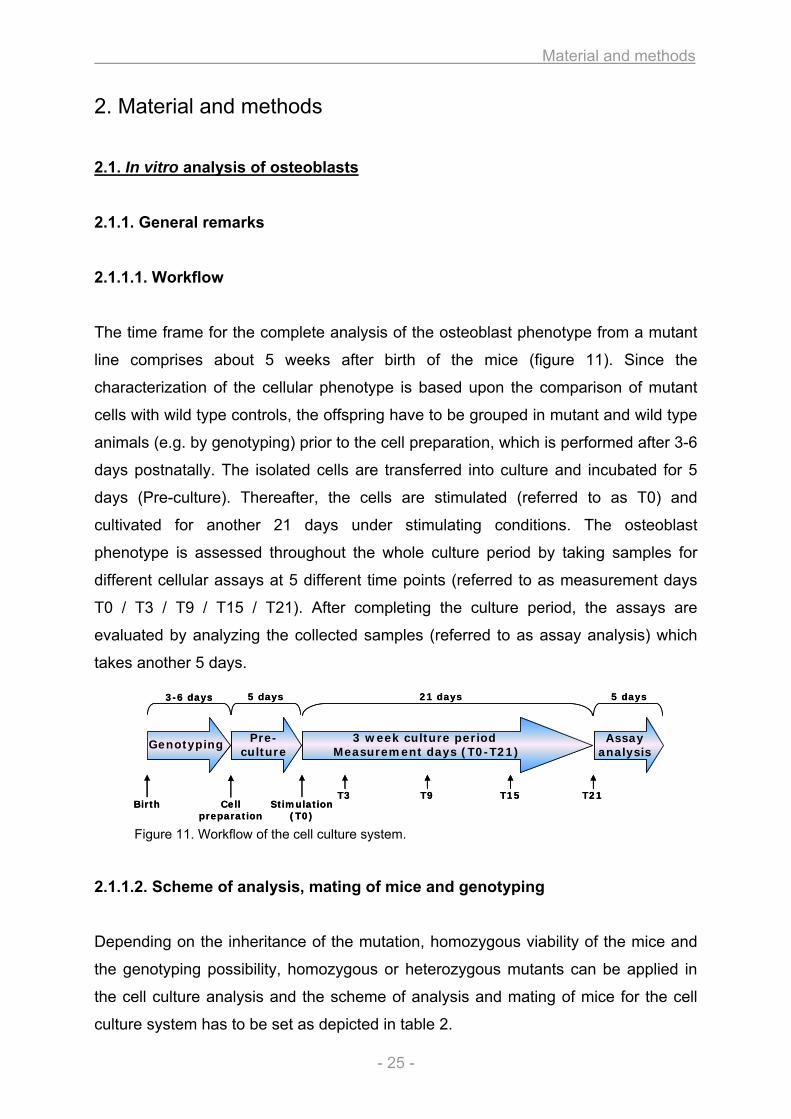
Material and methods
- 25 -
Genotyping 3 week culture periodMeasurement days (T0-T21)
Assayanalysis
Pre-culture
Birth Cellpreparation
Stimulation(T0)
T3 T9 T15 T21
3-6 days 5 days 21 days 5 days
Genotyping 3 week culture periodMeasurement days (T0-T21)
Assayanalysis
Pre-culture
Birth Cellpreparation
Stimulation(T0)
T3 T9 T15 T21
3-6 days 5 days 21 days 5 days
2. Material and methods
2.1. In vitro analysis of osteoblasts
2.1.1. General remarks
2.1.1.1. Workflow
The time frame for the complete analysis of the osteoblast phenotype from a mutant
line comprises about 5 weeks after birth of the mice (figure 11). Since the
characterization of the cellular phenotype is based upon the comparison of mutant
cells with wild type controls, the offspring have to be grouped in mutant and wild type
animals (e.g. by genotyping) prior to the cell preparation, which is performed after 3-6
days postnatally. The isolated cells are transferred into culture and incubated for 5
days (Pre-culture). Thereafter, the cells are stimulated (referred to as T0) and
cultivated for another 21 days under stimulating conditions. The osteoblast
phenotype is assessed throughout the whole culture period by taking samples for
different cellular assays at 5 different time points (referred to as measurement days
T0 / T3 / T9 / T15 / T21). After completing the culture period, the assays are
evaluated by analyzing the collected samples (referred to as assay analysis) which
takes another 5 days.
Figure 11. Workflow of the cell culture system.
2.1.1.2. Scheme of analysis, mating of mice and genotyping
Depending on the inheritance of the mutation, homozygous viability of the mice and
the genotyping possibility, homozygous or heterozygous mutants can be applied in
the cell culture analysis and the scheme of analysis and mating of mice for the cell
culture system has to be set as depicted in table 2.
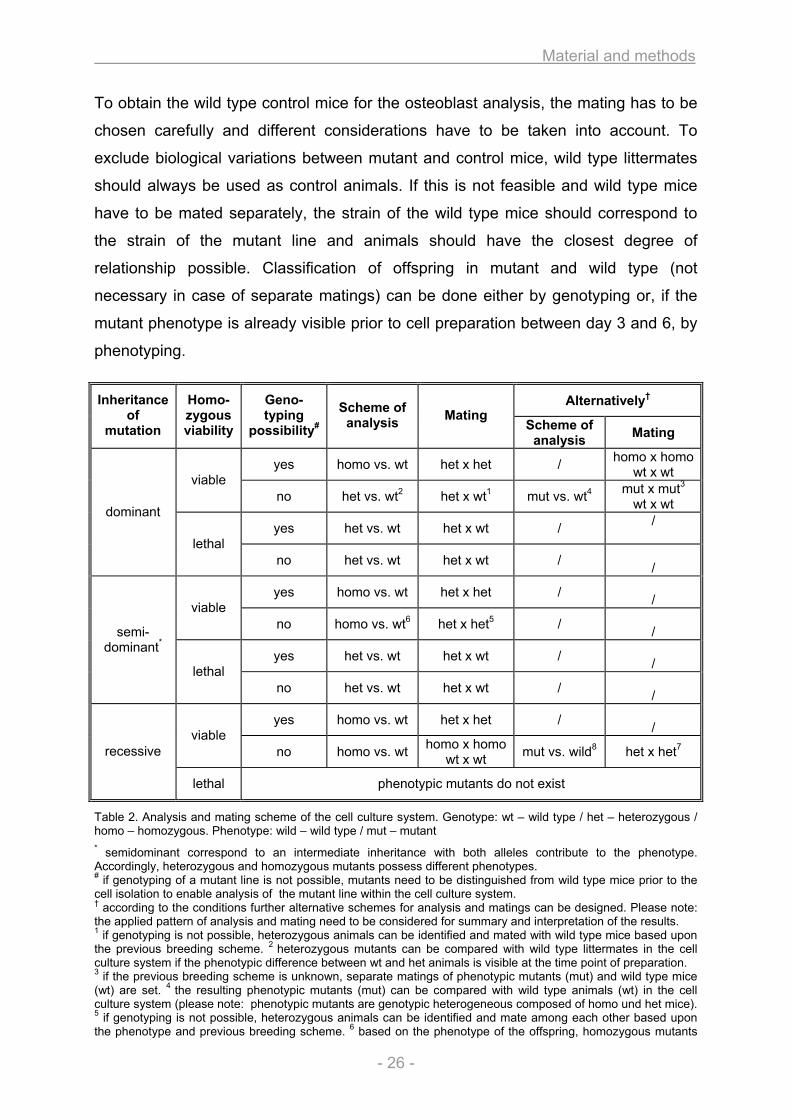
Material and methods
- 26 -
To obtain the wild type control mice for the osteoblast analysis, the mating has to be
chosen carefully and different considerations have to be taken into account. To
exclude biological variations between mutant and control mice, wild type littermates
should always be used as control animals. If this is not feasible and wild type mice
have to be mated separately, the strain of the wild type mice should correspond to
the strain of the mutant line and animals should have the closest degree of
relationship possible. Classification of offspring in mutant and wild type (not
necessary in case of separate matings) can be done either by genotyping or, if the
mutant phenotype is already visible prior to cell preparation between day 3 and 6, by
phenotyping.
Table 2. Analysis and mating scheme of the cell culture system. Genotype: wt – wild type / het – heterozygous / homo – homozygous. Phenotype: wild – wild type / mut – mutant * semidominant correspond to an intermediate inheritance with both alleles contribute to the phenotype. Accordingly, heterozygous and homozygous mutants possess different phenotypes. # if genotyping of a mutant line is not possible, mutants need to be distinguished from wild type mice prior to the cell isolation to enable analysis of the mutant line within the cell culture system. † according to the conditions further alternative schemes for analysis and matings can be designed. Please note: the applied pattern of analysis and mating need to be considered for summary and interpretation of the results. 1 if genotyping is not possible, heterozygous animals can be identified and mated with wild type mice based upon the previous breeding scheme. 2 heterozygous mutants can be compared with wild type littermates in the cell culture system if the phenotypic difference between wt and het animals is visible at the time point of preparation. 3 if the previous breeding scheme is unknown, separate matings of phenotypic mutants (mut) and wild type mice (wt) are set. 4 the resulting phenotypic mutants (mut) can be compared with wild type animals (wt) in the cell culture system (please note: phenotypic mutants are genotypic heterogeneous composed of homo und het mice). 5 if genotyping is not possible, heterozygous animals can be identified and mate among each other based upon the phenotype and previous breeding scheme. 6 based on the phenotype of the offspring, homozygous mutants
Alternatively† Inheritance of
mutation
Homo-zygous viability
Geno-typing
possibility#
Scheme of analysis Mating
Scheme of analysis Mating
yes homo vs. wt het x het / homo x homowt x wt viable
no het vs. wt2 het x wt1 mut vs. wt4 mut x mut3 wt x wt
yes het vs. wt het x wt / /
dominant
lethal no het vs. wt het x wt /
/
yes homo vs. wt het x het / / viable
no homo vs. wt6 het x het5 / /
yes het vs. wt het x wt / /
semi-dominant*
lethal no het vs. wt het x wt /
/
yes homo vs. wt het x het / / viable
no homo vs. wt homo x homo wt x wt mut vs. wild8 het x het7 recessive
lethal phenotypic mutants do not exist
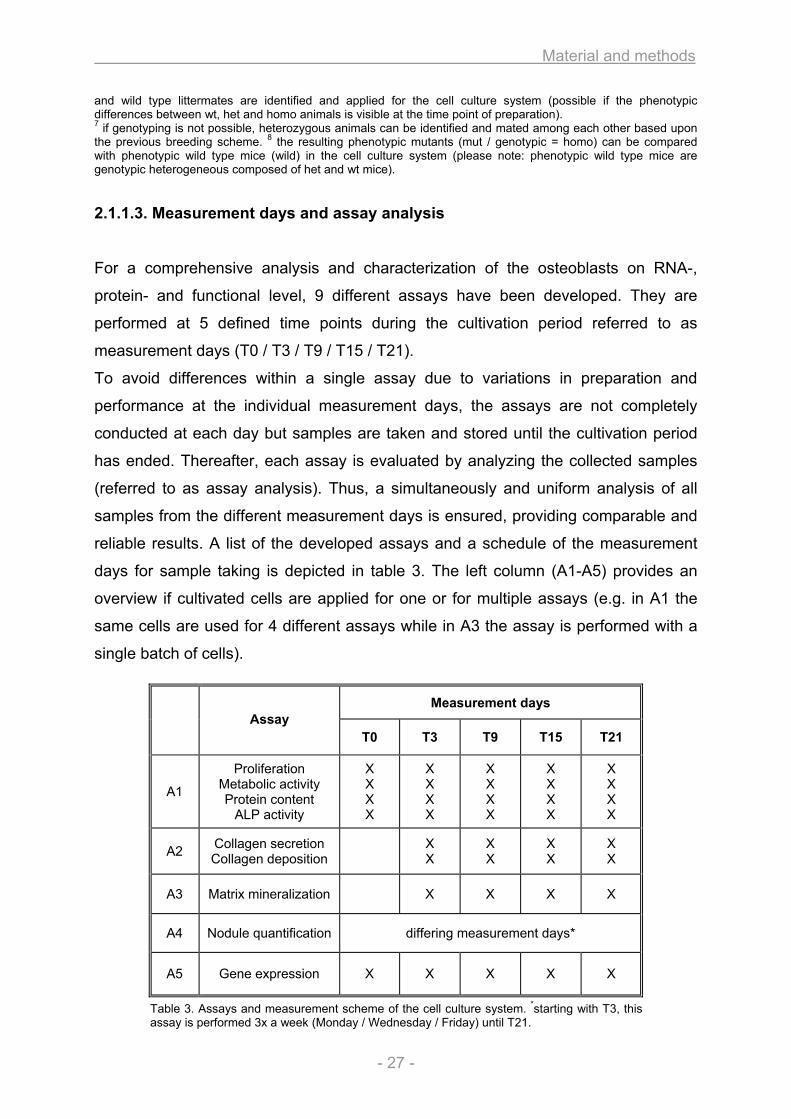
Material and methods
- 27 -
and wild type littermates are identified and applied for the cell culture system (possible if the phenotypic differences between wt, het and homo animals is visible at the time point of preparation). 7 if genotyping is not possible, heterozygous animals can be identified and mated among each other based upon the previous breeding scheme. 8 the resulting phenotypic mutants (mut / genotypic = homo) can be compared with phenotypic wild type mice (wild) in the cell culture system (please note: phenotypic wild type mice are genotypic heterogeneous composed of het and wt mice).
2.1.1.3. Measurement days and assay analysis
For a comprehensive analysis and characterization of the osteoblasts on RNA-,
protein- and functional level, 9 different assays have been developed. They are
performed at 5 defined time points during the cultivation period referred to as
measurement days (T0 / T3 / T9 / T15 / T21).
To avoid differences within a single assay due to variations in preparation and
performance at the individual measurement days, the assays are not completely
conducted at each day but samples are taken and stored until the cultivation period
has ended. Thereafter, each assay is evaluated by analyzing the collected samples
(referred to as assay analysis). Thus, a simultaneously and uniform analysis of all
samples from the different measurement days is ensured, providing comparable and
reliable results. A list of the developed assays and a schedule of the measurement
days for sample taking is depicted in table 3. The left column (A1-A5) provides an
overview if cultivated cells are applied for one or for multiple assays (e.g. in A1 the
same cells are used for 4 different assays while in A3 the assay is performed with a
single batch of cells).
Table 3. Assays and measurement scheme of the cell culture system. *starting with T3, this assay is performed 3x a week (Monday / Wednesday / Friday) until T21.
Measurement days Assay
T0 T3 T9 T15 T21
A1
Proliferation Metabolic activity Protein content
ALP activity
X X X X
X X X X
X X X X
X X X X
X X X X
A2 Collagen secretion Collagen deposition X
X X X
X X
X X
A3 Matrix mineralization X X X X
A4 Nodule quantification differing measurement days*
A5 Gene expression X X X X X
Material and methods
- 28 -
2.1.1.4. Cell preparation and cultivation
For the cell culture system, the cells are classified in two groups for cultivation,
sample taking at the measurement days and the assay analysis and interpretation:
1) wild type cells (control / reference) = wt
2) mutant cells (to be assessed / investigated) = mut
Preparation of osteoblasts is performed with mice at the age of day 3 to 6 postnatal
and cells are isolated enzymatically from the calvaria of the animals. Given the fact
that 12.4x10⁶ cells are needed for the culture system and that 7.5x10⁵ cells are
obtained on average out of a single calvaria, at least 16 mice (calvariae) have to be
prepared for each group (mutant and wild type). However, it is recommended to
prepare 20 mice to ensure the required number of 12.4x10⁶ cells.
The isolated cells are cultivated under standard conditions with 37°C / 90% humidity /
5% CO2 in a cell incubator using the following mediums:
Culture medium A (preparation / prior to stimulation / assay A1)
• α-MEM supplemented with 10% FCS / 2 mM glutamine / 100 U/ml penicillin /
100 µg/ml streptomycin
Culture medium B (stimulation from T0 - T21):
• α-MEM supplemented with 10% FCS / 2 mM glutamine / 100 U/ml penicillin /
100 µg/ml streptomycin / 10 mM β-glycerophosphate / 50 µg/ml ascorbic acid
Culture medium C (assay A2)
• α-MEM supplemented with 5% FCS / 2 mM glutamine / 100 U/ml penicillin /
100 µg/ml streptomycin / 10 mM β-glycerophosphate / 50 µg/ml ascorbic acid
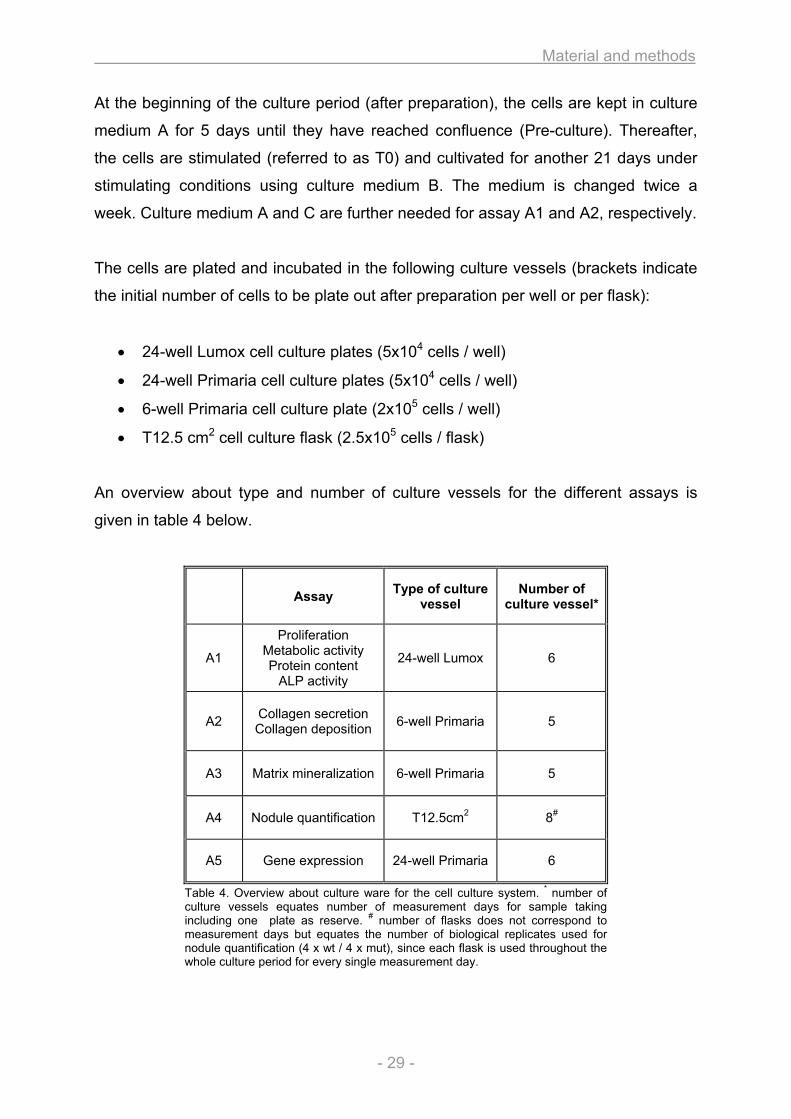
Material and methods
- 29 -
At the beginning of the culture period (after preparation), the cells are kept in culture
medium A for 5 days until they have reached confluence (Pre-culture). Thereafter,
the cells are stimulated (referred to as T0) and cultivated for another 21 days under
stimulating conditions using culture medium B. The medium is changed twice a
week. Culture medium A and C are further needed for assay A1 and A2, respectively.
The cells are plated and incubated in the following culture vessels (brackets indicate
the initial number of cells to be plate out after preparation per well or per flask):
• 24-well Lumox cell culture plates (5x10⁴ cells / well)
• 24-well Primaria cell culture plates (5x10⁴ cells / well)
• 6-well Primaria cell culture plate (2x10⁵ cells / well)
• T12.5 cm2 cell culture flask (2.5x10⁵ cells / flask)
An overview about type and number of culture vessels for the different assays is
given in table 4 below.
Table 4. Overview about culture ware for the cell culture system. * number of culture vessels equates number of measurement days for sample taking including one plate as reserve. # number of flasks does not correspond to measurement days but equates the number of biological replicates used for nodule quantification (4 x wt / 4 x mut), since each flask is used throughout the whole culture period for every single measurement day.
Assay Type of culture vessel
Number of culture vessel*
A1
Proliferation Metabolic activity Protein content
ALP activity
24-well Lumox 6
A2 Collagen secretion Collagen deposition 6-well Primaria 5
A3 Matrix mineralization 6-well Primaria 5
A4 Nodule quantification T12.5cm2 8#
A5 Gene expression 24-well Primaria 6
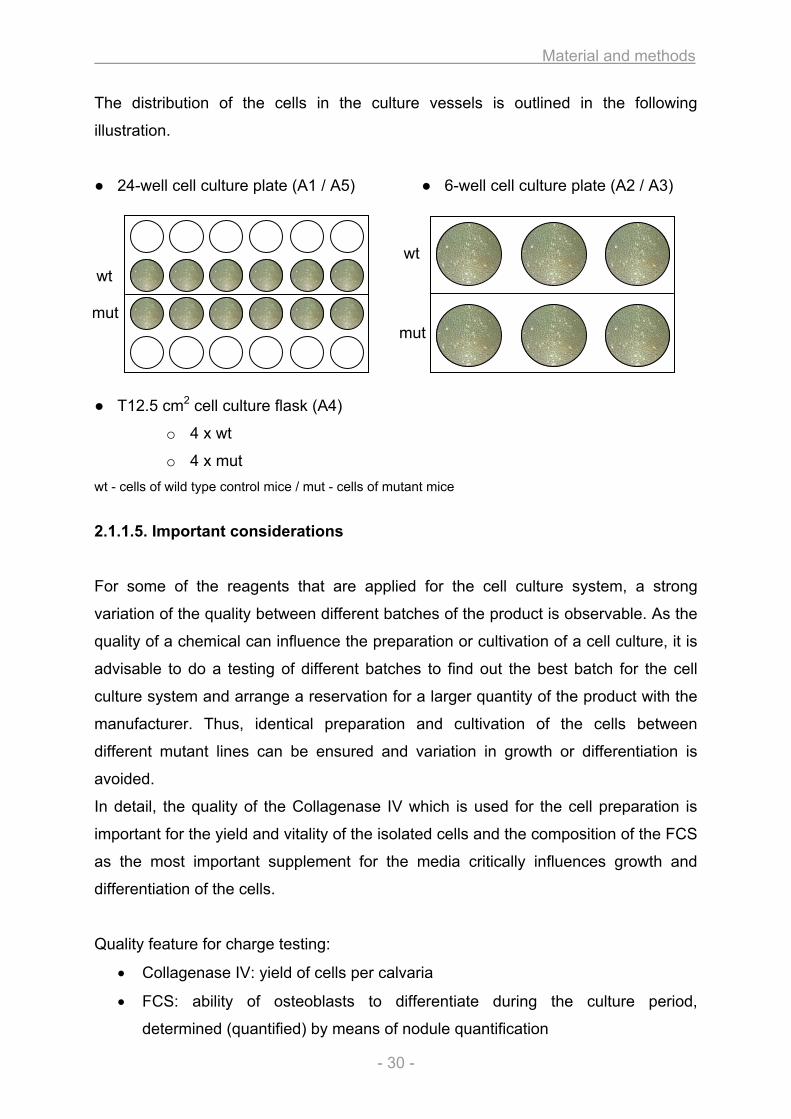
Material and methods
- 30 -
The distribution of the cells in the culture vessels is outlined in the following
illustration.
● 24-well cell culture plate (A1 / A5) ● 6-well cell culture plate (A2 / A3)
● T12.5 cm2 cell culture flask (A4)
o 4 x wt
o 4 x mut wt - cells of wild type control mice / mut - cells of mutant mice
2.1.1.5. Important considerations
For some of the reagents that are applied for the cell culture system, a strong
variation of the quality between different batches of the product is observable. As the
quality of a chemical can influence the preparation or cultivation of a cell culture, it is
advisable to do a testing of different batches to find out the best batch for the cell
culture system and arrange a reservation for a larger quantity of the product with the
manufacturer. Thus, identical preparation and cultivation of the cells between
different mutant lines can be ensured and variation in growth or differentiation is
avoided.
In detail, the quality of the Collagenase IV which is used for the cell preparation is
important for the yield and vitality of the isolated cells and the composition of the FCS
as the most important supplement for the media critically influences growth and
differentiation of the cells.
Quality feature for charge testing:
• Collagenase IV: yield of cells per calvaria
• FCS: ability of osteoblasts to differentiate during the culture period,
determined (quantified) by means of nodule quantification
wt mut
wt mut
Material and methods
- 31 -
2.1.1.6. Statistical analysis
The mutant as well as the wild type control cultures each descends from a single
pool of cells. Therefore, biological replicates of each group are not performed and
thus, statistical analysis of the results can not be obtained. The multiple wells / flasks
of each group that are used for the assays A1 / A2 / A3 / A4 (n = number of wells or
flasks per group) only represent technical replicates and the error bars drawn in the
diagrams represent the standard error of the mean (SEM) calculated from these
technical replicates (from n). In assay A5 (Gene expression), the single wells of each
group are pooled for the experiment and therefore no technical replicates are
performed. Hence, SEM can not be calculated for the Gene expression assay.
Accordingly, the cell culture system only provide trends of the differences between
mutant and wild type osteoblasts, but the development and course of each
investigated parameter during the cultivation time should allow to assess possible
disparities between mutant and wild type cells.
Material and methods
- 32 -
2.1.2. Material and methods 2.1.2.1. Cell preparation and cultivation I. Material
• EDTA • 1x PBS (Lonza / BE17-516F) • Collagenase IV (Sigma-Aldrich / C5138-500MG / charge of importance) • α-MEM (Lonza / BE12-169F) • FCS (Gibco / 10500-064 / charge of importance) • Glutamine (Lonza / BE17-605E) • Penicillin / streptomycin (Lonza / DE17-602E) • Ascorbic acid (Sigma-Aldrich / A4544-25G) • β-glycerol phosphate (AppliChem / A2253,0100) • Ethanol 70% • Trypan blue 0.4%
• 15 ml / 50 ml tubes • Petri dishes • 0.22 µm syringe filter (Millipore / SLGP033RS) • 40 µm cell strainer (BD / 3523409) • 0.2 µm bottle-top-filter (NeoLab / 431097) • 24-well Lumox cell culture plates (Greiner bio one / 96110024) • 24-well Primaria cell culture plates (BD / 353847) • 6-well Primaria cell culture plates (BD / 353846) • T12.5 cm2 cell culture flasks (BD / 353107) • Dissecting set • Neubauer cell counting chamber • 37°C water bath • Laminar flow • Cell culture incubator
• 0.1% Collagenase IV in 1x PBS (filter steril 0.22 µm syringe filter / make fresh) • 4 mM EDTA in 1x PBS (ph7) (superposable) • Culture medium A:
o α-MEM supplemented with 10% FCS / 2mM glutamine / 100 U/ml penicillin / 100 µg/ml streptomycin
• Culture medium B: o α-MEM supplemented with 10% FCS / 2mM glutamine / 100 U/ml
penicillin / 100 µg/ml streptomycin / 10 mM β-glycerol phosphate / 50 µg/ml ascorbic acid
Material and methods
- 33 -
II. Method
• Preparation of mutant and wild type control mice is performed in parallel but in two separate groups (mut / wt)
• After decapitation of mice the skull is briefly immerged in 70% ethanol and afterwards kept on ice in 1x PBS
• The following steps are performed under a laminar flow • Calvariae are dissected by cutting the skin from posterior (foramen magnum)
to anterior (nose), the skin is removed and the calvaria is carefully taken off from the brain
• Calvariae are placed in a petri dish with 1x PBS and superfluous contaminating tissues are removed
• For each group (mut / wt): 4-5 calvariae are placed in a 15 ml tube - it is advisable to split the total number of calvariae from each group in 4 x 15 ml tubes (correspond to 4 tubes with 5 calvaria each if preparing 20 calvaria per group)
• Each tube is incubated twice with 4-5 ml (1 ml per calvaria) 4 mM EDTA in 1x PBS for 7 min at 37°C (water bath), the supernatant is discarded
• Each tube is washed three times with 4-5 ml (1 ml per calvaria) 1x PBS • Predigestion: each tube is incubated once with 2 ml 0.1% Collagenase IV for
7 min at 37°C (water bath) and the supernatant is discarded • Digestion step 1: each tube is incubated with 5 ml 0.1% Collagenase IV for
30 min at 37°C (water bath) under occasionally agitation, the supernatant from the digestion of each group (4 x 15 ml tubes a 5 ml) is filtered through a 44 µm cell strainer in one 50 ml tube and 20 ml culture medium A is added (yield in 40 ml cell suspension per group) - attention should be paid to retain the undigested remains of the calvariae in the 15 ml tubes for the second digestion step
• Digestion step 2: equal to digestion 1 • During the second digestion both 50 ml tubes with the cell suspension of the
first digestion (1 x wt / 1x mut) are kept at 37°C in the incubator • The resulting 4 x 50 ml tubes of both digestion steps (2 x wt / 2 x mut) are
centrifuged for 10 min / 1200 rpm / RT • For each group: the supernatant is discarded and the cell pellets of both 50 ml
tubes are resuspended and put together in 10 ml culture medium A, the quantity of cells is estimated using the Neubauer counting chamber and cells are plated according to the scheme in 2.1.1.4.
• The medium is changed 24 h after plating using culture medium A and thereafter, the medium is regularly changed twice a week (monday / thursday or tuesday / friday), starting with the first stimulation at T0 using culture medium B
Material and methods
- 34 -
2.1.2.2. Proliferation / Metabolic activity / Protein content / ALP activity (A1) I. Material
• CellQuanti-Blue (BioAssay Systems; Biotrend Chemikalien GmbH / CQBL-05K)
• CellyticM (Sigma-Aldrich / C2978-50ML) • Complete Mini Protease Inhibitor (Roche / 11836153001) • Quant-iT dsDNA Assay Kit Broad Range (Invitrogen / Q33130) • BCA-Protein Assay Kit (Thermo Scientific / 23225) • 4-Nitrophenylphosphate (PNPP) (Sigma-Aldrich / N4645-1G) • Proteinase K (20 mg/ml) • EDTA • Glycine • MgCl2 • NaCl • NaOH • SDS • Tris • ZnCl2
• 96-well plate black (Nunc / 237107) • 96-well plate transparent (Nunc / 260860) • Bench top centrifuge with refrigeration to 4°C • Fluorescence micro plate reader (Tecan Safire2) • Spectrophotometer for 96-well plates (Molecular Devices / SpectraMax 190)
including software (SOFTmaxPRO 3.1.2)
• SDS-buffer (for 200ml / superposable): o 2% SDS o 10 mM Tris o 5 mM EDTA o 200 mM NaCl
• ALP-buffer (for 100ml / superposable): o 0,1 M glycine (pH 9,6) o 1 mM MgCl2 o 1 mM ZnCl2
• PNPP-buffer (for 500ml / superposable): o 3,75 g glycine o 1 mM MgCl2 o 1 mM ZnCl2 o dissolve in in 400 mL H2O o adjust pH to 10,4 using NaOH o fill up to 500 ml with H2O
• PNPP in PNPP-buffer (make fresh): o 1 ml PNPP-buffer + 20 mg PNPP
Material and methods
- 35 -
II. Measurement day
• 24-well lumox cell culture plate • The samples (n wells) of both biological groups are prepared separately
(technical replicates) o 6 x wt o 6 x mut
• CellQuanti-Blue reagent is diluted 1:10 with culture medium A (CQBM-
solution) • Aspiration of old media from the wells • 1 ml CQBM solution is added per well and incubated for 1 h at 37°C
(the lower row of wells without cells is used as blank by adding 1 ml CQBM solution per well)
• Fluorescence spectroscopy with the cell culture plate (Tecan – Safire2) o extinction: 530 nm o emission: 590 nm o band width: 10 nm o z-value: 11200 µm o gain: 65 nm (manual) o range of temperature: 36.5 – 37.5°C o measurement is saved → Metabolic activity
• Preparation of cell lysis reagent: 10 ml CellyticM + 1 tablet Complete Mini
Protease Inhibitor (CMCM solution) • CQBM solution is aspirated and cells are washed once with 1x PBS • 500 µl CMCM solution is added per well and incubated for 15 min at 4°C
under continuous shaking (orbital shaker) • 4°C room: supernatant of each well is transfered under multiple up and down
pipetting (complete lysis of cells) in 1.5 ml Eppendorf tubes and centrifuged for 10 min / 4°C / 12000 rpm
• 350 µl supernatant is carefully transfered in new 1.5 ml tube and stored at -20°C (tube 1) → Protein content / ALP activity
• Pellet (contains nuclei) including remaining 150 µl supernatant is stored at -20°C (tube 2) → Proliferation (DNA-contant)
Material and methods
- 36 -
III. Assay analysis
→ Metabolic activity • The metabolic activity of the cells is directly obtained and saved as fluorescent
value per sample (well) at every measurement day [fluorescence/well] • A standard curve is not applied, metabolic activity is described as raw
fluorescence value (RFU)
→ Protein content
• An existing standard curve is applied for the analysis o the standard curve is generated according to the protocol of the BCA
Protein Assay Kit with µg/ml protein (x-axis) again OD (y-axis), saved and reused for every analysis
• For each group (wt = 30 samples / mut = 30 samples) one 96-well plate (transparent) is used, samples can be measured in duplicate
• Two plates are needed, each plate is prepared according to the following scheme
o 30 samples in duplicate (60 wells) o blank (CMCM solution) in duplicate (2 wells)
• Tube 1 (350 µl supernatant) is thawed at 4°C • Analysis of protein is performed using the BCA Protein Assay Kit in the 96-well
plates o working solution (WS) is prepared: 50 units BCA reagent A + 1 unit
BCA reagent B o samples: 25 µl of lysate (tube 1) per well o blank: 25 µl CMCM solution per well o 200 µl WS is added to each well and both plates are incubated for
30 min at 37°C o photometric absorption reading (photometer Spectramax)
o endpoint reading o wave length: 562 nm
• The protein content of each sample is calculated according to the following
scheme o both plates (wt / mut) are analysed separately o standard curve with [µg/ml] of protein o automatically via SOFT maxPRO: blank value is subtracted from the
absorption values of the samples, thereafter the protein content of each sample is calculated on the basis of the standard curve in [µg/well]
o please note: the applied volume of 500 µl CMCM solution per well (for cell lysis at the measurement days) has to be taken into account for the calculation
Material and methods
- 37 -
→ ALP activity
• A standard curve is not applied, ALP activity is described as absorption value (arbitrary units)
• For each group (wt = 30 samples / mut = 30 samples) one 96-well plate (transparent) is used, samples can be measured in duplicate
• Two plates are needed, each plate is prepared according to the following scheme
o 30 samples in duplicate (60 wells) o blank (CMCM solution) in duplicate (2 wells)
• Tube 1 (350 µl supernatant) is thawed at 4°C • Analysis of ALP activity is performed in the 96-well plates according to the
following procedure o working solution (WS) is prepared: 9 units ALP-buffer + 1 unit PNPP in
PNPP-buffer o samples T0: 100 µl lysat (tube 1) per well (undiluted) o samples T3-T21: 5 µl lysat (tube 1) + 95 µl H2O per well (1:20) o blank: 5 µl CMCM solution + 95 µl H2O per well (1:20) o 100 µl WS is added to each well and both plates are incubated for
30 min at 37°C o 50 µl 1 M NaOH is added to each well o photometric absorption reading (photometer Spectramax)
o endpoint reading o wave lenght: 405 nm
• The ALP activity of each sample is calculated according to the following
scheme o both plates (wt / mut) are analysed separately o without standard curve o automatically via SOFT maxPRO: blank value is subtracted from the
absorption values of the samples, thereafter the ALP-activity of each sample is described as absolute absorption value in [absorption/well]
o please note: from the 500 µl CMCM solution per well (for cell lysis at the measurement days) only 100 µl were used for the analysis either undiluted (T0) or 1:20 diluted (T3-T21)
→ Proliferation (DNA content)
• A standard curve is used for the analysis and prepared for each measurement
(each plate) o the standard curve is described as µg DNA (x-axis) again fluorescence
(y-axis) • Both groups (wt = 30 samples / mut = 30 samples) are analysed on one 96-
well plate (black), the samples can not be measured in duplicate • To still analyze each sample in duplicate, two plates are used and identically
prepared according to the following scheme o 60 samples (60 wells) o 8 standard concentrations (0 – 1 µg) in duplicate (16 wells) o blank (1:1 mixture of CMCM solution and SDS-buffer with Proteinase K)
in triplicate (3 wells)
Material and methods
- 38 -
• Tube 2 (pellet including 150 µl supernatant) is thawed at 4°C • 150 µl SDS-buffer and 1.5 µl Proteinase K is added to each well (yield in
300 µl lysat), vortexed, spinned down and incubated for 3 h at 56°C using a thermo shaker (750 rpm)
• Analysis of DNA content is performed using the Quant-iT DNA Assay Kit Broad Range in the 96-well plates
o working solution (WS) is prepared: Quant-iT reagent is diluted 1:200 with Quant-iT buffer
o samples: 10µl lysat (tube 2) + 10 µl H2O per well o standard: 10µl blank (1:1 mixture of CMCM solution and SDS-buffer
with Proteinase K) + 10 µl of each DNA standard concentration from the kit per well
o blank: 10 µl blank (1:1 mixture of CMCM solution and SDS-buffer with Proteinase K) + 10 µl H2O per well
o 200 µl WS is added to each well and both plates are incubated for 5 min at RT
o fluorescence spectroscopy (Tecan – Safire2) o extinction: 490nm o emission: 527nm o band width: 10 nm o gain: optimal
• DNA content of each sample is calculated according to the following scheme
o both plates (wt / mut) are analysed separately o standard curve with [µg] of DNA (based on the fluorescence values of
the standards of each plate) o blank value is subtracted from the fluorescence values of the samples,
thereafter the DNA content of each sample is calculated on the basis of the standard curve in [µg/well]
o please note: from the 300 µl overall lysate per sample (150 µl pellet + 150 µl SDS-buffer) only 10 µl were used for the analysis
o the mean value from both measurements (plate 1 / plate 2) result in the DNA content of each sample
Material and methods
- 39 -
VI. Results and presentation
→ Proliferation (DNA content) • For each sample (well) the DNA content is determined in [µg DNA/well] • For each measurement day the mean value of each group (wt / mut) is
calculated by averaging the 6 single values of each group (6 x wt / 6 x mut) • For graphic presentation of the proliferation during the culture period, a
combined diagram for both groups is drawn with the obtained values on the y-axis [µg DNA/well] against the measurement days on the x-axis
→ Metabolic activity
• For each sample (well) the metabolic activity is determined in [fluorescence
(RFU)/well] • To normalize the metabolic activity to the cell number, the value is divided by
the DNA content of the sample to obtain the metabolic activity per DNA amount in [fluorescence (RFU)/µg DNA] for each sample
• For each measurement day the mean value of each group (wt / mut) is calculated by averaging the 6 single values of each group (6 x wt / 6 x mut)
• For graphic presentation of the metabolic activity during the culture period, a combined diagram for both groups is drawn with the obtained values on the y-axis [fluorescence (RFU)/µg DNA] against the measurement days on the x-axis
→ Protein content
• For each sample (well) the protein content is determined in [µg protein/well] • To normalize the protein content to the cell number, the value is divided by
the DNA content of the sample to obtain the protein content per DNA amount in [µg protein/µg DNA] for each sample
• For each measurement day the mean value of each group (wt / mut) is calculated by averaging the 6 single values of each group (6 x wt / 6 x mut)
• For graphic presentation of the protein content during the culture period, a combined diagram for both groups is drawn with the obtained values on the y-axis [µg protein/µg DNA] against the measurement days on the x-axis
→ ALP activity
• For each sample (well) the ALP activity is determined in [absorption (arbitrary
units)/well] • To normalize the ALP activity to the cell number, the value is divided by the
DNA content of the sample to obtain the ALP activity per DNA amount in [absorption (arbitrary units)/µg DNA] for each sample
• For each measurement day the mean value of each group (wt / mut) is calculated by averaging the 6 single values of each group (6 x wt / 6 x mut)
• For graphic presentation of the ALP activity during the culture period, a combined diagram for both groups is drawn with the obtained values on the y-axis [absorption (arbitrary units)/µg DNA] against the measurement days on the x-axis
Material and methods
- 40 -
2.1.2.3. Collagen secretion / Collagen deposition (A2) I. Material
• Bouin’s solution (Sigma-Aldrich / HT10132-1L) • Sircol Dye reagent (from Sircol Collagen Assay Kit) (Biocolor; Tebu-bio /
S1005) • Sirius Red FB3 (Fluka; Sigma-Aldrich / 43665) • Saturated picric acid solution (Fluka; Sigma-Aldrich / 80456) • Picric acid (Sigma-Aldrich / 239801-50G) • Collagen solution • HCl / NaOH
• 96-well plate transparent (Nunc / 260860) • Spectrophotometer for 96-well plates (Molecular Devices / SpectraMax 190)
including software (SOFTmaxPRO 3.1.2)
• Culture medium C: o α-MEM supplemented with 5% FCS / 2 mM glutamine / 100 U/ml
penicillin / 100 µg/ml streptomycin / 10 mM β-glycerol phosphate / 50 µg/ml ascorbic acid
• Sirius Red solution: o 0.25 g Sirius Red FB3 o 250 ml saturated picric acid solution o 1 ml picric acid (to ensure saturation of the solution)
• Please note: the medium has to be changed in the cells to be analyzed 24 h
before the measurement day o 6-well Primaria cell culture plate o aspiration of old media from the wells o 2 ml culture medium C is added per well and incubated for 24 h at 37°C
II. Measurement day
• 6-well Primaria cell culture plate with culture medium C for 24 h • The samples (n wells) of both biological groups are prepared separately
(technical replicates) o 3 x wt o 3 x mut
• 1ml of the cell culture supernatant (culture medium C) is transferred in a
1.5 ml tube and stored at -20°C → Collagen secretion • Aspiration of the remaining media from the wells • Cells are washed once with 1x PBS • 2ml Bouin’s solution is added to each well and incubated for 60 min at RT • Bouin’s solution is aspirated and cells are washed twice with H2O for 5 min at
RT each • 5 ml of H2O and 200 µl Penicillin / Streptomycin solution is added to each well,
the plates are sealed with parafilm and stored in a closed box (e.g. styrofoam-box) at RT → Collagen deposition
Material and methods
- 41 -
III. Assay analysis
→ Collagen secretion
• An existing standard curve is applied for the analysis o the standard curve is generated according to the protocol explained
below with µg/ml collagen (x-axis) again OD (y-axis), saved and reused for every analysis
• The Sircol Dye reagent (from Sircol Collagen Assay Kit) is used for the analysis
• Both groups (wt = 12 samples / mut = 12 samples) are analyzed on one 96-well plate (transparent), the samples can be measured in duplicate, the plate is prepared according to the following scheme
o 24 samples in duplicate (48 wells) o blank (culture medium C) in duplicate (2 wells)
• Supernatant is thawed at 4°C • 200 µl of the supernatant of each sample is transferred to a new 1.5 ml tube • Preparation of blank: 200 µl of fresh culture medium C is transferred to a new
1.5 ml tube • 1 ml Sircol Dye reagent is added, tubes are briefly vortexed, spinned down
and incubated for 30 min at RT under continuing shaking (750 rpm on shaker) • Tubes are centrifuged for 10 min / RT / 13000 rpm • Supernatant is discarded and tubes are centrifuged for another 5 min / RT /
13000 rpm • Remaining supernatant is carefully removed via pipette tip (contact of pipette
tip with pellet has to be avoided) • 1 ml 0.5 M NaOH is added, the tubes are briefly vortexed, spinned down and
incubated for 10 min at RT under continuing shaking (750 rpm on shaker) → pellet has to be completely dissolved (tubes have to be vortexed again if necessary)
• The Sircol Dye reagent that was bounded to the collagen of the cell culture supernatant (pellet) is unhinged by the NaOH and the concentration of the dye in each sample is determined by photometric absorption reading in a 96-well plate according to the following scheme:
o samples and blank: 40 µl NaOH-Sircol Dye solution and 160 µl H2O is added per well (1:5)
o photometric absorption reading (photometer Spectramax) o endpoint reading o wave length: 550 nm
• The absorption values correlate with the amount of bounded Sircol Dye
reagent, that is proportional to the concentration of collagen in the respective sample (200 µl cell culture supernatant); therefore, the amount of collagen in each sample can be calculated by the absorption values according to the following scheme
o standard curve with [µg/ml] collagen o automatically via SOFT maxPRO: blank value is subtracted from the
absorption values of the samples, thereafter the amount of collagen in each sample is calculated on the basis of the standard curve in [µg/well]
Material and methods
- 42 -
o please note: given that 1 ml NaOH was applied for unhinge the Sircol Dye reagent from the pellet and that the standard curve is depicted in µg/ml, the amount of collagen can directly be obtained from the standard curve, but it has to be taken into account, that only 200 µl from the 2 ml cell culture supernatant of each well were used for the analysis and that the NaOH-Sircol Dye solution was 1:5 diluted for the absorption reading
→ Collagen deposition
• An existing standard curve is applied for the analysis
o the standard curve is generated according to the protocol explained below with µg/ml collagen (x-axis) again OD (y-axis), saved and reused for every analysis
• The Sirus Red solution (self-made) is used for the analysis • Both groups (wt = 12 samples / mut = 12 samples) are analyzed on one
96-well plate (transparent), the samples can be measured in duplicate, the plate is prepared according to the following scheme
o 24 samples in duplicate (48 wells) o blank (NaOH) in duplicate (2 wells)
• Aspiration of the water in the wells • 2 ml Sirius Red solution is added to each well and incubated for 1 h at RT • Sirius Red is aspirated and cells are washed twice with H2O for 5 min at RT • Cells are washed once with 0.01 M HCl for 2 min at RT • 1 ml 0.5 M NaOH is added per well and incubated for 60 min at RT • The Sirius Red solution that was bounded to the collagen of the cell matrix
(well) is unhinged by the NaOH and the concentration of the dye in each sample is determined by photometric absorption reading in a 96-well plate according to the following scheme:
o samples: 20 µl NaOH-Sirius Red solution and 180 µl H2O are added per well (1:10)
o blank: 20 µl fresh NaOH solution and 180 µl H2O are added per well (1:10)
o photometric absorption reading (photometer Spectramax) o endpoint reading o wave length: 550 nm
• The absorption values correlate with the amount of bounded Sirius Red
solution, that is proportional to the concentration of collagen in the respective sample (well), therefore, the amount of collagen in each sample can be calculated by the absorption values according to the following scheme
o standard curve with [µg/ml] collagen o automatically via SOFT maxPRO: blank value is subtracted from the
absorption values of the samples, thereafter the amount of collagen in each sample is calculated on the basis of the standard curve in [µg/well]
o please note: given that 1 ml NaOH was applied for unhinge the Sirius Red solution from the well and that the standard curve is depicted in µg/ml, the amount of collagen can directly be obtained from the
Material and methods
- 43 -
standard curve, but it has to be taken into account, that the NaOH-Sirius Red solution was 1:10 diluted for the absorption reading
Generation of the standard curve for Collagen secretion / Collagen deposition
• Material: 96-well plate (transparent) / collagen solution [1mg/ml] / 0.1 M NaOH
/ Sircol Dye reagent (from Sircol Collagen Assay Kit)
• Using the collagen solution [1mg/ml] 6 standard samples are prepared in 1.5 ml tubes with an amount of 0 / 20 / 40 / 60 / 80 / 100 µg collagen
• 1 ml Sircol Dye reagent is added to each standard sample, the tubes are briefly vortexed, spinned down and incubated for 30 min at RT under continuing shaking (750 rpm on shaker)
• Centrifugation for 10 min / RT / 13000 rpm • Supernatant is discarded and the tubes are centrifuged for another 5 min / RT
/ 13000 rpm • Remaining supernatant is carefully removed via pipette tip (contact of pipette
tip with pellet has to be avoided) • 1 ml 0.5 M NaOH is added, the tubes are briefly vortexed, spinned down and
incubated for 10 min at RT under continuing shaking (750 rpm on shaker) → pellet has to be completely dissolved (tubes have to be vortexed again if necessary)
• The Sircol Dye reagent that was bounded to the collagen in the standard samples (pellet) is unhinged by the NaOH and the concentration of the dye in each standard sample is determined by photometric absorption reading in a 96-well plate according to the following scheme:
o standards (in duplicate): 200 µl NaOH-Sircol Dye solution are added per well
o blank (in duplicate): 200 µl fresh NaOH is added per well o photometric absorption reading (photometer Spectramax)
o endpoint reading o wave length: 550 nm
• The absorption values correlate with the amount of bounded Sircol Dye
reagent, that is proportional to the concentration of collagen in the respective standard samples (0 / 20 / 40 / 60 / 80 / 100 µg), therefore, a standard curve can be generated with µg/ml collagen (x-axis) again OD (y-axis), saved and reused for every analysis

Material and methods
- 44 -
IV. Results and presentation
→ Collagen secretion
• For each sample (well) the amount of secreted collagen is determined in [µg collagen/well]
• The value correspond to the overall amount of secreted collagen from the cells of one sample (well) inbetween 24h of incubation [µg collagen/well/24h]
• For each measurement day the mean value of each group (wt / mut) is calculated by averaging the 3 single values of each group (3 x wt / 3 x mut)
• For graphic presentation of the collagen secretion during the culture period a combined diagram for both groups is drawn with the obtained values on the y-axis [µg collagen/well/24h] against the measurement days on the x-axis
→ Collagen deposition
• For each sample (well) the amount of deposited collagen is determined in
[µg collagen/well] • For each measurement day the mean value of each group (wt / mut) is
calculated by averaging the 3 single values of each group (3 x wt / 3 x mut) • For graphic presentation of the collagen deposition during the culture period a
combined diagram for both groups is drawn with the obtained values on the y-axis [µg collagen/well] against the measurement days on the x-axis
Material and methods
- 45 -
2.1.2.4. Matrix mineralization (A3) I. Material
• 4% paraformaldehyde • Alizarin Red S (Sigma-Aldrich / A5533-25G) • Cetylpyridinium chloride (Sigma-Aldrich / C5460-100G) • 96-well plate transparent (Nunc / 260860) • Spectrophotometer for 96-well plates (Molecular Devices / SpectraMax 190)
including software (SOFTmaxPRO 3.1.2) • 5% Alizarin Red S stock solution in H2O (ph 4.0 / filter sterile 0.22 µm /
superposable) • 0.5% Alizarin Red S working solution in H2O (make fresh) • 10% cetylpyridinium chloride solution in H2O (make fresh)
II. Measurement day
• 6-well Primaria cell culture plate • The samples (n wells) of both biological groups are prepared separately
(technical replicates) o 3 x wt o 3 x mut
• Aspiration of old media from the wells • Cells are washed once with 1x PBS • 2 ml 4% PFA is added per well and incubated for 15 min at 4°C • PFA is aspirated and cells are washed twice for 5 min at RT with H2O • Plates are air-dried and afterwards stored in a closed box (e.g. styrofoam-box)
at RT III. Assay analysis
• An existing standard curve is applied for the analysis o the standard curve is generated according to the protocol explained
below with µM Alizarin (x-axis) again OD (y-axis), saved and reused for every analysis
• Both groups (wt = 12 samples / mut = 12 samples) are analyzed on one 96-
well plate (transparent), the samples can be measured in duplicate, the plate is prepared according to the following scheme
o 24 samples in duplicate (48 wells) o blank (10% cetylpyridinium chloride) in duplicate (2 wells)
• 2 ml 0.5% Alizarin Red S is added per well and incubated for 60 min at RT • Alizarin is aspirated and cells are washed 4 times with H2O for 5 min at RT
each • 1 ml 10% cetylpyridinium chloride is added per well and incubated for 60 min
at RT
Material and methods
- 46 -
• Bounded Alizarin is unhinged by the cetylpyridinium chloride and the concentration of the dye in each sample is determined by photometric absorption reading in a 96-well plate according to the following scheme:
o samples T3: 200 µl of the cetylpyridinium chloride-Alizarin solution is added per well (undiluted)
o samples T9-T21: 40 µl of the cetylpyridinium chloride-Alizarin solution and 160 µl H2O are added per well (1:5)
o blank: 40 µl fresh cetylpyridinium chloride and 160 µl H2O are added per well (1:5)
o photometric absorption reading (photometer Spectramax) o endpoint Reading o wave length: 562 nm
• The absorption values correlate with the concentration of Alizarin Red S in the
respective sample and therefore, the amount of bounded Alizarin in each well (sample) can be calculated according to the following scheme
o standard curve with [µM] Alizarin o automatically via SOFT maxPRO: blank value is subtracted from the
absorption values of the samples, thereafter the amount of bounded Alizarin of each sample is calculated on the basis of the standard curve in [µmol/well]
o please note: the applied volume of 1ml cetylpyridinium chloride per well and the 1:5 dilution for absorption reading in the samples T9-T21 (T3 undiluted) has to be taken into account for the calculation
Generation of the standard curve for Matrix mineralization
• Material: 96-well plate (transparent) / 0.5% Alizarin Red S (=14.6 mM) / 10%
cetylpyridinium chlorid • Preparation of 10 standard solutions according to table 5
Table 5. Preparation of a standard curve for the Matrix mineralization assay. * final concentration already including a 1:5 dilution of the standard solutions for the absorption reading
Standard µl Alizarin Red S µl cetylpyridinium chloride Final concentration in µM*
1 0 1000 0 2 0.68 999.32 2 3 3.4 996.6 10 4 6.84 993.16 20 5 17.1 982.9 50 6 34.2 965.8 100 7 68.4 931.6 200 8 136.8 863.2 400 9 205.2 794.8 600
10 273.6 726.4 800

Material and methods
- 47 -
• Concentration of all 10 standards is determined according to the following scheme
o standards (in duplicate): 40 µl standard solution + 160 µl H2O is added per well (1:5)
o blank (in duplicate): 200 µl H2O is added per well o photometric absorption reading (photometer Spectramax)
o endpoint reading o wave length: 562 nm
• The absorption values correlate with the concentration of Alizarin Red S in the
respective standards and thus, a standard curve can be generated with µM Alizarin (x-axis) again OD (y-axis), saved and reused for every analysis
• Please note: the final concentration [µM] of the standards depicted in table 5 already include the 1:5 dilution of the standard solutions for the absorption reading
IV. Resultats and presentation
• For each sample (well) the amount of bounded Alizarin is determined in [µmol Alizarin/well]
• For each measurement day the mean value of each group (wt / mut) is calculated by averaging the 3 single values of each group (3 x wt / 3 x mut)
• For graphic presentation of the matrix mineralization during the culture period a combined diagram for both groups is drawn with the obtained values on the y-axis [µmol Alizarin/well] against the measurement days on the x-axis
Material and methods
- 48 -
2.1.2.5. Nodule quantification (A4) I. Material
• Stereo microscope equipped with camera and software for image acquisition (Leica MZ16F / DFC320 / Firecam)
• Holding frame for T12.5 cm2 cell culture flasks (enables identical positioning of the culture flask under the stereo microscope at every measurement day)
• Pixel counting software (Image J 1.38x) II. Measurement day
• T12.5 cm2 cell culture flasks • The samples (n cell culture flasks) of both biological groups are used for the
whole culture period and are analyzed separately at each measurement day (technical replicates)
o 4 x wt o 4 x mut
• Transmitted light images are taken from all cell culture flasks using a stereo
microscope with the following settings (Leica MZ16F / DFC320 / Firecam) o Source of light: Leica KL1500LCD / 3200K (5/E) o Bright field o Objective: 0.63x o Magnification: 1.0x o Exposure: 10msec o Gain: 1.0x o Live Video: Progressive VGA o Color: Auto o Levels: Auto o Output: Full Frame HQ 2088 / JPEG o to arrange and arrest the flasks in the same position on the microscope
stage at each measurement day, they are placed in a special custom-built holding frame for T12.5 cm2 cell culture flasks
o the raw images are stored until the Assay analysis III. Assay analysis
• The JPEG images are analyzed using the pixel counting software ImageJ (Version 1.38x) according to the following procedure (all images from both groups are analyzed in parallel in terms of a stack analysis):
o File → Import → Image Sequence… o Process → Substract Background… → Rolling Ball Radius: 50 / Light
Background √ → Process all slices yes √ o Process → Binary → Make Binary → Calculated Threshold for Each
Image √ o Analyze → Set Scale → Distance in Pixel: 97 / Unit of Length: mm /
Global √ o Analyze → Analyze Particle → Display Results √ / Summarize √ →
Process all slices √

Material and methods
- 49 -
o for each image the parameter Count / Total Area / Average Size / Area Fraction are obtained and summarized in the Summary Table (according to the parameter, the numerical values correspond to mm or mm2)
o the results of the Summary Table are transferred into an Excel Table o the different parameter of an image correspond to the following feature
in the respective sample (cell culture flask): o Count → number of nodules o Total Area → total area of nodules o Average Size → average size of a nodule o Area Fraction → fraction of nodule area from total area in the
flask (%) IV. Results and presentation
• For each sample (cell culture flask) the total area of nodules is determined in [mm2]
• For each measurement day the mean value of each group (wt / mut) is calculated by averaging the 4 single values of each group (4 x wt / 4 x mut)
• For graphic presentation of the nodule development during the culture period a combined diagram for both groups is drawn with the obtained values on the y-axis [mm2] against the measurement days on the x-axis
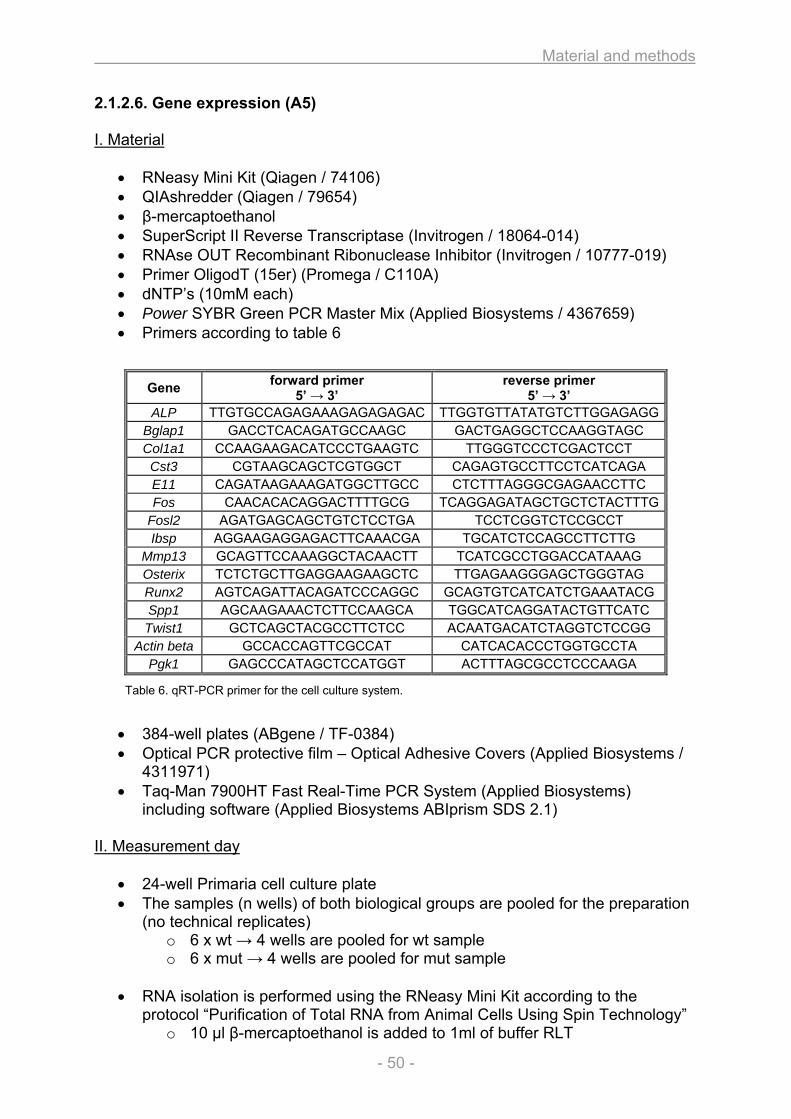
Material and methods
- 50 -
2.1.2.6. Gene expression (A5) I. Material
• RNeasy Mini Kit (Qiagen / 74106) • QIAshredder (Qiagen / 79654) • β-mercaptoethanol • SuperScript II Reverse Transcriptase (Invitrogen / 18064-014) • RNAse OUT Recombinant Ribonuclease Inhibitor (Invitrogen / 10777-019) • Primer OligodT (15er) (Promega / C110A) • dNTP’s (10mM each) • Power SYBR Green PCR Master Mix (Applied Biosystems / 4367659) • Primers according to table 6
Table 6. qRT-PCR primer for the cell culture system.
• 384-well plates (ABgene / TF-0384) • Optical PCR protective film – Optical Adhesive Covers (Applied Biosystems /
4311971) • Taq-Man 7900HT Fast Real-Time PCR System (Applied Biosystems)
including software (Applied Biosystems ABIprism SDS 2.1) II. Measurement day
• 24-well Primaria cell culture plate • The samples (n wells) of both biological groups are pooled for the preparation
(no technical replicates) o 6 x wt → 4 wells are pooled for wt sample o 6 x mut → 4 wells are pooled for mut sample
• RNA isolation is performed using the RNeasy Mini Kit according to the
protocol “Purification of Total RNA from Animal Cells Using Spin Technology” o 10 µl β-mercaptoethanol is added to 1ml of buffer RLT
Gene forward primer 5’ → 3’
reverse primer 5’ → 3’
ALP TTGTGCCAGAGAAAGAGAGAGAC TTGGTGTTATATGTCTTGGAGAGGBglap1 GACCTCACAGATGCCAAGC GACTGAGGCTCCAAGGTAGC Col1a1 CCAAGAAGACATCCCTGAAGTC TTGGGTCCCTCGACTCCT Cst3 CGTAAGCAGCTCGTGGCT CAGAGTGCCTTCCTCATCAGA E11 CAGATAAGAAAGATGGCTTGCC CTCTTTAGGGCGAGAACCTTC Fos CAACACACAGGACTTTTGCG TCAGGAGATAGCTGCTCTACTTTG
Fosl2 AGATGAGCAGCTGTCTCCTGA TCCTCGGTCTCCGCCT Ibsp AGGAAGAGGAGACTTCAAACGA TGCATCTCCAGCCTTCTTG
Mmp13 GCAGTTCCAAAGGCTACAACTT TCATCGCCTGGACCATAAAG Osterix TCTCTGCTTGAGGAAGAAGCTC TTGAGAAGGGAGCTGGGTAG Runx2 AGTCAGATTACAGATCCCAGGC GCAGTGTCATCATCTGAAATACG Spp1 AGCAAGAAACTCTTCCAAGCA TGGCATCAGGATACTGTTCATC Twist1 GCTCAGCTACGCCTTCTCC ACAATGACATCTAGGTCTCCGG
Actin beta GCCACCAGTTCGCCAT CATCACACCCTGGTGCCTA Pgk1 GAGCCCATAGCTCCATGGT ACTTTAGCGCCTCCCAAGA
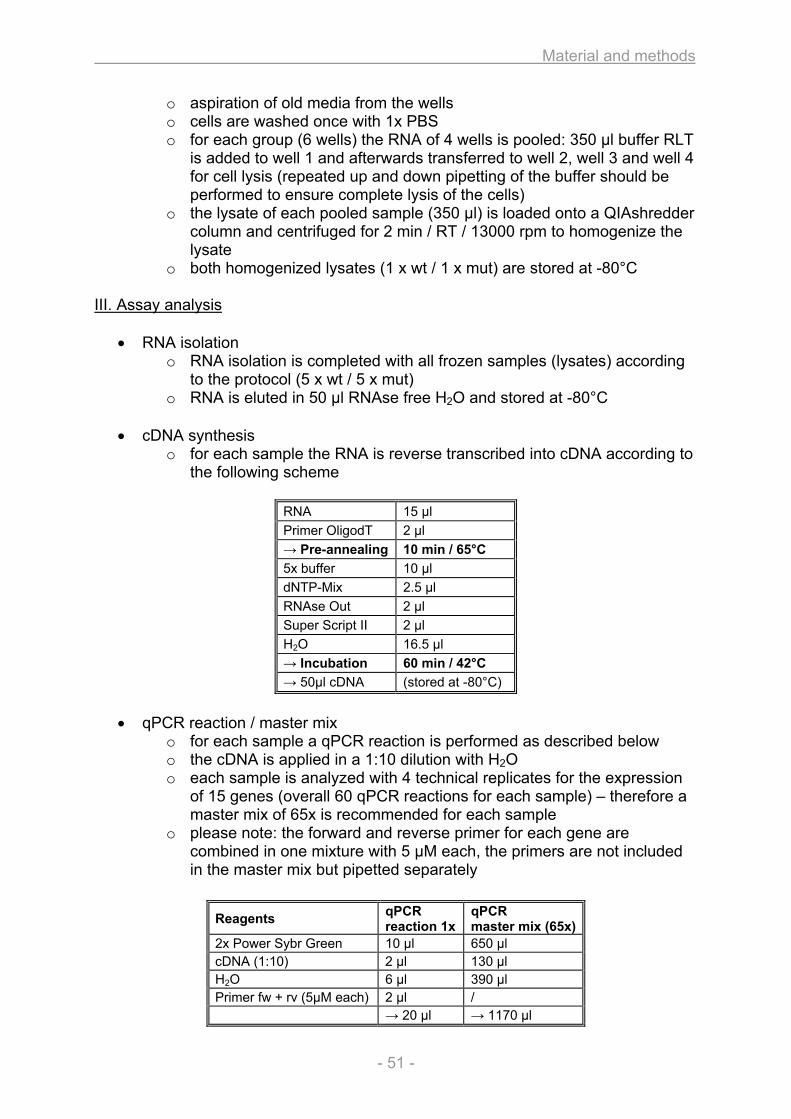
Material and methods
- 51 -
o aspiration of old media from the wells o cells are washed once with 1x PBS o for each group (6 wells) the RNA of 4 wells is pooled: 350 µl buffer RLT
is added to well 1 and afterwards transferred to well 2, well 3 and well 4 for cell lysis (repeated up and down pipetting of the buffer should be performed to ensure complete lysis of the cells)
o the lysate of each pooled sample (350 µl) is loaded onto a QIAshredder column and centrifuged for 2 min / RT / 13000 rpm to homogenize the lysate
o both homogenized lysates (1 x wt / 1 x mut) are stored at -80°C III. Assay analysis
• RNA isolation o RNA isolation is completed with all frozen samples (lysates) according
to the protocol (5 x wt / 5 x mut) o RNA is eluted in 50 µl RNAse free H2O and stored at -80°C
• cDNA synthesis
o for each sample the RNA is reverse transcribed into cDNA according to the following scheme
RNA 15 µl Primer OligodT 2 µl → Pre-annealing 10 min / 65°C 5x buffer 10 µl dNTP-Mix 2.5 µl RNAse Out 2 µl Super Script II 2 µl H2O 16.5 µl → Incubation 60 min / 42°C → 50µl cDNA (stored at -80°C)
• qPCR reaction / master mix
o for each sample a qPCR reaction is performed as described below o the cDNA is applied in a 1:10 dilution with H2O o each sample is analyzed with 4 technical replicates for the expression
of 15 genes (overall 60 qPCR reactions for each sample) – therefore a master mix of 65x is recommended for each sample
o please note: the forward and reverse primer for each gene are combined in one mixture with 5 µM each, the primers are not included in the master mix but pipetted separately
Reagents qPCR reaction 1x
qPCR master mix (65x)
2x Power Sybr Green 10 µl 650 µl cDNA (1:10) 2 µl 130 µl H2O 6 µl 390 µl Primer fw + rv (5µM each) 2 µl / → 20 µl → 1170 µl
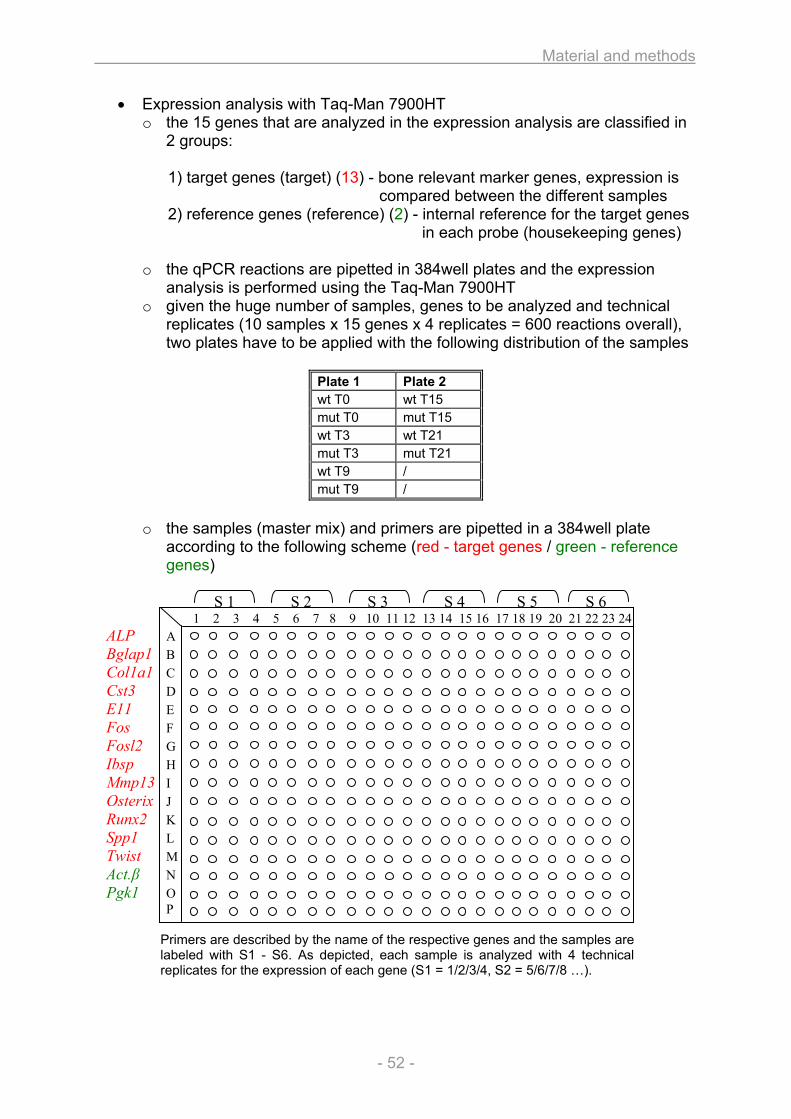
Material and methods
- 52 -
• Expression analysis with Taq-Man 7900HT o the 15 genes that are analyzed in the expression analysis are classified in
2 groups:
1) target genes (target) (13) - bone relevant marker genes, expression is compared between the different samples
2) reference genes (reference) (2) - internal reference for the target genes in each probe (housekeeping genes)
o the qPCR reactions are pipetted in 384well plates and the expression
analysis is performed using the Taq-Man 7900HT o given the huge number of samples, genes to be analyzed and technical
replicates (10 samples x 15 genes x 4 replicates = 600 reactions overall), two plates have to be applied with the following distribution of the samples
Plate 1 Plate 2 wt T0 wt T15 mut T0 mut T15 wt T3 wt T21 mut T3 mut T21 wt T9 / mut T9 /
o the samples (master mix) and primers are pipetted in a 384well plate
according to the following scheme (red - target genes / green - reference genes)
S 1 S 2 S 3 S 4 S 5 S 6
1 2 3 4 5 6 7 8 9 10 11 12 13 14 15 16 17 18 19 20 21 22 23 24 ALP A Bglap1 B Col1a1 C Cst3 D E11 E Fos F Fosl2 G Ibsp H Mmp13 I Osterix J Runx2 K Spp1 L Twist M Act.β N Pgk1 O
P
Primers are described by the name of the respective genes and the samples are labeled with S1 - S6. As depicted, each sample is analyzed with 4 technical replicates for the expression of each gene (S1 = 1/2/3/4, S2 = 5/6/7/8 …).
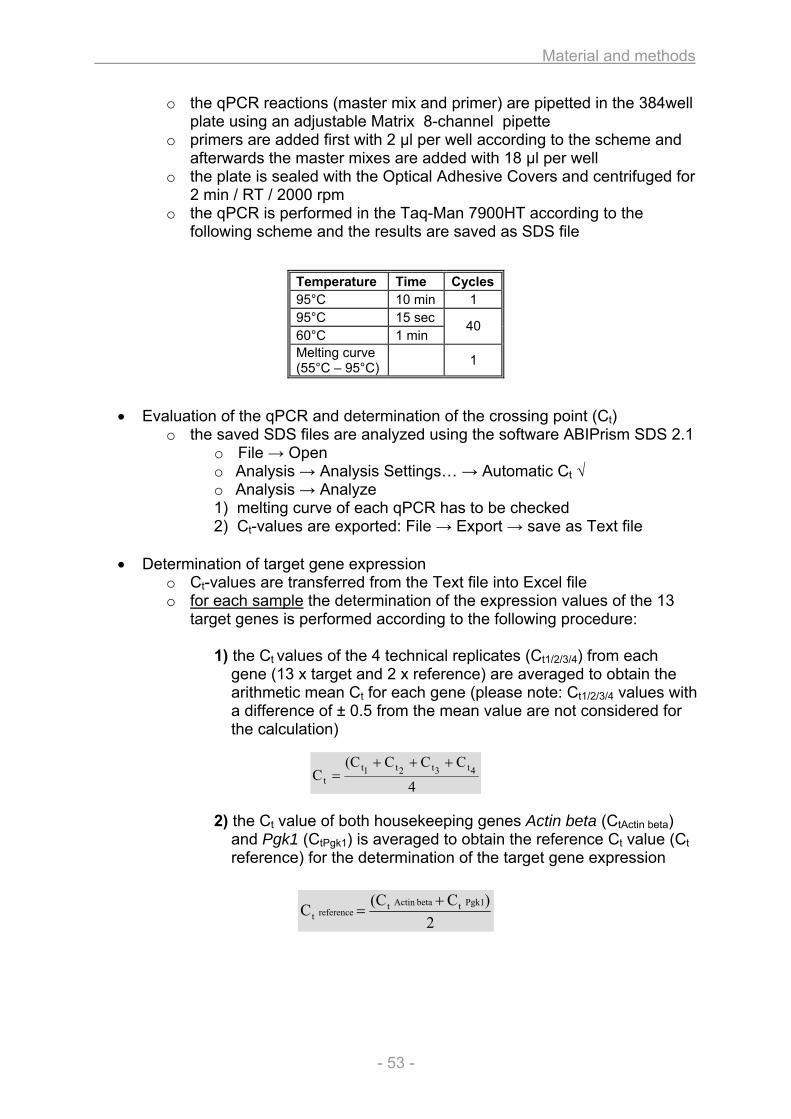
Material and methods
- 53 -
4
CCC(CC 4t3t2t1t
t
+++=
2)C(CC Pgk1tbetaActin t
referencet+
=
o the qPCR reactions (master mix and primer) are pipetted in the 384well plate using an adjustable Matrix 8-channel pipette
o primers are added first with 2 µl per well according to the scheme and afterwards the master mixes are added with 18 µl per well
o the plate is sealed with the Optical Adhesive Covers and centrifuged for 2 min / RT / 2000 rpm
o the qPCR is performed in the Taq-Man 7900HT according to the following scheme and the results are saved as SDS file
• Evaluation of the qPCR and determination of the crossing point (Ct) o the saved SDS files are analyzed using the software ABIPrism SDS 2.1
o File → Open o Analysis → Analysis Settings… → Automatic Ct √ o Analysis → Analyze 1) melting curve of each qPCR has to be checked 2) Ct-values are exported: File → Export → save as Text file
• Determination of target gene expression
o Ct-values are transferred from the Text file into Excel file o for each sample the determination of the expression values of the 13
target genes is performed according to the following procedure:
1) the Ct values of the 4 technical replicates (Ct1/2/3/4) from each gene (13 x target and 2 x reference) are averaged to obtain the arithmetic mean Ct for each gene (please note: Ct1/2/3/4 values with a difference of ± 0.5 from the mean value are not considered for the calculation)
2) the Ct value of both housekeeping genes Actin beta (CtActin beta) and Pgk1 (CtPgk1) is averaged to obtain the reference Ct value (Ct reference) for the determination of the target gene expression
Temperature Time Cycles95°C 10 min 1 95°C 15 sec 60°C 1 min
40
Melting curve (55°C – 95°C) 1
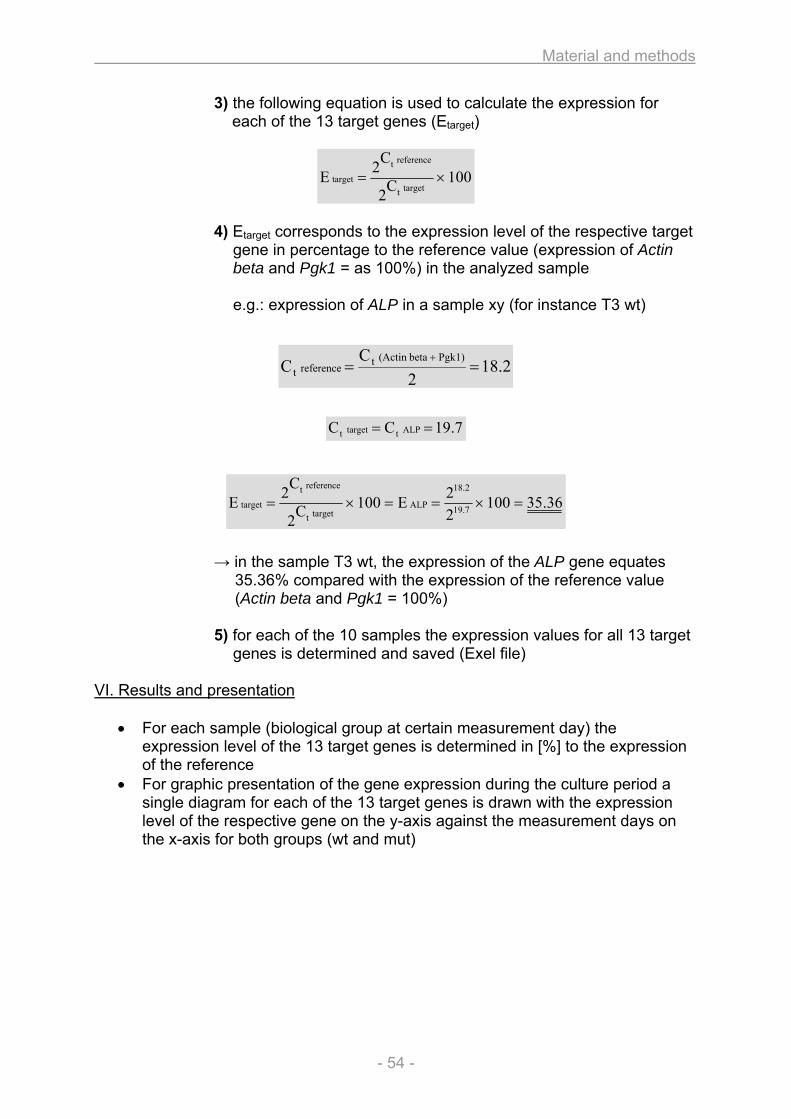
Material and methods
- 54 -
100C2
C2Etargett
referencettarget ×=
36.3510022E100C2
C2E 19.7
2.18
ALPtargett
referencettarget =×==×=
7.19CC ALPttargett ==
2.182
CC Pgk1) beta(Actin treferencet ==+
3) the following equation is used to calculate the expression for each of the 13 target genes (Etarget)
4) Etarget corresponds to the expression level of the respective target gene in percentage to the reference value (expression of Actin beta and Pgk1 = as 100%) in the analyzed sample
e.g.: expression of ALP in a sample xy (for instance T3 wt)
→ in the sample T3 wt, the expression of the ALP gene equates 35.36% compared with the expression of the reference value (Actin beta and Pgk1 = 100%)
5) for each of the 10 samples the expression values for all 13 target
genes is determined and saved (Exel file) VI. Results and presentation
• For each sample (biological group at certain measurement day) the expression level of the 13 target genes is determined in [%] to the expression of the reference
• For graphic presentation of the gene expression during the culture period a single diagram for each of the 13 target genes is drawn with the expression level of the respective gene on the y-axis against the measurement days on the x-axis for both groups (wt and mut)
Material and methods
- 55 -
2.2. Heart and lung investigation in the Aga2 OI mouse model
2.2.1. Animal keeping and handling
As the Aga2 mutant line was generated on the C3HeB/FeJ background in the Munich
ENU mutagenesis screen [54, 55], breeding for animal maintenance and
experimental needs were performed by continuing mating of heterozygous Aga2
males with wild type C3HeB/FeJ female mice.
Mouse husbandry was conducted under a continuously controlled specific-pathogen-
free (SPF) hygiene standard in compliance with the Federation of European
Laboratory Animal Science Associations (FELASA) protocols. Mice received
standard rodent nutrition and water ad libitum and all animal experiments were
performed under the approval of the responsible animal welfare authority.
2.2.2. Genotyping
The offspring were tail-clipped and the DNA was isolated using QIAamp DNA Mini Kit
(Qiagen, Germany). Afterwards, forward primer 5’-ggcaacagtcgcttcaccta-3’ and
reverse primer 5’-ggaggtcttggtggttttgt-3’ were used to amplify the entire intron 50 of
Col1a1 in a standard PCR. The product was cleaved using MspAII yielding 156 bp
and 75 bp fragments in wild type mice and 231 bp / 156 bp and 75 bp fragments in
heterozygous Aga2 as detected on a 2% agarose gel [55].
2.2.3. Cardiovascular phenotyping
Heart function and performance was investigated in living mice using the
cardiovascular screen of the German Mouse Clinic (GMC). The GMC is a unique
mouse phenotypic center consisting of 14 different screens covering various fields of
mouse biology, thus allowing for comprehensive phenotyping [61].
Within the primary cardiovascular screen 20 Aga2mild and 19 wild type control mice at
the age of 14 weeks underwent ECG analysis.
ECG was performed on isoflurane anesthetized mice (Baxter, Germany). Three
metal bracelets were bonded to the feet joints together with electrode gel. The
Material and methods
- 56 -
complete setup was located in a faraday cage. The electrodes were positioned on
the front-paws and the left hind-paw, resulting in the bipolar standard limb leads I, II
and III and the augmented unipolar leads AVF, AVR, AVL. ECG was recorded for
approximately seven minutes and a shape analysis of the ECG traces was performed
with the ECG-auto software (EMKA technologies, France). For each animal, intervals
and amplitudes were evaluated from five different sets of averaged beats (usually
lead II). The parameter Q-T interval was also corrected for the RR interval. In
addition, the recordings were screened for arrhythmias including supraventricular and
ventricular extrasystoles and conduction blockages. In the quantitative ECG analysis,
sets of five analyzed beats were averaged for one animal.
The data were statistically analyzed using the Statistica program. Analysis of
variance (ANOVA) tests were used for multi-factorial analysis of sex and genotype.
Post hoc analysis for multiple comparisons included a Duncan's Multiple Range Test
and Critical Ranges.
The secondary screen comprised echocardiography followed by an ECG analysis
and was performed with 6 Aga2severe and 6 wild type control mice at the age of 10
and 11 days.
Left ventricular function was determined by transthoracic echocardiography using
high-frequency ultrasound biomicroscopy with a Vevo 660 30-MHz transducer and 30
Hz frame rate (VisualSonics, Canada). The shaved and isoflurane (1%) anesthetized
mice (Baxter, Germany) were fixed in supine position on a heated platform. Thus, the
body temperature was maintained at 36°C - 38°C and monitored via a rectal
thermometer (Indus Instruments, USA). Left ventricular parasternal short-axis views
were obtained in M-mode imaging at the papillary muscle level. We performed four
recordings and averaged the measurements from four cardiac cycles of each record
for the left ventricular end-diastolic internal diameter (LVEDD) and the left ventricular
end-systolic internal diameter (LVESD) using the leading-edge convention, as
suggested by the American Society of Echocardiography [62]. Fractional shortening
was calculated as FS (%) = [(LVEDD – LVESD) / LVEDD] × 100 and ejection fraction
as EF (%) = [7/(2.4+LVEDD) x LVEDD3] – [7/(2.4+LVESD) x LVESD3] as described
elsewhere [63, 64].
Material and methods
- 57 -
2.2.4. pO2 measurement
We collected blood samples from 4 Aga2severe as well as 6 Aga2mild and 15 wild type
control mice at the age of 8 to 11 day to measure blood gas parameters. Animals
were decapitated and blood leaking from the arteria carotis was directly soaked into
an 85 µl blood gas capillary (Kabe, Germany). Blood pH, pO2 and pCO2 was
immediately determined by direct measurement using an ABL5 blood gas analyzer
(Radiometer, Germany) and the corresponding parameters O2 saturation, carbon
dioxide concentration (HCO3-) and actual base excess (ABE) were automatically
calculated.
2.2.5. Histology and SEM
Animals at the age of 11 and 10 days were used for histological studies and SEM
analyses, respectively.
For histological evaluation of the heart, Aga2severe were compared to wild type
littermates and lung tissues were investigated by comparing Aga2severe and Aga2mild
with wild type controls. After decapitation of the animals, organs were removed and
fixed in 4% paraformaldehyde at 4°C over night. To overcome the drawbacks of
examining collapsed lungs, we additionally applied the technique of lung perfusion
prior to histological procedures. Under deep anesthesia by intraperitonal injection of
a mixture of xylazin and ketamine, the animals were exsanguinated through chopping
of the abdominal aorta. After dissection of the thorax, the lungs were uncovered and
surrounding tissues removed. A blunted 22-gauge needle was used for intratracheal
injection of the fixative (4% paraformaldehyde) to perfuse the lungs. Finally the
trachea was ligated with a surgical thread to avoid leakage of the fixative and the
lungs were immersed in 4% paraformaldehyd and incubated at 4°C over night.
After fixation, heart and lung tissues were either paraffin embedded or cryosectioned.
Paraffin embedding was performed by dehydrating tissues through a graded ethanol
series, clearing in xylene and embedding them in paraffin. Afterwards, samples were
cut to 7 µm sections for staining procedures. For cryosectioning, tissues were
infiltraded in graded series of 5%, 10% and 20% sucrose and finally embedded in
O.C.T. medium. Thereafter, they were cut to 10 µm or 50 µm thickness according to
the staining requirements.
Material and methods
- 58 -
For histological examination, sections were stained by haematoxylin and eosin (H&E)
or for more detailed analysis subjected to immunohistochemistry (IHC).
Primary antibodies used for IHC include polyclonal rabbit-anti type I collagen and
polyclonal rabbit-anti CD31 (Abcam, UK) as well as polyclonal rabbit-anti activated
caspase-3 (R&D Systems, Germany). They were applied according to
manufacturer’s recommendations and detected with fluorescent labelled Alexa Fluor
594 donkey-anti-rabbit IgG (Molecular Probes) or by using Vectastain ABC kits for
DAB staining (Linaris, Germany).
Samples were analysed under a Zeiss Axioplan2 fluorescent microscope equipped
with AxioVision 4.6.3.0 software and under a Zeiss LSM510 confocal microscope
with the corresponding program 3.2 SP2 (Zeiss, Germany).
For scanning electron microscopy (SEM) of the hearts, tissues were additionally
subjected to a maceration protocol to remove cellular components and ECM
elements, thereby preserving and exposing the remaining collagen structure and
network [65, 66].
Briefly, bisected hearts were fixed in 2.5% glutaraldehyde for 6 days and immersed in
2 M NaOH for additional 6 days with replacing the NaOH maceration solution every
second day.
Subsequently, hearts were washed in several changes of distilled water to remove
the cellular debris. Tissue was further immersed in 1% Tannic acid for 3 hours, rinsed
in distilled water for several hours and postfixed in 1% OsO4 for 1 hour. Samples
were dehydrated in a graded series of 25%, 50%, 70%, 95% and 100% ethanol.
Finally, the specimens were critical-point-dried, coated with platin and observed
under a JEOL JSM 6300F scanning electron microscope (JEOL, Japan).
Material and methods
- 59 -
2.2.6. In vitro cell culture and TEM
For in vitro analysis of the heart and lung phenotype, we include cell culture
experiments for primary heart and lung fibroblasts comparing Aga2severe with Aga2mild
and wild type littermate controls at the age of 12 days.
To isolate the cells, we used an enzymatic collagenase digestion method previously
described for both cell types [67-72]. We optimized the protocol according to our
requirements and isolation of heart and lung fibroblasts was performed in a similar
manner.
Animals were killed by decapitation, tissues were excised, immediately placed in 4°C
HBSS and brought under a sterile working bench for subsequent preparation steps.
Tissues were minced with scissors to pieces of approximately 1-2 mm and washed 3
times with HBSS buffer. To remove debris and loosely attached contaminating cells,
the pieces were subjected to a 5 minute predigesting step with 0.1% collagenase IV
(Sigma) at 37°C. The supernatant was discarded and to obtain the required
fibroblasts, two successively digestion steps were performed. Briefly, the tissues
were treated with fresh collagenase mixture for 30 minutes at 37°C. The supernatant
containing dispersed cells was collected by filtration through sterile gauze, leaving
behind the undigested tissue. Equal amounts of DMEM supplemented with 10%
FCS, 2 mM Glutamine and antibiotics (Penicillin / Streptomycin 100U/ml each) were
added and the cell suspension was stored at 4°C. The remaining tissue underwent a
second digestion step with fresh collagenase solution for a further 30 minutes. After
gauze filtration of the second digestion mixture, the supernatants of both digestion
steps were pooled and the containing cells were pelleted by centrifugation for 10
minutes at 1200 rpm. The pellet was resuspended in DMEM media and the cells
were plated in T25 cm2 cell culture flask for 1 hour. Thereafter, non-adherent cells
were removed by rinsing with PBS and fresh media was added to the attached cells.
The fibroblasts were incubated in a humidified incubator at 37°C and 5% CO2 with
media changes twice a week. After reaching confluence, the cells were passaged by
detaching with 0.25% trypsin-EDTA solution and splitting 1:2 or 1:3 in new flasks.
Cells from single mice were cultivated individually, or they were pooled between
phenotype-alike animals (WT, Aga2mild, Aga2severe).
Material and methods
- 60 -
Cultures were used for the experiments between the first and third passage and
therefore seeded on Lumox™ 24-well plates (Greiner, Germany) for ICC studies, on
Thermanox™ coverslips (Nunc, Germany) for TEM analysis and on standard 24-well
plates for RNA isolation, with an initial density of 1x10⁵ cells per well. After 48 hours
of incubation, ascorbic acid (50 µg/ml) was added and the cells were grown for
another 24 hours before being deployed in our studies.
For immunocytochemistry (ICC), fibroblasts were washed with PBS, fixed in 4%
paraformaldehyde for 15 min and permeabilized in 0.1% Trition-X100 for 5 minutes.
After incubation with 5% bovine serum albumin over night, the ICC was performed
with polyclonal rabbit-anti type I collagen, polyclonal rabbit-anti activated caspase 3
and monoclonal mouse-anti alpha-Tubulin as primary antibodies according to the
manufacturer’s recommendations (Abcam, UK). According to the primary antibodies,
we used fluorescent labelled Alexa Fluor 488 goat-anti-rabbit IgG or Alexa Fluor 594
goat-anti-mouse IgG (Abcam, UK) as secondary antibodies. Finally, specimens were
coated with Vectashield mounting medium (Linaris, Germany) containing DAPI for
concomitant counterstaining of the nuclei. Samples were observed under a Zeiss
Axioplan2 fluorescent microscope equipped with AxioVision 4.6.3.0 software (Zeiss,
Germany).
Transmission electron microscopy (TEM) was conducted by Microscopy Services
Dähnhardt GmbH (Flintbek, Germany) according to the following procedure. Cells
were washed with PBS and fixed in a mixture of 2% paraformaldehyde and 2.5%
glutaraldehyde for at least 24 hours at 4°C. After rinsing twice with 0.133 M Na-
cacodylatbuffer for 5 minutes each, they were postfixed in 1% osmium tetroxide for
10 minutes and again rinsed twice with 0.133M Na-cacodylatbuffer for another 5
minutes each. Specimens were dehydrated in a graded series of 50%, 70%, 90%
and 100% ethanol 10 minutes each and embedded in graded series of 30%, 50%,
70% and 100% Agar 100 epoxy resin (Plano, Germany) for 20min each. Ultra-thin
sections were cut, stained with uranyl acetate and lead citrate and examined with a
Tecnai Spirit G2 transmission electron microscope (FEI, the Netherlands).
RNA isolation of the primary cultures was done as described below.
Material and methods
- 61 -
2.2.7. RNA Isolation
For isolation of RNA from heart and lung tissue, animals were killed at the indicated
ages by decapitation for postnatal stages or by CO2 for pregnant mice with
subsequent embryo withdrawal for prenatal stages. The organs were immediately
removed and frozen in liquid N2. In some cases, animals were used for pO2
measurement or cardiovascular examination and afterwards killed as described.
Before the RNA extraction was performed, hearts and lungs were treated with Trizol
(Invitrogen, Germany). Afterwards the tissues were homogenized using a Polytron
homogeniser (Heidolph, Germany) and total RNA from each sample was obtained
using the RNeasy Mini or Micro Kit – depending on the tissue weight – according to
manufacturer’s protocol (Qiagen, Germany). The RNA was eluted with RNase free
water and the concentrations were determined by OD260/280 readings with NanoDrop
ND-1000 Spectrophotometer (peqlab, Germany). The samples were stored at -80°C
until used for expression profiling or qPCR study.
For RNA extraction of in vitro cultivated primary heart and lung fibroblasts, the cells
were seeded in 24 well-plates and 24 hours before extraction additionally treated with
50 µg/ml ascorbic acid (see below). Cultures were washed in PBS one time and RNA
was isolated by use of RNeasy Mini Kit pursuant to manufacturer’s recommendations
with addition of β-mercaptoethanol to buffer RLT (10 µl/ml) for cell lysis. After elution
in RNase free water, the specimens were stored at -80°C until qRT-PCR analysis
was conducted.
Material and methods
- 62 -
2.2.8. Expression profiling
We performed a cDNA-chip based expression profiling study of heart and lung tissue.
Therefore we include three Aga2severe female mice and four wild type female
littermate controls at the age of 11 days.
Glass cDNA-chips were made encompassing the fully sequenced 20K cDNA mouse
array TAG library (Lion Bioscience, Germany) as well as several hundred cDNA
clones not included in the commercial clone set as previously described [73]. A full
description of the probes on our microarray is available in the GEO database under
GPL4937 [74].
PCR products with 5’ amino modification were amplified from these clone set and
purified by use of multiscreen PCR filter plates (Macherey & Nagel, Germany) in a
liquid handling robot (Tecan, Switzerland). Amplified probes were dissolved in three-
fold SSC buffer and spotted on aldehyde-coated microarray slides (CEL Associates,
USA) using a Micorgrid TAS II spotter (Genomic Solutions, UK) with Stealth™ SMP3
pins (CEL Associates, USA). Spotted slides were rehydrated overnight, blocked in
sodium borohydride solution, heat denatured by boiling in water for two minutes,
immersed in 100% ethanol and air-dried. Slides were treated with prehybridisation
buffer (6x SSC, 1% BSA, 0.5% SDS), rinsed in water, dried and hybridised the same
day as described below.
The RNA was isolated from heart and lungs as described above, the concentration
measured by OD260/280 readings and the integrity checked by running 2 µg of each
sample on a formaldehyde agarose gel.
For RNA labeling and hybridisation to cDNA microarrays, the RNA samples of the
three Aga2severe mice were treated as single probes and from the four RNA samples
of the wild type littermate controls, one pool was made to obtain a reference, each
with heart and lung.
Per chip experiment, 20 µg of each RNA sample was reverse transcribed and
indirectly labelled with Cy3 or Cy5 fluorescent dye (Amersham, Germany) in
accordance with a modified TIGR protocol [75].
Labelled cDNA was dissolved in 50 µl hybridisation buffer (6x SSC, 0.5% SDS, 5x
Denhardt’s solution and 50% formamide) and mixed with equal volume of reference
Material and methods
- 63 -
cDNA solution labelled with the second dye. The hybridisation mixture was placed on
a prehybridised microarray and incubated for 16-18 h in a thermostatic water bath at
42°C. Afterwards, slides were consecutively washed with 3x SSC, 1x SSC, 0.5x SSC
and 0.1x SSC at room temperature and dried by centrifugation. Prehybridisation,
hybridisation, washing and drying (nitrogen) steps were automated by application of
a HS400 Hybstation (Tecan, Switzerland).
Slides were scanned with a GenePix 4000A microarray scanner and the images
were analyzed using the GenePix Pro6.1 image processing software (Molecular
Devices, USA). Two independent dual colour hybridisations (technical replicates)
including a dye swap experiment were performed for each of the individual Aga2severe
RNA samples (biological replicates) using the wild type RNA pool as reference.
Expression data of the analysed Aga2 samples from heart and lung have been
submitted to the GEO database (GSE12847).
Statistical analyses were performed using TM4 Microarray software suite including
MIDAS (Microarray Data Analysis System) for normalization [76] and SAM
(Significant Analysis of Microarrays) for determination of genes showing significant
differential regulation [77]. Expression data were processed applying a total intensity
normalization to transform the mean log2 ration to zero. To identify significantly
regulated genes, a one class analysis was performed for each probe of the Aga2severe
mice. The false discovery rate (FDR) - which is the percentage of genes identified by
change - was estimated by calculating 1000 permutations of the measurements and
the cut-off for discrimination of the top differentially expressed genes with
reproducible up- or down regulation was set below 10% false positives (FDR).
In silico analysis of differentially expressed genes was performed using EASE, a
module of the DAVID database [78], assigning genes to Gene Ontology (GO)
functional categories. EASE analysis includes a Bonferroni multiplicity correlation and
evaluates the set of differentially expressed genes for over-representation of
biological processes. In depth analysis and description of the denoted genes for
molecular function and pathological involvements was additionally done using
BiblioSphere Pathway Edition including a comprehensive manual interpretation of the
gene functions by intensive literature study with EndNote program.
Material and methods
- 64 -
2.2.9. qRT-PCR
Quantitative RT-PCR studies (qRT-PCR) were carried out with RNA extracted from
heart and lung tissue or primary cell cultures as specified and RNA was isolated as
described above.
cDNA was synthesized by using Superscript II ReverseTranscriptase Kit (Invitrogen,
Germany) and Oligo(dT)15 primer (Promega, Germany). Briefly, 15 µl of RNA was
incubated with 2 µl of Oligo(dT) primer for 10 minutes at 65°C. Thereafter the
preincubation mixture was supplemented with 10 µl 5x first strand buffer, 2.5 µl dNTP
mixture, 2 µl Superscript II, 2 µl RNaseOUT ribonuclease inhibitor and 16.5 µl RNase
free water and incubated for 1 hour at 42°C. The cDNA was stored at -80°C or
directly implemented for qPCR.
For conducting the qPCR we prepared an amplification mixture consisting of 2 µl
1:10 diluted cDNA, 10 µl Power Sybr Green (Applied Biosystems, Germany), 6 µl
water and 1 µl of forward and reverse primer (10 µM each). Reactions were pipette
on Thermo-Fast 384-well PCR plates (Thermo Scientific, Germany) and run on an
ABI Prism 7900HT Sequence Detection System (Applied Biosystems, Germany).
Cycling conditions comprised of 10 min at 95°C for initial denaturation and activation
of Hotstart Polymerase followed by 40 cycles of 15 sec at 95°C for denaturation and
1 min at 60°C for annealing as well as elongation. Finally all PCR reactions were
validated by presence of a single peak in a melting curve analysis starting at 55°C
reaching 95°C under continuous fluorescence measurement. Each PCR was done in
3 technical replicates.
Ct values were obtained by automatic Ct analysis of the ABI Prism SDS 2.1 software
(Applied Biosystems, Germany) and the mean Ct value from the 3 replicates of each
PCR was determined.
Table 7 compile the Primers used for the qPCR analysis. To avoid contaminating
amplification of genomic DNA, each single primer was designed to prime in
contiguous sequences of two adjacent exons, allowing binding of primers exclusively
after introns are spliced out. Thereby, the product automatically span at least one
intron to additional impede the amplification of genomic DNA.
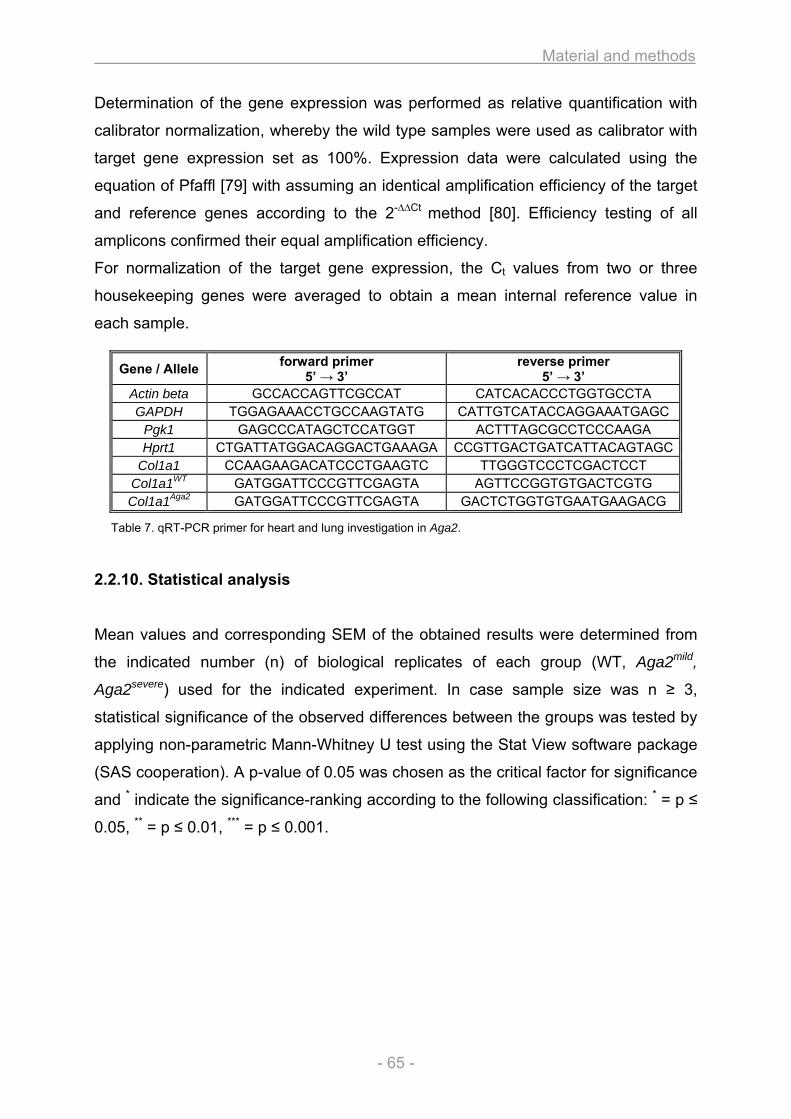
Material and methods
- 65 -
Determination of the gene expression was performed as relative quantification with
calibrator normalization, whereby the wild type samples were used as calibrator with
target gene expression set as 100%. Expression data were calculated using the
equation of Pfaffl [79] with assuming an identical amplification efficiency of the target
and reference genes according to the 2-∆∆Ct method [80]. Efficiency testing of all
amplicons confirmed their equal amplification efficiency.
For normalization of the target gene expression, the Ct values from two or three
housekeeping genes were averaged to obtain a mean internal reference value in
each sample.
Table 7. qRT-PCR primer for heart and lung investigation in Aga2.
2.2.10. Statistical analysis
Mean values and corresponding SEM of the obtained results were determined from
the indicated number (n) of biological replicates of each group (WT, Aga2mild,
Aga2severe) used for the indicated experiment. In case sample size was n ≥ 3,
statistical significance of the observed differences between the groups was tested by
applying non-parametric Mann-Whitney U test using the Stat View software package
(SAS cooperation). A p-value of 0.05 was chosen as the critical factor for significance
and * indicate the significance-ranking according to the following classification: * = p ≤
0.05, ** = p ≤ 0.01, *** = p ≤ 0.001.
Gene / Allele forward primer 5’ → 3’
reverse primer 5’ → 3’
Actin beta GCCACCAGTTCGCCAT CATCACACCCTGGTGCCTA GAPDH TGGAGAAACCTGCCAAGTATG CATTGTCATACCAGGAAATGAGC
Pgk1 GAGCCCATAGCTCCATGGT ACTTTAGCGCCTCCCAAGA Hprt1 CTGATTATGGACAGGACTGAAAGA CCGTTGACTGATCATTACAGTAGC
Col1a1 CCAAGAAGACATCCCTGAAGTC TTGGGTCCCTCGACTCCT Col1a1WT GATGGATTCCCGTTCGAGTA AGTTCCGGTGTGACTCGTG Col1a1Aga2 GATGGATTCCCGTTCGAGTA GACTCTGGTGTGAATGAAGACG
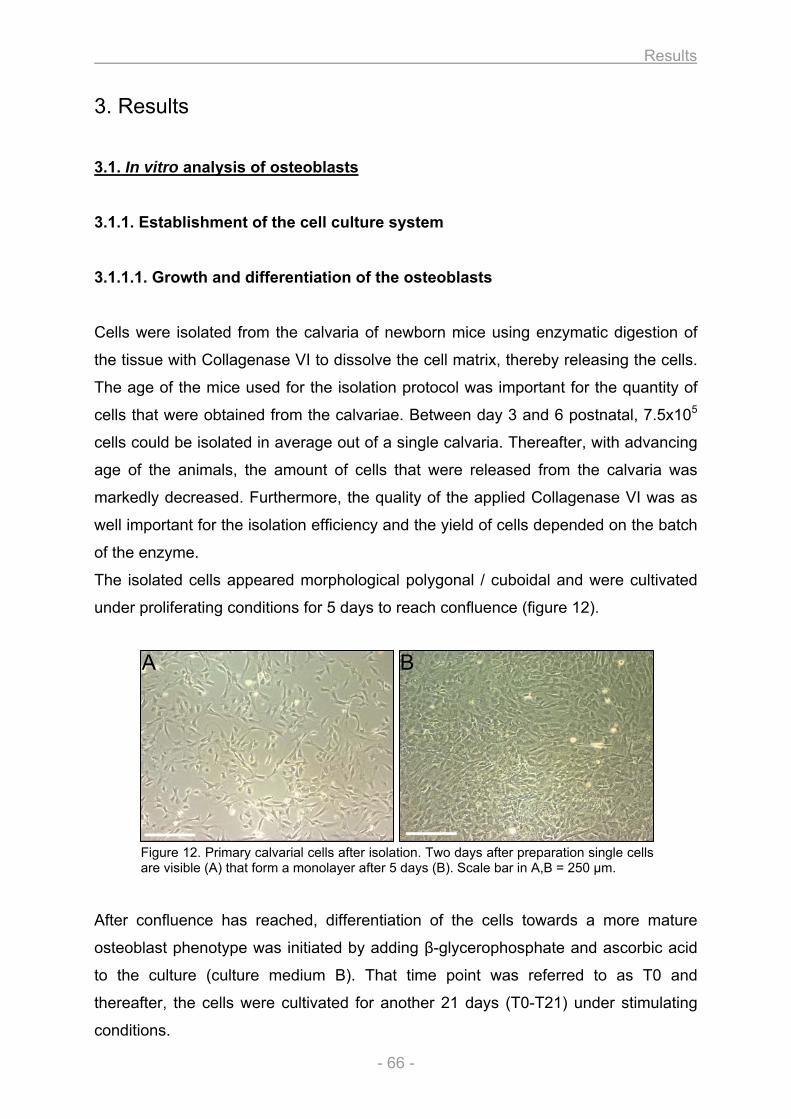
Results
- 66 -
3. Results
3.1. In vitro analysis of osteoblasts
3.1.1. Establishment of the cell culture system
3.1.1.1. Growth and differentiation of the osteoblasts
Cells were isolated from the calvaria of newborn mice using enzymatic digestion of
the tissue with Collagenase VI to dissolve the cell matrix, thereby releasing the cells.
The age of the mice used for the isolation protocol was important for the quantity of
cells that were obtained from the calvariae. Between day 3 and 6 postnatal, 7.5x10⁵
cells could be isolated in average out of a single calvaria. Thereafter, with advancing
age of the animals, the amount of cells that were released from the calvaria was
markedly decreased. Furthermore, the quality of the applied Collagenase VI was as
well important for the isolation efficiency and the yield of cells depended on the batch
of the enzyme.
The isolated cells appeared morphological polygonal / cuboidal and were cultivated
under proliferating conditions for 5 days to reach confluence (figure 12).
Figure 12. Primary calvarial cells after isolation. Two days after preparation single cells are visible (A) that form a monolayer after 5 days (B). Scale bar in A,B = 250 µm.
After confluence has reached, differentiation of the cells towards a more mature
osteoblast phenotype was initiated by adding β-glycerophosphate and ascorbic acid
to the culture (culture medium B). That time point was referred to as T0 and
thereafter, the cells were cultivated for another 21 days (T0-T21) under stimulating
conditions.
A B
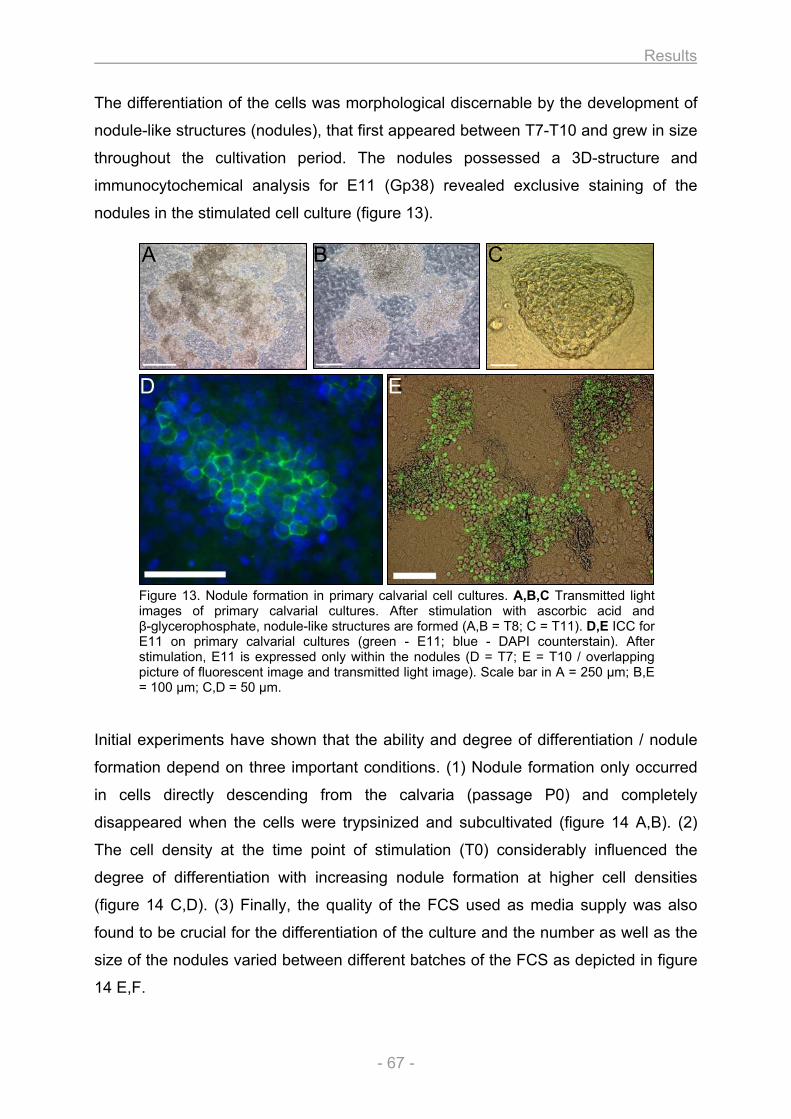
Results
- 67 -
The differentiation of the cells was morphological discernable by the development of
nodule-like structures (nodules), that first appeared between T7-T10 and grew in size
throughout the cultivation period. The nodules possessed a 3D-structure and
immunocytochemical analysis for E11 (Gp38) revealed exclusive staining of the
nodules in the stimulated cell culture (figure 13).
Figure 13. Nodule formation in primary calvarial cell cultures. A,B,C Transmitted light images of primary calvarial cultures. After stimulation with ascorbic acid and β-glycerophosphate, nodule-like structures are formed (A,B = T8; C = T11). D,E ICC for E11 on primary calvarial cultures (green - E11; blue - DAPI counterstain). After stimulation, E11 is expressed only within the nodules (D = T7; E = T10 / overlapping picture of fluorescent image and transmitted light image). Scale bar in A = 250 µm; B,E = 100 µm; C,D = 50 µm.
Initial experiments have shown that the ability and degree of differentiation / nodule
formation depend on three important conditions. (1) Nodule formation only occurred
in cells directly descending from the calvaria (passage P0) and completely
disappeared when the cells were trypsinized and subcultivated (figure 14 A,B). (2)
The cell density at the time point of stimulation (T0) considerably influenced the
degree of differentiation with increasing nodule formation at higher cell densities
(figure 14 C,D). (3) Finally, the quality of the FCS used as media supply was also
found to be crucial for the differentiation of the culture and the number as well as the
size of the nodules varied between different batches of the FCS as depicted in figure
14 E,F.
A B C
D E
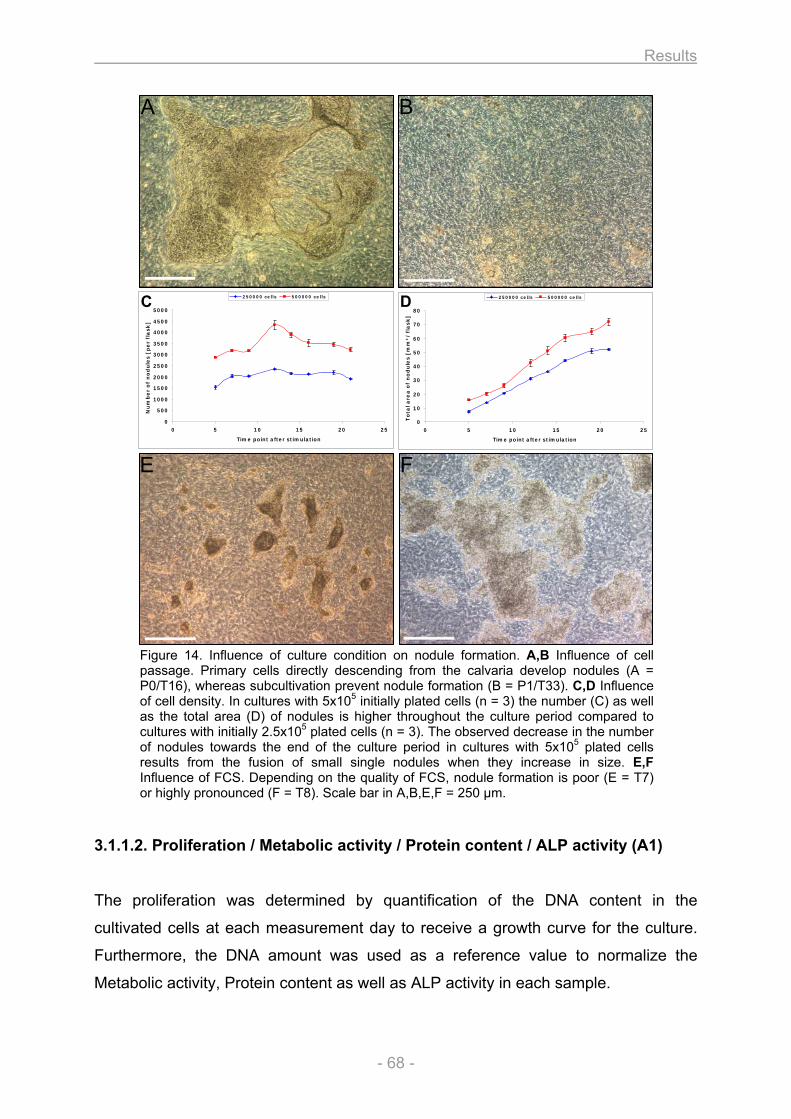
Results
- 68 -
Figure 14. Influence of culture condition on nodule formation. A,B Influence of cell passage. Primary cells directly descending from the calvaria develop nodules (A = P0/T16), whereas subcultivation prevent nodule formation (B = P1/T33). C,D Influence of cell density. In cultures with 5x10⁵ initially plated cells (n = 3) the number (C) as well as the total area (D) of nodules is higher throughout the culture period compared to cultures with initially 2.5x10⁵ plated cells (n = 3). The observed decrease in the number of nodules towards the end of the culture period in cultures with 5x10⁵ plated cells results from the fusion of small single nodules when they increase in size. E,F Influence of FCS. Depending on the quality of FCS, nodule formation is poor (E = T7) or highly pronounced (F = T8). Scale bar in A,B,E,F = 250 µm.
3.1.1.2. Proliferation / Metabolic activity / Protein content / ALP activity (A1)
The proliferation was determined by quantification of the DNA content in the
cultivated cells at each measurement day to receive a growth curve for the culture.
Furthermore, the DNA amount was used as a reference value to normalize the
Metabolic activity, Protein content as well as ALP activity in each sample.
0
500
1000
1500
2000
2500
3000
3500
4000
4500
5000
0 5 10 15 20 25
Time point after stimulation
Nu
mb
er
of
no
du
les [
pe
r fl
ask
]
250000 cells 500000 cells
0
10
20
30
40
50
60
70
80
0 5 10 15 20 25
Time point after stimulation
To
tal a
rea
of
no
du
les [
mm
²/
fla
sk
]
250000 cells 500000 cells
A B
C
E F
D
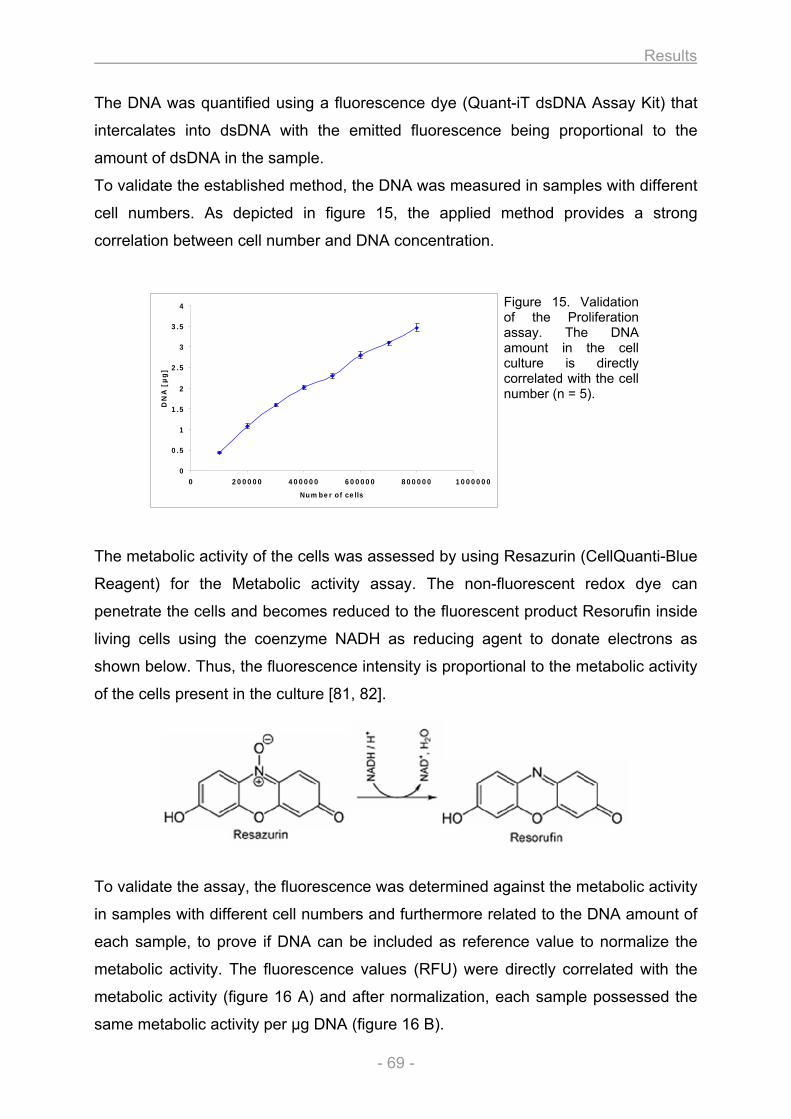
Results
- 69 -
0
0.5
1
1.5
2
2.5
3
3.5
4
0 200000 400000 600000 800000 1000000
Number of cells
DN
A [
µg
]
The DNA was quantified using a fluorescence dye (Quant-iT dsDNA Assay Kit) that
intercalates into dsDNA with the emitted fluorescence being proportional to the
amount of dsDNA in the sample.
To validate the established method, the DNA was measured in samples with different
cell numbers. As depicted in figure 15, the applied method provides a strong
correlation between cell number and DNA concentration.
Figure 15. Validation of the Proliferation assay. The DNA amount in the cell culture is directly correlated with the cell number (n = 5).
The metabolic activity of the cells was assessed by using Resazurin (CellQuanti-Blue
Reagent) for the Metabolic activity assay. The non-fluorescent redox dye can
penetrate the cells and becomes reduced to the fluorescent product Resorufin inside
living cells using the coenzyme NADH as reducing agent to donate electrons as
shown below. Thus, the fluorescence intensity is proportional to the metabolic activity
of the cells present in the culture [81, 82].
To validate the assay, the fluorescence was determined against the metabolic activity
in samples with different cell numbers and furthermore related to the DNA amount of
each sample, to prove if DNA can be included as reference value to normalize the
metabolic activity. The fluorescence values (RFU) were directly correlated with the
metabolic activity (figure 16 A) and after normalization, each sample possessed the
same metabolic activity per µg DNA (figure 16 B).
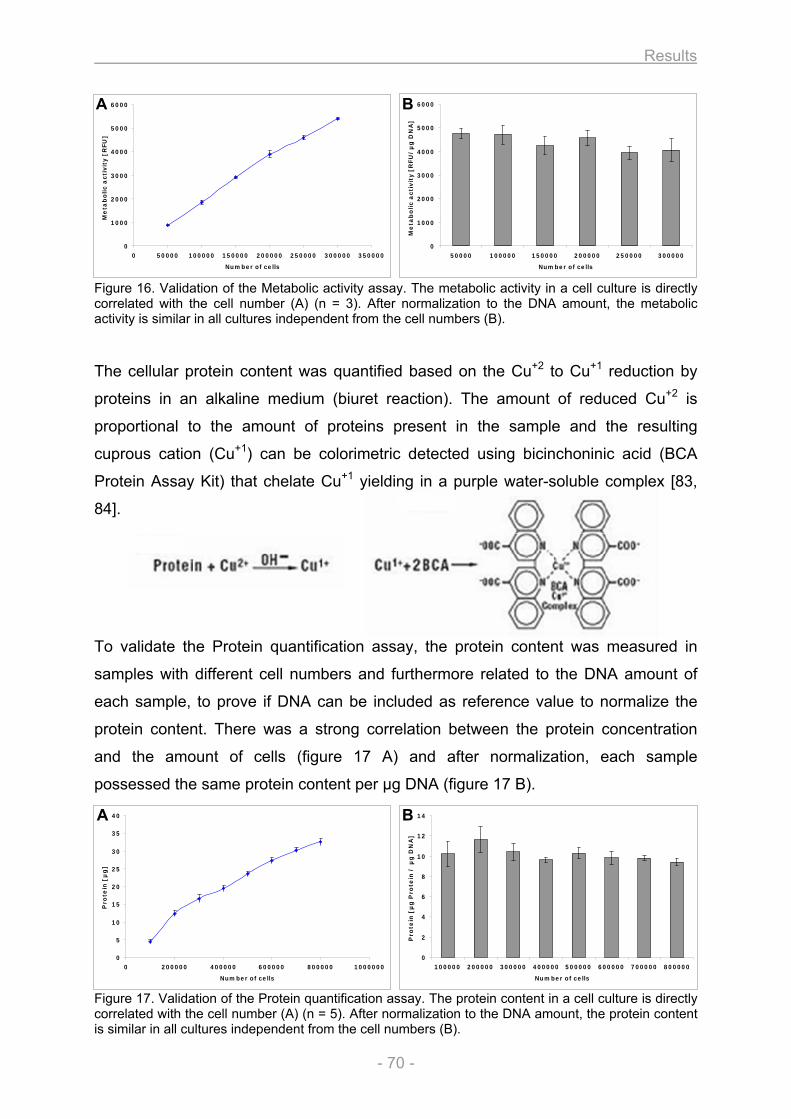
Results
- 70 -
Figure 16. Validation of the Metabolic activity assay. The metabolic activity in a cell culture is directly correlated with the cell number (A) (n = 3). After normalization to the DNA amount, the metabolic activity is similar in all cultures independent from the cell numbers (B).
The cellular protein content was quantified based on the Cu+2 to Cu+1 reduction by
proteins in an alkaline medium (biuret reaction). The amount of reduced Cu+2 is
proportional to the amount of proteins present in the sample and the resulting
cuprous cation (Cu+1) can be colorimetric detected using bicinchoninic acid (BCA
Protein Assay Kit) that chelate Cu+1 yielding in a purple water-soluble complex [83,
84].
To validate the Protein quantification assay, the protein content was measured in
samples with different cell numbers and furthermore related to the DNA amount of
each sample, to prove if DNA can be included as reference value to normalize the
protein content. There was a strong correlation between the protein concentration
and the amount of cells (figure 17 A) and after normalization, each sample
possessed the same protein content per µg DNA (figure 17 B).
Figure 17. Validation of the Protein quantification assay. The protein content in a cell culture is directly correlated with the cell number (A) (n = 5). After normalization to the DNA amount, the protein content is similar in all cultures independent from the cell numbers (B).
0
1000
2000
3000
4000
5000
6000
0 50000 100000 150000 200000 250000 300000 350000
Number of cells
Me
tab
olic a
cti
vit
y [
RFU
]
0
1000
2000
3000
4000
5000
6000
50000 100000 150000 200000 250000 300000
Number of cells
Me
tab
olic a
cti
vit
y [
RFU
/µ
g D
NA
]
A B
0
5
10
15
20
25
30
35
40
0 200000 400000 600000 800000 1000000
Number of cells
Pro
tein
[µ
g]
0
2
4
6
8
10
12
14
100000 200000 300000 400000 500000 600000 700000 800000
Number of cells
Pro
tein
[µ
g P
rote
in /
µg
DN
A]
A B
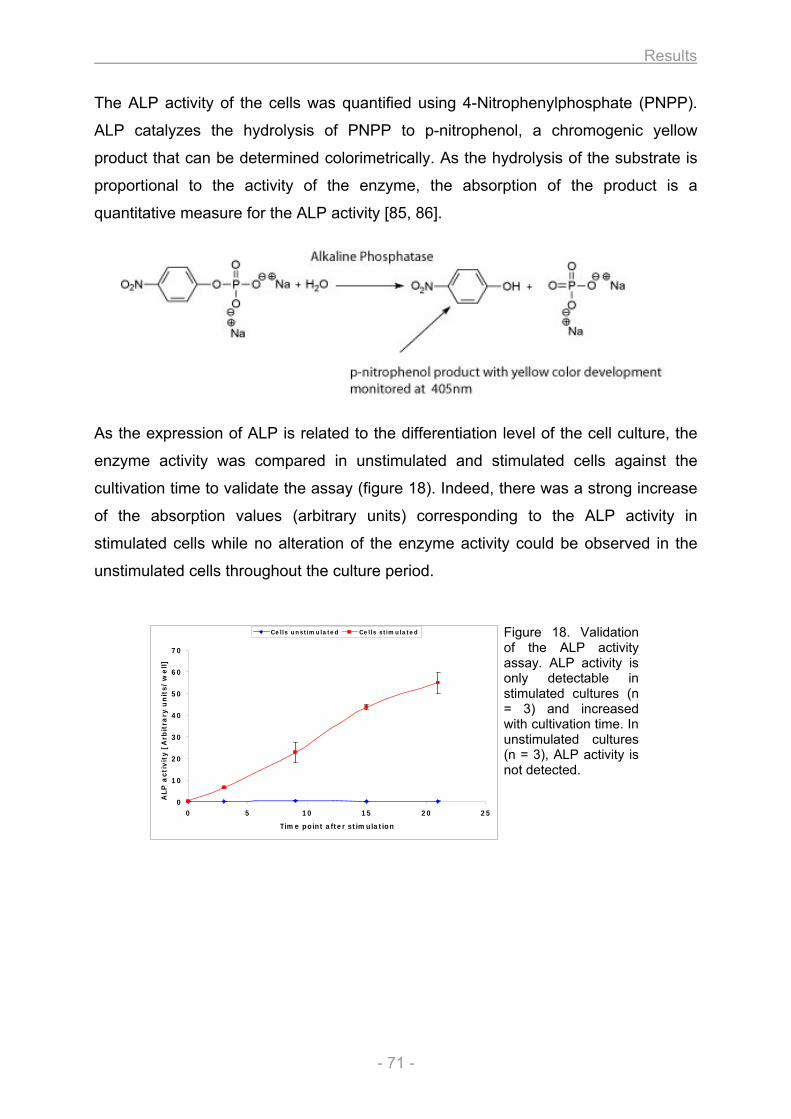
Results
- 71 -
0
10
20
30
40
50
60
70
0 5 10 15 20 25
Time point after stimulation
ALP
acti
vit
y [
Arb
itra
ry u
nit
s/
we
ll]
Cells unstimulated Cells stimulated
The ALP activity of the cells was quantified using 4-Nitrophenylphosphate (PNPP).
ALP catalyzes the hydrolysis of PNPP to p-nitrophenol, a chromogenic yellow
product that can be determined colorimetrically. As the hydrolysis of the substrate is
proportional to the activity of the enzyme, the absorption of the product is a
quantitative measure for the ALP activity [85, 86].
As the expression of ALP is related to the differentiation level of the cell culture, the
enzyme activity was compared in unstimulated and stimulated cells against the
cultivation time to validate the assay (figure 18). Indeed, there was a strong increase
of the absorption values (arbitrary units) corresponding to the ALP activity in
stimulated cells while no alteration of the enzyme activity could be observed in the
unstimulated cells throughout the culture period.
Figure 18. Validation of the ALP activity assay. ALP activity is only detectable in stimulated cultures (n = 3) and increased with cultivation time. In unstimulated cultures (n = 3), ALP activity is not detected.
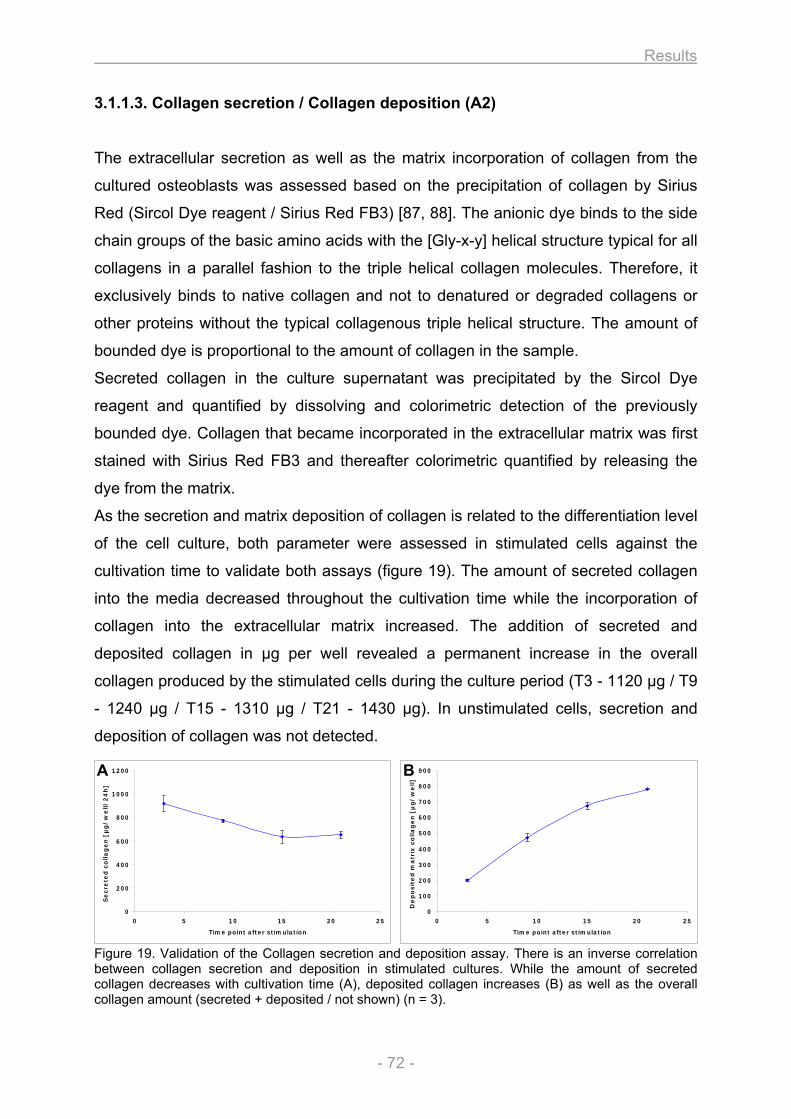
Results
- 72 -
3.1.1.3. Collagen secretion / Collagen deposition (A2)
The extracellular secretion as well as the matrix incorporation of collagen from the
cultured osteoblasts was assessed based on the precipitation of collagen by Sirius
Red (Sircol Dye reagent / Sirius Red FB3) [87, 88]. The anionic dye binds to the side
chain groups of the basic amino acids with the [Gly-x-y] helical structure typical for all
collagens in a parallel fashion to the triple helical collagen molecules. Therefore, it
exclusively binds to native collagen and not to denatured or degraded collagens or
other proteins without the typical collagenous triple helical structure. The amount of
bounded dye is proportional to the amount of collagen in the sample.
Secreted collagen in the culture supernatant was precipitated by the Sircol Dye
reagent and quantified by dissolving and colorimetric detection of the previously
bounded dye. Collagen that became incorporated in the extracellular matrix was first
stained with Sirius Red FB3 and thereafter colorimetric quantified by releasing the
dye from the matrix.
As the secretion and matrix deposition of collagen is related to the differentiation level
of the cell culture, both parameter were assessed in stimulated cells against the
cultivation time to validate both assays (figure 19). The amount of secreted collagen
into the media decreased throughout the cultivation time while the incorporation of
collagen into the extracellular matrix increased. The addition of secreted and
deposited collagen in µg per well revealed a permanent increase in the overall
collagen produced by the stimulated cells during the culture period (T3 - 1120 µg / T9
- 1240 µg / T15 - 1310 µg / T21 - 1430 µg). In unstimulated cells, secretion and
deposition of collagen was not detected.
Figure 19. Validation of the Collagen secretion and deposition assay. There is an inverse correlation between collagen secretion and deposition in stimulated cultures. While the amount of secreted collagen decreases with cultivation time (A), deposited collagen increases (B) as well as the overall collagen amount (secreted + deposited / not shown) (n = 3).
0
100
200
300
400
500
600
700
800
900
0 5 10 15 20 25
Time point after stimulation
De
po
sit
ed
ma
trix
co
lla
ge
n [
µg
/w
ell]
0
200
400
600
800
1000
1200
0 5 10 15 20 25
Time point after stimulation
Se
cre
ted
co
lla
ge
n [
µg
/w
ell/
24
h]
A B
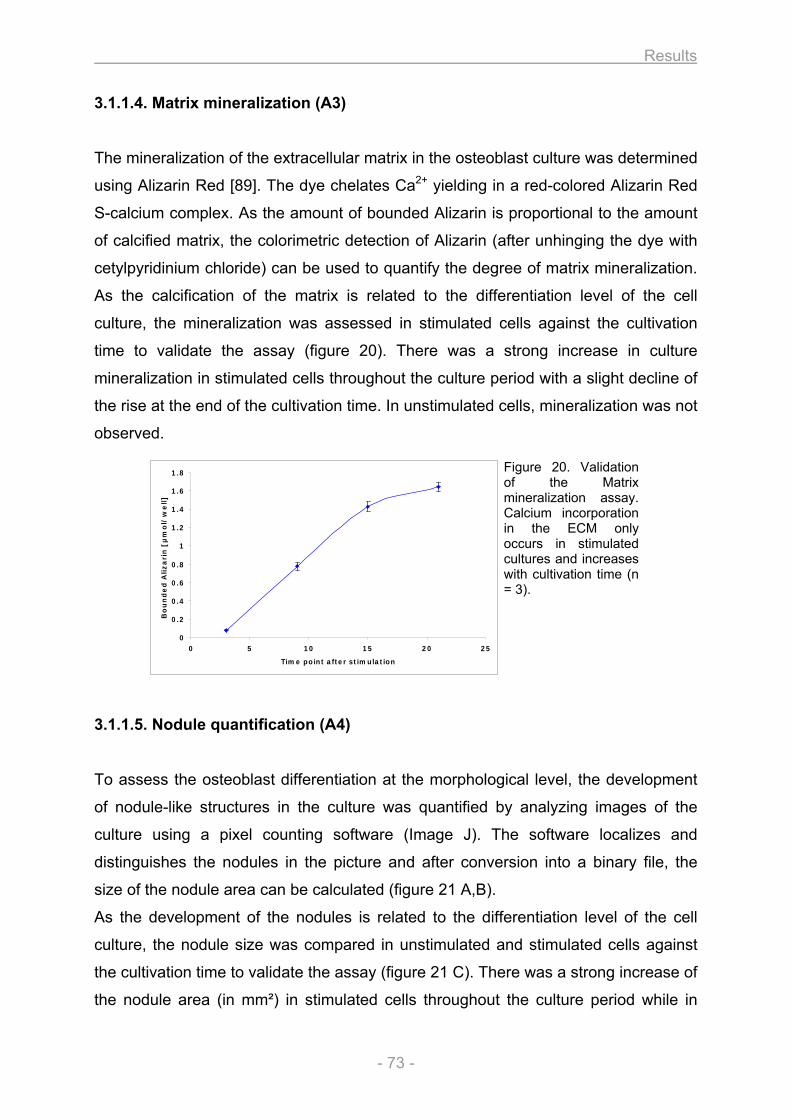
Results
- 73 -
0
0.2
0.4
0.6
0.8
1
1.2
1.4
1.6
1.8
0 5 10 15 20 25
Time point after stimulation
Bo
un
de
d A
liza
rin
[µ
mo
l/w
ell]
3.1.1.4. Matrix mineralization (A3)
The mineralization of the extracellular matrix in the osteoblast culture was determined
using Alizarin Red [89]. The dye chelates Ca2+ yielding in a red-colored Alizarin Red
S-calcium complex. As the amount of bounded Alizarin is proportional to the amount
of calcified matrix, the colorimetric detection of Alizarin (after unhinging the dye with
cetylpyridinium chloride) can be used to quantify the degree of matrix mineralization.
As the calcification of the matrix is related to the differentiation level of the cell
culture, the mineralization was assessed in stimulated cells against the cultivation
time to validate the assay (figure 20). There was a strong increase in culture
mineralization in stimulated cells throughout the culture period with a slight decline of
the rise at the end of the cultivation time. In unstimulated cells, mineralization was not
observed.
Figure 20. Validation of the Matrix mineralization assay. Calcium incorporation in the ECM only occurs in stimulated cultures and increases with cultivation time (n = 3).
3.1.1.5. Nodule quantification (A4)
To assess the osteoblast differentiation at the morphological level, the development
of nodule-like structures in the culture was quantified by analyzing images of the
culture using a pixel counting software (Image J). The software localizes and
distinguishes the nodules in the picture and after conversion into a binary file, the
size of the nodule area can be calculated (figure 21 A,B).
As the development of the nodules is related to the differentiation level of the cell
culture, the nodule size was compared in unstimulated and stimulated cells against
the cultivation time to validate the assay (figure 21 C). There was a strong increase of
the nodule area (in mm²) in stimulated cells throughout the culture period while in
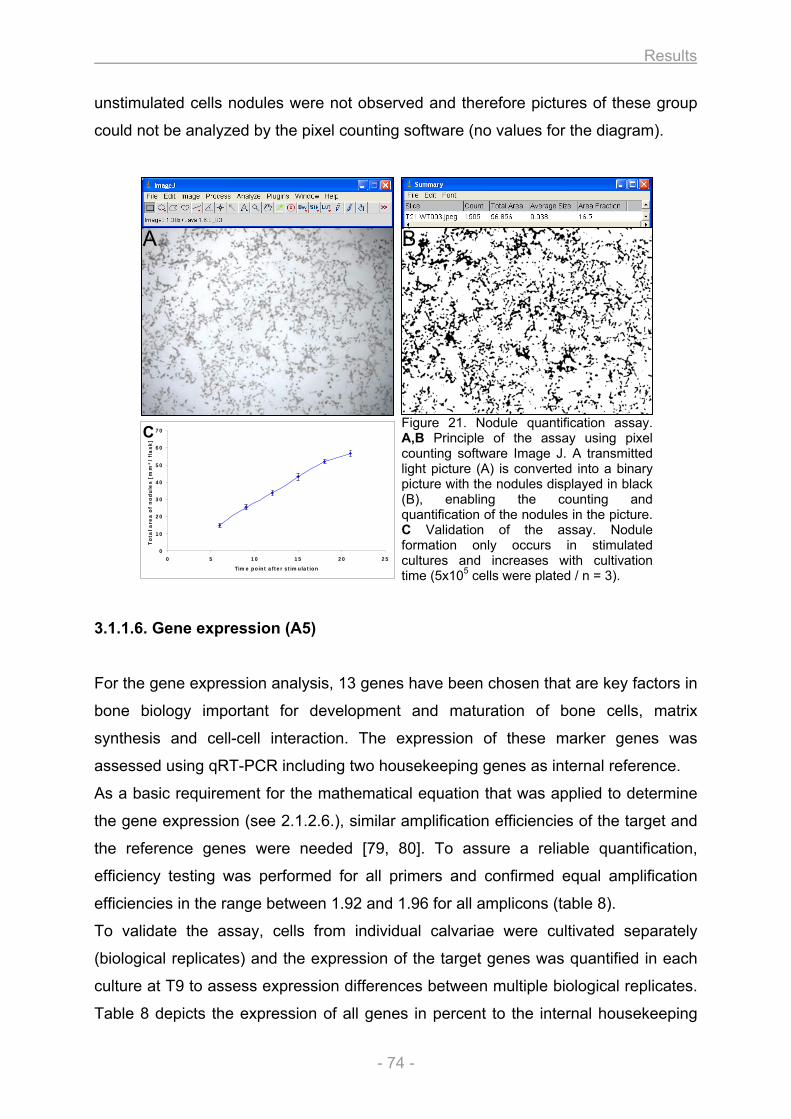
Results
- 74 -
unstimulated cells nodules were not observed and therefore pictures of these group
could not be analyzed by the pixel counting software (no values for the diagram).
Figure 21. Nodule quantification assay. A,B Principle of the assay using pixel counting software Image J. A transmitted light picture (A) is converted into a binary picture with the nodules displayed in black (B), enabling the counting and quantification of the nodules in the picture. C Validation of the assay. Nodule formation only occurs in stimulated cultures and increases with cultivation time (5x10⁵ cells were plated / n = 3).
3.1.1.6. Gene expression (A5)
For the gene expression analysis, 13 genes have been chosen that are key factors in
bone biology important for development and maturation of bone cells, matrix
synthesis and cell-cell interaction. The expression of these marker genes was
assessed using qRT-PCR including two housekeeping genes as internal reference.
As a basic requirement for the mathematical equation that was applied to determine
the gene expression (see 2.1.2.6.), similar amplification efficiencies of the target and
the reference genes were needed [79, 80]. To assure a reliable quantification,
efficiency testing was performed for all primers and confirmed equal amplification
efficiencies in the range between 1.92 and 1.96 for all amplicons (table 8).
To validate the assay, cells from individual calvariae were cultivated separately
(biological replicates) and the expression of the target genes was quantified in each
culture at T9 to assess expression differences between multiple biological replicates.
Table 8 depicts the expression of all genes in percent to the internal housekeeping
0
10
20
30
40
50
60
70
0 5 10 15 20 25
Time point after stimulation
To
tal a
rea
of
no
du
les [
mm
²/
fla
sk
]
A B
C
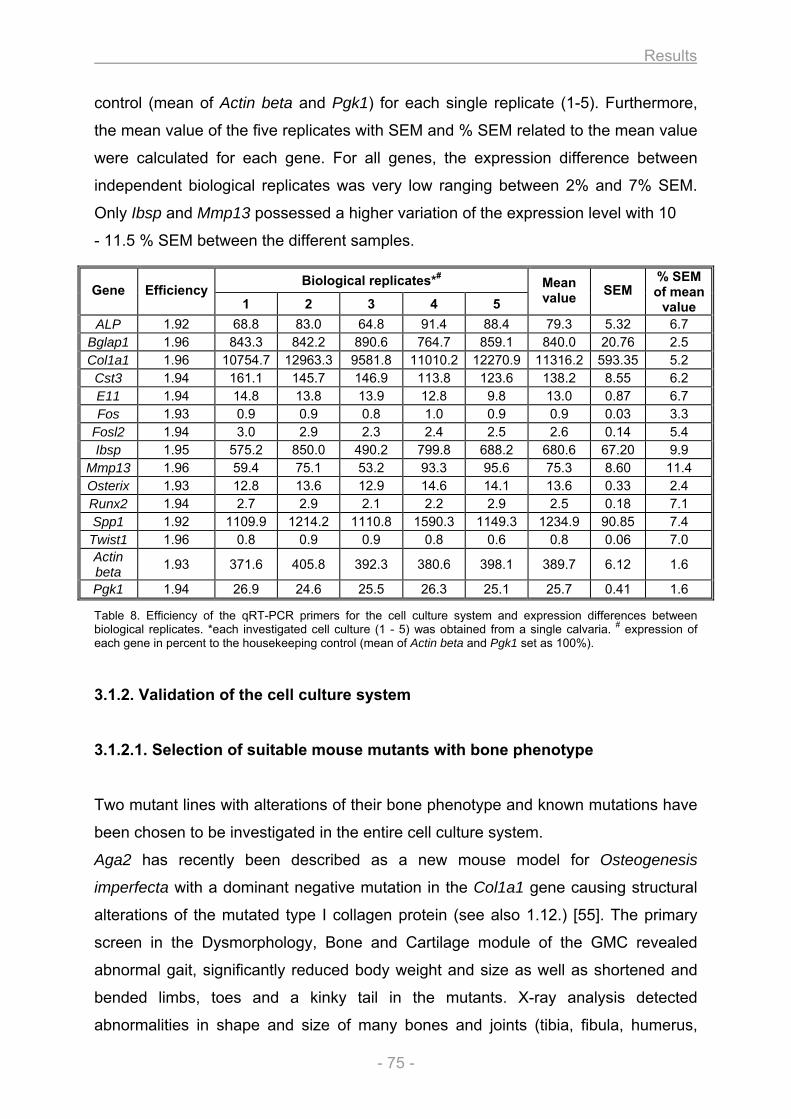
Results
- 75 -
control (mean of Actin beta and Pgk1) for each single replicate (1-5). Furthermore,
the mean value of the five replicates with SEM and % SEM related to the mean value
were calculated for each gene. For all genes, the expression difference between
independent biological replicates was very low ranging between 2% and 7% SEM.
Only Ibsp and Mmp13 possessed a higher variation of the expression level with 10
- 11.5 % SEM between the different samples.
Table 8. Efficiency of the qRT-PCR primers for the cell culture system and expression differences between biological replicates. *each investigated cell culture (1 - 5) was obtained from a single calvaria. # expression of each gene in percent to the housekeeping control (mean of Actin beta and Pgk1 set as 100%).
3.1.2. Validation of the cell culture system
3.1.2.1. Selection of suitable mouse mutants with bone phenotype
Two mutant lines with alterations of their bone phenotype and known mutations have
been chosen to be investigated in the entire cell culture system.
Aga2 has recently been described as a new mouse model for Osteogenesis
imperfecta with a dominant negative mutation in the Col1a1 gene causing structural
alterations of the mutated type I collagen protein (see also 1.12.) [55]. The primary
screen in the Dysmorphology, Bone and Cartilage module of the GMC revealed
abnormal gait, significantly reduced body weight and size as well as shortened and
bended limbs, toes and a kinky tail in the mutants. X-ray analysis detected
abnormalities in shape and size of many bones and joints (tibia, fibula, humerus,
Biological replicates*#
Gene Efficiency 1 2 3 4 5
Mean value SEM
% SEM of mean
value ALP 1.92 68.8 83.0 64.8 91.4 88.4 79.3 5.32 6.7
Bglap1 1.96 843.3 842.2 890.6 764.7 859.1 840.0 20.76 2.5 Col1a1 1.96 10754.7 12963.3 9581.8 11010.2 12270.9 11316.2 593.35 5.2
Cst3 1.94 161.1 145.7 146.9 113.8 123.6 138.2 8.55 6.2 E11 1.94 14.8 13.8 13.9 12.8 9.8 13.0 0.87 6.7 Fos 1.93 0.9 0.9 0.8 1.0 0.9 0.9 0.03 3.3
Fosl2 1.94 3.0 2.9 2.3 2.4 2.5 2.6 0.14 5.4 Ibsp 1.95 575.2 850.0 490.2 799.8 688.2 680.6 67.20 9.9
Mmp13 1.96 59.4 75.1 53.2 93.3 95.6 75.3 8.60 11.4 Osterix 1.93 12.8 13.6 12.9 14.6 14.1 13.6 0.33 2.4 Runx2 1.94 2.7 2.9 2.1 2.2 2.9 2.5 0.18 7.1 Spp1 1.92 1109.9 1214.2 1110.8 1590.3 1149.3 1234.9 90.85 7.4
Twist1 1.96 0.8 0.9 0.9 0.8 0.6 0.8 0.06 7.0 Actin beta 1.93 371.6 405.8 392.3 380.6 398.1 389.7 6.12 1.6
Pgk1 1.94 26.9 24.6 25.5 26.3 25.1 25.7 0.41 1.6
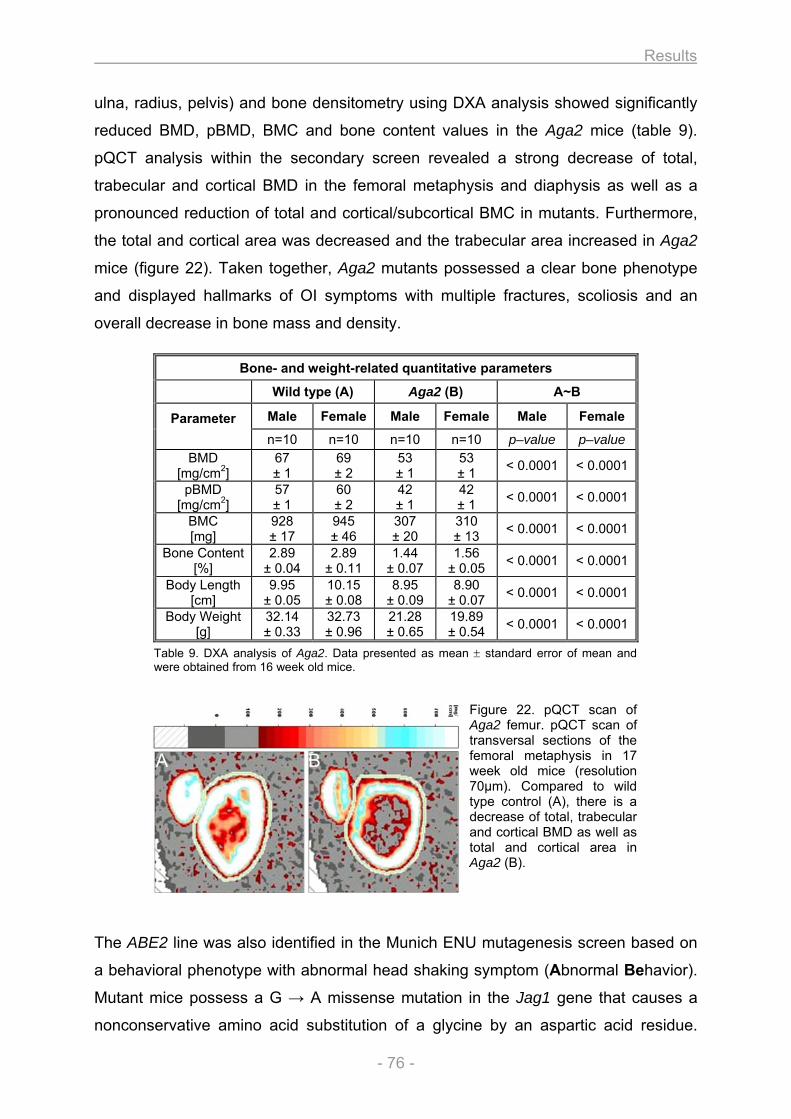
Results
- 76 -
ulna, radius, pelvis) and bone densitometry using DXA analysis showed significantly
reduced BMD, pBMD, BMC and bone content values in the Aga2 mice (table 9).
pQCT analysis within the secondary screen revealed a strong decrease of total,
trabecular and cortical BMD in the femoral metaphysis and diaphysis as well as a
pronounced reduction of total and cortical/subcortical BMC in mutants. Furthermore,
the total and cortical area was decreased and the trabecular area increased in Aga2
mice (figure 22). Taken together, Aga2 mutants possessed a clear bone phenotype
and displayed hallmarks of OI symptoms with multiple fractures, scoliosis and an
overall decrease in bone mass and density.
Table 9. DXA analysis of Aga2. Data presented as mean ± standard error of mean and were obtained from 16 week old mice.
Figure 22. pQCT scan of Aga2 femur. pQCT scan of transversal sections of the femoral metaphysis in 17 week old mice (resolution 70µm). Compared to wild type control (A), there is a decrease of total, trabecular and cortical BMD as well as total and cortical area in Aga2 (B).
The ABE2 line was also identified in the Munich ENU mutagenesis screen based on
a behavioral phenotype with abnormal head shaking symptom (Abnormal Behavior).
Mutant mice possess a G → A missense mutation in the Jag1 gene that causes a
nonconservative amino acid substitution of a glycine by an aspartic acid residue.
Bone- and weight-related quantitative parameters
Wild type (A) Aga2 (B) A~B
Male Female Male Female Male Female Parameter n=10 n=10 n=10 n=10 p–value p–value
BMD [mg/cm2]
67 ± 1
69 ± 2
53 ± 1
53 ± 1 < 0.0001 < 0.0001
pBMD [mg/cm2]
57 ± 1
60 ± 2
42 ± 1
42 ± 1 < 0.0001 < 0.0001
BMC [mg]
928 ± 17
945 ± 46
307 ± 20
310 ± 13 < 0.0001 < 0.0001
Bone Content [%]
2.89 ± 0.04
2.89 ± 0.11
1.44 ± 0.07
1.56 ± 0.05 < 0.0001 < 0.0001
Body Length [cm]
9.95 ± 0.05
10.15 ± 0.08
8.95 ± 0.09
8.90 ± 0.07 < 0.0001 < 0.0001
Body Weight [g]
32.14 ± 0.33
32.73 ± 0.96
21.28 ± 0.65
19.89 ± 0.54 < 0.0001 < 0.0001
A B
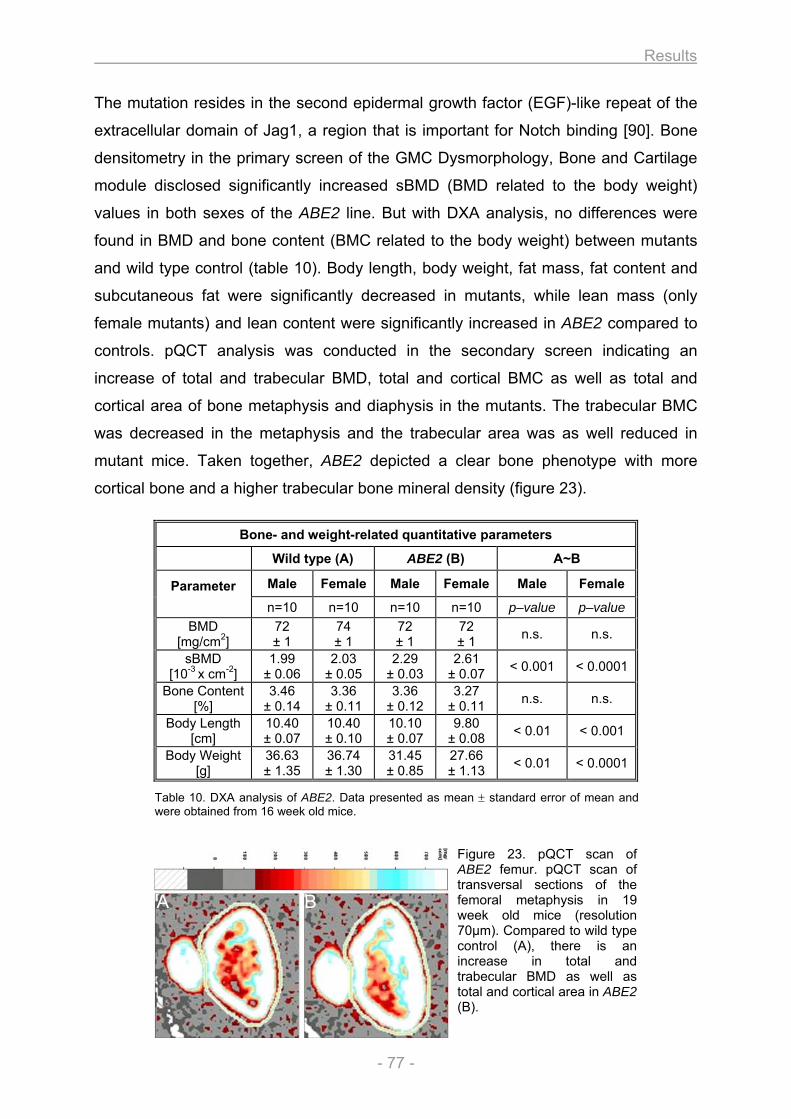
Results
- 77 -
The mutation resides in the second epidermal growth factor (EGF)-like repeat of the
extracellular domain of Jag1, a region that is important for Notch binding [90]. Bone
densitometry in the primary screen of the GMC Dysmorphology, Bone and Cartilage
module disclosed significantly increased sBMD (BMD related to the body weight)
values in both sexes of the ABE2 line. But with DXA analysis, no differences were
found in BMD and bone content (BMC related to the body weight) between mutants
and wild type control (table 10). Body length, body weight, fat mass, fat content and
subcutaneous fat were significantly decreased in mutants, while lean mass (only
female mutants) and lean content were significantly increased in ABE2 compared to
controls. pQCT analysis was conducted in the secondary screen indicating an
increase of total and trabecular BMD, total and cortical BMC as well as total and
cortical area of bone metaphysis and diaphysis in the mutants. The trabecular BMC
was decreased in the metaphysis and the trabecular area was as well reduced in
mutant mice. Taken together, ABE2 depicted a clear bone phenotype with more
cortical bone and a higher trabecular bone mineral density (figure 23).
Table 10. DXA analysis of ABE2. Data presented as mean ± standard error of mean and were obtained from 16 week old mice.
Figure 23. pQCT scan of ABE2 femur. pQCT scan of transversal sections of the femoral metaphysis in 19 week old mice (resolution 70µm). Compared to wild type control (A), there is an increase in total and trabecular BMD as well as total and cortical area in ABE2 (B).
Bone- and weight-related quantitative parameters
Wild type (A) ABE2 (B) A~B
Male Female Male Female Male Female Parameter n=10 n=10 n=10 n=10 p–value p–value
BMD [mg/cm2]
72
± 1 74 ± 1
72 ± 1
72 ± 1 n.s. n.s.
sBMD [10-3 x cm-2]
1.99 ± 0.06
2.03 ± 0.05
2.29 ± 0.03
2.61 ± 0.07 < 0.001 < 0.0001
Bone Content[%]
3.46 ± 0.14
3.36 ± 0.11
3.36 ± 0.12
3.27 ± 0.11 n.s. n.s.
Body Length [cm]
10.40 ± 0.07
10.40 ± 0.10
10.10 ± 0.07
9.80 ± 0.08 < 0.01 < 0.001
Body Weight [g]
36.63 ± 1.35
36.74 ± 1.30
31.45 ± 0.85
27.66 ± 1.13 < 0.01 < 0.0001
A B
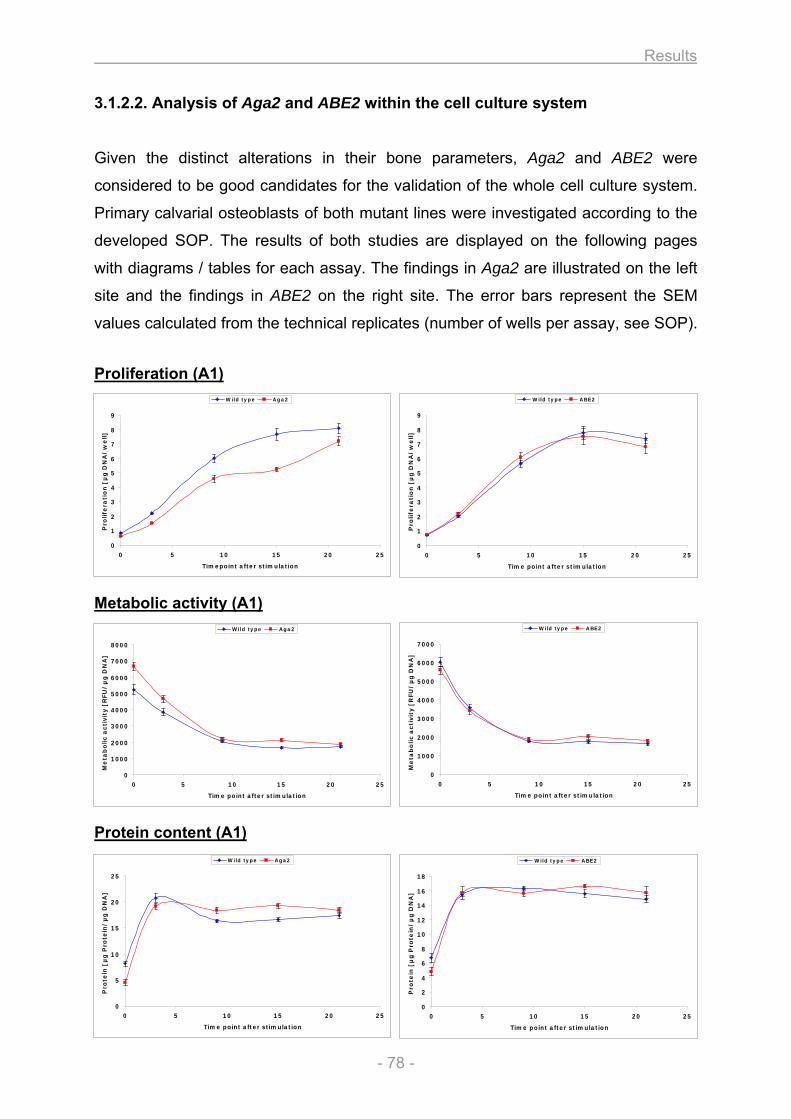
Results
- 78 -
0
1
2
3
4
5
6
7
8
9
0 5 10 15 20 25
Timepoint after stimulation
Pro
life
rati
on
[µ
g D
NA
/w
ell]
Wild type Aga2
0
1
2
3
4
5
6
7
8
9
0 5 10 15 20 25
Time point after stimulation
Pro
life
rati
on
[µ
g D
NA
/w
ell]
Wild type ABE2
0
1000
2000
3000
4000
5000
6000
7000
8000
0 5 10 15 20 25
Time point after stimulation
Me
tab
olic a
cti
vit
y [
RFU
/µ
g D
NA
]
Wild type Aga2
0
1000
2000
3000
4000
5000
6000
7000
0 5 10 15 20 25
Time point after stimulation
Me
tab
olic a
cti
vit
y [
RFU
/µ
g D
NA
]
Wild type ABE2
0
5
10
15
20
25
0 5 10 15 20 25
Time point after stimulation
Pro
tein
[µ
g P
rote
in/
µg
DN
A]
Wild type Aga2
0
2
4
6
8
10
12
14
16
18
0 5 10 15 20 25
Time point after stimulation
Pro
tein
[µ
g P
rote
in/
µg
DN
A]
Wild type ABE2
3.1.2.2. Analysis of Aga2 and ABE2 within the cell culture system
Given the distinct alterations in their bone parameters, Aga2 and ABE2 were
considered to be good candidates for the validation of the whole cell culture system.
Primary calvarial osteoblasts of both mutant lines were investigated according to the
developed SOP. The results of both studies are displayed on the following pages
with diagrams / tables for each assay. The findings in Aga2 are illustrated on the left
site and the findings in ABE2 on the right site. The error bars represent the SEM
values calculated from the technical replicates (number of wells per assay, see SOP).
Proliferation (A1) Metabolic activity (A1) Protein content (A1)
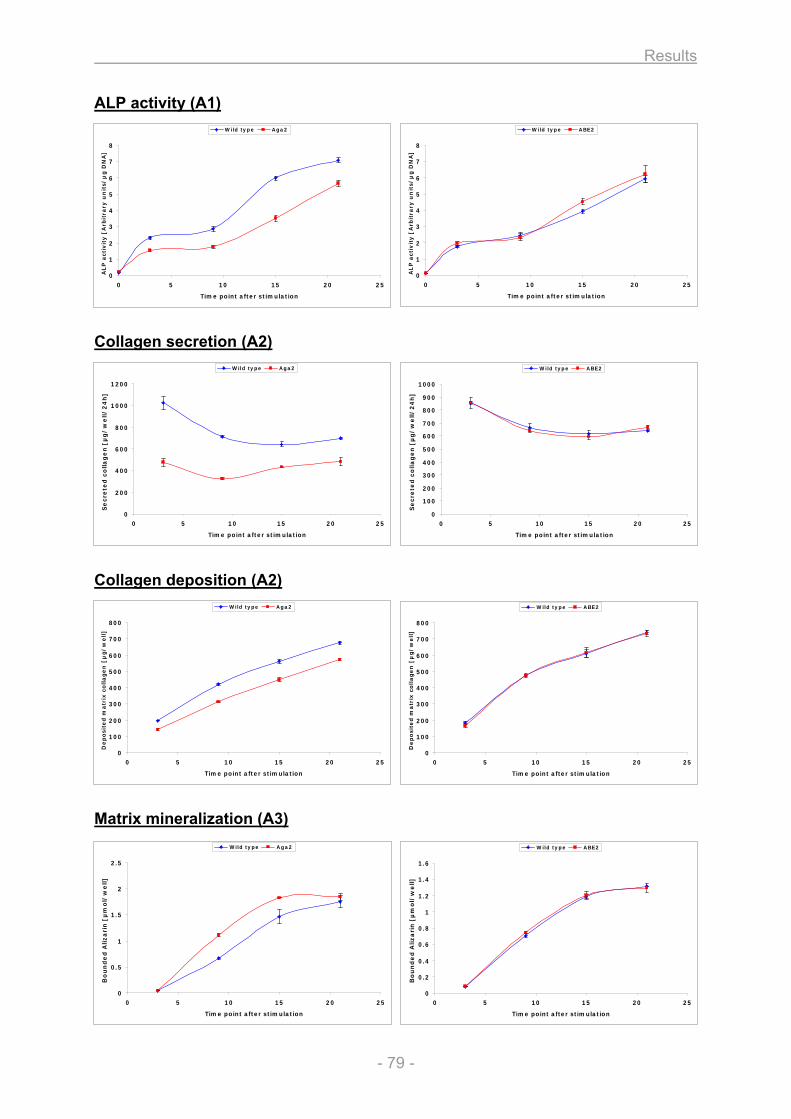
Results
- 79 -
0
1
2
3
4
5
6
7
8
0 5 10 15 20 25
Time point after stimulation
AL
P a
ctiv
ity
[A
rbit
rary
un
its/
µg
DN
A]
Wild type Aga2
0
1
2
3
4
5
6
7
8
0 5 10 15 20 25
Time point after stimulation
AL
P a
ctiv
ity
[A
rbit
rary
un
its/
µg
DN
A]
Wild type ABE2
0
200
400
600
800
1000
1200
0 5 10 15 20 25
Time point after stimulation
Se
cre
ted
co
lla
ge
n [
µg
/w
ell/
24
h]
Wild type Aga2
0
100
200
300
400
500
600
700
800
900
1000
0 5 10 15 20 25
Time point after stimulation
Se
cre
ted
co
lla
ge
n [
µg
/w
ell/
24
h]
Wild type ABE2
0
100
200
300
400
500
600
700
800
0 5 10 15 20 25
Time point after stimulation
De
po
site
d m
atr
ix c
oll
ag
en
[µ
g/
we
ll]
Wild type Aga2
0
100
200
300
400
500
600
700
800
0 5 10 15 20 25
Time point after stimulation
De
po
site
d m
atr
ix c
oll
ag
en
[µ
g/
we
ll]
Wild type ABE2
0
0.5
1
1.5
2
2.5
0 5 10 15 20 25
Time point after stimulation
Bo
un
de
d A
liza
rin
[µ
mo
l/w
ell]
Wild type Aga2
0
0.2
0.4
0.6
0.8
1
1.2
1.4
1.6
0 5 10 15 20 25
Time point after stimulation
Bo
un
de
d A
liza
rin
[µ
mo
l/w
ell]
Wild type ABE2
ALP activity (A1) Collagen secretion (A2) Collagen deposition (A2) Matrix mineralization (A3)
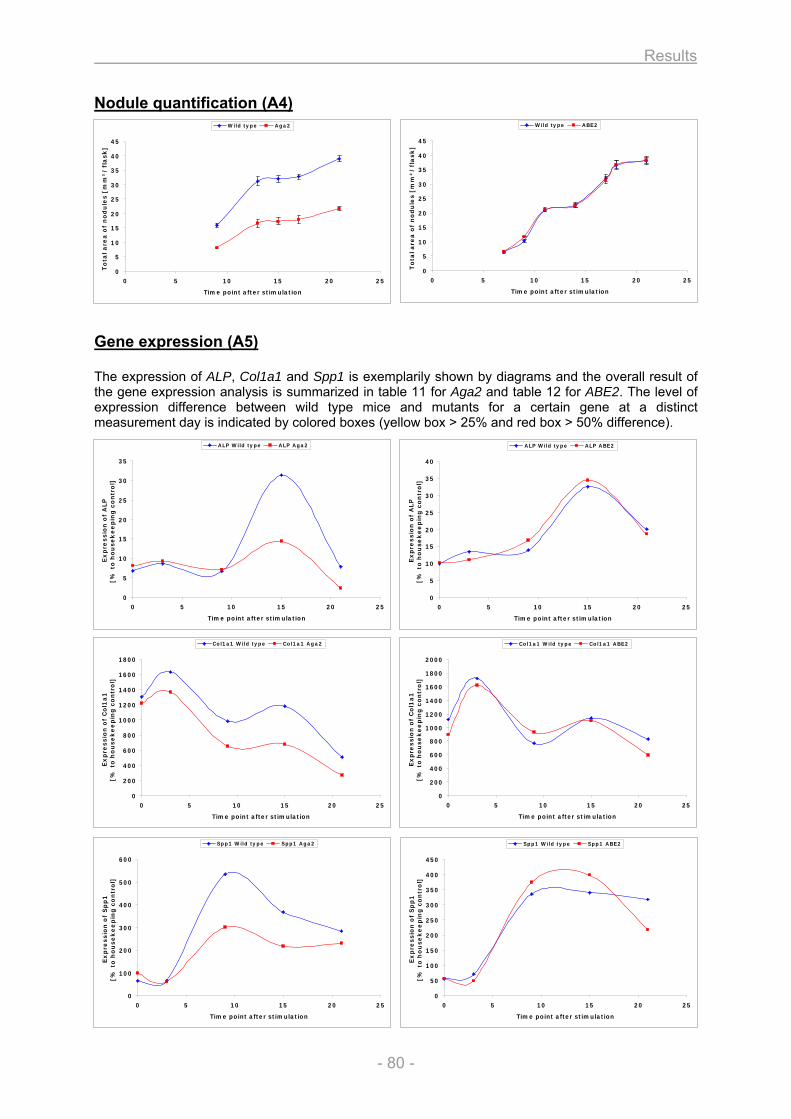
Results
- 80 -
0
5
10
15
20
25
30
35
0 5 10 15 20 25
Time point after stimulation
Ex
pre
ssio
n o
f A
LP
[% t
o h
ou
se
ke
ep
ing
co
ntr
ol]
ALP Wild type ALP Aga2
0
200
400
600
800
1000
1200
1400
1600
1800
0 5 10 15 20 25
Time point after stimulation
Ex
pre
ssio
n o
f C
ol1
a1
[% t
o h
ou
se
ke
ep
ing
co
ntr
ol]
Col1a1 Wild type Col1a1 Aga2
0
100
200
300
400
500
600
0 5 10 15 20 25
Time point after stimulation
Ex
pre
ssio
n o
f S
pp
1[%
to
ho
use
ke
ep
ing
co
ntr
ol]
Spp1 Wild type Spp1 Aga2
0
200
400
600
800
1000
1200
1400
1600
1800
2000
0 5 10 15 20 25
Time point after stimulation
Ex
pre
ssio
n o
f C
ol1
a1
[% t
o h
ou
sek
ee
pin
g c
on
tro
l]
Col1a1 Wild type Col1a1 ABE2
0
50
100
150
200
250
300
350
400
450
0 5 10 15 20 25
Time point after stimulation
Ex
pre
ssio
n o
f S
pp
1[%
to
ho
use
ke
ep
ing
co
ntr
ol]
Spp1 Wild type Spp1 ABE2
0
5
10
15
20
25
30
35
40
0 5 10 15 20 25
Time point after stimulation
Ex
pre
ssio
n o
f A
LP
[% t
o h
ou
sek
ee
pin
g c
on
tro
l]
ALP Wild type ALP ABE2
0
5
10
15
20
25
30
35
40
45
0 5 10 15 20 25
Time point after stimulation
To
tal a
rea
of
no
du
les [
mm
²/
fla
sk
]
Wild type Aga2
0
5
10
15
20
25
30
35
40
45
0 5 10 15 20 25
Time point after stimulation
To
tal a
rea
of
no
du
les [
mm
²/
fla
sk
]
Wild type ABE2
Nodule quantification (A4) Gene expression (A5) The expression of ALP, Col1a1 and Spp1 is exemplarily shown by diagrams and the overall result of the gene expression analysis is summarized in table 11 for Aga2 and table 12 for ABE2. The level of expression difference between wild type mice and mutants for a certain gene at a distinct measurement day is indicated by colored boxes (yellow box > 25% and red box > 50% difference).
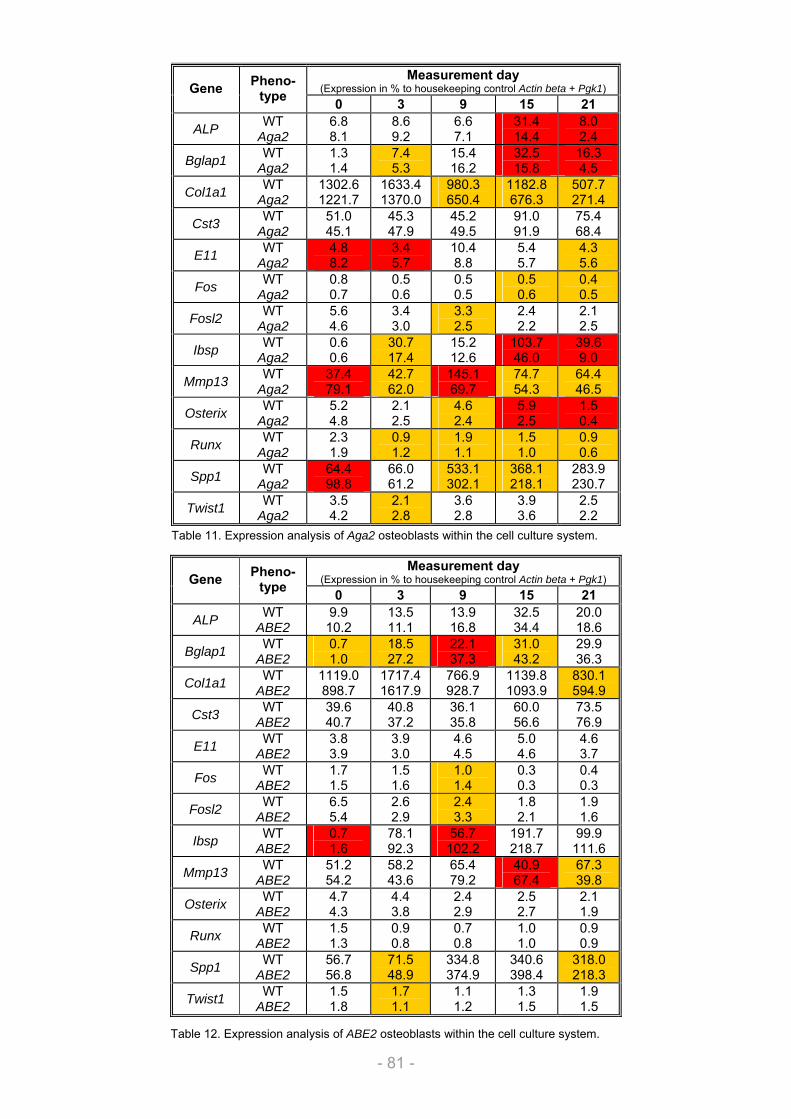
Results
- 81 -
Table 11. Expression analysis of Aga2 osteoblasts within the cell culture system.
Table 12. Expression analysis of ABE2 osteoblasts within the cell culture system.
Measurement day (Expression in % to housekeeping control Actin beta + Pgk1) Gene Pheno-
type 0 3 9 15 21
ALP WT Aga2
6.8 8.1
8.6 9.2
6.6 7.1
31.4 14.4
8.0 2.4
Bglap1 WT Aga2
1.3 1.4
7.4 5.3
15.4 16.2
32.5 15.8
16.3 4.5
Col1a1 WT Aga2
1302.6 1221.7
1633.4 1370.0
980.3 650.4
1182.8 676.3
507.7 271.4
Cst3 WT Aga2
51.0 45.1
45.3 47.9
45.2 49.5
91.0 91.9
75.4 68.4
E11 WT Aga2
4.8 8.2
3.4 5.7
10.4 8.8
5.4 5.7
4.3 5.6
Fos WT Aga2
0.8 0.7
0.5 0.6
0.5 0.5
0.5 0.6
0.4 0.5
Fosl2 WT Aga2
5.6 4.6
3.4 3.0
3.3 2.5
2.4 2.2
2.1 2.5
Ibsp WT Aga2
0.6 0.6
30.7 17.4
15.2 12.6
103.7 46.0
39.6 9.0
Mmp13 WT Aga2
37.4 79.1
42.7 62.0
145.1 69.7
74.7 54.3
64.4 46.5
Osterix WT Aga2
5.2 4.8
2.1 2.5
4.6 2.4
5.9 2.5
1.5 0.4
Runx WT Aga2
2.3 1.9
0.9 1.2
1.9 1.1
1.5 1.0
0.9 0.6
Spp1 WT Aga2
64.4 98.8
66.0 61.2
533.1 302.1
368.1 218.1
283.9 230.7
Twist1 WT Aga2
3.5 4.2
2.1 2.8
3.6 2.8
3.9 3.6
2.5 2.2
Measurement day (Expression in % to housekeeping control Actin beta + Pgk1) Gene Pheno-
type 0 3 9 15 21
ALP WT ABE2
9.9 10.2
13.5 11.1
13.9 16.8
32.5 34.4
20.0 18.6
Bglap1 WT ABE2
0.7 1.0
18.5 27.2
22.1 37.3
31.0 43.2
29.9 36.3
Col1a1 WT ABE2
1119.0 898.7
1717.4 1617.9
766.9 928.7
1139.8 1093.9
830.1 594.9
Cst3 WT ABE2
39.6 40.7
40.8 37.2
36.1 35.8
60.0 56.6
73.5 76.9
E11 WT ABE2
3.8 3.9
3.9 3.0
4.6 4.5
5.0 4.6
4.6 3.7
Fos WT ABE2
1.7 1.5
1.5 1.6
1.0 1.4
0.3 0.3
0.4 0.3
Fosl2 WT ABE2
6.5 5.4
2.6 2.9
2.4 3.3
1.8 2.1
1.9 1.6
Ibsp WT ABE2
0.7 1.6
78.1 92.3
56.7 102.2
191.7 218.7
99.9 111.6
Mmp13 WT ABE2
51.2 54.2
58.2 43.6
65.4 79.2
40.9 67.4
67.3 39.8
Osterix WT ABE2
4.7 4.3
4.4 3.8
2.4 2.9
2.5 2.7
2.1 1.9
Runx WT ABE2
1.5 1.3
0.9 0.8
0.7 0.8
1.0 1.0
0.9 0.9
Spp1 WT ABE2
56.7 56.8
71.5 48.9
334.8 374.9
340.6 398.4
318.0 218.3
Twist1 WT ABE2
1.5 1.8
1.7 1.1
1.1 1.2
1.3 1.5
1.9 1.5
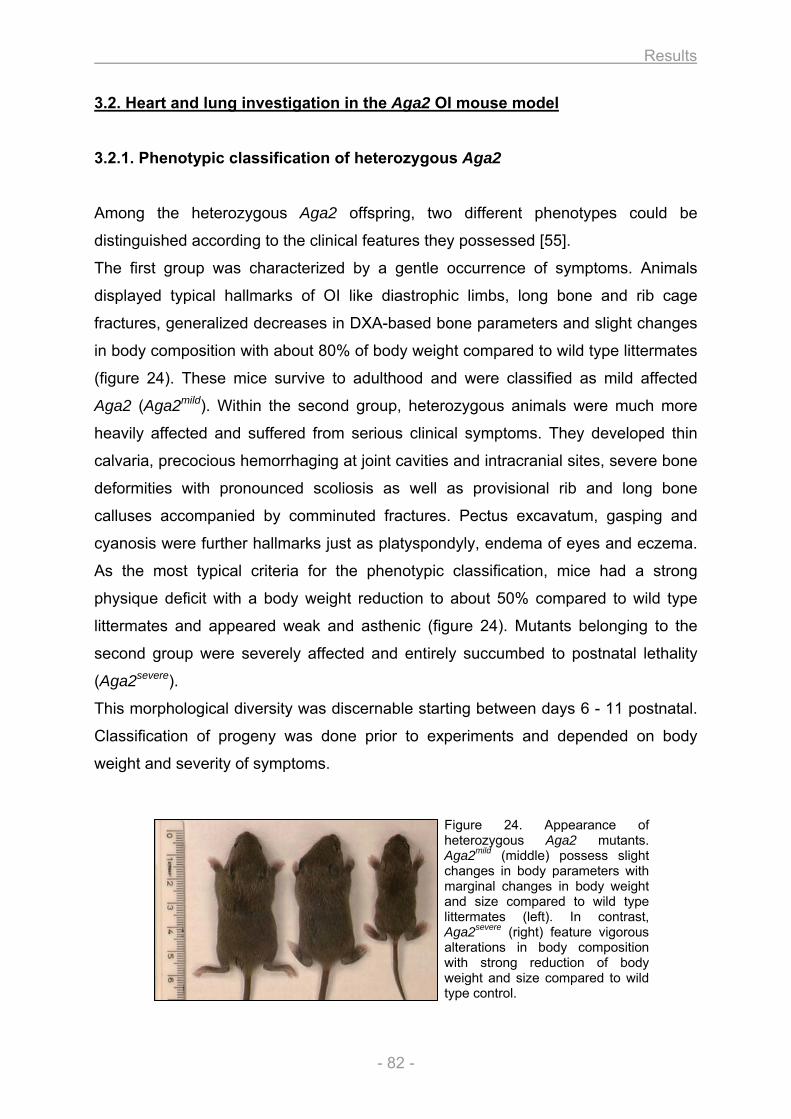
Results
- 82 -
3.2. Heart and lung investigation in the Aga2 OI mouse model
3.2.1. Phenotypic classification of heterozygous Aga2
Among the heterozygous Aga2 offspring, two different phenotypes could be
distinguished according to the clinical features they possessed [55].
The first group was characterized by a gentle occurrence of symptoms. Animals
displayed typical hallmarks of OI like diastrophic limbs, long bone and rib cage
fractures, generalized decreases in DXA-based bone parameters and slight changes
in body composition with about 80% of body weight compared to wild type littermates
(figure 24). These mice survive to adulthood and were classified as mild affected
Aga2 (Aga2mild). Within the second group, heterozygous animals were much more
heavily affected and suffered from serious clinical symptoms. They developed thin
calvaria, precocious hemorrhaging at joint cavities and intracranial sites, severe bone
deformities with pronounced scoliosis as well as provisional rib and long bone
calluses accompanied by comminuted fractures. Pectus excavatum, gasping and
cyanosis were further hallmarks just as platyspondyly, endema of eyes and eczema.
As the most typical criteria for the phenotypic classification, mice had a strong
physique deficit with a body weight reduction to about 50% compared to wild type
littermates and appeared weak and asthenic (figure 24). Mutants belonging to the
second group were severely affected and entirely succumbed to postnatal lethality
(Aga2severe).
This morphological diversity was discernable starting between days 6 - 11 postnatal.
Classification of progeny was done prior to experiments and depended on body
weight and severity of symptoms.
Figure 24. Appearance of heterozygous Aga2 mutants. Aga2mild (middle) possess slight changes in body parameters with marginal changes in body weight and size compared to wild type littermates (left). In contrast, Aga2severe (right) feature vigorous alterations in body composition with strong reduction of body weight and size compared to wild type control.
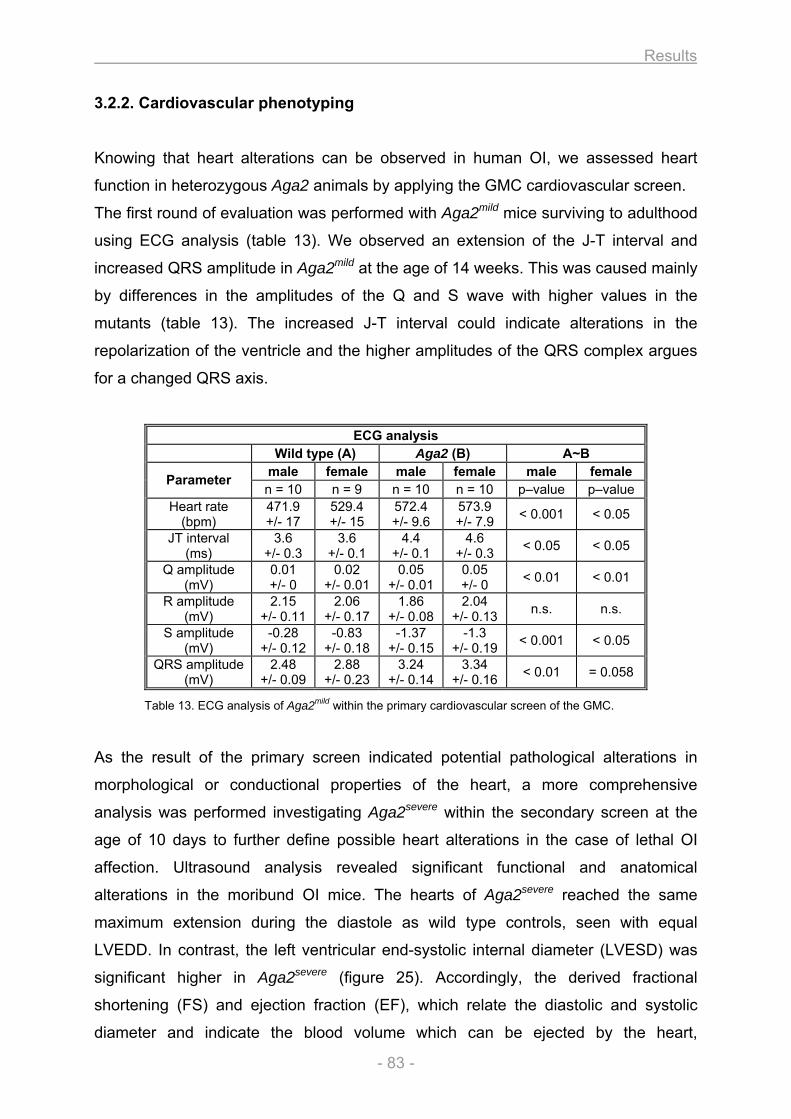
Results
- 83 -
3.2.2. Cardiovascular phenotyping
Knowing that heart alterations can be observed in human OI, we assessed heart
function in heterozygous Aga2 animals by applying the GMC cardiovascular screen.
The first round of evaluation was performed with Aga2mild mice surviving to adulthood
using ECG analysis (table 13). We observed an extension of the J-T interval and
increased QRS amplitude in Aga2mild at the age of 14 weeks. This was caused mainly
by differences in the amplitudes of the Q and S wave with higher values in the
mutants (table 13). The increased J-T interval could indicate alterations in the
repolarization of the ventricle and the higher amplitudes of the QRS complex argues
for a changed QRS axis.
Table 13. ECG analysis of Aga2mild within the primary cardiovascular screen of the GMC.
As the result of the primary screen indicated potential pathological alterations in
morphological or conductional properties of the heart, a more comprehensive
analysis was performed investigating Aga2severe within the secondary screen at the
age of 10 days to further define possible heart alterations in the case of lethal OI
affection. Ultrasound analysis revealed significant functional and anatomical
alterations in the moribund OI mice. The hearts of Aga2severe reached the same
maximum extension during the diastole as wild type controls, seen with equal
LVEDD. In contrast, the left ventricular end-systolic internal diameter (LVESD) was
significant higher in Aga2severe (figure 25). Accordingly, the derived fractional
shortening (FS) and ejection fraction (EF), which relate the diastolic and systolic
diameter and indicate the blood volume which can be ejected by the heart,
ECG analysis Wild type (A) Aga2 (B) A~B
male female male female male female Parameter n = 10 n = 9 n = 10 n = 10 p–value p–value
Heart rate (bpm)
471.9 +/- 17
529.4 +/- 15
572.4 +/- 9.6
573.9 +/- 7.9 < 0.001 < 0.05
JT interval (ms)
3.6 +/- 0.3
3.6 +/- 0.1
4.4 +/- 0.1
4.6 +/- 0.3 < 0.05 < 0.05
Q amplitude (mV)
0.01 +/- 0
0.02 +/- 0.01
0.05 +/- 0.01
0.05 +/- 0 < 0.01 < 0.01
R amplitude (mV)
2.15 +/- 0.11
2.06 +/- 0.17
1.86 +/- 0.08
2.04 +/- 0.13 n.s. n.s.
S amplitude (mV)
-0.28 +/- 0.12
-0.83 +/- 0.18
-1.37 +/- 0.15
-1.3 +/- 0.19 < 0.001 < 0.05
QRS amplitude (mV)
2.48 +/- 0.09
2.88 +/- 0.23
3.24 +/- 0.14
3.34 +/- 0.16 < 0.01 = 0.058
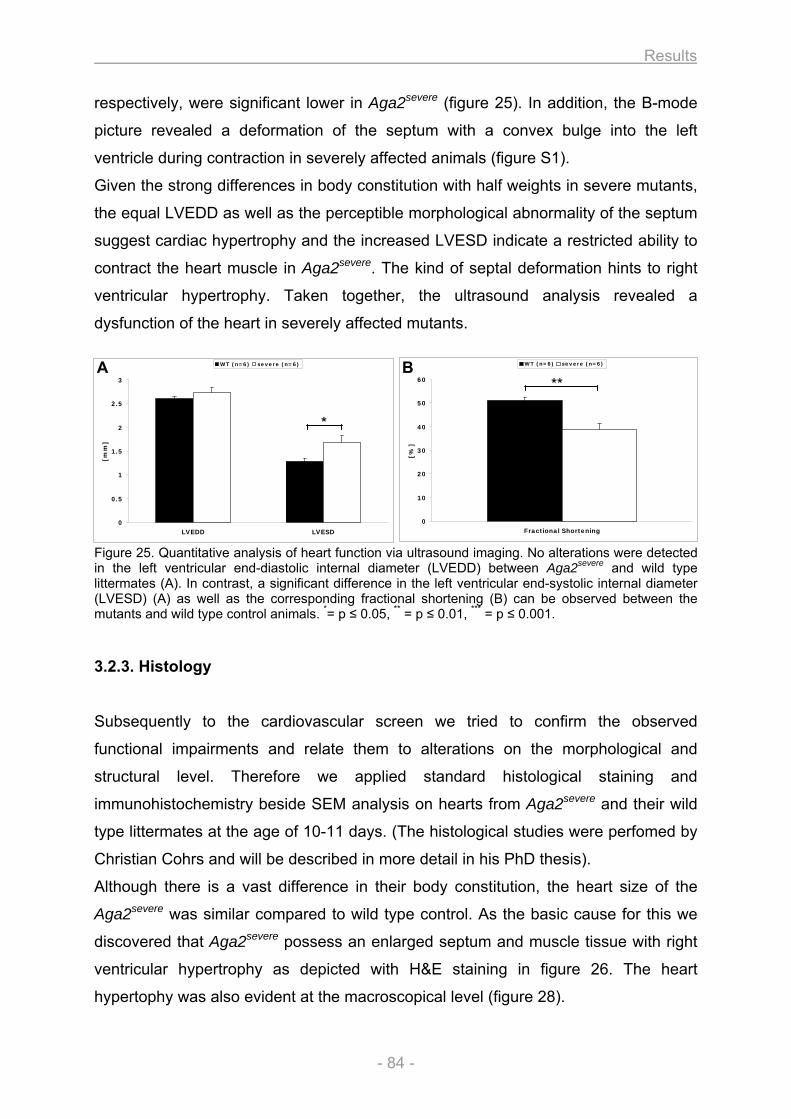
Results
- 84 -
respectively, were significant lower in Aga2severe (figure 25). In addition, the B-mode
picture revealed a deformation of the septum with a convex bulge into the left
ventricle during contraction in severely affected animals (figure S1).
Given the strong differences in body constitution with half weights in severe mutants,
the equal LVEDD as well as the perceptible morphological abnormality of the septum
suggest cardiac hypertrophy and the increased LVESD indicate a restricted ability to
contract the heart muscle in Aga2severe. The kind of septal deformation hints to right
ventricular hypertrophy. Taken together, the ultrasound analysis revealed a
dysfunction of the heart in severely affected mutants.
Figure 25. Quantitative analysis of heart function via ultrasound imaging. No alterations were detected in the left ventricular end-diastolic internal diameter (LVEDD) between Aga2severe and wild type littermates (A). In contrast, a significant difference in the left ventricular end-systolic internal diameter (LVESD) (A) as well as the corresponding fractional shortening (B) can be observed between the mutants and wild type control animals. *= p ≤ 0.05, ** = p ≤ 0.01, *** = p ≤ 0.001.
3.2.3. Histology
Subsequently to the cardiovascular screen we tried to confirm the observed
functional impairments and relate them to alterations on the morphological and
structural level. Therefore we applied standard histological staining and
immunohistochemistry beside SEM analysis on hearts from Aga2severe and their wild
type littermates at the age of 10-11 days. (The histological studies were perfomed by
Christian Cohrs and will be described in more detail in his PhD thesis).
Although there is a vast difference in their body constitution, the heart size of the
Aga2severe was similar compared to wild type control. As the basic cause for this we
discovered that Aga2severe possess an enlarged septum and muscle tissue with right
ventricular hypertrophy as depicted with H&E staining in figure 26. The heart
hypertophy was also evident at the macroscopical level (figure 28).
0
0.5
1
1.5
2
2.5
3
LVEDD LVESD
[mm
]
WT (n=6) severe (n=6)
*
0
10
20
30
40
50
60
Fractional Shortening
[%]
WT (n=6) severe (n=6)
**A B
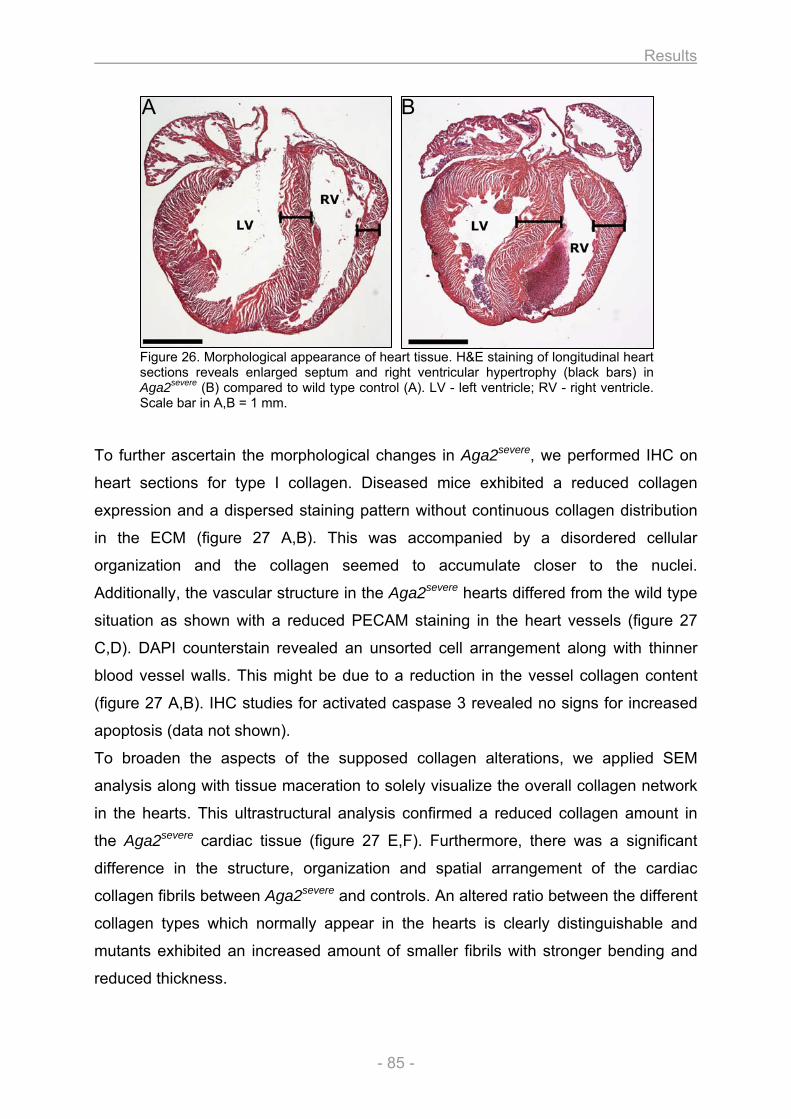
Results
- 85 -
Figure 26. Morphological appearance of heart tissue. H&E staining of longitudinal heart sections reveals enlarged septum and right ventricular hypertrophy (black bars) in Aga2severe (B) compared to wild type control (A). LV - left ventricle; RV - right ventricle. Scale bar in A,B = 1 mm.
To further ascertain the morphological changes in Aga2severe, we performed IHC on
heart sections for type I collagen. Diseased mice exhibited a reduced collagen
expression and a dispersed staining pattern without continuous collagen distribution
in the ECM (figure 27 A,B). This was accompanied by a disordered cellular
organization and the collagen seemed to accumulate closer to the nuclei.
Additionally, the vascular structure in the Aga2severe hearts differed from the wild type
situation as shown with a reduced PECAM staining in the heart vessels (figure 27
C,D). DAPI counterstain revealed an unsorted cell arrangement along with thinner
blood vessel walls. This might be due to a reduction in the vessel collagen content
(figure 27 A,B). IHC studies for activated caspase 3 revealed no signs for increased
apoptosis (data not shown).
To broaden the aspects of the supposed collagen alterations, we applied SEM
analysis along with tissue maceration to solely visualize the overall collagen network
in the hearts. This ultrastructural analysis confirmed a reduced collagen amount in
the Aga2severe cardiac tissue (figure 27 E,F). Furthermore, there was a significant
difference in the structure, organization and spatial arrangement of the cardiac
collagen fibrils between Aga2severe and controls. An altered ratio between the different
collagen types which normally appear in the hearts is clearly distinguishable and
mutants exhibited an increased amount of smaller fibrils with stronger bending and
reduced thickness.
A B
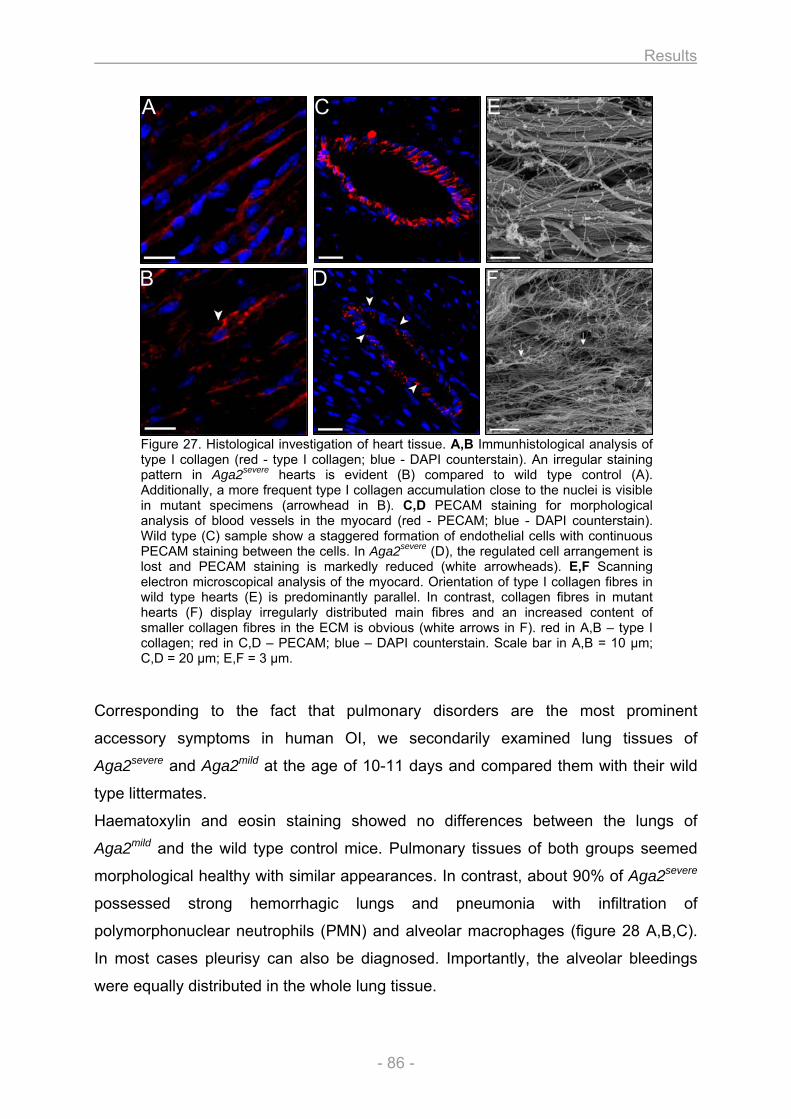
Results
- 86 -
Figure 27. Histological investigation of heart tissue. A,B Immunhistological analysis of type I collagen (red - type I collagen; blue - DAPI counterstain). An irregular staining pattern in Aga2severe hearts is evident (B) compared to wild type control (A). Additionally, a more frequent type I collagen accumulation close to the nuclei is visible in mutant specimens (arrowhead in B). C,D PECAM staining for morphological analysis of blood vessels in the myocard (red - PECAM; blue - DAPI counterstain). Wild type (C) sample show a staggered formation of endothelial cells with continuous PECAM staining between the cells. In Aga2severe (D), the regulated cell arrangement is lost and PECAM staining is markedly reduced (white arrowheads). E,F Scanning electron microscopical analysis of the myocard. Orientation of type I collagen fibres in wild type hearts (E) is predominantly parallel. In contrast, collagen fibres in mutant hearts (F) display irregularly distributed main fibres and an increased content of smaller collagen fibres in the ECM is obvious (white arrows in F). red in A,B – type I collagen; red in C,D – PECAM; blue – DAPI counterstain. Scale bar in A,B = 10 µm; C,D = 20 µm; E,F = 3 µm.
Corresponding to the fact that pulmonary disorders are the most prominent
accessory symptoms in human OI, we secondarily examined lung tissues of
Aga2severe and Aga2mild at the age of 10-11 days and compared them with their wild
type littermates.
Haematoxylin and eosin staining showed no differences between the lungs of
Aga2mild and the wild type control mice. Pulmonary tissues of both groups seemed
morphological healthy with similar appearances. In contrast, about 90% of Aga2severe
possessed strong hemorrhagic lungs and pneumonia with infiltration of
polymorphonuclear neutrophils (PMN) and alveolar macrophages (figure 28 A,B,C).
In most cases pleurisy can also be diagnosed. Importantly, the alveolar bleedings
were equally distributed in the whole lung tissue.
A C E
B D F
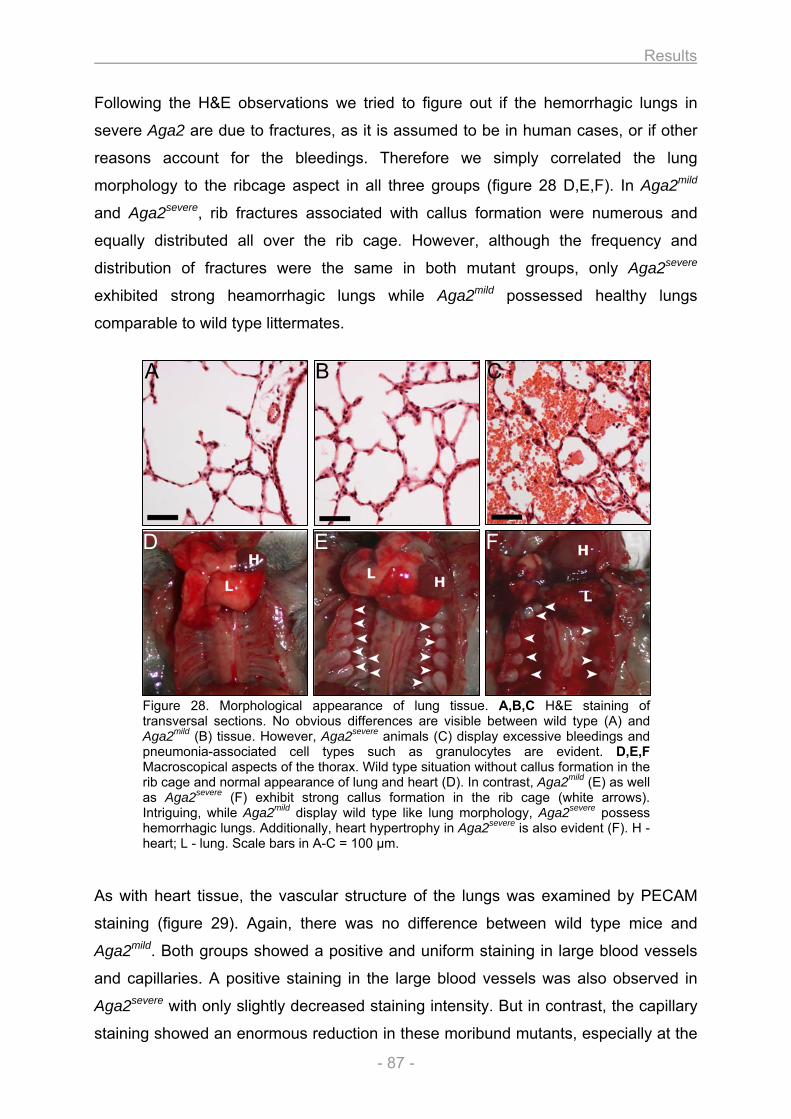
Results
- 87 -
Following the H&E observations we tried to figure out if the hemorrhagic lungs in
severe Aga2 are due to fractures, as it is assumed to be in human cases, or if other
reasons account for the bleedings. Therefore we simply correlated the lung
morphology to the ribcage aspect in all three groups (figure 28 D,E,F). In Aga2mild
and Aga2severe, rib fractures associated with callus formation were numerous and
equally distributed all over the rib cage. However, although the frequency and
distribution of fractures were the same in both mutant groups, only Aga2severe
exhibited strong heamorrhagic lungs while Aga2mild possessed healthy lungs
comparable to wild type littermates.
Figure 28. Morphological appearance of lung tissue. A,B,C H&E staining of transversal sections. No obvious differences are visible between wild type (A) and Aga2mild (B) tissue. However, Aga2severe animals (C) display excessive bleedings and pneumonia-associated cell types such as granulocytes are evident. D,E,F Macroscopical aspects of the thorax. Wild type situation without callus formation in the rib cage and normal appearance of lung and heart (D). In contrast, Aga2mild (E) as well as Aga2severe (F) exhibit strong callus formation in the rib cage (white arrows). Intriguing, while Aga2mild display wild type like lung morphology, Aga2severe possess hemorrhagic lungs. Additionally, heart hypertrophy in Aga2severe is also evident (F). H - heart; L - lung. Scale bars in A-C = 100 µm.
As with heart tissue, the vascular structure of the lungs was examined by PECAM
staining (figure 29). Again, there was no difference between wild type mice and
Aga2mild. Both groups showed a positive and uniform staining in large blood vessels
and capillaries. A positive staining in the large blood vessels was also observed in
Aga2severe with only slightly decreased staining intensity. But in contrast, the capillary
staining showed an enormous reduction in these moribund mutants, especially at the
A B C
D E F
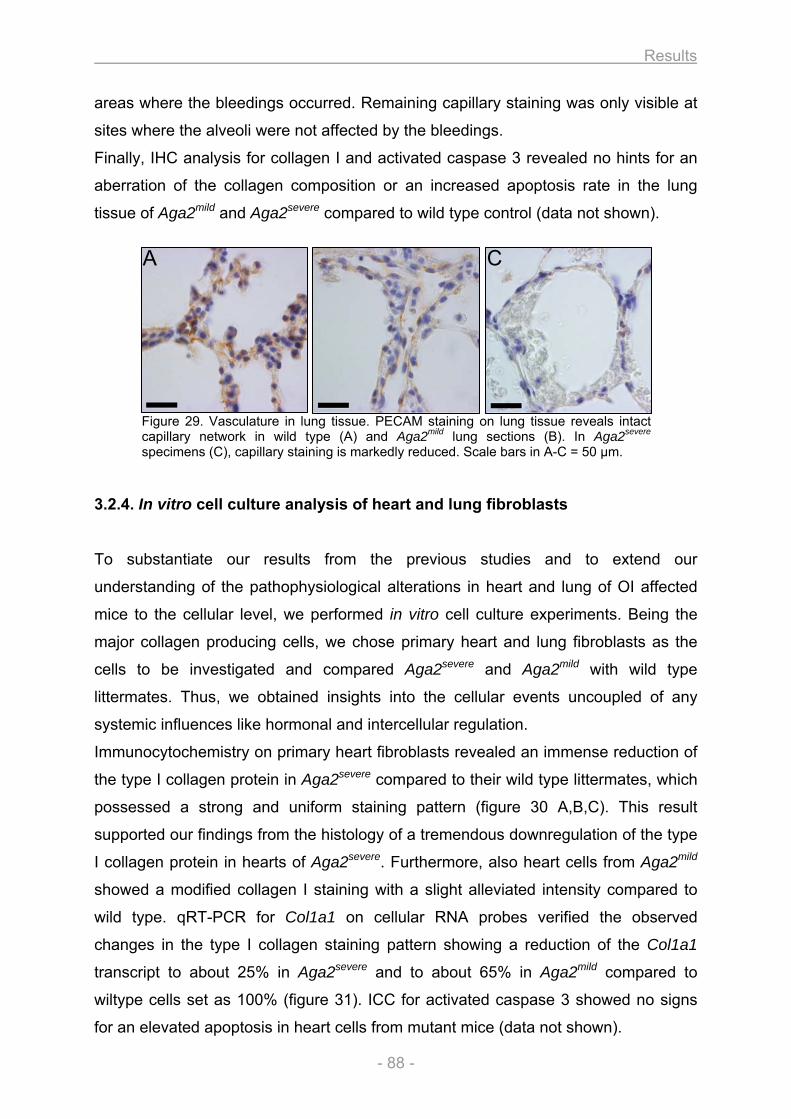
Results
- 88 -
areas where the bleedings occurred. Remaining capillary staining was only visible at
sites where the alveoli were not affected by the bleedings.
Finally, IHC analysis for collagen I and activated caspase 3 revealed no hints for an
aberration of the collagen composition or an increased apoptosis rate in the lung
tissue of Aga2mild and Aga2severe compared to wild type control (data not shown).
Figure 29. Vasculature in lung tissue. PECAM staining on lung tissue reveals intact capillary network in wild type (A) and Aga2mild lung sections (B). In Aga2severe specimens (C), capillary staining is markedly reduced. Scale bars in A-C = 50 µm.
3.2.4. In vitro cell culture analysis of heart and lung fibroblasts
To substantiate our results from the previous studies and to extend our
understanding of the pathophysiological alterations in heart and lung of OI affected
mice to the cellular level, we performed in vitro cell culture experiments. Being the
major collagen producing cells, we chose primary heart and lung fibroblasts as the
cells to be investigated and compared Aga2severe and Aga2mild with wild type
littermates. Thus, we obtained insights into the cellular events uncoupled of any
systemic influences like hormonal and intercellular regulation.
Immunocytochemistry on primary heart fibroblasts revealed an immense reduction of
the type I collagen protein in Aga2severe compared to their wild type littermates, which
possessed a strong and uniform staining pattern (figure 30 A,B,C). This result
supported our findings from the histology of a tremendous downregulation of the type
I collagen protein in hearts of Aga2severe. Furthermore, also heart cells from Aga2mild
showed a modified collagen I staining with a slight alleviated intensity compared to
wild type. qRT-PCR for Col1a1 on cellular RNA probes verified the observed
changes in the type I collagen staining pattern showing a reduction of the Col1a1
transcript to about 25% in Aga2severe and to about 65% in Aga2mild compared to
wiltype cells set as 100% (figure 31). ICC for activated caspase 3 showed no signs
for an elevated apoptosis in heart cells from mutant mice (data not shown).
A C
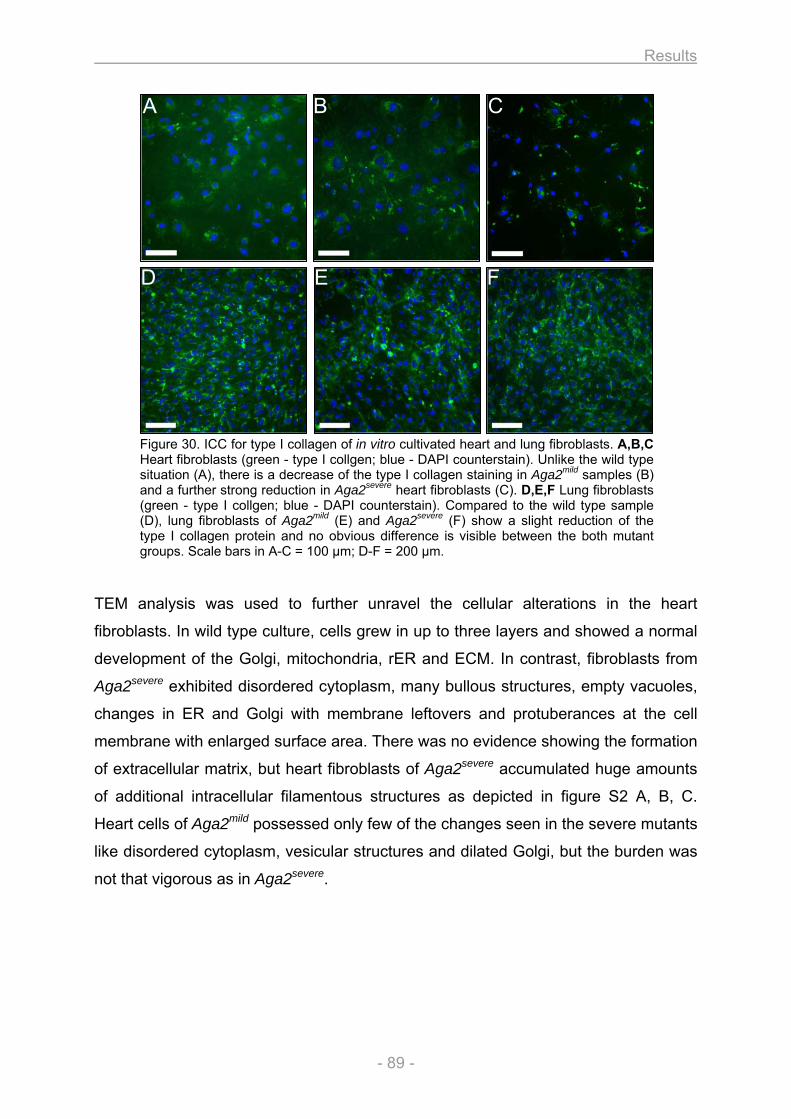
Results
- 89 -
Figure 30. ICC for type I collagen of in vitro cultivated heart and lung fibroblasts. A,B,C Heart fibroblasts (green - type I collgen; blue - DAPI counterstain). Unlike the wild type situation (A), there is a decrease of the type I collagen staining in Aga2mild samples (B) and a further strong reduction in Aga2severe heart fibroblasts (C). D,E,F Lung fibroblasts (green - type I collgen; blue - DAPI counterstain). Compared to the wild type sample (D), lung fibroblasts of Aga2mild (E) and Aga2severe (F) show a slight reduction of the type I collagen protein and no obvious difference is visible between the both mutant groups. Scale bars in A-C = 100 µm; D-F = 200 µm.
TEM analysis was used to further unravel the cellular alterations in the heart
fibroblasts. In wild type culture, cells grew in up to three layers and showed a normal
development of the Golgi, mitochondria, rER and ECM. In contrast, fibroblasts from
Aga2severe exhibited disordered cytoplasm, many bullous structures, empty vacuoles,
changes in ER and Golgi with membrane leftovers and protuberances at the cell
membrane with enlarged surface area. There was no evidence showing the formation
of extracellular matrix, but heart fibroblasts of Aga2severe accumulated huge amounts
of additional intracellular filamentous structures as depicted in figure S2 A, B, C.
Heart cells of Aga2mild possessed only few of the changes seen in the severe mutants
like disordered cytoplasm, vesicular structures and dilated Golgi, but the burden was
not that vigorous as in Aga2severe.
A B C
D E F
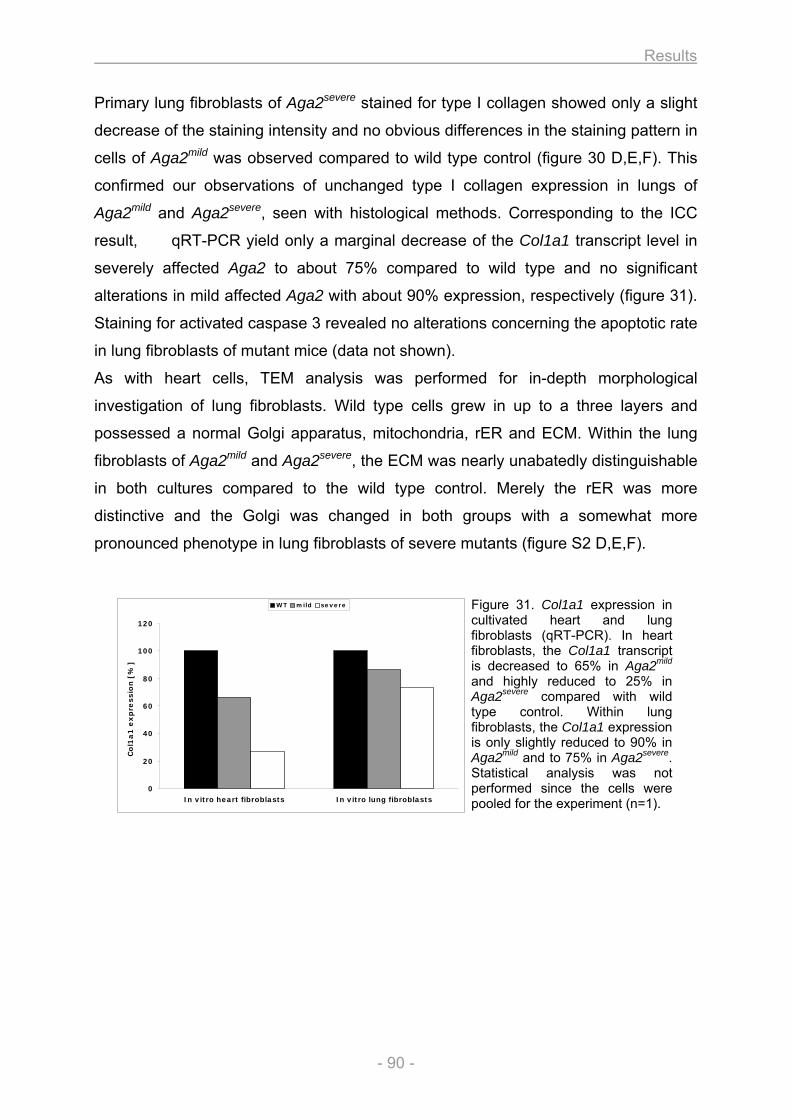
Results
- 90 -
0
20
40
60
80
100
120
In vitro heart fibroblasts In vitro lung fibroblasts
Co
l1a
1 e
xp
ressio
n [
%]
WT mild severe
Primary lung fibroblasts of Aga2severe stained for type I collagen showed only a slight
decrease of the staining intensity and no obvious differences in the staining pattern in
cells of Aga2mild was observed compared to wild type control (figure 30 D,E,F). This
confirmed our observations of unchanged type I collagen expression in lungs of
Aga2mild and Aga2severe, seen with histological methods. Corresponding to the ICC
result, qRT-PCR yield only a marginal decrease of the Col1a1 transcript level in
severely affected Aga2 to about 75% compared to wild type and no significant
alterations in mild affected Aga2 with about 90% expression, respectively (figure 31).
Staining for activated caspase 3 revealed no alterations concerning the apoptotic rate
in lung fibroblasts of mutant mice (data not shown).
As with heart cells, TEM analysis was performed for in-depth morphological
investigation of lung fibroblasts. Wild type cells grew in up to a three layers and
possessed a normal Golgi apparatus, mitochondria, rER and ECM. Within the lung
fibroblasts of Aga2mild and Aga2severe, the ECM was nearly unabatedly distinguishable
in both cultures compared to the wild type control. Merely the rER was more
distinctive and the Golgi was changed in both groups with a somewhat more
pronounced phenotype in lung fibroblasts of severe mutants (figure S2 D,E,F).
Figure 31. Col1a1 expression in cultivated heart and lung fibroblasts (qRT-PCR). In heart fibroblasts, the Col1a1 transcript is decreased to 65% in Aga2mild and highly reduced to 25% in Aga2severe compared with wild type control. Within lung fibroblasts, the Col1a1 expression is only slightly reduced to 90% in Aga2mild and to 75% in Aga2severe. Statistical analysis was not performed since the cells were pooled for the experiment (n=1).
Results
- 91 -
3.2.5. Expression profiling
To further understand the observed structural alterations from the histological
examination and to explain them on the molecular and genetic level, we applied chip
based expression profiling. RNA samples of three Aga2/+severe at the age of 11 days
were used as individual probes and compared against one wild type reference RNA
pool made from four littermate control mice - each with heart and lung.
In heart tissue of Aga2severe we identified 56 significantly regulated genes, whereas
35 of which were upregulated and 21 downregulated (figure S3). As indicated in the
figure, the regulation of the listed genes ranged between 1.5 and 3.1 fold compared
to wild type control and the strong correlation of the denoted genes between all three
single mutants argues for a high reproducibility of the selected genes. The estimated
number of falsely significant genes was calculated for 1000 permutations, yielding a
FDR of 0.5% for this data set including six chip experiments.
In silico analysis of the differentially expressed genes revealed multiple over-
represented biological processes in the heart, summarized in table S1.
Several of the differentially regulated genes were associated with the constitution and
remodeling of the extracellular matrix (ECM). Striking, the Col1a1 was the most
prominent dysregulated gene of these ECM associated factors showing a 2.5 fold
downregulation in Aga2severe. To strengthen the observed decrease of the Col1a1
transcript, we additional applied qRT-PCR for the Col1a1 using aliquots of the same
RNA probes as for the expression analysis. Thus, we confirmed the assumed
downregulation of Col1a1 to about 25% in Aga2severe hearts compared to the
littermate controls (figure 32). Noticeable, the estimated reduction of the Col1a1
transcript on tissue level in severe Aga2 hearts correspond to the calculated
decrease seen on cellular level in severe Aga2 heart fibroblasts obtained in the cell
culture experiments described above. Intriguing, Col1a2 was also downregulated and
the alteration of the both collagen I transcripts was confirmed by the fact, that three
independent probes for Col1a1 and four independent probes for Col1a2 on the array
showed the similar decrease on the expression level. Moreover, we found a
downregulation of the genes for Col2 and Col3. In accordance with the decline of the
different collagen types there was a downregulation of Dpt and Mfap4, important
factors for the collagen fibrillogenese and matrix assembly. Upregulation of Col8,
Tgm2 and Ctgf further indicate pronounced ECM remodeling.
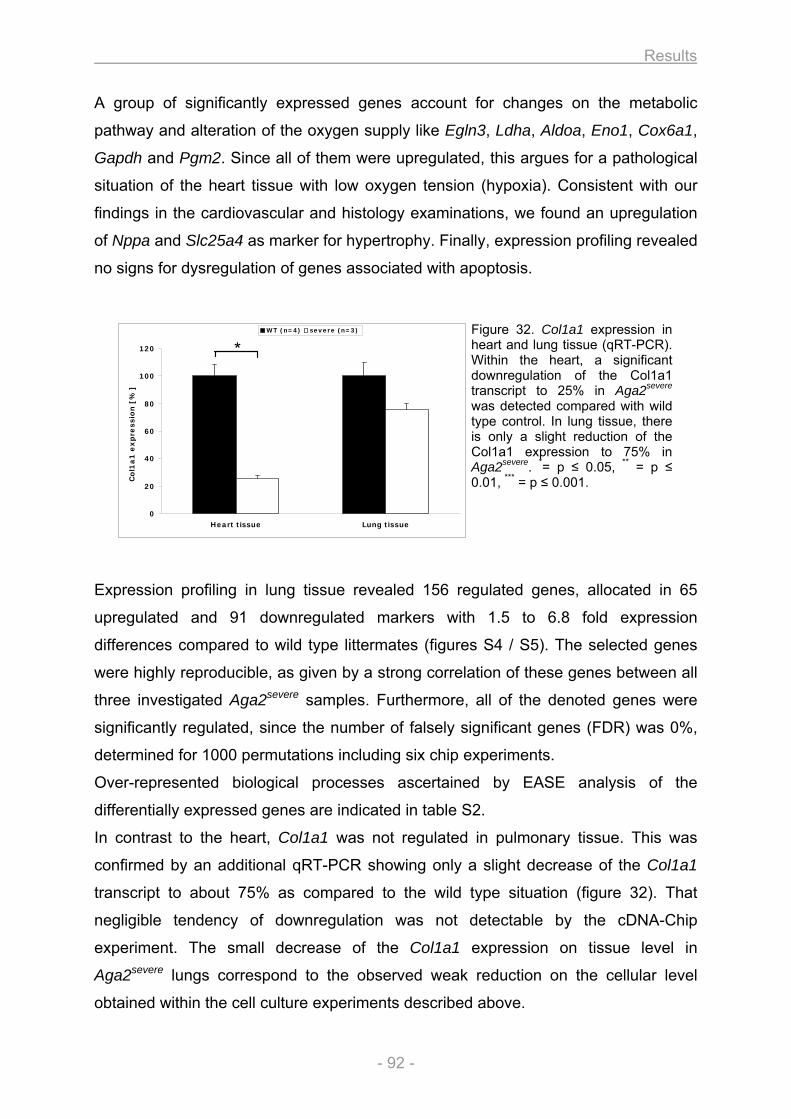
Results
- 92 -
0
20
40
60
80
100
120
Heart tissue Lung tissue
Co
l1a
1 e
xp
ressio
n [
%]
WT (n=4) severe (n=3)
*
A group of significantly expressed genes account for changes on the metabolic
pathway and alteration of the oxygen supply like Egln3, Ldha, Aldoa, Eno1, Cox6a1,
Gapdh and Pgm2. Since all of them were upregulated, this argues for a pathological
situation of the heart tissue with low oxygen tension (hypoxia). Consistent with our
findings in the cardiovascular and histology examinations, we found an upregulation
of Nppa and Slc25a4 as marker for hypertrophy. Finally, expression profiling revealed
no signs for dysregulation of genes associated with apoptosis.
Figure 32. Col1a1 expression in heart and lung tissue (qRT-PCR). Within the heart, a significant downregulation of the Col1a1 transcript to 25% in Aga2severe was detected compared with wild type control. In lung tissue, there is only a slight reduction of the Col1a1 expression to 75% in Aga2severe. *= p ≤ 0.05, ** = p ≤ 0.01, *** = p ≤ 0.001.
Expression profiling in lung tissue revealed 156 regulated genes, allocated in 65
upregulated and 91 downregulated markers with 1.5 to 6.8 fold expression
differences compared to wild type littermates (figures S4 / S5). The selected genes
were highly reproducible, as given by a strong correlation of these genes between all
three investigated Aga2severe samples. Furthermore, all of the denoted genes were
significantly regulated, since the number of falsely significant genes (FDR) was 0%,
determined for 1000 permutations including six chip experiments.
Over-represented biological processes ascertained by EASE analysis of the
differentially expressed genes are indicated in table S2.
In contrast to the heart, Col1a1 was not regulated in pulmonary tissue. This was
confirmed by an additional qRT-PCR showing only a slight decrease of the Col1a1
transcript to about 75% as compared to the wild type situation (figure 32). That
negligible tendency of downregulation was not detectable by the cDNA-Chip
experiment. The small decrease of the Col1a1 expression on tissue level in
Aga2severe lungs correspond to the observed weak reduction on the cellular level
obtained within the cell culture experiments described above.
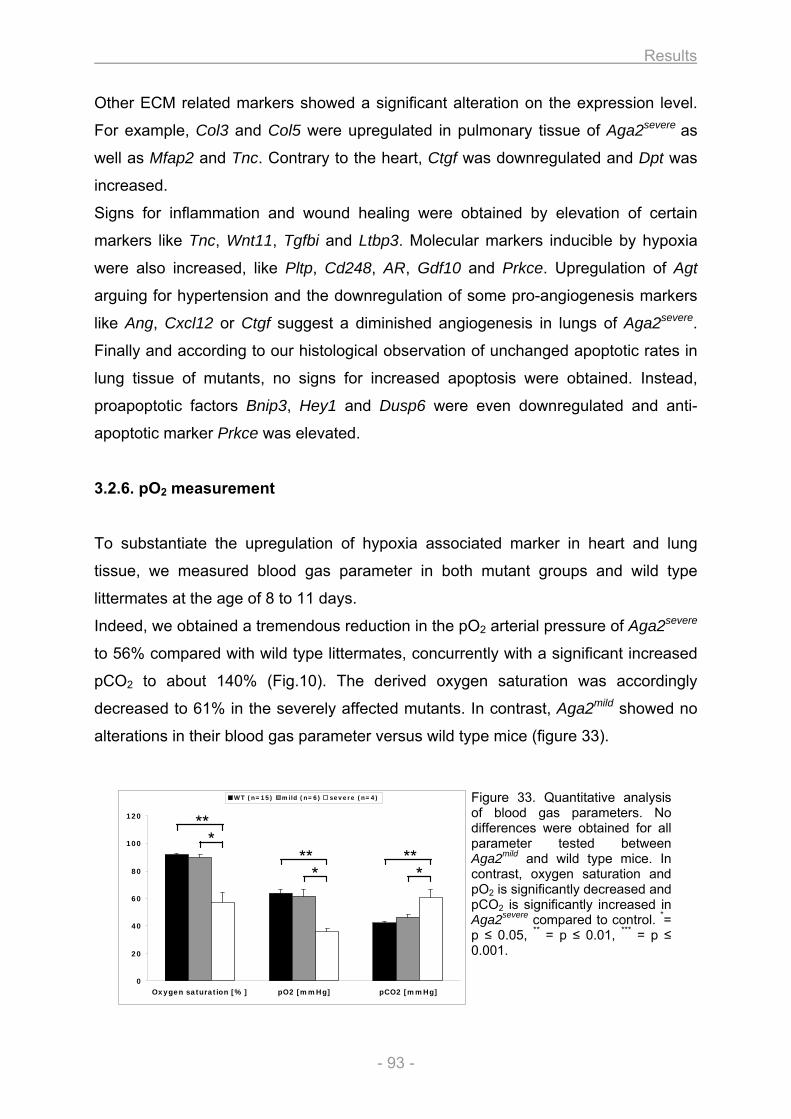
Results
- 93 -
0
20
40
60
80
100
120
Oxygen saturation [%] pO2 [mmHg] pCO2 [mmHg]
WT (n=15) mild (n=6) severe (n=4)
* **
* **
* **
Other ECM related markers showed a significant alteration on the expression level.
For example, Col3 and Col5 were upregulated in pulmonary tissue of Aga2severe as
well as Mfap2 and Tnc. Contrary to the heart, Ctgf was downregulated and Dpt was
increased.
Signs for inflammation and wound healing were obtained by elevation of certain
markers like Tnc, Wnt11, Tgfbi and Ltbp3. Molecular markers inducible by hypoxia
were also increased, like Pltp, Cd248, AR, Gdf10 and Prkce. Upregulation of Agt
arguing for hypertension and the downregulation of some pro-angiogenesis markers
like Ang, Cxcl12 or Ctgf suggest a diminished angiogenesis in lungs of Aga2severe.
Finally and according to our histological observation of unchanged apoptotic rates in
lung tissue of mutants, no signs for increased apoptosis were obtained. Instead,
proapoptotic factors Bnip3, Hey1 and Dusp6 were even downregulated and anti-
apoptotic marker Prkce was elevated.
3.2.6. pO2 measurement
To substantiate the upregulation of hypoxia associated marker in heart and lung
tissue, we measured blood gas parameter in both mutant groups and wild type
littermates at the age of 8 to 11 days.
Indeed, we obtained a tremendous reduction in the pO2 arterial pressure of Aga2severe
to 56% compared with wild type littermates, concurrently with a significant increased
pCO2 to about 140% (Fig.10). The derived oxygen saturation was accordingly
decreased to 61% in the severely affected mutants. In contrast, Aga2mild showed no
alterations in their blood gas parameter versus wild type mice (figure 33).
Figure 33. Quantitative analysis of blood gas parameters. No differences were obtained for all parameter tested between Aga2mild and wild type mice. In contrast, oxygen saturation and pO2 is significantly decreased and pCO2 is significantly increased in Aga2severe compared to control. *= p ≤ 0.05, ** = p ≤ 0.01, *** = p ≤ 0.001.
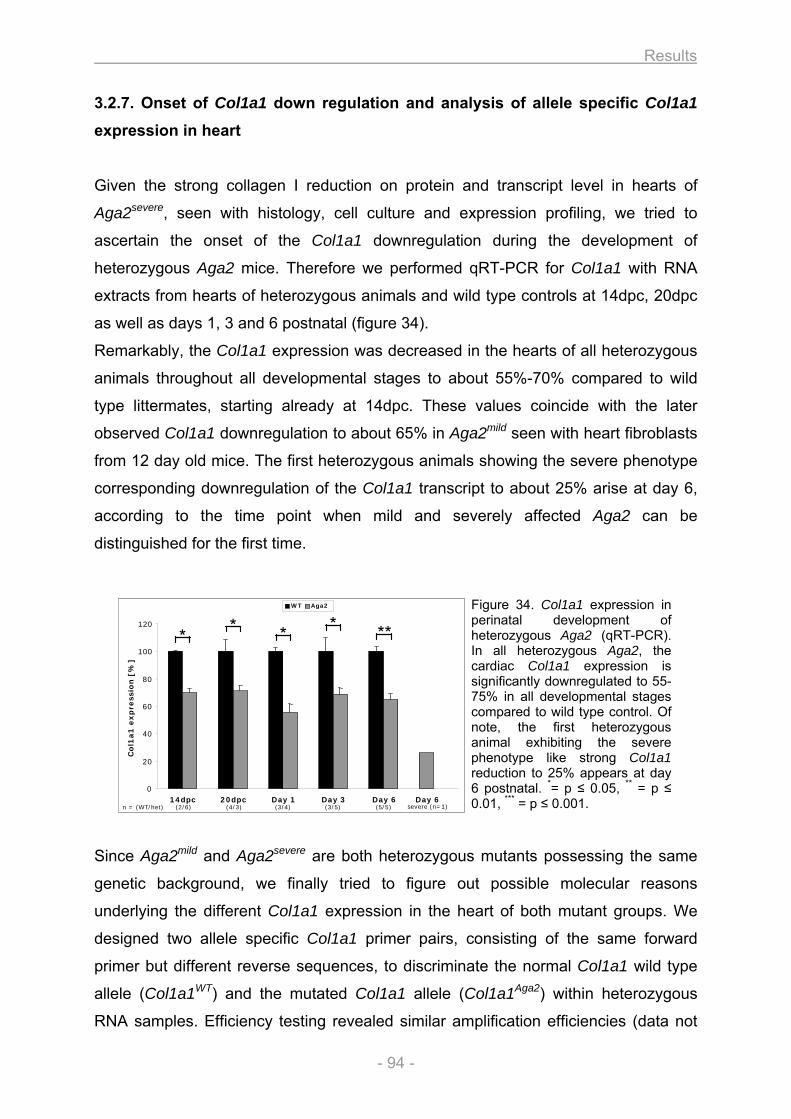
Results
- 94 -
0
20
40
60
80
100
120
14dpc 20dpc Day 1 Day 3 Day 6 Day 6
Col1
a1
exp
ress
ion
[%]
WT Aga2
*
n = (WT/het)
* * * **
(2/6) (4/3) (3/4) (3/5) (5/5) severe (n=1)
0
20
40
60
80
100
120
14dpc 20dpc Day 1 Day 3 Day 6 Day 6
Col1
a1
exp
ress
ion
[%]
WT Aga2
*
n = (WT/het)
* * * **
(2/6) (4/3) (3/4) (3/5) (5/5) severe (n=1)
3.2.7. Onset of Col1a1 down regulation and analysis of allele specific Col1a1
expression in heart
Given the strong collagen I reduction on protein and transcript level in hearts of
Aga2severe, seen with histology, cell culture and expression profiling, we tried to
ascertain the onset of the Col1a1 downregulation during the development of
heterozygous Aga2 mice. Therefore we performed qRT-PCR for Col1a1 with RNA
extracts from hearts of heterozygous animals and wild type controls at 14dpc, 20dpc
as well as days 1, 3 and 6 postnatal (figure 34).
Remarkably, the Col1a1 expression was decreased in the hearts of all heterozygous
animals throughout all developmental stages to about 55%-70% compared to wild
type littermates, starting already at 14dpc. These values coincide with the later
observed Col1a1 downregulation to about 65% in Aga2mild seen with heart fibroblasts
from 12 day old mice. The first heterozygous animals showing the severe phenotype
corresponding downregulation of the Col1a1 transcript to about 25% arise at day 6,
according to the time point when mild and severely affected Aga2 can be
distinguished for the first time.
Figure 34. Col1a1 expression in perinatal development of heterozygous Aga2 (qRT-PCR). In all heterozygous Aga2, the cardiac Col1a1 expression is significantly downregulated to 55-75% in all developmental stages compared to wild type control. Of note, the first heterozygous animal exhibiting the severe phenotype like strong Col1a1 reduction to 25% appears at day 6 postnatal. *= p ≤ 0.05, ** = p ≤ 0.01, *** = p ≤ 0.001.
Since Aga2mild and Aga2severe are both heterozygous mutants possessing the same
genetic background, we finally tried to figure out possible molecular reasons
underlying the different Col1a1 expression in the heart of both mutant groups. We
designed two allele specific Col1a1 primer pairs, consisting of the same forward
primer but different reverse sequences, to discriminate the normal Col1a1 wild type
allele (Col1a1WT) and the mutated Col1a1 allele (Col1a1Aga2) within heterozygous
RNA samples. Efficiency testing revealed similar amplification efficiencies (data not
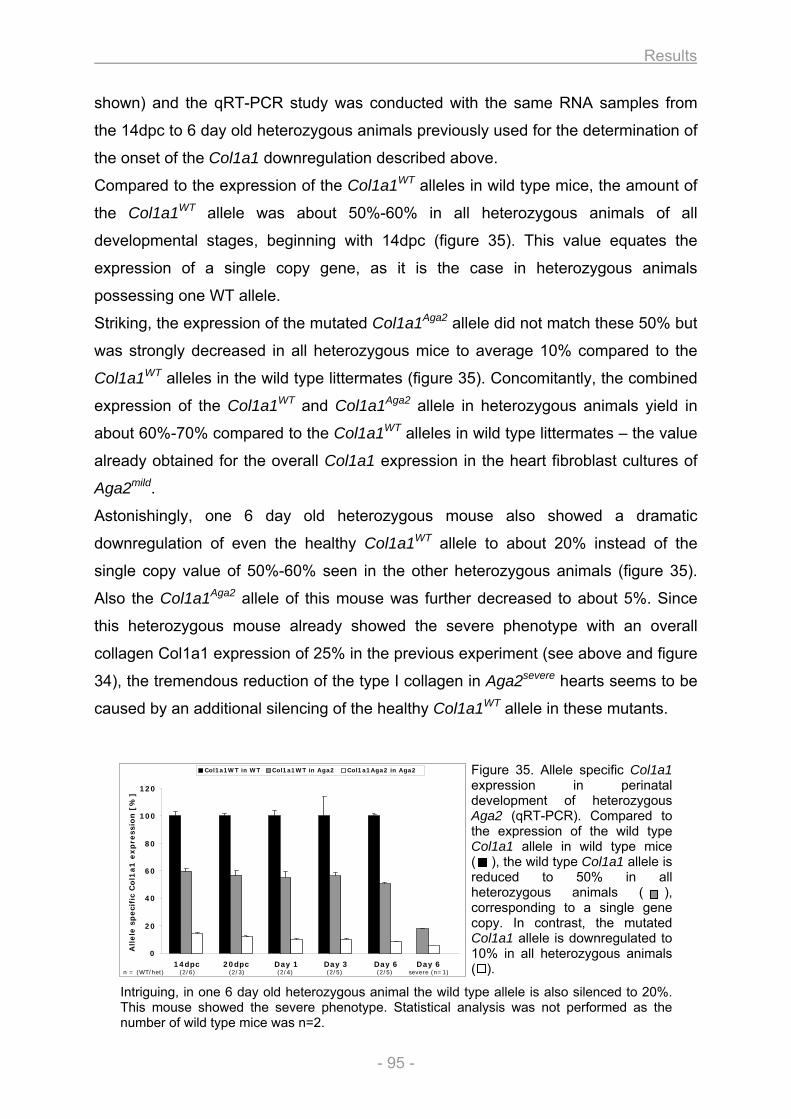
Results
- 95 -
0
20
40
60
80
100
120
14dpc 20dpc Day 1 Day 3 Day 6 Day 6
Allele
speci
fic
Col1
a1
exp
ress
ion
[%]
Col1a1WT in WT Col1a1WT in Aga2 Col1a1Aga2 in Aga2
n = (WT/het) (2/6) (2/3) (2/4) (2/5) (2/5) severe (n=1)
0
20
40
60
80
100
120
14dpc 20dpc Day 1 Day 3 Day 6 Day 6
Allele
speci
fic
Col1
a1
exp
ress
ion
[%]
Col1a1WT in WT Col1a1WT in Aga2 Col1a1Aga2 in Aga2
n = (WT/het) (2/6) (2/3) (2/4) (2/5) (2/5) severe (n=1)
shown) and the qRT-PCR study was conducted with the same RNA samples from
the 14dpc to 6 day old heterozygous animals previously used for the determination of
the onset of the Col1a1 downregulation described above.
Compared to the expression of the Col1a1WT alleles in wild type mice, the amount of
the Col1a1WT allele was about 50%-60% in all heterozygous animals of all
developmental stages, beginning with 14dpc (figure 35). This value equates the
expression of a single copy gene, as it is the case in heterozygous animals
possessing one WT allele.
Striking, the expression of the mutated Col1a1Aga2 allele did not match these 50% but
was strongly decreased in all heterozygous mice to average 10% compared to the
Col1a1WT alleles in the wild type littermates (figure 35). Concomitantly, the combined
expression of the Col1a1WT and Col1a1Aga2 allele in heterozygous animals yield in
about 60%-70% compared to the Col1a1WT alleles in wild type littermates – the value
already obtained for the overall Col1a1 expression in the heart fibroblast cultures of
Aga2mild.
Astonishingly, one 6 day old heterozygous mouse also showed a dramatic
downregulation of even the healthy Col1a1WT allele to about 20% instead of the
single copy value of 50%-60% seen in the other heterozygous animals (figure 35).
Also the Col1a1Aga2 allele of this mouse was further decreased to about 5%. Since
this heterozygous mouse already showed the severe phenotype with an overall
collagen Col1a1 expression of 25% in the previous experiment (see above and figure
34), the tremendous reduction of the type I collagen in Aga2severe hearts seems to be
caused by an additional silencing of the healthy Col1a1WT allele in these mutants.
Figure 35. Allele specific Col1a1 expression in perinatal development of heterozygous Aga2 (qRT-PCR). Compared to the expression of the wild type Col1a1 allele in wild type mice ( ), the wild type Col1a1 allele is reduced to 50% in all heterozygous animals ( ), corresponding to a single gene copy. In contrast, the mutated Col1a1 allele is downregulated to 10% in all heterozygous animals ( ).
Intriguing, in one 6 day old heterozygous animal the wild type allele is also silenced to 20%. This mouse showed the severe phenotype. Statistical analysis was not performed as the number of wild type mice was n=2.
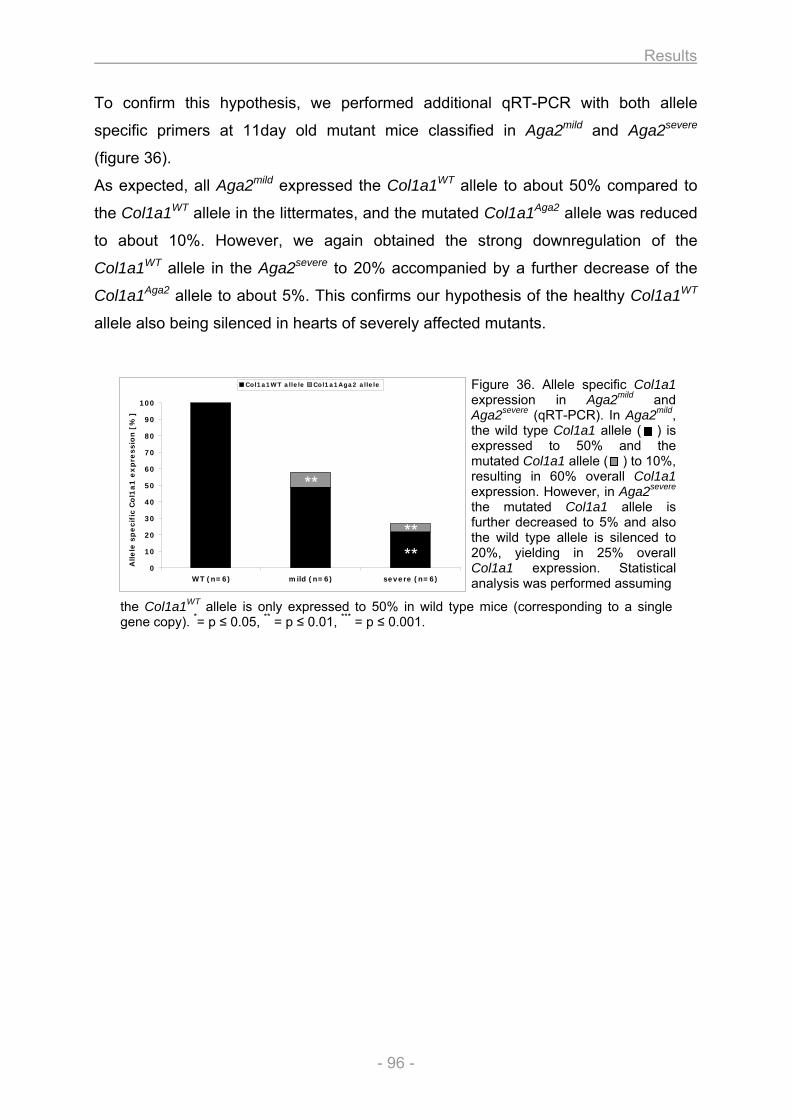
Results
- 96 -
0
10
20
30
40
50
60
70
80
90
100
WT (n=6) mild (n=6) severe (n=6)
Alle
le s
pe
cif
ic C
ol1
a1
ex
pre
ssio
n [
%]
Col1a1WT allele Col1a1Aga2 allele
**
****
To confirm this hypothesis, we performed additional qRT-PCR with both allele
specific primers at 11day old mutant mice classified in Aga2mild and Aga2severe
(figure 36).
As expected, all Aga2mild expressed the Col1a1WT allele to about 50% compared to
the Col1a1WT allele in the littermates, and the mutated Col1a1Aga2 allele was reduced
to about 10%. However, we again obtained the strong downregulation of the
Col1a1WT allele in the Aga2severe to 20% accompanied by a further decrease of the
Col1a1Aga2 allele to about 5%. This confirms our hypothesis of the healthy Col1a1WT
allele also being silenced in hearts of severely affected mutants.
Figure 36. Allele specific Col1a1 expression in Aga2mild and Aga2severe (qRT-PCR). In Aga2mild, the wild type Col1a1 allele ( ) is expressed to 50% and the mutated Col1a1 allele ( ) to 10%, resulting in 60% overall Col1a1 expression. However, in Aga2severe the mutated Col1a1 allele is further decreased to 5% and also the wild type allele is silenced to 20%, yielding in 25% overall Col1a1 expression. Statistical analysis was performed assuming
the Col1a1WT allele is only expressed to 50% in wild type mice (corresponding to a single gene copy). *= p ≤ 0.05, ** = p ≤ 0.01, *** = p ≤ 0.001.
Discussion
- 97 -
4. Discussion
4.1. In vitro analysis of osteoblasts
4.1.1. Establishment of the cell culture system
4.1.1.1. Growth and differentiation of the osteoblasts
In vitro cell culture is the most appropriate way to study the behavior and phenotype
as well as biochemical pathways and molecular mechanisms of cells independent
from systemic influences of the whole organism. For bone cells, the first method to
isolate and cultivate osteoblasts was based on explant cultures with outgrowth of
cells from bone fragments [91-93]. However, cell migration first occurs several days
after incubation, is slow and the quantity of isolated cells is often insufficient for many
experimental needs. Therefore, a new method for osteoblast isolation was presented
by Peck, Birge and Fedak in 1964 using enzymatic digestion of rat calvariae via
crude collagenase solution to obtain a high quantity of morphological intact and
viable cells that contained alkaline phosphatase [94]. The isolation protocol was
further refined by several researchers to obtain a homogeneous population of the
isolated bone cells with improved osteoblastic character [95].
For the cell culture system presented here, the enzymatic isolation of bone cells from
neonatal calvariae has been chosen as the method of choice for several reasons. (1)
Fetal rat or immature mouse calvariae are suitable for enzymatic digestion because
they possess a high surface to volume ratio (large surface area compared to small
volume), they are not heavily mineralized at that stage of development and there is a
substantial amount of collagen in the matrix that can be disaggregated by
collagenase [96]. (2) A recent study has compared osteoblastic cells from different
sources (long bones vs. calvaria), ages (adult vs. fetal) and isolation techniques
(explant vs. enzymatic digestion). They demonstrated that enzymatic released fetal
calvaria cells are the most suitable cells concerning proliferative capacity and
osteogenic potential [97]. (3) The calvaria as flat bone is formed by intramembranous
ossification like most bones of the craniofacial skeleton whereas most of the
vertebrate appendicular and axial skeleton is formed by endochondral ossification
[30]. However, the actual process of bone formation is the same in both cases and
Discussion
- 98 -
they only differ in the material that is replaced during the bone formation (embryonic
mesenchymal condensation vs. hyaline cartilage model). The cells and the chemical
reactions that are involved are identical and the osteoblasts originate from
mesenchymal progenitors in both ossification types. For example, mechanosensitivity
of bone cells was investigated in vitro and no differences were found in
responsiveness of osteoblasts from adult mouse calvaria or long bones suggesting
that both cell cultures can be used for these kind of experiments [95]. On the other
hand, a few restrictions have to be taken into account when working with calvarial
cells that will be discussed below (see Concluding remarks and further directions
4.1.1.4.).
Given these facts and the high number of cells needed for the cell culture system, we
applied the enzymatic digestion method with an optimized protocol for maximum
recovery of viable cells within a short preparation time. Two factors determined the
isolation efficiency. (1) The age of the mice deployed for the isolation protocol was
crucial for cell preparation, as with increasing age the mineralization of the calvaria
proceeds [98], thus impeding the disintegration of the ECM and accordingly reducing
the yield of cells released from the matrix. (2) The quantity and viability of isolated
cells was further determined by the quality of the collagenase used for the isolation
procedure. There is a high variability of the commercial product and the effectiveness
varies between different lots [96]. The quality is mainly defined by the formulation of
the mixture that determines the proportion of protease activity and the amount of
cytotoxic enzymes like clostripain that can also be found in crude collagenase.
Therefore it has been recommended to screen several lots to identify one that is
suitable and then purchasing a larger quantity to continue the work for an extended
period [96].
The calvarial cells that were isolated possessed the typical cuboidal morphology of
osteoblasts [95] and differentiation of the cells was initiated by application of ascorbic
acid and β-glycerophosphate. Ascorbic acid induces collagen synthesis necessary
for development of the ECM by increasing the proline hydroxylation of intracellular
procollagens, stimulating the cleavage of type I collagen propeptides and enhancing
the rate of procollagen secretion from the cell layers to the culture media. It
furthermore enhances the synthesis of several osteoblast-related proteins like ALP
and osteocalcin [99]. ALP in turn is necessary for hydroxyapatite formation by
providing Pi and concomitantly reducing the amount of inhibitory pyrophosphate
Discussion
- 99 -
molecules [22-24]. Since appropriate levels of organic phosphate are further required
for mineralization to occur, β-glycerophosphate can induce mineralization in vitro
[100] and provide a substrate for ALP that hydrolyzes the organic phosphate to
supply Pi [23, 24, 100]. The supplementation considerably enhanced the osteogenic
potential of the culture, seen by increased ALP activity, expression of bone relevant
marker genes, mineralization and formation of nodule-like structures as well as
secretion and matrix deposition of collagen (see below).
Our findings that the degree of differentiation is markedly determined by the cell
density and the quality of the FCS used as media supply are consistant with previous
observations. It has been reported that mineralization in primary cultures only occurs
in multilayer areas [101] and that the number of mineralized nodules is correlated
with the density of plated cells [102]. Furthermore, micromass cultures possess a
higher ALP activity per DNA than monolayer cultures and promote the differentiation
of osteoblast-like cells [102]. It has been suggested that compaction and cell
interactions are required to obtain an adequate environment at mineralizing sites
[101] and cell-cell contacts and cell-cell communication are important for the
differentiation process [102]. Micromass inoculation corresponds to the mesenchymal
condensations during the process of intramembranous ossification and cells in the
condensation exhibit a dramatically increased cell-cell communication, cell-cell
contact and increase the number of gap junctions [102]. Also the quality of FCS has
been shown to affect nodule formation, the level of ALP activity, osteocalcin
synthesis and total mineral accumulation concerning the onset and amount of
differentiation [103]. The concentration of endogenous factors which differ between
various serum lots may be important for osteoblast differentiation like glucocorticoids
which initially promote osteoprogenitor differentiation in vitro or EGF that inhibits ALP
activity and decreases collagen synthesis as well as nodule formation [103].
4.1.1.2. Cellular assays for the characterization of the osteoblast phenotype
To allow for a comprehensive investigation of the osteoblast phenotype, nine
different assays have been designed comprising methods to assess common
features of cell growth and function as well as bone specific parameters.
Proliferative capacity, metabolic activity and protein content are determined to
receive an overall impression of the cellular viability and behavior under culture
Discussion
- 100 -
conditions. As the parameters are obtained within the same biological sample, the
DNA amount can be used to normalize the metabolic activity and protein content.
The applicability of each assay could be verified by a linear correlation between cell
number and assay values (DNA / RFU / µg protein), whereas increasing cell numbers
yield in increasing values but similar values are obtained for all cell number after
normalization to the DNA amount of each samples.
The determination of ALP, mineralization and nodule formation has been included as
widely used indicators and accepted markers for the osteogenic potential of calvarial
cell cultures [97, 103]. The ALP assay based on the colorimetric detection of PNPP
turnover [24, 95] and mineralization was assessed by colorimetric measurement of
calcium deposits using Alizarin Red S [104]. Both methods could be verified by
comparison of the respective parameter between unstimulated vs. stimulated cells
over a cultivation period, that result in a strong increase of the ALP activity as well as
the matrix mineralization in stimulated cells with time, whereas in unstimulated cells
no activity nor staining was detectable. Nodules appear in stimulated cultures and
possess morphological, ultrastructural and biochemical features of embryonic/woven
bone [105]. Osteocyte-like cells are embedded within these three-dimensional
structures [106, 107]. To assess the nature of the nodules in our cell culture system,
we performed ICC for E11 in stimulated cultures. E11 (gp38) was described as a
marker that binds selectively to cells of the late osteogenic cell lineage and was
exclusively found on cell membranes of osteocytes in calvaria specimen and not at
those of osteoblasts [108, 109]. Given the defined expression pattern of E11 with
exclusively staining of the nodules in stimulated cultures, we confirmed the
occurrence of osteocyte-like cells being embedded in the nodule structures.
Therefore we investigated the nodule formation to assess the ability of functional
osteoblasts to differentiate to a more mature (osteocyte-like) phenotype in our culture
system. The strong increase of total nodule area in stimulated cultures with time
verified the established method for investigating the nodule formation.
Given that collagen is the most abundantly expressed protein of the ECM and
isolated osteoblasts in culture synthesize primarily type I collagen (~ 95%) [101], the
measurement of collagen secretion and deposition based on colorimetric
determination with Sirius Red [87] has been implemented to further assess the
osteogenic capacity of the cell culture. Comparable to the verification of the ALP,
mineralization and nodule assay, we have proven the established method for
Discussion
- 101 -
detection of secreted and deposited collagen by comparing both parameters between
unstimulated and stimulated cultures. The overall collagen synthesis increases in
stimulated cultures with time and during this process, the ratio of secreted and
deposited collagen gets reversed. This might be explained by the enhanced
incorporation of collagen into the matrix during formation and maturation of the ECM.
In contrast, neither collagen secretion nor deposition could be detected by the
developed assays in unstimulated cultures.
To further characterize the molecular phenotype of the bone cells, gene expression
analysis has been implemented in the cell culture system. Several studies have been
conducted using comprehensive microarray-based expression profiling to unravel
changes in gene expression during in vitro differentiation of osteoblasts and to find
marker genes for certain developmental stages [110-113]. However, to limit cost and
time intensive experiments, we have developed a qRT-PCR based expression assay
limited to 13 important bone marker genes. The repertoire of marker genes was
chosen to cover all developmental stages of in vitro osteoblast culture with 1)
proliferation 2) differentiation and extracellular matrix maturation and 3)
mineralization [114] as briefly discussed below.
1) Proliferation
The first period is characterized by expression of mitotic active genes important for
regulation of cell cycle and cell growth as well as several genes associated with the
formation of the extracellular matrix [114, 115].
Fos (c-fos) is a nuclear phosphoprotein (Fos family) that after dimerization with c-jun
(Jun family) forms a transcription factor (AP-1). It is considered to be important for the
regulation of skeletal development and highly expressed in proliferating cells. Since
AP-1 can prevent differentiation by inhibition of tissue-specific genes like osteocalcin
(Bglap1), c-fos is downregulated when cells switch to differentiation [115].
Twist1 is a transcription factor involved in the negative regulation of cellular
determination and differentiation of several lineages including myogenesis,
neurogenesis and osteogenesis. As inhibitor of osteoblast differentiation,
overexpression leads to reduced levels of ALP, whereas repression leads to
increased levels of ALP, osteopontin (Spp1) and type I collagen [112, 116].
Therefore, Twist1 must be repressed for osteoblast differentiation to occur [111].
Discussion
- 102 -
Col1a1 is part of the type I collagen heterotrimer - the most abundant expressed
protein of the extracellular matrix fundamental for the development of the osteoid. It is
expressed in the late proliferative phase at the beginning of the differentiation /
extracellular matrix maturation and therefore considered as a marker for the transition
between both developmental stages [117]. Furthermore, mineralization is not
observed if collagen is not produced properly [118].
2) Differentiation and extracellular matrix maturation
During the second developmental stage, genes associated with osteoblast and
matrix maturation are detected and the ECM undergoes a series of modification that
renders it competent for mineralization [114, 115].
Runx2 (Cbfa1) is a transcription factor essential for skeletal morphogenesis and
maturation of osteoblasts in intramembranous and endochondral ossification. It binds
to numerous enhancers and promoters including osteocalcin, osteopontin and bone
sialoprotein. Runx2 performs an antiproliferative function by suppression of cell cycle
progression through G1 and supporting the transition from active cell growth to
quiescence (G0/G1) in osteoblasts [119]. ALP (Akp2) is an important enzyme for matrix calcification by providing Pi for
hydroxyapatite formation and hydrolyzing inhibitory pyrophosphate as mentioned
above [22-24]. It is a widely used marker for the mature osteoblast phenotype and
indicates the late proliferative and early matrix maturation stage [116]. ALP peaks at
the maturation period and decreases to baseline levels in the mineralization phase
[118].
Osterix (Sp7) is a transcription factor that is specifically expressed in all developing
bones. It decreases osteoblast proliferation and is required for the differentiation of
preosteoblasts into functional osteoblasts. Osterix inhibits Wnt pathway activity and
acts downstream of Runx2 [120, 121].
3) Mineralization
The third period is characterized by expression of late stage marker genes for the
mature osteoblast phenotype and by mineralization of the extracellular matrix [115].
Spp1 (osteopontin) is an ECM protein involved in ossification and cell adhesion that
binds tightly to hydroxyapatite and is important to cell-matrix interactions. Spp1
expression reaches peak levels during the initial mineralization period [114] and has
Discussion
- 103 -
therefore been considered as marker of late osteoblastic maturation [111] and pre-
osteocytic stage of ECM mineralization [116].
Fosl2 (Fra2) is an important factor in the development of the mature osteoblast
phenotype. Fra2 (Fos family) dimerizes with JunD (Jun family) to build up a
transcription factor (AP-1). In contrast to c-fos and c-jun which show highest
expression during proliferation, Fra2 and JunD reach highest expression during
mineralization and are involved in the development of the mature osteoblast
phenotype [122].
Bglap1 (osteocalcin) is an ECM protein that constitutes 1-2% of total bone protein,
binds strongly to hydroxyapatite and is involved in ossification and regulation of bone
mineralization. Bglap1 is a marker of mature osteoblasts [115, 117] and its
expression was found to be correlated with the formation of bone nodules [118].
Cst3 (cystatin C) is an ECM protein and member of the cystatin family of proteinase
inhibitors. Cst3 has been found to inhibit bone resorption and it has been postulated
that Cst3 maintains the integrity of newly formed bone matrix by inhibiting the action
of ECM degradating enzymes [113].
Mmp13 (Collagenase 3) is a matrix metallopeptidase that degrades type I collagen
and is involved in bone mineralization and cartilage development (collagen
catabolism). Osteoblast-derived matrix metalloproteinases are key mediators of bone
resorption during the initial stage of osteoid removal prior to osteoclast attachement.
The expression of Mmp13 has been reported to increase during osteoblast
differentiation and mineralization in vitro and is controlled by Runx2 [110].
Ibsp (bone sialoprotein) is a noncollagenous glycoprotein that stimulates cell
attachment and its distribution is restricted to bone and mineralized tissues in vivo. It
is a marker for osteoblast differentiation and overexpression of Ibsp has been shown
to increase osteoblast-related gene expression as well as calcium incorporation and
nodule formation in osteoblast cultures. Thus, Ibsp promotes osteoblast
differentiation and it has been furthermore considered to be an initial center of
hydroxyapatite crystal precipitation [123, 124].
E11 (Gp38) is described as a marker of the late osteogenic cell lineage and was
found to be expressed exclusively on osteocytes and not osteoblasts within calvaria
specimen [108, 109]. Since we confirmed its expression in nodule-like structures,
E11 has been included in the expression analysis as a marker for terminally
differentiated osteoblasts / osteocyte-like cells.
Discussion
- 104 -
The established qRT-PCR gene expression assay and the developed primer pairs
could be verified by a high accordance of the expression values for each marker
gene between single biological replicates (separate cell cultures from individual
calvariae).
To achieve a reasonable and significant comparison of the osteoblast phenotype
between two biological groups, all assays have been designed to allow for a
quantification of the measured parameters and to assess the development of the
cellular phenotype by means of a kinetic collection of the data throughout the whole
culture period.
4.1.1.3. Validation of the cell culture system
To validate the established cell culture system, two mutant lines were investigated to
assess the biological significance of the system and further examine the practicability
of the developed SOP for an entire analysis of the cells comprising all developed
assays. Aga2 and ABE2 were chosen as mutant lines possessing strong alterations
of the bone phenotype previously identified and described within the primary and
secondary screening in the Dysmorphology, Bone and Cartilage module of the GMC.
1. Wild type osteoblasts
If the behavior of the wild type control cells of both analyses are compared to each
other, a similar picture of the cellular development and osteoblast differentiation is
obtained. As revealed by the proliferation assay, cell growth is highest during the
initial phase of development and afterwards decreases to the end of the culture
period. The course of cell growth reflects three distinct proliferation periods during the
in vitro culture. The exponential growth at the beginning supports the expansion of
the osteoblast population. Postconfluent proliferation supports focal multilayering of
bone forming cells and biosynthesis of type I collagen to establish a bone tissue-like
organization with developing nodules. Compensatory proliferation occurs in a limited
extent in mature, mineralizing bone nodules accompanying collagenase-mediated
apoptotic restructuring of the nodules [8]. Given that replication and cell growth are
energy-expensive processes, the metabolic activity of the culture is highest at the
beginning of the culture period and decreases during matrix maturation and
mineralization when the initial proliferation phase is restricted for differentiation to
Discussion
- 105 -
occur [8, 125]. In contrast, protein synthesis is low during the initial proliferation stage
but increases when the ECM is produced and remains high for maintaining and
restructuring of the matrix.
The osteogenic potential of the culture markedly increases at the end of the growth
period, according to the reciprocal and functionally coupled relationship between the
decline in proliferative activity and the subsequent induction of genes associated with
matrix maturation and mineralization [114, 125]. For example: the ALP gene was
expressed as previously described reaching the maximum mRNA-level during the
stage of differentiation and extracellular matrix maturation (about T15) [125], whereas
the enzyme activity increased until the end of the cultivation period [102, 103].
Although Col1a1 mRNA already peaked during the proliferative stage [8, 125], the
overall synthesis and ECM incorporation of collagen increased during the culture time
[125]. That shifting of mRNA level and collagen incorporation has previously been
reported and it was shown that type I collagen synthesis and collagen accumulation
are uncoupled in the developing osteoblast [126]. Accompanied by an strong
increase of Spp1 (osteopontin) and Bglap1 (osteocalcin) - two markers for mature
osteoblasts that bind to hydroxyapatite, regulate ossification and peak during the
beginning of mineralization [125] - matrix mineralization and nodule formation starts
at the late stage of exponential growth and proceed by the end of the culture period
[103, 107, 125].
Taken together, the wild type cells recapitulate the aforementioned developmental
sequence of 1) proliferation, 2) differentiation and extracellular matrix maturation and
3) mineralization [114].
Aga2 osteoblasts
In comparison to the wild type culture, calvarial cells from Aga2 mutants depict a
different characteristic of osteoblast development and maturation. No obvious
differences where found in the metabolic activity and overall protein synthesis. It has
been reported that, although the amount of collagen was significantly reduced (see
below), the amount of total protein synthesized by OI bone cells in culture was
unchanged compared to controls [127]. In contrast, the proliferation of mutant cells
was significantly changed. After a slightly reduced exponential growth phase, the
proliferation plateaued and again increased during the end of the culture period. This
Discussion
- 106 -
goes well with the previously described decrease of the maximal growth rate of
human osteoblasts from OI patients in vitro [127, 128].
Strikingly, the development of the osteogenic phenotype was completely disordered.
The reduction of the ALP activity is due to the almost unchanged ALP gene
expression throughout the culture period with a 3-fold lower peak expression
compared to wild type cells. As previously described for bone cells from human OI
patients [127, 129], the overall collagen synthesis (secreted and deposited) was
decreased in accordance with the lower expression of the Col1a1 gene. The matrix
mineralization assay revealed higher values of calcium incorporation in the Aga2
matrix compared to controls. Recent findings indicate a relation between collagen
structure and mineralization pattern [130, 131]. Thus, it is conceivable that – although
the overall secretion of collagen is decreased in Aga2 – structural changes in the
matrix by incorporation of mutated Col1a1 chains entail alterations in nucleation sites
leading to higher calcium incorporations. However, our findings are in correlation to
studies showing higher mineralization in human OI patients [132], but further
investigations regarding this matter are needed. Finally, the diminished osteogenic
potential of the Aga2 calvarial cells was further indicated and morphological
discernable by a strong reduction of nodule formation.
The alterations on the protein and functional level could be confirmed with the
expression analysis. Beside the already mentioned alteration of the ALP and Col1a1
transcript level, the expression of almost all bone marker genes were changed. In
most cases, the changes comprise three or more time points during the culture
period in a manner that indicates diminished differentiation and matrix maturation.
For example, the decrease in Runx2 and Osterix after the exponential growth phase
are in accordance to the observed secondary rise of the proliferative activity and the
reduced osteogenic potential of the Aga2 osteoblasts, since both transcription factors
have anti-proliferative functions and are important for the transition from cell growth
to the differentiation of the osteoblasts [119-121]. The downregulation of Bglap1,
Spp1 and Ibsp at the end of the cultivation period also indicate a disordered
osteoblast differentiation in Aga2, since these ECM proteins are considered as
markers of late osteoblastic maturation and found to be correlated with bone nodule
formation [111, 118, 123].
Discussion
- 107 -
The results obtained within the Aga2 cell culture might be explained by the
interaction between proliferation, ECM maturation and osteoblast differentiation in
bone development. The Col1a1 mutation in Aga2 leads to structural alterations of the
type I collagen protein with reduced extracellular secretion causing impairment of
structural and functional ECM integrity [55]. Since a proper matrix is necessary for
cellular differentiation and function [30], and a critical role of type I collagen in
mediating the expression of a mature osteoblast phenotype has been proposed
[133], the decreased collagen expression and failing ECM in Aga2 cultures prevent
appropriate osteoblast development. Furthermore, there is a reciprocal correlation
between proliferation and matrix maturation, hence proliferation needs to be
decreased for differentiation to occur [114, 125]. Thus, the secondary increase in
proliferation during the end of the culture in Aga2 cells might impede or delay the
transition between the proliferation stage and the phase of differentiation and
extracellular matrix maturation.
The course of cell growth with reduced proliferation at the beginning and the
secondary increase towards the end of the culture period might be explained by the
previously reported link between type I collagen synthesis and cellular proliferation,
whereas destabilized collagen triple helix formation and altered collagen secretion
also decreases the maximal growth rate [128]. Thus, the reduced extracellular
secretion of type I collagen in Aga2 diminish the proliferation at the beginning and
after a basal level of collagen has incorporated in the matrix, proliferation might
increase a second time. In wild type cells such a second growth phase does not
occur, as the transition point towards extracellular matrix maturation and
differentiation has been exceeded after the first phase of proliferation.
Given that the osteoblasts are cultivated under identical conditions independent from
systemic influences in vitro, the differences in the cellular behavior and development
between mutant cells and wild type control refer to a primary defect of the Aga2
osteoblasts, whereas inappropriate collagen synthesis and secretion yield in a
diminished or at least delayed extracellular matrix maturation and osteoblast
differentiation in Aga2.
Discussion
- 108 -
ABE2 osteoblasts
In contrast to Aga2, no significant differences were obtained in the cell culture system
between osteoblasts from ABE2 mice and wild type control animals in the assays
performed and parameters analyzed. The differences in the expression of some
marker genes are not considered as biological significant, since the alterations only
occurred at one out of five measurement days except for Mmp13 and Ibsp - but these
two markers already showed the highest variability in the validation experiment with
biological replicates (see Gene expression (A5) 3.1.1.6. and table 8). Only the
expression of osteocalcin (Bglap1) differed from the wild type control over the
complete cultivation period with elevated values observed in ABE2 osteoblasts. One
possibility for the elevated osteocalcin expression might be a failing of Notch
activation in the osteoblasts by the mutated Jagged1 ligand. Since Notch normally
inhibits osteoblastogenesis and impairs osteoblast differentiation [134], the
insufficient Notch activation in ABE2 bone cells promotes osteoblast differentiation
and thus, osteocalcin as differentiation marker is elevated.
This alteration in the Jagged1 - Notch interaction might also explain the overall bone
phenotype with more cortical bone and a higher trabecular bone mineral density in
ABE2 mice, as previous studies with transgenic mice lacking Notch signaling reveal
increases of osteoblastogenesis and bone parameter in the mutants [135]. However,
the effect is reversed in older mice and long term inhibition of Notch results in
osteoporotic mice [135], which to our knowledge has never been observed in ABE2.
Moreover, Notch1/2 mutants have increased trabecular bone volume but ABE2 mice
possess strong alterations of the cortical bone. Finally, although Notch and Jagged1
are expressed in osteoblasts [134] and could therefore influence themselves in
culture, no alterations (except for osteocalcin gene expression) were observed in the
analyzed cellular parameters. In contrast, in vitro cultivation under identical conditions
without systemic influences reveals identical behavior and development of ABE2
calvarial cultures compared to wild type control. Thus, we assume a secondary effect
occurs in the ABE2 mutants leading to the bone phenotype rather than a disordered
Jagged1 - Notch interaction in bone cells.
A possible explanation for the alteration of the bone structure in ABE2 might be the
increased angular velocity and forward locomotor activity in mutant mice, which was
revealed in the Behavior Screen of the GMC (unpublished data) and might be related
to the vestibular defect in these mutants [90]. Previous studies have shown that
Discussion
- 109 -
enhanced locomotor activity in laboratory mice markedly increased bone mineral
content, bone mass and density as well as cortical area and concomitantly enhances
bone mechanical properties [136, 137]. Therefore, the increased bone parameters
might be explained as a secondary effect due to elevated physical activity that
positively effects bone homeostasis and remodeling [32].
It should be emphasized, that the aforementioned speculation about the unaffected
Notch signaling is not a general consideration for the mutants. In contrast, given that
the mutation of Jagged1 resides in the second EGF-like repeat of the extracellular
domain important for Notch binding [90], a disordered Jagged1 - Notch signaling is
actually likely but might be unrecognized in bone development, since osteoblasts
also express Delta-like1 which may rescue the Jagged1 mutation with regards to
Notch activation [134]. Further studies concerning this matter are necessary that
might also elucidate the observed alterations in the osteocalcin expression in primary
calvarial osteoblasts of ABE2.
4.1.1.4. Concluding remarks and further directions
A comprehensive and multifaceted cell culture system has been established to
unravel and describe the cellular phenotype of in vitro cultivated osteoblasts isolated
from mice with bone alterations in a quick and timely fashion. The combination of
nine different assays - each performed at multiple time points during a 3 week culture
period - allows for the assessment of general properties of cell growth and function
as well as concurrently the determination of bone specific parameters on functional-,
protein- and RNA-level. As the cells are cultivated and investigated independently
from systemic influences of the whole organism under identical and well known
conditions, it is possible to assess whether a primary cell autonomous or a secondary
systemic effect is responsible for the observed bone phenotype [138].
However, the system should be regarded as a first line investigation and important
considerations have to be taken into account for the interpretation of the results.
1) Variation in isolation, initial plating and cultivation of the cells can occur between
different days and replicated cultures. Since the osteoblast differentiation is
determined by the culture conditions as shown in initial experiments, wild type control
cells have to be isolated, cultivated and analyzed in parallel to every mutant line. This
ensures identical treatment of wild type and mutant cells which is the basic
Discussion
- 110 -
requirement for a reliable comparison of both cultures and the assessment of the
mutant phenotype.
2) Given that the mutant and wild type cultures each arise from a single pool of cells,
biological replicates are not performed within the culture system and therefore,
statistical predications are not feasible. Thus, it should be kept in mind that only
trends in the differences between mutant and wild type cells can be obtained, but the
development and course of each single parameter during the culture period provide
valuable information to assess possible differences between both cultures.
3) It has been mentioned above, that neonatal calvarial cells are the most suitable
cells concerning proliferative capacity and osteogenic potential. However, this means
that osteoblasts from different sources (e.g. long bones) possess changes in their in
vitro development and indeed, differences in ALP activity and mineralization between
cultures from calvaria and long bones were found [97]. In contrast, for other
parameters like mechanosensitivity no differences were found [95]. As
aforementioned, the actual process of bone formation is the same between
intramembranous and endochondral ossification with the same cells and chemical
reactions being involved. However, the intramembranous origin of the calvaria should
always been taken into account when correlating the result from the culture system to
bone alterations observed in the long bones (endochondral). Furthermore, it has
been noted that neonatal cell cultures behave differently and contain more immature,
rapidly growing cells than cultures from adult bone [95]. Therefore, the age of the
calvaria also has to be considered when explaining the result of the cell culture
system in association to a bone disease with late onset in adult mice.
4) The established system enables the analysis of osteoblasts. However, the skeletal
system is maintained by a precisely regulated interaction between bone formation
(osteoblasts) and bone resorption (osteoclasts) in the process of remodeling
(homeostasis). Thus, the investigation of osteoblasts allows for assessing the
formation process but alterations in bone resorption cannot be disclosed. Therefore,
in vitro analysis of osteoclasts can be implemented to broaden the phenotyping
options of the cell culture system. TRAP staining and pit formation assays could be
performed to evaluate osteoclast development and function [139]. To further extend
the cellular analysis and unravel possible dysregulations in cell-cell communication,
coculture systems can be applied combining osteoblasts and MSC [140], osteoblasts
and osteoclasts [141] or osteoblasts and chondrocytes [142] for example.
Discussion
- 111 -
4.2. Heart and lung investigation in the Aga2 OI mouse model
Although primarily described as a bone disorder, alterations in other organ systems
are known associated symptoms in Osteogenesis imperfecta and in the most severe
cases, pulmonary and cardiovascular impairments are described as the main causes
for lethality. However, there is no direct association between the underlying collagen
mutation and the pathological tissue alterations leading to death so far. Moreover, the
malfunctions in lung and heart are considered as secondary effects due to bone
deformities and fractures, respectively.
Comparable to clinical heterogeneity in human Osteogenesis imperfecta,
heterozygous Aga2 mice possess two different phenotypes concerning symptoms
and lethality. Aga2mild possess a moderate phenotype and survive to adulthood, while
Aga2severe exhibit a serious onset of symptoms and succumb to postnatal lethality. To
elucidate the pathological differences and molecular reasons leading to death in the
severe affected mice, comprehensive investigation of the Aga2 mutant line was
performed. Functional, morphological and molecular-genetical analyses were
conducted concentrating on heart and lung as the most affected organs in lethal
human OI cases.
4.2.1. Downregulation of cardiac type I collagen in Aga2
In Aga2severe, we observed a tremendous downregulation of the type I collagen
protein in heart tissue and cardiac fibroblasts, both in vivo and in vitro. The result was
confirmed independently on protein level by IHC and ICC as well as transcript level
using expression profiling and qRT-PCR. On the RNA level we found a 4 fold
decrease in the Col1a1 expression (to 25%) in Aga2severe compared to wildtpye
tissue. To our knowledge, such strong reduction of the collagen content in hearts of
lethal OI has not been shown before. There is one study describing a downregulation
of collagen in hearts of the oim mouse model for OI [49]. However, the investigation
was done in surviving animals at the age of 16 weeks which do not succumb to
earlier lethality [143] and the mutation affects the Col1a2 gene, which can be partially
rescued by the formation of homotrimers composed of Col1a1 [144]. Furthermore,
echocardiograms showed no differences and the collagen concentration was only
about 1.8 fold reduced - comparable to the downregulation of the collagen in Aga2mild
Discussion
- 112 -
animals which as well survive to adulthood. Only one study hints to a downregulation
of the collagen content in the lethal form of type II OI by investigating the hearts of
two deceased fetuses using SEM and TEM analysis. However, they did not relate the
collagen alterations with the onset of heart failure [50].
To explain the strong downregulation of type I collagen in hearts of Aga2severe, we
have to consider two important facts regarding cardiac fibroblasts. First, as one of the
pivotal organs in the body, the maintenance of heart function during stress situations
is essential for survival of the organism and therefore, mechanisms of resistance
against stress-induced cell death in this organ have been evolved [145]. Since
cardiac fibroblasts play an essential role for heart physiology by producing the ECM
as well as angiogenic and cardioprotective factors, they possess the most enhanced
survival potential in cases of serious insults in the heart [146]. Space left by dead
myocytes is filled by several cell types including fibroblasts and newly synthesized
extracellular matrix [147, 148]. It has been shown that cardiac fibroblasts have
decreased apoptosis and sustained proliferation in case of hypoxia, alcohol exposure
and oxidative stress, for example [149-151]. On the other hand it is known, that
unfolded or misfolded collagens triggers the activation of ER stress related genes
such as BiP, CHOP and HSP47 in affected cells like chondrocytes and fibroblasts
[152, 153]. Furthermore, the expression and intracellular retention of mutant collagen
is accompanied by ER stress in OI [154]. Additionally, we have recently shown that
the expression of the mutated Col1a1 in our Aga2 OI model also causes ER stress-
associated unfolded protein response in osteoblasts and induces apoptosis in the
cells [55]. Considering both issues - the necessity for ECM production while avoiding
apoptosis and the increased cell death after expression of malformed collagen - the
cardiac fibroblasts, in the case of OI, run into a dilemma if they express the mutated
collagen. The observed collagen reduction might therefore be the only escape to
circumvent cell death in cardiac fibroblasts. Indeed, we found no signs for apoptosis
in the heart, neither on protein nor on RNA level. In contrast, Cox6a1 which has been
recently described as a novel suppressor of Bax-mediated cell death was elevated
[155], strengthening our hypothesis that decreased collagen expression prevents
apoptosis.
Moreover, the Col1a2 allele as the binding partner for the collagen I heterotrimer was
as well downregulated together with Dpt and Mfap4, two important proteins for
collagen fibrillogenesis and matrix assembly [156-159]. Thus, the collagen reduction
Discussion
- 113 -
seems to be a well-regulated cellular process. And since the decreased collagen
expression was additionally verified in cultivated heart fibroblasts of Aga2severe in vitro,
the downregulation appears to be primarily caused and intrinsic to the fibroblasts,
independent from systemic influences and pathological tissue alterations.
4.2.2. Structural alterations and dysfunction of the heart in Aga2
The downregulation of type I collagen as the major ECM protein entail structural
alterations and impair the integrity of the heart connective tissue in Aga2severe. IHC
points out the collagen meshwork as fundamentally disordered with interrupted
collagen distribution throughout the extracellular matrix. SEM analysis further
discloses considerable alterations in structure, organization and spatial arrangement
of the collagen fibrils. The reduced thickness, stronger bending and increased ratio of
smaller fibrils is similar to the observation made in the two studies which showed a
slight collagen downregulation mentioned above [49, 50]. Finally, expression profiling
hint to an increased remodeling of the ECM showing upregulation of Col8a1, Ctgf
and Tgm2, which might simultaneously indicate a possible rescue mechanism for
maintenance and stabilisation of the heart connective tissue [160-162]. Additionally,
reduced PECAM staining indicates impairments in cardiac vessel integrity. This is
confirmed by the upregulation of Col8a1 that was shown to be elevated after vessel
injury in hearts [163].
An appropriate collagen scaffold is needed for attachment, connection and
orientation of myocytes and muscle fibers, confers myocardial stiffness and
biomechanical strength to resist contraction force and is required for adequate
diastolic and systolic ventricular function [164, 165]. Furthermore, since a broad
decrease of the collagen amount results in a dilated ventricle with increased
compliance [166], the disordered collagen matrix in Aga2severe leads to impaired
cardiac function and the development of heart failure in these lethal OI mice.
Indeed, histological examination clearly depicts the expected morphological
alterations in hearts of Aga2severe. Given the huge differences in the body constitution
between severe mutants and wild type littermates, the even heart size is pathological
and caused by enlarged septum and right ventricular hypertrophy. Expression
profiling confirmed the morphological findings with upregulation of Nppa, Tgm2 and
Slc25a4 as marker for hypertrophy and stress. Nppa is a hormone exclusively
Discussion
- 114 -
secreted by heart cells in response to stress, high blood pressure and atrial stretch to
modulate cardiac growth and hypertrophy [167, 168]. Tgm2 was shown to be
markedly increased during transition to heart failure and development of hypertrophy
[169] and Slc25a4 (Ant1) activation is involved in cardioprotective program to
improve myocardial functions in failing hearts [170]. Furthermore, the combined
strong upregulation of Mt1 with decreased D0H0S114 (P311) expression hints at
muscular atrophy of the heart [171], which might argue for an alteration of the cellular
tissue composition with reduced myocyte fraction.
The accompanied functional impairments could be clearly disclosed by ultrasound
analysis. Left ventricular end-systolic internal diameter (LVESD) is significant
elevated in the lethal Aga2severe and the fractional shortening and ejection fraction
accordingly decreased. This alludes to an impaired mechanical property of the
cardiac ECM and restricted ability of the ventricular muscle to contract, which might
be due to the collagen deterioration [164, 165] and/or a diminished myocyte fraction
which decreases brawniness and muscle strength. The hypertrophic tissue
accompanied by the impaired cardiac function might be referred to as hypertrophic
cardiomyopathy [172].
4.2.3. Hemorrhagic lungs and impaired pulmonary function in Aga2
Consistent with the literature [46], we also observed a strong lung phenotype in
Aga2severe with hemorrhagic lungs accompanied by pneumonia and pleurisy as the
most distinctive features. These morphological observations could be affirmed by the
significant regulation of markers for injury and inflammation within the expression
profiling. Tgfbi and Ltbp3 – both associated with TGF beta and marker for wound
healing and inflammatory response [173, 174] are upregulated as well as Tnc, which
reappears in adult tissue during injury and wound healing [175]. Furthermore, the
elevation of Wnt11, which has been shown to be involved in inflammation of joints
and the intestine further hint to inflammatory processes in the lungs of Aga2severe
[176, 177]. In addition, the Wnt pathway has also been associated with lung diseases
such as interstitial lung disease (ILD) and asthma [178].
Discussion
- 115 -
Intriguingly, comparison of the ribcage morphology and the blood gas analysis
revealed the bleedings in Aga2severe are not caused by bone fractures, since Aga2mild
exhibit the same strong fracture rate as Aga2severe but concurrently possess a normal
lung phenotype without bleedings and normal blood gas parameter. The ubiquitous
distribution of the bleedings over the lung parenchyma argues for an intrinsic onset of
the hemorrhages. Therefore, most important and contrary to the published literature
describing lung problems due to bone alterations [40, 47], we found that the
bleedings are primarily caused and bone-independent not due to ribcage fractures.
Concomitantly with the hemorrhagic lungs, vessel problems shown by reduced
PECAM staining in lung capillaries might be related to the bleedings. Moreover, the
upregulation of Agt as an antiangiogenic factor can prevent neovascularization [179]
and the simultaneous decrease of some angiogenesis supporting markers like Ang,
Cxcl12 or Ctgf hint to a diminished angiogenesis in lungs of Aga2severe [180-182].
Bleedings prevent adequate respiration. Therefore, as expected from the
hemorrhagic lungs, molecular markers inducible by hypoxemia and hypoxia were
upregulated in the lung of Aga2severe, like Pltp, Cd248, AR and Gdf10 [183-186].
Furthermore, Prkce which contributes to pulmonary vasoconstriction in case of
hypoxia was elevated [187]. Importantly, various markers indicating low oxygen
supply were as well upregulated in the heart tissue, like Aldoa, Eno, Ldha or Egln3
[188, 189], thus confirming our hypothesis of hypoxic conditions in Aga2severe. Indeed,
electrochemical analysis of blood gas parameter discloses a tremendous reduction of
the pO2 arterial pressure and corresponding low oxygen saturation in the blood of
Aga2severe, confirming our hypothesis and referring to hypoxemic hypoxia in lethal
mutants. Beside, the equal blood gas parameter in Aga2mild with strong rib fractures
and wild type littermates possessing healthy ribcages, strengthen our assumption for
a bone-independent incidence of the lung alterations. Since hypoxia has shown to
cause greater injury and cell death in myocytes compared with cardiac fibroblasts
[149], the hypoxic conditions might also explain the aforementioned speculated
decrease in the myocyte fraction of the heart.
Discussion
- 116 -
4.2.4. Pulmonary ECM in Aga2
In contrast to the heart tissue, we obtained no hints for a substantial remodeling of
the extracellular matrix in lungs of Aga2severe and Col1a1 was not found to be
significantly altered. This was confirmed independently on the protein level using
histology and in vitro cultivation of pulmonary fibroblasts as well as on the transcript
level applying expression profiling and qRT-PCR. We found a negligible tendency of
Col1a1 downregulation to about 75% as compared to the wild type situation. The
morphological absence of fibrotic tissue in the lung was further supported by the
downregulation of Ctgf as a transcription factor responsible for enhanced tissue
assembly and fibrotic processes [190-192], that was upregulated in the heart.
Concomitantly, Fli1 as a negative regulator of Ctgf was upregulated, explaining the
decrease of the Ctgf transcript [193].
Contrary to the Col1a1, some other ECM related markers showed a significant
alteration on the expression level. For example, Mfap2 as an elastin binding
microfibrillar glycoprotein important for the formation of elastic fibers [194] was
upregulated in Aga2severe as were type III and type V collagens. Concurrently, we
observed an upregulation of Dpt as an important protein for the fibrillation of the
collagen molecules, that was downregulated in the heart [157, 158]. Another
upregulated ECM molecule was tenascin C (Tnc). Beside its function in wound
healing described above, it is known to be induced in pulmonary vascular disease
affecting vascular remodeling [195]. Importantly, it has been shown that denatured
collagen increases the activity of the Tnc promoter [195] and moreover, nonmodified
native type I collagen suppresses its activity [196]. Therefore, although the quantity of
the type I collagen was only marginal changed in the lungs, this might be a slight hint
for possible structural alterations of the mutated collagen which is able to induce the
Tnc promoter. Accordingly, the upregulation of type III and V collagens as interaction
partner of type I collagen and some other ECM proteins could be seen as a rescue
mechanism, to support the constitution of a functioning matrix in presence of the
mutated and therefore structural altered type I collagen.
Surprisingly, no signs for augmented apoptosis could be obtained in lungs of
Aga2severe. Contrariwise, the proapoptotic factors Bnip3, Hey1 and Dusp6 were even
slightly downregulated as shown in expression profiling [197-199] whereas Prkce, an
anti-apoptotic PKC isoform was upregulated [200].
Discussion
- 117 -
4.2.5. Pathological linkage between heart and lung dysfunction in Aga2
To explain the correlation between the heart and lung alterations seen in lethal
Aga2severe, we have to consider the pathological interactions between lung function
and cardiovascular disease, whereas pulmonary hypertension and hypoxia contribute
to cardiac remodeling and heart failure, and vice versa [201-205].
Indeed, besides the described structural and functional impairments in the heart and
the hypoxic conditions, we found an upregulation of marker for hypertension within
the expression profiling of Aga2severe. Tgm2 has been shown to contribute to the
development of hypertension [206] and beside its antiangiogenic effects mentioned
above, Agt increases blood pressure due to vasoconstriction [207]. Additionally,
tenascin c - already mentioned above - has also been implicated to be expressed
upon mechanical stress and in clinical pulmonary hypertension [208-210]. All these
markers are elevated in heart and lung, respectively, alluding to hypertension in the
cardiopulmonary system of Aga2severe.
Consequently, we assume a vicious cycle of heart failure, pulmonary hypertension
and hypoxia is enforced in Aga2severe and the vast abatement of the oxygen supply
finally leads to death in severely affected mice. It is important to mention that an
increase and progressive remodeling of cardiac type I collagen has been found to
occur in failing myocardium as a kind of reparative myocardial fibrosis, to at least
partially ameliorate life-threatening consequences [146, 150, 211]. But as explained
before, the upregulation of mutated type I collagen in cardiac fibroblasts would cause
cellular deterioration in this pivotal organ [212], precluding this adaptive mechanism,
thereby fortifying the pathological cycle leading to death.
4.2.6. Origin and molecular onset of the cardiopulmonary disorder in Aga2
The early onset of the Col1a1 downregulation during the embryonic development
allude to the heart as the origin of the pathological changes. Since downregulation
and structural alterations of the cardiac type I collagen lead to the functional
impairments [164, 165], we assume this as the initial point for the pathological
alterations in terms of an intrinsic cardiomyopathy in Aga2severe mice. The heart
dysfunction might entail a secondary pulmonary hypertension [213], which triggers
the bleedings and the emerging hypoxia, additionally favored by vessel problems and
Discussion
- 118 -
an impaired angiogenesis in the lungs. Furthermore, the in vitro observed collagen I
downregulation in cardiac fibroblasts under normoxic conditions independent from
further systemic influences argue for the cardiac origin of the pathological cycle in
Aga2severe.
Admittedly, the downregulation of the type I collagen in the embryonic heart tissue
was not that strong as in Aga2severe but yield the values obtained in Aga2mild that
survive to adulthood. Therefore, we also have to consider further mechanisms occur
in parallel to the heart alterations and trigger simultaneously the onset of the
pathological changes in the cardiopulmonary system. It might be conceivable that the
hypertension occurs first or in parallel as idiopathic (primary) pulmonary hypertension
[214] and the accompanied bleedings are fostered by vessel alterations. Indeed, an
upregulation of Wnt11 has previously been shown in idiopathic pulmonary arterial
hypertension [215]. The resulting hypoxia then entails the cardiac hypertrophy as an
extrinsic cardiomyopathy which in turn fortifies the pathological cycle. To clarify this
issue, additional investigations have to be done. However, several reasons discussed
above argue for a bone-independent primary nature of the pathological alterations in
heart and lung that finally lead to premature death in severely affected Aga2 mice.
To finally explain the molecular mechanism for the strong collagen I downregualtion
in hearts of Aga2severe and to reveal the differences in the type I collagen expression
between both mutant groups, allele specific Col1a1 expression was investigated in
heart tissue of heterozygous animals. In Aga2mild, the wild type Col1a1WT allele was
expressed to about 50%-60% compared with wild type littermates, corresponding to
the amount of a single copy gene. The downregulation of the mutated Col1a1Aga2
allele to about 10% is likely to avoid the formation of malformed collagen
heterotrimers, which might cause cellular stress [55, 154]. Intriguingly, in Aga2severe
the mutated Col1a1Aga2 allele is further silenced down to 5% and most strikingly and
unexpectedly, even the wild type Col1a1WT allele is dramatically decreased to about
20% in severely affected Aga2 mice. In Osteogenesis imperfecta, such
downregulation of the wild type Col1a1 allele has not been shown before or allele
specific differences of the Col1a1 expression could not be detected [154].
Discussion
- 119 -
A possible explanation for this phenomenon was obtained in the expression profiling
with the strongest upregulation of Mt1 in the hearts of Aga2severe. Beside its
expression as a cell protective factor in cases of stress and hypoxia [216], Mt1 has
also been found to be expressed in cardiac injury [217, 218]. But most importantly,
Mt1 positively regulates the cellular level and activity of the transcription factor
NF-kappaB [219, 220], which in turn inhibits the expression of Col1a1 [221]. Given
that NFkappaB is also known to inhibit the Col1a2 allele [222], the concomitantly
strong decrease of the Col1a2 allele in Aga2severe hearts point further to the assumed
Mt1 - NFkappaB induced downregulation of the type I collagen. Additionally, the
downregulation of Rabgef1 as a potent inhibitor of NF-kappaB activation [223]
strengthen our hypothesis of NF-kappaB mediated collagen reduction. Since
NFkappaB affects the promoter activity, this might explain the downregulation of the
mutant as well as the wild type Col1a1 allele in Aga2severe. In contrast, the slight type I
collagen reduction in Aga2mild seems to be a more epigenetic regulation of allele
specific silencing, only inhibiting the mutated Col1a1Aga2 allele. Beside the supposed
Mt1 - NFkappaB mechanism, also Nppa, which is strongly upregulated in hearts of
Aga2severe, has been described to reduce the collagen expression [224, 225].
However, this assumption is hypothetical and the precise molecular mechanism for
the strong collagen downregulation in Aga2severe remains to be further elucidated and
the molecular switch determining the mild and severe phenotype in heterozygous
Aga2 has yet to be identified.
4.2.7. Concluding remarks
To date, various clinical studies have been performed showing pathological
alterations in combination with pulmonary and cardiac dysfunction in Osteogenesis
imperfecta. However, the impact of abnormal collagen is poorly understood and lung
disease and heart failure are thought to be secondary due to fractures and bone
deformities. Therefore, lethality in OI patients suffering from cardiovascular and
pulmonary disorders has been seen as asymptomatic subjects.
Within this work, bone-independent and primary pathological alterations of heart and
lung in the case of OI have been described for the first time using a new mouse
model for this severe bone disorder. A strong downregulation of cardiac type I
collagen was shown to occur in severely affected mice and related to structural as
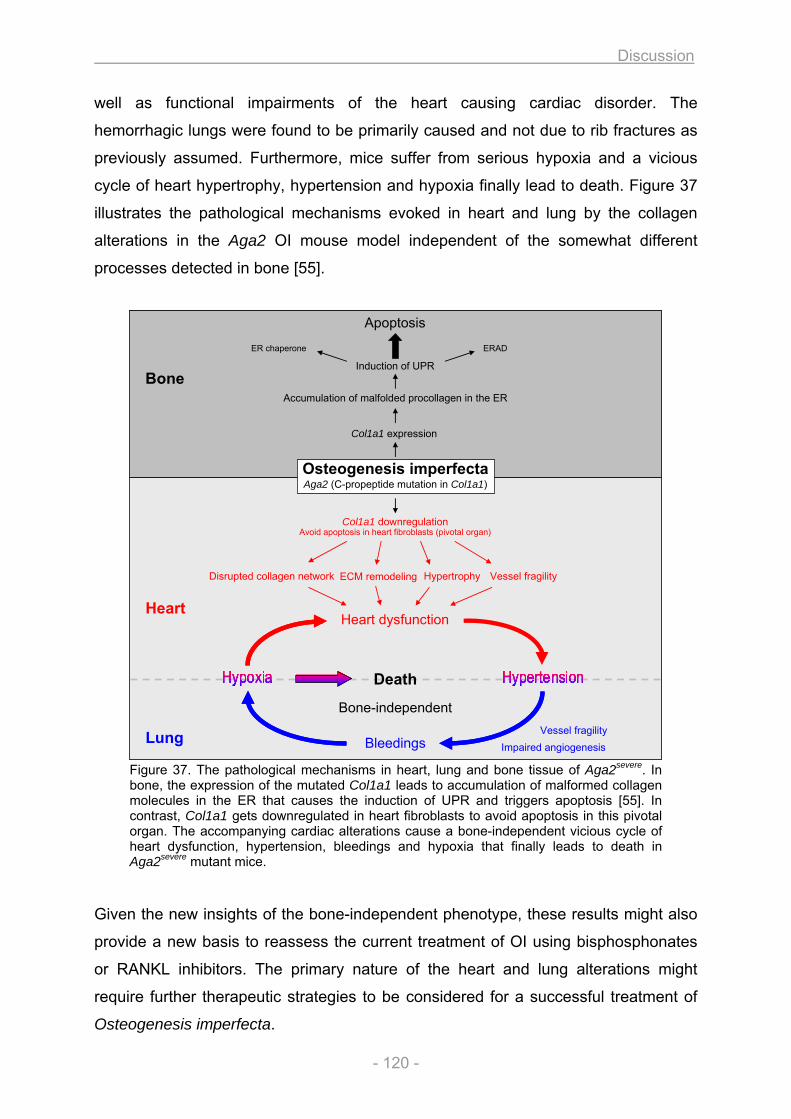
Discussion
- 120 -
Bone
Col1a1 expression
Accumulation of malfolded procollagen in the ER
Induction of UPR
ER chaperone
Apoptosis
Heart
ERAD
Avoid apoptosis in heart fibroblasts (pivotal organ)Col1a1 downregulation
ECM remodelingDisrupted collagen network Hypertrophy Vessel fragility
Lung
Heart dysfunction
Bleedings
Osteogenesis imperfectaAga2 (C-propeptide mutation in Col1a1)
Vessel fragilityImpaired angiogenesis
Death
Bone-independent
well as functional impairments of the heart causing cardiac disorder. The
hemorrhagic lungs were found to be primarily caused and not due to rib fractures as
previously assumed. Furthermore, mice suffer from serious hypoxia and a vicious
cycle of heart hypertrophy, hypertension and hypoxia finally lead to death. Figure 37
illustrates the pathological mechanisms evoked in heart and lung by the collagen
alterations in the Aga2 OI mouse model independent of the somewhat different
processes detected in bone [55].
Figure 37. The pathological mechanisms in heart, lung and bone tissue of Aga2severe. In bone, the expression of the mutated Col1a1 leads to accumulation of malformed collagen molecules in the ER that causes the induction of UPR and triggers apoptosis [55]. In contrast, Col1a1 gets downregulated in heart fibroblasts to avoid apoptosis in this pivotal organ. The accompanying cardiac alterations cause a bone-independent vicious cycle of heart dysfunction, hypertension, bleedings and hypoxia that finally leads to death in Aga2severe mutant mice.
Given the new insights of the bone-independent phenotype, these results might also
provide a new basis to reassess the current treatment of OI using bisphosphonates
or RANKL inhibitors. The primary nature of the heart and lung alterations might
require further therapeutic strategies to be considered for a successful treatment of
Osteogenesis imperfecta.
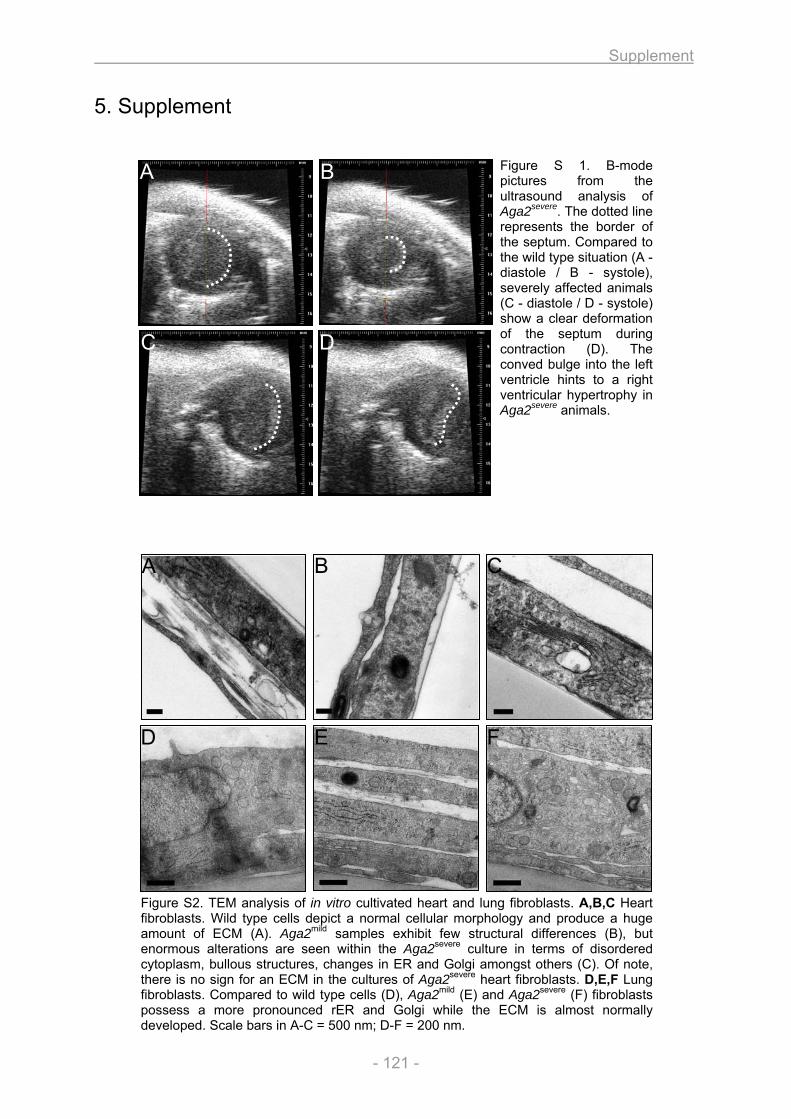
Supplement
- 121 -
5. Supplement
Figure S 1. B-mode pictures from the ultrasound analysis of Aga2severe. The dotted line represents the border of the septum. Compared to the wild type situation (A - diastole / B - systole), severely affected animals (C - diastole / D - systole) show a clear deformation of the septum during contraction (D). The conved bulge into the left ventricle hints to a right ventricular hypertrophy in Aga2severe animals.
Figure S2. TEM analysis of in vitro cultivated heart and lung fibroblasts. A,B,C Heart fibroblasts. Wild type cells depict a normal cellular morphology and produce a huge amount of ECM (A). Aga2mild samples exhibit few structural differences (B), but enormous alterations are seen within the Aga2severe culture in terms of disordered cytoplasm, bullous structures, changes in ER and Golgi amongst others (C). Of note, there is no sign for an ECM in the cultures of Aga2severe heart fibroblasts. D,E,F Lung fibroblasts. Compared to wild type cells (D), Aga2mild (E) and Aga2severe (F) fibroblasts possess a more pronounced rER and Golgi while the ECM is almost normally developed. Scale bars in A-C = 500 nm; D-F = 200 nm.
A B C
D E F
A B
C D
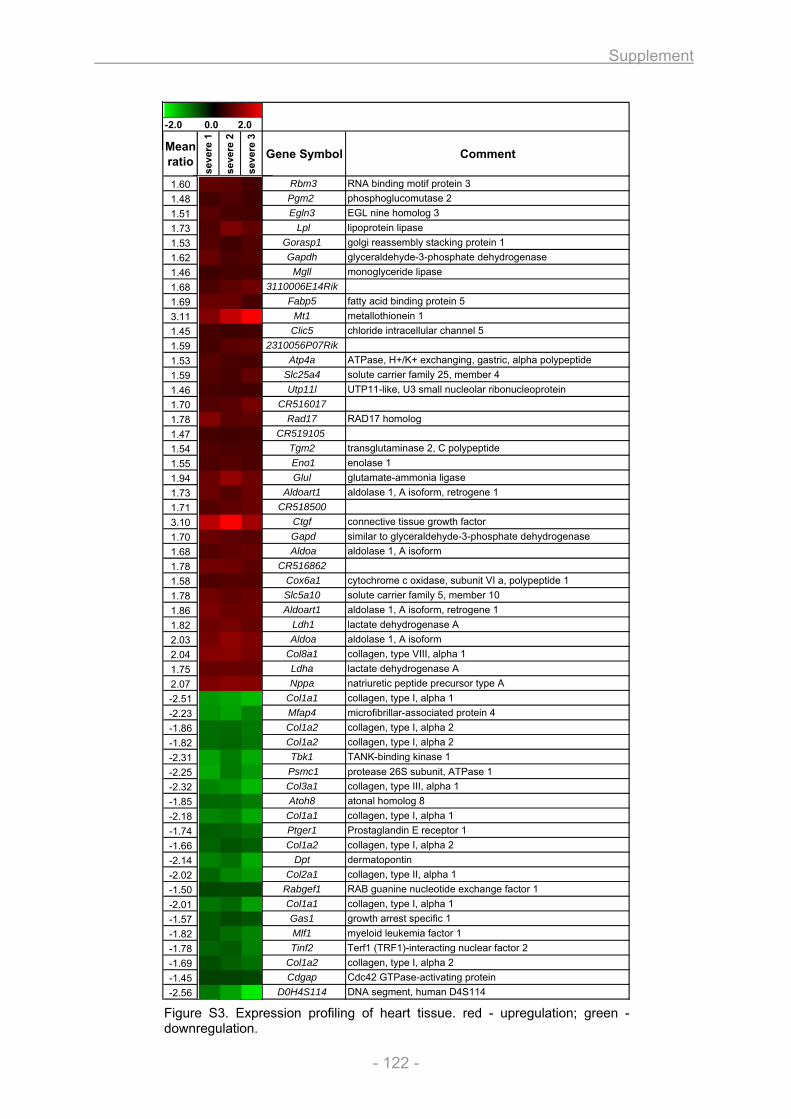
Supplement
- 122 -
-2.0 0.0 2.0
Mean ratio
seve
re 1
seve
re 2
seve
re 3
Gene Symbol Comment
1.60 Rbm3 RNA binding motif protein 31.48 Pgm2 phosphoglucomutase 21.51 Egln3 EGL nine homolog 3 1.73 Lpl lipoprotein lipase1.53 Gorasp1 golgi reassembly stacking protein 11.62 Gapdh glyceraldehyde-3-phosphate dehydrogenase1.46 Mgll monoglyceride lipase1.68 3110006E14Rik 1.69 Fabp5 fatty acid binding protein 53.11 Mt1 metallothionein 11.45 Clic5 chloride intracellular channel 51.59 2310056P07Rik 1.53 Atp4a ATPase, H+/K+ exchanging, gastric, alpha polypeptide1.59 Slc25a4 solute carrier family 25, member 41.46 Utp11l UTP11-like, U3 small nucleolar ribonucleoprotein1.70 CR516017 1.78 Rad17 RAD17 homolog1.47 CR519105 1.54 Tgm2 transglutaminase 2, C polypeptide1.55 Eno1 enolase 11.94 Glul glutamate-ammonia ligase1.73 Aldoart1 aldolase 1, A isoform, retrogene 11.71 CR518500 3.10 Ctgf connective tissue growth factor1.70 Gapd similar to glyceraldehyde-3-phosphate dehydrogenase1.68 Aldoa aldolase 1, A isoform1.78 CR516862 1.58 Cox6a1 cytochrome c oxidase, subunit VI a, polypeptide 11.78 Slc5a10 solute carrier family 5, member 101.86 Aldoart1 aldolase 1, A isoform, retrogene 11.82 Ldh1 lactate dehydrogenase A2.03 Aldoa aldolase 1, A isoform2.04 Col8a1 collagen, type VIII, alpha 11.75 Ldha lactate dehydrogenase A2.07 Nppa natriuretic peptide precursor type A-2.51 Col1a1 collagen, type I, alpha 1-2.23 Mfap4 microfibrillar-associated protein 4-1.86 Col1a2 collagen, type I, alpha 2-1.82 Col1a2 collagen, type I, alpha 2-2.31 Tbk1 TANK-binding kinase 1-2.25 Psmc1 protease 26S subunit, ATPase 1-2.32 Col3a1 collagen, type III, alpha 1-1.85 Atoh8 atonal homolog 8-2.18 Col1a1 collagen, type I, alpha 1-1.74 Ptger1 Prostaglandin E receptor 1-1.66 Col1a2 collagen, type I, alpha 2-2.14 Dpt dermatopontin-2.02 Col2a1 collagen, type II, alpha 1-1.50 Rabgef1 RAB guanine nucleotide exchange factor 1-2.01 Col1a1 collagen, type I, alpha 1-1.57 Gas1 growth arrest specific 1-1.82 Mlf1 myeloid leukemia factor 1-1.78 Tinf2 Terf1 (TRF1)-interacting nuclear factor 2-1.69 Col1a2 collagen, type I, alpha 2-1.45 Cdgap Cdc42 GTPase-activating protein-2.56 D0H4S114 DNA segment, human D4S114
Figure S3. Expression profiling of heart tissue. red - upregulation; green - downregulation.
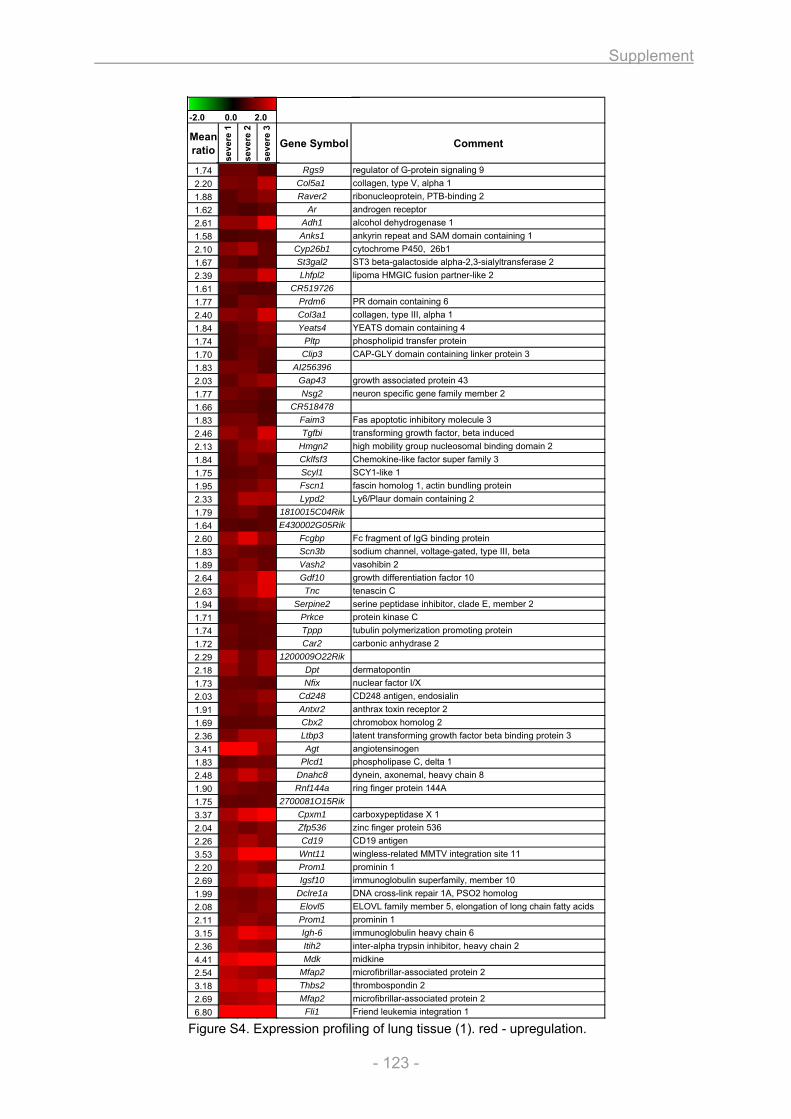
Supplement
- 123 -
-2.0 0.0 2.0
Mean ratio
seve
re 1
seve
re 2
seve
re 3
Gene Symbol Comment
1.74 Rgs9 regulator of G-protein signaling 92.20 Col5a1 collagen, type V, alpha 11.88 Raver2 ribonucleoprotein, PTB-binding 21.62 Ar androgen receptor2.61 Adh1 alcohol dehydrogenase 11.58 Anks1 ankyrin repeat and SAM domain containing 12.10 Cyp26b1 cytochrome P450, 26b11.67 St3gal2 ST3 beta-galactoside alpha-2,3-sialyltransferase 22.39 Lhfpl2 lipoma HMGIC fusion partner-like 21.61 CR519726 1.77 Prdm6 PR domain containing 62.40 Col3a1 collagen, type III, alpha 11.84 Yeats4 YEATS domain containing 41.74 Pltp phospholipid transfer protein1.70 Clip3 CAP-GLY domain containing linker protein 31.83 AI256396 2.03 Gap43 growth associated protein 431.77 Nsg2 neuron specific gene family member 21.66 CR518478 1.83 Faim3 Fas apoptotic inhibitory molecule 32.46 Tgfbi transforming growth factor, beta induced2.13 Hmgn2 high mobility group nucleosomal binding domain 21.84 Cklfsf3 Chemokine-like factor super family 31.75 Scyl1 SCY1-like 11.95 Fscn1 fascin homolog 1, actin bundling protein2.33 Lypd2 Ly6/Plaur domain containing 21.79 1810015C04Rik 1.64 E430002G05Rik 2.60 Fcgbp Fc fragment of IgG binding protein1.83 Scn3b sodium channel, voltage-gated, type III, beta1.89 Vash2 vasohibin 22.64 Gdf10 growth differentiation factor 102.63 Tnc tenascin C1.94 Serpine2 serine peptidase inhibitor, clade E, member 21.71 Prkce protein kinase C1.74 Tppp tubulin polymerization promoting protein1.72 Car2 carbonic anhydrase 22.29 1200009O22Rik 2.18 Dpt dermatopontin1.73 Nfix nuclear factor I/X2.03 Cd248 CD248 antigen, endosialin1.91 Antxr2 anthrax toxin receptor 21.69 Cbx2 chromobox homolog 22.36 Ltbp3 latent transforming growth factor beta binding protein 33.41 Agt angiotensinogen1.83 Plcd1 phospholipase C, delta 12.48 Dnahc8 dynein, axonemal, heavy chain 81.90 Rnf144a ring finger protein 144A1.75 2700081O15Rik 3.37 Cpxm1 carboxypeptidase X 12.04 Zfp536 zinc finger protein 5362.26 Cd19 CD19 antigen3.53 Wnt11 wingless-related MMTV integration site 112.20 Prom1 prominin 12.69 Igsf10 immunoglobulin superfamily, member 101.99 Dclre1a DNA cross-link repair 1A, PSO2 homolog2.08 Elovl5 ELOVL family member 5, elongation of long chain fatty acids2.11 Prom1 prominin 13.15 Igh-6 immunoglobulin heavy chain 62.36 Itih2 inter-alpha trypsin inhibitor, heavy chain 24.41 Mdk midkine2.54 Mfap2 microfibrillar-associated protein 23.18 Thbs2 thrombospondin 22.69 Mfap2 microfibrillar-associated protein 26.80 Fli1 Friend leukemia integration 1
Figure S4. Expression profiling of lung tissue (1). red - upregulation.
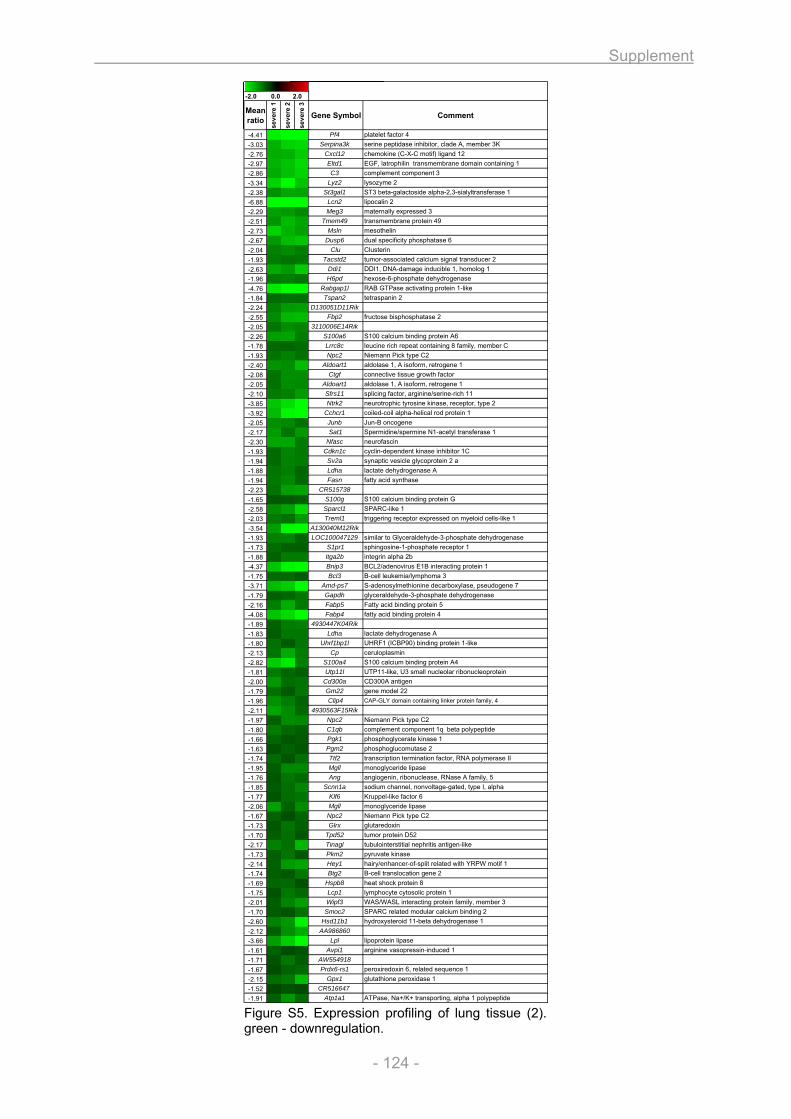
Supplement
- 124 -
-2.0 0.0 2.0
Mean ratio
seve
re 1
seve
re 2
seve
re 3
Gene Symbol Comment
-4.41 Pf4 platelet factor 4-3.03 Serpina3k serine peptidase inhibitor, clade A, member 3K-2.76 Cxcl12 chemokine (C-X-C motif) ligand 12-2.97 Eltd1 EGF, latrophilin transmembrane domain containing 1-2.86 C3 complement component 3-3.34 Lyz2 lysozyme 2-2.38 St3gal1 ST3 beta-galactoside alpha-2,3-sialyltransferase 1-6.88 Lcn2 lipocalin 2-2.29 Meg3 maternally expressed 3-2.51 Tmem49 transmembrane protein 49-2.73 Msln mesothelin-2.67 Dusp6 dual specificity phosphatase 6-2.04 Clu Clusterin-1.93 Tacstd2 tumor-associated calcium signal transducer 2-2.63 Ddi1 DDI1, DNA-damage inducible 1, homolog 1-1.96 H6pd hexose-6-phosphate dehydrogenase-4.76 Rabgap1l RAB GTPase activating protein 1-like-1.84 Tspan2 tetraspanin 2-2.24 D130051D11Rik -2.55 Fbp2 fructose bisphosphatase 2-2.05 3110006E14Rik -2.26 S100a6 S100 calcium binding protein A6-1.78 Lrrc8c leucine rich repeat containing 8 family, member C-1.93 Npc2 Niemann Pick type C2-2.40 Aldoart1 aldolase 1, A isoform, retrogene 1-2.08 Ctgf connective tissue growth factor-2.05 Aldoart1 aldolase 1, A isoform, retrogene 1-2.10 Sfrs11 splicing factor, arginine/serine-rich 11-3.85 Ntrk2 neurotrophic tyrosine kinase, receptor, type 2-3.92 Cchcr1 coiled-coil alpha-helical rod protein 1-2.05 Junb Jun-B oncogene-2.17 Sat1 Spermidine/spermine N1-acetyl transferase 1-2.30 Nfasc neurofascin-1.93 Cdkn1c cyclin-dependent kinase inhibitor 1C-1.94 Sv2a synaptic vesicle glycoprotein 2 a-1.88 Ldha lactate dehydrogenase A-1.94 Fasn fatty acid synthase-2.23 CR515738 -1.65 S100g S100 calcium binding protein G-2.58 Sparcl1 SPARC-like 1-2.03 Treml1 triggering receptor expressed on myeloid cells-like 1-3.54 A130040M12Rik -1.93 LOC100047129 similar to Glyceraldehyde-3-phosphate dehydrogenase-1.73 S1pr1 sphingosine-1-phosphate receptor 1-1.88 Itga2b integrin alpha 2b-4.37 Bnip3 BCL2/adenovirus E1B interacting protein 1-1.75 Bcl3 B-cell leukemia/lymphoma 3-3.71 Amd-ps7 S-adenosylmethionine decarboxylase, pseudogene 7-1.79 Gapdh glyceraldehyde-3-phosphate dehydrogenase-2.16 Fabp5 Fatty acid binding protein 5-4.08 Fabp4 fatty acid binding protein 4-1.89 4930447K04Rik -1.83 Ldha lactate dehydrogenase A-1.80 Uhrf1bp1l UHRF1 (ICBP90) binding protein 1-like-2.13 Cp ceruloplasmin-2.82 S100a4 S100 calcium binding protein A4-1.81 Utp11l UTP11-like, U3 small nucleolar ribonucleoprotein-2.00 Cd300a CD300A antigen-1.79 Gm22 gene model 22-1.96 Clip4 CAP-GLY domain containing linker protein family, 4
-2.11 4930563F15Rik -1.97 Npc2 Niemann Pick type C2-1.80 C1qb complement component 1q beta polypeptide-1.66 Pgk1 phosphoglycerate kinase 1-1.63 Pgm2 phosphoglucomutase 2-1.74 Ttf2 transcription termination factor, RNA polymerase II-1.95 Mgll monoglyceride lipase-1.76 Ang angiogenin, ribonuclease, RNase A family, 5-1.85 Scnn1a sodium channel, nonvoltage-gated, type I, alpha-1.77 Klf6 Kruppel-like factor 6-2.06 Mgll monoglyceride lipase-1.67 Npc2 Niemann Pick type C2-1.73 Glrx glutaredoxin-1.70 Tpd52 tumor protein D52-2.17 Tinagl tubulointerstitial nephritis antigen-like-1.73 Pkm2 pyruvate kinase-2.14 Hey1 hairy/enhancer-of-split related with YRPW motif 1-1.74 Btg2 B-cell translocation gene 2-1.69 Hspb8 heat shock protein 8-1.75 Lcp1 lymphocyte cytosolic protein 1-2.01 Wipf3 WAS/WASL interacting protein family, member 3-1.70 Smoc2 SPARC related modular calcium binding 2-2.60 Hsd11b1 hydroxysteroid 11-beta dehydrogenase 1-2.12 AA986860 -3.66 Lpl lipoprotein lipase-1.61 Avpi1 arginine vasopressin-induced 1-1.71 AW554918 -1.67 Prdx6-rs1 peroxiredoxin 6, related sequence 1-2.15 Gpx1 glutathione peroxidase 1-1.52 CR516647 -1.91 Atp1a1 ATPase, Na+/K+ transporting, alpha 1 polypeptide
Figure S5. Expression profiling of lung tissue (2). green - downregulation.
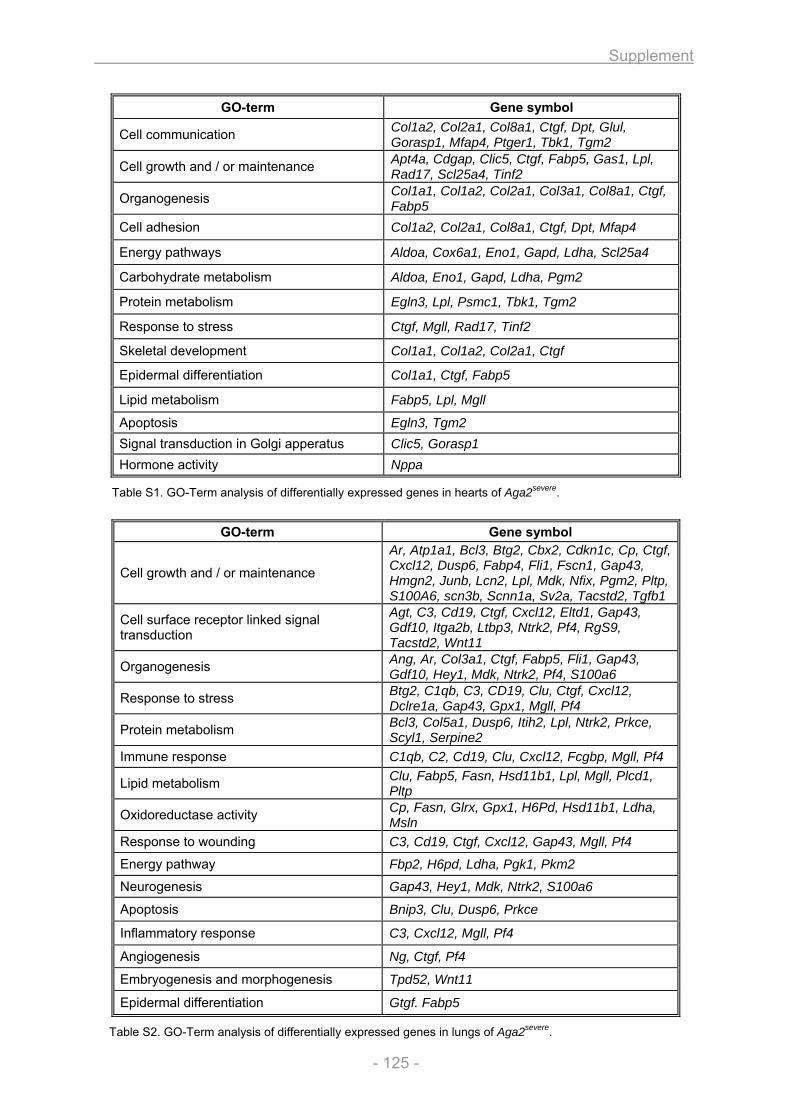
Supplement
- 125 -
Table S1. GO-Term analysis of differentially expressed genes in hearts of Aga2severe.
GO-term Gene symbol
Cell growth and / or maintenance
Ar, Atp1a1, Bcl3, Btg2, Cbx2, Cdkn1c, Cp, Ctgf, Cxcl12, Dusp6, Fabp4, Fli1, Fscn1, Gap43, Hmgn2, Junb, Lcn2, Lpl, Mdk, Nfix, Pgm2, Pltp, S100A6, scn3b, Scnn1a, Sv2a, Tacstd2, Tgfb1
Cell surface receptor linked signal transduction
Agt, C3, Cd19, Ctgf, Cxcl12, Eltd1, Gap43, Gdf10, Itga2b, Ltbp3, Ntrk2, Pf4, RgS9, Tacstd2, Wnt11
Organogenesis Ang, Ar, Col3a1, Ctgf, Fabp5, Fli1, Gap43, Gdf10, Hey1, Mdk, Ntrk2, Pf4, S100a6
Response to stress Btg2, C1qb, C3, CD19, Clu, Ctgf, Cxcl12, Dclre1a, Gap43, Gpx1, Mgll, Pf4
Protein metabolism Bcl3, Col5a1, Dusp6, Itih2, Lpl, Ntrk2, Prkce, Scyl1, Serpine2
Immune response C1qb, C2, Cd19, Clu, Cxcl12, Fcgbp, Mgll, Pf4
Lipid metabolism Clu, Fabp5, Fasn, Hsd11b1, Lpl, Mgll, Plcd1, Pltp
Oxidoreductase activity Cp, Fasn, Glrx, Gpx1, H6Pd, Hsd11b1, Ldha, Msln
Response to wounding C3, Cd19, Ctgf, Cxcl12, Gap43, Mgll, Pf4
Energy pathway Fbp2, H6pd, Ldha, Pgk1, Pkm2
Neurogenesis Gap43, Hey1, Mdk, Ntrk2, S100a6
Apoptosis Bnip3, Clu, Dusp6, Prkce
Inflammatory response C3, Cxcl12, Mgll, Pf4
Angiogenesis Ng, Ctgf, Pf4
Embryogenesis and morphogenesis Tpd52, Wnt11
Epidermal differentiation Gtgf. Fabp5
Table S2. GO-Term analysis of differentially expressed genes in lungs of Aga2severe.
GO-term Gene symbol
Cell communication Col1a2, Col2a1, Col8a1, Ctgf, Dpt, Glul, Gorasp1, Mfap4, Ptger1, Tbk1, Tgm2
Cell growth and / or maintenance Apt4a, Cdgap, Clic5, Ctgf, Fabp5, Gas1, Lpl, Rad17, Scl25a4, Tinf2
Organogenesis Col1a1, Col1a2, Col2a1, Col3a1, Col8a1, Ctgf, Fabp5
Cell adhesion Col1a2, Col2a1, Col8a1, Ctgf, Dpt, Mfap4
Energy pathways Aldoa, Cox6a1, Eno1, Gapd, Ldha, Scl25a4
Carbohydrate metabolism Aldoa, Eno1, Gapd, Ldha, Pgm2
Protein metabolism Egln3, Lpl, Psmc1, Tbk1, Tgm2
Response to stress Ctgf, Mgll, Rad17, Tinf2
Skeletal development Col1a1, Col1a2, Col2a1, Ctgf
Epidermal differentiation Col1a1, Ctgf, Fabp5
Lipid metabolism Fabp5, Lpl, Mgll
Apoptosis Egln3, Tgm2 Signal transduction in Golgi apperatus Clic5, Gorasp1 Hormone activity Nppa
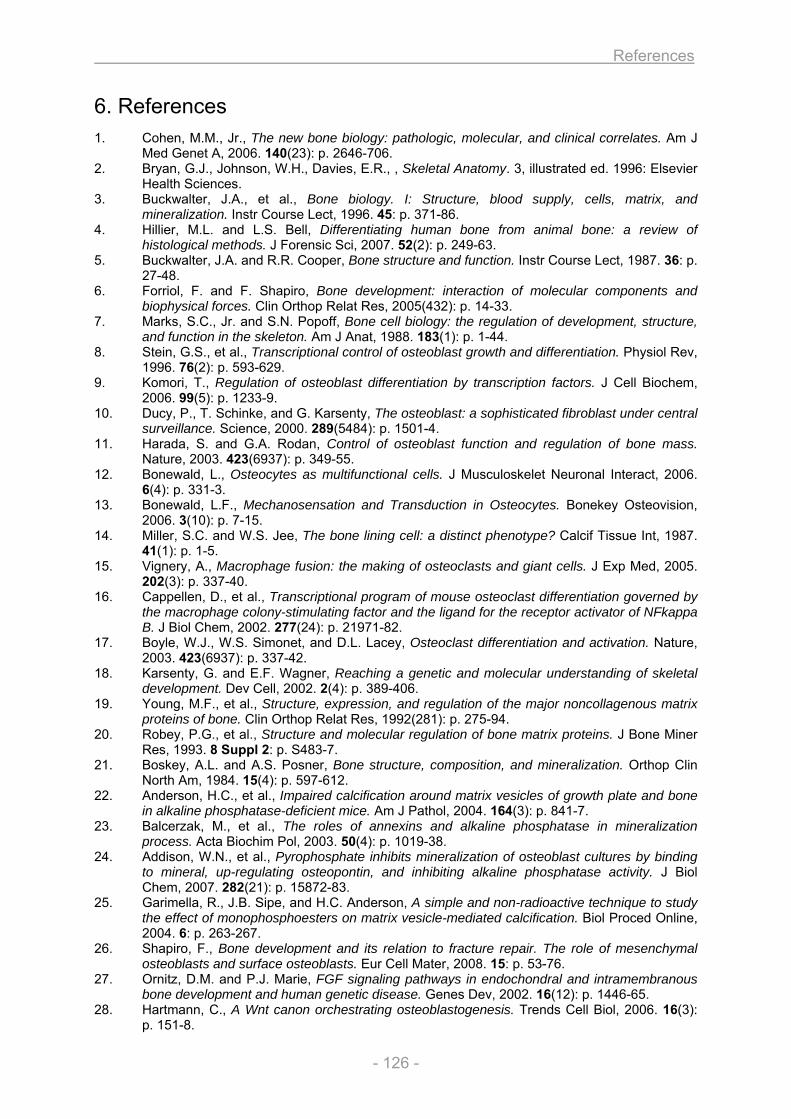
References
- 126 -
6. References 1. Cohen, M.M., Jr., The new bone biology: pathologic, molecular, and clinical correlates. Am J
Med Genet A, 2006. 140(23): p. 2646-706. 2. Bryan, G.J., Johnson, W.H., Davies, E.R., , Skeletal Anatomy. 3, illustrated ed. 1996: Elsevier
Health Sciences. 3. Buckwalter, J.A., et al., Bone biology. I: Structure, blood supply, cells, matrix, and
mineralization. Instr Course Lect, 1996. 45: p. 371-86. 4. Hillier, M.L. and L.S. Bell, Differentiating human bone from animal bone: a review of
histological methods. J Forensic Sci, 2007. 52(2): p. 249-63. 5. Buckwalter, J.A. and R.R. Cooper, Bone structure and function. Instr Course Lect, 1987. 36: p.
27-48. 6. Forriol, F. and F. Shapiro, Bone development: interaction of molecular components and
biophysical forces. Clin Orthop Relat Res, 2005(432): p. 14-33. 7. Marks, S.C., Jr. and S.N. Popoff, Bone cell biology: the regulation of development, structure,
and function in the skeleton. Am J Anat, 1988. 183(1): p. 1-44. 8. Stein, G.S., et al., Transcriptional control of osteoblast growth and differentiation. Physiol Rev,
1996. 76(2): p. 593-629. 9. Komori, T., Regulation of osteoblast differentiation by transcription factors. J Cell Biochem,
2006. 99(5): p. 1233-9. 10. Ducy, P., T. Schinke, and G. Karsenty, The osteoblast: a sophisticated fibroblast under central
surveillance. Science, 2000. 289(5484): p. 1501-4. 11. Harada, S. and G.A. Rodan, Control of osteoblast function and regulation of bone mass.
Nature, 2003. 423(6937): p. 349-55. 12. Bonewald, L., Osteocytes as multifunctional cells. J Musculoskelet Neuronal Interact, 2006.
6(4): p. 331-3. 13. Bonewald, L.F., Mechanosensation and Transduction in Osteocytes. Bonekey Osteovision,
2006. 3(10): p. 7-15. 14. Miller, S.C. and W.S. Jee, The bone lining cell: a distinct phenotype? Calcif Tissue Int, 1987.
41(1): p. 1-5. 15. Vignery, A., Macrophage fusion: the making of osteoclasts and giant cells. J Exp Med, 2005.
202(3): p. 337-40. 16. Cappellen, D., et al., Transcriptional program of mouse osteoclast differentiation governed by
the macrophage colony-stimulating factor and the ligand for the receptor activator of NFkappa B. J Biol Chem, 2002. 277(24): p. 21971-82.
17. Boyle, W.J., W.S. Simonet, and D.L. Lacey, Osteoclast differentiation and activation. Nature, 2003. 423(6937): p. 337-42.
18. Karsenty, G. and E.F. Wagner, Reaching a genetic and molecular understanding of skeletal development. Dev Cell, 2002. 2(4): p. 389-406.
19. Young, M.F., et al., Structure, expression, and regulation of the major noncollagenous matrix proteins of bone. Clin Orthop Relat Res, 1992(281): p. 275-94.
20. Robey, P.G., et al., Structure and molecular regulation of bone matrix proteins. J Bone Miner Res, 1993. 8 Suppl 2: p. S483-7.
21. Boskey, A.L. and A.S. Posner, Bone structure, composition, and mineralization. Orthop Clin North Am, 1984. 15(4): p. 597-612.
22. Anderson, H.C., et al., Impaired calcification around matrix vesicles of growth plate and bone in alkaline phosphatase-deficient mice. Am J Pathol, 2004. 164(3): p. 841-7.
23. Balcerzak, M., et al., The roles of annexins and alkaline phosphatase in mineralization process. Acta Biochim Pol, 2003. 50(4): p. 1019-38.
24. Addison, W.N., et al., Pyrophosphate inhibits mineralization of osteoblast cultures by binding to mineral, up-regulating osteopontin, and inhibiting alkaline phosphatase activity. J Biol Chem, 2007. 282(21): p. 15872-83.
25. Garimella, R., J.B. Sipe, and H.C. Anderson, A simple and non-radioactive technique to study the effect of monophosphoesters on matrix vesicle-mediated calcification. Biol Proced Online, 2004. 6: p. 263-267.
26. Shapiro, F., Bone development and its relation to fracture repair. The role of mesenchymal osteoblasts and surface osteoblasts. Eur Cell Mater, 2008. 15: p. 53-76.
27. Ornitz, D.M. and P.J. Marie, FGF signaling pathways in endochondral and intramembranous bone development and human genetic disease. Genes Dev, 2002. 16(12): p. 1446-65.
28. Hartmann, C., A Wnt canon orchestrating osteoblastogenesis. Trends Cell Biol, 2006. 16(3): p. 151-8.
References
- 127 -
29. Goldring, M.B., K. Tsuchimochi, and K. Ijiri, The control of chondrogenesis. J Cell Biochem, 2006. 97(1): p. 33-44.
30. Ortega, N., D.J. Behonick, and Z. Werb, Matrix remodeling during endochondral ossification. Trends Cell Biol, 2004. 14(2): p. 86-93.
31. Marx, R.E. and A.K. Garg, Bone structure, metabolism, and physiology: its impact on dental implantology. Implant Dent, 1998. 7(4): p. 267-76.
32. Benjamin, M. and B. Hillen, Mechanical influences on cells, tissues and organs - 'Mechanical Morphogenesis'. Eur J Morphol, 2003. 41(1): p. 3-7.
33. Boyce, B.F. and L. Xing, Osteoclasts, no longer osteoblast slaves. Nat Med, 2006. 12(12): p. 1356-8.
34. Hill, P.A., Bone remodelling. Br J Orthod, 1998. 25(2): p. 101-7. 35. Superti-Furga, A., L. Bonafe, and D.L. Rimoin, Molecular-pathogenetic classification of genetic
disorders of the skeleton. Am J Med Genet, 2001. 106(4): p. 282-93. 36. Fuchs, H., Lisse, T., Abe, K., Hrabé de Angelis, M., Screening for bone and cartilage
phenotypes in mice. In Standards of Mouse Model Phenotyping, ed. M. Hrabé de Angelis, Chambon, P., Brown, S. 2006, Weinheim: Wiley-VCH. 35-85.
37. Reeder, J. and E. Orwoll, Images in clinical medicine. Adults with osteogenesis imperfecta. N Engl J Med, 2006. 355(26): p. e28.
38. Martin, E. and J.R. Shapiro, Osteogenesis imperfecta:epidemiology and pathophysiology. Curr Osteoporos Rep, 2007. 5(3): p. 91-7.
39. Glorieux, F.H., Osteogenesis imperfecta. Best Pract Res Clin Rheumatol, 2008. 22(1): p. 85-100.
40. Rauch, F. and F.H. Glorieux, Osteogenesis imperfecta. Lancet, 2004. 363(9418): p. 1377-85. 41. Kocher, M.S. and F. Shapiro, Osteogenesis imperfecta. J Am Acad Orthop Surg, 1998. 6(4):
p. 225-36. 42. Marini, J.C., et al., Components of the collagen prolyl 3-hydroxylation complex are crucial for
normal bone development. Cell Cycle, 2007. 6(14): p. 1675-81. 43. Roughley, P.J., F. Rauch, and F.H. Glorieux, Osteogenesis imperfecta--clinical and molecular
diversity. Eur Cell Mater, 2003. 5: p. 41-7; discussion 47. 44. Ralston, S.H. and B. de Crombrugghe, Genetic regulation of bone mass and susceptibility to
osteoporosis. Genes Dev, 2006. 20(18): p. 2492-506. 45. Singer, R.B., S.A. Ogston, and C.R. Paterson, Mortality in various types of osteogenesis
imperfecta. J Insur Med, 2001. 33(3): p. 216-20. 46. McAllion, S.J. and C.R. Paterson, Causes of death in osteogenesis imperfecta. J Clin Pathol,
1996. 49(8): p. 627-30. 47. Widmann, R.F., et al., Spinal deformity, pulmonary compromise, and quality of life in
osteogenesis imperfecta. Spine, 1999. 24(16): p. 1673-8. 48. Shapiro, J.R., et al., Pulmonary hypoplasia and osteogenesis imperfecta type II with defective
synthesis of alpha I(1) procollagen. Bone, 1989. 10(3): p. 165-71. 49. Weis, S.M., et al., Myocardial mechanics and collagen structure in the osteogenesis
imperfecta murine (oim). Circ Res, 2000. 87(8): p. 663-9. 50. Wheeler, V.R., N.R. Cooley, Jr., and W.R. Blackburn, Cardiovascular pathology in
osteogenesis imperfecta type IIA with a review of the literature. Pediatr Pathol, 1988. 8(1): p. 55-64.
51. Perkins, A.S., Functional genomics in the mouse. Funct Integr Genomics, 2002. 2(3): p. 81-91.
52. Darling, S., Mice as models of human developmental disorders: natural and artificial mutants. Curr Opin Genet Dev, 1996. 6(3): p. 289-94.
53. Soewarto, D., M. Klaften, and I. Rubio-Aliaga, Features and strategies of ENU mouse mutagenesis. Curr Pharm Biotechnol, 2009. 10(2): p. 198-213.
54. Hrabe de Angelis, M.H., et al., Genome-wide, large-scale production of mutant mice by ENU mutagenesis. Nat Genet, 2000. 25(4): p. 444-7.
55. Lisse, T.S., et al., ER stress-mediated apoptosis in a new mouse model of osteogenesis imperfecta. PLoS Genet, 2008. 4(2): p. e7.
56. Fuchs, H., et al., The German Mouse Clinic: a platform for systemic phenotype analysis of mouse models. Curr Pharm Biotechnol, 2009. 10(2): p. 236-43.
57. Fuchs, H., et al., Phenotypic characterization of mouse models for bone-related diseases in the German Mouse Clinic. J Musculoskelet Neuronal Interact, 2008. 8(1): p. 13-4.
58. Harrison, R.G., Observations on the living developing nerve fibre. Anat Rec, 1907. 1: p. 116-118.
59. Carrel, A., On the permanent life of tissues outside of the organism. J Exp Med, 1912. 15: p. 516-528.
References
- 128 -
60. Freshney, R.I., Culture of animal cells: a manual of basic techniques. 4th ed. 2000: Wiley-Liss. 61. Gailus-Durner, V., et al., Introducing the German Mouse Clinic: open access platform for
standardized phenotyping. Nat Methods, 2005. 2(6): p. 403-4. 62. Sahn, D.J., et al., Recommendations regarding quantitation in M-mode echocardiography:
results of a survey of echocardiographic measurements. Circulation, 1978. 58(6): p. 1072-83. 63. Collins, K.A., C.E. Korcarz, and R.M. Lang, Use of echocardiography for the phenotypic
assessment of genetically altered mice. Physiol Genomics, 2003. 13(3): p. 227-39. 64. Teichholz, L.E., et al., Study of left ventricular geometry and function by B-scan
ultrasonography in patients with and without asynergy. N Engl J Med, 1974. 291(23): p. 1220-6.
65. Ohtani, O., et al., Collagen fibrillar networks as skeletal frameworks: a demonstration by cell-maceration/scanning electron microscope method. Arch Histol Cytol, 1988. 51(3): p. 249-61.
66. Macchiarelli, G., et al., A micro-anatomical model of the distribution of myocardial endomysial collagen. Histol Histopathol, 2002. 17(3): p. 699-706.
67. Agocha, A.E. and M. Eghbali-Webb, A simple method for preparation of cultured cardiac fibroblasts from adult human ventricular tissue. Mol Cell Biochem, 1997. 172(1-2): p. 195-8.
68. Neuss, M., et al., Isolation and characterisation of human cardiac fibroblasts from explanted adult hearts. Cell Tissue Res, 1996. 286(1): p. 145-53.
69. Eghbali, M., et al., Cardiac fibroblasts are predisposed to convert into myocyte phenotype: specific effect of transforming growth factor beta. Proc Natl Acad Sci U S A, 1991. 88(3): p. 795-9.
70. Phan, S.H., J. Varani, and D. Smith, Rat lung fibroblast collagen metabolism in bleomycin-induced pulmonary fibrosis. J Clin Invest, 1985. 76(1): p. 241-7.
71. Raghow, R., A.H. Kang, and D. Pidikiti, Phenotypic plasticity of extracellular matrix gene expression in cultured hamster lung fibroblasts. Regulation of type I procollagen and fibronectin synthesis. J Biol Chem, 1987. 262(17): p. 8409-15.
72. Pardo, A., et al., Production of collagenase and tissue inhibitor of metalloproteinases by fibroblasts derived from normal and fibrotic human lungs. Chest, 1992. 102(4): p. 1085-9.
73. Horsch, M., et al., Systematic gene expression profiling of mouse model series reveals coexpressed genes. Proteomics, 2008. 8(6): p. 1248-56.
74. Edgar, R., M. Domrachev, and A.E. Lash, Gene Expression Omnibus: NCBI gene expression and hybridization array data repository. Nucleic Acids Res, 2002. 30(1): p. 207-10.
75. Hegde, P., et al., A concise guide to cDNA microarray analysis. Biotechniques, 2000. 29(3): p. 548-50, 552-4, 556 passim.
76. Quackenbush, J., Microarray data normalization and transformation. Nat Genet, 2002. 32 Suppl: p. 496-501.
77. Tusher, V.G., R. Tibshirani, and G. Chu, Significance analysis of microarrays applied to the ionizing radiation response. Proc Natl Acad Sci U S A, 2001. 98(9): p. 5116-21.
78. Dennis, G., Jr., et al., DAVID: Database for Annotation, Visualization, and Integrated Discovery. Genome Biol, 2003. 4(5): p. P3.
79. Pfaffl, M.W., A new mathematical model for relative quantification in real-time RT-PCR. Nucleic Acids Res, 2001. 29(9): p. e45.
80. Livak, K.J. and T.D. Schmittgen, Analysis of relative gene expression data using real-time quantitative PCR and the 2(-Delta Delta C(T)) Method. Methods, 2001. 25(4): p. 402-8.
81. Zhang, H.X., G.H. Du, and J.T. Zhang, Assay of mitochondrial functions by resazurin in vitro. Acta Pharmacol Sin, 2004. 25(3): p. 385-9.
82. Candeias, L.P., et al., The catalysed NADH reduction of resazurin to resorufin. J. Chem. Soc., Perkin Trans. 2, 1998: p. 2333-2334.
83. Krohn, R.I., The colorimetric detection and quantitation of total protein. Curr Protoc Cell Biol, 2002. Appendix 3: p. Appendix 3H.
84. Walker, J.M., The bicinchoninic acid (BCA) assay for protein quantitation. Methods Mol Biol, 1994. 32: p. 5-8.
85. Bessey, O.A., O.H. Lowry, and M.J. Brock, A method for the rapid determination of alkaline phosphatase with five cubic millimeters of serum. J Biol Cem, 1946. 164: p. 321-329.
86. von Schroeder, H.P., et al., Endothelin-1 promotes osteoprogenitor proliferation and differentiation in fetal rat calvarial cell cultures. Bone, 2003. 33(4): p. 673-84.
87. Tullberg-Reinert, H. and G. Jundt, In situ measurement of collagen synthesis by human bone cells with a sirius red-based colorimetric microassay: effects of transforming growth factor beta2 and ascorbic acid 2-phosphate. Histochem Cell Biol, 1999. 112(4): p. 271-6.
88. Lee, D.A., E. Assoku, and V. Doyle, A specific quantitative assay for collagen synthesis by cells seeded in collagen-based biomaterials using sirius red F3B precipitation. J Mater Sci Mater Med, 1998. 9(1): p. 47-51.
References
- 129 -
89. Puchtler, H., S.N. Meloan, and M.S. Terry, On the history and mechanism of alizarin and alizarin red S stains for calcium. J Histochem Cytochem, 1969. 17(2): p. 110-24.
90. Kiernan, A.E., et al., The Notch ligand Jagged1 is required for inner ear sensory development. Proc Natl Acad Sci U S A, 2001. 98(7): p. 3873-8.
91. Fell, H.B., The Osteogenic Capacity in vitro of Periosteum and Endosteum Isolated from the Limb Skeleton of Fowl Embryos and Young Chicks. J Anat, 1932. 66(Pt 2): p. 157-180 11.
92. Rose, G.G. and T.O. Shindler, The cytodifferentiation of osteoblasts in tissue culture. A description of cellular emigrations from embryo chick-leg bones. J Bone Joint Surg Am, 1960. 42-A: p. 485-98.
93. Jones, S.J. and A. Boyde, The migration of osteoblasts. Cell Tissue Res, 1977. 184(2): p. 179-93.
94. Peck, W.A., S.J. Birge, Jr., and S.A. Fedak, Bone Cells: Biochemical and Biological Studies after Enzymatic Isolation. Science, 1964. 146: p. 1476-7.
95. Bakker, A. and J. Klein-Nulend, Osteoblast isolation from murine calvariae and long bones. Methods Mol Med, 2003. 80: p. 19-28.
96. Hefley, T., J. Cushing, and J.S. Brand, Enzymatic isolation of cells from bone: cytotoxic enzymes of bacterial collagenase. Am J Physiol, 1981. 240(5): p. C234-8.
97. Declercq, H., et al., Isolation, proliferation and differentiation of osteoblastic cells to study cell/biomaterial interactions: comparison of different isolation techniques and source. Biomaterials, 2004. 25(5): p. 757-68.
98. Tarnowski, C.P., M.A. Ignelzi, Jr., and M.D. Morris, Mineralization of developing mouse calvaria as revealed by Raman microspectroscopy. J Bone Miner Res, 2002. 17(6): p. 1118-26.
99. Franceschi, R.T., B.S. Iyer, and Y. Cui, Effects of ascorbic acid on collagen matrix formation and osteoblast differentiation in murine MC3T3-E1 cells. J Bone Miner Res, 1994. 9(6): p. 843-54.
100. Tenenbaum, H.C. and J.N. Heersche, Differentiation of osteoblasts and formation of mineralized bone in vitro. Calcif Tissue Int, 1982. 34(1): p. 76-9.
101. Ecarot-Charrier, B., et al., Osteoblasts isolated from mouse calvaria initiate matrix mineralization in culture. J Cell Biol, 1983. 96(3): p. 639-43.
102. Gerber, I. and I. ap Gwynn, Influence of cell isolation, cell culture density, and cell nutrition on differentiation of rat calvarial osteoblast-like cells in vitro. Eur Cell Mater, 2001. 2: p. 10-20.
103. Aronow, M.A., et al., Factors that promote progressive development of the osteoblast phenotype in cultured fetal rat calvaria cells. J Cell Physiol, 1990. 143(2): p. 213-21.
104. Chang, Y.L., C.M. Stanford, and J.C. Keller, Calcium and phosphate supplementation promotes bone cell mineralization: implications for hydroxyapatite (HA)-enhanced bone formation. J Biomed Mater Res, 2000. 52(2): p. 270-8.
105. Beresford, J.N., S.E. Graves, and C.A. Smoothy, Formation of mineralized nodules by bone derived cells in vitro: a model of bone formation? Am J Med Genet, 1993. 45(2): p. 163-78.
106. Bhargava, U., et al., Ultrastructural analysis of bone nodules formed in vitro by isolated fetal rat calvaria cells. Bone, 1988. 9(3): p. 155-63.
107. Sudo, H., et al., In vitro differentiation and calcification in a new clonal osteogenic cell line derived from newborn mouse calvaria. J Cell Biol, 1983. 96(1): p. 191-8.
108. Schulze, E., et al., Immunohistochemical investigations on the differentiation marker protein E11 in rat calvaria, calvaria cell culture and the osteoblastic cell line ROS 17/2.8. Histochem Cell Biol, 1999. 111(1): p. 61-9.
109. Bonewald, L.F., Generation and function of osteocyte dendritic processes. J Musculoskelet Neuronal Interact, 2005. 5(4): p. 321-4.
110. Roman-Roman, S., et al., Identification of genes regulated during osteoblastic differentiation by genome-wide expression analysis of mouse calvaria primary osteoblasts in vitro. Bone, 2003. 32(5): p. 474-82.
111. Garcia, T., et al., Behavior of osteoblast, adipocyte, and myoblast markers in genome-wide expression analysis of mouse calvaria primary osteoblasts in vitro. Bone, 2002. 31(1): p. 205-11.
112. Beck, G.R., Jr., B. Zerler, and E. Moran, Gene array analysis of osteoblast differentiation. Cell Growth Differ, 2001. 12(2): p. 61-83.
113. Raouf, A. and A. Seth, Discovery of osteoblast-associated genes using cDNA microarrays. Bone, 2002. 30(3): p. 463-71.
114. Stein, G.S., J.B. Lian, and T.A. Owen, Relationship of cell growth to the regulation of tissue-specific gene expression during osteoblast differentiation. FASEB J, 1990. 4(13): p. 3111-23.
References
- 130 -
115. Varga, F., et al., Triiodothyronine, a regulator of osteoblastic differentiation: depression of histone H4, attenuation of c-fos/c-jun, and induction of osteocalcin expression. Calcif Tissue Int, 1997. 61(5): p. 404-11.
116. Billiard, J., et al., Transcriptional profiling of human osteoblast differentiation. J Cell Biochem, 2003. 89(2): p. 389-400.
117. Kitching, R., et al., Coordinate gene expression patterns during osteoblast maturation and retinoic acid treatment of MC3T3-E1 cells. J Bone Miner Metab, 2002. 20(5): p. 269-80.
118. Choi, J.Y., et al., Expression patterns of bone-related proteins during osteoblastic differentiation in MC3T3-E1 cells. J Cell Biochem, 1996. 61(4): p. 609-18.
119. Galindo, M., et al., The bone-specific expression of Runx2 oscillates during the cell cycle to support a G1-related antiproliferative function in osteoblasts. J Biol Chem, 2005. 280(21): p. 20274-85.
120. Zhang, C., et al., Inhibition of Wnt signaling by the osteoblast-specific transcription factor Osterix. Proc Natl Acad Sci U S A, 2008. 105(19): p. 6936-41.
121. Nakashima, K., et al., The novel zinc finger-containing transcription factor osterix is required for osteoblast differentiation and bone formation. Cell, 2002. 108(1): p. 17-29.
122. McCauley, L.K., et al., Parathyroid hormone stimulates fra-2 expression in osteoblastic cells in vitro and in vivo. Endocrinology, 2001. 142(5): p. 1975-81.
123. Gordon, J.A., et al., Bone sialoprotein expression enhances osteoblast differentiation and matrix mineralization in vitro. Bone, 2007. 41(3): p. 462-73.
124. Mizuno, M., et al., Bone sialoprotein (BSP) is a crucial factor for the expression of osteoblastic phenotypes of bone marrow cells cultured on type I collagen matrix. Calcif Tissue Int, 2000. 66(5): p. 388-96.
125. Owen, T.A., et al., Progressive development of the rat osteoblast phenotype in vitro: reciprocal relationships in expression of genes associated with osteoblast proliferation and differentiation during formation of the bone extracellular matrix. J Cell Physiol, 1990. 143(3): p. 420-30.
126. Quarles, L.D., et al., Distinct proliferative and differentiated stages of murine MC3T3-E1 cells in culture: an in vitro model of osteoblast development. J Bone Miner Res, 1992. 7(6): p. 683-92.
127. Fedarko, N.S., et al., Extracellular matrix formation by osteoblasts from patients with osteogenesis imperfecta. J Bone Miner Res, 1992. 7(8): p. 921-30.
128. Fedarko, N.S., et al., Cell proliferation of human fibroblasts and osteoblasts in osteogenesis imperfecta: influence of age. J Bone Miner Res, 1995. 10(11): p. 1705-12.
129. Morike, M., et al., Collagen metabolism in cultured osteoblasts from osteogenesis imperfecta patients. Biochem J, 1992. 286 ( Pt 1): p. 73-7.
130. Xu, P., et al., Osteogenesis imperfecta collagen-like peptides: self-assembly and mineralization on surfaces. Biomacromolecules, 2008. 9(6): p. 1551-7.
131. Sweeney, S.M., et al., Candidate cell and matrix interaction domains on the collagen fibril, the predominant protein of vertebrates. J Biol Chem, 2008. 283(30): p. 21187-97.
132. Boyde, A., et al., The mineralization density of iliac crest bone from children with osteogenesis imperfecta. Calcif Tissue Int, 1999. 64(3): p. 185-90.
133. Lynch, M.P., et al., The influence of type I collagen on the development and maintenance of the osteoblast phenotype in primary and passaged rat calvarial osteoblasts: modification of expression of genes supporting cell growth, adhesion, and extracellular matrix mineralization. Exp Cell Res, 1995. 216(1): p. 35-45.
134. Canalis, E., Notch signaling in osteoblasts. Sci Signal, 2008. 1(17): p. pe17. 135. Hilton, M.J., et al., Notch signaling maintains bone marrow mesenchymal progenitors by
suppressing osteoblast differentiation. Nat Med, 2008. 14(3): p. 306-14. 136. Hamrick, M.W., et al., Increased osteogenic response to exercise in metaphyseal versus
diaphyseal cortical bone. J Musculoskelet Neuronal Interact, 2006. 6(3): p. 258-63. 137. Hoshi, A., et al., Effects of exercise at different ages on bone density and mechanical
properties of femoral bone of aged mice. Tohoku J Exp Med, 1998. 185(1): p. 15-24. 138. Sheng, M.H., et al., In vivo and in vitro evidence that the high osteoblastic activity in C3H/HeJ
mice compared to C57BL/6J mice is intrinsic to bone cells. Bone, 2004. 35(3): p. 711-9. 139. Bradley, E.W. and M.J. Oursler, Osteoclast culture and resorption assays. Methods Mol Biol,
2008. 455: p. 19-35. 140. Csaki, C., et al., Co-culture of canine mesenchymal stem cells with primary bone-derived
osteoblasts promotes osteogenic differentiation. Histochem Cell Biol, 2009. 131(2): p. 251-66. 141. van't Hof, R.J., Osteoclast Formation in the Mouse Coculture Assay. Methods Mol Med, 2003.
80: p. 145-152. 142. Jiang, J., S.B. Nicoll, and H.H. Lu, Co-culture of osteoblasts and chondrocytes modulates
cellular differentiation in vitro. Biochem Biophys Res Commun, 2005. 338(2): p. 762-70.
References
- 131 -
143. Chipman, S.D., et al., Defective pro alpha 2(I) collagen synthesis in a recessive mutation in mice: a model of human osteogenesis imperfecta. Proc Natl Acad Sci U S A, 1993. 90(5): p. 1701-5.
144. Kuznetsova, N.V., D.J. McBride, and S. Leikin, Changes in thermal stability and microunfolding pattern of collagen helix resulting from the loss of alpha2(I) chain in osteogenesis imperfecta murine. J Mol Biol, 2003. 331(1): p. 191-200.
145. Marin-Garcia, J. and M.J. Goldenthal, Mitochondria play a critical role in cardioprotection. J Card Fail, 2004. 10(1): p. 55-66.
146. Mayorga, M., et al., Bcl-2 is a key factor for cardiac fibroblast resistance to programmed cell death. J Biol Chem, 2004. 279(33): p. 34882-9.
147. Frangogiannis, N.G., C.W. Smith, and M.L. Entman, The inflammatory response in myocardial infarction. Cardiovasc Res, 2002. 53(1): p. 31-47.
148. Schaper, J. and B. Speiser, The extracellular matrix in the failing human heart. Basic Res Cardiol, 1992. 87 Suppl 1: p. 303-9.
149. Long, X., et al., p53 and the hypoxia-induced apoptosis of cultured neonatal rat cardiac myocytes. J Clin Invest, 1997. 99(11): p. 2635-43.
150. Li, P.F., R. Dietz, and R. von Harsdorf, Superoxide induces apoptosis in cardiomyocytes, but proliferation and expression of transforming growth factor-beta1 in cardiac fibroblasts. FEBS Lett, 1999. 448(2-3): p. 206-10.
151. Zhang, X., et al., Differential vulnerability to oxidative stress in rat cardiac myocytes versus fibroblasts. J Am Coll Cardiol, 2001. 38(7): p. 2055-62.
152. Tsang, K.Y., et al., Surviving endoplasmic reticulum stress is coupled to altered chondrocyte differentiation and function. PLoS Biol, 2007. 5(3): p. e44.
153. Kojima, T., et al., The retention of abnormal type I procollagen and correlated expression of HSP 47 in fibroblasts from a patient with lethal osteogenesis imperfecta. J Pathol, 1998. 184(2): p. 212-8.
154. Forlino, A., et al., Differential expression of both extracellular and intracellular proteins is involved in the lethal or nonlethal phenotypic variation of BrtlIV, a murine model for osteogenesis imperfecta. Proteomics, 2007. 7(11): p. 1877-91.
155. Eun, S.Y., et al., Identification of cytochrome c oxidase subunit 6A1 as a suppressor of Bax-induced cell death by yeast-based functional screening. Biochem Biophys Res Commun, 2008. 373(1): p. 58-63.
156. Okamoto, O. and S. Fujiwara, Dermatopontin, a novel player in the biology of the extracellular matrix. Connect Tissue Res, 2006. 47(4): p. 177-89.
157. MacBeath, J.R., D.R. Shackleton, and D.J. Hulmes, Tyrosine-rich acidic matrix protein (TRAMP) accelerates collagen fibril formation in vitro. J Biol Chem, 1993. 268(26): p. 19826-32.
158. Takeda, U., et al., Targeted disruption of dermatopontin causes abnormal collagen fibrillogenesis. J Invest Dermatol, 2002. 119(3): p. 678-83.
159. Toyoshima, T., et al., Differential gene expression of 36-kDa microfibril-associated glycoprotein (MAGP-36/MFAP4) in rat organs. Cell Tissue Res, 2008. 332(2): p. 271-8.
160. Chen, M.M., et al., CTGF expression is induced by TGF- beta in cardiac fibroblasts and cardiac myocytes: a potential role in heart fibrosis. J Mol Cell Cardiol, 2000. 32(10): p. 1805-19.
161. Griffin, M., R. Casadio, and C.M. Bergamini, Transglutaminases: nature's biological glues. Biochem J, 2002. 368(Pt 2): p. 377-96.
162. Chau, D.Y., et al., The cellular response to transglutaminase-cross-linked collagen. Biomaterials, 2005. 26(33): p. 6518-29.
163. Sibinga, N.E., et al., Collagen VIII is expressed by vascular smooth muscle cells in response to vascular injury. Circ Res, 1997. 80(4): p. 532-41.
164. Janicki, J.S. and G.L. Brower, The role of myocardial fibrillar collagen in ventricular remodeling and function. J Card Fail, 2002. 8(6 Suppl): p. S319-25.
165. de Simone, G. and O. de Divitiis, Extracellular matrix and left ventricular mechanics in overload hypertrophy. Adv Clin Path, 2002. 6(1): p. 3-10.
166. Janicki, J.S., Myocardial collagen remodeling and left ventricular diastolic function. Braz J Med Biol Res, 1992. 25(10): p. 975-82.
167. Mori, T., et al., Volume overload results in exaggerated cardiac hypertrophy in the atrial natriuretic peptide knockout mouse. Cardiovasc Res, 2004. 61(4): p. 771-9.
168. Houweling, A.C., et al., Expression and regulation of the atrial natriuretic factor encoding gene Nppa during development and disease. Cardiovasc Res, 2005. 67(4): p. 583-93.
169. Iwai, N., H. Shimoike, and M. Kinoshita, Genes up-regulated in hypertrophied ventricle. Biochem Biophys Res Commun, 1995. 209(2): p. 527-34.
References
- 132 -
170. Walther, T., et al., Accelerated mitochondrial adenosine diphosphate/adenosine triphosphate transport improves hypertension-induced heart disease. Circulation, 2007. 115(3): p. 333-44.
171. Lecker, S.H., et al., Multiple types of skeletal muscle atrophy involve a common program of changes in gene expression. FASEB J, 2004. 18(1): p. 39-51.
172. Towbin, J.A. and N.E. Bowles, The failing heart. Nature, 2002. 415(6868): p. 227-33. 173. Thapa, N., B.H. Lee, and I.S. Kim, TGFBIp/betaig-h3 protein: a versatile matrix molecule
induced by TGF-beta. Int J Biochem Cell Biol, 2007. 39(12): p. 2183-94. 174. ten Dijke, P. and H.M. Arthur, Extracellular control of TGFbeta signalling in vascular
development and disease. Nat Rev Mol Cell Biol, 2007. 8(11): p. 857-69. 175. Chiquet-Ehrismann, R. and M. Chiquet, Tenascins: regulation and putative functions during
pathological stress. J Pathol, 2003. 200(4): p. 488-99. 176. Nakamura, Y., M. Nawata, and S. Wakitani, Expression profiles and functional analyses of
Wnt-related genes in human joint disorders. Am J Pathol, 2005. 167(1): p. 97-105. 177. You, J., et al., Wnt pathway-related gene expression in inflammatory bowel disease. Dig Dis
Sci, 2008. 53(4): p. 1013-9. 178. Van Scoyk, M., et al., Wnt signaling pathway and lung disease. Transl Res, 2008. 151(4): p.
175-80. 179. Corvol, P., et al., Inhibition of angiogenesis: a new function for angiotensinogen and
des(angiotensin I)angiotensinogen. Curr Hypertens Rep, 2003. 5(2): p. 149-54. 180. Gao, X. and Z. Xu, Mechanisms of action of angiogenin. Acta Biochim Biophys Sin
(Shanghai), 2008. 40(7): p. 619-24. 181. Li, M. and R.M. Ransohoff, The roles of chemokine CXCL12 in embryonic and brain tumor
angiogenesis. Semin Cancer Biol, 2008. 182. Brigstock, D.R., Regulation of angiogenesis and endothelial cell function by connective tissue
growth factor (CTGF) and cysteine-rich 61 (CYR61). Angiogenesis, 2002. 5(3): p. 153-65. 183. Jiang, X.C., et al., Expression of plasma phospholipid transfer protein mRNA in normal and
emphysematous lungs and regulation by hypoxia. J Biol Chem, 1998. 273(25): p. 15714-8. 184. Ohradanova, A., et al., Hypoxia upregulates expression of human endosialin gene via
hypoxia-inducible factor 2. Br J Cancer, 2008. 99(8): p. 1348-56. 185. Park, S.Y., et al., Hypoxia increases androgen receptor activity in prostate cancer cells.
Cancer Res, 2006. 66(10): p. 5121-9. 186. Lafont, J.E., et al., Hypoxia promotes the differentiated human articular chondrocyte
phenotype through SOX9-dependent and -independent pathways. J Biol Chem, 2008. 283(8): p. 4778-86.
187. Littler, C.M., et al., Protein kinase C-epsilon-null mice have decreased hypoxic pulmonary vasoconstriction. Am J Physiol Heart Circ Physiol, 2003. 284(4): p. H1321-31.
188. Semenza, G.L., et al., Hypoxia response elements in the aldolase A, enolase 1, and lactate dehydrogenase A gene promoters contain essential binding sites for hypoxia-inducible factor 1. J Biol Chem, 1996. 271(51): p. 32529-37.
189. Pescador, N., et al., Identification of a functional hypoxia-responsive element that regulates the expression of the egl nine homologue 3 (egln3/phd3) gene. Biochem J, 2005. 390(Pt 1): p. 189-97.
190. Lasky, J.A., et al., Connective tissue growth factor mRNA expression is upregulated in bleomycin-induced lung fibrosis. Am J Physiol, 1998. 275(2 Pt 1): p. L365-71.
191. Mori, T., et al., Role and interaction of connective tissue growth factor with transforming growth factor-beta in persistent fibrosis: A mouse fibrosis model. J Cell Physiol, 1999. 181(1): p. 153-9.
192. Grotendorst, G.R., Connective tissue growth factor: a mediator of TGF-beta action on fibroblasts. Cytokine Growth Factor Rev, 1997. 8(3): p. 171-9.
193. Nakerakanti, S.S., et al., Fli1 and Ets1 have distinct roles in connective tissue growth factor/CCN2 gene regulation and induction of the profibrotic gene program. J Biol Chem, 2006. 281(35): p. 25259-69.
194. Jensen, S.A., et al., Protein interaction studies of MAGP-1 with tropoelastin and fibrillin-1. J Biol Chem, 2001. 276(43): p. 39661-6.
195. Jones, P.L., J. Crack, and M. Rabinovitch, Regulation of tenascin-C, a vascular smooth muscle cell survival factor that interacts with the alpha v beta 3 integrin to promote epidermal growth factor receptor phosphorylation and growth. J Cell Biol, 1997. 139(1): p. 279-93.
196. Jones, P.L., et al., Altered hemodynamics controls matrix metalloproteinase activity and tenascin-C expression in neonatal pig lung. Am J Physiol Lung Cell Mol Physiol, 2002. 282(1): p. L26-35.
197. Yasuda, M., et al., BNIP3alpha: a human homolog of mitochondrial proapoptotic protein BNIP3. Cancer Res, 1999. 59(3): p. 533-7.
References
- 133 -
198. Huang, Q., et al., Identification of p53 regulators by genome-wide functional analysis. Proc Natl Acad Sci U S A, 2004. 101(10): p. 3456-61.
199. Furukawa, T., et al., Potential tumor suppressive pathway involving DUSP6/MKP-3 in pancreatic cancer. Am J Pathol, 2003. 162(6): p. 1807-15.
200. Ding, L., et al., Protein kinase C-epsilon promotes survival of lung cancer cells by suppressing apoptosis through dysregulation of the mitochondrial caspase pathway. J Biol Chem, 2002. 277(38): p. 35305-13.
201. Campbell, F.E., Cardiac effects of pulmonary disease. Vet Clin North Am Small Anim Pract, 2007. 37(5): p. 949-62, vii.
202. Chowdhuri, S., et al., Cardiovascular complications of respiratory diseases. Am J Med Sci, 2007. 334(5): p. 361-80.
203. Moraes, D.L., W.S. Colucci, and M.M. Givertz, Secondary pulmonary hypertension in chronic heart failure: the role of the endothelium in pathophysiology and management. Circulation, 2000. 102(14): p. 1718-23.
204. Hoshikawa, Y., et al., Generation of oxidative stress contributes to the development of pulmonary hypertension induced by hypoxia. J Appl Physiol, 2001. 90(4): p. 1299-306.
205. Bonnet, P., et al., Chronic hypoxia induces nonreversible right ventricle dysfunction and dysplasia in rats. Am J Physiol Heart Circ Physiol, 2004. 287(3): p. H1023-8.
206. Sane, D.C., J.L. Kontos, and C.S. Greenberg, Roles of transglutaminases in cardiac and vascular diseases. Front Biosci, 2007. 12: p. 2530-45.
207. Ohkubo, H., et al., Cloning and sequence analysis of cDNA for rat angiotensinogen. Proc Natl Acad Sci U S A, 1983. 80(8): p. 2196-200.
208. Chiquet-Ehrismann, R., et al., Tenascin-C expression by fibroblasts is elevated in stressed collagen gels. J Cell Biol, 1994. 127(6 Pt 2): p. 2093-101.
209. Chiquet, M., et al., Regulation of extracellular matrix synthesis by mechanical stress. Biochem Cell Biol, 1996. 74(6): p. 737-44.
210. Jeffery, T.K. and N.W. Morrell, Molecular and cellular basis of pulmonary vascular remodeling in pulmonary hypertension. Prog Cardiovasc Dis, 2002. 45(3): p. 173-202.
211. Agocha, A., H.W. Lee, and M. Eghbali-Webb, Hypoxia regulates basal and induced DNA synthesis and collagen type I production in human cardiac fibroblasts: effects of transforming growth factor-beta1, thyroid hormone, angiotensin II and basic fibroblast growth factor. J Mol Cell Cardiol, 1997. 29(8): p. 2233-44.
212. Bateman, J.F., R.P. Boot-Handford, and S.R. Lamande, Genetic diseases of connective tissues: cellular and extracellular effects of ECM mutations. Nat Rev Genet, 2009. 10(3): p. 173-83.
213. Shah, R.V. and M.J. Semigran, Pulmonary hypertension secondary to left ventricular systolic dysfunction: contemporary diagnosis and management. Curr Heart Fail Rep, 2008. 5(4): p. 226-32.
214. Runo, J.R. and J.E. Loyd, Primary pulmonary hypertension. Lancet, 2003. 361(9368): p. 1533-44.
215. Laumanns, I.P., et al., The Non-canonical WNT-pathway Is Operative in Idiopathic Pulmonary Arterial Hypertension. Am J Respir Cell Mol Biol, 2008.
216. Wang, G.W., et al., Inhibition of hypoxia/reoxygenation-induced apoptosis in metallothionein-overexpressing cardiomyocytes. Am J Physiol Heart Circ Physiol, 2001. 280(5): p. H2292-9.
217. Adeghate, E., Molecular and cellular basis of the aetiology and management of diabetic cardiomyopathy: a short review. Mol Cell Biochem, 2004. 261(1-2): p. 187-91.
218. Liang, Q., et al., Overexpression of metallothionein reduces diabetic cardiomyopathy. Diabetes, 2002. 51(1): p. 174-81.
219. Butcher, H.L., et al., Metallothionein mediates the level and activity of nuclear factor kappa B in murine fibroblasts. J Pharmacol Exp Ther, 2004. 310(2): p. 589-98.
220. Abdel-Mageed, A.B. and K.C. Agrawal, Activation of nuclear factor kappaB: potential role in metallothionein-mediated mitogenic response. Cancer Res, 1998. 58(11): p. 2335-8.
221. Rippe, R.A., et al., NF-kappaB inhibits expression of the alpha1(I) collagen gene. DNA Cell Biol, 1999. 18(10): p. 751-61.
222. Novitskiy, G., et al., Identification of a novel NF-kappaB-binding site with regulation of the murine alpha2(I) collagen promoter. J Biol Chem, 2004. 279(15): p. 15639-44.
223. Diatchenko, L., et al., Identification of novel mediators of NF-kappaB through genome-wide survey of monocyte adherence-induced genes. J Leukoc Biol, 2005. 78(6): p. 1366-77.
224. Franco, V., et al., Atrial natriuretic peptide dose-dependently inhibits pressure overload-induced cardiac remodeling. Hypertension, 2004. 44(5): p. 746-50.
225. Cao, L. and D.G. Gardner, Natriuretic peptides inhibit DNA synthesis in cardiac fibroblasts. Hypertension, 1995. 25(2): p. 227-34.
Summary
- 134 -
7. Summary
7.1. In vitro analysis of osteoblasts
The German Mouse Clinic (GMC) provides a large scale phenotyping platform for
standardized and comprehensive analysis of mouse mutants in various clinical and
biological fields. The Dysmorphology screen of the GMC comprises the analysis of
the bone and cartilage phenotype. DXA measurements, X-ray analysis, µCT and
pQCT analysis amongst others provide a comprehensive picture of morphological
and structural alterations of the skeletal system in mutant mice. However, as the
screen is of a descriptive nature, the cellular and molecular causes of the observed
bone alterations cannot be defined. To broaden the phenotyping options of the GMC
Dysmorphology screen to the cellular level, a comprehensive and multifaceted cell
culture system for primary calvarial osteoblasts has been established. Nine different
assays have been developed to assess general properties of cell growth and to
investigate the cells concerning bone specific parameters at the functional-, protein-
and RNA-level. As the cells are cultivated and investigated independently from
systemic influences of the whole organism, it is possible to assess whether direct
alterations of the bone cells (primary effect) or systemic influences in terms of
hormonal / metabolic dysreguations (secondary effect) are responsible for the bone
phenotype of the mutants. The culture system has been validated by the
investigation of two mutant lines that have shown strong alterations in their bone
parameters within the Dysmorphology screen. Osteoblasts of Aga2 mice - a new
mouse model for Osteogenesis imperfecta - showed strong differences within the cell
culture system compared to wild type control cells. The cellular behavior and
development indicates a primary defect of the osteoblasts, whereas inappropriate
collagen synthesis causes diminished and delayed extracellular matrix maturation
and osteoblast differentiation in Aga2. In contrast, no significant differences were
found between osteoblasts from ABE2 mutants and wild type littermates, arguing for
a secondary effect as the cause of the bone alterations that might be due to the
hyperactive phenotype where elevated physical activity in the mutants positively
effects bone homeostasis and remodeling.
Summary
- 135 -
7.2. Heart and lung investigation in the Aga2 OI mouse model
Osteogenesis imperfecta (OI) is a group of inherited connective tissue disorders,
predominantly caused by mutations in the collagen I genes (Col1a1/Col1a2). It is
characterized by brittle bones, fractures and osteoporosis and is associated with
increased mortality reaching 100% perinatal lethality in the most severe type II OI.
Cardiovascular and pulmonary diseases have been described as the main causes of
death in OI patients. However, the pathological alterations in heart and lung tissues
are generally considered as secondary effects due to skeletal deformities and the
bone disorders. Comparable to human cases, heterozygous Aga2 mice - a new
mouse model for OI - vary in their etiopathology and severely affected mutants
(Aga2severe) die shortly after birth. To explain the postnatal lethality in Aga2severe and
to elucidate the pathological and molecular reasons, comprehensive analysis of Aga2
mice were performed. Given the cardiopulmonary complication in human OI patients,
heart and lung have been chosen as the most relevant and reasonable organs to be
examined and investigations were performed on the functional, morphological and
molecular level. In cardiac tissue of Aga2severe, a strong downregulation of Col1a1 on
mRNA and protein level was found both in vivo and in vitro. Histological and SEM
analysis revealed disordered collagen fibers in the ECM and right ventricular
hypertrophy. In addition, echocardiography depicts functional impairments with
decreased fractional shortening of the hearts in severely affected mutants. In lungs of
Aga2severe, pronounced pulmonary hemorrhages were found and it could be
demonstrated, that these bleedings are not due to rib fractures. Blood gas analysis
indicated hypoxia with significantly reduced pO2 (hypoxemic hypoxia). Finally, gene-
expression analysis verified all pathological observations by significant misregulation
of respective marker genes. These results provide clear evidence to support the
hypothesis that the cardiac collagen alterations represent the primary cause of the OI
lethality. Taken together, a vicious cycle of heart dysfunction, pulmonary
hypertension and hypoxia is thought to provoke early death in severely affected Aga2
mice - independently from the bone phenotype.
Zusammenfassung
- 136 -
8. Zusammenfassung
8.1. In vitro Analyse von Osteoblasten
Die „Deutsche Maus Klinik“ (GMC - German Mouse Clinic) ermöglicht auf Grundlage
einer umfangreichen Phänotypisierungsplattform eine standardisierte und
umfassende Analyse von Mausmutanten in verschiedenen klinischen und
biologischen Bereichen. Untersuchungen des Knochen- und Knorpelapparates
werden im Dysmorphologie-Modul der GMC durchgeführt. Durch den Einsatz von
u.a. Knochendichtemessungen (DXA), Röntgenanalysen, µCT als auch pQCT
Untersuchungen kann ein umfassendes Bild morphologischer und struktureller
Veränderungen des Skelettsystems von mutanten Mäusen gewonnen werden. Da
diese Untersuchungstechniken jedoch einen überwiegend diagnostischen und
beschreibenden Charakter besitzen, können die zellulären und molekularen
Ursachen der beobachteten Knochenveränderungen nicht bestimmt werden. Um die
Phänotypisierungmöglichkeiten des Dysmorphologie-Modules auf zellulärer Ebene
zu erweitern, wurde ein umfangreiches und vielfältiges Zellkultursystem für primäre
Osteoblasten entwickelt. Die Kombination von 9 verschiedenen Assays ermöglicht
dabei das Abschätzen von allgemeinen Eigenschaften des Zellwachstums und die
Untersuchung von knochenspezifischen Parametern auf funtioneller-, Protein- und
RNA-Ebene. Da die Kultivierung und Untersuchung der Zellen unabhängig von
systemischen Einflüssen des Organismus erfolgt, kann anhand der Ergebnisse eine
Aussage darüber getroffen werden, ob eine direkte Veränderung der Knochenzellen
(primärer Effekt) oder systemische Einflüsse in Form von beispielsweise hormonellen
oder metabolischen Störungen (sekundärer Effekt) die Knochenveränderungen
bedingt. Das Kultursystem wurde anhand von zwei Mutantenlinien validiert, bei
denen zuvor Veränderungen der Knochenparameter im Dysmorphologie-Modul
beobachtet wurden. Die Untersuchung von Osteoblasten aus Aga2 Mäusen - einem
neuen Modellsystem für Osteogenesis imperfecta - ergaben große Unterschiede im
Zellkultursystem im Vergleich zu wildtypischen Kontrollzellen. Das Verhalten und die
Entwicklung der Zellen deutet auf einen primären Defekt in den Osteoblasten hin,
wobei eine unzureichende Kollagensynthese eine verminderte und verzögerte
extrazelluläre Matrix Reifung und Osteoblastendifferenzierung in den Aga2 Mutanten
verursacht. Im Gegensatz dazu zeigte die Untersuchung von Osteoblasten aus ABE2
Zusammenfassung
- 137 -
Mäusen keine signifikanten Unterschiede zu Zellen aus gesunden Kontrolltieren.
Dies deutet auf einen sekundären Effekt als Ursache der Knochenveränderung hin,
wobei der hyperaktive Phenotyp in Verbindung mit der gesteigerten körperlichen
Aktivität der ABE2 Mutanten die Homöostase und das Remodelling der Knochen
positiv beeinflusst.
8.2. Herz- und Lungenuntersuchung beim Aga2 OI Mausmodell
Osteogenesis imperfecta (OI) bezeichnet eine Gruppe von vererbbaren
Bindegewebserkrankungen, die vorwiegend von Mutationen in den Genen für
Kollagen Typ I (Col1a1/Col1a2) verursacht werden. Brüchigen Knochen (engl. „brittle
bone disease“), häufigen Frakturen und Osteoporose sind typische
krankheitsassoziierte Symptome. In Abhängigkeit des Schweregrades der
Erkrankung ist eine erhöhte Mortalität unter OI Patienten beschrieben, wobei die
Sterblichkeit bei der schwerste Verlaufsform 100% im perinatalen Stadium beträgt
(Typ II OI). Als Haupttodesursache bei OI Patienten sind kardiovaskuläre und
pulmonale Erkrankungen bekannt, wobei die pathologischen Veränderungen im
Herz- und Lungengewebe bis heute als sekundäre Effekte durch
Knochenveränderungen und skelettale Deformitäten beschrieben sind. Vergleichbar
zu humanen Erkrankungsfällen, variieren heterozygote Aga2 Mäuse - ein neues
Mausmodell für OI - in ihrer Ätiopathologie und schwer erkrankte Tiere (Aga2severe)
sterben kurz nach der Geburt. Um die Gründe für die postnatale Sterblichkeit der
Agasevere Mutanten aufzuklären und die pathologischen und molekularen Ursachen
dafür zu beschreiben, wurde eine umfangreiche Analyse von Aga2 Mäusen
durchgeführt. Basierend auf den cardiopulmonären Störungen bei OI Patienten,
wurden Herz und Lunge als wichtigste krankheitsassoziierte Organe für die
Untersuchungen ausgewählt und funktionell, morphologischer und molekular
analysiert. Im Herzgewebe von Aga2severe wurde sowohl in vivo als auch in vitro eine
starke Herunterregulierung von Col1a1 auf mRNA- und Proteinebene nachgewiesen.
Histologische Untersuchungen ergaben eine rechtsventrikuläre Hypertrophie des
Herzens und Rasterelektronenmikroskopische Analysen zeigten eine gestörte
Anordnung kollagener Fibrillen in der extrazellulären Matrix des Herzgewebes in
Aga2severe Mäusen. Durch den Einsatz von Echokardiographie konnte weiterhin eine
Funktionsstörung des Herzens mit einer verminderten Kontraktionsfähigkeit des
Zusammenfassung
- 138 -
linken Herzventikels während der Systole in den mutanten Mäusen nachgewiesen
werden. Die Lungen von Aga2severe Tieren sind durch das Auftreten von exzessiven
Hämorrhagien gekennzeichnet, wobei der Nachweis erbracht werden konnte, dass
diese Blutungen nicht auf die zahlreich vorkommenden Frakturen im Bereich des
Brustkorbes zurückzuführen sind. Blutgas-Untersuchungen weisen auf einen
hypoxischen Zustand mit stark vermindertem Sauerstoffpartialdruck (pO2) in
Aga2severe Mäusen hin (Hypoxämische Hypoxie). Alle pathologischen Veränderungen
in Herz- und Lungengewebe konnten mittels Genexpressionsstudien durch die
signifikante Regulation entsprechender Markergene verifiziert werden. Die
gewonnenen Untersuchungsergebnisse sind Grundlage für die Hypothese, dass die
kardialen Kollagenveränderungen die primäre Ursache für die OI assoziierte
Lethalität darstellen. Zusammenfassend wird ein pathologischer Kreislauf aus
Herzinsuffizienz, pulmonärer Hypertonie und Hypoxie vermutet, welcher die
postnatale Sterblichkeit der Aga2severe Tiere unabhängig vom Knochenphänotyp der
Mutanten verursacht.
- IX -
IV. Publications
Poster Frank Thiele, Thomas S. Lisse, Gerhard K.H. Przemeck, Helmut Fuchs, Martin Hrabé de Angelis. “In vitro and molecular characterization of bone related phenotypes”. 20th IMGC conference, 2006. Charleston, USA. Thomas S. Lisse, Frank Thiele, Koichiro Abe, Wolfgang Hans, Matthias Klaften, Michael Schulz, Helmut Fuchs, Martin Hrabé de Angelis. “Characterization and mapping of ALI34: A new ENU-derived murine model for osteoarthritis“. 20th IMGC conference, 2006. Charleston, USA. Wolfgang Hans, Helmut Fuchs, Koichiro Abe, Thomas S. Lisse, Frank Thiele, Valerie Gailus-Durner, Martin Hrabé de Angelis. “The German Mouse Clinic – Dysmorphology, Bone and Cartilage Screen“. 3rd EUMORPHIA meeting, 2007. Barcelona, Spain. Frank Thiele, Thomas S. Lisse, Gerhard K.H. Przemeck, Helmut Fuchs, Valerie Gailus-Durner, Martin Hrabé de Angelis. “Cellular Screening of bone related disease in mice”. 34th European Symposium on Calcified Tissues, 2007. Kopenhagen, Denmark. Thomas S. Lisse, Frank Thiele, Koichiro Abe, Wolfgang Hans, Stuart Ralston, Helmut Fuchs, Martin Hrabé de Angelis. ”ER stress induced apoptosis in a new murine model for type II Osteogenesis imperfecta“. 34th European Symposium on Calcified Tissues, 2007. Kopenhagen, Denmark. Thomas S. Lisse, Christian Cohrs, Frank Thiele, Wolfgang Hans, Matthias Klaften, Helmut Fuchs, Martin Hrabé de Angelis. “Characterization and mapping of ALI34: A new ENU-derived murine model for Osteoarthritis and Chondrodysplasia”. 34th European Symposium on Calcified Tissues, 2007. Kopenhagen, Denmark. Wolfgang Hans, Thomas S. Lisse, Helmut Fuchs, Koichiro Abe, Frank Thiele, Valeria Gailus-Durner, Martin Hrabé de Angelis. “New models and mechanisms for bone and cartilage disorders”. 19th annual meeting on mouse molecular genetics, 2007. Hinxton, GB. Thomas S. Lisse, Frank Thiele, Helmut Fuchs, Wolfgang Hans, Koichiro Abe, Gerhard K.H. Przemeck, Martin Hrabé de Angelis. “ER stress-mediated apoptosis in a new mouse model of osteogenesis imperfecta”. 22th IMGC conference, 2008. Prag, Czech Republik. Wolfgang Hans, Thomas Lisse, Helmut Fuchs, Koichiro Abe, Frank Thiele, Christian Cohrs, Valerie Gailus-Durner, Martin Hrabé de Angelis. “New mouse models and mechanisms for bone and cartilage disorders”. 35th European Symposium on Calcified Tissues, 2008. Barcelona, Spain. Cohrs C.M., Thiele F., Lisse T.S., Przemeck G.K.H., Fuchs H., Hans W. and Hrabé de Angelis M. “Molecular and functional characterization of Aga2 – a mouse model for osteogenesis imperfecta”. 36th European Symposium on Calcified Tissues, 2009. Vienna, Austria. W. Hans, T. Lisse, H. Fuchs, K. Abe, F. Thiele, C.M. Cohrs, V. Gailus-Durner, M. Hrabé de Angelis. „New mouse models and mechanisms for bone and cartilage disorders“.36th European Symposium on Calcified Tissues, 2009. Vienna, Austria.
- X -
Oral presentations “In vitro and molecular characterization of bone related phenotypes”. 20th IMGC conference, 2006. Charleston, USA. “Aga2, OI and collagen: considerations beyond the bone”. 8th NGFN workshop, 2007. Grassau/Chiemgau, Germany. “Aga2 and osteogenesis imperfecta - more than a bone disease ?”. 9th NGFN workshop, 2008. Grassau/Chiemgau, Germany. Paper Fuchs H., Lisse T., Hans W., Abe K., Thiele F., Gailus-Durner V., Hrabe de Angelis M. “Phenotypic characterization of mouse models for bone-related disease in the German Mouse Clinic”. J Musculoskelet Neuronal Interact. 2008 Jan-Mar; 8(1):13-4. Lisse T.S., Thiele F., Fuchs H., Hans W., Przemeck G.K., Abe K., Rathkolb B., Quintanilla-Martinez L., Hoelzlwimmer G., Helfrich M., Wolf E., Ralston S.H., Hrabé de Angelis M. “ER stress-mediated apoptosis in a new mouse model of osteogenesis imperfecta”. PLoS Genet. 2008 Feb; 4(2):e7. Fuchs, H., Gailus-Durner, V., Adler, T., Pimentel, J. A., Becker, L., Bolle, I., Brielmeier, M., Calzada-Wack, J., Dalke, C., Ehrhardt, N., Fasnacht, N., Ferwagner, B., Frischmann, U., Hans, W., Holter, S. M., Holzlwimmer, G., Horsch, M., Javaheri, A., Kallnik, M., Kling, E., Lengger, C., Maier, H., Mossbrugger, I., Morth, C., Naton, B., Noth, U., Pasche, B., Prehn, C., Przemeck, G., Puk, O., Racz, I., Rathkolb, B., Rozman, J., Schable, K., Schreiner, R., Schrewe, A., Sina, C., Steinkamp, R., Thiele, F., Willershauser, M., Zeh, R., Adamski, J., Busch, D. H., Beckers, J., Behrendt, H., Daniel, H., Esposito, I., Favor, J., Graw, J., Heldmaier, G., Hofler, H., Ivandic, B., Katus, H., Klingenspor, M., Klopstock, T., Lengeling, A., Mempel, M., Muller, W., Neschen, S., Ollert, M., Quintanilla-Martinez, L., Rosenstiel, P., Schmidt, J., Schreiber, S., Schughart, K., Schulz, H., Wolf, E., Wurst, W., Zimmer, A., Hrabe de Angelis, M. “The German Mouse Clinic: A platform for systemic phenotype analysis of mouse models”. Curr Pharm Biotechnol. 2009 10, 236-243. Gailus-Durner, V., Fuchs, H., Adler, T., Aguilar Pimentel, A., Becker, L., Bolle, I., Calzada-Wack, J., Dalke, C., Ehrhardt, N., Ferwagner, B., Hans, W., Holter, S. M., Holzlwimmer, G., Horsch, M., Javaheri, A., Kallnik, M., Kling, E., Lengger, C., Morth, C., Mossbrugger, I., Naton, B., Prehn, C., Puk, O., Rathkolb, B., Rozman, J., Schrewe, A., Thiele, F., Adamski, J., Aigner, B., Behrendt, H., Busch, D. H., Favor, J., Graw, J., Heldmaier, G., Ivandic, B., Katus, H., Klingenspor, M., Elisabeth Kremmer, T. K., Ollert, M., Quintanilla-Martinez, L., Schulz, H., Wolf, E., Wurst, W., de Angelis, M. H. “Systemic first-line phenotyping”. Methods Mol Biol. 2009 530, 1-47. Thiele, F., Cohrs, C.M., Lisse T.S., Przemeck, G.K., Horsch, M., Schrewe, A., Fuchs, H., Hans, W., Beckers, J., Hrabé de Angelis, M. “Col1a1 mutation triggers early lethality in a mouse model for Osteogenesis imperfecta due to bone-independent primary defects in heart and lung”. Manuscript in preparation. Thiele, F., Cohrs, C.M., Przemeck, G.K., Fuchs, H., Hrabé de Angelis, M. „Comprehensive in vitro analysis of bone phenotypes in mice using osteoblast cell culture“. Manuscript in preparation.
- XI -
V. Curriculum Vitae
Personal Data Name Frank Thiele Date of birth February 4th 1979 Place of birth Borna Citizenship German Highschool 1992 - 1997 “Heinrich Pestalozzi” Secondary School in Borna 1997 Abitur / finale grade: 2,3 Military Service 1997 - 1998 Soldier at basic military service / Military Police at 4.FJgBtl 740 University 1998 - 2003 University of Leipzig
Faculty of Life Science, Pharmacy and Psychology Subject: Biology Main focus: Genetics / Immunology / Microbiology / Molecular Medicine
2003 - 2005 Diploma thesis
Institute of Virology at the Medical School Leipzig Topic: Investigation of the infectivity of Measles Virus RNA between neuronal cells
2005 Degree: certified biologist / final grade: 1,6 Dissertation 2005 - 2009 Helmholtz Zentrum Munich
Institute of Experimental Genetics Topic: Development of an osteoblast cell culture system for functional characterization and comparative analyses of mouse models with bone phenotypes and systemic investigation of an Osteogenesis imperfecta disease model
- XII -
VI. Affirmation
Ich erkläre hiermit an Eides statt, dass ich die vorliegende Arbeit selbstständig, ohne
unzulässige fremde Hilfe und ausschließlich mit den angegebenen Quellen und
Hilfsmitteln angefertigt habe.
Die verwendeten Literaturquellen sind im Literaturverzeichnis (References)
vollsändig zitiert.
Diese Arbeit hat in dieser oder ähnlicher Form noch keiner anderen Prüfungsbehörde
vorgelegen.
München, den 16.07.2009 Frank Thiele
- XIII -
VII. Acknowledgment
Ich möchte mich ganz herzlich bei Herrn Prof. Dr. Martin Hrabé de Angelis für die
Überlassung des interessanten Themas und das damit verbundene Vertrauen in
meine Person und meine Arbeit bedanken. Die ständige Diskussionsbereitschaft
sowie die mir ermöglichten Freiräume bei der Durchführung des Projektes waren
Grundstein und Wegbereiter für das erfolgreiche Abschließen dieser Arbeit.
Für die großartige Betreuung und ständige Bereitschaft, sich allen großen und
kleinen Problemen anzunehmen und mich dabei mit kompetenten Ratschlägen zu
unterstützen, danke ich Herrn Dr. Gerhard Przemeck. Ebenso danke ich Herrn Dr.
Helmut Fuchs und Herrn Dr. Wolfgang Hans für ihre fachliche Unterstützung.
Herrn Dr. Thomas Lisse und Herrn Christian Cohrs bin ich zutiefst für die ständige
Hilfsbereitschaft und Unterstützung bei der Planung und Verwirklichung der
experimentellen Arbeiten dankbar. Die konstruktiven Diskussionen und der ständige
Ideenaustausch waren eine großartige Unterstützung für mich.
Ich danke Herrn Dr. Uwe Kornak für die Einweihung in die Geheimnisse der
Osteoblastenkultivierung, Frau Dr. Anja Schrewe für die Durchführung der
cardiovaskulären Experimente, Frau Dr. Marion Horsch für das Erstellen der
Genexpressionsdaten und Frau Helga Wehnes für die Unterstützung bei der SEM.
Ich möchte mich ganz herzlich bei allen Technischen Assistenten und Mitarbeitern
des Institutes für das freundliche und angenehme Arbeitsklima sowie die vielen
großen und kleinen Gefallen bedanken. Ein ganz großer Dank an Micha, Tommy,
Reinhard, Nina, Nicole, Silvia, Conny, Susann, die Sandras und alle anderen …
Ein ganz besonderer Dank gilt meinen Eltern und Großeltern. Sie waren mir immer
ein Vorbild und haben mich durch ihr Handeln und Wirken in meiner Persönlichkeit
geformt. Für ihre stetige moralische und finanzielle Unterstützung während meines
Studiums und dieser Arbeit möchte ich mich ganz herzlich bedanken. Abschließend
möchte ich mich bei Monique und Alexander bedanken, die für mich stets ein offenes
Ohr haben und mir immer als Ansprechpartner in jeder Lebenslage zur Seite stehen.