Embed Size (px)
Citation preview
WIFO 1030 WIEN, ARSENAL, OBJEKT 20
TEL. 798 26 01 • FAX 798 93 86
ÖSTERREICHISCHES INSTITUT FÜR WIRTSCHAFTSFORSCHUNG
Labour Market Monitor 2018 A Europe-wide Labour Market Monitoring System Updated Annually Executive Summary: EU in a Nutshell Ulrike Huemer, Helmut Mahringer
Research assistance: Anna Albert
March 2019
Labour Market Monitor 2018 A Europe-wide Labour Market Monitoring System Updated Annually Executive Summary: EU in a Nutshell Ulrike Huemer, Helmut Mahringer March 2019
Austrian Institute of Economic Research Commissioned by the Chamber of Labour: Vienna Internal review: Hedwig Lutz • Research assistance: Anna Albert
Abstract The report is an update of a set of labour market indices first developed and tested in 2010 in collaboration with experts of the Vienna Chamber of Labour (AK). The Austrian labour market is examined relative to the other 27 EU countries (including UK) according to the following key dimensions: overall labour market performance, participation of different groups of peo- ple, exclusion risks on the labour market, distribution of earnings and redistribution by the welfare state.
ISBN: 978-3-7063-0774-1
Please refer to: [email protected], [email protected], [email protected]
2019/063/A/WIFO project no: 13218
© 2019 Austrian Institute of Economic Research
– 1 –
1. Introduction
The assessment of the labour market situation in the European Union is often carried out by Eurostat on the basis of a few regularly updated key indicators. In particular much emphasis is placed on the unemployment rate. However, focusing on a single indicator captures only a certain aspect of the labour market. Employment opportunities and national labour markets are diverse. Against this background, the Vienna Chamber of Labour (AK) aims to more closely examine a broader spectrum of labour market issues within a European context. In 2010, in collaboration with WIFO, a team of AK (Austrian Federal Chamber of Labour) and ETUI (Euro- pean Trade Union Institute) experts identified five key labour market dimensions:
1. Overall labour market performance 2. Participation 3. Exclusion risks on the labour market 4. Distribution of earnings 5. Redistribution by the Welfare State
Based on a series of indicators, an index was created for each of these five dimensions and applied to all EU member countries. The labour market monitor therefore consists of five sepa- rate indices (dimensions). Each index can have a value between 1 and 10 for the countries considered, with 10 representing the best and 1 the worst possible outcome.
The labour market monitor should represent a monitoring system that condenses significant aspects of labour market development from a multitude of indicators. Indicators that are com- parable and regularly available throughout Europe are used. This facilitates regular updates of these indices and allows for monitoring over time. The present edition represents the eighth update of the labour market monitor.
The advantage of this set of instruments lies in the
□ bundling of complex economic, political and social contexts into a few index values, □ comparability of national conditions, which can also be used for benchmarking, □ regular and fast updates, □ creation of a descriptive overview that can serve as a starting point for more in-depth
analysis.
However, the generation of indices also represents a tightrope walk. On the one hand, indices reduce the complexity of the information processed; on the other hand, it is precisely this sim- plicity that bears the risk of misinterpretations – we aim to counteract by a transparent meth- odology and documentation of data and methods as well as by the separate presentation of five aspects of the labour market.
– 2 –
The present report summarises the current results1 of the five dimensions: It provides a (carto- )graphic overview and presents the main characteristics of the top countries in the five key labour market dimensions. In addition, this year's edition of the Executive Summary outlines the long-term development of labour market performance (dimension 1 – overall labour market performance index).
2. Labour market monitoring with the labour market monitor
A total of 58 indicators are represented in the labour market monitor and its five dimensions. Content related considerations, as well as the aspects of regular availability and comparability of data determined the selection of indicators. The labour market monitor is mainly based on data from Eurostat (EU-LFS and EU-SILC) and always uses the most recent data – in the 2018 labour market monitor these were primarily data from the years 2016 and 2017. However, not all indicators are as quickly and completely available as others. Where the most recent data for individual countries are missing, data from the previous year are used. If this information is also missing, the country in question is left out of the calculation.
2.1 The five dimensions
The first two dimensions reflect general aspects of the labour market and are measured based on seven respectively 13 indicators. Dimension (1), "overall performance", refers to the labour market in the context of the overall economic situation of a country based on the interplay of employment, unemployment, economic growth and productivity (seven key indicators). Di- mension (2), "participation", captures the extent to which different groups of people (e.g. young and old, women and men) are integrated into the labour market. The third dimension (3), "exclusion risks on the labour market", should capture the capacity of a country to enable fair access to the labour market and the chances of remaining employed; here, an important role is undoubtedly played by the level of education and the availability of childcare infra- structure, and 20 indicators are used in this dimension. The fourth (4) and fifth (5) dimensions mainly reflect differences in earnings and Welfare State activities within the European Union: dimension (4) shows the "distribution of earnings" based on eight indicators; dimension (5) "re- distribution by the Welfare State" uses ten indicators to measure the effectiveness of state inter- ventions and public expenditures for social protection and education.
1 Huemer, U., Mahringer, H., Arbeitsmarktmonitor 2018 – Update des jährlichen, EU-weiten Arbeitsmarktbeobachtungs- systems, WIFO-Monographie, 2019, forthcoming.

– 3 –
Figure 1: Structure of the Labour Market Monitor 2018 – dimensions and sub-dimensions
Source: WIFO.
Labour Market Monitor 2018 (58 indicators)
Overall Labour Market
Performance Index (7 indicators, EU-28)
Participation Index
(13 indicators, EU-28 without IT and UK)
Exclusion Risks on the Labour Market
Index (20 indicators, EU-28 without BG and LT)
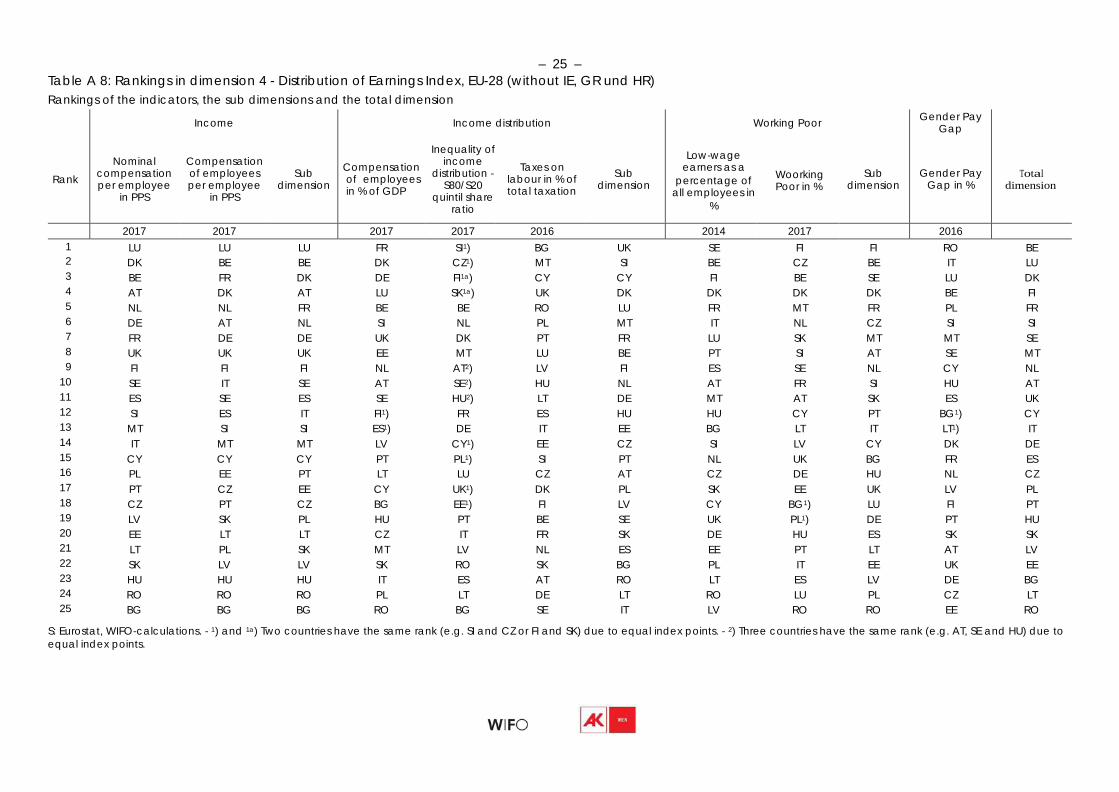
Distributionof Earnings Index
(8 indicators, EU-28 without IE, GR and HR)
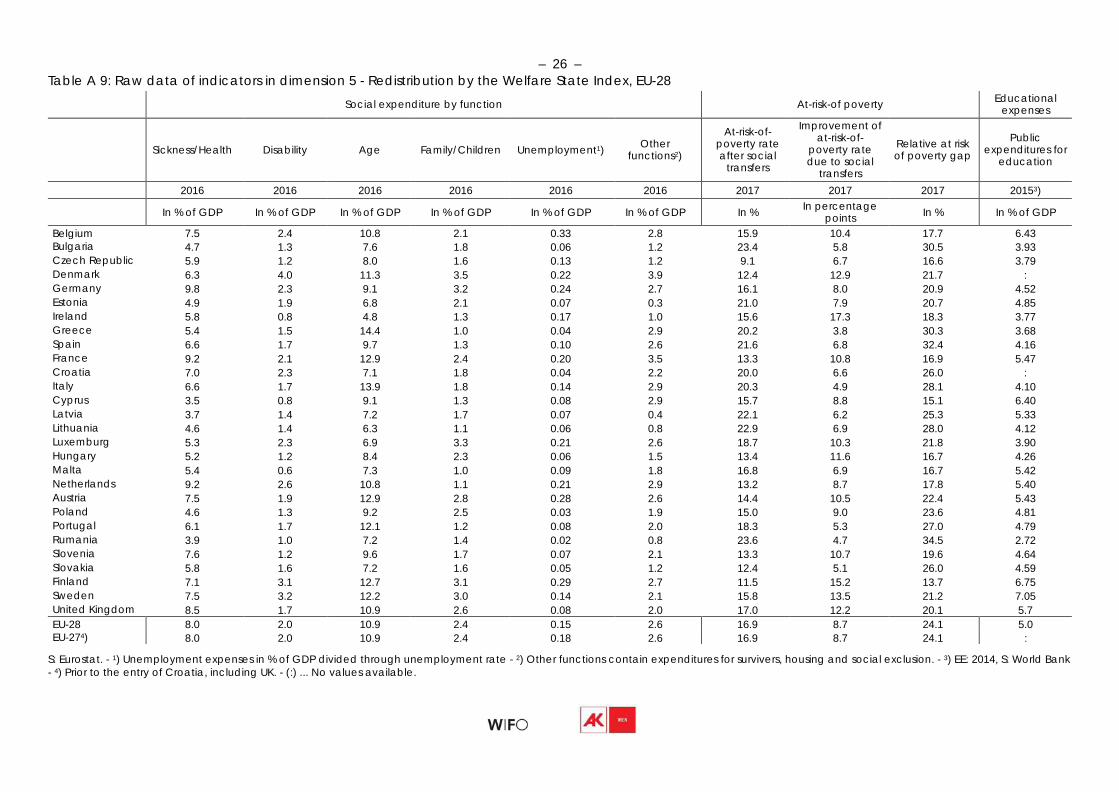
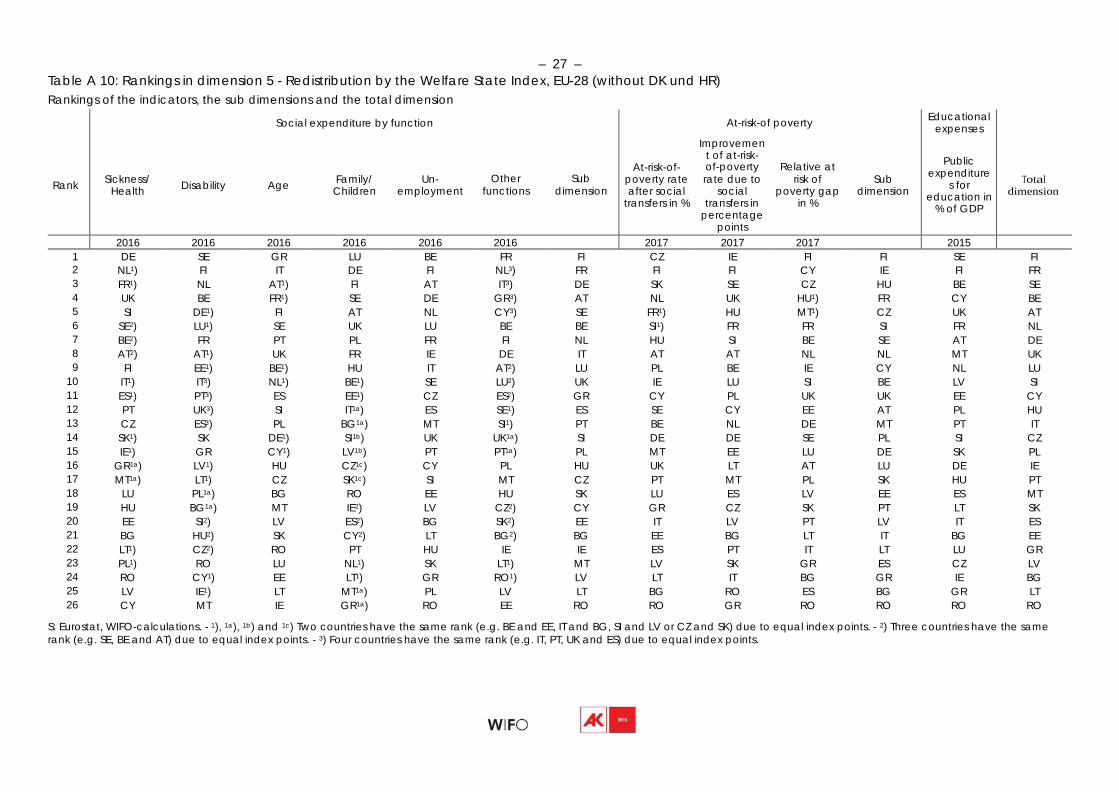
Redistributionby the Welfare State
Index (10 indicators, EU-28 without DK and HR)
Employment
(3 indicators, 2017)
Employment
(6 indicators, 2017)
Education
(7 indicators, 2017, 2015)
Income/Salary (2 indicators, 2017)
Unemployment (1 indicator, 2017)
Unemployment (4 indicators, 2017)
Exclusion
(3 indicators, 2017)
Income Distribution (3 indicators, 2017, 2016)
Economic Growth and Productivity
(3 indicators, 2017)
Labour Market
Policy (3 indicators, 2016)
Childcare
(2 indicators, 2017)
Working Poor
(2 indicators, 2017, 2014)
Social Protection
Benefits (6 indicators, 2016)
At-Risk-of Poverty
(3 indicators, 2017)
Expenditure on
Education (1 indicator, 2015)
Health
(8 indicators, 2017, 2016)
Gender Pay Gap
(1 indicator, 2016)
3. Index methodology
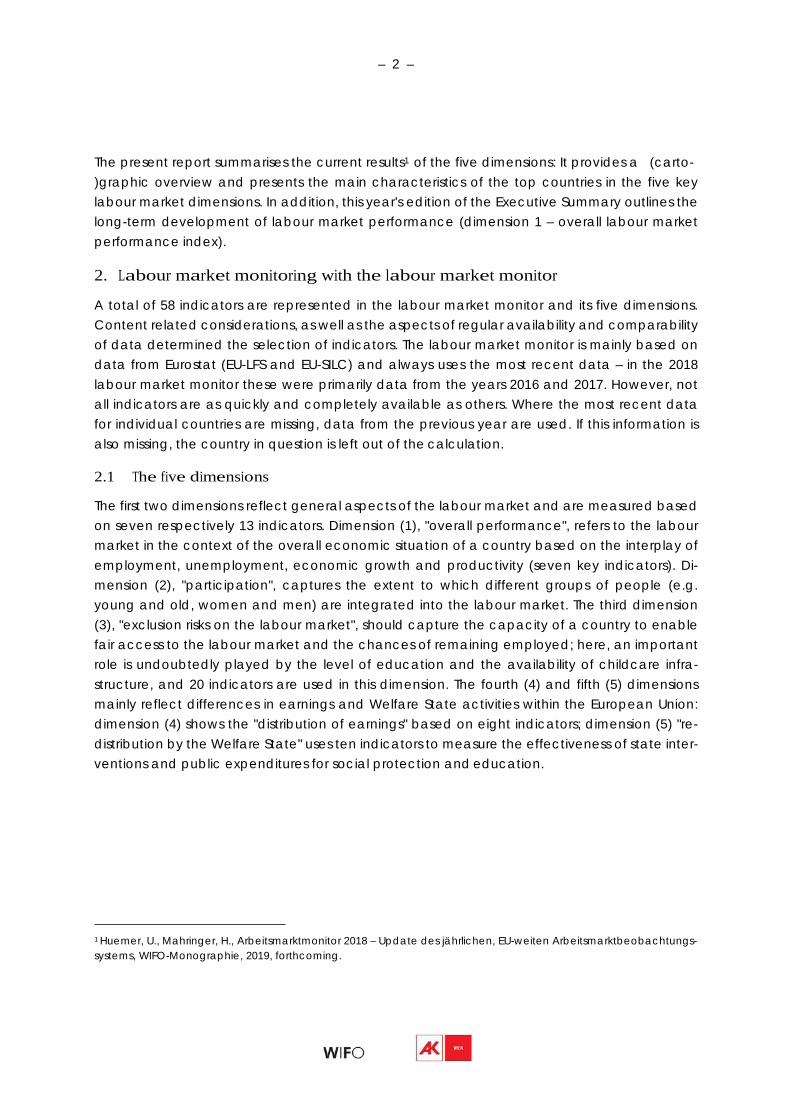
The calculation of the five dimensions is based on standard methods of index construction (see Haas et al. 2010, p. 15ff). This involves a five-step process. In a first step, the indicators, which are in part measured in different units (e.g. Euros, percentage shares) are normalized by using the min-max method. In a second step, the standardized indicators are transformed on a scale of 1 (worst value) to 10 (best value). In a third step, the indicators are weighted (on the basis of their standard deviation), thus making sure that indicators with a higher variation are not rep- resented disproportionately higher or exert a higher influence on the overall index. In a fourth step, the values gained for each index in steps 1 to 3 are added together and once again normalized and transformed. In this way, the different country and dimension indicators of the Labour Market Monitor are condensed into one index figure.
Figure 2: Multi-step calculation process for the five indices
Source: WIFO.
Finally, a sensitivity analysis is applied to test the robustness of our results and compares the performance of the index to alternative configurations (change of weighting of indicators or the composition of indicators per index). This model proves highly robust with respect to the different weighting variations and selection of indicators.
3.1 Presentation of results
Based on the calculated point values four country groups are formed along the quartile limits ("top" field, "upper middle field", "lower middle" field, and "bottom" field). These country groups are used to carry out a comparison to the previous year): not the changes in rankings but rather the categorization of the Member States in terms of the four groups of the distribution are eval- uated. In forming four equally occupied country groups, however, the distance in point values between neighbouring groups can be quite small. For this reason, an additional alternative group categorisation is carried out: countries are clustered in such a way as to minimize the distance between the countries point values within each group, while at the same time max- imize the distance to the neighbouring groups (point difference of at least 0.5 on the ten-part point value scale).
The following points must be taken into consideration when interpreting the indices: despite a comprehensive selection process of figures, an index can never completely capture all na- tional differences and country-specific institutional contexts. Thus, the results are to be under- stood as an approximation of a labour market country pattern.
Normalization
Re-Scaling
Weighting
Aggregation
Sensitivity Analysis
– 5 –
Dimension 1 – Overall Labour Market Performance Index
S.: Labour Market Monitor 2018.
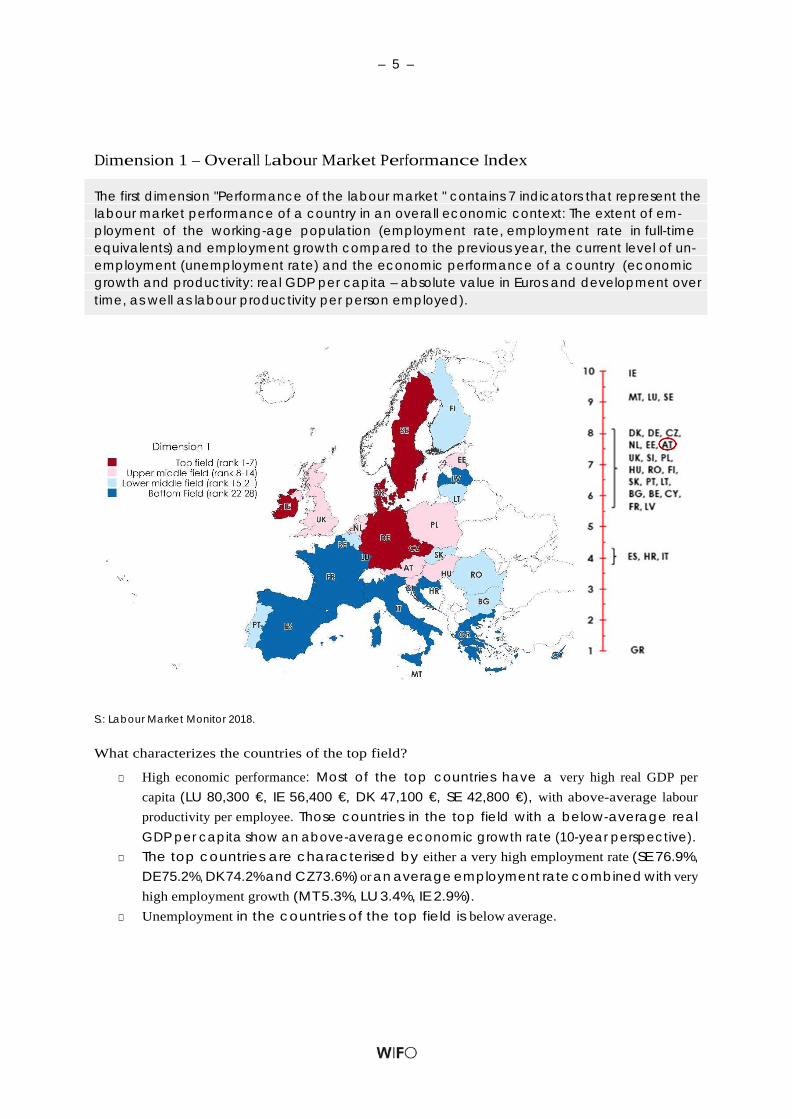
What characterizes the countries of the top field?
□ High economic performance: Most of the top countries have a very high real GDP per capita (LU 80,300 €, IE 56,400 €, DK 47,100 €, SE 42,800 €), with above-average labour productivity per employee. Those countries in the top field with a below-average real GDP per capita show an above-average economic growth rate (10-year perspective).
□ The top countries are characterised by either a very high employment rate (SE 76.9%, DE 75.2%, DK 74.2% and CZ 73.6%) or an average employment rate combined with very high employment growth (MT 5.3%, LU 3.4%, IE 2.9%).
□ Unemployment in the countries of the top field is below average.
The first dimension "Performance of the labour market " contains 7 indicators that represent the labour market performance of a country in an overall economic context: The extent of em- ployment of the working-age population (employment rate, employment rate in full-time equivalents) and employment growth compared to the previous year, the current level of un- employment (unemployment rate) and the economic performance of a country (economic growth and productivity: real GDP per capita – absolute value in Euros and development over time, as well as labour productivity per person employed).
– 6 –
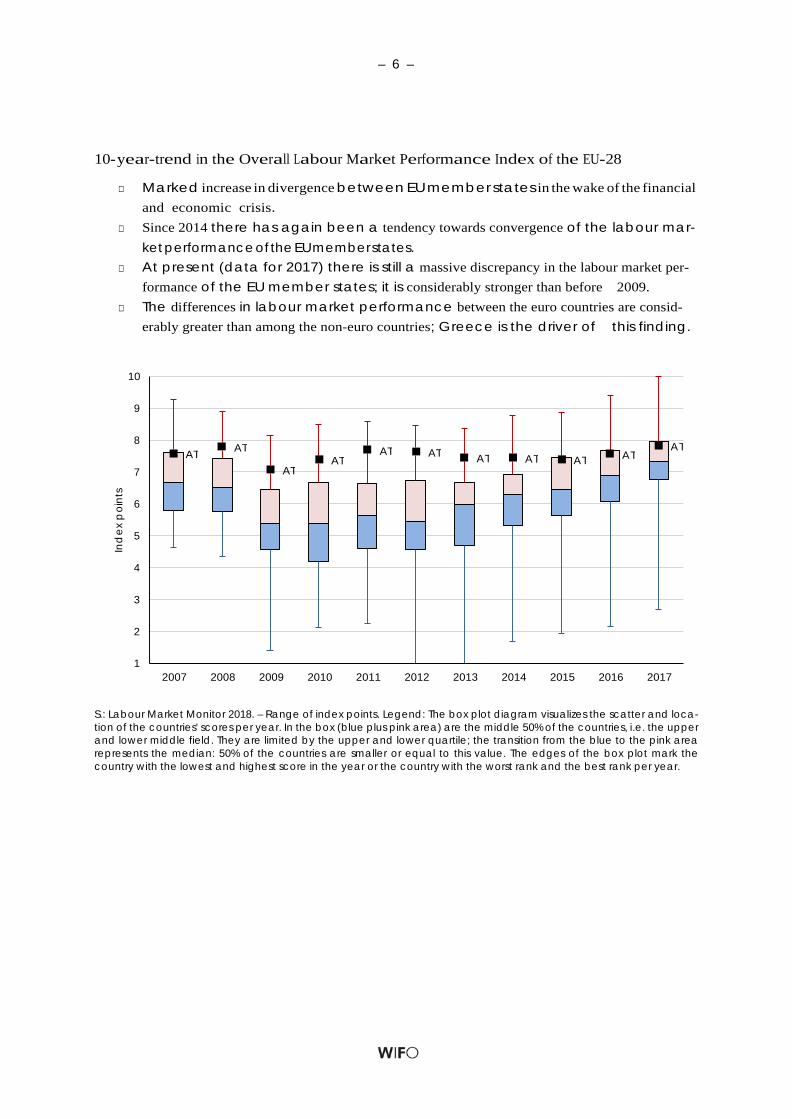
10- year-trend in the Overall Labour Market Performance Index of the EU-28
□ Marked increase in divergence between EU member states in the wake of the financial and economic crisis.
□ Since 2014 there has again been a tendency towards convergence of the labour mar- ket performance of the EU member states.
□ At present (data for 2017) there is still a massive discrepancy in the labour market per- formance of the EU member states; it is considerably stronger than before 2009.
□ The differences in labour market performance between the euro countries are consid- erably greater than among the non-euro countries; Greece is the driver of this finding.
10
9
8
7
6
5
4
3
2
1 2007 2008 2009 2010 2011 2012 2013 2014 2015 2016 2017
S.: Labour Market Monitor 2018. – Range of index points. Legend: The box plot diagram visualizes the scatter and loca- tion of the countries' scores per year. In the box (blue plus pink area) are the middle 50% of the countries, i.e. the upper and lower middle field. They are limited by the upper and lower quartile; the transition from the blue to the pink area represents the median: 50% of the countries are smaller or equal to this value. The edges of the box plot mark the country with the lowest and highest score in the year or the country with the worst rank and the best rank per year.
AT AT AT
AT AT AT AT AT AT AT
AT
Ind
ex p
oint
s
– 7 –
Dimension 2 – Participation Index
10
9
8
7
6
5
4
3
2
1
S.: Labour Market Monitor 2018. – Index calculation without United Kingdom and Italy.
DK
SE
LT, LU, AT, FI, HU, DE, EE, NL, CZ, LV, BE, PL, SI, IE, FR, BG, PT, RO, MT, HR, SK, CY
ES
GR
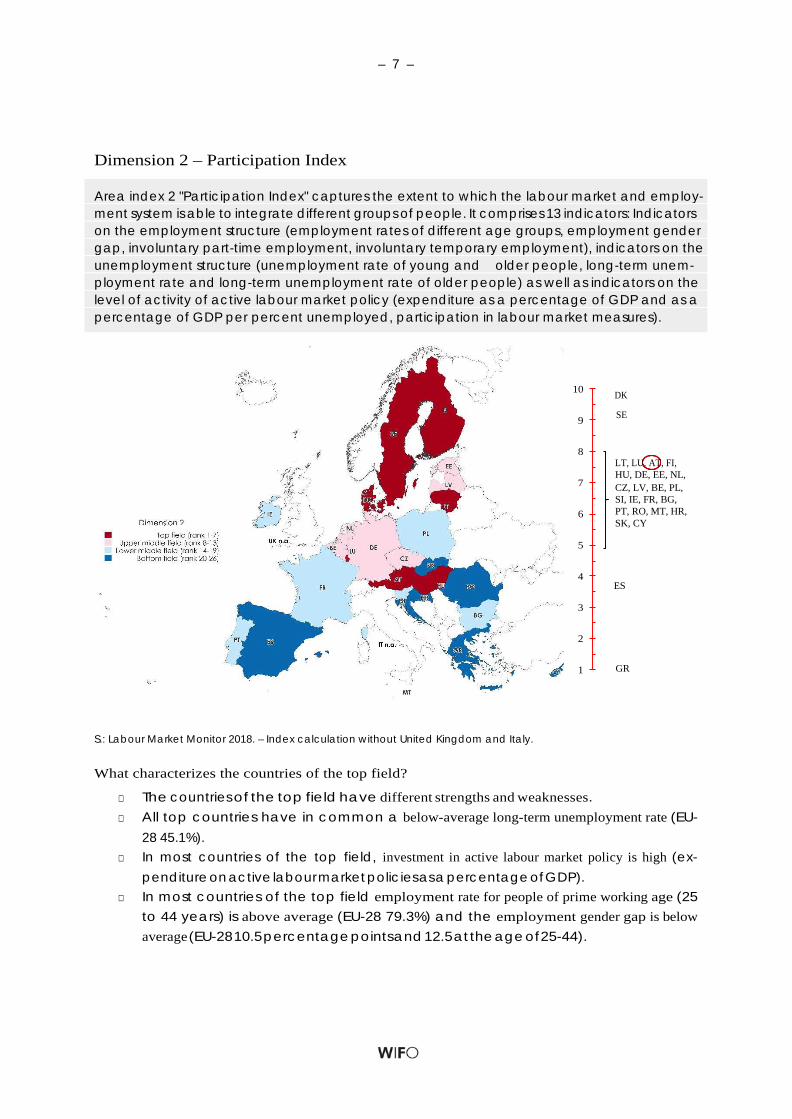
What characterizes the countries of the top field?
□ The countries of the top field have different strengths and weaknesses. □ All top countries have in common a below-average long-term unemployment rate (EU-
28 45.1%). □ In most countries of the top field, investment in active labour market policy is high (ex-
penditure on active labour market policies as a percentage of GDP). □ In most countries of the top field employment rate for people of prime working age (25
to 44 years) is above average (EU-28 79.3%) and the employment gender gap is below average (EU-28 10.5 percentage points and 12.5 at the age of 25-44).
Area index 2 "Participation Index" captures the extent to which the labour market and employ- ment system is able to integrate different groups of people. It comprises 13 indicators: Indicators on the employment structure (employment rates of different age groups, employment gender gap, involuntary part-time employment, involuntary temporary employment), indicators on the unemployment structure (unemployment rate of young and older people, long-term unem- ployment rate and long-term unemployment rate of older people) as well as indicators on the level of activity of active labour market policy (expenditure as a percentage of GDP and as a percentage of GDP per percent unemployed, participation in labour market measures).
– 8 –
Dimension 3 – Exclusion Risks on the Labour Market Index
10 SE
9
8 DK
7 FI, IE, CY, SI, NL
6
FR, DE, UK, BE, LU, CZ,
5 AT, PL, ES, EE, GR, MT
4
LV, HR, PT, 3 SK, IT
2 HU
1 RO
S.: Labour Market Monitor 2018. – Index calculation without Bulgaria and Lithuania.
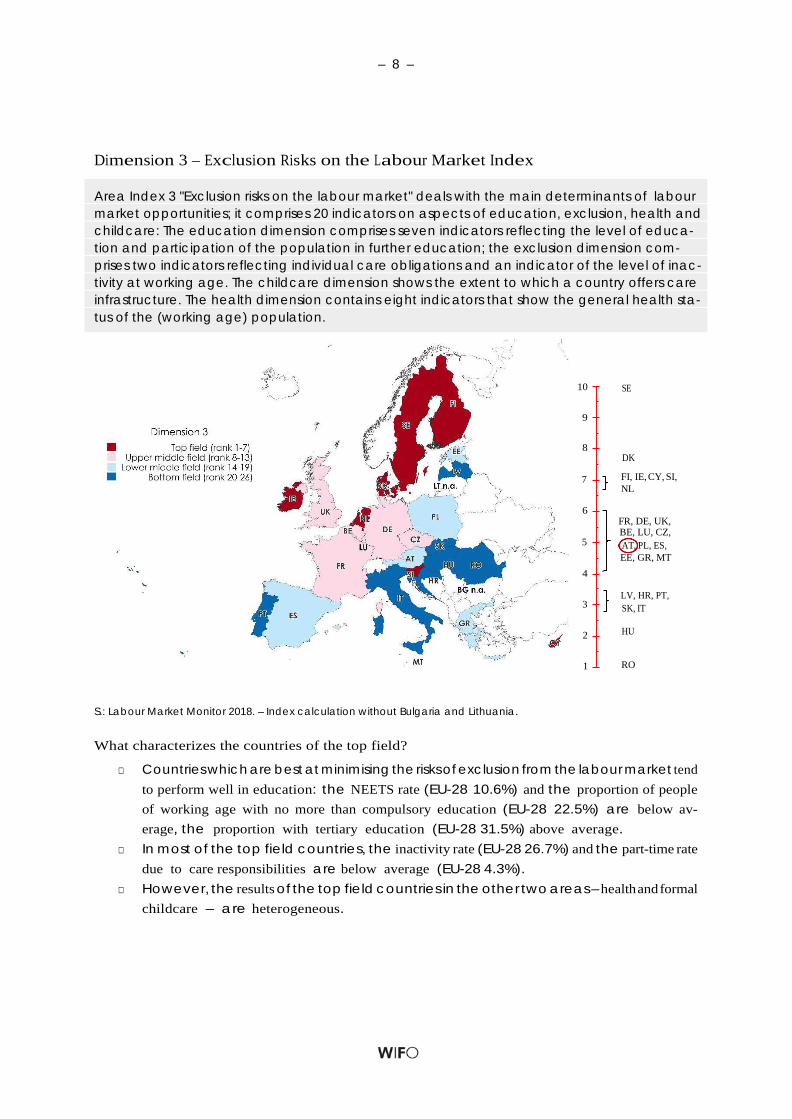
What characterizes the countries of the top field?
□ Countries which are best at minimising the risks of exclusion from the labour market tend to perform well in education: the NEETS rate (EU-28 10.6%) and the proportion of people of working age with no more than compulsory education (EU-28 22.5%) are below av- erage, the proportion with tertiary education (EU-28 31.5%) above average.
□ In most of the top field countries, the inactivity rate (EU-28 26.7%) and the part-time rate due to care responsibilities are below average (EU-28 4.3%).
□ However, the results of the top field countries in the other two areas – health and formal childcare – are heterogeneous.
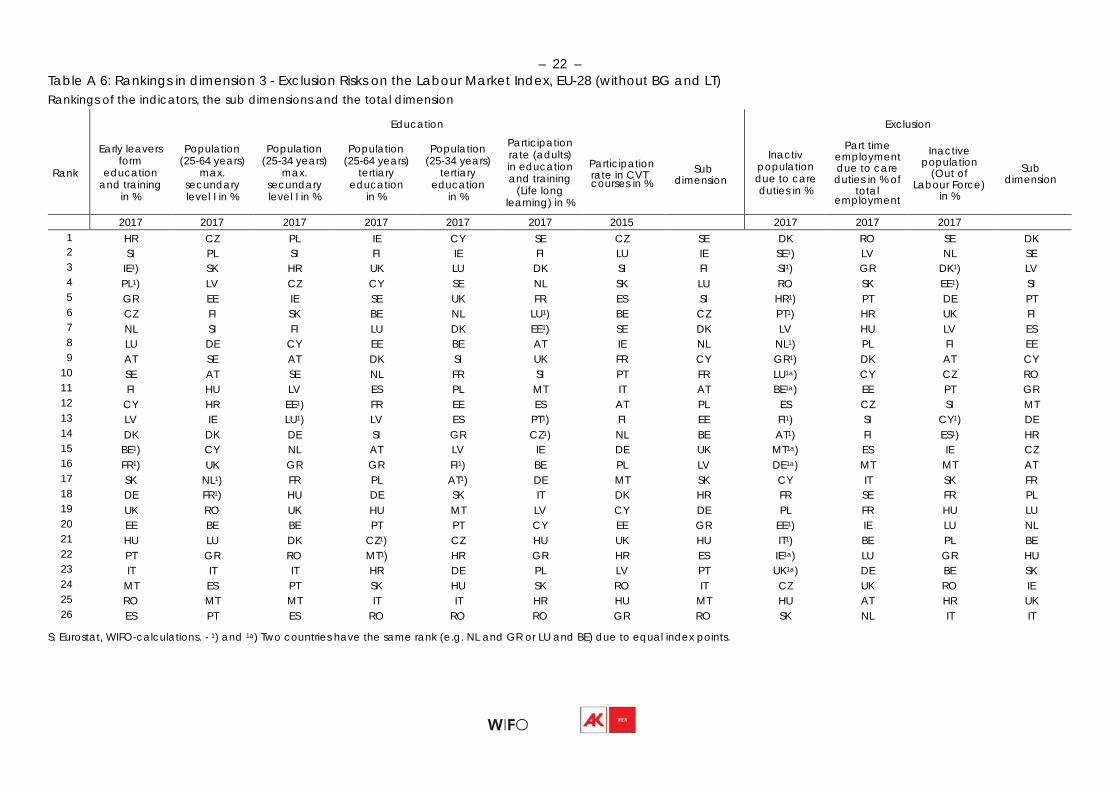
Area Index 3 "Exclusion risks on the labour market" deals with the main determinants of labour market opportunities; it comprises 20 indicators on aspects of education, exclusion, health and childcare: The education dimension comprises seven indicators reflecting the level of educa- tion and participation of the population in further education; the exclusion dimension com- prises two indicators reflecting individual care obligations and an indicator of the level of inac- tivity at working age. The childcare dimension shows the extent to which a country offers care infrastructure. The health dimension contains eight indicators that show the general health sta- tus of the (working age) population.
– 9 –
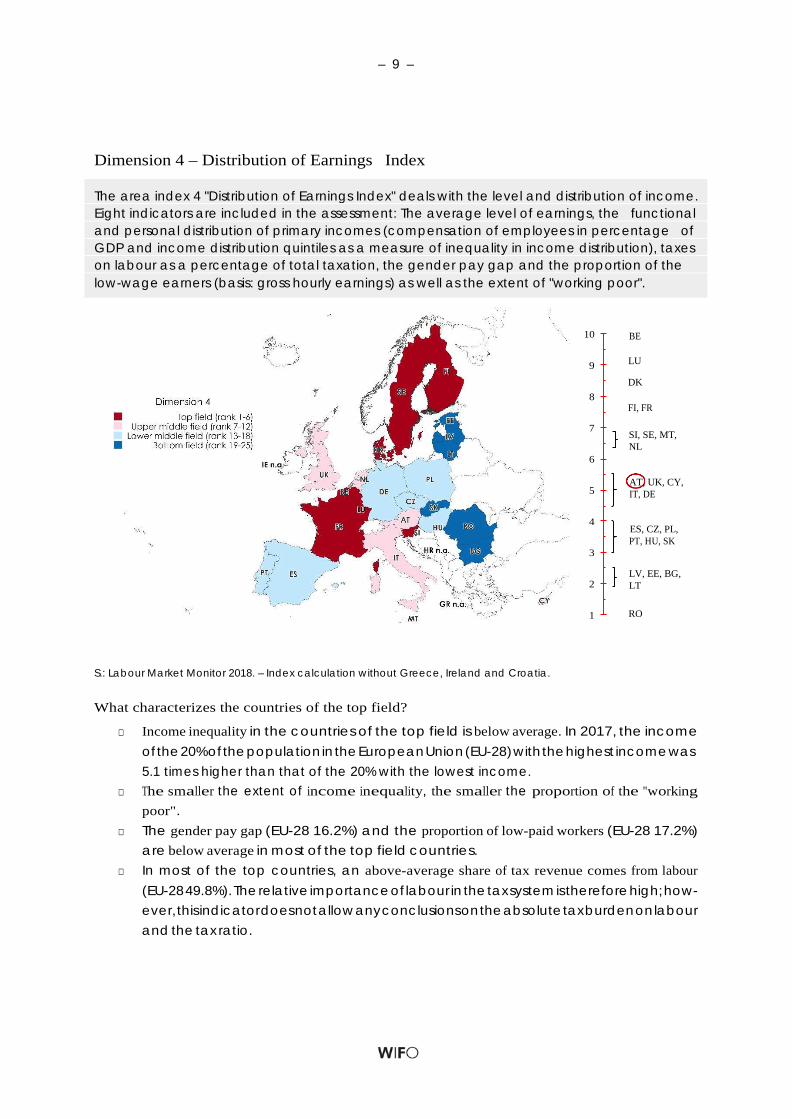
Dimension 4 – Distribution of Earnings Index
10
9
8
7
6
5
4
3
2
1
S.: Labour Market Monitor 2018. – Index calculation without Greece, Ireland and Croatia.
BE
LU
DK
FI, FR
SI, SE, MT, NL
AT, UK, CY, IT, DE
ES, CZ, PL, PT, HU, SK
LV, EE, BG, LT
RO
What characterizes the countries of the top field?
□ Income inequality in the countries of the top field is below average. In 2017, the income of the 20% of the population in the European Union (EU-28) with the highest income was 5.1 times higher than that of the 20% with the lowest income.
□ The smaller the extent of income inequality, the smaller the proportion of the "working poor".
□ The gender pay gap (EU-28 16.2%) and the proportion of low-paid workers (EU-28 17.2%) are below average in most of the top field countries.
□ In most of the top countries, an above-average share of tax revenue comes from labour (EU-28 49.8%). The relative importance of labour in the tax system is therefore high; how- ever, this indicator does not allow any conclusions on the absolute tax burden on labour and the tax ratio.
The area index 4 "Distribution of Earnings Index" deals with the level and distribution of income. Eight indicators are included in the assessment: The average level of earnings, the functional and personal distribution of primary incomes (compensation of employees in percentage of GDP and income distribution quintiles as a measure of inequality in income distribution), taxes on labour as a percentage of total taxation, the gender pay gap and the proportion of the low-wage earners (basis: gross hourly earnings) as well as the extent of "working poor".
– 10 –
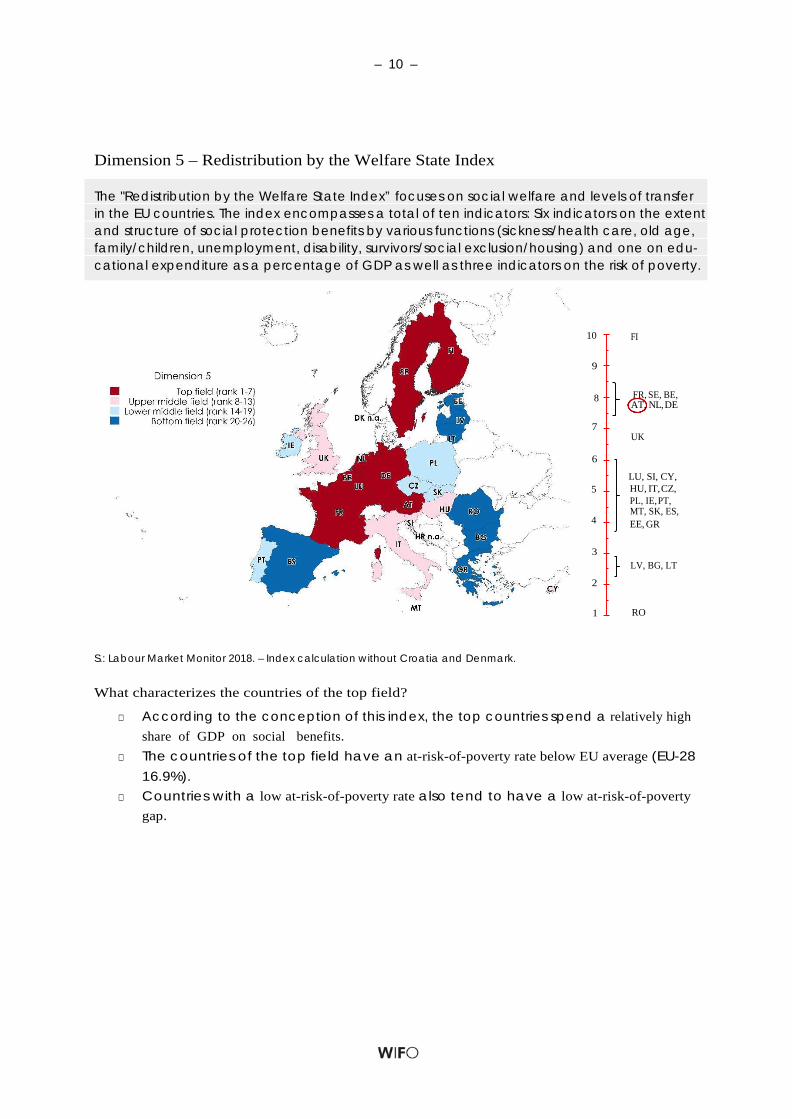
Dimension 5 – Redistribution by the Welfare State Index
10 FI
9
8 FR, SE, BE, AT, NL, DE
7
UK
6
LU, SI, CY, 5 HU, IT, CZ,
PL, IE, PT, MT, SK, ES,
4 EE, GR
3 LV, BG, LT
2
1 RO
S.: Labour Market Monitor 2018. – Index calculation without Croatia and Denmark.
What characterizes the countries of the top field?
□ According to the conception of this index, the top countries spend a relatively high share of GDP on social benefits.
□ The countries of the top field have an at-risk-of-poverty rate below EU average (EU-28 16.9%).
□ Countries with a low at-risk-of-poverty rate also tend to have a low at-risk-of-poverty gap.
The "Redistribution by the Welfare State Index” focuses on social welfare and levels of transfer in the EU countries. The index encompasses a total of ten indicators: Six indicators on the extent and structure of social protection benefits by various functions (sickness/health care, old age, family/children, unemployment, disability, survivors/social exclusion/housing) and one on edu- cational expenditure as a percentage of GDP as well as three indicators on the risk of poverty.
– 11 –
Table appendix
In the following, both the raw data and the results of the main version of the Labour Market Monitor 2018 are presented in tabular form of the rankings. At the request of experts from the Vienna Chamber of Labour, some indicators were included in the raw data on a gender-spe- cific basis, so separately for men and women. However, indicators which are presented by gender are only included in the calculation of the respective dimension indices as ""total"".
The calculation of the sector indices is based, with a few exceptions, predominantly on the years 2017 and 2016; a footnote indicates whether a year other than 2017 or 2016 is included in the calculation of the respective sector indices. Some countries have the same ranking be- cause they have the same scores. Equal rankings are also indicated by footnotes.
The raw data are presented for all EU-28 member states. However, due to missing data, not all EU-28 member states could be included in the calculation for four out of five range indices.
– 12 –
Abbreviations
The 28 member countries of the European Union (including UK)
BE Belgium NL Netherlands BG Bulgaria AT Austria CZ Czech Republic PL Poland DK Denmark PT Portugal DE Germany RO Rumania EE Estonia SI Slovenia IE Ireland SK Slovakia GR Greece FI Finland ES Spain SE Sweden FR France UK United Kingdom HR Croatia IT Italy CY Cyprus LV Latvia LMM Labour Market Monitor LT Lithuania LMP Labour Market Policy LU Luxemburg GDP Gross Domestic Product HU Hungary PPS Purchasing Power Standard MT Malta SNA System of National Accounts
Sources of data AMP (LMP) Arbeitsmarktpolitik Datenbank
Labour Market Policy Database CVTS5 Fünfte Europäische Erhebung über betriebliche Bildung
Fifth European Continuing Vocational Training Survey DG TAX DU Steuertrends in der Europäischen Union, 2016 - Generaldirektion Steuern und Zollunion
Taxation Trends in the European Union, 2016 - The Directorate-General for Taxation and Customs Union
ESAW Europäische Statistik über Arbeitsunfälle European Statistics on Accidents at Work
ESSOSS (ESSPROS) Europäisches System der Integrierter Sozialschutzstatistiken European System of integrated Social Protection Statistics
EU-AKE (EU-LFS) Arbeitskräfteerhebung EU Labour Force Survey
EU-SILC Gemeinschaftsstatistiken über Einkommen und Lebensbedingungen European Statistics of Income and Living Condition
HLY Gesunde Lebensjahre Healthy Life Years
UOE UNESCO-UIS, OECD, EUROSTAT Datenerhebung zur Bildungsstatistik UNESCO-UIS, OECD, EUROSTAT data collection on education statistics
VGR (NAS) Volkswirtschaftliche Gesamtrechnung National Account Systems
VSE (SES) Verdienststrukturerhebung Structure of Earnings Survey
– 13 –
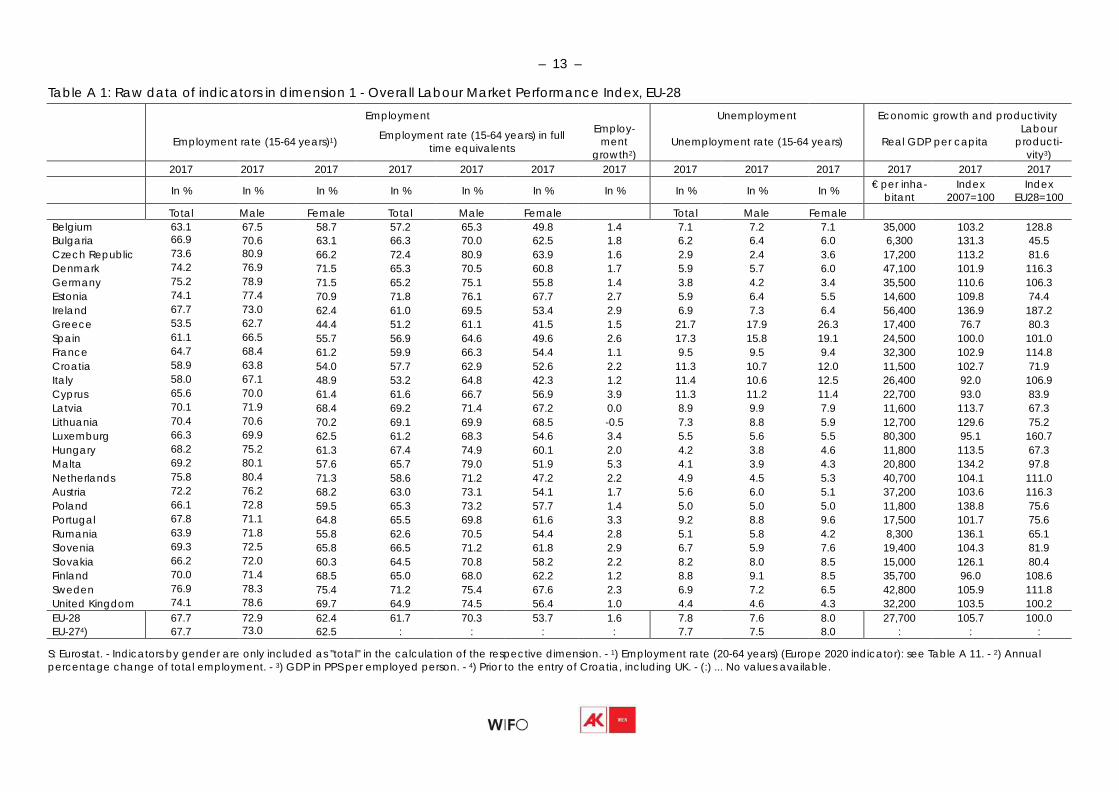
Table A 1: Raw data of indicators in dimension 1 - Overall Labour Market Performance Index, EU-28
Employment
rate (15-64
years)1)
Employment
Employment rate (15-64 years) in full time equivalents
Employ-
ment growth2)
Unemployment
Unemployment rate (15-64
years)
Economic
Real GDP
growth and
per capita
productivity Labour
producti- vity3)
2017 2017 2017 2017 2017 2017 2017 2017 2017 2017 2017 2017 2017
In % In % In % In % In % In % In % In % In % In % € per inha- bitant
Index 2007=100
Index EU28=100
Total Male Female Total Male Female Total Male Female Belgium 63.1 67.5 58.7 57.2 65.3 49.8 1.4 7.1 7.2 7.1 35,000 103.2 128.8 Bulgaria 66.9 70.6 63.1 66.3 70.0 62.5 1.8 6.2 6.4 6.0 6,300 131.3 45.5 Czech Republic 73.6 80.9 66.2 72.4 80.9 63.9 1.6 2.9 2.4 3.6 17,200 113.2 81.6 Denmark 74.2 76.9 71.5 65.3 70.5 60.8 1.7 5.9 5.7 6.0 47,100 101.9 116.3 Germany 75.2 78.9 71.5 65.2 75.1 55.8 1.4 3.8 4.2 3.4 35,500 110.6 106.3 Estonia 74.1 77.4 70.9 71.8 76.1 67.7 2.7 5.9 6.4 5.5 14,600 109.8 74.4 Ireland 67.7 73.0 62.4 61.0 69.5 53.4 2.9 6.9 7.3 6.4 56,400 136.9 187.2 Greece 53.5 62.7 44.4 51.2 61.1 41.5 1.5 21.7 17.9 26.3 17,400 76.7 80.3 Spain 61.1 66.5 55.7 56.9 64.6 49.6 2.6 17.3 15.8 19.1 24,500 100.0 101.0 France 64.7 68.4 61.2 59.9 66.3 54.4 1.1 9.5 9.5 9.4 32,300 102.9 114.8 Croatia 58.9 63.8 54.0 57.7 62.9 52.6 2.2 11.3 10.7 12.0 11,500 102.7 71.9 Italy 58.0 67.1 48.9 53.2 64.8 42.3 1.2 11.4 10.6 12.5 26,400 92.0 106.9 Cyprus 65.6 70.0 61.4 61.6 66.7 56.9 3.9 11.3 11.2 11.4 22,700 93.0 83.9 Latvia 70.1 71.9 68.4 69.2 71.4 67.2 0.0 8.9 9.9 7.9 11,600 113.7 67.3 Lithuania 70.4 70.6 70.2 69.1 69.9 68.5 -0.5 7.3 8.8 5.9 12,700 129.6 75.2 Luxemburg 66.3 69.9 62.5 61.2 68.3 54.6 3.4 5.5 5.6 5.5 80,300 95.1 160.7 Hungary 68.2 75.2 61.3 67.4 74.9 60.1 2.0 4.2 3.8 4.6 11,800 113.5 67.3 Malta 69.2 80.1 57.6 65.7 79.0 51.9 5.3 4.1 3.9 4.3 20,800 134.2 97.8 Netherlands 75.8 80.4 71.3 58.6 71.2 47.2 2.2 4.9 4.5 5.3 40,700 104.1 111.0 Austria 72.2 76.2 68.2 63.0 73.1 54.1 1.7 5.6 6.0 5.1 37,200 103.6 116.3 Poland 66.1 72.8 59.5 65.3 73.2 57.7 1.4 5.0 5.0 5.0 11,800 138.8 75.6 Portugal 67.8 71.1 64.8 65.5 69.8 61.6 3.3 9.2 8.8 9.6 17,500 101.7 75.6 Rumania 63.9 71.8 55.8 62.6 70.5 54.4 2.8 5.1 5.8 4.2 8,300 136.1 65.1 Slovenia 69.3 72.5 65.8 66.5 71.2 61.8 2.9 6.7 5.9 7.6 19,400 104.3 81.9 Slovakia 66.2 72.0 60.3 64.5 70.8 58.2 2.2 8.2 8.0 8.5 15,000 126.1 80.4 Finland 70.0 71.4 68.5 65.0 68.0 62.2 1.2 8.8 9.1 8.5 35,700 96.0 108.6 Sweden 76.9 78.3 75.4 71.2 75.4 67.6 2.3 6.9 7.2 6.5 42,800 105.9 111.8 United Kingdom 74.1 78.6 69.7 64.9 74.5 56.4 1.0 4.4 4.6 4.3 32,200 103.5 100.2 EU-28 67.7 72.9 62.4 61.7 70.3 53.7 1.6 7.8 7.6 8.0 27,700 105.7 100.0 EU-274) 67.7 73.0 62.5 : : : : 7.7 7.5 8.0 : : :
S: Eurostat. - Indicators by gender are only included as "total" in the calculation of the respective dimension. - 1) Employment rate (20-64 years) (Europe 2020 indicator): see Table A 11. - 2) Annual percentage change of total employment. - 3) GDP in PPS per employed person. - 4) Prior to the entry of Croatia, including UK. - (:) ... No values available.
– 14 –
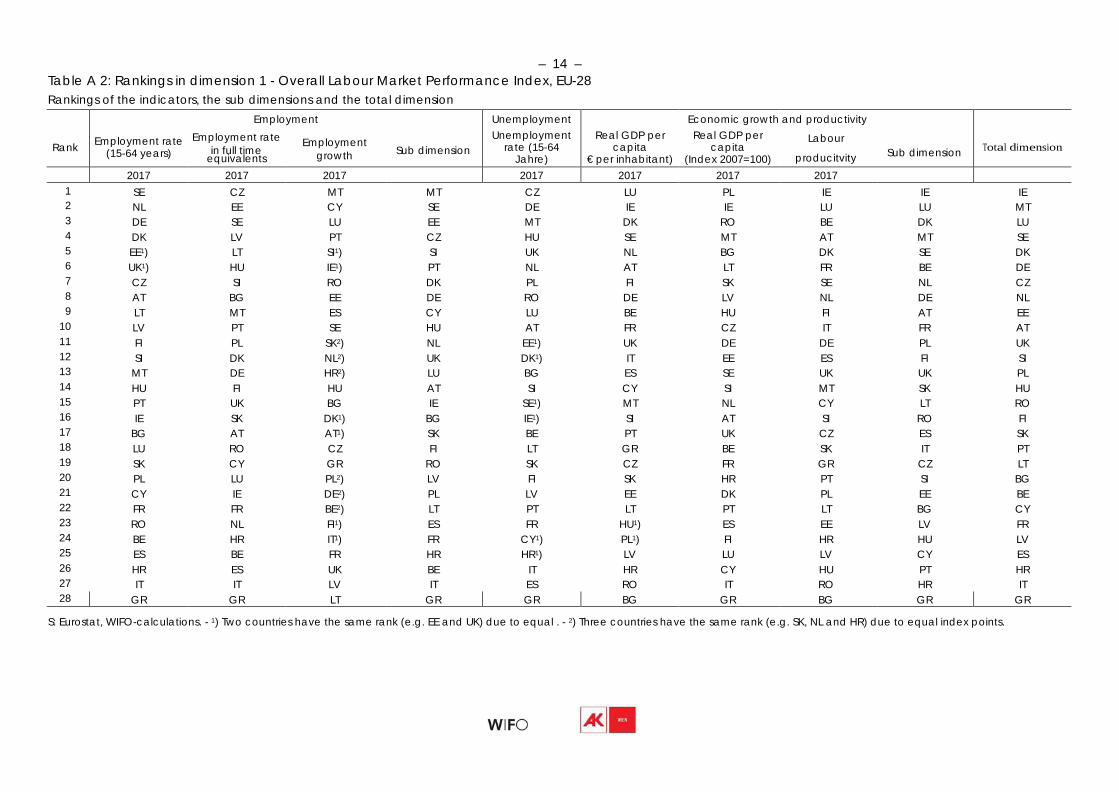
Table A 2: Rankings in dimension 1 - Overall Labour Market Performance Index, EU-28 Rankings of the indicators, the sub dimensions and the total dimension Rank
Employment rate (15-64 years)
Employment Employment rate Employment
in full time growth Sub dimension equivalents
Unemployment Unemployment
rate (15-64 Jahre)
Real GDP per
capita € per inhabitant)
Economic growth Real GDP per
capita (Index 2007=100)
and productivity
Labour
producitvity Sub dimension
Total dimension
2017 2017 2017 2017 2017 2017 2017 1 SE CZ MT MT CZ LU PL IE IE IE 2 NL EE CY SE DE IE IE LU LU MT 3 DE SE LU EE MT DK RO BE DK LU 4 DK LV PT CZ HU SE MT AT MT SE 5 EE1) LT SI1) SI UK NL BG DK SE DK 6 UK1) HU IE1) PT NL AT LT FR BE DE 7 CZ SI RO DK PL FI SK SE NL CZ 8 AT BG EE DE RO DE LV NL DE NL 9 LT MT ES CY LU BE HU FI AT EE
10 LV PT SE HU AT FR CZ IT FR AT 11 FI PL SK2) NL EE1) UK DE DE PL UK 12 SI DK NL2) UK DK1) IT EE ES FI SI 13 MT DE HR2) LU BG ES SE UK UK PL 14 HU FI HU AT SI CY SI MT SK HU 15 PT UK BG IE SE1) MT NL CY LT RO 16 IE SK DK1) BG IE1) SI AT SI RO FI 17 BG AT AT1) SK BE PT UK CZ ES SK 18 LU RO CZ FI LT GR BE SK IT PT 19 SK CY GR RO SK CZ FR GR CZ LT 20 PL LU PL2) LV FI SK HR PT SI BG 21 CY IE DE2) PL LV EE DK PL EE BE 22 FR FR BE2) LT PT LT PT LT BG CY 23 RO NL FI1) ES FR HU1) ES EE LV FR 24 BE HR IT1) FR CY1) PL1) FI HR HU LV 25 ES BE FR HR HR1) LV LU LV CY ES 26 HR ES UK BE IT HR CY HU PT HR 27 IT IT LV IT ES RO IT RO HR IT 28 GR GR LT GR GR BG GR BG GR GR
S: Eurostat, WIFO-calculations. - 1) Two countries have the same rank (e.g. EE and UK) due to equal . - 2) Three countries have the same rank (e.g. SK, NL and HR) due to equal index points.
– 15 –
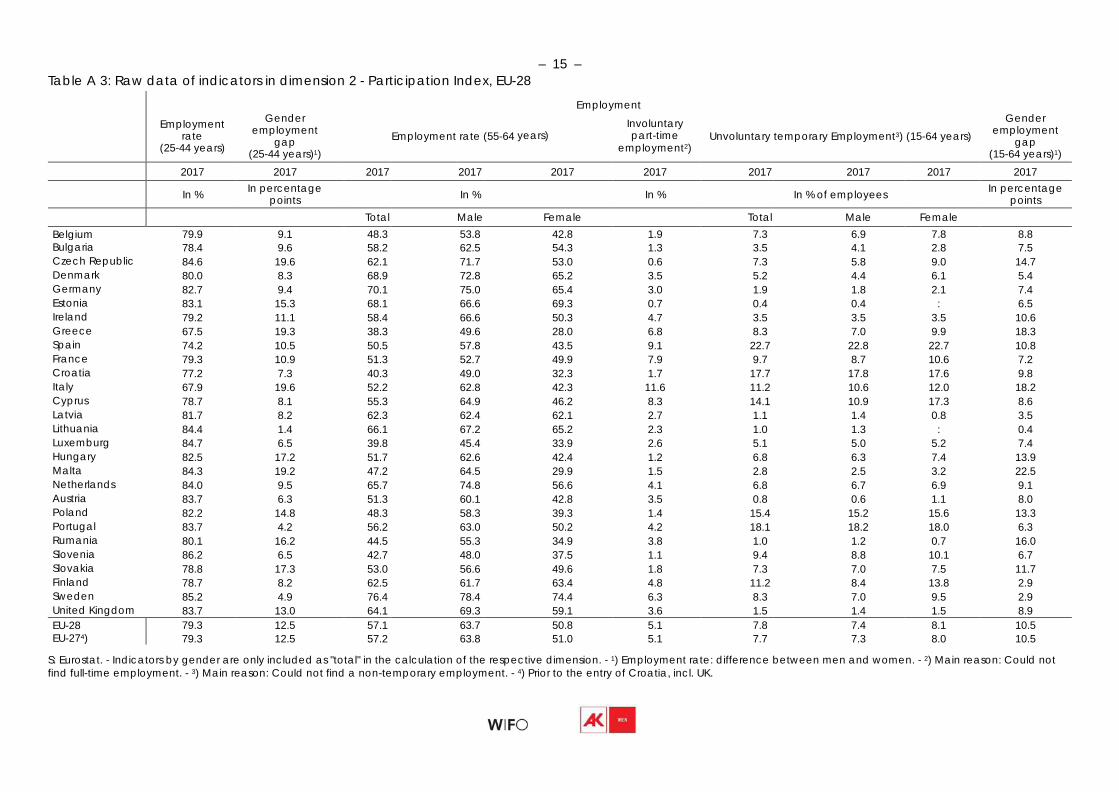
Table A 3: Raw data of indicators in dimension 2 - Participation Index, EU-28
Employment
rate (25-44 years)
Gender
employment gap
(25-44 years)1)
Employment
rate
(55-64
Employment
Involuntary years) part-time
employment2)
Unvoluntary
temporary Employment3)
(15-64 years)
Gender
employment gap
(15-64 years)1)
2017 2017 2017 2017 2017 2017 2017 2017 2017 2017
In % In percentage points
In % In % In % of employees In percentage points
Total Male Female Total Male Female Belgium 79.9 9.1 48.3 53.8 42.8 1.9 7.3 6.9 7.8 8.8 Bulgaria 78.4 9.6 58.2 62.5 54.3 1.3 3.5 4.1 2.8 7.5 Czech Republic 84.6 19.6 62.1 71.7 53.0 0.6 7.3 5.8 9.0 14.7 Denmark 80.0 8.3 68.9 72.8 65.2 3.5 5.2 4.4 6.1 5.4 Germany 82.7 9.4 70.1 75.0 65.4 3.0 1.9 1.8 2.1 7.4 Estonia 83.1 15.3 68.1 66.6 69.3 0.7 0.4 0.4 : 6.5 Ireland 79.2 11.1 58.4 66.6 50.3 4.7 3.5 3.5 3.5 10.6 Greece 67.5 19.3 38.3 49.6 28.0 6.8 8.3 7.0 9.9 18.3 Spain 74.2 10.5 50.5 57.8 43.5 9.1 22.7 22.8 22.7 10.8 France 79.3 10.9 51.3 52.7 49.9 7.9 9.7 8.7 10.6 7.2 Croatia 77.2 7.3 40.3 49.0 32.3 1.7 17.7 17.8 17.6 9.8 Italy 67.9 19.6 52.2 62.8 42.3 11.6 11.2 10.6 12.0 18.2 Cyprus 78.7 8.1 55.3 64.9 46.2 8.3 14.1 10.9 17.3 8.6 Latvia 81.7 8.2 62.3 62.4 62.1 2.7 1.1 1.4 0.8 3.5 Lithuania 84.4 1.4 66.1 67.2 65.2 2.3 1.0 1.3 : 0.4 Luxemburg 84.7 6.5 39.8 45.4 33.9 2.6 5.1 5.0 5.2 7.4 Hungary 82.5 17.2 51.7 62.6 42.4 1.2 6.8 6.3 7.4 13.9 Malta 84.3 19.2 47.2 64.5 29.9 1.5 2.8 2.5 3.2 22.5 Netherlands 84.0 9.5 65.7 74.8 56.6 4.1 6.8 6.7 6.9 9.1 Austria 83.7 6.3 51.3 60.1 42.8 3.5 0.8 0.6 1.1 8.0 Poland 82.2 14.8 48.3 58.3 39.3 1.4 15.4 15.2 15.6 13.3 Portugal 83.7 4.2 56.2 63.0 50.2 4.2 18.1 18.2 18.0 6.3 Rumania 80.1 16.2 44.5 55.3 34.9 3.8 1.0 1.2 0.7 16.0 Slovenia 86.2 6.5 42.7 48.0 37.5 1.1 9.4 8.8 10.1 6.7 Slovakia 78.8 17.3 53.0 56.6 49.6 1.8 7.3 7.0 7.5 11.7 Finland 78.7 8.2 62.5 61.7 63.4 4.8 11.2 8.4 13.8 2.9 Sweden 85.2 4.9 76.4 78.4 74.4 6.3 8.3 7.0 9.5 2.9 United Kingdom 83.7 13.0 64.1 69.3 59.1 3.6 1.5 1.4 1.5 8.9 EU-28 79.3 12.5 57.1 63.7 50.8 5.1 7.8 7.4 8.1 10.5 EU-274) 79.3 12.5 57.2 63.8 51.0 5.1 7.7 7.3 8.0 10.5
S: Eurostat. - Indicators by gender are only included as "total" in the calculation of the respective dimension. - 1) Employment rate: difference between men and women. - 2) Main reason: Could not find full-time employment. - 3) Main reason: Could not find a non-temporary employment. - 4) Prior to the entry of Croatia, incl. UK.
– 16 –
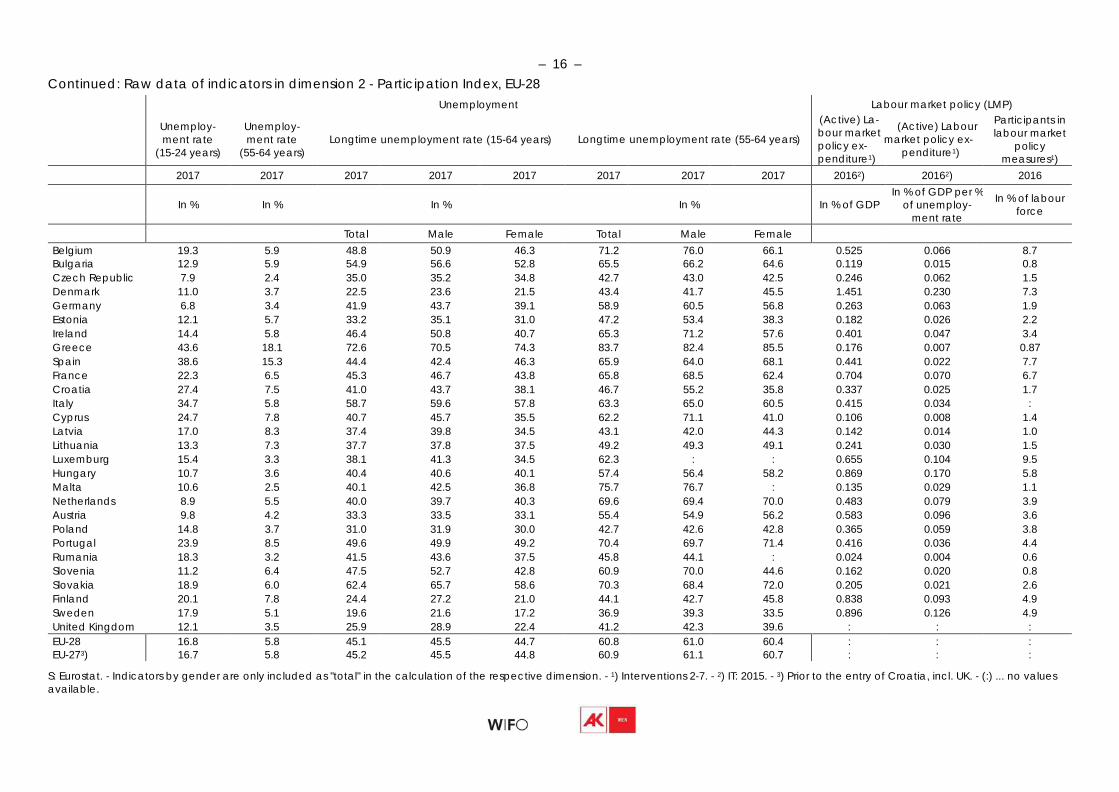
Continued: Raw data of indicators in dimension 2 - Participation Index, EU-28
Unemploy- ment rate
(15-24 years)
Unemploy- ment rate
(55-64 years)
Longtime
Unemployment
unemployment rate (15-64 years)
Longtime
unemployment
rate
(55-64 years)
Labour market policy (Active) La- (Active) Labour bour market market policy ex- policy ex- penditure1) penditure1)
(LMP) Participants in labour market
policy measures1)
2017 2017 2017 2017 2017 2017 2017 2017 20162) 20162) 2016
In %
In %
In %
In %
In % of GDP
In % of GDP per % of unemploy-
ment rate
In % of labour force
Total Male Female Total Male Female Belgium 19.3 5.9 48.8 50.9 46.3 71.2 76.0 66.1 0.525 0.066 8.7 Bulgaria 12.9 5.9 54.9 56.6 52.8 65.5 66.2 64.6 0.119 0.015 0.8 Czech Republic 7.9 2.4 35.0 35.2 34.8 42.7 43.0 42.5 0.246 0.062 1.5 Denmark 11.0 3.7 22.5 23.6 21.5 43.4 41.7 45.5 1.451 0.230 7.3 Germany 6.8 3.4 41.9 43.7 39.1 58.9 60.5 56.8 0.263 0.063 1.9 Estonia 12.1 5.7 33.2 35.1 31.0 47.2 53.4 38.3 0.182 0.026 2.2 Ireland 14.4 5.8 46.4 50.8 40.7 65.3 71.2 57.6 0.401 0.047 3.4 Greece 43.6 18.1 72.6 70.5 74.3 83.7 82.4 85.5 0.176 0.007 0.87 Spain 38.6 15.3 44.4 42.4 46.3 65.9 64.0 68.1 0.441 0.022 7.7 France 22.3 6.5 45.3 46.7 43.8 65.8 68.5 62.4 0.704 0.070 6.7 Croatia 27.4 7.5 41.0 43.7 38.1 46.7 55.2 35.8 0.337 0.025 1.7 Italy 34.7 5.8 58.7 59.6 57.8 63.3 65.0 60.5 0.415 0.034 : Cyprus 24.7 7.8 40.7 45.7 35.5 62.2 71.1 41.0 0.106 0.008 1.4 Latvia 17.0 8.3 37.4 39.8 34.5 43.1 42.0 44.3 0.142 0.014 1.0 Lithuania 13.3 7.3 37.7 37.8 37.5 49.2 49.3 49.1 0.241 0.030 1.5 Luxemburg 15.4 3.3 38.1 41.3 34.5 62.3 : : 0.655 0.104 9.5 Hungary 10.7 3.6 40.4 40.6 40.1 57.4 56.4 58.2 0.869 0.170 5.8 Malta 10.6 2.5 40.1 42.5 36.8 75.7 76.7 : 0.135 0.029 1.1 Netherlands 8.9 5.5 40.0 39.7 40.3 69.6 69.4 70.0 0.483 0.079 3.9 Austria 9.8 4.2 33.3 33.5 33.1 55.4 54.9 56.2 0.583 0.096 3.6 Poland 14.8 3.7 31.0 31.9 30.0 42.7 42.6 42.8 0.365 0.059 3.8 Portugal 23.9 8.5 49.6 49.9 49.2 70.4 69.7 71.4 0.416 0.036 4.4 Rumania 18.3 3.2 41.5 43.6 37.5 45.8 44.1 : 0.024 0.004 0.6 Slovenia 11.2 6.4 47.5 52.7 42.8 60.9 70.0 44.6 0.162 0.020 0.8 Slovakia 18.9 6.0 62.4 65.7 58.6 70.3 68.4 72.0 0.205 0.021 2.6 Finland 20.1 7.8 24.4 27.2 21.0 44.1 42.7 45.8 0.838 0.093 4.9 Sweden 17.9 5.1 19.6 21.6 17.2 36.9 39.3 33.5 0.896 0.126 4.9 United Kingdom 12.1 3.5 25.9 28.9 22.4 41.2 42.3 39.6 : : : EU-28 16.8 5.8 45.1 45.5 44.7 60.8 61.0 60.4 : : : EU-273) 16.7 5.8 45.2 45.5 44.8 60.9 61.1 60.7 : : :
S: Eurostat. - Indicators by gender are only included as "total" in the calculation of the respective dimension. - 1) Interventions 2-7. - 2) IT: 2015. - 3) Prior to the entry of Croatia, incl. UK. - (:) ... no values available.
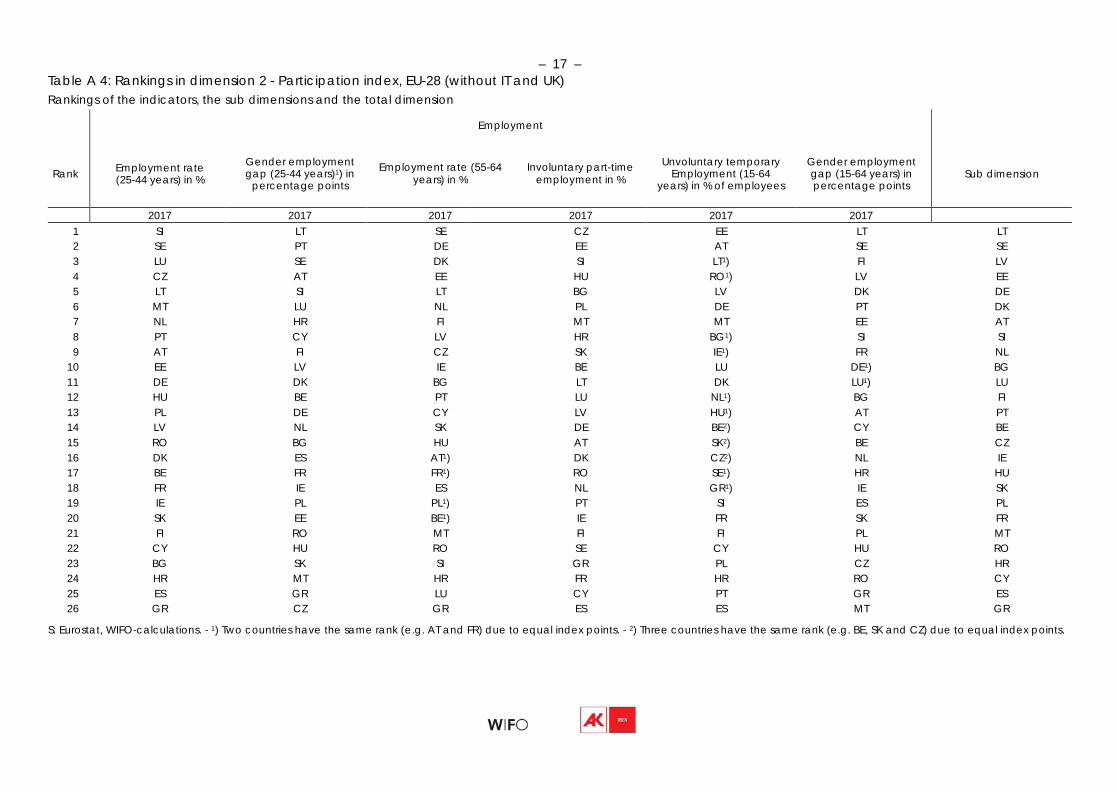
– 17 –
Table A 4: Rankings in dimension 2 - Participation index, EU-28 (without IT and UK) Rankings of the indicators, the sub dimensions and the total dimension Rank
Employment rate (25-44 years) in %
Gender employment gap (25-44 years)1) in
percentage points
Employment rate years) in %
Employment (55-64 Involuntary part-time
employment in %
Unvoluntary temporary Employment (15-64
years) in % of employees
Gender employment gap (15-64 years) in percentage points
Sub dimension
2017 2017 2017 2017 2017 2017 1 SI LT SE CZ EE LT LT 2 SE PT DE EE AT SE SE 3 LU SE DK SI LT1) FI LV 4 CZ AT EE HU RO1) LV EE 5 LT SI LT BG LV DK DE 6 MT LU NL PL DE PT DK 7 NL HR FI MT MT EE AT 8 PT CY LV HR BG1) SI SI 9 AT FI CZ SK IE1) FR NL
10 EE LV IE BE LU DE1) BG 11 DE DK BG LT DK LU1) LU 12 HU BE PT LU NL1) BG FI 13 PL DE CY LV HU1) AT PT 14 LV NL SK DE BE2) CY BE 15 RO BG HU AT SK2) BE CZ 16 DK ES AT1) DK CZ2) NL IE 17 BE FR FR1) RO SE1) HR HU 18 FR IE ES NL GR1) IE SK 19 IE PL PL1) PT SI ES PL 20 SK EE BE1) IE FR SK FR 21 FI RO MT FI FI PL MT 22 CY HU RO SE CY HU RO 23 BG SK SI GR PL CZ HR 24 HR MT HR FR HR RO CY 25 ES GR LU CY PT GR ES 26 GR CZ GR ES ES MT GR
S: Eurostat, WIFO-calculations. - 1) Two countries have the same rank (e.g. AT and FR) due to equal index points. - 2) Three countries have the same rank (e.g. BE, SK and CZ) due to equal index points.
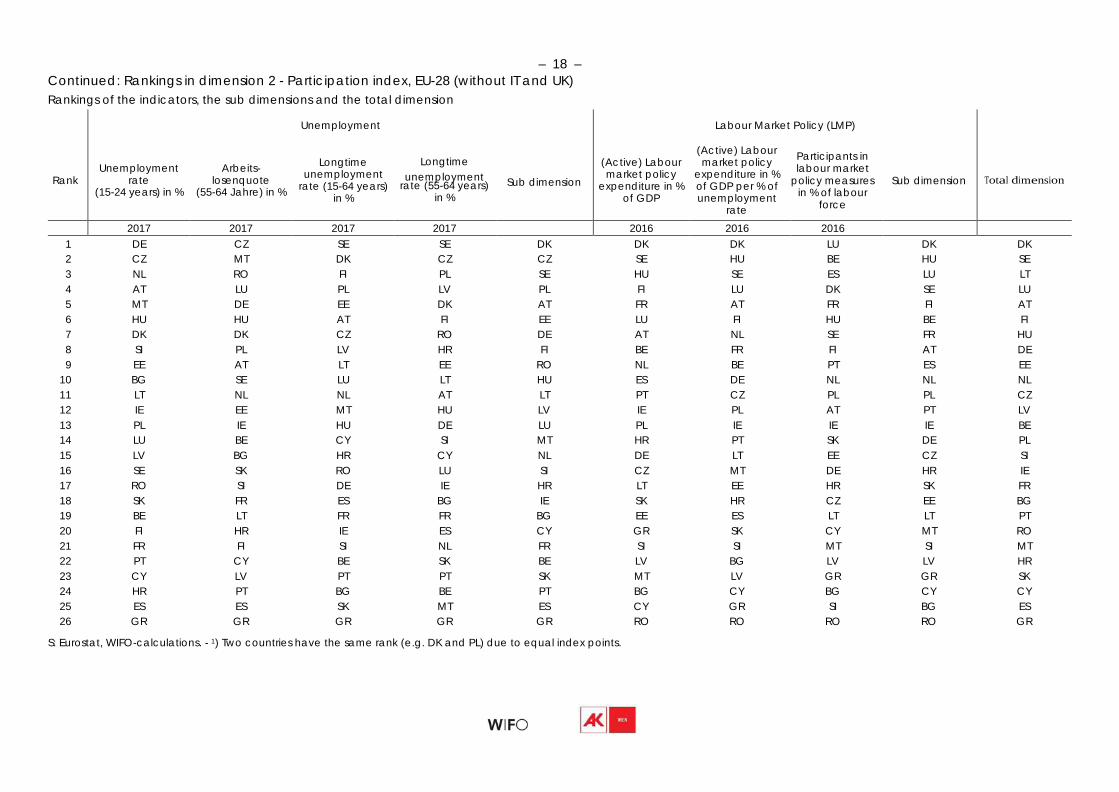
– 18 –
Continued: Rankings in dimension 2 - Participation index, EU-28 (without IT and UK) Rankings of the indicators, the sub dimensions and the total dimension Rank
Unemployment rate
(15-24 years) in %
Arbeits- losenquote
(55-64 Jahre) in %
Unemployment
Longtime unemployment
rate (15-64 years) in %
Longtime unemployment Sub dimension rate (55-64 years)
in %
(Active) Labour market policy
expenditure in % of GDP
Labour Market
(Active) Labour market policy
expenditure in % of GDP per % of unemployment
rate
Policy (LMP) Participants in labour market
policy measures Sub dimension in % of labour
force
Total dimension
2017 2017 2017 2017 2016 2016 2016 1 DE CZ SE SE DK DK DK LU DK DK 2 CZ MT DK CZ CZ SE HU BE HU SE 3 NL RO FI PL SE HU SE ES LU LT 4 AT LU PL LV PL FI LU DK SE LU 5 MT DE EE DK AT FR AT FR FI AT 6 HU HU AT FI EE LU FI HU BE FI 7 DK DK CZ RO DE AT NL SE FR HU 8 SI PL LV HR FI BE FR FI AT DE 9 EE AT LT EE RO NL BE PT ES EE
10 BG SE LU LT HU ES DE NL NL NL 11 LT NL NL AT LT PT CZ PL PL CZ 12 IE EE MT HU LV IE PL AT PT LV 13 PL IE HU DE LU PL IE IE IE BE 14 LU BE CY SI MT HR PT SK DE PL 15 LV BG HR CY NL DE LT EE CZ SI 16 SE SK RO LU SI CZ MT DE HR IE 17 RO SI DE IE HR LT EE HR SK FR 18 SK FR ES BG IE SK HR CZ EE BG 19 BE LT FR FR BG EE ES LT LT PT 20 FI HR IE ES CY GR SK CY MT RO 21 FR FI SI NL FR SI SI MT SI MT 22 PT CY BE SK BE LV BG LV LV HR 23 CY LV PT PT SK MT LV GR GR SK 24 HR PT BG BE PT BG CY BG CY CY 25 ES ES SK MT ES CY GR SI BG ES 26 GR GR GR GR GR RO RO RO RO GR
S: Eurostat, WIFO-calculations. - 1) Two countries have the same rank (e.g. DK and PL) due to equal index points.
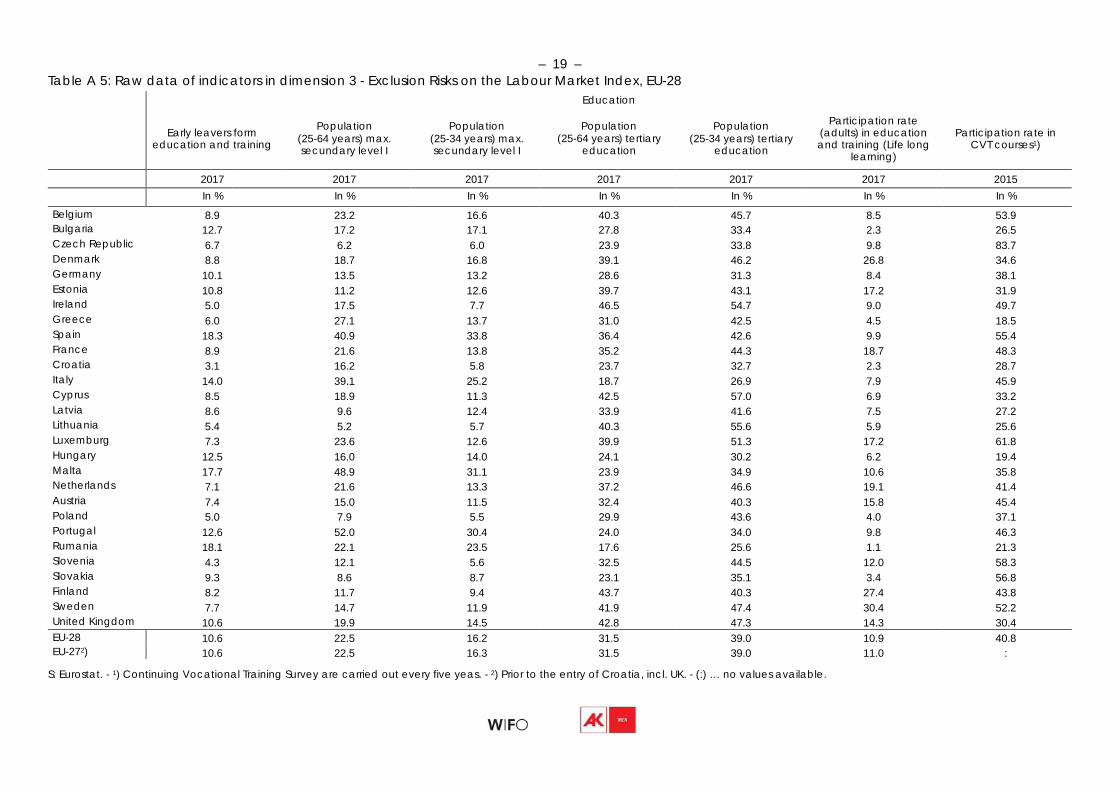
– 19 –
Table A 5: Raw data of indicators in dimension 3 - Exclusion Risks on the Labour Market Index, EU-28
Early leavers
education and
form training
Population (25-64 years) max. secundary level I
Population (25-34 years) max. secundary level I
Education
Population (25-64 years) tertiary
education
Population (25-34 years) tertiary
education
Participation rate (adults) in education and training (Life long
learning)
Participation rate in CVT courses1)
2017 2017 2017 2017 2017 2017 2015
In % In % In % In % In % In % In %
Belgium 8.9 23.2 16.6 40.3 45.7 8.5 53.9 Bulgaria 12.7 17.2 17.1 27.8 33.4 2.3 26.5 Czech Republic 6.7 6.2 6.0 23.9 33.8 9.8 83.7 Denmark 8.8 18.7 16.8 39.1 46.2 26.8 34.6 Germany 10.1 13.5 13.2 28.6 31.3 8.4 38.1 Estonia 10.8 11.2 12.6 39.7 43.1 17.2 31.9 Ireland 5.0 17.5 7.7 46.5 54.7 9.0 49.7 Greece 6.0 27.1 13.7 31.0 42.5 4.5 18.5 Spain 18.3 40.9 33.8 36.4 42.6 9.9 55.4 France 8.9 21.6 13.8 35.2 44.3 18.7 48.3 Croatia 3.1 16.2 5.8 23.7 32.7 2.3 28.7 Italy 14.0 39.1 25.2 18.7 26.9 7.9 45.9 Cyprus 8.5 18.9 11.3 42.5 57.0 6.9 33.2 Latvia 8.6 9.6 12.4 33.9 41.6 7.5 27.2 Lithuania 5.4 5.2 5.7 40.3 55.6 5.9 25.6 Luxemburg 7.3 23.6 12.6 39.9 51.3 17.2 61.8 Hungary 12.5 16.0 14.0 24.1 30.2 6.2 19.4 Malta 17.7 48.9 31.1 23.9 34.9 10.6 35.8 Netherlands 7.1 21.6 13.3 37.2 46.6 19.1 41.4 Austria 7.4 15.0 11.5 32.4 40.3 15.8 45.4 Poland 5.0 7.9 5.5 29.9 43.6 4.0 37.1 Portugal 12.6 52.0 30.4 24.0 34.0 9.8 46.3 Rumania 18.1 22.1 23.5 17.6 25.6 1.1 21.3 Slovenia 4.3 12.1 5.6 32.5 44.5 12.0 58.3 Slovakia 9.3 8.6 8.7 23.1 35.1 3.4 56.8 Finland 8.2 11.7 9.4 43.7 40.3 27.4 43.8 Sweden 7.7 14.7 11.9 41.9 47.4 30.4 52.2 United Kingdom 10.6 19.9 14.5 42.8 47.3 14.3 30.4 EU-28 10.6 22.5 16.2 31.5 39.0 10.9 40.8 EU-272) 10.6 22.5 16.3 31.5 39.0 11.0 :
S: Eurostat. - 1) Continuing Vocational Training Survey are carried out every five yeas. - 2) Prior to the entry of Croatia, incl. UK. - (:) … no values available.
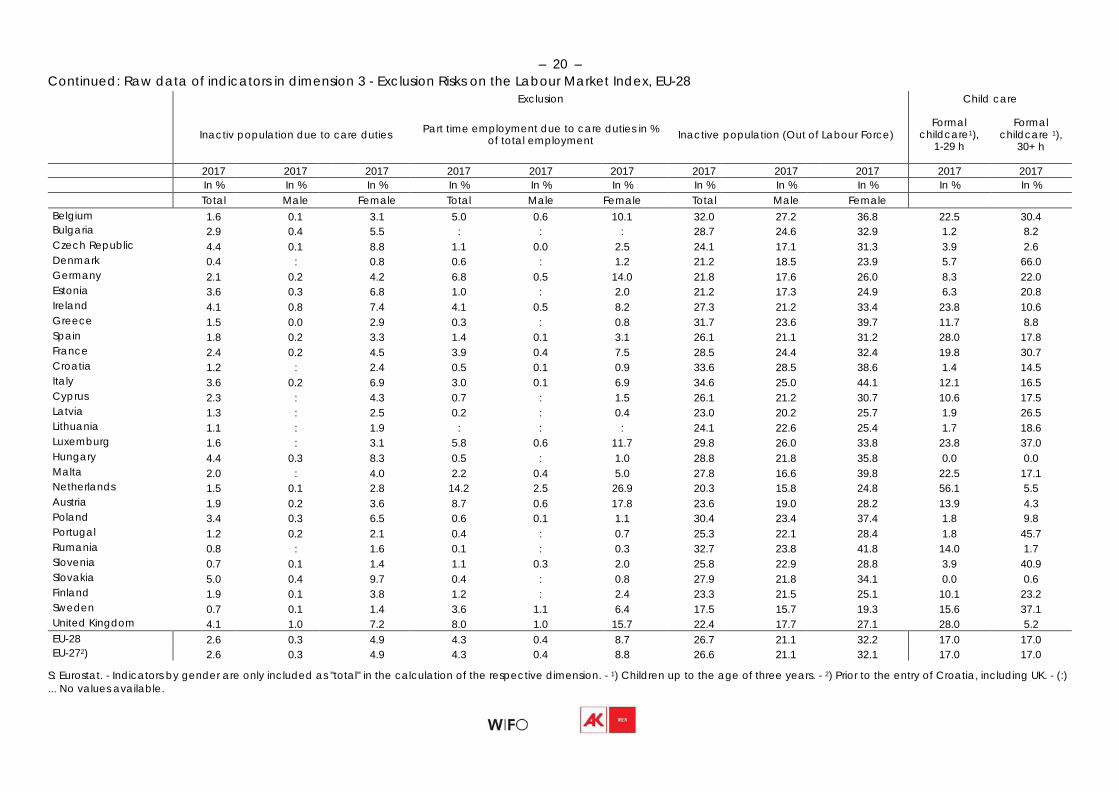
– 20 – Continued: Raw data of indicators in dimension 3 - Exclusion Risks on the Labour Market Index, EU-28
Inactiv
population due
to
care
duties
Part
time
Exclusion employment due to care
of total employment
duties in %
Inactive
population (Out
of
Labour Force)
Child
Formal childcare1),
1-29 h
care
Formal childcare 1),
30+ h
2017 2017 2017 2017 2017 2017 2017 2017 2017 2017 2017 In % In % In % In % In % In % In % In % In % In % In %
Total Male Female Total Male Female Total Male Female Belgium 1.6 0.1 3.1 5.0 0.6 10.1 32.0 27.2 36.8 22.5 30.4 Bulgaria 2.9 0.4 5.5 : : : 28.7 24.6 32.9 1.2 8.2 Czech Republic 4.4 0.1 8.8 1.1 0.0 2.5 24.1 17.1 31.3 3.9 2.6 Denmark 0.4 : 0.8 0.6 : 1.2 21.2 18.5 23.9 5.7 66.0 Germany 2.1 0.2 4.2 6.8 0.5 14.0 21.8 17.6 26.0 8.3 22.0 Estonia 3.6 0.3 6.8 1.0 : 2.0 21.2 17.3 24.9 6.3 20.8 Ireland 4.1 0.8 7.4 4.1 0.5 8.2 27.3 21.2 33.4 23.8 10.6 Greece 1.5 0.0 2.9 0.3 : 0.8 31.7 23.6 39.7 11.7 8.8 Spain 1.8 0.2 3.3 1.4 0.1 3.1 26.1 21.1 31.2 28.0 17.8 France 2.4 0.2 4.5 3.9 0.4 7.5 28.5 24.4 32.4 19.8 30.7 Croatia 1.2 : 2.4 0.5 0.1 0.9 33.6 28.5 38.6 1.4 14.5 Italy 3.6 0.2 6.9 3.0 0.1 6.9 34.6 25.0 44.1 12.1 16.5 Cyprus 2.3 : 4.3 0.7 : 1.5 26.1 21.2 30.7 10.6 17.5 Latvia 1.3 : 2.5 0.2 : 0.4 23.0 20.2 25.7 1.9 26.5 Lithuania 1.1 : 1.9 : : : 24.1 22.6 25.4 1.7 18.6 Luxemburg 1.6 : 3.1 5.8 0.6 11.7 29.8 26.0 33.8 23.8 37.0 Hungary 4.4 0.3 8.3 0.5 : 1.0 28.8 21.8 35.8 0.0 0.0 Malta 2.0 : 4.0 2.2 0.4 5.0 27.8 16.6 39.8 22.5 17.1 Netherlands 1.5 0.1 2.8 14.2 2.5 26.9 20.3 15.8 24.8 56.1 5.5 Austria 1.9 0.2 3.6 8.7 0.6 17.8 23.6 19.0 28.2 13.9 4.3 Poland 3.4 0.3 6.5 0.6 0.1 1.1 30.4 23.4 37.4 1.8 9.8 Portugal 1.2 0.2 2.1 0.4 : 0.7 25.3 22.1 28.4 1.8 45.7 Rumania 0.8 : 1.6 0.1 : 0.3 32.7 23.8 41.8 14.0 1.7 Slovenia 0.7 0.1 1.4 1.1 0.3 2.0 25.8 22.9 28.8 3.9 40.9 Slovakia 5.0 0.4 9.7 0.4 : 0.8 27.9 21.8 34.1 0.0 0.6 Finland 1.9 0.1 3.8 1.2 : 2.4 23.3 21.5 25.1 10.1 23.2 Sweden 0.7 0.1 1.4 3.6 1.1 6.4 17.5 15.7 19.3 15.6 37.1 United Kingdom 4.1 1.0 7.2 8.0 1.0 15.7 22.4 17.7 27.1 28.0 5.2 EU-28 2.6 0.3 4.9 4.3 0.4 8.7 26.7 21.1 32.2 17.0 17.0 EU-272) 2.6 0.3 4.9 4.3 0.4 8.8 26.6 21.1 32.1 17.0 17.0
S: Eurostat. - Indicators by gender are only included as "total" in the calculation of the respective dimension. - 1) Children up to the age of three years. - 2) Prior to the entry of Croatia, including UK. - (:) ... No values available.
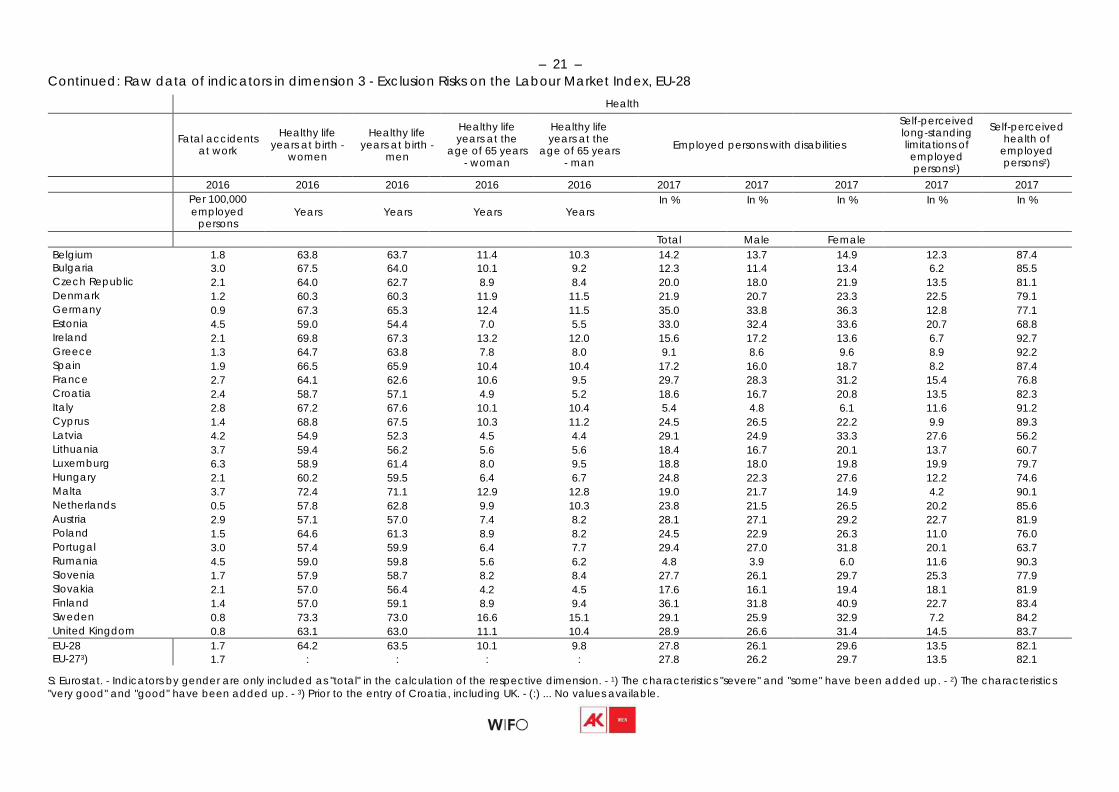
– 21 – Continued: Raw data of indicators in dimension 3 - Exclusion Risks on the Labour Market Index, EU-28
Health
Fatal accidents
at work
Healthy life
years at birth women
-
Healthy life
years at birth men
- Healthy life years at the
age of 65 years - woman
Healthy life years at the
age of 65 years - man
Employed
persons with
disabilities
Self-perceived long-standing limitations of employed persons1)
Self-perceived health of
employed persons2)
2016 2016 2016 2016 2016 2017 2017 2017 2017 2017
Per 100,000 employed
persons
Years
Years
Years
Years
In % In % In % In % In %
Total Male Female Belgium 1.8 63.8 63.7 11.4 10.3 14.2 13.7 14.9 12.3 87.4 Bulgaria 3.0 67.5 64.0 10.1 9.2 12.3 11.4 13.4 6.2 85.5 Czech Republic 2.1 64.0 62.7 8.9 8.4 20.0 18.0 21.9 13.5 81.1 Denmark 1.2 60.3 60.3 11.9 11.5 21.9 20.7 23.3 22.5 79.1 Germany 0.9 67.3 65.3 12.4 11.5 35.0 33.8 36.3 12.8 77.1 Estonia 4.5 59.0 54.4 7.0 5.5 33.0 32.4 33.6 20.7 68.8 Ireland 2.1 69.8 67.3 13.2 12.0 15.6 17.2 13.6 6.7 92.7 Greece 1.3 64.7 63.8 7.8 8.0 9.1 8.6 9.6 8.9 92.2 Spain 1.9 66.5 65.9 10.4 10.4 17.2 16.0 18.7 8.2 87.4 France 2.7 64.1 62.6 10.6 9.5 29.7 28.3 31.2 15.4 76.8 Croatia 2.4 58.7 57.1 4.9 5.2 18.6 16.7 20.8 13.5 82.3 Italy 2.8 67.2 67.6 10.1 10.4 5.4 4.8 6.1 11.6 91.2 Cyprus 1.4 68.8 67.5 10.3 11.2 24.5 26.5 22.2 9.9 89.3 Latvia 4.2 54.9 52.3 4.5 4.4 29.1 24.9 33.3 27.6 56.2 Lithuania 3.7 59.4 56.2 5.6 5.6 18.4 16.7 20.1 13.7 60.7 Luxemburg 6.3 58.9 61.4 8.0 9.5 18.8 18.0 19.8 19.9 79.7 Hungary 2.1 60.2 59.5 6.4 6.7 24.8 22.3 27.6 12.2 74.6 Malta 3.7 72.4 71.1 12.9 12.8 19.0 21.7 14.9 4.2 90.1 Netherlands 0.5 57.8 62.8 9.9 10.3 23.8 21.5 26.5 20.2 85.6 Austria 2.9 57.1 57.0 7.4 8.2 28.1 27.1 29.2 22.7 81.9 Poland 1.5 64.6 61.3 8.9 8.2 24.5 22.9 26.3 11.0 76.0 Portugal 3.0 57.4 59.9 6.4 7.7 29.4 27.0 31.8 20.1 63.7 Rumania 4.5 59.0 59.8 5.6 6.2 4.8 3.9 6.0 11.6 90.3 Slovenia 1.7 57.9 58.7 8.2 8.4 27.7 26.1 29.7 25.3 77.9 Slovakia 2.1 57.0 56.4 4.2 4.5 17.6 16.1 19.4 18.1 81.9 Finland 1.4 57.0 59.1 8.9 9.4 36.1 31.8 40.9 22.7 83.4 Sweden 0.8 73.3 73.0 16.6 15.1 29.1 25.9 32.9 7.2 84.2 United Kingdom 0.8 63.1 63.0 11.1 10.4 28.9 26.6 31.4 14.5 83.7 EU-28 1.7 64.2 63.5 10.1 9.8 27.8 26.1 29.6 13.5 82.1 EU-273) 1.7 : : : : 27.8 26.2 29.7 13.5 82.1
S: Eurostat. - Indicators by gender are only included as "total" in the calculation of the respective dimension. - 1) The characteristics "severe" and "some" have been added up. - 2) The characteristics "very good" and "good" have been added up. - 3) Prior to the entry of Croatia, including UK. - (:) ... No values available.
– 22 –
Table A 6: Rankings in dimension 3 - Exclusion Risks on the Labour Market Index, EU-28 (without BG and LT) Rankings of the indicators, the sub dimensions and the total dimension Rank
Early leavers form
education and training
in %
Population (25-64 years)
max. secundary level I in %
Population (25-34 years)
max. secundary level I in %
Education
Population Population (25-64 years) (25-34 years)
tertiary tertiary education education
in % in %
Participation rate (adults) in education and training
(Life long learning) in %
Participation Sub rate in CVT dimension courses in %
Inactiv population due to care duties in %
Exclusion
Part time Inactive employment population due to care (Out of Sub duties in % of Labour Force) dimension
total in % employment
2017 2017 2017 2017 2017 2017 2015 2017 2017 2017 1 HR CZ PL IE CY SE CZ SE DK RO SE DK 2 SI PL SI FI IE FI LU IE SE1) LV NL SE 3 IE1) SK HR UK LU DK SI FI SI1) GR DK1) LV 4 PL1) LV CZ CY SE NL SK LU RO SK EE1) SI 5 GR EE IE SE UK FR ES SI HR1) PT DE PT 6 CZ FI SK BE NL LU1) BE CZ PT1) HR UK FI 7 NL SI FI LU DK EE1) SE DK LV HU LV ES 8 LU DE CY EE BE AT IE NL NL1) PL FI EE 9 AT SE AT DK SI UK FR CY GR1) DK AT CY
10 SE AT SE NL FR SI PT FR LU1a) CY CZ RO 11 FI HU LV ES PL MT IT AT BE1a) EE PT GR 12 CY HR EE1) FR EE ES AT PL ES CZ SI MT 13 LV IE LU1) LV ES PT1) FI EE FI1) SI CY1) DE 14 DK DK DE SI GR CZ1) NL BE AT1) FI ES1) HR 15 BE1) CY NL AT LV IE DE UK MT1a) ES IE CZ 16 FR1) UK GR GR FI1) BE PL LV DE1a) MT MT AT 17 SK NL1) FR PL AT1) DE MT SK CY IT SK FR 18 DE FR1) HU DE SK IT DK HR FR SE FR PL 19 UK RO UK HU MT LV CY DE PL FR HU LU 20 EE BE BE PT PT CY EE GR EE1) IE LU NL 21 HU LU DK CZ1) CZ HU UK HU IT1) BE PL BE 22 PT GR RO MT1) HR GR HR ES IE1a) LU GR HU 23 IT IT IT HR DE PL LV PT UK1a) DE BE SK 24 MT ES PT SK HU SK RO IT CZ UK RO IE 25 RO MT MT IT IT HR HU MT HU AT HR UK 26 ES PT ES RO RO RO GR RO SK NL IT IT
S: Eurostat, WIFO-calculations. - 1) and 1a) Two countries have the same rank (e.g. NL and GR or LU and BE) due to equal index points.
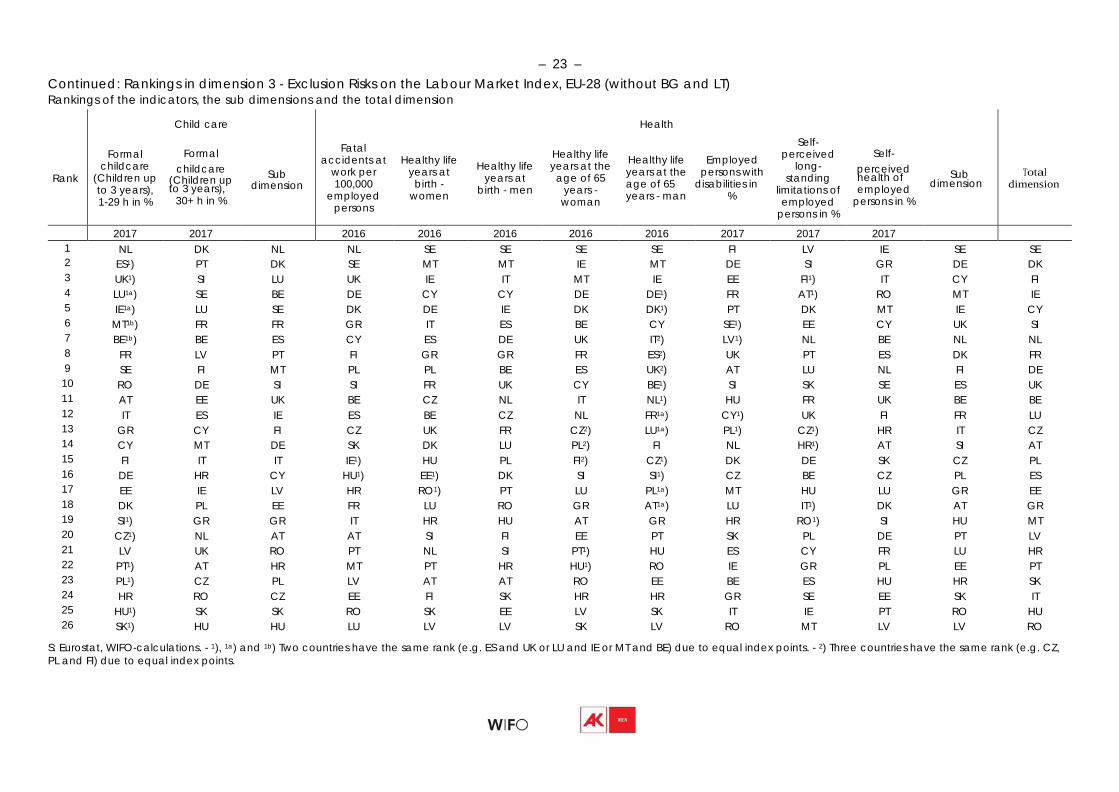
– 23 –
Continued: Rankings in dimension 3 - Exclusion Risks on the Labour Market Index, EU-28 (without BG and LT) Rankings of the indicators, the sub dimensions and the total dimension Rank
Formal childcare
(Children up to 3 years), 1-29 h in %
Child care
Formal childcare Sub (Children up dimension to 3 years), 30+ h in %
Fatal accidents at
work per 100,000
employed persons
Healthy life years at birth -
women
Healthy life years at
birth - men
Healthy life years at the age of 65
years - woman
Health
Healthy life Employed years at the persons with age of 65 disabilities in years - man %
Self- perceived
long- standing
limitations of employed
persons in %
Self- perceived Sub health of dimension employed
persons in %
Total dimension
2017 2017 2016 2016 2016 2016 2016 2017 2017 2017 1 NL DK NL NL SE SE SE SE FI LV IE SE SE 2 ES1) PT DK SE MT MT IE MT DE SI GR DE DK 3 UK1) SI LU UK IE IT MT IE EE FI1) IT CY FI 4 LU1a) SE BE DE CY CY DE DE1) FR AT1) RO MT IE 5 IE1a) LU SE DK DE IE DK DK1) PT DK MT IE CY 6 MT1b) FR FR GR IT ES BE CY SE1) EE CY UK SI 7 BE1b) BE ES CY ES DE UK IT2) LV1) NL BE NL NL 8 FR LV PT FI GR GR FR ES2) UK PT ES DK FR 9 SE FI MT PL PL BE ES UK2) AT LU NL FI DE 10 RO DE SI SI FR UK CY BE1) SI SK SE ES UK 11 AT EE UK BE CZ NL IT NL1) HU FR UK BE BE 12 IT ES IE ES BE CZ NL FR1a) CY1) UK FI FR LU 13 GR CY FI CZ UK FR CZ2) LU1a) PL1) CZ1) HR IT CZ 14 CY MT DE SK DK LU PL2) FI NL HR1) AT SI AT 15 FI IT IT IE1) HU PL FI2) CZ1) DK DE SK CZ PL 16 DE HR CY HU1) EE1) DK SI SI1) CZ BE CZ PL ES 17 EE IE LV HR RO1) PT LU PL1a) MT HU LU GR EE 18 DK PL EE FR LU RO GR AT1a) LU IT1) DK AT GR 19 SI1) GR GR IT HR HU AT GR HR RO1) SI HU MT 20 CZ1) NL AT AT SI FI EE PT SK PL DE PT LV 21 LV UK RO PT NL SI PT1) HU ES CY FR LU HR 22 PT1) AT HR MT PT HR HU1) RO IE GR PL EE PT 23 PL1) CZ PL LV AT AT RO EE BE ES HU HR SK 24 HR RO CZ EE FI SK HR HR GR SE EE SK IT 25 HU1) SK SK RO SK EE LV SK IT IE PT RO HU 26 SK1) HU HU LU LV LV SK LV RO MT LV LV RO
S: Eurostat, WIFO-calculations. - 1), 1a) and 1b) Two countries have the same rank (e.g. ES and UK or LU and IE or MT and BE) due to equal index points. - 2) Three countries have the same rank (e.g. CZ, PL and FI) due to equal index points.
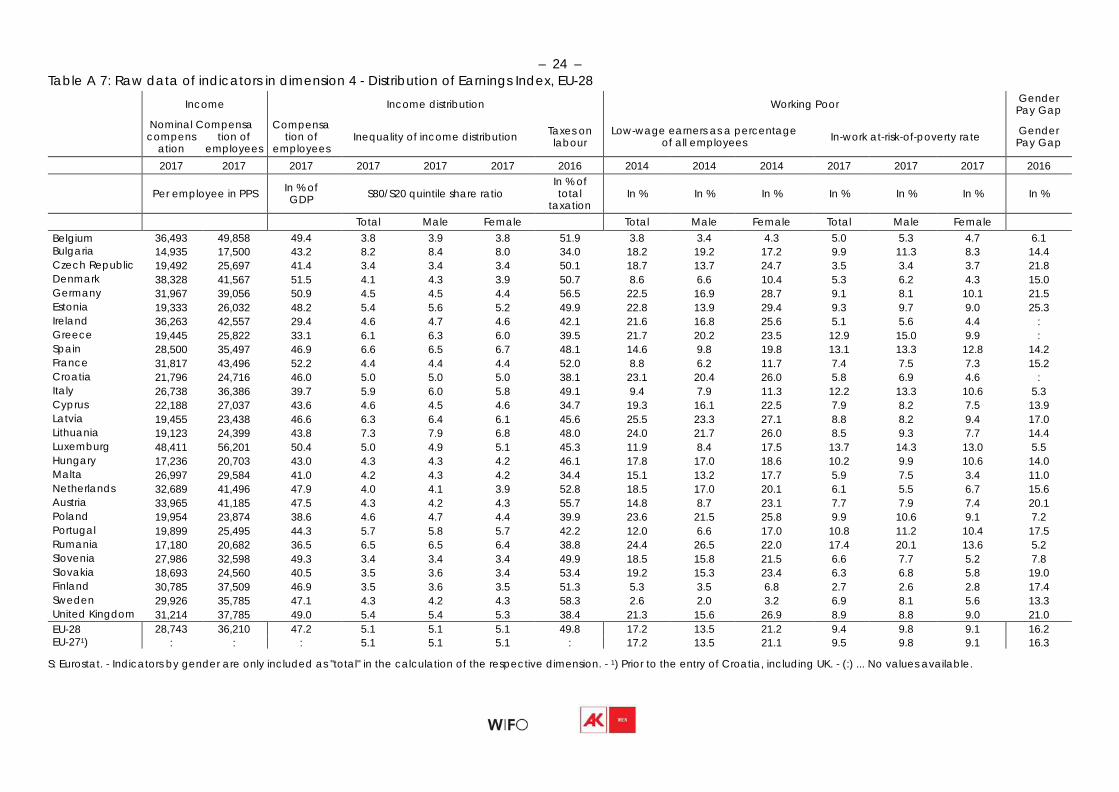
– 24 –
Table A 7: Raw data of indicators in dimension 4 - Distribution of Earnings Index, EU-28 Income
Nominal Compensa compens tion of
ation employees
Compensa
tion of employees
Income distribution
Inequality of income distribution
Taxes on labour
Working
Low-wage earners as a percentage of all employees
Poor
In-work
at-risk-of-poverty rate
Gender Pay Gap
Gender Pay Gap
2017 2017 2017 2017 2017 2017 2016 2014 2014 2014 2017 2017 2017 2016
Per employee in PPS In % of
GDP
S80/S20 quintile share ratio
In % of total
taxation
In %
In %
In %
In %
In %
In %
In %
Total Male Female Total Male Female Total Male Female Belgium 36,493 49,858 49.4 3.8 3.9 3.8 51.9 3.8 3.4 4.3 5.0 5.3 4.7 6.1 Bulgaria 14,935 17,500 43.2 8.2 8.4 8.0 34.0 18.2 19.2 17.2 9.9 11.3 8.3 14.4 Czech Republic 19,492 25,697 41.4 3.4 3.4 3.4 50.1 18.7 13.7 24.7 3.5 3.4 3.7 21.8 Denmark 38,328 41,567 51.5 4.1 4.3 3.9 50.7 8.6 6.6 10.4 5.3 6.2 4.3 15.0 Germany 31,967 39,056 50.9 4.5 4.5 4.4 56.5 22.5 16.9 28.7 9.1 8.1 10.1 21.5 Estonia 19,333 26,032 48.2 5.4 5.6 5.2 49.9 22.8 13.9 29.4 9.3 9.7 9.0 25.3 Ireland 36,263 42,557 29.4 4.6 4.7 4.6 42.1 21.6 16.8 25.6 5.1 5.6 4.4 : Greece 19,445 25,822 33.1 6.1 6.3 6.0 39.5 21.7 20.2 23.5 12.9 15.0 9.9 : Spain 28,500 35,497 46.9 6.6 6.5 6.7 48.1 14.6 9.8 19.8 13.1 13.3 12.8 14.2 France 31,817 43,496 52.2 4.4 4.4 4.4 52.0 8.8 6.2 11.7 7.4 7.5 7.3 15.2 Croatia 21,796 24,716 46.0 5.0 5.0 5.0 38.1 23.1 20.4 26.0 5.8 6.9 4.6 : Italy 26,738 36,386 39.7 5.9 6.0 5.8 49.1 9.4 7.9 11.3 12.2 13.3 10.6 5.3 Cyprus 22,188 27,037 43.6 4.6 4.5 4.6 34.7 19.3 16.1 22.5 7.9 8.2 7.5 13.9 Latvia 19,455 23,438 46.6 6.3 6.4 6.1 45.6 25.5 23.3 27.1 8.8 8.2 9.4 17.0 Lithuania 19,123 24,399 43.8 7.3 7.9 6.8 48.0 24.0 21.7 26.0 8.5 9.3 7.7 14.4 Luxemburg 48,411 56,201 50.4 5.0 4.9 5.1 45.3 11.9 8.4 17.5 13.7 14.3 13.0 5.5 Hungary 17,236 20,703 43.0 4.3 4.3 4.2 46.1 17.8 17.0 18.6 10.2 9.9 10.6 14.0 Malta 26,997 29,584 41.0 4.2 4.3 4.2 34.4 15.1 13.2 17.7 5.9 7.5 3.4 11.0 Netherlands 32,689 41,496 47.9 4.0 4.1 3.9 52.8 18.5 17.0 20.1 6.1 5.5 6.7 15.6 Austria 33,965 41,185 47.5 4.3 4.2 4.3 55.7 14.8 8.7 23.1 7.7 7.9 7.4 20.1 Poland 19,954 23,874 38.6 4.6 4.7 4.4 39.9 23.6 21.5 25.8 9.9 10.6 9.1 7.2 Portugal 19,899 25,495 44.3 5.7 5.8 5.7 42.2 12.0 6.6 17.0 10.8 11.2 10.4 17.5 Rumania 17,180 20,682 36.5 6.5 6.5 6.4 38.8 24.4 26.5 22.0 17.4 20.1 13.6 5.2 Slovenia 27,986 32,598 49.3 3.4 3.4 3.4 49.9 18.5 15.8 21.5 6.6 7.7 5.2 7.8 Slovakia 18,693 24,560 40.5 3.5 3.6 3.4 53.4 19.2 15.3 23.4 6.3 6.8 5.8 19.0 Finland 30,785 37,509 46.9 3.5 3.6 3.5 51.3 5.3 3.5 6.8 2.7 2.6 2.8 17.4 Sweden 29,926 35,785 47.1 4.3 4.2 4.3 58.3 2.6 2.0 3.2 6.9 8.1 5.6 13.3 United Kingdom 31,214 37,785 49.0 5.4 5.4 5.3 38.4 21.3 15.6 26.9 8.9 8.8 9.0 21.0 EU-28 28,743 36,210 47.2 5.1 5.1 5.1 49.8 17.2 13.5 21.2 9.4 9.8 9.1 16.2 EU-271) : : : 5.1 5.1 5.1 : 17.2 13.5 21.1 9.5 9.8 9.1 16.3
S: Eurostat. - Indicators by gender are only included as "total" in the calculation of the respective dimension. - 1) Prior to the entry of Croatia, including UK. - (:) ... No values available.
– 25 –
Table A 8: Rankings in dimension 4 - Distribution of Earnings Index, EU-28 (without IE, GR und HR) Rankings of the indicators, the sub dimensions and the total dimension Rank
Nominal compensation per employee
in PPS
Income
Compensation of employees per employee
in PPS
Sub dimension
Compensation of employees in % of GDP
Income Inequality of
income distribution -
S80/S20 quintil share
ratio
distribution
Taxes on labour in % of total taxation
Sub dimension
Working Poor
Low-wage
earners as a percentage of Woorking
all employees in Poor in % %
Sub dimension
Gender Pay Gap
Gender Pay Gap in %
Total dimension
2017 2017 2017 2017 2016 2014 2017 2016 1 LU LU LU FR SI1) BG UK SE FI FI RO BE 2 DK BE BE DK CZ1) MT SI BE CZ BE IT LU 3 BE FR DK DE FI1a) CY CY FI BE SE LU DK 4 AT DK AT LU SK1a) UK DK DK DK DK BE FI 5 NL NL FR BE BE RO LU FR MT FR PL FR 6 DE AT NL SI NL PL MT IT NL CZ SI SI 7 FR DE DE UK DK PT FR LU SK MT MT SE 8 UK UK UK EE MT LU BE PT SI AT SE MT 9 FI FI FI NL AT2) LV FI ES SE NL CY NL
10 SE IT SE AT SE2) HU NL AT FR SI HU AT 11 ES SE ES SE HU2) LT DE MT AT SK ES UK 12 SI ES IT FI1) FR ES HU HU CY PT BG1) CY 13 MT SI SI ES1) DE IT EE BG LT IT LT1) IT 14 IT MT MT LV CY1) EE CZ SI LV CY DK DE 15 CY CY CY PT PL1) SI PT NL UK BG FR ES 16 PL EE PT LT LU CZ AT CZ DE HU NL CZ 17 PT CZ EE CY UK1) DK PL SK EE UK LV PL 18 CZ PT CZ BG EE1) FI LV CY BG1) LU FI PT 19 LV SK PL HU PT BE SE UK PL1) DE PT HU 20 EE LT LT CZ IT FR SK DE HU ES SK SK 21 LT PL SK MT LV NL ES EE PT LT AT LV 22 SK LV LV SK RO SK BG PL IT EE UK EE 23 HU HU HU IT ES AT RO LT ES LV DE BG 24 RO RO RO PL LT DE LT RO LU PL CZ LT 25 BG BG BG RO BG SE IT LV RO RO EE RO
S: Eurostat, WIFO-calculations. - 1) and 1a) Two countries have the same rank (e.g. SI and CZ or FI and SK) due to equal index points. - 2) Three countries have the same rank (e.g. AT, SE and HU) due to equal index points.
– 26 –
Table A 9: Raw data of indicators in dimension 5 - Redistribution by the Welfare State Index, EU-28 Social expenditure by function At-risk-of poverty Educational
expenses
Sickness/Health
Disability
Age
Family/Children
Unemployment1)
Other
functions2)
At-risk-of- poverty rate after social
transfers
Improvement of at-risk-of-
poverty rate due to social
transfers
Relative at risk of poverty gap
Public
expenditures for education
2016 2016 2016 2016 2016 2016 2017 2017 2017 20153)
In % of GDP In % of GDP In % of GDP In % of GDP In % of GDP In % of GDP In % In percentage points In % In % of GDP
Belgium 7.5 2.4 10.8 2.1 0.33 2.8 15.9 10.4 17.7 6.43 Bulgaria 4.7 1.3 7.6 1.8 0.06 1.2 23.4 5.8 30.5 3.93 Czech Republic 5.9 1.2 8.0 1.6 0.13 1.2 9.1 6.7 16.6 3.79 Denmark 6.3 4.0 11.3 3.5 0.22 3.9 12.4 12.9 21.7 : Germany 9.8 2.3 9.1 3.2 0.24 2.7 16.1 8.0 20.9 4.52 Estonia 4.9 1.9 6.8 2.1 0.07 0.3 21.0 7.9 20.7 4.85 Ireland 5.8 0.8 4.8 1.3 0.17 1.0 15.6 17.3 18.3 3.77 Greece 5.4 1.5 14.4 1.0 0.04 2.9 20.2 3.8 30.3 3.68 Spain 6.6 1.7 9.7 1.3 0.10 2.6 21.6 6.8 32.4 4.16 France 9.2 2.1 12.9 2.4 0.20 3.5 13.3 10.8 16.9 5.47 Croatia 7.0 2.3 7.1 1.8 0.04 2.2 20.0 6.6 26.0 : Italy 6.6 1.7 13.9 1.8 0.14 2.9 20.3 4.9 28.1 4.10 Cyprus 3.5 0.8 9.1 1.3 0.08 2.9 15.7 8.8 15.1 6.40 Latvia 3.7 1.4 7.2 1.7 0.07 0.4 22.1 6.2 25.3 5.33 Lithuania 4.6 1.4 6.3 1.1 0.06 0.8 22.9 6.9 28.0 4.12 Luxemburg 5.3 2.3 6.9 3.3 0.21 2.6 18.7 10.3 21.8 3.90 Hungary 5.2 1.2 8.4 2.3 0.06 1.5 13.4 11.6 16.7 4.26 Malta 5.4 0.6 7.3 1.0 0.09 1.8 16.8 6.9 16.7 5.42 Netherlands 9.2 2.6 10.8 1.1 0.21 2.9 13.2 8.7 17.8 5.40 Austria 7.5 1.9 12.9 2.8 0.28 2.6 14.4 10.5 22.4 5.43 Poland 4.6 1.3 9.2 2.5 0.03 1.9 15.0 9.0 23.6 4.81 Portugal 6.1 1.7 12.1 1.2 0.08 2.0 18.3 5.3 27.0 4.79 Rumania 3.9 1.0 7.2 1.4 0.02 0.8 23.6 4.7 34.5 2.72 Slovenia 7.6 1.2 9.6 1.7 0.07 2.1 13.3 10.7 19.6 4.64 Slovakia 5.8 1.6 7.2 1.6 0.05 1.2 12.4 5.1 26.0 4.59 Finland 7.1 3.1 12.7 3.1 0.29 2.7 11.5 15.2 13.7 6.75 Sweden 7.5 3.2 12.2 3.0 0.14 2.1 15.8 13.5 21.2 7.05 United Kingdom 8.5 1.7 10.9 2.6 0.08 2.0 17.0 12.2 20.1 5.7 EU-28 8.0 2.0 10.9 2.4 0.15 2.6 16.9 8.7 24.1 5.0 EU-274) 8.0 2.0 10.9 2.4 0.18 2.6 16.9 8.7 24.1 :
S: Eurostat. - 1) Unemployment expenses in % of GDP divided through unemployment rate - 2) Other functions contain expenditures for survivers, housing and social exclusion. - 3) EE: 2014, S: World Bank - 4) Prior to the entry of Croatia, including UK. - (:) ... No values available.
– 27 –
Table A 10: Rankings in dimension 5 - Redistribution by the Welfare State Index, EU-28 (without DK und HR) Rankings of the indicators, the sub dimensions and the total dimension
Rank
Sickness/ Health
Disability
Social
Age
expenditure by
Family/ Children
function
Un- employment
Other Sub functions dimension
At-risk-of- poverty rate after social
transfers in %
At-risk-of poverty
Improvemen t of at-risk- of-poverty Relative at rate due to risk of Sub
social poverty gap dimension transfers in in %
percentage points
Educational expenses
Public
expenditure s for
education in % of GDP
Total dimension
2016 2016 2016 2016 2016 2016 2017 2017 2017 2015 1 DE SE GR LU BE FR FI CZ IE FI FI SE FI 2 NL1) FI IT DE FI NL3) FR FI FI CY IE FI FR 3 FR1) NL AT1) FI AT IT3) DE SK SE CZ HU BE SE 4 UK BE FR1) SE DE GR3) AT NL UK HU1) FR CY BE 5 SI DE1) FI AT NL CY3) SE FR1) HU MT1) CZ UK AT 6 SE2) LU1) SE UK LU BE BE SI1) FR FR SI FR NL 7 BE2) FR PT PL FR FI NL HU SI BE SE AT DE 8 AT2) AT1) UK FR IE DE IT AT AT NL NL MT UK 9 FI EE1) BE1) HU IT AT2) LU PL BE IE CY NL LU
10 IT1) IT3) NL1) BE1) SE LU2) UK IE LU SI BE LV SI 11 ES1) PT3) ES EE1) CZ ES2) GR CY PL UK UK EE CY 12 PT UK3) SI IT1a) ES SE1) ES SE CY EE AT PL HU 13 CZ ES3) PL BG1a) MT SI1) PT BE NL DE MT PT IT 14 SK1) SK DE1) SI1b) UK UK1a) SI DE DE SE PL SI CZ 15 IE1) GR CY1) LV1b) PT PT1a) PL MT EE LU DE SK PL 16 GR1a) LV1) HU CZ1c) CY PL HU UK LT AT LU DE IE 17 MT1a) LT1) CZ SK1c) SI MT CZ PT MT PL SK HU PT 18 LU PL1a) BG RO EE HU SK LU ES LV EE ES MT 19 HU BG1a) MT IE2) LV CZ2) CY GR CZ SK PT LT SK 20 EE SI2) LV ES2) BG SK2) EE IT LV PT LV IT ES 21 BG HU2) SK CY2) LT BG2) BG EE BG LT IT BG EE 22 LT1) CZ2) RO PT HU IE IE ES PT IT LT LU GR 23 PL1) RO LU NL1) SK LT1) MT LV SK GR ES CZ LV 24 RO CY1) EE LT1) GR RO1) LV LT IT BG GR IE BG 25 LV IE1) LT MT1a) PL LV LT BG RO ES BG GR LT 26 CY MT IE GR1a) RO EE RO RO GR RO RO RO RO
S: Eurostat, WIFO-calculations. - 1), 1a), 1b) and 1c) Two countries have the same rank (e.g. BE and EE, IT and BG, SI and LV or CZ and SK) due to equal index points. - 2) Three countries have the same rank (e.g. SE, BE and AT) due to equal index points. - 3) Four countries have the same rank (e.g. IT, PT, UK and ES) due to equal index points.
– 28 –
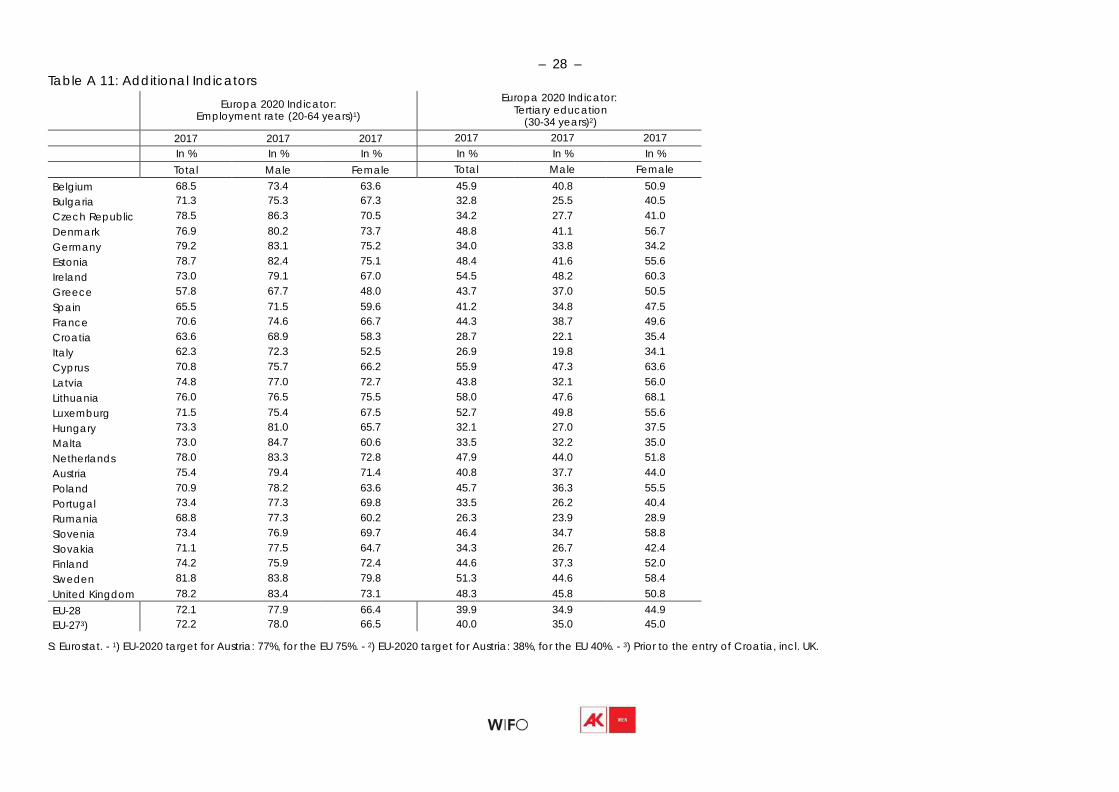
Table A 11: Additional Indicators Europa 2020 Indicator:
Employment rate (20-64 years)1)
Europa 2020 Indicator: Tertiary education
(30-34 years)2)
2017 2017 2017 2017 2017 2017
In % In % In % In % In % In %
Total Male Female Total Male Female Belgium 68.5 73.4 63.6 45.9 40.8 50.9 Bulgaria 71.3 75.3 67.3 32.8 25.5 40.5 Czech Republic 78.5 86.3 70.5 34.2 27.7 41.0 Denmark 76.9 80.2 73.7 48.8 41.1 56.7 Germany 79.2 83.1 75.2 34.0 33.8 34.2 Estonia 78.7 82.4 75.1 48.4 41.6 55.6 Ireland 73.0 79.1 67.0 54.5 48.2 60.3 Greece 57.8 67.7 48.0 43.7 37.0 50.5 Spain 65.5 71.5 59.6 41.2 34.8 47.5 France 70.6 74.6 66.7 44.3 38.7 49.6 Croatia 63.6 68.9 58.3 28.7 22.1 35.4 Italy 62.3 72.3 52.5 26.9 19.8 34.1 Cyprus 70.8 75.7 66.2 55.9 47.3 63.6 Latvia 74.8 77.0 72.7 43.8 32.1 56.0 Lithuania 76.0 76.5 75.5 58.0 47.6 68.1 Luxemburg 71.5 75.4 67.5 52.7 49.8 55.6 Hungary 73.3 81.0 65.7 32.1 27.0 37.5 Malta 73.0 84.7 60.6 33.5 32.2 35.0 Netherlands 78.0 83.3 72.8 47.9 44.0 51.8 Austria 75.4 79.4 71.4 40.8 37.7 44.0 Poland 70.9 78.2 63.6 45.7 36.3 55.5 Portugal 73.4 77.3 69.8 33.5 26.2 40.4 Rumania 68.8 77.3 60.2 26.3 23.9 28.9 Slovenia 73.4 76.9 69.7 46.4 34.7 58.8 Slovakia 71.1 77.5 64.7 34.3 26.7 42.4 Finland 74.2 75.9 72.4 44.6 37.3 52.0 Sweden 81.8 83.8 79.8 51.3 44.6 58.4 United Kingdom 78.2 83.4 73.1 48.3 45.8 50.8 EU-28 72.1 77.9 66.4 39.9 34.9 44.9 EU-273) 72.2 78.0 66.5 40.0 35.0 45.0
S: Eurostat. - 1) EU-2020 target for Austria: 77%, for the EU 75%. - 2) EU-2020 target for Austria: 38%, for the EU 40%. - 3) Prior to the entry of Croatia, incl. UK.
– 29 –
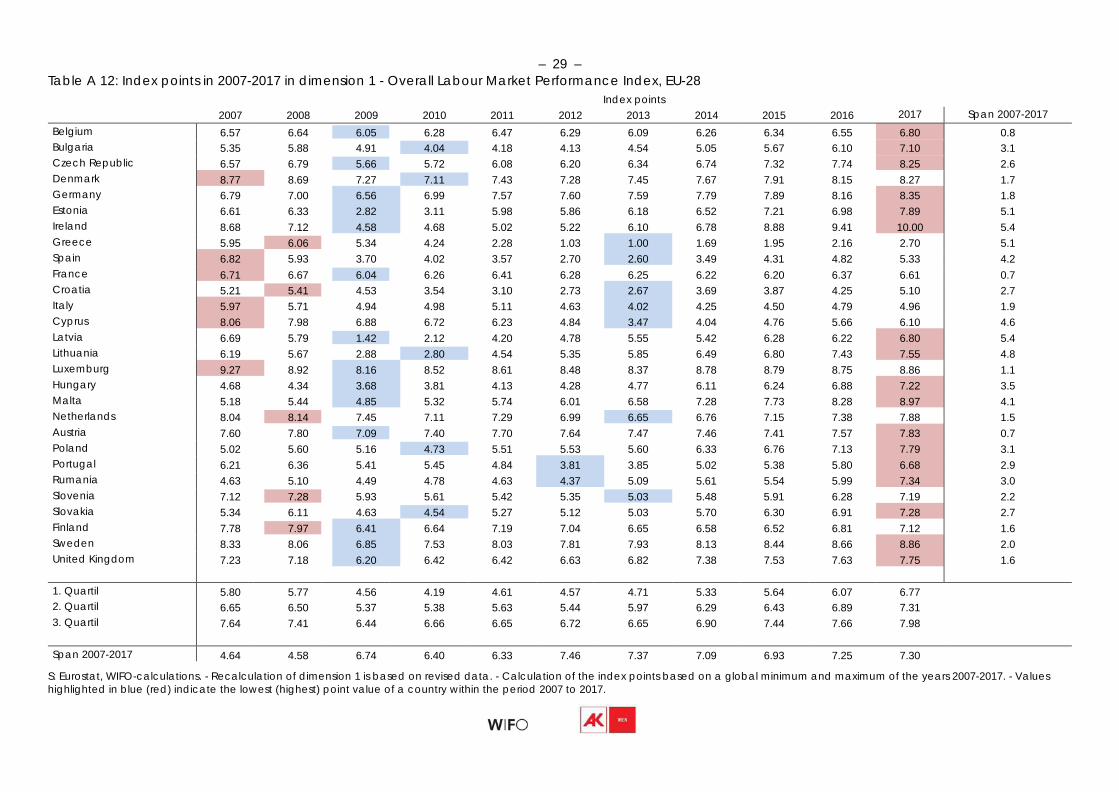
Table A 12: Index points in 2007-2017 in dimension 1 - Overall Labour Market Performance Index, EU-28 Index points
2007 2008 2009 2010 2011 2012 2013 2014 2015 2016 2017 Span 2007-2017 Belgium 6.57 6.64 6.05 6.28 6.47 6.29 6.09 6.26 6.34 6.55 6.80 0.8 Bulgaria 5.35 5.88 4.91 4.04 4.18 4.13 4.54 5.05 5.67 6.10 7.10 3.1 Czech Republic 6.57 6.79 5.66 5.72 6.08 6.20 6.34 6.74 7.32 7.74 8.25 2.6 Denmark 8.77 8.69 7.27 7.11 7.43 7.28 7.45 7.67 7.91 8.15 8.27 1.7 Germany 6.79 7.00 6.56 6.99 7.57 7.60 7.59 7.79 7.89 8.16 8.35 1.8 Estonia 6.61 6.33 2.82 3.11 5.98 5.86 6.18 6.52 7.21 6.98 7.89 5.1 Ireland 8.68 7.12 4.58 4.68 5.02 5.22 6.10 6.78 8.88 9.41 10.00 5.4 Greece 5.95 6.06 5.34 4.24 2.28 1.03 1.00 1.69 1.95 2.16 2.70 5.1 Spain 6.82 5.93 3.70 4.02 3.57 2.70 2.60 3.49 4.31 4.82 5.33 4.2 France 6.71 6.67 6.04 6.26 6.41 6.28 6.25 6.22 6.20 6.37 6.61 0.7 Croatia 5.21 5.41 4.53 3.54 3.10 2.73 2.67 3.69 3.87 4.25 5.10 2.7 Italy 5.97 5.71 4.94 4.98 5.11 4.63 4.02 4.25 4.50 4.79 4.96 1.9 Cyprus 8.06 7.98 6.88 6.72 6.23 4.84 3.47 4.04 4.76 5.66 6.10 4.6 Latvia 6.69 5.79 1.42 2.12 4.20 4.78 5.55 5.42 6.28 6.22 6.80 5.4 Lithuania 6.19 5.67 2.88 2.80 4.54 5.35 5.85 6.49 6.80 7.43 7.55 4.8 Luxemburg 9.27 8.92 8.16 8.52 8.61 8.48 8.37 8.78 8.79 8.75 8.86 1.1 Hungary 4.68 4.34 3.68 3.81 4.13 4.28 4.77 6.11 6.24 6.88 7.22 3.5 Malta 5.18 5.44 4.85 5.32 5.74 6.01 6.58 7.28 7.73 8.28 8.97 4.1 Netherlands 8.04 8.14 7.45 7.11 7.29 6.99 6.65 6.76 7.15 7.38 7.88 1.5 Austria 7.60 7.80 7.09 7.40 7.70 7.64 7.47 7.46 7.41 7.57 7.83 0.7 Poland 5.02 5.60 5.16 4.73 5.51 5.53 5.60 6.33 6.76 7.13 7.79 3.1 Portugal 6.21 6.36 5.41 5.45 4.84 3.81 3.85 5.02 5.38 5.80 6.68 2.9 Rumania 4.63 5.10 4.49 4.78 4.63 4.37 5.09 5.61 5.54 5.99 7.34 3.0 Slovenia 7.12 7.28 5.93 5.61 5.42 5.35 5.03 5.48 5.91 6.28 7.19 2.2 Slovakia 5.34 6.11 4.63 4.54 5.27 5.12 5.03 5.70 6.30 6.91 7.28 2.7 Finland 7.78 7.97 6.41 6.64 7.19 7.04 6.65 6.58 6.52 6.81 7.12 1.6 Sweden 8.33 8.06 6.85 7.53 8.03 7.81 7.93 8.13 8.44 8.66 8.86 2.0 United Kingdom 7.23 7.18 6.20 6.42 6.42 6.63 6.82 7.38 7.53 7.63 7.75 1.6
1. Quartil 5.80 5.77 4.56 4.19 4.61 4.57 4.71 5.33 5.64 6.07 6.77 2. Quartil 6.65 6.50 5.37 5.38 5.63 5.44 5.97 6.29 6.43 6.89 7.31 3. Quartil 7.64 7.41 6.44 6.66 6.65 6.72 6.65 6.90 7.44 7.66 7.98
Span 2007-2017 4.64 4.58 6.74 6.40 6.33 7.46 7.37 7.09 6.93 7.25 7.30 S: Eurostat, WIFO-calculations. - Recalculation of dimension 1 is based on revised data. - Calculation of the index points based on a global minimum and maximum of the years 2007-2017. - Values highlighted in blue (red) indicate the lowest (highest) point value of a country within the period 2007 to 2017.
– 30 –
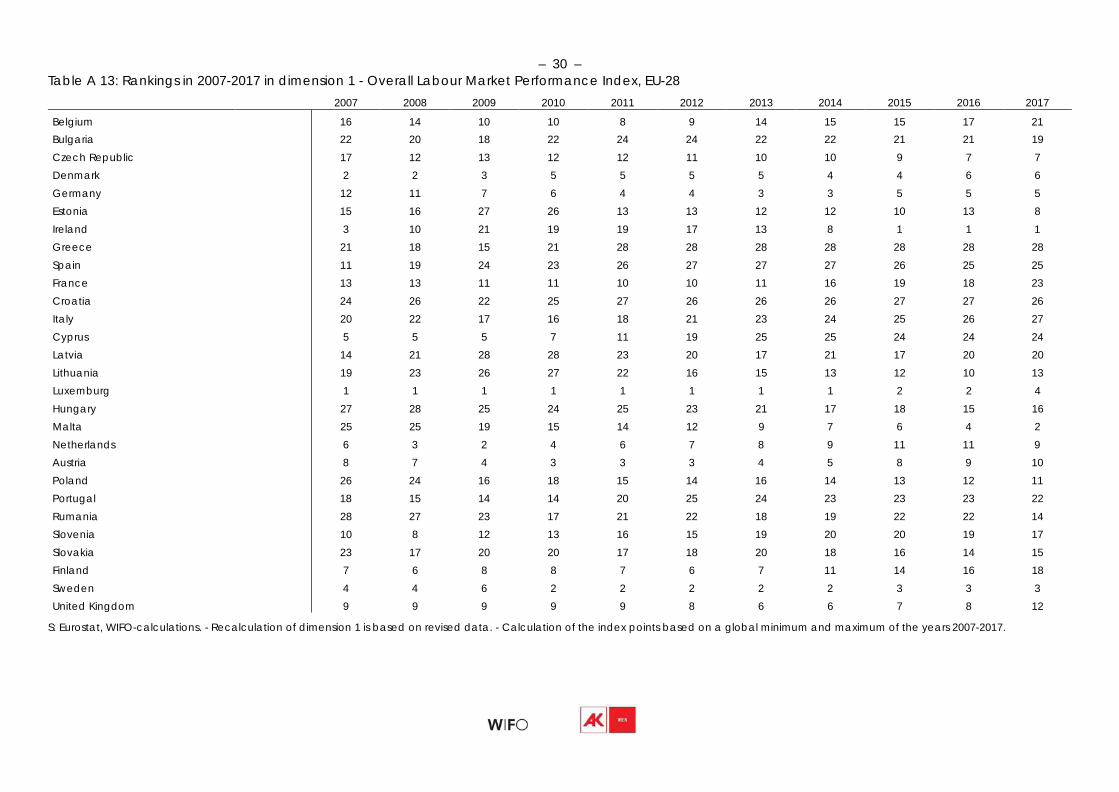
Table A 13: Rankings in 2007-2017 in dimension 1 - Overall Labour Market Performance Index, EU-28
2007 2008 2009 2010 2011 2012 2013 2014 2015 2016 2017
Belgium 16 14 10 10 8 9 14 15 15 17 21 Bulgaria 22 20 18 22 24 24 22 22 21 21 19 Czech Republic 17 12 13 12 12 11 10 10 9 7 7 Denmark 2 2 3 5 5 5 5 4 4 6 6 Germany 12 11 7 6 4 4 3 3 5 5 5 Estonia 15 16 27 26 13 13 12 12 10 13 8 Ireland 3 10 21 19 19 17 13 8 1 1 1 Greece 21 18 15 21 28 28 28 28 28 28 28 Spain 11 19 24 23 26 27 27 27 26 25 25 France 13 13 11 11 10 10 11 16 19 18 23 Croatia 24 26 22 25 27 26 26 26 27 27 26 Italy 20 22 17 16 18 21 23 24 25 26 27 Cyprus 5 5 5 7 11 19 25 25 24 24 24 Latvia 14 21 28 28 23 20 17 21 17 20 20 Lithuania 19 23 26 27 22 16 15 13 12 10 13 Luxemburg 1 1 1 1 1 1 1 1 2 2 4 Hungary 27 28 25 24 25 23 21 17 18 15 16 Malta 25 25 19 15 14 12 9 7 6 4 2 Netherlands 6 3 2 4 6 7 8 9 11 11 9 Austria 8 7 4 3 3 3 4 5 8 9 10 Poland 26 24 16 18 15 14 16 14 13 12 11 Portugal 18 15 14 14 20 25 24 23 23 23 22 Rumania 28 27 23 17 21 22 18 19 22 22 14 Slovenia 10 8 12 13 16 15 19 20 20 19 17 Slovakia 23 17 20 20 17 18 20 18 16 14 15 Finland 7 6 8 8 7 6 7 11 14 16 18 Sweden 4 4 6 2 2 2 2 2 3 3 3 United Kingdom 9 9 9 9 9 8 6 6 7 8 12
S: Eurostat, WIFO-calculations. - Recalculation of dimension 1 is based on revised data. - Calculation of the index points based on a global minimum and maximum of the years 2007-2017.
– 31 –
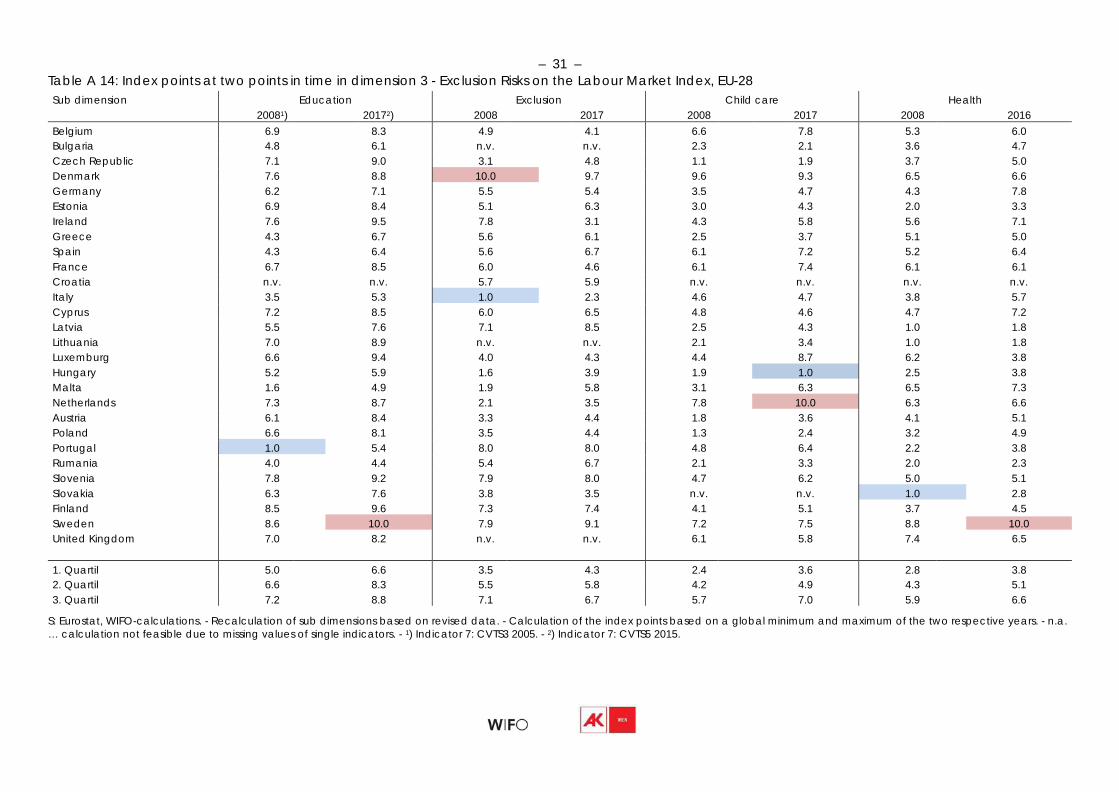
Table A 14: Index points at two points in time in dimension 3 - Exclusion Risks on the Labour Market Index, EU-28 Sub dimension
20081) Education
20172)
2008 Exclusion
2017
2008 Child care
2017
2008 Health
2016 Belgium 6.9 8.3 4.9 4.1 6.6 7.8 5.3 6.0 Bulgaria 4.8 6.1 n.v. n.v. 2.3 2.1 3.6 4.7 Czech Republic 7.1 9.0 3.1 4.8 1.1 1.9 3.7 5.0 Denmark 7.6 8.8 10.0 9.7 9.6 9.3 6.5 6.6 Germany 6.2 7.1 5.5 5.4 3.5 4.7 4.3 7.8 Estonia 6.9 8.4 5.1 6.3 3.0 4.3 2.0 3.3 Ireland 7.6 9.5 7.8 3.1 4.3 5.8 5.6 7.1 Greece 4.3 6.7 5.6 6.1 2.5 3.7 5.1 5.0 Spain 4.3 6.4 5.6 6.7 6.1 7.2 5.2 6.4 France 6.7 8.5 6.0 4.6 6.1 7.4 6.1 6.1 Croatia n.v. n.v. 5.7 5.9 n.v. n.v. n.v. n.v. Italy 3.5 5.3 1.0 2.3 4.6 4.7 3.8 5.7 Cyprus 7.2 8.5 6.0 6.5 4.8 4.6 4.7 7.2 Latvia 5.5 7.6 7.1 8.5 2.5 4.3 1.0 1.8 Lithuania 7.0 8.9 n.v. n.v. 2.1 3.4 1.0 1.8 Luxemburg 6.6 9.4 4.0 4.3 4.4 8.7 6.2 3.8 Hungary 5.2 5.9 1.6 3.9 1.9 1.0 2.5 3.8 Malta 1.6 4.9 1.9 5.8 3.1 6.3 6.5 7.3 Netherlands 7.3 8.7 2.1 3.5 7.8 10.0 6.3 6.6 Austria 6.1 8.4 3.3 4.4 1.8 3.6 4.1 5.1 Poland 6.6 8.1 3.5 4.4 1.3 2.4 3.2 4.9 Portugal 1.0 5.4 8.0 8.0 4.8 6.4 2.2 3.8 Rumania 4.0 4.4 5.4 6.7 2.1 3.3 2.0 2.3 Slovenia 7.8 9.2 7.9 8.0 4.7 6.2 5.0 5.1 Slovakia 6.3 7.6 3.8 3.5 n.v. n.v. 1.0 2.8 Finland 8.5 9.6 7.3 7.4 4.1 5.1 3.7 4.5 Sweden 8.6 10.0 7.9 9.1 7.2 7.5 8.8 10.0 United Kingdom 7.0 8.2 n.v. n.v. 6.1 5.8 7.4 6.5
1. Quartil 5.0 6.6 3.5 4.3 2.4 3.6 2.8 3.8 2. Quartil 6.6 8.3 5.5 5.8 4.2 4.9 4.3 5.1 3. Quartil 7.2 8.8 7.1 6.7 5.7 7.0 5.9 6.6
S: Eurostat, WIFO-calculations. - Recalculation of sub dimensions based on revised data. - Calculation of the index points based on a global minimum and maximum of the two respective years. - n.a. … calculation not feasible due to missing values of single indicators. - 1) Indicator 7: CVTS3 2005. - 2) Indicator 7: CVTS5 2015.
– 32 –
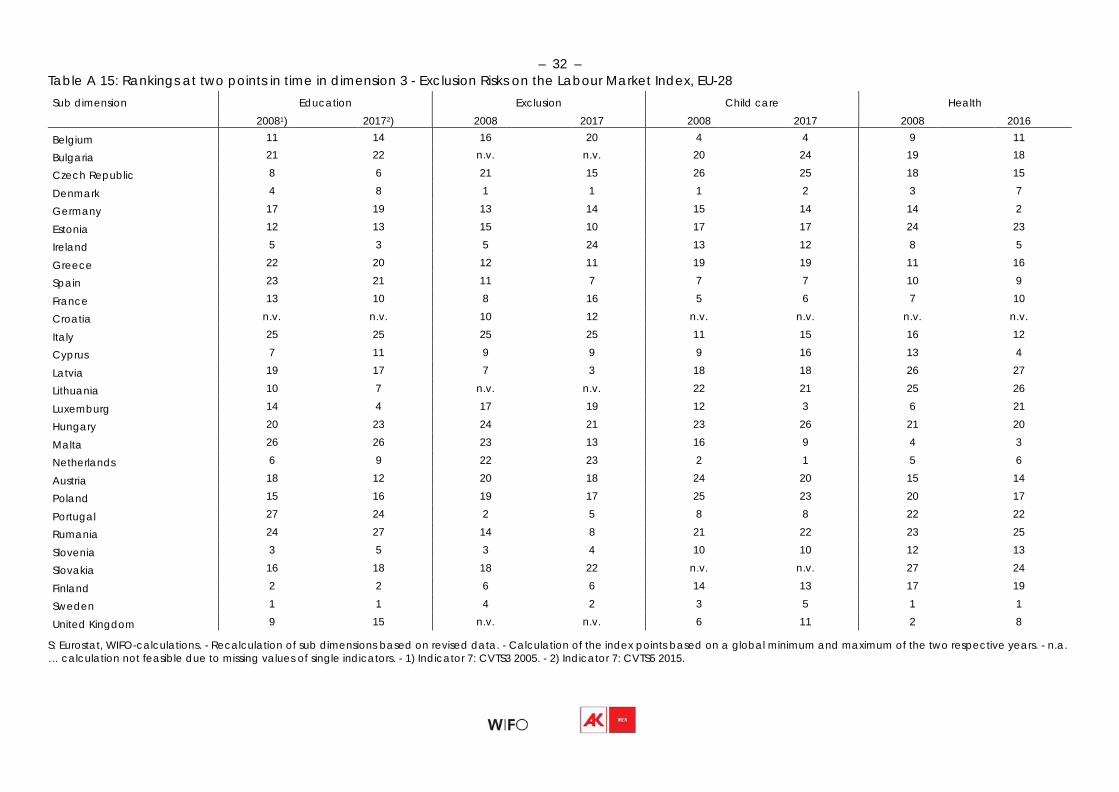
Table A 15: Rankings at two points in time in dimension 3 - Exclusion Risks on the Labour Market Index, EU-28 Sub dimension Education Exclusion Child care Health
20081) 20172) 2008 2017 2008 2017 2008 2016
Belgium 11 14 16 20 4 4 9 11
Bulgaria 21 22 n.v. n.v. 20 24 19 18
Czech Republic 8 6 21 15 26 25 18 15
Denmark 4 8 1 1 1 2 3 7
Germany 17 19 13 14 15 14 14 2
Estonia 12 13 15 10 17 17 24 23
Ireland 5 3 5 24 13 12 8 5
Greece 22 20 12 11 19 19 11 16
Spain 23 21 11 7 7 7 10 9
France 13 10 8 16 5 6 7 10
Croatia n.v. n.v. 10 12 n.v. n.v. n.v. n.v.
Italy 25 25 25 25 11 15 16 12
Cyprus 7 11 9 9 9 16 13 4
Latvia 19 17 7 3 18 18 26 27
Lithuania 10 7 n.v. n.v. 22 21 25 26
Luxemburg 14 4 17 19 12 3 6 21
Hungary 20 23 24 21 23 26 21 20
Malta 26 26 23 13 16 9 4 3
Netherlands 6 9 22 23 2 1 5 6
Austria 18 12 20 18 24 20 15 14
Poland 15 16 19 17 25 23 20 17
Portugal 27 24 2 5 8 8 22 22
Rumania 24 27 14 8 21 22 23 25
Slovenia 3 5 3 4 10 10 12 13
Slovakia 16 18 18 22 n.v. n.v. 27 24
Finland 2 2 6 6 14 13 17 19
Sweden 1 1 4 2 3 5 1 1
United Kingdom 9 15 n.v. n.v. 6 11 2 8
S: Eurostat, WIFO-calculations. - Recalculation of sub dimensions based on revised data. - Calculation of the index points based on a global minimum and maximum of the two respective years. - n.a. … calculation not feasible due to missing values of single indicators. - 1) Indicator 7: CVTS3 2005. - 2) Indicator 7: CVTS5 2015.


![REFLEXION (s) SUR LUSAGE DES INDICES...T + 4 semaines T + 4 semaines Enlève adulte (nombre, biomasse) + [bioaccumulation] 10 adultes /essai Enlève juvénile (nombre, biomasse) +](https://img.pdfslide.org/doc/110x75/5fe37433d5c2177b997c8ff6/reflexion-s-sur-lusage-des-indices-t-4-semaines-t-4-semaines-enlve-adulte.jpg)