Embed Size (px)
Citation preview
DISSERTATION Doctoral Thesis
The contribution of bike-sharing to sustainable mobility in Europe
ausgeführt zum Zwecke der Erlangung des akademischen Grades eines Doktors der technischen Wissenschaft
eingereicht an der Fakultät für Bauingenieurwesen der Technischen Universität Wien
von
Dipl.-Ing. Alberto Castro Fernández Matrikelnummer 0526611
Erlafstraße 1/16 – 1020 Wien
Gutachter: Ao. Univ. Prof. Mag. Dr. Günter Emberger Institut für Verkehrswissenschaften Technische Universität Wien Gutachter: Univ. Prof. Dipl. -Ing. Dr. Andrés Monzón TRANSyT Universidad Politécnica de Madrid Wien, Dezember 2011 ……………………….

Acknowledgement
1
Acknowledgement I would like to thank every bike-sharing stakeholder that has provided data for this
dissertation. I especially appreciate the contribution of the partners of the EU-project OBIS
(Optimising Bike Sharing in European Cities) because the sample of case studies and many
data of this dissertation are based on the information compiled in this project.
Abstract
2
Abstract Traffic congestion and air pollution are common and current concerns of urban areas.
To solve these problems, municipalities have implemented sustainable mobility plans. Bike-
sharing schemes (BSSs) have been promoted as an additional tool to encourage sustainable
mobility.
Bike-sharing is a bicycle rental system that allows, without additional charge, to take a
bicycle in one point and to return it in a different one, where the bicycle can be rented by
another user.
Despite the first BSS was implemented in 1968 in Amsterdam, bike-sharing is a recent
way of urban mobility because its real expansion did not take place until the 21st Century. The
first high-technology scheme was introduced in 1996 in Portsmouth (United Kingdom). In 2005
the first large scale project providing a high amount of bike-sharing stations was implemented in
Lyon (France). However, the current largest BSS in Europe was initiated in 2007 in Paris
(France). Numerous European cities that were impressed by the high use of these systems
have followed the example and they have implemented a BSS.
The success of BSSs achieving sustainability goals have been evaluated in this
dissertation based on 51 case studies. The positive and negative effects of BSSs on European
cities are assessed in terms of mobility, environment, health, traffic safety and economy to
obtain their contribution to sustainable mobility.
Furthermore, this dissertation defines the city factors and bike-sharing factors that may
increase the success of BSSs and quantifies their influence on the final level of use of BSSs.
On the other hand, barriers that can arise when operating BSSs are identified and likely
solutions are suggested.
Kurzfassung
3
Kurzfassung Verkehrsprobleme und Luftverschmutzung sind Probleme städtischer Räume.
Nachhaltige Mobilitätsmasterpläne sollen diese Probleme lösen, aber auch die
Implementierung von Fahrradverleihsysteme (FVS) kann eine effektive Strategie sein um
nachhaltige Mobilität zu fördern.
FVS sind Systeme, welches NutzerInnen ermöglicht, ohne zusätzliche Kosten, ein
Fahrrad an einer Verleihstation auszuleihen und an einer anderen Station wieder
zurückzugeben, an der wiederum andere NutzerInnen das Leihrad wieder ausleihen können.
Das erste FVS wurde 1968 implementiert, dennoch sind FVS ein junges urbanes
Verkehrsmittel, da die reale Umsetzung des Systems erst im 21. Jahrhundert erfolgte. Das
erste High-Tech-FVS wurde 1996 in Portsmouth (Vereinigtes Königreich) initiiert und seit 2005
gibt es das erste städtische FVS mit vielen Fahrrädern und Stationen in Lyon (Frankreich). Seit
2007 wird das größte FVS Europas in Paris (Frankreich) betrieben. Viele europäische Städte
folgten, da sie die hohe Anzahl der NutzerInnen der Leihräder beeindruckte und
implementierten ebenfalls FVS.
Diese Dissertation erforscht den Erfolg der FVS anhand ihrer nachhaltigen Ziele. 51
Case-Studies werden untersucht. Positive und negative Auswirkungen der FVS auf Mobilität,
Umwelt, Gesundheit, Verkehrssicherheit und Wirtschaft der ausgewählten Städte werden
analysiert.
Weiters werden städtische Faktoren und FVS-Faktoren, die auf den Erfolg von FVS
Auswirkung haben, definiert und deren Einfluss auf die Nutzung der FVS quantifiziert. Mögliche
Probleme werden identifiziert und Lösungen vorgeschlagen.
Table of contents
4
Table of contents
1 INTRODUCTION ....................................................................................................... 17
1.1 RATIONALE ....................................................................................................... 17
1.2 STRUCTURE ...................................................................................................... 18
2 OVERVIEW ............................................................................................................... 19
2.1 INTRODUCTION .................................................................................................. 19
2.2 SUSTAINABLE MOBILITY ...................................................................................... 19
2.2.1 Definition ............................................................................................... 19
2.2.2 Goals ..................................................................................................... 21
2.3 CYCLING ........................................................................................................... 23
2.3.1 Sustainability of cycling ......................................................................... 23
2.3.2 Determinants of bicycle use .................................................................. 24
2.4 BIKE-SHARING ................................................................................................... 27
2.4.1 Definition ............................................................................................... 27
2.4.2 Naming .................................................................................................. 28
2.4.3 Historical evolution ................................................................................ 29
2.4.4 Expansion ............................................................................................. 36
2.4.5 Advantages for users ............................................................................ 38
2.5 SUMMARY ......................................................................................................... 41
3 RESEARCH OBJECTIVES AND METHODOLOGY ................................................ 43
3.1 OBJECTIVES ...................................................................................................... 43
3.2 METHODOLOGY ................................................................................................. 43
3.2.1 Bottom-up approach ............................................................................. 43
3.2.2 Case studies and data collection .......................................................... 44
3.2.3 Analysis of success ............................................................................... 45
3.2.4 Analysis of factors ................................................................................. 49
4 CASE STUDIES ........................................................................................................ 54
5 ELEMENTS AND VARIANTS ................................................................................... 56
5.1 INTRODUCTION .................................................................................................. 56
5.2 REGISTRATION .................................................................................................. 56
5.2.1 Obligation .............................................................................................. 57
5.2.2 Age restriction ....................................................................................... 57
5.2.3 Target group ......................................................................................... 57
5.2.4 Period of validity .................................................................................... 58
5.2.5 Subscription fee .................................................................................... 59
5.2.6 Deposit .................................................................................................. 60
5.2.7 Insurance .............................................................................................. 61
Table of contents
5
5.3 INFRASTRUCTURE .............................................................................................. 61
5.3.1 Bicycles ................................................................................................. 61
5.3.2 Stations ................................................................................................. 62
5.4 AVAILABILITY OF SERVICE ................................................................................... 65
5.4.1 Throughout the year .............................................................................. 65
5.4.2 Throughout the day ............................................................................... 65
5.5 RENT ................................................................................................................ 65
5.5.1 Identification .......................................................................................... 66
5.5.2 Return of the bike .................................................................................. 66
5.5.3 Operating area ...................................................................................... 66
5.5.4 Limit of rental period ............................................................................. 67
5.5.5 Fine ....................................................................................................... 67
5.6 PAYMENT OF SERVICE ........................................................................................ 68
5.6.1 Usage fee .............................................................................................. 68
5.6.2 Way to pay ............................................................................................ 69
5.7 MANAGEMENT ................................................................................................... 69
5.7.1 Investor ................................................................................................. 69
5.7.2 Operator ................................................................................................ 70
5.7.3 Provider ................................................................................................. 71
5.8 SUMMARY ......................................................................................................... 72
6 SUCCESS OF BIKE-SHARING ................................................................................ 76
6.1 INTRODUCTION .................................................................................................. 76
6.2 MOBILITY .......................................................................................................... 76
6.2.1 Introduction ........................................................................................... 76
6.2.2 General impacts on mobility ................................................................. 76
6.2.3 Reduction of car traffic .......................................................................... 80
6.2.4 Increase of public transport attractiveness ........................................... 84
6.2.5 Increase of cycling ................................................................................ 90
6.2.6 Summary ............................................................................................... 96
6.3 ENVIRONMENT ................................................................................................... 98
6.3.1 Introduction ........................................................................................... 98
6.3.2 CO2 saving ............................................................................................ 99
6.3.3 CO2 emission ...................................................................................... 103
6.3.4 Balance ............................................................................................... 108
6.3.5 Summary ............................................................................................. 109
6.4 HEALTH .......................................................................................................... 110
6.4.1 Introduction ......................................................................................... 110
6.4.2 Increase of air quality .......................................................................... 111
6.4.3 Increase of fitness level ...................................................................... 113
6.4.4 Summary ............................................................................................. 119
Table of contents
6
6.5 TRAFFIC SAFETY .............................................................................................. 120
6.5.1 Introduction ......................................................................................... 120
6.5.2 Increase of traffic safety ...................................................................... 120
6.5.3 Summary ............................................................................................. 123
6.6 ECONOMY ....................................................................................................... 124
6.6.1 Introduction ......................................................................................... 124
6.6.2 Job creation ........................................................................................ 124
6.6.3 Reduction of transport costs for households ...................................... 126
6.6.4 Increase of tourism attractiveness ...................................................... 128
6.6.5 Improvement of city image .................................................................. 130
6.6.6 Externalities ........................................................................................ 130
6.6.7 Summary ............................................................................................. 131
6.7 ECONOMIC VIABILITY ........................................................................................ 132
6.7.1 Introduction ......................................................................................... 132
6.7.2 Costs ................................................................................................... 132
6.7.3 Incomes .............................................................................................. 136
6.7.4 Balance ............................................................................................... 137
6.7.5 Summary ............................................................................................. 138
7 FACTORS AFFECTING SUCCESS ....................................................................... 141
7.1 INTRODUCTION ................................................................................................ 141
7.2 DRIVING FORCES ............................................................................................. 141
7.2.1 Bicycles and stations .......................................................................... 141
7.2.2 Technology ......................................................................................... 148
7.2.3 Availability of service ........................................................................... 150
7.2.4 Subscription and usage fee ................................................................ 151
7.2.5 Integration with public transport .......................................................... 153
7.2.6 Population ........................................................................................... 157
7.2.7 Topography ......................................................................................... 160
7.2.8 Climate ................................................................................................ 160
7.2.9 Car use ............................................................................................... 162
7.2.10 Public transport use ............................................................................ 164
7.2.11 Bicycle use .......................................................................................... 166
7.2.12 Tourism ............................................................................................... 167
7.2.13 Vandalism ........................................................................................... 168
7.2.14 Traffic safety ....................................................................................... 169
7.2.15 Multiple influence ................................................................................ 170
7.3 BARRIERS ....................................................................................................... 175
7.3.1 Overuse .............................................................................................. 175
7.3.2 Underuse ............................................................................................ 177
7.3.3 Theft and damage of bicycles ............................................................. 179
Table of contents
7
7.3.4 Breakdowns ........................................................................................ 183
7.3.5 Redistribution ...................................................................................... 184
7.3.6 Traffic accidents .................................................................................. 188
7.3.7 Public space conflicts .......................................................................... 189
7.3.8 Competition with bike rental shops ..................................................... 190
7.3.9 Dissatisfaction and bad image ............................................................ 193
7.4 SUMMARY ....................................................................................................... 194
8 CONCLUSION ........................................................................................................ 197
8.1 DISCUSSION .................................................................................................... 197
8.2 GENERAL RECOMMENDATIONS FOR BSSS ........................................................ 202
8.3 CREATING NEW BIKE-SHARING CONCEPTS ......................................................... 203
8.4 SCIENTIFIC CONTRIBUTION AND OPEN RESEARCH ISSUES ................................... 205
9 ABBREVIATIONS ................................................................................................... 208
10 ANNEXES ............................................................................................................... 209
10.1 DATABASE ...................................................................................................... 209
10.2 CALCULATIONS BASED ON THE DATABASE ......................................................... 217
11 BIBLIOGRAPHY ..................................................................................................... 224
11.1 JOURNAL ARTICLES, ACADEMIC THESES AND BOOKS .......................................... 224
11.2 REPORTS, CONFERENCE PRESENTATIONS AND DATA BASES ............................... 225
11.3 INTERNET WEBSITES, BLOGS AND PRESS ........................................................... 232
Figures
8
Figures Figure 1: Scheme of sustainable development as a confluence of three dimensions:
environment, social and economic aspects (IUCN 2006; Wikipedia 2010g) ..................... 20
Figure 2: White Bikes of Amsterdam (Austinyellowbike 2010) ................................................... 30
Figure 3: Bycyclen in Copenhagen (left) (Svenningsen 2010) and bicycle of Viennabike being
rescued from the Danube Canal (right) (Der Standard 2010) ........................................... 32
Figure 4: Bike-sharing stations of Vélo à la carte in Rennes (left ) (Vyi 2007) and Vélo’v in Lyon
(right) .................................................................................................................................. 35
Figure 5: Evolution of the number of third generation BSSs worldwide between 2004 and 2010
(DeMaio 2009a) .................................................................................................................. 36
Figure 6: Expansion of BSSs in European countries between 2001 and 2009 (Büttner 2010) .. 37
Figure 7: Evolution of the number of BSSs in Spain between 2002 and 2010 (Sanz & Kisters
2010) ................................................................................................................................... 37
Figure 8: Bike-sharing World Map in 2010 (MetroBike 2011) ..................................................... 38
Figure 9: Bike-sharing European Map in 2010 (MetroBike 2011) ............................................... 38
Figure 10: Enlargement of the influence area of a public transport station through bike & ride
(Sassen 2009) .................................................................................................................... 39
Figure 11: Bottom-up approach of this dissertation .................................................................... 44
Figure 12: Goals of bike-sharing ................................................................................................. 47
Figure 13: Sustainability of the categories of success used in this dissertation to analyze bike-
sharing ................................................................................................................................ 48
Figure 14: Main variables affecting success ............................................................................... 51
Figure 15: Correlation of the number of rents per day with the number of bike-sharing bicycles
and with population. Data source: Annex 10.1 ................................................................... 52
Figure 16: Linear model of the number of bike-sharing bicycles and the number of daily rents
with all case studies (left) and without Paris (right). Data source: Annex 10.1 .................. 52
Figure 17: Linear model of city population and the number of daily rents. Data source: Annex
10.1 ..................................................................................................................................... 52
Figure 18: Rotation in the BSSs studied. Data source: Annex 10.1 ........................................... 53
Figure 19: Bike-sharing station of C'entro in bici in Modena (left) and bike-sharing bicycle of Call
a Bike in Berlin (right) ......................................................................................................... 63
Figure 20: Docking posts of Vélib’ in Paris (left) and docking bar of Bicing in Barcelona (right) 64
Figure 21: Variants concerning registration (bold means most frequent case) .......................... 73
Figure 22: Variants concerning infrastructure (bold means most frequent case) ....................... 74
Figure 23: Variants concerning availability of service (bold means most frequent case) ........... 74
Figure 24: Variants concerning rental process (bold means most frequent case) ..................... 74
Figure 25: Variants concerning payment (bold means most frequent case) .............................. 75
Figure 26: Variants concerning management (bold means most frequent case) ....................... 75
Figure 27: Former way of transport used by bike-sharing members before using bike-sharing.
Data source: Annex 10.1 .................................................................................................... 77
Figures
9
Figure 28: Share of bike-sharing trips that have as purpose working and education. Data source:
Annex 10.1 .......................................................................................................................... 78
Figure 29: Share of rents throughout the day in Citybike Wien, Vienna. Data source: (Castro
2009) ................................................................................................................................... 78
Figure 30: Daily bike-sharing rents in 2008 in all case studies with available data (above) and
without Paris, Barcelona and Lyon (below). Data source: Annex 10.1 .............................. 79
Figure 31: Bike-sharing modal share. Data source: Annex 10.1 ................................................ 80
Figure 32: Share of bike-sharing trips shifted from car. Data source: Annex 10.1 ..................... 81
Figure 33: Number of municipal daily car trips shifted to bike-sharing in all case studies with
available data (above) and without Paris, Barcelona and Lyon (below). Data source:
Annex 10.1 .......................................................................................................................... 82
Figure 34: Share of municipal car trips shifted to bike-sharing. Data source: Annex 10.1 ......... 83
Figure 35: Daily car trips shifted to bike-sharing per bicycle. Data source: Annex 10.1 ............. 84
Figure 36: Share of bike-sharing trips shifted from PT. Data source: Annex 10.1 ..................... 85
Figure 37: Number of municipal public transport trips shifted to bike-sharing in all case studies
with available data (above) and without Paris, Barcelona and Lyon (below). Data source:
Annex 10.1 .......................................................................................................................... 86
Figure 38: Share of municipal PT trips shifted to bike-sharing. Data source: Annex 10.1 ......... 86
Figure 39: Number of daily former PT trips shifted to bike-sharing per bicycle. Data source:
Annex 10.1 .......................................................................................................................... 87
Figure 40: Share of bike-sharing trips connected with public transport. Data source: Annex 10.1
............................................................................................................................................ 88
Figure 41: Share of PT trips connected with bike-sharing. Data source: Annex 10.1 ................ 88
Figure 42: Yearly bike-sharing trips connected with PT per bike. Data source: Annex 10.1 ...... 89
Figure 43: Share of bike-sharing users holding a seasonal PT card. Data source: Annex 10.1 89
Figure 44: Bicycle ownership of BSS users. Data source: Annex 10.1 ...................................... 90
Figure 45: Daily direct increase of cycling (bike-sharing trips) in 2008 compared to level of
cycling before the start of the BSS. Data source: Annex 10.1 ........................................... 91
Figure 46: Daily direct increase of cycling (bike-sharing trips) per bike-sharing bicycle in 2008.
Data source: Annex 10.1 .................................................................................................... 92
Figure 47: Monthly evolution the number of bicycles counted in 16 points of the city of Lyon after
the launch of Vélo’v (Grand Lyon 2009a) ........................................................................... 93
Figure 48: Yearly evolution of the length of available bicycle lanes in Barcelona from 1990 to
2006 (Romero 2008) .......................................................................................................... 94
Figure 49: Evolution of the bicycle modal share and length of the cycle network in Vienna (BSS
launched in 2003). Data source: (BMVIT 2010) ................................................................. 94
Figure 50: Yearly evolution of the number of municipal cycle trips in Seville from 2006 to 2009
(left) (García Jaén n.d.) and yearly evolution of the number of municipal cycle trips and
BSS trips in Barcelona from 2004 to 2008 (right) (Sanz & Kisters 2010) .......................... 95
Figures
10
Figure 51: Monthly evolution of the average number of cycling trips registered by 16 counters in
Lyon before and after the implementation of Vélo’v (Beroud 2007) ................................... 95
Figure 52: Indicators and data required for evaluating the reduction of car traffic ..................... 96
Figure 53: Indicators and data required for evaluating the increase of public transport
attractiveness (discontinuous lines represent less accurate but still complementary helpful
indicators) ........................................................................................................................... 96
Figure 54: Indicators and data required for evaluating the increase of cycling (items highlighted
with grey and italic characters are necessary for the evaluation but they were not
calculated because of unavailability of data) ...................................................................... 97
Figure 55: Average distance covered in a BSS rent. Data source: Annex 10.1 ......................... 99
Figure 56: Former annual car trip distance replaced by bike-sharing in all case studies with
available data (above) and without Paris, Barcelona and Lyon (below). Data source:
Annex 10.1 ........................................................................................................................ 100
Figure 57: Annual CO2 tonnes saved by bike-sharing. Data source: Annex 10.1 .................... 101
Figure 58: Annual CO2 tonnes saved per 1,000 inhabitants. Data source: Annex 10.1 ........... 102
Figure 59: Annual CO2 tonnes saved per bicycle. Data source: Annex 10.1 ........................... 103
Figure 60: Number of redistribution vans. Data source: Annex 10.1 ........................................ 104
Figure 61: Daily distance covered per van. Data source: Annex 10.1 ...................................... 104
Figure 62: Daily distance covered by all redistribution vehicles in all case studies with available
data (above) and without Paris and Barcelona (below). Data source: Annex 10.1 .......... 105
Figure 63: Annual CO2 tonnes emitted by bike-sharing redistribution. Data source: Annex 10.1
.......................................................................................................................................... 106
Figure 64: Annual CO2 kilograms per 1,000 inhabitants emitted due to bike-sharing
redistribution. Data source: Annex 10.1 ........................................................................... 107
Figure 65: Annual CO2 kilograms per bicycle emitted due to bike-sharing redistribution. Data
source: Annex 10.1 ........................................................................................................... 107
Figure 66: Balance of annual motor vehicle kilometres. Data source: Annex 10.1 .................. 108
Figure 67: Net CO2 reduction of bike-sharing. Data source: Annex 10.1 ................................. 109
Figure 68: Indicators and data required for evaluating the reduction of CO2 reduction ............ 109
Figure 69: Annual net PM, CO and NOx reduction due to bike-sharing. Data source: Annex 10.1
.......................................................................................................................................... 112
Figure 70: Impact of the annual net PM, CO and NOx reduction due to bike-sharing. Data
source: Annex 10.1 ........................................................................................................... 113
Figure 71: Efficiency of the annual net PM, CO and NOx reduction due to bike-sharing. Data
source: Annex 10.1 ........................................................................................................... 113
Figure 72: Daily duration of physical activity associated to bike-sharing. Data source: Annex
10.1 ................................................................................................................................... 115
Figure 73: Daily duration of round bike-sharing trips and health benefits associated. Data source:
Annex 10.1 ........................................................................................................................ 115
Figure 74: Duration of private bicycle trips. Data source: Annex 10.1 ...................................... 116
Figures
11
Figure 75: Speed of bike-sharing trips. Data source: Annex 10.1 ............................................ 117
Figure 76: Share of population registered in the BSS. Data source: Annex 10.1 ..................... 117
Figure 77: Share of bike-sharing subscribers who use daily the BSS. Data source: Annex 10.1
.......................................................................................................................................... 118
Figure 78: Indicators and data required for evaluating the improvement of health (discontinuous
lines represent links of less accurate but relevant complementary indicators) ................ 119
Figure 79: Yearly number of cyclists involved in traffic accidents in Austria, average data from
2002 to 2010. Data source: (BMVIT 2010) ....................................................................... 121
Figure 80: Correlation between accident rates and kilometres cycled per person (ETRA n.d.) 121
Figure 81: Evolution of the number of cycle accidents and the number of cycle accidents per
cycle trip in Barcelona (López 2009) ................................................................................ 122
Figure 82: Indicators and data required for evaluating the increase of traffic safety (items
highlighted with grey and italic characters means that they are necessary for the
evaluation but they were not calculated because of unavailability of data) ..................... 123
Figure 83: Direct jobs generated by BSSs. Data source: Annex 10.1 ...................................... 124
Figure 84: Direct jobs per 1,000 inhabitant generated by BSSs. Data source: Annex 10.1 ..... 125
Figure 85: Direct jobs per bicycle generated by BSSs. Data source: Annex 10.1 .................... 126
Figure 86: Share of customers that state that the main reason for using the BSS is because it is
cheaper than other transport modes. Data source: Annex 10.1 ...................................... 127
Figure 87: Share of bike-sharing rents fitting than the period without charge. Data source:
Annex 10.1 ........................................................................................................................ 127
Figure 88: Share of different kinds of subscription in Barclays Cycle Hire in London. Data source:
(Georgiou 2010) ............................................................................................................... 129
Figure 89: Share of bike-sharing customers with short-term subscriptions. Data source: Annex
10.1 ................................................................................................................................... 129
Figure 90: Indicators and data required for evaluating the improvement of municipal economy
(discontinuous lines represent links of less accurate but relevant complementary indicators,
items highlighted with grey and italic characters might be necessary for the evaluation but
they were not calculated because of unavailability of data) ............................................. 131
Figure 91: Allocation of implementation costs of Bicing in Barcelona. Data Source: (Büttner et al.
2011) ................................................................................................................................. 133
Figure 92: Unitary cost of a bike-sharing station. Data source: Annex 10.1 ............................. 133
Figure 93: Unitary cost of a bike-sharing bicycle. Data source: Annex 10.1 ............................ 134
Figure 94: Total running costs per bicycle and year. Data source: Annex 10.1 ....................... 135
Figure 95: Allocation of running costs of Bicing in Barcelona. Data source: (Büttner et al. 2011)
.......................................................................................................................................... 135
Figure 96: Indicators and data required for evaluating the improvement of economic viability 139
Figure 97: Model and correlation between the number of bicycles and rotation. Data source:
Annex 10.1 ........................................................................................................................ 142
Figures
12
Figure 98: Model and correlation between the number of stations and rotation. Data source:
Annex 10.1 ........................................................................................................................ 143
Figure 99: Model and correlation between the number of stations and bicycles. Data source:
Annex 10.1 ........................................................................................................................ 143
Figure 100: Evolution of the number of bicycles and daily rents in Citybike Wien, Vienna. Data
source: (Dechant 2009). ................................................................................................... 144
Figure 101: Evolution of the number of bicycles and rotation in Citybike Wien, Vienna. Data
source: (Dechant 2009). ................................................................................................... 144
Figure 102: Model and correlation between the number of bike-sharing stations and the yearly
distance covered for redistribution. All case studies on the right and all cases without Paris
and Barcelona on the left. Data source: Annex 10.1 ........................................................ 145
Figure 103: Model and correlation between the distance between bike-sharing stations and
rotation. Data source: Annex 10.1 .................................................................................... 146
Figure 104: Model and correlation between the density of stations per city km2 and rotation.
Data source: Annex 10.1 .................................................................................................. 147
Figure 105: Availability of round-the-clock service in BSSs depending on technology of stations.
Data source: Annex 10.1 .................................................................................................. 148
Figure 106: Correlation between the level of technology of the locking devices at bike-sharing
stations and rotation. Data source: Annex 10.1 ............................................................... 149
Figure 107: Rotation regarding the way of identification (N=28) . Data source: Annex 10.1 .... 149
Figure 108: Correlation between the availability throughout the year and rotation. Data source:
Annex 10.1 ........................................................................................................................ 150
Figure 109: Correlation between the availability throughout the day and rotation. Data source:
Annex 10.1 ........................................................................................................................ 151
Figure 110: Correlation between the validity of long-term subscriptions and rotation. Data
source: Annex 10.1 ........................................................................................................... 151
Figure 111: Rotation regarding the duration of the rental period free of charge (N=28) . Data
source: Annex 10.1 ........................................................................................................... 152
Figure 112: Model and correlation between the share of bike-sharing trips that are intermodal
with public transport and the share of metro stations provided with bike-sharing stations.
Data source: Annex 10.1 .................................................................................................. 154
Figure 113: Model and correlation between the share of metro stations provided with bike-
sharing stations and rotation. Data source: Annex 10.1 .................................................. 155
Figure 114: Correlation between the availability of advantageous fees for holders of seasonal
PT cards and rotation. Data source: Annex 10.1 ............................................................. 155
Figure 115: Correlation between the advantageous bike-sharing fees for holders of seasonal PT
cards and the number of daily rents per bicycle. Data source: Annex 10.1 ..................... 156
Figure 116: Sign (left) and map (right) indicating the closest Bicing terminal in a metro station of
Barcelona. ......................................................................................................................... 156
Figures
13
Figure 117: Level of technology of bike-sharing stations regarding the city-size of the location
(Castro & Emberger 2010) ............................................................................................... 157
Figure 118: Availability throughout the day regarding the city-size of the location (Castro &
Emberger 2010) ................................................................................................................ 158
Figure 119: Duration of the rental period free of charge regarding the city-size (Castro &
Emberger 2010) ................................................................................................................ 158
Figure 120: Model and correlation between population and rotation. Data source: Annex 10.1
.......................................................................................................................................... 159
Figure 121: Model and correlation between the population density and rotation. Data source:
Annex 10.1 ........................................................................................................................ 160
Figure 122: Availability throughout the year regarding the temperature of the city (Castro &
Emberger 2010) ................................................................................................................ 161
Figure 123: Model and correlation between the average yearly temperature and rotation. Data
source: Annex 10.1 ........................................................................................................... 162
Figure 124: Model and correlation between the car modal share and rotation. Data source:
Annex 10.1 ........................................................................................................................ 163
Figure 125: Model and correlation between the car modal share and the share of bike-sharing
trips coming from car. Data source: Annex 10.1 .............................................................. 164
Figure 126: Correlation between the public transport modal share and rotation. Data source:
Annex 10.1 ........................................................................................................................ 165
Figure 127: Model and correlation between the permission to carry bicycles in trains and
rotation. Data source: Annex 10.1 .................................................................................... 165
Figure 128: Correlation between the cycle network density and rotation. Data source: Annex
10.1 ................................................................................................................................... 166
Figure 129: Correlation between the cycle modal share and rotation. Data source: Annex 10.1
.......................................................................................................................................... 167
Figure 130: Model and correlation between tourism density and rotation. Data source: Annex
10.1 ................................................................................................................................... 168
Figure 131: Model and correlation between municipal bicycle theft per 100,000 inhabitants and
rotation. Data source: Annex 10.1 .................................................................................... 169
Figure 132: Model and correlation between the number of cycle accidents per 100,000
municipal cycle trips and rotation. All case studies on the right and all cases except Bari on
the right. . Data source: Annex 10.1 ................................................................................. 170
Figure 133: Registration of customers of Bicing regarding rising subscription costs. Data source:
(López 2009)..................................................................................................................... 177
Figure 134: Metal superficial station of Bixi in Montreal (right) (DeMaio 2009b) and concrete
station of StadtRAD in Berlin (left) (Büttner et al. 2011) ................................................... 179
Figure 135: Stolen bicycles per year of operation. Data source: Annex 10.1 ........................... 179
Figure 136: Average share of the bicycle fleet annually stolen. Data source: Annex 10.1 ....... 180
Figure 137: Cost of theft per available bicycle and year. Data source: Annex 10.1 ................. 181
Figures
14
Figure 138: Information in the handlebar of a bicycle of the Barclays Cycle Hire of London ... 182
Figure 139: Device in the docking point used by customers to report damaged bicycles in the
Barclays Cycle Hire of London (Georgiou 2010). ............................................................. 184
Figure 140: Unequal distribution of bicycles at BSS stations in Barcelona (López 2009). ....... 185
Figure 141: Electric vehicle for redistribution in Barclays Cycle Hire, London. Source (Georgiou
2010) ................................................................................................................................. 187
Figure 142: Traffic safety campaign in London (Georgiou 2010) ............................................. 188
Figure 143: Rental price up to 3 hours of usage in BSSs and bike rental shops of different cities.
Data source: (Petersen 2009; Frühauf & Hayes 2009; Robert 2009b; Robert 2009a; Vélib’
2009b; Gröper 2009). ....................................................................................................... 191
Figure 144: Rental price up of 24 hours of usage in BSS and bike rental shops of different cities.
Data source: (Petersen 2009; Frühauf & Hayes 2009; Robert 2009b; Robert 2009a; Vélib’
2009b; Gröper 2009). ....................................................................................................... 192
Figure 145: Score and relevance of aspects of Bicing according to the opinion of users. Data
source: (López 2009) ........................................................................................................ 193
Figure 146: Evolution of the satisfaction grade, the availability of bicycles, claims, complains
and rents in Bicing in 2008, 2009 and 2010 (Hayes & Frühauf 2010) ............................. 194
Figure 147: Loop of increasing bike-sharing use ...................................................................... 201
Figure 148: Linear concept of bike-sharing ............................................................................... 204
Figure 149: “Open-closed hand” concept of bike-sharing ......................................................... 205
Tables
15
Tables Table 1: Analysis of the sustainability of transport systems suggested by the SUMMA project
(Litman 2010)...................................................................................................................... 22
Table 2: Dimensions and goals of sustainable transport. Data source: (SUMMA 2005) ............ 41
Table 3: Determinants of cycling. Data source: (Heinen et al. 2010) ......................................... 41
Table 4: Primary and secondary attributes of bike-sharing......................................................... 42
Table 5: Overview of the three BSS generations ........................................................................ 42
Table 6: Bike-sharing factors and city factors ............................................................................. 50
Table 7: List of case studies sorted by countries and alphabetic order ...................................... 55
Table 8: Minimum age allowed for using bike-sharing ................................................................ 57
Table 9: Target group allowed using bike-sharing ...................................................................... 58
Table 10: Validity of bike-sharing subscriptions .......................................................................... 59
Table 11: Subscription fees sorted by period of validity .............................................................. 60
Table 12: Deposit required at the registration ............................................................................. 60
Table 13: Insurance coverage included in the subscription of bike-sharing members ............... 61
Table 14: Bicycle equipment ....................................................................................................... 62
Table 15: Station equipment ....................................................................................................... 63
Table 16: Availability throughout the year ................................................................................... 65
Table 17: Availability throughout the day .................................................................................... 65
Table 18: Way of identification of bike-sharing users ................................................................. 66
Table 19: Operating area ............................................................................................................ 67
Table 20: Limit of use .................................................................................................................. 67
Table 21: Fine ............................................................................................................................. 68
Table 22: Rental time free of charge, usage fee period and flat rate availability ........................ 69
Table 23: Available payment options (systems can allow more than one way of payment) ....... 69
Table 24: Kind of stakeholders in the role of investor ................................................................. 70
Table 25: Kind of stakeholders in the role of operator ................................................................ 71
Table 26: Kind of stakeholders in the role of provider ................................................................. 72
Table 27: Companies playing the role of providers ..................................................................... 72
Table 28: Key values of the bike-sharing success in terms of mobility ....................................... 97
Table 29: Key values of the bike-sharing success in terms of environment ............................. 110
Table 30: Estimated health impact of ambient air pollution in Europe (EAA 1999) .................. 111
Table 31: Key values of the bike-sharing success in terms of health ....................................... 119
Table 32: Key values of the bike-sharing success in terms of economy .................................. 131
Table 33: Key values of the economic viability of BSSs ........................................................... 139
Table 34: Number of bicycles per 10,000 inhabitants, number of stations per 10,000 inhabitants
and station size regarding the city-size (Castro & Emberger 2010) ................................. 159
Table 35: Variables for the multiple regression model .............................................................. 171
Table 36: Linear regression model that determines the value of the rotation regarding five
explanatory variables. Data source: Annex 10.1 .............................................................. 172
Tables
16
Table 37: Collinearity diagnostic. Data source: Annex 10.1 ..................................................... 173
Table 38: Linear regression model that determines the value of the rotation regarding two
explanatory variables. Data source: Annex 10.1 .............................................................. 174
Table 39: Outcome of the correlation and the multiple regression analysis ............................. 195
Table 40: Causes, consequences and solutions of likely barriers of BSS ................................ 196
Table 41: Database of case studies .......................................................................................... 216
Table 42: Calculations ............................................................................................................... 223
Introduction
17
1 INTRODUCTION
1.1 Rationale
Urban population rate has highly increased in the last decades and currently European
population concentrates mainly in cities. Cities generate a considerable part of environment and
socio-economic impacts and most people that could be potentially affected by these impacts
live in urban areas. Urban mobility is one of the most relevant human activities in cities.
Individuals produce numerous trips with diverse purposes e.g. for working, for education, for
shopping or for social relationships. The excessive use of cars for covering these routes causes
significant negative impacts. Pollution emitted by vehicles is harmful for environment and public
health, and traffic congestions lead to loss of time and money for individual and collective
economy.
Consequences of climate change due to greenhouse gasses have special relevance
nowadays in our society. Motor vehicles, as a result of the combustion of fuel, emit CO2, which
is one of the main originators of climate change. New fuels, gasoline-electric hybrid vehicles
and even total electric vehicles have been developed to reduce air pollutants. These “green
vehicles” have started to be introduced in European cities. Nevertheless, they still represent a
small part of the car fleet and air pollution caused by cars is still nowadays a general concern.
Electro-mobility might contribute to reduce pollution in urban areas, but it will not solve
traffic congestions. Low occupancy of cars together with limited space availability in cities cause
traffic jams that make urban transport inefficient. To solve these and other collateral problems
generated by car traffic, sustainable development, and specifically sustainable mobility, has
become a priority in urban areas. City councils have implemented new mobility plans and
policies that promote the use of other more efficient transport modes in terms of energy and
space such as public transport, cycling and walking. However, these actions have not been
totally successful and people still seem to be reluctant to shift from car to other more
sustainable transport modes. Therefore, new strategies are searched to achieve the goals of
sustainability.
At the end of 20th century, bike-sharing schemes (BSSs) emerged as a likely solution
for mobility problems. Many cities were persuaded to implement BSSs and the number of these
schemes in Europe augmented exponentially. It has been assumed that BSSs contribute to
sustainable urban mobility. However, so far very few researches have actually investigated
them and have measured and studied consequences, benefits and troubles, associated to the
operation of these systems.
This dissertation analyzes and quantifies the success of BSSs in terms of sustainability
comprising mobility, environment, health, traffic safety and economy aspects. Moreover, the
influence of certain driving forces (city factors and bike-sharing factors) on the success of BSSs
has been evaluated. These findings clarify the effects are BSSs for European cities and
Introduction
18
contribute to increase the success when introducing a BSS respectively. Furthermore, this
dissertation provides a review of likely barriers for success and solutions that may avoid fails of
bike-sharing projects.
1.2 Structure
This dissertation can be structured in two blocks as follows:
The first block comprises sections 1 to 5 and describes the main characteristics of bike-
sharing as transport mode. After the introductory section 1, section 2 provides an overview of
relevant topics such as sustainable transport, cycling and conception of bike-sharing that will
help the reader to understand this thesis work. Section 3 shows the objectives and the
methodology of this research. Section 4 describes in detail the case studies analyzed in this
dissertation. And finally, section 5 describe the diversity of models and elements of BSSs
through the 51 case studies of this dissertation
The second block of the dissertation comprises section 6 and section 7. They describe
the quantitative outcomes of the data processing. Concretely, section 6 analyzes the success of
BSSs in terms of sustainability and section 7 studies the main factors that influence the success
of BSSs.
Overview
19
2 OVERVIEW
2.1 Introduction
The goal of this chapter is to provide the background knowledge to understand the topic
discussed in this doctoral research. The chapter is divided in three sections that go from a
rather more general scope to a more specific scope: sustainable mobility (section 2.2), cycling
(section 2.3) and bike-sharing (2.4).
In the first section, the meaning of sustainable transport (section 2.2.1) as well as the
main goals of sustainability (section 2.2.2) are discussed. The second section will focus on
explaining the benefits of cycling in terms of sustainability (section 2.3.1) and the favourable and
negative conditions for the bicycle use (section 2.3.2). Finally, the third block will define the
concept “bike sharing” (section 2.4.1), justify the choice of this term (section 2.4.2), describe the
historical evolution of the system (section 2.4.3), explain the expansion of BSSs (section 2.4.4)
and expose the advantages of bike-sharing compared to private bicycles (section 2.4.5).
2.2 Sustainable mobility
2.2.1 Definition
The title of this dissertation is: “The contribution of bike-sharing to sustainable mobility
in Europe”. Thus, defining “sustainable mobility” is the first step to assess the real contribution
of bike-sharing in the framework of this doctoral research.
In 1987, the World Commission on Environment and Development of the United
Nations published the report entitled “Our Common Future”, also known as “Brundtland Report”
because of the name of its Chairwoman: Gro Harlem Brundtland (Wikipedia 2010b). The
Brundtland report defined sustainable development as “development, which meets the needs of
the present without compromising the ability of future generations to meet their own needs”
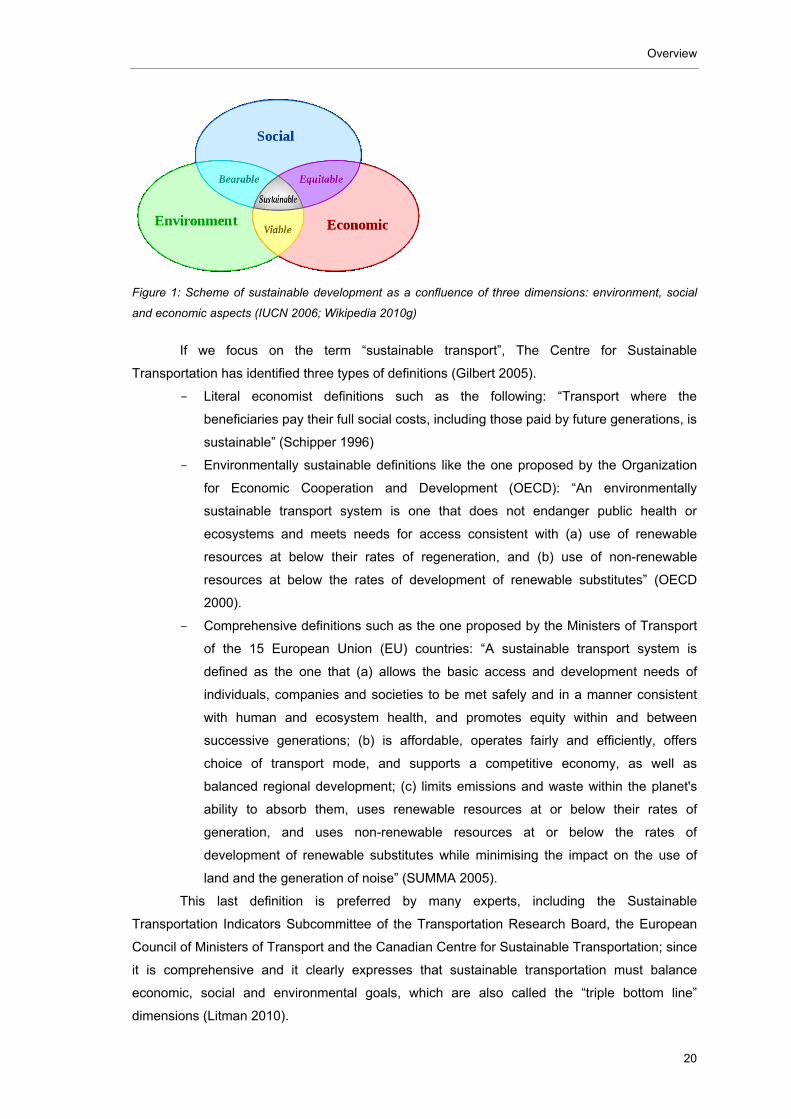
(UNO 1987).
In 2005, the United Nations through the World Summit Outcome Document,
emphasized the difference between the three "interdependent and mutually reinforcing pillars"
that hold sustainable development: economic development, social development, and
environmental protection (UNO 2005). From then on, sustainability has been generally
understood as the conjunction of the environmental, social and economic dimensions (Figure 1).
Overview
20
Figure 1: Scheme of sustainable development as a confluence of three dimensions: environment, social
and economic aspects (IUCN 2006; Wikipedia 2010g)
If we focus on the term “sustainable transport”, The Centre for Sustainable
Transportation has identified three types of definitions (Gilbert 2005).
- Literal economist definitions such as the following: “Transport where the
beneficiaries pay their full social costs, including those paid by future generations, is
sustainable” (Schipper 1996)
- Environmentally sustainable definitions like the one proposed by the Organization
for Economic Cooperation and Development (OECD): “An environmentally
sustainable transport system is one that does not endanger public health or
ecosystems and meets needs for access consistent with (a) use of renewable
resources at below their rates of regeneration, and (b) use of non-renewable
resources at below the rates of development of renewable substitutes” (OECD
2000).
- Comprehensive definitions such as the one proposed by the Ministers of Transport
of the 15 European Union (EU) countries: “A sustainable transport system is
defined as the one that (a) allows the basic access and development needs of
individuals, companies and societies to be met safely and in a manner consistent
with human and ecosystem health, and promotes equity within and between
successive generations; (b) is affordable, operates fairly and efficiently, offers
choice of transport mode, and supports a competitive economy, as well as
balanced regional development; (c) limits emissions and waste within the planet's
ability to absorb them, uses renewable resources at or below their rates of
generation, and uses non-renewable resources at or below the rates of
development of renewable substitutes while minimising the impact on the use of
land and the generation of noise” (SUMMA 2005).
This last definition is preferred by many experts, including the Sustainable
Transportation Indicators Subcommittee of the Transportation Research Board, the European
Council of Ministers of Transport and the Canadian Centre for Sustainable Transportation; since
it is comprehensive and it clearly expresses that sustainable transportation must balance
economic, social and environmental goals, which are also called the “triple bottom line”
dimensions (Litman 2010).
Overview
21
2.2.2 Goals
Since one of the aims of this dissertation is to analyze the success of bike-sharing on
increasing sustainable mobility, apart from “sustainable mobility”, “success” is another key term
to be specified. According to the Oxford Dictionary, “success” is “the accomplishment of an aim
or purpose” (Oxford Dictionary 2010). It means that no success can be achieved without an aim
to be accomplished. Therefore, when analyzing the success of bike-sharing in terms of
sustainability, as this dissertation does, a previous set of goals is required. Todd Litman,
director of the Victoria Transport Policy Institute, appeals for the distinction between the
following four terms: “goal”, “objective”, “target” and “indicator”. “Goal” is what one wants to
achieve; “objective” is a way to achieve this goal; “target” is a specified realistic and measurable
objective and “indicator” is a variable selected and defined to measure progress toward the
objective (Litman 2010).
Litman defines “indicator set” as “a group of indicators selected to measure
comprehensive progress toward goals”. Diverse institutions have built different indicator sets to
achieve the most convenient method to evaluate the sustainability of transport systems or
transport modes. For example, the Centre for Sustainable Transportation of Canada, the
Organization for Economic Co-operation and Development (OCDE), the World Business
Council’s Sustainable Mobility project, the United States Environmental Protection Agency
(USEPA), the Transport and Environmental Reporting Mechanism of the EU (TERM) and
Sustainable Mobility Measures and Assessment project (SUMMA) manage their own indicator
sets for the study of the sustainability of transport.
Since this dissertation focuses the research on Europe, it pays special attention to
European organisms related to sustainability such as the TERM and SUMMA. The European
Environmental Agency (EEA) elaborated the indicator set of the TERM in 2002. However, the
TERM program directly concerned environmental performance while sustainable transport only
indirectly. In contrast, the SUMMA project focused rather more on sustainable transport than
TERM (Litman 2010).
The SUMMA project was funded by Directorate-General for Energy and Transport of
the European Commission and its indicator set was published in 2005 (Gilbert 2005). The
mission of SUMMA was a) to define sustainable mobility and develop indicators for the
monitoring of sustainability, b) to assess the scale of sustainability problems associated with
transport and c) to identify policy measures to promote sustainable transport (SUMMA 2005).
SUMMA distinguishes between two types of indicators: system indicators and outcome
indicators. The system indicators are proxies that describe what is happening inside the system
and the outcome indicators represent the impacts of the transport system. Outcome indicators
are also called “outcomes of interest”.
The outcomes of interest of SUMMA were selected to cover the main elements of the
definition of sustainable transport and the three dimensions of sustainability: social,
environmental, and economic dimension. The outcomes of interest correspond with the goals
that a transport system has to fulfil to achieve the sustainability. Each one of these goals may
Overview
22
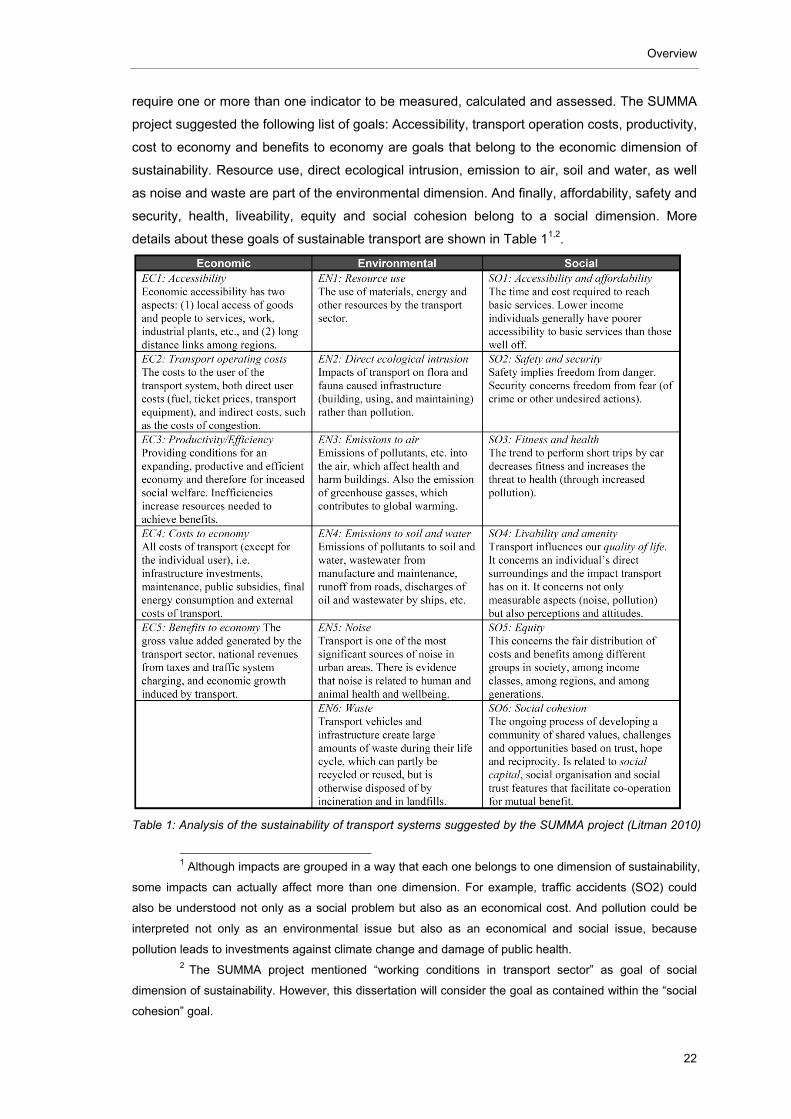
require one or more than one indicator to be measured, calculated and assessed. The SUMMA
project suggested the following list of goals: Accessibility, transport operation costs, productivity,
cost to economy and benefits to economy are goals that belong to the economic dimension of
sustainability. Resource use, direct ecological intrusion, emission to air, soil and water, as well
as noise and waste are part of the environmental dimension. And finally, affordability, safety and
security, health, liveability, equity and social cohesion belong to a social dimension. More
details about these goals of sustainable transport are shown in Table 11,2.
Table 1: Analysis of the sustainability of transport systems suggested by the SUMMA project (Litman 2010)
1 Although impacts are grouped in a way that each one belongs to one dimension of sustainability,
some impacts can actually affect more than one dimension. For example, traffic accidents (SO2) could
also be understood not only as a social problem but also as an economical cost. And pollution could be
interpreted not only as an environmental issue but also as an economical and social issue, because
pollution leads to investments against climate change and damage of public health. 2 The SUMMA project mentioned “working conditions in transport sector” as goal of social
dimension of sustainability. However, this dissertation will consider the goal as contained within the “social
cohesion” goal.
Overview
23
2.3 Cycling
2.3.1 Sustainability of cycling
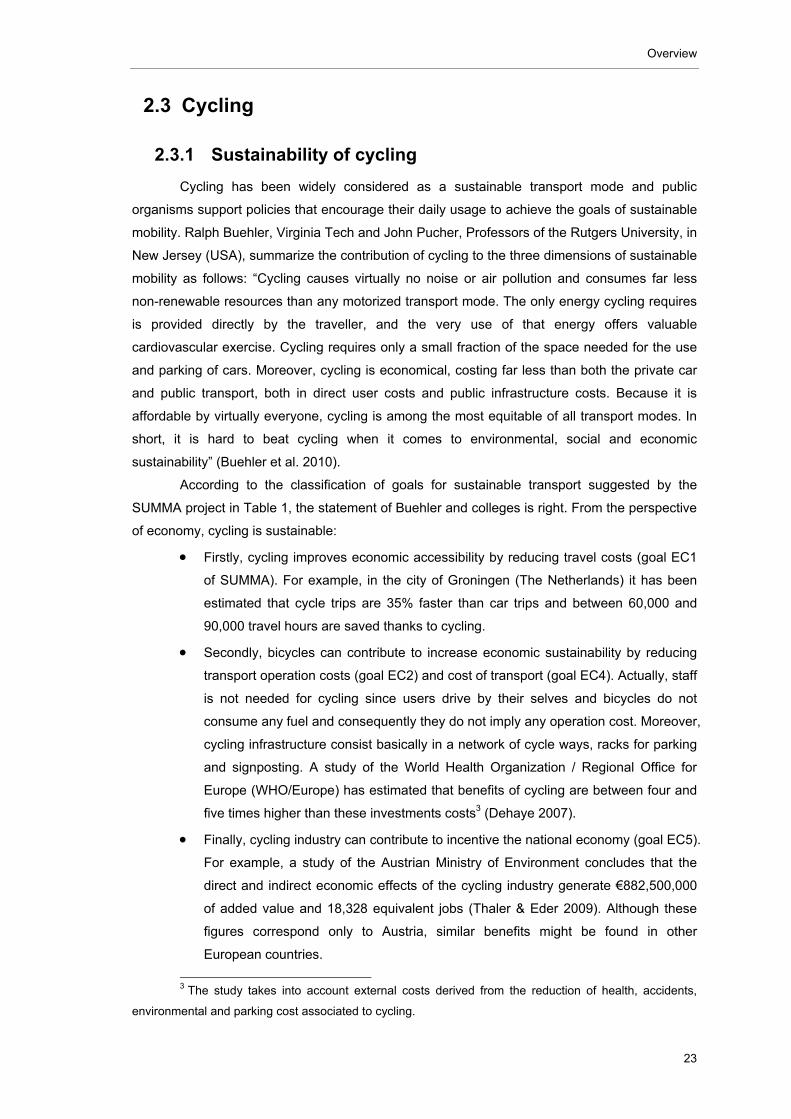
Cycling has been widely considered as a sustainable transport mode and public
organisms support policies that encourage their daily usage to achieve the goals of sustainable
mobility. Ralph Buehler, Virginia Tech and John Pucher, Professors of the Rutgers University, in
New Jersey (USA), summarize the contribution of cycling to the three dimensions of sustainable
mobility as follows: “Cycling causes virtually no noise or air pollution and consumes far less
non-renewable resources than any motorized transport mode. The only energy cycling requires
is provided directly by the traveller, and the very use of that energy offers valuable
cardiovascular exercise. Cycling requires only a small fraction of the space needed for the use
and parking of cars. Moreover, cycling is economical, costing far less than both the private car
and public transport, both in direct user costs and public infrastructure costs. Because it is
affordable by virtually everyone, cycling is among the most equitable of all transport modes. In
short, it is hard to beat cycling when it comes to environmental, social and economic
sustainability” (Buehler et al. 2010).
According to the classification of goals for sustainable transport suggested by the
SUMMA project in Table 1, the statement of Buehler and colleges is right. From the perspective
of economy, cycling is sustainable:
Firstly, cycling improves economic accessibility by reducing travel costs (goal EC1
of SUMMA). For example, in the city of Groningen (The Netherlands) it has been
estimated that cycle trips are 35% faster than car trips and between 60,000 and
90,000 travel hours are saved thanks to cycling.
Secondly, bicycles can contribute to increase economic sustainability by reducing
transport operation costs (goal EC2) and cost of transport (goal EC4). Actually, staff
is not needed for cycling since users drive by their selves and bicycles do not
consume any fuel and consequently they do not imply any operation cost. Moreover,
cycling infrastructure consist basically in a network of cycle ways, racks for parking
and signposting. A study of the World Health Organization / Regional Office for
Europe (WHO/Europe) has estimated that benefits of cycling are between four and
five times higher than these investments costs3 (Dehaye 2007).
Finally, cycling industry can contribute to incentive the national economy (goal EC5).
For example, a study of the Austrian Ministry of Environment concludes that the
direct and indirect economic effects of the cycling industry generate €882,500,000
of added value and 18,328 equivalent jobs (Thaler & Eder 2009). Although these
figures correspond only to Austria, similar benefits might be found in other
European countries.
3 The study takes into account external costs derived from the reduction of health, accidents,
environmental and parking cost associated to cycling.
Overview
24
Cycling is environmental sustainable due to the following reasons:
The amount of material required to build a bicycle is much lower compared with
motor vehicles (goal EN1 of SUMMA).
In addition bicycles do not cause impact in flora and fauna (goal EN2), do not emit
any air pollutant (goal EN2) or any water and soil pollutant (goal EN4), cycles do
not produce noise (goal EN5) or waste (goal EN6).
Cycling can be socially sustainable since it meets the requirements below:
Firstly, cycling guarantees the accessibility of their users in terms of time and cost
(goal SO1 of SUMMA). It is assumed that urban trips up to 5 kilometres long are
affordable with a bicycle. Since 50% of car trips in Europe are shorter than 5
kilometres and urban trips below 5 kilometres might be faster by bicycle than by car,
it would mean that 50% of car trips could be made faster by bicycle. In addition,
bicycles have not operation costs for users apart from repairs and maintenance
(WALCYNG 1997; Dekoster & Schollaert 1999).
Secondly, bicycle theft is still a current concern of cyclists (Bikeoff 2008a) but it has
been demonstrated that cycling increases traffic safety in different ways (goal SO2).
Cycling is a safe transport mode and cycling reduces general accident risk of all
modes. The risk of a fatal injury per kilometre is about 2½ times higher for cyclists
than for passengers of motor vehicles. Nevertheless, taking the time instead of
distance as reference shows that cycling seems to be safer because risk of dying in
a bicycle trip is above 2 times lower than in a motor vehicle trip (Kifer 2000).
Moreover, the higher the number of pedestrians and cyclists, the lower the risk of
accident is. According to Jacobsen, the number of motorists that collide with
pedestrians or cyclists increases at about 0.4 power of the number of existing
people walking or bicycling. It means that if a city doubles its walking and cycling
share, a 32% of increase of injuries can be expected. However, taking into account
the amount of walking and bicycling trips, the probability that a motorist will strike an
individual person walking or bicycling declines 66% (Jacobsen 2003).
Thirdly, cyclists improve their individual health by doing a physical exercise as a
consequence of the pedalling, and the collective health by avoiding the emission of
harmful air pollutants (Cavill & Davis 2007) (goal SO3).
Finally, cycling contributes to make cities more liveable since bicycles do not emit
noise or pollution (goal SO4). Bicycle use increases the equity of the society in the
mobility since bicycles occupy less public space and they are cheaper than motor
vehicles and consequently economically affordable for low incomers too (goal SO5).
2.3.2 Determinants of bicycle use
As section 2.3.1 shows, cycling meets most of the requirements for sustainability by
contributing with numerous environmental, economic and social benefits. Cyclists seem to be
Overview
25
convinced about advantages of bicycles. According to several surveys, cyclists declare that they
ride a bicycle because it is “healthy, environmental friendly, funny, flexible, relaxing, cheap,
controllable, predictable, free, quick, exciting, relaxing and convenient” (Wiersma 2010). Despite
all these advantages of cycling, only 5% to 10% of European trips are covered by bicycle
(WALCYNG 1997). If bicycles are so beneficial and the cyclists agree, why is the rest of the
society not persuaded to cycle?
Heinen and her colleges of the Delft University of Technology carried out one of
broadest and most comprehensive literature review concerning the determinants of bicycle use.
They compiled and listed the main factors that affect bicycle use and evidences found in studies
worldwide. According to the conclusions of this review, the reasons that induce people to use or
not to use a bicycle as a frequent transport mode can be classified in four groups: Built
environment, natural environment, socio-economic variables and psychological factors (Heinen
et al. 2010)4.
Determinants of bicycle use concerning the first group, built environment, are the
following:
Smaller cities, higher population densities and mixer land uses lead to shorter
urban trips. Since short distances benefit the daily use of bicycles, the presence of
these three city factors may increase cycling modal share.
Safe bicycle parking facility is a crucial condition for bicycle use according to most
of studies.
The risk of accident is other frequent reason argued by non-cyclists to refuse using
bicycles. Therefore, the higher the risk of accident, the lower the possibility to
persuade people to cycle is. We should take into account that safety can be an
objective and measurable data or a subjective perception. Although people tend to
say that they would cycle more often if they would have more accessible and well
connected bicycle paths and although separated bicycle paths provide higher levels
of subjective safety, the impact of density, segregation grade, quality and continuity
of the cycle network on the levels of bicycle use might be rather moderate.
Cyclists have a negative perception of traffic lights, dense traffic and wide streets
and generally avoid them when choosing a route, but there is no general agreement
whether this really affects the frequency or modal choice.
The natural environment has a large influence on cycling share levels:
It has been found that hilliness has an evident negative effect on bicycle use.
On the other hand, beauty of routes has been mentioned in some researches as
likely attractive factor but it has not been demonstrated yet.
4 Heinen originally consider a fifth miscellaneous group comprising transport costs, safety and
travel time as well as effort as affecting aspects. Nevertheless, in this dissertation transport costs have
been included in the group of socio-economic aspects and safety, travel time and effort have been
included in the group of built environment.

Overview
26
Many studies state that the rain, low temperatures and darkness discourage cycling
and although little literature studies the effect of wind on bicycle use, it is
demonstrated that wind raises the effort when pedalling. The hostility towards these
weather factors seem to confirm other research results that affirm that summer is
perceived as more attractive to ride than winter.
The relationship between socio-economic factors and cycling is uncertain:
Most researches conclude that men cycle more than women but as the cycling rate
increase, both men and women seem to cycle the same.
There is no consensus concerning the connection between age and bicycle use.
The same occurs to the influence of income on cycling; while some studies confirm
the causality, others do not find any relevant effect.
Regarding the household structure, individuals without children, students and part-
time workers seem to be more willing to cycle though this relationship have not
been widely demonstrated.
On the other hand, two factors that clearly influence cycling levels are car and
bicycle ownership. High car presence use to decrease the use of bicycle while high
bike ownership is a relevant indicator of usage.
Finally, transport costs are relevant when encouraging people to use the bicycle.
Although the bicycle is a cheap transport mode, not only the usage costs of bicycle
influence but also the costs of other transport modes. For example, although there
is no consensus concerning the influence of fuel price, free public transport may
lead to decrease cycling and monetary incentive for cyclists may be effective for the
bicycle use.
Psychological factors influence the decision of individuals to use the bicycle.
Attitude, defined by Heinen and her colleges as “the expectation of all the outcomes
of an activity, and the personal value of these outcomes”, seems to be crucial.
People that have a positive attitude towards cycling are more likely to commute
cycling than those that have a negative attitude.
Social norms and public image play an important role in the level of cycling. For
example, individuals that perceive more public support for cycling and those who
realized that work-colleagues cycle are more willing to use the bicycle.
Ideological beliefs count when choosing the transport mode. Thus, for instance
people with strong environmental awareness are more likely to cycle.
Perceived behavioural control, defined as a “personal evaluation of the ability of
performing certain behaviour”, results relevant. For instance, individuals who do not
commute by bicycle perceive more barriers and dangers in commuting by bicycle
than frequent users of bicycles.
Finally, one of the strongest psychological factors is the habit or repetition of certain
behaviour. It has been found that people do not take every factor into consideration
Overview
27
when making a transport choice. They just repeat a habit disregarding likely
disadvantages. If the tendency is changed and the individual starts using a different
mode, perception can change. Thus, for instance, leisure oriented cycling may
contribute to initiate people to use more frequently bicycles as transport mode.
2.4 Bike-sharing
2.4.1 Definition
Bike-sharing is a relative new way of urban mobility. Although the first bike-sharing
scheme was implemented in 1968 in Amsterdam, the real expansion of the system did not take
place until the beginning of 21st Century. Since then, not only the number of BSSs but also the
variety of models has extremely grown all over Europe (section 2.4.4). Nowadays, the existence
of such a diversity of schemes has made difficult to build a general accepted definition. Early
publications have contributed to outline some of the main characteristics of bike sharing and
differences with traditional bike rental (Beroud 2007; SpiCycles 2008; NICHES 2007; Sassen
2009). Nevertheless, very few accurate definitions of bike sharing have been formulated so far
(IDAE 2007; MetroBike 2011; NYC Department of City Planning 2009; Wiersma 2010; Büttner
et al. 2011).
A definition of bike-sharing should comprise common features of different types of
BSSs and particularities that make the concept unique and different in comparison to similar
concepts. The core of the definition is rather overall accepted: bike-sharing is basically a bicycle
rental, i.e. a lending of bicycles to customers who need their use, but not their property, for a
specific goal and period of time (MetroBike 2011; DeMaio 2004; IDAE 2007; Beroud 2007;
NICHES 2007; Sassen 2009). However, the main challenge of a bike-sharing definition is to find
out the limits of the meaning, i.e. the key distinctions that make bike-sharing different to
traditional bike rental.
The vice-president of the agglomeration Grand Lyon, Gilles Veso, who supported the
implementation of Vélo’v, the local BSS, stated that they “invented the public individual-
transport” (Bührmann 2008). Invention is “something which has never been made before”
(Cambrigde University 2009). Since bike-sharing is in essence bike rental and since bike rental
existed previously, why is bike sharing an invention?
Three primary attributes define all bike-sharing models as innovative, unique and
different to traditional bike rental:
One-way trips are allowed
Unidirectional trips involve no additional charge
Bicycles can be rented where other users returned them
Normally bike rental companies do not allow the return of a bicycle out of the shop. If
unidirectional rents are allowed, a truck of the company transports the bicycle again to the shop
to be rented again and the customer has to pay for the service. In contrast, most of bikes-
Overview
28
sharing rents are unidirectional and do not imply any additional charge. For example, 95% of
trips of the scheme Call a Bike start and finish in different places (Sassen 2009).
Considering the above mentioned aspects, a likely definition of bike-sharing would be
the following: “Bike-sharing is a bicycle rental system which allows, without additional charge, to
take a bicycle in one point and to return it in a different one, where the bicycle can be rented by
another user” (Castro, Büttner, et al. 2010).
The three primary attributes included in the definition are valid of all BSSs.
Nevertheless, some secondary attributes that are not valid for all models of BSS but are
applicable for most of them can help to complete the meaning. Quasi-common features of BSSs
are the following:
Easy and unattended rental process (Sassen 2009; NICHES 2007)
Round-the-clock service (Beroud 2007; Sassen 2009)
Location in public space (Sassen 2009)
Low usage fee (Beroud 2007) (NYC Department of City Planning 2009)
External funding from public subsidies or advertisement (Sassen 2009)
Daily mobility oriented (SpiCycles 2008; IDAE 2007)
Several BSSs are provided with only one point where bicycles can be taken and
returned. Thus, they lack one essential characteristic of bike-sharing: the possibility to make
one-way trips. These schemes with only one station are not really BSSs but rather more “public
bicycle rentals”, since their only difference with traditional bike rental is that they are usually
funded by public subsidies instead of private companies (DeMaio 2009b). Nevertheless, they
are generally considered as BSSs either because they plan to implement more stations and
they will become then real BSSs or because secondary attributes make the rental indirectly
similar to bike-sharing. For example, some rental programs with only one station that offer very
inexpensive fees make long rental times convenient. In this way unidirectional trips and free of
charge returns through provisional stops within the whole rent are possible.
2.4.2 Naming
As mentioned in section 2.2, bike-sharing is a relative new concept of urban mobility
and there is no general agreement about the naming yet. Numerous different terms have been
used so far to refer to the same concept. Below are shown some examples collected from
existing publications in English.
Self-service bike rental program (Fietsberaad 2009)
City bikes (The new mobility agenda 2008)
Smart bikes5 (Noland & Ishaque 2006; DeMaio 2003)
5 “Smart bike” is the common name of all BSSs provided by Clear Channel. Since Clear Channel
was the first company that introduced this third generation of systems, bike-sharing was named “smart
bikes” by some authors (Sassen 2009).
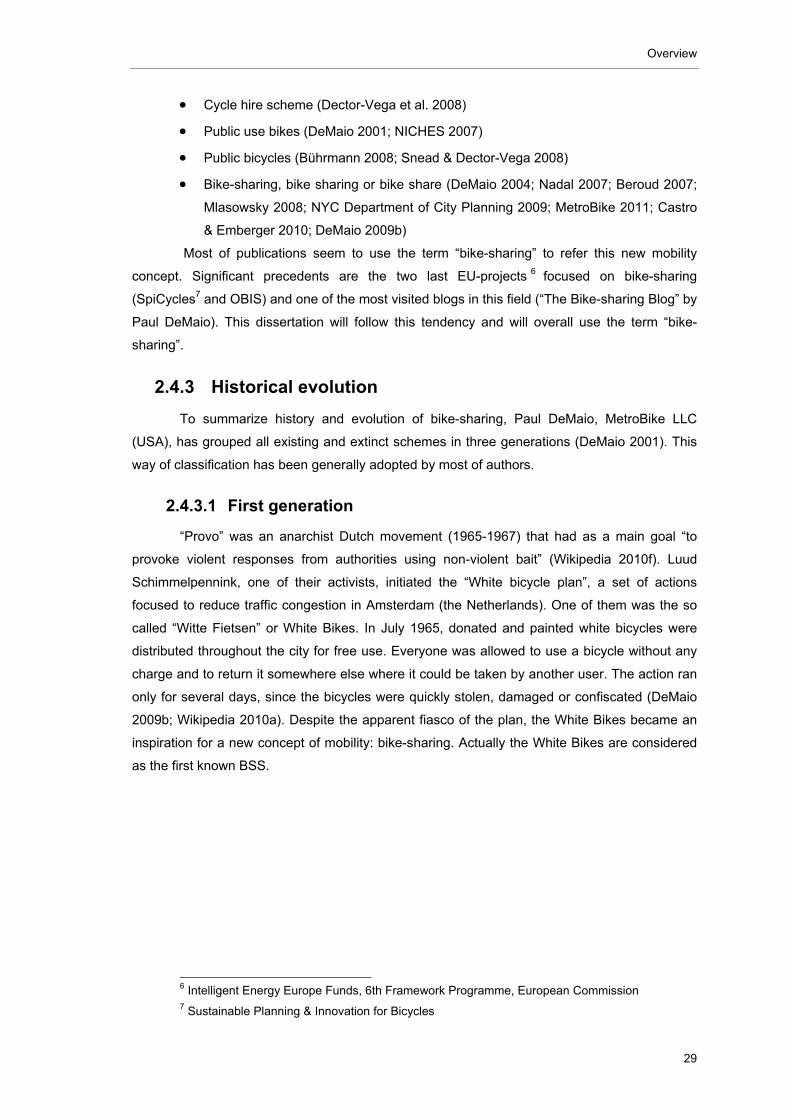
Overview
29
Cycle hire scheme (Dector-Vega et al. 2008)
Public use bikes (DeMaio 2001; NICHES 2007)
Public bicycles (Bührmann 2008; Snead & Dector-Vega 2008)
Bike-sharing, bike sharing or bike share (DeMaio 2004; Nadal 2007; Beroud 2007;
Mlasowsky 2008; NYC Department of City Planning 2009; MetroBike 2011; Castro
& Emberger 2010; DeMaio 2009b)
Most of publications seem to use the term “bike-sharing” to refer this new mobility
concept. Significant precedents are the two last EU-projects 6 focused on bike-sharing
(SpiCycles7 and OBIS) and one of the most visited blogs in this field (“The Bike-sharing Blog” by
Paul DeMaio). This dissertation will follow this tendency and will overall use the term “bike-
sharing”.
2.4.3 Historical evolution
To summarize history and evolution of bike-sharing, Paul DeMaio, MetroBike LLC
(USA), has grouped all existing and extinct schemes in three generations (DeMaio 2001). This
way of classification has been generally adopted by most of authors.
2.4.3.1 First generation
“Provo” was an anarchist Dutch movement (1965-1967) that had as a main goal “to
provoke violent responses from authorities using non-violent bait” (Wikipedia 2010f). Luud
Schimmelpennink, one of their activists, initiated the “White bicycle plan”, a set of actions
focused to reduce traffic congestion in Amsterdam (the Netherlands). One of them was the so
called “Witte Fietsen” or White Bikes. In July 1965, donated and painted white bicycles were
distributed throughout the city for free use. Everyone was allowed to use a bicycle without any
charge and to return it somewhere else where it could be taken by another user. The action ran
only for several days, since the bicycles were quickly stolen, damaged or confiscated (DeMaio
2009b; Wikipedia 2010a). Despite the apparent fiasco of the plan, the White Bikes became an
inspiration for a new concept of mobility: bike-sharing. Actually the White Bikes are considered
as the first known BSS.
6 Intelligent Energy Europe Funds, 6th Framework Programme, European Commission 7 Sustainable Planning & Innovation for Bicycles
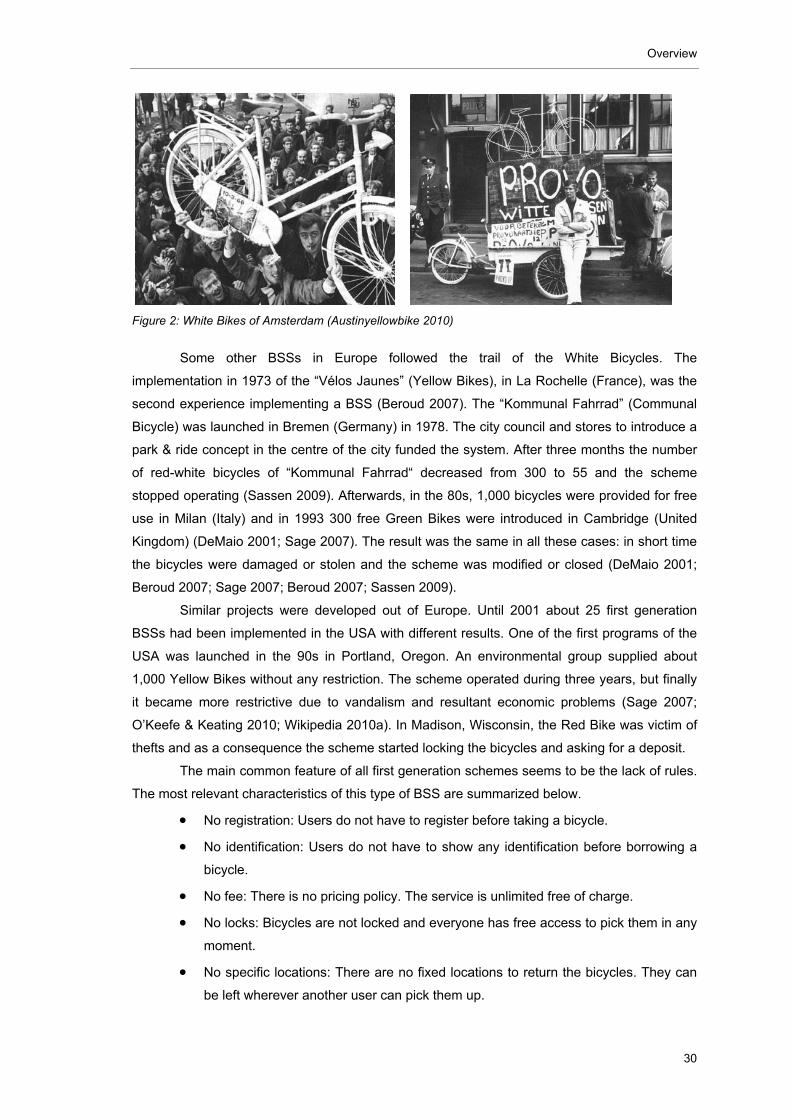
Overview
30
Figure 2: White Bikes of Amsterdam (Austinyellowbike 2010)
Some other BSSs in Europe followed the trail of the White Bicycles. The
implementation in 1973 of the “Vélos Jaunes” (Yellow Bikes), in La Rochelle (France), was the
second experience implementing a BSS (Beroud 2007). The “Kommunal Fahrrad” (Communal
Bicycle) was launched in Bremen (Germany) in 1978. The city council and stores to introduce a
park & ride concept in the centre of the city funded the system. After three months the number
of red-white bicycles of “Kommunal Fahrrad“ decreased from 300 to 55 and the scheme
stopped operating (Sassen 2009). Afterwards, in the 80s, 1,000 bicycles were provided for free
use in Milan (Italy) and in 1993 300 free Green Bikes were introduced in Cambridge (United
Kingdom) (DeMaio 2001; Sage 2007). The result was the same in all these cases: in short time
the bicycles were damaged or stolen and the scheme was modified or closed (DeMaio 2001;
Beroud 2007; Sage 2007; Beroud 2007; Sassen 2009).
Similar projects were developed out of Europe. Until 2001 about 25 first generation
BSSs had been implemented in the USA with different results. One of the first programs of the
USA was launched in the 90s in Portland, Oregon. An environmental group supplied about
1,000 Yellow Bikes without any restriction. The scheme operated during three years, but finally
it became more restrictive due to vandalism and resultant economic problems (Sage 2007;
O’Keefe & Keating 2010; Wikipedia 2010a). In Madison, Wisconsin, the Red Bike was victim of
thefts and as a consequence the scheme started locking the bicycles and asking for a deposit.
The main common feature of all first generation schemes seems to be the lack of rules.
The most relevant characteristics of this type of BSS are summarized below.
No registration: Users do not have to register before taking a bicycle.
No identification: Users do not have to show any identification before borrowing a
bicycle.
No fee: There is no pricing policy. The service is unlimited free of charge.
No locks: Bicycles are not locked and everyone has free access to pick them in any
moment.
No specific locations: There are no fixed locations to return the bicycles. They can
be left wherever another user can pick them up.
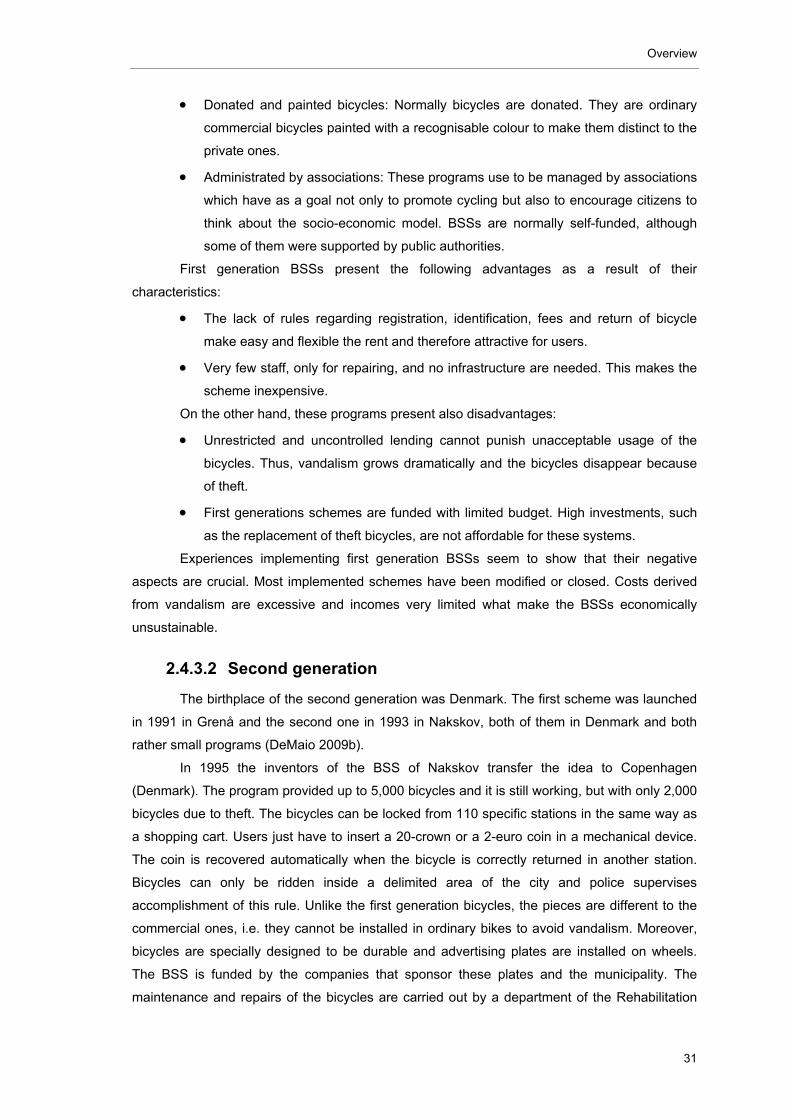
Overview
31
Donated and painted bicycles: Normally bicycles are donated. They are ordinary
commercial bicycles painted with a recognisable colour to make them distinct to the
private ones.
Administrated by associations: These programs use to be managed by associations
which have as a goal not only to promote cycling but also to encourage citizens to
think about the socio-economic model. BSSs are normally self-funded, although
some of them were supported by public authorities.
First generation BSSs present the following advantages as a result of their
characteristics:
The lack of rules regarding registration, identification, fees and return of bicycle
make easy and flexible the rent and therefore attractive for users.
Very few staff, only for repairing, and no infrastructure are needed. This makes the
scheme inexpensive.
On the other hand, these programs present also disadvantages:
Unrestricted and uncontrolled lending cannot punish unacceptable usage of the
bicycles. Thus, vandalism grows dramatically and the bicycles disappear because
of theft.
First generations schemes are funded with limited budget. High investments, such
as the replacement of theft bicycles, are not affordable for these systems.
Experiences implementing first generation BSSs seem to show that their negative
aspects are crucial. Most implemented schemes have been modified or closed. Costs derived
from vandalism are excessive and incomes very limited what make the BSSs economically
unsustainable.
2.4.3.2 Second generation
The birthplace of the second generation was Denmark. The first scheme was launched
in 1991 in Grenå and the second one in 1993 in Nakskov, both of them in Denmark and both
rather small programs (DeMaio 2009b).
In 1995 the inventors of the BSS of Nakskov transfer the idea to Copenhagen
(Denmark). The program provided up to 5,000 bicycles and it is still working, but with only 2,000
bicycles due to theft. The bicycles can be locked from 110 specific stations in the same way as
a shopping cart. Users just have to insert a 20-crown or a 2-euro coin in a mechanical device.
The coin is recovered automatically when the bicycle is correctly returned in another station.
Bicycles can only be ridden inside a delimited area of the city and police supervises
accomplishment of this rule. Unlike the first generation bicycles, the pieces are different to the
commercial ones, i.e. they cannot be installed in ordinary bikes to avoid vandalism. Moreover,
bicycles are specially designed to be durable and advertising plates are installed on wheels.
The BSS is funded by the companies that sponsor these plates and the municipality. The
maintenance and repairs of the bicycles are carried out by a department of the Rehabilitation
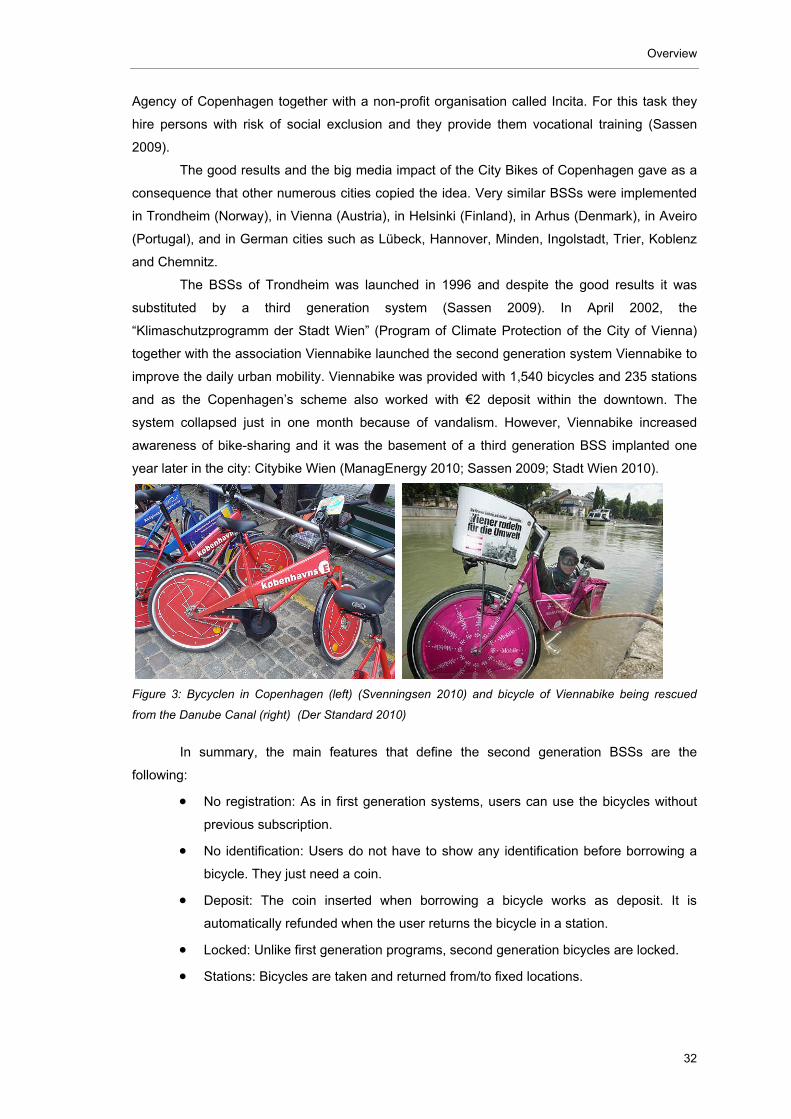
Overview
32
Agency of Copenhagen together with a non-profit organisation called Incita. For this task they
hire persons with risk of social exclusion and they provide them vocational training (Sassen
2009).
The good results and the big media impact of the City Bikes of Copenhagen gave as a
consequence that other numerous cities copied the idea. Very similar BSSs were implemented
in Trondheim (Norway), in Vienna (Austria), in Helsinki (Finland), in Arhus (Denmark), in Aveiro
(Portugal), and in German cities such as Lübeck, Hannover, Minden, Ingolstadt, Trier, Koblenz
and Chemnitz.
The BSSs of Trondheim was launched in 1996 and despite the good results it was
substituted by a third generation system (Sassen 2009). In April 2002, the
“Klimaschutzprogramm der Stadt Wien” (Program of Climate Protection of the City of Vienna)
together with the association Viennabike launched the second generation system Viennabike to
improve the daily urban mobility. Viennabike was provided with 1,540 bicycles and 235 stations
and as the Copenhagen’s scheme also worked with €2 deposit within the downtown. The
system collapsed just in one month because of vandalism. However, Viennabike increased
awareness of bike-sharing and it was the basement of a third generation BSS implanted one
year later in the city: Citybike Wien (ManagEnergy 2010; Sassen 2009; Stadt Wien 2010).
Figure 3: Bycyclen in Copenhagen (left) (Svenningsen 2010) and bicycle of Viennabike being rescued
from the Danube Canal (right) (Der Standard 2010)
In summary, the main features that define the second generation BSSs are the
following:
No registration: As in first generation systems, users can use the bicycles without
previous subscription.
No identification: Users do not have to show any identification before borrowing a
bicycle. They just need a coin.
Deposit: The coin inserted when borrowing a bicycle works as deposit. It is
automatically refunded when the user returns the bicycle in a station.
Locked: Unlike first generation programs, second generation bicycles are locked.
Stations: Bicycles are taken and returned from/to fixed locations.
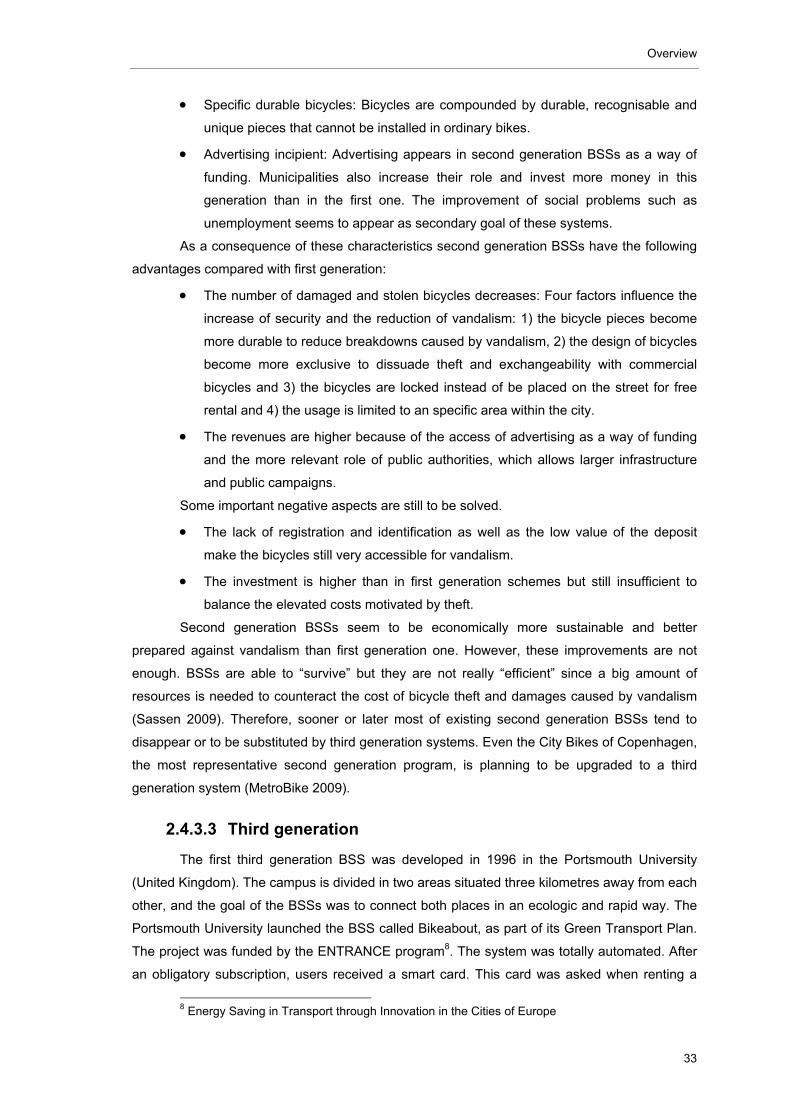
Overview
33
Specific durable bicycles: Bicycles are compounded by durable, recognisable and
unique pieces that cannot be installed in ordinary bikes.
Advertising incipient: Advertising appears in second generation BSSs as a way of
funding. Municipalities also increase their role and invest more money in this
generation than in the first one. The improvement of social problems such as
unemployment seems to appear as secondary goal of these systems.
As a consequence of these characteristics second generation BSSs have the following
advantages compared with first generation:
The number of damaged and stolen bicycles decreases: Four factors influence the
increase of security and the reduction of vandalism: 1) the bicycle pieces become
more durable to reduce breakdowns caused by vandalism, 2) the design of bicycles
become more exclusive to dissuade theft and exchangeability with commercial
bicycles and 3) the bicycles are locked instead of be placed on the street for free
rental and 4) the usage is limited to an specific area within the city.
The revenues are higher because of the access of advertising as a way of funding
and the more relevant role of public authorities, which allows larger infrastructure
and public campaigns.
Some important negative aspects are still to be solved.
The lack of registration and identification as well as the low value of the deposit
make the bicycles still very accessible for vandalism.
The investment is higher than in first generation schemes but still insufficient to
balance the elevated costs motivated by theft.
Second generation BSSs seem to be economically more sustainable and better
prepared against vandalism than first generation one. However, these improvements are not
enough. BSSs are able to “survive” but they are not really “efficient” since a big amount of
resources is needed to counteract the cost of bicycle theft and damages caused by vandalism
(Sassen 2009). Therefore, sooner or later most of existing second generation BSSs tend to
disappear or to be substituted by third generation systems. Even the City Bikes of Copenhagen,
the most representative second generation program, is planning to be upgraded to a third
generation system (MetroBike 2009).
2.4.3.3 Third generation
The first third generation BSS was developed in 1996 in the Portsmouth University
(United Kingdom). The campus is divided in two areas situated three kilometres away from each
other, and the goal of the BSSs was to connect both places in an ecologic and rapid way. The
Portsmouth University launched the BSS called Bikeabout, as part of its Green Transport Plan.
The project was funded by the ENTRANCE program8. The system was totally automated. After
an obligatory subscription, users received a smart card. This card was asked when renting a
8 Energy Saving in Transport through Innovation in the Cities of Europe
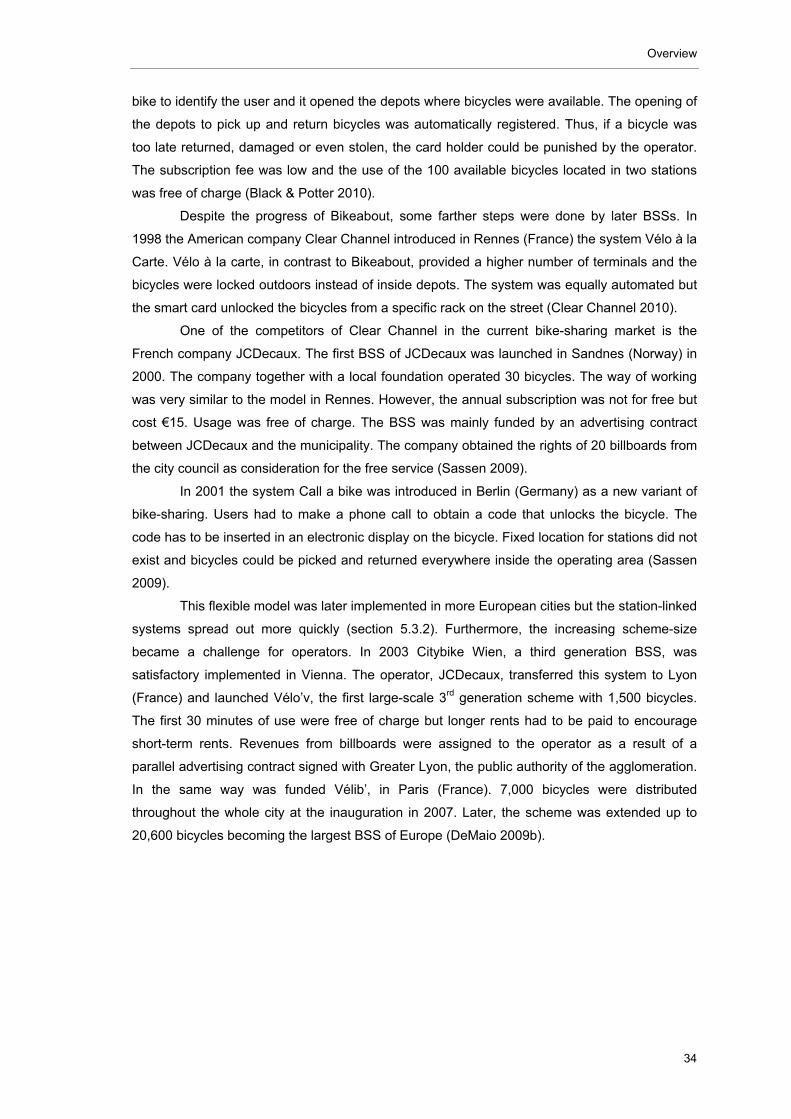
Overview
34
bike to identify the user and it opened the depots where bicycles were available. The opening of
the depots to pick up and return bicycles was automatically registered. Thus, if a bicycle was
too late returned, damaged or even stolen, the card holder could be punished by the operator.
The subscription fee was low and the use of the 100 available bicycles located in two stations
was free of charge (Black & Potter 2010).
Despite the progress of Bikeabout, some farther steps were done by later BSSs. In
1998 the American company Clear Channel introduced in Rennes (France) the system Vélo à la
Carte. Vélo à la carte, in contrast to Bikeabout, provided a higher number of terminals and the
bicycles were locked outdoors instead of inside depots. The system was equally automated but
the smart card unlocked the bicycles from a specific rack on the street (Clear Channel 2010).
One of the competitors of Clear Channel in the current bike-sharing market is the
French company JCDecaux. The first BSS of JCDecaux was launched in Sandnes (Norway) in
2000. The company together with a local foundation operated 30 bicycles. The way of working
was very similar to the model in Rennes. However, the annual subscription was not for free but
cost €15. Usage was free of charge. The BSS was mainly funded by an advertising contract
between JCDecaux and the municipality. The company obtained the rights of 20 billboards from
the city council as consideration for the free service (Sassen 2009).
In 2001 the system Call a bike was introduced in Berlin (Germany) as a new variant of
bike-sharing. Users had to make a phone call to obtain a code that unlocks the bicycle. The
code has to be inserted in an electronic display on the bicycle. Fixed location for stations did not
exist and bicycles could be picked and returned everywhere inside the operating area (Sassen
2009).
This flexible model was later implemented in more European cities but the station-linked
systems spread out more quickly (section 5.3.2). Furthermore, the increasing scheme-size
became a challenge for operators. In 2003 Citybike Wien, a third generation BSS, was
satisfactory implemented in Vienna. The operator, JCDecaux, transferred this system to Lyon
(France) and launched Vélo’v, the first large-scale 3rd generation scheme with 1,500 bicycles.
The first 30 minutes of use were free of charge but longer rents had to be paid to encourage
short-term rents. Revenues from billboards were assigned to the operator as a result of a
parallel advertising contract signed with Greater Lyon, the public authority of the agglomeration.
In the same way was funded Vélib’, in Paris (France). 7,000 bicycles were distributed
throughout the whole city at the inauguration in 2007. Later, the scheme was extended up to
20,600 bicycles becoming the largest BSS of Europe (DeMaio 2009b).
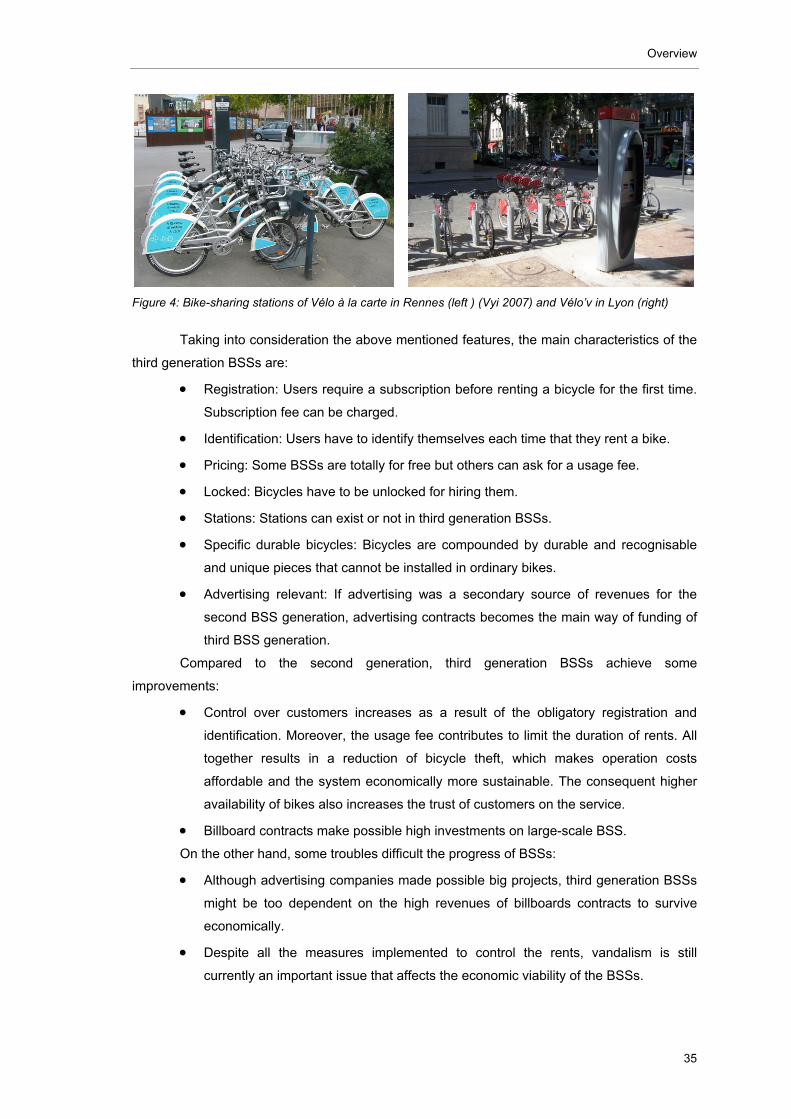
Overview
35
Figure 4: Bike-sharing stations of Vélo à la carte in Rennes (left ) (Vyi 2007) and Vélo’v in Lyon (right)
Taking into consideration the above mentioned features, the main characteristics of the
third generation BSSs are:
Registration: Users require a subscription before renting a bicycle for the first time.
Subscription fee can be charged.
Identification: Users have to identify themselves each time that they rent a bike.
Pricing: Some BSSs are totally for free but others can ask for a usage fee.
Locked: Bicycles have to be unlocked for hiring them.
Stations: Stations can exist or not in third generation BSSs.
Specific durable bicycles: Bicycles are compounded by durable and recognisable
and unique pieces that cannot be installed in ordinary bikes.
Advertising relevant: If advertising was a secondary source of revenues for the
second BSS generation, advertising contracts becomes the main way of funding of
third BSS generation.
Compared to the second generation, third generation BSSs achieve some
improvements:
Control over customers increases as a result of the obligatory registration and
identification. Moreover, the usage fee contributes to limit the duration of rents. All
together results in a reduction of bicycle theft, which makes operation costs
affordable and the system economically more sustainable. The consequent higher
availability of bikes also increases the trust of customers on the service.
Billboard contracts make possible high investments on large-scale BSS.
On the other hand, some troubles difficult the progress of BSSs:
Although advertising companies made possible big projects, third generation BSSs
might be too dependent on the high revenues of billboards contracts to survive
economically.
Despite all the measures implemented to control the rents, vandalism is still
currently an important issue that affects the economic viability of the BSSs.
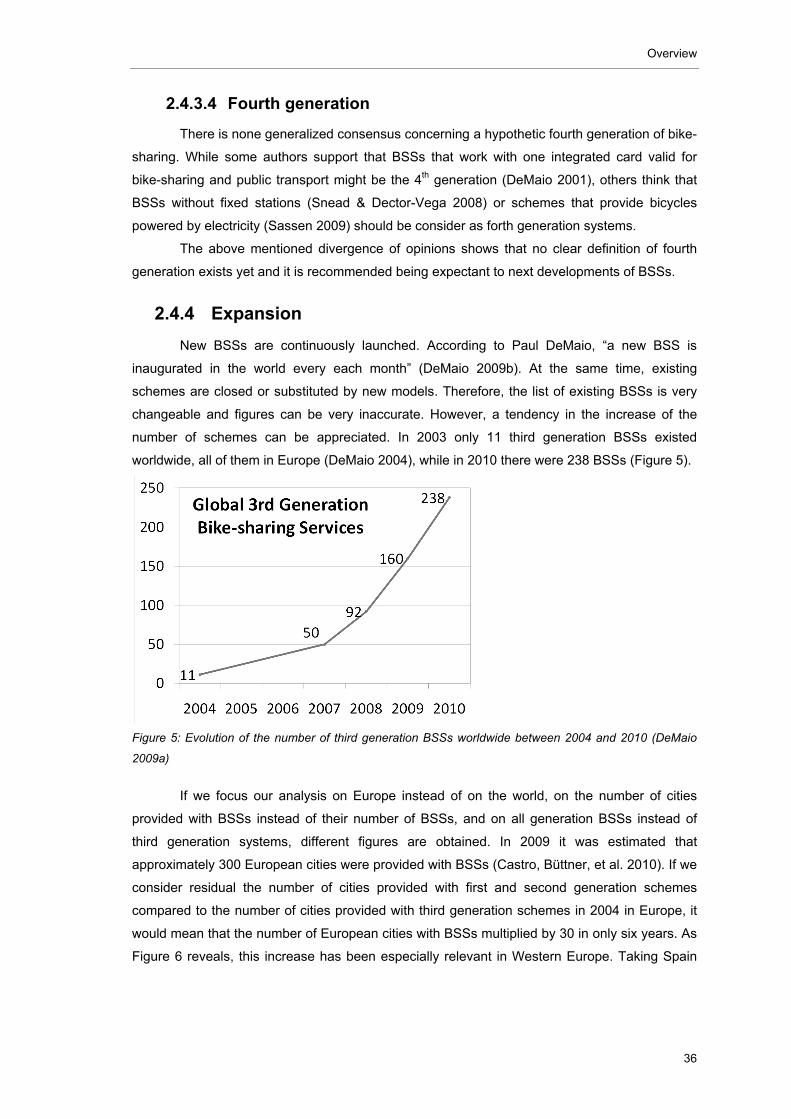
Overview
36
2.4.3.4 Fourth generation
There is none generalized consensus concerning a hypothetic fourth generation of bike-
sharing. While some authors support that BSSs that work with one integrated card valid for
bike-sharing and public transport might be the 4th generation (DeMaio 2001), others think that
BSSs without fixed stations (Snead & Dector-Vega 2008) or schemes that provide bicycles
powered by electricity (Sassen 2009) should be consider as forth generation systems.
The above mentioned divergence of opinions shows that no clear definition of fourth
generation exists yet and it is recommended being expectant to next developments of BSSs.
2.4.4 Expansion
New BSSs are continuously launched. According to Paul DeMaio, “a new BSS is
inaugurated in the world every each month” (DeMaio 2009b). At the same time, existing
schemes are closed or substituted by new models. Therefore, the list of existing BSSs is very
changeable and figures can be very inaccurate. However, a tendency in the increase of the
number of schemes can be appreciated. In 2003 only 11 third generation BSSs existed
worldwide, all of them in Europe (DeMaio 2004), while in 2010 there were 238 BSSs (Figure 5).
Figure 5: Evolution of the number of third generation BSSs worldwide between 2004 and 2010 (DeMaio
2009a)
If we focus our analysis on Europe instead of on the world, on the number of cities
provided with BSSs instead of their number of BSSs, and on all generation BSSs instead of
third generation systems, different figures are obtained. In 2009 it was estimated that
approximately 300 European cities were provided with BSSs (Castro, Büttner, et al. 2010). If we
consider residual the number of cities provided with first and second generation schemes
compared to the number of cities provided with third generation schemes in 2004 in Europe, it
would mean that the number of European cities with BSSs multiplied by 30 in only six years. As
Figure 6 reveals, this increase has been especially relevant in Western Europe. Taking Spain
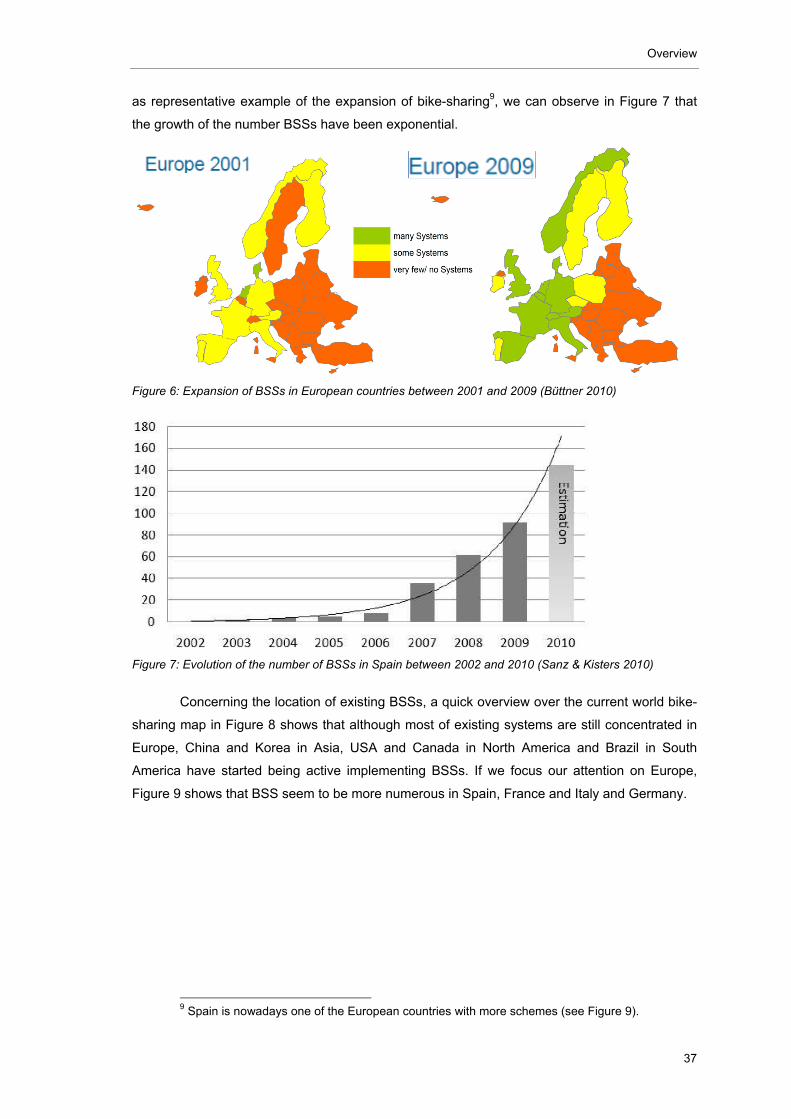
Overview
37
as representative example of the expansion of bike-sharing9, we can observe in Figure 7 that
the growth of the number BSSs have been exponential.
Figure 6: Expansion of BSSs in European countries between 2001 and 2009 (Büttner 2010)
Figure 7: Evolution of the number of BSSs in Spain between 2002 and 2010 (Sanz & Kisters 2010)
Concerning the location of existing BSSs, a quick overview over the current world bike-
sharing map in Figure 8 shows that although most of existing systems are still concentrated in
Europe, China and Korea in Asia, USA and Canada in North America and Brazil in South
America have started being active implementing BSSs. If we focus our attention on Europe,
Figure 9 shows that BSS seem to be more numerous in Spain, France and Italy and Germany.
9 Spain is nowadays one of the European countries with more schemes (see Figure 9).
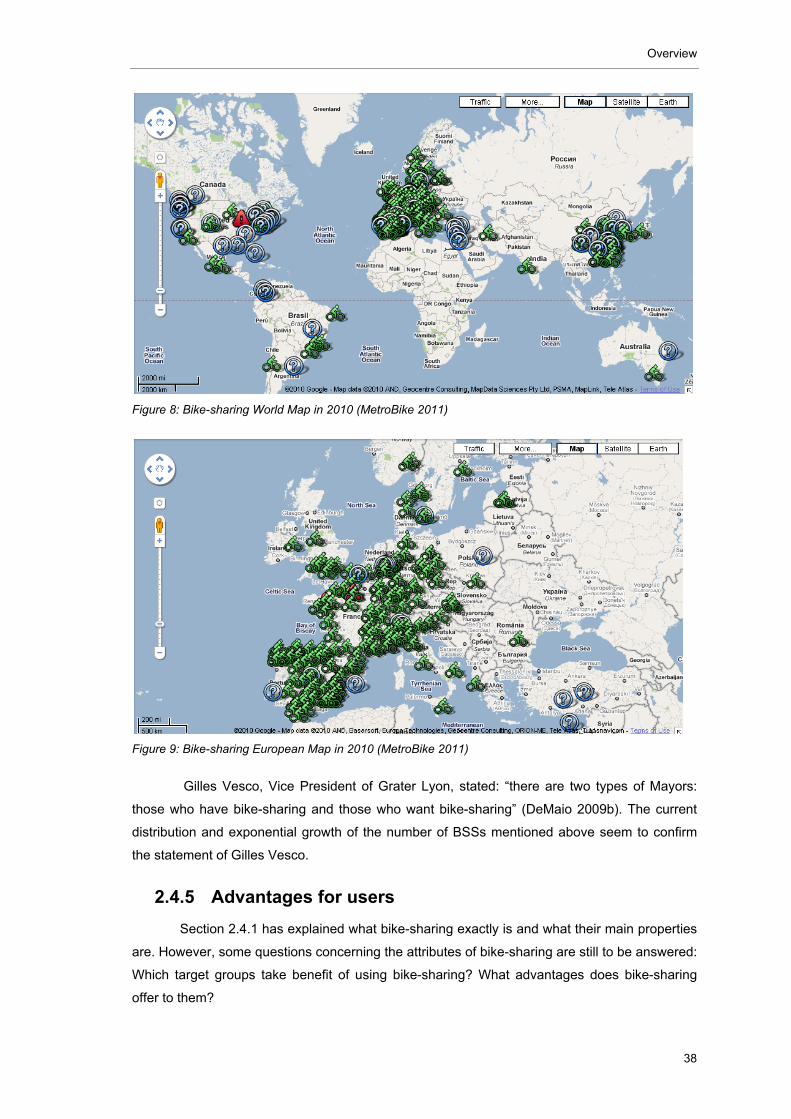
Overview
38
Figure 8: Bike-sharing World Map in 2010 (MetroBike 2011)
Figure 9: Bike-sharing European Map in 2010 (MetroBike 2011)
Gilles Vesco, Vice President of Grater Lyon, stated: “there are two types of Mayors:
those who have bike-sharing and those who want bike-sharing” (DeMaio 2009b). The current
distribution and exponential growth of the number of BSSs mentioned above seem to confirm
the statement of Gilles Vesco.
2.4.5 Advantages for users
Section 2.4.1 has explained what bike-sharing exactly is and what their main properties
are. However, some questions concerning the attributes of bike-sharing are still to be answered:
Which target groups take benefit of using bike-sharing? What advantages does bike-sharing
offer to them?
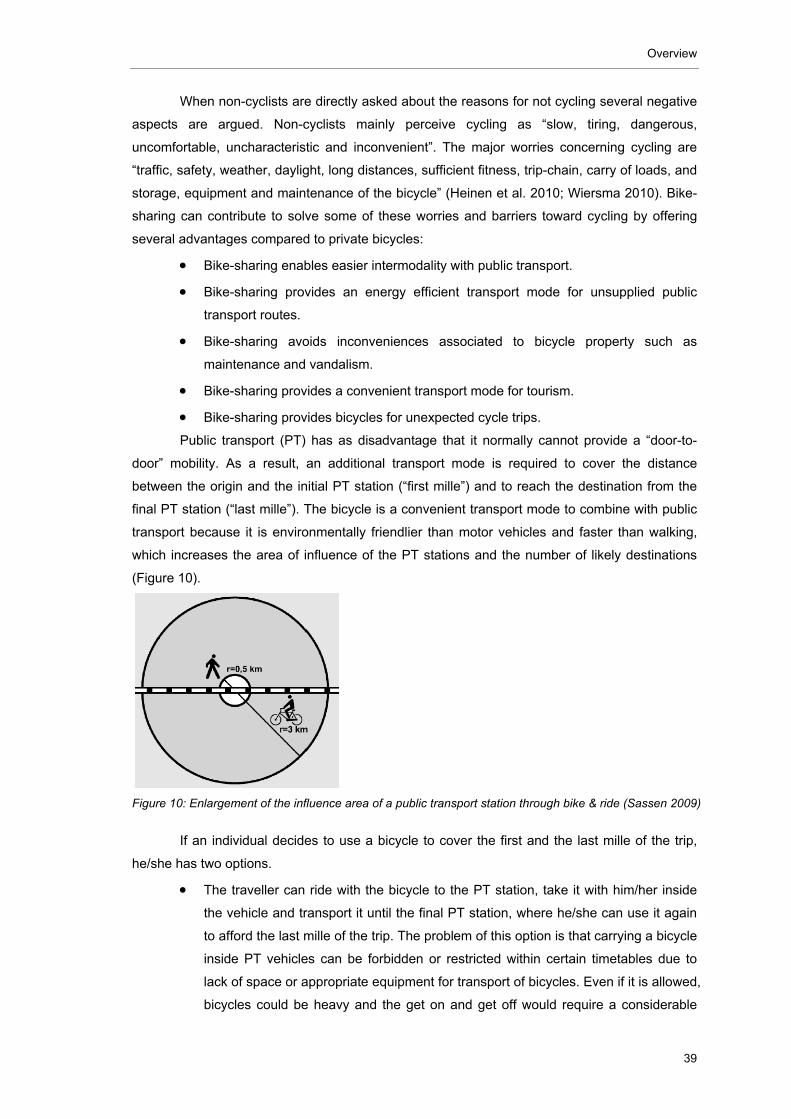
Overview
39
When non-cyclists are directly asked about the reasons for not cycling several negative
aspects are argued. Non-cyclists mainly perceive cycling as “slow, tiring, dangerous,
uncomfortable, uncharacteristic and inconvenient”. The major worries concerning cycling are
“traffic, safety, weather, daylight, long distances, sufficient fitness, trip-chain, carry of loads, and
storage, equipment and maintenance of the bicycle” (Heinen et al. 2010; Wiersma 2010). Bike-
sharing can contribute to solve some of these worries and barriers toward cycling by offering
several advantages compared to private bicycles:
Bike-sharing enables easier intermodality with public transport.
Bike-sharing provides an energy efficient transport mode for unsupplied public
transport routes.
Bike-sharing avoids inconveniences associated to bicycle property such as
maintenance and vandalism.
Bike-sharing provides a convenient transport mode for tourism.
Bike-sharing provides bicycles for unexpected cycle trips.
Public transport (PT) has as disadvantage that it normally cannot provide a “door-to-
door” mobility. As a result, an additional transport mode is required to cover the distance
between the origin and the initial PT station (“first mille”) and to reach the destination from the
final PT station (“last mille”). The bicycle is a convenient transport mode to combine with public
transport because it is environmentally friendlier than motor vehicles and faster than walking,
which increases the area of influence of the PT stations and the number of likely destinations
(Figure 10).
Figure 10: Enlargement of the influence area of a public transport station through bike & ride (Sassen 2009)
If an individual decides to use a bicycle to cover the first and the last mille of the trip,
he/she has two options.
The traveller can ride with the bicycle to the PT station, take it with him/her inside
the vehicle and transport it until the final PT station, where he/she can use it again
to afford the last mille of the trip. The problem of this option is that carrying a bicycle
inside PT vehicles can be forbidden or restricted within certain timetables due to
lack of space or appropriate equipment for transport of bicycles. Even if it is allowed,
bicycles could be heavy and the get on and get off would require a considerable
Overview
40
effort for the traveller. Therefore, this option may be unattractive and can dissuade
people to cycle in such intermodal trips.
The traveller can ride with the bicycle to the PT station and there he/she can leave
the bicycle in a parking place. In this way he/she can travel avoiding
inconveniences regarding the transport of the bicycle inside PT vehicles. At the
destination the traveller could walk or use a second bicycle that he/she previously
left parked there to cover last mille of the trip. The main troubles of this option are
two: 1) unavailability of parking places and 2) vandalism risk due to unattended
parking during the day at the origin of the trip. If the person has a second bicycle, it
is more costly and the second bicycle stays unattended during the night in a parking
place at the final PT station. Since one of the main barriers of non-cyclists to cycle
is the worry about bicycle theft or vandalism, this option could also dissuade
potential cyclists to ride.
BSSs offer a third option when undertaking intermodal trips. The bike-sharing users can
rent a bicycle at the origin of the trip and return it in bike-sharing terminal close to the initial PT
station. After undertaking the main part of the trip by public transport, he/she can rent an
additional bicycle at the final PT station and undertake the last mille of the trip using again a
bike-sharing bicycle. Coming back to the primary attributes of bike-sharing (section 2.4.1) and
unlike private bicycles, BSSs enable unidirectional trips. This advantage can solve at the same
time the two main troubles associated to urban intermodality: the problematic transport of
bicycles in PT vehicles and the risk of bicycle theft.
Apart from more convenient intermodal trips, bike-sharing offers additional advantages.
For example, if a route is not supplied with public transport and a person does not own any
motor vehicle or bicycle (or has no intention to use it), then in principal he/she can just walk or
avoid the route. However, bike-sharing offer the possibility to cover this unsupplied route in a
faster way than by foot.
Moreover, since bike-sharing is a rental service, it does not imply property of the bicycle
and avoids several inconveniences associated to bicycle ownership. Apart from the already
mentioned worry about bicycle theft and vandalism, non-cyclists are afraid about their aptitude
to keep the bicycle well maintained or the consequent maintenance costs. Since bike-sharing
users do not own the bicycle that they use, they do not have to take care about these two
dissuading concerns. In this way people might find more convenient cycling using a BSS.
Tourists may also find convenient BSSs. Since they usually do not have any available
vehicle in the city that they visit, tourists mainly use public transport. However, active people
may prefer to cycle instead of using public transport because they can enjoy the scenery when
pedalling. Traditionally active tourists have rented bicycles in bike rental shops for visiting a city.
Nevertheless, usage fees for short rental periods of some bike-sharing models can be cheaper
than the tariffs offered by traditional shops (section 7.2.12) and this motivates that some
customers prefer to use BSSs.
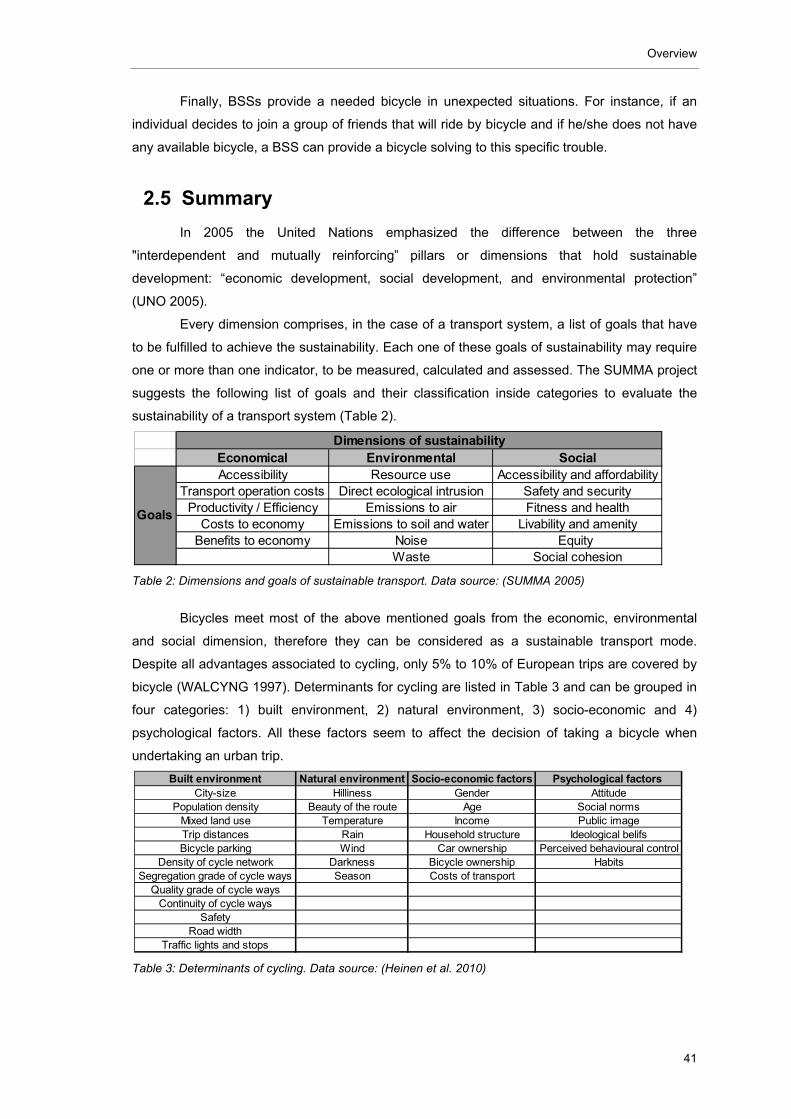
Overview
41
Finally, BSSs provide a needed bicycle in unexpected situations. For instance, if an
individual decides to join a group of friends that will ride by bicycle and if he/she does not have
any available bicycle, a BSS can provide a bicycle solving to this specific trouble.
2.5 Summary
In 2005 the United Nations emphasized the difference between the three
"interdependent and mutually reinforcing” pillars or dimensions that hold sustainable
development: “economic development, social development, and environmental protection”
(UNO 2005).
Every dimension comprises, in the case of a transport system, a list of goals that have
to be fulfilled to achieve the sustainability. Each one of these goals of sustainability may require
one or more than one indicator, to be measured, calculated and assessed. The SUMMA project
suggests the following list of goals and their classification inside categories to evaluate the
sustainability of a transport system (Table 2).
Table 2: Dimensions and goals of sustainable transport. Data source: (SUMMA 2005)
Bicycles meet most of the above mentioned goals from the economic, environmental
and social dimension, therefore they can be considered as a sustainable transport mode.
Despite all advantages associated to cycling, only 5% to 10% of European trips are covered by
bicycle (WALCYNG 1997). Determinants for cycling are listed in Table 3 and can be grouped in
four categories: 1) built environment, 2) natural environment, 3) socio-economic and 4)
psychological factors. All these factors seem to affect the decision of taking a bicycle when
undertaking an urban trip.
Table 3: Determinants of cycling. Data source: (Heinen et al. 2010)
Economical Environmental SocialAccessibility Resource use Accessibility and affordability
Transport operation costs Direct ecological intrusion Safety and securityProductivity / Efficiency Emissions to air Fitness and health
Costs to economy Emissions to soil and water Livability and amenityBenefits to economy Noise Equity
Waste Social cohesion
Goals
Dimensions of sustainability
Built environment Natural environment Socio-economic factors Psychological factors City-size Hilliness Gender Attitude
Population density Beauty of the route Age Social normsMixed land use Temperature Income Public imageTrip distances Rain Household structure Ideological belifsBicycle parking Wind Car ownership Perceived behavioural control
Density of cycle network Darkness Bicycle ownership HabitsSegregation grade of cycle ways Season Costs of transport
Quality grade of cycle waysContinuity of cycle ways
SafetyRoad width
Traffic lights and stops
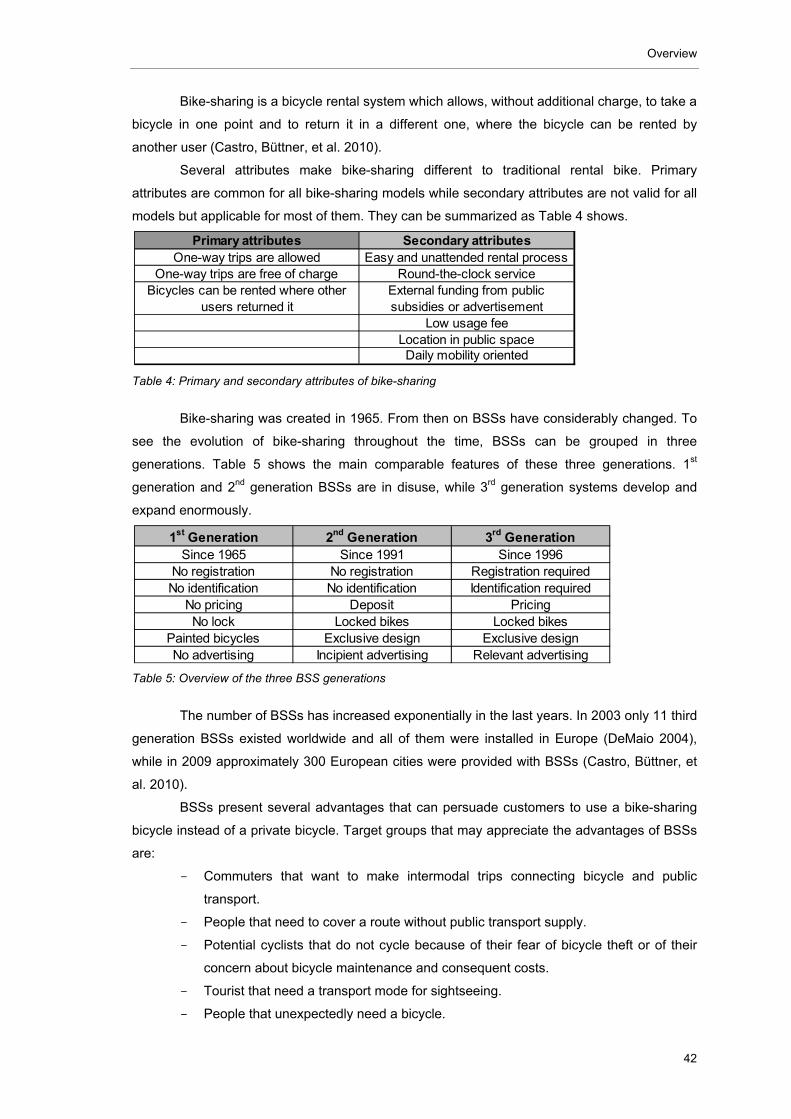
Overview
42
Bike-sharing is a bicycle rental system which allows, without additional charge, to take a
bicycle in one point and to return it in a different one, where the bicycle can be rented by
another user (Castro, Büttner, et al. 2010).
Several attributes make bike-sharing different to traditional rental bike. Primary
attributes are common for all bike-sharing models while secondary attributes are not valid for all
models but applicable for most of them. They can be summarized as Table 4 shows.
Table 4: Primary and secondary attributes of bike-sharing
Bike-sharing was created in 1965. From then on BSSs have considerably changed. To
see the evolution of bike-sharing throughout the time, BSSs can be grouped in three
generations. Table 5 shows the main comparable features of these three generations. 1st
generation and 2nd generation BSSs are in disuse, while 3rd generation systems develop and
expand enormously.
Table 5: Overview of the three BSS generations
The number of BSSs has increased exponentially in the last years. In 2003 only 11 third
generation BSSs existed worldwide and all of them were installed in Europe (DeMaio 2004),
while in 2009 approximately 300 European cities were provided with BSSs (Castro, Büttner, et
al. 2010).
BSSs present several advantages that can persuade customers to use a bike-sharing
bicycle instead of a private bicycle. Target groups that may appreciate the advantages of BSSs
are:
- Commuters that want to make intermodal trips connecting bicycle and public
transport.
- People that need to cover a route without public transport supply.
- Potential cyclists that do not cycle because of their fear of bicycle theft or of their
concern about bicycle maintenance and consequent costs.
- Tourist that need a transport mode for sightseeing.
- People that unexpectedly need a bicycle.
Primary attributes Secondary attributesOne-way trips are allowed Easy and unattended rental process
One-way trips are free of charge Round-the-clock service Bicycles can be rented where other
users returned itExternal funding from public subsidies or advertisement
Low usage fee Location in public space Daily mobility oriented
1st Generation 2nd Generation 3rd GenerationSince 1965 Since 1991 Since 1996
No registration No registration Registration requiredNo identification No identification Identification required
No pricing Deposit PricingNo lock Locked bikes Locked bikes
Painted bicycles Exclusive design Exclusive designNo advertising Incipient advertising Relevant advertising
Research objectives and methodology
43
3 RESEARCH OBJECTIVES AND METHODOLOGY
3.1 Objectives
Taking into account the state of the art of section 2, the aim of this doctoral dissertation
is to enumerate and quantify the main benefits and inconveniences of BSSs in terms of
sustainability and to suggest strategies to make bike-sharing more efficient and sustainable.
Therefore, the main questions to be answered in this dissertation are the following:
What are the likely positive (or negative) impacts of bike-sharing for urban
sustainability? (section 6)
Which driving forces influence the success of BSSs? (section 7.2)
What are the barriers that hinder the success of BSSs and how could these barriers
be minimized or solved? (section 7.3)
The final purpose of answering all these questions is to find out the role that bike-
sharing should play in urban mobility to optimize its contribution to sustainability.
3.2 Methodology
3.2.1 Bottom-up approach
To achieve the objectives of this dissertation, a bottom-up approach has been used.
According to this approach, the state of the art has motivated the research objectives. These
objectives have required a certain methodology that answers the questions in the most accurate
way. The methodology used can be summarized in the three next research steps: 1) the
selection and description of case studies, 2) the analysis of success of bike-sharing and 3) the
analysis of factors that influence success. The data collected from the case studies have been
processed in both analyses and they have provided the final results and conclusions. These
research findings have answered the questions listed in the objectives of the dissertation.
Figure 11 shows this bottom-up approach.
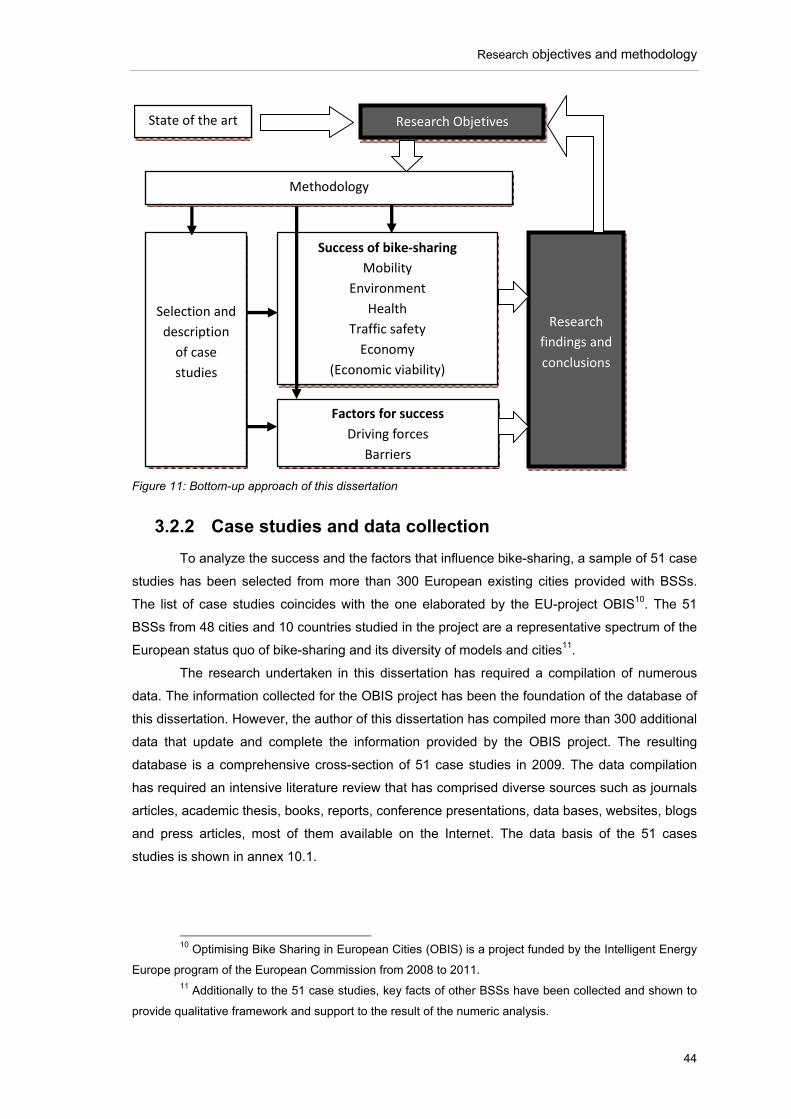
Research objectives and methodology
44
Figure 11: Bottom-up approach of this dissertation
3.2.2 Case studies and data collection
To analyze the success and the factors that influence bike-sharing, a sample of 51 case
studies has been selected from more than 300 European existing cities provided with BSSs.
The list of case studies coincides with the one elaborated by the EU-project OBIS10. The 51
BSSs from 48 cities and 10 countries studied in the project are a representative spectrum of the
European status quo of bike-sharing and its diversity of models and cities11.
The research undertaken in this dissertation has required a compilation of numerous
data. The information collected for the OBIS project has been the foundation of the database of
this dissertation. However, the author of this dissertation has compiled more than 300 additional
data that update and complete the information provided by the OBIS project. The resulting
database is a comprehensive cross-section of 51 case studies in 2009. The data compilation
has required an intensive literature review that has comprised diverse sources such as journals
articles, academic thesis, books, reports, conference presentations, data bases, websites, blogs
and press articles, most of them available on the Internet. The data basis of the 51 cases
studies is shown in annex 10.1.
10 Optimising Bike Sharing in European Cities (OBIS) is a project funded by the Intelligent Energy
Europe program of the European Commission from 2008 to 2011. 11 Additionally to the 51 case studies, key facts of other BSSs have been collected and shown to
provide qualitative framework and support to the result of the numeric analysis.
State of the art Research Objetives
Research
findings and
conclusions
Methodology
Selection and
description
of case
studies
Success of bike‐sharing
Mobility
Environment
Health
Traffic safety
Economy
(Economic viability)
Factors for success
Driving forces
Barriers
Research objectives and methodology
45
Apart from the lack of previous research focused on bike-sharing, the three main
difficulties of the data collection have been the following: 1) inexistence of information, 2)
opacity of informants and 3) unreliability of data.
Firstly, it was not possible to compile all required data because information was not
available. Those case studies without enough information to complete calculations had to be
removed from data processes. Lack of data may be motivated by the short lifetime of the bike-
sharing concept. Since bike-sharing is a newly implemented transport mode, it is still under
development. Therefore, some operators did not standardize a systematic collection of data yet
and this might cause the current absence of data.
Secondly, in some cases data exist but they can neither be published nor used for
researches because of the privacy policy of their owners. A considerable part of BSSs operate
in private hands and these companies use to consider some data as commercial secrets.
Finally, the two previous difficulties lead to a low reliability of information. For example,
certain figures can be contradictory just depending on the source. To discern the most suitable
data in case of contradiction of sources, criteria such as confirmation in a third publication,
feasibility considering the framework and reliability of the source were applied in this
dissertation.
The collected data have been processed using Microsoft Excel 2003-2007 and IBM
SPSS Statistics version 19.0 to calculate and represent the analysis of success in section 6
and the analysis of factors in section 7.
3.2.3 Analysis of success
As section 2.4.4 has explained, BSSs have quickly spread over Europe and currently
numerous cities are provided with bike-sharing services. Many municipalities and bike-sharing
operators have reported the success of their BSSs in terms of the increasing number of rents or
bike-sharing bicycles. However, a high number of rents or bicycles do not mean itself “success”.
According to the Oxford Dictionary, “success” is defined as “the accomplishment of an aim or
purpose” (Oxford Dictionary 2010) and according to the Cambridge Dictionary success is “the
achieving of the results wanted or hoped for” (Cambrigde University 2009). Therefore, “success”
obligatory implies the statement of previous goals and only BSSs that achieve these initial goals
should be considered as “successful”.
Which are these goals? There are different reasons to implement a BSS. Section 2.4.5
has shown that bike-sharing offers several advantages for individuals but bike-sharing can also
be a mechanism to improve the whole city. For instance, a user survey carried out in Paris in
2009 revealed that 93% of users agreed that Vélib’ contributes to improve the image of the city,
90% stated that the BSS improves environment, 90% mobility, 85% health and 69% economy
(Vélib’ 2009a). If we take into account existing literature about the benefits of bike-sharing
(Beroud 2007; Sassen 2009; IDAE 2007; DeMaio 2004; DeMaio 2003; SpiCycles 2008) and we
assume that the aim of any municipality when implementing a BSS is to ameliorate the
Research objectives and methodology
46
conditions of life of the citizens, some likely reasons that could be argued to introduce a BSS
are the following:
To reduce car traffic
To increase PT attractiveness
To increase cycling
To reduce pollution
To improve air quality
To increase fitness level
To reduce traffic accidents with cyclists involved
To create jobs
To reduce transport costs for households
To improve city image
To increase city attractiveness for tourism
The municipalities that have as a goal reducing car traffic, increasing PT attractiveness
or/and increasing cycling in their cities have all of them a common goal, which is to improve
urban mobility in terms of reduction of traffic congestions as well as optimization of travel time
and urban space. Other municipalities could have as a priority to reduce pollution that implies
an environmental improvement as a goal12. Cities that have as a goal to increase fitness of
people and quality of air have in common the wish to improve public health. A reduction of
accidents with cyclists involved as a result of the introduction of a BSS leads actually to
increase general traffic safety. And finally, those municipalities that implement a BSS with the
primary goal to increase job opportunities, to reduce travel costs for citizens, to improve the city
image or/and to promote tourism have in common the goal of improving local economy.
The achievement of any of these primary goals implies the success of a BSS. However,
no BSS can be considered successful if it is not economically sustainable. For instance, if a
BSS obtains very good results reducing CO2 but it has to close several months after the launch
because of insufficient funding, it cannot be considered successful. Success must be long-term
maintained. Therefore, together with the achievement of goals, the requirement of economic
viability must be always met.
This dissertation has grouped the likely goals of bike-sharing into five categories (Figure
12):
12Although a reduction of car traffic and an increase of public transport and cycling (mobility goals)
give as a result a reduction of pollution (environmental goals), both goals have been considered as
different in this dissertation since municipalities may set priority goal without considering side effects. For
instance, there might be municipalities that set as a goal to improve mobility because there are continuous
traffic jams in their cities. Although these municipalities might appreciate the consequent reduction of
pollution, it is not their priority. In contrast, other municipalities might set the improvement of environmental
conditions as a priority goal because e.g. few traffic congestions take place and the implementation of the
BSS is integrated in a national policy to fight against climate change.
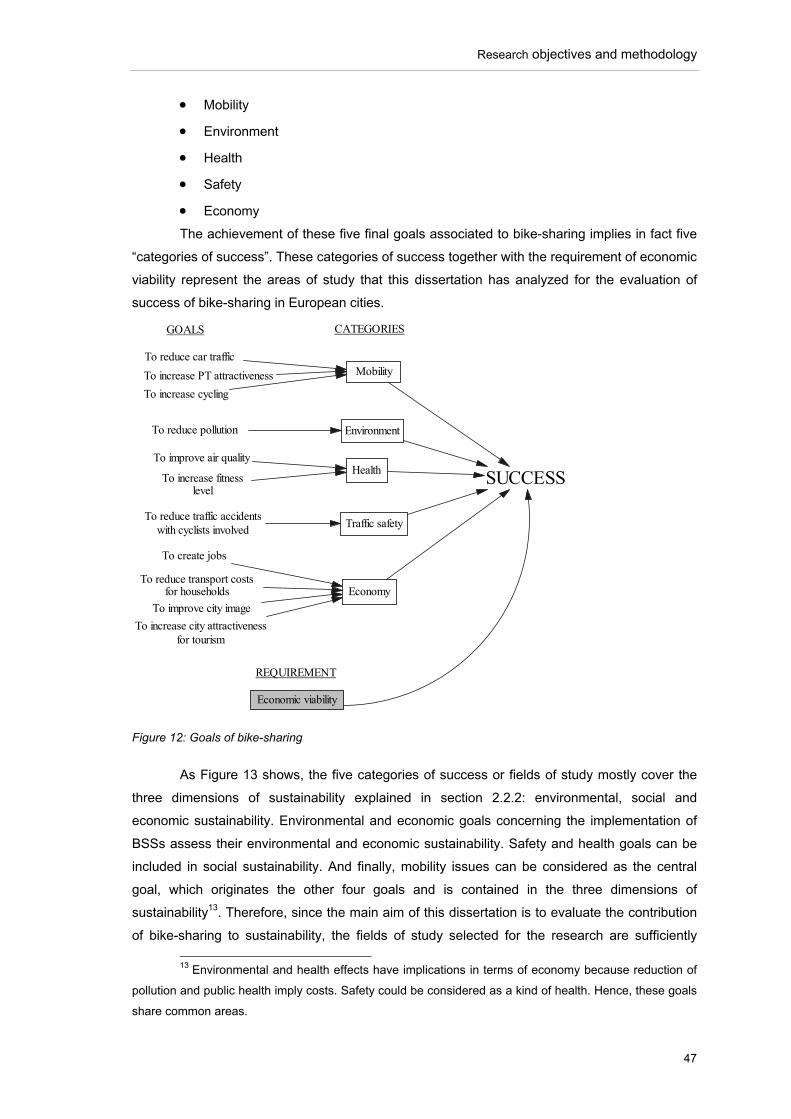
Research objectives and methodology
47
Mobility
Environment
Health
Safety
Economy
The achievement of these five final goals associated to bike-sharing implies in fact five
“categories of success”. These categories of success together with the requirement of economic
viability represent the areas of study that this dissertation has analyzed for the evaluation of
success of bike-sharing in European cities.
Figure 12: Goals of bike-sharing
As Figure 13 shows, the five categories of success or fields of study mostly cover the
three dimensions of sustainability explained in section 2.2.2: environmental, social and
economic sustainability. Environmental and economic goals concerning the implementation of
BSSs assess their environmental and economic sustainability. Safety and health goals can be
included in social sustainability. And finally, mobility issues can be considered as the central
goal, which originates the other four goals and is contained in the three dimensions of
sustainability13. Therefore, since the main aim of this dissertation is to evaluate the contribution
of bike-sharing to sustainability, the fields of study selected for the research are sufficiently
13 Environmental and health effects have implications in terms of economy because reduction of
pollution and public health imply costs. Safety could be considered as a kind of health. Hence, these goals
share common areas.
Economic viability
SUCCESS
To reduce car traffic
To increase PT attractiveness
To increase cycling
To reduce pollution
To increase fitnesslevel
To improve air quality
To reduce traffic accidentswith cyclists involved
To create jobs
To reduce transport costsfor households
To improve city image
To increase city attractivenessfor tourism
Mobility
Environment
Health
Traffic safety
Economy
GOALS
REQUIREMENT
CATEGORIES
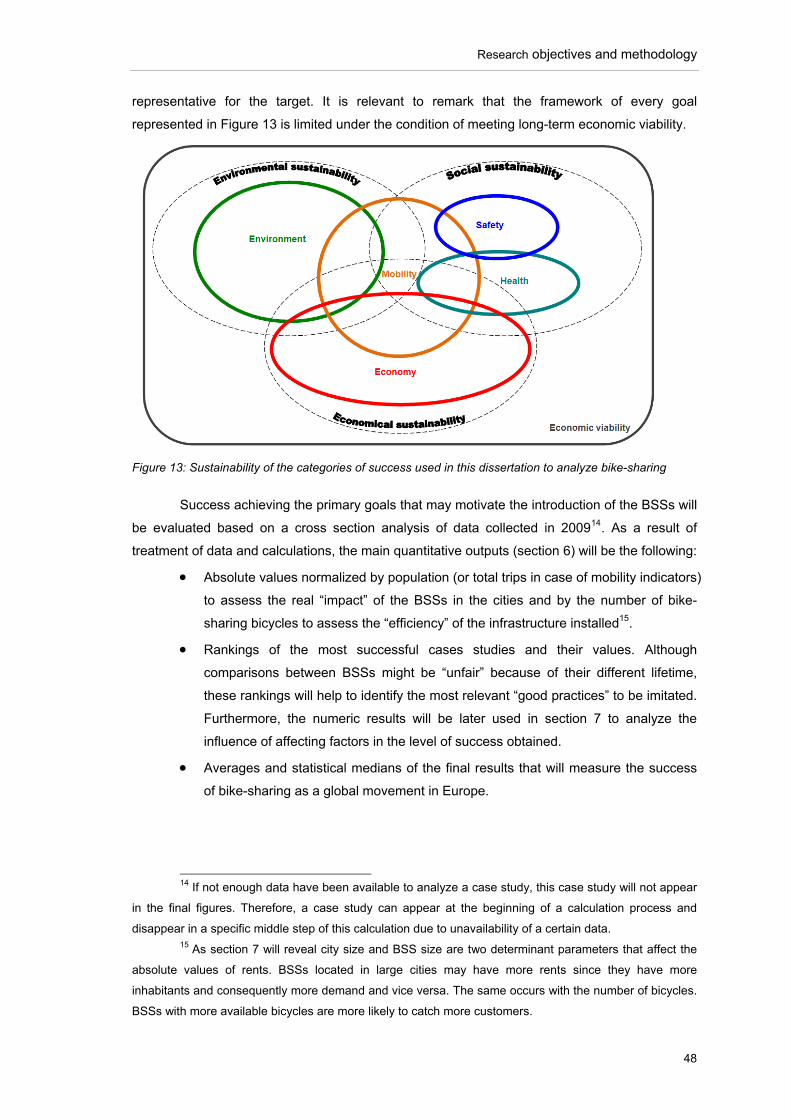
Research objectives and methodology
48
representative for the target. It is relevant to remark that the framework of every goal
represented in Figure 13 is limited under the condition of meeting long-term economic viability.
Figure 13: Sustainability of the categories of success used in this dissertation to analyze bike-sharing
Success achieving the primary goals that may motivate the introduction of the BSSs will
be evaluated based on a cross section analysis of data collected in 200914. As a result of
treatment of data and calculations, the main quantitative outputs (section 6) will be the following:
Absolute values normalized by population (or total trips in case of mobility indicators)
to assess the real “impact” of the BSSs in the cities and by the number of bike-
sharing bicycles to assess the “efficiency” of the infrastructure installed15.
Rankings of the most successful cases studies and their values. Although
comparisons between BSSs might be “unfair” because of their different lifetime,
these rankings will help to identify the most relevant “good practices” to be imitated.
Furthermore, the numeric results will be later used in section 7 to analyze the
influence of affecting factors in the level of success obtained.
Averages and statistical medians of the final results that will measure the success
of bike-sharing as a global movement in Europe.
14 If not enough data have been available to analyze a case study, this case study will not appear
in the final figures. Therefore, a case study can appear at the beginning of a calculation process and
disappear in a specific middle step of this calculation due to unavailability of a certain data. 15 As section 7 will reveal city size and BSS size are two determinant parameters that affect the
absolute values of rents. BSSs located in large cities may have more rents since they have more
inhabitants and consequently more demand and vice versa. The same occurs with the number of bicycles.
BSSs with more available bicycles are more likely to catch more customers.
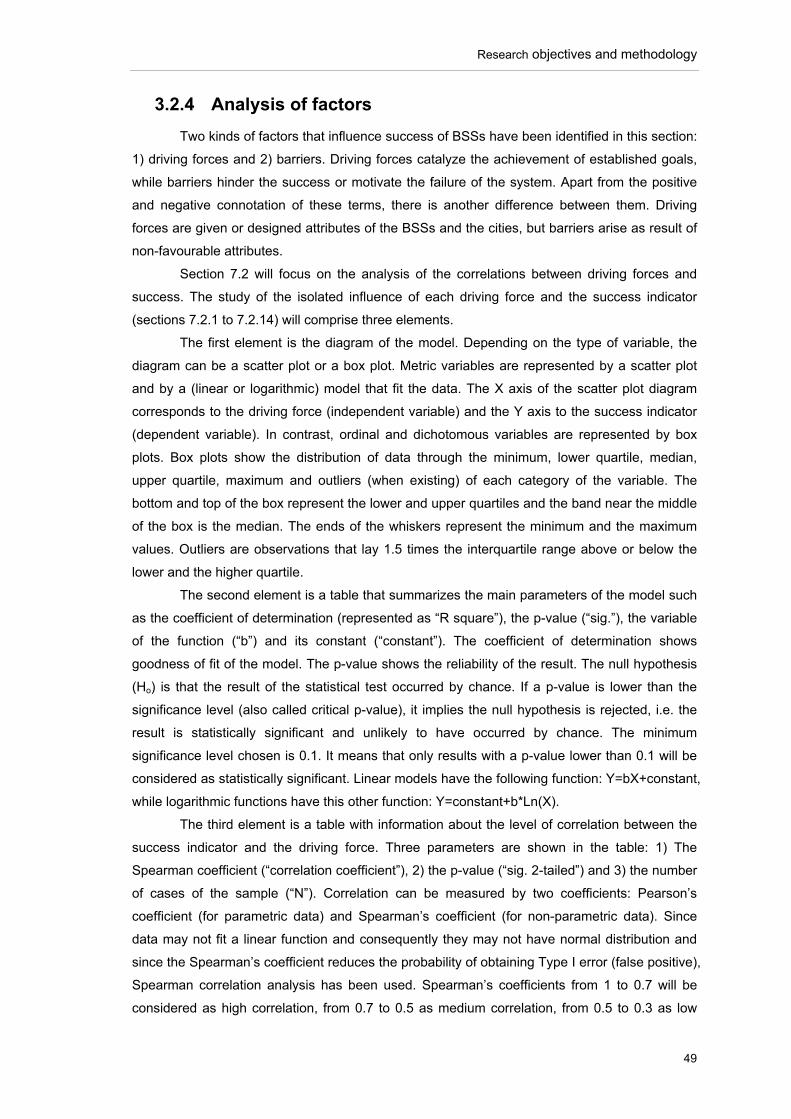
Research objectives and methodology
49
3.2.4 Analysis of factors
Two kinds of factors that influence success of BSSs have been identified in this section:
1) driving forces and 2) barriers. Driving forces catalyze the achievement of established goals,
while barriers hinder the success or motivate the failure of the system. Apart from the positive
and negative connotation of these terms, there is another difference between them. Driving
forces are given or designed attributes of the BSSs and the cities, but barriers arise as result of
non-favourable attributes.
Section 7.2 will focus on the analysis of the correlations between driving forces and
success. The study of the isolated influence of each driving force and the success indicator
(sections 7.2.1 to 7.2.14) will comprise three elements.
The first element is the diagram of the model. Depending on the type of variable, the
diagram can be a scatter plot or a box plot. Metric variables are represented by a scatter plot
and by a (linear or logarithmic) model that fit the data. The X axis of the scatter plot diagram
corresponds to the driving force (independent variable) and the Y axis to the success indicator
(dependent variable). In contrast, ordinal and dichotomous variables are represented by box
plots. Box plots show the distribution of data through the minimum, lower quartile, median,
upper quartile, maximum and outliers (when existing) of each category of the variable. The
bottom and top of the box represent the lower and upper quartiles and the band near the middle
of the box is the median. The ends of the whiskers represent the minimum and the maximum
values. Outliers are observations that lay 1.5 times the interquartile range above or below the
lower and the higher quartile.
The second element is a table that summarizes the main parameters of the model such
as the coefficient of determination (represented as “R square”), the p-value (“sig.”), the variable
of the function (“b”) and its constant (“constant”). The coefficient of determination shows
goodness of fit of the model. The p-value shows the reliability of the result. The null hypothesis
(Ho) is that the result of the statistical test occurred by chance. If a p-value is lower than the
significance level (also called critical p-value), it implies the null hypothesis is rejected, i.e. the
result is statistically significant and unlikely to have occurred by chance. The minimum
significance level chosen is 0.1. It means that only results with a p-value lower than 0.1 will be
considered as statistically significant. Linear models have the following function: Y=bX+constant,
while logarithmic functions have this other function: Y=constant+b*Ln(X).
The third element is a table with information about the level of correlation between the
success indicator and the driving force. Three parameters are shown in the table: 1) The
Spearman coefficient (“correlation coefficient”), 2) the p-value (“sig. 2-tailed”) and 3) the number
of cases of the sample (“N”). Correlation can be measured by two coefficients: Pearson’s
coefficient (for parametric data) and Spearman’s coefficient (for non-parametric data). Since
data may not fit a linear function and consequently they may not have normal distribution and
since the Spearman’s coefficient reduces the probability of obtaining Type I error (false positive),
Spearman correlation analysis has been used. Spearman’s coefficients from 1 to 0.7 will be
considered as high correlation, from 0.7 to 0.5 as medium correlation, from 0.5 to 0.3 as low
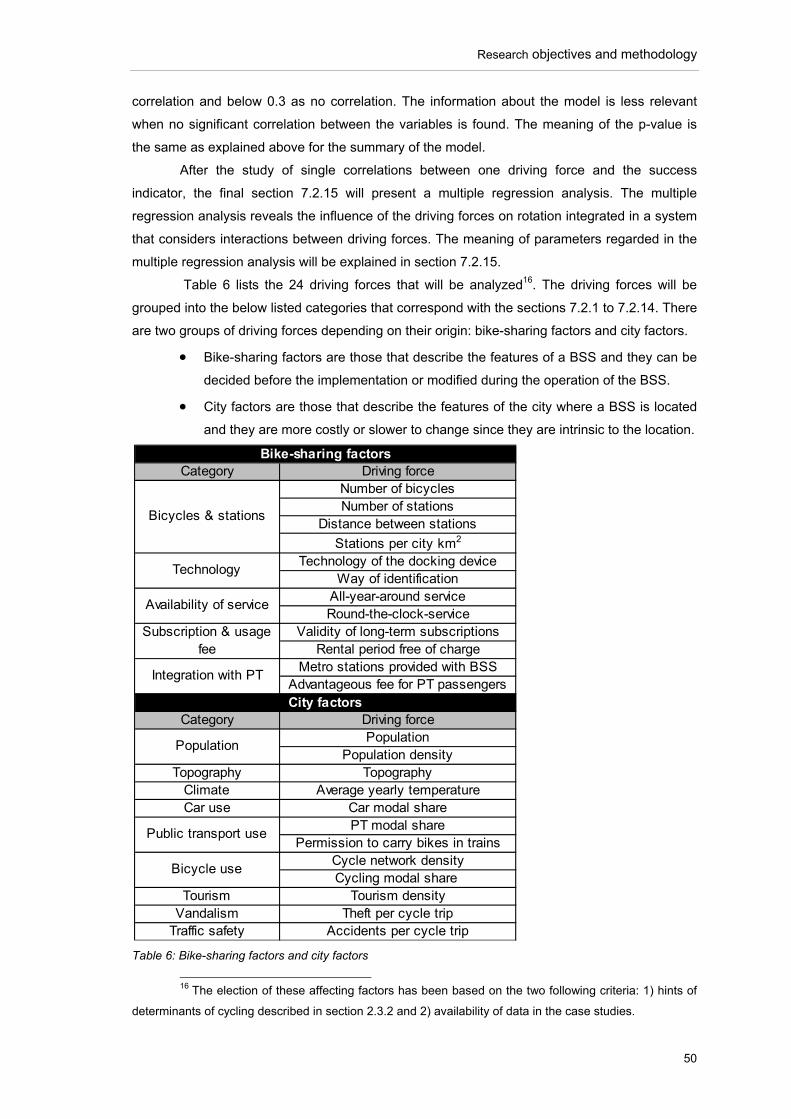
Research objectives and methodology
50
correlation and below 0.3 as no correlation. The information about the model is less relevant
when no significant correlation between the variables is found. The meaning of the p-value is
the same as explained above for the summary of the model.
After the study of single correlations between one driving force and the success
indicator, the final section 7.2.15 will present a multiple regression analysis. The multiple
regression analysis reveals the influence of the driving forces on rotation integrated in a system
that considers interactions between driving forces. The meaning of parameters regarded in the
multiple regression analysis will be explained in section 7.2.15.
Table 6 lists the 24 driving forces that will be analyzed16. The driving forces will be
grouped into the below listed categories that correspond with the sections 7.2.1 to 7.2.14. There
are two groups of driving forces depending on their origin: bike-sharing factors and city factors.
Bike-sharing factors are those that describe the features of a BSS and they can be
decided before the implementation or modified during the operation of the BSS.
City factors are those that describe the features of the city where a BSS is located
and they are more costly or slower to change since they are intrinsic to the location.
Table 6: Bike-sharing factors and city factors
16 The election of these affecting factors has been based on the two following criteria: 1) hints of
determinants of cycling described in section 2.3.2 and 2) availability of data in the case studies.
Category Driving forceNumber of bicyclesNumber of stations
Distance between stations
Stations per city km2
Technology of the docking deviceWay of identification
All-year-around serviceRound-the-clock-service
Validity of long-term subscriptionsRental period free of charge
Metro stations provided with BSSAdvantageous fee for PT passengers
Category Driving forcePopulation
Population densityTopography Topography
Climate Average yearly temperatureCar use Car modal share
PT modal sharePermission to carry bikes in trains
Cycle network densityCycling modal share
Tourism Tourism densityVandalism Theft per cycle trip
Traffic safety Accidents per cycle trip
Bicycle use
Public transport use
Technology
Availability of service
Bike-sharing factors
Bicycles & stations
Subscription & usage fee
City factors
Population
Integration with PT
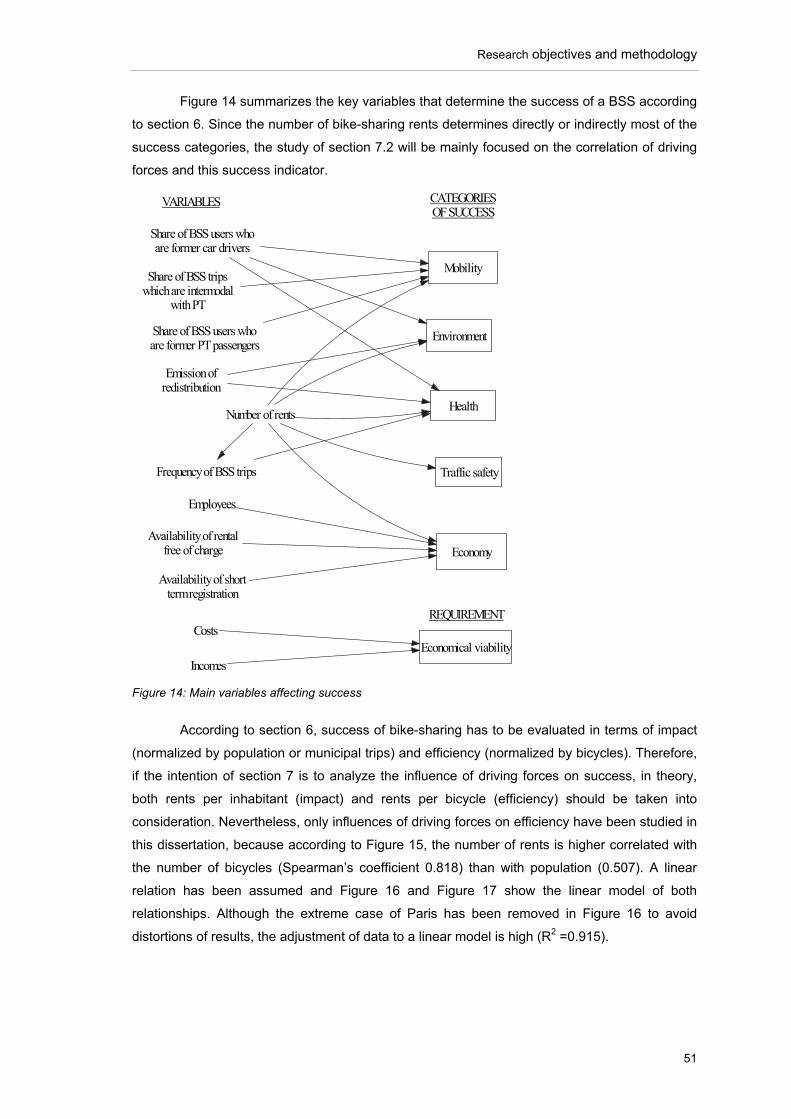
Research objectives and methodology
51
Figure 14 summarizes the key variables that determine the success of a BSS according
to section 6. Since the number of bike-sharing rents determines directly or indirectly most of the
success categories, the study of section 7.2 will be mainly focused on the correlation of driving
forces and this success indicator.
Figure 14: Main variables affecting success
According to section 6, success of bike-sharing has to be evaluated in terms of impact
(normalized by population or municipal trips) and efficiency (normalized by bicycles). Therefore,
if the intention of section 7 is to analyze the influence of driving forces on success, in theory,
both rents per inhabitant (impact) and rents per bicycle (efficiency) should be taken into
consideration. Nevertheless, only influences of driving forces on efficiency have been studied in
this dissertation, because according to Figure 15, the number of rents is higher correlated with
the number of bicycles (Spearman’s coefficient 0.818) than with population (0.507). A linear
relation has been assumed and Figure 16 and Figure 17 show the linear model of both
relationships. Although the extreme case of Paris has been removed in Figure 16 to avoid
distortions of results, the adjustment of data to a linear model is high (R2 =0.915).
Mobility
Share of BSS users whoare former car drivers
Number of rents
Share of BSS tripswhich are intermodal
with PT
Share of BSS users whoare former PT passengers
CATEGORIESOF SUCCESS
VARIABLES
Environment
Frequency of BSS trips
Health
Traffic safety
Economy
Availability of shortterm registration
Availability of rentalfree of charge
Employees
Economical viability
Emission ofredistribution
Costs
Incomes
REQUIREMENT
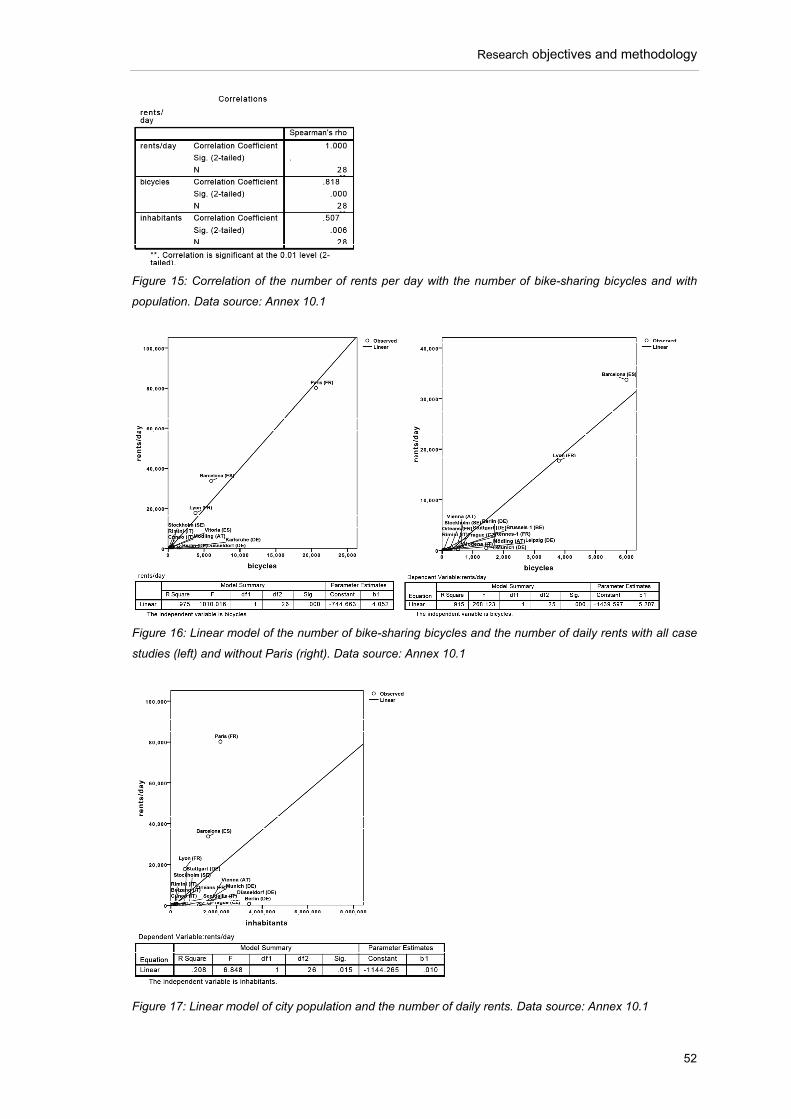
Research objectives and methodology
52
Figure 15: Correlation of the number of rents per day with the number of bike-sharing bicycles and with
population. Data source: Annex 10.1
Figure 16: Linear model of the number of bike-sharing bicycles and the number of daily rents with all case
studies (left) and without Paris (right). Data source: Annex 10.1
Figure 17: Linear model of city population and the number of daily rents. Data source: Annex 10.1
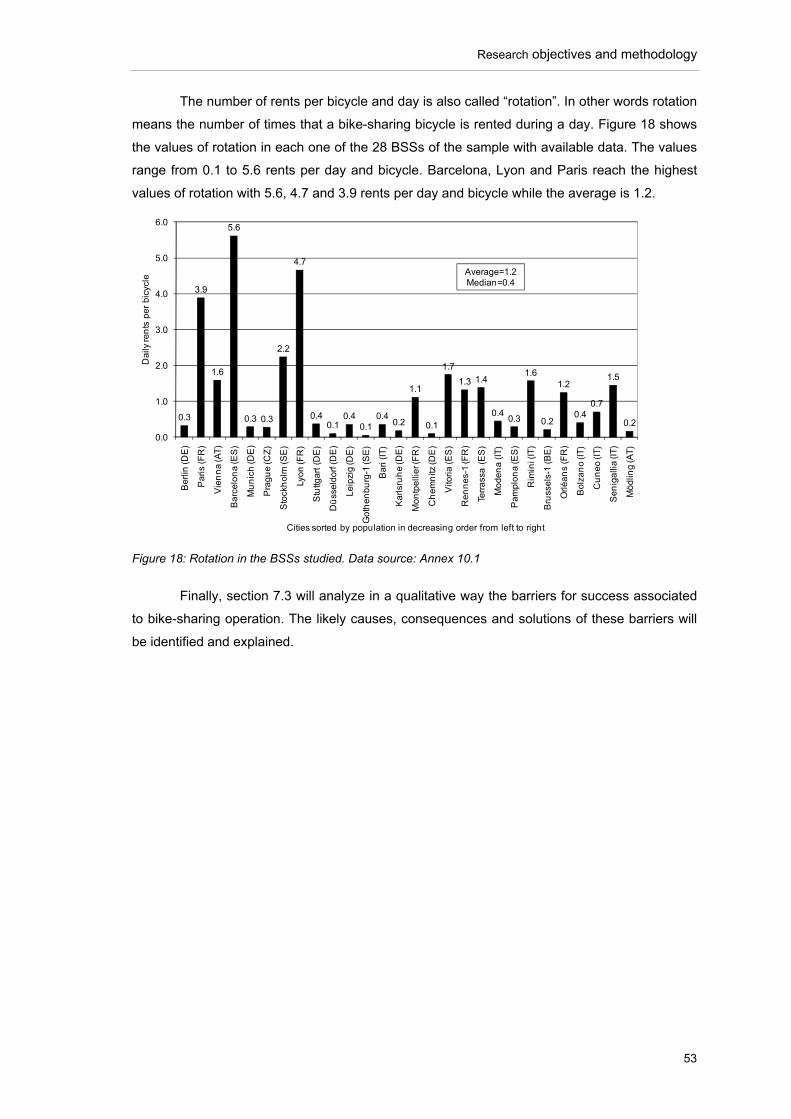
Research objectives and methodology
53
The number of rents per bicycle and day is also called “rotation”. In other words rotation
means the number of times that a bike-sharing bicycle is rented during a day. Figure 18 shows
the values of rotation in each one of the 28 BSSs of the sample with available data. The values
range from 0.1 to 5.6 rents per day and bicycle. Barcelona, Lyon and Paris reach the highest
values of rotation with 5.6, 4.7 and 3.9 rents per day and bicycle while the average is 1.2.
Figure 18: Rotation in the BSSs studied. Data source: Annex 10.1
Finally, section 7.3 will analyze in a qualitative way the barriers for success associated
to bike-sharing operation. The likely causes, consequences and solutions of these barriers will
be identified and explained.
0.3
3.9
1.6
5.6
0.3 0.3
2.2
4.7
0.40.1
0.40.1
0.40.2
1.1
0.1
1.7
1.3 1.4
0.40.3
1.6
0.2
1.2
0.40.7
1.5
0.2
0.0
1.0
2.0
3.0
4.0
5.0
6.0
Be
rlin
(DE
)
Pa
ris
(FR
)
Vie
nn
a (A
T)
Ba
rce
lon
a (E
S)
Mu
nic
h (D
E)
Pra
gu
e (C
Z)
Sto
ckh
olm
(S
E)
Lyo
n (F
R)
Stu
ttga
rt (
DE
)
Dü
sse
ldo
rf (D
E)
Le
ipzi
g (D
E)
Go
the
nb
urg
-1 (S
E)
Ba
ri (
IT)
Ka
rlsr
uh
e (D
E)
Mo
ntp
elli
er (
FR
)
Ch
em
nitz
(DE
)
Vito
ria
(E
S)
Re
nn
es-
1 (F
R)
Terr
ass
a (
ES
)
Mo
de
na
(IT
)
Pa
mp
lon
a (E
S)
Rim
ini (
IT)
Bru
sse
ls-1
(B
E)
Orl
éa
ns
(FR
)
Bo
lza
no
(IT
)
Cu
ne
o (I
T)
Se
nig
alli
a (I
T)
Mö
dlin
g (A
T)
Da
ily re
nts
pe
r b
icyc
le
Cities sorted by population in decreasing order from left to right
Average=1.2Median=0.4
Case studies
54
4 CASE STUDIES
As section 2.4.4 has explained, more than 300 European cities were provided with a
BSS in 2009. A sample of 51 BSSs located in 48 cities from 10 different countries was selected
by the EU-project OBIS as case studies to investigate the optimisation of bike-sharing. This
dissertation adopts the same list of case studies as sample. The high number of case studies
and their diversity offers a wide and representative overview of the bike-sharing reality in
Europe.
Numerous available data from the 51 selected cases studies have been collected and
processed in this dissertation to analyze the success of BSSs in terms of sustainability (section
6) and the influence of factors affecting this success (section 7). Table 7 shows the main
features of the BSSs selected. As it can be observed, the 48 cities studied belong to the
following ten countries: Austria, Belgium, Czech Republic, France, Italy, Germany, Italy, Poland,
Spain, Sweden, and United Kingdom. Italy with eleven schemes, France with eight, Spain and
Germany with seven BSSs are the countries with a higher representation in the sample.
In each city only one BSS was analyzed, with the exception of Rennes, Gothenburg
and Brussels, where two schemes were studied. In Rennes and Brussels two BSSs were
analyzed because during the research one of them was closed and substituted by a new one,
while in Gothenburg both BSSs operate at the same time17 (Robert 2009a; Robert & Richard
2009; Petersen & Robèrt 2009).
Only two BSSs of the list of case studies were introduced in the 20th century,
Cyklestaden in Gothenburg in 1978 and Vélo a la Carte in Rennes in 1998. In contrast, the
other 49 systems were implemented in the 21st century. The most modern BSSs of the list were
introduced in 2009 in Rennes and Brussels.
Apart from Vélo a la Carte and Cyclocity, the schemes located Rennes and Brussels
respectively, other two BSSs studied in this research are currently closed and do not operate
anymore. They are Freiradl in Mödling and Oybike in London. Both were substituted by
upgraded BSSs (Castro & Emberger 2009; Williamson 2009a).
Regarding the number of available bicycles, the list of case studies shows the wide
variety of models that the selected sample contains. The largest BSS, Vélib’ in Paris, offer
20,600 bicycles. Other relevant BSSs in terms of size of bicycle fleet are Bicing in Barcelona
with 6,000 and Vélo’v in Lyon with 3,800 bicycles.
These case studies are described in more detail through the characterisation of their
elements in section 5.
17 BSSs located in cities where more than one BSS operate or have operated are named with the
number 1 and 2. For instance: Rennes-1 and Rennes-2.
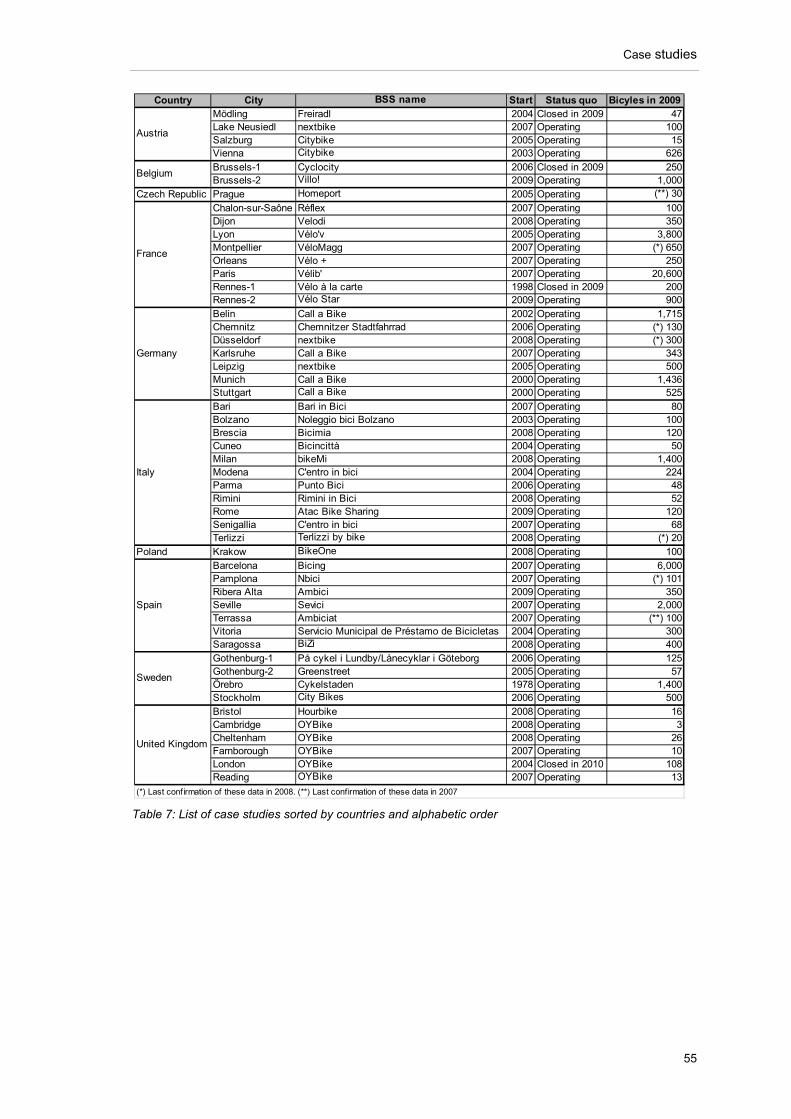
Case studies
55
Table 7: List of case studies sorted by countries and alphabetic order
Country City BSS name Start Status quo Bicyles in 2009Mödling Freiradl 2004 Closed in 2009 47Lake Neusiedl nextbike 2007 Operating 100Salzburg Citybike 2005 Operating 15Vienna Citybike 2003 Operating 626Brussels-1 Cyclocity 2006 Closed in 2009 250Brussels-2 Villo! 2009 Operating 1,000
Czech Republic Prague Homeport 2005 Operating (**) 30
Chalon-sur-Saône Réflex 2007 Operating 100Dijon Velodi 2008 Operating 350Lyon Vélo'v 2005 Operating 3,800Montpellier VéloMagg 2007 Operating (*) 650Orleans Vélo + 2007 Operating 250Paris Vélib' 2007 Operating 20,600Rennes-1 Vélo à la carte 1998 Closed in 2009 200Rennes-2 Vélo Star 2009 Operating 900Belin Call a Bike 2002 Operating 1,715Chemnitz Chemnitzer Stadtfahrrad 2006 Operating (*) 130Düsseldorf nextbike 2008 Operating (*) 300Karlsruhe Call a Bike 2007 Operating 343Leipzig nextbike 2005 Operating 500Munich Call a Bike 2000 Operating 1,436Stuttgart Call a Bike 2000 Operating 525Bari Bari in Bici 2007 Operating 80Bolzano Noleggio bici Bolzano 2003 Operating 100Brescia Bicimia 2008 Operating 120Cuneo Bicincittà 2004 Operating 50Milan bikeMi 2008 Operating 1,400Modena C'entro in bici 2004 Operating 224Parma Punto Bici 2006 Operating 48Rimini Rimini in Bici 2008 Operating 52Rome Atac Bike Sharing 2009 Operating 120Senigallia C'entro in bici 2007 Operating 68Terlizzi Terlizzi by bike 2008 Operating (*) 20
Poland Krakow BikeOne 2008 Operating 100Barcelona Bicing 2007 Operating 6,000Pamplona Nbici 2007 Operating (*) 101Ribera Alta Ambici 2009 Operating 350Seville Sevici 2007 Operating 2,000Terrassa Ambiciat 2007 Operating (**) 100Vitoria Servicio Municipal de Préstamo de Bicicletas 2004 Operating 300Saragossa BiZi 2008 Operating 400Gothenburg-1 På cykel i Lundby/Lånecyklar i Göteborg 2006 Operating 125Gothenburg-2 Greenstreet 2005 Operating 57Örebro Cykelstaden 1978 Operating 1,400Stockholm City Bikes 2006 Operating 500Bristol Hourbike 2008 Operating 16Cambridge OYBike 2008 Operating 3Cheltenham OYBike 2008 Operating 26Farnborough OYBike 2007 Operating 10London OYBike 2004 Closed in 2010 108Reading OYBike 2007 Operating 13
(*) Last confirmation of these data in 2008. (**) Last confirmation of these data in 2007
Austria
Belgium
France
Germany
Italy
Spain
Sweden
United Kingdom
Elements and variants
56
5 ELEMENTS AND VARIANTS
5.1 Introduction
Bike-sharing has not the same appearance everywhere. A wide diversity of BSSs is
currently operating all around Europe and BSSs can be totally different from one city to another.
The aim of this chapter is, 1) to explain how BSSs work from an operational and organisational
perspective, 2) to describe the case studies and the elements that compose the schemes, 3) to
present the likely variants of these elements and 4) to show the proportion of each variant in the
existing bike-sharing market.
From an operative point of view, section 5.2 will explain what users have to be aware
before using the system for the first time. After the previous obligations, section 5.3 will describe
the tangible infrastructure that enables users to recognise and access the service. The periods
of time when BSSs are operative and opened to customers will be described in section 5.4.
The rental procedure as well as conditions concerning the usage of bike-sharing bicycles will be
described in section 5.5. Finally, obligations after a bicycle rent, such as payment of fees, will be
described in section 5.6. From an organisational point of view the different stakeholders and
roles in bike-sharing management will be presented in section 5.7.
5.2 Registration
Before using a bike sharing service for the first time, customers can be obligated to
become members of the BSSs through the fulfilment of a registration. The main goal of
registrations is to provide operators with a way of contact with customers for charging fees or
fines. Data of customers for statistical purposes as well as signed acceptance of usage
conditions are also registered by mean of registrations. The data to be fulfilled in registration
forms depend on the BSS, but some of the most usual ones are shown below:
Contact data, e.g. name, post address, e-mail address and telephone number.
Other personal data for statistical purposes, like e.g. gender or birthday.
A username and a password to unlock the bicycle or to have access to the personal
website profile.
Way of payment selected for subscription fee and usage fee (when several options
are available) as well as bank data (when a bank payment is available).
The approval of usage and payment conditions to enforce the contract between
operator and customer.
When the form is fulfilled, it has to be delivered. While some BSSs require registrations
in person, either in a bike-sharing office or in a bike-sharing station, others allow sending the
form by Internet, telephone or post. Some BSSs combine both possibilities and allow pre-
registration online but the registration has to be confirmed in a bike-sharing station.
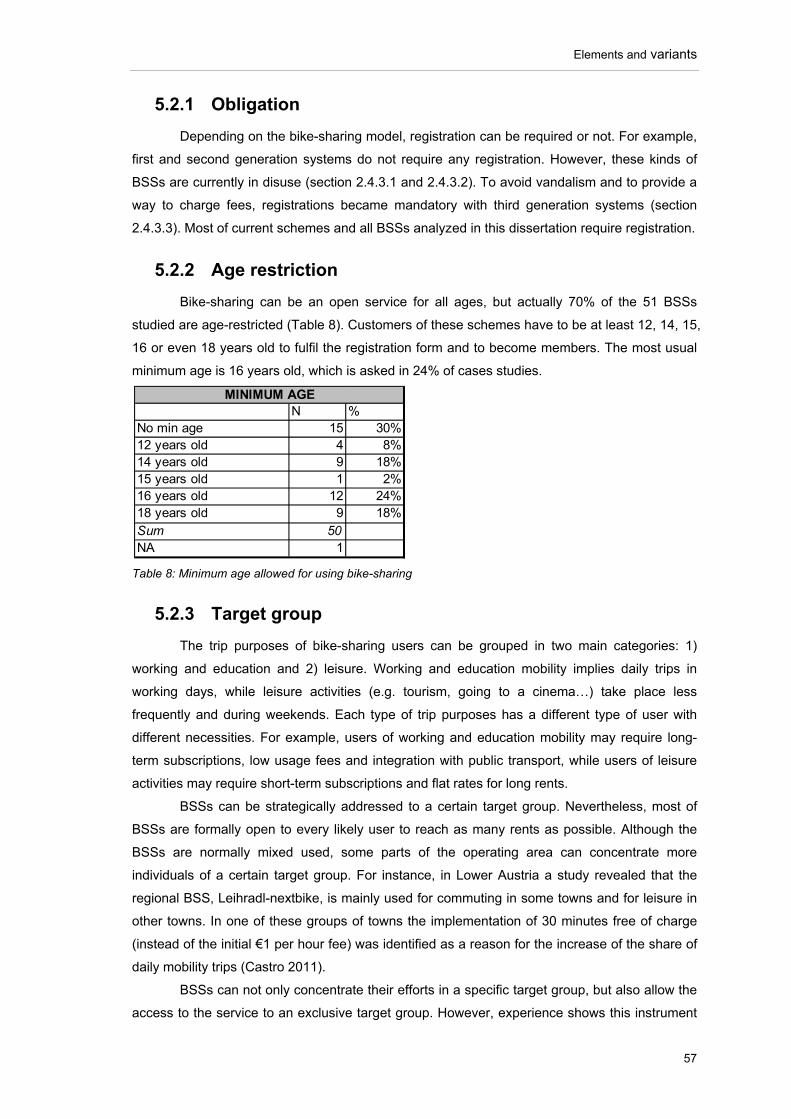
Elements and variants
57
5.2.1 Obligation
Depending on the bike-sharing model, registration can be required or not. For example,
first and second generation systems do not require any registration. However, these kinds of
BSSs are currently in disuse (section 2.4.3.1 and 2.4.3.2). To avoid vandalism and to provide a
way to charge fees, registrations became mandatory with third generation systems (section
2.4.3.3). Most of current schemes and all BSSs analyzed in this dissertation require registration.
5.2.2 Age restriction
Bike-sharing can be an open service for all ages, but actually 70% of the 51 BSSs
studied are age-restricted (Table 8). Customers of these schemes have to be at least 12, 14, 15,
16 or even 18 years old to fulfil the registration form and to become members. The most usual
minimum age is 16 years old, which is asked in 24% of cases studies.
Table 8: Minimum age allowed for using bike-sharing
5.2.3 Target group
The trip purposes of bike-sharing users can be grouped in two main categories: 1)
working and education and 2) leisure. Working and education mobility implies daily trips in
working days, while leisure activities (e.g. tourism, going to a cinema…) take place less
frequently and during weekends. Each type of trip purposes has a different type of user with
different necessities. For example, users of working and education mobility may require long-
term subscriptions, low usage fees and integration with public transport, while users of leisure
activities may require short-term subscriptions and flat rates for long rents.
BSSs can be strategically addressed to a certain target group. Nevertheless, most of
BSSs are formally open to every likely user to reach as many rents as possible. Although the
BSSs are normally mixed used, some parts of the operating area can concentrate more
individuals of a certain target group. For instance, in Lower Austria a study revealed that the
regional BSS, Leihradl-nextbike, is mainly used for commuting in some towns and for leisure in
other towns. In one of these groups of towns the implementation of 30 minutes free of charge
(instead of the initial €1 per hour fee) was identified as a reason for the increase of the share of
daily mobility trips (Castro 2011).
BSSs can not only concentrate their efforts in a specific target group, but also allow the
access to the service to an exclusive target group. However, experience shows this instrument
N %No min age 15 30%12 years old 4 8%14 years old 9 18%15 years old 1 2%16 years old 12 24%18 years old 9 18%Sum 50NA 1
MINIMUM AGE
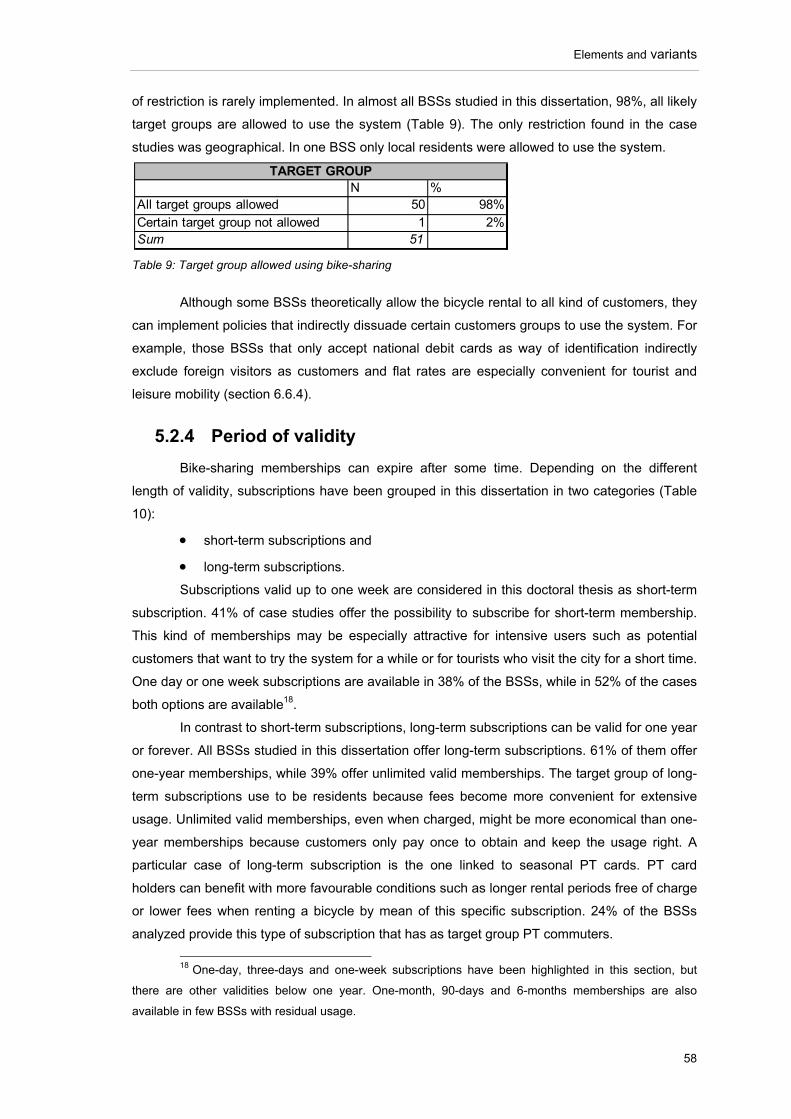
Elements and variants
58
of restriction is rarely implemented. In almost all BSSs studied in this dissertation, 98%, all likely
target groups are allowed to use the system (Table 9). The only restriction found in the case
studies was geographical. In one BSS only local residents were allowed to use the system.
Table 9: Target group allowed using bike-sharing
Although some BSSs theoretically allow the bicycle rental to all kind of customers, they
can implement policies that indirectly dissuade certain customers groups to use the system. For
example, those BSSs that only accept national debit cards as way of identification indirectly
exclude foreign visitors as customers and flat rates are especially convenient for tourist and
leisure mobility (section 6.6.4).
5.2.4 Period of validity
Bike-sharing memberships can expire after some time. Depending on the different
length of validity, subscriptions have been grouped in this dissertation in two categories (Table
10):
short-term subscriptions and
long-term subscriptions.
Subscriptions valid up to one week are considered in this doctoral thesis as short-term
subscription. 41% of case studies offer the possibility to subscribe for short-term membership.
This kind of memberships may be especially attractive for intensive users such as potential
customers that want to try the system for a while or for tourists who visit the city for a short time.
One day or one week subscriptions are available in 38% of the BSSs, while in 52% of the cases
both options are available18.
In contrast to short-term subscriptions, long-term subscriptions can be valid for one year
or forever. All BSSs studied in this dissertation offer long-term subscriptions. 61% of them offer
one-year memberships, while 39% offer unlimited valid memberships. The target group of long-
term subscriptions use to be residents because fees become more convenient for extensive
usage. Unlimited valid memberships, even when charged, might be more economical than one-
year memberships because customers only pay once to obtain and keep the usage right. A
particular case of long-term subscription is the one linked to seasonal PT cards. PT card
holders can benefit with more favourable conditions such as longer rental periods free of charge
or lower fees when renting a bicycle by mean of this specific subscription. 24% of the BSSs
analyzed provide this type of subscription that has as target group PT commuters.
18 One-day, three-days and one-week subscriptions have been highlighted in this section, but
there are other validities below one year. One-month, 90-days and 6-months memberships are also
available in few BSSs with residual usage.
N %All target groups allowed 50 98%Certain target group not allowed 1 2%Sum 51
TARGET GROUP
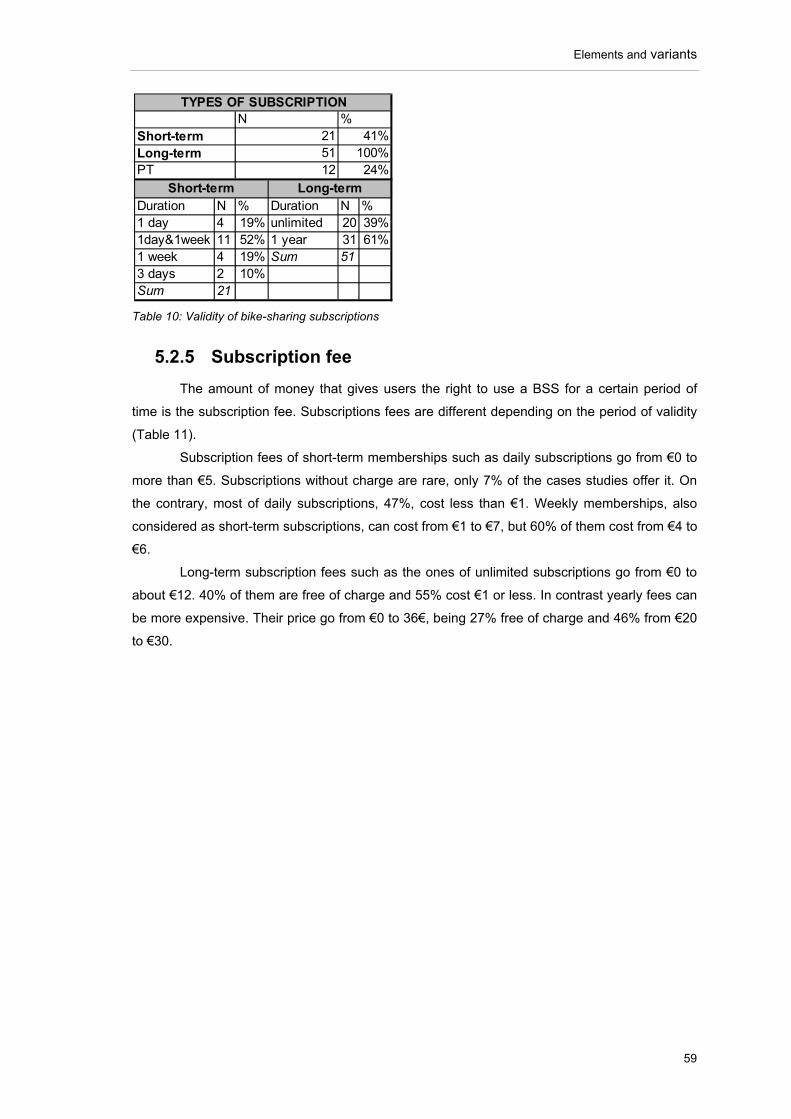
Elements and variants
59
Table 10: Validity of bike-sharing subscriptions
5.2.5 Subscription fee
The amount of money that gives users the right to use a BSS for a certain period of
time is the subscription fee. Subscriptions fees are different depending on the period of validity
(Table 11).
Subscription fees of short-term memberships such as daily subscriptions go from €0 to
more than €5. Subscriptions without charge are rare, only 7% of the cases studies offer it. On
the contrary, most of daily subscriptions, 47%, cost less than €1. Weekly memberships, also
considered as short-term subscriptions, can cost from €1 to €7, but 60% of them cost from €4 to
€6.
Long-term subscription fees such as the ones of unlimited subscriptions go from €0 to
about €12. 40% of them are free of charge and 55% cost €1 or less. In contrast yearly fees can
be more expensive. Their price go from €0 to 36€, being 27% free of charge and 46% from €20
to €30.
Duration N % Duration N %1 day 4 19% unlimited 20 39%1day&1week 11 52% 1 year 31 61%1 week 4 19% Sum 513 days 2 10%Sum 21
%41%
100%24%
5112
Long-termShort-term
TYPES OF SUBSCRIPTION
Short-termLong-termPT
N21
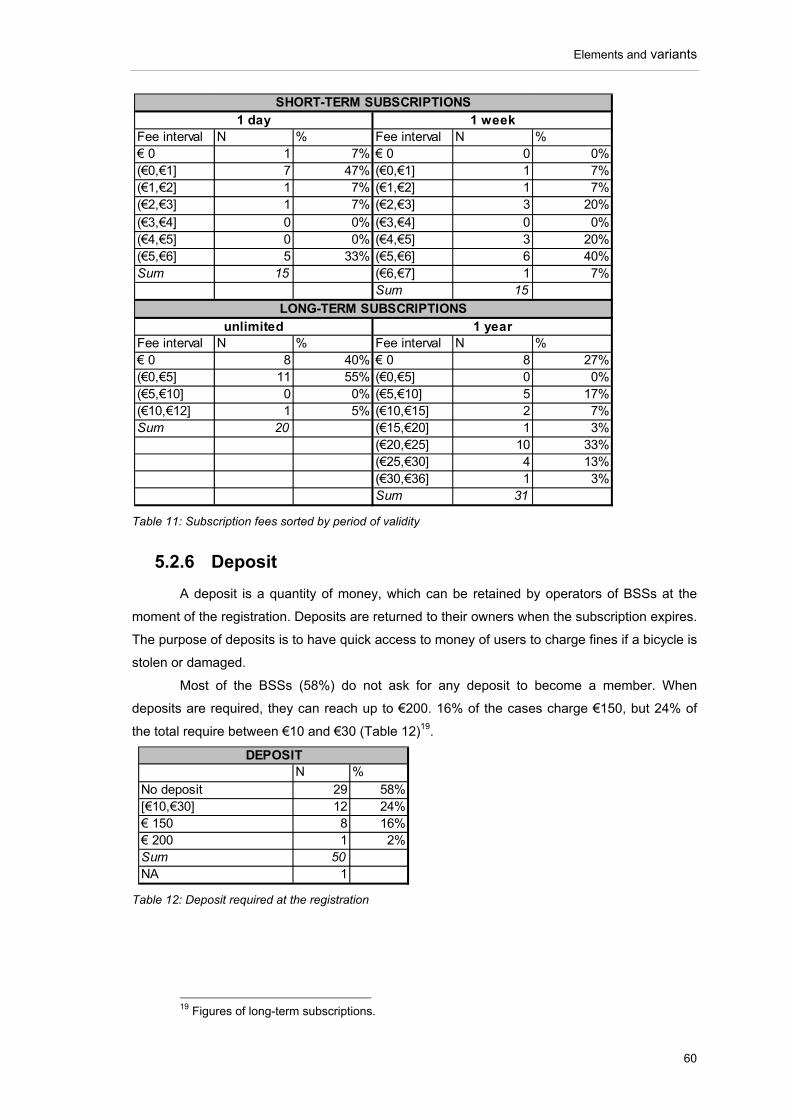
Elements and variants
60
Table 11: Subscription fees sorted by period of validity
5.2.6 Deposit
A deposit is a quantity of money, which can be retained by operators of BSSs at the
moment of the registration. Deposits are returned to their owners when the subscription expires.
The purpose of deposits is to have quick access to money of users to charge fines if a bicycle is
stolen or damaged.
Most of the BSSs (58%) do not ask for any deposit to become a member. When
deposits are required, they can reach up to €200. 16% of the cases charge €150, but 24% of
the total require between €10 and €30 (Table 12)19.
Table 12: Deposit required at the registration
19 Figures of long-term subscriptions.
Fee interval N % Fee interval N %€ 0 1 7% € 0 0 0%(€0,€1] 7 47% (€0,€1] 1 7%(€1,€2] 1 7% (€1,€2] 1 7%(€2,€3] 1 7% (€2,€3] 3 20%(€3,€4] 0 0% (€3,€4] 0 0%(€4,€5] 0 0% (€4,€5] 3 20%(€5,€6] 5 33% (€5,€6] 6 40%Sum 15 (€6,€7] 1 7%
Sum 15
Fee interval N % Fee interval N %€ 0 8 40% € 0 8 27%(€0,€5] 11 55% (€0,€5] 0 0%(€5,€10] 0 0% (€5,€10] 5 17%(€10,€12] 1 5% (€10,€15] 2 7%Sum 20 (€15,€20] 1 3%
(€20,€25] 10 33%(€25,€30] 4 13%(€30,€36] 1 3%Sum 31
LONG-TERM SUBSCRIPTIONS
SHORT-TERM SUBSCRIPTIONS1 day 1 week
unlimited 1 year
N %No deposit 29 58%[€10,€30] 12 24%€ 150 8 16%€ 200 1 2%Sum 50NA 1
DEPOSIT
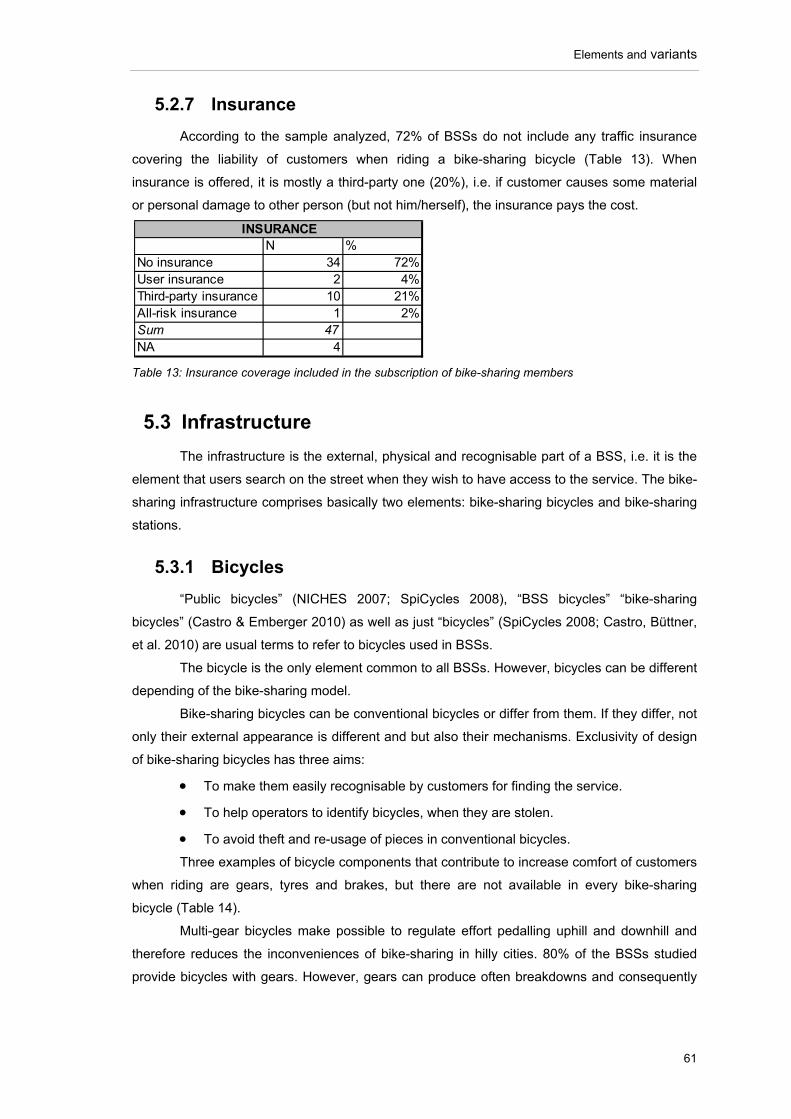
Elements and variants
61
5.2.7 Insurance
According to the sample analyzed, 72% of BSSs do not include any traffic insurance
covering the liability of customers when riding a bike-sharing bicycle (Table 13). When
insurance is offered, it is mostly a third-party one (20%), i.e. if customer causes some material
or personal damage to other person (but not him/herself), the insurance pays the cost.
Table 13: Insurance coverage included in the subscription of bike-sharing members
5.3 Infrastructure
The infrastructure is the external, physical and recognisable part of a BSS, i.e. it is the
element that users search on the street when they wish to have access to the service. The bike-
sharing infrastructure comprises basically two elements: bike-sharing bicycles and bike-sharing
stations.
5.3.1 Bicycles
“Public bicycles” (NICHES 2007; SpiCycles 2008), “BSS bicycles” “bike-sharing
bicycles” (Castro & Emberger 2010) as well as just “bicycles” (SpiCycles 2008; Castro, Büttner,
et al. 2010) are usual terms to refer to bicycles used in BSSs.
The bicycle is the only element common to all BSSs. However, bicycles can be different
depending of the bike-sharing model.
Bike-sharing bicycles can be conventional bicycles or differ from them. If they differ, not
only their external appearance is different and but also their mechanisms. Exclusivity of design
of bike-sharing bicycles has three aims:
To make them easily recognisable by customers for finding the service.
To help operators to identify bicycles, when they are stolen.
To avoid theft and re-usage of pieces in conventional bicycles.
Three examples of bicycle components that contribute to increase comfort of customers
when riding are gears, tyres and brakes, but there are not available in every bike-sharing
bicycle (Table 14).
Multi-gear bicycles make possible to regulate effort pedalling uphill and downhill and
therefore reduces the inconveniences of bike-sharing in hilly cities. 80% of the BSSs studied
provide bicycles with gears. However, gears can produce often breakdowns and consequently
N %No insurance 34 72%User insurance 2 4%Third-party insurance 10 21%All-risk insurance 1 2%Sum 47NA 4
INSURANCE
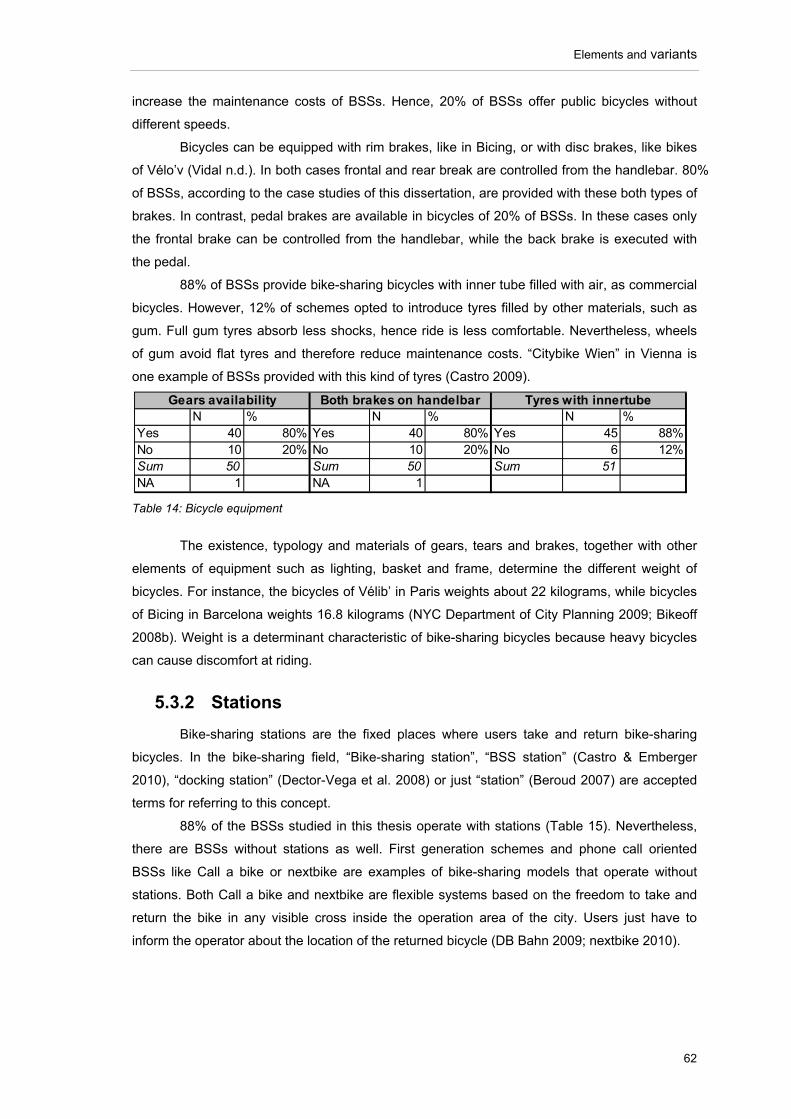
Elements and variants
62
increase the maintenance costs of BSSs. Hence, 20% of BSSs offer public bicycles without
different speeds.
Bicycles can be equipped with rim brakes, like in Bicing, or with disc brakes, like bikes
of Vélo’v (Vidal n.d.). In both cases frontal and rear break are controlled from the handlebar. 80%
of BSSs, according to the case studies of this dissertation, are provided with these both types of
brakes. In contrast, pedal brakes are available in bicycles of 20% of BSSs. In these cases only
the frontal brake can be controlled from the handlebar, while the back brake is executed with
the pedal.
88% of BSSs provide bike-sharing bicycles with inner tube filled with air, as commercial
bicycles. However, 12% of schemes opted to introduce tyres filled by other materials, such as
gum. Full gum tyres absorb less shocks, hence ride is less comfortable. Nevertheless, wheels
of gum avoid flat tyres and therefore reduce maintenance costs. “Citybike Wien” in Vienna is
one example of BSSs provided with this kind of tyres (Castro 2009).
Table 14: Bicycle equipment
The existence, typology and materials of gears, tears and brakes, together with other
elements of equipment such as lighting, basket and frame, determine the different weight of
bicycles. For instance, the bicycles of Vélib’ in Paris weights about 22 kilograms, while bicycles
of Bicing in Barcelona weights 16.8 kilograms (NYC Department of City Planning 2009; Bikeoff
2008b). Weight is a determinant characteristic of bike-sharing bicycles because heavy bicycles
can cause discomfort at riding.
5.3.2 Stations
Bike-sharing stations are the fixed places where users take and return bike-sharing
bicycles. In the bike-sharing field, “Bike-sharing station”, “BSS station” (Castro & Emberger
2010), “docking station” (Dector-Vega et al. 2008) or just “station” (Beroud 2007) are accepted
terms for referring to this concept.
88% of the BSSs studied in this thesis operate with stations (Table 15). Nevertheless,
there are BSSs without stations as well. First generation schemes and phone call oriented
BSSs like Call a bike or nextbike are examples of bike-sharing models that operate without
stations. Both Call a bike and nextbike are flexible systems based on the freedom to take and
return the bike in any visible cross inside the operation area of the city. Users just have to
inform the operator about the location of the returned bicycle (DB Bahn 2009; nextbike 2010).
N % N % N %Yes 40 80% Yes 40 80% Yes 45 88%No 10 20% No 10 20% No 6 12%Sum 50 Sum 50 Sum 51NA 1 NA 1
Gears availability Both brakes on handelbar Tyres with innertube
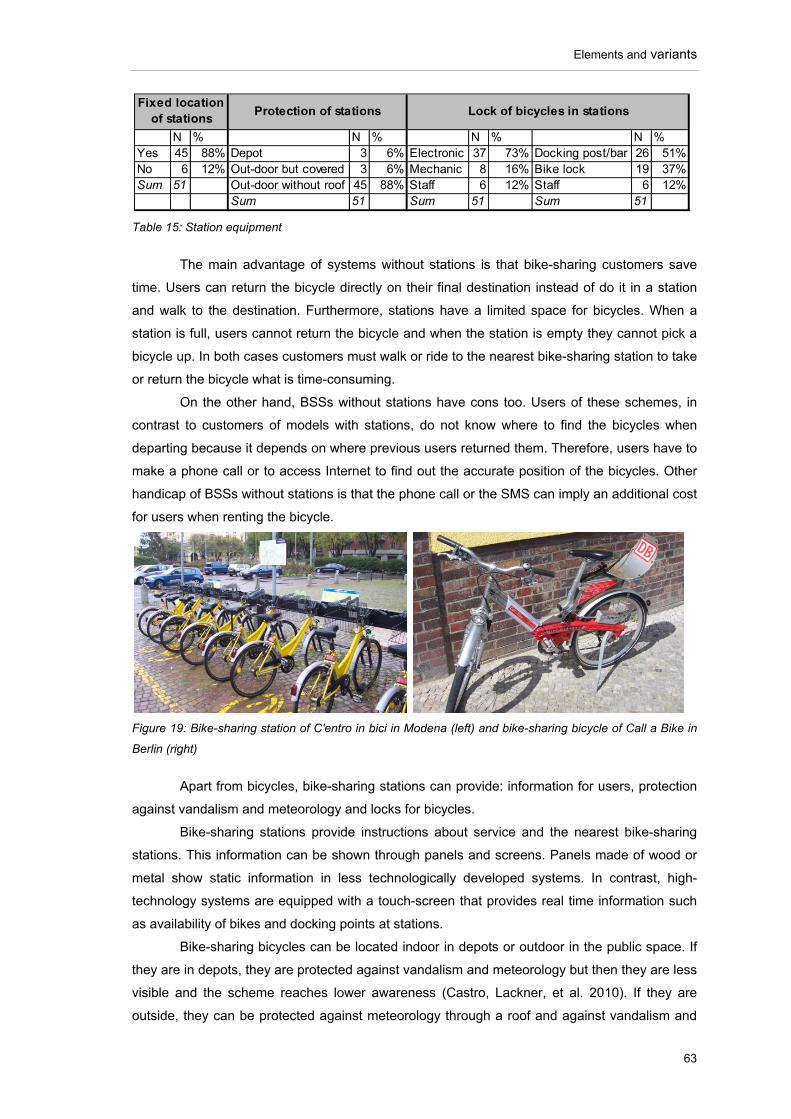
Elements and variants
63
Table 15: Station equipment
The main advantage of systems without stations is that bike-sharing customers save
time. Users can return the bicycle directly on their final destination instead of do it in a station
and walk to the destination. Furthermore, stations have a limited space for bicycles. When a
station is full, users cannot return the bicycle and when the station is empty they cannot pick a
bicycle up. In both cases customers must walk or ride to the nearest bike-sharing station to take
or return the bicycle what is time-consuming.
On the other hand, BSSs without stations have cons too. Users of these schemes, in
contrast to customers of models with stations, do not know where to find the bicycles when
departing because it depends on where previous users returned them. Therefore, users have to
make a phone call or to access Internet to find out the accurate position of the bicycles. Other
handicap of BSSs without stations is that the phone call or the SMS can imply an additional cost
for users when renting the bicycle.
Figure 19: Bike-sharing station of C'entro in bici in Modena (left) and bike-sharing bicycle of Call a Bike in
Berlin (right)
Apart from bicycles, bike-sharing stations can provide: information for users, protection
against vandalism and meteorology and locks for bicycles.
Bike-sharing stations provide instructions about service and the nearest bike-sharing
stations. This information can be shown through panels and screens. Panels made of wood or
metal show static information in less technologically developed systems. In contrast, high-
technology systems are equipped with a touch-screen that provides real time information such
as availability of bikes and docking points at stations.
Bike-sharing bicycles can be located indoor in depots or outdoor in the public space. If
they are in depots, they are protected against vandalism and meteorology but then they are less
visible and the scheme reaches lower awareness (Castro, Lackner, et al. 2010). If they are
outside, they can be protected against meteorology through a roof and against vandalism and
N % N % N % N %Yes 45 88% Depot 3 6% Electronic 37 73% Docking post/bar 26 51%No 6 12% Out-door but covered 3 6% Mechanic 8 16% Bike lock 19 37%Sum 51 Out-door without roof 45 88% Staff 6 12% Staff 6 12%
Sum 51 Sum 51 Sum 51
Protection of stationsFixed location
of stationsLock of bicycles in stations
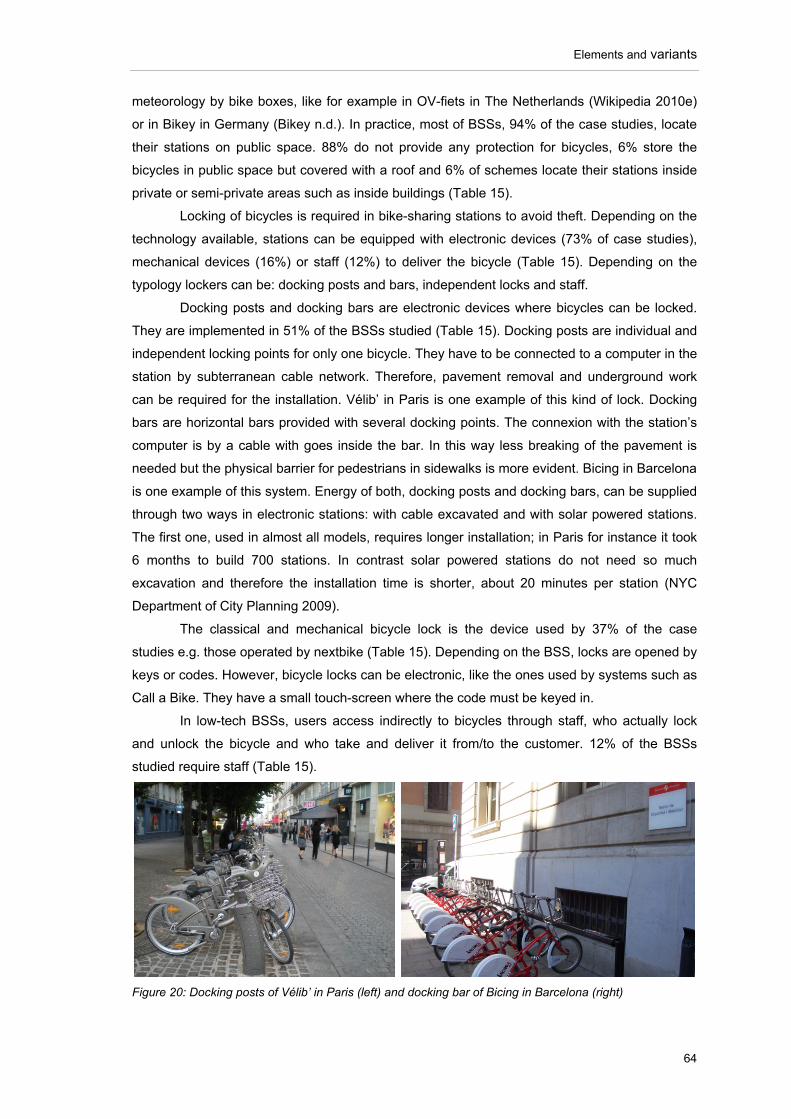
Elements and variants
64
meteorology by bike boxes, like for example in OV-fiets in The Netherlands (Wikipedia 2010e)
or in Bikey in Germany (Bikey n.d.). In practice, most of BSSs, 94% of the case studies, locate
their stations on public space. 88% do not provide any protection for bicycles, 6% store the
bicycles in public space but covered with a roof and 6% of schemes locate their stations inside
private or semi-private areas such as inside buildings (Table 15).
Locking of bicycles is required in bike-sharing stations to avoid theft. Depending on the
technology available, stations can be equipped with electronic devices (73% of case studies),
mechanical devices (16%) or staff (12%) to deliver the bicycle (Table 15). Depending on the
typology lockers can be: docking posts and bars, independent locks and staff.
Docking posts and docking bars are electronic devices where bicycles can be locked.
They are implemented in 51% of the BSSs studied (Table 15). Docking posts are individual and
independent locking points for only one bicycle. They have to be connected to a computer in the
station by subterranean cable network. Therefore, pavement removal and underground work
can be required for the installation. Vélib’ in Paris is one example of this kind of lock. Docking
bars are horizontal bars provided with several docking points. The connexion with the station’s
computer is by a cable with goes inside the bar. In this way less breaking of the pavement is
needed but the physical barrier for pedestrians in sidewalks is more evident. Bicing in Barcelona
is one example of this system. Energy of both, docking posts and docking bars, can be supplied
through two ways in electronic stations: with cable excavated and with solar powered stations.
The first one, used in almost all models, requires longer installation; in Paris for instance it took
6 months to build 700 stations. In contrast solar powered stations do not need so much
excavation and therefore the installation time is shorter, about 20 minutes per station (NYC
Department of City Planning 2009).
The classical and mechanical bicycle lock is the device used by 37% of the case
studies e.g. those operated by nextbike (Table 15). Depending on the BSS, locks are opened by
keys or codes. However, bicycle locks can be electronic, like the ones used by systems such as
Call a Bike. They have a small touch-screen where the code must be keyed in.
In low-tech BSSs, users access indirectly to bicycles through staff, who actually lock
and unlock the bicycle and who take and deliver it from/to the customer. 12% of the BSSs
studied require staff (Table 15).
Figure 20: Docking posts of Vélib’ in Paris (left) and docking bar of Bicing in Barcelona (right)
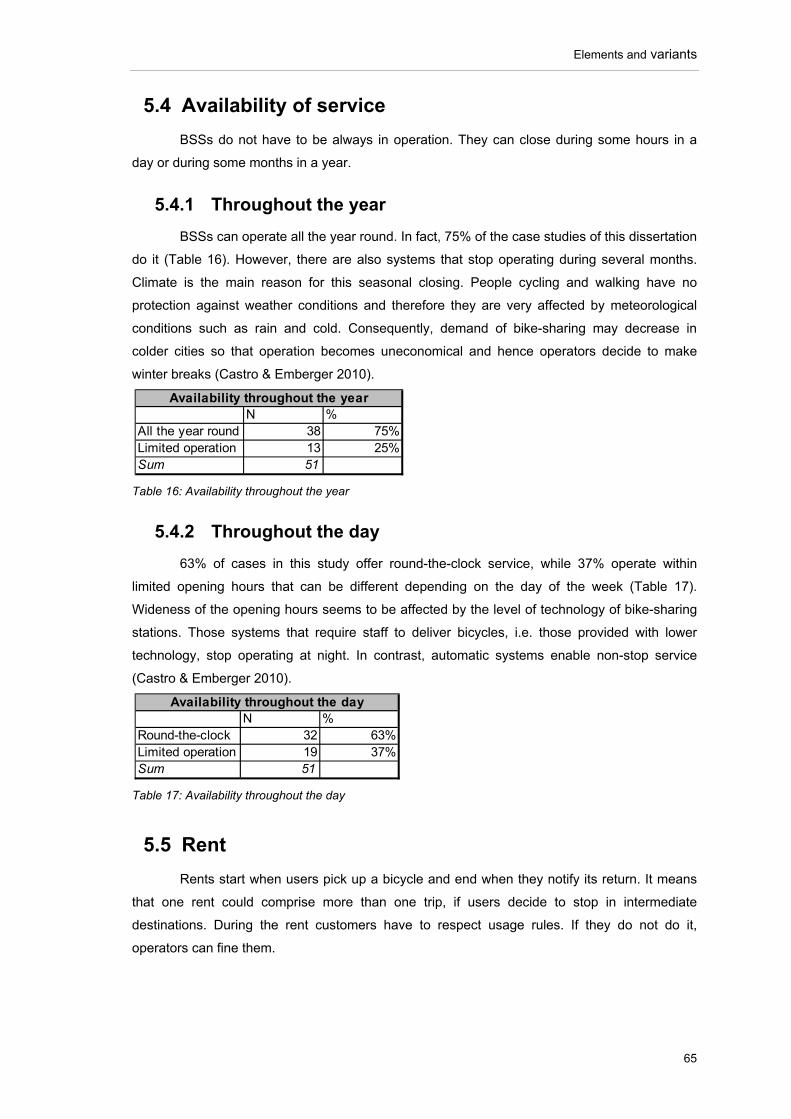
Elements and variants
65
5.4 Availability of service
BSSs do not have to be always in operation. They can close during some hours in a
day or during some months in a year.
5.4.1 Throughout the year
BSSs can operate all the year round. In fact, 75% of the case studies of this dissertation
do it (Table 16). However, there are also systems that stop operating during several months.
Climate is the main reason for this seasonal closing. People cycling and walking have no
protection against weather conditions and therefore they are very affected by meteorological
conditions such as rain and cold. Consequently, demand of bike-sharing may decrease in
colder cities so that operation becomes uneconomical and hence operators decide to make
winter breaks (Castro & Emberger 2010).
Table 16: Availability throughout the year
5.4.2 Throughout the day
63% of cases in this study offer round-the-clock service, while 37% operate within
limited opening hours that can be different depending on the day of the week (Table 17).
Wideness of the opening hours seems to be affected by the level of technology of bike-sharing
stations. Those systems that require staff to deliver bicycles, i.e. those provided with lower
technology, stop operating at night. In contrast, automatic systems enable non-stop service
(Castro & Emberger 2010).
Table 17: Availability throughout the day
5.5 Rent
Rents start when users pick up a bicycle and end when they notify its return. It means
that one rent could comprise more than one trip, if users decide to stop in intermediate
destinations. During the rent customers have to respect usage rules. If they do not do it,
operators can fine them.
N %All the year round 38 75%Limited operation 13 25%Sum 51
Availability throughout the year
N %Round-the-clock 32 63%Limited operation 19 37%Sum 51
Availability throughout the day
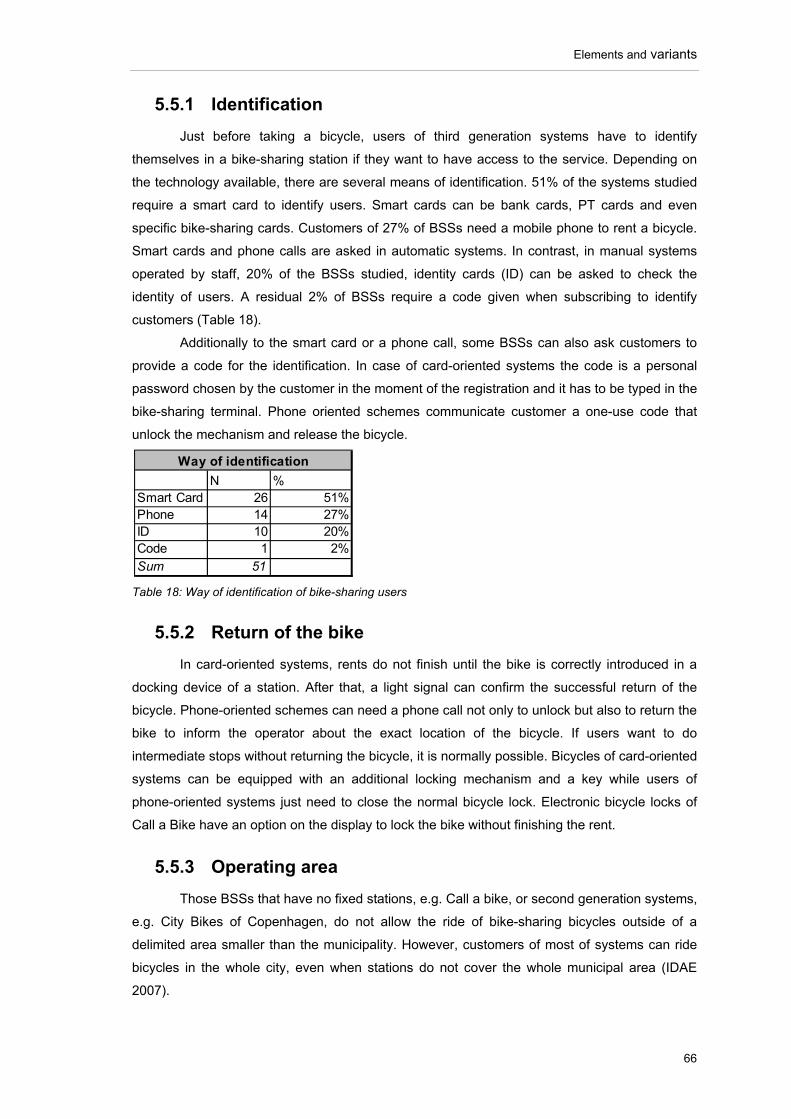
Elements and variants
66
5.5.1 Identification
Just before taking a bicycle, users of third generation systems have to identify
themselves in a bike-sharing station if they want to have access to the service. Depending on
the technology available, there are several means of identification. 51% of the systems studied
require a smart card to identify users. Smart cards can be bank cards, PT cards and even
specific bike-sharing cards. Customers of 27% of BSSs need a mobile phone to rent a bicycle.
Smart cards and phone calls are asked in automatic systems. In contrast, in manual systems
operated by staff, 20% of the BSSs studied, identity cards (ID) can be asked to check the
identity of users. A residual 2% of BSSs require a code given when subscribing to identify
customers (Table 18).
Additionally to the smart card or a phone call, some BSSs can also ask customers to
provide a code for the identification. In case of card-oriented systems the code is a personal
password chosen by the customer in the moment of the registration and it has to be typed in the
bike-sharing terminal. Phone oriented schemes communicate customer a one-use code that
unlock the mechanism and release the bicycle.
Table 18: Way of identification of bike-sharing users
5.5.2 Return of the bike
In card-oriented systems, rents do not finish until the bike is correctly introduced in a
docking device of a station. After that, a light signal can confirm the successful return of the
bicycle. Phone-oriented schemes can need a phone call not only to unlock but also to return the
bike to inform the operator about the exact location of the bicycle. If users want to do
intermediate stops without returning the bicycle, it is normally possible. Bicycles of card-oriented
systems can be equipped with an additional locking mechanism and a key while users of
phone-oriented systems just need to close the normal bicycle lock. Electronic bicycle locks of
Call a Bike have an option on the display to lock the bike without finishing the rent.
5.5.3 Operating area
Those BSSs that have no fixed stations, e.g. Call a bike, or second generation systems,
e.g. City Bikes of Copenhagen, do not allow the ride of bike-sharing bicycles outside of a
delimited area smaller than the municipality. However, customers of most of systems can ride
bicycles in the whole city, even when stations do not cover the whole municipal area (IDAE
2007).
N %Smart Card 26 51%Phone 14 27%ID 10 20%Code 1 2%Sum 51
Way of identification
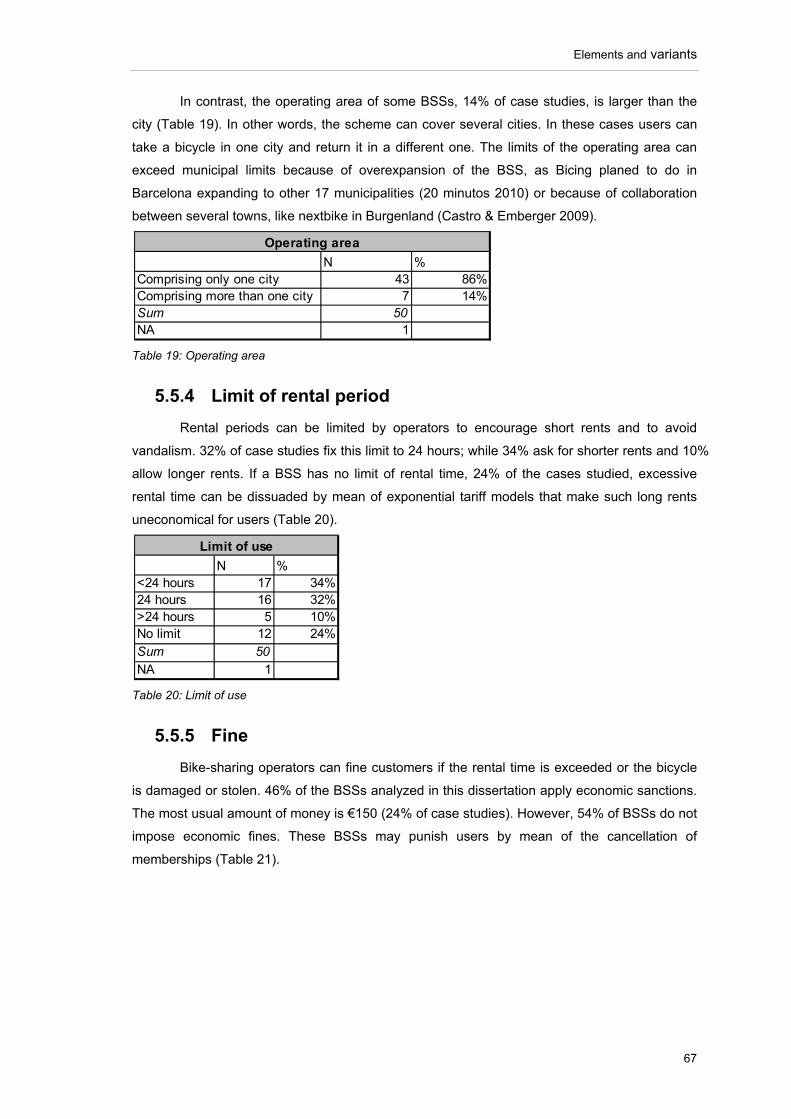
Elements and variants
67
In contrast, the operating area of some BSSs, 14% of case studies, is larger than the
city (Table 19). In other words, the scheme can cover several cities. In these cases users can
take a bicycle in one city and return it in a different one. The limits of the operating area can
exceed municipal limits because of overexpansion of the BSS, as Bicing planed to do in
Barcelona expanding to other 17 municipalities (20 minutos 2010) or because of collaboration
between several towns, like nextbike in Burgenland (Castro & Emberger 2009).
Table 19: Operating area
5.5.4 Limit of rental period
Rental periods can be limited by operators to encourage short rents and to avoid
vandalism. 32% of case studies fix this limit to 24 hours; while 34% ask for shorter rents and 10%
allow longer rents. If a BSS has no limit of rental time, 24% of the cases studied, excessive
rental time can be dissuaded by mean of exponential tariff models that make such long rents
uneconomical for users (Table 20).
Table 20: Limit of use
5.5.5 Fine
Bike-sharing operators can fine customers if the rental time is exceeded or the bicycle
is damaged or stolen. 46% of the BSSs analyzed in this dissertation apply economic sanctions.
The most usual amount of money is €150 (24% of case studies). However, 54% of BSSs do not
impose economic fines. These BSSs may punish users by mean of the cancellation of
memberships (Table 21).
N %Comprising only one city 43 86%Comprising more than one city 7 14%Sum 50NA 1
Operating area
N %<24 hours 17 34%24 hours 16 32%>24 hours 5 10%No limit 12 24%Sum 50NA 1
Limit of use
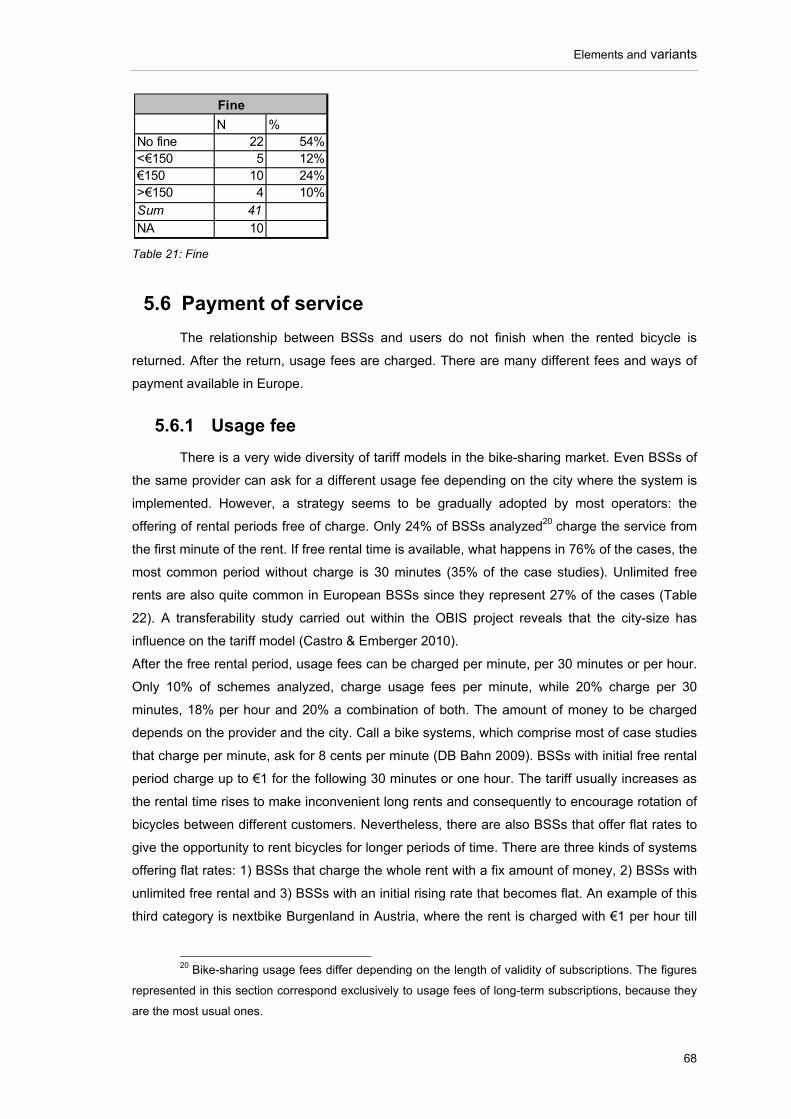
Elements and variants
68
Table 21: Fine
5.6 Payment of service
The relationship between BSSs and users do not finish when the rented bicycle is
returned. After the return, usage fees are charged. There are many different fees and ways of
payment available in Europe.
5.6.1 Usage fee
There is a very wide diversity of tariff models in the bike-sharing market. Even BSSs of
the same provider can ask for a different usage fee depending on the city where the system is
implemented. However, a strategy seems to be gradually adopted by most operators: the
offering of rental periods free of charge. Only 24% of BSSs analyzed20 charge the service from
the first minute of the rent. If free rental time is available, what happens in 76% of the cases, the
most common period without charge is 30 minutes (35% of the case studies). Unlimited free
rents are also quite common in European BSSs since they represent 27% of the cases (Table
22). A transferability study carried out within the OBIS project reveals that the city-size has
influence on the tariff model (Castro & Emberger 2010).
After the free rental period, usage fees can be charged per minute, per 30 minutes or per hour.
Only 10% of schemes analyzed, charge usage fees per minute, while 20% charge per 30
minutes, 18% per hour and 20% a combination of both. The amount of money to be charged
depends on the provider and the city. Call a bike systems, which comprise most of case studies
that charge per minute, ask for 8 cents per minute (DB Bahn 2009). BSSs with initial free rental
period charge up to €1 for the following 30 minutes or one hour. The tariff usually increases as
the rental time rises to make inconvenient long rents and consequently to encourage rotation of
bicycles between different customers. Nevertheless, there are also BSSs that offer flat rates to
give the opportunity to rent bicycles for longer periods of time. There are three kinds of systems
offering flat rates: 1) BSSs that charge the whole rent with a fix amount of money, 2) BSSs with
unlimited free rental and 3) BSSs with an initial rising rate that becomes flat. An example of this
third category is nextbike Burgenland in Austria, where the rent is charged with €1 per hour till
20 Bike-sharing usage fees differ depending on the length of validity of subscriptions. The figures
represented in this section correspond exclusively to usage fees of long-term subscriptions, because they
are the most usual ones.
N %No fine 22 54%<€150 5 12%€150 10 24%>€150 4 10%Sum 41NA 10
Fine
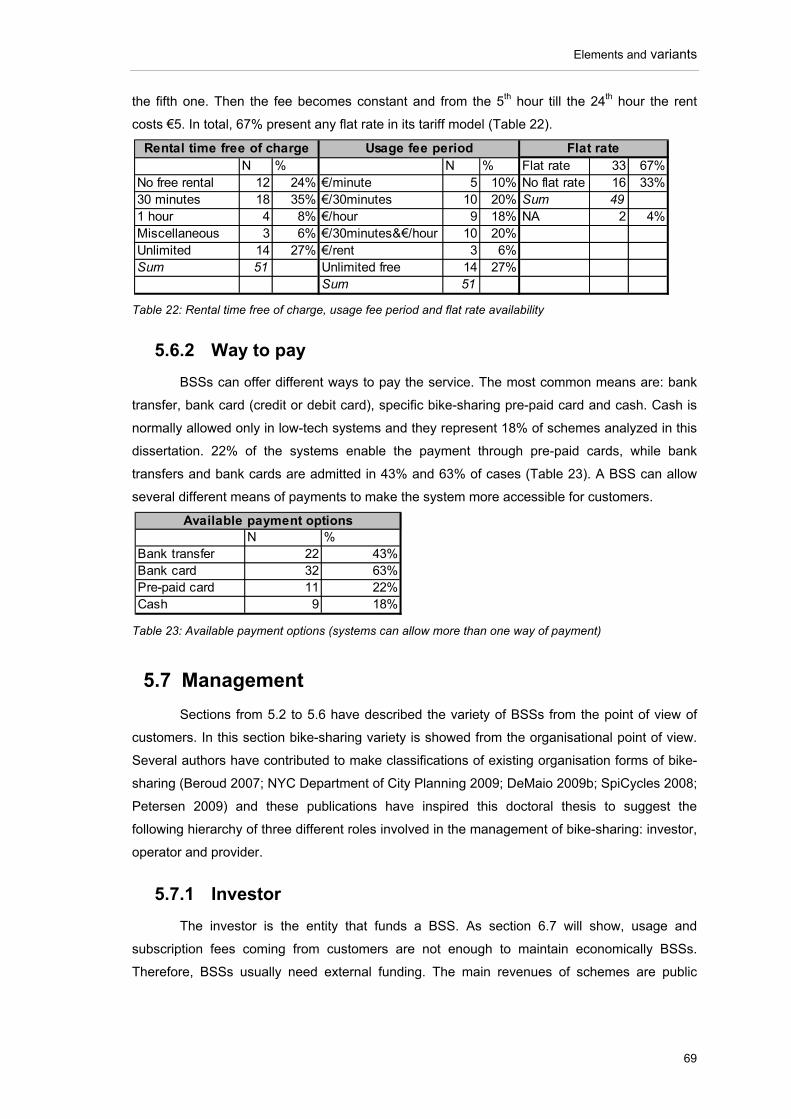
Elements and variants
69
the fifth one. Then the fee becomes constant and from the 5th hour till the 24th hour the rent
costs €5. In total, 67% present any flat rate in its tariff model (Table 22).
Table 22: Rental time free of charge, usage fee period and flat rate availability
5.6.2 Way to pay
BSSs can offer different ways to pay the service. The most common means are: bank
transfer, bank card (credit or debit card), specific bike-sharing pre-paid card and cash. Cash is
normally allowed only in low-tech systems and they represent 18% of schemes analyzed in this
dissertation. 22% of the systems enable the payment through pre-paid cards, while bank
transfers and bank cards are admitted in 43% and 63% of cases (Table 23). A BSS can allow
several different means of payments to make the system more accessible for customers.
Table 23: Available payment options (systems can allow more than one way of payment)
5.7 Management
Sections from 5.2 to 5.6 have described the variety of BSSs from the point of view of
customers. In this section bike-sharing variety is showed from the organisational point of view.
Several authors have contributed to make classifications of existing organisation forms of bike-
sharing (Beroud 2007; NYC Department of City Planning 2009; DeMaio 2009b; SpiCycles 2008;
Petersen 2009) and these publications have inspired this doctoral thesis to suggest the
following hierarchy of three different roles involved in the management of bike-sharing: investor,
operator and provider.
5.7.1 Investor
The investor is the entity that funds a BSS. As section 6.7 will show, usage and
subscription fees coming from customers are not enough to maintain economically BSSs.
Therefore, BSSs usually need external funding. The main revenues of schemes are public
N % N % Flat rate 33 67%No free rental 12 24% €/minute 5 10% No flat rate 16 33%30 minutes 18 35% €/30minutes 10 20% Sum 491 hour 4 8% €/hour 9 18% NA 2 4%Miscellaneous 3 6% €/30minutes&€/hour 10 20%Unlimited 14 27% €/rent 3 6%Sum 51 Unlimited free 14 27%
Sum 51
Rental time free of charge Usage fee period Flat rate
N %Bank transfer 22 43%Bank card 32 63%Pre-paid card 11 22%Cash 9 18%
Available payment options
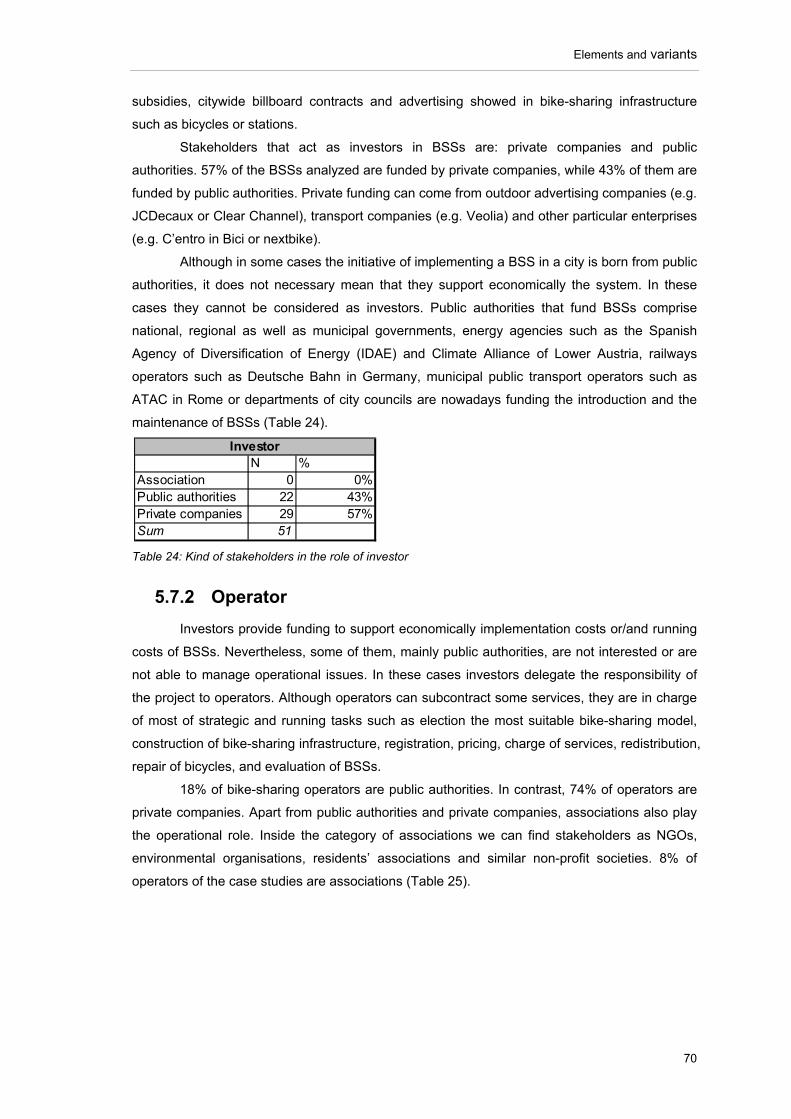
Elements and variants
70
subsidies, citywide billboard contracts and advertising showed in bike-sharing infrastructure
such as bicycles or stations.
Stakeholders that act as investors in BSSs are: private companies and public
authorities. 57% of the BSSs analyzed are funded by private companies, while 43% of them are
funded by public authorities. Private funding can come from outdoor advertising companies (e.g.
JCDecaux or Clear Channel), transport companies (e.g. Veolia) and other particular enterprises
(e.g. C’entro in Bici or nextbike).
Although in some cases the initiative of implementing a BSS in a city is born from public
authorities, it does not necessary mean that they support economically the system. In these
cases they cannot be considered as investors. Public authorities that fund BSSs comprise
national, regional as well as municipal governments, energy agencies such as the Spanish
Agency of Diversification of Energy (IDAE) and Climate Alliance of Lower Austria, railways
operators such as Deutsche Bahn in Germany, municipal public transport operators such as
ATAC in Rome or departments of city councils are nowadays funding the introduction and the
maintenance of BSSs (Table 24).
Table 24: Kind of stakeholders in the role of investor
5.7.2 Operator
Investors provide funding to support economically implementation costs or/and running
costs of BSSs. Nevertheless, some of them, mainly public authorities, are not interested or are
not able to manage operational issues. In these cases investors delegate the responsibility of
the project to operators. Although operators can subcontract some services, they are in charge
of most of strategic and running tasks such as election the most suitable bike-sharing model,
construction of bike-sharing infrastructure, registration, pricing, charge of services, redistribution,
repair of bicycles, and evaluation of BSSs.
18% of bike-sharing operators are public authorities. In contrast, 74% of operators are
private companies. Apart from public authorities and private companies, associations also play
the operational role. Inside the category of associations we can find stakeholders as NGOs,
environmental organisations, residents’ associations and similar non-profit societies. 8% of
operators of the case studies are associations (Table 25).
N %Association 0 0%Public authorities 22 43%Private companies 29 57%Sum 51
Investor
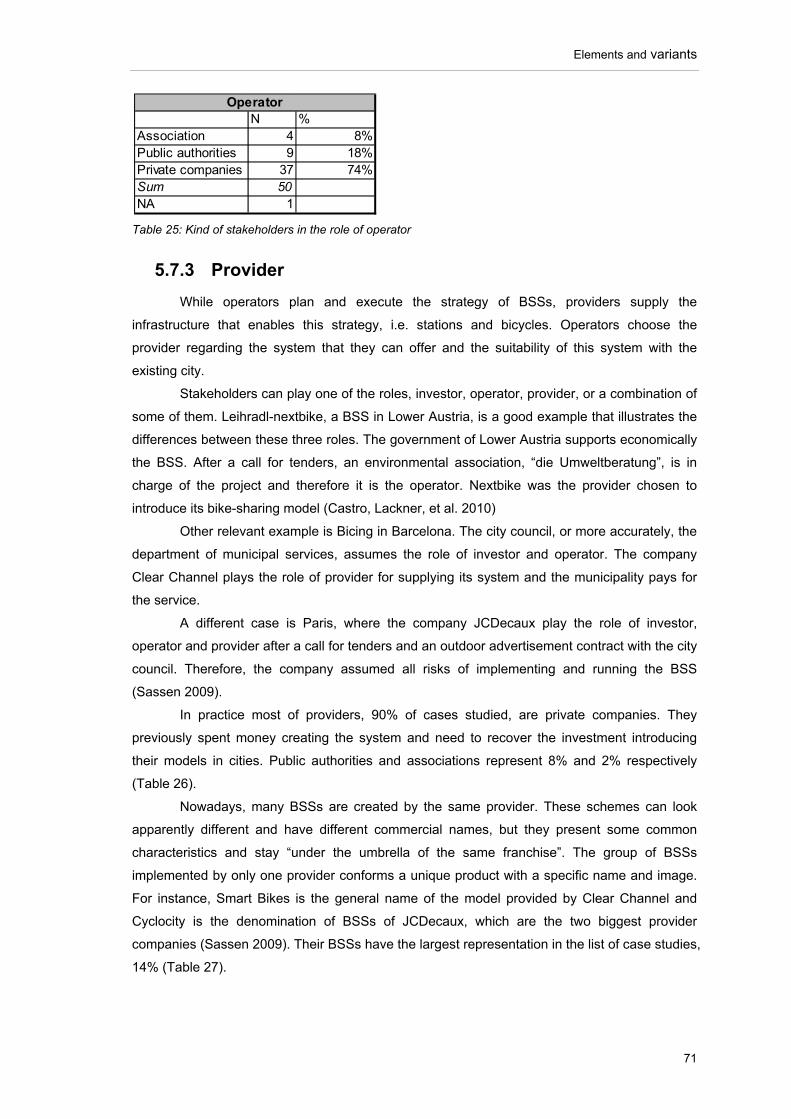
Elements and variants
71
Table 25: Kind of stakeholders in the role of operator
5.7.3 Provider
While operators plan and execute the strategy of BSSs, providers supply the
infrastructure that enables this strategy, i.e. stations and bicycles. Operators choose the
provider regarding the system that they can offer and the suitability of this system with the
existing city.
Stakeholders can play one of the roles, investor, operator, provider, or a combination of
some of them. Leihradl-nextbike, a BSS in Lower Austria, is a good example that illustrates the
differences between these three roles. The government of Lower Austria supports economically
the BSS. After a call for tenders, an environmental association, “die Umweltberatung”, is in
charge of the project and therefore it is the operator. Nextbike was the provider chosen to
introduce its bike-sharing model (Castro, Lackner, et al. 2010)
Other relevant example is Bicing in Barcelona. The city council, or more accurately, the
department of municipal services, assumes the role of investor and operator. The company
Clear Channel plays the role of provider for supplying its system and the municipality pays for
the service.
A different case is Paris, where the company JCDecaux play the role of investor,
operator and provider after a call for tenders and an outdoor advertisement contract with the city
council. Therefore, the company assumed all risks of implementing and running the BSS
(Sassen 2009).
In practice most of providers, 90% of cases studied, are private companies. They
previously spent money creating the system and need to recover the investment introducing
their models in cities. Public authorities and associations represent 8% and 2% respectively
(Table 26).
Nowadays, many BSSs are created by the same provider. These schemes can look
apparently different and have different commercial names, but they present some common
characteristics and stay “under the umbrella of the same franchise”. The group of BSSs
implemented by only one provider conforms a unique product with a specific name and image.
For instance, Smart Bikes is the general name of the model provided by Clear Channel and
Cyclocity is the denomination of BSSs of JCDecaux, which are the two biggest provider
companies (Sassen 2009). Their BSSs have the largest representation in the list of case studies,
14% (Table 27).
N %Association 4 8%Public authorities 9 18%Private companies 37 74%Sum 50NA 1
Operator
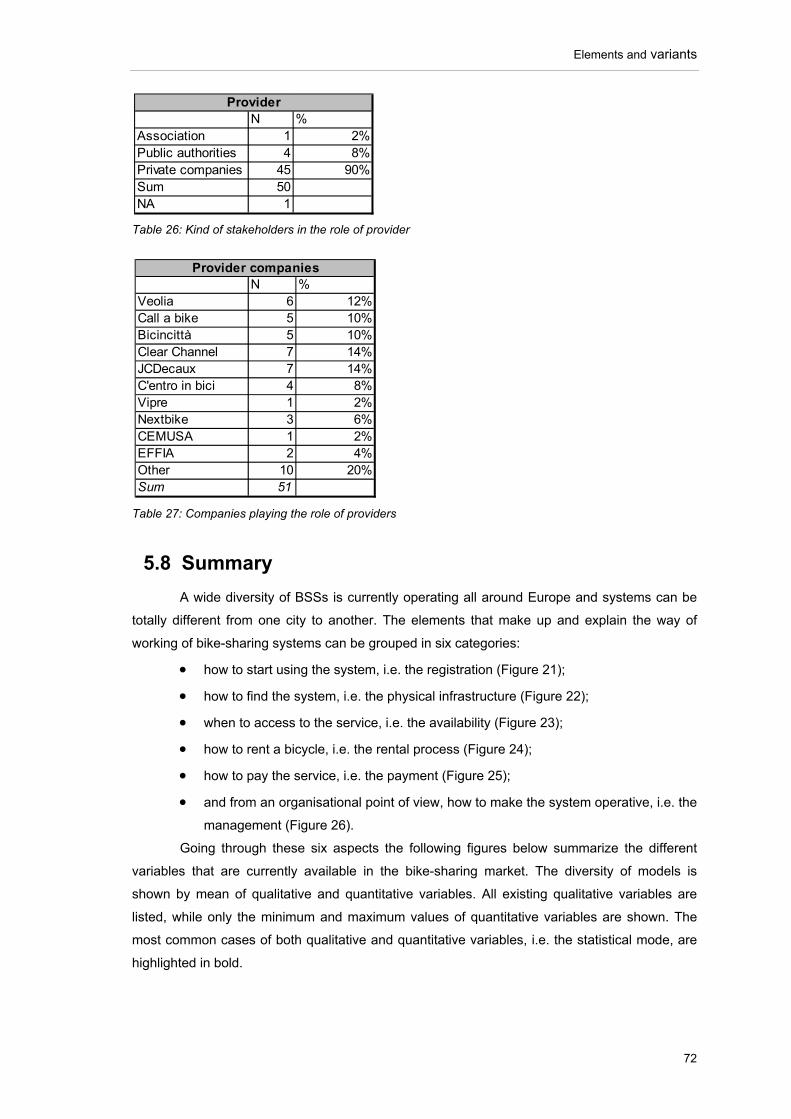
Elements and variants
72
Table 26: Kind of stakeholders in the role of provider
Table 27: Companies playing the role of providers
5.8 Summary
A wide diversity of BSSs is currently operating all around Europe and systems can be
totally different from one city to another. The elements that make up and explain the way of
working of bike-sharing systems can be grouped in six categories:
how to start using the system, i.e. the registration (Figure 21);
how to find the system, i.e. the physical infrastructure (Figure 22);
when to access to the service, i.e. the availability (Figure 23);
how to rent a bicycle, i.e. the rental process (Figure 24);
how to pay the service, i.e. the payment (Figure 25);
and from an organisational point of view, how to make the system operative, i.e. the
management (Figure 26).
Going through these six aspects the following figures below summarize the different
variables that are currently available in the bike-sharing market. The diversity of models is
shown by mean of qualitative and quantitative variables. All existing qualitative variables are
listed, while only the minimum and maximum values of quantitative variables are shown. The
most common cases of both qualitative and quantitative variables, i.e. the statistical mode, are
highlighted in bold.
N %Association 1 2%Public authorities 4 8%Private companies 45 90%Sum 50NA 1
Provider
N %Veolia 6 12%Call a bike 5 10%Bicincittà 5 10%Clear Channel 7 14%JCDecaux 7 14%C'entro in bici 4 8%Vipre 1 2%Nextbike 3 6%CEMUSA 1 2%EFFIA 2 4%Other 10 20%Sum 51
Provider companies
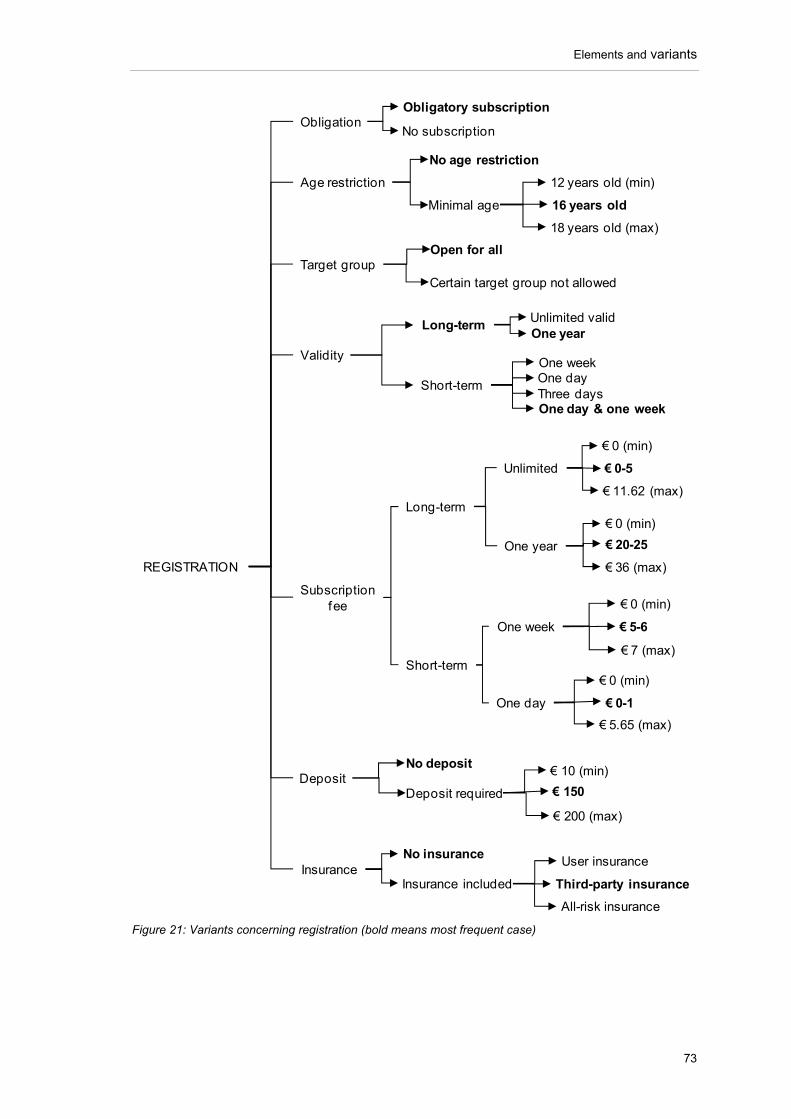
Elements and variants
73
Figure 21: Variants concerning registration (bold means most frequent case)
Obligatory subscription
No subscription
Subscription fee
Validity
Short-term
Long-termUnlimited validOne year
One weekOne day
Short-term
Long-term
Unlimited
One year
One week
One day
€ 0 (min)
€ 11.62 (max)
€ 0-5
€ 0 (min)
€ 20-25
€ 7 (max)
€ 5-6
€ 0 (min)
€ 5.65 (max)
€ 0-1
€ 0 (min)
Deposit
€ 200 (max)
€ 150
Obligation
€ 10 (min)
Age restriction
18 years old (max)
12 years old (min)
16 years old
Insurance
All-risk insurance
User insuranceNo insurance
Third-party insurance
REGISTRATION € 36 (max)
Three daysOne day & one week
No deposit
Deposit required
No age restriction
Minimal age
Insurance included
Target groupOpen for all
Certain target group not allowed
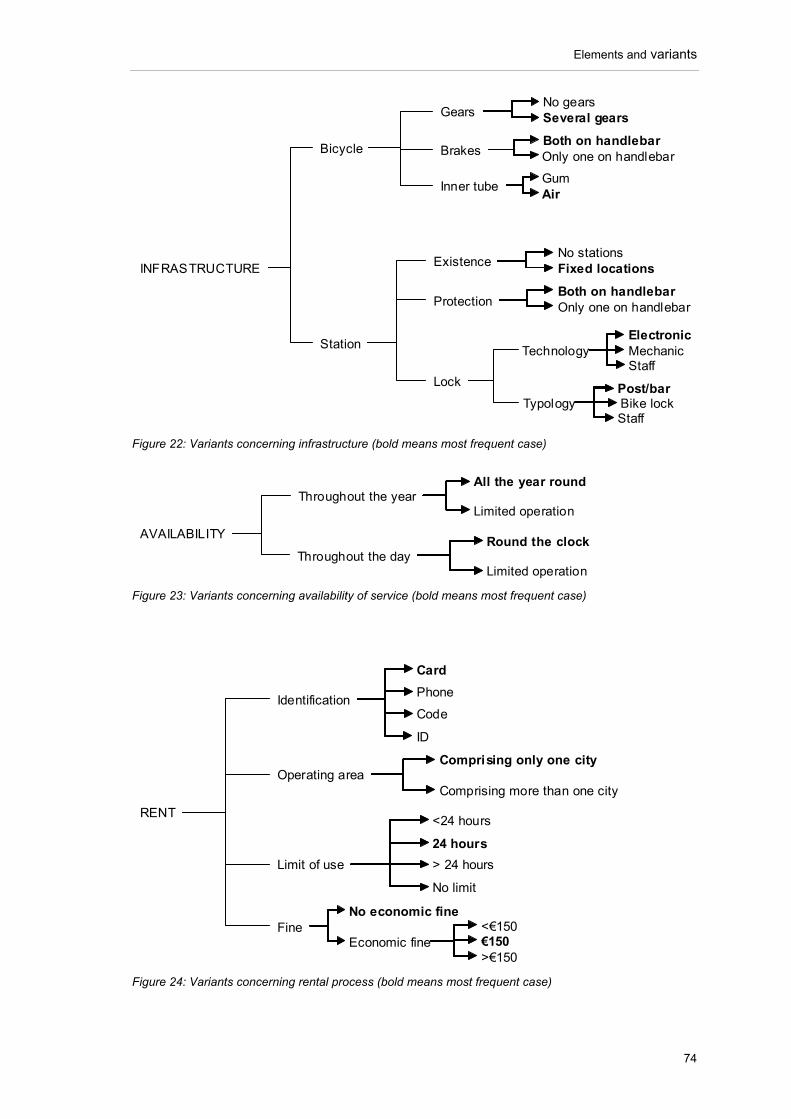
Elements and variants
74
Figure 22: Variants concerning infrastructure (bold means most frequent case)
Figure 23: Variants concerning availability of service (bold means most frequent case)
Figure 24: Variants concerning rental process (bold means most frequent case)
Station
Bicycle
Inner tube
BrakesBoth on handlebarOnly one on handlebar
AirGum
INFRASTRUCTURE
GearsNo gearsSeveral gears
Lock
ProtectionBoth on handlebarOnly one on handlebar
Technology
Typology
ExistenceNo stationsFixed locations
ElectronicMechanicStaff
Post/barBike lockStaff
Throughout the yearLimited operation
All the year round
Throughout the day
AVAILABILITY
Limited operation
Round the clock
Operating area
Identification
Limit of use
Fine
RENT
Phone
ID
Card
Code
Comprising only one city
Comprising more than one city
24 hours
No limit
<24 hours
> 24 hours
€150
No economic fine<€150
>€150Economic fine
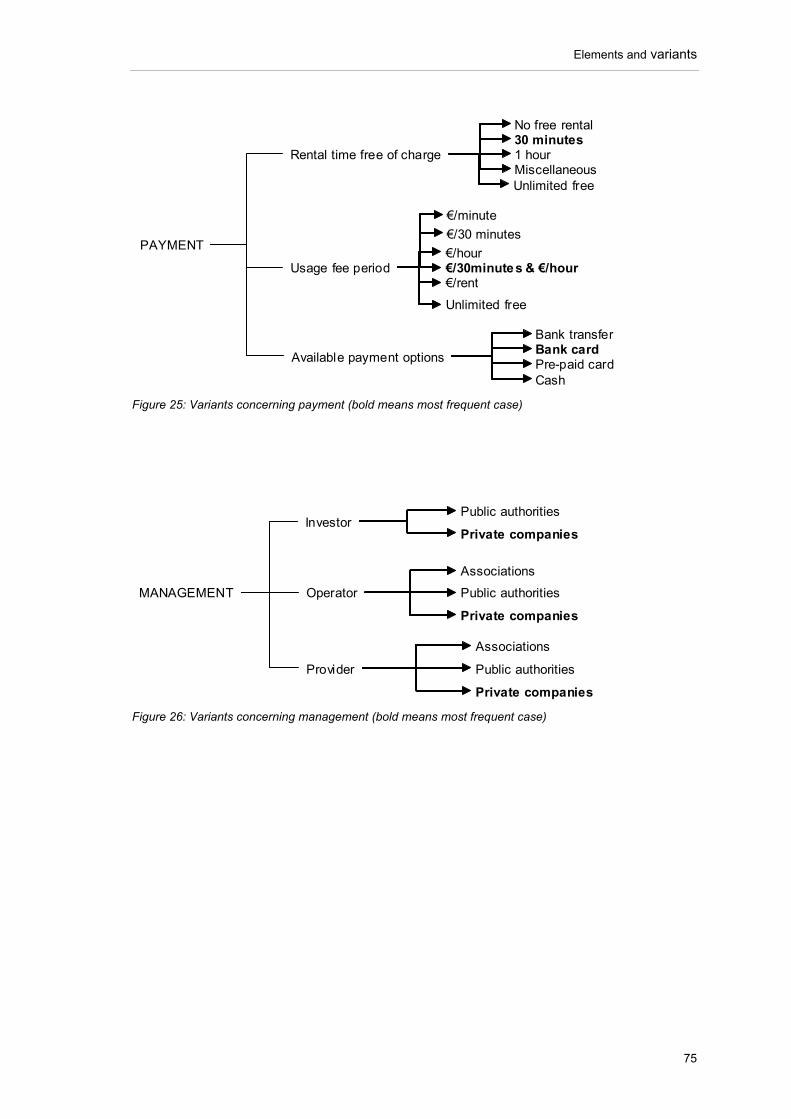
Elements and variants
75
Figure 25: Variants concerning payment (bold means most frequent case)
Figure 26: Variants concerning management (bold means most frequent case)
Rental time free of charge
Usage fee period
Available payment options
PAYMENT
30 minutes
Miscellaneous
No free rental
1 hour
€/30minutes & €/hour€/hour
€/minute
€/30 minutes
Pre-paid card
Bank transferBank card
Cash
Unlimited free
Unlimited free
€/rent
Investor
Operator
Provider
MANAGEMENT
Public authorities
Private companies
Public authorities
Associations
Private companies
Public authorities
Associations
Private companies
Success of bike-sharing
76
6 SUCCESS OF BIKE-SHARING
6.1 Introduction
The aim of section 6 is to analyze the success of BSSs in terms of sustainability.
Success means the achievement of a goal and this dissertation has grouped the likely goals of
bike-sharing into five categories: mobility, environment, health, traffic safety and economy.
Additionally, success requires durability. Therefore, economic viability is needed to preserve the
success.
This section is divided in six subsections (6.2, 6.3, 6.4, 6.5, 6.6 and 6.7) that correspond
with the five categories of success plus the requirement of economic viability. The approach and
methodology used in this section have been explained in detail in section 3.2.3.
6.2 Mobility
6.2.1 Introduction
Limited space availability in city centres and over-use of cars have caused traffic
congestions all around Europe. According to the European “Green Paper” (European
Commission 2007), “every year nearly 100 billion Euros, or 1% of the EU GDP, are lost to the
European economy as a result of traffic congestions”. To avoid these negative impacts derived
from transport, municipalities have developed new mobility concepts that try to reduce car use
and promote softer modes such as public transport, cycling and walking.
Section 6.2.2 will show the role that bike-sharing plays in changing mobility behaviour.
The following three sections will analyze the impact and efficiency of bike-sharing in the
achievement of three likely goals in terms of mobility:
Reduction of car traffic (section 6.2.3)
Increase of attractiveness of public transport (section 6.2.4)
Increase of cycling (section 6.2.5)21.
6.2.2 General impacts on mobility
The irruption of bike-sharing as a new alternative of urban transport has motivated
changes in mobility behaviour. For instance, in Paris 89% of bike-sharing users state that “it is
easier to move inside the city thanks to Vélib’”, 54% travel more often as a consequence of the
21 Although traffic jams emit air pollutants that generates environmental, health and economic
problems, this section focuses on a primary impact of car congestions: traffic flow. It means, in terms of
this dissertation, cities that have as a goal to improve mobility by mean of a BSS have as a priority to
speed up traffic flow and consequently to reduce duration of trips.
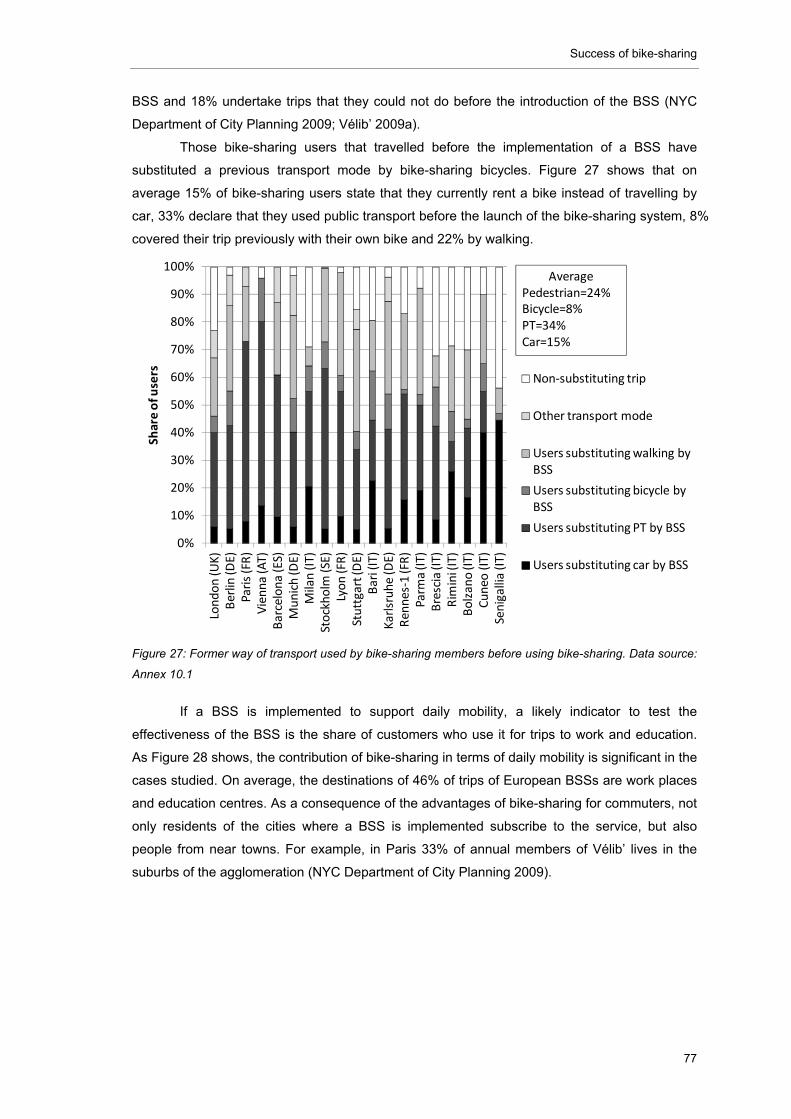
Success of bike-sharing
77
BSS and 18% undertake trips that they could not do before the introduction of the BSS (NYC
Department of City Planning 2009; Vélib’ 2009a).
Those bike-sharing users that travelled before the implementation of a BSS have
substituted a previous transport mode by bike-sharing bicycles. Figure 27 shows that on
average 15% of bike-sharing users state that they currently rent a bike instead of travelling by
car, 33% declare that they used public transport before the launch of the bike-sharing system, 8%
covered their trip previously with their own bike and 22% by walking.
Figure 27: Former way of transport used by bike-sharing members before using bike-sharing. Data source:
Annex 10.1
If a BSS is implemented to support daily mobility, a likely indicator to test the
effectiveness of the BSS is the share of customers who use it for trips to work and education.
As Figure 28 shows, the contribution of bike-sharing in terms of daily mobility is significant in the
cases studied. On average, the destinations of 46% of trips of European BSSs are work places
and education centres. As a consequence of the advantages of bike-sharing for commuters, not
only residents of the cities where a BSS is implemented subscribe to the service, but also
people from near towns. For example, in Paris 33% of annual members of Vélib’ lives in the
suburbs of the agglomeration (NYC Department of City Planning 2009).
0%
10%
20%
30%
40%
50%
60%
70%
80%
90%
100%
London (U
K)
Berlin (D
E)Paris (FR)
Vienna (AT)
Barcelona (ES)
Munich (D
E)Milan (IT)
Stockholm
(SE)
Lyon (FR)
Stuttgart (D
E)Bari (IT)
Karlsruhe (DE)
Rennes‐1 (FR)
Parm
a (IT)
Brescia (IT)
Rim
ini (IT)
Bolzano (IT)
Cuneo
(IT)
Senigallia (IT)
Share of u
sers Non‐substituting trip
Other transport mode
Users substituting walking by BSS
Users substituting bicycle by BSS
Users substituting PT by BSS
Users substituting car by BSS
AveragePedestrian=24%Bicycle=8%PT=34%Car=15%
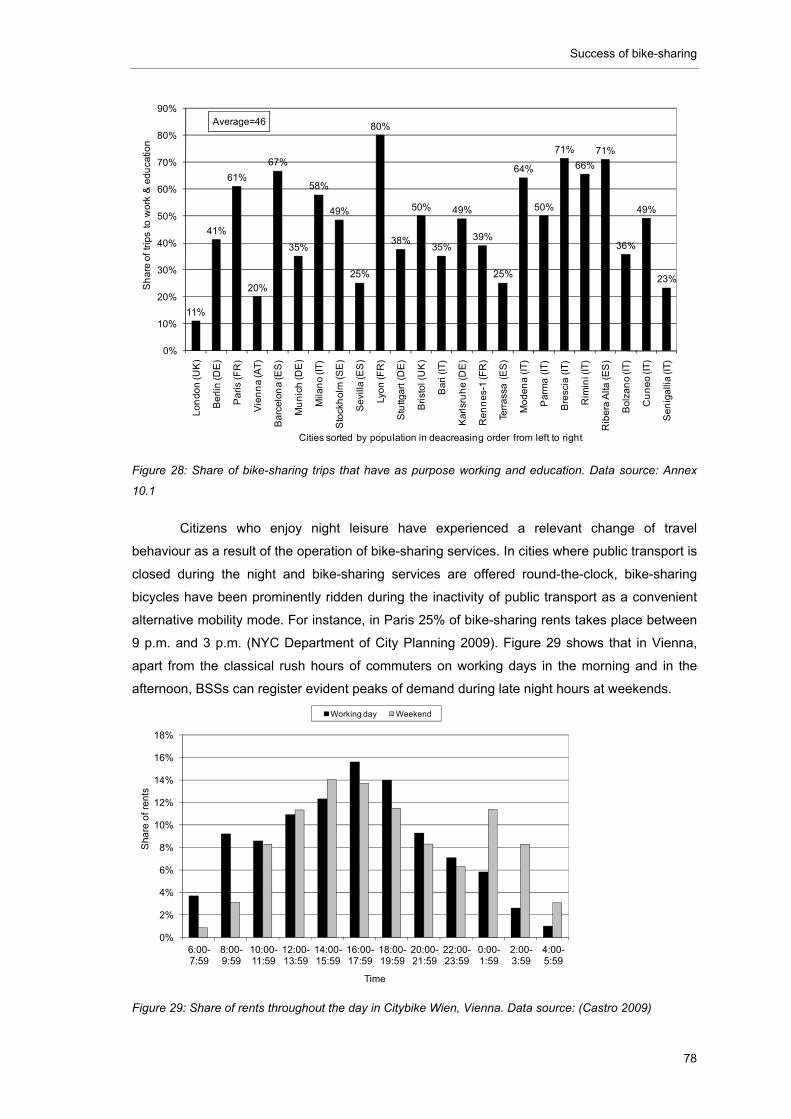
Success of bike-sharing
78
Figure 28: Share of bike-sharing trips that have as purpose working and education. Data source: Annex
10.1
Citizens who enjoy night leisure have experienced a relevant change of travel
behaviour as a result of the operation of bike-sharing services. In cities where public transport is
closed during the night and bike-sharing services are offered round-the-clock, bike-sharing
bicycles have been prominently ridden during the inactivity of public transport as a convenient
alternative mobility mode. For instance, in Paris 25% of bike-sharing rents takes place between
9 p.m. and 3 p.m. (NYC Department of City Planning 2009). Figure 29 shows that in Vienna,
apart from the classical rush hours of commuters on working days in the morning and in the
afternoon, BSSs can register evident peaks of demand during late night hours at weekends.
Figure 29: Share of rents throughout the day in Citybike Wien, Vienna. Data source: (Castro 2009)
11%
41%
61%
20%
67%
35%
58%
49%
25%
80%
38%
50%
35%
49%
39%
25%
64%
50%
71%
66%
71%
36%
49%
23%
0%
10%
20%
30%
40%
50%
60%
70%
80%
90%
Lo
nd
on
(UK
)
Be
rlin
(DE
)
Pa
ris
(FR
)
Vie
nn
a (A
T)
Ba
rce
lon
a (E
S)
Mu
nic
h (D
E)
Mila
no
(IT
)
Sto
ckh
olm
(S
E)
Se
villa
(ES
)
Lyo
n (F
R)
Stu
ttga
rt (
DE
)
Bri
sto
l (U
K)
Ba
ri (
IT)
Ka
rlsr
uh
e (D
E)
Re
nn
es-
1 (F
R)
Terr
ass
a (
ES
)
Mo
de
na
(IT
)
Pa
rma
(IT
)
Bre
scia
(IT
)
Rim
ini (
IT)
Rib
era
Alta
(E
S)
Bo
lza
no
(IT
)
Cu
ne
o (I
T)
Se
nig
alli
a (I
T)
Sh
are
of
trip
s to
wo
rk &
ed
uca
tion
Cities sorted by population in deacreasing order from left to right
Average=46
0%
2%
4%
6%
8%
10%
12%
14%
16%
18%
6:00-7:59
8:00-9:59
10:00-11:59
12:00-13:59
14:00-15:59
16:00-17:59
18:00-19:59
20:00-21:59
22:00-23:59
0:00-1:59
2:00-3:59
4:00-5:59
Sha
re o
f re
nts
Time
Working day Weekend
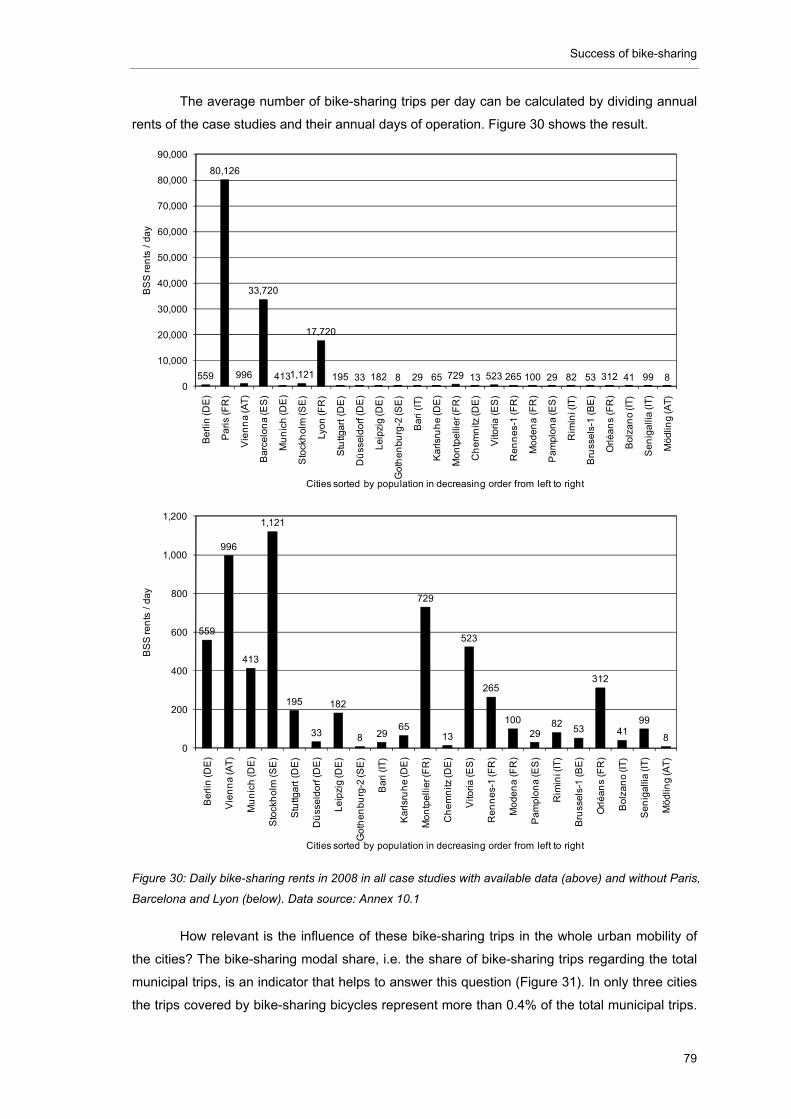
Success of bike-sharing
79
The average number of bike-sharing trips per day can be calculated by dividing annual
rents of the case studies and their annual days of operation. Figure 30 shows the result.
Figure 30: Daily bike-sharing rents in 2008 in all case studies with available data (above) and without Paris,
Barcelona and Lyon (below). Data source: Annex 10.1
How relevant is the influence of these bike-sharing trips in the whole urban mobility of
the cities? The bike-sharing modal share, i.e. the share of bike-sharing trips regarding the total
municipal trips, is an indicator that helps to answer this question (Figure 31). In only three cities
the trips covered by bike-sharing bicycles represent more than 0.4% of the total municipal trips.
559
80,126
996
33,720
4131,121
17,720
195 33 182 8 29 65 729 13 523 265 100 29 82 53 312 41 99 80
10,000
20,000
30,000
40,000
50,000
60,000
70,000
80,000
90,000
Be
rlin
(DE
)
Pa
ris
(FR
)
Vie
nn
a (A
T)
Ba
rce
lon
a (E
S)
Mu
nic
h (D
E)
Sto
ckh
olm
(S
E)
Lyo
n (F
R)
Stu
ttga
rt (
DE
)
Dü
sse
ldo
rf (D
E)
Le
ipzi
g (D
E)
Go
the
nb
urg
-2 (S
E)
Ba
ri (
IT)
Ka
rlsr
uh
e (D
E)
Mo
ntp
elli
er (
FR
)
Ch
em
nitz
(DE
)
Vito
ria
(E
S)
Re
nn
es-
1 (F
R)
Mo
de
na
(F
R)
Pa
mp
lon
a (E
S)
Rim
ini (
IT)
Bru
sse
ls-1
(B
E)
Orl
éa
ns
(FR
)
Bo
lza
no
(IT
)
Se
nig
alli
a (I
T)
Mö
dlin
g (A
T)
BS
S re
nts
/ d
ay
Cities sorted by population in decreasing order from left to right
559
996
413
1,121
195
33
182
8 2965
729
13
523
265
100
2982
53
312
4199
80
200
400
600
800
1,000
1,200
Be
rlin
(DE
)
Vie
nn
a (A
T)
Mu
nic
h (D
E)
Sto
ckh
olm
(S
E)
Stu
ttga
rt (
DE
)
Dü
sse
ldo
rf (D
E)
Le
ipzi
g (D
E)
Go
the
nb
urg
-2 (S
E)
Ba
ri (
IT)
Ka
rlsr
uh
e (D
E)
Mo
ntp
elli
er (
FR
)
Ch
em
nitz
(DE
)
Vito
ria
(E
S)
Re
nn
es-
1 (F
R)
Mo
de
na
(F
R)
Pa
mp
lon
a (E
S)
Rim
ini (
IT)
Bru
sse
ls-1
(B
E)
Orl
éa
ns
(FR
)
Bo
lza
no
(IT
)
Se
nig
alli
a (I
T)
Mö
dlin
g (A
T)
BS
S re
nts
/ d
ay
Cities sorted by population in decreasing order from left to right
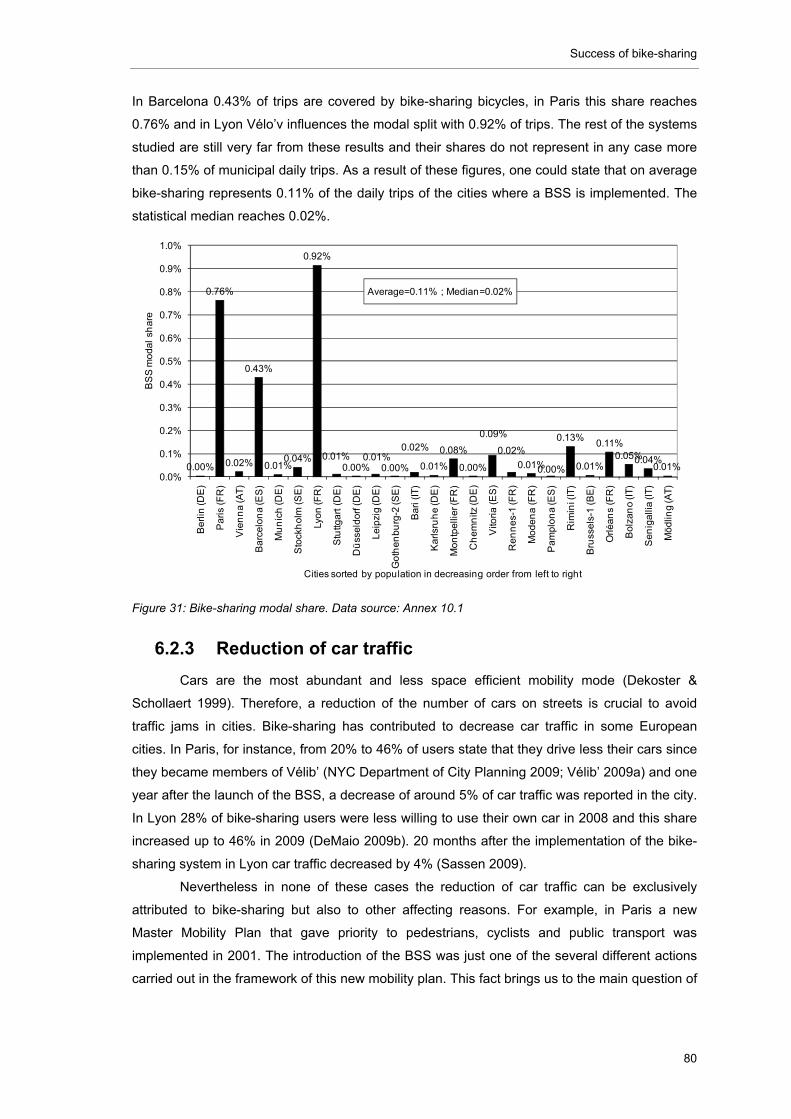
Success of bike-sharing
80
In Barcelona 0.43% of trips are covered by bike-sharing bicycles, in Paris this share reaches
0.76% and in Lyon Vélo’v influences the modal split with 0.92% of trips. The rest of the systems
studied are still very far from these results and their shares do not represent in any case more
than 0.15% of municipal daily trips. As a result of these figures, one could state that on average
bike-sharing represents 0.11% of the daily trips of the cities where a BSS is implemented. The
statistical median reaches 0.02%.
Figure 31: Bike-sharing modal share. Data source: Annex 10.1
6.2.3 Reduction of car traffic
Cars are the most abundant and less space efficient mobility mode (Dekoster &
Schollaert 1999). Therefore, a reduction of the number of cars on streets is crucial to avoid
traffic jams in cities. Bike-sharing has contributed to decrease car traffic in some European
cities. In Paris, for instance, from 20% to 46% of users state that they drive less their cars since
they became members of Vélib’ (NYC Department of City Planning 2009; Vélib’ 2009a) and one
year after the launch of the BSS, a decrease of around 5% of car traffic was reported in the city.
In Lyon 28% of bike-sharing users were less willing to use their own car in 2008 and this share
increased up to 46% in 2009 (DeMaio 2009b). 20 months after the implementation of the bike-
sharing system in Lyon car traffic decreased by 4% (Sassen 2009).
Nevertheless in none of these cases the reduction of car traffic can be exclusively
attributed to bike-sharing but also to other affecting reasons. For example, in Paris a new
Master Mobility Plan that gave priority to pedestrians, cyclists and public transport was
implemented in 2001. The introduction of the BSS was just one of the several different actions
carried out in the framework of this new mobility plan. This fact brings us to the main question of
0.00%
0.76%
0.02%
0.43%
0.01%0.04%
0.92%
0.01%0.00%
0.01%0.00%
0.02%
0.01%
0.08%
0.00%
0.09%
0.02%
0.01%0.00%
0.13%
0.01%
0.11%0.05%0.04%
0.01%0.0%
0.1%
0.2%
0.3%
0.4%
0.5%
0.6%
0.7%
0.8%
0.9%
1.0%
Be
rlin
(DE
)
Pa
ris
(FR
)
Vie
nn
a (A
T)
Ba
rce
lon
a (E
S)
Mu
nic
h (D
E)
Sto
ckh
olm
(S
E)
Lyo
n (F
R)
Stu
ttga
rt (
DE
)
Dü
sse
ldo
rf (D
E)
Le
ipzi
g (D
E)
Go
the
nb
urg
-2 (S
E)
Ba
ri (
IT)
Ka
rlsr
uh
e (D
E)
Mo
ntp
elli
er (
FR
)
Ch
em
nitz
(DE
)
Vito
ria
(E
S)
Re
nn
es-
1 (F
R)
Mo
de
na
(F
R)
Pa
mp
lon
a (E
S)
Rim
ini (
IT)
Bru
sse
ls-1
(B
E)
Orl
éa
ns
(FR
)
Bo
lza
no
(IT
)
Se
nig
alli
a (I
T)
Mö
dlin
g (A
T)
BS
S m
od
al
sha
re
Cities sorted by population in decreasing order from left to right
Average=0.11% ; Median=0.02%
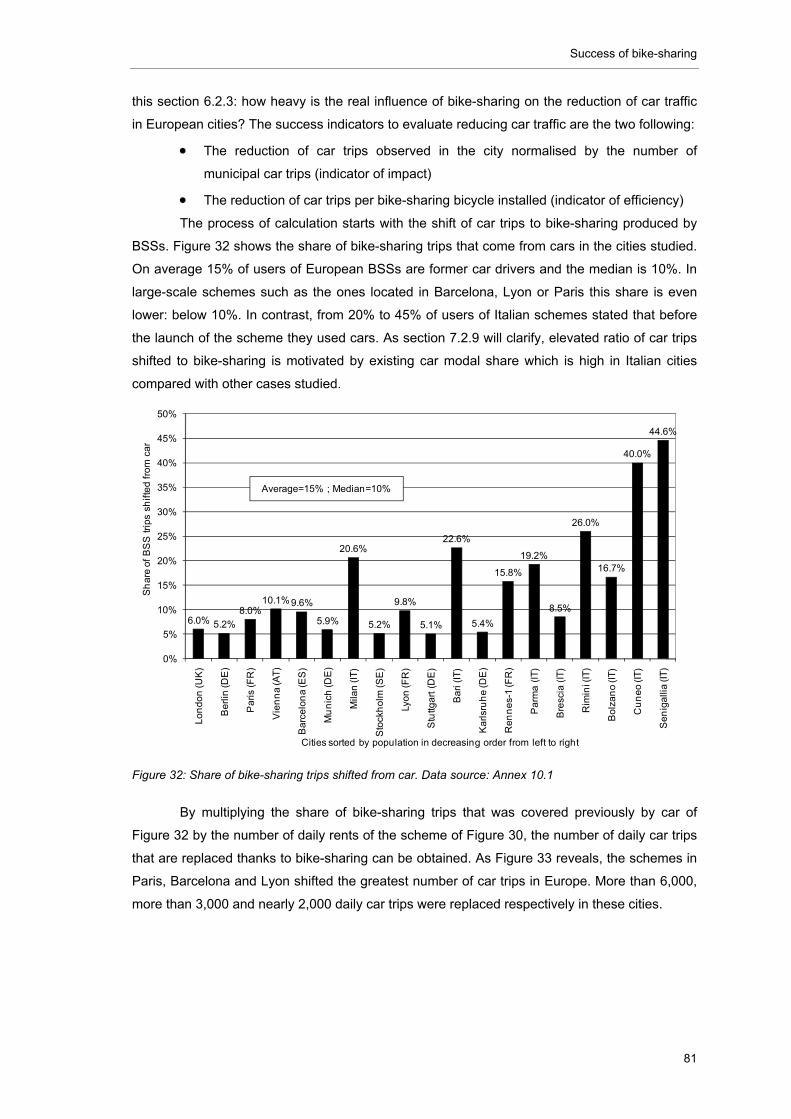
Success of bike-sharing
81
this section 6.2.3: how heavy is the real influence of bike-sharing on the reduction of car traffic
in European cities? The success indicators to evaluate reducing car traffic are the two following:
The reduction of car trips observed in the city normalised by the number of
municipal car trips (indicator of impact)
The reduction of car trips per bike-sharing bicycle installed (indicator of efficiency)
The process of calculation starts with the shift of car trips to bike-sharing produced by
BSSs. Figure 32 shows the share of bike-sharing trips that come from cars in the cities studied.
On average 15% of users of European BSSs are former car drivers and the median is 10%. In
large-scale schemes such as the ones located in Barcelona, Lyon or Paris this share is even
lower: below 10%. In contrast, from 20% to 45% of users of Italian schemes stated that before
the launch of the scheme they used cars. As section 7.2.9 will clarify, elevated ratio of car trips
shifted to bike-sharing is motivated by existing car modal share which is high in Italian cities
compared with other cases studied.
Figure 32: Share of bike-sharing trips shifted from car. Data source: Annex 10.1
By multiplying the share of bike-sharing trips that was covered previously by car of
Figure 32 by the number of daily rents of the scheme of Figure 30, the number of daily car trips
that are replaced thanks to bike-sharing can be obtained. As Figure 33 reveals, the schemes in
Paris, Barcelona and Lyon shifted the greatest number of car trips in Europe. More than 6,000,
more than 3,000 and nearly 2,000 daily car trips were replaced respectively in these cities.
6.0% 5.2%
8.0%10.1%9.6%
5.9%
20.6%
5.2%
9.8%
5.1%
22.6%
5.4%
15.8%
19.2%
8.5%
26.0%
16.7%
40.0%
44.6%
0%
5%
10%
15%
20%
25%
30%
35%
40%
45%
50%
Lo
nd
on
(UK
)
Be
rlin
(DE
)
Par
is (F
R)
Vie
nn
a (A
T)
Ba
rce
lon
a (E
S)
Mu
nic
h (D
E)
Mila
n (I
T)
Sto
ckh
olm
(S
E)
Lyon
(FR
)
Stu
ttga
rt (
DE
)
Ba
ri (I
T)
Ka
rlsr
uh
e (D
E)
Re
nn
es-
1 (F
R)
Pa
rma
(IT)
Bre
scia
(IT
)
Rim
ini (
IT)
Bo
lza
no
(IT
)
Cu
ne
o (I
T)
Se
nig
alli
a (I
T)
Sh
are
of
BS
S t
rips
sh
ifte
d f
rom
ca
r
Cities sorted by population in decreasing order from left to right
Average=15% ; Median=10%
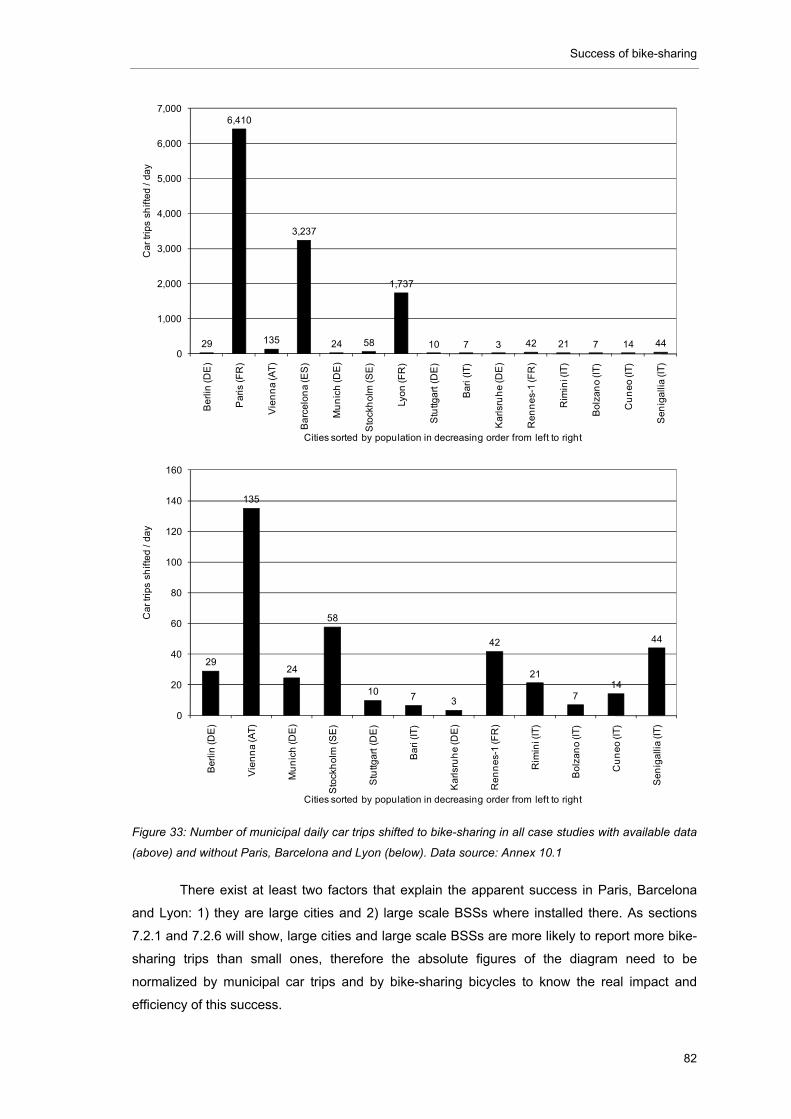
Success of bike-sharing
82
Figure 33: Number of municipal daily car trips shifted to bike-sharing in all case studies with available data
(above) and without Paris, Barcelona and Lyon (below). Data source: Annex 10.1
There exist at least two factors that explain the apparent success in Paris, Barcelona
and Lyon: 1) they are large cities and 2) large scale BSSs where installed there. As sections
7.2.1 and 7.2.6 will show, large cities and large scale BSSs are more likely to report more bike-
sharing trips than small ones, therefore the absolute figures of the diagram need to be
normalized by municipal car trips and by bike-sharing bicycles to know the real impact and
efficiency of this success.
29
6,410
135
3,237
24 58
1,737
10 7 3 42 21 7 14 440
1,000
2,000
3,000
4,000
5,000
6,000
7,000
Be
rlin
(DE
)
Pa
ris
(FR
)
Vie
nn
a (A
T)
Ba
rce
lon
a (E
S)
Mu
nic
h (D
E)
Sto
ckh
olm
(S
E)
Lyo
n (F
R)
Stu
ttga
rt (
DE
)
Ba
ri (
IT)
Ka
rlsr
uh
e (D
E)
Re
nn
es-
1 (F
R)
Rim
ini (
IT)
Bo
lza
no
(IT
)
Cu
ne
o (I
T)
Se
nig
alli
a (I
T)
Ca
r tr
ips
shif
ted
/ d
ay
Cities sorted by population in decreasing order from left to right
29
135
24
58
10 7 3
42
21
714
44
0
20
40
60
80
100
120
140
160
Be
rlin
(DE
)
Vie
nn
a (A
T)
Mu
nic
h (D
E)
Sto
ckh
olm
(S
E)
Stu
ttga
rt (
DE
)
Ba
ri (
IT)
Ka
rlsr
uh
e (D
E)
Re
nn
es-
1 (F
R)
Rim
ini (
IT)
Bo
lza
no
(IT
)
Cu
ne
o (I
T)
Se
nig
alli
a (I
T)
Ca
r tr
ips
shif
ted
/ d
ay
Cities sorted by population in decreasing order from left to right
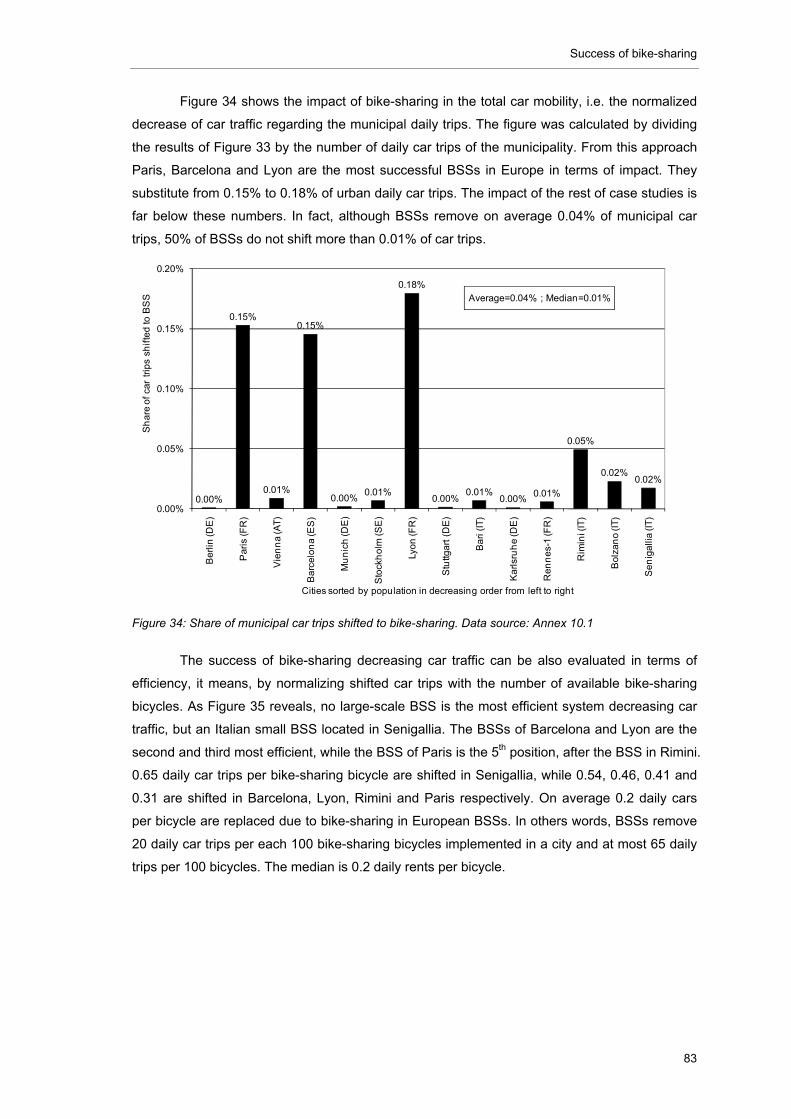
Success of bike-sharing
83
Figure 34 shows the impact of bike-sharing in the total car mobility, i.e. the normalized
decrease of car traffic regarding the municipal daily trips. The figure was calculated by dividing
the results of Figure 33 by the number of daily car trips of the municipality. From this approach
Paris, Barcelona and Lyon are the most successful BSSs in Europe in terms of impact. They
substitute from 0.15% to 0.18% of urban daily car trips. The impact of the rest of case studies is
far below these numbers. In fact, although BSSs remove on average 0.04% of municipal car
trips, 50% of BSSs do not shift more than 0.01% of car trips.
Figure 34: Share of municipal car trips shifted to bike-sharing. Data source: Annex 10.1
The success of bike-sharing decreasing car traffic can be also evaluated in terms of
efficiency, it means, by normalizing shifted car trips with the number of available bike-sharing
bicycles. As Figure 35 reveals, no large-scale BSS is the most efficient system decreasing car
traffic, but an Italian small BSS located in Senigallia. The BSSs of Barcelona and Lyon are the
second and third most efficient, while the BSS of Paris is the 5th position, after the BSS in Rimini.
0.65 daily car trips per bike-sharing bicycle are shifted in Senigallia, while 0.54, 0.46, 0.41 and
0.31 are shifted in Barcelona, Lyon, Rimini and Paris respectively. On average 0.2 daily cars
per bicycle are replaced due to bike-sharing in European BSSs. In others words, BSSs remove
20 daily car trips per each 100 bike-sharing bicycles implemented in a city and at most 65 daily
trips per 100 bicycles. The median is 0.2 daily rents per bicycle.
0.00%
0.15%
0.01%
0.15%
0.00%0.01%
0.18%
0.00%0.01%
0.00%0.01%
0.05%
0.02%0.02%
0.00%
0.05%
0.10%
0.15%
0.20%
Be
rlin
(DE
)
Pa
ris
(FR
)
Vie
nn
a (A
T)
Ba
rce
lon
a (E
S)
Mu
nic
h (D
E)
Sto
ckh
olm
(S
E)
Lyo
n (F
R)
Stu
ttga
rt (
DE
)
Ba
ri (
IT)
Ka
rlsr
uh
e (D
E)
Re
nn
es-
1 (F
R)
Rim
ini (
IT)
Bo
lza
no
(IT
)
Se
nig
alli
a (I
T)
Sh
are
of
car
trip
s sh
ifte
d to
BS
S
Cities sorted by population in decreasing order from left to right
Average=0.04% ; Median=0.01%
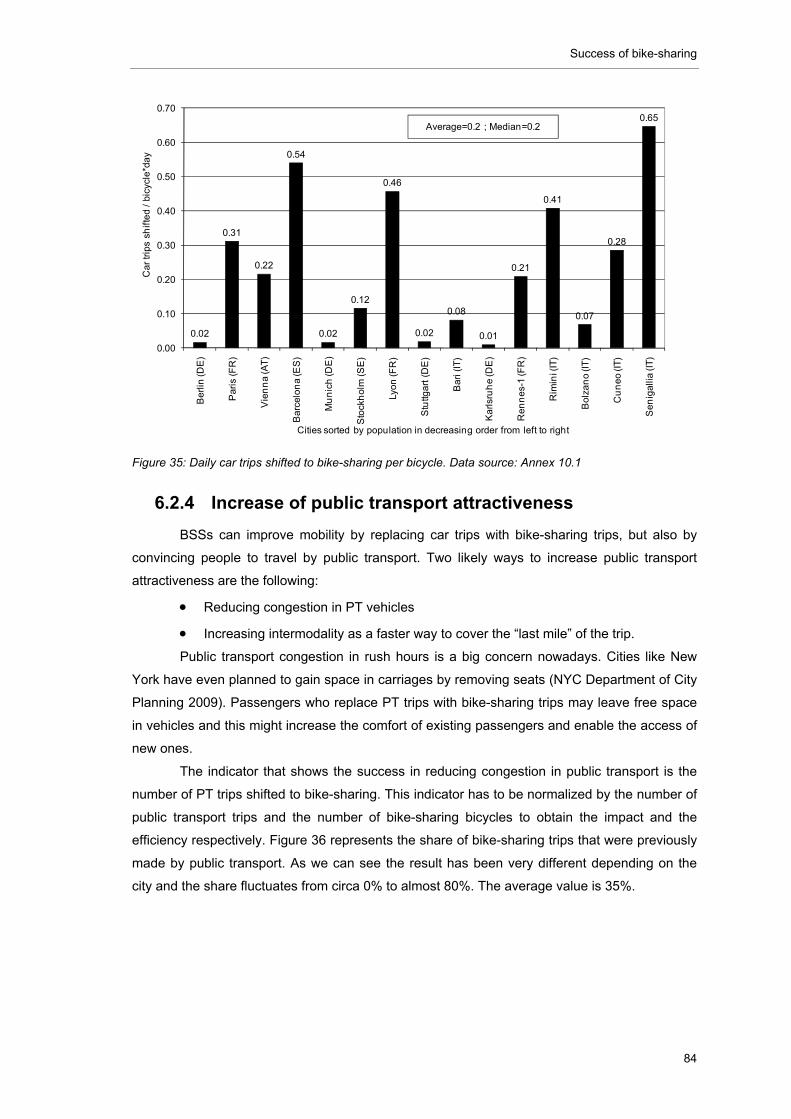
Success of bike-sharing
84
Figure 35: Daily car trips shifted to bike-sharing per bicycle. Data source: Annex 10.1
6.2.4 Increase of public transport attractiveness
BSSs can improve mobility by replacing car trips with bike-sharing trips, but also by
convincing people to travel by public transport. Two likely ways to increase public transport
attractiveness are the following:
Reducing congestion in PT vehicles
Increasing intermodality as a faster way to cover the “last mile” of the trip.
Public transport congestion in rush hours is a big concern nowadays. Cities like New
York have even planned to gain space in carriages by removing seats (NYC Department of City
Planning 2009). Passengers who replace PT trips with bike-sharing trips may leave free space
in vehicles and this might increase the comfort of existing passengers and enable the access of
new ones.
The indicator that shows the success in reducing congestion in public transport is the
number of PT trips shifted to bike-sharing. This indicator has to be normalized by the number of
public transport trips and the number of bike-sharing bicycles to obtain the impact and the
efficiency respectively. Figure 36 represents the share of bike-sharing trips that were previously
made by public transport. As we can see the result has been very different depending on the
city and the share fluctuates from circa 0% to almost 80%. The average value is 35%.
0.02
0.31
0.22
0.54
0.02
0.12
0.46
0.02
0.08
0.01
0.21
0.41
0.07
0.28
0.65
0.00
0.10
0.20
0.30
0.40
0.50
0.60
0.70
Be
rlin
(DE
)
Pa
ris
(FR
)
Vie
nn
a (A
T)
Ba
rce
lon
a (E
S)
Mu
nic
h (D
E)
Sto
ckh
olm
(S
E)
Lyo
n (F
R)
Stu
ttga
rt (
DE
)
Ba
ri (
IT)
Ka
rlsr
uh
e (D
E)
Re
nn
es-
1 (F
R)
Rim
ini (
IT)
Bo
lza
no
(IT
)
Cu
ne
o (I
T)
Se
nig
alli
a (I
T)
Ca
r tr
ips
shif
ted
/ bi
cycl
e*d
ay
Cities sorted by population in decreasing order from left to right
Average=0.2 ; Median=0.2
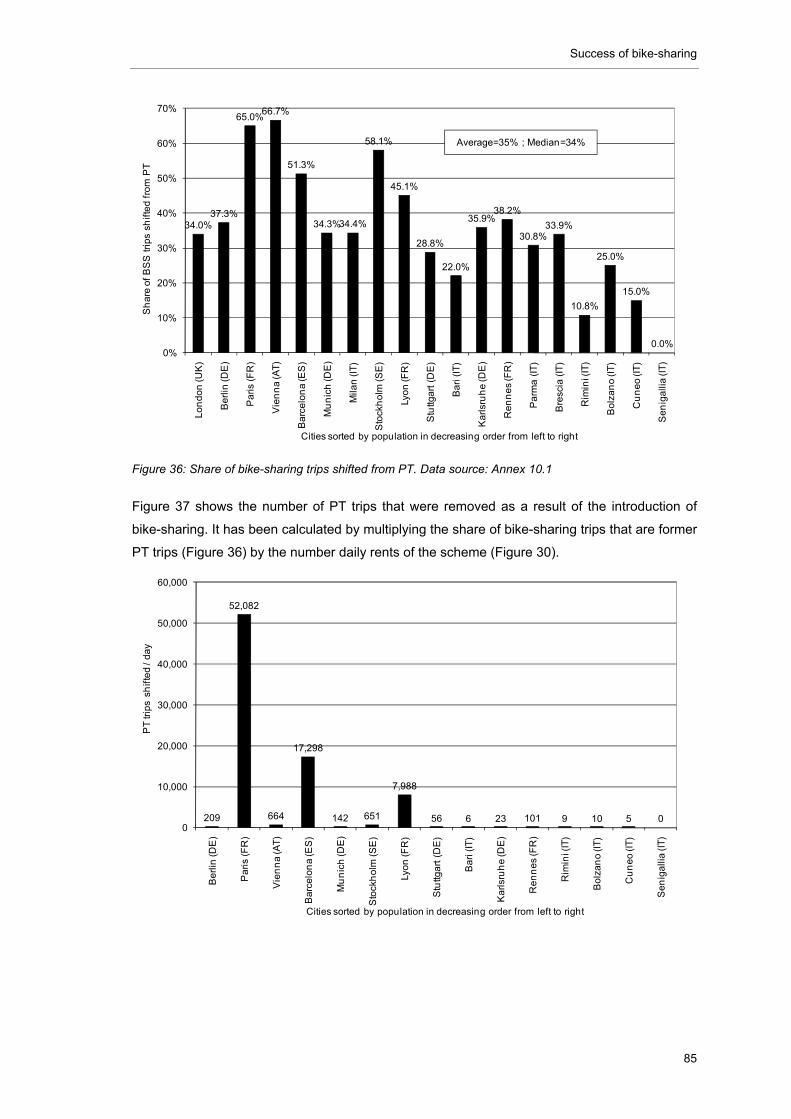
Success of bike-sharing
85
Figure 36: Share of bike-sharing trips shifted from PT. Data source: Annex 10.1
Figure 37 shows the number of PT trips that were removed as a result of the introduction of
bike-sharing. It has been calculated by multiplying the share of bike-sharing trips that are former
PT trips (Figure 36) by the number daily rents of the scheme (Figure 30).
34.0%37.3%
65.0%66.7%
51.3%
34.3%34.4%
58.1%
45.1%
28.8%
22.0%
35.9%38.2%
30.8%33.9%
10.8%
25.0%
15.0%
0.0%0%
10%
20%
30%
40%
50%
60%
70%
Lo
nd
on (U
K)
Be
rlin
(DE
)
Pa
ris (F
R)
Vie
nn
a (A
T)
Ba
rce
lon
a (E
S)
Mu
nic
h (D
E)
Mila
n (I
T)
Sto
ckh
olm
(SE
)
Lyo
n (F
R)
Stu
ttga
rt (
DE
)
Ba
ri (I
T)
Ka
rlsru
he
(DE
)
Re
nn
es
(FR
)
Pa
rma
(IT)
Bre
scia
(IT
)
Rim
ini (
IT)
Bo
lza
no
(IT
)
Cu
ne
o (I
T)
Se
nig
alli
a (I
T)
Sh
are
of
BS
S t
rips
sh
ifte
d f
rom
PT
Cities sorted by population in decreasing order from left to right
Average=35% ; Median=34%
209
52,082
664
17,298
142 651
7,988
56 6 23 101 9 10 5 00
10,000
20,000
30,000
40,000
50,000
60,000
Be
rlin
(DE
)
Pa
ris
(FR
)
Vie
nn
a (A
T)
Ba
rce
lon
a (E
S)
Mu
nic
h (D
E)
Sto
ckh
olm
(S
E)
Lyo
n (F
R)
Stu
ttga
rt (
DE
)
Ba
ri (
IT)
Ka
rlsr
uh
e (D
E)
Re
nn
es
(FR
)
Rim
ini (
IT)
Bo
lza
no
(IT
)
Cu
ne
o (I
T)
Se
nig
alli
a (I
T)
PT
trip
s sh
ifte
d /
da
y
Cities sorted by population in decreasing order from left to right
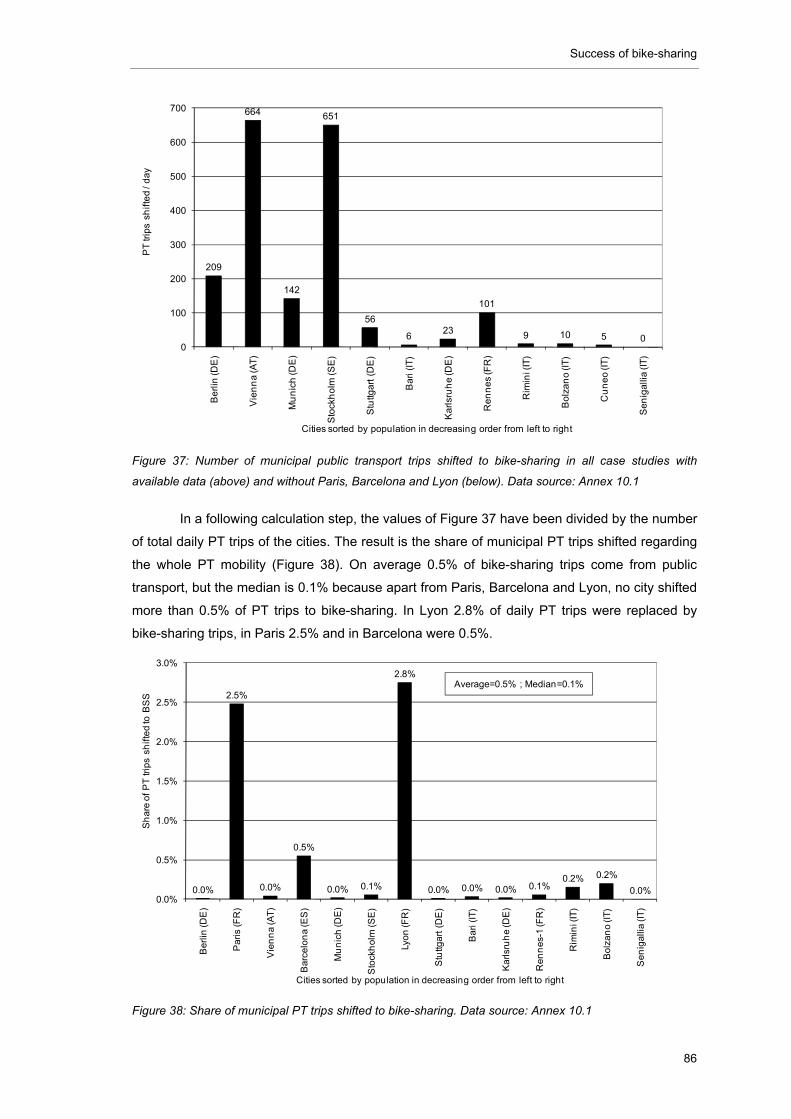
Success of bike-sharing
86
Figure 37: Number of municipal public transport trips shifted to bike-sharing in all case studies with
available data (above) and without Paris, Barcelona and Lyon (below). Data source: Annex 10.1
In a following calculation step, the values of Figure 37 have been divided by the number
of total daily PT trips of the cities. The result is the share of municipal PT trips shifted regarding
the whole PT mobility (Figure 38). On average 0.5% of bike-sharing trips come from public
transport, but the median is 0.1% because apart from Paris, Barcelona and Lyon, no city shifted
more than 0.5% of PT trips to bike-sharing. In Lyon 2.8% of daily PT trips were replaced by
bike-sharing trips, in Paris 2.5% and in Barcelona were 0.5%.
Figure 38: Share of municipal PT trips shifted to bike-sharing. Data source: Annex 10.1
209
664
142
651
56
623
101
9 10 5 00
100
200
300
400
500
600
700
Be
rlin
(DE
)
Vie
nn
a (A
T)
Mu
nic
h (D
E)
Sto
ckh
olm
(S
E)
Stu
ttga
rt (
DE
)
Ba
ri (
IT)
Ka
rlsr
uh
e (D
E)
Re
nn
es
(FR
)
Rim
ini (
IT)
Bo
lza
no
(IT
)
Cu
ne
o (I
T)
Se
nig
alli
a (I
T)
PT
trip
s sh
ifte
d /
da
y
Cities sorted by population in decreasing order from left to right
0.0%
2.5%
0.0%
0.5%
0.0% 0.1%
2.8%
0.0% 0.0% 0.0% 0.1%0.2% 0.2%
0.0%0.0%
0.5%
1.0%
1.5%
2.0%
2.5%
3.0%
Be
rlin
(DE
)
Pa
ris
(FR
)
Vie
nn
a (A
T)
Ba
rce
lon
a (E
S)
Mu
nic
h (D
E)
Sto
ckh
olm
(S
E)
Lyo
n (F
R)
Stu
ttga
rt (
DE
)
Ba
ri (I
T)
Ka
rlsr
uh
e (D
E)
Re
nn
es-
1 (F
R)
Rim
ini (
IT)
Bo
lza
no
(IT
)
Se
nig
alli
a (I
T)
Sh
are
of
PT
tri
ps
shif
ted
to B
SS
Cities sorted by population in decreasing order from left to right
Average=0.5% ; Median=0.1%
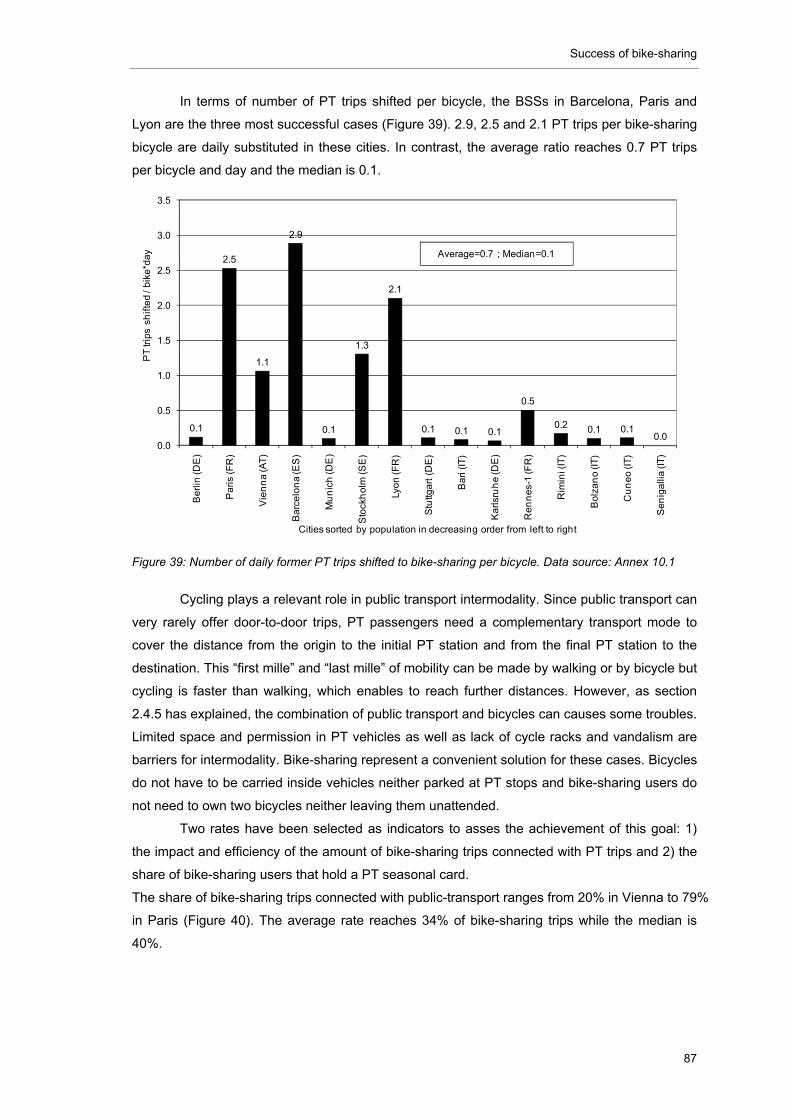
Success of bike-sharing
87
In terms of number of PT trips shifted per bicycle, the BSSs in Barcelona, Paris and
Lyon are the three most successful cases (Figure 39). 2.9, 2.5 and 2.1 PT trips per bike-sharing
bicycle are daily substituted in these cities. In contrast, the average ratio reaches 0.7 PT trips
per bicycle and day and the median is 0.1.
Figure 39: Number of daily former PT trips shifted to bike-sharing per bicycle. Data source: Annex 10.1
Cycling plays a relevant role in public transport intermodality. Since public transport can
very rarely offer door-to-door trips, PT passengers need a complementary transport mode to
cover the distance from the origin to the initial PT station and from the final PT station to the
destination. This “first mille” and “last mille” of mobility can be made by walking or by bicycle but
cycling is faster than walking, which enables to reach further distances. However, as section
2.4.5 has explained, the combination of public transport and bicycles can causes some troubles.
Limited space and permission in PT vehicles as well as lack of cycle racks and vandalism are
barriers for intermodality. Bike-sharing represent a convenient solution for these cases. Bicycles
do not have to be carried inside vehicles neither parked at PT stops and bike-sharing users do
not need to own two bicycles neither leaving them unattended.
Two rates have been selected as indicators to asses the achievement of this goal: 1)
the impact and efficiency of the amount of bike-sharing trips connected with PT trips and 2) the
share of bike-sharing users that hold a PT seasonal card.
The share of bike-sharing trips connected with public-transport ranges from 20% in Vienna to 79%
in Paris (Figure 40). The average rate reaches 34% of bike-sharing trips while the median is
40%.
0.1
2.5
1.1
2.9
0.1
1.3
2.1
0.1 0.1 0.1
0.5
0.2 0.1 0.10.0
0.0
0.5
1.0
1.5
2.0
2.5
3.0
3.5B
erl
in (D
E)
Pa
ris
(FR
)
Vie
nn
a (A
T)
Ba
rce
lon
a (E
S)
Mu
nic
h (D
E)
Sto
ckh
olm
(S
E)
Lyo
n (F
R)
Stu
ttga
rt (
DE
)
Ba
ri (
IT)
Ka
rlsr
uh
e (D
E)
Re
nn
es-
1 (F
R)
Rim
ini (
IT)
Bo
lza
no
(IT
)
Cu
ne
o (I
T)
Se
nig
alli
a (I
T)
PT
trip
s sh
ifte
d /
bik
e*d
ay
Cities sorted by population in decreasing order from left to right
Average=0.7 ; Median=0.1
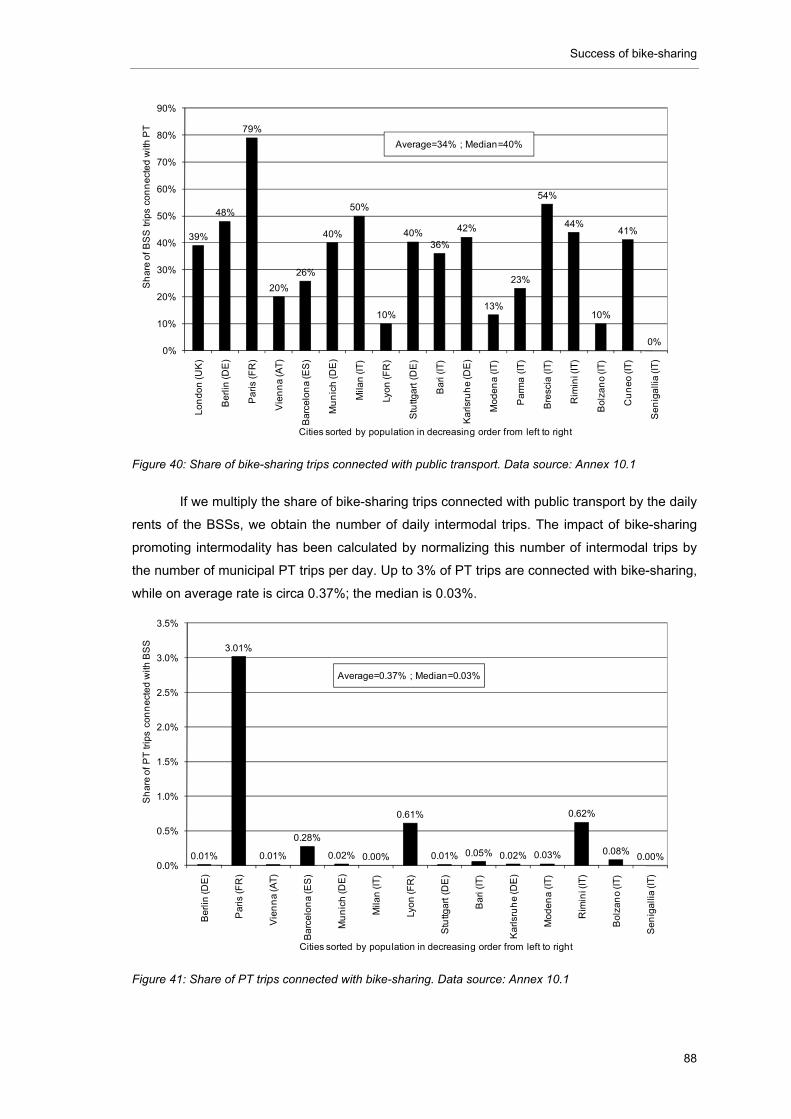
Success of bike-sharing
88
Figure 40: Share of bike-sharing trips connected with public transport. Data source: Annex 10.1
If we multiply the share of bike-sharing trips connected with public transport by the daily
rents of the BSSs, we obtain the number of daily intermodal trips. The impact of bike-sharing
promoting intermodality has been calculated by normalizing this number of intermodal trips by
the number of municipal PT trips per day. Up to 3% of PT trips are connected with bike-sharing,
while on average rate is circa 0.37%; the median is 0.03%.
Figure 41: Share of PT trips connected with bike-sharing. Data source: Annex 10.1
39%
48%
79%
20%
26%
40%
50%
10%
40%36%
42%
13%
23%
54%
44%
10%
41%
0%0%
10%
20%
30%
40%
50%
60%
70%
80%
90%
Lo
nd
on
(UK
)
Be
rlin
(DE
)
Pa
ris
(FR
)
Vie
nn
a (A
T)
Bar
celo
na
(ES
)
Mu
nic
h (D
E)
Mila
n (I
T)
Lyon
(FR
)
Stu
ttga
rt (
DE
)
Ba
ri (IT
)
Ka
rlsr
uh
e (D
E)
Mod
en
a (IT
)
Pa
rma
(IT
)
Bre
scia
(IT)
Rim
ini (
IT)
Bol
zan
o (I
T)
Cu
ne
o (I
T)
Se
nig
alli
a (I
T)
Sh
are
of
BS
S tr
ips
con
ne
cte
d w
ith P
T
Cities sorted by population in decreasing order from left to right
Average=34% ; Median=40%
0.01%
3.01%
0.01%
0.28%
0.02% 0.00%
0.61%
0.01% 0.05% 0.02% 0.03%
0.62%
0.08%0.00%
0.0%
0.5%
1.0%
1.5%
2.0%
2.5%
3.0%
3.5%
Be
rlin
(DE
)
Pa
ris
(FR
)
Vie
nn
a (A
T)
Ba
rce
lon
a (E
S)
Mu
nic
h (D
E)
Mila
n (I
T)
Lyo
n (F
R)
Stu
ttga
rt (D
E)
Ba
ri (
IT)
Ka
rlsr
uh
e (D
E)
Mo
de
na
(IT
)
Rim
ini (
IT)
Bo
lzan
o (I
T)
Se
nig
alli
a (I
T)
Sh
are
of
PT
trip
s co
nn
ect
ed
with
BS
S
Cities sorted by population in decreasing order from left to right
Average=0.37% ; Median=0.03%
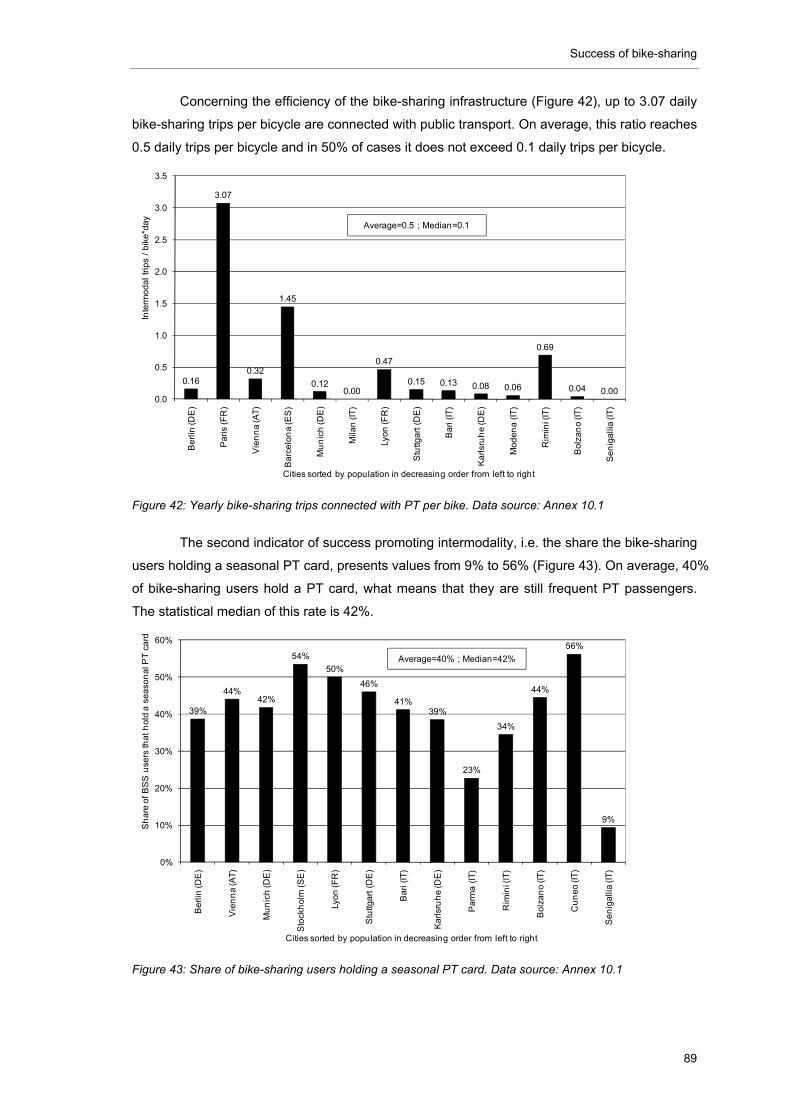
Success of bike-sharing
89
Concerning the efficiency of the bike-sharing infrastructure (Figure 42), up to 3.07 daily
bike-sharing trips per bicycle are connected with public transport. On average, this ratio reaches
0.5 daily trips per bicycle and in 50% of cases it does not exceed 0.1 daily trips per bicycle.
Figure 42: Yearly bike-sharing trips connected with PT per bike. Data source: Annex 10.1
The second indicator of success promoting intermodality, i.e. the share the bike-sharing
users holding a seasonal PT card, presents values from 9% to 56% (Figure 43). On average, 40%
of bike-sharing users hold a PT card, what means that they are still frequent PT passengers.
The statistical median of this rate is 42%.
Figure 43: Share of bike-sharing users holding a seasonal PT card. Data source: Annex 10.1
0.16
3.07
0.32
1.45
0.120.00
0.47
0.15 0.13 0.08 0.06
0.69
0.04 0.000.0
0.5
1.0
1.5
2.0
2.5
3.0
3.5
Be
rlin
(DE
)
Par
is (
FR
)
Vie
nn
a (A
T)
Bar
celo
na
(ES
)
Mu
nic
h (D
E)
Mila
n (I
T)
Lyon
(FR
)
Stu
ttga
rt (
DE
)
Bar
i (IT
)
Ka
rlsru
he
(DE
)
Mod
ena
(IT
)
Rim
ini (
IT)
Bol
zan
o (I
T)
Se
nig
alli
a (I
T)
Inte
rmo
dal t
rips
/ bi
ke*d
ay
Cities sorted by population in decreasing order from left to right
Average=0.5 ; Median=0.1
39%
44%42%
54%
50%
46%
41%39%
23%
34%
44%
56%
9%
0%
10%
20%
30%
40%
50%
60%
Be
rlin
(DE
)
Vie
nn
a (A
T)
Mu
nic
h (D
E)
Sto
ckh
olm
(S
E)
Lyon
(FR
)
Stu
ttga
rt (
DE
)
Bar
i (IT
)
Ka
rlsru
he
(DE
)
Pa
rma
(IT
)
Rim
ini (
IT)
Bol
zan
o (I
T)
Cu
neo
(IT
)
Se
nig
alli
a (I
T)
Sh
are
of
BS
S u
sers
tha
t h
old
a s
easo
na
l PT
ca
rd
Cities sorted by population in decreasing order from left to right
Average=40% ; Median=42%
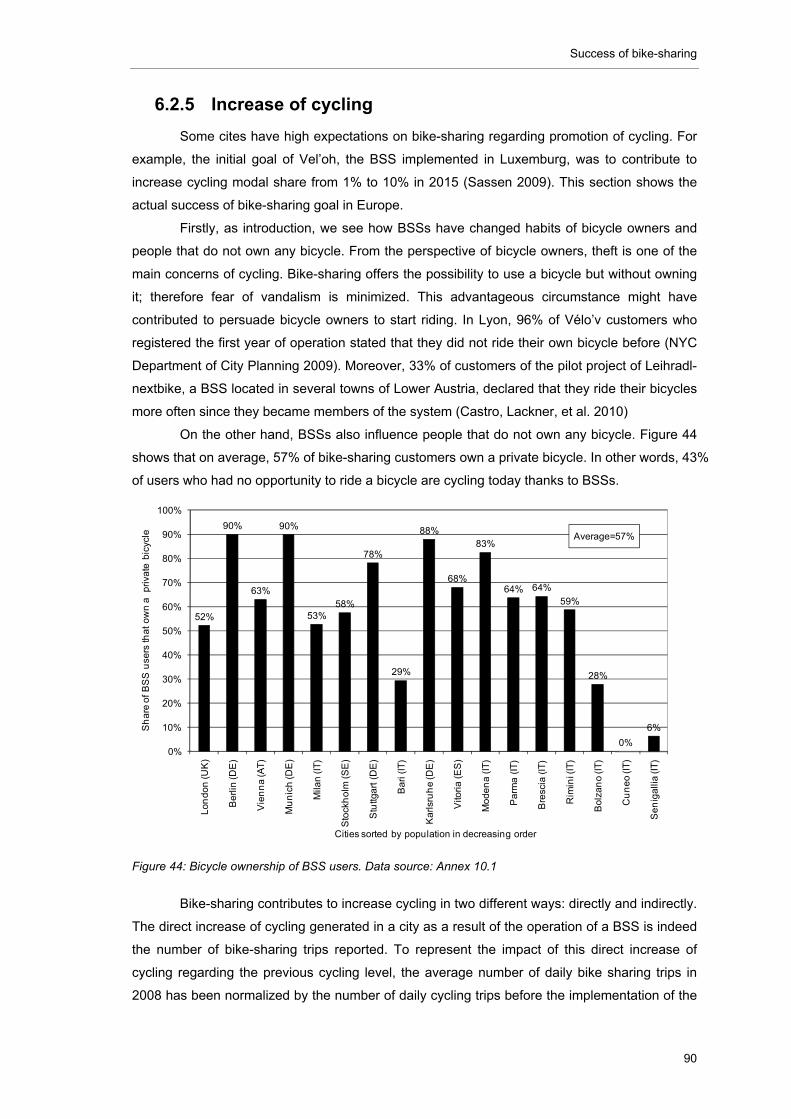
Success of bike-sharing
90
6.2.5 Increase of cycling
Some cites have high expectations on bike-sharing regarding promotion of cycling. For
example, the initial goal of Vel’oh, the BSS implemented in Luxemburg, was to contribute to
increase cycling modal share from 1% to 10% in 2015 (Sassen 2009). This section shows the
actual success of bike-sharing goal in Europe.
Firstly, as introduction, we see how BSSs have changed habits of bicycle owners and
people that do not own any bicycle. From the perspective of bicycle owners, theft is one of the
main concerns of cycling. Bike-sharing offers the possibility to use a bicycle but without owning
it; therefore fear of vandalism is minimized. This advantageous circumstance might have
contributed to persuade bicycle owners to start riding. In Lyon, 96% of Vélo’v customers who
registered the first year of operation stated that they did not ride their own bicycle before (NYC
Department of City Planning 2009). Moreover, 33% of customers of the pilot project of Leihradl-
nextbike, a BSS located in several towns of Lower Austria, declared that they ride their bicycles
more often since they became members of the system (Castro, Lackner, et al. 2010)
On the other hand, BSSs also influence people that do not own any bicycle. Figure 44
shows that on average, 57% of bike-sharing customers own a private bicycle. In other words, 43%
of users who had no opportunity to ride a bicycle are cycling today thanks to BSSs.
Figure 44: Bicycle ownership of BSS users. Data source: Annex 10.1
Bike-sharing contributes to increase cycling in two different ways: directly and indirectly.
The direct increase of cycling generated in a city as a result of the operation of a BSS is indeed
the number of bike-sharing trips reported. To represent the impact of this direct increase of
cycling regarding the previous cycling level, the average number of daily bike sharing trips in
2008 has been normalized by the number of daily cycling trips before the implementation of the
52%
90%
63%
90%
53%58%
78%
29%
88%
68%
83%
64% 64%
59%
28%
0%
6%
0%
10%
20%
30%
40%
50%
60%
70%
80%
90%
100%
Lon
don
(UK
)
Be
rlin
(DE
)
Vie
nn
a (A
T)
Mu
nic
h (D
E)
Mila
n (I
T)
Sto
ckh
olm
(S
E)
Stu
ttga
rt (
DE
)
Ba
ri (
IT)
Ka
rlsr
uh
e (D
E)
Vito
ria
(E
S)
Mo
de
na
(IT
)
Pa
rma
(IT
)
Bre
scia
(IT
)
Rim
ini (
IT)
Bo
lza
no
(IT
)
Cu
ne
o (I
T)
Se
nig
alli
a (I
T)
Sh
are
of
BS
S u
sers
tha
t o
wn
a
pri
vate
bic
ycle
Cities sorted by population in decreasing order
Average=57%
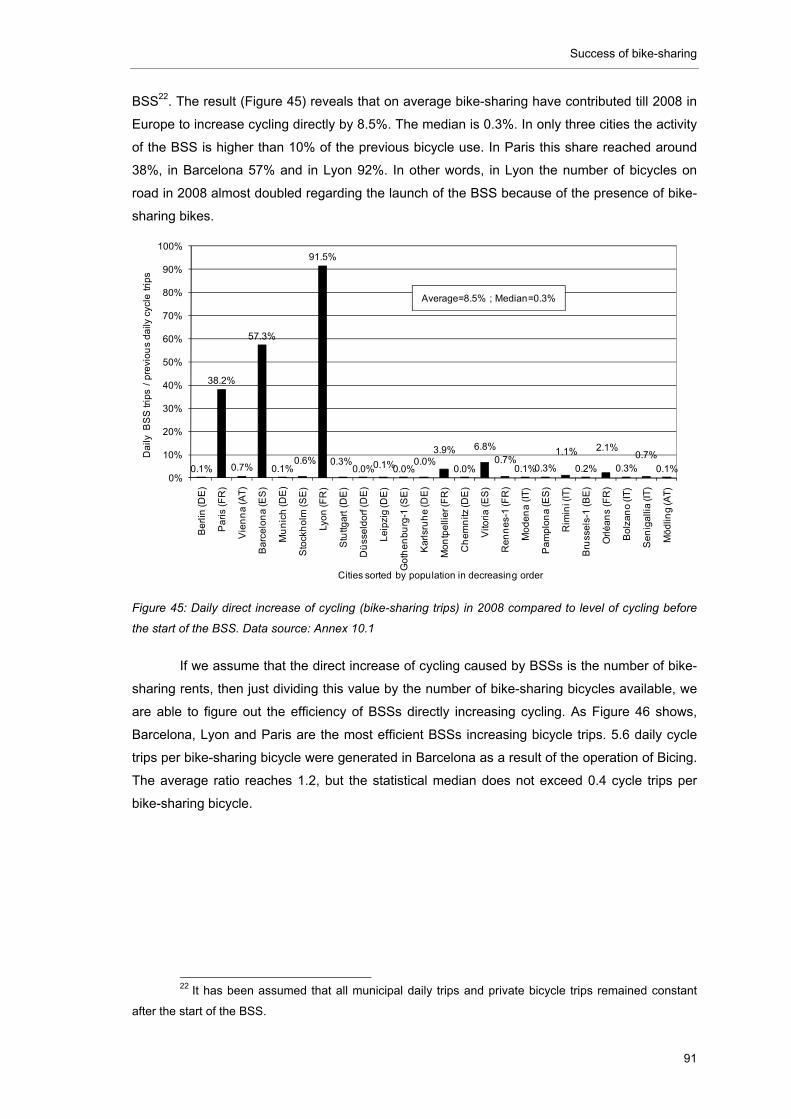
Success of bike-sharing
91
BSS22. The result (Figure 45) reveals that on average bike-sharing have contributed till 2008 in
Europe to increase cycling directly by 8.5%. The median is 0.3%. In only three cities the activity
of the BSS is higher than 10% of the previous bicycle use. In Paris this share reached around
38%, in Barcelona 57% and in Lyon 92%. In other words, in Lyon the number of bicycles on
road in 2008 almost doubled regarding the launch of the BSS because of the presence of bike-
sharing bikes.
Figure 45: Daily direct increase of cycling (bike-sharing trips) in 2008 compared to level of cycling before
the start of the BSS. Data source: Annex 10.1
If we assume that the direct increase of cycling caused by BSSs is the number of bike-
sharing rents, then just dividing this value by the number of bike-sharing bicycles available, we
are able to figure out the efficiency of BSSs directly increasing cycling. As Figure 46 shows,
Barcelona, Lyon and Paris are the most efficient BSSs increasing bicycle trips. 5.6 daily cycle
trips per bike-sharing bicycle were generated in Barcelona as a result of the operation of Bicing.
The average ratio reaches 1.2, but the statistical median does not exceed 0.4 cycle trips per
bike-sharing bicycle.
22 It has been assumed that all municipal daily trips and private bicycle trips remained constant
after the start of the BSS.
0.1%
38.2%
0.7%
57.3%
0.1%0.6%
91.5%
0.3%0.0%0.1%0.0%
0.0%3.9%
0.0%
6.8%0.7%
0.1%0.3%
1.1%
0.2%
2.1%
0.3%0.7%
0.1%0%
10%
20%
30%
40%
50%
60%
70%
80%
90%
100%
Be
rlin
(DE
)
Pa
ris
(FR
)
Vie
nn
a (A
T)
Ba
rce
lon
a (E
S)
Mu
nic
h (D
E)
Sto
ckh
olm
(S
E)
Lyo
n (F
R)
Stu
ttga
rt (
DE
)
Dü
sse
ldo
rf (D
E)
Le
ipzi
g (D
E)
Go
the
nb
urg
-1 (S
E)
Ka
rlsr
uh
e (D
E)
Mo
ntp
elli
er (
FR
)
Ch
em
nitz
(DE
)
Vito
ria
(E
S)
Re
nn
es-
1 (F
R)
Mo
de
na
(IT
)
Pa
mp
lon
a (E
S)
Rim
ini (
IT)
Bru
sse
ls-1
(B
E)
Orl
éa
ns
(FR
)
Bo
lza
no
(IT
)
Se
nig
alli
a (I
T)
Mö
dlin
g (A
T)
Da
ily B
SS
trip
s /
pre
vio
us
da
ily c
ycle
tri
ps
Cities sorted by population in decreasing order
Average=8.5% ; Median=0.3%
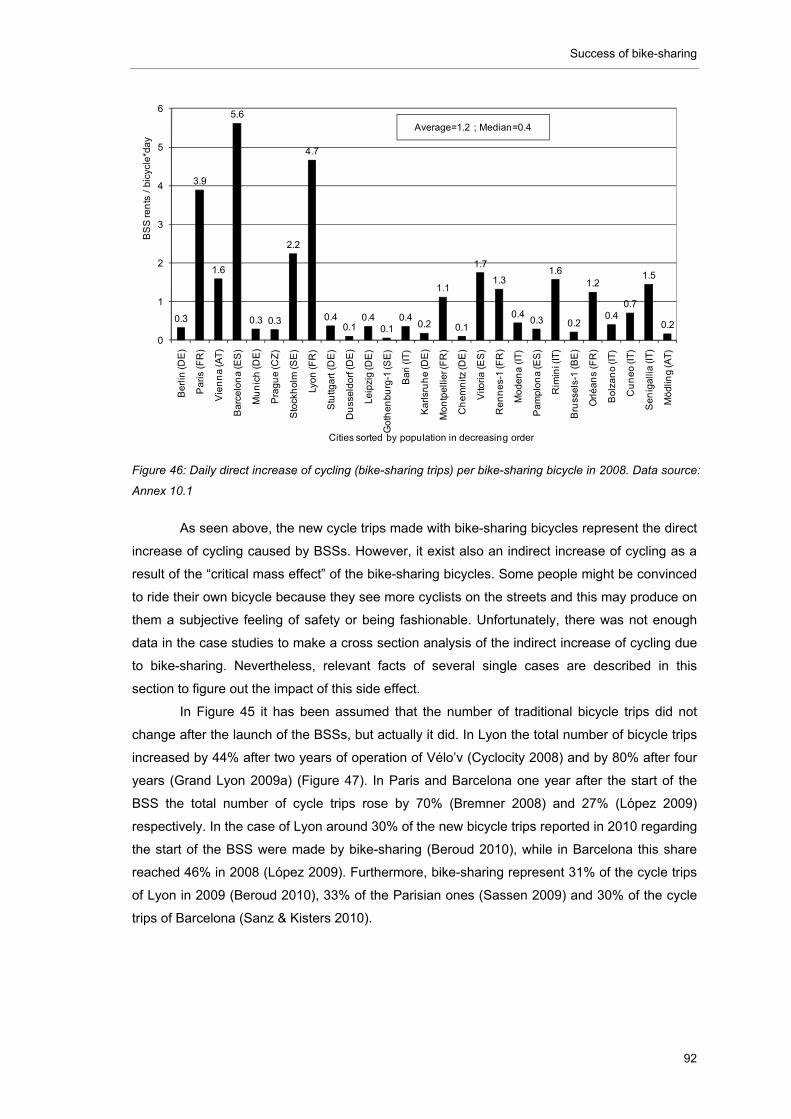
Success of bike-sharing
92
Figure 46: Daily direct increase of cycling (bike-sharing trips) per bike-sharing bicycle in 2008. Data source:
Annex 10.1
As seen above, the new cycle trips made with bike-sharing bicycles represent the direct
increase of cycling caused by BSSs. However, it exist also an indirect increase of cycling as a
result of the “critical mass effect” of the bike-sharing bicycles. Some people might be convinced
to ride their own bicycle because they see more cyclists on the streets and this may produce on
them a subjective feeling of safety or being fashionable. Unfortunately, there was not enough
data in the case studies to make a cross section analysis of the indirect increase of cycling due
to bike-sharing. Nevertheless, relevant facts of several single cases are described in this
section to figure out the impact of this side effect.
In Figure 45 it has been assumed that the number of traditional bicycle trips did not
change after the launch of the BSSs, but actually it did. In Lyon the total number of bicycle trips
increased by 44% after two years of operation of Vélo’v (Cyclocity 2008) and by 80% after four
years (Grand Lyon 2009a) (Figure 47). In Paris and Barcelona one year after the start of the
BSS the total number of cycle trips rose by 70% (Bremner 2008) and 27% (López 2009)
respectively. In the case of Lyon around 30% of the new bicycle trips reported in 2010 regarding
the start of the BSS were made by bike-sharing (Beroud 2010), while in Barcelona this share
reached 46% in 2008 (López 2009). Furthermore, bike-sharing represent 31% of the cycle trips
of Lyon in 2009 (Beroud 2010), 33% of the Parisian ones (Sassen 2009) and 30% of the cycle
trips of Barcelona (Sanz & Kisters 2010).
0.3
3.9
1.6
5.6
0.3 0.3
2.2
4.7
0.40.1
0.40.1
0.40.2
1.1
0.1
1.7
1.3
0.40.3
1.6
0.2
1.2
0.40.7
1.5
0.2
0
1
2
3
4
5
6
Be
rlin
(DE
)
Pa
ris
(FR
)
Vie
nn
a (A
T)
Ba
rce
lon
a (E
S)
Mu
nic
h (D
E)
Pra
gu
e (C
Z)
Sto
ckh
olm
(S
E)
Lyo
n (F
R)
Stu
ttga
rt (
DE
)
Du
sse
ldo
rf (D
E)
Le
ipzi
g (D
E)
Go
the
nb
urg
-1 (S
E)
Ba
ri (
IT)
Ka
rlsr
uh
e (D
E)
Mo
ntp
elli
er (
FR
)
Ch
em
nitz
(DE
)
Vito
ria
(E
S)
Re
nn
es-
1 (F
R)
Mo
de
na
(IT
)
Pa
mp
lon
a (E
S)
Rim
ini (
IT)
Bru
sse
ls-1
(B
E)
Orl
éa
ns
(FR
)
Bo
lza
no
(IT
)
Cu
ne
o (I
T)
Se
nig
alli
a (I
T)
Mö
dlin
g (A
T)
BS
S re
nts
/ b
icyc
le*d
ay
Cities sorted by population in decreasing order
Average=1.2 ; Median=0.4
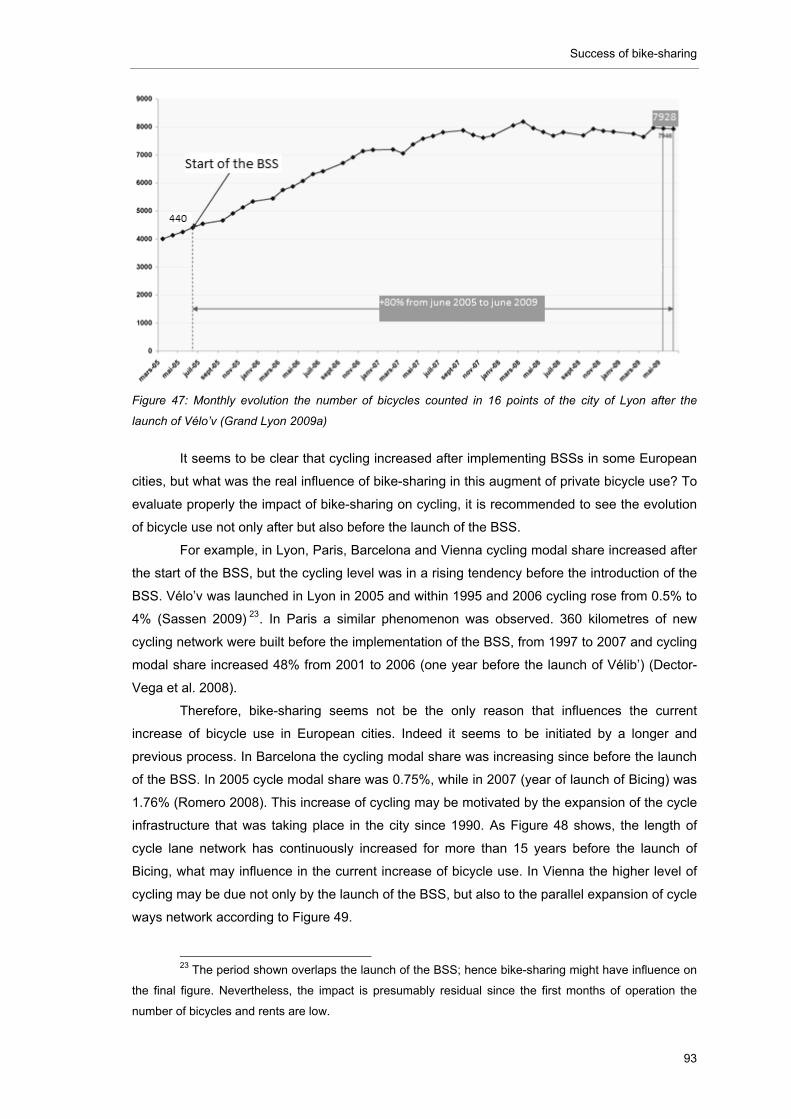
Success of bike-sharing
93
Figure 47: Monthly evolution the number of bicycles counted in 16 points of the city of Lyon after the
launch of Vélo’v (Grand Lyon 2009a)
It seems to be clear that cycling increased after implementing BSSs in some European
cities, but what was the real influence of bike-sharing in this augment of private bicycle use? To
evaluate properly the impact of bike-sharing on cycling, it is recommended to see the evolution
of bicycle use not only after but also before the launch of the BSS.
For example, in Lyon, Paris, Barcelona and Vienna cycling modal share increased after
the start of the BSS, but the cycling level was in a rising tendency before the introduction of the
BSS. Vélo’v was launched in Lyon in 2005 and within 1995 and 2006 cycling rose from 0.5% to
4% (Sassen 2009) 23. In Paris a similar phenomenon was observed. 360 kilometres of new
cycling network were built before the implementation of the BSS, from 1997 to 2007 and cycling
modal share increased 48% from 2001 to 2006 (one year before the launch of Vélib’) (Dector-
Vega et al. 2008).
Therefore, bike-sharing seems not be the only reason that influences the current
increase of bicycle use in European cities. Indeed it seems to be initiated by a longer and
previous process. In Barcelona the cycling modal share was increasing since before the launch
of the BSS. In 2005 cycle modal share was 0.75%, while in 2007 (year of launch of Bicing) was
1.76% (Romero 2008). This increase of cycling may be motivated by the expansion of the cycle
infrastructure that was taking place in the city since 1990. As Figure 48 shows, the length of
cycle lane network has continuously increased for more than 15 years before the launch of
Bicing, what may influence in the current increase of bicycle use. In Vienna the higher level of
cycling may be due not only by the launch of the BSS, but also to the parallel expansion of cycle
ways network according to Figure 49.
23 The period shown overlaps the launch of the BSS; hence bike-sharing might have influence on
the final figure. Nevertheless, the impact is presumably residual since the first months of operation the
number of bicycles and rents are low.
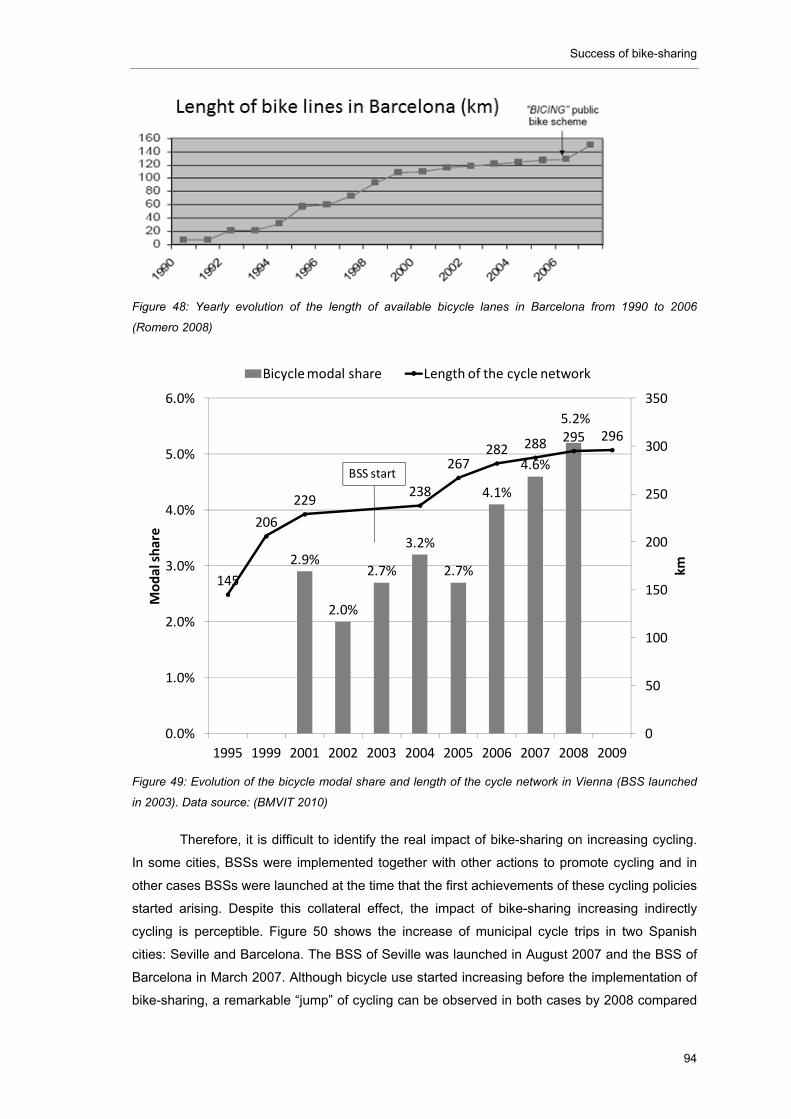
Success of bike-sharing
94
Figure 48: Yearly evolution of the length of available bicycle lanes in Barcelona from 1990 to 2006
(Romero 2008)
Figure 49: Evolution of the bicycle modal share and length of the cycle network in Vienna (BSS launched
in 2003). Data source: (BMVIT 2010)
Therefore, it is difficult to identify the real impact of bike-sharing on increasing cycling.
In some cities, BSSs were implemented together with other actions to promote cycling and in
other cases BSSs were launched at the time that the first achievements of these cycling policies
started arising. Despite this collateral effect, the impact of bike-sharing increasing indirectly
cycling is perceptible. Figure 50 shows the increase of municipal cycle trips in two Spanish
cities: Seville and Barcelona. The BSS of Seville was launched in August 2007 and the BSS of
Barcelona in March 2007. Although bicycle use started increasing before the implementation of
bike-sharing, a remarkable “jump” of cycling can be observed in both cases by 2008 compared
2.9%
2.0%
2.7%
3.2%
2.7%
4.1%
4.6%
5.2%
145
206
229238
267282 288 295 296
0
50
100
150
200
250
300
350
0.0%
1.0%
2.0%
3.0%
4.0%
5.0%
6.0%
1995 1999 2001 2002 2003 2004 2005 2006 2007 2008 2009
km
Modal share
Bicycle modal share Length of the cycle network
BSS start
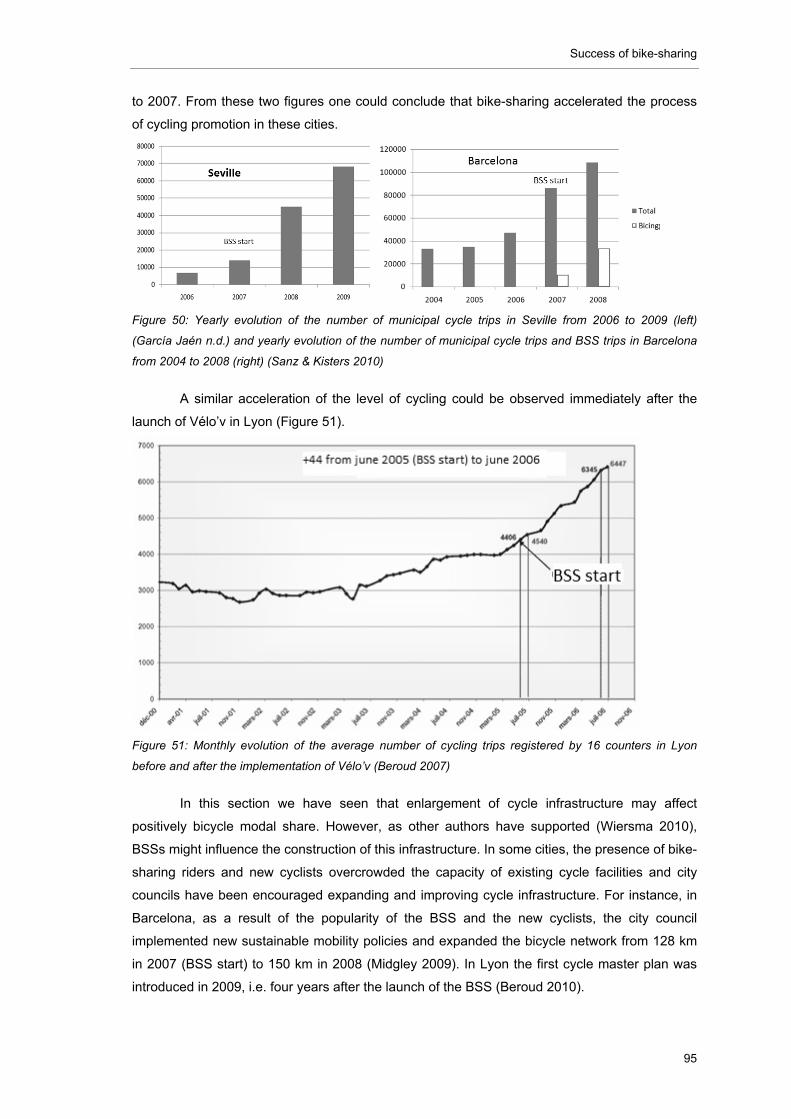
Success of bike-sharing
95
to 2007. From these two figures one could conclude that bike-sharing accelerated the process
of cycling promotion in these cities.
Figure 50: Yearly evolution of the number of municipal cycle trips in Seville from 2006 to 2009 (left)
(García Jaén n.d.) and yearly evolution of the number of municipal cycle trips and BSS trips in Barcelona
from 2004 to 2008 (right) (Sanz & Kisters 2010)
A similar acceleration of the level of cycling could be observed immediately after the
launch of Vélo’v in Lyon (Figure 51).
Figure 51: Monthly evolution of the average number of cycling trips registered by 16 counters in Lyon
before and after the implementation of Vélo’v (Beroud 2007)
In this section we have seen that enlargement of cycle infrastructure may affect
positively bicycle modal share. However, as other authors have supported (Wiersma 2010),
BSSs might influence the construction of this infrastructure. In some cities, the presence of bike-
sharing riders and new cyclists overcrowded the capacity of existing cycle facilities and city
councils have been encouraged expanding and improving cycle infrastructure. For instance, in
Barcelona, as a result of the popularity of the BSS and the new cyclists, the city council
implemented new sustainable mobility policies and expanded the bicycle network from 128 km
in 2007 (BSS start) to 150 km in 2008 (Midgley 2009). In Lyon the first cycle master plan was
introduced in 2009, i.e. four years after the launch of the BSS (Beroud 2010).
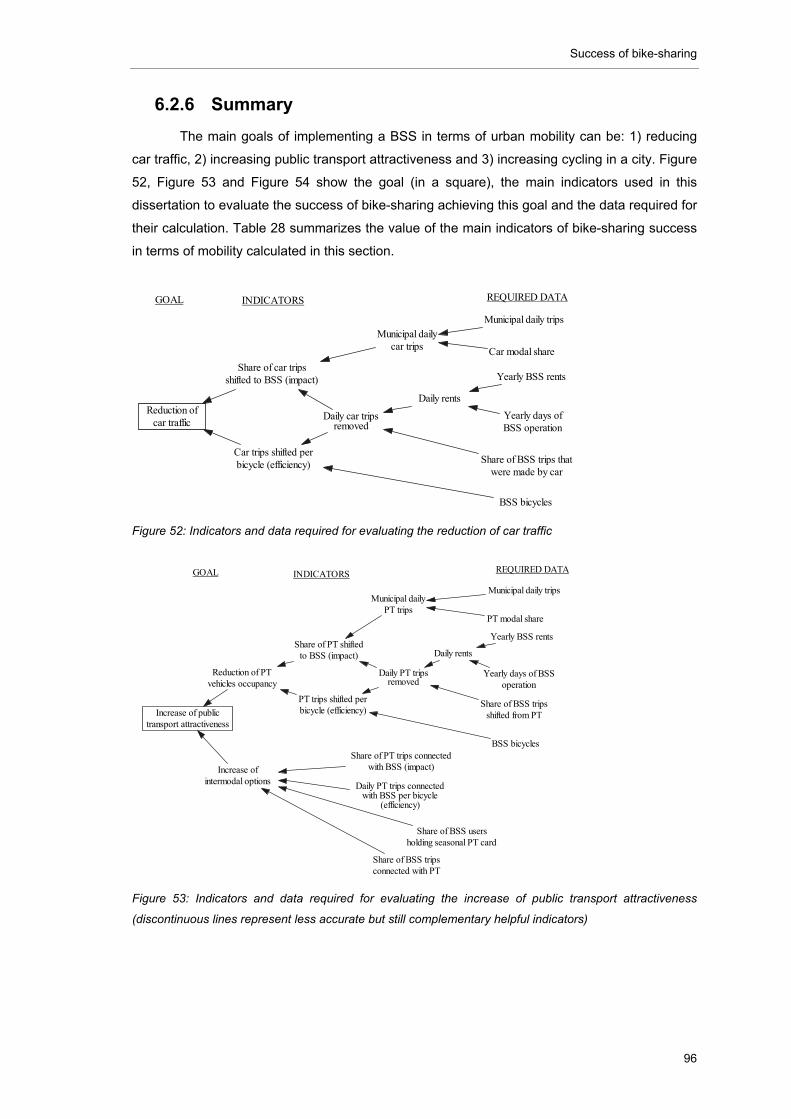
Success of bike-sharing
96
6.2.6 Summary
The main goals of implementing a BSS in terms of urban mobility can be: 1) reducing
car traffic, 2) increasing public transport attractiveness and 3) increasing cycling in a city. Figure
52, Figure 53 and Figure 54 show the goal (in a square), the main indicators used in this
dissertation to evaluate the success of bike-sharing achieving this goal and the data required for
their calculation. Table 28 summarizes the value of the main indicators of bike-sharing success
in terms of mobility calculated in this section.
Figure 52: Indicators and data required for evaluating the reduction of car traffic
Figure 53: Indicators and data required for evaluating the increase of public transport attractiveness
(discontinuous lines represent less accurate but still complementary helpful indicators)
Reduction ofcar traffic
Share of BSS trips thatwere made by car
Daily rents
Share of car tripsshifted to BSS (impact)
Municipal dailycar trips
INDICATORS
Municipal daily trips
Car modal share
Yearly BSS rents
Yearly days ofBSS operation
REQUIRED DATA
Car trips shifted perbicycle (efficiency)
BSS bicycles
Daily car tripsremoved
GOAL
Increase of publictransport attractiveness
Increase ofintermodal options
INDICATORS REQUIRED DATA
Reduction of PTvehicles occupancy
GOAL
Share of PT shiftedto BSS (impact)
Share of BSS tripsshifted from PT
Daily rents
Municipal dailyPT trips
Municipal daily trips
PT modal share
Yearly BSS rents
Yearly days of BSSoperation
Daily PT tripsremoved
PT trips shifted perbicycle (efficiency)
BSS bicyclesShare of PT trips connected
with BSS (impact)
Daily PT trips connectedwith BSS per bicycle
(efficiency)
Share of BSS usersholding seasonal PT card
Share of BSS tripsconnected with PT
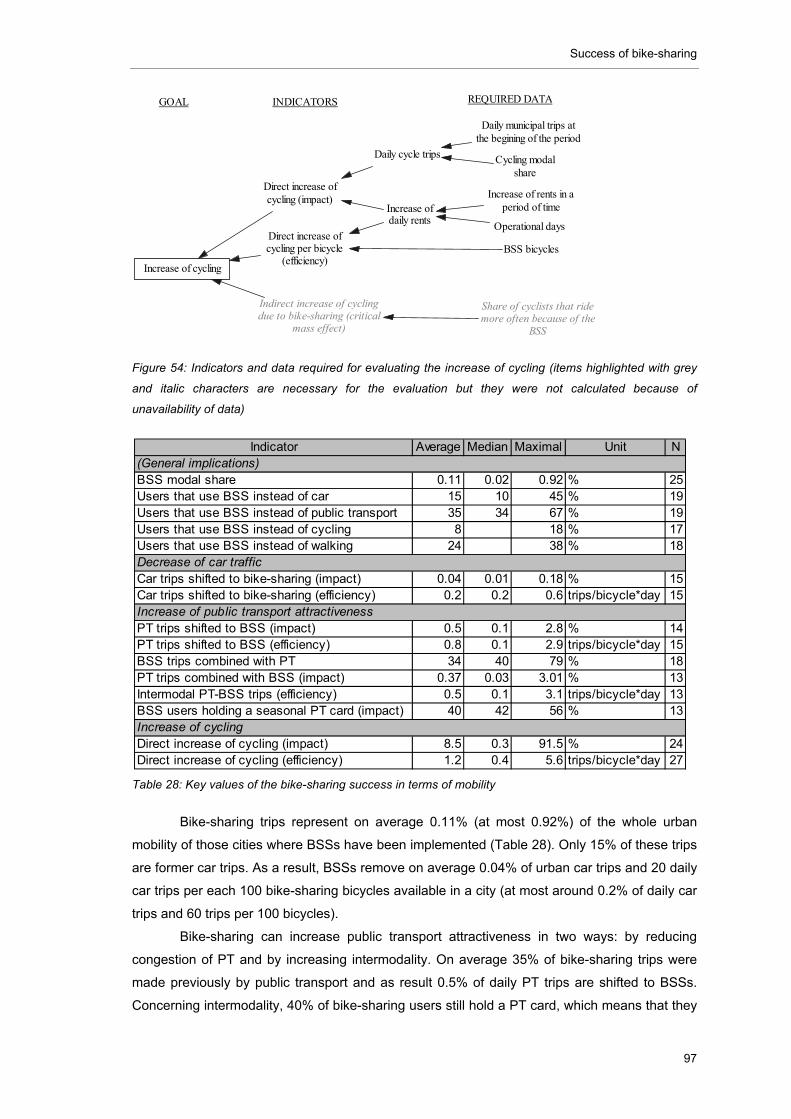
Success of bike-sharing
97
Figure 54: Indicators and data required for evaluating the increase of cycling (items highlighted with grey
and italic characters are necessary for the evaluation but they were not calculated because of
unavailability of data)
Table 28: Key values of the bike-sharing success in terms of mobility
Bike-sharing trips represent on average 0.11% (at most 0.92%) of the whole urban
mobility of those cities where BSSs have been implemented (Table 28). Only 15% of these trips
are former car trips. As a result, BSSs remove on average 0.04% of urban car trips and 20 daily
car trips per each 100 bike-sharing bicycles available in a city (at most around 0.2% of daily car
trips and 60 trips per 100 bicycles).
Bike-sharing can increase public transport attractiveness in two ways: by reducing
congestion of PT and by increasing intermodality. On average 35% of bike-sharing trips were
made previously by public transport and as result 0.5% of daily PT trips are shifted to BSSs.
Concerning intermodality, 40% of bike-sharing users still hold a PT card, which means that they
Increase of cycling
INDICATORS REQUIRED DATAGOAL
Direct increase ofcycling (impact) Increase of rents in a
period of time
Operational days
Increase ofdaily rents
Daily municipal trips atthe begining of the period
Cycling modalshare
Daily cycle trips
Indirect increase of cyclingdue to bike-sharing (critical
mass effect)
Share of cyclists that ridemore often because of the
BSS
BSS bicyclesDirect increase ofcycling per bicycle
(efficiency)
Indicator Average Median Maximal Unit N
BSS modal share 0.11 0.02 0.92 % 25Users that use BSS instead of car 15 10 45 % 19Users that use BSS instead of public transport 35 34 67 % 19Users that use BSS instead of cycling 8 18 % 17Users that use BSS instead of walking 24 38 % 18
Car trips shifted to bike-sharing (impact) 0.04 0.01 0.18 % 15Car trips shifted to bike-sharing (efficiency) 0.2 0.2 0.6 trips/bicycle*day 15
PT trips shifted to BSS (impact) 0.5 0.1 2.8 % 14PT trips shifted to BSS (efficiency) 0.8 0.1 2.9 trips/bicycle*day 15BSS trips combined with PT 34 40 79 % 18PT trips combined with BSS (impact) 0.37 0.03 3.01 % 13Intermodal PT-BSS trips (efficiency) 0.5 0.1 3.1 trips/bicycle*day 13BSS users holding a seasonal PT card (impact) 40 42 56 % 13
Direct increase of cycling (impact) 8.5 0.3 91.5 % 24Direct increase of cycling (efficiency) 1.2 0.4 5.6 trips/bicycle*day 27
(General implications)
Decrease of car traffic
Increase of public transport attractiveness
Increase of cycling
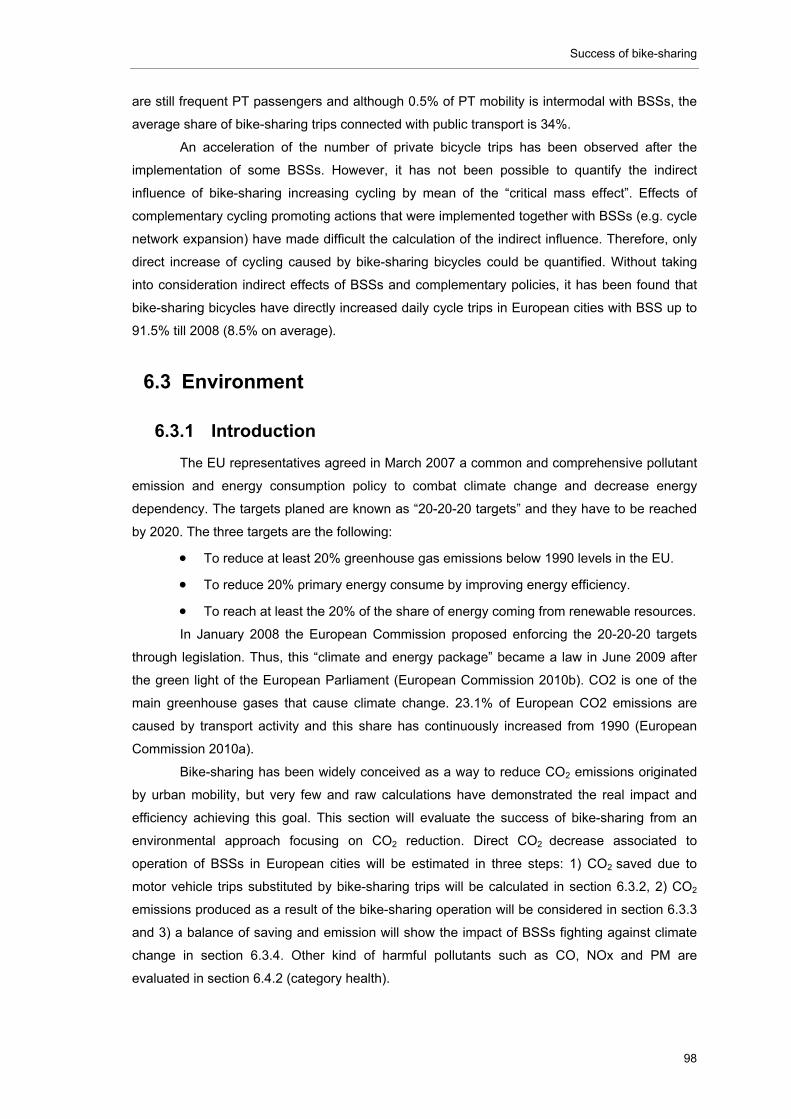
Success of bike-sharing
98
are still frequent PT passengers and although 0.5% of PT mobility is intermodal with BSSs, the
average share of bike-sharing trips connected with public transport is 34%.
An acceleration of the number of private bicycle trips has been observed after the
implementation of some BSSs. However, it has not been possible to quantify the indirect
influence of bike-sharing increasing cycling by mean of the “critical mass effect”. Effects of
complementary cycling promoting actions that were implemented together with BSSs (e.g. cycle
network expansion) have made difficult the calculation of the indirect influence. Therefore, only
direct increase of cycling caused by bike-sharing bicycles could be quantified. Without taking
into consideration indirect effects of BSSs and complementary policies, it has been found that
bike-sharing bicycles have directly increased daily cycle trips in European cities with BSS up to
91.5% till 2008 (8.5% on average).
6.3 Environment
6.3.1 Introduction
The EU representatives agreed in March 2007 a common and comprehensive pollutant
emission and energy consumption policy to combat climate change and decrease energy
dependency. The targets planed are known as “20-20-20 targets” and they have to be reached
by 2020. The three targets are the following:
To reduce at least 20% greenhouse gas emissions below 1990 levels in the EU.
To reduce 20% primary energy consume by improving energy efficiency.
To reach at least the 20% of the share of energy coming from renewable resources.
In January 2008 the European Commission proposed enforcing the 20-20-20 targets
through legislation. Thus, this “climate and energy package” became a law in June 2009 after
the green light of the European Parliament (European Commission 2010b). CO2 is one of the
main greenhouse gases that cause climate change. 23.1% of European CO2 emissions are
caused by transport activity and this share has continuously increased from 1990 (European
Commission 2010a).
Bike-sharing has been widely conceived as a way to reduce CO2 emissions originated
by urban mobility, but very few and raw calculations have demonstrated the real impact and
efficiency achieving this goal. This section will evaluate the success of bike-sharing from an
environmental approach focusing on CO2 reduction. Direct CO2 decrease associated to
operation of BSSs in European cities will be estimated in three steps: 1) CO2 saved due to
motor vehicle trips substituted by bike-sharing trips will be calculated in section 6.3.2, 2) CO2
emissions produced as a result of the bike-sharing operation will be considered in section 6.3.3
and 3) a balance of saving and emission will show the impact of BSSs fighting against climate
change in section 6.3.4. Other kind of harmful pollutants such as CO, NOx and PM are
evaluated in section 6.4.2 (category health).
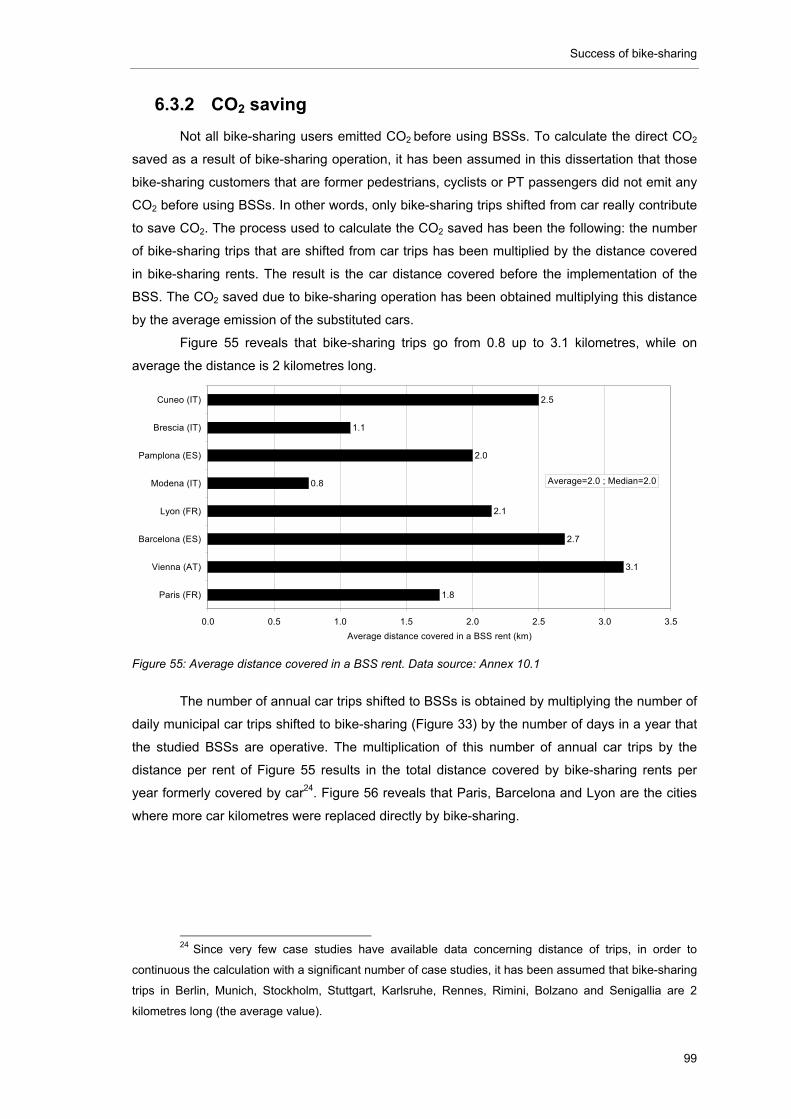
Success of bike-sharing
99
6.3.2 CO2 saving
Not all bike-sharing users emitted CO2 before using BSSs. To calculate the direct CO2
saved as a result of bike-sharing operation, it has been assumed in this dissertation that those
bike-sharing customers that are former pedestrians, cyclists or PT passengers did not emit any
CO2 before using BSSs. In other words, only bike-sharing trips shifted from car really contribute
to save CO2. The process used to calculate the CO2 saved has been the following: the number
of bike-sharing trips that are shifted from car trips has been multiplied by the distance covered
in bike-sharing rents. The result is the car distance covered before the implementation of the
BSS. The CO2 saved due to bike-sharing operation has been obtained multiplying this distance
by the average emission of the substituted cars.
Figure 55 reveals that bike-sharing trips go from 0.8 up to 3.1 kilometres, while on
average the distance is 2 kilometres long.
Figure 55: Average distance covered in a BSS rent. Data source: Annex 10.1
The number of annual car trips shifted to BSSs is obtained by multiplying the number of
daily municipal car trips shifted to bike-sharing (Figure 33) by the number of days in a year that
the studied BSSs are operative. The multiplication of this number of annual car trips by the
distance per rent of Figure 55 results in the total distance covered by bike-sharing rents per
year formerly covered by car24. Figure 56 reveals that Paris, Barcelona and Lyon are the cities
where more car kilometres were replaced directly by bike-sharing.
24 Since very few case studies have available data concerning distance of trips, in order to
continuous the calculation with a significant number of case studies, it has been assumed that bike-sharing
trips in Berlin, Munich, Stockholm, Stuttgart, Karlsruhe, Rennes, Rimini, Bolzano and Senigallia are 2
kilometres long (the average value).
1.8
3.1
2.7
2.1
0.8
2.0
1.1
2.5
0.0 0.5 1.0 1.5 2.0 2.5 3.0 3.5
Paris (FR)
Vienna (AT)
Barcelona (ES)
Lyon (FR)
Modena (IT)
Pamplona (ES)
Brescia (IT)
Cuneo (IT)
Average distance covered in a BSS rent (km)
Average=2.0 ; Median=2.0
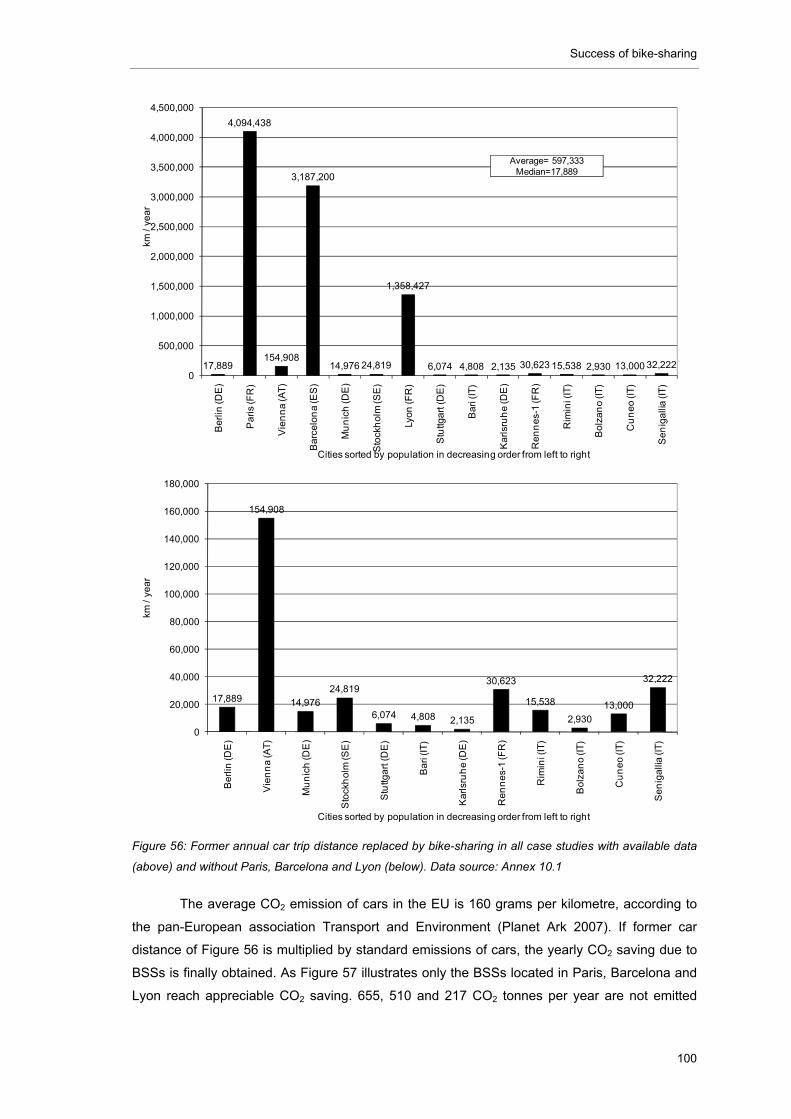
Success of bike-sharing
100
Figure 56: Former annual car trip distance replaced by bike-sharing in all case studies with available data
(above) and without Paris, Barcelona and Lyon (below). Data source: Annex 10.1
The average CO2 emission of cars in the EU is 160 grams per kilometre, according to
the pan-European association Transport and Environment (Planet Ark 2007). If former car
distance of Figure 56 is multiplied by standard emissions of cars, the yearly CO2 saving due to
BSSs is finally obtained. As Figure 57 illustrates only the BSSs located in Paris, Barcelona and
Lyon reach appreciable CO2 saving. 655, 510 and 217 CO2 tonnes per year are not emitted
17,889
4,094,438
154,908
3,187,200
14,976 24,819
1,358,427
6,074 4,808 2,135 30,623 15,538 2,930 13,000 32,2220
500,000
1,000,000
1,500,000
2,000,000
2,500,000
3,000,000
3,500,000
4,000,000
4,500,000
Be
rlin
(DE
)
Pa
ris
(FR
)
Vie
nn
a (A
T)
Ba
rce
lon
a (E
S)
Mu
nic
h (D
E)
Sto
ckh
olm
(SE
)
Lyon
(FR
)
Stu
ttga
rt (D
E)
Ba
ri (I
T)
Ka
rlsr
uh
e (D
E)
Re
nn
es-
1 (F
R)
Rim
ini (
IT)
Bo
lza
no
(IT
)
Cu
ne
o (I
T)
Se
nig
alli
a (I
T)
km /
yea
r
Cities sorted by population in decreasing order from left to right
Average= 597,333 Median=17,889
17,889
154,908
14,976
24,819
6,074 4,808 2,135
30,623
15,538
2,930
13,000
32,222
0
20,000
40,000
60,000
80,000
100,000
120,000
140,000
160,000
180,000
Be
rlin
(DE
)
Vie
nn
a (A
T)
Mu
nic
h (D
E)
Sto
ckh
olm
(SE
)
Stu
ttga
rt (
DE
)
Ba
ri (I
T)
Ka
rlsr
uh
e (D
E)
Re
nn
es-
1 (F
R)
Rim
ini (
IT)
Bo
lza
no
(IT
)
Cu
ne
o (I
T)
Se
nig
alli
a (I
T)
km /
yea
r
Cities sorted by population in decreasing order from left to right
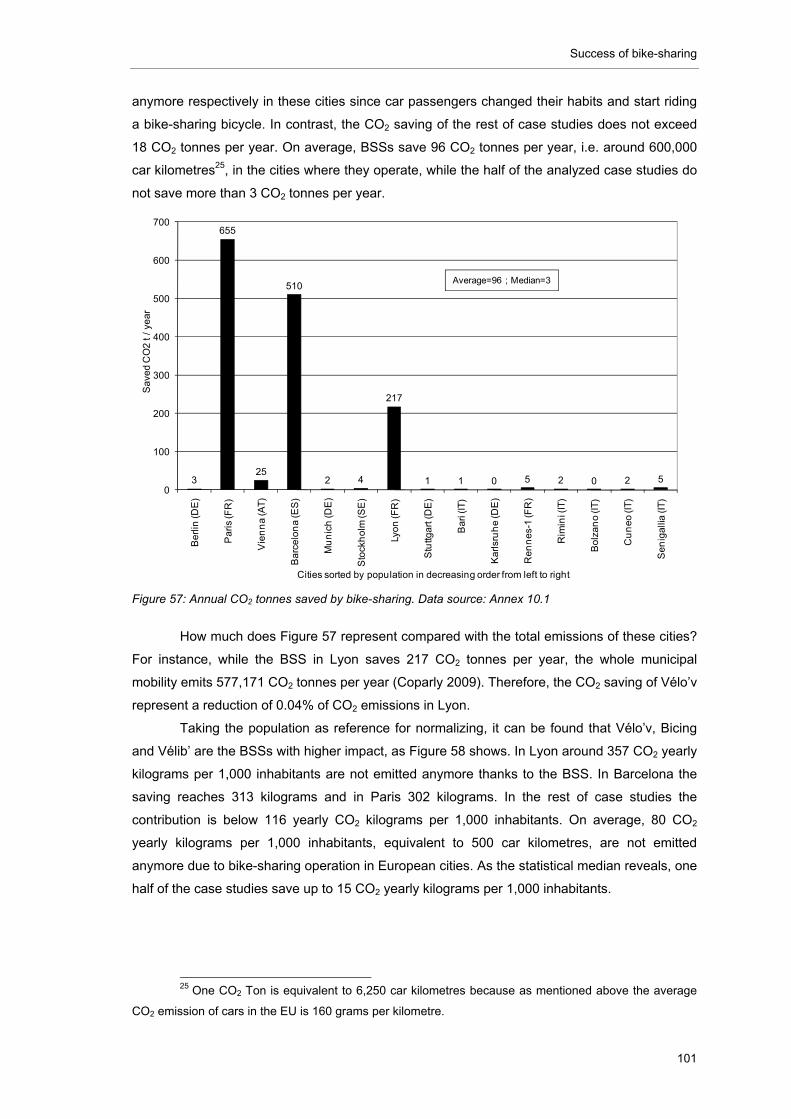
Success of bike-sharing
101
anymore respectively in these cities since car passengers changed their habits and start riding
a bike-sharing bicycle. In contrast, the CO2 saving of the rest of case studies does not exceed
18 CO2 tonnes per year. On average, BSSs save 96 CO2 tonnes per year, i.e. around 600,000
car kilometres25, in the cities where they operate, while the half of the analyzed case studies do
not save more than 3 CO2 tonnes per year.
Figure 57: Annual CO2 tonnes saved by bike-sharing. Data source: Annex 10.1
How much does Figure 57 represent compared with the total emissions of these cities?
For instance, while the BSS in Lyon saves 217 CO2 tonnes per year, the whole municipal
mobility emits 577,171 CO2 tonnes per year (Coparly 2009). Therefore, the CO2 saving of Vélo’v
represent a reduction of 0.04% of CO2 emissions in Lyon.
Taking the population as reference for normalizing, it can be found that Vélo’v, Bicing
and Vélib’ are the BSSs with higher impact, as Figure 58 shows. In Lyon around 357 CO2 yearly
kilograms per 1,000 inhabitants are not emitted anymore thanks to the BSS. In Barcelona the
saving reaches 313 kilograms and in Paris 302 kilograms. In the rest of case studies the
contribution is below 116 yearly CO2 kilograms per 1,000 inhabitants. On average, 80 CO2
yearly kilograms per 1,000 inhabitants, equivalent to 500 car kilometres, are not emitted
anymore due to bike-sharing operation in European cities. As the statistical median reveals, one
half of the case studies save up to 15 CO2 yearly kilograms per 1,000 inhabitants.
25 One CO2 Ton is equivalent to 6,250 car kilometres because as mentioned above the average
CO2 emission of cars in the EU is 160 grams per kilometre.
3
655
25
510
2 4
217
1 1 0 5 2 0 2 50
100
200
300
400
500
600
700
Be
rlin
(DE
)
Pa
ris
(FR
)
Vie
nn
a (A
T)
Ba
rce
lon
a (E
S)
Mu
nic
h (D
E)
Sto
ckh
olm
(SE
)
Lyo
n (F
R)
Stu
ttga
rt (
DE
)
Ba
ri (I
T)
Ka
rlsr
uh
e (D
E)
Re
nn
es-
1 (F
R)
Rim
ini (
IT)
Bo
lza
no
(IT
)
Cu
ne
o (I
T)
Se
nig
alli
a (I
T)
Sa
ved
CO
2 t
/ ye
ar
Cities sorted by population in decreasing order from left to right
Average=96 ; Median=3
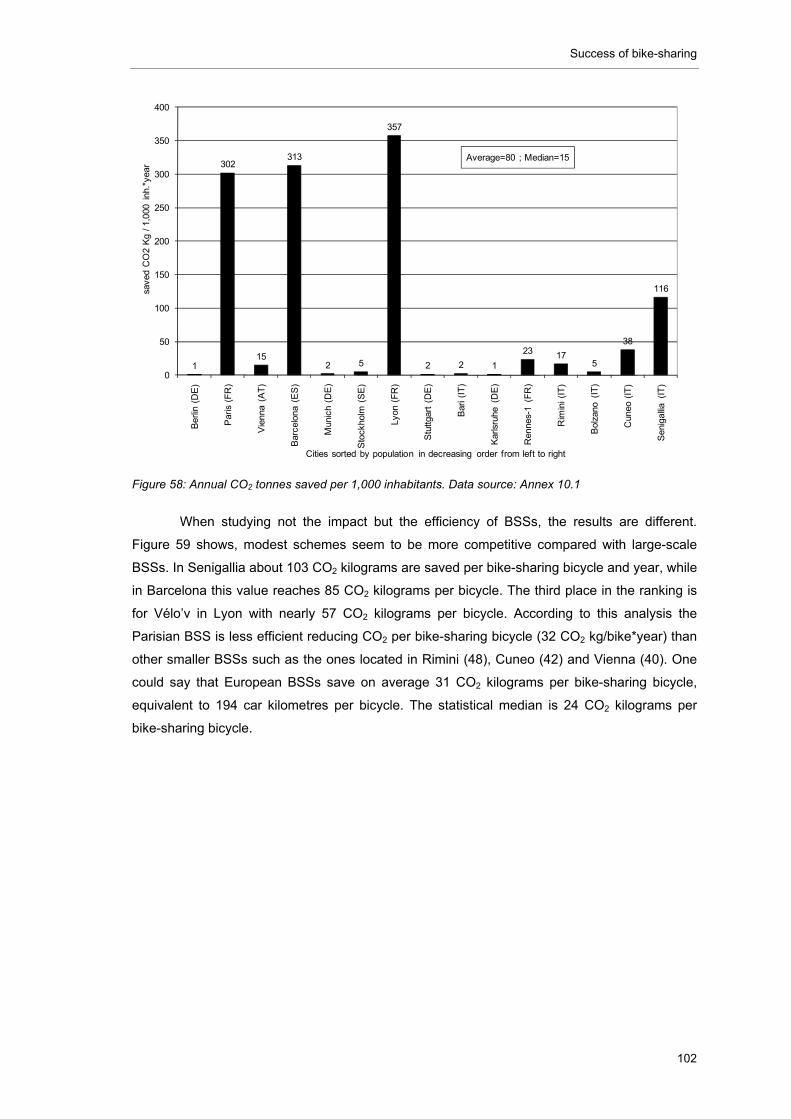
Success of bike-sharing
102
Figure 58: Annual CO2 tonnes saved per 1,000 inhabitants. Data source: Annex 10.1
When studying not the impact but the efficiency of BSSs, the results are different.
Figure 59 shows, modest schemes seem to be more competitive compared with large-scale
BSSs. In Senigallia about 103 CO2 kilograms are saved per bike-sharing bicycle and year, while
in Barcelona this value reaches 85 CO2 kilograms per bicycle. The third place in the ranking is
for Vélo’v in Lyon with nearly 57 CO2 kilograms per bicycle. According to this analysis the
Parisian BSS is less efficient reducing CO2 per bike-sharing bicycle (32 CO2 kg/bike*year) than
other smaller BSSs such as the ones located in Rimini (48), Cuneo (42) and Vienna (40). One
could say that European BSSs save on average 31 CO2 kilograms per bike-sharing bicycle,
equivalent to 194 car kilometres per bicycle. The statistical median is 24 CO2 kilograms per
bike-sharing bicycle.
1
302
15
313
2 5
357
2 2 1
23 175
38
116
0
50
100
150
200
250
300
350
400
Ber
lin (
DE
)
Par
is (
FR
)
Vie
nna
(AT
)
Bar
celo
na (
ES
)
Mun
ich
(DE
)
Sto
ckho
lm (
SE
)
Lyon
(F
R)
Stu
ttgar
t (D
E)
Bar
i (IT
)
Kar
lsru
he (
DE
)
Ren
nes-
1 (F
R)
Rim
ini (
IT)
Bol
zano
(IT
)
Cun
eo (
IT)
Sen
igal
lia (
IT)
save
d C
O2
Kg
/ 1,0
00 i
nh.*
year
Cities sorted by population in decreasing order from left to right
Average=80 ; Median=15
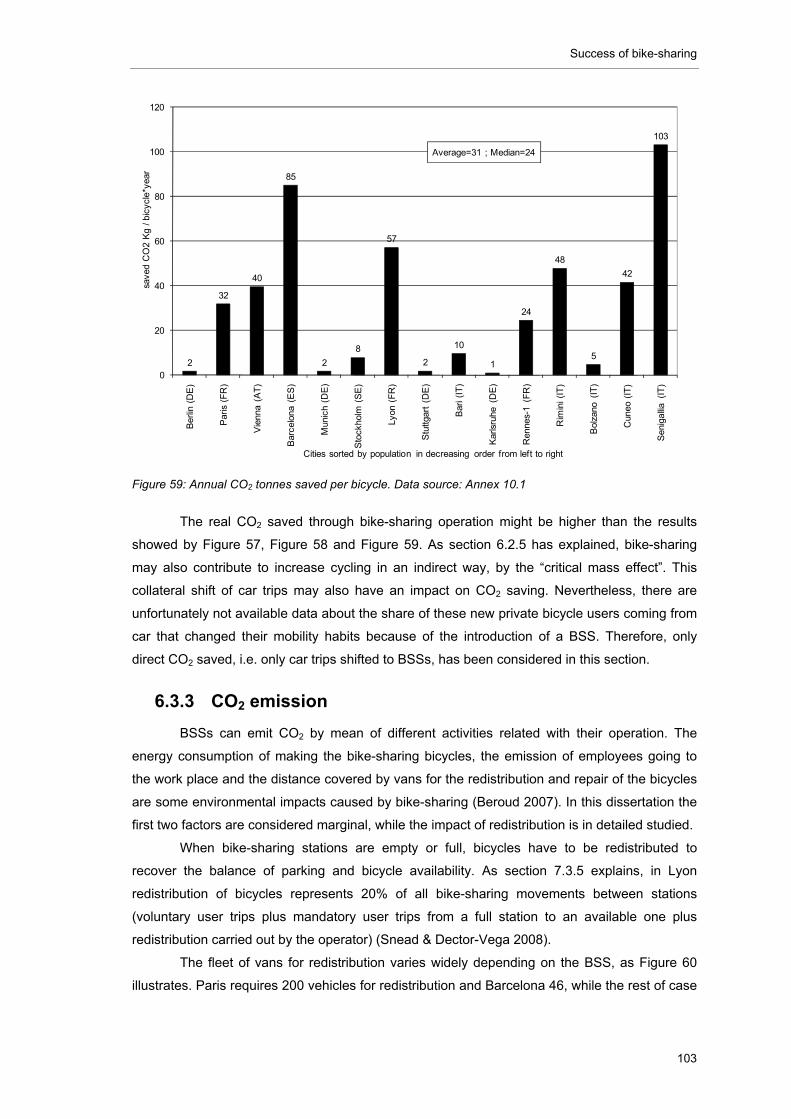
Success of bike-sharing
103
Figure 59: Annual CO2 tonnes saved per bicycle. Data source: Annex 10.1
The real CO2 saved through bike-sharing operation might be higher than the results
showed by Figure 57, Figure 58 and Figure 59. As section 6.2.5 has explained, bike-sharing
may also contribute to increase cycling in an indirect way, by the “critical mass effect”. This
collateral shift of car trips may also have an impact on CO2 saving. Nevertheless, there are
unfortunately not available data about the share of these new private bicycle users coming from
car that changed their mobility habits because of the introduction of a BSS. Therefore, only
direct CO2 saved, i.e. only car trips shifted to BSSs, has been considered in this section.
6.3.3 CO2 emission
BSSs can emit CO2 by mean of different activities related with their operation. The
energy consumption of making the bike-sharing bicycles, the emission of employees going to
the work place and the distance covered by vans for the redistribution and repair of the bicycles
are some environmental impacts caused by bike-sharing (Beroud 2007). In this dissertation the
first two factors are considered marginal, while the impact of redistribution is in detailed studied.
When bike-sharing stations are empty or full, bicycles have to be redistributed to
recover the balance of parking and bicycle availability. As section 7.3.5 explains, in Lyon
redistribution of bicycles represents 20% of all bike-sharing movements between stations
(voluntary user trips plus mandatory user trips from a full station to an available one plus
redistribution carried out by the operator) (Snead & Dector-Vega 2008).
The fleet of vans for redistribution varies widely depending on the BSS, as Figure 60
illustrates. Paris requires 200 vehicles for redistribution and Barcelona 46, while the rest of case
2
32
40
85
2
8
57
2
10
1
24
48
5
42
103
0
20
40
60
80
100
120
Ber
lin (
DE
)
Par
is (
FR
)
Vie
nna
(AT
)
Bar
celo
na (
ES
)
Mun
ich
(DE
)
Sto
ckho
lm (
SE
)
Lyon
(F
R)
Stu
ttgar
t (D
E)
Bar
i (IT
)
Kar
lsru
he (
DE
)
Ren
nes-
1 (F
R)
Rim
ini (
IT)
Bol
zano
(IT
)
Cun
eo (
IT)
Sen
igal
lia (
IT)
save
d C
O2
Kg
/ bic
ycle
*yea
r
Cities sorted by population in decreasing order from left to right
Average=31 ; Median=24
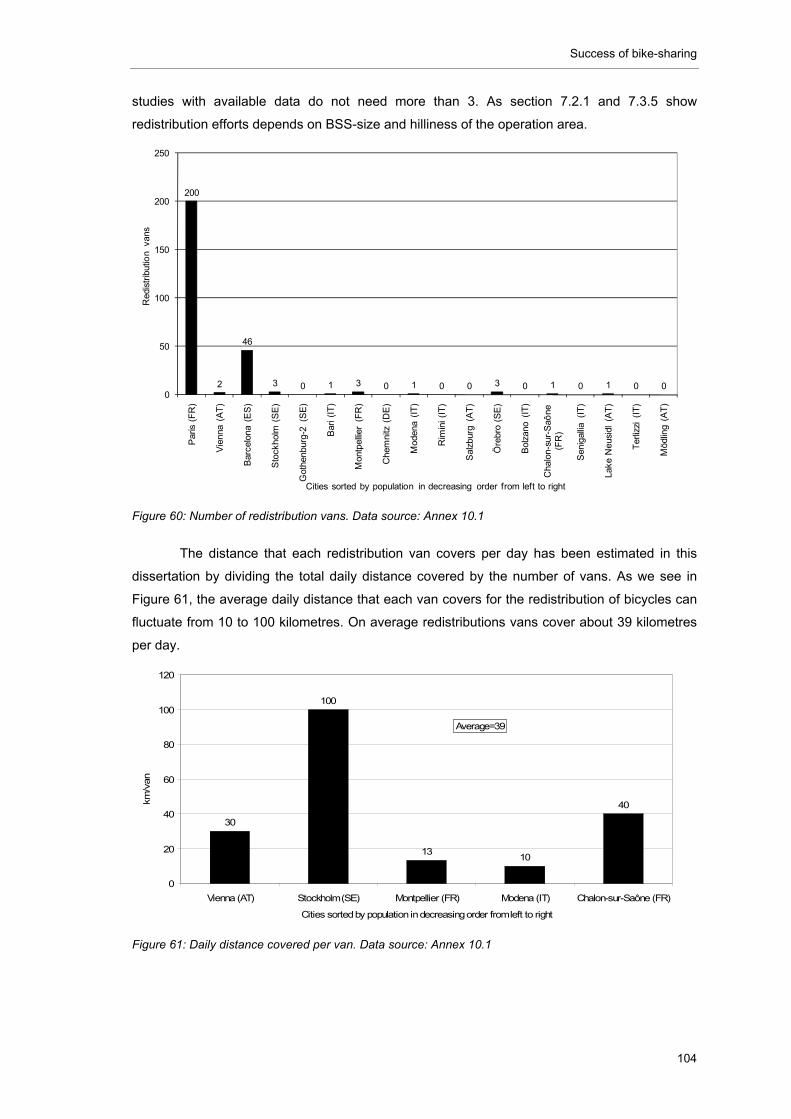
Success of bike-sharing
104
studies with available data do not need more than 3. As section 7.2.1 and 7.3.5 show
redistribution efforts depends on BSS-size and hilliness of the operation area.
Figure 60: Number of redistribution vans. Data source: Annex 10.1
The distance that each redistribution van covers per day has been estimated in this
dissertation by dividing the total daily distance covered by the number of vans. As we see in
Figure 61, the average daily distance that each van covers for the redistribution of bicycles can
fluctuate from 10 to 100 kilometres. On average redistributions vans cover about 39 kilometres
per day.
Figure 61: Daily distance covered per van. Data source: Annex 10.1
200
2
46
3 0 1 3 0 1 0 0 3 0 1 0 1 0 00
50
100
150
200
250
Par
is (
FR
)
Vie
nna
(AT
)
Bar
celo
na (
ES
)
Sto
ckho
lm (
SE
)
Got
henb
urg-
2 (S
E)
Bar
i (IT
)
Mon
tpel
lier
(FR
)
Che
mni
tz (
DE
)
Mod
ena
(IT
)
Rim
ini (
IT)
Sal
zbur
g (A
T)
Öre
bro
(SE
)
Bol
zano
(IT
)
Cha
lon-
sur-
Saô
ne
(FR
)
Sen
igal
lia (
IT)
Lake
Neu
sidl
(A
T)
Ter
lizzi
(IT
)
Möd
ling
(AT
)
Red
istr
ibut
ion
vans
Cities sorted by population in decreasing order from left to right
30
100
1310
40
0
20
40
60
80
100
120
Vienna (AT) Stockholm (SE) Montpellier (FR) Modena (IT) Chalon-sur-Saône (FR)
Cities sorted by population in decreasing order from left to right
km/v
an
Average=39
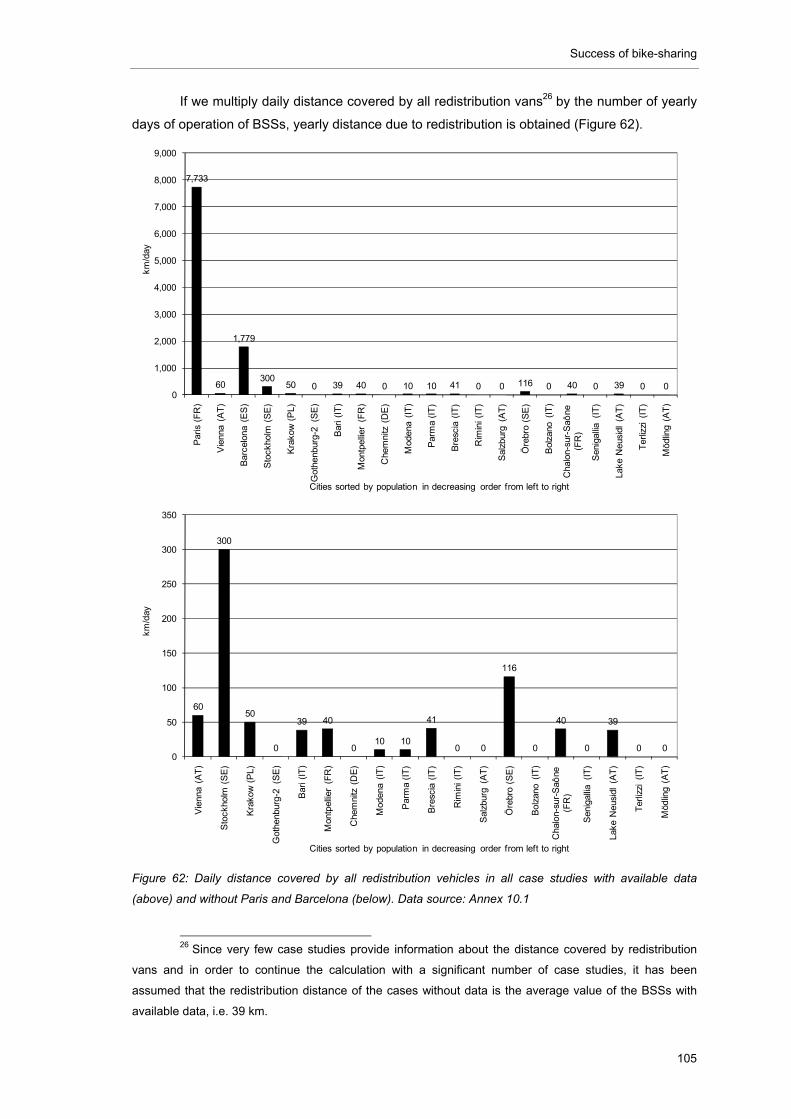
Success of bike-sharing
105
If we multiply daily distance covered by all redistribution vans26 by the number of yearly
days of operation of BSSs, yearly distance due to redistribution is obtained (Figure 62).
Figure 62: Daily distance covered by all redistribution vehicles in all case studies with available data
(above) and without Paris and Barcelona (below). Data source: Annex 10.1
26 Since very few case studies provide information about the distance covered by redistribution
vans and in order to continue the calculation with a significant number of case studies, it has been
assumed that the redistribution distance of the cases without data is the average value of the BSSs with
available data, i.e. 39 km.
7,733
60
1,779
30050 0 39 40 0 10 10 41 0 0 116 0 40 0 39 0 0
0
1,000
2,000
3,000
4,000
5,000
6,000
7,000
8,000
9,000
Par
is (
FR
)
Vie
nna
(AT
)
Bar
celo
na (
ES
)
Sto
ckho
lm (
SE
)
Kra
kow
(P
L)
Got
henb
urg-
2 (S
E)
Bar
i (IT
)
Mon
tpel
lier
(FR
)
Che
mni
tz (
DE
)
Mod
ena
(IT
)
Par
ma
(IT
)
Bre
scia
(IT
)
Rim
ini (
IT)
Sal
zbur
g (A
T)
Öre
bro
(SE
)
Bol
zano
(IT
)
Cha
lon-
sur-
Saô
ne
(FR
)
Sen
igal
lia (
IT)
Lake
Neu
sidl
(A
T)
Ter
lizzi
(IT
)
Möd
ling
(AT
)
km/d
ay
Cities sorted by population in decreasing order from left to right
60
300
50
0
39 40
010 10
41
0 0
116
0
40
0
39
0 00
50
100
150
200
250
300
350
Vie
nna
(AT
)
Sto
ckho
lm (
SE
)
Kra
kow
(P
L)
Got
henb
urg-
2 (S
E)
Bar
i (IT
)
Mon
tpel
lier
(FR
)
Che
mni
tz (
DE
)
Mod
ena
(IT
)
Par
ma
(IT
)
Bre
scia
(IT
)
Rim
ini (
IT)
Sal
zbur
g (A
T)
Öre
bro
(SE
)
Bol
zano
(IT
)
Cha
lon-
sur-
Saô
ne
(FR
)
Sen
igal
lia (
IT)
Lake
Neu
sidl
(A
T)
Ter
lizzi
(IT
)
Möd
ling
(AT
)
km/d
ay
Cities sorted by population in decreasing order from left to right
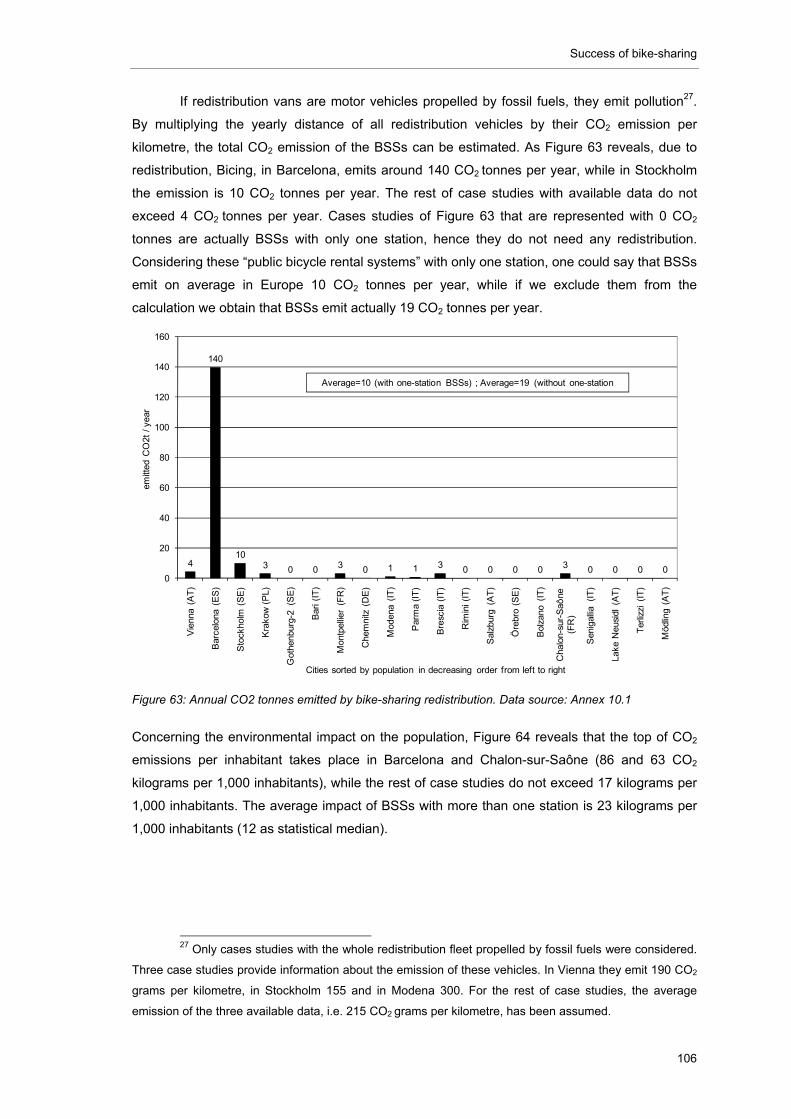
Success of bike-sharing
106
If redistribution vans are motor vehicles propelled by fossil fuels, they emit pollution27.
By multiplying the yearly distance of all redistribution vehicles by their CO2 emission per
kilometre, the total CO2 emission of the BSSs can be estimated. As Figure 63 reveals, due to
redistribution, Bicing, in Barcelona, emits around 140 CO2 tonnes per year, while in Stockholm
the emission is 10 CO2 tonnes per year. The rest of case studies with available data do not
exceed 4 CO2 tonnes per year. Cases studies of Figure 63 that are represented with 0 CO2
tonnes are actually BSSs with only one station, hence they do not need any redistribution.
Considering these “public bicycle rental systems” with only one station, one could say that BSSs
emit on average in Europe 10 CO2 tonnes per year, while if we exclude them from the
calculation we obtain that BSSs emit actually 19 CO2 tonnes per year.
Figure 63: Annual CO2 tonnes emitted by bike-sharing redistribution. Data source: Annex 10.1
Concerning the environmental impact on the population, Figure 64 reveals that the top of CO2
emissions per inhabitant takes place in Barcelona and Chalon-sur-Saône (86 and 63 CO2
kilograms per 1,000 inhabitants), while the rest of case studies do not exceed 17 kilograms per
1,000 inhabitants. The average impact of BSSs with more than one station is 23 kilograms per
1,000 inhabitants (12 as statistical median).
27 Only cases studies with the whole redistribution fleet propelled by fossil fuels were considered.
Three case studies provide information about the emission of these vehicles. In Vienna they emit 190 CO2
grams per kilometre, in Stockholm 155 and in Modena 300. For the rest of case studies, the average
emission of the three available data, i.e. 215 CO2 grams per kilometre, has been assumed.
4
140
103 0 0 3 0 1 1 3 0 0 0 0 3 0 0 0 0
0
20
40
60
80
100
120
140
160
Vie
nna
(AT
)
Bar
celo
na (
ES
)
Sto
ckho
lm (
SE
)
Kra
kow
(P
L)
Got
henb
urg-
2 (S
E)
Bar
i (IT
)
Mon
tpel
lier
(FR
)
Che
mni
tz (
DE
)
Mod
ena
(IT
)
Par
ma
(IT
)
Bre
scia
(IT
)
Rim
ini (
IT)
Sal
zbur
g (A
T)
Öre
bro
(SE
)
Bol
zano
(IT
)
Cha
lon-
sur-
Saô
ne
(FR
)
Sen
igal
lia (
IT)
Lake
Neu
sidl
(A
T)
Ter
lizzi
(IT
)
Möd
ling
(AT
)
emitt
ed C
O2t
/ y
ear
Cities sorted by population in decreasing order from left to right
Average=10 (with one-station BSSs) ; Average=19 (without one-station
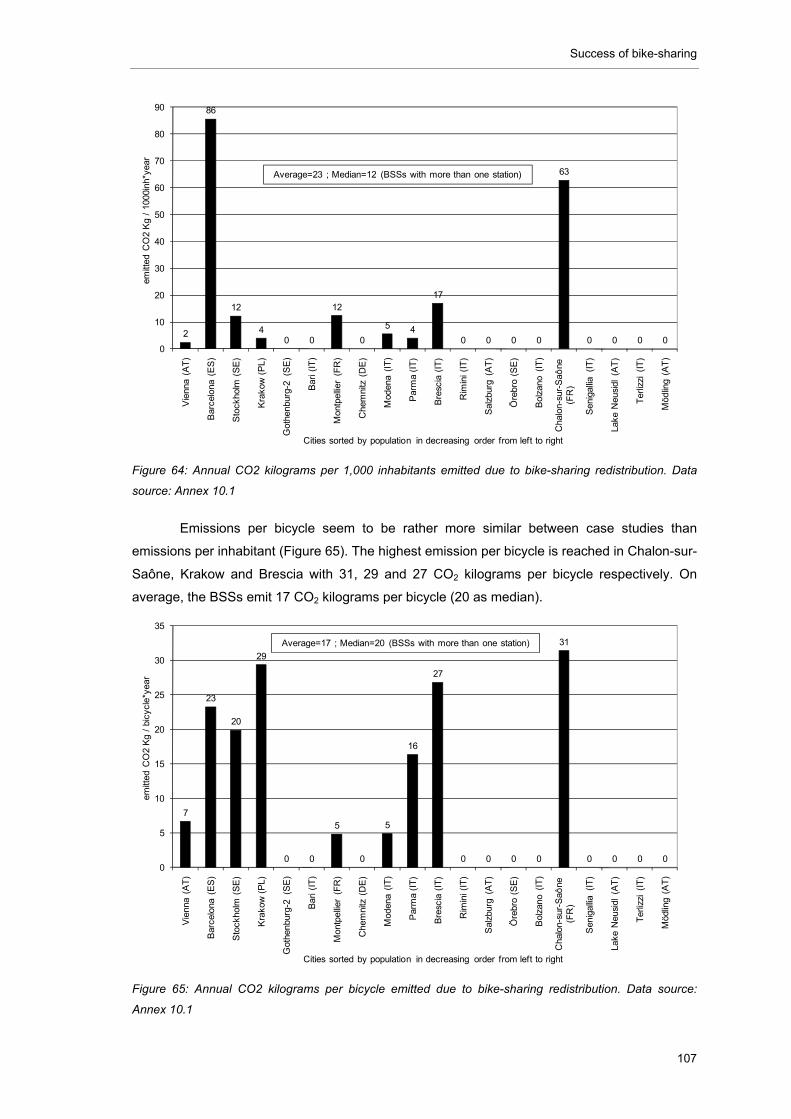
Success of bike-sharing
107
Figure 64: Annual CO2 kilograms per 1,000 inhabitants emitted due to bike-sharing redistribution. Data
source: Annex 10.1
Emissions per bicycle seem to be rather more similar between case studies than
emissions per inhabitant (Figure 65). The highest emission per bicycle is reached in Chalon-sur-
Saône, Krakow and Brescia with 31, 29 and 27 CO2 kilograms per bicycle respectively. On
average, the BSSs emit 17 CO2 kilograms per bicycle (20 as median).
Figure 65: Annual CO2 kilograms per bicycle emitted due to bike-sharing redistribution. Data source:
Annex 10.1
2
86
12
40 0
12
0
5 4
17
0 0 0 0
63
0 0 0 00
10
20
30
40
50
60
70
80
90
Vie
nna
(AT
)
Bar
celo
na (
ES
)
Sto
ckho
lm (
SE
)
Kra
kow
(P
L)
Got
henb
urg-
2 (S
E)
Bar
i (IT
)
Mon
tpel
lier
(FR
)
Che
mni
tz (
DE
)
Mod
ena
(IT
)
Par
ma
(IT
)
Bre
scia
(IT
)
Rim
ini (
IT)
Sal
zbur
g (A
T)
Öre
bro
(SE
)
Bol
zano
(IT
)
Cha
lon-
sur-
Saô
ne
(FR
)
Sen
igal
lia (
IT)
Lake
Neu
sidl
(A
T)
Ter
lizzi
(IT
)
Möd
ling
(AT
)
emitt
ed C
O2
Kg
/ 10
00in
h*ye
ar
Cities sorted by population in decreasing order from left to right
Average=23 ; Median=12 (BSSs with more than one station)
7
23
20
29
0 0
5
0
5
16
27
0 0 0 0
31
0 0 0 00
5
10
15
20
25
30
35
Vie
nna
(AT
)
Bar
celo
na (
ES
)
Sto
ckho
lm (
SE
)
Kra
kow
(P
L)
Got
henb
urg-
2 (S
E)
Bar
i (IT
)
Mon
tpel
lier
(FR
)
Che
mni
tz (
DE
)
Mod
ena
(IT
)
Par
ma
(IT
)
Bre
scia
(IT
)
Rim
ini (
IT)
Sal
zbur
g (A
T)
Öre
bro
(SE
)
Bol
zano
(IT
)
Cha
lon-
sur-
Saô
ne
(FR
)
Sen
igal
lia (
IT)
Lake
Neu
sidl
(A
T)
Ter
lizzi
(IT
)
Möd
ling
(AT
)
emitt
ed C
O2
Kg
/ bi
cycl
e*ye
ar
Cities sorted by population in decreasing order from left to right
Average=17 ; Median=20 (BSSs with more than one station)
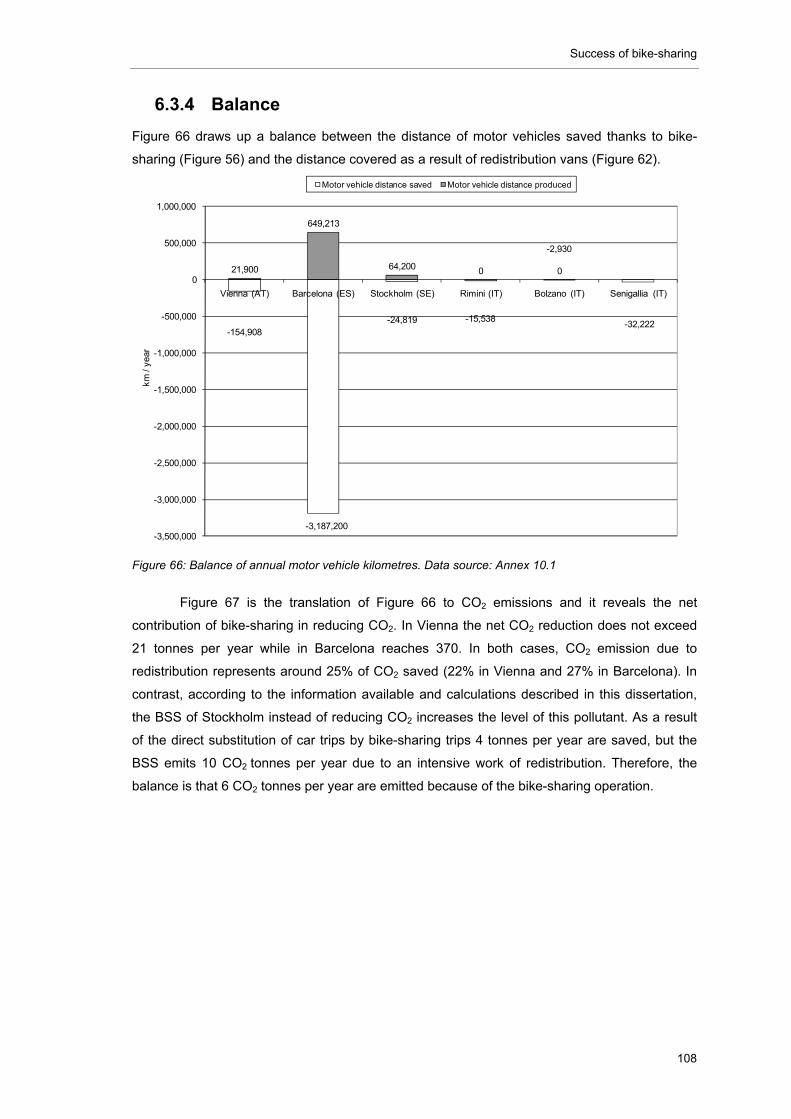
Success of bike-sharing
108
6.3.4 Balance
Figure 66 draws up a balance between the distance of motor vehicles saved thanks to bike-
sharing (Figure 56) and the distance covered as a result of redistribution vans (Figure 62).
Figure 66: Balance of annual motor vehicle kilometres. Data source: Annex 10.1
Figure 67 is the translation of Figure 66 to CO2 emissions and it reveals the net
contribution of bike-sharing in reducing CO2. In Vienna the net CO2 reduction does not exceed
21 tonnes per year while in Barcelona reaches 370. In both cases, CO2 emission due to
redistribution represents around 25% of CO2 saved (22% in Vienna and 27% in Barcelona). In
contrast, according to the information available and calculations described in this dissertation,
the BSS of Stockholm instead of reducing CO2 increases the level of this pollutant. As a result
of the direct substitution of car trips by bike-sharing trips 4 tonnes per year are saved, but the
BSS emits 10 CO2 tonnes per year due to an intensive work of redistribution. Therefore, the
balance is that 6 CO2 tonnes per year are emitted because of the bike-sharing operation.
-154,908
-3,187,200
-24,819 -15,538
-2,930
-32,222
21,900
649,213
64,200 0 0
-3,500,000
-3,000,000
-2,500,000
-2,000,000
-1,500,000
-1,000,000
-500,000
0
500,000
1,000,000
Vienna (AT) Barcelona (ES) Stockholm (SE) Rimini (IT) Bolzano (IT) Senigallia (IT)
km /
year
Motor vehicle distance saved Motor vehicle distance produced
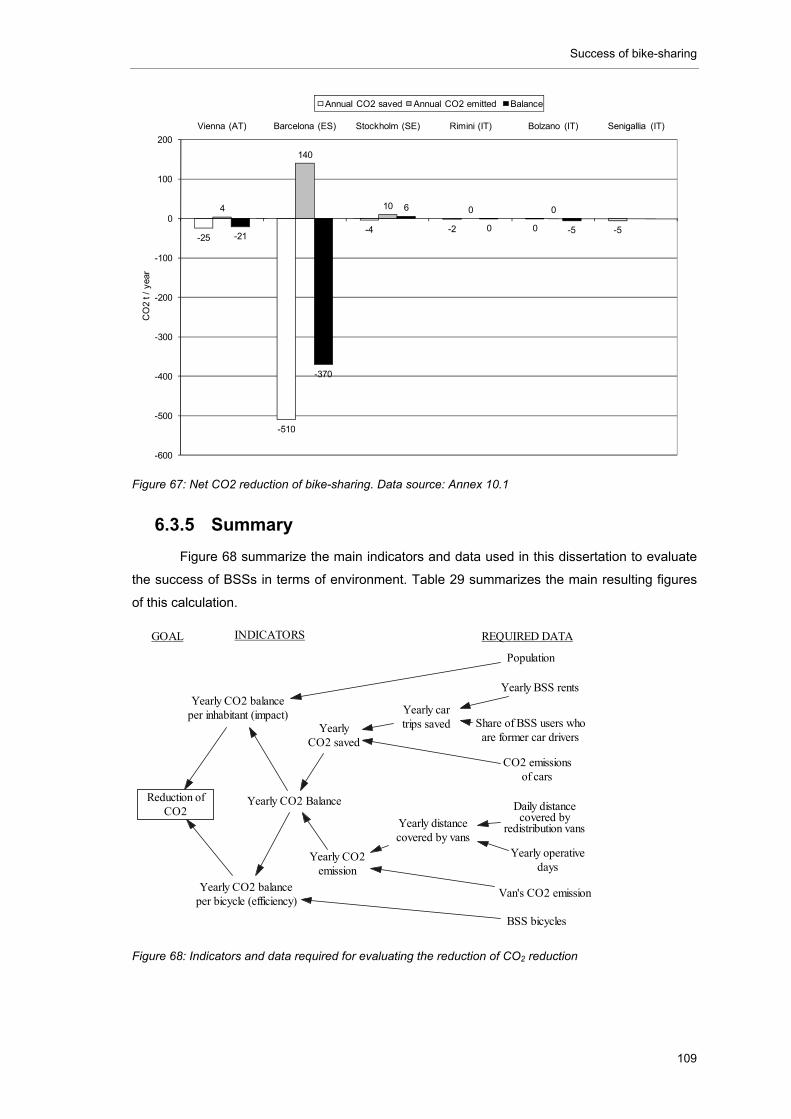
Success of bike-sharing
109
Figure 67: Net CO2 reduction of bike-sharing. Data source: Annex 10.1
6.3.5 Summary
Figure 68 summarize the main indicators and data used in this dissertation to evaluate
the success of BSSs in terms of environment. Table 29 summarizes the main resulting figures
of this calculation.
Figure 68: Indicators and data required for evaluating the reduction of CO2 reduction
-25
-510
-4 -2 0 -5
4
140
10 0 0
-21
-370
6
0 -5
-600
-500
-400
-300
-200
-100
0
100
200
Vienna (AT) Barcelona (ES) Stockholm (SE) Rimini (IT) Bolzano (IT) Senigallia (IT)
CO
2 t /
yea
r
Annual CO2 saved Annual CO2 emitted Balance
Reduction ofCO2
Share of BSS users whoare former car drivers
Population
INDICATORS
Yearly BSS rents
REQUIRED DATA
BSS bicycles
YearlyCO2 saved
Yearly cartrips saved
CO2 emissionsof cars
GOAL
Daily distancecovered by
redistribution vans
Yearly operativedays
Yearly distancecovered by vans
Van's CO2 emission
Yearly CO2emission
Yearly CO2 Balance
Yearly CO2 balanceper inhabitant (impact)
Yearly CO2 balanceper bicycle (efficiency)
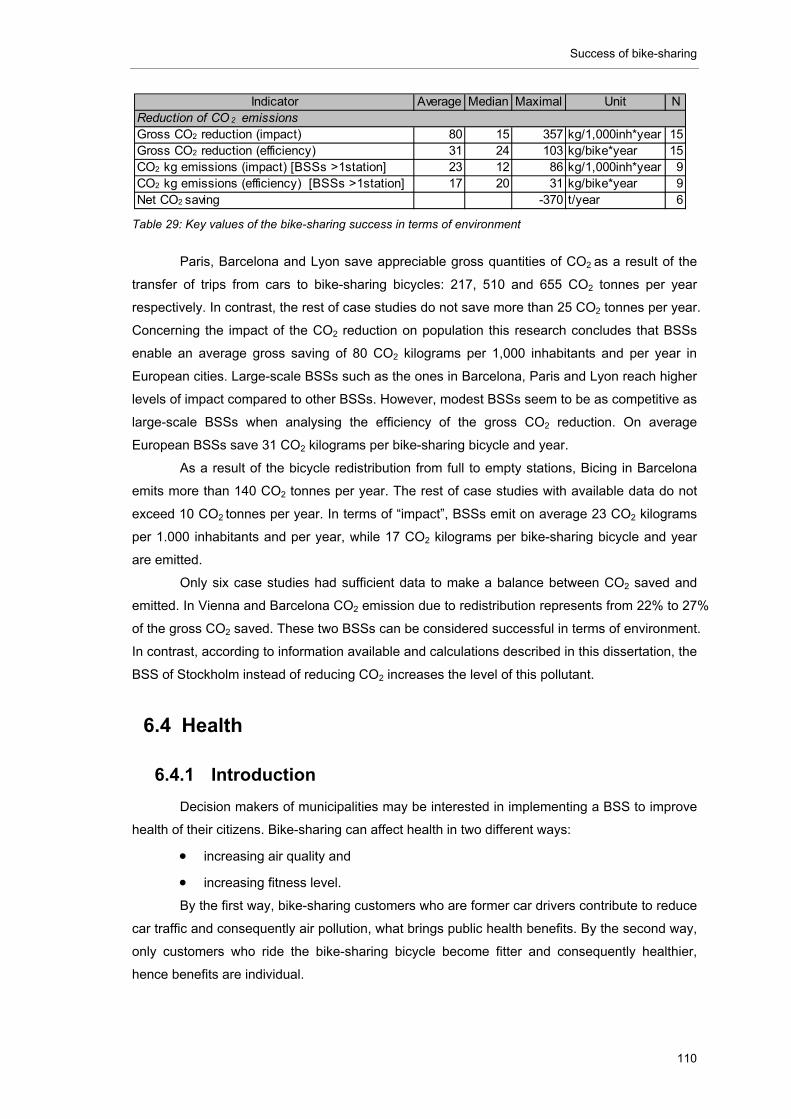
Success of bike-sharing
110
Table 29: Key values of the bike-sharing success in terms of environment
Paris, Barcelona and Lyon save appreciable gross quantities of CO2 as a result of the
transfer of trips from cars to bike-sharing bicycles: 217, 510 and 655 CO2 tonnes per year
respectively. In contrast, the rest of case studies do not save more than 25 CO2 tonnes per year.
Concerning the impact of the CO2 reduction on population this research concludes that BSSs
enable an average gross saving of 80 CO2 kilograms per 1,000 inhabitants and per year in
European cities. Large-scale BSSs such as the ones in Barcelona, Paris and Lyon reach higher
levels of impact compared to other BSSs. However, modest BSSs seem to be as competitive as
large-scale BSSs when analysing the efficiency of the gross CO2 reduction. On average
European BSSs save 31 CO2 kilograms per bike-sharing bicycle and year.
As a result of the bicycle redistribution from full to empty stations, Bicing in Barcelona
emits more than 140 CO2 tonnes per year. The rest of case studies with available data do not
exceed 10 CO2 tonnes per year. In terms of “impact”, BSSs emit on average 23 CO2 kilograms
per 1.000 inhabitants and per year, while 17 CO2 kilograms per bike-sharing bicycle and year
are emitted.
Only six case studies had sufficient data to make a balance between CO2 saved and
emitted. In Vienna and Barcelona CO2 emission due to redistribution represents from 22% to 27%
of the gross CO2 saved. These two BSSs can be considered successful in terms of environment.
In contrast, according to information available and calculations described in this dissertation, the
BSS of Stockholm instead of reducing CO2 increases the level of this pollutant.
6.4 Health
6.4.1 Introduction
Decision makers of municipalities may be interested in implementing a BSS to improve
health of their citizens. Bike-sharing can affect health in two different ways:
increasing air quality and
increasing fitness level.
By the first way, bike-sharing customers who are former car drivers contribute to reduce
car traffic and consequently air pollution, what brings public health benefits. By the second way,
only customers who ride the bike-sharing bicycle become fitter and consequently healthier,
hence benefits are individual.
Indicator Average Median Maximal Unit N
Gross CO2 reduction (impact) 80 15 357 kg/1,000inh*year 15Gross CO2 reduction (efficiency) 31 24 103 kg/bike*year 15CO2 kg emissions (impact) [BSSs >1station] 23 12 86 kg/1,000inh*year 9CO2 kg emissions (efficiency) [BSSs >1station] 17 20 31 kg/bike*year 9Net CO2 saving -370 t/year 6
Reduction of CO 2 emissions
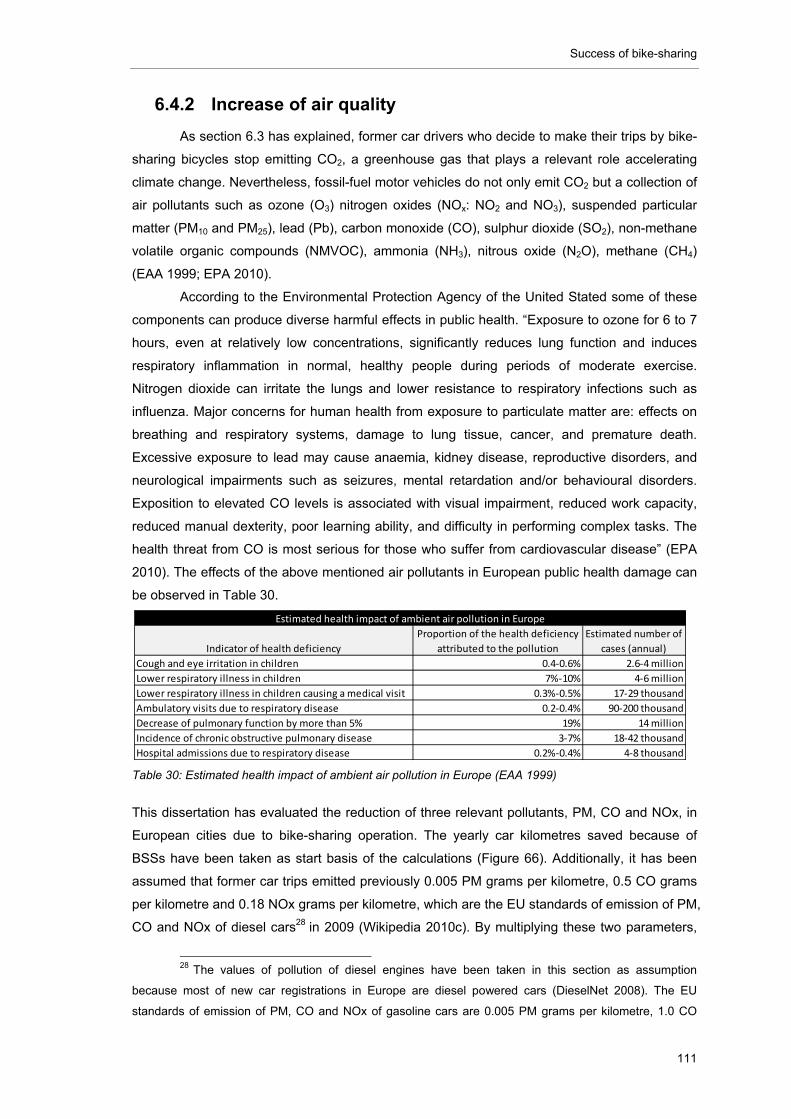
Success of bike-sharing
111
6.4.2 Increase of air quality
As section 6.3 has explained, former car drivers who decide to make their trips by bike-
sharing bicycles stop emitting CO2, a greenhouse gas that plays a relevant role accelerating
climate change. Nevertheless, fossil-fuel motor vehicles do not only emit CO2 but a collection of
air pollutants such as ozone (O3) nitrogen oxides (NOx: NO2 and NO3), suspended particular
matter (PM10 and PM25), lead (Pb), carbon monoxide (CO), sulphur dioxide (SO2), non-methane
volatile organic compounds (NMVOC), ammonia (NH3), nitrous oxide (N2O), methane (CH4)
(EAA 1999; EPA 2010).
According to the Environmental Protection Agency of the United Stated some of these
components can produce diverse harmful effects in public health. “Exposure to ozone for 6 to 7
hours, even at relatively low concentrations, significantly reduces lung function and induces
respiratory inflammation in normal, healthy people during periods of moderate exercise.
Nitrogen dioxide can irritate the lungs and lower resistance to respiratory infections such as
influenza. Major concerns for human health from exposure to particulate matter are: effects on
breathing and respiratory systems, damage to lung tissue, cancer, and premature death.
Excessive exposure to lead may cause anaemia, kidney disease, reproductive disorders, and
neurological impairments such as seizures, mental retardation and/or behavioural disorders.
Exposition to elevated CO levels is associated with visual impairment, reduced work capacity,
reduced manual dexterity, poor learning ability, and difficulty in performing complex tasks. The
health threat from CO is most serious for those who suffer from cardiovascular disease” (EPA
2010). The effects of the above mentioned air pollutants in European public health damage can
be observed in Table 30.
Table 30: Estimated health impact of ambient air pollution in Europe (EAA 1999)
This dissertation has evaluated the reduction of three relevant pollutants, PM, CO and NOx, in
European cities due to bike-sharing operation. The yearly car kilometres saved because of
BSSs have been taken as start basis of the calculations (Figure 66). Additionally, it has been
assumed that former car trips emitted previously 0.005 PM grams per kilometre, 0.5 CO grams
per kilometre and 0.18 NOx grams per kilometre, which are the EU standards of emission of PM,
CO and NOx of diesel cars28 in 2009 (Wikipedia 2010c). By multiplying these two parameters,
28 The values of pollution of diesel engines have been taken in this section as assumption
because most of new car registrations in Europe are diesel powered cars (DieselNet 2008). The EU
standards of emission of PM, CO and NOx of gasoline cars are 0.005 PM grams per kilometre, 1.0 CO
Indicator of health deficiency
Proportion of the health deficiency
attributed to the pollution
Estimated number of
cases (annual)
Cough and eye irritation in children 0.4‐0.6% 2.6‐4 million
Lower respiratory illness in children 7%‐10% 4‐6 million
Lower respiratory illness in children causing a medical visit 0.3%‐0.5% 17‐29 thousand
Ambulatory visits due to respiratory disease 0.2‐0.4% 90‐200 thousand
Decrease of pulmonary function by more than 5% 19% 14 million
Incidence of chronic obstructive pulmonary disease 3‐7% 18‐42 thousand
Hospital admissions due to respiratory disease 0.2%‐0.4% 4‐8 thousand
Estimated health impact of ambient air pollution in Europe
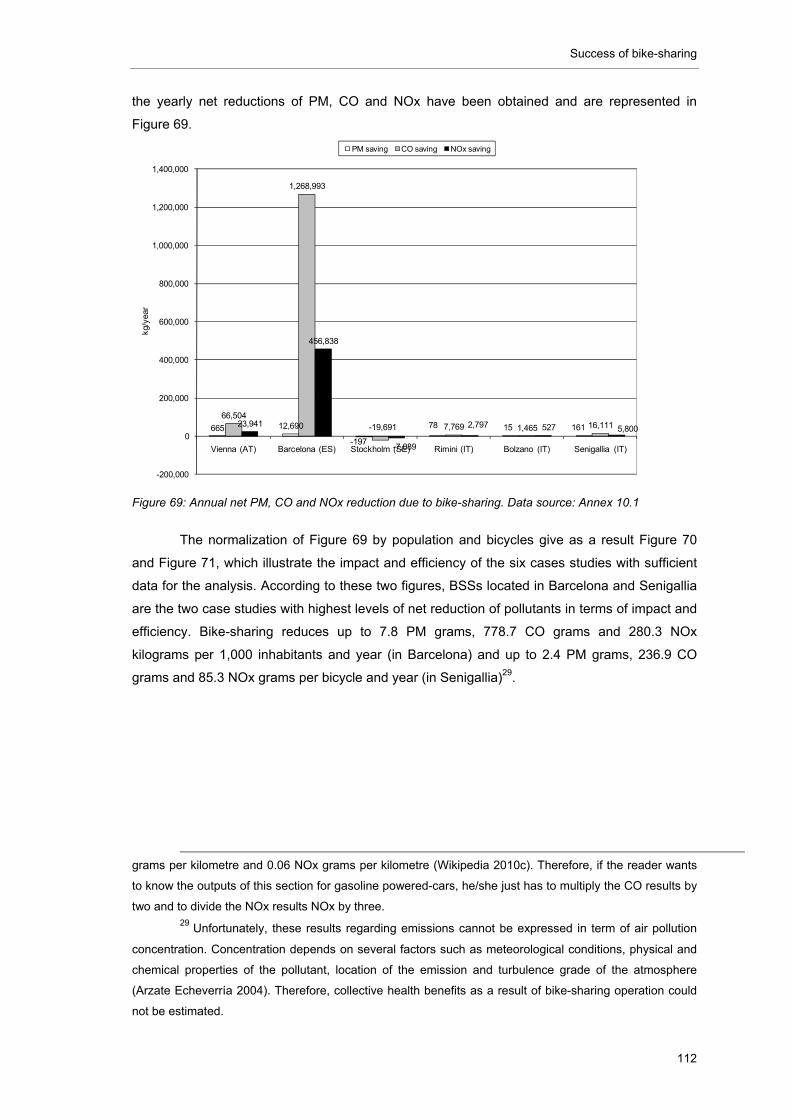
Success of bike-sharing
112
the yearly net reductions of PM, CO and NOx have been obtained and are represented in
Figure 69.
Figure 69: Annual net PM, CO and NOx reduction due to bike-sharing. Data source: Annex 10.1
The normalization of Figure 69 by population and bicycles give as a result Figure 70
and Figure 71, which illustrate the impact and efficiency of the six cases studies with sufficient
data for the analysis. According to these two figures, BSSs located in Barcelona and Senigallia
are the two case studies with highest levels of net reduction of pollutants in terms of impact and
efficiency. Bike-sharing reduces up to 7.8 PM grams, 778.7 CO grams and 280.3 NOx
kilograms per 1,000 inhabitants and year (in Barcelona) and up to 2.4 PM grams, 236.9 CO
grams and 85.3 NOx grams per bicycle and year (in Senigallia)29.
grams per kilometre and 0.06 NOx grams per kilometre (Wikipedia 2010c). Therefore, if the reader wants
to know the outputs of this section for gasoline powered-cars, he/she just has to multiply the CO results by
two and to divide the NOx results NOx by three. 29 Unfortunately, these results regarding emissions cannot be expressed in term of air pollution
concentration. Concentration depends on several factors such as meteorological conditions, physical and
chemical properties of the pollutant, location of the emission and turbulence grade of the atmosphere
(Arzate Echeverría 2004). Therefore, collective health benefits as a result of bike-sharing operation could
not be estimated.
665 12,690
-197
78 15 161
66,504
1,268,993
-19,691 7,769 1,465 16,11123,941
456,838
-7,089
2,797 527 5,800
-200,000
0
200,000
400,000
600,000
800,000
1,000,000
1,200,000
1,400,000
Vienna (AT) Barcelona (ES) Stockholm (SE) Rimini (IT) Bolzano (IT) Senigallia (IT)
kg/y
ear
PM saving CO saving NOx saving
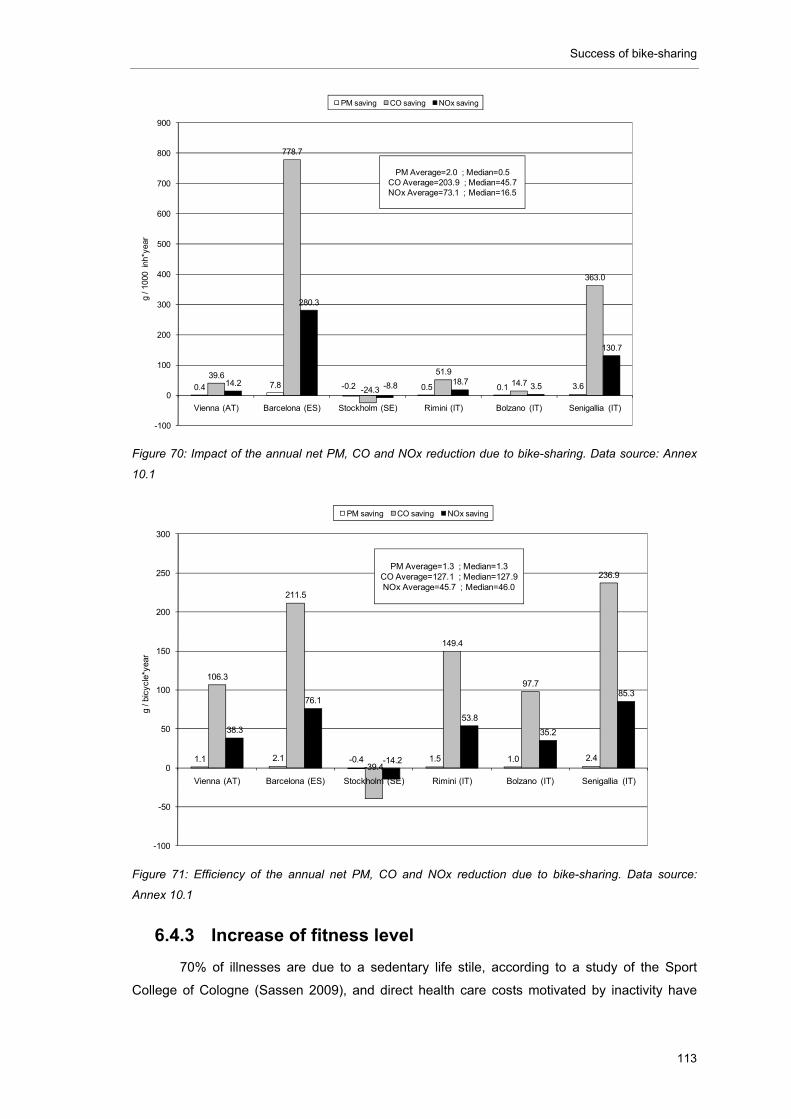
Success of bike-sharing
113
Figure 70: Impact of the annual net PM, CO and NOx reduction due to bike-sharing. Data source: Annex
10.1
Figure 71: Efficiency of the annual net PM, CO and NOx reduction due to bike-sharing. Data source:
Annex 10.1
6.4.3 Increase of fitness level
70% of illnesses are due to a sedentary life stile, according to a study of the Sport
College of Cologne (Sassen 2009), and direct health care costs motivated by inactivity have
0.4 7.8 -0.2 0.5 0.1 3.639.6
778.7
-24.3
51.914.7
363.0
14.2
280.3
-8.8 18.7 3.5
130.7
-100
0
100
200
300
400
500
600
700
800
900
Vienna (AT) Barcelona (ES) Stockholm (SE) Rimini (IT) Bolzano (IT) Senigallia (IT)
g / 1
000
inh*
year
PM saving CO saving NOx saving
PM Average=2.0 ; Median=0.5CO Average=203.9 ; Median=45.7NOx Average=73.1 ; Median=16.5
1.1 2.1 -0.4 1.5 1.0 2.4
106.3
211.5
-39.4
149.4
97.7
236.9
38.3
76.1
-14.2
53.8
35.2
85.3
-100
-50
0
50
100
150
200
250
300
Vienna (AT) Barcelona (ES) Stockholm (SE) Rimini (IT) Bolzano (IT) Senigallia (IT)
g / b
icyc
le*y
ear
PM saving CO saving NOx saving
PM Average=1.3 ; Median=1.3CO Average=127.1 ; Median=127.9NOx Average=45.7 ; Median=46.0
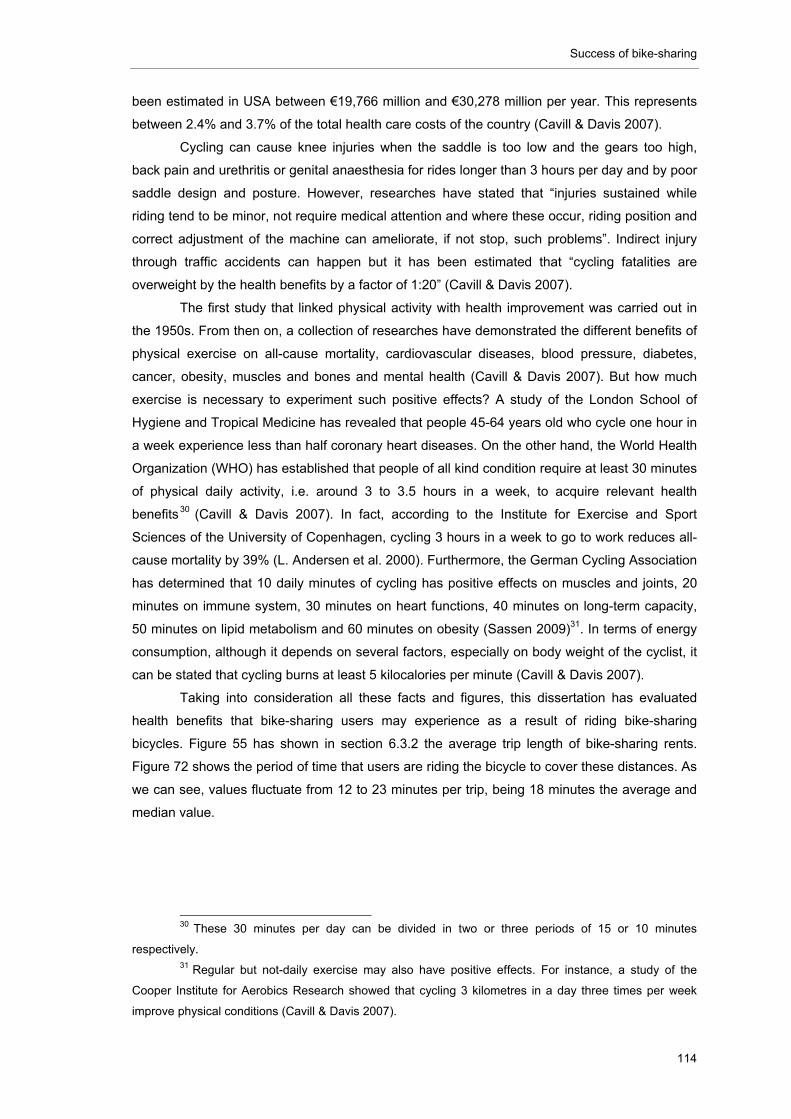
Success of bike-sharing
114
been estimated in USA between €19,766 million and €30,278 million per year. This represents
between 2.4% and 3.7% of the total health care costs of the country (Cavill & Davis 2007).
Cycling can cause knee injuries when the saddle is too low and the gears too high,
back pain and urethritis or genital anaesthesia for rides longer than 3 hours per day and by poor
saddle design and posture. However, researches have stated that “injuries sustained while
riding tend to be minor, not require medical attention and where these occur, riding position and
correct adjustment of the machine can ameliorate, if not stop, such problems”. Indirect injury
through traffic accidents can happen but it has been estimated that “cycling fatalities are
overweight by the health benefits by a factor of 1:20” (Cavill & Davis 2007).
The first study that linked physical activity with health improvement was carried out in
the 1950s. From then on, a collection of researches have demonstrated the different benefits of
physical exercise on all-cause mortality, cardiovascular diseases, blood pressure, diabetes,
cancer, obesity, muscles and bones and mental health (Cavill & Davis 2007). But how much
exercise is necessary to experiment such positive effects? A study of the London School of
Hygiene and Tropical Medicine has revealed that people 45-64 years old who cycle one hour in
a week experience less than half coronary heart diseases. On the other hand, the World Health
Organization (WHO) has established that people of all kind condition require at least 30 minutes
of physical daily activity, i.e. around 3 to 3.5 hours in a week, to acquire relevant health
benefits30 (Cavill & Davis 2007). In fact, according to the Institute for Exercise and Sport
Sciences of the University of Copenhagen, cycling 3 hours in a week to go to work reduces all-
cause mortality by 39% (L. Andersen et al. 2000). Furthermore, the German Cycling Association
has determined that 10 daily minutes of cycling has positive effects on muscles and joints, 20
minutes on immune system, 30 minutes on heart functions, 40 minutes on long-term capacity,
50 minutes on lipid metabolism and 60 minutes on obesity (Sassen 2009)31. In terms of energy
consumption, although it depends on several factors, especially on body weight of the cyclist, it
can be stated that cycling burns at least 5 kilocalories per minute (Cavill & Davis 2007).
Taking into consideration all these facts and figures, this dissertation has evaluated
health benefits that bike-sharing users may experience as a result of riding bike-sharing
bicycles. Figure 55 has shown in section 6.3.2 the average trip length of bike-sharing rents.
Figure 72 shows the period of time that users are riding the bicycle to cover these distances. As
we can see, values fluctuate from 12 to 23 minutes per trip, being 18 minutes the average and
median value.
30 These 30 minutes per day can be divided in two or three periods of 15 or 10 minutes
respectively. 31 Regular but not-daily exercise may also have positive effects. For instance, a study of the
Cooper Institute for Aerobics Research showed that cycling 3 kilometres in a day three times per week
improve physical conditions (Cavill & Davis 2007).
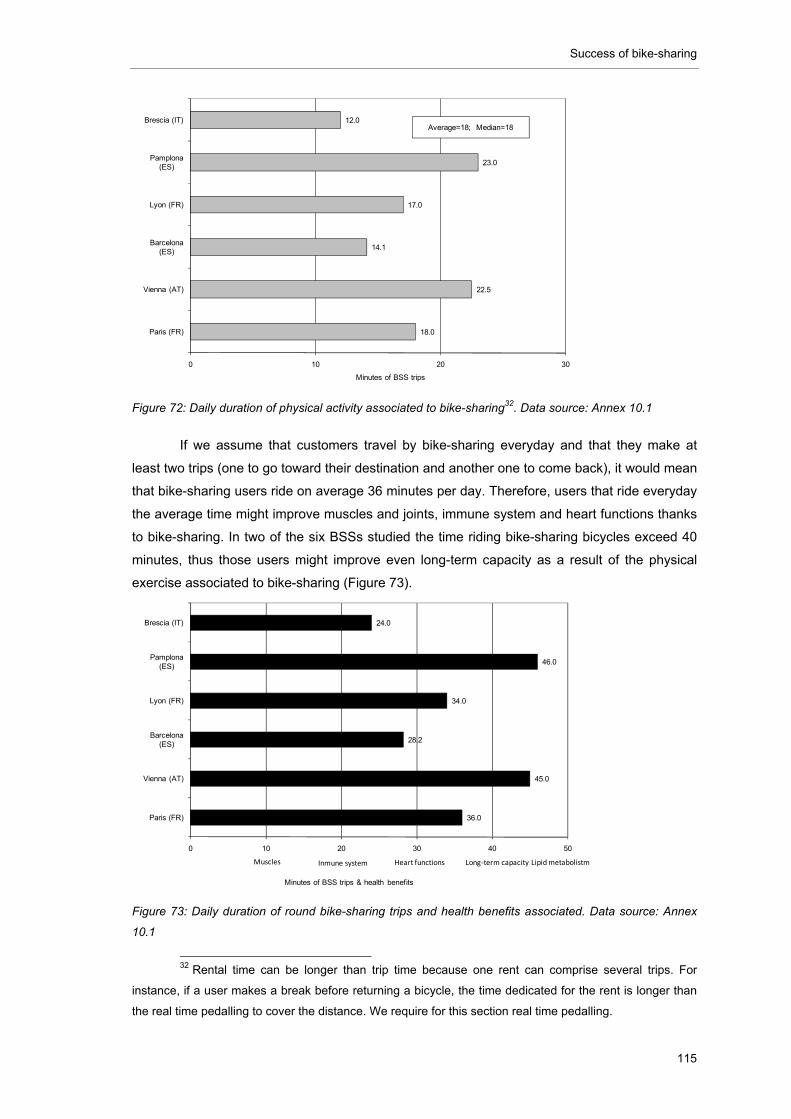
Success of bike-sharing
115
Figure 72: Daily duration of physical activity associated to bike-sharing32. Data source: Annex 10.1
If we assume that customers travel by bike-sharing everyday and that they make at
least two trips (one to go toward their destination and another one to come back), it would mean
that bike-sharing users ride on average 36 minutes per day. Therefore, users that ride everyday
the average time might improve muscles and joints, immune system and heart functions thanks
to bike-sharing. In two of the six BSSs studied the time riding bike-sharing bicycles exceed 40
minutes, thus those users might improve even long-term capacity as a result of the physical
exercise associated to bike-sharing (Figure 73).
Figure 73: Daily duration of round bike-sharing trips and health benefits associated. Data source: Annex
10.1
32 Rental time can be longer than trip time because one rent can comprise several trips. For
instance, if a user makes a break before returning a bicycle, the time dedicated for the rent is longer than
the real time pedalling to cover the distance. We require for this section real time pedalling.
18.0
22.5
14.1
17.0
23.0
12.0
0 10 20 30
Paris (FR)
Vienna (AT)
Barcelona (ES)
Lyon (FR)
Pamplona (ES)
Brescia (IT)
Minutes of BSS trips
Average=18; Median=18
36.0
45.0
28.2
34.0
46.0
24.0
0 10 20 30 40 50
Paris (FR)
Vienna (AT)
Barcelona (ES)
Lyon (FR)
Pamplona (ES)
Brescia (IT)
Minutes of BSS trips & health benefits
Muscles Inmune system Heart functions Long‐term capacity Lipidmetabolistm
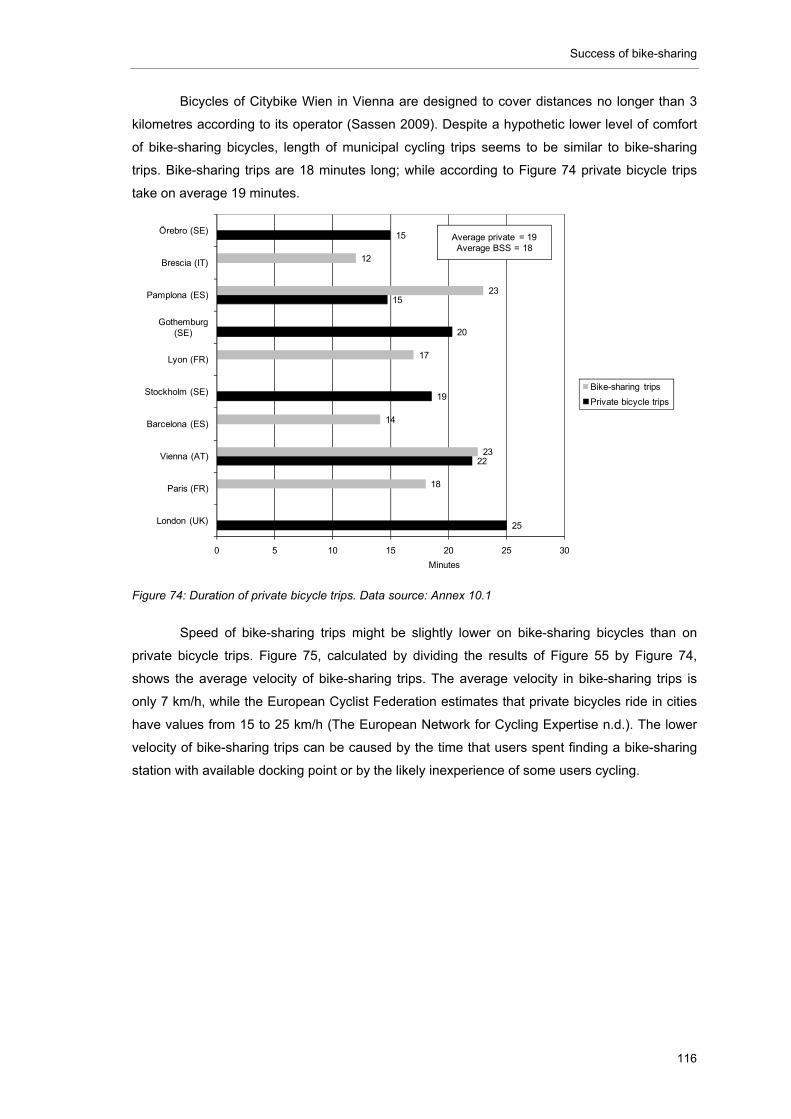
Success of bike-sharing
116
Bicycles of Citybike Wien in Vienna are designed to cover distances no longer than 3
kilometres according to its operator (Sassen 2009). Despite a hypothetic lower level of comfort
of bike-sharing bicycles, length of municipal cycling trips seems to be similar to bike-sharing
trips. Bike-sharing trips are 18 minutes long; while according to Figure 74 private bicycle trips
take on average 19 minutes.
Figure 74: Duration of private bicycle trips. Data source: Annex 10.1
Speed of bike-sharing trips might be slightly lower on bike-sharing bicycles than on
private bicycle trips. Figure 75, calculated by dividing the results of Figure 55 by Figure 74,
shows the average velocity of bike-sharing trips. The average velocity in bike-sharing trips is
only 7 km/h, while the European Cyclist Federation estimates that private bicycles ride in cities
have values from 15 to 25 km/h (The European Network for Cycling Expertise n.d.). The lower
velocity of bike-sharing trips can be caused by the time that users spent finding a bike-sharing
station with available docking point or by the likely inexperience of some users cycling.
25
22
19
20
15
15
18
23
14
17
23
12
0 5 10 15 20 25 30
London (UK)
Paris (FR)
Vienna (AT)
Barcelona (ES)
Stockholm (SE)
Lyon (FR)
Gothemburg (SE)
Pamplona (ES)
Brescia (IT)
Örebro (SE)
Minutes
Bike-sharing trips
Private bicycle trips
Average private = 19Average BSS = 18
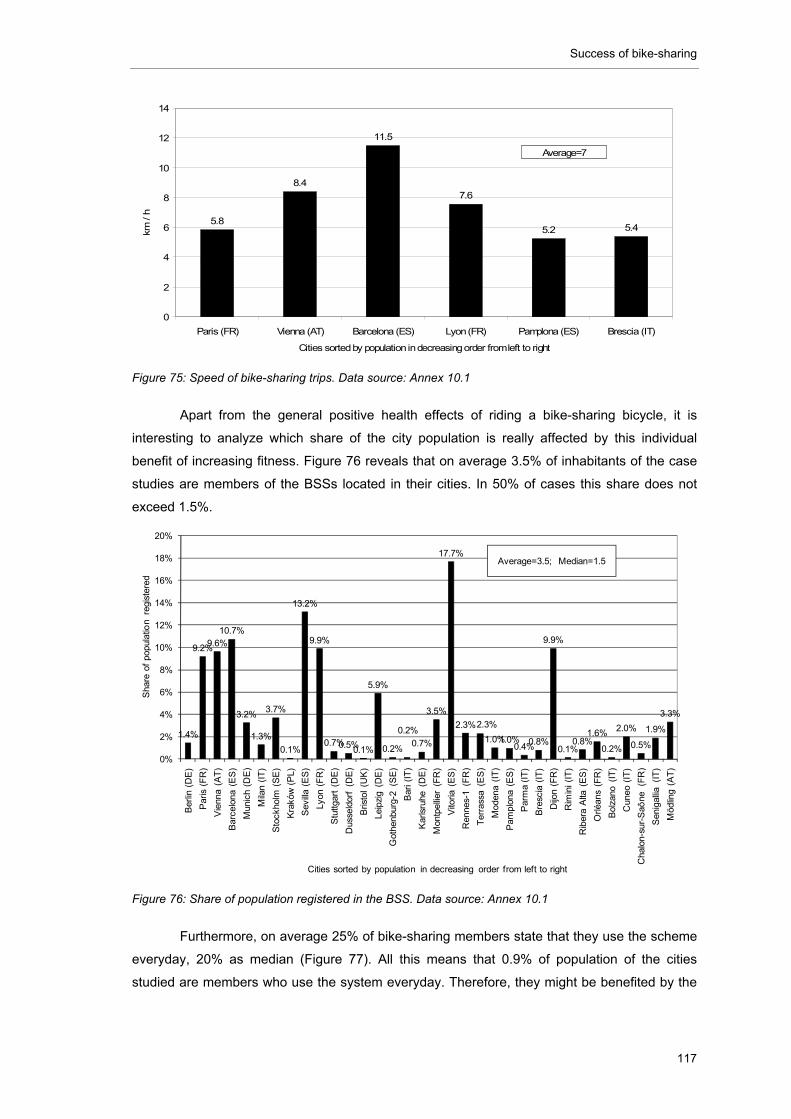
Success of bike-sharing
117
Figure 75: Speed of bike-sharing trips. Data source: Annex 10.1
Apart from the general positive health effects of riding a bike-sharing bicycle, it is
interesting to analyze which share of the city population is really affected by this individual
benefit of increasing fitness. Figure 76 reveals that on average 3.5% of inhabitants of the case
studies are members of the BSSs located in their cities. In 50% of cases this share does not
exceed 1.5%.
Figure 76: Share of population registered in the BSS. Data source: Annex 10.1
Furthermore, on average 25% of bike-sharing members state that they use the scheme
everyday, 20% as median (Figure 77). All this means that 0.9% of population of the cities
studied are members who use the system everyday. Therefore, they might be benefited by the
5.8
8.4
11.5
7.6
5.2 5.4
0
2
4
6
8
10
12
14
Paris (FR) Vienna (AT) Barcelona (ES) Lyon (FR) Pamplona (ES) Brescia (IT)
Cities sorted by population in decreasing order from left to right
km / h
Average=7
1.4%
9.2%9.6%10.7%
3.2%
1.3%
3.7%
0.1%
13.2%
9.9%
0.7%0.5%0.1%
5.9%
0.2%
0.2%
0.7%
3.5%
17.7%
2.3%2.3%
1.0%1.0%0.4%0.8%
9.9%
0.1%0.8%
1.6%
0.2%
2.0%
0.5%
1.9%
3.3%
0%
2%
4%
6%
8%
10%
12%
14%
16%
18%
20%
Ber
lin (
DE
)
Par
is (
FR
)
Vie
nna
(AT
)
Bar
celo
na (
ES
)
Mun
ich
(DE
)
Mila
n (I
T)
Sto
ckho
lm (
SE
)
Kra
ków
(P
L)
Sev
illa
(ES
)
Lyon
(F
R)
Stu
ttgar
t (D
E)
Dus
seld
orf
(DE
)
Bris
tol
(UK
)
Leip
zig
(DE
)
Got
henb
urg-
2 (S
E)
Bar
i (IT
)
Kar
lsru
he (
DE
)
Mon
tpel
lier
(FR
)
Vito
ria (
ES
)
Ren
nes-
1 (F
R)
Ter
rass
a (E
S)
Mod
ena
(IT
)
Pam
plon
a (E
S)
Par
ma
(IT
)
Bre
scia
(IT
)
Dijo
n (F
R)
Rim
ini (
IT)
Rib
era
Alta
(E
S)
Orlé
ans
(FR
)
Bol
zano
(IT
)
Cun
eo (
IT)
Cha
lon-
sur-
Saô
ne
(FR
)
Sen
igal
lia (
IT)
Möd
ling
(AT
)
Sha
re o
f po
pula
tion
regi
ster
ed
Cities sorted by population in decreasing order from left to right
Average=3.5; Median=1.5
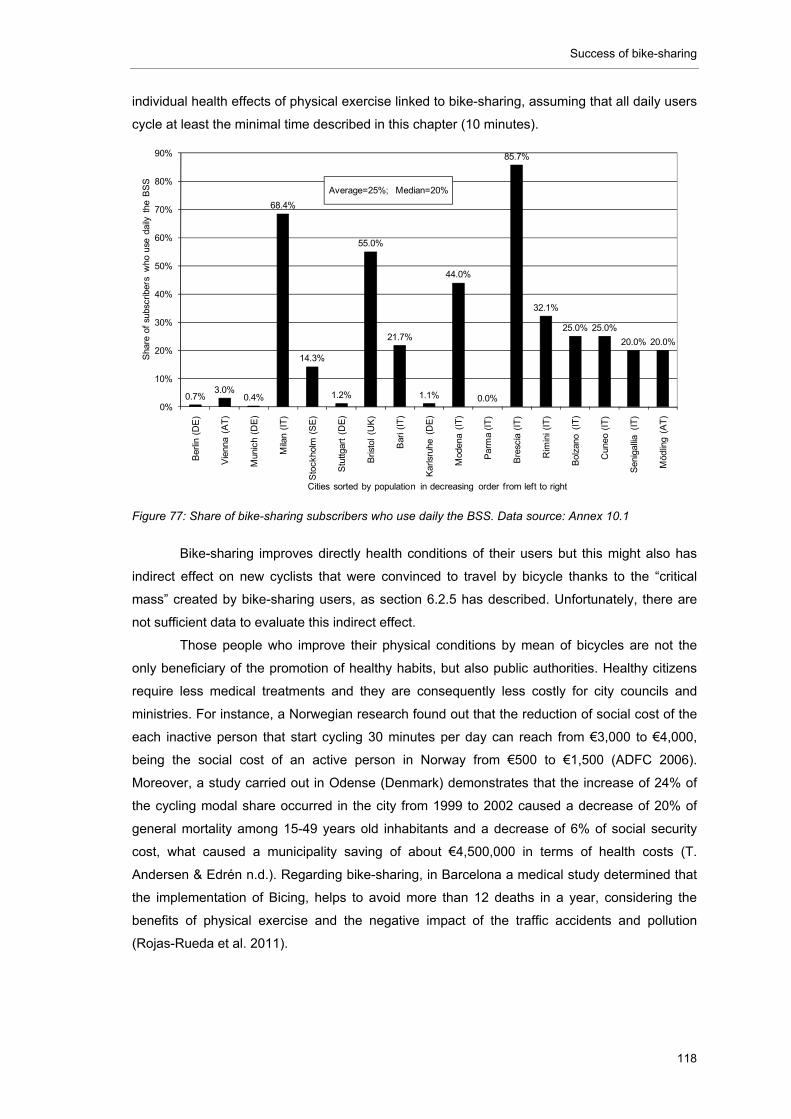
Success of bike-sharing
118
individual health effects of physical exercise linked to bike-sharing, assuming that all daily users
cycle at least the minimal time described in this chapter (10 minutes).
Figure 77: Share of bike-sharing subscribers who use daily the BSS. Data source: Annex 10.1
Bike-sharing improves directly health conditions of their users but this might also has
indirect effect on new cyclists that were convinced to travel by bicycle thanks to the “critical
mass” created by bike-sharing users, as section 6.2.5 has described. Unfortunately, there are
not sufficient data to evaluate this indirect effect.
Those people who improve their physical conditions by mean of bicycles are not the
only beneficiary of the promotion of healthy habits, but also public authorities. Healthy citizens
require less medical treatments and they are consequently less costly for city councils and
ministries. For instance, a Norwegian research found out that the reduction of social cost of the
each inactive person that start cycling 30 minutes per day can reach from €3,000 to €4,000,
being the social cost of an active person in Norway from €500 to €1,500 (ADFC 2006).
Moreover, a study carried out in Odense (Denmark) demonstrates that the increase of 24% of
the cycling modal share occurred in the city from 1999 to 2002 caused a decrease of 20% of
general mortality among 15-49 years old inhabitants and a decrease of 6% of social security
cost, what caused a municipality saving of about €4,500,000 in terms of health costs (T.
Andersen & Edrén n.d.). Regarding bike-sharing, in Barcelona a medical study determined that
the implementation of Bicing, helps to avoid more than 12 deaths in a year, considering the
benefits of physical exercise and the negative impact of the traffic accidents and pollution
(Rojas-Rueda et al. 2011).
0.7%3.0%
0.4%
68.4%
14.3%
1.2%
55.0%
21.7%
1.1%
44.0%
0.0%
85.7%
32.1%
25.0% 25.0%
20.0% 20.0%
0%
10%
20%
30%
40%
50%
60%
70%
80%
90%
Ber
lin (
DE
)
Vie
nna
(AT
)
Mun
ich
(DE
)
Mila
n (I
T)
Sto
ckho
lm (
SE
)
Stu
ttgar
t (D
E)
Bris
tol
(UK
)
Bar
i (IT
)
Kar
lsru
he (
DE
)
Mod
ena
(IT
)
Par
ma
(IT
)
Bre
scia
(IT
)
Rim
ini (
IT)
Bol
zano
(IT
)
Cun
eo (
IT)
Sen
igal
lia (
IT)
Möd
ling
(AT
)
Sha
re o
f su
bscr
iber
s w
ho u
se d
aily
the
BS
S
Cities sorted by population in decreasing order from left to right
Average=25%; Median=20%
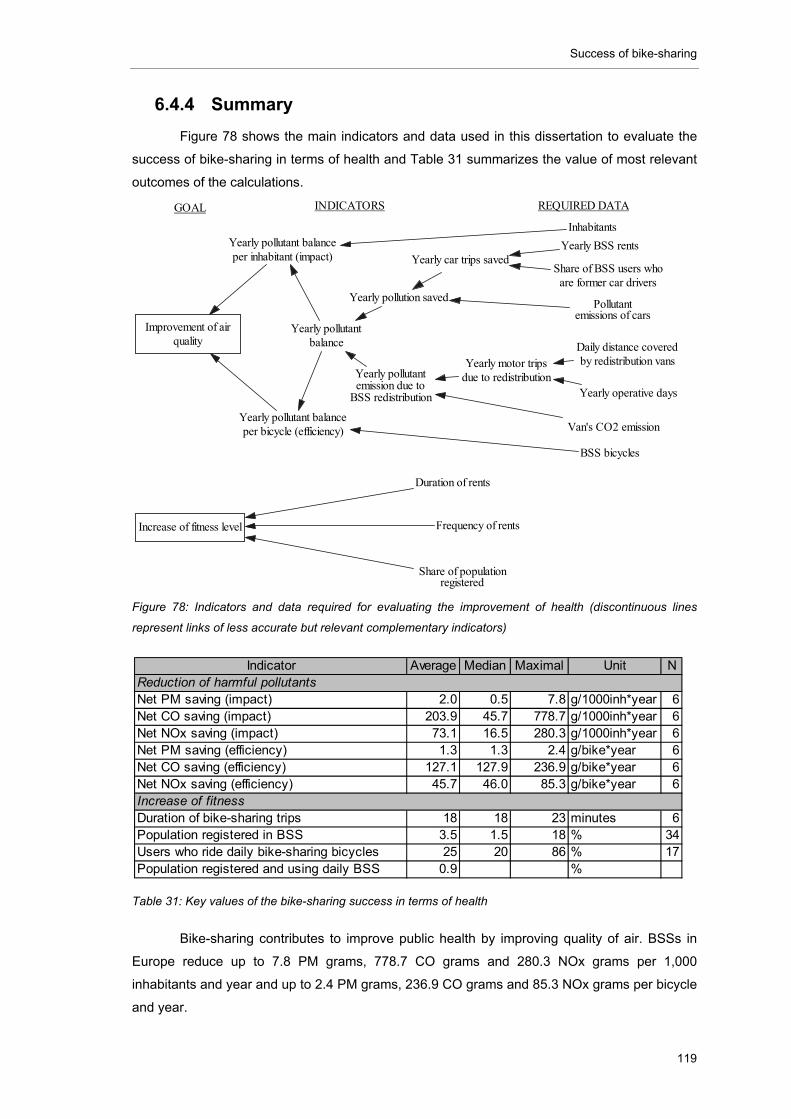
Success of bike-sharing
119
6.4.4 Summary
Figure 78 shows the main indicators and data used in this dissertation to evaluate the
success of bike-sharing in terms of health and Table 31 summarizes the value of most relevant
outcomes of the calculations.
Figure 78: Indicators and data required for evaluating the improvement of health (discontinuous lines
represent links of less accurate but relevant complementary indicators)
Table 31: Key values of the bike-sharing success in terms of health
Bike-sharing contributes to improve public health by improving quality of air. BSSs in
Europe reduce up to 7.8 PM grams, 778.7 CO grams and 280.3 NOx grams per 1,000
inhabitants and year and up to 2.4 PM grams, 236.9 CO grams and 85.3 NOx grams per bicycle
and year.
INDICATORS REQUIRED DATAGOAL
Increase of fitness level
Improvement of airquality
Duration of rents
Frequency of rents
Share of populationregistered
Share of BSS users whoare former car drivers
Yearly BSS rents
Yearly pollution saved
Yearly car trips saved
Pollutantemissions of cars
Daily distance coveredby redistribution vans
Yearly operative days
Yearly motor tripsdue to redistribution
Van's CO2 emission
Yearly pollutantemission due to
BSS redistribution
Yearly pollutantbalance
BSS bicycles
InhabitantsYearly pollutant balanceper inhabitant (impact)
Yearly pollutant balanceper bicycle (efficiency)
Indicator Average Median Maximal Unit N
Net PM saving (impact) 2.0 0.5 7.8 g/1000inh*year 6Net CO saving (impact) 203.9 45.7 778.7 g/1000inh*year 6Net NOx saving (impact) 73.1 16.5 280.3 g/1000inh*year 6Net PM saving (efficiency) 1.3 1.3 2.4 g/bike*year 6Net CO saving (efficiency) 127.1 127.9 236.9 g/bike*year 6Net NOx saving (efficiency) 45.7 46.0 85.3 g/bike*year 6
Duration of bike-sharing trips 18 18 23 minutes 6Population registered in BSS 3.5 1.5 18 % 34Users who ride daily bike-sharing bicycles 25 20 86 % 17Population registered and using daily BSS 0.9 %
Reduction of harmful pollutants
Increase of fitness
Success of bike-sharing
120
BSS can also contribute to improve individual health through fitness of users. Bike-
sharing customers ride on average 18 minutes per rent. It means 36 minutes for round trips.
Consequently, if these users ride everyday this distance, they would improve muscles and joints,
immune system and heart functions thanks to bike-sharing. However, 18% of bike-sharing
members use the BSS everyday and 3.5% of population are members of BSSs (on average).
Therefore, only 0.9% of population of the cities studied might experience the positive effects
derived of physical activity in bike-sharing trips.
6.5 Traffic safety
6.5.1 Introduction
As section 6.2.5 has explained high levels of bicycle use may lead to low number of
accidents involving cyclists. Since BSSs can increase directly and indirectly levels of cycling
modal share, it could be concluded that they contributes to enforce traffic safety. Thus, those
city councils concerned about high levels of accidents involving cyclists can plan to install a
BSS to make the municipality safer for soft mobility modes such as bicycles.
This section will study the observed effects of bike-sharing on traffic safety. Not only
positive but also negative effects will be analyzed and the success of existing BSSs achieving
this hypothetic goal will be evaluated.
6.5.2 Increase of traffic safety
Several studies have affirmed that available data concerning traffic safety contain high
levels of under-reporting and misclassification of injuries (Cavill & Davis 2007). Less than half of
existing accidents involving pedestrians and cyclists are actually reported and accidents that are
reported by the police use to have mistakes in the assessment of the severity of injuries due to
lack of medical knowledge (Spence 2003). A “Comparison of Hospital and Police Casualty Data”
carried out in United Kingdom in 1996 by the Transport Research of Laboratory assured that if
accidents would be right recorded, the real number of serious casualties will increase by 52%
(Cavill & Davis 2007). A study of the Traffic Safety Board of Austria (Kuratorium für
Verkehrssicherheit) shows that data concerning accidents differ very widely depending on the
source (BMVIT 2010). If data are collected in hospitals the number of cyclists involved in
accidents can be up to five times higher than the ones reported by police (Figure 79). A likely
reason for this is that accidents reported by police imply a traffic offence, while accidents
reported in hospitals can be caused out of roads in leisure trips.
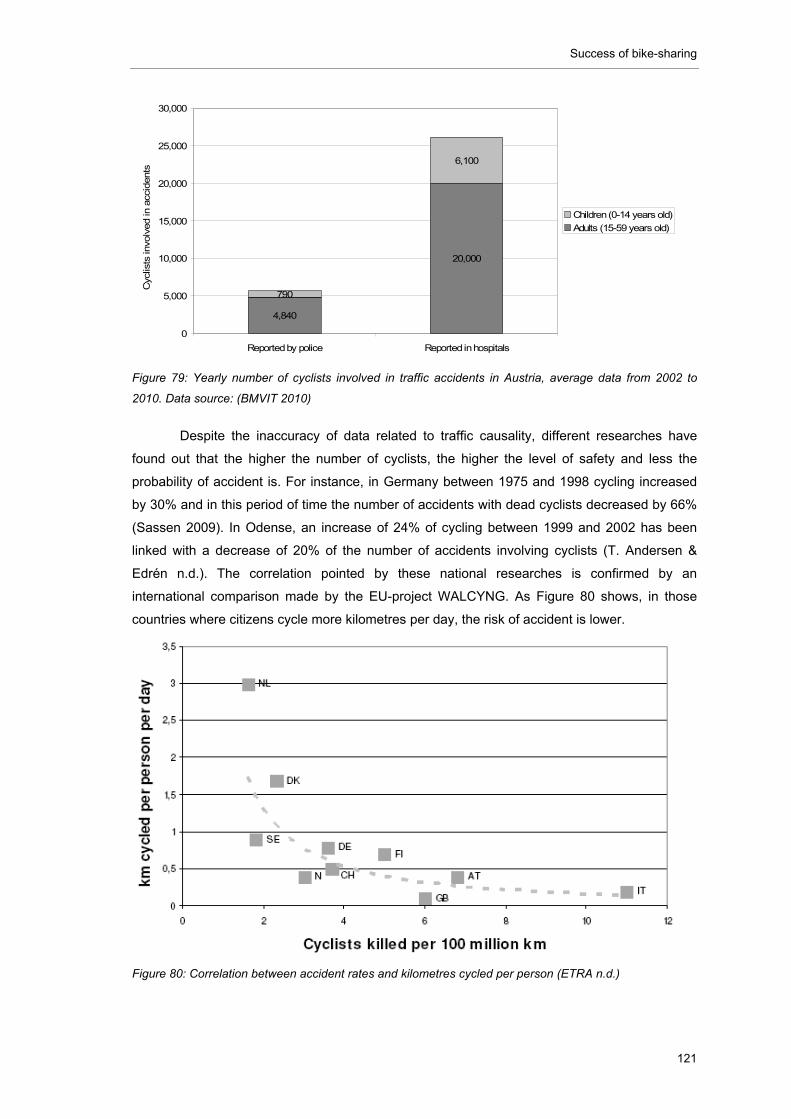
Success of bike-sharing
121
Figure 79: Yearly number of cyclists involved in traffic accidents in Austria, average data from 2002 to
2010. Data source: (BMVIT 2010)
Despite the inaccuracy of data related to traffic causality, different researches have
found out that the higher the number of cyclists, the higher the level of safety and less the
probability of accident is. For instance, in Germany between 1975 and 1998 cycling increased
by 30% and in this period of time the number of accidents with dead cyclists decreased by 66%
(Sassen 2009). In Odense, an increase of 24% of cycling between 1999 and 2002 has been
linked with a decrease of 20% of the number of accidents involving cyclists (T. Andersen &
Edrén n.d.). The correlation pointed by these national researches is confirmed by an
international comparison made by the EU-project WALCYNG. As Figure 80 shows, in those
countries where citizens cycle more kilometres per day, the risk of accident is lower.
Figure 80: Correlation between accident rates and kilometres cycled per person (ETRA n.d.)
4,840
20,000
790
6,100
0
5,000
10,000
15,000
20,000
25,000
30,000
Reported by police Reported in hospitals
Cyc
lists
invo
lved in
acc
idents
Children (0-14 years old)
Adults (15-59 years old)
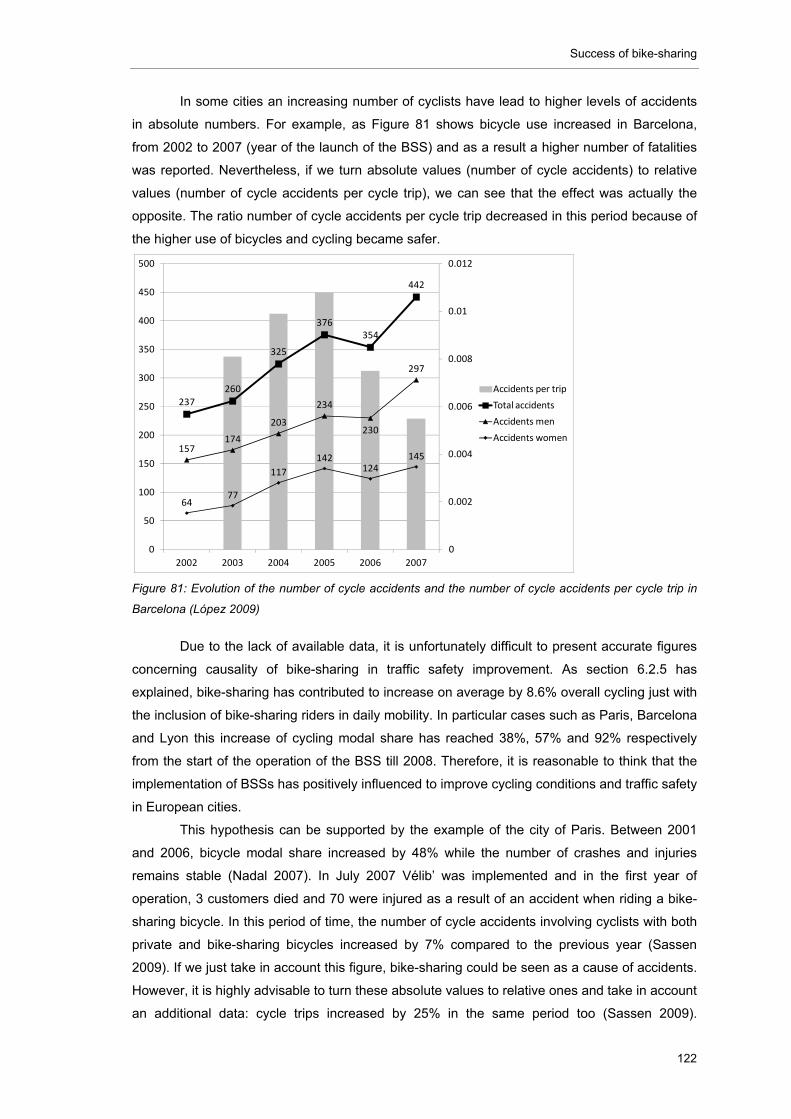
Success of bike-sharing
122
In some cities an increasing number of cyclists have lead to higher levels of accidents
in absolute numbers. For example, as Figure 81 shows bicycle use increased in Barcelona,
from 2002 to 2007 (year of the launch of the BSS) and as a result a higher number of fatalities
was reported. Nevertheless, if we turn absolute values (number of cycle accidents) to relative
values (number of cycle accidents per cycle trip), we can see that the effect was actually the
opposite. The ratio number of cycle accidents per cycle trip decreased in this period because of
the higher use of bicycles and cycling became safer.
Figure 81: Evolution of the number of cycle accidents and the number of cycle accidents per cycle trip in
Barcelona (López 2009)
Due to the lack of available data, it is unfortunately difficult to present accurate figures
concerning causality of bike-sharing in traffic safety improvement. As section 6.2.5 has
explained, bike-sharing has contributed to increase on average by 8.6% overall cycling just with
the inclusion of bike-sharing riders in daily mobility. In particular cases such as Paris, Barcelona
and Lyon this increase of cycling modal share has reached 38%, 57% and 92% respectively
from the start of the operation of the BSS till 2008. Therefore, it is reasonable to think that the
implementation of BSSs has positively influenced to improve cycling conditions and traffic safety
in European cities.
This hypothesis can be supported by the example of the city of Paris. Between 2001
and 2006, bicycle modal share increased by 48% while the number of crashes and injuries
remains stable (Nadal 2007). In July 2007 Vélib’ was implemented and in the first year of
operation, 3 customers died and 70 were injured as a result of an accident when riding a bike-
sharing bicycle. In this period of time, the number of cycle accidents involving cyclists with both
private and bike-sharing bicycles increased by 7% compared to the previous year (Sassen
2009). If we just take in account this figure, bike-sharing could be seen as a cause of accidents.
However, it is highly advisable to turn these absolute values to relative ones and take in account
an additional data: cycle trips increased by 25% in the same period too (Sassen 2009).
237
260
325
376354
442
157174
203
234
230
297
6477
117
142124
145
0
0.002
0.004
0.006
0.008
0.01
0.012
0
50
100
150
200
250
300
350
400
450
500
2002 2003 2004 2005 2006 2007
Accidents per trip
Total accidents
Accidents men
Accidents women
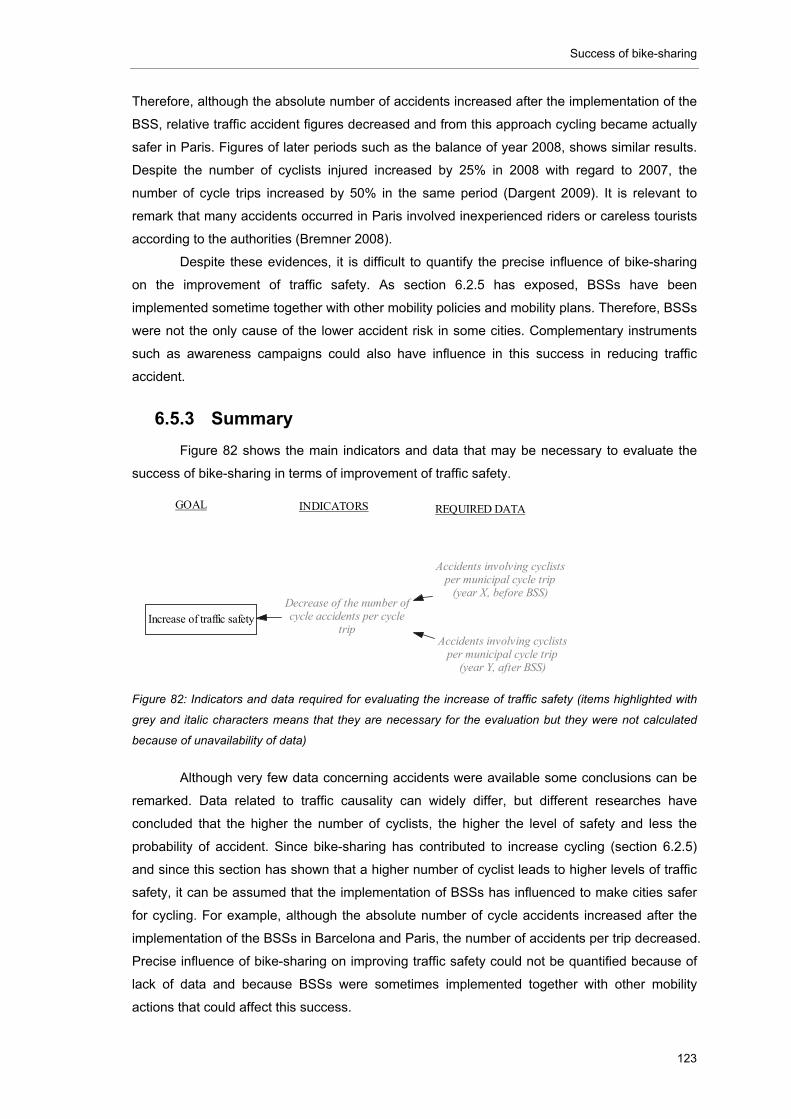
Success of bike-sharing
123
Therefore, although the absolute number of accidents increased after the implementation of the
BSS, relative traffic accident figures decreased and from this approach cycling became actually
safer in Paris. Figures of later periods such as the balance of year 2008, shows similar results.
Despite the number of cyclists injured increased by 25% in 2008 with regard to 2007, the
number of cycle trips increased by 50% in the same period (Dargent 2009). It is relevant to
remark that many accidents occurred in Paris involved inexperienced riders or careless tourists
according to the authorities (Bremner 2008).
Despite these evidences, it is difficult to quantify the precise influence of bike-sharing
on the improvement of traffic safety. As section 6.2.5 has exposed, BSSs have been
implemented sometime together with other mobility policies and mobility plans. Therefore, BSSs
were not the only cause of the lower accident risk in some cities. Complementary instruments
such as awareness campaigns could also have influence in this success in reducing traffic
accident.
6.5.3 Summary
Figure 82 shows the main indicators and data that may be necessary to evaluate the
success of bike-sharing in terms of improvement of traffic safety.
Figure 82: Indicators and data required for evaluating the increase of traffic safety (items highlighted with
grey and italic characters means that they are necessary for the evaluation but they were not calculated
because of unavailability of data)
Although very few data concerning accidents were available some conclusions can be
remarked. Data related to traffic causality can widely differ, but different researches have
concluded that the higher the number of cyclists, the higher the level of safety and less the
probability of accident. Since bike-sharing has contributed to increase cycling (section 6.2.5)
and since this section has shown that a higher number of cyclist leads to higher levels of traffic
safety, it can be assumed that the implementation of BSSs has influenced to make cities safer
for cycling. For example, although the absolute number of cycle accidents increased after the
implementation of the BSSs in Barcelona and Paris, the number of accidents per trip decreased.
Precise influence of bike-sharing on improving traffic safety could not be quantified because of
lack of data and because BSSs were sometimes implemented together with other mobility
actions that could affect this success.
Increase of traffic safety
INDICATORS REQUIRED DATAGOAL
Decrease of the number ofcycle accidents per cycle
trip
Accidents involving cyclistsper municipal cycle trip
(year X, before BSS)
Accidents involving cyclistsper municipal cycle trip
(year Y, after BSS)
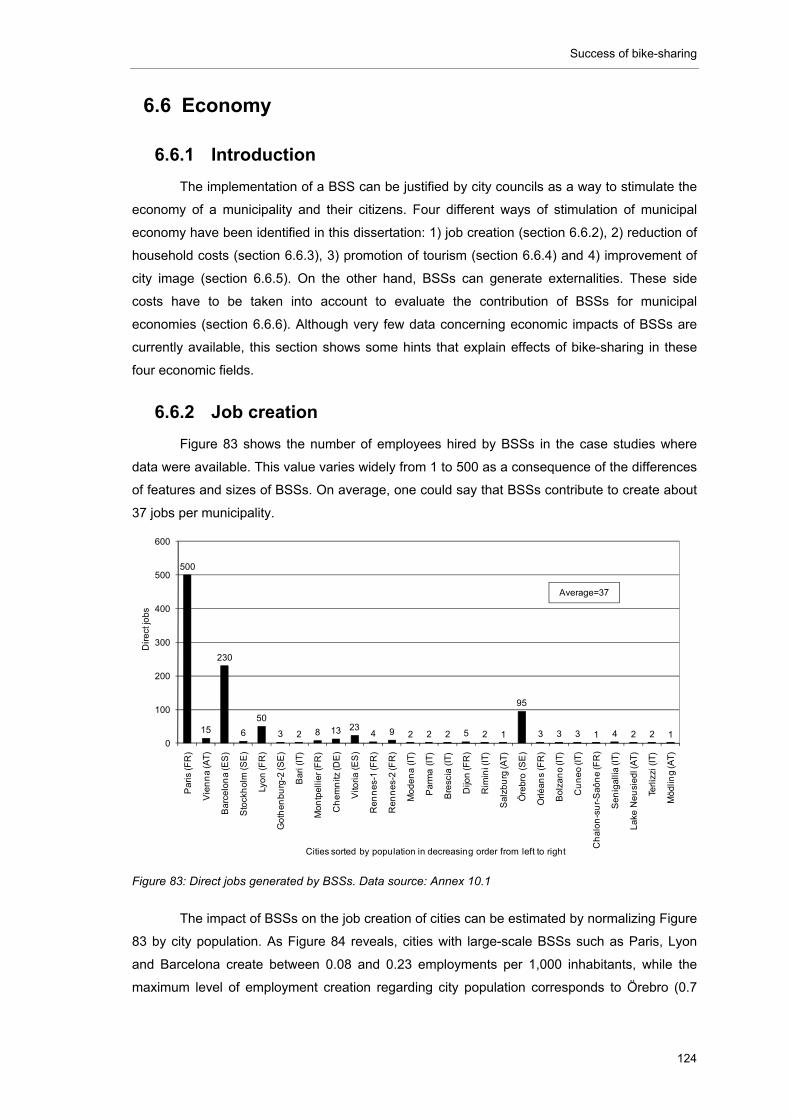
Success of bike-sharing
124
6.6 Economy
6.6.1 Introduction
The implementation of a BSS can be justified by city councils as a way to stimulate the
economy of a municipality and their citizens. Four different ways of stimulation of municipal
economy have been identified in this dissertation: 1) job creation (section 6.6.2), 2) reduction of
household costs (section 6.6.3), 3) promotion of tourism (section 6.6.4) and 4) improvement of
city image (section 6.6.5). On the other hand, BSSs can generate externalities. These side
costs have to be taken into account to evaluate the contribution of BSSs for municipal
economies (section 6.6.6). Although very few data concerning economic impacts of BSSs are
currently available, this section shows some hints that explain effects of bike-sharing in these
four economic fields.
6.6.2 Job creation
Figure 83 shows the number of employees hired by BSSs in the case studies where
data were available. This value varies widely from 1 to 500 as a consequence of the differences
of features and sizes of BSSs. On average, one could say that BSSs contribute to create about
37 jobs per municipality.
Figure 83: Direct jobs generated by BSSs. Data source: Annex 10.1
The impact of BSSs on the job creation of cities can be estimated by normalizing Figure
83 by city population. As Figure 84 reveals, cities with large-scale BSSs such as Paris, Lyon
and Barcelona create between 0.08 and 0.23 employments per 1,000 inhabitants, while the
maximum level of employment creation regarding city population corresponds to Örebro (0.7
500
15
230
6
50
3 2 8 13 234 9 2 2 2 5 2 1
95
3 3 3 1 4 2 2 10
100
200
300
400
500
600
Pa
ris (
FR
)
Vie
nn
a (A
T)
Bar
celo
na
(ES
)
Sto
ckh
olm
(S
E)
Lyon
(FR
)
Go
then
bu
rg-2
(SE
)
Bar
i (IT
)
Mon
tpe
llier
(FR
)
Ch
em
nitz
(DE
)
Vito
ria (
ES
)
Ren
nes
-1 (F
R)
Ren
nes
-2 (F
R)
Mo
den
a (I
T)
Par
ma
(IT
)
Bre
scia
(IT
)
Dijo
n (F
R)
Rim
ini (
IT)
Sal
zbu
rg (A
T)
Öre
bro
(SE
)
Orlé
ans
(FR
)
Bol
zan
o (I
T)
Cu
ne
o (I
T)
Ch
alo
n-s
ur-
Saô
ne
(FR
)
Se
nig
allia
(IT
)
Lak
e N
eu
sied
l (A
T)
Terl
izzi
(IT
)
Möd
ling
(AT
)
Dir
ect j
obs
Cities sorted by population in decreasing order from left to right
Average=37
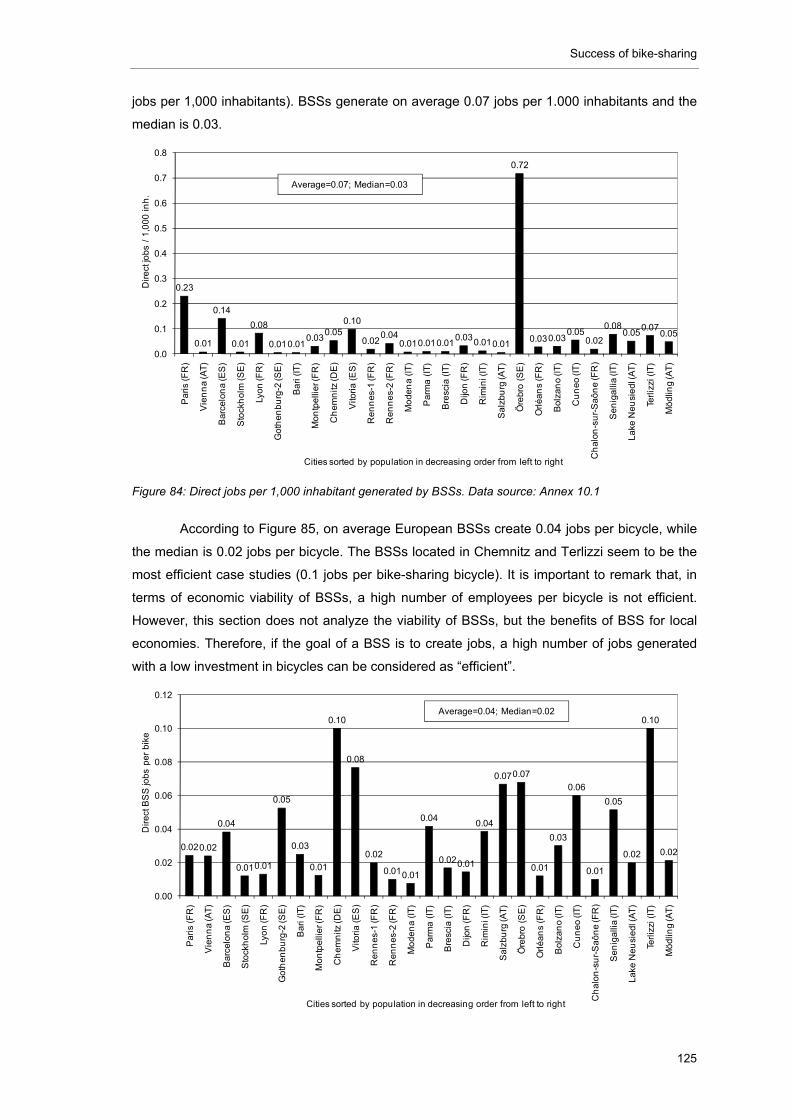
Success of bike-sharing
125
jobs per 1,000 inhabitants). BSSs generate on average 0.07 jobs per 1.000 inhabitants and the
median is 0.03.
Figure 84: Direct jobs per 1,000 inhabitant generated by BSSs. Data source: Annex 10.1
According to Figure 85, on average European BSSs create 0.04 jobs per bicycle, while
the median is 0.02 jobs per bicycle. The BSSs located in Chemnitz and Terlizzi seem to be the
most efficient case studies (0.1 jobs per bike-sharing bicycle). It is important to remark that, in
terms of economic viability of BSSs, a high number of employees per bicycle is not efficient.
However, this section does not analyze the viability of BSSs, but the benefits of BSS for local
economies. Therefore, if the goal of a BSS is to create jobs, a high number of jobs generated
with a low investment in bicycles can be considered as “efficient”.
0.23
0.01
0.14
0.01
0.08
0.010.010.03
0.050.10
0.020.04
0.010.010.010.030.010.01
0.72
0.030.030.05
0.02
0.080.05
0.070.05
0.0
0.1
0.2
0.3
0.4
0.5
0.6
0.7
0.8
Pa
ris
(FR
)
Vie
nn
a (A
T)
Ba
rce
lon
a (E
S)
Sto
ckh
olm
(S
E)
Lyo
n (F
R)
Go
the
nb
urg
-2 (S
E)
Ba
ri (
IT)
Mo
ntp
elli
er (
FR
)
Ch
em
nitz
(DE
)
Vito
ria
(E
S)
Re
nn
es-
1 (F
R)
Re
nn
es-
2 (F
R)
Mo
de
na
(IT
)
Pa
rma
(IT
)
Bre
scia
(IT
)
Dijo
n (F
R)
Rim
ini (
IT)
Sa
lzb
urg
(AT
)
Öre
bro
(S
E)
Orl
éa
ns
(FR
)
Bo
lza
no
(IT
)
Cu
ne
o (I
T)
Ch
alo
n-s
ur-
Sa
ôn
e (F
R)
Se
nig
alli
a (I
T)
La
ke N
eu
sie
dl (
AT
)
Terl
izzi
(IT
)
Mö
dlin
g (A
T)
Dir
ect
job
s /
1,0
00
in
h.
Cities sorted by population in decreasing order from left to right
Average=0.07; Median=0.03
0.020.02
0.04
0.010.01
0.05
0.03
0.01
0.10
0.08
0.02
0.010.01
0.04
0.020.01
0.04
0.070.07
0.01
0.03
0.06
0.01
0.05
0.02
0.10
0.02
0.00
0.02
0.04
0.06
0.08
0.10
0.12
Pa
ris
(FR
)
Vie
nn
a (A
T)
Ba
rce
lon
a (E
S)
Sto
ckh
olm
(S
E)
Lyo
n (F
R)
Go
the
nb
urg
-2 (S
E)
Ba
ri (
IT)
Mo
ntp
elli
er (
FR
)
Ch
em
nitz
(DE
)
Vito
ria
(E
S)
Re
nn
es-
1 (F
R)
Re
nn
es-
2 (F
R)
Mo
de
na
(IT
)
Pa
rma
(IT
)
Bre
scia
(IT
)
Dijo
n (F
R)
Rim
ini (
IT)
Sa
lzb
urg
(AT
)
Öre
bro
(S
E)
Orl
éa
ns
(FR
)
Bo
lza
no
(IT
)
Cu
ne
o (I
T)
Ch
alo
n-s
ur-
Sa
ôn
e (F
R)
Se
nig
alli
a (I
T)
La
ke N
eu
sie
dl (
AT
)
Terl
izzi
(IT
)
Mö
dlin
g (A
T)
Dir
ect
BS
S jo
bs
pe
r b
ike
Cities sorted by population in decreasing order from left to right
Average=0.04; Median=0.02
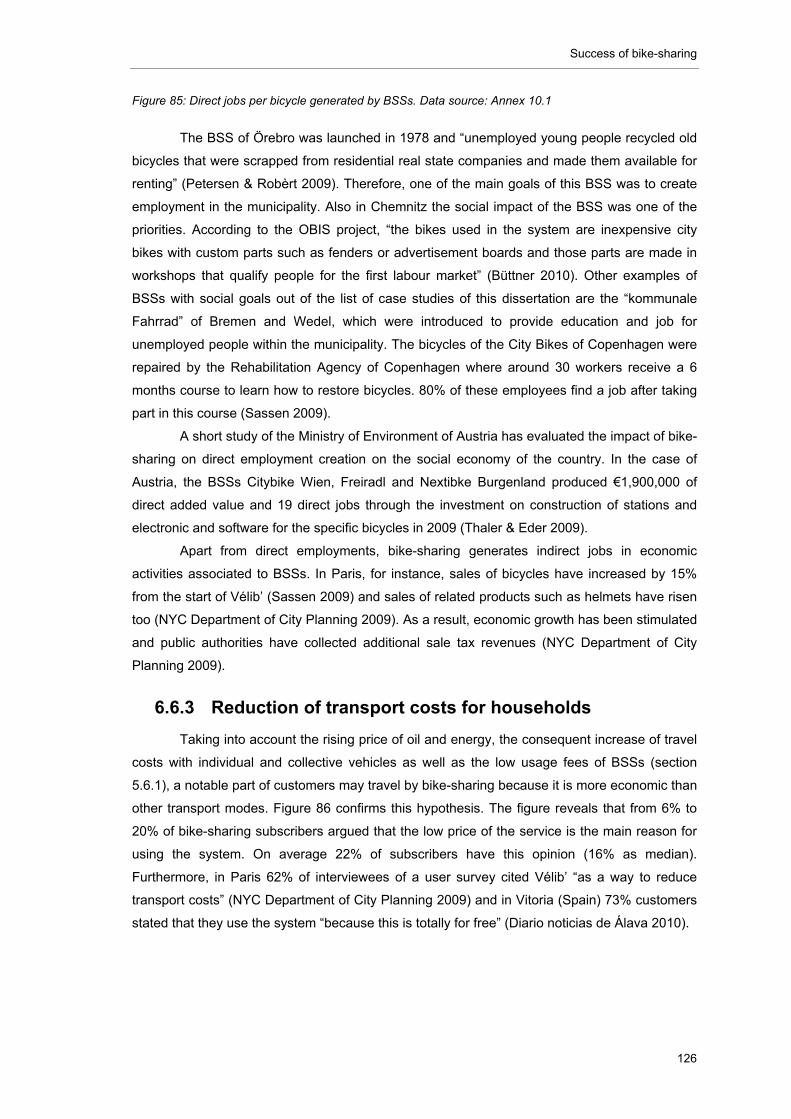
Success of bike-sharing
126
Figure 85: Direct jobs per bicycle generated by BSSs. Data source: Annex 10.1
The BSS of Örebro was launched in 1978 and “unemployed young people recycled old
bicycles that were scrapped from residential real state companies and made them available for
renting” (Petersen & Robèrt 2009). Therefore, one of the main goals of this BSS was to create
employment in the municipality. Also in Chemnitz the social impact of the BSS was one of the
priorities. According to the OBIS project, “the bikes used in the system are inexpensive city
bikes with custom parts such as fenders or advertisement boards and those parts are made in
workshops that qualify people for the first labour market” (Büttner 2010). Other examples of
BSSs with social goals out of the list of case studies of this dissertation are the “kommunale
Fahrrad” of Bremen and Wedel, which were introduced to provide education and job for
unemployed people within the municipality. The bicycles of the City Bikes of Copenhagen were
repaired by the Rehabilitation Agency of Copenhagen where around 30 workers receive a 6
months course to learn how to restore bicycles. 80% of these employees find a job after taking
part in this course (Sassen 2009).
A short study of the Ministry of Environment of Austria has evaluated the impact of bike-
sharing on direct employment creation on the social economy of the country. In the case of
Austria, the BSSs Citybike Wien, Freiradl and Nextibke Burgenland produced €1,900,000 of
direct added value and 19 direct jobs through the investment on construction of stations and
electronic and software for the specific bicycles in 2009 (Thaler & Eder 2009).
Apart from direct employments, bike-sharing generates indirect jobs in economic
activities associated to BSSs. In Paris, for instance, sales of bicycles have increased by 15%
from the start of Vélib’ (Sassen 2009) and sales of related products such as helmets have risen
too (NYC Department of City Planning 2009). As a result, economic growth has been stimulated
and public authorities have collected additional sale tax revenues (NYC Department of City
Planning 2009).
6.6.3 Reduction of transport costs for households
Taking into account the rising price of oil and energy, the consequent increase of travel
costs with individual and collective vehicles as well as the low usage fees of BSSs (section
5.6.1), a notable part of customers may travel by bike-sharing because it is more economic than
other transport modes. Figure 86 confirms this hypothesis. The figure reveals that from 6% to
20% of bike-sharing subscribers argued that the low price of the service is the main reason for
using the system. On average 22% of subscribers have this opinion (16% as median).
Furthermore, in Paris 62% of interviewees of a user survey cited Vélib’ “as a way to reduce
transport costs” (NYC Department of City Planning 2009) and in Vitoria (Spain) 73% customers
stated that they use the system “because this is totally for free” (Diario noticias de Álava 2010).
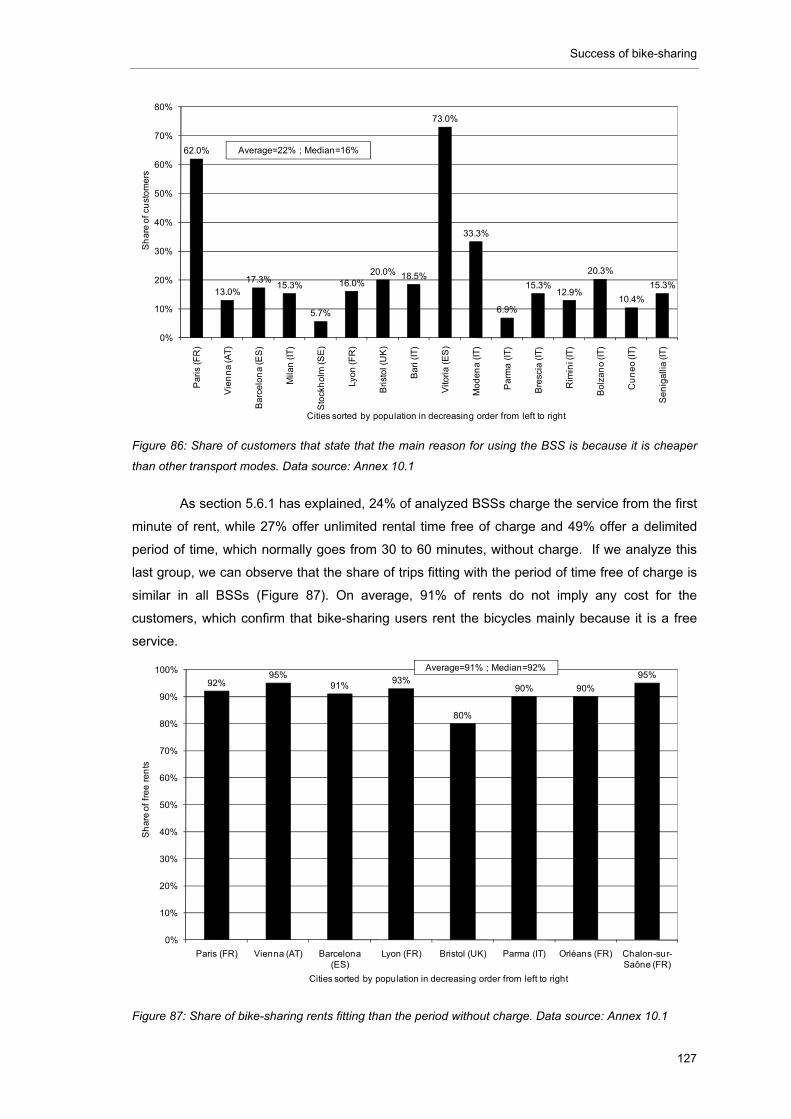
Success of bike-sharing
127
Figure 86: Share of customers that state that the main reason for using the BSS is because it is cheaper
than other transport modes. Data source: Annex 10.1
As section 5.6.1 has explained, 24% of analyzed BSSs charge the service from the first
minute of rent, while 27% offer unlimited rental time free of charge and 49% offer a delimited
period of time, which normally goes from 30 to 60 minutes, without charge. If we analyze this
last group, we can observe that the share of trips fitting with the period of time free of charge is
similar in all BSSs (Figure 87). On average, 91% of rents do not imply any cost for the
customers, which confirm that bike-sharing users rent the bicycles mainly because it is a free
service.
Figure 87: Share of bike-sharing rents fitting than the period without charge. Data source: Annex 10.1
62.0%
13.0%17.3%
15.3%
5.7%
16.0%20.0% 18.5%
73.0%
33.3%
6.9%
15.3%12.9%
20.3%
10.4%
15.3%
0%
10%
20%
30%
40%
50%
60%
70%
80%
Pa
ris
(FR
)
Vie
nn
a (A
T)
Ba
rce
lon
a (E
S)
Mila
n (I
T)
Sto
ckh
olm
(S
E)
Lyo
n (F
R)
Bri
sto
l (U
K)
Ba
ri (
IT)
Vito
ria
(E
S)
Mo
de
na
(IT
)
Pa
rma
(IT
)
Bre
scia
(IT
)
Rim
ini (
IT)
Bo
lza
no
(IT
)
Cu
ne
o (I
T)
Se
nig
alli
a (I
T)
Sh
are
of
cust
om
ers
Cities sorted by population in decreasing order from left to right
Average=22% ; Median=16%
92%95%
91%93%
80%
90% 90%
95%
0%
10%
20%
30%
40%
50%
60%
70%
80%
90%
100%
Paris (FR) Vienna (AT) Barcelona (ES)
Lyon (FR) Bristol (UK) Parma (IT) Orléans (FR) Chalon-sur-Saône (FR)
Sh
are
of
fre
e r
en
ts
Cities sorted by population in decreasing order from left to right
Average=91% ; Median=92%
Success of bike-sharing
128
6.6.4 Increase of tourism attractiveness
In Austria, tourism linked to cycling activities represented in 2009 5.65% of the total
added value of tourism dedicated to accommodation and catering. Furthermore, cycling
produced €317 million of added value in tourism economy what represents 7,616 equivalent full-
time jobs and 53% of the whole added value of cycling in all economic sectors (Thaler & Eder
2009).
Therefore, market potential of tourists interested in cycling has a significant relevance in
local economies and BSSs can be used as a way to promote this kind of tourism. In particular,
bike-sharing may contribute to attract tourism by providing an alternative or complementary way
to visit a city.
Unfortunately, no official data concerning the number of tourists using BSSs were found
and estimations or indicators of impact of bike-sharing encouraging tourism are not available.
However, some conclusions can be extracted from the role and influence of bike-sharing on
tourism. For example, as section 5.2.3 has shown, although BSSs rarely define themselves as
“tourist oriented”, some features can indicate whether tourists are one of their target groups: the
availability of short-term subscriptions and flat rates.
Short-terms subscriptions are memberships that mainly expire in 1 or 7 days. This
subscription fee could be more attractive for tourists, because visitors are only
temporally established in the city and they do not want to be linked to the BSS
when leaving the place. 41% of the BSSs studied offer this kind of subscription
(section 5.2.4).
Flat rate tariffs (including unlimited free systems) encourage long rents of bike-
sharing bicycles for a very cheap price. For instance, BSSs operated by nextbike
offer one hour of rent for €1 and 24 hours for €5 or €8, depending on the city
(Castro 2009; Gröper 2009). This fee is appreciated by tourists that make a one-
day excursion for visiting a city or a rural area. 27% of BSSs analyzed in this
dissertation are totally free and 65% have flat rates up to the whole day (section
5.6.1).
The influence of tourists is determinant in some cases. For example, in Barclays Cycle
Hire in London, opened in 2010, 61% of users subscribed just for one day and 5% for one week,
i.e. 66% are short-term subscriptions (Figure 88). If we assume that most short-term
subscriptions are signed by tourists, we could conclude that 66% of users of the Barclays Cycle
Hire in London are tourist, which demonstrates the high influence of tourism in some BSSs.
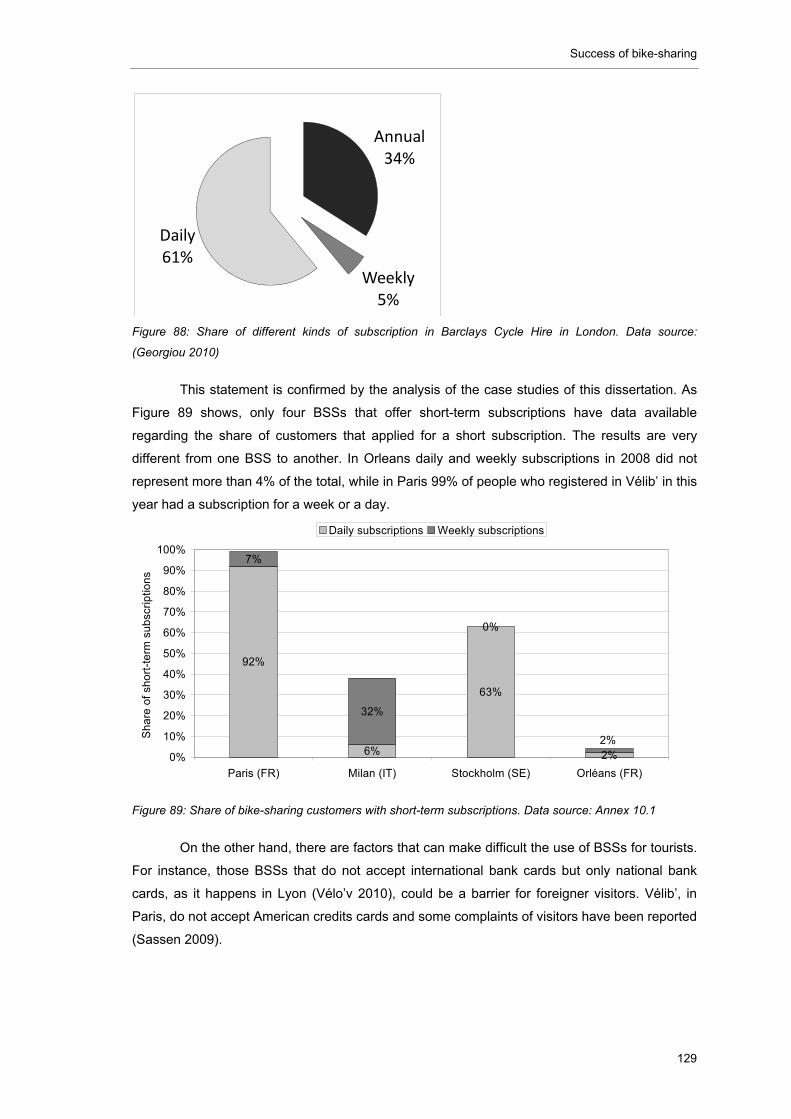
Success of bike-sharing
129
Figure 88: Share of different kinds of subscription in Barclays Cycle Hire in London. Data source:
(Georgiou 2010)
This statement is confirmed by the analysis of the case studies of this dissertation. As
Figure 89 shows, only four BSSs that offer short-term subscriptions have data available
regarding the share of customers that applied for a short subscription. The results are very
different from one BSS to another. In Orleans daily and weekly subscriptions in 2008 did not
represent more than 4% of the total, while in Paris 99% of people who registered in Vélib’ in this
year had a subscription for a week or a day.
Figure 89: Share of bike-sharing customers with short-term subscriptions. Data source: Annex 10.1
On the other hand, there are factors that can make difficult the use of BSSs for tourists.
For instance, those BSSs that do not accept international bank cards but only national bank
cards, as it happens in Lyon (Vélo’v 2010), could be a barrier for foreigner visitors. Vélib’, in
Paris, do not accept American credits cards and some complaints of visitors have been reported
(Sassen 2009).
Annual34%
Weekly5%
Daily61%
92%
6%
63%
2%
7%
32%
0%
2%
0%
10%
20%
30%
40%
50%
60%
70%
80%
90%
100%
Paris (FR) Milan (IT) Stockholm (SE) Orléans (FR)
Sha
re o
f sh
ort-
term
sub
scrip
tions
Daily subscriptions Weekly subscriptions
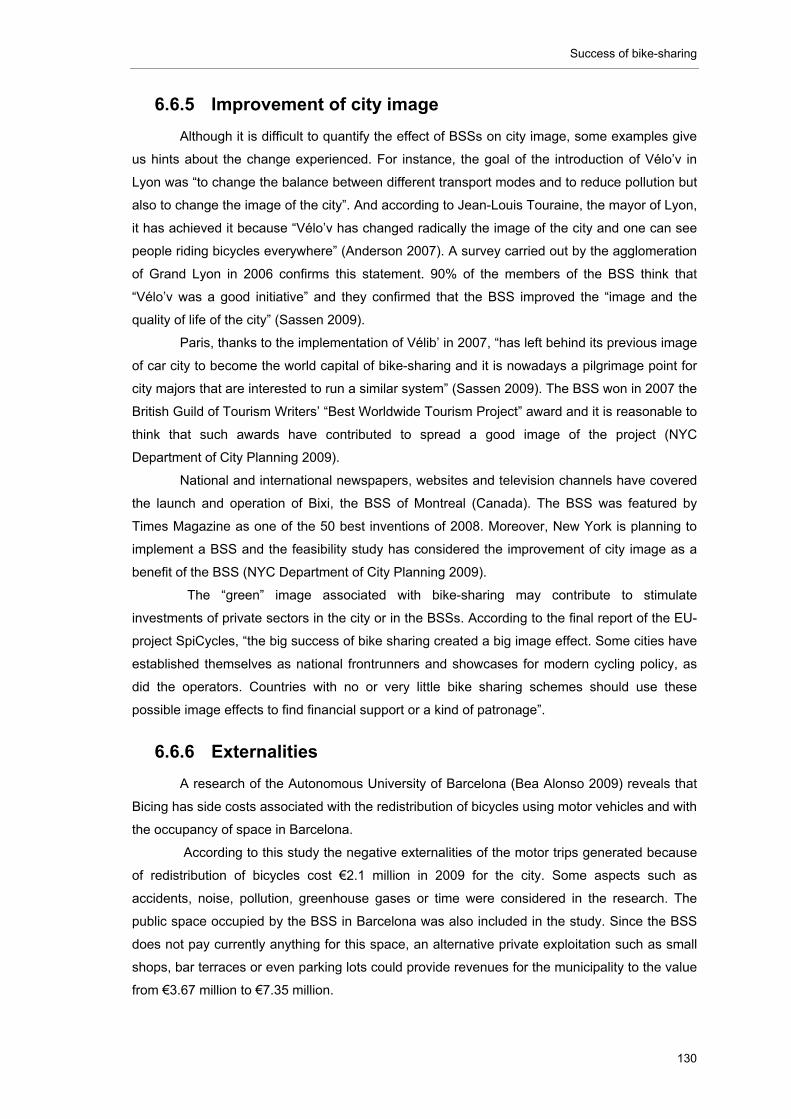
Success of bike-sharing
130
6.6.5 Improvement of city image
Although it is difficult to quantify the effect of BSSs on city image, some examples give
us hints about the change experienced. For instance, the goal of the introduction of Vélo’v in
Lyon was “to change the balance between different transport modes and to reduce pollution but
also to change the image of the city”. And according to Jean-Louis Touraine, the mayor of Lyon,
it has achieved it because “Vélo’v has changed radically the image of the city and one can see
people riding bicycles everywhere” (Anderson 2007). A survey carried out by the agglomeration
of Grand Lyon in 2006 confirms this statement. 90% of the members of the BSS think that
“Vélo’v was a good initiative” and they confirmed that the BSS improved the “image and the
quality of life of the city” (Sassen 2009).
Paris, thanks to the implementation of Vélib’ in 2007, “has left behind its previous image
of car city to become the world capital of bike-sharing and it is nowadays a pilgrimage point for
city majors that are interested to run a similar system” (Sassen 2009). The BSS won in 2007 the
British Guild of Tourism Writers’ “Best Worldwide Tourism Project” award and it is reasonable to
think that such awards have contributed to spread a good image of the project (NYC
Department of City Planning 2009).
National and international newspapers, websites and television channels have covered
the launch and operation of Bixi, the BSS of Montreal (Canada). The BSS was featured by
Times Magazine as one of the 50 best inventions of 2008. Moreover, New York is planning to
implement a BSS and the feasibility study has considered the improvement of city image as a
benefit of the BSS (NYC Department of City Planning 2009).
The “green” image associated with bike-sharing may contribute to stimulate
investments of private sectors in the city or in the BSSs. According to the final report of the EU-
project SpiCycles, “the big success of bike sharing created a big image effect. Some cities have
established themselves as national frontrunners and showcases for modern cycling policy, as
did the operators. Countries with no or very little bike sharing schemes should use these
possible image effects to find financial support or a kind of patronage”.
6.6.6 Externalities
A research of the Autonomous University of Barcelona (Bea Alonso 2009) reveals that
Bicing has side costs associated with the redistribution of bicycles using motor vehicles and with
the occupancy of space in Barcelona.
According to this study the negative externalities of the motor trips generated because
of redistribution of bicycles cost €2.1 million in 2009 for the city. Some aspects such as
accidents, noise, pollution, greenhouse gases or time were considered in the research. The
public space occupied by the BSS in Barcelona was also included in the study. Since the BSS
does not pay currently anything for this space, an alternative private exploitation such as small
shops, bar terraces or even parking lots could provide revenues for the municipality to the value
from €3.67 million to €7.35 million.
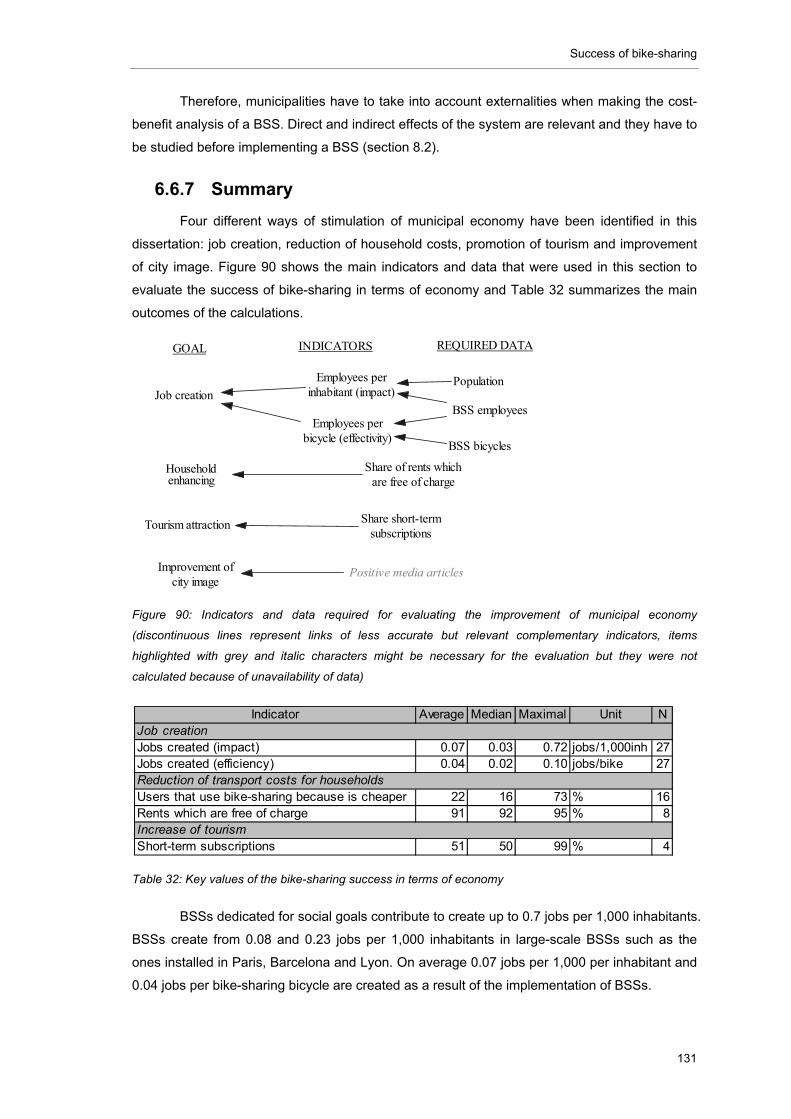
Success of bike-sharing
131
Therefore, municipalities have to take into account externalities when making the cost-
benefit analysis of a BSS. Direct and indirect effects of the system are relevant and they have to
be studied before implementing a BSS (section 8.2).
6.6.7 Summary
Four different ways of stimulation of municipal economy have been identified in this
dissertation: job creation, reduction of household costs, promotion of tourism and improvement
of city image. Figure 90 shows the main indicators and data that were used in this section to
evaluate the success of bike-sharing in terms of economy and Table 32 summarizes the main
outcomes of the calculations.
Figure 90: Indicators and data required for evaluating the improvement of municipal economy
(discontinuous lines represent links of less accurate but relevant complementary indicators, items
highlighted with grey and italic characters might be necessary for the evaluation but they were not
calculated because of unavailability of data)
Table 32: Key values of the bike-sharing success in terms of economy
BSSs dedicated for social goals contribute to create up to 0.7 jobs per 1,000 inhabitants.
BSSs create from 0.08 and 0.23 jobs per 1,000 inhabitants in large-scale BSSs such as the
ones installed in Paris, Barcelona and Lyon. On average 0.07 jobs per 1,000 per inhabitant and
0.04 jobs per bike-sharing bicycle are created as a result of the implementation of BSSs.
INDICATORS REQUIRED DATAGOAL
Job creation
Householdenhancing
Tourism attraction
Improvement ofcity image
Employees perbicycle (effectivity)
Employees perinhabitant (impact)
Share of rents whichare free of charge
BSS employees
BSS bicycles
Population
Share short-termsubscriptions
Positive media articles
Indicator Average Median Maximal Unit N
Jobs created (impact) 0.07 0.03 0.72 jobs/1,000inh 27Jobs created (efficiency) 0.04 0.02 0.10 jobs/bike 27
Users that use bike-sharing because is cheaper 22 16 73 % 16Rents which are free of charge 91 92 95 % 8
Short-term subscriptions 51 50 99 % 4
Job creation
Reduction of transport costs for households
Increase of tourism
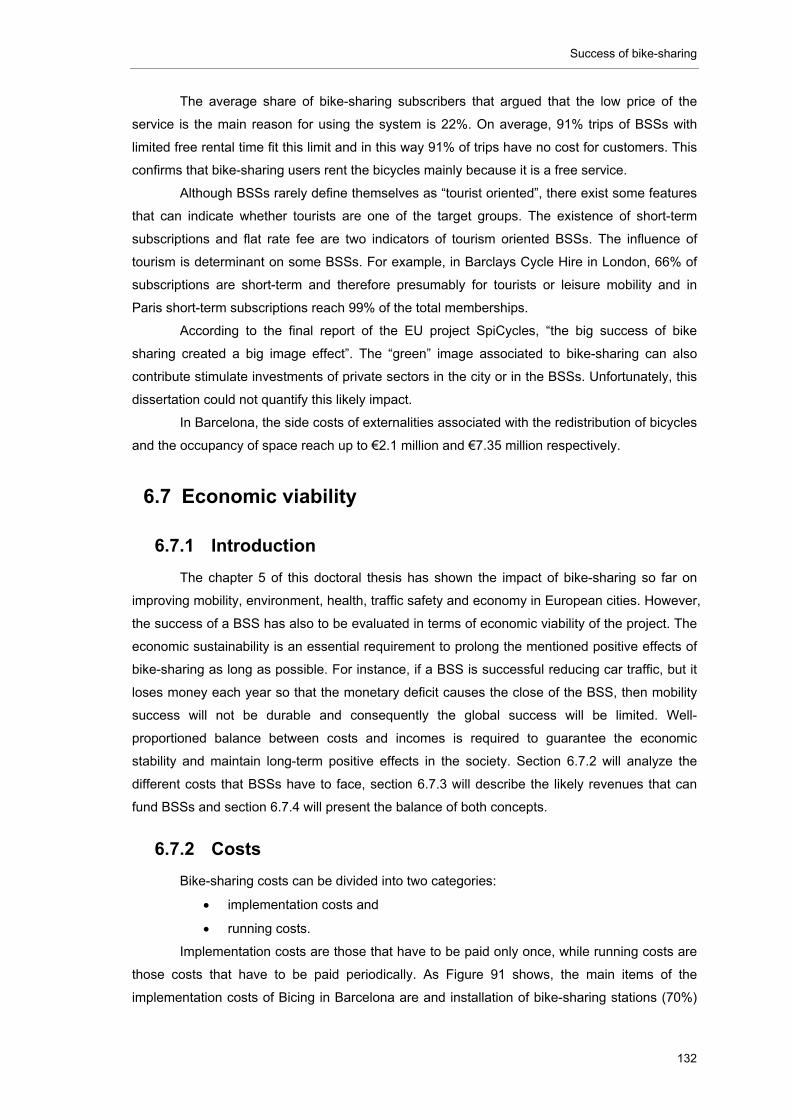
Success of bike-sharing
132
The average share of bike-sharing subscribers that argued that the low price of the
service is the main reason for using the system is 22%. On average, 91% trips of BSSs with
limited free rental time fit this limit and in this way 91% of trips have no cost for customers. This
confirms that bike-sharing users rent the bicycles mainly because it is a free service.
Although BSSs rarely define themselves as “tourist oriented”, there exist some features
that can indicate whether tourists are one of the target groups. The existence of short-term
subscriptions and flat rate fee are two indicators of tourism oriented BSSs. The influence of
tourism is determinant on some BSSs. For example, in Barclays Cycle Hire in London, 66% of
subscriptions are short-term and therefore presumably for tourists or leisure mobility and in
Paris short-term subscriptions reach 99% of the total memberships.
According to the final report of the EU project SpiCycles, “the big success of bike
sharing created a big image effect”. The “green” image associated to bike-sharing can also
contribute stimulate investments of private sectors in the city or in the BSSs. Unfortunately, this
dissertation could not quantify this likely impact.
In Barcelona, the side costs of externalities associated with the redistribution of bicycles
and the occupancy of space reach up to €2.1 million and €7.35 million respectively.
6.7 Economic viability
6.7.1 Introduction
The chapter 5 of this doctoral thesis has shown the impact of bike-sharing so far on
improving mobility, environment, health, traffic safety and economy in European cities. However,
the success of a BSS has also to be evaluated in terms of economic viability of the project. The
economic sustainability is an essential requirement to prolong the mentioned positive effects of
bike-sharing as long as possible. For instance, if a BSS is successful reducing car traffic, but it
loses money each year so that the monetary deficit causes the close of the BSS, then mobility
success will not be durable and consequently the global success will be limited. Well-
proportioned balance between costs and incomes is required to guarantee the economic
stability and maintain long-term positive effects in the society. Section 6.7.2 will analyze the
different costs that BSSs have to face, section 6.7.3 will describe the likely revenues that can
fund BSSs and section 6.7.4 will present the balance of both concepts.
6.7.2 Costs
Bike-sharing costs can be divided into two categories:
implementation costs and
running costs.
Implementation costs are those that have to be paid only once, while running costs are
those costs that have to be paid periodically. As Figure 91 shows, the main items of the
implementation costs of Bicing in Barcelona are and installation of bike-sharing stations (70%)

Success of bike-sharing
133
and the purchase of bicycles (17%). The set-up operations, the communication and the
administration cost represent the other 13%.
Figure 91: Allocation of implementation costs of Bicing in Barcelona. Data Source: (Büttner et al. 2011)
The cost of a bike-sharing station can vary very widely depending on the model.
According to representatives of the different European BSSs interviewed by the project OBIS,
the unitary cost of a bike-sharing station ranges from around €600 to €60,000. The average cost
of a bike-sharing station is about €12,600, while stations of 50% of models do not exceed
€3,800 (Figure 92). In contrast, prices of bicycles seem to be rather more similar between
systems. As Figure 93 reveals, one bicycle can cost from €110 to €2,000, while the average
price reaches €540.
Figure 92: Unitary cost of a bike-sharing station. Data source: Annex 10.1
Station implementation
(teminals, racks, locking technology, station planning,
ground work and cabling)
70%
Bikes17%
Set‐up operations
(work‐shop and logistics)
6%
Communication5%
Administration2%
Implementation costs
581
60,000
27,250
26,200
10,000
17,50015,000
581 650 800
13,076
25,000
3,750581 581
26,300
27,862
5813,800
6003,200
€ 0
€ 10,000
€ 20,000
€ 30,000
€ 40,000
€ 50,000
€ 60,000
€ 70,000
Lo
nd
on
(UK
)
Vie
nn
a (A
T)
Ba
rce
lon
a (E
S)
Mila
n (I
T)
Lyo
n (F
R)
Ba
ri (
IT)
Vito
ria
(E
S)
Re
ad
ing
(UK
)
Re
nn
es-
2 (F
R)
Mo
de
na
(IT
)
Pa
rma
(IT
)
Bre
scia
(IT
)
Rim
ini (
IT)
Ca
mb
rid
ge
(U
K)
Ch
elte
nh
am
(UK
)
Rib
era
Alta
(E
S)
Orl
éa
ns
(FR
)
Fa
rnb
oro
ug
h (U
K)
Ch
alo
n-s
ur-
Sa
ôn
e (F
R)
Se
nig
alli
a (I
T)
Terl
izzi
(IT
)
Co
st o
f a
sta
tion
Cities sorted by population in decreasing order from left to right
Average=12,566 ; Median=3,800
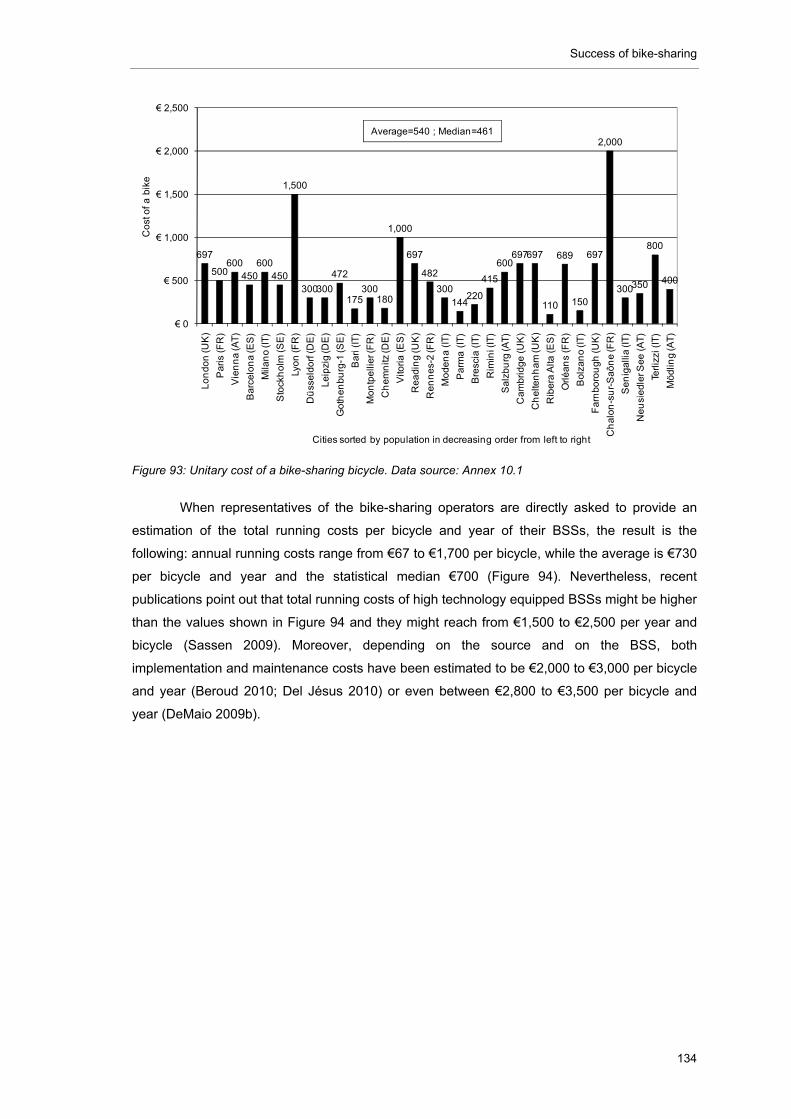
Success of bike-sharing
134
Figure 93: Unitary cost of a bike-sharing bicycle. Data source: Annex 10.1
When representatives of the bike-sharing operators are directly asked to provide an
estimation of the total running costs per bicycle and year of their BSSs, the result is the
following: annual running costs range from €67 to €1,700 per bicycle, while the average is €730
per bicycle and year and the statistical median €700 (Figure 94). Nevertheless, recent
publications point out that total running costs of high technology equipped BSSs might be higher
than the values shown in Figure 94 and they might reach from €1,500 to €2,500 per year and
bicycle (Sassen 2009). Moreover, depending on the source and on the BSS, both
implementation and maintenance costs have been estimated to be €2,000 to €3,000 per bicycle
and year (Beroud 2010; Del Jésus 2010) or even between €2,800 to €3,500 per bicycle and
year (DeMaio 2009b).
697
500600
450600
450
1,500
300300
472
175300
180
1,000
697
482
300144
220
415
600697697
110
689
150
697
2,000
300350
800
400
€ 0
€ 500
€ 1,000
€ 1,500
€ 2,000
€ 2,500
Lo
nd
on
(UK
)
Pa
ris
(FR
)
Vie
nn
a (A
T)
Ba
rce
lon
a (E
S)
Mila
no
(IT
)
Sto
ckh
olm
(S
E)
Lyo
n (F
R)
Dü
sse
ldo
rf (D
E)
Le
ipzi
g (D
E)
Go
the
nb
urg
-1 (S
E)
Ba
ri (
IT)
Mo
ntp
elli
er (
FR
)
Ch
em
nitz
(DE
)
Vito
ria
(E
S)
Re
ad
ing
(UK
)
Re
nn
es-
2 (F
R)
Mo
de
na
(IT
)
Pa
rma
(IT
)
Bre
scia
(IT
)
Rim
ini (
IT)
Sa
lzb
urg
(AT
)
Ca
mb
rid
ge
(U
K)
Ch
elte
nh
am
(UK
)
Rib
era
Alta
(E
S)
Orl
éa
ns
(FR
)
Bo
lza
no
(IT
)
Fa
rnb
oro
ug
h (U
K)
Ch
alo
n-s
ur-
Sa
ôn
e (F
R)
Se
nig
alli
a (I
T)
Ne
usi
ed
ler S
ee
(A
T)
Terl
izzi
(IT
)
Mö
dlin
g (A
T)
Co
st o
f a
bik
e
Cities sorted by population in decreasing order from left to right
Average=540 ; Median=461
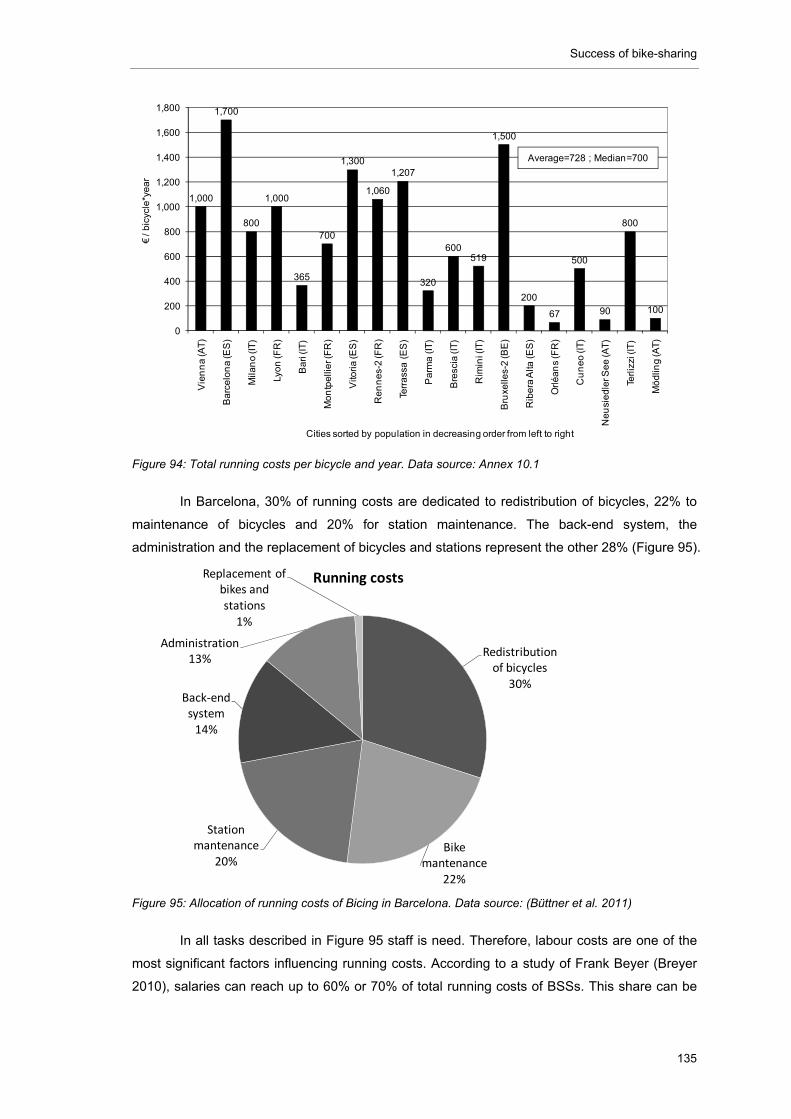
Success of bike-sharing
135
Figure 94: Total running costs per bicycle and year. Data source: Annex 10.1
In Barcelona, 30% of running costs are dedicated to redistribution of bicycles, 22% to
maintenance of bicycles and 20% for station maintenance. The back-end system, the
administration and the replacement of bicycles and stations represent the other 28% (Figure 95).
Figure 95: Allocation of running costs of Bicing in Barcelona. Data source: (Büttner et al. 2011)
In all tasks described in Figure 95 staff is need. Therefore, labour costs are one of the
most significant factors influencing running costs. According to a study of Frank Beyer (Breyer
2010), salaries can reach up to 60% or 70% of total running costs of BSSs. This share can be
1,000
1,700
800
1,000
365
700
1,300
1,060
1,207
320
600519
1,500
200
67
500
90
800
100
0
200
400
600
800
1,000
1,200
1,400
1,600
1,800
Vie
nn
a (A
T)
Ba
rce
lon
a (E
S)
Mila
no
(IT
)
Lyo
n (F
R)
Ba
ri (I
T)
Mo
ntp
ellie
r (F
R)
Vito
ria
(ES
)
Re
nn
es-
2 (F
R)
Terr
ass
a (
ES
)
Pa
rma
(IT
)
Bre
scia
(IT
)
Rim
ini (
IT)
Bru
xelle
s-2
(BE
)
Rib
era
Alta
(E
S)
Orl
éa
ns
(FR
)
Cu
ne
o (I
T)
Ne
usi
ed
ler S
ee
(AT)
Terl
izzi
(IT
)
Mö
dlin
g (A
T)
€/ b
icyc
le*y
ea
r
Cities sorted by population in decreasing order from left to right
Average=728 ; Median=700
Redistribution of bicycles
30%
Bike mantenance
22%
Station mantenance
20%
Back‐end system14%
Administration13%
Replacement of bikes and stations1%
Running costs
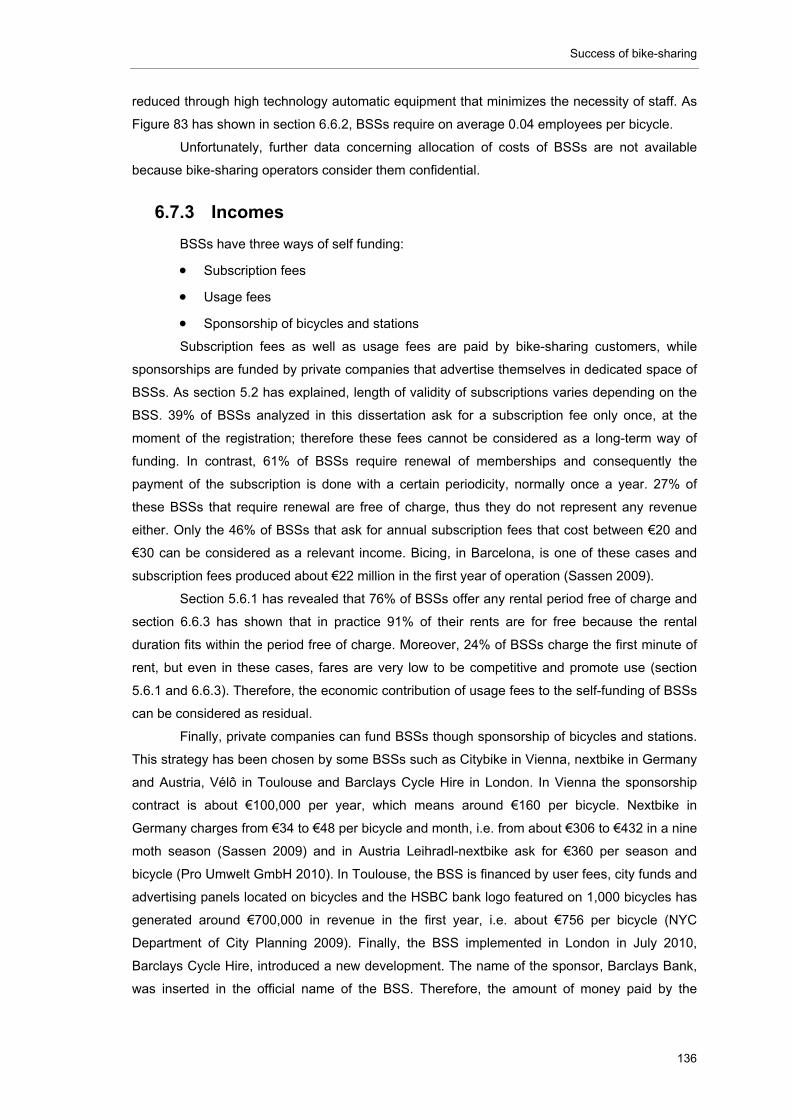
Success of bike-sharing
136
reduced through high technology automatic equipment that minimizes the necessity of staff. As
Figure 83 has shown in section 6.6.2, BSSs require on average 0.04 employees per bicycle.
Unfortunately, further data concerning allocation of costs of BSSs are not available
because bike-sharing operators consider them confidential.
6.7.3 Incomes
BSSs have three ways of self funding:
Subscription fees
Usage fees
Sponsorship of bicycles and stations
Subscription fees as well as usage fees are paid by bike-sharing customers, while
sponsorships are funded by private companies that advertise themselves in dedicated space of
BSSs. As section 5.2 has explained, length of validity of subscriptions varies depending on the
BSS. 39% of BSSs analyzed in this dissertation ask for a subscription fee only once, at the
moment of the registration; therefore these fees cannot be considered as a long-term way of
funding. In contrast, 61% of BSSs require renewal of memberships and consequently the
payment of the subscription is done with a certain periodicity, normally once a year. 27% of
these BSSs that require renewal are free of charge, thus they do not represent any revenue
either. Only the 46% of BSSs that ask for annual subscription fees that cost between €20 and
€30 can be considered as a relevant income. Bicing, in Barcelona, is one of these cases and
subscription fees produced about €22 million in the first year of operation (Sassen 2009).
Section 5.6.1 has revealed that 76% of BSSs offer any rental period free of charge and
section 6.6.3 has shown that in practice 91% of their rents are for free because the rental
duration fits within the period free of charge. Moreover, 24% of BSSs charge the first minute of
rent, but even in these cases, fares are very low to be competitive and promote use (section
5.6.1 and 6.6.3). Therefore, the economic contribution of usage fees to the self-funding of BSSs
can be considered as residual.
Finally, private companies can fund BSSs though sponsorship of bicycles and stations.
This strategy has been chosen by some BSSs such as Citybike in Vienna, nextbike in Germany
and Austria, Vélô in Toulouse and Barclays Cycle Hire in London. In Vienna the sponsorship
contract is about €100,000 per year, which means around €160 per bicycle. Nextbike in
Germany charges from €34 to €48 per bicycle and month, i.e. from about €306 to €432 in a nine
moth season (Sassen 2009) and in Austria Leihradl-nextbike ask for €360 per season and
bicycle (Pro Umwelt GmbH 2010). In Toulouse, the BSS is financed by user fees, city funds and
advertising panels located on bicycles and the HSBC bank logo featured on 1,000 bicycles has
generated around €700,000 in revenue in the first year, i.e. about €756 per bicycle (NYC
Department of City Planning 2009). Finally, the BSS implemented in London in July 2010,
Barclays Cycle Hire, introduced a new development. The name of the sponsor, Barclays Bank,
was inserted in the official name of the BSS. Therefore, the amount of money paid by the
Success of bike-sharing
137
Barclays Bank for the five-year sponsorship of the 6,000 planed bicycles reaches a £25 million,
around €30.4 million33, and €1,013 per bicycle and year (London Cycling Campaign 2010).
6.7.4 Balance
Although data concerning costs and incomes of BSSs are very rarely available, results
of this section and conclusions of other authors seem to confirm that no BSSs over the world
makes profit. In other words, all BSSs lose money and they have to receive direct or indirect
economic support to survive (Sassen 2009; DeMaio 2004; Breyer 2010).
In Barcelona, the only way of self-funding of Bicing is the revenue from customers
(subscription and usage fee) and it represents only 30% of total annual costs (Sanz & Kisters
2010). A research of Benoit Beroud has revealed the real price of Vélo’v in Lyon, i.e. the fee
that customers should actually pay for making the system auto sustainable (Beroud 2007).
According to his calculations each customer should pay at least €0.85 per rent or €70 for the
annual subscription to cover all costs of operation, while currently 93% of rents are free of
charge and annual subscription is €15 in Lyon.
The additional economic support that BSSs require to continue existing can come from
two different external sources:
Public subsidies
Billboard contracts
Public subsidies have been essential for the creation a development of numerous BSSs
in Europe. In fact 43% of the cases studies of this thesis are funded by public authorities
(section 5.7). There are two modalities of funding within the group of public subsidized BSSs: 1)
short-term subsidies and 2) long-term subsidies.
In Spain the Institute for the Energy Saving and Diversification (IDAE) has subsidized
many BSSs along the country to encourage their installation. In total IDAE has invested till 2010
€11,200 million (Sanz & Kisters 2010). In Germany, the Ministry of Transport will fund from
2009 to 2012 the implementation of innovative BSSs that integrate bike-sharing in the public
transport network of municipalities with above 100,000 inhabitants with a total budget of
€12,700 million (Bus & Bahn 2009; Borcherding et al. 2010). However, public subsidies are
single economic supports for punctual periods, e.g. the start of the operation. This short-term
subsidies are not a durable way of funding and BSSs subsidized will need additional revenues
in the future to survive (Sanz & Kisters 2010).
As section 5.7.1 has shown, public authorities can be investors of BSSs. Here we
present some particular examples of BSSs directly or indirectly funded by public authorities
through long-term subsidies. In Barcelona, the city does not only fund the system, but also owns
it and consequently the municipality is the beneficiary of the user revenues. For the operation of
the BSS the city pays a variable amount of money to a bike-sharing provider: Clear Channel.
33 This amount also includes the sponsorship of the main cycle ways of London, also called
Barclays Cycle Superhighways.
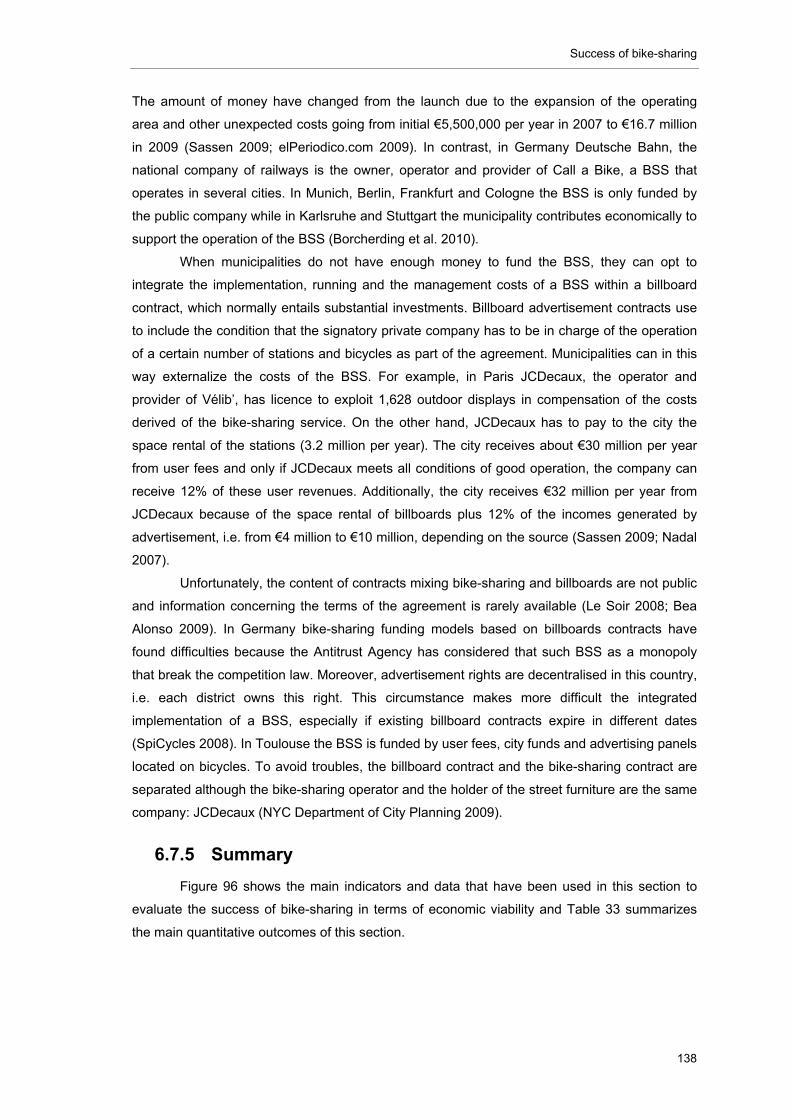
Success of bike-sharing
138
The amount of money have changed from the launch due to the expansion of the operating
area and other unexpected costs going from initial €5,500,000 per year in 2007 to €16.7 million
in 2009 (Sassen 2009; elPeriodico.com 2009). In contrast, in Germany Deutsche Bahn, the
national company of railways is the owner, operator and provider of Call a Bike, a BSS that
operates in several cities. In Munich, Berlin, Frankfurt and Cologne the BSS is only funded by
the public company while in Karlsruhe and Stuttgart the municipality contributes economically to
support the operation of the BSS (Borcherding et al. 2010).
When municipalities do not have enough money to fund the BSS, they can opt to
integrate the implementation, running and the management costs of a BSS within a billboard
contract, which normally entails substantial investments. Billboard advertisement contracts use
to include the condition that the signatory private company has to be in charge of the operation
of a certain number of stations and bicycles as part of the agreement. Municipalities can in this
way externalize the costs of the BSS. For example, in Paris JCDecaux, the operator and
provider of Vélib’, has licence to exploit 1,628 outdoor displays in compensation of the costs
derived of the bike-sharing service. On the other hand, JCDecaux has to pay to the city the
space rental of the stations (3.2 million per year). The city receives about €30 million per year
from user fees and only if JCDecaux meets all conditions of good operation, the company can
receive 12% of these user revenues. Additionally, the city receives €32 million per year from
JCDecaux because of the space rental of billboards plus 12% of the incomes generated by
advertisement, i.e. from €4 million to €10 million, depending on the source (Sassen 2009; Nadal
2007).
Unfortunately, the content of contracts mixing bike-sharing and billboards are not public
and information concerning the terms of the agreement is rarely available (Le Soir 2008; Bea
Alonso 2009). In Germany bike-sharing funding models based on billboards contracts have
found difficulties because the Antitrust Agency has considered that such BSS as a monopoly
that break the competition law. Moreover, advertisement rights are decentralised in this country,
i.e. each district owns this right. This circumstance makes more difficult the integrated
implementation of a BSS, especially if existing billboard contracts expire in different dates
(SpiCycles 2008). In Toulouse the BSS is funded by user fees, city funds and advertising panels
located on bicycles. To avoid troubles, the billboard contract and the bike-sharing contract are
separated although the bike-sharing operator and the holder of the street furniture are the same
company: JCDecaux (NYC Department of City Planning 2009).
6.7.5 Summary
Figure 96 shows the main indicators and data that have been used in this section to
evaluate the success of bike-sharing in terms of economic viability and Table 33 summarizes
the main quantitative outcomes of this section.
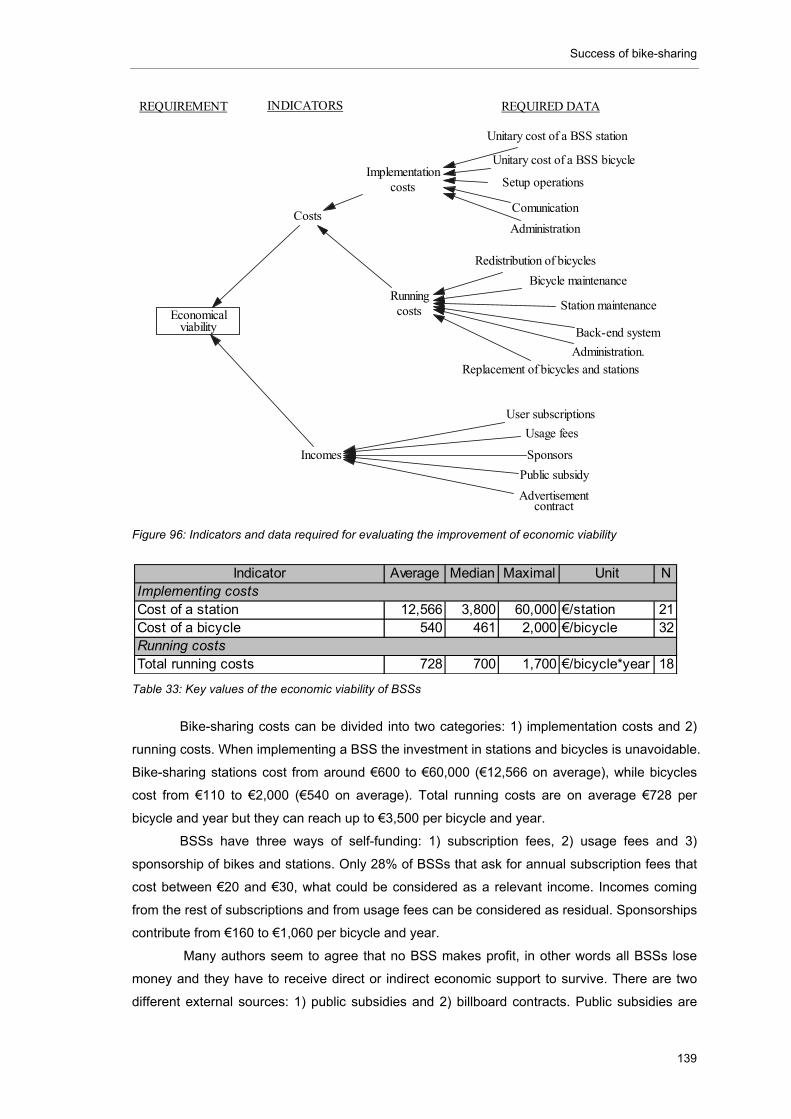
Success of bike-sharing
139
Figure 96: Indicators and data required for evaluating the improvement of economic viability
Table 33: Key values of the economic viability of BSSs
Bike-sharing costs can be divided into two categories: 1) implementation costs and 2)
running costs. When implementing a BSS the investment in stations and bicycles is unavoidable.
Bike-sharing stations cost from around €600 to €60,000 (€12,566 on average), while bicycles
cost from €110 to €2,000 (€540 on average). Total running costs are on average €728 per
bicycle and year but they can reach up to €3,500 per bicycle and year.
BSSs have three ways of self-funding: 1) subscription fees, 2) usage fees and 3)
sponsorship of bikes and stations. Only 28% of BSSs that ask for annual subscription fees that
cost between €20 and €30, what could be considered as a relevant income. Incomes coming
from the rest of subscriptions and from usage fees can be considered as residual. Sponsorships
contribute from €160 to €1,060 per bicycle and year.
Many authors seem to agree that no BSS makes profit, in other words all BSSs lose
money and they have to receive direct or indirect economic support to survive. There are two
different external sources: 1) public subsidies and 2) billboard contracts. Public subsidies are
Economicalviability
INDICATORS REQUIRED DATAREQUIREMENT
Incomes
Costs
Implementationcosts
Runningcosts
Unitary cost of a BSS station
Unitary cost of a BSS bicycle
User subscriptions
Usage fees
Sponsors
Public subsidy
Advertisementcontract
Setup operations
Comunication
Administration
Redistribution of bicycles
Bicycle maintenance
Station maintenance
Back-end system
Administration.Replacement of bicycles and stations
Indicator Average Median Maximal Unit N
Cost of a station 12,566 3,800 60,000 €/station 21Cost of a bicycle 540 461 2,000 €/bicycle 32
Total running costs 728 700 1,700 €/bicycle*year 18
Implementing costs
Running costs

Success of bike-sharing
140
single economic supports for punctual point of time and additional revenues are required to
guarantee the survival of the BSS. On the other hand, billboard contracts are economically
substantial but the BSS is integrated in the contract and unfortunately the terms of the
agreement between the billboard company and the municipality are normally not transparent
enough.
Factors affecting success
141
7 FACTORS AFFECTING SUCCESS
7.1 Introduction
Section 6 has estimated the level of success of bike-sharing in terms of sustainability.
The aim of this section 7 is to identify the factors that motivate this success (or failure) of BSSs
and to evaluate their influence. Two kinds of factors have been identified in this section: 1)
driving forces and 2) barriers.
Section 7.2 will analyze in a quantitative way the correlations between driving forces
and success and section 7.3 will study in a qualitative way the barriers for success of BSSs
providing causes, effects and likely solutions for these barriers.
The methodology used in this section has been explained in section 3.2.4.
7.2 Driving forces
7.2.1 Bicycles and stations
The relation between the number of rents per day and the number of bicycles has been
assumed as linear (section 3.2.4). In contrast, the relation between the number of rents per day
and bike and the number of bicycles must be assumed as logarithmic because the number of
rents per day and bike has a limit, i.e. rotation cannot become infinite as the number of bicycles
increases. The same principle can be applied for other driving forces affecting rotation.
Therefore, the relation between any driving force and the number of rents per day and bike will
be a logarithmic curve in this section 7.2.
According to Figure 97, the size of the bike-sharing bicycle fleet increases the level of
rents per bicycle, i.e. the higher the number of bicycles, the higher the number of times that they
are rented during a day. The Spearman’s coefficient is 0.314, which means that there is a low
correlation between both variables. Nevertheless, the p-value is 0.104 (higher than 0.1), which
reveals that the existing correlation cannot be strictly considered as statistically significant.
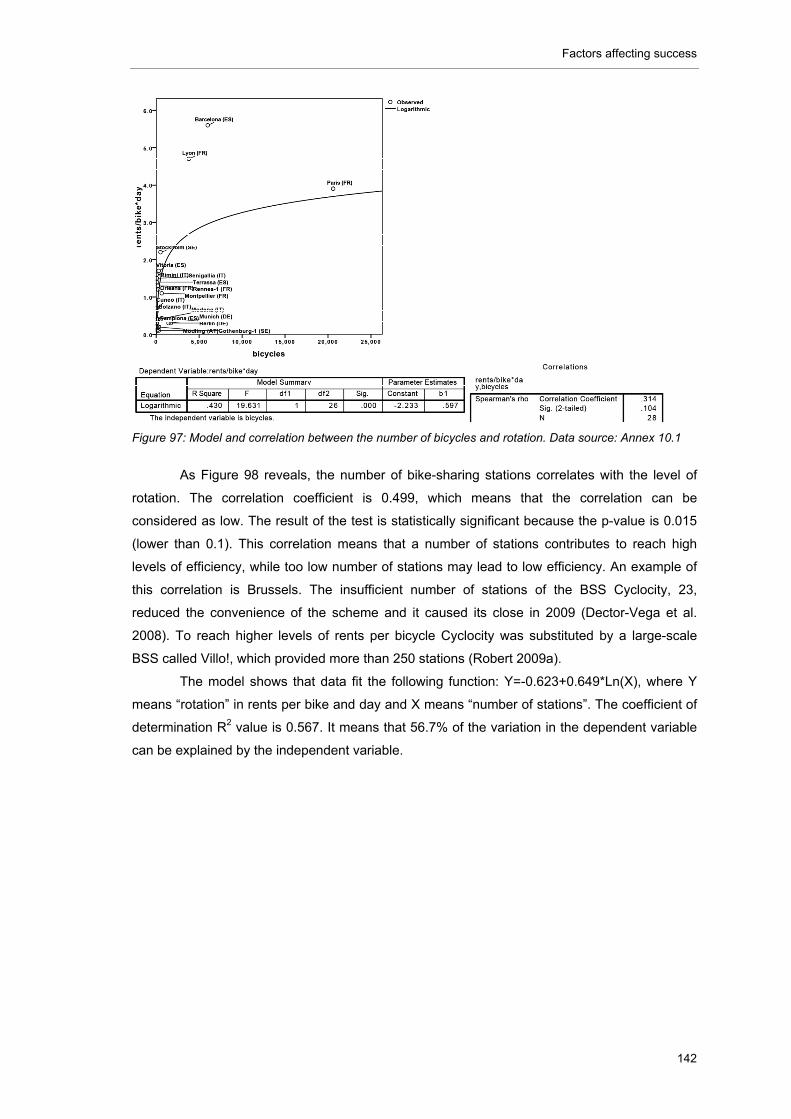
Factors affecting success
142
Figure 97: Model and correlation between the number of bicycles and rotation. Data source: Annex 10.1
As Figure 98 reveals, the number of bike-sharing stations correlates with the level of
rotation. The correlation coefficient is 0.499, which means that the correlation can be
considered as low. The result of the test is statistically significant because the p-value is 0.015
(lower than 0.1). This correlation means that a number of stations contributes to reach high
levels of efficiency, while too low number of stations may lead to low efficiency. An example of
this correlation is Brussels. The insufficient number of stations of the BSS Cyclocity, 23,
reduced the convenience of the scheme and it caused its close in 2009 (Dector-Vega et al.
2008). To reach higher levels of rents per bicycle Cyclocity was substituted by a large-scale
BSS called Villo!, which provided more than 250 stations (Robert 2009a).
The model shows that data fit the following function: Y=-0.623+0.649*Ln(X), where Y
means “rotation” in rents per bike and day and X means “number of stations”. The coefficient of
determination R2 value is 0.567. It means that 56.7% of the variation in the dependent variable
can be explained by the independent variable.
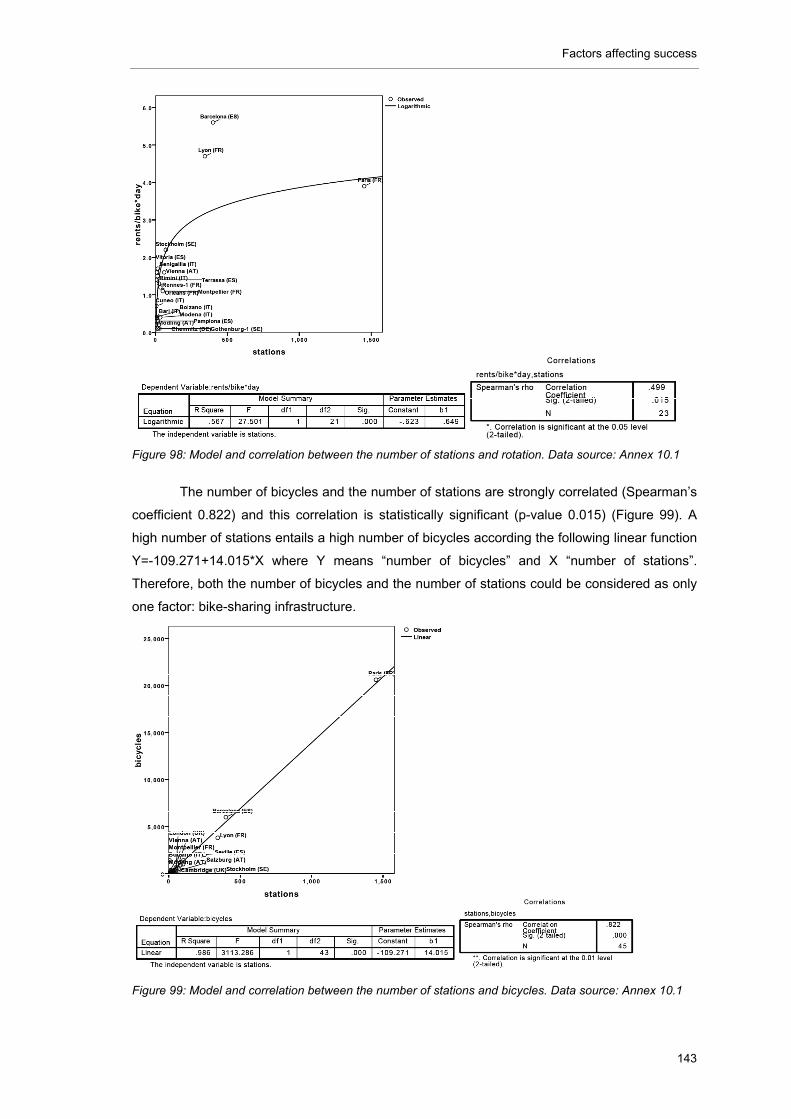
Factors affecting success
143
Figure 98: Model and correlation between the number of stations and rotation. Data source: Annex 10.1
The number of bicycles and the number of stations are strongly correlated (Spearman’s
coefficient 0.822) and this correlation is statistically significant (p-value 0.015) (Figure 99). A
high number of stations entails a high number of bicycles according the following linear function
Y=-109.271+14.015*X where Y means “number of bicycles” and X “number of stations”.
Therefore, both the number of bicycles and the number of stations could be considered as only
one factor: bike-sharing infrastructure.
Figure 99: Model and correlation between the number of stations and bicycles. Data source: Annex 10.1
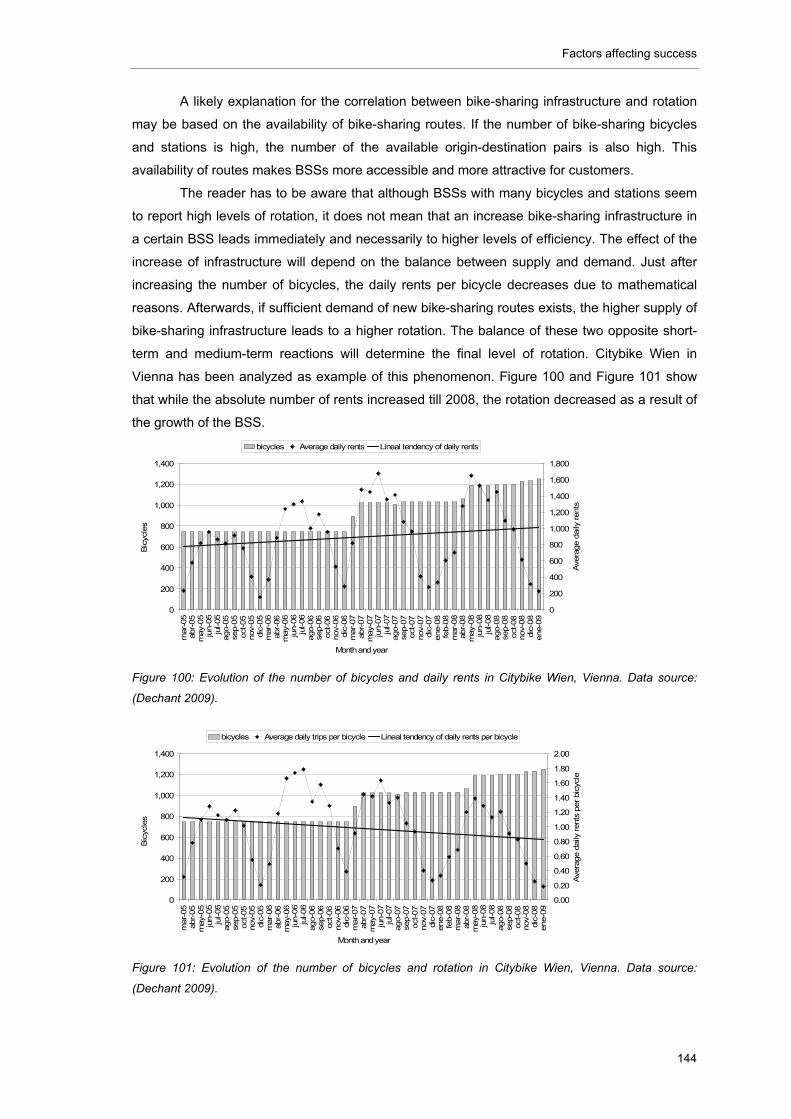
Factors affecting success
144
A likely explanation for the correlation between bike-sharing infrastructure and rotation
may be based on the availability of bike-sharing routes. If the number of bike-sharing bicycles
and stations is high, the number of the available origin-destination pairs is also high. This
availability of routes makes BSSs more accessible and more attractive for customers.
The reader has to be aware that although BSSs with many bicycles and stations seem
to report high levels of rotation, it does not mean that an increase bike-sharing infrastructure in
a certain BSS leads immediately and necessarily to higher levels of efficiency. The effect of the
increase of infrastructure will depend on the balance between supply and demand. Just after
increasing the number of bicycles, the daily rents per bicycle decreases due to mathematical
reasons. Afterwards, if sufficient demand of new bike-sharing routes exists, the higher supply of
bike-sharing infrastructure leads to a higher rotation. The balance of these two opposite short-
term and medium-term reactions will determine the final level of rotation. Citybike Wien in
Vienna has been analyzed as example of this phenomenon. Figure 100 and Figure 101 show
that while the absolute number of rents increased till 2008, the rotation decreased as a result of
the growth of the BSS.
Figure 100: Evolution of the number of bicycles and daily rents in Citybike Wien, Vienna. Data source:
(Dechant 2009).
Figure 101: Evolution of the number of bicycles and rotation in Citybike Wien, Vienna. Data source:
(Dechant 2009).
0
200
400
600
800
1,000
1,200
1,400
mar-
05
abr-
05
may-
05
jun-0
5ju
l-05
ago-0
5se
p-0
5oct
-05
nov-
05
dic
-05
mar-
06
abr-
06
may-
06
jun-0
6ju
l-06
ago-0
6se
p-0
6oct
-06
nov-
06
dic
-06
mar-
07
abr-
07
may-
07
jun-0
7ju
l-07
ago-0
7se
p-0
7oct
-07
nov-
07
dic
-07
ene-0
8fe
b-0
8m
ar-
08
abr-
08
may-
08
jun-0
8ju
l-08
ago-0
8se
p-0
8oct
-08
nov-
08
dic
-08
ene-0
9
Month and year
Bic
ycle
s
0
200
400
600
800
1,000
1,200
1,400
1,600
1,800
Ave
rage d
aily
rents
bicycles Average daily rents Lineal tendency of daily rents
0
200
400
600
800
1,000
1,200
1,400
mar-
05
abr-
05
may-
05
jun-0
5ju
l-05
ago-0
5se
p-0
5oct
-05
nov-
05
dic
-05
mar-
06
abr-
06
may-
06
jun-0
6ju
l-06
ago-0
6se
p-0
6oct
-06
nov-
06
dic
-06
mar-
07
abr-
07
may-
07
jun-0
7ju
l-07
ago-0
7se
p-0
7oct
-07
nov-
07
dic
-07
ene-0
8fe
b-0
8m
ar-
08
abr-
08
may-
08
jun-0
8ju
l-08
ago-0
8se
p-0
8oct
-08
nov-
08
dic
-08
ene-0
9
Month and year
Bic
ycle
s
0.00
0.20
0.40
0.60
0.80
1.00
1.20
1.40
1.60
1.80
2.00
Ave
rage d
aily
rents
per bic
ycle
bicycles Average daily trips per bicycle Lineal tendency of daily rents per bicycle
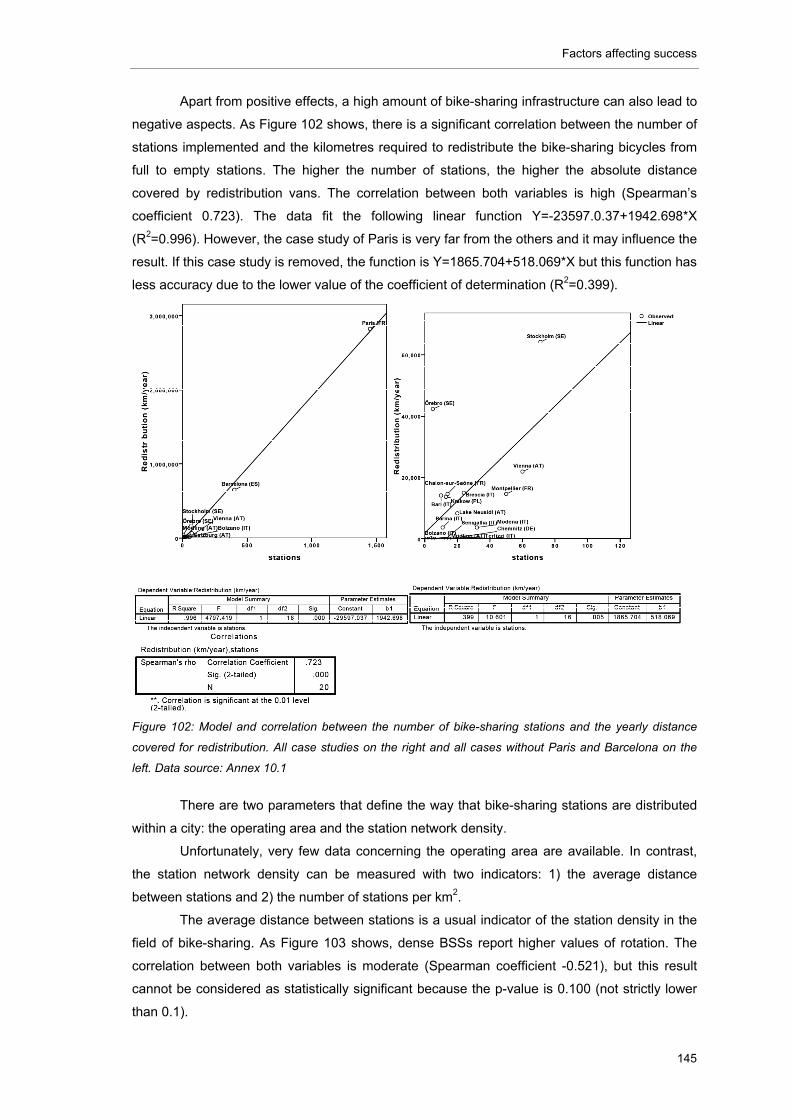
Factors affecting success
145
Apart from positive effects, a high amount of bike-sharing infrastructure can also lead to
negative aspects. As Figure 102 shows, there is a significant correlation between the number of
stations implemented and the kilometres required to redistribute the bike-sharing bicycles from
full to empty stations. The higher the number of stations, the higher the absolute distance
covered by redistribution vans. The correlation between both variables is high (Spearman’s
coefficient 0.723). The data fit the following linear function Y=-23597.0.37+1942.698*X
(R2=0.996). However, the case study of Paris is very far from the others and it may influence the
result. If this case study is removed, the function is Y=1865.704+518.069*X but this function has
less accuracy due to the lower value of the coefficient of determination (R2=0.399).
Figure 102: Model and correlation between the number of bike-sharing stations and the yearly distance
covered for redistribution. All case studies on the right and all cases without Paris and Barcelona on the
left. Data source: Annex 10.1
There are two parameters that define the way that bike-sharing stations are distributed
within a city: the operating area and the station network density.
Unfortunately, very few data concerning the operating area are available. In contrast,
the station network density can be measured with two indicators: 1) the average distance
between stations and 2) the number of stations per km2.
The average distance between stations is a usual indicator of the station density in the
field of bike-sharing. As Figure 103 shows, dense BSSs report higher values of rotation. The
correlation between both variables is moderate (Spearman coefficient -0.521), but this result
cannot be considered as statistically significant because the p-value is 0.100 (not strictly lower
than 0.1).
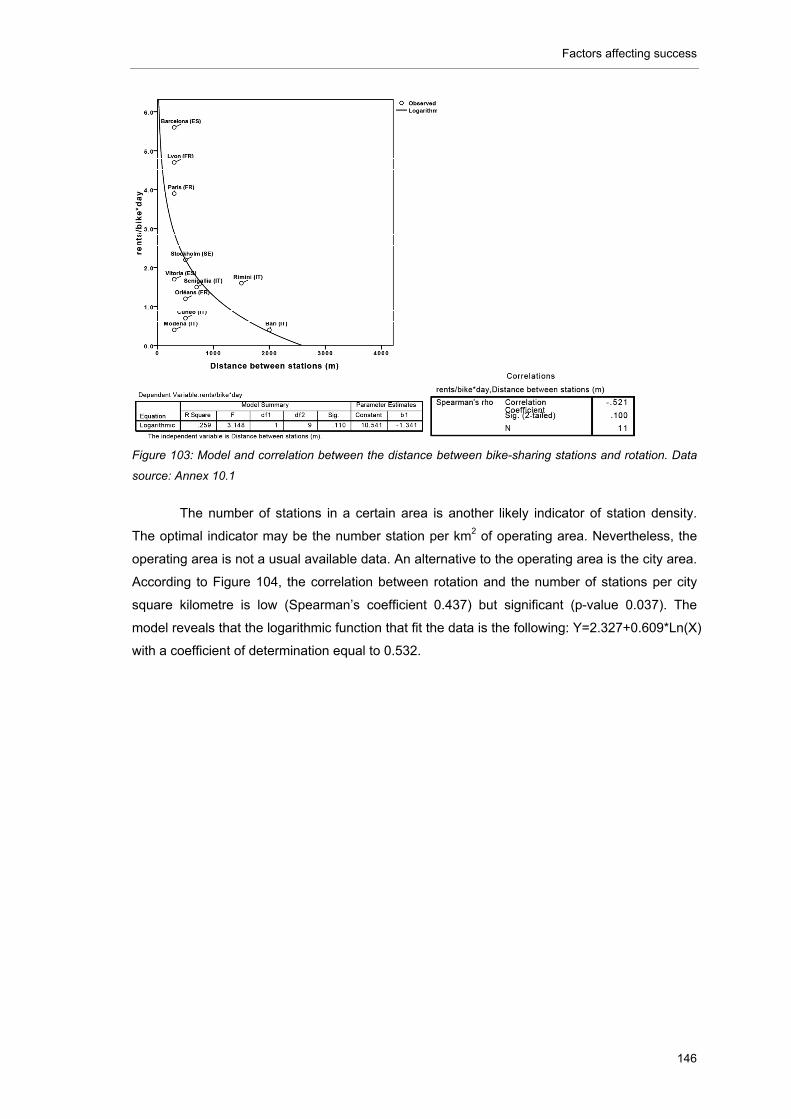
Factors affecting success
146
Figure 103: Model and correlation between the distance between bike-sharing stations and rotation. Data
source: Annex 10.1
The number of stations in a certain area is another likely indicator of station density.
The optimal indicator may be the number station per km2 of operating area. Nevertheless, the
operating area is not a usual available data. An alternative to the operating area is the city area.
According to Figure 104, the correlation between rotation and the number of stations per city
square kilometre is low (Spearman’s coefficient 0.437) but significant (p-value 0.037). The
model reveals that the logarithmic function that fit the data is the following: Y=2.327+0.609*Ln(X)
with a coefficient of determination equal to 0.532.
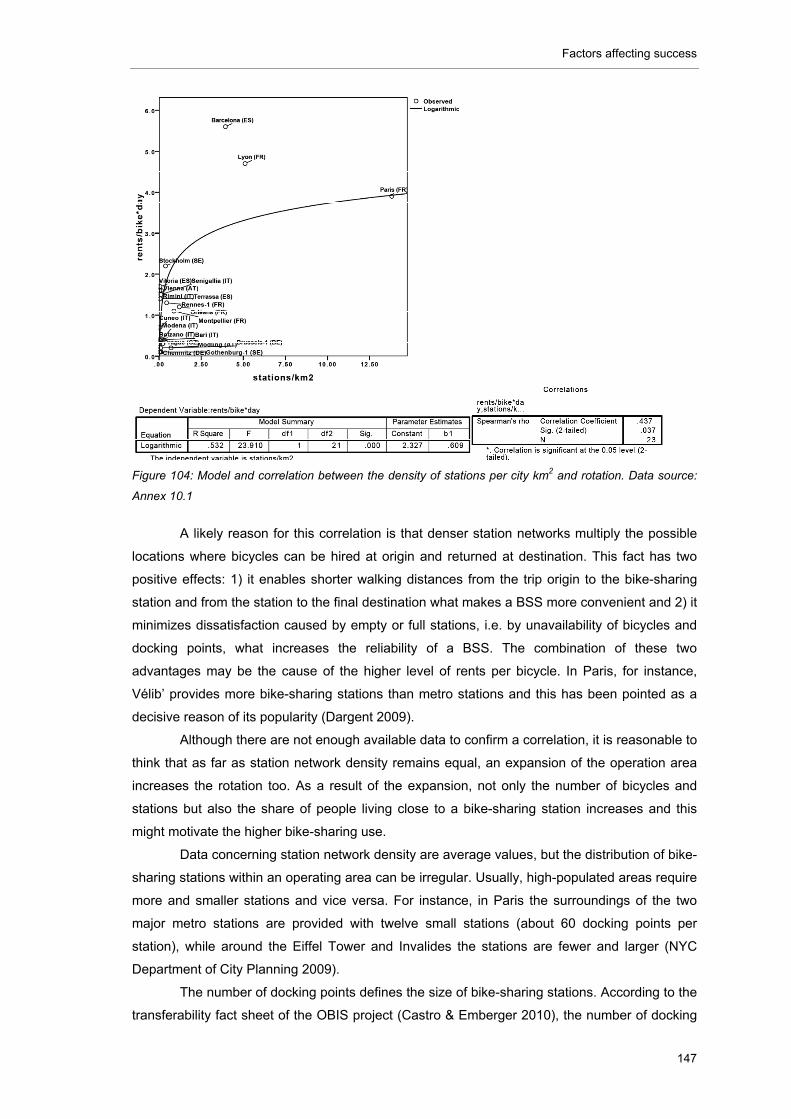
Factors affecting success
147
Figure 104: Model and correlation between the density of stations per city km2 and rotation. Data source:
Annex 10.1
A likely reason for this correlation is that denser station networks multiply the possible
locations where bicycles can be hired at origin and returned at destination. This fact has two
positive effects: 1) it enables shorter walking distances from the trip origin to the bike-sharing
station and from the station to the final destination what makes a BSS more convenient and 2) it
minimizes dissatisfaction caused by empty or full stations, i.e. by unavailability of bicycles and
docking points, what increases the reliability of a BSS. The combination of these two
advantages may be the cause of the higher level of rents per bicycle. In Paris, for instance,
Vélib’ provides more bike-sharing stations than metro stations and this has been pointed as a
decisive reason of its popularity (Dargent 2009).
Although there are not enough available data to confirm a correlation, it is reasonable to
think that as far as station network density remains equal, an expansion of the operation area
increases the rotation too. As a result of the expansion, not only the number of bicycles and
stations but also the share of people living close to a bike-sharing station increases and this
might motivate the higher bike-sharing use.
Data concerning station network density are average values, but the distribution of bike-
sharing stations within an operating area can be irregular. Usually, high-populated areas require
more and smaller stations and vice versa. For instance, in Paris the surroundings of the two
major metro stations are provided with twelve small stations (about 60 docking points per
station), while around the Eiffel Tower and Invalides the stations are fewer and larger (NYC
Department of City Planning 2009).
The number of docking points defines the size of bike-sharing stations. According to the
transferability fact sheet of the OBIS project (Castro & Emberger 2010), the number of docking
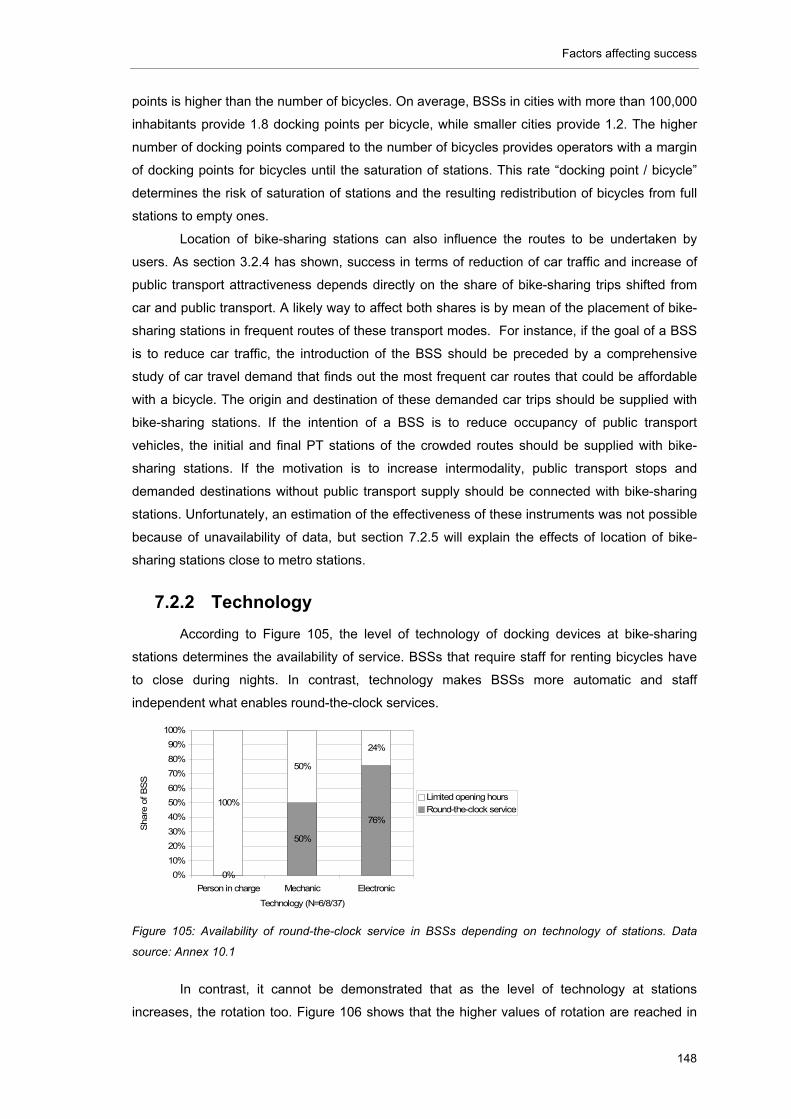
Factors affecting success
148
points is higher than the number of bicycles. On average, BSSs in cities with more than 100,000
inhabitants provide 1.8 docking points per bicycle, while smaller cities provide 1.2. The higher
number of docking points compared to the number of bicycles provides operators with a margin
of docking points for bicycles until the saturation of stations. This rate “docking point / bicycle”
determines the risk of saturation of stations and the resulting redistribution of bicycles from full
stations to empty ones.
Location of bike-sharing stations can also influence the routes to be undertaken by
users. As section 3.2.4 has shown, success in terms of reduction of car traffic and increase of
public transport attractiveness depends directly on the share of bike-sharing trips shifted from
car and public transport. A likely way to affect both shares is by mean of the placement of bike-
sharing stations in frequent routes of these transport modes. For instance, if the goal of a BSS
is to reduce car traffic, the introduction of the BSS should be preceded by a comprehensive
study of car travel demand that finds out the most frequent car routes that could be affordable
with a bicycle. The origin and destination of these demanded car trips should be supplied with
bike-sharing stations. If the intention of a BSS is to reduce occupancy of public transport
vehicles, the initial and final PT stations of the crowded routes should be supplied with bike-
sharing stations. If the motivation is to increase intermodality, public transport stops and
demanded destinations without public transport supply should be connected with bike-sharing
stations. Unfortunately, an estimation of the effectiveness of these instruments was not possible
because of unavailability of data, but section 7.2.5 will explain the effects of location of bike-
sharing stations close to metro stations.
7.2.2 Technology
According to Figure 105, the level of technology of docking devices at bike-sharing
stations determines the availability of service. BSSs that require staff for renting bicycles have
to close during nights. In contrast, technology makes BSSs more automatic and staff
independent what enables round-the-clock services.
Figure 105: Availability of round-the-clock service in BSSs depending on technology of stations. Data
source: Annex 10.1
In contrast, it cannot be demonstrated that as the level of technology at stations
increases, the rotation too. Figure 106 shows that the higher values of rotation are reached in
0%
50%
76%
100%
50%
24%
0%
10%
20%
30%
40%
50%
60%
70%
80%
90%
100%
Person in charge Mechanic Electronic
Technology (N=6/8/37)
Sha
re o
f B
SS
Limited opening hours
Round-the-clock service
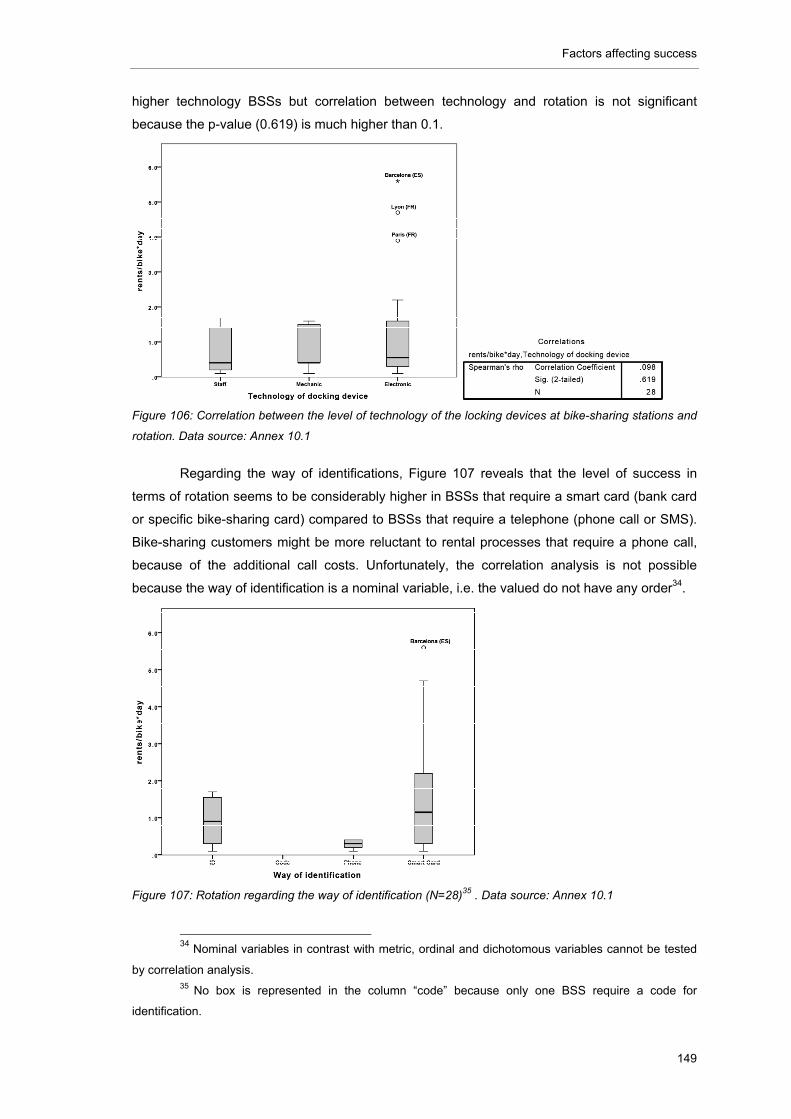
Factors affecting success
149
higher technology BSSs but correlation between technology and rotation is not significant
because the p-value (0.619) is much higher than 0.1.
Figure 106: Correlation between the level of technology of the locking devices at bike-sharing stations and
rotation. Data source: Annex 10.1
Regarding the way of identifications, Figure 107 reveals that the level of success in
terms of rotation seems to be considerably higher in BSSs that require a smart card (bank card
or specific bike-sharing card) compared to BSSs that require a telephone (phone call or SMS).
Bike-sharing customers might be more reluctant to rental processes that require a phone call,
because of the additional call costs. Unfortunately, the correlation analysis is not possible
because the way of identification is a nominal variable, i.e. the valued do not have any order34.
Figure 107: Rotation regarding the way of identification (N=28)35 . Data source: Annex 10.1
34 Nominal variables in contrast with metric, ordinal and dichotomous variables cannot be tested
by correlation analysis. 35 No box is represented in the column “code” because only one BSS require a code for
identification.
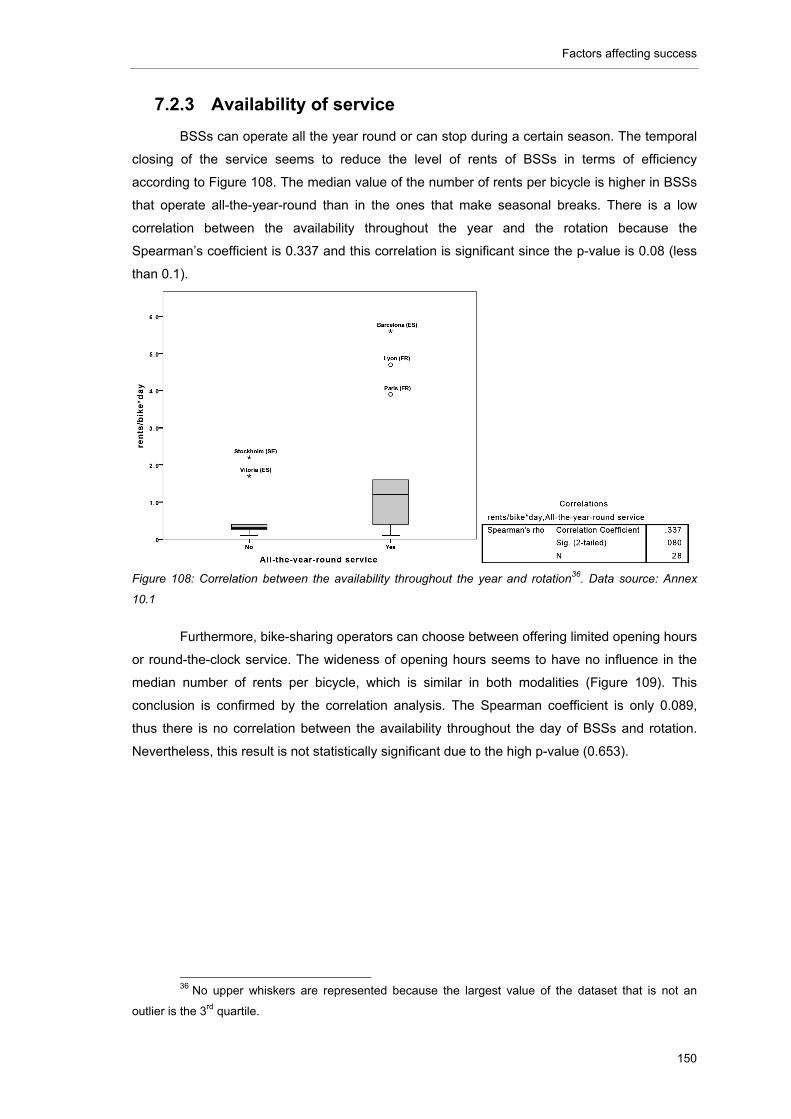
Factors affecting success
150
7.2.3 Availability of service
BSSs can operate all the year round or can stop during a certain season. The temporal
closing of the service seems to reduce the level of rents of BSSs in terms of efficiency
according to Figure 108. The median value of the number of rents per bicycle is higher in BSSs
that operate all-the-year-round than in the ones that make seasonal breaks. There is a low
correlation between the availability throughout the year and the rotation because the
Spearman’s coefficient is 0.337 and this correlation is significant since the p-value is 0.08 (less
than 0.1).
Figure 108: Correlation between the availability throughout the year and rotation36. Data source: Annex
10.1
Furthermore, bike-sharing operators can choose between offering limited opening hours
or round-the-clock service. The wideness of opening hours seems to have no influence in the
median number of rents per bicycle, which is similar in both modalities (Figure 109). This
conclusion is confirmed by the correlation analysis. The Spearman coefficient is only 0.089,
thus there is no correlation between the availability throughout the day of BSSs and rotation.
Nevertheless, this result is not statistically significant due to the high p-value (0.653).
36 No upper whiskers are represented because the largest value of the dataset that is not an
outlier is the 3rd quartile.
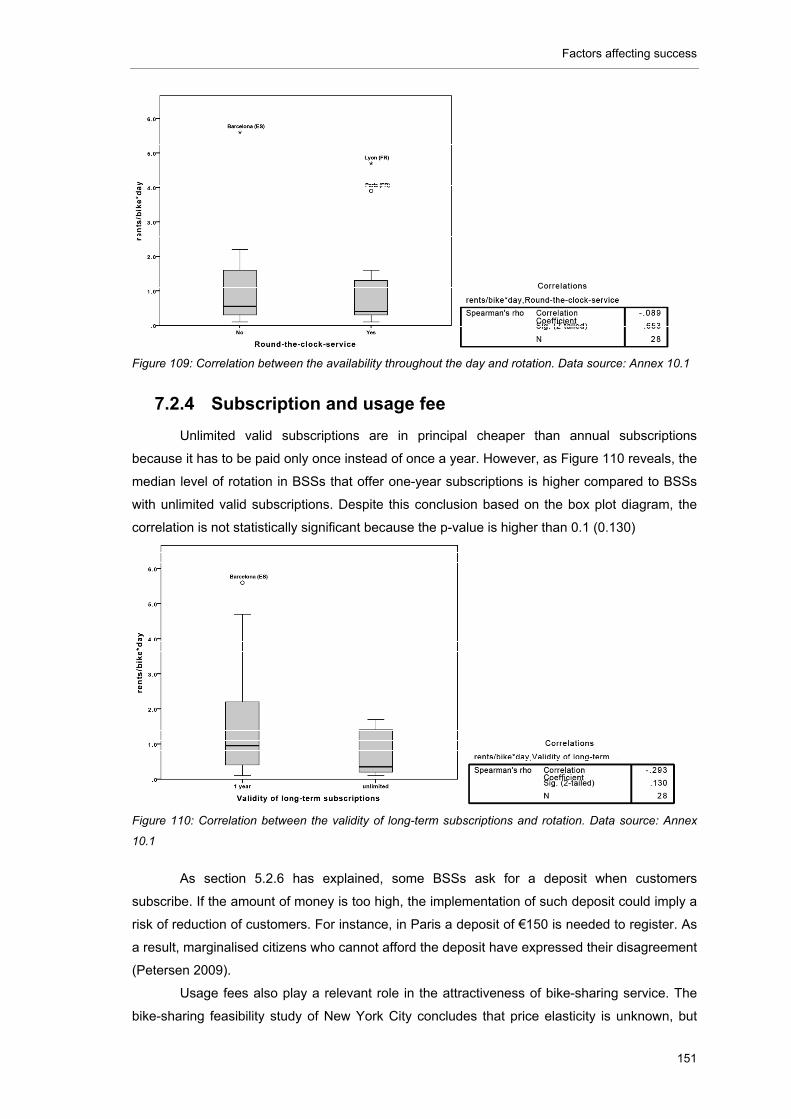
Factors affecting success
151
Figure 109: Correlation between the availability throughout the day and rotation. Data source: Annex 10.1
7.2.4 Subscription and usage fee
Unlimited valid subscriptions are in principal cheaper than annual subscriptions
because it has to be paid only once instead of once a year. However, as Figure 110 reveals, the
median level of rotation in BSSs that offer one-year subscriptions is higher compared to BSSs
with unlimited valid subscriptions. Despite this conclusion based on the box plot diagram, the
correlation is not statistically significant because the p-value is higher than 0.1 (0.130)
Figure 110: Correlation between the validity of long-term subscriptions and rotation. Data source: Annex
10.1
As section 5.2.6 has explained, some BSSs ask for a deposit when customers
subscribe. If the amount of money is too high, the implementation of such deposit could imply a
risk of reduction of customers. For instance, in Paris a deposit of €150 is needed to register. As
a result, marginalised citizens who cannot afford the deposit have expressed their disagreement
(Petersen 2009).
Usage fees also play a relevant role in the attractiveness of bike-sharing service. The
bike-sharing feasibility study of New York City concludes that price elasticity is unknown, but
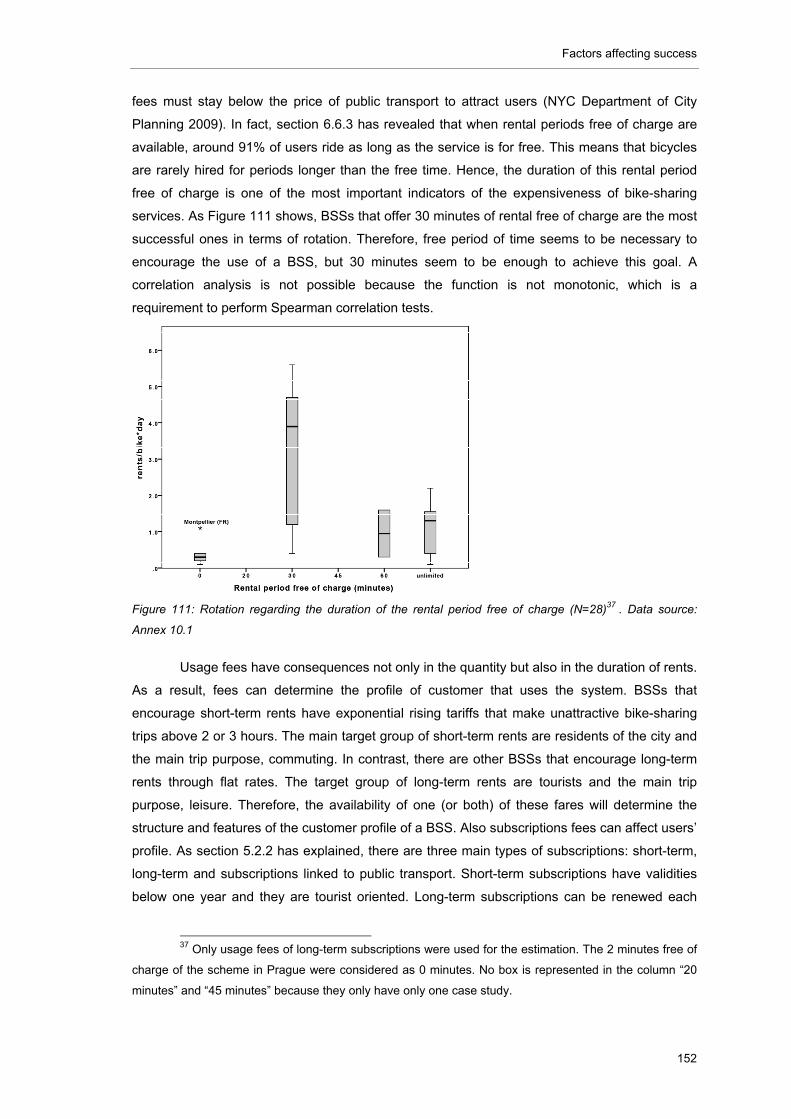
Factors affecting success
152
fees must stay below the price of public transport to attract users (NYC Department of City
Planning 2009). In fact, section 6.6.3 has revealed that when rental periods free of charge are
available, around 91% of users ride as long as the service is for free. This means that bicycles
are rarely hired for periods longer than the free time. Hence, the duration of this rental period
free of charge is one of the most important indicators of the expensiveness of bike-sharing
services. As Figure 111 shows, BSSs that offer 30 minutes of rental free of charge are the most
successful ones in terms of rotation. Therefore, free period of time seems to be necessary to
encourage the use of a BSS, but 30 minutes seem to be enough to achieve this goal. A
correlation analysis is not possible because the function is not monotonic, which is a
requirement to perform Spearman correlation tests.
Figure 111: Rotation regarding the duration of the rental period free of charge (N=28)37 . Data source:
Annex 10.1
Usage fees have consequences not only in the quantity but also in the duration of rents.
As a result, fees can determine the profile of customer that uses the system. BSSs that
encourage short-term rents have exponential rising tariffs that make unattractive bike-sharing
trips above 2 or 3 hours. The main target group of short-term rents are residents of the city and
the main trip purpose, commuting. In contrast, there are other BSSs that encourage long-term
rents through flat rates. The target group of long-term rents are tourists and the main trip
purpose, leisure. Therefore, the availability of one (or both) of these fares will determine the
structure and features of the customer profile of a BSS. Also subscriptions fees can affect users’
profile. As section 5.2.2 has explained, there are three main types of subscriptions: short-term,
long-term and subscriptions linked to public transport. Short-term subscriptions have validities
below one year and they are tourist oriented. Long-term subscriptions can be renewed each
37 Only usage fees of long-term subscriptions were used for the estimation. The 2 minutes free of
charge of the scheme in Prague were considered as 0 minutes. No box is represented in the column “20
minutes” and “45 minutes” because they only have only one case study.
Factors affecting success
153
year or valid forever. City residents and usual users require this kind of subscriptions. And
finally, economic advantages of subscriptions linked to public transport seasonal cards are
especially attractive for commuters. Therefore, depending on the type(s) of subscriptions
available in a BSS, the customer profile may vary. Unfortunately, there are no available data to
quantify the grade of effectiveness of the availability of a specific usage or subscription fees in
catching customers from each wished target group.
7.2.5 Integration with public transport
Section 6.2.4 has explained that a likely goal of the implementation of a BSS can be the
encouragement of intermodality with public transport and to make public transport more
attractive. The success increasing intermodality between public transport and bike-sharing
depends on the share of bike-sharing trips which are combined with public transport (section
3.2.4). If this rate increases, it means that PT passengers appreciate the possibility of riding a
public bicycle as a way to cover the first or the last mile of their trip. There are four main policies
for integrating bike-sharing with public transport:
By placing bike-sharing and public transport stations close to each other
By offering economical bike-sharing fees to public transport passengers
By creating a unified ticketing for BSS and PT
By providing information about how to connect both bike-sharing with public
transport stations
The first and the second option only require the decision of the bike-sharing operator,
while the third and forth option needs the cooperation with public authorities and public transport
companies.
In Paris all train and metro stations in the city are provided with bike-sharing stations,
which make easier accessibility and intermodality (NYC Department of City Planning 2009). The
placement of bike-sharing stations close to public transport nodes may be an effective
instrument to increase intermodality. However, the correlation between the share of metro
stations and the level of intermodality cannot be confirmed. As Figure 112 shows, the p-value is
very high, probably due to the very few available data. Therefore, the correlation is not
statistically significant (p-value 0.895)
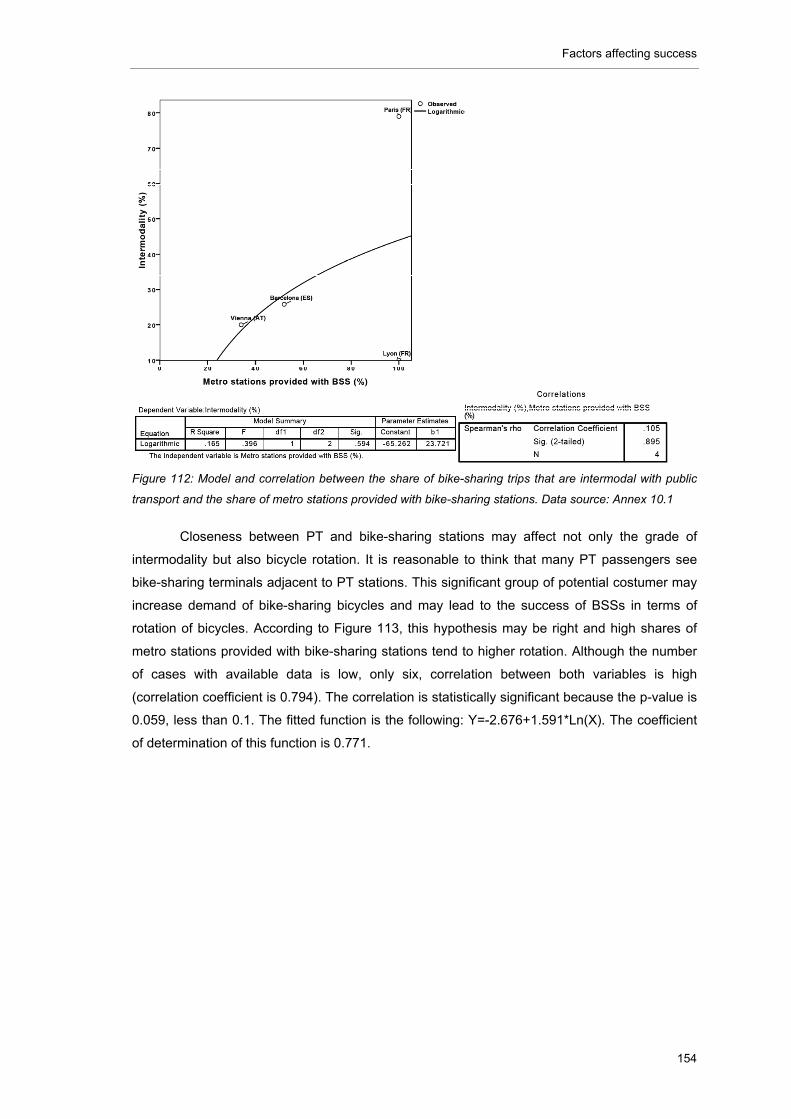
Factors affecting success
154
Figure 112: Model and correlation between the share of bike-sharing trips that are intermodal with public
transport and the share of metro stations provided with bike-sharing stations. Data source: Annex 10.1
Closeness between PT and bike-sharing stations may affect not only the grade of
intermodality but also bicycle rotation. It is reasonable to think that many PT passengers see
bike-sharing terminals adjacent to PT stations. This significant group of potential costumer may
increase demand of bike-sharing bicycles and may lead to the success of BSSs in terms of
rotation of bicycles. According to Figure 113, this hypothesis may be right and high shares of
metro stations provided with bike-sharing stations tend to higher rotation. Although the number
of cases with available data is low, only six, correlation between both variables is high
(correlation coefficient is 0.794). The correlation is statistically significant because the p-value is
0.059, less than 0.1. The fitted function is the following: Y=-2.676+1.591*Ln(X). The coefficient
of determination of this function is 0.771.
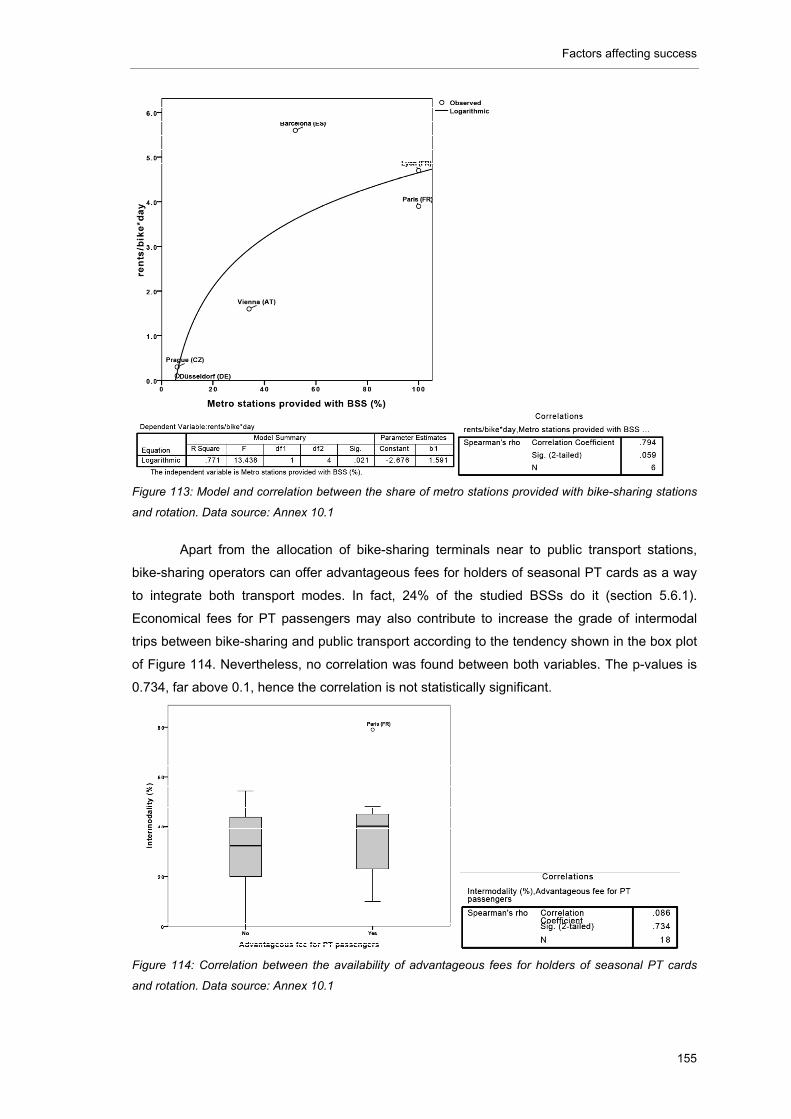
Factors affecting success
155
Figure 113: Model and correlation between the share of metro stations provided with bike-sharing stations
and rotation. Data source: Annex 10.1
Apart from the allocation of bike-sharing terminals near to public transport stations,
bike-sharing operators can offer advantageous fees for holders of seasonal PT cards as a way
to integrate both transport modes. In fact, 24% of the studied BSSs do it (section 5.6.1).
Economical fees for PT passengers may also contribute to increase the grade of intermodal
trips between bike-sharing and public transport according to the tendency shown in the box plot
of Figure 114. Nevertheless, no correlation was found between both variables. The p-values is
0.734, far above 0.1, hence the correlation is not statistically significant.
Figure 114: Correlation between the availability of advantageous fees for holders of seasonal PT cards
and rotation. Data source: Annex 10.1
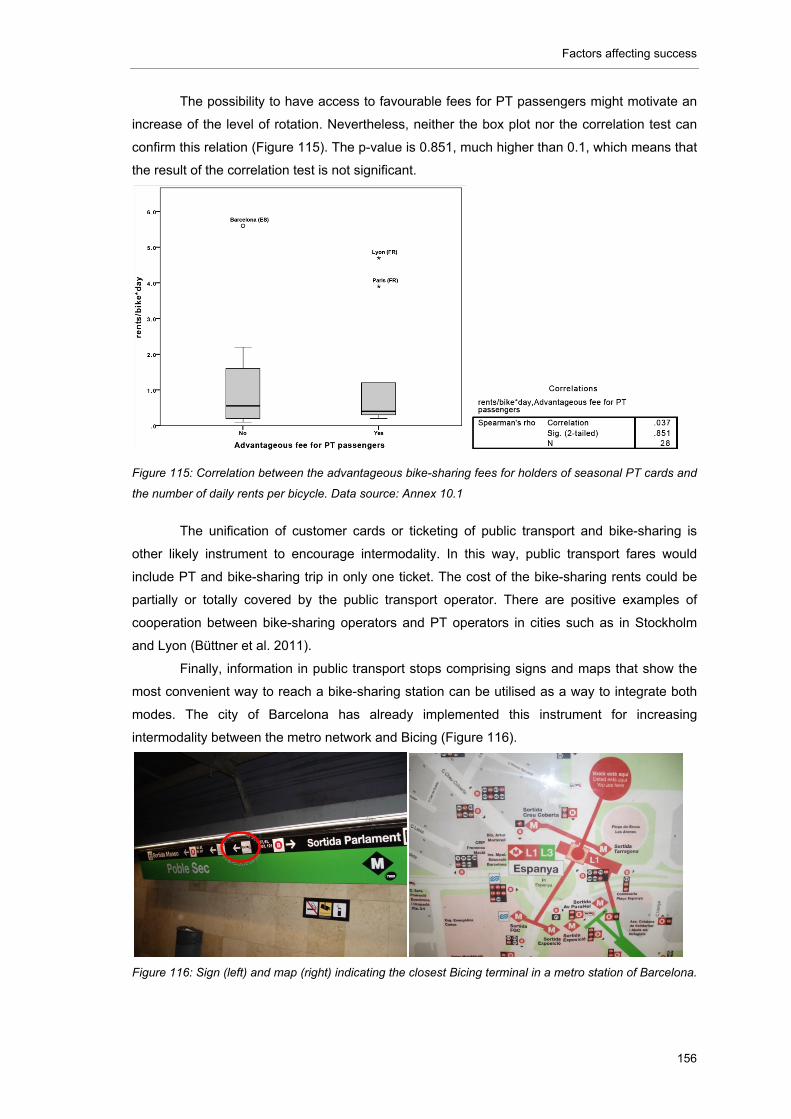
Factors affecting success
156
The possibility to have access to favourable fees for PT passengers might motivate an
increase of the level of rotation. Nevertheless, neither the box plot nor the correlation test can
confirm this relation (Figure 115). The p-value is 0.851, much higher than 0.1, which means that
the result of the correlation test is not significant.
Figure 115: Correlation between the advantageous bike-sharing fees for holders of seasonal PT cards and
the number of daily rents per bicycle. Data source: Annex 10.1
The unification of customer cards or ticketing of public transport and bike-sharing is
other likely instrument to encourage intermodality. In this way, public transport fares would
include PT and bike-sharing trip in only one ticket. The cost of the bike-sharing rents could be
partially or totally covered by the public transport operator. There are positive examples of
cooperation between bike-sharing operators and PT operators in cities such as in Stockholm
and Lyon (Büttner et al. 2011).
Finally, information in public transport stops comprising signs and maps that show the
most convenient way to reach a bike-sharing station can be utilised as a way to integrate both
modes. The city of Barcelona has already implemented this instrument for increasing
intermodality between the metro network and Bicing (Figure 116).
Figure 116: Sign (left) and map (right) indicating the closest Bicing terminal in a metro station of Barcelona.
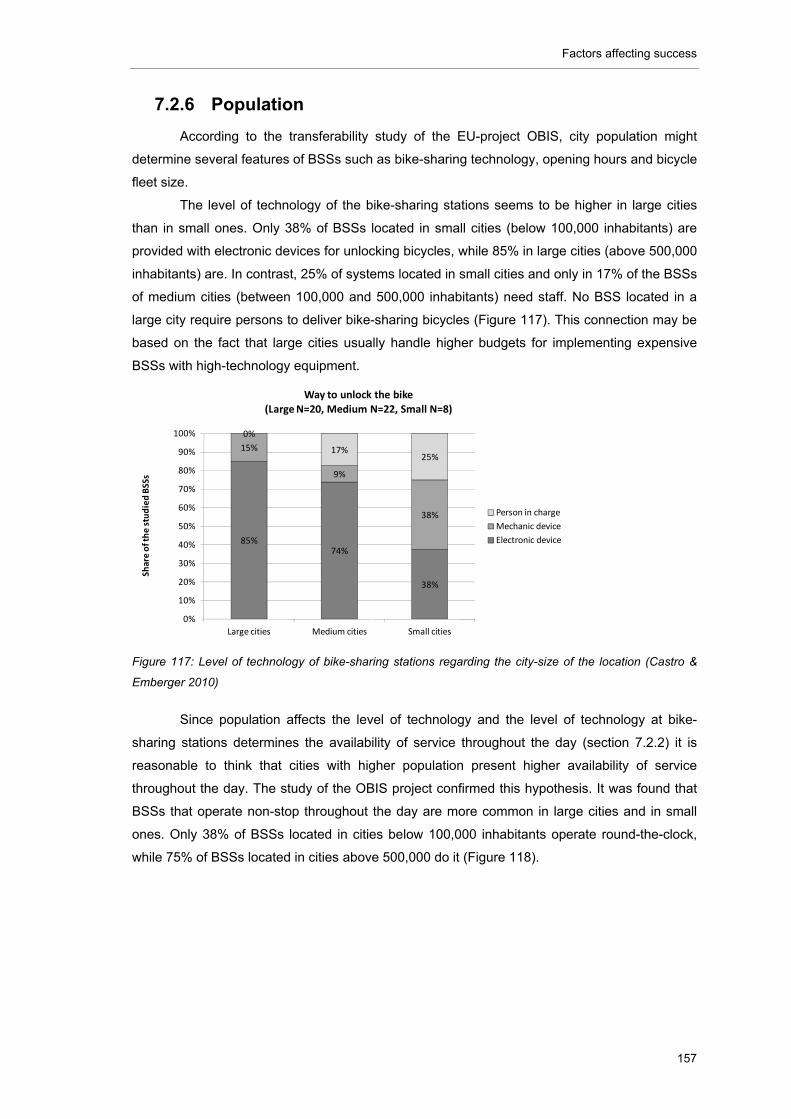
Factors affecting success
157
7.2.6 Population
According to the transferability study of the EU-project OBIS, city population might
determine several features of BSSs such as bike-sharing technology, opening hours and bicycle
fleet size.
The level of technology of the bike-sharing stations seems to be higher in large cities
than in small ones. Only 38% of BSSs located in small cities (below 100,000 inhabitants) are
provided with electronic devices for unlocking bicycles, while 85% in large cities (above 500,000
inhabitants) are. In contrast, 25% of systems located in small cities and only in 17% of the BSSs
of medium cities (between 100,000 and 500,000 inhabitants) need staff. No BSS located in a
large city require persons to deliver bike-sharing bicycles (Figure 117). This connection may be
based on the fact that large cities usually handle higher budgets for implementing expensive
BSSs with high-technology equipment.
Figure 117: Level of technology of bike-sharing stations regarding the city-size of the location (Castro &
Emberger 2010)
Since population affects the level of technology and the level of technology at bike-
sharing stations determines the availability of service throughout the day (section 7.2.2) it is
reasonable to think that cities with higher population present higher availability of service
throughout the day. The study of the OBIS project confirmed this hypothesis. It was found that
BSSs that operate non-stop throughout the day are more common in large cities and in small
ones. Only 38% of BSSs located in cities below 100,000 inhabitants operate round-the-clock,
while 75% of BSSs located in cities above 500,000 do it (Figure 118).
85%74%
38%
15%
9%
38%
0%
17%25%
0%
10%
20%
30%
40%
50%
60%
70%
80%
90%
100%
Large cities Medium cities Small cities
Share of the studied BSSs
Way to unlock the bike
(Large N=20, Medium N=22, Small N=8)
Person in charge
Mechanic device
Electronic device
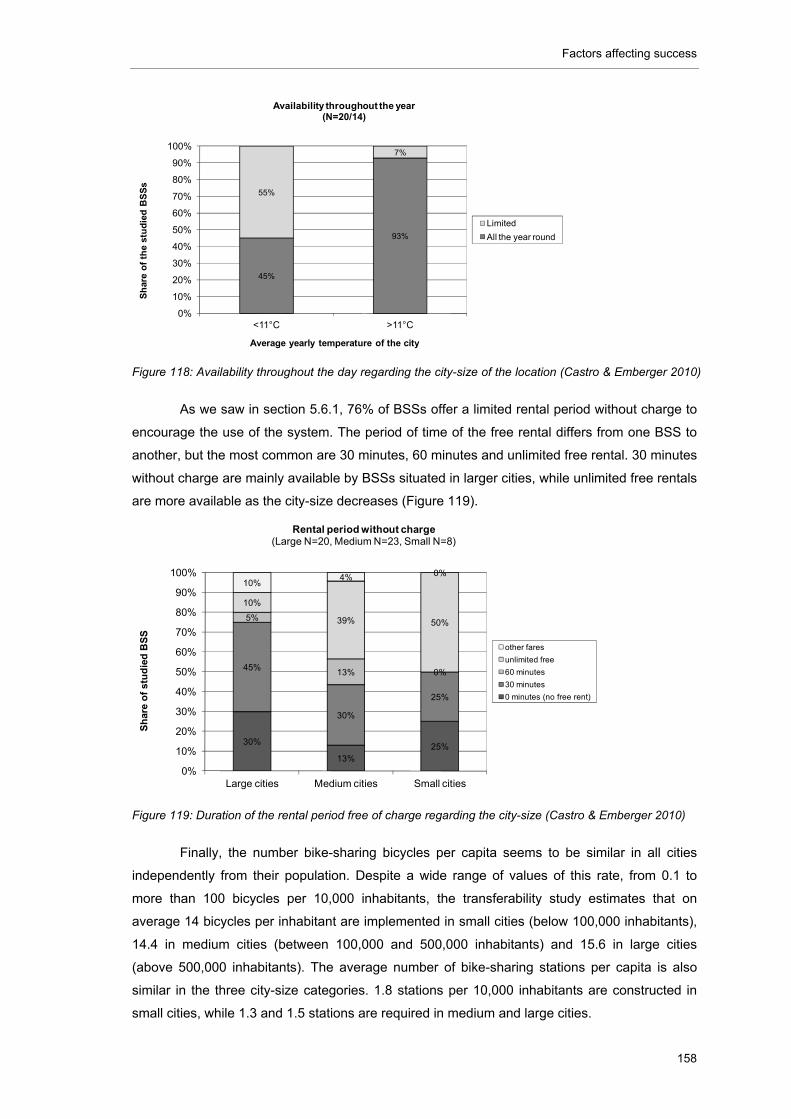
Factors affecting success
158
Figure 118: Availability throughout the day regarding the city-size of the location (Castro & Emberger 2010)
As we saw in section 5.6.1, 76% of BSSs offer a limited rental period without charge to
encourage the use of the system. The period of time of the free rental differs from one BSS to
another, but the most common are 30 minutes, 60 minutes and unlimited free rental. 30 minutes
without charge are mainly available by BSSs situated in larger cities, while unlimited free rentals
are more available as the city-size decreases (Figure 119).
Figure 119: Duration of the rental period free of charge regarding the city-size (Castro & Emberger 2010)
Finally, the number bike-sharing bicycles per capita seems to be similar in all cities
independently from their population. Despite a wide range of values of this rate, from 0.1 to
more than 100 bicycles per 10,000 inhabitants, the transferability study estimates that on
average 14 bicycles per inhabitant are implemented in small cities (below 100,000 inhabitants),
14.4 in medium cities (between 100,000 and 500,000 inhabitants) and 15.6 in large cities
(above 500,000 inhabitants). The average number of bike-sharing stations per capita is also
similar in the three city-size categories. 1.8 stations per 10,000 inhabitants are constructed in
small cities, while 1.3 and 1.5 stations are required in medium and large cities.
45%
93%
55%
7%
0%
10%
20%
30%
40%
50%
60%
70%
80%
90%
100%
<11°C >11°C
Sh
are
of
the
stu
die
d B
SS
s
Average yearly temperature of the city
Availability throughout the year(N=20/14)
Limited
All the year round
30%
13%25%
45%
30%
25%
5%
13% 0%
10%
39% 50%
10%4% 0%
0%
10%
20%
30%
40%
50%
60%
70%
80%
90%
100%
Large cities Medium cities Small cities
Sh
are
of
stu
die
d B
SS
Rental period without charge (Large N=20, Medium N=23, Small N=8)
other fares
unlimited free
60 minutes
30 minutes
0 minutes (no free rent)
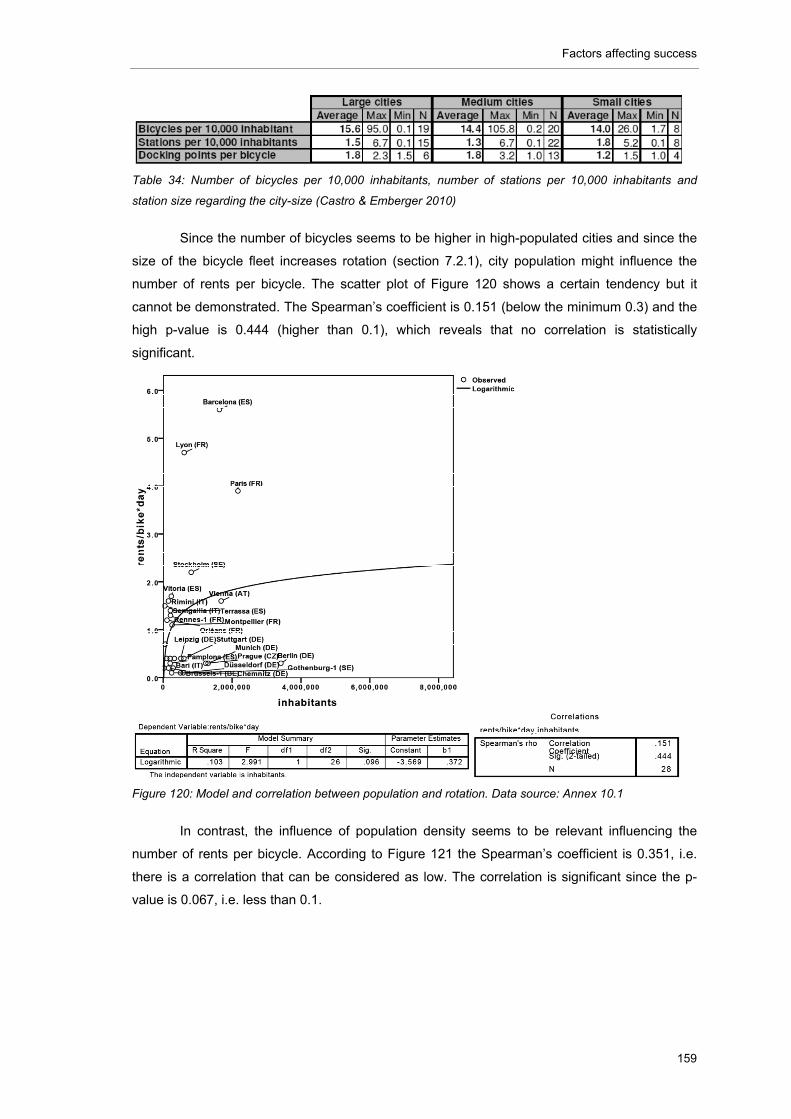
Factors affecting success
159
Table 34: Number of bicycles per 10,000 inhabitants, number of stations per 10,000 inhabitants and
station size regarding the city-size (Castro & Emberger 2010)
Since the number of bicycles seems to be higher in high-populated cities and since the
size of the bicycle fleet increases rotation (section 7.2.1), city population might influence the
number of rents per bicycle. The scatter plot of Figure 120 shows a certain tendency but it
cannot be demonstrated. The Spearman’s coefficient is 0.151 (below the minimum 0.3) and the
high p-value is 0.444 (higher than 0.1), which reveals that no correlation is statistically
significant.
Figure 120: Model and correlation between population and rotation. Data source: Annex 10.1
In contrast, the influence of population density seems to be relevant influencing the
number of rents per bicycle. According to Figure 121 the Spearman’s coefficient is 0.351, i.e.
there is a correlation that can be considered as low. The correlation is significant since the p-
value is 0.067, i.e. less than 0.1.
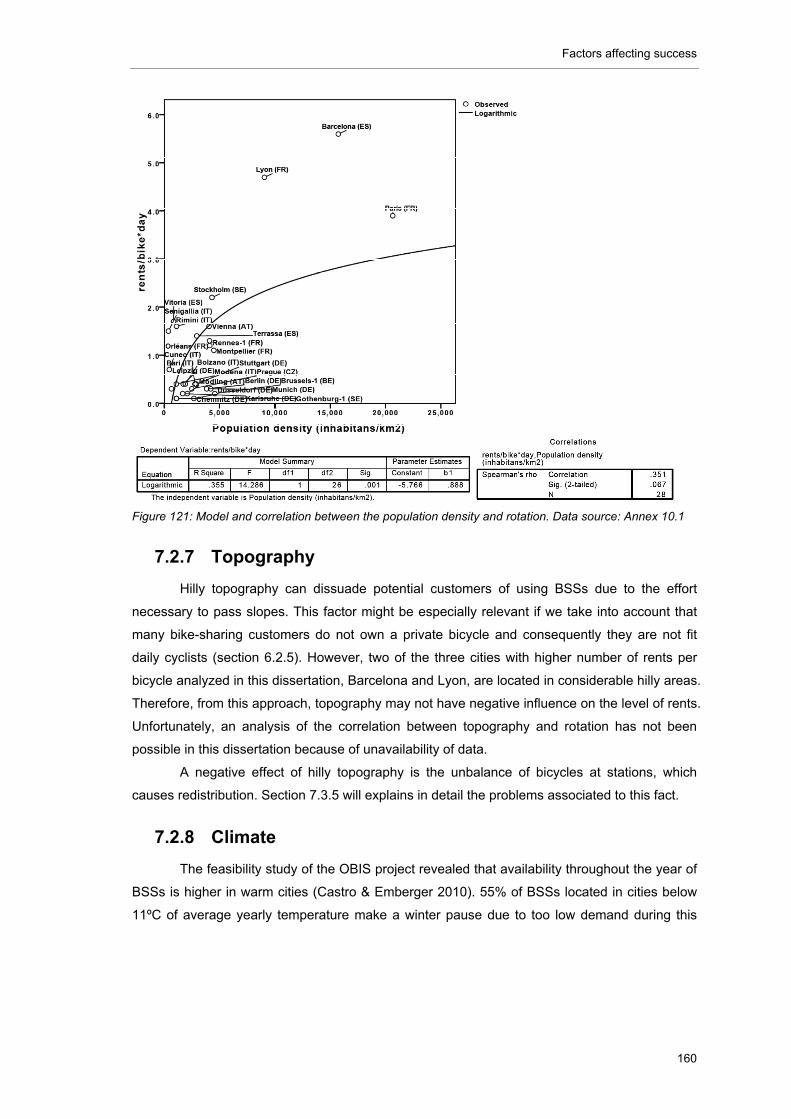
Factors affecting success
160
Figure 121: Model and correlation between the population density and rotation. Data source: Annex 10.1
7.2.7 Topography
Hilly topography can dissuade potential customers of using BSSs due to the effort
necessary to pass slopes. This factor might be especially relevant if we take into account that
many bike-sharing customers do not own a private bicycle and consequently they are not fit
daily cyclists (section 6.2.5). However, two of the three cities with higher number of rents per
bicycle analyzed in this dissertation, Barcelona and Lyon, are located in considerable hilly areas.
Therefore, from this approach, topography may not have negative influence on the level of rents.
Unfortunately, an analysis of the correlation between topography and rotation has not been
possible in this dissertation because of unavailability of data.
A negative effect of hilly topography is the unbalance of bicycles at stations, which
causes redistribution. Section 7.3.5 will explains in detail the problems associated to this fact.
7.2.8 Climate
The feasibility study of the OBIS project revealed that availability throughout the year of
BSSs is higher in warm cities (Castro & Emberger 2010). 55% of BSSs located in cities below
11ºC of average yearly temperature make a winter pause due to too low demand during this
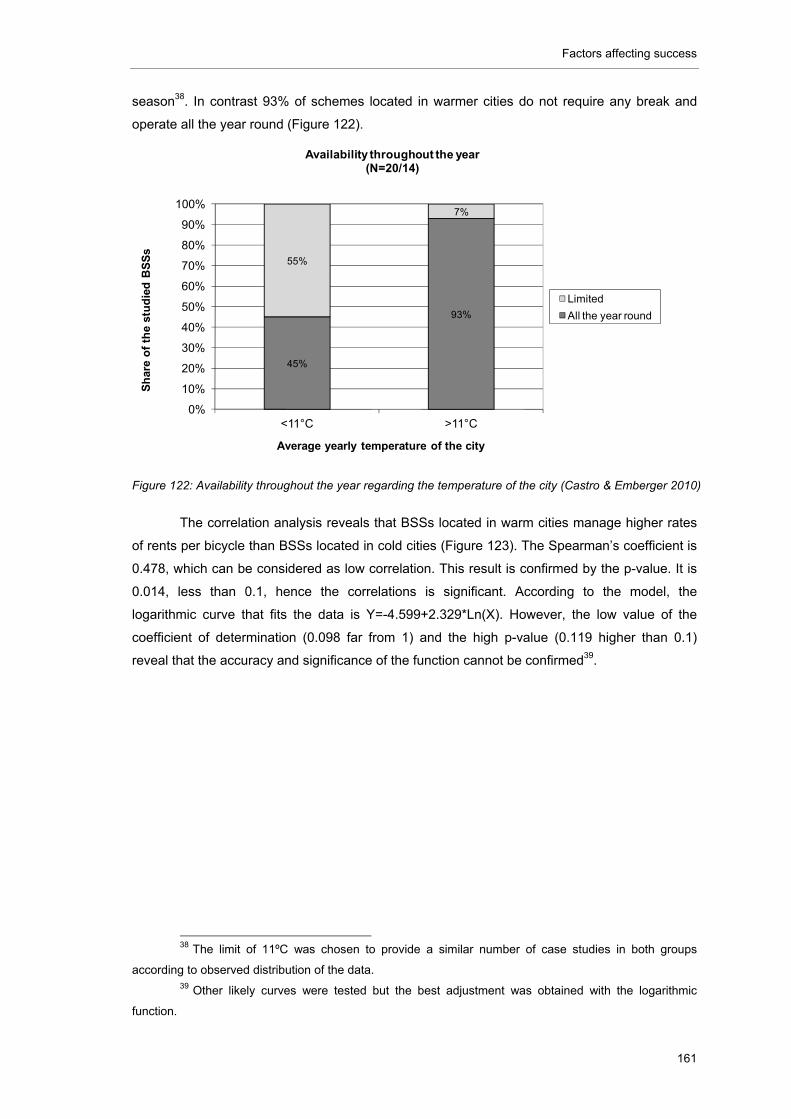
Factors affecting success
161
season38. In contrast 93% of schemes located in warmer cities do not require any break and
operate all the year round (Figure 122).
Figure 122: Availability throughout the year regarding the temperature of the city (Castro & Emberger 2010)
The correlation analysis reveals that BSSs located in warm cities manage higher rates
of rents per bicycle than BSSs located in cold cities (Figure 123). The Spearman’s coefficient is
0.478, which can be considered as low correlation. This result is confirmed by the p-value. It is
0.014, less than 0.1, hence the correlations is significant. According to the model, the
logarithmic curve that fits the data is Y=-4.599+2.329*Ln(X). However, the low value of the
coefficient of determination (0.098 far from 1) and the high p-value (0.119 higher than 0.1)
reveal that the accuracy and significance of the function cannot be confirmed39.
38 The limit of 11ºC was chosen to provide a similar number of case studies in both groups
according to observed distribution of the data. 39 Other likely curves were tested but the best adjustment was obtained with the logarithmic
function.
45%
93%
55%
7%
0%
10%
20%
30%
40%
50%
60%
70%
80%
90%
100%
<11°C >11°C
Sh
are
of
the
stu
die
d B
SS
s
Average yearly temperature of the city
Availability throughout the year(N=20/14)
Limited
All the year round
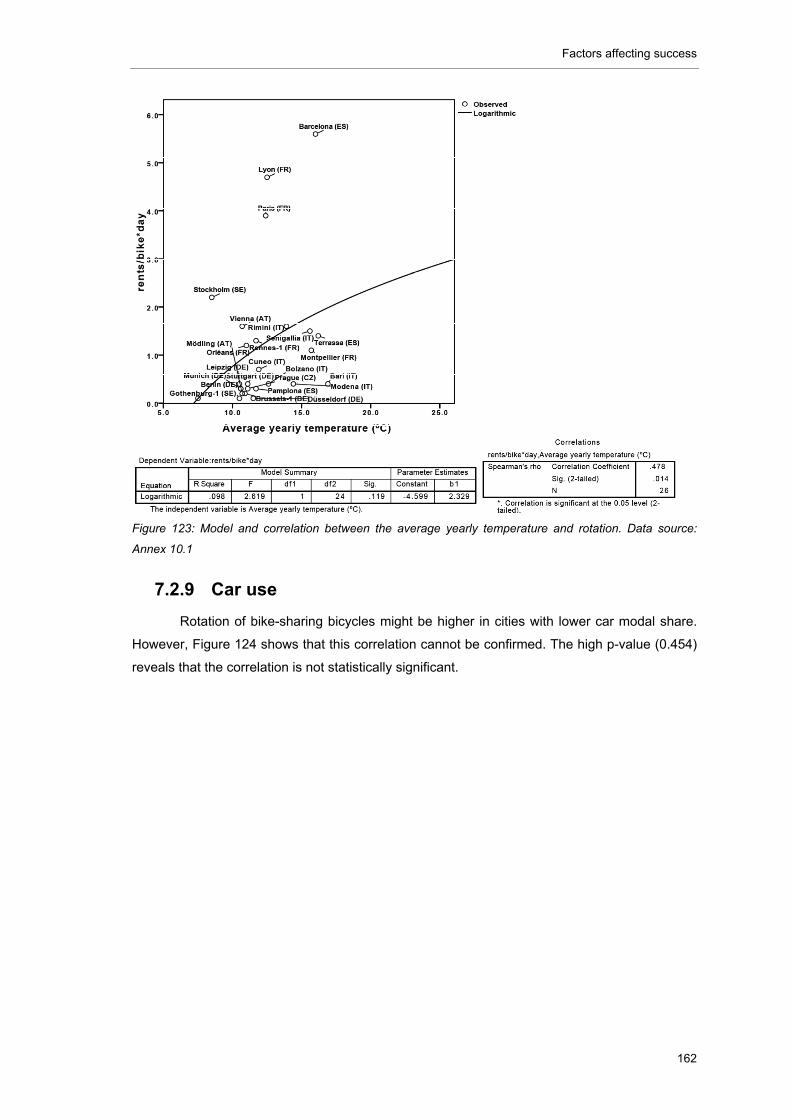
Factors affecting success
162
Figure 123: Model and correlation between the average yearly temperature and rotation. Data source:
Annex 10.1
7.2.9 Car use
Rotation of bike-sharing bicycles might be higher in cities with lower car modal share.
However, Figure 124 shows that this correlation cannot be confirmed. The high p-value (0.454)
reveals that the correlation is not statistically significant.
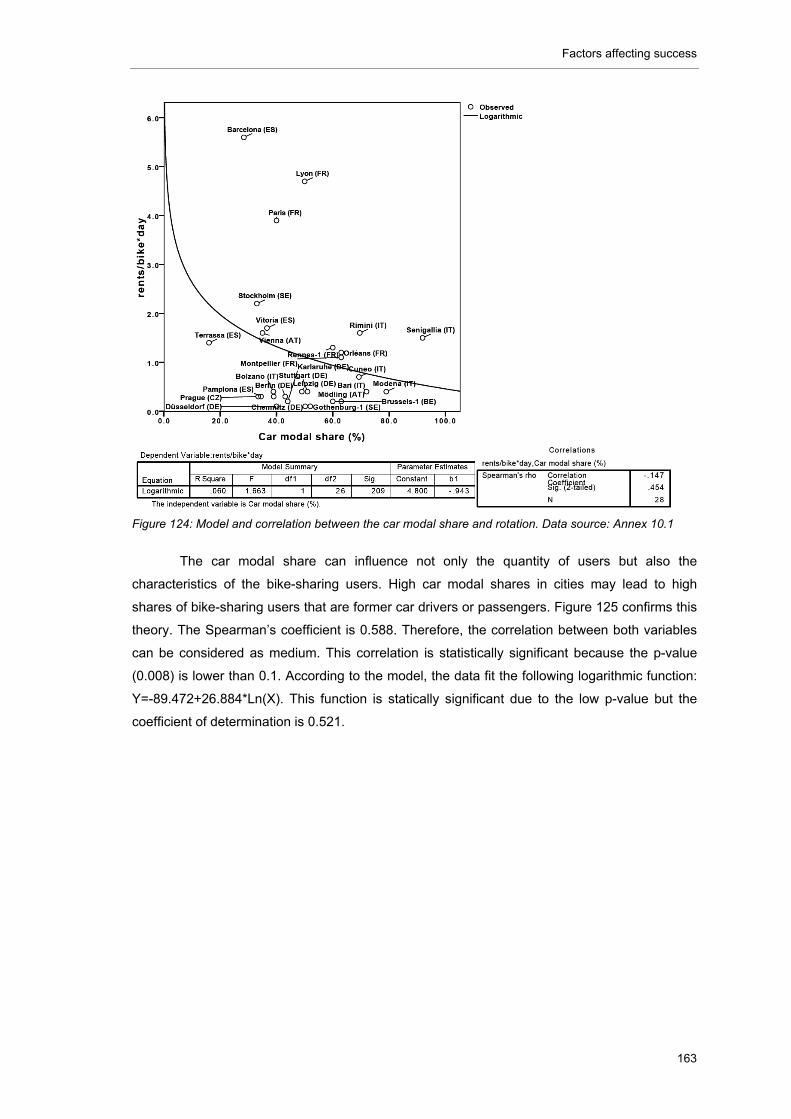
Factors affecting success
163
Figure 124: Model and correlation between the car modal share and rotation. Data source: Annex 10.1
The car modal share can influence not only the quantity of users but also the
characteristics of the bike-sharing users. High car modal shares in cities may lead to high
shares of bike-sharing users that are former car drivers or passengers. Figure 125 confirms this
theory. The Spearman’s coefficient is 0.588. Therefore, the correlation between both variables
can be considered as medium. This correlation is statistically significant because the p-value
(0.008) is lower than 0.1. According to the model, the data fit the following logarithmic function:
Y=-89.472+26.884*Ln(X). This function is statically significant due to the low p-value but the
coefficient of determination is 0.521.
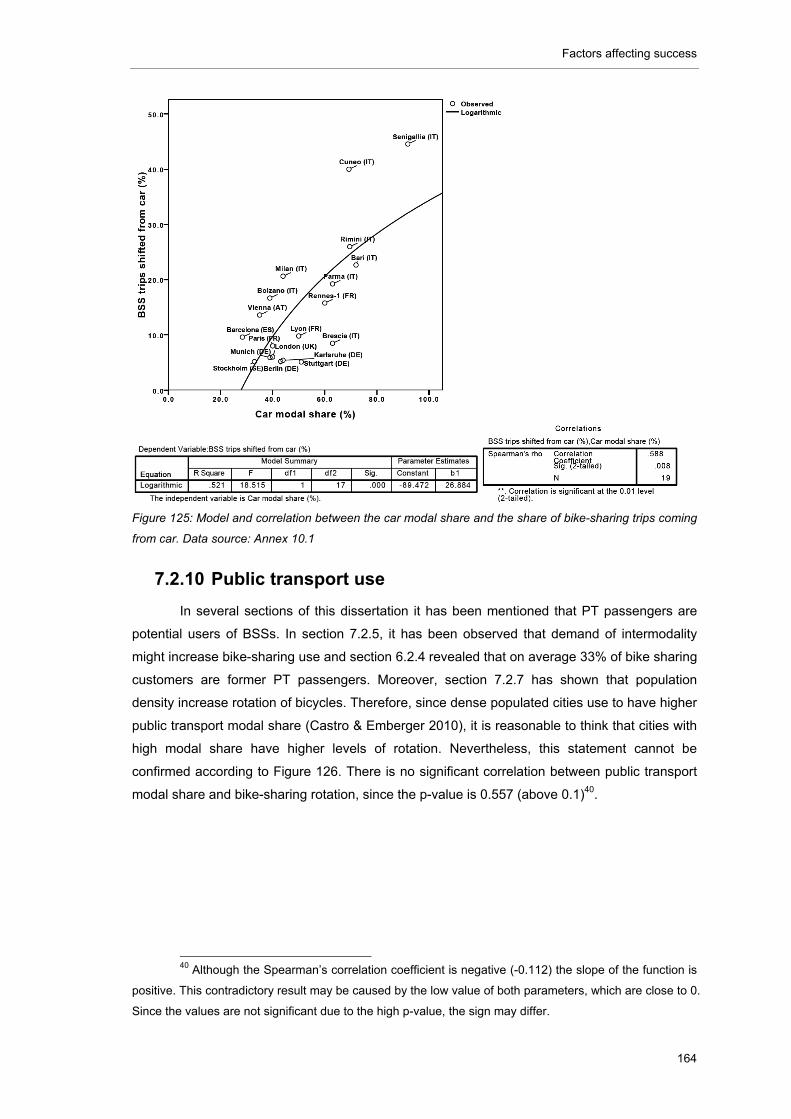
Factors affecting success
164
Figure 125: Model and correlation between the car modal share and the share of bike-sharing trips coming
from car. Data source: Annex 10.1
7.2.10 Public transport use
In several sections of this dissertation it has been mentioned that PT passengers are
potential users of BSSs. In section 7.2.5, it has been observed that demand of intermodality
might increase bike-sharing use and section 6.2.4 revealed that on average 33% of bike sharing
customers are former PT passengers. Moreover, section 7.2.7 has shown that population
density increase rotation of bicycles. Therefore, since dense populated cities use to have higher
public transport modal share (Castro & Emberger 2010), it is reasonable to think that cities with
high modal share have higher levels of rotation. Nevertheless, this statement cannot be
confirmed according to Figure 126. There is no significant correlation between public transport
modal share and bike-sharing rotation, since the p-value is 0.557 (above 0.1)40.
40 Although the Spearman’s correlation coefficient is negative (-0.112) the slope of the function is
positive. This contradictory result may be caused by the low value of both parameters, which are close to 0.
Since the values are not significant due to the high p-value, the sign may differ.
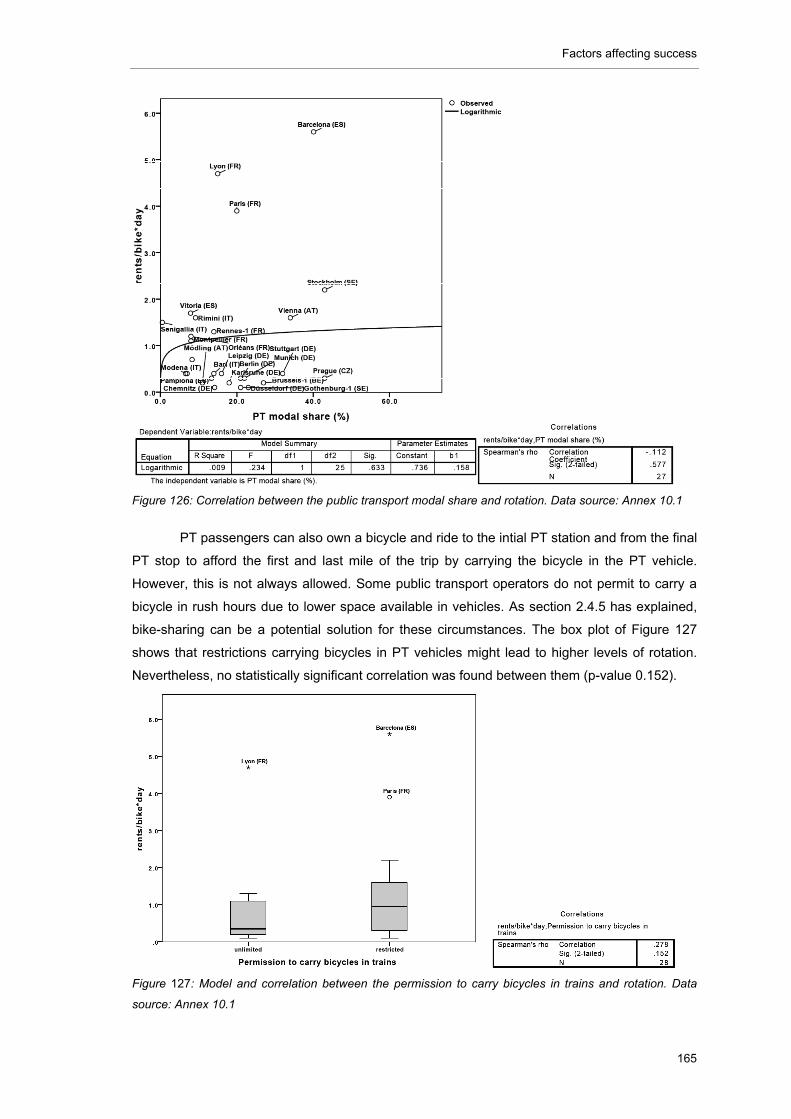
Factors affecting success
165
Figure 126: Correlation between the public transport modal share and rotation. Data source: Annex 10.1
PT passengers can also own a bicycle and ride to the intial PT station and from the final
PT stop to afford the first and last mile of the trip by carrying the bicycle in the PT vehicle.
However, this is not always allowed. Some public transport operators do not permit to carry a
bicycle in rush hours due to lower space available in vehicles. As section 2.4.5 has explained,
bike-sharing can be a potential solution for these circumstances. The box plot of Figure 127
shows that restrictions carrying bicycles in PT vehicles might lead to higher levels of rotation.
Nevertheless, no statistically significant correlation was found between them (p-value 0.152).
Figure 127: Model and correlation between the permission to carry bicycles in trains and rotation. Data
source: Annex 10.1
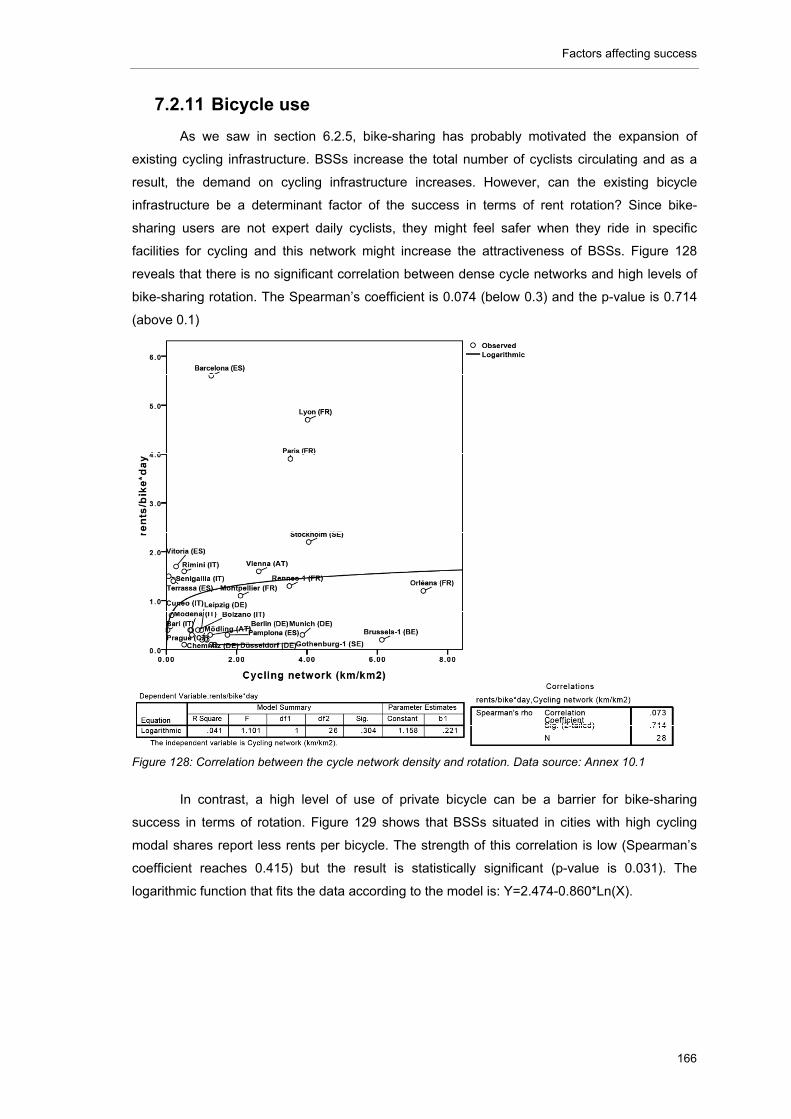
Factors affecting success
166
7.2.11 Bicycle use
As we saw in section 6.2.5, bike-sharing has probably motivated the expansion of
existing cycling infrastructure. BSSs increase the total number of cyclists circulating and as a
result, the demand on cycling infrastructure increases. However, can the existing bicycle
infrastructure be a determinant factor of the success in terms of rent rotation? Since bike-
sharing users are not expert daily cyclists, they might feel safer when they ride in specific
facilities for cycling and this network might increase the attractiveness of BSSs. Figure 128
reveals that there is no significant correlation between dense cycle networks and high levels of
bike-sharing rotation. The Spearman’s coefficient is 0.074 (below 0.3) and the p-value is 0.714
(above 0.1)
Figure 128: Correlation between the cycle network density and rotation. Data source: Annex 10.1
In contrast, a high level of use of private bicycle can be a barrier for bike-sharing
success in terms of rotation. Figure 129 shows that BSSs situated in cities with high cycling
modal shares report less rents per bicycle. The strength of this correlation is low (Spearman’s
coefficient reaches 0.415) but the result is statistically significant (p-value is 0.031). The
logarithmic function that fits the data according to the model is: Y=2.474-0.860*Ln(X).
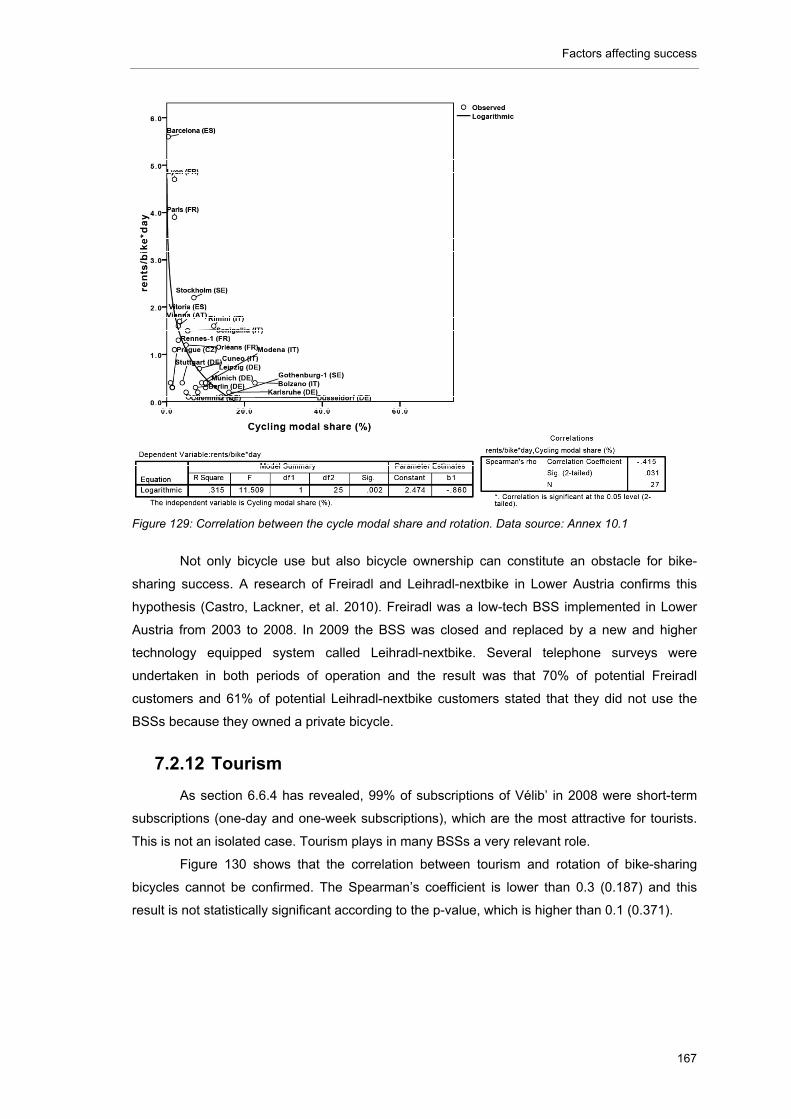
Factors affecting success
167
Figure 129: Correlation between the cycle modal share and rotation. Data source: Annex 10.1
Not only bicycle use but also bicycle ownership can constitute an obstacle for bike-
sharing success. A research of Freiradl and Leihradl-nextbike in Lower Austria confirms this
hypothesis (Castro, Lackner, et al. 2010). Freiradl was a low-tech BSS implemented in Lower
Austria from 2003 to 2008. In 2009 the BSS was closed and replaced by a new and higher
technology equipped system called Leihradl-nextbike. Several telephone surveys were
undertaken in both periods of operation and the result was that 70% of potential Freiradl
customers and 61% of potential Leihradl-nextbike customers stated that they did not use the
BSSs because they owned a private bicycle.
7.2.12 Tourism
As section 6.6.4 has revealed, 99% of subscriptions of Vélib’ in 2008 were short-term
subscriptions (one-day and one-week subscriptions), which are the most attractive for tourists.
This is not an isolated case. Tourism plays in many BSSs a very relevant role.
Figure 130 shows that the correlation between tourism and rotation of bike-sharing
bicycles cannot be confirmed. The Spearman’s coefficient is lower than 0.3 (0.187) and this
result is not statistically significant according to the p-value, which is higher than 0.1 (0.371).
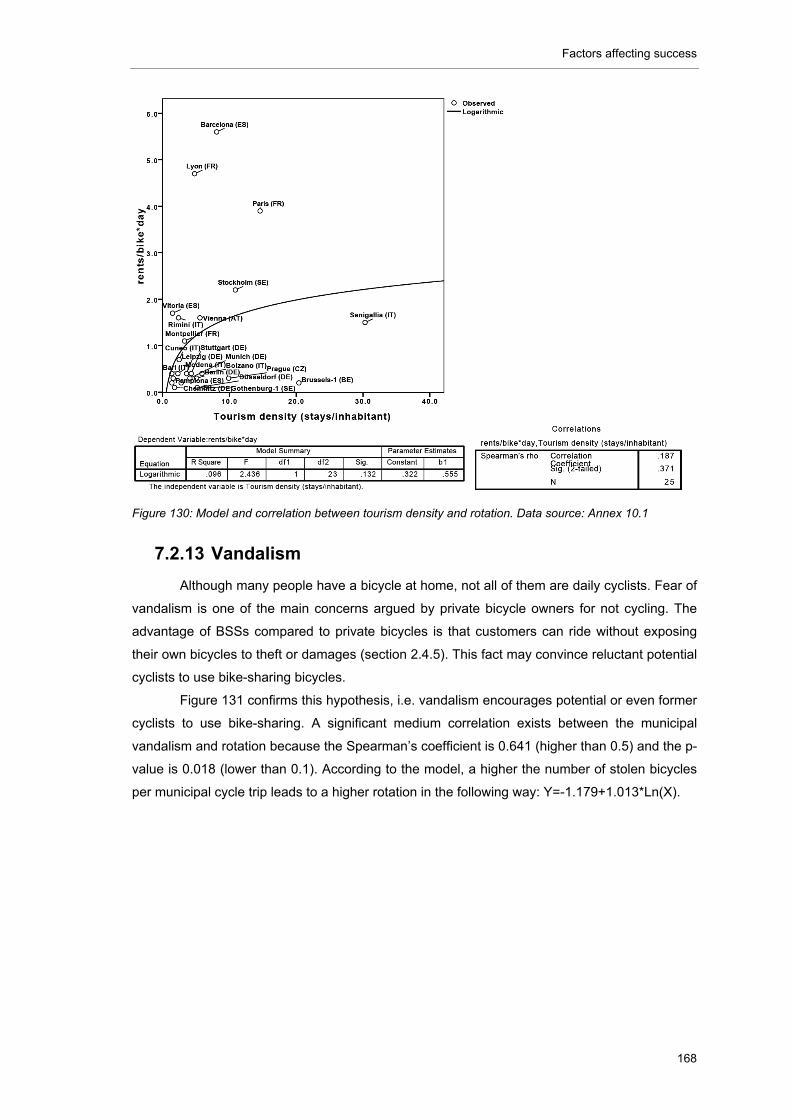
Factors affecting success
168
Figure 130: Model and correlation between tourism density and rotation. Data source: Annex 10.1
7.2.13 Vandalism
Although many people have a bicycle at home, not all of them are daily cyclists. Fear of
vandalism is one of the main concerns argued by private bicycle owners for not cycling. The
advantage of BSSs compared to private bicycles is that customers can ride without exposing
their own bicycles to theft or damages (section 2.4.5). This fact may convince reluctant potential
cyclists to use bike-sharing bicycles.
Figure 131 confirms this hypothesis, i.e. vandalism encourages potential or even former
cyclists to use bike-sharing. A significant medium correlation exists between the municipal
vandalism and rotation because the Spearman’s coefficient is 0.641 (higher than 0.5) and the p-
value is 0.018 (lower than 0.1). According to the model, a higher the number of stolen bicycles
per municipal cycle trip leads to a higher rotation in the following way: Y=-1.179+1.013*Ln(X).
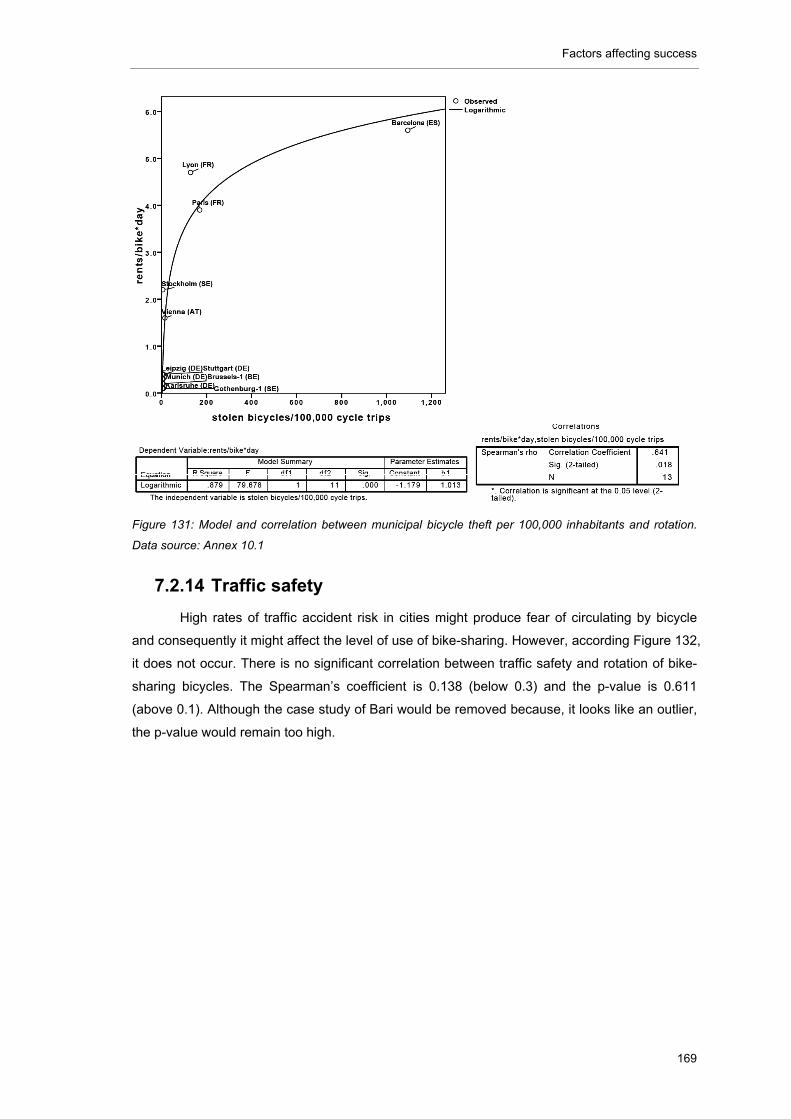
Factors affecting success
169
Figure 131: Model and correlation between municipal bicycle theft per 100,000 inhabitants and rotation.
Data source: Annex 10.1
7.2.14 Traffic safety
High rates of traffic accident risk in cities might produce fear of circulating by bicycle
and consequently it might affect the level of use of bike-sharing. However, according Figure 132,
it does not occur. There is no significant correlation between traffic safety and rotation of bike-
sharing bicycles. The Spearman’s coefficient is 0.138 (below 0.3) and the p-value is 0.611
(above 0.1). Although the case study of Bari would be removed because, it looks like an outlier,
the p-value would remain too high.
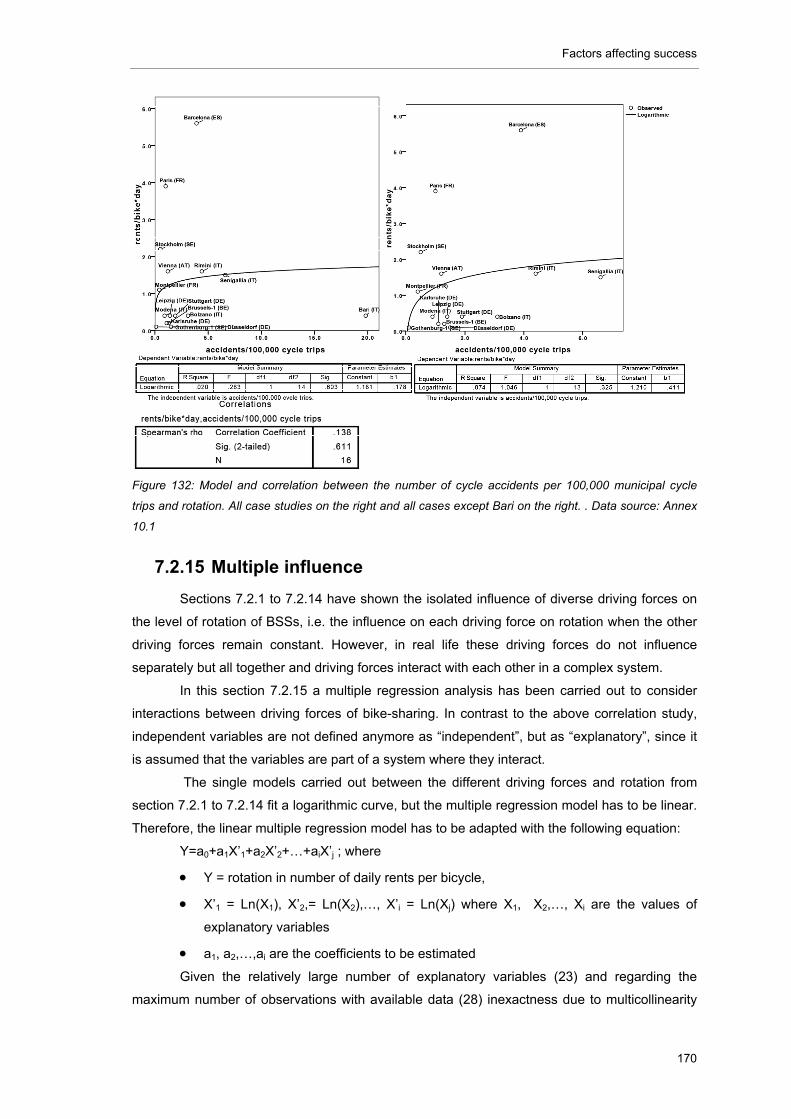
Factors affecting success
170
Figure 132: Model and correlation between the number of cycle accidents per 100,000 municipal cycle
trips and rotation. All case studies on the right and all cases except Bari on the right. . Data source: Annex
10.1
7.2.15 Multiple influence
Sections 7.2.1 to 7.2.14 have shown the isolated influence of diverse driving forces on
the level of rotation of BSSs, i.e. the influence on each driving force on rotation when the other
driving forces remain constant. However, in real life these driving forces do not influence
separately but all together and driving forces interact with each other in a complex system.
In this section 7.2.15 a multiple regression analysis has been carried out to consider
interactions between driving forces of bike-sharing. In contrast to the above correlation study,
independent variables are not defined anymore as “independent”, but as “explanatory”, since it
is assumed that the variables are part of a system where they interact.
The single models carried out between the different driving forces and rotation from
section 7.2.1 to 7.2.14 fit a logarithmic curve, but the multiple regression model has to be linear.
Therefore, the linear multiple regression model has to be adapted with the following equation:
Y=a0+a1X’1+a2X’2+…+aiX’j ; where
Y = rotation in number of daily rents per bicycle,
X’1 = Ln(X1), X’2,= Ln(X2),…, X’i = Ln(Xj) where X1, X2,…, Xi are the values of
explanatory variables
a1, a2,…,ai are the coefficients to be estimated
Given the relatively large number of explanatory variables (23) and regarding the
maximum number of observations with available data (28) inexactness due to multicollinearity

Factors affecting success
171
can be expected. To minimize this negative effect in calculations, the number of explanatory
variables has been reduced. The criteria for the selection of variables for the multiple regression
model are four: 1) correlation between variables have to exist, 2) the correlation has to be
significant, 3) the number of observations have to be higher than 20 and 4) the explanatory
variables have to be metric (Table 35)41.
Table 35: Variables for the multiple regression model
As a result of the selection, only the following five variables have been inserted in the
model:
41 Dichotomous, nominal and ordinal variables may be zero (option “no”). Since the explanatory
variables Xi are transformed into an logarithmic function Ln(Xi), if Xi =0 the model will not work.
Independent variable
Dependent variable
Correlation level
Significant NType of
explanatory variable
Selection multiple
regressionNumber of bicycles Low No 28 Metric NoNumber of stations Low Yes 23 Metric YesDistance between
stationsMedium No 11 Metric No
Density of stations (station/km2)
Low Yes 23 Metric Yes
Technology of the docking device
No correlation
No 28 Ordinal No
Way of identification Nominal
All-year-round service Low Yes 28 Dichotomous No
Round-the-clock-service
No correlation
No 28 Dichotomous No
Validity of long-term subscriptions
No correlation
No 28 Dichotomous No
Rental period free of charge
Ordinal
Metro stations provided with BSS
High Yes 6 Metric No
Advantageous fee for PT passengers
No correlation
No 28 Dichotomous No
PopulationNo correlation
No 28 Metric No
Population density Low Yes 28 Metric YesAverage yearly
temperatureLow Yes 26 Metric Yes
Car modal shareNo correlation
No 28 Metric No
Cycle network density
No correlation
No 28 Metric No
Cycling modal share Low Yes 27 Metric Yes
PT modal shareNo correlation
No 27 Metric No
Permission to carry bikes in trains
No correlation
No 28 Dichotomous No
Tourism densityNo correlation
No 25 Metric No
Theft per cycle trip Medium Yes 13 Metric NoAccidents per cycle
tripNo correlation
No 16 Metric No
Rents/bicycle*day
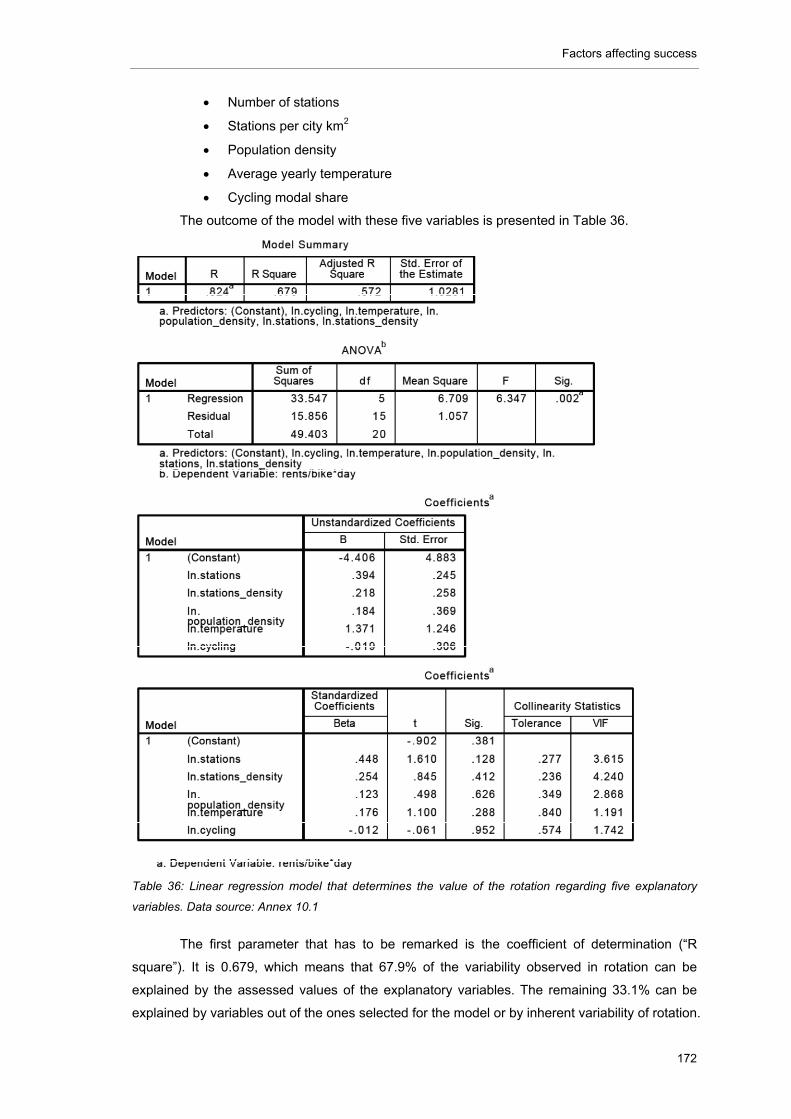
Factors affecting success
172
Number of stations
Stations per city km2
Population density
Average yearly temperature
Cycling modal share
The outcome of the model with these five variables is presented in Table 36.
Table 36: Linear regression model that determines the value of the rotation regarding five explanatory
variables. Data source: Annex 10.1
The first parameter that has to be remarked is the coefficient of determination (“R
square”). It is 0.679, which means that 67.9% of the variability observed in rotation can be
explained by the assessed values of the explanatory variables. The remaining 33.1% can be
explained by variables out of the ones selected for the model or by inherent variability of rotation.
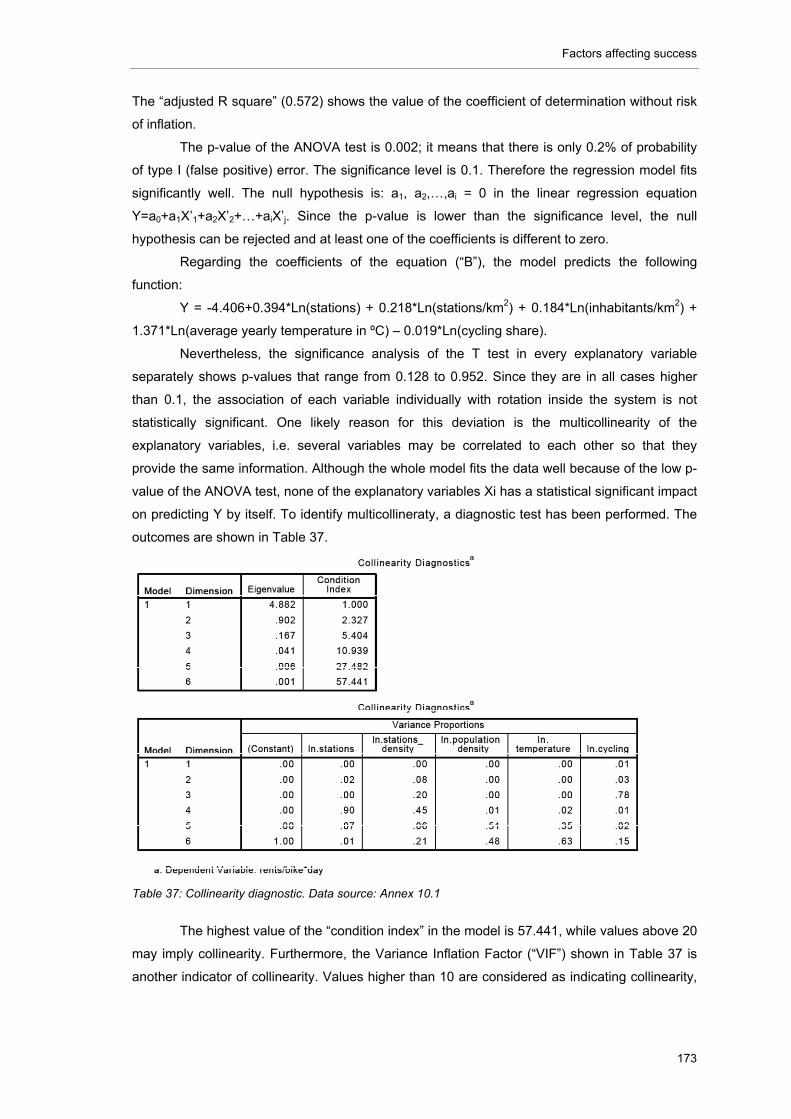
Factors affecting success
173
The “adjusted R square” (0.572) shows the value of the coefficient of determination without risk
of inflation.
The p-value of the ANOVA test is 0.002; it means that there is only 0.2% of probability
of type I (false positive) error. The significance level is 0.1. Therefore the regression model fits
significantly well. The null hypothesis is: a1, a2,…,ai = 0 in the linear regression equation
Y=a0+a1X’1+a2X’2+…+aiX’j. Since the p-value is lower than the significance level, the null
hypothesis can be rejected and at least one of the coefficients is different to zero.
Regarding the coefficients of the equation (“B”), the model predicts the following
function:
Y = -4.406+0.394*Ln(stations) + 0.218*Ln(stations/km2) + 0.184*Ln(inhabitants/km2) +
1.371*Ln(average yearly temperature in ºC) – 0.019*Ln(cycling share).
Nevertheless, the significance analysis of the T test in every explanatory variable
separately shows p-values that range from 0.128 to 0.952. Since they are in all cases higher
than 0.1, the association of each variable individually with rotation inside the system is not
statistically significant. One likely reason for this deviation is the multicollinearity of the
explanatory variables, i.e. several variables may be correlated to each other so that they
provide the same information. Although the whole model fits the data well because of the low p-
value of the ANOVA test, none of the explanatory variables Xi has a statistical significant impact
on predicting Y by itself. To identify multicollineraty, a diagnostic test has been performed. The
outcomes are shown in Table 37.
Table 37: Collinearity diagnostic. Data source: Annex 10.1
The highest value of the “condition index” in the model is 57.441, while values above 20
may imply collinearity. Furthermore, the Variance Inflation Factor (“VIF”) shown in Table 37 is
another indicator of collinearity. Values higher than 10 are considered as indicating collinearity,
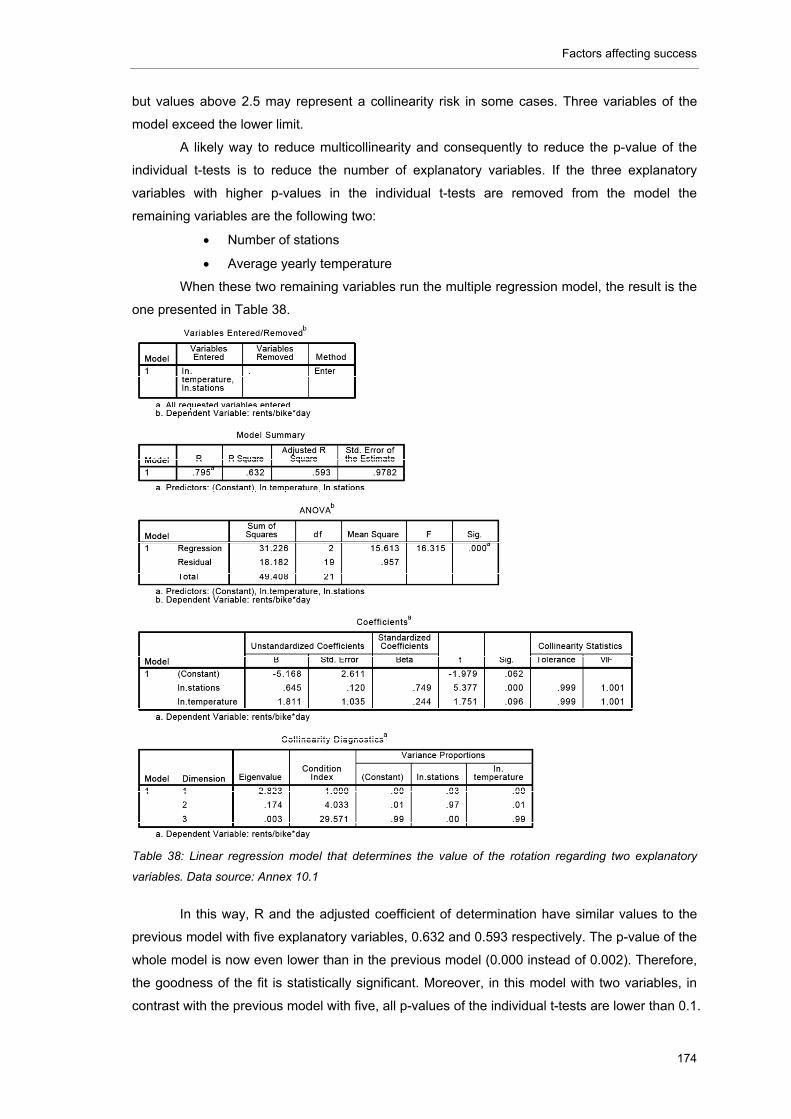
Factors affecting success
174
but values above 2.5 may represent a collinearity risk in some cases. Three variables of the
model exceed the lower limit.
A likely way to reduce multicollinearity and consequently to reduce the p-value of the
individual t-tests is to reduce the number of explanatory variables. If the three explanatory
variables with higher p-values in the individual t-tests are removed from the model the
remaining variables are the following two:
Number of stations
Average yearly temperature
When these two remaining variables run the multiple regression model, the result is the
one presented in Table 38.
Table 38: Linear regression model that determines the value of the rotation regarding two explanatory
variables. Data source: Annex 10.1
In this way, R and the adjusted coefficient of determination have similar values to the
previous model with five explanatory variables, 0.632 and 0.593 respectively. The p-value of the
whole model is now even lower than in the previous model (0.000 instead of 0.002). Therefore,
the goodness of the fit is statistically significant. Moreover, in this model with two variables, in
contrast with the previous model with five, all p-values of the individual t-tests are lower than 0.1.
Factors affecting success
175
They are now 0.000 for the number of station and 0.096 for the average temperature (0.062 for
the constant). Therefore, not only the model fits well, but also the variables individually are
significant correlated with rotation.
According to this model, the new function is:
Y = -5.168+0.645*Ln(stations) + 1.811*Ln(average yearly temperature in ºC)
This function can be interpreted as follow. Based on only these two variables, for
example, if a hypothetical city with 15ºC of average yearly temperature decides to implement a
BSS with 20 stations, it can expect around 1.67 rents per bicycles and day. If the city increases
the number of stations from 20 to 30 the expected increase of rotation will be 15.6% (from 1.67
to 1.93). If the number increases again from 30 to 40, rotation will be 9.3% higher. And from 40
to 50 stations the increase of rotation will be 5.2%. The decreasing increase of rotation as the
number of stations grows is indicative of the original logarithmic function of rotation.
Unfortunately, it is not possible to include more explanatory variables in the model due
to multicollinearity. Actually, this combination of explanatory variables is the only one that builds
a model with significant results in the individual t-tests (p-values below 0.1). To include more
than two explanatory variables in the model avoiding the effects of collinearity, it would be
necessary: 1) to search for new variables not included in Table 35, 2) to increase the size of the
sample, i.e. more than 28 cases studies with available data and 3) to fill the gaps of not
available data in the data matrix.
7.3 Barriers
7.3.1 Overuse
Overuse means that bike-sharing bicycles are rented and ridden more than expected or
desired. The level of overuse (and underuse) of a BSS can be determined and foreseen by
mean of three likely indicators:
The number of long-term subscriptions per available bicycle.
The rotation of bike-sharing bicycles, i.e. the number of times that a bicycle is
rented in a day.
The daily distance covered per bicycle.
Normally, the origin of overuse (and underuse) is an inaccurate estimation of demand
and supply of bike-sharing services. An insufficient number of bike-sharing bicycles compared
to demand or an excessive demand compared to the number bicycles can cause overuse of
BSSs.
Bicing is a representative example of under-estimation of demand. Before the launch of
the BSS, the City of Barcelona estimated that 40,000 persons would become members of the
BSS. However, 30,000 subscriptions were reported only in the first two months of operation and
after one year there were about 100,000 subscribers, more than the double of expected (Bikeoff
2008b; NYC Department of City Planning 2009).
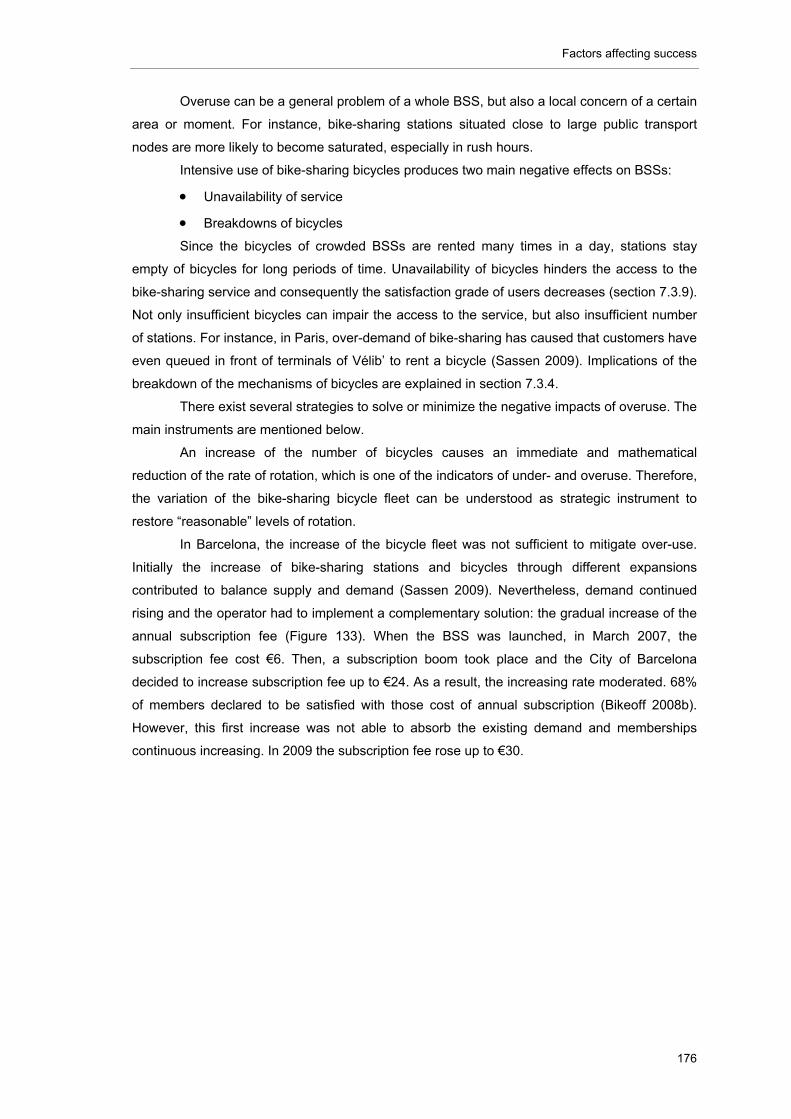
Factors affecting success
176
Overuse can be a general problem of a whole BSS, but also a local concern of a certain
area or moment. For instance, bike-sharing stations situated close to large public transport
nodes are more likely to become saturated, especially in rush hours.
Intensive use of bike-sharing bicycles produces two main negative effects on BSSs:
Unavailability of service
Breakdowns of bicycles
Since the bicycles of crowded BSSs are rented many times in a day, stations stay
empty of bicycles for long periods of time. Unavailability of bicycles hinders the access to the
bike-sharing service and consequently the satisfaction grade of users decreases (section 7.3.9).
Not only insufficient bicycles can impair the access to the service, but also insufficient number
of stations. For instance, in Paris, over-demand of bike-sharing has caused that customers have
even queued in front of terminals of Vélib’ to rent a bicycle (Sassen 2009). Implications of the
breakdown of the mechanisms of bicycles are explained in section 7.3.4.
There exist several strategies to solve or minimize the negative impacts of overuse. The
main instruments are mentioned below.
An increase of the number of bicycles causes an immediate and mathematical
reduction of the rate of rotation, which is one of the indicators of under- and overuse. Therefore,
the variation of the bike-sharing bicycle fleet can be understood as strategic instrument to
restore “reasonable” levels of rotation.
In Barcelona, the increase of the bicycle fleet was not sufficient to mitigate over-use.
Initially the increase of bike-sharing stations and bicycles through different expansions
contributed to balance supply and demand (Sassen 2009). Nevertheless, demand continued
rising and the operator had to implement a complementary solution: the gradual increase of the
annual subscription fee (Figure 133). When the BSS was launched, in March 2007, the
subscription fee cost €6. Then, a subscription boom took place and the City of Barcelona
decided to increase subscription fee up to €24. As a result, the increasing rate moderated. 68%
of members declared to be satisfied with those cost of annual subscription (Bikeoff 2008b).
However, this first increase was not able to absorb the existing demand and memberships
continuous increasing. In 2009 the subscription fee rose up to €30.
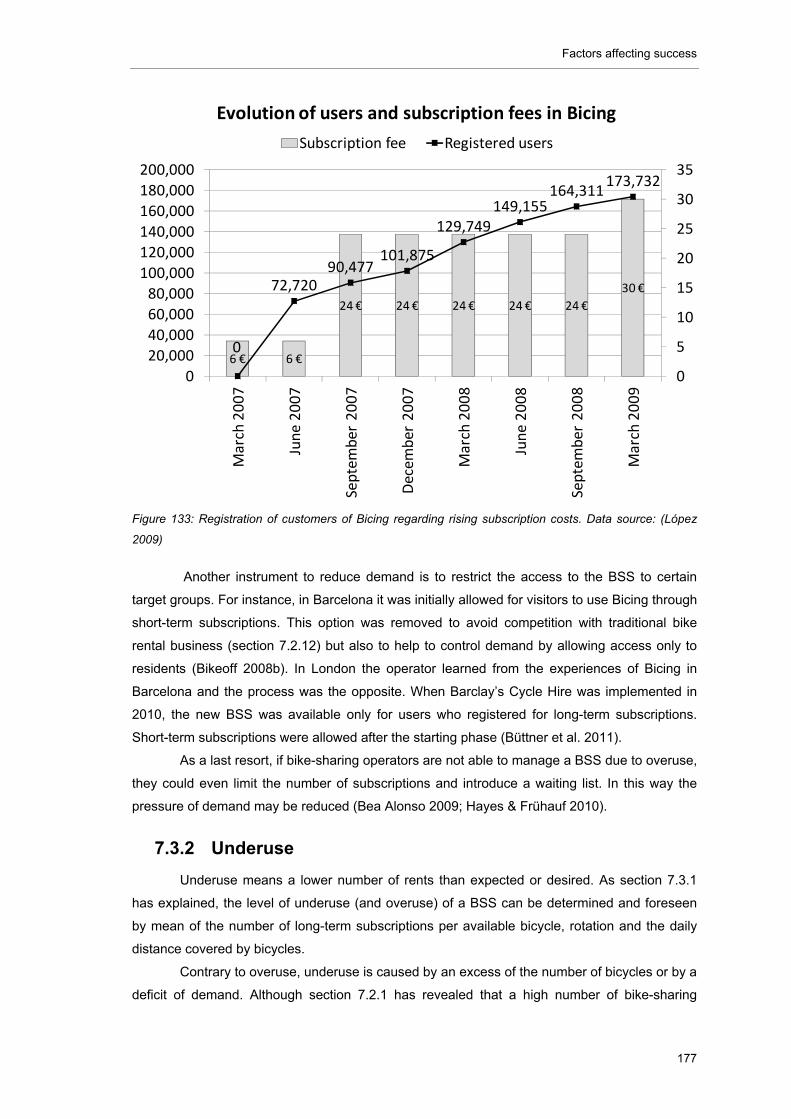
Factors affecting success
177
Figure 133: Registration of customers of Bicing regarding rising subscription costs. Data source: (López
2009)
Another instrument to reduce demand is to restrict the access to the BSS to certain
target groups. For instance, in Barcelona it was initially allowed for visitors to use Bicing through
short-term subscriptions. This option was removed to avoid competition with traditional bike
rental business (section 7.2.12) but also to help to control demand by allowing access only to
residents (Bikeoff 2008b). In London the operator learned from the experiences of Bicing in
Barcelona and the process was the opposite. When Barclay’s Cycle Hire was implemented in
2010, the new BSS was available only for users who registered for long-term subscriptions.
Short-term subscriptions were allowed after the starting phase (Büttner et al. 2011).
As a last resort, if bike-sharing operators are not able to manage a BSS due to overuse,
they could even limit the number of subscriptions and introduce a waiting list. In this way the
pressure of demand may be reduced (Bea Alonso 2009; Hayes & Frühauf 2010).
7.3.2 Underuse
Underuse means a lower number of rents than expected or desired. As section 7.3.1
has explained, the level of underuse (and overuse) of a BSS can be determined and foreseen
by mean of the number of long-term subscriptions per available bicycle, rotation and the daily
distance covered by bicycles.
Contrary to overuse, underuse is caused by an excess of the number of bicycles or by a
deficit of demand. Although section 7.2.1 has revealed that a high number of bike-sharing
6 € 6 €
24 € 24 € 24 € 24 € 24 €
30 €
0
72,72090,477
101,875
129,749149,155
164,311173,732
0
5
10
15
20
25
30
35
0
20,000
40,000
60,000
80,000
100,000
120,000
140,000
160,000
180,000
200,000
March 2007
June 2007
September 2007
Decem
ber 2007
March 2008
June 2008
September 2008
March 2009
Evolution of users and subscription fees in Bicing
Subscription fee Registered users
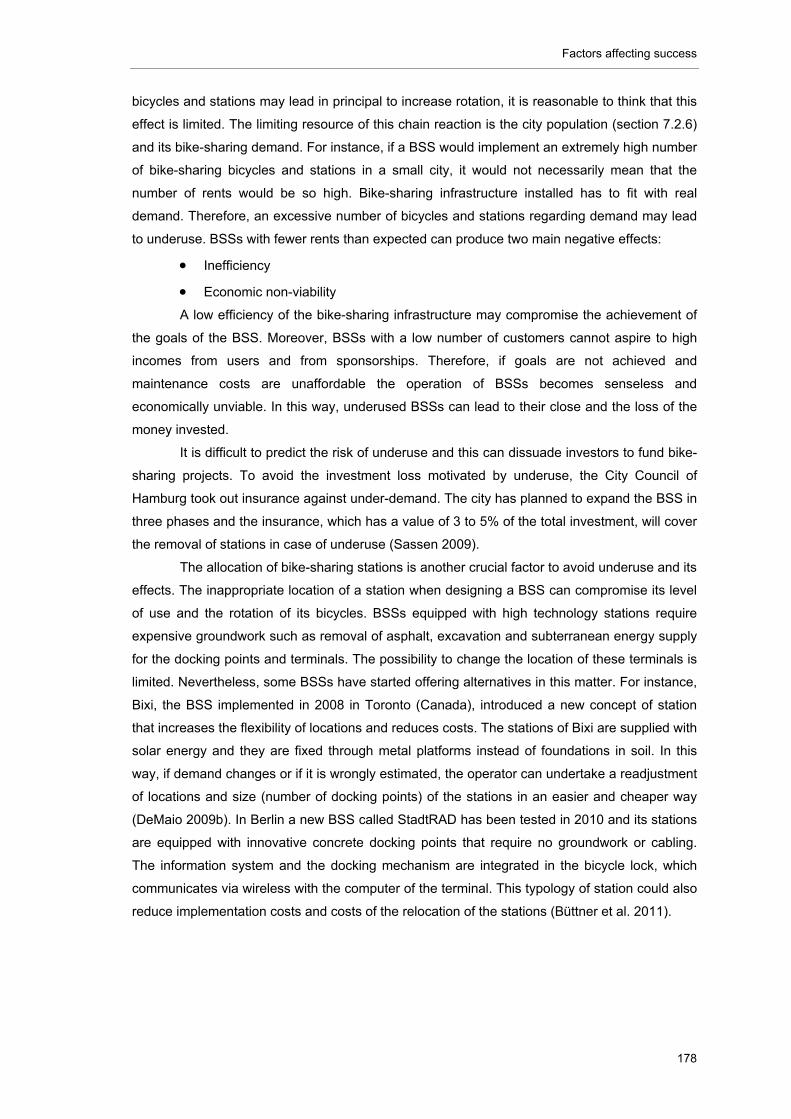
Factors affecting success
178
bicycles and stations may lead in principal to increase rotation, it is reasonable to think that this
effect is limited. The limiting resource of this chain reaction is the city population (section 7.2.6)
and its bike-sharing demand. For instance, if a BSS would implement an extremely high number
of bike-sharing bicycles and stations in a small city, it would not necessarily mean that the
number of rents would be so high. Bike-sharing infrastructure installed has to fit with real
demand. Therefore, an excessive number of bicycles and stations regarding demand may lead
to underuse. BSSs with fewer rents than expected can produce two main negative effects:
Inefficiency
Economic non-viability
A low efficiency of the bike-sharing infrastructure may compromise the achievement of
the goals of the BSS. Moreover, BSSs with a low number of customers cannot aspire to high
incomes from users and from sponsorships. Therefore, if goals are not achieved and
maintenance costs are unaffordable the operation of BSSs becomes senseless and
economically unviable. In this way, underused BSSs can lead to their close and the loss of the
money invested.
It is difficult to predict the risk of underuse and this can dissuade investors to fund bike-
sharing projects. To avoid the investment loss motivated by underuse, the City Council of
Hamburg took out insurance against under-demand. The city has planned to expand the BSS in
three phases and the insurance, which has a value of 3 to 5% of the total investment, will cover
the removal of stations in case of underuse (Sassen 2009).
The allocation of bike-sharing stations is another crucial factor to avoid underuse and its
effects. The inappropriate location of a station when designing a BSS can compromise its level
of use and the rotation of its bicycles. BSSs equipped with high technology stations require
expensive groundwork such as removal of asphalt, excavation and subterranean energy supply
for the docking points and terminals. The possibility to change the location of these terminals is
limited. Nevertheless, some BSSs have started offering alternatives in this matter. For instance,
Bixi, the BSS implemented in 2008 in Toronto (Canada), introduced a new concept of station
that increases the flexibility of locations and reduces costs. The stations of Bixi are supplied with
solar energy and they are fixed through metal platforms instead of foundations in soil. In this
way, if demand changes or if it is wrongly estimated, the operator can undertake a readjustment
of locations and size (number of docking points) of the stations in an easier and cheaper way
(DeMaio 2009b). In Berlin a new BSS called StadtRAD has been tested in 2010 and its stations
are equipped with innovative concrete docking points that require no groundwork or cabling.
The information system and the docking mechanism are integrated in the bicycle lock, which
communicates via wireless with the computer of the terminal. This typology of station could also
reduce implementation costs and costs of the relocation of the stations (Büttner et al. 2011).
Factors affecting success
179
Figure 134: Metal superficial station of Bixi in Montreal (right) (DeMaio 2009b) and concrete station of
StadtRAD in Berlin (left) (Büttner et al. 2011)
7.3.3 Theft and damage of bicycles
Although private bicycle theft in cities can be argued as a reason to use bike-sharing
(section 7.2.13), vandalism produces also negative effects in BSSs such as theft and damage of
bike-sharing bicycles.
Figure 135 shows the average annual number of bicycles stolen of the case studies of
this dissertation. It has been calculated by dividing the aggregated number of bicycles stolen
from the start of the BSS by the time of life of these BSSs.
Figure 135: Stolen bicycles per year of operation. Data source: Annex 10.1
If is normalized by the number of bicycles of the bike-sharing fleet, the resulting Figure
136 reveals that in cities such as Seville, Brescia, Krakow and Paris about 50%, 40%, 36% and
24% of the existing bike-sharing fleet is annually stolen. In contrast, in other cities the affection
2
4,926
29136
989
2 0 12 61 1 18 6 48 0 0 1 0 2 0 10
1,000
2,000
3,000
4,000
5,000
Lo
nd
on
(UK
)
Pa
ris
(FR
)
Ba
rce
lon
a (E
S)
Kra
kow
(P
L)
Se
ville
(ES
)
Bri
sto
l (U
K)
Go
the
nb
urg
-2
Mo
ntp
elli
er (
FR
)
Vito
ria
(E
S)
Mo
de
na
(IT
)
Pa
mp
lon
a (E
S)
Pa
rma
(IT
)
Bre
scia
(IT
)
Rim
ini (
IT)
Bo
lza
no
(IT
)
Cu
ne
o (I
T)
Ch
alo
n-s
ur-
Sa
ôn
e (F
R)
Se
nig
alli
a (I
T)
Terl
izzi
(IT
)
Mö
dlin
g (A
T)
Th
eft
s /
yea
r
Cities sorted by population in decreasing order from left to right
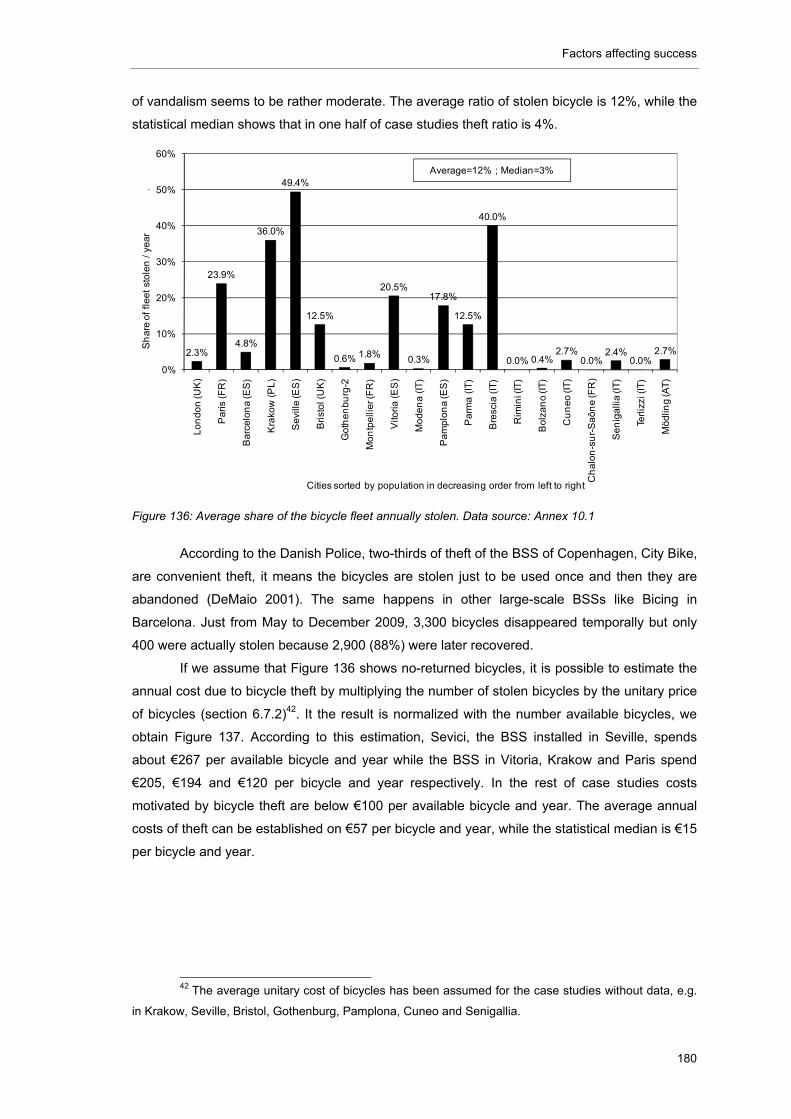
Factors affecting success
180
of vandalism seems to be rather moderate. The average ratio of stolen bicycle is 12%, while the
statistical median shows that in one half of case studies theft ratio is 4%.
Figure 136: Average share of the bicycle fleet annually stolen. Data source: Annex 10.1
According to the Danish Police, two-thirds of theft of the BSS of Copenhagen, City Bike,
are convenient theft, it means the bicycles are stolen just to be used once and then they are
abandoned (DeMaio 2001). The same happens in other large-scale BSSs like Bicing in
Barcelona. Just from May to December 2009, 3,300 bicycles disappeared temporally but only
400 were actually stolen because 2,900 (88%) were later recovered.
If we assume that Figure 136 shows no-returned bicycles, it is possible to estimate the
annual cost due to bicycle theft by multiplying the number of stolen bicycles by the unitary price
of bicycles (section 6.7.2)42. It the result is normalized with the number available bicycles, we
obtain Figure 137. According to this estimation, Sevici, the BSS installed in Seville, spends
about €267 per available bicycle and year while the BSS in Vitoria, Krakow and Paris spend
€205, €194 and €120 per bicycle and year respectively. In the rest of case studies costs
motivated by bicycle theft are below €100 per available bicycle and year. The average annual
costs of theft can be established on €57 per bicycle and year, while the statistical median is €15
per bicycle and year.
42 The average unitary cost of bicycles has been assumed for the case studies without data, e.g.
in Krakow, Seville, Bristol, Gothenburg, Pamplona, Cuneo and Senigallia.
2.3%
23.9%
4.8%
36.0%
49.4%
12.5%
0.6% 1.8%
20.5%
0.3%
17.8%
12.5%
40.0%
0.0% 0.4%2.7%
0.0%2.4%
0.0%2.7%
0%
10%
20%
30%
40%
50%
60%
Lo
nd
on
(UK
)
Pa
ris
(FR
)
Ba
rce
lon
a (E
S)
Kra
kow
(P
L)
Se
ville
(ES
)
Bri
sto
l (U
K)
Go
the
nb
urg
-2
Mo
ntp
elli
er (
FR
)
Vito
ria
(E
S)
Mo
de
na
(IT
)
Pa
mp
lon
a (E
S)
Pa
rma
(IT
)
Bre
scia
(IT
)
Rim
ini (
IT)
Bo
lza
no
(IT
)
Cu
ne
o (I
T)
Ch
alo
n-s
ur-
Sa
ôn
e (F
R)
Se
nig
alli
a (I
T)
Terl
izzi
(IT
)
Mö
dlin
g (A
T)
Sh
are
of
fle
et
sto
len
/ ye
ar
.
Cities sorted by population in decreasing order from left to right
Average=12% ; Median=3%
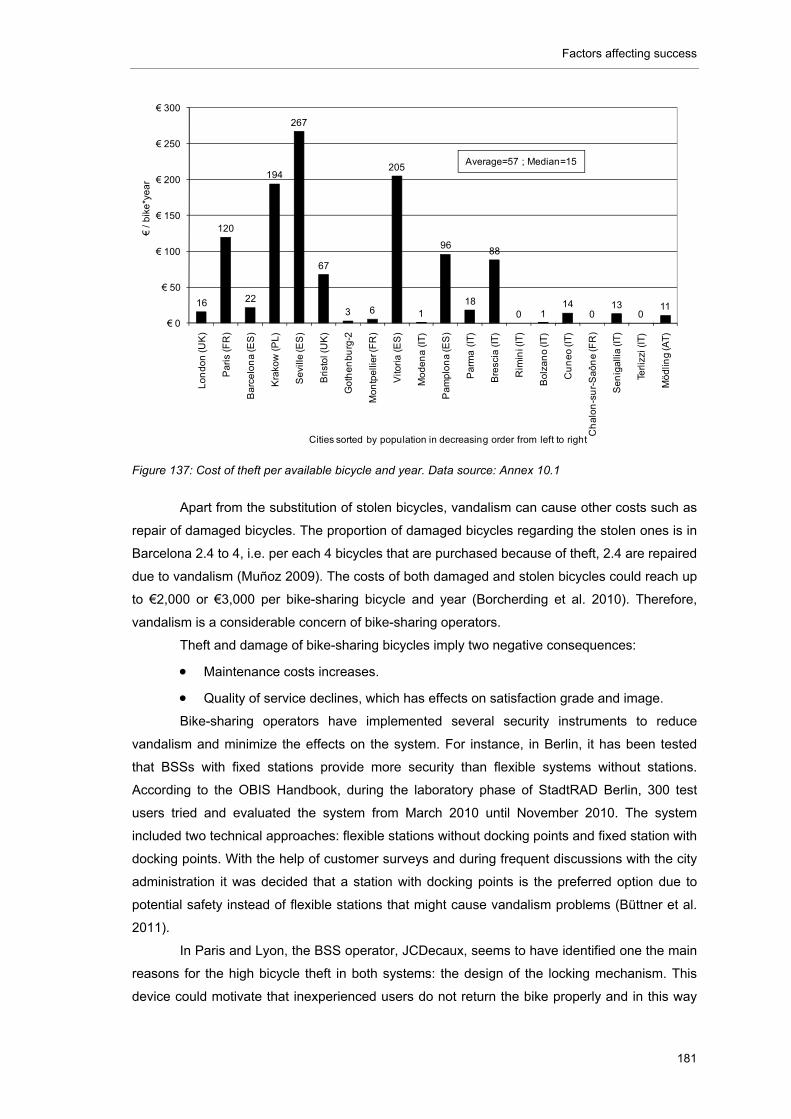
Factors affecting success
181
Figure 137: Cost of theft per available bicycle and year. Data source: Annex 10.1
Apart from the substitution of stolen bicycles, vandalism can cause other costs such as
repair of damaged bicycles. The proportion of damaged bicycles regarding the stolen ones is in
Barcelona 2.4 to 4, i.e. per each 4 bicycles that are purchased because of theft, 2.4 are repaired
due to vandalism (Muñoz 2009). The costs of both damaged and stolen bicycles could reach up
to €2,000 or €3,000 per bike-sharing bicycle and year (Borcherding et al. 2010). Therefore,
vandalism is a considerable concern of bike-sharing operators.
Theft and damage of bike-sharing bicycles imply two negative consequences:
Maintenance costs increases.
Quality of service declines, which has effects on satisfaction grade and image.
Bike-sharing operators have implemented several security instruments to reduce
vandalism and minimize the effects on the system. For instance, in Berlin, it has been tested
that BSSs with fixed stations provide more security than flexible systems without stations.
According to the OBIS Handbook, during the laboratory phase of StadtRAD Berlin, 300 test
users tried and evaluated the system from March 2010 until November 2010. The system
included two technical approaches: flexible stations without docking points and fixed station with
docking points. With the help of customer surveys and during frequent discussions with the city
administration it was decided that a station with docking points is the preferred option due to
potential safety instead of flexible stations that might cause vandalism problems (Büttner et al.
2011).
In Paris and Lyon, the BSS operator, JCDecaux, seems to have identified one the main
reasons for the high bicycle theft in both systems: the design of the locking mechanism. This
device could motivate that inexperienced users do not return the bike properly and in this way
16
120
22
194
267
67
3 6
205
1
96
18
88
0 114
013
011
€ 0
€ 50
€ 100
€ 150
€ 200
€ 250
€ 300
Lo
nd
on
(UK
)
Pa
ris
(FR
)
Ba
rce
lon
a (E
S)
Kra
kow
(P
L)
Se
ville
(ES
)
Bri
sto
l (U
K)
Go
the
nb
urg
-2
Mo
ntp
elli
er (
FR
)
Vito
ria
(E
S)
Mo
de
na
(IT
)
Pa
mp
lon
a (E
S)
Pa
rma
(IT
)
Bre
scia
(IT
)
Rim
ini (
IT)
Bo
lza
no
(IT
)
Cu
ne
o (I
T)
Ch
alo
n-s
ur-
Sa
ôn
e (F
R)
Se
nig
alli
a (I
T)
Terl
izzi
(IT
)
Mö
dlin
g (A
T)
€/
bik
e*y
ea
r
Cities sorted by population in decreasing order from left to right
Average=57 ; Median=15
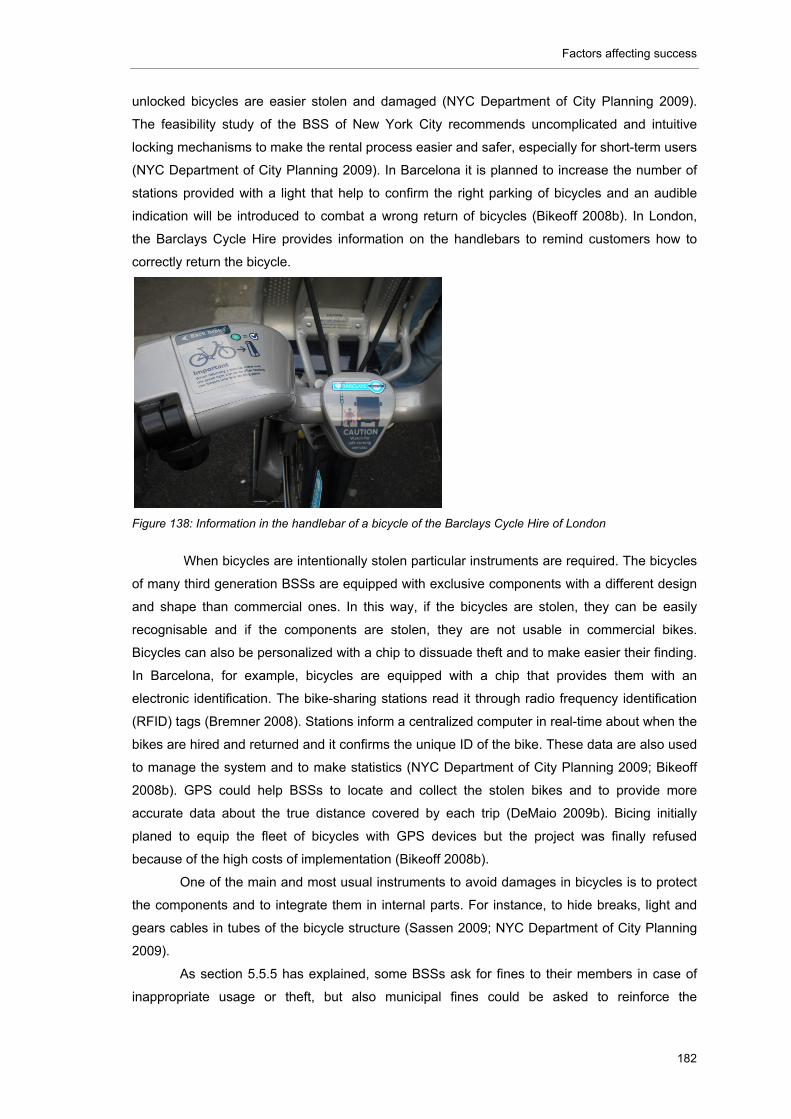
Factors affecting success
182
unlocked bicycles are easier stolen and damaged (NYC Department of City Planning 2009).
The feasibility study of the BSS of New York City recommends uncomplicated and intuitive
locking mechanisms to make the rental process easier and safer, especially for short-term users
(NYC Department of City Planning 2009). In Barcelona it is planned to increase the number of
stations provided with a light that help to confirm the right parking of bicycles and an audible
indication will be introduced to combat a wrong return of bicycles (Bikeoff 2008b). In London,
the Barclays Cycle Hire provides information on the handlebars to remind customers how to
correctly return the bicycle.
Figure 138: Information in the handlebar of a bicycle of the Barclays Cycle Hire of London
When bicycles are intentionally stolen particular instruments are required. The bicycles
of many third generation BSSs are equipped with exclusive components with a different design
and shape than commercial ones. In this way, if the bicycles are stolen, they can be easily
recognisable and if the components are stolen, they are not usable in commercial bikes.
Bicycles can also be personalized with a chip to dissuade theft and to make easier their finding.
In Barcelona, for example, bicycles are equipped with a chip that provides them with an
electronic identification. The bike-sharing stations read it through radio frequency identification
(RFID) tags (Bremner 2008). Stations inform a centralized computer in real-time about when the
bikes are hired and returned and it confirms the unique ID of the bike. These data are also used
to manage the system and to make statistics (NYC Department of City Planning 2009; Bikeoff
2008b). GPS could help BSSs to locate and collect the stolen bikes and to provide more
accurate data about the true distance covered by each trip (DeMaio 2009b). Bicing initially
planed to equip the fleet of bicycles with GPS devices but the project was finally refused
because of the high costs of implementation (Bikeoff 2008b).
One of the main and most usual instruments to avoid damages in bicycles is to protect
the components and to integrate them in internal parts. For instance, to hide breaks, light and
gears cables in tubes of the bicycle structure (Sassen 2009; NYC Department of City Planning
2009).
As section 5.5.5 has explained, some BSSs ask for fines to their members in case of
inappropriate usage or theft, but also municipal fines could be asked to reinforce the
Factors affecting success
183
punishment. A report of the Bikeoff project, which studied the main weakness and most
common incidents of the security of Bicing in Barcelona, has suggested this solution. Despite
the particular design of the fleet of Bicing, a considerable number of bicycles has been stolen
and some of them appear abandoned in the city of Barcelona, in the metropolitan area or even
in far cities such as Bilbao, where the cycles cannot be recognised. The chips with the
electronic identification have been sometimes removed, docking points have been manipulated
to avoid the right return of bicycles and enable theft, locks have been cut, bike seat have been
slit and chains, gears and lights damaged. To combat the high rate of vandalism, the City
Council of Barcelona plans to implement a municipal fine of €750 based on breach of the civil
laws (Muñoz 2009).
7.3.4 Breakdowns
During their operative life, bicycles can break down. The types of damages in bike-
sharing bicycles are diverse. A user survey carried out in 2006 in London revealed the most
frequent defects of bicycles of the BSS OYbike were the following (Noland & Ishaque 2006): 30%
of customers stated that “gears did not work well” while 26% assured that “locking device did
not work or was difficult to use”. Other problems found were that “pedals were broken” (17%),
“brakes did not work well” (15%), “seat adjustment was incorrect” (11%), “tyre pressure was too
low” (9%) and “lights and reflector was missing or damaged” (9%)43. Only 28% of customers
affirmed that used bike-sharing bicycles had no faults.
Similar figures can be found in other BSSs. The City Council of Barcelona considers
“normal” that 8% of the bicycle fleet of Bicing has to be daily repaired because of intensive
usage. According to a study of the city of Barcelona, 12% of bicycles available at bike-sharing
stations have heavy functional defects that avoid the normal usage and 55% of bicycles have
light defects such as broken bells and lights. These light defects are compatible with the usage
of the bicycle but illegal according to the municipal traffic rules (Muñoz 2009).
Breakdowns in bicycles can be caused by three reasons: 1) by climate conditions that
boost deterioration of bike-sharing bicycles situated outdoors and exposed to meteorological
agents, 2) by vandalism and 3) by intensive usage. Breakdowns generate unavailability of
bicycles and lower capacity of the service. Altogether motivates bad image of BSSs and
dissatisfaction of customers. Additionally, transport of staff and bicycles is required for minor
and major repairs. Therefore, breakdowns of bicycles can also increase maintenance costs and
CO2 emissions. High rates of damaged bicycles and the consequent lower level of service might
cause other indirect over-costs. For instance, the municipality of Paris may charge JCDecaux
for not maintaining the fleet in a good state (NYC Department of City Planning 2009).
Operators have implemented several instruments to reduce breakdowns. Bicycles are
especially designed to be robust. For instance, bicycles of Citybike Wien in Vienna are
equipped with tyres filled of gum instead of air filled inner tubes to avoid flats. Bicycles without
gears are also more durable and they report fewer breakdowns (Castro 2009). 43 Multiple responses were allowed in the questionnaire
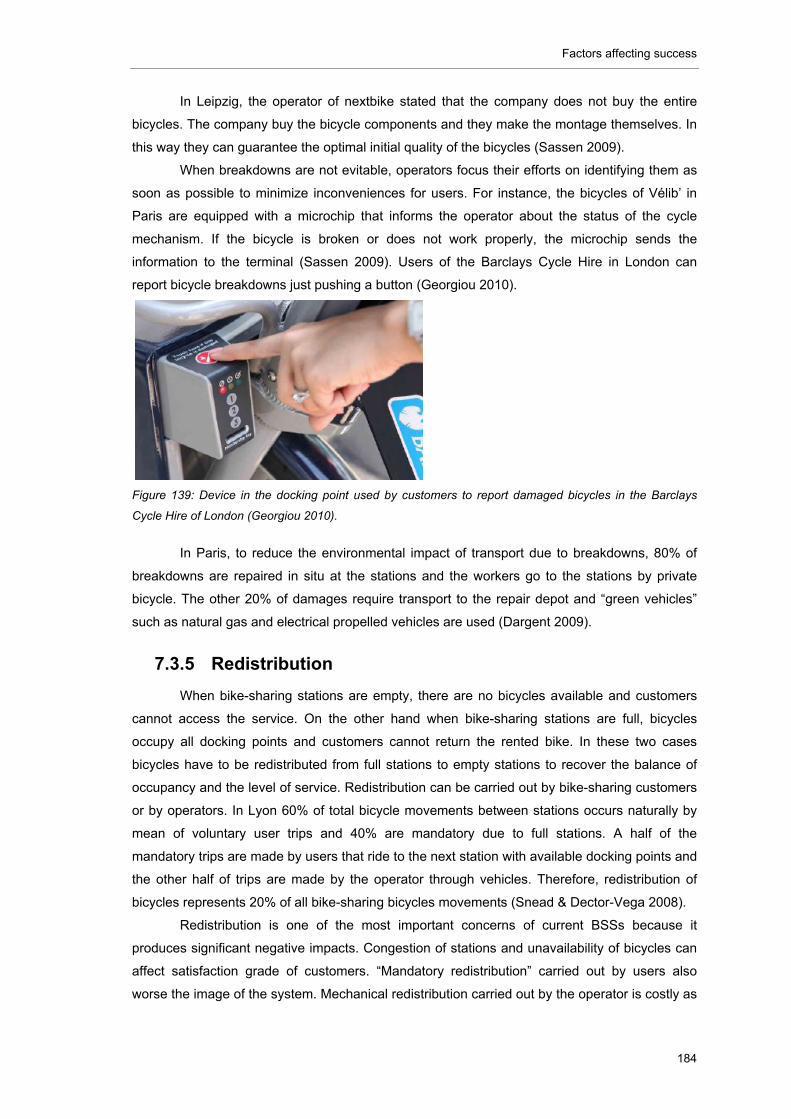
Factors affecting success
184
In Leipzig, the operator of nextbike stated that the company does not buy the entire
bicycles. The company buy the bicycle components and they make the montage themselves. In
this way they can guarantee the optimal initial quality of the bicycles (Sassen 2009).
When breakdowns are not evitable, operators focus their efforts on identifying them as
soon as possible to minimize inconveniences for users. For instance, the bicycles of Vélib’ in
Paris are equipped with a microchip that informs the operator about the status of the cycle
mechanism. If the bicycle is broken or does not work properly, the microchip sends the
information to the terminal (Sassen 2009). Users of the Barclays Cycle Hire in London can
report bicycle breakdowns just pushing a button (Georgiou 2010).
Figure 139: Device in the docking point used by customers to report damaged bicycles in the Barclays
Cycle Hire of London (Georgiou 2010).
In Paris, to reduce the environmental impact of transport due to breakdowns, 80% of
breakdowns are repaired in situ at the stations and the workers go to the stations by private
bicycle. The other 20% of damages require transport to the repair depot and “green vehicles”
such as natural gas and electrical propelled vehicles are used (Dargent 2009).
7.3.5 Redistribution
When bike-sharing stations are empty, there are no bicycles available and customers
cannot access the service. On the other hand when bike-sharing stations are full, bicycles
occupy all docking points and customers cannot return the rented bike. In these two cases
bicycles have to be redistributed from full stations to empty stations to recover the balance of
occupancy and the level of service. Redistribution can be carried out by bike-sharing customers
or by operators. In Lyon 60% of total bicycle movements between stations occurs naturally by
mean of voluntary user trips and 40% are mandatory due to full stations. A half of the
mandatory trips are made by users that ride to the next station with available docking points and
the other half of trips are made by the operator through vehicles. Therefore, redistribution of
bicycles represents 20% of all bike-sharing bicycles movements (Snead & Dector-Vega 2008).
Redistribution is one of the most important concerns of current BSSs because it
produces significant negative impacts. Congestion of stations and unavailability of bicycles can
affect satisfaction grade of customers. “Mandatory redistribution” carried out by users also
worse the image of the system. Mechanical redistribution carried out by the operator is costly as
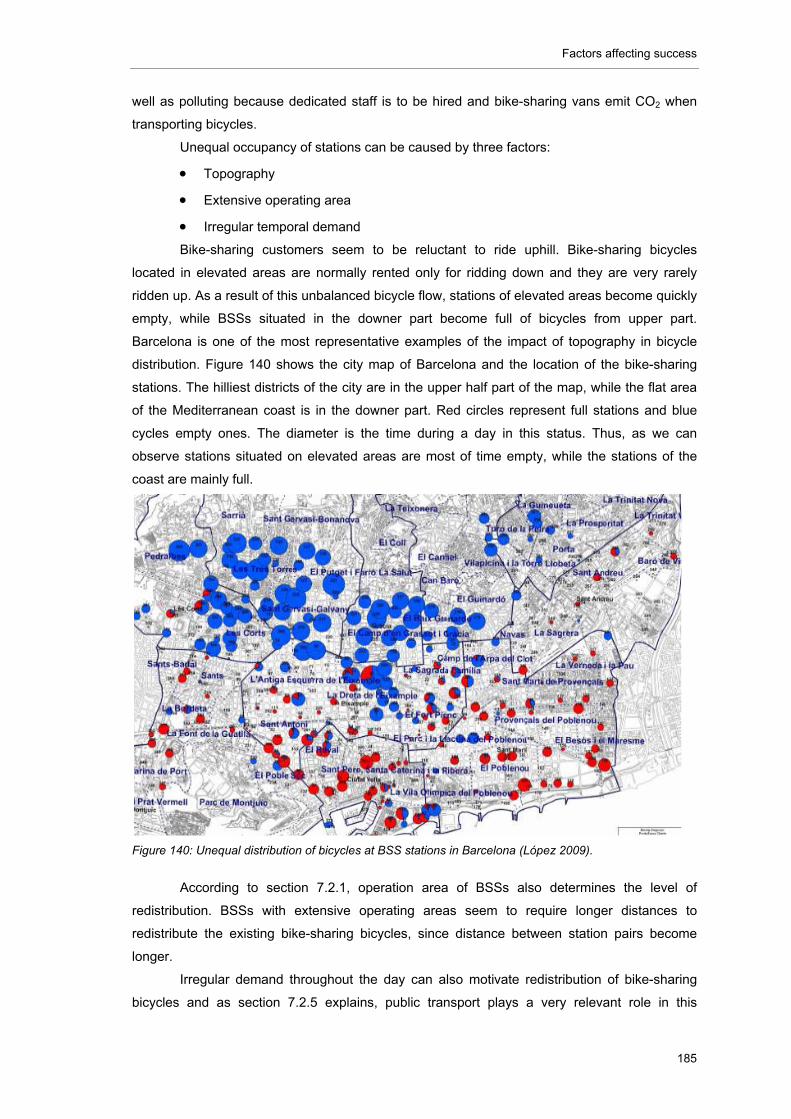
Factors affecting success
185
well as polluting because dedicated staff is to be hired and bike-sharing vans emit CO2 when
transporting bicycles.
Unequal occupancy of stations can be caused by three factors:
Topography
Extensive operating area
Irregular temporal demand
Bike-sharing customers seem to be reluctant to ride uphill. Bike-sharing bicycles
located in elevated areas are normally rented only for ridding down and they are very rarely
ridden up. As a result of this unbalanced bicycle flow, stations of elevated areas become quickly
empty, while BSSs situated in the downer part become full of bicycles from upper part.
Barcelona is one of the most representative examples of the impact of topography in bicycle
distribution. Figure 140 shows the city map of Barcelona and the location of the bike-sharing
stations. The hilliest districts of the city are in the upper half part of the map, while the flat area
of the Mediterranean coast is in the downer part. Red circles represent full stations and blue
cycles empty ones. The diameter is the time during a day in this status. Thus, as we can
observe stations situated on elevated areas are most of time empty, while the stations of the
coast are mainly full.
Figure 140: Unequal distribution of bicycles at BSS stations in Barcelona (López 2009).
According to section 7.2.1, operation area of BSSs also determines the level of
redistribution. BSSs with extensive operating areas seem to require longer distances to
redistribute the existing bike-sharing bicycles, since distance between station pairs become
longer.
Irregular demand throughout the day can also motivate redistribution of bike-sharing
bicycles and as section 7.2.5 explains, public transport plays a very relevant role in this
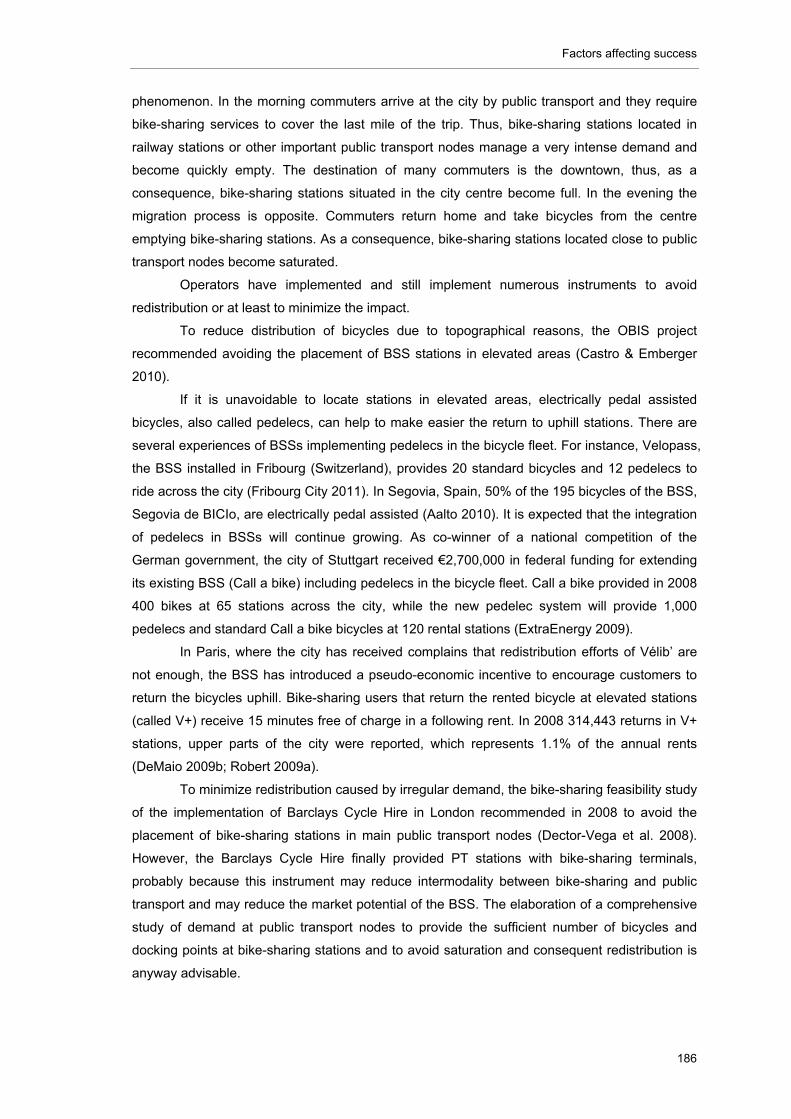
Factors affecting success
186
phenomenon. In the morning commuters arrive at the city by public transport and they require
bike-sharing services to cover the last mile of the trip. Thus, bike-sharing stations located in
railway stations or other important public transport nodes manage a very intense demand and
become quickly empty. The destination of many commuters is the downtown, thus, as a
consequence, bike-sharing stations situated in the city centre become full. In the evening the
migration process is opposite. Commuters return home and take bicycles from the centre
emptying bike-sharing stations. As a consequence, bike-sharing stations located close to public
transport nodes become saturated.
Operators have implemented and still implement numerous instruments to avoid
redistribution or at least to minimize the impact.
To reduce distribution of bicycles due to topographical reasons, the OBIS project
recommended avoiding the placement of BSS stations in elevated areas (Castro & Emberger
2010).
If it is unavoidable to locate stations in elevated areas, electrically pedal assisted
bicycles, also called pedelecs, can help to make easier the return to uphill stations. There are
several experiences of BSSs implementing pedelecs in the bicycle fleet. For instance, Velopass,
the BSS installed in Fribourg (Switzerland), provides 20 standard bicycles and 12 pedelecs to
ride across the city (Fribourg City 2011). In Segovia, Spain, 50% of the 195 bicycles of the BSS,
Segovia de BICIo, are electrically pedal assisted (Aalto 2010). It is expected that the integration
of pedelecs in BSSs will continue growing. As co-winner of a national competition of the
German government, the city of Stuttgart received €2,700,000 in federal funding for extending
its existing BSS (Call a bike) including pedelecs in the bicycle fleet. Call a bike provided in 2008
400 bikes at 65 stations across the city, while the new pedelec system will provide 1,000
pedelecs and standard Call a bike bicycles at 120 rental stations (ExtraEnergy 2009).
In Paris, where the city has received complains that redistribution efforts of Vélib’ are
not enough, the BSS has introduced a pseudo-economic incentive to encourage customers to
return the bicycles uphill. Bike-sharing users that return the rented bicycle at elevated stations
(called V+) receive 15 minutes free of charge in a following rent. In 2008 314,443 returns in V+
stations, upper parts of the city were reported, which represents 1.1% of the annual rents
(DeMaio 2009b; Robert 2009a).
To minimize redistribution caused by irregular demand, the bike-sharing feasibility study
of the implementation of Barclays Cycle Hire in London recommended in 2008 to avoid the
placement of bike-sharing stations in main public transport nodes (Dector-Vega et al. 2008).
However, the Barclays Cycle Hire finally provided PT stations with bike-sharing terminals,
probably because this instrument may reduce intermodality between bike-sharing and public
transport and may reduce the market potential of the BSS. The elaboration of a comprehensive
study of demand at public transport nodes to provide the sufficient number of bicycles and
docking points at bike-sharing stations and to avoid saturation and consequent redistribution is
anyway advisable.
Factors affecting success
187
When despite the instruments against redistribution, unbalance of bicycles at bike-
sharing stations still exist; operators focus their efforts on minimizing the environmental impact
and minimizing the unavailability of bicycles. Concerning the environmental impact of
unavoidable redistribution, some BSSs have introduced clean vehicles to reduce emission of
pollution. For instance, Barclays Cycle Hire in London and Velomagg’ in Montpellier
redistributes bicycles with electric vehicles that do not emit pollution (Büttner et al. 2011;
Georgiou 2010). In Paris, redistribution and maintenance fleet comprises 130 electric bicycles,
20 natural gas and electric vans (NYC Department of City Planning 2009). Moreover, “CO2
emissions of these vehicles are offset by a contract with Climat Mundi, cycle racks are powered
with renewable energy and bicycles are cleaned with collected rainwater without detergent”
(Dargent 2009).
Figure 141: Electric vehicle for redistribution in Barclays Cycle Hire, London. Source (Georgiou 2010)
Concerning the unavailability of bicycles, several different instruments have been
introduced. If a bike-sharing customer arrives at a bike-sharing station to hire a bicycle and the
station is empty or he/she wants to return a bicycle and the station full, in both cases the
customer has to look for another station, what causes his/her dissatisfaction. Most of BSSs
show maps of the bike-sharing station network at terminals to facilitate this search. However, if
live information about the occupancy of stations is offered in advance either by Internet or
mobile phone, customers can go directly to the available station and without inconveniences.
On-line live information is currently rather common in BSSs, while mobile phone information
platforms have started to be implemented. For instance, Bicing provides a mobile phone
platform called I-Bicing, which provides information of the current location of customer, the
closest station and the availability of bicycles and parking places in stations (Romero 2010).
When the arrival of customers to an empty or full station is unavoidable, BSSs have
some tools to minimize the dissatisfaction of users. Certain BSSs such as Citybike Wien in
Vienna encourage “mandatory redistribution” by offering about 15 minutes of additional rental
time if the station is full. Users just have to report this situation at the bike-sharing station and
they receive the extra-time (Citybike Wien 2010). In Barcelona and Stockholm if a station is
empty, customers can make a phone call to report the unavailability of bicycles and the operator,
Clear Channel in both cases, transports bikes with a van and supply immediately the station
with bicycles (Dector-Vega et al. 2008).
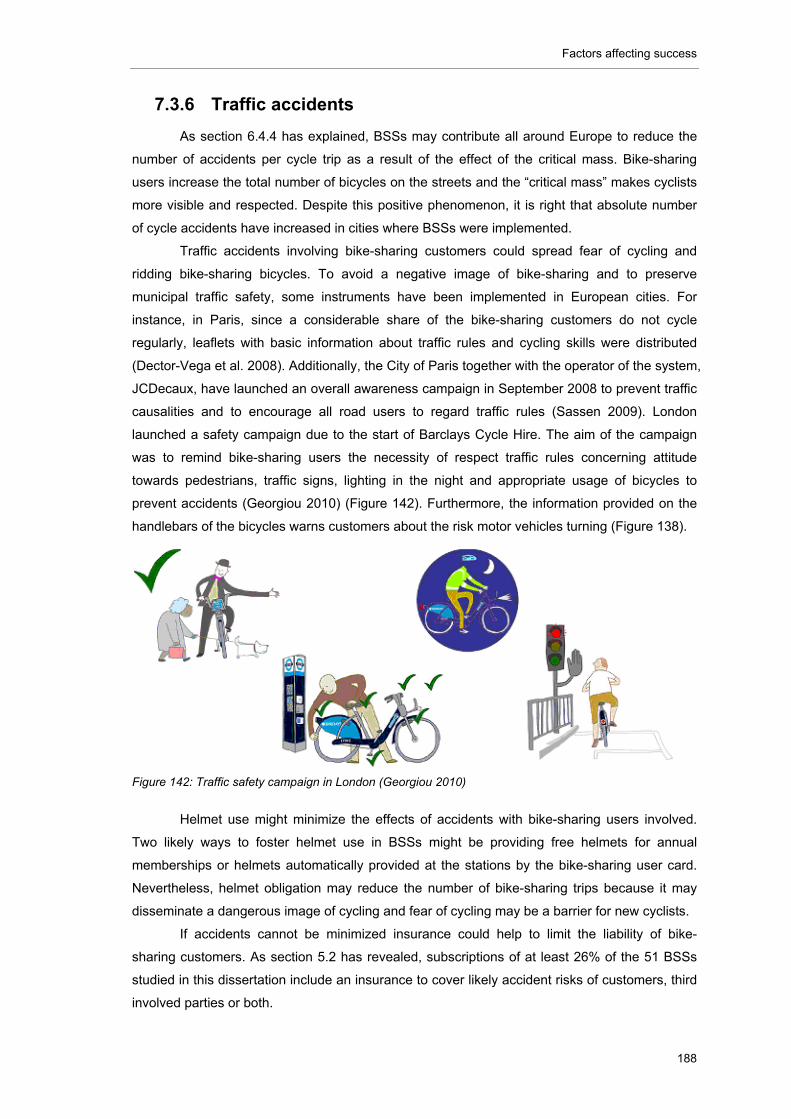
Factors affecting success
188
7.3.6 Traffic accidents
As section 6.4.4 has explained, BSSs may contribute all around Europe to reduce the
number of accidents per cycle trip as a result of the effect of the critical mass. Bike-sharing
users increase the total number of bicycles on the streets and the “critical mass” makes cyclists
more visible and respected. Despite this positive phenomenon, it is right that absolute number
of cycle accidents have increased in cities where BSSs were implemented.
Traffic accidents involving bike-sharing customers could spread fear of cycling and
ridding bike-sharing bicycles. To avoid a negative image of bike-sharing and to preserve
municipal traffic safety, some instruments have been implemented in European cities. For
instance, in Paris, since a considerable share of the bike-sharing customers do not cycle
regularly, leaflets with basic information about traffic rules and cycling skills were distributed
(Dector-Vega et al. 2008). Additionally, the City of Paris together with the operator of the system,
JCDecaux, have launched an overall awareness campaign in September 2008 to prevent traffic
causalities and to encourage all road users to regard traffic rules (Sassen 2009). London
launched a safety campaign due to the start of Barclays Cycle Hire. The aim of the campaign
was to remind bike-sharing users the necessity of respect traffic rules concerning attitude
towards pedestrians, traffic signs, lighting in the night and appropriate usage of bicycles to
prevent accidents (Georgiou 2010) (Figure 142). Furthermore, the information provided on the
handlebars of the bicycles warns customers about the risk motor vehicles turning (Figure 138).
Figure 142: Traffic safety campaign in London (Georgiou 2010)
Helmet use might minimize the effects of accidents with bike-sharing users involved.
Two likely ways to foster helmet use in BSSs might be providing free helmets for annual
memberships or helmets automatically provided at the stations by the bike-sharing user card.
Nevertheless, helmet obligation may reduce the number of bike-sharing trips because it may
disseminate a dangerous image of cycling and fear of cycling may be a barrier for new cyclists.
If accidents cannot be minimized insurance could help to limit the liability of bike-
sharing customers. As section 5.2 has revealed, subscriptions of at least 26% of the 51 BSSs
studied in this dissertation include an insurance to cover likely accident risks of customers, third
involved parties or both.
Factors affecting success
189
7.3.7 Public space conflicts
When planning the introduction of a BSS in a city, the placement of bike-sharing
stations can become a challenge because of unavailability of free public space. Public space in
cities is currently divided by dedicated infrastructure such as sidewalks, cycle ways, roads or
public transport lanes and it is occupied by municipal equipment such as light posting, trees,
benches, billboards and other types of street furniture. As a result of the level of occupancy of
public space, BSSs deal with troubles such as protests from social groups, incompatibility of
existing laws and costs of opportunity.
Bike-sharing stations are mainly located in former sidewalks or car parking places. In
Paris, around 3,000 car-parking slots were converted to bike-sharing stations (Büttner et al.
2011). In contrast, in Barcelona very few stations of Bicing are located on road space (Bikeoff
2008b). In both cities, Paris and Barcelona, when the stations are placed on roads, the limited
bike-sharing area is marked and protected with coloured bollards to avoid incidents and
accidents with car traffic (NYC Department of City Planning 2009). Stations situated in
sidewalks may limit the pedestrian flow and can motivate complaints of pedestrian lobbies and
neighbours associations, while car parking spaces shifted to bike-sharing can cause complaints
of car lobbies. Even cycling associations might feel aggrieved due the occupancy of public
space for bike-sharing stations. For instance, in Hamburg the German Cycling Club (ADFC) has
demanded for a long time the installation of cycling racks for private bicycles and finally
available space has been occupied by a BSS, what has motivated a public complain of the
association (Sassen 2009). Public complains from pedestrians, cars and cyclist might worse the
image of BSSs and reduce the popularity and willingness to use of potential customers.
Moreover, according to the OBIS project “difficulties in terms of physical integration do
mostly occur when stations shall be erected on property around PT stations. Space is often
hardly available especially in crowded inner cities. Additionally PT operators struggle with the
implementation of bike stands for private bikes. Thus the process of authorisation by the PT
operator can take a considerable time span” (Büttner et al. 2011).
The introduction of bike-sharing stations can also entail problems related to the design
and the integration in the urban landscape. For instance, the City of Paris prioritizes sightlines
and has strict rules regarding historical urban landscape. Hence, bike-sharing stations cannot
be found in historic boulevards but inside secondary streets or city parks. Location and design
of bicycles, stations and billboards annexes has been closely controlled to guarantee sightlines
and pedestrian access as well as to minimize visual impact in historical urban areas. The
placement and design of bike-sharing infrastructure has been guided by three organisations: the
Studio of City Planning of Paris (Atelier Parisien d’Urbanisme), the French Architectural
Association (Architectes de Batiments de France) and the Transportation Department (Sections
Territoriales de Voire) (NYC Department of City Planning 2009).
Finally, not only the direct costs of construction of bike-sharing stations but also indirect
costs, such as costs of opportunity of the space occupancy, have to be taken into account. As
Factors affecting success
190
section 6.6.6 explains, the City of Barcelona could earn from €3,670,000 to €7,350,000 as a
result of an alternative exploitation of the public space occupied by the BSS.
To avoid such problems, the EU-project OBIS recommends elaborating a
comprehensive space availability study before implementing any BSS (Castro & Emberger
2010). Afterwards, it is advisable to conduct round tables with all stakeholders affected by the
occupancy of space (social groups and competent departments) and to agree the final location
of stations.
BSSs should be as most space-efficient as possible to enable their implementation but
some considerations concerning station placement should be taken into account. According to
the feasibility study of New York City (NYC Department of City Planning 2009):
“Bike-sharing stations should be placed primarily on roadbeds because this location
does not impact on pedestrians and do not require costly modifications to existing
networks of public services such as sewer”.
“If the station has to be installed on sidewalks, narrow sidewalks have to be avoided
and the bike-sharing infrastructures should be place in line with street furniture and
trees to facilitate the pedestrian flow. Frontages of open-air municipal parking lots,
peripheries of parks and recycling of underutilized places such as under viaducts
are also especially advisable”.
Additionally, the OBIS project points that “the placement of the stations should be safe
without disturbing other road and pavement users. It must not interfere with other users of the
public space, like cleaning vehicles, snow clearing, disabled people, etc. And special
consideration should be made for the visibility to and from the bicycles and stations” (Petersen
2009).
Finally, bike-sharing station models based on concrete or metal modules without
subterranean foundation could also facilitate the introduction or even the reallocation of
conflictive stations in cities with limited space available (section 7.3.2).
7.3.8 Competition with bike rental shops
Rental shops have been for a long time the only way to rent a bicycle in cities and
tourists have been their quasi-exclusive target group. When bike-sharing started to be
implemented in European cities, BSSs introduced two main advantages compared to rental
shops: unidirectional trips instead of bidirectional ones and cheaper usage fees. In fact, as
section 5.6.1 and 5.2 have revealed the usage of 27% of BSSs studied in this dissertation is
totally free of charge, while 27% of one yearly subscription and 40% of unlimited subscriptions
fees are free of charge.
Figure 143 shows five examples of pricing competition between bike-sharing and rental
shops, if bike-sharing registration or usage is charged. If a tourist would arrive to Stockholm,
Barcelona, Paris, Berlin or Leipzig and he/she would like to rent a bicycle, in all cities he/she
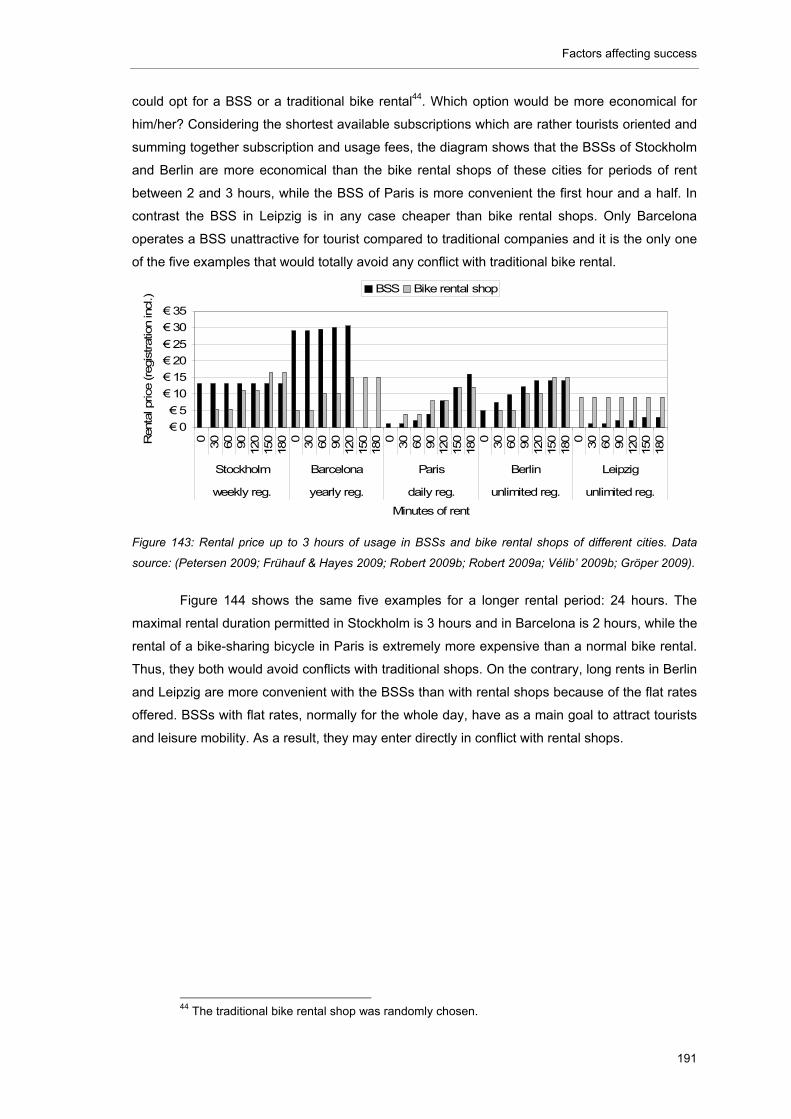
Factors affecting success
191
could opt for a BSS or a traditional bike rental44. Which option would be more economical for
him/her? Considering the shortest available subscriptions which are rather tourists oriented and
summing together subscription and usage fees, the diagram shows that the BSSs of Stockholm
and Berlin are more economical than the bike rental shops of these cities for periods of rent
between 2 and 3 hours, while the BSS of Paris is more convenient the first hour and a half. In
contrast the BSS in Leipzig is in any case cheaper than bike rental shops. Only Barcelona
operates a BSS unattractive for tourist compared to traditional companies and it is the only one
of the five examples that would totally avoid any conflict with traditional bike rental.
Figure 143: Rental price up to 3 hours of usage in BSSs and bike rental shops of different cities. Data
source: (Petersen 2009; Frühauf & Hayes 2009; Robert 2009b; Robert 2009a; Vélib’ 2009b; Gröper 2009).
Figure 144 shows the same five examples for a longer rental period: 24 hours. The
maximal rental duration permitted in Stockholm is 3 hours and in Barcelona is 2 hours, while the
rental of a bike-sharing bicycle in Paris is extremely more expensive than a normal bike rental.
Thus, they both would avoid conflicts with traditional shops. On the contrary, long rents in Berlin
and Leipzig are more convenient with the BSSs than with rental shops because of the flat rates
offered. BSSs with flat rates, normally for the whole day, have as a main goal to attract tourists
and leisure mobility. As a result, they may enter directly in conflict with rental shops.
44 The traditional bike rental shop was randomly chosen.
€ 0
€ 5
€ 10
€ 15
€ 20
€ 25
€ 30
€ 35
030
60
90
120
150
180 0
30
60
90
120
150
180 0
30
60
90
120
150
180 0
30
60
90
120
150
180 0
30
60
90
120
150
180
Stockholm Barcelona Paris Berlin Leipzig
weekly reg. yearly reg. daily reg. unlimited reg. unlimited reg.
Minutes of rent
Rent
al p
rice
(re
gist
ratio
n in
cl.) BSS Bike rental shop
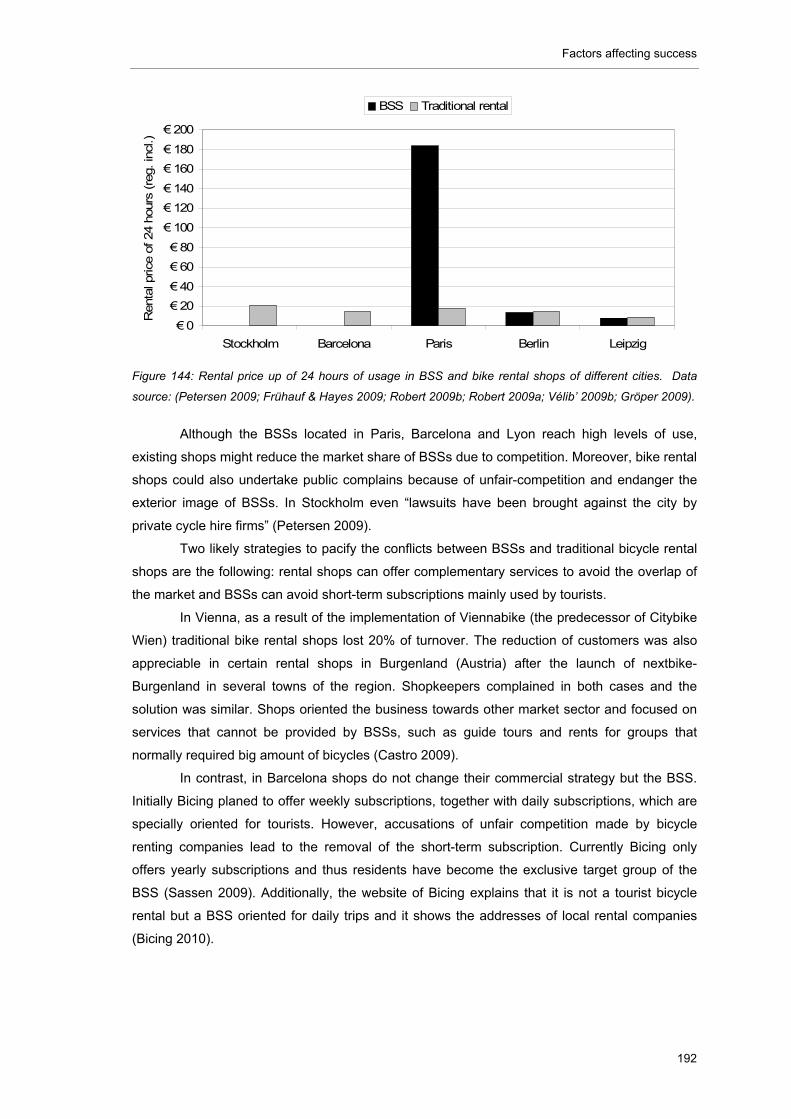
Factors affecting success
192
Figure 144: Rental price up of 24 hours of usage in BSS and bike rental shops of different cities. Data
source: (Petersen 2009; Frühauf & Hayes 2009; Robert 2009b; Robert 2009a; Vélib’ 2009b; Gröper 2009).
Although the BSSs located in Paris, Barcelona and Lyon reach high levels of use,
existing shops might reduce the market share of BSSs due to competition. Moreover, bike rental
shops could also undertake public complains because of unfair-competition and endanger the
exterior image of BSSs. In Stockholm even “lawsuits have been brought against the city by
private cycle hire firms” (Petersen 2009).
Two likely strategies to pacify the conflicts between BSSs and traditional bicycle rental
shops are the following: rental shops can offer complementary services to avoid the overlap of
the market and BSSs can avoid short-term subscriptions mainly used by tourists.
In Vienna, as a result of the implementation of Viennabike (the predecessor of Citybike
Wien) traditional bike rental shops lost 20% of turnover. The reduction of customers was also
appreciable in certain rental shops in Burgenland (Austria) after the launch of nextbike-
Burgenland in several towns of the region. Shopkeepers complained in both cases and the
solution was similar. Shops oriented the business towards other market sector and focused on
services that cannot be provided by BSSs, such as guide tours and rents for groups that
normally required big amount of bicycles (Castro 2009).
In contrast, in Barcelona shops do not change their commercial strategy but the BSS.
Initially Bicing planed to offer weekly subscriptions, together with daily subscriptions, which are
specially oriented for tourists. However, accusations of unfair competition made by bicycle
renting companies lead to the removal of the short-term subscription. Currently Bicing only
offers yearly subscriptions and thus residents have become the exclusive target group of the
BSS (Sassen 2009). Additionally, the website of Bicing explains that it is not a tourist bicycle
rental but a BSS oriented for daily trips and it shows the addresses of local rental companies
(Bicing 2010).
€ 0
€ 20
€ 40
€ 60
€ 80
€ 100
€ 120
€ 140
€ 160
€ 180
€ 200
Stockholm Barcelona Paris Berlin Leipzig
Ren
tal p
rice
of 2
4 ho
urs
(reg
. in
cl.)
BSS Traditional rental
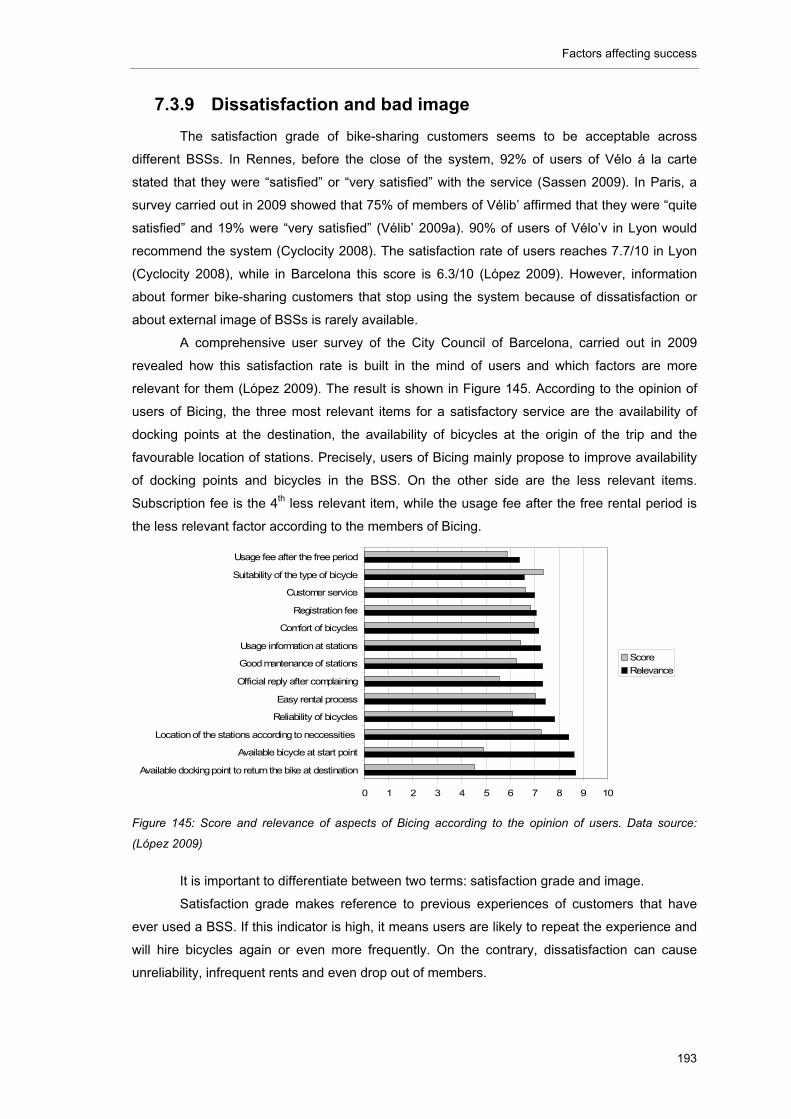
Factors affecting success
193
7.3.9 Dissatisfaction and bad image
The satisfaction grade of bike-sharing customers seems to be acceptable across
different BSSs. In Rennes, before the close of the system, 92% of users of Vélo á la carte
stated that they were “satisfied” or “very satisfied” with the service (Sassen 2009). In Paris, a
survey carried out in 2009 showed that 75% of members of Vélib’ affirmed that they were “quite
satisfied” and 19% were “very satisfied” (Vélib’ 2009a). 90% of users of Vélo’v in Lyon would
recommend the system (Cyclocity 2008). The satisfaction rate of users reaches 7.7/10 in Lyon
(Cyclocity 2008), while in Barcelona this score is 6.3/10 (López 2009). However, information
about former bike-sharing customers that stop using the system because of dissatisfaction or
about external image of BSSs is rarely available.
A comprehensive user survey of the City Council of Barcelona, carried out in 2009
revealed how this satisfaction rate is built in the mind of users and which factors are more
relevant for them (López 2009). The result is shown in Figure 145. According to the opinion of
users of Bicing, the three most relevant items for a satisfactory service are the availability of
docking points at the destination, the availability of bicycles at the origin of the trip and the
favourable location of stations. Precisely, users of Bicing mainly propose to improve availability
of docking points and bicycles in the BSS. On the other side are the less relevant items.
Subscription fee is the 4th less relevant item, while the usage fee after the free rental period is
the less relevant factor according to the members of Bicing.
Figure 145: Score and relevance of aspects of Bicing according to the opinion of users. Data source:
(López 2009)
It is important to differentiate between two terms: satisfaction grade and image.
Satisfaction grade makes reference to previous experiences of customers that have
ever used a BSS. If this indicator is high, it means users are likely to repeat the experience and
will hire bicycles again or even more frequently. On the contrary, dissatisfaction can cause
unreliability, infrequent rents and even drop out of members.
0 1 2 3 4 5 6 7 8 9 10
Available docking point to return the bike at destination
Available bicycle at start point
Location of the stations according to neccessities
Reliability of bicycles
Easy rental process
Official reply after complaining
Good mantenance of stations
Usage information at stations
Comfort of bicycles
Registration fee
Customer service
Suitability of the type of bicycle
Usage fee after the free period
Score
Relevance
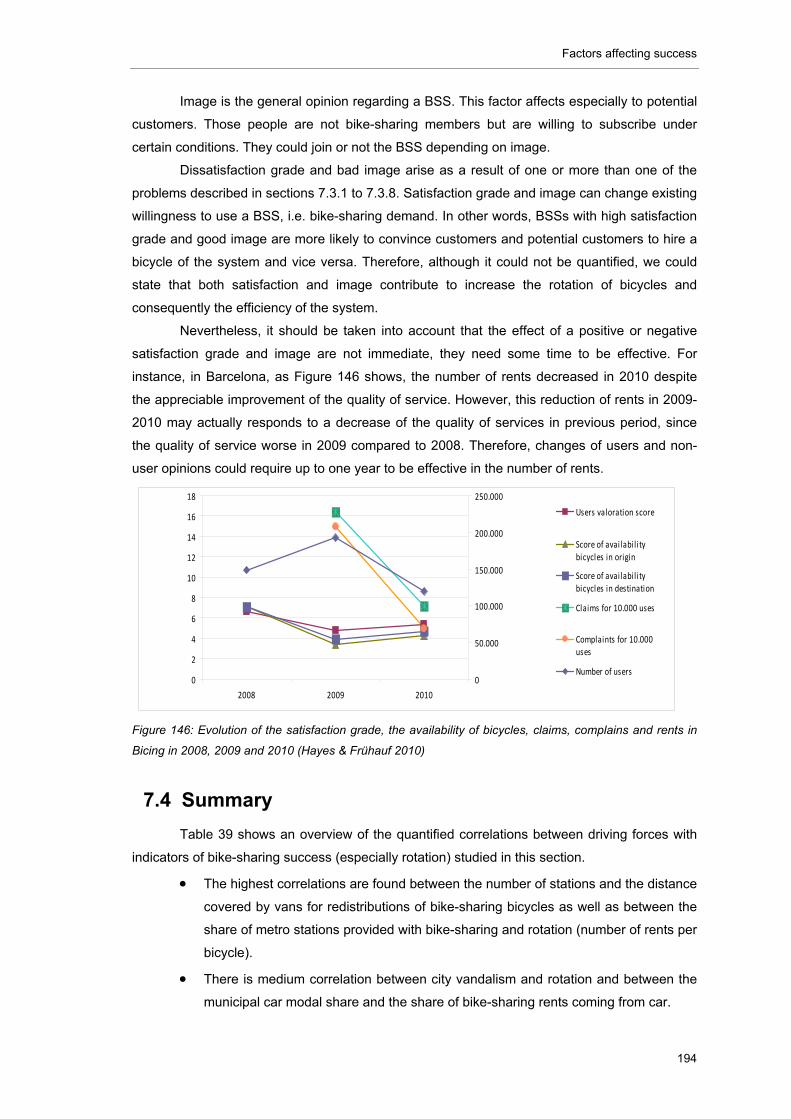
Factors affecting success
194
Image is the general opinion regarding a BSS. This factor affects especially to potential
customers. Those people are not bike-sharing members but are willing to subscribe under
certain conditions. They could join or not the BSS depending on image.
Dissatisfaction grade and bad image arise as a result of one or more than one of the
problems described in sections 7.3.1 to 7.3.8. Satisfaction grade and image can change existing
willingness to use a BSS, i.e. bike-sharing demand. In other words, BSSs with high satisfaction
grade and good image are more likely to convince customers and potential customers to hire a
bicycle of the system and vice versa. Therefore, although it could not be quantified, we could
state that both satisfaction and image contribute to increase the rotation of bicycles and
consequently the efficiency of the system.
Nevertheless, it should be taken into account that the effect of a positive or negative
satisfaction grade and image are not immediate, they need some time to be effective. For
instance, in Barcelona, as Figure 146 shows, the number of rents decreased in 2010 despite
the appreciable improvement of the quality of service. However, this reduction of rents in 2009-
2010 may actually responds to a decrease of the quality of services in previous period, since
the quality of service worse in 2009 compared to 2008. Therefore, changes of users and non-
user opinions could require up to one year to be effective in the number of rents.
Figure 146: Evolution of the satisfaction grade, the availability of bicycles, claims, complains and rents in
Bicing in 2008, 2009 and 2010 (Hayes & Frühauf 2010)
7.4 Summary
Table 39 shows an overview of the quantified correlations between driving forces with
indicators of bike-sharing success (especially rotation) studied in this section.
The highest correlations are found between the number of stations and the distance
covered by vans for redistributions of bike-sharing bicycles as well as between the
share of metro stations provided with bike-sharing and rotation (number of rents per
bicycle).
There is medium correlation between city vandalism and rotation and between the
municipal car modal share and the share of bike-sharing rents coming from car.
0
2
4
6
8
10
12
14
16
18
2008 2009 2010
0
50.000
100.000
150.000
200.000
250.000
Users valoration score
Score of availabil itybicycles in origin
Score of availabil itybicycles in destination
Claims for 10.000 uses
Complaints for 10.000uses
Number of users
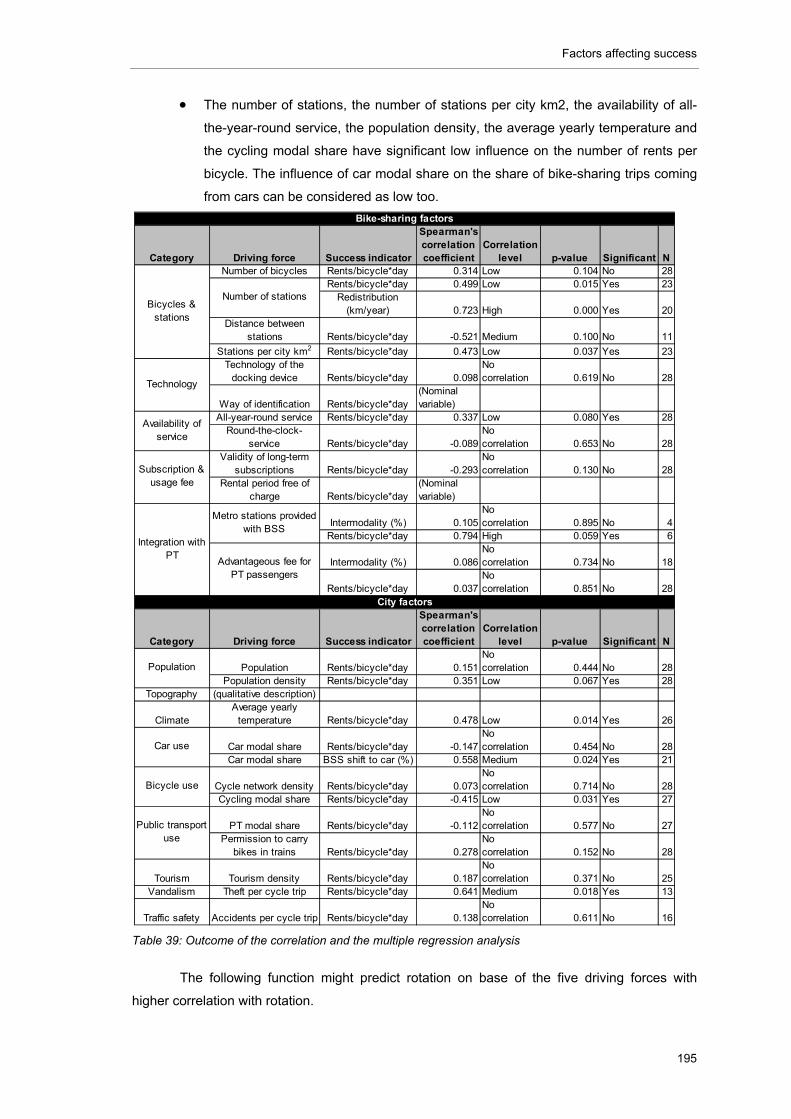
Factors affecting success
195
The number of stations, the number of stations per city km2, the availability of all-
the-year-round service, the population density, the average yearly temperature and
the cycling modal share have significant low influence on the number of rents per
bicycle. The influence of car modal share on the share of bike-sharing trips coming
from cars can be considered as low too.
Table 39: Outcome of the correlation and the multiple regression analysis
The following function might predict rotation on base of the five driving forces with
higher correlation with rotation.
Category Driving force Success indicator
Spearman's correlation coefficient
Correlation level p-value Significant N
Number of bicycles Rents/bicycle*day 0.314 Low 0.104 No 28Rents/bicycle*day 0.499 Low 0.015 Yes 23
Redistribution (km/year) 0.723 High 0.000 Yes 20
Distance between stations Rents/bicycle*day -0.521 Medium 0.100 No 11
Stations per city km2 Rents/bicycle*day 0.473 Low 0.037 Yes 23Technology of the
docking device Rents/bicycle*day 0.098No correlation 0.619 No 28
Way of identification Rents/bicycle*day(Nominal variable)
All-year-round service Rents/bicycle*day 0.337 Low 0.080 Yes 28Round-the-clock-
service Rents/bicycle*day -0.089No correlation 0.653 No 28
Validity of long-term subscriptions Rents/bicycle*day -0.293
No correlation 0.130 No 28
Rental period free of charge Rents/bicycle*day
(Nominal variable)
Intermodality (%) 0.105No correlation 0.895 No 4
Rents/bicycle*day 0.794 High 0.059 Yes 6
Intermodality (%) 0.086No correlation 0.734 No 18
Rents/bicycle*day 0.037No correlation 0.851 No 28
Category Driving force Success indicator
Spearman's correlation coefficient
Correlation level p-value Significant N
Population Rents/bicycle*day 0.151No correlation 0.444 No 28
Population density Rents/bicycle*day 0.351 Low 0.067 Yes 28Topography (qualitative description)
ClimateAverage yearly
temperature Rents/bicycle*day 0.478 Low 0.014 Yes 26
Car modal share Rents/bicycle*day -0.147No correlation 0.454 No 28
Car modal share BSS shift to car (%) 0.558 Medium 0.024 Yes 21
Cycle network density Rents/bicycle*day 0.073No correlation 0.714 No 28
Cycling modal share Rents/bicycle*day -0.415 Low 0.031 Yes 27
PT modal share Rents/bicycle*day -0.112No correlation 0.577 No 27
Permission to carry bikes in trains Rents/bicycle*day 0.278
No correlation 0.152 No 28
Tourism Tourism density Rents/bicycle*day 0.187No correlation 0.371 No 25
Vandalism Theft per cycle trip Rents/bicycle*day 0.641 Medium 0.018 Yes 13
Traffic safety Accidents per cycle trip Rents/bicycle*day 0.138No correlation 0.611 No 16
Population
Bicycle use
Public transport use
Number of stations
Integration with PT
Metro stations provided with BSS
Car use
Advantageous fee for PT passengers
City factors
Bicycles & stations
Technology
Availability of service
Subscription & usage fee
Bike-sharing factors
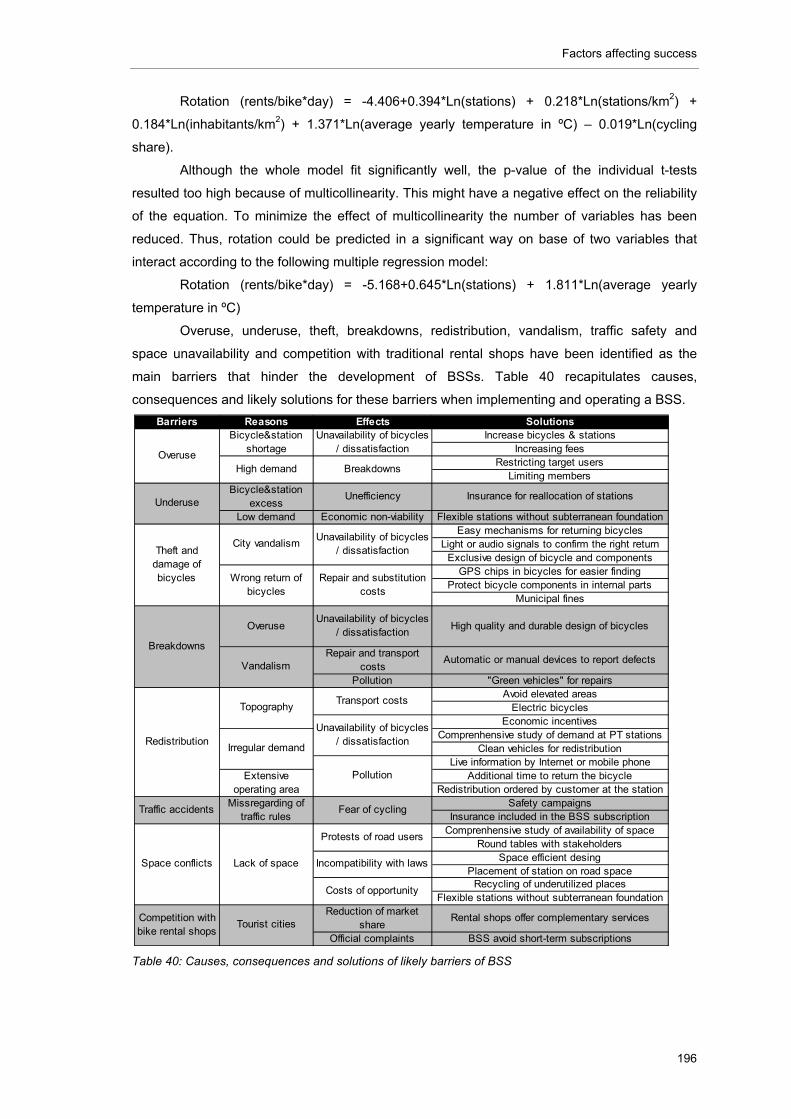
Factors affecting success
196
Rotation (rents/bike*day) = -4.406+0.394*Ln(stations) + 0.218*Ln(stations/km2) +
0.184*Ln(inhabitants/km2) + 1.371*Ln(average yearly temperature in ºC) – 0.019*Ln(cycling
share).
Although the whole model fit significantly well, the p-value of the individual t-tests
resulted too high because of multicollinearity. This might have a negative effect on the reliability
of the equation. To minimize the effect of multicollinearity the number of variables has been
reduced. Thus, rotation could be predicted in a significant way on base of two variables that
interact according to the following multiple regression model:
Rotation (rents/bike*day) = -5.168+0.645*Ln(stations) + 1.811*Ln(average yearly
temperature in ºC)
Overuse, underuse, theft, breakdowns, redistribution, vandalism, traffic safety and
space unavailability and competition with traditional rental shops have been identified as the
main barriers that hinder the development of BSSs. Table 40 recapitulates causes,
consequences and likely solutions for these barriers when implementing and operating a BSS.
Table 40: Causes, consequences and solutions of likely barriers of BSS
Barriers Reasons Effects SolutionsIncrease bicycles & stations
Increasing feesRestricting target users
Limiting membersBicycle&station
excessUnefficiency Insurance for reallocation of stations
Low demand Economic non-viability Flexible stations without subterranean foundationEasy mechanisms for returning bicycles
Light or audio signals to confirm the right returnExclusive design of bicycle and components
GPS chips in bicycles for easier findingProtect bicycle components in internal parts
Municipal fines
OveruseUnavailability of bicycles
/ dissatisfactionHigh quality and durable design of bicycles
Repair and transport costs
Automatic or manual devices to report defects
Pollution "Green vehicles" for repairsAvoid elevated areas
Electric bicyclesEconomic incentives
Comprenhensive study of demand at PT stationsClean vehicles for redistribution
Live information by Internet or mobile phone Additional time to return the bicycle
Redistribution ordered by customer at the stationSafety campaigns
Insurance included in the BSS subscriptionComprenhensive study of availability of space
Round tables with stakeholdersSpace efficient desing
Placement of station on road spaceRecycling of underutilized places
Flexible stations without subterranean foundationReduction of market
shareRental shops offer complementary services
Official complaints BSS avoid short-term subscriptions
Traffic accidentsMissregarding of
traffic rulesFear of cycling
Theft and damage of bicycles Wrong return of
bicycles
City vandalism
Extensive operating area
Unavailability of bicycles / dissatisfaction
Unavailability of bicycles / dissatisfactionRedistribution
Irregular demand
Topography
Pollution
Breakdowns
OveruseHigh demand
Bicycle&station shortage
Unavailability of bicycles / dissatisfaction
Breakdowns
Transport costs
Repair and substitution costs
Vandalism
Underuse
Lack of space
Competition with bike rental shops
Tourist cities
Space conflicts
Protests of road users
Incompatibility with laws
Costs of opportunity
Conclusion
197
8 CONCLUSION
8.1 Discussion
Bike-sharing trips represent on average around 0.1% of all urban journeys generated in
European cities where BSSs are operating (section 6.2.2). At most this share reaches circa
0.9%. Therefore, bike-sharing is still a very small part of European mobility. On the other hand,
it is also remarkable that the BSSs have achieved these results in very short time. For example,
the most used BSSs, located in Paris, Barcelona started their operation in 2007 and Lyon in
2005. Since the calculations of this doctoral thesis are based on a cross section analysis mostly
with data from 2008, it means that these BSSs obtained the presented impacts in just one and
three years, what is remarkable. Moreover, future (and present) expansions and optimisations
of bike-sharing systems might contribute to increase the number of bike-sharing trips and their
role in urban mobility.
Some municipalities may have implemented or may plan to implement a BSS to reduce
car traffic. However, as it has been stated by other authors “while reduced traffic congestion is a
noble goal, bike-sharing is likely to contribute minimally to this goal” (DeMaio 2004). This
dissertation has numerically confirmed this assumption and it has demonstrated that the impact
of BSSs on car mobility can be currently considered as very low (section 6.2.3). On average
only 0.04% of daily car traffic has been removed thanks to BSSs in European cities and the
maximal reported car trip shift reaches around 0.2%. Hence, taking into account the ambitious
goals of some municipalities concerning car traffic reduction, these figures might be
disappointing. Two reasons might explain the poor success obtained by BSSs reducing car
traffic: the limited role of bike-sharing in the whole urban mobility and the reluctance of car-
users to shift to other transport modes. Firstly, as long as bike-sharing bicycles only represents
up to 0.9% of urban daily trips, we should assume that BSSs will be able to affect only minimally
absolute figures of mobility. Secondly, on average only 15% bike-sharing trips were made
previously by car. This share is even lower than 10% in the BSSs of Paris, Barcelona and Lyon
despite they are the most influent BBSs on mobility due to their high number of rents.
The influence of bike-sharing reducing public transport vehicles occupancy seems to be
more significant that car trip shift but it is also limited (section 6.2.4). On average, only 0.45% of
public transport trips were transferred to bike-sharing bicycles as a result of the implementation
of BSSs in European cities. Nevertheless, a significant contribution of BSSs to increase the
synergy with public transport through intermodality has been observed. On average, 40% of
bike-sharing users still hold a public transport seasonal card, which means that they are
frequent public transport passengers and they may combine their trips with bike-sharing.
Actually, although only 0.37% of PT trips are connected with BSSs, 34% of bike-sharing trips
are connected with public transport. These and other outcomes of this dissertation confirm the
hypothesis of Paul DeMaio: “Residents living downtown who want to bike will likely have their
Conclusion
198
own bicycle and prefer its use. However, commuters will either drive or take transit downtown.
Those arriving by car will likely not use a bike-sharing bicycle as a segment of their trip due to
the directness car travel provides. On the other hand, commuters who take transit and must
transfer or walk as part of their trip may choose to use a bike-sharing bicycle to save time
instead of transferring or walking. Thus, of those trips made for commuting purposes, bike-
sharing bicycles will likely be most useful for the last leg of a trip to work or the first leg of the
return home.” Therefore, intermodality between bike-sharing and public transport is one the
main potentials of BSSs to improve urban mobility.
Only the direct increase of bicycles on streets due to bike-sharing operation could be
estimated in this dissertation (section 6.2.5). On average, the introduction of bike-sharing
bicycles in urban mobility meant an increase of 8.5% regarding the initial number of trips made
by bicycle, but increases of up to 91.5% have been reported. Although indirect increase of bike-
sharing due to critical mass effects could not be quantified, they may be relevant. Some
municipalities and bike-sharing operators have attributed to bike-sharing the whole
responsibility of reported increases of cycling. Nevertheless, such conclusions might be tricky.
As this dissertation has demonstrated, BSSs have been implemented together with other
cycling policies (e.g. expansion of the cycleway network) and they also might impact on the
existing increases of the cycling modal share in European cities.
According to the calculations carried out in this research, the net contribution of BSSs to
reduce CO2 has been very low (section 6.3). Two reasons explain this fact: the modest gross
reduction of CO2 reached by BSSs and the CO2 emission caused as a result of the bike-sharing
operation. Even in successful cases in terms of absolute values like Vélo’v, the CO2 saving only
represents 0.04% of the total yearly mobility CO2 emissions of the city of Lyon. Gross CO2
reduction due to BSSs is minimized by CO2 emissions produced as a result of redistribution of
bike-sharing bicycles. On average BSSs save more CO2 than they emit: 80 CO2 kilograms per
1.000 inhabitants and year are saved and 23 CO2 kilograms per 1.000 inhabitants and year are
emitted. Although the CO2 balance might be in principal positive in all bike-sharing, final net CO2
could be very modest and it makes questionable the success of BSSs in terms of environment.
BSSs can contribute to improve health of citizen twofold: reducing harmful pollutants
and increasing fitness of users. However, in practice only the second way seem to be really
effective (section 6.4). Since this dissertation has demonstrated that BSSs have affected
minimally to reduce car traffic, their contribution reducing CO2 and other pollutants such as PM,
CO and NOx can be assessed as modest. In contrast, the 36 minutes that users ride on bike-
sharing bicycles (if we assume they make round trips of the average rental duration, 18 minutes)
may contribute to improve their fitness and therefore their health. In this case, the likely positive
effects on muscles and joints, immune system and heart functions associated to cycling bike-
sharing bicycles during more than 30 minutes would be relevant. The only pitfall of the bike-
sharing success increasing fitness of citizens is the share of people benefited, which is still very
limited. Positive health effects of cycling only happen if customers ride frequently and only 0.9%
of the population are bike-sharing members that ride everyday bike-sharing bicycles.
Conclusion
199
It was demonstrated in other publications that the higher the number of cycling modal
share in a city, the lower the accident rate of cyclists is (section 6.5). This dissertation has found
a significant increase of bicycle use in cities where BSSs were implemented. Therefore, it is
reasonable to state that bike-sharing may increase traffic safety by increasing the number of
cyclists. Unfortunately, the accurate reduction of accidents could not be quantified. The
qualitative analysis of the several single cases studied has shown that although the absolute
number of accidents with cyclists involved increased after the introduction of BSSs, the relative
rate, i.e. the number of accidents normalised by the total number of trips by bicycle, actually
decreased. That would mean that bike-sharing contribute in a relevant way to increase traffic
safety of cyclists in European cities.
The economic implications of BSSs were also analyzed in this dissertation (section 6.6).
Some small and manual BSSs that set as a priority to contribute to improve employment
opportunities were successful. For instance, the BSS in Örebro obtains the highest impact
creating jobs with 0.7 jobs per 1,000 inhabitants and the BSS in Chemnitz is creates 0.1 jobs
per bike-sharing bicycle. Although these values are modest, they are far away from other cases
studies analyzed (even from large-scale BSSs). Therefore, we could state that only manual
BSSs that do aim create jobs might reach a significant influence on employment market.
However, most of existing BSSs are automatic or are planning to upgrade to an automatic
system. This minimizes the benefits of BSSs in job creation. In contrast, the success of bike-
sharing reducing household’s travel costs seems to be more relevant. On average, 22% of
customers use bike-sharing because it is cheaper than other transport modes and the 91% of
rents are free of charge (when limited free rental time is offered). These two indicators confirm
that citizens that want to save transport costs ride bike-sharing bicycles and BSSs seem to be
successful. Unfortunately, the success of bike-sharing increasing tourism could not be
demonstrated. What the dissertation revealed is the great influence of tourist in some BSSs. In
Paris, for example, 99% of subscriptions are short-term subscriptions (one-day or one-week
validity), which is the most convenient subscription type for city visitors. Contributions of bike-
sharing to city image could not be proved either. Although some favourable hints could be
observed, the impact of the green image could not be quantified.
Finally, this dissertation has shown that BSSs are loss making and not economically
self-sustainable, because costs are in every case higher than incomes (Section 6.7). BSSs do
require compensating the losses either through economic support of public authorities or
integrating bike-sharing costs in a billboard contract. A handicap of BSSs integrated in billboard
contracts is that BSSs become completely owned and operated by private companies and
excluded from the integrated transport planning of the city. Moreover, municipal governments
and private companies have different interests. According to the EU-project SpiCycles, private
operators have normally interest only in making profit (SpiCycles 2008) and according to the
bike-sharing feasibility study of New York, locations of bike-sharing stations that are lucrative for
the company might not be such convenient for the public needs (NYC Department of City
Planning 2009). Furthermore, when billboard contract finish the future of BSSs is uncertain.
Conclusion
200
Although it did not happen yet, it might happen that if a contract expires, bike-sharing services
would stop being offered and the BSS could even be abandoned. In contrast, municipal BSSs
might enable better integration with all transport modes and better coordination with city
development plans. Nevertheless, the survival of BSSs should not depend on short-term
subsidies that compromise the future of the system. The economic support of public authorities,
when existing, should be durable.
This creates a dilemma: since BSSs are all loss making, why should public authorities
fund them? In opinion of the author of this dissertation, costs generated by BSSs, if they are
affordable, should be internalised by municipalities in the same way that they do it with public
transport. Public transport is normally loss making. Passengers do not pay the real full price of
the tickets. Public authorities subsidize the service because it contributes to avoid traffic jams
and consequent undesired effects (pollution, time-spending…). If the real goal of a municipality
is e.g. to reduce car traffic, it should be assumed that some investments will be required. BSSs
should be seen as a tool to achieve a goal that imply monetary costs but that will bring future
benefits if the BSS is successful. Public transport companies could internalizes bike-sharing
costs as Deutsche Bahn does in Germany. Call a Bike is not conceived as a direct income
generating but a as way to offer a complementary service to their customers that will make the
travel by train more attractive and what will bring future incomes. Concerning the efficiency of
BSSs there is still an open discussion (Bea Alonso 2009). It has been questioned whether
achievements of BSSs are enough to justify their internal and external costs. For instance, if a
municipality aims to increase cycling, would it not be cheaper and more effective to build more
dedicated cycling infrastructure instead of implementing a BSS? Lack of data regarding whole
costs of BSSs makes very difficult to answer such questions. According to the figures presented
in this dissertation, bike-sharing success seems to be very limited in comparison with the money
invested. Nevertheless, it is out of the capacity of this research to determine which kind of
instruments could be more cost-effective than BSSs achieving the sustainability goals.
In sum, the main strengths of BSSs seem to be the following: 1) making intermodal trips
with public transport more attractive, 2) increasing bicycle use and 3) increasing traffic safety.
These three facts actually interact with each other as the “loop of increasing bike-sharing use”
of Figure 147 explains. If intermodality between transport mode and bike-sharing is favoured, a
relevant sector of potential customers may be willing to rent bicycles. Moreover, one of the
advantages of bike-sharing bicycles compared with private ones is that customers do not have
to worry about bicycle theft. Mainly, these two factors might generate the first wave of bike-
sharing customers renting bicycles. According to section 6.5, the presence of bike-sharing
bicycles helps to increase visibility of cyclists in cities and to increase respect of car drivers
toward cyclists. As a result, not only objective, but also subjective perception of traffic safety
increases. Therefore, potential cyclists initially reluctant to ride because of traffic dangers start
riding their own bicycles. Again the number of bicycles on the street increases and traffic safety
too. This fact convinces new customers to become members of the BSS. And in this way the
loop closes and re-starts. The limiting factor of this reaction is the size of the BSS.
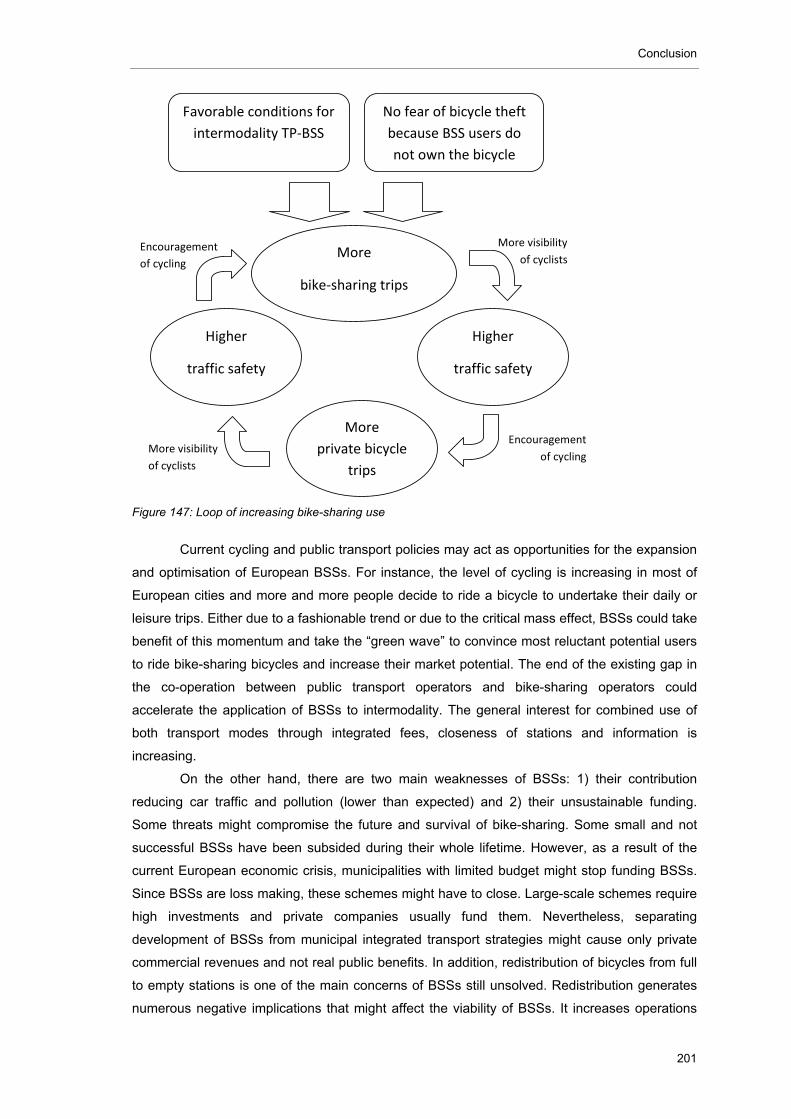
Conclusion
201
Figure 147: Loop of increasing bike-sharing use
Current cycling and public transport policies may act as opportunities for the expansion
and optimisation of European BSSs. For instance, the level of cycling is increasing in most of
European cities and more and more people decide to ride a bicycle to undertake their daily or
leisure trips. Either due to a fashionable trend or due to the critical mass effect, BSSs could take
benefit of this momentum and take the “green wave” to convince most reluctant potential users
to ride bike-sharing bicycles and increase their market potential. The end of the existing gap in
the co-operation between public transport operators and bike-sharing operators could
accelerate the application of BSSs to intermodality. The general interest for combined use of
both transport modes through integrated fees, closeness of stations and information is
increasing.
On the other hand, there are two main weaknesses of BSSs: 1) their contribution
reducing car traffic and pollution (lower than expected) and 2) their unsustainable funding.
Some threats might compromise the future and survival of bike-sharing. Some small and not
successful BSSs have been subsided during their whole lifetime. However, as a result of the
current European economic crisis, municipalities with limited budget might stop funding BSSs.
Since BSSs are loss making, these schemes might have to close. Large-scale schemes require
high investments and private companies usually fund them. Nevertheless, separating
development of BSSs from municipal integrated transport strategies might cause only private
commercial revenues and not real public benefits. In addition, redistribution of bicycles from full
to empty stations is one of the main concerns of BSSs still unsolved. Redistribution generates
numerous negative implications that might affect the viability of BSSs. It increases operations
Favorable conditions for
intermodality TP‐BSS
No fear of bicycle theft
because BSS users do
not own the bicycle
More
bike‐sharing trips
Higher
traffic safety
Higher
traffic safety
More
private bicycle
trips
More visibility
of cyclists
More visibility
of cyclists
Encouragement
of cycling
Encouragement
of cycling
Conclusion
202
costs, it reduces environmental achievements, it causes unavailability of service and it may
affect satisfaction grade of users, which might reduce level of rents.
8.2 General recommendations for BSSs
If we consider bike-sharing as a tool to achieve public benefits, then municipalities,
which are the main stakeholders watching over welfare of citizens, should regulate the
introduction of BSSs. Based on the outcomes of this dissertation, the following general
recommendations should be taken into account when introducing or optimizing a BSS:
1. Consider the option of not implementing a BSS: After the popularity of some large-
scale BSSs, numerous cities have implemented or have planed to introduce a BSS.
In some cases bike-sharing has become “chic” and have been considered as a
“must have” (Büttner et al. 2011). Nevertheless, as not all cities have to provide
metro network because a minimum density of demand is required, not all cities
have to provide bike-sharing services. Depending on the specific necessities and
characteristics of the city, bike-sharing may be (or not) a positive option.
2. Define the goal of the BSS: The goals of the bike-sharing should be clear, basically
because without goals there is not success. Success means achievement of goals
and cities can only evaluate the success of a BSS if the goals are enough defined
in advance. The following likely goals could justify the introduction of a BSS:
reducing car traffic, increasing cycling, increasing public transport attractiveness,
reducing CO2, increasing health, increasing traffic safety or enhancing municipal
economy (section 6).
3. Set quantitative evaluating indicators: Once the goal of the BSS is clear, the next
question to be answered should be “how will we evaluate the success achieving
this goal?” Indicators provide a unit of measure. The number of rents is a very
widely used and a representative indicator of every likely goal. Nevertheless, it is
not the only one. Other variables can determine the final success of a BSS. For
instance, if the intention of a BSS is to reduce car traffic and pollution, not only the
number of rents should be high but also the share of bike-sharing trips coming from
motor vehicles (section 7.1).
4. Define the characteristics of the BSS according to the goal and the city: There are
numerous and very different models of BSSs and success will depend significantly
on the selected bike-sharing configuration (section 5). Bike-sharing characteristics
should be specific for the set goal and all variables affecting this type of success.
For instance, if the goal of a BSS is to reduce car traffic and pollution, its features
should enable not only a high level of rents in general but also a high level of
specific rents coming from motor vehicles (section 7.2.15)
5. Set realistic objectives within a period according to the city and the BSS
characteristics: Objectives represent the value to be achieved in selected indicators.
Conclusion
203
City factors and bike-sharing factors can contribute to achieve (or hinder) success
(section 7.2).
6. Ensure durable funding: If the BSS is successful achieving the goal, but lack of
funding causes its close, the project will be a failure (section 6.7).
7. Collect data for the evaluating indicators: Data will be very important to evaluate the
success of the BSS. Data collection may require automatic devices for operational
information (e.g., number of rents, date and location of the rent and return, etc.) and
surveys to know the opinion of user and non-users.
8. Evaluate regularly the success of the BSS in terms of impact and efficiency: If the
values of the indicators reach the wished quantitative objective for this date, it
means that the BSS was successful so far.
9. Identify external and internal barriers that (may) affect negatively the success of the
BSS and provide strategies to minimize them: Unexpected problems can arise
when operating the BSS (section 7.3). Innovative solutions as well as good
practices of other BSSs can help to minimize negative impacts.
8.3 Creating new bike-sharing concepts
So far existing BSSs have focused their efforts on reaching high number of rents by
providing as many stations and bicycles as possible. It is right that the quantity of bike-sharing
infrastructure affects positively the number of rents (section 7.2.1) but this strategy may have
two main failures:
As mentioned in section 8.2, current focus on reaching high number of rents
underestimates the relevance of the other variables. Although the number of rents
is a significant variable for achieving all kinds of success, it is not the only one. For
instance, if the goal of a BSS is reduce car traffic, for having success not only the
number of rents should be high but also the share of car trips shifted to bike-sharing.
Specific goals might require selective actions within the corresponding target group.
Large-scale bike-sharing infrastructure requires high investments and maintenance
costs and they may cause negative consequences such as bicycle redistribution
from full to empty station (section 7.3.5). A high number of stations provide a big
variety of likely bike-sharing routes, which makes the service more attractive for
customers, but on the other hand a high number of places for returning for bicycles
multiply the possibilities of unbalance (section 7.2.1).
Based on the outcomes of this dissertation, the author suggests a different approach:
creating small-scale BSSs that solve specific problems instead of implementing expensive
large-scale BSSs with low impact in ambitious goals. It has been demonstrated that the impact
of BSSs decreasing car traffic and pollution is very limited even in large-scale BSSs (section
6.2.3 and 6.3). And although large-scale BSSs play a relevant role promoting safe traffic and
cycling habits, extended bike-sharing infrastructure causes the above-mentioned problems of
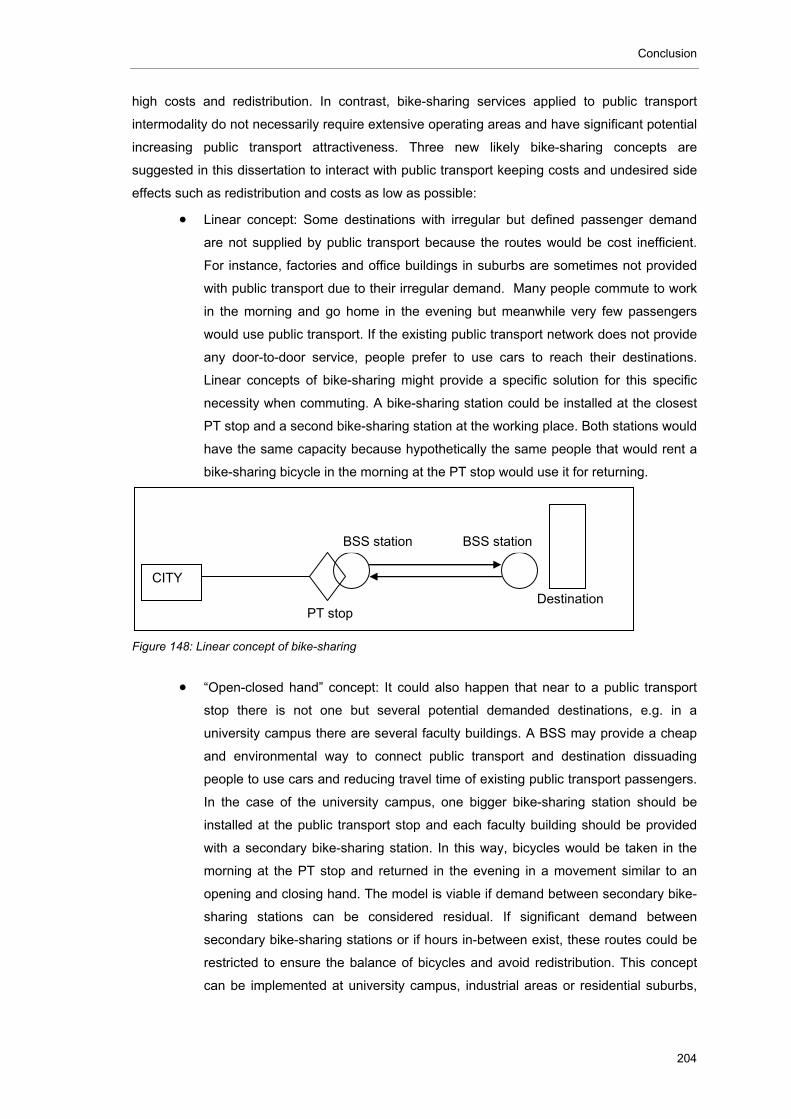
Conclusion
204
high costs and redistribution. In contrast, bike-sharing services applied to public transport
intermodality do not necessarily require extensive operating areas and have significant potential
increasing public transport attractiveness. Three new likely bike-sharing concepts are
suggested in this dissertation to interact with public transport keeping costs and undesired side
effects such as redistribution and costs as low as possible:
Linear concept: Some destinations with irregular but defined passenger demand
are not supplied by public transport because the routes would be cost inefficient.
For instance, factories and office buildings in suburbs are sometimes not provided
with public transport due to their irregular demand. Many people commute to work
in the morning and go home in the evening but meanwhile very few passengers
would use public transport. If the existing public transport network does not provide
any door-to-door service, people prefer to use cars to reach their destinations.
Linear concepts of bike-sharing might provide a specific solution for this specific
necessity when commuting. A bike-sharing station could be installed at the closest
PT stop and a second bike-sharing station at the working place. Both stations would
have the same capacity because hypothetically the same people that would rent a
bike-sharing bicycle in the morning at the PT stop would use it for returning.
Figure 148: Linear concept of bike-sharing
“Open-closed hand” concept: It could also happen that near to a public transport
stop there is not one but several potential demanded destinations, e.g. in a
university campus there are several faculty buildings. A BSS may provide a cheap
and environmental way to connect public transport and destination dissuading
people to use cars and reducing travel time of existing public transport passengers.
In the case of the university campus, one bigger bike-sharing station should be
installed at the public transport stop and each faculty building should be provided
with a secondary bike-sharing station. In this way, bicycles would be taken in the
morning at the PT stop and returned in the evening in a movement similar to an
opening and closing hand. The model is viable if demand between secondary bike-
sharing stations can be considered residual. If significant demand between
secondary bike-sharing stations or if hours in-between exist, these routes could be
restricted to ensure the balance of bicycles and avoid redistribution. This concept
can be implemented at university campus, industrial areas or residential suburbs,
PT stop Destination
CITY
BSS station BSS station
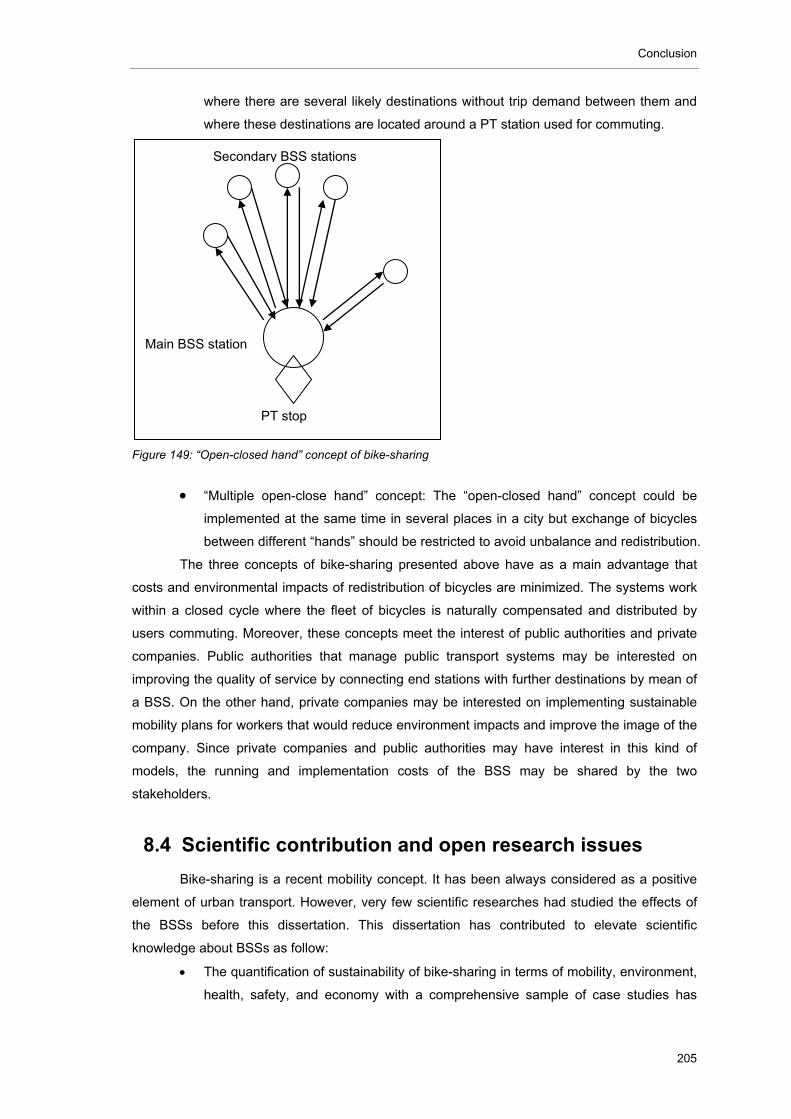
Conclusion
205
where there are several likely destinations without trip demand between them and
where these destinations are located around a PT station used for commuting.
Figure 149: “Open-closed hand” concept of bike-sharing
“Multiple open-close hand” concept: The “open-closed hand” concept could be
implemented at the same time in several places in a city but exchange of bicycles
between different “hands” should be restricted to avoid unbalance and redistribution.
The three concepts of bike-sharing presented above have as a main advantage that
costs and environmental impacts of redistribution of bicycles are minimized. The systems work
within a closed cycle where the fleet of bicycles is naturally compensated and distributed by
users commuting. Moreover, these concepts meet the interest of public authorities and private
companies. Public authorities that manage public transport systems may be interested on
improving the quality of service by connecting end stations with further destinations by mean of
a BSS. On the other hand, private companies may be interested on implementing sustainable
mobility plans for workers that would reduce environment impacts and improve the image of the
company. Since private companies and public authorities may have interest in this kind of
models, the running and implementation costs of the BSS may be shared by the two
stakeholders.
8.4 Scientific contribution and open research issues
Bike-sharing is a recent mobility concept. It has been always considered as a positive
element of urban transport. However, very few scientific researches had studied the effects of
the BSSs before this dissertation. This dissertation has contributed to elevate scientific
knowledge about BSSs as follow:
The quantification of sustainability of bike-sharing in terms of mobility, environment,
health, safety, and economy with a comprehensive sample of case studies has
PT stop
Main BSS station
Secondary BSS stations
Conclusion
206
revealed that the most relevant positive effects of BSSs are the increase of
intermodality with public transport, the increase of cycling and traffic safety. On
average, 34% of bike-sharing trips are connected with public transport and 40% of
bike-sharing users hold a public transport seasonal card. Furthermore, the direct
increase of cycling due to bike-sharing trips is on average 8.5%, while the maximal
value reaches 91.5%. Although indirect effects of bike-sharing on cycling as a result
of the critical mass could not be quantified, they may be relevant. Both direct and
indirect effects increase traffic safety through a higher visibility of cyclists. In
contrast, quantified impacts of BSSs on car traffic and environment are still limited.
On average only 15% of bike-sharing users come from cars and 0.04% of the total
daily car trips have been shifted to BSSs. The maximal value of car shift reaches
around 0.2%.
The calculation of the level of correlation between several key factors and the
success of BSSs through statistical methods has showed that the highest influence
on a increased number of rents per bicycle and day are found in the following
factors: the share of metro stations provided with bike-sharing, city vandalism, the
number of stations, the number of stations per city km2, the availability of all-the-
year-round service, the population density, the average yearly temperature and
cycling.
Equations that describe the single and multiple influences of these factors on the
level of use of BSSs using single and multiple regression analyses conclude that
the following function might predict rotation on base of the five driving forces with
higher correlation with rotation. Rotation (rents/bike*day) = -
4.406+0.394*Ln(stations) + 0.218*Ln(stations/km2) + 0.184*Ln(inhabitants/km2) +
1.371*Ln(average yearly temperature in ºC) – 0.019*Ln(cycling share). This rotation
could be predicted in a statistical significant way on base of two variables that
interact according to the following multiple regression model: Rotation
(rents/bike*day) = -5.168+0.645*Ln(stations) + 1.811*Ln(average yearly
temperature in ºC)
On the other hand, some issues could not be studied in this dissertation because of
lack of data or capacity. Five open issues that can be analyzed in future researches are the
following:
Influence of BSSs on indirect increase of cycling: The number of cyclists that were
convinced to ride their own bicycles as a result of the bike-sharing operation and
the critical mass effect is a key factor to determine the total increase of cycling
motivated by BSSs. However, it is based on subjective perceptions and very
specific surveys will be needed to study this relevant influence of bike-sharing. Lack
of data also hindered the quantification of bike-sharing success in terms of traffic
safety, municipal economy and economic viability.
Conclusion
207
Effectiveness on different target groups: With more specific data it would be
interesting to identify problems and to quantify the grade of effectiveness of the
bike-sharing policies (e.g. especial usage or subscription fees, location of stations,
etc.) in catching customers from a specific target group.
Financing form: Due to the confidentiality of data regarding financing of BSSs, this
dissertation could not make a comprehensive analysis of the economic viability of
bike-sharing. Conclusions of future researches focused on this matter may entail
ideas for new ways of funding and new strategies for reduction of costs.
Convenience of bike-sharing compared with other instruments: If it is taken into
consideration the impact and efficiency of BSSs achieving a goal, certain
instruments might be more effective. For example, if the goal of a municipality is to
increase cycling, the introduction of a BSS might be questioned as best strategy
compared to other cycling policies such as dedicated infrastructure for private
bicycles. It would be interesting to contrast impact and efficiency of BSSs compared
with different complementary instruments
Interactions between factors: Higher availability of data may enable more reliable
multiple regression analysis to find up interconnections between different affecting
factors. This network of influences might even make possible the creation of a
model that predicts the success of a BSS depending on the existing and modifiable
circumstances.
Suitability of cities for BSS: Not all cities have to implement a BSS. There can be
cities where BSSs are not the best tool to achieve the sustainability goals. The
finding of a methodology that determines whether a city is suitable or not for a BSS
may be appreciated. Furthermore, if the decision is to implement a BSS, a
methodology that defines the most favourable characteristics of the BSS for the
given city may represent a valuable tool.

Abbreviations
208
9 ABBREVIATIONS
AT: Austria
BE: Belgium
BSS: Bike-Sharing Scheme
CZ: Czech Republic
DE: Germany
ES: Spain
EU: European Union
FR: France
GDP: Gross Domestic Product
ID: Identity card
IT: Italy
Kg: kilograms
LT: Long-term
max: maximum
min: minimum
N: Number of cases
NA: Not available
NS: No sense
PL: Poland
PT: Public transport
OBIS: Optimising Bike Sharing in European Cities
SE: Sweden
ST: Short-term
SWOT: Strengths, Weaknesses, Opportunities and Threats
UK: United Kingdom
USA: United States of America
WHO: World Health Organisation
Annexes
209
10 ANNEXES
10.1 Database
Table 41 shows the database that fundament the calculations of this dissertation. The
case studies are ordered, as in section 6, by city population. The data sources of the case
studies are following:
London: (Williamson 2009b; Williamson 2009a; Noland & Ishaque 2006; Oybike
2010)
Berlin: (Gröper 2009; Büttner 2009; Sassen 2009; City council of Berlin 2010)
Rome: (Menichetti 2009; Vecchiotti & Menichetti 2009; Atac Bikesharing 2010)
Paris: (Robert 2009b; Robert 2009a; Vélib’ 2009b; Sassen 2009; Vélib’ 2007; Nadal
2007; Vélib’ 2008; Vélib’ 2009a; Dargent 2009; Bea Alonso 2009; DeMaio 2009b;
City of Paris 2004; NYC Department of City Planning 2009)
Vienna: (Castro 2009; Castro & Emberger 2009; Dechant 2009; Schneeweiss 2007;
Stadt Wien 2010; Citybike Wien 2010)
Barcelona: (Frühauf 2009; Frühauf & Hayes 2009; Bicing 2010; Bea Alonso 2009;
elPeriodico.com 2009; Sassen 2009; NYC Department of City Planning 2009;
Dector-Vega et al. 2008; Bikeoff 2008b; Bicing 2009; Cazorla 2009; City council of
Barcelona 2008; Romero 2008)
Munich: (Gröper 2009; Büttner 2009)
Milan: (Menichetti 2009; Vecchiotti & Menichetti 2009; Bikemi 2010)
Prague: (Martinek 2009b; Martinek 2009a; Carbusters n.d.; Beroud 2007; Homeport
n.d.)
Stockholm: (Petersen 2009; Petersen & Robèrt 2009; Stockholm City Bikes 2010;
Sassen 2009; Wikipedia 2010d; ManagEnergy 2010; City of Stockholm 2010)
Krakow: (Dworak 2009; Kowalewska & Ejsmont 2009; Bikeone 2010)
Seville: (Frühauf 2009; Frühauf & Hayes 2009; Sevici 2010; Gonzalo et al. 2008;
García Jaén n.d.)
Saragossa:(Frühauf 2009; Frühauf & Hayes 2009; Bizi 2010)
Lyon: (Robert 2009b; Robert & Richard 2009; Vélo’v 2010; Vélo’v 2009; Sassen
2009; Grand Lyon 2009b; Snead & Dector-Vega 2008; Beroud 2007; Pignon sur
Rue 2010; Grand Lyon 2006; NYC Department of City Planning 2009)
Stuttgart: (Gröper 2009; Büttner 2009; Wikipedia 2010d)
Düsseldorf: (Gröper 2009; Büttner 2009; nextbike 2010; Sassen 2009)
Bristol: (Williamson 2009b; Williamson 2009a)
Annexes
210
Leipzig: (Gröper 2009; Büttner 2009; nextbike 2010)
Gothenburg-1: (Petersen 2009; Petersen & Robèrt 2009; Wikipedia 2010d)
Gothenburg-2: (Petersen 2009; Petersen & Robèrt 2009; Wikipedia 2010d)
Bari: (Vecchiotti 2009; Vecchiotti & Menichetti 2009; Bicincittà 2010)
Karlsruhe: (Gröper 2009; Büttner 2009; DB Bahn 2009; City of Karlsruhe 2007)
Montpellier: (Robert 2009b; Robert & Richard 2009; Vélomagg’ 2008; maville.com
2009)
Chemnitz: (Gröper 2009; Büttner 2009; Gemnitzer Gewölbegänge e.V. 2009)
Vitoria: (Frühauf 2009; Frühauf & Hayes 2009; Gonzalo et al. 2008; City council of
Vitoria 2009b; Diario noticias de Álava 2010; City council of Vitoria n.d.; City council
of Vitoria 2009a; Escudero n.d.)
Reading: (Williamson 2009b; Williamson 2009a; Oybike 2010)
Rennes-1: (Robert 2009b; Robert & Richard 2009; Sassen 2009; Clear Channel
2010)
Rennes-2: (Robert 2009b; Robert & Richard 2009; le vélo star 2009)
Terrassa: (Frühauf 2009; Frühauf & Hayes 2009; Gonzalo et al. 2008; Ajuntament
Terrassa 2009; AEMET 2010)
Modena: (Vecchiotti 2009; Vecchiotti & Menichetti 2009; PROMT 2003)
Pamplona: (Frühauf 2009; Frühauf & Hayes 2009; Europa Press 2010; City council
of Pamplona 2007b; AEMET 2010; City council of Pamplona 2007a)
Parma: (Vecchiotti 2009; Vecchiotti & Menichetti 2009; Bicincittà 2010; PuntoBici
2010)
Brescia: (Menichetti 2009; Vecchiotti & Menichetti 2009; Bicimia 2009)
Dijon: (Robert 2009b; Robert & Richard 2009; Velodi n.d.)
Rimini: (Vecchiotti 2009; Vecchiotti & Menichetti 2009; City of Rimini 2008; Tu
Tiempo 2010)
Salzburg: (Castro 2009; Castro & Emberger 2009)
Brussels-1: (Robert 2009b; Robert 2009a; Le Soir 2008; Cyclocity 2008; Statistics
Belgium 2008)
Brussels-2: (Robert 2009b; Robert & Richard 2009; Villo! 2010; Statistics Belgium
2008)
Örebro: (Petersen 2009; Petersen & Robèrt 2009)
Cambridge: (Williamson 2009b; Williamson 2009a; Oybike 2010)
Cheltenham: (Williamson 2009b; Williamson 2009a; Oybike 2010)
Ribera Alta: (Frühauf 2009; Frühauf & Hayes 2009; Talavera 2009; Ambici 2009)
Orléans: (Robert 2009b; Robert & Richard 2009; Véló+ 2009)

Annexes
211
Bolzano: (Vecchiotti 2009; Vecchiotti & Menichetti 2009; City council of Bolzano
2010; ViaNova n.d.)
Farnborough: (Williamson 2009b; Williamson 2009a; Oybike 2010)
Cuneo: (Vecchiotti 2009; Vecchiotti & Menichetti 2009; City of Cuneo 2005)
Chalon-sur-Saône: (Robert 2009b; Robert & Richard 2009)
Senigallia: (Vecchiotti 2009; Vecchiotti & Menichetti 2009; City of Senigallia 2008)
Lake Neusiedl: (Castro 2009; Castro & Emberger 2009)
Terlizzi: (Vecchiotti 2009; Vecchiotti & Menichetti 2009)
Mödling: (Castro 2009; Castro & Emberger 2009)
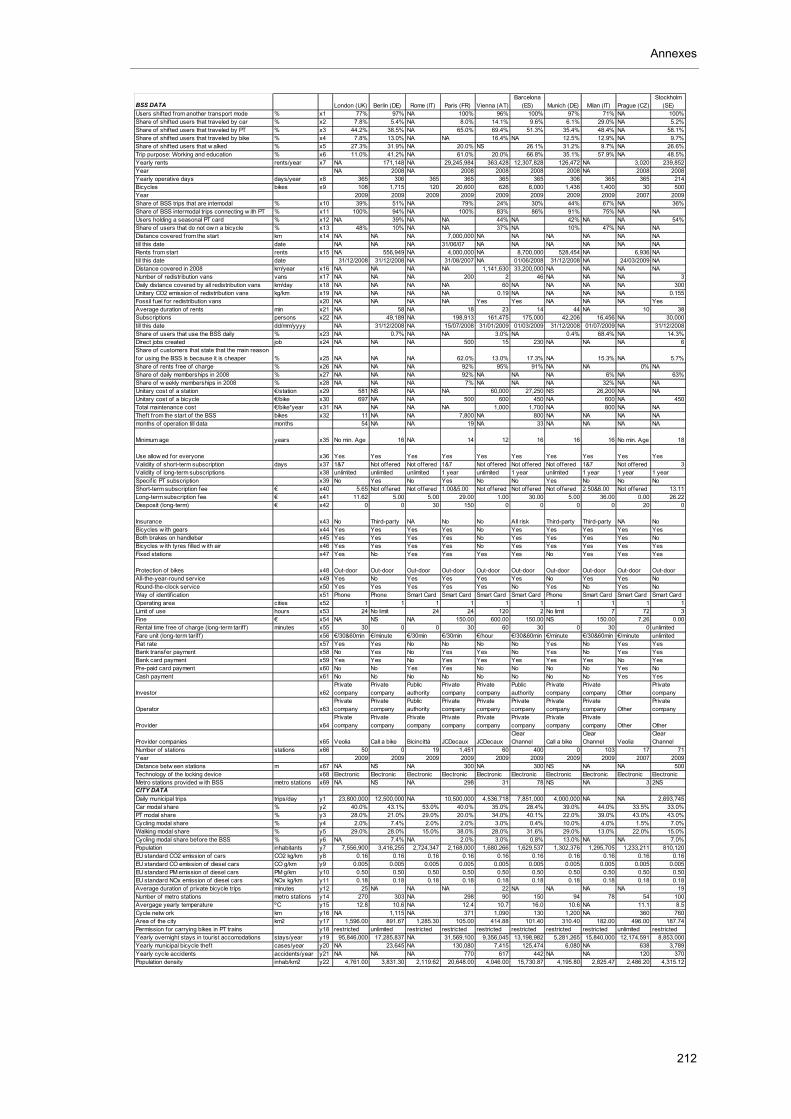
Annexes
212
BSS DATA London (UK) Berlin (DE) Rome (IT) Paris (FR) Vienna (AT)Barcelona
(ES) Munich (DE) Milan (IT) Prague (CZ)Stockholm
(SE)Users shifted from another transport mode % x1 77% 97% NA 100% 96% 100% 97% 71% NA 100%Share of shif ted users that traveled by car % x2 7.8% 5.4% NA 8.0% 14.1% 9.6% 6.1% 29.0% NA 5.2%Share of shif ted users that traveled by PT % x3 44.2% 38.5% NA 65.0% 69.4% 51.3% 35.4% 48.4% NA 58.1%Share of shif ted users that traveled by bike % x4 7.8% 13.0% NA NA 16.4% NA 12.5% 12.9% NA 9.7%Share of shif ted users that w alked % x5 27.3% 31.9% NA 20.0% NS 26.1% 31.2% 9.7% NA 26.6%Trip purpose: Working and education % x6 11.0% 41.2% NA 61.0% 20.0% 66.8% 35.1% 57.9% NA 48.5%Yearly rents rents/year x7 NA 171,148 NA 29,245,984 363,428 12,307,828 126,472 NA 3,020 239,852Year NA 2008 NA 2008 2008 2008 2008 NA 2008 2008Yearly operative days days/year x8 365 306 365 365 365 365 306 365 365 214Bicycles bikes x9 108 1,715 120 20,600 626 6,000 1,436 1,400 30 500Year 2009 2009 2009 2009 2009 2009 2009 2009 2007 2009Share of BSS trips that are intemodal % x10 39% 51% NA 79% 24% 30% 44% 67% NA 36%Share of BSS intermodal trips connecting w ith PT % x11 100% 94% NA 100% 83% 86% 91% 75% NA NAUsers holding a seasonal PT card % x12 NA 39% NA NA 44% NA 42% NA NA 54%Share of users that do not ow n a bicycle % x13 48% 10% NA NA 37% NA 10% 47% NA NADistance covered from the start km x14 NA NA NA 7,000,000 NA NA NA NA NA NAtill this date date NA NA NA 31/06/07 NA NA NA NA NA NARents from start rents x15 NA 556,949 NA 4,000,000 NA 8,700,000 528,454 NA 6,936 NAtill this date date 31/12/2008 31/12/2008 NA 31/08/2007 NA 01/06/2008 31/12/2008 NA 24/03/2009 NADistance covered in 2008 km/year x16 NA NA NA NA 1,141,630 33,200,000 NA NA NA NANumber of redistribution vans vans x17 NA NA NA 200 2 46 NA NA NA 3Daily distance covered by all redistribution vans km/day x18 NA NA NA NA 60 NA NA NA NA 300Unitary CO2 emission of redistribution vans kg/km x19 NA NA NA NA 0.19 NA NA NA NA 0.155Fossil fuel for redistribution vans x20 NA NA NA NA Yes Yes NA NA NA YesAverage duration of rents min x21 NA 58 NA 18 23 14 44 NA 10 38Subscriptions persons x22 NA 49,189 NA 198,913 161,475 175,000 42,206 16,456 NA 30,000till this date dd/mm/yyyy NA 31/12/2008 NA 15/07/2008 31/01/2009 01/03/2009 31/12/2008 01/07/2009 NA 31/12/2008Share of users that use the BSS daily % x23 NA 0.7% NA NA 3.0% NA 0.4% 68.4% NA 14.3%Direct jobs created job x24 NA NA NA 500 15 230 NA NA NA 6Share of customers that state that the main reason for using the BSS is because it is cheaper % x25 NA NA NA 62.0% 13.0% 17.3% NA 15.3% NA 5.7%Share of rents free of charge % x26 NA NA NA 92% 95% 91% NA NA 0% NAShare of daily memberships in 2008 % x27 NA NA NA 92% NA NA NA 6% NA 63%Share of w eekly memberships in 2008 % x28 NA NA NA 7% NA NA NA 32% NA NAUnitary cost of a station €/station x29 581 NS NA NA 60,000 27,250 NS 26,200 NA NAUnitary cost of a bicycle €/bike x30 697 NA NA 500 600 450 NA 600 NA 450Total maintenance cost €/bike*year x31 NA NA NA NA 1,000 1,700 NA 800 NA NATheft from the start of the BSS bikes x32 11 NA NA 7,800 NA 800 NA NA NA NAmonths of operation till data months 54 NA NA 19 NA 33 NA NA NA NA
Minimum age years x35 No min. Age 16 NA 14 12 16 16 16 No min. Age 18
Use allow ed for everyone x36 Yes Yes Yes Yes Yes Yes Yes Yes Yes YesValidity of short-term subscription days x37 1&7 Not offered Not offered 1&7 Not offered Not offered Not offered 1&7 Not offered 3Validity of long-term subscriptions x38 unlimited unlimited unlimited 1 year unlimited 1 year unlimited 1 year 1 year 1 yearSpecif ic PT subscription x39 No Yes No Yes No No Yes No No NoShort-term subscription fee € x40 5.65 Not offered Not offered 1.00&5.00 Not offered Not offered Not offered 2.50&6.00 Not offered 13.11Long-term subscription fee € x41 11.62 5.00 5.00 29.00 1.00 30.00 5.00 36.00 0.00 26.22Desposit (long-term) € x42 0 0 30 150 0 0 0 0 20 0
Insurance x43 No Third-party NA No No All risk Third-party Third-party NA NoBicycles w ith gears x44 Yes Yes Yes Yes No Yes Yes Yes Yes YesBoth brakes on handlebar x45 Yes Yes Yes Yes No Yes Yes Yes Yes NoBicycles w ith tyres f illed w ith air x46 Yes Yes Yes Yes No Yes Yes Yes Yes YesFixed stations x47 Yes No Yes Yes Yes Yes No Yes Yes Yes
Protection of bikes x48 Out-door Out-door Out-door Out-door Out-door Out-door Out-door Out-door Out-door Out-doorAll-the-year-round service x49 Yes No Yes Yes Yes Yes No Yes Yes NoRound-the-clock service x50 Yes Yes Yes Yes Yes No Yes No Yes NoWay of identif ication x51 Phone Phone Smart Card Smart Card Smart Card Smart Card Phone Smart Card Smart Card Smart CardOperating area cities x52 1 1 1 1 1 1 1 1 1 1Limit of use hours x53 24 No limit 24 24 120 2 No limit 7 72 3Fine € x54 NA NS NA 150.00 600.00 150.00 NS 150.00 7.26 0.00Rental time free of charge (long-term tariff) minutes x55 30 0 0 30 60 30 0 30 0 unlimitedFare unit (long-term tarif f) x56 €/30&60min €/minute €/30min €/30min €/hour €/30&60min €/minute €/30&60min €/minute unlimitedFlat rate x57 Yes Yes No No No No Yes No Yes YesBank transfer payment x58 No Yes No Yes Yes No Yes No Yes YesBank card payment x59 Yes Yes No Yes Yes Yes Yes Yes No YesPre-paid card payment x60 No No Yes Yes No No No No Yes NoCash payment x61 No No No No No No No No Yes Yes
Investor x62Private company
Private company
Public authority
Private company
Private company
Public authority
Private company
Private company Other
Private company
Operator x63Private company
Private company
Public authority
Private company
Private company
Private company
Private company
Private company Other
Private company
Provider x64Private company
Private company
Private company
Private company
Private company
Private company
Private company
Private company Other Other
Provider companies x65 Veolia Call a bike Bicincittà JCDecaux JCDecauxClear Channel Call a bike
Clear Channel Veolia
Clear Channel
Number of stations stations x66 50 0 19 1,451 60 400 0 103 17 71Year 2009 2009 2009 2009 2009 2009 2009 2009 2007 2009Distance betw een stations m x67 NA NS NA 300 NA 300 NS NA NA 500Technology of the locking device x68 Electronic Electronic Electronic Electronic Electronic Electronic Electronic Electronic Electronic ElectronicMetro stations provided w ith BSS metro stations x69 NA NS NA 298 31 78 NS NA 3 2NSCITY DATA
Daily municipal trips trips/day y1 23,800,000 12,500,000 NA 10,500,000 4,536,718 7,851,000 4,000,000 NA NA 2,693,745Car modal share % y2 40.0% 43.1% 53.0% 40.0% 35.0% 28.4% 39.0% 44.0% 33.5% 33.0%PT modal share % y3 28.0% 21.0% 29.0% 20.0% 34.0% 40.1% 22.0% 39.0% 43.0% 43.0%Cycling modal share % y4 2.0% 7.4% 2.0% 2.0% 3.0% 0.4% 10.0% 4.0% 1.5% 7.0%Walking modal share % y5 29.0% 28.0% 15.0% 38.0% 28.0% 31.6% 29.0% 13.0% 22.0% 15.0%Cycling modal share before the BSS % y6 NA 7.4% NA 2.0% 3.0% 0.8% 13.0% NA NA 7.0%Population inhabitants y7 7,556,900 3,416,255 2,724,347 2,168,000 1,680,266 1,629,537 1,302,376 1,295,705 1,233,211 810,120EU standard CO2 emission of cars CO2 kg/km y8 0.16 0.16 0.16 0.16 0.16 0.16 0.16 0.16 0.16 0.16EU standard CO emission of diesel cars CO g/km y9 0.005 0.005 0.005 0.005 0.005 0.005 0.005 0.005 0.005 0.005EU standard PM emission of diesel cars PM g/km y10 0.50 0.50 0.50 0.50 0.50 0.50 0.50 0.50 0.50 0.50EU standard NOx emission of diesel cars NOx kg/km y11 0.18 0.18 0.18 0.18 0.18 0.18 0.18 0.18 0.18 0.18Average duration of private bicycle trips minutes y12 25 NA NA NA 22 NA NA NA NA 19Number of metro stations metro stations y14 270 303 NA 298 90 150 94 78 54 100Avergage yearly temperature ºC y15 12.8 10.6 NA 12.4 10.7 16.0 10.6 NA 11.1 8.5Cycle netw ork km y16 NA 1,115 NA 371 1,090 130 1,200 NA 360 760Area of the city km2 y17 1,596.00 891.67 1,285.30 105.00 414.88 101.40 310.40 182.00 496.00 187.74Permission for carrying bikes in PT trains y18 restricted unlimited restricted restricted restricted restricted restricted restricted unlimited restrictedYearly overnight stays in tourist accomodations stays/year y19 95,846,000 17,285,837 NA 31,569,100 9,356,045 13,198,982 5,281,265 15,840,000 12,174,591 8,853,000Yearly municipal bicycle theft cases/year y20 NA 23,645 NA 130,080 7,415 125,474 6,080 NA 638 3,789Yearly cycle accidents accidents/year y21 NA NA NA 770 617 442 NA NA 120 370Population density inhab/km2 y22 4,761.00 3,831.30 2,119.62 20,648.00 4,046.00 15,730.87 4,195.80 2,825.47 2,486.20 4,315.12
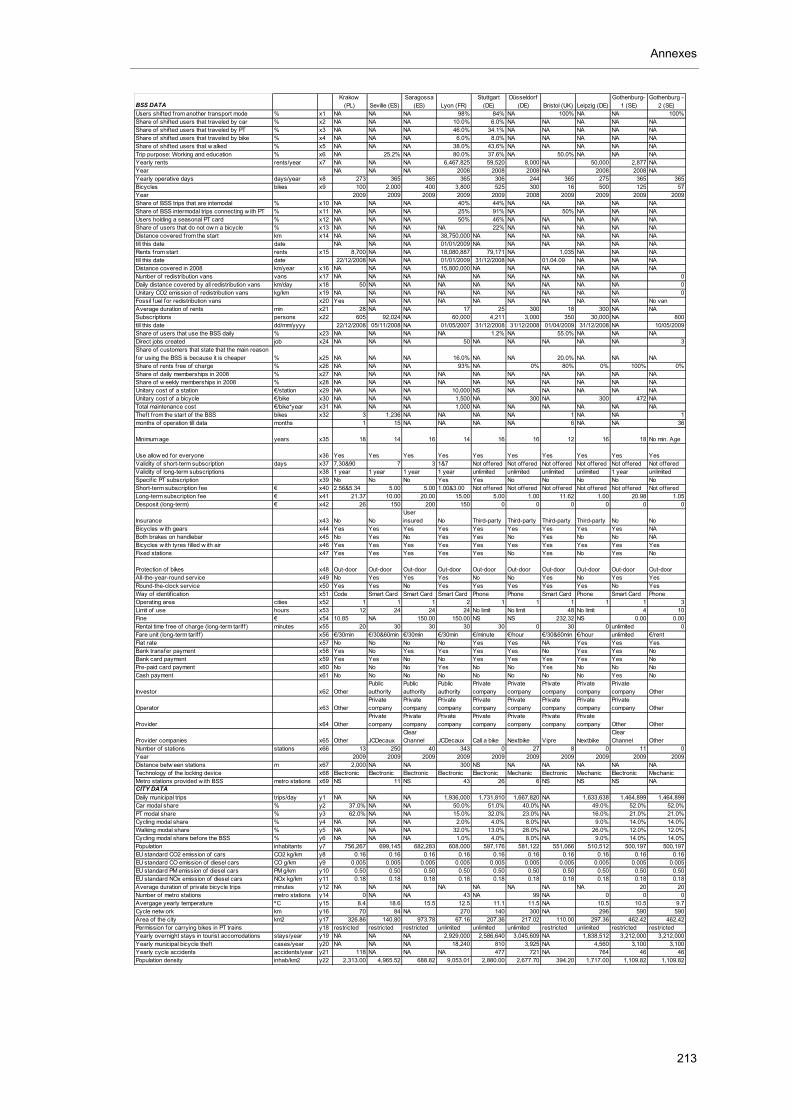
Annexes
213
BSS DATAKrakow
(PL) Seville (ES)Saragossa
(ES) Lyon (FR)Stuttgart
(DE)Düsseldorf
(DE) Bristol (UK) Leipzig (DE)Gothenburg-
1 (SE)Gothenburg -
2 (SE)Users shifted from another transport mode % x1 NA NA NA 98% 84% NA 100% NA NA 100%Share of shifted users that traveled by car % x2 NA NA NA 10.0% 6.0% NA NA NA NA NAShare of shifted users that traveled by PT % x3 NA NA NA 46.0% 34.1% NA NA NA NA NAShare of shifted users that traveled by bike % x4 NA NA NA 6.0% 8.0% NA NA NA NA NAShare of shifted users that w alked % x5 NA NA NA 38.0% 43.6% NA NA NA NA NATrip purpose: Working and education % x6 NA 25.2% NA 80.0% 37.6% NA 50.0% NA NA NAYearly rents rents/year x7 NA NA NA 6,467,825 59,520 8,000 NA 50,000 2,877 NAYear NA NA NA 2008 2008 2008 NA 2008 2008 NAYearly operative days days/year x8 273 365 365 365 306 244 365 275 365 365Bicycles bikes x9 100 2,000 400 3,800 525 300 16 500 125 57Year 2009 2009 2009 2009 2009 2008 2009 2009 2009 2009Share of BSS trips that are intemodal % x10 NA NA NA 40% 44% NA NA NA NA NAShare of BSS intermodal trips connecting w ith PT % x11 NA NA NA 25% 91% NA 50% NA NA NAUsers holding a seasonal PT card % x12 NA NA NA 50% 46% NA NA NA NA NAShare of users that do not ow n a bicycle % x13 NA NA NA NA 22% NA NA NA NA NADistance covered from the start km x14 NA NA NA 38,750,000 NA NA NA NA NA NAtill this date date NA NA NA 01/01/2009 NA NA NA NA NA NARents from start rents x15 8,700 NA NA 18,080,887 79,171 NA 1,035 NA NA NAtill this date date 22/12/2008 NA NA 01/01/2009 31/12/2008 NA 01.04.09 NA NA NADistance covered in 2008 km/year x16 NA NA NA 15,800,000 NA NA NA NA NA NANumber of redistribution vans vans x17 NA NA NA NA NA NA NA NA NA 0Daily distance covered by all redistribution vans km/day x18 50 NA NA NA NA NA NA NA NA 0Unitary CO2 emission of redistribution vans kg/km x19 NA NA NA NA NA NA NA NA NA 0Fossil fuel for redistribution vans x20 Yes NA NA NA NA NA NA NA NA No vanAverage duration of rents min x21 28 NA NA 17 25 300 18 300 NA NASubscriptions persons x22 605 92,024 NA 60,000 4,211 3,000 350 30,000 NA 800till this date dd/mm/yyyy 22/12/2008 05/11/2008 NA 01/05/2007 31/12/2008 31/12/2008 01/04/2009 31/12/2008 NA 10/05/2009Share of users that use the BSS daily % x23 NA NA NA NA 1.2% NA 55.0% NA NA NADirect jobs created job x24 NA NA NA 50 NA NA NA NA NA 3Share of customers that state that the main reason for using the BSS is because it is cheaper % x25 NA NA NA 16.0% NA NA 20.0% NA NA NAShare of rents free of charge % x26 NA NA NA 93% NA 0% 80% 0% 100% 0%Share of daily memberships in 2008 % x27 NA NA NA NA NA NA NA NA NA NAShare of w eekly memberships in 2008 % x28 NA NA NA NA NA NA NA NA NA NAUnitary cost of a station €/station x29 NA NA NA 10,000 NS NA NA NA NA NAUnitary cost of a bicycle €/bike x30 NA NA NA 1,500 NA 300 NA 300 472 NATotal maintenance cost €/bike*year x31 NA NA NA 1,000 NA NA NA NA NA NATheft from the start of the BSS bikes x32 3 1,236 NA NA NA NA 1 NA NA 1months of operation till data months 1 15 NA NA NA NA 6 NA NA 36
Minimum age years x35 18 14 16 14 16 16 12 16 18 No min. Age
Use allow ed for everyone x36 Yes Yes Yes Yes Yes Yes Yes Yes Yes YesValidity of short-term subscription days x37 7,30&90 7 3 1&7 Not offered Not offered Not offered Not offered Not offered Not offeredValidity of long-term subscriptions x38 1 year 1 year 1 year 1 year unlimited unlimited unlimited unlimited 1 year unlimitedSpecif ic PT subscription x39 No No No Yes Yes No No No No NoShort-term subscription fee € x40 2.56&5.34 5.00 5.00 1.00&3.00 Not offered Not offered Not offered Not offered Not offered Not offeredLong-term subscription fee € x41 21.37 10.00 20.00 15.00 5.00 1.00 11.62 1.00 20.98 1.05Desposit (long-term) € x42 26 150 200 150 0 0 0 0 0 0
Insurance x43 No NoUser insured No Third-party Third-party Third-party Third-party No No
Bicycles w ith gears x44 Yes Yes Yes Yes Yes Yes Yes Yes Yes NABoth brakes on handlebar x45 No Yes No Yes Yes No Yes No No NABicycles w ith tyres f illed w ith air x46 Yes Yes Yes Yes Yes Yes Yes Yes Yes YesFixed stations x47 Yes Yes Yes Yes Yes No Yes No Yes No
Protection of bikes x48 Out-door Out-door Out-door Out-door Out-door Out-door Out-door Out-door Out-door Out-doorAll-the-year-round service x49 No Yes Yes Yes No No Yes No Yes YesRound-the-clock service x50 Yes Yes No Yes Yes Yes Yes Yes No YesWay of identif ication x51 Code Smart Card Smart Card Smart Card Phone Phone Smart Card Phone Smart Card PhoneOperating area cities x52 1 1 1 2 1 1 1 1 1 3Limit of use hours x53 12 24 24 24 No limit No limit 48 No limit 4 10Fine € x54 10.85 NA 150.00 150.00 NS NS 232.32 NS 0.00 0.00Rental time free of charge (long-term tarif f) minutes x55 20 30 30 30 30 0 30 0 unlimited 0Fare unit (long-term tariff) x56 €/30min €/30&60min €/30min €/30min €/minute €/hour €/30&60min €/hour unlimited €/rentFlat rate x57 No No No No Yes Yes NA Yes Yes YesBank transfer payment x58 Yes No Yes Yes Yes Yes No Yes Yes NoBank card payment x59 Yes Yes No No Yes Yes Yes Yes Yes NoPre-paid card payment x60 No No No Yes No No Yes No No NoCash payment x61 No No No No No No No No Yes No
Investor x62 OtherPublic authority
Public authority
Public authority
Private company
Private company
Private company
Private company
Private company Other
Operator x63 OtherPrivate company
Private company
Private company
Private company
Private company
Private company
Private company
Private company Other
Provider x64 OtherPrivate company
Private company
Private company
Private company
Private company
Private company
Private company Other Other
Provider companies x65 Other JCDecauxClear Channel JCDecaux Call a bike Nextbike Vipre Nextbike
Clear Channel Other
Number of stations stations x66 13 250 40 343 0 27 8 0 11 0Year 2009 2009 2009 2009 2009 2009 2009 2009 2009 2009Distance betw een stations m x67 2,000 NA NA 300 NS NA NA NA NA NATechnology of the locking device x68 Electronic Electronic Electronic Electronic Electronic Mechanic Electronic Mechanic Electronic MechanicMetro stations provided w ith BSS metro stations x69 NS 11 NS 43 26 6 NS NS NS NACITY DATA
Daily municipal trips trips/day y1 NA NA NA 1,936,000 1,731,810 1,667,820 NA 1,633,638 1,464,899 1,464,899Car modal share % y2 37.0% NA NA 50.0% 51.0% 40.0% NA 49.0% 52.0% 52.0%PT modal share % y3 62.0% NA NA 15.0% 32.0% 23.0% NA 16.0% 21.0% 21.0%Cycling modal share % y4 NA NA NA 2.0% 4.0% 8.0% NA 9.0% 14.0% 14.0%Walking modal share % y5 NA NA NA 32.0% 13.0% 28.0% NA 26.0% 12.0% 12.0%Cycling modal share before the BSS % y6 NA NA NA 1.0% 4.0% 8.0% NA 9.0% 14.0% 14.0%Population inhabitants y7 756,267 699,145 682,283 608,000 597,176 581,122 551,066 510,512 500,197 500,197EU standard CO2 emission of cars CO2 kg/km y8 0.16 0.16 0.16 0.16 0.16 0.16 0.16 0.16 0.16 0.16EU standard CO emission of diesel cars CO g/km y9 0.005 0.005 0.005 0.005 0.005 0.005 0.005 0.005 0.005 0.005EU standard PM emission of diesel cars PM g/km y10 0.50 0.50 0.50 0.50 0.50 0.50 0.50 0.50 0.50 0.50EU standard NOx emission of diesel cars NOx kg/km y11 0.18 0.18 0.18 0.18 0.18 0.18 0.18 0.18 0.18 0.18Average duration of private bicycle trips minutes y12 NA NA NA NA NA NA NA NA 20 20Number of metro stations metro stations y14 0 NA NA 43 NA 99 NA 0 0 0Avergage yearly temperature ºC y15 8.4 18.6 15.5 12.5 11.1 11.5 NA 10.5 10.5 9.7Cycle netw ork km y16 70 84 NA 270 140 300 NA 296 590 590Area of the city km2 y17 326.86 140.80 973.78 67.16 207.36 217.02 110.00 297.36 462.42 462.42Permission for carrying bikes in PT trains y18 restricted restricted restricted unlimited unlimited unlimited restricted unlimited restricted restrictedYearly overnight stays in tourist accomodations stays/year y19 NA NA NA 2,929,000 2,586,640 3,045,609 NA 1,838,512 3,212,000 3,212,000Yearly municipal bicycle theft cases/year y20 NA NA NA 18,240 810 3,925 NA 4,560 3,100 3,100Yearly cycle accidents accidents/year y21 118 NA NA NA 477 721 NA 764 46 46Population density inhab/km2 y22 2,313.00 4,965.52 688.82 9,053.01 2,880.00 2,677.70 394.20 1,717.00 1,109.82 1,109.82
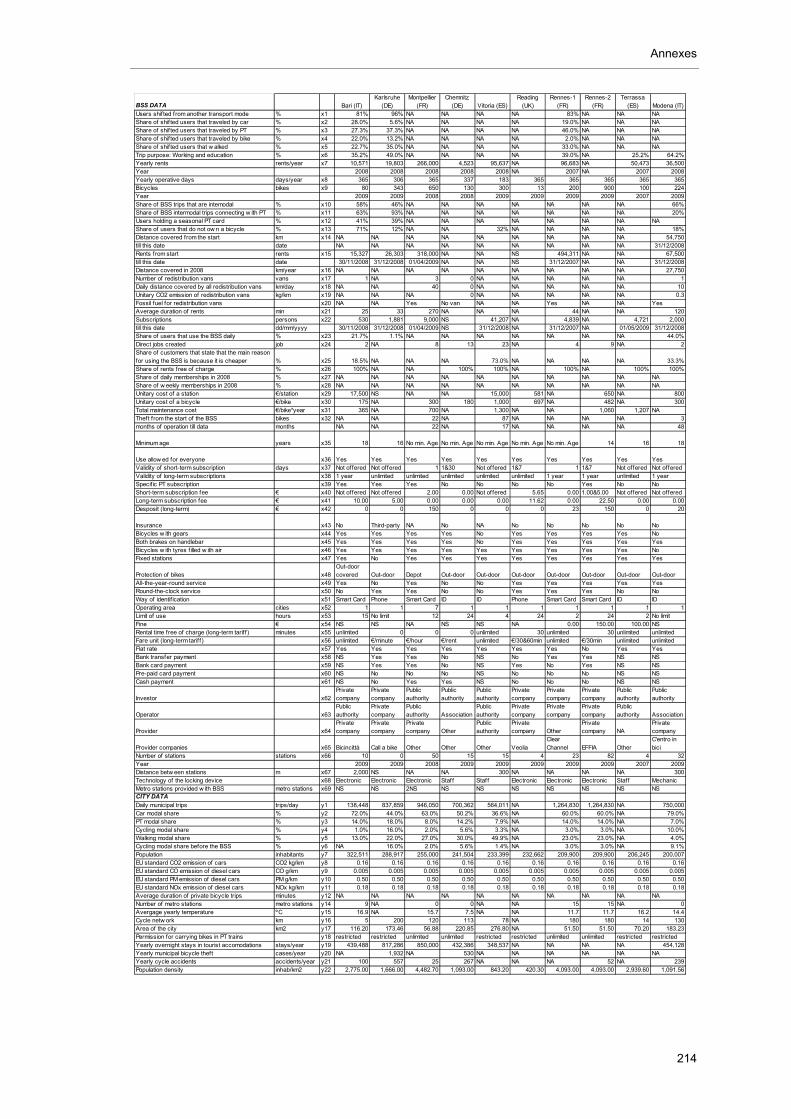
Annexes
214
BSS DATA Bari (IT)Karlsruhe
(DE)Montpellier
(FR)Chemnitz
(DE) Vitoria (ES)Reading
(UK)Rennes-1
(FR)Rennes-2
(FR)Terrassa
(ES) Modena (IT)Users shifted from another transport mode % x1 81% 96% NA NA NA NA 83% NA NA NAShare of shif ted users that traveled by car % x2 28.0% 5.6% NA NA NA NA 19.0% NA NA NAShare of shif ted users that traveled by PT % x3 27.3% 37.3% NA NA NA NA 46.0% NA NA NAShare of shif ted users that traveled by bike % x4 22.0% 13.2% NA NA NA NA 2.0% NA NA NAShare of shif ted users that w alked % x5 22.7% 35.0% NA NA NA NA 33.0% NA NA NATrip purpose: Working and education % x6 35.2% 49.0% NA NA NA NA 39.0% NA 25.2% 64.2%Yearly rents rents/year x7 10,571 19,803 266,000 4,523 95,637 NA 96,683 NA 50,473 36,500Year 2008 2008 2008 2008 2008 NA 2007 NA 2007 2008Yearly operative days days/year x8 365 306 365 337 183 365 365 365 365 365Bicycles bikes x9 80 343 650 130 300 13 200 900 100 224Year 2009 2009 2008 2008 2009 2009 2009 2009 2007 2009Share of BSS trips that are intemodal % x10 58% 46% NA NA NA NA NA NA NA 66%Share of BSS intermodal trips connecting w ith PT % x11 63% 93% NA NA NA NA NA NA NA 20%Users holding a seasonal PT card % x12 41% 39% NA NA NA NA NA NA NA NAShare of users that do not ow n a bicycle % x13 71% 12% NA NA 32% NA NA NA NA 18%Distance covered from the start km x14 NA NA NA NA NA NA NA NA NA 54,750till this date date NA NA NA NA NA NA NA NA NA 31/12/2008Rents from start rents x15 15,327 26,303 318,000 NA NA NS 494,311 NA NA 67,500till this date date 30/11/2008 31/12/2008 01/04/2009 NA NA NS 31/12/2007 NA NA 31/12/2008Distance covered in 2008 km/year x16 NA NA NA NA NA NA NA NA NA 27,750Number of redistribution vans vans x17 1 NA 3 0 NA NA NA NA NA 1Daily distance covered by all redistribution vans km/day x18 NA NA 40 0 NA NA NA NA NA 10Unitary CO2 emission of redistribution vans kg/km x19 NA NA NA 0 NA NA NA NA NA 0.3Fossil fuel for redistribution vans x20 NA NA Yes No van NA NA Yes NA NA YesAverage duration of rents min x21 25 33 270 NA NA NA 44 NA NA 120Subscriptions persons x22 530 1,881 9,000 NS 41,207 NA 4,839 NA 4,721 2,000till this date dd/mm/yyyy 30/11/2008 31/12/2008 01/04/2009 NS 31/12/2008 NA 31/12/2007 NA 01/05/2009 31/12/2008Share of users that use the BSS daily % x23 21.7% 1.1% NA NA NA NA NA NA NA 44.0%Direct jobs created job x24 2 NA 8 13 23 NA 4 9 NA 2Share of customers that state that the main reason for using the BSS is because it is cheaper % x25 18.5% NA NA NA 73.0% NA NA NA NA 33.3%Share of rents free of charge % x26 100% NA NA 100% 100% NA 100% NA 100% 100%Share of daily memberships in 2008 % x27 NA NA NA NA NA NA NA NA NA NAShare of w eekly memberships in 2008 % x28 NA NA NA NA NA NA NA NA NA NAUnitary cost of a station €/station x29 17,500 NS NA NA 15,000 581 NA 650 NA 800Unitary cost of a bicycle €/bike x30 175 NA 300 180 1,000 697 NA 482 NA 300Total maintenance cost €/bike*year x31 365 NA 700 NA 1,300 NA NA 1,060 1,207 NATheft from the start of the BSS bikes x32 NA NA 22 NA 87 NA NA NA NA 3months of operation till data months NA NA 22 NA 17 NA NA NA NA 48
Minimum age years x35 18 16 No min. Age No min. Age No min. Age No min. Age No min. Age 14 16 18
Use allow ed for everyone x36 Yes Yes Yes Yes Yes Yes Yes Yes Yes YesValidity of short-term subscription days x37 Not offered Not offered 1 1&30 Not offered 1&7 1 1&7 Not offered Not offeredValidity of long-term subscriptions x38 1 year unlimited unlimited unlimited unlimited unlimited 1 year 1 year unlimited 1 yearSpecif ic PT subscription x39 Yes Yes Yes No No No No Yes No NoShort-term subscription fee € x40 Not offered Not offered 2.00 0.00 Not offered 5.65 0.00 1.00&5.00 Not offered Not offeredLong-term subscription fee € x41 10.00 5.00 0.00 0.00 0.00 11.62 0.00 22.50 0.00 0.00Desposit (long-term) € x42 0 0 150 0 0 0 23 150 0 20
Insurance x43 No Third-party NA No NA No No No No NoBicycles w ith gears x44 Yes Yes Yes Yes No Yes Yes Yes Yes NoBoth brakes on handlebar x45 Yes Yes Yes Yes No Yes Yes Yes Yes YesBicycles w ith tyres filled w ith air x46 Yes Yes Yes Yes Yes Yes Yes Yes Yes NoFixed stations x47 Yes No Yes Yes Yes Yes Yes Yes Yes Yes
Protection of bikes x48Out-door covered Out-door Depot Out-door Out-door Out-door Out-door Out-door Out-door Out-door
All-the-year-round service x49 Yes No Yes No No Yes Yes Yes Yes YesRound-the-clock service x50 No Yes Yes No No Yes Yes Yes No NoWay of identif ication x51 Smart Card Phone Smart Card ID ID Phone Smart Card Smart Card ID IDOperating area cities x52 1 1 7 1 1 1 1 1 1 1Limit of use hours x53 15 No limit 12 24 4 24 2 24 2 No limitFine € x54 NS NS NA NS NS NA 0.00 150.00 100.00 NSRental time free of charge (long-term tarif f) minutes x55 unlimited 0 0 0 unlimited 30 unlimited 30 unlimited unlimitedFare unit (long-term tariff) x56 unlimited €/minute €/hour €/rent unlimited €/30&60min unlimited €/30min unlimited unlimitedFlat rate x57 Yes Yes Yes Yes Yes Yes Yes No Yes YesBank transfer payment x58 NS Yes Yes No NS No Yes Yes NS NSBank card payment x59 NS Yes Yes No NS Yes No Yes NS NSPre-paid card payment x60 NS No No No NS No No No NS NSCash payment x61 NS No Yes Yes NS No No No NS NS
Investor x62Private company
Private company
Public authority
Public authority
Public authority
Private company
Private company
Private company
Public authority
Public authority
Operator x63Public authority
Private company
Public authority Association
Public authority
Private company
Private company
Private company
Public authority Association
Provider x64Private company
Private company
Private company Other
Public authority
Private company Other
Private company NA
Private company
Provider companies x65 Bicincittà Call a bike Other Other Other VeoliaClear Channel EFFIA Other
C'entro in bici
Number of stations stations x66 10 0 50 15 15 4 23 82 4 32Year 2009 2009 2008 2009 2009 2009 2009 2009 2007 2009Distance betw een stations m x67 2,000 NS NA NA 300 NA NA NA NA 300Technology of the locking device x68 Electronic Electronic Electronic Staff Staff Electronic Electronic Electronic Staff MechanicMetro stations provided w ith BSS metro stations x69 NS NS 2NS NS NS NS NS NS NS NSCITY DATA
Daily municipal trips trips/day y1 138,448 837,859 946,050 700,362 564,011 NA 1,264,830 1,264,830 NA 750,000Car modal share % y2 72.0% 44.0% 63.0% 50.2% 36.6% NA 60.0% 60.0% NA 79.0%PT modal share % y3 14.0% 18.0% 8.0% 14.2% 7.9% NA 14.0% 14.0% NA 7.0%Cycling modal share % y4 1.0% 16.0% 2.0% 5.6% 3.3% NA 3.0% 3.0% NA 10.0%Walking modal share % y5 13.0% 22.0% 27.0% 30.0% 49.9% NA 23.0% 23.0% NA 4.0%Cycling modal share before the BSS % y6 NA 16.0% 2.0% 5.6% 1.4% NA 3.0% 3.0% NA 9.1%Population inhabitants y7 322,511 288,917 255,000 241,504 233,399 232,662 209,900 209,900 206,245 200,007EU standard CO2 emission of cars CO2 kg/km y8 0.16 0.16 0.16 0.16 0.16 0.16 0.16 0.16 0.16 0.16EU standard CO emission of diesel cars CO g/km y9 0.005 0.005 0.005 0.005 0.005 0.005 0.005 0.005 0.005 0.005EU standard PM emission of diesel cars PM g/km y10 0.50 0.50 0.50 0.50 0.50 0.50 0.50 0.50 0.50 0.50EU standard NOx emission of diesel cars NOx kg/km y11 0.18 0.18 0.18 0.18 0.18 0.18 0.18 0.18 0.18 0.18Average duration of private bicycle trips minutes y12 NA NA NA NA NA NA NA NA NA NANumber of metro stations metro stations y14 9 NA 0 0 NA NA 15 15 NA 0Avergage yearly temperature ºC y15 16.9 NA 15.7 7.5 NA NA 11.7 11.7 16.2 14.4Cycle netw ork km y16 5 200 120 113 78 NA 180 180 14 130Area of the city km2 y17 116.20 173.46 56.88 220.85 276.80 NA 51.50 51.50 70.20 183.23Permission for carrying bikes in PT trains y18 restricted restricted unlimited unlimited restricted restricted unlimited unlimited restricted restrictedYearly overnight stays in tourist accomodations stays/year y19 439,488 817,286 850,000 432,386 348,537 NA NA NA NA 454,128Yearly municipal bicycle theft cases/year y20 NA 1,932 NA 530 NA NA NA NA NA NAYearly cycle accidents accidents/year y21 100 557 25 267 NA NA NA 52 NA 239Population density inhab/km2 y22 2,775.00 1,666.00 4,482.70 1,093.00 843.20 420.30 4,093.00 4,093.00 2,939.60 1,091.56
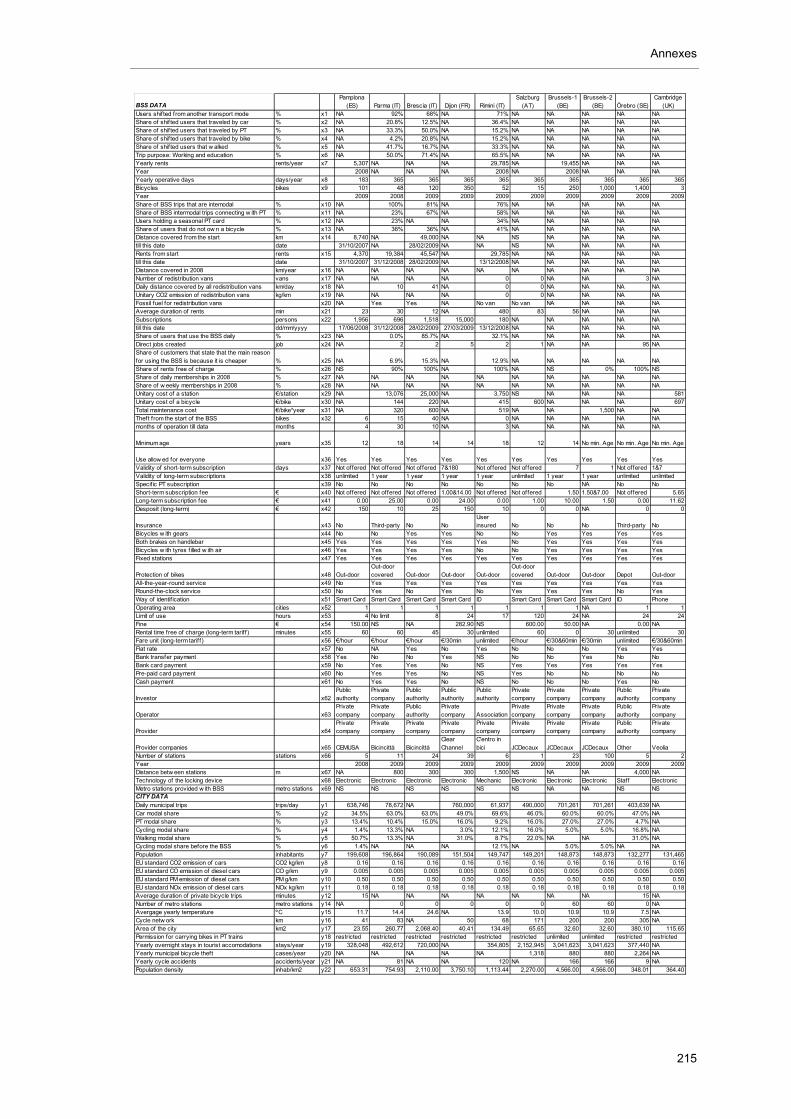
Annexes
215
BSS DATAPamplona
(ES) Parma (IT) Brescia (IT) Dijon (FR) Rimini (IT)Salzburg
(AT)Brussels-1
(BE)Brussels-2
(BE) Örebro (SE)Cambridge
(UK)Users shifted from another transport mode % x1 NA 92% 68% NA 71% NA NA NA NA NAShare of shif ted users that traveled by car % x2 NA 20.8% 12.5% NA 36.4% NA NA NA NA NAShare of shif ted users that traveled by PT % x3 NA 33.3% 50.0% NA 15.2% NA NA NA NA NAShare of shif ted users that traveled by bike % x4 NA 4.2% 20.8% NA 15.2% NA NA NA NA NAShare of shif ted users that w alked % x5 NA 41.7% 16.7% NA 33.3% NA NA NA NA NATrip purpose: Working and education % x6 NA 50.0% 71.4% NA 65.5% NA NA NA NA NAYearly rents rents/year x7 5,307 NA NA NA 29,785 NA 19,455 NA NA NAYear 2008 NA NA NA 2008 NA 2008 NA NA NAYearly operative days days/year x8 183 365 365 365 365 365 365 365 365 365Bicycles bikes x9 101 48 120 350 52 15 250 1,000 1,400 3Year 2009 2008 2009 2009 2009 2009 2009 2009 2009 2009Share of BSS trips that are intemodal % x10 NA 100% 81% NA 76% NA NA NA NA NAShare of BSS intermodal trips connecting w ith PT % x11 NA 23% 67% NA 58% NA NA NA NA NAUsers holding a seasonal PT card % x12 NA 23% NA NA 34% NA NA NA NA NAShare of users that do not ow n a bicycle % x13 NA 36% 36% NA 41% NA NA NA NA NADistance covered from the start km x14 8,740 NA 49,000 NA NA NS NA NA NA NAtill this date date 31/10/2007 NA 28/02/2009 NA NA NS NA NA NA NARents from start rents x15 4,370 19,384 45,547 NA 29,785 NA NA NA NA NAtill this date date 31/10/2007 31/12/2008 28/02/2009 NA 13/12/2008 NA NA NA NA NADistance covered in 2008 km/year x16 NA NA NA NA NA NA NA NA NA NANumber of redistribution vans vans x17 NA NA NA NA 0 0 NA NA 3 NADaily distance covered by all redistribution vans km/day x18 NA 10 41 NA 0 0 NA NA NA NAUnitary CO2 emission of redistribution vans kg/km x19 NA NA NA NA 0 0 NA NA NA NAFossil fuel for redistribution vans x20 NA Yes Yes NA No van No van NA NA NA NAAverage duration of rents min x21 23 30 12 NA 480 83 56 NA NA NASubscriptions persons x22 1,956 696 1,518 15,000 180 NA NA NA NA NAtill this date dd/mm/yyyy 17/06/2008 31/12/2008 28/02/2009 27/03/2009 13/12/2008 NA NA NA NA NAShare of users that use the BSS daily % x23 NA 0.0% 85.7% NA 32.1% NA NA NA NA NADirect jobs created job x24 NA 2 2 5 2 1 NA NA 95 NAShare of customers that state that the main reason for using the BSS is because it is cheaper % x25 NA 6.9% 15.3% NA 12.9% NA NA NA NA NAShare of rents free of charge % x26 NS 90% 100% NA 100% NA NS 0% 100% NSShare of daily memberships in 2008 % x27 NA NA NA NA NA NA NA NA NA NAShare of w eekly memberships in 2008 % x28 NA NA NA NA NA NA NA NA NA NAUnitary cost of a station €/station x29 NA 13,076 25,000 NA 3,750 NS NA NA NA 581Unitary cost of a bicycle €/bike x30 NA 144 220 NA 415 600 NA NA NA 697Total maintenance cost €/bike*year x31 NA 320 600 NA 519 NA NA 1,500 NA NATheft from the start of the BSS bikes x32 6 15 40 NA 0 NA NA NA NA NAmonths of operation till data months 4 30 10 NA 3 NA NA NA NA NA
Minimum age years x35 12 18 14 14 18 12 14 No min. Age No min. Age No min. Age
Use allow ed for everyone x36 Yes Yes Yes Yes Yes Yes Yes Yes Yes YesValidity of short-term subscription days x37 Not offered Not offered Not offered 7&180 Not offered Not offered 7 1 Not offered 1&7Validity of long-term subscriptions x38 unlimited 1 year 1 year 1 year 1 year unlimited 1 year 1 year unlimited unlimitedSpecif ic PT subscription x39 No No No No No No No NA No NoShort-term subscription fee € x40 Not offered Not offered Not offered 1.00&14.00 Not offered Not offered 1.50 1.50&7.00 Not offered 5.65Long-term subscription fee € x41 0.00 25.00 0.00 24.00 0.00 1.00 10.00 1.50 0.00 11.62Desposit (long-term) € x42 150 10 25 150 10 0 0 NA 0 0
Insurance x43 No Third-party No NoUser insured No No No Third-party No
Bicycles w ith gears x44 No No Yes Yes No No Yes Yes Yes YesBoth brakes on handlebar x45 Yes Yes Yes Yes Yes No Yes Yes Yes YesBicycles w ith tyres filled w ith air x46 Yes Yes Yes Yes No No Yes Yes Yes YesFixed stations x47 Yes Yes Yes Yes Yes Yes Yes Yes Yes Yes
Protection of bikes x48 Out-doorOut-door covered Out-door Out-door Out-door
Out-door covered Out-door Out-door Depot Out-door
All-the-year-round service x49 No Yes Yes Yes Yes Yes Yes Yes Yes YesRound-the-clock service x50 No Yes No Yes No Yes Yes Yes No YesWay of identif ication x51 Smart Card Smart Card Smart Card Smart Card ID Smart Card Smart Card Smart Card ID PhoneOperating area cities x52 1 1 1 1 1 1 1 NA 1 1Limit of use hours x53 4 No limit 8 24 17 120 24 NA 24 24Fine € x54 150.00 NS NA 282.90 NS 600.00 50.00 NA 0.00 NARental time free of charge (long-term tarif f) minutes x55 60 60 45 30 unlimited 60 0 30 unlimited 30Fare unit (long-term tariff) x56 €/hour €/hour €/hour €/30min unlimited €/hour €/30&60min €/30min unlimited €/30&60minFlat rate x57 No NA Yes No Yes No No No Yes YesBank transfer payment x58 Yes No No Yes NS No No Yes No NoBank card payment x59 No Yes Yes No NS Yes Yes Yes Yes YesPre-paid card payment x60 No Yes Yes No NS Yes No No No NoCash payment x61 No Yes Yes No NS No No No Yes No
Investor x62Public authority
Private company
Public authority
Public authority
Public authority
Private company
Private company
Private company
Public authority
Private company
Operator x63Private company
Private company
Public authority
Private company Association
Private company
Private company
Private company
Public authority
Private company
Provider x64Private company
Private company
Private company
Private company
Private company
Private company
Private company
Private company
Public authority
Private company
Provider companies x65 CEMUSA Bicincittà BicincittàClear Channel
C'entro in bici JCDecaux JCDecaux JCDecaux Other Veolia
Number of stations stations x66 5 11 24 39 6 1 23 100 5 2Year 2008 2009 2009 2009 2009 2009 2009 2009 2009 2009Distance betw een stations m x67 NA 800 300 300 1,500 NS NA NA 4,000 NATechnology of the locking device x68 Electronic Electronic Electronic Electronic Mechanic Electronic Electronic Electronic Staff ElectronicMetro stations provided w ith BSS metro stations x69 NS NS NS NS NS NS NA NA NS NSCITY DATA
Daily municipal trips trips/day y1 638,746 78,672 NA 760,000 61,937 490,000 701,261 701,261 403,639 NACar modal share % y2 34.5% 63.0% 63.0% 49.0% 69.6% 46.0% 60.0% 60.0% 47.0% NAPT modal share % y3 13.4% 10.4% 15.0% 16.0% 9.2% 16.0% 27.0% 27.0% 4.7% NACycling modal share % y4 1.4% 13.3% NA 3.0% 12.1% 16.0% 5.0% 5.0% 16.8% NAWalking modal share % y5 50.7% 13.3% NA 31.0% 8.7% 22.0% NA NA 31.0% NACycling modal share before the BSS % y6 1.4% NA NA NA 12.1% NA 5.0% 5.0% NA NAPopulation inhabitants y7 199,608 196,864 190,089 151,504 149,747 149,201 148,873 148,873 132,277 131,465EU standard CO2 emission of cars CO2 kg/km y8 0.16 0.16 0.16 0.16 0.16 0.16 0.16 0.16 0.16 0.16EU standard CO emission of diesel cars CO g/km y9 0.005 0.005 0.005 0.005 0.005 0.005 0.005 0.005 0.005 0.005EU standard PM emission of diesel cars PM g/km y10 0.50 0.50 0.50 0.50 0.50 0.50 0.50 0.50 0.50 0.50EU standard NOx emission of diesel cars NOx kg/km y11 0.18 0.18 0.18 0.18 0.18 0.18 0.18 0.18 0.18 0.18Average duration of private bicycle trips minutes y12 15 NA NA NA NA NA NA NA 15 NANumber of metro stations metro stations y14 NA 0 0 0 0 0 60 60 0 NAAvergage yearly temperature ºC y15 11.7 14.4 24.6 NA 13.9 10.0 10.9 10.9 7.5 NACycle netw ork km y16 41 83 NA 50 68 171 200 200 305 NAArea of the city km2 y17 23.55 260.77 2,068.40 40.41 134.49 65.65 32.60 32.60 380.10 115.65Permission for carrying bikes in PT trains y18 restricted restricted restricted restricted restricted restricted unlimited unlimited restricted restrictedYearly overnight stays in tourist accomodations stays/year y19 328,048 492,612 720,000 NA 354,805 2,152,945 3,041,623 3,041,623 377,440 NAYearly municipal bicycle theft cases/year y20 NA NA NA NA NA 1,318 880 880 2,264 NAYearly cycle accidents accidents/year y21 NA 81 NA NA 120 NA 166 166 9 NAPopulation density inhab/km2 y22 653.31 754.93 2,110.00 3,750.10 1,113.44 2,270.00 4,566.00 4,566.00 348.01 364.40
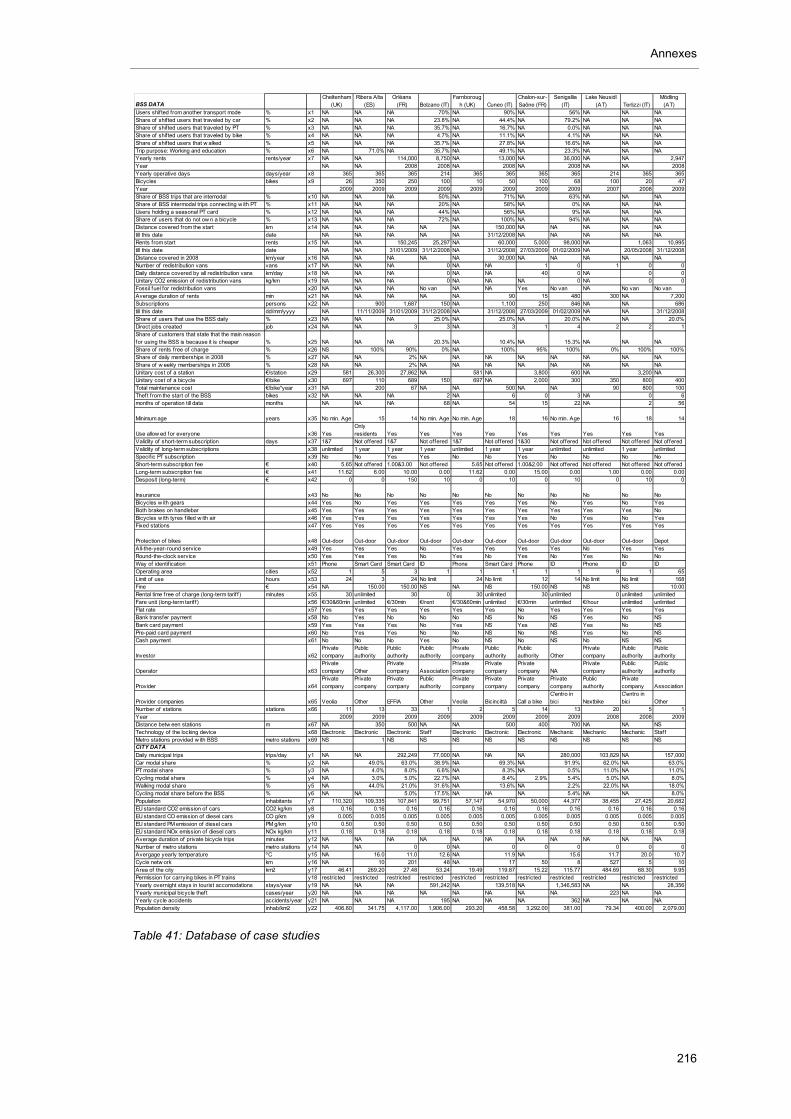
Annexes
216
Table 41: Database of case studies
BSS DATACheltenham
(UK)Ribera Alta
(ES)Orléans
(FR) Bolzano (IT)Farnboroug
h (UK) Cuneo (IT)Chalon-sur-Saône (FR)
Senigallia (IT)
Lake Neusidl (AT) Terlizzi (IT)
Mödling (AT)
Users shif ted from another transport mode % x1 NA NA NA 70% NA 90% NA 56% NA NA NAShare of shif ted users that traveled by car % x2 NA NA NA 23.8% NA 44.4% NA 79.2% NA NA NAShare of shif ted users that traveled by PT % x3 NA NA NA 35.7% NA 16.7% NA 0.0% NA NA NAShare of shif ted users that traveled by bike % x4 NA NA NA 4.7% NA 11.1% NA 4.1% NA NA NAShare of shif ted users that w alked % x5 NA NA NA 35.7% NA 27.8% NA 16.6% NA NA NATrip purpose: Working and education % x6 NA 71.0% NA 35.7% NA 49.1% NA 23.3% NA NA NAYearly rents rents/year x7 NA NA 114,000 8,750 NA 13,000 NA 36,000 NA NA 2,947Year NA NA 2008 2008 NA 2008 NA 2008 NA NA 2008Yearly operative days days/year x8 365 365 365 214 365 365 365 365 214 365 365Bicycles bikes x9 26 350 250 100 10 50 100 68 100 20 47Year 2009 2009 2009 2009 2009 2009 2009 2009 2007 2008 2009Share of BSS trips that are intemodal % x10 NA NA NA 50% NA 71% NA 63% NA NA NAShare of BSS intermodal trips connecting w ith PT % x11 NA NA NA 20% NA 58% NA 0% NA NA NAUsers holding a seasonal PT card % x12 NA NA NA 44% NA 56% NA 9% NA NA NAShare of users that do not ow n a bicycle % x13 NA NA NA 72% NA 100% NA 94% NA NA NADistance covered from the start km x14 NA NA NA NA NA 150,000 NA NA NA NA NAtill this date date NA NA NA NA NA 31/12/2008 NA NA NA NA NARents from start rents x15 NA NA 150,245 25,297 NA 60,000 5,000 98,000 NA 1,063 10,995till this date date NA NA 31/01/2009 31/12/2008 NA 31/12/2008 27/03/2009 01/02/2009 NA 20/05/2008 31/12/2008Distance covered in 2008 km/year x16 NA NA NA NA NA 30,000 NA NA NA NA NANumber of redistribution vans vans x17 NA NA NA 0 NA NA 1 0 1 0 0Daily distance covered by all redistribution vans km/day x18 NA NA NA 0 NA NA 40 0 NA 0 0Unitary CO2 emission of redistribution vans kg/km x19 NA NA NA 0 NA NA NA 0 NA 0 0Fossil fuel for redistribution vans x20 NA NA NA No van NA NA Yes No van NA No van No vanAverage duration of rents min x21 NA NA NA NA NA 90 15 480 300 NA 7,200Subscriptions persons x22 NA 900 1,687 150 NA 1,100 250 846 NA NA 686till this date dd/mm/yyyy NA 11/11/2009 31/01/2009 31/12/2008 NA 31/12/2008 27/03/2009 01/02/2009 NA NA 31/12/2008Share of users that use the BSS daily % x23 NA NA NA 25.0% NA 25.0% NA 20.0% NA NA 20.0%Direct jobs created job x24 NA NA 3 3 NA 3 1 4 2 2 1Share of customers that state that the main reason for using the BSS is because it is cheaper % x25 NA NA NA 20.3% NA 10.4% NA 15.3% NA NA NAShare of rents free of charge % x26 NS 100% 90% 0% NA 100% 95% 100% 0% 100% 100%Share of daily memberships in 2008 % x27 NA NA 2% NA NA NA NA NA NA NA NAShare of w eekly memberships in 2008 % x28 NA NA 2% NA NA NA NA NA NA NA NAUnitary cost of a station €/station x29 581 26,300 27,862 NA 581 NA 3,800 600 NA 3,200 NAUnitary cost of a bicycle €/bike x30 697 110 689 150 697 NA 2,000 300 350 800 400Total maintenance cost €/bike*year x31 NA 200 67 NA NA 500 NA NA 90 800 100Theft from the start of the BSS bikes x32 NA NA NA 2 NA 6 0 3 NA 0 6months of operation till data months NA NA NA 68 NA 54 15 22 NA 2 56
Minimum age years x35 No min. Age 15 14 No min. Age No min. Age 18 16 No min. Age 16 18 14
Use allow ed for everyone x36 YesOnly residents Yes Yes Yes Yes Yes Yes Yes Yes Yes
Validity of short-term subscription days x37 1&7 Not offered 1&7 Not offered 1&7 Not offered 1&30 Not offered Not offered Not offered Not offeredValidity of long-term subscriptions x38 unlimited 1 year 1 year 1 year unlimited 1 year 1 year unlimited unlimited 1 year unlimitedSpecific PT subscription x39 No No Yes Yes No No Yes No No No NoShort-term subscription fee € x40 5.65 Not offered 1.00&3.00 Not offered 5.65 Not offered 1.00&2.00 Not offered Not offered Not offered Not offeredLong-term subscription fee € x41 11.62 6.00 10.00 0.00 11.62 0.00 15.00 0.00 1.00 0.00 0.00Desposit (long-term) € x42 0 0 150 10 0 10 0 10 0 10 0
Insurance x43 No No No No No No No No No No NoBicycles w ith gears x44 Yes No Yes Yes Yes Yes Yes No Yes No YesBoth brakes on handlebar x45 Yes Yes Yes Yes Yes Yes Yes Yes Yes Yes NoBicycles w ith tyres filled w ith air x46 Yes Yes Yes Yes Yes Yes Yes No Yes No YesFixed stations x47 Yes Yes Yes Yes Yes Yes Yes Yes Yes Yes Yes
Protection of bikes x48 Out-door Out-door Out-door Out-door Out-door Out-door Out-door Out-door Out-door Out-door DepotAll-the-year-round service x49 Yes Yes Yes No Yes Yes Yes Yes No Yes YesRound-the-clock service x50 Yes Yes Yes No Yes No Yes No Yes No NoWay of identif ication x51 Phone Smart Card Smart Card ID Phone Smart Card Phone ID Phone ID IDOperating area cities x52 1 5 3 1 1 1 1 1 9 1 65Limit of use hours x53 24 3 24 No limit 24 No limit 12 14 No limit No limit 168Fine € x54 NA 150.00 150.00 NS NA NS 150.00 NS NS NS 10.00Rental time free of charge (long-term tarif f) minutes x55 30 unlimited 30 0 30 unlimited 30 unlimited 0 unlimited unlimitedFare unit (long-term tarif f) x56 €/30&60min unlimited €/30min €/rent €/30&60min unlimited €/30min unlimited €/hour unlimited unlimitedFlat rate x57 Yes Yes Yes Yes Yes Yes No Yes Yes Yes YesBank transfer payment x58 No Yes No No No NS No NS Yes No NSBank card payment x59 Yes Yes Yes No Yes NS Yes NS Yes No NSPre-paid card payment x60 No Yes Yes No No NS No NS Yes No NSCash payment x61 No No No Yes No NS No NS No NS NS
Investor x62Private company
Public authority
Public authority
Public authority
Private company
Public authority
Public authority Other
Private company
Public authority
Public authority
Operator x63Private company Other
Private company Association
Private company
Private company
Private company NA
Private company
Public authority
Public authority
Provider x64Private company
Private company
Private company
Public authority
Private company
Private company
Private company
Private company
Public authority
Private company Association
Provider companies x65 Veolia Other EFFIA Other Veolia Bicincittà Call a bikeC'entro in bici Nextbike
C'entro in bici Other
Number of stations stations x66 11 13 33 1 2 5 14 13 20 5 1Year 2009 2009 2009 2009 2009 2009 2009 2009 2008 2008 2009Distance betw een stations m x67 NA 350 500 NA NA 500 400 700 NA NA NSTechnology of the locking device x68 Electronic Electronic Electronic Staff Electronic Electronic Electronic Mechanic Mechanic Mechanic StaffMetro stations provided w ith BSS metro stations x69 NS 1 NS NS NS NS NS NS NS NS NSCITY DATA
Daily municipal trips trips/day y1 NA NA 292,249 77,000 NA NA NA 280,000 103,829 NA 157,000Car modal share % y2 NA 49.0% 63.0% 38.9% NA 69.3% NA 91.9% 62.0% NA 63.0%PT modal share % y3 NA 4.0% 8.0% 6.6% NA 8.3% NA 0.5% 11.0% NA 11.0%Cycling modal share % y4 NA 3.0% 5.0% 22.7% NA 8.4% 2.9% 5.4% 5.0% NA 8.0%Walking modal share % y5 NA 44.0% 21.0% 31.6% NA 13.6% NA 2.2% 22.0% NA 18.0%Cycling modal share before the BSS % y6 NA NA 5.0% 17.5% NA NA NA 5.4% NA NA 8.0%Population inhabitants y7 110,320 109,335 107,841 99,751 57,147 54,970 50,000 44,377 38,455 27,425 20,682EU standard CO2 emission of cars CO2 kg/km y8 0.16 0.16 0.16 0.16 0.16 0.16 0.16 0.16 0.16 0.16 0.16EU standard CO emission of diesel cars CO g/km y9 0.005 0.005 0.005 0.005 0.005 0.005 0.005 0.005 0.005 0.005 0.005EU standard PM emission of diesel cars PM g/km y10 0.50 0.50 0.50 0.50 0.50 0.50 0.50 0.50 0.50 0.50 0.50EU standard NOx emission of diesel cars NOx kg/km y11 0.18 0.18 0.18 0.18 0.18 0.18 0.18 0.18 0.18 0.18 0.18Average duration of private bicycle trips minutes y12 NA NA NA NA NA NA NA NA NA NA NANumber of metro stations metro stations y14 NA NA 0 0 NA 0 0 0 0 0 0Avergage yearly temperature ºC y15 NA 16.0 11.0 12.6 NA 11.9 NA 15.6 11.7 20.0 10.7Cycle netw ork km y16 NA 10 201 48 NA 17 50 8 527 5 10Area of the city km2 y17 46.41 269.20 27.48 53.24 19.49 119.87 15.22 115.77 484.69 68.30 9.95Permission for carrying bikes in PT trains y18 restricted restricted restricted restricted restricted restricted restricted restricted restricted restricted restrictedYearly overnight stays in tourist accomodations stays/year y19 NA NA NA 591,242 NA 139,518 NA 1,346,583 NA NA 28,356Yearly municipal bicycle theft cases/year y20 NA NA NA NA NA NA NA NA 223 NA NAYearly cycle accidents accidents/year y21 NA NA NA 195 NA NA NA 362 NA NA NAPopulation density inhab/km2 y22 406.80 341.75 4,117.00 1,906.00 293.20 458.58 3,292.00 381.00 79.34 400.00 2,079.00
Annexes
217
10.2 Calculations based on the database
The following assumptions and additional explanations about the calculation and the
database are to be considered:
It was assumed that the share of users that declared to shift from a transport mode
to bike-sharing is the same as the share of trips.
The data of Vienna concerning the travel shift from another transport mode to bike-
sharing was extracted from the results of an Internet survey. It was exactly asked
"How often would you drive a car if Citybike is out of service?” The share of shifted
trips corresponds to the share of the people who stated that they would use “very
often” a certain transport mode. “Walking” was not a likely answer of the survey.
The data concerning the purpose of bike-sharing rents in German case studies
were taken from multi-answer surveys.
The data of yearly bike-sharing rents correspond to the year 2008, except data from
Rennes-1 and Terrassa that correspond to 2007.
The data of the total municipal trips are in some cases previous to the introduction
of the BSSs and therefore they do not include the bike-sharing trips. Nevertheless,
the number of bike-sharing trips is so low compared to the total municipal trips that
the influence of this fact can be considered as residual in the final result of the bike-
sharing modal share.
Daily municipal trips of Vienna, Stuttgart, Düsseldorf, Leipzig, Karlsruhe, Montpellier,
Chemnitz, Pamplona and Orleans were obtained by mean of population and
average daily trips per person.
It was assumed that each bike-sharing rent comprises only one trip.
Bicycle trips made before the implementation of a BSS have been considered
residual for the calculation of the increase of cycling due to bike-sharing.
The “share of bike-sharing intermodal trips connecting with PT” corresponds to the
sum of shares of all kind of public transport modes that are taken before connecting
with bike-sharing. Public transport modes used after bike-sharing are minority.
The distance covered by bike-sharing trip was calculated by dividing total distance
from the launch of the BSSs by total rents since this date. As exception, the
distance per trip in Vienna and Barcelona, was calculated by dividing annual
distance by annual trips in 2008 because aggregate data were not available in
these two cities. Since very few case studies have available data concerning
distance of trips, to continuous the calculation with a significant number of case
studies, it has been assumed that bike-sharing trips in Berlin, Munich, Stockholm,
Stuttgart, Karlsruhe, Rennes, Rimini, Bolzano and Senigallia are 2 kilometres long
(the average value).
Annexes
218
No variation of CO2 emission of redistribution vehicles depending on load has been
considered.
Very few case studies provide information about the distance covered by
redistribution vans. To continue the calculation with a significant number of case
studies, it has been assumed that the redistribution distance of cases without data
is the average BSSs with available data (Vienna, Stockholm, Montpellier, Modena
and Chalon-sur-Saône), i.e. 39 km.
After checking the correspondence between time and distance of the BSSs of
Modena and Cuneo, these two case studies have been removed from the
estimation of pedalling time. Their rental time is much longer than reasonable for
the reported distance, what indicates time without pedalling.
The average unitary cost of bicycles has been assumed for case studies without
data.
Bike-sharing rents data corresponds mostly to 2008, while bike-sharing bicycle data
corresponds to 2009. The number of bicycles in 2008 may be lower than in 2009.
Therefore, the reader must be aware this fact might affect some results of section 6
and 7.
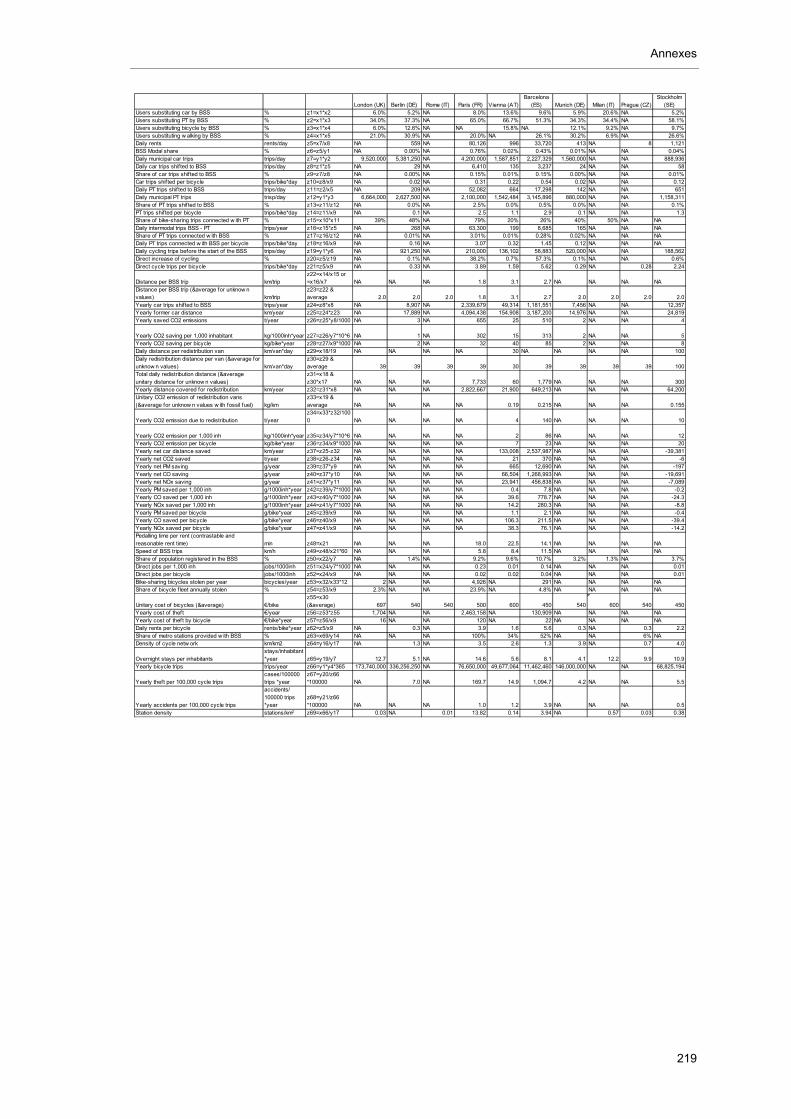
Annexes
219
London (UK) Berlin (DE) Rome (IT) Paris (FR) Vienna (AT)Barcelona
(ES) Munich (DE) Milan (IT) Prague (CZ)Stockholm
(SE)Users substituting car by BSS % z1=x1*x2 6.0% 5.2% NA 8.0% 13.6% 9.6% 5.9% 20.6% NA 5.2%Users substituting PT by BSS % z2=x1*x3 34.0% 37.3% NA 65.0% 66.7% 51.3% 34.3% 34.4% NA 58.1%Users substituting bicycle by BSS % z3=x1*x4 6.0% 12.6% NA NA 15.8% NA 12.1% 9.2% NA 9.7%Users substituting w alking by BSS % z4=x1*x5 21.0% 30.9% NA 20.0% NA 26.1% 30.2% 6.9% NA 26.6%Daily rents rents/day z5=x7/x8 NA 559 NA 80,126 996 33,720 413 NA 8 1,121BSS Modal share % z6=z5/y1 NA 0.00% NA 0.76% 0.02% 0.43% 0.01% NA NA 0.04%Daily municipal car trips trips/day z7=y1*y2 9,520,000 5,381,250 NA 4,200,000 1,587,851 2,227,329 1,560,000 NA NA 888,936Daily car trips shifted to BSS trips/day z8=z1*z5 NA 29 NA 6,410 135 3,237 24 NA NA 58Share of car trips shif ted to BSS % z9=z7/z8 NA 0.00% NA 0.15% 0.01% 0.15% 0.00% NA NA 0.01%Car trips shif ted per bicycle trips/bike*day z10=z8/x9 NA 0.02 NA 0.31 0.22 0.54 0.02 NA NA 0.12Daily PT trips shif ted to BSS trips/day z11=z2/x5 NA 209 NA 52,082 664 17,298 142 NA NA 651Daily municipal PT trips trisp/day z12=y1*y3 6,664,000 2,627,500 NA 2,100,000 1,542,484 3,145,896 880,000 NA NA 1,158,311Share of PT trips shif ted to BSS % z13=z11/z12 NA 0.0% NA 2.5% 0.0% 0.5% 0.0% NA NA 0.1%PT trips shif ted per bicycle trips/bike*day z14=z11/x9 NA 0.1 NA 2.5 1.1 2.9 0.1 NA NA 1.3Share of bike-sharing trips connected w ith PT % z15=x10*x11 39% 48% NA 79% 20% 26% 40% 50% NA NADaily intermodal trips BSS - PT trips/year z16=z15*z5 NA 268 NA 63,300 199 8,685 165 NA NA NAShare of PT trips connected w ith BSS % z17=z16/z12 NA 0.01% NA 3.01% 0.01% 0.28% 0.02% NA NA NADaily PT trips connected w ith BSS per bicycle trips/bike*day z18=z16/x9 NA 0.16 NA 3.07 0.32 1.45 0.12 NA NA NADaily cycling trips before the start of the BSS trips/day z19=y1*y6 NA 921,250 NA 210,000 136,102 58,883 520,000 NA NA 188,562Direct increase of cycling % z20=z5/z19 NA 0.1% NA 38.2% 0.7% 57.3% 0.1% NA NA 0.6%Direct cycle trips per bicycle trips/bike*day z21=z5/x9 NA 0.33 NA 3.89 1.59 5.62 0.29 NA 0.28 2.24
Distance per BSS trip km/tripz22=x14/x15 or =x16/x7 NA NA NA 1.8 3.1 2.7 NA NA NA NA
Distance per BSS trip (&average for unknow n values) km/trip
z23=z22 & average 2.0 2.0 2.0 1.8 3.1 2.7 2.0 2.0 2.0 2.0
Yearly car trips shifted to BSS trips/year z24=z8*x8 NA 8,907 NA 2,339,679 49,314 1,181,551 7,456 NA NA 12,357Yearly former car distance km/year z25=z24*z23 NA 17,889 NA 4,094,438 154,908 3,187,200 14,976 NA NA 24,819Yearly saved CO2 emissions t/year z26=z25*y8/1000 NA 3 NA 655 25 510 2 NA NA 4
Yearly CO2 saving per 1,000 inhabitant kg/1000inh*year z27=z26/y7*10^6 NA 1 NA 302 15 313 2 NA NA 5Yearly CO2 saving per bicycle kg/bike*year z28=z27/x9*1000 NA 2 NA 32 40 85 2 NA NA 8Daily distance per redistribution van km/van*day z29=x18/19 NA NA NA NA 30 NA NA NA NA 100Daily redistribution distance per van (&average for unknow n values) km/van*day
z30=z29 & average 39 39 39 39 30 39 39 39 39 100
Total daily redistribution distance (&average unitary distance for unknow n values)
z31=x18 & z30*x17 NA NA NA 7,733 60 1,779 NA NA NA 300
Yearly distance covered for redistribution km/year z32=z31*x8 NA NA NA 2,822,667 21,900 649,213 NA NA NA 64,200Unitary CO2 emission of redistribution vans (&average for unknow n values w ith fossil fuel) kg/km
z33=x19 & average NA NA NA NA 0.19 0.215 NA NA NA 0.155
Yearly CO2 emission due to redistribution t/yearz34=x33*z32/1000 NA NA NA NA 4 140 NA NA NA 10
Yearly CO2 emission per 1,000 inh kg/1000inh*year z35=z34/y7*10^6 NA NA NA NA 2 86 NA NA NA 12Yearly CO2 emission per bicycle kg/bike*year z36=z34/x9*1000 NA NA NA NA 7 23 NA NA NA 20Yearly net car distance saved km/year z37=z25-z32 NA NA NA NA 133,008 2,537,987 NA NA NA -39,381Yearly net CO2 saved t/year z38=z26-z34 NA NA NA NA 21 370 NA NA NA -6Yearly net PM saving g/year z39=z37*y9 NA NA NA NA 665 12,690 NA NA NA -197Yearly net CO saving g/year z40=z37*y10 NA NA NA NA 66,504 1,268,993 NA NA NA -19,691Yearly net NOx saving g/year z41=z37*y11 NA NA NA NA 23,941 456,838 NA NA NA -7,089Yearly PM saved per 1,000 inh g/1000inh*year z42=z39/y7*1000 NA NA NA NA 0.4 7.8 NA NA NA -0.2Yearly CO saved per 1,000 inh g/1000inh*year z43=z40/y7*1000 NA NA NA NA 39.6 778.7 NA NA NA -24.3Yearly NOx saved per 1,000 inh g/1000inh*year z44=z41/y7*1000 NA NA NA NA 14.2 280.3 NA NA NA -8.8Yearly PM saved per bicycle g/bike*year z45=z39/x9 NA NA NA NA 1.1 2.1 NA NA NA -0.4Yearly CO saved per bicycle g/bike*year z46=z40/x9 NA NA NA NA 106.3 211.5 NA NA NA -39.4Yearly NOx saved per bicycle g/bike*year z47=z41/x9 NA NA NA NA 38.3 76.1 NA NA NA -14.2Pedalling time per rent (contrastable and reasonable rent time) min z48=x21 NA NA NA 18.0 22.5 14.1 NA NA NA NASpeed of BSS trips km/h z49=z48/x21*60 NA NA NA 5.8 8.4 11.5 NA NA NA NAShare of population registered in the BSS % z50=x22/y7 NA 1.4% NA 9.2% 9.6% 10.7% 3.2% 1.3% NA 3.7%Direct jobs per 1,000 inh jobs/1000inh z51=x24/y7*1000 NA NA NA 0.23 0.01 0.14 NA NA NA 0.01Direct jobs per bicycle jobs/1000inh z52=x24/x9 NA NA NA 0.02 0.02 0.04 NA NA NA 0.01Bike-sharing bicycles stolen per year bicycles/year z53=x32/x33*12 2 NA NA 4,926 NA 291 NA NA NA NAShare of bicycle f leet annually stolen % z54=z53/x9 2.3% NA NA 23.9% NA 4.8% NA NA NA NA
Unitary cost of bicycles (&average) €/bikez55=x30 (&average) 697 540 540 500 600 450 540 600 540 450
Yearly cost of theft €/year z56=z53*z55 1,704 NA NA 2,463,158 NA 130,909 NA NA NA NAYearly cost of theft by bicycle €/bike*year z57=z56/x9 16 NA NA 120 NA 22 NA NA NA NADaily rents per bicycle rents/bike*year z62=z5/x9 NA 0.3 NA 3.9 1.6 5.6 0.3 NA 0.3 2.2Share of metro stations provided w ith BSS % z63=x69/y14 NA NA NA 100% 34% 52% NA NA 6% NADensity of cycle netw ork km/km2 z64=y16/y17 NA 1.3 NA 3.5 2.6 1.3 3.9 NA 0.7 4.0
Overnight stays per inhabitantsstays/inhabitant *year z65=y19/y7 12.7 5.1 NA 14.6 5.6 8.1 4.1 12.2 9.9 10.9
Yearly bicycle trips trips/year z66=y1*y4*365 173,740,000 336,256,250 NA 76,650,000 49,677,064 11,462,460 146,000,000 NA NA 68,825,194
Yearly theft per 100,000 cycle tripscases/100000 trips *year
z67=y20/z66 *100000 NA 7.0 NA 169.7 14.9 1,094.7 4.2 NA NA 5.5
Yearly accidents per 100,000 cycle trips
accidents/ 100000 trips *year
z68=y21/z66 *100000 NA NA NA 1.0 1.2 3.9 NA NA NA 0.5
Station density stations/km2 z69=x66/y17 0.03 NA 0.01 13.82 0.14 3.94 NA 0.57 0.03 0.38
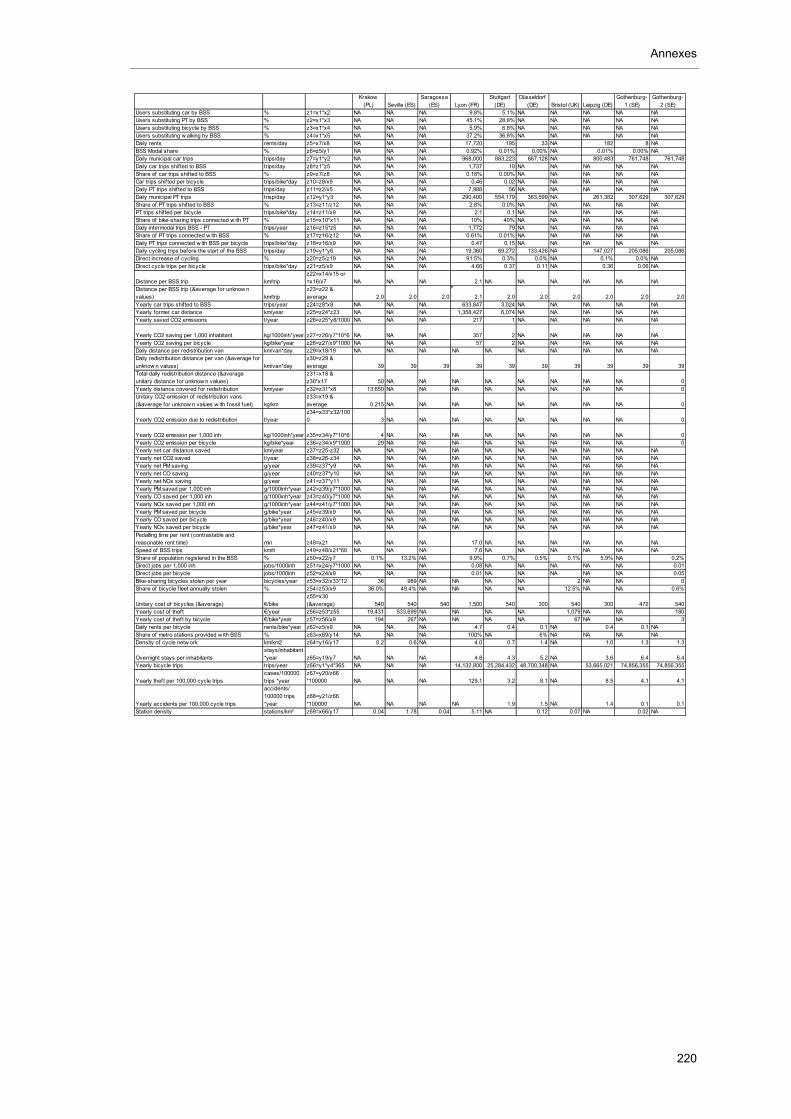
Annexes
220
Krakow (PL) Seville (ES)
Saragossa (ES) Lyon (FR)
Stuttgart (DE)
Düsseldorf (DE) Bristol (UK) Leipzig (DE)
Gothenburg-1 (SE)
Gothenburg-2 (SE)
Users substituting car by BSS % z1=x1*x2 NA NA NA 9.8% 5.1% NA NA NA NA NAUsers substituting PT by BSS % z2=x1*x3 NA NA NA 45.1% 28.8% NA NA NA NA NAUsers substituting bicycle by BSS % z3=x1*x4 NA NA NA 5.9% 6.8% NA NA NA NA NAUsers substituting w alking by BSS % z4=x1*x5 NA NA NA 37.2% 36.8% NA NA NA NA NADaily rents rents/day z5=x7/x8 NA NA NA 17,720 195 33 NA 182 8 NABSS Modal share % z6=z5/y1 NA NA NA 0.92% 0.01% 0.00% NA 0.01% 0.00% NADaily municipal car trips trips/day z7=y1*y2 NA NA NA 968,000 883,223 667,128 NA 800,483 761,748 761,748Daily car trips shifted to BSS trips/day z8=z1*z5 NA NA NA 1,737 10 NA NA NA NA NAShare of car trips shifted to BSS % z9=z7/z8 NA NA NA 0.18% 0.00% NA NA NA NA NACar trips shif ted per bicycle trips/bike*day z10=z8/x9 NA NA NA 0.46 0.02 NA NA NA NA NADaily PT trips shif ted to BSS trips/day z11=z2/x5 NA NA NA 7,988 56 NA NA NA NA NADaily municipal PT trips trisp/day z12=y1*y3 NA NA NA 290,400 554,179 383,599 NA 261,382 307,629 307,629Share of PT trips shif ted to BSS % z13=z11/z12 NA NA NA 2.8% 0.0% NA NA NA NA NAPT trips shif ted per bicycle trips/bike*day z14=z11/x9 NA NA NA 2.1 0.1 NA NA NA NA NAShare of bike-sharing trips connected w ith PT % z15=x10*x11 NA NA NA 10% 40% NA NA NA NA NADaily intermodal trips BSS - PT trips/year z16=z15*z5 NA NA NA 1,772 79 NA NA NA NA NAShare of PT trips connected w ith BSS % z17=z16/z12 NA NA NA 0.61% 0.01% NA NA NA NA NADaily PT trips connected w ith BSS per bicycle trips/bike*day z18=z16/x9 NA NA NA 0.47 0.15 NA NA NA NA NADaily cycling trips before the start of the BSS trips/day z19=y1*y6 NA NA NA 19,360 69,272 133,426 NA 147,027 205,086 205,086Direct increase of cycling % z20=z5/z19 NA NA NA 91.5% 0.3% 0.0% NA 0.1% 0.0% NADirect cycle trips per bicycle trips/bike*day z21=z5/x9 NA NA NA 4.66 0.37 0.11 NA 0.36 0.06 NA
Distance per BSS trip km/tripz22=x14/x15 or =x16/x7 NA NA NA 2.1 NA NA NA NA NA NA
Distance per BSS trip (&average for unknow n values) km/trip
z23=z22 & average 2.0 2.0 2.0 2.1 2.0 2.0 2.0 2.0 2.0 2.0
Yearly car trips shif ted to BSS trips/year z24=z8*x8 NA NA NA 633,847 3,024 NA NA NA NA NAYearly former car distance km/year z25=z24*z23 NA NA NA 1,358,427 6,074 NA NA NA NA NAYearly saved CO2 emissions t/year z26=z25*y8/1000 NA NA NA 217 1 NA NA NA NA NA
Yearly CO2 saving per 1,000 inhabitant kg/1000inh*year z27=z26/y7*10^6 NA NA NA 357 2 NA NA NA NA NAYearly CO2 saving per bicycle kg/bike*year z28=z27/x9*1000 NA NA NA 57 2 NA NA NA NA NADaily distance per redistribution van km/van*day z29=x18/19 NA NA NA NA NA NA NA NA NA NADaily redistribution distance per van (&average for unknow n values) km/van*day
z30=z29 & average 39 39 39 39 39 39 39 39 39 39
Total daily redistribution distance (&average unitary distance for unknow n values)
z31=x18 & z30*x17 50 NA NA NA NA NA NA NA NA 0
Yearly distance covered for redistribution km/year z32=z31*x8 13,650 NA NA NA NA NA NA NA NA 0Unitary CO2 emission of redistribution vans (&average for unknow n values w ith fossil fuel) kg/km
z33=x19 & average 0.215 NA NA NA NA NA NA NA NA 0
Yearly CO2 emission due to redistribution t/yearz34=x33*z32/1000 3 NA NA NA NA NA NA NA NA 0
Yearly CO2 emission per 1,000 inh kg/1000inh*year z35=z34/y7*10^6 4 NA NA NA NA NA NA NA NA 0Yearly CO2 emission per bicycle kg/bike*year z36=z34/x9*1000 29 NA NA NA NA NA NA NA NA 0Yearly net car distance saved km/year z37=z25-z32 NA NA NA NA NA NA NA NA NA NAYearly net CO2 saved t/year z38=z26-z34 NA NA NA NA NA NA NA NA NA NAYearly net PM saving g/year z39=z37*y9 NA NA NA NA NA NA NA NA NA NAYearly net CO saving g/year z40=z37*y10 NA NA NA NA NA NA NA NA NA NAYearly net NOx saving g/year z41=z37*y11 NA NA NA NA NA NA NA NA NA NAYearly PM saved per 1,000 inh g/1000inh*year z42=z39/y7*1000 NA NA NA NA NA NA NA NA NA NAYearly CO saved per 1,000 inh g/1000inh*year z43=z40/y7*1000 NA NA NA NA NA NA NA NA NA NAYearly NOx saved per 1,000 inh g/1000inh*year z44=z41/y7*1000 NA NA NA NA NA NA NA NA NA NAYearly PM saved per bicycle g/bike*year z45=z39/x9 NA NA NA NA NA NA NA NA NA NAYearly CO saved per bicycle g/bike*year z46=z40/x9 NA NA NA NA NA NA NA NA NA NAYearly NOx saved per bicycle g/bike*year z47=z41/x9 NA NA NA NA NA NA NA NA NA NAPedalling time per rent (contrastable and reasonable rent time) min z48=x21 NA NA NA 17.0 NA NA NA NA NA NASpeed of BSS trips km/h z49=z48/x21*60 NA NA NA 7.6 NA NA NA NA NA NAShare of population registered in the BSS % z50=x22/y7 0.1% 13.2% NA 9.9% 0.7% 0.5% 0.1% 5.9% NA 0.2%Direct jobs per 1,000 inh jobs/1000inh z51=x24/y7*1000 NA NA NA 0.08 NA NA NA NA NA 0.01Direct jobs per bicycle jobs/1000inh z52=x24/x9 NA NA NA 0.01 NA NA NA NA NA 0.05Bike-sharing bicycles stolen per year bicycles/year z53=x32/x33*12 36 989 NA NA NA NA 2 NA NA 0Share of bicycle f leet annually stolen % z54=z53/x9 36.0% 49.4% NA NA NA NA 12.5% NA NA 0.6%
Unitary cost of bicycles (&average) €/bikez55=x30 (&average) 540 540 540 1,500 540 300 540 300 472 540
Yearly cost of theft €/year z56=z53*z55 19,431 533,699 NA NA NA NA 1,079 NA NA 180Yearly cost of theft by bicycle €/bike*year z57=z56/x9 194 267 NA NA NA NA 67 NA NA 3Daily rents per bicycle rents/bike*year z62=z5/x9 NA NA NA 4.7 0.4 0.1 NA 0.4 0.1 NAShare of metro stations provided w ith BSS % z63=x69/y14 NA NA NA 100% NA 6% NA NA NA NADensity of cycle netw ork km/km2 z64=y16/y17 0.2 0.6 NA 4.0 0.7 1.4 NA 1.0 1.3 1.3
Overnight stays per inhabitantsstays/inhabitant *year z65=y19/y7 NA NA NA 4.8 4.3 5.2 NA 3.6 6.4 6.4
Yearly bicycle trips trips/year z66=y1*y4*365 NA NA NA 14,132,800 25,284,432 48,700,348 NA 53,665,021 74,856,355 74,856,355
Yearly theft per 100,000 cycle tripscases/100000 trips *year
z67=y20/z66 *100000 NA NA NA 129.1 3.2 8.1 NA 8.5 4.1 4.1
Yearly accidents per 100,000 cycle trips
accidents/ 100000 trips *year
z68=y21/z66 *100000 NA NA NA NA 1.9 1.5 NA 1.4 0.1 0.1
Station density stations/km2 z69=x66/y17 0.04 1.78 0.04 5.11 NA 0.12 0.07 NA 0.02 NA
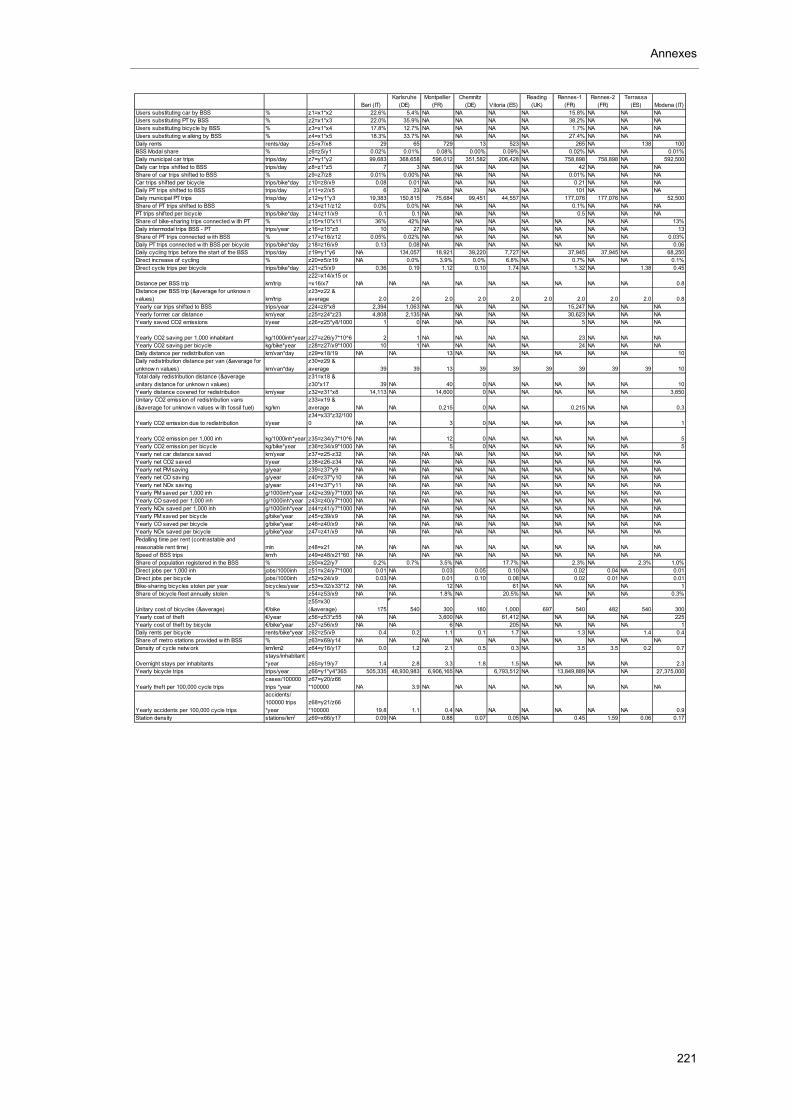
Annexes
221
Bari (IT)Karlsruhe
(DE)Montpellier
(FR)Chemnitz
(DE) Vitoria (ES)Reading
(UK)Rennes-1
(FR)Rennes-2
(FR)Terrassa
(ES) Modena (IT)Users substituting car by BSS % z1=x1*x2 22.6% 5.4% NA NA NA NA 15.8% NA NA NAUsers substituting PT by BSS % z2=x1*x3 22.0% 35.9% NA NA NA NA 38.2% NA NA NAUsers substituting bicycle by BSS % z3=x1*x4 17.8% 12.7% NA NA NA NA 1.7% NA NA NAUsers substituting w alking by BSS % z4=x1*x5 18.3% 33.7% NA NA NA NA 27.4% NA NA NADaily rents rents/day z5=x7/x8 29 65 729 13 523 NA 265 NA 138 100BSS Modal share % z6=z5/y1 0.02% 0.01% 0.08% 0.00% 0.09% NA 0.02% NA NA 0.01%Daily municipal car trips trips/day z7=y1*y2 99,683 368,658 596,012 351,582 206,428 NA 758,898 758,898 NA 592,500Daily car trips shifted to BSS trips/day z8=z1*z5 7 3 NA NA NA NA 42 NA NA NAShare of car trips shifted to BSS % z9=z7/z8 0.01% 0.00% NA NA NA NA 0.01% NA NA NACar trips shifted per bicycle trips/bike*day z10=z8/x9 0.08 0.01 NA NA NA NA 0.21 NA NA NADaily PT trips shifted to BSS trips/day z11=z2/x5 6 23 NA NA NA NA 101 NA NA NADaily municipal PT trips trisp/day z12=y1*y3 19,383 150,815 75,684 99,451 44,557 NA 177,076 177,076 NA 52,500Share of PT trips shifted to BSS % z13=z11/z12 0.0% 0.0% NA NA NA NA 0.1% NA NA NAPT trips shifted per bicycle trips/bike*day z14=z11/x9 0.1 0.1 NA NA NA NA 0.5 NA NA NAShare of bike-sharing trips connected w ith PT % z15=x10*x11 36% 42% NA NA NA NA NA NA NA 13%Daily intermodal trips BSS - PT trips/year z16=z15*z5 10 27 NA NA NA NA NA NA NA 13Share of PT trips connected w ith BSS % z17=z16/z12 0.05% 0.02% NA NA NA NA NA NA NA 0.03%Daily PT trips connected w ith BSS per bicycle trips/bike*day z18=z16/x9 0.13 0.08 NA NA NA NA NA NA NA 0.06Daily cycling trips before the start of the BSS trips/day z19=y1*y6 NA 134,057 18,921 39,220 7,727 NA 37,945 37,945 NA 68,250Direct increase of cycling % z20=z5/z19 NA 0.0% 3.9% 0.0% 6.8% NA 0.7% NA NA 0.1%Direct cycle trips per bicycle trips/bike*day z21=z5/x9 0.36 0.19 1.12 0.10 1.74 NA 1.32 NA 1.38 0.45
Distance per BSS trip km/tripz22=x14/x15 or =x16/x7 NA NA NA NA NA NA NA NA NA 0.8
Distance per BSS trip (&average for unknow n values) km/trip
z23=z22 & average 2.0 2.0 2.0 2.0 2.0 2.0 2.0 2.0 2.0 0.8
Yearly car trips shifted to BSS trips/year z24=z8*x8 2,394 1,063 NA NA NA NA 15,247 NA NA NAYearly former car distance km/year z25=z24*z23 4,808 2,135 NA NA NA NA 30,623 NA NA NAYearly saved CO2 emissions t/year z26=z25*y8/1000 1 0 NA NA NA NA 5 NA NA NA
Yearly CO2 saving per 1,000 inhabitant kg/1000inh*year z27=z26/y7*10^6 2 1 NA NA NA NA 23 NA NA NAYearly CO2 saving per bicycle kg/bike*year z28=z27/x9*1000 10 1 NA NA NA NA 24 NA NA NADaily distance per redistribution van km/van*day z29=x18/19 NA NA 13 NA NA NA NA NA NA 10Daily redistribution distance per van (&average for unknow n values) km/van*day
z30=z29 & average 39 39 13 39 39 39 39 39 39 10
Total daily redistribution distance (&average unitary distance for unknow n values)
z31=x18 & z30*x17 39 NA 40 0 NA NA NA NA NA 10
Yearly distance covered for redistribution km/year z32=z31*x8 14,113 NA 14,600 0 NA NA NA NA NA 3,650Unitary CO2 emission of redistribution vans (&average for unknow n values w ith fossil fuel) kg/km
z33=x19 & average NA NA 0.215 0 NA NA 0.215 NA NA 0.3
Yearly CO2 emission due to redistribution t/yearz34=x33*z32/1000 NA NA 3 0 NA NA NA NA NA 1
Yearly CO2 emission per 1,000 inh kg/1000inh*year z35=z34/y7*10^6 NA NA 12 0 NA NA NA NA NA 5Yearly CO2 emission per bicycle kg/bike*year z36=z34/x9*1000 NA NA 5 0 NA NA NA NA NA 5Yearly net car distance saved km/year z37=z25-z32 NA NA NA NA NA NA NA NA NA NAYearly net CO2 saved t/year z38=z26-z34 NA NA NA NA NA NA NA NA NA NAYearly net PM saving g/year z39=z37*y9 NA NA NA NA NA NA NA NA NA NAYearly net CO saving g/year z40=z37*y10 NA NA NA NA NA NA NA NA NA NAYearly net NOx saving g/year z41=z37*y11 NA NA NA NA NA NA NA NA NA NAYearly PM saved per 1,000 inh g/1000inh*year z42=z39/y7*1000 NA NA NA NA NA NA NA NA NA NAYearly CO saved per 1,000 inh g/1000inh*year z43=z40/y7*1000 NA NA NA NA NA NA NA NA NA NAYearly NOx saved per 1,000 inh g/1000inh*year z44=z41/y7*1000 NA NA NA NA NA NA NA NA NA NAYearly PM saved per bicycle g/bike*year z45=z39/x9 NA NA NA NA NA NA NA NA NA NAYearly CO saved per bicycle g/bike*year z46=z40/x9 NA NA NA NA NA NA NA NA NA NAYearly NOx saved per bicycle g/bike*year z47=z41/x9 NA NA NA NA NA NA NA NA NA NAPedalling time per rent (contrastable and reasonable rent time) min z48=x21 NA NA NA NA NA NA NA NA NA NASpeed of BSS trips km/h z49=z48/x21*60 NA NA NA NA NA NA NA NA NA NAShare of population registered in the BSS % z50=x22/y7 0.2% 0.7% 3.5% NA 17.7% NA 2.3% NA 2.3% 1.0%Direct jobs per 1,000 inh jobs/1000inh z51=x24/y7*1000 0.01 NA 0.03 0.05 0.10 NA 0.02 0.04 NA 0.01Direct jobs per bicycle jobs/1000inh z52=x24/x9 0.03 NA 0.01 0.10 0.08 NA 0.02 0.01 NA 0.01Bike-sharing bicycles stolen per year bicycles/year z53=x32/x33*12 NA NA 12 NA 61 NA NA NA NA 1Share of bicycle f leet annually stolen % z54=z53/x9 NA NA 1.8% NA 20.5% NA NA NA NA 0.3%
Unitary cost of bicycles (&average) €/bikez55=x30 (&average) 175 540 300 180 1,000 697 540 482 540 300
Yearly cost of theft €/year z56=z53*z55 NA NA 3,600 NA 61,412 NA NA NA NA 225Yearly cost of theft by bicycle €/bike*year z57=z56/x9 NA NA 6 NA 205 NA NA NA NA 1Daily rents per bicycle rents/bike*year z62=z5/x9 0.4 0.2 1.1 0.1 1.7 NA 1.3 NA 1.4 0.4Share of metro stations provided w ith BSS % z63=x69/y14 NA NA NA NA NA NA NA NA NA NADensity of cycle netw ork km/km2 z64=y16/y17 0.0 1.2 2.1 0.5 0.3 NA 3.5 3.5 0.2 0.7
Overnight stays per inhabitantsstays/inhabitant *year z65=y19/y7 1.4 2.8 3.3 1.8 1.5 NA NA NA NA 2.3
Yearly bicycle trips trips/year z66=y1*y4*365 505,335 48,930,983 6,906,165 NA 6,793,512 NA 13,849,889 NA NA 27,375,000
Yearly theft per 100,000 cycle tripscases/100000 trips *year
z67=y20/z66 *100000 NA 3.9 NA NA NA NA NA NA NA NA
Yearly accidents per 100,000 cycle trips
accidents/ 100000 trips *year
z68=y21/z66 *100000 19.8 1.1 0.4 NA NA NA NA NA NA 0.9
Station density stations/km2 z69=x66/y17 0.09 NA 0.88 0.07 0.05 NA 0.45 1.59 0.06 0.17
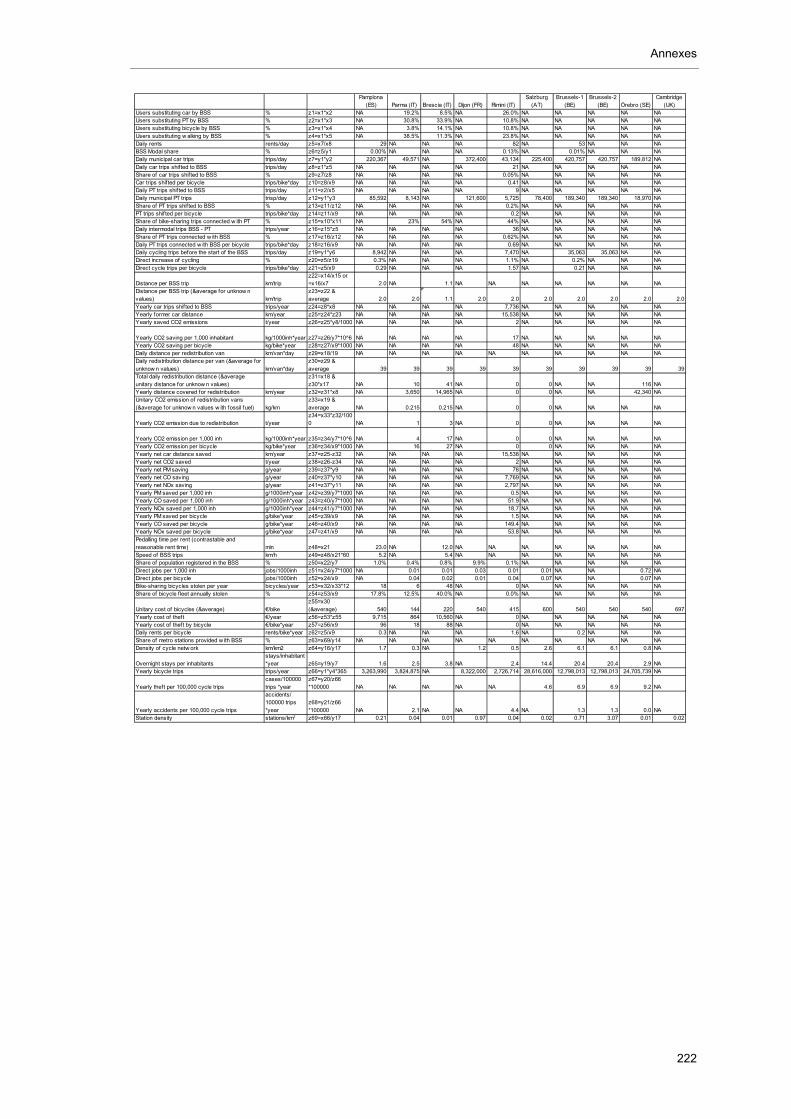
Annexes
222
Pamplona (ES) Parma (IT) Brescia (IT) Dijon (FR) Rimini (IT)
Salzburg (AT)
Brussels-1 (BE)
Brussels-2 (BE) Örebro (SE)
Cambridge (UK)
Users substituting car by BSS % z1=x1*x2 NA 19.2% 8.5% NA 26.0% NA NA NA NA NAUsers substituting PT by BSS % z2=x1*x3 NA 30.8% 33.9% NA 10.8% NA NA NA NA NAUsers substituting bicycle by BSS % z3=x1*x4 NA 3.8% 14.1% NA 10.8% NA NA NA NA NAUsers substituting w alking by BSS % z4=x1*x5 NA 38.5% 11.3% NA 23.8% NA NA NA NA NADaily rents rents/day z5=x7/x8 29 NA NA NA 82 NA 53 NA NA NABSS Modal share % z6=z5/y1 0.00% NA NA NA 0.13% NA 0.01% NA NA NADaily municipal car trips trips/day z7=y1*y2 220,367 49,571 NA 372,400 43,134 225,400 420,757 420,757 189,812 NADaily car trips shifted to BSS trips/day z8=z1*z5 NA NA NA NA 21 NA NA NA NA NAShare of car trips shifted to BSS % z9=z7/z8 NA NA NA NA 0.05% NA NA NA NA NACar trips shifted per bicycle trips/bike*day z10=z8/x9 NA NA NA NA 0.41 NA NA NA NA NADaily PT trips shifted to BSS trips/day z11=z2/x5 NA NA NA NA 9 NA NA NA NA NADaily municipal PT trips trisp/day z12=y1*y3 85,592 8,143 NA 121,600 5,725 78,400 189,340 189,340 18,970 NAShare of PT trips shifted to BSS % z13=z11/z12 NA NA NA NA 0.2% NA NA NA NA NAPT trips shifted per bicycle trips/bike*day z14=z11/x9 NA NA NA NA 0.2 NA NA NA NA NAShare of bike-sharing trips connected w ith PT % z15=x10*x11 NA 23% 54% NA 44% NA NA NA NA NADaily intermodal trips BSS - PT trips/year z16=z15*z5 NA NA NA NA 36 NA NA NA NA NAShare of PT trips connected w ith BSS % z17=z16/z12 NA NA NA NA 0.62% NA NA NA NA NADaily PT trips connected w ith BSS per bicycle trips/bike*day z18=z16/x9 NA NA NA NA 0.69 NA NA NA NA NADaily cycling trips before the start of the BSS trips/day z19=y1*y6 8,942 NA NA NA 7,470 NA 35,063 35,063 NA NADirect increase of cycling % z20=z5/z19 0.3% NA NA NA 1.1% NA 0.2% NA NA NADirect cycle trips per bicycle trips/bike*day z21=z5/x9 0.29 NA NA NA 1.57 NA 0.21 NA NA NA
Distance per BSS trip km/tripz22=x14/x15 or =x16/x7 2.0 NA 1.1 NA NA NA NA NA NA NA
Distance per BSS trip (&average for unknow n values) km/trip
z23=z22 & average 2.0 2.0 1.1 2.0 2.0 2.0 2.0 2.0 2.0 2.0
Yearly car trips shifted to BSS trips/year z24=z8*x8 NA NA NA NA 7,736 NA NA NA NA NAYearly former car distance km/year z25=z24*z23 NA NA NA NA 15,538 NA NA NA NA NAYearly saved CO2 emissions t/year z26=z25*y8/1000 NA NA NA NA 2 NA NA NA NA NA
Yearly CO2 saving per 1,000 inhabitant kg/1000inh*year z27=z26/y7*10^6 NA NA NA NA 17 NA NA NA NA NAYearly CO2 saving per bicycle kg/bike*year z28=z27/x9*1000 NA NA NA NA 48 NA NA NA NA NADaily distance per redistribution van km/van*day z29=x18/19 NA NA NA NA NA NA NA NA NA NADaily redistribution distance per van (&average for unknow n values) km/van*day
z30=z29 & average 39 39 39 39 39 39 39 39 39 39
Total daily redistribution distance (&average unitary distance for unknow n values)
z31=x18 & z30*x17 NA 10 41 NA 0 0 NA NA 116 NA
Yearly distance covered for redistribution km/year z32=z31*x8 NA 3,650 14,965 NA 0 0 NA NA 42,340 NAUnitary CO2 emission of redistribution vans (&average for unknow n values w ith fossil fuel) kg/km
z33=x19 & average NA 0.215 0.215 NA 0 0 NA NA NA NA
Yearly CO2 emission due to redistribution t/yearz34=x33*z32/1000 NA 1 3 NA 0 0 NA NA NA NA
Yearly CO2 emission per 1,000 inh kg/1000inh*year z35=z34/y7*10^6 NA 4 17 NA 0 0 NA NA NA NAYearly CO2 emission per bicycle kg/bike*year z36=z34/x9*1000 NA 16 27 NA 0 0 NA NA NA NAYearly net car distance saved km/year z37=z25-z32 NA NA NA NA 15,538 NA NA NA NA NAYearly net CO2 saved t/year z38=z26-z34 NA NA NA NA 2 NA NA NA NA NAYearly net PM saving g/year z39=z37*y9 NA NA NA NA 78 NA NA NA NA NAYearly net CO saving g/year z40=z37*y10 NA NA NA NA 7,769 NA NA NA NA NAYearly net NOx saving g/year z41=z37*y11 NA NA NA NA 2,797 NA NA NA NA NAYearly PM saved per 1,000 inh g/1000inh*year z42=z39/y7*1000 NA NA NA NA 0.5 NA NA NA NA NAYearly CO saved per 1,000 inh g/1000inh*year z43=z40/y7*1000 NA NA NA NA 51.9 NA NA NA NA NAYearly NOx saved per 1,000 inh g/1000inh*year z44=z41/y7*1000 NA NA NA NA 18.7 NA NA NA NA NAYearly PM saved per bicycle g/bike*year z45=z39/x9 NA NA NA NA 1.5 NA NA NA NA NAYearly CO saved per bicycle g/bike*year z46=z40/x9 NA NA NA NA 149.4 NA NA NA NA NAYearly NOx saved per bicycle g/bike*year z47=z41/x9 NA NA NA NA 53.8 NA NA NA NA NAPedalling time per rent (contrastable and reasonable rent time) min z48=x21 23.0 NA 12.0 NA NA NA NA NA NA NASpeed of BSS trips km/h z49=z48/x21*60 5.2 NA 5.4 NA NA NA NA NA NA NAShare of population registered in the BSS % z50=x22/y7 1.0% 0.4% 0.8% 9.9% 0.1% NA NA NA NA NADirect jobs per 1,000 inh jobs/1000inh z51=x24/y7*1000 NA 0.01 0.01 0.03 0.01 0.01 NA NA 0.72 NADirect jobs per bicycle jobs/1000inh z52=x24/x9 NA 0.04 0.02 0.01 0.04 0.07 NA NA 0.07 NABike-sharing bicycles stolen per year bicycles/year z53=x32/x33*12 18 6 48 NA 0 NA NA NA NA NAShare of bicycle f leet annually stolen % z54=z53/x9 17.8% 12.5% 40.0% NA 0.0% NA NA NA NA NA
Unitary cost of bicycles (&average) €/bikez55=x30 (&average) 540 144 220 540 415 600 540 540 540 697
Yearly cost of theft €/year z56=z53*z55 9,715 864 10,560 NA 0 NA NA NA NA NAYearly cost of theft by bicycle €/bike*year z57=z56/x9 96 18 88 NA 0 NA NA NA NA NADaily rents per bicycle rents/bike*year z62=z5/x9 0.3 NA NA NA 1.6 NA 0.2 NA NA NAShare of metro stations provided w ith BSS % z63=x69/y14 NA NA NA NA NA NA NA NA NA NADensity of cycle netw ork km/km2 z64=y16/y17 1.7 0.3 NA 1.2 0.5 2.6 6.1 6.1 0.8 NA
Overnight stays per inhabitantsstays/inhabitant *year z65=y19/y7 1.6 2.5 3.8 NA 2.4 14.4 20.4 20.4 2.9 NA
Yearly bicycle trips trips/year z66=y1*y4*365 3,263,990 3,824,875 NA 8,322,000 2,726,714 28,616,000 12,798,013 12,798,013 24,705,739 NA
Yearly theft per 100,000 cycle tripscases/100000 trips *year
z67=y20/z66 *100000 NA NA NA NA NA 4.6 6.9 6.9 9.2 NA
Yearly accidents per 100,000 cycle trips
accidents/ 100000 trips *year
z68=y21/z66 *100000 NA 2.1 NA NA 4.4 NA 1.3 1.3 0.0 NA
Station density stations/km2 z69=x66/y17 0.21 0.04 0.01 0.97 0.04 0.02 0.71 3.07 0.01 0.02
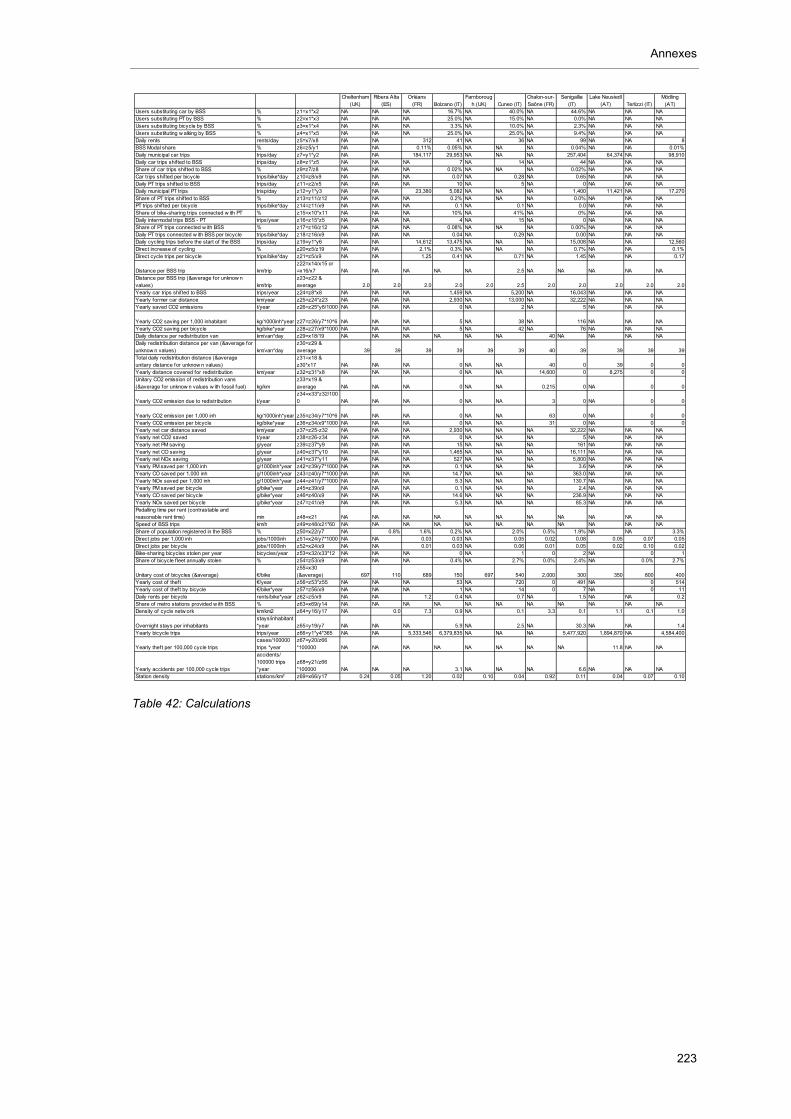
Annexes
223
Table 42: Calculations
Cheltenham (UK)
Ribera Alta (ES)
Orléans (FR) Bolzano (IT)
Farnborough (UK) Cuneo (IT)
Chalon-sur-Saône (FR)
Senigallia (IT)
Lake Neusiedl (AT) Terlizzi (IT)
Mödling (AT)
Users substituting car by BSS % z1=x1*x2 NA NA NA 16.7% NA 40.0% NA 44.6% NA NA NAUsers substituting PT by BSS % z2=x1*x3 NA NA NA 25.0% NA 15.0% NA 0.0% NA NA NAUsers substituting bicycle by BSS % z3=x1*x4 NA NA NA 3.3% NA 10.0% NA 2.3% NA NA NAUsers substituting w alking by BSS % z4=x1*x5 NA NA NA 25.0% NA 25.0% NA 9.4% NA NA NADaily rents rents/day z5=x7/x8 NA NA 312 41 NA 36 NA 99 NA NA 8BSS Modal share % z6=z5/y1 NA NA 0.11% 0.05% NA NA NA 0.04% NA NA 0.01%Daily municipal car trips trips/day z7=y1*y2 NA NA 184,117 29,953 NA NA NA 257,404 64,374 NA 98,910Daily car trips shifted to BSS trips/day z8=z1*z5 NA NA NA 7 NA 14 NA 44 NA NA NAShare of car trips shifted to BSS % z9=z7/z8 NA NA NA 0.02% NA NA NA 0.02% NA NA NACar trips shifted per bicycle trips/bike*day z10=z8/x9 NA NA NA 0.07 NA 0.28 NA 0.65 NA NA NADaily PT trips shifted to BSS trips/day z11=z2/x5 NA NA NA 10 NA 5 NA 0 NA NA NADaily municipal PT trips trisp/day z12=y1*y3 NA NA 23,380 5,082 NA NA NA 1,400 11,421 NA 17,270Share of PT trips shifted to BSS % z13=z11/z12 NA NA NA 0.2% NA NA NA 0.0% NA NA NAPT trips shifted per bicycle trips/bike*day z14=z11/x9 NA NA NA 0.1 NA 0.1 NA 0.0 NA NA NAShare of bike-sharing trips connected w ith PT % z15=x10*x11 NA NA NA 10% NA 41% NA 0% NA NA NADaily intermodal trips BSS - PT trips/year z16=z15*z5 NA NA NA 4 NA 15 NA 0 NA NA NAShare of PT trips connected w ith BSS % z17=z16/z12 NA NA NA 0.08% NA NA NA 0.00% NA NA NADaily PT trips connected w ith BSS per bicycle trips/bike*day z18=z16/x9 NA NA NA 0.04 NA 0.29 NA 0.00 NA NA NADaily cycling trips before the start of the BSS trips/day z19=y1*y6 NA NA 14,612 13,475 NA NA NA 15,008 NA NA 12,560Direct increase of cycling % z20=z5/z19 NA NA 2.1% 0.3% NA NA NA 0.7% NA NA 0.1%Direct cycle trips per bicycle trips/bike*day z21=z5/x9 NA NA 1.25 0.41 NA 0.71 NA 1.45 NA NA 0.17
Distance per BSS trip km/tripz22=x14/x15 or =x16/x7 NA NA NA NA NA 2.5 NA NA NA NA NA
Distance per BSS trip (&average for unknow n values) km/trip
z23=z22 & average 2.0 2.0 2.0 2.0 2.0 2.5 2.0 2.0 2.0 2.0 2.0
Yearly car trips shifted to BSS trips/year z24=z8*x8 NA NA NA 1,459 NA 5,200 NA 16,043 NA NA NAYearly former car distance km/year z25=z24*z23 NA NA NA 2,930 NA 13,000 NA 32,222 NA NA NAYearly saved CO2 emissions t/year z26=z25*y8/1000 NA NA NA 0 NA 2 NA 5 NA NA NA
Yearly CO2 saving per 1,000 inhabitant kg/1000inh*year z27=z26/y7*10^6 NA NA NA 5 NA 38 NA 116 NA NA NAYearly CO2 saving per bicycle kg/bike*year z28=z27/x9*1000 NA NA NA 5 NA 42 NA 76 NA NA NADaily distance per redistribution van km/van*day z29=x18/19 NA NA NA NA NA NA 40 NA NA NA NADaily redistribution distance per van (&average for unknow n values) km/van*day
z30=z29 & average 39 39 39 39 39 39 40 39 39 39 39
Total daily redistribution distance (&average unitary distance for unknow n values)
z31=x18 & z30*x17 NA NA NA 0 NA NA 40 0 39 0 0
Yearly distance covered for redistribution km/year z32=z31*x8 NA NA NA 0 NA NA 14,600 0 8,275 0 0Unitary CO2 emission of redistribution vans (&average for unknow n values w ith fossil fuel) kg/km
z33=x19 & average NA NA NA 0 NA NA 0.215 0 NA 0 0
Yearly CO2 emission due to redistribution t/yearz34=x33*z32/1000 NA NA NA 0 NA NA 3 0 NA 0 0
Yearly CO2 emission per 1,000 inh kg/1000inh*year z35=z34/y7*10^6 NA NA NA 0 NA NA 63 0 NA 0 0Yearly CO2 emission per bicycle kg/bike*year z36=z34/x9*1000 NA NA NA 0 NA NA 31 0 NA 0 0Yearly net car distance saved km/year z37=z25-z32 NA NA NA 2,930 NA NA NA 32,222 NA NA NAYearly net CO2 saved t/year z38=z26-z34 NA NA NA 0 NA NA NA 5 NA NA NAYearly net PM saving g/year z39=z37*y9 NA NA NA 15 NA NA NA 161 NA NA NAYearly net CO saving g/year z40=z37*y10 NA NA NA 1,465 NA NA NA 16,111 NA NA NAYearly net NOx saving g/year z41=z37*y11 NA NA NA 527 NA NA NA 5,800 NA NA NAYearly PM saved per 1,000 inh g/1000inh*year z42=z39/y7*1000 NA NA NA 0.1 NA NA NA 3.6 NA NA NAYearly CO saved per 1,000 inh g/1000inh*year z43=z40/y7*1000 NA NA NA 14.7 NA NA NA 363.0 NA NA NAYearly NOx saved per 1,000 inh g/1000inh*year z44=z41/y7*1000 NA NA NA 5.3 NA NA NA 130.7 NA NA NAYearly PM saved per bicycle g/bike*year z45=z39/x9 NA NA NA 0.1 NA NA NA 2.4 NA NA NAYearly CO saved per bicycle g/bike*year z46=z40/x9 NA NA NA 14.6 NA NA NA 236.9 NA NA NAYearly NOx saved per bicycle g/bike*year z47=z41/x9 NA NA NA 5.3 NA NA NA 85.3 NA NA NAPedalling time per rent (contrastable and reasonable rent time) min z48=x21 NA NA NA NA NA NA NA NA NA NA NASpeed of BSS trips km/h z49=z48/x21*60 NA NA NA NA NA NA NA NA NA NA NAShare of population registered in the BSS % z50=x22/y7 NA 0.8% 1.6% 0.2% NA 2.0% 0.5% 1.9% NA NA 3.3%Direct jobs per 1,000 inh jobs/1000inh z51=x24/y7*1000 NA NA 0.03 0.03 NA 0.05 0.02 0.08 0.05 0.07 0.05Direct jobs per bicycle jobs/1000inh z52=x24/x9 NA NA 0.01 0.03 NA 0.06 0.01 0.05 0.02 0.10 0.02Bike-sharing bicycles stolen per year bicycles/year z53=x32/x33*12 NA NA NA 0 NA 1 0 2 NA 0 1Share of bicycle f leet annually stolen % z54=z53/x9 NA NA NA 0.4% NA 2.7% 0.0% 2.4% NA 0.0% 2.7%
Unitary cost of bicycles (&average) €/bikez55=x30 (&average) 697 110 689 150 697 540 2,000 300 350 800 400
Yearly cost of theft €/year z56=z53*z55 NA NA NA 53 NA 720 0 491 NA 0 514Yearly cost of theft by bicycle €/bike*year z57=z56/x9 NA NA NA 1 NA 14 0 7 NA 0 11Daily rents per bicycle rents/bike*year z62=z5/x9 NA NA 1.2 0.4 NA 0.7 NA 1.5 NA NA 0.2Share of metro stations provided w ith BSS % z63=x69/y14 NA NA NA NA NA NA NA NA NA NA NADensity of cycle netw ork km/km2 z64=y16/y17 NA 0.0 7.3 0.9 NA 0.1 3.3 0.1 1.1 0.1 1.0
Overnight stays per inhabitantsstays/inhabitant *year z65=y19/y7 NA NA NA 5.9 NA 2.5 NA 30.3 NA NA 1.4
Yearly bicycle trips trips/year z66=y1*y4*365 NA NA 5,333,546 6,379,835 NA NA NA 5,477,920 1,894,870 NA 4,584,400
Yearly theft per 100,000 cycle tripscases/100000 trips *year
z67=y20/z66 *100000 NA NA NA NA NA NA NA NA 11.8 NA NA
Yearly accidents per 100,000 cycle trips
accidents/ 100000 trips *year
z68=y21/z66 *100000 NA NA NA 3.1 NA NA NA 6.6 NA NA NA
Station density stations/km2 z69=x66/y17 0.24 0.05 1.20 0.02 0.10 0.04 0.92 0.11 0.04 0.07 0.10
Bibliography
224
11 BIBLIOGRAPHY
11.1 Journal articles, academic theses and books
Andersen, L. et al., 2000. All-cause mortality associated with physical activity during
leisure time, work, sports, and cycling to work.
Arzate Echeverría, C.I., 2004. Realización de software educativo para simular la
dispersión de contaminantes atmosféricos. Mexico: Universidad de las Américas Puebla.
Available at: http://catarina.udlap.mx/u_dl_a/tales/documentos/leip/arzate_e_ci/portada.html.
Bea Alonso, M., 2009. Los sistemas de bicicletas públicas urbanas. Universitat
Autònoma de Barcelona.
Beroud, B., 2007. Velo’v: Un service de mobilité de personnes a transférer?
Comparaison des Systemes Automatisés de Location de Vélos sur l’Espace Public en Europe.
Université Lumière Lyon 2.
Buehler, R., Tech, V. & Puchler, J., 2010. Cycling to Sustainability in Amsterdam.
Sustain. A journal of environmental and sustainability issues, (21). Available at:
http://policy.rutgers.edu/faculty/pucher/amsterdam.pdf.
Bus & Bahn, 2009. 12,7 Mio Euro für Fahrradverleihsysteme. Bus & Bahn, 9.
Castro, A., Lackner, M., et al., 2010. Evolution eines Fahrradverleihsystems. Von
FREIRADL zu LEIHRADL - nextbike. Österreichische Zeitschrift für Verkehrswissenschaft, 57/3.
DeMaio, P., 2003. Smart Bikes: Public Transportation for the 21st Century.
Transportation Quarterly, 57(1), pp.9-11.
DeMaio, P., 2004. Will Smart Bikes Succeed as Public Transportation in the United
States? Journal of Public Transportation, 7(2). Available at:
www.metrobike.net/index.php?s=file_download&id=22.
Heinen, E., van Wee, B. & Maat, K., 2010. Commuting by Bicycle: An Overview of the
Literature. Transport reviews, 30(1), pp.59-96.
Jacobsen, P.L., 2003. Safety in numbers: more walkers and bicyclists, safer walking
and bicycling. British Medical Journal. Injury prevention, 9, pp. 205-209. Available at:
http://estaticos.soitu.es/documentos/2009/09/jacobsen.pdf.
Kowalewska, M. & Ejsmont, R., 2009. Bike sharing in ten European countriesreport.
Module 7: Poland., OBIS Project. Intelligent Energy Europe. Available at:
http://www.obisproject.com/palio/html.wmedia?_Instance=obis&_Connector=data&_ID=69&_Ch
eckSum=1335488103.
Litman, T., 2010. Well Measured: Developing Indicators for Sustainable and Livable
Transport Planning. Available at: http://www.vtpi.org/wellmeas.pdf.
Midgley, P., 2009. The Role of Smart Bike-sharing Systems in Urban Mobility.
Journeys. Sharing Urban Transport Solutions, 2, pp 23-32. Available at:
http://www.ltaacademy.gov.sg/doc/IS02-p23%20Bike-sharing.pdf.
Bibliography
225
Nadal, L., 2007. Bike sharing sweeps Paris off its feet. Sustainable Transport, 19.
Available at: http://bikesharephiladelphia.org/PDF%20DOC/SustainableTravelMagazine-
19Fall2007s.pdf.
Noland, R.B. & Ishaque, M.M., 2006. Smart Bicycles in an Urban Area:Evaluation of a
Pilot Schemein London. Journal of Public Transportation, 9(5), pp.71-95.
Rojas-Rueda, D. et al., 2011. The health risks and benefits of cycling in urban
environments compared with car use: health impact assessment study. The British Medical
Journal. Available at: http://www.bmj.com/content/343/bmj.d4521 [Accessed August 26, 2011].
Sassen, W. von, 2009. Öffentliche Fahrradverleihsysteme im Vergleich. Analyse,
Bewertung und Entwicklungsperspektiven. Universität Trier.
Spence, K., 2003. Traffic safety for walkers and cyclists: the danger reduction
approach. Creating sustainable transport, Cambridge: Woodhead publishing
Wiersma, B., 2010. Bicycle sharing systems: Role, effects, and application to Plymouth.
University of Groningen.
11.2 Reports, conference presentations and data bases
ADFC, 2006. Jeder Radfahrer erspart dem Gesundheitssystem 1.200 Euro Kosten pro
Jahr. ADFC Allgemeiner Deutscher Fahrrad-Club e. V. Available at:
http://www.adfc.de/Gesundheit/Gesund-bleiben/Studie-Radfahrer-und-das-
Gesundheitssystem/Jeder-Radfahrer-erspart-dem-Gesundheitssystem-1200-Euro [Accessed
June 12, 2010].
Andersen, T. & Edrén, K., Evaluering af Odense - Danmarks Nationale Cykelby,
Available at:
http://www.dcf.dk/media%28447,1030%29/Odense_Cykelby_%5B.pdf_2%2C5MB%5D.pdf.
Beroud, B., 2010. Four years down the path. What is the mobility impact of Vélo’v?
Available at:
http://www.mobiped.com/cariboost_files/4_years_down_the_path_2C_what_is_the_mobility_im
pact_of_Velo_v.pdf.
Bikeoff, 2008b. Taking the bicing. Your new public transport in Barcelona, Bikeoff
project.
Bikey, Bikey. Eine Idee mit System, ein System voller Ideen.
BMVIT, 2010. Radverkehr in Zahlen. Daten, Fakten und Stimmungen, Wien:
Bundesministerium für Verkehr, Innovation und Technologie.
Borcherding, A., Hartwig, K. & Karl, A., 2010. Evaluation der Barrieren und Hindernisse
der Beteiligungvon Städten und Kommunen am Wettbewerb Modellversuch„Innovative
öffentliche Fahrradverleihsysteme“, Available at: http://bibliothek.wz-berlin.de/pdf/2010/iii10-
601.pdf.
Breyer, F., 2010. Operating a bike rental system – cost impact.
Bibliography
226
Bührmann, S., 2008. Bicycles as public-individual transport. In Meetbike Desdren 2008.
Dresden. Available at: http://www.rupprecht-
consult.de/download/Meetbike_article_Buehrmann_040408.pdf [Accessed April 5, 2009].
Büttner, J., 2009. Bike sharing in ten European countriesreport. Module 5: Germany,
OBIS Project. Intelligent Energy Europe. Available at:
http://www.obisproject.com/palio/html.wmedia?_Instance=obis&_Connector=data&_ID=65&_Ch
eckSum=-1340785941.
Büttner, J., 2010. OBIS. Optimising Bike Sharing in European Cities. Available at:
http://www.obisproject.com/palio/html.wmedia?_Instance=obis&_Connector=data&_ID=130&_C
heckSum=-1099341412.
Büttner, J., Mlasowsky, H. & Birkholz, T., 2011. Optimising Bike Sharing in European
Cities, Available at:
http://www.obisproject.com/palio/html.wmedia?_Instance=obis&_Connector=data&_ID=739&_C
heckSum=521968685.
Castro, A., 2009. Country Study and Market Potential Data File. Austria.
Castro, A., 2011. From Freiradl to Leihradl. Available at:
http://www.obisproject.com/palio/html.wmedia?_Instance=obis&_Connector=data&_ID=793&_C
heckSum=695216377.
Castro, A. & Emberger, G., 2009. Bike sharing in ten European countriesreport.
Module1: Austria, OBIS Project. Intelligent Energy Europe. Available at:
http://www.obisproject.com/palio/html.wmedia?_Instance=obis&_Connector=data&_ID=55&_Ch
eckSum=466668522.
Castro, A. & Emberger, G., 2010. European transferability fact sheet, OBIS Project.
Intelligent Energy Europe. Available at:
http://www.obisproject.com/palio/html.wmedia?_Instance=obis&_Connector=data&_ID=108&_C
heckSum=1085635473.
Castro, A., Büttner, J., et al., 2010. Transferability of bike-sharing. Implementing a new
way of transport in European cities. In ECOMM. Graz.
Cavill, N. & Davis, A., 2007. Cycling and health. What’s the evidence., Available at:
www.dft.gov.uk/cyclingengland/docs/cycling_and_health_full_report.pdf.
Coparly, 2009. Cadastre des émissions de CO2et bilan énergétique, Available at:
http://www.atmo-rhonealpes.org/Site/media/telecharger/650556.
Cyclocity, 2008. A revolutionary public transport system accesible to all. Available at:
http://www.bikesharephiladelphia.org/PDF%20DOC/V%C3%A9lo%27V_A_REVOLUTIONARY_
PUBLIC_TRANSPORT_SYSTEM_ACCESSI.pdf.
Dargent, C., 2009. Velib’. A revolutionary public transport system in Paris. Available at:
http://www.impacts.org/intercontconference/berlin2009/day3/09_Dargent_2%20velib%20Berlin
%20IMPACTS%203%205%20juin%2009%20anglais%20v%20short.pdf.
Dechant, H., 2009. Kundedaten von Citiybike Wien.
Bibliography
227
Dector-Vega, G., Snead, C. & Phillips, A., 2008. Feasibility study for a central London
cycle hire scheme, Transport for London. Mayor of London.
Dehaye, B., 2007. Investing in cycling track networks may provide quite profitable. In
Velo-city 2007. Munich.
Dekoster, J. & Schollaert, U., 1999. Cycling: the way ahead for towns and cities,
European Commission.
DeMaio, P., 2009b. Bike-sharing: Its History, Models of Provision and Future. In Velo-
city conference. Available at: http://www.velo-city2009.com/assets/files/paper-DeMaio-
Bike%20sharing-sub5.2.pdf.
DeMaio, P., 2001. Smart bikes: the public transportation of 21st century. Available at:
http://www.scribd.com/doc/238427/Smart-Bikes-for-a-Better-Future.
Dworak, J., 2009. Country Study and Market Potential Data File. Poland.
EAA, 1999. Air and Health - Local authorities, health and environment. European
Environment Agency. Available at: http://www.eea.europa.eu/publications/2599XXX [Accessed
May 30, 2010].
Escudero, J.C., Plan director de movilidad ciclista de Vitoria-Gasteiz, Observatorio de
Sostenibilidad. Centro de Estudios Ambientales. Ayuntamiento de Vitoria-Gasteiz.
ETRA, Contribution for the European Commission’s stakeholders’ consultation on the
European Strategy on clean and energy efficient vehicles., European Two-wheel Retailers’
Association.
European Commission, 2010a. EU Energy in figures 2010,
European Commission, 2007. Green paper. Towards a new culture for urban mobility,
Available at:
http://ec.europa.eu/transport/clean/green_paper_urban_transport/doc/2007_09_25_gp_urban_
mobility_en.pdf.
Frühauf, C., 2009. Country Study and Market Potential Data File. Spain.
Frühauf, C. & Hayes, S., 2009. Bike sharing in ten European countries report. Module 8:
Spain, OBIS Project. Intelligent Energy Europe.
Georgiou, E., 2010. Bike-sharing in London. Barclays Cycle Hire.
Gilbert, R., 2005. Defining Sustainable Transportation, The Centre for Sustainable
Transportation. Available at:
http://richardgilbert.ca/Files/2005/Defining%20Sustainable%20Transportation%202%20%28We
b%29.pdf.
Gonzalo, H., Rojo, M. & Murga, P., 2008. Los sistemas de bicicletas públicas: Revisión
de las principales experiencias en Europa. In CIMO 2008.
Gröper, D., 2009. Country Study and Market Potential Data File. Germany.
Hayes, S. & Frühauf, C., 2010. OBIS Fact sheet “Optimising Bike Sharing,” OBIS
Project. Intelligent Energy Europe.
IDAE, 2007. Guia metodológica para la implantación de sistemas de bicicletas públicas
en España, Madrid. Available at:
Bibliography
228
http://www.idae.es/index.php/mod.documentos/mem.descarga?file=/documentos_Guia_Biciclet
as_8367007d.pdf [Accessed April 9, 2009].
IUCN, 2006. The Future of Sustainability:Re-thinking Environment and Development iin
the Twenty-first Century, The World Conservation Union.
López, Á., 2009. Bicing: el nuevo transporte público individual de Barcelona. Available
at: http://www.bicicletapublica.org/PDF/Bicing-
El%20nuevo%20transporte%20publico%20individual%20en%20bicicleta%20de%20Barcelona.
ppt [Accessed June 28, 2010].
Martinek, J., 2009a. Bike sharing in ten European countriesreport. Module 3: Czech
Republic, OBIS Project. Intelligent Energy Europe. Available at:
http://www.obisproject.com/palio/html.wmedia?_Instance=obis&_Connector=data&_ID=59&_Ch
eckSum=-1152024730.
Martinek, J., 2009b. Country Study and Market Potential Data File. Czech Republic.
Menichetti, M., 2009. Country Study and Market Potential Data File. Italy.
Mlasowsky, H., 2008. Bike sharing. Key findings and recommendations, SpiCycles
project. European Commission.
NICHES, P., 2007. Public bikes, European Commission. Available at:
http://www.niches-
transport.org/fileadmin/archive/Deliverables/D4.3b_5.8_b_PolicyNotes/14397_pn4_public_bikes
_ok_low.pdf [Accessed April 5, 2009].
NYC Department of City Planning, 2009. Bike-share. Opportunities in New York City,
Available at: http://www.nyc.gov/html/dcp/pdf/transportation/bike_share_complete.pdf.
OECD, 2000. Synthesis report. Environmentally Sustainable Transport. Furtures,
strategies and best practices, International est! Conference, Vienna.
Petersen, T., 2009. Country Study and Market Potential Data File. Sweden.
Petersen, T. & Robèrt, M., 2009. Bike sharing in ten European countries report. Module
9: Sweden, OBIS Project. Intelligent Energy Europe. Available at:
http://www.obisproject.com/palio/html.wmedia?_Instance=obis&_Connector=data&_ID=73&_Ch
eckSum=1956073518.
PROMT, 2003. Final report WP5 Intermodality, New Means to Promote Pedestrian
Traffic in Cities. Available at:
http://virtual.vtt.fi/virtual/prompt/topical%20analyses/intermodality/national%20analyses/prompt_
intermodality_italy.pdf.
Robert, S., 2009a. Bike sharing in ten European countries report. Module 2: Belgium,
OBIS Project. Intelligent Energy Europe.
Robert, S., 2009b. Country Study and Market Potential Data File. France.
Robert, S. & Richard, O., 2009. Bike sharing in ten European countries report. Module
4: France., OBIS Project. Intelligent Energy Europe. Available at:
http://www.obisproject.com/palio/html.wmedia?_Instance=obis&_Connector=data&_ID=63&_Ch
eckSum=-531439315.
Bibliography
229
Romero, C., 2008. Final Conference of Spicycle.
Romero, C., 2010. i-BICING. OBIS Workshop. Milan
Sanz, A. & Kisters, C., 2010. Public bike boom in Spain. Available at:
http://www.obisproject.com/palio/html.wmedia?_Instance=obis&_Connector=data&_ID=133&_C
heckSum=-165877703.
Schneeweiss, H., 2007. The bicycle as public means of transportation. In Velo-city
2007.
Snead, C. & Dector-Vega, G., 2008. Public bikes. A new form of public transport. In
CIMO 2008. Madrid.
Schipper, L., 1996. Sustainable Transport: What It is, and Whether It Is. In International
Coference “Towards Sustainable Transportation.”Vancouver: OCDE. Available at:
http://www.oecd.org/dataoecd/28/54/2396815.pdf.
Statistics Belgium, 2008. Arrivées et nuitées - par commune. Available at:
http://statbel.fgov.be/fr/binaries/Arriv%C3%A9es%20et%20nuit%C3%A9es%20touristiques%20
(2008)_tcm326-74365.xls.
Stockholm City Bikes, 2010. Official website of Stockholm City Bikes. Available at:
http://www.citybikes.se/sv/ [Accessed April 23, 2010].
SUMMA, 2005. Final Publishable Report, European Commission.
Thaler, R. & Eder, M., 2009. Kurzstudie Wirtschaftsfaktor Radfahren,
Lebensministierium. Available at: http://www.klimaaktiv.at/filemanager/download/43687
The European Network for Cycling Expertise, Cycling and economics. Available at:
http://www.velo.info/Library/Cycling_Economics.pdf.
The new mobility agenda, 2008. World city bike implementation strategies, Available at:
http://www.ecoplan.org/library/prospectus.pdf [Accessed April 25, 2009].
UNO, 2005. 2005 World Summit Outcome. Available at:
http://www.who.int/hiv/universalaccess2010/worldsummit.pdf.
Vecchiotti, F., 2009. Country Study and Market Potential Data File. Italy.
Vecchiotti, F. & Menichetti, M., 2009. Bike sharing in ten European countriesreport.
Module 6: Italy, OBIS Project. Intelligent Energy Europe.
ViaNova, A slightly different race in the city of Bolzano/Bozen. Available at:
http://www.eltis.org/docs/studies/BZ_cycling_Race_EN.pdf.
WALCYNG, 1997. Walking & Cycling instead of short car trips, WALCYNG project,
European Commission. Available at: www.ictct.org/dlObject.php?document_nr=319&/16.pdf.
Williamson, C., 2009a. Bike sharing in ten European countriesreport. Module 10: United
Kingdom, OBIS Project. European Commission. Available at:
http://www.obisproject.com/palio/html.wmedia?_Instance=obis&_Connector=data&_ID=75&_Ch
eckSum=1146726892.
Williamson, C., 2009b. Country Study and Market Potential Data File. UK.
Bibliography
230
11.3 Internet websites, blogs and press
20 minutos, 2010. El Bicing se extiende y llegará a 17 ciudades del área metropolitana
de Barcelona. Available at:
http://www.20minutos.es/noticia/399859/0/bicing/barcelona/ciudades/ [Accessed April 22,
2010].
Aalto, 2010. Segovia de BICIo - Servicio de préstamo de bicicletas - en bici por madrid.
En bici por Madrid. Available at: http://www.enbicipormadrid.es/2010/06/segovia-de-bicio-
servicio-de-prestamo.html [Accessed February 6, 2011].
AEMET, 2010. Valores climatológicos normales. Agencia Estatal de Meteorología -
AEMET. Gobierno de España. Available at:
http://www.aemet.es/es/elclima/datosclimatologicos/valoresclimatologicos [Accessed July 2,
2010].
Ajuntament Terrassa, 2009. Official website of Ambicia’t. Available at:
http://web.terrassa.org/web-mediambient/ambiciat/index.html.
Ambici, 2009. Official website of Ambici. Available at: http://ambici.com/.
Anderson, J.W., 2007. Paris Embraces Plan to Become City of Bikes.
Atac Bikesharing, 2010. Official website of Atac Bikesharing. Available at:
http://bikesharing.roma.it/ [Accessed April 23, 2010].
Austinyellowbike, 2010. Provo 1, Available at:
http://farm4.static.flickr.com/3320/3416070388_23093384a2.jpg [Accessed April 3, 2010].
DB Bahn, 2009. Official website of Call a Bike. Available at: http://www.callabike-
interaktiv.de/kundenbuchung/ [Accessed May 15, 2009].
Bicimia, 2009. Official website of Bicimia. Available at: http://www.bicimia.it/.
Bicincittà, 2010. Official website of Bicincittà. Available at: http://www.atac-
bikesharing.it/ [Accessed April 9, 2010].
Bicing, 2009. Newsletter Bicing Enero 2009. Available at:
http://www.bicing.com/pfw_files/cma/newsletters/Newsletter_Bicing_Enero_2009.pdf.
Bicing, 2010. Official website of Bicing. Available at:
http://www.bicing.cat/home/home.php [Accessed April 9, 2010].
Bikemi, 2010. Official website of Bikemi. Available at: http://www.bikemi.com/ [Accessed
September 10, 2010].
Bikeoff, 2008a. Bikeoff website. Available at: http://www.bikeoff.org/about/ [Accessed
August 26, 2010].
Bikeone, 2010. Official website of BikeOne. Available at: http://www.bikeone.pl/
[Accessed April 23, 2010].
Bizi, 2010. Official website of BIZI Zaragoza. Available at: http://www.bizizaragoza.com/
[Accessed April 22, 2010].
Black, C. & Potter, S., 2010. Portsmouth Bikeabout. Available at:
http://www.metrobike.net/index.php?s=file_download&id=11 [Accessed April 3, 2010].
Bremner, C., 2008. A year on, the cycle experiment has hit some bumps. Times online.
Bibliography
231
Cambrigde University, 2009. Cambridge Dictionaries Online - Cambridge University
Press. Available at: http://dictionary.cambridge.org/ [Accessed April 25, 2009].
Carbusters, City Bikes: Residents and visitors alike benefits from 21st century
automated bike rental. Carbusters. Available at: http://carbusters.org/files/2009/12/Carbusters-
30.pdf.
Cazorla, B., 2009. El Bicing pincha por “el truco de la llave.” El Pais.
City council of Barcelona, 2008. Dades bàsiques de mobilitat, Available at:
http://w3.bcn.es/fitxers/mobilitat/dadesbasiques08web.173.pdf.
City council of Berlin, 2010. Verkehrspolitik und Verkehrsplanung
Gesamtverkehrsprognose 2025. Senatsverwaltung für Stadtentwicklung Berlin. Available at:
http://www.stadtentwicklung.berlin.de/verkehr/politik_planung/prognose_2025/ [Accessed May
1, 2010].
City council of Bolzano, 2010. Official website of Noleggio biciclete Bolzano. Available
at: http://www.comune.bolzano.it/context.jsp?ID_LINK=1199&area=19&page=2 [Accessed April
11, 2010].
City council of Pamplona, 2007a. Observatorio Turístico de Pamplona, Available at:
http://www.pamplona.net/pdf/informe2.pdf.
City council of Pamplona, 2007b. Sistema de promoción del transporte urbano en
bicicleta.
City council of Vitoria, 2009a. Anuario estadístico 2009, Available at: http://www.vitoria-
gasteiz.org/wb021/http/contenidosEstaticos/adjuntos/29916.pdf.
City council of Vitoria, 2009b. Estudio sobre el servicio municipal de préstamo de
bicicletas, Available at: http://www.vitoria-
gasteiz.org/wb021/http/contenidosEstaticos/adjuntos/23164.pdf.
City council of Vitoria, La movilidad urbana,
City of Cuneo, 2005. II Piano Strategico della Città e del suo Territorio, Available at:
http://www.pianostrategico.cuneo.it/fasi/parolechiave/turismo_appr1.pdf.
City of Karlsruhe, 2007. Karlsruhe: Radverkehrsnetz. Available at:
http://www.karlsruhe.de/bauen/verkehr/radverkehr/radnetz.de [Accessed July 6, 2010].
City of Paris, 2004. Bilan des deplacement de Paris, Available at:
http://www.paris.fr/portail/viewmultimediadocument?multimediadocument-id=12306.
City of Rimini, 2008. Dichiarazione del Vice Sindaco e Assessore al Turismo del
Comune di Rimini, Maurizio Melucci. Available at:
http://www.comune.rimini.it/eventi/pagina5688.html [Accessed July 7, 2010].
City of Senigallia, 2008. Senigallia Arrivi e Presenze Turistiche, Available at:
http://www.vivereitalia.eu/upload/2008_11/18185_presenze.pdf.
City of Stockholm, 2010. 3. Mobility and sustainable travelling. Available at:
http://international.stockholm.se/Stockholm-by-theme/European-Green-Capital/Professional-
study-visits/3-Mobility-and-sustainable-travelling/ [Accessed July 6, 2010].
Bibliography
232
Citybike Wien, 2010. Official website of Citybike Wien. Available at:
http://www.citybikewien.at/ [Accessed April 9, 2010].
Clear Channel, 2010. Vélo à la carte. Available at: http://veloalacarte.free.fr/index2.html
[Accessed April 3, 2010].
DeMaio, P., 2009a. 2009 Wrap-up. The Bike-sharing Blog. Available at: http://bike-
sharing.blogspot.com/2009/12/2009-wrap-up.html [Accessed April 3, 2010].
Diario noticias de Álava, 2010. El servicio de préstamo de bicicletas de Vitoria sufre un
robo cada tres días. Available at:
http://www2.noticiasdealava.com/ediciones/2009/03/03/vecinos/vitoria-
gasteiz/d03vit29.1179184.php [Accessed May 9, 2010].
DieselNet, 2008. EU diesel market share at 53%. Available at:
http://www.dieselnet.com/news/2008/02acea.php [Accessed July 27, 2011].
elPeriodico.com, 2009. El coste de Bicing crece un 40% hasta los 16,7 millones.
elPeriodico.com.
EPA, 2010. Health Effects of Pollution. Environmental Protection Agency of United
States. Available at: http://www.epa.gov/Region7/air/quality/health.htm#co [Accessed May 30,
2010].
Europa Press, 2010. El servicio “nbici” vuelve a funcionar. Available at:
http://www.europapress.es/navarra/noticia-servicio-nbici-vuelve-funcionar-
20100102155004.html [Accessed May 21, 2010].
European Commission, 2010b. The EU climate and energy package. Available at:
http://ec.europa.eu/environment/climat/climate_action.htm [Accessed May 22, 2010].
ExtraEnergy, 2009. Federal Government funds Pedelecs in Stuttgart - ExtraEnergy.org.
Available at: http://extraenergy.org/main.php?language=en&id=2899 [Accessed February 7,
2011].
Fietsberaad, 2009. Legal issues slowing down bike rental programs in USA. Available
at:
http://www.fietsberaad.nl/index.cfm?lang=en§ion=nieuws&mode=newsArticle&repository=L
egal+issues+slowing+down+bike+rental+programs+in+USA [Accessed April 25, 2009].
Fribourg City, 2011. Fribourg, living up the differences - Switzerland - Velopass.
Available at: http://www.fribourgtourisme.ch/en/news.cfm?category=&subcat=&id=341292
[Accessed February 6, 2011].
García Jaén, P., El boom de la bicicleta en Sevilla ysus efectos en la movilidad
peatonal. Available at:
http://www.transyt.upm.es/files/difusion/cursos_y_seminarios/stic09/B3_Garcia.pdf.
Gemnitzer Gewölbegänge e.V., 2009. Das Chemnitzer Stadtfahrrad. Available at:
http://www.chemnitzer-
gewoelbegaenge.de/index.php?option=com_content&task=view&id=20&Itemid=25.
Grand Lyon, 2009a. Comptage des vélos. Available at:
http://www.grandlyon.com/comptage-des-velos.2231.0.html [Accessed May 22, 2010].
Bibliography
233
Grand Lyon, 2006. Enquête auprès des usagers Vélo’v. Grand Lyon, communauté
urbaine. Available at: http://www.grandlyon.com/Info.1164+M53f7b303bcf.0.html [Accessed
May 4, 2010].
Grand Lyon, 2009b. Vélo’v fait sa révolution�! Available at:
http://www.grandlyon.com/fileadmin/user_upload/Pdf/actualites/GLM/numero_29/GLM29_depla
cements.pdf.
Homeport, Official website of Homeport. Available at: http://vipre.homeport.info/
[Accessed April 29, 2011].
Del Jésus, T., 2010. Les coûts du vélib explosent. Slate.fr. Available at:
http://www.slate.fr/story/26287/velib-couts-paris-explosent-ville.
Kifer, K., 2000. Is Cycling Dangerous? Available at:
http://www.kenkifer.com/bikepages/health/risks.htm [Accessed August 26, 2010].
London Cycling Campaign, 2010. Barclays £25 million sponsorship of Cycle Hire could
herald major expansion. Available at: http://www.lcc.org.uk/index.asp?PageID=1853 [Accessed
August 13, 2010].
ManagEnergy, 2010. Case Study: Vienna Citybike - Vienna, Austria. ManagEnergy.
Available at: http://www.managenergy.net/products/R1407.htm [Accessed April 3, 2010].
maville.com, 2009. La ville a enregistré 850 000 nuitées en 2009. Available at:
http://www.montpellier.maville.com/actu/actudet_-Tourisme-La-ville-a-enregistre-850-000-
nuitees-en-2009-_dep-1247694_actu.Htm [Accessed July 7, 2010].
MetroBike, 2011. Bike-sharing Blog. The Bike-sharing Blog. Available at: http://bike-
sharing.blogspot.com/.
MetroBike, 2009. Copenhagen Bike-Share Competition. The Bike-sharing Blog.
Available at: http://bike-sharing.blogspot.com/2009/12/copenhagen-bike-share-competition.html
[Accessed April 2, 2010].
Muñoz, Ó., 2009. Más del 10% de la flota del bicing es robada o atacada.
lavanguardia.es. Available at:
http://www.lavanguardia.es/premium/publica/publica?COMPID=53701933714&ID_PAGINA=22
088&ID_FORMATO=9&turbourl=false [Accessed July 9, 2010].
nextbike, 2010. Official website of nextbike. Available at:
https://nextbike.net/de/index.php?id= [Accessed April 5, 2010].
O’Keefe, T. & Keating, J., 2010. The Yellow Bike Story. Available at:
http://c2.com/ybp/story.html [Accessed April 2, 2010].
Oxford Dictionary, 2010. Success. Available at:
http://oxforddictionaries.com/view/entry/m_en_gb0826150#m_en_gb0826150 [Accessed
August 20, 2010].
Oybike, 2010. Official website of OYBike. Available at:
http://www.oybike.com/oybike/cms.nsf/Home [Accessed April 5, 2010].
Bibliography
234
Pignon sur Rue, 2010. 14 déc.�: enquête usagers vélo’v, Lyon - Villeurbanne, Part
Dieu - Tête d’Or. Pignon sur Rue, la maison du vélo et des modes doux de Lyon. Available at:
http://www.pignonsurrue.org/spip.php?article151 [Accessed May 1, 2010].
Planet Ark, 2007. EU Car CO2 Emissions Down 0.2 Pct in ’06 - Group - Planet Ark.
Planet Ark. Your daily guide to helping the planet. Available at:
http://www.planetark.com/dailynewsstory.cfm/newsid/44167/story.htm [Accessed May 21,
2010].
Pro Umwelt GmbH, 2010. Information für WerbepartnerInnen.
PuntoBici, 2010. Official website of Parma PuntoBici. Available at:
http://www.parmapuntobici.pr.it/index.php?option=com_content&task=view&id=13&Itemid=28
[Accessed April 22, 2010].
Sage, A., 2007. Sailing through the lights, riding for a fall. Times online. Available at:
http://www.timesonline.co.uk/tol/news/world/europe/article1717314.ece [Accessed April 2,
2010].
Sevici, 2010. Official website of Sevici. Available at: http://www.sevici.es/ [Accessed
April 22, 2010].
Le Soir, 2008. Cyclocity est toujours un boulet. Le Soir.
SpiCycles, P., 2008. Bike sharing – Key findings and recommendations, European
Commission. Available at:
http://spicycles.velo.info/LinkClick.aspx?fileticket=xr50ylpfP5g%3D&tabid=104 [Accessed April
5, 2009].
Stadt Wien, 2010. Citybike Wien (MA 46). Available at:
http://www.wien.gv.at/verkehr/radfahren/service/citybike.html [Accessed April 3, 2010].
Der Standard, 2010. Viennabike, Available at:
http://images.derstandard.at/20030525/bik11.jpg [Accessed April 3, 2010].
Svenningsen, U., 2010. Bycyklen, Available at:
http://umebike.files.wordpress.com/2009/02/bycyklen.jpg?w=300&h=225 [Accessed April 3,
2010].
Talavera, A., 2009. El robo de 360 bicicletas de alquiler deja a los vecinos de la Ribera
sin servicio. lasprovincias.es.
Tu Tiempo, 2010. Clima en Rimini - datos climáticos históricos desde el año 1945.
Available at: http://www.tutiempo.net/clima/Rimini/161490.htm [Accessed July 2, 2010].
UNO, 1987. Our Common Future, Chapter 2: Towards Sustainable Development -
A/42/427 Annex. Available at: http://www.un-documents.net/ocf-02.htm#I [Accessed August 19,
2010].
Vélib’, 2009a. Newsletter Vélib’ juin 2009 - #22. Bientôt 2 ans�: votre opinion sur le
service�! Available at:
http://velib.centraldoc.com/newsletter/22_bientot_2_ans_d_utilisation_votre_regard_sur_le_serv
ice [Accessed May 1, 2010].
Bibliography
235
Vélib’, 2008. Newsletter Vélib’ mai 2008 - #10. Aujourd’hui, nous vous connaissons
mieux�! Official website of Vélib. Available at: http://www.velib.paris.fr/Les-newsletters/10-
Aujourd-hui-nous-vous-connaissons-mieux-! [Accessed May 1, 2010].
Vélib’, 2007. Newsletter Vélib’ septembre 2007 - #2. Available at:
http://www.velib.paris.fr/les_newsletters/ [Accessed May 1, 2008].
Vélib’, 2009b. Official website of Vélib’. Available at: http://www.velib.paris.fr/ [Accessed
May 15, 2009].
le vélo star, 2009. Official website of le vélo star. Available at: http://www.levelostar.fr/.
Vélo’v, 2009. Archives Vélo’V. Vélo’v. Available at:
http://www.velov.grandlyon.com/Archives-Velo-V.63.0.html [Accessed June 12, 2010].
Vélo’v, 2010. Official website of Vélo’v. Available at: http://www.velov.grandlyon.com/
[Accessed April 9, 2010].
Véló+, 2009. Official website of véló+. Available at: https://www.agglo-veloplus.fr/.
Velodi, Official website of Velodi. Available at: http://www.velodi.net/.
Vélomagg’, 2008. Official website of Vélomagg’. Available at:
http://www.velomagg.com/10004.html [Accessed June 19, 2010].
Vidal, R., Dos bicicletas muy distintas.
Villo!, 2010. Official website of Villo! Available at: http://www.villo.be/ [Accessed April 9,
2010].
Vyi, M., 2007. Vélo à la carte, Available at:
http://upload.wikimedia.org/wikipedia/commons/thumb/1/19/V%C3%A9lo_%C3%A0_la_carte%
2C_Rennes.jpg/800px-V%C3%A9lo_%C3%A0_la_carte%2C_Rennes.jpg [Accessed April 3,
2010].
Wikipedia, 2010a. Bicycle sharing system. Available at:
http://en.wikipedia.org/wiki/Bicycle_sharing_system#cite_note-6 [Accessed April 2, 2010].
Wikipedia, 2010b. Brundtland Commission. Available at:
http://en.wikipedia.org/wiki/Brundtland_Commission#Brundtland_Report [Accessed August 27,
2010].
Wikipedia, 2010c. European emission standards. Available at:
http://en.wikipedia.org/wiki/European_emission_standards [Accessed May 30, 2010].
Wikipedia, 2010d. Modal share. Available at: http://en.wikipedia.org/wiki/Modal_share
[Accessed May 1, 2010].
Wikipedia, 2010e. OV-fiets. Available at: http://nl.wikipedia.org/wiki/OV-fiets [Accessed
April 11, 2010].
Wikipedia, 2010f. Provo (movement). Available at:
http://en.wikipedia.org/wiki/Provo_(movement) [Accessed April 1, 2010].
Wikipedia, 2010g. Sustainable development -. Available at:
http://en.wikipedia.org/wiki/Sustainable_development [Accessed August 19, 2010].


![Kondylis’s contribution to the “basic historical€™s contribution to the “basic...political-social language in Germany”], Stuttgart 1972-1997, ed. by Reinhart Koselleck](https://img.pdfslide.org/doc/110x75/5e80609c88488170be05521c/kondylisas-contribution-to-the-aoebasic-historical-s-contribution-to-the-aoebasic.jpg)