Embed Size (px)
Citation preview
econstor www.econstor.eu
Der Open-Access-Publikationsserver der ZBW – Leibniz-Informationszentrum WirtschaftThe Open Access Publication Server of the ZBW – Leibniz Information Centre for Economics
Standard-Nutzungsbedingungen:
Die Dokumente auf EconStor dürfen zu eigenen wissenschaftlichenZwecken und zum Privatgebrauch gespeichert und kopiert werden.
Sie dürfen die Dokumente nicht für öffentliche oder kommerzielleZwecke vervielfältigen, öffentlich ausstellen, öffentlich zugänglichmachen, vertreiben oder anderweitig nutzen.
Sofern die Verfasser die Dokumente unter Open-Content-Lizenzen(insbesondere CC-Lizenzen) zur Verfügung gestellt haben sollten,gelten abweichend von diesen Nutzungsbedingungen die in der dortgenannten Lizenz gewährten Nutzungsrechte.
Terms of use:
Documents in EconStor may be saved and copied for yourpersonal and scholarly purposes.
You are not to copy documents for public or commercialpurposes, to exhibit the documents publicly, to make thempublicly available on the internet, or to distribute or otherwiseuse the documents in public.
If the documents have been made available under an OpenContent Licence (especially Creative Commons Licences), youmay exercise further usage rights as specified in the indicatedlicence.
zbw Leibniz-Informationszentrum WirtschaftLeibniz Information Centre for Economics
Ødegaard, Fredrik; Roos, Pontus
Working Paper
Measuring workers' health and psychosocial work-environment on firm productivity
Working Paper, IFAU - Institute for Evaluation of Labour Market and Education Policy, No.2012:17
Provided in Cooperation with:IFAU - Institute for Evaluation of Labour Market and Education Policy,Uppsala
Suggested Citation: Ødegaard, Fredrik; Roos, Pontus (2012) : Measuring workers' healthand psychosocial work-environment on firm productivity, Working Paper, IFAU - Institute forEvaluation of Labour Market and Education Policy, No. 2012:17
This Version is available at:http://hdl.handle.net/10419/82278
Measuring workers’ health and psychosocial work-environment
on firm productivity
Fredrik Ødegaard Pontus Roos
WORKING PAPER 2012:17

The Institute for Evaluation of Labour Market and Education Policy (IFAU) is a research institute under the Swedish Ministry of Employment, situated in Uppsala. IFAU’s objective is to promote, support and carry out scientific evaluations. The assignment includes: the effects of labour market and educational policies, studies of the functioning of the labour market and the labour market effects of social insurance policies. IFAU shall also disseminate its results so that they become accessible to different interested parties in Sweden and abroad. IFAU also provides funding for research projects within its areas of interest. The deadline for applications is October 1 each year. Since the researchers at IFAU are mainly economists, researchers from other disciplines are encouraged to apply for funding. IFAU is run by a Director-General. The institute has a scientific council, consisting of a chairman, the Director-General and five other members. Among other things, the scientific council proposes a decision for the allocation of research grants. A reference group including representatives for employer organizations and trade unions, as well as the ministries and authorities concerned is also connected to the institute. Postal address: P.O. Box 513, 751 20 Uppsala Visiting address: Kyrkogårdsgatan 6, Uppsala Phone: +46 18 471 70 70 Fax: +46 18 471 70 71 [email protected] www.ifau.se Papers published in the Working Paper Series should, according to the IFAU policy, have been discussed at seminars held at IFAU and at least one other academic forum, and have been read by one external and one internal referee. They need not, however, have undergone the standard scrutiny for publication in a scientific journal. The purpose of the Working Paper Series is to provide a factual basis for public policy and the public policy discussion. ISSN 1651-1166
Measuring workers’ health and psychosocialwork-environment on firm productivity a
by
Fredrik Ødegaardb and Pontus Roosc
4th October, 2012
AbstractWe discuss a model for analyzing and measuring workers’ health and psychosocial work-environment on firm productivity. Productivity is measured through the Malmquist pro-ductivity index approach using Data Envelopment Analysis. A novel component of themodel is that in addition to standard quantity (or tradable) variables, we incorporate qual-ity (or non-tradable) variables. Specifically we focus on two quality input variables: work-ers’ health status and psychosocial work-environment. The two variables are modeled aslatent or unobserved variables using Item Response Theory. Changes over time in pro-ductivity are decomposed to asses the contribution from the changes of the input qualityvariables. The model is illustrated using data from a worksite health promotion programconducted at three large Swedish manufacturing plants (2 paper mills, 1 steel factory)from 2000 to 2003. Over the four years we observe a general improvement in efficiencyof 2-5%, out of which half can be attributed to the improvement in the quality input vari-ables.
Keywords: Productivity, Decomposition of Efficiency, Human Resource Management,Health Status, Psychosocial Work-Environment, Ordinal Data, Latent Variables.
aWe would like to thank Erik Gronqvist, seminar participants at IFAU-Uppsala, and the two reviewers fortheir constructive comments and critiques.
bIvey School of Business, Western University, [email protected]. Institute of Applied Economics, deceased
IFAU – Workers’ health and psychosocial work-environment on firm productivity 1
Contents
1 Introduction . . . . . . . . . . . . . . . . . . . . . . . . . . . . . . . . . . . . . . . . . . . . . . . . . . . . . . . . . . . . . . . . . . . . . . . . . . 3
2 Measuring firm productivity and labor quality process . . . . . . . . . . . . . . . . . . . . . . . . . . . . 5
3 Deriving and estimating labor quality variables . . . . . . . . . . . . . . . . . . . . . . . . . . . . . . . . . . . . 133.1 Measuring Health status of workers . . . . . . . . . . . . . . . . . . . . . . . . . . . . . . . . . . . . . . . . . . . . . . . . 153.2 Measuring psychosocial work-environment . . . . . . . . . . . . . . . . . . . . . . . . . . . . . . . . . . . . . . . . 16
4 Input data . . . . . . . . . . . . . . . . . . . . . . . . . . . . . . . . . . . . . . . . . . . . . . . . . . . . . . . . . . . . . . . . . . . . . . . . . . . . . 194.1 Production data . . . . . . . . . . . . . . . . . . . . . . . . . . . . . . . . . . . . . . . . . . . . . . . . . . . . . . . . . . . . . . . . . . . . . . 194.2 Health status data . . . . . . . . . . . . . . . . . . . . . . . . . . . . . . . . . . . . . . . . . . . . . . . . . . . . . . . . . . . . . . . . . . . . 214.3 Psychosocial work-environment data . . . . . . . . . . . . . . . . . . . . . . . . . . . . . . . . . . . . . . . . . . . . . . . 23
5 Results . . . . . . . . . . . . . . . . . . . . . . . . . . . . . . . . . . . . . . . . . . . . . . . . . . . . . . . . . . . . . . . . . . . . . . . . . . . . . . . . 24
6 Concluding remarks . . . . . . . . . . . . . . . . . . . . . . . . . . . . . . . . . . . . . . . . . . . . . . . . . . . . . . . . . . . . . . . . . 26
References . . . . . . . . . . . . . . . . . . . . . . . . . . . . . . . . . . . . . . . . . . . . . . . . . . . . . . . . . . . . . . . . . . . . . . . . . . . . . . . . . . 30
2 IFAU – Workers’ health and psychosocial work-environment on firm productivity
1 IntroductionPartly in response to public policies and recommendations, many firms have started to
invest in the health of their workers and the psychosocial work-environment. The World
Health Organization, the UK Health and Safety Executive, and the European Network
for Workplace Health Promotion are some examples with developed guidelines for how
to implement and operationalize programs to improve health and psychosocial working
environment (World Health Organization 2011, UK Health and Safety Executive 2011,
European Network for Workplace Health Promotion 2011). However, beyond responding
to public recommendations, firms may voluntarily make these investments in the belief
that promoting health and improving the work-environment increases firm productivity
and profit. Besides reducing the cost associated with absenteeism, employee turn-over,
and health care coverage, the management of a firm may also believe that a healthier
workforce would, b also have a positive effect on the productivity of the firm. These pro-
ductivity improvements may, for instance, derive from that a healthier workforce perform
better, and/or requires fewer substitute workers who comparatively may need more input
(e.g. work-hours, etc.) to produce less output and of lower quality.
The objective of this paper is to discuss a model for measuring the productivity of an
organization when the effect from labor quality promotion activities are included. The
model provides a method for considering both overall firm productivity as well as a mea-
surement for the contribution of the labor quality to overall firm productivity. We argue
that the production process of a firm consists of two sub-processes: (1) the operational
or physical production process; and, (2) the labor quality process. See Figure 1. Our
goal is to analyze, from a firm’s perspective, the overall productivity of the firm and
its two sub-index of efficiency. For the measurement of firm productivity, the proposed
framework draws on Data Envelopment Analysis (DEA) and Index Theory. This frame-
work has a straightforward link to the measurement of economic performance when data
consist of actual observations on inputs, outputs and quality aspects, and when the rela-
tive measure of efficiency reflects the relationship between actual performance and what
could be reached, see: Afriat (1972), Charnes et al. (1994), Fare (1988), Roos (2002),
IFAU – Workers’ health and psychosocial work-environment on firm productivity 3
Fare & Grosskopf (2004). For labor quality process, we focus on the promotion of work-
ers’ health status and the psychosocial work-environment of the firm. We model these
as latent or unobservable variables using Item Response Theory (IRT). Even though IRT
models are well-established and have been used extensively in Psychology and Education
Research, the application to measure health status is a relatively recent development. For
general comments and reviews regarding the use of IRT to measure health status and other
clinical measurements, see: Cella & Chang (2000) and Reise & Waller (2009). We test
our model on data from three Swedish manufacturing plants that participated in a coordi-
nated worksite health promotion (WHP) study and implementation program from 2000 to
2003. The empirical results indicate a general improvement in efficiency of about 2-5%,
out of which half can be attributed to improvement in the labor quality variables.
Social and economical effects of health are important research topics and as such
have been studied extensively. Similarly firm productivity is also an important economic
research topic with an extensive literature. There has so far, however, been little effort
or success in properly linking the two issues. One reason for this is the challenge of
collecting data that aligns workers’ health and firm productivity. Studies often revert to
measuring the effect of health on firm/labor productivity (or rather loss thereof) through
proxies, such as absenteeism or presenteeism per employee. See, for instance, the review
articles by Loeppke et al. (2003), Lofland et al. (2004), Mattke et al. (2007). Although
these types of analysis and variables may be of interest in a social context, their usefulness
is limited in measuring firm efficiency and productivity because these proxies measure the
means rather than contribution to firm performance. For instance, a pulp mill employs and
organizes the plant such that production is more or less independent of an individual’s ab-
sence. Another recourse to link health and productivity is to perform the analysis on an
aggregate level, such as country or region, see, for instance, Arora (2001) and Røed &
Fevang (2007). This type of macro-level analysis regarding health and productivity may
be of interest and importance to policy related topics, but is not germane to our objective.
We seek to measure the effect at a micro-level and to decompose the productivity effect
from health and other input quality aspects.
4 IFAU – Workers’ health and psychosocial work-environment on firm productivity
Although there are many papers that discuss various decompositions of productivity
and efficiency indices, to the best of our knowledge, we are the first to show this with re-
gard to labor quality attributes. In the economics literature, the primary focus has been on
industries or countries, and how growth in labor productivity can be decomposed into fac-
tors such as technological progress, efficiency changes, and changes in the ratio between
physical capital and human capital. For instance, Kumar & Russell (2002) and Henderson
& Russell (2005) present index approaches to the measurement of labor productivity and
how to decompose the index into factors behind changes in labor productivity at an ag-
gregate industry or country level. In this paper, we take a more narrow view and consider
firm productivity by examining the effects from labor quality activities. More directly
related to our work, Fare et al. (1995), also consider the effect of quality attributes on firm
productivity. The main difference is that while they consider output quality attributes, our
focus is on input quality attributes and how these contribute to overall firm productivity.
The remaining paper is organized as follows. In Section 2, we present a model for
measuring the efficiency and productivity performance regarding three aspects of a firm:
(i) the overall firm process, (ii) the physical production process, and (iii) the labor qual-
ity process. In Section 3, we present a method for deriving and estimating labor quality
attributes as latent variables, and showcase the method on workers’ health status and psy-
chosocial work-environment. In Section 4, we discuss the data used in the empirical
study; and in Section 5, we present the results. Finally in Section 6, we summarize our
main contributions and provide ideas for future research.
2 Measuring firm productivity and labor quality pro-
cessA firm’s production process is described by observations on resources and processes.
Namely, what goes into the process (input), and what comes out of the process (output).
Among the input and output variables, we distinguish between those that are traded and
those that are non-traded. The traded input and output variables include number of total
hours worked, number of employees, amount of produced goods or services, amount of
IFAU – Workers’ health and psychosocial work-environment on firm productivity 5
raw material, etc. The non-traded input and output variables are quality attributes, and
include employee health status, psychosocial work-environment, pollution, on-time de-
livery, quality indicator of final product or service, etc. Note that although the non-traded
variables are not physically disconnected from the traded variables and cannot, for in-
stance, be sold individually, they are separate variables and measured independently from
their counterpart traded variables. For example, a pulp mill may include tonnes of raw
material (traded) and a grade quality measurement of the raw material (non-traded) as two
separate input variables. Incorporating quality attributes of the labor force as non-traded
input variables and to decompose this effect on firm productivity are two of the main con-
tributions of this paper. It should however, also be stressed that the effort and time-line
for making changes to the traded versus non-traded variables are significantly different.
A firm may with relative little effort and time make changes to the number of employees,
amount of raw material, etc. While making changes to the quality of the work force or
quality of the raw material or final product may take a significant effort and time (and be
costly).
We analyze the firm in terms of two sub-processes. First, the physical production
process, which is the production of goods or services a firm can achieve from available
input given decisions about production technology, short run operations, cost saving ac-
tivities, production plan, etc. Second, the labor quality process, which are activities aimed
at improving a firm’s operation through promotion of the non-traded input labor quality
variables or attributes. These activities are often run by the human resource department
and can be seen as a separate process within the firm. Examples include worksite health
promotion programs or other labor or work-environment quality promotions. Labor qual-
ity variables are non-traded variables or attributes that represent something that is good
for the firm or final output and should provide value for the consumer. Although it is
often understood that the higher the labor quality the better, arguably from a firm’s per-
spective more is only better if it creates a potential for an increase in firm productivity
and efficiency, and the firm is able to benefit from this potential. We again stress that
the non-traded labor quality variables are and should be considered as separate from their
counterpart traded input labor variables, such as number of employees or total work hours.
6 IFAU – Workers’ health and psychosocial work-environment on firm productivity
In the same way that a batch of output can be either of low or high quality, we assume
that a given work force may be evaluated as more or less healthy. The motivation for
considering the effect of the labor quality variables is to evaluate the potential in effi-
ciency improvement due to possible restrictions imposed on the labor quality variables by
management decisions. Therefore, the focus of our analysis is on the firm’s performance
of the labor quality process (QP); formally defined below in equation (3). If the labor
quality variables are restricted then the performance of the labor quality process may be
lower, and our QP measure would show what could be reached in terms of improvement
in labor quality process efficiency and firm productivity. In other words, the proposed
QP measures the firm’s potential improvement in productivity, if the labor quality vari-
ables were not restricted. Note that the management decisions restricting the labor quality
variables need not be deliberate or for cost saving purposes, but nevertheless may have a
detrimental effect on firm productivity and efficiency. Likewise managerial decisions to
improve labor quality variables may indicate that there are no restrictions imposed and
that there is no room for further efficiency improvement. Therefore, with QP as a factor
driving changes in firm productivity we are interested in whether or not QP comes closer
to efficiency over time.
All estimations of firm performance are based on observed data and assumed to reflect
what actually happened. We denote the tradable input variables by x = (x1,x2, . . . ,xN),
the non-tradable quality input variables by q = (q1,q2, . . . ,qH), and the tradable and non-
tradable output variables by y = (y1,y2, . . . ,yM). Note, the y variables include both trad-
able and non-tradeable output variables, and (x,q) and y may be considered the input
and output vector respectively. The reason why we only separate the input variables into
tradable (x) and non-tradeable (q), but not the output variable, is because we are only
interested in decomposing the effect from the non-tradeable input variables. The input
and output vectors at time t are denoted by (xt ,qt) and yt respectively, t = 1,2, . . . ,T .
The production technology S consist of the set of all feasible input and output vectors,
S = {(y,x,q)|(x,q) can produce y}. Following the original ideas of Farrell (1957) and
successive framework of Charnes et al. (1978), we define the output based measure of
technical efficiency of the physical production process at time t as follows, for (yt ,xt ,qt),
IFAU – Workers’ health and psychosocial work-environment on firm productivity 7
t = 1,2, . . . ,T ,
T Et(yt ,xt ,qt) = inf{θ |(yt/θ ,xt ,qt) ∈ S} (1)
In an output based approach, efficiency measures the possible increase in output for
a given level of input. In other words, at time-period t, for output efficient observations
T Et(y,x,q) = 1, while output inefficient observations T Et(y,x,q) < 1. An output based
measure is motivated by the overall operating goal to fulfill incoming orders with products
of sufficient quality given the available input and input quality. Note that we only have
one technology for T E which is defined as the grand technology over all time-periods,
and that it is assumed the technology is known to the firm at each time-period. Equation
(1) is also known as a distance function. For more information on distance functions in the
analysis of production performance see Fare (1988) and Fare & Grosskopf (2004). Given
values at each time-period, we can calculate a Malmquist productivity index through the
changes in efficiency over time, ∆T Et ≡ T Et(yt ,xt ,qt)/T Et−1(yt−1,xt−1,qt−1). Improve-
ments over time are reflected by ∆T Et > 1.
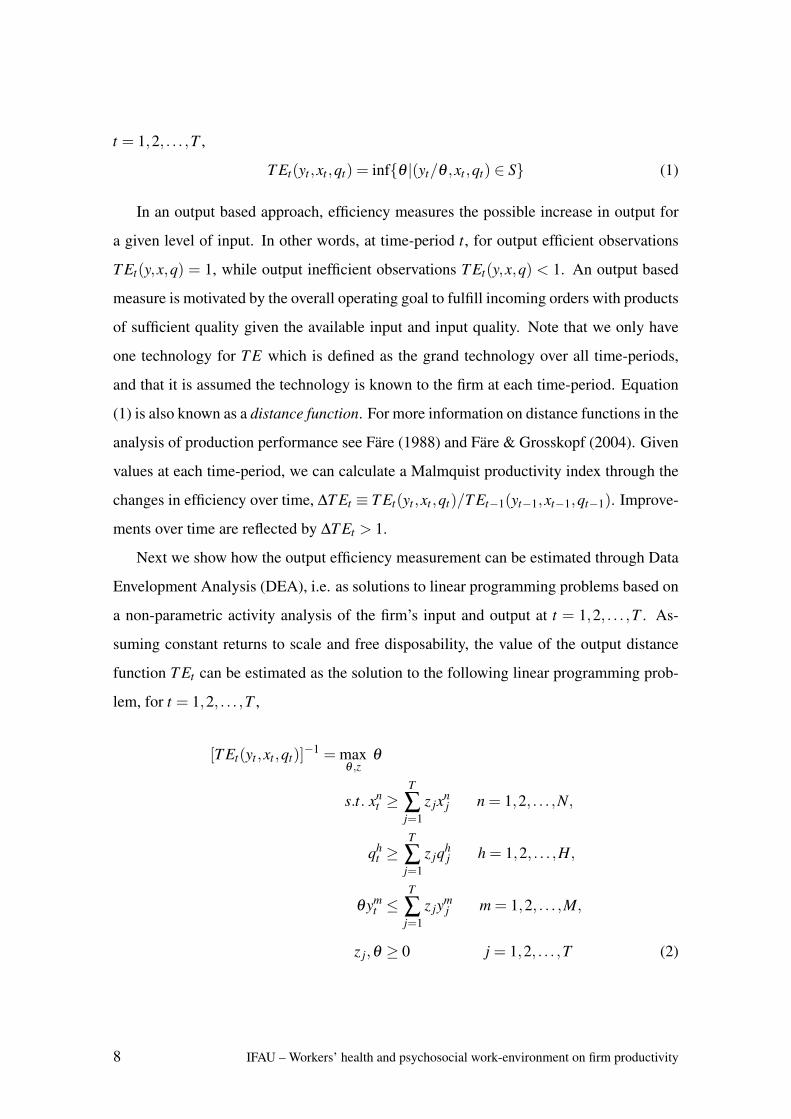
Next we show how the output efficiency measurement can be estimated through Data
Envelopment Analysis (DEA), i.e. as solutions to linear programming problems based on
a non-parametric activity analysis of the firm’s input and output at t = 1,2, . . . ,T . As-
suming constant returns to scale and free disposability, the value of the output distance
function T Et can be estimated as the solution to the following linear programming prob-
lem, for t = 1,2, . . . ,T ,
[T Et(yt ,xt ,qt)]−1 = max
θ ,zθ
s.t. xnt ≥
T
∑j=1
z jxnj n = 1,2, . . . ,N,
qht ≥
T
∑j=1
z jqhj h = 1,2, . . . ,H,
θymt ≤
T
∑j=1
z jymj m = 1,2, . . . ,M,
z j,θ ≥ 0 j = 1,2, . . . ,T (2)
8 IFAU – Workers’ health and psychosocial work-environment on firm productivity
where the intensity variables z j are used to model the technology as convex combinations
of input, output and quality attributes. One of the benefits with DEA as a non-parametric
approach is that it does not assume a specific functional form for the frontier, and hence
avoids issues associated with misspecfications. On the other hand, since all deviations
from the efficient frontier are due to the deterministic modeling, the DEA framework
does not allow for statistical noise, random shocks or measurement error. One alternative
is to of course perform sensitivity and robustness checks by modifying or omitting the
data. For brevity of the paper we have left this out.
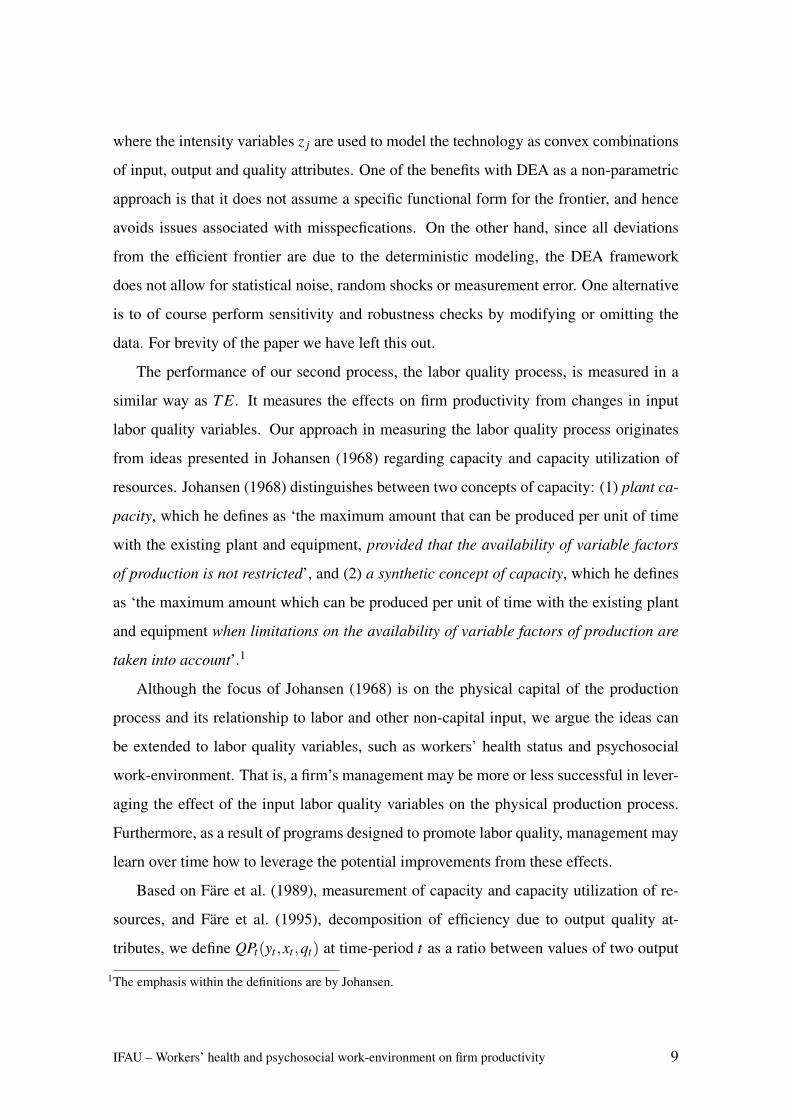
The performance of our second process, the labor quality process, is measured in a
similar way as T E. It measures the effects on firm productivity from changes in input
labor quality variables. Our approach in measuring the labor quality process originates
from ideas presented in Johansen (1968) regarding capacity and capacity utilization of
resources. Johansen (1968) distinguishes between two concepts of capacity: (1) plant ca-
pacity, which he defines as ‘the maximum amount that can be produced per unit of time
with the existing plant and equipment, provided that the availability of variable factors
of production is not restricted’, and (2) a synthetic concept of capacity, which he defines
as ‘the maximum amount which can be produced per unit of time with the existing plant
and equipment when limitations on the availability of variable factors of production are
taken into account’.1
Although the focus of Johansen (1968) is on the physical capital of the production
process and its relationship to labor and other non-capital input, we argue the ideas can
be extended to labor quality variables, such as workers’ health status and psychosocial
work-environment. That is, a firm’s management may be more or less successful in lever-
aging the effect of the input labor quality variables on the physical production process.
Furthermore, as a result of programs designed to promote labor quality, management may
learn over time how to leverage the potential improvements from these effects.
Based on Fare et al. (1989), measurement of capacity and capacity utilization of re-
sources, and Fare et al. (1995), decomposition of efficiency due to output quality at-
tributes, we define QPt(yt ,xt ,qt) at time-period t as a ratio between values of two output
1The emphasis within the definitions are by Johansen.
IFAU – Workers’ health and psychosocial work-environment on firm productivity 9
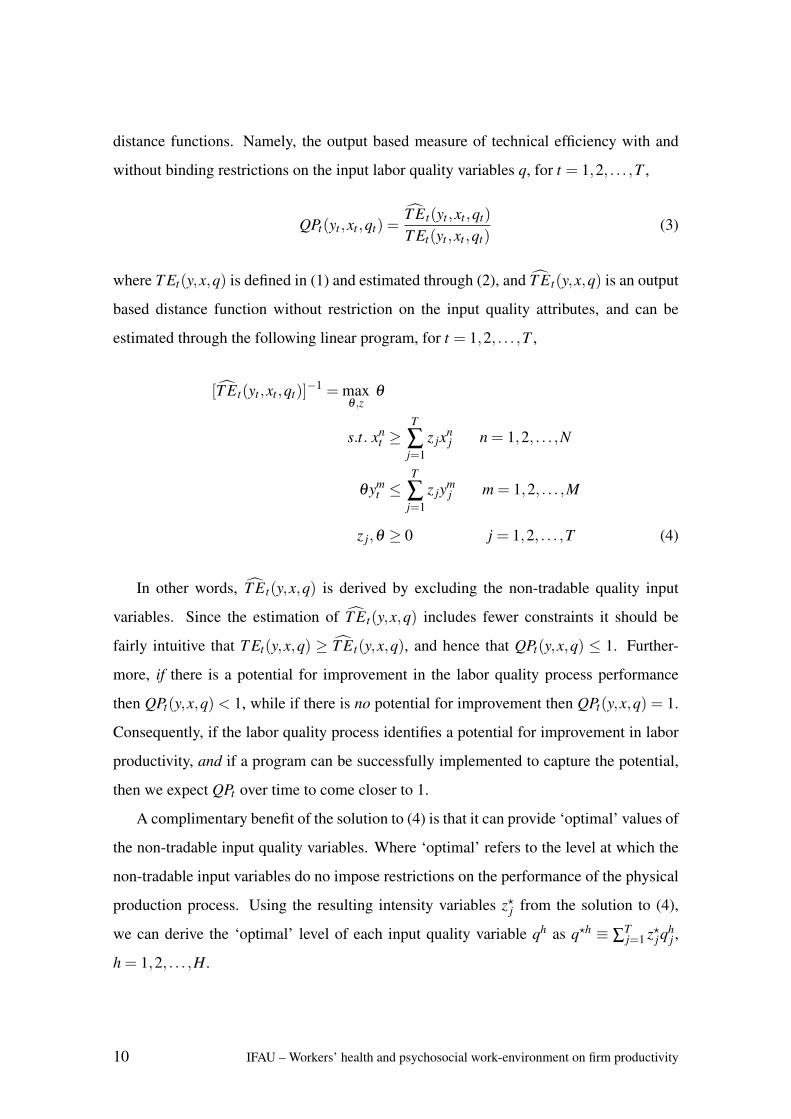
distance functions. Namely, the output based measure of technical efficiency with and
without binding restrictions on the input labor quality variables q, for t = 1,2, . . . ,T ,
QPt(yt ,xt ,qt) =T Et(yt ,xt ,qt)
T Et(yt ,xt ,qt)(3)
where T Et(y,x,q) is defined in (1) and estimated through (2), and T Et(y,x,q) is an output
based distance function without restriction on the input quality attributes, and can be
estimated through the following linear program, for t = 1,2, . . . ,T ,
[T Et(yt ,xt ,qt)]−1 = max
θ ,zθ
s.t. xnt ≥
T
∑j=1
z jxnj n = 1,2, . . . ,N
θymt ≤
T
∑j=1
z jymj m = 1,2, . . . ,M
z j,θ ≥ 0 j = 1,2, . . . ,T (4)
In other words, T Et(y,x,q) is derived by excluding the non-tradable quality input
variables. Since the estimation of T Et(y,x,q) includes fewer constraints it should be
fairly intuitive that T Et(y,x,q) ≥ T Et(y,x,q), and hence that QPt(y,x,q) ≤ 1. Further-
more, if there is a potential for improvement in the labor quality process performance
then QPt(y,x,q)< 1, while if there is no potential for improvement then QPt(y,x,q) = 1.
Consequently, if the labor quality process identifies a potential for improvement in labor
productivity, and if a program can be successfully implemented to capture the potential,
then we expect QPt over time to come closer to 1.
A complimentary benefit of the solution to (4) is that it can provide ‘optimal’ values of
the non-tradable input quality variables. Where ‘optimal’ refers to the level at which the
non-tradable input variables do no impose restrictions on the performance of the physical
production process. Using the resulting intensity variables z?j from the solution to (4),
we can derive the ‘optimal’ level of each input quality variable qh as q?h ≡ ∑Tj=1 z?jq
hj ,
h = 1,2, . . . ,H.
10 IFAU – Workers’ health and psychosocial work-environment on firm productivity
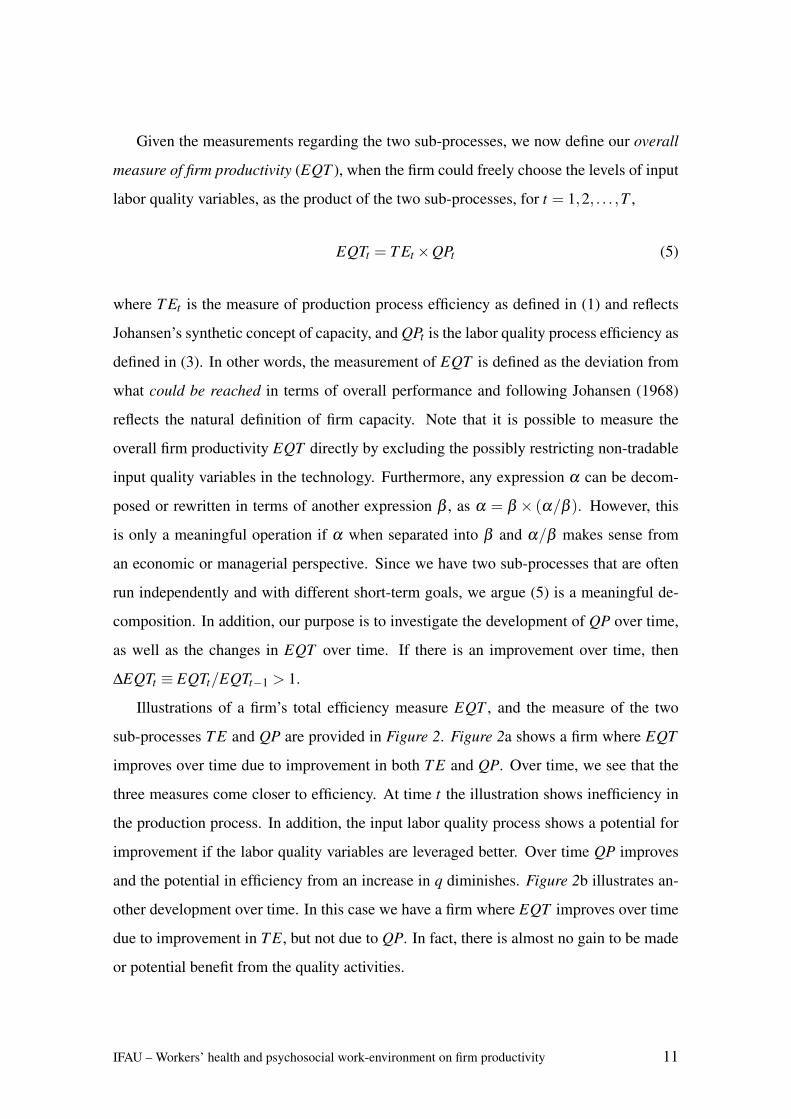
Given the measurements regarding the two sub-processes, we now define our overall
measure of firm productivity (EQT ), when the firm could freely choose the levels of input
labor quality variables, as the product of the two sub-processes, for t = 1,2, . . . ,T ,
EQTt = T Et×QPt (5)
where T Et is the measure of production process efficiency as defined in (1) and reflects
Johansen’s synthetic concept of capacity, and QPt is the labor quality process efficiency as
defined in (3). In other words, the measurement of EQT is defined as the deviation from
what could be reached in terms of overall performance and following Johansen (1968)
reflects the natural definition of firm capacity. Note that it is possible to measure the
overall firm productivity EQT directly by excluding the possibly restricting non-tradable
input quality variables in the technology. Furthermore, any expression α can be decom-
posed or rewritten in terms of another expression β , as α = β × (α/β ). However, this
is only a meaningful operation if α when separated into β and α/β makes sense from
an economic or managerial perspective. Since we have two sub-processes that are often
run independently and with different short-term goals, we argue (5) is a meaningful de-
composition. In addition, our purpose is to investigate the development of QP over time,
as well as the changes in EQT over time. If there is an improvement over time, then
∆EQTt ≡ EQTt/EQTt−1 > 1.
Illustrations of a firm’s total efficiency measure EQT , and the measure of the two
sub-processes T E and QP are provided in Figure 2. Figure 2a shows a firm where EQT
improves over time due to improvement in both T E and QP. Over time, we see that the
three measures come closer to efficiency. At time t the illustration shows inefficiency in
the production process. In addition, the input labor quality process shows a potential for
improvement if the labor quality variables are leveraged better. Over time QP improves
and the potential in efficiency from an increase in q diminishes. Figure 2b illustrates an-
other development over time. In this case we have a firm where EQT improves over time
due to improvement in T E, but not due to QP. In fact, there is almost no gain to be made
or potential benefit from the quality activities.
IFAU – Workers’ health and psychosocial work-environment on firm productivity 11
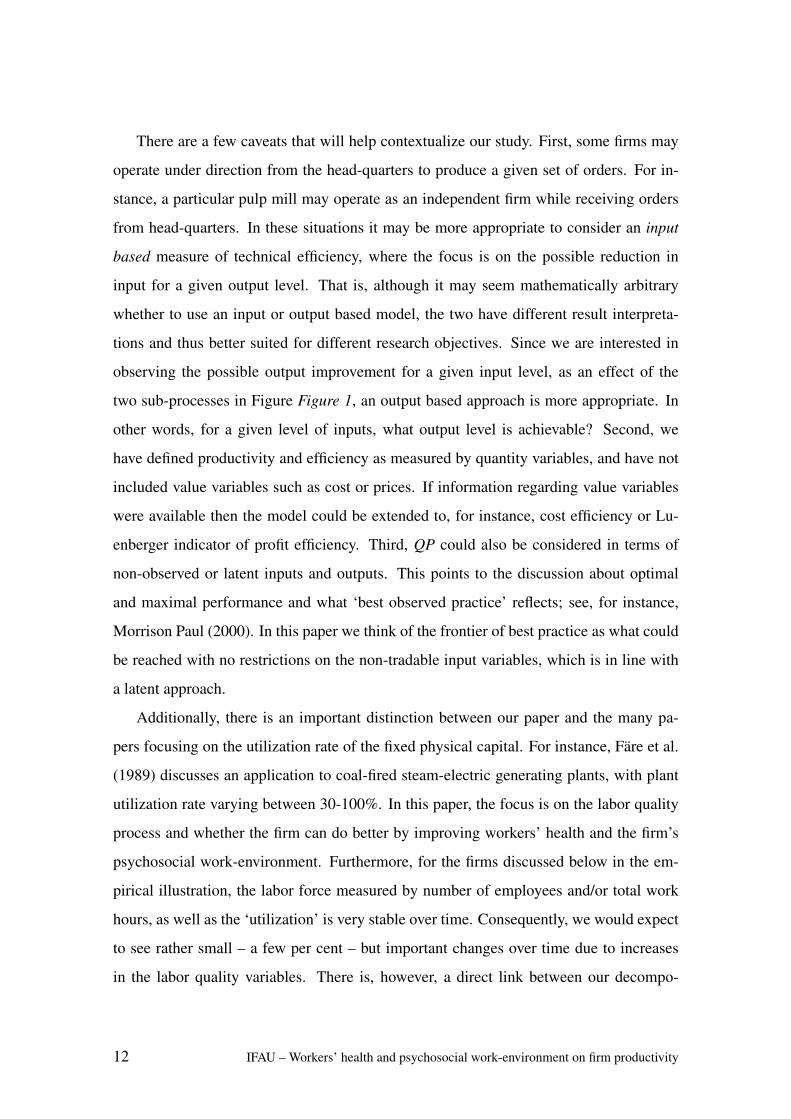
There are a few caveats that will help contextualize our study. First, some firms may
operate under direction from the head-quarters to produce a given set of orders. For in-
stance, a particular pulp mill may operate as an independent firm while receiving orders
from head-quarters. In these situations it may be more appropriate to consider an input
based measure of technical efficiency, where the focus is on the possible reduction in
input for a given output level. That is, although it may seem mathematically arbitrary
whether to use an input or output based model, the two have different result interpreta-
tions and thus better suited for different research objectives. Since we are interested in
observing the possible output improvement for a given input level, as an effect of the
two sub-processes in Figure Figure 1, an output based approach is more appropriate. In
other words, for a given level of inputs, what output level is achievable? Second, we
have defined productivity and efficiency as measured by quantity variables, and have not
included value variables such as cost or prices. If information regarding value variables
were available then the model could be extended to, for instance, cost efficiency or Lu-
enberger indicator of profit efficiency. Third, QP could also be considered in terms of
non-observed or latent inputs and outputs. This points to the discussion about optimal
and maximal performance and what ‘best observed practice’ reflects; see, for instance,
Morrison Paul (2000). In this paper we think of the frontier of best practice as what could
be reached with no restrictions on the non-tradable input variables, which is in line with
a latent approach.
Additionally, there is an important distinction between our paper and the many pa-
pers focusing on the utilization rate of the fixed physical capital. For instance, Fare et al.
(1989) discusses an application to coal-fired steam-electric generating plants, with plant
utilization rate varying between 30-100%. In this paper, the focus is on the labor quality
process and whether the firm can do better by improving workers’ health and the firm’s
psychosocial work-environment. Furthermore, for the firms discussed below in the em-
pirical illustration, the labor force measured by number of employees and/or total work
hours, as well as the ‘utilization’ is very stable over time. Consequently, we would expect
to see rather small – a few per cent – but important changes over time due to increases
in the labor quality variables. There is, however, a direct link between our decompo-
12 IFAU – Workers’ health and psychosocial work-environment on firm productivity
sition and the one suggested by Fare et al. (1989). They suggest that a Farrell output
based measure of efficiency can be decomposed into a plant capacity utilization rate and a
Farrell output measure of efficiency with variable input freely available as follows (their
equation 2.11), Ko(xk,uk) = Ko(xkf ,u
k) · (pcu)k. Re-written in terms of output based dis-
tance functions and using our notation, this is equivalent to 1T Et
= 1T Et× T Et
T Et, which when
re-arranged becomes T Et = T Et × T Et/T Et , i.e. expression (5). Finally, as we have
stressed, the production process must be able to extract the benefit from the potential that
has been created by labor quality process. For instance, in the long-run the management
of a firm may implement changes in the ‘size’ and characteristics of the labor force. The
ensuing empirical analysis was done using the software program OnFront (2000).
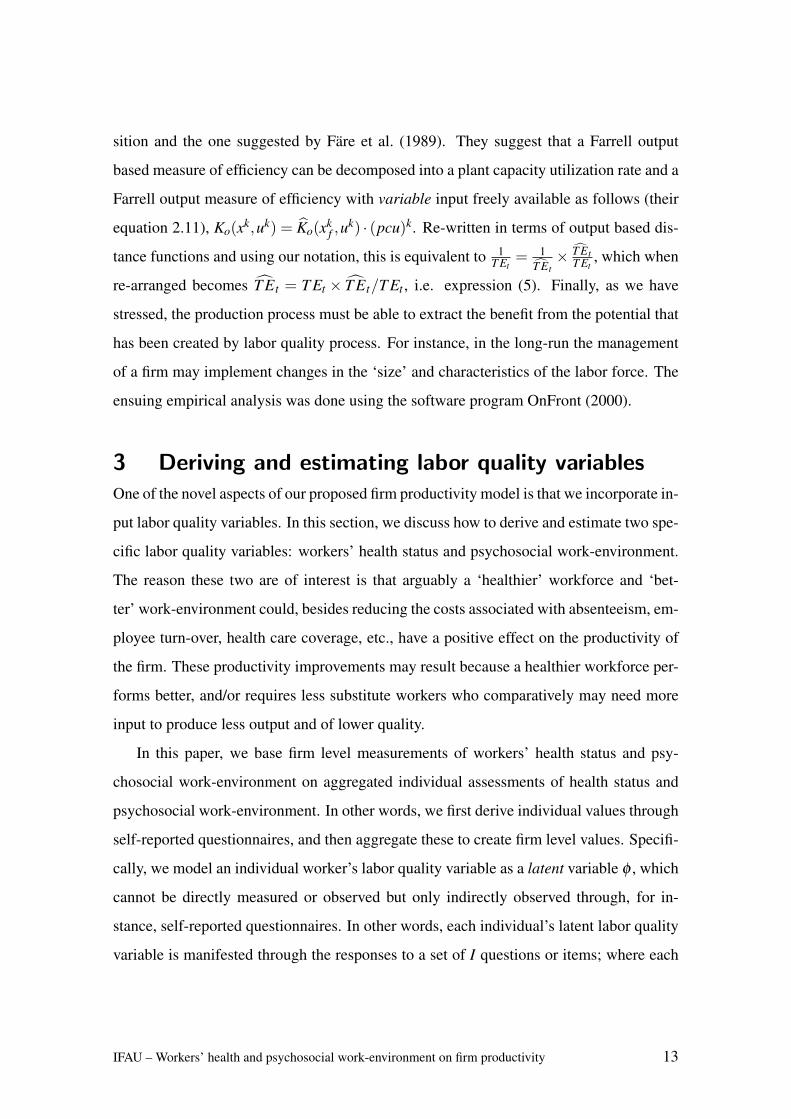
3 Deriving and estimating labor quality variablesOne of the novel aspects of our proposed firm productivity model is that we incorporate in-
put labor quality variables. In this section, we discuss how to derive and estimate two spe-
cific labor quality variables: workers’ health status and psychosocial work-environment.
The reason these two are of interest is that arguably a ‘healthier’ workforce and ‘bet-
ter’ work-environment could, besides reducing the costs associated with absenteeism, em-
ployee turn-over, health care coverage, etc., have a positive effect on the productivity of
the firm. These productivity improvements may result because a healthier workforce per-
forms better, and/or requires less substitute workers who comparatively may need more
input to produce less output and of lower quality.
In this paper, we base firm level measurements of workers’ health status and psy-
chosocial work-environment on aggregated individual assessments of health status and
psychosocial work-environment. In other words, we first derive individual values through
self-reported questionnaires, and then aggregate these to create firm level values. Specifi-
cally, we model an individual worker’s labor quality variable as a latent variable φ , which
cannot be directly measured or observed but only indirectly observed through, for in-
stance, self-reported questionnaires. In other words, each individual’s latent labor quality
variable is manifested through the responses to a set of I questions or items; where each
IFAU – Workers’ health and psychosocial work-environment on firm productivity 13
question or item has C ordered possible answers. Although we assume the underlying
labor quality variable φ is latent or unobservable, we need a mechanism to derive and
estimate individual values of the variables. In addition, though the individual workers’
response are ordinal, the overall firm level labor quality variables required for the produc-
tivity model described in Section 2 must be well-defined variables with metric properties
(i.e. with well-defined unit of measure and zero). Therefore, we require a mechanism to
convert individual’s ordinal responses to a labor quality variable measurement with metric
properties.
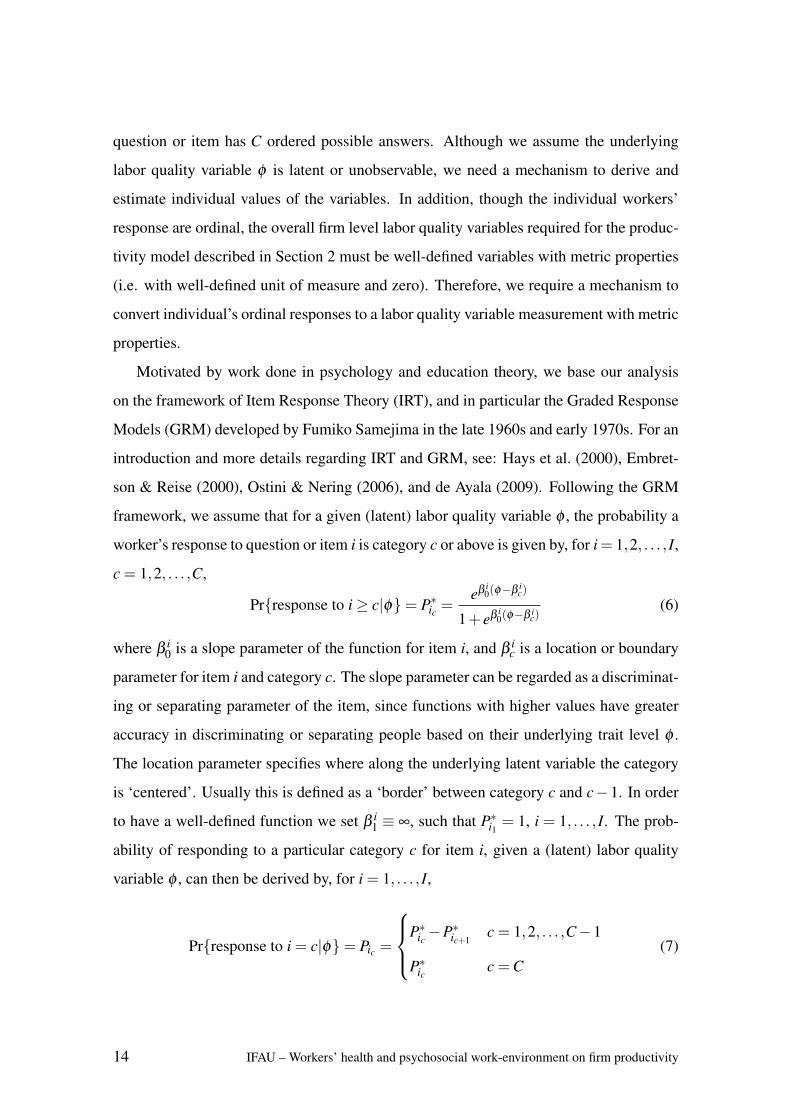
Motivated by work done in psychology and education theory, we base our analysis
on the framework of Item Response Theory (IRT), and in particular the Graded Response
Models (GRM) developed by Fumiko Samejima in the late 1960s and early 1970s. For an
introduction and more details regarding IRT and GRM, see: Hays et al. (2000), Embret-
son & Reise (2000), Ostini & Nering (2006), and de Ayala (2009). Following the GRM
framework, we assume that for a given (latent) labor quality variable φ , the probability a
worker’s response to question or item i is category c or above is given by, for i= 1,2, . . . , I,
c = 1,2, . . . ,C,
Pr{response to i≥ c|φ}= P∗ic =eβ i
0(φ−β ic)
1+ eβ i0(φ−β i
c)(6)
where β i0 is a slope parameter of the function for item i, and β i
c is a location or boundary
parameter for item i and category c. The slope parameter can be regarded as a discriminat-
ing or separating parameter of the item, since functions with higher values have greater
accuracy in discriminating or separating people based on their underlying trait level φ .
The location parameter specifies where along the underlying latent variable the category
is ‘centered’. Usually this is defined as a ‘border’ between category c and c−1. In order
to have a well-defined function we set β i1 ≡ ∞, such that P∗i1 = 1, i = 1, . . . , I. The prob-
ability of responding to a particular category c for item i, given a (latent) labor quality
variable φ , can then be derived by, for i = 1, . . . , I,
Pr{response to i = c|φ}= Pic =
P∗ic−P∗ic+1c = 1,2, . . . ,C−1
P∗ic c =C(7)
14 IFAU – Workers’ health and psychosocial work-environment on firm productivity
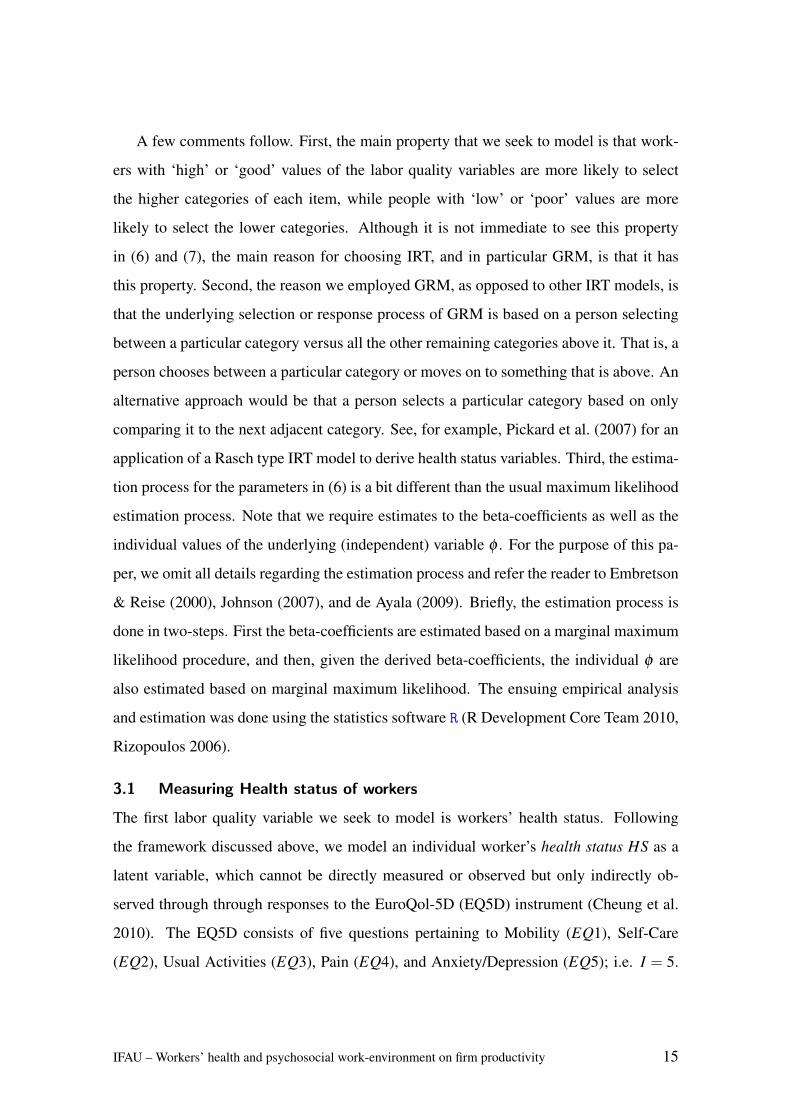
A few comments follow. First, the main property that we seek to model is that work-
ers with ‘high’ or ‘good’ values of the labor quality variables are more likely to select
the higher categories of each item, while people with ‘low’ or ‘poor’ values are more
likely to select the lower categories. Although it is not immediate to see this property
in (6) and (7), the main reason for choosing IRT, and in particular GRM, is that it has
this property. Second, the reason we employed GRM, as opposed to other IRT models, is
that the underlying selection or response process of GRM is based on a person selecting
between a particular category versus all the other remaining categories above it. That is, a
person chooses between a particular category or moves on to something that is above. An
alternative approach would be that a person selects a particular category based on only
comparing it to the next adjacent category. See, for example, Pickard et al. (2007) for an
application of a Rasch type IRT model to derive health status variables. Third, the estima-
tion process for the parameters in (6) is a bit different than the usual maximum likelihood
estimation process. Note that we require estimates to the beta-coefficients as well as the
individual values of the underlying (independent) variable φ . For the purpose of this pa-
per, we omit all details regarding the estimation process and refer the reader to Embretson
& Reise (2000), Johnson (2007), and de Ayala (2009). Briefly, the estimation process is
done in two-steps. First the beta-coefficients are estimated based on a marginal maximum
likelihood procedure, and then, given the derived beta-coefficients, the individual φ are
also estimated based on marginal maximum likelihood. The ensuing empirical analysis
and estimation was done using the statistics software R (R Development Core Team 2010,
Rizopoulos 2006).
3.1 Measuring Health status of workers
The first labor quality variable we seek to model is workers’ health status. Following
the framework discussed above, we model an individual worker’s health status HS as a
latent variable, which cannot be directly measured or observed but only indirectly ob-
served through through responses to the EuroQol-5D (EQ5D) instrument (Cheung et al.
2010). The EQ5D consists of five questions pertaining to Mobility (EQ1), Self-Care
(EQ2), Usual Activities (EQ3), Pain (EQ4), and Anxiety/Depression (EQ5); i.e. I = 5.
IFAU – Workers’ health and psychosocial work-environment on firm productivity 15
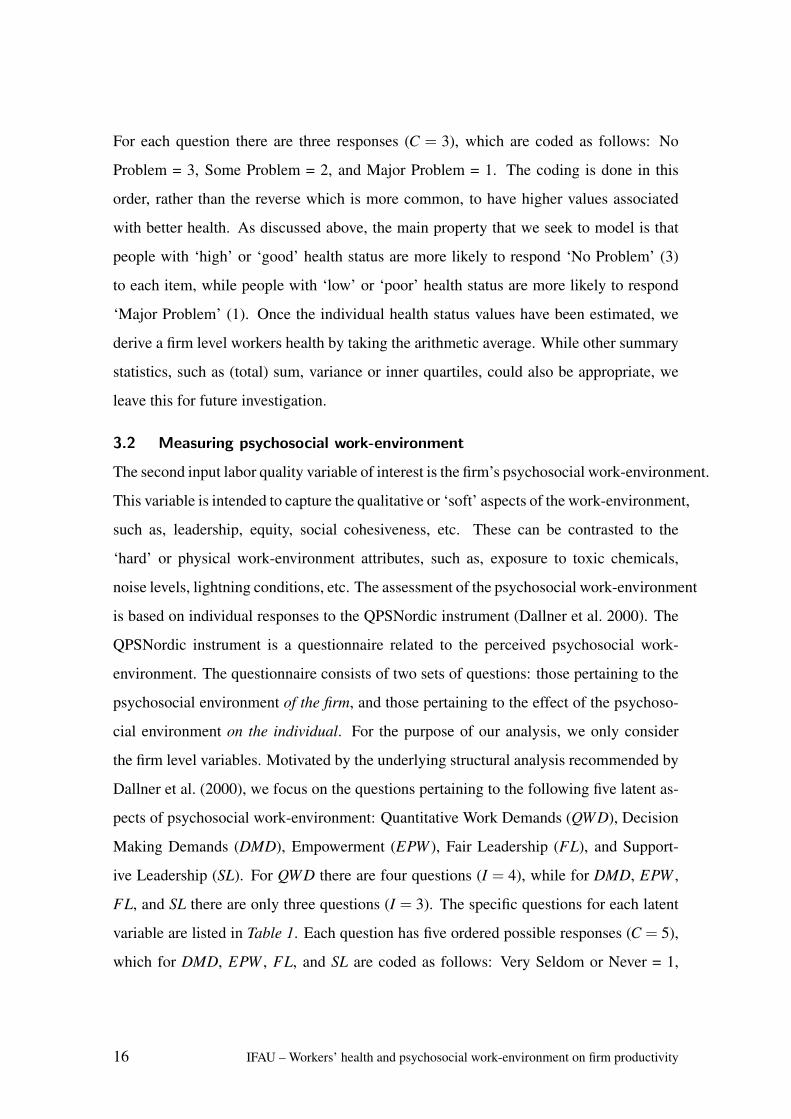
For each question there are three responses (C = 3), which are coded as follows: No
Problem = 3, Some Problem = 2, and Major Problem = 1. The coding is done in this
order, rather than the reverse which is more common, to have higher values associated
with better health. As discussed above, the main property that we seek to model is that
people with ‘high’ or ‘good’ health status are more likely to respond ‘No Problem’ (3)
to each item, while people with ‘low’ or ‘poor’ health status are more likely to respond
‘Major Problem’ (1). Once the individual health status values have been estimated, we
derive a firm level workers health by taking the arithmetic average. While other summary
statistics, such as (total) sum, variance or inner quartiles, could also be appropriate, we
leave this for future investigation.
3.2 Measuring psychosocial work-environment
The second input labor quality variable of interest is the firm’s psychosocial work-environment.
This variable is intended to capture the qualitative or ‘soft’ aspects of the work-environment,
such as, leadership, equity, social cohesiveness, etc. These can be contrasted to the
‘hard’ or physical work-environment attributes, such as, exposure to toxic chemicals,
noise levels, lightning conditions, etc. The assessment of the psychosocial work-environment
is based on individual responses to the QPSNordic instrument (Dallner et al. 2000). The
QPSNordic instrument is a questionnaire related to the perceived psychosocial work-
environment. The questionnaire consists of two sets of questions: those pertaining to the
psychosocial environment of the firm, and those pertaining to the effect of the psychoso-
cial environment on the individual. For the purpose of our analysis, we only consider
the firm level variables. Motivated by the underlying structural analysis recommended by
Dallner et al. (2000), we focus on the questions pertaining to the following five latent as-
pects of psychosocial work-environment: Quantitative Work Demands (QWD), Decision
Making Demands (DMD), Empowerment (EPW ), Fair Leadership (FL), and Support-
ive Leadership (SL). For QWD there are four questions (I = 4), while for DMD, EPW ,
FL, and SL there are only three questions (I = 3). The specific questions for each latent
variable are listed in Table 1. Each question has five ordered possible responses (C = 5),
which for DMD, EPW , FL, and SL are coded as follows: Very Seldom or Never = 1,
16 IFAU – Workers’ health and psychosocial work-environment on firm productivity
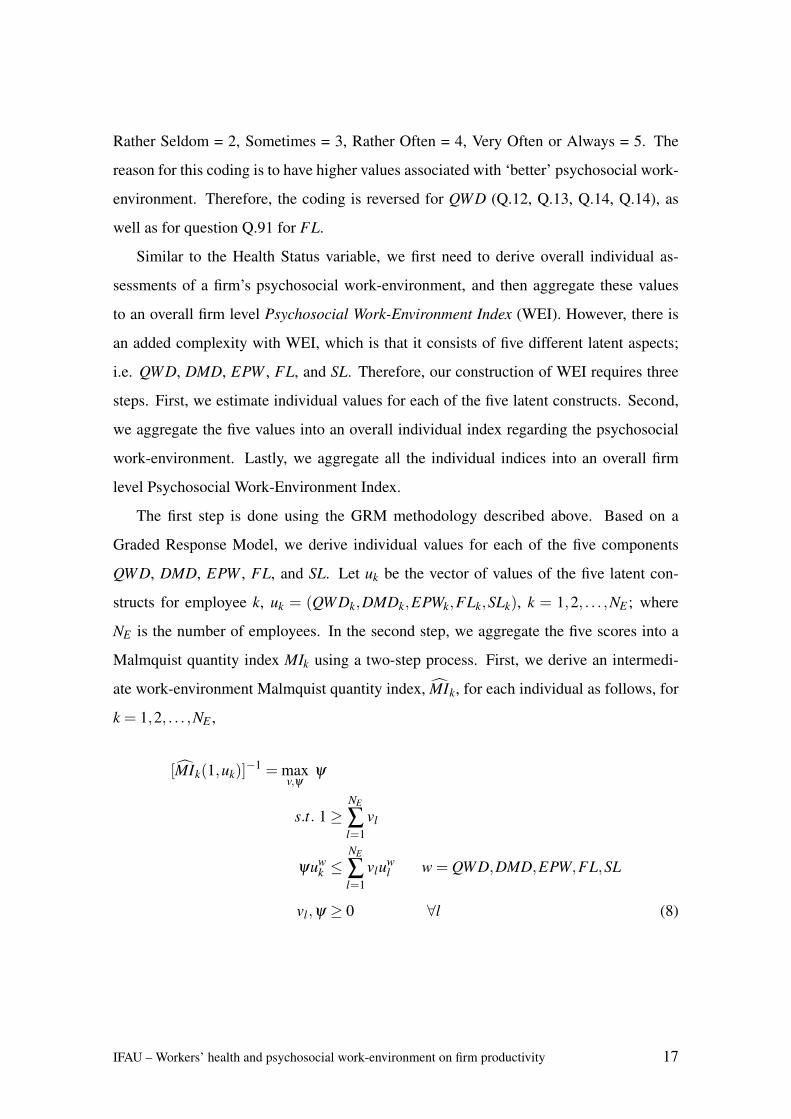
Rather Seldom = 2, Sometimes = 3, Rather Often = 4, Very Often or Always = 5. The
reason for this coding is to have higher values associated with ‘better’ psychosocial work-
environment. Therefore, the coding is reversed for QWD (Q.12, Q.13, Q.14, Q.14), as
well as for question Q.91 for FL.
Similar to the Health Status variable, we first need to derive overall individual as-
sessments of a firm’s psychosocial work-environment, and then aggregate these values
to an overall firm level Psychosocial Work-Environment Index (WEI). However, there is
an added complexity with WEI, which is that it consists of five different latent aspects;
i.e. QWD, DMD, EPW , FL, and SL. Therefore, our construction of WEI requires three
steps. First, we estimate individual values for each of the five latent constructs. Second,
we aggregate the five values into an overall individual index regarding the psychosocial
work-environment. Lastly, we aggregate all the individual indices into an overall firm
level Psychosocial Work-Environment Index.
The first step is done using the GRM methodology described above. Based on a
Graded Response Model, we derive individual values for each of the five components
QWD, DMD, EPW , FL, and SL. Let uk be the vector of values of the five latent con-
structs for employee k, uk = (QWDk,DMDk,EPWk,FLk,SLk), k = 1,2, . . . ,NE ; where
NE is the number of employees. In the second step, we aggregate the five scores into a
Malmquist quantity index MIk using a two-step process. First, we derive an intermedi-
ate work-environment Malmquist quantity index, MIk, for each individual as follows, for
k = 1,2, . . . ,NE ,
[MIk(1,uk)]−1 = max
v,ψψ
s.t. 1≥NE
∑l=1
vl
ψuwk ≤
NE
∑l=1
vluwl w = QWD,DMD,EPW,FL,SL
vl,ψ ≥ 0 ∀l (8)
IFAU – Workers’ health and psychosocial work-environment on firm productivity 17
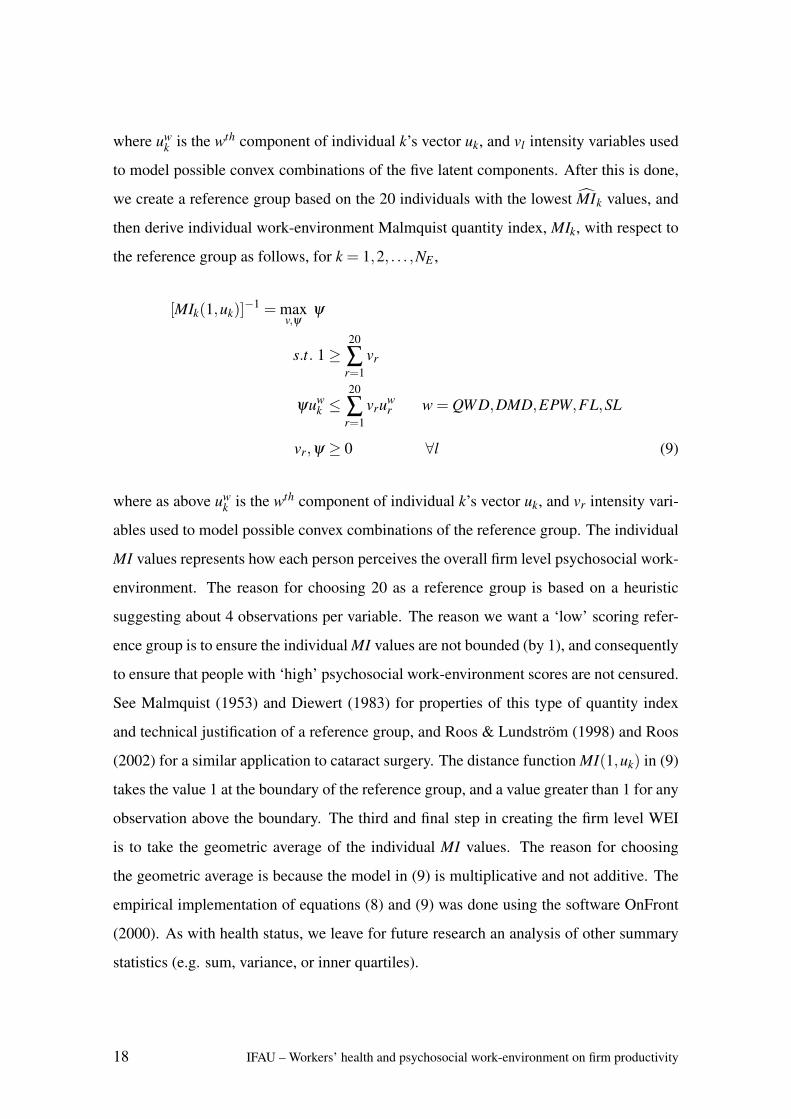
where uwk is the wth component of individual k’s vector uk, and vl intensity variables used
to model possible convex combinations of the five latent components. After this is done,
we create a reference group based on the 20 individuals with the lowest MIk values, and
then derive individual work-environment Malmquist quantity index, MIk, with respect to
the reference group as follows, for k = 1,2, . . . ,NE ,
[MIk(1,uk)]−1 = max
v,ψψ
s.t. 1≥20
∑r=1
vr
ψuwk ≤
20
∑r=1
vruwr w = QWD,DMD,EPW,FL,SL
vr,ψ ≥ 0 ∀l (9)
where as above uwk is the wth component of individual k’s vector uk, and vr intensity vari-
ables used to model possible convex combinations of the reference group. The individual
MI values represents how each person perceives the overall firm level psychosocial work-
environment. The reason for choosing 20 as a reference group is based on a heuristic
suggesting about 4 observations per variable. The reason we want a ‘low’ scoring refer-
ence group is to ensure the individual MI values are not bounded (by 1), and consequently
to ensure that people with ‘high’ psychosocial work-environment scores are not censured.
See Malmquist (1953) and Diewert (1983) for properties of this type of quantity index
and technical justification of a reference group, and Roos & Lundstrom (1998) and Roos
(2002) for a similar application to cataract surgery. The distance function MI(1,uk) in (9)
takes the value 1 at the boundary of the reference group, and a value greater than 1 for any
observation above the boundary. The third and final step in creating the firm level WEI
is to take the geometric average of the individual MI values. The reason for choosing
the geometric average is because the model in (9) is multiplicative and not additive. The
empirical implementation of equations (8) and (9) was done using the software OnFront
(2000). As with health status, we leave for future research an analysis of other summary
statistics (e.g. sum, variance, or inner quartiles).
18 IFAU – Workers’ health and psychosocial work-environment on firm productivity
4 Input dataData was gathered in conjunction with a worksite health promotion (WHP) study and
intervention program conducted by the Karolinska Institute at three large Swedish man-
ufacturing plants from 2000 to 2003. The study involved two paper and pulp mills, and
one steel plant; labeled as Firm1, Firm2 and Firm3. Firm1, an environmentally progres-
sive pulp mill, was among the first in the world to switch to an entirely chlorine-free pulp
production. Firm2 is one of the oldest pulp mills in Sweden, and produces both paper
pulp and fluff pulp. Firm3 is a world leading producer of seamless stainless steel tubes,
which are used in chemical and petrochemical, oil and gas, and power generation indus-
tries. The demographic composition at the three firms were very similar: average age
45; roughly 85% male/15% female; and roughly 75% blue-collar/25% white-collar. The
overall purpose with the WHP study was to develop a tool for sustainable work related
health. In contrast to other WHP, which usually only focus on a specific health issue,
the WHP was more comprehensive and designed to address four health and diagnostic
areas, namely (1) neck and back pain; (2) cardiovascular diseases; (3) asthma and chronic
pulmonary diseases; and, (4) hazardous alcohol consumption. The study also included
education in sustainable health and suggestions for activities to improve health and the
psychosocial work-environment. A descriptive presentation of the study and aggregated
results regarding health, lifestyle and sick leave are presented in Jensen et al. (2004) and
Bergstrom et al. (2008), some of the psychosocial work-environment data are also pre-
sented in Karlsson et al. (2010). A complimentary analysis based on a different framework
of workers’ health status, lifestyle and stress attributes can be found in Ødegaard & Roos
(2012).
4.1 Production data
In addition to individual questionnaire data, monthly production data from the three firms
was also collected over the four year WHP study period. For the purpose of our analysis,
we only include production input variables related to the labor process, and did not include
variables related to raw material. For Firm1 and Firm2, we consider the following input
variables: ‘Production Days’, which is the number of days in the month, ‘Number of Em-
IFAU – Workers’ health and psychosocial work-environment on firm productivity 19
ployees’, which is the number of workers the plants employed, and ‘Total Work Hours’,
which is the sum of the total hours the employees worked. For Firm3, the ‘Number of
Employees’ were unfortunately inconsistently reported and had to be ignored. Therefore,
for Firm3 we only include ‘Total Work Hours’ as the input variable. All three plants run
their production process 24-7, and so ‘Total Work Hours’ partially varies with the number
of days per month (and number of employees).
For production output variables, we consider both quantity and quality aspects. For
Firm1, the specific output variables are ‘Paper Pulp’, which is the total amount in tonnes
of softwood paper pulp produced each month, and ‘Pulp Quality Index’, which is an over-
all quality score assigned to the monthly production according to engineering established
criteria. For Firm2, in addition to ‘Paper Pulp’ and ‘Pulp Quality Index’ (both defined
similarly as Firm1, although the actual product and standards are different), there is a
production line for fluff pulp; the total amount in tonnes produced we define by ‘Fluff
Pulp’. For Firm3, there are two main categories of seamless steel-tubes as defined by
their respective production process: warm versus cold. Therefore, the two main output
variables are ‘Seamless Tubes Warm’ and ‘Seamless Tubes Cold’, which represent the
total amount in tonnes of seamless steel tubes from each of the processes. As a quality
aspect of the output we consider ‘Re-work Indicator’, which is a measure of the amount
of re-work that was needed; Re-work Indicator ≡ 1/Amount of Re-Worked Steel (kg) ×
100,000.
Table 2 provides descriptive statistics of the monthly production variables for each
year. Firm2 is approximately 50% larger than Firm1, both in regard to input and output.
While Firm2 produces almost the same amount of paper pulp as Firm1, it also produces
about 17,000 tonnes of fluff pulp. For both Firm1 and Firm2, there is considerable vari-
ation with regard to both the input and output variables. Some of this variation is due to
the number of days per month, and some due to changes in number of workers. Firm3 has
almost twice the workforce of Firm2. We also note that Firm3 has some variation in both
input and output variables. Although it may not be clear from Table 2, in Firm1 there is
an increase over time in the amount of Paper Pulp produced, as well as a small positive
trend regarding the quality. Firm2 had a small increase in Paper Pulp production, almost
20 IFAU – Workers’ health and psychosocial work-environment on firm productivity
no change in Fluff Pulp production, and a small improvement in quality. Firm3 increased
its production of Seamless Tubes Cold, decreased production of Seamless Tubes Warm,
and had a small increase in quality. These development are in line with our expectations.
Firm1 and Firm2 meet a fairly stable demand for their products and the production tech-
nology is ‘well known’. In addition, the labor force is stable over time with small changes
in age structure or skills. Firm3 is a little bit different because most orders are make-to-
order rather than make-to-stock. Therefore, the observed variation does not necessarily
indicate direct issues with the production process. It should also be noted that the physical
production technology at Firm2 and Firm3 experienced no significant changes over the
studied time period. However, Firm1 did make one partial new technology investment,
namely the installment of a new ‘soda ash pan’. We would expect that the possible impact
from this investment mainly affected the efficiency index T E and not the QP.
4.2 Health status data
The WHP study and intervention program included ten quarterly self-reported assess-
ments of health status. The ten quarters for each questionnaire are designated as time-
period t1, t2, . . . , t10. For the purpose of our productivity measurement model we only
focus on the five EuroQol questions regarding Mobility (EQ1), Self-Care (EQ2), Usual
Activities (EQ3), Pain/Discomfort (EQ4), and Anxiety/Depression (EQ5). For each time-
period only questionnaires with complete responses to each of the five EQ5D questions
are included. Consequently the number of responses for each time-period may vary and
all employees may not be included each time. In addition, although the work-force at the
three firms is relatively stable, there was employee intake and attrition.
With five questions and three responses, there are a total of 243 possible response
combinations. However, empirically we only observe about 20 different response combi-
nations at each plant. Estimation of the GRM parameters is based on the responses from
all ten time-periods grouped together. After the GRM parameters have been estimated,
the individual values of the latent variable health status HS (at each time-period) is esti-
mated based on the derived GRM parameters. Table 3 lists the slope or discriminatory
parameter (β0), and the two relevant location parameters (β2 and β3). We observe that the
IFAU – Workers’ health and psychosocial work-environment on firm productivity 21
parameters are quite similar across the three firms which reflects that the response patterns
are generally quite consistent across the three firms. Another noteworthy observation is
that the slope parameter for EQ5 is relatively small and hence indicates a reduced abil-
ity in discriminating the employees. Figure 3 displays the distribution of HS at the ten
time-periods. For each time-period, the line inside the box represents the median, while
the lower and upper edge of the box represents the 25th and 75th percentile respectively.
We see that the values range from about -2.5, which represents the worst reported health
status, to about .6, which represents the best reported health status and corresponds to
answering ‘No Problem’ (3) to all five EQ5D questions. The specific value this response
pattern represents is .58 for Firm1, .57 for Firm2, and .60 for Firm3. Although no one
responded with ‘Major Problem’ (1) to all five questions, based on the beta-coefficients
we can derive a value for this response pattern. This turns out to be -3.03 for Firm1, -2.92
for Firm2, and -2.83 for Firm3. Overall, in Firm1 there seems to be an improvement in
health status as reflected by the increase in the median value. For Firm2 and Firm3, the
results do not appear as promising; the median value is decreasing over time. One expla-
nation for this might be due to the drop in people returning the questionnaires, particularly
from people consistently reporting no health problem. In other words, there seems to be
some selection bias. Although the issue of selection bias is important, we leave this for
future investigation. Furthermore, we stress that our objective is not to establish statistical
significance whether health status improved due to the WHP intervention study. Follow-
ing the DEA framework, we seek to measure the efficiency and productivity based on
observed data, which is assumed to reflect what actually happened.
Since the productivity model described in Section 2 requires non-negative variables,
we make a simple transformation by shifting the Health Status values up by the amount
of the lowest possible score. For each employee’s Health Status we add 3.03 for Firm1,
2.92 for Firm2, and 2.83 for Firm3. To derive the firm level workers’ health value we take
the arithmetic average of the individual Health Status values. Recall that the EQ5D ques-
tionnaire is suppose to reflect the workers’ Health Status for a given quarter. To match the
quarterly Health Status data to the monthly production data we assume that for a given
quarter the three monthly Health Status are the same; namely the Health Status value for
22 IFAU – Workers’ health and psychosocial work-environment on firm productivity
that quarter. For months that were not covered by one of the 10 questionnaires, we set the
Health Status to the average of the two adjacent quarterly values.
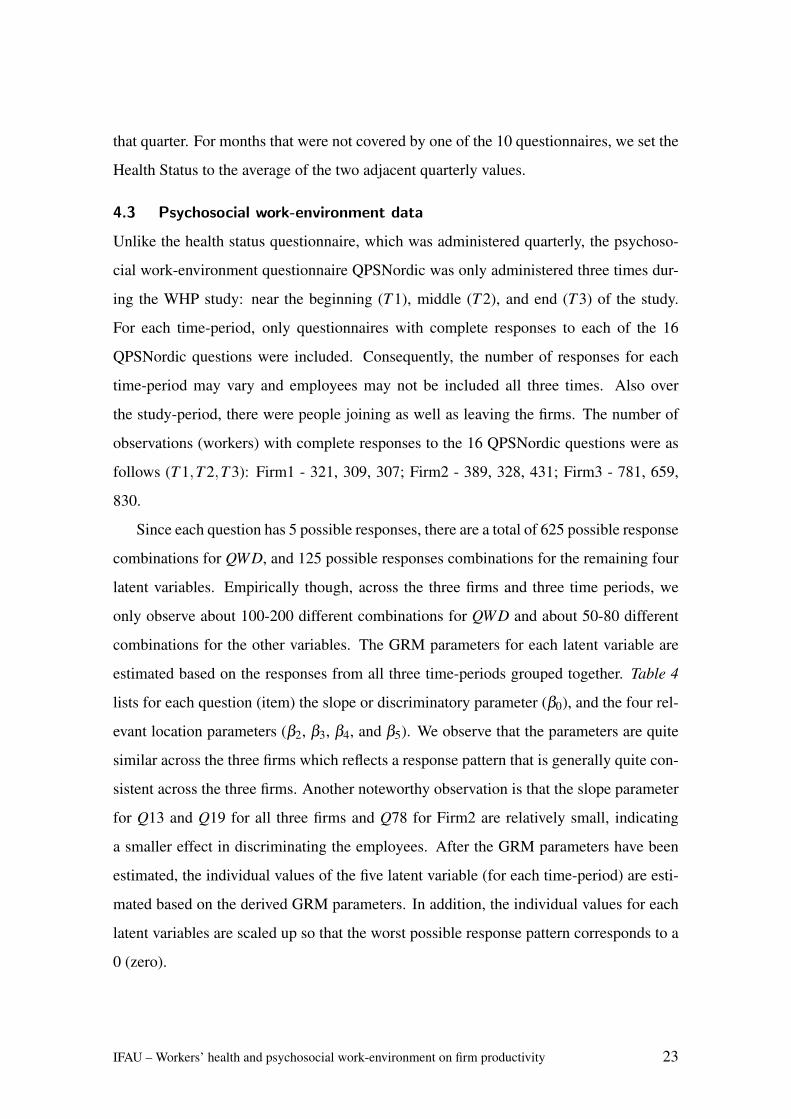
4.3 Psychosocial work-environment data
Unlike the health status questionnaire, which was administered quarterly, the psychoso-
cial work-environment questionnaire QPSNordic was only administered three times dur-
ing the WHP study: near the beginning (T 1), middle (T 2), and end (T 3) of the study.
For each time-period, only questionnaires with complete responses to each of the 16
QPSNordic questions were included. Consequently, the number of responses for each
time-period may vary and employees may not be included all three times. Also over
the study-period, there were people joining as well as leaving the firms. The number of
observations (workers) with complete responses to the 16 QPSNordic questions were as
follows (T 1,T 2,T 3): Firm1 - 321, 309, 307; Firm2 - 389, 328, 431; Firm3 - 781, 659,
830.
Since each question has 5 possible responses, there are a total of 625 possible response
combinations for QWD, and 125 possible responses combinations for the remaining four
latent variables. Empirically though, across the three firms and three time periods, we
only observe about 100-200 different combinations for QWD and about 50-80 different
combinations for the other variables. The GRM parameters for each latent variable are
estimated based on the responses from all three time-periods grouped together. Table 4
lists for each question (item) the slope or discriminatory parameter (β0), and the four rel-
evant location parameters (β2, β3, β4, and β5). We observe that the parameters are quite
similar across the three firms which reflects a response pattern that is generally quite con-
sistent across the three firms. Another noteworthy observation is that the slope parameter
for Q13 and Q19 for all three firms and Q78 for Firm2 are relatively small, indicating
a smaller effect in discriminating the employees. After the GRM parameters have been
estimated, the individual values of the five latent variable (for each time-period) are esti-
mated based on the derived GRM parameters. In addition, the individual values for each
latent variables are scaled up so that the worst possible response pattern corresponds to a
0 (zero).
IFAU – Workers’ health and psychosocial work-environment on firm productivity 23
After individual values for each of the five latent variables were estimated, we ag-
gregated these into an overall individual psychosocial work-environment index MIk, k =
1,2, . . .NE . As stated in Section 3.2, this is done in a two-step Malmquist quantity in-
dex approach. In the first step, we derive a reference group based on the 20 workers
with ‘bad’ scores. In the second step, based on the reference group, we derive the indi-
vidual MI values. Figure 4 displays the distribution of the individual MI values at each
time-period. For each time-period, the line inside the box represents the median of the
observed values, while the lower and upper edge of the box represents the 25th and 75th
percentile respectively. We observe a general improvement in the median value across all
three firms, with Firm2 exhibiting the greatest relative increase. To represent the overall
firm level psychosocial work-environment index (WEI), we take the geometric average of
the individual MI values. The resulting WEI scores were as follows (T 1,T 2,T 3): Firm1
- 1.456, 1.483, 1.541; Firm2 - 1.471, 1.499, 1.547; Firm3 - 1.716, 1.757, 1.768. To match
the aperiodic WEI data to the monthly production data, we assume that up to the time of
the next QPSNordic questionnaire the monthly WEI are the same. This roughly means
that for the first 1.3 years, the monthly WEI are the first value, for the next 1.3 years the
monthly WEI are the second value, and for the last 1.3 years the monthly WEI are the
third value.
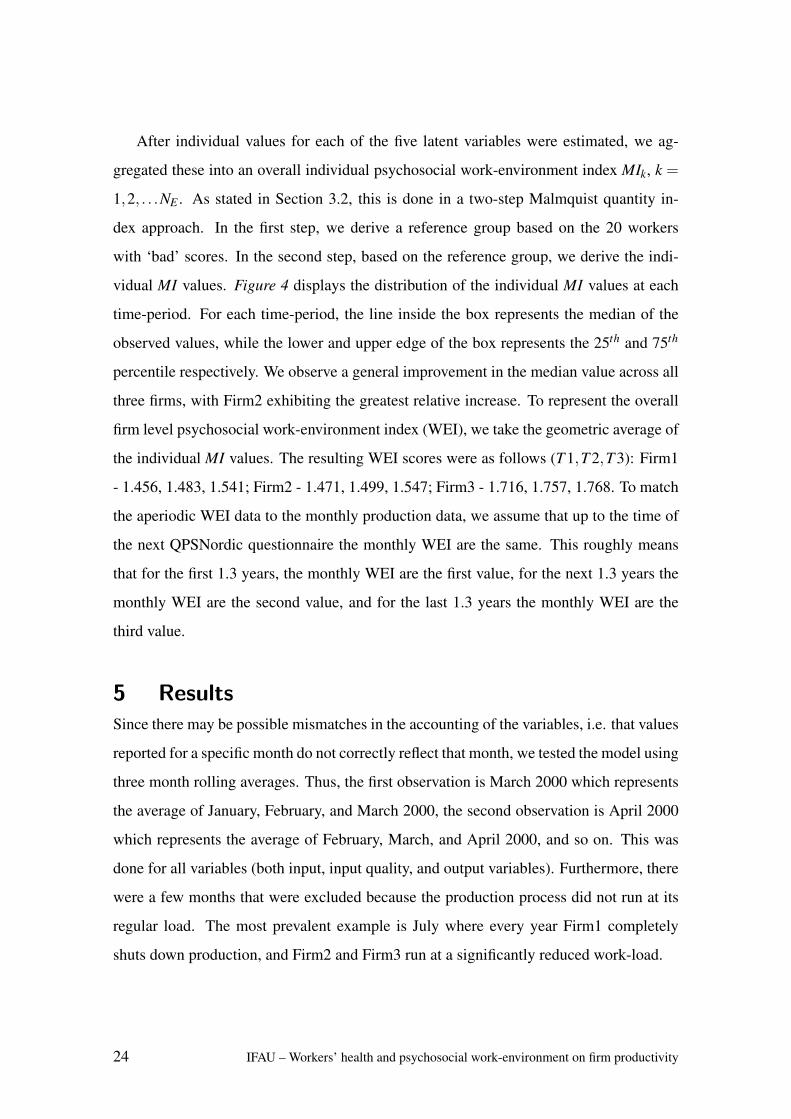
5 ResultsSince there may be possible mismatches in the accounting of the variables, i.e. that values
reported for a specific month do not correctly reflect that month, we tested the model using
three month rolling averages. Thus, the first observation is March 2000 which represents
the average of January, February, and March 2000, the second observation is April 2000
which represents the average of February, March, and April 2000, and so on. This was
done for all variables (both input, input quality, and output variables). Furthermore, there
were a few months that were excluded because the production process did not run at its
regular load. The most prevalent example is July where every year Firm1 completely
shuts down production, and Firm2 and Firm3 run at a significantly reduced work-load.
24 IFAU – Workers’ health and psychosocial work-environment on firm productivity
The result for productivity and efficiency are presented in Figure 5. In each graph
the solid black line represents the overall firm productivity EQT , the dashed blue line the
technical efficiency of the physical production T E, the dotted red line the quality process
performance QP, and the dotted black line a simple linear regression on the QP values.
Note that the scale on the y-axis is different for the three firms. For Firm1 and Firm3, we
observe a positive trend regarding the overall productivity (EQT ), while for Firm2, there
seems to be very little or no change in productivity. At all three firms, we also observe
periods with a decrease in productivity. The low scores for some months for Firm1 and
Firm3 can partly be explained by decreases in output quality together with increases in
work hours. In general, we observe over the study period that productivity increased
around 2% in Firm1 and approximately 5% in Firm3. A final comment is that our results
showed little or no sensitivity to the output quality variables. For instance, the results for
Firm3 were very similar and consistent when output quality was measured by percentage
of on-time customer delivery instead of the re-work indicator.
For our labor quality input process (QP), the result shows differences between the
three plants. In Figure 5, the dotted black line represents a simple linear trend for the QP
values. We observe that the changes for QP are much smaller and have less variability
compared to the development of firm productivity (EQT ) and efficiency of the operating
production process (T E). Furthermore, we observe positive trends at Firm1 and Firm3
and almost no changes in QP for Firm2. The results of Firm1 and Firm3 reflect the
illustration of Figure 2a while Firm2 reflects the illustration of Figure 2b. Over the entire
study-period, the results indicates an increase in QP with about 2-3% at Firm3, and around
1% at Firm1. We, therefore, conclude that changes in overall productivity in Firm1 and
Firm3 can be partially explained by the positive contribution from improvement in the
labor quality process. Around half of the increase in productivity can be related to an
increase in QP. Given the general work-environment policy at the three firms, our results
are in line with what was expected. We have a positive trend for Firm1 at a relative high
level, in line with a long term project aimed to improve the general work-environment.
Firm3 also shows a positive trend in QP, which may reflect the long term project for
improving the work-environment, but starts at a lower level than Firm1. The project at
IFAU – Workers’ health and psychosocial work-environment on firm productivity 25
Firm3 started much later than the project at Firm1, and it would have been interesting to
include data from 2004 to see if the potential for improvement narrows down. Both Firm1
and Firm3 have policies for rather quick implementation of activities for improvement in
the psychosocial work-environment. Firm2, on the other hand, although they too started
long term work-environment projects over the study period, did not manage to implement
them to the same degree. The results confirm this by showing no changes and no potential
for improvement in QP, or at least that the human resource department has not been able
to identify a potential. These results may change if we extend the time horizon, since
the plant may learn how to create a potential for improvement in QP and productivity
performance EQT .
6 Concluding remarksWe have presented a model for measuring the contribution of labor quality input on firm
productivity. More specifically, we have focused on the effect of workers’ health sta-
tus and psychosocial work-environment. The framework of the analysis is based on the
premise that there are two processes within a firm that contribute to overall productivity
performance: the physical production process and the labor quality process. Although the
proposed model can be seen as an extension of the traditional DEA methods for measur-
ing efficiency and productivity, we stress that the extension to include the performance of
the labor quality process is both a novel and a major contribution. Furthermore, we would
also argue that the proposed firm productivity model and approach for measuring input
labor quality variables, can be seen in the context of sustainability of employees work re-
lated well-being. In recent years ‘sustainability’ has become a much discussed topic, and
to that extent our hope is that we constructively served the call made by Pfeffer (2010):
One lesson for those interested in human sustainability is that developing a
consistent set of measures or indicators of the construct, gathering data on
them, and publicizing such data might provide more impetus for focusing on
the human sustainability implications of what organizations do.
26 IFAU – Workers’ health and psychosocial work-environment on firm productivity
Another major contribution of the paper is that it has provided an alternative methodol-
ogy for incorporating ordinal data into the optimization models for measuring efficiency.
Based on Item Response Theory, we have modeled the labor quality aspects as latent vari-
ables. This has enabled us to construct meaningful metrics based on individual responses
to self-reported ordinal questionnaires. This approach is drastically different from some
of the traditional approaches that directly include the ordinal variables into the optimiza-
tion models; see for example Cook & Zhu (2006). The two main reasons we chose to
pursue an alternative methodology was that: (1) we wanted to separate the variable defi-
nition and variable measurement process from the firm efficiency analysis; and, (2) given
individual based data we face the issue of aggregating the data to firm level. In other
words, our philosophy is that the measurement of variables should be separate or exoge-
nous from the optimization routine to estimate firm efficiency. In addition, we addressed
the problem that data consisted both at a firm level and individual level. It would, how-
ever, be interesting to compare the results and implications from our approach with the
more traditional approaches in incorporating ordinal data.
There are many ways to further improve the model and analysis, and the paper should
be seen as a first step. For instance, one natural extension would be to include cost and/or
profit efficiency, by incorporating additional data. Another potential for improvement and
future research is to consider other firm level aggregations of the individual labor quality
measurements. In this paper, we used arithmetic and geometric mean as a representa-
tion of the two labor quality variables, and it may be argued that other summary statistics
would be more appropriate. A third interesting issue to consider would be to extend the
method to higher levels of analysis, such as industry or country. This would beside the
variable selection also entail a focus on data availability and index approaches for aggre-
gation.
The model was illustrated on data from three large manufacturing firms that took part
in a coordinated worksite health promotion study from 2000 to 2003. The empirical anal-
ysis indicated that at two firms there was a general positive trend regarding overall firm
productivity and the labor quality process. Quite remarkably, we noted that about half of
the contribution in changes of overall firm productivity can be attributed to the improve-
IFAU – Workers’ health and psychosocial work-environment on firm productivity 27
ment in the performance of labor quality process. The results for the third firm indicated
less tangible insights, which appears to be mainly due to a short time-frame. We, there-
fore, can only hypothesize that given a longer time-frame, we might be able to observe
a similar positive development as with the other two firms. An objection to the empiri-
cal study could be that random fluctuation of the processes and/or measurements is not
considered. In other words, the statistically inclined reader might want to establish that
improvements over time of the labor quality variables are significant (statistically speak-
ing), and that there is a causal relationship (statistically speaking) to firm productivity.
Note though that the proposed model is based on the deterministic framework of DEA,
and as such assumes the observed data reflect what actually happened. However, future
research to account for random fluctuation of the processes and measurement error would
of course be very interesting.
We end this section with some general comments regarding the work-environment
and labor quality process at the three firms. The main results presented should be seen in
relation to the firms’ general policy regarding activities related to the work-environment.
Firm1 has since the 1970s been engaged in a broad and long term project aimed at im-
proving the work-environment. The policy at Firm1 was to quickly share results from
the WHP activities to key employees, board of directors, and union representatives as
well as through internal newsletters. The firms overall goal was that all employees should
be involved in improving the work-environment. At Firm2, the goal was to become a
world leader within the pulp industry. To reach this goal, Firm2 developed a strategy
for the work-environment including psychosocial aspects, and has since 2000 been in-
volved in a European quality assurance program. The program revolved around seven
criteria (leadership, strategy, information/communication, employee development, orga-
nizational process, results and customer satisfaction). At the time of the study, the activ-
ities for improving the psychosocial work-environment had led to an improved engage-
ment and discussions, but with little implementation at the various production units. At
Firm3, various policies were implemented with the goal of ensuring that the working en-
vironment stimulates employees to work effectively and autonomously, and to promote
opportunities for professional development. The results from the activities to improve the
28 IFAU – Workers’ health and psychosocial work-environment on firm productivity

work-environment were regularly reported to the board of directors, general management,
union representatives, and the internal health care unit. The goal was to have 80% of the
activities implemented at the various units.
IFAU – Workers’ health and psychosocial work-environment on firm productivity 29
ReferencesAfriat, S. (1972), ‘Efficiency estimation of production functions’, International Economic
Review 13, 568–598.
Arora, S. (2001), ‘Health, human productivity, and long-term economic growth’, The
Journal of Economic History 61(03), 699–749.
Bergstrom, G., Bjorklund, C., Fried, I., Lisspers, J., Nathell, L., Hermansson, U., He-
lander, A., Bodin, L. & Jensen, I. (2008), ‘A comprehensive workplace intervention
and its outcome with regard to lifestyle, health and sick leave: The aha study’, Work
31, 167–180.
Cella, D. & Chang, C.-H. (2000), ‘A discussion of item response theory and its applica-
tions in health status assessment’, Medical Care 38, II66–II72.
Charnes, A., Cooper, W., Lewin, A. & Seiford, L., eds (1994), Data envelopment analysis:
Theory, methodology, and application, Kluwer Academic Publishers, Norwell, MA,
USA.
Charnes, A., Cooper, W. & Rhodes, E. (1978), ‘Measuring the efficiency of decision
making units’, European Journal of Operational Research 2, 429–444.
Cheung, K., Oemar, M., Oppe, M. & Rabin, R. (2010), User guide: Basic information
on how to use EQ-5D. Version 3.0, available at: http://www.euroqol.org, accessed
2010-05-03.
Cook, W. & Zhu, J. (2006), ‘Rank order data in DEA: A general framework’, European
Journal of Operational Research 174, 1021–1038.
Dallner, M., Lindstrom, K., Elo, A., Skogstad, A., Gamberale, F., Hottinen, V., Knar-
dahl, S. & Ørhede, E. (2000), Anvaandarmanual for QPSNordic, frageformular om
psykologiska och sociala faktorer i arbetslivet utprovat i Danmark, Finland, Norge
och Sverige. available in Swedish at: http://www.ammuppsala.se/upload/File/
FHV-metoder/QPSnordic%20manual.pdf, accessed 2010-09-21; an English version
30 IFAU – Workers’ health and psychosocial work-environment on firm productivity
of the questionnaire is available here: https://www.qps-nordic.org/en/doc/
QPSNordic_questionnaire.pdf, accessed 2010-09-21.
de Ayala, R. (2009), Theory and Practice of Item Response Theory, The Guilford Press,
New York, New York.
Diewert, W. (1983), The theory of the cost-of-living index and the measurement of wel-
fare change, in W. Diewert & C. Montmarquette, eds, ‘Price Level Measurement’,
Statistics Canada, Ottawa, Canada, pp. 163–239.
Embretson, S. & Reise, S. (2000), Item Response Theory for Psychologists, Lawrence
Erlbaum Associates, Inc., Mahwah, New Jersey.
European Network for Workplace Health Promotion (2011), Workplace health promotion.
accessed 2011-05-13.
URL: http://www.enwhp.org/workplace-health-promotion.html
Fare, R. (1988), Fundamentals of Production Theory, Springer, USA.
Fare, R. & Grosskopf, S. (2004), New Directions: Efficiency and Productivity, Springer,
USA.
Fare, R., Grosskopf, S. & Kokkelenberg, E. (1989), ‘Measuring plant capacity, utiliza-
tion and technical change: A nonparametric approach’, International Economic Review
30, 655–666.
Fare, R., Grosskopf, S. & Roos, P. (1995), ‘Productivity and quality changes in swedish
pharmacies’, International Journal of Production Economics 39, 137–147.
Farrell, M. (1957), ‘The measurement of productive efficiency’, Journal of Royal Statis-
tical Society, Series A (General) 120, 253–290.
Hays, R., Morales, L. & Reise, S. (2000), ‘Item response theory and health outcomes
measurement in the 21st century’, Medical Care 38(9), II28–II42.
IFAU – Workers’ health and psychosocial work-environment on firm productivity 31
Henderson, D. & Russell, R. (2005), ‘Human capital and convergence: A production-
frontier approach’, International Economic Review 46, 1167–1205.
Jensen et al. (2004), Arbete och halsa inom process och verkstadsindustrin, aha-studien
slutrapport: Del 1. Karolinska Institute, available in Swedish only at http://ki.se/
content/1/c6/02/95/78/Slutrapport_AHA.pdf, accessed 2009-11-30.
Johansen, L. (1968), Production functions and the concept of capacity, in ‘Recherches
Recentes sur la Function de Production’, Collection Economie Mathematique et
Econometrie 2, pp. 46–72.
Johnson, M. (2007), ‘Marginal maximum likelihood estimation of item response models
in R’, Journal of Statistical Software 20, 1–24.
Karlsson, M., Bjorklund, C. & Jensen, I. (2010), ‘The effects of psychosocial work factors
on production loss, and the mediating effect on employee health’, Journal of Occupa-
tional and Environmental Medicine 52, 310–317.
Kumar, S. & Russell, R. (2002), ‘Technological change, technological catch-up, and cap-
ital deepening: Relative contributions to growth and convergence’, The American Eco-
nomic Review 92, 527–548.
Loeppke, R., Hymel, P., Lofland, J., Pizzi, L., Konicki, D., Anstadt, G., Baase, C.,
Fortuna, J. & Scharf, T. (2003), ‘Health-related workplace productivity measurement:
General and migraine-specific recommendations from the acoem expert panel’, Journal
of Occupational and Environmental Medicine 45, 349–359.
Lofland, J., Pizzi, L. & Frick, K. (2004), ‘A review of health-related workplace produc-
tivity loss instruments’, PharmacoEconomics 22(3), 165–184.
Malmquist, S. (1953), ‘Index numbers and indifference surfaces’, Trabajos de Estadıstica
y de Investigacion Operativa 4, 209–242.
Mattke, S., Balakrishnan, A., Bergamo, G. & Newberry, S. (2007), ‘A review of methods
32 IFAU – Workers’ health and psychosocial work-environment on firm productivity
to measure health-related productivity loss’, The American Journal of Managed Care
13, 211–217.
Morrison Paul, C. (2000), Thoughts on productivity, efficiency, and capacity utilization
measurement for fisheries. UC Davis, Department of Agricultural and Resource Eco-
nomics Working Paper #00-031, available at: http://arelibrary.ucdavis.edu/
working_papers/files/00-031.pdf, accessed 2010-10-12.
Ødegaard, F. & Roos, P. (2012), ‘Measuring worksite health promotion programs: an
application of structural equation modeling with ordinal data’, European Journal of
Health Economics . forthcoming.
OnFront (2000), OnFront 2.02: The Professional Tool for Efficiency and Productivity
Measurement, Economic Measurement and Quality Corporation AB, Lund, Sweden.
the software is no longer supported.
Ostini, R. & Nering, M. (2006), Polytomous Item Response Theory Models, Sage Publi-
cations, Thousand Oaks, California.
Pfeffer, J. (2010), ‘Building sustainable organizations: The human factor’, The Academy
of Management Perspectives 24, 34–45.
Pickard, A., De Leon, M., Kohlmann, T., Cella, D. & Rosenbloom, S. (2007), ‘Psychome-
tric comparison of the standard eq-5d to a 5 level version in cancer patients’, Medical
Care 45, 259–263.
R Development Core Team (2010), R: A Language and Environment for Statistical Com-
puting, R Foundation for Statistical Computing, Vienna, Austria. ISBN 3-900051-07-0,
http://www.R-project.org.
Reise, S. & Waller, N. (2009), ‘Item response theory and clinical measurement’, Annual
Review of Clinical Psychology 5, 27–48.
Rizopoulos, D. (2006), ‘ltm: An R package for latent variable modeling and item response
theory analyses’, Journal of Statistical Software 17, 1–25.
IFAU – Workers’ health and psychosocial work-environment on firm productivity 33
Røed, K. & Fevang, E. (2007), ‘Organizational change, absenteeism, and welfare depen-
dency’, Journal of Human Resources XLII(1), 156–193.
Roos, P. (2002), Measuring output of hospital services, in K. J. Fox, ed., ‘Efficiency in
the Public Sector’, Kluwer Academic Publishers, Norwell, MA, USA.
Roos, P. & Lundstrom, M. (1998), ‘An index approach for the measurement of patient
benefits from surgery - illustrated in the case of cataract extraction’, Information Sys-
tems and Operational Research 36, 120–128.
UK Health and Safety Executive (2011), What are the management standards. accessed
2011-05-13.
URL: http://www.hse.gov.uk/stress/standards/
World Health Organization (2011), Launching healthy workplaces: a global model for
action on the occasion of the world day for health and safety at work. accessed 2011-
05-13.
URL: http://www.who.int/occupational health/healthy workplaces/en/index.html
34 IFAU – Workers’ health and psychosocial work-environment on firm productivity
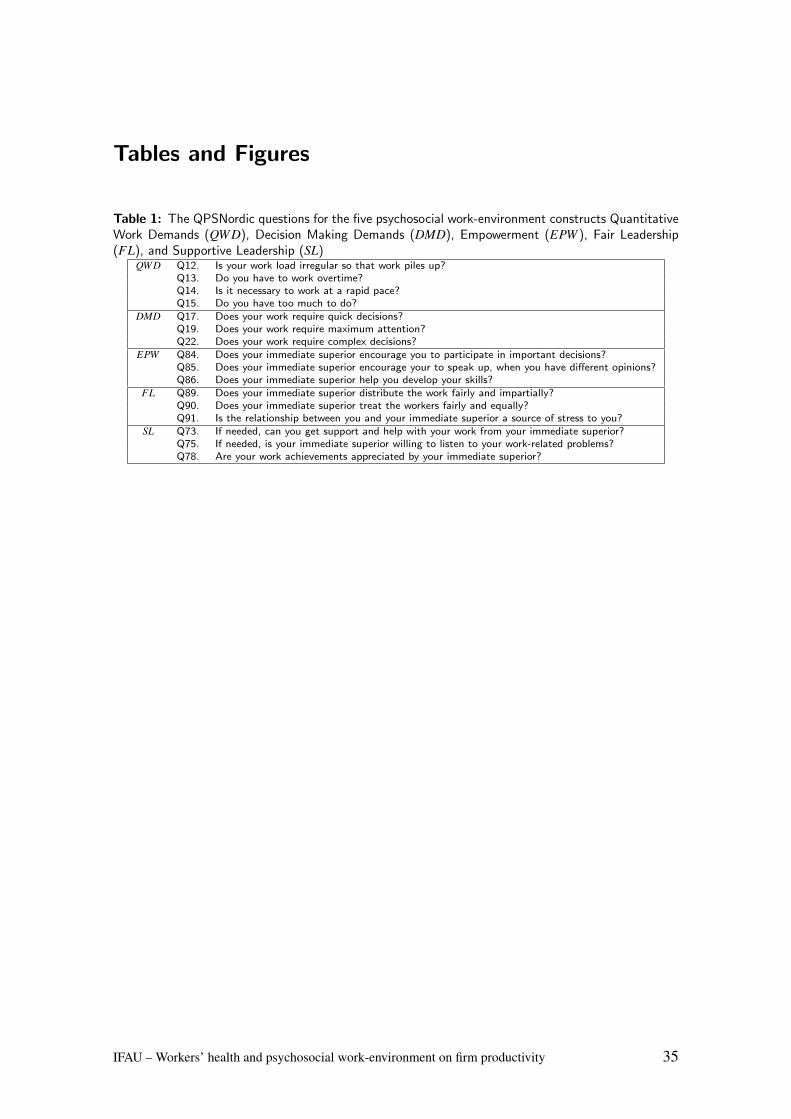
Tables and Figures
Table 1: The QPSNordic questions for the five psychosocial work-environment constructs QuantitativeWork Demands (QWD), Decision Making Demands (DMD), Empowerment (EPW ), Fair Leadership(FL), and Supportive Leadership (SL)
QWD Q12. Is your work load irregular so that work piles up?Q13. Do you have to work overtime?Q14. Is it necessary to work at a rapid pace?Q15. Do you have too much to do?
DMD Q17. Does your work require quick decisions?Q19. Does your work require maximum attention?Q22. Does your work require complex decisions?
EPW Q84. Does your immediate superior encourage you to participate in important decisions?Q85. Does your immediate superior encourage your to speak up, when you have different opinions?Q86. Does your immediate superior help you develop your skills?
FL Q89. Does your immediate superior distribute the work fairly and impartially?Q90. Does your immediate superior treat the workers fairly and equally?Q91. Is the relationship between you and your immediate superior a source of stress to you?
SL Q73. If needed, can you get support and help with your work from your immediate superior?Q75. If needed, is your immediate superior willing to listen to your work-related problems?Q78. Are your work achievements appreciated by your immediate superior?
IFAU – Workers’ health and psychosocial work-environment on firm productivity 35
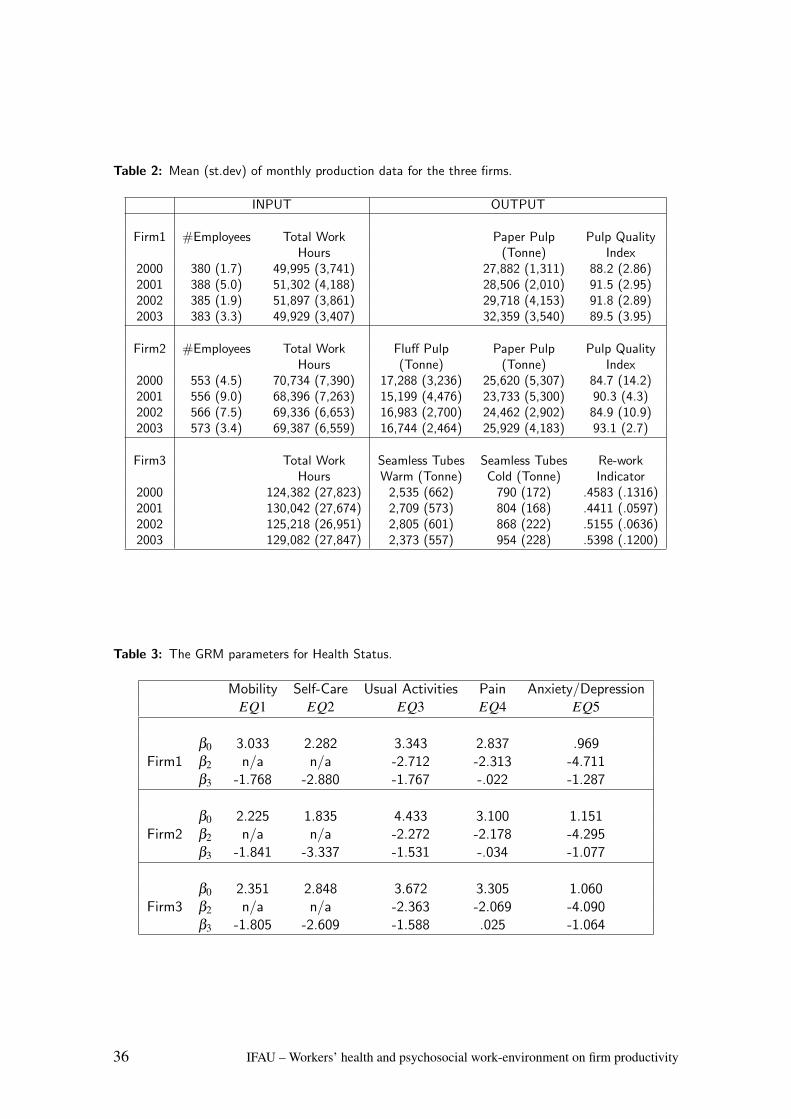
Table 2: Mean (st.dev) of monthly production data for the three firms.
INPUT OUTPUT
Firm1 #Employees Total Work Paper Pulp Pulp QualityHours (Tonne) Index
2000 380 (1.7) 49,995 (3,741) 27,882 (1,311) 88.2 (2.86)2001 388 (5.0) 51,302 (4,188) 28,506 (2,010) 91.5 (2.95)2002 385 (1.9) 51,897 (3,861) 29,718 (4,153) 91.8 (2.89)2003 383 (3.3) 49,929 (3,407) 32,359 (3,540) 89.5 (3.95)
Firm2 #Employees Total Work Fluff Pulp Paper Pulp Pulp QualityHours (Tonne) (Tonne) Index
2000 553 (4.5) 70,734 (7,390) 17,288 (3,236) 25,620 (5,307) 84.7 (14.2)2001 556 (9.0) 68,396 (7,263) 15,199 (4,476) 23,733 (5,300) 90.3 (4.3)2002 566 (7.5) 69,336 (6,653) 16,983 (2,700) 24,462 (2,902) 84.9 (10.9)2003 573 (3.4) 69,387 (6,559) 16,744 (2,464) 25,929 (4,183) 93.1 (2.7)
Firm3 Total Work Seamless Tubes Seamless Tubes Re-workHours Warm (Tonne) Cold (Tonne) Indicator
2000 124,382 (27,823) 2,535 (662) 790 (172) .4583 (.1316)2001 130,042 (27,674) 2,709 (573) 804 (168) .4411 (.0597)2002 125,218 (26,951) 2,805 (601) 868 (222) .5155 (.0636)2003 129,082 (27,847) 2,373 (557) 954 (228) .5398 (.1200)
Table 3: The GRM parameters for Health Status.
Mobility Self-Care Usual Activities Pain Anxiety/DepressionEQ1 EQ2 EQ3 EQ4 EQ5
β0 3.033 2.282 3.343 2.837 .969Firm1 β2 n/a n/a -2.712 -2.313 -4.711
β3 -1.768 -2.880 -1.767 -.022 -1.287
β0 2.225 1.835 4.433 3.100 1.151Firm2 β2 n/a n/a -2.272 -2.178 -4.295
β3 -1.841 -3.337 -1.531 -.034 -1.077
β0 2.351 2.848 3.672 3.305 1.060Firm3 β2 n/a n/a -2.363 -2.069 -4.090
β3 -1.805 -2.609 -1.588 .025 -1.064
36 IFAU – Workers’ health and psychosocial work-environment on firm productivity
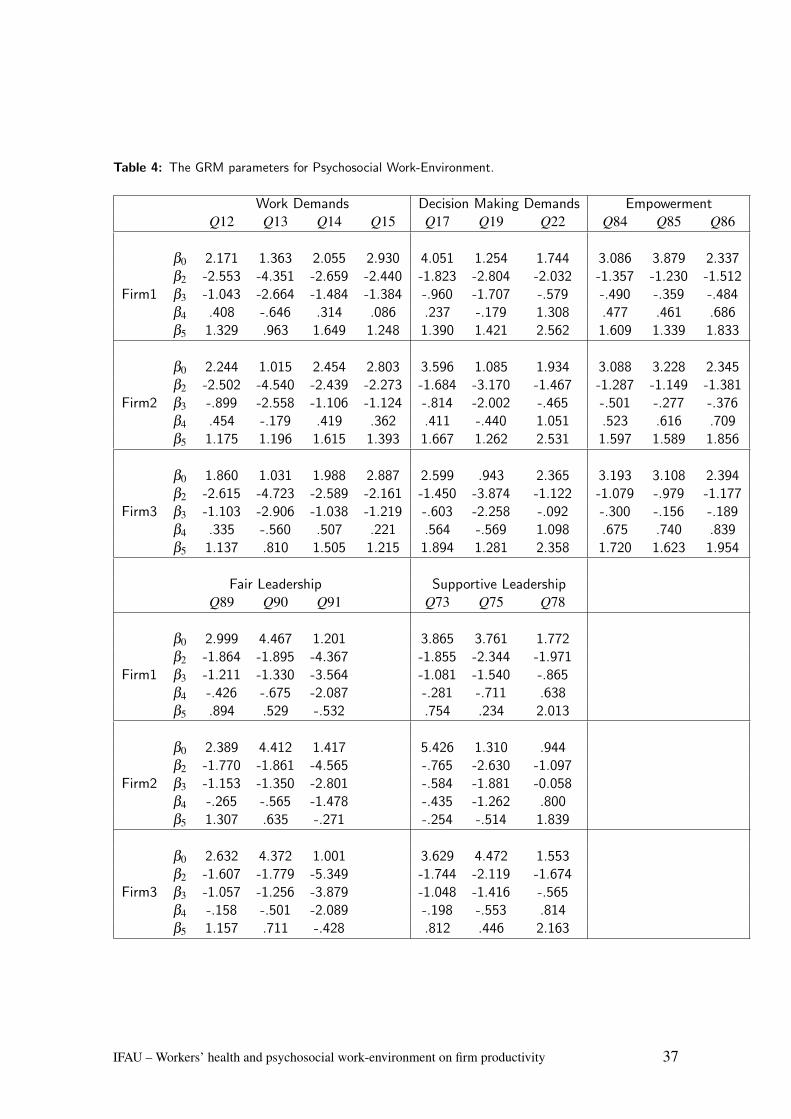
Table 4: The GRM parameters for Psychosocial Work-Environment.
Work Demands Decision Making Demands EmpowermentQ12 Q13 Q14 Q15 Q17 Q19 Q22 Q84 Q85 Q86
β0 2.171 1.363 2.055 2.930 4.051 1.254 1.744 3.086 3.879 2.337β2 -2.553 -4.351 -2.659 -2.440 -1.823 -2.804 -2.032 -1.357 -1.230 -1.512
Firm1 β3 -1.043 -2.664 -1.484 -1.384 -.960 -1.707 -.579 -.490 -.359 -.484β4 .408 -.646 .314 .086 .237 -.179 1.308 .477 .461 .686β5 1.329 .963 1.649 1.248 1.390 1.421 2.562 1.609 1.339 1.833
β0 2.244 1.015 2.454 2.803 3.596 1.085 1.934 3.088 3.228 2.345β2 -2.502 -4.540 -2.439 -2.273 -1.684 -3.170 -1.467 -1.287 -1.149 -1.381
Firm2 β3 -.899 -2.558 -1.106 -1.124 -.814 -2.002 -.465 -.501 -.277 -.376β4 .454 -.179 .419 .362 .411 -.440 1.051 .523 .616 .709β5 1.175 1.196 1.615 1.393 1.667 1.262 2.531 1.597 1.589 1.856
β0 1.860 1.031 1.988 2.887 2.599 .943 2.365 3.193 3.108 2.394β2 -2.615 -4.723 -2.589 -2.161 -1.450 -3.874 -1.122 -1.079 -.979 -1.177
Firm3 β3 -1.103 -2.906 -1.038 -1.219 -.603 -2.258 -.092 -.300 -.156 -.189β4 .335 -.560 .507 .221 .564 -.569 1.098 .675 .740 .839β5 1.137 .810 1.505 1.215 1.894 1.281 2.358 1.720 1.623 1.954
Fair Leadership Supportive LeadershipQ89 Q90 Q91 Q73 Q75 Q78
β0 2.999 4.467 1.201 3.865 3.761 1.772β2 -1.864 -1.895 -4.367 -1.855 -2.344 -1.971
Firm1 β3 -1.211 -1.330 -3.564 -1.081 -1.540 -.865β4 -.426 -.675 -2.087 -.281 -.711 .638β5 .894 .529 -.532 .754 .234 2.013
β0 2.389 4.412 1.417 5.426 1.310 .944β2 -1.770 -1.861 -4.565 -.765 -2.630 -1.097
Firm2 β3 -1.153 -1.350 -2.801 -.584 -1.881 -0.058β4 -.265 -.565 -1.478 -.435 -1.262 .800β5 1.307 .635 -.271 -.254 -.514 1.839
β0 2.632 4.372 1.001 3.629 4.472 1.553β2 -1.607 -1.779 -5.349 -1.744 -2.119 -1.674
Firm3 β3 -1.057 -1.256 -3.879 -1.048 -1.416 -.565β4 -.158 -.501 -2.089 -.198 -.553 .814β5 1.157 .711 -.428 .812 .446 2.163
IFAU – Workers’ health and psychosocial work-environment on firm productivity 37
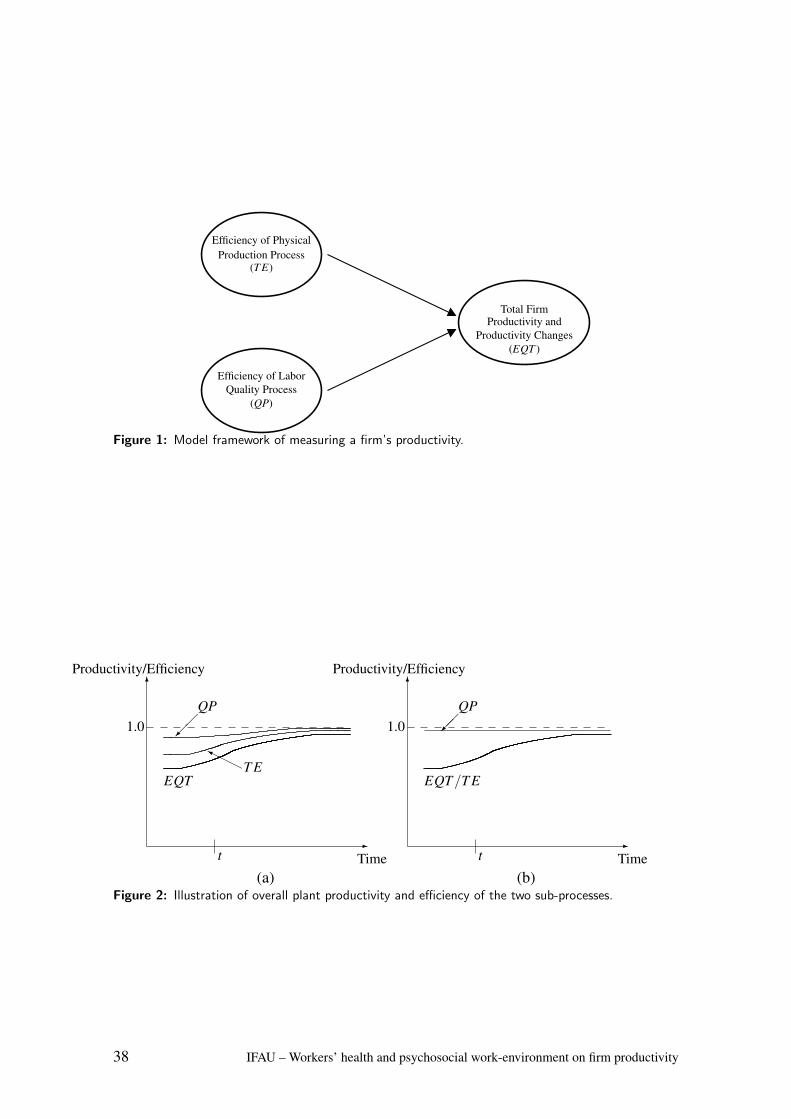
Efficiency of PhysicalProduction Process
(T E)
Efficiency of LaborQuality Process
(QP)
Total FirmProductivity and
Productivity Changes(EQT )
Figure 1: Model framework of measuring a firm’s productivity.
-
Timet
6
Productivity/Efficiency
1.0
EQTT EH
HHY
QP��
-
Timet
6
Productivity/Efficiency
1.0
EQT/T E
QP��
(a) (b)Figure 2: Illustration of overall plant productivity and efficiency of the two sub-processes.
38 IFAU – Workers’ health and psychosocial work-environment on firm productivity
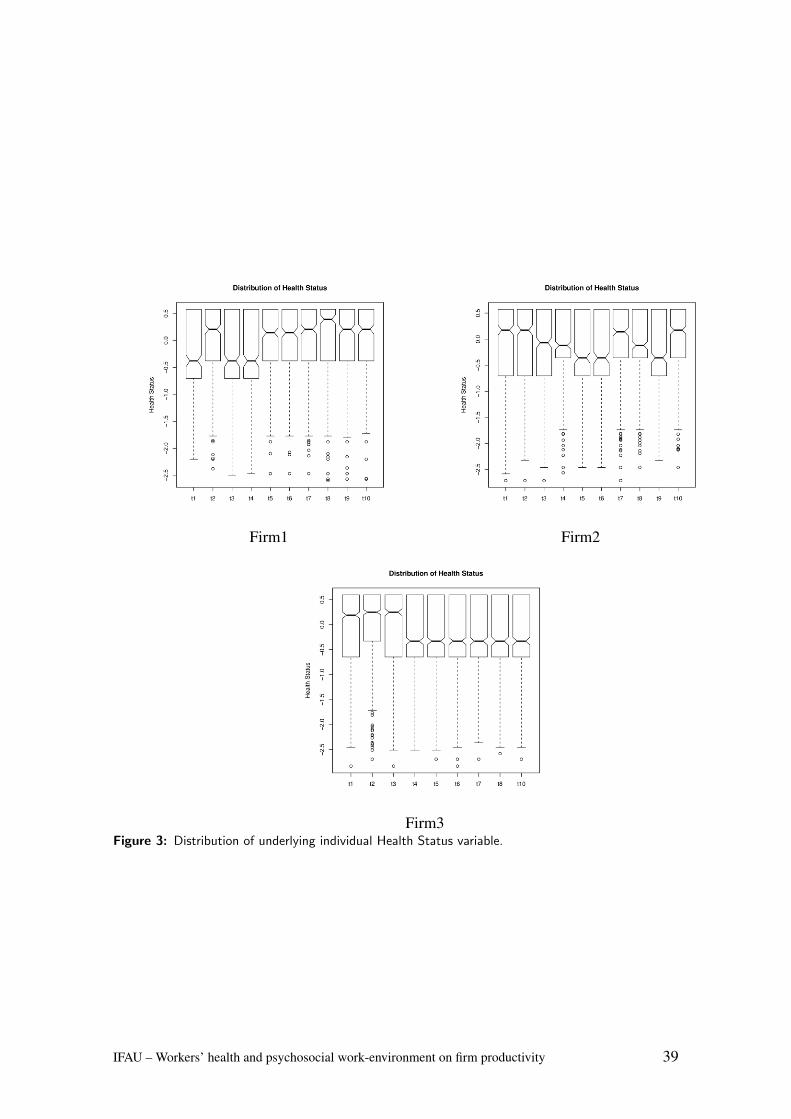
Firm1 Firm2
Firm3Figure 3: Distribution of underlying individual Health Status variable.
IFAU – Workers’ health and psychosocial work-environment on firm productivity 39
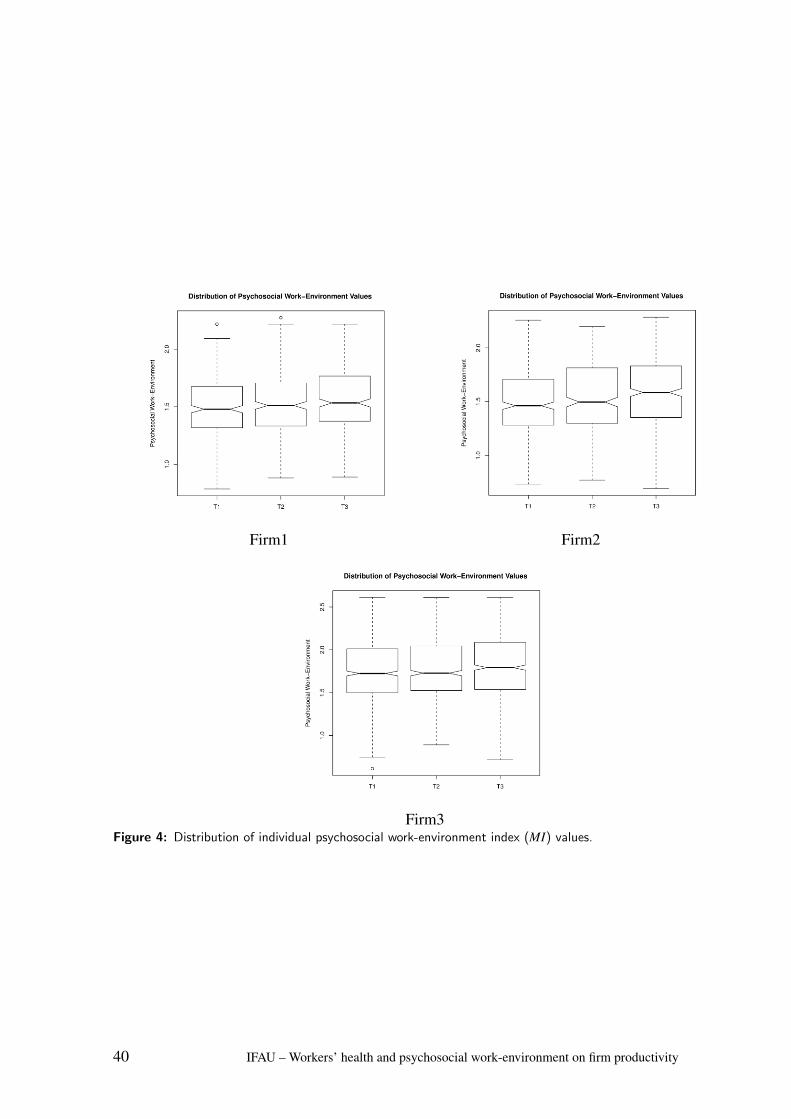
Firm1 Firm2
Firm3Figure 4: Distribution of individual psychosocial work-environment index (MI) values.
40 IFAU – Workers’ health and psychosocial work-environment on firm productivity
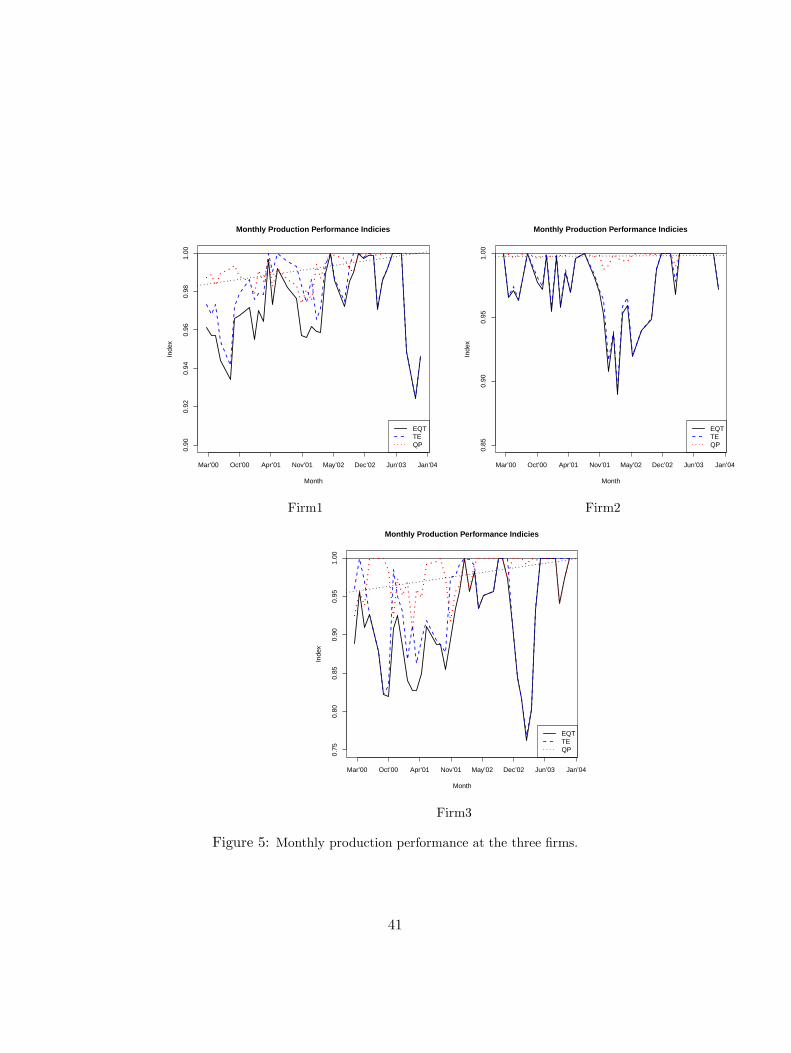
0.90
0.92
0.94
0.96
0.98
1.00
Monthly Production Performance Indicies
Month
Inde
x
Mar’00 Oct’00 Apr’01 Nov’01 May’02 Dec’02 Jun’03 Jan’04
EQTTEQP
0.85
0.90
0.95
1.00
Monthly Production Performance Indicies
Month
Inde
xMar’00 Oct’00 Apr’01 Nov’01 May’02 Dec’02 Jun’03 Jan’04
EQTTEQP
Firm1 Firm2
0.75
0.80
0.85
0.90
0.95
1.00
Monthly Production Performance Indicies
Month
Inde
x
Mar’00 Oct’00 Apr’01 Nov’01 May’02 Dec’02 Jun’03 Jan’04
EQTTEQP
Firm3
Figure 5: Monthly production performance at the three firms.
41
Publication series published by IFAU – latest issues
Rapporter/Reports
2012:1 Lundin Martin and Jonas Thelander ”Ner och upp – decentralisering och centralisering inom svensk arbetsmarknadspolitik 1995–2010”
2012:2 Edmark Karin, Che-Yuan Liang, Eva Mörk and Håkan Selin ”Jobbskatteavdraget”
2012:3 Jönsson Lisa and Peter Skogman Thoursie ”Kan privatisering av arbetslivsinriktad rehabili-tering öka återgång i arbete?”
2012:4 Lundin Martin and PerOla Öberg ”Politiska förhållanden och användningen av expert-kunskaper i kommunala beslutsprocesser”
2012:5 Fredriksson Peter, Hessel Oosterbeek and Björn Öckert ”Långsiktiga effekter av mindre klasser”
2012:6 Liljeberg Linus, Anna Sjögren and Johan Vikström ”Leder nystartsjobben till högre syssel-sättning?”
2012:7 Bennmarker Helge, Oskar Nordström Skans and Ulrika Vikman ”Tidigarelagda obligatoriska program för äldre långtidsarbetslösa – erfarenheter från 1990-talet”
2012:8 Lohela Karlsson Malin, Christina Björklund and Irene Jensen ”Sambandet mellan psykosociala arbetsmiljöfaktorer, anställdas hälsa och organisationers produktion – en systematisk litteratur-genomgång”
2012:9 Johansson Per, Tuomas Pekkarinen and Jouko Verho ”Gränshandel med alkohol och dess effekter på hälsa och produktivitet”
2012:10 Grönqvist Hans, Per Johansson and Susan Niknami ”Påverkar inkomstskillnader hälsan? Lärdomar från den svenska flyktinplaceringspolitiken”
2012:11 von Greiff Camilo, Anna Sjögren and Ing-Marie Wieselgren ”En god start? En rapport om att stötta barns utveckling”
2012:12 Lindahl Mikael, Mårten Palme, Sofia Sandgren Massih and Anna Sjögren ”Intergenerationell rörlighet i inkomster och utbildning – en analys av fyra generationer”
2012:13 Eriksson Stefan, Per Johansson and Sophie Langenskiöld ”Vad är rätt profil för att få ett jobb? En experimentell studie av rekryteringsprocessen”
2012:14 Böhlmark Anders and Helena Holmlund ”Lika möjligheter? Familjebakgrund och skolprestationer 1988–2010”
2012:15 Böhlmark Anders, Erik Grönqvist and Jonas Vlachos ”Rektors betydelse för skola, elever och lärare”
Working papers
2012:1 Edmark Karin, Che-Yuan Liang, Eva Mörk and Håkan Selin ”Evaluation of the Swedish earned income tax credit”
2012:2 Jönsson Lisa and Peter Skogman Thoursie “Does privatisation of vocational rehabilitation improve labour market opportunities? Evidence from a field experiment in Sweden”
2012:3 Johansson Per and Martin Nilsson “Should sickness insurance and health care be administrated by the same jurisdiction? An empirical analysis
2012:4 Lundin Martin and PerOla Öberg “Towards reason: political disputes, public attention and the use of expert knowledge in policymaking”
2012:5 Fredriksson Peter, Björn Öckert and Hessel Oosterbeek “Long-term effects of class size”
2012:6 van den Berg Gerard J, Pia R. Pinger and Johannes Schoch “Instrumental variable estimation of the causal effect of hunger early in life on health later in life”
2012:7 Bennmarker Helge, Oskar Nordström Skans and Ulrika Vikman “Workfare for the old and long-term unemployed”
2012:8 Lohela Karlsson Malin, Christina Björklund and Irene Jensen ”The relationship between psychosocial work factors, employee health and organisational production – a systematic review”
2012:9 Engström Per, Pathric Hägglund and Per Johansson ”Early interventions and disability insurance: experience from a field experiment”
2012:10 Johansson Per, Tuomas Pekkarinen and Jouko Verho ”Cross-border health and productivity effects of alcohol policies”
2012:11 Grönqvist Hans, Per Johansson and Susan Niknami ”Income inequality and health: lessons from a refugee residential assignment program”
2012:12 Lindahl Mikael, Mårten Palme, Sofia Sandgren Massih and Anna Sjögren ”The inter-generational persistence of human capital: an empirical analysis of four generations”
2012:13 Eriksson Stefan, Per Johansson and Sophie Langenskiöld ”What is the right profile for getting a job? A stated choice experiment of the recruitment process”
2012:14 de Luna Xavier and Per Johansson ”Testing for nonparametric identification of causal effects in the presence of a quasi-instrument”
2012:15 Scholte Robert S., Gerard J. van den Berg and Maarten Lindeboom ”Long-run effects of gestation during the Dutch hunger winter famine on labor market and hospitalization outcomes”
2012:16 Böhlmark Anders, Erik Grönqvist and Jonas Vlachos ”The headmaster ritual: the importance of management for school outcomes”
2012:17 Ødegaard Fredrik and Pontus Roos ”Measuring workers’ health and psychosocial work- environment on firm productivity”
Dissertation series 2011:1 Hensvik Lena “The effects of markets, managers and peers on worker outcomes”


![Taguchi Method Applied to Environmental Engineering · Taguchi’s method uses orthogonal arrays to study diverse factors with a reduced number of experiments [35]. Besides that,](https://img.pdfslide.org/doc/110x75/5f541fca2eb4384f022983c5/taguchi-method-applied-to-environmental-engineering-taguchias-method-uses-orthogonal.jpg)