Embed Size (px)
Citation preview
The mesoscale structure of a mature polar lowAirborne measurements and numerical simulations
Andreas Dörnbrack1, Johannes Wagner2, Alexander Gohm2 and Andreas Schäfler1
(1) Institut für Physik der Atmosphäre, Deutsches Zentrum für Luft und Raumfahrt (DLR), Oberpfaffenhofen, Germany
Folie 1EGU Session AS1.1: Dynamical Meteorology, Vienna 8 April 2011
(2) Institute of Meteorology and Geophysics, University of Innsbruck, Innrain 52, A-6020 Innsbruck, Austria
in cooperation with the Norwegian IPY-THORPEX project lead by J. E. Kristjánsson and the Norwegian Met Service
Table of Contents
1 Objectives
2 Model Description
3 Synoptic Situation
Folie 2EGU Session AS1.1: Dynamical Meteorology, Vienna 8 April 2011
3 Synoptic Situation
4 Comparison Model-Observations
5 Polar Low Core Structure
6 Conclusions
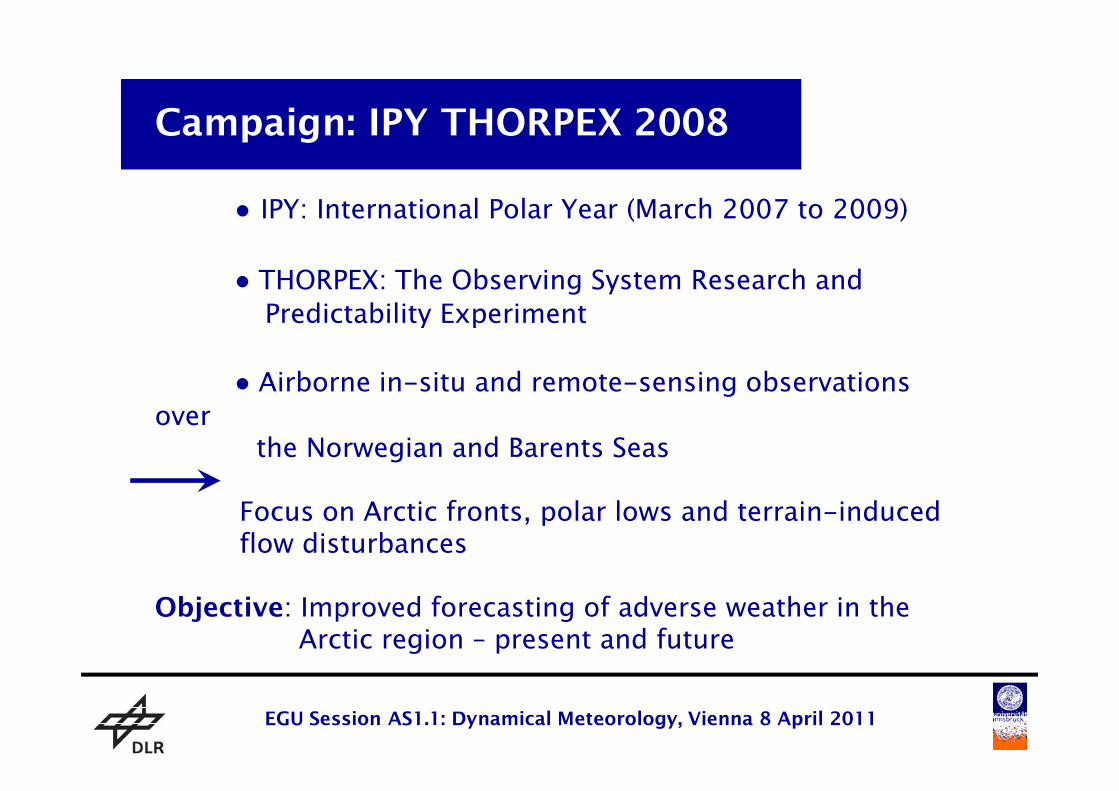
Campaign: IPY THORPEX 2008
● IPY: International Polar Year (March 2007 to 2009)
● THORPEX: The Observing System Research and
Predictability Experiment
● Airborne in)situ and remote)sensing observations
Folie 3EGU Session AS1.1: Dynamical Meteorology, Vienna 8 April 2011
● Airborne in)situ and remote)sensing observations
over
the Norwegian and Barents Seas
Focus on Arctic fronts, polar lows and terrain)inducedflow disturbances
Objective: Improved forecasting of adverse weather in theArctic region – present and future
Folie 4EGU Session AS1.1: Dynamical Meteorology, Vienna 8 April 2011
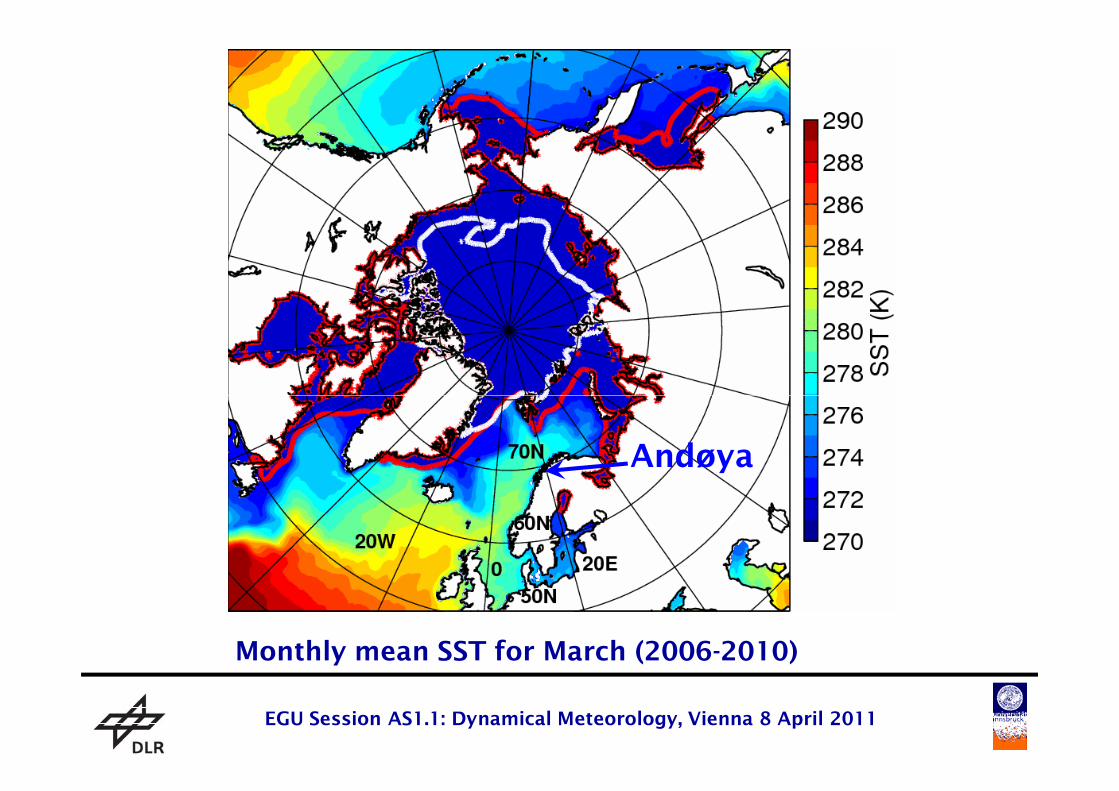
Monthly mean SST for March (2006-2010)
Andøya
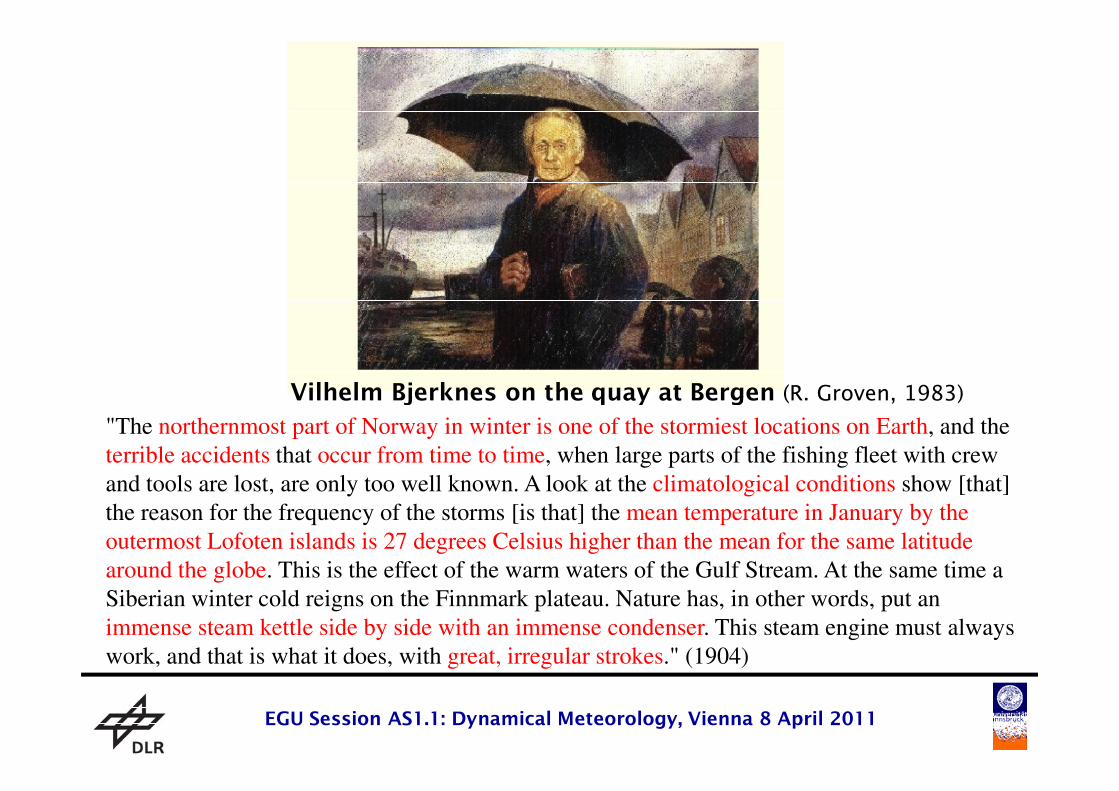
Vilhelm Bjerknes on the quay at Bergen (R. Groven, 1983)
Folie 5EGU Session AS1.1: Dynamical Meteorology, Vienna 8 April 2011
"The northernmost part of Norway in winter is one of the stormiest locations on Earth, and the
terrible accidents that occur from time to time, when large parts of the fishing fleet with crew
and tools are lost, are only too well known. A look at the climatological conditions show [that]
the reason for the frequency of the storms [is that] the mean temperature in January by the
outermost Lofoten islands is 27 degrees Celsius higher than the mean for the same latitude
around the globe. This is the effect of the warm waters of the Gulf Stream. At the same time a
Siberian winter cold reigns on the Finnmark plateau. Nature has, in other words, put an
immense steam kettle side by side with an immense condenser. This steam engine must always
work, and that is what it does, with great, irregular strokes." (1904)
Vilhelm Bjerknes on the quay at Bergen (R. Groven, 1983)
Folie 6EGU Session AS1.1: Dynamical Meteorology, Vienna 8 April 2011
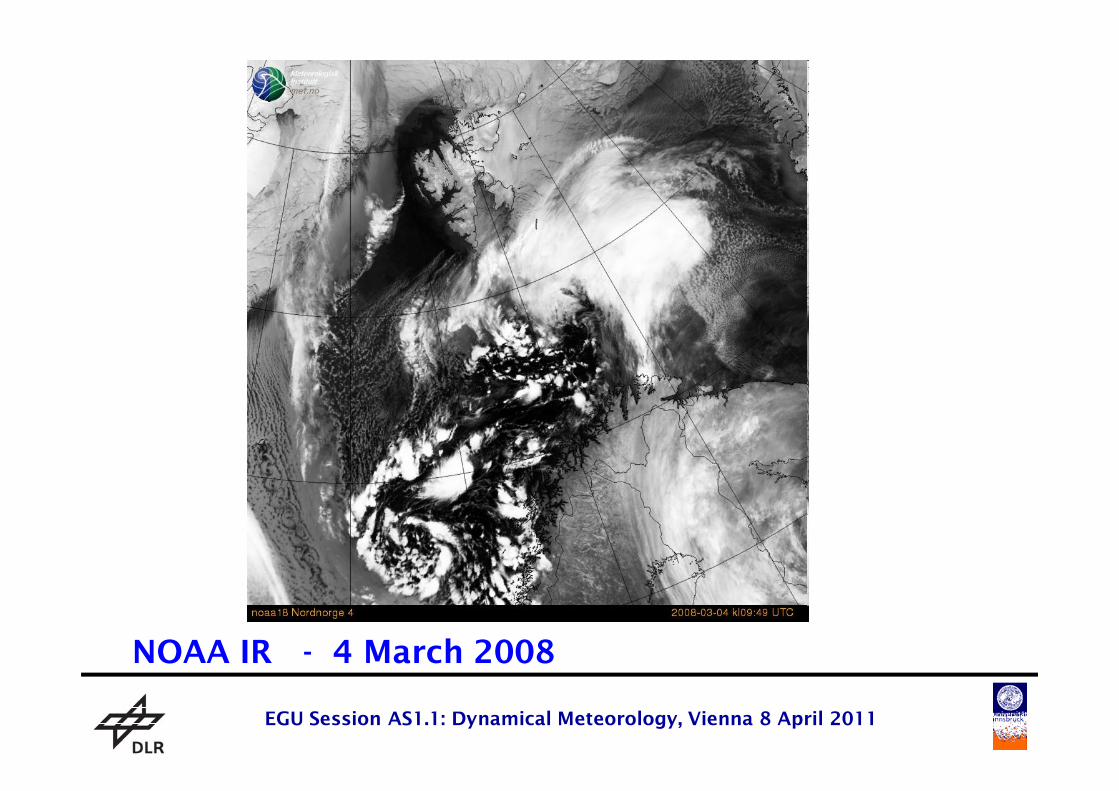
NOAA IR - 4 March 2008
Folie 7EGU Session AS1.1: Dynamical Meteorology, Vienna 8 April 2011
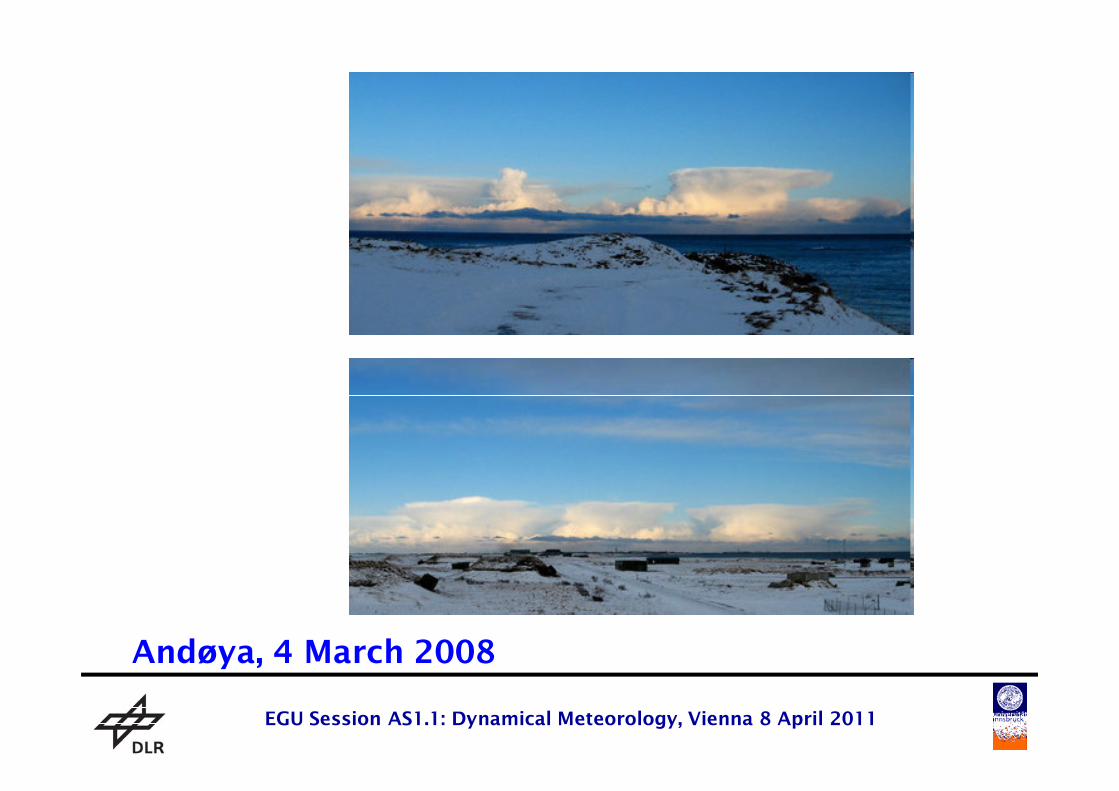
Andøya, 4 March 2008
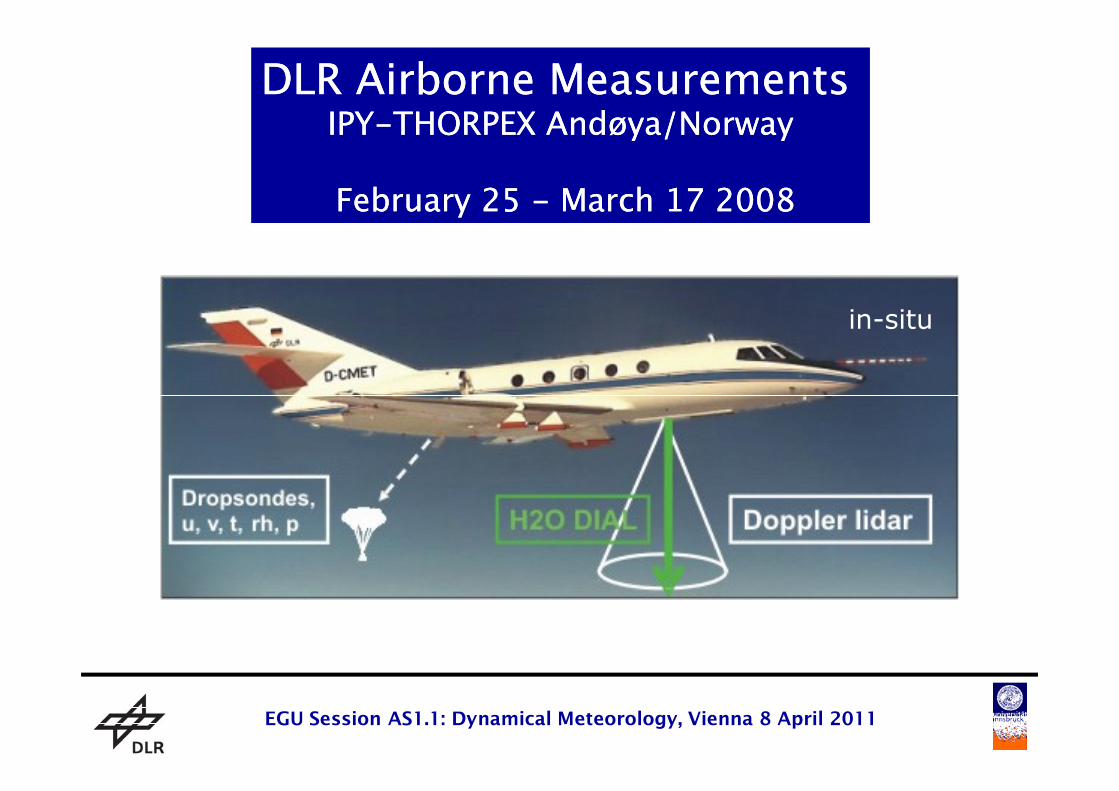
in-situ
DLR Airborne MeasurementsDLR Airborne MeasurementsIPYIPY))THORPEX Andøya/NorwayTHORPEX Andøya/Norway
February 25 February 25 )) March 17 2008March 17 2008
Folie 8EGU Session AS1.1: Dynamical Meteorology, Vienna 8 April 2011
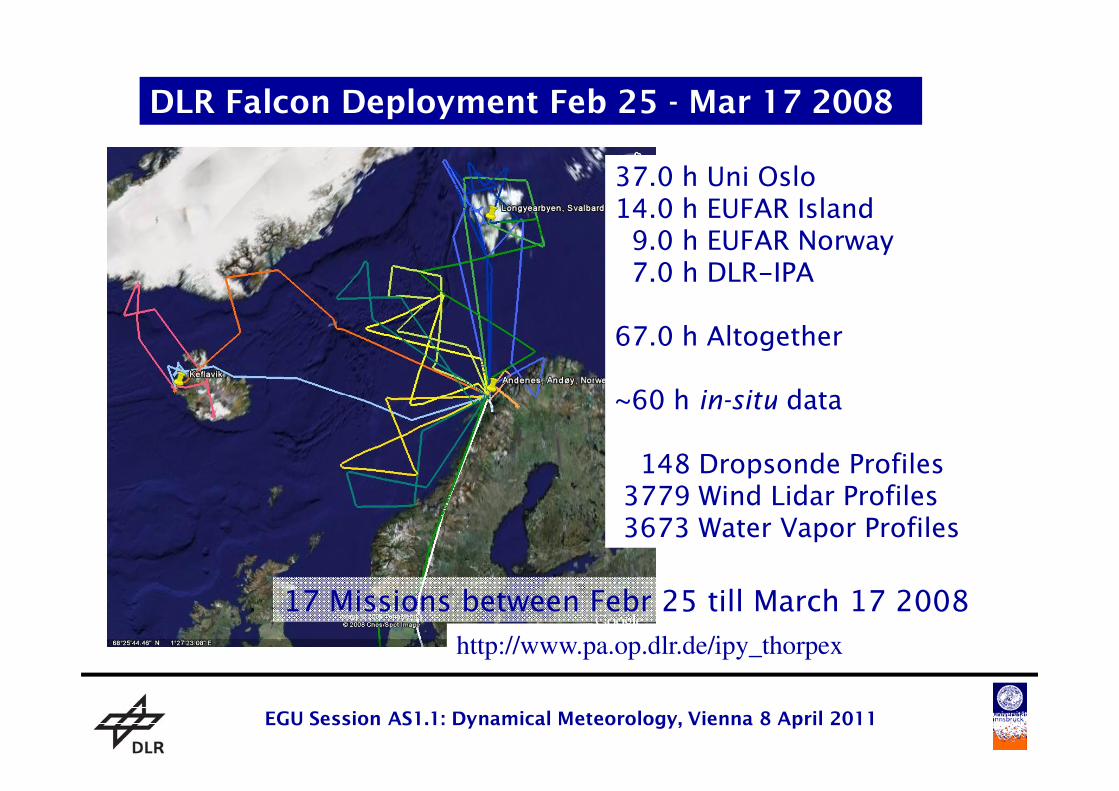
37.0 h Uni Oslo
14.0 h EUFAR Island
9.0 h EUFAR Norway7.0 h DLR)IPA
67.0 h Altogether
~60 h in-situ data
DLR Falcon Deployment Feb 25 - Mar 17 2008
Folie 9EGU Session AS1.1: Dynamical Meteorology, Vienna 8 April 2011
~60 h in-situ data
148 Dropsonde Profiles3779 Wind Lidar Profiles
3673 Water Vapor Profiles
17 Missions between Febr 25 till March 17 2008
http://www.pa.op.dlr.de/ipy_thorpex
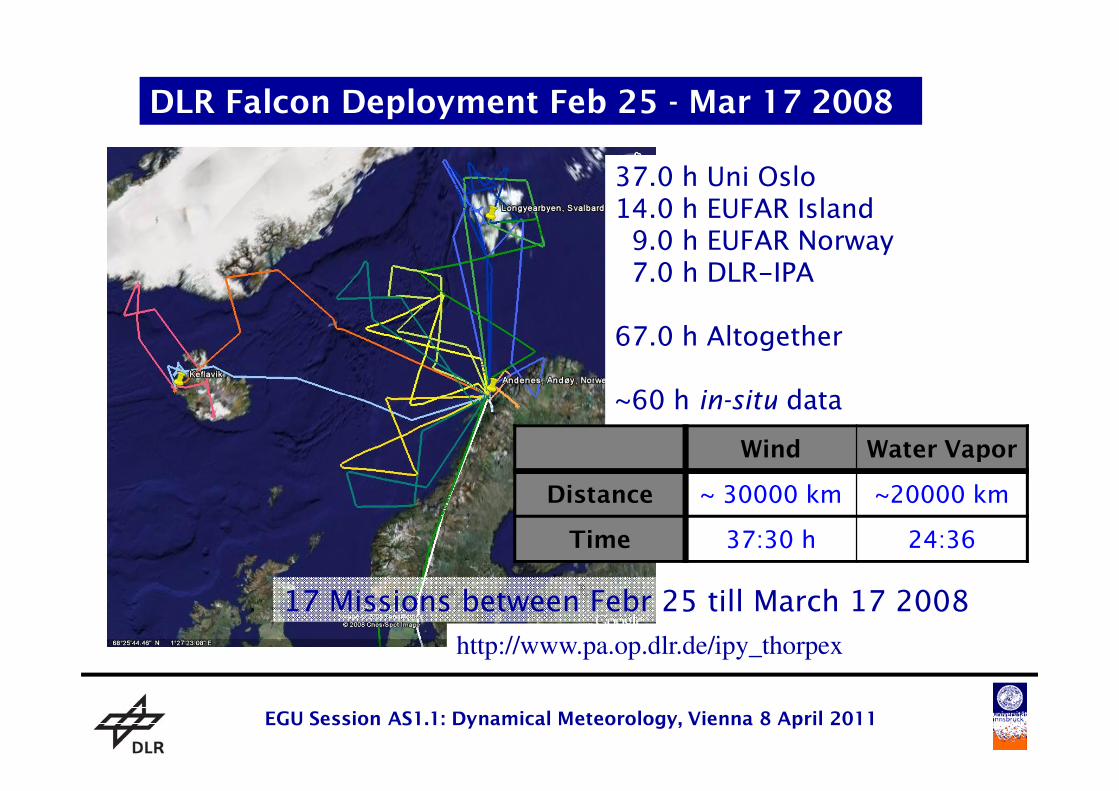
37.0 h Uni Oslo
14.0 h EUFAR Island
9.0 h EUFAR Norway7.0 h DLR)IPA
67.0 h Altogether
~60 h in-situ data
DLR Falcon Deployment Feb 25 - Mar 17 2008
Folie 10EGU Session AS1.1: Dynamical Meteorology, Vienna 8 April 2011
~60 h in-situ data
148 Dropsonde Profiles3779 Wind Lidar Profiles
3673 Water Vapor Profiles
Wind Water Vapor
Distance ~ 30000 km ~20000 km
Time 37:30 h 24:36
17 Missions between Febr 25 till March 17 2008
http://www.pa.op.dlr.de/ipy_thorpex
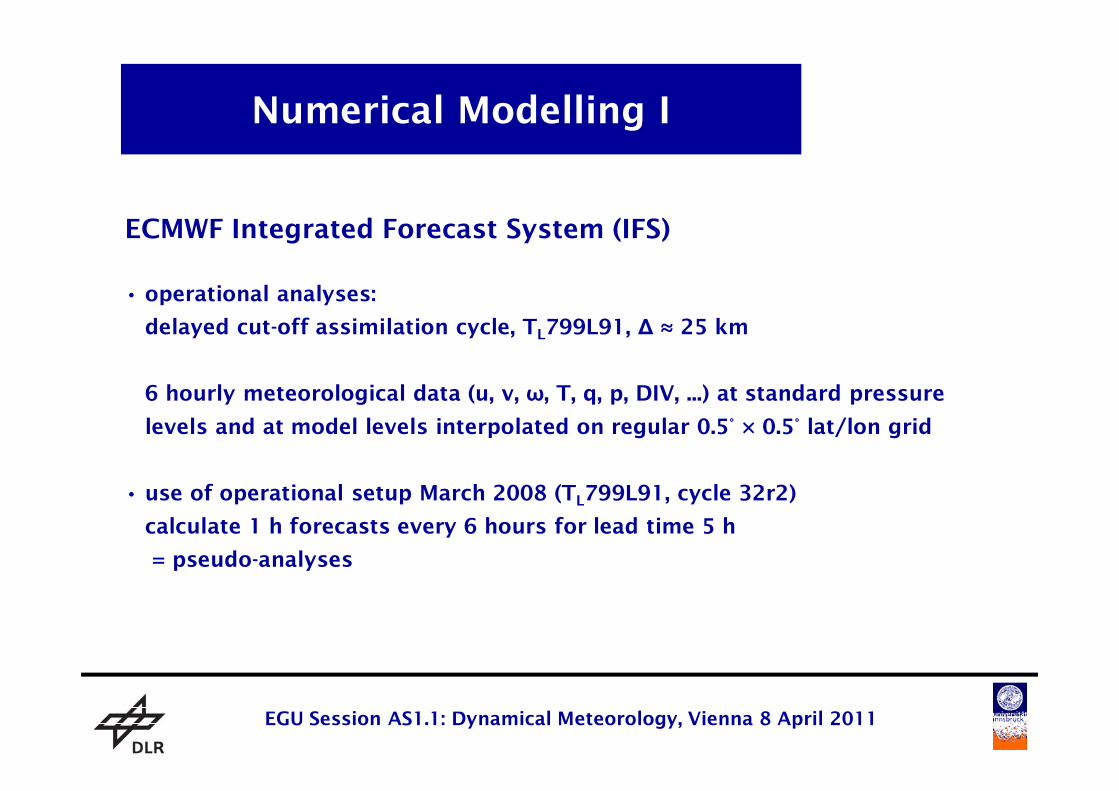
Numerical Modelling I
ECMWF Integrated Forecast System (IFS)
• operational analyses:
delayed cut-off assimilation cycle, TL799L91, ∆ ≈ 25 km
6 hourly meteorological data (u, v, ω, T, q, p, DIV, ...) at standard pressure
Folie 11EGU Session AS1.1: Dynamical Meteorology, Vienna 8 April 2011
6 hourly meteorological data (u, v, ω, T, q, p, DIV, ...) at standard pressure
levels and at model levels interpolated on regular 0.5° × 0.5° lat/lon grid
• use of operational setup March 2008 (TL799L91, cycle 32r2)
calculate 1 h forecasts every 6 hours for lead time 5 h
= pseudo-analyses
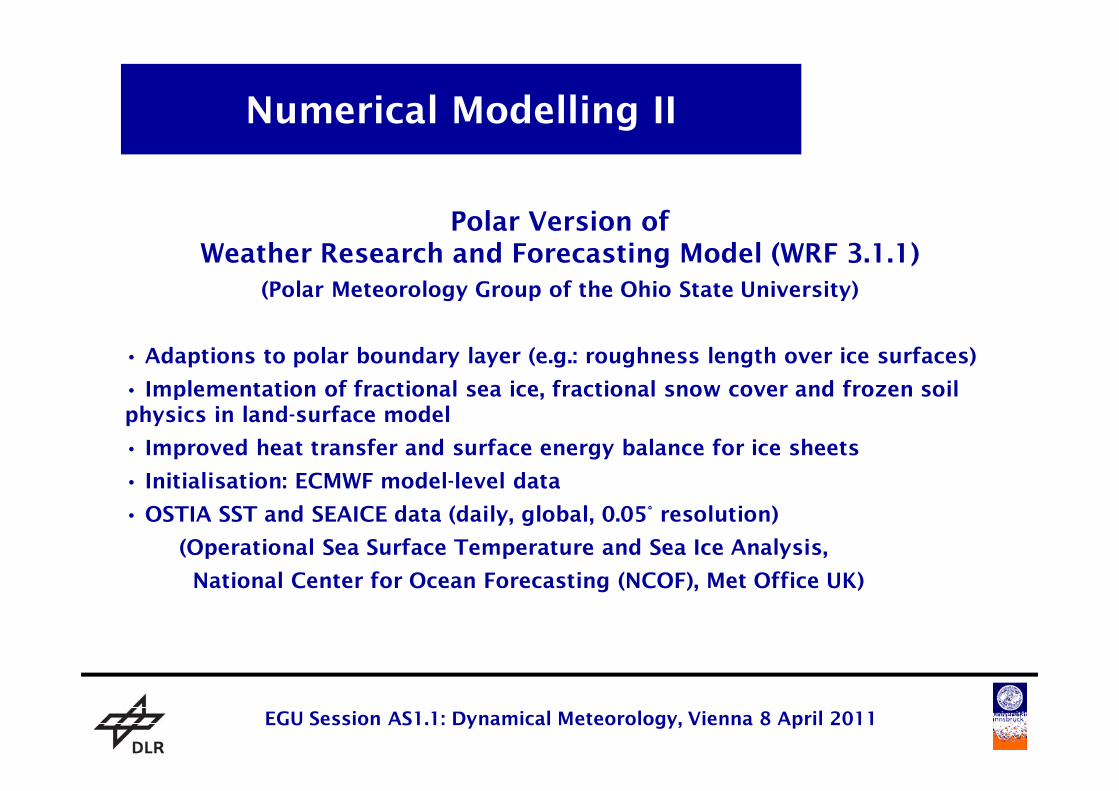
Numerical Modelling II
Polar Version of Weather Research and Forecasting Model (WRF 3.1.1)
(Polar Meteorology Group of the Ohio State University)
• Adaptions to polar boundary layer (e.g.: roughness length over ice surfaces)
• Implementation of fractional sea ice, fractional snow cover and frozen soil
Folie 12EGU Session AS1.1: Dynamical Meteorology, Vienna 8 April 2011
• Implementation of fractional sea ice, fractional snow cover and frozen soil physics in land-surface model
• Improved heat transfer and surface energy balance for ice sheets
• Initialisation: ECMWF model-level data
• OSTIA SST and SEAICE data (daily, global, 0.05° resolution)
(Operational Sea Surface Temperature and Sea Ice Analysis,
National Center for Ocean Forecasting (NCOF), Met Office UK)
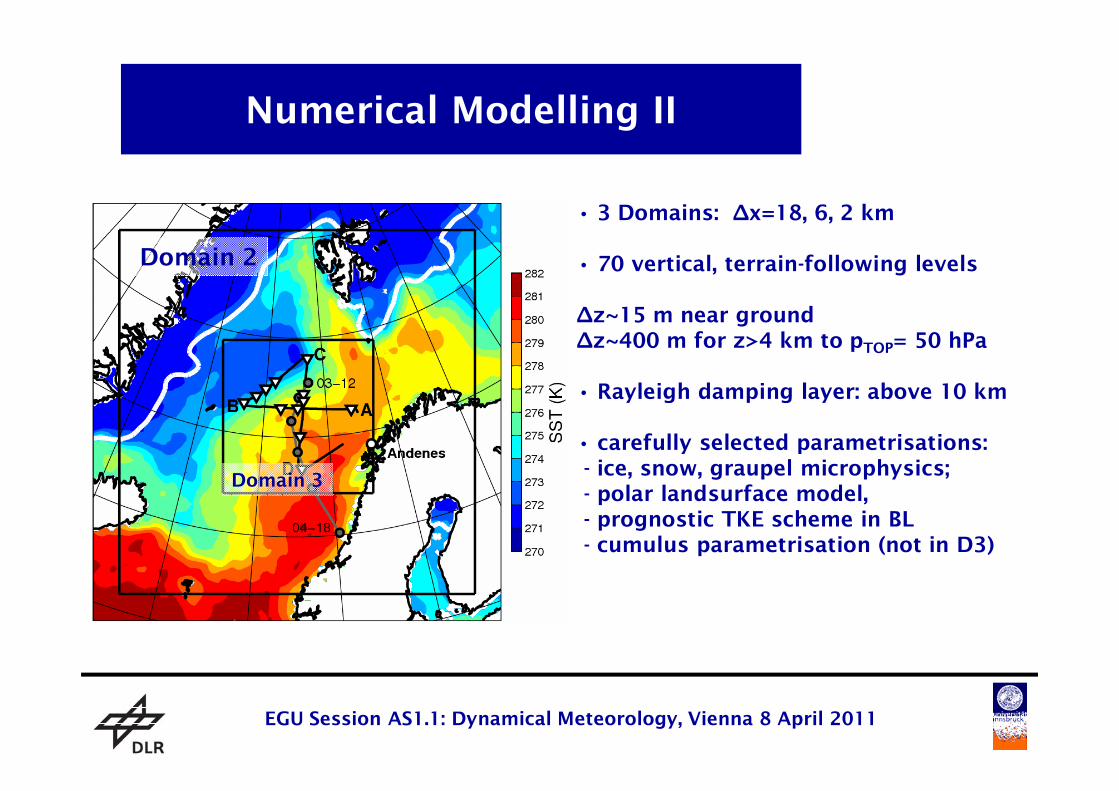
Numerical Modelling II
• 3 Domains: ∆x=18, 6, 2 km
• 70 vertical, terrain-following levels
∆z~15 m near ground∆z~400 m for z>4 km to pTOP= 50 hPa
• Rayleigh damping layer: above 10 km
Domain 2
Folie 13EGU Session AS1.1: Dynamical Meteorology, Vienna 8 April 2011
• Rayleigh damping layer: above 10 km
• carefully selected parametrisations: - ice, snow, graupel microphysics;- polar landsurface model, - prognostic TKE scheme in BL - cumulus parametrisation (not in D3)
Domain 3
Evolution of the Polar Low
• sequence of NOAA AVHRR infrared satellite images
covering the early development of the observed polar low
on 3/4 March 2008
• start of development: 3 March 2008 00 - 12 UTC
Folie 14EGU Session AS1.1: Dynamical Meteorology, Vienna 8 April 2011
• landfall: 4 March 2008 18 UTC
Lifetime: about 36 hours
• flight during mature stage: 3 March 2008 1515 - 1800 UTC
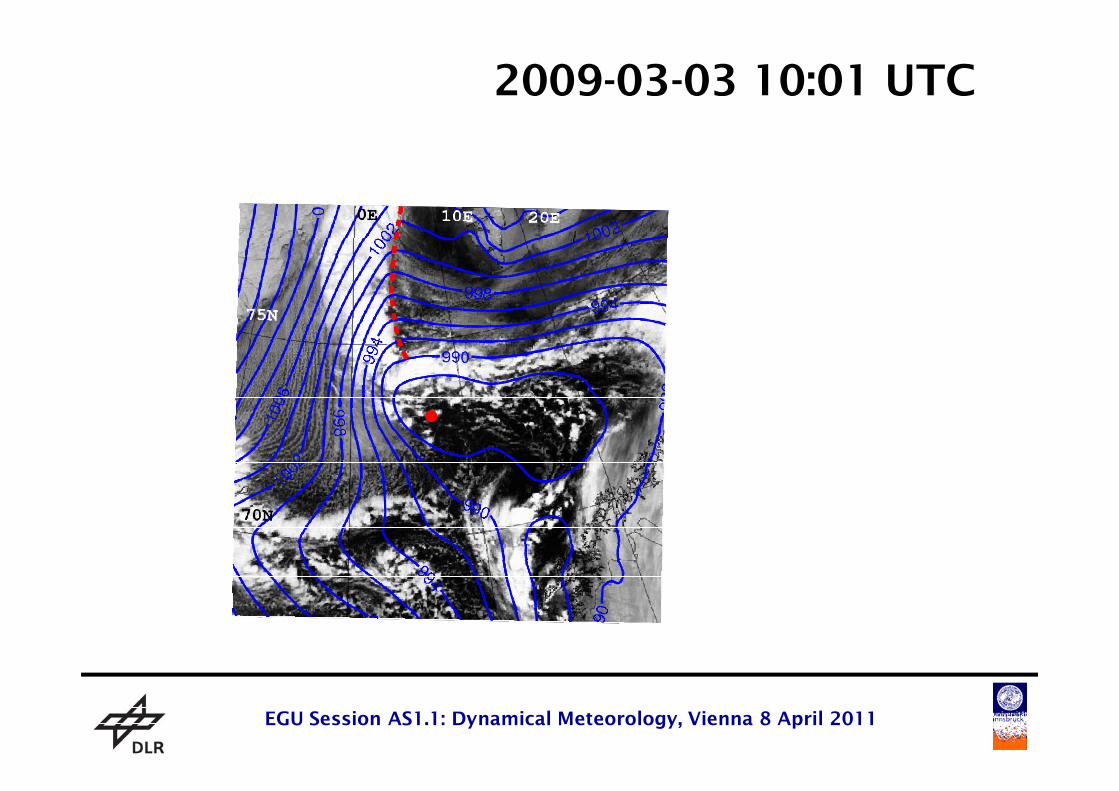
2009-03-03 10:01 UTC
Folie 15EGU Session AS1.1: Dynamical Meteorology, Vienna 8 April 2011
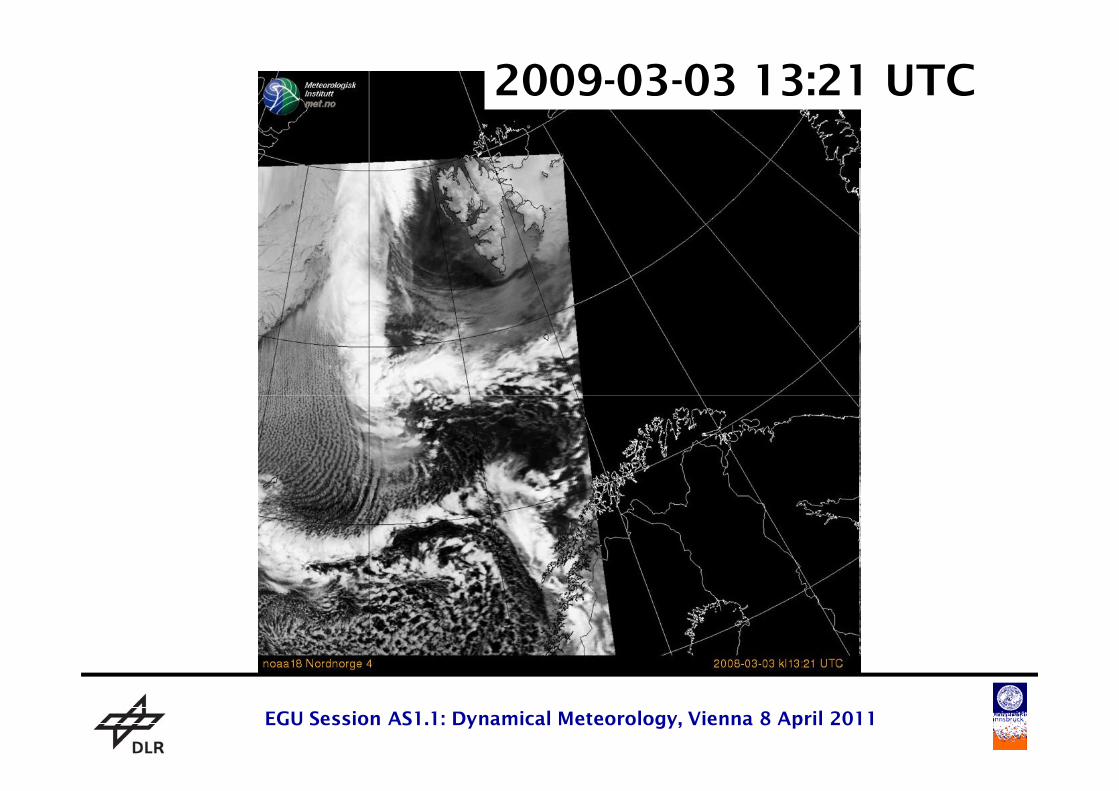
2009-03-03 13:21 UTC
Folie 16EGU Session AS1.1: Dynamical Meteorology, Vienna 8 April 2011
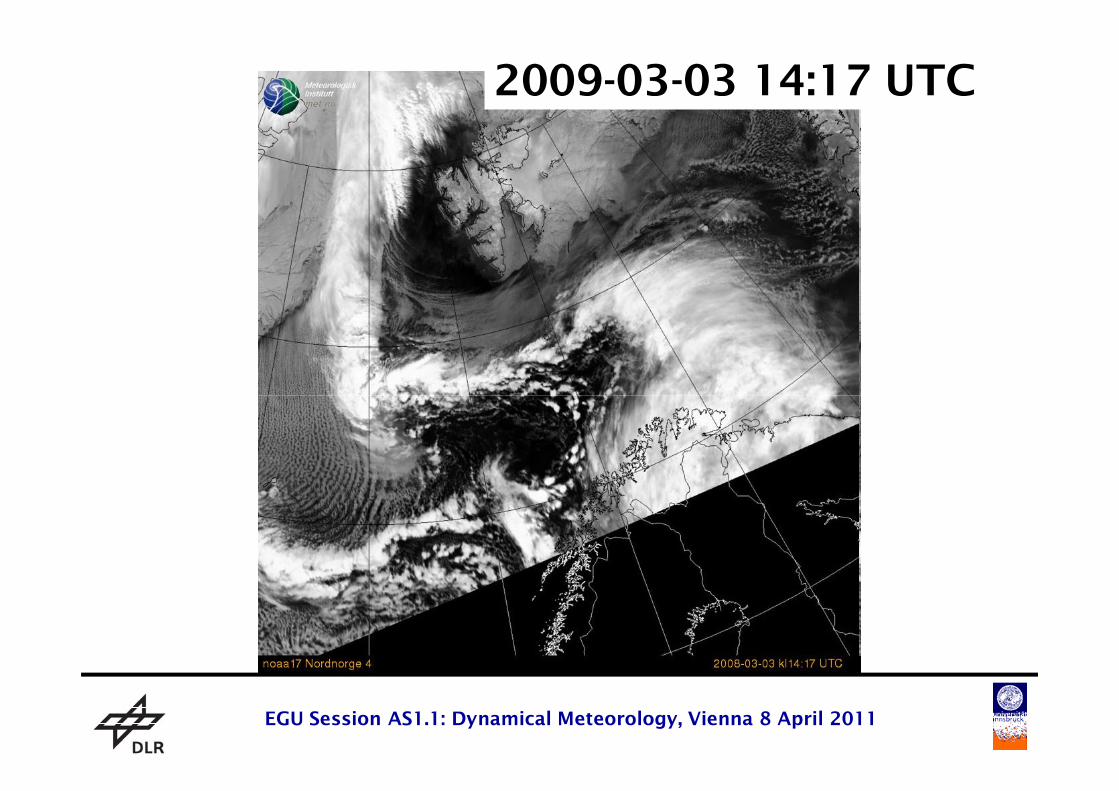
2009-03-03 14:17 UTC
Folie 17EGU Session AS1.1: Dynamical Meteorology, Vienna 8 April 2011
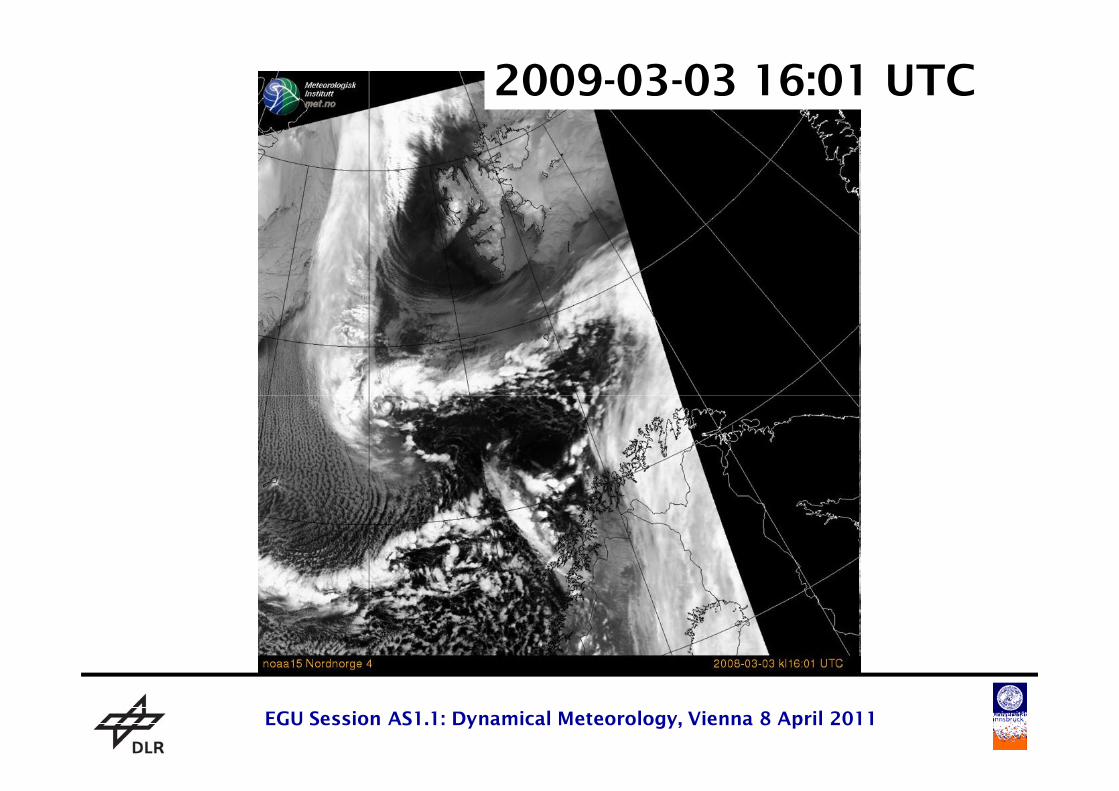
2009-03-03 16:01 UTC
Folie 18EGU Session AS1.1: Dynamical Meteorology, Vienna 8 April 2011
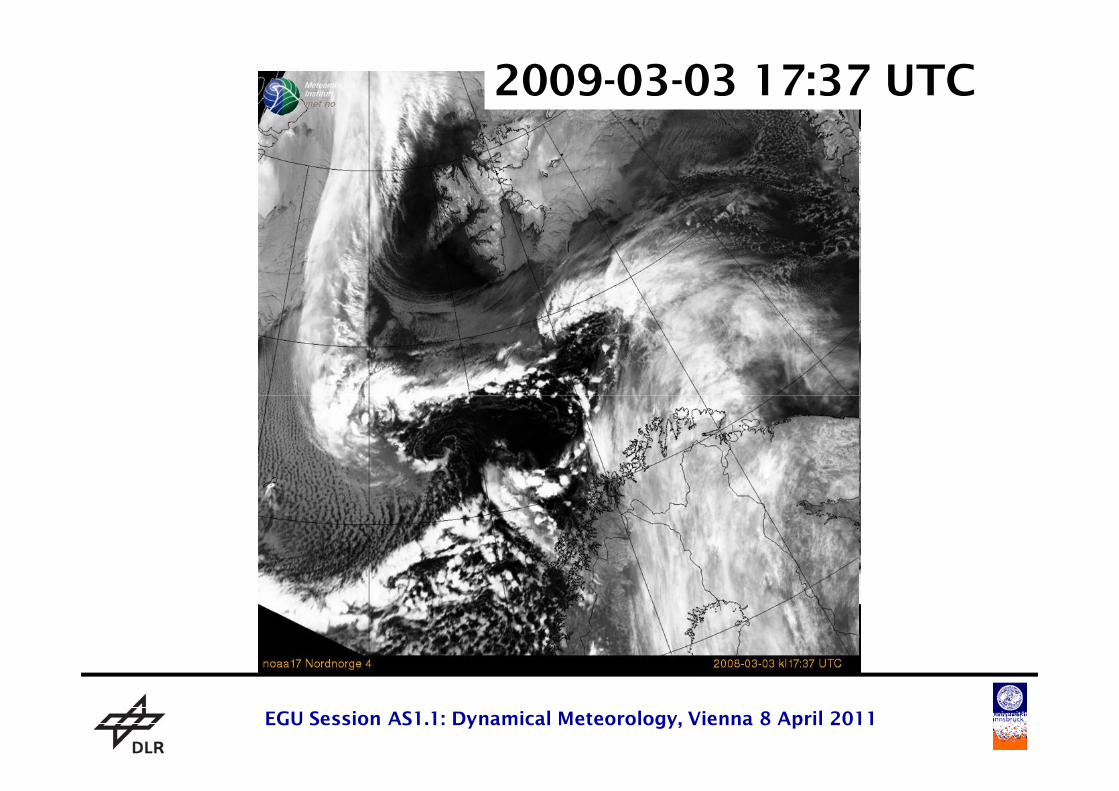
2009-03-03 17:37 UTC
Folie 19EGU Session AS1.1: Dynamical Meteorology, Vienna 8 April 2011
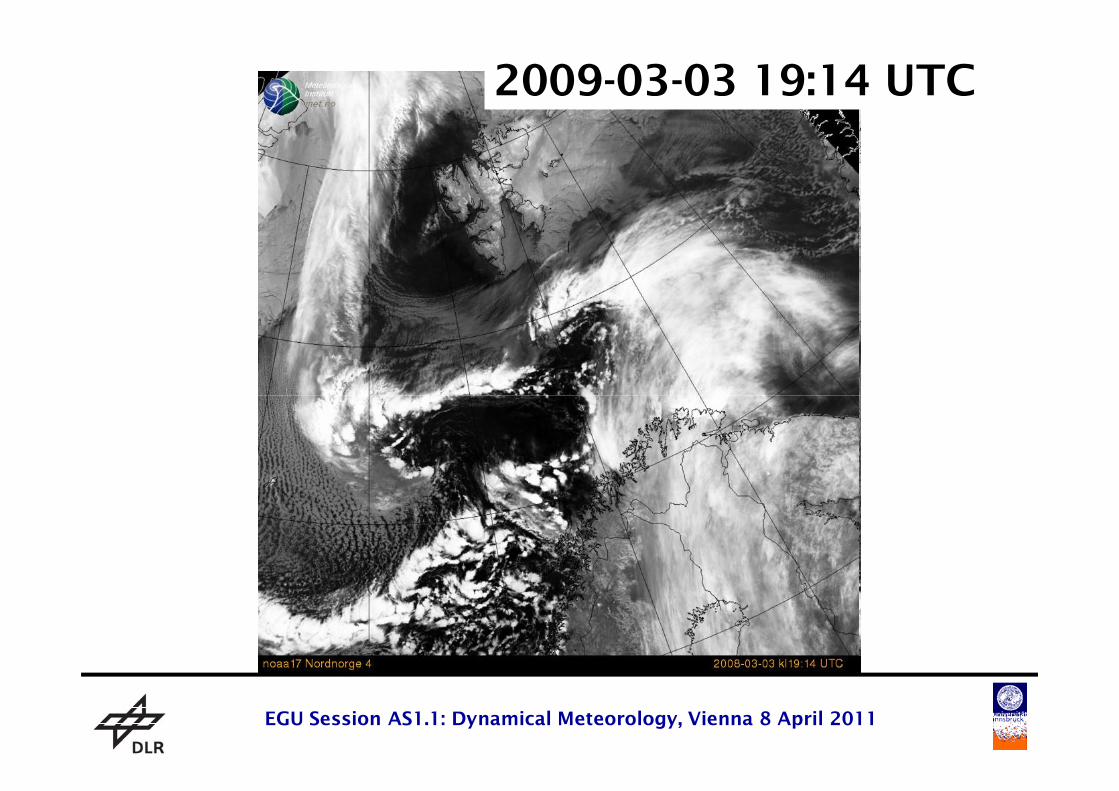
2009-03-03 19:14 UTC
Folie 20EGU Session AS1.1: Dynamical Meteorology, Vienna 8 April 2011
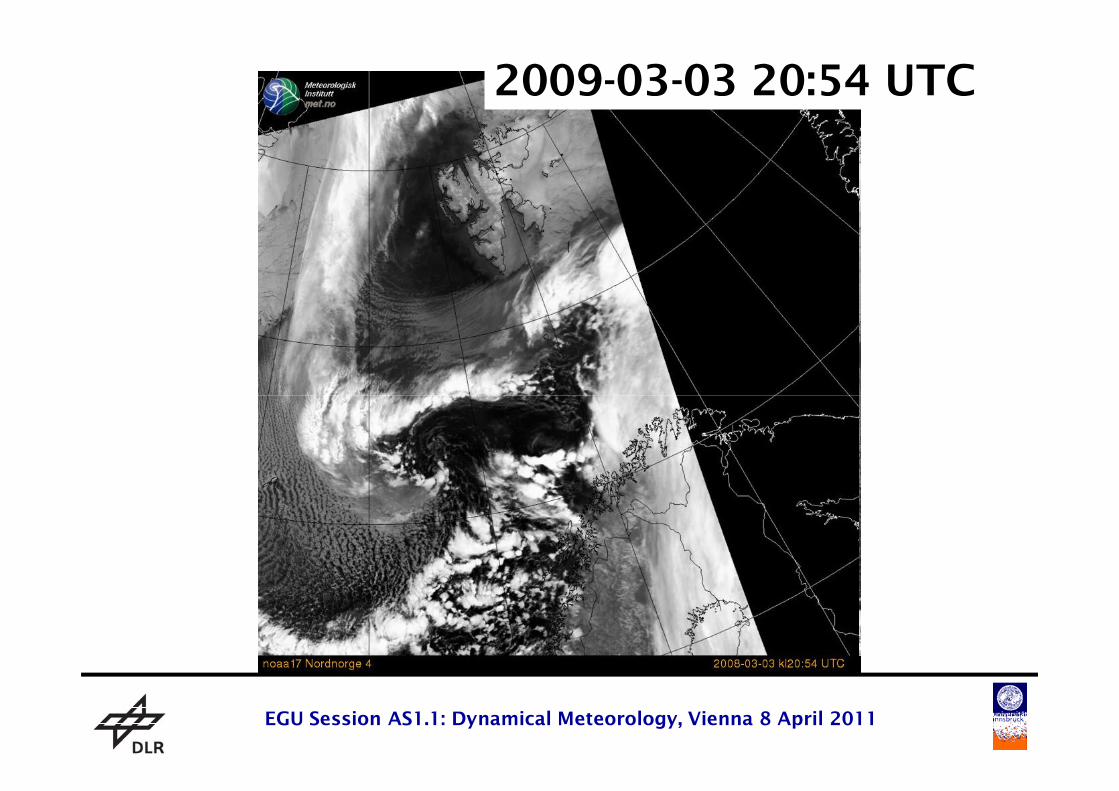
2009-03-03 20:54 UTC
Folie 21EGU Session AS1.1: Dynamical Meteorology, Vienna 8 April 2011
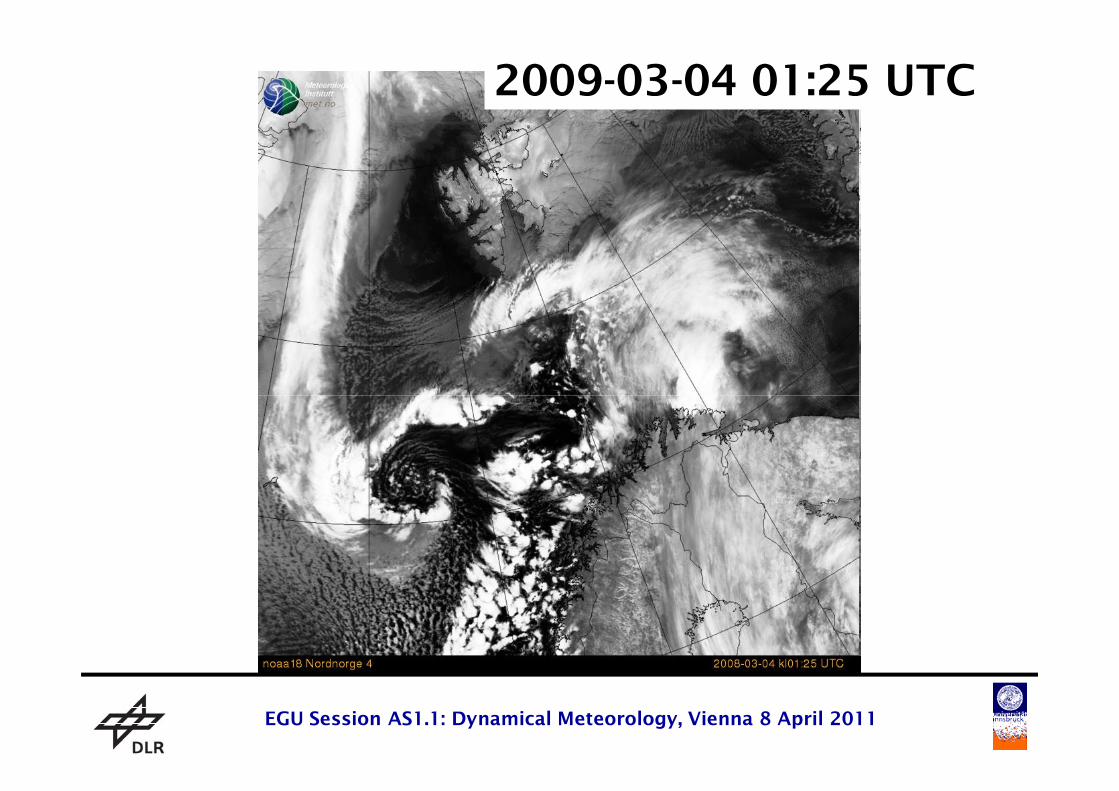
2009-03-04 01:25 UTC
Folie 22EGU Session AS1.1: Dynamical Meteorology, Vienna 8 April 2011
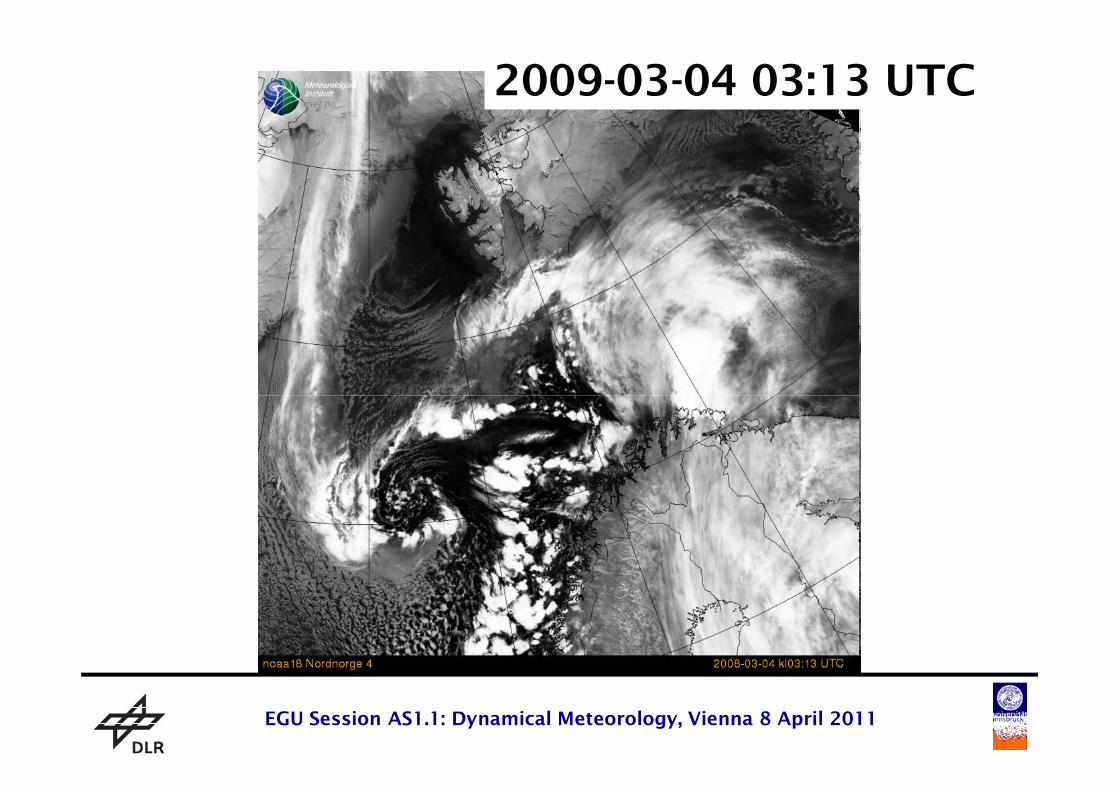
2009-03-04 03:13 UTC
Folie 23EGU Session AS1.1: Dynamical Meteorology, Vienna 8 April 2011
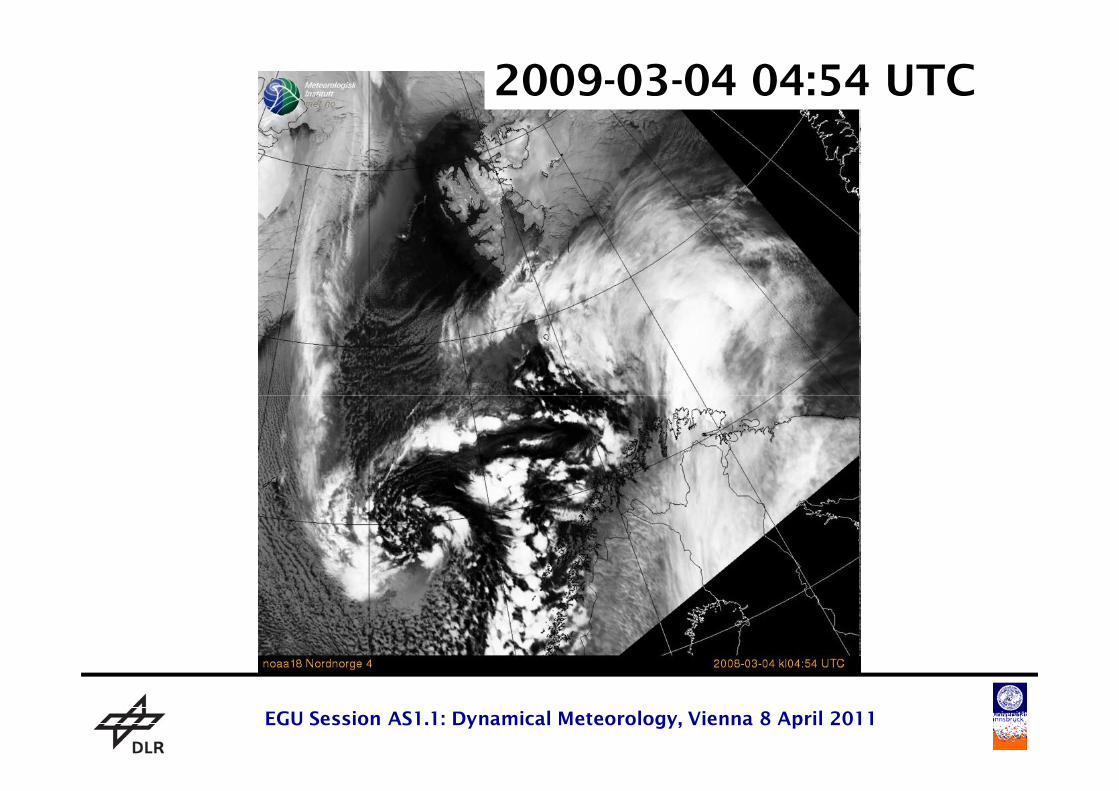
2009-03-04 04:54 UTC
Folie 24EGU Session AS1.1: Dynamical Meteorology, Vienna 8 April 2011
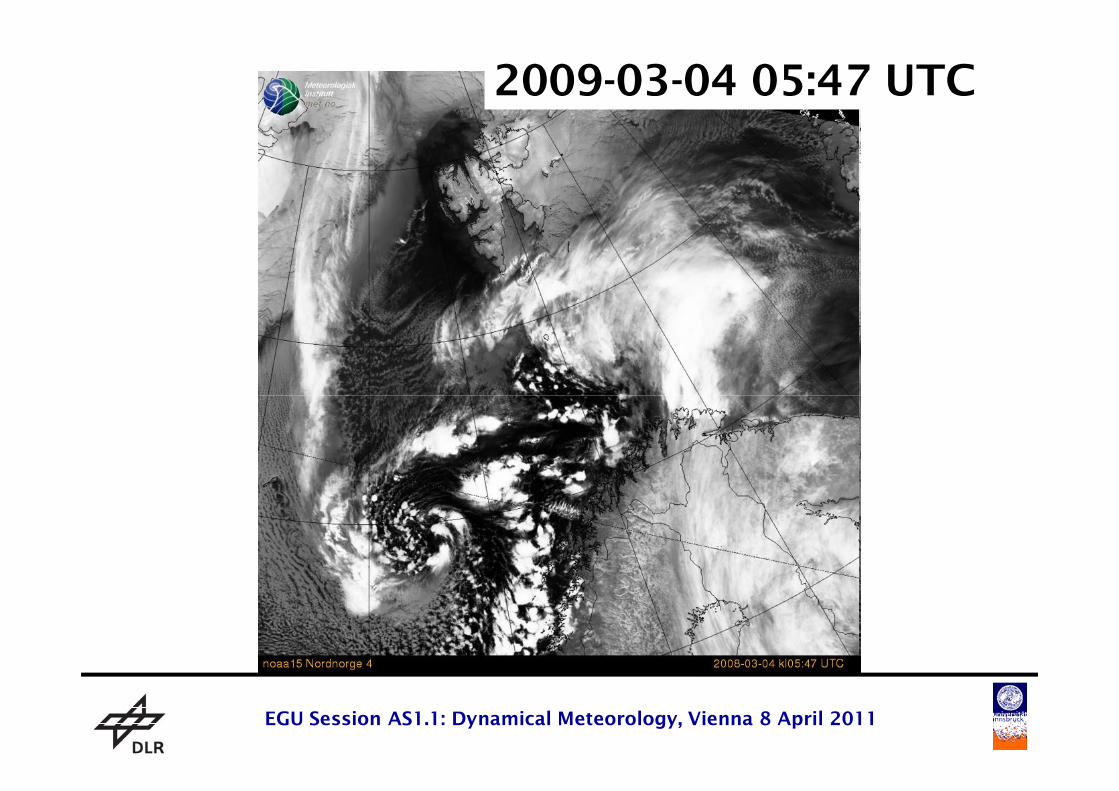
2009-03-04 05:47 UTC
Folie 25EGU Session AS1.1: Dynamical Meteorology, Vienna 8 April 2011
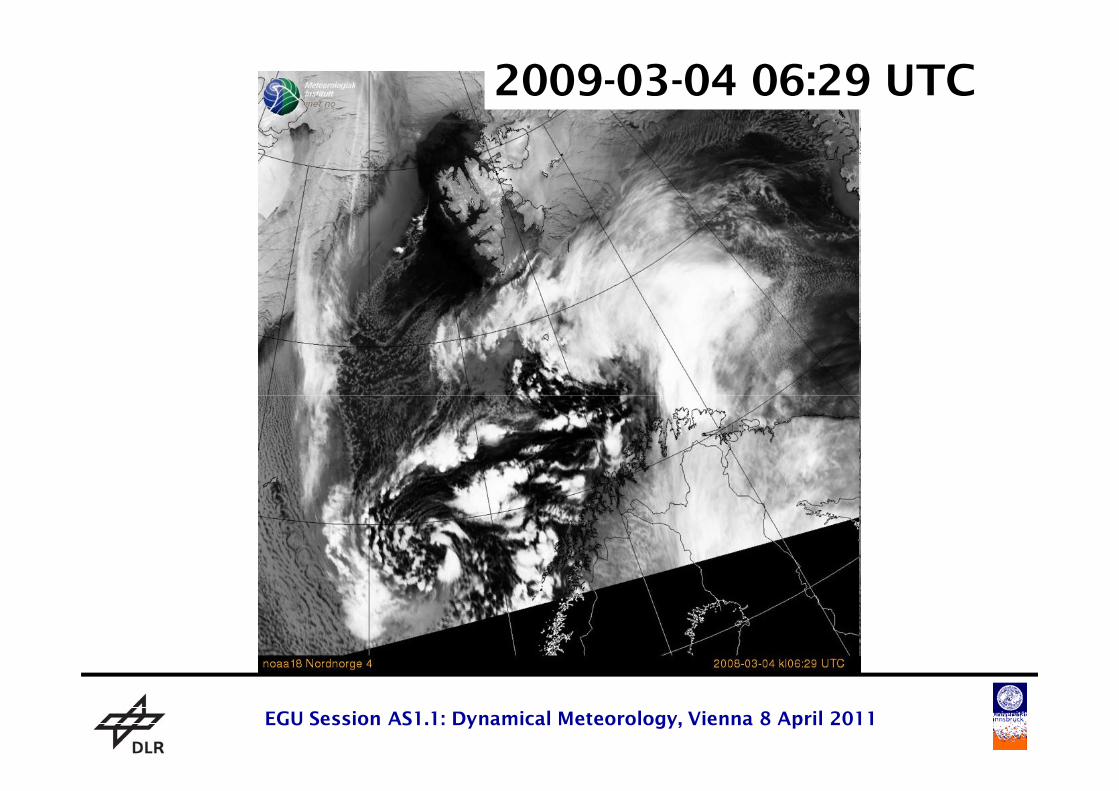
2009-03-04 06:29 UTC
Folie 26EGU Session AS1.1: Dynamical Meteorology, Vienna 8 April 2011
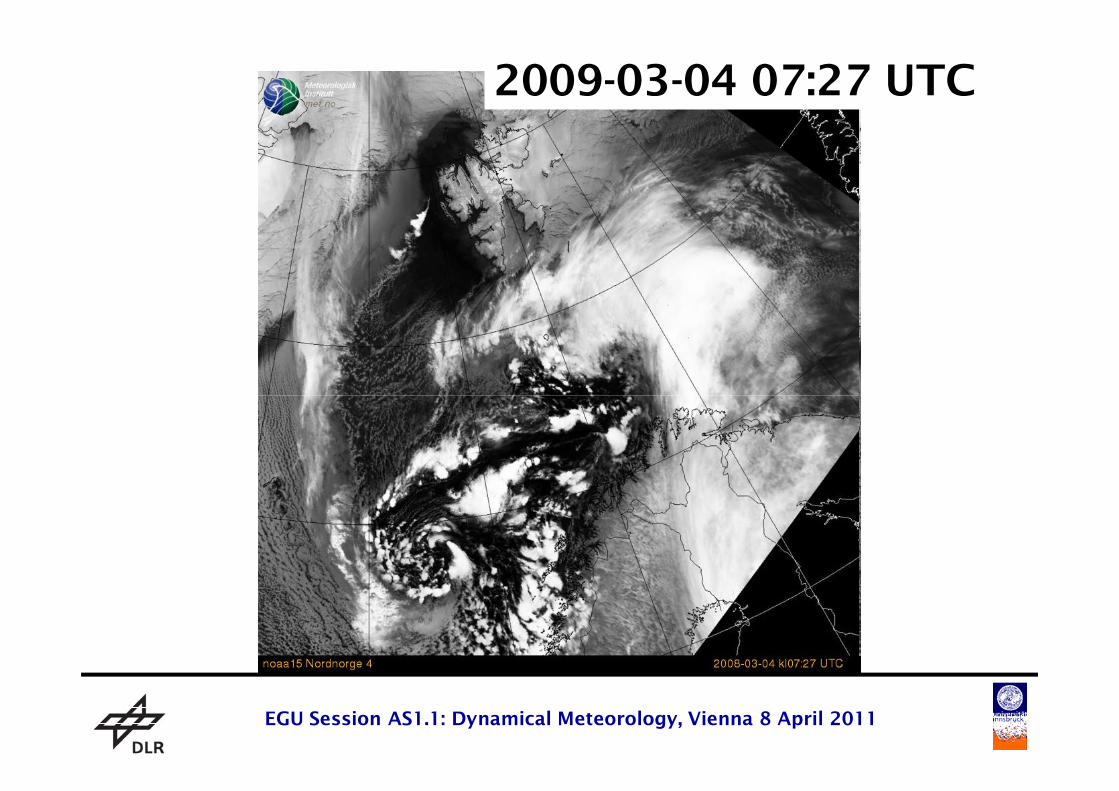
2009-03-04 07:27 UTC
Folie 27EGU Session AS1.1: Dynamical Meteorology, Vienna 8 April 2011
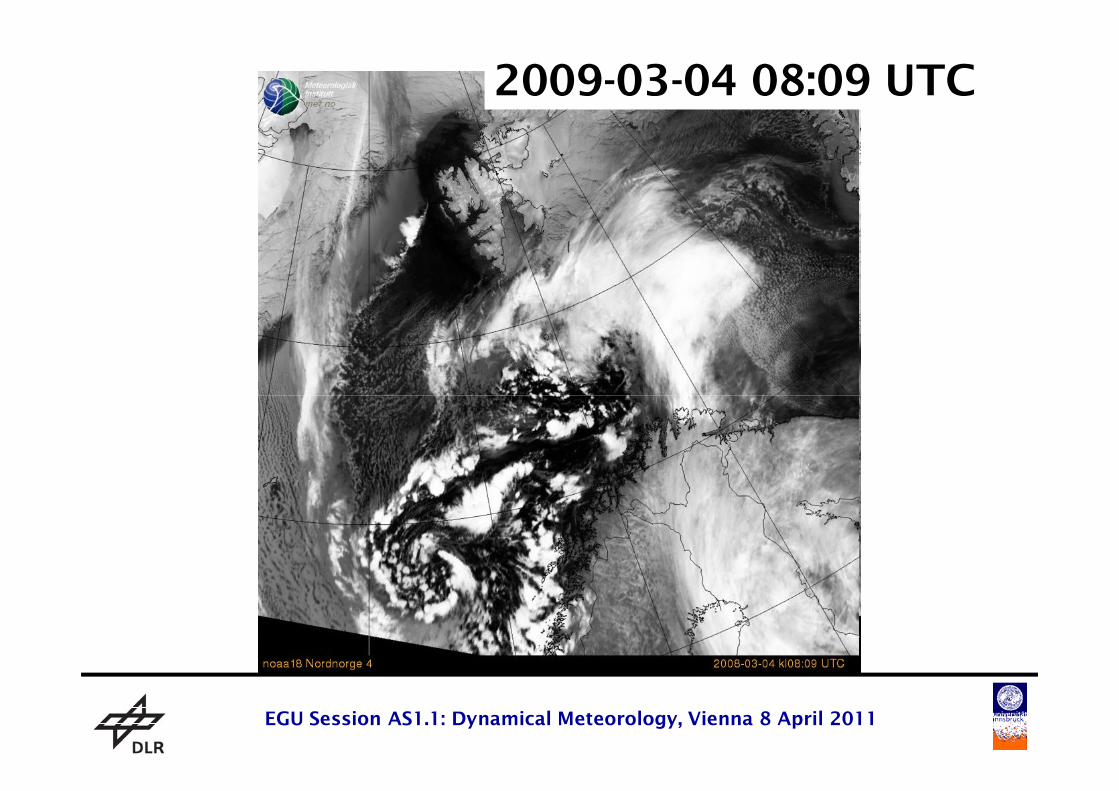
2009-03-04 08:09 UTC
Folie 28EGU Session AS1.1: Dynamical Meteorology, Vienna 8 April 2011
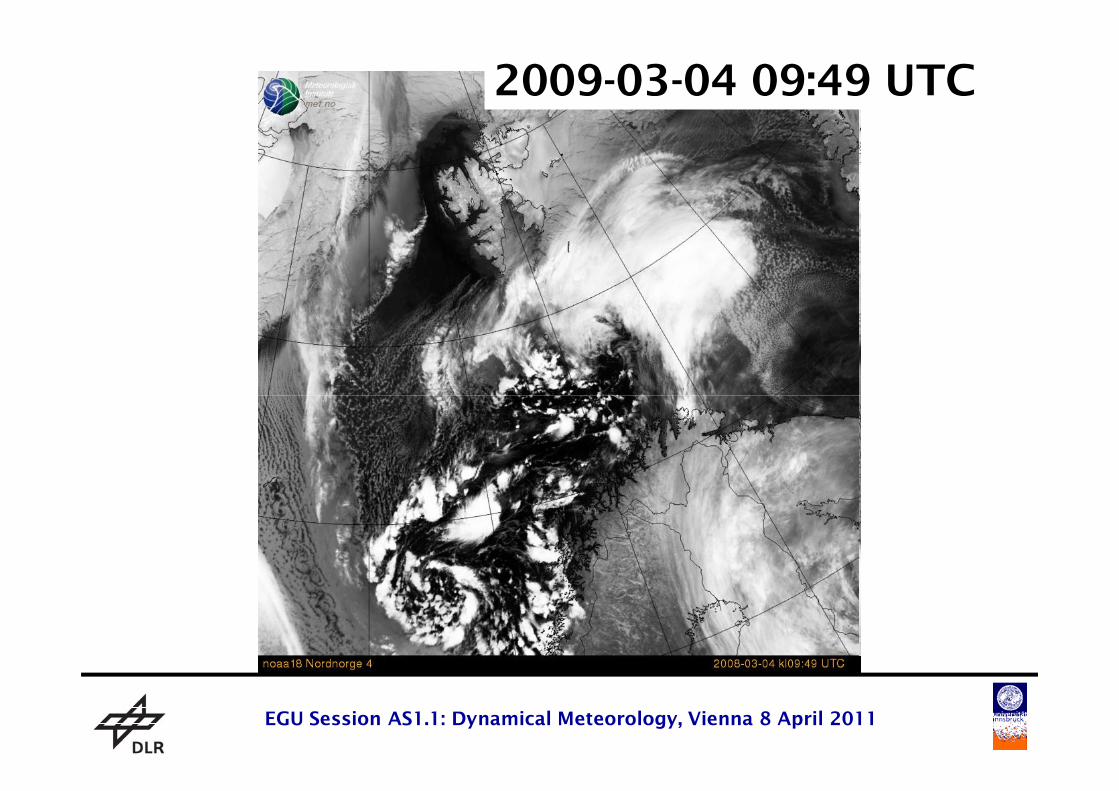
2009-03-04 09:49 UTC
Folie 29EGU Session AS1.1: Dynamical Meteorology, Vienna 8 April 2011
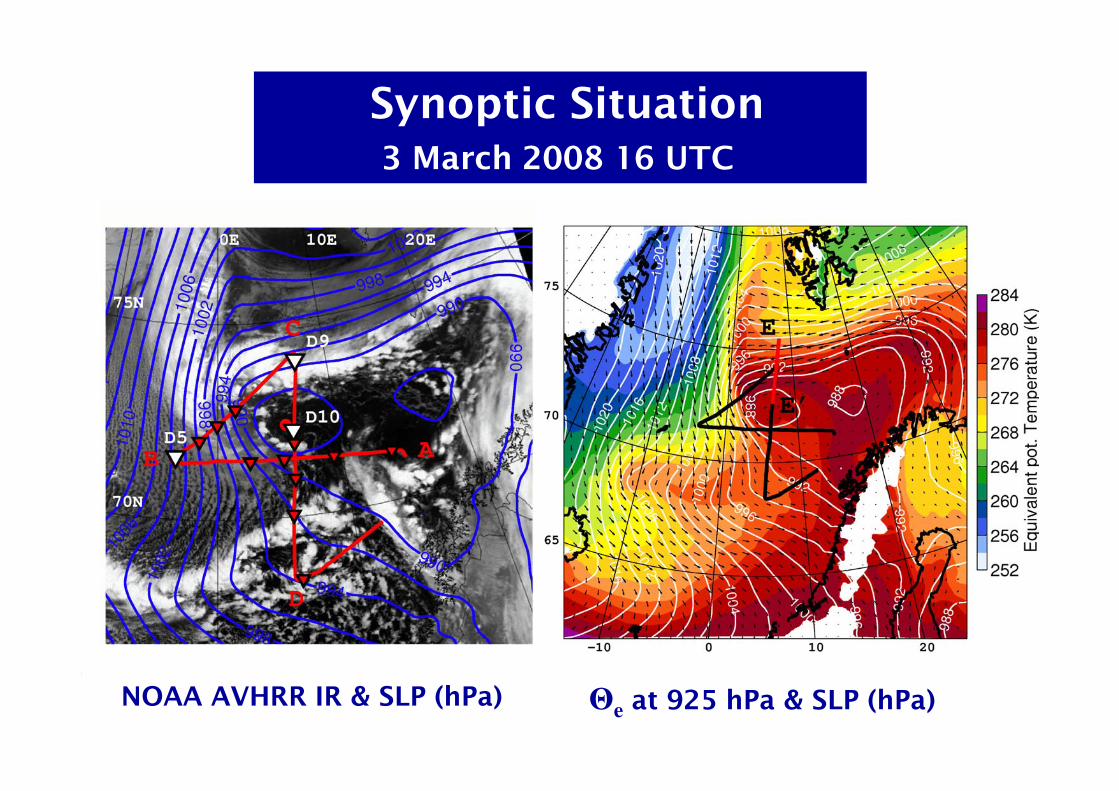
3 March 2008 16 UTC
Synoptic Situation 3 March 2008 16 UTC
Folie 30EGU Session AS1.1: Dynamical Meteorology, Vienna 8 April 2011NOAA AVHRR IR & SLP (hPa) Θ
eat 925 hPa & SLP (hPa)
3 March 2008 16 UTC
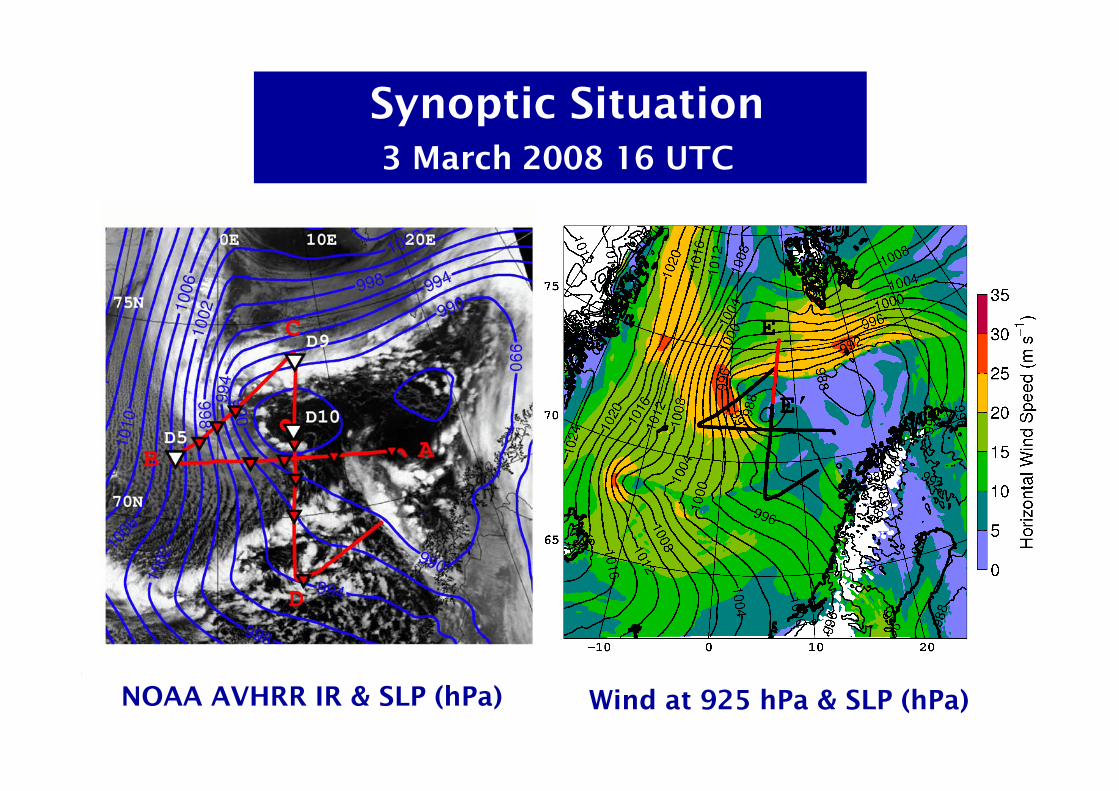
Synoptic Situation 3 March 2008 16 UTC
Folie 31EGU Session AS1.1: Dynamical Meteorology, Vienna 8 April 2011NOAA AVHRR IR & SLP (hPa) Wind at 925 hPa & SLP (hPa)
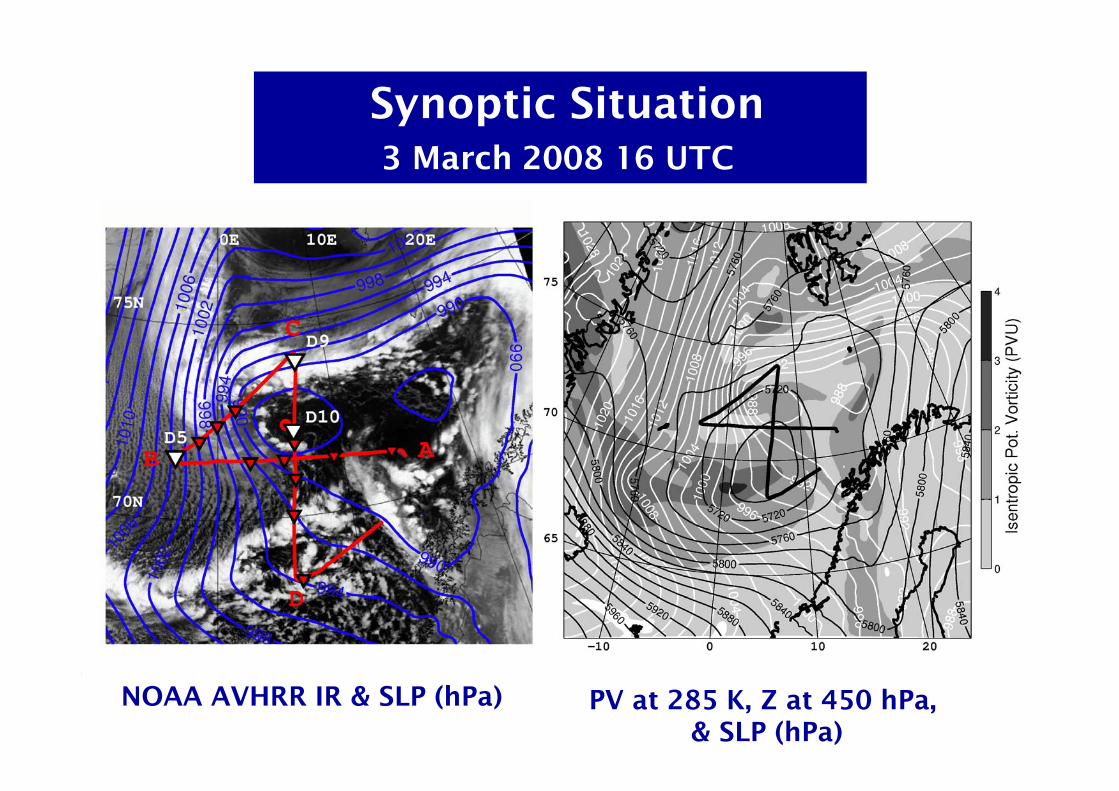
Synoptic Situation 3 March 2008 16 UTC
Folie 32EGU Session AS1.1: Dynamical Meteorology, Vienna 8 April 2011PV at 285 K, Z at 450 hPa,
& SLP (hPa)
NOAA AVHRR IR & SLP (hPa)
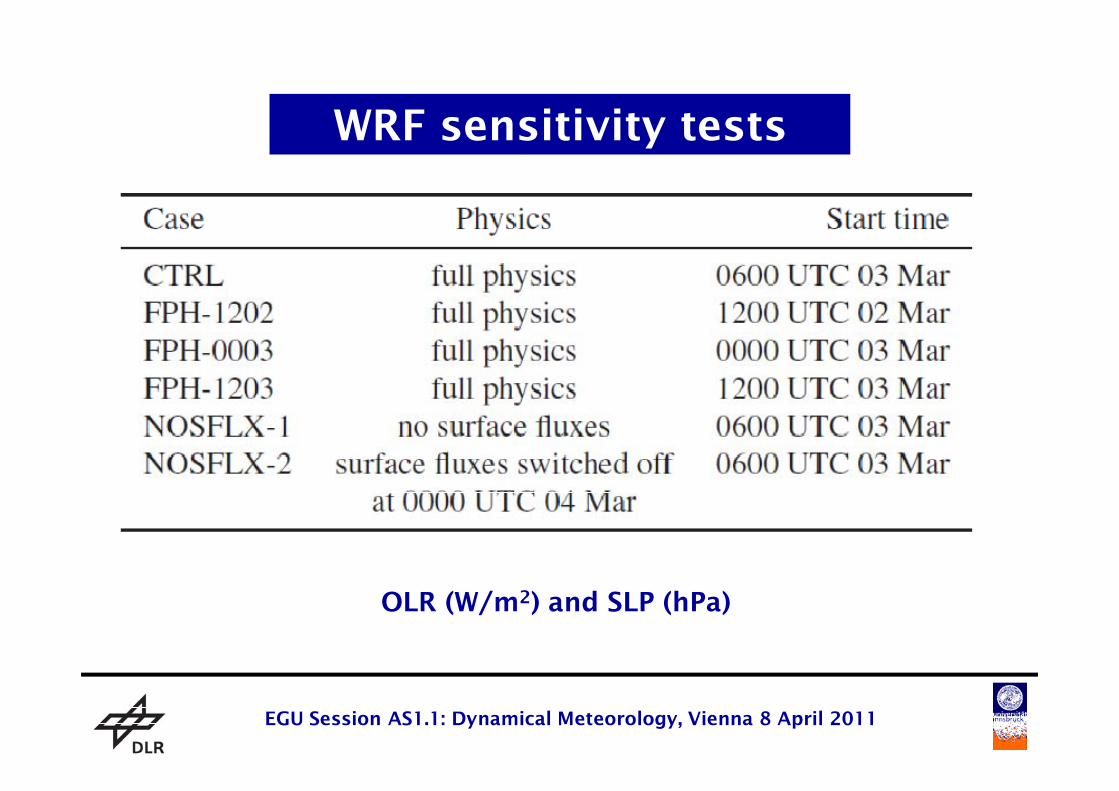
WRF sensitivity tests
Folie 33EGU Session AS1.1: Dynamical Meteorology, Vienna 8 April 2011
OLR (W/m2) and SLP (hPa)
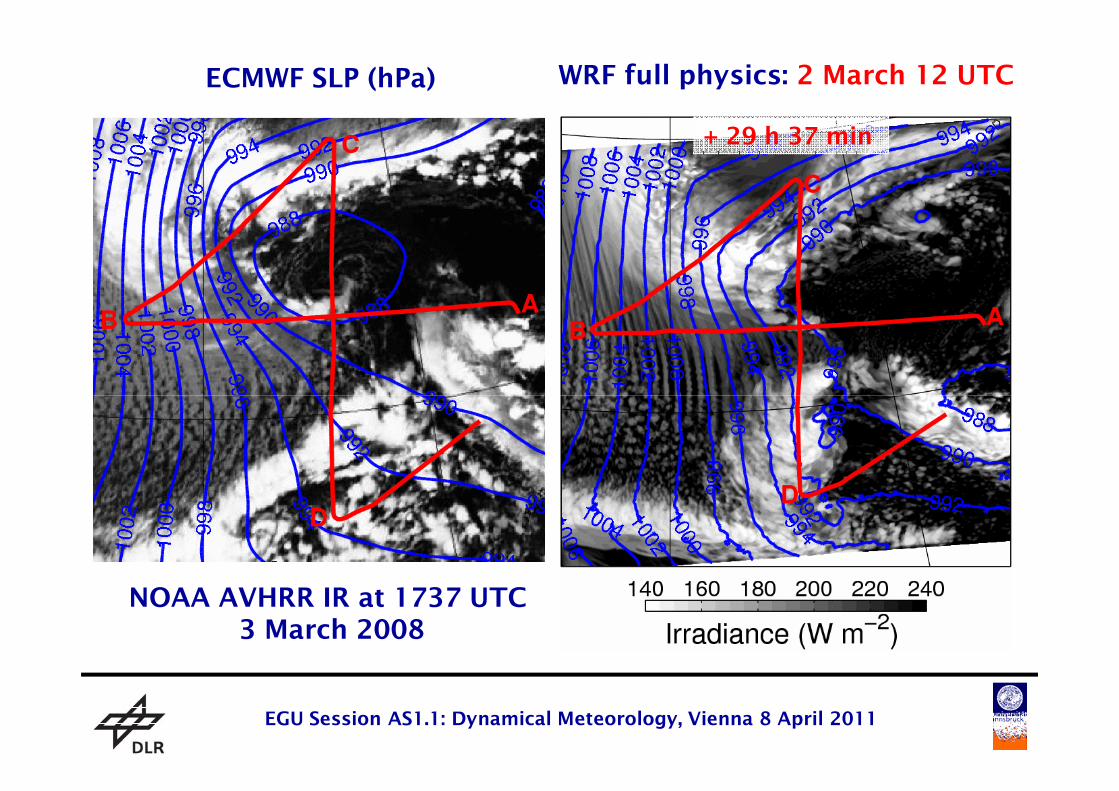
WRF full physics: 2 March 12 UTCECMWF SLP (hPa)
+ 29 h 37 min
Folie 34EGU Session AS1.1: Dynamical Meteorology, Vienna 8 April 2011
NOAA AVHRR IR at 1737 UTC3 March 2008
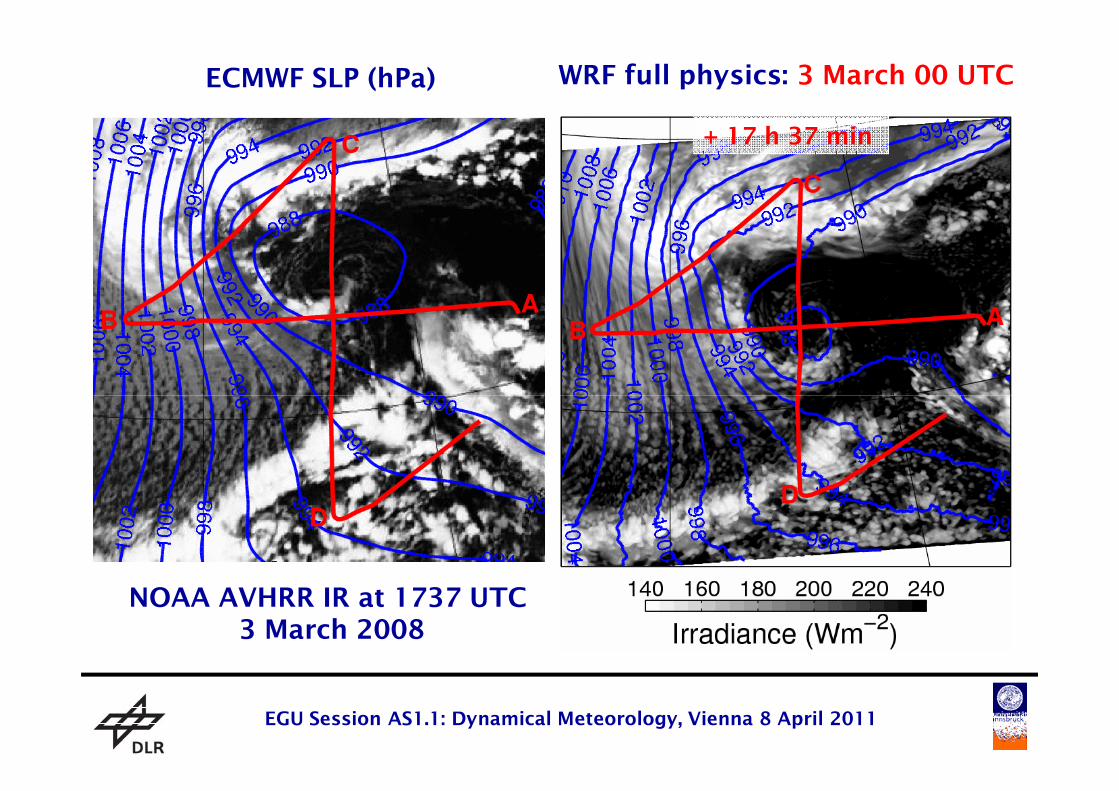
WRF full physics: 3 March 00 UTCECMWF SLP (hPa)
+ 17 h 37 min
Folie 35EGU Session AS1.1: Dynamical Meteorology, Vienna 8 April 2011
NOAA AVHRR IR at 1737 UTC3 March 2008
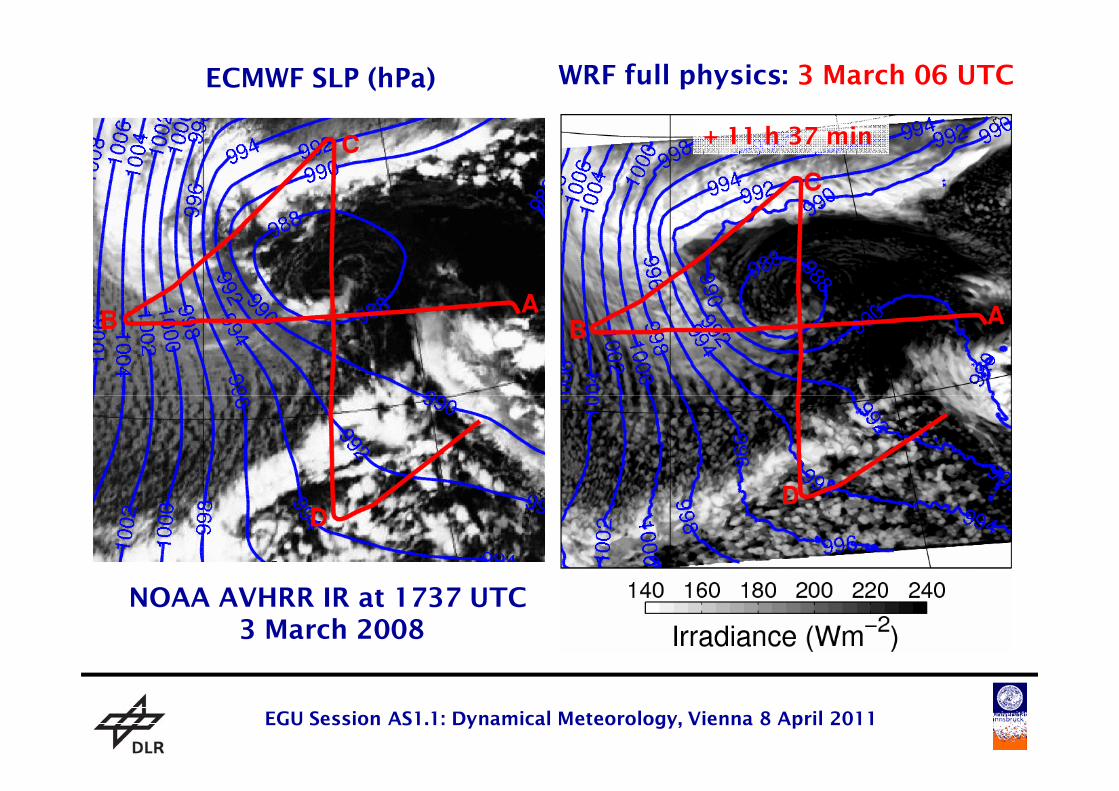
WRF full physics: 3 March 06 UTCECMWF SLP (hPa)
+ 11 h 37 min
Folie 36EGU Session AS1.1: Dynamical Meteorology, Vienna 8 April 2011
NOAA AVHRR IR at 1737 UTC3 March 2008
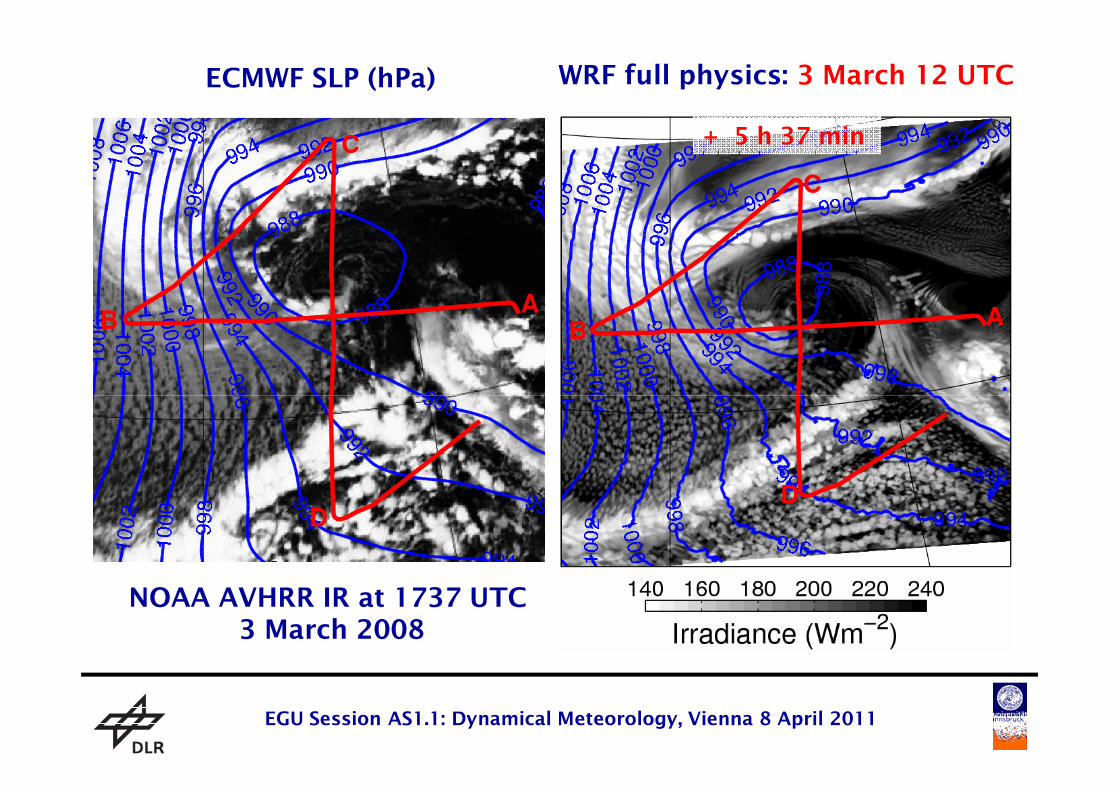
WRF full physics: 3 March 12 UTCECMWF SLP (hPa)
+ 5 h 37 min
Folie 37EGU Session AS1.1: Dynamical Meteorology, Vienna 8 April 2011
NOAA AVHRR IR at 1737 UTC3 March 2008
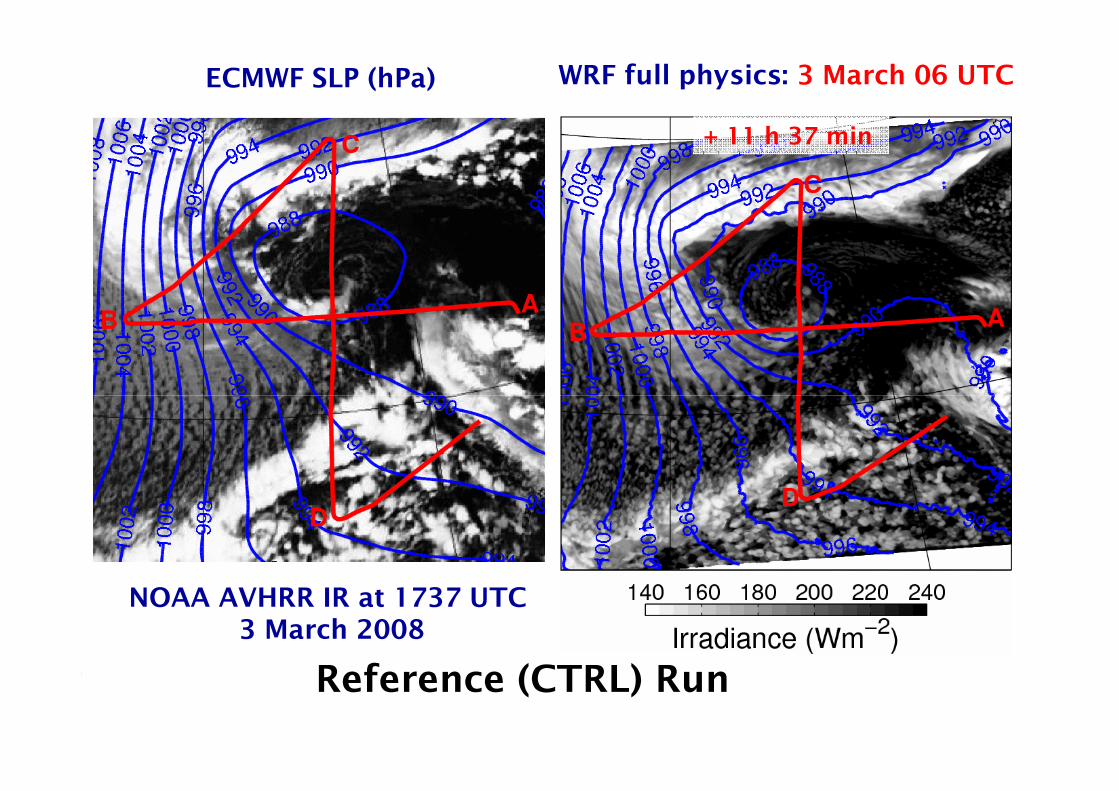
WRF full physics: 3 March 06 UTCECMWF SLP (hPa)
+ 11 h 37 min
Folie 38EGU Session AS1.1: Dynamical Meteorology, Vienna 8 April 2011
NOAA AVHRR IR at 1737 UTC3 March 2008
Reference (CTRL) Run
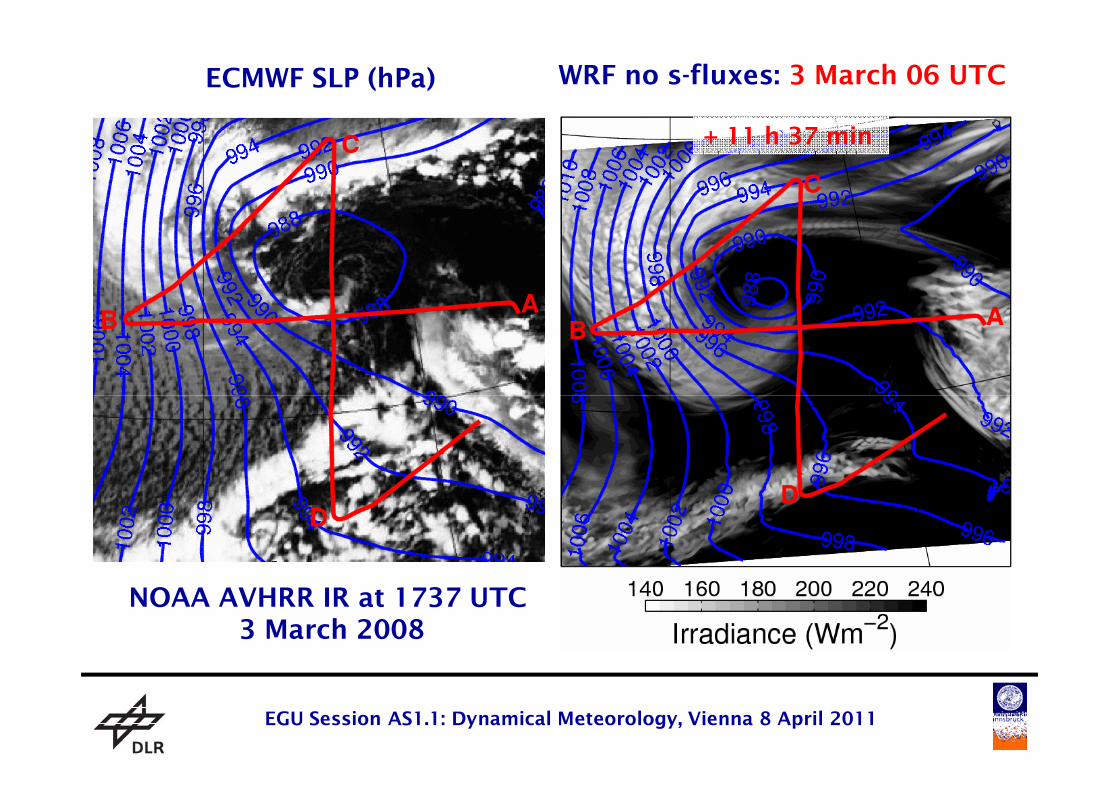
WRF no s-fluxes: 3 March 06 UTCECMWF SLP (hPa)
+ 11 h 37 min
Folie 39EGU Session AS1.1: Dynamical Meteorology, Vienna 8 April 2011
NOAA AVHRR IR at 1737 UTC3 March 2008
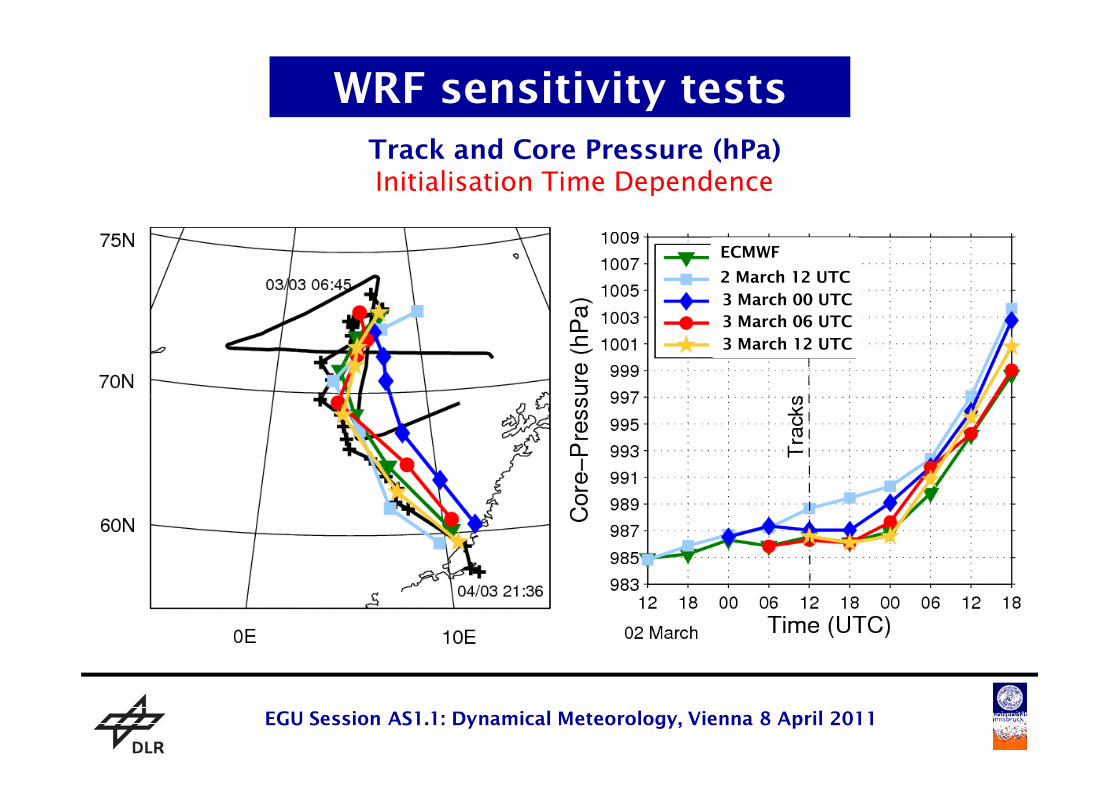
WRF sensitivity tests
Track and Core Pressure (hPa)Initialisation Time Dependence
3 March 00 UTC
3 March 06 UTC
3 March 12 UTC
ECMWF
2 March 12 UTC
Folie 40EGU Session AS1.1: Dynamical Meteorology, Vienna 8 April 2011
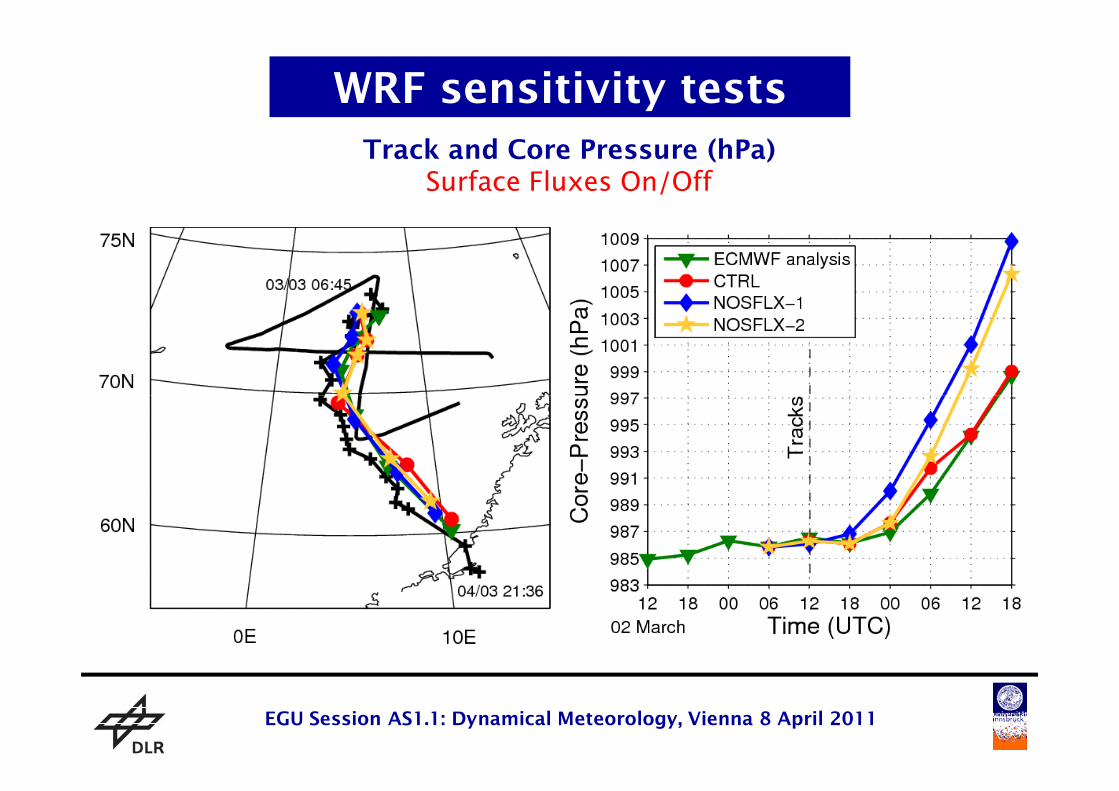
WRF sensitivity tests
Track and Core Pressure (hPa)Surface Fluxes On/Off
Folie 41EGU Session AS1.1: Dynamical Meteorology, Vienna 8 April 2011
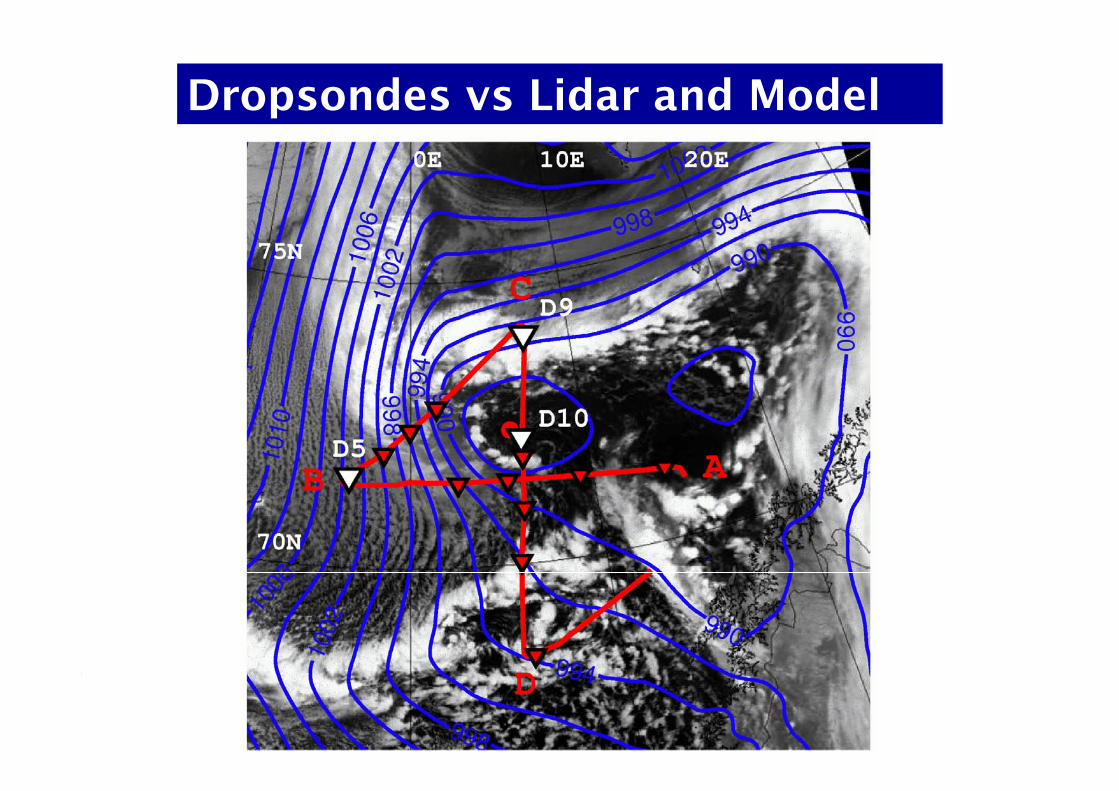
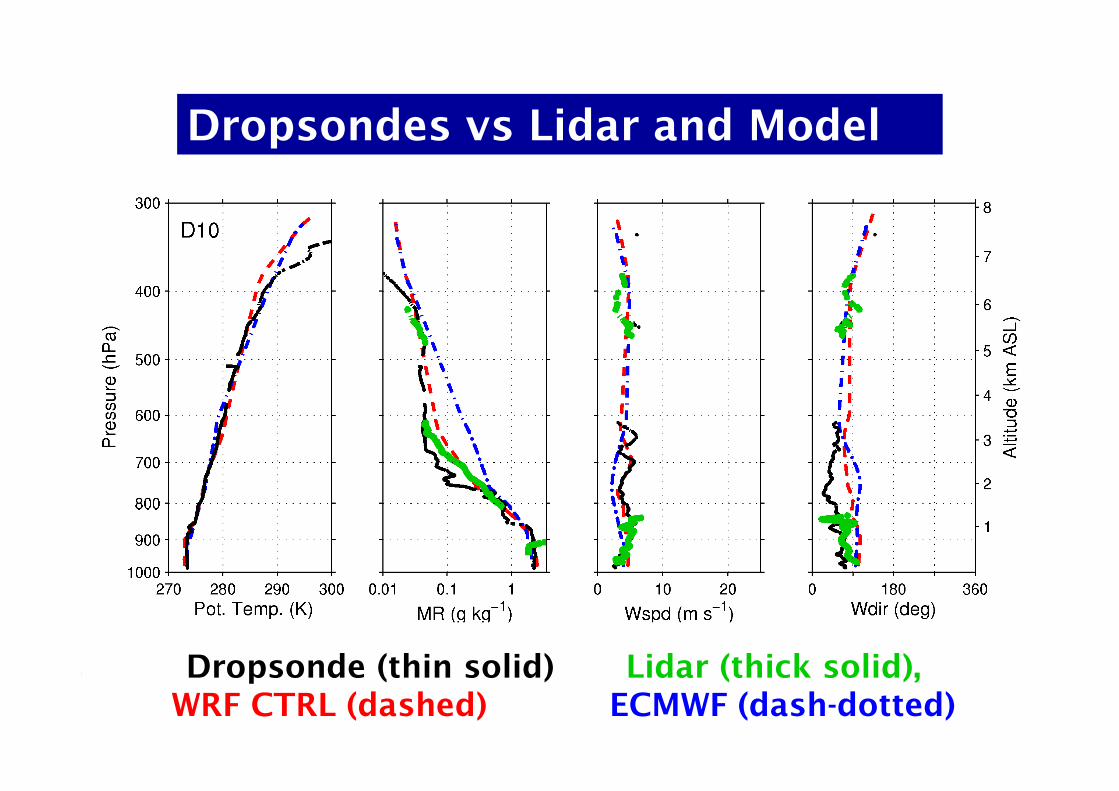
Dropsondes vs Lidar and Model
Folie 42EGU Session AS1.1: Dynamical Meteorology, Vienna 8 April 2011
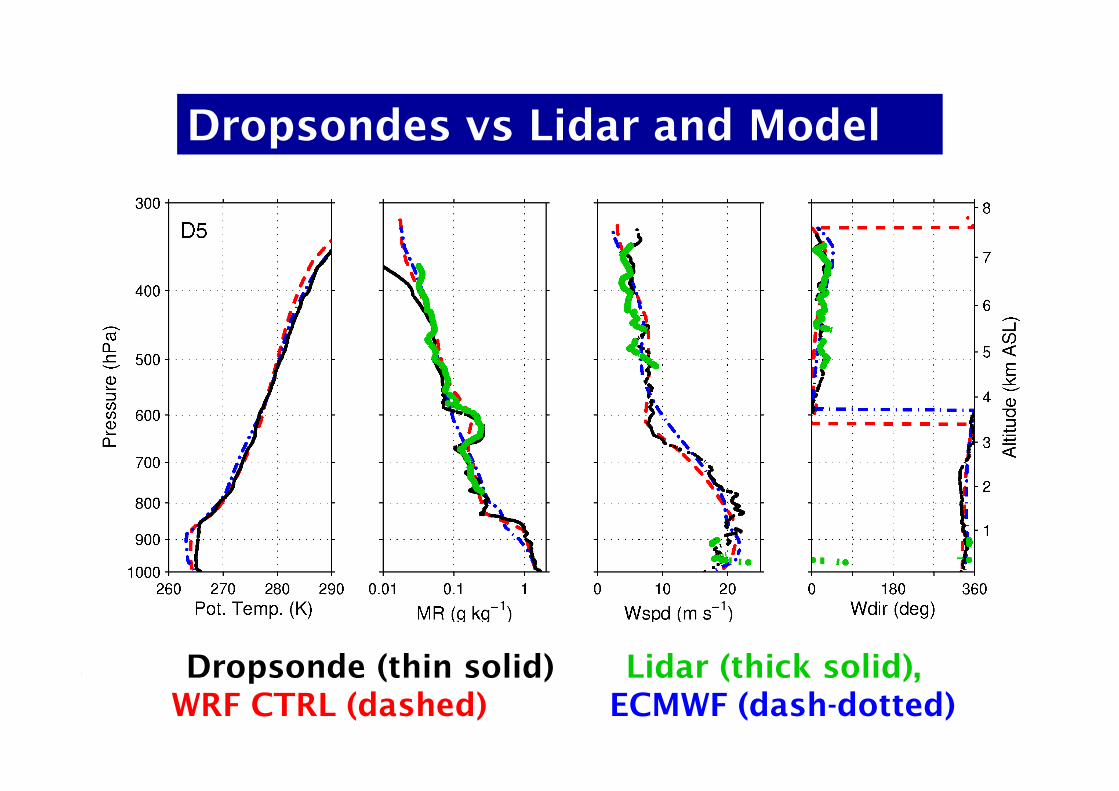
Dropsondes vs Lidar and Model
Folie 43EGU Session AS1.1: Dynamical Meteorology, Vienna 8 April 2011
Dropsonde (thin solid) Lidar (thick solid),WRF CTRL (dashed) ECMWF (dash-dotted)
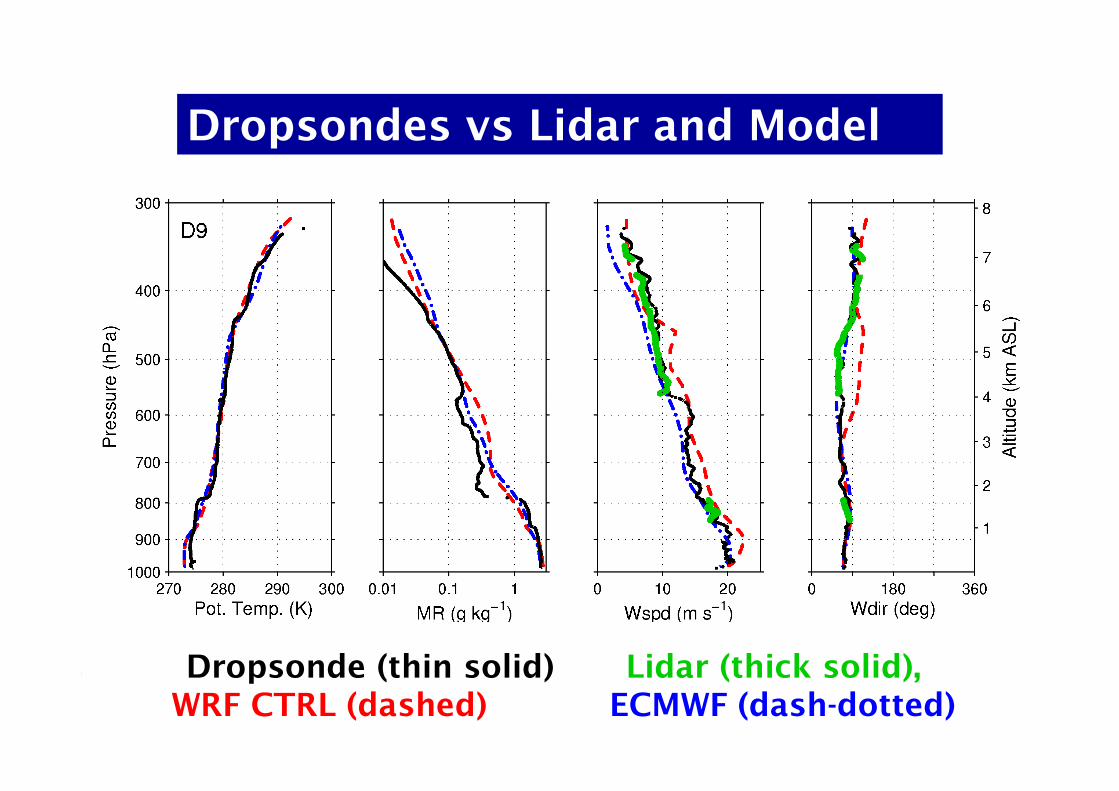
Dropsondes vs Lidar and Model
Folie 44EGU Session AS1.1: Dynamical Meteorology, Vienna 8 April 2011
Dropsonde (thin solid) Lidar (thick solid),WRF CTRL (dashed) ECMWF (dash-dotted)
Dropsondes vs Lidar and Model
Folie 45EGU Session AS1.1: Dynamical Meteorology, Vienna 8 April 2011
Dropsonde (thin solid) Lidar (thick solid),WRF CTRL (dashed) ECMWF (dash-dotted)
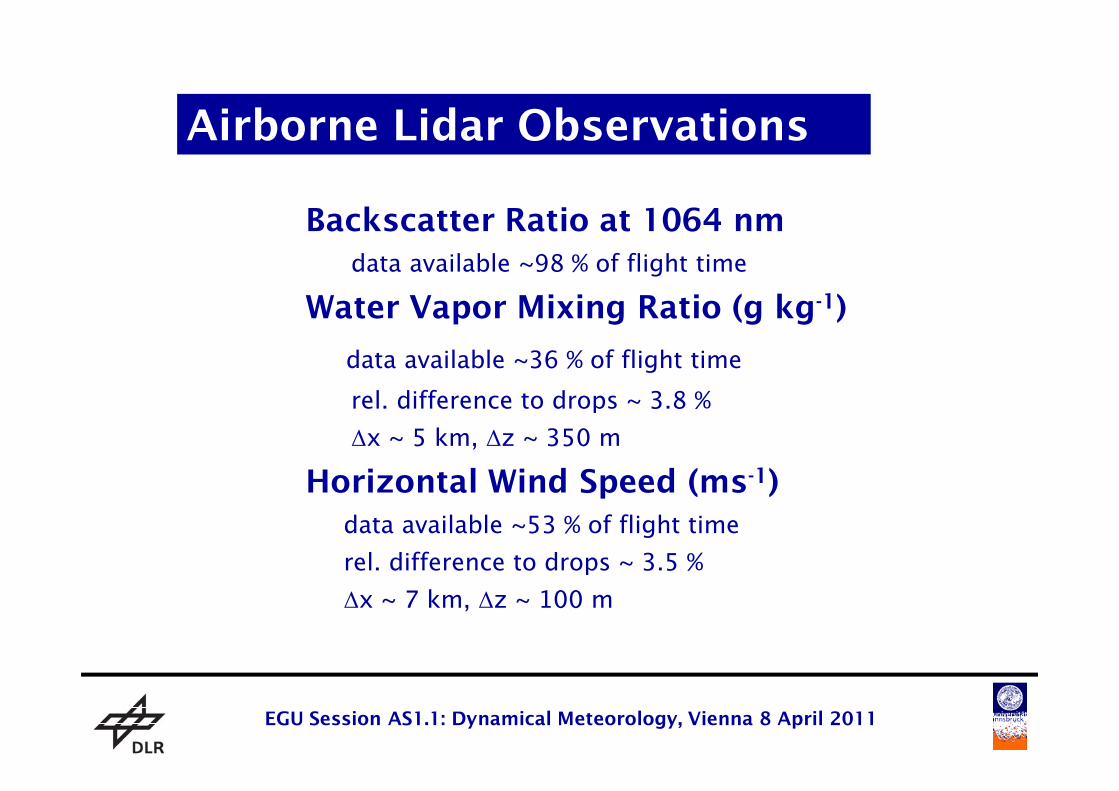
Airborne Lidar Observations
Backscatter Ratio at 1064 nm
data available ~98 % of flight time
Water Vapor Mixing Ratio (g kg-1)
data available ~36 % of flight time
rel. difference to drops ~ 3.8 %
Folie 46EGU Session AS1.1: Dynamical Meteorology, Vienna 8 April 2011
rel. difference to drops ~ 3.8 %
∆x ~ 5 km, ∆z ~ 350 m
Horizontal Wind Speed (ms-1)
data available ~53 % of flight time
rel. difference to drops ~ 3.5 %
∆x ~ 7 km, ∆z ~ 100 m
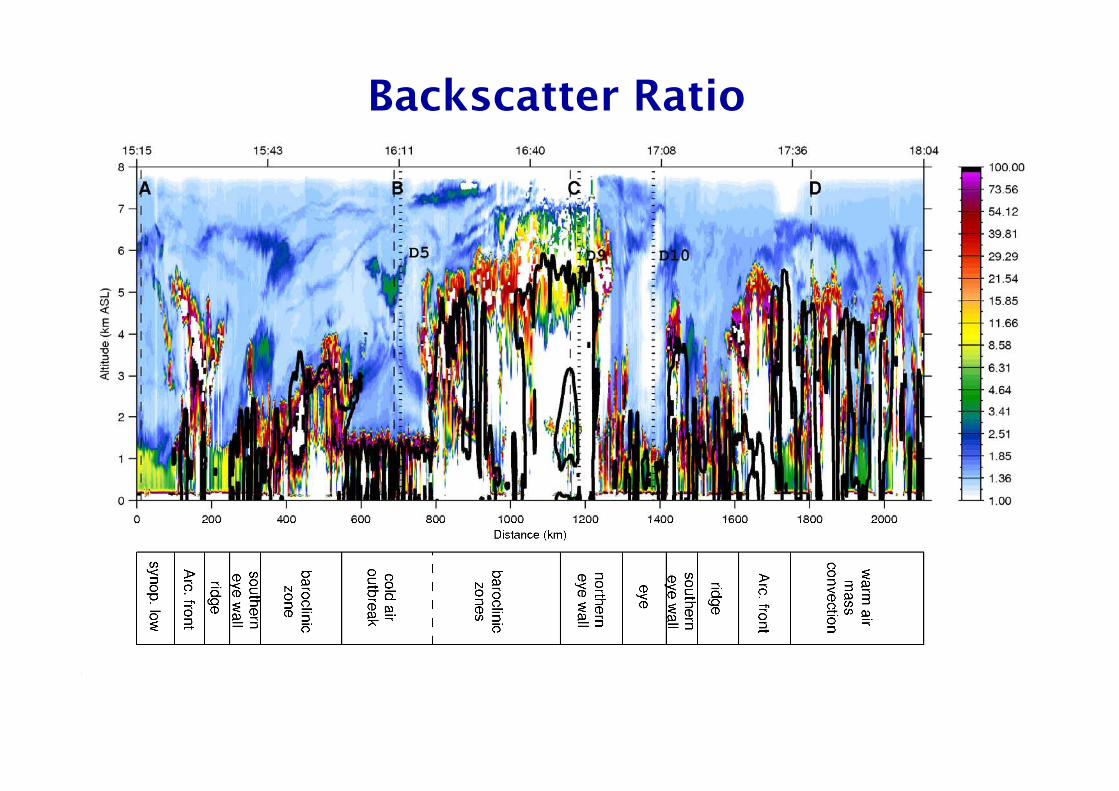
Backscatter Ratio
Folie 47EGU Session AS1.1: Dynamical Meteorology, Vienna 8 April 2011
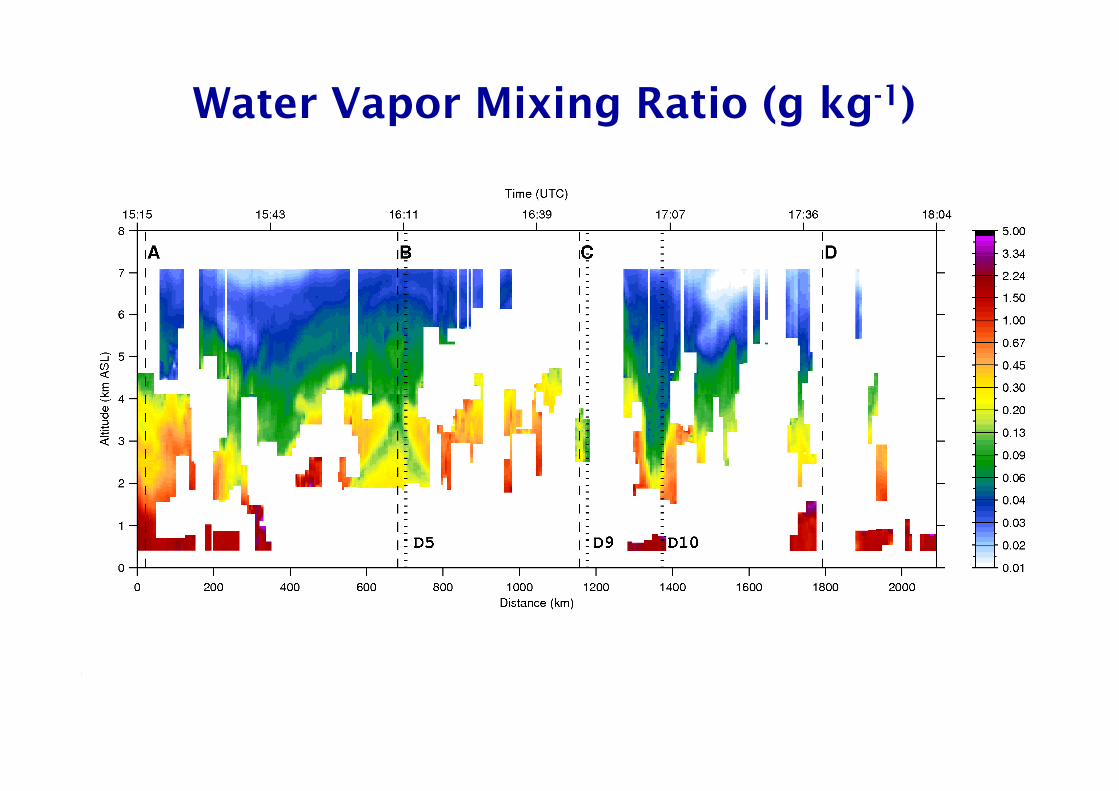
Water Vapor Mixing Ratio (g kg-1)
Folie 48EGU Session AS1.1: Dynamical Meteorology, Vienna 8 April 2011
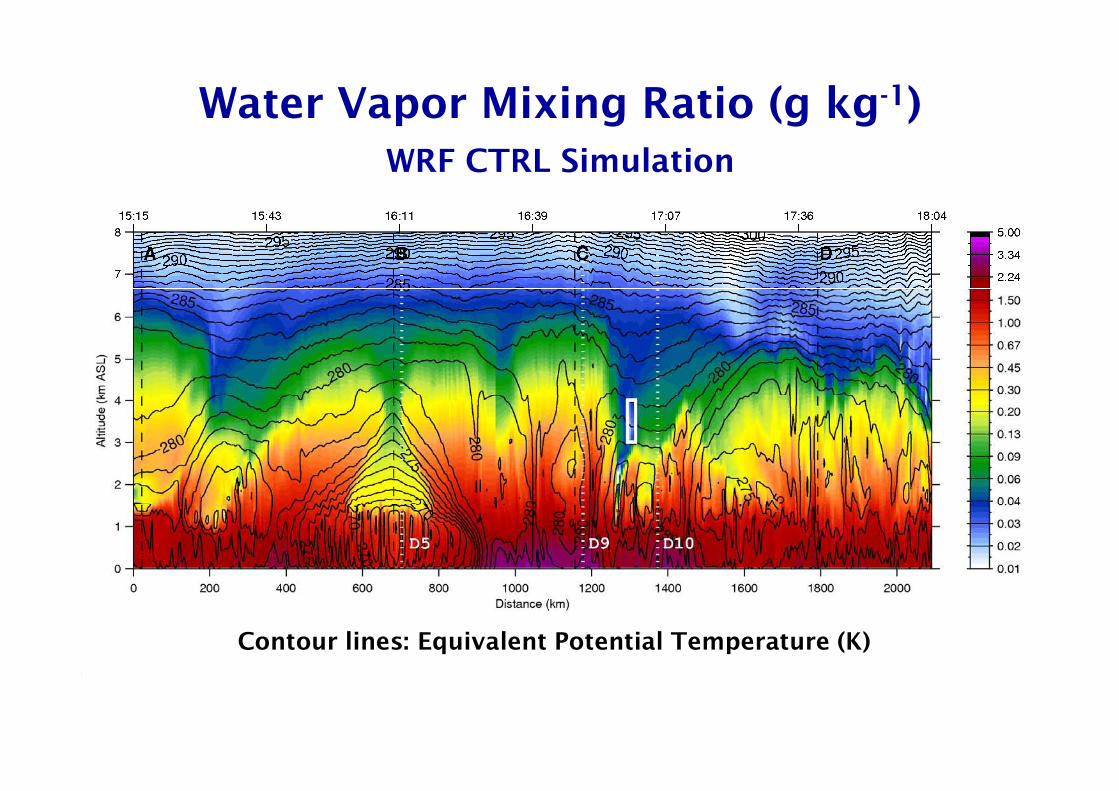
Water Vapor Mixing Ratio (g kg-1)
WRF CTRL Simulation
Folie 49EGU Session AS1.1: Dynamical Meteorology, Vienna 8 April 2011
Contour lines: Equivalent Potential Temperature (K)
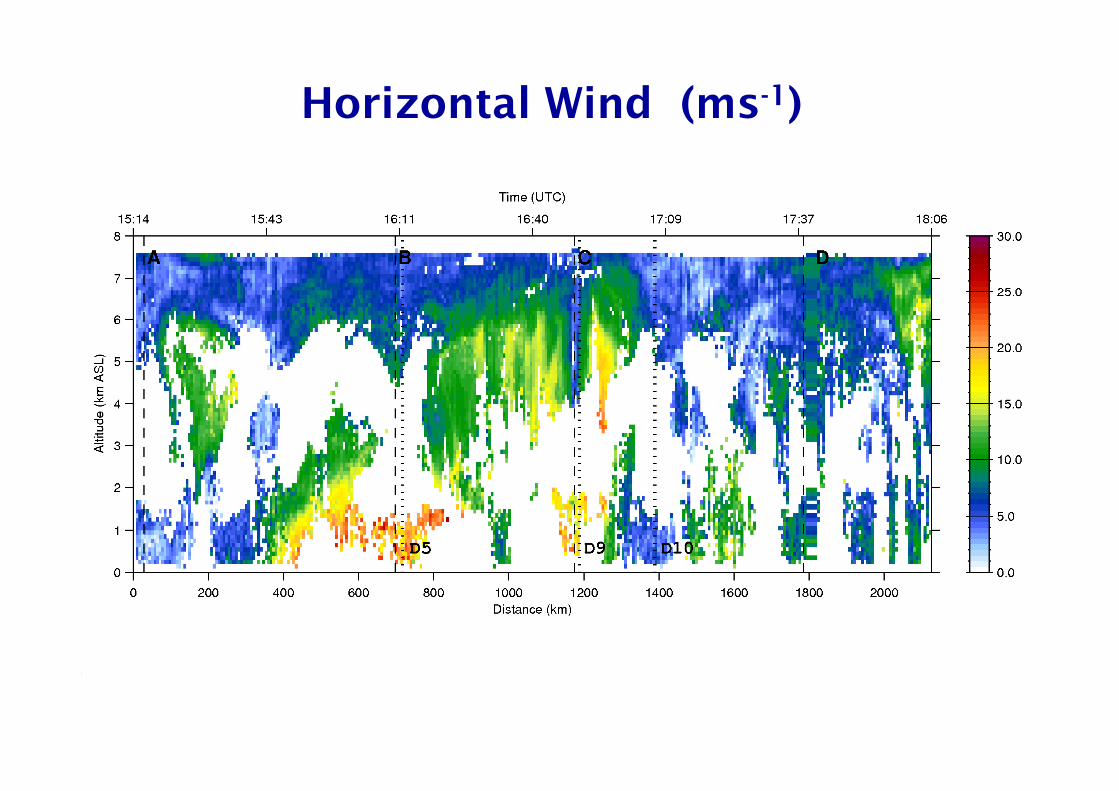
Horizontal Wind (ms-1)
Folie 50EGU Session AS1.1: Dynamical Meteorology, Vienna 8 April 2011
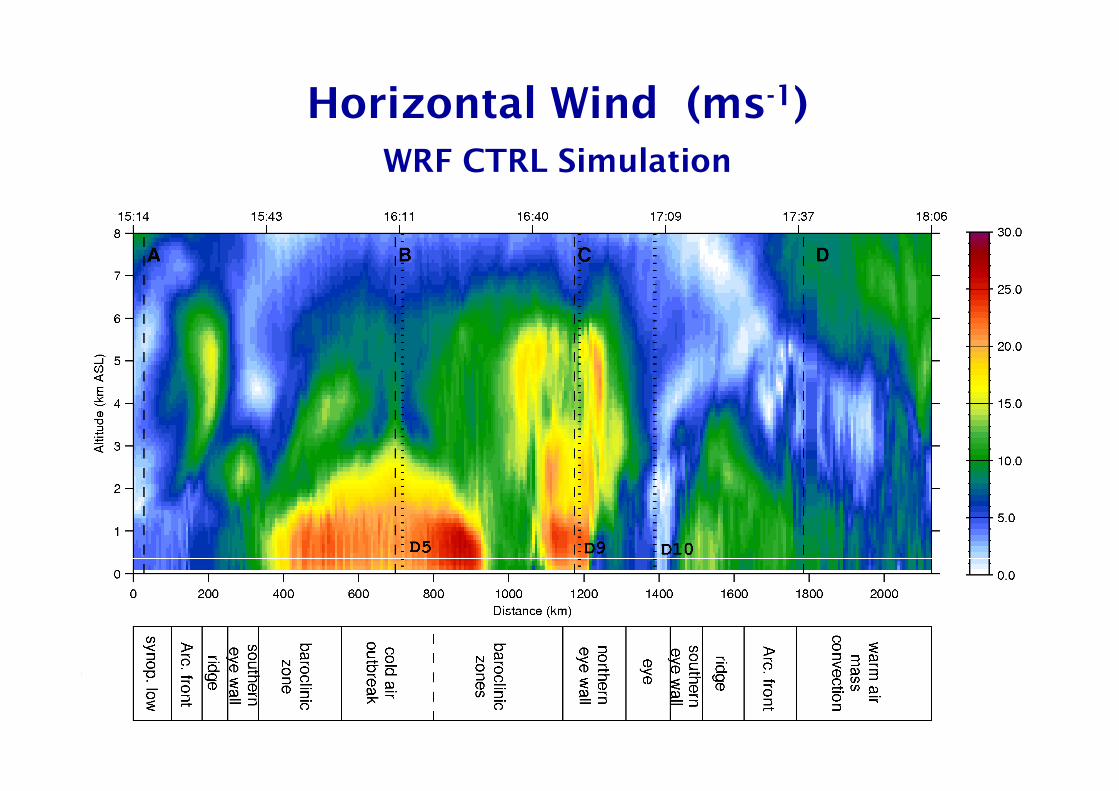
Horizontal Wind (ms-1)
WRF CTRL Simulation
Folie 51EGU Session AS1.1: Dynamical Meteorology, Vienna 8 April 2011
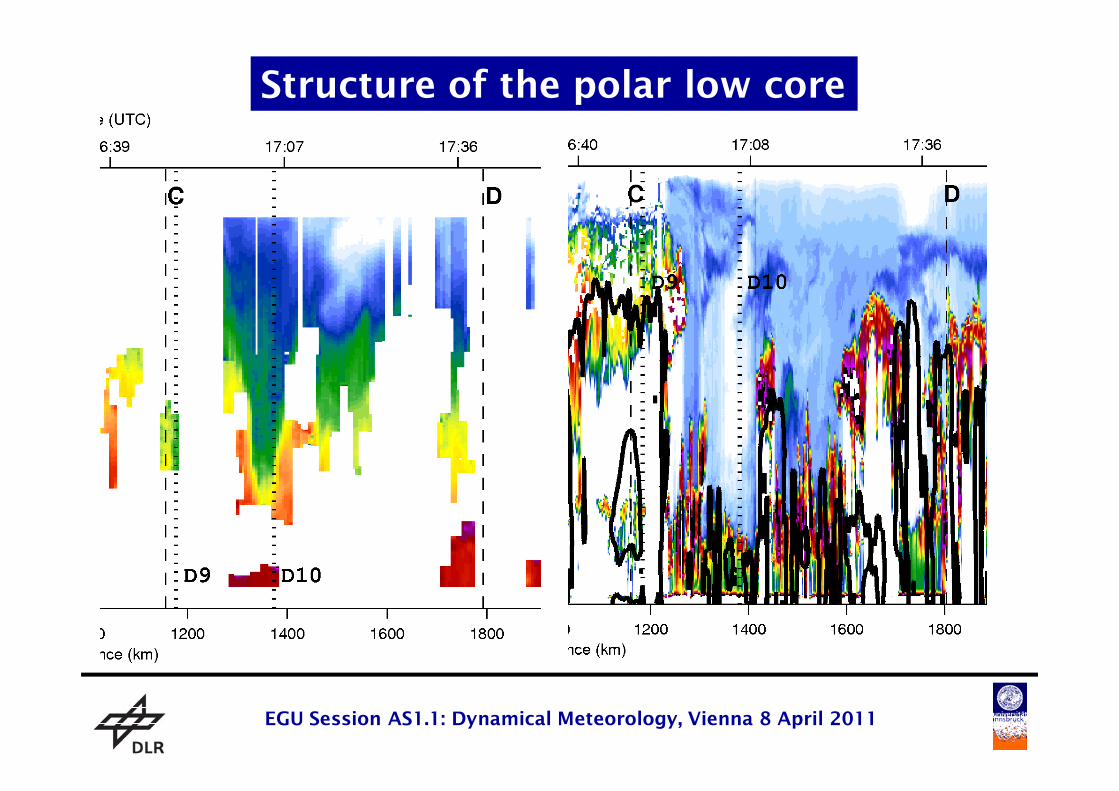
Structure of the polar low core
Folie 52EGU Session AS1.1: Dynamical Meteorology, Vienna 8 April 2011
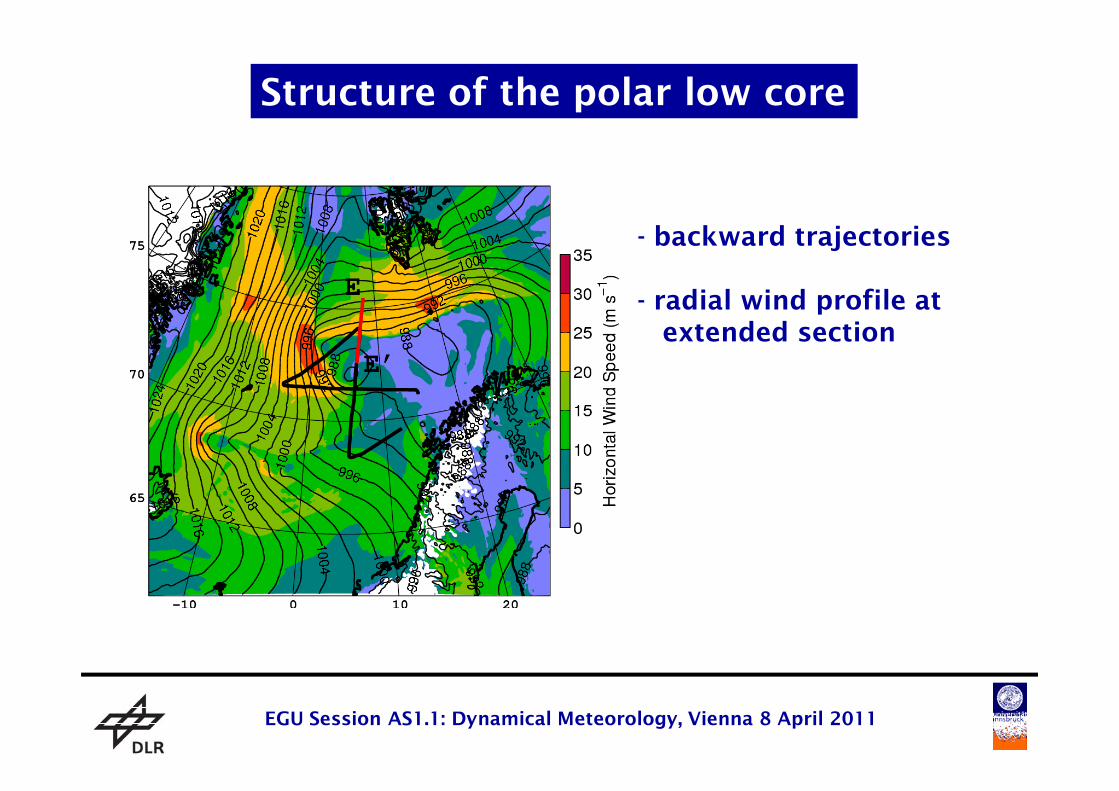
Structure of the polar low core
- backward trajectories
- radial wind profile at extended section
Folie 53EGU Session AS1.1: Dynamical Meteorology, Vienna 8 April 2011
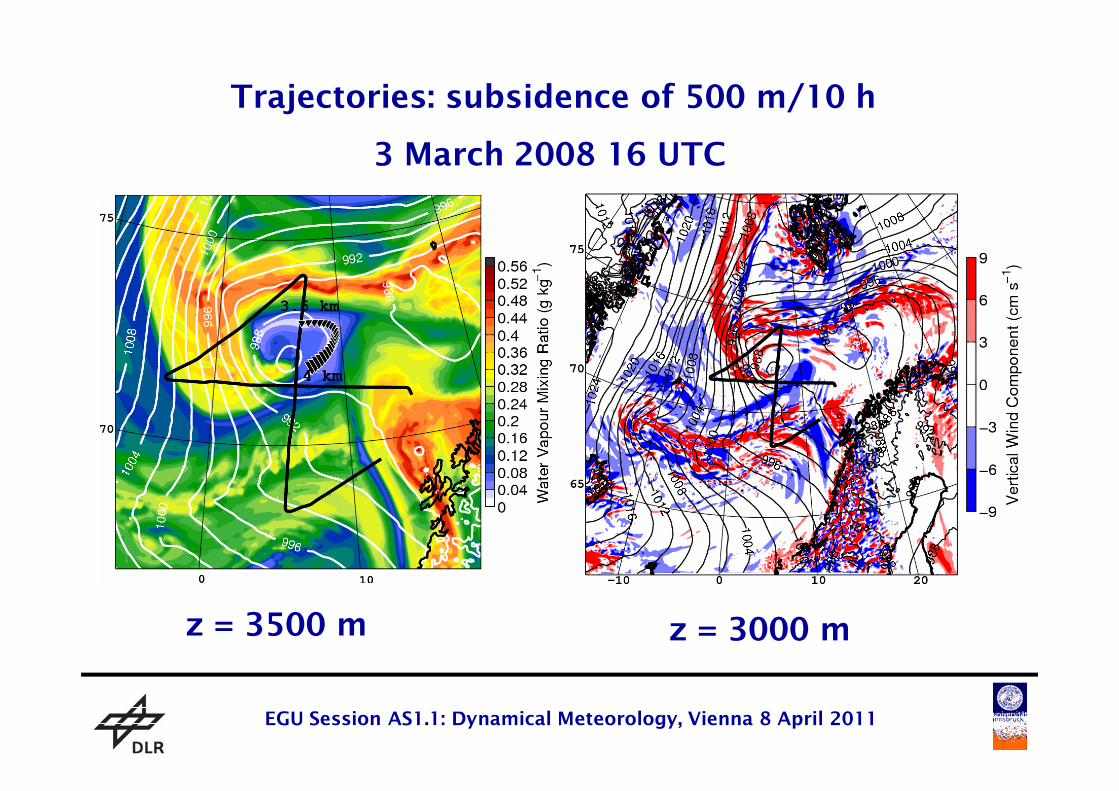
3 March 2008 16 UTC
Trajectories: subsidence of 500 m/10 h
Folie 54EGU Session AS1.1: Dynamical Meteorology, Vienna 8 April 2011
z = 3000 mz = 3500 m
Folie 55EGU Session AS1.1: Dynamical Meteorology, Vienna 8 April 2011
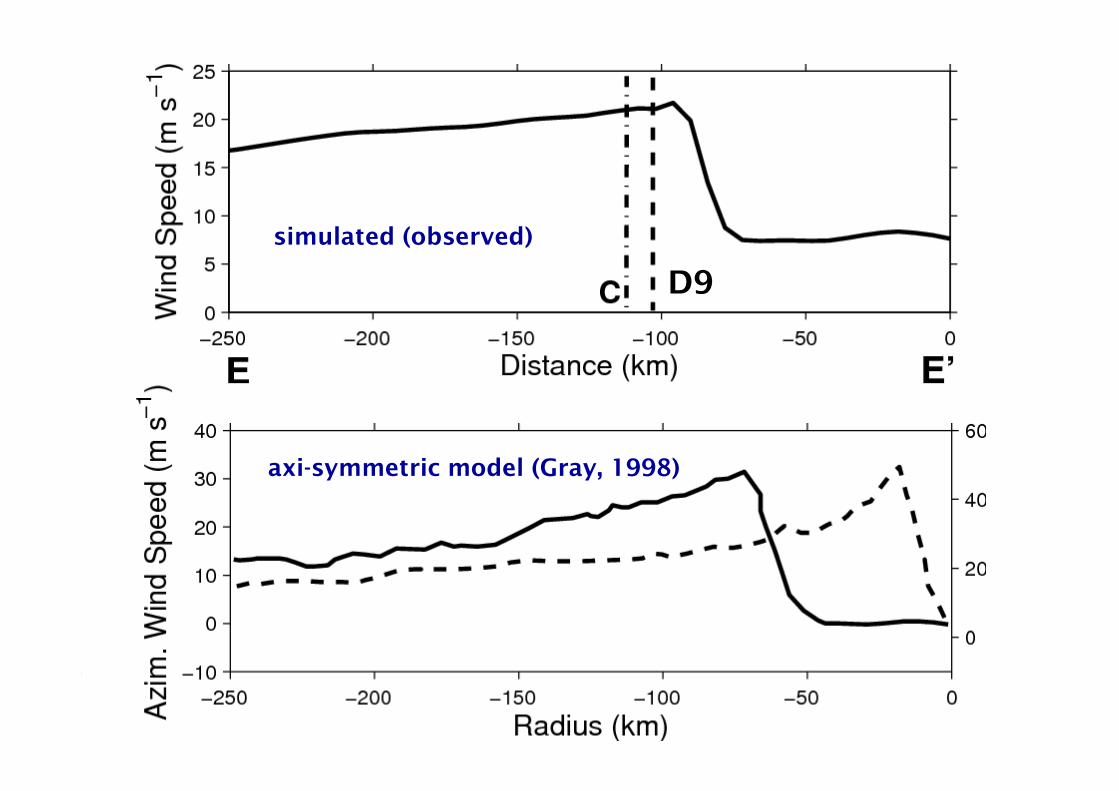
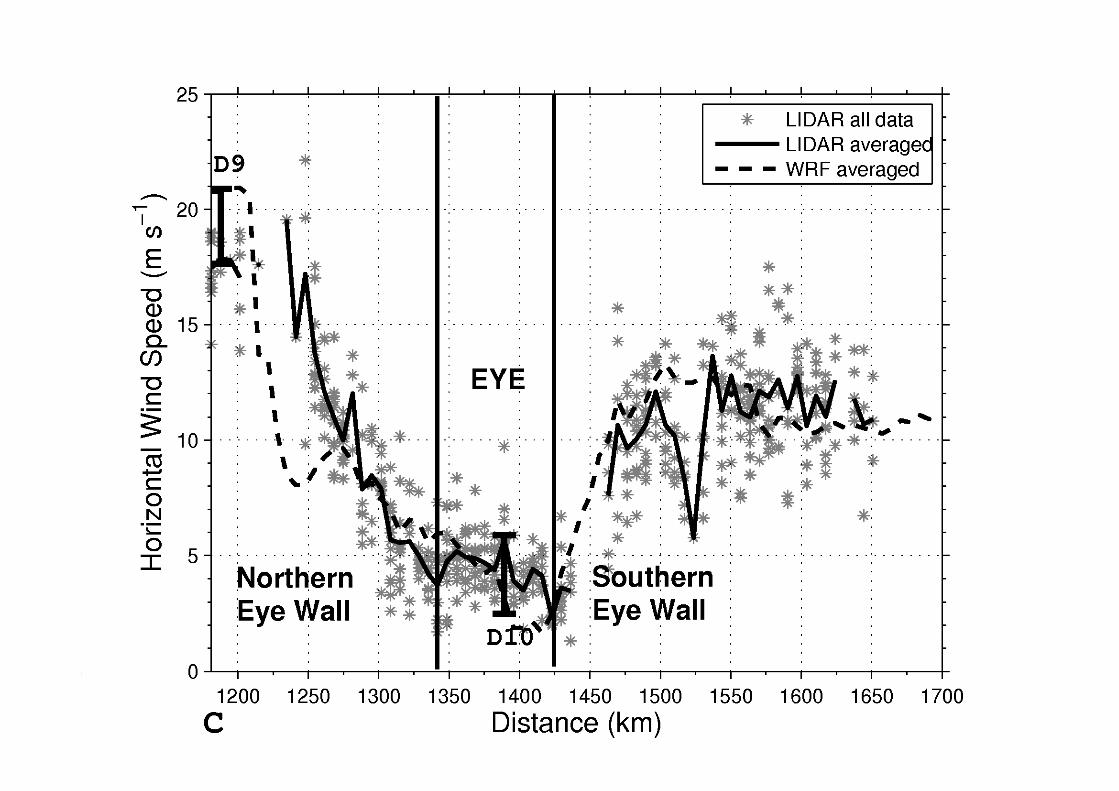
simulated (observed)
D9
Folie 56EGU Session AS1.1: Dynamical Meteorology, Vienna 8 April 2011
axi-symmetric model (Gray, 1998)
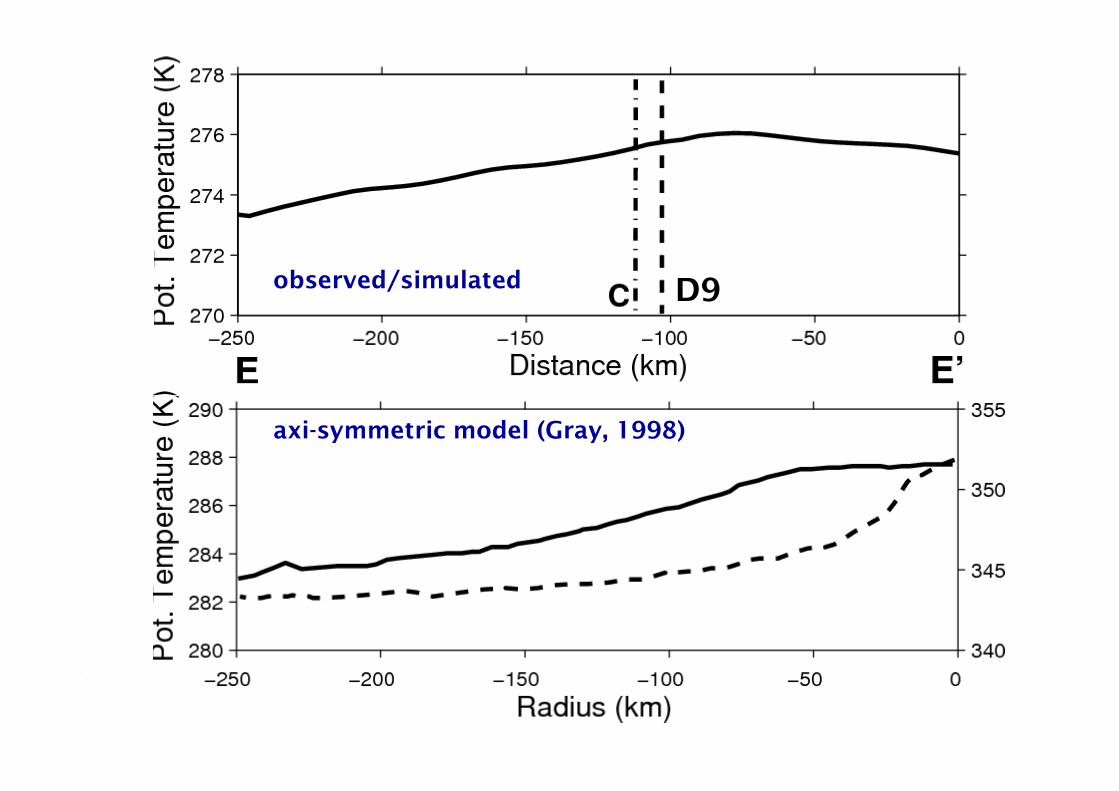
observed/simulated D9
Folie 57EGU Session AS1.1: Dynamical Meteorology, Vienna 8 April 2011
axi-symmetric model (Gray, 1998)
Conclusions
• LIDAR suitable instrumentation to characterize the
H2O, wind and aerosol particle structure above and around Polar Lows (PL), in intrusions and in the PL core
• careful selection of model parameters necessary to obtainreliable simulations to quantify hypotheses and theories) WRF and ECMWF IFS runs capture the formation of a PL
) Model Verification has been done with different types of
Folie 58EGU Session AS1.1: Dynamical Meteorology, Vienna 8 April 2011
) Model Verification has been done with different types ofobservational data
) dignificant dependence of simulation results on initialisationtime
) use of new high resolution SST/SEAICE data set) usage of ECMWF model)level data brings great improvementscompared to pressure)level data (not shown)
• verification of radial wind structure in the polar low core
Thank you for your attention!
Folie 59EGU Session AS1.1: Dynamical Meteorology, Vienna 8 April 2011