Embed Size (px)
Citation preview
Dissertation zur Erlangung des Doktorgrades der Fakultaumlt fuumlr Chemie und Pharmazie
der Ludwig-Maximilians-Universitaumlt Muumlnchen
Thin Films
from
Porous Nanoparticles
von
Johannes Georg Kobler
aus
Muumlnchen
2008
Erklaumlrung
Diese Dissertation wurde im Sinne von sect 13 Abs 3 der Promotionsordnung vom 29 Januar
1998 von Herrn Professor Dr Thomas Bein betreut
Ehrenwoumlrtliche Versicherung
Diese Dissertation wurde selbststaumlndig ohne unerlaubte Hilfe erarbeitet
Muumlnchen am 5 11 2008
___________________________
(Unterschrift des Autors)
Dissertation eingereicht am 10 11 2008
1 Gutachter Prof Dr Thomas Bein
2 Gutachter Prof Dr Konstantin Karaghiosoff
Muumlndliche Pruumlfung am 08 12 2008
Danksagung
Die vorliegende Arbeit konnte nur mit Hilfe vieler Beschaumlftigter an der Ludwig-
Maximilians-Universitaumlt Muumlnchen vieler netter Kollegen im Arbeitskreis Prof Dr
Thomas Bein und insbesondere meiner Eltern entstehen
Meinem Doktorvater Herrn Professor Thomas Bein danke sehr ich fuumlr die freundliche
Aufnahme in den Arbeitskreis sein Vertrauen in meine Arbeit sein fortwaumlhrendes
Interesse und die hilfreichen Diskussionen
Herrn Professor Konstantin Karaghiosoff moumlchte ich fuumlr sein ehrliches Interesse an
meiner Arbeit und die Uumlbernahme des Zweitgutachtens herzlich danken Zusaumltzlich
danke ich dem Pruumlfungskomitee fuumlr Ihren Einsatz
Ein groszliger Dank gilt Juumlrgen Sauer der mir auch weiterhin mit seinem Fachwissen und
seiner Erfahrung zusammen mit Wayne Daniell und Andreas Kohl zur Seite steht sowie
allen Kolleginnen und Kollegen im Arbeitskreis mit denen ich einige sehr schoumlne und
lustige Jahre verbringen durfte Fuumlr die Unterhaltung in den Kaffeepausen die
abendlichen Grillpartys und Stammtische und ihre Freundschaft danke ich vor allem
Stephan Steinlein Enrica Biemmi Alex Darga Johann Kecht Andreas Keilbach
Camilla Scherb Joumlrg Schuster Axel Schlossbauer Ralf Koumlhn Regina Huber und
besonders meinem alten und neuen Kollegen Hendrik van Heyden
Ein ganz herzliches Dankeschoumln fuumlr ihre liebe Unterstuumltzung geht an meine Eltern
meinen Bruder und Mirjam
ABSTRACT
ABSTRACT
Porous materials in the nanometer range are interesting materials in many fields of
science and technology Especially in terms of colloidal suspensions these materials are
promising candidates for applications such as gas sensing host-guest chemistry drug
delivery and coatings in the semiconductor industry In this work syntheses of
monodisperse stable colloidal suspensions of different materials for the preparation of
porous thin films were described
Colloidal suspensions of zeolite Beta nanocrystals with low aluminum content were
prepared and the crystallization kinetics was studied The crystalline Beta was stabilized
in colloidal suspensions by addition of inorganic silica-based binders and applied for the
preparation of films by a spin-on process The thickness of the films was controlled by
repeated coating steps speed of deposition and Beta concentration of the coating
suspensions The Beta films exhibit good mechanical properties smooth surfaces and
show a low refractive index which is typical for highly porous silica based materials
Additionally a synthetic approach for the preparation of colloidal mesoporous silica
spheres and functionalized colloidal suspensions of nanoscale mesoporous materials
with high yields from concentrated solutions is presented Narrow particle size
distributions in the range of about 50 to 150 nm were established with Dynamic Light
Scattering measurements and electron microscopy before and after template extraction
Discrete nanoscale mesoporous particles with functionalized pore surfaces resulted
when adding functional organoalkoxysilanes directly to the initial silica precursor
ABSTRACT
solutions Nitrogen sorption analysis indicated that the functional groups were located at
the inner surfaces of the mesoporous channel systems
By further decreasing the diameter of these mesoporous silica spheres their scattering
ability for visible light was also drastically decreased We have demonstrated the
synthesis of extremely small mesoporous silica nanoparticles via a specific co-
condensation process with phenyl groups If the size of the particles falls below about
110 of the wavelength of the incoming light (01 ) the colloidal suspensions show
optical transparency Because of an easy handling and a good reproducibility the
suspensions are ideal for the production of thin film by spin-coating The films showed
excellent optical qualities exhibited good diffusion properties and a highly accessible
pore system Thanks to the small particle size and the resulting low surface roughness
the formation of multilayers was possible without transmitting defects on the surface
with every following coating step The availability of such homogeneous porous thin
films made it possible to use ellipsometry as analysis method Ellipsometric
porosimetry (EP) is a convenient method to determine the effective porosity of a thin
film on its original support without destroying it It was possible to record sorption
isotherms of the thin films with ellipsometry and to correlate the data with nitrogen
sorption data of dried powders of the same material The thin films showed very low
refractive indices around 12 in the case of both zeolites and functionalized mesoporous
silica nanoparticles
Besides a synthesis procedure for TiO2 particles in an acidic medium by a simple sol-
gel process was investigated The material showed a high surface area and the thin films
ABSTRACT
prepared from the colloidal suspensions had a high refractive index combined with a
certain porosity Thus the preparation of wavelength specific Bragg mirrors could be
realized by a simple and reproducible spin-coating approach using colloidal suspensions
of functionalized porous silica nanoparticles and titania sols The Bragg reflectors show
a sensitivity towards specific relative pressures of organic vapors like isopropanol or
toluene
TABLE OF CONTENTS
1 INTRODUCTION 1
Nanotechnology 3
Self-Assembly 5
Nanoparticles 6
Colloid Science 8
Fabrication of Nanoparticles 12
Sol-gel Chemistry 13
Porous Materials 16
Zeolites 17
Mesoporous Silica 19
Mesoporous Titania 26
Optical Properties of Thin Films 27
2 MOTIVATION 30
3 CHARACTERIZATION METHODS 34
Sorption 35
Quartz Crystal Microbalance 42
Ellipsometry 43
Ellipsometric porosimetry 46
Light Scattering 49
Electron Microscopy 53
Thermogravimetric Analysis 54
Powder X-ray Diffraction 55
Solid-State NMR 56
IR and Raman Spectroscopy 57
4 RESULTS AND DISCUSSION 59
41 High Silica Zeolite Beta From Stable Colloidal Suspensions to Thin Films 60
Introduction 61
Experimental 63
TABLE OF CONTENTS
Results and Discussion 67
Conclusion 80
42 Synthesis and Characterization of Functionalized Mesoporous Silica
Nanoparticles 82
Introduction 83
Experimental 85
Results and Discussion 88
Conclusion 101
43 Porous Thin Films of Functionalized Mesoporous Silica Nanoparticle 103
Introduction 104
Experimental 107
Results and Discussion 111
Conclusion 123
44 Vapor-Sensitive Bragg Mirrors and Optical Isotherms from Mesoporous
Nanoparticle Suspensions 135
Introduction 136
Experimental 138
Results and Discussion 139
Conclusion 151
5 CONCLUSION AND OUTLOOK 152
6 APPENDIX 155
61 Functionalized Mesoporous Silica Nanoparticles as Host System for the
Synthesis of CdS Quantum Dots 156
Introduction 156
Experimental 158
Results and Discussion 163
Conclusion 175
62 Colloidal Suspensions of TiO2 Nanoparticles for the Preparation of Porous
Thin Films 176
TABLE OF CONTENTS
Introduction 176
Experimental 179
Results and Discussion 184
Conclusion 203
7 REFERENCES 205
INTRODUCTION
1
1 INTRODUCTION
INTRODUCTION
2
Nanosystems are already playing a major role in information technology the electronic
components in computers and communication technology are becoming smaller and
smaller However this development cannot go on forever once the nanometer scale has
been reached At that level novel physical phenomena often arise that may present
potential problems for conventional uses ndash and an opportunity for innovations and new
applications Micro- and nanosystems are also becoming increasingly important in life
science and medicine They can be introduced into living organisms for instance to
bring a cancer medication to tumor cells The increasing interest in this field can be
illustrated by simply typing the four letters ldquonanordquo into the research discovery tool
SciFinder and sort the publications in chronological order
19
87
19
88
19
89
19
90
19
91
19
92
19
93
19
94
19
95
19
96
19
97
19
98
19
99
20
00
20
01
20
02
20
03
20
04
20
05
20
06
20
07
0
2000
4000
6000
8000
10000
12000
nu
mb
er
of
pu
blicati
on
s
0
500
1000
1500
2000
2500 an
nu
al in
cre
ase o
f pu
blic
atio
ns
Fig 1 Occurrence of the word ldquonanordquo in SciFinder from 1987 to 2007
INTRODUCTION
3
Nanotechnology
One nanometer (nm) is one billionth or 10-9
of a meter For comparison a DNA
double-helix has a diameter around 2 nm and the smallest cellular life forms the
bacteria of the genus Mycoplasma are around 200 nm in length The term
ldquonanotechnologyrdquo was defined by Tokyo Science University Professor Norio Taniguchi
in 1974 as follows ldquoNano-technology mainly consists of the processing of separation
consolidation and deformation of materials by one atom or by one moleculerdquo[1]
In the
1980s the basic idea of this definition was explored in much more depth by Dr K Eric
Drexler who promoted the technological significance of nano-scale phenomena and
devices through speeches and books[2 3]
The first distinguishing concepts in
nanotechnology (but predating use of that term) were elaborated in ldquoTheres Plenty of
Room at the Bottomrdquo a talk given by physicist Richard Feynman at an American
Physical Society meeting at Caltech on December 29 1959 Feynman described a
process by which the ability to manipulate individual atoms and molecules might be
developed using one set of precise tools to build and operate another proportionally
smaller set so on down to the needed scale In the course of this he noted scaling
issues would arise from the changing magnitude of various physical phenomena gravity
would become less important surface tension and Van-der-Waals-attraction would
become more important etc
Nanotechnology and nanoscience got started in the early 1980s The driving force for
nanotechnology came from a renewed interest in colloid science coupled with a new
generation of analytical tools that allow observing and characterizing the materials or
INTRODUCTION
4
devices even in the sub-nanometer domain The invention of the scanning tunneling
microscope (STM) the discovery of fullerenes in 1986 and carbon nanotubes a few
years later as well as the synthesis of semiconductor nanocrystals (quantum dots) or the
atomic force microscope (AFM) can be mentioned as milestones in the early years
Nanotechnology today is a field of applied science and technology covering a broad
range of topics The main unifying theme is the control of matter on a scale smaller than
one micrometer normally approximately 1 to 100 nanometers as well as the fabrication
of devices of this size It is a highly multidisciplinary enterprise drawing from fields
such as applied physics materials science colloid science device physics
supramolecular chemistry and mechanical and electrical engineering Nanoscience can
be seen as an extension of existing sciences into the nanoscale (or sometimes as a
recasting of existing sciences using a newer more modern term)
Two main approaches are used in nanotechnology In the ldquotop-downrdquo approach nano-
objects are constructed from larger entities without atomic-level control Many
technologies originating from conventional solid-state silicon processing methods for
fabricating microprocessors are capable of creating features much smaller than 100 nm
thus falling under the definition of nanotechnology A complementary and from a
chemical point of view much more challenging strategy is the ldquobottom-uprdquo approach
The materials and devices are built from molecular components or other nano-objects
by an appropriate combination of driving forces such as molecular recognition self-
assembly hydrogen bonding etc
INTRODUCTION
5
Self-Assembly
Self-assembly can be defined as spontaneous and reversible organization of molecular
units or other nano-objects into ordered structures by non-covalent interactions The
interactions responsible for the formation of the self-assembled system act on a strictly
local level - in other words the nanostructure builds itself[4]
There are at least three features that distinguish self-assembly from common chemical
reactions driving atoms and molecules to assemble into larger structures First the self-
assembled structure must have a higher order than the isolated components The second
important aspect of self-assembly is the key role of weak interactions eg Van-der-
Waals- capillary- πminusπ- or hydrogen bonds The third distinctive feature is that the
building blocks can be not only atoms and molecules but span a wide range of nano-
and mesoscopic structures with different chemical compositions shapes and
functionalities Examples of self-assembly in materials science include the formation of
colloidal crystals lipid bilayers phase-separated polymers or self-assembled
monolayers
Another characteristic that is common to nearly all self-assembled systems is their
thermodynamic stability In covalent synthesis and polymerization the scientist links
atoms together in any desired conformation In order for self-assembly to take place
without the intervention of external forces the process must lead to a lower Gibbs
energy thus self-assembled structures are thermodynamically more stable than the
single un-assembled components A direct consequence is the general tendency of self-
assembled structures to be relatively free of defects
INTRODUCTION
6
By choosing precursors with suitable physicochemical properties it is possible to exert
a fine control on the formation processes in order to obtain complex architectures
Popular examples for such self-organizing units are surfactant micelles - aggregates of
surface-active molecules dispersed in a liquid
Fig 2 Surfactant molecule and micelle
A typical micelle in aqueous solution forms an aggregate with the hydrophilic ldquoheadrdquo
regions in contact with surrounding solvent sequestering the hydrophobic tail regions in
the micelle centre The shape and size of a micelle is a function of the molecular
geometry of its surfactant molecules and solution conditions such as surfactant
concentration temperature pH and ionic strength Such micelles are already simple
examples for nano-objects
Nanoparticles
Nanoparticles are often defined as microscopic particles with at least one dimension less
than 100 nm A nanoscopic film for example has vertical dimensions in the range of
01ndash100 nm according to the IUPAC definition[5]
Due to a wide variety of potential
applications in biomedical optical and electronic fields nanoparticles are of great
INTRODUCTION
7
scientific interest as they are effectively a bridge between bulk materials and atomic or
molecular structures
A bulk material should have constant physical properties regardless of its size but a
number of physical phenomena can noticeably change as the size of the system
decreases The properties of materials change as their size approaches the nanoscale and
as the percentage of atoms at the surface of a material becomes significant These
include quantum mechanical effects for example the ldquoquantum size effectrdquo where the
electronic properties of solids are altered with great reductions in particle size This
effect does not come into play by going from macro to micro dimensions but it does
become dominant when the nanometer size range is reached
Additionally a number of physical properties change when compared to macroscopic
systems thus enabling unique applications For instance the melting point of gold is
shifted to lower temperatures[6]
Much of the fascination with nanoscience stems from
these unique quantum and surface phenomena that matter exhibits at the nanoscale
A unique aspect of nanoscience is the vastly increased ratio of surface area to volume
present in many nanoscale materials that opens new possibilities in surface-based
science such as catalysis Colloid science has given rise to many materials that may be
useful in nanotechnology for instance carbon nanotubes and nanometer-sized metal
oxide particles At the small end of the size range nanoparticles are often referred to as
clusters Metal dielectric and semiconductor nanoparticles have been formed as well
as hybrid structures eg core-shell particles Nanoparticles made of semiconducting
material may also be labeled quantum dots if they are small enough (typically sub
INTRODUCTION
8
10 nm) for quantization of electronic energy levels to occur Such nanoscale particles
are used in biomedical applications eg as imaging agents Semi-solid and soft
nanoparticles have been manufactured A prototype nanoparticle of semi-solid nature is
represented by the liposomes Various types of liposomes or other types of porous
nanoparticles are currently explored clinically as delivery systems for anticancer drugs
and vaccines[7 8]
But nanoparticles also present possible dangers both medically and environmentally
Most of these are due to the high surface to volume ratio which can make the particles
very reactive or catalytically active They may also be able to pass through cell walls in
organisms and their interactions with the body are relatively unknown However free
nanoparticles in the environment quickly tend to agglomerate and thus leave the nano-
regime and nature itself presents many nanoparticles to which organisms on earth may
have evolved immunity such as terpenes from plants[9]
or dust from volcanic eruptions
Colloid Science
As mentioned above much of the knowledge in todayrsquos nanoscience derives from
colloidal science Sol-gel chemistry for example is a typical ldquobottom-uprdquo approach
The Scottish scientist Thomas Graham introduced this field of study in 1861 Many
familiar substances including butter milk smoke paints and glues are colloids
A colloid or colloidal dispersion is a type of homogeneous mixture It consists of two
separate phases a dispersed phase and a continuous phase the dispersed phase is made
of very small particles or droplets that are distributed evenly throughout the continuous
INTRODUCTION
9
phase According to IUPAC the size of the dispersed phase particles is between 1 and
1000 nm in at least one dimension Homogeneous mixtures with a dispersed phase in
this size range may be called colloidal aerosols colloidal emulsions colloidal foams
colloidal dispersions or hydrosols The dispersed particles or droplets are largely
affected by the surface chemistry present in the colloid Homogeneous suspensions of
nanoparticles are possible if the interaction of the particle surface with the solvent is
strong enough to overcome differences in density which usually result in a material
either sinking or floating in a liquid
Fig 3 shows the free energy E as a function of the particle distance r (kB = Boltzmann
constant T = absolute temperature) The free energy reaches its minimum when the
particle distance r = δ This approach is only possible if the energy barrier ΔEc is of the
same order of magnitude as the thermal energy kBT in this case the dispersion is
kinetically unstable In contrast in case of a stable colloidal dispersion the energy
barrier is so high that the particles can not converge enough to coagulate
INTRODUCTION
10
Fig 3 Kinetic stability of colloidal dispersions
The following forces play an important role in the interactions of colloid particles and
thus the height of the energy barrier
Excluded volume repulsion This refers to the impossibility of any overlap between
hard particles
Electrostatic interaction Colloidal particles often carry an electrical charge (zeta
potential) and therefore attract or repel each other The charges of both the continuous
and the dispersed phase as well as the mobility of the phases are factors affecting this
interaction
INTRODUCTION
11
Van-der-Waals-forces This is due to interactions between two dipoles that are either
permanent or induced Even if the particles do not have a permanent dipole fluctuations
of the electron density give rise to a temporary dipole in the particle This temporary
dipole induces a dipole in particles nearby The temporary dipole and the induced
dipoles are then attracted to each other
Entropic forces According to the second law of thermodynamics a system progresses
to a state in which entropy is maximized
Steric forces between polymer-covered surfaces or in solutions containing non-
adsorbing polymer can modulate interparticle forces producing an additional repulsive
steric stabilization force or attractive depletion force between them
The two main mechanisms to prevent colloids from aggregating are steric stabilization
and electrostatic stabilization Electrostatic stabilization is based on the mutual
repulsion of like electrical charges Different phases generally have different charge
affinities so that a double-layer of charges forms at any interface Small particle sizes
lead to enormous surface areas and this effect is greatly amplified in colloids In a
stable colloid the mass of the individual particles in a dispersed phase is so low that
their kinetic energy is too small to overcome their electrostatic repulsion
INTRODUCTION
12
Unstable colloidal dispersions form flocks as the particles aggregate due to interparticle
attractions This can be accomplished by different methods
Adding salts or solvents to a suspension or changing the pH of a suspension to
effectively neutralize the surface charge of the dispersed particles can accomplish
removal of the electrostatic barrier that prevents aggregation of the particles This
removes the repulsive forces that keep colloidal particles separate and allows for
coagulation due to Van-der-Waals-forces
Addition of a charged polymeric flocculant can bridge individual colloidal particles by
attractive electrostatic interactions For example negatively charged colloidal silica
particles can be flocculated by the addition of a positively charged polymer
A stable colloidal suspension often appears opalescent because of the Tyndall effect
which is the scattering of light by particles in the colloid By decreasing the size of the
dispersed particles their ability to scatter light is also decreased
Fabrication of Nanoparticles
There are several methods for creating nanoparticles In attrition macro or micro scale
particles are ground in a ball mill a planetary ball mill or other size reducing
mechanism But the minimum particle size is strongly limited In pyrolysis an organic
precursor (liquid or gas) is forced through a nozzle at high pressure and burned
Thermal plasma can also deliver the energy necessary to cause evaporation of small
micrometer size particles The thermal plasma temperatures are at the order of 10000 K
such that a solid powder easily evaporates Nanoparticles are formed upon cooling
INTRODUCTION
13
while exiting the plasma region The radio frequency induction plasma method has been
used to synthesize for example various ceramic nanoparticles In sol-gel chemistry
smaller components are arranged into more complex assemblies[10 11]
Sol-gel Chemistry
The sol-gel process is a wet-chemical technique for the fabrication of materials
typically a metal oxide starting from a chemical solution containing colloidal
precursors (sol) Typical precursors are metal alkoxides and metal chlorides which
undergo hydrolysis and polycondensation reactions to form a colloid The sol evolves
then towards the formation of an inorganic network containing a liquid phase (gel) A
well-known synthesis in sol-gel chemistry is the Stoumlber process[12]
in which the silica
precursor is hydrolyzed in a solution of ammonia water and an alcohol
Precursor Chemistry
Very common precursors in silicate chemistry are tetraalkoxysilanes because the
released alcohols usually have no negative effects on the reaction and can be removed
easily The precursor can hydrolyze in an either acidic or basic aqueous medium and
afterwards condense to an inorganic network of amorphous silica The concepts shown
in Fig 4 can help to control the size and morphology of the synthesized particles
INTRODUCTION
14
Fig 4 Influence of the pH and precursor concentration in sol-gel chemistry[11]
A high pH in combination with a decreased precursor concentration can result in a
colloidal dispersion of discrete spheres with a monodisperse particle size distribution
Decreasing the pH normally leads to smaller particles but at the same time to a higher
degree of crosslinking
In combination with an increased precursor concentration the gelation process is
supported In order to direct the synthesis towards the formation of small discrete
particles the nucleation rate at the beginning should be high Thus a multitude of seeds
that can further grow is formed A very common model for the formation of
nanoparticles in sol-gel chemistry is described with the LaMer-diagram[13]
shown Fig 5
INTRODUCTION
15
Fig 5 LaMer-diagram for the formation of colloidal dispersions
The concentration of the precursor that forms the dispersed phase increases due to some
chemical or physical process At a certain degree of supersaturation nucleation occurs
either heterogeneously on impurity centers or homogeneously through spontaneous
nucleation The growth of these nuclei causes the concentration to fall below the
nucleation concentration below which no more particles are created The particles
continue to grow however until the concentration falls to the saturation concentration
The requirements for monodispersity are evident from the LaMer diagram
The rate of nucleation must be high enough so that the concentration does not continue
to increase
On the one hand the growth rate of these nuclei must be fast enough to reduce the
concentration below the nucleation concentration quickly In this way only a limited
number of particles are created
INTRODUCTION
16
On the other hand the growth rate must be slow enough that the growth period is long
compared to the nucleation period This usually narrows the size distribution
As already mentioned a material consisting of nanoparticles can reach very high
surface areas a fact that plays an important role eg in catalysis Another possibility to
increase the specific surface area is the introduction of an inherent porosity In this
context the synthesis of nanostructured porous materials has become an important topic
in the field of materials science
Porous Materials
The unique property of porous materials is the very high surface-to-mass ratio along
with a high absorption capacity They can be used in many applications including
catalysis as adsorbents in separation processes or depending on the framework charge
as ion exchangers Depending on the type of material the specific surface area can
reach several thousand square meters per gram The morphology of the particles the
pore size and their surface chemistry can be varied depending on the application Porous
materials are classified by their pore sizes in three categories namely micro- (d lt 2 nm)
meso- (2 nm lt d lt 50 nm) and macroporous (d gt 50 nm)[14]
Common macroporous materials are porous glasses silica gels and activated carbon In
these materials the pore system is often based on the space between particles which
often varies in a certain range and is difficult to control
Important microporous materials are zeolites which offer well-defined pore diameters
in the range between about 025 and 12 nm
INTRODUCTION
17
Zeolites
Zeolites are minerals that have a microporous structure More than 150 zeolite structure
types have been synthesized and 48 naturally occurring zeolites are known[15]
Natural
zeolites form where volcanic rocks and ash layers react with alkaline groundwater they
are often contaminated to varying degrees by other minerals metals quartz or other
zeolites For this reason naturally occurring zeolites are excluded from many important
commercial applications where uniformity and purity are essential There are several
types of synthetic zeolites that form by a process of slow crystallization of a silica-
alumina gel in the presence of alkali and sometimes organic structure-directing agents
(SDA) or templates The most important processes to carry out zeolite synthesis belong
to sol-gel chemistry The product properties depend on the composition of the reaction
mixture pH temperature reaction time or templates present Synthetic zeolites hold
some key advantages over their natural analogs They can be manufactured in a
uniform phase-pure state It is also possible to synthesize desirable structures that do
not appear in nature eg Zeolite A Zeolites are widely used as ion-exchange beds in
domestic and commercial water purification or softening In chemistry zeolites are used
as ldquomolecular sievesrdquo The term refers to a particular property of these materials ie
the ability to selectively sort molecules based primarily on a size exclusion process
This is due to the very regular pore structure of molecular dimensions which is
conventionally defined by the ring size of the aperture For example the term ldquo12-ringrdquo
refers to a closed loop that is built from 12 tetrahedrally coordinated silicon (or
aluminum) atoms and 12 oxygen atoms (Fig 6)
INTRODUCTION
18
Fig 6 Structure of zeolite BEA (projection viewed along [100])[16]
The largest outlet for synthetic zeolite is the global laundry detergent market But
synthetic zeolites are also well established as catalysts in the petrochemical industry for
instance in fluid catalytic cracking and hydro-cracking Zeolites confine molecules in
small spaces which causes changes in their structure and reactivity The hydrogen
forms of zeolites (prepared by ion-exchange) are powerful solid-state acids and can
facilitate acid-catalyzed reactions such as isomerization alkylation and cracking
Zeolites or zeo-type materials can also be used as solar thermal collectors and for
adsorption refrigeration In these applications their hygroscopic property coupled with
an inherent exothermic reaction when transitioning from a dehydrated to a hydrated
form (heat of adsorption) make zeolites effective in the storage of heat energy Due to
their high porosity in combination with a good thermal conductivity zeolites are also
being explored as dielectric thin films in low-k technology[17]
INTRODUCTION
19
Regardless of the variety the maximum pore size of zeolites and thus their use is
limited Therefore researchers tried to find materials with a well-ordered pore system
that exhibit pore diameters of more than 2 nm
Mesoporous Silica
In 1992 scientists of the Mobil Research and Development Corporation discovered the
first ordered mesoporous silica The synthesis was realized through a condensation of a
silica precursor in the presence of self-organizing surfactant molecules acting as
template Depending on the reaction conditions different modifications of mesoporous
silica can be synthesized A very common material is the so-called MCM-41 (Mobil
Composition of Matter No 41) with a hexagonal pore structure Other known types are
eg the cubic MCM-48 lamellar MCM-50 or disordered worm-like mesoporous silica
(Fig 7)
Fig 7 TEM-micrographs of MCM-41 MCM-48 and worm-like mesoporous silica
INTRODUCTION
20
In general four reagents are needed for the synthesis of mesoporous silica water a
surfactant a silica precursor and an agent catalyzing the hydrolysis The product
features can be controlled by the parameters temperature pH or batch composition
A widely accepted model for the formation mechanism of mesoporous silica is shown in
Fig 8 This cooperative templating model shows the formation of nanocomposite
biphasic arrays [18]
Fig 8 Cooperative silicate-template-mechanism[18]
INTRODUCTION
21
The formation of mesoporous silica via the S+I- synthesis route can be described as
follows
Single-chain surfactant cations (S+) react with silicate polyanions eg dimers double
three and four rings (I-) Micelles serve as a source for surfactant molecules or are
rearranged according to the anion charge density and shape requirements
Nucleation and rapid precipitation of organized arrays takes place with configurations
determined by the cooperative interactions of ion-pair charges geometries and Van-der-
Waals-forces
Condensation of the silicate phase with increasing time and temperature takes place
The silicate framework charge decreases during this process this may lead to liquid
crystal-like phase transitions as the surfactant phase tries to reorganize the changing
interface charge density
The framework becomes more and more stable through further condensation of silicate
anions into the inorganic network
Control over the pore size and pore topology can be achieved by using eg templates
with varying chain lengths or block-copolymers Thus pore diameters between about
15 to 20 nm can be realized This universally applicable model can also be transferred
to the synthesis of other mesoporous metal oxides like titania[19]
INTRODUCTION
22
Evaporation Induced Self Assembly (EISA)
The above model is also valid for the formation of mesoporous films by the so called
EISA approach[20]
In general thin films are thin material layers ranging from fractions
of a nanometer to several micrometers in thickness The EISA process (Evaporation
Induced Self Assembly) typically starts with a homogeneous solution of silica precursor
and surfactant prepared in ethanolwater with an initial surfactant concentration much
below the critical micelle concentration A preferential evaporation of ethanol
concentrates the surfactant and silica species in the remaining liquid phase The
progressively increasing surfactant concentration drives self-assembly of silica-
surfactant micelles and their further organization into liquid-crystalline mesophases
(Fig 9)
Fig 9 Mesophase formation during EISA thin film synthesis[20]
INTRODUCTION
23
Pre-existing incipient silica-surfactant mesostructures serve to nucleate and orient
mesophase development This results in the rapid formation of thin film mesophases
that are highly oriented with respect to the substrate surface It is possible to obtain
different final mesostructures through variation of the initial alcoholwatersurfactant
ratios
Functionalization
For some applications it can be interesting to modify the surface of the porous structure
- either bulk material or film By introducing for example organic groups the
hydrophobicity of the materials can be reduced (Fig 10) In general two approaches for
the modification of the mesoporous silica are followed The introduction of the organic
moieties can be accomplished either after synthesis (grafting)[21]
or during the synthesis
via co-condensation[22-24]
Fig 10 Functionalization of mesoporous silica with organic groups and the resulting
hydrophobicity[25]
INTRODUCTION
24
Grafting[26]
The post-synthetic grafting is achieved with organotrialkoxysilanes or
organotrichlorosilanes The template-free mesoporous silica is dispersed mostly in non-
polar anhydrous solvents to avoid a reaction of the organosilanes with anything but the
silica material The reaction takes place between the silanol groups on the surface and
the organoalkoxysilanes organotrichlorosilanes Studies showed that silanols located
on the exterior surface and near the pore openings are kinetically more accessible than
silanols on the interior pore wall Thus most organic functional groups are located
there It is possible to preferentially functionalize the surface of mesoporous silica
particles This is especially the case when the grafting is performed before the surfactant
is removed from the mesopores After the grafting has been performed the surfactant
can be removed This control over the location of functional groups may enable the
interaction of the porous particle with the environment through the surface
functionalization while not influencing the pore surface properties
The second important method for the synthesis of organically functionalized
mesoporous silica materials is the co-condensation In this direct ldquoone-potrdquo synthesis
method tetraalkoxysilanes together with an organo-substituted trialkoxysilane are
added to the aqueous surfactant solution Hydrophobic groups are supposed to interact
with the hydrocarbon tails of the surfactant templates and thereby evenly distribute
across the pore surface Furthermore the organic moieties are linked through multiple
siloxane bridges (Fig 11)
INTRODUCTION
25
Fig 11 Method for the functionalization of silica with an alkoxysilane [27]
Additionally this synthetic approach allows one to control the morphology of the
particles The influence of the organoalkoxysilanes on particle morphology depends
upon the abilities to stabilize or destabilize the micelles[28]
A great number of commercial available siloxanes can be introduced The register of
possible functional groups can be extended eg through a post-synthetic modification
after the co-condensation (Fig 12)
Fig 12 Post-synthetic modification of mesoporous organo-silica material[27]
INTRODUCTION
26
Extraction
In order to obtain a porous material after the templated synthesis the surfactant has to
be removed This can be realized either by calcination or extraction In the case of most
functionalized materials the template cannot be removed by calcination unless the
organic groups are sufficiently thermally stable[29]
In the literature one can find
different possibilities for the removal of the template by extraction ndash mainly complex
procedures such as extraction with supercritical carbon dioxide[30]
or treatment with
microwave radiation[31]
The most common method is some kind of ion-exchange in
alcoholic media eg with a mixture of ethanol and hydrochloric acid The material is
refluxed for several hours and thus protons replace the template cations It is also
possible to use more gentle extraction procedures eg a solution of ammonium nitrate
in ethanol[32]
Mesoporous Titania
After the discovery of the templated synthesis of mesoporous silica much effort was
made to adapt the synthesis principle to the formation of mesoporous titania ndash however
this turned out to be more challenging than for the silica system While the EISA-
approach is effective[20]
the synthesis of ordered mesoporous bulk material or
nanoparticles similar to MCM-41 is often less successful Synthesis problems are
mainly associated with the weak interaction between the cationic template molecules
and the inorganic phase and the faster hydrolysis of titania precursors[33 34]
Further
difficulties emerge from the preferred hexagonal coordination of Ti atoms often
INTRODUCTION
27
resulting in lamellar structures[33]
and the tendency to reorganize into stable crystalline
phases at relatively low temperatures eg as anatase or rutile
However there is a substantial interest in nanostructured titania films especially for
photocatalytic and photovoltaic applications The excellent electrical and mechanical
properties of porous nanostructured titania make it an ideal material for dye-sensitized
solar cells (DSSC)[35]
While DSSCs are cheaper to manufacture than silicon-based
cells they are still less efficient For the production of efficient DSSCs a
semiconducting layer with a high surface area is required to ensure a high loading with
a sensitizing dye Already a relatively thin film of titania nanoparticles doped with an
appropriate dye can produce a significant electric current
Optical Properties of Thin Films
In thin film deposition a thin layer of material is prepared on a substrate or previously
deposited layer ldquoThinrdquo is a relative term since a film may look operationally thin or
thick according to the procedure applied eg optically thin or thick compared to the
wavelength of the light used The most famous example for optically thin films may be
iridescent soap bubbles
Besides the thickness the refractive index is the second important variable in thin films
for optical applications The refractive index n of a medium is a measure for how much
the speed of light is reduced when traveling through it For example glass has a
refractive index of around 15 which means that light travels at 1 15 = 067 times the
speed in vacuum
INTRODUCTION
28
Dispersion and absorption
The effect that n varies with frequency (except in vacuum where all frequencies travel
at the same speed) is known as dispersion and it is what causes a prism to divide white
light into its constituent spectral colors In real materials the polarization does not
respond instantaneously to an applied field This causes dielectric loss which can be
expressed by a permittivity that is both complex and frequency dependent Real
materials are not perfect insulators either ie they have non-zero direct current
conductivity Taking both aspects into consideration a complex index of refraction can
be defined
inn ~
Here n is the refractive index indicating the phase velocity as above while κ is called
the extinction coefficient which indicates the amount of absorption loss when the
electromagnetic wave propagates through the material Both n and κ are dependent on
the wavelength In regions of the spectrum where the material does not absorb the real
part of the refractive index tends to increase with frequency Near absorption peaks the
curve of the refractive index is a complex form given by the Kramers-Kronig relations
and can decrease with frequency
Since the refractive index of a material varies with the frequency (and thus wavelength)
of light it is common to specify the corresponding vacuum wavelength at which the
refractive index is measured Typically this is done at a well-defined spectral emission
line for example the sodium D line at 589 nm (nD)
INTRODUCTION
29
Two common properties of transparent materials are directly related to the difference in
the refractive index of the materials Light is bended when it crosses the interface and it
reflects partially from surfaces
In thin film interference this phenomenon causes the characteristic colors like in the
case of soap bubbles or tarnished metals[36]
Fig 13 shows the dependence of the
interference colors on the thickness of a SiO2 film on silicon at a view angle of 45deg
Fig 13 Calculated interference colors of a silica film on silicon[37]
Stacking thin layers with different refractive indices can enforce this effect These
multilayer reflectors or so-called Bragg stacks can also be observed in nature when
chitin layers are alternated with different refractive index layers in order to control the
apparent color in a wide variety of animals[38]
In the laboratory these special thin films
can be prepared for example by alternation of low refractive index SiO2 with highly
refractive TiO2 films Regarding porous thin films the possible change of the
interference color upon adsorption of volatile species comes to mind This sensing
effect of porous films has already been reported in several publications[39-43]
also in
combination with the Bragg-stacks[44]
MOTIVATION
30
2 MOTIVATION
MOTIVATION
31
In summary it can be ascertained that porous materials are of great interest in many
fields of science and technology There are numerous publications on the synthesis of
all kinds of porous materials Meanwhile there is also a rapidly growing literature on
synthesis procedures for porous nanoparticles We then ask if it could be interesting to
synthesize porous materials at the nanometer scale and how could they be of use in
nanotechnology
As already mentioned nanoparticles exhibit a multitude of interesting properties In
combination with the characteristics of the zeolite materials the resulting nanoparticles
are ideal candidates for numerous applications[45]
However zeolites are often restricted by the small pore diameter Especially in the
liquid phase diffusion plays a major role The reactants need to diffuse rapidly towards
and away from catalytically active sites Due to the larger pore diameter and the
resulting improved diffusion properties of the mesoporous materials they are good
candidates for catalysis and sensing applications In order to obtain selectivity towards
different adsorbates or reactants the materials can be modified with various functional
groups[39]
In some domains the particle size and the existence of single particles is essential
Colloidal suspensions of discrete mesoporous silica nanoparticles which can be
synthesized in nearly every dimension and additionally functionalized with a multitude
of organic groups are ideal candidates for demanding application areas like drug
delivery[26]
The loading and release of the drug can be controlled by selectively
functionalizing the inner surface of the particle whereas the outer surface can be
MOTIVATION
32
modified with bioactive groups It is also imaginable to use porous particles as host
system for other materials such as quantum dots or dyes for biolabeling[46 47]
Encapsulating of sensitive dyes in the porous particles[48 49]
could be useful for the
incorporation in polymer matrices
Especially in the case of producing thin films homogeneous dispersions of
nanoparticles for the preparation eg by spin-coating are of great interest Electronic
semiconductor devices and optical coatings are the main applications for thin film
construction For example the use as low-k materials is intensively investigated And
porous titania films are a basic necessity in todayrsquos dye sensitized solar cells (DSSCs)
The preparation of thin films with porous nanoparticles has a range of advantages over
the common EISA approach for mesoporous films and the growth of zeolite films on
substrates
It is believed that the porous thin films made of (porous) nanoparticles exhibit improved
diffusion properties and a highly accessible pore system[50]
Additionally one can work with stable suspension of already extracted nanoparticles
assuring facile handling and good reproducibility
The coating of sensitive substrates is facilitated due to the mild conditions
Control over the thickness can be attained by varying concentration or by introducing
multiple step coating
Intricate template removal procedures between the coating steps are needless
The adhesion to different surfaces can be influenced by the addition of binders to the
coating suspensions
MOTIVATION
33
It could be also feasible to combine suspensions containing different kinds of
nanoparticles in order to assemble hybrid thin films
Finally the material is easier to characterize when bulk samples are available
Porous nanoparticles and thin films are viewed to have a tremendous potential in
various applications Thus the goal of this work was the synthesis of porous
nanoparticles as monodisperse colloidal suspensions These suspension were used for
the preparation of porous thin films Thorough characterization of the nanostructures is
necessary to establish understanding and control of their synthesis and applications
CHARACTERIZATION METHODS
34
3 CHARACTERIZATION
METHODS
CHARACTERIZATION METHODS
35
The characterization of porous nanoparticles can be done by using a variety of different
techniques mainly drawn from materials science Common techniques are electron
microscopy (TEM SEM) atomic force microscopy (AFM) dynamic light scattering
(DLS) powder x-ray diffractometry (XRD) and vibrational spectroscopy (IR Raman)
The determination of the inherent or interparticle porosity of the materials can be
achieved with different methods As the sorption plays a key role in many application
areas the characterization of the materials by their sorption properties is one of the most
important methods
Sorption
Gas adsorption is a prominent method to obtain a comprehensive characterization of
porous materials with respect to their specific surface area or pore size distribution In a
common gas sorption measurement the sample is attached to a vacuum manifold and
distinct relative pressures (p p0-1
) of the probe gas are adjusted During the measurement
the adsorbed and desorbed volumes of gas (in cm3 g
-1) on the sample surface (apparent
outer surface and accessible pore surface) is calculated for varying relative pressures at
a constant temperature From the obtained isotherms one can draw conclusions about
the size and morphology of pores The isotherms are categorized according to
IUPAC[51]
as shown in Fig 14
CHARACTERIZATION METHODS
36
Fig 14 The six isotherms defined by the IUPAC[51]
Type I is typical for microporous materials and shows a plateau after the filling of the
small pores at low relative pressures
Type II isotherms describe the formation of multilayers after the monolayer is
completed at point B This shape in combination with the complete reversibility upon
desorption is typical for non-porous materials
Type III and V are rarely observed and reflect a low interaction energy between
adsorbate and adsorbent
Type IV isotherms are typical for mesoporous samples The original IUPAC
classification defined the hysteresis as characteristic feature of mesoporous materials
Type VI shows an example isotherm for samples with a stepwise multilayer absorption
of a non-porous material
CHARACTERIZATION METHODS
37
In Fig 15 a typical isotherm for nanometer-sized mesoporous materials (Type IV) with
fields for the individual sorption steps is shown
00 02 04 06 08 10
E
DC
B
A
adsorption desorption
vo
lum
e a
dso
rbe
d
relative pressure pp0
Fig 15 Typical isotherm for a bulk sample of mesoporous nanoparticles
The steps A to E can be attributed to the following processes
A At low relative pressures p p0-1
a monolayer of adsorbate molecules is
forming on the high inner surface of the material
B Multilayers are established
C Filling of the mesopores occurs (capillary condensation)
D The remaining outer surface is covered (plateau)
E In samples with very small particles the adsorbate condenses in the
interparticle pores
CHARACTERIZATION METHODS
38
The most common sorption method is nitrogen sorption because of a suitable heat of
adsorption (5-25 kJ mol-1
) and a good access of nitrogen molecules (0354 nm) into
small pores An evacuated sample cooled with liquid nitrogen is loaded with gaseous
nitrogen Due to the low temperature the nitrogen is adsorbed on the sample surface
resulting in equilibrium between adsorbed film and gas phase at constant temperature
The isotherm shows the adsorbed amount of gas as a function of the pressure Different
models can describe the adsorption
BET-surface area
In contrast to the Langmuir model the method developed by Brunauer Emmet and
Teller[52]
allows the formation of multilayers For low partial pressures (p p0-1
lt 03) the
BET-equation can be transformed into a linear correlation
Cnp
p
Cn
C
p
pn
p
p
mm
11
10
0
0
n adsorbed gas quantity
nm monolayer adsorbed gas quantity
C BET-constant
p equilibrium pressure
p0 saturation pressure
CHARACTERIZATION METHODS
39
With this equation an adsorption isotherm can be plotted as a straight line with
n-1
[(p0 p-1
) minus 1]-1
on the y-axis and p p0-1
on the x-axis according to experimental results
This plot is called a BET plot The linear relationship of this equation is typically
maintained only in the range of 005 lt p p0-1
lt 03
With the required cross-section of an adsorbate molecule the monolayer adsorbed gas
quantity nm (mol g-1
) and the BET-constant C the specific surface area can be
calculated
Pore diameter
If gas molecules are introduced into a pore system their physical properties change
Capillary condensation into the curved surface can occur long before the saturation
vapor pressure is reached The Kelvin equation provides a thermodynamic correlation
between the relative pressure p p0-1
and the reduced radius (Kelvin radius) rk during
pore condensation
0
ln
2
p
pRT
Vr L
k
γ adsorbate surface tension
VL molar volume
CHARACTERIZATION METHODS
40
Fig 16 Adsorption and desorption in a pore
The reduced radius rk describes the curvature of the adsorbate film onto the surface and
is composed of pore radius r1 and the meniscus radius r2 in the filled pore (Fig 16)
21
112
rrrk
In adsorption r2 is infinite and thus rk is 2r1 In desorption r1 = r2 = rk For this reason
the desorption branch is commonly used for the determination of the pore diameter
BJH-Method
The pore radius can be determined with a method developed by Barrett Joyner and
Halenda (BJH) The radius of the cylindrical pore rp is composed of the Kelvin radius rk
and the thickness t of the adsorbed monolayer
trr Kp
CHARACTERIZATION METHODS
41
The thickness t has to be calculated using the density of the adsorbed liquid The
De Boer equation associates the thickness of the adsorbed layer with the relative
pressure in nitrogen sorption isotherms
0340log0
p
p
Kt
K Constant
The BJH-method as classical macroscopic concept based on the Kelvin equation is
linked to the pore condensation phenomena It is applicable for mesopore size analysis
but fails to correctly describe both the pore filling of micropores and of narrow
mesopores In contrast the Density Functional Theory (DFT) or methods of molecular
simulation such as Monte Carlo simulation or Molecular Dynamics provide a
microscopic model of adsorption based on a more realistic description of the
thermodynamic properties of the intra-pore fluid[53]
Other sorption measurements
Nitrogen sorption is a standard method for bulk materials Besides the common
adsorptives such as nitrogen argon or krypton it can be also interesting to investigate
the sorption properties of other gases like alkanes[54]
Especially when investigating
sorption properties of thin films other methods have to be used One possibility is the
sorption measurement using a quartz crystal microbalance
CHARACTERIZATION METHODS
42
Quartz Crystal Microbalance
In a quartz crystal microbalance (QCM) the changes in the resonance frequency of a
piezoelectric quartz crystal are correlated to mass changes deposited onto the crystal
surface Due to the high precision in frequency measurements it is possible to measure
very small mass changes For the correlation between mass and frequency changes the
Sauerbrey equation is used
mA
f
A
mff
qqqq
2
0
2
0 22
It gives the change Δf in the oscillation frequency of a piezoelectric quartz crystal as a
function of the mass Δm added to the crystal Here f0 is the resonant frequency of the
crystal A is the active area between the electrodes ρq is the density of quartz μq is the
shear modulus of quartz and υq is the shear wave velocity in quartz
The Sauerbrey equation was developed for oscillation in air and only applies to rigid
masses attached to the crystal for example thin films
For a certain quartz-crystal the material constants can be combined to a factor Cf and
thus the equation is reduced to
mCf f
For a 10 MHz quartz crystal (Fig 17) a loading of 1 ng per cm2 correlates with a
decrease in the resonant frequency by 0226 Hz
CHARACTERIZATION METHODS
43
Fig 17 10 MHz quartz crystal microbalance
Depositing porous films onto the QCM makes it possible to investigate the mass
changes associated with sorption and thus recording isotherms If the density of a
homogeneous coating is known one could also calculate the film thickness
An alternative investigation of the thickness and additionally of the optical properties of
thin films can be done by a versatile and powerful optical technique called ellipsometry
Ellipsometry
Ellipsometry measures the change of polarization of light upon the interaction with
matter The name stems from the fact that the reflected light will in general be
elliptically polarized Ellipsometry can yield information about layers that are thinner
than the wavelength of the probing light itself even down to a single atomic layer It
can probe the complex refractive index or dielectric function tensor which gives access
to fundamental physical parameters and is related to a variety of sample properties
including morphology crystal quality chemical composition or electrical conductivity
Ellipsometry is commonly used to characterize film thickness for single layers or
complex multilayer stacks ranging from a few tenths of a nanometer to several
micrometers
CHARACTERIZATION METHODS
44
Experimental setup
Electromagnetic radiation is emitted by a light source and linearly polarized before it
falls onto the sample After reflection the now elliptically polarized light passes a
second polarizer - the analyzer - and falls into the detector (Fig 18)
Fig 18 Schematic setup of an ellipsometry experiment
Ellipsometry measures two of the four Stokes parameters which are conventionally
denoted by Ψ and Δ The incident and the reflected beam span the plane of incidence
Light that is polarized parallel or perpendicular to the plane of incidence is called p or s
polarized respectively The amplitudes of the s and p components after reflection and
normalization to their initial values are denoted by rs and rp respectively (Fig 19)
CHARACTERIZATION METHODS
45
Fig 19 The quantities rs and rp in elliptically polarized light
The ratio of rs and rp is described by the fundamental equation of ellipsometry
i
s
pe
r
rtan
Thus tan Ψ is the amplitude ratio upon reflection and Δ is the phase shift (difference)
Since ellipsometry is measuring the ratio of two values it is very accurate and
reproducible relatively insensitive to scattering and fluctuations and requires no
standard sample or reference beam
Data analysis
Ellipsometry is an indirect method ie in general the measured Ψ and Δ cannot be
converted directly into the optical constants of the sample Normally a layer model
must be established which considers the optical constants (refractive index or dielectric
function tensor) and thickness parameters of all individual layers of the sample
including the correct layer sequence Using an iterative procedure (least-squares
CHARACTERIZATION METHODS
46
minimization) the unknown optical constants and thickness parameters are varied and
Ψ and Δ values are calculated using the Fresnel equations The calculated Ψ and Δ
values that match the experimental data best provide the optical constants and thickness
parameters of the sample In spectroscopic ellipsometry (SE) a broad-band light sources
is employed which covers a certain spectral range in the infrared visible or ultraviolet
region Thus the complex refractive index or the dielectric function tensor in the
corresponding spectral region can be obtained which gives access to a number of
fundamental physical properties
Ellipsometric porosimetry
Regarding porous transparent thin films ellipsometric porosimetry[55 56]
can be used to
describe the change of the optical properties that are associated with the sorption of
volatile species The method uses the Lorentz-Lorenz formula which is based on the
Clausius-Mossotti equation
032
1
A
rel
rel NM
It describes the relation between the macroscopic measurable relative dielectric constant
εrel and the electric polarizability α NA is the number of molecules in one mole
(Avogadro constant) and ε0 is the vacuum permittivity
CHARACTERIZATION METHODS
47
Mρ-1
is the molar volume Vm which can also be described as NAN-1
(N is the number
density of molecules)
N
NMV A
m
Thus the Clausius-Mossotti equation can be written as
032
1
N
rel
rel with vPN
03
Pv is the volume polarizability In a certain range of frequencies (visible and UV) the
Maxwell theory relates the refractive index of a substance with its relative dielectric
constant With εrel = n2 the Clausius-Mossotti equation can be converted into the
Lorentz-Lorenz function
vPn
n
2
12
2
The Lorentz-Lorenz equation is used for the characterization of porous substrates with
ellipsometric porosimetry The individual components act additive in the following
approximation
CHARACTERIZATION METHODS
48
A dense substrate with the refractive index nd
2
12
2
d
dvd
n
nP
An empty porous substrate with the refractive index ne (nair = 1 V = volume of open
pores)
2
11
2
11
2
1
2
12
2
2
2
2
2
2
2
d
d
d
d
air
air
e
eve
n
nV
n
nV
n
nV
n
nP
A filled porous substrate with the refractive index nf (nads = refr index of the adsorbate)
2
11
2
1
2
12
2
2
2
2
2
d
d
ads
ads
f
f
vfn
nV
n
nV
n
nP
When the refractive index of the filled and empty porous substrate is known one can
determine the porosity of the material without knowing the refractive index of the dense
material
2
1
2
1
2
12
2
2
2
2
2
ads
ads
e
e
f
f
vevfn
nV
n
n
n
nPP
Therefore the volume V of the open pores can be determined as follows
2
1
2
1
2
12
2
2
2
2
2
ads
ads
e
e
f
f
n
n
n
n
n
nV
CHARACTERIZATION METHODS
49
Light Scattering
Mie Scattering
For the description of the scattering ability of particles similar to or larger than the
wavelength of light the Mie theory or discrete dipole approximation can be used The
Mie solution also called Mie theory is a complete analytical solution of Maxwells
equations for the scattering of electromagnetic radiation by spherical particles In
contrast to Rayleigh scattering the Mie solution to the scattering problem is valid for all
possible ratios of diameter to wavelength although the technique results in numerical
summation of infinite sums Although scattering of light by a homogeneous sphere may
seem to be a simple process the Mie solution is very complex and not easy to
understand In its original formulation it assumed a homogeneous isotropic and
optically linear material irradiated by an infinitely extending plane wave Currently the
term ldquoMie solutionrdquo is also used in broader contexts for example when discussing
solutions of Maxwells equations for scattering by stratified spheres or by infinite
cylinders If particles are much smaller than the wavelength of the incoming light their
scattering ability can be described according to Rayleigh
Rayleigh Scattering
Rayleigh scattering describes the scattering of light or other electromagnetic radiation
by particles much smaller than the wavelength of the light It occurs when light travels
in transparent solids and liquids but is most prominently seen in gases The amount of
CHARACTERIZATION METHODS
50
Rayleigh scattering that occurs to a beam of light is dependent upon the size of the
particles and the wavelength of the light
The intensity of light scattered by a single small particle from a beam of unpolarized
light of wavelength λ and intensity I0 is given by
62
2
24
2
2
022
12
2
cos1
d
n
n
RII
Here R is the distance to the scattering particle θ is the scattering angle n is the
refractive index of the particle and d is the diameter of the particle In simple terms the
scattering coefficient - the intensity of scattered light - on small particles can be
described with the following dependencies
4
1~
I and 6~ rI
The wavelength dependence of the scattering means that blue light is scattered much
more than red light In the atmosphere this results in blue light being scattered to a
greater extent than red light and so one sees blue light coming from all regions of the
sky As a rule of thumb due to the strong dependence on the particle size a colloidal
suspension is expected to become transparent when the particle size is decreased below
110 of the wavelength of the incoming light Thus a potential transparent colloidal
dispersion ideally contains nanoparticles smaller than about 40 nm in diameter
CHARACTERIZATION METHODS
51
Dynamic Light Scattering in Colloidal Suspensions
Dynamic light scattering (DLS) also known as quasi elastic laser light scattering is a
powerful technique in physics which can be used to determine the size distribution
profile of small particles dispersed in a liquid phase When light hits small particles it is
scattered in all directions If the light source is a laser and thus is monochromatic and
coherent then one observes a time-dependent fluctuation in the scattering intensity
These fluctuations are due to the fact that the small particles in suspensions are
undergoing Brownian motion and thus the distance between the scattering centers in the
solution is constantly changing The scattered light interferes either constructively or
destructively These intensity fluctuations contain information about the time scale of
the particle movement The smaller the particles are the faster they diffuse and thus the
faster the intensity changes These fluctuations are correlated across microsecond time
scales by an autocorrelation function ie a function that describes how a given
measurement relates to itself in a time-dependent manner The second order
autocorrelation curve (gII) can be directly derived from the intensity trace
2)(
)()()(
tI
tItIqg II
q wave vector
τ delay time
I intensity
CHARACTERIZATION METHODS
52
At short time delays the correlation is high because the particles do not have a chance
to move to a great extent from the initial state that they were in As the time delays
become longer the correlation starts to exponentially decay to zero meaning that after a
long time period there is no correlation between the scattered intensity of the initial and
final states This exponential decay is related to the diffusion coefficient To fit the
autocorrelation function numerical methods are used If the sample is monodisperse
then the decay is simply a single exponential The Siegert equation relates the second
order autocorrelation function (gII) with the first order autocorrelation function (g
I) as
follows
2)(1)( qgqg III
β correcting factor
Once the autocorrelation data have been generated different mathematical approaches
can be employed to determine the z-averaged translational diffusion coefficient (D) In
case of a monodisperse sample a single exponential function is obtained for the decay
of the autocorrelation function where Γ is the decay rate
)exp()( qg I with 2Dq and
2sin
4 0
nq
λ is the incident laser wavelength n0 is the refractive index of the sample and θ is angle
at which the detector is located with respect to the sample cell The Stokes-Einstein
CHARACTERIZATION METHODS
53
equation describes the dependency of the diffusion coefficient D on the radius r of a
spherical particle in a liquid phase with the viscosity η at a certain temperature T
r
kTD
6
Electron Microscopy
As the maximum resolution of light microscopes is determined by the wavelength of the
photons that are being used to probe the sample imaging of nanoparticles becomes
difficult Like all matter electrons have both wave and particle properties (as proposed
by de Broglie) and their wave-like properties mean that a beam of electrons can be
focused by electrical and magnetic fields onto the sample As the wavelength is
dependent on their energy it can be tuned by adjustment of accelerating fields resulting
in a much smaller wavelength than that of light The wavelength of electrons
accelerated by 200 kV is only 251 pm but the theoretical resolution is limited to about
01 nm because of the aberration in todayrsquos electron lenses
In transmission electron microscopy (TEM) the beam of electrons is transmitted
through a specimen Then an image is formed magnified and directed to appear either
on a fluorescent screen a layer of photographic film or a CCD camera
With a Scanning Electron Microscope (SEM) it is possible to produce high-resolution
images of a sample surface with a characteristic three-dimensional appearance In a
typical SEM the emitted electrons are focused into a very fine focal spot sized 1 nm to
CHARACTERIZATION METHODS
54
5 nm The beam passes through pairs of scanning coils in the objective lens which
deflect the beam horizontally and vertically so that it scans in a raster fashion over a
rectangular area of the sample surface When the primary electron beam interacts with
the sample the electrons lose energy by repeated scattering and absorption The energy
exchange between the electron beam and sample results in the emission of electrons and
electromagnetic radiation which can be detected to produce an image
Thermogravimetric Analysis
Thermogravimetric Analysis (TGA) determines the changes in weight in relation to
changes in temperature by raising the temperature gradually and plotting weight against
temperature The weight loss curve may require transformation before results can be
interpreted The first derivative of the weight loss curve is used to find the points at
which weight-loss is most rapid TGA is commonly employed to determine
characteristics of materials such as degradation temperatures absorbed moisture the
proportions of inorganic and organic components in materials and solvent residues
Additionally Differential Scanning Calorimetry (DSC) provides data on
thermodynamic effects by measuring the time-dependent heat flow between the sample
and a reference
CHARACTERIZATION METHODS
55
Powder X-ray Diffraction
Powder XRD uses x-ray diffraction on powder or microcrystalline samples for the
structural characterization of materials It is based on the elastic scattering of
electromagnetic waves on lattice planes or more precisely at the electronic shells of
regularly arranged atoms Ideally every possible crystalline orientation is represented
equally in a powdered sample The Bragg equation is a simple method to determine the
distance d of lattice planes To derive the Bragg equation one considers the lattice
planes of a crystal as semitransparent mirrors partly reflecting an incoming beam (Fig
20)
Fig 20 Sketch to construct the Bragg equation
CHARACTERIZATION METHODS
56
For a monochromatic beam the reflected rays interfere constructively or destructively
depending on the angle of incidence θ and the lattice diameter d Two reflected
monochromatic beams interfere if the path difference is an integer multiple of the
wavelength λ This results in the Bragg equation for constructive interference
sin2dn with n = 1 2 3 hellip
When the scattered radiation is collected on a flat plate detector the averaging due to
random orientations of the particles leads to smooth diffraction rings around the beam
axis rather than the discrete Laue spots as observed for single crystal diffraction The
angle between the beam axis and the ring is called the scattering angle and in x-ray
crystallography denoted as 2θ
Solid-State NMR
A nuclear spin can interact with a magnetic or electric field Spatial proximity or a
chemical bond between two atoms can give rise to interactions In general these
interactions are orientation dependent In media with no or little mobility (eg crystal
powders large membrane vesicles molecular aggregates) anisotropic interactions have
a substantial influence on the behavior of a system of nuclear spins In contrast in a
classical solution-state NMR experiment Brownian motion leads to an averaging of
anisotropic interactions In such cases these interactions can be neglected on the time-
scale of the NMR experiment Examples of anisotropic nuclear interactions commonly
found in solid-state NMR are the chemical shift anisotropy and the internuclear dipolar
CHARACTERIZATION METHODS
57
coupling Anisotropic interactions modify the nuclear spin energy levels (and hence the
resonance frequency) of all sites in a molecule and often contribute to a line-broadening
effect in NMR spectra High-resolution conditions in solids can be established using
magic angle spinning (MAS) which facilitates averaging of interactions in real space
In 29
Si MAS NMR of functionalized silica samples typically five peaks can be
observed Qn-peaks are related to Si-atoms linked to two three or four other Si-atoms
by an oxygen bridge and to hydroxyl groups Tn-peaks derive from Si-atoms carrying
one organic moiety
[Q4] Si(OSi)4
[Q3] Si(OSi)3(OH) [T
3] RSi(OSi)3
[Q2] Si(OSi)2(OH)2 [T
2] RSi(OSi)2(OH)
The chemical shift of the T-peaks depends on the nature of the Si-C bond Thus
different functional groups can be distinguished Depending on the area of these peaks
one can make statements about the linkage in the solid state
IR and Raman Spectroscopy
FT-IR and FT-Raman spectroscopy are methods to investigate the vibrational modes of
a sample by absorption or scattering of radiation respectively Both techniques are
appropriate for the identification of specific functional groups especially in organic
moieties In inorganic solids hydroxyl groups or characteristic Raman active centers
CHARACTERIZATION METHODS
58
can be detected If a chemical group changes its dipole moment during vibration it can
be detectable in infrared spectroscopy The moieties of a molecule (for instance a
methyl group) can be identified by their specific absorption bands in the infrared
spectrum In Raman spectroscopy energy transfer from incident coherent laser light
induces vibrations of molecules and the scattered light from the sample is analyzed
The energy for exciting the molecular vibrations is taken from the photon energy
(Stokes frequencies) or the energy of the vibrations is transmitted to the photons (Anti-
Stokes frequencies) respectively During vibration the polarizability of the molecule
has to change in order to observe Raman-active modes
RESULTS AND DISCUSSION
59
4 RESULTS AND DISCUSSION
RESULTS AND DISCUSSION 41
60
41 High Silica Zeolite Beta
From Stable Colloidal Suspensions to
Thin Films
RESULTS AND DISCUSSION 41
61
Introduction
Zeolites and zeolite-like materials with their uniform pore sizes unique structural
topology and composition well defined acidity and good thermal stability are viable
commercial catalysts selective ion exchangers and absorbers Although many different
crystalline molecular sieves are already known there is a continuing need for zeolites
with new properties and a continuing search for new zeolite applications More recent
efforts have focused on exploring the possibilities of synthesizing zeolites in the
nanosized range by application of highly supersaturated precursor solutions[45 57]
By
using organic additives during the synthesis procedure colloidal solutions were formed
and used for the preparation of different nanosized molecular sieves[58-64]
Several
microporous materials including MFI LTA FAU BEA and LTL in the form of stable
colloidal suspensions with narrow particle size distribution (100 nm) are described in
the literature Intriguingly among the nanosized zeolites the pure silica forms were only
reported for the MFI MEL and BEA structure types[65-67]
BEA is a large-pore microporous material characterized by three sets of mutually
perpendicular channels with 12-membered ring apertures which can be prepared from
classical aluminosilicate gels with a wide range of SiAl ratios[68]
The main features of
this structure make the material suitable for numerous applications such as
heterogeneous catalysis sensors membranes etc[67 69-71]
The number of acid sites and
the hydrophobicity of the microporous materials can be tuned by controlling the SiAl
ratios in the final crystallites
RESULTS AND DISCUSSION 41
62
One important application of purely siliceous microporous zeolites exhibiting a high
degree of hydrophobicity and a high micropore volume is in the field of nanoscale
layers with low dielectric constant (low-k) for microelectronic applications as well as
for the preparation of hard coatings with unique properties[72 73]
Pure silica zeolite BEA
was synthesized by Corma and co-workers using tetraethylammonium hydroxide
(TEAOH) as a template and fluoride ions at near neutral pH[74]
In addition BEA
crystals were recently prepared via a solidndashsolid transformation method[69 75]
and the
synthesis of colloidal siliceous BEA from highly templated precursor solutions was
reported[76]
One of the focused applications of the pure silica BEA type molecular sieve
is in the preparation of highly porous and hydrophobic layers which can exhibit
variable optical and electronic properties depending on the method of preparation
Several strategies have been applied for the formation of microporous films and
recently a very effective method was established for deposition of ultrathin pure
siliceous MFI type films on two-dimensional supports via spin-coating of stable
colloidal suspensions[65]
Due to their unique properties particles at the nanometer scale
are of great interest in a number of advanced applications Homogeneously dispersed in
a solvent these colloidal suspensions show similarities to real solutions which make
them suitable for the preparation of thin homogeneous and transparent films by spin-
coating As a result of their crystallinity the coatings have high mechanical stability and
resistance to many solvents Additionally decreasing the crystal size of particles below
100 nm produces substantial changes in the physicochemical properties of the zeolite
RESULTS AND DISCUSSION 41
63
particularly in the external surface of the crystals as well as the ability of such
nanocrystals to pack closely in the film during spin-coating[77]
The aim of this paper is to describe a complete route for the synthesis of zeolite Beta
from templated precursor solutions with emphasis on the crystallization kinetics
stabilization of the nanosized crystallites in coating suspensions and the assembly in
thin films exhibiting variable physicochemical properties
Experimental
Synthesis of nanosized zeolite Beta
The composition of the precursor solution used for synthesis of nanosized zeolite Beta
crystals was 25 SiO2 1 Al2O3 15 TEAOH 375 H2O The initial compounds were
mixed in one pot until a clear solution was obtained Cab-o-sil M5 (Riedel-DeHaumlen) as
silica source aluminum sec-butoxide (Aldrich) as aluminum source
tetraethylammonium hydroxide (TEAOH 35 wt Aldrich) as organic template and
deionized water were used The hydrothermal (HT) treatment of the precursor mixtures
was performed in an oven at 140 degC under static conditions using steel autoclaves with
18 ml Teflon liners Every 24 hours one autoclave was taken out and the product was
purified by a series of centrifugation steps (1 h at 47800 g RCF) and subsequently
redispersed in water under sonication (1 h in ice) till the pH of the solution reached 10
A part of the final crystalline zeolite Beta was dealuminated according to the procedure
described in Ref[78]
The SiAl ratio of the as-synthesized and dealuminated zeolite Beta
was 32 and 100 respectively
RESULTS AND DISCUSSION 41
64
Stabilization of Beta nanoparticles in coating suspensions
The as-prepared and dealuminated zeolite Beta nanoparticles were treated with an
aqueous solution of diluted ammonium chloride and then washed with ethanol two
times in order to prepare stable zeolite suspensions and to prevent fast agglomeration
After washing and redispersion the colloidal suspensions were centrifuged at 12000 g
(RCF) for 5 min and the sediment was separated by decanting in order to eliminate the
larger agglomerates formed during the purification process The final solid
concentration of zeolite Beta nanoparticles was adjusted to 4 wt in ethanolic
suspension and further applied for the preparation of thin films
Three types of binders were used to improve the mechanical stability of the porous
films (1) aqueous colloidal silica suspension Nalco 2326 (SiO2 ~15 wt particle size
~ 5 nm) was diluted with ethanol to reach a concentration of 2 wt (2) pre-hydrolyzed
tetraethylorthosilicate (TEOS) in a mixture of ethanol water and HCl in the ratio of 1
TEOS 006 HCl 27 H2O 60 EtOH and (3) pre-hydrolyzed TEOS with
cetyltrimethylammonium bromide (CTAB) in the following ratio 1 TEOS 01 CTAB
006 HCl 27 H2O 60 EtOH The size of the amorphous silica particles formed in
TEOS-based binders (solutions 2 and 3) was kept constant eg about 2 nm in diameter
determined from dynamic light scattering (DLS) measurements The silica nanoparticles
in the binding solutions 2 and 3 were stable for about 10 days while afterwards a slight
increase in size was measured
RESULTS AND DISCUSSION 41
65
Deposition of thin Beta films on silicon wafers
The ethanolic zeolite suspension was either used directly for the film deposition or it
was mixed with the same volume of one of the three binders prior to spin-coating No
additional functionalization of the zeolite nanoparticles was carried out In order to
ensure the preparation of smooth and homogeneous films the coating suspensions were
filtrated through syringe filters (450 nm) prior to spinning
The nanoporous films were deposited on polished silicon wafers by spin-coating
(Laurell WS-400B-6NPP-Lite-AS) with a rate of 3000 rpm (acceleration 5000 rpm s-1
)
for 30 s All substrates were pre-cleaned with ethanol and acetone for 10 s under
spinning at 3000 rpm In order to prepare thick Beta films the spin-coating procedure
was repeated up to 6 times After each coating step the films were calcined at 450 degC
for about 30 min
From the numerous films prepared with different thickness the following will be
discussed in detail pure Beta film free of binder (Beta-pure) Beta crystals stabilized
with prehydrolyzed TEOS (Beta-TEOS) and Beta crystals stabilized with amorphous
silica (Beta-SiO2) (see Table 1) No significant differences were observed between the
samples prepared with the two types of TEOS binders (solutions 2 and 3) and therefore
only binder 2 will be discussed
RESULTS AND DISCUSSION 41
66
Table 1 Zeolite Beta films deposited on silicon wafers
Characterization
The degree of crystallinity of the zeolite materials was determined based on X-ray
diffraction patterns collected from purified powders with a STOE Stadi P diffractometer
using monochromatic Cu-Kα-radiation in transmission geometry Additionally the
degree of crystallinity size and morphology of the zeolite particles was proven by
collecting transmission electron micrographs (TEM) on a JEOL JEM 2011 instrument
with LaB6 cathode at 200 kV Samples were prepared on Plano holey carbon coated
copper grids by evaporating one droplet of the purified zeolite suspensions diluted with
water in the ratio of 1 100 Besides the evaluation of the particle size in the
suspensions was determined by DLS The DLS data were collected with an ALV-
NIBSHPPS High Performance Particle Sizer in PMMA cuvettes at 25degC under
continuous scans and analyzed according to the cumulant and distribution function
analysis (DFA) The polydispersity index (PDI) calculated for all samples was used as
an indication for a multi-modal particle size distribution The powder Beta samples
film binder deposition steps thickness
refractive
index
porosity
( void)
Beta-pure no 3 475 nm 110 77
Beta-TEOS TEOS 3 and 6 440 and 680 nm 113 70
Beta-SiO2 SiO2 1 and 6 185 and 950 nm 115 70
RESULTS AND DISCUSSION 41
67
were subjected to thermogravimetric analysis (TGA) after purification and freeze
drying The powders were heated in corundum crucibles from 30 to 900 degC (10 degCmin)
in a flow of synthetic air (25 mlmin) using a Netzsch STA 449 C Jupiter
thermobalance The amount of organic template and water in the framework type Beta
zeolite was determined in the samples prepared from 1 to 10 days of HT treatment The
surface features of the nanoparticles deposited in thin films were investigated with
scanning electron microscopy (Philips 40 XL) and ellipsometry The ellipsometric
measurements were performed on a Woollam M2000D at different angles (65deg 70deg and
75deg) in the entire spectral range of 190-1000 nm The data were fitted in the range
between 250-1000 nm using the Cauchy model for layered materials or using the EMA
layer (Bruggeman effective medium approximation) of SiO2 and introducing additional
voids[79]
Results and Discussion
Suspensions of Beta nanoparticles kinetic study and stabilization
In order to follow the crystallization kinetics of nanosized zeolite Beta the initial
solution with an SiAl ratio of 25 ratio was heated under hydrothermal conditions and
the crystallization process was interrupted at various times the solid phases extracted at
the different stages of crystallization were subjected to comprehensive characterization
The change in the solid products was followed with X-ray diffraction DLS TEM and
TGA The XRD patterns depicted in Fig 21 show that the amorphous precursor
RESULTS AND DISCUSSION 41
68
solutions transformed into crystalline zeolite Beta particles after 7 days and the
prolonged hydrothermal treatment did not change the degree of crystallinity
5 10 15 20 25 30 35 40 45
4 days
7 days
6 days
5 days
9 days
8 days
10 days
2 [degrees]
Fig 21 XRD pattern of the Beta samples synthesized under hydrothermal conditions
The first Bragg reflection at 62 2 occurs with a very low intensity in the sample after
heating for five days The low intensity of the Bragg reflection is possibly due to the
very small crystalline particles (lt 5 nm) that are present in the solid samples extracted
RESULTS AND DISCUSSION 41
69
from the reacting solutions or to the low amount of crystalline particles in comparison
to the amorphous matter It is important to note that the width of the Bragg reflections
did not change significantly which proves that no substantial change in the final
particle sizes occurred during the prolonged heating of the reaction systems (see
samples crystallized for 6 and 10 days)
The generation of amorphous and crystalline particles in the precursor solutions was
measured by DLS (see Fig 22)
1 10 100 1000 10000
1 day 5 days 7 days 10 days
inte
nsity
diameter [nm]
Fig 22 DLS data of purified suspensions hydrothermally treated from 1 and 10 days
It is important to note that the clear precursor solutions turned into dense transparent
gels after 24 h aging and kept the same texture even after hydrothermal treatment up to
six days A fluid translucent suspension is obtained after seven days of heating The
DLS curves of the samples treated for 1 and 2 days show a very broad particle size
distribution even after substantial dilution with water (PDI gt 05 the curves are not
shown here) This confirms the presence of unstable amorphous nanoparticles in the
RESULTS AND DISCUSSION 41
70
suspensions and the continuous dynamics of agglomeration and disintegration in the
reacting aluminosilicate species in the crystallizing system After three days of heating
two generations of particles one with an average hydrodynamic diameter of about 20-
60 nm and another of about 80 - 200 nm are detected in the precursor mixture It is also
observed that with increasing crystallization time only the width of the particle size
distribution curves is diminishing while the mean size does not change significantly
This observation can be explained with the higher stability of the growing particles in
the samples crystallized from 3 to 6 days However the colloidal zeolites tend to
agglomerate and at the same time disintegrate under purification of the reacting mixture
and redispersion in water or ethanol under sonication In the suspensions with a pH
lower than 8 and solid concentration above 6 wt a significant increase in the particle
diameter is observed Based on the DLS data one can conclude that the aggregates are
formed in the crystalline and intermediate suspensions and they are measured instead of
the individual particle grains This statement is proven by the TEM study where it can
be seen that the nanoparticles tend to agglomerate and do not exist as separated crystals
(Fig 23)
RESULTS AND DISCUSSION 41
71
Fig 23 TEM images of nanoparticles extracted from suspensions after a hydrothermal
treatment between 3 and 10 days
RESULTS AND DISCUSSION 41
72
The aggregation process is also accelerated with prolonging the time of hydrothermal
treatment (8 days) and the mean size of the zeolite domains in the particles is increased
from 20 up to 40 nm according to the TEM data At a very early time of HT treatment
any separation of the crystalline from the amorphous particles was not possible
Crystalline fringes representing the Beta crystalline phase in the mostly spherical
amorphous particles can be seen in the samples treated for 5 and 6 days The crystalline
particles have the same size and shape as the amorphous ones In many cases a good
alignment between several crystalline fringes in the particles is observed This process
is accelerated at the end of the hydrothermal treatment According to the TEM
micrographs particles with size in the range 8 - 15 nm were present during the entire
process of crystallization However after 5 days some of the particles contain
crystalline fringes and some of them appear amorphous After 6 days the fraction of
crystalline particles is increased while the number of amorphous particles is decreased
which is confirmed by both the XRD and DLS data (see Fig 21 and Fig 22) The
sample heated for 7 days contains fully crystalline nanoparticles which appear more
disintegrated in comparison to the ones heated for 10 days A slight increase in the size
of the individual particles and additional agglomeration is observed in the sample
heated for 10 days due to the longer crystallization time
The transformation of the amorphous aluminosilicate species into crystalline zeolite
Beta was also followed by TG analysis The amount of organic template and water is
changing depending on the degree of the samplesrsquo crystallinity As can be seen from
RESULTS AND DISCUSSION 41
73
Fig 24 the weight loss due to desorption of water and combustion of TEAOH is
decreased with increasing degree of crystallinity of the samples
100 200 300 400 500 600 700 800 900
75
80
85
90
95
100
1 day
5 days
7 days
10 days
we
igh
t [
]
temperature [degC]
Fig 24 TG data of the solid samples recovered from precursor solutions subjected to
hydrothermal treatment from 1 to 10 days
The samples heated for 7 and 10 days have almost the same amount of template and an
almost negligible amount of water which is expected for highly siliceous molecular
sieves In contrast in the partially crystalline sample (5 days HT treatment) the amount
of water and TEAOH is higher than in the crystalline Beta This can be explained with
an extra amount of template adsorbed on the surface and in the mesoporous
aluminosilicate amorphous grains Thus the weight loss of the washed and dried
products is decreased in the crystalline samples and the combustion of the template is
shifted to higher temperatures This is due to the different location of the template in the
amorphous or crystalline matrix ie the TEA+ cations are encapsulated in the zeolite
channels instead of the surface or in the mesopores In conclusion the amount of water
RESULTS AND DISCUSSION 41
74
and template encapsulated in the material is decreased while the temperature of
decomposition is increased with higher crystallinity
Beta nanocrystals stabilized in coating suspensions and films
The interfacial chemistry between the binders and the zeolite particles was studied
Dynamic light scattering measurements were performed in pure zeolite suspensions as
well as in binder-containing coating suspensions in order to study the stability prior to
film deposition The Beta crystals used for preparation of thin films were obtained
according to the procedure described above (140 ordmC 10 days) after dealumination The
XRD pattern from the solid sample synthesized in a larger amount (500 ml solid
concentration of 6 wt ) shows the presence of pure BEA-type zeolite (Fig 25)
5 10 15 20 25 30 35 40 45
sample sim BEA
Inte
nsity
2 [degree]
Fig 25 XRD patterns of pure zeolite Beta nanocrystals from the coating suspension
used for preparation of thin films in comparison with the simulated pattern
RESULTS AND DISCUSSION 41
75
The dynamic light scattering results of the same Beta-pure suspension reveals particles
with a hydrodynamic diameter in the range of 20 - 80 nm (Fig 26) which are attributed
to the zeolite Beta in the form of single crystals and probably as agglomerates in a
comparable amount This conclusion is based on the different presentations of the
scattering intensity (mass-weighted and unweighted) As can be seen the ratio between
the two classes of particles with size of 20 nm and 80 nm is increased substantially
when the scattering is expressed as mass-weighted It is known that this method better
represents the real picture (TEM investigations) in a suspension containing particles
with the same density crystallinity and chemical composition The particle size
distribution of this coating mixture does not change with time (at least one week) this
confirms its colloidal stability at ambient temperature (see Fig 26 left image)
1 10 100 1000 10000
mass-weighted unweighted
inte
nsity
diameter [nm]
Fig 26 DLS curves of zeolite coating suspension Beta-pure expressed as mass-
weighted and unweighted particle size distribution (a) and picture representing the
coating Beta-pure (right) and Beta-TEOS suspension (left)
RESULTS AND DISCUSSION 41
76
This coating suspension was mixed with the three binders and remained stable with no
sedimentation during one week at ambient conditions All suspensions with the three
binders appear transparent with minor scattering similar to the ones shown in Fig 26
The thin Beta films prepared with the above suspensions appear homogeneous and
transparent to the eye The thickness of the films is increased by several deposition steps
of the coating suspensions resulting also in a change of the defined interference color of
the films (Fig 27)
Fig 27 Picture of silicon wafers with Beta-TEOS films prepared by one step (l) two
step (m) and three step deposition (r)
SEM investigations of the Beta-pure Beta-TEOS and Beta-SiO2 were performed in
order to investigate the thickness of the layers their surface morphology and
homogeneity In general the films prepared with binder exhibit a smooth surface and do
not show big differences (Fig 28)
RESULTS AND DISCUSSION 41
77
Fig 28 SEM pictures of films deposited on silicon wafers based on zeolite Beta
without binder (Beta-pure left) and with binder (Beta-SiO2 right) at different
magnifications
RESULTS AND DISCUSSION 41
78
Homogeneous and continuous films at a centimeter scale were obtained by one- to six-
step spin-coatings and the homogeneity of the deposited layer is preserved by the close
packing of the Beta nanocrystals surrounded by the binding agents The individual
crystallites in the films prepared from Beta-SiO2 and Beta-TEOS suspensions are more
closely packed in comparison with pure Beta suspensions Besides the Beta-pure film
has lower adhesion in comparison to the films with added binder An increased surface
roughness of the multilayered films is observed in all films This can be explained by
the higher surface roughness of the intermediate porous layers in comparison to the bare
Si-wafer which is propagated and amplified with each coating step The smoothness of
the films could be improved by the application of smaller particles However small
particles tend to agglomerate faster than the bigger ones and therefore the stabilization
of zeolite grains with a size less then 10 nm could be a great challenge (provided they
could be made) Another possibility is to use an additional top layer of binder to fill all
gaps between the crystalline particles deposited in Beta-pure films However this will
influence the surface chemistry and more specifically the hydrophilicity of the entire
film which will increase whereas the porosity will decrease
Introducing porosity into a thin film strongly influences the optical properties compared
to a dense film of the same material The refractive index decreases with an increasing
proportion of voids in the material (see Bruggemann effective medium approximation
EMA) For ellipsometric data analysis the theoretical model was based on the
assumption that the film consists of nanoparticles and a certain fraction of void The
model layer system was designed as follows 0 the silicon substrate is infinitely thick (1
RESULTS AND DISCUSSION 41
79
mm) 1 a typical layer of 2 nm thermal oxide (SiO2) is presumed 2 the porous film is
described with a Cauchy layer Starting with a guessed film thickness the subsequent
fitting of the thickness and the Cauchy parameters resulted in a very good overlap with
the experimental data as shown in Fig 29
200 300 400 500 600 700 800 900 1000
0
10
20
30
40
50
Model Fit Exp 65iexcl Exp 70iexcl Exp 75iexcl
in d
egre
es
wavelength [nm]
200 300 400 500 600 700 800 900 10001125
1130
1135
1140
1145
1150
refr
active index
wavelength [nm]
Fig 29 Ellipsometry data of Beta-TEOS film after 6 coating steps
The determined thicknesses of the films reflect the values detected with SEM Based on
the ellipsometric data the refractive index (n) of the films prepared with and without
binders was determined The n-values at 589 nm were used for comparison of the films
All films showed a very low refractive index which is typical for porous silica films
Fig 29 shows the data of a film composed of microporous particles and a binder (Beta-
TEOS) prepared by spin-coating 6 times Although the film appears dense to the eye a
refractive index of only 1133 (589 nm) was found for this sample Equal results
concerning thickness and refractive index were achieved by replacing the Cauchy layer
with an EMA layer consisting of SiO2 and void The total porosity was found to be
70 in this case
RESULTS AND DISCUSSION 41
80
The mechanical properties of all films were investigated by tape tests In all films
except Beta-pure the mechanical stability was very high and the film could not be
removed from the silicon wafer with the tape The highest adhesion was diagnosed in
films prepared with amorphous SiO2 binder The efficiency of the binders mainly
depends on the size of the binding particles Small particles of SiO2 with a high external
surface are able to form many bonds (Si-O-Si) with the zeolite crystals and with the
thermal SiO2 on the silicon wafer
Conclusion
Colloidal suspensions of zeolite Beta nanocrystals with low aluminum content were
prepared and the crystallization kinetics were studied The crystallization process was
completed within seven days and the size and the shape of the first crystalline particles
detected in the crystallizing suspensions resemble the ones in the amorphous
suspensions Upon prolonged crystallization an agglomeration in the crystallizing
suspensions is observed however the size of the crystalline zeolite Beta particles did
not exceed 80 nm The crystalline Beta was stabilized in colloidal suspensions by
addition of inorganic silica-based binders and applied for the preparation of films by a
spin-on process The thickness of the films varied from 140 to 950 nm controlled by
repeating the number of coating steps speed of deposition and Beta concentration of the
coating suspensions The Beta films exhibit good mechanical properties smooth
surfaces and show a low refractive index which is typical for highly porous silica based
materials The refractive index of the films prepared with binders is increased slightly
RESULTS AND DISCUSSION 41
81
due to additional amorphous silica introduced in the film which is leading to the
formation of denser layers The spin-coating approach presented here allows for the
preparation of films with variable hydrophilicity thickness and mechanical stability on
supports with different shapes and size
RESULTS AND DISCUSSION 42
82
42 Synthesis and Characterization of
Functionalized Mesoporous Silica
Nanoparticles
RESULTS AND DISCUSSION 42
83
Introduction
Various synthetic methods have been developed for the preparation of periodic
mesoporous materials[80]
leading to different types of morphologies such as spheres[81]
fibers[82]
or vesicles[83]
The large internal surface of these materials can be modified
following two main strategies ie post-synthesis functionalization (grafting)[84 85]
or
in-situ functionalization (co-condensation)[22-24]
thus extending the use of mesoporous
materials to a wide range of applications[86]
Compared to the modification by grafting
the co-condensation reaction can be expected to improve the degree of bonding between
the organic groups and the pore walls and to result in a more homogeneous distribution
of the organic groups throughout the pore structure[27]
Common synthesis routes for mesoporous silica materials lead to particles with typical
diameters of 500 nm to several microns The synthesis of nanosized mesoporous
materials has only recently received attention Such mesoporous nanoparticles offer
interesting features that are useful in a number of applications such as chemical
sensors[87]
chromatography[88]
catalysis[89]
drug delivery[90]
or polymer fillers[91]
If
the particles are homogeneously dispersed in a solvent these colloidal suspensions
exhibit unique properties for example optical transparency Furthermore the utilization
of very small particles improves the mass transfer of molecules into or out of the pore
system The molecular functionalization of the large internal surface of these materials
can extend the range of possible applications for example towards selective
(ad)sorption or specific catalytic activity
RESULTS AND DISCUSSION 42
84
The preparation of nanosized particles can be realized through various methods Brinker
et al described an aerosol-based process resulting in a solid dry product[92]
Another
strategy utilizes the addition of a non-ionic surfactant as a suppressant of particle
growth through encapsulation leading to a gel of agglomerated small particles[93]
Amoros et al[94]
presented a facile method leading to nanosized mesoporous silica using
water tetraethylorthosilicate (TEOS) and cetyltrimethylammonium cations in
combination with triethanolamine (TEAH) which is supposed to act as a hydrolysis-
retarding agent However the final product of this procedure is a gel of fused particles
which cannot be redispersed
There are only few publications describing synthesis methods that lead to colloidal
suspensions of periodic mesoporous materials[95-99]
Their synthesis typically relies on
procedures applying high dilutions this can result in time-consuming subsequent
processing steps For instance truly colloidal suspensions of well-defined mesoporous
particles were obtained by Mann et al[18 100]
by diluting and quenching the
condensation reaction of TEOS in aqueous alkaline solution with a large excess of
water They could manipulate the particle size by varying the time interval for
quenching In a recent publication Rathousky et al[96]
also describe a method for the
preparation of colloidal MCM-41 working with even higher dilutions The utilization of
the polyalcohol triethanolamine can result in non-aggregated colloidal suspensions of
mesoporous silica (CMS) from concentrated solutions[98]
Round particles with
wormhole structures and diameters of about 100 nm with very narrow particle size
distributions were obtained in the form of stable suspensions Tuning the reaction
RESULTS AND DISCUSSION 42
85
conditions allowed controlling particle size down to 50 nm Colloidal stability was even
sustained after template extraction which resulted in surface areas of about 1000 m2 g
-1
Extraction of the template ndash in contrast to calcination ndash is the method of choice when
organic moieties are introduced in the wall structure by a co-condensation procedure
The method can be extended towards the generation of functionalized hydrophilic as
well as hydrophobic colloidal mesoporous silica with high yields As described in the
following various alkoxysilanes bearing organic moieties can be incorporated into the
pores of the colloidal nanoparticles using this general method
Experimental
Two slightly different synthesis methods were used as already described in our recent
publication about the synthesis of nanosized pure mesoporous silicates[98]
and adapted
for functionalization with organic moieties All chemicals were reagent grade (98 or
higher) purchased from Sigma-Aldrich and used without further purification The water
was deionized
Pure siliceous CMS-1 143 g (96 mmol) TEAH and 2 ml (9 mmol) TEOS were
combined in a 125 ml polypropylene bottle with a lid The two-phase mixture was
heated in an oil bath at 90 degC for 20 min without stirring Immediately after taking the
mixture out of the oil bath 267 g of an aqueous solution (25 wt ) of CTAC which
had been heated to 60 degC was added and the final mixture was stirred (600 rpm) for at
least 3 h at 23 degC The molar composition of CMS-1 is 075 Si 8 TEAH 017 CTAC
120 H2O
RESULTS AND DISCUSSION 42
86
Functionalized mesoporous silica CMS-R 143 g (96 mmol) TEAH and a mixture of
223 ml (10 mmol) TEOS plus the corresponding quantity of 2 mmol (Table 1) of
organotriethoxysilane (RTES) were combined in a 125 ml polypropylene bottle with lid
The two-phase mixture was heated in an oil bath at 90 degC for 20 min without stirring
Immediately after taking the mixture out of the oil bath 267 g of an aqueous solution
(25 wt ) of CTAC which had been heated to 60 degC was added and the final mixture
was stirred (600 rpm) for at least 3 h at 23 degC The molar composition of these
functionalized materials is 1 Si 8 TEAH 017 CTAC 120 H2O
Table 1 Type and amount of functionalized organotriethoxysilane used in the co-
condensation
sample RTES M (g mol-1) n (mmol) m (g)
CMS-VI vinyltriethoxysilane 1903 2 0381
CMS-PH phenyltriethoxysilane 2404 2 0481
CMS-BZ benzyltriethoxysilane 2544 2 0509
CMS-CP 3-cyanopropyltriethoxysilane 2314 2 0463
CMS-MP 3-mercaptopropyltriethoxysilane 2384 2 0477
Extraction of template from the mesoporous silica 50 ml of ethanol were added to the
translucent colloidal aqueous suspension of the mesoporous material The resulting
precipitate was centrifuged for 20 min at 40000 RCF (g) After decanting the sediment
was redispersed through vigorous stirring in 50 ml of an ethanolic solution of
ammonium nitrate (20 g l-1
) and then treated for 20 min in an ultrasonic bath (35 kHz)
RESULTS AND DISCUSSION 42
87
Alternatively the mixture can be refluxed for 1 h This procedure was repeated until the
sediment after centrifugation was completely transparent normally one or two times In
order to replace the ammonium ions in the structure this operation was repeated with a
solution of concentrated hydrochloric acid in ethanol (5 g l-1
) After washing with pure
ethanol the transparent gelatinous cake obtained after centrifugation can be redispersed
in ethanol leading to a colloidal suspension of the extracted product in ethanol
Characterization
Dynamic light scattering (DLS) data were collected with an ALV-NIBSHPPS High
Performance Particle Sizer in PMMA cuvettes at 25 degC Raman spectroscopy was
performed with a He-Ne laser (633 nm) on a LabRAM HR UV-Vis (HORIBA Jobin
Yvon) Raman Microscope (Olympus BX41) equipped with a Symphony CCD detection
system The spectra were baseline-corrected For thermogravimetric analysis (TGA)
10 mg of dry powder were heated in corundum crucibles from 30 to 800 degC
(10 degC min-1
) in a flow of synthetic air (25 ml min-1
) using a Netzsch STA 449 C Jupiter
thermobalance For the SEM analysis films were prepared on a gold-covered glass slide
by spin-coating using ethanolic suspensions of the extracted material Shape and
dimensions of the particles were determined with a JEOL JSM-6500F scanning electron
microscope (SEM) equipped with an Oxford EDX analysis system Transmission
electron microscopy (TEM) was carried out on a JEOL JEM 2011 instrument with LaB6
cathode at 200 kV Samples were prepared on a Plano holey carbon coated copper grid
by evaporating one droplet of diluted ethanolic suspension of the extracted material
RESULTS AND DISCUSSION 42
88
Cross-polarized 29
Si-MAS-NMR measurements were performed on a Bruker DSX
Avance500 FT spectrometer in a 4 mm ZrO2 rotor Nitrogen sorption isotherms (77 K)
were obtained using a Quantachrome NOVA 4000e Surface Area amp Pore Size
Analyzer Surface area calculations were made using the Brunauer-Emmett-Teller
(BET) equation in the range from p p0-1
= 005 - 025 Pore-size distributions were
determined using the DFT-method (NLDFT equilibrium model cylindrical pores N2 on
oxygen) The pore volume was determined for meso- and micropores for p p0-1
lt 08
Results and Discussion
Colloidal mesoporous silica was prepared in the form of non-functionalized pure-silica
MCM-like material (CMS) and as functionalized mesoporous materials carrying five
different organic groups (R) in the pore walls (CMS-R see Table 1)
Fig 30 Translucent colloidal suspension and TEM micrograph of functionalized
mesoporous nanoparticles
RESULTS AND DISCUSSION 42
89
The materials were obtained as colloidal suspensions with relatively uniform particle
sizes between 40 and 150 nm (Fig 30) Tetraethylorthosilicate (TEOS) and
organotriethoxysilanes (RTES) form the MCM-like material in combination with
cetyltrimethylammonium cations (CTMA+) as structure directing agent in a co-
condensation process (Fig 31)
Fig 31 Scheme of the co-condensation reaction of alkoxysilanes with a micelle-
forming surfactant
This S+I- assembly takes place in an alkaline aqueous medium with triethanolamine
(TEAH) as basic reactant TEAH can also act as a complexing agent that retards the
hydrolysis of the alkoxides[101-103]
The large excess of TEAH probably keeps the seeds
separated from each other during the condensation process giving finally rise to a large
number of particles with relatively small diameters
RESULTS AND DISCUSSION 42
90
The morphology and particle size of the synthesized materials was analyzed with
dynamic light scattering (DLS) and electron microscopy (TEM and SEM) In the TEM
micrographs discrete near-spherical particles with a disordered worm-like pore
arrangement are observed The particles show a narrow particle size distribution with a
polydispersion index (PDI) of around 01 This narrow size distribution is maintained
after extraction of the template by an ion-exchange method using an ethanolic solution
of ammonium nitrate (Fig 32)
Fig 32 TEM-micrograph and particle size distribution of sample CMS-1 determined by
dynamic light scattering
The synthesis procedure developed for pure siliceous nanoparticles was extended
towards a simultaneous reaction of TEOS and a variety of organotriethoxysilane
precursors to obtain functionalized surfaces Hybrid mesoporous materials incorporating
the following organic groups ie vinyl- (CMS-VI) benzyl- (CMS-BZ) phenyl-
(CMS-PH) cyanopropyl- (CMS-CP) and mercaptopropyl- (CMS-MP) residues were
RESULTS AND DISCUSSION 42
91
thus synthesized These surface-modified mesoporous organosilicas often show an even
narrower size distribution than the pure silica parent materials (Fig 33)
Fig 33 TEM-micrographs and particle size distributions calculated from DLS-data of
samples CMS-MP (a) and CMS-PH (b)
The observed mean particle size obtained from DLS measurements varies in most cases
from about 50 to 150 nm depending on the incorporated functional group and the
RESULTS AND DISCUSSION 42
92
synthesis method employed The particle size observed with electron microscopy is
often slightly smaller than the hydrodynamic diameter measured by DLS This
observation can be explained with occasional weak aggregation of the particles The
discrepancy is seen clearly in the case of the organically modified materials especially
if hydrophobic aromatic groups such as phenyl residues are incorporated in the
structure (Table 2)
Table 2 Properties of colloidal mesoporous materials as analyzed with different
methods
sample Particle size TGA data N2 sorption data
diameter
DLS
(nm)
diameter TEM
(nm)
T at
DTGmax
(degC)
surface
area
(m2 g
-1)
pore
volume at
p p0-1
lt 08
(cm3 g
-1)
pore
diameter
(nm)
CMS-1 100 80ndash120 - 1150 10 40
CMS-VI 120 50ndash100 290 1230 074 34
CMS-CP 130 80ndash150 350 1200 072 33
CMS-MP 90 50ndash70 350 970 063 34
CMS-PH 80 40ndash60 610 1040 073 28
CMS-BZ 110 50ndash100 470 1120 065 32
The products with incorporated organic groups especially CMS-PH or CMS-MP
appear as nearly perfect spheres with diameters of about 50 nm The narrow particle
size distribution of the mesoporous materials can also be confirmed with scanning
RESULTS AND DISCUSSION 42
93
electron microscopy (Fig 34) Here a stable colloidal suspension of extracted CMS-BZ
was used for spin-coating a gold-sputtered glass plate resulting in a homogeneous
coverage of mesoporous particles The benzyl-modified mesoporous spheres have
diameters in the range of 50 to 80 nm
Fig 34 SEM-micrograph of a mesoporous film prepared by spin-coating using a
colloidal suspension of CMS-BZ
An influence of organic functional surface groups upon the morphology of mesoporous
materials was also observed by Huh et al[24]
They found a strong increase of the particle
size when using hydrophilic organosilanes especially with amino-containing residues
while hydrophobic residues stimulated the formation of smaller particles They
concluded that hydrophobic groups are able to align with the organic tails of the
template while hydrophilic residues would disturb the Gouy-Chapman region thus
causing a different growth behavior The results for the hydrophobic functional groups
RESULTS AND DISCUSSION 42
94
support their findings Weakly acidic mercapto residues also stimulate the formation of
small spherical particles[99]
The presence of the organic functional groups can be verified with several methods
Thermogravimetric analysis (TGA) shows the decomposition behavior during the
heating of the samples in air The decomposition temperature more precisely the
temperature when the first derivative of the weight loss reaches a maximum varies over
a rather wide range for the different functional groups (Fig 35 and Fig 36)
Fig 35 Thermogravimetric analysis (TG-DTG) of washed CMS-1 with template (a)
and phenyl modified extracted mesoporous silica CMS-PH (b)
Fig 35a shows the weight-loss of the washed non-functionalized sample CMS-1 still
containing the template inside the pores with a maximum around 250 degC This
decomposition process of the template is completed well before the decomposition of
the phenyl-residue in sample CMS-PH starts Fig 35b shows the decomposition of this
group around a temperature of 600 degC in a sample that was previously template-
extracted This extreme stability is not observed for the other functional groups They
RESULTS AND DISCUSSION 42
95
start to decompose at a lower temperature which makes a clear separation from the
degradation of the template difficult (Fig 36) However when non-functionalized
samples were analyzed with TGA after template extraction a weight loss of around
4-7 wt between 100 and 500 degC is still observed Residual template fragments that
were detected by elemental analysis of non-functionalized samples can account for
about 3 weight loss Additionally the dehydroxylation of surface hydroxyl groups
should be considered Usually up to 3 SiOH groups per nm2 are found in mesoporous
materials[97 104]
With surface areas of about 1000 m2 g
-1 one can estimate a maximum
5 wt loss due to water release from these samples by dehydroxylation
Fig 36 Thermogravimetric analysis of the surface-modified and extracted mesoporous
silica materials (starting at 100 degC to compensate for different water losses)
This loss must be taken into account when the amount of organic residue is determined
from TGA measurements Usually a TGA weight loss between 15 ndash 25 wt in
template-extracted functionalized samples occurs (above 100 degC)
RESULTS AND DISCUSSION 42
96
The connectivity of the functional organic groups to the silica framework is best
demonstrated by cross-polarized 29
Si-MAS-NMR spectroscopy (Fig 37)
Fig 37 Cross-polarized 29
Si-MAS-NMR spectra of the functionalized mesoporous
materials
The spectra show peaks at -110 ppm (Q4) and -102 ppm (Q
3) [Q
n = Si(OSi)n(OH)4-n]
n = 2ndash4 representing the fully condensed silica and silica with one terminal hydroxyl
group Geminal hydroxyls are barely present in these samples (resonance at -92 ppm
Q2) One or two additional peaks are observed due to the T
2 and T
3 resonances of the
incorporated organosiloxanes [Tm
= RSi(OSi)m(OH)3-m] m = 2ndash3 at values commonly
RESULTS AND DISCUSSION 42
97
observed in functionalized mesoporous materials Propyl-bridged functional groups
display shifts around -67 and -60 ppm while directly bound residues with C=C bonds
show resonances at more negative values (Table 3)[24]
The prevalence of the T3 peak
ie the threefold coordination of the siloxane indicates (near) complete condensation of
the functional groups into the wall structure of the nanoparticles
Table 3 Cross-polarized 29
Si-MAS-NMR spectroscopy data of functionalized
mesoporous materials
sample chemical shift
Q4 Q
3 T
3 T
2
CMS-VI -110 -101 -80 -73
CMS-PH -110 -101 -79 -70
CMS-BZ -110 -101 -71 -63
CMS-CP -110 -101 -67 -58
CMS-MP -110 -101 -67 -
The characteristic vibrational modes of the incorporated functional groups are clearly
displayed in their Raman spectra which are not obscured by hydroxyl vibrations of the
host as in IR spectroscopy (Fig 38) Intensive peaks of the phenyl- and benzyl-
substituted samples CMS-PH and CMS-BZ originating from the in-plane C-H
deformation vibrations of the aromatic ring are seen at about 1000 cm-1 Additionally
these samples show the typical peaks for aromatic C-H and ring C=C stretching
vibrations at 3060 and 1590 cm-1 respectively[105]
RESULTS AND DISCUSSION 42
98
In the vinyl-modified sample (CMS-VI) we find the alkene C-H vibrations and the C=C
stretching vibrations at 3070 and 1605 cm-1
respectively The nitrile group of CMS-CP
causes a characteristic narrow band at 2250 cm-1
The typical peak for the S-H group in
the mercaptopropyl-containing CMS-MP occurs at 2580 cm-1
and additionally we find
a band at 657 cm-1
due to the C-S vibration Both Raman bands indicate that the
mercapto groups are intact and that no disulfide bridges have formed[106]
Fig 38 Raman spectra of template-extracted functionalized mesoporous materials
After extraction of the surfactant the functionalized porous materials show high surface
areas and pore volumes The sorption properties were determined using nitrogen
RESULTS AND DISCUSSION 42
99
adsorption-desorption at 77 K In case of the unmodified materials CMS-1 a typical
type IV isotherm with a clear hysteresis from filling of the cylindrical pores is observed
Textural pores of ~20 nm originating from the closely packed nanospheres in the
powders are visible above a relative pressure of 08 p p0-1
The entire surface area
calculated according to the BET-theory is 1150 m2 g
-1 for CMS-1 The product exhibits
a high pore volume of 1 cm3 g
-1 (for p p0
-1 lt 08) and a narrow pore size distribution
with an average diameter of 4 nm as determined with the DFT method (Fig 39)
Calcined CMS-1 shows an even higher surface area of 1400 m2 g
-1 with pore volumes
of 11 cm3 g
-1
Fig 39 Nitrogen sorption isotherm (left) and pore size distribution (right) according to
the DFT theory of mesoporous silica CMS-1
The type of adsorption isotherm is unchanged in the functionalized nanosized materials
and the inclusion of the functional groups does not significantly affect the overall
surface area of the materials (Fig 40)
RESULTS AND DISCUSSION 42
100
Fig 40 Nitrogen sorption isotherms of reference and co-condensed materials
To some extent the size of the functional groups influences the shrinkage of the pore
diameter While the unmodified mesoporous silica has an average pore diameter of
40 nm in vinyl-functionalized materials (CMS-VI) we find pores with a mean diameter
of 34 nm and the bulky nature of the benzyl group in CMS-BZ causes a reduction to
32 nm (Fig 41)
RESULTS AND DISCUSSION 42
101
10 100 1000
000
001
002
003
004
005
006
CMS-1 CMS-VI CMS-BZ
Dv(d
) [c
m-3
-1
g-1
]
pore diameter []
Fig 41 Changes in the pore size distribution with increasing size of the incorporated
organic moieties in mesoporous silica
The surface coverage of functional groups in the nanoscale mesoporous samples can be
estimated from thermogravimetric measurements in conjunction with the surface area
presuming that all organic groups are located on the surface For example the weight-
loss of CMS-PH due to the decomposition of the organic group is about 20 The
calculated surface area according to BET-theory is 1040 m2 g
-1 From these data a
surface coverage of 26 mmol g-1
or 15 phenyl groups per nm2 can be calculated
Conclusion
The synthetic approach presented here can serve as a general method for the preparation
of both colloidal mesoporous silica spheres (CMS) and functionalized colloidal
suspensions of nanoscale mesoporous materials with high yields from concentrated
solutions Narrow particle size distributions in the range of about 50 to 150 nm were
established with Dynamic Light Scattering (DLS) measurements and electron
RESULTS AND DISCUSSION 42
102
microscopy before and after template extraction Discrete nanoscale mesoporous
particles with functionalized pore surfaces result when adding functional
organoalkoxysilanes directly to the initial silica precursor solutions Nitrogen sorption
analysis and indicates that the functional groups are located at the inner surfaces of the
mesoporous channel systems
RESULTS AND DISCUSSION 43
103
43 Porous Thin Films of
Functionalized Mesoporous Silica
Nanoparticle
RESULTS AND DISCUSSION 43
104
Introduction
Porous materials in the nanometer range already attract a great deal of interest in many
fields of science and technology Especially in terms of colloidal suspensions these
materials are promising candidates for applications such as gas sensing host-guest
chemistry drug delivery and coatings in the semiconductor industry The preparation of
monodisperse stable colloidal suspensions of mesoporous silica particles has been
recently developed[98 99]
The synthesis parameters were gradually modified in order to
realize even smaller particles in the range below 40 nm As reported in the previous
publications the introduction of functional groups during the co-condensation reaction
has a great influence on the particle shape and size[24]
The synthesis with
phenyltriethoxysilane led to particles with a smallest diameter of only 50 nm[107]
Additionally the phenyl-modified particles are thermally more stable easy to
characterize and tend to peptize (disperse) more easily due to their sterically demanding
and inert aromatic rings
By further decreasing the diameter of these mesoporous silica spheres their scattering
ability for visible light is also drastically decreased If the size of the particles falls
below about 110 of the wavelength of the incoming light (01 ) their scattering ability
can no longer be described with the Lorenz-Mie-solution but with Rayleigh scattering
The colloidal suspensions thus show optical transparency when the particle size is small
enough Due to this optical transparency such nanoparticles would allow spectroscopic
investigations of physical processes or chemical reactions in a confined space
Furthermore it is possible to encapsulate sensitive dyes [108-111]
or to facilitate the
RESULTS AND DISCUSSION 43
105
dispersion of the particles in certain media Modifying the spheres with appropriate
functionalities such as caps or fluorescence markers would make them interesting
candidates for drug delivery[7 108]
or would permit observing their way into a cell[112
113] Another very promising area of application is thin film technology
[114 115] The
synthesis of mesoporous thin films is often achieved with the so-called ldquoEvaporation
Induced Self Assemblyrdquo (EISA) process[20]
The EISA process for mesoporous silica
thin films starts with a homogeneous solution of silica precursor and surfactant prepared
in ethanolwater with an initial surfactant concentration much below the critical micelle
concentration[20]
Upon dip-coating or spin-coating the preferential evaporation of
ethanol concentrates the surfactant and silica species The progressively increasing
surfactant concentration drives self-assembly of silica-surfactant micelles and their
further organization into liquid-crystalline mesophases This approach represents a
versatile strategy for the formation of mesoporous silica and other oxide thin films with
different pore sizes pore topologies and elemental composition[116]
However there are several issues that suggest the development of complementary
strategies The precursor is normally highly acidic which can cause problems on
sensitive substrates Removal of the template by extraction or calcination might also be
critical If the surfactant is removed thermally cracks can occur in thicker films and it
is known that the humidity has a great influence on the film formation Thus if the
orientation of the pores is less important the alternative preparation of thin films with
mesoporous nanoparticles can address several of these issues It is believed that a
porous thin film made of porous nanoparticles can exhibit improved diffusion properties
RESULTS AND DISCUSSION 43
106
and a highly accessible pore system[50]
Additionally one can work with stable
suspensions of already extracted nanoparticles thus ensuring an easy handling and good
reproducibility The coating of sensitive substrates is facilitated due to the mild
conditions Control over the thickness can be attained by varying the concentration or
by multiple step coating It could be also feasible to combine suspensions containing
different kinds of nanoparticles in order to assemble hybrid thin films Finally the
material is easier to characterize when bulk samples are available The synthesis of
completely transparent suspensions even after template extraction would be a great
improvement for the formation of homogeneous thin films with a low surface
roughness Especially for the formation of multilayers it is advantageous if the film is
very smooth Otherwise the defects on the surface are transmitted and amplified with
every following coating step Furthermore the availability of such homogeneous porous
thin films makes it possible to use ellipsometric porosimetry as an analysis method
This method has a set of advantages compared to conventional sorption methods which
are specified in a work of Eslava et al[56]
For an accurate determination of sorption isotherms of porous coatings via gravimetric
or volumetric methods an extremely sensitive device is needed The tiny amount of
porous material and the weight increase due to adsorption in the thin film can be
detected with a surface acoustic wave (SAW) device or a quartz crystal microbalance
(QCM) In both cases the coating has to be applied to the measuring device itself
which might have an influence on properties such as the orientation of the crystals the
presence of grain boundaries and the film thickness Scraping off from their supports
RESULTS AND DISCUSSION 43
107
and collecting a sufficient quantity of powdery sample for a conventional determination
is a drastic intervention The determination of sorption isotherms of a thin film via
ellipsometric porosimetry (EP) is a convenient method to determine the effective
porosity and pore size distribution of a thin film on its original support without
destroying it
Thus the aim of this work was the synthesis of monodisperse colloidal suspensions of
porous nanoparticles with a particle size small enough for the preparation of
homogeneous thin films Additionally the porosity of the final thin films is determined
with different methods
Experimental
All chemicals were purchased from Sigma-Aldrich with reagent grade (98 or higher)
and used without further purification The water was deionized In order to guarantee
the same conditions for all samples the syntheses were carried out in a heatable high-
throughput magnetic stirrer (1000 rpm) in 100 ml glass test tubes (diameter 25 cm)
Although it is necessary that the synthesis mixture be well stirred building of foam
should be avoided in order to prevent the formation of inhomogeneities The following
solutions were prepared and used for all syntheses S1 (surfactant) 300 g aqueous
solution of cetyltrimethylammonium chloride (25 wt ) and 2700 g deionized water
C1 (catalyst) 10 g triethanolamine (TEAH) and 90 g deionized water P1 (precursor)
208 g (01 mol) tetraethylorthosilicate (TEOS) and 24 g (001 mol)
phenyltriethoxysilane (PTES) E1 (extraction) 50 g concentrated hydrochloric acid
RESULTS AND DISCUSSION 43
108
(37 HCl) in 500 ml ethanol E2 (extraction) 10 g ammonium nitrate in 500 ml
ethanol
Samples CMS-Pxy
200 g S1 and 020 g (CMS-P2y) 040 g (CMS-P4y) or 080 g (CMS-P8y) C1 were
heated under stirring to 60 degC (CMS-Px6) 70 degC (CMS-Px7) or 80 degC (CMS-Px8) The
amount of 160 ml P1 was added and stirring was continued in the test tube for 1 h The
vessel was kept open in order to evaporate parts of the ethanol that were formed during
the condensation For a better overview all samples are listed in Table 4
Table 4 Prepared samples and synthesis conditions
sample synthesis
temperature
amount
TEAH (g)
CMS-P26 60 degC 002
CMS-P46 60 degC 004
CMS-P86 60 degC 008
CMS-P27 70 degC 002
CMS-P47 70 degC 004
CMS-P87 70 degC 008
CMS-P28 80 degC 002
CMS-P48 80 degC 004
CMS-P88 80 degC 008
RESULTS AND DISCUSSION 43
109
Extraction
The resulting colloidal suspension was flocculated with 20 ml E1 and the cloudy
precipitate was centrifuged for 5 min at 40000 g (RCF) After decanting the sediment
was redispersed through vigorous stirring in 20 ml E2 The clear suspension was treated
for 10 min in an ultrasonic bath After flocculating with 20 ml deionized water the
precipitate was again centrifuged the sediment was redispersed in 20 ml E1 and again
sonicated After flocculation with 20 ml deionized water and centrifugation the
sediment can be redispersed in ethanol leading to a suspension of colloidal mesoporous
silica (CMS) with approximately 5 wt solid content
Film preparation
Thin film preparation was performed by spin-coating with an ethanolic suspension
containing about 5 wt of solid material The substrate (silicon or glass) was coated
3 times at 3000 rpm (acceleration 5000 rpm s-1
) In order to remove potential
inhomogeneities the transparent ethanolic suspension was filtered through a 02 μm
syringe filter prior to spin-coating
Characterization
Dynamic light scattering (DLS) data were collected with a Malvern Nano ZS in PMMA
cuvettes at 25 degC For thermogravimetric analysis (TGA) 10 mg of dry powder were
heated in corundum crucibles from 30 to 900 degC (10 degC min-1
) in a flow of synthetic air
(25 ml min-1
) using a Netzsch STA 449 C Jupiter thermobalance Transmission electron
RESULTS AND DISCUSSION 43
110
microscopy (TEM) was carried out on a FEI Titan 80-300 at an accelerating voltage of
300 kV Samples were prepared on a Plano holey carbon coated copper grid by
evaporating one droplet of diluted ethanolic suspension of the extracted material The
nitrogen sorption isotherms (77 K) were obtained using a Quantachrome NOVA 4000e
Surface Area amp Pore Size Analyzer Surface area calculations were made using the
Brunauer-Emmett-Teller (BET) equation in the range from p p0-1
= 005 - 025 Pore-
size distributions were determined using the DFT-method (NLDFT equilibrium model
cylindrical pores N2 on carbon) Ellipsometry measurements were performed with a
Woollam M2000D at different angles (65deg 70deg and 75deg) in the spectral range of 190 ndash
1000 nm The data were fitted in the range between 250 ndash 1000 nm using the Cauchy
material as model layer Ellipsometric porosimetry measurements were carried out in a
closed cell at different partial pressures at a measurement angle of 75deg The recording of
isotherms was performed using a homemade Labview-controlled gas mixer Digital
mass flow controllers (W-101A-110-P F-201C Bronkhorst High-Tech) ensured the
accurate dosing of the carrier gas nitrogen and the liquid analyte which was vaporized
in a controlled evaporation and mixing element (W-101A Bronkhorst High-Tech)
Partial pressures were calculated using the van der Waals equation For a better
comparison with nitrogen sorption the relative pressure p px-1
(px saturation pressure)
is used for the vapor sorption analysis
RESULTS AND DISCUSSION 43
111
Results and Discussion
The synthesis results are in good accordance with the expectations based on the work of
Stoumlber[12]
and LaMer[13]
A first variable of course is the amount of precursor added to
the synthesis In a certain range decreasing the amount of precursor can reduce the size
of the final particles According to Stoumlber the particle size distribution passes a
maximum when the concentration is varied because the concentration of precursor
influences not only the growth of the seeds but also the nucleation rate und thus the
number of initial seeds Since high yield is a priority it is more interesting to choose
other options for a successful downsizing The experiments show that the final particle
size in the resultant suspensions (CMS-P26 ndash CMS-P88) is dependent on the amount of
added TEAH and the reaction temperature In Fig 42 the hydrodynamic diameter of all
samples is shown (CMS-P86 stand for synthesis with 008 g TEAH at 60 degC )
Fig 42 Initial particle size (DLS) of samples CMS-P26 ndash CMS-P88
RESULTS AND DISCUSSION 43
112
With increasing temperature and amount of catalyst (TEAH) the hydrolysis of the
precursor and condensation of the nanoparticles is supported and the reaction is faster
In this specific range these changes apparently promote the growth rate more than the
nucleation rate resulting in bigger particles Fig 43 shows micrographs (TEM) of
samples synthesized at different temperatures with the same amount of TEAH (CMS-
P8y) The difference in size can be clearly seen the particles that formed at 60 degC
(CMS-P86) show the smallest diameter of only 15 nm At 70 and 80 degC the diameter
reaches 25 and 30 nm respectively
Fig 43 Electron micrographs (TEM) of samples CMS-P86 CMS-P87 and CMS-P88
In agreement with DLS data TEM also shows that the variation of the amount of
catalyst TEAH at a constant reaction temperature (80 degC CMS-x8) has an influence on
the particle size The difference is less pronounced but the general tendency can be
confirmed The diameter varies between 22 nm (CMS-P28) 25 nm (CMS-P48) and
30 nm (CMS-P88) if the quantity of TEAH is increased
RESULTS AND DISCUSSION 43
113
Fig 44 Electron micrographs (TEM) of samples CMS-P28 CMS-P48 and CMS-P88
Table 5 shows a comparison of DLS and TEM data for selected particle sizes The
divergence in hydrodynamic diameter in DLS (36 - 130 nm) and discrete particle size in
TEM (15 - 30 nm) could be explained with a higher degree of agglomeration at higher
temperatures
The findings made it possible to synthesize colloidal suspensions of functionalized
mesoporous silica nanoparticles with a very small particle size between 15 and 30 nm
As the scattering intensity (I) of light strongly decreases with smaller particles size
(I ~ radius6) the suspensions with the smallest diameter (~ 15 nm) are completely clear
(Fig 45)
RESULTS AND DISCUSSION 43
114
Fig 45 Scattering of the initial colloidal suspensions containing particles with different
diameters (DLS) in the range between about 40 to 130 nm (from left to right CMS-P27
-P86 -P28 -P87 -P48 -P88)
When reaching a certain size separating particles with centrifuges becomes difficult as
the effective gravitational force is dependent on the mass of the particles An elegant
method to overcome this problem is the flocculation of the particles Therefore
acidified ethanol was added to the aqueous colloidal suspension leading to a cloudy
suspension of agglomerated particles The particles then could be separated from the
solution by centrifugation and were purified in the following steps The final gelatinous
sediment can be completely redispersed in ethanol leading to transparent colloidal
suspensions with almost exactly the initial particle size distribution in DLS Fig 46
shows the mean hydrodynamic diameter of CMS-P86 before and after template
extraction The polydispersity index (PDI) of all suspensions was below 02 The
suspensions with a diameter below 40 nm are completely transparent to the visible part
of the light and show nearly no scattering
RESULTS AND DISCUSSION 43
115
Fig 46 Hydrodynamic diameter of CMS-P86 before and after template extraction
In transmission electron microscopy (TEM) the diameter of the particles can be
specified as significantly smaller (by a factor of 3) than in dynamic light scattering Fig
47 shows micrographs of CMS-P86 with an average particle diameter around 20 nm
The size distribution of the discrete particles is very narrow High resolution images
clearly show the porous nature of the functionalized particles
RESULTS AND DISCUSSION 43
116
Fig 47 TEM micrographs of CMS-P86 (right HAADF-STEM)
In order to investigate the sorption properties of the porous nanoparticles the ethanolic
suspensions were dried at 60 degC The resulting solids were colorless and transparent
consisting of small platelets with about 1 mm diameter Despite of its dense appearance
the material has a high specific surface area of 640 m2 g
-1 as well as a high pore volume
(095 cm3 g
-1) in the case of CMS-P86 DFT calculations resulted in a bimodal pore size
distribution
Fig 48 N2 sorption data of dried extracted CMS-P86
RESULTS AND DISCUSSION 43
117
The first peak at 27 nm due to templated mesopores is in the expected range for
functionalized mesoporous silica templated by hexadecyltrimethylammonium ions The
second peak around 10 nm reflects the textural porosity of the material It is a widely
accepted concept that an inscribed sphere between adjacent spheres is an approximate
shape for the access opening to the interstitial void space between randomly packed
spheres[117-119]
Depending on the packing of the individual particles the pore opening
varies approximately between 02 and 06 times the radius of the equally sized particles
In the case of CMS-P86 this interparticle porosity is in the range between 5 and 15 nm
(compare Fig 48)
Thus the expected particle size based on sorption is about 25 nm which coincides well
with the observed diameter in the TEM With decreasing particle size this second peak
is shifted to smaller pore sizes as shown in Fig 49 The maximum of the interparticle
porosity is in the expected range for all samples (see Table 5)
RESULTS AND DISCUSSION 43
118
Fig 49 Pore size distribution from N2 sorption of differently sized mesoporous
particles with maximum for interparticle porosity
Table 5 Particle size (DLS TEM) and maximum in interparticle porosity (N2 sorption)
sample hydrodynamic
diameter (DLS)
diameter
(TEM)
max interparticle
porosity
CMS-P88 130 30 16
CMS-P48 95 25 14
CMS-P28 80 22 12
CMS-P87 80 25 14
CMS-P86 60 15 9
RESULTS AND DISCUSSION 43
119
Homogeneous Thin Films
The ethanolic suspensions of the template-free material are ideal candidates for the
preparation of homogeneous spin-on thin films The dry bulk material exhibits a high
surface area even though it appears to be a dense solid Thus one can expect a high
porosity for the corresponding thin film Fig 50 shows an image of a silicon wafer with
a thin film of mesoporous functionalized silica with a thickness of 650 nm The film
was prepared by spin-coating three times with an ethanolic suspension containing
5 wt of CMS-P86
Fig 50 Thin film of CMS-P86 on a silicon wafer
The film appears very homogeneous and transparent and thus has a definite interference
color Due to pronounced capillary forces occurring during the solvent evaporation the
nanoparticles are very closely packed ndash a phenomenon that also assists in the assembly
of colloidal crystals[120]
Because of the smooth surface no scattering is observed which
makes the films perfect candidates for ellipsometry investigations Modeling and fitting
RESULTS AND DISCUSSION 43
120
of the data was based on the assumption that the film consist of porous nanoparticles
the model layer is designed as follows
0 the silicon substrate is infinitely thick (1 mm) 1 a typical layer of 2 nm thermal
oxide (SiO2) is presumed 2 the material (organic functionalized silica) is described
with a Cauchy layer Starting with a guessed film thickness of 500 nm the subsequent
fitting of the thickness and the Cauchy parameters resulted in a 650 nm thick film As
show in Fig 51 this model layer fits exactly the experimental data
Fig 51 Ellipsometry data of a thin film of CMS-P86 in nitrogen atmosphere
The measurement was performed in a flow cell in a flow of nitrogen It was repeated at
different relative pressures of gaseous toluene The adsorption affinity of the thin film
can be also observed when the interference color changes due to the pore filling The
relative pressure of toluene was controlled between 0 and 0943 (p p0-1
) Plotting the
refractive index of the thin film versus the relative pressure of toluene resulted in the
isotherm shown in Fig 52
RESULTS AND DISCUSSION 43
121
Fig 52 Ellipsometry data of a thin film of CMS-P86 in toluene vapor in a nitrogen
atmosphere
After the templated mesopores are filled a second step due to the filling of the
interparticle porosity can be identified at a relative pressure of 06 - 08 The
ellipsometric data are in very good accordance with powder nitrogen sorption data (Fig
53) The overlay shows the same sorption behavior for the two different adsorbates
RESULTS AND DISCUSSION 43
122
Fig 53 Overlay of a powder N2 sorption isotherm (desorption) and a toluene isotherm
(equilibrium) of a thin film recorded with ellipsometry (CMS-P86)
With the Lorentz-Lorenz equation for ellipsometric porosimetry (EP) a porosity of
53 can be specified Knowing the area of the substrate - a 3 inch wafer - the volume
of the deposited film can be easily calculated assuming a cylinder with a height of
650 nm Based on the high precision of thickness measurements in ellipsometry the
calculated volume of 00030 cm3 can be considered as accurate If the total pore volume
of 095 cm3 g
-1 in N2 sorption is correlated to the 53 porosity in ellipsometric data a
density of 056 g cm-3
can be calculated Thus the expected weight of the film is
17 mg Weighing before and after the film deposition gave a difference of 21 mg This
can only act as a rough indication due to a relatively large measuring inaccuracy of the
analytical balance and possible adsorbed water due to air humidity
RESULTS AND DISCUSSION 43
123
Conclusion
In this study we have demonstrated the synthesis of extremely small mesoporous silica
nanoparticles via a specific co-condensation process with phenyl groups The size of the
suspended mesoporous silica spheres can be controlled in a wide range The
suspensions with a mean hydrodynamic particle diameter of 40 nm or less were
optically transparent After extraction of the surfactant dispersion in ethanol led to
transparent colloidal suspensions The existence of very small individual porous
particles was confirmed by transmission electron microscopy (TEM) and sorption
measurements The suspensions were used for the preparation of homogeneous porous
thin films by spin-coating The films showed excellent optical qualities and could thus
be characterized with ellipsometry It was possible to record sorption isotherms of the
thin films with ellipsometry and to correlate the data with nitrogen sorption data of
dried powders of the same material In the future exchange of the template is
anticipated to allow control over the pore size and the particles can be functionalized or
labeled with a fluorescent dye Examples for a successful functionalization are listed in
the supporting information
RESULTS AND DISCUSSION 43
124
Supporting Information
The versatility of the modified synthesis procedure described in Chapter 43 can be
illustrated by the production of several other functional nanoparticles If the particle size
in the resulting colloidal suspension is around 100 nm extraction and redispersion can
be performed as described in Chapter 42 The synthesis conditions were thus adjusted
for the following samples
Experimental Part
CMS-AP
022 g aminopropyltriethoxylsilane (APTES 1 mmol) 024 g phenyltriethoxysilane
(PTES 1 mmol) and 208 g tetraethylorthosilicate (TEOS 10 mmol) were combined
90 g triethanolamine (TEAH) and 100 g of an aqueous solution containing 25 wt
hexadecyltrimethylammonium chloride (CTAC) were heated to 70 degC The precursor
solution was added and the mixture was stirred for 2 h at 70 degC
CMS-FITC
390 mg fluorescein isothiocyanate (FITC 001 mmol) 011 g aminopropyl-
triethoxysilane (APTES 05 mmol) and 20 g abs ethanol were stirred 24 h under dry
nitrogen atmosphere The resulting fluorescent orange solution was combined with a
mixture of 208 g tetraethylorthosilicate (TEOS 10 mmol) and 024 g phenyltriethoxy-
silane (PTES 1 mmol) 90 g triethanolamine (TEAH) and 100 g of an aqueous solution
RESULTS AND DISCUSSION 43
125
containing 25 wt hexadecyltrimethylammonium chloride (CTAC) were heated to
70 degC The precursor solution was added and the mixture was stirred for 2 h at 70 degC
Extraction
Extraction of template was performed by adding an equal amount of ethanol to the
translucent colloidal aqueous suspension of the mesoporous material The resulting
precipitate was centrifuged for 10 min at 40000 g (RCF) After decanting the sediment
was redispersed through vigorous stirring in the initial volume (ca 100 ml) of an
ethanolic solution of ammonium nitrate (20 g l-1
) and then refluxed for 1 h This
procedure was repeated with the same amount of a solution of concentrated
hydrochloric acid in ethanol (5 g l-1
) After washing with pure ethanol the transparent
gelatinous cake obtained after centrifugation was suspended in ethanol
Results and Discussion
a) Introduction of Aminopropyl Groups through Co-condensation
The new method additionally allows the introduction of aminopropyl groups during the
co-condensation The presence of aminogroups in the silica precursor during the
synthesis is usually accompanied with gelation problems Hence the synthesis of
nanoparticle suspensions with aminopropyl moieties is mainly realized by grafting[121]
In combination with the steric demanding phenyl groups of the phenyltriethoxysilane
(PTES) it is possible to obtain dispersed discrete nanoscaled particles The particle size
RESULTS AND DISCUSSION 43
126
distribution in DLS (Fig 54) shows a slightly broadened signal probably due to partly
interconnected particles
1 10 100 1000 10000
extracted in EtOH in water
inte
nsity
particle size [nm]
Fig 54 Particle size distribution (DLS) of CMS-AP before and after extraction
The functional mesoporous organosilica particles show a similar mean diameter around
100 nm before and after template extraction The coexistence of the two different
functionalities can be demonstrated with various methods In this case TGA data is
difficult to interpret because the weight loss caused by the decomposition of the
aminopropyl groups and the template are overlapping Fig 55 shows two distinct steps
with the one at higher temperatures unequivocally deriving from the decay of the
aromatic phenyl groups whereas the first step can presumably be assigned to the
aminopropyl groups Decomposing of the template starts already at lower temperatures
around 150 degC (compare Fig 35 Chapter 42)
RESULTS AND DISCUSSION 43
127
100 200 300 400 500 600 700 800
25
20
15
10
5
0
we
igh
t lo
ss [
]
temperature [iexclC]
0 10 20 30 40 50 60 70
-10
-08
-06
-04
-02
00
02
time [min]
DT
G [
min-1
]
Fig 55 Thermogravimetric data of extracted CMS-AP
Spectroscopic methods such as NMR or Raman measurements are usually more reliable
methods for the characterization of functionalized silica materials However solid state
29Si-NMR can also just give an indication for the incorporation of the aliphatic group
Compared to the spectra of the single phenyl modified product a shoulder at lower field
occurs in sample CMS-AP[122]
RESULTS AND DISCUSSION 43
128
0 -20 -40 -60 -80 -100 -120 -140
CMS-PH CMS-AP
[ppm]
Fig 56 29
Si-NMR spectra of CMS-AP and CMS-PH
Even though it is difficult to detect the aliphatic aminogroups in Raman measurements
Fig 57 shows the appearance of an additional signal at 1050 cm-1
as a result of C-N
stretching in primary amines
850 900 950 1000 1050 1100 1150 1200 1250
primary aminesC-N stretching
CMS-PH CMS-AP
inte
nsity
wavelength [cm-1]
Fig 57 Raman spectra of CMS-PH and CMS-AP
The isotherm obtained by nitrogen sorption analysis (Fig 58a) shows the typical
pronounced hysteresis at high pressures due to interparticle condensation in
nanopowders The step for the condensation in the templated mesopores is smeared out
RESULTS AND DISCUSSION 43
129
inferring a relatively broad pore size distribution due to the existence of functional
groups inside the pore system Fig 58b shows the bimodal pore size distribution which
is characteristic for mesoporous particles in the scale of about 100 nm
00 01 02 03 04 05 06 07 08 09 100
200
400
600
800
1000
0
200
400
600
800
1000 adsorption desorption
volu
me a
dsorb
ed [
cm
3
g-1
] S
TP
relative pressure p p0
-1
10 100 1000
0000
0005
0010
0015
Dv(d
) [c
m-3
-1
g-1
]
pore diameter []
Fig 58 N2 sorption isotherm and pore size distribution (DFT) of CMS-AP
c) Labeling with Fluorescein Marker
A porous silica nanoparticle is a suitable host for fluorescent markers due to its
chemical and mechanical stability[108]
The encapsulated dye molecule is shielded from
external influences and can be further functionalized with biocompatible elements The
labeling with a fluorescein isothiocyanate (FITC) is a common method in biochemistry
The method was also adopted to silica particles[123]
and recently to mesoporous silica
structures[43]
and even mesoporous silica nanoparticles[47]
The availability of a synthesis recipe for colloidal suspensions with incorporated
aminogroups establishes a basis for the successful linking of a marker during a one-step
synthesis[124]
After the synthesis of a suitable precursor that already carries the
RESULTS AND DISCUSSION 43
130
fluorescence marker it can be incorporated into the above mentioned synthesis
procedure to form labeled colloidal silica particles The successful incorporation of the
dye can be easily verified by adding only fluorescein to a reference sample Both
suspensions are transparent and the exhibit the characteristic color (Fig 59)
Fig 59 CMS-FITC and reference sample with fluorescein
After flocculation and separation of the particles by centrifugation the successful
incorporation of the FITC modified precursor can be verified when the solution above
the sediment is analyzed Only in the case of a successful functionalization it appears
colorless or only pale colored from some FITC residues respectively (Fig 60)
RESULTS AND DISCUSSION 43
131
Fig 60 CMS-FITC and reference sample after centrifugation
The precipitation can be extracted and redispersed in ethanol resulting in translucent
and fluorescent colloidal suspensions of mesoporous silica nanoparticles (Fig 61)
Fig 61 CMS-FITC after extraction and under UV-irradiation
RESULTS AND DISCUSSION 43
132
DLS data confirmed the existence of discrete particles with a comparable particle size
distribution The mean diameter of the particles in the stable colloidal suspension before
and after extraction is around 100 nm
1 10 100 1000
inte
nsity
particle size [nm]
Fig 62 Particle size distribution (DLS) of extracted CMS-FITC
Due to the very small amount of FITC in the synthesis further characterization methods
give no distinct discrepancy to the sample CMS-AP TGA as well as nitrogen sorption
or Raman investigations are very similar
RESULTS AND DISCUSSION 43
133
Fig 63 Dry sample CMS-FITC under UV-irradiation
The dried sample also exhibits the characteristic fluorescence (Fig 63) In order to
investigate the porosity of the sample and the accessibility of the functional group a
simple gas phase reaction can be applied The yellow powder is brominates with
elemental gaseous bromine at normal atmospheric moisture resulting in a red-colored
product carrying now eosin moieties (Fig 64)
Fig 64 Gas phase reaction of CMS-FITC with bromine vapor
RESULTS AND DISCUSSION 43
134
Fig 65 Bromination of fluorescein moieties with gaseous bromine
RESULTS AND DISCUSSION 44
135
44 Vapor-Sensitive Bragg Mirrors and
Optical Isotherms from Mesoporous
Nanoparticle Suspensions
RESULTS AND DISCUSSION 44
136
Introduction
Bragg reflectors are multilayer structures composed of alternating layers of two
dielectric materials with different refractive indices (n) The optical properties of a
Bragg mirror are dependent on the thickness and refractive index of the individual
layers For ideal reflectors all layers exhibit an optical thickness of λ4 The efficiency
increases with the number of layer pairs and the contrast of the refractive indices of the
low and high refracting materials For the preparation of good Bragg mirrors the
individual films have to be homogeneous with smooth surfaces and reproducible
thickness Thus they were often produced by vapor deposition techniques But it is also
possible to assemble Bragg stacks using spin- or dip-coating
Bragg reflectors are also widespread in nature eg in butterfly wings or iridescent
elytra of beetles where chitin layers are alternated with different refractive index layers
in order to control the apparent color in a wide variety of animals[38]
In the laboratory
these special thin films can be prepared for example by alternation of low refractive
SiO2 with high refractive TiO2 films Regarding porous thin films the expected change
of the interference color upon adsorption or desorption of a volatile species suggests a
novel concept for chemical sensing Indeed this sensing effect of porous films has
already been studied in several publications[39-43]
also in combination with the Bragg
stacks[44]
The preparation of sensing Bragg mirrors faces several challenges In order to realize
high quality Bragg mirrors the individual layers have to be very homogeneous Defects
or a high surface roughness in the films would propagate and amplify with each
RESULTS AND DISCUSSION 44
137
additional layer For a high brilliance of the Bragg stack the thickness of the layer has
to be constant across the substrate surface If the stack is to be built from nanoparticle
layers there will be boundary conditions on the optimal size distribution of the
individual particles ie the smaller the nanoparticles are the smoother the film Porous
thin films by their nature have a relatively low refractive index but for intensive colors
the contrast needs to be high For sensing applications one needs two porous layers to
guarantee good pore accessibility normal to the surface of the film Porous SiO2 is a
material with a very low refractive index In Chapter 42 synthesis procedures for the
preparation of colloidal suspensions of functionalized mesoporous silica nanoparticles
with a very small particle size were discussed These colloidal suspensions are ideal
candidates for the production of highly porous homogeneous thin films with a low
refractive index For the high refractive index layer nanoparticulate colloidal titania is a
suitable material The preparation of thin films with porous nanoparticles can have some
advantages over the common EISA approach for mesoporous films and the growth of
zeolite films on substrates respectively a) It is anticipated that the porous thin films
made of randomly oriented (porous) nanoparticles exhibit improved diffusion properties
and a highly accessible pore system[50]
b) It is possible to prepare stable suspensions of
already extracted and characterized nanoparticles thus assuring good reproducibility
and well-characterized sorption properties c) The film thickness can be controlled over
a wide range by varying the particle concentration or the number of coating steps d)
The coating of sensitive substrates is facilitated due to the mild processing conditions
For example intricate or high-temperature template removal procedures between the
RESULTS AND DISCUSSION 44
138
coating steps are not required e) The last-coated layers are located only on top of the
layer structure ndash no soluble precursor constituents may percolate into the already
deposited underlying layer structure Such Bragg mirrors have numerous potential
applications in sensing devices wavelength-selective tunable optical filters in a broad
spectral range and reflective coatings
Experimental
The colloidal suspensions of low refractive index material (CMS-P86 porous SiO2
nanoparticles ndash see Chapter 43) and high refractive index material (CMT-6 TiO2
nanoparticles ndash see Chapter 62) were used for the preparation of thin films The
homogeneous colloidal suspensions contained between 2 and 5 wt solid
nanoparticulate material In order to remove potential inhomogeneities the coating
suspensions were filtered through 02 μm syringe filters prior to deposition The thin
films were deposited on polished silicon wafers or glass plates by spin-coating using a
Laurell WS-400B-6NPP-Lite-AS All substrates were pre-cleaned with ethanol for 5 s
under spinning at 3000 rpm The film thickness was adjusted by diluting the colloidal
suspensions with absolute ethanol by variation of the spinning rate between 3000 and
5000 rpm or by multi step coatings respectively After each deposition the film was
annealed for 10 s in a flow of hot air (heat gun ~ 300 degC) and cooled to room
temperature before measurements were performed and the next layer was added SEM
micrographs were recorded with a JEOL JSM-6500F scanning electron microscope
(SEM) equipped with an Oxford EDX analysis system Ellipsometry measurements
RESULTS AND DISCUSSION 44
139
were performed with a Woollam M2000D at an angle of 75 deg in the spectral range of
190 ndash 1000 nm The data was fitted in the range between 350 ndash 1000 nm using the
Cauchy material as model layer Transmittance and reflectance measurements were
recorded with the same ellipsometer using p-polarized light at 45 deg 75 deg or 90 deg
depending on the sample and the experimental setup In order to record the shift of the
transmitted (angle 90 deg) wavelength due to vapor sorption the films were placed into
quartz cuvettes with gas in- and outlet The recording of isotherms (at 22 degC) was
performed using a homemade Labview-controlled gas mixer Digital mass flow
controllers (W-101A-110-P F-201C Bronkhorst High-Tech) ensured the accurate
dosing of the carrier gas nitrogen and the liquid analyte which was vaporized in a
controlled evaporation and mixing element (W-101A Bronkhorst High-Tech) Partial
pressures (p) were calculated using the van der Waals equation The relative pressure
p p0-1
relates to the saturation pressure p0
Results and Discussion
The colloidal suspensions of CMS-P86 and CMT-6 were used for the stepwise
deposition of multilayer thin films on silicon wafers in order to examine the thickness
optical properties and homogeneity of the resulting stacks (sample BS-1) After each
coating step the sample was analyzed with ellipsometry Once the data was fitted these
layers were not changed in the following data acquisition After the last layer was
deposited the unrestricted fitting of all previous layers did only slightly improve the
quality of the fit This indicates that the previous films are not changing significantly
RESULTS AND DISCUSSION 44
140
upon heating and further deposition The final homogeneous film (BS-1) appeared
golden Fig 66 shows the ellipsometric data for a multilayer stack of 4 thin films
consisting of functionalized mesoporous silica nanoparticles The layers are intercalated
with mesoporous thin films of titania nanoparticles
Fig 66 Experimental ellipsometry data and model fit for a multilayer thin film (BS-1)
at 75 deg in nitrogen atmosphere
The data for the theoretical model stack exactly fits the experimental data The thickness
of the individual layers is reproducible and varies only in a narrow range (eg 135 nm
+- 8 nm in the case of CMS-P86) This ensures a narrow bandwidth in reflection and
transmission respectively Table 6 shows the composition of the multilayer stack
RESULTS AND DISCUSSION 44
141
Table 6 Layer thicknesses of the sample BS-1 determined with ellipsometry
number of layer layer describtion thickness
8 Cauchy 1 127 nm
7 Cauchy 2 74 nm
6 Cauchy 1 129 nm
5 Cauchy 2 76 nm
4 Cauchy 1 135 nm
3 Cauchy 2 73 nm
2 Cauchy 1 143 nm
1 silicon dioxide 2 nm
0 silicon 1 mm
In the model stack shown above the functionalized porous silica as well as the porous
titania layers are fitted using a Cauchy dispersion model for dielectric materials Cauchy
1 represents the silica material and Cauchy 2 stands for the titania layer Due to
inherent porosity of both materials the fitted refractive indices are significantly lower
than for the bulk materials (nD = 127 and 172 compared to 146 for glass and 249 for
anatase) The Bragg stack structure derived from the ellipsometric data was confirmed
with scanning electron microscopy Fig 67 shows side-view micrographs of the Bragg
stack BS-1 The dark layer represents the SiO2 layers which are intercalated by light
TiO2 layers Thus the depth profile obtained with ellipsometry is in good accordance
with the SEM investigations
RESULTS AND DISCUSSION 44
142
Fig 67 SEM pictures (side view) and a depth profile (ellipsometry) of the multilayer
stack BS-1
When exposed to an atmosphere of toluene close to saturation (p p0-1
= 086) the color
of the Bragg mirror immediately changes from yellow to red because the optical
thickness of the individual layers increases due to adsorption of toluene into the pores
This change of the optical properties can be also observed in the reflectance spectra of
BS-1 at an angle of 75deg in a flow of dry nitrogen (solid line) and of toluene-enriched
nitrogen (dotted line) in Fig 68
RESULTS AND DISCUSSION 44
143
Fig 68 Reflectance spectra (75 deg) of BS-1 in dry nitrogen (solid line) and in toluene-
containing nitrogen (p p0-1
= 086 dashed line)
Spectroscopic ellipsometry allows correlating the pore filling to the increase of the
refractive index of the individual layers Fig 69 shows the pronounced change due to
sorption of toluene The exchange of the gaseous nitrogen by liquid toluene inside the
porous multilayer stack significantly influences the refractive index of the individual
films
RESULTS AND DISCUSSION 44
144
Fig 69 Experimental ellipsometry data of BS-1 in nitrogen (solid line) and toluene
atmosphere (p p0-1
= 086 dashed line)
Fitting of the new experimental data is achieved by simply increasing the refractive
index of the layers at constant film thickness Thus the nD values for the silica layer
increases from 127 to 148 and the one of the titania layer from 172 to 193 Fig 70
shows the experimental data and the model fit of BS-1 in gaseous toluene with modified
optical properties The good correlation confirms the theory of filled pores
RESULTS AND DISCUSSION 44
145
Fig 70 Experimental ellipsometry data and model fit for sample BS-1 in toluene
atmosphere (p p0-1
= 086 dashed line)
The total porosity is calculated with ellipsometric porosimetry using the Lorentz-Lorenz
equation It is based on the Clausius-Mossotti equation which describes the relation
between the macroscopic measurable relative dielectric constant and the electric
polarizability α The adsorption of a volatile species in the film changes its refractive
index When the refractive index of the filled and empty porous substrate is known one
can determine the porosity of the material without knowing the refractive index of the
dense material The values are listed in Table 7
RESULTS AND DISCUSSION 44
146
Table 7 Porosity of the layers in BS-1 determined with ellipsometric porosimetry
layer describtion nD
in dry nitrogen
nD
in toluene vapor
nD
toluene
porosity
()
Cauchy 2 (titania)
1718 1925 1496 277
Cauchy 1 (silica) 1266 1476 1496 393
Knowing the optical properties of the materials one can predict the optical properties of
Bragg reflectors with different thicknesses for wavelength-selective coatings The
optical thickness (OT) of the layers is adjusted to one fourth of the desired wavelength
(OT = λ4) Depending on the refractive index of the material the physical thickness of
the film is calculated (OTn) If the Bragg mirror is supposed to reflect the green part of
the light (500 - 550 nm) the optical thickness of the layers should be about 130 nm In
order to observe a color change depending mainly on the low refractive and modifiable
SiO2-layer the titania-layer was chosen thin enough to realize an optical thickness (OT)
outside the visible part of the light (OT lt 100 nm) even in the filled state (refractive
index of the toluene filled layer at 350 nm 193) Table 8 shows the desired and realized
optical properties of the prepared individual layers of a green reflecting Bragg Stack
(BS-2)
RESULTS AND DISCUSSION 44
147
Table 8 Desired and actual layer thicknesses and optical properties of the sample BS-2
modified silica titania
reflected color green UV
selected wavelength range 500-550 nm lt 350 nm
optical thickness ~ 130 nm lt 90 nm
refractive index of filled layer (325 nm) - 193
refractive index (525 nm) 128 -
theoretical film thickness ~ 100 nm lt 47 nm
realized film thickness 102 nm 40 nm
Therefore the concentration of the colloidal suspensions and the spinning rate of the
spin-coater were adjusted in order to realize the preparation of thin films with the above
shown thickness for reflecting green light Single layers of the films were deposited on
silicon wafers in order to examine the thickness before the preparation of the stack was
performed on a glass plate Fig 71 shows the color of the transmitted and reflected light
of the Bragg stack BS-2 The coated transparent glass plate (perpendicular) is
illuminated from the right side with sunlight at an angle about 25 deg The transmitted and
reflected light falling onto the table is complementary Due to the illumination angle
the light is shifted to shorter wavelengths (Braggrsquos law)
RESULTS AND DISCUSSION 44
148
Fig 71 Sample BS-2 reflecting and transmitting sunlight
The desired theoretical reflected wavelength of the Bragg mirror (maximum ~ 525 nm)
was confirmed with transmission measurements Fig 72 shows the transmittance
spectrum at an angle of 90 deg of sample BS-2 The transmittance minimum is at 520 nm
Fig 72 Transmittance spectrum of BS-2 at an incident angle 90 deg
RESULTS AND DISCUSSION 44
149
The coated glass cover plate was placed in a quartz cuvette with gas in- and outlet in
order to follow the change in the reflectance and transmittance colors of the Bragg
reflector after adsorption of gaseous toluene Fig 73 shows the sample in dry nitrogen
atmosphere (above) and in an atmosphere of toluene (p p0-1
= 086) illuminated with
sunlight at an angle of about 45 deg
Fig 73 Wavelength shift due to adsorption of toluene in sample BS-2 (samples in a
quartz cuvette illuminated with sunlight at 45 deg)
The adsorption of toluene increases the optical thickness of the adsorbing layer and thus
drastically changes the reflected as well as the transmitted wavelength This change can
be clearly seen in the transmission spectrum at 45 deg (Fig 74) The transmission
minimum (reflection maximum) changes from about 510 nm (blue) to 590 nm (yellow)
This change happens within seconds when the film is exposed to the gaseous adsorbate
RESULTS AND DISCUSSION 44
150
Fig 74 Wavelength shift of transmitted light at an incident angle of 45 deg due to
adsorption of toluene in sample BS-2
Recording the transmission spectrum (90 deg) at different partial pressures of toluene
resulted in the isotherm shown in Fig 75 The curve resembles a type IV isotherm
typical for mesoporous materials After a relatively steep increase it passes nearly a
plateau at a relative pressure of about 053 before the slope increases again at about
070 The capillary condensation of the mesoporous film occurs at a higher relative
pressure
RESULTS AND DISCUSSION 44
151
Fig 75 Wavelength shift of transmitted light in BS-2 at different relative pressures of
toluene (90 deg incident angle)
Conclusion
Wavelength specific Bragg mirrors could be produced by a simple and reproducible
spin-coating approach These Bragg reflectors show a sensitivity towards specific
relative pressures of organic vapors such as toluene The existence of various colloidal
suspensions of porous nanoparticles opens a wide field of possible functional Bragg
mirrors The functionalization and thus the sorption properties may be varied by
introduction of different organic groups offering different interactions with the
adsorptives (or analytes) of interest The sensitive layer can also be replaced by other
low-refractive index materials such as zeolites The thickness of the individual layers
can be tuned in order to obtain reflectance or transmittance minima or maxima at a
desired wavelength even in the UV or IR region or a combination of different
wavelengths
CONCLUSION AND OUTLOOK
152
5 CONCLUSION AND OUTLOOK
CONCLUSION AND OUTLOOK
153
Colloidal suspensions of various kinds of discrete porous nanoparticles could be
synthesized and additionally functionalized with a multitude of organic groups
Due to the versatile functionalization of porous silica nanoparticles the materials have a
high potential in many applications eg as artificial viruses The pathway of a
fluorescently labeled particle into a cell could be observed with confocal microscopy
Due to the very small particle size the colloidal suspensions are completely transparent
to the visible part of the light Thus the material can be used eg as host material in
spectroscopic investigations Additionally liquid NMR-studies are possible due to the
fast rotation of such small objects in typical solvents The transparency is also
advantageous for the encapsulation of dyes or other materials which may allow one to
disperse otherwise insoluble substances in all kinds of matrices In combination with
sensitive caps the controlled release of drugs or other substances eg of initiators in
polymers constitute interesting topics for further research
Homogeneous colloidal suspensions of very small nanoparticles are of special interest
for the production of thin films by spin-coating on electronic semiconductor devices and
for optical coatings The thin films show very low refractive indices around 12 in the
case of zeolites and functionalized mesoporous silica nanoparticles respectively
The usage of porous nanoparticles has numerous advantages (see introduction in
Chapter 43) Porous titanium dioxide (thin) films may be interesting for the
development of dye-sensitized solar cells Thorough characterization and optimization
of the porosity can help to improve the loading with a dye or the permeation with the
electrolyte
CONCLUSION AND OUTLOOK
154
The ability eg of thiol-functionalized mesoporous silica to adsorb high amounts of
heavy metal ions could be further investigated in thin films Their presence should
influence the optical properties of the thin films
Finally the preparation of chemically sensitive Bragg mirrors using zeolites or other
porous metal oxides is also very promising Due to the usage of nanoparticles the
refractive index of the thin films can be easily adjusted by simply combining colloidal
suspensions of different materials Thus the color change due to adsorption can be
controlled in many respects
APPENDIX 61
155
6 APPENDIX
APPENDIX 61
156
61 Functionalized Mesoporous Silica
Nanoparticles as Host System for the
Synthesis of CdS Quantum Dots
Introduction
Mesoporous materials like MCM-41 can act as molds for the synthesis of structures by
inclusion chemistry in otherwise hardly accessible dimensions Depending on the pore
system the size and shape of the embedded structures can be controlled in a certain
range In the past many different nanoclusters such as Ge[125]
Fe2O3[126]
or
semiconducting GaAs[127]
have been synthesized within the channels The main
interesting features of semiconductor nanocrystals or quantum dots (QD) derive from
their atom-like electronic structure This atom-like electronic structure is a result of the
confinement of the electrons in all three spatial directions when very small sizes -
typically between 2 and 10 nm - are realized In contrast to atoms the energy spectrum
of a quantum dot can be engineered by controlling the geometrical size shape and the
strength of the confinement potential Quantum dots show unique properties concerning
their interaction with light Their high quantum yield and the possibility to tune the size
and thus the spectrum of quantum dots is advantageous for many applications
However it is sometimes difficult to benefit from these features because QDs are
APPENDIX 61
157
difficult to handle Depending on the desired application the QDs have to be
functionalized with specific shell molecules for example for in vivo optical
imaging[128]
or they have to be embedded in specific matrix materials when used with
high optical efficiency[129]
A striking example for a possible application of QDs is the utilization in a so called
Graumltzel or electrochemical solar cell (ECS)[130]
Until now commercially available
systems of that new kind of solar cell use TiO2 crystals in combination with dyes in
order to convert photons into excitons (electron-hole pairs) and realize charge
separation Quantum-dot sensitized mesoporous TiO2 features several advantages
compared to the standard electrochemical solar cell like a better optical tenability and
stability[131]
Common II-VI semiconductor nanoclusters include cadmium
chalcogenides eg cadmium sulfide or telluride The emission wavelength depends on
the diameter of the dots[132]
The desired size range coincides with the typical pore size
of the MCM-41-like mesoporous silica materials The typical synthesis of
semiconductor nanoclusters in the channels of mesoporous materials has been shown
following surface modification of the materials[133]
After functionalization eg with
thiol groups a dissolved cadmium salt is absorbed The resulting sample can be reacted
with a chalcogenide source eg H2S gas forming nanometer sized quantum dots or
wires inside the pores As discussed before the functionalized silica materials can also
be synthesized as nanoparticles These colloidal silica particles are of great interest for
several optical and biological applications The combination with a water-based
synthesis of cadmium chalcogenide nanocrystals promises large cost advantages
APPENDIX 61
158
compared to commonly synthesized quantum dots with organic stabilizing agents[134]
Here we describe the attempt to prepare CdS quantum-dots inside the pores of
mesoporous silica nanoparticles retaining the colloidal nature of the suspensions
Experimental
All chemicals were reagent grade (98 or higher) purchased from Sigma-Aldrich and
used without further purification The water was deionized The synthesis was carried
out in open polypropylene (PP) bottles
MS-1 host
The synthesis of MS-1 followed a method published by Gruumln et al[135]
24 g
cetyltrimethylammonium bromide (CTAB 66 mmol) were dissolved in 120 ml
deionized water in a 250 ml PP-bottle 95 g of ammonia solution (25 140 mmol
NH3) and 10 ml EtOH were added and the solution was stirred for 10 min After the
addition of 10 g tetraethoxysilane (TEOS 48 mmol) a white precipitate was formed and
the suspension was stirred for 1 h The product was recovered by filtration and washed
with water and EtOH
MS-SH host
Thiol-functionalized mesoporous silica was synthesized similarly in a co-condensation
process 24 g cetyltrimethylammonium bromide (CTAB 66 mmol) were dissolved in
120 ml deionized water in a 250 ml PP-bottle 95 g of ammonia solution (25
APPENDIX 61
159
140 mmol NH3) and 10 ml EtOH were added and the solution was stirred for 10 min
After the addition of a mixture of 85 g tetraethylorthosilicate (TEOS 41 mmol) and
163 g mercaptopropyltrimethoxysilane (MPTMS 83 mmol) a white precipitate was
formed and the suspension was stirred for 1 h The product was recovered by filtration
and washed with water and EtOH
Extraction of template from the bulk mesoporous hosts
For extraction of the template the product was suspended in 250 ml of an ethanolic
solution of ammonium nitrate (20 g l-1
) The mixture was refluxed under vigorous
stirring for 1 h and then filtrated The procedure was repeated with 250 ml of an
ethanolic solution of concentrated hydrochloric acid (5 g l-1
) The white filter cake was
washed with ethanol and dried at 60 degC
CMS-SH host
Colloidal mesoporous silica with thiol groups was synthesized following a published
procedure[99]
143 g (960 mmol) triethanolamine (TEAH) and a mixture of 223 ml
(100 mmol) TEOS plus 38 ml MPTMS (20 mmol) were combined in a 500 ml PP-
bottle with lid The two-phase mixture was heated in an oil bath at 90 degC for 20 min
without stirring Immediately after taking the mixture out of the oil bath 267 g of an
aqueous solution (25 wt ) of CTAC which had been heated to 60 degC was added and
the final mixture was stirred for at least 3 h at 23 degC
APPENDIX 61
160
Extraction of template from the colloidal mesoporous host
Extraction of template was performed by adding 250 ml of ethanol to the translucent
colloidal aqueous suspension of the mesoporous material The resulting precipitate was
centrifuged for 10 min at 40000 g (RCF) After decanting the sediment was
redispersed through vigorous stirring in 250 ml of an ethanolic solution of ammonium
nitrate (20 g l-1
) and then refluxed for 1 h This procedure was repeated with a 250 ml of
a solution of concentrated hydrochloric acid in ethanol (5 g l-1
) After washing with pure
ethanol the transparent gelatinous cake obtained after centrifugation could be
redispersed in ethanol leading to a colloidal suspension of the extracted product
CMS-SO3H host
The oxidation of the thiol groups in CMS-SH to sulfonic acid was performed with
concentrated hydrogen peroxide (33 ) before template extraction Hydrogen peroxide
(120 ml) was added to 25 g (calculated dry weight) of the wet sample CMS-SH and
stirred for 24 h at room temperature After oxidation the sample was washed first in
HCl-ethanol and subsequently in pure ethanol (CMS-SO3H-EtOH) or water (CMS-
SO3H-water) respectively
Incubation with Cd (II)
The amount of 10 ml of a 01 M solution of Cd(NO3)2 in ethanol or water respectively
were added to 2 g of mesoporous silica host (dry weight or calculated dry weight in the
case of colloidal suspensions) and stirred for 2 h The product was recovered by
APPENDIX 61
161
filtration or centrifugation and washed with ethanol or water ( sample-Cd-EtOH
sample-Cd-water)
Reaction with hydrogen sulfide
The ethanolic or aqueous suspensions of the corresponding products obtained after the
incubation with Cd(II) were treated with gaseous hydrogen sulfide as follows
FeS was slowly dissolved with 2 M hydrogen chloride and the developing H2S was
bubbled through the suspensions in a flow of nitrogen using the apparatus shown in Fig
76 Excessive H2S was eliminated in two washing bottles containing concentrated
aqueous NaOH or 2 M aqueous Cu(NO3)2 ( sample-CdS)
Fig 76 Setup for the reaction with hydrogen sulfide
Alternatively dry powder of the Cd(II)-containing mesoporous silica was exposed to
dry H2S atmosphere by connecting a CaCl2-column before the reaction vessel
APPENDIX 61
162
Characterization
Dynamic light scattering (DLS) data were collected with an ALV-NIBSHPPS High
Performance Particle Sizer in PMMA cuvettes at 25 degC Raman spectroscopy was
performed with a He-Ne laser (633 nm) on a LabRAM HR UV-Vis (HORIBA Jobin
Yvon) Raman Microscope (Olympus BX41) equipped with a Symphony CCD detection
system The spectra were baseline-corrected For thermogravimetric analysis (TGA)
10 mg of dry powder were heated in corundum crucibles from 30 to 900 degC
(10 degC min-1
) in a flow of synthetic air (25 ml min-1
) using a Netzsch STA 449 C Jupiter
thermobalance X-ray diffraction pattern were recorded on a Scintag Inc XDS 2000 in
theta-theta geometry (Cu-Kα1 λ=15406 Aring Cu-Kα2 λ=15444 Aring)
Transmission electron microscopy (TEM) was carried out on JEOL JEM 2011
instrument with LaB6 cathode at 200 kV Samples were prepared on a Plano holey
carbon coated copper grid by evaporating one droplet of diluted ethanolic suspension of
the extracted material The nitrogen sorption isotherms (77 K) were obtained using a
Quantachrome NOVA 4000e Surface Area amp Pore Size Analyzer Surface area
calculations were made using the Brunauer-Emmett-Teller (BET) equation in the range
from p p0-1
= 005 - 025 Pore-size distributions were determined using the DFT-
method (NLDFT equilibrium model cylindrical pores N2 on oxygen) The pore volume
was determined for meso- and micropores at p p0-1
lt 08
APPENDIX 61
163
Results and Discussion
Fig 77 shows the XRD patterns for the prepared bulk samples with (a) and without (b)
mercaptopropyl groups After template extraction the peaks become more pronounced
The typical reflection peak for such mesoporous materials can be observed at about 2 deg
(2θ) for the pure siliceous material (MS-1) and 23 deg for the functionalized one (MS-
SH) In the sample with thiol groups the reflections are less intense and shifted to
higher values This can be explained with the smaller pore size in combination with a
higher degree of disorder in the functionalized materials synthesized via co-
condensation
1 2 3 4 5 6 7
MS-1 extracted MS-1 with template
inte
nsity
2 [degrees]
1 2 3 4 5 6 7
MS-SH extracted MS-SH with template
inte
nsity
2 [degrees]
Fig 77 XRD powder pattern of pure siliceous and functionalized mesoporous bulk
material after drying and extracting
These two observations are naturally more pronounced when looking at dry powder of
functionalized mesoporous nanoparticles (Fig 78) Characterization of the colloidal
suspensions of mercaptopropyl functionalized nanoparticles is described in Chapter 42
APPENDIX 61
164
1 2 3 4 5 6 7
CMS-SH extracted CMS-SH with template
inte
nsity
2 [degrees]
Fig 78 XRD powder pattern of colloidal functionalized mesoporous silica (CMS-SH)
after drying and extraction
Sorption measurements (Fig 79) confirmed the successful extraction of the template
and the availability of highly porous materials
00 01 02 03 04 05 06 07 08 09 10
0
200
400
600
adsorption desorptionv
olu
me a
dsorb
ed [
cm
3
g-1
] S
TP
relative pressure p p0
-1
Fig 79 N2 sorption isotherm of extracted MS-1
APPENDIX 61
165
Incubation with Cd(II)
Evaluation of the thermogravimetric analysis data resulted in an estimated weight loss
of 190 mg mercaptopropyl residues per gram for MS-SH as well as for CMS-SH Using
the molar weight of 75 g mol-1
for these mercaptopropyl-residues resulted in a
calculated concentration of 25 mmol thiol per g material (ignoring residual template)
The more conclusive elemental analysis showed a sulfur content of 6 in weight
Using the molar weight of sulfur (32 g mol-1
) results in a concentration of 187 mmol
thiol per g silica Based on an average value of 2 mmol g-1
and the assumption that one
Cd2+
ion coordinates to two thiolates the maximum of adsorbed cadmium ions should
not exceed 1 mmol per g functionalized silica The usage of a great excess (5 mmol g-1
)
in the treatment with Cd(II) should ensure the coordination of every accessible thiol
group
TGA measurements after incubation and washing showed a successful loading with the
heavy metal ions The relative weight loss in percent caused by the decomposition of
the organic residues is lower in the material loaded with Cd2+
(Fig 80)
APPENDIX 61
166
100 200 300 400 500 600 700 800 900
-25
-20
-15
-10
-5
0
MS-SH-Cd MS-SH
weig
ht
loss [
]
temperature [iexclC]
Fig 80 TGA data of extracted MS-SH before and after loading with Cd(II)
A further indication for a successful coordination to the thiol groups is the decrease of
the pH-value when the cadmium salt is added to the suspensions of extracted MS-SH
The Cd2+
-ions replace the protons when coordinating to the SH-groups resulting in a
higher acidity Fig 81 shows that the pH-value of the suspension (35) decreases
significantly to 24 after addition of the aqueous cadmium salt solution (pH = 56)
0
1
2
3
4
5
6
24
35
56
MS
-SH
in
H2O
co
mb
ine
d
Cd
(NO3
)2 in
H2O
+
pH
Fig 81 Increase of the acidity caused by the coordination of Cd2+
in MS-SH
APPENDIX 61
167
Deprotonation of the SH-groups can also be observed in Raman measurements Fig 82
shows the spectra before and after insertion of cadmium ions in MCM-SH The
characteristic S-H-stretching at 2580 cmminus1
lost most of its intensity after the adsorption
of cadmium ions
500 1000 1500 2000 2500 3000 3500 4000
MS-SH-Cd MS-SH
inte
nsity
wavelength [cm-1]
Fig 82 Raman spectra of MS-SH before and after incubation with Cd2+
ions
Oxidation of CMS-SH
After the first adsorption experiments with cadmium salts in colloidal suspensions of
thiol-functionalized mesoporous silica it emerged that the particles tend to agglomerate
irreversibly
The selective oxidation of the external SH-groups into sulfonic acid groups (-SO3H)
was believed to solve the aggregation problem This modification should have been
achieved with hydrogen peroxide in combination with template-filled material The
APPENDIX 61
168
conversion of thiol groups in mesoporous silica nanoparticles into sulfonic acid with
hydrogen peroxide is proven[99]
Apparently the strength of the H2O2 and the reaction time were sufficient to oxidize all
thiol groups ndash also those inside the pore system Probably the organic template is
decomposed[136]
while the functional head of the organic residue is only converted into
sulfonic acid The completeness of the thiol oxidation can be observed in Raman
spectra Before the reaction with hydrogen peroxide the typical signals of the thiol
groups appear at 2580 cm-1
and 650 cm-1
These peaks completely disappear after the
treatment with H2O2 and instead a new one occurs at 1050 cm-1
(sulfonate stretching)
The signals for the aliphatic propyl groups around 2900 cm-1
are retained (Fig 83)
500 1000 1500 2000 2500 3000 3500 4000
CMS-SO3H
inte
nsity
wavenumber [cm-1]
CMS-SH
Fig 83 Raman-spectra before and after oxidation of CMS-SH with hydrogen peroxide
The coagulation of the particles after Cd(II)-salt addition could be avoided by oxidation
of the thiol groups The suspensions showed the same particle size distribution after
incubation with cadmium salts
APPENDIX 61
169
In order to further verify the effective coordination of heavy metal ions to the functional
groups equivalent amounts of the cadmium salt are introduced to the aqueous or
ethanolic suspensions of
pure siliceous bulk material (MS-1-Cd)
functionalized bulk material (MS-SH-Cd)
colloidal suspensions of functionalized material (CMS-SH-Cd)
colloidal suspensions of oxidized functionalized material (CMS-SO3H-Cd)
After washing the material the cadmium content was investigated with elemental
analysis As seen in Fig 84 the amount of incorporated cadmium found in the thiol
functionalized materials is significantly higher compared to the pure silica The amount
additionally depends on the solvent The remaining amount is higher when the loading
and washing is performed with ethanol Colloidal suspensions and suspension
containing bulk material adsorb comparable amounts Interestingly the suspension
containing the nanoparticles with sulfonic acid groups also adsorbs a considerable
amount of heavy metal ions - and the colloidal particles do not coagulate
APPENDIX 61
170
0 2 4 6 8 10
CMS-SH-Cd EtOH
MS-SH-Cd EtOH
CMS-SO3H-Cd EtOH
CMS-SH-Cd water
MS-SH-Cd water
MS-1-Cd water
MS-1-Cd EtOH
sam
ple
Cd2+
[wt - ICP]
Fig 84 Amount of Cd2+
in the different suspensions found with elemental analysis
Reaction with hydrogen sulfide
After the successful loading of the cadmium ions into the mesoporous hosts the
materials were exposed to gaseous hydrogen sulfide The aqueous as well as the
ethanolic suspensions immediately turned yellow upon bubbling with H2S Only if the
CdS is present as bulk material - or at least not as quantum dots - it shows its
characteristic bright yellow color The expected nanoparticles inside the pore system
should be colorless and fluorescent under UV-irradiation Fig 85 shows an image of
CMS-SO3H-CdS with the typical yellow color of bulk cadmium sulfide The colloidal
nature of the suspension with an average particle diameter of 170 nm is preserved
APPENDIX 61
171
1 10 100 1000 10000
inte
nsity
diameter [nm]
Fig 85 Image and DLS data of CMS-SO3H-CdS in ethanol after loading with Cd2+
and
reaction with H2S
Probably the initially formed CdS-clusters are very mobile in water or ethanol and tend
to leave the pore system in order to create larger particles on the surface of the
mesoporous hosts or in solution Even the supposedly dry powder (MS-SH-Cd) in H2S
atmosphere showed this yellow color after a few seconds Presumably the moisture
present with the development of hydrogen sulfide is problematic because it enhances the
mobility of the sulfide species involved Therefore the H2S was dried in a CaCl2-
column before it was reacted with the completely dry material (MS-SH-Cd) No change
in color could be observed under these conditions However after addition of water the
white powder instantly turned yellow (Fig 86) This observation supports the proposed
high mobility of initially formed CdS species
APPENDIX 61
172
Fig 86 MS-SH-Cd after exposure to dry H2S (A) and after addition of water (B)
Powder X-ray diffraction
Fig 87 shows the XRD pattern of CMS-SO3H-CdS in combination with the expected
diffraction pattern of bulk CdS material The peaks are significantly broadened
indicating the existence of small crystallites
20 30 40 50 60 70
CMS-SH-CdS
inte
nsity
2 [degrees]
Fig 87 Powder diffraction pattern of CMS-SO3H-CdS
APPENDIX 61
173
Applying the Scherrer equation allows approximating the average particle size For this
purpose the full width at half maximum (FWHM) of a peak at a certain angle (2θ) is
determined Here the instrumental broadening is neglected and the value of 094 was
chosen for the Scherrer constant K
cos
FWHM
KD
In combination with the wavelength of the Cu-Kα radiation (λ = 0154 nm) and a
FWHM of 0014 (radian measure) at 2θ = 44deg or θ = 22deg respectively an average
particle diameter D of approximately 11 nm can be calculated Thus the particles are
much too big to fit into the 3 nm pores
TEM-micrographs of the same sample show the monodisperse spherical particles with a
star-shaped pore system As expected from XRD measurements there is no evidence for
the existence of CdS particles inside the pores Instead a few dense particles in the
dimensions of about 10 nm can be found beside the porous silica particles (Fig 88)
APPENDIX 61
174
Fig 88 TEM-micrographs of CMS-SO3H-CdS
As mentioned above the colloidal suspension had a bright yellow color Interestingly
this coloration became less intense with time and nearly disappeared after 10 days The
suspension showed a pink fluorescence under UV-irradiation (Fig 89)
Fig 89 CMS-SO3H-CdS after 10 days (left) shows fluorescence under UV-light (right)
APPENDIX 61
175
Presumably the initially 11 nm-sized CdS particles slowly dissolved and temporarily
had the appropriate size to show fluorescence The undefined pink fluorescence may
derive from a rather diversified size distribution of the CdS clusters Two days later the
fluorescence disappeared
Conclusion
The aim of the project was to use the existent colloidal suspensions of functionalized
mesoporous silica nanoparticles as host system for the synthesis of CdS quantum dots
It was possible to load these porous particles with a high amount of heavy metal ions
preserving the colloidal state However when introducing the hydrogen sulfide it
appears that the initially formed CdS species inside the pores are very mobile and that
they can easily leave the pore system to form larger clusters at the outer surface of the
mesoporous particles or in the solvent They are not stabilized in the confined space as
desired It is imaginable that the synthesis could be successful with other solvents or
reagents
APPENDIX 62
176
62 Colloidal Suspensions of TiO2
Nanoparticles for the Preparation of
Porous Thin Films
Introduction
Titania exists in a number of crystalline forms of which the most important are anatase
and rutile It is inert does hardly react with other materials and is thermally stable non-
flammable and non-toxic TiO2 is the most widely used white pigment because of its
brightness and very high refractive index (n = 24) As effective opacifier in powder
form it is employed as a pigment to provide whiteness and opacity to products such as
glass and porcelain enamels cosmetics sunscreens paper paints and foods
Titanium dioxide particularly in the anatase form is a photocatalyst under ultraviolet
light The strong oxidative potential of the positive holes oxidizes water to create
hydroxyl radicals and the holes can also oxidize organic materials directly Titanium
dioxide is thus added to paints cements or directly coated as protective thin film onto
the desired surface When deposited as a thin film its high refractive index makes
titania an excellent reflective optical coating for dielectric mirrors A further important
application is the utilization as semiconducting layer in dye-sensitized solar cells
(DSSC)[130]
In these so-called Graumltzel cells nanoparticulate layers or homogeneous
APPENDIX 62
177
mesoporous films can potentially offer great improvements Their high surface areas
allow a high loading with dye For an efficient operation the titania layer should have a
highly accessible pore system Thus it is important to obtain the material as discrete
nanoparticles in colloidal suspensions The synthesis of titanium dioxide particles at the
nanometer scale can be achieved by several methods such as pyrolysis or sol-gel
chemistry[137]
In the last years several studies on the synthesis of mesoporous titania which should
exhibit a higher specific surface area than the nanoparticles were published Most of the
experiments are based on the synthesis of mesoporous silica for example the synthesis
procedure described by Amoros[138]
which uses a complexing agent in order to retard
the hydrolysis of the titaniumalkoxide Due to fundamental differences in hydrolysis
and condensation behavior as well as template interaction it turned out that the
principles used for the synthesis and extraction of mesoporous silica cannot be adopted
easily The main difficulty is the removal of the template either by extraction or
calcination In the latter case collapsing of the pore system due to the formation of large
crystalline domains is one reason
The preparation of mesoporous titanium dioxide in nanoparticulate form is also
frequently claimed[139 140]
For the preparation of thin films via spin-coating the
existence of discrete mesoporous particles in a homogeneous colloidal suspension is
necessary but the focus of the research is often on other objectives like a high
crystallinity or stability[140 141]
APPENDIX 62
178
The preparation of mesoporous titania in the form of thin films with the EISA approach
is well-investigated[20]
This recipe was also adopted for the synthesis of bulk material
by slowly evaporating the solvent[142 143]
Although the synthesis of homogeneous
mesoporous TiO2 thin films following the EISA-approach is practical the formation
from nanoparticles might be advantageous in some respects As already mentioned in
Chapter 43 it is believed that such films might exhibit improved diffusionial access
Additionally one can work with a stable suspension of already extracted and
characterized nanoparticles thus ensuring good reproducibility The coating of sensitive
substrates is facilitated due to the mild conditions and the thickness can be easily
controlled by varying the concentration or by multiple step coating As a further
treatment such as extraction or calcination is no longer necessary sensitive substances
eg dyes can already be added to the coating suspensions Finding an appropriate
titania precursor is the first challenge in titania sol-gel chemistry as the hydrolysis of
the titanium precursors is typically much faster than that of the silica analogues
Common precursors are titanium alkoxides and complexes eg
titanium(IV)bis(acetylacetonate)diisopropoxide or titanium(IV)(triethanolaminato)
isopropoxide The aim of this work was the preparation of homogeneous porous thin
films from TiO2 nanoparticles by a facile and reproducible spin-coating approach
APPENDIX 62
179
Experimental
CMT-1 CMT-1A
The amount of 244 g hexadecyltrimethylammonium bromide (CTAB 67 mmol) and
633 g titanium(IV) (triethanolaminato) isopropoxide (TiTEAiOPr 80 in isopropanol
20 mmol) were combined at room temperature and mixed with 60 ml water under
stirring Precursor and template were completely dissolved and stirred for 24 hours at
room temperature The initially clear solution started to become opalescent after about
2 hours One half of the final colloidal suspension was centrifuged and the sediment was
washed 3 times and then redispersed in water (CMT-1) The other half was autoclaved
at 100 degC for 24 hours and then washed and redispersed (CMT-1A) Parts of the
material were calcined (CMT-1-c CMT-1A-c) at 350 degC for 3 h (1 K min-1
) or
extracted (CMT-1-e CMT-1A-e) as described in Chapter 42
CMT-2
The experiment above was repeated at 50 degC without autoclaving
CMT-3
The amount of 20 g TiTEAOiPr (80 in isopropanol 63 mmol) was added to a
preheated (60 degC) solution of 05 g hexadecyltrimethylammonium chloride and 620 g
water under stirring The mixture was kept at 60 degC and stirred for 2 h The final
colloidal suspension was centrifuged and the sediment was washed 3 times and then
redispersed in water
APPENDIX 62
180
CMT-4
The amount of 276 g concentrated hydrochloric acid (37 ) was added to a solution of
568 g tetraisopropylorthotitanate and 10 g EtOH A mixture of 116 g
hexadecyltrimethyl-ammonium bromide (CTAB) in 84 g EtOH and 438 g dest H2O
were added and the clear solution was refluxed under stirring for 6 h while slowly
forming a white suspension The suspension was diluted with 20 ml EtOH centrifuged
for 30 min at 40000 g (RCF) and redispersed in a mixture of 20 ml EtOH and 2 g dest
H2O Centrifugation and redispersion in pure ethanol was repeated twice leading to a
colloidal suspension of TiO2 nanoparticles For characterization of the material a part of
the suspension was dried at 60 degC
CMT-5
The amount of 276 g concentrated hydrochloric acid (37 ) was added to a solution of
568 g tetraisopropylorthotitanate and 184 g EtOH The amount of 438 g dest H2O
was added and the clear solution was refluxed under stirring for 6 h while slowly
forming a white suspension The suspension was diluted with 20 ml EtOH centrifuged
for 30 min at 40000 g (RCF) and redispersed in a mixture of 20 ml EtOH and 2 g dest
H2O Centrifugation and redispersion in pure ethanol was repeated twice leading to a
colloidal suspension of TiO2 nanoparticles For characterization of the material a part of
the suspension was dried at 60 degC
APPENDIX 62
181
CMT-6
The amount of 552 g concentrated hydrochloric acid (37 ) was added to a solution of
1136 g tetraisopropylorthotitanate and 368 g EtOH The amount of 876 g dest H2O
was added and the clear solution was refluxed under stirring for 6 h while slowly
forming a white suspension
The suspension was diluted with 20 ml EtOH and peptized with 1 ml water before it
was centrifuged for 5 min at 40000 g (RCF) in order to remove big agglomerates The
supernatant suspension was flocculated with 20 g hydrochloric acid and after
centrifugation the sediment was redispersed in a mixture of 20 ml EtOH and 2 g dest
H2O This washing procedure was repeated once
APPENDIX 62
182
Thin film preparation
The colloidal suspensions of CMT-6 contained about 3 wt titaniumdioxide The
ethanolic suspension can be used directly for the preparation of thin films by spin-
coating The thin films were deposited on polished silicon wafers or QCM chips (XA
1600 AT-cut KVG Quartz Crystal Technology) by spin-coating using a Laurell WS-
400B-6NPP-Lite-AS All substrates were pre-cleaned with ethanol for 5 s under
spinning at 3000 rpm The film thickness was adjusted by diluting the colloidal
suspensions with absolute ethanol by variation of the spinning rate between 3000 and
5000 rpm and by multi step coatings
Characterization
Dynamic light scattering (DLS) data were collected with a Malvern Nano ZS in PMMA
cuvettes at 25 degC Raman spectroscopy was performed with a He-Ne laser (633 nm) on
a LabRAM HR UV-Vis (HORIBA Jobin Yvon) Raman Microscope (Olympus BX41)
equipped with a Symphony CCD detection system The spectra were baseline-corrected
For thermogravimetric analysis (TGA) 10 mg of dry powder were heated in corundum
crucibles from 30 to 900 degC (10 degC min-1
) in a flow of synthetic air (25 ml min-1
) using
a Netzsch STA 449 C Jupiter thermobalance X-ray diffraction pattern were recorded on
a Scintag Inc XDS 2000 in theta-theta geometry (Cu-Kα1 λ = 15406 Aring Cu-Kα2
λ = 15444 Aring) Transmission electron microscopy (TEM) was carried out on a JEOL
JEM 2011 instrument with LaB6 cathode at 200 kV Samples were prepared on a Plano
holey carbon coated copper grid by evaporating one droplet of diluted ethanolic
APPENDIX 62
183
suspension of the extracted material The nitrogen sorption isotherms (77 K) were
obtained using a Quantachrome NOVA 4000e Surface Area amp Pore Size Analyzer
Surface area calculations were made using the Brunauer-Emmett-Teller (BET) equation
in the range from p p0-1
= 005 - 025 Pore-size distributions were determined using the
DFT-method (NLDFT equilibrium model cylindrical pores N2 on oxygen) The pore
volume was determined for meso- and micropores at p p0-1
lt 08 Ellipsometry
measurements were performed with a Woollam M2000D at an angle of 75deg in the
spectral range of 190 - 1000 nm The data was fitted in the range between 350 ndash
1000 nm using the Cauchy material as model layer Ellipsometric porosimetry
measurements were carried out in a liquid cell at different partial pressures at a
measurement angle of 75 deg The recording of isotherms was performed using a
homemade Labview-controlled gas mixer Digital mass flow controllers (W-101A-110-
P F-201C Bronkhorst High-Tech) ensured the accurate dosing of the carrier gas
nitrogen and the liquid analyte which was vaporized in a controlled evaporation and
mixing element (W-101A Bronkhorst High-Tech) Partial pressures were calculated
using the van der Waals equation with real gas-state assumptions
(QCM) A 10 MHz Quartz Crystal Microbalance (QCM) device (XA 1600 AT-cut
KVG Quartz Crystal Technology) was used to measure frequency changes due to
additional adsorbed mass Some parameters of the Sauerbrey equation such as the
density ρq = 2648 gmiddotcm-3
and the shear modulus υq = 2947middot1011
gmiddotcm-1
middots-2
are
characteristics of the piezoelectric material quartz The Sauerbrey equation is
normalized to 1 cm2 sensing area on the QCM chip thus a frequency change of 1 Hz
APPENDIX 62
184
corresponds to a mass-loading of 442middot10-9
g The overall frequency fluctuation of the
system is plusmn1-2 Hz at room temperature
Results and Discussion
The first experiments (not shown) were inspired by the synthesis of mesoporous silica
nanoparticles described in Chapter 42 The pretreatment of the titaniumalkoxide with
triethanolamine at elevated temperature resulted in yellowish clear solutions which
slowly hydrolyzed in water compared to the titaniumalkoxides In the reactions shown
here the commercially available complexed precursor titanium(IV) (triethanolaminato)
isopropoxide was used
After hydrolysis the resulting colloidal suspension CMT-1 contained discrete particles
with an average hydrodynamic diameter (DLS) of almost 1 μm after washing (Fig 90)
APPENDIX 62
185
10 100 1000 10000
inte
nsity
diameter [nm]
Fig 90 DLS particle size distribution of washed CMT-1
The powder diffraction pattern (Fig 91) of the dry product shows a weak reflection at
23 deg (2 θ) which is typical for CTMA+ templated mesopores (Fig 77 Chapter 61)
1 2 3 4 5 6 7 8 9 10
max = 23iexcl
inte
nsity
2 (degree)
Fig 91 Powder diffraction pattern of the washed sample CMT-1
Although the material seems to possess a certain mesostructure TEM investigations
(Fig 92) could not confirm the existence of mesopores The material possibly exhibits a
fibrous structure but it was not further analysed
APPENDIX 62
186
Fig 92 TEM-micrographs of the washed sample CMT-1
The particles appear anisotropic with an irregular particle size distribution At higher
magnification an undefined mesostructure in the material can be observed However it
is not clear if this structure formed as a result of adding the template Therefore the
washed product was subjected to an extraction procedure and the weight loss before and
after this treatment was determined with TGA (Fig 93)
100 200 300 400 500 600
-60
-50
-40
-30
-20
-10
0 CMT-1 extracted
CMT-1 washed
weig
ht lo
ss [
]
temperature [degC]
Fig 93 Thermogravimetric analysis of washed and extracted sample CMT-1
APPENDIX 62
187
Heating of the washed product caused two distinct steps in the weight loss The first one
at about 250 degC could be assigned either to the template decomposition or further
condensation under elimination of alkoxygroups The second step at higher
temperatures between 400 and 500 degC might be due to complexing triethanolamine
residues After extraction the weight loss is much lower ndash but it cannot be assured that
the material is completely extracted mesoporous titania
Elimination of the template should also be achieved after heating to 300 degC Calcination
at temperatures up to 350 degC is also claimed in several publications [144]
Both materials
ndash extracted (CMT-1-e) and calcined (CMT-1-c) - were investigated by XRD (Fig
94)The initial reflection at 23 deg and thus the mesostructure completely disappeared
after the treatment
10 15 20 25 30 35 40 45 50
inte
nsity
2 [degree]
10 15 20 25 30 35 40 45 50
inte
nsity
2 [degree]
Fig 94 XRD pattern of (a) calcined (CMT-1-c) and (b) extracted (CMT-1-e) material
Nitrogen sorption analysis also suggests the absence of ordered mesopores in both
materials (Fig 95) The isotherms are typical for an ink-bottle type pore system but the
difference in the adsorption and the desorption step argue against pore channels with a
APPENDIX 62
188
defined diameter The BET-surface areas of the calcined and extracted material are
80 m2 g
-1 and 200 m
2 g
-1 respectively One would expect a significantly higher specific
surface area in ordered mesoporous titania even though it can not reach the value of a
comparable mesoporous silica due to the higher density of TiO2
The DFT-pore size distribution was not calculated because no appropriate model is
available at this time As expected from the isotherm a BJH pore size calculation
regarding the adsorption branch gives a rather undefined and meaningless distribution
00 01 02 03 04 05 06 07 08 09 10
0
20
40
60
80
100
adsorption
desorption
volu
me a
dsorb
ed [cm
3 g
-1] S
TP
relative pressure p p0
-1
00 01 02 03 04 05 06 07 08 09 100
10
20
30
40
50
60
70
adsorption
desorption
vo
lum
e a
dso
rbe
d [cm
3 g
-1] S
TP
relative pressure p p0
-1
Fig 95 N2-isotherms of extracted (CMT-1-e) and calcined (CMT-1-c) samples
In order to improve the condensation of the inorganic material and possibly an enhanced
debonding of the complexing triethanolamine the synthesis was repeated at an elevated
temperature The reaction at 50 degC resulted only in minor improvements for example a
more pronounced reflection at about 23 deg in x-ray diffraction (Fig 96)
APPENDIX 62
189
1 2 3 4 5 6 7 8 9 10
inte
nsity
2 [degrees]
Fig 96 Powder diffraction pattern of CMT-2
The particle size distribution in DLS as well as TGA data and sorption analysis showed
no significant difference or improvement In a further attempt to improve the
condensation and debonding of triethanolamine the suspension of CMT-1 was
autoclaved at 100 degC after synthesis Again the peaks in the XRD powder pattern were
more intensive and even showed higher-order reflections at 46 deg and 69 deg (Fig 97)
1 2 3 4 5 6 7 8 9 10
max 23 deg 46 deg 69 deg
inte
nsity
2 [degree]
Fig 97 Powder diffraction pattern of CMT-1A autoclaved at 100 degC
APPENDIX 62
190
The positions of the reflections indicate the existence of a lamellar structure This
structure is believed to be the thermodynamically more stable one The results in
transmission electron microscopy (Fig 98) could only confirm the expected lamellar
structure
Fig 98 TEM-micrograph of CMT-1A autoclaved at 100 degC
As expected for lamellar systems template removal resulted in a loss of the
mesostructure as shown in XRD patterns in Fig 99
APPENDIX 62
191
10 15 20 25 30 35 40 45 50
inte
nsity
2 [degree]
10 15 20 25 30 35 40 45 50
inte
nsity
2 [degree]
Fig 99 Powder diffraction pattern of the (a) calcined (CMT-1A-c) and (b) extracted
(CMT-1A-e) material
The combination of solid template (CTAB) and titania precursor might be
disadvantageous for the formation of nanoparticles Thus in further experiments an
aqueous solution of the template was prepared and heated before the slowly
hydrolyzing precursor was added (CMT-3) After hydrolysis at elevated temperature
(60 degC) a homogeneous colloidal suspension with a narrow particle size distribution
was obtained (Fig 100)
APPENDIX 62
192
10 100 1000 10000
CMT-3
inte
nsity
particle size [nm]
Fig 100 Colloidal suspension and particle size distribution (DLS) of CMT-3
The product was subjected to the same extraction process as the mesoporous silica
particles in Chapter 42 The particles in the resulting ethanolic suspension were
agglomerated to a high degree After drying the product was slightly yellow and
adhesive TGA (Fig 101) showed that the template was removed for the most part but
the material still seems to contain a noteworthy amount of triethanolamine as already
observed in the sample CMT-1
APPENDIX 62
193
100 200 300 400 500 600 700
-60
-50
-40
-30
-20
-10
0
weig
ht
loss [
]
temperature [iexclC]
0 10 20 30 40 50 60
-25
-20
-15
-10
-05
00
time [min]
DT
G [
m
in-1
]
100 200 300 400 500 600 700
-15
-10
-5
0
weig
ht
loss [
]
temperature [iexclC]
0 10 20 30 40 50 60
-075
-050
-025
000
time [min]
DT
G [
m
in-1
]
Fig 101 TGA data of washed CMT-3 before and after extraction procedure
However the nitrogen sorption isotherm of this sample differs from the one of CMT-2
The isotherm does not show such a pronounced hysteresis loop and the specific surface
area is significantly higher (330 m2 g
-1) The pore size distribution (DFT) shows a
broadening on both sides of the typical peak for CTMA+ at around 3 nm (Fig 102)
00 01 02 03 04 05 06 07 08 09 1040
50
60
70
80
90
100
110
120
adsorption desorptionv
olu
me a
dsorb
ed [
cm
3
g-1
] S
TP
relative pressure p p0
-1
10 100 1000
0000
0002
0004
0006
0008
0010
Dv(d
) [c
m-3
-1
g-1
]
pore diameter []
Fig 102 N2 sorption isotherm and DFT pore size distribution of extracted CMT-3
APPENDIX 62
194
Variation of the synthesis conditions such as temperature or batch composition as well
as the exchange of the template by shorter (dodecyltrimethylammonium chloride) or
neutral substitutes (dodecyl amine) in further experiments did not lead to improved
materials and were therefor not shown here The replacement of the precursor with
related complexes eg titanium diisopropoxide bis(acetylacetonate) was unsuccessful
because of a poor solubility in the aqueous medium The results of the first experiments
described above point out that in contrast to the silica material the basic synthesis
procedure for mesoporous titania is connected to several problems Especially in the
presence of triethanolamine extraction and redispersion is challenging
Thus the synthesis conditions were completely changed from basic to acidic conditions
Several synthesis procedures for mesoporous titania in acidic medium can be found in
the literature[143 145 146]
One promising method described by Soler-Illia et al[142]
is
based on the EISA approach for mesoporous TiO2 thin films This recipe was chosen as
basis for the synthesis of colloidal suspensions of mesoporous titanium dioxide
nanoparticles The newly developed synthesis also started from a clear solution that was
heated under reflux The formation of TiO2 particles in the initial solution caused a
slowly increasing turbidity resulting in a white viscous suspension Subsequent washing
and redispersion led to an ethanolic suspension of titanium dioxide nanoparticles
Peptization of the particles was realized by addition of very small amounts of water
The resulting colloidal translucent suspensions showed a narrow particle size
APPENDIX 62
195
distribution in dynamic light scattering (DLS) with a mean particle size of 130 nm (Fig
103)
1 10 100 1000 10000
inte
nsity
diameter [nm]
Fig 103 Particle size distribution (DLS) of an ethanolic colloidal suspension of CMT-4
Electron microscopy confirmed the existence of discrete particles in the nanometer
range The TiO2 nanoparticles can be described as prolate spheroids of approximately
the same average size as indicated by DLS (Fig 104)
Fig 104 TEM-micrograph of CMT-4
APPENDIX 62
196
Because of this anisotropic shape one can expect a certain order either due to template
interaction or crystallinity Therefore a dried sample of CMT-4 and CMT-5 was
investigated in thermogravimetric analysis
100 200 300 400 500 600 700 800 90016
14
12
10
8
6
4
2
0
we
igh
t lo
ss [
]
temperature [iexclC]
0 10 20 30 40 50 60 70 80
-075
-050
-025
000
time [min]
DT
G [
min-1
]
100 200 300 400 500 600 700 800 900
18
16
14
12
10
8
6
4
2
0
we
igh
t lo
ss [
]
temperature [iexclC]
0 10 20 30 40 50 60 70 80
-10
-05
00
time [min]
DT
G [
min-1
]
Fig 105 TGA data of washed CMT-4 (a) and washed CMT-5 (b)
Sample CMT-4 and the product synthesized with the same procedure but without any
template (CMT-5) do hardly show any difference The synthesis was also carried out
with different other templates ndash anionic and cationic (palmitic acid CTAC) or neutral
(pluronic dodecylamine) template In no case an ordered or disordered mesoporous
structure caused by organic templates could be confirmed Thus the weight loss at
around 250 degC which is typically assigned to template elimination in mesoporous silica
materials cannot be attributed to the template in the case of CMT-4 As this step can
also be observed in CMT-5 it is probably caused by further condensation of the
inorganic network and decomposition of alkoxy groups This relatively high weight loss
may be due to incomplete crystallinity of the samples Nevertheless the materials show
APPENDIX 62
197
a certain crystallinity in Raman spectroscopy The apparent signals can be attributed to
rutile
0 500 1000 1500 2000
CMT-4 rutile
inte
nsity
wavelength [cm-1]
Fig 106 Raman spectra of CMT-4 and spectra of rutile
X-ray powder diffraction patterns confirmed the existence of a crystalline phase in the
dry powder The relatively broad signals indicate the existence of small particles
15 20 25 30 35 40 45
CMT-4
inte
nsity
2 [degree]
rutile
Fig 107 X-ray powder diffraction pattern of CMT-4
APPENDIX 62
198
Nitrogen sorption analyses (Fig 108) showed that both materials exhibit a certain
mesoporosity Due to the shape of the isotherms and hysteresis loops the existence of a
channel-like pore structure can be excluded
00 01 02 03 04 05 06 07 08 09 100
25
50
75
100
125
150
175
200
adsorption desorptionv
olu
me a
dsorb
ed [
cm
3
g-1
] S
TP
relative pressure p p0
-1
00 01 02 03 04 05 06 07 08 09 100
25
50
75
100
125
150
175
200
adsorption desorptionv
olu
me a
dsorb
ed [
cm
3
g-1
] S
TP
relative pressure p p0
-1
1 10 100
00
05
10
15
20
25
desorp
tion D
v(d)
[m2
g-1
]
pore diameter [nm]
1 10 100
00
05
10
15
20
25
deso
rption D
v(d
) [m
2 g
-1]
pore diameter [nm]
Fig 108 N2 sorption data of CMT-4 (l) and CMT-5 (r)
These findings led to the conclusion that the interaction of template and titanium
precursor in the described procedures seems to be too weak to build up a mesostructure
This interpretation is corroborated by the fact that the best results concerning the surface
area of the resulting particles were achieved without any template The measured pore
size is not influenced by the addition of template CMT-5 showed a BET-surface area of
APPENDIX 62
199
more than 300 m2 g
-1 and a relatively narrow pore size distribution with a diameter
around 5 nm (Table 9)
Table 9 Nitrogen sorption data of CMT-4 and CMT-5
CMT-4 CMT-5
Surface area (BET) 276 m2 g
-1 311 m
2 g
-1
Total pore volume 024 cm3 g
-1 025 cm
3 g
-1
Mean pore width 48 nm 47 nm
The synthesis of similar hydrosols is already known[147]
The existence of a mesoporous
structure caused by agglomeration of the TiO2 nanoparticles and the resulting high
surface area is described in literature[148 149]
Due to the easy redispersability of the
washed particles and the high quality of the final ethanolic suspensions the material can
be used for the preparation of homogeneous thin films by spin-coating[150]
APPENDIX 62
200
Homogeneous Thin Films
For the preparation of homogeneous thin films the synthesis without template (CMT-5)
was repeated After purification of the nanoparticles received from hydrothermal
treatment (CMT-6) the colloidal suspension was used for the preparation of thin film
Fig 109 shows the mean particle size (80 nm) of the suspended titania nanoparticles in
the coating suspension
1 10 100 1000 10000
inte
nsity
diameter [nm]
Fig 109 Particle size distribution (DLS) of CMT-6
Fig 110 shows an image of a silicon wafer with a thin film of titania nanoparticles The
film was prepared by spin-coating two times with a suspension containing about 3 wt
of CMT-6
APPENDIX 62
201
300 400 500 600 700 800 900 10000
10
20
30
40
50
60
experimental data
model fit
in
deg
rees
wavelength [nm]
Fig 110 Thin film of CMT-6 (107 nm) on a silicon wafer and ellipsometric data
The film appears very homogeneous and transparent and thus has a definite interference
color Ellipsometric measurements resulted in a film thickness of 107 nm The same
film was deposited on a quartz crystal microbalance chip In order to achieve a higher
thickness the chip was coated four times The optical characterization was performed
with ellipsometry assuming the following theoretic model 0 the gold electrode was
chosen to be infinitely thick (1 mm) 1 the material (titania nanoparticles) is described
with a Cauchy layer Starting with a guessed film thickness of 200 nm the subsequent
fitting of the thickness and the Cauchy parameters resulted in a film thickness of 187
nm
The measurement was performed in a liquid cell in a flow of nitrogen It was repeated in
an atmosphere of gaseous toluene with a partial pressure of 0943 (p p0-1
) Fig 111
shows the change in the ellipsometric data due to physisorption of toluene
APPENDIX 62
202
300 400 500 600 700 800 900 1000-10
0
10
20
30
40
50
60
toluene atmosphere nitrogen atmosphere
in d
egre
es
wavelength [nm]
300 400 500 600 700 800 900 1000110017
18
19
20
21
22
23
24
toluene atmosphere nitrogen atmosphere
refr
active index
wavelength [nm]
Fig 111 Ellipsometry data of a thin film of CMT-6 on a QCM chip in nitrogen (dashed
line) and toluene (solid line) atmosphere
The refractive index nD of the film changes from 180 to 193 when filled with toluene
(nD = 15) With the Lorentz-Lorenz equation for ellipsometric porosimetry (EP)[55]
a
porosity of 16 can be specified The sorption measurement was repeated in a quartz
crystal microbalance at different partial pressures of toluene to record a full sorption
isotherm (Fig 112)
APPENDIX 62
203
00 02 04 06 08 1000
01
02
03
04
05
06
07
adsorb
ed v
olu
me [m
mol g
-1]
p p0
-1
Fig 112 Toluene sorption isotherm of a thin film of CMT-6 recorded in a QCM
The weight increase due to film deposition was 376 μg per cm2 With a film thickness
of 187 nm a density of 201 g cm-3
can be calculated The maximum weight increase
due to toluene adsorption was 21 μg per cm2 or 011 g per cm
3 respectively With a
density of 087 g cm-3
for liquid toluene a porosity of 13 can be calculated which
coincides well with the value determined with ellipsometric porosimetry
Conclusion
The synthesis of templated mesoporous titanium dioxide nanoparticles similar to the
silica analogues introduced in Chapter 42 could not be realized The TiO2 particles
forming in the acidic medium by a simple sol-gel process often show a higher surface
area and are much easier to redisperse than particles obtained in the basic synthesis
Although the general synthesis procedure is already known for a long time the resulting
colloidal suspensions are ideal candidates for the preparation of porous thin films
Especially if the synthesis by evaporation induced self-assembly is connected to
APPENDIX 62
204
problems the usage of these suspensions can be an interesting alternative Despite of
their porosity the prepared films have a high refractive index
REFERENCES
205
7 REFERENCES
REFERENCES
206
[1] Taniguchi N On the Basic Concept of Nano-Technology Japan Society of
Precision Engineering 1974
[2] Drexler E Engines of Creation The Coming Era of Nanotechnology New
York Anchor PressDoubleday 1986
[3] Drexler E Nanosystems Molecular Machinery Manufacturing and
Computation John Wiley amp Sons Inc 1992
[4] Boncheva M Whitesides G M Making things by self-assembly MRS Bull
2005 30 736-742
[5] Ter Minassian-Saraga L Thin films including layers terminology in relation to
their preparation and characterization Pure Appl Chem 1994 66 1667-1738
[6] Koga K Ikeshoji T Sugawara K-i Size- and Temperature-Dependent
Structural Transitions in Gold Nanoparticles Phys Rev Lett 2004 92 115507
[7] Trewyn B G Giri S Slowing I I Lin V S-Y Mesoporous silica
nanoparticle based controlled release drug delivery and biosensor systems
Chem Commun (Cambridge U K) 2007 3236-3245
[8] Barbe C Bartlett J Kong L Finnie K Lin H Q Larkin M Calleja S
Bush A Calleja G Silica particles A novel drug-delivery system Adv
Mater (Weinheim Ger) 2004 16 1959-1966
[9] Joutsensaari J Loivamaki M Vuorinen T Miettinen P Nerg A M
Holopainen J K Laaksonen A Nanoparticle formation by ozonolysis of
inducible plant volatiles Atmospheric Chemistry and Physics 2005 5 1489-
1495
[10] Mackenzie J D Bescher E P Chemical Routes in the Synthesis of
Nanomaterials Using the Sol-Gel Process Acc Chem Res 2007 40 810-818
[11] Cushing B L Kolesnichenko V L OConnor C J Recent Advances in the
Liquid-Phase Syntheses of Inorganic Nanoparticles Chem Rev (Washington
DC U S) 2004 104 3893-3946
[12] Stober W Fink A Bohn E Controlled growth of monodisperse silica
spheres in the micron size range J Colloid Interface Sci 1968 26 62-69
REFERENCES
207
[13] LaMer V K Dinegar R H Theory Production and Mechanism of Formation
of Monodispersed Hydrosols J Am Chem Soc 1950 72 4847-4854
[14] Sing K S W Everett D H Haul R A W Moscou L Pierotti R A
Rouquerol J Siemieniewska T Reporting Physisorption Data For GasSolid
Systems with Special Reference to the Determination of Surface Area and
Porosity Pure Appl Chem 1985 57 603-619
[15] Cundy C S Cox P A The hydrothermal synthesis of zeolites Precursors
intermediates and reaction mechanism Microporous Mesoporous Mater 2005
82 1-78
[16] Baerlocher C McCusker L B Database of Zeolite Structure wwwiza-
structureorgdatabases
[17] Yan Y Silica zeolite ultra low-k dielectric thin films PMSE Prepr 2004 90
89-94
[18] Fowler C E Khushalani D Lebeau B Mann S Nanoscale materials with
mesostructured interiors Adv Mater (Weinheim Ger) 2001 13 649-652
[19] Yang P Zhao D Margolese D I Chmelka B F Stucky G D Block
Copolymer Templating Syntheses of Mesoporous Metal Oxides with Large
Ordering Lengths and Semicrystalline Framework Chem Mater 1999 11
2813-2826
[20] Brinker C J Lu Y F Sellinger A Fan H Y Evaporation-induced self-
assembly Nanostructures made easy Adv Mater (Weinheim Ger) 1999 11
579-585
[21] Liu J Shin Y Nie Z M Chang J H Wang L Q Fryxell G E Samuels
W D Exarhos G J Molecular assembly in ordered mesoporosity A new
class of highly functional nanoscale materials J Phys Chem A 2000 104
8328-8339
[22] Burkett S L Sims S D Mann S Synthesis of hybrid inorganic-organic
mesoporous silica by co-condensation of siloxane and organosiloxane
precursors Chem Commun (Cambridge U K) 1996 1367-1368
REFERENCES
208
[23] Burleigh M C Markowitz M A Spector M S Gaber B P Direct
synthesis of periodic mesoporous organosilicas Functional incorporation by co-
condensation with organosilanes J Phys Chem B 2001 105 9935-9942
[24] Huh S Wiench J W Yoo J-C Pruski M Lin V S-Y Organic
Functionalization and Morphology Control of Mesoporous Silicas via a Co-
Condensation Synthesis Method Chem Mater 2003 15 4247-4256
[25] Igarashi N Hashimoto K Tatsumi T Studies on the structural stability of
mesoporous molecular sieves organically functionalized by a direct method J
Mater Chem 2002 12 3631-3636
[26] Trewyn B G Slowing I I Giri S Chen H-T Lin V S Y Synthesis and
Functionalization of a Mesoporous Silica Nanoparticle Based on the Sol-Gel
Process and Applications in Controlled Release Acc Chem Res 2007 40 846-
853
[27] Diaz I Mohino F Perez-Pariente J Sastre E Study by TG-MS of the
oxidation of SH-MCM-41 to SO3H-MCM-41 Thermochim Acta 2004 413
201-207
[28] Radu D R Lai C-Y Huang J Shu X Lin V S Y Fine-tuning the
degree of organic functionalization of mesoporous silica nanosphere materials
via an interfacially designed co-condensation method Chem Commun
(Cambridge U K) 2005 1264-1266
[29] Kumar R Chen H T Escoto J L V Lin V S Y Pruski M Template
Removal and Thermal Stability of Organically Functionalized Mesoporous
Silica Nanoparticles Chem Mater 2006 18 4319-4327
[30] Kawi S Lai M W Supercritical fluid extraction of surfactant template from
MCM-41 Chem Commun (Cambridge U K) 1998 1407-1408
[31] Tian B Liu X Yu C Gao F Luo Q Xie S Tu B Zhao D Microwave
assisted template removal of siliceous porous materials Chem Commun
(Cambridge U K) 2002 1186-1187
REFERENCES
209
[32] Lang N Tuel A A Fast and Efficient Ion-Exchange Procedure To Remove
Surfactant Molecules from MCM-41 Materials Chem Mater 2004 16 1961-
1966
[33] Schubert U Chemical modification of titanium alkoxides for sol-gel
processing J Mater Chem 2005 15 3701-3715
[34] Nagamine S Sasaoka E Synthesis of Nanostructured Titania Templated by
Anionic Surfactant in Acidic Conditions Journal of Porous Materials 2002 9
167-173
[35] ORegan B Graetzel M A low-cost high-efficiency solar cell based on dye-
sensitized colloidal titanium dioxide films Nature (London UK) 1991 353
737-740
[36] Evans U Die Interferenzfarben duumlnner Filme von Oxyden Sulfiden oder
Jodiden auf Metallen Colloid Polym Sci 1934 69 129-137
[37] Raacke J Interferenzfarben duumlnner Schichten (V27)
httpwwwraackedeindexhtmlairyhtml
[38] Parker A R McKenzie D R Large M C J Multilayer reflectors in animals
using green and gold beetles as contrasting examples J Exp Biol 1998 201
1307-1313
[39] Palaniappan A Su X Tay F Functionalized mesoporous silica films for gas
sensing applications J Electroceram 2006 16 503-505
[40] Nicole L Boissiere C Grosso D Hesemann P Moreau J Sanchez C
Advanced selective optical sensors based on periodically organized mesoporous
hybrid silica thin films Chem Commun (Cambridge U K) 2004 2312-2313
[41] Yuliarto B Zhou H Yamada T Honma I Katsumura Y Ichihara M
Effect of Tin Addition on Mesoporous Silica Thin Film and Its Application for
Surface Photovoltage NO2 Gas Sensor Anal Chem 2004 76 6719-6726
[42] Bearzotti A Mio Bertolo J Innocenzi P Falcaro P Traversa E Relative
humidity and alcohol sensors based on mesoporous silica thin films synthesised
from block copolymers Sens Actuators B 2003 B95 107-110
REFERENCES
210
[43] Wirnsberger G Scott B J Stucky G D pH sensing with mesoporous thin
films Chem Commun (Cambridge U K) 2001 119-120
[44] Choi S Y Mamak M vonFreymann G Chopra N Ozin G A
Mesoporous Bragg Stack Color Tunable Sensors Nano Lett 2006 6 2456-
2461
[45] Tosheva L Valtchev V P Nanozeolites Synthesis Crystallization
Mechanism and Applications Chem Mater 2005 17 2494-2513
[46] Bein T Zeolitic host-guest interactions and building blocks for the self-
assembly of complex materials MRS Bull 2005 30 713-720
[47] Slowing I Trewyn B G Lin V S Y Effect of Surface Functionalization of
MCM-41-Type Mesoporous Silica Nanoparticles on the Endocytosis by Human
Cancer Cells J Am Chem Soc 2006 128 14792-14793
[48] Schulz-Ekloff G Wohrle D van Duffel B Schoonheydt R A
Chromophores in porous silicas and minerals preparation and optical properties
Microporous Mesoporous Mater 2002 51 91-138
[49] Scott B J Wirnsberger G Stucky G D Mesoporous and mesostructured
materials for optical applications Chem Mater 2001 13 3140-3150
[50] Lee U H Kim M-H Kwon Y-U Mesoporous thin films with accessible
pores from surfaces Bull Korean Chem Soc 2006 27 808-816
[51] Sing K S W Everett D H Haul R A W Moscou L Pierotti R A
Rouquerol J Siemieniewska T Reporting physisorption data for gassolid
systems with special reference to the determination of surface area and porosity
(Recommendations 1984) Pure Appl Chem 1985 57 603-619
[52] Brunauer S Emmett P H Teller E Adsorption of Gases in Multimolecular
Layers J Am Chem Soc 1938 60 309-319
[53] Thommes M Kohn R Froba M Sorption and Pore Condensation Behavior
of Nitrogen Argon and Krypton in Mesoporous MCM-48 Silica Materials J
Phys Chem B 2000 104 7932-7943
[54] Moeller A Yang X Caro J Staudt R Measurements of the adsorption of
n-alkanes on 5A zeolites Chem Ing Tech 2006 78 1831-1836
REFERENCES
211
[55] Baklanov M R Mogilnikov K P Non-destructive characterisation of porous
low-k dielectric films Microelectron Eng 2002 64 335-349
[56] Eslava S Baklanov M R Kirschhock C E A Iacopi F Aldea S Maex
K Martens J A Characterization of a Molecular Sieve Coating Using
Ellipsometric Porosimetry Langmuir 2007 23 12811-12816
[57] Mintova S Nanosized molecular sieves Collect Czech Chem Commun 2003
68 2032-2054
[58] Holmberg B A Wang H Yan Y High silica zeolite Y nanocrystals by
dealumination and direct synthesis Microporous Mesoporous Mater 2004 74
189-198
[59] Zhu G Qiu S Yu J Sakamoto Y Xiao F Xu R Terasaki O Synthesis
and Characterization of High-Quality Zeolite LTA and FAU Single
Nanocrystals Chem Mater 1998 10 1483-1486
[60] Kecht J Mintova S Bein T Nanosized Zeolites Templated by Metal-
Ammine Complexes Chem Mater 2007 19 1203-1205
[61] Larsen S C Nanocrystalline Zeolites and Zeolite Structures Synthesis
Characterization and Applications Journal of Physical Chemistry C 2007 111
18464-18474
[62] Larlus O Mintova S Bein T Environmental syntheses of nanosized zeolites
with high yield and monomodal particle size distribution Microporous
Mesoporous Mater 2006 96 405-412
[63] Hsu C-Y Chiang A S T Selvin R Thompson R W Rapid Synthesis of
MFI Zeolite Nanocrystals J Phys Chem B 2005 109 18804-18814
[64] Lew C M Li Z Zones S I Sun M Yan Y Control of size and yield of
pure-silica-zeolite MFI nanocrystals by addition of methylene blue to the
synthesis solution Microporous Mesoporous Mater 2007 105 10-14
[65] Li Z J Li S Luo H M Yan Y S Effects of Crystallinity in Spin-On Pure-
Silica-Zeolite MFI Low-Dielectric-Constant Films Adv Funct Mater 2004 14
1019-1024
REFERENCES
212
[66] Li Z Lew C M Li S Medina D I Yan Y Pure-Silica-Zeolite MEL
Low-k Films from Nanoparticle Suspensions J Phys Chem B 2005 109 8652-
8658
[67] Mintova S Reinelt M Metzger T H Senker J Bein T Pure silica beta
colloidal zeolite assembled in thin films Chem Commun (Cambridge U K)
2003 326-327
[68] Camblor M A Corma A Valencia S Spontaneous nucleation and growth of
pure silica zeolite-b free of connectivity defects Chem Commun (Cambridge
U K) 1996 2365-2366
[69] Serrano D P Van Grieken R Sanchez P Sanz R Rodriguez L
Crystallization mechanism of all-silica zeolite beta in fluoride medium
Microporous Mesoporous Mater 2001 46 35-46
[70] Wang Z Mitra A Wang H Huang L Yan Y Pure silica zeolite films as
low-k dielectrics by spin-on of nanoparticle suspensions Adv Mater
(Weinheim Ger) 2001 13 1463-1466
[71] Mintova S Bein T Microporous Films Prepared by Spin-Coating Stable
Colloidal Suspensions of Zeolites Adv Mater (Weinheim Ger) 2001 13
1880-1883
[72] Johnson M Li Z Wang J Yan Y Mechanical characterization of zeolite
low dielectric constant thin films by nanoindentation Thin Solid Films 2007
515 3164-3170
[73] Tatlier M Demir M Tokay B Erdem-Senatalar A Kiwi-Minsker L
Substrate heating method for coating metal surfaces with high-silica zeolites
ZSM-5 coatings on stainless steel plates Microporous Mesoporous Mater 2007
101 374-380
[74] Barrett P A Camblor M A Corma A Jones R H Villaescusa L A
Structure of ITQ-4 a New Pure Silica Polymorph Containing Large Pores and a
Large Void Volume Chem Mater 1997 9 1713-1715
REFERENCES
213
[75] Selvam T Aresipathi C Mabande G T P Toufar H Schwieger W Solid
state transformation of TEAOH-intercalated kanemite into zeolite beta (BEA) J
Mater Chem 2005 15 2013-2019
[76] Schoeman B J Babouchkina E Mintova S Valtchev V P Sterte J The
Synthesis of Discrete Colloidal Crystals of Zeolite Beta and their Application in
the Preparation of Thin Microporous Films Journal of Porous Materials 2001
8 13-22
[77] Nery J G Hwang S-J Davis M E On the synthesis of SSZ-48 SSZ-43
and their variations Microporous Mesoporous Mater 2002 52 19-28
[78] Krijnen S Sanchez P Jakobs B T F van Hooff J H C A controlled post-
synthesis route to well-defined and active titanium Beta epoxidation catalysts
Microporous Mesoporous Mater 1999 31 163-173
[79] Bruggeman D A G The calculation of various physical constants of
heterogeneous substances I The dielectric constants and conductivities of
mixtures composed of isotropic substances Annalen der Physik (Berlin
Germany) 1935 24 665-679
[80] Kresge C T Leonowicz M E Roth W J Vartuli J C Beck J S Ordered
Mesoporous Molecular-Sieves Synthesized by a Liquid-Crystal Template
Mechanism Nature 1992 359 710-712
[81] Qi L M Ma J M Cheng H M Zhao Z G Micrometer-sized mesoporous
silica spheres grown under static conditions Chem Mater 1998 10 1623-1626
[82] Huo Q S Zhao D Y Feng J L Weston K Buratto S K Stucky G D
Schacht S Schuth F Room temperature growth of mesoporous silica fibers
A new high-surface-area optical waveguide Adv Mater (Weinheim Ger) 1997
9 974-978
[83] Li Y S Shi J L Hua Z L Chen H R Ruan M L Yan D S Hollow
Spheres of Mesoporous Aluminosilicate with a Three-Dimensional Pore
Network and Extraordinarily High Hydrothermal Stability Nano Lett 2003 3
609-612
REFERENCES
214
[84] Cauvel A Renard G Brunel D Monoglyceride synthesis by heterogeneous
catalysis using MCM-41 type silicas functionalized with amino groups J Org
Chem 1997 62 749-751
[85] Zhao X S Lu G Q Modification of MCM-41 by surface silylation with
trimethylchlorosilane and adsorption study J Phys Chem B 1998 102 1556-
1561
[86] Anwander R SOMCPMS Surface organometallic chemistry at periodic
mesoporous silica Chem Mater 2001 13 4419-4438
[87] Qi Z-m Honma I Zhou H Ordered-mesoporous-silica-thin-film-based
chemical gas sensors with integrated optical polarimetric interferometry Appl
Phys Lett 2006 88 053503053501-053503053503
[88] Boissiere C Kummel M Persin M Larbot A Prouzet E Spherical MSU-
1 mesoporous silica particles tuned for HPLC Adv Funct Mater 2001 11
129-135
[89] Ren J Ding J Chan K-Y Wang H Dual-Porosity Carbon Templated from
Monosize Mesoporous Silica Nanoparticles Chem Mater 2007 19 2786-2795
[90] Lu J Liong M Zink J I Tammanoi F Mesoporous silica nanoparticles as
a delivery system for hydrophobic anticancer drugs Small 2007 3 1341-1346
[91] Asai S Tominaga Y Sumita M Mesoporous silica as inorganic filler in
polymer composites Zeoraito 2006 23 117-124
[92] Lu Y F Fan H Y Stump A Ward T L Rieker T Brinker C J
Aerosol-assisted self-assembly of mesostructured spherical nanoparticles
Nature 1999 398 223-226
[93] Suzuki K Ikari K Imai H Synthesis of Silica Nanoparticles Having a Well-
Ordered Mesostructure Using a Double Surfactant System J Am Chem Soc
2004 126 462-463
[94] El Haskouri J Ortiz de Zarate D Guillem C Beltran-Porter A Caldes M
Marcos M D Beltran-Porter D Latorre J Amoros P Hierarchical Porous
Nanosized Organosilicas Chem Mater 2002 14 4502-4504
REFERENCES
215
[95] Nooney R I Thirunavukkarasu D Chen Y Josephs R Ostafin A E
Synthesis of Nanoscale Mesoporous Silica Spheres with Controlled Particle
Size Chem Mater 2002 14 4721-4728
[96] Rathousky J Zukalova M Kooyman P J Zukal A Synthesis and
characterization of colloidal MCM-41 Colloids Surf A 2004 241 81-86
[97] Cai Q Luo Z S Pang W Q Fan Y W Chen X H Cui F Z Dilute
solution routes to various controllable morphologies of MCM-41 silica with a
basic medium Chem Mater 2001 13 258-263
[98] Moeller K Kobler J Bein T Colloidal suspensions of nanometer-sized
mesoporous silica Adv Funct Mater 2007 17 605-612
[99] Moeller K Kobler J Bein T Colloidal suspensions of mercapto-
functionalized nanosized mesoporous silica J Mater Chem 2007 17 624-631
[100] Sadasivan S Khushalani D Mann S Synthesis and shape modification of
organo-functionalized silica nanoparticles with ordered mesostructured interiors
J Mater Chem 2003 13 1023-1029
[101] Frye C L Vincent G A Finzel W A Pentacoordinate silicon compounds
V Novel silatrane chemistry J Am Chem Soc 1971 93 6805-6811
[102] Verkade J G Atranes new examples with unexpected properties Acc Chem
Res 1993 26 483-489
[103] Cabrera S ElHaskouri J Guillem C Latorre J BeltranPorter A
BeltranPorter D Marcos M D Amoros P Generalised syntheses of ordered
mesoporous oxides the atrane route Solid State Sci 2000 2 405-420
[104] Zhao X S Lu G Q Whittaker A K Millar G J Zhu H Y
Comprehensive study of surface chemistry of MCM-41 using 29
Si CPMAS
NMR FTIR pyridine-TPD and TGA J Phys Chem B 1997 101 6525-6531
[105] Socrates G Infrared and Raman Characteristic Group Frequencies 3 ed
Wiley 2005
REFERENCES
216
[106] Okabayashi H Izawa K Yamamoto T Masuda H Nishio E OConnor
C J Surface structure of silica gel reacted with 3-
mercaptopropyltriethoxysilane and 3-aminopropyltriethoxysilane formation of
the S-S bridge structure and its characterization by Raman scattering and diffuse
reflectance Fourier transform spectroscopic studies Colloid Polym Sci 2002
280 135-145
[107] Kobler J Moumlller K Bein T Colloidal Suspensions of Functionalized
Mesoporous Silica Nanoparticles ACS Nano 2008 2 791-799
[108] Sokolov I Kievsky Y Y Kaszpurenko J M Self-assembly of ultrabright
fluorescent silica particles Small 2007 3 419-423
[109] Ren T-Z Yuan Z-Y Su B-L Encapsulation of direct blue dye into
mesoporous silica-based materials Colloids Surf A 2007 300 79-87
[110] Laerte de Castro F Santos J G Fernandes G J T Souza de Araujo A
Fernandes V J Politi M J Brochsztain S Solid state fluorescence of a
34910-perylenetetracarboxylic diimide derivative encapsulated in the pores of
mesoporous silica MCM-41 Microporous Mesoporous Mater 2007 102 258-
264
[111] Wark M Ganschow M Rohlfing Y Schulz-Ekloff G Woehrle D
Methods of synthesis for the encapsulation of dye molecules in molecular
sieves Stud Surf Sci Catal 2001 135 3292-3300
[112] Huang D-M Hung Y Ko B-S Hsu S-C Chen W-H Chien C-L
Tsai C-P Kuo C-T Kang J-C Yang C-S Mou C-Y Chen Y-C
Highly efficient cellular labeling of mesoporous nanoparticles in human
mesenchymal stem cells implication for stem cell tracking FASEB J 2005 19
2014-2016
[113] Torney F Trewyn B G Lin V S Y Wang K Mesoporous silica
nanoparticles deliver DNA and chemicals into plants Nat Nanotechnol 2007
2 295-300
REFERENCES
217
[114] Chen J Y Pan F M Chang L Cho A T Chao K J Thermal stability of
trimethylsilylated mesoporous silica thin films as the ultralow-k dielectric for
copper interconnects Journal of Vacuum Science amp Technology B
Microelectronics and Nanometer Structures--Processing Measurement and
Phenomena 2005 23 2034-2040
[115] Innocenzi P Martucci A Guglielmi M Bearzotti A Traversa E Pivin J
C Mesoporous silica thin films for alcohol sensors J Eur Ceram Soc 2001
21 1985-1988
[116] Brinker C J Evaporation-induced self-assembly Functional nanostructures
made easy MRS Bull 2004 29 631-640
[117] Mason G A model of the pore space in a random packing of equal spheres J
Colloid Interface Sci 1971 35 279-287
[118] Slobozhanin L A Alexander J I D Collicott S H Gonzalez S R
Capillary pressure of a liquid in a layer of close-packed uniform spheres
Physics of Fluids 2006 18 082104-082115
[119] Mayer R P Stowe R A Packed uniform sphere model for solids Interstitial
access opening sizes and pressure deficiencies for wetting liquids with
comparison to reported experimental results J Colloid Interface Sci 2006 294
139-150
[120] Juillerat F Bowen P Hofmann H Formation and Drying of Colloidal
Crystals Using Nanosized Silica Particles Langmuir 2006 22 2249-2257
[121] Suzuki T M Yamamoto M Fukumoto K Akimoto Y Yano K
Investigation of pore-size effects on base catalysis using amino-functionalized
monodispersed mesoporous silica spheres as a model catalyst J Catal 2007
251 249-257
[122] Pasqua L Testa F Aiello R Cundari S Nagy J B Preparation of
bifunctional hybrid mesoporous silica potentially useful for drug targeting
Microporous Mesoporous Mater 2007 103 166-173
REFERENCES
218
[123] Van Blaaderen A Vrij A Synthesis and characterization of colloidal
dispersions of fluorescent monodisperse silica spheres Langmuir 1992 8
2921-2931
[124] Ren T-Z Yuan Z-Y Su B-L Encapsulation of direct blue dye into
mesoporous silica-based materials Colloids and Surfaces A Physicochemical
and Engineering Aspects 2007 300 79-87
[125] Leon R Margolese D Stucky G Petroff P M Nanocrystalline Ge
filaments in the pores of a meso-silicate Physical Review B Condensed Matter
1995 52 r2285-r2288
[126] Abe T Tachibana Y Uematsu T Iwamoto M Preparation and
characterization of Fe2O3 nanoparticles in mesoporous silicate J Chem Soc
Chem Commun 1995 1617-1618
[127] Srdanov V I Alxneit I Stucky G D Reaves C M DenBaars S P
Optical Properties of GaAs Confined in the Pores of MCM-41 J Phys Chem B
1998 102 3341-3344
[128] Pathak S Cao E Davidson M C Jin S Silva G A Quantum Dot
Applications to Neuroscience New Tools for Probing Neurons and Glia J
Neurosci 2006 26 1893-1895
[129] Li C L Murase N Synthesis of Highly Luminescent Glasses Incorporating
CdTe Nanocrystals through Sol-Gel Processing Langmuir 2004 20 1-4
[130] ORegan B Gratzel M A low-cost high-efficiency solar cell based on dye-
sensitized colloidal TiO2 films Nature 1991 353 737-740
[131] Kongkanand A Tvrdy K Takechi K Kuno M Kamat P V Quantum Dot
Solar Cells Tuning Photoresponse through Size and Shape Control of CdSe-
TiO2 Architecture J Am Chem Soc 2008 130 4007-4015
[132] Franzl T Klar T A Schietinger S Rogach A L Feldmann J Exciton
Recycling in Graded Gap Nanocrystal Structures Nano Lett 2004 4 1599-
1603
REFERENCES
219
[133] Wellmann H Rathousky J Wark M Zukal A Schulz-Ekloff G
Formation of CdS nanoparticles within functionalized siliceous MCM-41
Microporous Mesoporous Mater 2001 44-45 419-425
[134] Murray C B Norris D J Bawendi M G Synthesis and characterization of
nearly monodisperse CdE (E = sulfur selenium tellurium) semiconductor
nanocrystallites J Am Chem Soc 1993 115 8706-8715
[135] Gruumln M Lauer I Unger K K The synthesis of micrometer- and
submicrometer-size spheres of ordered mesoporous oxide MCM-41 Adv Mater
(Weinheim Ger) 1997 9 254-257
[136] Melian-Cabrera I Kapteijn F Moulijn J A Room temperature detemplation
of zeolites through H2O2-mediated oxidation Chem Commun (Cambridge U
K) 2005 2744-2746
[137] Chen X Mao S S Synthesis of titanium dioxide (TiO2) nanomaterials J
Nanosci Nanotechnol 2006 6 906-925
[138] Cabrera S ElHaskouri J BeltranPorter A BeltranPorter D Marcos M D
Amoros P Enhanced surface area in thermally stable pure mesoporous TiO2
Solid State Sci 2000 2 513-518
[139] Abramson S Lasperas M Brunel D Design of mesoporous aluminosilicates
supported (1R 2S)-(-)-ephedrine evidence for the main factors influencing
catalytic activity in the enantioselective alkylation of benzaldehyde with
diethylzinc Tetrahedron Asymmetry 2002 13 357-367
[140] Peng T Zhao D Dai K Shi W Hirao K Synthesis of Titanium Dioxide
Nanoparticles with Mesoporous Anatase Wall and High Photocatalytic Activity
J Phys Chem B 2005 109 4947-4952
[141] Chen H Dai K Peng T Yang H Zhao D Synthesis of thermally stable
mesoporous titania nanoparticles via amine surfactant-mediated templating
method Mater Chem Phys 2006 96 176-181
[142] Soler-Illia G Louis A Sanchez C Synthesis and characterization of
mesostructured titania-based materials through evaporation-induced self-
assembly Chem Mater 2002 14 750-759
REFERENCES
220
[143] Cassiers K Linssen T Meynen V Voort P V D Cool P Vansant E F
A new strategy towards ultra stable mesoporous titania with nanosized anatase
walls Chem Commun (Cambridge U K) 2003 1178-1179
[144] Grosso D Soler-Illia G Babonneau F Sanchez C Albouy P A Brunet-
Bruneau A Balkenende A R Highly organized mesoporous titania thin films
showing mono-oriented 2D hexagonal channels Adv Mater (Weinheim Ger)
2001 13 1085
[145] Yusuf M M Imai H Hirashima H Preparation of mesoporous titania by
templating with polymer and surfactant and its characterization J Sol-Gel Sci
Technol 2003 28 97-104
[146] Shibata H Ogura T Mukai T Ohkubo T Sakai H Abe M Direct
Synthesis of Mesoporous Titania Particles Having a Crystalline Wall J Am
Chem Soc 2005 127 16396-16397
[147] Matijevic E Budnik M Meites L Preparation and mechanism of formation
of titanium dioxide hydrosols of narrow size distribution J Colloid Interface
Sci 1977 61 302-311
[148] Jinsoo Kim K-C S Oliver Wilhelm Sotiris E Pratsinis Sol-Gel Synthesis
and Spray Granulation of Porous Titania Powder Chem Ing Tech 2001 73
461-468
[149] Deshpande S B Potdar H S Khollam Y B Patil K R Pasricha R
Jacob N E Room temperature synthesis of mesoporous aggregates of anatase
TiO2 nanoparticles Mater Chem Phys 2006 97 207-212
[150] Benkstein K D Semancik S Mesoporous nanoparticle TiO2 thin films for
conductometric gas sensing on microhotplate platforms Sens Actuators B
2006 113 445-453
LEBENSLAUF
221
Persoumlnliche Daten
Name Johannes Georg Kobler
Geboren am 29121978 in Muumlnchen
Studium
seit 112004 Promotion an Ludwig-Maximilians-Universitaumlt Muumlnchen im Arbeitskreis
von Prof Bein Thin Films from Porous Nanoparticles
032004 ndash 092004 Diplomarbeit in physikalischer Chemie an der Ludwig-
Maximilians-Universitaumlt Muumlnchen im Arbeitskreis von
Prof Bein Kolloidale Loumlsungen mesoporoumlser Silica-
Nanopartikel mit funktionalisierter Oberflaumlche
022004 Diplomhauptpruumlfung an der Ludwig-Maximilians-
Universitaumlt Muumlnchen
101999 ndash 022004 Chemie-Studium an der Ludwig-Maximilians-Universitaumlt
Muumlnchen
Wehrdienst
071998 ndash 041999 Gebirgsjaumlgerbatallion 231 Bad Reichenhall
Schulausbildung
091989 ndash 061998 Maximilian-von-Montgelas Gymnasium Vilsbiburg
PUBLICATIONS AND POSTER PRESENTATIONS
222
Publications and Poster Presentations
Publications
1 K Moeller J Kobler T Bein Colloidal Suspensions of Nanometer-Sized
Mesoporous Silica Adv Funct Mater 2007 17 605-612
2 K Moeller J Kobler T Bein Colloidal Suspensions of Mercapto-
Functionalized Nanosized Mesoporous Silica J Mater Chem 2007 17 624-
631
3 J Kobler K Moeller T Bein Colloidal Suspensions of Functionalized
Mesoporous Silica Nanoparticles ACS Nano 2008 2 791-799
4 J Kobler H Abrevaya S Mintova T Bein High-Silica Zeolite-β From
Stable Colloidal Suspensions to Thin Films J Phys Chem C 2008 112
14274ndash14280
5 J Kobler T Bein Porous Thin Films of Functionalized Mesoporous Silica
Nanoparticles ACS Nano 2008 2 2324ndash2330
6 J Kobler B Lotsch G Ozin T Bein Vapor-Sensitive Bragg Mirrors and
Optical Isotherms from Mesoporous Nanoparticle Suspensions submitted
PUBLICATIONS AND POSTER PRESENTATIONS
223
Poster Presentations
1 J Kobler K Moeller T Bein Colloidal Functionalized Mesoporous Silica
17 Deutsche Zeolithtagung 2005 Giessen Germany
2 J Kobler S Mintova T Bein Films of Pure-Silica Zeolites 3 International
FEZA Conference 2005 Prague Czech Republic
3 J Kobler S Mintova T Bein Thin Microporous Films with Variable Optical
Properties Catalytic processes on advanced micro- and mesoporous materials
2005 Nessebar Bulgaria
4 J Kobler T Bein Transparent Sols of Mesoporous Silica Nanoparticles 19
Deutsche Zeolithtagung 2007 Leipzig Germany
5 M Hallermann D Georgiadou J Kobler D Fattakhova-Rohlfing A Susha
T Bein Electron Transfer Processes in the Electrochemical Solar Cell ndash
Comparison of Dye and Dot Sensitized Titania 2007 CeNS Winterschool
Mauterndorf Austria
6 J Kobler T Bein Transparent Sols of Mesoporous Silica Nanoparticles for
the Preparation of Thin Films for Chemical Sensors Catalytic processes on
advanced micro- and mesoporous materials 2007 Varna Bulgaria
ABSTRACT
ABSTRACT
Porous materials in the nanometer range are interesting materials in many fields of
science and technology Especially in terms of colloidal suspensions these materials are
promising candidates for applications such as gas sensing host-guest chemistry drug
delivery and coatings in the semiconductor industry In this work syntheses of
monodisperse stable colloidal suspensions of different materials for the preparation of
porous thin films were described
Colloidal suspensions of zeolite Beta nanocrystals with low aluminum content were
prepared and the crystallization kinetics was studied The crystalline Beta was stabilized
in colloidal suspensions by addition of inorganic silica-based binders and applied for the
preparation of films by a spin-on process The thickness of the films was controlled by
repeated coating steps speed of deposition and Beta concentration of the coating
suspensions The Beta films exhibit good mechanical properties smooth surfaces and
show a low refractive index which is typical for highly porous silica based materials
Additionally a synthetic approach for the preparation of colloidal mesoporous silica
spheres and functionalized colloidal suspensions of nanoscale mesoporous materials
with high yields from concentrated solutions is presented Narrow particle size
distributions in the range of about 50 to 150 nm were established with Dynamic Light
Scattering measurements and electron microscopy before and after template extraction
Discrete nanoscale mesoporous particles with functionalized pore surfaces resulted
when adding functional organoalkoxysilanes directly to the initial silica precursor
ABSTRACT
solutions Nitrogen sorption analysis indicated that the functional groups were located at
the inner surfaces of the mesoporous channel systems
By further decreasing the diameter of these mesoporous silica spheres their scattering
ability for visible light was also drastically decreased We have demonstrated the
synthesis of extremely small mesoporous silica nanoparticles via a specific co-
condensation process with phenyl groups If the size of the particles falls below about
110 of the wavelength of the incoming light (01 ) the colloidal suspensions show
optical transparency Because of an easy handling and a good reproducibility the
suspensions are ideal for the production of thin film by spin-coating The films showed
excellent optical qualities exhibited good diffusion properties and a highly accessible
pore system Thanks to the small particle size and the resulting low surface roughness
the formation of multilayers was possible without transmitting defects on the surface
with every following coating step The availability of such homogeneous porous thin
films made it possible to use ellipsometry as analysis method Ellipsometric
porosimetry (EP) is a convenient method to determine the effective porosity of a thin
film on its original support without destroying it It was possible to record sorption
isotherms of the thin films with ellipsometry and to correlate the data with nitrogen
sorption data of dried powders of the same material The thin films showed very low
refractive indices around 12 in the case of both zeolites and functionalized mesoporous
silica nanoparticles
Besides a synthesis procedure for TiO2 particles in an acidic medium by a simple sol-
gel process was investigated The material showed a high surface area and the thin films
ABSTRACT
prepared from the colloidal suspensions had a high refractive index combined with a
certain porosity Thus the preparation of wavelength specific Bragg mirrors could be
realized by a simple and reproducible spin-coating approach using colloidal suspensions
of functionalized porous silica nanoparticles and titania sols The Bragg reflectors show
a sensitivity towards specific relative pressures of organic vapors like isopropanol or
toluene
TABLE OF CONTENTS
1 INTRODUCTION 1
Nanotechnology 3
Self-Assembly 5
Nanoparticles 6
Colloid Science 8
Fabrication of Nanoparticles 12
Sol-gel Chemistry 13
Porous Materials 16
Zeolites 17
Mesoporous Silica 19
Mesoporous Titania 26
Optical Properties of Thin Films 27
2 MOTIVATION 30
3 CHARACTERIZATION METHODS 34
Sorption 35
Quartz Crystal Microbalance 42
Ellipsometry 43
Ellipsometric porosimetry 46
Light Scattering 49
Electron Microscopy 53
Thermogravimetric Analysis 54
Powder X-ray Diffraction 55
Solid-State NMR 56
IR and Raman Spectroscopy 57
4 RESULTS AND DISCUSSION 59
41 High Silica Zeolite Beta From Stable Colloidal Suspensions to Thin Films 60
Introduction 61
Experimental 63
TABLE OF CONTENTS
Results and Discussion 67
Conclusion 80
42 Synthesis and Characterization of Functionalized Mesoporous Silica
Nanoparticles 82
Introduction 83
Experimental 85
Results and Discussion 88
Conclusion 101
43 Porous Thin Films of Functionalized Mesoporous Silica Nanoparticle 103
Introduction 104
Experimental 107
Results and Discussion 111
Conclusion 123
44 Vapor-Sensitive Bragg Mirrors and Optical Isotherms from Mesoporous
Nanoparticle Suspensions 135
Introduction 136
Experimental 138
Results and Discussion 139
Conclusion 151
5 CONCLUSION AND OUTLOOK 152
6 APPENDIX 155
61 Functionalized Mesoporous Silica Nanoparticles as Host System for the
Synthesis of CdS Quantum Dots 156
Introduction 156
Experimental 158
Results and Discussion 163
Conclusion 175
62 Colloidal Suspensions of TiO2 Nanoparticles for the Preparation of Porous
Thin Films 176
TABLE OF CONTENTS
Introduction 176
Experimental 179
Results and Discussion 184
Conclusion 203
7 REFERENCES 205
INTRODUCTION
1
1 INTRODUCTION
INTRODUCTION
2
Nanosystems are already playing a major role in information technology the electronic
components in computers and communication technology are becoming smaller and
smaller However this development cannot go on forever once the nanometer scale has
been reached At that level novel physical phenomena often arise that may present
potential problems for conventional uses ndash and an opportunity for innovations and new
applications Micro- and nanosystems are also becoming increasingly important in life
science and medicine They can be introduced into living organisms for instance to
bring a cancer medication to tumor cells The increasing interest in this field can be
illustrated by simply typing the four letters ldquonanordquo into the research discovery tool
SciFinder and sort the publications in chronological order
19
87
19
88
19
89
19
90
19
91
19
92
19
93
19
94
19
95
19
96
19
97
19
98
19
99
20
00
20
01
20
02
20
03
20
04
20
05
20
06
20
07
0
2000
4000
6000
8000
10000
12000
nu
mb
er
of
pu
blicati
on
s
0
500
1000
1500
2000
2500 an
nu
al in
cre
ase o
f pu
blic
atio
ns
Fig 1 Occurrence of the word ldquonanordquo in SciFinder from 1987 to 2007
INTRODUCTION
3
Nanotechnology
One nanometer (nm) is one billionth or 10-9
of a meter For comparison a DNA
double-helix has a diameter around 2 nm and the smallest cellular life forms the
bacteria of the genus Mycoplasma are around 200 nm in length The term
ldquonanotechnologyrdquo was defined by Tokyo Science University Professor Norio Taniguchi
in 1974 as follows ldquoNano-technology mainly consists of the processing of separation
consolidation and deformation of materials by one atom or by one moleculerdquo[1]
In the
1980s the basic idea of this definition was explored in much more depth by Dr K Eric
Drexler who promoted the technological significance of nano-scale phenomena and
devices through speeches and books[2 3]
The first distinguishing concepts in
nanotechnology (but predating use of that term) were elaborated in ldquoTheres Plenty of
Room at the Bottomrdquo a talk given by physicist Richard Feynman at an American
Physical Society meeting at Caltech on December 29 1959 Feynman described a
process by which the ability to manipulate individual atoms and molecules might be
developed using one set of precise tools to build and operate another proportionally
smaller set so on down to the needed scale In the course of this he noted scaling
issues would arise from the changing magnitude of various physical phenomena gravity
would become less important surface tension and Van-der-Waals-attraction would
become more important etc
Nanotechnology and nanoscience got started in the early 1980s The driving force for
nanotechnology came from a renewed interest in colloid science coupled with a new
generation of analytical tools that allow observing and characterizing the materials or
INTRODUCTION
4
devices even in the sub-nanometer domain The invention of the scanning tunneling
microscope (STM) the discovery of fullerenes in 1986 and carbon nanotubes a few
years later as well as the synthesis of semiconductor nanocrystals (quantum dots) or the
atomic force microscope (AFM) can be mentioned as milestones in the early years
Nanotechnology today is a field of applied science and technology covering a broad
range of topics The main unifying theme is the control of matter on a scale smaller than
one micrometer normally approximately 1 to 100 nanometers as well as the fabrication
of devices of this size It is a highly multidisciplinary enterprise drawing from fields
such as applied physics materials science colloid science device physics
supramolecular chemistry and mechanical and electrical engineering Nanoscience can
be seen as an extension of existing sciences into the nanoscale (or sometimes as a
recasting of existing sciences using a newer more modern term)
Two main approaches are used in nanotechnology In the ldquotop-downrdquo approach nano-
objects are constructed from larger entities without atomic-level control Many
technologies originating from conventional solid-state silicon processing methods for
fabricating microprocessors are capable of creating features much smaller than 100 nm
thus falling under the definition of nanotechnology A complementary and from a
chemical point of view much more challenging strategy is the ldquobottom-uprdquo approach
The materials and devices are built from molecular components or other nano-objects
by an appropriate combination of driving forces such as molecular recognition self-
assembly hydrogen bonding etc
INTRODUCTION
5
Self-Assembly
Self-assembly can be defined as spontaneous and reversible organization of molecular
units or other nano-objects into ordered structures by non-covalent interactions The
interactions responsible for the formation of the self-assembled system act on a strictly
local level - in other words the nanostructure builds itself[4]
There are at least three features that distinguish self-assembly from common chemical
reactions driving atoms and molecules to assemble into larger structures First the self-
assembled structure must have a higher order than the isolated components The second
important aspect of self-assembly is the key role of weak interactions eg Van-der-
Waals- capillary- πminusπ- or hydrogen bonds The third distinctive feature is that the
building blocks can be not only atoms and molecules but span a wide range of nano-
and mesoscopic structures with different chemical compositions shapes and
functionalities Examples of self-assembly in materials science include the formation of
colloidal crystals lipid bilayers phase-separated polymers or self-assembled
monolayers
Another characteristic that is common to nearly all self-assembled systems is their
thermodynamic stability In covalent synthesis and polymerization the scientist links
atoms together in any desired conformation In order for self-assembly to take place
without the intervention of external forces the process must lead to a lower Gibbs
energy thus self-assembled structures are thermodynamically more stable than the
single un-assembled components A direct consequence is the general tendency of self-
assembled structures to be relatively free of defects
INTRODUCTION
6
By choosing precursors with suitable physicochemical properties it is possible to exert
a fine control on the formation processes in order to obtain complex architectures
Popular examples for such self-organizing units are surfactant micelles - aggregates of
surface-active molecules dispersed in a liquid
Fig 2 Surfactant molecule and micelle
A typical micelle in aqueous solution forms an aggregate with the hydrophilic ldquoheadrdquo
regions in contact with surrounding solvent sequestering the hydrophobic tail regions in
the micelle centre The shape and size of a micelle is a function of the molecular
geometry of its surfactant molecules and solution conditions such as surfactant
concentration temperature pH and ionic strength Such micelles are already simple
examples for nano-objects
Nanoparticles
Nanoparticles are often defined as microscopic particles with at least one dimension less
than 100 nm A nanoscopic film for example has vertical dimensions in the range of
01ndash100 nm according to the IUPAC definition[5]
Due to a wide variety of potential
applications in biomedical optical and electronic fields nanoparticles are of great
INTRODUCTION
7
scientific interest as they are effectively a bridge between bulk materials and atomic or
molecular structures
A bulk material should have constant physical properties regardless of its size but a
number of physical phenomena can noticeably change as the size of the system
decreases The properties of materials change as their size approaches the nanoscale and
as the percentage of atoms at the surface of a material becomes significant These
include quantum mechanical effects for example the ldquoquantum size effectrdquo where the
electronic properties of solids are altered with great reductions in particle size This
effect does not come into play by going from macro to micro dimensions but it does
become dominant when the nanometer size range is reached
Additionally a number of physical properties change when compared to macroscopic
systems thus enabling unique applications For instance the melting point of gold is
shifted to lower temperatures[6]
Much of the fascination with nanoscience stems from
these unique quantum and surface phenomena that matter exhibits at the nanoscale
A unique aspect of nanoscience is the vastly increased ratio of surface area to volume
present in many nanoscale materials that opens new possibilities in surface-based
science such as catalysis Colloid science has given rise to many materials that may be
useful in nanotechnology for instance carbon nanotubes and nanometer-sized metal
oxide particles At the small end of the size range nanoparticles are often referred to as
clusters Metal dielectric and semiconductor nanoparticles have been formed as well
as hybrid structures eg core-shell particles Nanoparticles made of semiconducting
material may also be labeled quantum dots if they are small enough (typically sub
INTRODUCTION
8
10 nm) for quantization of electronic energy levels to occur Such nanoscale particles
are used in biomedical applications eg as imaging agents Semi-solid and soft
nanoparticles have been manufactured A prototype nanoparticle of semi-solid nature is
represented by the liposomes Various types of liposomes or other types of porous
nanoparticles are currently explored clinically as delivery systems for anticancer drugs
and vaccines[7 8]
But nanoparticles also present possible dangers both medically and environmentally
Most of these are due to the high surface to volume ratio which can make the particles
very reactive or catalytically active They may also be able to pass through cell walls in
organisms and their interactions with the body are relatively unknown However free
nanoparticles in the environment quickly tend to agglomerate and thus leave the nano-
regime and nature itself presents many nanoparticles to which organisms on earth may
have evolved immunity such as terpenes from plants[9]
or dust from volcanic eruptions
Colloid Science
As mentioned above much of the knowledge in todayrsquos nanoscience derives from
colloidal science Sol-gel chemistry for example is a typical ldquobottom-uprdquo approach
The Scottish scientist Thomas Graham introduced this field of study in 1861 Many
familiar substances including butter milk smoke paints and glues are colloids
A colloid or colloidal dispersion is a type of homogeneous mixture It consists of two
separate phases a dispersed phase and a continuous phase the dispersed phase is made
of very small particles or droplets that are distributed evenly throughout the continuous
INTRODUCTION
9
phase According to IUPAC the size of the dispersed phase particles is between 1 and
1000 nm in at least one dimension Homogeneous mixtures with a dispersed phase in
this size range may be called colloidal aerosols colloidal emulsions colloidal foams
colloidal dispersions or hydrosols The dispersed particles or droplets are largely
affected by the surface chemistry present in the colloid Homogeneous suspensions of
nanoparticles are possible if the interaction of the particle surface with the solvent is
strong enough to overcome differences in density which usually result in a material
either sinking or floating in a liquid
Fig 3 shows the free energy E as a function of the particle distance r (kB = Boltzmann
constant T = absolute temperature) The free energy reaches its minimum when the
particle distance r = δ This approach is only possible if the energy barrier ΔEc is of the
same order of magnitude as the thermal energy kBT in this case the dispersion is
kinetically unstable In contrast in case of a stable colloidal dispersion the energy
barrier is so high that the particles can not converge enough to coagulate
INTRODUCTION
10
Fig 3 Kinetic stability of colloidal dispersions
The following forces play an important role in the interactions of colloid particles and
thus the height of the energy barrier
Excluded volume repulsion This refers to the impossibility of any overlap between
hard particles
Electrostatic interaction Colloidal particles often carry an electrical charge (zeta
potential) and therefore attract or repel each other The charges of both the continuous
and the dispersed phase as well as the mobility of the phases are factors affecting this
interaction
INTRODUCTION
11
Van-der-Waals-forces This is due to interactions between two dipoles that are either
permanent or induced Even if the particles do not have a permanent dipole fluctuations
of the electron density give rise to a temporary dipole in the particle This temporary
dipole induces a dipole in particles nearby The temporary dipole and the induced
dipoles are then attracted to each other
Entropic forces According to the second law of thermodynamics a system progresses
to a state in which entropy is maximized
Steric forces between polymer-covered surfaces or in solutions containing non-
adsorbing polymer can modulate interparticle forces producing an additional repulsive
steric stabilization force or attractive depletion force between them
The two main mechanisms to prevent colloids from aggregating are steric stabilization
and electrostatic stabilization Electrostatic stabilization is based on the mutual
repulsion of like electrical charges Different phases generally have different charge
affinities so that a double-layer of charges forms at any interface Small particle sizes
lead to enormous surface areas and this effect is greatly amplified in colloids In a
stable colloid the mass of the individual particles in a dispersed phase is so low that
their kinetic energy is too small to overcome their electrostatic repulsion
INTRODUCTION
12
Unstable colloidal dispersions form flocks as the particles aggregate due to interparticle
attractions This can be accomplished by different methods
Adding salts or solvents to a suspension or changing the pH of a suspension to
effectively neutralize the surface charge of the dispersed particles can accomplish
removal of the electrostatic barrier that prevents aggregation of the particles This
removes the repulsive forces that keep colloidal particles separate and allows for
coagulation due to Van-der-Waals-forces
Addition of a charged polymeric flocculant can bridge individual colloidal particles by
attractive electrostatic interactions For example negatively charged colloidal silica
particles can be flocculated by the addition of a positively charged polymer
A stable colloidal suspension often appears opalescent because of the Tyndall effect
which is the scattering of light by particles in the colloid By decreasing the size of the
dispersed particles their ability to scatter light is also decreased
Fabrication of Nanoparticles
There are several methods for creating nanoparticles In attrition macro or micro scale
particles are ground in a ball mill a planetary ball mill or other size reducing
mechanism But the minimum particle size is strongly limited In pyrolysis an organic
precursor (liquid or gas) is forced through a nozzle at high pressure and burned
Thermal plasma can also deliver the energy necessary to cause evaporation of small
micrometer size particles The thermal plasma temperatures are at the order of 10000 K
such that a solid powder easily evaporates Nanoparticles are formed upon cooling
INTRODUCTION
13
while exiting the plasma region The radio frequency induction plasma method has been
used to synthesize for example various ceramic nanoparticles In sol-gel chemistry
smaller components are arranged into more complex assemblies[10 11]
Sol-gel Chemistry
The sol-gel process is a wet-chemical technique for the fabrication of materials
typically a metal oxide starting from a chemical solution containing colloidal
precursors (sol) Typical precursors are metal alkoxides and metal chlorides which
undergo hydrolysis and polycondensation reactions to form a colloid The sol evolves
then towards the formation of an inorganic network containing a liquid phase (gel) A
well-known synthesis in sol-gel chemistry is the Stoumlber process[12]
in which the silica
precursor is hydrolyzed in a solution of ammonia water and an alcohol
Precursor Chemistry
Very common precursors in silicate chemistry are tetraalkoxysilanes because the
released alcohols usually have no negative effects on the reaction and can be removed
easily The precursor can hydrolyze in an either acidic or basic aqueous medium and
afterwards condense to an inorganic network of amorphous silica The concepts shown
in Fig 4 can help to control the size and morphology of the synthesized particles
INTRODUCTION
14
Fig 4 Influence of the pH and precursor concentration in sol-gel chemistry[11]
A high pH in combination with a decreased precursor concentration can result in a
colloidal dispersion of discrete spheres with a monodisperse particle size distribution
Decreasing the pH normally leads to smaller particles but at the same time to a higher
degree of crosslinking
In combination with an increased precursor concentration the gelation process is
supported In order to direct the synthesis towards the formation of small discrete
particles the nucleation rate at the beginning should be high Thus a multitude of seeds
that can further grow is formed A very common model for the formation of
nanoparticles in sol-gel chemistry is described with the LaMer-diagram[13]
shown Fig 5
INTRODUCTION
15
Fig 5 LaMer-diagram for the formation of colloidal dispersions
The concentration of the precursor that forms the dispersed phase increases due to some
chemical or physical process At a certain degree of supersaturation nucleation occurs
either heterogeneously on impurity centers or homogeneously through spontaneous
nucleation The growth of these nuclei causes the concentration to fall below the
nucleation concentration below which no more particles are created The particles
continue to grow however until the concentration falls to the saturation concentration
The requirements for monodispersity are evident from the LaMer diagram
The rate of nucleation must be high enough so that the concentration does not continue
to increase
On the one hand the growth rate of these nuclei must be fast enough to reduce the
concentration below the nucleation concentration quickly In this way only a limited
number of particles are created
INTRODUCTION
16
On the other hand the growth rate must be slow enough that the growth period is long
compared to the nucleation period This usually narrows the size distribution
As already mentioned a material consisting of nanoparticles can reach very high
surface areas a fact that plays an important role eg in catalysis Another possibility to
increase the specific surface area is the introduction of an inherent porosity In this
context the synthesis of nanostructured porous materials has become an important topic
in the field of materials science
Porous Materials
The unique property of porous materials is the very high surface-to-mass ratio along
with a high absorption capacity They can be used in many applications including
catalysis as adsorbents in separation processes or depending on the framework charge
as ion exchangers Depending on the type of material the specific surface area can
reach several thousand square meters per gram The morphology of the particles the
pore size and their surface chemistry can be varied depending on the application Porous
materials are classified by their pore sizes in three categories namely micro- (d lt 2 nm)
meso- (2 nm lt d lt 50 nm) and macroporous (d gt 50 nm)[14]
Common macroporous materials are porous glasses silica gels and activated carbon In
these materials the pore system is often based on the space between particles which
often varies in a certain range and is difficult to control
Important microporous materials are zeolites which offer well-defined pore diameters
in the range between about 025 and 12 nm
INTRODUCTION
17
Zeolites
Zeolites are minerals that have a microporous structure More than 150 zeolite structure
types have been synthesized and 48 naturally occurring zeolites are known[15]
Natural
zeolites form where volcanic rocks and ash layers react with alkaline groundwater they
are often contaminated to varying degrees by other minerals metals quartz or other
zeolites For this reason naturally occurring zeolites are excluded from many important
commercial applications where uniformity and purity are essential There are several
types of synthetic zeolites that form by a process of slow crystallization of a silica-
alumina gel in the presence of alkali and sometimes organic structure-directing agents
(SDA) or templates The most important processes to carry out zeolite synthesis belong
to sol-gel chemistry The product properties depend on the composition of the reaction
mixture pH temperature reaction time or templates present Synthetic zeolites hold
some key advantages over their natural analogs They can be manufactured in a
uniform phase-pure state It is also possible to synthesize desirable structures that do
not appear in nature eg Zeolite A Zeolites are widely used as ion-exchange beds in
domestic and commercial water purification or softening In chemistry zeolites are used
as ldquomolecular sievesrdquo The term refers to a particular property of these materials ie
the ability to selectively sort molecules based primarily on a size exclusion process
This is due to the very regular pore structure of molecular dimensions which is
conventionally defined by the ring size of the aperture For example the term ldquo12-ringrdquo
refers to a closed loop that is built from 12 tetrahedrally coordinated silicon (or
aluminum) atoms and 12 oxygen atoms (Fig 6)
INTRODUCTION
18
Fig 6 Structure of zeolite BEA (projection viewed along [100])[16]
The largest outlet for synthetic zeolite is the global laundry detergent market But
synthetic zeolites are also well established as catalysts in the petrochemical industry for
instance in fluid catalytic cracking and hydro-cracking Zeolites confine molecules in
small spaces which causes changes in their structure and reactivity The hydrogen
forms of zeolites (prepared by ion-exchange) are powerful solid-state acids and can
facilitate acid-catalyzed reactions such as isomerization alkylation and cracking
Zeolites or zeo-type materials can also be used as solar thermal collectors and for
adsorption refrigeration In these applications their hygroscopic property coupled with
an inherent exothermic reaction when transitioning from a dehydrated to a hydrated
form (heat of adsorption) make zeolites effective in the storage of heat energy Due to
their high porosity in combination with a good thermal conductivity zeolites are also
being explored as dielectric thin films in low-k technology[17]
INTRODUCTION
19
Regardless of the variety the maximum pore size of zeolites and thus their use is
limited Therefore researchers tried to find materials with a well-ordered pore system
that exhibit pore diameters of more than 2 nm
Mesoporous Silica
In 1992 scientists of the Mobil Research and Development Corporation discovered the
first ordered mesoporous silica The synthesis was realized through a condensation of a
silica precursor in the presence of self-organizing surfactant molecules acting as
template Depending on the reaction conditions different modifications of mesoporous
silica can be synthesized A very common material is the so-called MCM-41 (Mobil
Composition of Matter No 41) with a hexagonal pore structure Other known types are
eg the cubic MCM-48 lamellar MCM-50 or disordered worm-like mesoporous silica
(Fig 7)
Fig 7 TEM-micrographs of MCM-41 MCM-48 and worm-like mesoporous silica
INTRODUCTION
20
In general four reagents are needed for the synthesis of mesoporous silica water a
surfactant a silica precursor and an agent catalyzing the hydrolysis The product
features can be controlled by the parameters temperature pH or batch composition
A widely accepted model for the formation mechanism of mesoporous silica is shown in
Fig 8 This cooperative templating model shows the formation of nanocomposite
biphasic arrays [18]
Fig 8 Cooperative silicate-template-mechanism[18]
INTRODUCTION
21
The formation of mesoporous silica via the S+I- synthesis route can be described as
follows
Single-chain surfactant cations (S+) react with silicate polyanions eg dimers double
three and four rings (I-) Micelles serve as a source for surfactant molecules or are
rearranged according to the anion charge density and shape requirements
Nucleation and rapid precipitation of organized arrays takes place with configurations
determined by the cooperative interactions of ion-pair charges geometries and Van-der-
Waals-forces
Condensation of the silicate phase with increasing time and temperature takes place
The silicate framework charge decreases during this process this may lead to liquid
crystal-like phase transitions as the surfactant phase tries to reorganize the changing
interface charge density
The framework becomes more and more stable through further condensation of silicate
anions into the inorganic network
Control over the pore size and pore topology can be achieved by using eg templates
with varying chain lengths or block-copolymers Thus pore diameters between about
15 to 20 nm can be realized This universally applicable model can also be transferred
to the synthesis of other mesoporous metal oxides like titania[19]
INTRODUCTION
22
Evaporation Induced Self Assembly (EISA)
The above model is also valid for the formation of mesoporous films by the so called
EISA approach[20]
In general thin films are thin material layers ranging from fractions
of a nanometer to several micrometers in thickness The EISA process (Evaporation
Induced Self Assembly) typically starts with a homogeneous solution of silica precursor
and surfactant prepared in ethanolwater with an initial surfactant concentration much
below the critical micelle concentration A preferential evaporation of ethanol
concentrates the surfactant and silica species in the remaining liquid phase The
progressively increasing surfactant concentration drives self-assembly of silica-
surfactant micelles and their further organization into liquid-crystalline mesophases
(Fig 9)
Fig 9 Mesophase formation during EISA thin film synthesis[20]
INTRODUCTION
23
Pre-existing incipient silica-surfactant mesostructures serve to nucleate and orient
mesophase development This results in the rapid formation of thin film mesophases
that are highly oriented with respect to the substrate surface It is possible to obtain
different final mesostructures through variation of the initial alcoholwatersurfactant
ratios
Functionalization
For some applications it can be interesting to modify the surface of the porous structure
- either bulk material or film By introducing for example organic groups the
hydrophobicity of the materials can be reduced (Fig 10) In general two approaches for
the modification of the mesoporous silica are followed The introduction of the organic
moieties can be accomplished either after synthesis (grafting)[21]
or during the synthesis
via co-condensation[22-24]
Fig 10 Functionalization of mesoporous silica with organic groups and the resulting
hydrophobicity[25]
INTRODUCTION
24
Grafting[26]
The post-synthetic grafting is achieved with organotrialkoxysilanes or
organotrichlorosilanes The template-free mesoporous silica is dispersed mostly in non-
polar anhydrous solvents to avoid a reaction of the organosilanes with anything but the
silica material The reaction takes place between the silanol groups on the surface and
the organoalkoxysilanes organotrichlorosilanes Studies showed that silanols located
on the exterior surface and near the pore openings are kinetically more accessible than
silanols on the interior pore wall Thus most organic functional groups are located
there It is possible to preferentially functionalize the surface of mesoporous silica
particles This is especially the case when the grafting is performed before the surfactant
is removed from the mesopores After the grafting has been performed the surfactant
can be removed This control over the location of functional groups may enable the
interaction of the porous particle with the environment through the surface
functionalization while not influencing the pore surface properties
The second important method for the synthesis of organically functionalized
mesoporous silica materials is the co-condensation In this direct ldquoone-potrdquo synthesis
method tetraalkoxysilanes together with an organo-substituted trialkoxysilane are
added to the aqueous surfactant solution Hydrophobic groups are supposed to interact
with the hydrocarbon tails of the surfactant templates and thereby evenly distribute
across the pore surface Furthermore the organic moieties are linked through multiple
siloxane bridges (Fig 11)
INTRODUCTION
25
Fig 11 Method for the functionalization of silica with an alkoxysilane [27]
Additionally this synthetic approach allows one to control the morphology of the
particles The influence of the organoalkoxysilanes on particle morphology depends
upon the abilities to stabilize or destabilize the micelles[28]
A great number of commercial available siloxanes can be introduced The register of
possible functional groups can be extended eg through a post-synthetic modification
after the co-condensation (Fig 12)
Fig 12 Post-synthetic modification of mesoporous organo-silica material[27]
INTRODUCTION
26
Extraction
In order to obtain a porous material after the templated synthesis the surfactant has to
be removed This can be realized either by calcination or extraction In the case of most
functionalized materials the template cannot be removed by calcination unless the
organic groups are sufficiently thermally stable[29]
In the literature one can find
different possibilities for the removal of the template by extraction ndash mainly complex
procedures such as extraction with supercritical carbon dioxide[30]
or treatment with
microwave radiation[31]
The most common method is some kind of ion-exchange in
alcoholic media eg with a mixture of ethanol and hydrochloric acid The material is
refluxed for several hours and thus protons replace the template cations It is also
possible to use more gentle extraction procedures eg a solution of ammonium nitrate
in ethanol[32]
Mesoporous Titania
After the discovery of the templated synthesis of mesoporous silica much effort was
made to adapt the synthesis principle to the formation of mesoporous titania ndash however
this turned out to be more challenging than for the silica system While the EISA-
approach is effective[20]
the synthesis of ordered mesoporous bulk material or
nanoparticles similar to MCM-41 is often less successful Synthesis problems are
mainly associated with the weak interaction between the cationic template molecules
and the inorganic phase and the faster hydrolysis of titania precursors[33 34]
Further
difficulties emerge from the preferred hexagonal coordination of Ti atoms often
INTRODUCTION
27
resulting in lamellar structures[33]
and the tendency to reorganize into stable crystalline
phases at relatively low temperatures eg as anatase or rutile
However there is a substantial interest in nanostructured titania films especially for
photocatalytic and photovoltaic applications The excellent electrical and mechanical
properties of porous nanostructured titania make it an ideal material for dye-sensitized
solar cells (DSSC)[35]
While DSSCs are cheaper to manufacture than silicon-based
cells they are still less efficient For the production of efficient DSSCs a
semiconducting layer with a high surface area is required to ensure a high loading with
a sensitizing dye Already a relatively thin film of titania nanoparticles doped with an
appropriate dye can produce a significant electric current
Optical Properties of Thin Films
In thin film deposition a thin layer of material is prepared on a substrate or previously
deposited layer ldquoThinrdquo is a relative term since a film may look operationally thin or
thick according to the procedure applied eg optically thin or thick compared to the
wavelength of the light used The most famous example for optically thin films may be
iridescent soap bubbles
Besides the thickness the refractive index is the second important variable in thin films
for optical applications The refractive index n of a medium is a measure for how much
the speed of light is reduced when traveling through it For example glass has a
refractive index of around 15 which means that light travels at 1 15 = 067 times the
speed in vacuum
INTRODUCTION
28
Dispersion and absorption
The effect that n varies with frequency (except in vacuum where all frequencies travel
at the same speed) is known as dispersion and it is what causes a prism to divide white
light into its constituent spectral colors In real materials the polarization does not
respond instantaneously to an applied field This causes dielectric loss which can be
expressed by a permittivity that is both complex and frequency dependent Real
materials are not perfect insulators either ie they have non-zero direct current
conductivity Taking both aspects into consideration a complex index of refraction can
be defined
inn ~
Here n is the refractive index indicating the phase velocity as above while κ is called
the extinction coefficient which indicates the amount of absorption loss when the
electromagnetic wave propagates through the material Both n and κ are dependent on
the wavelength In regions of the spectrum where the material does not absorb the real
part of the refractive index tends to increase with frequency Near absorption peaks the
curve of the refractive index is a complex form given by the Kramers-Kronig relations
and can decrease with frequency
Since the refractive index of a material varies with the frequency (and thus wavelength)
of light it is common to specify the corresponding vacuum wavelength at which the
refractive index is measured Typically this is done at a well-defined spectral emission
line for example the sodium D line at 589 nm (nD)
INTRODUCTION
29
Two common properties of transparent materials are directly related to the difference in
the refractive index of the materials Light is bended when it crosses the interface and it
reflects partially from surfaces
In thin film interference this phenomenon causes the characteristic colors like in the
case of soap bubbles or tarnished metals[36]
Fig 13 shows the dependence of the
interference colors on the thickness of a SiO2 film on silicon at a view angle of 45deg
Fig 13 Calculated interference colors of a silica film on silicon[37]
Stacking thin layers with different refractive indices can enforce this effect These
multilayer reflectors or so-called Bragg stacks can also be observed in nature when
chitin layers are alternated with different refractive index layers in order to control the
apparent color in a wide variety of animals[38]
In the laboratory these special thin films
can be prepared for example by alternation of low refractive index SiO2 with highly
refractive TiO2 films Regarding porous thin films the possible change of the
interference color upon adsorption of volatile species comes to mind This sensing
effect of porous films has already been reported in several publications[39-43]
also in
combination with the Bragg-stacks[44]
MOTIVATION
30
2 MOTIVATION
MOTIVATION
31
In summary it can be ascertained that porous materials are of great interest in many
fields of science and technology There are numerous publications on the synthesis of
all kinds of porous materials Meanwhile there is also a rapidly growing literature on
synthesis procedures for porous nanoparticles We then ask if it could be interesting to
synthesize porous materials at the nanometer scale and how could they be of use in
nanotechnology
As already mentioned nanoparticles exhibit a multitude of interesting properties In
combination with the characteristics of the zeolite materials the resulting nanoparticles
are ideal candidates for numerous applications[45]
However zeolites are often restricted by the small pore diameter Especially in the
liquid phase diffusion plays a major role The reactants need to diffuse rapidly towards
and away from catalytically active sites Due to the larger pore diameter and the
resulting improved diffusion properties of the mesoporous materials they are good
candidates for catalysis and sensing applications In order to obtain selectivity towards
different adsorbates or reactants the materials can be modified with various functional
groups[39]
In some domains the particle size and the existence of single particles is essential
Colloidal suspensions of discrete mesoporous silica nanoparticles which can be
synthesized in nearly every dimension and additionally functionalized with a multitude
of organic groups are ideal candidates for demanding application areas like drug
delivery[26]
The loading and release of the drug can be controlled by selectively
functionalizing the inner surface of the particle whereas the outer surface can be
MOTIVATION
32
modified with bioactive groups It is also imaginable to use porous particles as host
system for other materials such as quantum dots or dyes for biolabeling[46 47]
Encapsulating of sensitive dyes in the porous particles[48 49]
could be useful for the
incorporation in polymer matrices
Especially in the case of producing thin films homogeneous dispersions of
nanoparticles for the preparation eg by spin-coating are of great interest Electronic
semiconductor devices and optical coatings are the main applications for thin film
construction For example the use as low-k materials is intensively investigated And
porous titania films are a basic necessity in todayrsquos dye sensitized solar cells (DSSCs)
The preparation of thin films with porous nanoparticles has a range of advantages over
the common EISA approach for mesoporous films and the growth of zeolite films on
substrates
It is believed that the porous thin films made of (porous) nanoparticles exhibit improved
diffusion properties and a highly accessible pore system[50]
Additionally one can work with stable suspension of already extracted nanoparticles
assuring facile handling and good reproducibility
The coating of sensitive substrates is facilitated due to the mild conditions
Control over the thickness can be attained by varying concentration or by introducing
multiple step coating
Intricate template removal procedures between the coating steps are needless
The adhesion to different surfaces can be influenced by the addition of binders to the
coating suspensions
MOTIVATION
33
It could be also feasible to combine suspensions containing different kinds of
nanoparticles in order to assemble hybrid thin films
Finally the material is easier to characterize when bulk samples are available
Porous nanoparticles and thin films are viewed to have a tremendous potential in
various applications Thus the goal of this work was the synthesis of porous
nanoparticles as monodisperse colloidal suspensions These suspension were used for
the preparation of porous thin films Thorough characterization of the nanostructures is
necessary to establish understanding and control of their synthesis and applications
CHARACTERIZATION METHODS
34
3 CHARACTERIZATION
METHODS
CHARACTERIZATION METHODS
35
The characterization of porous nanoparticles can be done by using a variety of different
techniques mainly drawn from materials science Common techniques are electron
microscopy (TEM SEM) atomic force microscopy (AFM) dynamic light scattering
(DLS) powder x-ray diffractometry (XRD) and vibrational spectroscopy (IR Raman)
The determination of the inherent or interparticle porosity of the materials can be
achieved with different methods As the sorption plays a key role in many application
areas the characterization of the materials by their sorption properties is one of the most
important methods
Sorption
Gas adsorption is a prominent method to obtain a comprehensive characterization of
porous materials with respect to their specific surface area or pore size distribution In a
common gas sorption measurement the sample is attached to a vacuum manifold and
distinct relative pressures (p p0-1
) of the probe gas are adjusted During the measurement
the adsorbed and desorbed volumes of gas (in cm3 g
-1) on the sample surface (apparent
outer surface and accessible pore surface) is calculated for varying relative pressures at
a constant temperature From the obtained isotherms one can draw conclusions about
the size and morphology of pores The isotherms are categorized according to
IUPAC[51]
as shown in Fig 14
CHARACTERIZATION METHODS
36
Fig 14 The six isotherms defined by the IUPAC[51]
Type I is typical for microporous materials and shows a plateau after the filling of the
small pores at low relative pressures
Type II isotherms describe the formation of multilayers after the monolayer is
completed at point B This shape in combination with the complete reversibility upon
desorption is typical for non-porous materials
Type III and V are rarely observed and reflect a low interaction energy between
adsorbate and adsorbent
Type IV isotherms are typical for mesoporous samples The original IUPAC
classification defined the hysteresis as characteristic feature of mesoporous materials
Type VI shows an example isotherm for samples with a stepwise multilayer absorption
of a non-porous material
CHARACTERIZATION METHODS
37
In Fig 15 a typical isotherm for nanometer-sized mesoporous materials (Type IV) with
fields for the individual sorption steps is shown
00 02 04 06 08 10
E
DC
B
A
adsorption desorption
vo
lum
e a
dso
rbe
d
relative pressure pp0
Fig 15 Typical isotherm for a bulk sample of mesoporous nanoparticles
The steps A to E can be attributed to the following processes
A At low relative pressures p p0-1
a monolayer of adsorbate molecules is
forming on the high inner surface of the material
B Multilayers are established
C Filling of the mesopores occurs (capillary condensation)
D The remaining outer surface is covered (plateau)
E In samples with very small particles the adsorbate condenses in the
interparticle pores
CHARACTERIZATION METHODS
38
The most common sorption method is nitrogen sorption because of a suitable heat of
adsorption (5-25 kJ mol-1
) and a good access of nitrogen molecules (0354 nm) into
small pores An evacuated sample cooled with liquid nitrogen is loaded with gaseous
nitrogen Due to the low temperature the nitrogen is adsorbed on the sample surface
resulting in equilibrium between adsorbed film and gas phase at constant temperature
The isotherm shows the adsorbed amount of gas as a function of the pressure Different
models can describe the adsorption
BET-surface area
In contrast to the Langmuir model the method developed by Brunauer Emmet and
Teller[52]
allows the formation of multilayers For low partial pressures (p p0-1
lt 03) the
BET-equation can be transformed into a linear correlation
Cnp
p
Cn
C
p
pn
p
p
mm
11
10
0
0
n adsorbed gas quantity
nm monolayer adsorbed gas quantity
C BET-constant
p equilibrium pressure
p0 saturation pressure
CHARACTERIZATION METHODS
39
With this equation an adsorption isotherm can be plotted as a straight line with
n-1
[(p0 p-1
) minus 1]-1
on the y-axis and p p0-1
on the x-axis according to experimental results
This plot is called a BET plot The linear relationship of this equation is typically
maintained only in the range of 005 lt p p0-1
lt 03
With the required cross-section of an adsorbate molecule the monolayer adsorbed gas
quantity nm (mol g-1
) and the BET-constant C the specific surface area can be
calculated
Pore diameter
If gas molecules are introduced into a pore system their physical properties change
Capillary condensation into the curved surface can occur long before the saturation
vapor pressure is reached The Kelvin equation provides a thermodynamic correlation
between the relative pressure p p0-1
and the reduced radius (Kelvin radius) rk during
pore condensation
0
ln
2
p
pRT
Vr L
k
γ adsorbate surface tension
VL molar volume
CHARACTERIZATION METHODS
40
Fig 16 Adsorption and desorption in a pore
The reduced radius rk describes the curvature of the adsorbate film onto the surface and
is composed of pore radius r1 and the meniscus radius r2 in the filled pore (Fig 16)
21
112
rrrk
In adsorption r2 is infinite and thus rk is 2r1 In desorption r1 = r2 = rk For this reason
the desorption branch is commonly used for the determination of the pore diameter
BJH-Method
The pore radius can be determined with a method developed by Barrett Joyner and
Halenda (BJH) The radius of the cylindrical pore rp is composed of the Kelvin radius rk
and the thickness t of the adsorbed monolayer
trr Kp
CHARACTERIZATION METHODS
41
The thickness t has to be calculated using the density of the adsorbed liquid The
De Boer equation associates the thickness of the adsorbed layer with the relative
pressure in nitrogen sorption isotherms
0340log0
p
p
Kt
K Constant
The BJH-method as classical macroscopic concept based on the Kelvin equation is
linked to the pore condensation phenomena It is applicable for mesopore size analysis
but fails to correctly describe both the pore filling of micropores and of narrow
mesopores In contrast the Density Functional Theory (DFT) or methods of molecular
simulation such as Monte Carlo simulation or Molecular Dynamics provide a
microscopic model of adsorption based on a more realistic description of the
thermodynamic properties of the intra-pore fluid[53]
Other sorption measurements
Nitrogen sorption is a standard method for bulk materials Besides the common
adsorptives such as nitrogen argon or krypton it can be also interesting to investigate
the sorption properties of other gases like alkanes[54]
Especially when investigating
sorption properties of thin films other methods have to be used One possibility is the
sorption measurement using a quartz crystal microbalance
CHARACTERIZATION METHODS
42
Quartz Crystal Microbalance
In a quartz crystal microbalance (QCM) the changes in the resonance frequency of a
piezoelectric quartz crystal are correlated to mass changes deposited onto the crystal
surface Due to the high precision in frequency measurements it is possible to measure
very small mass changes For the correlation between mass and frequency changes the
Sauerbrey equation is used
mA
f
A
mff
qqqq
2
0
2
0 22
It gives the change Δf in the oscillation frequency of a piezoelectric quartz crystal as a
function of the mass Δm added to the crystal Here f0 is the resonant frequency of the
crystal A is the active area between the electrodes ρq is the density of quartz μq is the
shear modulus of quartz and υq is the shear wave velocity in quartz
The Sauerbrey equation was developed for oscillation in air and only applies to rigid
masses attached to the crystal for example thin films
For a certain quartz-crystal the material constants can be combined to a factor Cf and
thus the equation is reduced to
mCf f
For a 10 MHz quartz crystal (Fig 17) a loading of 1 ng per cm2 correlates with a
decrease in the resonant frequency by 0226 Hz
CHARACTERIZATION METHODS
43
Fig 17 10 MHz quartz crystal microbalance
Depositing porous films onto the QCM makes it possible to investigate the mass
changes associated with sorption and thus recording isotherms If the density of a
homogeneous coating is known one could also calculate the film thickness
An alternative investigation of the thickness and additionally of the optical properties of
thin films can be done by a versatile and powerful optical technique called ellipsometry
Ellipsometry
Ellipsometry measures the change of polarization of light upon the interaction with
matter The name stems from the fact that the reflected light will in general be
elliptically polarized Ellipsometry can yield information about layers that are thinner
than the wavelength of the probing light itself even down to a single atomic layer It
can probe the complex refractive index or dielectric function tensor which gives access
to fundamental physical parameters and is related to a variety of sample properties
including morphology crystal quality chemical composition or electrical conductivity
Ellipsometry is commonly used to characterize film thickness for single layers or
complex multilayer stacks ranging from a few tenths of a nanometer to several
micrometers
CHARACTERIZATION METHODS
44
Experimental setup
Electromagnetic radiation is emitted by a light source and linearly polarized before it
falls onto the sample After reflection the now elliptically polarized light passes a
second polarizer - the analyzer - and falls into the detector (Fig 18)
Fig 18 Schematic setup of an ellipsometry experiment
Ellipsometry measures two of the four Stokes parameters which are conventionally
denoted by Ψ and Δ The incident and the reflected beam span the plane of incidence
Light that is polarized parallel or perpendicular to the plane of incidence is called p or s
polarized respectively The amplitudes of the s and p components after reflection and
normalization to their initial values are denoted by rs and rp respectively (Fig 19)
CHARACTERIZATION METHODS
45
Fig 19 The quantities rs and rp in elliptically polarized light
The ratio of rs and rp is described by the fundamental equation of ellipsometry
i
s
pe
r
rtan
Thus tan Ψ is the amplitude ratio upon reflection and Δ is the phase shift (difference)
Since ellipsometry is measuring the ratio of two values it is very accurate and
reproducible relatively insensitive to scattering and fluctuations and requires no
standard sample or reference beam
Data analysis
Ellipsometry is an indirect method ie in general the measured Ψ and Δ cannot be
converted directly into the optical constants of the sample Normally a layer model
must be established which considers the optical constants (refractive index or dielectric
function tensor) and thickness parameters of all individual layers of the sample
including the correct layer sequence Using an iterative procedure (least-squares
CHARACTERIZATION METHODS
46
minimization) the unknown optical constants and thickness parameters are varied and
Ψ and Δ values are calculated using the Fresnel equations The calculated Ψ and Δ
values that match the experimental data best provide the optical constants and thickness
parameters of the sample In spectroscopic ellipsometry (SE) a broad-band light sources
is employed which covers a certain spectral range in the infrared visible or ultraviolet
region Thus the complex refractive index or the dielectric function tensor in the
corresponding spectral region can be obtained which gives access to a number of
fundamental physical properties
Ellipsometric porosimetry
Regarding porous transparent thin films ellipsometric porosimetry[55 56]
can be used to
describe the change of the optical properties that are associated with the sorption of
volatile species The method uses the Lorentz-Lorenz formula which is based on the
Clausius-Mossotti equation
032
1
A
rel
rel NM
It describes the relation between the macroscopic measurable relative dielectric constant
εrel and the electric polarizability α NA is the number of molecules in one mole
(Avogadro constant) and ε0 is the vacuum permittivity
CHARACTERIZATION METHODS
47
Mρ-1
is the molar volume Vm which can also be described as NAN-1
(N is the number
density of molecules)
N
NMV A
m
Thus the Clausius-Mossotti equation can be written as
032
1
N
rel
rel with vPN
03
Pv is the volume polarizability In a certain range of frequencies (visible and UV) the
Maxwell theory relates the refractive index of a substance with its relative dielectric
constant With εrel = n2 the Clausius-Mossotti equation can be converted into the
Lorentz-Lorenz function
vPn
n
2
12
2
The Lorentz-Lorenz equation is used for the characterization of porous substrates with
ellipsometric porosimetry The individual components act additive in the following
approximation
CHARACTERIZATION METHODS
48
A dense substrate with the refractive index nd
2
12
2
d
dvd
n
nP
An empty porous substrate with the refractive index ne (nair = 1 V = volume of open
pores)
2
11
2
11
2
1
2
12
2
2
2
2
2
2
2
d
d
d
d
air
air
e
eve
n
nV
n
nV
n
nV
n
nP
A filled porous substrate with the refractive index nf (nads = refr index of the adsorbate)
2
11
2
1
2
12
2
2
2
2
2
d
d
ads
ads
f
f
vfn
nV
n
nV
n
nP
When the refractive index of the filled and empty porous substrate is known one can
determine the porosity of the material without knowing the refractive index of the dense
material
2
1
2
1
2
12
2
2
2
2
2
ads
ads
e
e
f
f
vevfn
nV
n
n
n
nPP
Therefore the volume V of the open pores can be determined as follows
2
1
2
1
2
12
2
2
2
2
2
ads
ads
e
e
f
f
n
n
n
n
n
nV
CHARACTERIZATION METHODS
49
Light Scattering
Mie Scattering
For the description of the scattering ability of particles similar to or larger than the
wavelength of light the Mie theory or discrete dipole approximation can be used The
Mie solution also called Mie theory is a complete analytical solution of Maxwells
equations for the scattering of electromagnetic radiation by spherical particles In
contrast to Rayleigh scattering the Mie solution to the scattering problem is valid for all
possible ratios of diameter to wavelength although the technique results in numerical
summation of infinite sums Although scattering of light by a homogeneous sphere may
seem to be a simple process the Mie solution is very complex and not easy to
understand In its original formulation it assumed a homogeneous isotropic and
optically linear material irradiated by an infinitely extending plane wave Currently the
term ldquoMie solutionrdquo is also used in broader contexts for example when discussing
solutions of Maxwells equations for scattering by stratified spheres or by infinite
cylinders If particles are much smaller than the wavelength of the incoming light their
scattering ability can be described according to Rayleigh
Rayleigh Scattering
Rayleigh scattering describes the scattering of light or other electromagnetic radiation
by particles much smaller than the wavelength of the light It occurs when light travels
in transparent solids and liquids but is most prominently seen in gases The amount of
CHARACTERIZATION METHODS
50
Rayleigh scattering that occurs to a beam of light is dependent upon the size of the
particles and the wavelength of the light
The intensity of light scattered by a single small particle from a beam of unpolarized
light of wavelength λ and intensity I0 is given by
62
2
24
2
2
022
12
2
cos1
d
n
n
RII
Here R is the distance to the scattering particle θ is the scattering angle n is the
refractive index of the particle and d is the diameter of the particle In simple terms the
scattering coefficient - the intensity of scattered light - on small particles can be
described with the following dependencies
4
1~
I and 6~ rI
The wavelength dependence of the scattering means that blue light is scattered much
more than red light In the atmosphere this results in blue light being scattered to a
greater extent than red light and so one sees blue light coming from all regions of the
sky As a rule of thumb due to the strong dependence on the particle size a colloidal
suspension is expected to become transparent when the particle size is decreased below
110 of the wavelength of the incoming light Thus a potential transparent colloidal
dispersion ideally contains nanoparticles smaller than about 40 nm in diameter
CHARACTERIZATION METHODS
51
Dynamic Light Scattering in Colloidal Suspensions
Dynamic light scattering (DLS) also known as quasi elastic laser light scattering is a
powerful technique in physics which can be used to determine the size distribution
profile of small particles dispersed in a liquid phase When light hits small particles it is
scattered in all directions If the light source is a laser and thus is monochromatic and
coherent then one observes a time-dependent fluctuation in the scattering intensity
These fluctuations are due to the fact that the small particles in suspensions are
undergoing Brownian motion and thus the distance between the scattering centers in the
solution is constantly changing The scattered light interferes either constructively or
destructively These intensity fluctuations contain information about the time scale of
the particle movement The smaller the particles are the faster they diffuse and thus the
faster the intensity changes These fluctuations are correlated across microsecond time
scales by an autocorrelation function ie a function that describes how a given
measurement relates to itself in a time-dependent manner The second order
autocorrelation curve (gII) can be directly derived from the intensity trace
2)(
)()()(
tI
tItIqg II
q wave vector
τ delay time
I intensity
CHARACTERIZATION METHODS
52
At short time delays the correlation is high because the particles do not have a chance
to move to a great extent from the initial state that they were in As the time delays
become longer the correlation starts to exponentially decay to zero meaning that after a
long time period there is no correlation between the scattered intensity of the initial and
final states This exponential decay is related to the diffusion coefficient To fit the
autocorrelation function numerical methods are used If the sample is monodisperse
then the decay is simply a single exponential The Siegert equation relates the second
order autocorrelation function (gII) with the first order autocorrelation function (g
I) as
follows
2)(1)( qgqg III
β correcting factor
Once the autocorrelation data have been generated different mathematical approaches
can be employed to determine the z-averaged translational diffusion coefficient (D) In
case of a monodisperse sample a single exponential function is obtained for the decay
of the autocorrelation function where Γ is the decay rate
)exp()( qg I with 2Dq and
2sin
4 0
nq
λ is the incident laser wavelength n0 is the refractive index of the sample and θ is angle
at which the detector is located with respect to the sample cell The Stokes-Einstein
CHARACTERIZATION METHODS
53
equation describes the dependency of the diffusion coefficient D on the radius r of a
spherical particle in a liquid phase with the viscosity η at a certain temperature T
r
kTD
6
Electron Microscopy
As the maximum resolution of light microscopes is determined by the wavelength of the
photons that are being used to probe the sample imaging of nanoparticles becomes
difficult Like all matter electrons have both wave and particle properties (as proposed
by de Broglie) and their wave-like properties mean that a beam of electrons can be
focused by electrical and magnetic fields onto the sample As the wavelength is
dependent on their energy it can be tuned by adjustment of accelerating fields resulting
in a much smaller wavelength than that of light The wavelength of electrons
accelerated by 200 kV is only 251 pm but the theoretical resolution is limited to about
01 nm because of the aberration in todayrsquos electron lenses
In transmission electron microscopy (TEM) the beam of electrons is transmitted
through a specimen Then an image is formed magnified and directed to appear either
on a fluorescent screen a layer of photographic film or a CCD camera
With a Scanning Electron Microscope (SEM) it is possible to produce high-resolution
images of a sample surface with a characteristic three-dimensional appearance In a
typical SEM the emitted electrons are focused into a very fine focal spot sized 1 nm to
CHARACTERIZATION METHODS
54
5 nm The beam passes through pairs of scanning coils in the objective lens which
deflect the beam horizontally and vertically so that it scans in a raster fashion over a
rectangular area of the sample surface When the primary electron beam interacts with
the sample the electrons lose energy by repeated scattering and absorption The energy
exchange between the electron beam and sample results in the emission of electrons and
electromagnetic radiation which can be detected to produce an image
Thermogravimetric Analysis
Thermogravimetric Analysis (TGA) determines the changes in weight in relation to
changes in temperature by raising the temperature gradually and plotting weight against
temperature The weight loss curve may require transformation before results can be
interpreted The first derivative of the weight loss curve is used to find the points at
which weight-loss is most rapid TGA is commonly employed to determine
characteristics of materials such as degradation temperatures absorbed moisture the
proportions of inorganic and organic components in materials and solvent residues
Additionally Differential Scanning Calorimetry (DSC) provides data on
thermodynamic effects by measuring the time-dependent heat flow between the sample
and a reference
CHARACTERIZATION METHODS
55
Powder X-ray Diffraction
Powder XRD uses x-ray diffraction on powder or microcrystalline samples for the
structural characterization of materials It is based on the elastic scattering of
electromagnetic waves on lattice planes or more precisely at the electronic shells of
regularly arranged atoms Ideally every possible crystalline orientation is represented
equally in a powdered sample The Bragg equation is a simple method to determine the
distance d of lattice planes To derive the Bragg equation one considers the lattice
planes of a crystal as semitransparent mirrors partly reflecting an incoming beam (Fig
20)
Fig 20 Sketch to construct the Bragg equation
CHARACTERIZATION METHODS
56
For a monochromatic beam the reflected rays interfere constructively or destructively
depending on the angle of incidence θ and the lattice diameter d Two reflected
monochromatic beams interfere if the path difference is an integer multiple of the
wavelength λ This results in the Bragg equation for constructive interference
sin2dn with n = 1 2 3 hellip
When the scattered radiation is collected on a flat plate detector the averaging due to
random orientations of the particles leads to smooth diffraction rings around the beam
axis rather than the discrete Laue spots as observed for single crystal diffraction The
angle between the beam axis and the ring is called the scattering angle and in x-ray
crystallography denoted as 2θ
Solid-State NMR
A nuclear spin can interact with a magnetic or electric field Spatial proximity or a
chemical bond between two atoms can give rise to interactions In general these
interactions are orientation dependent In media with no or little mobility (eg crystal
powders large membrane vesicles molecular aggregates) anisotropic interactions have
a substantial influence on the behavior of a system of nuclear spins In contrast in a
classical solution-state NMR experiment Brownian motion leads to an averaging of
anisotropic interactions In such cases these interactions can be neglected on the time-
scale of the NMR experiment Examples of anisotropic nuclear interactions commonly
found in solid-state NMR are the chemical shift anisotropy and the internuclear dipolar
CHARACTERIZATION METHODS
57
coupling Anisotropic interactions modify the nuclear spin energy levels (and hence the
resonance frequency) of all sites in a molecule and often contribute to a line-broadening
effect in NMR spectra High-resolution conditions in solids can be established using
magic angle spinning (MAS) which facilitates averaging of interactions in real space
In 29
Si MAS NMR of functionalized silica samples typically five peaks can be
observed Qn-peaks are related to Si-atoms linked to two three or four other Si-atoms
by an oxygen bridge and to hydroxyl groups Tn-peaks derive from Si-atoms carrying
one organic moiety
[Q4] Si(OSi)4
[Q3] Si(OSi)3(OH) [T
3] RSi(OSi)3
[Q2] Si(OSi)2(OH)2 [T
2] RSi(OSi)2(OH)
The chemical shift of the T-peaks depends on the nature of the Si-C bond Thus
different functional groups can be distinguished Depending on the area of these peaks
one can make statements about the linkage in the solid state
IR and Raman Spectroscopy
FT-IR and FT-Raman spectroscopy are methods to investigate the vibrational modes of
a sample by absorption or scattering of radiation respectively Both techniques are
appropriate for the identification of specific functional groups especially in organic
moieties In inorganic solids hydroxyl groups or characteristic Raman active centers
CHARACTERIZATION METHODS
58
can be detected If a chemical group changes its dipole moment during vibration it can
be detectable in infrared spectroscopy The moieties of a molecule (for instance a
methyl group) can be identified by their specific absorption bands in the infrared
spectrum In Raman spectroscopy energy transfer from incident coherent laser light
induces vibrations of molecules and the scattered light from the sample is analyzed
The energy for exciting the molecular vibrations is taken from the photon energy
(Stokes frequencies) or the energy of the vibrations is transmitted to the photons (Anti-
Stokes frequencies) respectively During vibration the polarizability of the molecule
has to change in order to observe Raman-active modes
RESULTS AND DISCUSSION
59
4 RESULTS AND DISCUSSION
RESULTS AND DISCUSSION 41
60
41 High Silica Zeolite Beta
From Stable Colloidal Suspensions to
Thin Films
RESULTS AND DISCUSSION 41
61
Introduction
Zeolites and zeolite-like materials with their uniform pore sizes unique structural
topology and composition well defined acidity and good thermal stability are viable
commercial catalysts selective ion exchangers and absorbers Although many different
crystalline molecular sieves are already known there is a continuing need for zeolites
with new properties and a continuing search for new zeolite applications More recent
efforts have focused on exploring the possibilities of synthesizing zeolites in the
nanosized range by application of highly supersaturated precursor solutions[45 57]
By
using organic additives during the synthesis procedure colloidal solutions were formed
and used for the preparation of different nanosized molecular sieves[58-64]
Several
microporous materials including MFI LTA FAU BEA and LTL in the form of stable
colloidal suspensions with narrow particle size distribution (100 nm) are described in
the literature Intriguingly among the nanosized zeolites the pure silica forms were only
reported for the MFI MEL and BEA structure types[65-67]
BEA is a large-pore microporous material characterized by three sets of mutually
perpendicular channels with 12-membered ring apertures which can be prepared from
classical aluminosilicate gels with a wide range of SiAl ratios[68]
The main features of
this structure make the material suitable for numerous applications such as
heterogeneous catalysis sensors membranes etc[67 69-71]
The number of acid sites and
the hydrophobicity of the microporous materials can be tuned by controlling the SiAl
ratios in the final crystallites
RESULTS AND DISCUSSION 41
62
One important application of purely siliceous microporous zeolites exhibiting a high
degree of hydrophobicity and a high micropore volume is in the field of nanoscale
layers with low dielectric constant (low-k) for microelectronic applications as well as
for the preparation of hard coatings with unique properties[72 73]
Pure silica zeolite BEA
was synthesized by Corma and co-workers using tetraethylammonium hydroxide
(TEAOH) as a template and fluoride ions at near neutral pH[74]
In addition BEA
crystals were recently prepared via a solidndashsolid transformation method[69 75]
and the
synthesis of colloidal siliceous BEA from highly templated precursor solutions was
reported[76]
One of the focused applications of the pure silica BEA type molecular sieve
is in the preparation of highly porous and hydrophobic layers which can exhibit
variable optical and electronic properties depending on the method of preparation
Several strategies have been applied for the formation of microporous films and
recently a very effective method was established for deposition of ultrathin pure
siliceous MFI type films on two-dimensional supports via spin-coating of stable
colloidal suspensions[65]
Due to their unique properties particles at the nanometer scale
are of great interest in a number of advanced applications Homogeneously dispersed in
a solvent these colloidal suspensions show similarities to real solutions which make
them suitable for the preparation of thin homogeneous and transparent films by spin-
coating As a result of their crystallinity the coatings have high mechanical stability and
resistance to many solvents Additionally decreasing the crystal size of particles below
100 nm produces substantial changes in the physicochemical properties of the zeolite
RESULTS AND DISCUSSION 41
63
particularly in the external surface of the crystals as well as the ability of such
nanocrystals to pack closely in the film during spin-coating[77]
The aim of this paper is to describe a complete route for the synthesis of zeolite Beta
from templated precursor solutions with emphasis on the crystallization kinetics
stabilization of the nanosized crystallites in coating suspensions and the assembly in
thin films exhibiting variable physicochemical properties
Experimental
Synthesis of nanosized zeolite Beta
The composition of the precursor solution used for synthesis of nanosized zeolite Beta
crystals was 25 SiO2 1 Al2O3 15 TEAOH 375 H2O The initial compounds were
mixed in one pot until a clear solution was obtained Cab-o-sil M5 (Riedel-DeHaumlen) as
silica source aluminum sec-butoxide (Aldrich) as aluminum source
tetraethylammonium hydroxide (TEAOH 35 wt Aldrich) as organic template and
deionized water were used The hydrothermal (HT) treatment of the precursor mixtures
was performed in an oven at 140 degC under static conditions using steel autoclaves with
18 ml Teflon liners Every 24 hours one autoclave was taken out and the product was
purified by a series of centrifugation steps (1 h at 47800 g RCF) and subsequently
redispersed in water under sonication (1 h in ice) till the pH of the solution reached 10
A part of the final crystalline zeolite Beta was dealuminated according to the procedure
described in Ref[78]
The SiAl ratio of the as-synthesized and dealuminated zeolite Beta
was 32 and 100 respectively
RESULTS AND DISCUSSION 41
64
Stabilization of Beta nanoparticles in coating suspensions
The as-prepared and dealuminated zeolite Beta nanoparticles were treated with an
aqueous solution of diluted ammonium chloride and then washed with ethanol two
times in order to prepare stable zeolite suspensions and to prevent fast agglomeration
After washing and redispersion the colloidal suspensions were centrifuged at 12000 g
(RCF) for 5 min and the sediment was separated by decanting in order to eliminate the
larger agglomerates formed during the purification process The final solid
concentration of zeolite Beta nanoparticles was adjusted to 4 wt in ethanolic
suspension and further applied for the preparation of thin films
Three types of binders were used to improve the mechanical stability of the porous
films (1) aqueous colloidal silica suspension Nalco 2326 (SiO2 ~15 wt particle size
~ 5 nm) was diluted with ethanol to reach a concentration of 2 wt (2) pre-hydrolyzed
tetraethylorthosilicate (TEOS) in a mixture of ethanol water and HCl in the ratio of 1
TEOS 006 HCl 27 H2O 60 EtOH and (3) pre-hydrolyzed TEOS with
cetyltrimethylammonium bromide (CTAB) in the following ratio 1 TEOS 01 CTAB
006 HCl 27 H2O 60 EtOH The size of the amorphous silica particles formed in
TEOS-based binders (solutions 2 and 3) was kept constant eg about 2 nm in diameter
determined from dynamic light scattering (DLS) measurements The silica nanoparticles
in the binding solutions 2 and 3 were stable for about 10 days while afterwards a slight
increase in size was measured
RESULTS AND DISCUSSION 41
65
Deposition of thin Beta films on silicon wafers
The ethanolic zeolite suspension was either used directly for the film deposition or it
was mixed with the same volume of one of the three binders prior to spin-coating No
additional functionalization of the zeolite nanoparticles was carried out In order to
ensure the preparation of smooth and homogeneous films the coating suspensions were
filtrated through syringe filters (450 nm) prior to spinning
The nanoporous films were deposited on polished silicon wafers by spin-coating
(Laurell WS-400B-6NPP-Lite-AS) with a rate of 3000 rpm (acceleration 5000 rpm s-1
)
for 30 s All substrates were pre-cleaned with ethanol and acetone for 10 s under
spinning at 3000 rpm In order to prepare thick Beta films the spin-coating procedure
was repeated up to 6 times After each coating step the films were calcined at 450 degC
for about 30 min
From the numerous films prepared with different thickness the following will be
discussed in detail pure Beta film free of binder (Beta-pure) Beta crystals stabilized
with prehydrolyzed TEOS (Beta-TEOS) and Beta crystals stabilized with amorphous
silica (Beta-SiO2) (see Table 1) No significant differences were observed between the
samples prepared with the two types of TEOS binders (solutions 2 and 3) and therefore
only binder 2 will be discussed
RESULTS AND DISCUSSION 41
66
Table 1 Zeolite Beta films deposited on silicon wafers
Characterization
The degree of crystallinity of the zeolite materials was determined based on X-ray
diffraction patterns collected from purified powders with a STOE Stadi P diffractometer
using monochromatic Cu-Kα-radiation in transmission geometry Additionally the
degree of crystallinity size and morphology of the zeolite particles was proven by
collecting transmission electron micrographs (TEM) on a JEOL JEM 2011 instrument
with LaB6 cathode at 200 kV Samples were prepared on Plano holey carbon coated
copper grids by evaporating one droplet of the purified zeolite suspensions diluted with
water in the ratio of 1 100 Besides the evaluation of the particle size in the
suspensions was determined by DLS The DLS data were collected with an ALV-
NIBSHPPS High Performance Particle Sizer in PMMA cuvettes at 25degC under
continuous scans and analyzed according to the cumulant and distribution function
analysis (DFA) The polydispersity index (PDI) calculated for all samples was used as
an indication for a multi-modal particle size distribution The powder Beta samples
film binder deposition steps thickness
refractive
index
porosity
( void)
Beta-pure no 3 475 nm 110 77
Beta-TEOS TEOS 3 and 6 440 and 680 nm 113 70
Beta-SiO2 SiO2 1 and 6 185 and 950 nm 115 70
RESULTS AND DISCUSSION 41
67
were subjected to thermogravimetric analysis (TGA) after purification and freeze
drying The powders were heated in corundum crucibles from 30 to 900 degC (10 degCmin)
in a flow of synthetic air (25 mlmin) using a Netzsch STA 449 C Jupiter
thermobalance The amount of organic template and water in the framework type Beta
zeolite was determined in the samples prepared from 1 to 10 days of HT treatment The
surface features of the nanoparticles deposited in thin films were investigated with
scanning electron microscopy (Philips 40 XL) and ellipsometry The ellipsometric
measurements were performed on a Woollam M2000D at different angles (65deg 70deg and
75deg) in the entire spectral range of 190-1000 nm The data were fitted in the range
between 250-1000 nm using the Cauchy model for layered materials or using the EMA
layer (Bruggeman effective medium approximation) of SiO2 and introducing additional
voids[79]
Results and Discussion
Suspensions of Beta nanoparticles kinetic study and stabilization
In order to follow the crystallization kinetics of nanosized zeolite Beta the initial
solution with an SiAl ratio of 25 ratio was heated under hydrothermal conditions and
the crystallization process was interrupted at various times the solid phases extracted at
the different stages of crystallization were subjected to comprehensive characterization
The change in the solid products was followed with X-ray diffraction DLS TEM and
TGA The XRD patterns depicted in Fig 21 show that the amorphous precursor
RESULTS AND DISCUSSION 41
68
solutions transformed into crystalline zeolite Beta particles after 7 days and the
prolonged hydrothermal treatment did not change the degree of crystallinity
5 10 15 20 25 30 35 40 45
4 days
7 days
6 days
5 days
9 days
8 days
10 days
2 [degrees]
Fig 21 XRD pattern of the Beta samples synthesized under hydrothermal conditions
The first Bragg reflection at 62 2 occurs with a very low intensity in the sample after
heating for five days The low intensity of the Bragg reflection is possibly due to the
very small crystalline particles (lt 5 nm) that are present in the solid samples extracted
RESULTS AND DISCUSSION 41
69
from the reacting solutions or to the low amount of crystalline particles in comparison
to the amorphous matter It is important to note that the width of the Bragg reflections
did not change significantly which proves that no substantial change in the final
particle sizes occurred during the prolonged heating of the reaction systems (see
samples crystallized for 6 and 10 days)
The generation of amorphous and crystalline particles in the precursor solutions was
measured by DLS (see Fig 22)
1 10 100 1000 10000
1 day 5 days 7 days 10 days
inte
nsity
diameter [nm]
Fig 22 DLS data of purified suspensions hydrothermally treated from 1 and 10 days
It is important to note that the clear precursor solutions turned into dense transparent
gels after 24 h aging and kept the same texture even after hydrothermal treatment up to
six days A fluid translucent suspension is obtained after seven days of heating The
DLS curves of the samples treated for 1 and 2 days show a very broad particle size
distribution even after substantial dilution with water (PDI gt 05 the curves are not
shown here) This confirms the presence of unstable amorphous nanoparticles in the
RESULTS AND DISCUSSION 41
70
suspensions and the continuous dynamics of agglomeration and disintegration in the
reacting aluminosilicate species in the crystallizing system After three days of heating
two generations of particles one with an average hydrodynamic diameter of about 20-
60 nm and another of about 80 - 200 nm are detected in the precursor mixture It is also
observed that with increasing crystallization time only the width of the particle size
distribution curves is diminishing while the mean size does not change significantly
This observation can be explained with the higher stability of the growing particles in
the samples crystallized from 3 to 6 days However the colloidal zeolites tend to
agglomerate and at the same time disintegrate under purification of the reacting mixture
and redispersion in water or ethanol under sonication In the suspensions with a pH
lower than 8 and solid concentration above 6 wt a significant increase in the particle
diameter is observed Based on the DLS data one can conclude that the aggregates are
formed in the crystalline and intermediate suspensions and they are measured instead of
the individual particle grains This statement is proven by the TEM study where it can
be seen that the nanoparticles tend to agglomerate and do not exist as separated crystals
(Fig 23)
RESULTS AND DISCUSSION 41
71
Fig 23 TEM images of nanoparticles extracted from suspensions after a hydrothermal
treatment between 3 and 10 days
RESULTS AND DISCUSSION 41
72
The aggregation process is also accelerated with prolonging the time of hydrothermal
treatment (8 days) and the mean size of the zeolite domains in the particles is increased
from 20 up to 40 nm according to the TEM data At a very early time of HT treatment
any separation of the crystalline from the amorphous particles was not possible
Crystalline fringes representing the Beta crystalline phase in the mostly spherical
amorphous particles can be seen in the samples treated for 5 and 6 days The crystalline
particles have the same size and shape as the amorphous ones In many cases a good
alignment between several crystalline fringes in the particles is observed This process
is accelerated at the end of the hydrothermal treatment According to the TEM
micrographs particles with size in the range 8 - 15 nm were present during the entire
process of crystallization However after 5 days some of the particles contain
crystalline fringes and some of them appear amorphous After 6 days the fraction of
crystalline particles is increased while the number of amorphous particles is decreased
which is confirmed by both the XRD and DLS data (see Fig 21 and Fig 22) The
sample heated for 7 days contains fully crystalline nanoparticles which appear more
disintegrated in comparison to the ones heated for 10 days A slight increase in the size
of the individual particles and additional agglomeration is observed in the sample
heated for 10 days due to the longer crystallization time
The transformation of the amorphous aluminosilicate species into crystalline zeolite
Beta was also followed by TG analysis The amount of organic template and water is
changing depending on the degree of the samplesrsquo crystallinity As can be seen from
RESULTS AND DISCUSSION 41
73
Fig 24 the weight loss due to desorption of water and combustion of TEAOH is
decreased with increasing degree of crystallinity of the samples
100 200 300 400 500 600 700 800 900
75
80
85
90
95
100
1 day
5 days
7 days
10 days
we
igh
t [
]
temperature [degC]
Fig 24 TG data of the solid samples recovered from precursor solutions subjected to
hydrothermal treatment from 1 to 10 days
The samples heated for 7 and 10 days have almost the same amount of template and an
almost negligible amount of water which is expected for highly siliceous molecular
sieves In contrast in the partially crystalline sample (5 days HT treatment) the amount
of water and TEAOH is higher than in the crystalline Beta This can be explained with
an extra amount of template adsorbed on the surface and in the mesoporous
aluminosilicate amorphous grains Thus the weight loss of the washed and dried
products is decreased in the crystalline samples and the combustion of the template is
shifted to higher temperatures This is due to the different location of the template in the
amorphous or crystalline matrix ie the TEA+ cations are encapsulated in the zeolite
channels instead of the surface or in the mesopores In conclusion the amount of water
RESULTS AND DISCUSSION 41
74
and template encapsulated in the material is decreased while the temperature of
decomposition is increased with higher crystallinity
Beta nanocrystals stabilized in coating suspensions and films
The interfacial chemistry between the binders and the zeolite particles was studied
Dynamic light scattering measurements were performed in pure zeolite suspensions as
well as in binder-containing coating suspensions in order to study the stability prior to
film deposition The Beta crystals used for preparation of thin films were obtained
according to the procedure described above (140 ordmC 10 days) after dealumination The
XRD pattern from the solid sample synthesized in a larger amount (500 ml solid
concentration of 6 wt ) shows the presence of pure BEA-type zeolite (Fig 25)
5 10 15 20 25 30 35 40 45
sample sim BEA
Inte
nsity
2 [degree]
Fig 25 XRD patterns of pure zeolite Beta nanocrystals from the coating suspension
used for preparation of thin films in comparison with the simulated pattern
RESULTS AND DISCUSSION 41
75
The dynamic light scattering results of the same Beta-pure suspension reveals particles
with a hydrodynamic diameter in the range of 20 - 80 nm (Fig 26) which are attributed
to the zeolite Beta in the form of single crystals and probably as agglomerates in a
comparable amount This conclusion is based on the different presentations of the
scattering intensity (mass-weighted and unweighted) As can be seen the ratio between
the two classes of particles with size of 20 nm and 80 nm is increased substantially
when the scattering is expressed as mass-weighted It is known that this method better
represents the real picture (TEM investigations) in a suspension containing particles
with the same density crystallinity and chemical composition The particle size
distribution of this coating mixture does not change with time (at least one week) this
confirms its colloidal stability at ambient temperature (see Fig 26 left image)
1 10 100 1000 10000
mass-weighted unweighted
inte
nsity
diameter [nm]
Fig 26 DLS curves of zeolite coating suspension Beta-pure expressed as mass-
weighted and unweighted particle size distribution (a) and picture representing the
coating Beta-pure (right) and Beta-TEOS suspension (left)
RESULTS AND DISCUSSION 41
76
This coating suspension was mixed with the three binders and remained stable with no
sedimentation during one week at ambient conditions All suspensions with the three
binders appear transparent with minor scattering similar to the ones shown in Fig 26
The thin Beta films prepared with the above suspensions appear homogeneous and
transparent to the eye The thickness of the films is increased by several deposition steps
of the coating suspensions resulting also in a change of the defined interference color of
the films (Fig 27)
Fig 27 Picture of silicon wafers with Beta-TEOS films prepared by one step (l) two
step (m) and three step deposition (r)
SEM investigations of the Beta-pure Beta-TEOS and Beta-SiO2 were performed in
order to investigate the thickness of the layers their surface morphology and
homogeneity In general the films prepared with binder exhibit a smooth surface and do
not show big differences (Fig 28)
RESULTS AND DISCUSSION 41
77
Fig 28 SEM pictures of films deposited on silicon wafers based on zeolite Beta
without binder (Beta-pure left) and with binder (Beta-SiO2 right) at different
magnifications
RESULTS AND DISCUSSION 41
78
Homogeneous and continuous films at a centimeter scale were obtained by one- to six-
step spin-coatings and the homogeneity of the deposited layer is preserved by the close
packing of the Beta nanocrystals surrounded by the binding agents The individual
crystallites in the films prepared from Beta-SiO2 and Beta-TEOS suspensions are more
closely packed in comparison with pure Beta suspensions Besides the Beta-pure film
has lower adhesion in comparison to the films with added binder An increased surface
roughness of the multilayered films is observed in all films This can be explained by
the higher surface roughness of the intermediate porous layers in comparison to the bare
Si-wafer which is propagated and amplified with each coating step The smoothness of
the films could be improved by the application of smaller particles However small
particles tend to agglomerate faster than the bigger ones and therefore the stabilization
of zeolite grains with a size less then 10 nm could be a great challenge (provided they
could be made) Another possibility is to use an additional top layer of binder to fill all
gaps between the crystalline particles deposited in Beta-pure films However this will
influence the surface chemistry and more specifically the hydrophilicity of the entire
film which will increase whereas the porosity will decrease
Introducing porosity into a thin film strongly influences the optical properties compared
to a dense film of the same material The refractive index decreases with an increasing
proportion of voids in the material (see Bruggemann effective medium approximation
EMA) For ellipsometric data analysis the theoretical model was based on the
assumption that the film consists of nanoparticles and a certain fraction of void The
model layer system was designed as follows 0 the silicon substrate is infinitely thick (1
RESULTS AND DISCUSSION 41
79
mm) 1 a typical layer of 2 nm thermal oxide (SiO2) is presumed 2 the porous film is
described with a Cauchy layer Starting with a guessed film thickness the subsequent
fitting of the thickness and the Cauchy parameters resulted in a very good overlap with
the experimental data as shown in Fig 29
200 300 400 500 600 700 800 900 1000
0
10
20
30
40
50
Model Fit Exp 65iexcl Exp 70iexcl Exp 75iexcl
in d
egre
es
wavelength [nm]
200 300 400 500 600 700 800 900 10001125
1130
1135
1140
1145
1150
refr
active index
wavelength [nm]
Fig 29 Ellipsometry data of Beta-TEOS film after 6 coating steps
The determined thicknesses of the films reflect the values detected with SEM Based on
the ellipsometric data the refractive index (n) of the films prepared with and without
binders was determined The n-values at 589 nm were used for comparison of the films
All films showed a very low refractive index which is typical for porous silica films
Fig 29 shows the data of a film composed of microporous particles and a binder (Beta-
TEOS) prepared by spin-coating 6 times Although the film appears dense to the eye a
refractive index of only 1133 (589 nm) was found for this sample Equal results
concerning thickness and refractive index were achieved by replacing the Cauchy layer
with an EMA layer consisting of SiO2 and void The total porosity was found to be
70 in this case
RESULTS AND DISCUSSION 41
80
The mechanical properties of all films were investigated by tape tests In all films
except Beta-pure the mechanical stability was very high and the film could not be
removed from the silicon wafer with the tape The highest adhesion was diagnosed in
films prepared with amorphous SiO2 binder The efficiency of the binders mainly
depends on the size of the binding particles Small particles of SiO2 with a high external
surface are able to form many bonds (Si-O-Si) with the zeolite crystals and with the
thermal SiO2 on the silicon wafer
Conclusion
Colloidal suspensions of zeolite Beta nanocrystals with low aluminum content were
prepared and the crystallization kinetics were studied The crystallization process was
completed within seven days and the size and the shape of the first crystalline particles
detected in the crystallizing suspensions resemble the ones in the amorphous
suspensions Upon prolonged crystallization an agglomeration in the crystallizing
suspensions is observed however the size of the crystalline zeolite Beta particles did
not exceed 80 nm The crystalline Beta was stabilized in colloidal suspensions by
addition of inorganic silica-based binders and applied for the preparation of films by a
spin-on process The thickness of the films varied from 140 to 950 nm controlled by
repeating the number of coating steps speed of deposition and Beta concentration of the
coating suspensions The Beta films exhibit good mechanical properties smooth
surfaces and show a low refractive index which is typical for highly porous silica based
materials The refractive index of the films prepared with binders is increased slightly
RESULTS AND DISCUSSION 41
81
due to additional amorphous silica introduced in the film which is leading to the
formation of denser layers The spin-coating approach presented here allows for the
preparation of films with variable hydrophilicity thickness and mechanical stability on
supports with different shapes and size
RESULTS AND DISCUSSION 42
82
42 Synthesis and Characterization of
Functionalized Mesoporous Silica
Nanoparticles
RESULTS AND DISCUSSION 42
83
Introduction
Various synthetic methods have been developed for the preparation of periodic
mesoporous materials[80]
leading to different types of morphologies such as spheres[81]
fibers[82]
or vesicles[83]
The large internal surface of these materials can be modified
following two main strategies ie post-synthesis functionalization (grafting)[84 85]
or
in-situ functionalization (co-condensation)[22-24]
thus extending the use of mesoporous
materials to a wide range of applications[86]
Compared to the modification by grafting
the co-condensation reaction can be expected to improve the degree of bonding between
the organic groups and the pore walls and to result in a more homogeneous distribution
of the organic groups throughout the pore structure[27]
Common synthesis routes for mesoporous silica materials lead to particles with typical
diameters of 500 nm to several microns The synthesis of nanosized mesoporous
materials has only recently received attention Such mesoporous nanoparticles offer
interesting features that are useful in a number of applications such as chemical
sensors[87]
chromatography[88]
catalysis[89]
drug delivery[90]
or polymer fillers[91]
If
the particles are homogeneously dispersed in a solvent these colloidal suspensions
exhibit unique properties for example optical transparency Furthermore the utilization
of very small particles improves the mass transfer of molecules into or out of the pore
system The molecular functionalization of the large internal surface of these materials
can extend the range of possible applications for example towards selective
(ad)sorption or specific catalytic activity
RESULTS AND DISCUSSION 42
84
The preparation of nanosized particles can be realized through various methods Brinker
et al described an aerosol-based process resulting in a solid dry product[92]
Another
strategy utilizes the addition of a non-ionic surfactant as a suppressant of particle
growth through encapsulation leading to a gel of agglomerated small particles[93]
Amoros et al[94]
presented a facile method leading to nanosized mesoporous silica using
water tetraethylorthosilicate (TEOS) and cetyltrimethylammonium cations in
combination with triethanolamine (TEAH) which is supposed to act as a hydrolysis-
retarding agent However the final product of this procedure is a gel of fused particles
which cannot be redispersed
There are only few publications describing synthesis methods that lead to colloidal
suspensions of periodic mesoporous materials[95-99]
Their synthesis typically relies on
procedures applying high dilutions this can result in time-consuming subsequent
processing steps For instance truly colloidal suspensions of well-defined mesoporous
particles were obtained by Mann et al[18 100]
by diluting and quenching the
condensation reaction of TEOS in aqueous alkaline solution with a large excess of
water They could manipulate the particle size by varying the time interval for
quenching In a recent publication Rathousky et al[96]
also describe a method for the
preparation of colloidal MCM-41 working with even higher dilutions The utilization of
the polyalcohol triethanolamine can result in non-aggregated colloidal suspensions of
mesoporous silica (CMS) from concentrated solutions[98]
Round particles with
wormhole structures and diameters of about 100 nm with very narrow particle size
distributions were obtained in the form of stable suspensions Tuning the reaction
RESULTS AND DISCUSSION 42
85
conditions allowed controlling particle size down to 50 nm Colloidal stability was even
sustained after template extraction which resulted in surface areas of about 1000 m2 g
-1
Extraction of the template ndash in contrast to calcination ndash is the method of choice when
organic moieties are introduced in the wall structure by a co-condensation procedure
The method can be extended towards the generation of functionalized hydrophilic as
well as hydrophobic colloidal mesoporous silica with high yields As described in the
following various alkoxysilanes bearing organic moieties can be incorporated into the
pores of the colloidal nanoparticles using this general method
Experimental
Two slightly different synthesis methods were used as already described in our recent
publication about the synthesis of nanosized pure mesoporous silicates[98]
and adapted
for functionalization with organic moieties All chemicals were reagent grade (98 or
higher) purchased from Sigma-Aldrich and used without further purification The water
was deionized
Pure siliceous CMS-1 143 g (96 mmol) TEAH and 2 ml (9 mmol) TEOS were
combined in a 125 ml polypropylene bottle with a lid The two-phase mixture was
heated in an oil bath at 90 degC for 20 min without stirring Immediately after taking the
mixture out of the oil bath 267 g of an aqueous solution (25 wt ) of CTAC which
had been heated to 60 degC was added and the final mixture was stirred (600 rpm) for at
least 3 h at 23 degC The molar composition of CMS-1 is 075 Si 8 TEAH 017 CTAC
120 H2O
RESULTS AND DISCUSSION 42
86
Functionalized mesoporous silica CMS-R 143 g (96 mmol) TEAH and a mixture of
223 ml (10 mmol) TEOS plus the corresponding quantity of 2 mmol (Table 1) of
organotriethoxysilane (RTES) were combined in a 125 ml polypropylene bottle with lid
The two-phase mixture was heated in an oil bath at 90 degC for 20 min without stirring
Immediately after taking the mixture out of the oil bath 267 g of an aqueous solution
(25 wt ) of CTAC which had been heated to 60 degC was added and the final mixture
was stirred (600 rpm) for at least 3 h at 23 degC The molar composition of these
functionalized materials is 1 Si 8 TEAH 017 CTAC 120 H2O
Table 1 Type and amount of functionalized organotriethoxysilane used in the co-
condensation
sample RTES M (g mol-1) n (mmol) m (g)
CMS-VI vinyltriethoxysilane 1903 2 0381
CMS-PH phenyltriethoxysilane 2404 2 0481
CMS-BZ benzyltriethoxysilane 2544 2 0509
CMS-CP 3-cyanopropyltriethoxysilane 2314 2 0463
CMS-MP 3-mercaptopropyltriethoxysilane 2384 2 0477
Extraction of template from the mesoporous silica 50 ml of ethanol were added to the
translucent colloidal aqueous suspension of the mesoporous material The resulting
precipitate was centrifuged for 20 min at 40000 RCF (g) After decanting the sediment
was redispersed through vigorous stirring in 50 ml of an ethanolic solution of
ammonium nitrate (20 g l-1
) and then treated for 20 min in an ultrasonic bath (35 kHz)
RESULTS AND DISCUSSION 42
87
Alternatively the mixture can be refluxed for 1 h This procedure was repeated until the
sediment after centrifugation was completely transparent normally one or two times In
order to replace the ammonium ions in the structure this operation was repeated with a
solution of concentrated hydrochloric acid in ethanol (5 g l-1
) After washing with pure
ethanol the transparent gelatinous cake obtained after centrifugation can be redispersed
in ethanol leading to a colloidal suspension of the extracted product in ethanol
Characterization
Dynamic light scattering (DLS) data were collected with an ALV-NIBSHPPS High
Performance Particle Sizer in PMMA cuvettes at 25 degC Raman spectroscopy was
performed with a He-Ne laser (633 nm) on a LabRAM HR UV-Vis (HORIBA Jobin
Yvon) Raman Microscope (Olympus BX41) equipped with a Symphony CCD detection
system The spectra were baseline-corrected For thermogravimetric analysis (TGA)
10 mg of dry powder were heated in corundum crucibles from 30 to 800 degC
(10 degC min-1
) in a flow of synthetic air (25 ml min-1
) using a Netzsch STA 449 C Jupiter
thermobalance For the SEM analysis films were prepared on a gold-covered glass slide
by spin-coating using ethanolic suspensions of the extracted material Shape and
dimensions of the particles were determined with a JEOL JSM-6500F scanning electron
microscope (SEM) equipped with an Oxford EDX analysis system Transmission
electron microscopy (TEM) was carried out on a JEOL JEM 2011 instrument with LaB6
cathode at 200 kV Samples were prepared on a Plano holey carbon coated copper grid
by evaporating one droplet of diluted ethanolic suspension of the extracted material
RESULTS AND DISCUSSION 42
88
Cross-polarized 29
Si-MAS-NMR measurements were performed on a Bruker DSX
Avance500 FT spectrometer in a 4 mm ZrO2 rotor Nitrogen sorption isotherms (77 K)
were obtained using a Quantachrome NOVA 4000e Surface Area amp Pore Size
Analyzer Surface area calculations were made using the Brunauer-Emmett-Teller
(BET) equation in the range from p p0-1
= 005 - 025 Pore-size distributions were
determined using the DFT-method (NLDFT equilibrium model cylindrical pores N2 on
oxygen) The pore volume was determined for meso- and micropores for p p0-1
lt 08
Results and Discussion
Colloidal mesoporous silica was prepared in the form of non-functionalized pure-silica
MCM-like material (CMS) and as functionalized mesoporous materials carrying five
different organic groups (R) in the pore walls (CMS-R see Table 1)
Fig 30 Translucent colloidal suspension and TEM micrograph of functionalized
mesoporous nanoparticles
RESULTS AND DISCUSSION 42
89
The materials were obtained as colloidal suspensions with relatively uniform particle
sizes between 40 and 150 nm (Fig 30) Tetraethylorthosilicate (TEOS) and
organotriethoxysilanes (RTES) form the MCM-like material in combination with
cetyltrimethylammonium cations (CTMA+) as structure directing agent in a co-
condensation process (Fig 31)
Fig 31 Scheme of the co-condensation reaction of alkoxysilanes with a micelle-
forming surfactant
This S+I- assembly takes place in an alkaline aqueous medium with triethanolamine
(TEAH) as basic reactant TEAH can also act as a complexing agent that retards the
hydrolysis of the alkoxides[101-103]
The large excess of TEAH probably keeps the seeds
separated from each other during the condensation process giving finally rise to a large
number of particles with relatively small diameters
RESULTS AND DISCUSSION 42
90
The morphology and particle size of the synthesized materials was analyzed with
dynamic light scattering (DLS) and electron microscopy (TEM and SEM) In the TEM
micrographs discrete near-spherical particles with a disordered worm-like pore
arrangement are observed The particles show a narrow particle size distribution with a
polydispersion index (PDI) of around 01 This narrow size distribution is maintained
after extraction of the template by an ion-exchange method using an ethanolic solution
of ammonium nitrate (Fig 32)
Fig 32 TEM-micrograph and particle size distribution of sample CMS-1 determined by
dynamic light scattering
The synthesis procedure developed for pure siliceous nanoparticles was extended
towards a simultaneous reaction of TEOS and a variety of organotriethoxysilane
precursors to obtain functionalized surfaces Hybrid mesoporous materials incorporating
the following organic groups ie vinyl- (CMS-VI) benzyl- (CMS-BZ) phenyl-
(CMS-PH) cyanopropyl- (CMS-CP) and mercaptopropyl- (CMS-MP) residues were
RESULTS AND DISCUSSION 42
91
thus synthesized These surface-modified mesoporous organosilicas often show an even
narrower size distribution than the pure silica parent materials (Fig 33)
Fig 33 TEM-micrographs and particle size distributions calculated from DLS-data of
samples CMS-MP (a) and CMS-PH (b)
The observed mean particle size obtained from DLS measurements varies in most cases
from about 50 to 150 nm depending on the incorporated functional group and the
RESULTS AND DISCUSSION 42
92
synthesis method employed The particle size observed with electron microscopy is
often slightly smaller than the hydrodynamic diameter measured by DLS This
observation can be explained with occasional weak aggregation of the particles The
discrepancy is seen clearly in the case of the organically modified materials especially
if hydrophobic aromatic groups such as phenyl residues are incorporated in the
structure (Table 2)
Table 2 Properties of colloidal mesoporous materials as analyzed with different
methods
sample Particle size TGA data N2 sorption data
diameter
DLS
(nm)
diameter TEM
(nm)
T at
DTGmax
(degC)
surface
area
(m2 g
-1)
pore
volume at
p p0-1
lt 08
(cm3 g
-1)
pore
diameter
(nm)
CMS-1 100 80ndash120 - 1150 10 40
CMS-VI 120 50ndash100 290 1230 074 34
CMS-CP 130 80ndash150 350 1200 072 33
CMS-MP 90 50ndash70 350 970 063 34
CMS-PH 80 40ndash60 610 1040 073 28
CMS-BZ 110 50ndash100 470 1120 065 32
The products with incorporated organic groups especially CMS-PH or CMS-MP
appear as nearly perfect spheres with diameters of about 50 nm The narrow particle
size distribution of the mesoporous materials can also be confirmed with scanning
RESULTS AND DISCUSSION 42
93
electron microscopy (Fig 34) Here a stable colloidal suspension of extracted CMS-BZ
was used for spin-coating a gold-sputtered glass plate resulting in a homogeneous
coverage of mesoporous particles The benzyl-modified mesoporous spheres have
diameters in the range of 50 to 80 nm
Fig 34 SEM-micrograph of a mesoporous film prepared by spin-coating using a
colloidal suspension of CMS-BZ
An influence of organic functional surface groups upon the morphology of mesoporous
materials was also observed by Huh et al[24]
They found a strong increase of the particle
size when using hydrophilic organosilanes especially with amino-containing residues
while hydrophobic residues stimulated the formation of smaller particles They
concluded that hydrophobic groups are able to align with the organic tails of the
template while hydrophilic residues would disturb the Gouy-Chapman region thus
causing a different growth behavior The results for the hydrophobic functional groups
RESULTS AND DISCUSSION 42
94
support their findings Weakly acidic mercapto residues also stimulate the formation of
small spherical particles[99]
The presence of the organic functional groups can be verified with several methods
Thermogravimetric analysis (TGA) shows the decomposition behavior during the
heating of the samples in air The decomposition temperature more precisely the
temperature when the first derivative of the weight loss reaches a maximum varies over
a rather wide range for the different functional groups (Fig 35 and Fig 36)
Fig 35 Thermogravimetric analysis (TG-DTG) of washed CMS-1 with template (a)
and phenyl modified extracted mesoporous silica CMS-PH (b)
Fig 35a shows the weight-loss of the washed non-functionalized sample CMS-1 still
containing the template inside the pores with a maximum around 250 degC This
decomposition process of the template is completed well before the decomposition of
the phenyl-residue in sample CMS-PH starts Fig 35b shows the decomposition of this
group around a temperature of 600 degC in a sample that was previously template-
extracted This extreme stability is not observed for the other functional groups They
RESULTS AND DISCUSSION 42
95
start to decompose at a lower temperature which makes a clear separation from the
degradation of the template difficult (Fig 36) However when non-functionalized
samples were analyzed with TGA after template extraction a weight loss of around
4-7 wt between 100 and 500 degC is still observed Residual template fragments that
were detected by elemental analysis of non-functionalized samples can account for
about 3 weight loss Additionally the dehydroxylation of surface hydroxyl groups
should be considered Usually up to 3 SiOH groups per nm2 are found in mesoporous
materials[97 104]
With surface areas of about 1000 m2 g
-1 one can estimate a maximum
5 wt loss due to water release from these samples by dehydroxylation
Fig 36 Thermogravimetric analysis of the surface-modified and extracted mesoporous
silica materials (starting at 100 degC to compensate for different water losses)
This loss must be taken into account when the amount of organic residue is determined
from TGA measurements Usually a TGA weight loss between 15 ndash 25 wt in
template-extracted functionalized samples occurs (above 100 degC)
RESULTS AND DISCUSSION 42
96
The connectivity of the functional organic groups to the silica framework is best
demonstrated by cross-polarized 29
Si-MAS-NMR spectroscopy (Fig 37)
Fig 37 Cross-polarized 29
Si-MAS-NMR spectra of the functionalized mesoporous
materials
The spectra show peaks at -110 ppm (Q4) and -102 ppm (Q
3) [Q
n = Si(OSi)n(OH)4-n]
n = 2ndash4 representing the fully condensed silica and silica with one terminal hydroxyl
group Geminal hydroxyls are barely present in these samples (resonance at -92 ppm
Q2) One or two additional peaks are observed due to the T
2 and T
3 resonances of the
incorporated organosiloxanes [Tm
= RSi(OSi)m(OH)3-m] m = 2ndash3 at values commonly
RESULTS AND DISCUSSION 42
97
observed in functionalized mesoporous materials Propyl-bridged functional groups
display shifts around -67 and -60 ppm while directly bound residues with C=C bonds
show resonances at more negative values (Table 3)[24]
The prevalence of the T3 peak
ie the threefold coordination of the siloxane indicates (near) complete condensation of
the functional groups into the wall structure of the nanoparticles
Table 3 Cross-polarized 29
Si-MAS-NMR spectroscopy data of functionalized
mesoporous materials
sample chemical shift
Q4 Q
3 T
3 T
2
CMS-VI -110 -101 -80 -73
CMS-PH -110 -101 -79 -70
CMS-BZ -110 -101 -71 -63
CMS-CP -110 -101 -67 -58
CMS-MP -110 -101 -67 -
The characteristic vibrational modes of the incorporated functional groups are clearly
displayed in their Raman spectra which are not obscured by hydroxyl vibrations of the
host as in IR spectroscopy (Fig 38) Intensive peaks of the phenyl- and benzyl-
substituted samples CMS-PH and CMS-BZ originating from the in-plane C-H
deformation vibrations of the aromatic ring are seen at about 1000 cm-1 Additionally
these samples show the typical peaks for aromatic C-H and ring C=C stretching
vibrations at 3060 and 1590 cm-1 respectively[105]
RESULTS AND DISCUSSION 42
98
In the vinyl-modified sample (CMS-VI) we find the alkene C-H vibrations and the C=C
stretching vibrations at 3070 and 1605 cm-1
respectively The nitrile group of CMS-CP
causes a characteristic narrow band at 2250 cm-1
The typical peak for the S-H group in
the mercaptopropyl-containing CMS-MP occurs at 2580 cm-1
and additionally we find
a band at 657 cm-1
due to the C-S vibration Both Raman bands indicate that the
mercapto groups are intact and that no disulfide bridges have formed[106]
Fig 38 Raman spectra of template-extracted functionalized mesoporous materials
After extraction of the surfactant the functionalized porous materials show high surface
areas and pore volumes The sorption properties were determined using nitrogen
RESULTS AND DISCUSSION 42
99
adsorption-desorption at 77 K In case of the unmodified materials CMS-1 a typical
type IV isotherm with a clear hysteresis from filling of the cylindrical pores is observed
Textural pores of ~20 nm originating from the closely packed nanospheres in the
powders are visible above a relative pressure of 08 p p0-1
The entire surface area
calculated according to the BET-theory is 1150 m2 g
-1 for CMS-1 The product exhibits
a high pore volume of 1 cm3 g
-1 (for p p0
-1 lt 08) and a narrow pore size distribution
with an average diameter of 4 nm as determined with the DFT method (Fig 39)
Calcined CMS-1 shows an even higher surface area of 1400 m2 g
-1 with pore volumes
of 11 cm3 g
-1
Fig 39 Nitrogen sorption isotherm (left) and pore size distribution (right) according to
the DFT theory of mesoporous silica CMS-1
The type of adsorption isotherm is unchanged in the functionalized nanosized materials
and the inclusion of the functional groups does not significantly affect the overall
surface area of the materials (Fig 40)
RESULTS AND DISCUSSION 42
100
Fig 40 Nitrogen sorption isotherms of reference and co-condensed materials
To some extent the size of the functional groups influences the shrinkage of the pore
diameter While the unmodified mesoporous silica has an average pore diameter of
40 nm in vinyl-functionalized materials (CMS-VI) we find pores with a mean diameter
of 34 nm and the bulky nature of the benzyl group in CMS-BZ causes a reduction to
32 nm (Fig 41)
RESULTS AND DISCUSSION 42
101
10 100 1000
000
001
002
003
004
005
006
CMS-1 CMS-VI CMS-BZ
Dv(d
) [c
m-3
-1
g-1
]
pore diameter []
Fig 41 Changes in the pore size distribution with increasing size of the incorporated
organic moieties in mesoporous silica
The surface coverage of functional groups in the nanoscale mesoporous samples can be
estimated from thermogravimetric measurements in conjunction with the surface area
presuming that all organic groups are located on the surface For example the weight-
loss of CMS-PH due to the decomposition of the organic group is about 20 The
calculated surface area according to BET-theory is 1040 m2 g
-1 From these data a
surface coverage of 26 mmol g-1
or 15 phenyl groups per nm2 can be calculated
Conclusion
The synthetic approach presented here can serve as a general method for the preparation
of both colloidal mesoporous silica spheres (CMS) and functionalized colloidal
suspensions of nanoscale mesoporous materials with high yields from concentrated
solutions Narrow particle size distributions in the range of about 50 to 150 nm were
established with Dynamic Light Scattering (DLS) measurements and electron
RESULTS AND DISCUSSION 42
102
microscopy before and after template extraction Discrete nanoscale mesoporous
particles with functionalized pore surfaces result when adding functional
organoalkoxysilanes directly to the initial silica precursor solutions Nitrogen sorption
analysis and indicates that the functional groups are located at the inner surfaces of the
mesoporous channel systems
RESULTS AND DISCUSSION 43
103
43 Porous Thin Films of
Functionalized Mesoporous Silica
Nanoparticle
RESULTS AND DISCUSSION 43
104
Introduction
Porous materials in the nanometer range already attract a great deal of interest in many
fields of science and technology Especially in terms of colloidal suspensions these
materials are promising candidates for applications such as gas sensing host-guest
chemistry drug delivery and coatings in the semiconductor industry The preparation of
monodisperse stable colloidal suspensions of mesoporous silica particles has been
recently developed[98 99]
The synthesis parameters were gradually modified in order to
realize even smaller particles in the range below 40 nm As reported in the previous
publications the introduction of functional groups during the co-condensation reaction
has a great influence on the particle shape and size[24]
The synthesis with
phenyltriethoxysilane led to particles with a smallest diameter of only 50 nm[107]
Additionally the phenyl-modified particles are thermally more stable easy to
characterize and tend to peptize (disperse) more easily due to their sterically demanding
and inert aromatic rings
By further decreasing the diameter of these mesoporous silica spheres their scattering
ability for visible light is also drastically decreased If the size of the particles falls
below about 110 of the wavelength of the incoming light (01 ) their scattering ability
can no longer be described with the Lorenz-Mie-solution but with Rayleigh scattering
The colloidal suspensions thus show optical transparency when the particle size is small
enough Due to this optical transparency such nanoparticles would allow spectroscopic
investigations of physical processes or chemical reactions in a confined space
Furthermore it is possible to encapsulate sensitive dyes [108-111]
or to facilitate the
RESULTS AND DISCUSSION 43
105
dispersion of the particles in certain media Modifying the spheres with appropriate
functionalities such as caps or fluorescence markers would make them interesting
candidates for drug delivery[7 108]
or would permit observing their way into a cell[112
113] Another very promising area of application is thin film technology
[114 115] The
synthesis of mesoporous thin films is often achieved with the so-called ldquoEvaporation
Induced Self Assemblyrdquo (EISA) process[20]
The EISA process for mesoporous silica
thin films starts with a homogeneous solution of silica precursor and surfactant prepared
in ethanolwater with an initial surfactant concentration much below the critical micelle
concentration[20]
Upon dip-coating or spin-coating the preferential evaporation of
ethanol concentrates the surfactant and silica species The progressively increasing
surfactant concentration drives self-assembly of silica-surfactant micelles and their
further organization into liquid-crystalline mesophases This approach represents a
versatile strategy for the formation of mesoporous silica and other oxide thin films with
different pore sizes pore topologies and elemental composition[116]
However there are several issues that suggest the development of complementary
strategies The precursor is normally highly acidic which can cause problems on
sensitive substrates Removal of the template by extraction or calcination might also be
critical If the surfactant is removed thermally cracks can occur in thicker films and it
is known that the humidity has a great influence on the film formation Thus if the
orientation of the pores is less important the alternative preparation of thin films with
mesoporous nanoparticles can address several of these issues It is believed that a
porous thin film made of porous nanoparticles can exhibit improved diffusion properties
RESULTS AND DISCUSSION 43
106
and a highly accessible pore system[50]
Additionally one can work with stable
suspensions of already extracted nanoparticles thus ensuring an easy handling and good
reproducibility The coating of sensitive substrates is facilitated due to the mild
conditions Control over the thickness can be attained by varying the concentration or
by multiple step coating It could be also feasible to combine suspensions containing
different kinds of nanoparticles in order to assemble hybrid thin films Finally the
material is easier to characterize when bulk samples are available The synthesis of
completely transparent suspensions even after template extraction would be a great
improvement for the formation of homogeneous thin films with a low surface
roughness Especially for the formation of multilayers it is advantageous if the film is
very smooth Otherwise the defects on the surface are transmitted and amplified with
every following coating step Furthermore the availability of such homogeneous porous
thin films makes it possible to use ellipsometric porosimetry as an analysis method
This method has a set of advantages compared to conventional sorption methods which
are specified in a work of Eslava et al[56]
For an accurate determination of sorption isotherms of porous coatings via gravimetric
or volumetric methods an extremely sensitive device is needed The tiny amount of
porous material and the weight increase due to adsorption in the thin film can be
detected with a surface acoustic wave (SAW) device or a quartz crystal microbalance
(QCM) In both cases the coating has to be applied to the measuring device itself
which might have an influence on properties such as the orientation of the crystals the
presence of grain boundaries and the film thickness Scraping off from their supports
RESULTS AND DISCUSSION 43
107
and collecting a sufficient quantity of powdery sample for a conventional determination
is a drastic intervention The determination of sorption isotherms of a thin film via
ellipsometric porosimetry (EP) is a convenient method to determine the effective
porosity and pore size distribution of a thin film on its original support without
destroying it
Thus the aim of this work was the synthesis of monodisperse colloidal suspensions of
porous nanoparticles with a particle size small enough for the preparation of
homogeneous thin films Additionally the porosity of the final thin films is determined
with different methods
Experimental
All chemicals were purchased from Sigma-Aldrich with reagent grade (98 or higher)
and used without further purification The water was deionized In order to guarantee
the same conditions for all samples the syntheses were carried out in a heatable high-
throughput magnetic stirrer (1000 rpm) in 100 ml glass test tubes (diameter 25 cm)
Although it is necessary that the synthesis mixture be well stirred building of foam
should be avoided in order to prevent the formation of inhomogeneities The following
solutions were prepared and used for all syntheses S1 (surfactant) 300 g aqueous
solution of cetyltrimethylammonium chloride (25 wt ) and 2700 g deionized water
C1 (catalyst) 10 g triethanolamine (TEAH) and 90 g deionized water P1 (precursor)
208 g (01 mol) tetraethylorthosilicate (TEOS) and 24 g (001 mol)
phenyltriethoxysilane (PTES) E1 (extraction) 50 g concentrated hydrochloric acid
RESULTS AND DISCUSSION 43
108
(37 HCl) in 500 ml ethanol E2 (extraction) 10 g ammonium nitrate in 500 ml
ethanol
Samples CMS-Pxy
200 g S1 and 020 g (CMS-P2y) 040 g (CMS-P4y) or 080 g (CMS-P8y) C1 were
heated under stirring to 60 degC (CMS-Px6) 70 degC (CMS-Px7) or 80 degC (CMS-Px8) The
amount of 160 ml P1 was added and stirring was continued in the test tube for 1 h The
vessel was kept open in order to evaporate parts of the ethanol that were formed during
the condensation For a better overview all samples are listed in Table 4
Table 4 Prepared samples and synthesis conditions
sample synthesis
temperature
amount
TEAH (g)
CMS-P26 60 degC 002
CMS-P46 60 degC 004
CMS-P86 60 degC 008
CMS-P27 70 degC 002
CMS-P47 70 degC 004
CMS-P87 70 degC 008
CMS-P28 80 degC 002
CMS-P48 80 degC 004
CMS-P88 80 degC 008
RESULTS AND DISCUSSION 43
109
Extraction
The resulting colloidal suspension was flocculated with 20 ml E1 and the cloudy
precipitate was centrifuged for 5 min at 40000 g (RCF) After decanting the sediment
was redispersed through vigorous stirring in 20 ml E2 The clear suspension was treated
for 10 min in an ultrasonic bath After flocculating with 20 ml deionized water the
precipitate was again centrifuged the sediment was redispersed in 20 ml E1 and again
sonicated After flocculation with 20 ml deionized water and centrifugation the
sediment can be redispersed in ethanol leading to a suspension of colloidal mesoporous
silica (CMS) with approximately 5 wt solid content
Film preparation
Thin film preparation was performed by spin-coating with an ethanolic suspension
containing about 5 wt of solid material The substrate (silicon or glass) was coated
3 times at 3000 rpm (acceleration 5000 rpm s-1
) In order to remove potential
inhomogeneities the transparent ethanolic suspension was filtered through a 02 μm
syringe filter prior to spin-coating
Characterization
Dynamic light scattering (DLS) data were collected with a Malvern Nano ZS in PMMA
cuvettes at 25 degC For thermogravimetric analysis (TGA) 10 mg of dry powder were
heated in corundum crucibles from 30 to 900 degC (10 degC min-1
) in a flow of synthetic air
(25 ml min-1
) using a Netzsch STA 449 C Jupiter thermobalance Transmission electron
RESULTS AND DISCUSSION 43
110
microscopy (TEM) was carried out on a FEI Titan 80-300 at an accelerating voltage of
300 kV Samples were prepared on a Plano holey carbon coated copper grid by
evaporating one droplet of diluted ethanolic suspension of the extracted material The
nitrogen sorption isotherms (77 K) were obtained using a Quantachrome NOVA 4000e
Surface Area amp Pore Size Analyzer Surface area calculations were made using the
Brunauer-Emmett-Teller (BET) equation in the range from p p0-1
= 005 - 025 Pore-
size distributions were determined using the DFT-method (NLDFT equilibrium model
cylindrical pores N2 on carbon) Ellipsometry measurements were performed with a
Woollam M2000D at different angles (65deg 70deg and 75deg) in the spectral range of 190 ndash
1000 nm The data were fitted in the range between 250 ndash 1000 nm using the Cauchy
material as model layer Ellipsometric porosimetry measurements were carried out in a
closed cell at different partial pressures at a measurement angle of 75deg The recording of
isotherms was performed using a homemade Labview-controlled gas mixer Digital
mass flow controllers (W-101A-110-P F-201C Bronkhorst High-Tech) ensured the
accurate dosing of the carrier gas nitrogen and the liquid analyte which was vaporized
in a controlled evaporation and mixing element (W-101A Bronkhorst High-Tech)
Partial pressures were calculated using the van der Waals equation For a better
comparison with nitrogen sorption the relative pressure p px-1
(px saturation pressure)
is used for the vapor sorption analysis
RESULTS AND DISCUSSION 43
111
Results and Discussion
The synthesis results are in good accordance with the expectations based on the work of
Stoumlber[12]
and LaMer[13]
A first variable of course is the amount of precursor added to
the synthesis In a certain range decreasing the amount of precursor can reduce the size
of the final particles According to Stoumlber the particle size distribution passes a
maximum when the concentration is varied because the concentration of precursor
influences not only the growth of the seeds but also the nucleation rate und thus the
number of initial seeds Since high yield is a priority it is more interesting to choose
other options for a successful downsizing The experiments show that the final particle
size in the resultant suspensions (CMS-P26 ndash CMS-P88) is dependent on the amount of
added TEAH and the reaction temperature In Fig 42 the hydrodynamic diameter of all
samples is shown (CMS-P86 stand for synthesis with 008 g TEAH at 60 degC )
Fig 42 Initial particle size (DLS) of samples CMS-P26 ndash CMS-P88
RESULTS AND DISCUSSION 43
112
With increasing temperature and amount of catalyst (TEAH) the hydrolysis of the
precursor and condensation of the nanoparticles is supported and the reaction is faster
In this specific range these changes apparently promote the growth rate more than the
nucleation rate resulting in bigger particles Fig 43 shows micrographs (TEM) of
samples synthesized at different temperatures with the same amount of TEAH (CMS-
P8y) The difference in size can be clearly seen the particles that formed at 60 degC
(CMS-P86) show the smallest diameter of only 15 nm At 70 and 80 degC the diameter
reaches 25 and 30 nm respectively
Fig 43 Electron micrographs (TEM) of samples CMS-P86 CMS-P87 and CMS-P88
In agreement with DLS data TEM also shows that the variation of the amount of
catalyst TEAH at a constant reaction temperature (80 degC CMS-x8) has an influence on
the particle size The difference is less pronounced but the general tendency can be
confirmed The diameter varies between 22 nm (CMS-P28) 25 nm (CMS-P48) and
30 nm (CMS-P88) if the quantity of TEAH is increased
RESULTS AND DISCUSSION 43
113
Fig 44 Electron micrographs (TEM) of samples CMS-P28 CMS-P48 and CMS-P88
Table 5 shows a comparison of DLS and TEM data for selected particle sizes The
divergence in hydrodynamic diameter in DLS (36 - 130 nm) and discrete particle size in
TEM (15 - 30 nm) could be explained with a higher degree of agglomeration at higher
temperatures
The findings made it possible to synthesize colloidal suspensions of functionalized
mesoporous silica nanoparticles with a very small particle size between 15 and 30 nm
As the scattering intensity (I) of light strongly decreases with smaller particles size
(I ~ radius6) the suspensions with the smallest diameter (~ 15 nm) are completely clear
(Fig 45)
RESULTS AND DISCUSSION 43
114
Fig 45 Scattering of the initial colloidal suspensions containing particles with different
diameters (DLS) in the range between about 40 to 130 nm (from left to right CMS-P27
-P86 -P28 -P87 -P48 -P88)
When reaching a certain size separating particles with centrifuges becomes difficult as
the effective gravitational force is dependent on the mass of the particles An elegant
method to overcome this problem is the flocculation of the particles Therefore
acidified ethanol was added to the aqueous colloidal suspension leading to a cloudy
suspension of agglomerated particles The particles then could be separated from the
solution by centrifugation and were purified in the following steps The final gelatinous
sediment can be completely redispersed in ethanol leading to transparent colloidal
suspensions with almost exactly the initial particle size distribution in DLS Fig 46
shows the mean hydrodynamic diameter of CMS-P86 before and after template
extraction The polydispersity index (PDI) of all suspensions was below 02 The
suspensions with a diameter below 40 nm are completely transparent to the visible part
of the light and show nearly no scattering
RESULTS AND DISCUSSION 43
115
Fig 46 Hydrodynamic diameter of CMS-P86 before and after template extraction
In transmission electron microscopy (TEM) the diameter of the particles can be
specified as significantly smaller (by a factor of 3) than in dynamic light scattering Fig
47 shows micrographs of CMS-P86 with an average particle diameter around 20 nm
The size distribution of the discrete particles is very narrow High resolution images
clearly show the porous nature of the functionalized particles
RESULTS AND DISCUSSION 43
116
Fig 47 TEM micrographs of CMS-P86 (right HAADF-STEM)
In order to investigate the sorption properties of the porous nanoparticles the ethanolic
suspensions were dried at 60 degC The resulting solids were colorless and transparent
consisting of small platelets with about 1 mm diameter Despite of its dense appearance
the material has a high specific surface area of 640 m2 g
-1 as well as a high pore volume
(095 cm3 g
-1) in the case of CMS-P86 DFT calculations resulted in a bimodal pore size
distribution
Fig 48 N2 sorption data of dried extracted CMS-P86
RESULTS AND DISCUSSION 43
117
The first peak at 27 nm due to templated mesopores is in the expected range for
functionalized mesoporous silica templated by hexadecyltrimethylammonium ions The
second peak around 10 nm reflects the textural porosity of the material It is a widely
accepted concept that an inscribed sphere between adjacent spheres is an approximate
shape for the access opening to the interstitial void space between randomly packed
spheres[117-119]
Depending on the packing of the individual particles the pore opening
varies approximately between 02 and 06 times the radius of the equally sized particles
In the case of CMS-P86 this interparticle porosity is in the range between 5 and 15 nm
(compare Fig 48)
Thus the expected particle size based on sorption is about 25 nm which coincides well
with the observed diameter in the TEM With decreasing particle size this second peak
is shifted to smaller pore sizes as shown in Fig 49 The maximum of the interparticle
porosity is in the expected range for all samples (see Table 5)
RESULTS AND DISCUSSION 43
118
Fig 49 Pore size distribution from N2 sorption of differently sized mesoporous
particles with maximum for interparticle porosity
Table 5 Particle size (DLS TEM) and maximum in interparticle porosity (N2 sorption)
sample hydrodynamic
diameter (DLS)
diameter
(TEM)
max interparticle
porosity
CMS-P88 130 30 16
CMS-P48 95 25 14
CMS-P28 80 22 12
CMS-P87 80 25 14
CMS-P86 60 15 9
RESULTS AND DISCUSSION 43
119
Homogeneous Thin Films
The ethanolic suspensions of the template-free material are ideal candidates for the
preparation of homogeneous spin-on thin films The dry bulk material exhibits a high
surface area even though it appears to be a dense solid Thus one can expect a high
porosity for the corresponding thin film Fig 50 shows an image of a silicon wafer with
a thin film of mesoporous functionalized silica with a thickness of 650 nm The film
was prepared by spin-coating three times with an ethanolic suspension containing
5 wt of CMS-P86
Fig 50 Thin film of CMS-P86 on a silicon wafer
The film appears very homogeneous and transparent and thus has a definite interference
color Due to pronounced capillary forces occurring during the solvent evaporation the
nanoparticles are very closely packed ndash a phenomenon that also assists in the assembly
of colloidal crystals[120]
Because of the smooth surface no scattering is observed which
makes the films perfect candidates for ellipsometry investigations Modeling and fitting
RESULTS AND DISCUSSION 43
120
of the data was based on the assumption that the film consist of porous nanoparticles
the model layer is designed as follows
0 the silicon substrate is infinitely thick (1 mm) 1 a typical layer of 2 nm thermal
oxide (SiO2) is presumed 2 the material (organic functionalized silica) is described
with a Cauchy layer Starting with a guessed film thickness of 500 nm the subsequent
fitting of the thickness and the Cauchy parameters resulted in a 650 nm thick film As
show in Fig 51 this model layer fits exactly the experimental data
Fig 51 Ellipsometry data of a thin film of CMS-P86 in nitrogen atmosphere
The measurement was performed in a flow cell in a flow of nitrogen It was repeated at
different relative pressures of gaseous toluene The adsorption affinity of the thin film
can be also observed when the interference color changes due to the pore filling The
relative pressure of toluene was controlled between 0 and 0943 (p p0-1
) Plotting the
refractive index of the thin film versus the relative pressure of toluene resulted in the
isotherm shown in Fig 52
RESULTS AND DISCUSSION 43
121
Fig 52 Ellipsometry data of a thin film of CMS-P86 in toluene vapor in a nitrogen
atmosphere
After the templated mesopores are filled a second step due to the filling of the
interparticle porosity can be identified at a relative pressure of 06 - 08 The
ellipsometric data are in very good accordance with powder nitrogen sorption data (Fig
53) The overlay shows the same sorption behavior for the two different adsorbates
RESULTS AND DISCUSSION 43
122
Fig 53 Overlay of a powder N2 sorption isotherm (desorption) and a toluene isotherm
(equilibrium) of a thin film recorded with ellipsometry (CMS-P86)
With the Lorentz-Lorenz equation for ellipsometric porosimetry (EP) a porosity of
53 can be specified Knowing the area of the substrate - a 3 inch wafer - the volume
of the deposited film can be easily calculated assuming a cylinder with a height of
650 nm Based on the high precision of thickness measurements in ellipsometry the
calculated volume of 00030 cm3 can be considered as accurate If the total pore volume
of 095 cm3 g
-1 in N2 sorption is correlated to the 53 porosity in ellipsometric data a
density of 056 g cm-3
can be calculated Thus the expected weight of the film is
17 mg Weighing before and after the film deposition gave a difference of 21 mg This
can only act as a rough indication due to a relatively large measuring inaccuracy of the
analytical balance and possible adsorbed water due to air humidity
RESULTS AND DISCUSSION 43
123
Conclusion
In this study we have demonstrated the synthesis of extremely small mesoporous silica
nanoparticles via a specific co-condensation process with phenyl groups The size of the
suspended mesoporous silica spheres can be controlled in a wide range The
suspensions with a mean hydrodynamic particle diameter of 40 nm or less were
optically transparent After extraction of the surfactant dispersion in ethanol led to
transparent colloidal suspensions The existence of very small individual porous
particles was confirmed by transmission electron microscopy (TEM) and sorption
measurements The suspensions were used for the preparation of homogeneous porous
thin films by spin-coating The films showed excellent optical qualities and could thus
be characterized with ellipsometry It was possible to record sorption isotherms of the
thin films with ellipsometry and to correlate the data with nitrogen sorption data of
dried powders of the same material In the future exchange of the template is
anticipated to allow control over the pore size and the particles can be functionalized or
labeled with a fluorescent dye Examples for a successful functionalization are listed in
the supporting information
RESULTS AND DISCUSSION 43
124
Supporting Information
The versatility of the modified synthesis procedure described in Chapter 43 can be
illustrated by the production of several other functional nanoparticles If the particle size
in the resulting colloidal suspension is around 100 nm extraction and redispersion can
be performed as described in Chapter 42 The synthesis conditions were thus adjusted
for the following samples
Experimental Part
CMS-AP
022 g aminopropyltriethoxylsilane (APTES 1 mmol) 024 g phenyltriethoxysilane
(PTES 1 mmol) and 208 g tetraethylorthosilicate (TEOS 10 mmol) were combined
90 g triethanolamine (TEAH) and 100 g of an aqueous solution containing 25 wt
hexadecyltrimethylammonium chloride (CTAC) were heated to 70 degC The precursor
solution was added and the mixture was stirred for 2 h at 70 degC
CMS-FITC
390 mg fluorescein isothiocyanate (FITC 001 mmol) 011 g aminopropyl-
triethoxysilane (APTES 05 mmol) and 20 g abs ethanol were stirred 24 h under dry
nitrogen atmosphere The resulting fluorescent orange solution was combined with a
mixture of 208 g tetraethylorthosilicate (TEOS 10 mmol) and 024 g phenyltriethoxy-
silane (PTES 1 mmol) 90 g triethanolamine (TEAH) and 100 g of an aqueous solution
RESULTS AND DISCUSSION 43
125
containing 25 wt hexadecyltrimethylammonium chloride (CTAC) were heated to
70 degC The precursor solution was added and the mixture was stirred for 2 h at 70 degC
Extraction
Extraction of template was performed by adding an equal amount of ethanol to the
translucent colloidal aqueous suspension of the mesoporous material The resulting
precipitate was centrifuged for 10 min at 40000 g (RCF) After decanting the sediment
was redispersed through vigorous stirring in the initial volume (ca 100 ml) of an
ethanolic solution of ammonium nitrate (20 g l-1
) and then refluxed for 1 h This
procedure was repeated with the same amount of a solution of concentrated
hydrochloric acid in ethanol (5 g l-1
) After washing with pure ethanol the transparent
gelatinous cake obtained after centrifugation was suspended in ethanol
Results and Discussion
a) Introduction of Aminopropyl Groups through Co-condensation
The new method additionally allows the introduction of aminopropyl groups during the
co-condensation The presence of aminogroups in the silica precursor during the
synthesis is usually accompanied with gelation problems Hence the synthesis of
nanoparticle suspensions with aminopropyl moieties is mainly realized by grafting[121]
In combination with the steric demanding phenyl groups of the phenyltriethoxysilane
(PTES) it is possible to obtain dispersed discrete nanoscaled particles The particle size
RESULTS AND DISCUSSION 43
126
distribution in DLS (Fig 54) shows a slightly broadened signal probably due to partly
interconnected particles
1 10 100 1000 10000
extracted in EtOH in water
inte
nsity
particle size [nm]
Fig 54 Particle size distribution (DLS) of CMS-AP before and after extraction
The functional mesoporous organosilica particles show a similar mean diameter around
100 nm before and after template extraction The coexistence of the two different
functionalities can be demonstrated with various methods In this case TGA data is
difficult to interpret because the weight loss caused by the decomposition of the
aminopropyl groups and the template are overlapping Fig 55 shows two distinct steps
with the one at higher temperatures unequivocally deriving from the decay of the
aromatic phenyl groups whereas the first step can presumably be assigned to the
aminopropyl groups Decomposing of the template starts already at lower temperatures
around 150 degC (compare Fig 35 Chapter 42)
RESULTS AND DISCUSSION 43
127
100 200 300 400 500 600 700 800
25
20
15
10
5
0
we
igh
t lo
ss [
]
temperature [iexclC]
0 10 20 30 40 50 60 70
-10
-08
-06
-04
-02
00
02
time [min]
DT
G [
min-1
]
Fig 55 Thermogravimetric data of extracted CMS-AP
Spectroscopic methods such as NMR or Raman measurements are usually more reliable
methods for the characterization of functionalized silica materials However solid state
29Si-NMR can also just give an indication for the incorporation of the aliphatic group
Compared to the spectra of the single phenyl modified product a shoulder at lower field
occurs in sample CMS-AP[122]
RESULTS AND DISCUSSION 43
128
0 -20 -40 -60 -80 -100 -120 -140
CMS-PH CMS-AP
[ppm]
Fig 56 29
Si-NMR spectra of CMS-AP and CMS-PH
Even though it is difficult to detect the aliphatic aminogroups in Raman measurements
Fig 57 shows the appearance of an additional signal at 1050 cm-1
as a result of C-N
stretching in primary amines
850 900 950 1000 1050 1100 1150 1200 1250
primary aminesC-N stretching
CMS-PH CMS-AP
inte
nsity
wavelength [cm-1]
Fig 57 Raman spectra of CMS-PH and CMS-AP
The isotherm obtained by nitrogen sorption analysis (Fig 58a) shows the typical
pronounced hysteresis at high pressures due to interparticle condensation in
nanopowders The step for the condensation in the templated mesopores is smeared out
RESULTS AND DISCUSSION 43
129
inferring a relatively broad pore size distribution due to the existence of functional
groups inside the pore system Fig 58b shows the bimodal pore size distribution which
is characteristic for mesoporous particles in the scale of about 100 nm
00 01 02 03 04 05 06 07 08 09 100
200
400
600
800
1000
0
200
400
600
800
1000 adsorption desorption
volu
me a
dsorb
ed [
cm
3
g-1
] S
TP
relative pressure p p0
-1
10 100 1000
0000
0005
0010
0015
Dv(d
) [c
m-3
-1
g-1
]
pore diameter []
Fig 58 N2 sorption isotherm and pore size distribution (DFT) of CMS-AP
c) Labeling with Fluorescein Marker
A porous silica nanoparticle is a suitable host for fluorescent markers due to its
chemical and mechanical stability[108]
The encapsulated dye molecule is shielded from
external influences and can be further functionalized with biocompatible elements The
labeling with a fluorescein isothiocyanate (FITC) is a common method in biochemistry
The method was also adopted to silica particles[123]
and recently to mesoporous silica
structures[43]
and even mesoporous silica nanoparticles[47]
The availability of a synthesis recipe for colloidal suspensions with incorporated
aminogroups establishes a basis for the successful linking of a marker during a one-step
synthesis[124]
After the synthesis of a suitable precursor that already carries the
RESULTS AND DISCUSSION 43
130
fluorescence marker it can be incorporated into the above mentioned synthesis
procedure to form labeled colloidal silica particles The successful incorporation of the
dye can be easily verified by adding only fluorescein to a reference sample Both
suspensions are transparent and the exhibit the characteristic color (Fig 59)
Fig 59 CMS-FITC and reference sample with fluorescein
After flocculation and separation of the particles by centrifugation the successful
incorporation of the FITC modified precursor can be verified when the solution above
the sediment is analyzed Only in the case of a successful functionalization it appears
colorless or only pale colored from some FITC residues respectively (Fig 60)
RESULTS AND DISCUSSION 43
131
Fig 60 CMS-FITC and reference sample after centrifugation
The precipitation can be extracted and redispersed in ethanol resulting in translucent
and fluorescent colloidal suspensions of mesoporous silica nanoparticles (Fig 61)
Fig 61 CMS-FITC after extraction and under UV-irradiation
RESULTS AND DISCUSSION 43
132
DLS data confirmed the existence of discrete particles with a comparable particle size
distribution The mean diameter of the particles in the stable colloidal suspension before
and after extraction is around 100 nm
1 10 100 1000
inte
nsity
particle size [nm]
Fig 62 Particle size distribution (DLS) of extracted CMS-FITC
Due to the very small amount of FITC in the synthesis further characterization methods
give no distinct discrepancy to the sample CMS-AP TGA as well as nitrogen sorption
or Raman investigations are very similar
RESULTS AND DISCUSSION 43
133
Fig 63 Dry sample CMS-FITC under UV-irradiation
The dried sample also exhibits the characteristic fluorescence (Fig 63) In order to
investigate the porosity of the sample and the accessibility of the functional group a
simple gas phase reaction can be applied The yellow powder is brominates with
elemental gaseous bromine at normal atmospheric moisture resulting in a red-colored
product carrying now eosin moieties (Fig 64)
Fig 64 Gas phase reaction of CMS-FITC with bromine vapor
RESULTS AND DISCUSSION 43
134
Fig 65 Bromination of fluorescein moieties with gaseous bromine
RESULTS AND DISCUSSION 44
135
44 Vapor-Sensitive Bragg Mirrors and
Optical Isotherms from Mesoporous
Nanoparticle Suspensions
RESULTS AND DISCUSSION 44
136
Introduction
Bragg reflectors are multilayer structures composed of alternating layers of two
dielectric materials with different refractive indices (n) The optical properties of a
Bragg mirror are dependent on the thickness and refractive index of the individual
layers For ideal reflectors all layers exhibit an optical thickness of λ4 The efficiency
increases with the number of layer pairs and the contrast of the refractive indices of the
low and high refracting materials For the preparation of good Bragg mirrors the
individual films have to be homogeneous with smooth surfaces and reproducible
thickness Thus they were often produced by vapor deposition techniques But it is also
possible to assemble Bragg stacks using spin- or dip-coating
Bragg reflectors are also widespread in nature eg in butterfly wings or iridescent
elytra of beetles where chitin layers are alternated with different refractive index layers
in order to control the apparent color in a wide variety of animals[38]
In the laboratory
these special thin films can be prepared for example by alternation of low refractive
SiO2 with high refractive TiO2 films Regarding porous thin films the expected change
of the interference color upon adsorption or desorption of a volatile species suggests a
novel concept for chemical sensing Indeed this sensing effect of porous films has
already been studied in several publications[39-43]
also in combination with the Bragg
stacks[44]
The preparation of sensing Bragg mirrors faces several challenges In order to realize
high quality Bragg mirrors the individual layers have to be very homogeneous Defects
or a high surface roughness in the films would propagate and amplify with each
RESULTS AND DISCUSSION 44
137
additional layer For a high brilliance of the Bragg stack the thickness of the layer has
to be constant across the substrate surface If the stack is to be built from nanoparticle
layers there will be boundary conditions on the optimal size distribution of the
individual particles ie the smaller the nanoparticles are the smoother the film Porous
thin films by their nature have a relatively low refractive index but for intensive colors
the contrast needs to be high For sensing applications one needs two porous layers to
guarantee good pore accessibility normal to the surface of the film Porous SiO2 is a
material with a very low refractive index In Chapter 42 synthesis procedures for the
preparation of colloidal suspensions of functionalized mesoporous silica nanoparticles
with a very small particle size were discussed These colloidal suspensions are ideal
candidates for the production of highly porous homogeneous thin films with a low
refractive index For the high refractive index layer nanoparticulate colloidal titania is a
suitable material The preparation of thin films with porous nanoparticles can have some
advantages over the common EISA approach for mesoporous films and the growth of
zeolite films on substrates respectively a) It is anticipated that the porous thin films
made of randomly oriented (porous) nanoparticles exhibit improved diffusion properties
and a highly accessible pore system[50]
b) It is possible to prepare stable suspensions of
already extracted and characterized nanoparticles thus assuring good reproducibility
and well-characterized sorption properties c) The film thickness can be controlled over
a wide range by varying the particle concentration or the number of coating steps d)
The coating of sensitive substrates is facilitated due to the mild processing conditions
For example intricate or high-temperature template removal procedures between the
RESULTS AND DISCUSSION 44
138
coating steps are not required e) The last-coated layers are located only on top of the
layer structure ndash no soluble precursor constituents may percolate into the already
deposited underlying layer structure Such Bragg mirrors have numerous potential
applications in sensing devices wavelength-selective tunable optical filters in a broad
spectral range and reflective coatings
Experimental
The colloidal suspensions of low refractive index material (CMS-P86 porous SiO2
nanoparticles ndash see Chapter 43) and high refractive index material (CMT-6 TiO2
nanoparticles ndash see Chapter 62) were used for the preparation of thin films The
homogeneous colloidal suspensions contained between 2 and 5 wt solid
nanoparticulate material In order to remove potential inhomogeneities the coating
suspensions were filtered through 02 μm syringe filters prior to deposition The thin
films were deposited on polished silicon wafers or glass plates by spin-coating using a
Laurell WS-400B-6NPP-Lite-AS All substrates were pre-cleaned with ethanol for 5 s
under spinning at 3000 rpm The film thickness was adjusted by diluting the colloidal
suspensions with absolute ethanol by variation of the spinning rate between 3000 and
5000 rpm or by multi step coatings respectively After each deposition the film was
annealed for 10 s in a flow of hot air (heat gun ~ 300 degC) and cooled to room
temperature before measurements were performed and the next layer was added SEM
micrographs were recorded with a JEOL JSM-6500F scanning electron microscope
(SEM) equipped with an Oxford EDX analysis system Ellipsometry measurements
RESULTS AND DISCUSSION 44
139
were performed with a Woollam M2000D at an angle of 75 deg in the spectral range of
190 ndash 1000 nm The data was fitted in the range between 350 ndash 1000 nm using the
Cauchy material as model layer Transmittance and reflectance measurements were
recorded with the same ellipsometer using p-polarized light at 45 deg 75 deg or 90 deg
depending on the sample and the experimental setup In order to record the shift of the
transmitted (angle 90 deg) wavelength due to vapor sorption the films were placed into
quartz cuvettes with gas in- and outlet The recording of isotherms (at 22 degC) was
performed using a homemade Labview-controlled gas mixer Digital mass flow
controllers (W-101A-110-P F-201C Bronkhorst High-Tech) ensured the accurate
dosing of the carrier gas nitrogen and the liquid analyte which was vaporized in a
controlled evaporation and mixing element (W-101A Bronkhorst High-Tech) Partial
pressures (p) were calculated using the van der Waals equation The relative pressure
p p0-1
relates to the saturation pressure p0
Results and Discussion
The colloidal suspensions of CMS-P86 and CMT-6 were used for the stepwise
deposition of multilayer thin films on silicon wafers in order to examine the thickness
optical properties and homogeneity of the resulting stacks (sample BS-1) After each
coating step the sample was analyzed with ellipsometry Once the data was fitted these
layers were not changed in the following data acquisition After the last layer was
deposited the unrestricted fitting of all previous layers did only slightly improve the
quality of the fit This indicates that the previous films are not changing significantly
RESULTS AND DISCUSSION 44
140
upon heating and further deposition The final homogeneous film (BS-1) appeared
golden Fig 66 shows the ellipsometric data for a multilayer stack of 4 thin films
consisting of functionalized mesoporous silica nanoparticles The layers are intercalated
with mesoporous thin films of titania nanoparticles
Fig 66 Experimental ellipsometry data and model fit for a multilayer thin film (BS-1)
at 75 deg in nitrogen atmosphere
The data for the theoretical model stack exactly fits the experimental data The thickness
of the individual layers is reproducible and varies only in a narrow range (eg 135 nm
+- 8 nm in the case of CMS-P86) This ensures a narrow bandwidth in reflection and
transmission respectively Table 6 shows the composition of the multilayer stack
RESULTS AND DISCUSSION 44
141
Table 6 Layer thicknesses of the sample BS-1 determined with ellipsometry
number of layer layer describtion thickness
8 Cauchy 1 127 nm
7 Cauchy 2 74 nm
6 Cauchy 1 129 nm
5 Cauchy 2 76 nm
4 Cauchy 1 135 nm
3 Cauchy 2 73 nm
2 Cauchy 1 143 nm
1 silicon dioxide 2 nm
0 silicon 1 mm
In the model stack shown above the functionalized porous silica as well as the porous
titania layers are fitted using a Cauchy dispersion model for dielectric materials Cauchy
1 represents the silica material and Cauchy 2 stands for the titania layer Due to
inherent porosity of both materials the fitted refractive indices are significantly lower
than for the bulk materials (nD = 127 and 172 compared to 146 for glass and 249 for
anatase) The Bragg stack structure derived from the ellipsometric data was confirmed
with scanning electron microscopy Fig 67 shows side-view micrographs of the Bragg
stack BS-1 The dark layer represents the SiO2 layers which are intercalated by light
TiO2 layers Thus the depth profile obtained with ellipsometry is in good accordance
with the SEM investigations
RESULTS AND DISCUSSION 44
142
Fig 67 SEM pictures (side view) and a depth profile (ellipsometry) of the multilayer
stack BS-1
When exposed to an atmosphere of toluene close to saturation (p p0-1
= 086) the color
of the Bragg mirror immediately changes from yellow to red because the optical
thickness of the individual layers increases due to adsorption of toluene into the pores
This change of the optical properties can be also observed in the reflectance spectra of
BS-1 at an angle of 75deg in a flow of dry nitrogen (solid line) and of toluene-enriched
nitrogen (dotted line) in Fig 68
RESULTS AND DISCUSSION 44
143
Fig 68 Reflectance spectra (75 deg) of BS-1 in dry nitrogen (solid line) and in toluene-
containing nitrogen (p p0-1
= 086 dashed line)
Spectroscopic ellipsometry allows correlating the pore filling to the increase of the
refractive index of the individual layers Fig 69 shows the pronounced change due to
sorption of toluene The exchange of the gaseous nitrogen by liquid toluene inside the
porous multilayer stack significantly influences the refractive index of the individual
films
RESULTS AND DISCUSSION 44
144
Fig 69 Experimental ellipsometry data of BS-1 in nitrogen (solid line) and toluene
atmosphere (p p0-1
= 086 dashed line)
Fitting of the new experimental data is achieved by simply increasing the refractive
index of the layers at constant film thickness Thus the nD values for the silica layer
increases from 127 to 148 and the one of the titania layer from 172 to 193 Fig 70
shows the experimental data and the model fit of BS-1 in gaseous toluene with modified
optical properties The good correlation confirms the theory of filled pores
RESULTS AND DISCUSSION 44
145
Fig 70 Experimental ellipsometry data and model fit for sample BS-1 in toluene
atmosphere (p p0-1
= 086 dashed line)
The total porosity is calculated with ellipsometric porosimetry using the Lorentz-Lorenz
equation It is based on the Clausius-Mossotti equation which describes the relation
between the macroscopic measurable relative dielectric constant and the electric
polarizability α The adsorption of a volatile species in the film changes its refractive
index When the refractive index of the filled and empty porous substrate is known one
can determine the porosity of the material without knowing the refractive index of the
dense material The values are listed in Table 7
RESULTS AND DISCUSSION 44
146
Table 7 Porosity of the layers in BS-1 determined with ellipsometric porosimetry
layer describtion nD
in dry nitrogen
nD
in toluene vapor
nD
toluene
porosity
()
Cauchy 2 (titania)
1718 1925 1496 277
Cauchy 1 (silica) 1266 1476 1496 393
Knowing the optical properties of the materials one can predict the optical properties of
Bragg reflectors with different thicknesses for wavelength-selective coatings The
optical thickness (OT) of the layers is adjusted to one fourth of the desired wavelength
(OT = λ4) Depending on the refractive index of the material the physical thickness of
the film is calculated (OTn) If the Bragg mirror is supposed to reflect the green part of
the light (500 - 550 nm) the optical thickness of the layers should be about 130 nm In
order to observe a color change depending mainly on the low refractive and modifiable
SiO2-layer the titania-layer was chosen thin enough to realize an optical thickness (OT)
outside the visible part of the light (OT lt 100 nm) even in the filled state (refractive
index of the toluene filled layer at 350 nm 193) Table 8 shows the desired and realized
optical properties of the prepared individual layers of a green reflecting Bragg Stack
(BS-2)
RESULTS AND DISCUSSION 44
147
Table 8 Desired and actual layer thicknesses and optical properties of the sample BS-2
modified silica titania
reflected color green UV
selected wavelength range 500-550 nm lt 350 nm
optical thickness ~ 130 nm lt 90 nm
refractive index of filled layer (325 nm) - 193
refractive index (525 nm) 128 -
theoretical film thickness ~ 100 nm lt 47 nm
realized film thickness 102 nm 40 nm
Therefore the concentration of the colloidal suspensions and the spinning rate of the
spin-coater were adjusted in order to realize the preparation of thin films with the above
shown thickness for reflecting green light Single layers of the films were deposited on
silicon wafers in order to examine the thickness before the preparation of the stack was
performed on a glass plate Fig 71 shows the color of the transmitted and reflected light
of the Bragg stack BS-2 The coated transparent glass plate (perpendicular) is
illuminated from the right side with sunlight at an angle about 25 deg The transmitted and
reflected light falling onto the table is complementary Due to the illumination angle
the light is shifted to shorter wavelengths (Braggrsquos law)
RESULTS AND DISCUSSION 44
148
Fig 71 Sample BS-2 reflecting and transmitting sunlight
The desired theoretical reflected wavelength of the Bragg mirror (maximum ~ 525 nm)
was confirmed with transmission measurements Fig 72 shows the transmittance
spectrum at an angle of 90 deg of sample BS-2 The transmittance minimum is at 520 nm
Fig 72 Transmittance spectrum of BS-2 at an incident angle 90 deg
RESULTS AND DISCUSSION 44
149
The coated glass cover plate was placed in a quartz cuvette with gas in- and outlet in
order to follow the change in the reflectance and transmittance colors of the Bragg
reflector after adsorption of gaseous toluene Fig 73 shows the sample in dry nitrogen
atmosphere (above) and in an atmosphere of toluene (p p0-1
= 086) illuminated with
sunlight at an angle of about 45 deg
Fig 73 Wavelength shift due to adsorption of toluene in sample BS-2 (samples in a
quartz cuvette illuminated with sunlight at 45 deg)
The adsorption of toluene increases the optical thickness of the adsorbing layer and thus
drastically changes the reflected as well as the transmitted wavelength This change can
be clearly seen in the transmission spectrum at 45 deg (Fig 74) The transmission
minimum (reflection maximum) changes from about 510 nm (blue) to 590 nm (yellow)
This change happens within seconds when the film is exposed to the gaseous adsorbate
RESULTS AND DISCUSSION 44
150
Fig 74 Wavelength shift of transmitted light at an incident angle of 45 deg due to
adsorption of toluene in sample BS-2
Recording the transmission spectrum (90 deg) at different partial pressures of toluene
resulted in the isotherm shown in Fig 75 The curve resembles a type IV isotherm
typical for mesoporous materials After a relatively steep increase it passes nearly a
plateau at a relative pressure of about 053 before the slope increases again at about
070 The capillary condensation of the mesoporous film occurs at a higher relative
pressure
RESULTS AND DISCUSSION 44
151
Fig 75 Wavelength shift of transmitted light in BS-2 at different relative pressures of
toluene (90 deg incident angle)
Conclusion
Wavelength specific Bragg mirrors could be produced by a simple and reproducible
spin-coating approach These Bragg reflectors show a sensitivity towards specific
relative pressures of organic vapors such as toluene The existence of various colloidal
suspensions of porous nanoparticles opens a wide field of possible functional Bragg
mirrors The functionalization and thus the sorption properties may be varied by
introduction of different organic groups offering different interactions with the
adsorptives (or analytes) of interest The sensitive layer can also be replaced by other
low-refractive index materials such as zeolites The thickness of the individual layers
can be tuned in order to obtain reflectance or transmittance minima or maxima at a
desired wavelength even in the UV or IR region or a combination of different
wavelengths
CONCLUSION AND OUTLOOK
152
5 CONCLUSION AND OUTLOOK
CONCLUSION AND OUTLOOK
153
Colloidal suspensions of various kinds of discrete porous nanoparticles could be
synthesized and additionally functionalized with a multitude of organic groups
Due to the versatile functionalization of porous silica nanoparticles the materials have a
high potential in many applications eg as artificial viruses The pathway of a
fluorescently labeled particle into a cell could be observed with confocal microscopy
Due to the very small particle size the colloidal suspensions are completely transparent
to the visible part of the light Thus the material can be used eg as host material in
spectroscopic investigations Additionally liquid NMR-studies are possible due to the
fast rotation of such small objects in typical solvents The transparency is also
advantageous for the encapsulation of dyes or other materials which may allow one to
disperse otherwise insoluble substances in all kinds of matrices In combination with
sensitive caps the controlled release of drugs or other substances eg of initiators in
polymers constitute interesting topics for further research
Homogeneous colloidal suspensions of very small nanoparticles are of special interest
for the production of thin films by spin-coating on electronic semiconductor devices and
for optical coatings The thin films show very low refractive indices around 12 in the
case of zeolites and functionalized mesoporous silica nanoparticles respectively
The usage of porous nanoparticles has numerous advantages (see introduction in
Chapter 43) Porous titanium dioxide (thin) films may be interesting for the
development of dye-sensitized solar cells Thorough characterization and optimization
of the porosity can help to improve the loading with a dye or the permeation with the
electrolyte
CONCLUSION AND OUTLOOK
154
The ability eg of thiol-functionalized mesoporous silica to adsorb high amounts of
heavy metal ions could be further investigated in thin films Their presence should
influence the optical properties of the thin films
Finally the preparation of chemically sensitive Bragg mirrors using zeolites or other
porous metal oxides is also very promising Due to the usage of nanoparticles the
refractive index of the thin films can be easily adjusted by simply combining colloidal
suspensions of different materials Thus the color change due to adsorption can be
controlled in many respects
APPENDIX 61
155
6 APPENDIX
APPENDIX 61
156
61 Functionalized Mesoporous Silica
Nanoparticles as Host System for the
Synthesis of CdS Quantum Dots
Introduction
Mesoporous materials like MCM-41 can act as molds for the synthesis of structures by
inclusion chemistry in otherwise hardly accessible dimensions Depending on the pore
system the size and shape of the embedded structures can be controlled in a certain
range In the past many different nanoclusters such as Ge[125]
Fe2O3[126]
or
semiconducting GaAs[127]
have been synthesized within the channels The main
interesting features of semiconductor nanocrystals or quantum dots (QD) derive from
their atom-like electronic structure This atom-like electronic structure is a result of the
confinement of the electrons in all three spatial directions when very small sizes -
typically between 2 and 10 nm - are realized In contrast to atoms the energy spectrum
of a quantum dot can be engineered by controlling the geometrical size shape and the
strength of the confinement potential Quantum dots show unique properties concerning
their interaction with light Their high quantum yield and the possibility to tune the size
and thus the spectrum of quantum dots is advantageous for many applications
However it is sometimes difficult to benefit from these features because QDs are
APPENDIX 61
157
difficult to handle Depending on the desired application the QDs have to be
functionalized with specific shell molecules for example for in vivo optical
imaging[128]
or they have to be embedded in specific matrix materials when used with
high optical efficiency[129]
A striking example for a possible application of QDs is the utilization in a so called
Graumltzel or electrochemical solar cell (ECS)[130]
Until now commercially available
systems of that new kind of solar cell use TiO2 crystals in combination with dyes in
order to convert photons into excitons (electron-hole pairs) and realize charge
separation Quantum-dot sensitized mesoporous TiO2 features several advantages
compared to the standard electrochemical solar cell like a better optical tenability and
stability[131]
Common II-VI semiconductor nanoclusters include cadmium
chalcogenides eg cadmium sulfide or telluride The emission wavelength depends on
the diameter of the dots[132]
The desired size range coincides with the typical pore size
of the MCM-41-like mesoporous silica materials The typical synthesis of
semiconductor nanoclusters in the channels of mesoporous materials has been shown
following surface modification of the materials[133]
After functionalization eg with
thiol groups a dissolved cadmium salt is absorbed The resulting sample can be reacted
with a chalcogenide source eg H2S gas forming nanometer sized quantum dots or
wires inside the pores As discussed before the functionalized silica materials can also
be synthesized as nanoparticles These colloidal silica particles are of great interest for
several optical and biological applications The combination with a water-based
synthesis of cadmium chalcogenide nanocrystals promises large cost advantages
APPENDIX 61
158
compared to commonly synthesized quantum dots with organic stabilizing agents[134]
Here we describe the attempt to prepare CdS quantum-dots inside the pores of
mesoporous silica nanoparticles retaining the colloidal nature of the suspensions
Experimental
All chemicals were reagent grade (98 or higher) purchased from Sigma-Aldrich and
used without further purification The water was deionized The synthesis was carried
out in open polypropylene (PP) bottles
MS-1 host
The synthesis of MS-1 followed a method published by Gruumln et al[135]
24 g
cetyltrimethylammonium bromide (CTAB 66 mmol) were dissolved in 120 ml
deionized water in a 250 ml PP-bottle 95 g of ammonia solution (25 140 mmol
NH3) and 10 ml EtOH were added and the solution was stirred for 10 min After the
addition of 10 g tetraethoxysilane (TEOS 48 mmol) a white precipitate was formed and
the suspension was stirred for 1 h The product was recovered by filtration and washed
with water and EtOH
MS-SH host
Thiol-functionalized mesoporous silica was synthesized similarly in a co-condensation
process 24 g cetyltrimethylammonium bromide (CTAB 66 mmol) were dissolved in
120 ml deionized water in a 250 ml PP-bottle 95 g of ammonia solution (25
APPENDIX 61
159
140 mmol NH3) and 10 ml EtOH were added and the solution was stirred for 10 min
After the addition of a mixture of 85 g tetraethylorthosilicate (TEOS 41 mmol) and
163 g mercaptopropyltrimethoxysilane (MPTMS 83 mmol) a white precipitate was
formed and the suspension was stirred for 1 h The product was recovered by filtration
and washed with water and EtOH
Extraction of template from the bulk mesoporous hosts
For extraction of the template the product was suspended in 250 ml of an ethanolic
solution of ammonium nitrate (20 g l-1
) The mixture was refluxed under vigorous
stirring for 1 h and then filtrated The procedure was repeated with 250 ml of an
ethanolic solution of concentrated hydrochloric acid (5 g l-1
) The white filter cake was
washed with ethanol and dried at 60 degC
CMS-SH host
Colloidal mesoporous silica with thiol groups was synthesized following a published
procedure[99]
143 g (960 mmol) triethanolamine (TEAH) and a mixture of 223 ml
(100 mmol) TEOS plus 38 ml MPTMS (20 mmol) were combined in a 500 ml PP-
bottle with lid The two-phase mixture was heated in an oil bath at 90 degC for 20 min
without stirring Immediately after taking the mixture out of the oil bath 267 g of an
aqueous solution (25 wt ) of CTAC which had been heated to 60 degC was added and
the final mixture was stirred for at least 3 h at 23 degC
APPENDIX 61
160
Extraction of template from the colloidal mesoporous host
Extraction of template was performed by adding 250 ml of ethanol to the translucent
colloidal aqueous suspension of the mesoporous material The resulting precipitate was
centrifuged for 10 min at 40000 g (RCF) After decanting the sediment was
redispersed through vigorous stirring in 250 ml of an ethanolic solution of ammonium
nitrate (20 g l-1
) and then refluxed for 1 h This procedure was repeated with a 250 ml of
a solution of concentrated hydrochloric acid in ethanol (5 g l-1
) After washing with pure
ethanol the transparent gelatinous cake obtained after centrifugation could be
redispersed in ethanol leading to a colloidal suspension of the extracted product
CMS-SO3H host
The oxidation of the thiol groups in CMS-SH to sulfonic acid was performed with
concentrated hydrogen peroxide (33 ) before template extraction Hydrogen peroxide
(120 ml) was added to 25 g (calculated dry weight) of the wet sample CMS-SH and
stirred for 24 h at room temperature After oxidation the sample was washed first in
HCl-ethanol and subsequently in pure ethanol (CMS-SO3H-EtOH) or water (CMS-
SO3H-water) respectively
Incubation with Cd (II)
The amount of 10 ml of a 01 M solution of Cd(NO3)2 in ethanol or water respectively
were added to 2 g of mesoporous silica host (dry weight or calculated dry weight in the
case of colloidal suspensions) and stirred for 2 h The product was recovered by
APPENDIX 61
161
filtration or centrifugation and washed with ethanol or water ( sample-Cd-EtOH
sample-Cd-water)
Reaction with hydrogen sulfide
The ethanolic or aqueous suspensions of the corresponding products obtained after the
incubation with Cd(II) were treated with gaseous hydrogen sulfide as follows
FeS was slowly dissolved with 2 M hydrogen chloride and the developing H2S was
bubbled through the suspensions in a flow of nitrogen using the apparatus shown in Fig
76 Excessive H2S was eliminated in two washing bottles containing concentrated
aqueous NaOH or 2 M aqueous Cu(NO3)2 ( sample-CdS)
Fig 76 Setup for the reaction with hydrogen sulfide
Alternatively dry powder of the Cd(II)-containing mesoporous silica was exposed to
dry H2S atmosphere by connecting a CaCl2-column before the reaction vessel
APPENDIX 61
162
Characterization
Dynamic light scattering (DLS) data were collected with an ALV-NIBSHPPS High
Performance Particle Sizer in PMMA cuvettes at 25 degC Raman spectroscopy was
performed with a He-Ne laser (633 nm) on a LabRAM HR UV-Vis (HORIBA Jobin
Yvon) Raman Microscope (Olympus BX41) equipped with a Symphony CCD detection
system The spectra were baseline-corrected For thermogravimetric analysis (TGA)
10 mg of dry powder were heated in corundum crucibles from 30 to 900 degC
(10 degC min-1
) in a flow of synthetic air (25 ml min-1
) using a Netzsch STA 449 C Jupiter
thermobalance X-ray diffraction pattern were recorded on a Scintag Inc XDS 2000 in
theta-theta geometry (Cu-Kα1 λ=15406 Aring Cu-Kα2 λ=15444 Aring)
Transmission electron microscopy (TEM) was carried out on JEOL JEM 2011
instrument with LaB6 cathode at 200 kV Samples were prepared on a Plano holey
carbon coated copper grid by evaporating one droplet of diluted ethanolic suspension of
the extracted material The nitrogen sorption isotherms (77 K) were obtained using a
Quantachrome NOVA 4000e Surface Area amp Pore Size Analyzer Surface area
calculations were made using the Brunauer-Emmett-Teller (BET) equation in the range
from p p0-1
= 005 - 025 Pore-size distributions were determined using the DFT-
method (NLDFT equilibrium model cylindrical pores N2 on oxygen) The pore volume
was determined for meso- and micropores at p p0-1
lt 08
APPENDIX 61
163
Results and Discussion
Fig 77 shows the XRD patterns for the prepared bulk samples with (a) and without (b)
mercaptopropyl groups After template extraction the peaks become more pronounced
The typical reflection peak for such mesoporous materials can be observed at about 2 deg
(2θ) for the pure siliceous material (MS-1) and 23 deg for the functionalized one (MS-
SH) In the sample with thiol groups the reflections are less intense and shifted to
higher values This can be explained with the smaller pore size in combination with a
higher degree of disorder in the functionalized materials synthesized via co-
condensation
1 2 3 4 5 6 7
MS-1 extracted MS-1 with template
inte
nsity
2 [degrees]
1 2 3 4 5 6 7
MS-SH extracted MS-SH with template
inte
nsity
2 [degrees]
Fig 77 XRD powder pattern of pure siliceous and functionalized mesoporous bulk
material after drying and extracting
These two observations are naturally more pronounced when looking at dry powder of
functionalized mesoporous nanoparticles (Fig 78) Characterization of the colloidal
suspensions of mercaptopropyl functionalized nanoparticles is described in Chapter 42
APPENDIX 61
164
1 2 3 4 5 6 7
CMS-SH extracted CMS-SH with template
inte
nsity
2 [degrees]
Fig 78 XRD powder pattern of colloidal functionalized mesoporous silica (CMS-SH)
after drying and extraction
Sorption measurements (Fig 79) confirmed the successful extraction of the template
and the availability of highly porous materials
00 01 02 03 04 05 06 07 08 09 10
0
200
400
600
adsorption desorptionv
olu
me a
dsorb
ed [
cm
3
g-1
] S
TP
relative pressure p p0
-1
Fig 79 N2 sorption isotherm of extracted MS-1
APPENDIX 61
165
Incubation with Cd(II)
Evaluation of the thermogravimetric analysis data resulted in an estimated weight loss
of 190 mg mercaptopropyl residues per gram for MS-SH as well as for CMS-SH Using
the molar weight of 75 g mol-1
for these mercaptopropyl-residues resulted in a
calculated concentration of 25 mmol thiol per g material (ignoring residual template)
The more conclusive elemental analysis showed a sulfur content of 6 in weight
Using the molar weight of sulfur (32 g mol-1
) results in a concentration of 187 mmol
thiol per g silica Based on an average value of 2 mmol g-1
and the assumption that one
Cd2+
ion coordinates to two thiolates the maximum of adsorbed cadmium ions should
not exceed 1 mmol per g functionalized silica The usage of a great excess (5 mmol g-1
)
in the treatment with Cd(II) should ensure the coordination of every accessible thiol
group
TGA measurements after incubation and washing showed a successful loading with the
heavy metal ions The relative weight loss in percent caused by the decomposition of
the organic residues is lower in the material loaded with Cd2+
(Fig 80)
APPENDIX 61
166
100 200 300 400 500 600 700 800 900
-25
-20
-15
-10
-5
0
MS-SH-Cd MS-SH
weig
ht
loss [
]
temperature [iexclC]
Fig 80 TGA data of extracted MS-SH before and after loading with Cd(II)
A further indication for a successful coordination to the thiol groups is the decrease of
the pH-value when the cadmium salt is added to the suspensions of extracted MS-SH
The Cd2+
-ions replace the protons when coordinating to the SH-groups resulting in a
higher acidity Fig 81 shows that the pH-value of the suspension (35) decreases
significantly to 24 after addition of the aqueous cadmium salt solution (pH = 56)
0
1
2
3
4
5
6
24
35
56
MS
-SH
in
H2O
co
mb
ine
d
Cd
(NO3
)2 in
H2O
+
pH
Fig 81 Increase of the acidity caused by the coordination of Cd2+
in MS-SH
APPENDIX 61
167
Deprotonation of the SH-groups can also be observed in Raman measurements Fig 82
shows the spectra before and after insertion of cadmium ions in MCM-SH The
characteristic S-H-stretching at 2580 cmminus1
lost most of its intensity after the adsorption
of cadmium ions
500 1000 1500 2000 2500 3000 3500 4000
MS-SH-Cd MS-SH
inte
nsity
wavelength [cm-1]
Fig 82 Raman spectra of MS-SH before and after incubation with Cd2+
ions
Oxidation of CMS-SH
After the first adsorption experiments with cadmium salts in colloidal suspensions of
thiol-functionalized mesoporous silica it emerged that the particles tend to agglomerate
irreversibly
The selective oxidation of the external SH-groups into sulfonic acid groups (-SO3H)
was believed to solve the aggregation problem This modification should have been
achieved with hydrogen peroxide in combination with template-filled material The
APPENDIX 61
168
conversion of thiol groups in mesoporous silica nanoparticles into sulfonic acid with
hydrogen peroxide is proven[99]
Apparently the strength of the H2O2 and the reaction time were sufficient to oxidize all
thiol groups ndash also those inside the pore system Probably the organic template is
decomposed[136]
while the functional head of the organic residue is only converted into
sulfonic acid The completeness of the thiol oxidation can be observed in Raman
spectra Before the reaction with hydrogen peroxide the typical signals of the thiol
groups appear at 2580 cm-1
and 650 cm-1
These peaks completely disappear after the
treatment with H2O2 and instead a new one occurs at 1050 cm-1
(sulfonate stretching)
The signals for the aliphatic propyl groups around 2900 cm-1
are retained (Fig 83)
500 1000 1500 2000 2500 3000 3500 4000
CMS-SO3H
inte
nsity
wavenumber [cm-1]
CMS-SH
Fig 83 Raman-spectra before and after oxidation of CMS-SH with hydrogen peroxide
The coagulation of the particles after Cd(II)-salt addition could be avoided by oxidation
of the thiol groups The suspensions showed the same particle size distribution after
incubation with cadmium salts
APPENDIX 61
169
In order to further verify the effective coordination of heavy metal ions to the functional
groups equivalent amounts of the cadmium salt are introduced to the aqueous or
ethanolic suspensions of
pure siliceous bulk material (MS-1-Cd)
functionalized bulk material (MS-SH-Cd)
colloidal suspensions of functionalized material (CMS-SH-Cd)
colloidal suspensions of oxidized functionalized material (CMS-SO3H-Cd)
After washing the material the cadmium content was investigated with elemental
analysis As seen in Fig 84 the amount of incorporated cadmium found in the thiol
functionalized materials is significantly higher compared to the pure silica The amount
additionally depends on the solvent The remaining amount is higher when the loading
and washing is performed with ethanol Colloidal suspensions and suspension
containing bulk material adsorb comparable amounts Interestingly the suspension
containing the nanoparticles with sulfonic acid groups also adsorbs a considerable
amount of heavy metal ions - and the colloidal particles do not coagulate
APPENDIX 61
170
0 2 4 6 8 10
CMS-SH-Cd EtOH
MS-SH-Cd EtOH
CMS-SO3H-Cd EtOH
CMS-SH-Cd water
MS-SH-Cd water
MS-1-Cd water
MS-1-Cd EtOH
sam
ple
Cd2+
[wt - ICP]
Fig 84 Amount of Cd2+
in the different suspensions found with elemental analysis
Reaction with hydrogen sulfide
After the successful loading of the cadmium ions into the mesoporous hosts the
materials were exposed to gaseous hydrogen sulfide The aqueous as well as the
ethanolic suspensions immediately turned yellow upon bubbling with H2S Only if the
CdS is present as bulk material - or at least not as quantum dots - it shows its
characteristic bright yellow color The expected nanoparticles inside the pore system
should be colorless and fluorescent under UV-irradiation Fig 85 shows an image of
CMS-SO3H-CdS with the typical yellow color of bulk cadmium sulfide The colloidal
nature of the suspension with an average particle diameter of 170 nm is preserved
APPENDIX 61
171
1 10 100 1000 10000
inte
nsity
diameter [nm]
Fig 85 Image and DLS data of CMS-SO3H-CdS in ethanol after loading with Cd2+
and
reaction with H2S
Probably the initially formed CdS-clusters are very mobile in water or ethanol and tend
to leave the pore system in order to create larger particles on the surface of the
mesoporous hosts or in solution Even the supposedly dry powder (MS-SH-Cd) in H2S
atmosphere showed this yellow color after a few seconds Presumably the moisture
present with the development of hydrogen sulfide is problematic because it enhances the
mobility of the sulfide species involved Therefore the H2S was dried in a CaCl2-
column before it was reacted with the completely dry material (MS-SH-Cd) No change
in color could be observed under these conditions However after addition of water the
white powder instantly turned yellow (Fig 86) This observation supports the proposed
high mobility of initially formed CdS species
APPENDIX 61
172
Fig 86 MS-SH-Cd after exposure to dry H2S (A) and after addition of water (B)
Powder X-ray diffraction
Fig 87 shows the XRD pattern of CMS-SO3H-CdS in combination with the expected
diffraction pattern of bulk CdS material The peaks are significantly broadened
indicating the existence of small crystallites
20 30 40 50 60 70
CMS-SH-CdS
inte
nsity
2 [degrees]
Fig 87 Powder diffraction pattern of CMS-SO3H-CdS
APPENDIX 61
173
Applying the Scherrer equation allows approximating the average particle size For this
purpose the full width at half maximum (FWHM) of a peak at a certain angle (2θ) is
determined Here the instrumental broadening is neglected and the value of 094 was
chosen for the Scherrer constant K
cos
FWHM
KD
In combination with the wavelength of the Cu-Kα radiation (λ = 0154 nm) and a
FWHM of 0014 (radian measure) at 2θ = 44deg or θ = 22deg respectively an average
particle diameter D of approximately 11 nm can be calculated Thus the particles are
much too big to fit into the 3 nm pores
TEM-micrographs of the same sample show the monodisperse spherical particles with a
star-shaped pore system As expected from XRD measurements there is no evidence for
the existence of CdS particles inside the pores Instead a few dense particles in the
dimensions of about 10 nm can be found beside the porous silica particles (Fig 88)
APPENDIX 61
174
Fig 88 TEM-micrographs of CMS-SO3H-CdS
As mentioned above the colloidal suspension had a bright yellow color Interestingly
this coloration became less intense with time and nearly disappeared after 10 days The
suspension showed a pink fluorescence under UV-irradiation (Fig 89)
Fig 89 CMS-SO3H-CdS after 10 days (left) shows fluorescence under UV-light (right)
APPENDIX 61
175
Presumably the initially 11 nm-sized CdS particles slowly dissolved and temporarily
had the appropriate size to show fluorescence The undefined pink fluorescence may
derive from a rather diversified size distribution of the CdS clusters Two days later the
fluorescence disappeared
Conclusion
The aim of the project was to use the existent colloidal suspensions of functionalized
mesoporous silica nanoparticles as host system for the synthesis of CdS quantum dots
It was possible to load these porous particles with a high amount of heavy metal ions
preserving the colloidal state However when introducing the hydrogen sulfide it
appears that the initially formed CdS species inside the pores are very mobile and that
they can easily leave the pore system to form larger clusters at the outer surface of the
mesoporous particles or in the solvent They are not stabilized in the confined space as
desired It is imaginable that the synthesis could be successful with other solvents or
reagents
APPENDIX 62
176
62 Colloidal Suspensions of TiO2
Nanoparticles for the Preparation of
Porous Thin Films
Introduction
Titania exists in a number of crystalline forms of which the most important are anatase
and rutile It is inert does hardly react with other materials and is thermally stable non-
flammable and non-toxic TiO2 is the most widely used white pigment because of its
brightness and very high refractive index (n = 24) As effective opacifier in powder
form it is employed as a pigment to provide whiteness and opacity to products such as
glass and porcelain enamels cosmetics sunscreens paper paints and foods
Titanium dioxide particularly in the anatase form is a photocatalyst under ultraviolet
light The strong oxidative potential of the positive holes oxidizes water to create
hydroxyl radicals and the holes can also oxidize organic materials directly Titanium
dioxide is thus added to paints cements or directly coated as protective thin film onto
the desired surface When deposited as a thin film its high refractive index makes
titania an excellent reflective optical coating for dielectric mirrors A further important
application is the utilization as semiconducting layer in dye-sensitized solar cells
(DSSC)[130]
In these so-called Graumltzel cells nanoparticulate layers or homogeneous
APPENDIX 62
177
mesoporous films can potentially offer great improvements Their high surface areas
allow a high loading with dye For an efficient operation the titania layer should have a
highly accessible pore system Thus it is important to obtain the material as discrete
nanoparticles in colloidal suspensions The synthesis of titanium dioxide particles at the
nanometer scale can be achieved by several methods such as pyrolysis or sol-gel
chemistry[137]
In the last years several studies on the synthesis of mesoporous titania which should
exhibit a higher specific surface area than the nanoparticles were published Most of the
experiments are based on the synthesis of mesoporous silica for example the synthesis
procedure described by Amoros[138]
which uses a complexing agent in order to retard
the hydrolysis of the titaniumalkoxide Due to fundamental differences in hydrolysis
and condensation behavior as well as template interaction it turned out that the
principles used for the synthesis and extraction of mesoporous silica cannot be adopted
easily The main difficulty is the removal of the template either by extraction or
calcination In the latter case collapsing of the pore system due to the formation of large
crystalline domains is one reason
The preparation of mesoporous titanium dioxide in nanoparticulate form is also
frequently claimed[139 140]
For the preparation of thin films via spin-coating the
existence of discrete mesoporous particles in a homogeneous colloidal suspension is
necessary but the focus of the research is often on other objectives like a high
crystallinity or stability[140 141]
APPENDIX 62
178
The preparation of mesoporous titania in the form of thin films with the EISA approach
is well-investigated[20]
This recipe was also adopted for the synthesis of bulk material
by slowly evaporating the solvent[142 143]
Although the synthesis of homogeneous
mesoporous TiO2 thin films following the EISA-approach is practical the formation
from nanoparticles might be advantageous in some respects As already mentioned in
Chapter 43 it is believed that such films might exhibit improved diffusionial access
Additionally one can work with a stable suspension of already extracted and
characterized nanoparticles thus ensuring good reproducibility The coating of sensitive
substrates is facilitated due to the mild conditions and the thickness can be easily
controlled by varying the concentration or by multiple step coating As a further
treatment such as extraction or calcination is no longer necessary sensitive substances
eg dyes can already be added to the coating suspensions Finding an appropriate
titania precursor is the first challenge in titania sol-gel chemistry as the hydrolysis of
the titanium precursors is typically much faster than that of the silica analogues
Common precursors are titanium alkoxides and complexes eg
titanium(IV)bis(acetylacetonate)diisopropoxide or titanium(IV)(triethanolaminato)
isopropoxide The aim of this work was the preparation of homogeneous porous thin
films from TiO2 nanoparticles by a facile and reproducible spin-coating approach
APPENDIX 62
179
Experimental
CMT-1 CMT-1A
The amount of 244 g hexadecyltrimethylammonium bromide (CTAB 67 mmol) and
633 g titanium(IV) (triethanolaminato) isopropoxide (TiTEAiOPr 80 in isopropanol
20 mmol) were combined at room temperature and mixed with 60 ml water under
stirring Precursor and template were completely dissolved and stirred for 24 hours at
room temperature The initially clear solution started to become opalescent after about
2 hours One half of the final colloidal suspension was centrifuged and the sediment was
washed 3 times and then redispersed in water (CMT-1) The other half was autoclaved
at 100 degC for 24 hours and then washed and redispersed (CMT-1A) Parts of the
material were calcined (CMT-1-c CMT-1A-c) at 350 degC for 3 h (1 K min-1
) or
extracted (CMT-1-e CMT-1A-e) as described in Chapter 42
CMT-2
The experiment above was repeated at 50 degC without autoclaving
CMT-3
The amount of 20 g TiTEAOiPr (80 in isopropanol 63 mmol) was added to a
preheated (60 degC) solution of 05 g hexadecyltrimethylammonium chloride and 620 g
water under stirring The mixture was kept at 60 degC and stirred for 2 h The final
colloidal suspension was centrifuged and the sediment was washed 3 times and then
redispersed in water
APPENDIX 62
180
CMT-4
The amount of 276 g concentrated hydrochloric acid (37 ) was added to a solution of
568 g tetraisopropylorthotitanate and 10 g EtOH A mixture of 116 g
hexadecyltrimethyl-ammonium bromide (CTAB) in 84 g EtOH and 438 g dest H2O
were added and the clear solution was refluxed under stirring for 6 h while slowly
forming a white suspension The suspension was diluted with 20 ml EtOH centrifuged
for 30 min at 40000 g (RCF) and redispersed in a mixture of 20 ml EtOH and 2 g dest
H2O Centrifugation and redispersion in pure ethanol was repeated twice leading to a
colloidal suspension of TiO2 nanoparticles For characterization of the material a part of
the suspension was dried at 60 degC
CMT-5
The amount of 276 g concentrated hydrochloric acid (37 ) was added to a solution of
568 g tetraisopropylorthotitanate and 184 g EtOH The amount of 438 g dest H2O
was added and the clear solution was refluxed under stirring for 6 h while slowly
forming a white suspension The suspension was diluted with 20 ml EtOH centrifuged
for 30 min at 40000 g (RCF) and redispersed in a mixture of 20 ml EtOH and 2 g dest
H2O Centrifugation and redispersion in pure ethanol was repeated twice leading to a
colloidal suspension of TiO2 nanoparticles For characterization of the material a part of
the suspension was dried at 60 degC
APPENDIX 62
181
CMT-6
The amount of 552 g concentrated hydrochloric acid (37 ) was added to a solution of
1136 g tetraisopropylorthotitanate and 368 g EtOH The amount of 876 g dest H2O
was added and the clear solution was refluxed under stirring for 6 h while slowly
forming a white suspension
The suspension was diluted with 20 ml EtOH and peptized with 1 ml water before it
was centrifuged for 5 min at 40000 g (RCF) in order to remove big agglomerates The
supernatant suspension was flocculated with 20 g hydrochloric acid and after
centrifugation the sediment was redispersed in a mixture of 20 ml EtOH and 2 g dest
H2O This washing procedure was repeated once
APPENDIX 62
182
Thin film preparation
The colloidal suspensions of CMT-6 contained about 3 wt titaniumdioxide The
ethanolic suspension can be used directly for the preparation of thin films by spin-
coating The thin films were deposited on polished silicon wafers or QCM chips (XA
1600 AT-cut KVG Quartz Crystal Technology) by spin-coating using a Laurell WS-
400B-6NPP-Lite-AS All substrates were pre-cleaned with ethanol for 5 s under
spinning at 3000 rpm The film thickness was adjusted by diluting the colloidal
suspensions with absolute ethanol by variation of the spinning rate between 3000 and
5000 rpm and by multi step coatings
Characterization
Dynamic light scattering (DLS) data were collected with a Malvern Nano ZS in PMMA
cuvettes at 25 degC Raman spectroscopy was performed with a He-Ne laser (633 nm) on
a LabRAM HR UV-Vis (HORIBA Jobin Yvon) Raman Microscope (Olympus BX41)
equipped with a Symphony CCD detection system The spectra were baseline-corrected
For thermogravimetric analysis (TGA) 10 mg of dry powder were heated in corundum
crucibles from 30 to 900 degC (10 degC min-1
) in a flow of synthetic air (25 ml min-1
) using
a Netzsch STA 449 C Jupiter thermobalance X-ray diffraction pattern were recorded on
a Scintag Inc XDS 2000 in theta-theta geometry (Cu-Kα1 λ = 15406 Aring Cu-Kα2
λ = 15444 Aring) Transmission electron microscopy (TEM) was carried out on a JEOL
JEM 2011 instrument with LaB6 cathode at 200 kV Samples were prepared on a Plano
holey carbon coated copper grid by evaporating one droplet of diluted ethanolic
APPENDIX 62
183
suspension of the extracted material The nitrogen sorption isotherms (77 K) were
obtained using a Quantachrome NOVA 4000e Surface Area amp Pore Size Analyzer
Surface area calculations were made using the Brunauer-Emmett-Teller (BET) equation
in the range from p p0-1
= 005 - 025 Pore-size distributions were determined using the
DFT-method (NLDFT equilibrium model cylindrical pores N2 on oxygen) The pore
volume was determined for meso- and micropores at p p0-1
lt 08 Ellipsometry
measurements were performed with a Woollam M2000D at an angle of 75deg in the
spectral range of 190 - 1000 nm The data was fitted in the range between 350 ndash
1000 nm using the Cauchy material as model layer Ellipsometric porosimetry
measurements were carried out in a liquid cell at different partial pressures at a
measurement angle of 75 deg The recording of isotherms was performed using a
homemade Labview-controlled gas mixer Digital mass flow controllers (W-101A-110-
P F-201C Bronkhorst High-Tech) ensured the accurate dosing of the carrier gas
nitrogen and the liquid analyte which was vaporized in a controlled evaporation and
mixing element (W-101A Bronkhorst High-Tech) Partial pressures were calculated
using the van der Waals equation with real gas-state assumptions
(QCM) A 10 MHz Quartz Crystal Microbalance (QCM) device (XA 1600 AT-cut
KVG Quartz Crystal Technology) was used to measure frequency changes due to
additional adsorbed mass Some parameters of the Sauerbrey equation such as the
density ρq = 2648 gmiddotcm-3
and the shear modulus υq = 2947middot1011
gmiddotcm-1
middots-2
are
characteristics of the piezoelectric material quartz The Sauerbrey equation is
normalized to 1 cm2 sensing area on the QCM chip thus a frequency change of 1 Hz
APPENDIX 62
184
corresponds to a mass-loading of 442middot10-9
g The overall frequency fluctuation of the
system is plusmn1-2 Hz at room temperature
Results and Discussion
The first experiments (not shown) were inspired by the synthesis of mesoporous silica
nanoparticles described in Chapter 42 The pretreatment of the titaniumalkoxide with
triethanolamine at elevated temperature resulted in yellowish clear solutions which
slowly hydrolyzed in water compared to the titaniumalkoxides In the reactions shown
here the commercially available complexed precursor titanium(IV) (triethanolaminato)
isopropoxide was used
After hydrolysis the resulting colloidal suspension CMT-1 contained discrete particles
with an average hydrodynamic diameter (DLS) of almost 1 μm after washing (Fig 90)
APPENDIX 62
185
10 100 1000 10000
inte
nsity
diameter [nm]
Fig 90 DLS particle size distribution of washed CMT-1
The powder diffraction pattern (Fig 91) of the dry product shows a weak reflection at
23 deg (2 θ) which is typical for CTMA+ templated mesopores (Fig 77 Chapter 61)
1 2 3 4 5 6 7 8 9 10
max = 23iexcl
inte
nsity
2 (degree)
Fig 91 Powder diffraction pattern of the washed sample CMT-1
Although the material seems to possess a certain mesostructure TEM investigations
(Fig 92) could not confirm the existence of mesopores The material possibly exhibits a
fibrous structure but it was not further analysed
APPENDIX 62
186
Fig 92 TEM-micrographs of the washed sample CMT-1
The particles appear anisotropic with an irregular particle size distribution At higher
magnification an undefined mesostructure in the material can be observed However it
is not clear if this structure formed as a result of adding the template Therefore the
washed product was subjected to an extraction procedure and the weight loss before and
after this treatment was determined with TGA (Fig 93)
100 200 300 400 500 600
-60
-50
-40
-30
-20
-10
0 CMT-1 extracted
CMT-1 washed
weig
ht lo
ss [
]
temperature [degC]
Fig 93 Thermogravimetric analysis of washed and extracted sample CMT-1
APPENDIX 62
187
Heating of the washed product caused two distinct steps in the weight loss The first one
at about 250 degC could be assigned either to the template decomposition or further
condensation under elimination of alkoxygroups The second step at higher
temperatures between 400 and 500 degC might be due to complexing triethanolamine
residues After extraction the weight loss is much lower ndash but it cannot be assured that
the material is completely extracted mesoporous titania
Elimination of the template should also be achieved after heating to 300 degC Calcination
at temperatures up to 350 degC is also claimed in several publications [144]
Both materials
ndash extracted (CMT-1-e) and calcined (CMT-1-c) - were investigated by XRD (Fig
94)The initial reflection at 23 deg and thus the mesostructure completely disappeared
after the treatment
10 15 20 25 30 35 40 45 50
inte
nsity
2 [degree]
10 15 20 25 30 35 40 45 50
inte
nsity
2 [degree]
Fig 94 XRD pattern of (a) calcined (CMT-1-c) and (b) extracted (CMT-1-e) material
Nitrogen sorption analysis also suggests the absence of ordered mesopores in both
materials (Fig 95) The isotherms are typical for an ink-bottle type pore system but the
difference in the adsorption and the desorption step argue against pore channels with a
APPENDIX 62
188
defined diameter The BET-surface areas of the calcined and extracted material are
80 m2 g
-1 and 200 m
2 g
-1 respectively One would expect a significantly higher specific
surface area in ordered mesoporous titania even though it can not reach the value of a
comparable mesoporous silica due to the higher density of TiO2
The DFT-pore size distribution was not calculated because no appropriate model is
available at this time As expected from the isotherm a BJH pore size calculation
regarding the adsorption branch gives a rather undefined and meaningless distribution
00 01 02 03 04 05 06 07 08 09 10
0
20
40
60
80
100
adsorption
desorption
volu
me a
dsorb
ed [cm
3 g
-1] S
TP
relative pressure p p0
-1
00 01 02 03 04 05 06 07 08 09 100
10
20
30
40
50
60
70
adsorption
desorption
vo
lum
e a
dso
rbe
d [cm
3 g
-1] S
TP
relative pressure p p0
-1
Fig 95 N2-isotherms of extracted (CMT-1-e) and calcined (CMT-1-c) samples
In order to improve the condensation of the inorganic material and possibly an enhanced
debonding of the complexing triethanolamine the synthesis was repeated at an elevated
temperature The reaction at 50 degC resulted only in minor improvements for example a
more pronounced reflection at about 23 deg in x-ray diffraction (Fig 96)
APPENDIX 62
189
1 2 3 4 5 6 7 8 9 10
inte
nsity
2 [degrees]
Fig 96 Powder diffraction pattern of CMT-2
The particle size distribution in DLS as well as TGA data and sorption analysis showed
no significant difference or improvement In a further attempt to improve the
condensation and debonding of triethanolamine the suspension of CMT-1 was
autoclaved at 100 degC after synthesis Again the peaks in the XRD powder pattern were
more intensive and even showed higher-order reflections at 46 deg and 69 deg (Fig 97)
1 2 3 4 5 6 7 8 9 10
max 23 deg 46 deg 69 deg
inte
nsity
2 [degree]
Fig 97 Powder diffraction pattern of CMT-1A autoclaved at 100 degC
APPENDIX 62
190
The positions of the reflections indicate the existence of a lamellar structure This
structure is believed to be the thermodynamically more stable one The results in
transmission electron microscopy (Fig 98) could only confirm the expected lamellar
structure
Fig 98 TEM-micrograph of CMT-1A autoclaved at 100 degC
As expected for lamellar systems template removal resulted in a loss of the
mesostructure as shown in XRD patterns in Fig 99
APPENDIX 62
191
10 15 20 25 30 35 40 45 50
inte
nsity
2 [degree]
10 15 20 25 30 35 40 45 50
inte
nsity
2 [degree]
Fig 99 Powder diffraction pattern of the (a) calcined (CMT-1A-c) and (b) extracted
(CMT-1A-e) material
The combination of solid template (CTAB) and titania precursor might be
disadvantageous for the formation of nanoparticles Thus in further experiments an
aqueous solution of the template was prepared and heated before the slowly
hydrolyzing precursor was added (CMT-3) After hydrolysis at elevated temperature
(60 degC) a homogeneous colloidal suspension with a narrow particle size distribution
was obtained (Fig 100)
APPENDIX 62
192
10 100 1000 10000
CMT-3
inte
nsity
particle size [nm]
Fig 100 Colloidal suspension and particle size distribution (DLS) of CMT-3
The product was subjected to the same extraction process as the mesoporous silica
particles in Chapter 42 The particles in the resulting ethanolic suspension were
agglomerated to a high degree After drying the product was slightly yellow and
adhesive TGA (Fig 101) showed that the template was removed for the most part but
the material still seems to contain a noteworthy amount of triethanolamine as already
observed in the sample CMT-1
APPENDIX 62
193
100 200 300 400 500 600 700
-60
-50
-40
-30
-20
-10
0
weig
ht
loss [
]
temperature [iexclC]
0 10 20 30 40 50 60
-25
-20
-15
-10
-05
00
time [min]
DT
G [
m
in-1
]
100 200 300 400 500 600 700
-15
-10
-5
0
weig
ht
loss [
]
temperature [iexclC]
0 10 20 30 40 50 60
-075
-050
-025
000
time [min]
DT
G [
m
in-1
]
Fig 101 TGA data of washed CMT-3 before and after extraction procedure
However the nitrogen sorption isotherm of this sample differs from the one of CMT-2
The isotherm does not show such a pronounced hysteresis loop and the specific surface
area is significantly higher (330 m2 g
-1) The pore size distribution (DFT) shows a
broadening on both sides of the typical peak for CTMA+ at around 3 nm (Fig 102)
00 01 02 03 04 05 06 07 08 09 1040
50
60
70
80
90
100
110
120
adsorption desorptionv
olu
me a
dsorb
ed [
cm
3
g-1
] S
TP
relative pressure p p0
-1
10 100 1000
0000
0002
0004
0006
0008
0010
Dv(d
) [c
m-3
-1
g-1
]
pore diameter []
Fig 102 N2 sorption isotherm and DFT pore size distribution of extracted CMT-3
APPENDIX 62
194
Variation of the synthesis conditions such as temperature or batch composition as well
as the exchange of the template by shorter (dodecyltrimethylammonium chloride) or
neutral substitutes (dodecyl amine) in further experiments did not lead to improved
materials and were therefor not shown here The replacement of the precursor with
related complexes eg titanium diisopropoxide bis(acetylacetonate) was unsuccessful
because of a poor solubility in the aqueous medium The results of the first experiments
described above point out that in contrast to the silica material the basic synthesis
procedure for mesoporous titania is connected to several problems Especially in the
presence of triethanolamine extraction and redispersion is challenging
Thus the synthesis conditions were completely changed from basic to acidic conditions
Several synthesis procedures for mesoporous titania in acidic medium can be found in
the literature[143 145 146]
One promising method described by Soler-Illia et al[142]
is
based on the EISA approach for mesoporous TiO2 thin films This recipe was chosen as
basis for the synthesis of colloidal suspensions of mesoporous titanium dioxide
nanoparticles The newly developed synthesis also started from a clear solution that was
heated under reflux The formation of TiO2 particles in the initial solution caused a
slowly increasing turbidity resulting in a white viscous suspension Subsequent washing
and redispersion led to an ethanolic suspension of titanium dioxide nanoparticles
Peptization of the particles was realized by addition of very small amounts of water
The resulting colloidal translucent suspensions showed a narrow particle size
APPENDIX 62
195
distribution in dynamic light scattering (DLS) with a mean particle size of 130 nm (Fig
103)
1 10 100 1000 10000
inte
nsity
diameter [nm]
Fig 103 Particle size distribution (DLS) of an ethanolic colloidal suspension of CMT-4
Electron microscopy confirmed the existence of discrete particles in the nanometer
range The TiO2 nanoparticles can be described as prolate spheroids of approximately
the same average size as indicated by DLS (Fig 104)
Fig 104 TEM-micrograph of CMT-4
APPENDIX 62
196
Because of this anisotropic shape one can expect a certain order either due to template
interaction or crystallinity Therefore a dried sample of CMT-4 and CMT-5 was
investigated in thermogravimetric analysis
100 200 300 400 500 600 700 800 90016
14
12
10
8
6
4
2
0
we
igh
t lo
ss [
]
temperature [iexclC]
0 10 20 30 40 50 60 70 80
-075
-050
-025
000
time [min]
DT
G [
min-1
]
100 200 300 400 500 600 700 800 900
18
16
14
12
10
8
6
4
2
0
we
igh
t lo
ss [
]
temperature [iexclC]
0 10 20 30 40 50 60 70 80
-10
-05
00
time [min]
DT
G [
min-1
]
Fig 105 TGA data of washed CMT-4 (a) and washed CMT-5 (b)
Sample CMT-4 and the product synthesized with the same procedure but without any
template (CMT-5) do hardly show any difference The synthesis was also carried out
with different other templates ndash anionic and cationic (palmitic acid CTAC) or neutral
(pluronic dodecylamine) template In no case an ordered or disordered mesoporous
structure caused by organic templates could be confirmed Thus the weight loss at
around 250 degC which is typically assigned to template elimination in mesoporous silica
materials cannot be attributed to the template in the case of CMT-4 As this step can
also be observed in CMT-5 it is probably caused by further condensation of the
inorganic network and decomposition of alkoxy groups This relatively high weight loss
may be due to incomplete crystallinity of the samples Nevertheless the materials show
APPENDIX 62
197
a certain crystallinity in Raman spectroscopy The apparent signals can be attributed to
rutile
0 500 1000 1500 2000
CMT-4 rutile
inte
nsity
wavelength [cm-1]
Fig 106 Raman spectra of CMT-4 and spectra of rutile
X-ray powder diffraction patterns confirmed the existence of a crystalline phase in the
dry powder The relatively broad signals indicate the existence of small particles
15 20 25 30 35 40 45
CMT-4
inte
nsity
2 [degree]
rutile
Fig 107 X-ray powder diffraction pattern of CMT-4
APPENDIX 62
198
Nitrogen sorption analyses (Fig 108) showed that both materials exhibit a certain
mesoporosity Due to the shape of the isotherms and hysteresis loops the existence of a
channel-like pore structure can be excluded
00 01 02 03 04 05 06 07 08 09 100
25
50
75
100
125
150
175
200
adsorption desorptionv
olu
me a
dsorb
ed [
cm
3
g-1
] S
TP
relative pressure p p0
-1
00 01 02 03 04 05 06 07 08 09 100
25
50
75
100
125
150
175
200
adsorption desorptionv
olu
me a
dsorb
ed [
cm
3
g-1
] S
TP
relative pressure p p0
-1
1 10 100
00
05
10
15
20
25
desorp
tion D
v(d)
[m2
g-1
]
pore diameter [nm]
1 10 100
00
05
10
15
20
25
deso
rption D
v(d
) [m
2 g
-1]
pore diameter [nm]
Fig 108 N2 sorption data of CMT-4 (l) and CMT-5 (r)
These findings led to the conclusion that the interaction of template and titanium
precursor in the described procedures seems to be too weak to build up a mesostructure
This interpretation is corroborated by the fact that the best results concerning the surface
area of the resulting particles were achieved without any template The measured pore
size is not influenced by the addition of template CMT-5 showed a BET-surface area of
APPENDIX 62
199
more than 300 m2 g
-1 and a relatively narrow pore size distribution with a diameter
around 5 nm (Table 9)
Table 9 Nitrogen sorption data of CMT-4 and CMT-5
CMT-4 CMT-5
Surface area (BET) 276 m2 g
-1 311 m
2 g
-1
Total pore volume 024 cm3 g
-1 025 cm
3 g
-1
Mean pore width 48 nm 47 nm
The synthesis of similar hydrosols is already known[147]
The existence of a mesoporous
structure caused by agglomeration of the TiO2 nanoparticles and the resulting high
surface area is described in literature[148 149]
Due to the easy redispersability of the
washed particles and the high quality of the final ethanolic suspensions the material can
be used for the preparation of homogeneous thin films by spin-coating[150]
APPENDIX 62
200
Homogeneous Thin Films
For the preparation of homogeneous thin films the synthesis without template (CMT-5)
was repeated After purification of the nanoparticles received from hydrothermal
treatment (CMT-6) the colloidal suspension was used for the preparation of thin film
Fig 109 shows the mean particle size (80 nm) of the suspended titania nanoparticles in
the coating suspension
1 10 100 1000 10000
inte
nsity
diameter [nm]
Fig 109 Particle size distribution (DLS) of CMT-6
Fig 110 shows an image of a silicon wafer with a thin film of titania nanoparticles The
film was prepared by spin-coating two times with a suspension containing about 3 wt
of CMT-6
APPENDIX 62
201
300 400 500 600 700 800 900 10000
10
20
30
40
50
60
experimental data
model fit
in
deg
rees
wavelength [nm]
Fig 110 Thin film of CMT-6 (107 nm) on a silicon wafer and ellipsometric data
The film appears very homogeneous and transparent and thus has a definite interference
color Ellipsometric measurements resulted in a film thickness of 107 nm The same
film was deposited on a quartz crystal microbalance chip In order to achieve a higher
thickness the chip was coated four times The optical characterization was performed
with ellipsometry assuming the following theoretic model 0 the gold electrode was
chosen to be infinitely thick (1 mm) 1 the material (titania nanoparticles) is described
with a Cauchy layer Starting with a guessed film thickness of 200 nm the subsequent
fitting of the thickness and the Cauchy parameters resulted in a film thickness of 187
nm
The measurement was performed in a liquid cell in a flow of nitrogen It was repeated in
an atmosphere of gaseous toluene with a partial pressure of 0943 (p p0-1
) Fig 111
shows the change in the ellipsometric data due to physisorption of toluene
APPENDIX 62
202
300 400 500 600 700 800 900 1000-10
0
10
20
30
40
50
60
toluene atmosphere nitrogen atmosphere
in d
egre
es
wavelength [nm]
300 400 500 600 700 800 900 1000110017
18
19
20
21
22
23
24
toluene atmosphere nitrogen atmosphere
refr
active index
wavelength [nm]
Fig 111 Ellipsometry data of a thin film of CMT-6 on a QCM chip in nitrogen (dashed
line) and toluene (solid line) atmosphere
The refractive index nD of the film changes from 180 to 193 when filled with toluene
(nD = 15) With the Lorentz-Lorenz equation for ellipsometric porosimetry (EP)[55]
a
porosity of 16 can be specified The sorption measurement was repeated in a quartz
crystal microbalance at different partial pressures of toluene to record a full sorption
isotherm (Fig 112)
APPENDIX 62
203
00 02 04 06 08 1000
01
02
03
04
05
06
07
adsorb
ed v
olu
me [m
mol g
-1]
p p0
-1
Fig 112 Toluene sorption isotherm of a thin film of CMT-6 recorded in a QCM
The weight increase due to film deposition was 376 μg per cm2 With a film thickness
of 187 nm a density of 201 g cm-3
can be calculated The maximum weight increase
due to toluene adsorption was 21 μg per cm2 or 011 g per cm
3 respectively With a
density of 087 g cm-3
for liquid toluene a porosity of 13 can be calculated which
coincides well with the value determined with ellipsometric porosimetry
Conclusion
The synthesis of templated mesoporous titanium dioxide nanoparticles similar to the
silica analogues introduced in Chapter 42 could not be realized The TiO2 particles
forming in the acidic medium by a simple sol-gel process often show a higher surface
area and are much easier to redisperse than particles obtained in the basic synthesis
Although the general synthesis procedure is already known for a long time the resulting
colloidal suspensions are ideal candidates for the preparation of porous thin films
Especially if the synthesis by evaporation induced self-assembly is connected to
APPENDIX 62
204
problems the usage of these suspensions can be an interesting alternative Despite of
their porosity the prepared films have a high refractive index
REFERENCES
205
7 REFERENCES
REFERENCES
206
[1] Taniguchi N On the Basic Concept of Nano-Technology Japan Society of
Precision Engineering 1974
[2] Drexler E Engines of Creation The Coming Era of Nanotechnology New
York Anchor PressDoubleday 1986
[3] Drexler E Nanosystems Molecular Machinery Manufacturing and
Computation John Wiley amp Sons Inc 1992
[4] Boncheva M Whitesides G M Making things by self-assembly MRS Bull
2005 30 736-742
[5] Ter Minassian-Saraga L Thin films including layers terminology in relation to
their preparation and characterization Pure Appl Chem 1994 66 1667-1738
[6] Koga K Ikeshoji T Sugawara K-i Size- and Temperature-Dependent
Structural Transitions in Gold Nanoparticles Phys Rev Lett 2004 92 115507
[7] Trewyn B G Giri S Slowing I I Lin V S-Y Mesoporous silica
nanoparticle based controlled release drug delivery and biosensor systems
Chem Commun (Cambridge U K) 2007 3236-3245
[8] Barbe C Bartlett J Kong L Finnie K Lin H Q Larkin M Calleja S
Bush A Calleja G Silica particles A novel drug-delivery system Adv
Mater (Weinheim Ger) 2004 16 1959-1966
[9] Joutsensaari J Loivamaki M Vuorinen T Miettinen P Nerg A M
Holopainen J K Laaksonen A Nanoparticle formation by ozonolysis of
inducible plant volatiles Atmospheric Chemistry and Physics 2005 5 1489-
1495
[10] Mackenzie J D Bescher E P Chemical Routes in the Synthesis of
Nanomaterials Using the Sol-Gel Process Acc Chem Res 2007 40 810-818
[11] Cushing B L Kolesnichenko V L OConnor C J Recent Advances in the
Liquid-Phase Syntheses of Inorganic Nanoparticles Chem Rev (Washington
DC U S) 2004 104 3893-3946
[12] Stober W Fink A Bohn E Controlled growth of monodisperse silica
spheres in the micron size range J Colloid Interface Sci 1968 26 62-69
REFERENCES
207
[13] LaMer V K Dinegar R H Theory Production and Mechanism of Formation
of Monodispersed Hydrosols J Am Chem Soc 1950 72 4847-4854
[14] Sing K S W Everett D H Haul R A W Moscou L Pierotti R A
Rouquerol J Siemieniewska T Reporting Physisorption Data For GasSolid
Systems with Special Reference to the Determination of Surface Area and
Porosity Pure Appl Chem 1985 57 603-619
[15] Cundy C S Cox P A The hydrothermal synthesis of zeolites Precursors
intermediates and reaction mechanism Microporous Mesoporous Mater 2005
82 1-78
[16] Baerlocher C McCusker L B Database of Zeolite Structure wwwiza-
structureorgdatabases
[17] Yan Y Silica zeolite ultra low-k dielectric thin films PMSE Prepr 2004 90
89-94
[18] Fowler C E Khushalani D Lebeau B Mann S Nanoscale materials with
mesostructured interiors Adv Mater (Weinheim Ger) 2001 13 649-652
[19] Yang P Zhao D Margolese D I Chmelka B F Stucky G D Block
Copolymer Templating Syntheses of Mesoporous Metal Oxides with Large
Ordering Lengths and Semicrystalline Framework Chem Mater 1999 11
2813-2826
[20] Brinker C J Lu Y F Sellinger A Fan H Y Evaporation-induced self-
assembly Nanostructures made easy Adv Mater (Weinheim Ger) 1999 11
579-585
[21] Liu J Shin Y Nie Z M Chang J H Wang L Q Fryxell G E Samuels
W D Exarhos G J Molecular assembly in ordered mesoporosity A new
class of highly functional nanoscale materials J Phys Chem A 2000 104
8328-8339
[22] Burkett S L Sims S D Mann S Synthesis of hybrid inorganic-organic
mesoporous silica by co-condensation of siloxane and organosiloxane
precursors Chem Commun (Cambridge U K) 1996 1367-1368
REFERENCES
208
[23] Burleigh M C Markowitz M A Spector M S Gaber B P Direct
synthesis of periodic mesoporous organosilicas Functional incorporation by co-
condensation with organosilanes J Phys Chem B 2001 105 9935-9942
[24] Huh S Wiench J W Yoo J-C Pruski M Lin V S-Y Organic
Functionalization and Morphology Control of Mesoporous Silicas via a Co-
Condensation Synthesis Method Chem Mater 2003 15 4247-4256
[25] Igarashi N Hashimoto K Tatsumi T Studies on the structural stability of
mesoporous molecular sieves organically functionalized by a direct method J
Mater Chem 2002 12 3631-3636
[26] Trewyn B G Slowing I I Giri S Chen H-T Lin V S Y Synthesis and
Functionalization of a Mesoporous Silica Nanoparticle Based on the Sol-Gel
Process and Applications in Controlled Release Acc Chem Res 2007 40 846-
853
[27] Diaz I Mohino F Perez-Pariente J Sastre E Study by TG-MS of the
oxidation of SH-MCM-41 to SO3H-MCM-41 Thermochim Acta 2004 413
201-207
[28] Radu D R Lai C-Y Huang J Shu X Lin V S Y Fine-tuning the
degree of organic functionalization of mesoporous silica nanosphere materials
via an interfacially designed co-condensation method Chem Commun
(Cambridge U K) 2005 1264-1266
[29] Kumar R Chen H T Escoto J L V Lin V S Y Pruski M Template
Removal and Thermal Stability of Organically Functionalized Mesoporous
Silica Nanoparticles Chem Mater 2006 18 4319-4327
[30] Kawi S Lai M W Supercritical fluid extraction of surfactant template from
MCM-41 Chem Commun (Cambridge U K) 1998 1407-1408
[31] Tian B Liu X Yu C Gao F Luo Q Xie S Tu B Zhao D Microwave
assisted template removal of siliceous porous materials Chem Commun
(Cambridge U K) 2002 1186-1187
REFERENCES
209
[32] Lang N Tuel A A Fast and Efficient Ion-Exchange Procedure To Remove
Surfactant Molecules from MCM-41 Materials Chem Mater 2004 16 1961-
1966
[33] Schubert U Chemical modification of titanium alkoxides for sol-gel
processing J Mater Chem 2005 15 3701-3715
[34] Nagamine S Sasaoka E Synthesis of Nanostructured Titania Templated by
Anionic Surfactant in Acidic Conditions Journal of Porous Materials 2002 9
167-173
[35] ORegan B Graetzel M A low-cost high-efficiency solar cell based on dye-
sensitized colloidal titanium dioxide films Nature (London UK) 1991 353
737-740
[36] Evans U Die Interferenzfarben duumlnner Filme von Oxyden Sulfiden oder
Jodiden auf Metallen Colloid Polym Sci 1934 69 129-137
[37] Raacke J Interferenzfarben duumlnner Schichten (V27)
httpwwwraackedeindexhtmlairyhtml
[38] Parker A R McKenzie D R Large M C J Multilayer reflectors in animals
using green and gold beetles as contrasting examples J Exp Biol 1998 201
1307-1313
[39] Palaniappan A Su X Tay F Functionalized mesoporous silica films for gas
sensing applications J Electroceram 2006 16 503-505
[40] Nicole L Boissiere C Grosso D Hesemann P Moreau J Sanchez C
Advanced selective optical sensors based on periodically organized mesoporous
hybrid silica thin films Chem Commun (Cambridge U K) 2004 2312-2313
[41] Yuliarto B Zhou H Yamada T Honma I Katsumura Y Ichihara M
Effect of Tin Addition on Mesoporous Silica Thin Film and Its Application for
Surface Photovoltage NO2 Gas Sensor Anal Chem 2004 76 6719-6726
[42] Bearzotti A Mio Bertolo J Innocenzi P Falcaro P Traversa E Relative
humidity and alcohol sensors based on mesoporous silica thin films synthesised
from block copolymers Sens Actuators B 2003 B95 107-110
REFERENCES
210
[43] Wirnsberger G Scott B J Stucky G D pH sensing with mesoporous thin
films Chem Commun (Cambridge U K) 2001 119-120
[44] Choi S Y Mamak M vonFreymann G Chopra N Ozin G A
Mesoporous Bragg Stack Color Tunable Sensors Nano Lett 2006 6 2456-
2461
[45] Tosheva L Valtchev V P Nanozeolites Synthesis Crystallization
Mechanism and Applications Chem Mater 2005 17 2494-2513
[46] Bein T Zeolitic host-guest interactions and building blocks for the self-
assembly of complex materials MRS Bull 2005 30 713-720
[47] Slowing I Trewyn B G Lin V S Y Effect of Surface Functionalization of
MCM-41-Type Mesoporous Silica Nanoparticles on the Endocytosis by Human
Cancer Cells J Am Chem Soc 2006 128 14792-14793
[48] Schulz-Ekloff G Wohrle D van Duffel B Schoonheydt R A
Chromophores in porous silicas and minerals preparation and optical properties
Microporous Mesoporous Mater 2002 51 91-138
[49] Scott B J Wirnsberger G Stucky G D Mesoporous and mesostructured
materials for optical applications Chem Mater 2001 13 3140-3150
[50] Lee U H Kim M-H Kwon Y-U Mesoporous thin films with accessible
pores from surfaces Bull Korean Chem Soc 2006 27 808-816
[51] Sing K S W Everett D H Haul R A W Moscou L Pierotti R A
Rouquerol J Siemieniewska T Reporting physisorption data for gassolid
systems with special reference to the determination of surface area and porosity
(Recommendations 1984) Pure Appl Chem 1985 57 603-619
[52] Brunauer S Emmett P H Teller E Adsorption of Gases in Multimolecular
Layers J Am Chem Soc 1938 60 309-319
[53] Thommes M Kohn R Froba M Sorption and Pore Condensation Behavior
of Nitrogen Argon and Krypton in Mesoporous MCM-48 Silica Materials J
Phys Chem B 2000 104 7932-7943
[54] Moeller A Yang X Caro J Staudt R Measurements of the adsorption of
n-alkanes on 5A zeolites Chem Ing Tech 2006 78 1831-1836
REFERENCES
211
[55] Baklanov M R Mogilnikov K P Non-destructive characterisation of porous
low-k dielectric films Microelectron Eng 2002 64 335-349
[56] Eslava S Baklanov M R Kirschhock C E A Iacopi F Aldea S Maex
K Martens J A Characterization of a Molecular Sieve Coating Using
Ellipsometric Porosimetry Langmuir 2007 23 12811-12816
[57] Mintova S Nanosized molecular sieves Collect Czech Chem Commun 2003
68 2032-2054
[58] Holmberg B A Wang H Yan Y High silica zeolite Y nanocrystals by
dealumination and direct synthesis Microporous Mesoporous Mater 2004 74
189-198
[59] Zhu G Qiu S Yu J Sakamoto Y Xiao F Xu R Terasaki O Synthesis
and Characterization of High-Quality Zeolite LTA and FAU Single
Nanocrystals Chem Mater 1998 10 1483-1486
[60] Kecht J Mintova S Bein T Nanosized Zeolites Templated by Metal-
Ammine Complexes Chem Mater 2007 19 1203-1205
[61] Larsen S C Nanocrystalline Zeolites and Zeolite Structures Synthesis
Characterization and Applications Journal of Physical Chemistry C 2007 111
18464-18474
[62] Larlus O Mintova S Bein T Environmental syntheses of nanosized zeolites
with high yield and monomodal particle size distribution Microporous
Mesoporous Mater 2006 96 405-412
[63] Hsu C-Y Chiang A S T Selvin R Thompson R W Rapid Synthesis of
MFI Zeolite Nanocrystals J Phys Chem B 2005 109 18804-18814
[64] Lew C M Li Z Zones S I Sun M Yan Y Control of size and yield of
pure-silica-zeolite MFI nanocrystals by addition of methylene blue to the
synthesis solution Microporous Mesoporous Mater 2007 105 10-14
[65] Li Z J Li S Luo H M Yan Y S Effects of Crystallinity in Spin-On Pure-
Silica-Zeolite MFI Low-Dielectric-Constant Films Adv Funct Mater 2004 14
1019-1024
REFERENCES
212
[66] Li Z Lew C M Li S Medina D I Yan Y Pure-Silica-Zeolite MEL
Low-k Films from Nanoparticle Suspensions J Phys Chem B 2005 109 8652-
8658
[67] Mintova S Reinelt M Metzger T H Senker J Bein T Pure silica beta
colloidal zeolite assembled in thin films Chem Commun (Cambridge U K)
2003 326-327
[68] Camblor M A Corma A Valencia S Spontaneous nucleation and growth of
pure silica zeolite-b free of connectivity defects Chem Commun (Cambridge
U K) 1996 2365-2366
[69] Serrano D P Van Grieken R Sanchez P Sanz R Rodriguez L
Crystallization mechanism of all-silica zeolite beta in fluoride medium
Microporous Mesoporous Mater 2001 46 35-46
[70] Wang Z Mitra A Wang H Huang L Yan Y Pure silica zeolite films as
low-k dielectrics by spin-on of nanoparticle suspensions Adv Mater
(Weinheim Ger) 2001 13 1463-1466
[71] Mintova S Bein T Microporous Films Prepared by Spin-Coating Stable
Colloidal Suspensions of Zeolites Adv Mater (Weinheim Ger) 2001 13
1880-1883
[72] Johnson M Li Z Wang J Yan Y Mechanical characterization of zeolite
low dielectric constant thin films by nanoindentation Thin Solid Films 2007
515 3164-3170
[73] Tatlier M Demir M Tokay B Erdem-Senatalar A Kiwi-Minsker L
Substrate heating method for coating metal surfaces with high-silica zeolites
ZSM-5 coatings on stainless steel plates Microporous Mesoporous Mater 2007
101 374-380
[74] Barrett P A Camblor M A Corma A Jones R H Villaescusa L A
Structure of ITQ-4 a New Pure Silica Polymorph Containing Large Pores and a
Large Void Volume Chem Mater 1997 9 1713-1715
REFERENCES
213
[75] Selvam T Aresipathi C Mabande G T P Toufar H Schwieger W Solid
state transformation of TEAOH-intercalated kanemite into zeolite beta (BEA) J
Mater Chem 2005 15 2013-2019
[76] Schoeman B J Babouchkina E Mintova S Valtchev V P Sterte J The
Synthesis of Discrete Colloidal Crystals of Zeolite Beta and their Application in
the Preparation of Thin Microporous Films Journal of Porous Materials 2001
8 13-22
[77] Nery J G Hwang S-J Davis M E On the synthesis of SSZ-48 SSZ-43
and their variations Microporous Mesoporous Mater 2002 52 19-28
[78] Krijnen S Sanchez P Jakobs B T F van Hooff J H C A controlled post-
synthesis route to well-defined and active titanium Beta epoxidation catalysts
Microporous Mesoporous Mater 1999 31 163-173
[79] Bruggeman D A G The calculation of various physical constants of
heterogeneous substances I The dielectric constants and conductivities of
mixtures composed of isotropic substances Annalen der Physik (Berlin
Germany) 1935 24 665-679
[80] Kresge C T Leonowicz M E Roth W J Vartuli J C Beck J S Ordered
Mesoporous Molecular-Sieves Synthesized by a Liquid-Crystal Template
Mechanism Nature 1992 359 710-712
[81] Qi L M Ma J M Cheng H M Zhao Z G Micrometer-sized mesoporous
silica spheres grown under static conditions Chem Mater 1998 10 1623-1626
[82] Huo Q S Zhao D Y Feng J L Weston K Buratto S K Stucky G D
Schacht S Schuth F Room temperature growth of mesoporous silica fibers
A new high-surface-area optical waveguide Adv Mater (Weinheim Ger) 1997
9 974-978
[83] Li Y S Shi J L Hua Z L Chen H R Ruan M L Yan D S Hollow
Spheres of Mesoporous Aluminosilicate with a Three-Dimensional Pore
Network and Extraordinarily High Hydrothermal Stability Nano Lett 2003 3
609-612
REFERENCES
214
[84] Cauvel A Renard G Brunel D Monoglyceride synthesis by heterogeneous
catalysis using MCM-41 type silicas functionalized with amino groups J Org
Chem 1997 62 749-751
[85] Zhao X S Lu G Q Modification of MCM-41 by surface silylation with
trimethylchlorosilane and adsorption study J Phys Chem B 1998 102 1556-
1561
[86] Anwander R SOMCPMS Surface organometallic chemistry at periodic
mesoporous silica Chem Mater 2001 13 4419-4438
[87] Qi Z-m Honma I Zhou H Ordered-mesoporous-silica-thin-film-based
chemical gas sensors with integrated optical polarimetric interferometry Appl
Phys Lett 2006 88 053503053501-053503053503
[88] Boissiere C Kummel M Persin M Larbot A Prouzet E Spherical MSU-
1 mesoporous silica particles tuned for HPLC Adv Funct Mater 2001 11
129-135
[89] Ren J Ding J Chan K-Y Wang H Dual-Porosity Carbon Templated from
Monosize Mesoporous Silica Nanoparticles Chem Mater 2007 19 2786-2795
[90] Lu J Liong M Zink J I Tammanoi F Mesoporous silica nanoparticles as
a delivery system for hydrophobic anticancer drugs Small 2007 3 1341-1346
[91] Asai S Tominaga Y Sumita M Mesoporous silica as inorganic filler in
polymer composites Zeoraito 2006 23 117-124
[92] Lu Y F Fan H Y Stump A Ward T L Rieker T Brinker C J
Aerosol-assisted self-assembly of mesostructured spherical nanoparticles
Nature 1999 398 223-226
[93] Suzuki K Ikari K Imai H Synthesis of Silica Nanoparticles Having a Well-
Ordered Mesostructure Using a Double Surfactant System J Am Chem Soc
2004 126 462-463
[94] El Haskouri J Ortiz de Zarate D Guillem C Beltran-Porter A Caldes M
Marcos M D Beltran-Porter D Latorre J Amoros P Hierarchical Porous
Nanosized Organosilicas Chem Mater 2002 14 4502-4504
REFERENCES
215
[95] Nooney R I Thirunavukkarasu D Chen Y Josephs R Ostafin A E
Synthesis of Nanoscale Mesoporous Silica Spheres with Controlled Particle
Size Chem Mater 2002 14 4721-4728
[96] Rathousky J Zukalova M Kooyman P J Zukal A Synthesis and
characterization of colloidal MCM-41 Colloids Surf A 2004 241 81-86
[97] Cai Q Luo Z S Pang W Q Fan Y W Chen X H Cui F Z Dilute
solution routes to various controllable morphologies of MCM-41 silica with a
basic medium Chem Mater 2001 13 258-263
[98] Moeller K Kobler J Bein T Colloidal suspensions of nanometer-sized
mesoporous silica Adv Funct Mater 2007 17 605-612
[99] Moeller K Kobler J Bein T Colloidal suspensions of mercapto-
functionalized nanosized mesoporous silica J Mater Chem 2007 17 624-631
[100] Sadasivan S Khushalani D Mann S Synthesis and shape modification of
organo-functionalized silica nanoparticles with ordered mesostructured interiors
J Mater Chem 2003 13 1023-1029
[101] Frye C L Vincent G A Finzel W A Pentacoordinate silicon compounds
V Novel silatrane chemistry J Am Chem Soc 1971 93 6805-6811
[102] Verkade J G Atranes new examples with unexpected properties Acc Chem
Res 1993 26 483-489
[103] Cabrera S ElHaskouri J Guillem C Latorre J BeltranPorter A
BeltranPorter D Marcos M D Amoros P Generalised syntheses of ordered
mesoporous oxides the atrane route Solid State Sci 2000 2 405-420
[104] Zhao X S Lu G Q Whittaker A K Millar G J Zhu H Y
Comprehensive study of surface chemistry of MCM-41 using 29
Si CPMAS
NMR FTIR pyridine-TPD and TGA J Phys Chem B 1997 101 6525-6531
[105] Socrates G Infrared and Raman Characteristic Group Frequencies 3 ed
Wiley 2005
REFERENCES
216
[106] Okabayashi H Izawa K Yamamoto T Masuda H Nishio E OConnor
C J Surface structure of silica gel reacted with 3-
mercaptopropyltriethoxysilane and 3-aminopropyltriethoxysilane formation of
the S-S bridge structure and its characterization by Raman scattering and diffuse
reflectance Fourier transform spectroscopic studies Colloid Polym Sci 2002
280 135-145
[107] Kobler J Moumlller K Bein T Colloidal Suspensions of Functionalized
Mesoporous Silica Nanoparticles ACS Nano 2008 2 791-799
[108] Sokolov I Kievsky Y Y Kaszpurenko J M Self-assembly of ultrabright
fluorescent silica particles Small 2007 3 419-423
[109] Ren T-Z Yuan Z-Y Su B-L Encapsulation of direct blue dye into
mesoporous silica-based materials Colloids Surf A 2007 300 79-87
[110] Laerte de Castro F Santos J G Fernandes G J T Souza de Araujo A
Fernandes V J Politi M J Brochsztain S Solid state fluorescence of a
34910-perylenetetracarboxylic diimide derivative encapsulated in the pores of
mesoporous silica MCM-41 Microporous Mesoporous Mater 2007 102 258-
264
[111] Wark M Ganschow M Rohlfing Y Schulz-Ekloff G Woehrle D
Methods of synthesis for the encapsulation of dye molecules in molecular
sieves Stud Surf Sci Catal 2001 135 3292-3300
[112] Huang D-M Hung Y Ko B-S Hsu S-C Chen W-H Chien C-L
Tsai C-P Kuo C-T Kang J-C Yang C-S Mou C-Y Chen Y-C
Highly efficient cellular labeling of mesoporous nanoparticles in human
mesenchymal stem cells implication for stem cell tracking FASEB J 2005 19
2014-2016
[113] Torney F Trewyn B G Lin V S Y Wang K Mesoporous silica
nanoparticles deliver DNA and chemicals into plants Nat Nanotechnol 2007
2 295-300
REFERENCES
217
[114] Chen J Y Pan F M Chang L Cho A T Chao K J Thermal stability of
trimethylsilylated mesoporous silica thin films as the ultralow-k dielectric for
copper interconnects Journal of Vacuum Science amp Technology B
Microelectronics and Nanometer Structures--Processing Measurement and
Phenomena 2005 23 2034-2040
[115] Innocenzi P Martucci A Guglielmi M Bearzotti A Traversa E Pivin J
C Mesoporous silica thin films for alcohol sensors J Eur Ceram Soc 2001
21 1985-1988
[116] Brinker C J Evaporation-induced self-assembly Functional nanostructures
made easy MRS Bull 2004 29 631-640
[117] Mason G A model of the pore space in a random packing of equal spheres J
Colloid Interface Sci 1971 35 279-287
[118] Slobozhanin L A Alexander J I D Collicott S H Gonzalez S R
Capillary pressure of a liquid in a layer of close-packed uniform spheres
Physics of Fluids 2006 18 082104-082115
[119] Mayer R P Stowe R A Packed uniform sphere model for solids Interstitial
access opening sizes and pressure deficiencies for wetting liquids with
comparison to reported experimental results J Colloid Interface Sci 2006 294
139-150
[120] Juillerat F Bowen P Hofmann H Formation and Drying of Colloidal
Crystals Using Nanosized Silica Particles Langmuir 2006 22 2249-2257
[121] Suzuki T M Yamamoto M Fukumoto K Akimoto Y Yano K
Investigation of pore-size effects on base catalysis using amino-functionalized
monodispersed mesoporous silica spheres as a model catalyst J Catal 2007
251 249-257
[122] Pasqua L Testa F Aiello R Cundari S Nagy J B Preparation of
bifunctional hybrid mesoporous silica potentially useful for drug targeting
Microporous Mesoporous Mater 2007 103 166-173
REFERENCES
218
[123] Van Blaaderen A Vrij A Synthesis and characterization of colloidal
dispersions of fluorescent monodisperse silica spheres Langmuir 1992 8
2921-2931
[124] Ren T-Z Yuan Z-Y Su B-L Encapsulation of direct blue dye into
mesoporous silica-based materials Colloids and Surfaces A Physicochemical
and Engineering Aspects 2007 300 79-87
[125] Leon R Margolese D Stucky G Petroff P M Nanocrystalline Ge
filaments in the pores of a meso-silicate Physical Review B Condensed Matter
1995 52 r2285-r2288
[126] Abe T Tachibana Y Uematsu T Iwamoto M Preparation and
characterization of Fe2O3 nanoparticles in mesoporous silicate J Chem Soc
Chem Commun 1995 1617-1618
[127] Srdanov V I Alxneit I Stucky G D Reaves C M DenBaars S P
Optical Properties of GaAs Confined in the Pores of MCM-41 J Phys Chem B
1998 102 3341-3344
[128] Pathak S Cao E Davidson M C Jin S Silva G A Quantum Dot
Applications to Neuroscience New Tools for Probing Neurons and Glia J
Neurosci 2006 26 1893-1895
[129] Li C L Murase N Synthesis of Highly Luminescent Glasses Incorporating
CdTe Nanocrystals through Sol-Gel Processing Langmuir 2004 20 1-4
[130] ORegan B Gratzel M A low-cost high-efficiency solar cell based on dye-
sensitized colloidal TiO2 films Nature 1991 353 737-740
[131] Kongkanand A Tvrdy K Takechi K Kuno M Kamat P V Quantum Dot
Solar Cells Tuning Photoresponse through Size and Shape Control of CdSe-
TiO2 Architecture J Am Chem Soc 2008 130 4007-4015
[132] Franzl T Klar T A Schietinger S Rogach A L Feldmann J Exciton
Recycling in Graded Gap Nanocrystal Structures Nano Lett 2004 4 1599-
1603
REFERENCES
219
[133] Wellmann H Rathousky J Wark M Zukal A Schulz-Ekloff G
Formation of CdS nanoparticles within functionalized siliceous MCM-41
Microporous Mesoporous Mater 2001 44-45 419-425
[134] Murray C B Norris D J Bawendi M G Synthesis and characterization of
nearly monodisperse CdE (E = sulfur selenium tellurium) semiconductor
nanocrystallites J Am Chem Soc 1993 115 8706-8715
[135] Gruumln M Lauer I Unger K K The synthesis of micrometer- and
submicrometer-size spheres of ordered mesoporous oxide MCM-41 Adv Mater
(Weinheim Ger) 1997 9 254-257
[136] Melian-Cabrera I Kapteijn F Moulijn J A Room temperature detemplation
of zeolites through H2O2-mediated oxidation Chem Commun (Cambridge U
K) 2005 2744-2746
[137] Chen X Mao S S Synthesis of titanium dioxide (TiO2) nanomaterials J
Nanosci Nanotechnol 2006 6 906-925
[138] Cabrera S ElHaskouri J BeltranPorter A BeltranPorter D Marcos M D
Amoros P Enhanced surface area in thermally stable pure mesoporous TiO2
Solid State Sci 2000 2 513-518
[139] Abramson S Lasperas M Brunel D Design of mesoporous aluminosilicates
supported (1R 2S)-(-)-ephedrine evidence for the main factors influencing
catalytic activity in the enantioselective alkylation of benzaldehyde with
diethylzinc Tetrahedron Asymmetry 2002 13 357-367
[140] Peng T Zhao D Dai K Shi W Hirao K Synthesis of Titanium Dioxide
Nanoparticles with Mesoporous Anatase Wall and High Photocatalytic Activity
J Phys Chem B 2005 109 4947-4952
[141] Chen H Dai K Peng T Yang H Zhao D Synthesis of thermally stable
mesoporous titania nanoparticles via amine surfactant-mediated templating
method Mater Chem Phys 2006 96 176-181
[142] Soler-Illia G Louis A Sanchez C Synthesis and characterization of
mesostructured titania-based materials through evaporation-induced self-
assembly Chem Mater 2002 14 750-759
REFERENCES
220
[143] Cassiers K Linssen T Meynen V Voort P V D Cool P Vansant E F
A new strategy towards ultra stable mesoporous titania with nanosized anatase
walls Chem Commun (Cambridge U K) 2003 1178-1179
[144] Grosso D Soler-Illia G Babonneau F Sanchez C Albouy P A Brunet-
Bruneau A Balkenende A R Highly organized mesoporous titania thin films
showing mono-oriented 2D hexagonal channels Adv Mater (Weinheim Ger)
2001 13 1085
[145] Yusuf M M Imai H Hirashima H Preparation of mesoporous titania by
templating with polymer and surfactant and its characterization J Sol-Gel Sci
Technol 2003 28 97-104
[146] Shibata H Ogura T Mukai T Ohkubo T Sakai H Abe M Direct
Synthesis of Mesoporous Titania Particles Having a Crystalline Wall J Am
Chem Soc 2005 127 16396-16397
[147] Matijevic E Budnik M Meites L Preparation and mechanism of formation
of titanium dioxide hydrosols of narrow size distribution J Colloid Interface
Sci 1977 61 302-311
[148] Jinsoo Kim K-C S Oliver Wilhelm Sotiris E Pratsinis Sol-Gel Synthesis
and Spray Granulation of Porous Titania Powder Chem Ing Tech 2001 73
461-468
[149] Deshpande S B Potdar H S Khollam Y B Patil K R Pasricha R
Jacob N E Room temperature synthesis of mesoporous aggregates of anatase
TiO2 nanoparticles Mater Chem Phys 2006 97 207-212
[150] Benkstein K D Semancik S Mesoporous nanoparticle TiO2 thin films for
conductometric gas sensing on microhotplate platforms Sens Actuators B
2006 113 445-453
LEBENSLAUF
221
Persoumlnliche Daten
Name Johannes Georg Kobler
Geboren am 29121978 in Muumlnchen
Studium
seit 112004 Promotion an Ludwig-Maximilians-Universitaumlt Muumlnchen im Arbeitskreis
von Prof Bein Thin Films from Porous Nanoparticles
032004 ndash 092004 Diplomarbeit in physikalischer Chemie an der Ludwig-
Maximilians-Universitaumlt Muumlnchen im Arbeitskreis von
Prof Bein Kolloidale Loumlsungen mesoporoumlser Silica-
Nanopartikel mit funktionalisierter Oberflaumlche
022004 Diplomhauptpruumlfung an der Ludwig-Maximilians-
Universitaumlt Muumlnchen
101999 ndash 022004 Chemie-Studium an der Ludwig-Maximilians-Universitaumlt
Muumlnchen
Wehrdienst
071998 ndash 041999 Gebirgsjaumlgerbatallion 231 Bad Reichenhall
Schulausbildung
091989 ndash 061998 Maximilian-von-Montgelas Gymnasium Vilsbiburg
PUBLICATIONS AND POSTER PRESENTATIONS
222
Publications and Poster Presentations
Publications
1 K Moeller J Kobler T Bein Colloidal Suspensions of Nanometer-Sized
Mesoporous Silica Adv Funct Mater 2007 17 605-612
2 K Moeller J Kobler T Bein Colloidal Suspensions of Mercapto-
Functionalized Nanosized Mesoporous Silica J Mater Chem 2007 17 624-
631
3 J Kobler K Moeller T Bein Colloidal Suspensions of Functionalized
Mesoporous Silica Nanoparticles ACS Nano 2008 2 791-799
4 J Kobler H Abrevaya S Mintova T Bein High-Silica Zeolite-β From
Stable Colloidal Suspensions to Thin Films J Phys Chem C 2008 112
14274ndash14280
5 J Kobler T Bein Porous Thin Films of Functionalized Mesoporous Silica
Nanoparticles ACS Nano 2008 2 2324ndash2330
6 J Kobler B Lotsch G Ozin T Bein Vapor-Sensitive Bragg Mirrors and
Optical Isotherms from Mesoporous Nanoparticle Suspensions submitted
PUBLICATIONS AND POSTER PRESENTATIONS
223
Poster Presentations
1 J Kobler K Moeller T Bein Colloidal Functionalized Mesoporous Silica
17 Deutsche Zeolithtagung 2005 Giessen Germany
2 J Kobler S Mintova T Bein Films of Pure-Silica Zeolites 3 International
FEZA Conference 2005 Prague Czech Republic
3 J Kobler S Mintova T Bein Thin Microporous Films with Variable Optical
Properties Catalytic processes on advanced micro- and mesoporous materials
2005 Nessebar Bulgaria
4 J Kobler T Bein Transparent Sols of Mesoporous Silica Nanoparticles 19
Deutsche Zeolithtagung 2007 Leipzig Germany
5 M Hallermann D Georgiadou J Kobler D Fattakhova-Rohlfing A Susha
T Bein Electron Transfer Processes in the Electrochemical Solar Cell ndash
Comparison of Dye and Dot Sensitized Titania 2007 CeNS Winterschool
Mauterndorf Austria
6 J Kobler T Bein Transparent Sols of Mesoporous Silica Nanoparticles for
the Preparation of Thin Films for Chemical Sensors Catalytic processes on
advanced micro- and mesoporous materials 2007 Varna Bulgaria
ABSTRACT
solutions Nitrogen sorption analysis indicated that the functional groups were located at
the inner surfaces of the mesoporous channel systems
By further decreasing the diameter of these mesoporous silica spheres their scattering
ability for visible light was also drastically decreased We have demonstrated the
synthesis of extremely small mesoporous silica nanoparticles via a specific co-
condensation process with phenyl groups If the size of the particles falls below about
110 of the wavelength of the incoming light (01 ) the colloidal suspensions show
optical transparency Because of an easy handling and a good reproducibility the
suspensions are ideal for the production of thin film by spin-coating The films showed
excellent optical qualities exhibited good diffusion properties and a highly accessible
pore system Thanks to the small particle size and the resulting low surface roughness
the formation of multilayers was possible without transmitting defects on the surface
with every following coating step The availability of such homogeneous porous thin
films made it possible to use ellipsometry as analysis method Ellipsometric
porosimetry (EP) is a convenient method to determine the effective porosity of a thin
film on its original support without destroying it It was possible to record sorption
isotherms of the thin films with ellipsometry and to correlate the data with nitrogen
sorption data of dried powders of the same material The thin films showed very low
refractive indices around 12 in the case of both zeolites and functionalized mesoporous
silica nanoparticles
Besides a synthesis procedure for TiO2 particles in an acidic medium by a simple sol-
gel process was investigated The material showed a high surface area and the thin films
ABSTRACT
prepared from the colloidal suspensions had a high refractive index combined with a
certain porosity Thus the preparation of wavelength specific Bragg mirrors could be
realized by a simple and reproducible spin-coating approach using colloidal suspensions
of functionalized porous silica nanoparticles and titania sols The Bragg reflectors show
a sensitivity towards specific relative pressures of organic vapors like isopropanol or
toluene
TABLE OF CONTENTS
1 INTRODUCTION 1
Nanotechnology 3
Self-Assembly 5
Nanoparticles 6
Colloid Science 8
Fabrication of Nanoparticles 12
Sol-gel Chemistry 13
Porous Materials 16
Zeolites 17
Mesoporous Silica 19
Mesoporous Titania 26
Optical Properties of Thin Films 27
2 MOTIVATION 30
3 CHARACTERIZATION METHODS 34
Sorption 35
Quartz Crystal Microbalance 42
Ellipsometry 43
Ellipsometric porosimetry 46
Light Scattering 49
Electron Microscopy 53
Thermogravimetric Analysis 54
Powder X-ray Diffraction 55
Solid-State NMR 56
IR and Raman Spectroscopy 57
4 RESULTS AND DISCUSSION 59
41 High Silica Zeolite Beta From Stable Colloidal Suspensions to Thin Films 60
Introduction 61
Experimental 63
TABLE OF CONTENTS
Results and Discussion 67
Conclusion 80
42 Synthesis and Characterization of Functionalized Mesoporous Silica
Nanoparticles 82
Introduction 83
Experimental 85
Results and Discussion 88
Conclusion 101
43 Porous Thin Films of Functionalized Mesoporous Silica Nanoparticle 103
Introduction 104
Experimental 107
Results and Discussion 111
Conclusion 123
44 Vapor-Sensitive Bragg Mirrors and Optical Isotherms from Mesoporous
Nanoparticle Suspensions 135
Introduction 136
Experimental 138
Results and Discussion 139
Conclusion 151
5 CONCLUSION AND OUTLOOK 152
6 APPENDIX 155
61 Functionalized Mesoporous Silica Nanoparticles as Host System for the
Synthesis of CdS Quantum Dots 156
Introduction 156
Experimental 158
Results and Discussion 163
Conclusion 175
62 Colloidal Suspensions of TiO2 Nanoparticles for the Preparation of Porous
Thin Films 176
TABLE OF CONTENTS
Introduction 176
Experimental 179
Results and Discussion 184
Conclusion 203
7 REFERENCES 205
INTRODUCTION
1
1 INTRODUCTION
INTRODUCTION
2
Nanosystems are already playing a major role in information technology the electronic
components in computers and communication technology are becoming smaller and
smaller However this development cannot go on forever once the nanometer scale has
been reached At that level novel physical phenomena often arise that may present
potential problems for conventional uses ndash and an opportunity for innovations and new
applications Micro- and nanosystems are also becoming increasingly important in life
science and medicine They can be introduced into living organisms for instance to
bring a cancer medication to tumor cells The increasing interest in this field can be
illustrated by simply typing the four letters ldquonanordquo into the research discovery tool
SciFinder and sort the publications in chronological order
19
87
19
88
19
89
19
90
19
91
19
92
19
93
19
94
19
95
19
96
19
97
19
98
19
99
20
00
20
01
20
02
20
03
20
04
20
05
20
06
20
07
0
2000
4000
6000
8000
10000
12000
nu
mb
er
of
pu
blicati
on
s
0
500
1000
1500
2000
2500 an
nu
al in
cre
ase o
f pu
blic
atio
ns
Fig 1 Occurrence of the word ldquonanordquo in SciFinder from 1987 to 2007
INTRODUCTION
3
Nanotechnology
One nanometer (nm) is one billionth or 10-9
of a meter For comparison a DNA
double-helix has a diameter around 2 nm and the smallest cellular life forms the
bacteria of the genus Mycoplasma are around 200 nm in length The term
ldquonanotechnologyrdquo was defined by Tokyo Science University Professor Norio Taniguchi
in 1974 as follows ldquoNano-technology mainly consists of the processing of separation
consolidation and deformation of materials by one atom or by one moleculerdquo[1]
In the
1980s the basic idea of this definition was explored in much more depth by Dr K Eric
Drexler who promoted the technological significance of nano-scale phenomena and
devices through speeches and books[2 3]
The first distinguishing concepts in
nanotechnology (but predating use of that term) were elaborated in ldquoTheres Plenty of
Room at the Bottomrdquo a talk given by physicist Richard Feynman at an American
Physical Society meeting at Caltech on December 29 1959 Feynman described a
process by which the ability to manipulate individual atoms and molecules might be
developed using one set of precise tools to build and operate another proportionally
smaller set so on down to the needed scale In the course of this he noted scaling
issues would arise from the changing magnitude of various physical phenomena gravity
would become less important surface tension and Van-der-Waals-attraction would
become more important etc
Nanotechnology and nanoscience got started in the early 1980s The driving force for
nanotechnology came from a renewed interest in colloid science coupled with a new
generation of analytical tools that allow observing and characterizing the materials or
INTRODUCTION
4
devices even in the sub-nanometer domain The invention of the scanning tunneling
microscope (STM) the discovery of fullerenes in 1986 and carbon nanotubes a few
years later as well as the synthesis of semiconductor nanocrystals (quantum dots) or the
atomic force microscope (AFM) can be mentioned as milestones in the early years
Nanotechnology today is a field of applied science and technology covering a broad
range of topics The main unifying theme is the control of matter on a scale smaller than
one micrometer normally approximately 1 to 100 nanometers as well as the fabrication
of devices of this size It is a highly multidisciplinary enterprise drawing from fields
such as applied physics materials science colloid science device physics
supramolecular chemistry and mechanical and electrical engineering Nanoscience can
be seen as an extension of existing sciences into the nanoscale (or sometimes as a
recasting of existing sciences using a newer more modern term)
Two main approaches are used in nanotechnology In the ldquotop-downrdquo approach nano-
objects are constructed from larger entities without atomic-level control Many
technologies originating from conventional solid-state silicon processing methods for
fabricating microprocessors are capable of creating features much smaller than 100 nm
thus falling under the definition of nanotechnology A complementary and from a
chemical point of view much more challenging strategy is the ldquobottom-uprdquo approach
The materials and devices are built from molecular components or other nano-objects
by an appropriate combination of driving forces such as molecular recognition self-
assembly hydrogen bonding etc
INTRODUCTION
5
Self-Assembly
Self-assembly can be defined as spontaneous and reversible organization of molecular
units or other nano-objects into ordered structures by non-covalent interactions The
interactions responsible for the formation of the self-assembled system act on a strictly
local level - in other words the nanostructure builds itself[4]
There are at least three features that distinguish self-assembly from common chemical
reactions driving atoms and molecules to assemble into larger structures First the self-
assembled structure must have a higher order than the isolated components The second
important aspect of self-assembly is the key role of weak interactions eg Van-der-
Waals- capillary- πminusπ- or hydrogen bonds The third distinctive feature is that the
building blocks can be not only atoms and molecules but span a wide range of nano-
and mesoscopic structures with different chemical compositions shapes and
functionalities Examples of self-assembly in materials science include the formation of
colloidal crystals lipid bilayers phase-separated polymers or self-assembled
monolayers
Another characteristic that is common to nearly all self-assembled systems is their
thermodynamic stability In covalent synthesis and polymerization the scientist links
atoms together in any desired conformation In order for self-assembly to take place
without the intervention of external forces the process must lead to a lower Gibbs
energy thus self-assembled structures are thermodynamically more stable than the
single un-assembled components A direct consequence is the general tendency of self-
assembled structures to be relatively free of defects
INTRODUCTION
6
By choosing precursors with suitable physicochemical properties it is possible to exert
a fine control on the formation processes in order to obtain complex architectures
Popular examples for such self-organizing units are surfactant micelles - aggregates of
surface-active molecules dispersed in a liquid
Fig 2 Surfactant molecule and micelle
A typical micelle in aqueous solution forms an aggregate with the hydrophilic ldquoheadrdquo
regions in contact with surrounding solvent sequestering the hydrophobic tail regions in
the micelle centre The shape and size of a micelle is a function of the molecular
geometry of its surfactant molecules and solution conditions such as surfactant
concentration temperature pH and ionic strength Such micelles are already simple
examples for nano-objects
Nanoparticles
Nanoparticles are often defined as microscopic particles with at least one dimension less
than 100 nm A nanoscopic film for example has vertical dimensions in the range of
01ndash100 nm according to the IUPAC definition[5]
Due to a wide variety of potential
applications in biomedical optical and electronic fields nanoparticles are of great
INTRODUCTION
7
scientific interest as they are effectively a bridge between bulk materials and atomic or
molecular structures
A bulk material should have constant physical properties regardless of its size but a
number of physical phenomena can noticeably change as the size of the system
decreases The properties of materials change as their size approaches the nanoscale and
as the percentage of atoms at the surface of a material becomes significant These
include quantum mechanical effects for example the ldquoquantum size effectrdquo where the
electronic properties of solids are altered with great reductions in particle size This
effect does not come into play by going from macro to micro dimensions but it does
become dominant when the nanometer size range is reached
Additionally a number of physical properties change when compared to macroscopic
systems thus enabling unique applications For instance the melting point of gold is
shifted to lower temperatures[6]
Much of the fascination with nanoscience stems from
these unique quantum and surface phenomena that matter exhibits at the nanoscale
A unique aspect of nanoscience is the vastly increased ratio of surface area to volume
present in many nanoscale materials that opens new possibilities in surface-based
science such as catalysis Colloid science has given rise to many materials that may be
useful in nanotechnology for instance carbon nanotubes and nanometer-sized metal
oxide particles At the small end of the size range nanoparticles are often referred to as
clusters Metal dielectric and semiconductor nanoparticles have been formed as well
as hybrid structures eg core-shell particles Nanoparticles made of semiconducting
material may also be labeled quantum dots if they are small enough (typically sub
INTRODUCTION
8
10 nm) for quantization of electronic energy levels to occur Such nanoscale particles
are used in biomedical applications eg as imaging agents Semi-solid and soft
nanoparticles have been manufactured A prototype nanoparticle of semi-solid nature is
represented by the liposomes Various types of liposomes or other types of porous
nanoparticles are currently explored clinically as delivery systems for anticancer drugs
and vaccines[7 8]
But nanoparticles also present possible dangers both medically and environmentally
Most of these are due to the high surface to volume ratio which can make the particles
very reactive or catalytically active They may also be able to pass through cell walls in
organisms and their interactions with the body are relatively unknown However free
nanoparticles in the environment quickly tend to agglomerate and thus leave the nano-
regime and nature itself presents many nanoparticles to which organisms on earth may
have evolved immunity such as terpenes from plants[9]
or dust from volcanic eruptions
Colloid Science
As mentioned above much of the knowledge in todayrsquos nanoscience derives from
colloidal science Sol-gel chemistry for example is a typical ldquobottom-uprdquo approach
The Scottish scientist Thomas Graham introduced this field of study in 1861 Many
familiar substances including butter milk smoke paints and glues are colloids
A colloid or colloidal dispersion is a type of homogeneous mixture It consists of two
separate phases a dispersed phase and a continuous phase the dispersed phase is made
of very small particles or droplets that are distributed evenly throughout the continuous
INTRODUCTION
9
phase According to IUPAC the size of the dispersed phase particles is between 1 and
1000 nm in at least one dimension Homogeneous mixtures with a dispersed phase in
this size range may be called colloidal aerosols colloidal emulsions colloidal foams
colloidal dispersions or hydrosols The dispersed particles or droplets are largely
affected by the surface chemistry present in the colloid Homogeneous suspensions of
nanoparticles are possible if the interaction of the particle surface with the solvent is
strong enough to overcome differences in density which usually result in a material
either sinking or floating in a liquid
Fig 3 shows the free energy E as a function of the particle distance r (kB = Boltzmann
constant T = absolute temperature) The free energy reaches its minimum when the
particle distance r = δ This approach is only possible if the energy barrier ΔEc is of the
same order of magnitude as the thermal energy kBT in this case the dispersion is
kinetically unstable In contrast in case of a stable colloidal dispersion the energy
barrier is so high that the particles can not converge enough to coagulate
INTRODUCTION
10
Fig 3 Kinetic stability of colloidal dispersions
The following forces play an important role in the interactions of colloid particles and
thus the height of the energy barrier
Excluded volume repulsion This refers to the impossibility of any overlap between
hard particles
Electrostatic interaction Colloidal particles often carry an electrical charge (zeta
potential) and therefore attract or repel each other The charges of both the continuous
and the dispersed phase as well as the mobility of the phases are factors affecting this
interaction
INTRODUCTION
11
Van-der-Waals-forces This is due to interactions between two dipoles that are either
permanent or induced Even if the particles do not have a permanent dipole fluctuations
of the electron density give rise to a temporary dipole in the particle This temporary
dipole induces a dipole in particles nearby The temporary dipole and the induced
dipoles are then attracted to each other
Entropic forces According to the second law of thermodynamics a system progresses
to a state in which entropy is maximized
Steric forces between polymer-covered surfaces or in solutions containing non-
adsorbing polymer can modulate interparticle forces producing an additional repulsive
steric stabilization force or attractive depletion force between them
The two main mechanisms to prevent colloids from aggregating are steric stabilization
and electrostatic stabilization Electrostatic stabilization is based on the mutual
repulsion of like electrical charges Different phases generally have different charge
affinities so that a double-layer of charges forms at any interface Small particle sizes
lead to enormous surface areas and this effect is greatly amplified in colloids In a
stable colloid the mass of the individual particles in a dispersed phase is so low that
their kinetic energy is too small to overcome their electrostatic repulsion
INTRODUCTION
12
Unstable colloidal dispersions form flocks as the particles aggregate due to interparticle
attractions This can be accomplished by different methods
Adding salts or solvents to a suspension or changing the pH of a suspension to
effectively neutralize the surface charge of the dispersed particles can accomplish
removal of the electrostatic barrier that prevents aggregation of the particles This
removes the repulsive forces that keep colloidal particles separate and allows for
coagulation due to Van-der-Waals-forces
Addition of a charged polymeric flocculant can bridge individual colloidal particles by
attractive electrostatic interactions For example negatively charged colloidal silica
particles can be flocculated by the addition of a positively charged polymer
A stable colloidal suspension often appears opalescent because of the Tyndall effect
which is the scattering of light by particles in the colloid By decreasing the size of the
dispersed particles their ability to scatter light is also decreased
Fabrication of Nanoparticles
There are several methods for creating nanoparticles In attrition macro or micro scale
particles are ground in a ball mill a planetary ball mill or other size reducing
mechanism But the minimum particle size is strongly limited In pyrolysis an organic
precursor (liquid or gas) is forced through a nozzle at high pressure and burned
Thermal plasma can also deliver the energy necessary to cause evaporation of small
micrometer size particles The thermal plasma temperatures are at the order of 10000 K
such that a solid powder easily evaporates Nanoparticles are formed upon cooling
INTRODUCTION
13
while exiting the plasma region The radio frequency induction plasma method has been
used to synthesize for example various ceramic nanoparticles In sol-gel chemistry
smaller components are arranged into more complex assemblies[10 11]
Sol-gel Chemistry
The sol-gel process is a wet-chemical technique for the fabrication of materials
typically a metal oxide starting from a chemical solution containing colloidal
precursors (sol) Typical precursors are metal alkoxides and metal chlorides which
undergo hydrolysis and polycondensation reactions to form a colloid The sol evolves
then towards the formation of an inorganic network containing a liquid phase (gel) A
well-known synthesis in sol-gel chemistry is the Stoumlber process[12]
in which the silica
precursor is hydrolyzed in a solution of ammonia water and an alcohol
Precursor Chemistry
Very common precursors in silicate chemistry are tetraalkoxysilanes because the
released alcohols usually have no negative effects on the reaction and can be removed
easily The precursor can hydrolyze in an either acidic or basic aqueous medium and
afterwards condense to an inorganic network of amorphous silica The concepts shown
in Fig 4 can help to control the size and morphology of the synthesized particles
INTRODUCTION
14
Fig 4 Influence of the pH and precursor concentration in sol-gel chemistry[11]
A high pH in combination with a decreased precursor concentration can result in a
colloidal dispersion of discrete spheres with a monodisperse particle size distribution
Decreasing the pH normally leads to smaller particles but at the same time to a higher
degree of crosslinking
In combination with an increased precursor concentration the gelation process is
supported In order to direct the synthesis towards the formation of small discrete
particles the nucleation rate at the beginning should be high Thus a multitude of seeds
that can further grow is formed A very common model for the formation of
nanoparticles in sol-gel chemistry is described with the LaMer-diagram[13]
shown Fig 5
INTRODUCTION
15
Fig 5 LaMer-diagram for the formation of colloidal dispersions
The concentration of the precursor that forms the dispersed phase increases due to some
chemical or physical process At a certain degree of supersaturation nucleation occurs
either heterogeneously on impurity centers or homogeneously through spontaneous
nucleation The growth of these nuclei causes the concentration to fall below the
nucleation concentration below which no more particles are created The particles
continue to grow however until the concentration falls to the saturation concentration
The requirements for monodispersity are evident from the LaMer diagram
The rate of nucleation must be high enough so that the concentration does not continue
to increase
On the one hand the growth rate of these nuclei must be fast enough to reduce the
concentration below the nucleation concentration quickly In this way only a limited
number of particles are created
INTRODUCTION
16
On the other hand the growth rate must be slow enough that the growth period is long
compared to the nucleation period This usually narrows the size distribution
As already mentioned a material consisting of nanoparticles can reach very high
surface areas a fact that plays an important role eg in catalysis Another possibility to
increase the specific surface area is the introduction of an inherent porosity In this
context the synthesis of nanostructured porous materials has become an important topic
in the field of materials science
Porous Materials
The unique property of porous materials is the very high surface-to-mass ratio along
with a high absorption capacity They can be used in many applications including
catalysis as adsorbents in separation processes or depending on the framework charge
as ion exchangers Depending on the type of material the specific surface area can
reach several thousand square meters per gram The morphology of the particles the
pore size and their surface chemistry can be varied depending on the application Porous
materials are classified by their pore sizes in three categories namely micro- (d lt 2 nm)
meso- (2 nm lt d lt 50 nm) and macroporous (d gt 50 nm)[14]
Common macroporous materials are porous glasses silica gels and activated carbon In
these materials the pore system is often based on the space between particles which
often varies in a certain range and is difficult to control
Important microporous materials are zeolites which offer well-defined pore diameters
in the range between about 025 and 12 nm
INTRODUCTION
17
Zeolites
Zeolites are minerals that have a microporous structure More than 150 zeolite structure
types have been synthesized and 48 naturally occurring zeolites are known[15]
Natural
zeolites form where volcanic rocks and ash layers react with alkaline groundwater they
are often contaminated to varying degrees by other minerals metals quartz or other
zeolites For this reason naturally occurring zeolites are excluded from many important
commercial applications where uniformity and purity are essential There are several
types of synthetic zeolites that form by a process of slow crystallization of a silica-
alumina gel in the presence of alkali and sometimes organic structure-directing agents
(SDA) or templates The most important processes to carry out zeolite synthesis belong
to sol-gel chemistry The product properties depend on the composition of the reaction
mixture pH temperature reaction time or templates present Synthetic zeolites hold
some key advantages over their natural analogs They can be manufactured in a
uniform phase-pure state It is also possible to synthesize desirable structures that do
not appear in nature eg Zeolite A Zeolites are widely used as ion-exchange beds in
domestic and commercial water purification or softening In chemistry zeolites are used
as ldquomolecular sievesrdquo The term refers to a particular property of these materials ie
the ability to selectively sort molecules based primarily on a size exclusion process
This is due to the very regular pore structure of molecular dimensions which is
conventionally defined by the ring size of the aperture For example the term ldquo12-ringrdquo
refers to a closed loop that is built from 12 tetrahedrally coordinated silicon (or
aluminum) atoms and 12 oxygen atoms (Fig 6)
INTRODUCTION
18
Fig 6 Structure of zeolite BEA (projection viewed along [100])[16]
The largest outlet for synthetic zeolite is the global laundry detergent market But
synthetic zeolites are also well established as catalysts in the petrochemical industry for
instance in fluid catalytic cracking and hydro-cracking Zeolites confine molecules in
small spaces which causes changes in their structure and reactivity The hydrogen
forms of zeolites (prepared by ion-exchange) are powerful solid-state acids and can
facilitate acid-catalyzed reactions such as isomerization alkylation and cracking
Zeolites or zeo-type materials can also be used as solar thermal collectors and for
adsorption refrigeration In these applications their hygroscopic property coupled with
an inherent exothermic reaction when transitioning from a dehydrated to a hydrated
form (heat of adsorption) make zeolites effective in the storage of heat energy Due to
their high porosity in combination with a good thermal conductivity zeolites are also
being explored as dielectric thin films in low-k technology[17]
INTRODUCTION
19
Regardless of the variety the maximum pore size of zeolites and thus their use is
limited Therefore researchers tried to find materials with a well-ordered pore system
that exhibit pore diameters of more than 2 nm
Mesoporous Silica
In 1992 scientists of the Mobil Research and Development Corporation discovered the
first ordered mesoporous silica The synthesis was realized through a condensation of a
silica precursor in the presence of self-organizing surfactant molecules acting as
template Depending on the reaction conditions different modifications of mesoporous
silica can be synthesized A very common material is the so-called MCM-41 (Mobil
Composition of Matter No 41) with a hexagonal pore structure Other known types are
eg the cubic MCM-48 lamellar MCM-50 or disordered worm-like mesoporous silica
(Fig 7)
Fig 7 TEM-micrographs of MCM-41 MCM-48 and worm-like mesoporous silica
INTRODUCTION
20
In general four reagents are needed for the synthesis of mesoporous silica water a
surfactant a silica precursor and an agent catalyzing the hydrolysis The product
features can be controlled by the parameters temperature pH or batch composition
A widely accepted model for the formation mechanism of mesoporous silica is shown in
Fig 8 This cooperative templating model shows the formation of nanocomposite
biphasic arrays [18]
Fig 8 Cooperative silicate-template-mechanism[18]
INTRODUCTION
21
The formation of mesoporous silica via the S+I- synthesis route can be described as
follows
Single-chain surfactant cations (S+) react with silicate polyanions eg dimers double
three and four rings (I-) Micelles serve as a source for surfactant molecules or are
rearranged according to the anion charge density and shape requirements
Nucleation and rapid precipitation of organized arrays takes place with configurations
determined by the cooperative interactions of ion-pair charges geometries and Van-der-
Waals-forces
Condensation of the silicate phase with increasing time and temperature takes place
The silicate framework charge decreases during this process this may lead to liquid
crystal-like phase transitions as the surfactant phase tries to reorganize the changing
interface charge density
The framework becomes more and more stable through further condensation of silicate
anions into the inorganic network
Control over the pore size and pore topology can be achieved by using eg templates
with varying chain lengths or block-copolymers Thus pore diameters between about
15 to 20 nm can be realized This universally applicable model can also be transferred
to the synthesis of other mesoporous metal oxides like titania[19]
INTRODUCTION
22
Evaporation Induced Self Assembly (EISA)
The above model is also valid for the formation of mesoporous films by the so called
EISA approach[20]
In general thin films are thin material layers ranging from fractions
of a nanometer to several micrometers in thickness The EISA process (Evaporation
Induced Self Assembly) typically starts with a homogeneous solution of silica precursor
and surfactant prepared in ethanolwater with an initial surfactant concentration much
below the critical micelle concentration A preferential evaporation of ethanol
concentrates the surfactant and silica species in the remaining liquid phase The
progressively increasing surfactant concentration drives self-assembly of silica-
surfactant micelles and their further organization into liquid-crystalline mesophases
(Fig 9)
Fig 9 Mesophase formation during EISA thin film synthesis[20]
INTRODUCTION
23
Pre-existing incipient silica-surfactant mesostructures serve to nucleate and orient
mesophase development This results in the rapid formation of thin film mesophases
that are highly oriented with respect to the substrate surface It is possible to obtain
different final mesostructures through variation of the initial alcoholwatersurfactant
ratios
Functionalization
For some applications it can be interesting to modify the surface of the porous structure
- either bulk material or film By introducing for example organic groups the
hydrophobicity of the materials can be reduced (Fig 10) In general two approaches for
the modification of the mesoporous silica are followed The introduction of the organic
moieties can be accomplished either after synthesis (grafting)[21]
or during the synthesis
via co-condensation[22-24]
Fig 10 Functionalization of mesoporous silica with organic groups and the resulting
hydrophobicity[25]
INTRODUCTION
24
Grafting[26]
The post-synthetic grafting is achieved with organotrialkoxysilanes or
organotrichlorosilanes The template-free mesoporous silica is dispersed mostly in non-
polar anhydrous solvents to avoid a reaction of the organosilanes with anything but the
silica material The reaction takes place between the silanol groups on the surface and
the organoalkoxysilanes organotrichlorosilanes Studies showed that silanols located
on the exterior surface and near the pore openings are kinetically more accessible than
silanols on the interior pore wall Thus most organic functional groups are located
there It is possible to preferentially functionalize the surface of mesoporous silica
particles This is especially the case when the grafting is performed before the surfactant
is removed from the mesopores After the grafting has been performed the surfactant
can be removed This control over the location of functional groups may enable the
interaction of the porous particle with the environment through the surface
functionalization while not influencing the pore surface properties
The second important method for the synthesis of organically functionalized
mesoporous silica materials is the co-condensation In this direct ldquoone-potrdquo synthesis
method tetraalkoxysilanes together with an organo-substituted trialkoxysilane are
added to the aqueous surfactant solution Hydrophobic groups are supposed to interact
with the hydrocarbon tails of the surfactant templates and thereby evenly distribute
across the pore surface Furthermore the organic moieties are linked through multiple
siloxane bridges (Fig 11)
INTRODUCTION
25
Fig 11 Method for the functionalization of silica with an alkoxysilane [27]
Additionally this synthetic approach allows one to control the morphology of the
particles The influence of the organoalkoxysilanes on particle morphology depends
upon the abilities to stabilize or destabilize the micelles[28]
A great number of commercial available siloxanes can be introduced The register of
possible functional groups can be extended eg through a post-synthetic modification
after the co-condensation (Fig 12)
Fig 12 Post-synthetic modification of mesoporous organo-silica material[27]
INTRODUCTION
26
Extraction
In order to obtain a porous material after the templated synthesis the surfactant has to
be removed This can be realized either by calcination or extraction In the case of most
functionalized materials the template cannot be removed by calcination unless the
organic groups are sufficiently thermally stable[29]
In the literature one can find
different possibilities for the removal of the template by extraction ndash mainly complex
procedures such as extraction with supercritical carbon dioxide[30]
or treatment with
microwave radiation[31]
The most common method is some kind of ion-exchange in
alcoholic media eg with a mixture of ethanol and hydrochloric acid The material is
refluxed for several hours and thus protons replace the template cations It is also
possible to use more gentle extraction procedures eg a solution of ammonium nitrate
in ethanol[32]
Mesoporous Titania
After the discovery of the templated synthesis of mesoporous silica much effort was
made to adapt the synthesis principle to the formation of mesoporous titania ndash however
this turned out to be more challenging than for the silica system While the EISA-
approach is effective[20]
the synthesis of ordered mesoporous bulk material or
nanoparticles similar to MCM-41 is often less successful Synthesis problems are
mainly associated with the weak interaction between the cationic template molecules
and the inorganic phase and the faster hydrolysis of titania precursors[33 34]
Further
difficulties emerge from the preferred hexagonal coordination of Ti atoms often
INTRODUCTION
27
resulting in lamellar structures[33]
and the tendency to reorganize into stable crystalline
phases at relatively low temperatures eg as anatase or rutile
However there is a substantial interest in nanostructured titania films especially for
photocatalytic and photovoltaic applications The excellent electrical and mechanical
properties of porous nanostructured titania make it an ideal material for dye-sensitized
solar cells (DSSC)[35]
While DSSCs are cheaper to manufacture than silicon-based
cells they are still less efficient For the production of efficient DSSCs a
semiconducting layer with a high surface area is required to ensure a high loading with
a sensitizing dye Already a relatively thin film of titania nanoparticles doped with an
appropriate dye can produce a significant electric current
Optical Properties of Thin Films
In thin film deposition a thin layer of material is prepared on a substrate or previously
deposited layer ldquoThinrdquo is a relative term since a film may look operationally thin or
thick according to the procedure applied eg optically thin or thick compared to the
wavelength of the light used The most famous example for optically thin films may be
iridescent soap bubbles
Besides the thickness the refractive index is the second important variable in thin films
for optical applications The refractive index n of a medium is a measure for how much
the speed of light is reduced when traveling through it For example glass has a
refractive index of around 15 which means that light travels at 1 15 = 067 times the
speed in vacuum
INTRODUCTION
28
Dispersion and absorption
The effect that n varies with frequency (except in vacuum where all frequencies travel
at the same speed) is known as dispersion and it is what causes a prism to divide white
light into its constituent spectral colors In real materials the polarization does not
respond instantaneously to an applied field This causes dielectric loss which can be
expressed by a permittivity that is both complex and frequency dependent Real
materials are not perfect insulators either ie they have non-zero direct current
conductivity Taking both aspects into consideration a complex index of refraction can
be defined
inn ~
Here n is the refractive index indicating the phase velocity as above while κ is called
the extinction coefficient which indicates the amount of absorption loss when the
electromagnetic wave propagates through the material Both n and κ are dependent on
the wavelength In regions of the spectrum where the material does not absorb the real
part of the refractive index tends to increase with frequency Near absorption peaks the
curve of the refractive index is a complex form given by the Kramers-Kronig relations
and can decrease with frequency
Since the refractive index of a material varies with the frequency (and thus wavelength)
of light it is common to specify the corresponding vacuum wavelength at which the
refractive index is measured Typically this is done at a well-defined spectral emission
line for example the sodium D line at 589 nm (nD)
INTRODUCTION
29
Two common properties of transparent materials are directly related to the difference in
the refractive index of the materials Light is bended when it crosses the interface and it
reflects partially from surfaces
In thin film interference this phenomenon causes the characteristic colors like in the
case of soap bubbles or tarnished metals[36]
Fig 13 shows the dependence of the
interference colors on the thickness of a SiO2 film on silicon at a view angle of 45deg
Fig 13 Calculated interference colors of a silica film on silicon[37]
Stacking thin layers with different refractive indices can enforce this effect These
multilayer reflectors or so-called Bragg stacks can also be observed in nature when
chitin layers are alternated with different refractive index layers in order to control the
apparent color in a wide variety of animals[38]
In the laboratory these special thin films
can be prepared for example by alternation of low refractive index SiO2 with highly
refractive TiO2 films Regarding porous thin films the possible change of the
interference color upon adsorption of volatile species comes to mind This sensing
effect of porous films has already been reported in several publications[39-43]
also in
combination with the Bragg-stacks[44]
MOTIVATION
30
2 MOTIVATION
MOTIVATION
31
In summary it can be ascertained that porous materials are of great interest in many
fields of science and technology There are numerous publications on the synthesis of
all kinds of porous materials Meanwhile there is also a rapidly growing literature on
synthesis procedures for porous nanoparticles We then ask if it could be interesting to
synthesize porous materials at the nanometer scale and how could they be of use in
nanotechnology
As already mentioned nanoparticles exhibit a multitude of interesting properties In
combination with the characteristics of the zeolite materials the resulting nanoparticles
are ideal candidates for numerous applications[45]
However zeolites are often restricted by the small pore diameter Especially in the
liquid phase diffusion plays a major role The reactants need to diffuse rapidly towards
and away from catalytically active sites Due to the larger pore diameter and the
resulting improved diffusion properties of the mesoporous materials they are good
candidates for catalysis and sensing applications In order to obtain selectivity towards
different adsorbates or reactants the materials can be modified with various functional
groups[39]
In some domains the particle size and the existence of single particles is essential
Colloidal suspensions of discrete mesoporous silica nanoparticles which can be
synthesized in nearly every dimension and additionally functionalized with a multitude
of organic groups are ideal candidates for demanding application areas like drug
delivery[26]
The loading and release of the drug can be controlled by selectively
functionalizing the inner surface of the particle whereas the outer surface can be
MOTIVATION
32
modified with bioactive groups It is also imaginable to use porous particles as host
system for other materials such as quantum dots or dyes for biolabeling[46 47]
Encapsulating of sensitive dyes in the porous particles[48 49]
could be useful for the
incorporation in polymer matrices
Especially in the case of producing thin films homogeneous dispersions of
nanoparticles for the preparation eg by spin-coating are of great interest Electronic
semiconductor devices and optical coatings are the main applications for thin film
construction For example the use as low-k materials is intensively investigated And
porous titania films are a basic necessity in todayrsquos dye sensitized solar cells (DSSCs)
The preparation of thin films with porous nanoparticles has a range of advantages over
the common EISA approach for mesoporous films and the growth of zeolite films on
substrates
It is believed that the porous thin films made of (porous) nanoparticles exhibit improved
diffusion properties and a highly accessible pore system[50]
Additionally one can work with stable suspension of already extracted nanoparticles
assuring facile handling and good reproducibility
The coating of sensitive substrates is facilitated due to the mild conditions
Control over the thickness can be attained by varying concentration or by introducing
multiple step coating
Intricate template removal procedures between the coating steps are needless
The adhesion to different surfaces can be influenced by the addition of binders to the
coating suspensions
MOTIVATION
33
It could be also feasible to combine suspensions containing different kinds of
nanoparticles in order to assemble hybrid thin films
Finally the material is easier to characterize when bulk samples are available
Porous nanoparticles and thin films are viewed to have a tremendous potential in
various applications Thus the goal of this work was the synthesis of porous
nanoparticles as monodisperse colloidal suspensions These suspension were used for
the preparation of porous thin films Thorough characterization of the nanostructures is
necessary to establish understanding and control of their synthesis and applications
CHARACTERIZATION METHODS
34
3 CHARACTERIZATION
METHODS
CHARACTERIZATION METHODS
35
The characterization of porous nanoparticles can be done by using a variety of different
techniques mainly drawn from materials science Common techniques are electron
microscopy (TEM SEM) atomic force microscopy (AFM) dynamic light scattering
(DLS) powder x-ray diffractometry (XRD) and vibrational spectroscopy (IR Raman)
The determination of the inherent or interparticle porosity of the materials can be
achieved with different methods As the sorption plays a key role in many application
areas the characterization of the materials by their sorption properties is one of the most
important methods
Sorption
Gas adsorption is a prominent method to obtain a comprehensive characterization of
porous materials with respect to their specific surface area or pore size distribution In a
common gas sorption measurement the sample is attached to a vacuum manifold and
distinct relative pressures (p p0-1
) of the probe gas are adjusted During the measurement
the adsorbed and desorbed volumes of gas (in cm3 g
-1) on the sample surface (apparent
outer surface and accessible pore surface) is calculated for varying relative pressures at
a constant temperature From the obtained isotherms one can draw conclusions about
the size and morphology of pores The isotherms are categorized according to
IUPAC[51]
as shown in Fig 14
CHARACTERIZATION METHODS
36
Fig 14 The six isotherms defined by the IUPAC[51]
Type I is typical for microporous materials and shows a plateau after the filling of the
small pores at low relative pressures
Type II isotherms describe the formation of multilayers after the monolayer is
completed at point B This shape in combination with the complete reversibility upon
desorption is typical for non-porous materials
Type III and V are rarely observed and reflect a low interaction energy between
adsorbate and adsorbent
Type IV isotherms are typical for mesoporous samples The original IUPAC
classification defined the hysteresis as characteristic feature of mesoporous materials
Type VI shows an example isotherm for samples with a stepwise multilayer absorption
of a non-porous material
CHARACTERIZATION METHODS
37
In Fig 15 a typical isotherm for nanometer-sized mesoporous materials (Type IV) with
fields for the individual sorption steps is shown
00 02 04 06 08 10
E
DC
B
A
adsorption desorption
vo
lum
e a
dso
rbe
d
relative pressure pp0
Fig 15 Typical isotherm for a bulk sample of mesoporous nanoparticles
The steps A to E can be attributed to the following processes
A At low relative pressures p p0-1
a monolayer of adsorbate molecules is
forming on the high inner surface of the material
B Multilayers are established
C Filling of the mesopores occurs (capillary condensation)
D The remaining outer surface is covered (plateau)
E In samples with very small particles the adsorbate condenses in the
interparticle pores
CHARACTERIZATION METHODS
38
The most common sorption method is nitrogen sorption because of a suitable heat of
adsorption (5-25 kJ mol-1
) and a good access of nitrogen molecules (0354 nm) into
small pores An evacuated sample cooled with liquid nitrogen is loaded with gaseous
nitrogen Due to the low temperature the nitrogen is adsorbed on the sample surface
resulting in equilibrium between adsorbed film and gas phase at constant temperature
The isotherm shows the adsorbed amount of gas as a function of the pressure Different
models can describe the adsorption
BET-surface area
In contrast to the Langmuir model the method developed by Brunauer Emmet and
Teller[52]
allows the formation of multilayers For low partial pressures (p p0-1
lt 03) the
BET-equation can be transformed into a linear correlation
Cnp
p
Cn
C
p
pn
p
p
mm
11
10
0
0
n adsorbed gas quantity
nm monolayer adsorbed gas quantity
C BET-constant
p equilibrium pressure
p0 saturation pressure
CHARACTERIZATION METHODS
39
With this equation an adsorption isotherm can be plotted as a straight line with
n-1
[(p0 p-1
) minus 1]-1
on the y-axis and p p0-1
on the x-axis according to experimental results
This plot is called a BET plot The linear relationship of this equation is typically
maintained only in the range of 005 lt p p0-1
lt 03
With the required cross-section of an adsorbate molecule the monolayer adsorbed gas
quantity nm (mol g-1
) and the BET-constant C the specific surface area can be
calculated
Pore diameter
If gas molecules are introduced into a pore system their physical properties change
Capillary condensation into the curved surface can occur long before the saturation
vapor pressure is reached The Kelvin equation provides a thermodynamic correlation
between the relative pressure p p0-1
and the reduced radius (Kelvin radius) rk during
pore condensation
0
ln
2
p
pRT
Vr L
k
γ adsorbate surface tension
VL molar volume
CHARACTERIZATION METHODS
40
Fig 16 Adsorption and desorption in a pore
The reduced radius rk describes the curvature of the adsorbate film onto the surface and
is composed of pore radius r1 and the meniscus radius r2 in the filled pore (Fig 16)
21
112
rrrk
In adsorption r2 is infinite and thus rk is 2r1 In desorption r1 = r2 = rk For this reason
the desorption branch is commonly used for the determination of the pore diameter
BJH-Method
The pore radius can be determined with a method developed by Barrett Joyner and
Halenda (BJH) The radius of the cylindrical pore rp is composed of the Kelvin radius rk
and the thickness t of the adsorbed monolayer
trr Kp
CHARACTERIZATION METHODS
41
The thickness t has to be calculated using the density of the adsorbed liquid The
De Boer equation associates the thickness of the adsorbed layer with the relative
pressure in nitrogen sorption isotherms
0340log0
p
p
Kt
K Constant
The BJH-method as classical macroscopic concept based on the Kelvin equation is
linked to the pore condensation phenomena It is applicable for mesopore size analysis
but fails to correctly describe both the pore filling of micropores and of narrow
mesopores In contrast the Density Functional Theory (DFT) or methods of molecular
simulation such as Monte Carlo simulation or Molecular Dynamics provide a
microscopic model of adsorption based on a more realistic description of the
thermodynamic properties of the intra-pore fluid[53]
Other sorption measurements
Nitrogen sorption is a standard method for bulk materials Besides the common
adsorptives such as nitrogen argon or krypton it can be also interesting to investigate
the sorption properties of other gases like alkanes[54]
Especially when investigating
sorption properties of thin films other methods have to be used One possibility is the
sorption measurement using a quartz crystal microbalance
CHARACTERIZATION METHODS
42
Quartz Crystal Microbalance
In a quartz crystal microbalance (QCM) the changes in the resonance frequency of a
piezoelectric quartz crystal are correlated to mass changes deposited onto the crystal
surface Due to the high precision in frequency measurements it is possible to measure
very small mass changes For the correlation between mass and frequency changes the
Sauerbrey equation is used
mA
f
A
mff
qqqq
2
0
2
0 22
It gives the change Δf in the oscillation frequency of a piezoelectric quartz crystal as a
function of the mass Δm added to the crystal Here f0 is the resonant frequency of the
crystal A is the active area between the electrodes ρq is the density of quartz μq is the
shear modulus of quartz and υq is the shear wave velocity in quartz
The Sauerbrey equation was developed for oscillation in air and only applies to rigid
masses attached to the crystal for example thin films
For a certain quartz-crystal the material constants can be combined to a factor Cf and
thus the equation is reduced to
mCf f
For a 10 MHz quartz crystal (Fig 17) a loading of 1 ng per cm2 correlates with a
decrease in the resonant frequency by 0226 Hz
CHARACTERIZATION METHODS
43
Fig 17 10 MHz quartz crystal microbalance
Depositing porous films onto the QCM makes it possible to investigate the mass
changes associated with sorption and thus recording isotherms If the density of a
homogeneous coating is known one could also calculate the film thickness
An alternative investigation of the thickness and additionally of the optical properties of
thin films can be done by a versatile and powerful optical technique called ellipsometry
Ellipsometry
Ellipsometry measures the change of polarization of light upon the interaction with
matter The name stems from the fact that the reflected light will in general be
elliptically polarized Ellipsometry can yield information about layers that are thinner
than the wavelength of the probing light itself even down to a single atomic layer It
can probe the complex refractive index or dielectric function tensor which gives access
to fundamental physical parameters and is related to a variety of sample properties
including morphology crystal quality chemical composition or electrical conductivity
Ellipsometry is commonly used to characterize film thickness for single layers or
complex multilayer stacks ranging from a few tenths of a nanometer to several
micrometers
CHARACTERIZATION METHODS
44
Experimental setup
Electromagnetic radiation is emitted by a light source and linearly polarized before it
falls onto the sample After reflection the now elliptically polarized light passes a
second polarizer - the analyzer - and falls into the detector (Fig 18)
Fig 18 Schematic setup of an ellipsometry experiment
Ellipsometry measures two of the four Stokes parameters which are conventionally
denoted by Ψ and Δ The incident and the reflected beam span the plane of incidence
Light that is polarized parallel or perpendicular to the plane of incidence is called p or s
polarized respectively The amplitudes of the s and p components after reflection and
normalization to their initial values are denoted by rs and rp respectively (Fig 19)
CHARACTERIZATION METHODS
45
Fig 19 The quantities rs and rp in elliptically polarized light
The ratio of rs and rp is described by the fundamental equation of ellipsometry
i
s
pe
r
rtan
Thus tan Ψ is the amplitude ratio upon reflection and Δ is the phase shift (difference)
Since ellipsometry is measuring the ratio of two values it is very accurate and
reproducible relatively insensitive to scattering and fluctuations and requires no
standard sample or reference beam
Data analysis
Ellipsometry is an indirect method ie in general the measured Ψ and Δ cannot be
converted directly into the optical constants of the sample Normally a layer model
must be established which considers the optical constants (refractive index or dielectric
function tensor) and thickness parameters of all individual layers of the sample
including the correct layer sequence Using an iterative procedure (least-squares
CHARACTERIZATION METHODS
46
minimization) the unknown optical constants and thickness parameters are varied and
Ψ and Δ values are calculated using the Fresnel equations The calculated Ψ and Δ
values that match the experimental data best provide the optical constants and thickness
parameters of the sample In spectroscopic ellipsometry (SE) a broad-band light sources
is employed which covers a certain spectral range in the infrared visible or ultraviolet
region Thus the complex refractive index or the dielectric function tensor in the
corresponding spectral region can be obtained which gives access to a number of
fundamental physical properties
Ellipsometric porosimetry
Regarding porous transparent thin films ellipsometric porosimetry[55 56]
can be used to
describe the change of the optical properties that are associated with the sorption of
volatile species The method uses the Lorentz-Lorenz formula which is based on the
Clausius-Mossotti equation
032
1
A
rel
rel NM
It describes the relation between the macroscopic measurable relative dielectric constant
εrel and the electric polarizability α NA is the number of molecules in one mole
(Avogadro constant) and ε0 is the vacuum permittivity
CHARACTERIZATION METHODS
47
Mρ-1
is the molar volume Vm which can also be described as NAN-1
(N is the number
density of molecules)
N
NMV A
m
Thus the Clausius-Mossotti equation can be written as
032
1
N
rel
rel with vPN
03
Pv is the volume polarizability In a certain range of frequencies (visible and UV) the
Maxwell theory relates the refractive index of a substance with its relative dielectric
constant With εrel = n2 the Clausius-Mossotti equation can be converted into the
Lorentz-Lorenz function
vPn
n
2
12
2
The Lorentz-Lorenz equation is used for the characterization of porous substrates with
ellipsometric porosimetry The individual components act additive in the following
approximation
CHARACTERIZATION METHODS
48
A dense substrate with the refractive index nd
2
12
2
d
dvd
n
nP
An empty porous substrate with the refractive index ne (nair = 1 V = volume of open
pores)
2
11
2
11
2
1
2
12
2
2
2
2
2
2
2
d
d
d
d
air
air
e
eve
n
nV
n
nV
n
nV
n
nP
A filled porous substrate with the refractive index nf (nads = refr index of the adsorbate)
2
11
2
1
2
12
2
2
2
2
2
d
d
ads
ads
f
f
vfn
nV
n
nV
n
nP
When the refractive index of the filled and empty porous substrate is known one can
determine the porosity of the material without knowing the refractive index of the dense
material
2
1
2
1
2
12
2
2
2
2
2
ads
ads
e
e
f
f
vevfn
nV
n
n
n
nPP
Therefore the volume V of the open pores can be determined as follows
2
1
2
1
2
12
2
2
2
2
2
ads
ads
e
e
f
f
n
n
n
n
n
nV
CHARACTERIZATION METHODS
49
Light Scattering
Mie Scattering
For the description of the scattering ability of particles similar to or larger than the
wavelength of light the Mie theory or discrete dipole approximation can be used The
Mie solution also called Mie theory is a complete analytical solution of Maxwells
equations for the scattering of electromagnetic radiation by spherical particles In
contrast to Rayleigh scattering the Mie solution to the scattering problem is valid for all
possible ratios of diameter to wavelength although the technique results in numerical
summation of infinite sums Although scattering of light by a homogeneous sphere may
seem to be a simple process the Mie solution is very complex and not easy to
understand In its original formulation it assumed a homogeneous isotropic and
optically linear material irradiated by an infinitely extending plane wave Currently the
term ldquoMie solutionrdquo is also used in broader contexts for example when discussing
solutions of Maxwells equations for scattering by stratified spheres or by infinite
cylinders If particles are much smaller than the wavelength of the incoming light their
scattering ability can be described according to Rayleigh
Rayleigh Scattering
Rayleigh scattering describes the scattering of light or other electromagnetic radiation
by particles much smaller than the wavelength of the light It occurs when light travels
in transparent solids and liquids but is most prominently seen in gases The amount of
CHARACTERIZATION METHODS
50
Rayleigh scattering that occurs to a beam of light is dependent upon the size of the
particles and the wavelength of the light
The intensity of light scattered by a single small particle from a beam of unpolarized
light of wavelength λ and intensity I0 is given by
62
2
24
2
2
022
12
2
cos1
d
n
n
RII
Here R is the distance to the scattering particle θ is the scattering angle n is the
refractive index of the particle and d is the diameter of the particle In simple terms the
scattering coefficient - the intensity of scattered light - on small particles can be
described with the following dependencies
4
1~
I and 6~ rI
The wavelength dependence of the scattering means that blue light is scattered much
more than red light In the atmosphere this results in blue light being scattered to a
greater extent than red light and so one sees blue light coming from all regions of the
sky As a rule of thumb due to the strong dependence on the particle size a colloidal
suspension is expected to become transparent when the particle size is decreased below
110 of the wavelength of the incoming light Thus a potential transparent colloidal
dispersion ideally contains nanoparticles smaller than about 40 nm in diameter
CHARACTERIZATION METHODS
51
Dynamic Light Scattering in Colloidal Suspensions
Dynamic light scattering (DLS) also known as quasi elastic laser light scattering is a
powerful technique in physics which can be used to determine the size distribution
profile of small particles dispersed in a liquid phase When light hits small particles it is
scattered in all directions If the light source is a laser and thus is monochromatic and
coherent then one observes a time-dependent fluctuation in the scattering intensity
These fluctuations are due to the fact that the small particles in suspensions are
undergoing Brownian motion and thus the distance between the scattering centers in the
solution is constantly changing The scattered light interferes either constructively or
destructively These intensity fluctuations contain information about the time scale of
the particle movement The smaller the particles are the faster they diffuse and thus the
faster the intensity changes These fluctuations are correlated across microsecond time
scales by an autocorrelation function ie a function that describes how a given
measurement relates to itself in a time-dependent manner The second order
autocorrelation curve (gII) can be directly derived from the intensity trace
2)(
)()()(
tI
tItIqg II
q wave vector
τ delay time
I intensity
CHARACTERIZATION METHODS
52
At short time delays the correlation is high because the particles do not have a chance
to move to a great extent from the initial state that they were in As the time delays
become longer the correlation starts to exponentially decay to zero meaning that after a
long time period there is no correlation between the scattered intensity of the initial and
final states This exponential decay is related to the diffusion coefficient To fit the
autocorrelation function numerical methods are used If the sample is monodisperse
then the decay is simply a single exponential The Siegert equation relates the second
order autocorrelation function (gII) with the first order autocorrelation function (g
I) as
follows
2)(1)( qgqg III
β correcting factor
Once the autocorrelation data have been generated different mathematical approaches
can be employed to determine the z-averaged translational diffusion coefficient (D) In
case of a monodisperse sample a single exponential function is obtained for the decay
of the autocorrelation function where Γ is the decay rate
)exp()( qg I with 2Dq and
2sin
4 0
nq
λ is the incident laser wavelength n0 is the refractive index of the sample and θ is angle
at which the detector is located with respect to the sample cell The Stokes-Einstein
CHARACTERIZATION METHODS
53
equation describes the dependency of the diffusion coefficient D on the radius r of a
spherical particle in a liquid phase with the viscosity η at a certain temperature T
r
kTD
6
Electron Microscopy
As the maximum resolution of light microscopes is determined by the wavelength of the
photons that are being used to probe the sample imaging of nanoparticles becomes
difficult Like all matter electrons have both wave and particle properties (as proposed
by de Broglie) and their wave-like properties mean that a beam of electrons can be
focused by electrical and magnetic fields onto the sample As the wavelength is
dependent on their energy it can be tuned by adjustment of accelerating fields resulting
in a much smaller wavelength than that of light The wavelength of electrons
accelerated by 200 kV is only 251 pm but the theoretical resolution is limited to about
01 nm because of the aberration in todayrsquos electron lenses
In transmission electron microscopy (TEM) the beam of electrons is transmitted
through a specimen Then an image is formed magnified and directed to appear either
on a fluorescent screen a layer of photographic film or a CCD camera
With a Scanning Electron Microscope (SEM) it is possible to produce high-resolution
images of a sample surface with a characteristic three-dimensional appearance In a
typical SEM the emitted electrons are focused into a very fine focal spot sized 1 nm to
CHARACTERIZATION METHODS
54
5 nm The beam passes through pairs of scanning coils in the objective lens which
deflect the beam horizontally and vertically so that it scans in a raster fashion over a
rectangular area of the sample surface When the primary electron beam interacts with
the sample the electrons lose energy by repeated scattering and absorption The energy
exchange between the electron beam and sample results in the emission of electrons and
electromagnetic radiation which can be detected to produce an image
Thermogravimetric Analysis
Thermogravimetric Analysis (TGA) determines the changes in weight in relation to
changes in temperature by raising the temperature gradually and plotting weight against
temperature The weight loss curve may require transformation before results can be
interpreted The first derivative of the weight loss curve is used to find the points at
which weight-loss is most rapid TGA is commonly employed to determine
characteristics of materials such as degradation temperatures absorbed moisture the
proportions of inorganic and organic components in materials and solvent residues
Additionally Differential Scanning Calorimetry (DSC) provides data on
thermodynamic effects by measuring the time-dependent heat flow between the sample
and a reference
CHARACTERIZATION METHODS
55
Powder X-ray Diffraction
Powder XRD uses x-ray diffraction on powder or microcrystalline samples for the
structural characterization of materials It is based on the elastic scattering of
electromagnetic waves on lattice planes or more precisely at the electronic shells of
regularly arranged atoms Ideally every possible crystalline orientation is represented
equally in a powdered sample The Bragg equation is a simple method to determine the
distance d of lattice planes To derive the Bragg equation one considers the lattice
planes of a crystal as semitransparent mirrors partly reflecting an incoming beam (Fig
20)
Fig 20 Sketch to construct the Bragg equation
CHARACTERIZATION METHODS
56
For a monochromatic beam the reflected rays interfere constructively or destructively
depending on the angle of incidence θ and the lattice diameter d Two reflected
monochromatic beams interfere if the path difference is an integer multiple of the
wavelength λ This results in the Bragg equation for constructive interference
sin2dn with n = 1 2 3 hellip
When the scattered radiation is collected on a flat plate detector the averaging due to
random orientations of the particles leads to smooth diffraction rings around the beam
axis rather than the discrete Laue spots as observed for single crystal diffraction The
angle between the beam axis and the ring is called the scattering angle and in x-ray
crystallography denoted as 2θ
Solid-State NMR
A nuclear spin can interact with a magnetic or electric field Spatial proximity or a
chemical bond between two atoms can give rise to interactions In general these
interactions are orientation dependent In media with no or little mobility (eg crystal
powders large membrane vesicles molecular aggregates) anisotropic interactions have
a substantial influence on the behavior of a system of nuclear spins In contrast in a
classical solution-state NMR experiment Brownian motion leads to an averaging of
anisotropic interactions In such cases these interactions can be neglected on the time-
scale of the NMR experiment Examples of anisotropic nuclear interactions commonly
found in solid-state NMR are the chemical shift anisotropy and the internuclear dipolar
CHARACTERIZATION METHODS
57
coupling Anisotropic interactions modify the nuclear spin energy levels (and hence the
resonance frequency) of all sites in a molecule and often contribute to a line-broadening
effect in NMR spectra High-resolution conditions in solids can be established using
magic angle spinning (MAS) which facilitates averaging of interactions in real space
In 29
Si MAS NMR of functionalized silica samples typically five peaks can be
observed Qn-peaks are related to Si-atoms linked to two three or four other Si-atoms
by an oxygen bridge and to hydroxyl groups Tn-peaks derive from Si-atoms carrying
one organic moiety
[Q4] Si(OSi)4
[Q3] Si(OSi)3(OH) [T
3] RSi(OSi)3
[Q2] Si(OSi)2(OH)2 [T
2] RSi(OSi)2(OH)
The chemical shift of the T-peaks depends on the nature of the Si-C bond Thus
different functional groups can be distinguished Depending on the area of these peaks
one can make statements about the linkage in the solid state
IR and Raman Spectroscopy
FT-IR and FT-Raman spectroscopy are methods to investigate the vibrational modes of
a sample by absorption or scattering of radiation respectively Both techniques are
appropriate for the identification of specific functional groups especially in organic
moieties In inorganic solids hydroxyl groups or characteristic Raman active centers
CHARACTERIZATION METHODS
58
can be detected If a chemical group changes its dipole moment during vibration it can
be detectable in infrared spectroscopy The moieties of a molecule (for instance a
methyl group) can be identified by their specific absorption bands in the infrared
spectrum In Raman spectroscopy energy transfer from incident coherent laser light
induces vibrations of molecules and the scattered light from the sample is analyzed
The energy for exciting the molecular vibrations is taken from the photon energy
(Stokes frequencies) or the energy of the vibrations is transmitted to the photons (Anti-
Stokes frequencies) respectively During vibration the polarizability of the molecule
has to change in order to observe Raman-active modes
RESULTS AND DISCUSSION
59
4 RESULTS AND DISCUSSION
RESULTS AND DISCUSSION 41
60
41 High Silica Zeolite Beta
From Stable Colloidal Suspensions to
Thin Films
RESULTS AND DISCUSSION 41
61
Introduction
Zeolites and zeolite-like materials with their uniform pore sizes unique structural
topology and composition well defined acidity and good thermal stability are viable
commercial catalysts selective ion exchangers and absorbers Although many different
crystalline molecular sieves are already known there is a continuing need for zeolites
with new properties and a continuing search for new zeolite applications More recent
efforts have focused on exploring the possibilities of synthesizing zeolites in the
nanosized range by application of highly supersaturated precursor solutions[45 57]
By
using organic additives during the synthesis procedure colloidal solutions were formed
and used for the preparation of different nanosized molecular sieves[58-64]
Several
microporous materials including MFI LTA FAU BEA and LTL in the form of stable
colloidal suspensions with narrow particle size distribution (100 nm) are described in
the literature Intriguingly among the nanosized zeolites the pure silica forms were only
reported for the MFI MEL and BEA structure types[65-67]
BEA is a large-pore microporous material characterized by three sets of mutually
perpendicular channels with 12-membered ring apertures which can be prepared from
classical aluminosilicate gels with a wide range of SiAl ratios[68]
The main features of
this structure make the material suitable for numerous applications such as
heterogeneous catalysis sensors membranes etc[67 69-71]
The number of acid sites and
the hydrophobicity of the microporous materials can be tuned by controlling the SiAl
ratios in the final crystallites
RESULTS AND DISCUSSION 41
62
One important application of purely siliceous microporous zeolites exhibiting a high
degree of hydrophobicity and a high micropore volume is in the field of nanoscale
layers with low dielectric constant (low-k) for microelectronic applications as well as
for the preparation of hard coatings with unique properties[72 73]
Pure silica zeolite BEA
was synthesized by Corma and co-workers using tetraethylammonium hydroxide
(TEAOH) as a template and fluoride ions at near neutral pH[74]
In addition BEA
crystals were recently prepared via a solidndashsolid transformation method[69 75]
and the
synthesis of colloidal siliceous BEA from highly templated precursor solutions was
reported[76]
One of the focused applications of the pure silica BEA type molecular sieve
is in the preparation of highly porous and hydrophobic layers which can exhibit
variable optical and electronic properties depending on the method of preparation
Several strategies have been applied for the formation of microporous films and
recently a very effective method was established for deposition of ultrathin pure
siliceous MFI type films on two-dimensional supports via spin-coating of stable
colloidal suspensions[65]
Due to their unique properties particles at the nanometer scale
are of great interest in a number of advanced applications Homogeneously dispersed in
a solvent these colloidal suspensions show similarities to real solutions which make
them suitable for the preparation of thin homogeneous and transparent films by spin-
coating As a result of their crystallinity the coatings have high mechanical stability and
resistance to many solvents Additionally decreasing the crystal size of particles below
100 nm produces substantial changes in the physicochemical properties of the zeolite
RESULTS AND DISCUSSION 41
63
particularly in the external surface of the crystals as well as the ability of such
nanocrystals to pack closely in the film during spin-coating[77]
The aim of this paper is to describe a complete route for the synthesis of zeolite Beta
from templated precursor solutions with emphasis on the crystallization kinetics
stabilization of the nanosized crystallites in coating suspensions and the assembly in
thin films exhibiting variable physicochemical properties
Experimental
Synthesis of nanosized zeolite Beta
The composition of the precursor solution used for synthesis of nanosized zeolite Beta
crystals was 25 SiO2 1 Al2O3 15 TEAOH 375 H2O The initial compounds were
mixed in one pot until a clear solution was obtained Cab-o-sil M5 (Riedel-DeHaumlen) as
silica source aluminum sec-butoxide (Aldrich) as aluminum source
tetraethylammonium hydroxide (TEAOH 35 wt Aldrich) as organic template and
deionized water were used The hydrothermal (HT) treatment of the precursor mixtures
was performed in an oven at 140 degC under static conditions using steel autoclaves with
18 ml Teflon liners Every 24 hours one autoclave was taken out and the product was
purified by a series of centrifugation steps (1 h at 47800 g RCF) and subsequently
redispersed in water under sonication (1 h in ice) till the pH of the solution reached 10
A part of the final crystalline zeolite Beta was dealuminated according to the procedure
described in Ref[78]
The SiAl ratio of the as-synthesized and dealuminated zeolite Beta
was 32 and 100 respectively
RESULTS AND DISCUSSION 41
64
Stabilization of Beta nanoparticles in coating suspensions
The as-prepared and dealuminated zeolite Beta nanoparticles were treated with an
aqueous solution of diluted ammonium chloride and then washed with ethanol two
times in order to prepare stable zeolite suspensions and to prevent fast agglomeration
After washing and redispersion the colloidal suspensions were centrifuged at 12000 g
(RCF) for 5 min and the sediment was separated by decanting in order to eliminate the
larger agglomerates formed during the purification process The final solid
concentration of zeolite Beta nanoparticles was adjusted to 4 wt in ethanolic
suspension and further applied for the preparation of thin films
Three types of binders were used to improve the mechanical stability of the porous
films (1) aqueous colloidal silica suspension Nalco 2326 (SiO2 ~15 wt particle size
~ 5 nm) was diluted with ethanol to reach a concentration of 2 wt (2) pre-hydrolyzed
tetraethylorthosilicate (TEOS) in a mixture of ethanol water and HCl in the ratio of 1
TEOS 006 HCl 27 H2O 60 EtOH and (3) pre-hydrolyzed TEOS with
cetyltrimethylammonium bromide (CTAB) in the following ratio 1 TEOS 01 CTAB
006 HCl 27 H2O 60 EtOH The size of the amorphous silica particles formed in
TEOS-based binders (solutions 2 and 3) was kept constant eg about 2 nm in diameter
determined from dynamic light scattering (DLS) measurements The silica nanoparticles
in the binding solutions 2 and 3 were stable for about 10 days while afterwards a slight
increase in size was measured
RESULTS AND DISCUSSION 41
65
Deposition of thin Beta films on silicon wafers
The ethanolic zeolite suspension was either used directly for the film deposition or it
was mixed with the same volume of one of the three binders prior to spin-coating No
additional functionalization of the zeolite nanoparticles was carried out In order to
ensure the preparation of smooth and homogeneous films the coating suspensions were
filtrated through syringe filters (450 nm) prior to spinning
The nanoporous films were deposited on polished silicon wafers by spin-coating
(Laurell WS-400B-6NPP-Lite-AS) with a rate of 3000 rpm (acceleration 5000 rpm s-1
)
for 30 s All substrates were pre-cleaned with ethanol and acetone for 10 s under
spinning at 3000 rpm In order to prepare thick Beta films the spin-coating procedure
was repeated up to 6 times After each coating step the films were calcined at 450 degC
for about 30 min
From the numerous films prepared with different thickness the following will be
discussed in detail pure Beta film free of binder (Beta-pure) Beta crystals stabilized
with prehydrolyzed TEOS (Beta-TEOS) and Beta crystals stabilized with amorphous
silica (Beta-SiO2) (see Table 1) No significant differences were observed between the
samples prepared with the two types of TEOS binders (solutions 2 and 3) and therefore
only binder 2 will be discussed
RESULTS AND DISCUSSION 41
66
Table 1 Zeolite Beta films deposited on silicon wafers
Characterization
The degree of crystallinity of the zeolite materials was determined based on X-ray
diffraction patterns collected from purified powders with a STOE Stadi P diffractometer
using monochromatic Cu-Kα-radiation in transmission geometry Additionally the
degree of crystallinity size and morphology of the zeolite particles was proven by
collecting transmission electron micrographs (TEM) on a JEOL JEM 2011 instrument
with LaB6 cathode at 200 kV Samples were prepared on Plano holey carbon coated
copper grids by evaporating one droplet of the purified zeolite suspensions diluted with
water in the ratio of 1 100 Besides the evaluation of the particle size in the
suspensions was determined by DLS The DLS data were collected with an ALV-
NIBSHPPS High Performance Particle Sizer in PMMA cuvettes at 25degC under
continuous scans and analyzed according to the cumulant and distribution function
analysis (DFA) The polydispersity index (PDI) calculated for all samples was used as
an indication for a multi-modal particle size distribution The powder Beta samples
film binder deposition steps thickness
refractive
index
porosity
( void)
Beta-pure no 3 475 nm 110 77
Beta-TEOS TEOS 3 and 6 440 and 680 nm 113 70
Beta-SiO2 SiO2 1 and 6 185 and 950 nm 115 70
RESULTS AND DISCUSSION 41
67
were subjected to thermogravimetric analysis (TGA) after purification and freeze
drying The powders were heated in corundum crucibles from 30 to 900 degC (10 degCmin)
in a flow of synthetic air (25 mlmin) using a Netzsch STA 449 C Jupiter
thermobalance The amount of organic template and water in the framework type Beta
zeolite was determined in the samples prepared from 1 to 10 days of HT treatment The
surface features of the nanoparticles deposited in thin films were investigated with
scanning electron microscopy (Philips 40 XL) and ellipsometry The ellipsometric
measurements were performed on a Woollam M2000D at different angles (65deg 70deg and
75deg) in the entire spectral range of 190-1000 nm The data were fitted in the range
between 250-1000 nm using the Cauchy model for layered materials or using the EMA
layer (Bruggeman effective medium approximation) of SiO2 and introducing additional
voids[79]
Results and Discussion
Suspensions of Beta nanoparticles kinetic study and stabilization
In order to follow the crystallization kinetics of nanosized zeolite Beta the initial
solution with an SiAl ratio of 25 ratio was heated under hydrothermal conditions and
the crystallization process was interrupted at various times the solid phases extracted at
the different stages of crystallization were subjected to comprehensive characterization
The change in the solid products was followed with X-ray diffraction DLS TEM and
TGA The XRD patterns depicted in Fig 21 show that the amorphous precursor
RESULTS AND DISCUSSION 41
68
solutions transformed into crystalline zeolite Beta particles after 7 days and the
prolonged hydrothermal treatment did not change the degree of crystallinity
5 10 15 20 25 30 35 40 45
4 days
7 days
6 days
5 days
9 days
8 days
10 days
2 [degrees]
Fig 21 XRD pattern of the Beta samples synthesized under hydrothermal conditions
The first Bragg reflection at 62 2 occurs with a very low intensity in the sample after
heating for five days The low intensity of the Bragg reflection is possibly due to the
very small crystalline particles (lt 5 nm) that are present in the solid samples extracted
RESULTS AND DISCUSSION 41
69
from the reacting solutions or to the low amount of crystalline particles in comparison
to the amorphous matter It is important to note that the width of the Bragg reflections
did not change significantly which proves that no substantial change in the final
particle sizes occurred during the prolonged heating of the reaction systems (see
samples crystallized for 6 and 10 days)
The generation of amorphous and crystalline particles in the precursor solutions was
measured by DLS (see Fig 22)
1 10 100 1000 10000
1 day 5 days 7 days 10 days
inte
nsity
diameter [nm]
Fig 22 DLS data of purified suspensions hydrothermally treated from 1 and 10 days
It is important to note that the clear precursor solutions turned into dense transparent
gels after 24 h aging and kept the same texture even after hydrothermal treatment up to
six days A fluid translucent suspension is obtained after seven days of heating The
DLS curves of the samples treated for 1 and 2 days show a very broad particle size
distribution even after substantial dilution with water (PDI gt 05 the curves are not
shown here) This confirms the presence of unstable amorphous nanoparticles in the
RESULTS AND DISCUSSION 41
70
suspensions and the continuous dynamics of agglomeration and disintegration in the
reacting aluminosilicate species in the crystallizing system After three days of heating
two generations of particles one with an average hydrodynamic diameter of about 20-
60 nm and another of about 80 - 200 nm are detected in the precursor mixture It is also
observed that with increasing crystallization time only the width of the particle size
distribution curves is diminishing while the mean size does not change significantly
This observation can be explained with the higher stability of the growing particles in
the samples crystallized from 3 to 6 days However the colloidal zeolites tend to
agglomerate and at the same time disintegrate under purification of the reacting mixture
and redispersion in water or ethanol under sonication In the suspensions with a pH
lower than 8 and solid concentration above 6 wt a significant increase in the particle
diameter is observed Based on the DLS data one can conclude that the aggregates are
formed in the crystalline and intermediate suspensions and they are measured instead of
the individual particle grains This statement is proven by the TEM study where it can
be seen that the nanoparticles tend to agglomerate and do not exist as separated crystals
(Fig 23)
RESULTS AND DISCUSSION 41
71
Fig 23 TEM images of nanoparticles extracted from suspensions after a hydrothermal
treatment between 3 and 10 days
RESULTS AND DISCUSSION 41
72
The aggregation process is also accelerated with prolonging the time of hydrothermal
treatment (8 days) and the mean size of the zeolite domains in the particles is increased
from 20 up to 40 nm according to the TEM data At a very early time of HT treatment
any separation of the crystalline from the amorphous particles was not possible
Crystalline fringes representing the Beta crystalline phase in the mostly spherical
amorphous particles can be seen in the samples treated for 5 and 6 days The crystalline
particles have the same size and shape as the amorphous ones In many cases a good
alignment between several crystalline fringes in the particles is observed This process
is accelerated at the end of the hydrothermal treatment According to the TEM
micrographs particles with size in the range 8 - 15 nm were present during the entire
process of crystallization However after 5 days some of the particles contain
crystalline fringes and some of them appear amorphous After 6 days the fraction of
crystalline particles is increased while the number of amorphous particles is decreased
which is confirmed by both the XRD and DLS data (see Fig 21 and Fig 22) The
sample heated for 7 days contains fully crystalline nanoparticles which appear more
disintegrated in comparison to the ones heated for 10 days A slight increase in the size
of the individual particles and additional agglomeration is observed in the sample
heated for 10 days due to the longer crystallization time
The transformation of the amorphous aluminosilicate species into crystalline zeolite
Beta was also followed by TG analysis The amount of organic template and water is
changing depending on the degree of the samplesrsquo crystallinity As can be seen from
RESULTS AND DISCUSSION 41
73
Fig 24 the weight loss due to desorption of water and combustion of TEAOH is
decreased with increasing degree of crystallinity of the samples
100 200 300 400 500 600 700 800 900
75
80
85
90
95
100
1 day
5 days
7 days
10 days
we
igh
t [
]
temperature [degC]
Fig 24 TG data of the solid samples recovered from precursor solutions subjected to
hydrothermal treatment from 1 to 10 days
The samples heated for 7 and 10 days have almost the same amount of template and an
almost negligible amount of water which is expected for highly siliceous molecular
sieves In contrast in the partially crystalline sample (5 days HT treatment) the amount
of water and TEAOH is higher than in the crystalline Beta This can be explained with
an extra amount of template adsorbed on the surface and in the mesoporous
aluminosilicate amorphous grains Thus the weight loss of the washed and dried
products is decreased in the crystalline samples and the combustion of the template is
shifted to higher temperatures This is due to the different location of the template in the
amorphous or crystalline matrix ie the TEA+ cations are encapsulated in the zeolite
channels instead of the surface or in the mesopores In conclusion the amount of water
RESULTS AND DISCUSSION 41
74
and template encapsulated in the material is decreased while the temperature of
decomposition is increased with higher crystallinity
Beta nanocrystals stabilized in coating suspensions and films
The interfacial chemistry between the binders and the zeolite particles was studied
Dynamic light scattering measurements were performed in pure zeolite suspensions as
well as in binder-containing coating suspensions in order to study the stability prior to
film deposition The Beta crystals used for preparation of thin films were obtained
according to the procedure described above (140 ordmC 10 days) after dealumination The
XRD pattern from the solid sample synthesized in a larger amount (500 ml solid
concentration of 6 wt ) shows the presence of pure BEA-type zeolite (Fig 25)
5 10 15 20 25 30 35 40 45
sample sim BEA
Inte
nsity
2 [degree]
Fig 25 XRD patterns of pure zeolite Beta nanocrystals from the coating suspension
used for preparation of thin films in comparison with the simulated pattern
RESULTS AND DISCUSSION 41
75
The dynamic light scattering results of the same Beta-pure suspension reveals particles
with a hydrodynamic diameter in the range of 20 - 80 nm (Fig 26) which are attributed
to the zeolite Beta in the form of single crystals and probably as agglomerates in a
comparable amount This conclusion is based on the different presentations of the
scattering intensity (mass-weighted and unweighted) As can be seen the ratio between
the two classes of particles with size of 20 nm and 80 nm is increased substantially
when the scattering is expressed as mass-weighted It is known that this method better
represents the real picture (TEM investigations) in a suspension containing particles
with the same density crystallinity and chemical composition The particle size
distribution of this coating mixture does not change with time (at least one week) this
confirms its colloidal stability at ambient temperature (see Fig 26 left image)
1 10 100 1000 10000
mass-weighted unweighted
inte
nsity
diameter [nm]
Fig 26 DLS curves of zeolite coating suspension Beta-pure expressed as mass-
weighted and unweighted particle size distribution (a) and picture representing the
coating Beta-pure (right) and Beta-TEOS suspension (left)
RESULTS AND DISCUSSION 41
76
This coating suspension was mixed with the three binders and remained stable with no
sedimentation during one week at ambient conditions All suspensions with the three
binders appear transparent with minor scattering similar to the ones shown in Fig 26
The thin Beta films prepared with the above suspensions appear homogeneous and
transparent to the eye The thickness of the films is increased by several deposition steps
of the coating suspensions resulting also in a change of the defined interference color of
the films (Fig 27)
Fig 27 Picture of silicon wafers with Beta-TEOS films prepared by one step (l) two
step (m) and three step deposition (r)
SEM investigations of the Beta-pure Beta-TEOS and Beta-SiO2 were performed in
order to investigate the thickness of the layers their surface morphology and
homogeneity In general the films prepared with binder exhibit a smooth surface and do
not show big differences (Fig 28)
RESULTS AND DISCUSSION 41
77
Fig 28 SEM pictures of films deposited on silicon wafers based on zeolite Beta
without binder (Beta-pure left) and with binder (Beta-SiO2 right) at different
magnifications
RESULTS AND DISCUSSION 41
78
Homogeneous and continuous films at a centimeter scale were obtained by one- to six-
step spin-coatings and the homogeneity of the deposited layer is preserved by the close
packing of the Beta nanocrystals surrounded by the binding agents The individual
crystallites in the films prepared from Beta-SiO2 and Beta-TEOS suspensions are more
closely packed in comparison with pure Beta suspensions Besides the Beta-pure film
has lower adhesion in comparison to the films with added binder An increased surface
roughness of the multilayered films is observed in all films This can be explained by
the higher surface roughness of the intermediate porous layers in comparison to the bare
Si-wafer which is propagated and amplified with each coating step The smoothness of
the films could be improved by the application of smaller particles However small
particles tend to agglomerate faster than the bigger ones and therefore the stabilization
of zeolite grains with a size less then 10 nm could be a great challenge (provided they
could be made) Another possibility is to use an additional top layer of binder to fill all
gaps between the crystalline particles deposited in Beta-pure films However this will
influence the surface chemistry and more specifically the hydrophilicity of the entire
film which will increase whereas the porosity will decrease
Introducing porosity into a thin film strongly influences the optical properties compared
to a dense film of the same material The refractive index decreases with an increasing
proportion of voids in the material (see Bruggemann effective medium approximation
EMA) For ellipsometric data analysis the theoretical model was based on the
assumption that the film consists of nanoparticles and a certain fraction of void The
model layer system was designed as follows 0 the silicon substrate is infinitely thick (1
RESULTS AND DISCUSSION 41
79
mm) 1 a typical layer of 2 nm thermal oxide (SiO2) is presumed 2 the porous film is
described with a Cauchy layer Starting with a guessed film thickness the subsequent
fitting of the thickness and the Cauchy parameters resulted in a very good overlap with
the experimental data as shown in Fig 29
200 300 400 500 600 700 800 900 1000
0
10
20
30
40
50
Model Fit Exp 65iexcl Exp 70iexcl Exp 75iexcl
in d
egre
es
wavelength [nm]
200 300 400 500 600 700 800 900 10001125
1130
1135
1140
1145
1150
refr
active index
wavelength [nm]
Fig 29 Ellipsometry data of Beta-TEOS film after 6 coating steps
The determined thicknesses of the films reflect the values detected with SEM Based on
the ellipsometric data the refractive index (n) of the films prepared with and without
binders was determined The n-values at 589 nm were used for comparison of the films
All films showed a very low refractive index which is typical for porous silica films
Fig 29 shows the data of a film composed of microporous particles and a binder (Beta-
TEOS) prepared by spin-coating 6 times Although the film appears dense to the eye a
refractive index of only 1133 (589 nm) was found for this sample Equal results
concerning thickness and refractive index were achieved by replacing the Cauchy layer
with an EMA layer consisting of SiO2 and void The total porosity was found to be
70 in this case
RESULTS AND DISCUSSION 41
80
The mechanical properties of all films were investigated by tape tests In all films
except Beta-pure the mechanical stability was very high and the film could not be
removed from the silicon wafer with the tape The highest adhesion was diagnosed in
films prepared with amorphous SiO2 binder The efficiency of the binders mainly
depends on the size of the binding particles Small particles of SiO2 with a high external
surface are able to form many bonds (Si-O-Si) with the zeolite crystals and with the
thermal SiO2 on the silicon wafer
Conclusion
Colloidal suspensions of zeolite Beta nanocrystals with low aluminum content were
prepared and the crystallization kinetics were studied The crystallization process was
completed within seven days and the size and the shape of the first crystalline particles
detected in the crystallizing suspensions resemble the ones in the amorphous
suspensions Upon prolonged crystallization an agglomeration in the crystallizing
suspensions is observed however the size of the crystalline zeolite Beta particles did
not exceed 80 nm The crystalline Beta was stabilized in colloidal suspensions by
addition of inorganic silica-based binders and applied for the preparation of films by a
spin-on process The thickness of the films varied from 140 to 950 nm controlled by
repeating the number of coating steps speed of deposition and Beta concentration of the
coating suspensions The Beta films exhibit good mechanical properties smooth
surfaces and show a low refractive index which is typical for highly porous silica based
materials The refractive index of the films prepared with binders is increased slightly
RESULTS AND DISCUSSION 41
81
due to additional amorphous silica introduced in the film which is leading to the
formation of denser layers The spin-coating approach presented here allows for the
preparation of films with variable hydrophilicity thickness and mechanical stability on
supports with different shapes and size
RESULTS AND DISCUSSION 42
82
42 Synthesis and Characterization of
Functionalized Mesoporous Silica
Nanoparticles
RESULTS AND DISCUSSION 42
83
Introduction
Various synthetic methods have been developed for the preparation of periodic
mesoporous materials[80]
leading to different types of morphologies such as spheres[81]
fibers[82]
or vesicles[83]
The large internal surface of these materials can be modified
following two main strategies ie post-synthesis functionalization (grafting)[84 85]
or
in-situ functionalization (co-condensation)[22-24]
thus extending the use of mesoporous
materials to a wide range of applications[86]
Compared to the modification by grafting
the co-condensation reaction can be expected to improve the degree of bonding between
the organic groups and the pore walls and to result in a more homogeneous distribution
of the organic groups throughout the pore structure[27]
Common synthesis routes for mesoporous silica materials lead to particles with typical
diameters of 500 nm to several microns The synthesis of nanosized mesoporous
materials has only recently received attention Such mesoporous nanoparticles offer
interesting features that are useful in a number of applications such as chemical
sensors[87]
chromatography[88]
catalysis[89]
drug delivery[90]
or polymer fillers[91]
If
the particles are homogeneously dispersed in a solvent these colloidal suspensions
exhibit unique properties for example optical transparency Furthermore the utilization
of very small particles improves the mass transfer of molecules into or out of the pore
system The molecular functionalization of the large internal surface of these materials
can extend the range of possible applications for example towards selective
(ad)sorption or specific catalytic activity
RESULTS AND DISCUSSION 42
84
The preparation of nanosized particles can be realized through various methods Brinker
et al described an aerosol-based process resulting in a solid dry product[92]
Another
strategy utilizes the addition of a non-ionic surfactant as a suppressant of particle
growth through encapsulation leading to a gel of agglomerated small particles[93]
Amoros et al[94]
presented a facile method leading to nanosized mesoporous silica using
water tetraethylorthosilicate (TEOS) and cetyltrimethylammonium cations in
combination with triethanolamine (TEAH) which is supposed to act as a hydrolysis-
retarding agent However the final product of this procedure is a gel of fused particles
which cannot be redispersed
There are only few publications describing synthesis methods that lead to colloidal
suspensions of periodic mesoporous materials[95-99]
Their synthesis typically relies on
procedures applying high dilutions this can result in time-consuming subsequent
processing steps For instance truly colloidal suspensions of well-defined mesoporous
particles were obtained by Mann et al[18 100]
by diluting and quenching the
condensation reaction of TEOS in aqueous alkaline solution with a large excess of
water They could manipulate the particle size by varying the time interval for
quenching In a recent publication Rathousky et al[96]
also describe a method for the
preparation of colloidal MCM-41 working with even higher dilutions The utilization of
the polyalcohol triethanolamine can result in non-aggregated colloidal suspensions of
mesoporous silica (CMS) from concentrated solutions[98]
Round particles with
wormhole structures and diameters of about 100 nm with very narrow particle size
distributions were obtained in the form of stable suspensions Tuning the reaction
RESULTS AND DISCUSSION 42
85
conditions allowed controlling particle size down to 50 nm Colloidal stability was even
sustained after template extraction which resulted in surface areas of about 1000 m2 g
-1
Extraction of the template ndash in contrast to calcination ndash is the method of choice when
organic moieties are introduced in the wall structure by a co-condensation procedure
The method can be extended towards the generation of functionalized hydrophilic as
well as hydrophobic colloidal mesoporous silica with high yields As described in the
following various alkoxysilanes bearing organic moieties can be incorporated into the
pores of the colloidal nanoparticles using this general method
Experimental
Two slightly different synthesis methods were used as already described in our recent
publication about the synthesis of nanosized pure mesoporous silicates[98]
and adapted
for functionalization with organic moieties All chemicals were reagent grade (98 or
higher) purchased from Sigma-Aldrich and used without further purification The water
was deionized
Pure siliceous CMS-1 143 g (96 mmol) TEAH and 2 ml (9 mmol) TEOS were
combined in a 125 ml polypropylene bottle with a lid The two-phase mixture was
heated in an oil bath at 90 degC for 20 min without stirring Immediately after taking the
mixture out of the oil bath 267 g of an aqueous solution (25 wt ) of CTAC which
had been heated to 60 degC was added and the final mixture was stirred (600 rpm) for at
least 3 h at 23 degC The molar composition of CMS-1 is 075 Si 8 TEAH 017 CTAC
120 H2O
RESULTS AND DISCUSSION 42
86
Functionalized mesoporous silica CMS-R 143 g (96 mmol) TEAH and a mixture of
223 ml (10 mmol) TEOS plus the corresponding quantity of 2 mmol (Table 1) of
organotriethoxysilane (RTES) were combined in a 125 ml polypropylene bottle with lid
The two-phase mixture was heated in an oil bath at 90 degC for 20 min without stirring
Immediately after taking the mixture out of the oil bath 267 g of an aqueous solution
(25 wt ) of CTAC which had been heated to 60 degC was added and the final mixture
was stirred (600 rpm) for at least 3 h at 23 degC The molar composition of these
functionalized materials is 1 Si 8 TEAH 017 CTAC 120 H2O
Table 1 Type and amount of functionalized organotriethoxysilane used in the co-
condensation
sample RTES M (g mol-1) n (mmol) m (g)
CMS-VI vinyltriethoxysilane 1903 2 0381
CMS-PH phenyltriethoxysilane 2404 2 0481
CMS-BZ benzyltriethoxysilane 2544 2 0509
CMS-CP 3-cyanopropyltriethoxysilane 2314 2 0463
CMS-MP 3-mercaptopropyltriethoxysilane 2384 2 0477
Extraction of template from the mesoporous silica 50 ml of ethanol were added to the
translucent colloidal aqueous suspension of the mesoporous material The resulting
precipitate was centrifuged for 20 min at 40000 RCF (g) After decanting the sediment
was redispersed through vigorous stirring in 50 ml of an ethanolic solution of
ammonium nitrate (20 g l-1
) and then treated for 20 min in an ultrasonic bath (35 kHz)
RESULTS AND DISCUSSION 42
87
Alternatively the mixture can be refluxed for 1 h This procedure was repeated until the
sediment after centrifugation was completely transparent normally one or two times In
order to replace the ammonium ions in the structure this operation was repeated with a
solution of concentrated hydrochloric acid in ethanol (5 g l-1
) After washing with pure
ethanol the transparent gelatinous cake obtained after centrifugation can be redispersed
in ethanol leading to a colloidal suspension of the extracted product in ethanol
Characterization
Dynamic light scattering (DLS) data were collected with an ALV-NIBSHPPS High
Performance Particle Sizer in PMMA cuvettes at 25 degC Raman spectroscopy was
performed with a He-Ne laser (633 nm) on a LabRAM HR UV-Vis (HORIBA Jobin
Yvon) Raman Microscope (Olympus BX41) equipped with a Symphony CCD detection
system The spectra were baseline-corrected For thermogravimetric analysis (TGA)
10 mg of dry powder were heated in corundum crucibles from 30 to 800 degC
(10 degC min-1
) in a flow of synthetic air (25 ml min-1
) using a Netzsch STA 449 C Jupiter
thermobalance For the SEM analysis films were prepared on a gold-covered glass slide
by spin-coating using ethanolic suspensions of the extracted material Shape and
dimensions of the particles were determined with a JEOL JSM-6500F scanning electron
microscope (SEM) equipped with an Oxford EDX analysis system Transmission
electron microscopy (TEM) was carried out on a JEOL JEM 2011 instrument with LaB6
cathode at 200 kV Samples were prepared on a Plano holey carbon coated copper grid
by evaporating one droplet of diluted ethanolic suspension of the extracted material
RESULTS AND DISCUSSION 42
88
Cross-polarized 29
Si-MAS-NMR measurements were performed on a Bruker DSX
Avance500 FT spectrometer in a 4 mm ZrO2 rotor Nitrogen sorption isotherms (77 K)
were obtained using a Quantachrome NOVA 4000e Surface Area amp Pore Size
Analyzer Surface area calculations were made using the Brunauer-Emmett-Teller
(BET) equation in the range from p p0-1
= 005 - 025 Pore-size distributions were
determined using the DFT-method (NLDFT equilibrium model cylindrical pores N2 on
oxygen) The pore volume was determined for meso- and micropores for p p0-1
lt 08
Results and Discussion
Colloidal mesoporous silica was prepared in the form of non-functionalized pure-silica
MCM-like material (CMS) and as functionalized mesoporous materials carrying five
different organic groups (R) in the pore walls (CMS-R see Table 1)
Fig 30 Translucent colloidal suspension and TEM micrograph of functionalized
mesoporous nanoparticles
RESULTS AND DISCUSSION 42
89
The materials were obtained as colloidal suspensions with relatively uniform particle
sizes between 40 and 150 nm (Fig 30) Tetraethylorthosilicate (TEOS) and
organotriethoxysilanes (RTES) form the MCM-like material in combination with
cetyltrimethylammonium cations (CTMA+) as structure directing agent in a co-
condensation process (Fig 31)
Fig 31 Scheme of the co-condensation reaction of alkoxysilanes with a micelle-
forming surfactant
This S+I- assembly takes place in an alkaline aqueous medium with triethanolamine
(TEAH) as basic reactant TEAH can also act as a complexing agent that retards the
hydrolysis of the alkoxides[101-103]
The large excess of TEAH probably keeps the seeds
separated from each other during the condensation process giving finally rise to a large
number of particles with relatively small diameters
RESULTS AND DISCUSSION 42
90
The morphology and particle size of the synthesized materials was analyzed with
dynamic light scattering (DLS) and electron microscopy (TEM and SEM) In the TEM
micrographs discrete near-spherical particles with a disordered worm-like pore
arrangement are observed The particles show a narrow particle size distribution with a
polydispersion index (PDI) of around 01 This narrow size distribution is maintained
after extraction of the template by an ion-exchange method using an ethanolic solution
of ammonium nitrate (Fig 32)
Fig 32 TEM-micrograph and particle size distribution of sample CMS-1 determined by
dynamic light scattering
The synthesis procedure developed for pure siliceous nanoparticles was extended
towards a simultaneous reaction of TEOS and a variety of organotriethoxysilane
precursors to obtain functionalized surfaces Hybrid mesoporous materials incorporating
the following organic groups ie vinyl- (CMS-VI) benzyl- (CMS-BZ) phenyl-
(CMS-PH) cyanopropyl- (CMS-CP) and mercaptopropyl- (CMS-MP) residues were
RESULTS AND DISCUSSION 42
91
thus synthesized These surface-modified mesoporous organosilicas often show an even
narrower size distribution than the pure silica parent materials (Fig 33)
Fig 33 TEM-micrographs and particle size distributions calculated from DLS-data of
samples CMS-MP (a) and CMS-PH (b)
The observed mean particle size obtained from DLS measurements varies in most cases
from about 50 to 150 nm depending on the incorporated functional group and the
RESULTS AND DISCUSSION 42
92
synthesis method employed The particle size observed with electron microscopy is
often slightly smaller than the hydrodynamic diameter measured by DLS This
observation can be explained with occasional weak aggregation of the particles The
discrepancy is seen clearly in the case of the organically modified materials especially
if hydrophobic aromatic groups such as phenyl residues are incorporated in the
structure (Table 2)
Table 2 Properties of colloidal mesoporous materials as analyzed with different
methods
sample Particle size TGA data N2 sorption data
diameter
DLS
(nm)
diameter TEM
(nm)
T at
DTGmax
(degC)
surface
area
(m2 g
-1)
pore
volume at
p p0-1
lt 08
(cm3 g
-1)
pore
diameter
(nm)
CMS-1 100 80ndash120 - 1150 10 40
CMS-VI 120 50ndash100 290 1230 074 34
CMS-CP 130 80ndash150 350 1200 072 33
CMS-MP 90 50ndash70 350 970 063 34
CMS-PH 80 40ndash60 610 1040 073 28
CMS-BZ 110 50ndash100 470 1120 065 32
The products with incorporated organic groups especially CMS-PH or CMS-MP
appear as nearly perfect spheres with diameters of about 50 nm The narrow particle
size distribution of the mesoporous materials can also be confirmed with scanning
RESULTS AND DISCUSSION 42
93
electron microscopy (Fig 34) Here a stable colloidal suspension of extracted CMS-BZ
was used for spin-coating a gold-sputtered glass plate resulting in a homogeneous
coverage of mesoporous particles The benzyl-modified mesoporous spheres have
diameters in the range of 50 to 80 nm
Fig 34 SEM-micrograph of a mesoporous film prepared by spin-coating using a
colloidal suspension of CMS-BZ
An influence of organic functional surface groups upon the morphology of mesoporous
materials was also observed by Huh et al[24]
They found a strong increase of the particle
size when using hydrophilic organosilanes especially with amino-containing residues
while hydrophobic residues stimulated the formation of smaller particles They
concluded that hydrophobic groups are able to align with the organic tails of the
template while hydrophilic residues would disturb the Gouy-Chapman region thus
causing a different growth behavior The results for the hydrophobic functional groups
RESULTS AND DISCUSSION 42
94
support their findings Weakly acidic mercapto residues also stimulate the formation of
small spherical particles[99]
The presence of the organic functional groups can be verified with several methods
Thermogravimetric analysis (TGA) shows the decomposition behavior during the
heating of the samples in air The decomposition temperature more precisely the
temperature when the first derivative of the weight loss reaches a maximum varies over
a rather wide range for the different functional groups (Fig 35 and Fig 36)
Fig 35 Thermogravimetric analysis (TG-DTG) of washed CMS-1 with template (a)
and phenyl modified extracted mesoporous silica CMS-PH (b)
Fig 35a shows the weight-loss of the washed non-functionalized sample CMS-1 still
containing the template inside the pores with a maximum around 250 degC This
decomposition process of the template is completed well before the decomposition of
the phenyl-residue in sample CMS-PH starts Fig 35b shows the decomposition of this
group around a temperature of 600 degC in a sample that was previously template-
extracted This extreme stability is not observed for the other functional groups They
RESULTS AND DISCUSSION 42
95
start to decompose at a lower temperature which makes a clear separation from the
degradation of the template difficult (Fig 36) However when non-functionalized
samples were analyzed with TGA after template extraction a weight loss of around
4-7 wt between 100 and 500 degC is still observed Residual template fragments that
were detected by elemental analysis of non-functionalized samples can account for
about 3 weight loss Additionally the dehydroxylation of surface hydroxyl groups
should be considered Usually up to 3 SiOH groups per nm2 are found in mesoporous
materials[97 104]
With surface areas of about 1000 m2 g
-1 one can estimate a maximum
5 wt loss due to water release from these samples by dehydroxylation
Fig 36 Thermogravimetric analysis of the surface-modified and extracted mesoporous
silica materials (starting at 100 degC to compensate for different water losses)
This loss must be taken into account when the amount of organic residue is determined
from TGA measurements Usually a TGA weight loss between 15 ndash 25 wt in
template-extracted functionalized samples occurs (above 100 degC)
RESULTS AND DISCUSSION 42
96
The connectivity of the functional organic groups to the silica framework is best
demonstrated by cross-polarized 29
Si-MAS-NMR spectroscopy (Fig 37)
Fig 37 Cross-polarized 29
Si-MAS-NMR spectra of the functionalized mesoporous
materials
The spectra show peaks at -110 ppm (Q4) and -102 ppm (Q
3) [Q
n = Si(OSi)n(OH)4-n]
n = 2ndash4 representing the fully condensed silica and silica with one terminal hydroxyl
group Geminal hydroxyls are barely present in these samples (resonance at -92 ppm
Q2) One or two additional peaks are observed due to the T
2 and T
3 resonances of the
incorporated organosiloxanes [Tm
= RSi(OSi)m(OH)3-m] m = 2ndash3 at values commonly
RESULTS AND DISCUSSION 42
97
observed in functionalized mesoporous materials Propyl-bridged functional groups
display shifts around -67 and -60 ppm while directly bound residues with C=C bonds
show resonances at more negative values (Table 3)[24]
The prevalence of the T3 peak
ie the threefold coordination of the siloxane indicates (near) complete condensation of
the functional groups into the wall structure of the nanoparticles
Table 3 Cross-polarized 29
Si-MAS-NMR spectroscopy data of functionalized
mesoporous materials
sample chemical shift
Q4 Q
3 T
3 T
2
CMS-VI -110 -101 -80 -73
CMS-PH -110 -101 -79 -70
CMS-BZ -110 -101 -71 -63
CMS-CP -110 -101 -67 -58
CMS-MP -110 -101 -67 -
The characteristic vibrational modes of the incorporated functional groups are clearly
displayed in their Raman spectra which are not obscured by hydroxyl vibrations of the
host as in IR spectroscopy (Fig 38) Intensive peaks of the phenyl- and benzyl-
substituted samples CMS-PH and CMS-BZ originating from the in-plane C-H
deformation vibrations of the aromatic ring are seen at about 1000 cm-1 Additionally
these samples show the typical peaks for aromatic C-H and ring C=C stretching
vibrations at 3060 and 1590 cm-1 respectively[105]
RESULTS AND DISCUSSION 42
98
In the vinyl-modified sample (CMS-VI) we find the alkene C-H vibrations and the C=C
stretching vibrations at 3070 and 1605 cm-1
respectively The nitrile group of CMS-CP
causes a characteristic narrow band at 2250 cm-1
The typical peak for the S-H group in
the mercaptopropyl-containing CMS-MP occurs at 2580 cm-1
and additionally we find
a band at 657 cm-1
due to the C-S vibration Both Raman bands indicate that the
mercapto groups are intact and that no disulfide bridges have formed[106]
Fig 38 Raman spectra of template-extracted functionalized mesoporous materials
After extraction of the surfactant the functionalized porous materials show high surface
areas and pore volumes The sorption properties were determined using nitrogen
RESULTS AND DISCUSSION 42
99
adsorption-desorption at 77 K In case of the unmodified materials CMS-1 a typical
type IV isotherm with a clear hysteresis from filling of the cylindrical pores is observed
Textural pores of ~20 nm originating from the closely packed nanospheres in the
powders are visible above a relative pressure of 08 p p0-1
The entire surface area
calculated according to the BET-theory is 1150 m2 g
-1 for CMS-1 The product exhibits
a high pore volume of 1 cm3 g
-1 (for p p0
-1 lt 08) and a narrow pore size distribution
with an average diameter of 4 nm as determined with the DFT method (Fig 39)
Calcined CMS-1 shows an even higher surface area of 1400 m2 g
-1 with pore volumes
of 11 cm3 g
-1
Fig 39 Nitrogen sorption isotherm (left) and pore size distribution (right) according to
the DFT theory of mesoporous silica CMS-1
The type of adsorption isotherm is unchanged in the functionalized nanosized materials
and the inclusion of the functional groups does not significantly affect the overall
surface area of the materials (Fig 40)
RESULTS AND DISCUSSION 42
100
Fig 40 Nitrogen sorption isotherms of reference and co-condensed materials
To some extent the size of the functional groups influences the shrinkage of the pore
diameter While the unmodified mesoporous silica has an average pore diameter of
40 nm in vinyl-functionalized materials (CMS-VI) we find pores with a mean diameter
of 34 nm and the bulky nature of the benzyl group in CMS-BZ causes a reduction to
32 nm (Fig 41)
RESULTS AND DISCUSSION 42
101
10 100 1000
000
001
002
003
004
005
006
CMS-1 CMS-VI CMS-BZ
Dv(d
) [c
m-3
-1
g-1
]
pore diameter []
Fig 41 Changes in the pore size distribution with increasing size of the incorporated
organic moieties in mesoporous silica
The surface coverage of functional groups in the nanoscale mesoporous samples can be
estimated from thermogravimetric measurements in conjunction with the surface area
presuming that all organic groups are located on the surface For example the weight-
loss of CMS-PH due to the decomposition of the organic group is about 20 The
calculated surface area according to BET-theory is 1040 m2 g
-1 From these data a
surface coverage of 26 mmol g-1
or 15 phenyl groups per nm2 can be calculated
Conclusion
The synthetic approach presented here can serve as a general method for the preparation
of both colloidal mesoporous silica spheres (CMS) and functionalized colloidal
suspensions of nanoscale mesoporous materials with high yields from concentrated
solutions Narrow particle size distributions in the range of about 50 to 150 nm were
established with Dynamic Light Scattering (DLS) measurements and electron
RESULTS AND DISCUSSION 42
102
microscopy before and after template extraction Discrete nanoscale mesoporous
particles with functionalized pore surfaces result when adding functional
organoalkoxysilanes directly to the initial silica precursor solutions Nitrogen sorption
analysis and indicates that the functional groups are located at the inner surfaces of the
mesoporous channel systems
RESULTS AND DISCUSSION 43
103
43 Porous Thin Films of
Functionalized Mesoporous Silica
Nanoparticle
RESULTS AND DISCUSSION 43
104
Introduction
Porous materials in the nanometer range already attract a great deal of interest in many
fields of science and technology Especially in terms of colloidal suspensions these
materials are promising candidates for applications such as gas sensing host-guest
chemistry drug delivery and coatings in the semiconductor industry The preparation of
monodisperse stable colloidal suspensions of mesoporous silica particles has been
recently developed[98 99]
The synthesis parameters were gradually modified in order to
realize even smaller particles in the range below 40 nm As reported in the previous
publications the introduction of functional groups during the co-condensation reaction
has a great influence on the particle shape and size[24]
The synthesis with
phenyltriethoxysilane led to particles with a smallest diameter of only 50 nm[107]
Additionally the phenyl-modified particles are thermally more stable easy to
characterize and tend to peptize (disperse) more easily due to their sterically demanding
and inert aromatic rings
By further decreasing the diameter of these mesoporous silica spheres their scattering
ability for visible light is also drastically decreased If the size of the particles falls
below about 110 of the wavelength of the incoming light (01 ) their scattering ability
can no longer be described with the Lorenz-Mie-solution but with Rayleigh scattering
The colloidal suspensions thus show optical transparency when the particle size is small
enough Due to this optical transparency such nanoparticles would allow spectroscopic
investigations of physical processes or chemical reactions in a confined space
Furthermore it is possible to encapsulate sensitive dyes [108-111]
or to facilitate the
RESULTS AND DISCUSSION 43
105
dispersion of the particles in certain media Modifying the spheres with appropriate
functionalities such as caps or fluorescence markers would make them interesting
candidates for drug delivery[7 108]
or would permit observing their way into a cell[112
113] Another very promising area of application is thin film technology
[114 115] The
synthesis of mesoporous thin films is often achieved with the so-called ldquoEvaporation
Induced Self Assemblyrdquo (EISA) process[20]
The EISA process for mesoporous silica
thin films starts with a homogeneous solution of silica precursor and surfactant prepared
in ethanolwater with an initial surfactant concentration much below the critical micelle
concentration[20]
Upon dip-coating or spin-coating the preferential evaporation of
ethanol concentrates the surfactant and silica species The progressively increasing
surfactant concentration drives self-assembly of silica-surfactant micelles and their
further organization into liquid-crystalline mesophases This approach represents a
versatile strategy for the formation of mesoporous silica and other oxide thin films with
different pore sizes pore topologies and elemental composition[116]
However there are several issues that suggest the development of complementary
strategies The precursor is normally highly acidic which can cause problems on
sensitive substrates Removal of the template by extraction or calcination might also be
critical If the surfactant is removed thermally cracks can occur in thicker films and it
is known that the humidity has a great influence on the film formation Thus if the
orientation of the pores is less important the alternative preparation of thin films with
mesoporous nanoparticles can address several of these issues It is believed that a
porous thin film made of porous nanoparticles can exhibit improved diffusion properties
RESULTS AND DISCUSSION 43
106
and a highly accessible pore system[50]
Additionally one can work with stable
suspensions of already extracted nanoparticles thus ensuring an easy handling and good
reproducibility The coating of sensitive substrates is facilitated due to the mild
conditions Control over the thickness can be attained by varying the concentration or
by multiple step coating It could be also feasible to combine suspensions containing
different kinds of nanoparticles in order to assemble hybrid thin films Finally the
material is easier to characterize when bulk samples are available The synthesis of
completely transparent suspensions even after template extraction would be a great
improvement for the formation of homogeneous thin films with a low surface
roughness Especially for the formation of multilayers it is advantageous if the film is
very smooth Otherwise the defects on the surface are transmitted and amplified with
every following coating step Furthermore the availability of such homogeneous porous
thin films makes it possible to use ellipsometric porosimetry as an analysis method
This method has a set of advantages compared to conventional sorption methods which
are specified in a work of Eslava et al[56]
For an accurate determination of sorption isotherms of porous coatings via gravimetric
or volumetric methods an extremely sensitive device is needed The tiny amount of
porous material and the weight increase due to adsorption in the thin film can be
detected with a surface acoustic wave (SAW) device or a quartz crystal microbalance
(QCM) In both cases the coating has to be applied to the measuring device itself
which might have an influence on properties such as the orientation of the crystals the
presence of grain boundaries and the film thickness Scraping off from their supports
RESULTS AND DISCUSSION 43
107
and collecting a sufficient quantity of powdery sample for a conventional determination
is a drastic intervention The determination of sorption isotherms of a thin film via
ellipsometric porosimetry (EP) is a convenient method to determine the effective
porosity and pore size distribution of a thin film on its original support without
destroying it
Thus the aim of this work was the synthesis of monodisperse colloidal suspensions of
porous nanoparticles with a particle size small enough for the preparation of
homogeneous thin films Additionally the porosity of the final thin films is determined
with different methods
Experimental
All chemicals were purchased from Sigma-Aldrich with reagent grade (98 or higher)
and used without further purification The water was deionized In order to guarantee
the same conditions for all samples the syntheses were carried out in a heatable high-
throughput magnetic stirrer (1000 rpm) in 100 ml glass test tubes (diameter 25 cm)
Although it is necessary that the synthesis mixture be well stirred building of foam
should be avoided in order to prevent the formation of inhomogeneities The following
solutions were prepared and used for all syntheses S1 (surfactant) 300 g aqueous
solution of cetyltrimethylammonium chloride (25 wt ) and 2700 g deionized water
C1 (catalyst) 10 g triethanolamine (TEAH) and 90 g deionized water P1 (precursor)
208 g (01 mol) tetraethylorthosilicate (TEOS) and 24 g (001 mol)
phenyltriethoxysilane (PTES) E1 (extraction) 50 g concentrated hydrochloric acid
RESULTS AND DISCUSSION 43
108
(37 HCl) in 500 ml ethanol E2 (extraction) 10 g ammonium nitrate in 500 ml
ethanol
Samples CMS-Pxy
200 g S1 and 020 g (CMS-P2y) 040 g (CMS-P4y) or 080 g (CMS-P8y) C1 were
heated under stirring to 60 degC (CMS-Px6) 70 degC (CMS-Px7) or 80 degC (CMS-Px8) The
amount of 160 ml P1 was added and stirring was continued in the test tube for 1 h The
vessel was kept open in order to evaporate parts of the ethanol that were formed during
the condensation For a better overview all samples are listed in Table 4
Table 4 Prepared samples and synthesis conditions
sample synthesis
temperature
amount
TEAH (g)
CMS-P26 60 degC 002
CMS-P46 60 degC 004
CMS-P86 60 degC 008
CMS-P27 70 degC 002
CMS-P47 70 degC 004
CMS-P87 70 degC 008
CMS-P28 80 degC 002
CMS-P48 80 degC 004
CMS-P88 80 degC 008
RESULTS AND DISCUSSION 43
109
Extraction
The resulting colloidal suspension was flocculated with 20 ml E1 and the cloudy
precipitate was centrifuged for 5 min at 40000 g (RCF) After decanting the sediment
was redispersed through vigorous stirring in 20 ml E2 The clear suspension was treated
for 10 min in an ultrasonic bath After flocculating with 20 ml deionized water the
precipitate was again centrifuged the sediment was redispersed in 20 ml E1 and again
sonicated After flocculation with 20 ml deionized water and centrifugation the
sediment can be redispersed in ethanol leading to a suspension of colloidal mesoporous
silica (CMS) with approximately 5 wt solid content
Film preparation
Thin film preparation was performed by spin-coating with an ethanolic suspension
containing about 5 wt of solid material The substrate (silicon or glass) was coated
3 times at 3000 rpm (acceleration 5000 rpm s-1
) In order to remove potential
inhomogeneities the transparent ethanolic suspension was filtered through a 02 μm
syringe filter prior to spin-coating
Characterization
Dynamic light scattering (DLS) data were collected with a Malvern Nano ZS in PMMA
cuvettes at 25 degC For thermogravimetric analysis (TGA) 10 mg of dry powder were
heated in corundum crucibles from 30 to 900 degC (10 degC min-1
) in a flow of synthetic air
(25 ml min-1
) using a Netzsch STA 449 C Jupiter thermobalance Transmission electron
RESULTS AND DISCUSSION 43
110
microscopy (TEM) was carried out on a FEI Titan 80-300 at an accelerating voltage of
300 kV Samples were prepared on a Plano holey carbon coated copper grid by
evaporating one droplet of diluted ethanolic suspension of the extracted material The
nitrogen sorption isotherms (77 K) were obtained using a Quantachrome NOVA 4000e
Surface Area amp Pore Size Analyzer Surface area calculations were made using the
Brunauer-Emmett-Teller (BET) equation in the range from p p0-1
= 005 - 025 Pore-
size distributions were determined using the DFT-method (NLDFT equilibrium model
cylindrical pores N2 on carbon) Ellipsometry measurements were performed with a
Woollam M2000D at different angles (65deg 70deg and 75deg) in the spectral range of 190 ndash
1000 nm The data were fitted in the range between 250 ndash 1000 nm using the Cauchy
material as model layer Ellipsometric porosimetry measurements were carried out in a
closed cell at different partial pressures at a measurement angle of 75deg The recording of
isotherms was performed using a homemade Labview-controlled gas mixer Digital
mass flow controllers (W-101A-110-P F-201C Bronkhorst High-Tech) ensured the
accurate dosing of the carrier gas nitrogen and the liquid analyte which was vaporized
in a controlled evaporation and mixing element (W-101A Bronkhorst High-Tech)
Partial pressures were calculated using the van der Waals equation For a better
comparison with nitrogen sorption the relative pressure p px-1
(px saturation pressure)
is used for the vapor sorption analysis
RESULTS AND DISCUSSION 43
111
Results and Discussion
The synthesis results are in good accordance with the expectations based on the work of
Stoumlber[12]
and LaMer[13]
A first variable of course is the amount of precursor added to
the synthesis In a certain range decreasing the amount of precursor can reduce the size
of the final particles According to Stoumlber the particle size distribution passes a
maximum when the concentration is varied because the concentration of precursor
influences not only the growth of the seeds but also the nucleation rate und thus the
number of initial seeds Since high yield is a priority it is more interesting to choose
other options for a successful downsizing The experiments show that the final particle
size in the resultant suspensions (CMS-P26 ndash CMS-P88) is dependent on the amount of
added TEAH and the reaction temperature In Fig 42 the hydrodynamic diameter of all
samples is shown (CMS-P86 stand for synthesis with 008 g TEAH at 60 degC )
Fig 42 Initial particle size (DLS) of samples CMS-P26 ndash CMS-P88
RESULTS AND DISCUSSION 43
112
With increasing temperature and amount of catalyst (TEAH) the hydrolysis of the
precursor and condensation of the nanoparticles is supported and the reaction is faster
In this specific range these changes apparently promote the growth rate more than the
nucleation rate resulting in bigger particles Fig 43 shows micrographs (TEM) of
samples synthesized at different temperatures with the same amount of TEAH (CMS-
P8y) The difference in size can be clearly seen the particles that formed at 60 degC
(CMS-P86) show the smallest diameter of only 15 nm At 70 and 80 degC the diameter
reaches 25 and 30 nm respectively
Fig 43 Electron micrographs (TEM) of samples CMS-P86 CMS-P87 and CMS-P88
In agreement with DLS data TEM also shows that the variation of the amount of
catalyst TEAH at a constant reaction temperature (80 degC CMS-x8) has an influence on
the particle size The difference is less pronounced but the general tendency can be
confirmed The diameter varies between 22 nm (CMS-P28) 25 nm (CMS-P48) and
30 nm (CMS-P88) if the quantity of TEAH is increased
RESULTS AND DISCUSSION 43
113
Fig 44 Electron micrographs (TEM) of samples CMS-P28 CMS-P48 and CMS-P88
Table 5 shows a comparison of DLS and TEM data for selected particle sizes The
divergence in hydrodynamic diameter in DLS (36 - 130 nm) and discrete particle size in
TEM (15 - 30 nm) could be explained with a higher degree of agglomeration at higher
temperatures
The findings made it possible to synthesize colloidal suspensions of functionalized
mesoporous silica nanoparticles with a very small particle size between 15 and 30 nm
As the scattering intensity (I) of light strongly decreases with smaller particles size
(I ~ radius6) the suspensions with the smallest diameter (~ 15 nm) are completely clear
(Fig 45)
RESULTS AND DISCUSSION 43
114
Fig 45 Scattering of the initial colloidal suspensions containing particles with different
diameters (DLS) in the range between about 40 to 130 nm (from left to right CMS-P27
-P86 -P28 -P87 -P48 -P88)
When reaching a certain size separating particles with centrifuges becomes difficult as
the effective gravitational force is dependent on the mass of the particles An elegant
method to overcome this problem is the flocculation of the particles Therefore
acidified ethanol was added to the aqueous colloidal suspension leading to a cloudy
suspension of agglomerated particles The particles then could be separated from the
solution by centrifugation and were purified in the following steps The final gelatinous
sediment can be completely redispersed in ethanol leading to transparent colloidal
suspensions with almost exactly the initial particle size distribution in DLS Fig 46
shows the mean hydrodynamic diameter of CMS-P86 before and after template
extraction The polydispersity index (PDI) of all suspensions was below 02 The
suspensions with a diameter below 40 nm are completely transparent to the visible part
of the light and show nearly no scattering
RESULTS AND DISCUSSION 43
115
Fig 46 Hydrodynamic diameter of CMS-P86 before and after template extraction
In transmission electron microscopy (TEM) the diameter of the particles can be
specified as significantly smaller (by a factor of 3) than in dynamic light scattering Fig
47 shows micrographs of CMS-P86 with an average particle diameter around 20 nm
The size distribution of the discrete particles is very narrow High resolution images
clearly show the porous nature of the functionalized particles
RESULTS AND DISCUSSION 43
116
Fig 47 TEM micrographs of CMS-P86 (right HAADF-STEM)
In order to investigate the sorption properties of the porous nanoparticles the ethanolic
suspensions were dried at 60 degC The resulting solids were colorless and transparent
consisting of small platelets with about 1 mm diameter Despite of its dense appearance
the material has a high specific surface area of 640 m2 g
-1 as well as a high pore volume
(095 cm3 g
-1) in the case of CMS-P86 DFT calculations resulted in a bimodal pore size
distribution
Fig 48 N2 sorption data of dried extracted CMS-P86
RESULTS AND DISCUSSION 43
117
The first peak at 27 nm due to templated mesopores is in the expected range for
functionalized mesoporous silica templated by hexadecyltrimethylammonium ions The
second peak around 10 nm reflects the textural porosity of the material It is a widely
accepted concept that an inscribed sphere between adjacent spheres is an approximate
shape for the access opening to the interstitial void space between randomly packed
spheres[117-119]
Depending on the packing of the individual particles the pore opening
varies approximately between 02 and 06 times the radius of the equally sized particles
In the case of CMS-P86 this interparticle porosity is in the range between 5 and 15 nm
(compare Fig 48)
Thus the expected particle size based on sorption is about 25 nm which coincides well
with the observed diameter in the TEM With decreasing particle size this second peak
is shifted to smaller pore sizes as shown in Fig 49 The maximum of the interparticle
porosity is in the expected range for all samples (see Table 5)
RESULTS AND DISCUSSION 43
118
Fig 49 Pore size distribution from N2 sorption of differently sized mesoporous
particles with maximum for interparticle porosity
Table 5 Particle size (DLS TEM) and maximum in interparticle porosity (N2 sorption)
sample hydrodynamic
diameter (DLS)
diameter
(TEM)
max interparticle
porosity
CMS-P88 130 30 16
CMS-P48 95 25 14
CMS-P28 80 22 12
CMS-P87 80 25 14
CMS-P86 60 15 9
RESULTS AND DISCUSSION 43
119
Homogeneous Thin Films
The ethanolic suspensions of the template-free material are ideal candidates for the
preparation of homogeneous spin-on thin films The dry bulk material exhibits a high
surface area even though it appears to be a dense solid Thus one can expect a high
porosity for the corresponding thin film Fig 50 shows an image of a silicon wafer with
a thin film of mesoporous functionalized silica with a thickness of 650 nm The film
was prepared by spin-coating three times with an ethanolic suspension containing
5 wt of CMS-P86
Fig 50 Thin film of CMS-P86 on a silicon wafer
The film appears very homogeneous and transparent and thus has a definite interference
color Due to pronounced capillary forces occurring during the solvent evaporation the
nanoparticles are very closely packed ndash a phenomenon that also assists in the assembly
of colloidal crystals[120]
Because of the smooth surface no scattering is observed which
makes the films perfect candidates for ellipsometry investigations Modeling and fitting
RESULTS AND DISCUSSION 43
120
of the data was based on the assumption that the film consist of porous nanoparticles
the model layer is designed as follows
0 the silicon substrate is infinitely thick (1 mm) 1 a typical layer of 2 nm thermal
oxide (SiO2) is presumed 2 the material (organic functionalized silica) is described
with a Cauchy layer Starting with a guessed film thickness of 500 nm the subsequent
fitting of the thickness and the Cauchy parameters resulted in a 650 nm thick film As
show in Fig 51 this model layer fits exactly the experimental data
Fig 51 Ellipsometry data of a thin film of CMS-P86 in nitrogen atmosphere
The measurement was performed in a flow cell in a flow of nitrogen It was repeated at
different relative pressures of gaseous toluene The adsorption affinity of the thin film
can be also observed when the interference color changes due to the pore filling The
relative pressure of toluene was controlled between 0 and 0943 (p p0-1
) Plotting the
refractive index of the thin film versus the relative pressure of toluene resulted in the
isotherm shown in Fig 52
RESULTS AND DISCUSSION 43
121
Fig 52 Ellipsometry data of a thin film of CMS-P86 in toluene vapor in a nitrogen
atmosphere
After the templated mesopores are filled a second step due to the filling of the
interparticle porosity can be identified at a relative pressure of 06 - 08 The
ellipsometric data are in very good accordance with powder nitrogen sorption data (Fig
53) The overlay shows the same sorption behavior for the two different adsorbates
RESULTS AND DISCUSSION 43
122
Fig 53 Overlay of a powder N2 sorption isotherm (desorption) and a toluene isotherm
(equilibrium) of a thin film recorded with ellipsometry (CMS-P86)
With the Lorentz-Lorenz equation for ellipsometric porosimetry (EP) a porosity of
53 can be specified Knowing the area of the substrate - a 3 inch wafer - the volume
of the deposited film can be easily calculated assuming a cylinder with a height of
650 nm Based on the high precision of thickness measurements in ellipsometry the
calculated volume of 00030 cm3 can be considered as accurate If the total pore volume
of 095 cm3 g
-1 in N2 sorption is correlated to the 53 porosity in ellipsometric data a
density of 056 g cm-3
can be calculated Thus the expected weight of the film is
17 mg Weighing before and after the film deposition gave a difference of 21 mg This
can only act as a rough indication due to a relatively large measuring inaccuracy of the
analytical balance and possible adsorbed water due to air humidity
RESULTS AND DISCUSSION 43
123
Conclusion
In this study we have demonstrated the synthesis of extremely small mesoporous silica
nanoparticles via a specific co-condensation process with phenyl groups The size of the
suspended mesoporous silica spheres can be controlled in a wide range The
suspensions with a mean hydrodynamic particle diameter of 40 nm or less were
optically transparent After extraction of the surfactant dispersion in ethanol led to
transparent colloidal suspensions The existence of very small individual porous
particles was confirmed by transmission electron microscopy (TEM) and sorption
measurements The suspensions were used for the preparation of homogeneous porous
thin films by spin-coating The films showed excellent optical qualities and could thus
be characterized with ellipsometry It was possible to record sorption isotherms of the
thin films with ellipsometry and to correlate the data with nitrogen sorption data of
dried powders of the same material In the future exchange of the template is
anticipated to allow control over the pore size and the particles can be functionalized or
labeled with a fluorescent dye Examples for a successful functionalization are listed in
the supporting information
RESULTS AND DISCUSSION 43
124
Supporting Information
The versatility of the modified synthesis procedure described in Chapter 43 can be
illustrated by the production of several other functional nanoparticles If the particle size
in the resulting colloidal suspension is around 100 nm extraction and redispersion can
be performed as described in Chapter 42 The synthesis conditions were thus adjusted
for the following samples
Experimental Part
CMS-AP
022 g aminopropyltriethoxylsilane (APTES 1 mmol) 024 g phenyltriethoxysilane
(PTES 1 mmol) and 208 g tetraethylorthosilicate (TEOS 10 mmol) were combined
90 g triethanolamine (TEAH) and 100 g of an aqueous solution containing 25 wt
hexadecyltrimethylammonium chloride (CTAC) were heated to 70 degC The precursor
solution was added and the mixture was stirred for 2 h at 70 degC
CMS-FITC
390 mg fluorescein isothiocyanate (FITC 001 mmol) 011 g aminopropyl-
triethoxysilane (APTES 05 mmol) and 20 g abs ethanol were stirred 24 h under dry
nitrogen atmosphere The resulting fluorescent orange solution was combined with a
mixture of 208 g tetraethylorthosilicate (TEOS 10 mmol) and 024 g phenyltriethoxy-
silane (PTES 1 mmol) 90 g triethanolamine (TEAH) and 100 g of an aqueous solution
RESULTS AND DISCUSSION 43
125
containing 25 wt hexadecyltrimethylammonium chloride (CTAC) were heated to
70 degC The precursor solution was added and the mixture was stirred for 2 h at 70 degC
Extraction
Extraction of template was performed by adding an equal amount of ethanol to the
translucent colloidal aqueous suspension of the mesoporous material The resulting
precipitate was centrifuged for 10 min at 40000 g (RCF) After decanting the sediment
was redispersed through vigorous stirring in the initial volume (ca 100 ml) of an
ethanolic solution of ammonium nitrate (20 g l-1
) and then refluxed for 1 h This
procedure was repeated with the same amount of a solution of concentrated
hydrochloric acid in ethanol (5 g l-1
) After washing with pure ethanol the transparent
gelatinous cake obtained after centrifugation was suspended in ethanol
Results and Discussion
a) Introduction of Aminopropyl Groups through Co-condensation
The new method additionally allows the introduction of aminopropyl groups during the
co-condensation The presence of aminogroups in the silica precursor during the
synthesis is usually accompanied with gelation problems Hence the synthesis of
nanoparticle suspensions with aminopropyl moieties is mainly realized by grafting[121]
In combination with the steric demanding phenyl groups of the phenyltriethoxysilane
(PTES) it is possible to obtain dispersed discrete nanoscaled particles The particle size
RESULTS AND DISCUSSION 43
126
distribution in DLS (Fig 54) shows a slightly broadened signal probably due to partly
interconnected particles
1 10 100 1000 10000
extracted in EtOH in water
inte
nsity
particle size [nm]
Fig 54 Particle size distribution (DLS) of CMS-AP before and after extraction
The functional mesoporous organosilica particles show a similar mean diameter around
100 nm before and after template extraction The coexistence of the two different
functionalities can be demonstrated with various methods In this case TGA data is
difficult to interpret because the weight loss caused by the decomposition of the
aminopropyl groups and the template are overlapping Fig 55 shows two distinct steps
with the one at higher temperatures unequivocally deriving from the decay of the
aromatic phenyl groups whereas the first step can presumably be assigned to the
aminopropyl groups Decomposing of the template starts already at lower temperatures
around 150 degC (compare Fig 35 Chapter 42)
RESULTS AND DISCUSSION 43
127
100 200 300 400 500 600 700 800
25
20
15
10
5
0
we
igh
t lo
ss [
]
temperature [iexclC]
0 10 20 30 40 50 60 70
-10
-08
-06
-04
-02
00
02
time [min]
DT
G [
min-1
]
Fig 55 Thermogravimetric data of extracted CMS-AP
Spectroscopic methods such as NMR or Raman measurements are usually more reliable
methods for the characterization of functionalized silica materials However solid state
29Si-NMR can also just give an indication for the incorporation of the aliphatic group
Compared to the spectra of the single phenyl modified product a shoulder at lower field
occurs in sample CMS-AP[122]
RESULTS AND DISCUSSION 43
128
0 -20 -40 -60 -80 -100 -120 -140
CMS-PH CMS-AP
[ppm]
Fig 56 29
Si-NMR spectra of CMS-AP and CMS-PH
Even though it is difficult to detect the aliphatic aminogroups in Raman measurements
Fig 57 shows the appearance of an additional signal at 1050 cm-1
as a result of C-N
stretching in primary amines
850 900 950 1000 1050 1100 1150 1200 1250
primary aminesC-N stretching
CMS-PH CMS-AP
inte
nsity
wavelength [cm-1]
Fig 57 Raman spectra of CMS-PH and CMS-AP
The isotherm obtained by nitrogen sorption analysis (Fig 58a) shows the typical
pronounced hysteresis at high pressures due to interparticle condensation in
nanopowders The step for the condensation in the templated mesopores is smeared out
RESULTS AND DISCUSSION 43
129
inferring a relatively broad pore size distribution due to the existence of functional
groups inside the pore system Fig 58b shows the bimodal pore size distribution which
is characteristic for mesoporous particles in the scale of about 100 nm
00 01 02 03 04 05 06 07 08 09 100
200
400
600
800
1000
0
200
400
600
800
1000 adsorption desorption
volu
me a
dsorb
ed [
cm
3
g-1
] S
TP
relative pressure p p0
-1
10 100 1000
0000
0005
0010
0015
Dv(d
) [c
m-3
-1
g-1
]
pore diameter []
Fig 58 N2 sorption isotherm and pore size distribution (DFT) of CMS-AP
c) Labeling with Fluorescein Marker
A porous silica nanoparticle is a suitable host for fluorescent markers due to its
chemical and mechanical stability[108]
The encapsulated dye molecule is shielded from
external influences and can be further functionalized with biocompatible elements The
labeling with a fluorescein isothiocyanate (FITC) is a common method in biochemistry
The method was also adopted to silica particles[123]
and recently to mesoporous silica
structures[43]
and even mesoporous silica nanoparticles[47]
The availability of a synthesis recipe for colloidal suspensions with incorporated
aminogroups establishes a basis for the successful linking of a marker during a one-step
synthesis[124]
After the synthesis of a suitable precursor that already carries the
RESULTS AND DISCUSSION 43
130
fluorescence marker it can be incorporated into the above mentioned synthesis
procedure to form labeled colloidal silica particles The successful incorporation of the
dye can be easily verified by adding only fluorescein to a reference sample Both
suspensions are transparent and the exhibit the characteristic color (Fig 59)
Fig 59 CMS-FITC and reference sample with fluorescein
After flocculation and separation of the particles by centrifugation the successful
incorporation of the FITC modified precursor can be verified when the solution above
the sediment is analyzed Only in the case of a successful functionalization it appears
colorless or only pale colored from some FITC residues respectively (Fig 60)
RESULTS AND DISCUSSION 43
131
Fig 60 CMS-FITC and reference sample after centrifugation
The precipitation can be extracted and redispersed in ethanol resulting in translucent
and fluorescent colloidal suspensions of mesoporous silica nanoparticles (Fig 61)
Fig 61 CMS-FITC after extraction and under UV-irradiation
RESULTS AND DISCUSSION 43
132
DLS data confirmed the existence of discrete particles with a comparable particle size
distribution The mean diameter of the particles in the stable colloidal suspension before
and after extraction is around 100 nm
1 10 100 1000
inte
nsity
particle size [nm]
Fig 62 Particle size distribution (DLS) of extracted CMS-FITC
Due to the very small amount of FITC in the synthesis further characterization methods
give no distinct discrepancy to the sample CMS-AP TGA as well as nitrogen sorption
or Raman investigations are very similar
RESULTS AND DISCUSSION 43
133
Fig 63 Dry sample CMS-FITC under UV-irradiation
The dried sample also exhibits the characteristic fluorescence (Fig 63) In order to
investigate the porosity of the sample and the accessibility of the functional group a
simple gas phase reaction can be applied The yellow powder is brominates with
elemental gaseous bromine at normal atmospheric moisture resulting in a red-colored
product carrying now eosin moieties (Fig 64)
Fig 64 Gas phase reaction of CMS-FITC with bromine vapor
RESULTS AND DISCUSSION 43
134
Fig 65 Bromination of fluorescein moieties with gaseous bromine
RESULTS AND DISCUSSION 44
135
44 Vapor-Sensitive Bragg Mirrors and
Optical Isotherms from Mesoporous
Nanoparticle Suspensions
RESULTS AND DISCUSSION 44
136
Introduction
Bragg reflectors are multilayer structures composed of alternating layers of two
dielectric materials with different refractive indices (n) The optical properties of a
Bragg mirror are dependent on the thickness and refractive index of the individual
layers For ideal reflectors all layers exhibit an optical thickness of λ4 The efficiency
increases with the number of layer pairs and the contrast of the refractive indices of the
low and high refracting materials For the preparation of good Bragg mirrors the
individual films have to be homogeneous with smooth surfaces and reproducible
thickness Thus they were often produced by vapor deposition techniques But it is also
possible to assemble Bragg stacks using spin- or dip-coating
Bragg reflectors are also widespread in nature eg in butterfly wings or iridescent
elytra of beetles where chitin layers are alternated with different refractive index layers
in order to control the apparent color in a wide variety of animals[38]
In the laboratory
these special thin films can be prepared for example by alternation of low refractive
SiO2 with high refractive TiO2 films Regarding porous thin films the expected change
of the interference color upon adsorption or desorption of a volatile species suggests a
novel concept for chemical sensing Indeed this sensing effect of porous films has
already been studied in several publications[39-43]
also in combination with the Bragg
stacks[44]
The preparation of sensing Bragg mirrors faces several challenges In order to realize
high quality Bragg mirrors the individual layers have to be very homogeneous Defects
or a high surface roughness in the films would propagate and amplify with each
RESULTS AND DISCUSSION 44
137
additional layer For a high brilliance of the Bragg stack the thickness of the layer has
to be constant across the substrate surface If the stack is to be built from nanoparticle
layers there will be boundary conditions on the optimal size distribution of the
individual particles ie the smaller the nanoparticles are the smoother the film Porous
thin films by their nature have a relatively low refractive index but for intensive colors
the contrast needs to be high For sensing applications one needs two porous layers to
guarantee good pore accessibility normal to the surface of the film Porous SiO2 is a
material with a very low refractive index In Chapter 42 synthesis procedures for the
preparation of colloidal suspensions of functionalized mesoporous silica nanoparticles
with a very small particle size were discussed These colloidal suspensions are ideal
candidates for the production of highly porous homogeneous thin films with a low
refractive index For the high refractive index layer nanoparticulate colloidal titania is a
suitable material The preparation of thin films with porous nanoparticles can have some
advantages over the common EISA approach for mesoporous films and the growth of
zeolite films on substrates respectively a) It is anticipated that the porous thin films
made of randomly oriented (porous) nanoparticles exhibit improved diffusion properties
and a highly accessible pore system[50]
b) It is possible to prepare stable suspensions of
already extracted and characterized nanoparticles thus assuring good reproducibility
and well-characterized sorption properties c) The film thickness can be controlled over
a wide range by varying the particle concentration or the number of coating steps d)
The coating of sensitive substrates is facilitated due to the mild processing conditions
For example intricate or high-temperature template removal procedures between the
RESULTS AND DISCUSSION 44
138
coating steps are not required e) The last-coated layers are located only on top of the
layer structure ndash no soluble precursor constituents may percolate into the already
deposited underlying layer structure Such Bragg mirrors have numerous potential
applications in sensing devices wavelength-selective tunable optical filters in a broad
spectral range and reflective coatings
Experimental
The colloidal suspensions of low refractive index material (CMS-P86 porous SiO2
nanoparticles ndash see Chapter 43) and high refractive index material (CMT-6 TiO2
nanoparticles ndash see Chapter 62) were used for the preparation of thin films The
homogeneous colloidal suspensions contained between 2 and 5 wt solid
nanoparticulate material In order to remove potential inhomogeneities the coating
suspensions were filtered through 02 μm syringe filters prior to deposition The thin
films were deposited on polished silicon wafers or glass plates by spin-coating using a
Laurell WS-400B-6NPP-Lite-AS All substrates were pre-cleaned with ethanol for 5 s
under spinning at 3000 rpm The film thickness was adjusted by diluting the colloidal
suspensions with absolute ethanol by variation of the spinning rate between 3000 and
5000 rpm or by multi step coatings respectively After each deposition the film was
annealed for 10 s in a flow of hot air (heat gun ~ 300 degC) and cooled to room
temperature before measurements were performed and the next layer was added SEM
micrographs were recorded with a JEOL JSM-6500F scanning electron microscope
(SEM) equipped with an Oxford EDX analysis system Ellipsometry measurements
RESULTS AND DISCUSSION 44
139
were performed with a Woollam M2000D at an angle of 75 deg in the spectral range of
190 ndash 1000 nm The data was fitted in the range between 350 ndash 1000 nm using the
Cauchy material as model layer Transmittance and reflectance measurements were
recorded with the same ellipsometer using p-polarized light at 45 deg 75 deg or 90 deg
depending on the sample and the experimental setup In order to record the shift of the
transmitted (angle 90 deg) wavelength due to vapor sorption the films were placed into
quartz cuvettes with gas in- and outlet The recording of isotherms (at 22 degC) was
performed using a homemade Labview-controlled gas mixer Digital mass flow
controllers (W-101A-110-P F-201C Bronkhorst High-Tech) ensured the accurate
dosing of the carrier gas nitrogen and the liquid analyte which was vaporized in a
controlled evaporation and mixing element (W-101A Bronkhorst High-Tech) Partial
pressures (p) were calculated using the van der Waals equation The relative pressure
p p0-1
relates to the saturation pressure p0
Results and Discussion
The colloidal suspensions of CMS-P86 and CMT-6 were used for the stepwise
deposition of multilayer thin films on silicon wafers in order to examine the thickness
optical properties and homogeneity of the resulting stacks (sample BS-1) After each
coating step the sample was analyzed with ellipsometry Once the data was fitted these
layers were not changed in the following data acquisition After the last layer was
deposited the unrestricted fitting of all previous layers did only slightly improve the
quality of the fit This indicates that the previous films are not changing significantly
RESULTS AND DISCUSSION 44
140
upon heating and further deposition The final homogeneous film (BS-1) appeared
golden Fig 66 shows the ellipsometric data for a multilayer stack of 4 thin films
consisting of functionalized mesoporous silica nanoparticles The layers are intercalated
with mesoporous thin films of titania nanoparticles
Fig 66 Experimental ellipsometry data and model fit for a multilayer thin film (BS-1)
at 75 deg in nitrogen atmosphere
The data for the theoretical model stack exactly fits the experimental data The thickness
of the individual layers is reproducible and varies only in a narrow range (eg 135 nm
+- 8 nm in the case of CMS-P86) This ensures a narrow bandwidth in reflection and
transmission respectively Table 6 shows the composition of the multilayer stack
RESULTS AND DISCUSSION 44
141
Table 6 Layer thicknesses of the sample BS-1 determined with ellipsometry
number of layer layer describtion thickness
8 Cauchy 1 127 nm
7 Cauchy 2 74 nm
6 Cauchy 1 129 nm
5 Cauchy 2 76 nm
4 Cauchy 1 135 nm
3 Cauchy 2 73 nm
2 Cauchy 1 143 nm
1 silicon dioxide 2 nm
0 silicon 1 mm
In the model stack shown above the functionalized porous silica as well as the porous
titania layers are fitted using a Cauchy dispersion model for dielectric materials Cauchy
1 represents the silica material and Cauchy 2 stands for the titania layer Due to
inherent porosity of both materials the fitted refractive indices are significantly lower
than for the bulk materials (nD = 127 and 172 compared to 146 for glass and 249 for
anatase) The Bragg stack structure derived from the ellipsometric data was confirmed
with scanning electron microscopy Fig 67 shows side-view micrographs of the Bragg
stack BS-1 The dark layer represents the SiO2 layers which are intercalated by light
TiO2 layers Thus the depth profile obtained with ellipsometry is in good accordance
with the SEM investigations
RESULTS AND DISCUSSION 44
142
Fig 67 SEM pictures (side view) and a depth profile (ellipsometry) of the multilayer
stack BS-1
When exposed to an atmosphere of toluene close to saturation (p p0-1
= 086) the color
of the Bragg mirror immediately changes from yellow to red because the optical
thickness of the individual layers increases due to adsorption of toluene into the pores
This change of the optical properties can be also observed in the reflectance spectra of
BS-1 at an angle of 75deg in a flow of dry nitrogen (solid line) and of toluene-enriched
nitrogen (dotted line) in Fig 68
RESULTS AND DISCUSSION 44
143
Fig 68 Reflectance spectra (75 deg) of BS-1 in dry nitrogen (solid line) and in toluene-
containing nitrogen (p p0-1
= 086 dashed line)
Spectroscopic ellipsometry allows correlating the pore filling to the increase of the
refractive index of the individual layers Fig 69 shows the pronounced change due to
sorption of toluene The exchange of the gaseous nitrogen by liquid toluene inside the
porous multilayer stack significantly influences the refractive index of the individual
films
RESULTS AND DISCUSSION 44
144
Fig 69 Experimental ellipsometry data of BS-1 in nitrogen (solid line) and toluene
atmosphere (p p0-1
= 086 dashed line)
Fitting of the new experimental data is achieved by simply increasing the refractive
index of the layers at constant film thickness Thus the nD values for the silica layer
increases from 127 to 148 and the one of the titania layer from 172 to 193 Fig 70
shows the experimental data and the model fit of BS-1 in gaseous toluene with modified
optical properties The good correlation confirms the theory of filled pores
RESULTS AND DISCUSSION 44
145
Fig 70 Experimental ellipsometry data and model fit for sample BS-1 in toluene
atmosphere (p p0-1
= 086 dashed line)
The total porosity is calculated with ellipsometric porosimetry using the Lorentz-Lorenz
equation It is based on the Clausius-Mossotti equation which describes the relation
between the macroscopic measurable relative dielectric constant and the electric
polarizability α The adsorption of a volatile species in the film changes its refractive
index When the refractive index of the filled and empty porous substrate is known one
can determine the porosity of the material without knowing the refractive index of the
dense material The values are listed in Table 7
RESULTS AND DISCUSSION 44
146
Table 7 Porosity of the layers in BS-1 determined with ellipsometric porosimetry
layer describtion nD
in dry nitrogen
nD
in toluene vapor
nD
toluene
porosity
()
Cauchy 2 (titania)
1718 1925 1496 277
Cauchy 1 (silica) 1266 1476 1496 393
Knowing the optical properties of the materials one can predict the optical properties of
Bragg reflectors with different thicknesses for wavelength-selective coatings The
optical thickness (OT) of the layers is adjusted to one fourth of the desired wavelength
(OT = λ4) Depending on the refractive index of the material the physical thickness of
the film is calculated (OTn) If the Bragg mirror is supposed to reflect the green part of
the light (500 - 550 nm) the optical thickness of the layers should be about 130 nm In
order to observe a color change depending mainly on the low refractive and modifiable
SiO2-layer the titania-layer was chosen thin enough to realize an optical thickness (OT)
outside the visible part of the light (OT lt 100 nm) even in the filled state (refractive
index of the toluene filled layer at 350 nm 193) Table 8 shows the desired and realized
optical properties of the prepared individual layers of a green reflecting Bragg Stack
(BS-2)
RESULTS AND DISCUSSION 44
147
Table 8 Desired and actual layer thicknesses and optical properties of the sample BS-2
modified silica titania
reflected color green UV
selected wavelength range 500-550 nm lt 350 nm
optical thickness ~ 130 nm lt 90 nm
refractive index of filled layer (325 nm) - 193
refractive index (525 nm) 128 -
theoretical film thickness ~ 100 nm lt 47 nm
realized film thickness 102 nm 40 nm
Therefore the concentration of the colloidal suspensions and the spinning rate of the
spin-coater were adjusted in order to realize the preparation of thin films with the above
shown thickness for reflecting green light Single layers of the films were deposited on
silicon wafers in order to examine the thickness before the preparation of the stack was
performed on a glass plate Fig 71 shows the color of the transmitted and reflected light
of the Bragg stack BS-2 The coated transparent glass plate (perpendicular) is
illuminated from the right side with sunlight at an angle about 25 deg The transmitted and
reflected light falling onto the table is complementary Due to the illumination angle
the light is shifted to shorter wavelengths (Braggrsquos law)
RESULTS AND DISCUSSION 44
148
Fig 71 Sample BS-2 reflecting and transmitting sunlight
The desired theoretical reflected wavelength of the Bragg mirror (maximum ~ 525 nm)
was confirmed with transmission measurements Fig 72 shows the transmittance
spectrum at an angle of 90 deg of sample BS-2 The transmittance minimum is at 520 nm
Fig 72 Transmittance spectrum of BS-2 at an incident angle 90 deg
RESULTS AND DISCUSSION 44
149
The coated glass cover plate was placed in a quartz cuvette with gas in- and outlet in
order to follow the change in the reflectance and transmittance colors of the Bragg
reflector after adsorption of gaseous toluene Fig 73 shows the sample in dry nitrogen
atmosphere (above) and in an atmosphere of toluene (p p0-1
= 086) illuminated with
sunlight at an angle of about 45 deg
Fig 73 Wavelength shift due to adsorption of toluene in sample BS-2 (samples in a
quartz cuvette illuminated with sunlight at 45 deg)
The adsorption of toluene increases the optical thickness of the adsorbing layer and thus
drastically changes the reflected as well as the transmitted wavelength This change can
be clearly seen in the transmission spectrum at 45 deg (Fig 74) The transmission
minimum (reflection maximum) changes from about 510 nm (blue) to 590 nm (yellow)
This change happens within seconds when the film is exposed to the gaseous adsorbate
RESULTS AND DISCUSSION 44
150
Fig 74 Wavelength shift of transmitted light at an incident angle of 45 deg due to
adsorption of toluene in sample BS-2
Recording the transmission spectrum (90 deg) at different partial pressures of toluene
resulted in the isotherm shown in Fig 75 The curve resembles a type IV isotherm
typical for mesoporous materials After a relatively steep increase it passes nearly a
plateau at a relative pressure of about 053 before the slope increases again at about
070 The capillary condensation of the mesoporous film occurs at a higher relative
pressure
RESULTS AND DISCUSSION 44
151
Fig 75 Wavelength shift of transmitted light in BS-2 at different relative pressures of
toluene (90 deg incident angle)
Conclusion
Wavelength specific Bragg mirrors could be produced by a simple and reproducible
spin-coating approach These Bragg reflectors show a sensitivity towards specific
relative pressures of organic vapors such as toluene The existence of various colloidal
suspensions of porous nanoparticles opens a wide field of possible functional Bragg
mirrors The functionalization and thus the sorption properties may be varied by
introduction of different organic groups offering different interactions with the
adsorptives (or analytes) of interest The sensitive layer can also be replaced by other
low-refractive index materials such as zeolites The thickness of the individual layers
can be tuned in order to obtain reflectance or transmittance minima or maxima at a
desired wavelength even in the UV or IR region or a combination of different
wavelengths
CONCLUSION AND OUTLOOK
152
5 CONCLUSION AND OUTLOOK
CONCLUSION AND OUTLOOK
153
Colloidal suspensions of various kinds of discrete porous nanoparticles could be
synthesized and additionally functionalized with a multitude of organic groups
Due to the versatile functionalization of porous silica nanoparticles the materials have a
high potential in many applications eg as artificial viruses The pathway of a
fluorescently labeled particle into a cell could be observed with confocal microscopy
Due to the very small particle size the colloidal suspensions are completely transparent
to the visible part of the light Thus the material can be used eg as host material in
spectroscopic investigations Additionally liquid NMR-studies are possible due to the
fast rotation of such small objects in typical solvents The transparency is also
advantageous for the encapsulation of dyes or other materials which may allow one to
disperse otherwise insoluble substances in all kinds of matrices In combination with
sensitive caps the controlled release of drugs or other substances eg of initiators in
polymers constitute interesting topics for further research
Homogeneous colloidal suspensions of very small nanoparticles are of special interest
for the production of thin films by spin-coating on electronic semiconductor devices and
for optical coatings The thin films show very low refractive indices around 12 in the
case of zeolites and functionalized mesoporous silica nanoparticles respectively
The usage of porous nanoparticles has numerous advantages (see introduction in
Chapter 43) Porous titanium dioxide (thin) films may be interesting for the
development of dye-sensitized solar cells Thorough characterization and optimization
of the porosity can help to improve the loading with a dye or the permeation with the
electrolyte
CONCLUSION AND OUTLOOK
154
The ability eg of thiol-functionalized mesoporous silica to adsorb high amounts of
heavy metal ions could be further investigated in thin films Their presence should
influence the optical properties of the thin films
Finally the preparation of chemically sensitive Bragg mirrors using zeolites or other
porous metal oxides is also very promising Due to the usage of nanoparticles the
refractive index of the thin films can be easily adjusted by simply combining colloidal
suspensions of different materials Thus the color change due to adsorption can be
controlled in many respects
APPENDIX 61
155
6 APPENDIX
APPENDIX 61
156
61 Functionalized Mesoporous Silica
Nanoparticles as Host System for the
Synthesis of CdS Quantum Dots
Introduction
Mesoporous materials like MCM-41 can act as molds for the synthesis of structures by
inclusion chemistry in otherwise hardly accessible dimensions Depending on the pore
system the size and shape of the embedded structures can be controlled in a certain
range In the past many different nanoclusters such as Ge[125]
Fe2O3[126]
or
semiconducting GaAs[127]
have been synthesized within the channels The main
interesting features of semiconductor nanocrystals or quantum dots (QD) derive from
their atom-like electronic structure This atom-like electronic structure is a result of the
confinement of the electrons in all three spatial directions when very small sizes -
typically between 2 and 10 nm - are realized In contrast to atoms the energy spectrum
of a quantum dot can be engineered by controlling the geometrical size shape and the
strength of the confinement potential Quantum dots show unique properties concerning
their interaction with light Their high quantum yield and the possibility to tune the size
and thus the spectrum of quantum dots is advantageous for many applications
However it is sometimes difficult to benefit from these features because QDs are
APPENDIX 61
157
difficult to handle Depending on the desired application the QDs have to be
functionalized with specific shell molecules for example for in vivo optical
imaging[128]
or they have to be embedded in specific matrix materials when used with
high optical efficiency[129]
A striking example for a possible application of QDs is the utilization in a so called
Graumltzel or electrochemical solar cell (ECS)[130]
Until now commercially available
systems of that new kind of solar cell use TiO2 crystals in combination with dyes in
order to convert photons into excitons (electron-hole pairs) and realize charge
separation Quantum-dot sensitized mesoporous TiO2 features several advantages
compared to the standard electrochemical solar cell like a better optical tenability and
stability[131]
Common II-VI semiconductor nanoclusters include cadmium
chalcogenides eg cadmium sulfide or telluride The emission wavelength depends on
the diameter of the dots[132]
The desired size range coincides with the typical pore size
of the MCM-41-like mesoporous silica materials The typical synthesis of
semiconductor nanoclusters in the channels of mesoporous materials has been shown
following surface modification of the materials[133]
After functionalization eg with
thiol groups a dissolved cadmium salt is absorbed The resulting sample can be reacted
with a chalcogenide source eg H2S gas forming nanometer sized quantum dots or
wires inside the pores As discussed before the functionalized silica materials can also
be synthesized as nanoparticles These colloidal silica particles are of great interest for
several optical and biological applications The combination with a water-based
synthesis of cadmium chalcogenide nanocrystals promises large cost advantages
APPENDIX 61
158
compared to commonly synthesized quantum dots with organic stabilizing agents[134]
Here we describe the attempt to prepare CdS quantum-dots inside the pores of
mesoporous silica nanoparticles retaining the colloidal nature of the suspensions
Experimental
All chemicals were reagent grade (98 or higher) purchased from Sigma-Aldrich and
used without further purification The water was deionized The synthesis was carried
out in open polypropylene (PP) bottles
MS-1 host
The synthesis of MS-1 followed a method published by Gruumln et al[135]
24 g
cetyltrimethylammonium bromide (CTAB 66 mmol) were dissolved in 120 ml
deionized water in a 250 ml PP-bottle 95 g of ammonia solution (25 140 mmol
NH3) and 10 ml EtOH were added and the solution was stirred for 10 min After the
addition of 10 g tetraethoxysilane (TEOS 48 mmol) a white precipitate was formed and
the suspension was stirred for 1 h The product was recovered by filtration and washed
with water and EtOH
MS-SH host
Thiol-functionalized mesoporous silica was synthesized similarly in a co-condensation
process 24 g cetyltrimethylammonium bromide (CTAB 66 mmol) were dissolved in
120 ml deionized water in a 250 ml PP-bottle 95 g of ammonia solution (25
APPENDIX 61
159
140 mmol NH3) and 10 ml EtOH were added and the solution was stirred for 10 min
After the addition of a mixture of 85 g tetraethylorthosilicate (TEOS 41 mmol) and
163 g mercaptopropyltrimethoxysilane (MPTMS 83 mmol) a white precipitate was
formed and the suspension was stirred for 1 h The product was recovered by filtration
and washed with water and EtOH
Extraction of template from the bulk mesoporous hosts
For extraction of the template the product was suspended in 250 ml of an ethanolic
solution of ammonium nitrate (20 g l-1
) The mixture was refluxed under vigorous
stirring for 1 h and then filtrated The procedure was repeated with 250 ml of an
ethanolic solution of concentrated hydrochloric acid (5 g l-1
) The white filter cake was
washed with ethanol and dried at 60 degC
CMS-SH host
Colloidal mesoporous silica with thiol groups was synthesized following a published
procedure[99]
143 g (960 mmol) triethanolamine (TEAH) and a mixture of 223 ml
(100 mmol) TEOS plus 38 ml MPTMS (20 mmol) were combined in a 500 ml PP-
bottle with lid The two-phase mixture was heated in an oil bath at 90 degC for 20 min
without stirring Immediately after taking the mixture out of the oil bath 267 g of an
aqueous solution (25 wt ) of CTAC which had been heated to 60 degC was added and
the final mixture was stirred for at least 3 h at 23 degC
APPENDIX 61
160
Extraction of template from the colloidal mesoporous host
Extraction of template was performed by adding 250 ml of ethanol to the translucent
colloidal aqueous suspension of the mesoporous material The resulting precipitate was
centrifuged for 10 min at 40000 g (RCF) After decanting the sediment was
redispersed through vigorous stirring in 250 ml of an ethanolic solution of ammonium
nitrate (20 g l-1
) and then refluxed for 1 h This procedure was repeated with a 250 ml of
a solution of concentrated hydrochloric acid in ethanol (5 g l-1
) After washing with pure
ethanol the transparent gelatinous cake obtained after centrifugation could be
redispersed in ethanol leading to a colloidal suspension of the extracted product
CMS-SO3H host
The oxidation of the thiol groups in CMS-SH to sulfonic acid was performed with
concentrated hydrogen peroxide (33 ) before template extraction Hydrogen peroxide
(120 ml) was added to 25 g (calculated dry weight) of the wet sample CMS-SH and
stirred for 24 h at room temperature After oxidation the sample was washed first in
HCl-ethanol and subsequently in pure ethanol (CMS-SO3H-EtOH) or water (CMS-
SO3H-water) respectively
Incubation with Cd (II)
The amount of 10 ml of a 01 M solution of Cd(NO3)2 in ethanol or water respectively
were added to 2 g of mesoporous silica host (dry weight or calculated dry weight in the
case of colloidal suspensions) and stirred for 2 h The product was recovered by
APPENDIX 61
161
filtration or centrifugation and washed with ethanol or water ( sample-Cd-EtOH
sample-Cd-water)
Reaction with hydrogen sulfide
The ethanolic or aqueous suspensions of the corresponding products obtained after the
incubation with Cd(II) were treated with gaseous hydrogen sulfide as follows
FeS was slowly dissolved with 2 M hydrogen chloride and the developing H2S was
bubbled through the suspensions in a flow of nitrogen using the apparatus shown in Fig
76 Excessive H2S was eliminated in two washing bottles containing concentrated
aqueous NaOH or 2 M aqueous Cu(NO3)2 ( sample-CdS)
Fig 76 Setup for the reaction with hydrogen sulfide
Alternatively dry powder of the Cd(II)-containing mesoporous silica was exposed to
dry H2S atmosphere by connecting a CaCl2-column before the reaction vessel
APPENDIX 61
162
Characterization
Dynamic light scattering (DLS) data were collected with an ALV-NIBSHPPS High
Performance Particle Sizer in PMMA cuvettes at 25 degC Raman spectroscopy was
performed with a He-Ne laser (633 nm) on a LabRAM HR UV-Vis (HORIBA Jobin
Yvon) Raman Microscope (Olympus BX41) equipped with a Symphony CCD detection
system The spectra were baseline-corrected For thermogravimetric analysis (TGA)
10 mg of dry powder were heated in corundum crucibles from 30 to 900 degC
(10 degC min-1
) in a flow of synthetic air (25 ml min-1
) using a Netzsch STA 449 C Jupiter
thermobalance X-ray diffraction pattern were recorded on a Scintag Inc XDS 2000 in
theta-theta geometry (Cu-Kα1 λ=15406 Aring Cu-Kα2 λ=15444 Aring)
Transmission electron microscopy (TEM) was carried out on JEOL JEM 2011
instrument with LaB6 cathode at 200 kV Samples were prepared on a Plano holey
carbon coated copper grid by evaporating one droplet of diluted ethanolic suspension of
the extracted material The nitrogen sorption isotherms (77 K) were obtained using a
Quantachrome NOVA 4000e Surface Area amp Pore Size Analyzer Surface area
calculations were made using the Brunauer-Emmett-Teller (BET) equation in the range
from p p0-1
= 005 - 025 Pore-size distributions were determined using the DFT-
method (NLDFT equilibrium model cylindrical pores N2 on oxygen) The pore volume
was determined for meso- and micropores at p p0-1
lt 08
APPENDIX 61
163
Results and Discussion
Fig 77 shows the XRD patterns for the prepared bulk samples with (a) and without (b)
mercaptopropyl groups After template extraction the peaks become more pronounced
The typical reflection peak for such mesoporous materials can be observed at about 2 deg
(2θ) for the pure siliceous material (MS-1) and 23 deg for the functionalized one (MS-
SH) In the sample with thiol groups the reflections are less intense and shifted to
higher values This can be explained with the smaller pore size in combination with a
higher degree of disorder in the functionalized materials synthesized via co-
condensation
1 2 3 4 5 6 7
MS-1 extracted MS-1 with template
inte
nsity
2 [degrees]
1 2 3 4 5 6 7
MS-SH extracted MS-SH with template
inte
nsity
2 [degrees]
Fig 77 XRD powder pattern of pure siliceous and functionalized mesoporous bulk
material after drying and extracting
These two observations are naturally more pronounced when looking at dry powder of
functionalized mesoporous nanoparticles (Fig 78) Characterization of the colloidal
suspensions of mercaptopropyl functionalized nanoparticles is described in Chapter 42
APPENDIX 61
164
1 2 3 4 5 6 7
CMS-SH extracted CMS-SH with template
inte
nsity
2 [degrees]
Fig 78 XRD powder pattern of colloidal functionalized mesoporous silica (CMS-SH)
after drying and extraction
Sorption measurements (Fig 79) confirmed the successful extraction of the template
and the availability of highly porous materials
00 01 02 03 04 05 06 07 08 09 10
0
200
400
600
adsorption desorptionv
olu
me a
dsorb
ed [
cm
3
g-1
] S
TP
relative pressure p p0
-1
Fig 79 N2 sorption isotherm of extracted MS-1
APPENDIX 61
165
Incubation with Cd(II)
Evaluation of the thermogravimetric analysis data resulted in an estimated weight loss
of 190 mg mercaptopropyl residues per gram for MS-SH as well as for CMS-SH Using
the molar weight of 75 g mol-1
for these mercaptopropyl-residues resulted in a
calculated concentration of 25 mmol thiol per g material (ignoring residual template)
The more conclusive elemental analysis showed a sulfur content of 6 in weight
Using the molar weight of sulfur (32 g mol-1
) results in a concentration of 187 mmol
thiol per g silica Based on an average value of 2 mmol g-1
and the assumption that one
Cd2+
ion coordinates to two thiolates the maximum of adsorbed cadmium ions should
not exceed 1 mmol per g functionalized silica The usage of a great excess (5 mmol g-1
)
in the treatment with Cd(II) should ensure the coordination of every accessible thiol
group
TGA measurements after incubation and washing showed a successful loading with the
heavy metal ions The relative weight loss in percent caused by the decomposition of
the organic residues is lower in the material loaded with Cd2+
(Fig 80)
APPENDIX 61
166
100 200 300 400 500 600 700 800 900
-25
-20
-15
-10
-5
0
MS-SH-Cd MS-SH
weig
ht
loss [
]
temperature [iexclC]
Fig 80 TGA data of extracted MS-SH before and after loading with Cd(II)
A further indication for a successful coordination to the thiol groups is the decrease of
the pH-value when the cadmium salt is added to the suspensions of extracted MS-SH
The Cd2+
-ions replace the protons when coordinating to the SH-groups resulting in a
higher acidity Fig 81 shows that the pH-value of the suspension (35) decreases
significantly to 24 after addition of the aqueous cadmium salt solution (pH = 56)
0
1
2
3
4
5
6
24
35
56
MS
-SH
in
H2O
co
mb
ine
d
Cd
(NO3
)2 in
H2O
+
pH
Fig 81 Increase of the acidity caused by the coordination of Cd2+
in MS-SH
APPENDIX 61
167
Deprotonation of the SH-groups can also be observed in Raman measurements Fig 82
shows the spectra before and after insertion of cadmium ions in MCM-SH The
characteristic S-H-stretching at 2580 cmminus1
lost most of its intensity after the adsorption
of cadmium ions
500 1000 1500 2000 2500 3000 3500 4000
MS-SH-Cd MS-SH
inte
nsity
wavelength [cm-1]
Fig 82 Raman spectra of MS-SH before and after incubation with Cd2+
ions
Oxidation of CMS-SH
After the first adsorption experiments with cadmium salts in colloidal suspensions of
thiol-functionalized mesoporous silica it emerged that the particles tend to agglomerate
irreversibly
The selective oxidation of the external SH-groups into sulfonic acid groups (-SO3H)
was believed to solve the aggregation problem This modification should have been
achieved with hydrogen peroxide in combination with template-filled material The
APPENDIX 61
168
conversion of thiol groups in mesoporous silica nanoparticles into sulfonic acid with
hydrogen peroxide is proven[99]
Apparently the strength of the H2O2 and the reaction time were sufficient to oxidize all
thiol groups ndash also those inside the pore system Probably the organic template is
decomposed[136]
while the functional head of the organic residue is only converted into
sulfonic acid The completeness of the thiol oxidation can be observed in Raman
spectra Before the reaction with hydrogen peroxide the typical signals of the thiol
groups appear at 2580 cm-1
and 650 cm-1
These peaks completely disappear after the
treatment with H2O2 and instead a new one occurs at 1050 cm-1
(sulfonate stretching)
The signals for the aliphatic propyl groups around 2900 cm-1
are retained (Fig 83)
500 1000 1500 2000 2500 3000 3500 4000
CMS-SO3H
inte
nsity
wavenumber [cm-1]
CMS-SH
Fig 83 Raman-spectra before and after oxidation of CMS-SH with hydrogen peroxide
The coagulation of the particles after Cd(II)-salt addition could be avoided by oxidation
of the thiol groups The suspensions showed the same particle size distribution after
incubation with cadmium salts
APPENDIX 61
169
In order to further verify the effective coordination of heavy metal ions to the functional
groups equivalent amounts of the cadmium salt are introduced to the aqueous or
ethanolic suspensions of
pure siliceous bulk material (MS-1-Cd)
functionalized bulk material (MS-SH-Cd)
colloidal suspensions of functionalized material (CMS-SH-Cd)
colloidal suspensions of oxidized functionalized material (CMS-SO3H-Cd)
After washing the material the cadmium content was investigated with elemental
analysis As seen in Fig 84 the amount of incorporated cadmium found in the thiol
functionalized materials is significantly higher compared to the pure silica The amount
additionally depends on the solvent The remaining amount is higher when the loading
and washing is performed with ethanol Colloidal suspensions and suspension
containing bulk material adsorb comparable amounts Interestingly the suspension
containing the nanoparticles with sulfonic acid groups also adsorbs a considerable
amount of heavy metal ions - and the colloidal particles do not coagulate
APPENDIX 61
170
0 2 4 6 8 10
CMS-SH-Cd EtOH
MS-SH-Cd EtOH
CMS-SO3H-Cd EtOH
CMS-SH-Cd water
MS-SH-Cd water
MS-1-Cd water
MS-1-Cd EtOH
sam
ple
Cd2+
[wt - ICP]
Fig 84 Amount of Cd2+
in the different suspensions found with elemental analysis
Reaction with hydrogen sulfide
After the successful loading of the cadmium ions into the mesoporous hosts the
materials were exposed to gaseous hydrogen sulfide The aqueous as well as the
ethanolic suspensions immediately turned yellow upon bubbling with H2S Only if the
CdS is present as bulk material - or at least not as quantum dots - it shows its
characteristic bright yellow color The expected nanoparticles inside the pore system
should be colorless and fluorescent under UV-irradiation Fig 85 shows an image of
CMS-SO3H-CdS with the typical yellow color of bulk cadmium sulfide The colloidal
nature of the suspension with an average particle diameter of 170 nm is preserved
APPENDIX 61
171
1 10 100 1000 10000
inte
nsity
diameter [nm]
Fig 85 Image and DLS data of CMS-SO3H-CdS in ethanol after loading with Cd2+
and
reaction with H2S
Probably the initially formed CdS-clusters are very mobile in water or ethanol and tend
to leave the pore system in order to create larger particles on the surface of the
mesoporous hosts or in solution Even the supposedly dry powder (MS-SH-Cd) in H2S
atmosphere showed this yellow color after a few seconds Presumably the moisture
present with the development of hydrogen sulfide is problematic because it enhances the
mobility of the sulfide species involved Therefore the H2S was dried in a CaCl2-
column before it was reacted with the completely dry material (MS-SH-Cd) No change
in color could be observed under these conditions However after addition of water the
white powder instantly turned yellow (Fig 86) This observation supports the proposed
high mobility of initially formed CdS species
APPENDIX 61
172
Fig 86 MS-SH-Cd after exposure to dry H2S (A) and after addition of water (B)
Powder X-ray diffraction
Fig 87 shows the XRD pattern of CMS-SO3H-CdS in combination with the expected
diffraction pattern of bulk CdS material The peaks are significantly broadened
indicating the existence of small crystallites
20 30 40 50 60 70
CMS-SH-CdS
inte
nsity
2 [degrees]
Fig 87 Powder diffraction pattern of CMS-SO3H-CdS
APPENDIX 61
173
Applying the Scherrer equation allows approximating the average particle size For this
purpose the full width at half maximum (FWHM) of a peak at a certain angle (2θ) is
determined Here the instrumental broadening is neglected and the value of 094 was
chosen for the Scherrer constant K
cos
FWHM
KD
In combination with the wavelength of the Cu-Kα radiation (λ = 0154 nm) and a
FWHM of 0014 (radian measure) at 2θ = 44deg or θ = 22deg respectively an average
particle diameter D of approximately 11 nm can be calculated Thus the particles are
much too big to fit into the 3 nm pores
TEM-micrographs of the same sample show the monodisperse spherical particles with a
star-shaped pore system As expected from XRD measurements there is no evidence for
the existence of CdS particles inside the pores Instead a few dense particles in the
dimensions of about 10 nm can be found beside the porous silica particles (Fig 88)
APPENDIX 61
174
Fig 88 TEM-micrographs of CMS-SO3H-CdS
As mentioned above the colloidal suspension had a bright yellow color Interestingly
this coloration became less intense with time and nearly disappeared after 10 days The
suspension showed a pink fluorescence under UV-irradiation (Fig 89)
Fig 89 CMS-SO3H-CdS after 10 days (left) shows fluorescence under UV-light (right)
APPENDIX 61
175
Presumably the initially 11 nm-sized CdS particles slowly dissolved and temporarily
had the appropriate size to show fluorescence The undefined pink fluorescence may
derive from a rather diversified size distribution of the CdS clusters Two days later the
fluorescence disappeared
Conclusion
The aim of the project was to use the existent colloidal suspensions of functionalized
mesoporous silica nanoparticles as host system for the synthesis of CdS quantum dots
It was possible to load these porous particles with a high amount of heavy metal ions
preserving the colloidal state However when introducing the hydrogen sulfide it
appears that the initially formed CdS species inside the pores are very mobile and that
they can easily leave the pore system to form larger clusters at the outer surface of the
mesoporous particles or in the solvent They are not stabilized in the confined space as
desired It is imaginable that the synthesis could be successful with other solvents or
reagents
APPENDIX 62
176
62 Colloidal Suspensions of TiO2
Nanoparticles for the Preparation of
Porous Thin Films
Introduction
Titania exists in a number of crystalline forms of which the most important are anatase
and rutile It is inert does hardly react with other materials and is thermally stable non-
flammable and non-toxic TiO2 is the most widely used white pigment because of its
brightness and very high refractive index (n = 24) As effective opacifier in powder
form it is employed as a pigment to provide whiteness and opacity to products such as
glass and porcelain enamels cosmetics sunscreens paper paints and foods
Titanium dioxide particularly in the anatase form is a photocatalyst under ultraviolet
light The strong oxidative potential of the positive holes oxidizes water to create
hydroxyl radicals and the holes can also oxidize organic materials directly Titanium
dioxide is thus added to paints cements or directly coated as protective thin film onto
the desired surface When deposited as a thin film its high refractive index makes
titania an excellent reflective optical coating for dielectric mirrors A further important
application is the utilization as semiconducting layer in dye-sensitized solar cells
(DSSC)[130]
In these so-called Graumltzel cells nanoparticulate layers or homogeneous
APPENDIX 62
177
mesoporous films can potentially offer great improvements Their high surface areas
allow a high loading with dye For an efficient operation the titania layer should have a
highly accessible pore system Thus it is important to obtain the material as discrete
nanoparticles in colloidal suspensions The synthesis of titanium dioxide particles at the
nanometer scale can be achieved by several methods such as pyrolysis or sol-gel
chemistry[137]
In the last years several studies on the synthesis of mesoporous titania which should
exhibit a higher specific surface area than the nanoparticles were published Most of the
experiments are based on the synthesis of mesoporous silica for example the synthesis
procedure described by Amoros[138]
which uses a complexing agent in order to retard
the hydrolysis of the titaniumalkoxide Due to fundamental differences in hydrolysis
and condensation behavior as well as template interaction it turned out that the
principles used for the synthesis and extraction of mesoporous silica cannot be adopted
easily The main difficulty is the removal of the template either by extraction or
calcination In the latter case collapsing of the pore system due to the formation of large
crystalline domains is one reason
The preparation of mesoporous titanium dioxide in nanoparticulate form is also
frequently claimed[139 140]
For the preparation of thin films via spin-coating the
existence of discrete mesoporous particles in a homogeneous colloidal suspension is
necessary but the focus of the research is often on other objectives like a high
crystallinity or stability[140 141]
APPENDIX 62
178
The preparation of mesoporous titania in the form of thin films with the EISA approach
is well-investigated[20]
This recipe was also adopted for the synthesis of bulk material
by slowly evaporating the solvent[142 143]
Although the synthesis of homogeneous
mesoporous TiO2 thin films following the EISA-approach is practical the formation
from nanoparticles might be advantageous in some respects As already mentioned in
Chapter 43 it is believed that such films might exhibit improved diffusionial access
Additionally one can work with a stable suspension of already extracted and
characterized nanoparticles thus ensuring good reproducibility The coating of sensitive
substrates is facilitated due to the mild conditions and the thickness can be easily
controlled by varying the concentration or by multiple step coating As a further
treatment such as extraction or calcination is no longer necessary sensitive substances
eg dyes can already be added to the coating suspensions Finding an appropriate
titania precursor is the first challenge in titania sol-gel chemistry as the hydrolysis of
the titanium precursors is typically much faster than that of the silica analogues
Common precursors are titanium alkoxides and complexes eg
titanium(IV)bis(acetylacetonate)diisopropoxide or titanium(IV)(triethanolaminato)
isopropoxide The aim of this work was the preparation of homogeneous porous thin
films from TiO2 nanoparticles by a facile and reproducible spin-coating approach
APPENDIX 62
179
Experimental
CMT-1 CMT-1A
The amount of 244 g hexadecyltrimethylammonium bromide (CTAB 67 mmol) and
633 g titanium(IV) (triethanolaminato) isopropoxide (TiTEAiOPr 80 in isopropanol
20 mmol) were combined at room temperature and mixed with 60 ml water under
stirring Precursor and template were completely dissolved and stirred for 24 hours at
room temperature The initially clear solution started to become opalescent after about
2 hours One half of the final colloidal suspension was centrifuged and the sediment was
washed 3 times and then redispersed in water (CMT-1) The other half was autoclaved
at 100 degC for 24 hours and then washed and redispersed (CMT-1A) Parts of the
material were calcined (CMT-1-c CMT-1A-c) at 350 degC for 3 h (1 K min-1
) or
extracted (CMT-1-e CMT-1A-e) as described in Chapter 42
CMT-2
The experiment above was repeated at 50 degC without autoclaving
CMT-3
The amount of 20 g TiTEAOiPr (80 in isopropanol 63 mmol) was added to a
preheated (60 degC) solution of 05 g hexadecyltrimethylammonium chloride and 620 g
water under stirring The mixture was kept at 60 degC and stirred for 2 h The final
colloidal suspension was centrifuged and the sediment was washed 3 times and then
redispersed in water
APPENDIX 62
180
CMT-4
The amount of 276 g concentrated hydrochloric acid (37 ) was added to a solution of
568 g tetraisopropylorthotitanate and 10 g EtOH A mixture of 116 g
hexadecyltrimethyl-ammonium bromide (CTAB) in 84 g EtOH and 438 g dest H2O
were added and the clear solution was refluxed under stirring for 6 h while slowly
forming a white suspension The suspension was diluted with 20 ml EtOH centrifuged
for 30 min at 40000 g (RCF) and redispersed in a mixture of 20 ml EtOH and 2 g dest
H2O Centrifugation and redispersion in pure ethanol was repeated twice leading to a
colloidal suspension of TiO2 nanoparticles For characterization of the material a part of
the suspension was dried at 60 degC
CMT-5
The amount of 276 g concentrated hydrochloric acid (37 ) was added to a solution of
568 g tetraisopropylorthotitanate and 184 g EtOH The amount of 438 g dest H2O
was added and the clear solution was refluxed under stirring for 6 h while slowly
forming a white suspension The suspension was diluted with 20 ml EtOH centrifuged
for 30 min at 40000 g (RCF) and redispersed in a mixture of 20 ml EtOH and 2 g dest
H2O Centrifugation and redispersion in pure ethanol was repeated twice leading to a
colloidal suspension of TiO2 nanoparticles For characterization of the material a part of
the suspension was dried at 60 degC
APPENDIX 62
181
CMT-6
The amount of 552 g concentrated hydrochloric acid (37 ) was added to a solution of
1136 g tetraisopropylorthotitanate and 368 g EtOH The amount of 876 g dest H2O
was added and the clear solution was refluxed under stirring for 6 h while slowly
forming a white suspension
The suspension was diluted with 20 ml EtOH and peptized with 1 ml water before it
was centrifuged for 5 min at 40000 g (RCF) in order to remove big agglomerates The
supernatant suspension was flocculated with 20 g hydrochloric acid and after
centrifugation the sediment was redispersed in a mixture of 20 ml EtOH and 2 g dest
H2O This washing procedure was repeated once
APPENDIX 62
182
Thin film preparation
The colloidal suspensions of CMT-6 contained about 3 wt titaniumdioxide The
ethanolic suspension can be used directly for the preparation of thin films by spin-
coating The thin films were deposited on polished silicon wafers or QCM chips (XA
1600 AT-cut KVG Quartz Crystal Technology) by spin-coating using a Laurell WS-
400B-6NPP-Lite-AS All substrates were pre-cleaned with ethanol for 5 s under
spinning at 3000 rpm The film thickness was adjusted by diluting the colloidal
suspensions with absolute ethanol by variation of the spinning rate between 3000 and
5000 rpm and by multi step coatings
Characterization
Dynamic light scattering (DLS) data were collected with a Malvern Nano ZS in PMMA
cuvettes at 25 degC Raman spectroscopy was performed with a He-Ne laser (633 nm) on
a LabRAM HR UV-Vis (HORIBA Jobin Yvon) Raman Microscope (Olympus BX41)
equipped with a Symphony CCD detection system The spectra were baseline-corrected
For thermogravimetric analysis (TGA) 10 mg of dry powder were heated in corundum
crucibles from 30 to 900 degC (10 degC min-1
) in a flow of synthetic air (25 ml min-1
) using
a Netzsch STA 449 C Jupiter thermobalance X-ray diffraction pattern were recorded on
a Scintag Inc XDS 2000 in theta-theta geometry (Cu-Kα1 λ = 15406 Aring Cu-Kα2
λ = 15444 Aring) Transmission electron microscopy (TEM) was carried out on a JEOL
JEM 2011 instrument with LaB6 cathode at 200 kV Samples were prepared on a Plano
holey carbon coated copper grid by evaporating one droplet of diluted ethanolic
APPENDIX 62
183
suspension of the extracted material The nitrogen sorption isotherms (77 K) were
obtained using a Quantachrome NOVA 4000e Surface Area amp Pore Size Analyzer
Surface area calculations were made using the Brunauer-Emmett-Teller (BET) equation
in the range from p p0-1
= 005 - 025 Pore-size distributions were determined using the
DFT-method (NLDFT equilibrium model cylindrical pores N2 on oxygen) The pore
volume was determined for meso- and micropores at p p0-1
lt 08 Ellipsometry
measurements were performed with a Woollam M2000D at an angle of 75deg in the
spectral range of 190 - 1000 nm The data was fitted in the range between 350 ndash
1000 nm using the Cauchy material as model layer Ellipsometric porosimetry
measurements were carried out in a liquid cell at different partial pressures at a
measurement angle of 75 deg The recording of isotherms was performed using a
homemade Labview-controlled gas mixer Digital mass flow controllers (W-101A-110-
P F-201C Bronkhorst High-Tech) ensured the accurate dosing of the carrier gas
nitrogen and the liquid analyte which was vaporized in a controlled evaporation and
mixing element (W-101A Bronkhorst High-Tech) Partial pressures were calculated
using the van der Waals equation with real gas-state assumptions
(QCM) A 10 MHz Quartz Crystal Microbalance (QCM) device (XA 1600 AT-cut
KVG Quartz Crystal Technology) was used to measure frequency changes due to
additional adsorbed mass Some parameters of the Sauerbrey equation such as the
density ρq = 2648 gmiddotcm-3
and the shear modulus υq = 2947middot1011
gmiddotcm-1
middots-2
are
characteristics of the piezoelectric material quartz The Sauerbrey equation is
normalized to 1 cm2 sensing area on the QCM chip thus a frequency change of 1 Hz
APPENDIX 62
184
corresponds to a mass-loading of 442middot10-9
g The overall frequency fluctuation of the
system is plusmn1-2 Hz at room temperature
Results and Discussion
The first experiments (not shown) were inspired by the synthesis of mesoporous silica
nanoparticles described in Chapter 42 The pretreatment of the titaniumalkoxide with
triethanolamine at elevated temperature resulted in yellowish clear solutions which
slowly hydrolyzed in water compared to the titaniumalkoxides In the reactions shown
here the commercially available complexed precursor titanium(IV) (triethanolaminato)
isopropoxide was used
After hydrolysis the resulting colloidal suspension CMT-1 contained discrete particles
with an average hydrodynamic diameter (DLS) of almost 1 μm after washing (Fig 90)
APPENDIX 62
185
10 100 1000 10000
inte
nsity
diameter [nm]
Fig 90 DLS particle size distribution of washed CMT-1
The powder diffraction pattern (Fig 91) of the dry product shows a weak reflection at
23 deg (2 θ) which is typical for CTMA+ templated mesopores (Fig 77 Chapter 61)
1 2 3 4 5 6 7 8 9 10
max = 23iexcl
inte
nsity
2 (degree)
Fig 91 Powder diffraction pattern of the washed sample CMT-1
Although the material seems to possess a certain mesostructure TEM investigations
(Fig 92) could not confirm the existence of mesopores The material possibly exhibits a
fibrous structure but it was not further analysed
APPENDIX 62
186
Fig 92 TEM-micrographs of the washed sample CMT-1
The particles appear anisotropic with an irregular particle size distribution At higher
magnification an undefined mesostructure in the material can be observed However it
is not clear if this structure formed as a result of adding the template Therefore the
washed product was subjected to an extraction procedure and the weight loss before and
after this treatment was determined with TGA (Fig 93)
100 200 300 400 500 600
-60
-50
-40
-30
-20
-10
0 CMT-1 extracted
CMT-1 washed
weig
ht lo
ss [
]
temperature [degC]
Fig 93 Thermogravimetric analysis of washed and extracted sample CMT-1
APPENDIX 62
187
Heating of the washed product caused two distinct steps in the weight loss The first one
at about 250 degC could be assigned either to the template decomposition or further
condensation under elimination of alkoxygroups The second step at higher
temperatures between 400 and 500 degC might be due to complexing triethanolamine
residues After extraction the weight loss is much lower ndash but it cannot be assured that
the material is completely extracted mesoporous titania
Elimination of the template should also be achieved after heating to 300 degC Calcination
at temperatures up to 350 degC is also claimed in several publications [144]
Both materials
ndash extracted (CMT-1-e) and calcined (CMT-1-c) - were investigated by XRD (Fig
94)The initial reflection at 23 deg and thus the mesostructure completely disappeared
after the treatment
10 15 20 25 30 35 40 45 50
inte
nsity
2 [degree]
10 15 20 25 30 35 40 45 50
inte
nsity
2 [degree]
Fig 94 XRD pattern of (a) calcined (CMT-1-c) and (b) extracted (CMT-1-e) material
Nitrogen sorption analysis also suggests the absence of ordered mesopores in both
materials (Fig 95) The isotherms are typical for an ink-bottle type pore system but the
difference in the adsorption and the desorption step argue against pore channels with a
APPENDIX 62
188
defined diameter The BET-surface areas of the calcined and extracted material are
80 m2 g
-1 and 200 m
2 g
-1 respectively One would expect a significantly higher specific
surface area in ordered mesoporous titania even though it can not reach the value of a
comparable mesoporous silica due to the higher density of TiO2
The DFT-pore size distribution was not calculated because no appropriate model is
available at this time As expected from the isotherm a BJH pore size calculation
regarding the adsorption branch gives a rather undefined and meaningless distribution
00 01 02 03 04 05 06 07 08 09 10
0
20
40
60
80
100
adsorption
desorption
volu
me a
dsorb
ed [cm
3 g
-1] S
TP
relative pressure p p0
-1
00 01 02 03 04 05 06 07 08 09 100
10
20
30
40
50
60
70
adsorption
desorption
vo
lum
e a
dso
rbe
d [cm
3 g
-1] S
TP
relative pressure p p0
-1
Fig 95 N2-isotherms of extracted (CMT-1-e) and calcined (CMT-1-c) samples
In order to improve the condensation of the inorganic material and possibly an enhanced
debonding of the complexing triethanolamine the synthesis was repeated at an elevated
temperature The reaction at 50 degC resulted only in minor improvements for example a
more pronounced reflection at about 23 deg in x-ray diffraction (Fig 96)
APPENDIX 62
189
1 2 3 4 5 6 7 8 9 10
inte
nsity
2 [degrees]
Fig 96 Powder diffraction pattern of CMT-2
The particle size distribution in DLS as well as TGA data and sorption analysis showed
no significant difference or improvement In a further attempt to improve the
condensation and debonding of triethanolamine the suspension of CMT-1 was
autoclaved at 100 degC after synthesis Again the peaks in the XRD powder pattern were
more intensive and even showed higher-order reflections at 46 deg and 69 deg (Fig 97)
1 2 3 4 5 6 7 8 9 10
max 23 deg 46 deg 69 deg
inte
nsity
2 [degree]
Fig 97 Powder diffraction pattern of CMT-1A autoclaved at 100 degC
APPENDIX 62
190
The positions of the reflections indicate the existence of a lamellar structure This
structure is believed to be the thermodynamically more stable one The results in
transmission electron microscopy (Fig 98) could only confirm the expected lamellar
structure
Fig 98 TEM-micrograph of CMT-1A autoclaved at 100 degC
As expected for lamellar systems template removal resulted in a loss of the
mesostructure as shown in XRD patterns in Fig 99
APPENDIX 62
191
10 15 20 25 30 35 40 45 50
inte
nsity
2 [degree]
10 15 20 25 30 35 40 45 50
inte
nsity
2 [degree]
Fig 99 Powder diffraction pattern of the (a) calcined (CMT-1A-c) and (b) extracted
(CMT-1A-e) material
The combination of solid template (CTAB) and titania precursor might be
disadvantageous for the formation of nanoparticles Thus in further experiments an
aqueous solution of the template was prepared and heated before the slowly
hydrolyzing precursor was added (CMT-3) After hydrolysis at elevated temperature
(60 degC) a homogeneous colloidal suspension with a narrow particle size distribution
was obtained (Fig 100)
APPENDIX 62
192
10 100 1000 10000
CMT-3
inte
nsity
particle size [nm]
Fig 100 Colloidal suspension and particle size distribution (DLS) of CMT-3
The product was subjected to the same extraction process as the mesoporous silica
particles in Chapter 42 The particles in the resulting ethanolic suspension were
agglomerated to a high degree After drying the product was slightly yellow and
adhesive TGA (Fig 101) showed that the template was removed for the most part but
the material still seems to contain a noteworthy amount of triethanolamine as already
observed in the sample CMT-1
APPENDIX 62
193
100 200 300 400 500 600 700
-60
-50
-40
-30
-20
-10
0
weig
ht
loss [
]
temperature [iexclC]
0 10 20 30 40 50 60
-25
-20
-15
-10
-05
00
time [min]
DT
G [
m
in-1
]
100 200 300 400 500 600 700
-15
-10
-5
0
weig
ht
loss [
]
temperature [iexclC]
0 10 20 30 40 50 60
-075
-050
-025
000
time [min]
DT
G [
m
in-1
]
Fig 101 TGA data of washed CMT-3 before and after extraction procedure
However the nitrogen sorption isotherm of this sample differs from the one of CMT-2
The isotherm does not show such a pronounced hysteresis loop and the specific surface
area is significantly higher (330 m2 g
-1) The pore size distribution (DFT) shows a
broadening on both sides of the typical peak for CTMA+ at around 3 nm (Fig 102)
00 01 02 03 04 05 06 07 08 09 1040
50
60
70
80
90
100
110
120
adsorption desorptionv
olu
me a
dsorb
ed [
cm
3
g-1
] S
TP
relative pressure p p0
-1
10 100 1000
0000
0002
0004
0006
0008
0010
Dv(d
) [c
m-3
-1
g-1
]
pore diameter []
Fig 102 N2 sorption isotherm and DFT pore size distribution of extracted CMT-3
APPENDIX 62
194
Variation of the synthesis conditions such as temperature or batch composition as well
as the exchange of the template by shorter (dodecyltrimethylammonium chloride) or
neutral substitutes (dodecyl amine) in further experiments did not lead to improved
materials and were therefor not shown here The replacement of the precursor with
related complexes eg titanium diisopropoxide bis(acetylacetonate) was unsuccessful
because of a poor solubility in the aqueous medium The results of the first experiments
described above point out that in contrast to the silica material the basic synthesis
procedure for mesoporous titania is connected to several problems Especially in the
presence of triethanolamine extraction and redispersion is challenging
Thus the synthesis conditions were completely changed from basic to acidic conditions
Several synthesis procedures for mesoporous titania in acidic medium can be found in
the literature[143 145 146]
One promising method described by Soler-Illia et al[142]
is
based on the EISA approach for mesoporous TiO2 thin films This recipe was chosen as
basis for the synthesis of colloidal suspensions of mesoporous titanium dioxide
nanoparticles The newly developed synthesis also started from a clear solution that was
heated under reflux The formation of TiO2 particles in the initial solution caused a
slowly increasing turbidity resulting in a white viscous suspension Subsequent washing
and redispersion led to an ethanolic suspension of titanium dioxide nanoparticles
Peptization of the particles was realized by addition of very small amounts of water
The resulting colloidal translucent suspensions showed a narrow particle size
APPENDIX 62
195
distribution in dynamic light scattering (DLS) with a mean particle size of 130 nm (Fig
103)
1 10 100 1000 10000
inte
nsity
diameter [nm]
Fig 103 Particle size distribution (DLS) of an ethanolic colloidal suspension of CMT-4
Electron microscopy confirmed the existence of discrete particles in the nanometer
range The TiO2 nanoparticles can be described as prolate spheroids of approximately
the same average size as indicated by DLS (Fig 104)
Fig 104 TEM-micrograph of CMT-4
APPENDIX 62
196
Because of this anisotropic shape one can expect a certain order either due to template
interaction or crystallinity Therefore a dried sample of CMT-4 and CMT-5 was
investigated in thermogravimetric analysis
100 200 300 400 500 600 700 800 90016
14
12
10
8
6
4
2
0
we
igh
t lo
ss [
]
temperature [iexclC]
0 10 20 30 40 50 60 70 80
-075
-050
-025
000
time [min]
DT
G [
min-1
]
100 200 300 400 500 600 700 800 900
18
16
14
12
10
8
6
4
2
0
we
igh
t lo
ss [
]
temperature [iexclC]
0 10 20 30 40 50 60 70 80
-10
-05
00
time [min]
DT
G [
min-1
]
Fig 105 TGA data of washed CMT-4 (a) and washed CMT-5 (b)
Sample CMT-4 and the product synthesized with the same procedure but without any
template (CMT-5) do hardly show any difference The synthesis was also carried out
with different other templates ndash anionic and cationic (palmitic acid CTAC) or neutral
(pluronic dodecylamine) template In no case an ordered or disordered mesoporous
structure caused by organic templates could be confirmed Thus the weight loss at
around 250 degC which is typically assigned to template elimination in mesoporous silica
materials cannot be attributed to the template in the case of CMT-4 As this step can
also be observed in CMT-5 it is probably caused by further condensation of the
inorganic network and decomposition of alkoxy groups This relatively high weight loss
may be due to incomplete crystallinity of the samples Nevertheless the materials show
APPENDIX 62
197
a certain crystallinity in Raman spectroscopy The apparent signals can be attributed to
rutile
0 500 1000 1500 2000
CMT-4 rutile
inte
nsity
wavelength [cm-1]
Fig 106 Raman spectra of CMT-4 and spectra of rutile
X-ray powder diffraction patterns confirmed the existence of a crystalline phase in the
dry powder The relatively broad signals indicate the existence of small particles
15 20 25 30 35 40 45
CMT-4
inte
nsity
2 [degree]
rutile
Fig 107 X-ray powder diffraction pattern of CMT-4
APPENDIX 62
198
Nitrogen sorption analyses (Fig 108) showed that both materials exhibit a certain
mesoporosity Due to the shape of the isotherms and hysteresis loops the existence of a
channel-like pore structure can be excluded
00 01 02 03 04 05 06 07 08 09 100
25
50
75
100
125
150
175
200
adsorption desorptionv
olu
me a
dsorb
ed [
cm
3
g-1
] S
TP
relative pressure p p0
-1
00 01 02 03 04 05 06 07 08 09 100
25
50
75
100
125
150
175
200
adsorption desorptionv
olu
me a
dsorb
ed [
cm
3
g-1
] S
TP
relative pressure p p0
-1
1 10 100
00
05
10
15
20
25
desorp
tion D
v(d)
[m2
g-1
]
pore diameter [nm]
1 10 100
00
05
10
15
20
25
deso
rption D
v(d
) [m
2 g
-1]
pore diameter [nm]
Fig 108 N2 sorption data of CMT-4 (l) and CMT-5 (r)
These findings led to the conclusion that the interaction of template and titanium
precursor in the described procedures seems to be too weak to build up a mesostructure
This interpretation is corroborated by the fact that the best results concerning the surface
area of the resulting particles were achieved without any template The measured pore
size is not influenced by the addition of template CMT-5 showed a BET-surface area of
APPENDIX 62
199
more than 300 m2 g
-1 and a relatively narrow pore size distribution with a diameter
around 5 nm (Table 9)
Table 9 Nitrogen sorption data of CMT-4 and CMT-5
CMT-4 CMT-5
Surface area (BET) 276 m2 g
-1 311 m
2 g
-1
Total pore volume 024 cm3 g
-1 025 cm
3 g
-1
Mean pore width 48 nm 47 nm
The synthesis of similar hydrosols is already known[147]
The existence of a mesoporous
structure caused by agglomeration of the TiO2 nanoparticles and the resulting high
surface area is described in literature[148 149]
Due to the easy redispersability of the
washed particles and the high quality of the final ethanolic suspensions the material can
be used for the preparation of homogeneous thin films by spin-coating[150]
APPENDIX 62
200
Homogeneous Thin Films
For the preparation of homogeneous thin films the synthesis without template (CMT-5)
was repeated After purification of the nanoparticles received from hydrothermal
treatment (CMT-6) the colloidal suspension was used for the preparation of thin film
Fig 109 shows the mean particle size (80 nm) of the suspended titania nanoparticles in
the coating suspension
1 10 100 1000 10000
inte
nsity
diameter [nm]
Fig 109 Particle size distribution (DLS) of CMT-6
Fig 110 shows an image of a silicon wafer with a thin film of titania nanoparticles The
film was prepared by spin-coating two times with a suspension containing about 3 wt
of CMT-6
APPENDIX 62
201
300 400 500 600 700 800 900 10000
10
20
30
40
50
60
experimental data
model fit
in
deg
rees
wavelength [nm]
Fig 110 Thin film of CMT-6 (107 nm) on a silicon wafer and ellipsometric data
The film appears very homogeneous and transparent and thus has a definite interference
color Ellipsometric measurements resulted in a film thickness of 107 nm The same
film was deposited on a quartz crystal microbalance chip In order to achieve a higher
thickness the chip was coated four times The optical characterization was performed
with ellipsometry assuming the following theoretic model 0 the gold electrode was
chosen to be infinitely thick (1 mm) 1 the material (titania nanoparticles) is described
with a Cauchy layer Starting with a guessed film thickness of 200 nm the subsequent
fitting of the thickness and the Cauchy parameters resulted in a film thickness of 187
nm
The measurement was performed in a liquid cell in a flow of nitrogen It was repeated in
an atmosphere of gaseous toluene with a partial pressure of 0943 (p p0-1
) Fig 111
shows the change in the ellipsometric data due to physisorption of toluene
APPENDIX 62
202
300 400 500 600 700 800 900 1000-10
0
10
20
30
40
50
60
toluene atmosphere nitrogen atmosphere
in d
egre
es
wavelength [nm]
300 400 500 600 700 800 900 1000110017
18
19
20
21
22
23
24
toluene atmosphere nitrogen atmosphere
refr
active index
wavelength [nm]
Fig 111 Ellipsometry data of a thin film of CMT-6 on a QCM chip in nitrogen (dashed
line) and toluene (solid line) atmosphere
The refractive index nD of the film changes from 180 to 193 when filled with toluene
(nD = 15) With the Lorentz-Lorenz equation for ellipsometric porosimetry (EP)[55]
a
porosity of 16 can be specified The sorption measurement was repeated in a quartz
crystal microbalance at different partial pressures of toluene to record a full sorption
isotherm (Fig 112)
APPENDIX 62
203
00 02 04 06 08 1000
01
02
03
04
05
06
07
adsorb
ed v
olu
me [m
mol g
-1]
p p0
-1
Fig 112 Toluene sorption isotherm of a thin film of CMT-6 recorded in a QCM
The weight increase due to film deposition was 376 μg per cm2 With a film thickness
of 187 nm a density of 201 g cm-3
can be calculated The maximum weight increase
due to toluene adsorption was 21 μg per cm2 or 011 g per cm
3 respectively With a
density of 087 g cm-3
for liquid toluene a porosity of 13 can be calculated which
coincides well with the value determined with ellipsometric porosimetry
Conclusion
The synthesis of templated mesoporous titanium dioxide nanoparticles similar to the
silica analogues introduced in Chapter 42 could not be realized The TiO2 particles
forming in the acidic medium by a simple sol-gel process often show a higher surface
area and are much easier to redisperse than particles obtained in the basic synthesis
Although the general synthesis procedure is already known for a long time the resulting
colloidal suspensions are ideal candidates for the preparation of porous thin films
Especially if the synthesis by evaporation induced self-assembly is connected to
APPENDIX 62
204
problems the usage of these suspensions can be an interesting alternative Despite of
their porosity the prepared films have a high refractive index
REFERENCES
205
7 REFERENCES
REFERENCES
206
[1] Taniguchi N On the Basic Concept of Nano-Technology Japan Society of
Precision Engineering 1974
[2] Drexler E Engines of Creation The Coming Era of Nanotechnology New
York Anchor PressDoubleday 1986
[3] Drexler E Nanosystems Molecular Machinery Manufacturing and
Computation John Wiley amp Sons Inc 1992
[4] Boncheva M Whitesides G M Making things by self-assembly MRS Bull
2005 30 736-742
[5] Ter Minassian-Saraga L Thin films including layers terminology in relation to
their preparation and characterization Pure Appl Chem 1994 66 1667-1738
[6] Koga K Ikeshoji T Sugawara K-i Size- and Temperature-Dependent
Structural Transitions in Gold Nanoparticles Phys Rev Lett 2004 92 115507
[7] Trewyn B G Giri S Slowing I I Lin V S-Y Mesoporous silica
nanoparticle based controlled release drug delivery and biosensor systems
Chem Commun (Cambridge U K) 2007 3236-3245
[8] Barbe C Bartlett J Kong L Finnie K Lin H Q Larkin M Calleja S
Bush A Calleja G Silica particles A novel drug-delivery system Adv
Mater (Weinheim Ger) 2004 16 1959-1966
[9] Joutsensaari J Loivamaki M Vuorinen T Miettinen P Nerg A M
Holopainen J K Laaksonen A Nanoparticle formation by ozonolysis of
inducible plant volatiles Atmospheric Chemistry and Physics 2005 5 1489-
1495
[10] Mackenzie J D Bescher E P Chemical Routes in the Synthesis of
Nanomaterials Using the Sol-Gel Process Acc Chem Res 2007 40 810-818
[11] Cushing B L Kolesnichenko V L OConnor C J Recent Advances in the
Liquid-Phase Syntheses of Inorganic Nanoparticles Chem Rev (Washington
DC U S) 2004 104 3893-3946
[12] Stober W Fink A Bohn E Controlled growth of monodisperse silica
spheres in the micron size range J Colloid Interface Sci 1968 26 62-69
REFERENCES
207
[13] LaMer V K Dinegar R H Theory Production and Mechanism of Formation
of Monodispersed Hydrosols J Am Chem Soc 1950 72 4847-4854
[14] Sing K S W Everett D H Haul R A W Moscou L Pierotti R A
Rouquerol J Siemieniewska T Reporting Physisorption Data For GasSolid
Systems with Special Reference to the Determination of Surface Area and
Porosity Pure Appl Chem 1985 57 603-619
[15] Cundy C S Cox P A The hydrothermal synthesis of zeolites Precursors
intermediates and reaction mechanism Microporous Mesoporous Mater 2005
82 1-78
[16] Baerlocher C McCusker L B Database of Zeolite Structure wwwiza-
structureorgdatabases
[17] Yan Y Silica zeolite ultra low-k dielectric thin films PMSE Prepr 2004 90
89-94
[18] Fowler C E Khushalani D Lebeau B Mann S Nanoscale materials with
mesostructured interiors Adv Mater (Weinheim Ger) 2001 13 649-652
[19] Yang P Zhao D Margolese D I Chmelka B F Stucky G D Block
Copolymer Templating Syntheses of Mesoporous Metal Oxides with Large
Ordering Lengths and Semicrystalline Framework Chem Mater 1999 11
2813-2826
[20] Brinker C J Lu Y F Sellinger A Fan H Y Evaporation-induced self-
assembly Nanostructures made easy Adv Mater (Weinheim Ger) 1999 11
579-585
[21] Liu J Shin Y Nie Z M Chang J H Wang L Q Fryxell G E Samuels
W D Exarhos G J Molecular assembly in ordered mesoporosity A new
class of highly functional nanoscale materials J Phys Chem A 2000 104
8328-8339
[22] Burkett S L Sims S D Mann S Synthesis of hybrid inorganic-organic
mesoporous silica by co-condensation of siloxane and organosiloxane
precursors Chem Commun (Cambridge U K) 1996 1367-1368
REFERENCES
208
[23] Burleigh M C Markowitz M A Spector M S Gaber B P Direct
synthesis of periodic mesoporous organosilicas Functional incorporation by co-
condensation with organosilanes J Phys Chem B 2001 105 9935-9942
[24] Huh S Wiench J W Yoo J-C Pruski M Lin V S-Y Organic
Functionalization and Morphology Control of Mesoporous Silicas via a Co-
Condensation Synthesis Method Chem Mater 2003 15 4247-4256
[25] Igarashi N Hashimoto K Tatsumi T Studies on the structural stability of
mesoporous molecular sieves organically functionalized by a direct method J
Mater Chem 2002 12 3631-3636
[26] Trewyn B G Slowing I I Giri S Chen H-T Lin V S Y Synthesis and
Functionalization of a Mesoporous Silica Nanoparticle Based on the Sol-Gel
Process and Applications in Controlled Release Acc Chem Res 2007 40 846-
853
[27] Diaz I Mohino F Perez-Pariente J Sastre E Study by TG-MS of the
oxidation of SH-MCM-41 to SO3H-MCM-41 Thermochim Acta 2004 413
201-207
[28] Radu D R Lai C-Y Huang J Shu X Lin V S Y Fine-tuning the
degree of organic functionalization of mesoporous silica nanosphere materials
via an interfacially designed co-condensation method Chem Commun
(Cambridge U K) 2005 1264-1266
[29] Kumar R Chen H T Escoto J L V Lin V S Y Pruski M Template
Removal and Thermal Stability of Organically Functionalized Mesoporous
Silica Nanoparticles Chem Mater 2006 18 4319-4327
[30] Kawi S Lai M W Supercritical fluid extraction of surfactant template from
MCM-41 Chem Commun (Cambridge U K) 1998 1407-1408
[31] Tian B Liu X Yu C Gao F Luo Q Xie S Tu B Zhao D Microwave
assisted template removal of siliceous porous materials Chem Commun
(Cambridge U K) 2002 1186-1187
REFERENCES
209
[32] Lang N Tuel A A Fast and Efficient Ion-Exchange Procedure To Remove
Surfactant Molecules from MCM-41 Materials Chem Mater 2004 16 1961-
1966
[33] Schubert U Chemical modification of titanium alkoxides for sol-gel
processing J Mater Chem 2005 15 3701-3715
[34] Nagamine S Sasaoka E Synthesis of Nanostructured Titania Templated by
Anionic Surfactant in Acidic Conditions Journal of Porous Materials 2002 9
167-173
[35] ORegan B Graetzel M A low-cost high-efficiency solar cell based on dye-
sensitized colloidal titanium dioxide films Nature (London UK) 1991 353
737-740
[36] Evans U Die Interferenzfarben duumlnner Filme von Oxyden Sulfiden oder
Jodiden auf Metallen Colloid Polym Sci 1934 69 129-137
[37] Raacke J Interferenzfarben duumlnner Schichten (V27)
httpwwwraackedeindexhtmlairyhtml
[38] Parker A R McKenzie D R Large M C J Multilayer reflectors in animals
using green and gold beetles as contrasting examples J Exp Biol 1998 201
1307-1313
[39] Palaniappan A Su X Tay F Functionalized mesoporous silica films for gas
sensing applications J Electroceram 2006 16 503-505
[40] Nicole L Boissiere C Grosso D Hesemann P Moreau J Sanchez C
Advanced selective optical sensors based on periodically organized mesoporous
hybrid silica thin films Chem Commun (Cambridge U K) 2004 2312-2313
[41] Yuliarto B Zhou H Yamada T Honma I Katsumura Y Ichihara M
Effect of Tin Addition on Mesoporous Silica Thin Film and Its Application for
Surface Photovoltage NO2 Gas Sensor Anal Chem 2004 76 6719-6726
[42] Bearzotti A Mio Bertolo J Innocenzi P Falcaro P Traversa E Relative
humidity and alcohol sensors based on mesoporous silica thin films synthesised
from block copolymers Sens Actuators B 2003 B95 107-110
REFERENCES
210
[43] Wirnsberger G Scott B J Stucky G D pH sensing with mesoporous thin
films Chem Commun (Cambridge U K) 2001 119-120
[44] Choi S Y Mamak M vonFreymann G Chopra N Ozin G A
Mesoporous Bragg Stack Color Tunable Sensors Nano Lett 2006 6 2456-
2461
[45] Tosheva L Valtchev V P Nanozeolites Synthesis Crystallization
Mechanism and Applications Chem Mater 2005 17 2494-2513
[46] Bein T Zeolitic host-guest interactions and building blocks for the self-
assembly of complex materials MRS Bull 2005 30 713-720
[47] Slowing I Trewyn B G Lin V S Y Effect of Surface Functionalization of
MCM-41-Type Mesoporous Silica Nanoparticles on the Endocytosis by Human
Cancer Cells J Am Chem Soc 2006 128 14792-14793
[48] Schulz-Ekloff G Wohrle D van Duffel B Schoonheydt R A
Chromophores in porous silicas and minerals preparation and optical properties
Microporous Mesoporous Mater 2002 51 91-138
[49] Scott B J Wirnsberger G Stucky G D Mesoporous and mesostructured
materials for optical applications Chem Mater 2001 13 3140-3150
[50] Lee U H Kim M-H Kwon Y-U Mesoporous thin films with accessible
pores from surfaces Bull Korean Chem Soc 2006 27 808-816
[51] Sing K S W Everett D H Haul R A W Moscou L Pierotti R A
Rouquerol J Siemieniewska T Reporting physisorption data for gassolid
systems with special reference to the determination of surface area and porosity
(Recommendations 1984) Pure Appl Chem 1985 57 603-619
[52] Brunauer S Emmett P H Teller E Adsorption of Gases in Multimolecular
Layers J Am Chem Soc 1938 60 309-319
[53] Thommes M Kohn R Froba M Sorption and Pore Condensation Behavior
of Nitrogen Argon and Krypton in Mesoporous MCM-48 Silica Materials J
Phys Chem B 2000 104 7932-7943
[54] Moeller A Yang X Caro J Staudt R Measurements of the adsorption of
n-alkanes on 5A zeolites Chem Ing Tech 2006 78 1831-1836
REFERENCES
211
[55] Baklanov M R Mogilnikov K P Non-destructive characterisation of porous
low-k dielectric films Microelectron Eng 2002 64 335-349
[56] Eslava S Baklanov M R Kirschhock C E A Iacopi F Aldea S Maex
K Martens J A Characterization of a Molecular Sieve Coating Using
Ellipsometric Porosimetry Langmuir 2007 23 12811-12816
[57] Mintova S Nanosized molecular sieves Collect Czech Chem Commun 2003
68 2032-2054
[58] Holmberg B A Wang H Yan Y High silica zeolite Y nanocrystals by
dealumination and direct synthesis Microporous Mesoporous Mater 2004 74
189-198
[59] Zhu G Qiu S Yu J Sakamoto Y Xiao F Xu R Terasaki O Synthesis
and Characterization of High-Quality Zeolite LTA and FAU Single
Nanocrystals Chem Mater 1998 10 1483-1486
[60] Kecht J Mintova S Bein T Nanosized Zeolites Templated by Metal-
Ammine Complexes Chem Mater 2007 19 1203-1205
[61] Larsen S C Nanocrystalline Zeolites and Zeolite Structures Synthesis
Characterization and Applications Journal of Physical Chemistry C 2007 111
18464-18474
[62] Larlus O Mintova S Bein T Environmental syntheses of nanosized zeolites
with high yield and monomodal particle size distribution Microporous
Mesoporous Mater 2006 96 405-412
[63] Hsu C-Y Chiang A S T Selvin R Thompson R W Rapid Synthesis of
MFI Zeolite Nanocrystals J Phys Chem B 2005 109 18804-18814
[64] Lew C M Li Z Zones S I Sun M Yan Y Control of size and yield of
pure-silica-zeolite MFI nanocrystals by addition of methylene blue to the
synthesis solution Microporous Mesoporous Mater 2007 105 10-14
[65] Li Z J Li S Luo H M Yan Y S Effects of Crystallinity in Spin-On Pure-
Silica-Zeolite MFI Low-Dielectric-Constant Films Adv Funct Mater 2004 14
1019-1024
REFERENCES
212
[66] Li Z Lew C M Li S Medina D I Yan Y Pure-Silica-Zeolite MEL
Low-k Films from Nanoparticle Suspensions J Phys Chem B 2005 109 8652-
8658
[67] Mintova S Reinelt M Metzger T H Senker J Bein T Pure silica beta
colloidal zeolite assembled in thin films Chem Commun (Cambridge U K)
2003 326-327
[68] Camblor M A Corma A Valencia S Spontaneous nucleation and growth of
pure silica zeolite-b free of connectivity defects Chem Commun (Cambridge
U K) 1996 2365-2366
[69] Serrano D P Van Grieken R Sanchez P Sanz R Rodriguez L
Crystallization mechanism of all-silica zeolite beta in fluoride medium
Microporous Mesoporous Mater 2001 46 35-46
[70] Wang Z Mitra A Wang H Huang L Yan Y Pure silica zeolite films as
low-k dielectrics by spin-on of nanoparticle suspensions Adv Mater
(Weinheim Ger) 2001 13 1463-1466
[71] Mintova S Bein T Microporous Films Prepared by Spin-Coating Stable
Colloidal Suspensions of Zeolites Adv Mater (Weinheim Ger) 2001 13
1880-1883
[72] Johnson M Li Z Wang J Yan Y Mechanical characterization of zeolite
low dielectric constant thin films by nanoindentation Thin Solid Films 2007
515 3164-3170
[73] Tatlier M Demir M Tokay B Erdem-Senatalar A Kiwi-Minsker L
Substrate heating method for coating metal surfaces with high-silica zeolites
ZSM-5 coatings on stainless steel plates Microporous Mesoporous Mater 2007
101 374-380
[74] Barrett P A Camblor M A Corma A Jones R H Villaescusa L A
Structure of ITQ-4 a New Pure Silica Polymorph Containing Large Pores and a
Large Void Volume Chem Mater 1997 9 1713-1715
REFERENCES
213
[75] Selvam T Aresipathi C Mabande G T P Toufar H Schwieger W Solid
state transformation of TEAOH-intercalated kanemite into zeolite beta (BEA) J
Mater Chem 2005 15 2013-2019
[76] Schoeman B J Babouchkina E Mintova S Valtchev V P Sterte J The
Synthesis of Discrete Colloidal Crystals of Zeolite Beta and their Application in
the Preparation of Thin Microporous Films Journal of Porous Materials 2001
8 13-22
[77] Nery J G Hwang S-J Davis M E On the synthesis of SSZ-48 SSZ-43
and their variations Microporous Mesoporous Mater 2002 52 19-28
[78] Krijnen S Sanchez P Jakobs B T F van Hooff J H C A controlled post-
synthesis route to well-defined and active titanium Beta epoxidation catalysts
Microporous Mesoporous Mater 1999 31 163-173
[79] Bruggeman D A G The calculation of various physical constants of
heterogeneous substances I The dielectric constants and conductivities of
mixtures composed of isotropic substances Annalen der Physik (Berlin
Germany) 1935 24 665-679
[80] Kresge C T Leonowicz M E Roth W J Vartuli J C Beck J S Ordered
Mesoporous Molecular-Sieves Synthesized by a Liquid-Crystal Template
Mechanism Nature 1992 359 710-712
[81] Qi L M Ma J M Cheng H M Zhao Z G Micrometer-sized mesoporous
silica spheres grown under static conditions Chem Mater 1998 10 1623-1626
[82] Huo Q S Zhao D Y Feng J L Weston K Buratto S K Stucky G D
Schacht S Schuth F Room temperature growth of mesoporous silica fibers
A new high-surface-area optical waveguide Adv Mater (Weinheim Ger) 1997
9 974-978
[83] Li Y S Shi J L Hua Z L Chen H R Ruan M L Yan D S Hollow
Spheres of Mesoporous Aluminosilicate with a Three-Dimensional Pore
Network and Extraordinarily High Hydrothermal Stability Nano Lett 2003 3
609-612
REFERENCES
214
[84] Cauvel A Renard G Brunel D Monoglyceride synthesis by heterogeneous
catalysis using MCM-41 type silicas functionalized with amino groups J Org
Chem 1997 62 749-751
[85] Zhao X S Lu G Q Modification of MCM-41 by surface silylation with
trimethylchlorosilane and adsorption study J Phys Chem B 1998 102 1556-
1561
[86] Anwander R SOMCPMS Surface organometallic chemistry at periodic
mesoporous silica Chem Mater 2001 13 4419-4438
[87] Qi Z-m Honma I Zhou H Ordered-mesoporous-silica-thin-film-based
chemical gas sensors with integrated optical polarimetric interferometry Appl
Phys Lett 2006 88 053503053501-053503053503
[88] Boissiere C Kummel M Persin M Larbot A Prouzet E Spherical MSU-
1 mesoporous silica particles tuned for HPLC Adv Funct Mater 2001 11
129-135
[89] Ren J Ding J Chan K-Y Wang H Dual-Porosity Carbon Templated from
Monosize Mesoporous Silica Nanoparticles Chem Mater 2007 19 2786-2795
[90] Lu J Liong M Zink J I Tammanoi F Mesoporous silica nanoparticles as
a delivery system for hydrophobic anticancer drugs Small 2007 3 1341-1346
[91] Asai S Tominaga Y Sumita M Mesoporous silica as inorganic filler in
polymer composites Zeoraito 2006 23 117-124
[92] Lu Y F Fan H Y Stump A Ward T L Rieker T Brinker C J
Aerosol-assisted self-assembly of mesostructured spherical nanoparticles
Nature 1999 398 223-226
[93] Suzuki K Ikari K Imai H Synthesis of Silica Nanoparticles Having a Well-
Ordered Mesostructure Using a Double Surfactant System J Am Chem Soc
2004 126 462-463
[94] El Haskouri J Ortiz de Zarate D Guillem C Beltran-Porter A Caldes M
Marcos M D Beltran-Porter D Latorre J Amoros P Hierarchical Porous
Nanosized Organosilicas Chem Mater 2002 14 4502-4504
REFERENCES
215
[95] Nooney R I Thirunavukkarasu D Chen Y Josephs R Ostafin A E
Synthesis of Nanoscale Mesoporous Silica Spheres with Controlled Particle
Size Chem Mater 2002 14 4721-4728
[96] Rathousky J Zukalova M Kooyman P J Zukal A Synthesis and
characterization of colloidal MCM-41 Colloids Surf A 2004 241 81-86
[97] Cai Q Luo Z S Pang W Q Fan Y W Chen X H Cui F Z Dilute
solution routes to various controllable morphologies of MCM-41 silica with a
basic medium Chem Mater 2001 13 258-263
[98] Moeller K Kobler J Bein T Colloidal suspensions of nanometer-sized
mesoporous silica Adv Funct Mater 2007 17 605-612
[99] Moeller K Kobler J Bein T Colloidal suspensions of mercapto-
functionalized nanosized mesoporous silica J Mater Chem 2007 17 624-631
[100] Sadasivan S Khushalani D Mann S Synthesis and shape modification of
organo-functionalized silica nanoparticles with ordered mesostructured interiors
J Mater Chem 2003 13 1023-1029
[101] Frye C L Vincent G A Finzel W A Pentacoordinate silicon compounds
V Novel silatrane chemistry J Am Chem Soc 1971 93 6805-6811
[102] Verkade J G Atranes new examples with unexpected properties Acc Chem
Res 1993 26 483-489
[103] Cabrera S ElHaskouri J Guillem C Latorre J BeltranPorter A
BeltranPorter D Marcos M D Amoros P Generalised syntheses of ordered
mesoporous oxides the atrane route Solid State Sci 2000 2 405-420
[104] Zhao X S Lu G Q Whittaker A K Millar G J Zhu H Y
Comprehensive study of surface chemistry of MCM-41 using 29
Si CPMAS
NMR FTIR pyridine-TPD and TGA J Phys Chem B 1997 101 6525-6531
[105] Socrates G Infrared and Raman Characteristic Group Frequencies 3 ed
Wiley 2005
REFERENCES
216
[106] Okabayashi H Izawa K Yamamoto T Masuda H Nishio E OConnor
C J Surface structure of silica gel reacted with 3-
mercaptopropyltriethoxysilane and 3-aminopropyltriethoxysilane formation of
the S-S bridge structure and its characterization by Raman scattering and diffuse
reflectance Fourier transform spectroscopic studies Colloid Polym Sci 2002
280 135-145
[107] Kobler J Moumlller K Bein T Colloidal Suspensions of Functionalized
Mesoporous Silica Nanoparticles ACS Nano 2008 2 791-799
[108] Sokolov I Kievsky Y Y Kaszpurenko J M Self-assembly of ultrabright
fluorescent silica particles Small 2007 3 419-423
[109] Ren T-Z Yuan Z-Y Su B-L Encapsulation of direct blue dye into
mesoporous silica-based materials Colloids Surf A 2007 300 79-87
[110] Laerte de Castro F Santos J G Fernandes G J T Souza de Araujo A
Fernandes V J Politi M J Brochsztain S Solid state fluorescence of a
34910-perylenetetracarboxylic diimide derivative encapsulated in the pores of
mesoporous silica MCM-41 Microporous Mesoporous Mater 2007 102 258-
264
[111] Wark M Ganschow M Rohlfing Y Schulz-Ekloff G Woehrle D
Methods of synthesis for the encapsulation of dye molecules in molecular
sieves Stud Surf Sci Catal 2001 135 3292-3300
[112] Huang D-M Hung Y Ko B-S Hsu S-C Chen W-H Chien C-L
Tsai C-P Kuo C-T Kang J-C Yang C-S Mou C-Y Chen Y-C
Highly efficient cellular labeling of mesoporous nanoparticles in human
mesenchymal stem cells implication for stem cell tracking FASEB J 2005 19
2014-2016
[113] Torney F Trewyn B G Lin V S Y Wang K Mesoporous silica
nanoparticles deliver DNA and chemicals into plants Nat Nanotechnol 2007
2 295-300
REFERENCES
217
[114] Chen J Y Pan F M Chang L Cho A T Chao K J Thermal stability of
trimethylsilylated mesoporous silica thin films as the ultralow-k dielectric for
copper interconnects Journal of Vacuum Science amp Technology B
Microelectronics and Nanometer Structures--Processing Measurement and
Phenomena 2005 23 2034-2040
[115] Innocenzi P Martucci A Guglielmi M Bearzotti A Traversa E Pivin J
C Mesoporous silica thin films for alcohol sensors J Eur Ceram Soc 2001
21 1985-1988
[116] Brinker C J Evaporation-induced self-assembly Functional nanostructures
made easy MRS Bull 2004 29 631-640
[117] Mason G A model of the pore space in a random packing of equal spheres J
Colloid Interface Sci 1971 35 279-287
[118] Slobozhanin L A Alexander J I D Collicott S H Gonzalez S R
Capillary pressure of a liquid in a layer of close-packed uniform spheres
Physics of Fluids 2006 18 082104-082115
[119] Mayer R P Stowe R A Packed uniform sphere model for solids Interstitial
access opening sizes and pressure deficiencies for wetting liquids with
comparison to reported experimental results J Colloid Interface Sci 2006 294
139-150
[120] Juillerat F Bowen P Hofmann H Formation and Drying of Colloidal
Crystals Using Nanosized Silica Particles Langmuir 2006 22 2249-2257
[121] Suzuki T M Yamamoto M Fukumoto K Akimoto Y Yano K
Investigation of pore-size effects on base catalysis using amino-functionalized
monodispersed mesoporous silica spheres as a model catalyst J Catal 2007
251 249-257
[122] Pasqua L Testa F Aiello R Cundari S Nagy J B Preparation of
bifunctional hybrid mesoporous silica potentially useful for drug targeting
Microporous Mesoporous Mater 2007 103 166-173
REFERENCES
218
[123] Van Blaaderen A Vrij A Synthesis and characterization of colloidal
dispersions of fluorescent monodisperse silica spheres Langmuir 1992 8
2921-2931
[124] Ren T-Z Yuan Z-Y Su B-L Encapsulation of direct blue dye into
mesoporous silica-based materials Colloids and Surfaces A Physicochemical
and Engineering Aspects 2007 300 79-87
[125] Leon R Margolese D Stucky G Petroff P M Nanocrystalline Ge
filaments in the pores of a meso-silicate Physical Review B Condensed Matter
1995 52 r2285-r2288
[126] Abe T Tachibana Y Uematsu T Iwamoto M Preparation and
characterization of Fe2O3 nanoparticles in mesoporous silicate J Chem Soc
Chem Commun 1995 1617-1618
[127] Srdanov V I Alxneit I Stucky G D Reaves C M DenBaars S P
Optical Properties of GaAs Confined in the Pores of MCM-41 J Phys Chem B
1998 102 3341-3344
[128] Pathak S Cao E Davidson M C Jin S Silva G A Quantum Dot
Applications to Neuroscience New Tools for Probing Neurons and Glia J
Neurosci 2006 26 1893-1895
[129] Li C L Murase N Synthesis of Highly Luminescent Glasses Incorporating
CdTe Nanocrystals through Sol-Gel Processing Langmuir 2004 20 1-4
[130] ORegan B Gratzel M A low-cost high-efficiency solar cell based on dye-
sensitized colloidal TiO2 films Nature 1991 353 737-740
[131] Kongkanand A Tvrdy K Takechi K Kuno M Kamat P V Quantum Dot
Solar Cells Tuning Photoresponse through Size and Shape Control of CdSe-
TiO2 Architecture J Am Chem Soc 2008 130 4007-4015
[132] Franzl T Klar T A Schietinger S Rogach A L Feldmann J Exciton
Recycling in Graded Gap Nanocrystal Structures Nano Lett 2004 4 1599-
1603
REFERENCES
219
[133] Wellmann H Rathousky J Wark M Zukal A Schulz-Ekloff G
Formation of CdS nanoparticles within functionalized siliceous MCM-41
Microporous Mesoporous Mater 2001 44-45 419-425
[134] Murray C B Norris D J Bawendi M G Synthesis and characterization of
nearly monodisperse CdE (E = sulfur selenium tellurium) semiconductor
nanocrystallites J Am Chem Soc 1993 115 8706-8715
[135] Gruumln M Lauer I Unger K K The synthesis of micrometer- and
submicrometer-size spheres of ordered mesoporous oxide MCM-41 Adv Mater
(Weinheim Ger) 1997 9 254-257
[136] Melian-Cabrera I Kapteijn F Moulijn J A Room temperature detemplation
of zeolites through H2O2-mediated oxidation Chem Commun (Cambridge U
K) 2005 2744-2746
[137] Chen X Mao S S Synthesis of titanium dioxide (TiO2) nanomaterials J
Nanosci Nanotechnol 2006 6 906-925
[138] Cabrera S ElHaskouri J BeltranPorter A BeltranPorter D Marcos M D
Amoros P Enhanced surface area in thermally stable pure mesoporous TiO2
Solid State Sci 2000 2 513-518
[139] Abramson S Lasperas M Brunel D Design of mesoporous aluminosilicates
supported (1R 2S)-(-)-ephedrine evidence for the main factors influencing
catalytic activity in the enantioselective alkylation of benzaldehyde with
diethylzinc Tetrahedron Asymmetry 2002 13 357-367
[140] Peng T Zhao D Dai K Shi W Hirao K Synthesis of Titanium Dioxide
Nanoparticles with Mesoporous Anatase Wall and High Photocatalytic Activity
J Phys Chem B 2005 109 4947-4952
[141] Chen H Dai K Peng T Yang H Zhao D Synthesis of thermally stable
mesoporous titania nanoparticles via amine surfactant-mediated templating
method Mater Chem Phys 2006 96 176-181
[142] Soler-Illia G Louis A Sanchez C Synthesis and characterization of
mesostructured titania-based materials through evaporation-induced self-
assembly Chem Mater 2002 14 750-759
REFERENCES
220
[143] Cassiers K Linssen T Meynen V Voort P V D Cool P Vansant E F
A new strategy towards ultra stable mesoporous titania with nanosized anatase
walls Chem Commun (Cambridge U K) 2003 1178-1179
[144] Grosso D Soler-Illia G Babonneau F Sanchez C Albouy P A Brunet-
Bruneau A Balkenende A R Highly organized mesoporous titania thin films
showing mono-oriented 2D hexagonal channels Adv Mater (Weinheim Ger)
2001 13 1085
[145] Yusuf M M Imai H Hirashima H Preparation of mesoporous titania by
templating with polymer and surfactant and its characterization J Sol-Gel Sci
Technol 2003 28 97-104
[146] Shibata H Ogura T Mukai T Ohkubo T Sakai H Abe M Direct
Synthesis of Mesoporous Titania Particles Having a Crystalline Wall J Am
Chem Soc 2005 127 16396-16397
[147] Matijevic E Budnik M Meites L Preparation and mechanism of formation
of titanium dioxide hydrosols of narrow size distribution J Colloid Interface
Sci 1977 61 302-311
[148] Jinsoo Kim K-C S Oliver Wilhelm Sotiris E Pratsinis Sol-Gel Synthesis
and Spray Granulation of Porous Titania Powder Chem Ing Tech 2001 73
461-468
[149] Deshpande S B Potdar H S Khollam Y B Patil K R Pasricha R
Jacob N E Room temperature synthesis of mesoporous aggregates of anatase
TiO2 nanoparticles Mater Chem Phys 2006 97 207-212
[150] Benkstein K D Semancik S Mesoporous nanoparticle TiO2 thin films for
conductometric gas sensing on microhotplate platforms Sens Actuators B
2006 113 445-453
LEBENSLAUF
221
Persoumlnliche Daten
Name Johannes Georg Kobler
Geboren am 29121978 in Muumlnchen
Studium
seit 112004 Promotion an Ludwig-Maximilians-Universitaumlt Muumlnchen im Arbeitskreis
von Prof Bein Thin Films from Porous Nanoparticles
032004 ndash 092004 Diplomarbeit in physikalischer Chemie an der Ludwig-
Maximilians-Universitaumlt Muumlnchen im Arbeitskreis von
Prof Bein Kolloidale Loumlsungen mesoporoumlser Silica-
Nanopartikel mit funktionalisierter Oberflaumlche
022004 Diplomhauptpruumlfung an der Ludwig-Maximilians-
Universitaumlt Muumlnchen
101999 ndash 022004 Chemie-Studium an der Ludwig-Maximilians-Universitaumlt
Muumlnchen
Wehrdienst
071998 ndash 041999 Gebirgsjaumlgerbatallion 231 Bad Reichenhall
Schulausbildung
091989 ndash 061998 Maximilian-von-Montgelas Gymnasium Vilsbiburg
PUBLICATIONS AND POSTER PRESENTATIONS
222
Publications and Poster Presentations
Publications
1 K Moeller J Kobler T Bein Colloidal Suspensions of Nanometer-Sized
Mesoporous Silica Adv Funct Mater 2007 17 605-612
2 K Moeller J Kobler T Bein Colloidal Suspensions of Mercapto-
Functionalized Nanosized Mesoporous Silica J Mater Chem 2007 17 624-
631
3 J Kobler K Moeller T Bein Colloidal Suspensions of Functionalized
Mesoporous Silica Nanoparticles ACS Nano 2008 2 791-799
4 J Kobler H Abrevaya S Mintova T Bein High-Silica Zeolite-β From
Stable Colloidal Suspensions to Thin Films J Phys Chem C 2008 112
14274ndash14280
5 J Kobler T Bein Porous Thin Films of Functionalized Mesoporous Silica
Nanoparticles ACS Nano 2008 2 2324ndash2330
6 J Kobler B Lotsch G Ozin T Bein Vapor-Sensitive Bragg Mirrors and
Optical Isotherms from Mesoporous Nanoparticle Suspensions submitted
PUBLICATIONS AND POSTER PRESENTATIONS
223
Poster Presentations
1 J Kobler K Moeller T Bein Colloidal Functionalized Mesoporous Silica
17 Deutsche Zeolithtagung 2005 Giessen Germany
2 J Kobler S Mintova T Bein Films of Pure-Silica Zeolites 3 International
FEZA Conference 2005 Prague Czech Republic
3 J Kobler S Mintova T Bein Thin Microporous Films with Variable Optical
Properties Catalytic processes on advanced micro- and mesoporous materials
2005 Nessebar Bulgaria
4 J Kobler T Bein Transparent Sols of Mesoporous Silica Nanoparticles 19
Deutsche Zeolithtagung 2007 Leipzig Germany
5 M Hallermann D Georgiadou J Kobler D Fattakhova-Rohlfing A Susha
T Bein Electron Transfer Processes in the Electrochemical Solar Cell ndash
Comparison of Dye and Dot Sensitized Titania 2007 CeNS Winterschool
Mauterndorf Austria
6 J Kobler T Bein Transparent Sols of Mesoporous Silica Nanoparticles for
the Preparation of Thin Films for Chemical Sensors Catalytic processes on
advanced micro- and mesoporous materials 2007 Varna Bulgaria
TABLE OF CONTENTS
1 INTRODUCTION 1
Nanotechnology 3
Self-Assembly 5
Nanoparticles 6
Colloid Science 8
Fabrication of Nanoparticles 12
Sol-gel Chemistry 13
Porous Materials 16
Zeolites 17
Mesoporous Silica 19
Mesoporous Titania 26
Optical Properties of Thin Films 27
2 MOTIVATION 30
3 CHARACTERIZATION METHODS 34
Sorption 35
Quartz Crystal Microbalance 42
Ellipsometry 43
Ellipsometric porosimetry 46
Light Scattering 49
Electron Microscopy 53
Thermogravimetric Analysis 54
Powder X-ray Diffraction 55
Solid-State NMR 56
IR and Raman Spectroscopy 57
4 RESULTS AND DISCUSSION 59
41 High Silica Zeolite Beta From Stable Colloidal Suspensions to Thin Films 60
Introduction 61
Experimental 63
TABLE OF CONTENTS
Results and Discussion 67
Conclusion 80
42 Synthesis and Characterization of Functionalized Mesoporous Silica
Nanoparticles 82
Introduction 83
Experimental 85
Results and Discussion 88
Conclusion 101
43 Porous Thin Films of Functionalized Mesoporous Silica Nanoparticle 103
Introduction 104
Experimental 107
Results and Discussion 111
Conclusion 123
44 Vapor-Sensitive Bragg Mirrors and Optical Isotherms from Mesoporous
Nanoparticle Suspensions 135
Introduction 136
Experimental 138
Results and Discussion 139
Conclusion 151
5 CONCLUSION AND OUTLOOK 152
6 APPENDIX 155
61 Functionalized Mesoporous Silica Nanoparticles as Host System for the
Synthesis of CdS Quantum Dots 156
Introduction 156
Experimental 158
Results and Discussion 163
Conclusion 175
62 Colloidal Suspensions of TiO2 Nanoparticles for the Preparation of Porous
Thin Films 176
TABLE OF CONTENTS
Introduction 176
Experimental 179
Results and Discussion 184
Conclusion 203
7 REFERENCES 205
INTRODUCTION
1
1 INTRODUCTION
INTRODUCTION
2
Nanosystems are already playing a major role in information technology the electronic
components in computers and communication technology are becoming smaller and
smaller However this development cannot go on forever once the nanometer scale has
been reached At that level novel physical phenomena often arise that may present
potential problems for conventional uses ndash and an opportunity for innovations and new
applications Micro- and nanosystems are also becoming increasingly important in life
science and medicine They can be introduced into living organisms for instance to
bring a cancer medication to tumor cells The increasing interest in this field can be
illustrated by simply typing the four letters ldquonanordquo into the research discovery tool
SciFinder and sort the publications in chronological order
19
87
19
88
19
89
19
90
19
91
19
92
19
93
19
94
19
95
19
96
19
97
19
98
19
99
20
00
20
01
20
02
20
03
20
04
20
05
20
06
20
07
0
2000
4000
6000
8000
10000
12000
nu
mb
er
of
pu
blicati
on
s
0
500
1000
1500
2000
2500 an
nu
al in
cre
ase o
f pu
blic
atio
ns
Fig 1 Occurrence of the word ldquonanordquo in SciFinder from 1987 to 2007
INTRODUCTION
3
Nanotechnology
One nanometer (nm) is one billionth or 10-9
of a meter For comparison a DNA
double-helix has a diameter around 2 nm and the smallest cellular life forms the
bacteria of the genus Mycoplasma are around 200 nm in length The term
ldquonanotechnologyrdquo was defined by Tokyo Science University Professor Norio Taniguchi
in 1974 as follows ldquoNano-technology mainly consists of the processing of separation
consolidation and deformation of materials by one atom or by one moleculerdquo[1]
In the
1980s the basic idea of this definition was explored in much more depth by Dr K Eric
Drexler who promoted the technological significance of nano-scale phenomena and
devices through speeches and books[2 3]
The first distinguishing concepts in
nanotechnology (but predating use of that term) were elaborated in ldquoTheres Plenty of
Room at the Bottomrdquo a talk given by physicist Richard Feynman at an American
Physical Society meeting at Caltech on December 29 1959 Feynman described a
process by which the ability to manipulate individual atoms and molecules might be
developed using one set of precise tools to build and operate another proportionally
smaller set so on down to the needed scale In the course of this he noted scaling
issues would arise from the changing magnitude of various physical phenomena gravity
would become less important surface tension and Van-der-Waals-attraction would
become more important etc
Nanotechnology and nanoscience got started in the early 1980s The driving force for
nanotechnology came from a renewed interest in colloid science coupled with a new
generation of analytical tools that allow observing and characterizing the materials or
INTRODUCTION
4
devices even in the sub-nanometer domain The invention of the scanning tunneling
microscope (STM) the discovery of fullerenes in 1986 and carbon nanotubes a few
years later as well as the synthesis of semiconductor nanocrystals (quantum dots) or the
atomic force microscope (AFM) can be mentioned as milestones in the early years
Nanotechnology today is a field of applied science and technology covering a broad
range of topics The main unifying theme is the control of matter on a scale smaller than
one micrometer normally approximately 1 to 100 nanometers as well as the fabrication
of devices of this size It is a highly multidisciplinary enterprise drawing from fields
such as applied physics materials science colloid science device physics
supramolecular chemistry and mechanical and electrical engineering Nanoscience can
be seen as an extension of existing sciences into the nanoscale (or sometimes as a
recasting of existing sciences using a newer more modern term)
Two main approaches are used in nanotechnology In the ldquotop-downrdquo approach nano-
objects are constructed from larger entities without atomic-level control Many
technologies originating from conventional solid-state silicon processing methods for
fabricating microprocessors are capable of creating features much smaller than 100 nm
thus falling under the definition of nanotechnology A complementary and from a
chemical point of view much more challenging strategy is the ldquobottom-uprdquo approach
The materials and devices are built from molecular components or other nano-objects
by an appropriate combination of driving forces such as molecular recognition self-
assembly hydrogen bonding etc
INTRODUCTION
5
Self-Assembly
Self-assembly can be defined as spontaneous and reversible organization of molecular
units or other nano-objects into ordered structures by non-covalent interactions The
interactions responsible for the formation of the self-assembled system act on a strictly
local level - in other words the nanostructure builds itself[4]
There are at least three features that distinguish self-assembly from common chemical
reactions driving atoms and molecules to assemble into larger structures First the self-
assembled structure must have a higher order than the isolated components The second
important aspect of self-assembly is the key role of weak interactions eg Van-der-
Waals- capillary- πminusπ- or hydrogen bonds The third distinctive feature is that the
building blocks can be not only atoms and molecules but span a wide range of nano-
and mesoscopic structures with different chemical compositions shapes and
functionalities Examples of self-assembly in materials science include the formation of
colloidal crystals lipid bilayers phase-separated polymers or self-assembled
monolayers
Another characteristic that is common to nearly all self-assembled systems is their
thermodynamic stability In covalent synthesis and polymerization the scientist links
atoms together in any desired conformation In order for self-assembly to take place
without the intervention of external forces the process must lead to a lower Gibbs
energy thus self-assembled structures are thermodynamically more stable than the
single un-assembled components A direct consequence is the general tendency of self-
assembled structures to be relatively free of defects
INTRODUCTION
6
By choosing precursors with suitable physicochemical properties it is possible to exert
a fine control on the formation processes in order to obtain complex architectures
Popular examples for such self-organizing units are surfactant micelles - aggregates of
surface-active molecules dispersed in a liquid
Fig 2 Surfactant molecule and micelle
A typical micelle in aqueous solution forms an aggregate with the hydrophilic ldquoheadrdquo
regions in contact with surrounding solvent sequestering the hydrophobic tail regions in
the micelle centre The shape and size of a micelle is a function of the molecular
geometry of its surfactant molecules and solution conditions such as surfactant
concentration temperature pH and ionic strength Such micelles are already simple
examples for nano-objects
Nanoparticles
Nanoparticles are often defined as microscopic particles with at least one dimension less
than 100 nm A nanoscopic film for example has vertical dimensions in the range of
01ndash100 nm according to the IUPAC definition[5]
Due to a wide variety of potential
applications in biomedical optical and electronic fields nanoparticles are of great
INTRODUCTION
7
scientific interest as they are effectively a bridge between bulk materials and atomic or
molecular structures
A bulk material should have constant physical properties regardless of its size but a
number of physical phenomena can noticeably change as the size of the system
decreases The properties of materials change as their size approaches the nanoscale and
as the percentage of atoms at the surface of a material becomes significant These
include quantum mechanical effects for example the ldquoquantum size effectrdquo where the
electronic properties of solids are altered with great reductions in particle size This
effect does not come into play by going from macro to micro dimensions but it does
become dominant when the nanometer size range is reached
Additionally a number of physical properties change when compared to macroscopic
systems thus enabling unique applications For instance the melting point of gold is
shifted to lower temperatures[6]
Much of the fascination with nanoscience stems from
these unique quantum and surface phenomena that matter exhibits at the nanoscale
A unique aspect of nanoscience is the vastly increased ratio of surface area to volume
present in many nanoscale materials that opens new possibilities in surface-based
science such as catalysis Colloid science has given rise to many materials that may be
useful in nanotechnology for instance carbon nanotubes and nanometer-sized metal
oxide particles At the small end of the size range nanoparticles are often referred to as
clusters Metal dielectric and semiconductor nanoparticles have been formed as well
as hybrid structures eg core-shell particles Nanoparticles made of semiconducting
material may also be labeled quantum dots if they are small enough (typically sub
INTRODUCTION
8
10 nm) for quantization of electronic energy levels to occur Such nanoscale particles
are used in biomedical applications eg as imaging agents Semi-solid and soft
nanoparticles have been manufactured A prototype nanoparticle of semi-solid nature is
represented by the liposomes Various types of liposomes or other types of porous
nanoparticles are currently explored clinically as delivery systems for anticancer drugs
and vaccines[7 8]
But nanoparticles also present possible dangers both medically and environmentally
Most of these are due to the high surface to volume ratio which can make the particles
very reactive or catalytically active They may also be able to pass through cell walls in
organisms and their interactions with the body are relatively unknown However free
nanoparticles in the environment quickly tend to agglomerate and thus leave the nano-
regime and nature itself presents many nanoparticles to which organisms on earth may
have evolved immunity such as terpenes from plants[9]
or dust from volcanic eruptions
Colloid Science
As mentioned above much of the knowledge in todayrsquos nanoscience derives from
colloidal science Sol-gel chemistry for example is a typical ldquobottom-uprdquo approach
The Scottish scientist Thomas Graham introduced this field of study in 1861 Many
familiar substances including butter milk smoke paints and glues are colloids
A colloid or colloidal dispersion is a type of homogeneous mixture It consists of two
separate phases a dispersed phase and a continuous phase the dispersed phase is made
of very small particles or droplets that are distributed evenly throughout the continuous
INTRODUCTION
9
phase According to IUPAC the size of the dispersed phase particles is between 1 and
1000 nm in at least one dimension Homogeneous mixtures with a dispersed phase in
this size range may be called colloidal aerosols colloidal emulsions colloidal foams
colloidal dispersions or hydrosols The dispersed particles or droplets are largely
affected by the surface chemistry present in the colloid Homogeneous suspensions of
nanoparticles are possible if the interaction of the particle surface with the solvent is
strong enough to overcome differences in density which usually result in a material
either sinking or floating in a liquid
Fig 3 shows the free energy E as a function of the particle distance r (kB = Boltzmann
constant T = absolute temperature) The free energy reaches its minimum when the
particle distance r = δ This approach is only possible if the energy barrier ΔEc is of the
same order of magnitude as the thermal energy kBT in this case the dispersion is
kinetically unstable In contrast in case of a stable colloidal dispersion the energy
barrier is so high that the particles can not converge enough to coagulate
INTRODUCTION
10
Fig 3 Kinetic stability of colloidal dispersions
The following forces play an important role in the interactions of colloid particles and
thus the height of the energy barrier
Excluded volume repulsion This refers to the impossibility of any overlap between
hard particles
Electrostatic interaction Colloidal particles often carry an electrical charge (zeta
potential) and therefore attract or repel each other The charges of both the continuous
and the dispersed phase as well as the mobility of the phases are factors affecting this
interaction
INTRODUCTION
11
Van-der-Waals-forces This is due to interactions between two dipoles that are either
permanent or induced Even if the particles do not have a permanent dipole fluctuations
of the electron density give rise to a temporary dipole in the particle This temporary
dipole induces a dipole in particles nearby The temporary dipole and the induced
dipoles are then attracted to each other
Entropic forces According to the second law of thermodynamics a system progresses
to a state in which entropy is maximized
Steric forces between polymer-covered surfaces or in solutions containing non-
adsorbing polymer can modulate interparticle forces producing an additional repulsive
steric stabilization force or attractive depletion force between them
The two main mechanisms to prevent colloids from aggregating are steric stabilization
and electrostatic stabilization Electrostatic stabilization is based on the mutual
repulsion of like electrical charges Different phases generally have different charge
affinities so that a double-layer of charges forms at any interface Small particle sizes
lead to enormous surface areas and this effect is greatly amplified in colloids In a
stable colloid the mass of the individual particles in a dispersed phase is so low that
their kinetic energy is too small to overcome their electrostatic repulsion
INTRODUCTION
12
Unstable colloidal dispersions form flocks as the particles aggregate due to interparticle
attractions This can be accomplished by different methods
Adding salts or solvents to a suspension or changing the pH of a suspension to
effectively neutralize the surface charge of the dispersed particles can accomplish
removal of the electrostatic barrier that prevents aggregation of the particles This
removes the repulsive forces that keep colloidal particles separate and allows for
coagulation due to Van-der-Waals-forces
Addition of a charged polymeric flocculant can bridge individual colloidal particles by
attractive electrostatic interactions For example negatively charged colloidal silica
particles can be flocculated by the addition of a positively charged polymer
A stable colloidal suspension often appears opalescent because of the Tyndall effect
which is the scattering of light by particles in the colloid By decreasing the size of the
dispersed particles their ability to scatter light is also decreased
Fabrication of Nanoparticles
There are several methods for creating nanoparticles In attrition macro or micro scale
particles are ground in a ball mill a planetary ball mill or other size reducing
mechanism But the minimum particle size is strongly limited In pyrolysis an organic
precursor (liquid or gas) is forced through a nozzle at high pressure and burned
Thermal plasma can also deliver the energy necessary to cause evaporation of small
micrometer size particles The thermal plasma temperatures are at the order of 10000 K
such that a solid powder easily evaporates Nanoparticles are formed upon cooling
INTRODUCTION
13
while exiting the plasma region The radio frequency induction plasma method has been
used to synthesize for example various ceramic nanoparticles In sol-gel chemistry
smaller components are arranged into more complex assemblies[10 11]
Sol-gel Chemistry
The sol-gel process is a wet-chemical technique for the fabrication of materials
typically a metal oxide starting from a chemical solution containing colloidal
precursors (sol) Typical precursors are metal alkoxides and metal chlorides which
undergo hydrolysis and polycondensation reactions to form a colloid The sol evolves
then towards the formation of an inorganic network containing a liquid phase (gel) A
well-known synthesis in sol-gel chemistry is the Stoumlber process[12]
in which the silica
precursor is hydrolyzed in a solution of ammonia water and an alcohol
Precursor Chemistry
Very common precursors in silicate chemistry are tetraalkoxysilanes because the
released alcohols usually have no negative effects on the reaction and can be removed
easily The precursor can hydrolyze in an either acidic or basic aqueous medium and
afterwards condense to an inorganic network of amorphous silica The concepts shown
in Fig 4 can help to control the size and morphology of the synthesized particles
INTRODUCTION
14
Fig 4 Influence of the pH and precursor concentration in sol-gel chemistry[11]
A high pH in combination with a decreased precursor concentration can result in a
colloidal dispersion of discrete spheres with a monodisperse particle size distribution
Decreasing the pH normally leads to smaller particles but at the same time to a higher
degree of crosslinking
In combination with an increased precursor concentration the gelation process is
supported In order to direct the synthesis towards the formation of small discrete
particles the nucleation rate at the beginning should be high Thus a multitude of seeds
that can further grow is formed A very common model for the formation of
nanoparticles in sol-gel chemistry is described with the LaMer-diagram[13]
shown Fig 5
INTRODUCTION
15
Fig 5 LaMer-diagram for the formation of colloidal dispersions
The concentration of the precursor that forms the dispersed phase increases due to some
chemical or physical process At a certain degree of supersaturation nucleation occurs
either heterogeneously on impurity centers or homogeneously through spontaneous
nucleation The growth of these nuclei causes the concentration to fall below the
nucleation concentration below which no more particles are created The particles
continue to grow however until the concentration falls to the saturation concentration
The requirements for monodispersity are evident from the LaMer diagram
The rate of nucleation must be high enough so that the concentration does not continue
to increase
On the one hand the growth rate of these nuclei must be fast enough to reduce the
concentration below the nucleation concentration quickly In this way only a limited
number of particles are created
INTRODUCTION
16
On the other hand the growth rate must be slow enough that the growth period is long
compared to the nucleation period This usually narrows the size distribution
As already mentioned a material consisting of nanoparticles can reach very high
surface areas a fact that plays an important role eg in catalysis Another possibility to
increase the specific surface area is the introduction of an inherent porosity In this
context the synthesis of nanostructured porous materials has become an important topic
in the field of materials science
Porous Materials
The unique property of porous materials is the very high surface-to-mass ratio along
with a high absorption capacity They can be used in many applications including
catalysis as adsorbents in separation processes or depending on the framework charge
as ion exchangers Depending on the type of material the specific surface area can
reach several thousand square meters per gram The morphology of the particles the
pore size and their surface chemistry can be varied depending on the application Porous
materials are classified by their pore sizes in three categories namely micro- (d lt 2 nm)
meso- (2 nm lt d lt 50 nm) and macroporous (d gt 50 nm)[14]
Common macroporous materials are porous glasses silica gels and activated carbon In
these materials the pore system is often based on the space between particles which
often varies in a certain range and is difficult to control
Important microporous materials are zeolites which offer well-defined pore diameters
in the range between about 025 and 12 nm
INTRODUCTION
17
Zeolites
Zeolites are minerals that have a microporous structure More than 150 zeolite structure
types have been synthesized and 48 naturally occurring zeolites are known[15]
Natural
zeolites form where volcanic rocks and ash layers react with alkaline groundwater they
are often contaminated to varying degrees by other minerals metals quartz or other
zeolites For this reason naturally occurring zeolites are excluded from many important
commercial applications where uniformity and purity are essential There are several
types of synthetic zeolites that form by a process of slow crystallization of a silica-
alumina gel in the presence of alkali and sometimes organic structure-directing agents
(SDA) or templates The most important processes to carry out zeolite synthesis belong
to sol-gel chemistry The product properties depend on the composition of the reaction
mixture pH temperature reaction time or templates present Synthetic zeolites hold
some key advantages over their natural analogs They can be manufactured in a
uniform phase-pure state It is also possible to synthesize desirable structures that do
not appear in nature eg Zeolite A Zeolites are widely used as ion-exchange beds in
domestic and commercial water purification or softening In chemistry zeolites are used
as ldquomolecular sievesrdquo The term refers to a particular property of these materials ie
the ability to selectively sort molecules based primarily on a size exclusion process
This is due to the very regular pore structure of molecular dimensions which is
conventionally defined by the ring size of the aperture For example the term ldquo12-ringrdquo
refers to a closed loop that is built from 12 tetrahedrally coordinated silicon (or
aluminum) atoms and 12 oxygen atoms (Fig 6)
INTRODUCTION
18
Fig 6 Structure of zeolite BEA (projection viewed along [100])[16]
The largest outlet for synthetic zeolite is the global laundry detergent market But
synthetic zeolites are also well established as catalysts in the petrochemical industry for
instance in fluid catalytic cracking and hydro-cracking Zeolites confine molecules in
small spaces which causes changes in their structure and reactivity The hydrogen
forms of zeolites (prepared by ion-exchange) are powerful solid-state acids and can
facilitate acid-catalyzed reactions such as isomerization alkylation and cracking
Zeolites or zeo-type materials can also be used as solar thermal collectors and for
adsorption refrigeration In these applications their hygroscopic property coupled with
an inherent exothermic reaction when transitioning from a dehydrated to a hydrated
form (heat of adsorption) make zeolites effective in the storage of heat energy Due to
their high porosity in combination with a good thermal conductivity zeolites are also
being explored as dielectric thin films in low-k technology[17]
INTRODUCTION
19
Regardless of the variety the maximum pore size of zeolites and thus their use is
limited Therefore researchers tried to find materials with a well-ordered pore system
that exhibit pore diameters of more than 2 nm
Mesoporous Silica
In 1992 scientists of the Mobil Research and Development Corporation discovered the
first ordered mesoporous silica The synthesis was realized through a condensation of a
silica precursor in the presence of self-organizing surfactant molecules acting as
template Depending on the reaction conditions different modifications of mesoporous
silica can be synthesized A very common material is the so-called MCM-41 (Mobil
Composition of Matter No 41) with a hexagonal pore structure Other known types are
eg the cubic MCM-48 lamellar MCM-50 or disordered worm-like mesoporous silica
(Fig 7)
Fig 7 TEM-micrographs of MCM-41 MCM-48 and worm-like mesoporous silica
INTRODUCTION
20
In general four reagents are needed for the synthesis of mesoporous silica water a
surfactant a silica precursor and an agent catalyzing the hydrolysis The product
features can be controlled by the parameters temperature pH or batch composition
A widely accepted model for the formation mechanism of mesoporous silica is shown in
Fig 8 This cooperative templating model shows the formation of nanocomposite
biphasic arrays [18]
Fig 8 Cooperative silicate-template-mechanism[18]
INTRODUCTION
21
The formation of mesoporous silica via the S+I- synthesis route can be described as
follows
Single-chain surfactant cations (S+) react with silicate polyanions eg dimers double
three and four rings (I-) Micelles serve as a source for surfactant molecules or are
rearranged according to the anion charge density and shape requirements
Nucleation and rapid precipitation of organized arrays takes place with configurations
determined by the cooperative interactions of ion-pair charges geometries and Van-der-
Waals-forces
Condensation of the silicate phase with increasing time and temperature takes place
The silicate framework charge decreases during this process this may lead to liquid
crystal-like phase transitions as the surfactant phase tries to reorganize the changing
interface charge density
The framework becomes more and more stable through further condensation of silicate
anions into the inorganic network
Control over the pore size and pore topology can be achieved by using eg templates
with varying chain lengths or block-copolymers Thus pore diameters between about
15 to 20 nm can be realized This universally applicable model can also be transferred
to the synthesis of other mesoporous metal oxides like titania[19]
INTRODUCTION
22
Evaporation Induced Self Assembly (EISA)
The above model is also valid for the formation of mesoporous films by the so called
EISA approach[20]
In general thin films are thin material layers ranging from fractions
of a nanometer to several micrometers in thickness The EISA process (Evaporation
Induced Self Assembly) typically starts with a homogeneous solution of silica precursor
and surfactant prepared in ethanolwater with an initial surfactant concentration much
below the critical micelle concentration A preferential evaporation of ethanol
concentrates the surfactant and silica species in the remaining liquid phase The
progressively increasing surfactant concentration drives self-assembly of silica-
surfactant micelles and their further organization into liquid-crystalline mesophases
(Fig 9)
Fig 9 Mesophase formation during EISA thin film synthesis[20]
INTRODUCTION
23
Pre-existing incipient silica-surfactant mesostructures serve to nucleate and orient
mesophase development This results in the rapid formation of thin film mesophases
that are highly oriented with respect to the substrate surface It is possible to obtain
different final mesostructures through variation of the initial alcoholwatersurfactant
ratios
Functionalization
For some applications it can be interesting to modify the surface of the porous structure
- either bulk material or film By introducing for example organic groups the
hydrophobicity of the materials can be reduced (Fig 10) In general two approaches for
the modification of the mesoporous silica are followed The introduction of the organic
moieties can be accomplished either after synthesis (grafting)[21]
or during the synthesis
via co-condensation[22-24]
Fig 10 Functionalization of mesoporous silica with organic groups and the resulting
hydrophobicity[25]
INTRODUCTION
24
Grafting[26]
The post-synthetic grafting is achieved with organotrialkoxysilanes or
organotrichlorosilanes The template-free mesoporous silica is dispersed mostly in non-
polar anhydrous solvents to avoid a reaction of the organosilanes with anything but the
silica material The reaction takes place between the silanol groups on the surface and
the organoalkoxysilanes organotrichlorosilanes Studies showed that silanols located
on the exterior surface and near the pore openings are kinetically more accessible than
silanols on the interior pore wall Thus most organic functional groups are located
there It is possible to preferentially functionalize the surface of mesoporous silica
particles This is especially the case when the grafting is performed before the surfactant
is removed from the mesopores After the grafting has been performed the surfactant
can be removed This control over the location of functional groups may enable the
interaction of the porous particle with the environment through the surface
functionalization while not influencing the pore surface properties
The second important method for the synthesis of organically functionalized
mesoporous silica materials is the co-condensation In this direct ldquoone-potrdquo synthesis
method tetraalkoxysilanes together with an organo-substituted trialkoxysilane are
added to the aqueous surfactant solution Hydrophobic groups are supposed to interact
with the hydrocarbon tails of the surfactant templates and thereby evenly distribute
across the pore surface Furthermore the organic moieties are linked through multiple
siloxane bridges (Fig 11)
INTRODUCTION
25
Fig 11 Method for the functionalization of silica with an alkoxysilane [27]
Additionally this synthetic approach allows one to control the morphology of the
particles The influence of the organoalkoxysilanes on particle morphology depends
upon the abilities to stabilize or destabilize the micelles[28]
A great number of commercial available siloxanes can be introduced The register of
possible functional groups can be extended eg through a post-synthetic modification
after the co-condensation (Fig 12)
Fig 12 Post-synthetic modification of mesoporous organo-silica material[27]
INTRODUCTION
26
Extraction
In order to obtain a porous material after the templated synthesis the surfactant has to
be removed This can be realized either by calcination or extraction In the case of most
functionalized materials the template cannot be removed by calcination unless the
organic groups are sufficiently thermally stable[29]
In the literature one can find
different possibilities for the removal of the template by extraction ndash mainly complex
procedures such as extraction with supercritical carbon dioxide[30]
or treatment with
microwave radiation[31]
The most common method is some kind of ion-exchange in
alcoholic media eg with a mixture of ethanol and hydrochloric acid The material is
refluxed for several hours and thus protons replace the template cations It is also
possible to use more gentle extraction procedures eg a solution of ammonium nitrate
in ethanol[32]
Mesoporous Titania
After the discovery of the templated synthesis of mesoporous silica much effort was
made to adapt the synthesis principle to the formation of mesoporous titania ndash however
this turned out to be more challenging than for the silica system While the EISA-
approach is effective[20]
the synthesis of ordered mesoporous bulk material or
nanoparticles similar to MCM-41 is often less successful Synthesis problems are
mainly associated with the weak interaction between the cationic template molecules
and the inorganic phase and the faster hydrolysis of titania precursors[33 34]
Further
difficulties emerge from the preferred hexagonal coordination of Ti atoms often
INTRODUCTION
27
resulting in lamellar structures[33]
and the tendency to reorganize into stable crystalline
phases at relatively low temperatures eg as anatase or rutile
However there is a substantial interest in nanostructured titania films especially for
photocatalytic and photovoltaic applications The excellent electrical and mechanical
properties of porous nanostructured titania make it an ideal material for dye-sensitized
solar cells (DSSC)[35]
While DSSCs are cheaper to manufacture than silicon-based
cells they are still less efficient For the production of efficient DSSCs a
semiconducting layer with a high surface area is required to ensure a high loading with
a sensitizing dye Already a relatively thin film of titania nanoparticles doped with an
appropriate dye can produce a significant electric current
Optical Properties of Thin Films
In thin film deposition a thin layer of material is prepared on a substrate or previously
deposited layer ldquoThinrdquo is a relative term since a film may look operationally thin or
thick according to the procedure applied eg optically thin or thick compared to the
wavelength of the light used The most famous example for optically thin films may be
iridescent soap bubbles
Besides the thickness the refractive index is the second important variable in thin films
for optical applications The refractive index n of a medium is a measure for how much
the speed of light is reduced when traveling through it For example glass has a
refractive index of around 15 which means that light travels at 1 15 = 067 times the
speed in vacuum
INTRODUCTION
28
Dispersion and absorption
The effect that n varies with frequency (except in vacuum where all frequencies travel
at the same speed) is known as dispersion and it is what causes a prism to divide white
light into its constituent spectral colors In real materials the polarization does not
respond instantaneously to an applied field This causes dielectric loss which can be
expressed by a permittivity that is both complex and frequency dependent Real
materials are not perfect insulators either ie they have non-zero direct current
conductivity Taking both aspects into consideration a complex index of refraction can
be defined
inn ~
Here n is the refractive index indicating the phase velocity as above while κ is called
the extinction coefficient which indicates the amount of absorption loss when the
electromagnetic wave propagates through the material Both n and κ are dependent on
the wavelength In regions of the spectrum where the material does not absorb the real
part of the refractive index tends to increase with frequency Near absorption peaks the
curve of the refractive index is a complex form given by the Kramers-Kronig relations
and can decrease with frequency
Since the refractive index of a material varies with the frequency (and thus wavelength)
of light it is common to specify the corresponding vacuum wavelength at which the
refractive index is measured Typically this is done at a well-defined spectral emission
line for example the sodium D line at 589 nm (nD)
INTRODUCTION
29
Two common properties of transparent materials are directly related to the difference in
the refractive index of the materials Light is bended when it crosses the interface and it
reflects partially from surfaces
In thin film interference this phenomenon causes the characteristic colors like in the
case of soap bubbles or tarnished metals[36]
Fig 13 shows the dependence of the
interference colors on the thickness of a SiO2 film on silicon at a view angle of 45deg
Fig 13 Calculated interference colors of a silica film on silicon[37]
Stacking thin layers with different refractive indices can enforce this effect These
multilayer reflectors or so-called Bragg stacks can also be observed in nature when
chitin layers are alternated with different refractive index layers in order to control the
apparent color in a wide variety of animals[38]
In the laboratory these special thin films
can be prepared for example by alternation of low refractive index SiO2 with highly
refractive TiO2 films Regarding porous thin films the possible change of the
interference color upon adsorption of volatile species comes to mind This sensing
effect of porous films has already been reported in several publications[39-43]
also in
combination with the Bragg-stacks[44]
MOTIVATION
30
2 MOTIVATION
MOTIVATION
31
In summary it can be ascertained that porous materials are of great interest in many
fields of science and technology There are numerous publications on the synthesis of
all kinds of porous materials Meanwhile there is also a rapidly growing literature on
synthesis procedures for porous nanoparticles We then ask if it could be interesting to
synthesize porous materials at the nanometer scale and how could they be of use in
nanotechnology
As already mentioned nanoparticles exhibit a multitude of interesting properties In
combination with the characteristics of the zeolite materials the resulting nanoparticles
are ideal candidates for numerous applications[45]
However zeolites are often restricted by the small pore diameter Especially in the
liquid phase diffusion plays a major role The reactants need to diffuse rapidly towards
and away from catalytically active sites Due to the larger pore diameter and the
resulting improved diffusion properties of the mesoporous materials they are good
candidates for catalysis and sensing applications In order to obtain selectivity towards
different adsorbates or reactants the materials can be modified with various functional
groups[39]
In some domains the particle size and the existence of single particles is essential
Colloidal suspensions of discrete mesoporous silica nanoparticles which can be
synthesized in nearly every dimension and additionally functionalized with a multitude
of organic groups are ideal candidates for demanding application areas like drug
delivery[26]
The loading and release of the drug can be controlled by selectively
functionalizing the inner surface of the particle whereas the outer surface can be
MOTIVATION
32
modified with bioactive groups It is also imaginable to use porous particles as host
system for other materials such as quantum dots or dyes for biolabeling[46 47]
Encapsulating of sensitive dyes in the porous particles[48 49]
could be useful for the
incorporation in polymer matrices
Especially in the case of producing thin films homogeneous dispersions of
nanoparticles for the preparation eg by spin-coating are of great interest Electronic
semiconductor devices and optical coatings are the main applications for thin film
construction For example the use as low-k materials is intensively investigated And
porous titania films are a basic necessity in todayrsquos dye sensitized solar cells (DSSCs)
The preparation of thin films with porous nanoparticles has a range of advantages over
the common EISA approach for mesoporous films and the growth of zeolite films on
substrates
It is believed that the porous thin films made of (porous) nanoparticles exhibit improved
diffusion properties and a highly accessible pore system[50]
Additionally one can work with stable suspension of already extracted nanoparticles
assuring facile handling and good reproducibility
The coating of sensitive substrates is facilitated due to the mild conditions
Control over the thickness can be attained by varying concentration or by introducing
multiple step coating
Intricate template removal procedures between the coating steps are needless
The adhesion to different surfaces can be influenced by the addition of binders to the
coating suspensions
MOTIVATION
33
It could be also feasible to combine suspensions containing different kinds of
nanoparticles in order to assemble hybrid thin films
Finally the material is easier to characterize when bulk samples are available
Porous nanoparticles and thin films are viewed to have a tremendous potential in
various applications Thus the goal of this work was the synthesis of porous
nanoparticles as monodisperse colloidal suspensions These suspension were used for
the preparation of porous thin films Thorough characterization of the nanostructures is
necessary to establish understanding and control of their synthesis and applications
CHARACTERIZATION METHODS
34
3 CHARACTERIZATION
METHODS
CHARACTERIZATION METHODS
35
The characterization of porous nanoparticles can be done by using a variety of different
techniques mainly drawn from materials science Common techniques are electron
microscopy (TEM SEM) atomic force microscopy (AFM) dynamic light scattering
(DLS) powder x-ray diffractometry (XRD) and vibrational spectroscopy (IR Raman)
The determination of the inherent or interparticle porosity of the materials can be
achieved with different methods As the sorption plays a key role in many application
areas the characterization of the materials by their sorption properties is one of the most
important methods
Sorption
Gas adsorption is a prominent method to obtain a comprehensive characterization of
porous materials with respect to their specific surface area or pore size distribution In a
common gas sorption measurement the sample is attached to a vacuum manifold and
distinct relative pressures (p p0-1
) of the probe gas are adjusted During the measurement
the adsorbed and desorbed volumes of gas (in cm3 g
-1) on the sample surface (apparent
outer surface and accessible pore surface) is calculated for varying relative pressures at
a constant temperature From the obtained isotherms one can draw conclusions about
the size and morphology of pores The isotherms are categorized according to
IUPAC[51]
as shown in Fig 14
CHARACTERIZATION METHODS
36
Fig 14 The six isotherms defined by the IUPAC[51]
Type I is typical for microporous materials and shows a plateau after the filling of the
small pores at low relative pressures
Type II isotherms describe the formation of multilayers after the monolayer is
completed at point B This shape in combination with the complete reversibility upon
desorption is typical for non-porous materials
Type III and V are rarely observed and reflect a low interaction energy between
adsorbate and adsorbent
Type IV isotherms are typical for mesoporous samples The original IUPAC
classification defined the hysteresis as characteristic feature of mesoporous materials
Type VI shows an example isotherm for samples with a stepwise multilayer absorption
of a non-porous material
CHARACTERIZATION METHODS
37
In Fig 15 a typical isotherm for nanometer-sized mesoporous materials (Type IV) with
fields for the individual sorption steps is shown
00 02 04 06 08 10
E
DC
B
A
adsorption desorption
vo
lum
e a
dso
rbe
d
relative pressure pp0
Fig 15 Typical isotherm for a bulk sample of mesoporous nanoparticles
The steps A to E can be attributed to the following processes
A At low relative pressures p p0-1
a monolayer of adsorbate molecules is
forming on the high inner surface of the material
B Multilayers are established
C Filling of the mesopores occurs (capillary condensation)
D The remaining outer surface is covered (plateau)
E In samples with very small particles the adsorbate condenses in the
interparticle pores
CHARACTERIZATION METHODS
38
The most common sorption method is nitrogen sorption because of a suitable heat of
adsorption (5-25 kJ mol-1
) and a good access of nitrogen molecules (0354 nm) into
small pores An evacuated sample cooled with liquid nitrogen is loaded with gaseous
nitrogen Due to the low temperature the nitrogen is adsorbed on the sample surface
resulting in equilibrium between adsorbed film and gas phase at constant temperature
The isotherm shows the adsorbed amount of gas as a function of the pressure Different
models can describe the adsorption
BET-surface area
In contrast to the Langmuir model the method developed by Brunauer Emmet and
Teller[52]
allows the formation of multilayers For low partial pressures (p p0-1
lt 03) the
BET-equation can be transformed into a linear correlation
Cnp
p
Cn
C
p
pn
p
p
mm
11
10
0
0
n adsorbed gas quantity
nm monolayer adsorbed gas quantity
C BET-constant
p equilibrium pressure
p0 saturation pressure
CHARACTERIZATION METHODS
39
With this equation an adsorption isotherm can be plotted as a straight line with
n-1
[(p0 p-1
) minus 1]-1
on the y-axis and p p0-1
on the x-axis according to experimental results
This plot is called a BET plot The linear relationship of this equation is typically
maintained only in the range of 005 lt p p0-1
lt 03
With the required cross-section of an adsorbate molecule the monolayer adsorbed gas
quantity nm (mol g-1
) and the BET-constant C the specific surface area can be
calculated
Pore diameter
If gas molecules are introduced into a pore system their physical properties change
Capillary condensation into the curved surface can occur long before the saturation
vapor pressure is reached The Kelvin equation provides a thermodynamic correlation
between the relative pressure p p0-1
and the reduced radius (Kelvin radius) rk during
pore condensation
0
ln
2
p
pRT
Vr L
k
γ adsorbate surface tension
VL molar volume
CHARACTERIZATION METHODS
40
Fig 16 Adsorption and desorption in a pore
The reduced radius rk describes the curvature of the adsorbate film onto the surface and
is composed of pore radius r1 and the meniscus radius r2 in the filled pore (Fig 16)
21
112
rrrk
In adsorption r2 is infinite and thus rk is 2r1 In desorption r1 = r2 = rk For this reason
the desorption branch is commonly used for the determination of the pore diameter
BJH-Method
The pore radius can be determined with a method developed by Barrett Joyner and
Halenda (BJH) The radius of the cylindrical pore rp is composed of the Kelvin radius rk
and the thickness t of the adsorbed monolayer
trr Kp
CHARACTERIZATION METHODS
41
The thickness t has to be calculated using the density of the adsorbed liquid The
De Boer equation associates the thickness of the adsorbed layer with the relative
pressure in nitrogen sorption isotherms
0340log0
p
p
Kt
K Constant
The BJH-method as classical macroscopic concept based on the Kelvin equation is
linked to the pore condensation phenomena It is applicable for mesopore size analysis
but fails to correctly describe both the pore filling of micropores and of narrow
mesopores In contrast the Density Functional Theory (DFT) or methods of molecular
simulation such as Monte Carlo simulation or Molecular Dynamics provide a
microscopic model of adsorption based on a more realistic description of the
thermodynamic properties of the intra-pore fluid[53]
Other sorption measurements
Nitrogen sorption is a standard method for bulk materials Besides the common
adsorptives such as nitrogen argon or krypton it can be also interesting to investigate
the sorption properties of other gases like alkanes[54]
Especially when investigating
sorption properties of thin films other methods have to be used One possibility is the
sorption measurement using a quartz crystal microbalance
CHARACTERIZATION METHODS
42
Quartz Crystal Microbalance
In a quartz crystal microbalance (QCM) the changes in the resonance frequency of a
piezoelectric quartz crystal are correlated to mass changes deposited onto the crystal
surface Due to the high precision in frequency measurements it is possible to measure
very small mass changes For the correlation between mass and frequency changes the
Sauerbrey equation is used
mA
f
A
mff
qqqq
2
0
2
0 22
It gives the change Δf in the oscillation frequency of a piezoelectric quartz crystal as a
function of the mass Δm added to the crystal Here f0 is the resonant frequency of the
crystal A is the active area between the electrodes ρq is the density of quartz μq is the
shear modulus of quartz and υq is the shear wave velocity in quartz
The Sauerbrey equation was developed for oscillation in air and only applies to rigid
masses attached to the crystal for example thin films
For a certain quartz-crystal the material constants can be combined to a factor Cf and
thus the equation is reduced to
mCf f
For a 10 MHz quartz crystal (Fig 17) a loading of 1 ng per cm2 correlates with a
decrease in the resonant frequency by 0226 Hz
CHARACTERIZATION METHODS
43
Fig 17 10 MHz quartz crystal microbalance
Depositing porous films onto the QCM makes it possible to investigate the mass
changes associated with sorption and thus recording isotherms If the density of a
homogeneous coating is known one could also calculate the film thickness
An alternative investigation of the thickness and additionally of the optical properties of
thin films can be done by a versatile and powerful optical technique called ellipsometry
Ellipsometry
Ellipsometry measures the change of polarization of light upon the interaction with
matter The name stems from the fact that the reflected light will in general be
elliptically polarized Ellipsometry can yield information about layers that are thinner
than the wavelength of the probing light itself even down to a single atomic layer It
can probe the complex refractive index or dielectric function tensor which gives access
to fundamental physical parameters and is related to a variety of sample properties
including morphology crystal quality chemical composition or electrical conductivity
Ellipsometry is commonly used to characterize film thickness for single layers or
complex multilayer stacks ranging from a few tenths of a nanometer to several
micrometers
CHARACTERIZATION METHODS
44
Experimental setup
Electromagnetic radiation is emitted by a light source and linearly polarized before it
falls onto the sample After reflection the now elliptically polarized light passes a
second polarizer - the analyzer - and falls into the detector (Fig 18)
Fig 18 Schematic setup of an ellipsometry experiment
Ellipsometry measures two of the four Stokes parameters which are conventionally
denoted by Ψ and Δ The incident and the reflected beam span the plane of incidence
Light that is polarized parallel or perpendicular to the plane of incidence is called p or s
polarized respectively The amplitudes of the s and p components after reflection and
normalization to their initial values are denoted by rs and rp respectively (Fig 19)
CHARACTERIZATION METHODS
45
Fig 19 The quantities rs and rp in elliptically polarized light
The ratio of rs and rp is described by the fundamental equation of ellipsometry
i
s
pe
r
rtan
Thus tan Ψ is the amplitude ratio upon reflection and Δ is the phase shift (difference)
Since ellipsometry is measuring the ratio of two values it is very accurate and
reproducible relatively insensitive to scattering and fluctuations and requires no
standard sample or reference beam
Data analysis
Ellipsometry is an indirect method ie in general the measured Ψ and Δ cannot be
converted directly into the optical constants of the sample Normally a layer model
must be established which considers the optical constants (refractive index or dielectric
function tensor) and thickness parameters of all individual layers of the sample
including the correct layer sequence Using an iterative procedure (least-squares
CHARACTERIZATION METHODS
46
minimization) the unknown optical constants and thickness parameters are varied and
Ψ and Δ values are calculated using the Fresnel equations The calculated Ψ and Δ
values that match the experimental data best provide the optical constants and thickness
parameters of the sample In spectroscopic ellipsometry (SE) a broad-band light sources
is employed which covers a certain spectral range in the infrared visible or ultraviolet
region Thus the complex refractive index or the dielectric function tensor in the
corresponding spectral region can be obtained which gives access to a number of
fundamental physical properties
Ellipsometric porosimetry
Regarding porous transparent thin films ellipsometric porosimetry[55 56]
can be used to
describe the change of the optical properties that are associated with the sorption of
volatile species The method uses the Lorentz-Lorenz formula which is based on the
Clausius-Mossotti equation
032
1
A
rel
rel NM
It describes the relation between the macroscopic measurable relative dielectric constant
εrel and the electric polarizability α NA is the number of molecules in one mole
(Avogadro constant) and ε0 is the vacuum permittivity
CHARACTERIZATION METHODS
47
Mρ-1
is the molar volume Vm which can also be described as NAN-1
(N is the number
density of molecules)
N
NMV A
m
Thus the Clausius-Mossotti equation can be written as
032
1
N
rel
rel with vPN
03
Pv is the volume polarizability In a certain range of frequencies (visible and UV) the
Maxwell theory relates the refractive index of a substance with its relative dielectric
constant With εrel = n2 the Clausius-Mossotti equation can be converted into the
Lorentz-Lorenz function
vPn
n
2
12
2
The Lorentz-Lorenz equation is used for the characterization of porous substrates with
ellipsometric porosimetry The individual components act additive in the following
approximation
CHARACTERIZATION METHODS
48
A dense substrate with the refractive index nd
2
12
2
d
dvd
n
nP
An empty porous substrate with the refractive index ne (nair = 1 V = volume of open
pores)
2
11
2
11
2
1
2
12
2
2
2
2
2
2
2
d
d
d
d
air
air
e
eve
n
nV
n
nV
n
nV
n
nP
A filled porous substrate with the refractive index nf (nads = refr index of the adsorbate)
2
11
2
1
2
12
2
2
2
2
2
d
d
ads
ads
f
f
vfn
nV
n
nV
n
nP
When the refractive index of the filled and empty porous substrate is known one can
determine the porosity of the material without knowing the refractive index of the dense
material
2
1
2
1
2
12
2
2
2
2
2
ads
ads
e
e
f
f
vevfn
nV
n
n
n
nPP
Therefore the volume V of the open pores can be determined as follows
2
1
2
1
2
12
2
2
2
2
2
ads
ads
e
e
f
f
n
n
n
n
n
nV
CHARACTERIZATION METHODS
49
Light Scattering
Mie Scattering
For the description of the scattering ability of particles similar to or larger than the
wavelength of light the Mie theory or discrete dipole approximation can be used The
Mie solution also called Mie theory is a complete analytical solution of Maxwells
equations for the scattering of electromagnetic radiation by spherical particles In
contrast to Rayleigh scattering the Mie solution to the scattering problem is valid for all
possible ratios of diameter to wavelength although the technique results in numerical
summation of infinite sums Although scattering of light by a homogeneous sphere may
seem to be a simple process the Mie solution is very complex and not easy to
understand In its original formulation it assumed a homogeneous isotropic and
optically linear material irradiated by an infinitely extending plane wave Currently the
term ldquoMie solutionrdquo is also used in broader contexts for example when discussing
solutions of Maxwells equations for scattering by stratified spheres or by infinite
cylinders If particles are much smaller than the wavelength of the incoming light their
scattering ability can be described according to Rayleigh
Rayleigh Scattering
Rayleigh scattering describes the scattering of light or other electromagnetic radiation
by particles much smaller than the wavelength of the light It occurs when light travels
in transparent solids and liquids but is most prominently seen in gases The amount of
CHARACTERIZATION METHODS
50
Rayleigh scattering that occurs to a beam of light is dependent upon the size of the
particles and the wavelength of the light
The intensity of light scattered by a single small particle from a beam of unpolarized
light of wavelength λ and intensity I0 is given by
62
2
24
2
2
022
12
2
cos1
d
n
n
RII
Here R is the distance to the scattering particle θ is the scattering angle n is the
refractive index of the particle and d is the diameter of the particle In simple terms the
scattering coefficient - the intensity of scattered light - on small particles can be
described with the following dependencies
4
1~
I and 6~ rI
The wavelength dependence of the scattering means that blue light is scattered much
more than red light In the atmosphere this results in blue light being scattered to a
greater extent than red light and so one sees blue light coming from all regions of the
sky As a rule of thumb due to the strong dependence on the particle size a colloidal
suspension is expected to become transparent when the particle size is decreased below
110 of the wavelength of the incoming light Thus a potential transparent colloidal
dispersion ideally contains nanoparticles smaller than about 40 nm in diameter
CHARACTERIZATION METHODS
51
Dynamic Light Scattering in Colloidal Suspensions
Dynamic light scattering (DLS) also known as quasi elastic laser light scattering is a
powerful technique in physics which can be used to determine the size distribution
profile of small particles dispersed in a liquid phase When light hits small particles it is
scattered in all directions If the light source is a laser and thus is monochromatic and
coherent then one observes a time-dependent fluctuation in the scattering intensity
These fluctuations are due to the fact that the small particles in suspensions are
undergoing Brownian motion and thus the distance between the scattering centers in the
solution is constantly changing The scattered light interferes either constructively or
destructively These intensity fluctuations contain information about the time scale of
the particle movement The smaller the particles are the faster they diffuse and thus the
faster the intensity changes These fluctuations are correlated across microsecond time
scales by an autocorrelation function ie a function that describes how a given
measurement relates to itself in a time-dependent manner The second order
autocorrelation curve (gII) can be directly derived from the intensity trace
2)(
)()()(
tI
tItIqg II
q wave vector
τ delay time
I intensity
CHARACTERIZATION METHODS
52
At short time delays the correlation is high because the particles do not have a chance
to move to a great extent from the initial state that they were in As the time delays
become longer the correlation starts to exponentially decay to zero meaning that after a
long time period there is no correlation between the scattered intensity of the initial and
final states This exponential decay is related to the diffusion coefficient To fit the
autocorrelation function numerical methods are used If the sample is monodisperse
then the decay is simply a single exponential The Siegert equation relates the second
order autocorrelation function (gII) with the first order autocorrelation function (g
I) as
follows
2)(1)( qgqg III
β correcting factor
Once the autocorrelation data have been generated different mathematical approaches
can be employed to determine the z-averaged translational diffusion coefficient (D) In
case of a monodisperse sample a single exponential function is obtained for the decay
of the autocorrelation function where Γ is the decay rate
)exp()( qg I with 2Dq and
2sin
4 0
nq
λ is the incident laser wavelength n0 is the refractive index of the sample and θ is angle
at which the detector is located with respect to the sample cell The Stokes-Einstein
CHARACTERIZATION METHODS
53
equation describes the dependency of the diffusion coefficient D on the radius r of a
spherical particle in a liquid phase with the viscosity η at a certain temperature T
r
kTD
6
Electron Microscopy
As the maximum resolution of light microscopes is determined by the wavelength of the
photons that are being used to probe the sample imaging of nanoparticles becomes
difficult Like all matter electrons have both wave and particle properties (as proposed
by de Broglie) and their wave-like properties mean that a beam of electrons can be
focused by electrical and magnetic fields onto the sample As the wavelength is
dependent on their energy it can be tuned by adjustment of accelerating fields resulting
in a much smaller wavelength than that of light The wavelength of electrons
accelerated by 200 kV is only 251 pm but the theoretical resolution is limited to about
01 nm because of the aberration in todayrsquos electron lenses
In transmission electron microscopy (TEM) the beam of electrons is transmitted
through a specimen Then an image is formed magnified and directed to appear either
on a fluorescent screen a layer of photographic film or a CCD camera
With a Scanning Electron Microscope (SEM) it is possible to produce high-resolution
images of a sample surface with a characteristic three-dimensional appearance In a
typical SEM the emitted electrons are focused into a very fine focal spot sized 1 nm to
CHARACTERIZATION METHODS
54
5 nm The beam passes through pairs of scanning coils in the objective lens which
deflect the beam horizontally and vertically so that it scans in a raster fashion over a
rectangular area of the sample surface When the primary electron beam interacts with
the sample the electrons lose energy by repeated scattering and absorption The energy
exchange between the electron beam and sample results in the emission of electrons and
electromagnetic radiation which can be detected to produce an image
Thermogravimetric Analysis
Thermogravimetric Analysis (TGA) determines the changes in weight in relation to
changes in temperature by raising the temperature gradually and plotting weight against
temperature The weight loss curve may require transformation before results can be
interpreted The first derivative of the weight loss curve is used to find the points at
which weight-loss is most rapid TGA is commonly employed to determine
characteristics of materials such as degradation temperatures absorbed moisture the
proportions of inorganic and organic components in materials and solvent residues
Additionally Differential Scanning Calorimetry (DSC) provides data on
thermodynamic effects by measuring the time-dependent heat flow between the sample
and a reference
CHARACTERIZATION METHODS
55
Powder X-ray Diffraction
Powder XRD uses x-ray diffraction on powder or microcrystalline samples for the
structural characterization of materials It is based on the elastic scattering of
electromagnetic waves on lattice planes or more precisely at the electronic shells of
regularly arranged atoms Ideally every possible crystalline orientation is represented
equally in a powdered sample The Bragg equation is a simple method to determine the
distance d of lattice planes To derive the Bragg equation one considers the lattice
planes of a crystal as semitransparent mirrors partly reflecting an incoming beam (Fig
20)
Fig 20 Sketch to construct the Bragg equation
CHARACTERIZATION METHODS
56
For a monochromatic beam the reflected rays interfere constructively or destructively
depending on the angle of incidence θ and the lattice diameter d Two reflected
monochromatic beams interfere if the path difference is an integer multiple of the
wavelength λ This results in the Bragg equation for constructive interference
sin2dn with n = 1 2 3 hellip
When the scattered radiation is collected on a flat plate detector the averaging due to
random orientations of the particles leads to smooth diffraction rings around the beam
axis rather than the discrete Laue spots as observed for single crystal diffraction The
angle between the beam axis and the ring is called the scattering angle and in x-ray
crystallography denoted as 2θ
Solid-State NMR
A nuclear spin can interact with a magnetic or electric field Spatial proximity or a
chemical bond between two atoms can give rise to interactions In general these
interactions are orientation dependent In media with no or little mobility (eg crystal
powders large membrane vesicles molecular aggregates) anisotropic interactions have
a substantial influence on the behavior of a system of nuclear spins In contrast in a
classical solution-state NMR experiment Brownian motion leads to an averaging of
anisotropic interactions In such cases these interactions can be neglected on the time-
scale of the NMR experiment Examples of anisotropic nuclear interactions commonly
found in solid-state NMR are the chemical shift anisotropy and the internuclear dipolar
CHARACTERIZATION METHODS
57
coupling Anisotropic interactions modify the nuclear spin energy levels (and hence the
resonance frequency) of all sites in a molecule and often contribute to a line-broadening
effect in NMR spectra High-resolution conditions in solids can be established using
magic angle spinning (MAS) which facilitates averaging of interactions in real space
In 29
Si MAS NMR of functionalized silica samples typically five peaks can be
observed Qn-peaks are related to Si-atoms linked to two three or four other Si-atoms
by an oxygen bridge and to hydroxyl groups Tn-peaks derive from Si-atoms carrying
one organic moiety
[Q4] Si(OSi)4
[Q3] Si(OSi)3(OH) [T
3] RSi(OSi)3
[Q2] Si(OSi)2(OH)2 [T
2] RSi(OSi)2(OH)
The chemical shift of the T-peaks depends on the nature of the Si-C bond Thus
different functional groups can be distinguished Depending on the area of these peaks
one can make statements about the linkage in the solid state
IR and Raman Spectroscopy
FT-IR and FT-Raman spectroscopy are methods to investigate the vibrational modes of
a sample by absorption or scattering of radiation respectively Both techniques are
appropriate for the identification of specific functional groups especially in organic
moieties In inorganic solids hydroxyl groups or characteristic Raman active centers
CHARACTERIZATION METHODS
58
can be detected If a chemical group changes its dipole moment during vibration it can
be detectable in infrared spectroscopy The moieties of a molecule (for instance a
methyl group) can be identified by their specific absorption bands in the infrared
spectrum In Raman spectroscopy energy transfer from incident coherent laser light
induces vibrations of molecules and the scattered light from the sample is analyzed
The energy for exciting the molecular vibrations is taken from the photon energy
(Stokes frequencies) or the energy of the vibrations is transmitted to the photons (Anti-
Stokes frequencies) respectively During vibration the polarizability of the molecule
has to change in order to observe Raman-active modes
RESULTS AND DISCUSSION
59
4 RESULTS AND DISCUSSION
RESULTS AND DISCUSSION 41
60
41 High Silica Zeolite Beta
From Stable Colloidal Suspensions to
Thin Films
RESULTS AND DISCUSSION 41
61
Introduction
Zeolites and zeolite-like materials with their uniform pore sizes unique structural
topology and composition well defined acidity and good thermal stability are viable
commercial catalysts selective ion exchangers and absorbers Although many different
crystalline molecular sieves are already known there is a continuing need for zeolites
with new properties and a continuing search for new zeolite applications More recent
efforts have focused on exploring the possibilities of synthesizing zeolites in the
nanosized range by application of highly supersaturated precursor solutions[45 57]
By
using organic additives during the synthesis procedure colloidal solutions were formed
and used for the preparation of different nanosized molecular sieves[58-64]
Several
microporous materials including MFI LTA FAU BEA and LTL in the form of stable
colloidal suspensions with narrow particle size distribution (100 nm) are described in
the literature Intriguingly among the nanosized zeolites the pure silica forms were only
reported for the MFI MEL and BEA structure types[65-67]
BEA is a large-pore microporous material characterized by three sets of mutually
perpendicular channels with 12-membered ring apertures which can be prepared from
classical aluminosilicate gels with a wide range of SiAl ratios[68]
The main features of
this structure make the material suitable for numerous applications such as
heterogeneous catalysis sensors membranes etc[67 69-71]
The number of acid sites and
the hydrophobicity of the microporous materials can be tuned by controlling the SiAl
ratios in the final crystallites
RESULTS AND DISCUSSION 41
62
One important application of purely siliceous microporous zeolites exhibiting a high
degree of hydrophobicity and a high micropore volume is in the field of nanoscale
layers with low dielectric constant (low-k) for microelectronic applications as well as
for the preparation of hard coatings with unique properties[72 73]
Pure silica zeolite BEA
was synthesized by Corma and co-workers using tetraethylammonium hydroxide
(TEAOH) as a template and fluoride ions at near neutral pH[74]
In addition BEA
crystals were recently prepared via a solidndashsolid transformation method[69 75]
and the
synthesis of colloidal siliceous BEA from highly templated precursor solutions was
reported[76]
One of the focused applications of the pure silica BEA type molecular sieve
is in the preparation of highly porous and hydrophobic layers which can exhibit
variable optical and electronic properties depending on the method of preparation
Several strategies have been applied for the formation of microporous films and
recently a very effective method was established for deposition of ultrathin pure
siliceous MFI type films on two-dimensional supports via spin-coating of stable
colloidal suspensions[65]
Due to their unique properties particles at the nanometer scale
are of great interest in a number of advanced applications Homogeneously dispersed in
a solvent these colloidal suspensions show similarities to real solutions which make
them suitable for the preparation of thin homogeneous and transparent films by spin-
coating As a result of their crystallinity the coatings have high mechanical stability and
resistance to many solvents Additionally decreasing the crystal size of particles below
100 nm produces substantial changes in the physicochemical properties of the zeolite
RESULTS AND DISCUSSION 41
63
particularly in the external surface of the crystals as well as the ability of such
nanocrystals to pack closely in the film during spin-coating[77]
The aim of this paper is to describe a complete route for the synthesis of zeolite Beta
from templated precursor solutions with emphasis on the crystallization kinetics
stabilization of the nanosized crystallites in coating suspensions and the assembly in
thin films exhibiting variable physicochemical properties
Experimental
Synthesis of nanosized zeolite Beta
The composition of the precursor solution used for synthesis of nanosized zeolite Beta
crystals was 25 SiO2 1 Al2O3 15 TEAOH 375 H2O The initial compounds were
mixed in one pot until a clear solution was obtained Cab-o-sil M5 (Riedel-DeHaumlen) as
silica source aluminum sec-butoxide (Aldrich) as aluminum source
tetraethylammonium hydroxide (TEAOH 35 wt Aldrich) as organic template and
deionized water were used The hydrothermal (HT) treatment of the precursor mixtures
was performed in an oven at 140 degC under static conditions using steel autoclaves with
18 ml Teflon liners Every 24 hours one autoclave was taken out and the product was
purified by a series of centrifugation steps (1 h at 47800 g RCF) and subsequently
redispersed in water under sonication (1 h in ice) till the pH of the solution reached 10
A part of the final crystalline zeolite Beta was dealuminated according to the procedure
described in Ref[78]
The SiAl ratio of the as-synthesized and dealuminated zeolite Beta
was 32 and 100 respectively
RESULTS AND DISCUSSION 41
64
Stabilization of Beta nanoparticles in coating suspensions
The as-prepared and dealuminated zeolite Beta nanoparticles were treated with an
aqueous solution of diluted ammonium chloride and then washed with ethanol two
times in order to prepare stable zeolite suspensions and to prevent fast agglomeration
After washing and redispersion the colloidal suspensions were centrifuged at 12000 g
(RCF) for 5 min and the sediment was separated by decanting in order to eliminate the
larger agglomerates formed during the purification process The final solid
concentration of zeolite Beta nanoparticles was adjusted to 4 wt in ethanolic
suspension and further applied for the preparation of thin films
Three types of binders were used to improve the mechanical stability of the porous
films (1) aqueous colloidal silica suspension Nalco 2326 (SiO2 ~15 wt particle size
~ 5 nm) was diluted with ethanol to reach a concentration of 2 wt (2) pre-hydrolyzed
tetraethylorthosilicate (TEOS) in a mixture of ethanol water and HCl in the ratio of 1
TEOS 006 HCl 27 H2O 60 EtOH and (3) pre-hydrolyzed TEOS with
cetyltrimethylammonium bromide (CTAB) in the following ratio 1 TEOS 01 CTAB
006 HCl 27 H2O 60 EtOH The size of the amorphous silica particles formed in
TEOS-based binders (solutions 2 and 3) was kept constant eg about 2 nm in diameter
determined from dynamic light scattering (DLS) measurements The silica nanoparticles
in the binding solutions 2 and 3 were stable for about 10 days while afterwards a slight
increase in size was measured
RESULTS AND DISCUSSION 41
65
Deposition of thin Beta films on silicon wafers
The ethanolic zeolite suspension was either used directly for the film deposition or it
was mixed with the same volume of one of the three binders prior to spin-coating No
additional functionalization of the zeolite nanoparticles was carried out In order to
ensure the preparation of smooth and homogeneous films the coating suspensions were
filtrated through syringe filters (450 nm) prior to spinning
The nanoporous films were deposited on polished silicon wafers by spin-coating
(Laurell WS-400B-6NPP-Lite-AS) with a rate of 3000 rpm (acceleration 5000 rpm s-1
)
for 30 s All substrates were pre-cleaned with ethanol and acetone for 10 s under
spinning at 3000 rpm In order to prepare thick Beta films the spin-coating procedure
was repeated up to 6 times After each coating step the films were calcined at 450 degC
for about 30 min
From the numerous films prepared with different thickness the following will be
discussed in detail pure Beta film free of binder (Beta-pure) Beta crystals stabilized
with prehydrolyzed TEOS (Beta-TEOS) and Beta crystals stabilized with amorphous
silica (Beta-SiO2) (see Table 1) No significant differences were observed between the
samples prepared with the two types of TEOS binders (solutions 2 and 3) and therefore
only binder 2 will be discussed
RESULTS AND DISCUSSION 41
66
Table 1 Zeolite Beta films deposited on silicon wafers
Characterization
The degree of crystallinity of the zeolite materials was determined based on X-ray
diffraction patterns collected from purified powders with a STOE Stadi P diffractometer
using monochromatic Cu-Kα-radiation in transmission geometry Additionally the
degree of crystallinity size and morphology of the zeolite particles was proven by
collecting transmission electron micrographs (TEM) on a JEOL JEM 2011 instrument
with LaB6 cathode at 200 kV Samples were prepared on Plano holey carbon coated
copper grids by evaporating one droplet of the purified zeolite suspensions diluted with
water in the ratio of 1 100 Besides the evaluation of the particle size in the
suspensions was determined by DLS The DLS data were collected with an ALV-
NIBSHPPS High Performance Particle Sizer in PMMA cuvettes at 25degC under
continuous scans and analyzed according to the cumulant and distribution function
analysis (DFA) The polydispersity index (PDI) calculated for all samples was used as
an indication for a multi-modal particle size distribution The powder Beta samples
film binder deposition steps thickness
refractive
index
porosity
( void)
Beta-pure no 3 475 nm 110 77
Beta-TEOS TEOS 3 and 6 440 and 680 nm 113 70
Beta-SiO2 SiO2 1 and 6 185 and 950 nm 115 70
RESULTS AND DISCUSSION 41
67
were subjected to thermogravimetric analysis (TGA) after purification and freeze
drying The powders were heated in corundum crucibles from 30 to 900 degC (10 degCmin)
in a flow of synthetic air (25 mlmin) using a Netzsch STA 449 C Jupiter
thermobalance The amount of organic template and water in the framework type Beta
zeolite was determined in the samples prepared from 1 to 10 days of HT treatment The
surface features of the nanoparticles deposited in thin films were investigated with
scanning electron microscopy (Philips 40 XL) and ellipsometry The ellipsometric
measurements were performed on a Woollam M2000D at different angles (65deg 70deg and
75deg) in the entire spectral range of 190-1000 nm The data were fitted in the range
between 250-1000 nm using the Cauchy model for layered materials or using the EMA
layer (Bruggeman effective medium approximation) of SiO2 and introducing additional
voids[79]
Results and Discussion
Suspensions of Beta nanoparticles kinetic study and stabilization
In order to follow the crystallization kinetics of nanosized zeolite Beta the initial
solution with an SiAl ratio of 25 ratio was heated under hydrothermal conditions and
the crystallization process was interrupted at various times the solid phases extracted at
the different stages of crystallization were subjected to comprehensive characterization
The change in the solid products was followed with X-ray diffraction DLS TEM and
TGA The XRD patterns depicted in Fig 21 show that the amorphous precursor
RESULTS AND DISCUSSION 41
68
solutions transformed into crystalline zeolite Beta particles after 7 days and the
prolonged hydrothermal treatment did not change the degree of crystallinity
5 10 15 20 25 30 35 40 45
4 days
7 days
6 days
5 days
9 days
8 days
10 days
2 [degrees]
Fig 21 XRD pattern of the Beta samples synthesized under hydrothermal conditions
The first Bragg reflection at 62 2 occurs with a very low intensity in the sample after
heating for five days The low intensity of the Bragg reflection is possibly due to the
very small crystalline particles (lt 5 nm) that are present in the solid samples extracted
RESULTS AND DISCUSSION 41
69
from the reacting solutions or to the low amount of crystalline particles in comparison
to the amorphous matter It is important to note that the width of the Bragg reflections
did not change significantly which proves that no substantial change in the final
particle sizes occurred during the prolonged heating of the reaction systems (see
samples crystallized for 6 and 10 days)
The generation of amorphous and crystalline particles in the precursor solutions was
measured by DLS (see Fig 22)
1 10 100 1000 10000
1 day 5 days 7 days 10 days
inte
nsity
diameter [nm]
Fig 22 DLS data of purified suspensions hydrothermally treated from 1 and 10 days
It is important to note that the clear precursor solutions turned into dense transparent
gels after 24 h aging and kept the same texture even after hydrothermal treatment up to
six days A fluid translucent suspension is obtained after seven days of heating The
DLS curves of the samples treated for 1 and 2 days show a very broad particle size
distribution even after substantial dilution with water (PDI gt 05 the curves are not
shown here) This confirms the presence of unstable amorphous nanoparticles in the
RESULTS AND DISCUSSION 41
70
suspensions and the continuous dynamics of agglomeration and disintegration in the
reacting aluminosilicate species in the crystallizing system After three days of heating
two generations of particles one with an average hydrodynamic diameter of about 20-
60 nm and another of about 80 - 200 nm are detected in the precursor mixture It is also
observed that with increasing crystallization time only the width of the particle size
distribution curves is diminishing while the mean size does not change significantly
This observation can be explained with the higher stability of the growing particles in
the samples crystallized from 3 to 6 days However the colloidal zeolites tend to
agglomerate and at the same time disintegrate under purification of the reacting mixture
and redispersion in water or ethanol under sonication In the suspensions with a pH
lower than 8 and solid concentration above 6 wt a significant increase in the particle
diameter is observed Based on the DLS data one can conclude that the aggregates are
formed in the crystalline and intermediate suspensions and they are measured instead of
the individual particle grains This statement is proven by the TEM study where it can
be seen that the nanoparticles tend to agglomerate and do not exist as separated crystals
(Fig 23)
RESULTS AND DISCUSSION 41
71
Fig 23 TEM images of nanoparticles extracted from suspensions after a hydrothermal
treatment between 3 and 10 days
RESULTS AND DISCUSSION 41
72
The aggregation process is also accelerated with prolonging the time of hydrothermal
treatment (8 days) and the mean size of the zeolite domains in the particles is increased
from 20 up to 40 nm according to the TEM data At a very early time of HT treatment
any separation of the crystalline from the amorphous particles was not possible
Crystalline fringes representing the Beta crystalline phase in the mostly spherical
amorphous particles can be seen in the samples treated for 5 and 6 days The crystalline
particles have the same size and shape as the amorphous ones In many cases a good
alignment between several crystalline fringes in the particles is observed This process
is accelerated at the end of the hydrothermal treatment According to the TEM
micrographs particles with size in the range 8 - 15 nm were present during the entire
process of crystallization However after 5 days some of the particles contain
crystalline fringes and some of them appear amorphous After 6 days the fraction of
crystalline particles is increased while the number of amorphous particles is decreased
which is confirmed by both the XRD and DLS data (see Fig 21 and Fig 22) The
sample heated for 7 days contains fully crystalline nanoparticles which appear more
disintegrated in comparison to the ones heated for 10 days A slight increase in the size
of the individual particles and additional agglomeration is observed in the sample
heated for 10 days due to the longer crystallization time
The transformation of the amorphous aluminosilicate species into crystalline zeolite
Beta was also followed by TG analysis The amount of organic template and water is
changing depending on the degree of the samplesrsquo crystallinity As can be seen from
RESULTS AND DISCUSSION 41
73
Fig 24 the weight loss due to desorption of water and combustion of TEAOH is
decreased with increasing degree of crystallinity of the samples
100 200 300 400 500 600 700 800 900
75
80
85
90
95
100
1 day
5 days
7 days
10 days
we
igh
t [
]
temperature [degC]
Fig 24 TG data of the solid samples recovered from precursor solutions subjected to
hydrothermal treatment from 1 to 10 days
The samples heated for 7 and 10 days have almost the same amount of template and an
almost negligible amount of water which is expected for highly siliceous molecular
sieves In contrast in the partially crystalline sample (5 days HT treatment) the amount
of water and TEAOH is higher than in the crystalline Beta This can be explained with
an extra amount of template adsorbed on the surface and in the mesoporous
aluminosilicate amorphous grains Thus the weight loss of the washed and dried
products is decreased in the crystalline samples and the combustion of the template is
shifted to higher temperatures This is due to the different location of the template in the
amorphous or crystalline matrix ie the TEA+ cations are encapsulated in the zeolite
channels instead of the surface or in the mesopores In conclusion the amount of water
RESULTS AND DISCUSSION 41
74
and template encapsulated in the material is decreased while the temperature of
decomposition is increased with higher crystallinity
Beta nanocrystals stabilized in coating suspensions and films
The interfacial chemistry between the binders and the zeolite particles was studied
Dynamic light scattering measurements were performed in pure zeolite suspensions as
well as in binder-containing coating suspensions in order to study the stability prior to
film deposition The Beta crystals used for preparation of thin films were obtained
according to the procedure described above (140 ordmC 10 days) after dealumination The
XRD pattern from the solid sample synthesized in a larger amount (500 ml solid
concentration of 6 wt ) shows the presence of pure BEA-type zeolite (Fig 25)
5 10 15 20 25 30 35 40 45
sample sim BEA
Inte
nsity
2 [degree]
Fig 25 XRD patterns of pure zeolite Beta nanocrystals from the coating suspension
used for preparation of thin films in comparison with the simulated pattern
RESULTS AND DISCUSSION 41
75
The dynamic light scattering results of the same Beta-pure suspension reveals particles
with a hydrodynamic diameter in the range of 20 - 80 nm (Fig 26) which are attributed
to the zeolite Beta in the form of single crystals and probably as agglomerates in a
comparable amount This conclusion is based on the different presentations of the
scattering intensity (mass-weighted and unweighted) As can be seen the ratio between
the two classes of particles with size of 20 nm and 80 nm is increased substantially
when the scattering is expressed as mass-weighted It is known that this method better
represents the real picture (TEM investigations) in a suspension containing particles
with the same density crystallinity and chemical composition The particle size
distribution of this coating mixture does not change with time (at least one week) this
confirms its colloidal stability at ambient temperature (see Fig 26 left image)
1 10 100 1000 10000
mass-weighted unweighted
inte
nsity
diameter [nm]
Fig 26 DLS curves of zeolite coating suspension Beta-pure expressed as mass-
weighted and unweighted particle size distribution (a) and picture representing the
coating Beta-pure (right) and Beta-TEOS suspension (left)
RESULTS AND DISCUSSION 41
76
This coating suspension was mixed with the three binders and remained stable with no
sedimentation during one week at ambient conditions All suspensions with the three
binders appear transparent with minor scattering similar to the ones shown in Fig 26
The thin Beta films prepared with the above suspensions appear homogeneous and
transparent to the eye The thickness of the films is increased by several deposition steps
of the coating suspensions resulting also in a change of the defined interference color of
the films (Fig 27)
Fig 27 Picture of silicon wafers with Beta-TEOS films prepared by one step (l) two
step (m) and three step deposition (r)
SEM investigations of the Beta-pure Beta-TEOS and Beta-SiO2 were performed in
order to investigate the thickness of the layers their surface morphology and
homogeneity In general the films prepared with binder exhibit a smooth surface and do
not show big differences (Fig 28)
RESULTS AND DISCUSSION 41
77
Fig 28 SEM pictures of films deposited on silicon wafers based on zeolite Beta
without binder (Beta-pure left) and with binder (Beta-SiO2 right) at different
magnifications
RESULTS AND DISCUSSION 41
78
Homogeneous and continuous films at a centimeter scale were obtained by one- to six-
step spin-coatings and the homogeneity of the deposited layer is preserved by the close
packing of the Beta nanocrystals surrounded by the binding agents The individual
crystallites in the films prepared from Beta-SiO2 and Beta-TEOS suspensions are more
closely packed in comparison with pure Beta suspensions Besides the Beta-pure film
has lower adhesion in comparison to the films with added binder An increased surface
roughness of the multilayered films is observed in all films This can be explained by
the higher surface roughness of the intermediate porous layers in comparison to the bare
Si-wafer which is propagated and amplified with each coating step The smoothness of
the films could be improved by the application of smaller particles However small
particles tend to agglomerate faster than the bigger ones and therefore the stabilization
of zeolite grains with a size less then 10 nm could be a great challenge (provided they
could be made) Another possibility is to use an additional top layer of binder to fill all
gaps between the crystalline particles deposited in Beta-pure films However this will
influence the surface chemistry and more specifically the hydrophilicity of the entire
film which will increase whereas the porosity will decrease
Introducing porosity into a thin film strongly influences the optical properties compared
to a dense film of the same material The refractive index decreases with an increasing
proportion of voids in the material (see Bruggemann effective medium approximation
EMA) For ellipsometric data analysis the theoretical model was based on the
assumption that the film consists of nanoparticles and a certain fraction of void The
model layer system was designed as follows 0 the silicon substrate is infinitely thick (1
RESULTS AND DISCUSSION 41
79
mm) 1 a typical layer of 2 nm thermal oxide (SiO2) is presumed 2 the porous film is
described with a Cauchy layer Starting with a guessed film thickness the subsequent
fitting of the thickness and the Cauchy parameters resulted in a very good overlap with
the experimental data as shown in Fig 29
200 300 400 500 600 700 800 900 1000
0
10
20
30
40
50
Model Fit Exp 65iexcl Exp 70iexcl Exp 75iexcl
in d
egre
es
wavelength [nm]
200 300 400 500 600 700 800 900 10001125
1130
1135
1140
1145
1150
refr
active index
wavelength [nm]
Fig 29 Ellipsometry data of Beta-TEOS film after 6 coating steps
The determined thicknesses of the films reflect the values detected with SEM Based on
the ellipsometric data the refractive index (n) of the films prepared with and without
binders was determined The n-values at 589 nm were used for comparison of the films
All films showed a very low refractive index which is typical for porous silica films
Fig 29 shows the data of a film composed of microporous particles and a binder (Beta-
TEOS) prepared by spin-coating 6 times Although the film appears dense to the eye a
refractive index of only 1133 (589 nm) was found for this sample Equal results
concerning thickness and refractive index were achieved by replacing the Cauchy layer
with an EMA layer consisting of SiO2 and void The total porosity was found to be
70 in this case
RESULTS AND DISCUSSION 41
80
The mechanical properties of all films were investigated by tape tests In all films
except Beta-pure the mechanical stability was very high and the film could not be
removed from the silicon wafer with the tape The highest adhesion was diagnosed in
films prepared with amorphous SiO2 binder The efficiency of the binders mainly
depends on the size of the binding particles Small particles of SiO2 with a high external
surface are able to form many bonds (Si-O-Si) with the zeolite crystals and with the
thermal SiO2 on the silicon wafer
Conclusion
Colloidal suspensions of zeolite Beta nanocrystals with low aluminum content were
prepared and the crystallization kinetics were studied The crystallization process was
completed within seven days and the size and the shape of the first crystalline particles
detected in the crystallizing suspensions resemble the ones in the amorphous
suspensions Upon prolonged crystallization an agglomeration in the crystallizing
suspensions is observed however the size of the crystalline zeolite Beta particles did
not exceed 80 nm The crystalline Beta was stabilized in colloidal suspensions by
addition of inorganic silica-based binders and applied for the preparation of films by a
spin-on process The thickness of the films varied from 140 to 950 nm controlled by
repeating the number of coating steps speed of deposition and Beta concentration of the
coating suspensions The Beta films exhibit good mechanical properties smooth
surfaces and show a low refractive index which is typical for highly porous silica based
materials The refractive index of the films prepared with binders is increased slightly
RESULTS AND DISCUSSION 41
81
due to additional amorphous silica introduced in the film which is leading to the
formation of denser layers The spin-coating approach presented here allows for the
preparation of films with variable hydrophilicity thickness and mechanical stability on
supports with different shapes and size
RESULTS AND DISCUSSION 42
82
42 Synthesis and Characterization of
Functionalized Mesoporous Silica
Nanoparticles
RESULTS AND DISCUSSION 42
83
Introduction
Various synthetic methods have been developed for the preparation of periodic
mesoporous materials[80]
leading to different types of morphologies such as spheres[81]
fibers[82]
or vesicles[83]
The large internal surface of these materials can be modified
following two main strategies ie post-synthesis functionalization (grafting)[84 85]
or
in-situ functionalization (co-condensation)[22-24]
thus extending the use of mesoporous
materials to a wide range of applications[86]
Compared to the modification by grafting
the co-condensation reaction can be expected to improve the degree of bonding between
the organic groups and the pore walls and to result in a more homogeneous distribution
of the organic groups throughout the pore structure[27]
Common synthesis routes for mesoporous silica materials lead to particles with typical
diameters of 500 nm to several microns The synthesis of nanosized mesoporous
materials has only recently received attention Such mesoporous nanoparticles offer
interesting features that are useful in a number of applications such as chemical
sensors[87]
chromatography[88]
catalysis[89]
drug delivery[90]
or polymer fillers[91]
If
the particles are homogeneously dispersed in a solvent these colloidal suspensions
exhibit unique properties for example optical transparency Furthermore the utilization
of very small particles improves the mass transfer of molecules into or out of the pore
system The molecular functionalization of the large internal surface of these materials
can extend the range of possible applications for example towards selective
(ad)sorption or specific catalytic activity
RESULTS AND DISCUSSION 42
84
The preparation of nanosized particles can be realized through various methods Brinker
et al described an aerosol-based process resulting in a solid dry product[92]
Another
strategy utilizes the addition of a non-ionic surfactant as a suppressant of particle
growth through encapsulation leading to a gel of agglomerated small particles[93]
Amoros et al[94]
presented a facile method leading to nanosized mesoporous silica using
water tetraethylorthosilicate (TEOS) and cetyltrimethylammonium cations in
combination with triethanolamine (TEAH) which is supposed to act as a hydrolysis-
retarding agent However the final product of this procedure is a gel of fused particles
which cannot be redispersed
There are only few publications describing synthesis methods that lead to colloidal
suspensions of periodic mesoporous materials[95-99]
Their synthesis typically relies on
procedures applying high dilutions this can result in time-consuming subsequent
processing steps For instance truly colloidal suspensions of well-defined mesoporous
particles were obtained by Mann et al[18 100]
by diluting and quenching the
condensation reaction of TEOS in aqueous alkaline solution with a large excess of
water They could manipulate the particle size by varying the time interval for
quenching In a recent publication Rathousky et al[96]
also describe a method for the
preparation of colloidal MCM-41 working with even higher dilutions The utilization of
the polyalcohol triethanolamine can result in non-aggregated colloidal suspensions of
mesoporous silica (CMS) from concentrated solutions[98]
Round particles with
wormhole structures and diameters of about 100 nm with very narrow particle size
distributions were obtained in the form of stable suspensions Tuning the reaction
RESULTS AND DISCUSSION 42
85
conditions allowed controlling particle size down to 50 nm Colloidal stability was even
sustained after template extraction which resulted in surface areas of about 1000 m2 g
-1
Extraction of the template ndash in contrast to calcination ndash is the method of choice when
organic moieties are introduced in the wall structure by a co-condensation procedure
The method can be extended towards the generation of functionalized hydrophilic as
well as hydrophobic colloidal mesoporous silica with high yields As described in the
following various alkoxysilanes bearing organic moieties can be incorporated into the
pores of the colloidal nanoparticles using this general method
Experimental
Two slightly different synthesis methods were used as already described in our recent
publication about the synthesis of nanosized pure mesoporous silicates[98]
and adapted
for functionalization with organic moieties All chemicals were reagent grade (98 or
higher) purchased from Sigma-Aldrich and used without further purification The water
was deionized
Pure siliceous CMS-1 143 g (96 mmol) TEAH and 2 ml (9 mmol) TEOS were
combined in a 125 ml polypropylene bottle with a lid The two-phase mixture was
heated in an oil bath at 90 degC for 20 min without stirring Immediately after taking the
mixture out of the oil bath 267 g of an aqueous solution (25 wt ) of CTAC which
had been heated to 60 degC was added and the final mixture was stirred (600 rpm) for at
least 3 h at 23 degC The molar composition of CMS-1 is 075 Si 8 TEAH 017 CTAC
120 H2O
RESULTS AND DISCUSSION 42
86
Functionalized mesoporous silica CMS-R 143 g (96 mmol) TEAH and a mixture of
223 ml (10 mmol) TEOS plus the corresponding quantity of 2 mmol (Table 1) of
organotriethoxysilane (RTES) were combined in a 125 ml polypropylene bottle with lid
The two-phase mixture was heated in an oil bath at 90 degC for 20 min without stirring
Immediately after taking the mixture out of the oil bath 267 g of an aqueous solution
(25 wt ) of CTAC which had been heated to 60 degC was added and the final mixture
was stirred (600 rpm) for at least 3 h at 23 degC The molar composition of these
functionalized materials is 1 Si 8 TEAH 017 CTAC 120 H2O
Table 1 Type and amount of functionalized organotriethoxysilane used in the co-
condensation
sample RTES M (g mol-1) n (mmol) m (g)
CMS-VI vinyltriethoxysilane 1903 2 0381
CMS-PH phenyltriethoxysilane 2404 2 0481
CMS-BZ benzyltriethoxysilane 2544 2 0509
CMS-CP 3-cyanopropyltriethoxysilane 2314 2 0463
CMS-MP 3-mercaptopropyltriethoxysilane 2384 2 0477
Extraction of template from the mesoporous silica 50 ml of ethanol were added to the
translucent colloidal aqueous suspension of the mesoporous material The resulting
precipitate was centrifuged for 20 min at 40000 RCF (g) After decanting the sediment
was redispersed through vigorous stirring in 50 ml of an ethanolic solution of
ammonium nitrate (20 g l-1
) and then treated for 20 min in an ultrasonic bath (35 kHz)
RESULTS AND DISCUSSION 42
87
Alternatively the mixture can be refluxed for 1 h This procedure was repeated until the
sediment after centrifugation was completely transparent normally one or two times In
order to replace the ammonium ions in the structure this operation was repeated with a
solution of concentrated hydrochloric acid in ethanol (5 g l-1
) After washing with pure
ethanol the transparent gelatinous cake obtained after centrifugation can be redispersed
in ethanol leading to a colloidal suspension of the extracted product in ethanol
Characterization
Dynamic light scattering (DLS) data were collected with an ALV-NIBSHPPS High
Performance Particle Sizer in PMMA cuvettes at 25 degC Raman spectroscopy was
performed with a He-Ne laser (633 nm) on a LabRAM HR UV-Vis (HORIBA Jobin
Yvon) Raman Microscope (Olympus BX41) equipped with a Symphony CCD detection
system The spectra were baseline-corrected For thermogravimetric analysis (TGA)
10 mg of dry powder were heated in corundum crucibles from 30 to 800 degC
(10 degC min-1
) in a flow of synthetic air (25 ml min-1
) using a Netzsch STA 449 C Jupiter
thermobalance For the SEM analysis films were prepared on a gold-covered glass slide
by spin-coating using ethanolic suspensions of the extracted material Shape and
dimensions of the particles were determined with a JEOL JSM-6500F scanning electron
microscope (SEM) equipped with an Oxford EDX analysis system Transmission
electron microscopy (TEM) was carried out on a JEOL JEM 2011 instrument with LaB6
cathode at 200 kV Samples were prepared on a Plano holey carbon coated copper grid
by evaporating one droplet of diluted ethanolic suspension of the extracted material
RESULTS AND DISCUSSION 42
88
Cross-polarized 29
Si-MAS-NMR measurements were performed on a Bruker DSX
Avance500 FT spectrometer in a 4 mm ZrO2 rotor Nitrogen sorption isotherms (77 K)
were obtained using a Quantachrome NOVA 4000e Surface Area amp Pore Size
Analyzer Surface area calculations were made using the Brunauer-Emmett-Teller
(BET) equation in the range from p p0-1
= 005 - 025 Pore-size distributions were
determined using the DFT-method (NLDFT equilibrium model cylindrical pores N2 on
oxygen) The pore volume was determined for meso- and micropores for p p0-1
lt 08
Results and Discussion
Colloidal mesoporous silica was prepared in the form of non-functionalized pure-silica
MCM-like material (CMS) and as functionalized mesoporous materials carrying five
different organic groups (R) in the pore walls (CMS-R see Table 1)
Fig 30 Translucent colloidal suspension and TEM micrograph of functionalized
mesoporous nanoparticles
RESULTS AND DISCUSSION 42
89
The materials were obtained as colloidal suspensions with relatively uniform particle
sizes between 40 and 150 nm (Fig 30) Tetraethylorthosilicate (TEOS) and
organotriethoxysilanes (RTES) form the MCM-like material in combination with
cetyltrimethylammonium cations (CTMA+) as structure directing agent in a co-
condensation process (Fig 31)
Fig 31 Scheme of the co-condensation reaction of alkoxysilanes with a micelle-
forming surfactant
This S+I- assembly takes place in an alkaline aqueous medium with triethanolamine
(TEAH) as basic reactant TEAH can also act as a complexing agent that retards the
hydrolysis of the alkoxides[101-103]
The large excess of TEAH probably keeps the seeds
separated from each other during the condensation process giving finally rise to a large
number of particles with relatively small diameters
RESULTS AND DISCUSSION 42
90
The morphology and particle size of the synthesized materials was analyzed with
dynamic light scattering (DLS) and electron microscopy (TEM and SEM) In the TEM
micrographs discrete near-spherical particles with a disordered worm-like pore
arrangement are observed The particles show a narrow particle size distribution with a
polydispersion index (PDI) of around 01 This narrow size distribution is maintained
after extraction of the template by an ion-exchange method using an ethanolic solution
of ammonium nitrate (Fig 32)
Fig 32 TEM-micrograph and particle size distribution of sample CMS-1 determined by
dynamic light scattering
The synthesis procedure developed for pure siliceous nanoparticles was extended
towards a simultaneous reaction of TEOS and a variety of organotriethoxysilane
precursors to obtain functionalized surfaces Hybrid mesoporous materials incorporating
the following organic groups ie vinyl- (CMS-VI) benzyl- (CMS-BZ) phenyl-
(CMS-PH) cyanopropyl- (CMS-CP) and mercaptopropyl- (CMS-MP) residues were
RESULTS AND DISCUSSION 42
91
thus synthesized These surface-modified mesoporous organosilicas often show an even
narrower size distribution than the pure silica parent materials (Fig 33)
Fig 33 TEM-micrographs and particle size distributions calculated from DLS-data of
samples CMS-MP (a) and CMS-PH (b)
The observed mean particle size obtained from DLS measurements varies in most cases
from about 50 to 150 nm depending on the incorporated functional group and the
RESULTS AND DISCUSSION 42
92
synthesis method employed The particle size observed with electron microscopy is
often slightly smaller than the hydrodynamic diameter measured by DLS This
observation can be explained with occasional weak aggregation of the particles The
discrepancy is seen clearly in the case of the organically modified materials especially
if hydrophobic aromatic groups such as phenyl residues are incorporated in the
structure (Table 2)
Table 2 Properties of colloidal mesoporous materials as analyzed with different
methods
sample Particle size TGA data N2 sorption data
diameter
DLS
(nm)
diameter TEM
(nm)
T at
DTGmax
(degC)
surface
area
(m2 g
-1)
pore
volume at
p p0-1
lt 08
(cm3 g
-1)
pore
diameter
(nm)
CMS-1 100 80ndash120 - 1150 10 40
CMS-VI 120 50ndash100 290 1230 074 34
CMS-CP 130 80ndash150 350 1200 072 33
CMS-MP 90 50ndash70 350 970 063 34
CMS-PH 80 40ndash60 610 1040 073 28
CMS-BZ 110 50ndash100 470 1120 065 32
The products with incorporated organic groups especially CMS-PH or CMS-MP
appear as nearly perfect spheres with diameters of about 50 nm The narrow particle
size distribution of the mesoporous materials can also be confirmed with scanning
RESULTS AND DISCUSSION 42
93
electron microscopy (Fig 34) Here a stable colloidal suspension of extracted CMS-BZ
was used for spin-coating a gold-sputtered glass plate resulting in a homogeneous
coverage of mesoporous particles The benzyl-modified mesoporous spheres have
diameters in the range of 50 to 80 nm
Fig 34 SEM-micrograph of a mesoporous film prepared by spin-coating using a
colloidal suspension of CMS-BZ
An influence of organic functional surface groups upon the morphology of mesoporous
materials was also observed by Huh et al[24]
They found a strong increase of the particle
size when using hydrophilic organosilanes especially with amino-containing residues
while hydrophobic residues stimulated the formation of smaller particles They
concluded that hydrophobic groups are able to align with the organic tails of the
template while hydrophilic residues would disturb the Gouy-Chapman region thus
causing a different growth behavior The results for the hydrophobic functional groups
RESULTS AND DISCUSSION 42
94
support their findings Weakly acidic mercapto residues also stimulate the formation of
small spherical particles[99]
The presence of the organic functional groups can be verified with several methods
Thermogravimetric analysis (TGA) shows the decomposition behavior during the
heating of the samples in air The decomposition temperature more precisely the
temperature when the first derivative of the weight loss reaches a maximum varies over
a rather wide range for the different functional groups (Fig 35 and Fig 36)
Fig 35 Thermogravimetric analysis (TG-DTG) of washed CMS-1 with template (a)
and phenyl modified extracted mesoporous silica CMS-PH (b)
Fig 35a shows the weight-loss of the washed non-functionalized sample CMS-1 still
containing the template inside the pores with a maximum around 250 degC This
decomposition process of the template is completed well before the decomposition of
the phenyl-residue in sample CMS-PH starts Fig 35b shows the decomposition of this
group around a temperature of 600 degC in a sample that was previously template-
extracted This extreme stability is not observed for the other functional groups They
RESULTS AND DISCUSSION 42
95
start to decompose at a lower temperature which makes a clear separation from the
degradation of the template difficult (Fig 36) However when non-functionalized
samples were analyzed with TGA after template extraction a weight loss of around
4-7 wt between 100 and 500 degC is still observed Residual template fragments that
were detected by elemental analysis of non-functionalized samples can account for
about 3 weight loss Additionally the dehydroxylation of surface hydroxyl groups
should be considered Usually up to 3 SiOH groups per nm2 are found in mesoporous
materials[97 104]
With surface areas of about 1000 m2 g
-1 one can estimate a maximum
5 wt loss due to water release from these samples by dehydroxylation
Fig 36 Thermogravimetric analysis of the surface-modified and extracted mesoporous
silica materials (starting at 100 degC to compensate for different water losses)
This loss must be taken into account when the amount of organic residue is determined
from TGA measurements Usually a TGA weight loss between 15 ndash 25 wt in
template-extracted functionalized samples occurs (above 100 degC)
RESULTS AND DISCUSSION 42
96
The connectivity of the functional organic groups to the silica framework is best
demonstrated by cross-polarized 29
Si-MAS-NMR spectroscopy (Fig 37)
Fig 37 Cross-polarized 29
Si-MAS-NMR spectra of the functionalized mesoporous
materials
The spectra show peaks at -110 ppm (Q4) and -102 ppm (Q
3) [Q
n = Si(OSi)n(OH)4-n]
n = 2ndash4 representing the fully condensed silica and silica with one terminal hydroxyl
group Geminal hydroxyls are barely present in these samples (resonance at -92 ppm
Q2) One or two additional peaks are observed due to the T
2 and T
3 resonances of the
incorporated organosiloxanes [Tm
= RSi(OSi)m(OH)3-m] m = 2ndash3 at values commonly
RESULTS AND DISCUSSION 42
97
observed in functionalized mesoporous materials Propyl-bridged functional groups
display shifts around -67 and -60 ppm while directly bound residues with C=C bonds
show resonances at more negative values (Table 3)[24]
The prevalence of the T3 peak
ie the threefold coordination of the siloxane indicates (near) complete condensation of
the functional groups into the wall structure of the nanoparticles
Table 3 Cross-polarized 29
Si-MAS-NMR spectroscopy data of functionalized
mesoporous materials
sample chemical shift
Q4 Q
3 T
3 T
2
CMS-VI -110 -101 -80 -73
CMS-PH -110 -101 -79 -70
CMS-BZ -110 -101 -71 -63
CMS-CP -110 -101 -67 -58
CMS-MP -110 -101 -67 -
The characteristic vibrational modes of the incorporated functional groups are clearly
displayed in their Raman spectra which are not obscured by hydroxyl vibrations of the
host as in IR spectroscopy (Fig 38) Intensive peaks of the phenyl- and benzyl-
substituted samples CMS-PH and CMS-BZ originating from the in-plane C-H
deformation vibrations of the aromatic ring are seen at about 1000 cm-1 Additionally
these samples show the typical peaks for aromatic C-H and ring C=C stretching
vibrations at 3060 and 1590 cm-1 respectively[105]
RESULTS AND DISCUSSION 42
98
In the vinyl-modified sample (CMS-VI) we find the alkene C-H vibrations and the C=C
stretching vibrations at 3070 and 1605 cm-1
respectively The nitrile group of CMS-CP
causes a characteristic narrow band at 2250 cm-1
The typical peak for the S-H group in
the mercaptopropyl-containing CMS-MP occurs at 2580 cm-1
and additionally we find
a band at 657 cm-1
due to the C-S vibration Both Raman bands indicate that the
mercapto groups are intact and that no disulfide bridges have formed[106]
Fig 38 Raman spectra of template-extracted functionalized mesoporous materials
After extraction of the surfactant the functionalized porous materials show high surface
areas and pore volumes The sorption properties were determined using nitrogen
RESULTS AND DISCUSSION 42
99
adsorption-desorption at 77 K In case of the unmodified materials CMS-1 a typical
type IV isotherm with a clear hysteresis from filling of the cylindrical pores is observed
Textural pores of ~20 nm originating from the closely packed nanospheres in the
powders are visible above a relative pressure of 08 p p0-1
The entire surface area
calculated according to the BET-theory is 1150 m2 g
-1 for CMS-1 The product exhibits
a high pore volume of 1 cm3 g
-1 (for p p0
-1 lt 08) and a narrow pore size distribution
with an average diameter of 4 nm as determined with the DFT method (Fig 39)
Calcined CMS-1 shows an even higher surface area of 1400 m2 g
-1 with pore volumes
of 11 cm3 g
-1
Fig 39 Nitrogen sorption isotherm (left) and pore size distribution (right) according to
the DFT theory of mesoporous silica CMS-1
The type of adsorption isotherm is unchanged in the functionalized nanosized materials
and the inclusion of the functional groups does not significantly affect the overall
surface area of the materials (Fig 40)
RESULTS AND DISCUSSION 42
100
Fig 40 Nitrogen sorption isotherms of reference and co-condensed materials
To some extent the size of the functional groups influences the shrinkage of the pore
diameter While the unmodified mesoporous silica has an average pore diameter of
40 nm in vinyl-functionalized materials (CMS-VI) we find pores with a mean diameter
of 34 nm and the bulky nature of the benzyl group in CMS-BZ causes a reduction to
32 nm (Fig 41)
RESULTS AND DISCUSSION 42
101
10 100 1000
000
001
002
003
004
005
006
CMS-1 CMS-VI CMS-BZ
Dv(d
) [c
m-3
-1
g-1
]
pore diameter []
Fig 41 Changes in the pore size distribution with increasing size of the incorporated
organic moieties in mesoporous silica
The surface coverage of functional groups in the nanoscale mesoporous samples can be
estimated from thermogravimetric measurements in conjunction with the surface area
presuming that all organic groups are located on the surface For example the weight-
loss of CMS-PH due to the decomposition of the organic group is about 20 The
calculated surface area according to BET-theory is 1040 m2 g
-1 From these data a
surface coverage of 26 mmol g-1
or 15 phenyl groups per nm2 can be calculated
Conclusion
The synthetic approach presented here can serve as a general method for the preparation
of both colloidal mesoporous silica spheres (CMS) and functionalized colloidal
suspensions of nanoscale mesoporous materials with high yields from concentrated
solutions Narrow particle size distributions in the range of about 50 to 150 nm were
established with Dynamic Light Scattering (DLS) measurements and electron
RESULTS AND DISCUSSION 42
102
microscopy before and after template extraction Discrete nanoscale mesoporous
particles with functionalized pore surfaces result when adding functional
organoalkoxysilanes directly to the initial silica precursor solutions Nitrogen sorption
analysis and indicates that the functional groups are located at the inner surfaces of the
mesoporous channel systems
RESULTS AND DISCUSSION 43
103
43 Porous Thin Films of
Functionalized Mesoporous Silica
Nanoparticle
RESULTS AND DISCUSSION 43
104
Introduction
Porous materials in the nanometer range already attract a great deal of interest in many
fields of science and technology Especially in terms of colloidal suspensions these
materials are promising candidates for applications such as gas sensing host-guest
chemistry drug delivery and coatings in the semiconductor industry The preparation of
monodisperse stable colloidal suspensions of mesoporous silica particles has been
recently developed[98 99]
The synthesis parameters were gradually modified in order to
realize even smaller particles in the range below 40 nm As reported in the previous
publications the introduction of functional groups during the co-condensation reaction
has a great influence on the particle shape and size[24]
The synthesis with
phenyltriethoxysilane led to particles with a smallest diameter of only 50 nm[107]
Additionally the phenyl-modified particles are thermally more stable easy to
characterize and tend to peptize (disperse) more easily due to their sterically demanding
and inert aromatic rings
By further decreasing the diameter of these mesoporous silica spheres their scattering
ability for visible light is also drastically decreased If the size of the particles falls
below about 110 of the wavelength of the incoming light (01 ) their scattering ability
can no longer be described with the Lorenz-Mie-solution but with Rayleigh scattering
The colloidal suspensions thus show optical transparency when the particle size is small
enough Due to this optical transparency such nanoparticles would allow spectroscopic
investigations of physical processes or chemical reactions in a confined space
Furthermore it is possible to encapsulate sensitive dyes [108-111]
or to facilitate the
RESULTS AND DISCUSSION 43
105
dispersion of the particles in certain media Modifying the spheres with appropriate
functionalities such as caps or fluorescence markers would make them interesting
candidates for drug delivery[7 108]
or would permit observing their way into a cell[112
113] Another very promising area of application is thin film technology
[114 115] The
synthesis of mesoporous thin films is often achieved with the so-called ldquoEvaporation
Induced Self Assemblyrdquo (EISA) process[20]
The EISA process for mesoporous silica
thin films starts with a homogeneous solution of silica precursor and surfactant prepared
in ethanolwater with an initial surfactant concentration much below the critical micelle
concentration[20]
Upon dip-coating or spin-coating the preferential evaporation of
ethanol concentrates the surfactant and silica species The progressively increasing
surfactant concentration drives self-assembly of silica-surfactant micelles and their
further organization into liquid-crystalline mesophases This approach represents a
versatile strategy for the formation of mesoporous silica and other oxide thin films with
different pore sizes pore topologies and elemental composition[116]
However there are several issues that suggest the development of complementary
strategies The precursor is normally highly acidic which can cause problems on
sensitive substrates Removal of the template by extraction or calcination might also be
critical If the surfactant is removed thermally cracks can occur in thicker films and it
is known that the humidity has a great influence on the film formation Thus if the
orientation of the pores is less important the alternative preparation of thin films with
mesoporous nanoparticles can address several of these issues It is believed that a
porous thin film made of porous nanoparticles can exhibit improved diffusion properties
RESULTS AND DISCUSSION 43
106
and a highly accessible pore system[50]
Additionally one can work with stable
suspensions of already extracted nanoparticles thus ensuring an easy handling and good
reproducibility The coating of sensitive substrates is facilitated due to the mild
conditions Control over the thickness can be attained by varying the concentration or
by multiple step coating It could be also feasible to combine suspensions containing
different kinds of nanoparticles in order to assemble hybrid thin films Finally the
material is easier to characterize when bulk samples are available The synthesis of
completely transparent suspensions even after template extraction would be a great
improvement for the formation of homogeneous thin films with a low surface
roughness Especially for the formation of multilayers it is advantageous if the film is
very smooth Otherwise the defects on the surface are transmitted and amplified with
every following coating step Furthermore the availability of such homogeneous porous
thin films makes it possible to use ellipsometric porosimetry as an analysis method
This method has a set of advantages compared to conventional sorption methods which
are specified in a work of Eslava et al[56]
For an accurate determination of sorption isotherms of porous coatings via gravimetric
or volumetric methods an extremely sensitive device is needed The tiny amount of
porous material and the weight increase due to adsorption in the thin film can be
detected with a surface acoustic wave (SAW) device or a quartz crystal microbalance
(QCM) In both cases the coating has to be applied to the measuring device itself
which might have an influence on properties such as the orientation of the crystals the
presence of grain boundaries and the film thickness Scraping off from their supports
RESULTS AND DISCUSSION 43
107
and collecting a sufficient quantity of powdery sample for a conventional determination
is a drastic intervention The determination of sorption isotherms of a thin film via
ellipsometric porosimetry (EP) is a convenient method to determine the effective
porosity and pore size distribution of a thin film on its original support without
destroying it
Thus the aim of this work was the synthesis of monodisperse colloidal suspensions of
porous nanoparticles with a particle size small enough for the preparation of
homogeneous thin films Additionally the porosity of the final thin films is determined
with different methods
Experimental
All chemicals were purchased from Sigma-Aldrich with reagent grade (98 or higher)
and used without further purification The water was deionized In order to guarantee
the same conditions for all samples the syntheses were carried out in a heatable high-
throughput magnetic stirrer (1000 rpm) in 100 ml glass test tubes (diameter 25 cm)
Although it is necessary that the synthesis mixture be well stirred building of foam
should be avoided in order to prevent the formation of inhomogeneities The following
solutions were prepared and used for all syntheses S1 (surfactant) 300 g aqueous
solution of cetyltrimethylammonium chloride (25 wt ) and 2700 g deionized water
C1 (catalyst) 10 g triethanolamine (TEAH) and 90 g deionized water P1 (precursor)
208 g (01 mol) tetraethylorthosilicate (TEOS) and 24 g (001 mol)
phenyltriethoxysilane (PTES) E1 (extraction) 50 g concentrated hydrochloric acid
RESULTS AND DISCUSSION 43
108
(37 HCl) in 500 ml ethanol E2 (extraction) 10 g ammonium nitrate in 500 ml
ethanol
Samples CMS-Pxy
200 g S1 and 020 g (CMS-P2y) 040 g (CMS-P4y) or 080 g (CMS-P8y) C1 were
heated under stirring to 60 degC (CMS-Px6) 70 degC (CMS-Px7) or 80 degC (CMS-Px8) The
amount of 160 ml P1 was added and stirring was continued in the test tube for 1 h The
vessel was kept open in order to evaporate parts of the ethanol that were formed during
the condensation For a better overview all samples are listed in Table 4
Table 4 Prepared samples and synthesis conditions
sample synthesis
temperature
amount
TEAH (g)
CMS-P26 60 degC 002
CMS-P46 60 degC 004
CMS-P86 60 degC 008
CMS-P27 70 degC 002
CMS-P47 70 degC 004
CMS-P87 70 degC 008
CMS-P28 80 degC 002
CMS-P48 80 degC 004
CMS-P88 80 degC 008
RESULTS AND DISCUSSION 43
109
Extraction
The resulting colloidal suspension was flocculated with 20 ml E1 and the cloudy
precipitate was centrifuged for 5 min at 40000 g (RCF) After decanting the sediment
was redispersed through vigorous stirring in 20 ml E2 The clear suspension was treated
for 10 min in an ultrasonic bath After flocculating with 20 ml deionized water the
precipitate was again centrifuged the sediment was redispersed in 20 ml E1 and again
sonicated After flocculation with 20 ml deionized water and centrifugation the
sediment can be redispersed in ethanol leading to a suspension of colloidal mesoporous
silica (CMS) with approximately 5 wt solid content
Film preparation
Thin film preparation was performed by spin-coating with an ethanolic suspension
containing about 5 wt of solid material The substrate (silicon or glass) was coated
3 times at 3000 rpm (acceleration 5000 rpm s-1
) In order to remove potential
inhomogeneities the transparent ethanolic suspension was filtered through a 02 μm
syringe filter prior to spin-coating
Characterization
Dynamic light scattering (DLS) data were collected with a Malvern Nano ZS in PMMA
cuvettes at 25 degC For thermogravimetric analysis (TGA) 10 mg of dry powder were
heated in corundum crucibles from 30 to 900 degC (10 degC min-1
) in a flow of synthetic air
(25 ml min-1
) using a Netzsch STA 449 C Jupiter thermobalance Transmission electron
RESULTS AND DISCUSSION 43
110
microscopy (TEM) was carried out on a FEI Titan 80-300 at an accelerating voltage of
300 kV Samples were prepared on a Plano holey carbon coated copper grid by
evaporating one droplet of diluted ethanolic suspension of the extracted material The
nitrogen sorption isotherms (77 K) were obtained using a Quantachrome NOVA 4000e
Surface Area amp Pore Size Analyzer Surface area calculations were made using the
Brunauer-Emmett-Teller (BET) equation in the range from p p0-1
= 005 - 025 Pore-
size distributions were determined using the DFT-method (NLDFT equilibrium model
cylindrical pores N2 on carbon) Ellipsometry measurements were performed with a
Woollam M2000D at different angles (65deg 70deg and 75deg) in the spectral range of 190 ndash
1000 nm The data were fitted in the range between 250 ndash 1000 nm using the Cauchy
material as model layer Ellipsometric porosimetry measurements were carried out in a
closed cell at different partial pressures at a measurement angle of 75deg The recording of
isotherms was performed using a homemade Labview-controlled gas mixer Digital
mass flow controllers (W-101A-110-P F-201C Bronkhorst High-Tech) ensured the
accurate dosing of the carrier gas nitrogen and the liquid analyte which was vaporized
in a controlled evaporation and mixing element (W-101A Bronkhorst High-Tech)
Partial pressures were calculated using the van der Waals equation For a better
comparison with nitrogen sorption the relative pressure p px-1
(px saturation pressure)
is used for the vapor sorption analysis
RESULTS AND DISCUSSION 43
111
Results and Discussion
The synthesis results are in good accordance with the expectations based on the work of
Stoumlber[12]
and LaMer[13]
A first variable of course is the amount of precursor added to
the synthesis In a certain range decreasing the amount of precursor can reduce the size
of the final particles According to Stoumlber the particle size distribution passes a
maximum when the concentration is varied because the concentration of precursor
influences not only the growth of the seeds but also the nucleation rate und thus the
number of initial seeds Since high yield is a priority it is more interesting to choose
other options for a successful downsizing The experiments show that the final particle
size in the resultant suspensions (CMS-P26 ndash CMS-P88) is dependent on the amount of
added TEAH and the reaction temperature In Fig 42 the hydrodynamic diameter of all
samples is shown (CMS-P86 stand for synthesis with 008 g TEAH at 60 degC )
Fig 42 Initial particle size (DLS) of samples CMS-P26 ndash CMS-P88
RESULTS AND DISCUSSION 43
112
With increasing temperature and amount of catalyst (TEAH) the hydrolysis of the
precursor and condensation of the nanoparticles is supported and the reaction is faster
In this specific range these changes apparently promote the growth rate more than the
nucleation rate resulting in bigger particles Fig 43 shows micrographs (TEM) of
samples synthesized at different temperatures with the same amount of TEAH (CMS-
P8y) The difference in size can be clearly seen the particles that formed at 60 degC
(CMS-P86) show the smallest diameter of only 15 nm At 70 and 80 degC the diameter
reaches 25 and 30 nm respectively
Fig 43 Electron micrographs (TEM) of samples CMS-P86 CMS-P87 and CMS-P88
In agreement with DLS data TEM also shows that the variation of the amount of
catalyst TEAH at a constant reaction temperature (80 degC CMS-x8) has an influence on
the particle size The difference is less pronounced but the general tendency can be
confirmed The diameter varies between 22 nm (CMS-P28) 25 nm (CMS-P48) and
30 nm (CMS-P88) if the quantity of TEAH is increased
RESULTS AND DISCUSSION 43
113
Fig 44 Electron micrographs (TEM) of samples CMS-P28 CMS-P48 and CMS-P88
Table 5 shows a comparison of DLS and TEM data for selected particle sizes The
divergence in hydrodynamic diameter in DLS (36 - 130 nm) and discrete particle size in
TEM (15 - 30 nm) could be explained with a higher degree of agglomeration at higher
temperatures
The findings made it possible to synthesize colloidal suspensions of functionalized
mesoporous silica nanoparticles with a very small particle size between 15 and 30 nm
As the scattering intensity (I) of light strongly decreases with smaller particles size
(I ~ radius6) the suspensions with the smallest diameter (~ 15 nm) are completely clear
(Fig 45)
RESULTS AND DISCUSSION 43
114
Fig 45 Scattering of the initial colloidal suspensions containing particles with different
diameters (DLS) in the range between about 40 to 130 nm (from left to right CMS-P27
-P86 -P28 -P87 -P48 -P88)
When reaching a certain size separating particles with centrifuges becomes difficult as
the effective gravitational force is dependent on the mass of the particles An elegant
method to overcome this problem is the flocculation of the particles Therefore
acidified ethanol was added to the aqueous colloidal suspension leading to a cloudy
suspension of agglomerated particles The particles then could be separated from the
solution by centrifugation and were purified in the following steps The final gelatinous
sediment can be completely redispersed in ethanol leading to transparent colloidal
suspensions with almost exactly the initial particle size distribution in DLS Fig 46
shows the mean hydrodynamic diameter of CMS-P86 before and after template
extraction The polydispersity index (PDI) of all suspensions was below 02 The
suspensions with a diameter below 40 nm are completely transparent to the visible part
of the light and show nearly no scattering
RESULTS AND DISCUSSION 43
115
Fig 46 Hydrodynamic diameter of CMS-P86 before and after template extraction
In transmission electron microscopy (TEM) the diameter of the particles can be
specified as significantly smaller (by a factor of 3) than in dynamic light scattering Fig
47 shows micrographs of CMS-P86 with an average particle diameter around 20 nm
The size distribution of the discrete particles is very narrow High resolution images
clearly show the porous nature of the functionalized particles
RESULTS AND DISCUSSION 43
116
Fig 47 TEM micrographs of CMS-P86 (right HAADF-STEM)
In order to investigate the sorption properties of the porous nanoparticles the ethanolic
suspensions were dried at 60 degC The resulting solids were colorless and transparent
consisting of small platelets with about 1 mm diameter Despite of its dense appearance
the material has a high specific surface area of 640 m2 g
-1 as well as a high pore volume
(095 cm3 g
-1) in the case of CMS-P86 DFT calculations resulted in a bimodal pore size
distribution
Fig 48 N2 sorption data of dried extracted CMS-P86
RESULTS AND DISCUSSION 43
117
The first peak at 27 nm due to templated mesopores is in the expected range for
functionalized mesoporous silica templated by hexadecyltrimethylammonium ions The
second peak around 10 nm reflects the textural porosity of the material It is a widely
accepted concept that an inscribed sphere between adjacent spheres is an approximate
shape for the access opening to the interstitial void space between randomly packed
spheres[117-119]
Depending on the packing of the individual particles the pore opening
varies approximately between 02 and 06 times the radius of the equally sized particles
In the case of CMS-P86 this interparticle porosity is in the range between 5 and 15 nm
(compare Fig 48)
Thus the expected particle size based on sorption is about 25 nm which coincides well
with the observed diameter in the TEM With decreasing particle size this second peak
is shifted to smaller pore sizes as shown in Fig 49 The maximum of the interparticle
porosity is in the expected range for all samples (see Table 5)
RESULTS AND DISCUSSION 43
118
Fig 49 Pore size distribution from N2 sorption of differently sized mesoporous
particles with maximum for interparticle porosity
Table 5 Particle size (DLS TEM) and maximum in interparticle porosity (N2 sorption)
sample hydrodynamic
diameter (DLS)
diameter
(TEM)
max interparticle
porosity
CMS-P88 130 30 16
CMS-P48 95 25 14
CMS-P28 80 22 12
CMS-P87 80 25 14
CMS-P86 60 15 9
RESULTS AND DISCUSSION 43
119
Homogeneous Thin Films
The ethanolic suspensions of the template-free material are ideal candidates for the
preparation of homogeneous spin-on thin films The dry bulk material exhibits a high
surface area even though it appears to be a dense solid Thus one can expect a high
porosity for the corresponding thin film Fig 50 shows an image of a silicon wafer with
a thin film of mesoporous functionalized silica with a thickness of 650 nm The film
was prepared by spin-coating three times with an ethanolic suspension containing
5 wt of CMS-P86
Fig 50 Thin film of CMS-P86 on a silicon wafer
The film appears very homogeneous and transparent and thus has a definite interference
color Due to pronounced capillary forces occurring during the solvent evaporation the
nanoparticles are very closely packed ndash a phenomenon that also assists in the assembly
of colloidal crystals[120]
Because of the smooth surface no scattering is observed which
makes the films perfect candidates for ellipsometry investigations Modeling and fitting
RESULTS AND DISCUSSION 43
120
of the data was based on the assumption that the film consist of porous nanoparticles
the model layer is designed as follows
0 the silicon substrate is infinitely thick (1 mm) 1 a typical layer of 2 nm thermal
oxide (SiO2) is presumed 2 the material (organic functionalized silica) is described
with a Cauchy layer Starting with a guessed film thickness of 500 nm the subsequent
fitting of the thickness and the Cauchy parameters resulted in a 650 nm thick film As
show in Fig 51 this model layer fits exactly the experimental data
Fig 51 Ellipsometry data of a thin film of CMS-P86 in nitrogen atmosphere
The measurement was performed in a flow cell in a flow of nitrogen It was repeated at
different relative pressures of gaseous toluene The adsorption affinity of the thin film
can be also observed when the interference color changes due to the pore filling The
relative pressure of toluene was controlled between 0 and 0943 (p p0-1
) Plotting the
refractive index of the thin film versus the relative pressure of toluene resulted in the
isotherm shown in Fig 52
RESULTS AND DISCUSSION 43
121
Fig 52 Ellipsometry data of a thin film of CMS-P86 in toluene vapor in a nitrogen
atmosphere
After the templated mesopores are filled a second step due to the filling of the
interparticle porosity can be identified at a relative pressure of 06 - 08 The
ellipsometric data are in very good accordance with powder nitrogen sorption data (Fig
53) The overlay shows the same sorption behavior for the two different adsorbates
RESULTS AND DISCUSSION 43
122
Fig 53 Overlay of a powder N2 sorption isotherm (desorption) and a toluene isotherm
(equilibrium) of a thin film recorded with ellipsometry (CMS-P86)
With the Lorentz-Lorenz equation for ellipsometric porosimetry (EP) a porosity of
53 can be specified Knowing the area of the substrate - a 3 inch wafer - the volume
of the deposited film can be easily calculated assuming a cylinder with a height of
650 nm Based on the high precision of thickness measurements in ellipsometry the
calculated volume of 00030 cm3 can be considered as accurate If the total pore volume
of 095 cm3 g
-1 in N2 sorption is correlated to the 53 porosity in ellipsometric data a
density of 056 g cm-3
can be calculated Thus the expected weight of the film is
17 mg Weighing before and after the film deposition gave a difference of 21 mg This
can only act as a rough indication due to a relatively large measuring inaccuracy of the
analytical balance and possible adsorbed water due to air humidity
RESULTS AND DISCUSSION 43
123
Conclusion
In this study we have demonstrated the synthesis of extremely small mesoporous silica
nanoparticles via a specific co-condensation process with phenyl groups The size of the
suspended mesoporous silica spheres can be controlled in a wide range The
suspensions with a mean hydrodynamic particle diameter of 40 nm or less were
optically transparent After extraction of the surfactant dispersion in ethanol led to
transparent colloidal suspensions The existence of very small individual porous
particles was confirmed by transmission electron microscopy (TEM) and sorption
measurements The suspensions were used for the preparation of homogeneous porous
thin films by spin-coating The films showed excellent optical qualities and could thus
be characterized with ellipsometry It was possible to record sorption isotherms of the
thin films with ellipsometry and to correlate the data with nitrogen sorption data of
dried powders of the same material In the future exchange of the template is
anticipated to allow control over the pore size and the particles can be functionalized or
labeled with a fluorescent dye Examples for a successful functionalization are listed in
the supporting information
RESULTS AND DISCUSSION 43
124
Supporting Information
The versatility of the modified synthesis procedure described in Chapter 43 can be
illustrated by the production of several other functional nanoparticles If the particle size
in the resulting colloidal suspension is around 100 nm extraction and redispersion can
be performed as described in Chapter 42 The synthesis conditions were thus adjusted
for the following samples
Experimental Part
CMS-AP
022 g aminopropyltriethoxylsilane (APTES 1 mmol) 024 g phenyltriethoxysilane
(PTES 1 mmol) and 208 g tetraethylorthosilicate (TEOS 10 mmol) were combined
90 g triethanolamine (TEAH) and 100 g of an aqueous solution containing 25 wt
hexadecyltrimethylammonium chloride (CTAC) were heated to 70 degC The precursor
solution was added and the mixture was stirred for 2 h at 70 degC
CMS-FITC
390 mg fluorescein isothiocyanate (FITC 001 mmol) 011 g aminopropyl-
triethoxysilane (APTES 05 mmol) and 20 g abs ethanol were stirred 24 h under dry
nitrogen atmosphere The resulting fluorescent orange solution was combined with a
mixture of 208 g tetraethylorthosilicate (TEOS 10 mmol) and 024 g phenyltriethoxy-
silane (PTES 1 mmol) 90 g triethanolamine (TEAH) and 100 g of an aqueous solution
RESULTS AND DISCUSSION 43
125
containing 25 wt hexadecyltrimethylammonium chloride (CTAC) were heated to
70 degC The precursor solution was added and the mixture was stirred for 2 h at 70 degC
Extraction
Extraction of template was performed by adding an equal amount of ethanol to the
translucent colloidal aqueous suspension of the mesoporous material The resulting
precipitate was centrifuged for 10 min at 40000 g (RCF) After decanting the sediment
was redispersed through vigorous stirring in the initial volume (ca 100 ml) of an
ethanolic solution of ammonium nitrate (20 g l-1
) and then refluxed for 1 h This
procedure was repeated with the same amount of a solution of concentrated
hydrochloric acid in ethanol (5 g l-1
) After washing with pure ethanol the transparent
gelatinous cake obtained after centrifugation was suspended in ethanol
Results and Discussion
a) Introduction of Aminopropyl Groups through Co-condensation
The new method additionally allows the introduction of aminopropyl groups during the
co-condensation The presence of aminogroups in the silica precursor during the
synthesis is usually accompanied with gelation problems Hence the synthesis of
nanoparticle suspensions with aminopropyl moieties is mainly realized by grafting[121]
In combination with the steric demanding phenyl groups of the phenyltriethoxysilane
(PTES) it is possible to obtain dispersed discrete nanoscaled particles The particle size
RESULTS AND DISCUSSION 43
126
distribution in DLS (Fig 54) shows a slightly broadened signal probably due to partly
interconnected particles
1 10 100 1000 10000
extracted in EtOH in water
inte
nsity
particle size [nm]
Fig 54 Particle size distribution (DLS) of CMS-AP before and after extraction
The functional mesoporous organosilica particles show a similar mean diameter around
100 nm before and after template extraction The coexistence of the two different
functionalities can be demonstrated with various methods In this case TGA data is
difficult to interpret because the weight loss caused by the decomposition of the
aminopropyl groups and the template are overlapping Fig 55 shows two distinct steps
with the one at higher temperatures unequivocally deriving from the decay of the
aromatic phenyl groups whereas the first step can presumably be assigned to the
aminopropyl groups Decomposing of the template starts already at lower temperatures
around 150 degC (compare Fig 35 Chapter 42)
RESULTS AND DISCUSSION 43
127
100 200 300 400 500 600 700 800
25
20
15
10
5
0
we
igh
t lo
ss [
]
temperature [iexclC]
0 10 20 30 40 50 60 70
-10
-08
-06
-04
-02
00
02
time [min]
DT
G [
min-1
]
Fig 55 Thermogravimetric data of extracted CMS-AP
Spectroscopic methods such as NMR or Raman measurements are usually more reliable
methods for the characterization of functionalized silica materials However solid state
29Si-NMR can also just give an indication for the incorporation of the aliphatic group
Compared to the spectra of the single phenyl modified product a shoulder at lower field
occurs in sample CMS-AP[122]
RESULTS AND DISCUSSION 43
128
0 -20 -40 -60 -80 -100 -120 -140
CMS-PH CMS-AP
[ppm]
Fig 56 29
Si-NMR spectra of CMS-AP and CMS-PH
Even though it is difficult to detect the aliphatic aminogroups in Raman measurements
Fig 57 shows the appearance of an additional signal at 1050 cm-1
as a result of C-N
stretching in primary amines
850 900 950 1000 1050 1100 1150 1200 1250
primary aminesC-N stretching
CMS-PH CMS-AP
inte
nsity
wavelength [cm-1]
Fig 57 Raman spectra of CMS-PH and CMS-AP
The isotherm obtained by nitrogen sorption analysis (Fig 58a) shows the typical
pronounced hysteresis at high pressures due to interparticle condensation in
nanopowders The step for the condensation in the templated mesopores is smeared out
RESULTS AND DISCUSSION 43
129
inferring a relatively broad pore size distribution due to the existence of functional
groups inside the pore system Fig 58b shows the bimodal pore size distribution which
is characteristic for mesoporous particles in the scale of about 100 nm
00 01 02 03 04 05 06 07 08 09 100
200
400
600
800
1000
0
200
400
600
800
1000 adsorption desorption
volu
me a
dsorb
ed [
cm
3
g-1
] S
TP
relative pressure p p0
-1
10 100 1000
0000
0005
0010
0015
Dv(d
) [c
m-3
-1
g-1
]
pore diameter []
Fig 58 N2 sorption isotherm and pore size distribution (DFT) of CMS-AP
c) Labeling with Fluorescein Marker
A porous silica nanoparticle is a suitable host for fluorescent markers due to its
chemical and mechanical stability[108]
The encapsulated dye molecule is shielded from
external influences and can be further functionalized with biocompatible elements The
labeling with a fluorescein isothiocyanate (FITC) is a common method in biochemistry
The method was also adopted to silica particles[123]
and recently to mesoporous silica
structures[43]
and even mesoporous silica nanoparticles[47]
The availability of a synthesis recipe for colloidal suspensions with incorporated
aminogroups establishes a basis for the successful linking of a marker during a one-step
synthesis[124]
After the synthesis of a suitable precursor that already carries the
RESULTS AND DISCUSSION 43
130
fluorescence marker it can be incorporated into the above mentioned synthesis
procedure to form labeled colloidal silica particles The successful incorporation of the
dye can be easily verified by adding only fluorescein to a reference sample Both
suspensions are transparent and the exhibit the characteristic color (Fig 59)
Fig 59 CMS-FITC and reference sample with fluorescein
After flocculation and separation of the particles by centrifugation the successful
incorporation of the FITC modified precursor can be verified when the solution above
the sediment is analyzed Only in the case of a successful functionalization it appears
colorless or only pale colored from some FITC residues respectively (Fig 60)
RESULTS AND DISCUSSION 43
131
Fig 60 CMS-FITC and reference sample after centrifugation
The precipitation can be extracted and redispersed in ethanol resulting in translucent
and fluorescent colloidal suspensions of mesoporous silica nanoparticles (Fig 61)
Fig 61 CMS-FITC after extraction and under UV-irradiation
RESULTS AND DISCUSSION 43
132
DLS data confirmed the existence of discrete particles with a comparable particle size
distribution The mean diameter of the particles in the stable colloidal suspension before
and after extraction is around 100 nm
1 10 100 1000
inte
nsity
particle size [nm]
Fig 62 Particle size distribution (DLS) of extracted CMS-FITC
Due to the very small amount of FITC in the synthesis further characterization methods
give no distinct discrepancy to the sample CMS-AP TGA as well as nitrogen sorption
or Raman investigations are very similar
RESULTS AND DISCUSSION 43
133
Fig 63 Dry sample CMS-FITC under UV-irradiation
The dried sample also exhibits the characteristic fluorescence (Fig 63) In order to
investigate the porosity of the sample and the accessibility of the functional group a
simple gas phase reaction can be applied The yellow powder is brominates with
elemental gaseous bromine at normal atmospheric moisture resulting in a red-colored
product carrying now eosin moieties (Fig 64)
Fig 64 Gas phase reaction of CMS-FITC with bromine vapor
RESULTS AND DISCUSSION 43
134
Fig 65 Bromination of fluorescein moieties with gaseous bromine
RESULTS AND DISCUSSION 44
135
44 Vapor-Sensitive Bragg Mirrors and
Optical Isotherms from Mesoporous
Nanoparticle Suspensions
RESULTS AND DISCUSSION 44
136
Introduction
Bragg reflectors are multilayer structures composed of alternating layers of two
dielectric materials with different refractive indices (n) The optical properties of a
Bragg mirror are dependent on the thickness and refractive index of the individual
layers For ideal reflectors all layers exhibit an optical thickness of λ4 The efficiency
increases with the number of layer pairs and the contrast of the refractive indices of the
low and high refracting materials For the preparation of good Bragg mirrors the
individual films have to be homogeneous with smooth surfaces and reproducible
thickness Thus they were often produced by vapor deposition techniques But it is also
possible to assemble Bragg stacks using spin- or dip-coating
Bragg reflectors are also widespread in nature eg in butterfly wings or iridescent
elytra of beetles where chitin layers are alternated with different refractive index layers
in order to control the apparent color in a wide variety of animals[38]
In the laboratory
these special thin films can be prepared for example by alternation of low refractive
SiO2 with high refractive TiO2 films Regarding porous thin films the expected change
of the interference color upon adsorption or desorption of a volatile species suggests a
novel concept for chemical sensing Indeed this sensing effect of porous films has
already been studied in several publications[39-43]
also in combination with the Bragg
stacks[44]
The preparation of sensing Bragg mirrors faces several challenges In order to realize
high quality Bragg mirrors the individual layers have to be very homogeneous Defects
or a high surface roughness in the films would propagate and amplify with each
RESULTS AND DISCUSSION 44
137
additional layer For a high brilliance of the Bragg stack the thickness of the layer has
to be constant across the substrate surface If the stack is to be built from nanoparticle
layers there will be boundary conditions on the optimal size distribution of the
individual particles ie the smaller the nanoparticles are the smoother the film Porous
thin films by their nature have a relatively low refractive index but for intensive colors
the contrast needs to be high For sensing applications one needs two porous layers to
guarantee good pore accessibility normal to the surface of the film Porous SiO2 is a
material with a very low refractive index In Chapter 42 synthesis procedures for the
preparation of colloidal suspensions of functionalized mesoporous silica nanoparticles
with a very small particle size were discussed These colloidal suspensions are ideal
candidates for the production of highly porous homogeneous thin films with a low
refractive index For the high refractive index layer nanoparticulate colloidal titania is a
suitable material The preparation of thin films with porous nanoparticles can have some
advantages over the common EISA approach for mesoporous films and the growth of
zeolite films on substrates respectively a) It is anticipated that the porous thin films
made of randomly oriented (porous) nanoparticles exhibit improved diffusion properties
and a highly accessible pore system[50]
b) It is possible to prepare stable suspensions of
already extracted and characterized nanoparticles thus assuring good reproducibility
and well-characterized sorption properties c) The film thickness can be controlled over
a wide range by varying the particle concentration or the number of coating steps d)
The coating of sensitive substrates is facilitated due to the mild processing conditions
For example intricate or high-temperature template removal procedures between the
RESULTS AND DISCUSSION 44
138
coating steps are not required e) The last-coated layers are located only on top of the
layer structure ndash no soluble precursor constituents may percolate into the already
deposited underlying layer structure Such Bragg mirrors have numerous potential
applications in sensing devices wavelength-selective tunable optical filters in a broad
spectral range and reflective coatings
Experimental
The colloidal suspensions of low refractive index material (CMS-P86 porous SiO2
nanoparticles ndash see Chapter 43) and high refractive index material (CMT-6 TiO2
nanoparticles ndash see Chapter 62) were used for the preparation of thin films The
homogeneous colloidal suspensions contained between 2 and 5 wt solid
nanoparticulate material In order to remove potential inhomogeneities the coating
suspensions were filtered through 02 μm syringe filters prior to deposition The thin
films were deposited on polished silicon wafers or glass plates by spin-coating using a
Laurell WS-400B-6NPP-Lite-AS All substrates were pre-cleaned with ethanol for 5 s
under spinning at 3000 rpm The film thickness was adjusted by diluting the colloidal
suspensions with absolute ethanol by variation of the spinning rate between 3000 and
5000 rpm or by multi step coatings respectively After each deposition the film was
annealed for 10 s in a flow of hot air (heat gun ~ 300 degC) and cooled to room
temperature before measurements were performed and the next layer was added SEM
micrographs were recorded with a JEOL JSM-6500F scanning electron microscope
(SEM) equipped with an Oxford EDX analysis system Ellipsometry measurements
RESULTS AND DISCUSSION 44
139
were performed with a Woollam M2000D at an angle of 75 deg in the spectral range of
190 ndash 1000 nm The data was fitted in the range between 350 ndash 1000 nm using the
Cauchy material as model layer Transmittance and reflectance measurements were
recorded with the same ellipsometer using p-polarized light at 45 deg 75 deg or 90 deg
depending on the sample and the experimental setup In order to record the shift of the
transmitted (angle 90 deg) wavelength due to vapor sorption the films were placed into
quartz cuvettes with gas in- and outlet The recording of isotherms (at 22 degC) was
performed using a homemade Labview-controlled gas mixer Digital mass flow
controllers (W-101A-110-P F-201C Bronkhorst High-Tech) ensured the accurate
dosing of the carrier gas nitrogen and the liquid analyte which was vaporized in a
controlled evaporation and mixing element (W-101A Bronkhorst High-Tech) Partial
pressures (p) were calculated using the van der Waals equation The relative pressure
p p0-1
relates to the saturation pressure p0
Results and Discussion
The colloidal suspensions of CMS-P86 and CMT-6 were used for the stepwise
deposition of multilayer thin films on silicon wafers in order to examine the thickness
optical properties and homogeneity of the resulting stacks (sample BS-1) After each
coating step the sample was analyzed with ellipsometry Once the data was fitted these
layers were not changed in the following data acquisition After the last layer was
deposited the unrestricted fitting of all previous layers did only slightly improve the
quality of the fit This indicates that the previous films are not changing significantly
RESULTS AND DISCUSSION 44
140
upon heating and further deposition The final homogeneous film (BS-1) appeared
golden Fig 66 shows the ellipsometric data for a multilayer stack of 4 thin films
consisting of functionalized mesoporous silica nanoparticles The layers are intercalated
with mesoporous thin films of titania nanoparticles
Fig 66 Experimental ellipsometry data and model fit for a multilayer thin film (BS-1)
at 75 deg in nitrogen atmosphere
The data for the theoretical model stack exactly fits the experimental data The thickness
of the individual layers is reproducible and varies only in a narrow range (eg 135 nm
+- 8 nm in the case of CMS-P86) This ensures a narrow bandwidth in reflection and
transmission respectively Table 6 shows the composition of the multilayer stack
RESULTS AND DISCUSSION 44
141
Table 6 Layer thicknesses of the sample BS-1 determined with ellipsometry
number of layer layer describtion thickness
8 Cauchy 1 127 nm
7 Cauchy 2 74 nm
6 Cauchy 1 129 nm
5 Cauchy 2 76 nm
4 Cauchy 1 135 nm
3 Cauchy 2 73 nm
2 Cauchy 1 143 nm
1 silicon dioxide 2 nm
0 silicon 1 mm
In the model stack shown above the functionalized porous silica as well as the porous
titania layers are fitted using a Cauchy dispersion model for dielectric materials Cauchy
1 represents the silica material and Cauchy 2 stands for the titania layer Due to
inherent porosity of both materials the fitted refractive indices are significantly lower
than for the bulk materials (nD = 127 and 172 compared to 146 for glass and 249 for
anatase) The Bragg stack structure derived from the ellipsometric data was confirmed
with scanning electron microscopy Fig 67 shows side-view micrographs of the Bragg
stack BS-1 The dark layer represents the SiO2 layers which are intercalated by light
TiO2 layers Thus the depth profile obtained with ellipsometry is in good accordance
with the SEM investigations
RESULTS AND DISCUSSION 44
142
Fig 67 SEM pictures (side view) and a depth profile (ellipsometry) of the multilayer
stack BS-1
When exposed to an atmosphere of toluene close to saturation (p p0-1
= 086) the color
of the Bragg mirror immediately changes from yellow to red because the optical
thickness of the individual layers increases due to adsorption of toluene into the pores
This change of the optical properties can be also observed in the reflectance spectra of
BS-1 at an angle of 75deg in a flow of dry nitrogen (solid line) and of toluene-enriched
nitrogen (dotted line) in Fig 68
RESULTS AND DISCUSSION 44
143
Fig 68 Reflectance spectra (75 deg) of BS-1 in dry nitrogen (solid line) and in toluene-
containing nitrogen (p p0-1
= 086 dashed line)
Spectroscopic ellipsometry allows correlating the pore filling to the increase of the
refractive index of the individual layers Fig 69 shows the pronounced change due to
sorption of toluene The exchange of the gaseous nitrogen by liquid toluene inside the
porous multilayer stack significantly influences the refractive index of the individual
films
RESULTS AND DISCUSSION 44
144
Fig 69 Experimental ellipsometry data of BS-1 in nitrogen (solid line) and toluene
atmosphere (p p0-1
= 086 dashed line)
Fitting of the new experimental data is achieved by simply increasing the refractive
index of the layers at constant film thickness Thus the nD values for the silica layer
increases from 127 to 148 and the one of the titania layer from 172 to 193 Fig 70
shows the experimental data and the model fit of BS-1 in gaseous toluene with modified
optical properties The good correlation confirms the theory of filled pores
RESULTS AND DISCUSSION 44
145
Fig 70 Experimental ellipsometry data and model fit for sample BS-1 in toluene
atmosphere (p p0-1
= 086 dashed line)
The total porosity is calculated with ellipsometric porosimetry using the Lorentz-Lorenz
equation It is based on the Clausius-Mossotti equation which describes the relation
between the macroscopic measurable relative dielectric constant and the electric
polarizability α The adsorption of a volatile species in the film changes its refractive
index When the refractive index of the filled and empty porous substrate is known one
can determine the porosity of the material without knowing the refractive index of the
dense material The values are listed in Table 7
RESULTS AND DISCUSSION 44
146
Table 7 Porosity of the layers in BS-1 determined with ellipsometric porosimetry
layer describtion nD
in dry nitrogen
nD
in toluene vapor
nD
toluene
porosity
()
Cauchy 2 (titania)
1718 1925 1496 277
Cauchy 1 (silica) 1266 1476 1496 393
Knowing the optical properties of the materials one can predict the optical properties of
Bragg reflectors with different thicknesses for wavelength-selective coatings The
optical thickness (OT) of the layers is adjusted to one fourth of the desired wavelength
(OT = λ4) Depending on the refractive index of the material the physical thickness of
the film is calculated (OTn) If the Bragg mirror is supposed to reflect the green part of
the light (500 - 550 nm) the optical thickness of the layers should be about 130 nm In
order to observe a color change depending mainly on the low refractive and modifiable
SiO2-layer the titania-layer was chosen thin enough to realize an optical thickness (OT)
outside the visible part of the light (OT lt 100 nm) even in the filled state (refractive
index of the toluene filled layer at 350 nm 193) Table 8 shows the desired and realized
optical properties of the prepared individual layers of a green reflecting Bragg Stack
(BS-2)
RESULTS AND DISCUSSION 44
147
Table 8 Desired and actual layer thicknesses and optical properties of the sample BS-2
modified silica titania
reflected color green UV
selected wavelength range 500-550 nm lt 350 nm
optical thickness ~ 130 nm lt 90 nm
refractive index of filled layer (325 nm) - 193
refractive index (525 nm) 128 -
theoretical film thickness ~ 100 nm lt 47 nm
realized film thickness 102 nm 40 nm
Therefore the concentration of the colloidal suspensions and the spinning rate of the
spin-coater were adjusted in order to realize the preparation of thin films with the above
shown thickness for reflecting green light Single layers of the films were deposited on
silicon wafers in order to examine the thickness before the preparation of the stack was
performed on a glass plate Fig 71 shows the color of the transmitted and reflected light
of the Bragg stack BS-2 The coated transparent glass plate (perpendicular) is
illuminated from the right side with sunlight at an angle about 25 deg The transmitted and
reflected light falling onto the table is complementary Due to the illumination angle
the light is shifted to shorter wavelengths (Braggrsquos law)
RESULTS AND DISCUSSION 44
148
Fig 71 Sample BS-2 reflecting and transmitting sunlight
The desired theoretical reflected wavelength of the Bragg mirror (maximum ~ 525 nm)
was confirmed with transmission measurements Fig 72 shows the transmittance
spectrum at an angle of 90 deg of sample BS-2 The transmittance minimum is at 520 nm
Fig 72 Transmittance spectrum of BS-2 at an incident angle 90 deg
RESULTS AND DISCUSSION 44
149
The coated glass cover plate was placed in a quartz cuvette with gas in- and outlet in
order to follow the change in the reflectance and transmittance colors of the Bragg
reflector after adsorption of gaseous toluene Fig 73 shows the sample in dry nitrogen
atmosphere (above) and in an atmosphere of toluene (p p0-1
= 086) illuminated with
sunlight at an angle of about 45 deg
Fig 73 Wavelength shift due to adsorption of toluene in sample BS-2 (samples in a
quartz cuvette illuminated with sunlight at 45 deg)
The adsorption of toluene increases the optical thickness of the adsorbing layer and thus
drastically changes the reflected as well as the transmitted wavelength This change can
be clearly seen in the transmission spectrum at 45 deg (Fig 74) The transmission
minimum (reflection maximum) changes from about 510 nm (blue) to 590 nm (yellow)
This change happens within seconds when the film is exposed to the gaseous adsorbate
RESULTS AND DISCUSSION 44
150
Fig 74 Wavelength shift of transmitted light at an incident angle of 45 deg due to
adsorption of toluene in sample BS-2
Recording the transmission spectrum (90 deg) at different partial pressures of toluene
resulted in the isotherm shown in Fig 75 The curve resembles a type IV isotherm
typical for mesoporous materials After a relatively steep increase it passes nearly a
plateau at a relative pressure of about 053 before the slope increases again at about
070 The capillary condensation of the mesoporous film occurs at a higher relative
pressure
RESULTS AND DISCUSSION 44
151
Fig 75 Wavelength shift of transmitted light in BS-2 at different relative pressures of
toluene (90 deg incident angle)
Conclusion
Wavelength specific Bragg mirrors could be produced by a simple and reproducible
spin-coating approach These Bragg reflectors show a sensitivity towards specific
relative pressures of organic vapors such as toluene The existence of various colloidal
suspensions of porous nanoparticles opens a wide field of possible functional Bragg
mirrors The functionalization and thus the sorption properties may be varied by
introduction of different organic groups offering different interactions with the
adsorptives (or analytes) of interest The sensitive layer can also be replaced by other
low-refractive index materials such as zeolites The thickness of the individual layers
can be tuned in order to obtain reflectance or transmittance minima or maxima at a
desired wavelength even in the UV or IR region or a combination of different
wavelengths
CONCLUSION AND OUTLOOK
152
5 CONCLUSION AND OUTLOOK
CONCLUSION AND OUTLOOK
153
Colloidal suspensions of various kinds of discrete porous nanoparticles could be
synthesized and additionally functionalized with a multitude of organic groups
Due to the versatile functionalization of porous silica nanoparticles the materials have a
high potential in many applications eg as artificial viruses The pathway of a
fluorescently labeled particle into a cell could be observed with confocal microscopy
Due to the very small particle size the colloidal suspensions are completely transparent
to the visible part of the light Thus the material can be used eg as host material in
spectroscopic investigations Additionally liquid NMR-studies are possible due to the
fast rotation of such small objects in typical solvents The transparency is also
advantageous for the encapsulation of dyes or other materials which may allow one to
disperse otherwise insoluble substances in all kinds of matrices In combination with
sensitive caps the controlled release of drugs or other substances eg of initiators in
polymers constitute interesting topics for further research
Homogeneous colloidal suspensions of very small nanoparticles are of special interest
for the production of thin films by spin-coating on electronic semiconductor devices and
for optical coatings The thin films show very low refractive indices around 12 in the
case of zeolites and functionalized mesoporous silica nanoparticles respectively
The usage of porous nanoparticles has numerous advantages (see introduction in
Chapter 43) Porous titanium dioxide (thin) films may be interesting for the
development of dye-sensitized solar cells Thorough characterization and optimization
of the porosity can help to improve the loading with a dye or the permeation with the
electrolyte
CONCLUSION AND OUTLOOK
154
The ability eg of thiol-functionalized mesoporous silica to adsorb high amounts of
heavy metal ions could be further investigated in thin films Their presence should
influence the optical properties of the thin films
Finally the preparation of chemically sensitive Bragg mirrors using zeolites or other
porous metal oxides is also very promising Due to the usage of nanoparticles the
refractive index of the thin films can be easily adjusted by simply combining colloidal
suspensions of different materials Thus the color change due to adsorption can be
controlled in many respects
APPENDIX 61
155
6 APPENDIX
APPENDIX 61
156
61 Functionalized Mesoporous Silica
Nanoparticles as Host System for the
Synthesis of CdS Quantum Dots
Introduction
Mesoporous materials like MCM-41 can act as molds for the synthesis of structures by
inclusion chemistry in otherwise hardly accessible dimensions Depending on the pore
system the size and shape of the embedded structures can be controlled in a certain
range In the past many different nanoclusters such as Ge[125]
Fe2O3[126]
or
semiconducting GaAs[127]
have been synthesized within the channels The main
interesting features of semiconductor nanocrystals or quantum dots (QD) derive from
their atom-like electronic structure This atom-like electronic structure is a result of the
confinement of the electrons in all three spatial directions when very small sizes -
typically between 2 and 10 nm - are realized In contrast to atoms the energy spectrum
of a quantum dot can be engineered by controlling the geometrical size shape and the
strength of the confinement potential Quantum dots show unique properties concerning
their interaction with light Their high quantum yield and the possibility to tune the size
and thus the spectrum of quantum dots is advantageous for many applications
However it is sometimes difficult to benefit from these features because QDs are
APPENDIX 61
157
difficult to handle Depending on the desired application the QDs have to be
functionalized with specific shell molecules for example for in vivo optical
imaging[128]
or they have to be embedded in specific matrix materials when used with
high optical efficiency[129]
A striking example for a possible application of QDs is the utilization in a so called
Graumltzel or electrochemical solar cell (ECS)[130]
Until now commercially available
systems of that new kind of solar cell use TiO2 crystals in combination with dyes in
order to convert photons into excitons (electron-hole pairs) and realize charge
separation Quantum-dot sensitized mesoporous TiO2 features several advantages
compared to the standard electrochemical solar cell like a better optical tenability and
stability[131]
Common II-VI semiconductor nanoclusters include cadmium
chalcogenides eg cadmium sulfide or telluride The emission wavelength depends on
the diameter of the dots[132]
The desired size range coincides with the typical pore size
of the MCM-41-like mesoporous silica materials The typical synthesis of
semiconductor nanoclusters in the channels of mesoporous materials has been shown
following surface modification of the materials[133]
After functionalization eg with
thiol groups a dissolved cadmium salt is absorbed The resulting sample can be reacted
with a chalcogenide source eg H2S gas forming nanometer sized quantum dots or
wires inside the pores As discussed before the functionalized silica materials can also
be synthesized as nanoparticles These colloidal silica particles are of great interest for
several optical and biological applications The combination with a water-based
synthesis of cadmium chalcogenide nanocrystals promises large cost advantages
APPENDIX 61
158
compared to commonly synthesized quantum dots with organic stabilizing agents[134]
Here we describe the attempt to prepare CdS quantum-dots inside the pores of
mesoporous silica nanoparticles retaining the colloidal nature of the suspensions
Experimental
All chemicals were reagent grade (98 or higher) purchased from Sigma-Aldrich and
used without further purification The water was deionized The synthesis was carried
out in open polypropylene (PP) bottles
MS-1 host
The synthesis of MS-1 followed a method published by Gruumln et al[135]
24 g
cetyltrimethylammonium bromide (CTAB 66 mmol) were dissolved in 120 ml
deionized water in a 250 ml PP-bottle 95 g of ammonia solution (25 140 mmol
NH3) and 10 ml EtOH were added and the solution was stirred for 10 min After the
addition of 10 g tetraethoxysilane (TEOS 48 mmol) a white precipitate was formed and
the suspension was stirred for 1 h The product was recovered by filtration and washed
with water and EtOH
MS-SH host
Thiol-functionalized mesoporous silica was synthesized similarly in a co-condensation
process 24 g cetyltrimethylammonium bromide (CTAB 66 mmol) were dissolved in
120 ml deionized water in a 250 ml PP-bottle 95 g of ammonia solution (25
APPENDIX 61
159
140 mmol NH3) and 10 ml EtOH were added and the solution was stirred for 10 min
After the addition of a mixture of 85 g tetraethylorthosilicate (TEOS 41 mmol) and
163 g mercaptopropyltrimethoxysilane (MPTMS 83 mmol) a white precipitate was
formed and the suspension was stirred for 1 h The product was recovered by filtration
and washed with water and EtOH
Extraction of template from the bulk mesoporous hosts
For extraction of the template the product was suspended in 250 ml of an ethanolic
solution of ammonium nitrate (20 g l-1
) The mixture was refluxed under vigorous
stirring for 1 h and then filtrated The procedure was repeated with 250 ml of an
ethanolic solution of concentrated hydrochloric acid (5 g l-1
) The white filter cake was
washed with ethanol and dried at 60 degC
CMS-SH host
Colloidal mesoporous silica with thiol groups was synthesized following a published
procedure[99]
143 g (960 mmol) triethanolamine (TEAH) and a mixture of 223 ml
(100 mmol) TEOS plus 38 ml MPTMS (20 mmol) were combined in a 500 ml PP-
bottle with lid The two-phase mixture was heated in an oil bath at 90 degC for 20 min
without stirring Immediately after taking the mixture out of the oil bath 267 g of an
aqueous solution (25 wt ) of CTAC which had been heated to 60 degC was added and
the final mixture was stirred for at least 3 h at 23 degC
APPENDIX 61
160
Extraction of template from the colloidal mesoporous host
Extraction of template was performed by adding 250 ml of ethanol to the translucent
colloidal aqueous suspension of the mesoporous material The resulting precipitate was
centrifuged for 10 min at 40000 g (RCF) After decanting the sediment was
redispersed through vigorous stirring in 250 ml of an ethanolic solution of ammonium
nitrate (20 g l-1
) and then refluxed for 1 h This procedure was repeated with a 250 ml of
a solution of concentrated hydrochloric acid in ethanol (5 g l-1
) After washing with pure
ethanol the transparent gelatinous cake obtained after centrifugation could be
redispersed in ethanol leading to a colloidal suspension of the extracted product
CMS-SO3H host
The oxidation of the thiol groups in CMS-SH to sulfonic acid was performed with
concentrated hydrogen peroxide (33 ) before template extraction Hydrogen peroxide
(120 ml) was added to 25 g (calculated dry weight) of the wet sample CMS-SH and
stirred for 24 h at room temperature After oxidation the sample was washed first in
HCl-ethanol and subsequently in pure ethanol (CMS-SO3H-EtOH) or water (CMS-
SO3H-water) respectively
Incubation with Cd (II)
The amount of 10 ml of a 01 M solution of Cd(NO3)2 in ethanol or water respectively
were added to 2 g of mesoporous silica host (dry weight or calculated dry weight in the
case of colloidal suspensions) and stirred for 2 h The product was recovered by
APPENDIX 61
161
filtration or centrifugation and washed with ethanol or water ( sample-Cd-EtOH
sample-Cd-water)
Reaction with hydrogen sulfide
The ethanolic or aqueous suspensions of the corresponding products obtained after the
incubation with Cd(II) were treated with gaseous hydrogen sulfide as follows
FeS was slowly dissolved with 2 M hydrogen chloride and the developing H2S was
bubbled through the suspensions in a flow of nitrogen using the apparatus shown in Fig
76 Excessive H2S was eliminated in two washing bottles containing concentrated
aqueous NaOH or 2 M aqueous Cu(NO3)2 ( sample-CdS)
Fig 76 Setup for the reaction with hydrogen sulfide
Alternatively dry powder of the Cd(II)-containing mesoporous silica was exposed to
dry H2S atmosphere by connecting a CaCl2-column before the reaction vessel
APPENDIX 61
162
Characterization
Dynamic light scattering (DLS) data were collected with an ALV-NIBSHPPS High
Performance Particle Sizer in PMMA cuvettes at 25 degC Raman spectroscopy was
performed with a He-Ne laser (633 nm) on a LabRAM HR UV-Vis (HORIBA Jobin
Yvon) Raman Microscope (Olympus BX41) equipped with a Symphony CCD detection
system The spectra were baseline-corrected For thermogravimetric analysis (TGA)
10 mg of dry powder were heated in corundum crucibles from 30 to 900 degC
(10 degC min-1
) in a flow of synthetic air (25 ml min-1
) using a Netzsch STA 449 C Jupiter
thermobalance X-ray diffraction pattern were recorded on a Scintag Inc XDS 2000 in
theta-theta geometry (Cu-Kα1 λ=15406 Aring Cu-Kα2 λ=15444 Aring)
Transmission electron microscopy (TEM) was carried out on JEOL JEM 2011
instrument with LaB6 cathode at 200 kV Samples were prepared on a Plano holey
carbon coated copper grid by evaporating one droplet of diluted ethanolic suspension of
the extracted material The nitrogen sorption isotherms (77 K) were obtained using a
Quantachrome NOVA 4000e Surface Area amp Pore Size Analyzer Surface area
calculations were made using the Brunauer-Emmett-Teller (BET) equation in the range
from p p0-1
= 005 - 025 Pore-size distributions were determined using the DFT-
method (NLDFT equilibrium model cylindrical pores N2 on oxygen) The pore volume
was determined for meso- and micropores at p p0-1
lt 08
APPENDIX 61
163
Results and Discussion
Fig 77 shows the XRD patterns for the prepared bulk samples with (a) and without (b)
mercaptopropyl groups After template extraction the peaks become more pronounced
The typical reflection peak for such mesoporous materials can be observed at about 2 deg
(2θ) for the pure siliceous material (MS-1) and 23 deg for the functionalized one (MS-
SH) In the sample with thiol groups the reflections are less intense and shifted to
higher values This can be explained with the smaller pore size in combination with a
higher degree of disorder in the functionalized materials synthesized via co-
condensation
1 2 3 4 5 6 7
MS-1 extracted MS-1 with template
inte
nsity
2 [degrees]
1 2 3 4 5 6 7
MS-SH extracted MS-SH with template
inte
nsity
2 [degrees]
Fig 77 XRD powder pattern of pure siliceous and functionalized mesoporous bulk
material after drying and extracting
These two observations are naturally more pronounced when looking at dry powder of
functionalized mesoporous nanoparticles (Fig 78) Characterization of the colloidal
suspensions of mercaptopropyl functionalized nanoparticles is described in Chapter 42
APPENDIX 61
164
1 2 3 4 5 6 7
CMS-SH extracted CMS-SH with template
inte
nsity
2 [degrees]
Fig 78 XRD powder pattern of colloidal functionalized mesoporous silica (CMS-SH)
after drying and extraction
Sorption measurements (Fig 79) confirmed the successful extraction of the template
and the availability of highly porous materials
00 01 02 03 04 05 06 07 08 09 10
0
200
400
600
adsorption desorptionv
olu
me a
dsorb
ed [
cm
3
g-1
] S
TP
relative pressure p p0
-1
Fig 79 N2 sorption isotherm of extracted MS-1
APPENDIX 61
165
Incubation with Cd(II)
Evaluation of the thermogravimetric analysis data resulted in an estimated weight loss
of 190 mg mercaptopropyl residues per gram for MS-SH as well as for CMS-SH Using
the molar weight of 75 g mol-1
for these mercaptopropyl-residues resulted in a
calculated concentration of 25 mmol thiol per g material (ignoring residual template)
The more conclusive elemental analysis showed a sulfur content of 6 in weight
Using the molar weight of sulfur (32 g mol-1
) results in a concentration of 187 mmol
thiol per g silica Based on an average value of 2 mmol g-1
and the assumption that one
Cd2+
ion coordinates to two thiolates the maximum of adsorbed cadmium ions should
not exceed 1 mmol per g functionalized silica The usage of a great excess (5 mmol g-1
)
in the treatment with Cd(II) should ensure the coordination of every accessible thiol
group
TGA measurements after incubation and washing showed a successful loading with the
heavy metal ions The relative weight loss in percent caused by the decomposition of
the organic residues is lower in the material loaded with Cd2+
(Fig 80)
APPENDIX 61
166
100 200 300 400 500 600 700 800 900
-25
-20
-15
-10
-5
0
MS-SH-Cd MS-SH
weig
ht
loss [
]
temperature [iexclC]
Fig 80 TGA data of extracted MS-SH before and after loading with Cd(II)
A further indication for a successful coordination to the thiol groups is the decrease of
the pH-value when the cadmium salt is added to the suspensions of extracted MS-SH
The Cd2+
-ions replace the protons when coordinating to the SH-groups resulting in a
higher acidity Fig 81 shows that the pH-value of the suspension (35) decreases
significantly to 24 after addition of the aqueous cadmium salt solution (pH = 56)
0
1
2
3
4
5
6
24
35
56
MS
-SH
in
H2O
co
mb
ine
d
Cd
(NO3
)2 in
H2O
+
pH
Fig 81 Increase of the acidity caused by the coordination of Cd2+
in MS-SH
APPENDIX 61
167
Deprotonation of the SH-groups can also be observed in Raman measurements Fig 82
shows the spectra before and after insertion of cadmium ions in MCM-SH The
characteristic S-H-stretching at 2580 cmminus1
lost most of its intensity after the adsorption
of cadmium ions
500 1000 1500 2000 2500 3000 3500 4000
MS-SH-Cd MS-SH
inte
nsity
wavelength [cm-1]
Fig 82 Raman spectra of MS-SH before and after incubation with Cd2+
ions
Oxidation of CMS-SH
After the first adsorption experiments with cadmium salts in colloidal suspensions of
thiol-functionalized mesoporous silica it emerged that the particles tend to agglomerate
irreversibly
The selective oxidation of the external SH-groups into sulfonic acid groups (-SO3H)
was believed to solve the aggregation problem This modification should have been
achieved with hydrogen peroxide in combination with template-filled material The
APPENDIX 61
168
conversion of thiol groups in mesoporous silica nanoparticles into sulfonic acid with
hydrogen peroxide is proven[99]
Apparently the strength of the H2O2 and the reaction time were sufficient to oxidize all
thiol groups ndash also those inside the pore system Probably the organic template is
decomposed[136]
while the functional head of the organic residue is only converted into
sulfonic acid The completeness of the thiol oxidation can be observed in Raman
spectra Before the reaction with hydrogen peroxide the typical signals of the thiol
groups appear at 2580 cm-1
and 650 cm-1
These peaks completely disappear after the
treatment with H2O2 and instead a new one occurs at 1050 cm-1
(sulfonate stretching)
The signals for the aliphatic propyl groups around 2900 cm-1
are retained (Fig 83)
500 1000 1500 2000 2500 3000 3500 4000
CMS-SO3H
inte
nsity
wavenumber [cm-1]
CMS-SH
Fig 83 Raman-spectra before and after oxidation of CMS-SH with hydrogen peroxide
The coagulation of the particles after Cd(II)-salt addition could be avoided by oxidation
of the thiol groups The suspensions showed the same particle size distribution after
incubation with cadmium salts
APPENDIX 61
169
In order to further verify the effective coordination of heavy metal ions to the functional
groups equivalent amounts of the cadmium salt are introduced to the aqueous or
ethanolic suspensions of
pure siliceous bulk material (MS-1-Cd)
functionalized bulk material (MS-SH-Cd)
colloidal suspensions of functionalized material (CMS-SH-Cd)
colloidal suspensions of oxidized functionalized material (CMS-SO3H-Cd)
After washing the material the cadmium content was investigated with elemental
analysis As seen in Fig 84 the amount of incorporated cadmium found in the thiol
functionalized materials is significantly higher compared to the pure silica The amount
additionally depends on the solvent The remaining amount is higher when the loading
and washing is performed with ethanol Colloidal suspensions and suspension
containing bulk material adsorb comparable amounts Interestingly the suspension
containing the nanoparticles with sulfonic acid groups also adsorbs a considerable
amount of heavy metal ions - and the colloidal particles do not coagulate
APPENDIX 61
170
0 2 4 6 8 10
CMS-SH-Cd EtOH
MS-SH-Cd EtOH
CMS-SO3H-Cd EtOH
CMS-SH-Cd water
MS-SH-Cd water
MS-1-Cd water
MS-1-Cd EtOH
sam
ple
Cd2+
[wt - ICP]
Fig 84 Amount of Cd2+
in the different suspensions found with elemental analysis
Reaction with hydrogen sulfide
After the successful loading of the cadmium ions into the mesoporous hosts the
materials were exposed to gaseous hydrogen sulfide The aqueous as well as the
ethanolic suspensions immediately turned yellow upon bubbling with H2S Only if the
CdS is present as bulk material - or at least not as quantum dots - it shows its
characteristic bright yellow color The expected nanoparticles inside the pore system
should be colorless and fluorescent under UV-irradiation Fig 85 shows an image of
CMS-SO3H-CdS with the typical yellow color of bulk cadmium sulfide The colloidal
nature of the suspension with an average particle diameter of 170 nm is preserved
APPENDIX 61
171
1 10 100 1000 10000
inte
nsity
diameter [nm]
Fig 85 Image and DLS data of CMS-SO3H-CdS in ethanol after loading with Cd2+
and
reaction with H2S
Probably the initially formed CdS-clusters are very mobile in water or ethanol and tend
to leave the pore system in order to create larger particles on the surface of the
mesoporous hosts or in solution Even the supposedly dry powder (MS-SH-Cd) in H2S
atmosphere showed this yellow color after a few seconds Presumably the moisture
present with the development of hydrogen sulfide is problematic because it enhances the
mobility of the sulfide species involved Therefore the H2S was dried in a CaCl2-
column before it was reacted with the completely dry material (MS-SH-Cd) No change
in color could be observed under these conditions However after addition of water the
white powder instantly turned yellow (Fig 86) This observation supports the proposed
high mobility of initially formed CdS species
APPENDIX 61
172
Fig 86 MS-SH-Cd after exposure to dry H2S (A) and after addition of water (B)
Powder X-ray diffraction
Fig 87 shows the XRD pattern of CMS-SO3H-CdS in combination with the expected
diffraction pattern of bulk CdS material The peaks are significantly broadened
indicating the existence of small crystallites
20 30 40 50 60 70
CMS-SH-CdS
inte
nsity
2 [degrees]
Fig 87 Powder diffraction pattern of CMS-SO3H-CdS
APPENDIX 61
173
Applying the Scherrer equation allows approximating the average particle size For this
purpose the full width at half maximum (FWHM) of a peak at a certain angle (2θ) is
determined Here the instrumental broadening is neglected and the value of 094 was
chosen for the Scherrer constant K
cos
FWHM
KD
In combination with the wavelength of the Cu-Kα radiation (λ = 0154 nm) and a
FWHM of 0014 (radian measure) at 2θ = 44deg or θ = 22deg respectively an average
particle diameter D of approximately 11 nm can be calculated Thus the particles are
much too big to fit into the 3 nm pores
TEM-micrographs of the same sample show the monodisperse spherical particles with a
star-shaped pore system As expected from XRD measurements there is no evidence for
the existence of CdS particles inside the pores Instead a few dense particles in the
dimensions of about 10 nm can be found beside the porous silica particles (Fig 88)
APPENDIX 61
174
Fig 88 TEM-micrographs of CMS-SO3H-CdS
As mentioned above the colloidal suspension had a bright yellow color Interestingly
this coloration became less intense with time and nearly disappeared after 10 days The
suspension showed a pink fluorescence under UV-irradiation (Fig 89)
Fig 89 CMS-SO3H-CdS after 10 days (left) shows fluorescence under UV-light (right)
APPENDIX 61
175
Presumably the initially 11 nm-sized CdS particles slowly dissolved and temporarily
had the appropriate size to show fluorescence The undefined pink fluorescence may
derive from a rather diversified size distribution of the CdS clusters Two days later the
fluorescence disappeared
Conclusion
The aim of the project was to use the existent colloidal suspensions of functionalized
mesoporous silica nanoparticles as host system for the synthesis of CdS quantum dots
It was possible to load these porous particles with a high amount of heavy metal ions
preserving the colloidal state However when introducing the hydrogen sulfide it
appears that the initially formed CdS species inside the pores are very mobile and that
they can easily leave the pore system to form larger clusters at the outer surface of the
mesoporous particles or in the solvent They are not stabilized in the confined space as
desired It is imaginable that the synthesis could be successful with other solvents or
reagents
APPENDIX 62
176
62 Colloidal Suspensions of TiO2
Nanoparticles for the Preparation of
Porous Thin Films
Introduction
Titania exists in a number of crystalline forms of which the most important are anatase
and rutile It is inert does hardly react with other materials and is thermally stable non-
flammable and non-toxic TiO2 is the most widely used white pigment because of its
brightness and very high refractive index (n = 24) As effective opacifier in powder
form it is employed as a pigment to provide whiteness and opacity to products such as
glass and porcelain enamels cosmetics sunscreens paper paints and foods
Titanium dioxide particularly in the anatase form is a photocatalyst under ultraviolet
light The strong oxidative potential of the positive holes oxidizes water to create
hydroxyl radicals and the holes can also oxidize organic materials directly Titanium
dioxide is thus added to paints cements or directly coated as protective thin film onto
the desired surface When deposited as a thin film its high refractive index makes
titania an excellent reflective optical coating for dielectric mirrors A further important
application is the utilization as semiconducting layer in dye-sensitized solar cells
(DSSC)[130]
In these so-called Graumltzel cells nanoparticulate layers or homogeneous
APPENDIX 62
177
mesoporous films can potentially offer great improvements Their high surface areas
allow a high loading with dye For an efficient operation the titania layer should have a
highly accessible pore system Thus it is important to obtain the material as discrete
nanoparticles in colloidal suspensions The synthesis of titanium dioxide particles at the
nanometer scale can be achieved by several methods such as pyrolysis or sol-gel
chemistry[137]
In the last years several studies on the synthesis of mesoporous titania which should
exhibit a higher specific surface area than the nanoparticles were published Most of the
experiments are based on the synthesis of mesoporous silica for example the synthesis
procedure described by Amoros[138]
which uses a complexing agent in order to retard
the hydrolysis of the titaniumalkoxide Due to fundamental differences in hydrolysis
and condensation behavior as well as template interaction it turned out that the
principles used for the synthesis and extraction of mesoporous silica cannot be adopted
easily The main difficulty is the removal of the template either by extraction or
calcination In the latter case collapsing of the pore system due to the formation of large
crystalline domains is one reason
The preparation of mesoporous titanium dioxide in nanoparticulate form is also
frequently claimed[139 140]
For the preparation of thin films via spin-coating the
existence of discrete mesoporous particles in a homogeneous colloidal suspension is
necessary but the focus of the research is often on other objectives like a high
crystallinity or stability[140 141]
APPENDIX 62
178
The preparation of mesoporous titania in the form of thin films with the EISA approach
is well-investigated[20]
This recipe was also adopted for the synthesis of bulk material
by slowly evaporating the solvent[142 143]
Although the synthesis of homogeneous
mesoporous TiO2 thin films following the EISA-approach is practical the formation
from nanoparticles might be advantageous in some respects As already mentioned in
Chapter 43 it is believed that such films might exhibit improved diffusionial access
Additionally one can work with a stable suspension of already extracted and
characterized nanoparticles thus ensuring good reproducibility The coating of sensitive
substrates is facilitated due to the mild conditions and the thickness can be easily
controlled by varying the concentration or by multiple step coating As a further
treatment such as extraction or calcination is no longer necessary sensitive substances
eg dyes can already be added to the coating suspensions Finding an appropriate
titania precursor is the first challenge in titania sol-gel chemistry as the hydrolysis of
the titanium precursors is typically much faster than that of the silica analogues
Common precursors are titanium alkoxides and complexes eg
titanium(IV)bis(acetylacetonate)diisopropoxide or titanium(IV)(triethanolaminato)
isopropoxide The aim of this work was the preparation of homogeneous porous thin
films from TiO2 nanoparticles by a facile and reproducible spin-coating approach
APPENDIX 62
179
Experimental
CMT-1 CMT-1A
The amount of 244 g hexadecyltrimethylammonium bromide (CTAB 67 mmol) and
633 g titanium(IV) (triethanolaminato) isopropoxide (TiTEAiOPr 80 in isopropanol
20 mmol) were combined at room temperature and mixed with 60 ml water under
stirring Precursor and template were completely dissolved and stirred for 24 hours at
room temperature The initially clear solution started to become opalescent after about
2 hours One half of the final colloidal suspension was centrifuged and the sediment was
washed 3 times and then redispersed in water (CMT-1) The other half was autoclaved
at 100 degC for 24 hours and then washed and redispersed (CMT-1A) Parts of the
material were calcined (CMT-1-c CMT-1A-c) at 350 degC for 3 h (1 K min-1
) or
extracted (CMT-1-e CMT-1A-e) as described in Chapter 42
CMT-2
The experiment above was repeated at 50 degC without autoclaving
CMT-3
The amount of 20 g TiTEAOiPr (80 in isopropanol 63 mmol) was added to a
preheated (60 degC) solution of 05 g hexadecyltrimethylammonium chloride and 620 g
water under stirring The mixture was kept at 60 degC and stirred for 2 h The final
colloidal suspension was centrifuged and the sediment was washed 3 times and then
redispersed in water
APPENDIX 62
180
CMT-4
The amount of 276 g concentrated hydrochloric acid (37 ) was added to a solution of
568 g tetraisopropylorthotitanate and 10 g EtOH A mixture of 116 g
hexadecyltrimethyl-ammonium bromide (CTAB) in 84 g EtOH and 438 g dest H2O
were added and the clear solution was refluxed under stirring for 6 h while slowly
forming a white suspension The suspension was diluted with 20 ml EtOH centrifuged
for 30 min at 40000 g (RCF) and redispersed in a mixture of 20 ml EtOH and 2 g dest
H2O Centrifugation and redispersion in pure ethanol was repeated twice leading to a
colloidal suspension of TiO2 nanoparticles For characterization of the material a part of
the suspension was dried at 60 degC
CMT-5
The amount of 276 g concentrated hydrochloric acid (37 ) was added to a solution of
568 g tetraisopropylorthotitanate and 184 g EtOH The amount of 438 g dest H2O
was added and the clear solution was refluxed under stirring for 6 h while slowly
forming a white suspension The suspension was diluted with 20 ml EtOH centrifuged
for 30 min at 40000 g (RCF) and redispersed in a mixture of 20 ml EtOH and 2 g dest
H2O Centrifugation and redispersion in pure ethanol was repeated twice leading to a
colloidal suspension of TiO2 nanoparticles For characterization of the material a part of
the suspension was dried at 60 degC
APPENDIX 62
181
CMT-6
The amount of 552 g concentrated hydrochloric acid (37 ) was added to a solution of
1136 g tetraisopropylorthotitanate and 368 g EtOH The amount of 876 g dest H2O
was added and the clear solution was refluxed under stirring for 6 h while slowly
forming a white suspension
The suspension was diluted with 20 ml EtOH and peptized with 1 ml water before it
was centrifuged for 5 min at 40000 g (RCF) in order to remove big agglomerates The
supernatant suspension was flocculated with 20 g hydrochloric acid and after
centrifugation the sediment was redispersed in a mixture of 20 ml EtOH and 2 g dest
H2O This washing procedure was repeated once
APPENDIX 62
182
Thin film preparation
The colloidal suspensions of CMT-6 contained about 3 wt titaniumdioxide The
ethanolic suspension can be used directly for the preparation of thin films by spin-
coating The thin films were deposited on polished silicon wafers or QCM chips (XA
1600 AT-cut KVG Quartz Crystal Technology) by spin-coating using a Laurell WS-
400B-6NPP-Lite-AS All substrates were pre-cleaned with ethanol for 5 s under
spinning at 3000 rpm The film thickness was adjusted by diluting the colloidal
suspensions with absolute ethanol by variation of the spinning rate between 3000 and
5000 rpm and by multi step coatings
Characterization
Dynamic light scattering (DLS) data were collected with a Malvern Nano ZS in PMMA
cuvettes at 25 degC Raman spectroscopy was performed with a He-Ne laser (633 nm) on
a LabRAM HR UV-Vis (HORIBA Jobin Yvon) Raman Microscope (Olympus BX41)
equipped with a Symphony CCD detection system The spectra were baseline-corrected
For thermogravimetric analysis (TGA) 10 mg of dry powder were heated in corundum
crucibles from 30 to 900 degC (10 degC min-1
) in a flow of synthetic air (25 ml min-1
) using
a Netzsch STA 449 C Jupiter thermobalance X-ray diffraction pattern were recorded on
a Scintag Inc XDS 2000 in theta-theta geometry (Cu-Kα1 λ = 15406 Aring Cu-Kα2
λ = 15444 Aring) Transmission electron microscopy (TEM) was carried out on a JEOL
JEM 2011 instrument with LaB6 cathode at 200 kV Samples were prepared on a Plano
holey carbon coated copper grid by evaporating one droplet of diluted ethanolic
APPENDIX 62
183
suspension of the extracted material The nitrogen sorption isotherms (77 K) were
obtained using a Quantachrome NOVA 4000e Surface Area amp Pore Size Analyzer
Surface area calculations were made using the Brunauer-Emmett-Teller (BET) equation
in the range from p p0-1
= 005 - 025 Pore-size distributions were determined using the
DFT-method (NLDFT equilibrium model cylindrical pores N2 on oxygen) The pore
volume was determined for meso- and micropores at p p0-1
lt 08 Ellipsometry
measurements were performed with a Woollam M2000D at an angle of 75deg in the
spectral range of 190 - 1000 nm The data was fitted in the range between 350 ndash
1000 nm using the Cauchy material as model layer Ellipsometric porosimetry
measurements were carried out in a liquid cell at different partial pressures at a
measurement angle of 75 deg The recording of isotherms was performed using a
homemade Labview-controlled gas mixer Digital mass flow controllers (W-101A-110-
P F-201C Bronkhorst High-Tech) ensured the accurate dosing of the carrier gas
nitrogen and the liquid analyte which was vaporized in a controlled evaporation and
mixing element (W-101A Bronkhorst High-Tech) Partial pressures were calculated
using the van der Waals equation with real gas-state assumptions
(QCM) A 10 MHz Quartz Crystal Microbalance (QCM) device (XA 1600 AT-cut
KVG Quartz Crystal Technology) was used to measure frequency changes due to
additional adsorbed mass Some parameters of the Sauerbrey equation such as the
density ρq = 2648 gmiddotcm-3
and the shear modulus υq = 2947middot1011
gmiddotcm-1
middots-2
are
characteristics of the piezoelectric material quartz The Sauerbrey equation is
normalized to 1 cm2 sensing area on the QCM chip thus a frequency change of 1 Hz
APPENDIX 62
184
corresponds to a mass-loading of 442middot10-9
g The overall frequency fluctuation of the
system is plusmn1-2 Hz at room temperature
Results and Discussion
The first experiments (not shown) were inspired by the synthesis of mesoporous silica
nanoparticles described in Chapter 42 The pretreatment of the titaniumalkoxide with
triethanolamine at elevated temperature resulted in yellowish clear solutions which
slowly hydrolyzed in water compared to the titaniumalkoxides In the reactions shown
here the commercially available complexed precursor titanium(IV) (triethanolaminato)
isopropoxide was used
After hydrolysis the resulting colloidal suspension CMT-1 contained discrete particles
with an average hydrodynamic diameter (DLS) of almost 1 μm after washing (Fig 90)
APPENDIX 62
185
10 100 1000 10000
inte
nsity
diameter [nm]
Fig 90 DLS particle size distribution of washed CMT-1
The powder diffraction pattern (Fig 91) of the dry product shows a weak reflection at
23 deg (2 θ) which is typical for CTMA+ templated mesopores (Fig 77 Chapter 61)
1 2 3 4 5 6 7 8 9 10
max = 23iexcl
inte
nsity
2 (degree)
Fig 91 Powder diffraction pattern of the washed sample CMT-1
Although the material seems to possess a certain mesostructure TEM investigations
(Fig 92) could not confirm the existence of mesopores The material possibly exhibits a
fibrous structure but it was not further analysed
APPENDIX 62
186
Fig 92 TEM-micrographs of the washed sample CMT-1
The particles appear anisotropic with an irregular particle size distribution At higher
magnification an undefined mesostructure in the material can be observed However it
is not clear if this structure formed as a result of adding the template Therefore the
washed product was subjected to an extraction procedure and the weight loss before and
after this treatment was determined with TGA (Fig 93)
100 200 300 400 500 600
-60
-50
-40
-30
-20
-10
0 CMT-1 extracted
CMT-1 washed
weig
ht lo
ss [
]
temperature [degC]
Fig 93 Thermogravimetric analysis of washed and extracted sample CMT-1
APPENDIX 62
187
Heating of the washed product caused two distinct steps in the weight loss The first one
at about 250 degC could be assigned either to the template decomposition or further
condensation under elimination of alkoxygroups The second step at higher
temperatures between 400 and 500 degC might be due to complexing triethanolamine
residues After extraction the weight loss is much lower ndash but it cannot be assured that
the material is completely extracted mesoporous titania
Elimination of the template should also be achieved after heating to 300 degC Calcination
at temperatures up to 350 degC is also claimed in several publications [144]
Both materials
ndash extracted (CMT-1-e) and calcined (CMT-1-c) - were investigated by XRD (Fig
94)The initial reflection at 23 deg and thus the mesostructure completely disappeared
after the treatment
10 15 20 25 30 35 40 45 50
inte
nsity
2 [degree]
10 15 20 25 30 35 40 45 50
inte
nsity
2 [degree]
Fig 94 XRD pattern of (a) calcined (CMT-1-c) and (b) extracted (CMT-1-e) material
Nitrogen sorption analysis also suggests the absence of ordered mesopores in both
materials (Fig 95) The isotherms are typical for an ink-bottle type pore system but the
difference in the adsorption and the desorption step argue against pore channels with a
APPENDIX 62
188
defined diameter The BET-surface areas of the calcined and extracted material are
80 m2 g
-1 and 200 m
2 g
-1 respectively One would expect a significantly higher specific
surface area in ordered mesoporous titania even though it can not reach the value of a
comparable mesoporous silica due to the higher density of TiO2
The DFT-pore size distribution was not calculated because no appropriate model is
available at this time As expected from the isotherm a BJH pore size calculation
regarding the adsorption branch gives a rather undefined and meaningless distribution
00 01 02 03 04 05 06 07 08 09 10
0
20
40
60
80
100
adsorption
desorption
volu
me a
dsorb
ed [cm
3 g
-1] S
TP
relative pressure p p0
-1
00 01 02 03 04 05 06 07 08 09 100
10
20
30
40
50
60
70
adsorption
desorption
vo
lum
e a
dso
rbe
d [cm
3 g
-1] S
TP
relative pressure p p0
-1
Fig 95 N2-isotherms of extracted (CMT-1-e) and calcined (CMT-1-c) samples
In order to improve the condensation of the inorganic material and possibly an enhanced
debonding of the complexing triethanolamine the synthesis was repeated at an elevated
temperature The reaction at 50 degC resulted only in minor improvements for example a
more pronounced reflection at about 23 deg in x-ray diffraction (Fig 96)
APPENDIX 62
189
1 2 3 4 5 6 7 8 9 10
inte
nsity
2 [degrees]
Fig 96 Powder diffraction pattern of CMT-2
The particle size distribution in DLS as well as TGA data and sorption analysis showed
no significant difference or improvement In a further attempt to improve the
condensation and debonding of triethanolamine the suspension of CMT-1 was
autoclaved at 100 degC after synthesis Again the peaks in the XRD powder pattern were
more intensive and even showed higher-order reflections at 46 deg and 69 deg (Fig 97)
1 2 3 4 5 6 7 8 9 10
max 23 deg 46 deg 69 deg
inte
nsity
2 [degree]
Fig 97 Powder diffraction pattern of CMT-1A autoclaved at 100 degC
APPENDIX 62
190
The positions of the reflections indicate the existence of a lamellar structure This
structure is believed to be the thermodynamically more stable one The results in
transmission electron microscopy (Fig 98) could only confirm the expected lamellar
structure
Fig 98 TEM-micrograph of CMT-1A autoclaved at 100 degC
As expected for lamellar systems template removal resulted in a loss of the
mesostructure as shown in XRD patterns in Fig 99
APPENDIX 62
191
10 15 20 25 30 35 40 45 50
inte
nsity
2 [degree]
10 15 20 25 30 35 40 45 50
inte
nsity
2 [degree]
Fig 99 Powder diffraction pattern of the (a) calcined (CMT-1A-c) and (b) extracted
(CMT-1A-e) material
The combination of solid template (CTAB) and titania precursor might be
disadvantageous for the formation of nanoparticles Thus in further experiments an
aqueous solution of the template was prepared and heated before the slowly
hydrolyzing precursor was added (CMT-3) After hydrolysis at elevated temperature
(60 degC) a homogeneous colloidal suspension with a narrow particle size distribution
was obtained (Fig 100)
APPENDIX 62
192
10 100 1000 10000
CMT-3
inte
nsity
particle size [nm]
Fig 100 Colloidal suspension and particle size distribution (DLS) of CMT-3
The product was subjected to the same extraction process as the mesoporous silica
particles in Chapter 42 The particles in the resulting ethanolic suspension were
agglomerated to a high degree After drying the product was slightly yellow and
adhesive TGA (Fig 101) showed that the template was removed for the most part but
the material still seems to contain a noteworthy amount of triethanolamine as already
observed in the sample CMT-1
APPENDIX 62
193
100 200 300 400 500 600 700
-60
-50
-40
-30
-20
-10
0
weig
ht
loss [
]
temperature [iexclC]
0 10 20 30 40 50 60
-25
-20
-15
-10
-05
00
time [min]
DT
G [
m
in-1
]
100 200 300 400 500 600 700
-15
-10
-5
0
weig
ht
loss [
]
temperature [iexclC]
0 10 20 30 40 50 60
-075
-050
-025
000
time [min]
DT
G [
m
in-1
]
Fig 101 TGA data of washed CMT-3 before and after extraction procedure
However the nitrogen sorption isotherm of this sample differs from the one of CMT-2
The isotherm does not show such a pronounced hysteresis loop and the specific surface
area is significantly higher (330 m2 g
-1) The pore size distribution (DFT) shows a
broadening on both sides of the typical peak for CTMA+ at around 3 nm (Fig 102)
00 01 02 03 04 05 06 07 08 09 1040
50
60
70
80
90
100
110
120
adsorption desorptionv
olu
me a
dsorb
ed [
cm
3
g-1
] S
TP
relative pressure p p0
-1
10 100 1000
0000
0002
0004
0006
0008
0010
Dv(d
) [c
m-3
-1
g-1
]
pore diameter []
Fig 102 N2 sorption isotherm and DFT pore size distribution of extracted CMT-3
APPENDIX 62
194
Variation of the synthesis conditions such as temperature or batch composition as well
as the exchange of the template by shorter (dodecyltrimethylammonium chloride) or
neutral substitutes (dodecyl amine) in further experiments did not lead to improved
materials and were therefor not shown here The replacement of the precursor with
related complexes eg titanium diisopropoxide bis(acetylacetonate) was unsuccessful
because of a poor solubility in the aqueous medium The results of the first experiments
described above point out that in contrast to the silica material the basic synthesis
procedure for mesoporous titania is connected to several problems Especially in the
presence of triethanolamine extraction and redispersion is challenging
Thus the synthesis conditions were completely changed from basic to acidic conditions
Several synthesis procedures for mesoporous titania in acidic medium can be found in
the literature[143 145 146]
One promising method described by Soler-Illia et al[142]
is
based on the EISA approach for mesoporous TiO2 thin films This recipe was chosen as
basis for the synthesis of colloidal suspensions of mesoporous titanium dioxide
nanoparticles The newly developed synthesis also started from a clear solution that was
heated under reflux The formation of TiO2 particles in the initial solution caused a
slowly increasing turbidity resulting in a white viscous suspension Subsequent washing
and redispersion led to an ethanolic suspension of titanium dioxide nanoparticles
Peptization of the particles was realized by addition of very small amounts of water
The resulting colloidal translucent suspensions showed a narrow particle size
APPENDIX 62
195
distribution in dynamic light scattering (DLS) with a mean particle size of 130 nm (Fig
103)
1 10 100 1000 10000
inte
nsity
diameter [nm]
Fig 103 Particle size distribution (DLS) of an ethanolic colloidal suspension of CMT-4
Electron microscopy confirmed the existence of discrete particles in the nanometer
range The TiO2 nanoparticles can be described as prolate spheroids of approximately
the same average size as indicated by DLS (Fig 104)
Fig 104 TEM-micrograph of CMT-4
APPENDIX 62
196
Because of this anisotropic shape one can expect a certain order either due to template
interaction or crystallinity Therefore a dried sample of CMT-4 and CMT-5 was
investigated in thermogravimetric analysis
100 200 300 400 500 600 700 800 90016
14
12
10
8
6
4
2
0
we
igh
t lo
ss [
]
temperature [iexclC]
0 10 20 30 40 50 60 70 80
-075
-050
-025
000
time [min]
DT
G [
min-1
]
100 200 300 400 500 600 700 800 900
18
16
14
12
10
8
6
4
2
0
we
igh
t lo
ss [
]
temperature [iexclC]
0 10 20 30 40 50 60 70 80
-10
-05
00
time [min]
DT
G [
min-1
]
Fig 105 TGA data of washed CMT-4 (a) and washed CMT-5 (b)
Sample CMT-4 and the product synthesized with the same procedure but without any
template (CMT-5) do hardly show any difference The synthesis was also carried out
with different other templates ndash anionic and cationic (palmitic acid CTAC) or neutral
(pluronic dodecylamine) template In no case an ordered or disordered mesoporous
structure caused by organic templates could be confirmed Thus the weight loss at
around 250 degC which is typically assigned to template elimination in mesoporous silica
materials cannot be attributed to the template in the case of CMT-4 As this step can
also be observed in CMT-5 it is probably caused by further condensation of the
inorganic network and decomposition of alkoxy groups This relatively high weight loss
may be due to incomplete crystallinity of the samples Nevertheless the materials show
APPENDIX 62
197
a certain crystallinity in Raman spectroscopy The apparent signals can be attributed to
rutile
0 500 1000 1500 2000
CMT-4 rutile
inte
nsity
wavelength [cm-1]
Fig 106 Raman spectra of CMT-4 and spectra of rutile
X-ray powder diffraction patterns confirmed the existence of a crystalline phase in the
dry powder The relatively broad signals indicate the existence of small particles
15 20 25 30 35 40 45
CMT-4
inte
nsity
2 [degree]
rutile
Fig 107 X-ray powder diffraction pattern of CMT-4
APPENDIX 62
198
Nitrogen sorption analyses (Fig 108) showed that both materials exhibit a certain
mesoporosity Due to the shape of the isotherms and hysteresis loops the existence of a
channel-like pore structure can be excluded
00 01 02 03 04 05 06 07 08 09 100
25
50
75
100
125
150
175
200
adsorption desorptionv
olu
me a
dsorb
ed [
cm
3
g-1
] S
TP
relative pressure p p0
-1
00 01 02 03 04 05 06 07 08 09 100
25
50
75
100
125
150
175
200
adsorption desorptionv
olu
me a
dsorb
ed [
cm
3
g-1
] S
TP
relative pressure p p0
-1
1 10 100
00
05
10
15
20
25
desorp
tion D
v(d)
[m2
g-1
]
pore diameter [nm]
1 10 100
00
05
10
15
20
25
deso
rption D
v(d
) [m
2 g
-1]
pore diameter [nm]
Fig 108 N2 sorption data of CMT-4 (l) and CMT-5 (r)
These findings led to the conclusion that the interaction of template and titanium
precursor in the described procedures seems to be too weak to build up a mesostructure
This interpretation is corroborated by the fact that the best results concerning the surface
area of the resulting particles were achieved without any template The measured pore
size is not influenced by the addition of template CMT-5 showed a BET-surface area of
APPENDIX 62
199
more than 300 m2 g
-1 and a relatively narrow pore size distribution with a diameter
around 5 nm (Table 9)
Table 9 Nitrogen sorption data of CMT-4 and CMT-5
CMT-4 CMT-5
Surface area (BET) 276 m2 g
-1 311 m
2 g
-1
Total pore volume 024 cm3 g
-1 025 cm
3 g
-1
Mean pore width 48 nm 47 nm
The synthesis of similar hydrosols is already known[147]
The existence of a mesoporous
structure caused by agglomeration of the TiO2 nanoparticles and the resulting high
surface area is described in literature[148 149]
Due to the easy redispersability of the
washed particles and the high quality of the final ethanolic suspensions the material can
be used for the preparation of homogeneous thin films by spin-coating[150]
APPENDIX 62
200
Homogeneous Thin Films
For the preparation of homogeneous thin films the synthesis without template (CMT-5)
was repeated After purification of the nanoparticles received from hydrothermal
treatment (CMT-6) the colloidal suspension was used for the preparation of thin film
Fig 109 shows the mean particle size (80 nm) of the suspended titania nanoparticles in
the coating suspension
1 10 100 1000 10000
inte
nsity
diameter [nm]
Fig 109 Particle size distribution (DLS) of CMT-6
Fig 110 shows an image of a silicon wafer with a thin film of titania nanoparticles The
film was prepared by spin-coating two times with a suspension containing about 3 wt
of CMT-6
APPENDIX 62
201
300 400 500 600 700 800 900 10000
10
20
30
40
50
60
experimental data
model fit
in
deg
rees
wavelength [nm]
Fig 110 Thin film of CMT-6 (107 nm) on a silicon wafer and ellipsometric data
The film appears very homogeneous and transparent and thus has a definite interference
color Ellipsometric measurements resulted in a film thickness of 107 nm The same
film was deposited on a quartz crystal microbalance chip In order to achieve a higher
thickness the chip was coated four times The optical characterization was performed
with ellipsometry assuming the following theoretic model 0 the gold electrode was
chosen to be infinitely thick (1 mm) 1 the material (titania nanoparticles) is described
with a Cauchy layer Starting with a guessed film thickness of 200 nm the subsequent
fitting of the thickness and the Cauchy parameters resulted in a film thickness of 187
nm
The measurement was performed in a liquid cell in a flow of nitrogen It was repeated in
an atmosphere of gaseous toluene with a partial pressure of 0943 (p p0-1
) Fig 111
shows the change in the ellipsometric data due to physisorption of toluene
APPENDIX 62
202
300 400 500 600 700 800 900 1000-10
0
10
20
30
40
50
60
toluene atmosphere nitrogen atmosphere
in d
egre
es
wavelength [nm]
300 400 500 600 700 800 900 1000110017
18
19
20
21
22
23
24
toluene atmosphere nitrogen atmosphere
refr
active index
wavelength [nm]
Fig 111 Ellipsometry data of a thin film of CMT-6 on a QCM chip in nitrogen (dashed
line) and toluene (solid line) atmosphere
The refractive index nD of the film changes from 180 to 193 when filled with toluene
(nD = 15) With the Lorentz-Lorenz equation for ellipsometric porosimetry (EP)[55]
a
porosity of 16 can be specified The sorption measurement was repeated in a quartz
crystal microbalance at different partial pressures of toluene to record a full sorption
isotherm (Fig 112)
APPENDIX 62
203
00 02 04 06 08 1000
01
02
03
04
05
06
07
adsorb
ed v
olu
me [m
mol g
-1]
p p0
-1
Fig 112 Toluene sorption isotherm of a thin film of CMT-6 recorded in a QCM
The weight increase due to film deposition was 376 μg per cm2 With a film thickness
of 187 nm a density of 201 g cm-3
can be calculated The maximum weight increase
due to toluene adsorption was 21 μg per cm2 or 011 g per cm
3 respectively With a
density of 087 g cm-3
for liquid toluene a porosity of 13 can be calculated which
coincides well with the value determined with ellipsometric porosimetry
Conclusion
The synthesis of templated mesoporous titanium dioxide nanoparticles similar to the
silica analogues introduced in Chapter 42 could not be realized The TiO2 particles
forming in the acidic medium by a simple sol-gel process often show a higher surface
area and are much easier to redisperse than particles obtained in the basic synthesis
Although the general synthesis procedure is already known for a long time the resulting
colloidal suspensions are ideal candidates for the preparation of porous thin films
Especially if the synthesis by evaporation induced self-assembly is connected to
APPENDIX 62
204
problems the usage of these suspensions can be an interesting alternative Despite of
their porosity the prepared films have a high refractive index
REFERENCES
205
7 REFERENCES
REFERENCES
206
[1] Taniguchi N On the Basic Concept of Nano-Technology Japan Society of
Precision Engineering 1974
[2] Drexler E Engines of Creation The Coming Era of Nanotechnology New
York Anchor PressDoubleday 1986
[3] Drexler E Nanosystems Molecular Machinery Manufacturing and
Computation John Wiley amp Sons Inc 1992
[4] Boncheva M Whitesides G M Making things by self-assembly MRS Bull
2005 30 736-742
[5] Ter Minassian-Saraga L Thin films including layers terminology in relation to
their preparation and characterization Pure Appl Chem 1994 66 1667-1738
[6] Koga K Ikeshoji T Sugawara K-i Size- and Temperature-Dependent
Structural Transitions in Gold Nanoparticles Phys Rev Lett 2004 92 115507
[7] Trewyn B G Giri S Slowing I I Lin V S-Y Mesoporous silica
nanoparticle based controlled release drug delivery and biosensor systems
Chem Commun (Cambridge U K) 2007 3236-3245
[8] Barbe C Bartlett J Kong L Finnie K Lin H Q Larkin M Calleja S
Bush A Calleja G Silica particles A novel drug-delivery system Adv
Mater (Weinheim Ger) 2004 16 1959-1966
[9] Joutsensaari J Loivamaki M Vuorinen T Miettinen P Nerg A M
Holopainen J K Laaksonen A Nanoparticle formation by ozonolysis of
inducible plant volatiles Atmospheric Chemistry and Physics 2005 5 1489-
1495
[10] Mackenzie J D Bescher E P Chemical Routes in the Synthesis of
Nanomaterials Using the Sol-Gel Process Acc Chem Res 2007 40 810-818
[11] Cushing B L Kolesnichenko V L OConnor C J Recent Advances in the
Liquid-Phase Syntheses of Inorganic Nanoparticles Chem Rev (Washington
DC U S) 2004 104 3893-3946
[12] Stober W Fink A Bohn E Controlled growth of monodisperse silica
spheres in the micron size range J Colloid Interface Sci 1968 26 62-69
REFERENCES
207
[13] LaMer V K Dinegar R H Theory Production and Mechanism of Formation
of Monodispersed Hydrosols J Am Chem Soc 1950 72 4847-4854
[14] Sing K S W Everett D H Haul R A W Moscou L Pierotti R A
Rouquerol J Siemieniewska T Reporting Physisorption Data For GasSolid
Systems with Special Reference to the Determination of Surface Area and
Porosity Pure Appl Chem 1985 57 603-619
[15] Cundy C S Cox P A The hydrothermal synthesis of zeolites Precursors
intermediates and reaction mechanism Microporous Mesoporous Mater 2005
82 1-78
[16] Baerlocher C McCusker L B Database of Zeolite Structure wwwiza-
structureorgdatabases
[17] Yan Y Silica zeolite ultra low-k dielectric thin films PMSE Prepr 2004 90
89-94
[18] Fowler C E Khushalani D Lebeau B Mann S Nanoscale materials with
mesostructured interiors Adv Mater (Weinheim Ger) 2001 13 649-652
[19] Yang P Zhao D Margolese D I Chmelka B F Stucky G D Block
Copolymer Templating Syntheses of Mesoporous Metal Oxides with Large
Ordering Lengths and Semicrystalline Framework Chem Mater 1999 11
2813-2826
[20] Brinker C J Lu Y F Sellinger A Fan H Y Evaporation-induced self-
assembly Nanostructures made easy Adv Mater (Weinheim Ger) 1999 11
579-585
[21] Liu J Shin Y Nie Z M Chang J H Wang L Q Fryxell G E Samuels
W D Exarhos G J Molecular assembly in ordered mesoporosity A new
class of highly functional nanoscale materials J Phys Chem A 2000 104
8328-8339
[22] Burkett S L Sims S D Mann S Synthesis of hybrid inorganic-organic
mesoporous silica by co-condensation of siloxane and organosiloxane
precursors Chem Commun (Cambridge U K) 1996 1367-1368
REFERENCES
208
[23] Burleigh M C Markowitz M A Spector M S Gaber B P Direct
synthesis of periodic mesoporous organosilicas Functional incorporation by co-
condensation with organosilanes J Phys Chem B 2001 105 9935-9942
[24] Huh S Wiench J W Yoo J-C Pruski M Lin V S-Y Organic
Functionalization and Morphology Control of Mesoporous Silicas via a Co-
Condensation Synthesis Method Chem Mater 2003 15 4247-4256
[25] Igarashi N Hashimoto K Tatsumi T Studies on the structural stability of
mesoporous molecular sieves organically functionalized by a direct method J
Mater Chem 2002 12 3631-3636
[26] Trewyn B G Slowing I I Giri S Chen H-T Lin V S Y Synthesis and
Functionalization of a Mesoporous Silica Nanoparticle Based on the Sol-Gel
Process and Applications in Controlled Release Acc Chem Res 2007 40 846-
853
[27] Diaz I Mohino F Perez-Pariente J Sastre E Study by TG-MS of the
oxidation of SH-MCM-41 to SO3H-MCM-41 Thermochim Acta 2004 413
201-207
[28] Radu D R Lai C-Y Huang J Shu X Lin V S Y Fine-tuning the
degree of organic functionalization of mesoporous silica nanosphere materials
via an interfacially designed co-condensation method Chem Commun
(Cambridge U K) 2005 1264-1266
[29] Kumar R Chen H T Escoto J L V Lin V S Y Pruski M Template
Removal and Thermal Stability of Organically Functionalized Mesoporous
Silica Nanoparticles Chem Mater 2006 18 4319-4327
[30] Kawi S Lai M W Supercritical fluid extraction of surfactant template from
MCM-41 Chem Commun (Cambridge U K) 1998 1407-1408
[31] Tian B Liu X Yu C Gao F Luo Q Xie S Tu B Zhao D Microwave
assisted template removal of siliceous porous materials Chem Commun
(Cambridge U K) 2002 1186-1187
REFERENCES
209
[32] Lang N Tuel A A Fast and Efficient Ion-Exchange Procedure To Remove
Surfactant Molecules from MCM-41 Materials Chem Mater 2004 16 1961-
1966
[33] Schubert U Chemical modification of titanium alkoxides for sol-gel
processing J Mater Chem 2005 15 3701-3715
[34] Nagamine S Sasaoka E Synthesis of Nanostructured Titania Templated by
Anionic Surfactant in Acidic Conditions Journal of Porous Materials 2002 9
167-173
[35] ORegan B Graetzel M A low-cost high-efficiency solar cell based on dye-
sensitized colloidal titanium dioxide films Nature (London UK) 1991 353
737-740
[36] Evans U Die Interferenzfarben duumlnner Filme von Oxyden Sulfiden oder
Jodiden auf Metallen Colloid Polym Sci 1934 69 129-137
[37] Raacke J Interferenzfarben duumlnner Schichten (V27)
httpwwwraackedeindexhtmlairyhtml
[38] Parker A R McKenzie D R Large M C J Multilayer reflectors in animals
using green and gold beetles as contrasting examples J Exp Biol 1998 201
1307-1313
[39] Palaniappan A Su X Tay F Functionalized mesoporous silica films for gas
sensing applications J Electroceram 2006 16 503-505
[40] Nicole L Boissiere C Grosso D Hesemann P Moreau J Sanchez C
Advanced selective optical sensors based on periodically organized mesoporous
hybrid silica thin films Chem Commun (Cambridge U K) 2004 2312-2313
[41] Yuliarto B Zhou H Yamada T Honma I Katsumura Y Ichihara M
Effect of Tin Addition on Mesoporous Silica Thin Film and Its Application for
Surface Photovoltage NO2 Gas Sensor Anal Chem 2004 76 6719-6726
[42] Bearzotti A Mio Bertolo J Innocenzi P Falcaro P Traversa E Relative
humidity and alcohol sensors based on mesoporous silica thin films synthesised
from block copolymers Sens Actuators B 2003 B95 107-110
REFERENCES
210
[43] Wirnsberger G Scott B J Stucky G D pH sensing with mesoporous thin
films Chem Commun (Cambridge U K) 2001 119-120
[44] Choi S Y Mamak M vonFreymann G Chopra N Ozin G A
Mesoporous Bragg Stack Color Tunable Sensors Nano Lett 2006 6 2456-
2461
[45] Tosheva L Valtchev V P Nanozeolites Synthesis Crystallization
Mechanism and Applications Chem Mater 2005 17 2494-2513
[46] Bein T Zeolitic host-guest interactions and building blocks for the self-
assembly of complex materials MRS Bull 2005 30 713-720
[47] Slowing I Trewyn B G Lin V S Y Effect of Surface Functionalization of
MCM-41-Type Mesoporous Silica Nanoparticles on the Endocytosis by Human
Cancer Cells J Am Chem Soc 2006 128 14792-14793
[48] Schulz-Ekloff G Wohrle D van Duffel B Schoonheydt R A
Chromophores in porous silicas and minerals preparation and optical properties
Microporous Mesoporous Mater 2002 51 91-138
[49] Scott B J Wirnsberger G Stucky G D Mesoporous and mesostructured
materials for optical applications Chem Mater 2001 13 3140-3150
[50] Lee U H Kim M-H Kwon Y-U Mesoporous thin films with accessible
pores from surfaces Bull Korean Chem Soc 2006 27 808-816
[51] Sing K S W Everett D H Haul R A W Moscou L Pierotti R A
Rouquerol J Siemieniewska T Reporting physisorption data for gassolid
systems with special reference to the determination of surface area and porosity
(Recommendations 1984) Pure Appl Chem 1985 57 603-619
[52] Brunauer S Emmett P H Teller E Adsorption of Gases in Multimolecular
Layers J Am Chem Soc 1938 60 309-319
[53] Thommes M Kohn R Froba M Sorption and Pore Condensation Behavior
of Nitrogen Argon and Krypton in Mesoporous MCM-48 Silica Materials J
Phys Chem B 2000 104 7932-7943
[54] Moeller A Yang X Caro J Staudt R Measurements of the adsorption of
n-alkanes on 5A zeolites Chem Ing Tech 2006 78 1831-1836
REFERENCES
211
[55] Baklanov M R Mogilnikov K P Non-destructive characterisation of porous
low-k dielectric films Microelectron Eng 2002 64 335-349
[56] Eslava S Baklanov M R Kirschhock C E A Iacopi F Aldea S Maex
K Martens J A Characterization of a Molecular Sieve Coating Using
Ellipsometric Porosimetry Langmuir 2007 23 12811-12816
[57] Mintova S Nanosized molecular sieves Collect Czech Chem Commun 2003
68 2032-2054
[58] Holmberg B A Wang H Yan Y High silica zeolite Y nanocrystals by
dealumination and direct synthesis Microporous Mesoporous Mater 2004 74
189-198
[59] Zhu G Qiu S Yu J Sakamoto Y Xiao F Xu R Terasaki O Synthesis
and Characterization of High-Quality Zeolite LTA and FAU Single
Nanocrystals Chem Mater 1998 10 1483-1486
[60] Kecht J Mintova S Bein T Nanosized Zeolites Templated by Metal-
Ammine Complexes Chem Mater 2007 19 1203-1205
[61] Larsen S C Nanocrystalline Zeolites and Zeolite Structures Synthesis
Characterization and Applications Journal of Physical Chemistry C 2007 111
18464-18474
[62] Larlus O Mintova S Bein T Environmental syntheses of nanosized zeolites
with high yield and monomodal particle size distribution Microporous
Mesoporous Mater 2006 96 405-412
[63] Hsu C-Y Chiang A S T Selvin R Thompson R W Rapid Synthesis of
MFI Zeolite Nanocrystals J Phys Chem B 2005 109 18804-18814
[64] Lew C M Li Z Zones S I Sun M Yan Y Control of size and yield of
pure-silica-zeolite MFI nanocrystals by addition of methylene blue to the
synthesis solution Microporous Mesoporous Mater 2007 105 10-14
[65] Li Z J Li S Luo H M Yan Y S Effects of Crystallinity in Spin-On Pure-
Silica-Zeolite MFI Low-Dielectric-Constant Films Adv Funct Mater 2004 14
1019-1024
REFERENCES
212
[66] Li Z Lew C M Li S Medina D I Yan Y Pure-Silica-Zeolite MEL
Low-k Films from Nanoparticle Suspensions J Phys Chem B 2005 109 8652-
8658
[67] Mintova S Reinelt M Metzger T H Senker J Bein T Pure silica beta
colloidal zeolite assembled in thin films Chem Commun (Cambridge U K)
2003 326-327
[68] Camblor M A Corma A Valencia S Spontaneous nucleation and growth of
pure silica zeolite-b free of connectivity defects Chem Commun (Cambridge
U K) 1996 2365-2366
[69] Serrano D P Van Grieken R Sanchez P Sanz R Rodriguez L
Crystallization mechanism of all-silica zeolite beta in fluoride medium
Microporous Mesoporous Mater 2001 46 35-46
[70] Wang Z Mitra A Wang H Huang L Yan Y Pure silica zeolite films as
low-k dielectrics by spin-on of nanoparticle suspensions Adv Mater
(Weinheim Ger) 2001 13 1463-1466
[71] Mintova S Bein T Microporous Films Prepared by Spin-Coating Stable
Colloidal Suspensions of Zeolites Adv Mater (Weinheim Ger) 2001 13
1880-1883
[72] Johnson M Li Z Wang J Yan Y Mechanical characterization of zeolite
low dielectric constant thin films by nanoindentation Thin Solid Films 2007
515 3164-3170
[73] Tatlier M Demir M Tokay B Erdem-Senatalar A Kiwi-Minsker L
Substrate heating method for coating metal surfaces with high-silica zeolites
ZSM-5 coatings on stainless steel plates Microporous Mesoporous Mater 2007
101 374-380
[74] Barrett P A Camblor M A Corma A Jones R H Villaescusa L A
Structure of ITQ-4 a New Pure Silica Polymorph Containing Large Pores and a
Large Void Volume Chem Mater 1997 9 1713-1715
REFERENCES
213
[75] Selvam T Aresipathi C Mabande G T P Toufar H Schwieger W Solid
state transformation of TEAOH-intercalated kanemite into zeolite beta (BEA) J
Mater Chem 2005 15 2013-2019
[76] Schoeman B J Babouchkina E Mintova S Valtchev V P Sterte J The
Synthesis of Discrete Colloidal Crystals of Zeolite Beta and their Application in
the Preparation of Thin Microporous Films Journal of Porous Materials 2001
8 13-22
[77] Nery J G Hwang S-J Davis M E On the synthesis of SSZ-48 SSZ-43
and their variations Microporous Mesoporous Mater 2002 52 19-28
[78] Krijnen S Sanchez P Jakobs B T F van Hooff J H C A controlled post-
synthesis route to well-defined and active titanium Beta epoxidation catalysts
Microporous Mesoporous Mater 1999 31 163-173
[79] Bruggeman D A G The calculation of various physical constants of
heterogeneous substances I The dielectric constants and conductivities of
mixtures composed of isotropic substances Annalen der Physik (Berlin
Germany) 1935 24 665-679
[80] Kresge C T Leonowicz M E Roth W J Vartuli J C Beck J S Ordered
Mesoporous Molecular-Sieves Synthesized by a Liquid-Crystal Template
Mechanism Nature 1992 359 710-712
[81] Qi L M Ma J M Cheng H M Zhao Z G Micrometer-sized mesoporous
silica spheres grown under static conditions Chem Mater 1998 10 1623-1626
[82] Huo Q S Zhao D Y Feng J L Weston K Buratto S K Stucky G D
Schacht S Schuth F Room temperature growth of mesoporous silica fibers
A new high-surface-area optical waveguide Adv Mater (Weinheim Ger) 1997
9 974-978
[83] Li Y S Shi J L Hua Z L Chen H R Ruan M L Yan D S Hollow
Spheres of Mesoporous Aluminosilicate with a Three-Dimensional Pore
Network and Extraordinarily High Hydrothermal Stability Nano Lett 2003 3
609-612
REFERENCES
214
[84] Cauvel A Renard G Brunel D Monoglyceride synthesis by heterogeneous
catalysis using MCM-41 type silicas functionalized with amino groups J Org
Chem 1997 62 749-751
[85] Zhao X S Lu G Q Modification of MCM-41 by surface silylation with
trimethylchlorosilane and adsorption study J Phys Chem B 1998 102 1556-
1561
[86] Anwander R SOMCPMS Surface organometallic chemistry at periodic
mesoporous silica Chem Mater 2001 13 4419-4438
[87] Qi Z-m Honma I Zhou H Ordered-mesoporous-silica-thin-film-based
chemical gas sensors with integrated optical polarimetric interferometry Appl
Phys Lett 2006 88 053503053501-053503053503
[88] Boissiere C Kummel M Persin M Larbot A Prouzet E Spherical MSU-
1 mesoporous silica particles tuned for HPLC Adv Funct Mater 2001 11
129-135
[89] Ren J Ding J Chan K-Y Wang H Dual-Porosity Carbon Templated from
Monosize Mesoporous Silica Nanoparticles Chem Mater 2007 19 2786-2795
[90] Lu J Liong M Zink J I Tammanoi F Mesoporous silica nanoparticles as
a delivery system for hydrophobic anticancer drugs Small 2007 3 1341-1346
[91] Asai S Tominaga Y Sumita M Mesoporous silica as inorganic filler in
polymer composites Zeoraito 2006 23 117-124
[92] Lu Y F Fan H Y Stump A Ward T L Rieker T Brinker C J
Aerosol-assisted self-assembly of mesostructured spherical nanoparticles
Nature 1999 398 223-226
[93] Suzuki K Ikari K Imai H Synthesis of Silica Nanoparticles Having a Well-
Ordered Mesostructure Using a Double Surfactant System J Am Chem Soc
2004 126 462-463
[94] El Haskouri J Ortiz de Zarate D Guillem C Beltran-Porter A Caldes M
Marcos M D Beltran-Porter D Latorre J Amoros P Hierarchical Porous
Nanosized Organosilicas Chem Mater 2002 14 4502-4504
REFERENCES
215
[95] Nooney R I Thirunavukkarasu D Chen Y Josephs R Ostafin A E
Synthesis of Nanoscale Mesoporous Silica Spheres with Controlled Particle
Size Chem Mater 2002 14 4721-4728
[96] Rathousky J Zukalova M Kooyman P J Zukal A Synthesis and
characterization of colloidal MCM-41 Colloids Surf A 2004 241 81-86
[97] Cai Q Luo Z S Pang W Q Fan Y W Chen X H Cui F Z Dilute
solution routes to various controllable morphologies of MCM-41 silica with a
basic medium Chem Mater 2001 13 258-263
[98] Moeller K Kobler J Bein T Colloidal suspensions of nanometer-sized
mesoporous silica Adv Funct Mater 2007 17 605-612
[99] Moeller K Kobler J Bein T Colloidal suspensions of mercapto-
functionalized nanosized mesoporous silica J Mater Chem 2007 17 624-631
[100] Sadasivan S Khushalani D Mann S Synthesis and shape modification of
organo-functionalized silica nanoparticles with ordered mesostructured interiors
J Mater Chem 2003 13 1023-1029
[101] Frye C L Vincent G A Finzel W A Pentacoordinate silicon compounds
V Novel silatrane chemistry J Am Chem Soc 1971 93 6805-6811
[102] Verkade J G Atranes new examples with unexpected properties Acc Chem
Res 1993 26 483-489
[103] Cabrera S ElHaskouri J Guillem C Latorre J BeltranPorter A
BeltranPorter D Marcos M D Amoros P Generalised syntheses of ordered
mesoporous oxides the atrane route Solid State Sci 2000 2 405-420
[104] Zhao X S Lu G Q Whittaker A K Millar G J Zhu H Y
Comprehensive study of surface chemistry of MCM-41 using 29
Si CPMAS
NMR FTIR pyridine-TPD and TGA J Phys Chem B 1997 101 6525-6531
[105] Socrates G Infrared and Raman Characteristic Group Frequencies 3 ed
Wiley 2005
REFERENCES
216
[106] Okabayashi H Izawa K Yamamoto T Masuda H Nishio E OConnor
C J Surface structure of silica gel reacted with 3-
mercaptopropyltriethoxysilane and 3-aminopropyltriethoxysilane formation of
the S-S bridge structure and its characterization by Raman scattering and diffuse
reflectance Fourier transform spectroscopic studies Colloid Polym Sci 2002
280 135-145
[107] Kobler J Moumlller K Bein T Colloidal Suspensions of Functionalized
Mesoporous Silica Nanoparticles ACS Nano 2008 2 791-799
[108] Sokolov I Kievsky Y Y Kaszpurenko J M Self-assembly of ultrabright
fluorescent silica particles Small 2007 3 419-423
[109] Ren T-Z Yuan Z-Y Su B-L Encapsulation of direct blue dye into
mesoporous silica-based materials Colloids Surf A 2007 300 79-87
[110] Laerte de Castro F Santos J G Fernandes G J T Souza de Araujo A
Fernandes V J Politi M J Brochsztain S Solid state fluorescence of a
34910-perylenetetracarboxylic diimide derivative encapsulated in the pores of
mesoporous silica MCM-41 Microporous Mesoporous Mater 2007 102 258-
264
[111] Wark M Ganschow M Rohlfing Y Schulz-Ekloff G Woehrle D
Methods of synthesis for the encapsulation of dye molecules in molecular
sieves Stud Surf Sci Catal 2001 135 3292-3300
[112] Huang D-M Hung Y Ko B-S Hsu S-C Chen W-H Chien C-L
Tsai C-P Kuo C-T Kang J-C Yang C-S Mou C-Y Chen Y-C
Highly efficient cellular labeling of mesoporous nanoparticles in human
mesenchymal stem cells implication for stem cell tracking FASEB J 2005 19
2014-2016
[113] Torney F Trewyn B G Lin V S Y Wang K Mesoporous silica
nanoparticles deliver DNA and chemicals into plants Nat Nanotechnol 2007
2 295-300
REFERENCES
217
[114] Chen J Y Pan F M Chang L Cho A T Chao K J Thermal stability of
trimethylsilylated mesoporous silica thin films as the ultralow-k dielectric for
copper interconnects Journal of Vacuum Science amp Technology B
Microelectronics and Nanometer Structures--Processing Measurement and
Phenomena 2005 23 2034-2040
[115] Innocenzi P Martucci A Guglielmi M Bearzotti A Traversa E Pivin J
C Mesoporous silica thin films for alcohol sensors J Eur Ceram Soc 2001
21 1985-1988
[116] Brinker C J Evaporation-induced self-assembly Functional nanostructures
made easy MRS Bull 2004 29 631-640
[117] Mason G A model of the pore space in a random packing of equal spheres J
Colloid Interface Sci 1971 35 279-287
[118] Slobozhanin L A Alexander J I D Collicott S H Gonzalez S R
Capillary pressure of a liquid in a layer of close-packed uniform spheres
Physics of Fluids 2006 18 082104-082115
[119] Mayer R P Stowe R A Packed uniform sphere model for solids Interstitial
access opening sizes and pressure deficiencies for wetting liquids with
comparison to reported experimental results J Colloid Interface Sci 2006 294
139-150
[120] Juillerat F Bowen P Hofmann H Formation and Drying of Colloidal
Crystals Using Nanosized Silica Particles Langmuir 2006 22 2249-2257
[121] Suzuki T M Yamamoto M Fukumoto K Akimoto Y Yano K
Investigation of pore-size effects on base catalysis using amino-functionalized
monodispersed mesoporous silica spheres as a model catalyst J Catal 2007
251 249-257
[122] Pasqua L Testa F Aiello R Cundari S Nagy J B Preparation of
bifunctional hybrid mesoporous silica potentially useful for drug targeting
Microporous Mesoporous Mater 2007 103 166-173
REFERENCES
218
[123] Van Blaaderen A Vrij A Synthesis and characterization of colloidal
dispersions of fluorescent monodisperse silica spheres Langmuir 1992 8
2921-2931
[124] Ren T-Z Yuan Z-Y Su B-L Encapsulation of direct blue dye into
mesoporous silica-based materials Colloids and Surfaces A Physicochemical
and Engineering Aspects 2007 300 79-87
[125] Leon R Margolese D Stucky G Petroff P M Nanocrystalline Ge
filaments in the pores of a meso-silicate Physical Review B Condensed Matter
1995 52 r2285-r2288
[126] Abe T Tachibana Y Uematsu T Iwamoto M Preparation and
characterization of Fe2O3 nanoparticles in mesoporous silicate J Chem Soc
Chem Commun 1995 1617-1618
[127] Srdanov V I Alxneit I Stucky G D Reaves C M DenBaars S P
Optical Properties of GaAs Confined in the Pores of MCM-41 J Phys Chem B
1998 102 3341-3344
[128] Pathak S Cao E Davidson M C Jin S Silva G A Quantum Dot
Applications to Neuroscience New Tools for Probing Neurons and Glia J
Neurosci 2006 26 1893-1895
[129] Li C L Murase N Synthesis of Highly Luminescent Glasses Incorporating
CdTe Nanocrystals through Sol-Gel Processing Langmuir 2004 20 1-4
[130] ORegan B Gratzel M A low-cost high-efficiency solar cell based on dye-
sensitized colloidal TiO2 films Nature 1991 353 737-740
[131] Kongkanand A Tvrdy K Takechi K Kuno M Kamat P V Quantum Dot
Solar Cells Tuning Photoresponse through Size and Shape Control of CdSe-
TiO2 Architecture J Am Chem Soc 2008 130 4007-4015
[132] Franzl T Klar T A Schietinger S Rogach A L Feldmann J Exciton
Recycling in Graded Gap Nanocrystal Structures Nano Lett 2004 4 1599-
1603
REFERENCES
219
[133] Wellmann H Rathousky J Wark M Zukal A Schulz-Ekloff G
Formation of CdS nanoparticles within functionalized siliceous MCM-41
Microporous Mesoporous Mater 2001 44-45 419-425
[134] Murray C B Norris D J Bawendi M G Synthesis and characterization of
nearly monodisperse CdE (E = sulfur selenium tellurium) semiconductor
nanocrystallites J Am Chem Soc 1993 115 8706-8715
[135] Gruumln M Lauer I Unger K K The synthesis of micrometer- and
submicrometer-size spheres of ordered mesoporous oxide MCM-41 Adv Mater
(Weinheim Ger) 1997 9 254-257
[136] Melian-Cabrera I Kapteijn F Moulijn J A Room temperature detemplation
of zeolites through H2O2-mediated oxidation Chem Commun (Cambridge U
K) 2005 2744-2746
[137] Chen X Mao S S Synthesis of titanium dioxide (TiO2) nanomaterials J
Nanosci Nanotechnol 2006 6 906-925
[138] Cabrera S ElHaskouri J BeltranPorter A BeltranPorter D Marcos M D
Amoros P Enhanced surface area in thermally stable pure mesoporous TiO2
Solid State Sci 2000 2 513-518
[139] Abramson S Lasperas M Brunel D Design of mesoporous aluminosilicates
supported (1R 2S)-(-)-ephedrine evidence for the main factors influencing
catalytic activity in the enantioselective alkylation of benzaldehyde with
diethylzinc Tetrahedron Asymmetry 2002 13 357-367
[140] Peng T Zhao D Dai K Shi W Hirao K Synthesis of Titanium Dioxide
Nanoparticles with Mesoporous Anatase Wall and High Photocatalytic Activity
J Phys Chem B 2005 109 4947-4952
[141] Chen H Dai K Peng T Yang H Zhao D Synthesis of thermally stable
mesoporous titania nanoparticles via amine surfactant-mediated templating
method Mater Chem Phys 2006 96 176-181
[142] Soler-Illia G Louis A Sanchez C Synthesis and characterization of
mesostructured titania-based materials through evaporation-induced self-
assembly Chem Mater 2002 14 750-759
REFERENCES
220
[143] Cassiers K Linssen T Meynen V Voort P V D Cool P Vansant E F
A new strategy towards ultra stable mesoporous titania with nanosized anatase
walls Chem Commun (Cambridge U K) 2003 1178-1179
[144] Grosso D Soler-Illia G Babonneau F Sanchez C Albouy P A Brunet-
Bruneau A Balkenende A R Highly organized mesoporous titania thin films
showing mono-oriented 2D hexagonal channels Adv Mater (Weinheim Ger)
2001 13 1085
[145] Yusuf M M Imai H Hirashima H Preparation of mesoporous titania by
templating with polymer and surfactant and its characterization J Sol-Gel Sci
Technol 2003 28 97-104
[146] Shibata H Ogura T Mukai T Ohkubo T Sakai H Abe M Direct
Synthesis of Mesoporous Titania Particles Having a Crystalline Wall J Am
Chem Soc 2005 127 16396-16397
[147] Matijevic E Budnik M Meites L Preparation and mechanism of formation
of titanium dioxide hydrosols of narrow size distribution J Colloid Interface
Sci 1977 61 302-311
[148] Jinsoo Kim K-C S Oliver Wilhelm Sotiris E Pratsinis Sol-Gel Synthesis
and Spray Granulation of Porous Titania Powder Chem Ing Tech 2001 73
461-468
[149] Deshpande S B Potdar H S Khollam Y B Patil K R Pasricha R
Jacob N E Room temperature synthesis of mesoporous aggregates of anatase
TiO2 nanoparticles Mater Chem Phys 2006 97 207-212
[150] Benkstein K D Semancik S Mesoporous nanoparticle TiO2 thin films for
conductometric gas sensing on microhotplate platforms Sens Actuators B
2006 113 445-453
LEBENSLAUF
221
Persoumlnliche Daten
Name Johannes Georg Kobler
Geboren am 29121978 in Muumlnchen
Studium
seit 112004 Promotion an Ludwig-Maximilians-Universitaumlt Muumlnchen im Arbeitskreis
von Prof Bein Thin Films from Porous Nanoparticles
032004 ndash 092004 Diplomarbeit in physikalischer Chemie an der Ludwig-
Maximilians-Universitaumlt Muumlnchen im Arbeitskreis von
Prof Bein Kolloidale Loumlsungen mesoporoumlser Silica-
Nanopartikel mit funktionalisierter Oberflaumlche
022004 Diplomhauptpruumlfung an der Ludwig-Maximilians-
Universitaumlt Muumlnchen
101999 ndash 022004 Chemie-Studium an der Ludwig-Maximilians-Universitaumlt
Muumlnchen
Wehrdienst
071998 ndash 041999 Gebirgsjaumlgerbatallion 231 Bad Reichenhall
Schulausbildung
091989 ndash 061998 Maximilian-von-Montgelas Gymnasium Vilsbiburg
PUBLICATIONS AND POSTER PRESENTATIONS
222
Publications and Poster Presentations
Publications
1 K Moeller J Kobler T Bein Colloidal Suspensions of Nanometer-Sized
Mesoporous Silica Adv Funct Mater 2007 17 605-612
2 K Moeller J Kobler T Bein Colloidal Suspensions of Mercapto-
Functionalized Nanosized Mesoporous Silica J Mater Chem 2007 17 624-
631
3 J Kobler K Moeller T Bein Colloidal Suspensions of Functionalized
Mesoporous Silica Nanoparticles ACS Nano 2008 2 791-799
4 J Kobler H Abrevaya S Mintova T Bein High-Silica Zeolite-β From
Stable Colloidal Suspensions to Thin Films J Phys Chem C 2008 112
14274ndash14280
5 J Kobler T Bein Porous Thin Films of Functionalized Mesoporous Silica
Nanoparticles ACS Nano 2008 2 2324ndash2330
6 J Kobler B Lotsch G Ozin T Bein Vapor-Sensitive Bragg Mirrors and
Optical Isotherms from Mesoporous Nanoparticle Suspensions submitted
PUBLICATIONS AND POSTER PRESENTATIONS
223
Poster Presentations
1 J Kobler K Moeller T Bein Colloidal Functionalized Mesoporous Silica
17 Deutsche Zeolithtagung 2005 Giessen Germany
2 J Kobler S Mintova T Bein Films of Pure-Silica Zeolites 3 International
FEZA Conference 2005 Prague Czech Republic
3 J Kobler S Mintova T Bein Thin Microporous Films with Variable Optical
Properties Catalytic processes on advanced micro- and mesoporous materials
2005 Nessebar Bulgaria
4 J Kobler T Bein Transparent Sols of Mesoporous Silica Nanoparticles 19
Deutsche Zeolithtagung 2007 Leipzig Germany
5 M Hallermann D Georgiadou J Kobler D Fattakhova-Rohlfing A Susha
T Bein Electron Transfer Processes in the Electrochemical Solar Cell ndash
Comparison of Dye and Dot Sensitized Titania 2007 CeNS Winterschool
Mauterndorf Austria
6 J Kobler T Bein Transparent Sols of Mesoporous Silica Nanoparticles for
the Preparation of Thin Films for Chemical Sensors Catalytic processes on
advanced micro- and mesoporous materials 2007 Varna Bulgaria


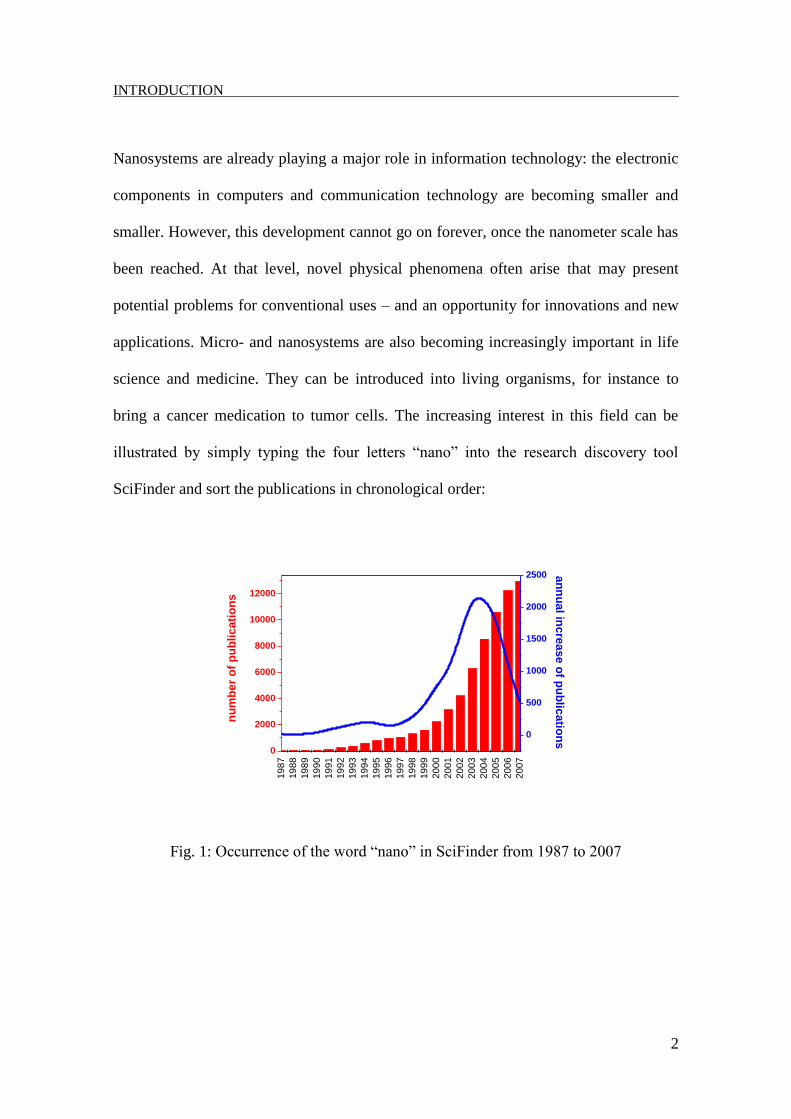
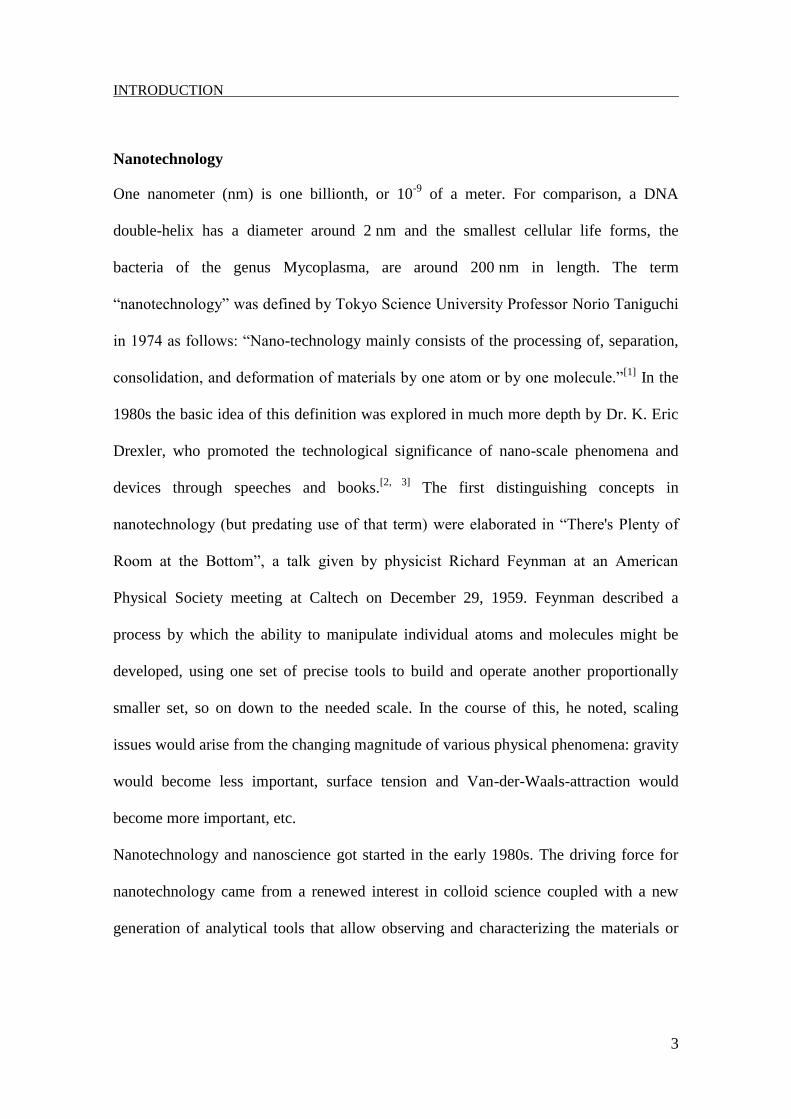
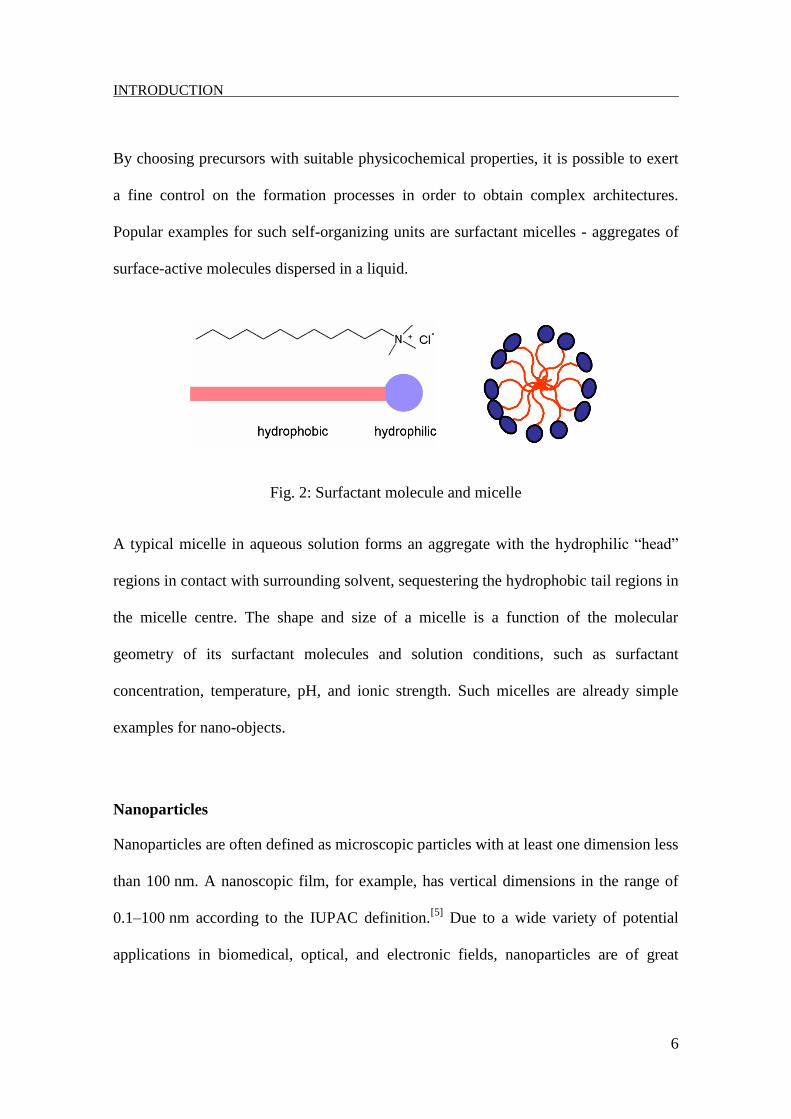
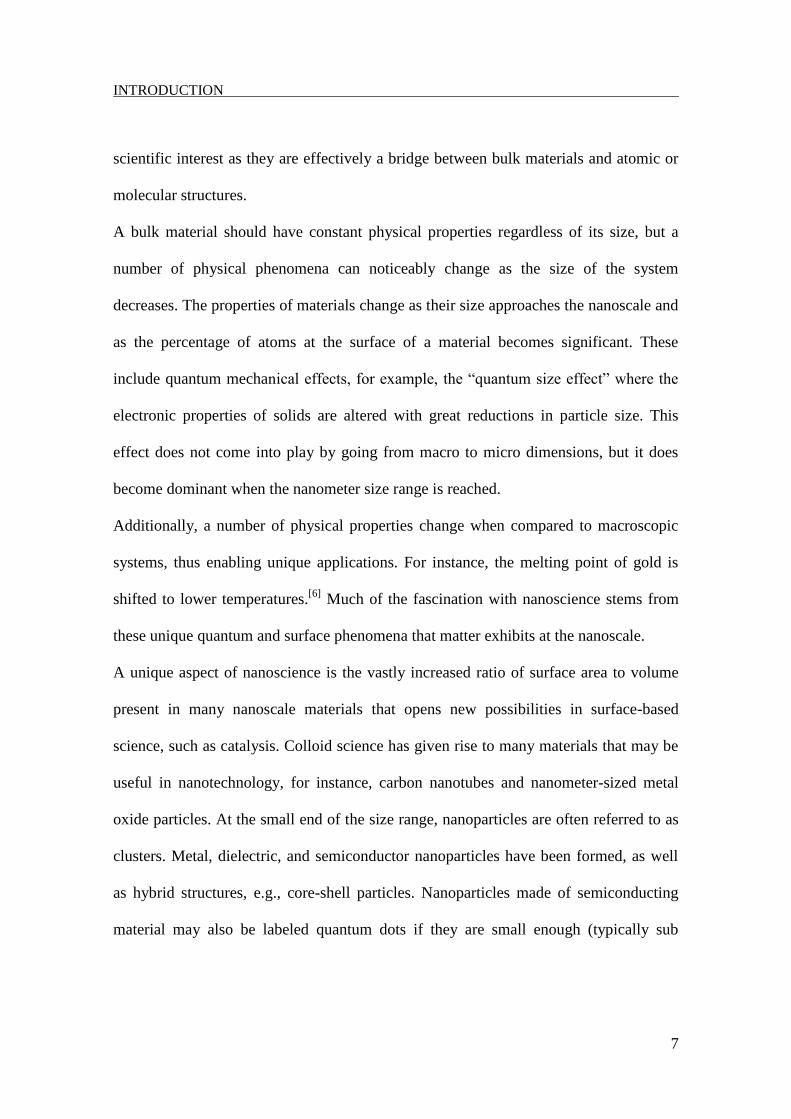
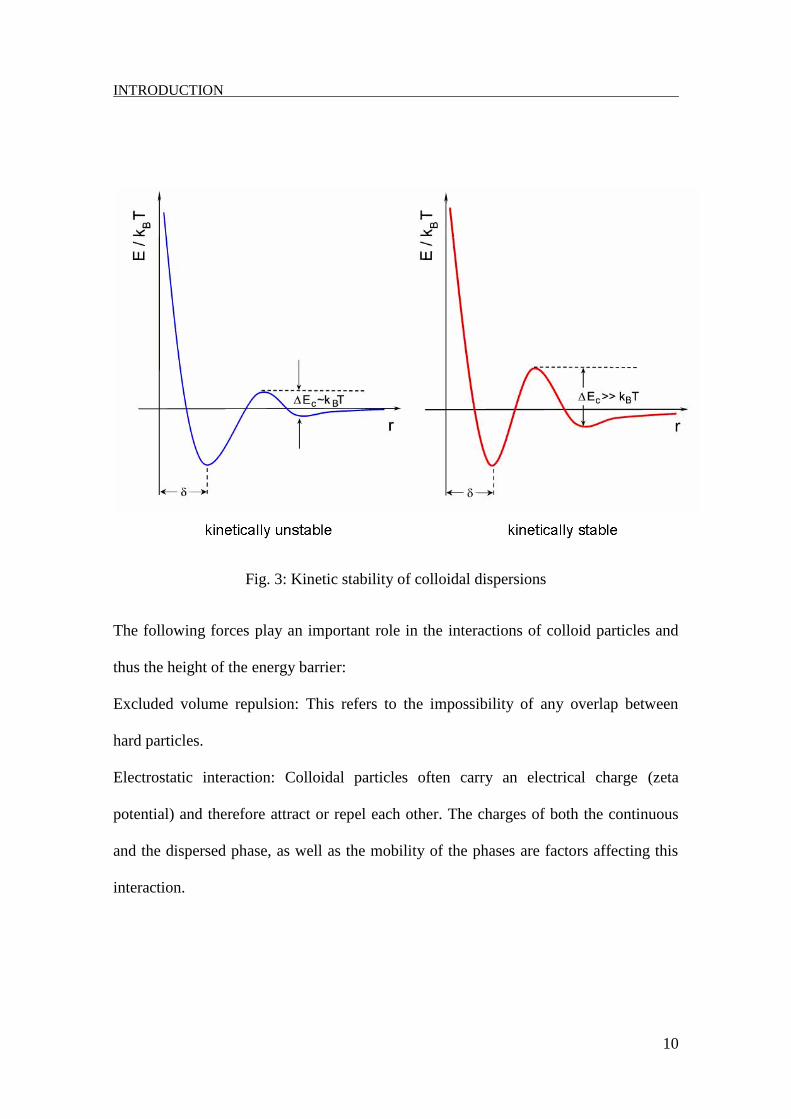
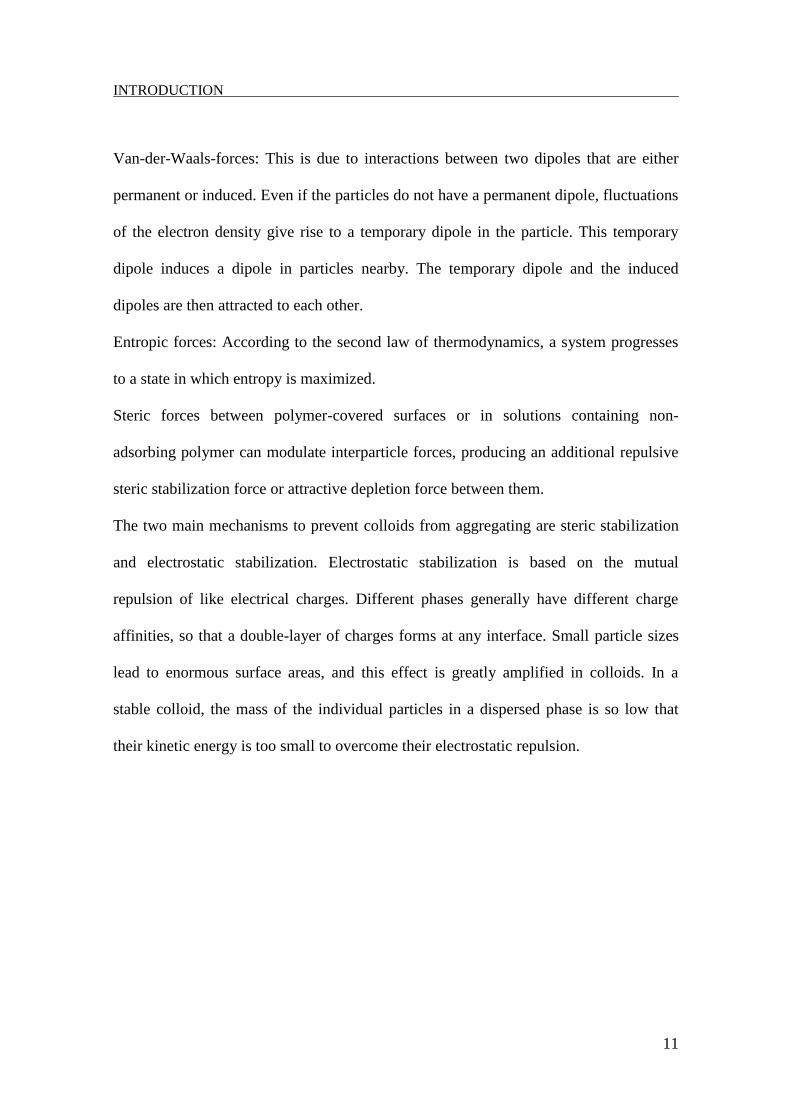
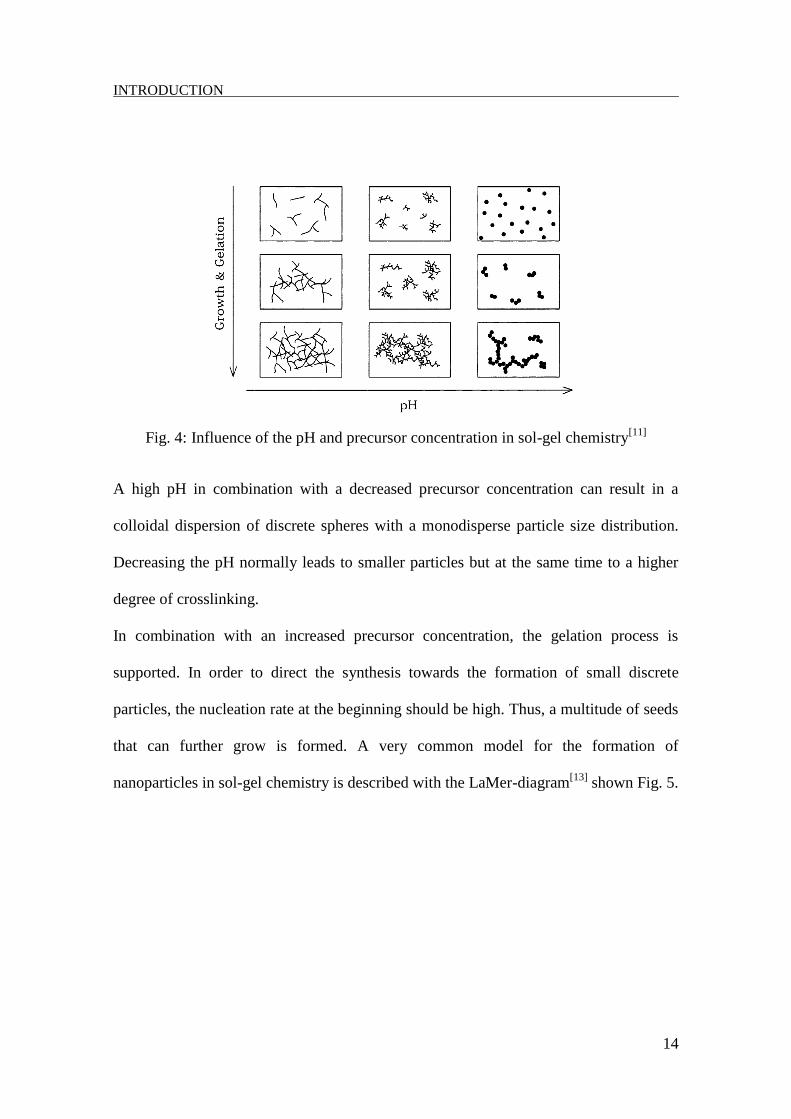
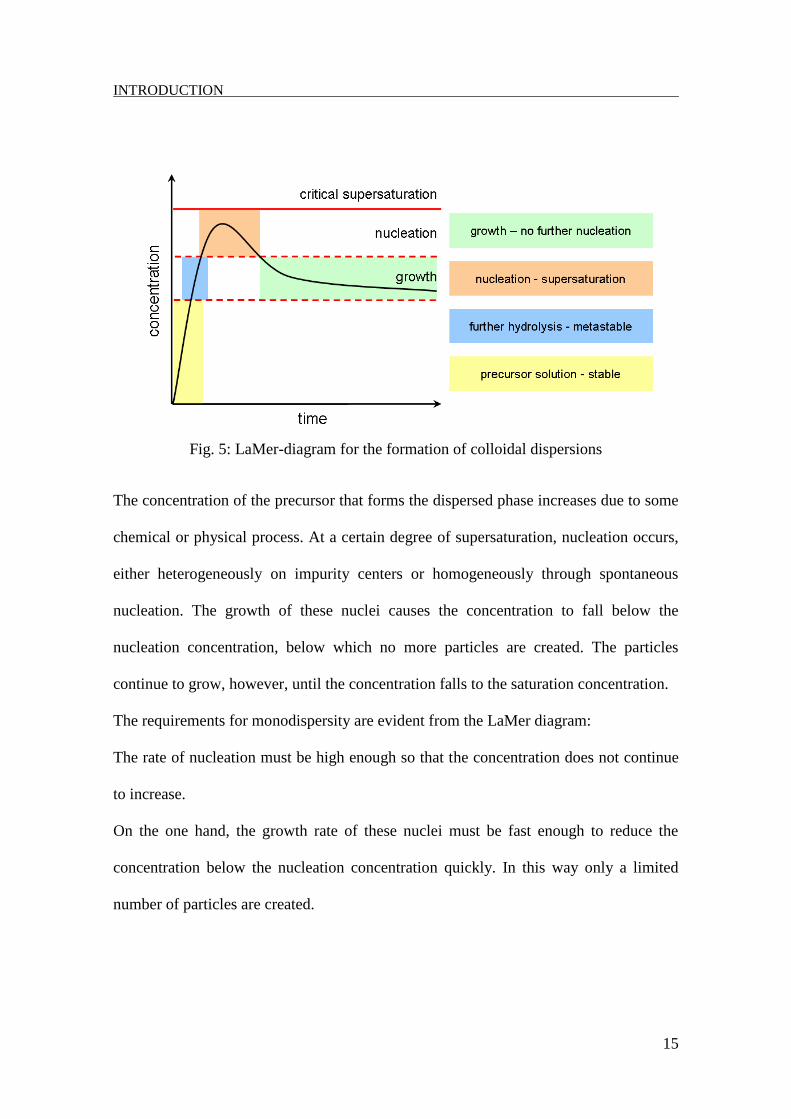
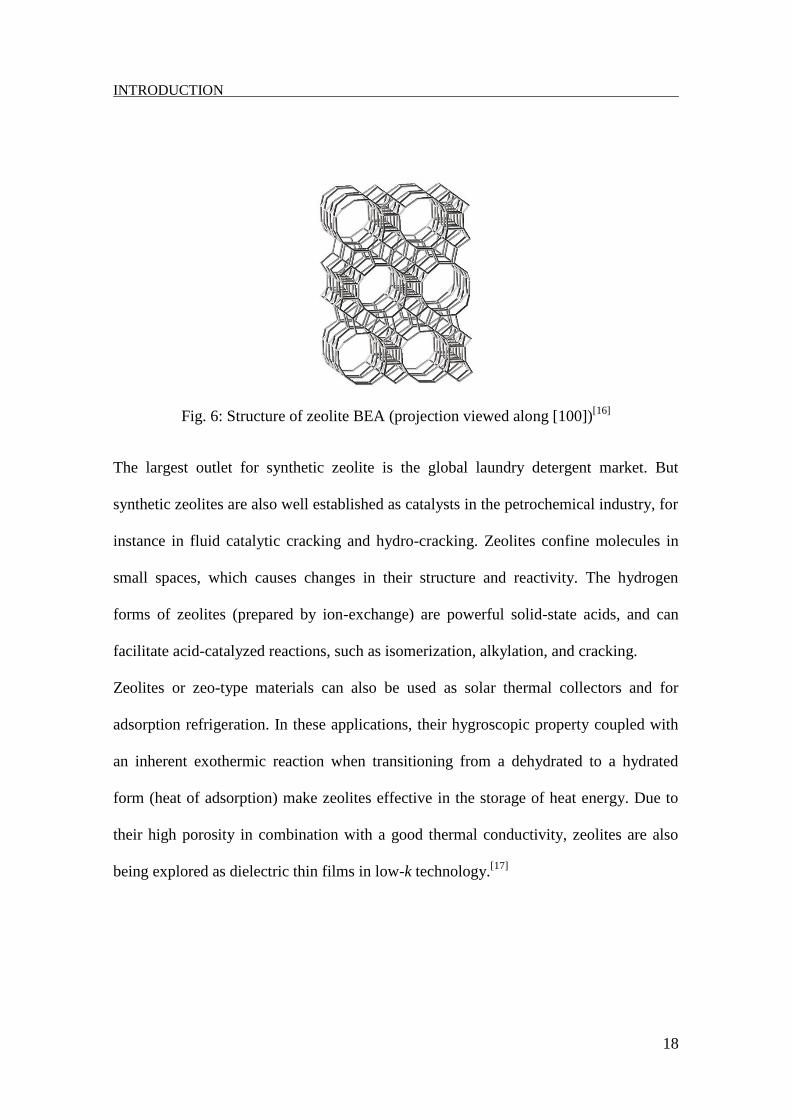
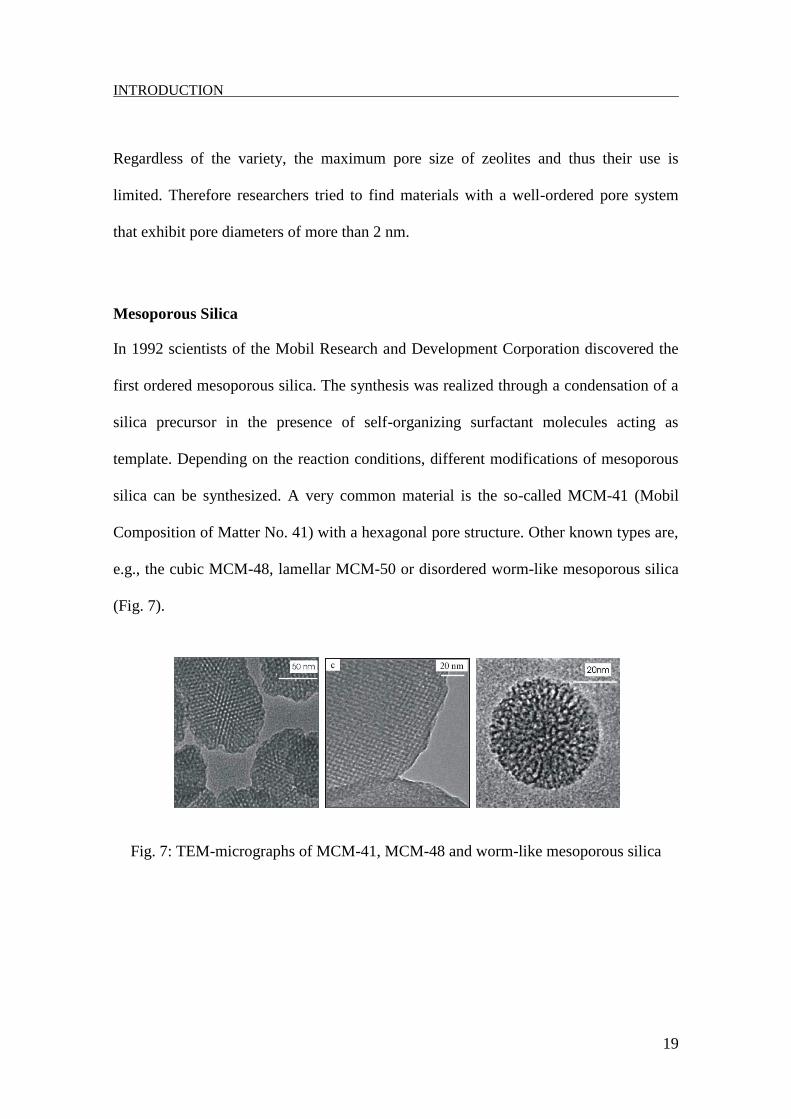
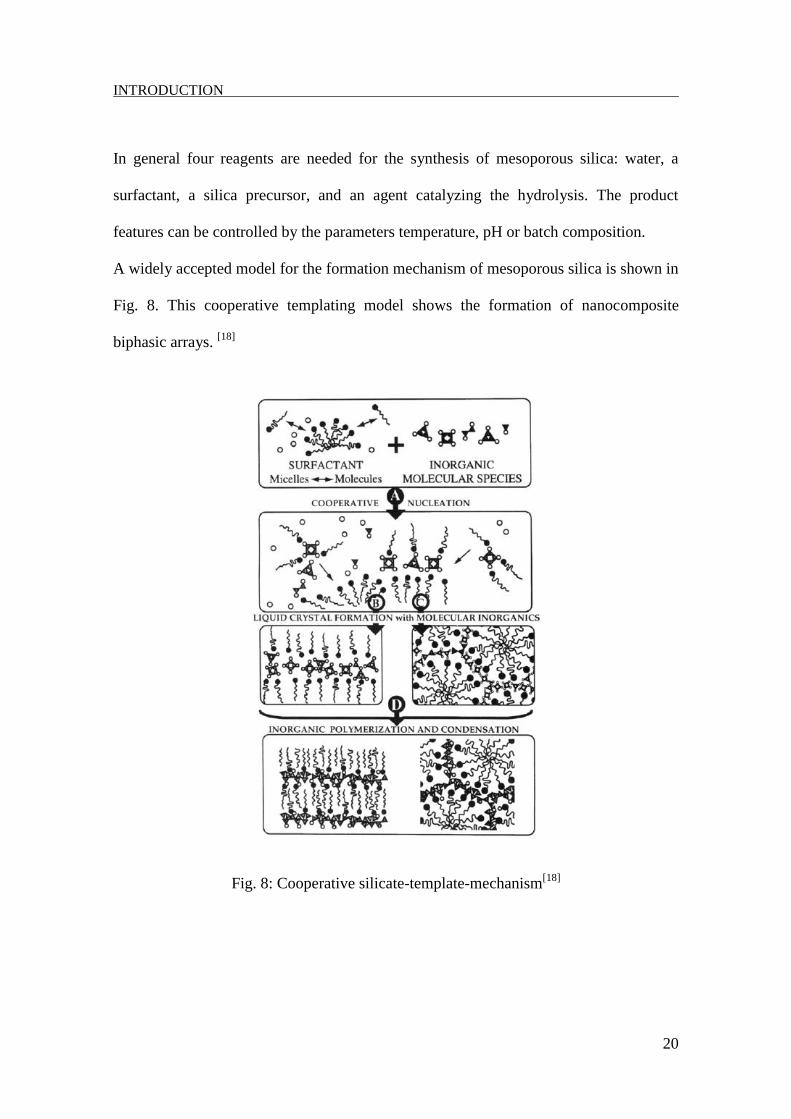
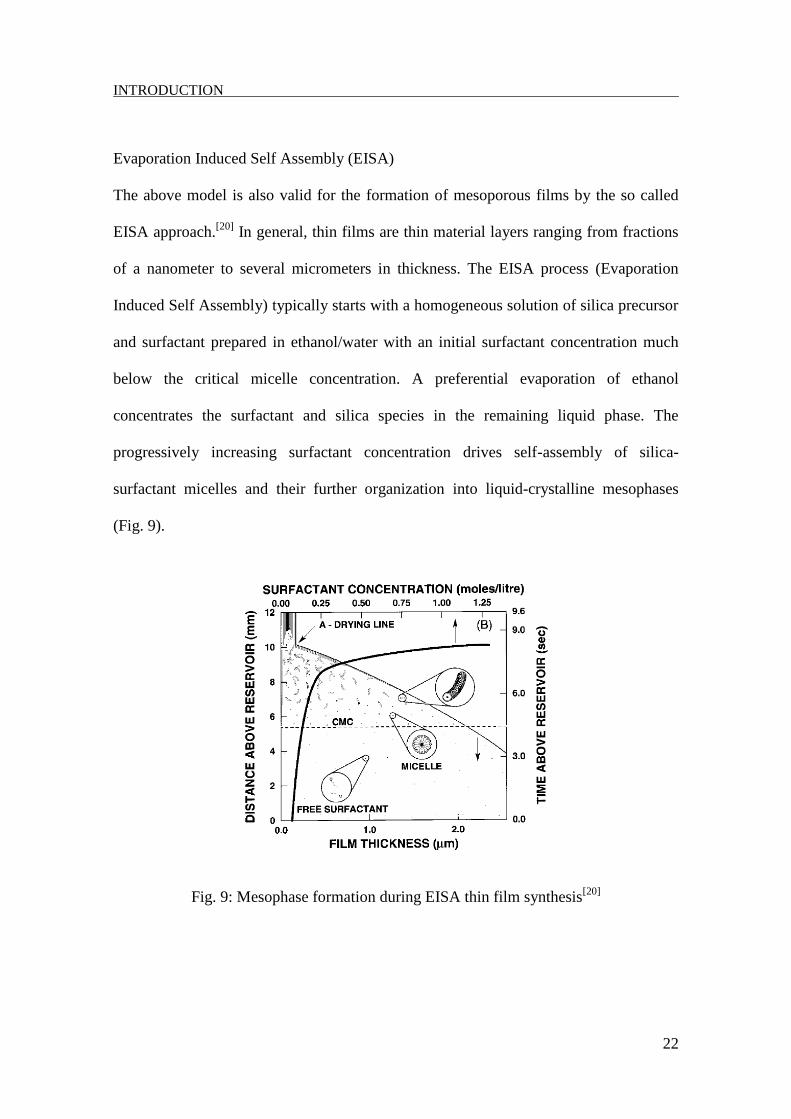
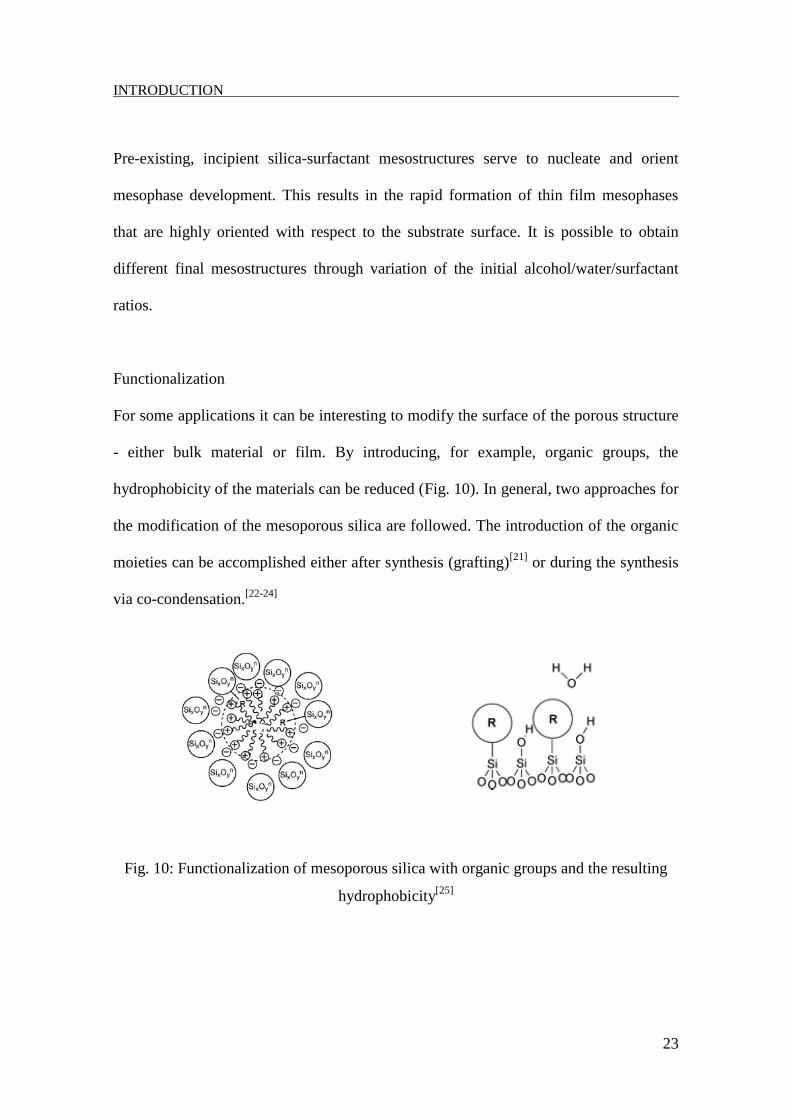
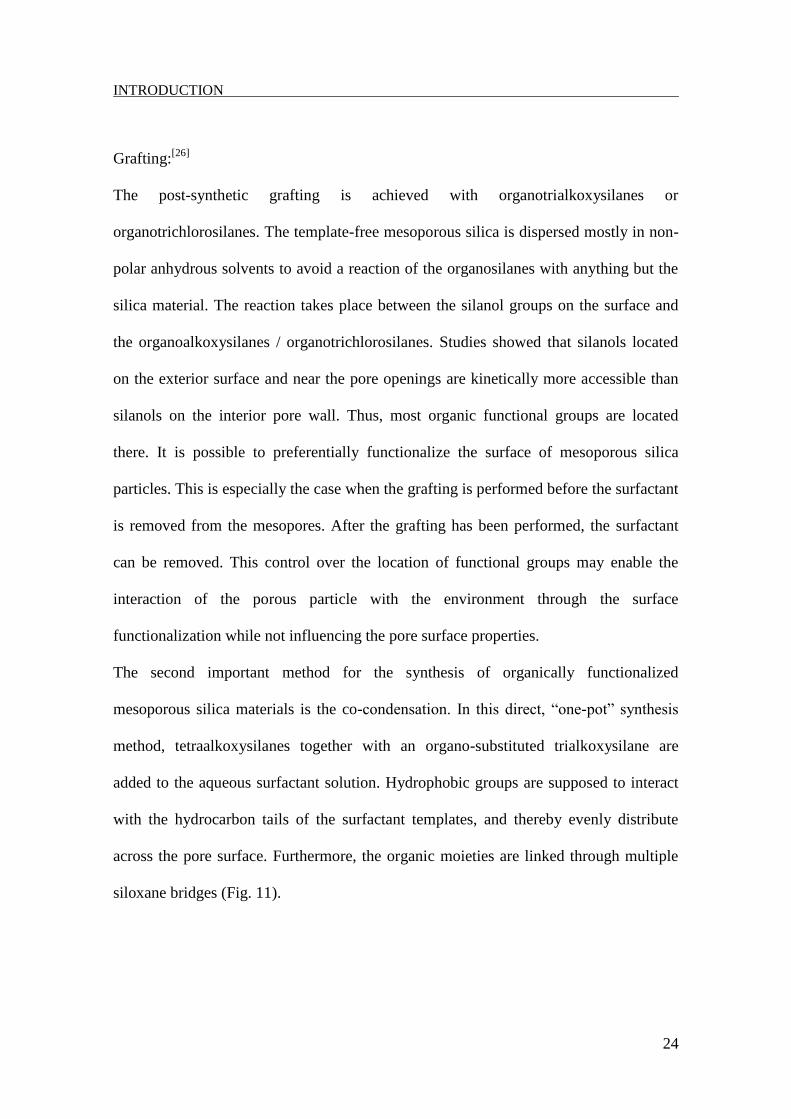
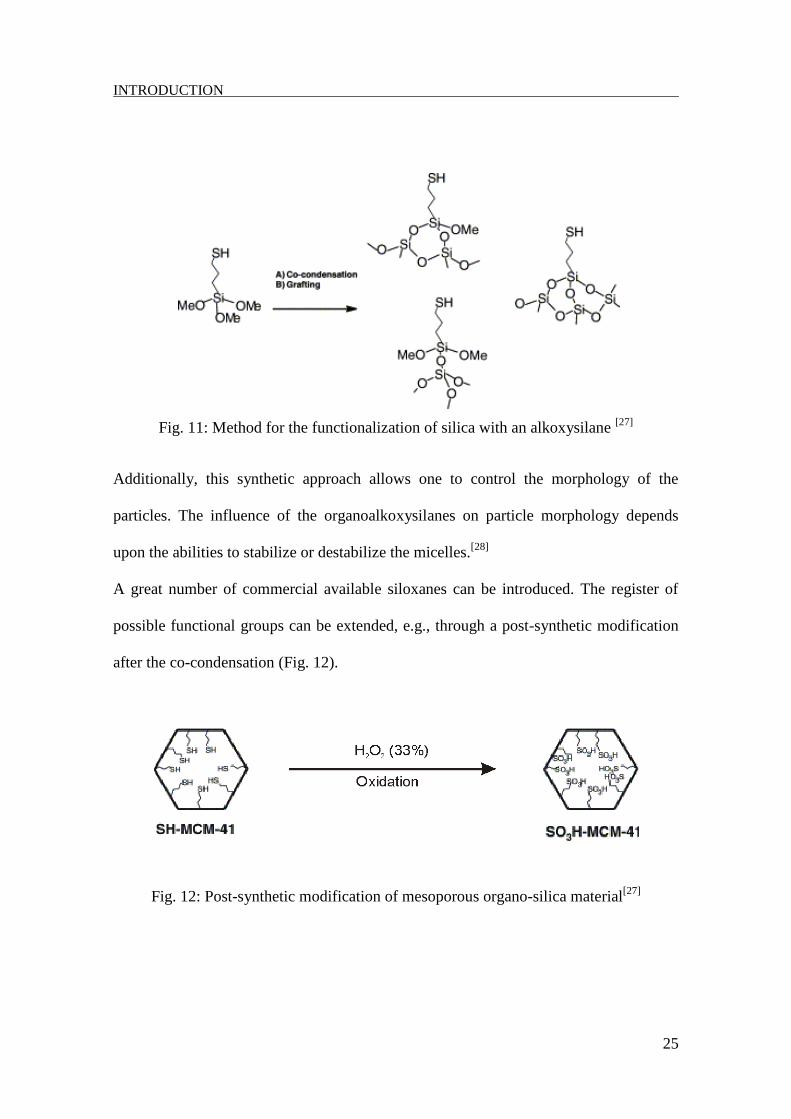
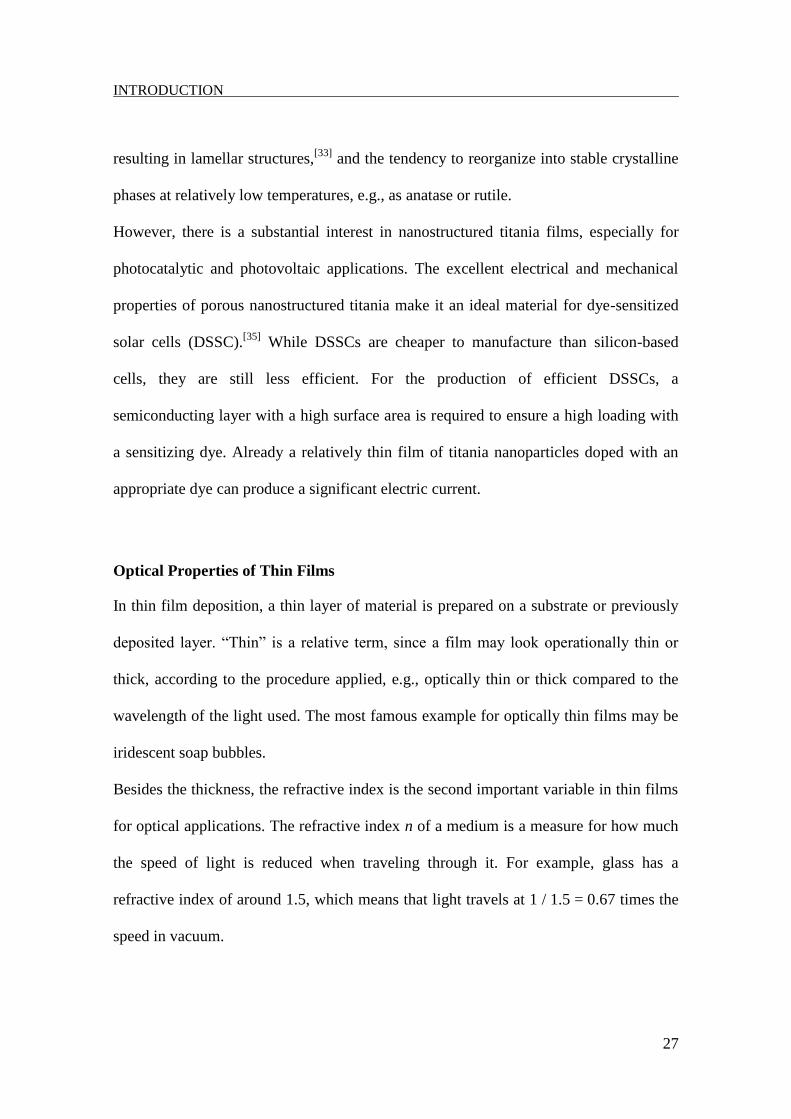
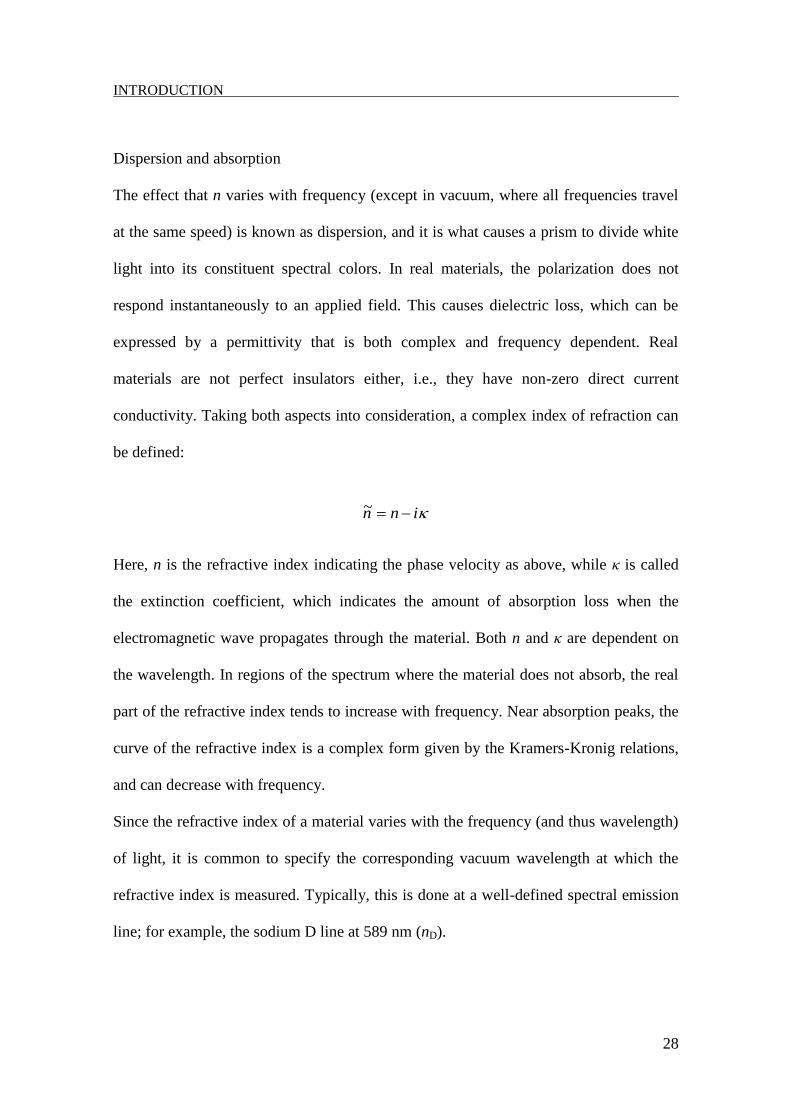
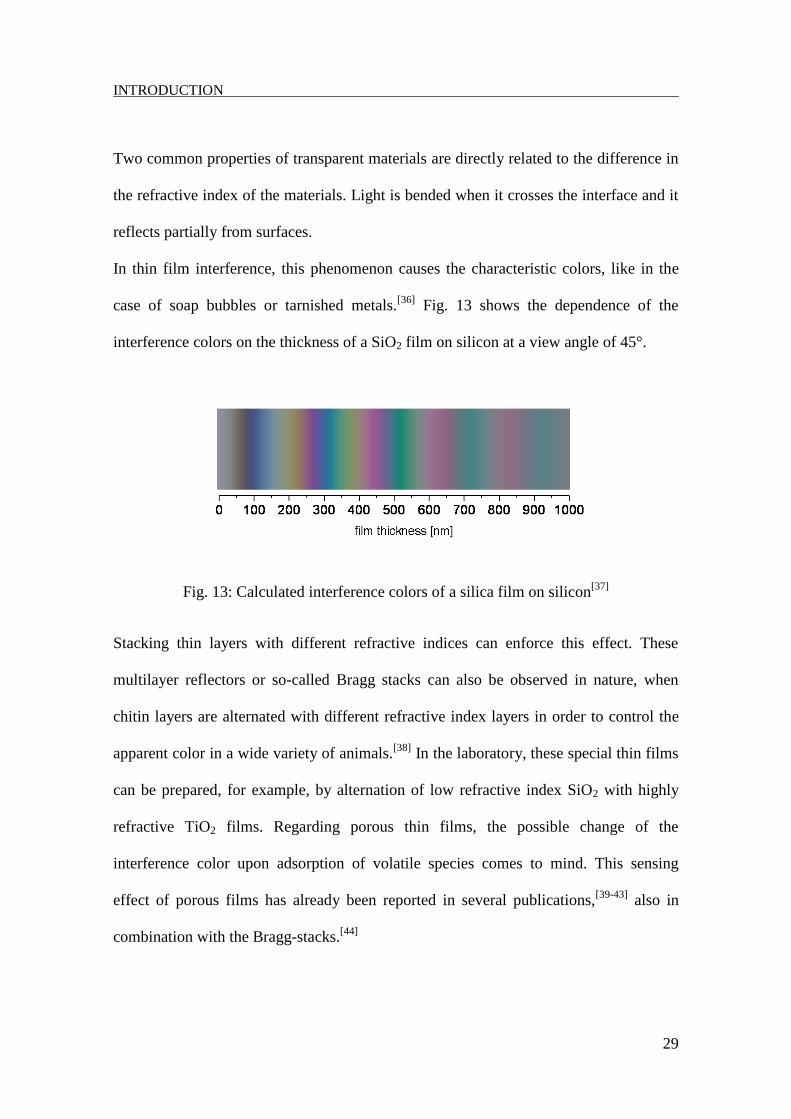

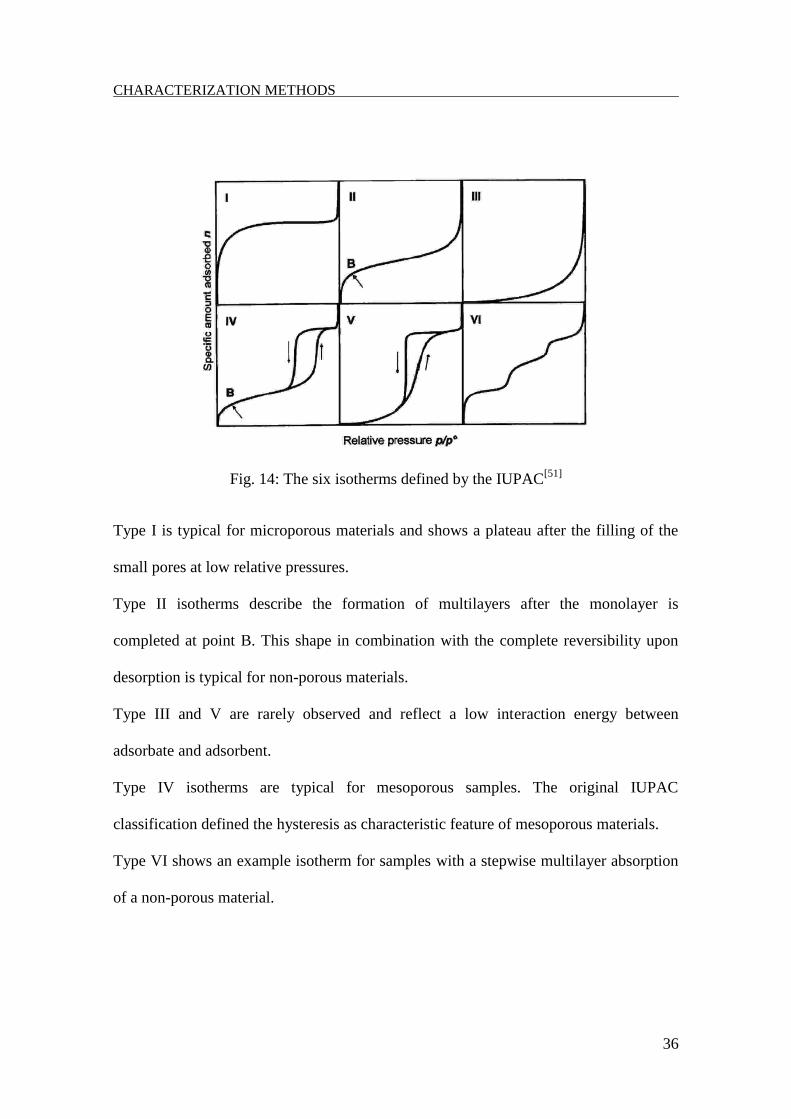
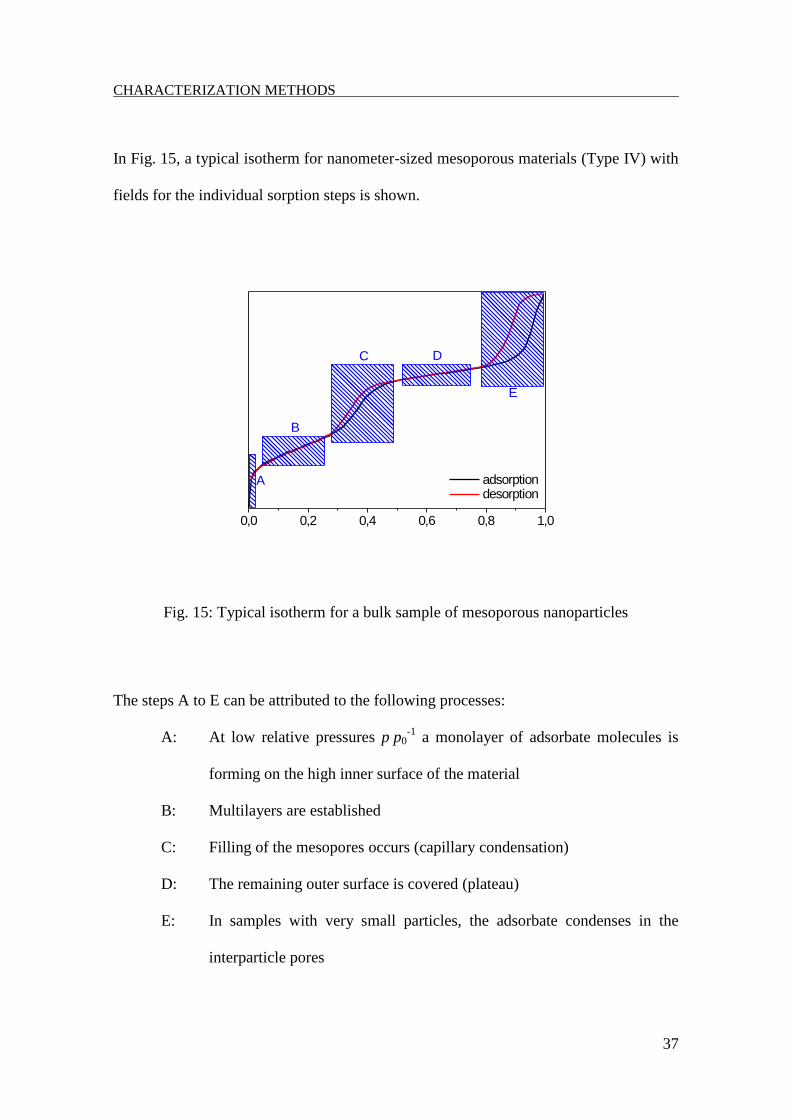
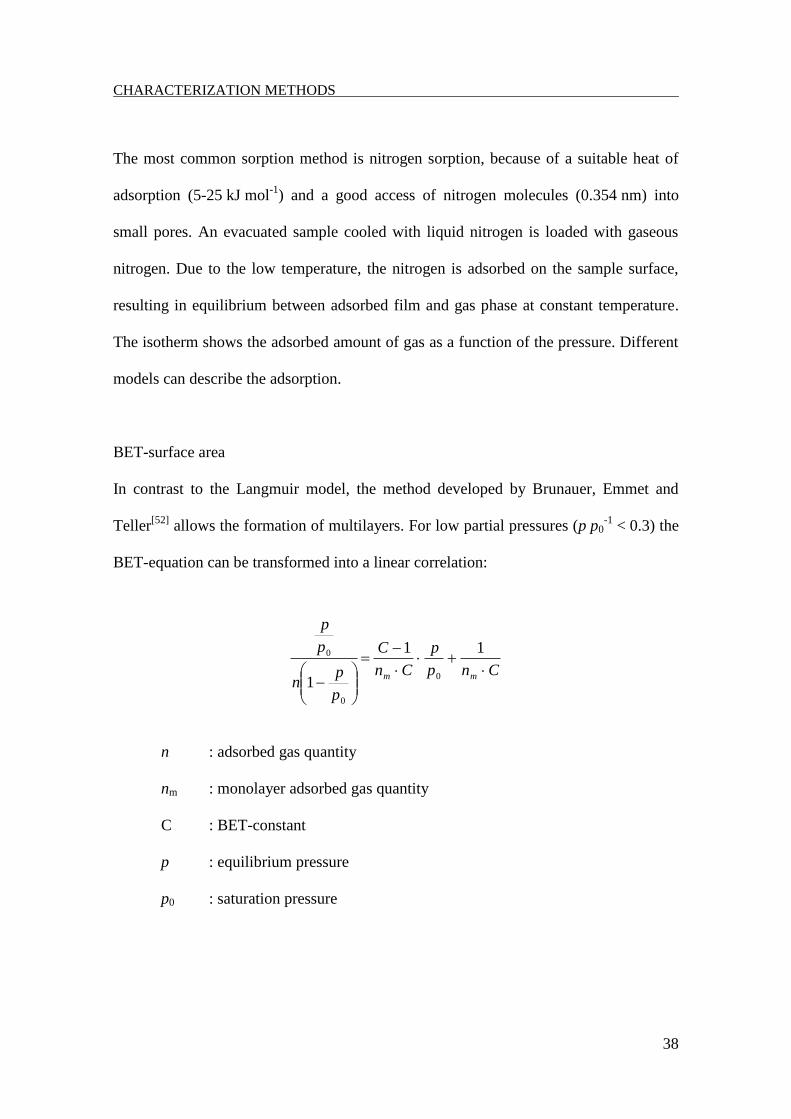
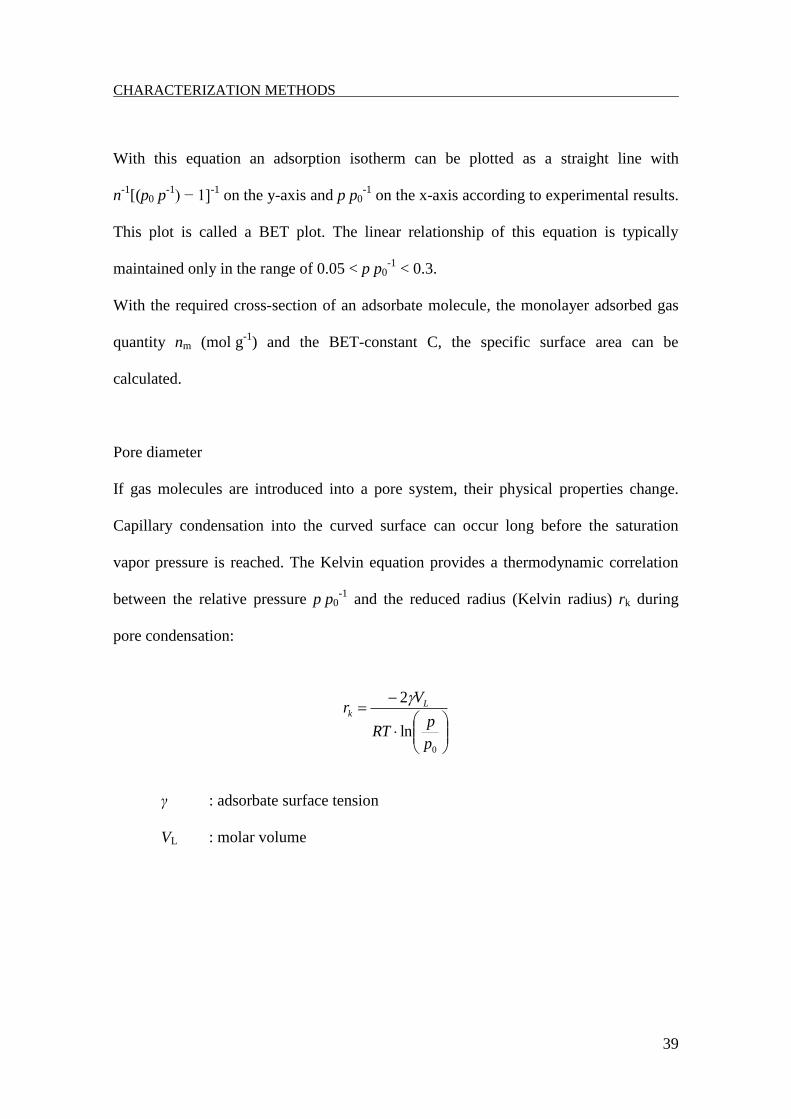
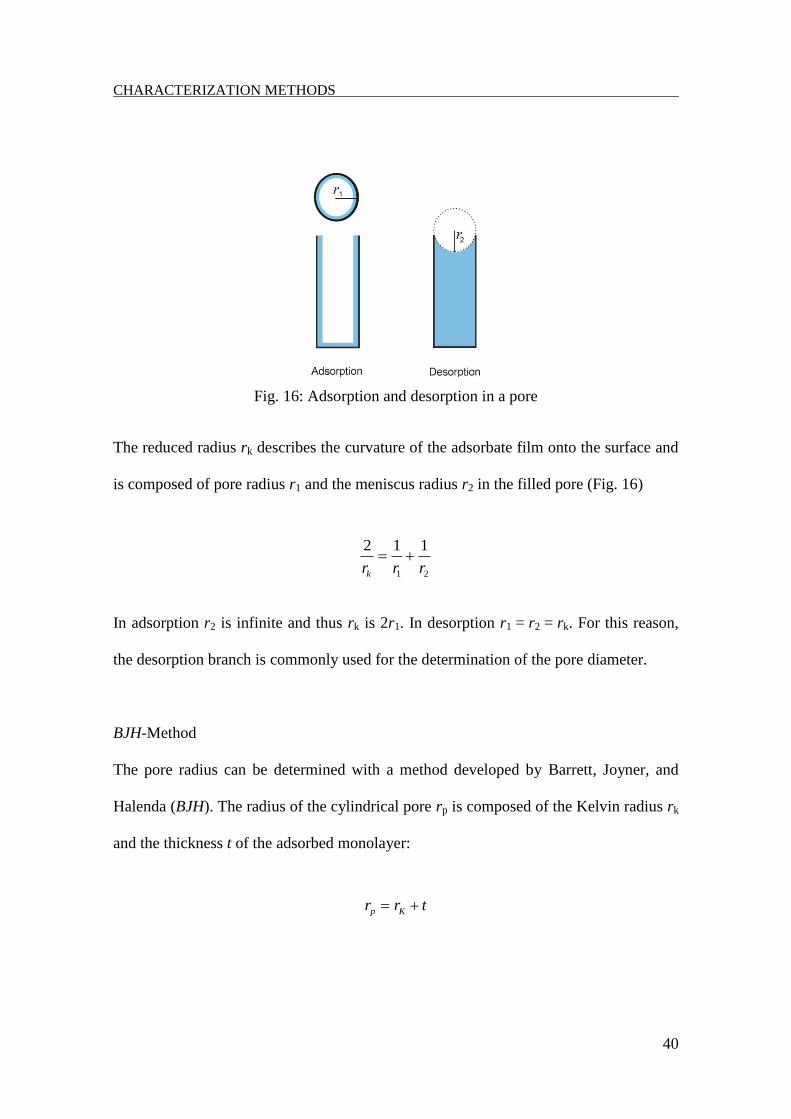
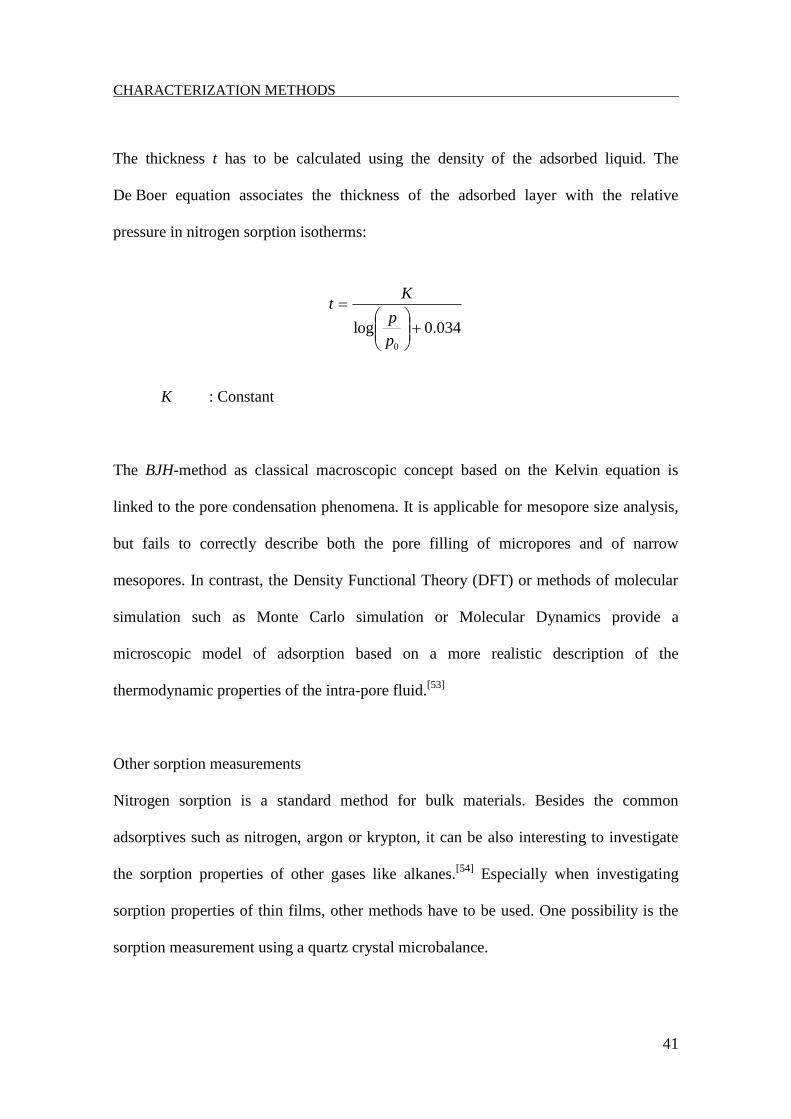
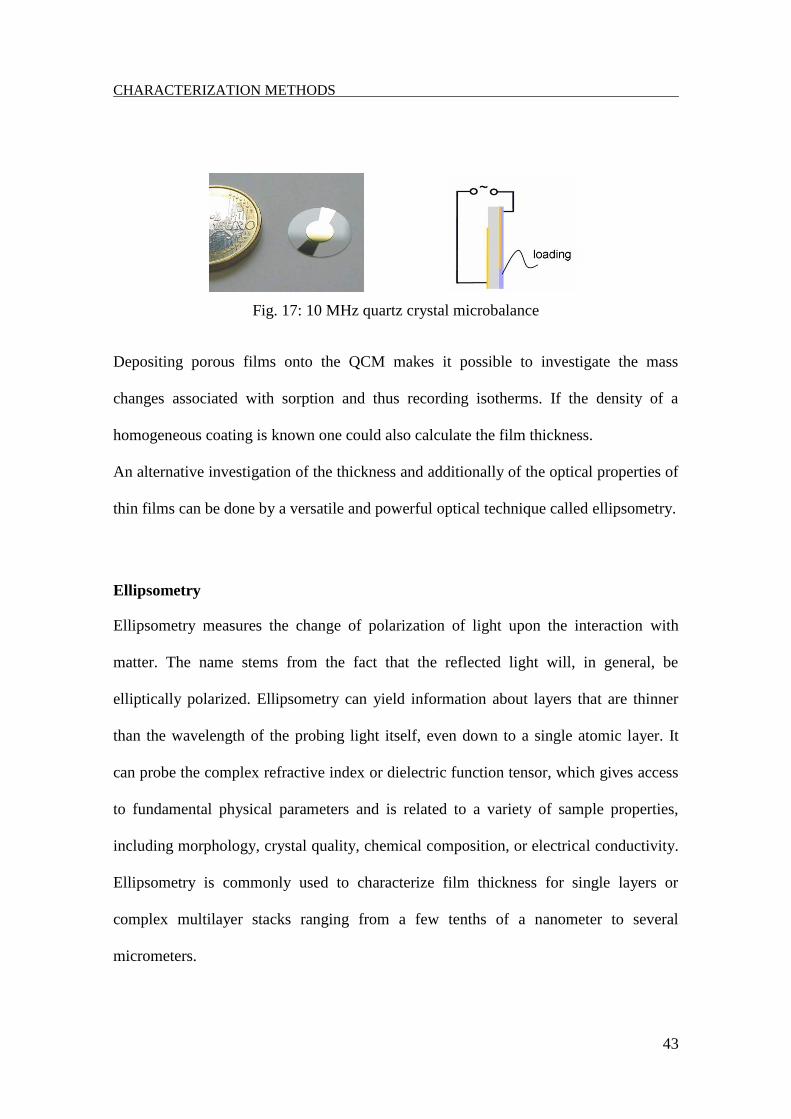
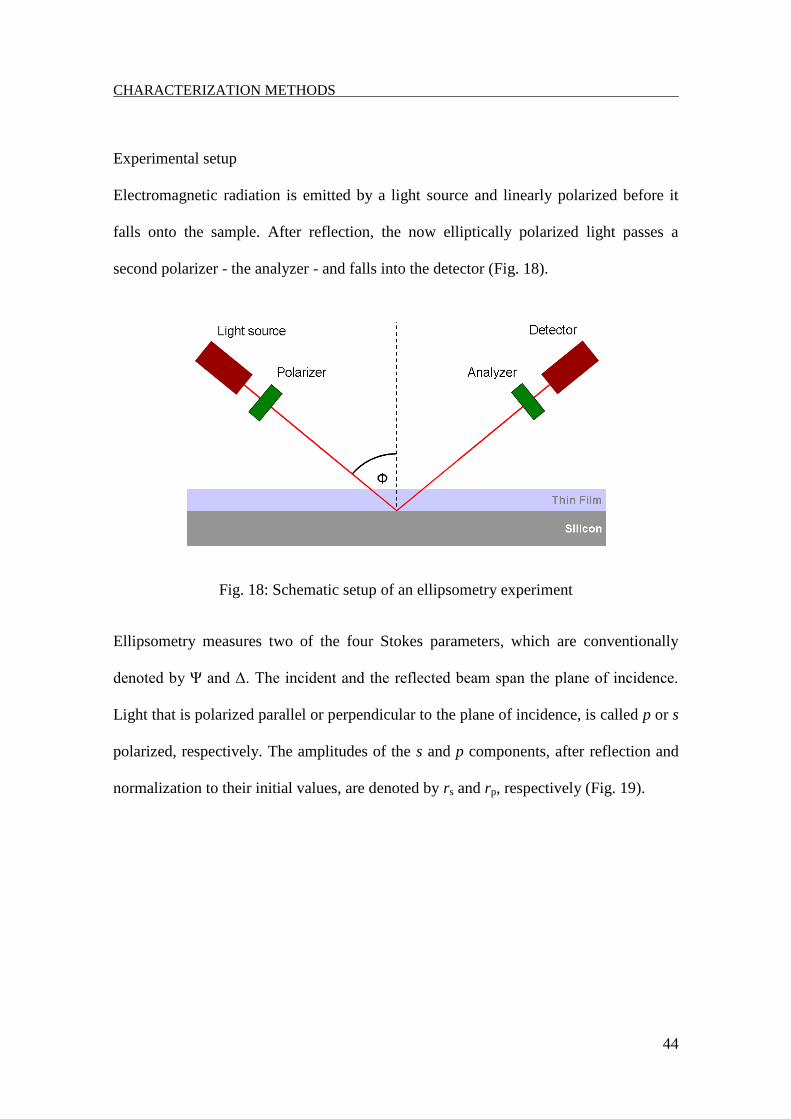
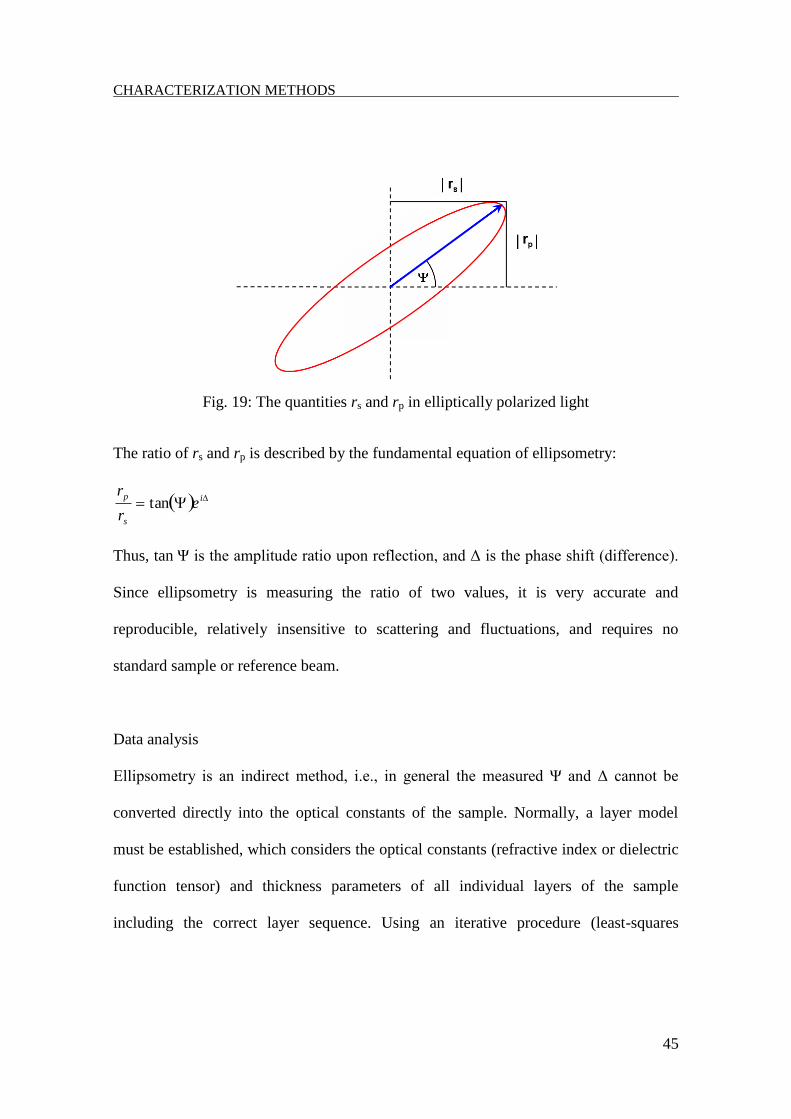
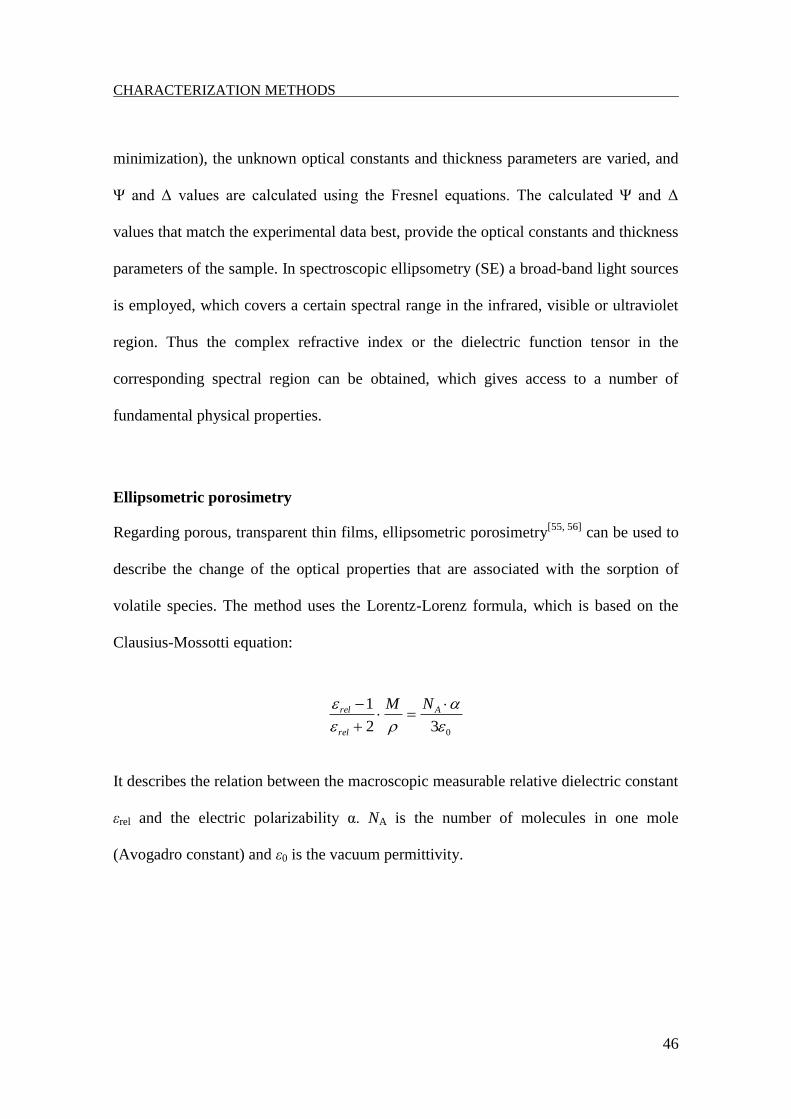
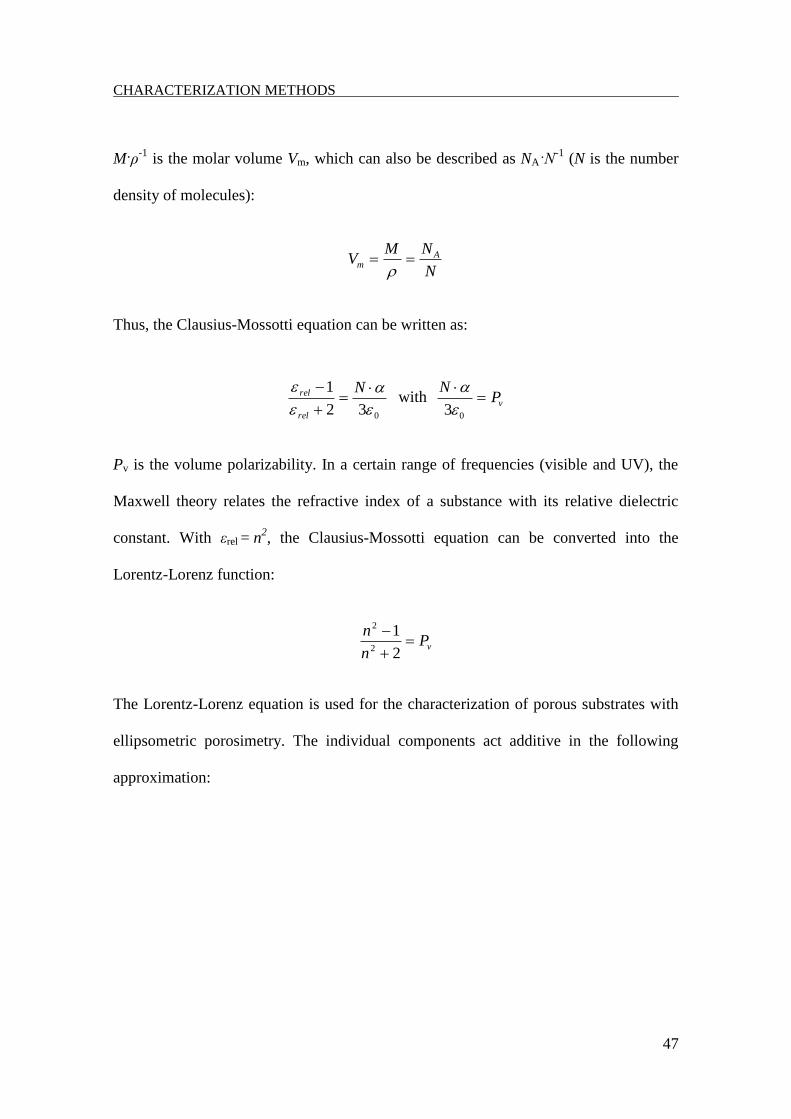
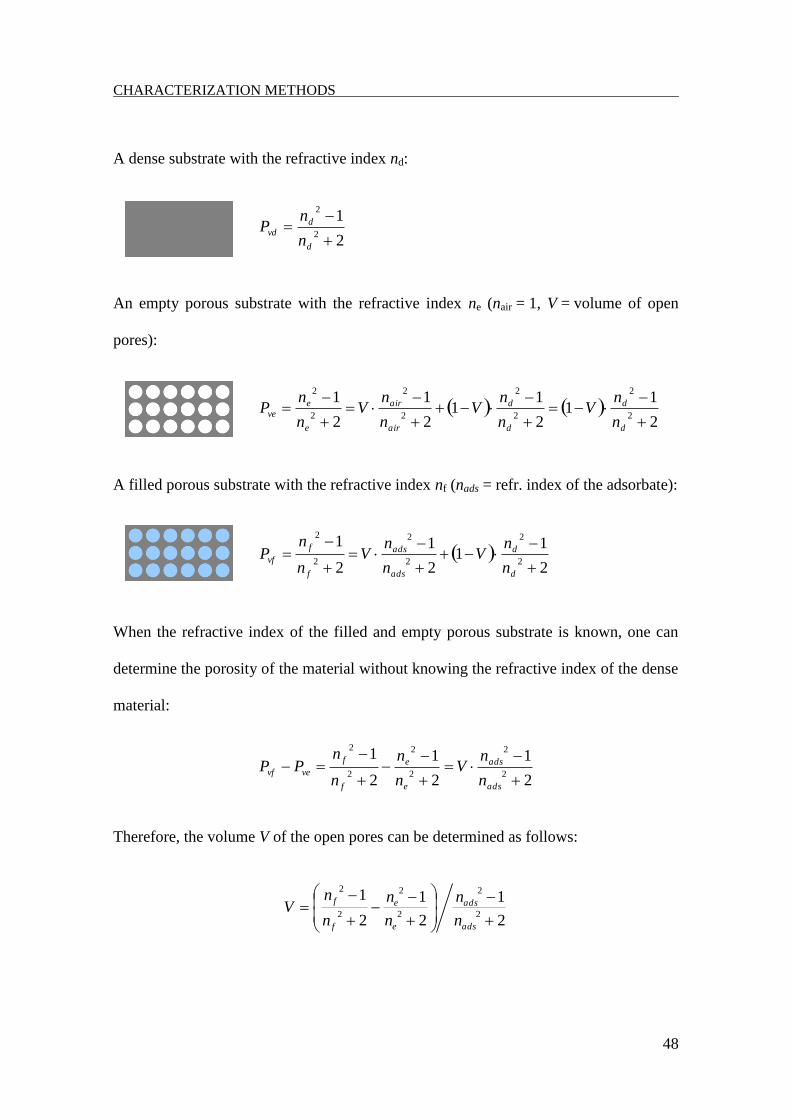
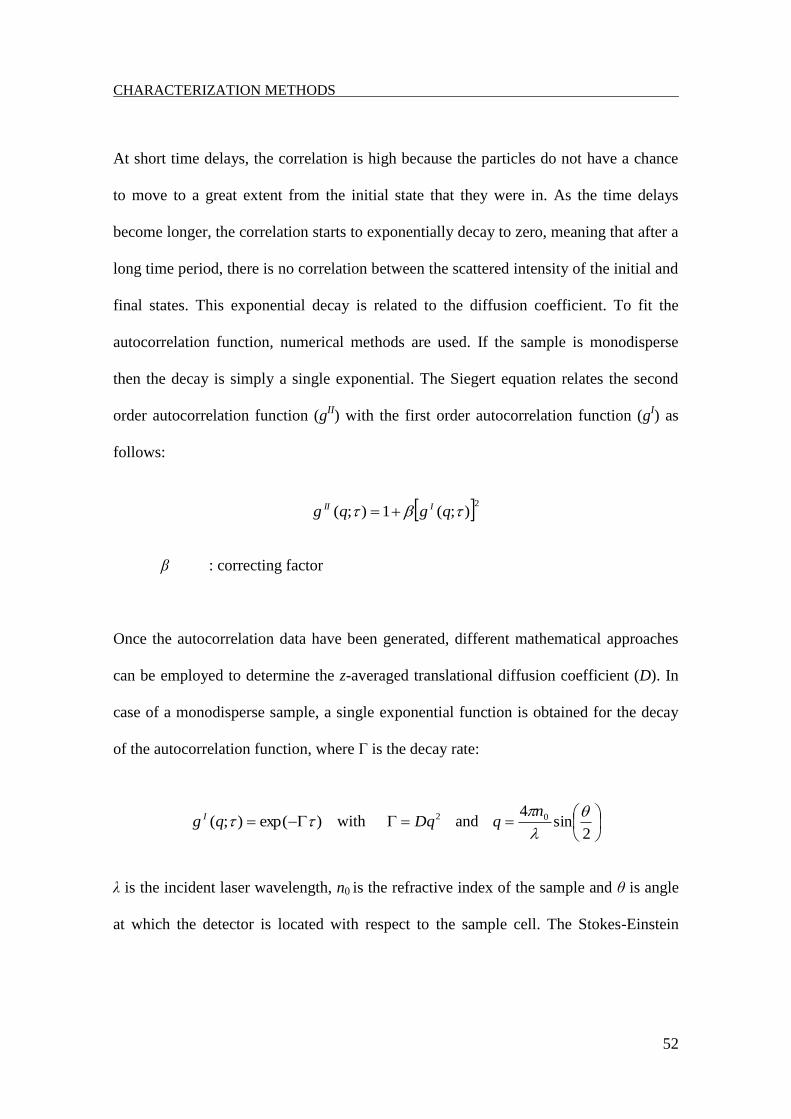
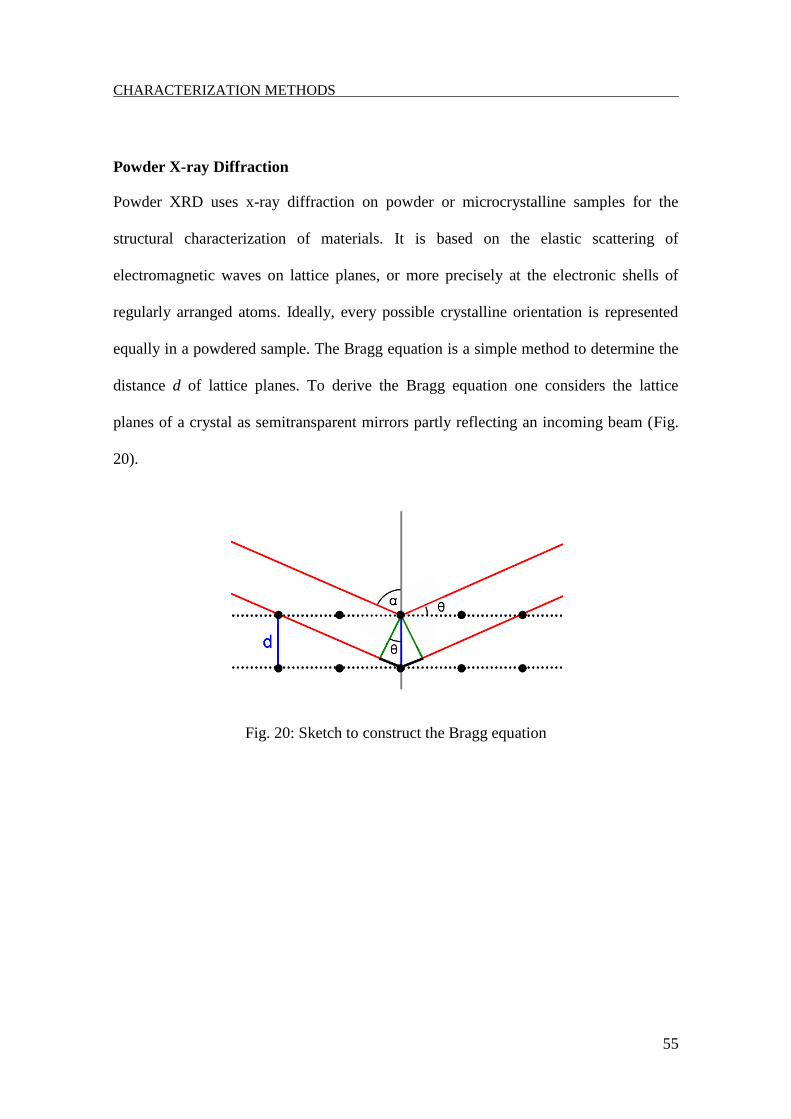
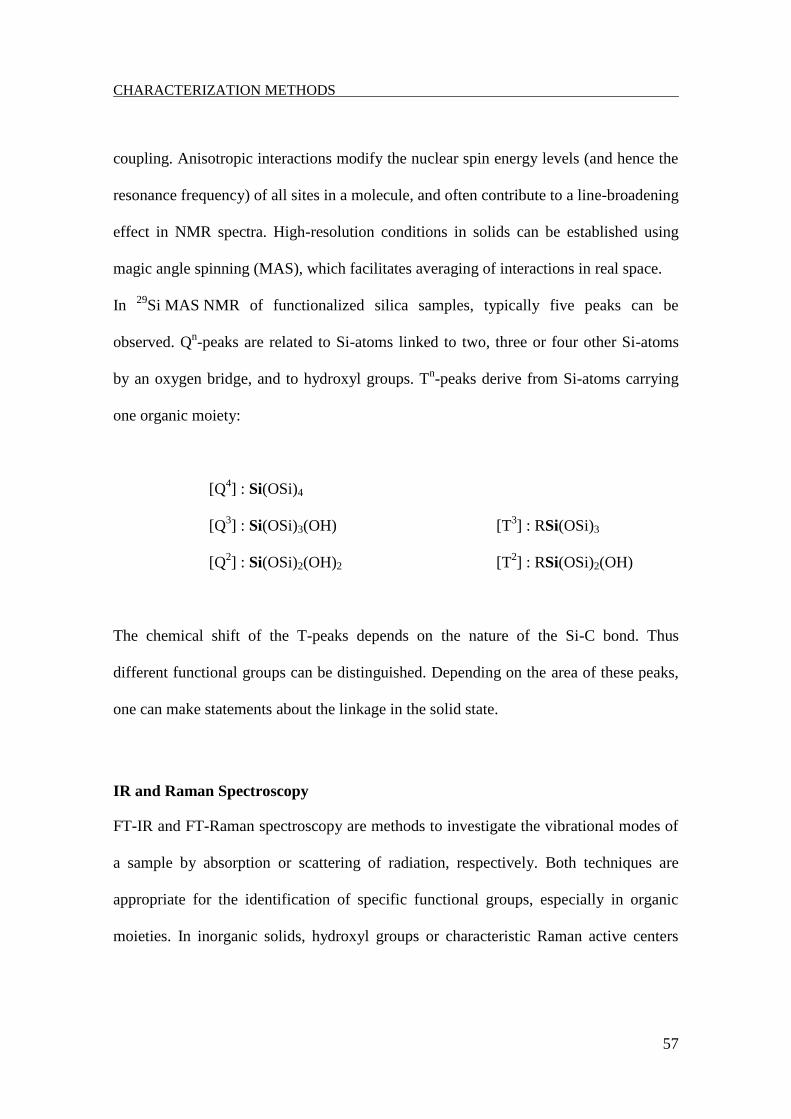

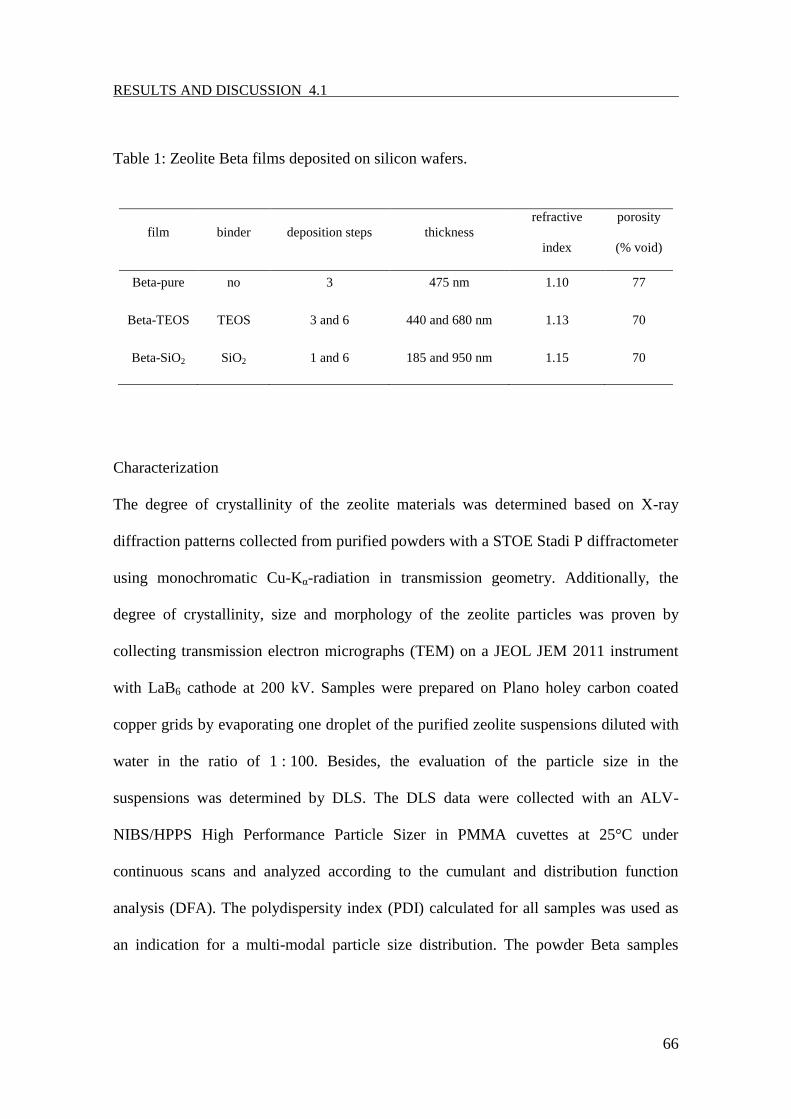
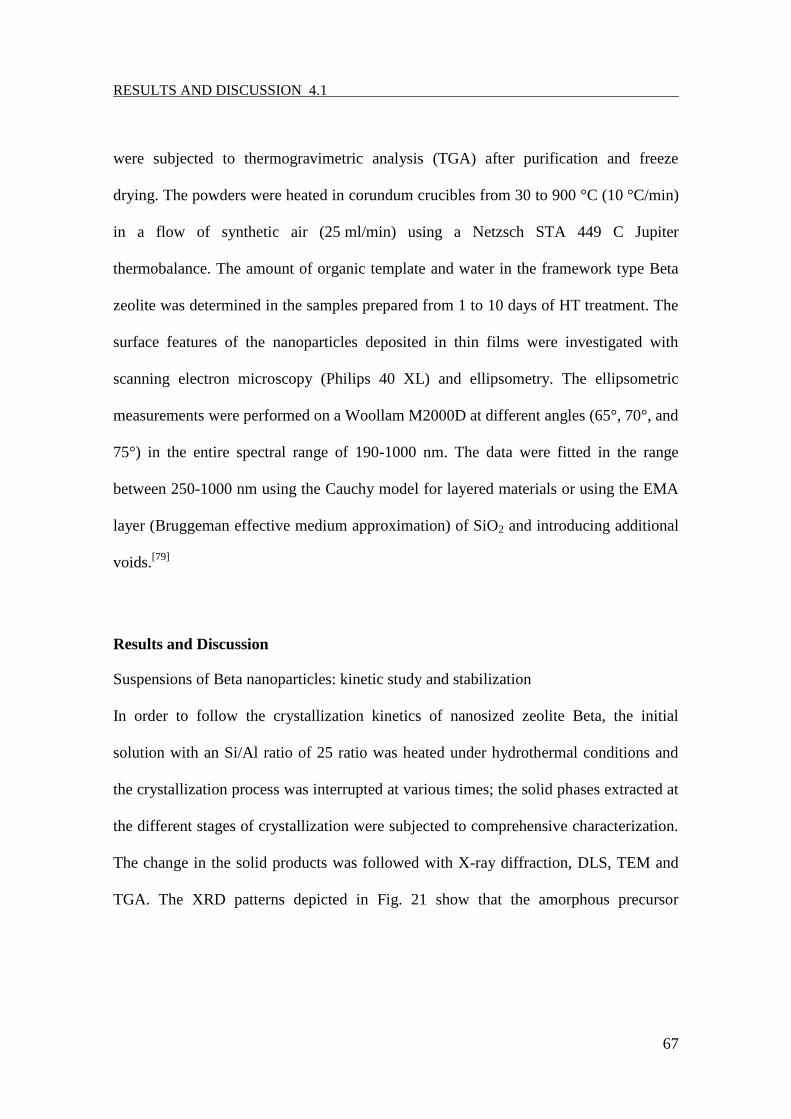
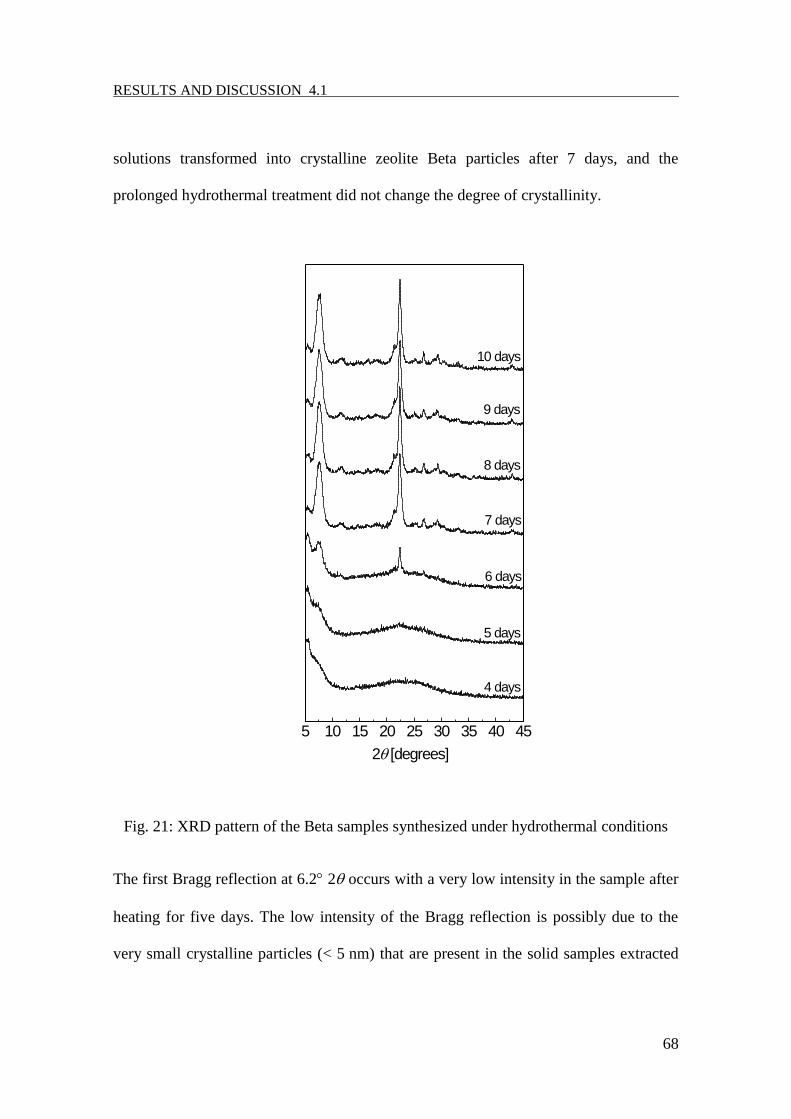
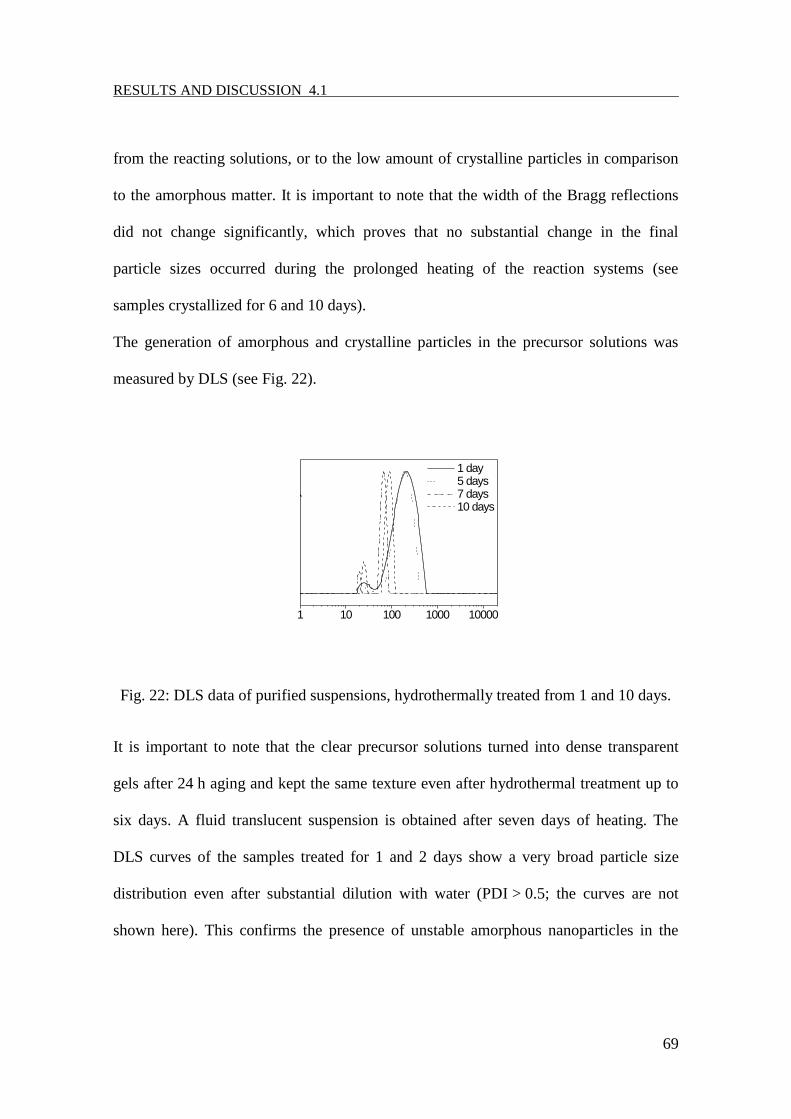
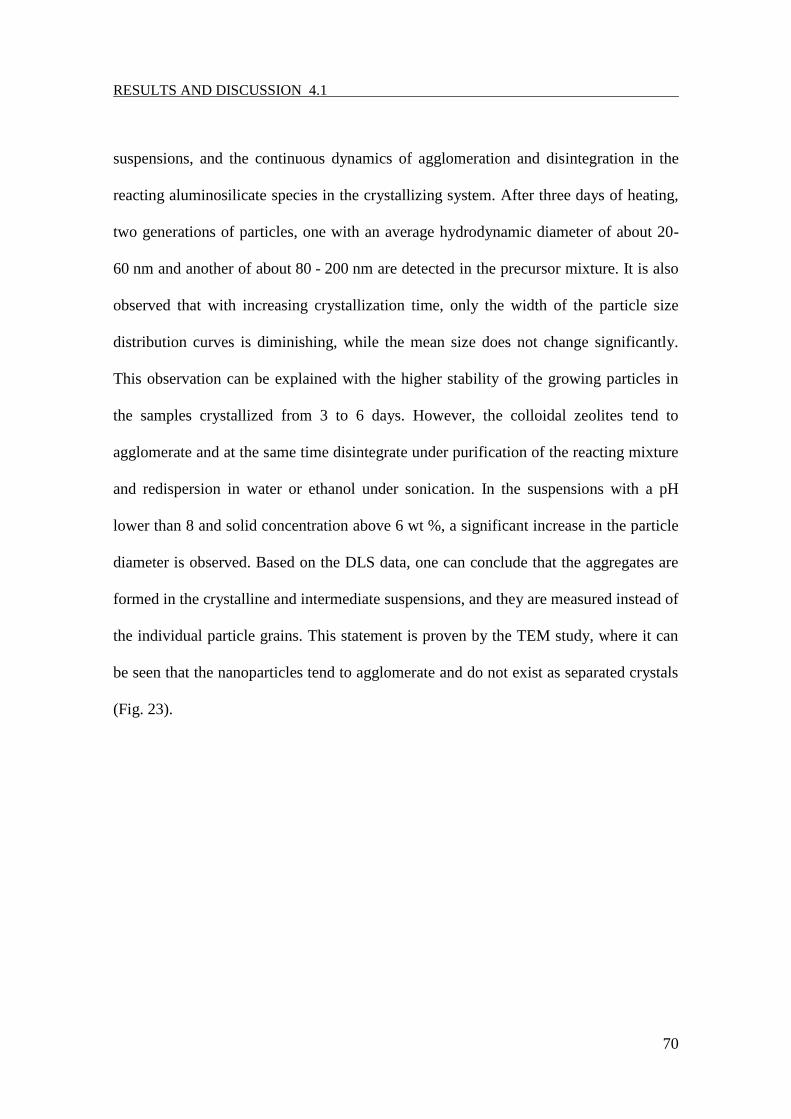
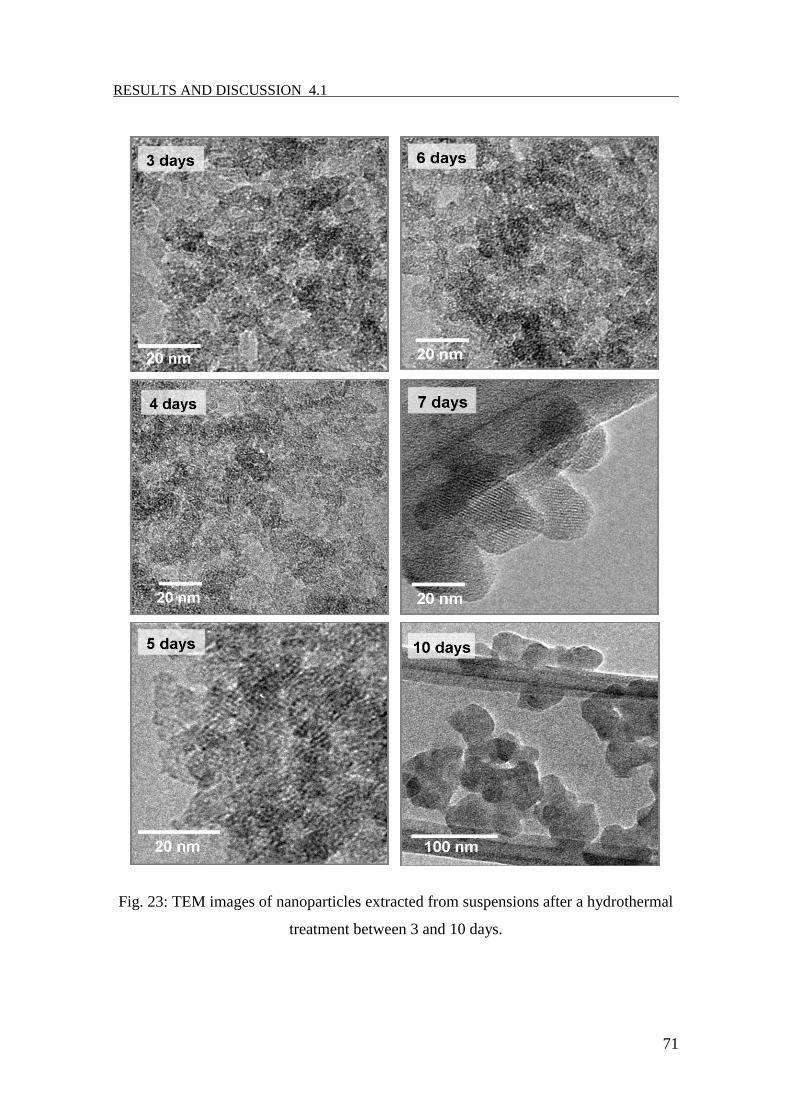
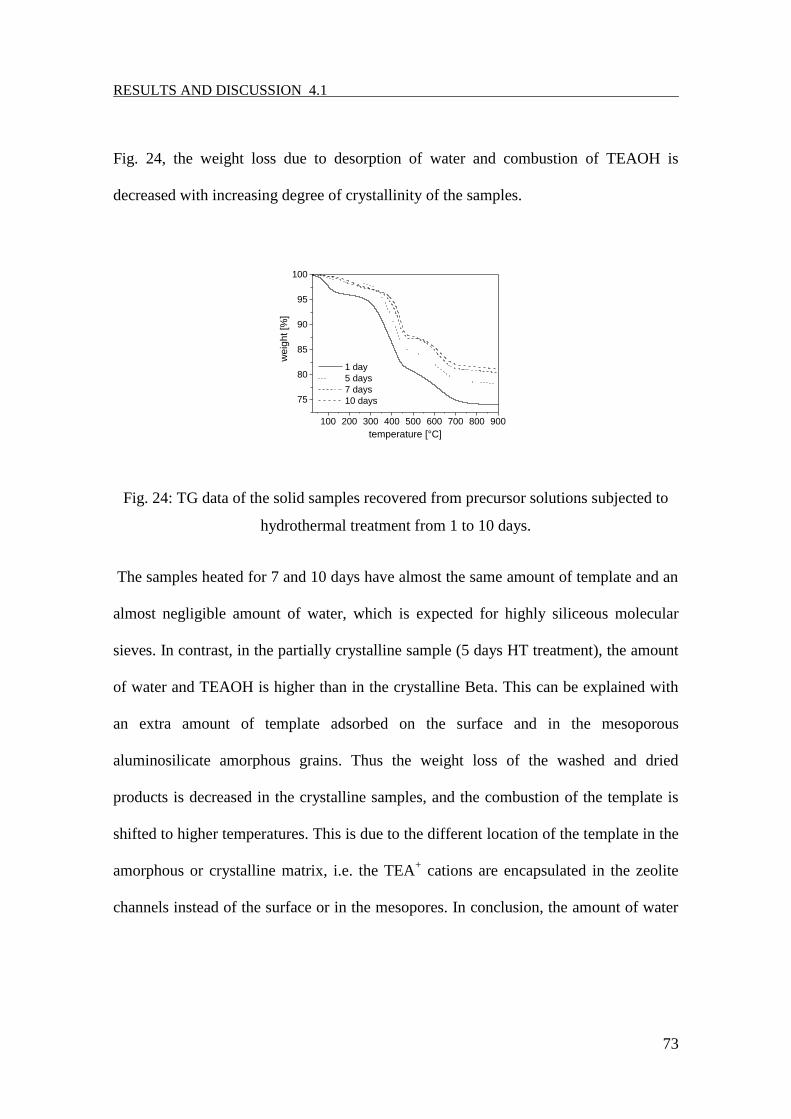
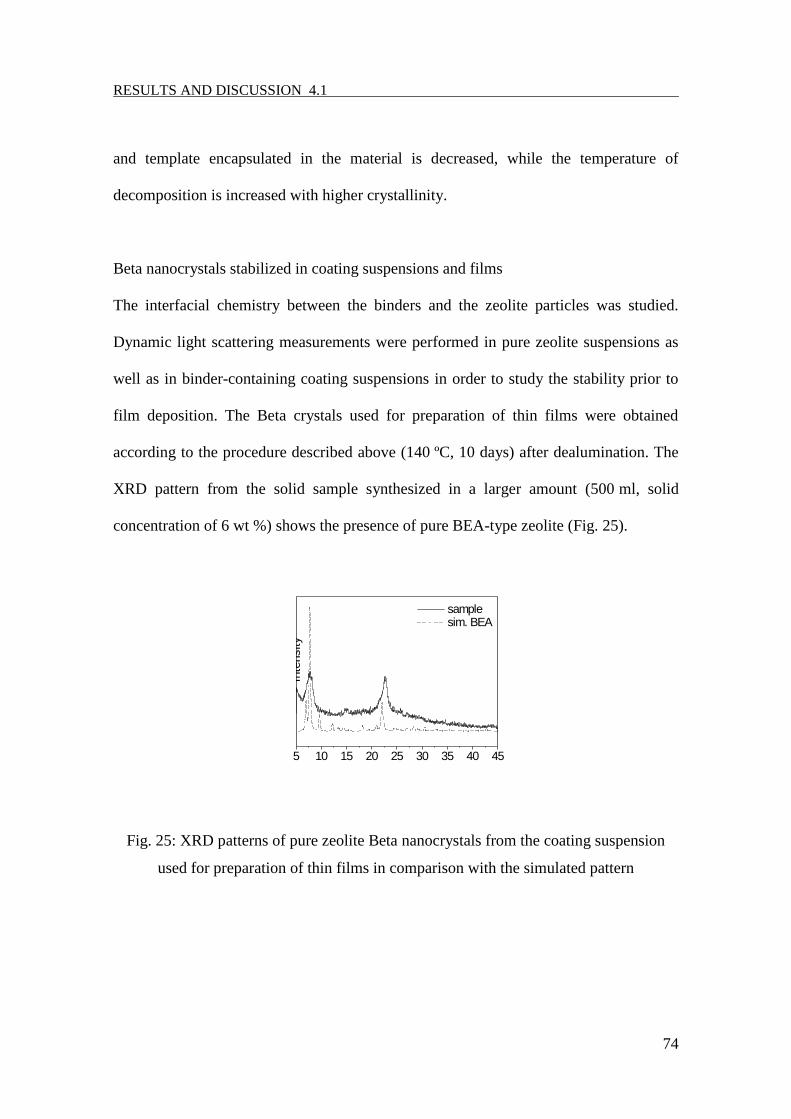
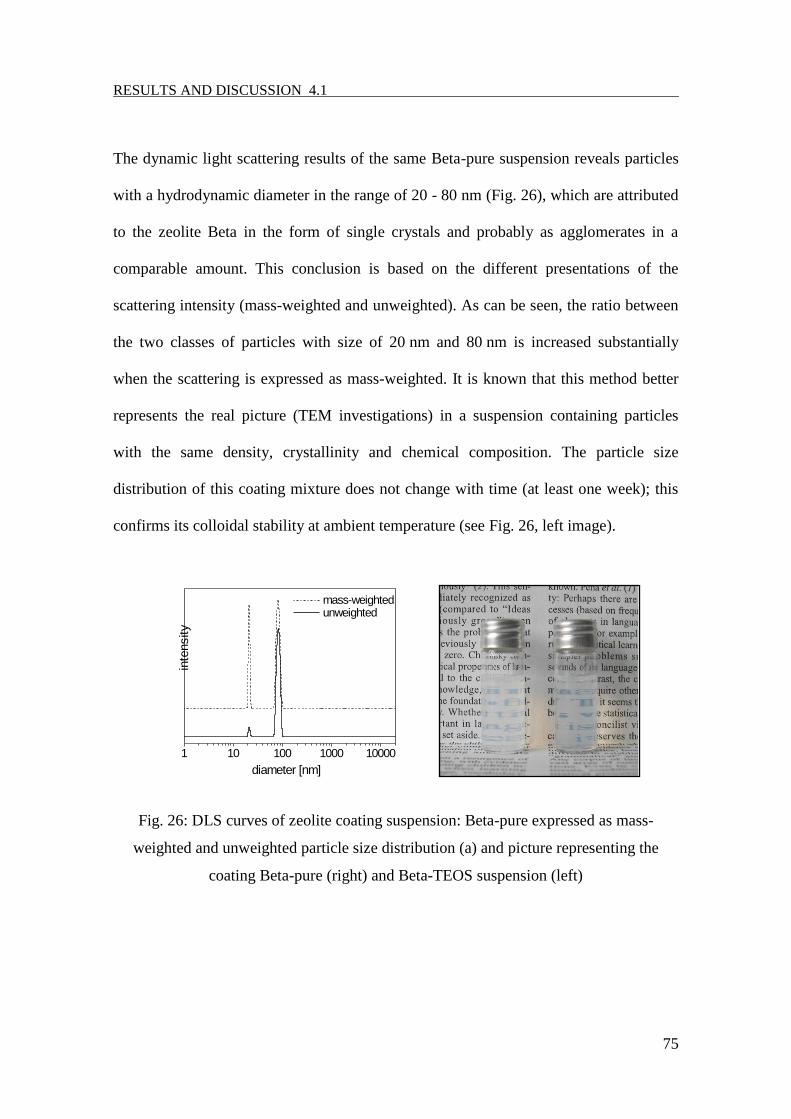
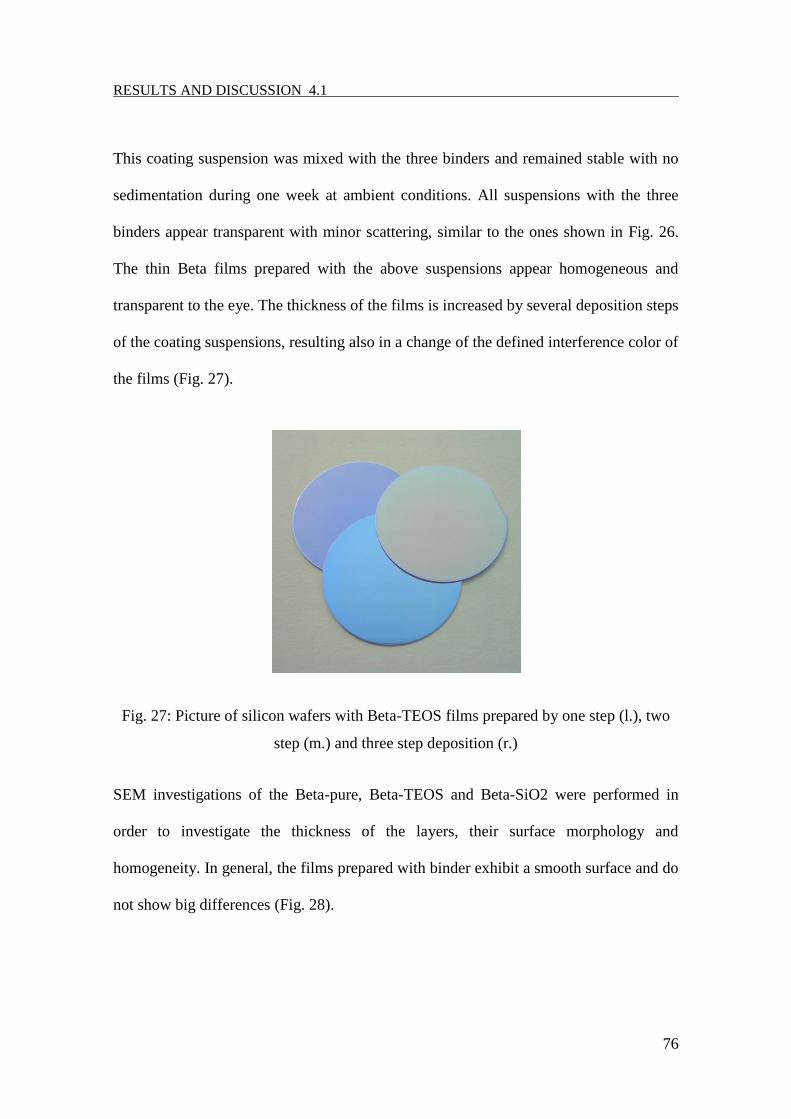
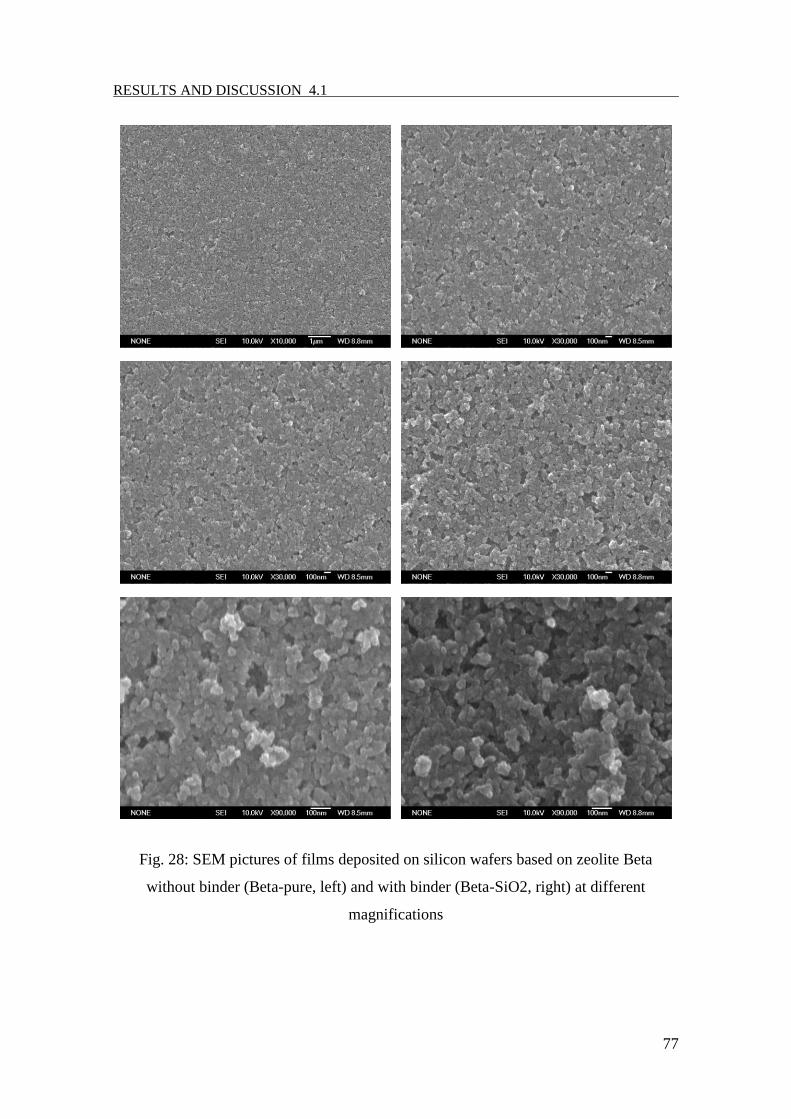
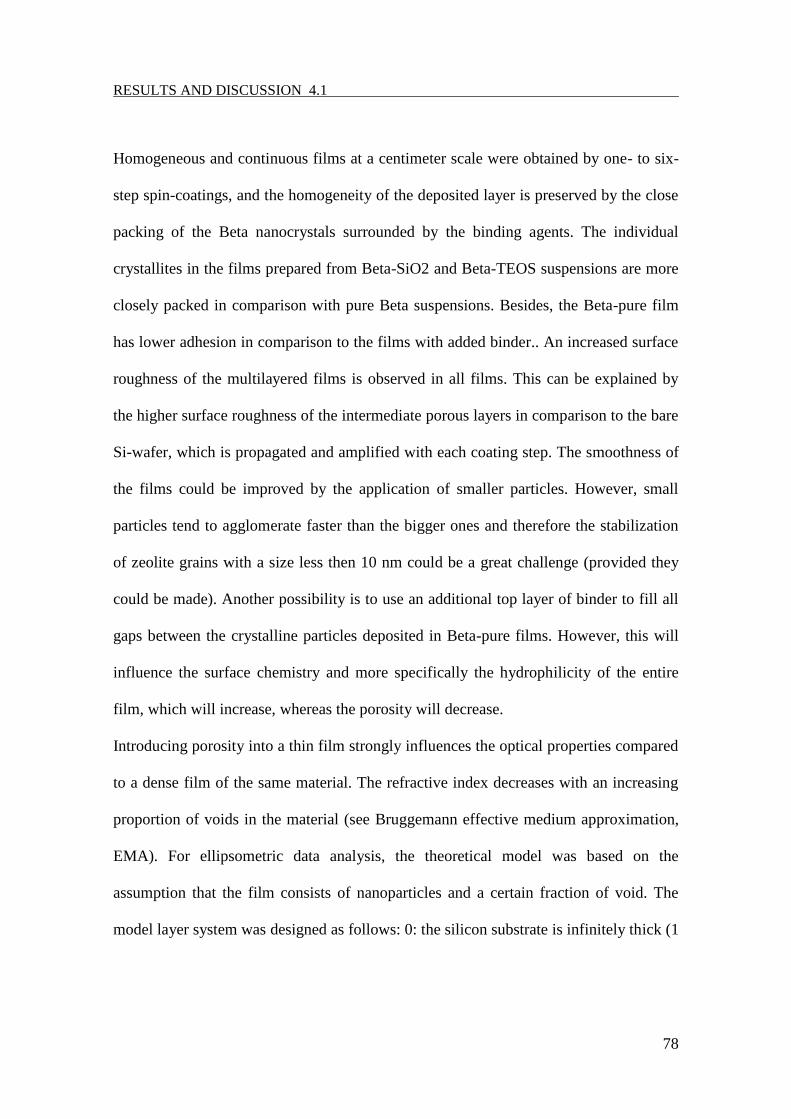

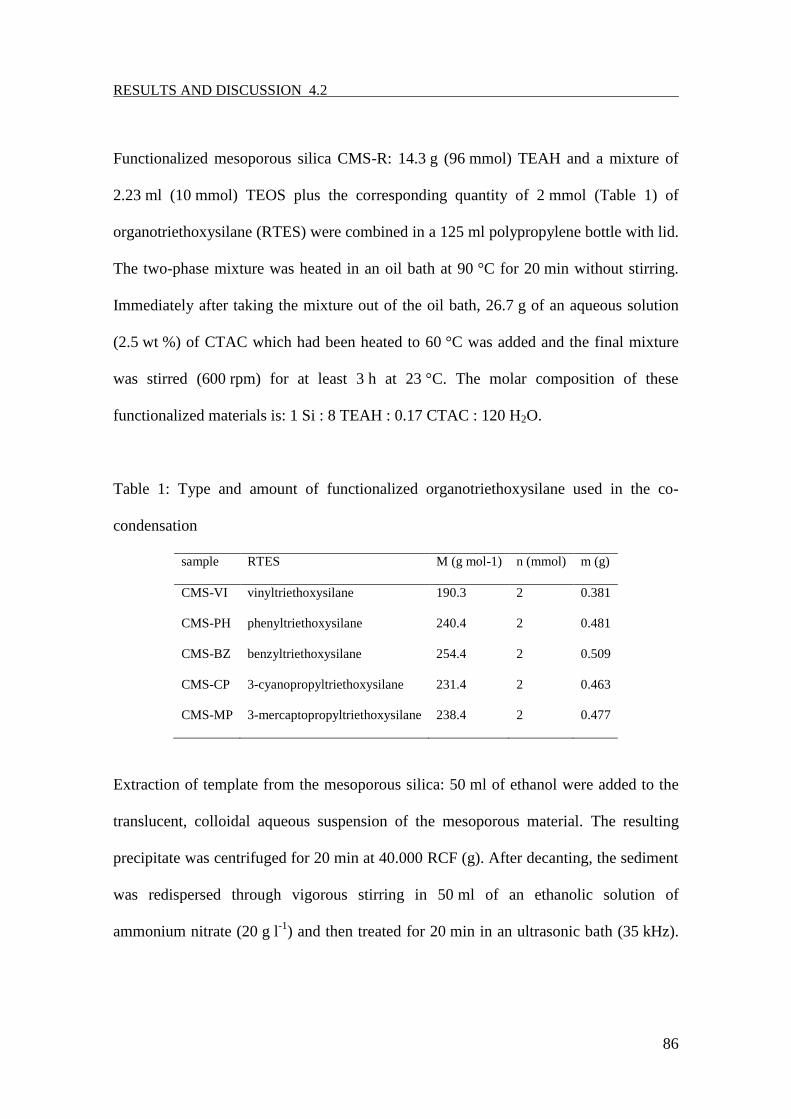
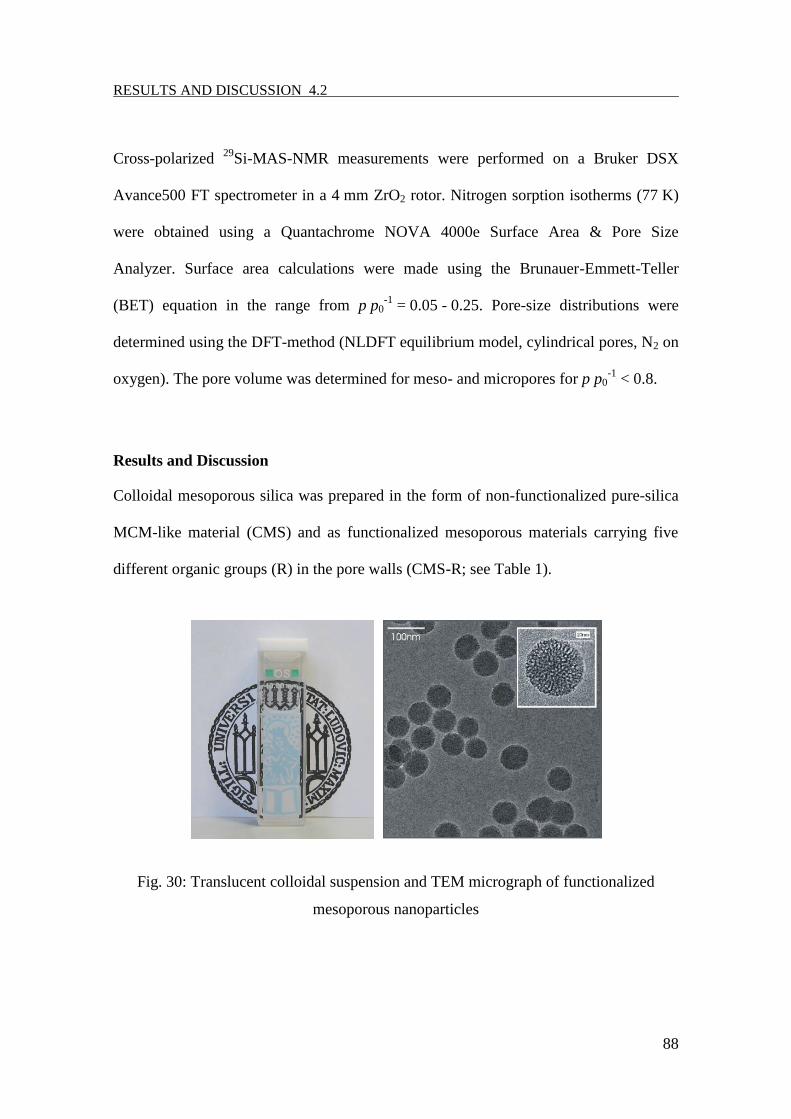
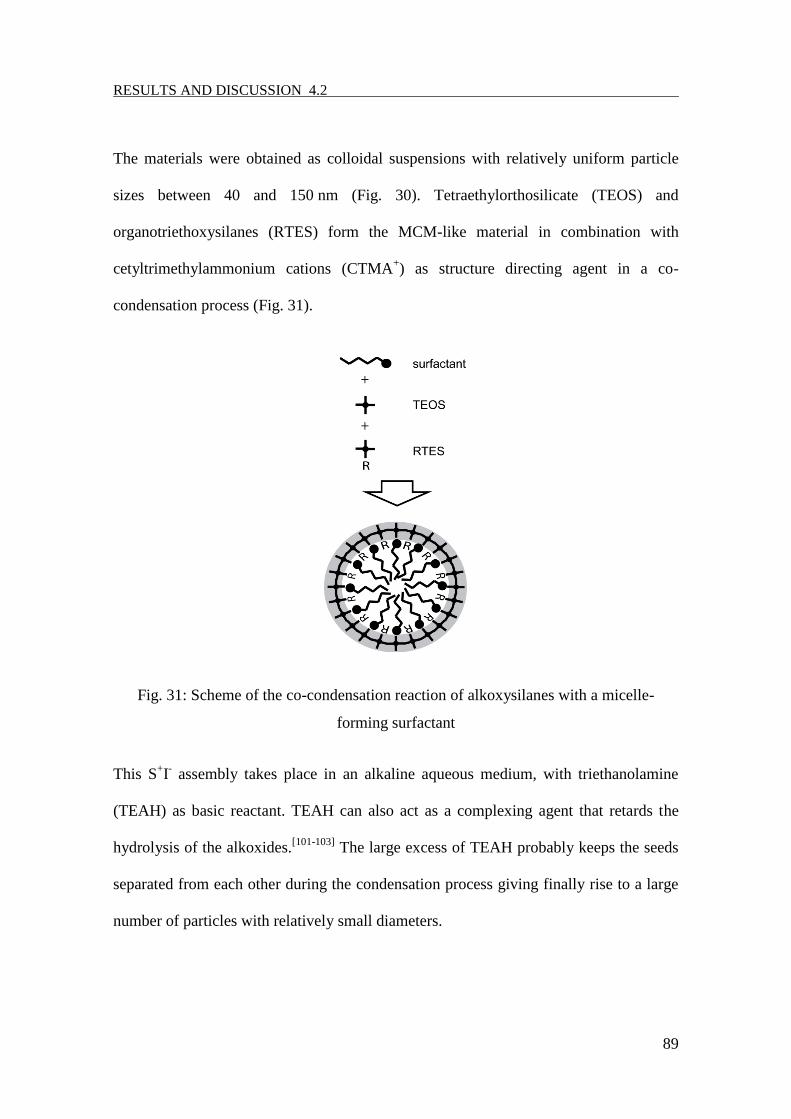
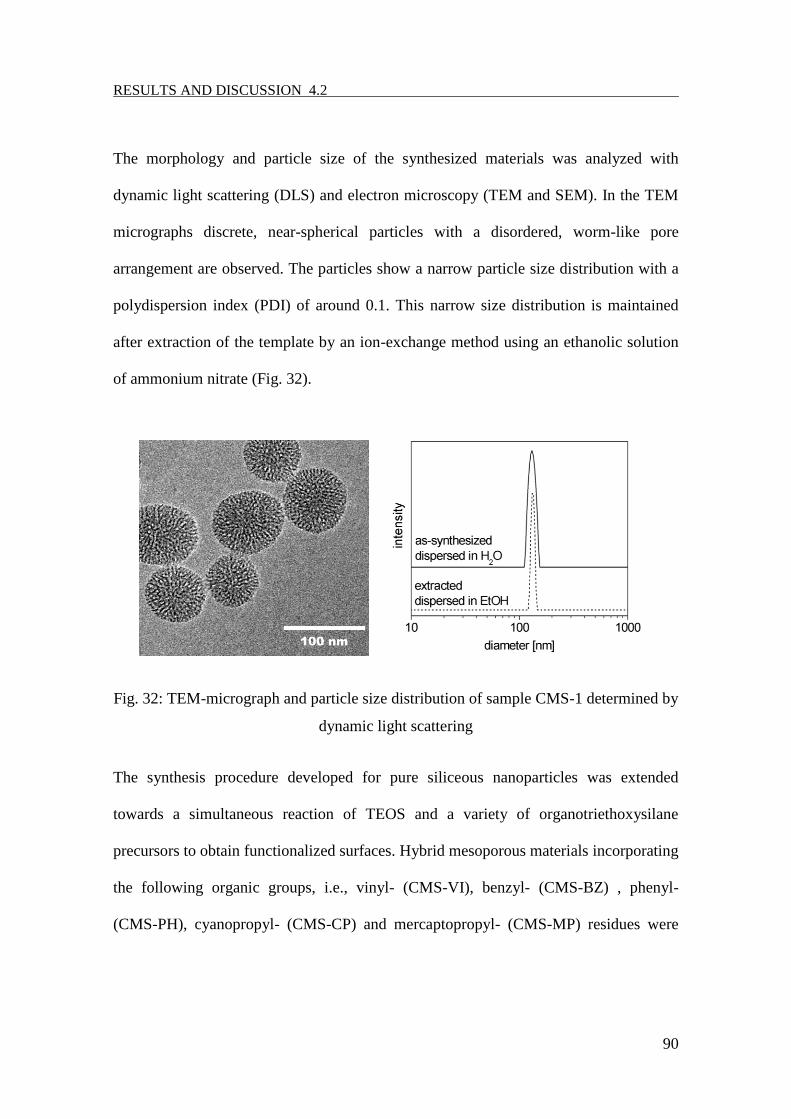
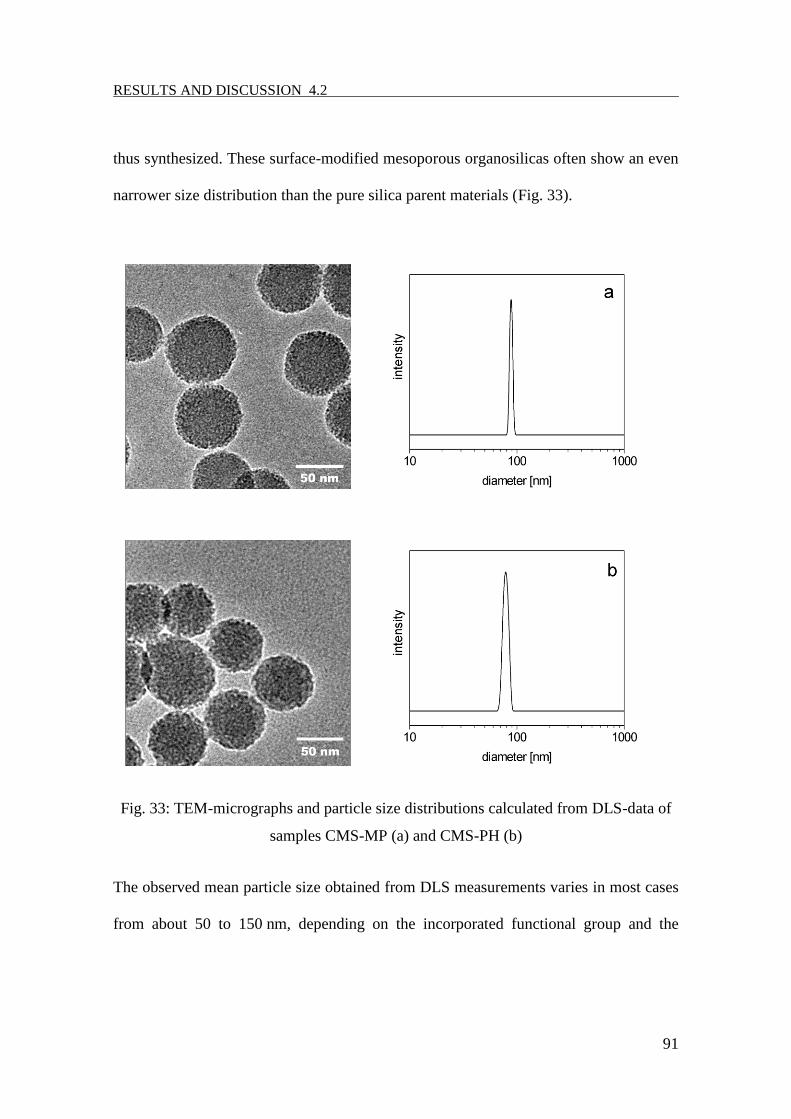
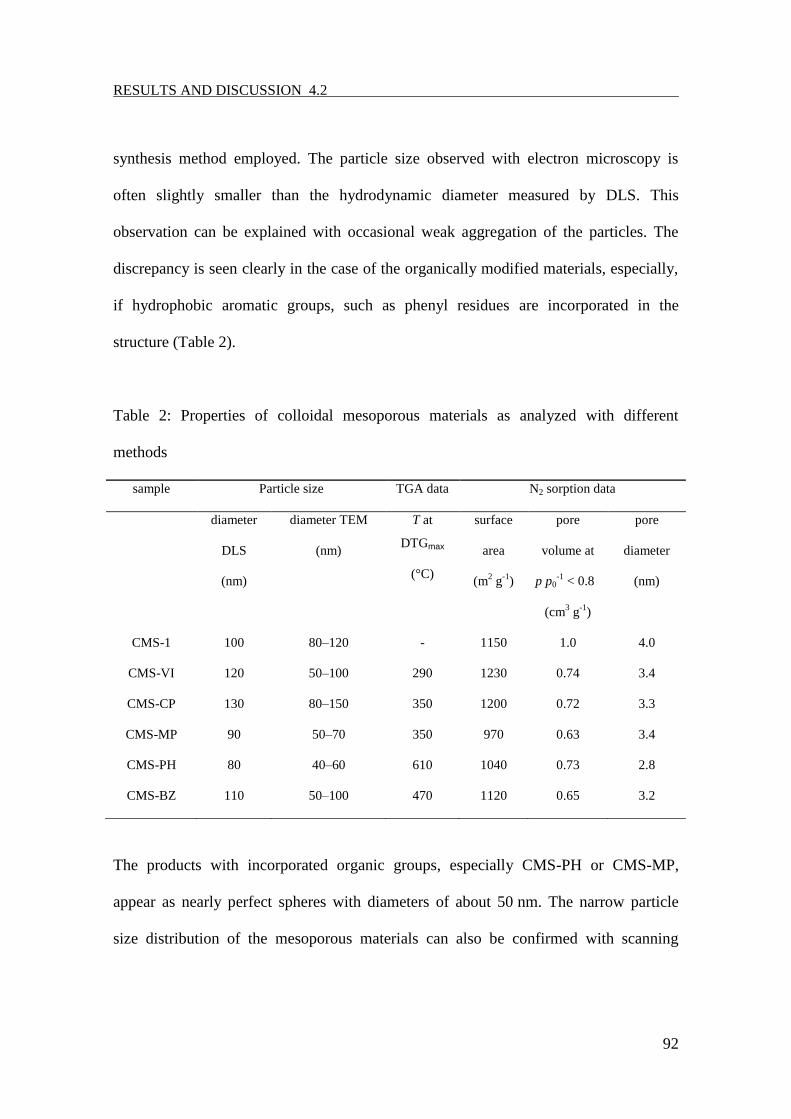
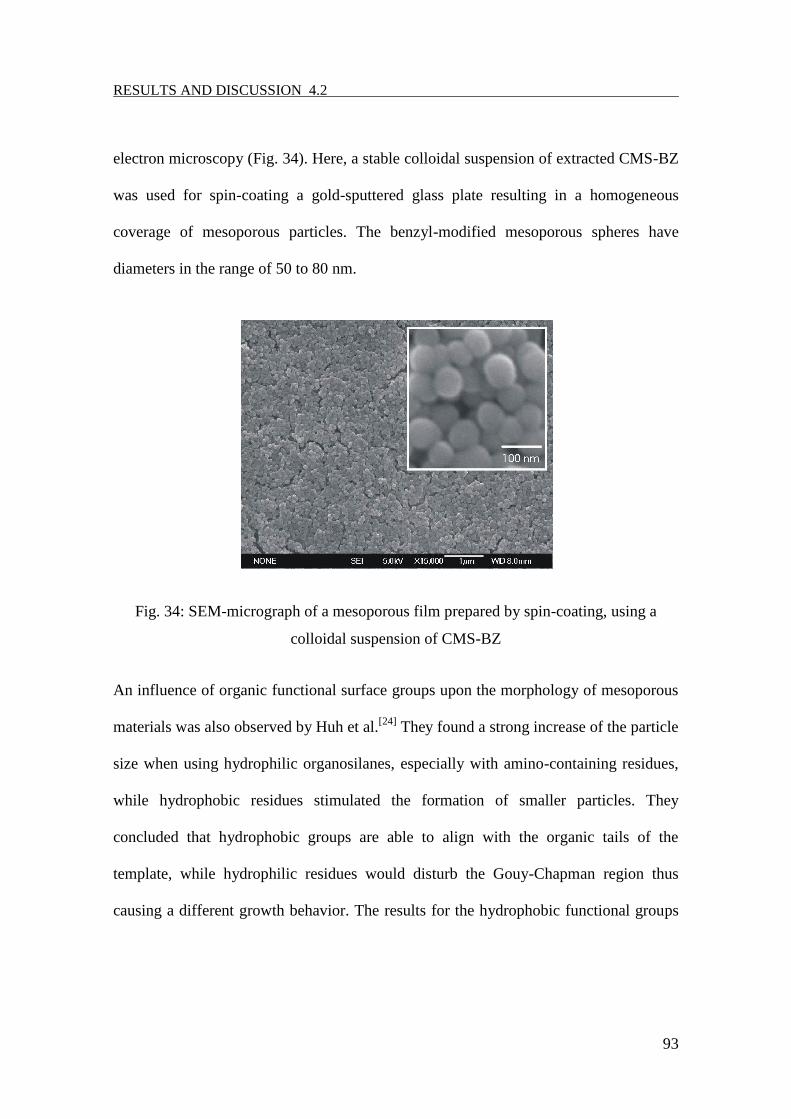
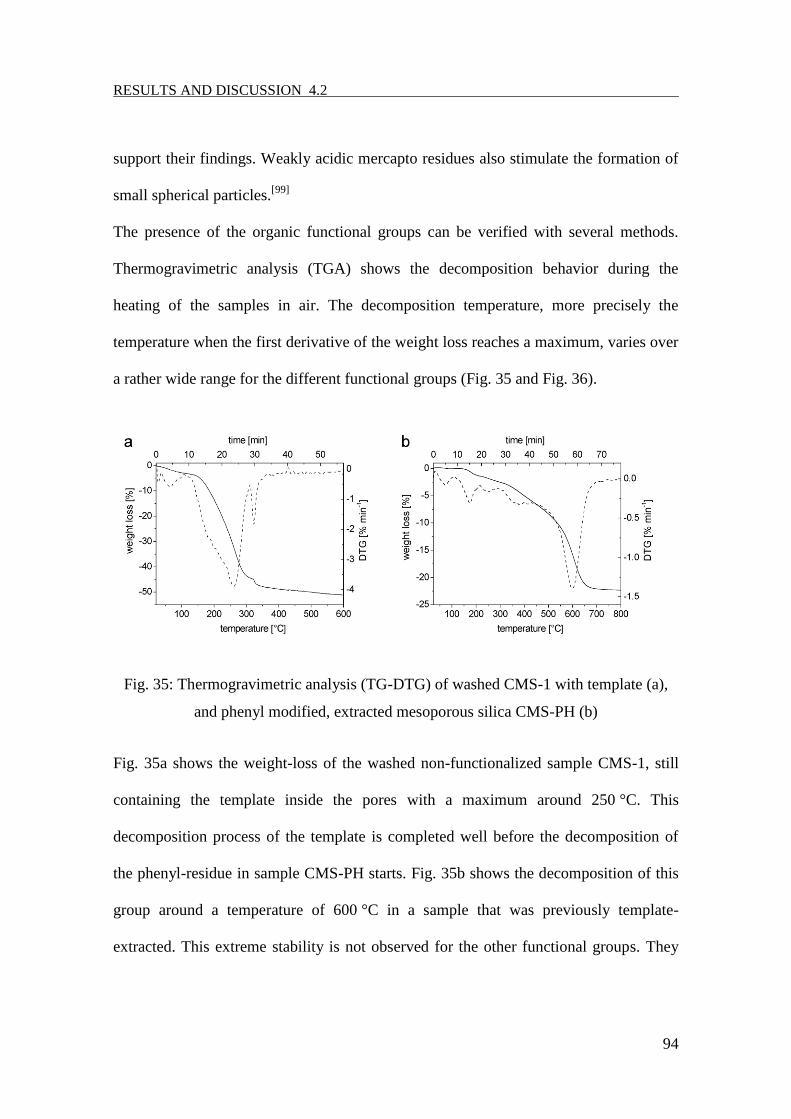
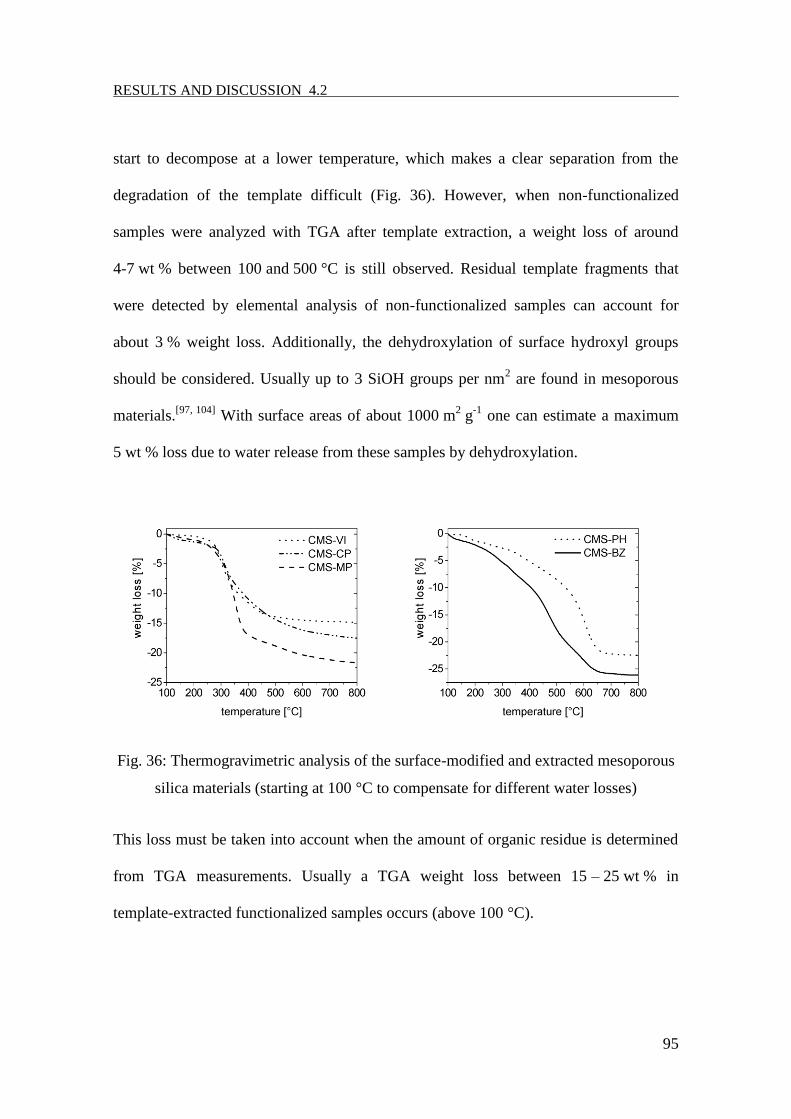
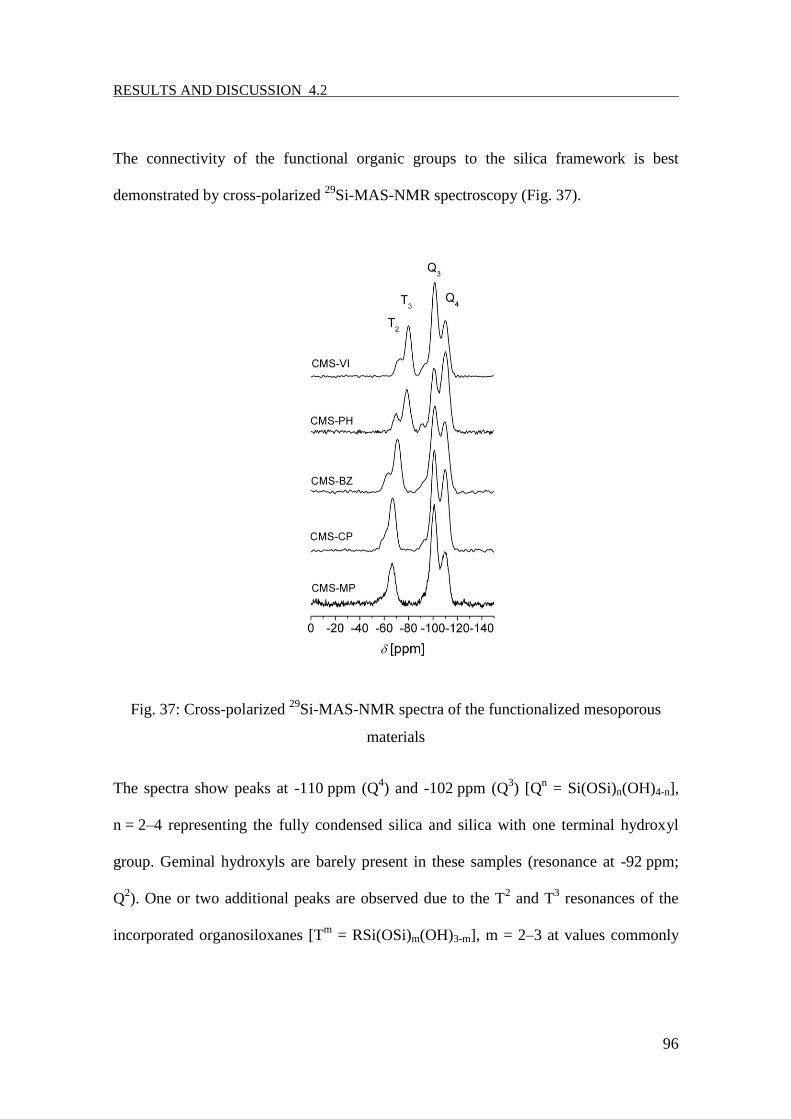
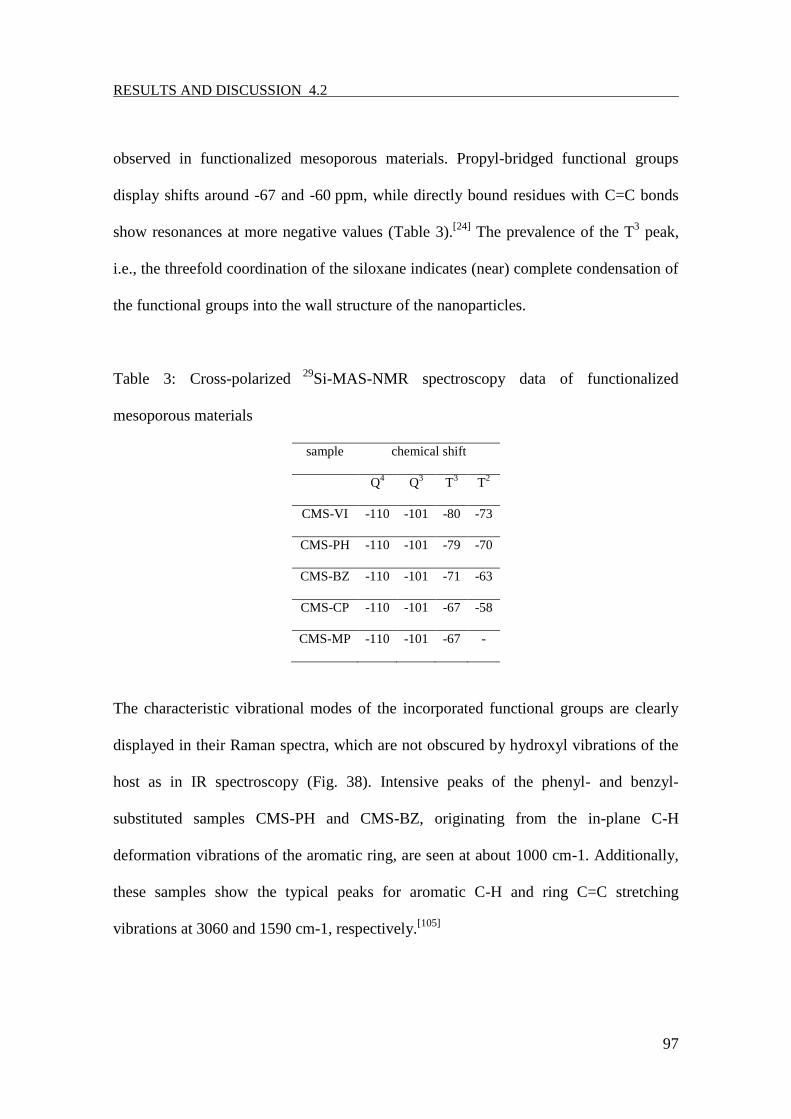
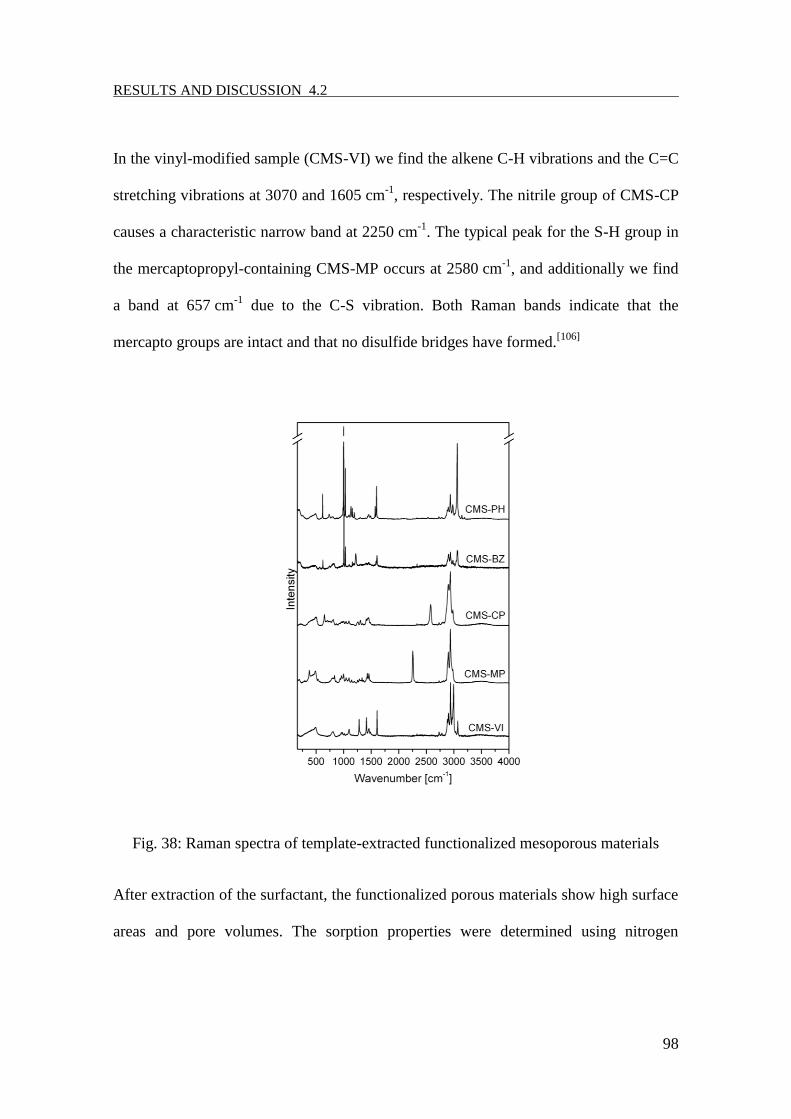
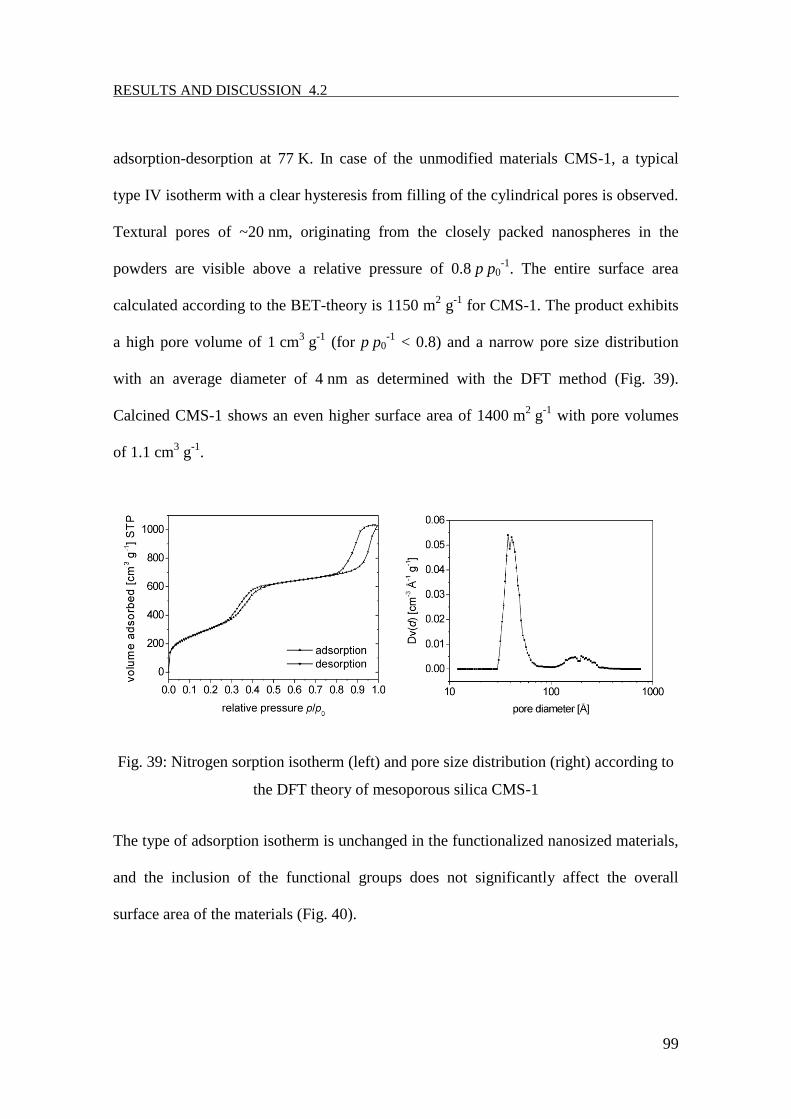
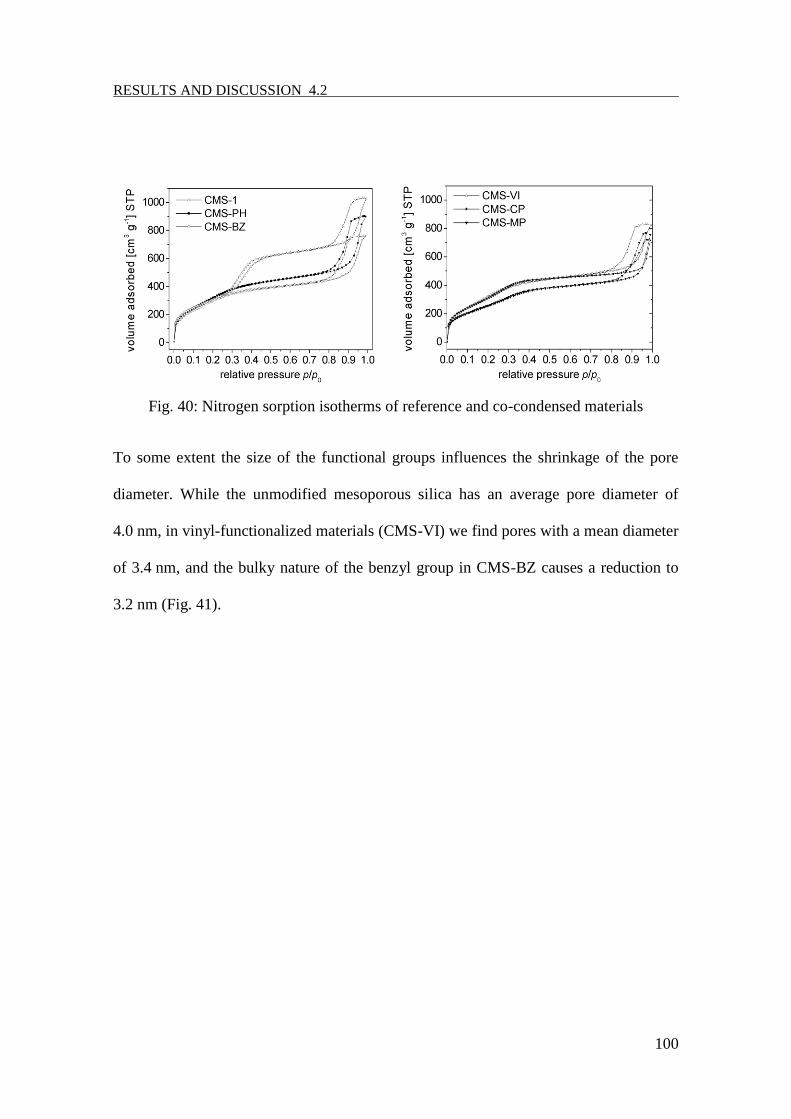
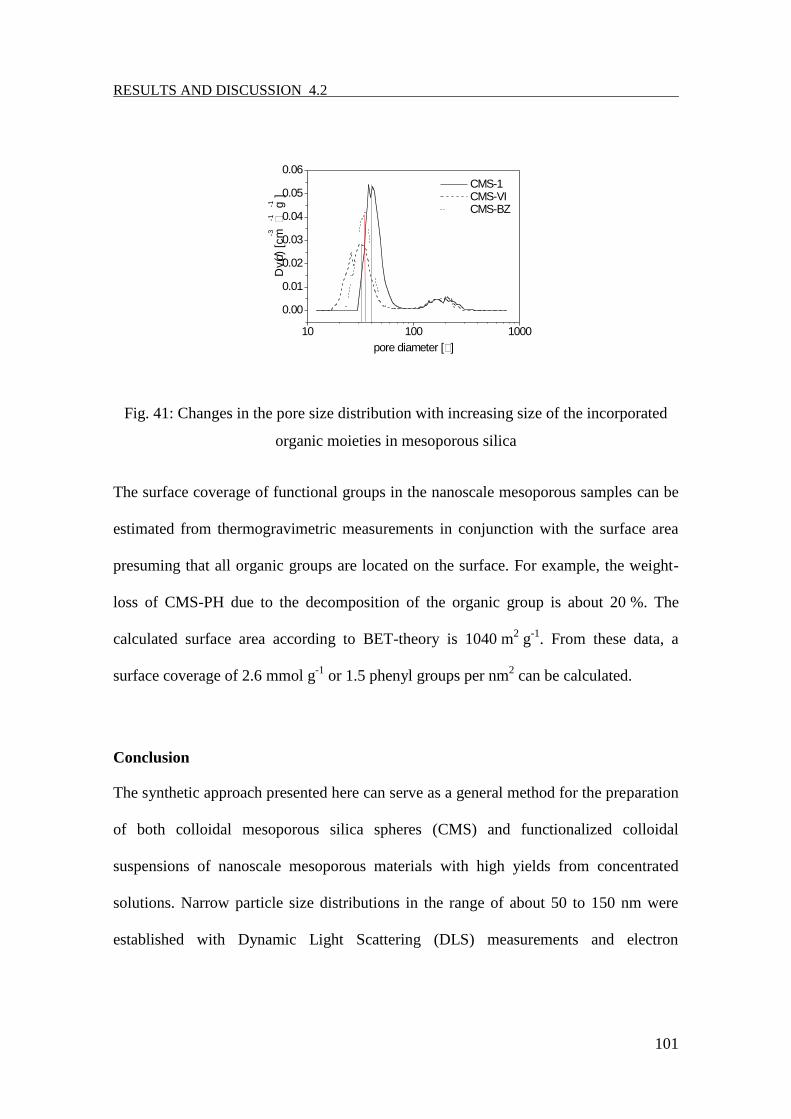

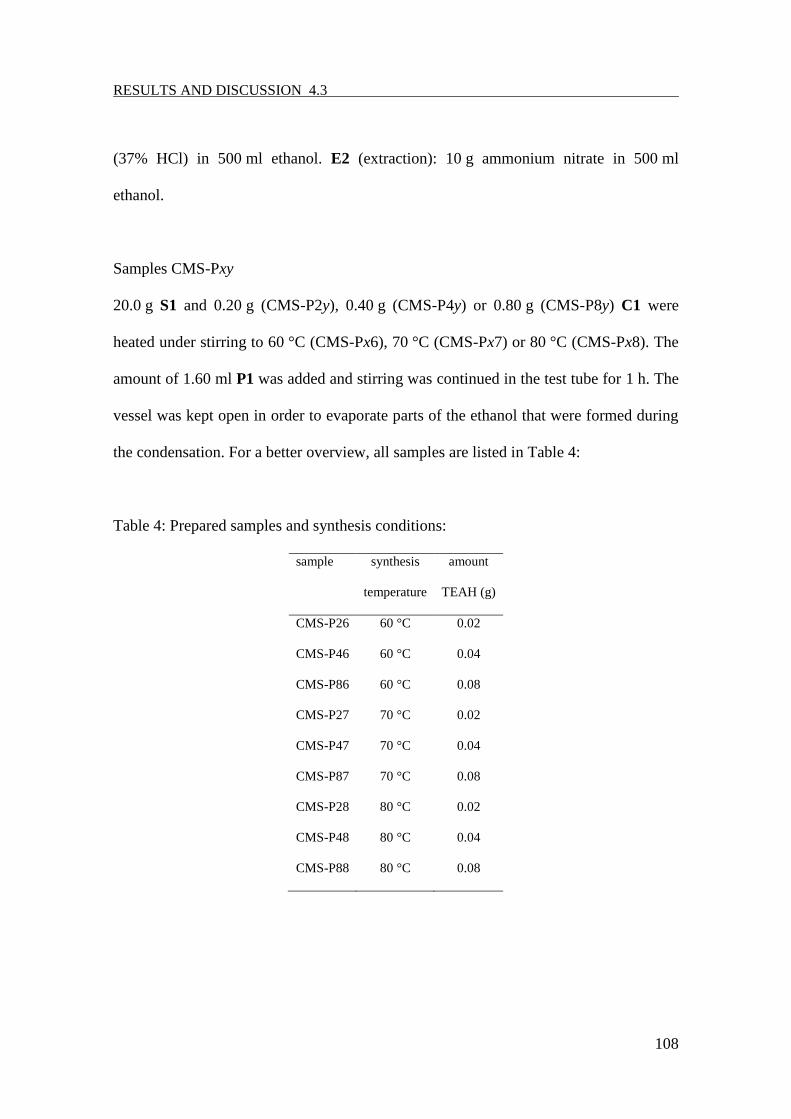
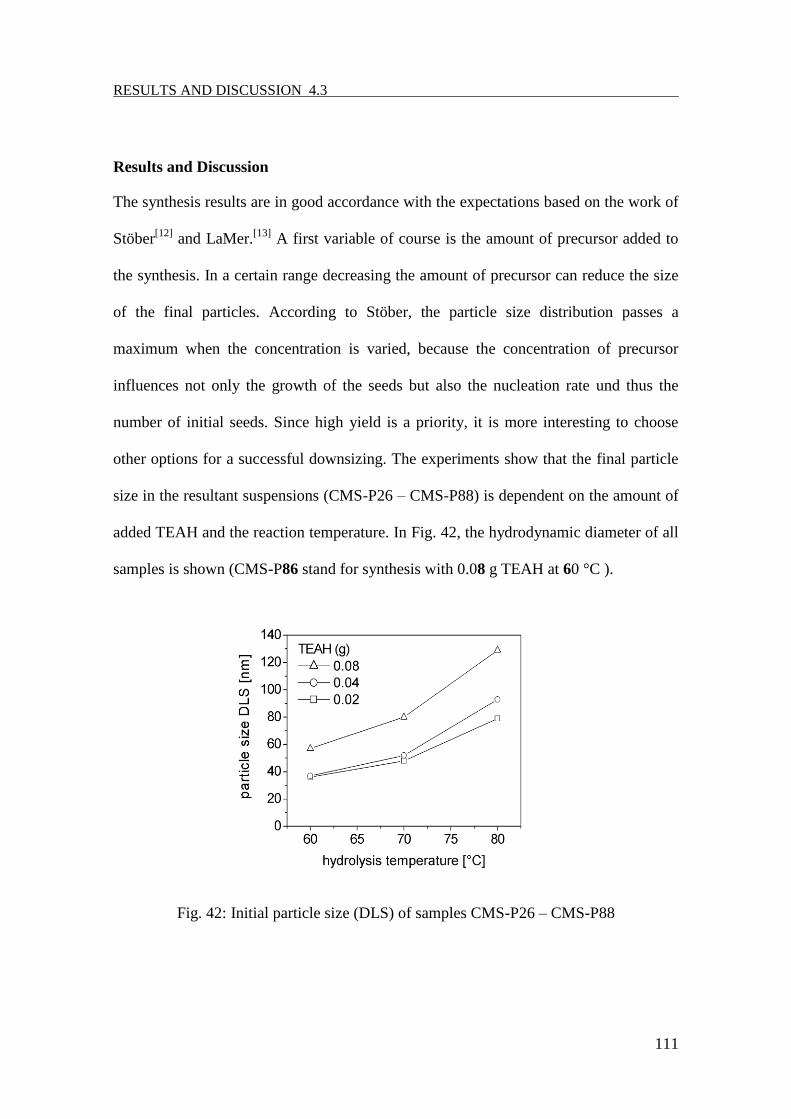
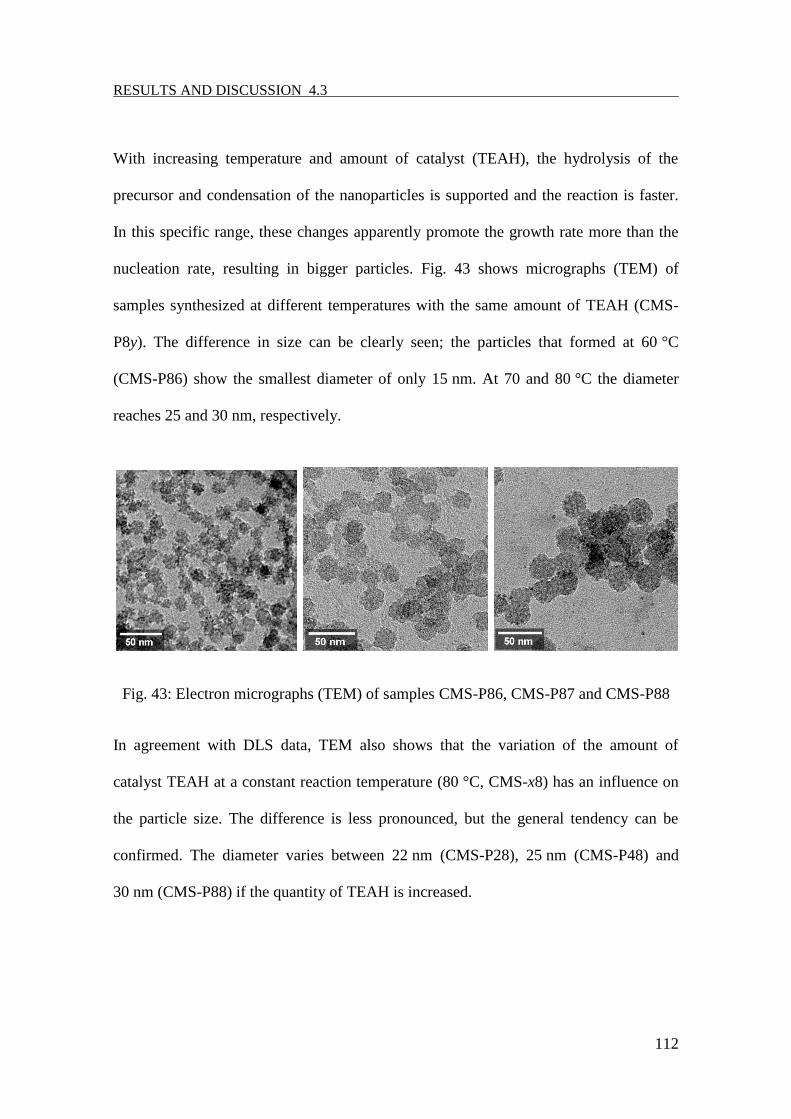
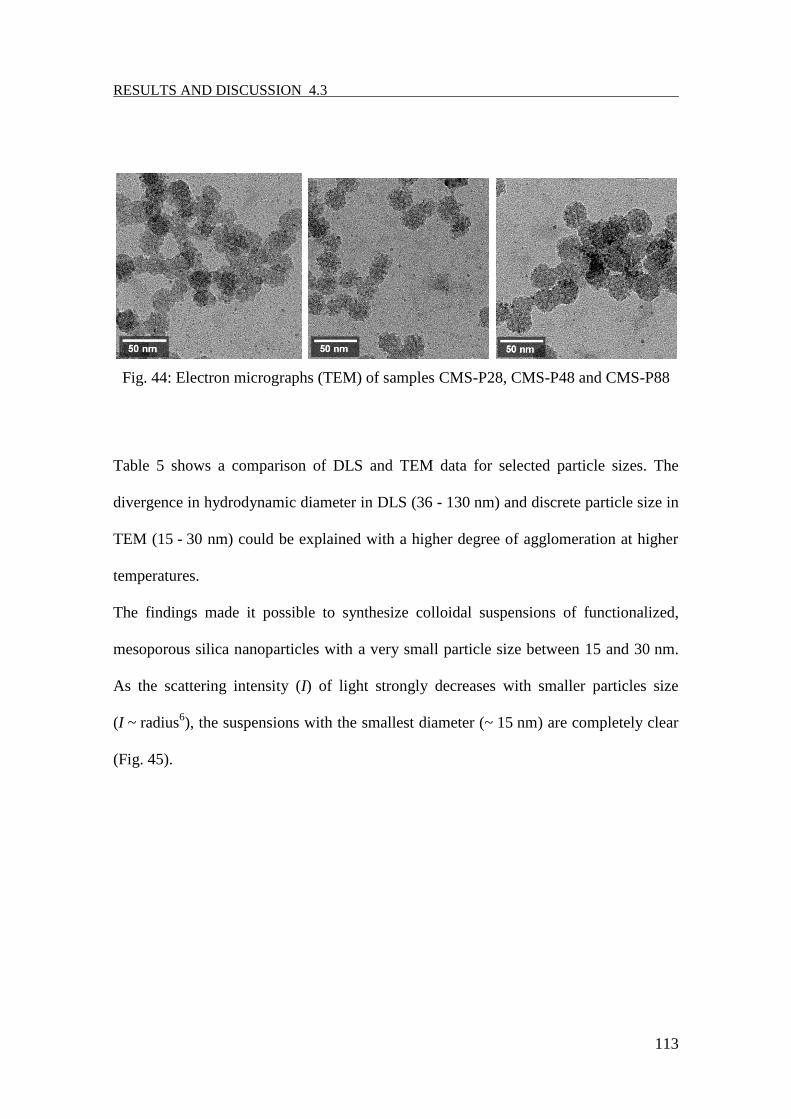
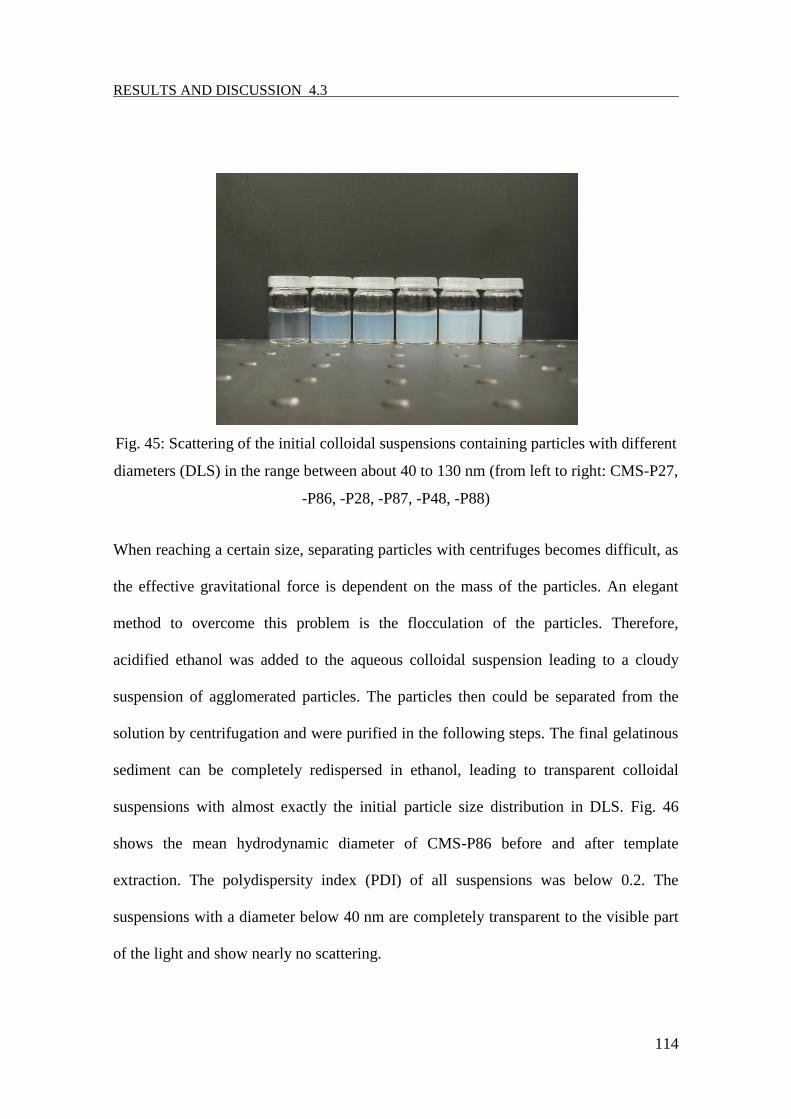
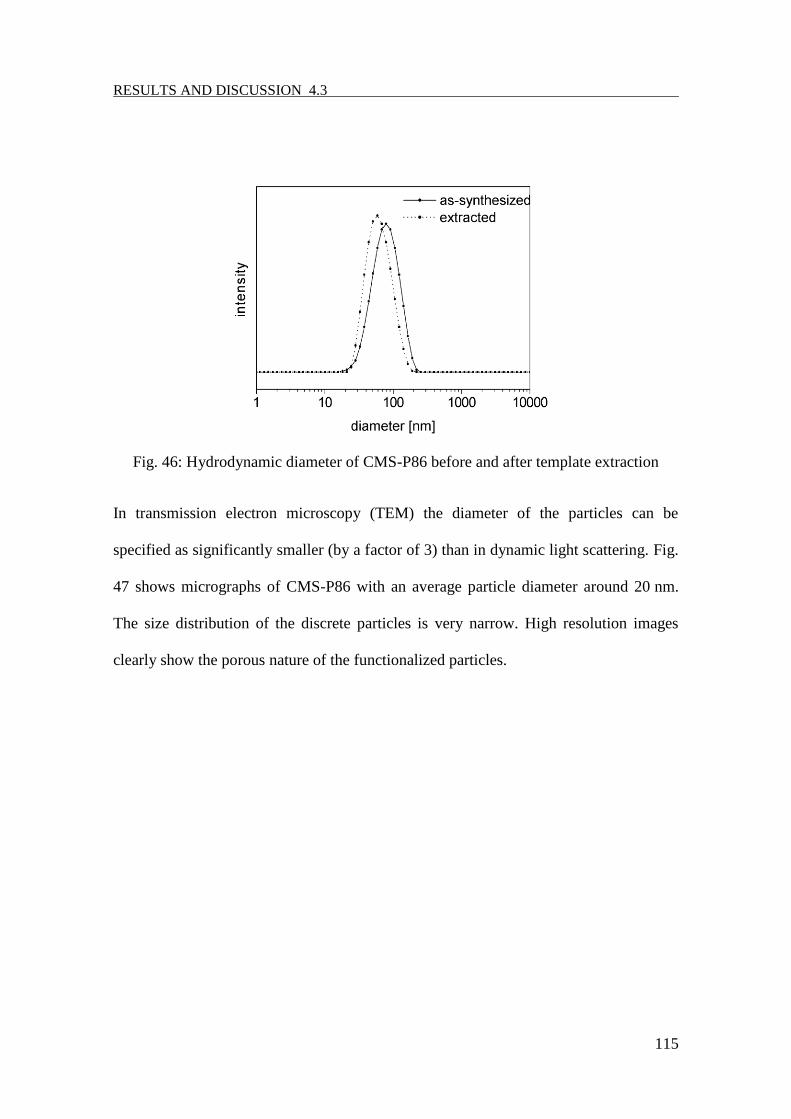
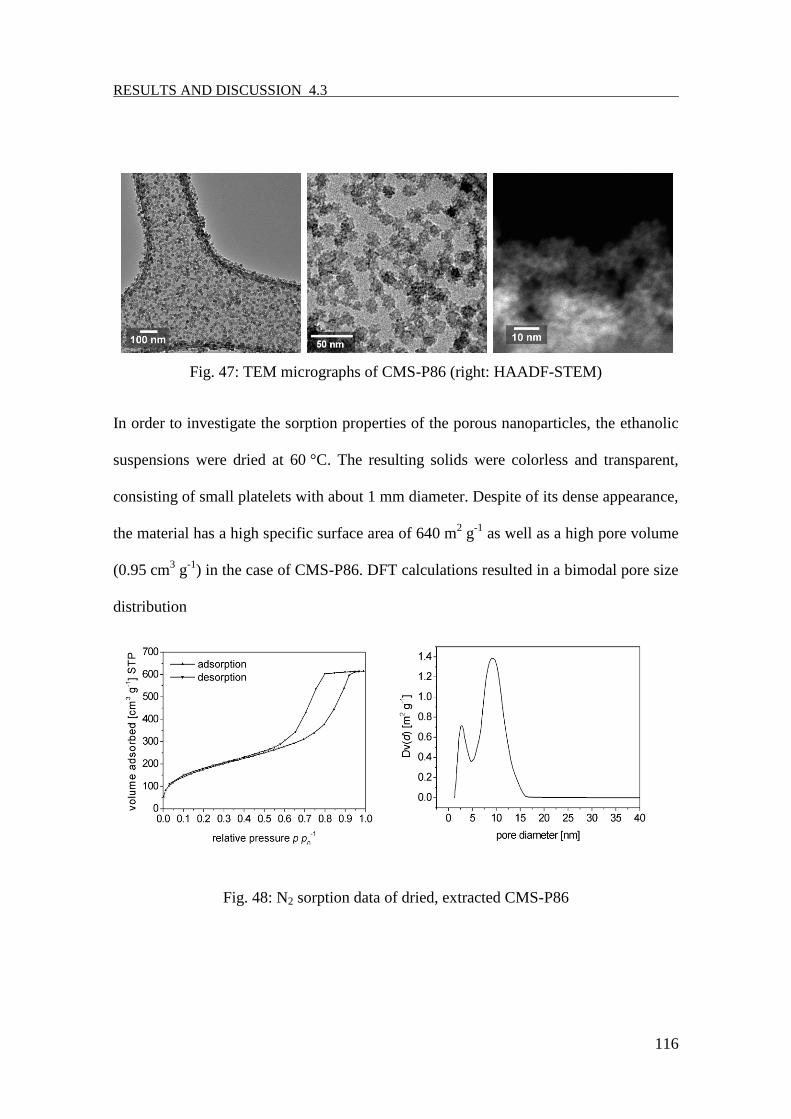
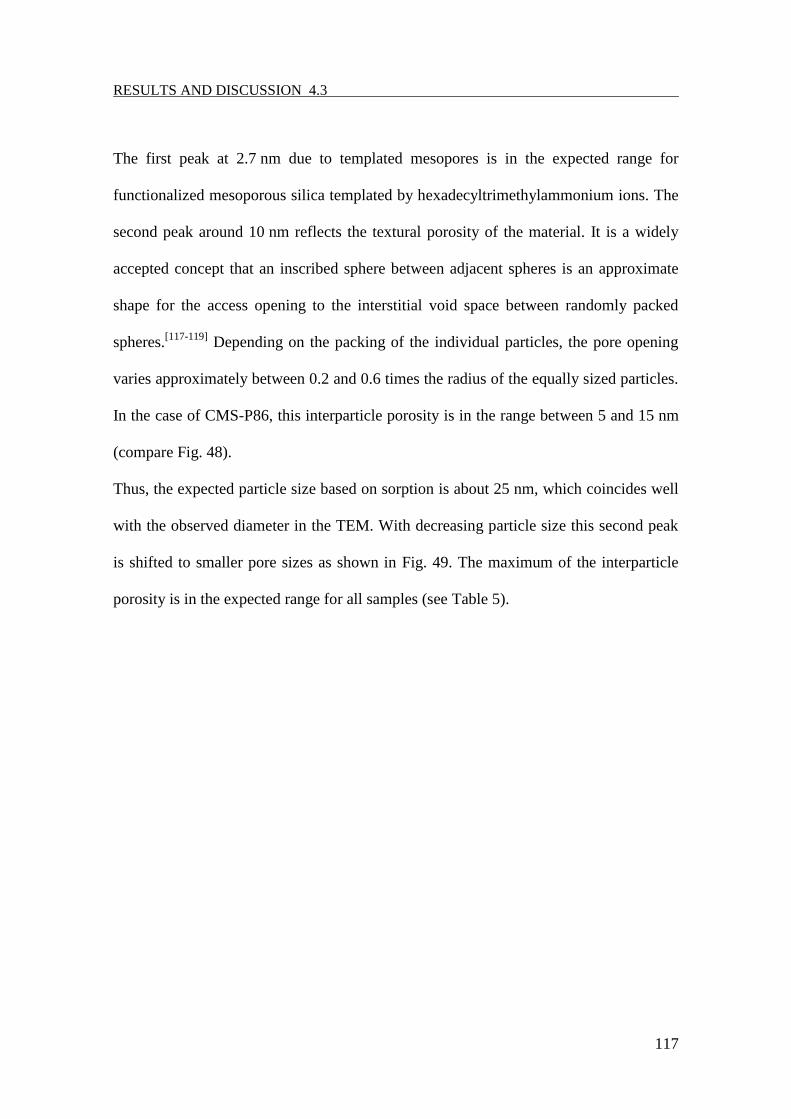
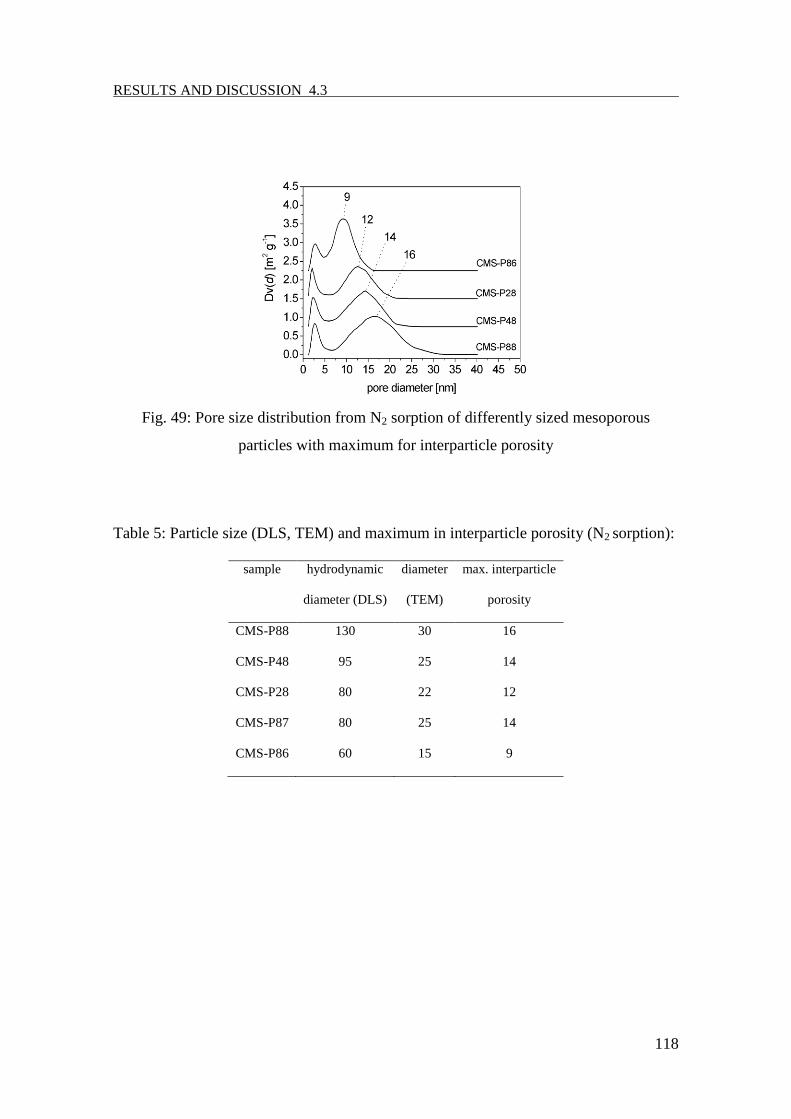
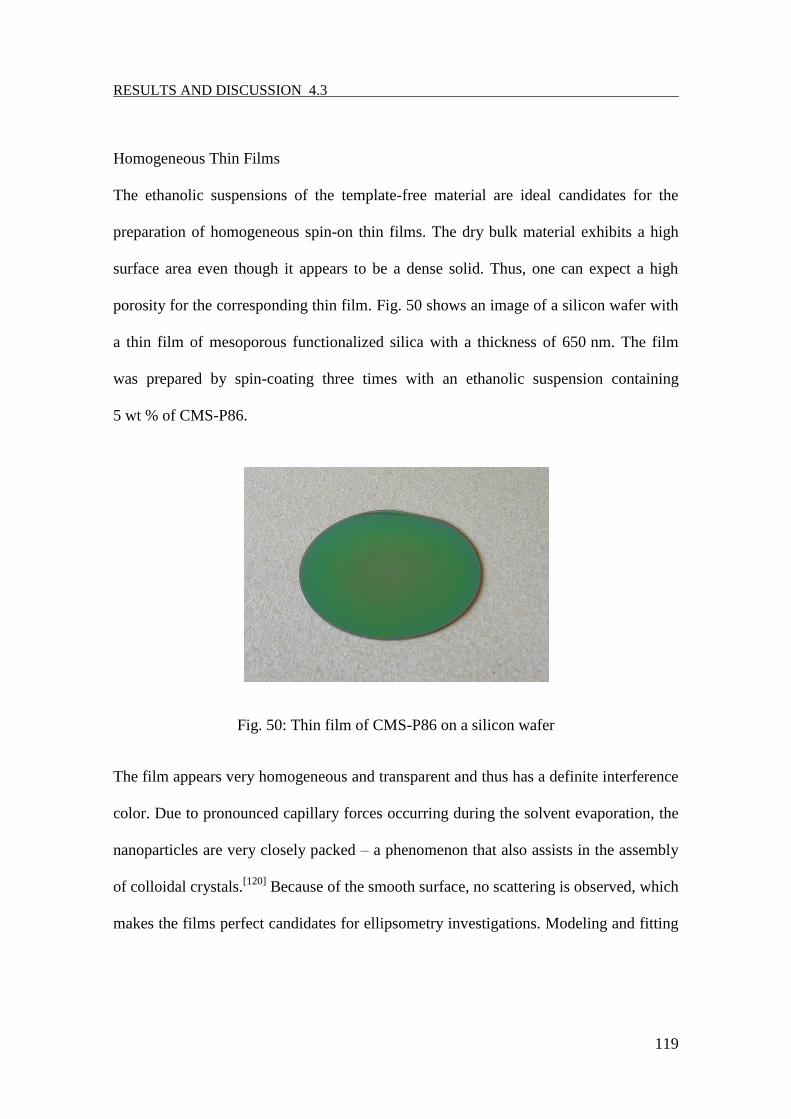
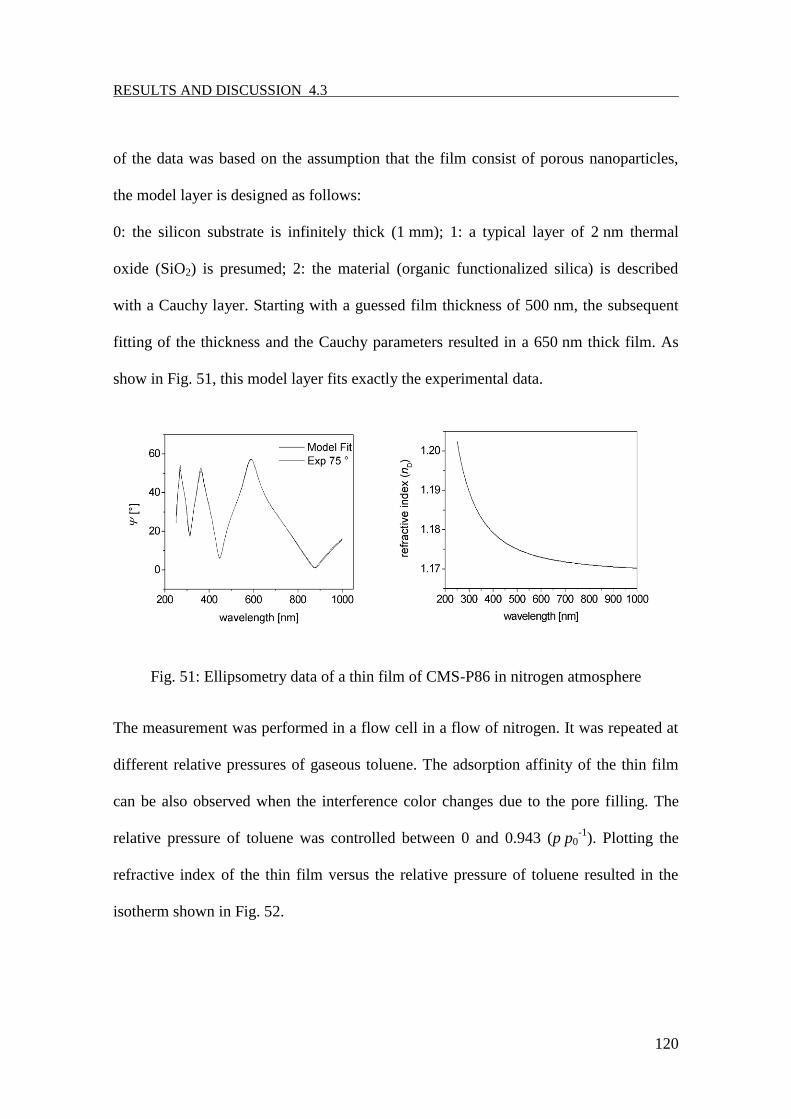
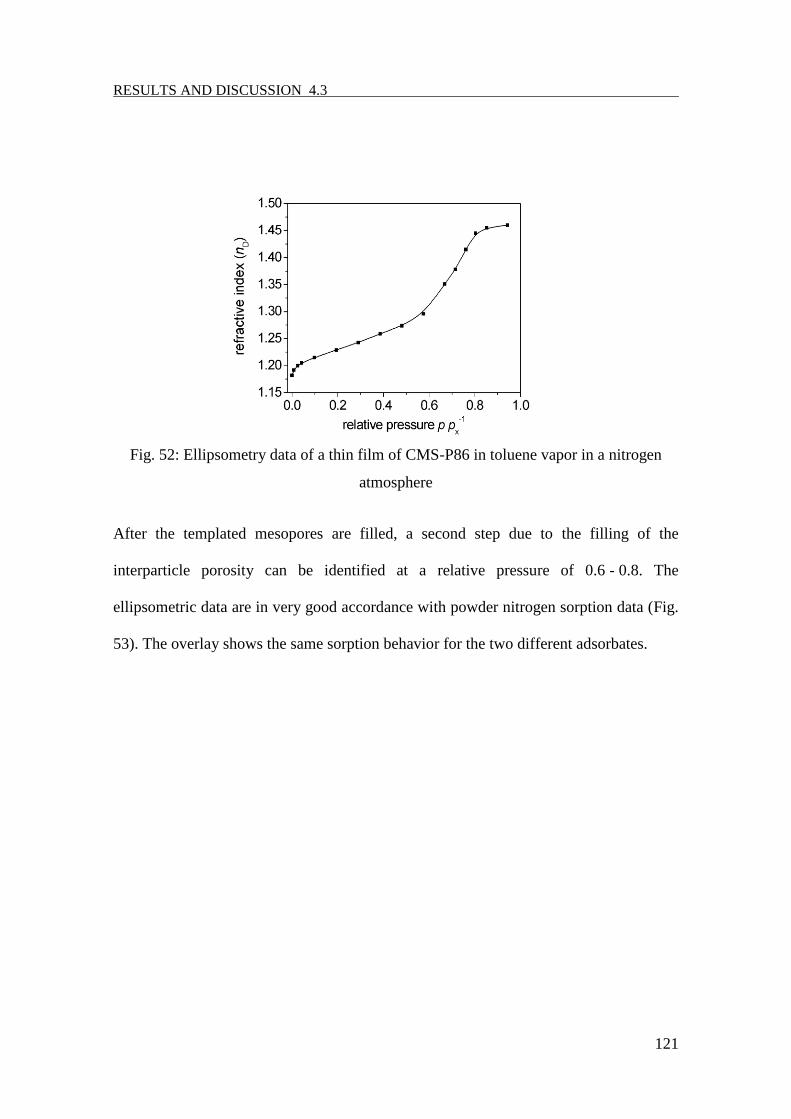
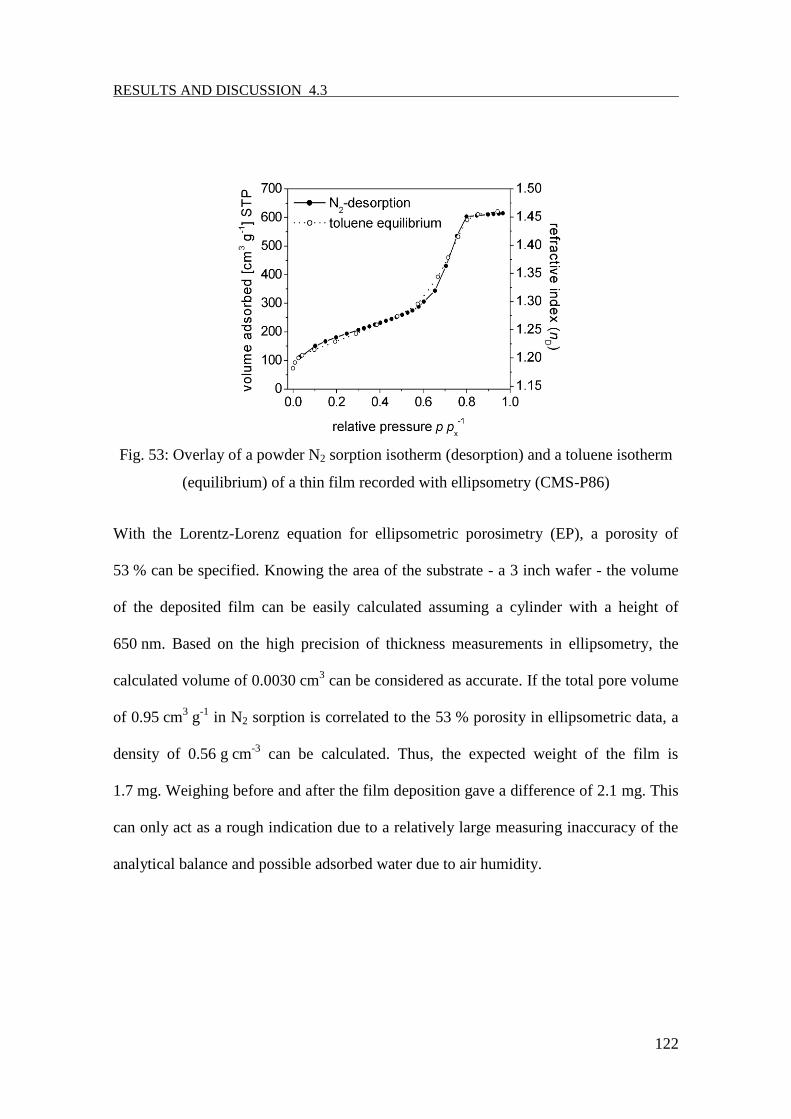
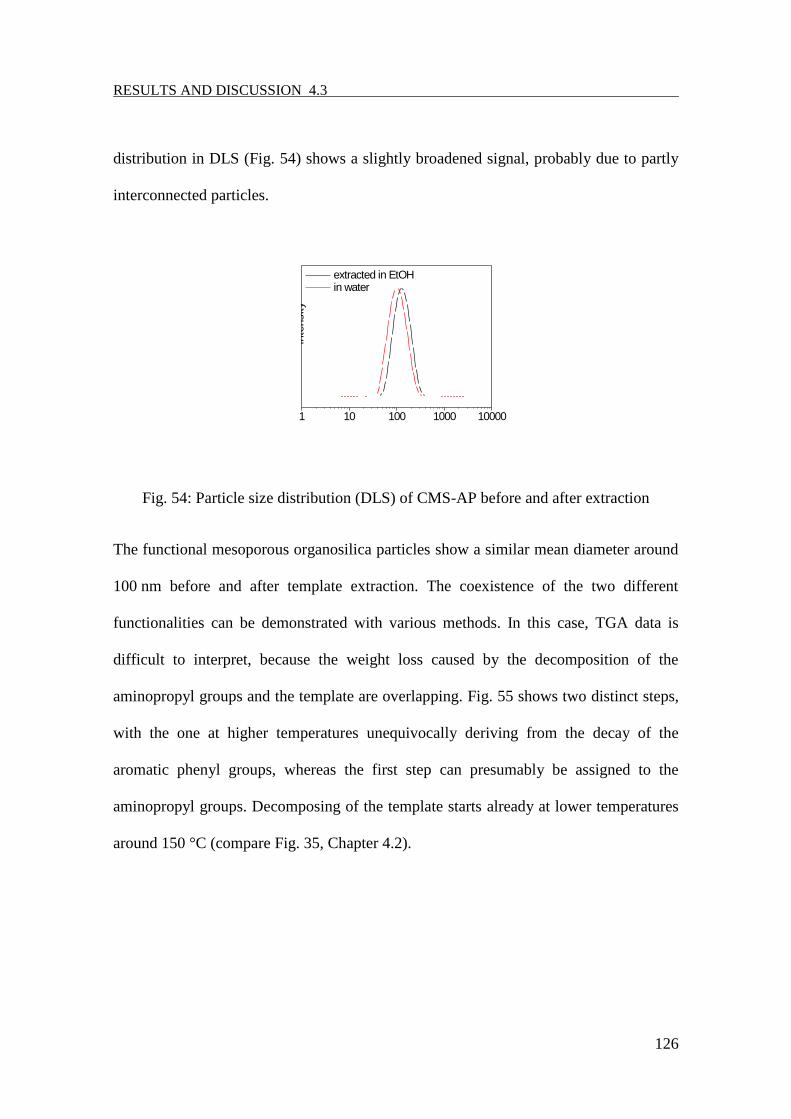
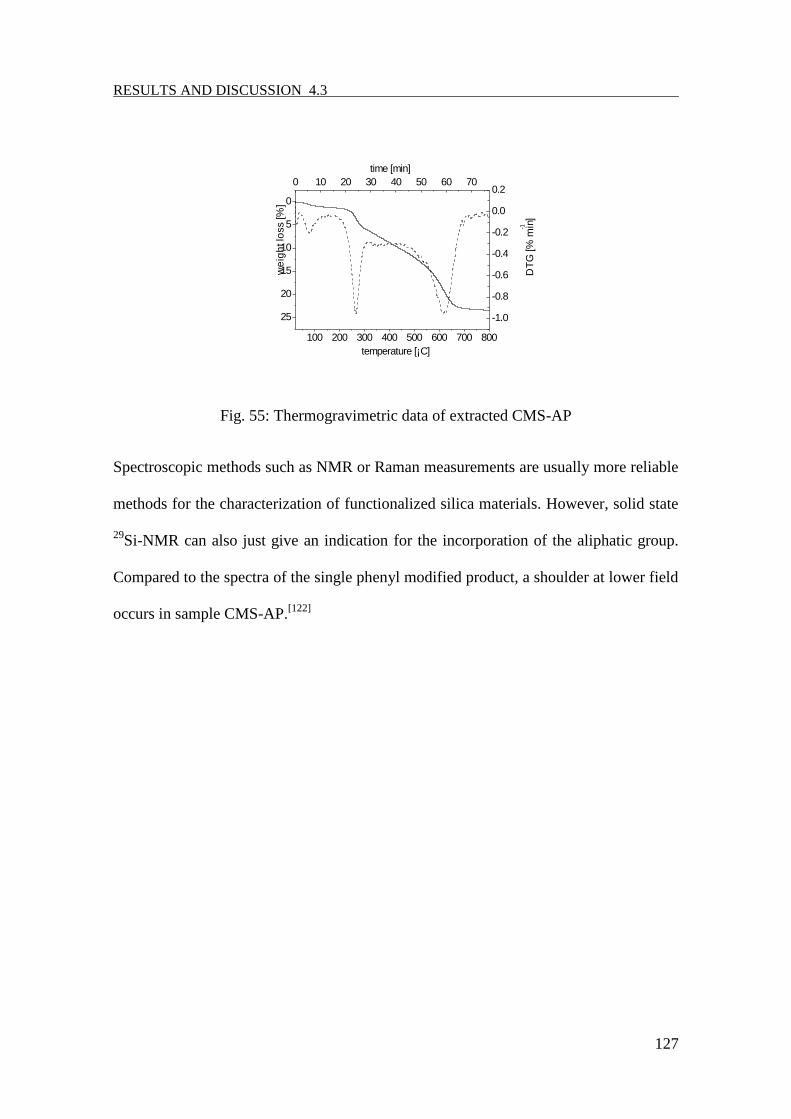
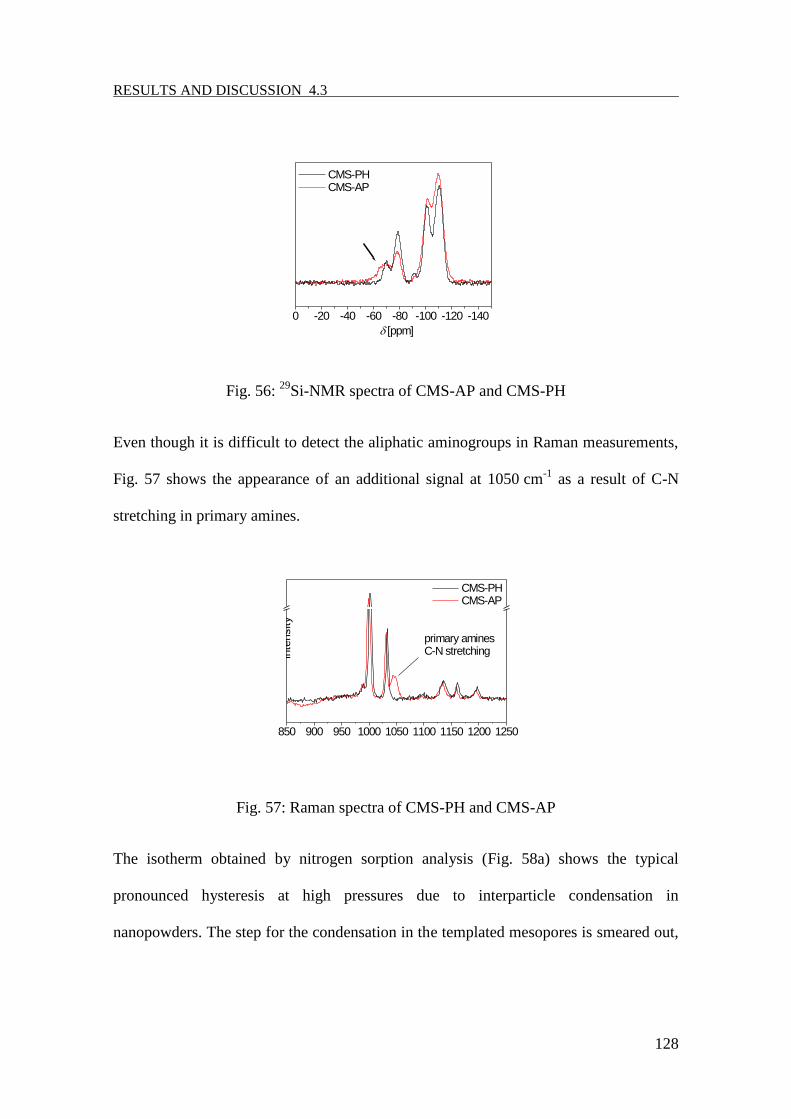
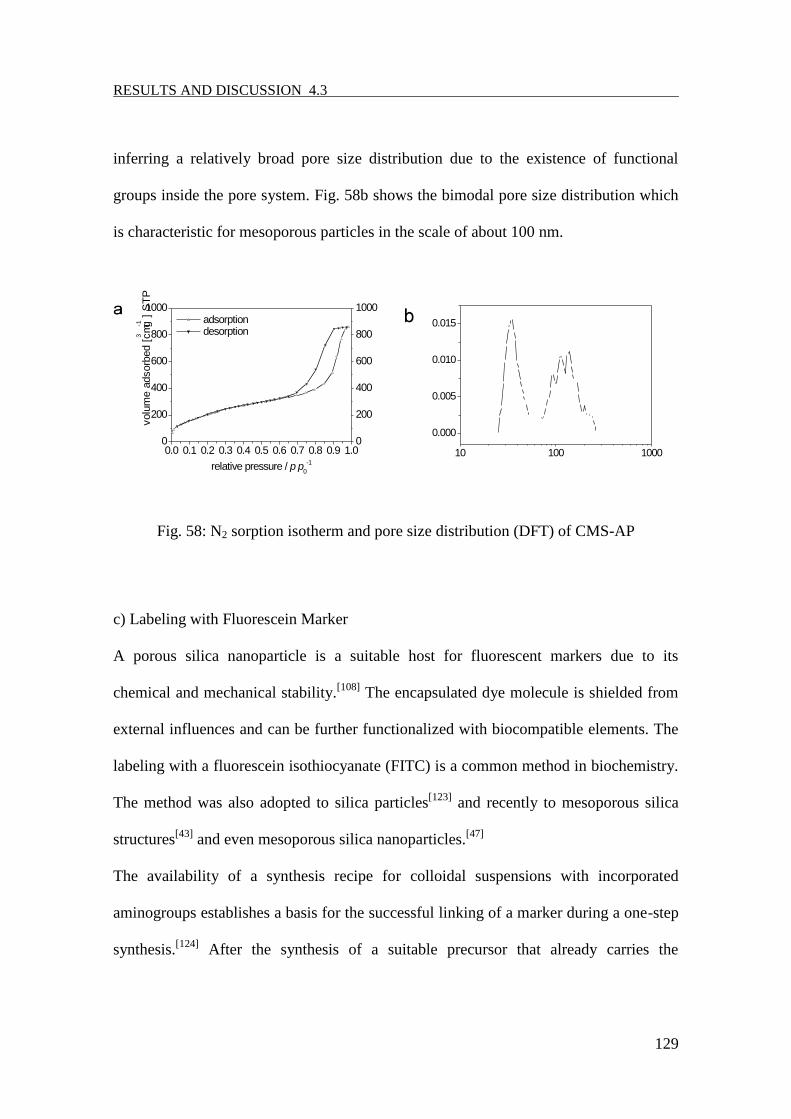
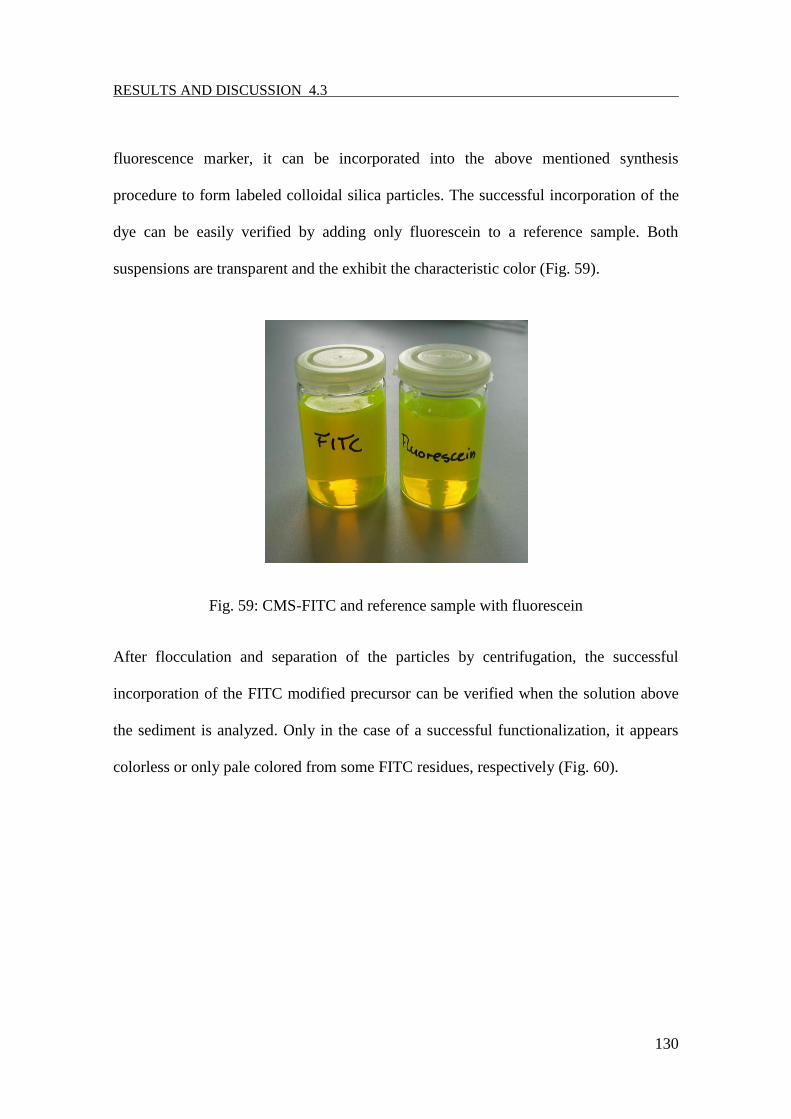
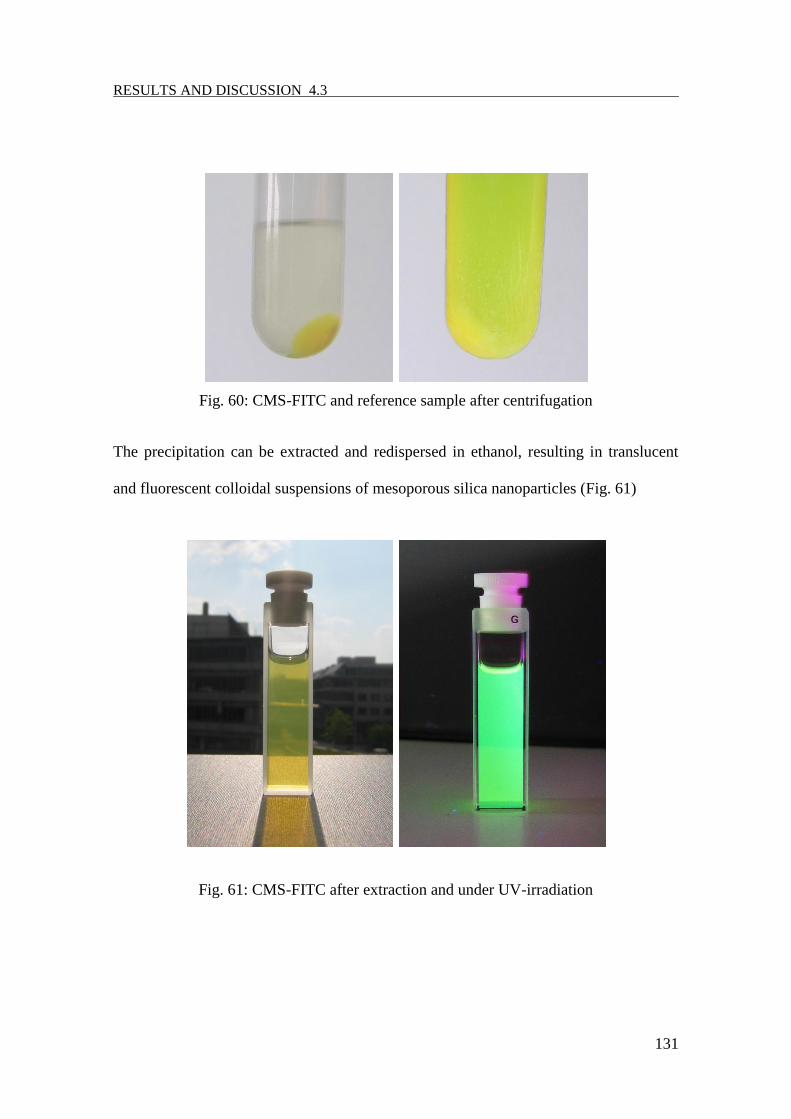
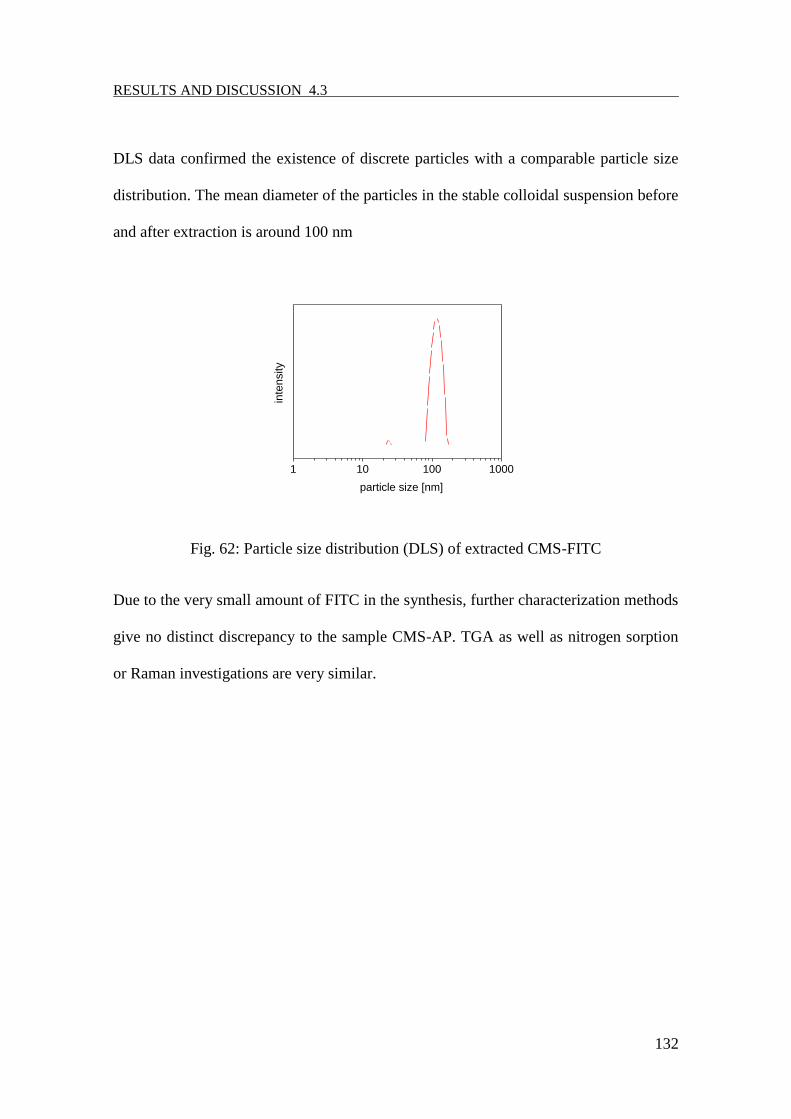
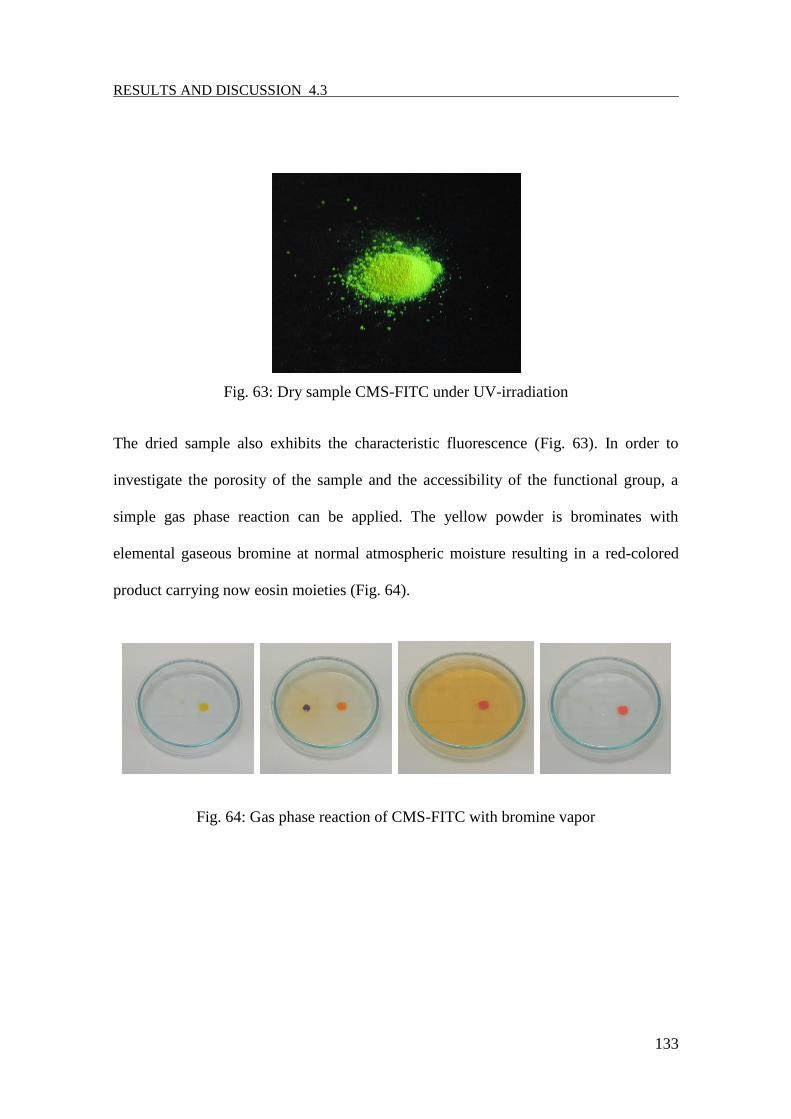
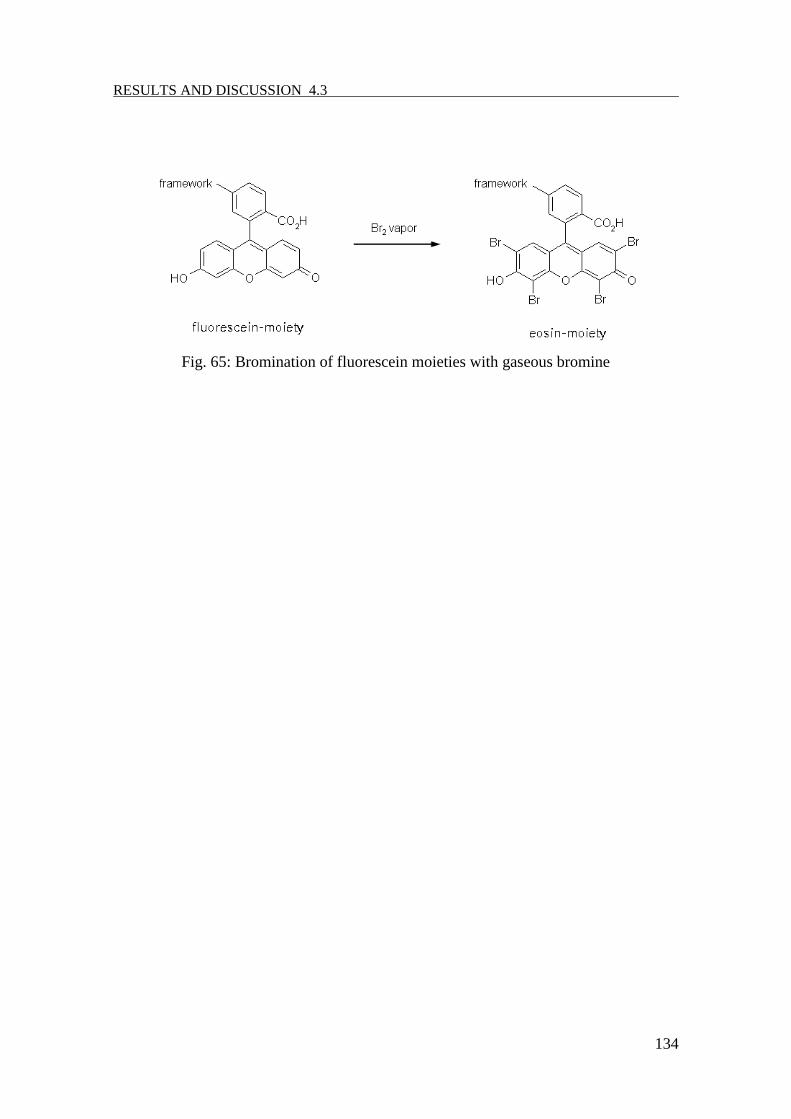
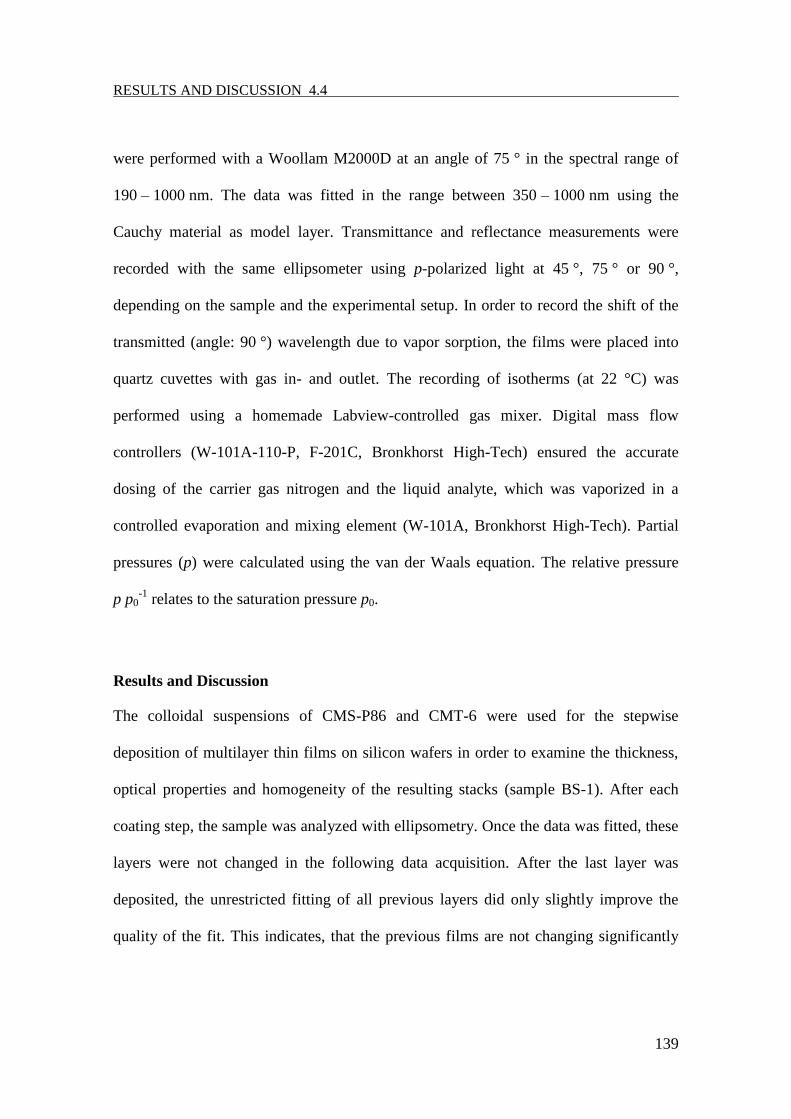
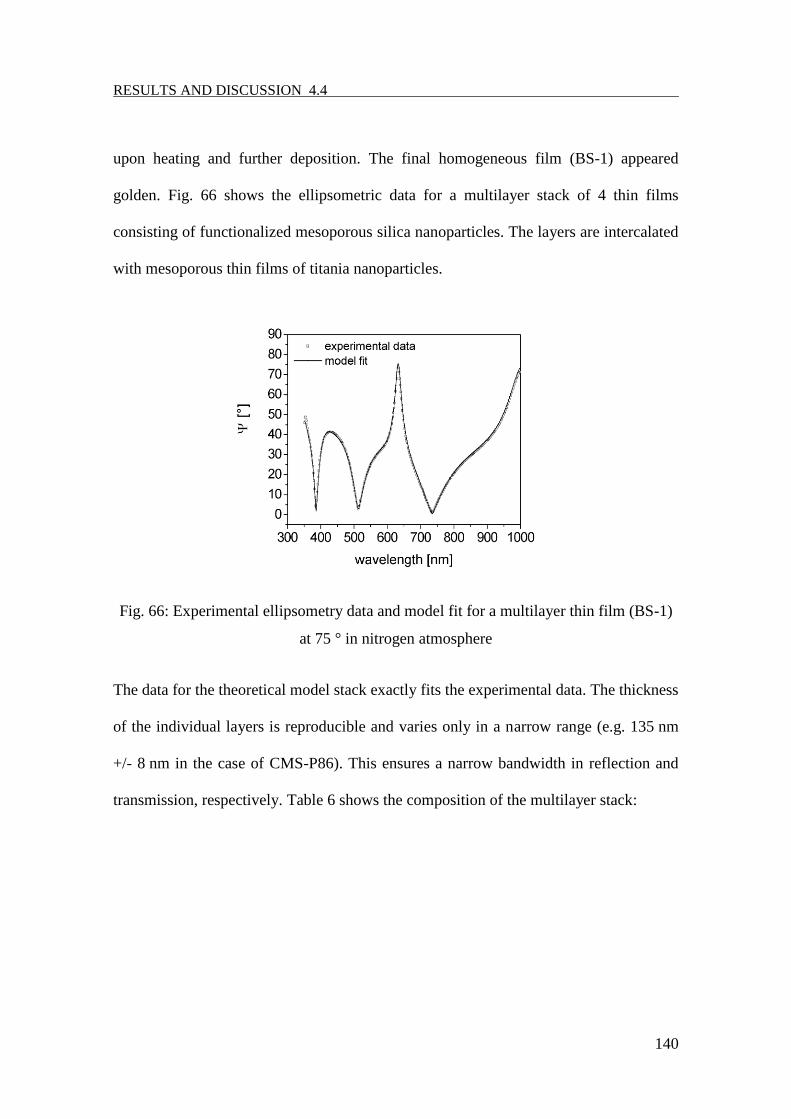
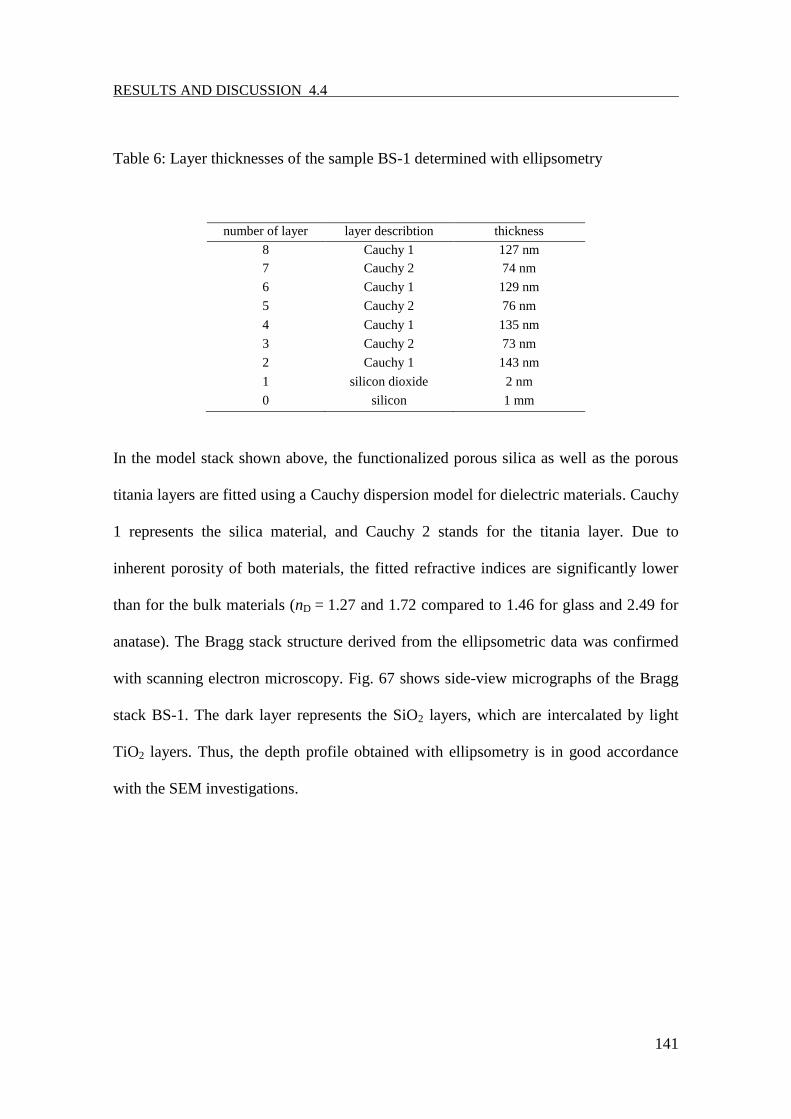
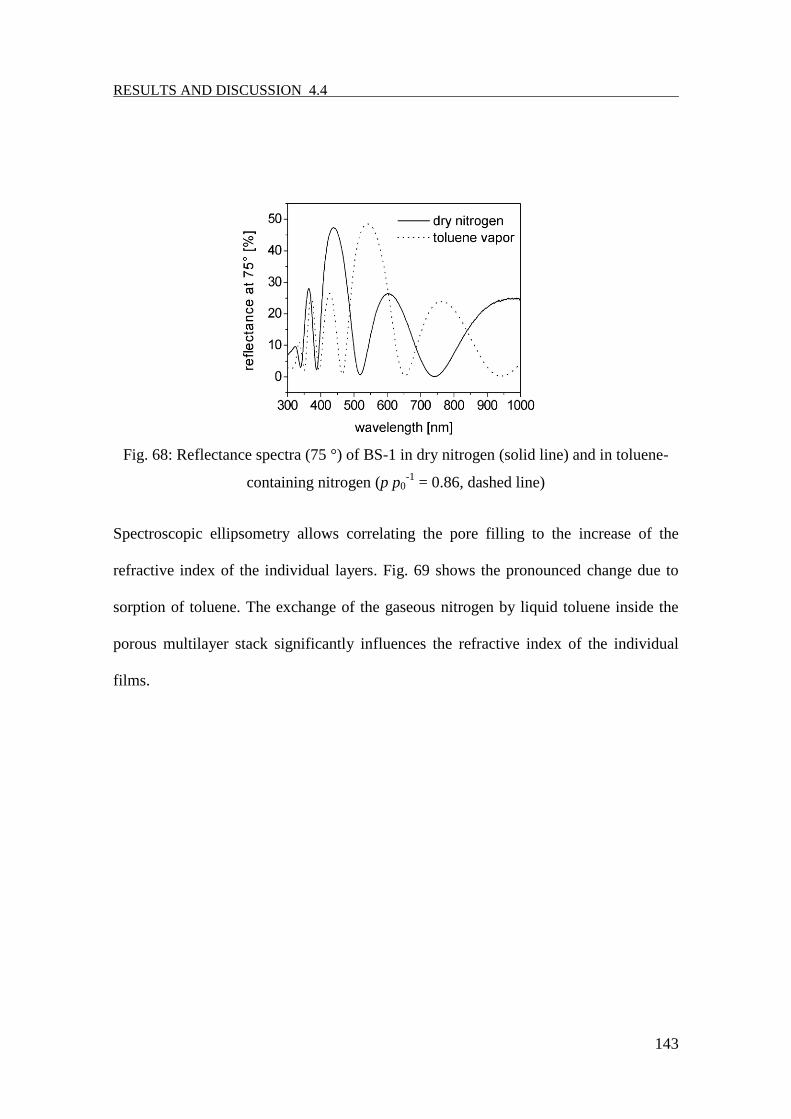
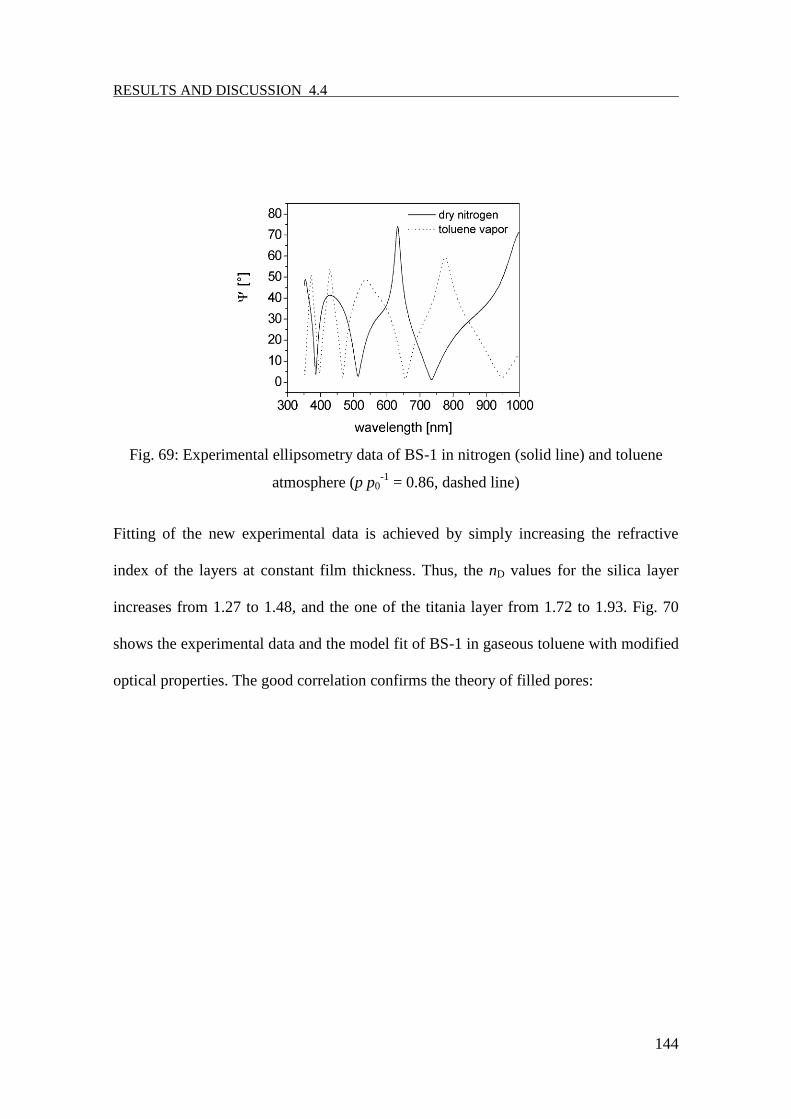
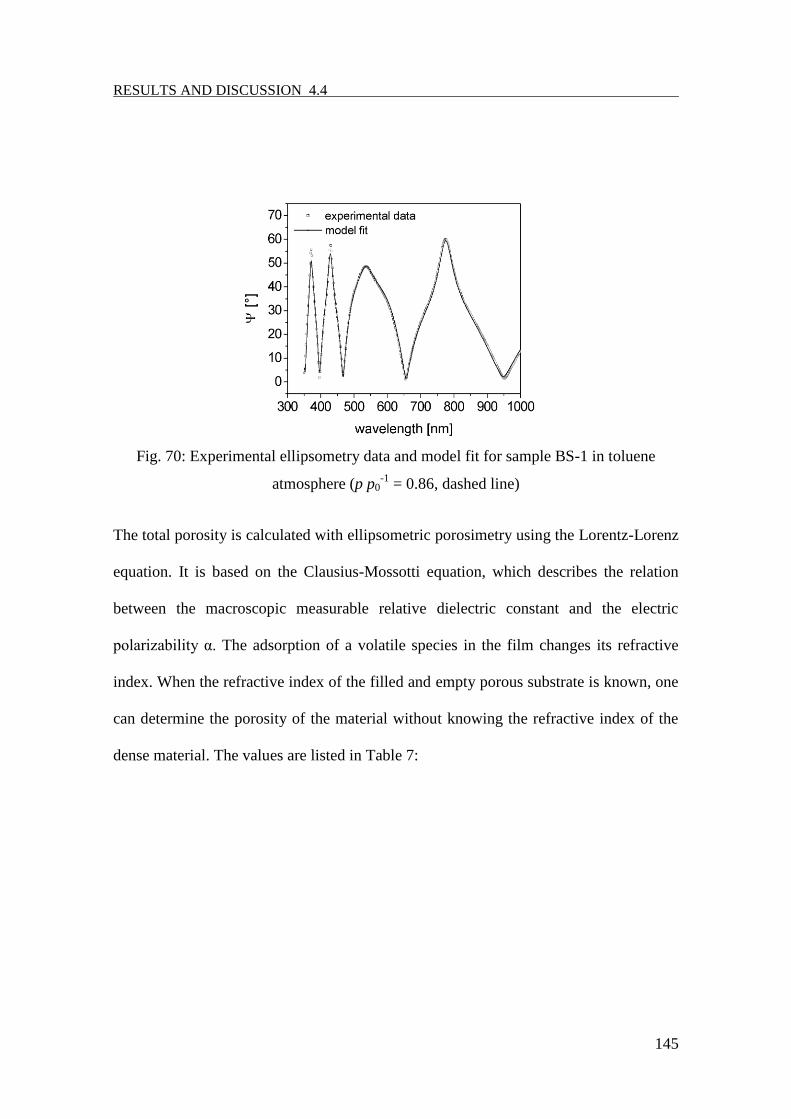
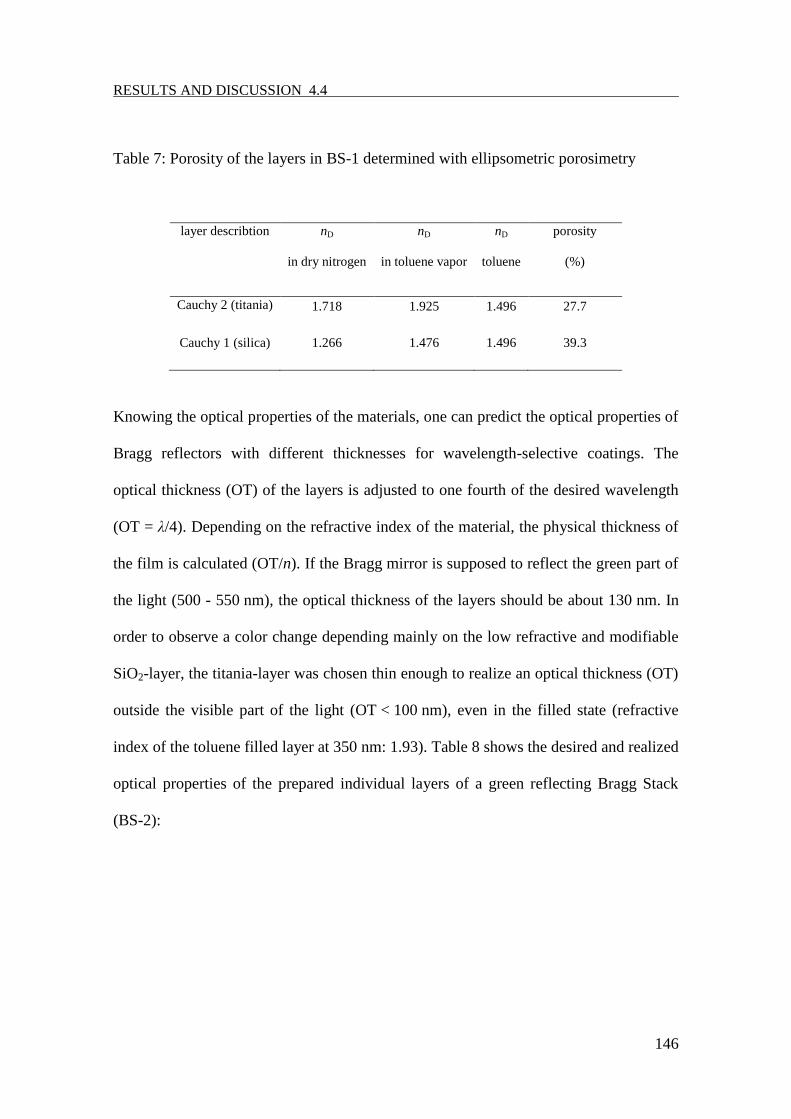
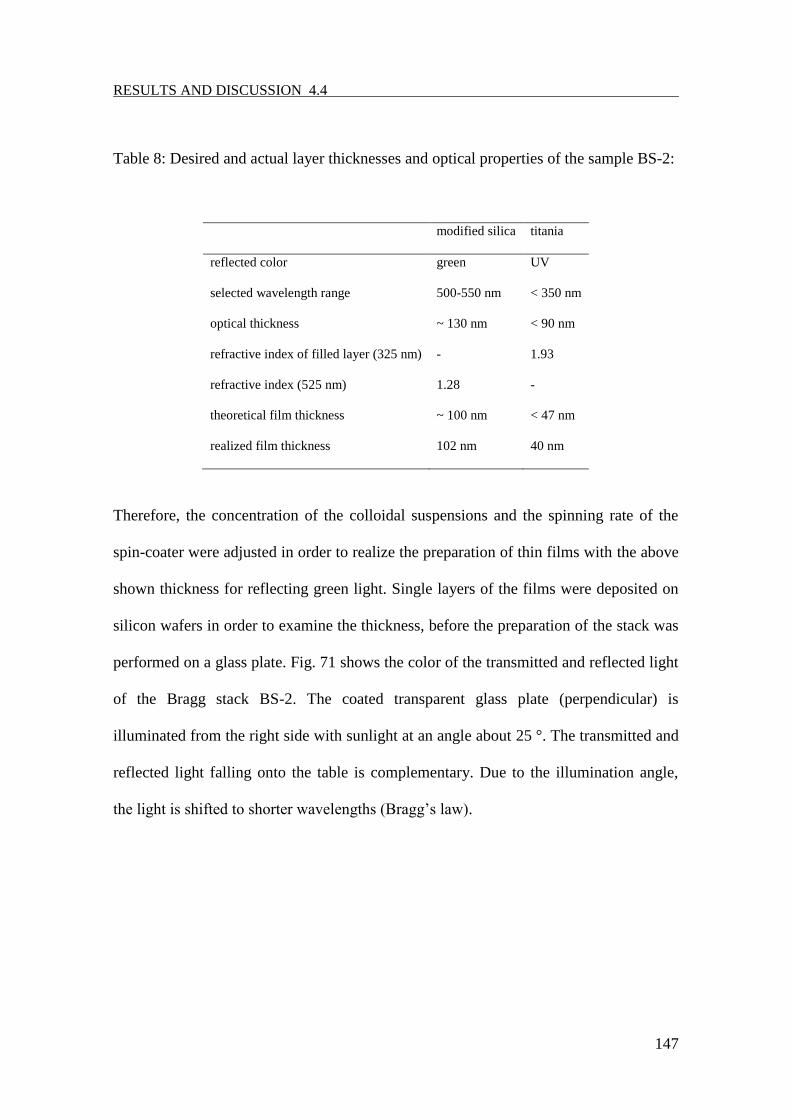
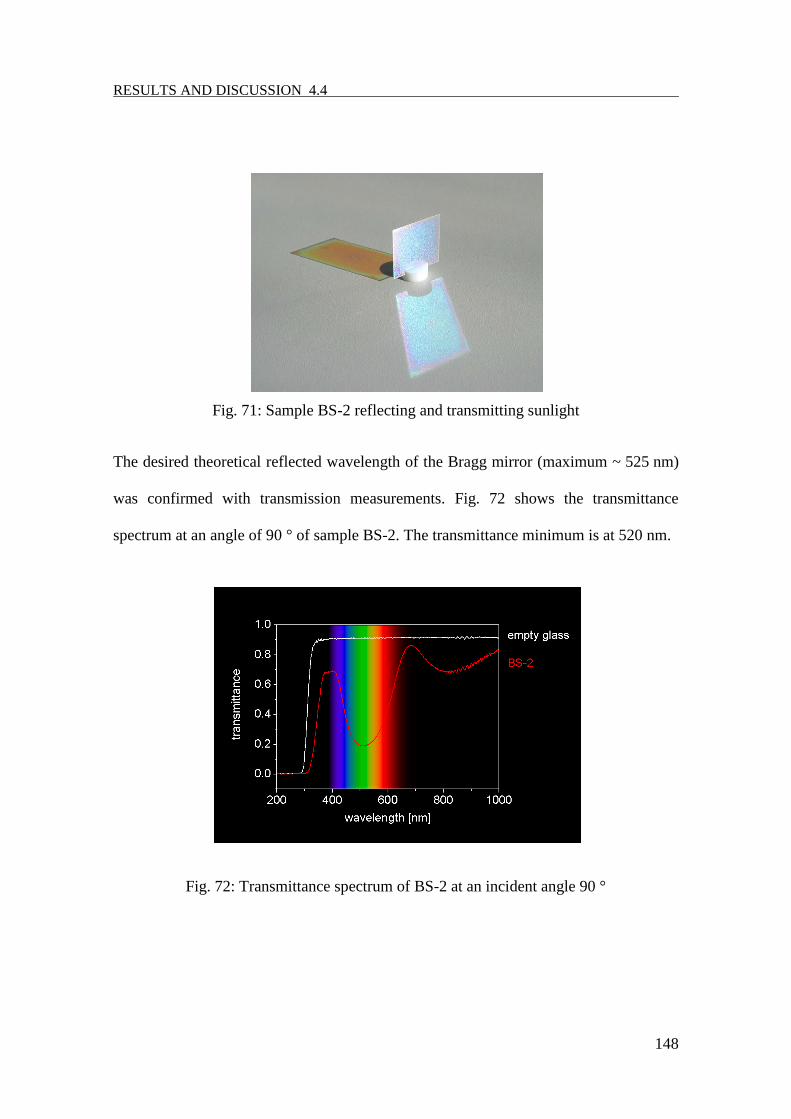
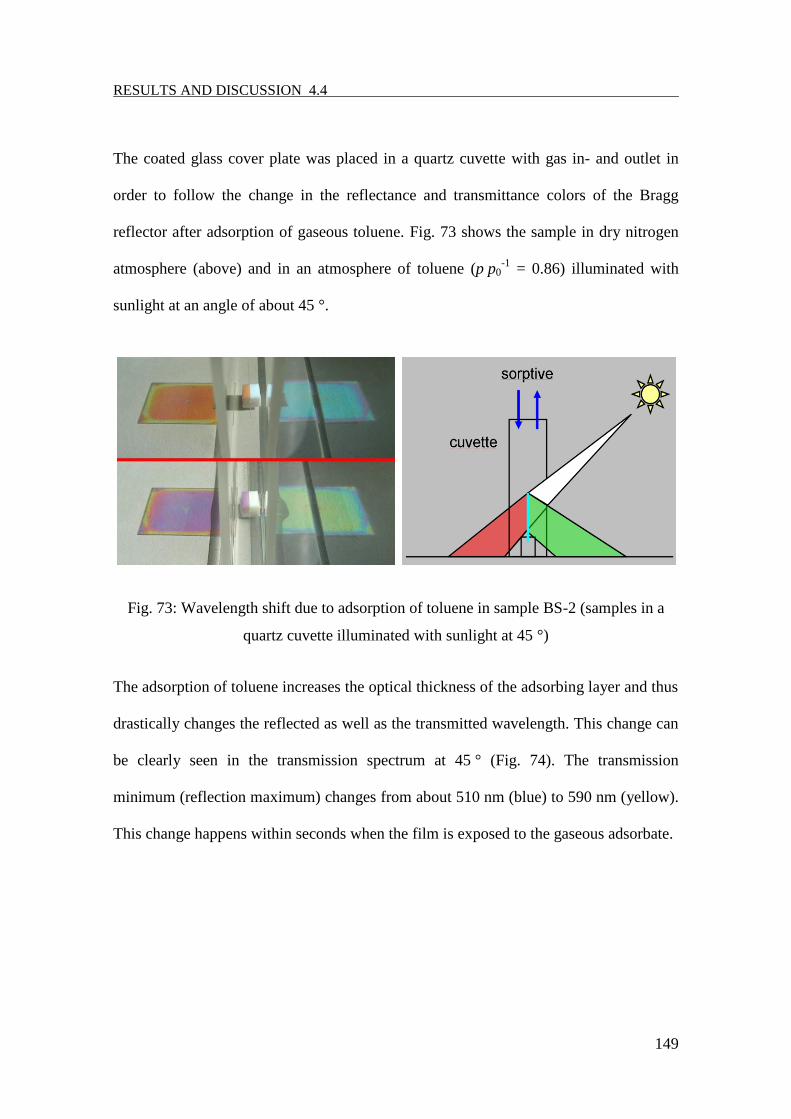
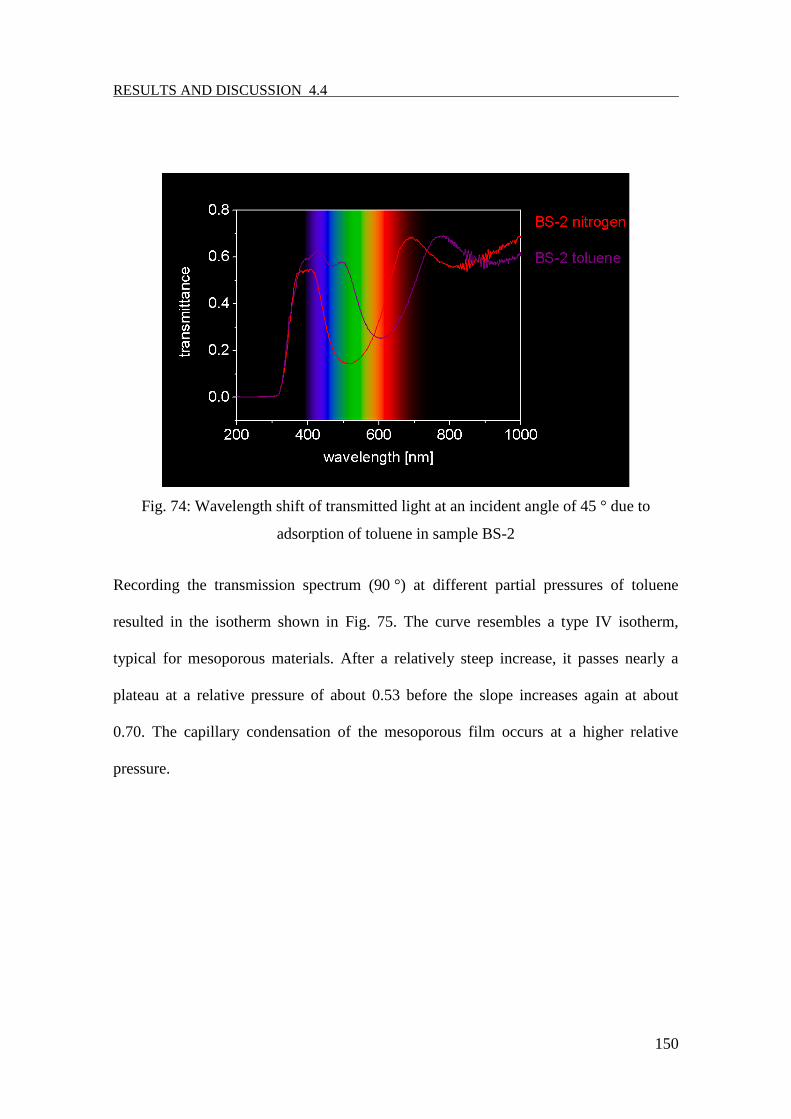
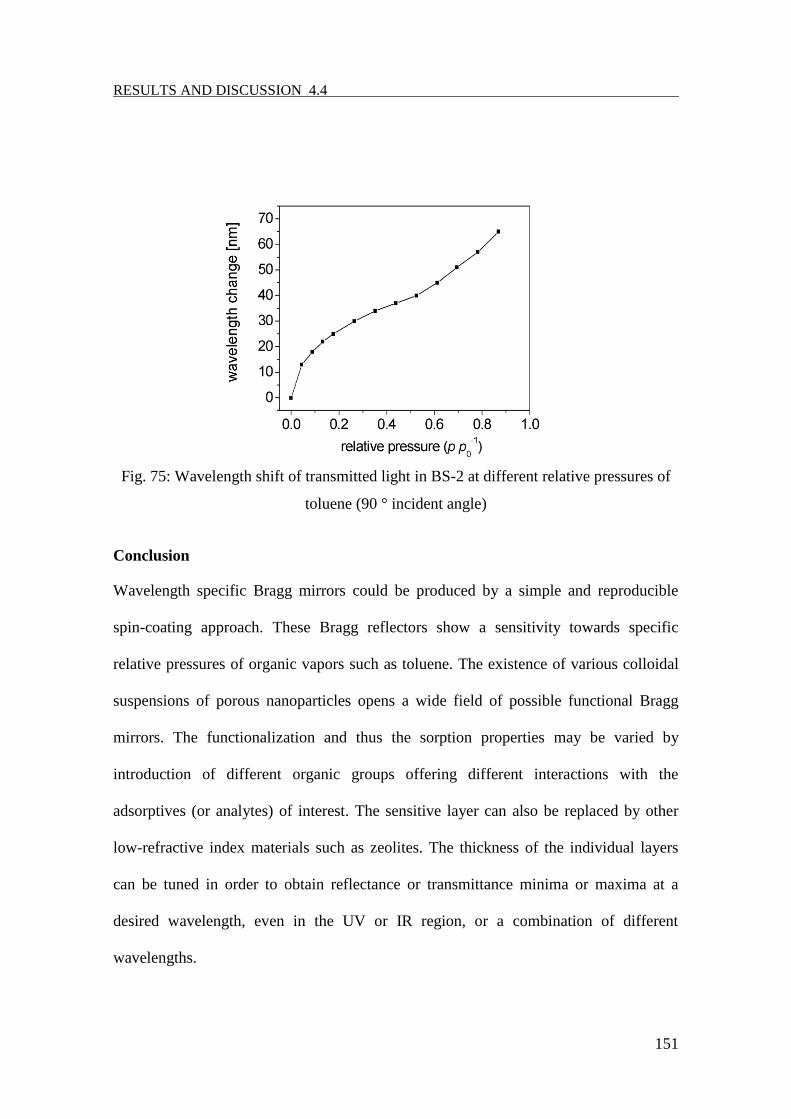

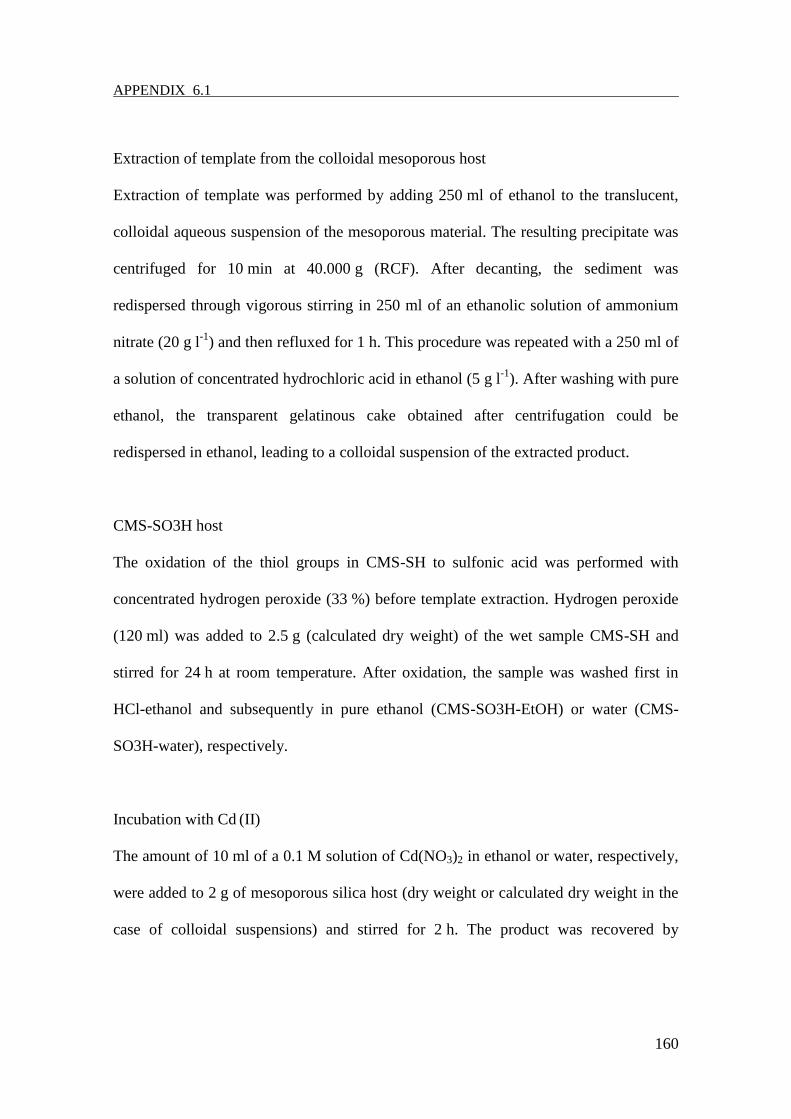
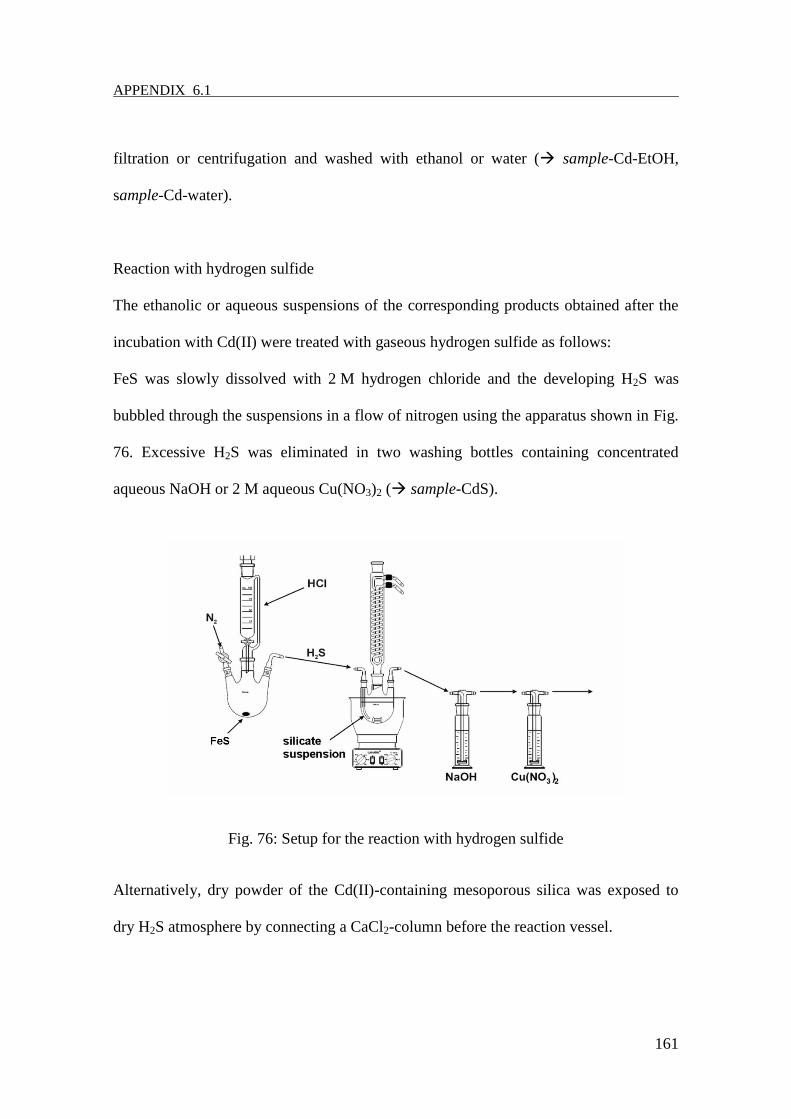
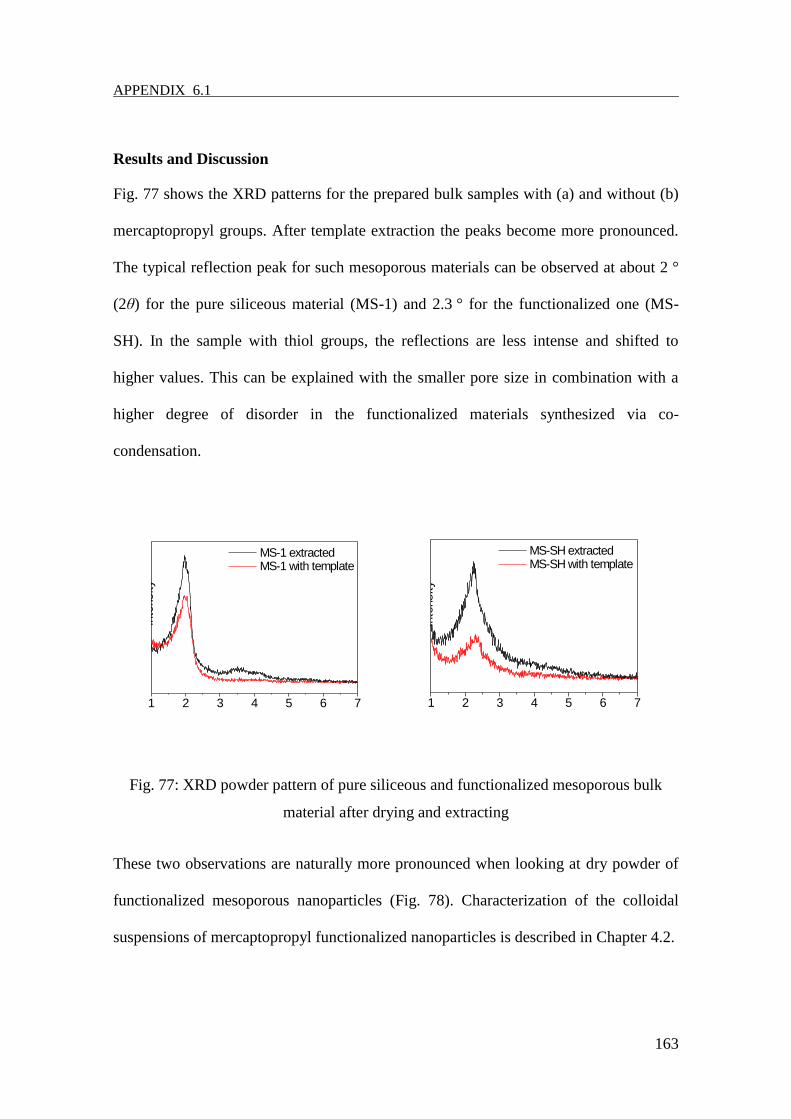
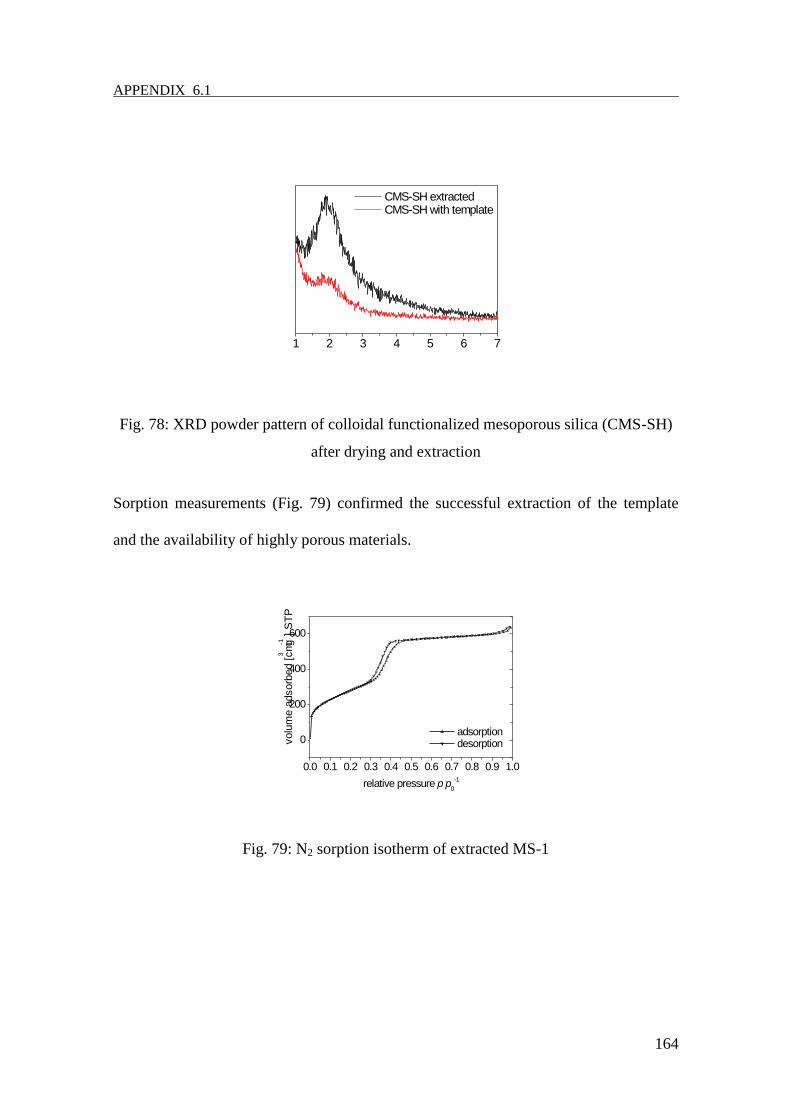
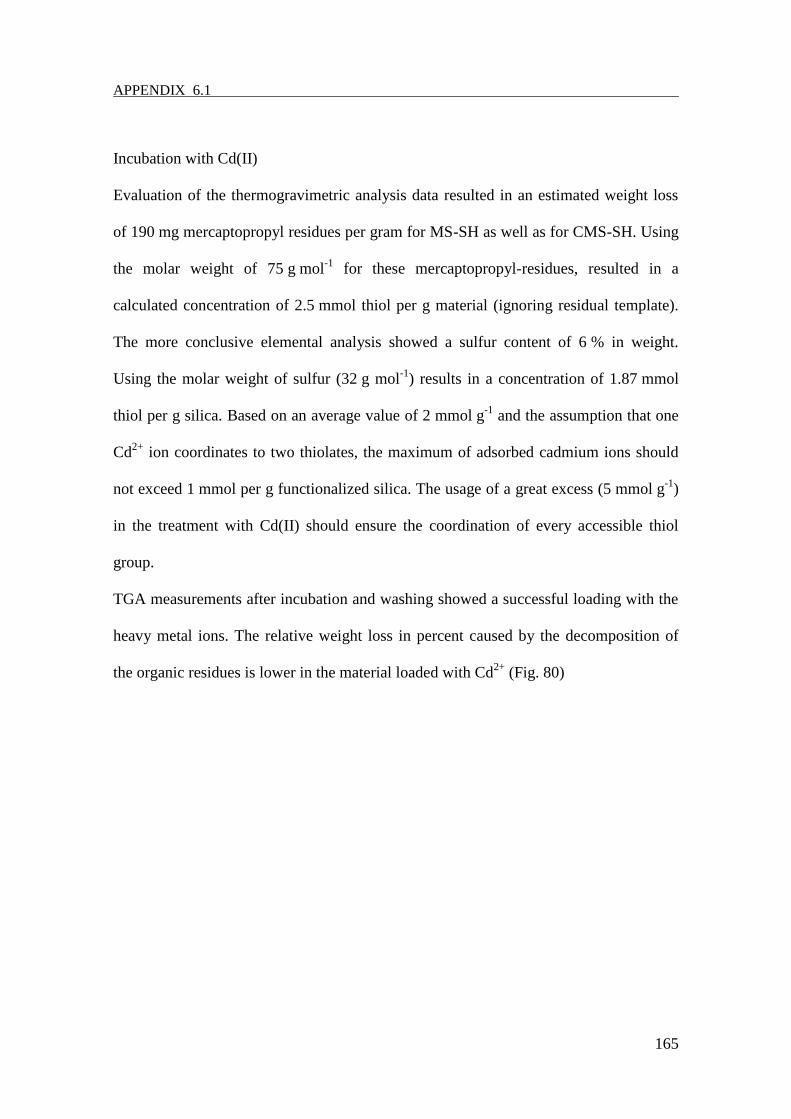
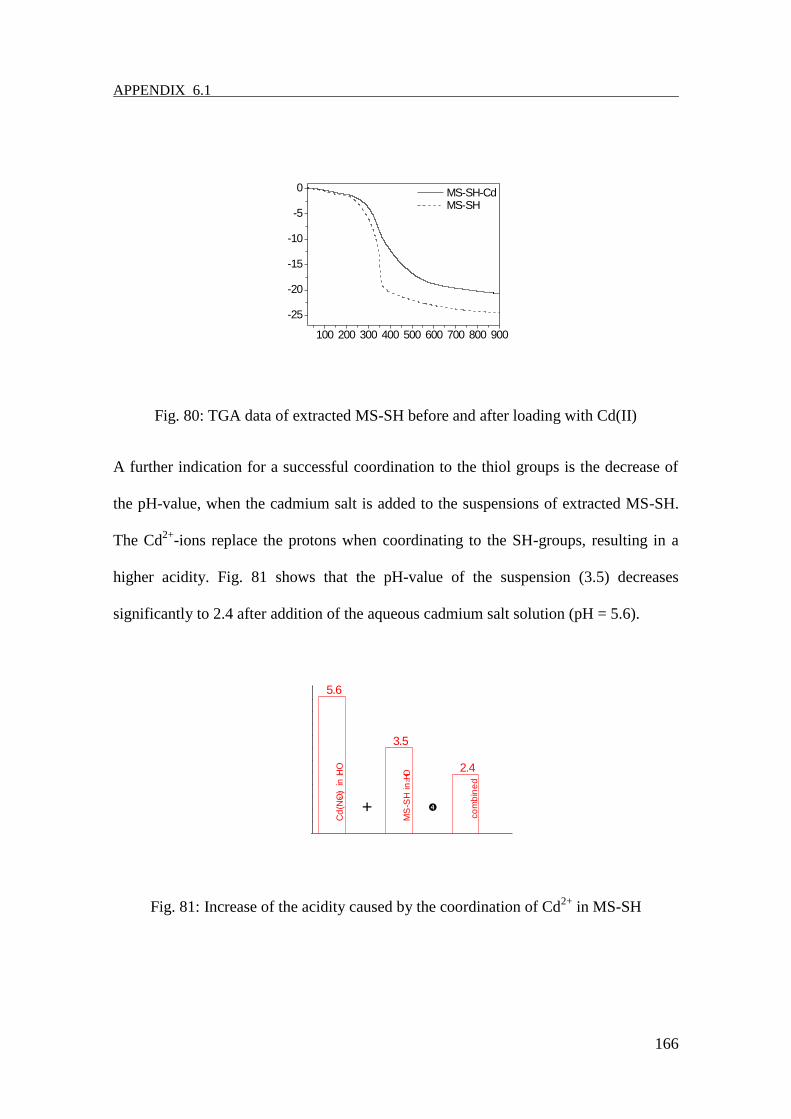
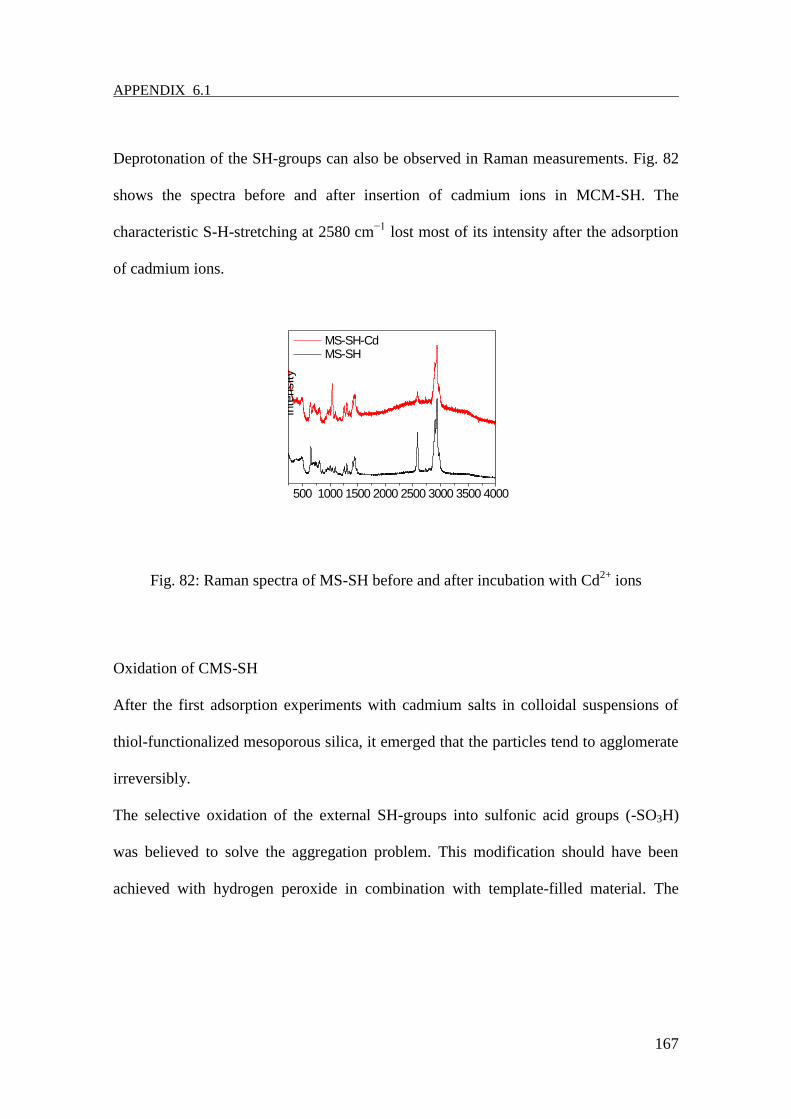
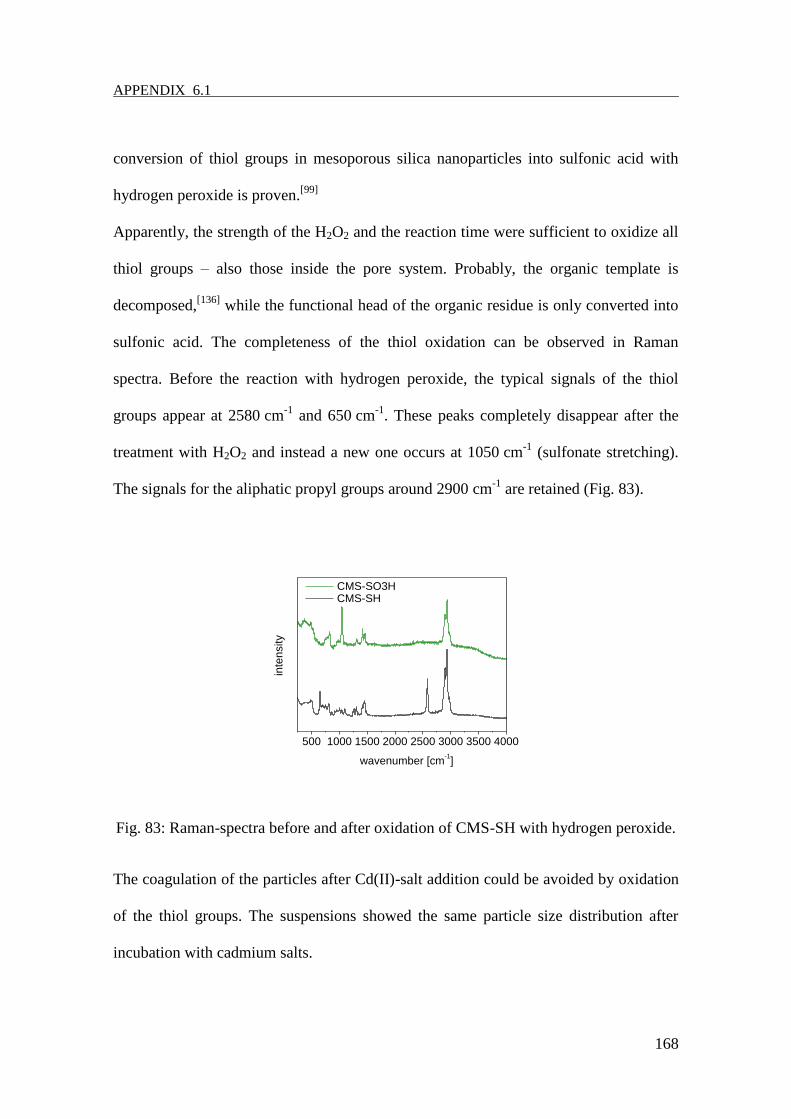
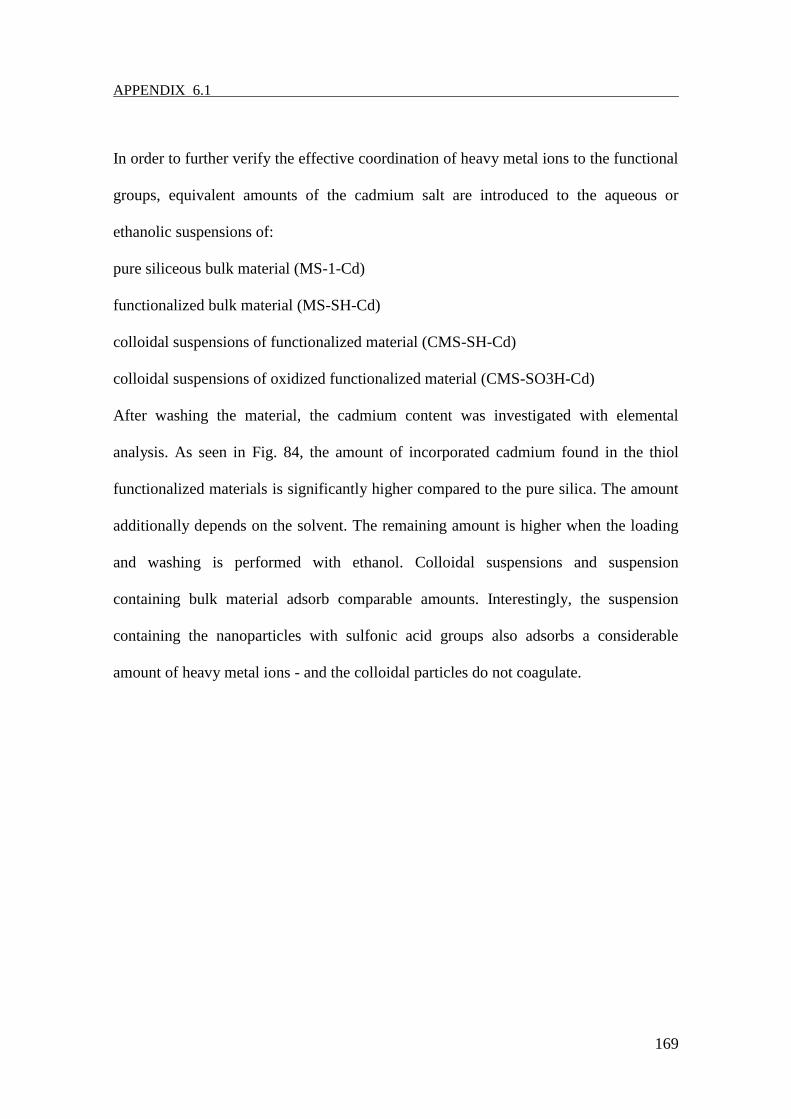
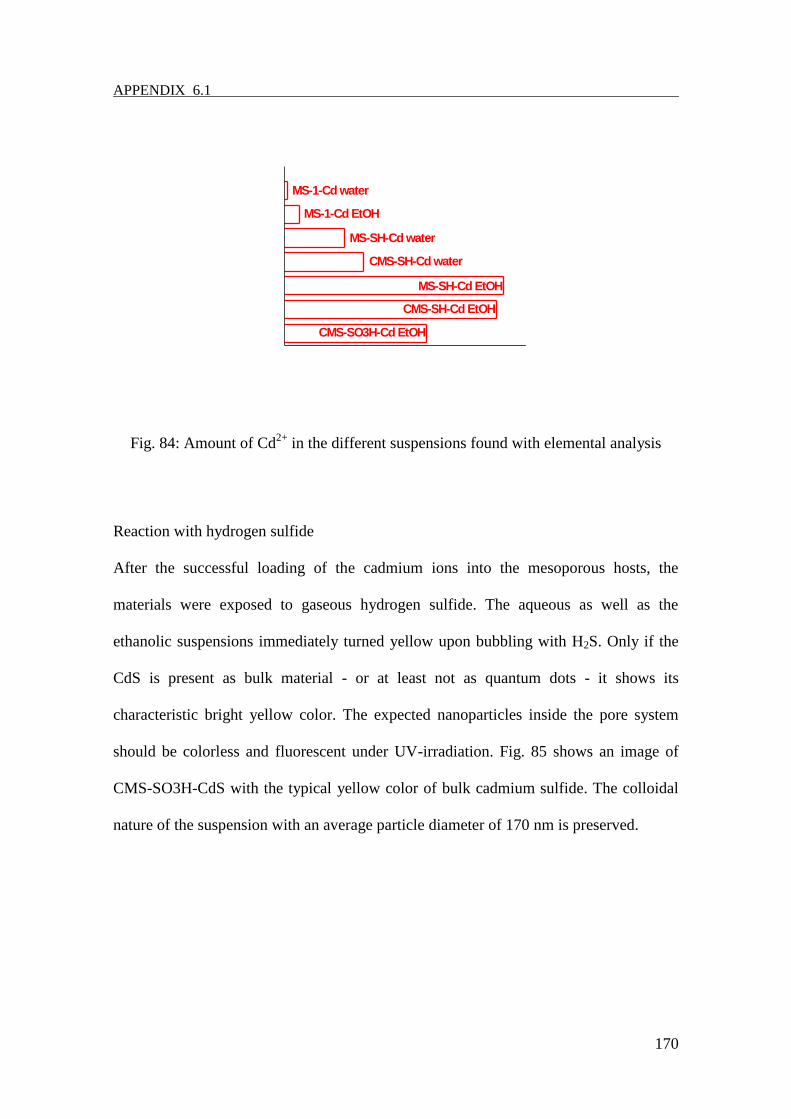
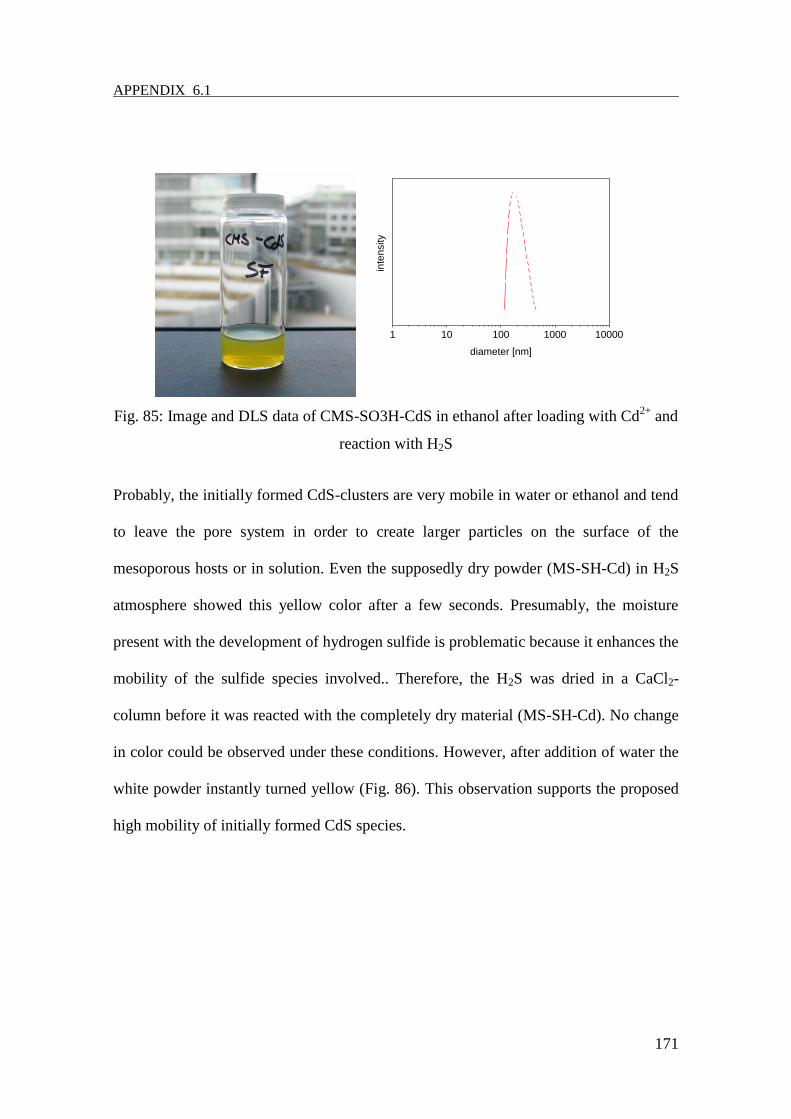
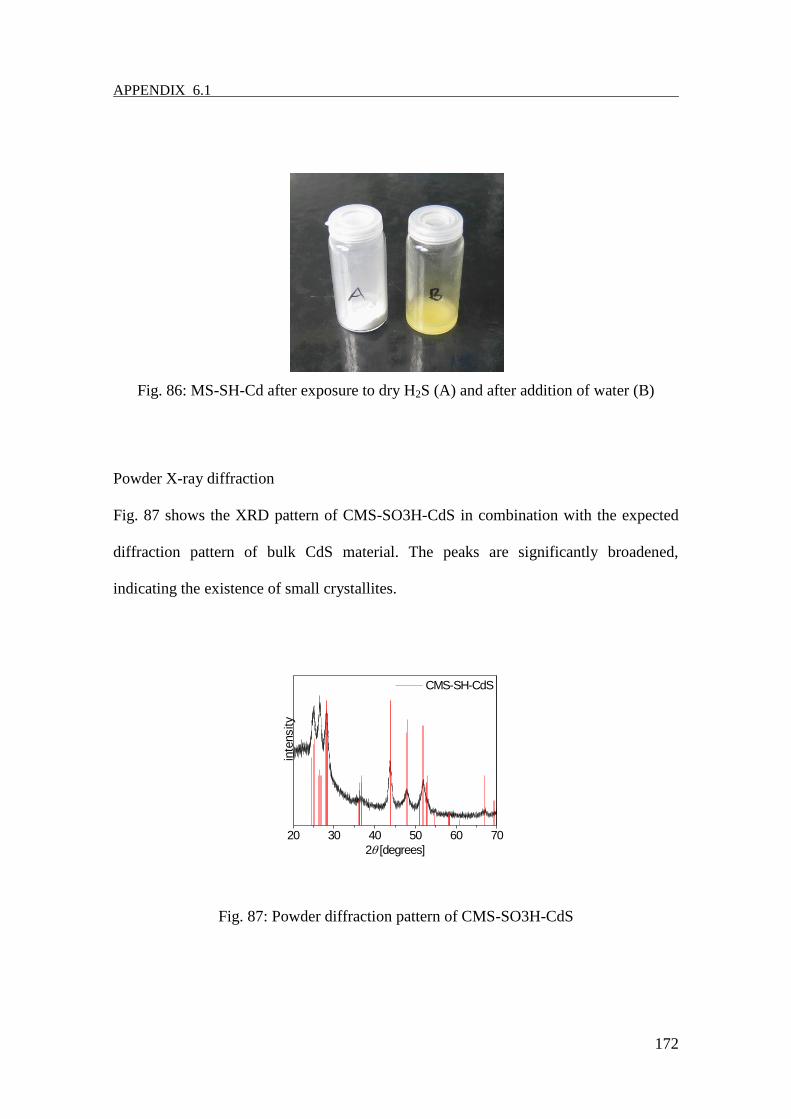
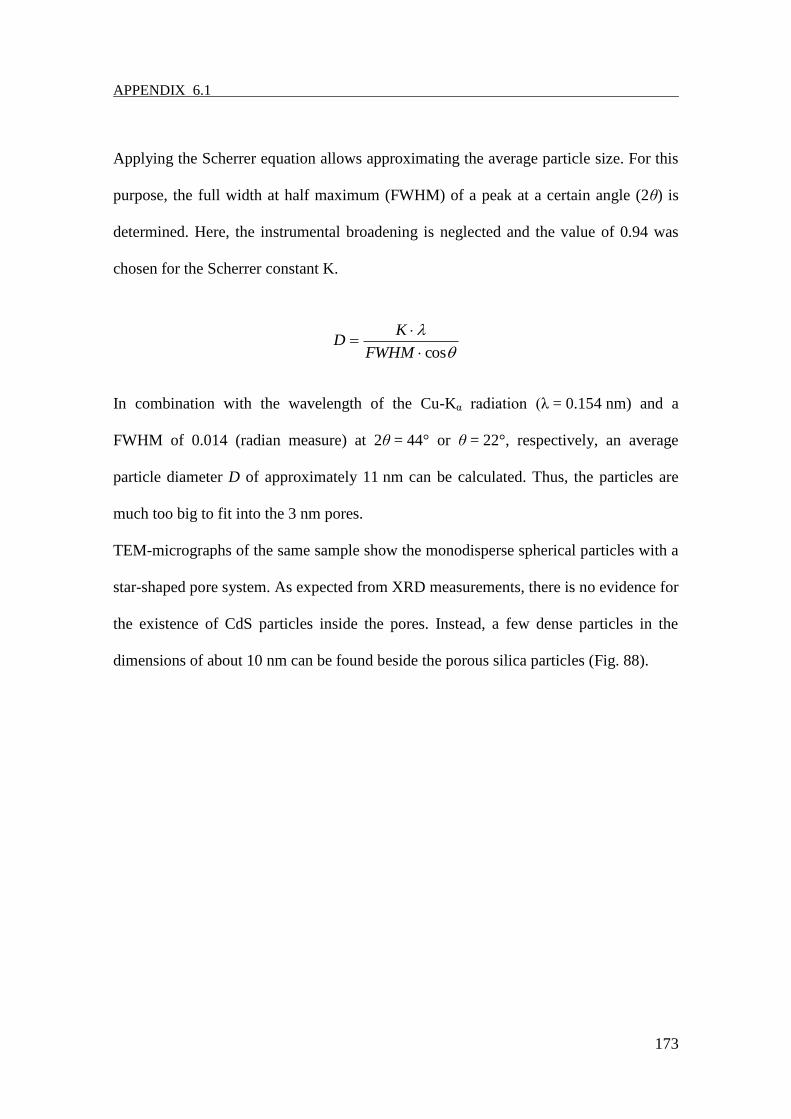
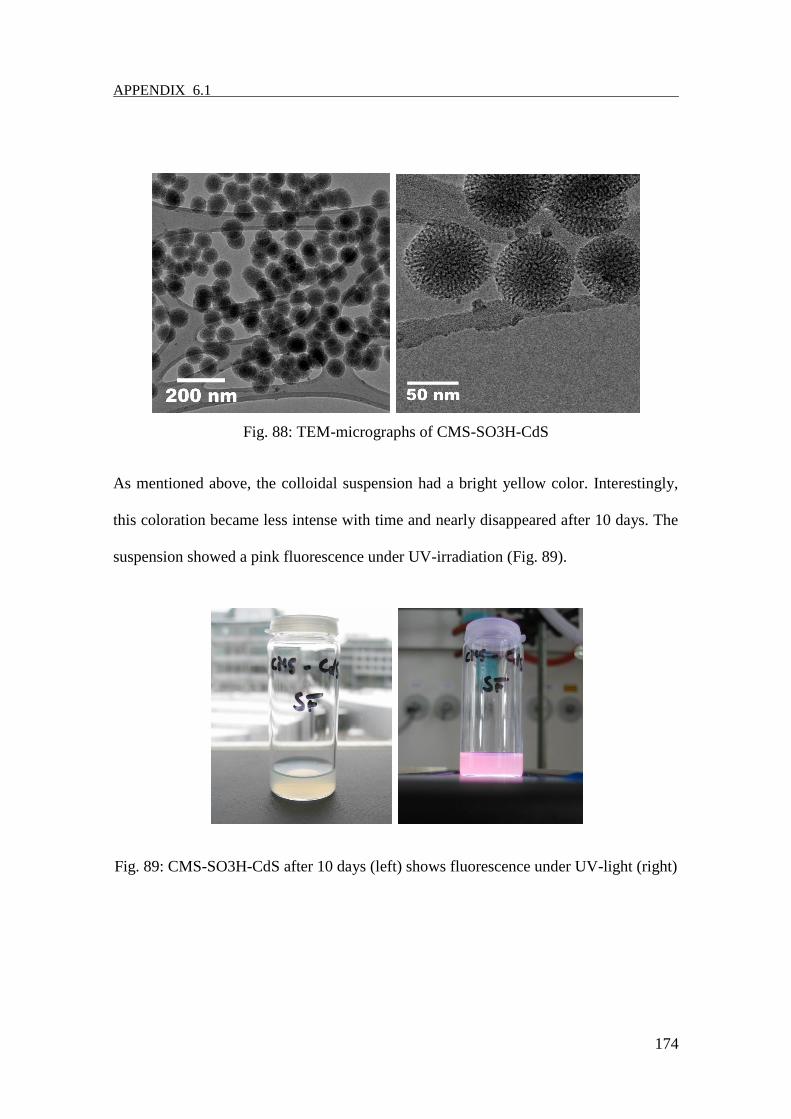
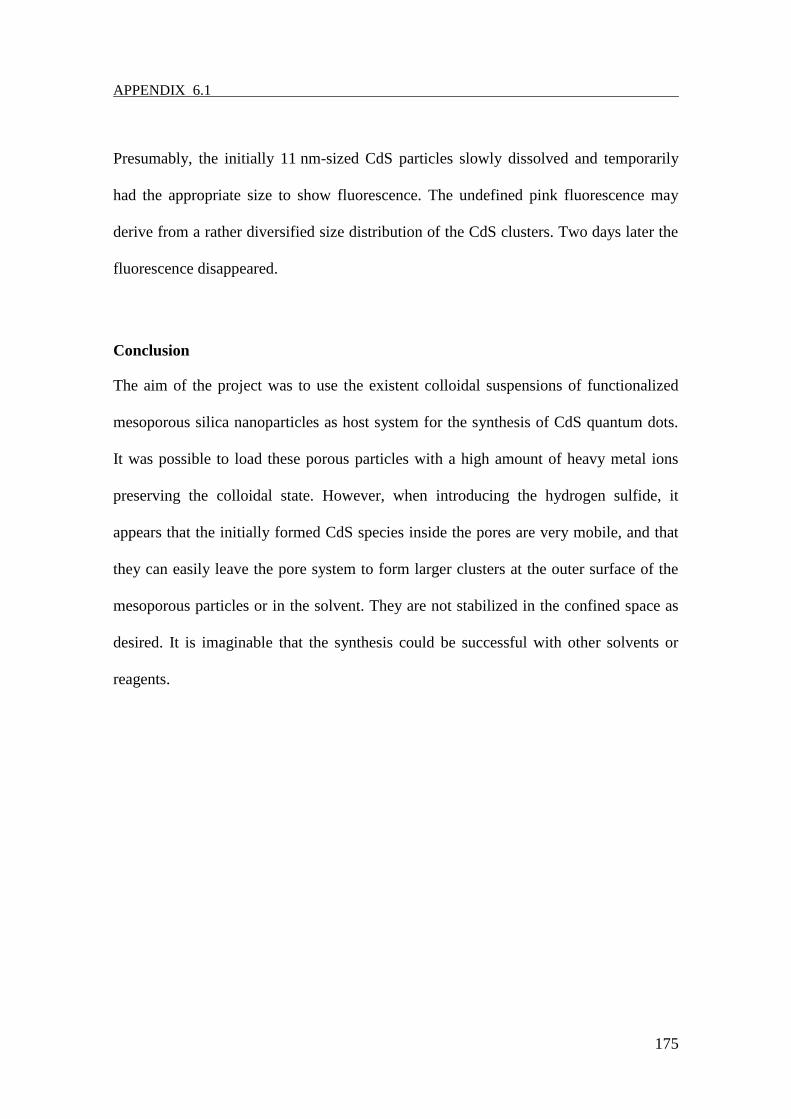
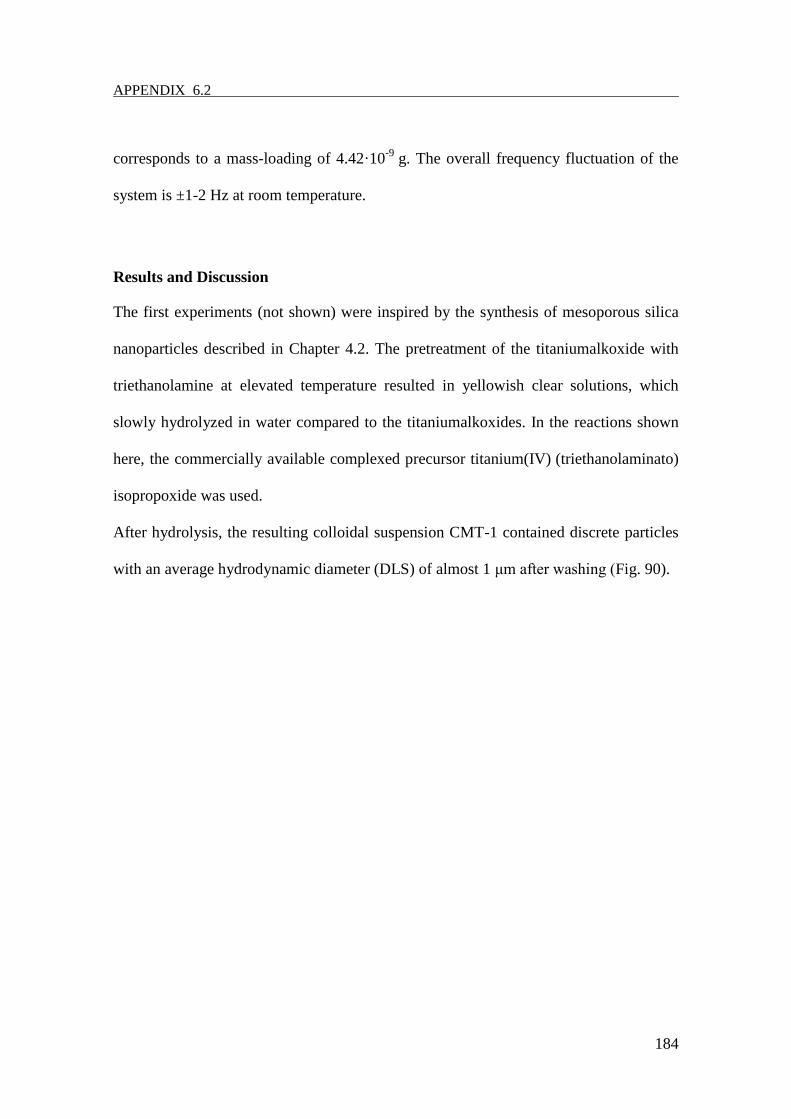
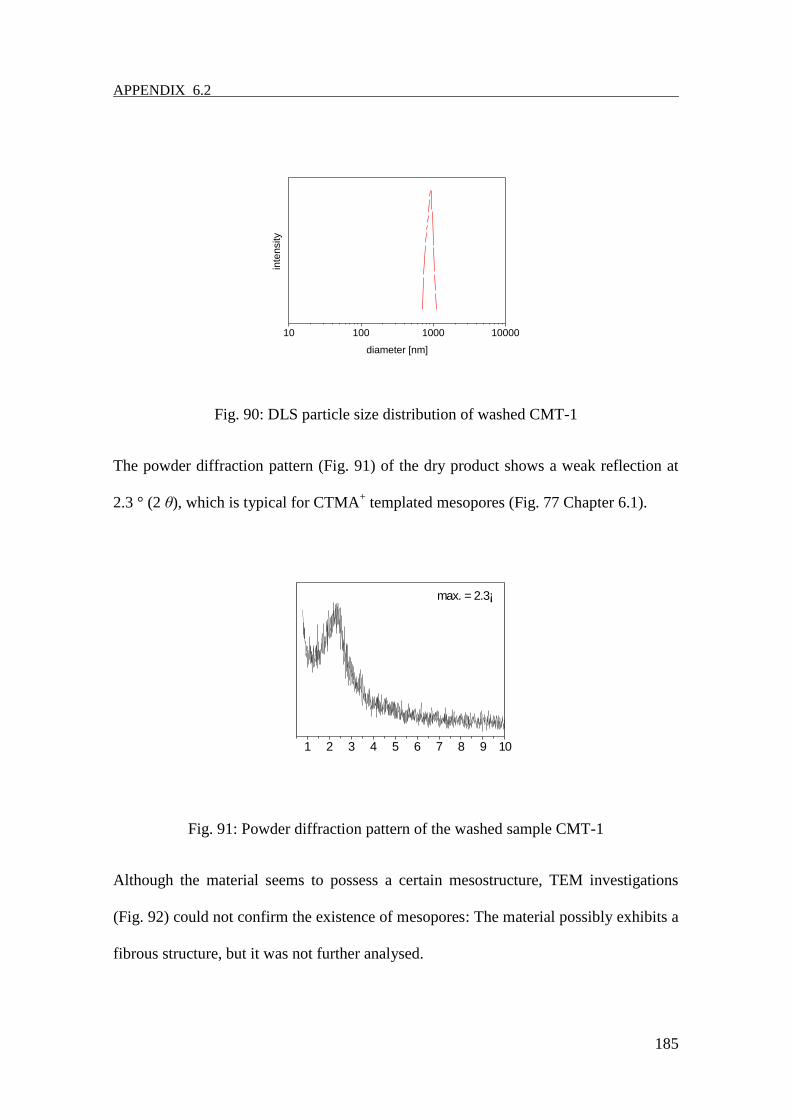
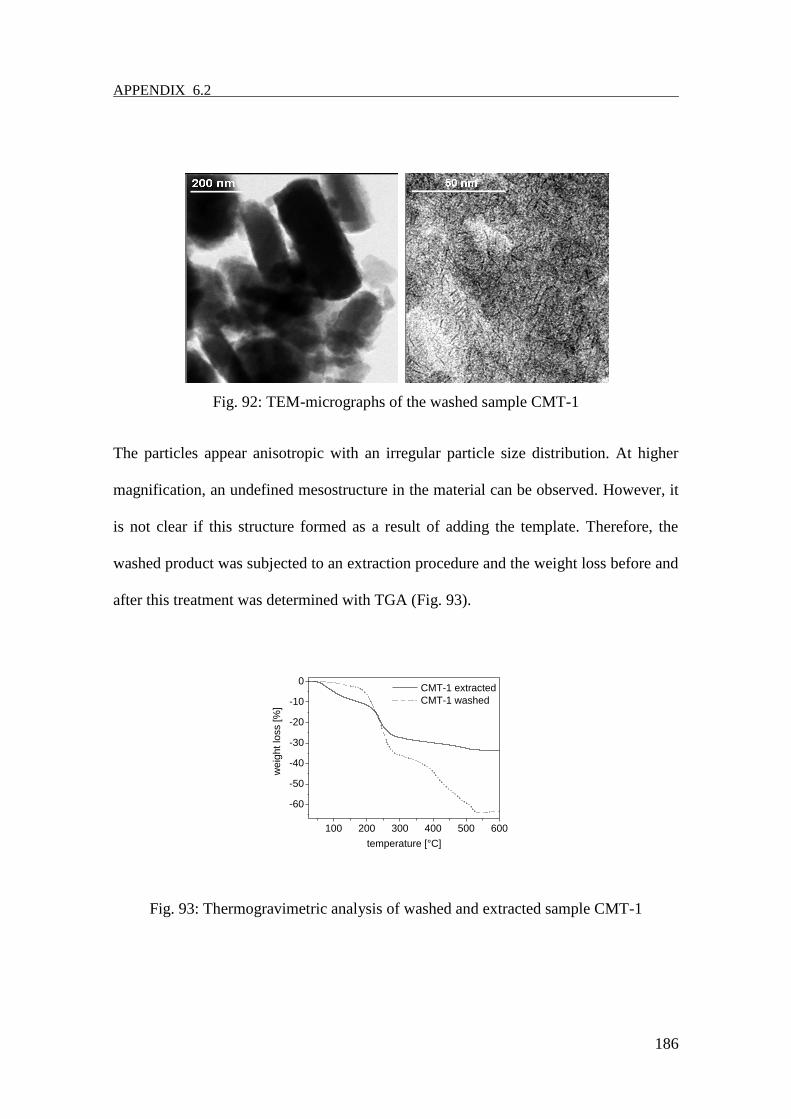
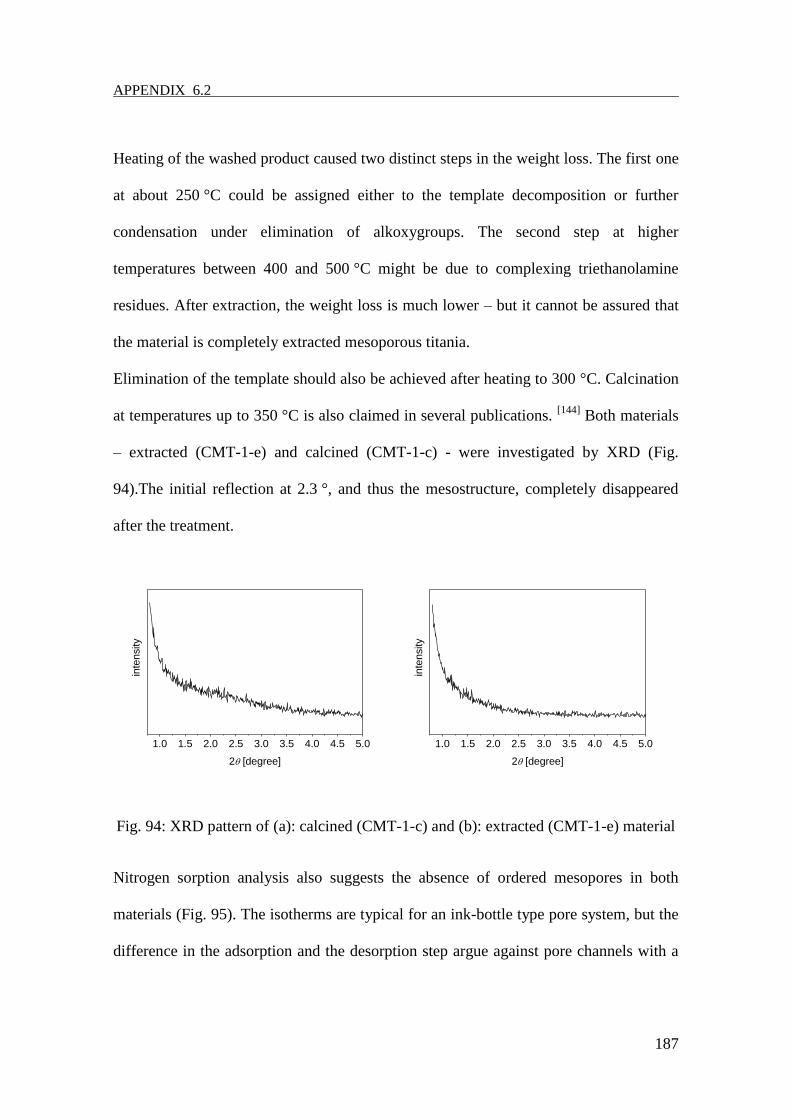
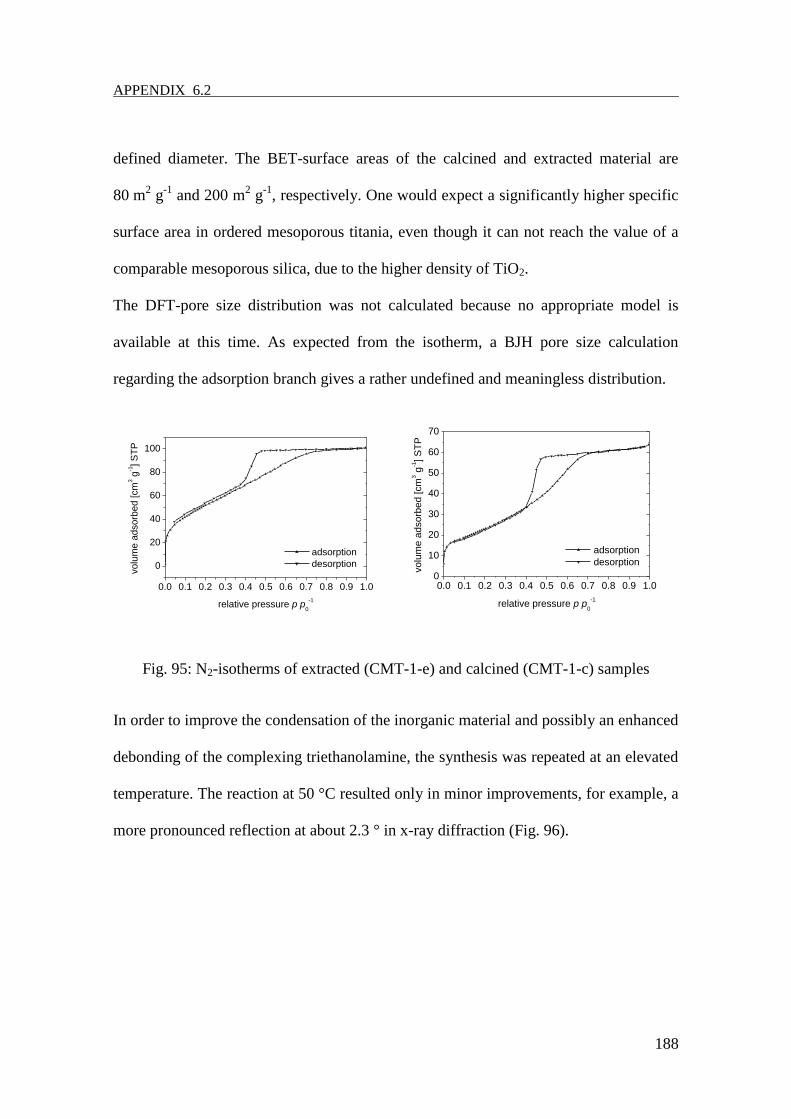
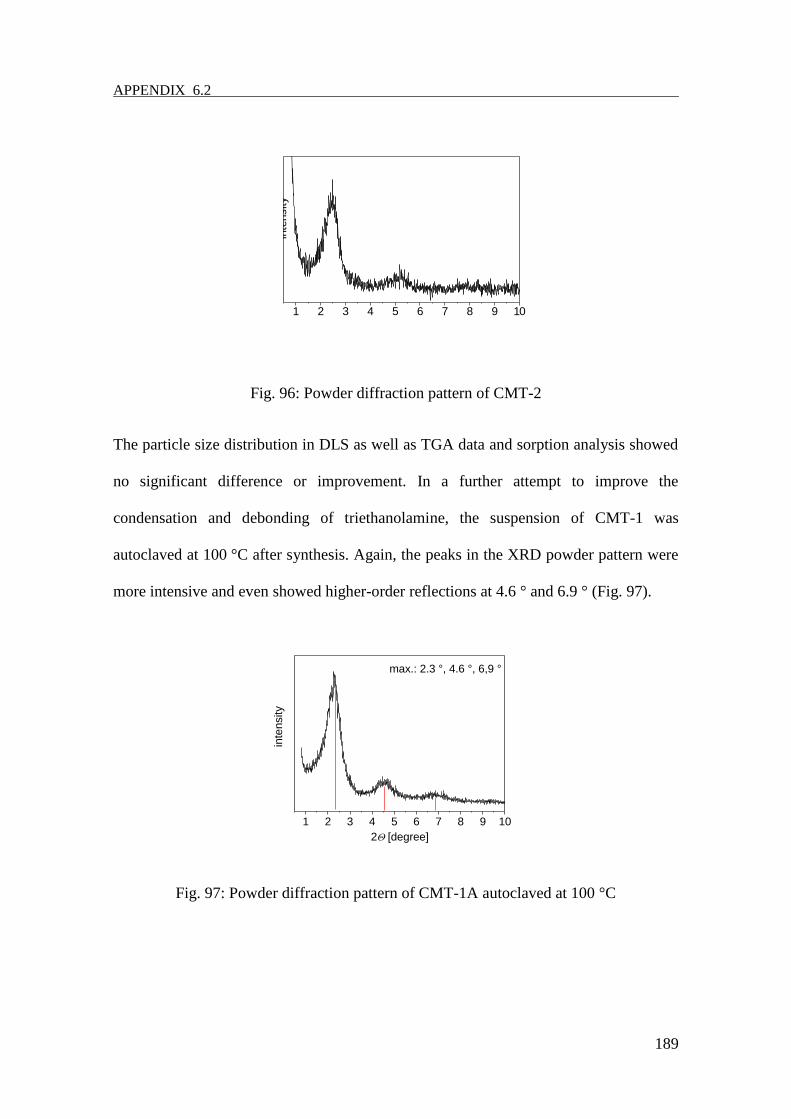
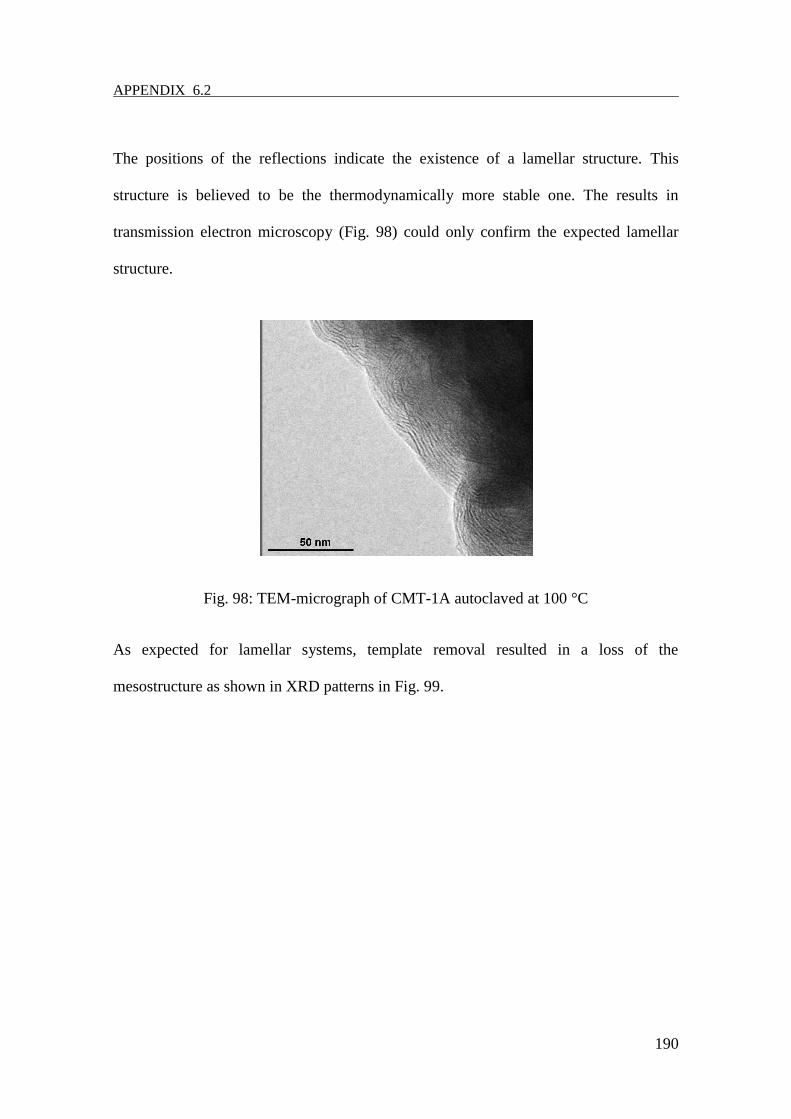
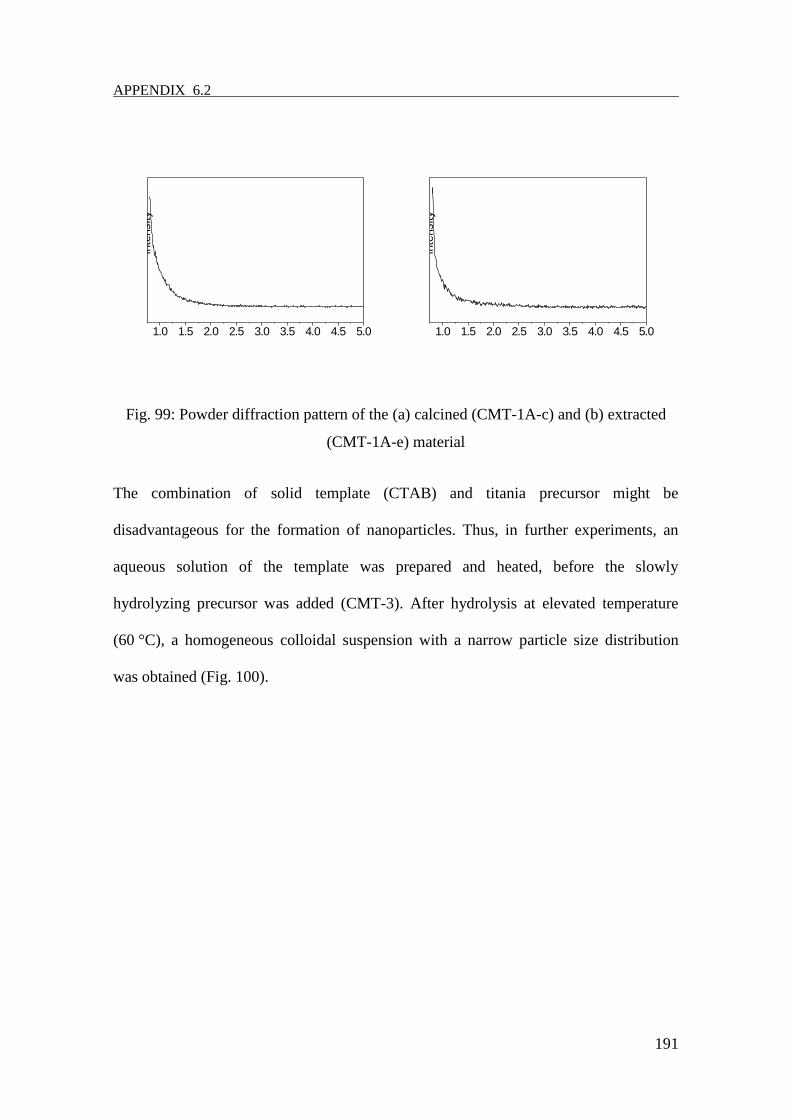
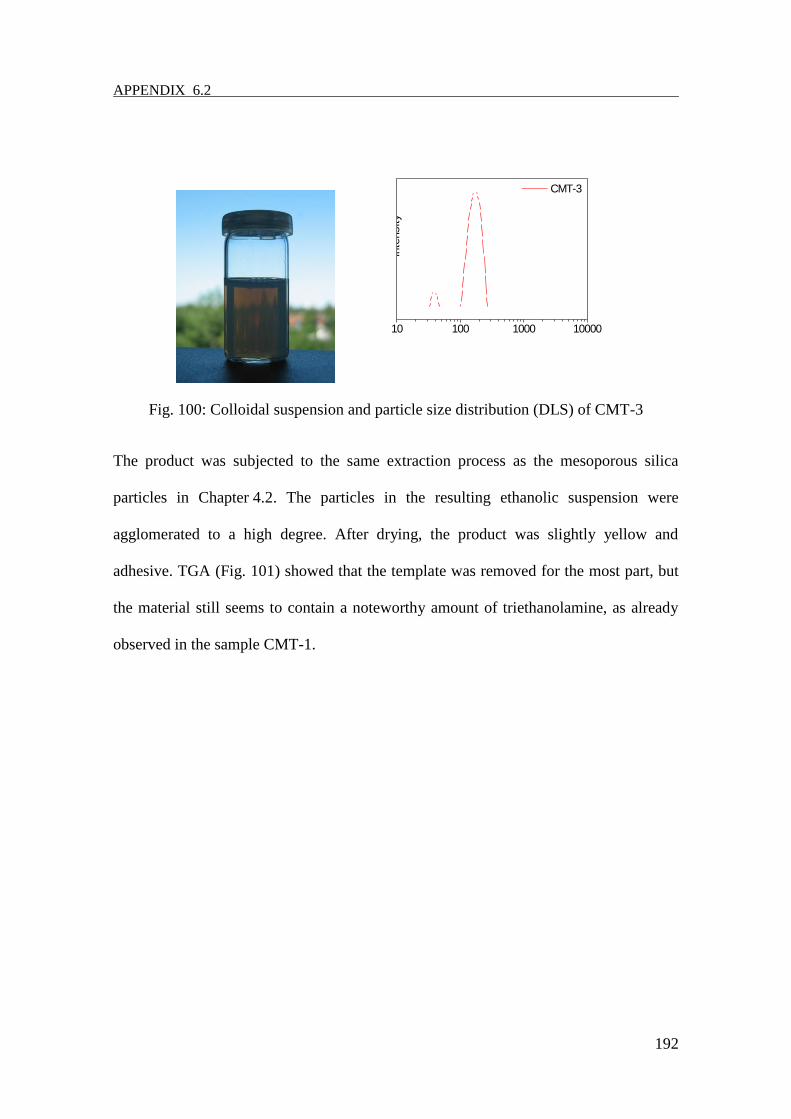
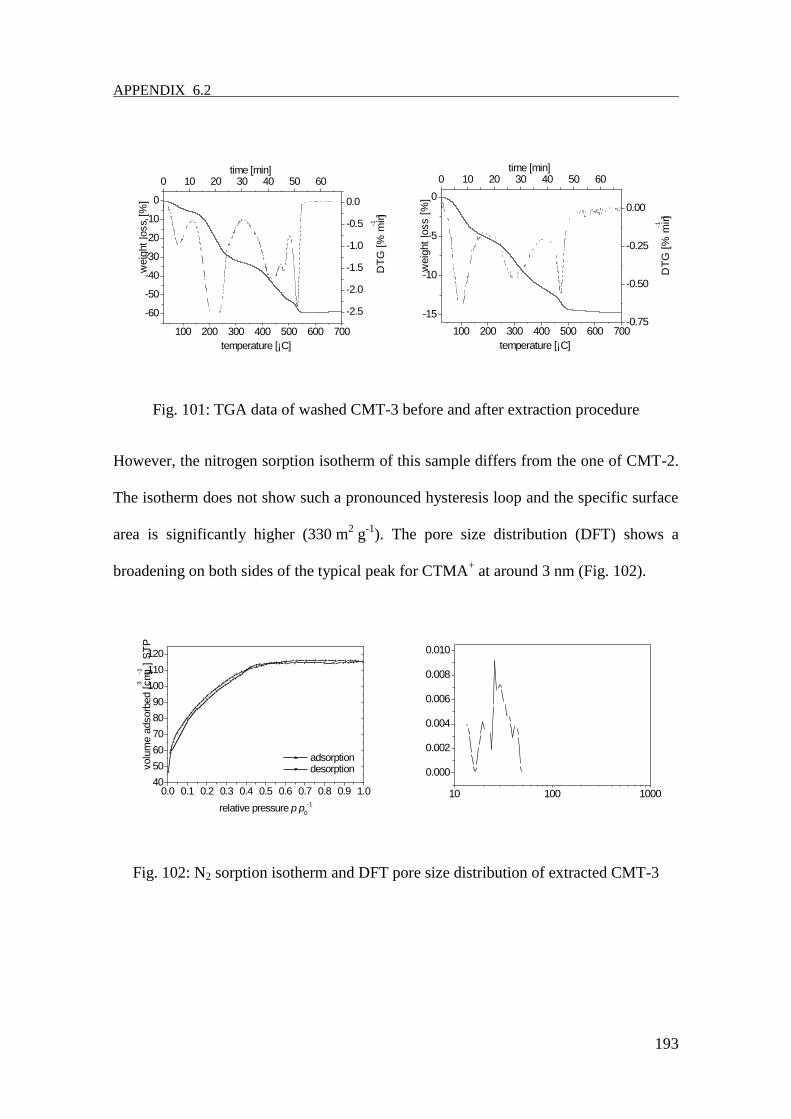
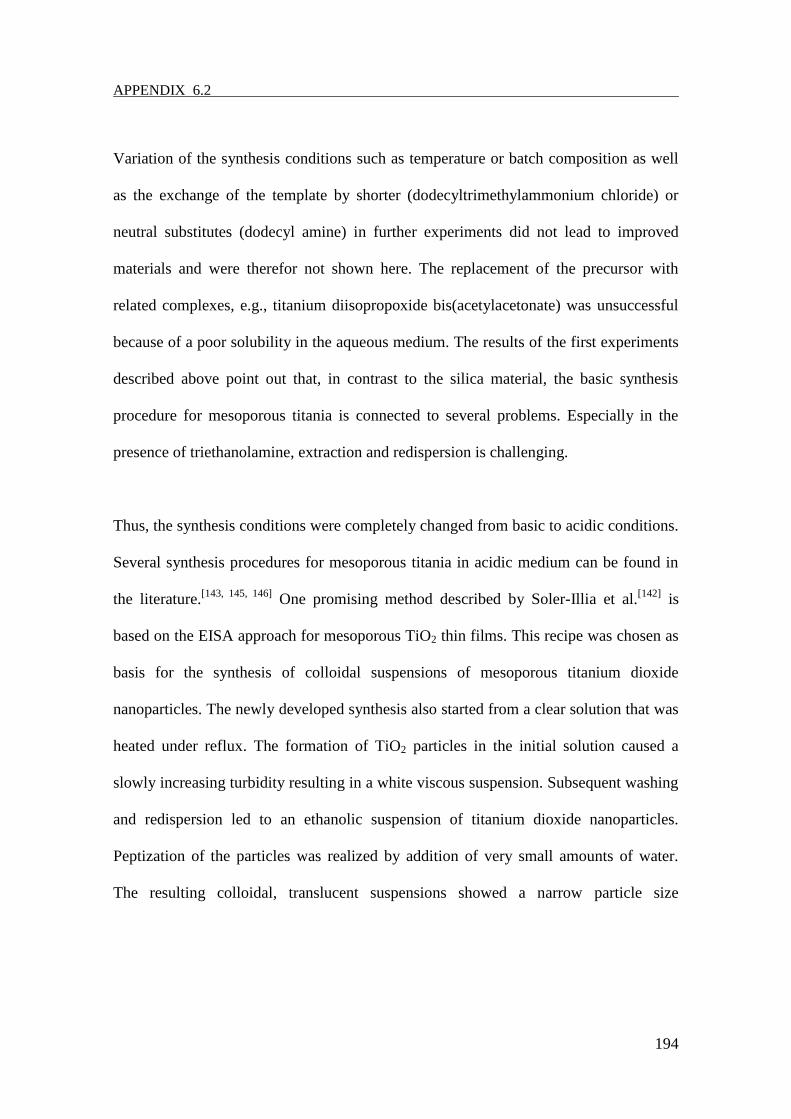
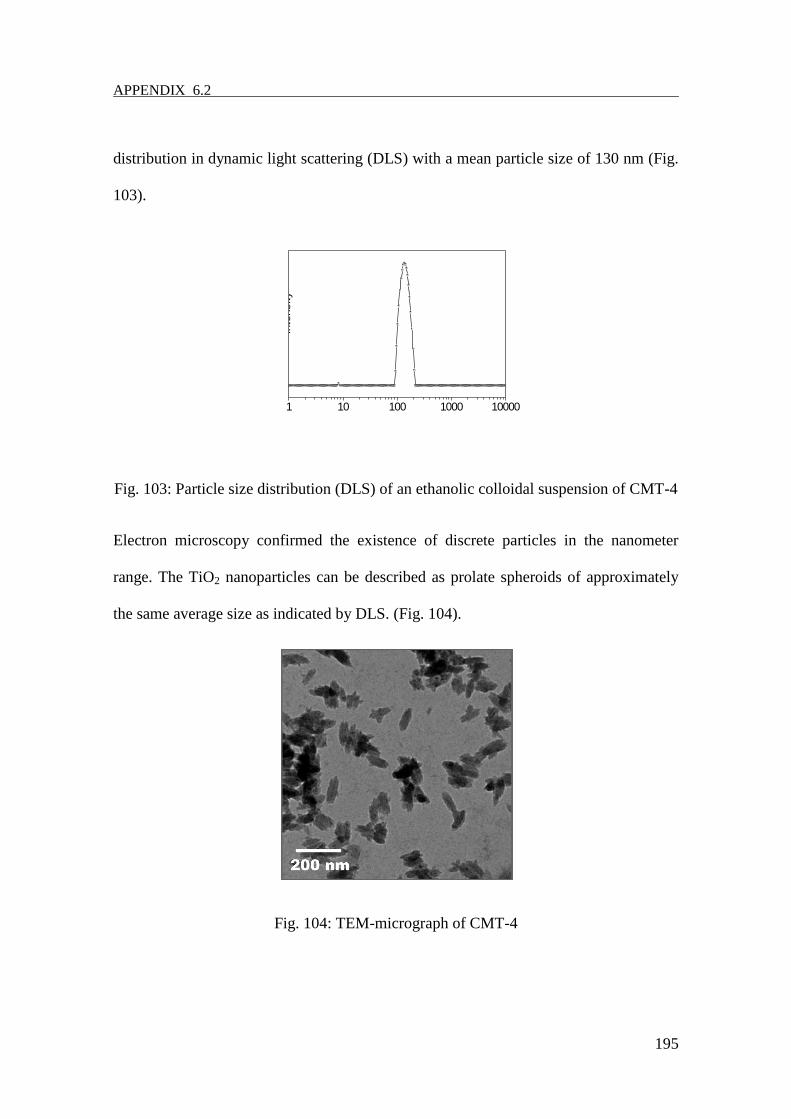
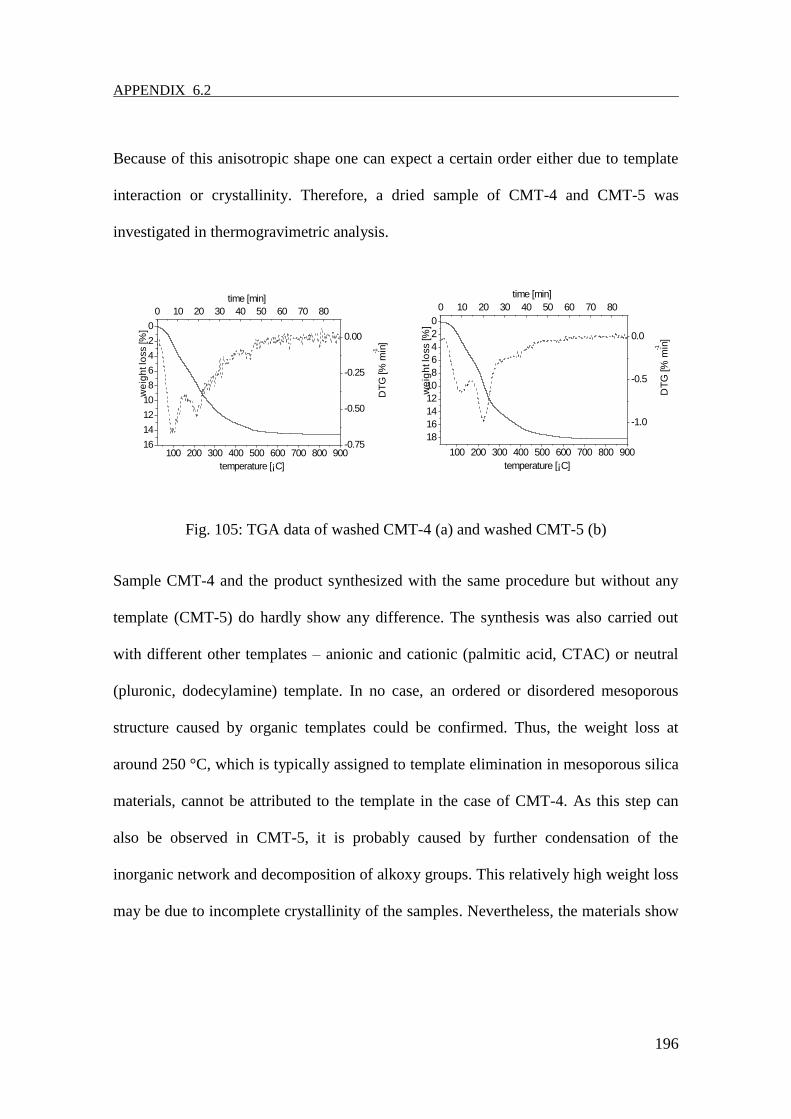
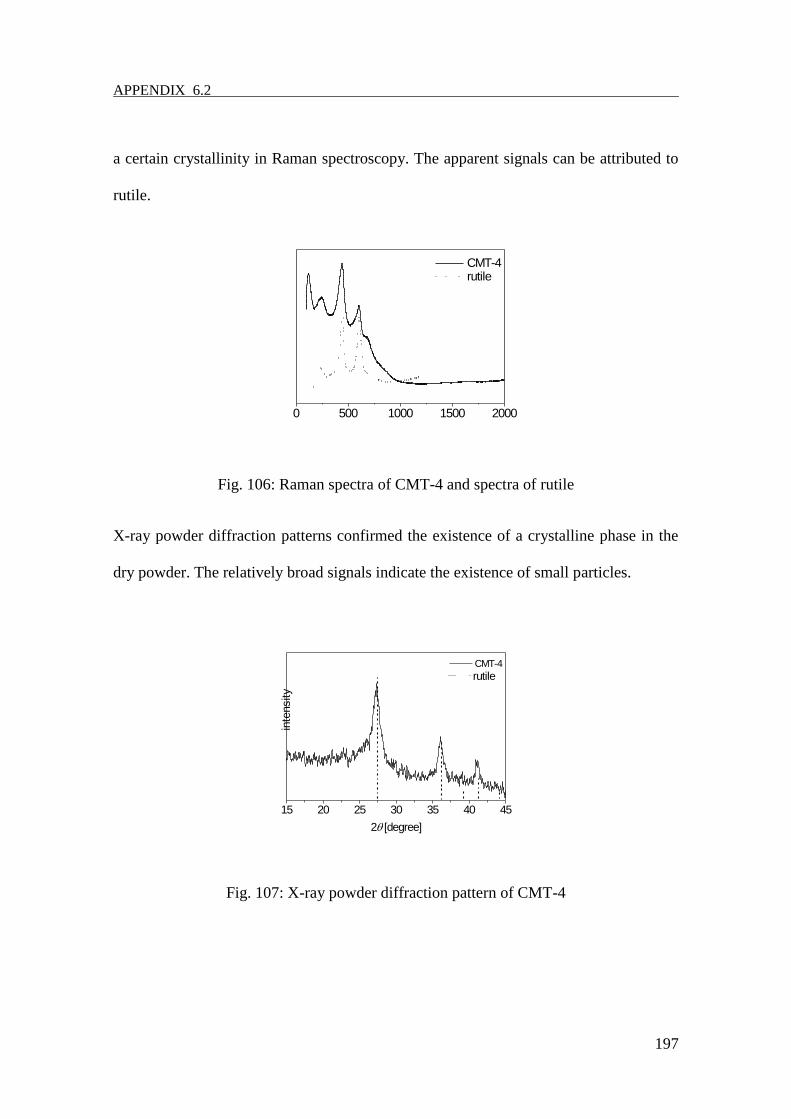
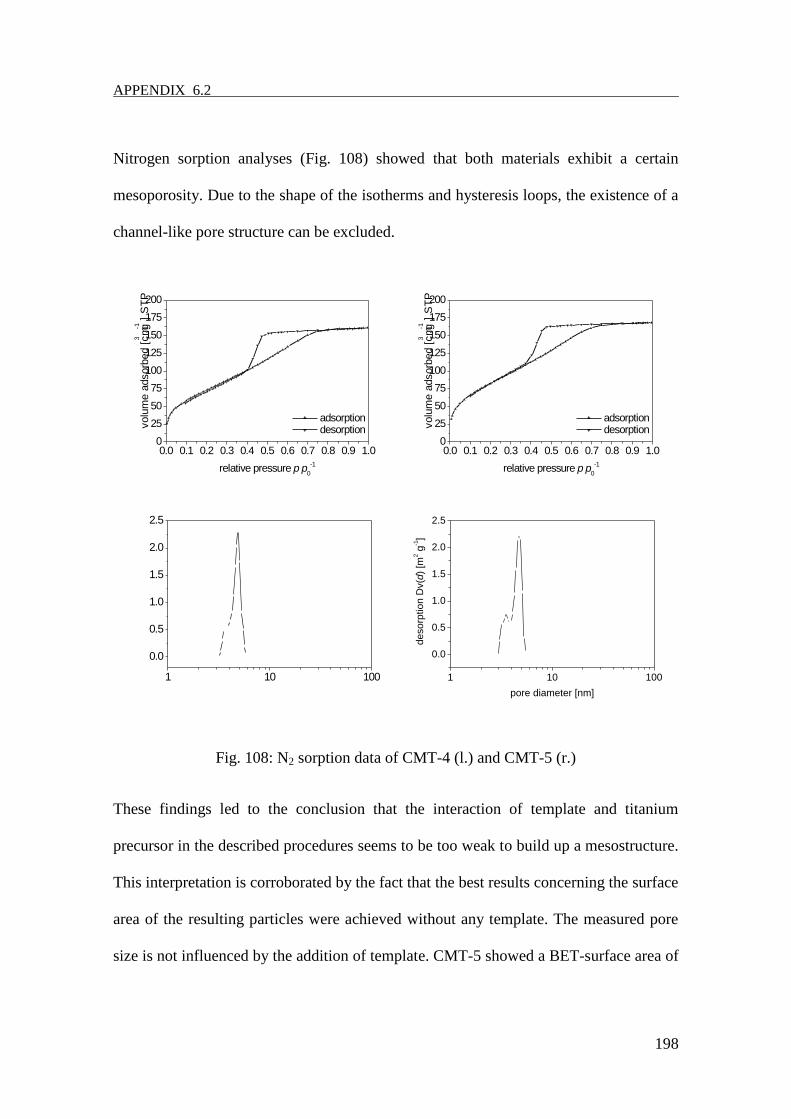
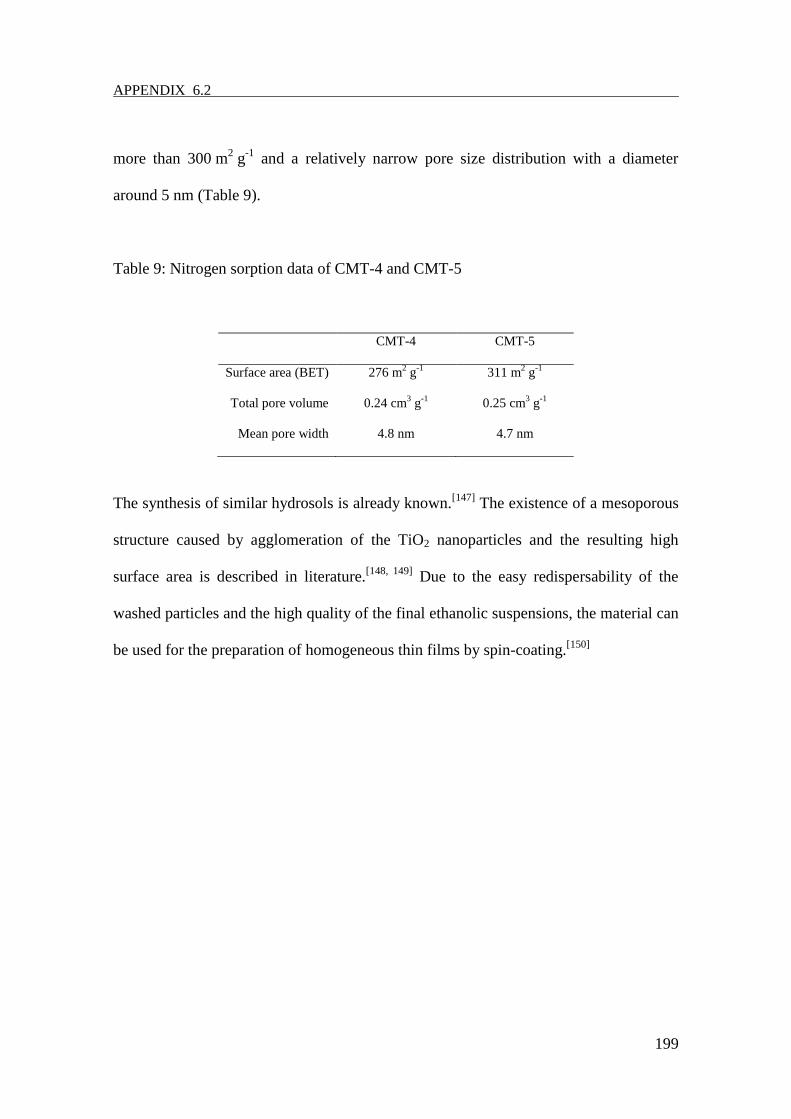
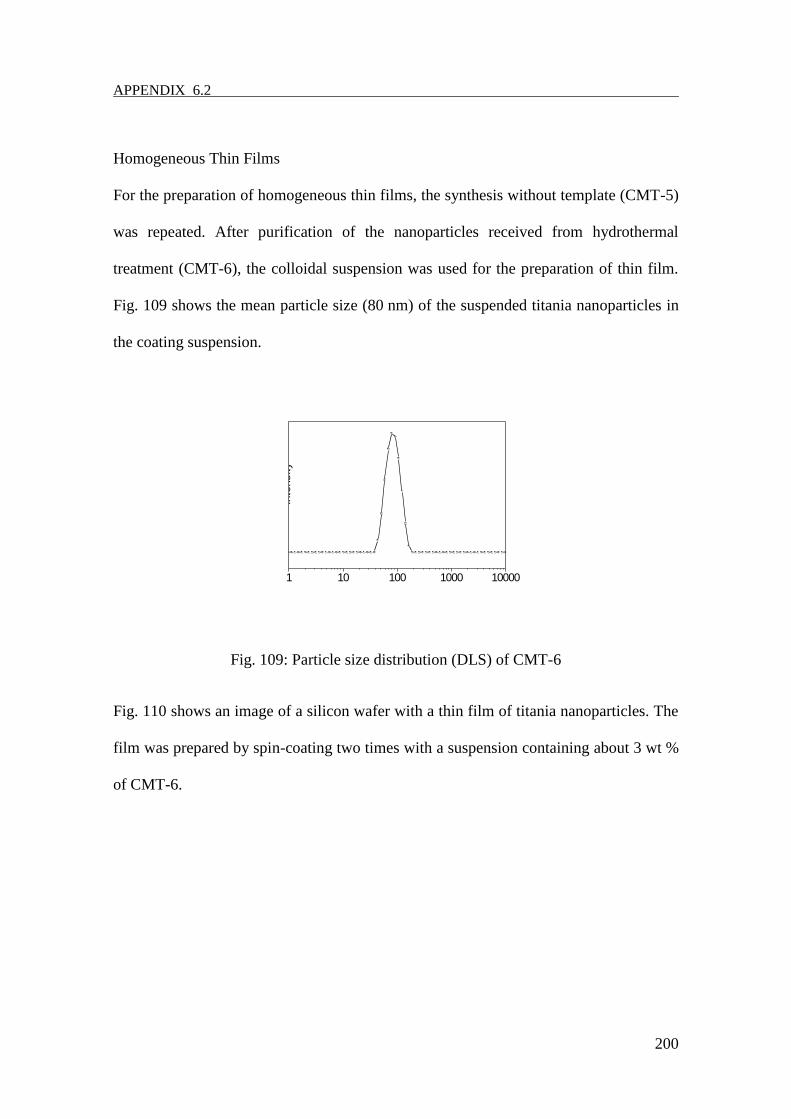
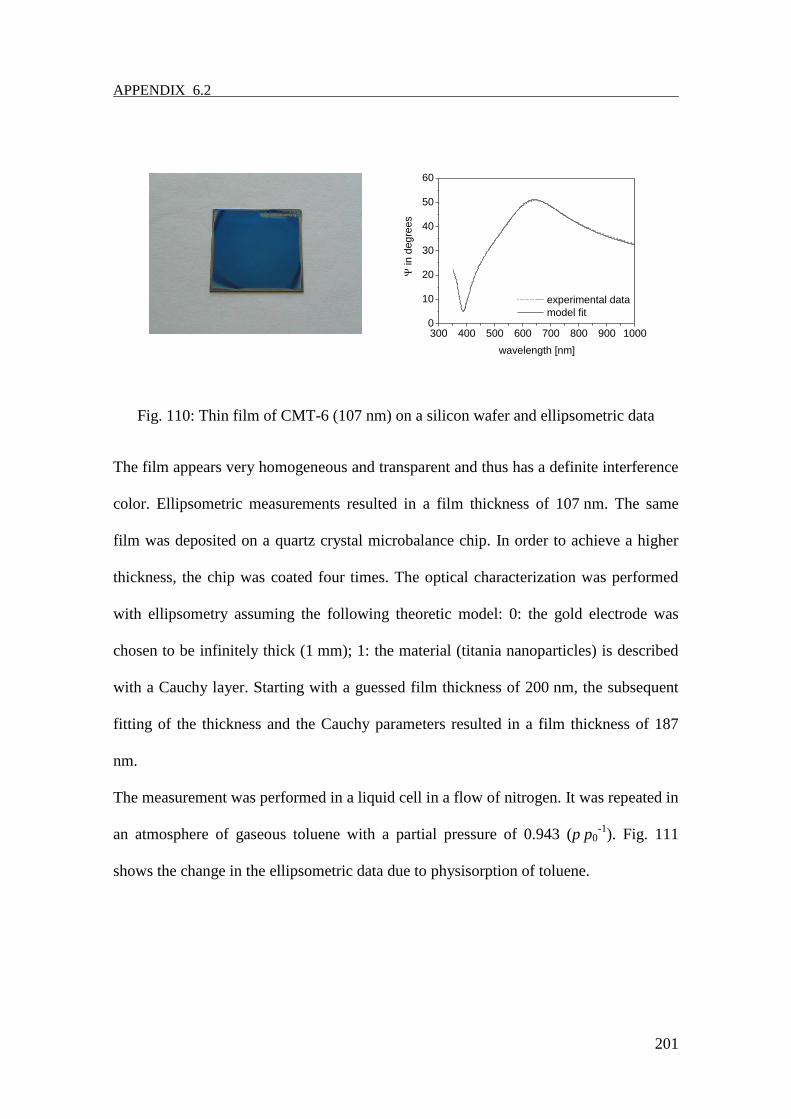
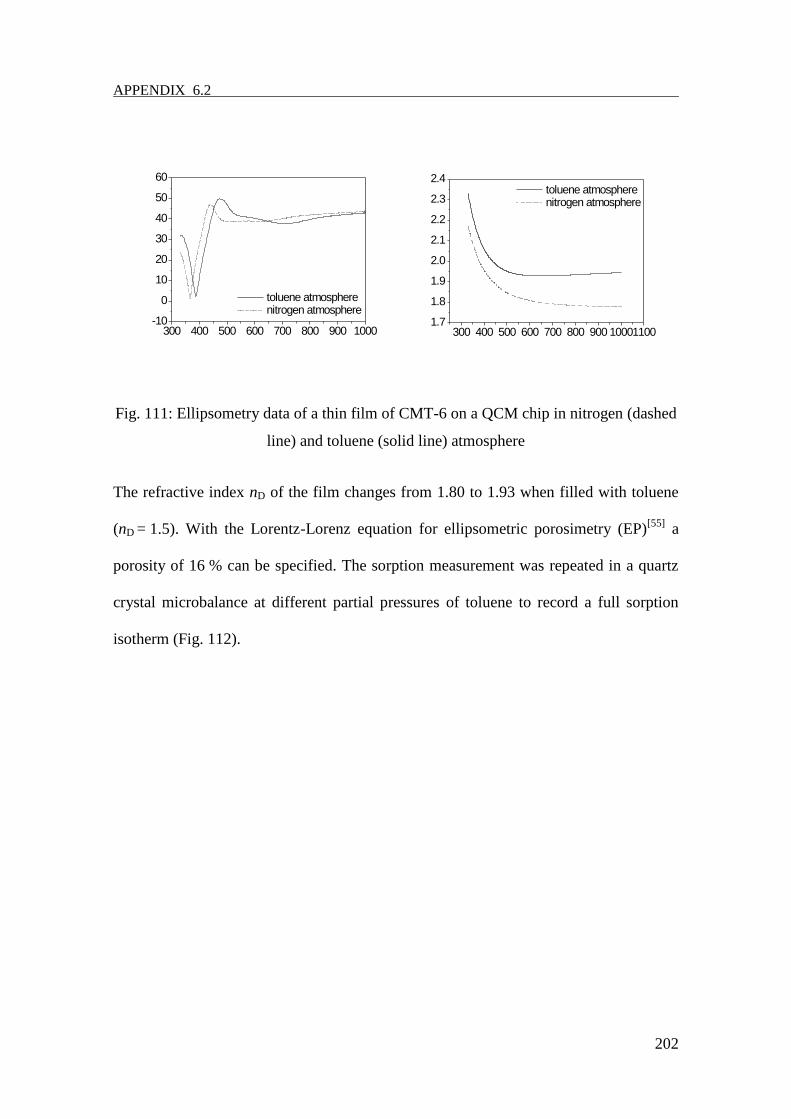
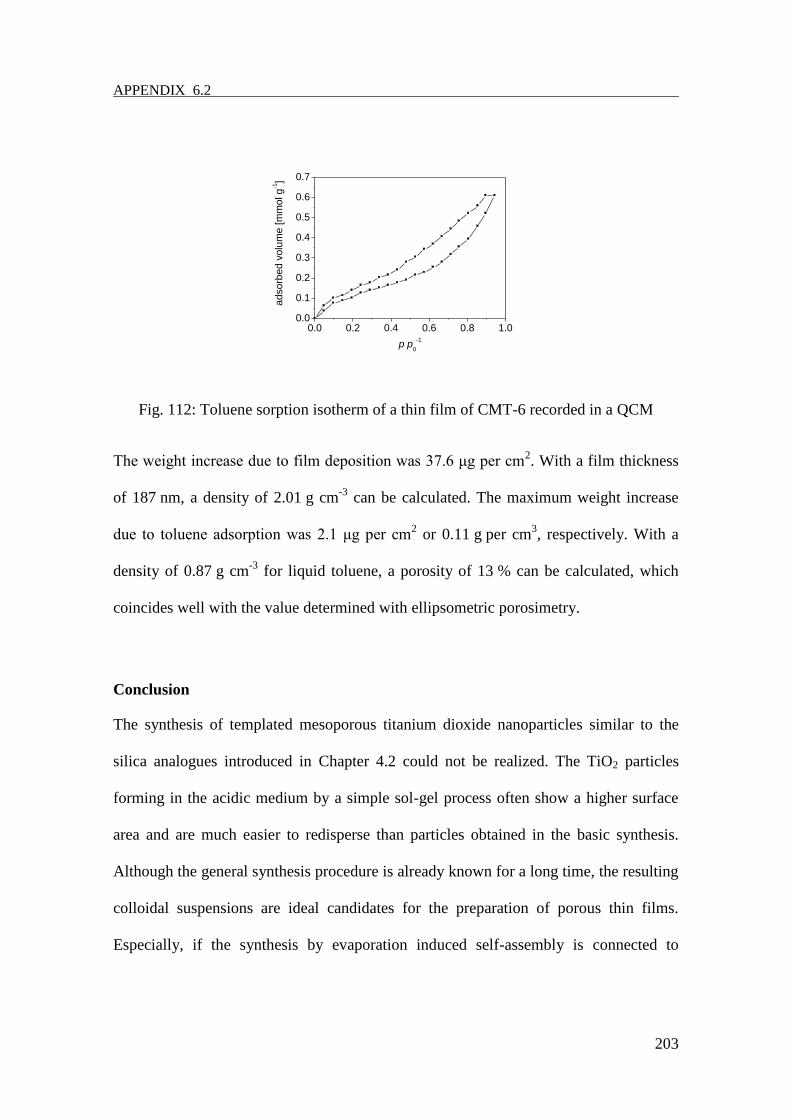


![Computation of the permeability of porous materials from their microstructure by … · 2013. 1. 21. · images of many porous materials [24, 8]. There is great interest in performing](https://img.pdfslide.org/doc/110x75/60aef016c07a5904946638d7/computation-of-the-permeability-of-porous-materials-from-their-microstructure-by.jpg)