Embed Size (px)
Citation preview
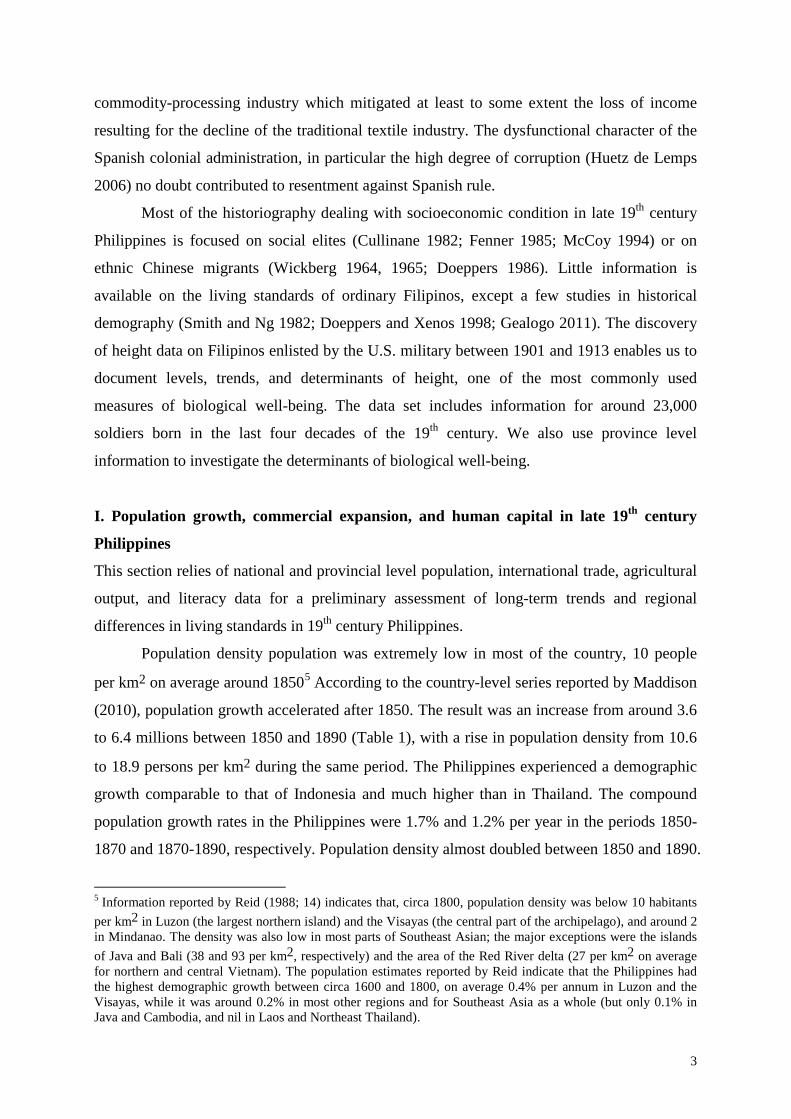
econstor www.econstor.eu
Der Open-Access-Publikationsserver der ZBW – Leibniz-Informationszentrum WirtschaftThe Open Access Publication Server of the ZBW – Leibniz Information Centre for Economics
Standard-Nutzungsbedingungen:
Die Dokumente auf EconStor dürfen zu eigenen wissenschaftlichenZwecken und zum Privatgebrauch gespeichert und kopiert werden.
Sie dürfen die Dokumente nicht für öffentliche oder kommerzielleZwecke vervielfältigen, öffentlich ausstellen, öffentlich zugänglichmachen, vertreiben oder anderweitig nutzen.
Sofern die Verfasser die Dokumente unter Open-Content-Lizenzen(insbesondere CC-Lizenzen) zur Verfügung gestellt haben sollten,gelten abweichend von diesen Nutzungsbedingungen die in der dortgenannten Lizenz gewährten Nutzungsrechte.
Terms of use:
Documents in EconStor may be saved and copied for yourpersonal and scholarly purposes.
You are not to copy documents for public or commercialpurposes, to exhibit the documents publicly, to make thempublicly available on the internet, or to distribute or otherwiseuse the documents in public.
If the documents have been made available under an OpenContent Licence (especially Creative Commons Licences), youmay exercise further usage rights as specified in the indicatedlicence.
zbw Leibniz-Informationszentrum WirtschaftLeibniz Information Centre for Economics
Bassino, Jean-Pascal; Dovis, Marion; Komlos, John
Working Paper
Biological Well-Being in Late 19th CenturyPhilippines
CESifo Working Paper, No. 5432
Provided in Cooperation with:Ifo Institute – Leibniz Institute for Economic Research at the University ofMunich
Suggested Citation: Bassino, Jean-Pascal; Dovis, Marion; Komlos, John (2015) : BiologicalWell-Being in Late 19th Century Philippines, CESifo Working Paper, No. 5432
This Version is available at:http://hdl.handle.net/10419/113769
Biological Well-Being in Late 19th Century Philippines
Jean-Pascal Bassino Marion Dovis John Komlos
CESIFO WORKING PAPER NO. 5432 CATEGORY 3: SOCIAL PROTECTION
JULY 2015
An electronic version of the paper may be downloaded • from the SSRN website: www.SSRN.com • from the RePEc website: www.RePEc.org
• from the CESifo website: Twww.CESifo-group.org/wp T
ISSN 2364-1428
CESifo Working Paper No. 5432
Biological Well-Being in Late 19th Century Philippines
Abstract
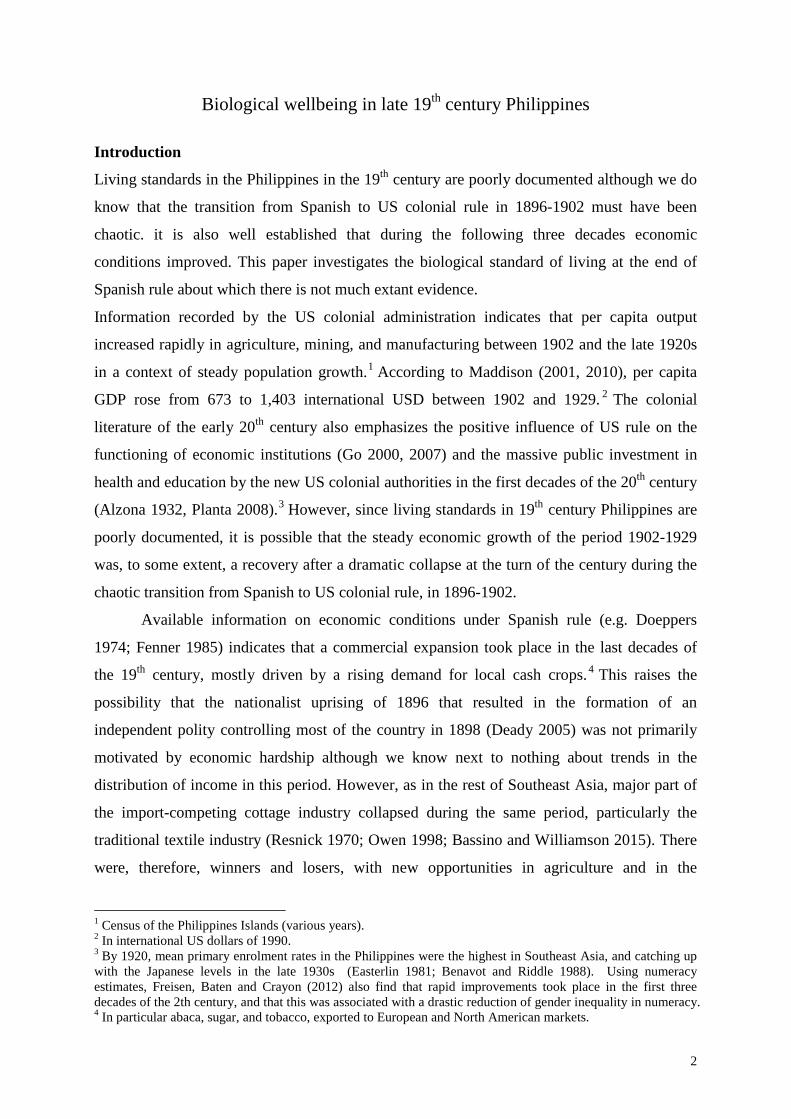
This paper investigates the biological standard of living toward the end of Spanish rule. We investigate levels, trends, and determinants of physical stature from the birth cohorts of the 1860s to the 1890s using data on 23,000 Filipino soldiers enlisted by the U.S. military between 1901 and 1913. We use truncated regression technique for estimating average height and use province level information for investigating the determinants of biological wellbeing. The results indicate a decline of more than 1.5 cm (0.6 inches) in the height of soldiers born between the early 1870s and the late 1880s. The decline in heights at the end of the 19th century occurred at a time when there was an expansion of commercial activity in cash crop production for export. Heights did not regain the level of the 1870s until the late 1930s and early 1940s. We also find that at 159.3 cm (62.7 inches), the average height of soldiers born in the mid-1870s was very short even for the time. The low biological standard of living observed in late 19th century Philippines was not due to the tropical disease environment alone since greater average heights were recorded for the same period in other parts of Asia with a similar climate.
JEL-Code: I100, N350, N950.
Keywords: height, biological standard of living, human capital, tropical diseases, truncated regression, Philippines.
Jean-Pascal Bassino* Institute of East Asian Studies
(Institut d’Asie Orientale, IAO) ENS de Lyon / University of Lyon / France
Marion Dovis GREQAM, Aix-Marseille School of
Economics / Aix-Marseille University Aix-en-Provence Les Milles / France
John Komlos Professor Emeritus
Ludwig Maximilian University Munich / Germany
*corresponding author
2
Biological wellbeing in late 19th century Philippines
Introduction
Living standards in the Philippines in the 19th century are poorly documented although we do
know that the transition from Spanish to US colonial rule in 1896-1902 must have been
chaotic. it is also well established that during the following three decades economic
conditions improved. This paper investigates the biological standard of living at the end of
Spanish rule about which there is not much extant evidence.
Information recorded by the US colonial administration indicates that per capita output
increased rapidly in agriculture, mining, and manufacturing between 1902 and the late 1920s
in a context of steady population growth.1 According to Maddison (2001, 2010), per capita
GDP rose from 673 to 1,403 international USD between 1902 and 1929. 2 The colonial
literature of the early 20th century also emphasizes the positive influence of US rule on the
functioning of economic institutions (Go 2000, 2007) and the massive public investment in
health and education by the new US colonial authorities in the first decades of the 20th century
(Alzona 1932, Planta 2008).3 However, since living standards in 19th century Philippines are
poorly documented, it is possible that the steady economic growth of the period 1902-1929
was, to some extent, a recovery after a dramatic collapse at the turn of the century during the
chaotic transition from Spanish to US colonial rule, in 1896-1902.
Available information on economic conditions under Spanish rule (e.g. Doeppers
1974; Fenner 1985) indicates that a commercial expansion took place in the last decades of
the 19th century, mostly driven by a rising demand for local cash crops.4 This raises the
possibility that the nationalist uprising of 1896 that resulted in the formation of an
independent polity controlling most of the country in 1898 (Deady 2005) was not primarily
motivated by economic hardship although we know next to nothing about trends in the
distribution of income in this period. However, as in the rest of Southeast Asia, major part of
the import-competing cottage industry collapsed during the same period, particularly the
traditional textile industry (Resnick 1970; Owen 1998; Bassino and Williamson 2015). There
were, therefore, winners and losers, with new opportunities in agriculture and in the
1 Census of the Philippines Islands (various years). 2 In international US dollars of 1990. 3 By 1920, mean primary enrolment rates in the Philippines were the highest in Southeast Asia, and catching up with the Japanese levels in the late 1930s (Easterlin 1981; Benavot and Riddle 1988). Using numeracy estimates, Freisen, Baten and Crayon (2012) also find that rapid improvements took place in the first three decades of the 2th century, and that this was associated with a drastic reduction of gender inequality in numeracy. 4 In particular abaca, sugar, and tobacco, exported to European and North American markets.
3
commodity-processing industry which mitigated at least to some extent the loss of income
resulting for the decline of the traditional textile industry. The dysfunctional character of the
Spanish colonial administration, in particular the high degree of corruption (Huetz de Lemps
2006) no doubt contributed to resentment against Spanish rule.
Most of the historiography dealing with socioeconomic condition in late 19th century
Philippines is focused on social elites (Cullinane 1982; Fenner 1985; McCoy 1994) or on
ethnic Chinese migrants (Wickberg 1964, 1965; Doeppers 1986). Little information is
available on the living standards of ordinary Filipinos, except a few studies in historical
demography (Smith and Ng 1982; Doeppers and Xenos 1998; Gealogo 2011). The discovery
of height data on Filipinos enlisted by the U.S. military between 1901 and 1913 enables us to
document levels, trends, and determinants of height, one of the most commonly used
measures of biological well-being. The data set includes information for around 23,000
soldiers born in the last four decades of the 19th century. We also use province level
information to investigate the determinants of biological well-being.
I. Population growth, commercial expansion, and human capital in late 19th century
Philippines
This section relies of national and provincial level population, international trade, agricultural
output, and literacy data for a preliminary assessment of long-term trends and regional
differences in living standards in 19th century Philippines.
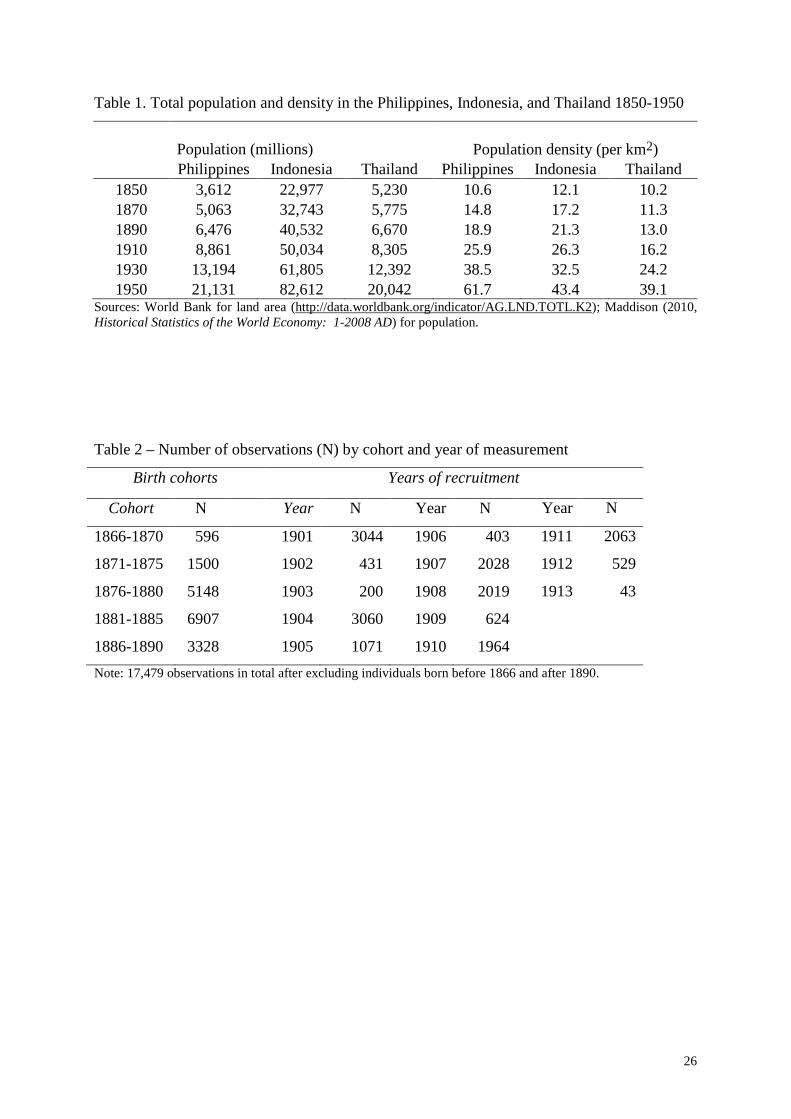
Population density population was extremely low in most of the country, 10 people
per km2 on average around 18505 According to the country-level series reported by Maddison
(2010), population growth accelerated after 1850. The result was an increase from around 3.6
to 6.4 millions between 1850 and 1890 (Table 1), with a rise in population density from 10.6
to 18.9 persons per km2 during the same period. The Philippines experienced a demographic
growth comparable to that of Indonesia and much higher than in Thailand. The compound
population growth rates in the Philippines were 1.7% and 1.2% per year in the periods 1850-
1870 and 1870-1890, respectively. Population density almost doubled between 1850 and 1890.
5 Information reported by Reid (1988; 14) indicates that, circa 1800, population density was below 10 habitants per km2 in Luzon (the largest northern island) and the Visayas (the central part of the archipelago), and around 2 in Mindanao. The density was also low in most parts of Southeast Asian; the major exceptions were the islands of Java and Bali (38 and 93 per km2, respectively) and the area of the Red River delta (27 per km2 on average for northern and central Vietnam). The population estimates reported by Reid indicate that the Philippines had the highest demographic growth between circa 1600 and 1800, on average 0.4% per annum in Luzon and the Visayas, while it was around 0.2% in most other regions and for Southeast Asia as a whole (but only 0.1% in Java and Cambodia, and nil in Laos and Northeast Thailand).
4
The temporary slowdown experienced between 1890 and 1910, with a compound growth rate
of 1.25% per year, seems mostly attributable to war of independence in 1896-1898 and the
insurgency again US military occupation between 1898 and 1902 (and to a lesser degree
between 1902 and 1913). According to De Bevoise (1995: 13), excess wartime excess
mortality in 1899-1903, mostly due to diseases, was “about 755,000 over the number than
would have died has no war taken place”. He also noted that “(N)o direct statistics exist but a
statistical profile of the population in 1918 reveals a deficit of at least 400,000 persons who
should have been in the cohort of those born between 1904-1908” (ibid.).6
Table 1 around here
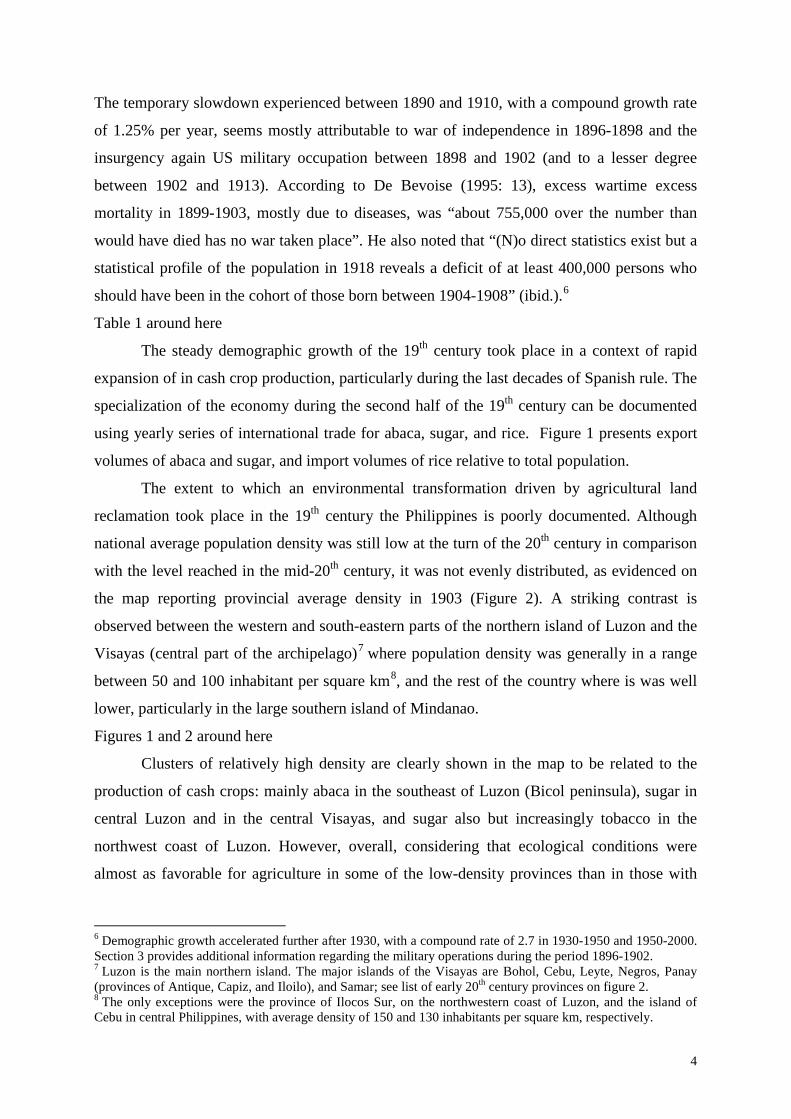
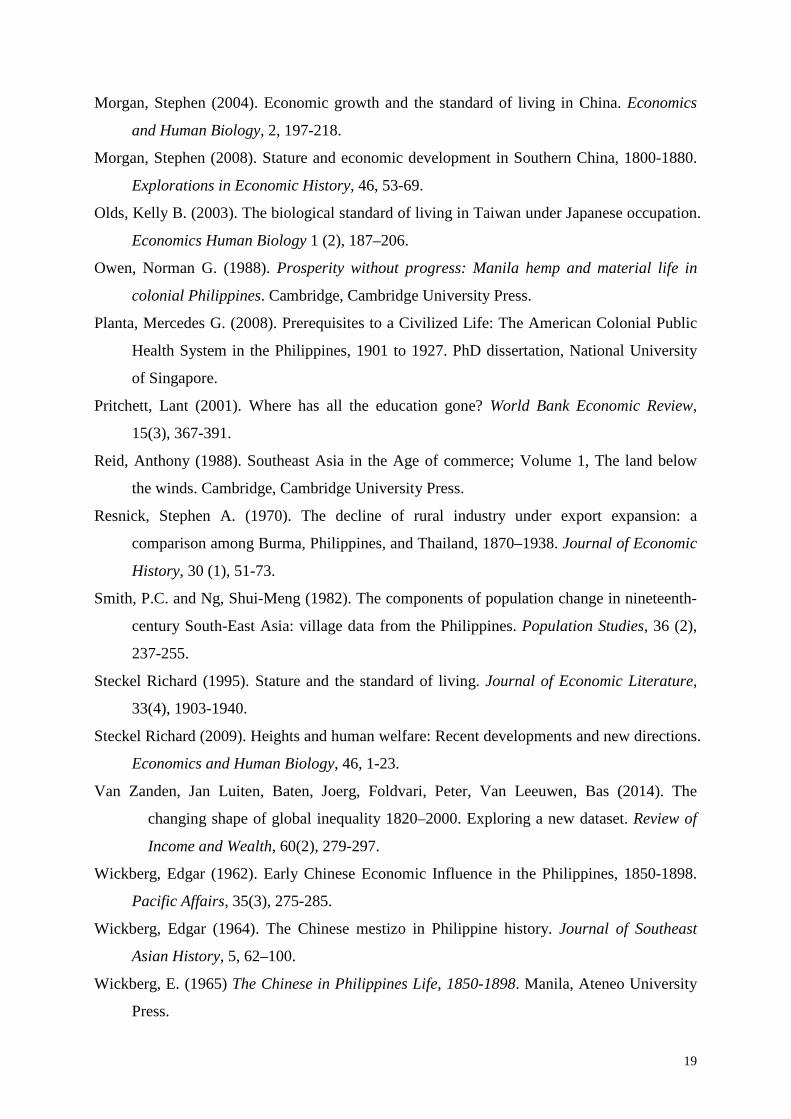
The steady demographic growth of the 19th century took place in a context of rapid
expansion of in cash crop production, particularly during the last decades of Spanish rule. The
specialization of the economy during the second half of the 19th century can be documented
using yearly series of international trade for abaca, sugar, and rice. Figure 1 presents export
volumes of abaca and sugar, and import volumes of rice relative to total population.
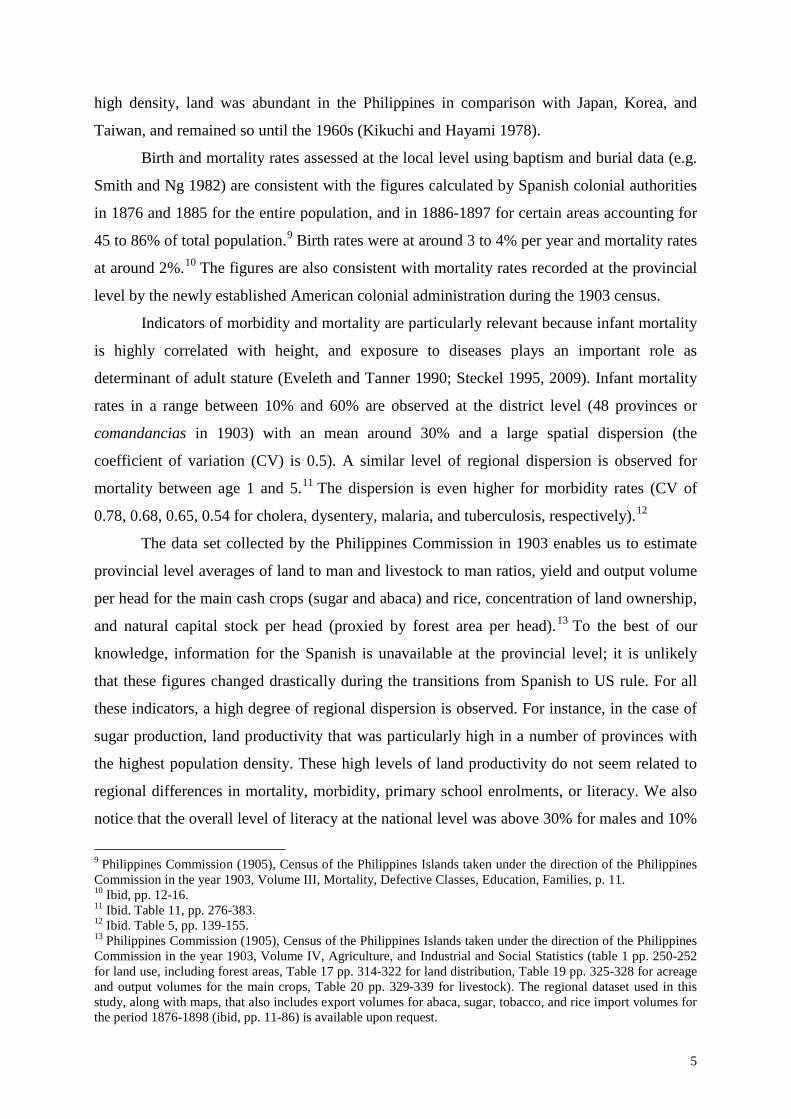
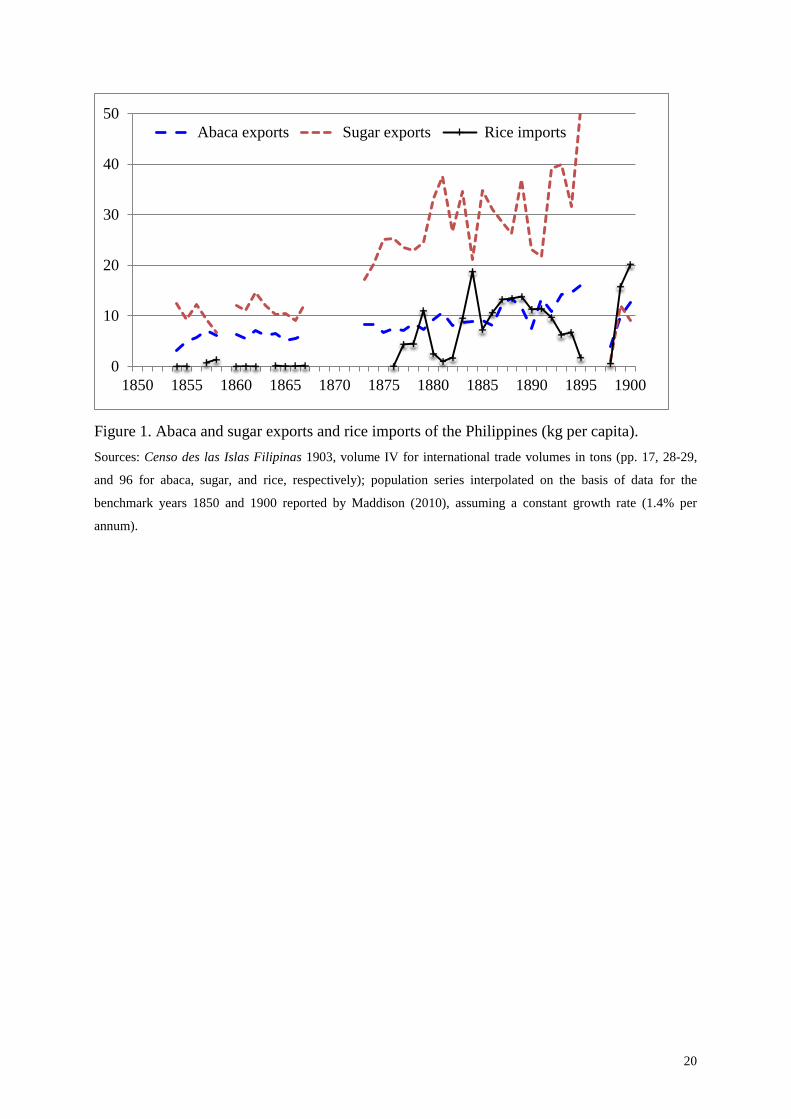
The extent to which an environmental transformation driven by agricultural land
reclamation took place in the 19th century the Philippines is poorly documented. Although
national average population density was still low at the turn of the 20th century in comparison
with the level reached in the mid-20th century, it was not evenly distributed, as evidenced on
the map reporting provincial average density in 1903 (Figure 2). A striking contrast is
observed between the western and south-eastern parts of the northern island of Luzon and the
Visayas (central part of the archipelago)7 where population density was generally in a range
between 50 and 100 inhabitant per square km8, and the rest of the country where is was well
lower, particularly in the large southern island of Mindanao.
Figures 1 and 2 around here
Clusters of relatively high density are clearly shown in the map to be related to the
production of cash crops: mainly abaca in the southeast of Luzon (Bicol peninsula), sugar in
central Luzon and in the central Visayas, and sugar also but increasingly tobacco in the
northwest coast of Luzon. However, overall, considering that ecological conditions were
almost as favorable for agriculture in some of the low-density provinces than in those with
6 Demographic growth accelerated further after 1930, with a compound rate of 2.7 in 1930-1950 and 1950-2000. Section 3 provides additional information regarding the military operations during the period 1896-1902. 7 Luzon is the main northern island. The major islands of the Visayas are Bohol, Cebu, Leyte, Negros, Panay (provinces of Antique, Capiz, and Iloilo), and Samar; see list of early 20th century provinces on figure 2. 8 The only exceptions were the province of Ilocos Sur, on the northwestern coast of Luzon, and the island of Cebu in central Philippines, with average density of 150 and 130 inhabitants per square km, respectively.
5
high density, land was abundant in the Philippines in comparison with Japan, Korea, and
Taiwan, and remained so until the 1960s (Kikuchi and Hayami 1978).
Birth and mortality rates assessed at the local level using baptism and burial data (e.g.
Smith and Ng 1982) are consistent with the figures calculated by Spanish colonial authorities
in 1876 and 1885 for the entire population, and in 1886-1897 for certain areas accounting for
45 to 86% of total population.9 Birth rates were at around 3 to 4% per year and mortality rates
at around 2%.10 The figures are also consistent with mortality rates recorded at the provincial
level by the newly established American colonial administration during the 1903 census.
Indicators of morbidity and mortality are particularly relevant because infant mortality
is highly correlated with height, and exposure to diseases plays an important role as
determinant of adult stature (Eveleth and Tanner 1990; Steckel 1995, 2009). Infant mortality
rates in a range between 10% and 60% are observed at the district level (48 provinces or
comandancias in 1903) with an mean around 30% and a large spatial dispersion (the
coefficient of variation (CV) is 0.5). A similar level of regional dispersion is observed for
mortality between age 1 and 5.11 The dispersion is even higher for morbidity rates (CV of
0.78, 0.68, 0.65, 0.54 for cholera, dysentery, malaria, and tuberculosis, respectively).12
The data set collected by the Philippines Commission in 1903 enables us to estimate
provincial level averages of land to man and livestock to man ratios, yield and output volume
per head for the main cash crops (sugar and abaca) and rice, concentration of land ownership,
and natural capital stock per head (proxied by forest area per head).13 To the best of our
knowledge, information for the Spanish is unavailable at the provincial level; it is unlikely
that these figures changed drastically during the transitions from Spanish to US rule. For all
these indicators, a high degree of regional dispersion is observed. For instance, in the case of
sugar production, land productivity that was particularly high in a number of provinces with
the highest population density. These high levels of land productivity do not seem related to
regional differences in mortality, morbidity, primary school enrolments, or literacy. We also
notice that the overall level of literacy at the national level was above 30% for males and 10%
9 Philippines Commission (1905), Census of the Philippines Islands taken under the direction of the Philippines Commission in the year 1903, Volume III, Mortality, Defective Classes, Education, Families, p. 11. 10 Ibid, pp. 12-16. 11 Ibid. Table 11, pp. 276-383. 12 Ibid. Table 5, pp. 139-155. 13 Philippines Commission (1905), Census of the Philippines Islands taken under the direction of the Philippines Commission in the year 1903, Volume IV, Agriculture, and Industrial and Social Statistics (table 1 pp. 250-252 for land use, including forest areas, Table 17 pp. 314-322 for land distribution, Table 19 pp. 325-328 for acreage and output volumes for the main crops, Table 20 pp. 329-339 for livestock). The regional dataset used in this study, along with maps, that also includes export volumes for abaca, sugar, tobacco, and rice import volumes for the period 1876-1898 (ibid, pp. 11-86) is available upon request.
6
for females. It appears therefore that the process of human capital accumulation was under
way before the implementation of the American policy of transferring to the colony the US
model of public education.
II. Insurgency, counterinsurgency, and the recruitment of Filipino soldiers by US
authorities
The Filipino nationalist revolt against Spanish rule expanded only gradually between
1896 and 1898, from the provinces of central Luzon to the rest of the country. It is tempting to
investigate to what extent the pattern of spatial diffusion of the insurgency is related to
regional differences in the biological living standard, literacy, and economic performance.
The result indicates that only population density correlated with the insurgency at the regional
level. The provinces that remained under Spanish control until 1898 were, with the exception
of a few parts of southeastern Luzon, those with the lowest population density.
In their attempt to occupy the country after the treaty of Paris of 1898, the US
authorities faced a massive insurgency that quickly expanded to the entire territory. With an
estimated military force of 80,000 to 100,000 volunteers, the First Philippine Republic
enjoyed initial success against 40,000 US troops in 1898, which were increased to a peak of
74,000 in 1900, one for every 110 residents of the Philippines (Deady 2005, 66). US troops
were scattered all across the country in relatively small garrisons but the counterinsurgency
policy focused first on central Luzon, particularly the Tagalog speaking areas of central
Luzon that were the stronghold of the nationalist movement (Deady 205, 55). US military
operations were extended to northern and southern Luzon, the Visayas and Mindanao only in
1900.14
US military losses were limited to around 4,000. On the Filipino side about 16,000
soldiers died and civilian casualties numbered around 200,000, including those due to
diseases, starvation, and maltreatment by both sides (Deady 2005, 64), accounting for more
than 2% of total population of the archipelago. One of the major causes of the high civilian
death toll was the American “pacification” policy that relied on concentrating civilians in
camps modeled on Indian reservations where poor nutrition and health conditions prevailed.15
The nationalist uprising ended in 1902 with the fall of the Philippines Republic and the U.S.
occupation of the entire archipelago.
14 Among the various descriptions of military operations, Barrows (1905), LeRoy (1914), Deady (2005), and Angeles (2013) are the most detailed. 15 It is estimated that 300,000 civilians were in concentration camps in southern Luzon during the campaign of 1901 (Deady 2005).
7
The US authorities quickly realized that, in order to effectively control and rule the
country, they had to rely on Filipino auxiliary troops. In 1901, they decided to recruit 15,000
soldiers who became increasingly involved in counterinsurgency (Linn 2000, 128). By 1903,
US troops were reduced to 15,000 (Deady 2005). In total, around 23,000 Filipino soldiers
were recruited between 1901 and 1913; our data set includes all of their heights individuals.
Roughly one percent of Filipino male adults (i.e. above age 20) were recruited.16
Individual information regarding these soldiers17 provides a data set of exceptional
size for early 20th century Southeast Asia. In addition to individual height in inches,
information related to these individuals includes year of recruitment, age in years and months,
and for a majority of observations, occupation and place of birth (province and/or city or
district). After excluding individuals born before 1866, due to concern over the effect of age
shrinkage on height, and after 1890, since they were not fully grown adults, 77% of the
records (17,479 out of a total of 22,793) are available for analysis.
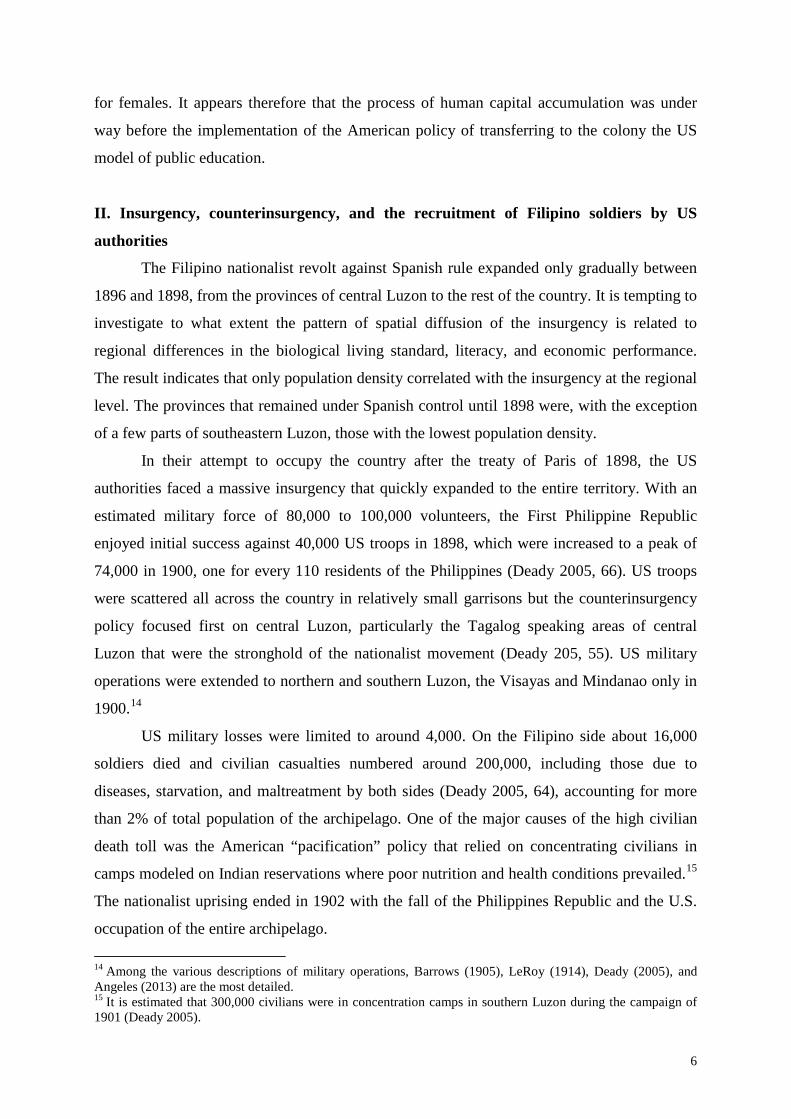
Table 2 summarizes the number of observations by birth cohort and year of enlistment.
The size of the subsamples appears sufficient for conducting quantitative analysis, except for
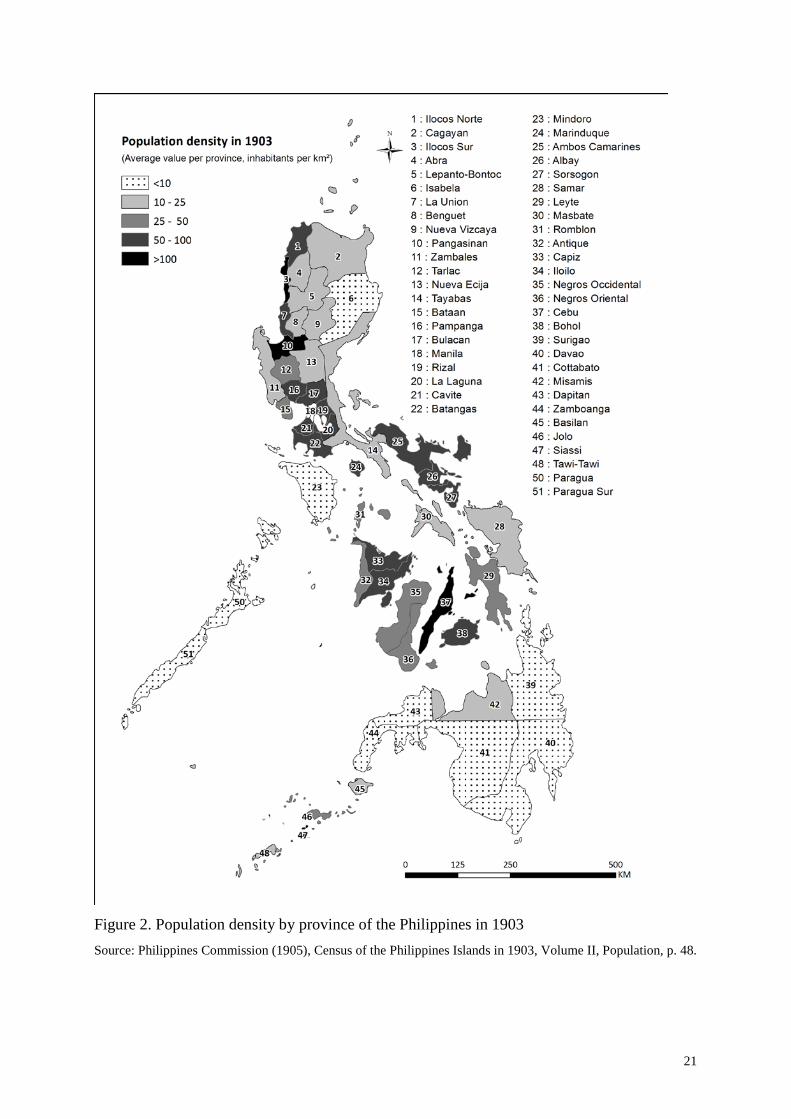
the first sub-period 1866-70. As can be expected in a population with relatively low levels of
literacy, some heaping is observed in the height distribution, with a strong preference for
measures rounded in inches or half-inch rather than quarter of inch. The distribution in quarter
inch intervals (figure 3) exhibits a normal pattern with a leptokurtic tendency.
Table 2 and Figure 3 around here
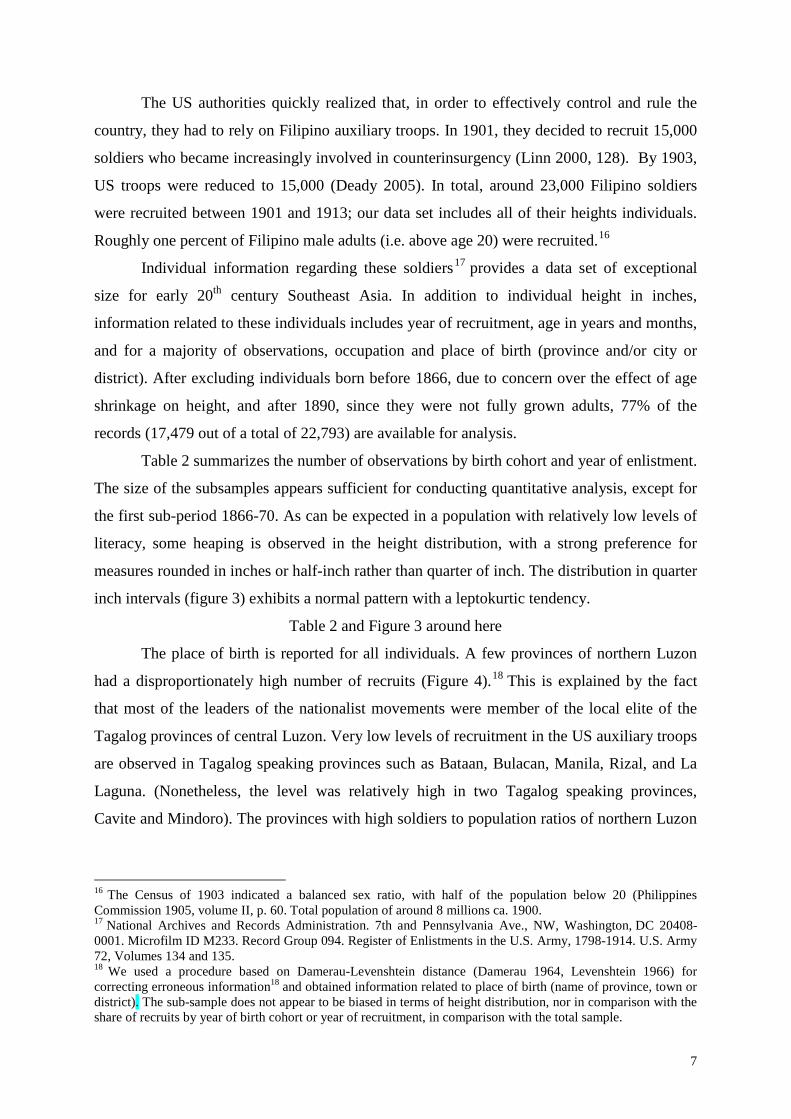
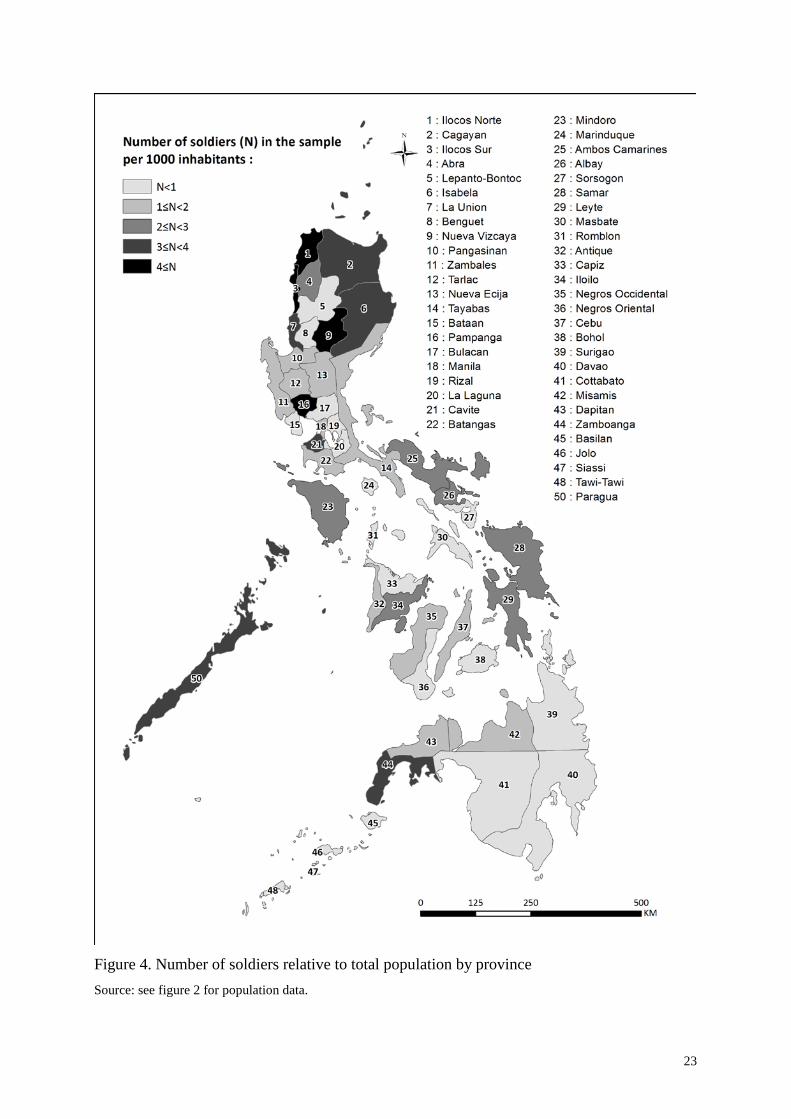
The place of birth is reported for all individuals. A few provinces of northern Luzon
had a disproportionately high number of recruits (Figure 4).18 This is explained by the fact
that most of the leaders of the nationalist movements were member of the local elite of the
Tagalog provinces of central Luzon. Very low levels of recruitment in the US auxiliary troops
are observed in Tagalog speaking provinces such as Bataan, Bulacan, Manila, Rizal, and La
Laguna. (Nonetheless, the level was relatively high in two Tagalog speaking provinces,
Cavite and Mindoro). The provinces with high soldiers to population ratios of northern Luzon
16 The Census of 1903 indicated a balanced sex ratio, with half of the population below 20 (Philippines Commission 1905, volume II, p. 60. Total population of around 8 millions ca. 1900. 17 National Archives and Records Administration. 7th and Pennsylvania Ave., NW, Washington, DC 20408-0001. Microfilm ID M233. Record Group 094. Register of Enlistments in the U.S. Army, 1798-1914. U.S. Army 72, Volumes 134 and 135. 18 We used a procedure based on Damerau-Levenshtein distance (Damerau 1964, Levenshtein 1966) for correcting erroneous information18 and obtained information related to place of birth (name of province, town or district). The sub-sample does not appear to be biased in terms of height distribution, nor in comparison with the share of recruits by year of birth cohort or year of recruitment, in comparison with the total sample.
8
correspond mostly to Iloko19 speaking areas. Several other provinces where the predominant
language was neither Tagalog nor Iloko had a relatively high participation in the US auxiliary
troops, in particular Pampanga (in central Luzon) and Zamboanga (in the western part of
Mindanao island), while the contribution was close to the median in the Visayas islands
(Iliolo, Leyte and Samar provinces). Considering the diversity of environmental conditions in
the different provinces, the overall sample is probably not a perfectly geographically
representative sample.
Figure 4 around here
III. Estimation of average height levels, trends, and regional patterns
We estimate average height controlling for year of birth, occupation, region of provenance,
some characteristics of province of birth, as well as probable minimal height requirement
(MHR). On the basis of these results, we also estimate trends by 5-year cohorts in the period
1866-1890.
No explicit mention of MHR was found in US military records but an examination of
the data set suggested that informal MHR existed (albeit not very strict since a few short
individuals, below 145 or even 140 cm, were also recruited). The level of MHR identified
were at 61.9 inches (157.22 cm) for all recruitment years except 1907 for which it was
identified as 62.9 inches (159.77 cm). We also set an upper limit at 70.1 inches (178.05 cm) in
the truncated regression.
We use truncated maximum likelihood estimator in order to account for the MHR
insofar as one would obtain biased results using an OLS estimator (A’Hearn 2004; Komlos
2004).20 The independent variables used include Birth cohort dummy variables equal to one if
the individual was born during the specific 5-year cohort and 0 otherwise, Young, a dummy
variable equal to one if the individual was 20 or 21 years old and 0 otherwise, the occupation
of the individuals represented by Musician, Police or Sailor, dummy variables equal to one
for the corresponding occupation of each individual and 0 otherwise.
We excluded from the estimation the individuals born after 1890 or before 1866. This
leaves us with a sample of 17,479 observations. Information regarding occupation prior to
recruitment is reported for a subsample of 62% the soldiers (14,080 individuals out of a total
of 22,793). In order to control for local conditions, the provincial level (48 provinces or
19 Also designed as Ilocano. 20 Similar results were obtained with OLS or Tobit estimator (estimation results with these specifications are available upon request).
9
comandancias) socio-economic variables for 1903 are introduced in the regression 21
Although output volume of cash crops declined, we can assume that the regional variance in
disease environment, population density, land and livestock to man ratios, yields of main
crops, land distribution, or literacy did not change dramatically between the end of the
Spanish colonial period and the first decade of American rule.
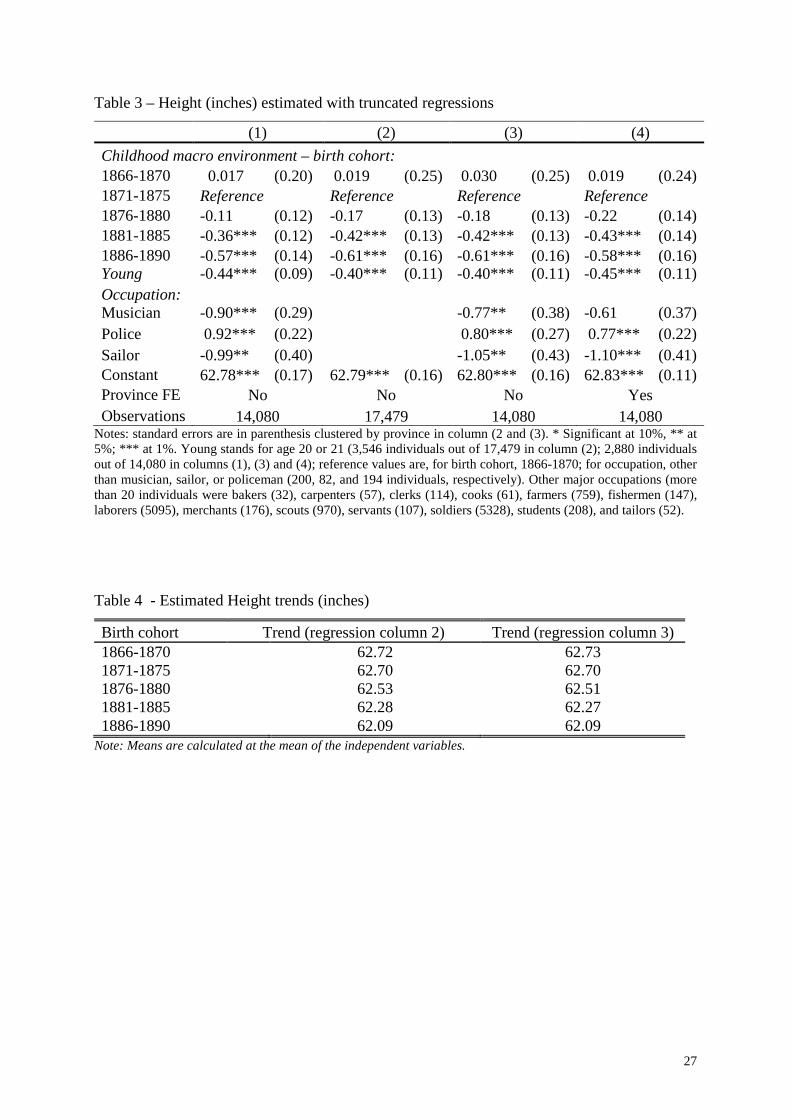
Table 3 presents the results of this regression, with four specifications. The first one
uses information available at the individual level only. The second and third ones include
provincial characteristics in the analysis as provincial clusters. The fourth one includes
province level fixed effects. The results are almost identical for the coefficient for the birth
cohorts in the four specifications, and for the three occupations for which significant
coefficients are obtained in specifications 1, 3, and 4, the same signs and similar magnitudes
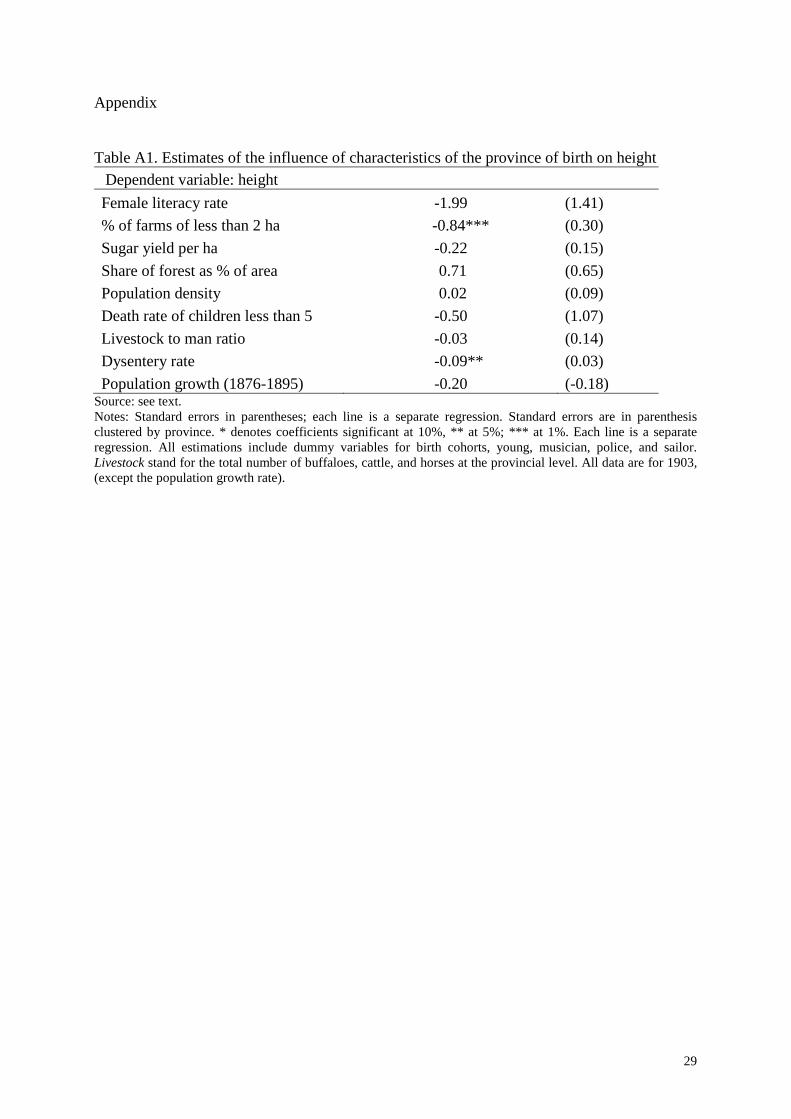
are observed. Moreover, we find that the characteristics of the place of birth did not have a
major influence on heights insofar as significant coefficients are obtained only with two
provincial level variables: the percentage of farms of less than 2 hectares and the prevalence
of dysentery (see appendix, table A1, for detailed information). The coefficients for provincial
fixed effects were significant with specification 4.
Table 3 around here
The results indicate that height declined significantly among the birth cohorts of the
1880s (Table 3), by about 0.6 inches (1.5 cm). As expected, a negative and significant
coefficient is observed for young individuals (aged 20 or 21). Undernourished populations
tend to grow for a longer period of time than well-nourished ones. Among the prior
occupations of these soldiers, significant coefficients are obtained only for musicians,
policemen, and sailors, which indicate selectivity into these occupations.
The coefficients obtained in table 3 with the two preferred specifications (columns 2
and 3) are used to estimate the national trend of heights for 5-year cohorts. The two results are
virtually identical and show that average height declined by 0.63 inches (1.5 cm) between
1866-1870 and 1886-1890 (Table 4).
Table 4 around here
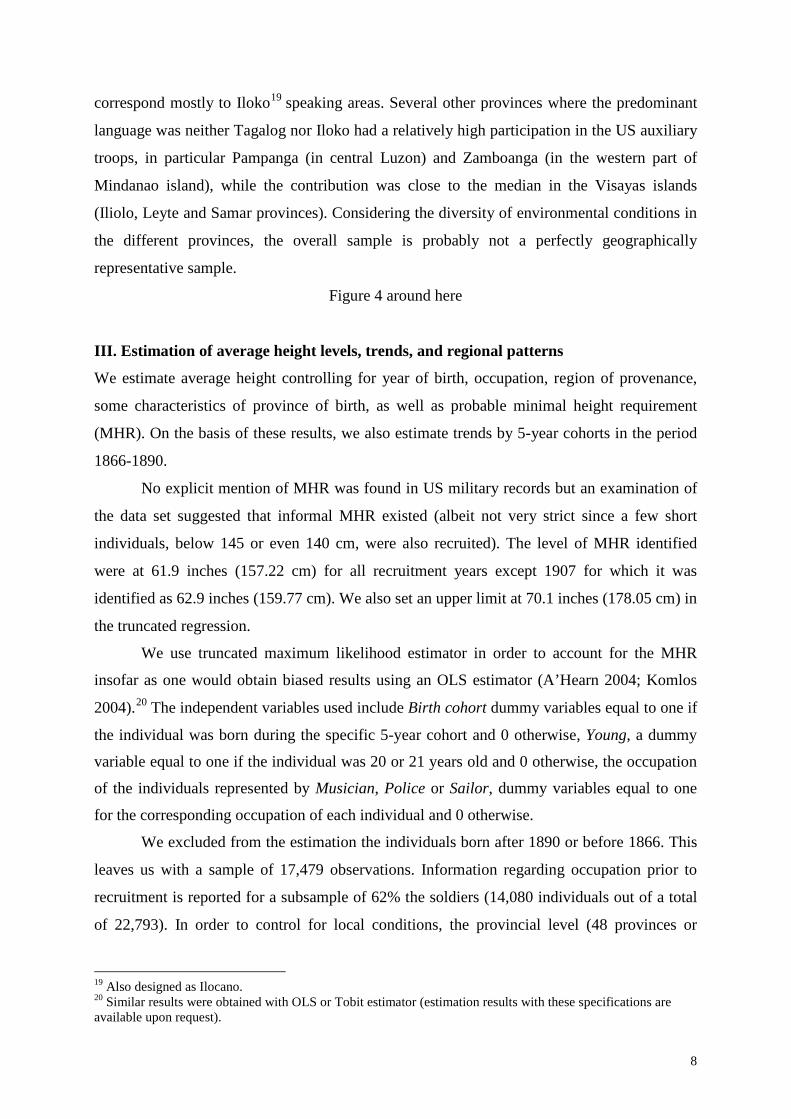
Although the number of observations is relatively small in about half of the provinces
(below 200 individuals), it is also possible to provide an overview of regional differences in
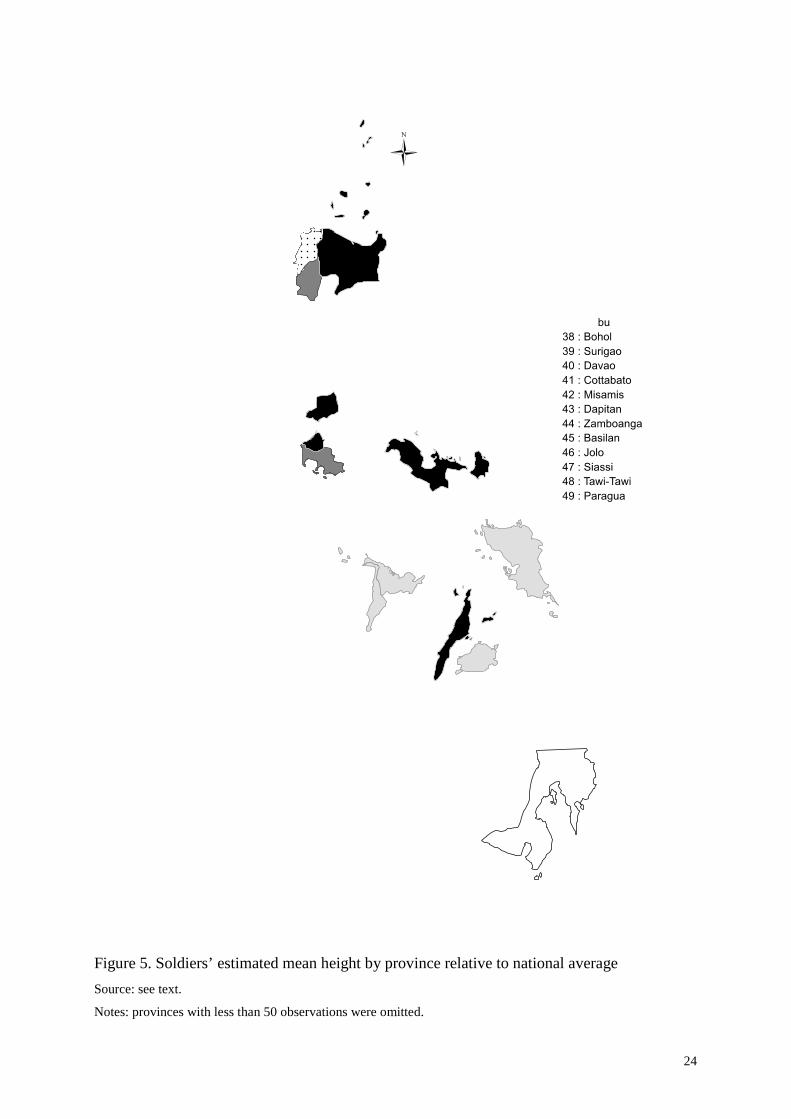
height adjusted fixed effects coefficients in the truncated regression (specification 4). Figure 5
21 All data were obtained from the 4 volumes of the Philippines Commission (1905), Census of the Philippines Islands. To the best of our knowledge, the equivalent provincial level information for the late 19th century is unavailable in Spanish colonial records.
10
presents differences in soldiers’ mean height relative to the national average in percentage.
The provinces with less than 50 observations were omitted. The provinces with comparatively
high biological wellbeing do not have homogenous characteristics. Height was greater in
some of the Tagalog speaking areas of central Luzon, (Bulacan and Cavite provinces), in the
central Visayas (Cebu and Negros Oriental), and in part of the Bicol peninsula, in southeast of
Luzon (provinces of Ambos Camarines and Sorsogon), which were regions with high
population density. But recruits were also relatively tall from some areas of low density such
as Palawan Island (province of Paragua) and in northeastern Luzon (provinces of Cagayan
and Isabela), and in Dapitan province (in western Mindanao). Furthermore, there is no evident
relationship between the number of soldiers relative to the population presented in Figure 3
and mean provincial heights. In particular, height appears to be below the national average in
the three of the four Iloko speaking provinces of northwestern Luzon that were major
contributors to the auxiliary troops.
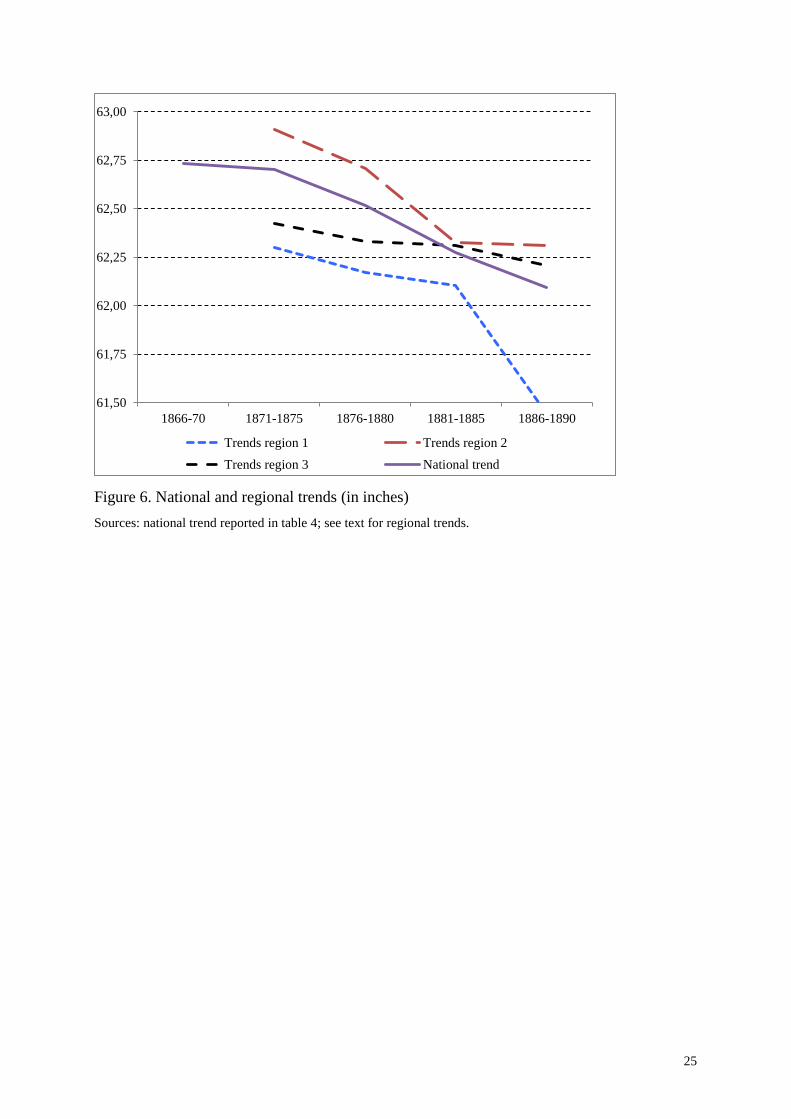
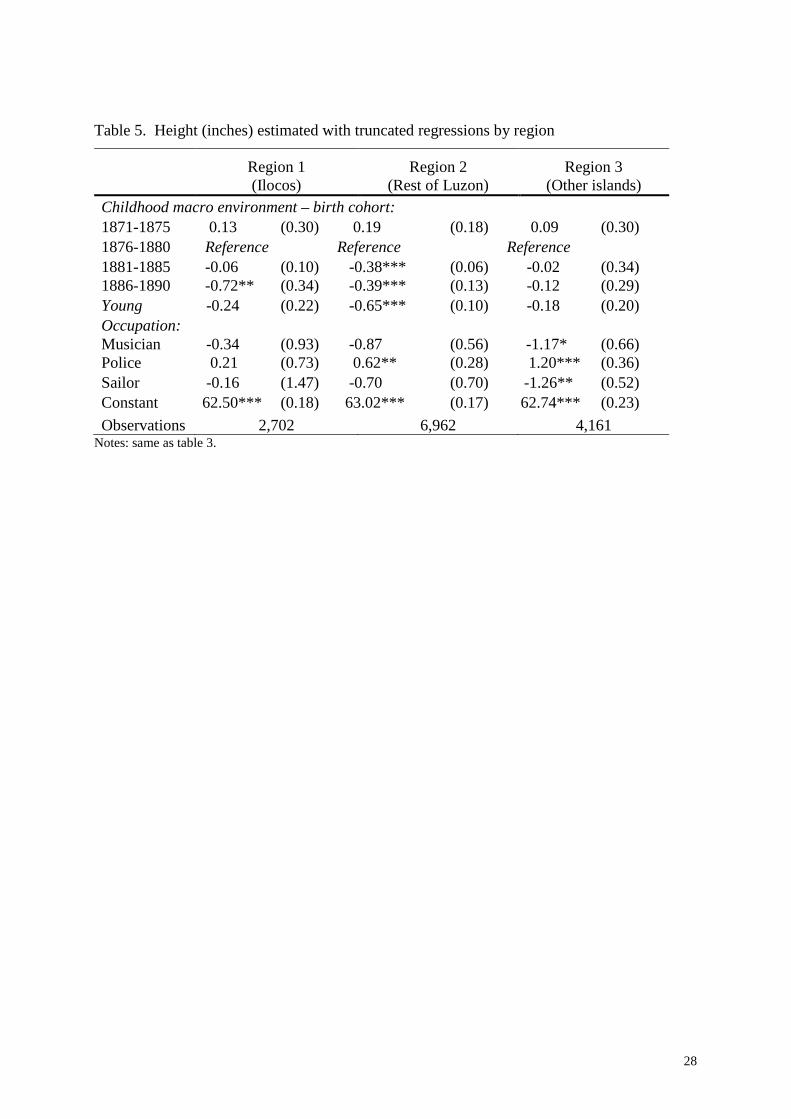
In order to ascertain that there was a downward trend in stature in the entire country,
we use the specification of the truncated regression presented in column 3 of table 3 with a
regional breakdown. Because sample sizes are too small to estimate the trend in each province,
we combine provinces on the basis of present-day borders of administrative regions in order
to obtain 3 macro-regions.22 Due to the small number of observations for 1866-1870, this
cohort is excluded from the regional estimations (Table 5).
Table 5 around here
Region 1 corresponds approximately the present-day Ilocos administrative region,23
region 2 covers the rest of Luzon,24 and region 3 includes the other islands.25 The reason for
merging the provinces in this manner is the following: Ilocos is specific as it has been a
region of massive emigration to the rest of Luzon in the 19th century (and to other island, the
USA, and the rest of the world in the 20th century). The rest of Luzon (region 2) combines
province of emigration and immigration with flows of temporary or permanent migrants using
mostly land routes in the 19th century. The rest of the country is an archipelago; region 3
22 See the interactive map of the Library of Congress; http://www.loc.gov/resource/g8061f.ct001416/ 23 In our case, six provinces of the administrative map of 1903: the four original Iloko speaking provinces of Ilocos Norte, Ilocos Sur, La Union, and Pangasinàn, and two mountainous provinces of 1903 Abra and Lepanto-Bontoc, mostly colonized by Iloko speakers in the 20th century. 24 Corresponding to the administrative regions of Cordillera, National Capital, Cagayan, Central Luzon, Calabarzon, and Bicol 25 The administrative regions of Mimaropa, Western Visayas, Central Visayas, Eastern Visaya, and Mindanao
11
combines province of emigration and immigration with flows of temporary or permanent
migrants using mostly sea routes in the 19th century.26
Although several of the coefficients in the regional regressions are not significant
anymore, particularly for occupations in region 1 and birth cohorts in region 3, the results are
overall consistent with those presented in Table 3 for the country as a whole. The coefficients
are used to generate estimates of mean height by cohort for the three regions. The results
confirm the downward trend in height that is particularly steep in region 1 (Ilocos) for the
cohort 1886-1890, for which the coefficient is significant (Figure 6).
Figure 6 around here
IV. International comparison and interpretation of the decline in biological wellbeing in
the Philippines
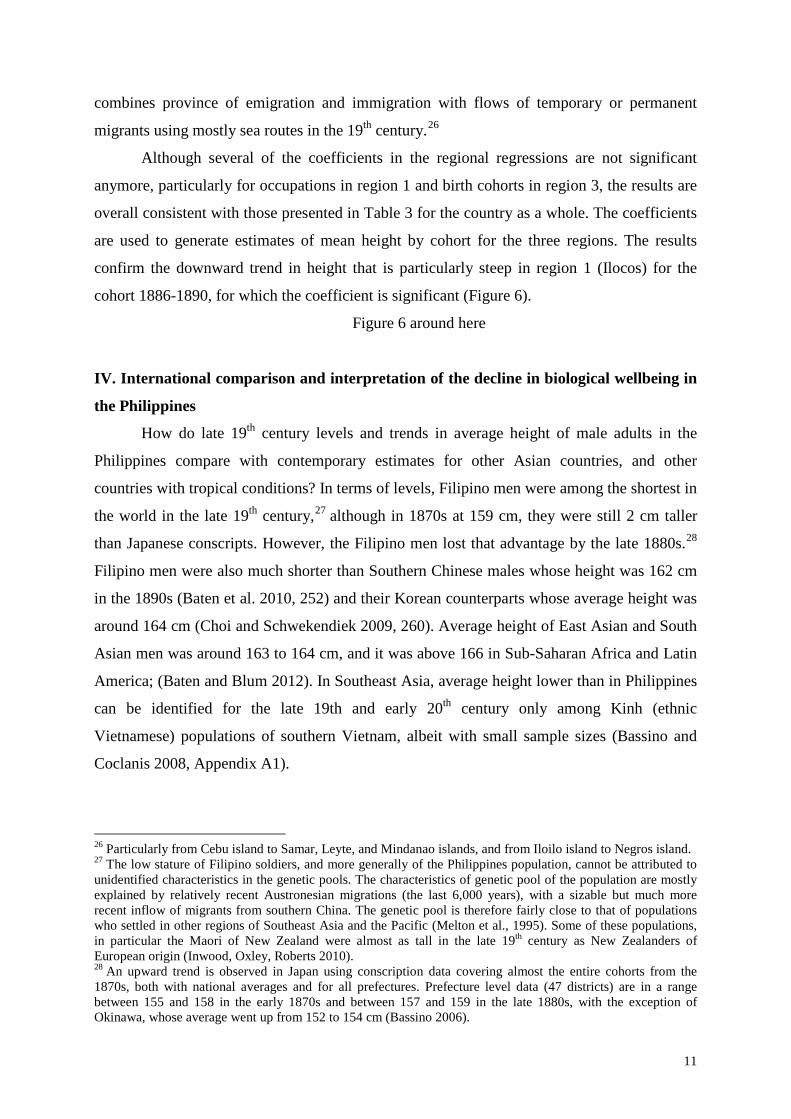
How do late 19th century levels and trends in average height of male adults in the
Philippines compare with contemporary estimates for other Asian countries, and other
countries with tropical conditions? In terms of levels, Filipino men were among the shortest in
the world in the late 19th century,27 although in 1870s at 159 cm, they were still 2 cm taller
than Japanese conscripts. However, the Filipino men lost that advantage by the late 1880s.28
Filipino men were also much shorter than Southern Chinese males whose height was 162 cm
in the 1890s (Baten et al. 2010, 252) and their Korean counterparts whose average height was
around 164 cm (Choi and Schwekendiek 2009, 260). Average height of East Asian and South
Asian men was around 163 to 164 cm, and it was above 166 in Sub-Saharan Africa and Latin
America; (Baten and Blum 2012). In Southeast Asia, average height lower than in Philippines
can be identified for the late 19th and early 20th century only among Kinh (ethnic
Vietnamese) populations of southern Vietnam, albeit with small sample sizes (Bassino and
Coclanis 2008, Appendix A1).
26 Particularly from Cebu island to Samar, Leyte, and Mindanao islands, and from Iloilo island to Negros island. 27 The low stature of Filipino soldiers, and more generally of the Philippines population, cannot be attributed to unidentified characteristics in the genetic pools. The characteristics of genetic pool of the population are mostly explained by relatively recent Austronesian migrations (the last 6,000 years), with a sizable but much more recent inflow of migrants from southern China. The genetic pool is therefore fairly close to that of populations who settled in other regions of Southeast Asia and the Pacific (Melton et al., 1995). Some of these populations, in particular the Maori of New Zealand were almost as tall in the late 19th century as New Zealanders of European origin (Inwood, Oxley, Roberts 2010). 28 An upward trend is observed in Japan using conscription data covering almost the entire cohorts from the 1870s, both with national averages and for all prefectures. Prefecture level data (47 districts) are in a range between 155 and 158 in the early 1870s and between 157 and 159 in the late 1880s, with the exception of Okinawa, whose average went up from 152 to 154 cm (Bassino 2006).
12
In terms of trend, average male height was following in the Philippines the same
pattern as in several other Asian countries during the last decades of the 19th century in stark
contrast to European heights which were increasing in this period. For instance, male height
declined in southern China from 164 to 162 cm (Morgan 2008), and in Taiwan from 164 to
163 cm (Olds 2003). The same trend is also identified among Chinese migrants to Australia,
Canada, and the US (Baten et al. 2010), but with much higher initial levels and a north-south
gap of around 3 cm (Morgan 2004). In lower Burma too, a decline in stature occurred
between the 1860s and the 1880s, but increased in upper Burma during the same period
(Bassino and Coclanis 2008). A downward trend is also identified for Indonesia in the 1860s,
from above 160 to 158 cm, but with a partial recovery to 159 cm in the late 1880s that marks
the start of an upward trend only temporarily interrupted in the 1930s and during WWII
(Baten, Stegl, and van der Eng, 2013). This general pattern of decline of average stature in
late 19th century Southeast and East Asian countries (with the notable exception of Japan)
suggests that the first globalization, in particular the rise of intra-Asia and international trade,
resulted generally in a degradation of the biological wellbeing in this region of the globe. The
fact that height was shrinking in a growing economy echoes the observation made for mid-
19th century Britain and the United States (Komlos 1998).
In investigating the determinants of height, significant coefficients were obtained for
only two provincial variables, the prevalence of dysentery and the share of farms of less than
2 hectares. This suggests that the factors of decline in stature were similar all over the country,
although we cannot rule out that the downward trend was amplified in several provinces by
the rapid rise in the production of cash crops, in particular abaca and sugar. Three main
explanatory factors could be envisioned in our attempt at identification of the main drivers of
the decline in biological well-being: an increase in the exposure to diseases, a rise in
inequality, and the effects of rapid population growth in a context of poor nutritional status.
The significant coefficient obtained for the provincial level prevalence of dysentery
should be considered tentative, because part of the variance may reflect the impact of the
military operations in 1896-1902 rather than local conditions in earlier decades. De Bevoise
(1995) describes a link between commercial expansion and the increase in the prevalence of
the diseases that affected the Philippines in the last decades of the 19th century. Although his
study is mostly qualitative, it contains useful insights on the cause of the rise in prevalence of
beriberi, resulting directly from the specialization in cash crops and therefore the import of
rice processed in steam mills (De Bevoise 1995, 118-141); but beriberi was mostly restricted
to the lower income households of Manila and sugar plantation areas such as in the province
13
of Negros Occidental. The major cause of rise in the disease claims on calories and protein
intake was the rise of severity and frequency of malaria, a consequence of land reclamation in
the highlands with seasonal migration bringing a severe strain of disease to the villages of
origins in the lowlands. Additional claims were due to the increase in the diffusion and
periodicity of smallpox and cholera epidemics resulting from market integration in a context
of failure of the colonial health care system (De Bevoise, 1995, 94-117, 164-184).
The negative and significant coefficient obtained for the share of small farms suggests
that the decline in stature could have been due to a rise in inequality. The studies on the
development of cash crop productions such as abaca and sugar highlight the tendency toward
land concentration and the formation of large-scale haciendas (Owen 1988; Larkin 1995). In
addition, the traditional textile cottage industry declined rapidly from the 1870s due to the
massive import of British cotton yarns and fabrics (Resnick 1970). The calculation of the
coefficient of variation of individual height by 5-year birth cohorts indicates however that this
measure of inequality declined over time from 3.4% for the cohort 1871-1875, to 3.1% for the
cohort 1886-1890. As van Zanden et al. (2014) identify a positive and significant relationship
between height CV and income Gini, we can use the linear formula they estimated to generate
proxies of income CV. 29 The implied Gini coefficients obtained are: 38.8 for the cohort 1871-
1875, to 36.2 for the cohort 1886-1890.
A more plausible explanation of the decline in biological well-being could lie in the
extremely rapid demographic growth resulting in a high dependency ratio. Population
increased between 1870 and 1890 at an annual rate of 1.2% in the Philippines, higher than in
Indonesia, and well above the population growth rate of Thailand (around 1.07% and 0.72%
respectively). 30 Using individual data for mid-20th century Philippines “finds only limited
support for the idea that parents were concerned about average child quality, since the results
show that there are strong birth order effects on nutritional status” (Horton 1988), and a
negative link between family size and children height is also identified in late 19th and early
20th century Britain (Hatton and Martin 2010).
V. Conclusion
The results obtained on the basis of the height Filipino soldiers enlisted by the US
military imply that during the last decades of the Spanish rule the average height of the native
29 The formula that we regard as the most appropriate is that obtained with model (5) FE 1820-1929 Appendix 2 (Table 3, p. 33). In this specification, Giniit = 9.19 + 8.71*CVit ; 30 Calculation based on figures reported by Maddison (2010).
14
population was low by the international standards. It also appears that few socio-economic
characteristics of the province of birth had a significant influence on individual height.
The low biological standard of living observed in late 19th century Philippines cannot
be explained exclusively by the tropical disease environment since greater average heights
were recorded for the same period in other parts of Asia. Furthermore, and just as importantly,
average heights declined in the Philippines at the end of the 19th century in spite of an
expansion of commercial activity, in particular the expansion of cash crop production for
export. The onset of commercialization has been found to coincide with a decline in the
biological well being in other contexts as well (Komlos 1998). A decline in nutritional status
indicates that the population was suffering and this could have been one of the causes of the
independence movement. After all, a decline in nutritional status also preceded the French
Revolution (Komlos et al. 2004). Finally, although per capita GDP was well above
subsistence level in 1902, more than doubled between 1902 and 1929, and remained fairly
stable until 1940 (Maddison 2001, 2010) average height barely recovered to the level of the
early 1870s by the 1930s. This raises the possibility that the rapid economic growth between
1902 and 1929 was to a large extent a period of recovery from the collapse of the economy
during the chaotic transition from Spanish to American rule in 1896-1902.
Average height in late 19th century Philippines can be compared also to more recent
data in order to assess to what extent improvements in biological living standards took place
under American rule in the first half of the 20th century, and more recently. To the best of our
knowledge, there is no large-size sample available for the mid- or late-20th century, which
could be compared to our results. However, The Food and Nutrition Research Institute
(Department of Science and Technology, 2003) reported heights of 163.5, 162,6, and 159.7
cm, on average, for men aged 20-39, 40-59, and above 60, respectively.31 Assuming that these
samples are representative, and allowing for shrinkage due to old age, this would imply that
average male stature of the cohort born in the 1930s and early 1940s was only slightly above
the level recorded for the birth cohort of the early 1870s.
31 FNRI (2003, part II, Table 33). The figures for female cohorts were 151.76, 151.11, and 147.96, respectively. Standard deviations and sample sizes are not reported, but the FNRI report states: “the 2003 Master Sample (MS) that was developed by the National Statistics Office (NSO) was used for the 6th National Nutrition Survey. The 2003 MS three-stage stratified sampling design had the province as the stratum, barangay or contiguous barangays with at least 500 households as the primary sampling unit (PSU).” For the younger cohort, the figure is consistent with information, reported by De Cao (2010) from the Cebu Longitudinal Health and Nutrition Survey (CLHNS), a cohort of Filipino children followed from conception, in 1983-84, to 2005. Average height of the male population at age 20 was slightly above 160 cm. The comparatively low level of stature in the early 21st century could be explained to a large extent by high level of malnutrition among children aged 0-5, 30% and in 2003 (FNRI 2003, Part II, figures 9), with a similar percentage of under-height in the height for age measurement (ibid., Table 28).
15
We can also observe an unexplained mismatch between biological and economic
indicators of well-being, both in terms of levels and trends. With an average male stature
around 159 cm and per capita GDP close to 1500 USD (of 1990) in the 1930s, the Philippines
is one of the main outliers in Asia, along with Japan, in the overall relationship between per
capita GDP and stature identified by Steckel (1995).32 A similar mismatch is also observed
between the two main components of human capital, education and health.
Although rising education levels and increase in per capita income translated into a
rapid secular trend in stature in late 19th and early 20th century Japan, spectacular
improvements in education levels in the Philippines were not associated with proportionate
improvements in biological well-being. In terms of enrolment rates in primary education
(relative to total population) Philippines was well ahead of Burma, Thailand, Indonesia, China,
and even Korea in the 1920s and 1930s, and even close to the Japanese level in the late 1930s
(Easterlin 1981, 9, Figure 1). In spite of this impressive human capital accumulation, the
Philippines did not experience the same economic growth performance as the East Asian
miracle economies; one may wonder: “where has all the education gone?” (Pritchett 2001). A
large part of the explanation, both on the lack of return to education and on the low biological
wellbeing, could well lie in the other legacy of the Spanish colonial period, the sub-optimal
institutions that fuelled the insurgency of 1896-98 and that the US colonial authorities failed
to ameliorate in the 1920s and 1930s.
References
A'Hearn, Brian (2004). A restricted maximum likelihood estimator for truncated height
samples. Economics and Human Biology, 2 (1), 5–20.
Aguilar, Filomeno (1994) Beyond inevitability: The opening of Philippine provincial ports in
1855. Journal of Southeast Asian Studies, 25, 70–90.
Alzona, Encarnación. (1932). A history of education in the Philippines from 1565 to 1930.
Manila: University of the Philippines Press.
Angeles, José A. (2013). As our might grows less: the Philippines-American War in context.
PhD dissertation, University of Oregon.
Barrows, David .P. (1905). History of the Philippines. Indianapolis, Bobbs-Merill.
Bassino JP. 2006. Regional inequality in Japan, 1892-1941: income, health, and stature”,
Economics and Human Biology, 4, 62-88
32 The predicted value for average male height at 1500 USD per head is 165 cm.
16
Bassino Jean-Pascal, and Coclanis, Peter (2008). Economic transformation and biological
welfare in colonial Burma: regional differentiation in the evolution of average height”,
Economics and Human Biology, 6, 212-227
Bassino Jean-Pascal, and Williamson, Jeffrey G. (2015). From commodity booms to
economic miracles: why Southeast Asian industry lagged behind, in K. O’Rourke and
JG Williamson, The Spread of Manufacturing in the periphery. Oxford University Press
(forthcoming). CEPR
Baten, Joerg, Ma, Debin, Morgan, Stephen, and Wang, Qing (2010). Evolution of living
standards and human capital in China in the 18–20th centuries: Evidences from real
wages, age-heaping, and anthropometrics, Explorations in Economic History, 47, 347–
359.
Baten, Joerg, Stegl, Mojgan, van der Eng, Pierre (2013). The biological standard of living and
body height in colonial and post-colonial Indonesia, 1770–2000, Journal of
Bioeconomics, 15, 103–122.
Baten, Joerg, Blum, Matthias (2012). Growing tall but unequal: new findings and new
background evidence on anthropometric welfare in 156 countries, 1810–1989.
Economic History of Developing Regions, 27, S1, 66-85.
Benavot, Aaron and Phyllis Riddle (1988), "The Expansion of Primary Education, 1870-
1940: Trends and Issues," Sociology of Education 61, 191-210.
Choi Seong-Jin and, Schwekendiek Daniel (2009). The biological standard of living in
colonial Korea, 1910-1945. Economics and Human Biology 49, 60-74.
Cullinane, Michael (1982). The changing nature of the Cebu urban elite in the 19th century.
In: McCoy, Alfred W., and De Jesus, Ed C., eds. (1982) Philippine Social History:
Global Trade and Local Transformations. Quezon City: Ateneo de Manila University
Press.
Damerau, Fred J. (1964). A technique for computer detection and correction of spelling errors.
Communications on the ACM. 7(3), 171-176.
De Bevoise, Ken (1995). Agents of apocalypse: epidemic disease in the colonial Philippines.
Princeton, N.J., Princeton University Press.
De Cao, Elisabetta (2010). The height production function from birth to early adulthood.
CEIS Working Paper No. 165.
Deady, Timothy K. (2005). Lessons from a successful counterinsurgency: the Philippines,
1899-1902. US Army War College Quarterly, 35(1).
17
Doeppers, Daniel F. (1974). The development of Philippines Cities before 1900. Journal of
Asian Studies, 31(4), 769-772.
Doeppers, Daniel F. (1986). Destination, selection and turnover among Chinese migrants to
Philippine cities in the nineteenth century. Journal of Historical Geography, 12(4), 281-
401.
Doeppers, Daniel F. and Xenos, Peter eds (1998), Population and history: the demographic
history of the modern Philippines. University of Wisconsin-Madison Center for
Southeast Asian Studies, Monograph Number 16.
Easterlin, Richard A. 1981. Why isn’t the whole world developed? Journal of Economic
History, 41 (1), 1-19.
Eveleth, Phyllis B. and Tanner, James M. (1990). Worldwide Variation in Human Growth.
Cambridge, Cambridge University Press.
Fradera, Josep M. (2004). The historical origin of the Philippine Economy: A survey of recent
research of the Spanish colonial era. Australian Economic History Review, 44 (3), 307-
320.
Fenner, Bruce L. (1985). Cebu under the Spanish Flag: 1521-1896: An economic-social
history. Cebu City. San Carlos Publications, University of San Carlos.
FNRI 2003. Philippines fact and figures 2003, Part II, Anthropometric facts and figures. Food
and Nutrition Research Institute (Department of Science and technology).
http://www.fnri.dost.gov.ph/index.php?option=content&task=view&id=1130
Gealogo, Francis A. (2011). Counting people, Nineteenth Century population history of four
Manila Arrabales using the Planes de Almas. Philippines Studies, 59 (3), 399-423.
Go, Julian (2000). Chains of Empire, projects of State: political education and US colonial
rule in Puerto Rico and the Philippines. Comparative Studies in Societies and History,
42(2), 333-362.
Go, Julian (2007). The provinciality of American Empire: ‘Liberal Exceptionalism’ and U.S.
colonial rule, 1898–1912. Comparative Studies in Society and History, 49, 74-108.
Hatton, Timothy J. and Martin, Richard M. (2010). Fertility decline and the heights of
children in Britain, 1886–1938. Explorations in Economic History, 47, 505–519
Henley, David (2011). Forced labour and rising fertility in colonial Indonesia. Asian
Population Studies, 7(1), 3-13.
Hooley, R (2005). American economic policy in the Philippines, 1902–1940: Exploring a
dark age in colonial statistics, Journal of Asian Economics, 16, 464-488.
18
Horton, Susan (1986). Child nutrition and family size in the Philippines. Journal of
Development Economics, 23, 161-176.
Huetz de Lemps, Xavier (2006). L'archipel des épices. La corruption de l'administration
espagnole aux Philippines (fin XVIIIe - fin XIXe siècle), Madrid, Casa de Velázquez.
Inwood, Kris, Oxley, Les, Roberts, Evan (2010). Physical stature in late 19th century New
Zealand, A preliminary interpretation. Australian Economic History Review, 50 (3),
262-283.
Kikuchi, Masao, and Hayami, Yujiro (1978). Agricultural growth against a land resource
constraint: a comparative history of Japan, Taiwan, Korea, and the Philippines. Journal
of Economic History, 39(4), 859-864.
Komlos, John. (1998). Shrinking in a Growing Economy? The Mystery of Physical Stature
during the Industrial Revolution. Journal of Economic History, 58(3), 779-802.
Komlos, John (2004). How to (and how not to) analyze deficient height samples: an
introduction. Historical Methods, 37 (4), 160–173.
Larkin, John (1972). The Pampangans: Colonial Society in a Philippine Province. Berkeley,
University of California Press.
Larkin, John A. (1993). Sugar and the origins of modern Philippines society. Berkeley,
University of California Press.
LeRoy, James A. (1914). The Americans in the Philippines: a history of the conquest and first
years of occupation, with and introductory account of the Spanish rule. Boston,
Houghton Mifflin.
Levenshtein, Vladimir I. (1966). Binary codes capable of correcting deletions, insertions and
reversals. Soviet Physics Doklady, 10(8), 845-848.
Linn, B. M. (2000). The Philippine War, 1899-1902. Lawrence, University of Kansas Press.
Maddison, Angus (2001). The World economy, a millennial perspective. Paris, OECD.
Maddison, Angus (2010). www.ggdc.net/maddison/Historical_Statistics/horizontal- file_02-
2010.xls.
McCoy, Alfred W. (1994). An Anarchy of Families: State and Family in the Philippines.
Quezon City: Ateneo de Manila University Press.
Melton, Terry, Peterson, Raymond, Redd, Alan J., Saha, N., Sofro, A. S. M., Martinson,
Jeremy, Stoneking, Mark (1995) Polynesian Genetic Affinities with Southeast Asian
Populations as Identified by mtDNA Analysis. American Journal of Human Genetics,
57, 403-414.
19
Morgan, Stephen (2004). Economic growth and the standard of living in China. Economics
and Human Biology, 2, 197-218.
Morgan, Stephen (2008). Stature and economic development in Southern China, 1800-1880.
Explorations in Economic History, 46, 53-69.
Olds, Kelly B. (2003). The biological standard of living in Taiwan under Japanese occupation.
Economics Human Biology 1 (2), 187–206.
Owen, Norman G. (1988). Prosperity without progress: Manila hemp and material life in
colonial Philippines. Cambridge, Cambridge University Press.
Planta, Mercedes G. (2008). Prerequisites to a Civilized Life: The American Colonial Public
Health System in the Philippines, 1901 to 1927. PhD dissertation, National University
of Singapore.
Pritchett, Lant (2001). Where has all the education gone? World Bank Economic Review,
15(3), 367-391.
Reid, Anthony (1988). Southeast Asia in the Age of commerce; Volume 1, The land below
the winds. Cambridge, Cambridge University Press.
Resnick, Stephen A. (1970). The decline of rural industry under export expansion: a
comparison among Burma, Philippines, and Thailand, 1870–1938. Journal of Economic
History, 30 (1), 51-73.
Smith, P.C. and Ng, Shui-Meng (1982). The components of population change in nineteenth-
century South-East Asia: village data from the Philippines. Population Studies, 36 (2),
237-255.
Steckel Richard (1995). Stature and the standard of living. Journal of Economic Literature,
33(4), 1903-1940.
Steckel Richard (2009). Heights and human welfare: Recent developments and new directions.
Economics and Human Biology, 46, 1-23.
Van Zanden, Jan Luiten, Baten, Joerg, Foldvari, Peter, Van Leeuwen, Bas (2014). The
changing shape of global inequality 1820–2000. Exploring a new dataset. Review of
Income and Wealth, 60(2), 279-297.
Wickberg, Edgar (1962). Early Chinese Economic Influence in the Philippines, 1850-1898.
Pacific Affairs, 35(3), 275-285.
Wickberg, Edgar (1964). The Chinese mestizo in Philippine history. Journal of Southeast
Asian History, 5, 62–100.
Wickberg, E. (1965) The Chinese in Philippines Life, 1850-1898. Manila, Ateneo University
Press.
20
Figure 1. Abaca and sugar exports and rice imports of the Philippines (kg per capita). Sources: Censo des las Islas Filipinas 1903, volume IV for international trade volumes in tons (pp. 17, 28-29,
and 96 for abaca, sugar, and rice, respectively); population series interpolated on the basis of data for the
benchmark years 1850 and 1900 reported by Maddison (2010), assuming a constant growth rate (1.4% per
annum).
0
10
20
30
40
50
1850 1855 1860 1865 1870 1875 1880 1885 1890 1895 1900
Abaca exports Sugar exports Rice imports
21
Figure 2. Population density by province of the Philippines in 1903 Source: Philippines Commission (1905), Census of the Philippines Islands in 1903, Volume II, Population, p. 48.
22
Figure 3. Height distribution in quarter inch intervals (0.635 cm)
0.1
.2.3
.4De
nsity
57 58 59 60 61 62 63 64 65 66 67 68 69 70 71 72Height in inch
23
Figure 4. Number of soldiers relative to total population by province Source: see figure 2 for population data.
24
Figure 5. Soldiers’ estimated mean height by province relative to national average Source: see text.
Notes: provinces with less than 50 observations were omitted.
25
Figure 6. National and regional trends (in inches) Sources: national trend reported in table 4; see text for regional trends.
61,50
61,75
62,00
62,25
62,50
62,75
63,00
1866-70 1871-1875 1876-1880 1881-1885 1886-1890
Trends region 1 Trends region 2
Trends region 3 National trend
26
Table 1. Total population and density in the Philippines, Indonesia, and Thailand 1850-1950
Population (millions) Population density (per km2) Philippines Indonesia Thailand Philippines Indonesia Thailand
1850 3,612 22,977 5,230 10.6 12.1 10.2 1870 5,063 32,743 5,775 14.8 17.2 11.3 1890 6,476 40,532 6,670 18.9 21.3 13.0 1910 8,861 50,034 8,305 25.9 26.3 16.2 1930 13,194 61,805 12,392 38.5 32.5 24.2 1950 21,131 82,612 20,042 61.7 43.4 39.1
Sources: World Bank for land area (http://data.worldbank.org/indicator/AG.LND.TOTL.K2); Maddison (2010, Historical Statistics of the World Economy: 1-2008 AD) for population. Table 2 – Number of observations (N) by cohort and year of measurement
Birth cohorts Years of recruitment
Cohort N Year N Year N Year N
1866-1870 596 1901 3044 1906 403 1911 2063
1871-1875 1500 1902 431 1907 2028 1912 529
1876-1880 5148 1903 200 1908 2019 1913 43
1881-1885 6907 1904 3060 1909 624
1886-1890 3328 1905 1071 1910 1964 Note: 17,479 observations in total after excluding individuals born before 1866 and after 1890.
27
Table 3 – Height (inches) estimated with truncated regressions
(1) (2) (3) (4) Childhood macro environment – birth cohort: 1866-1870 0.017 (0.20) 0.019 (0.25) 0.030 (0.25) 0.019 (0.24) 1871-1875 Reference Reference Reference Reference 1876-1880 -0.11 (0.12) -0.17 (0.13) -0.18 (0.13) -0.22 (0.14) 1881-1885 -0.36*** (0.12) -0.42*** (0.13) -0.42*** (0.13) -0.43*** (0.14) 1886-1890 -0.57*** (0.14) -0.61*** (0.16) -0.61*** (0.16) -0.58*** (0.16) Young -0.44*** (0.09) -0.40*** (0.11) -0.40*** (0.11) -0.45*** (0.11) Occupation: Musician -0.90*** (0.29) -0.77** (0.38) -0.61 (0.37) Police 0.92*** (0.22) 0.80*** (0.27) 0.77*** (0.22) Sailor -0.99** (0.40) -1.05** (0.43) -1.10*** (0.41) Constant 62.78*** (0.17) 62.79*** (0.16) 62.80*** (0.16) 62.83*** (0.11) Province FE No No No Yes Observations 14,080 17,479 14,080 14,080
Notes: standard errors are in parenthesis clustered by province in column (2 and (3). * Significant at 10%, ** at 5%; *** at 1%. Young stands for age 20 or 21 (3,546 individuals out of 17,479 in column (2); 2,880 individuals out of 14,080 in columns (1), (3) and (4); reference values are, for birth cohort, 1866-1870; for occupation, other than musician, sailor, or policeman (200, 82, and 194 individuals, respectively). Other major occupations (more than 20 individuals were bakers (32), carpenters (57), clerks (114), cooks (61), farmers (759), fishermen (147), laborers (5095), merchants (176), scouts (970), servants (107), soldiers (5328), students (208), and tailors (52). Table 4 - Estimated Height trends (inches)
Birth cohort Trend (regression column 2) Trend (regression column 3) 1866-1870 62.72 62.73 1871-1875 62.70 62.70 1876-1880 62.53 62.51 1881-1885 62.28 62.27 1886-1890 62.09 62.09
Note: Means are calculated at the mean of the independent variables.
28
Table 5. Height (inches) estimated with truncated regressions by region
Region 1 (Ilocos)
Region 2 (Rest of Luzon)
Region 3 (Other islands)
Childhood macro environment – birth cohort: 1871-1875 0.13 (0.30) 0.19 (0.18) 0.09 (0.30) 1876-1880 Reference Reference Reference 1881-1885 -0.06 (0.10) -0.38*** (0.06) -0.02 (0.34) 1886-1890 -0.72** (0.34) -0.39*** (0.13) -0.12 (0.29) Young -0.24 (0.22) -0.65*** (0.10) -0.18 (0.20) Occupation: Musician -0.34 (0.93) -0.87 (0.56) -1.17* (0.66) Police 0.21 (0.73) 0.62** (0.28) 1.20*** (0.36) Sailor -0.16 (1.47) -0.70 (0.70) -1.26** (0.52) Constant 62.50*** (0.18) 63.02*** (0.17) 62.74*** (0.23) Observations 2,702 6,962 4,161
Notes: same as table 3.
29
Appendix Table A1. Estimates of the influence of characteristics of the province of birth on height Dependent variable: height Female literacy rate -1.99 (1.41) % of farms of less than 2 ha -0.84*** (0.30) Sugar yield per ha -0.22 (0.15) Share of forest as % of area 0.71 (0.65) Population density 0.02 (0.09) Death rate of children less than 5 -0.50 (1.07) Livestock to man ratio -0.03 (0.14) Dysentery rate -0.09** (0.03) Population growth (1876-1895) -0.20 (-0.18)
Source: see text. Notes: Standard errors in parentheses; each line is a separate regression. Standard errors are in parenthesis clustered by province. * denotes coefficients significant at 10%, ** at 5%; *** at 1%. Each line is a separate regression. All estimations include dummy variables for birth cohorts, young, musician, police, and sailor. Livestock stand for the total number of buffaloes, cattle, and horses at the provincial level. All data are for 1903, (except the population growth rate).