Embed Size (px)
Citation preview
TU Kaiserslautern – Lehrstuhl integrierte SensorsystemeProf. Dr.-Ing. König
Kunststofffolien - Industrie 4.0
Dr.-Ing. Michael Kohlert / 12.2017Head of IT & Automation bei Mondi Group
CONCEPT
Mondi Gronau GmbH
2
3
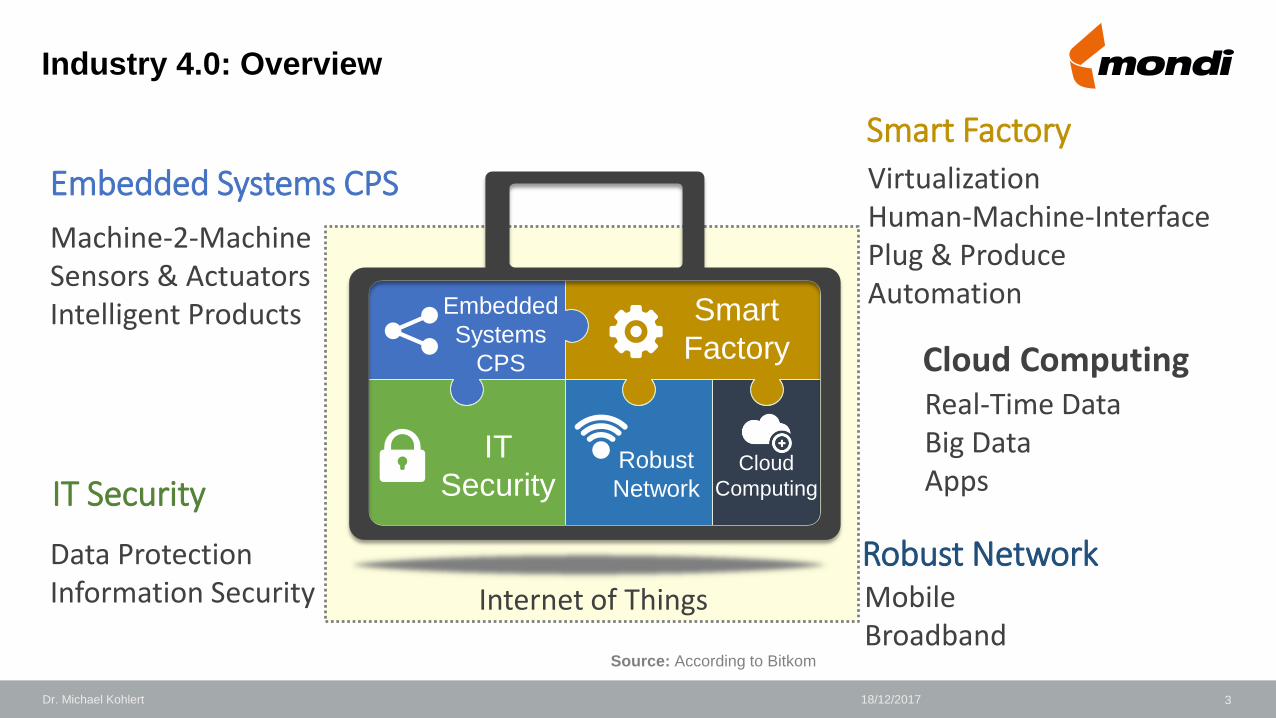
Industry 4.0: Overview
Embedded
Systems
CPS
Smart
Factory
IT
SecurityRobust
Network Cloud
Computing
Robust NetworkMobileBroadband
Cloud ComputingReal-Time DataBig DataAppsIT Security
Data ProtectionInformation Security
Embedded Systems CPS
Machine-2-MachineSensors & ActuatorsIntelligent Products
Smart Factory
VirtualizationHuman-Machine-InterfacePlug & ProduceAutomation
Source: According to Bitkom
Internet of Things
Dr. Michael Kohlert 18/12/2017
4
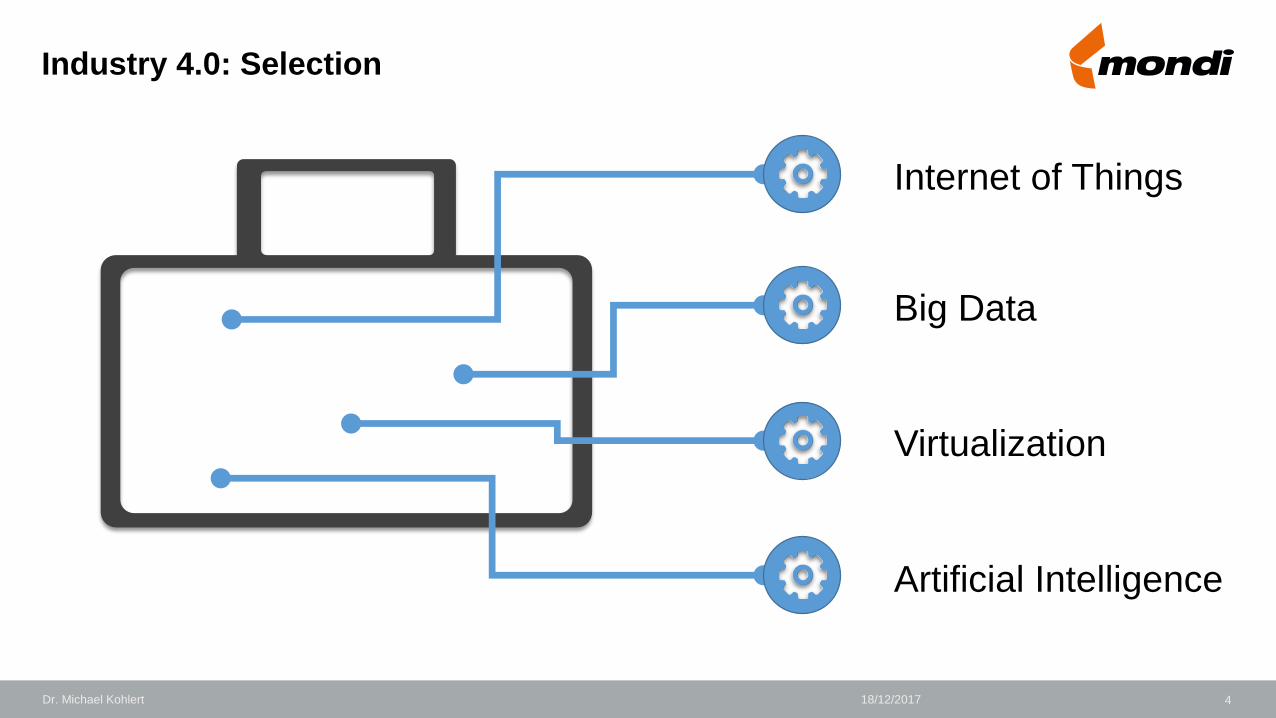
Industry 4.0: Selection
Internet of Things
Big Data
Virtualization
Artificial Intelligence
Dr. Michael Kohlert 18/12/2017
5
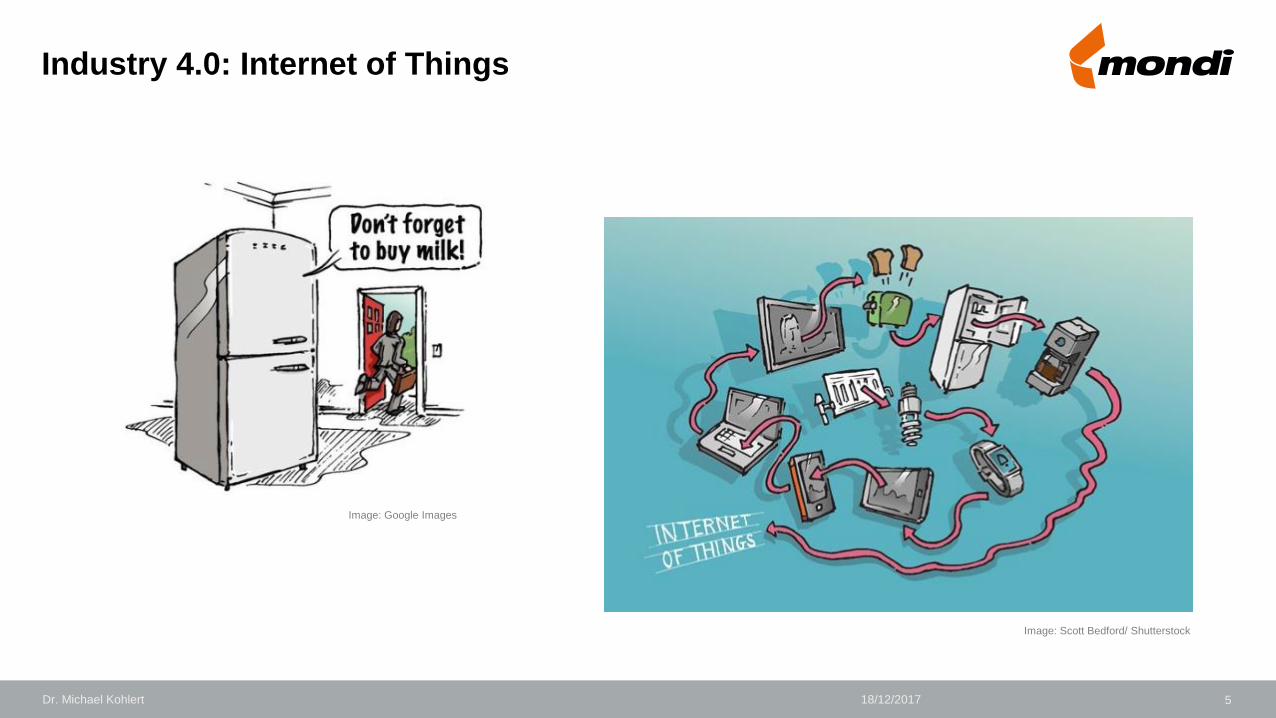
Industry 4.0: Internet of Things
Image: Google Images
Image: Scott Bedford/ Shutterstock
Dr. Michael Kohlert 18/12/2017
6
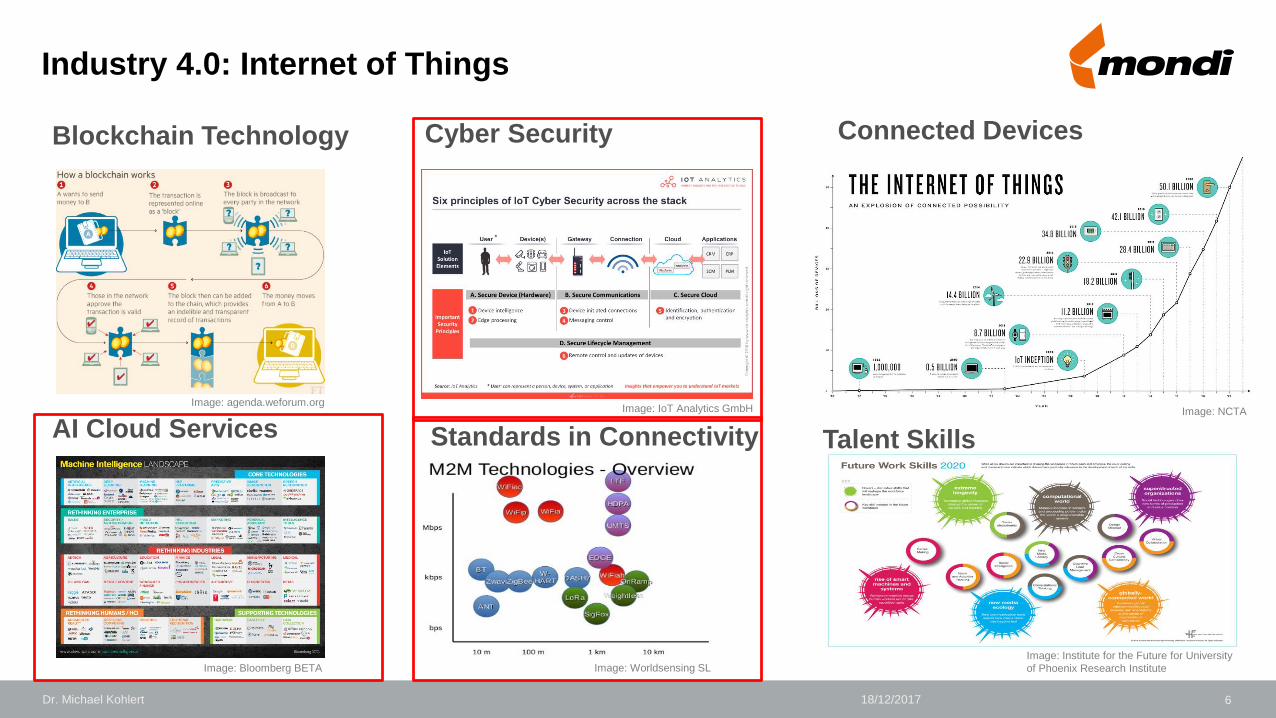
Industry 4.0: Internet of Things
Blockchain Technology
Image: agenda.weforum.org
Cyber Security
Image: IoT Analytics GmbH Image: NCTA
Connected Devices
AI Cloud Services
Image: Bloomberg BETA
Standards in Connectivity
Image: Worldsensing SLImage: Institute for the Future for University
of Phoenix Research Institute
Talent Skills
Dr. Michael Kohlert 18/12/2017
7
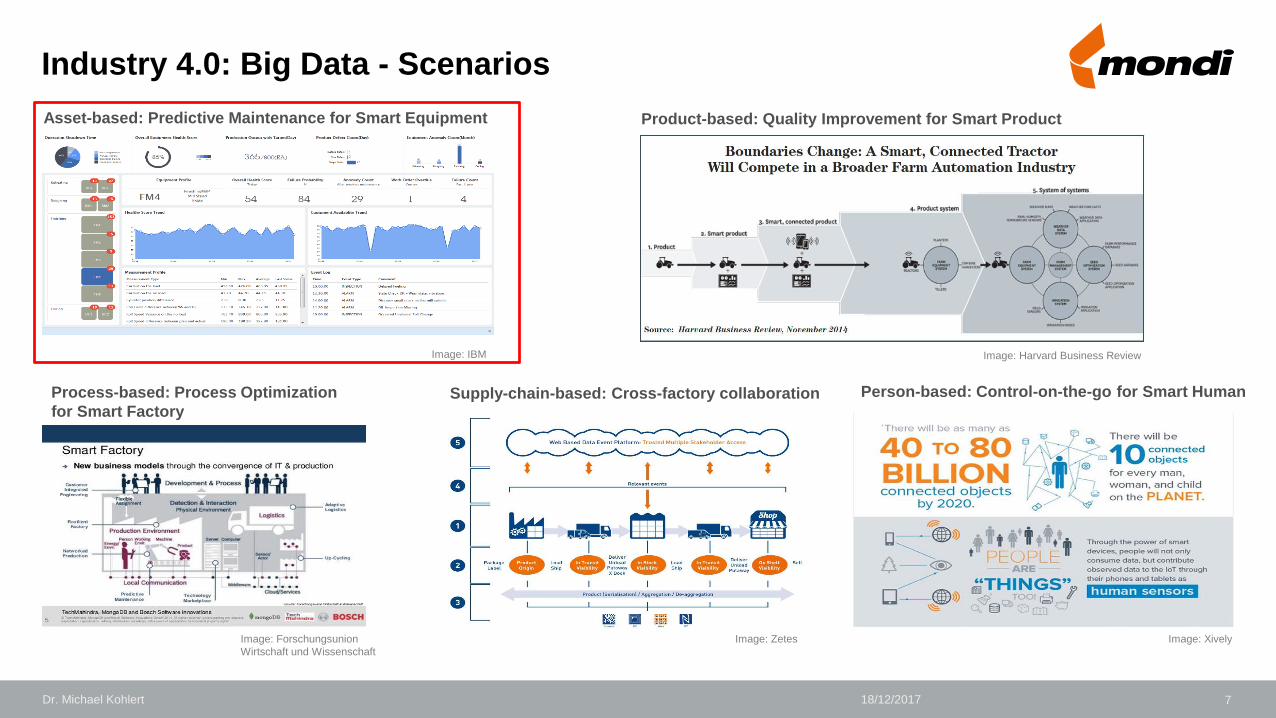
Industry 4.0: Big Data - Scenarios
Image: IBM
Asset-based: Predictive Maintenance for Smart Equipment
Process-based: Process Optimization
for Smart Factory
Image: Forschungsunion
Wirtschaft und Wissenschaft
Image: Harvard Business Review
Product-based: Quality Improvement for Smart Product
Supply-chain-based: Cross-factory collaboration Person-based: Control-on-the-go for Smart Human
Image: Zetes Image: Xively
Dr. Michael Kohlert 18/12/2017
8
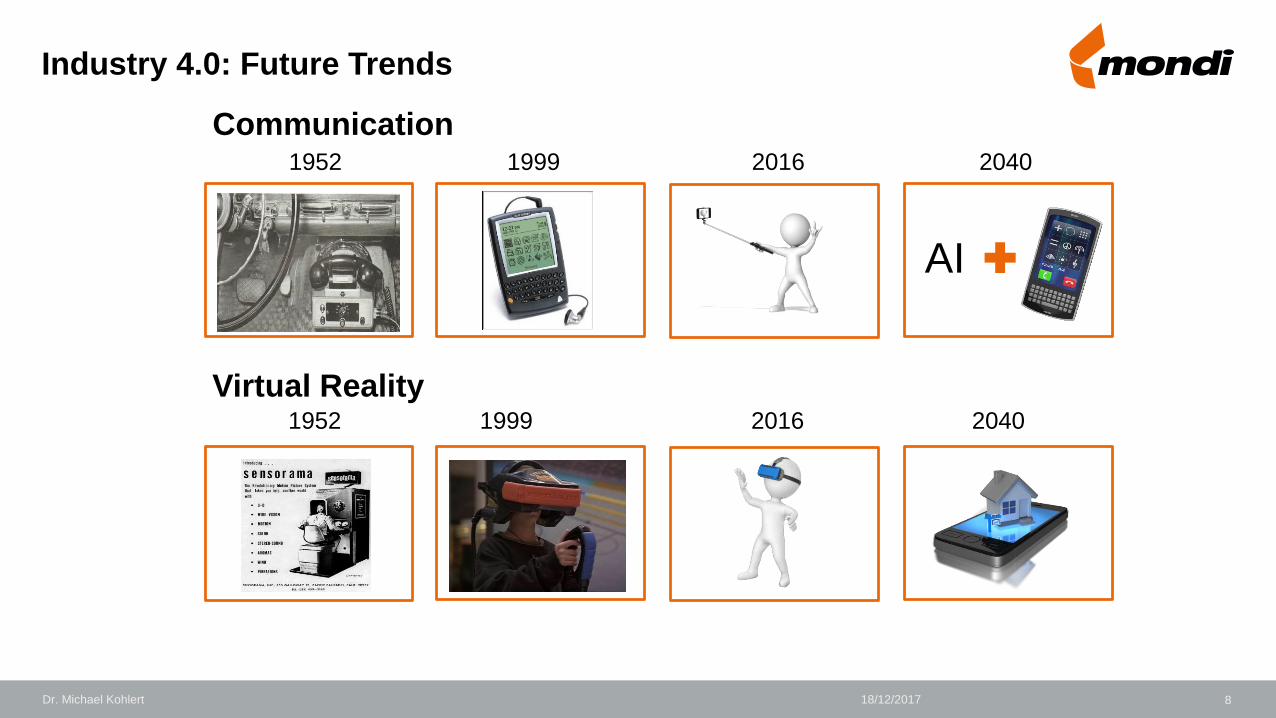
Industry 4.0: Future Trends
Communication
Virtual Reality
1952 1999 2016 2040
1952 1999 2016 2040
Dr. Michael Kohlert 18/12/2017
AI
9
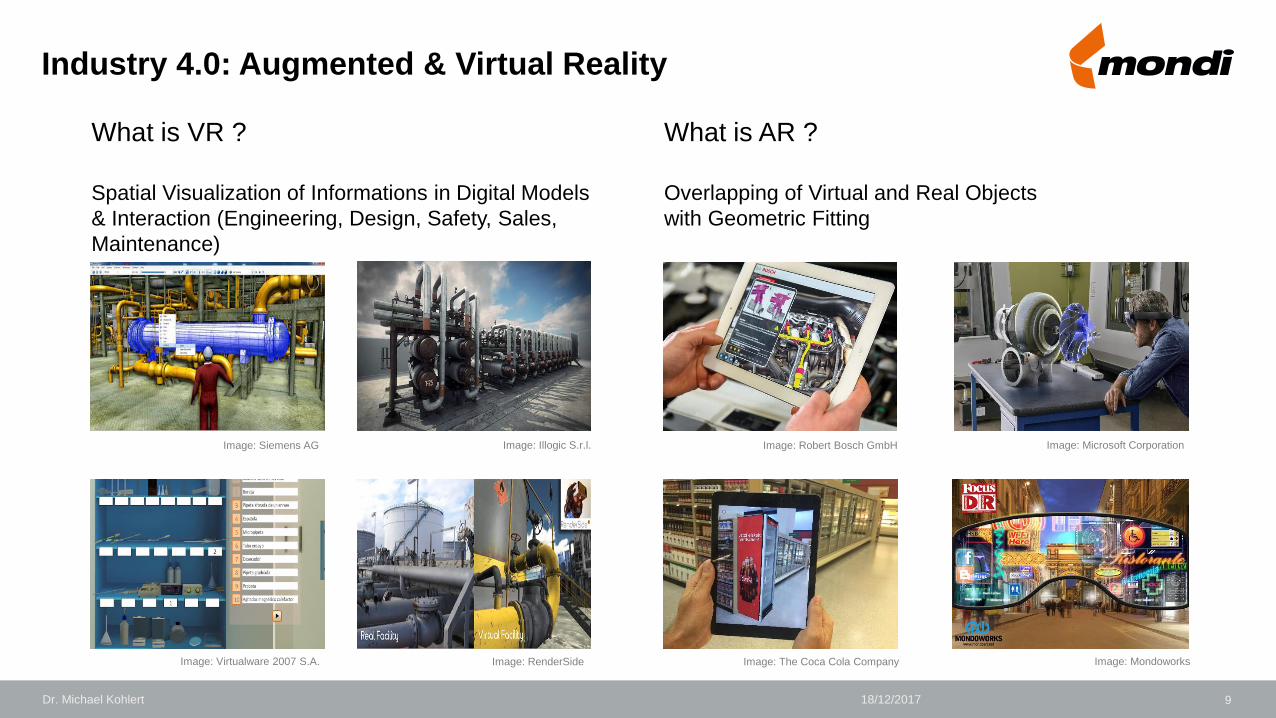
Industry 4.0: Augmented & Virtual Reality
What is VR ?
Spatial Visualization of Informations in Digital Models
& Interaction (Engineering, Design, Safety, Sales,
Maintenance)
What is AR ?
Overlapping of Virtual and Real Objects
with Geometric Fitting
Image: Robert Bosch GmbH Image: Microsoft Corporation
Image: The Coca Cola Company Image: Mondoworks
Image: Siemens AG Image: Illogic S.r.l.
Image: Virtualware 2007 S.A. Image: RenderSide
Dr. Michael Kohlert 18/12/2017
10
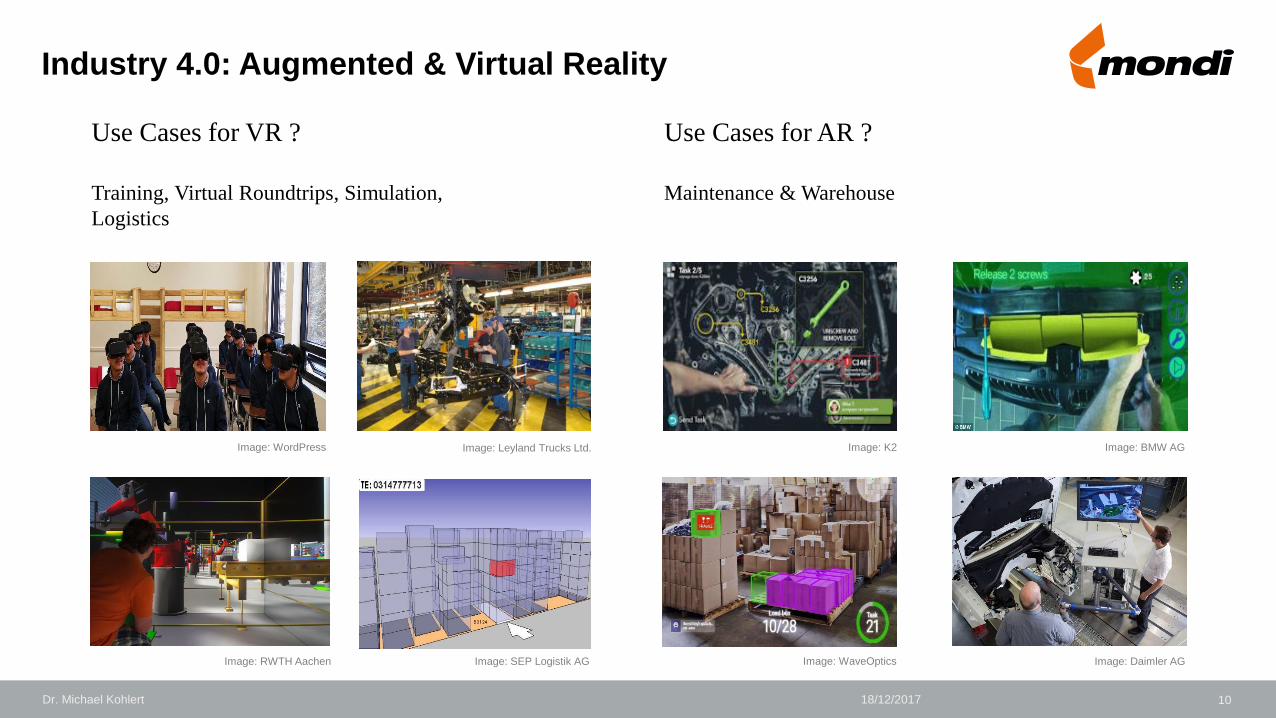
Industry 4.0: Augmented & Virtual Reality
Use Cases for VR ?
Training, Virtual Roundtrips, Simulation,
Logistics
Use Cases for AR ?
Maintenance & Warehouse
Image: K2 Image: BMW AG
Image: WaveOptics Image: Daimler AG
Image: WordPress Image: Leyland Trucks Ltd.
Image: RWTH Aachen Image: SEP Logistik AG
Dr. Michael Kohlert 18/12/2017
11Dr. Michael Kohlert 18/12/2017
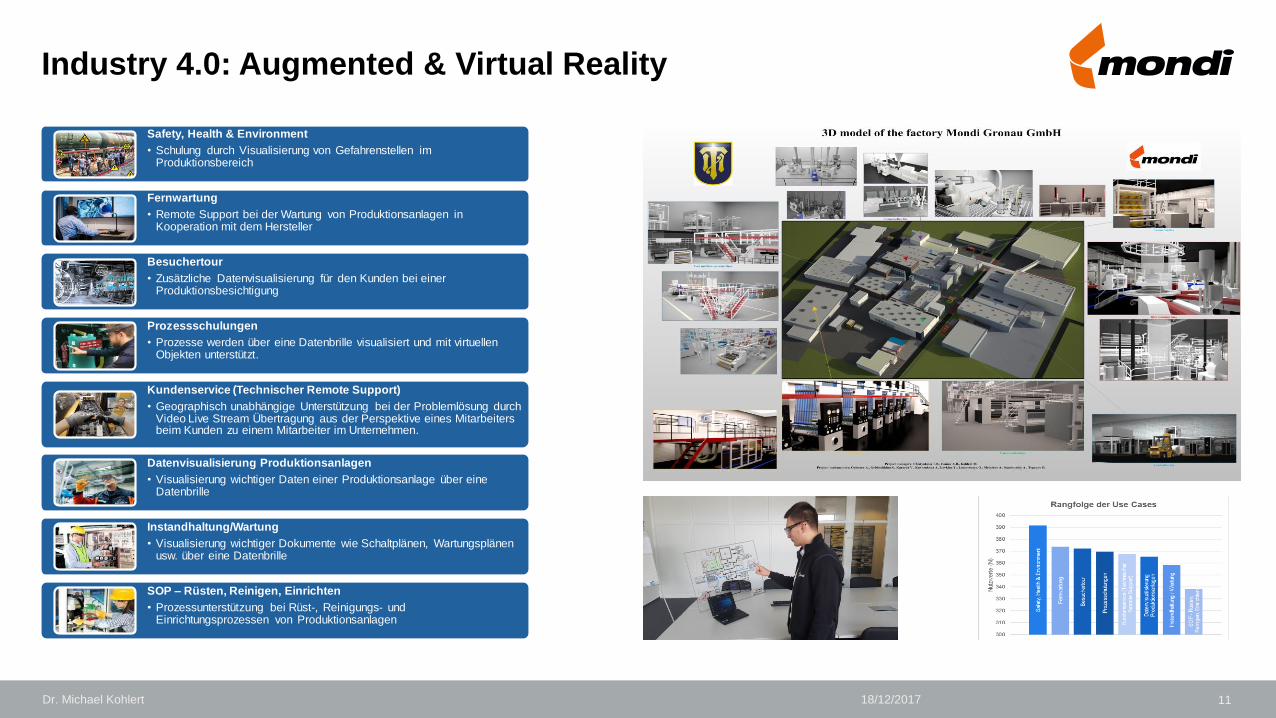
Safety, Health & Environment
• Schulung durch Visualisierung von Gefahrenstellen im Produktionsbereich
Fernwartung
• Remote Support bei der Wartung von Produktionsanlagen in Kooperation mit dem Hersteller
Besuchertour
• Zusätzliche Datenvisualisierung für den Kunden bei einer Produktionsbesichtigung
Prozessschulungen
• Prozesse werden über eine Datenbrille visualisiert und mit virtuellen Objekten unterstützt.
Kundenservice (Technischer Remote Support)
• Geographisch unabhängige Unterstützung bei der Problemlösung durch Video Live Stream Übertragung aus der Perspektive eines Mitarbeiters beim Kunden zu einem Mitarbeiter im Unternehmen.
Datenvisualisierung Produktionsanlagen
• Visualisierung wichtiger Daten einer Produktionsanlage über eine Datenbrille
Instandhaltung/Wartung
• Visualisierung wichtiger Dokumente wie Schaltplänen, Wartungsplänen usw. über eine Datenbrille
SOP – Rüsten, Reinigen, Einrichten
• Prozessunterstützung bei Rüst-, Reinigungs- und Einrichtungsprozessen von Produktionsanlagen
Industry 4.0: Augmented & Virtual Reality
1218/12/2017
Daten
Dr. Michael Kohlert
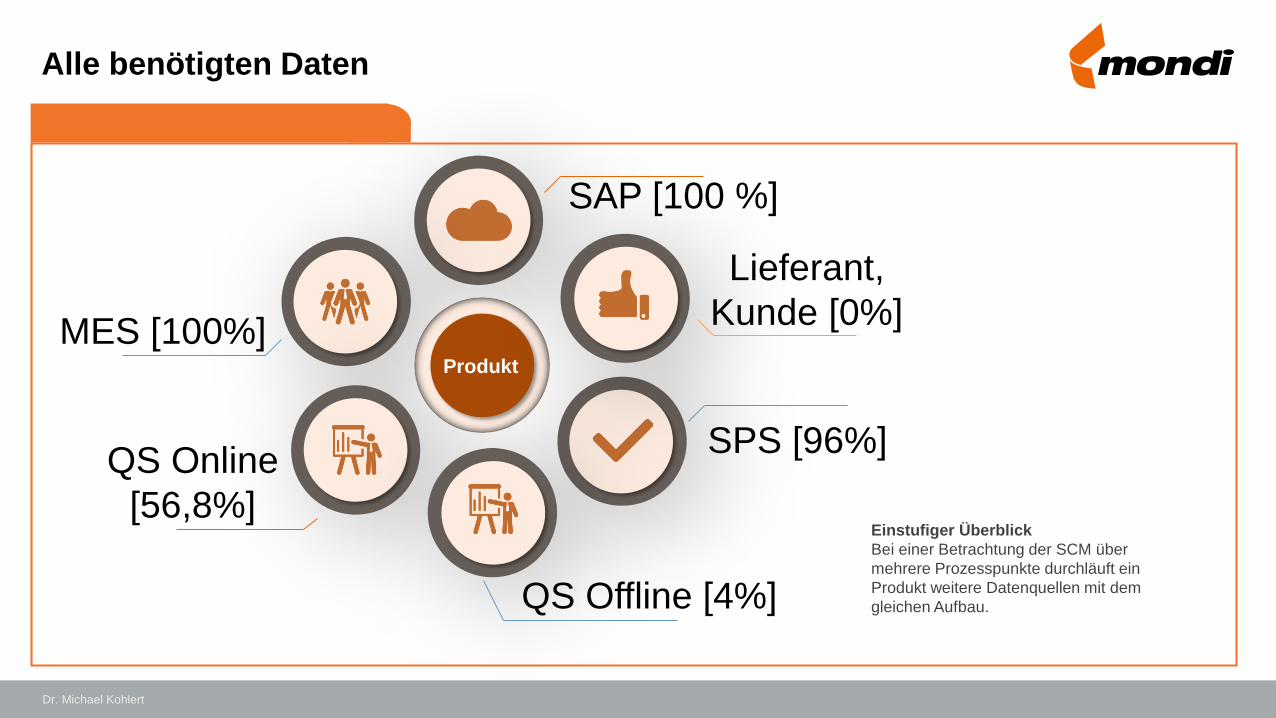
Alle benötigten Daten
Good Product
SAP [100 %]
Produkt
Einstufiger Überblick
Bei einer Betrachtung der SCM über
mehrere Prozesspunkte durchläuft ein
Produkt weitere Datenquellen mit dem
gleichen Aufbau.
QS Online
[56,8%]
MES [100%]
QS Offline [4%]
SPS [96%]
Lieferant,
Kunde [0%]
Dr. Michael Kohlert
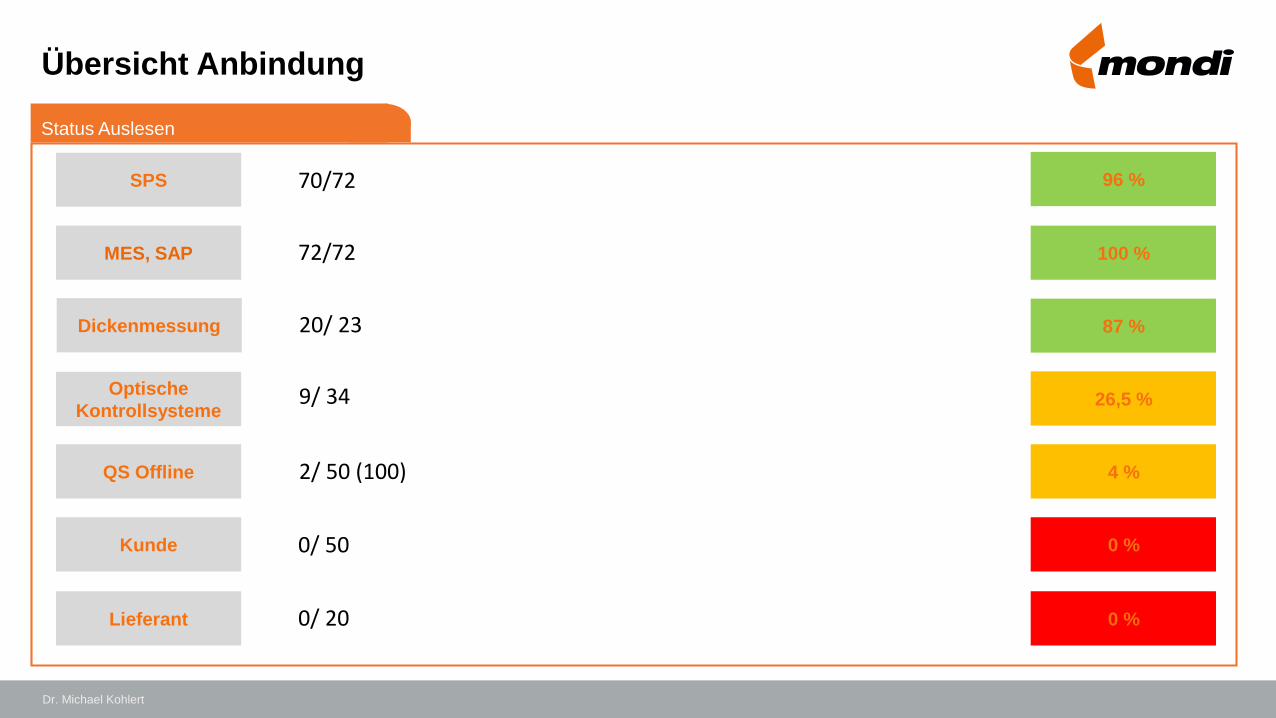
Übersicht Anbindung
Good ProductStatus Auslesen
Lieferant
Kunde
QS Offline
Dickenmessung
Optische
Kontrollsysteme
MES, SAP
SPS 70/72 96 %
72/72 100 %
26,5 %
87 %
4 %
0 %
0 %
20/ 23
2/ 50 (100)
0/ 50
0/ 20
9/ 34
Dr. Michael Kohlert
1518/12/2017
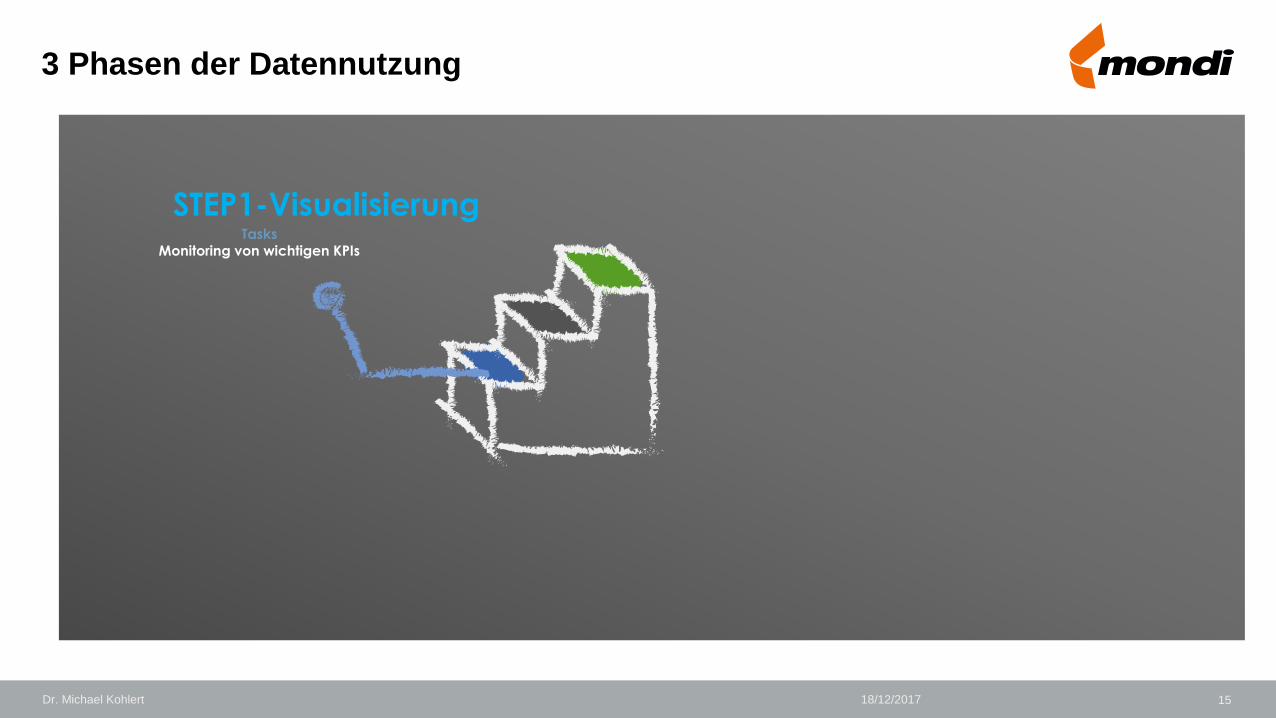
3 Phasen der Datennutzung
TasksMonitoring von wichtigen KPIs
STEP1-Visualisierung
Dr. Michael Kohlert
16
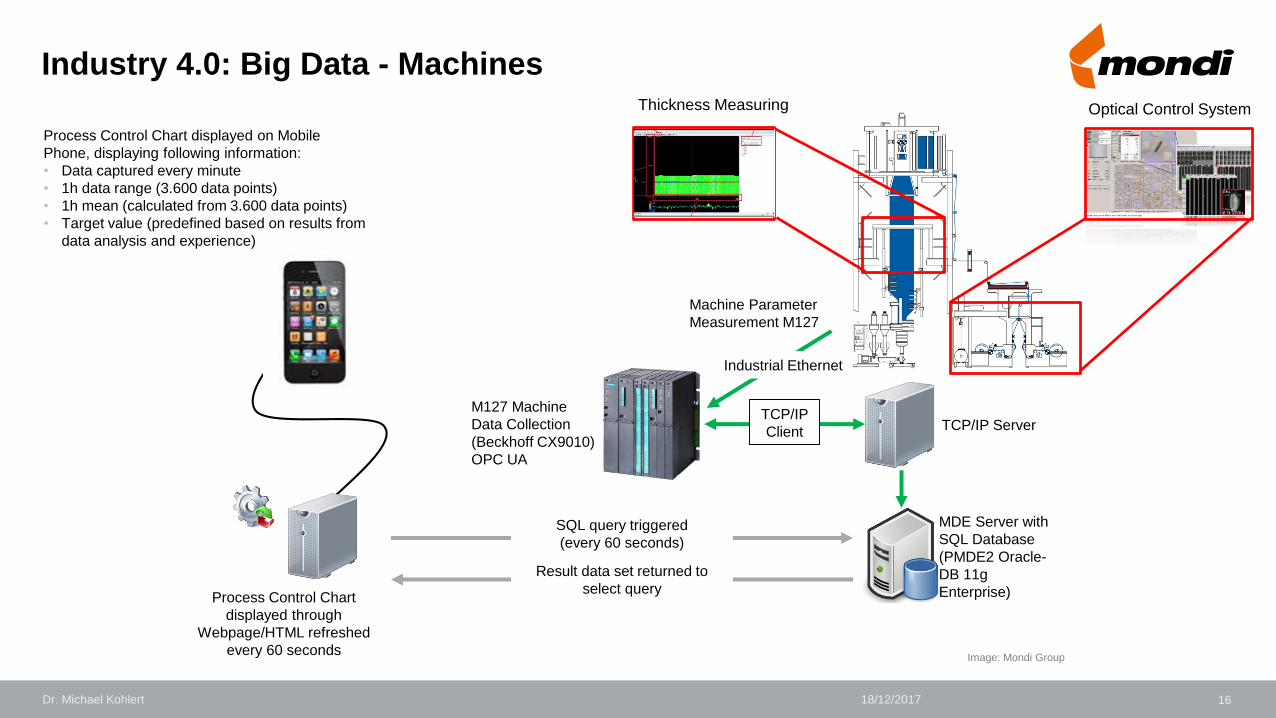
Industry 4.0: Big Data - Machines
Machine Parameter
Measurement M127
MDE Server with
SQL Database
(PMDE2 Oracle-
DB 11g
Enterprise)
Industrial Ethernet
SQL query triggered
(every 60 seconds)
Result data set returned to
select queryProcess Control Chart
displayed through
Webpage/HTML refreshed
every 60 seconds
Process Control Chart displayed on Mobile
Phone, displaying following information:
• Data captured every minute
• 1h data range (3.600 data points)
• 1h mean (calculated from 3.600 data points)
• Target value (predefined based on results from
data analysis and experience)
M127 Machine
Data Collection
(Beckhoff CX9010)
OPC UA
TCP/IP
Client TCP/IP Server
Image: Mondi Group
Dr. Michael Kohlert 18/12/2017
Thickness Measuring Optical Control System
1718/12/2017
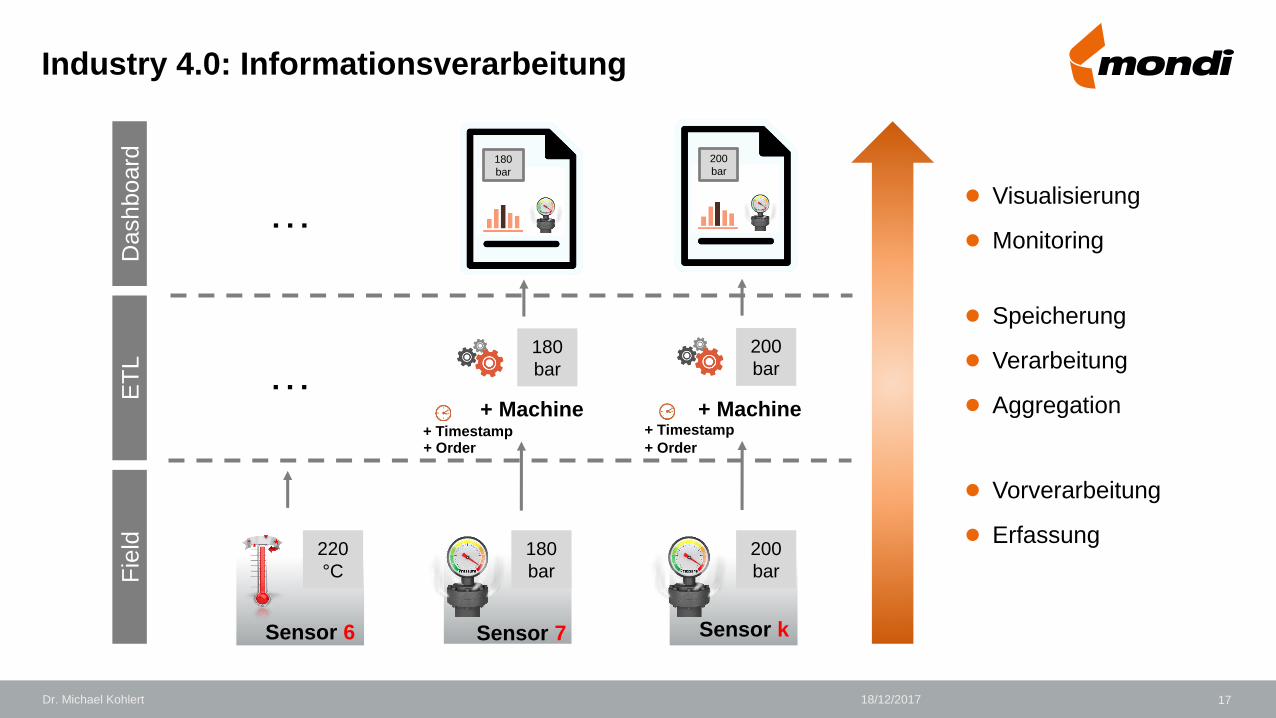
Fie
ldE
TL
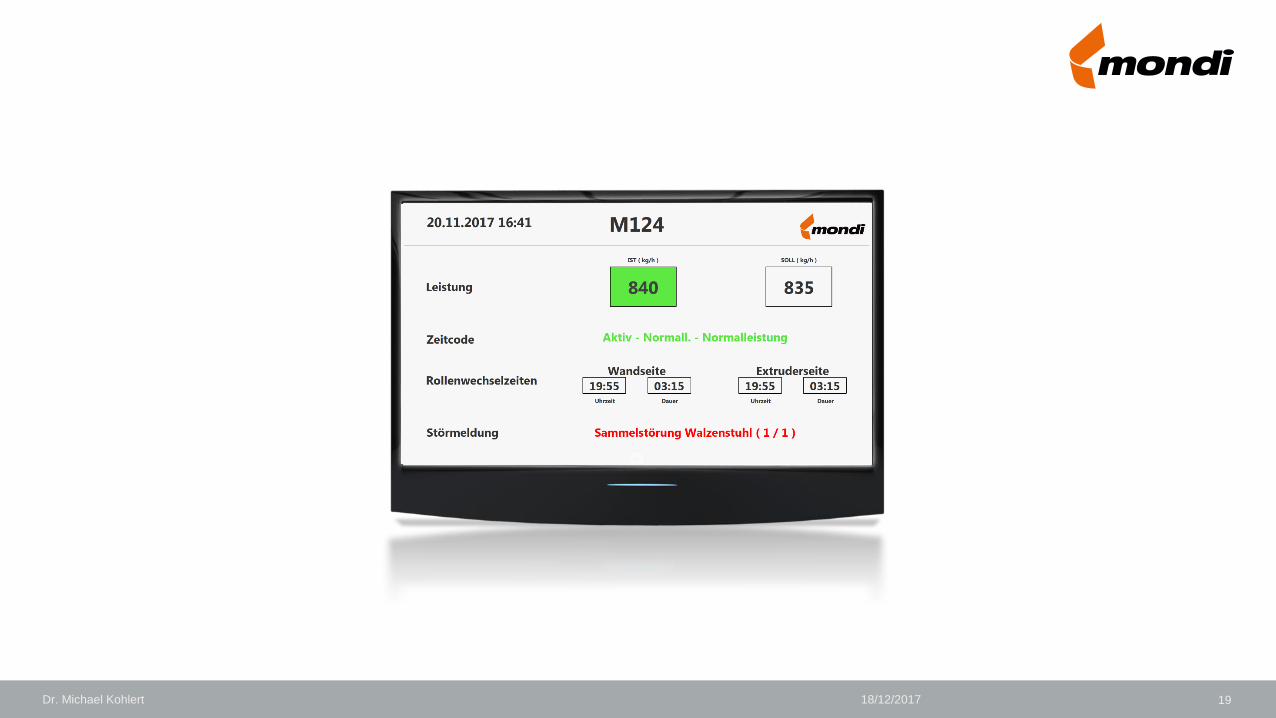
Dashboard
● Visualisierung
● Monitoring
● Speicherung
● Verarbeitung
● Aggregation
● Vorverarbeitung
● Erfassung
Industry 4.0: Informationsverarbeitung
180
bar
200
bar
220
°C
200
bar180
bar
Sensor kSensor 7Sensor 6
200
bar
+ Machine
180
bar
+ Machine+ Timestamp+ Timestamp+ Order+ Order
…
…
Dr. Michael Kohlert
1818/12/2017
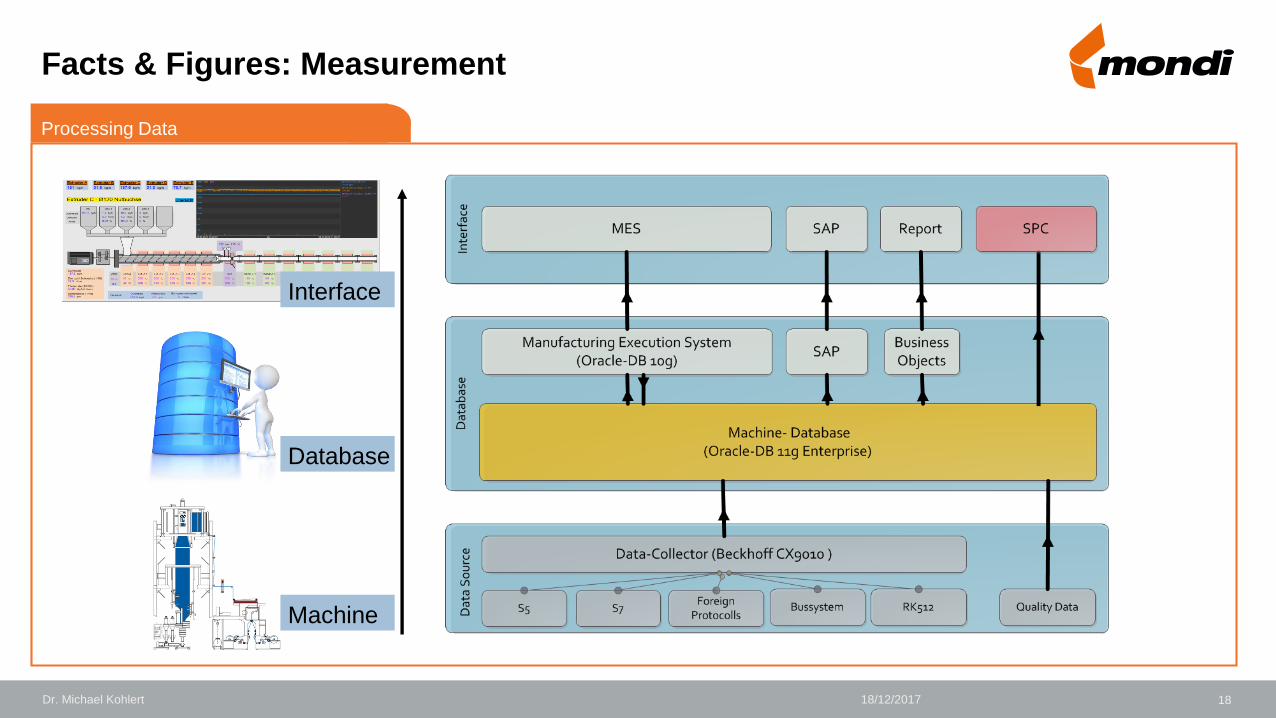
Database
Machine
Interface
Processing Data
Facts & Figures: Measurement
Dr. Michael Kohlert
1918/12/2017Dr. Michael Kohlert
2018/12/2017
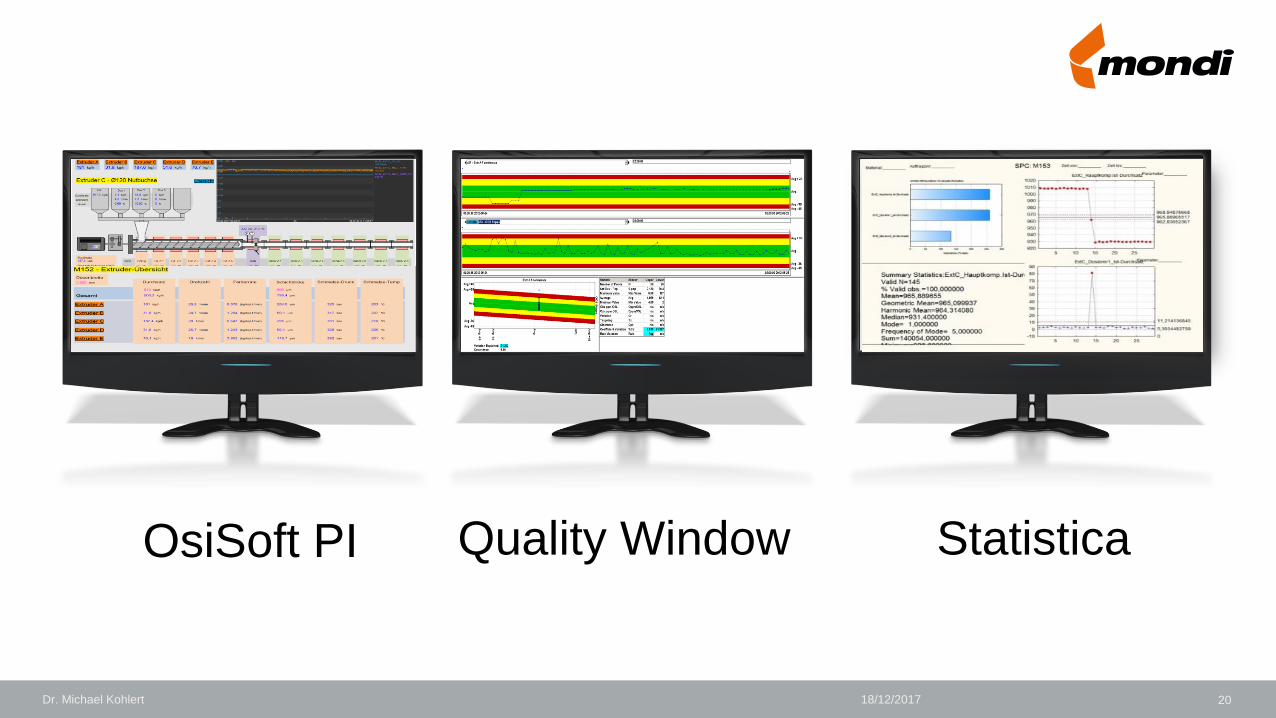
OsiSoft PI Quality Window Statistica
Dr. Michael Kohlert
2118/12/2017
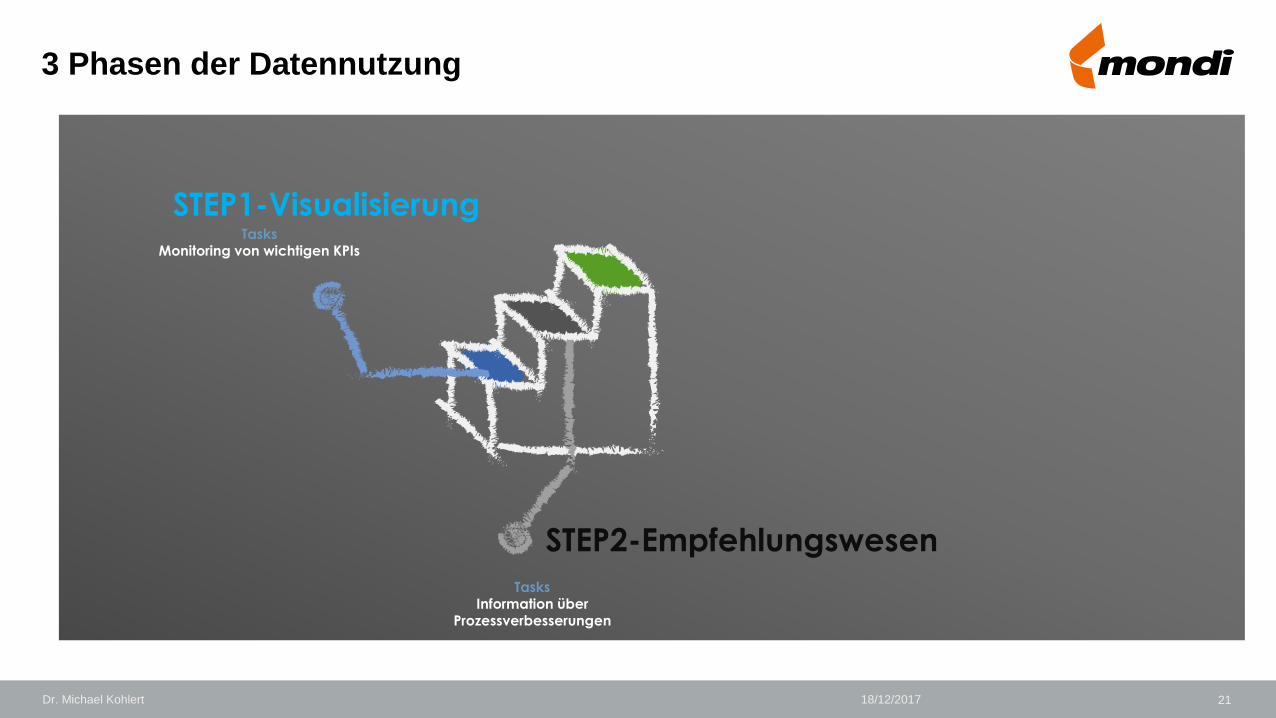
3 Phasen der Datennutzung
TasksMonitoring von wichtigen KPIs
STEP1-Visualisierung
TasksInformation über
Prozessverbesserungen
STEP2-Empfehlungswesen
Dr. Michael Kohlert
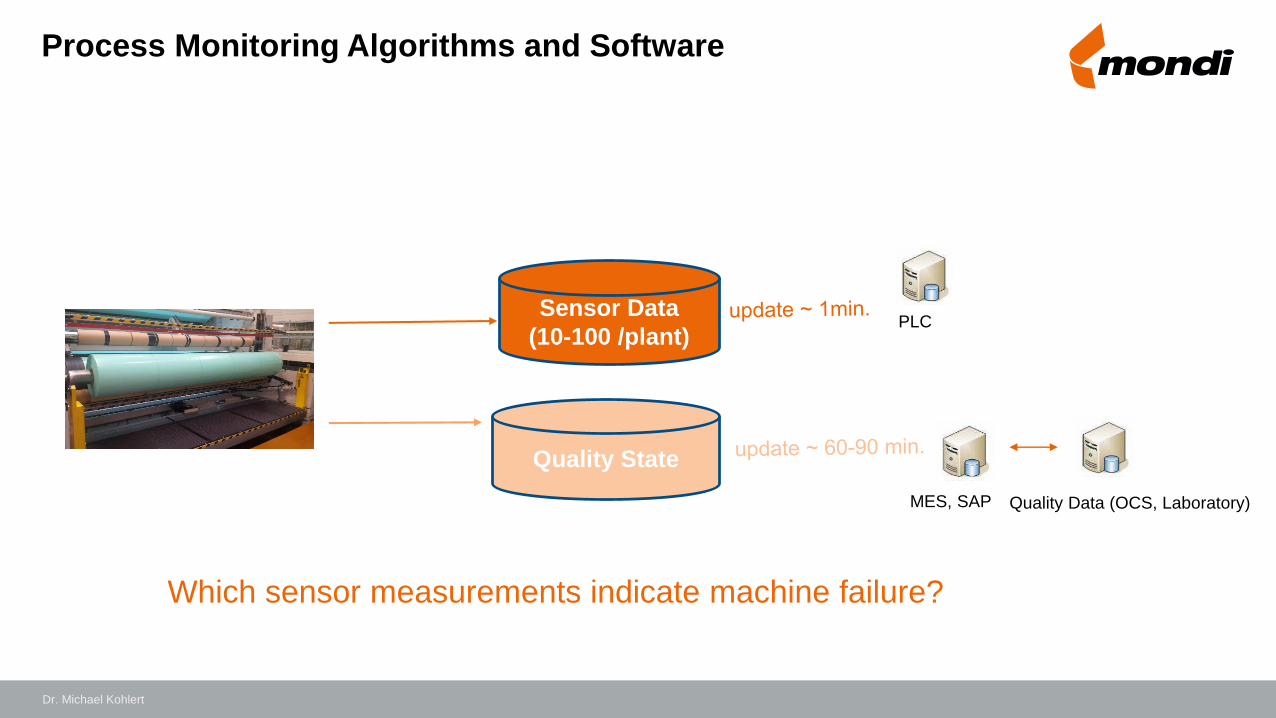
Process Monitoring Algorithms and Software
Sensor Data
(10-100 /plant)
Quality State
Which sensor measurements indicate machine failure?
Quality Data (OCS, Laboratory)MES, SAP
PLC
Dr. Michael Kohlert
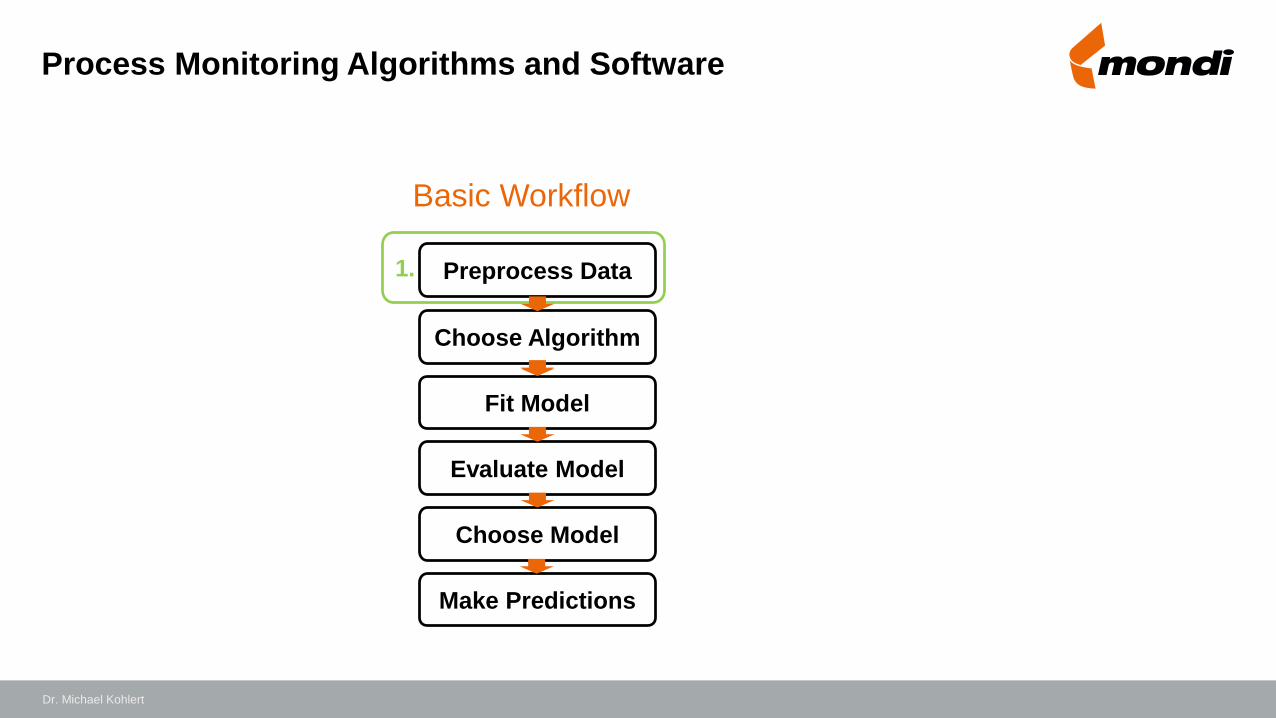
Basic Workflow
1.
Process Monitoring Algorithms and Software
Evaluate Model
Fit Model
Choose Algorithm
Preprocess Data
Choose Model
Make Predictions
Dr. Michael Kohlert
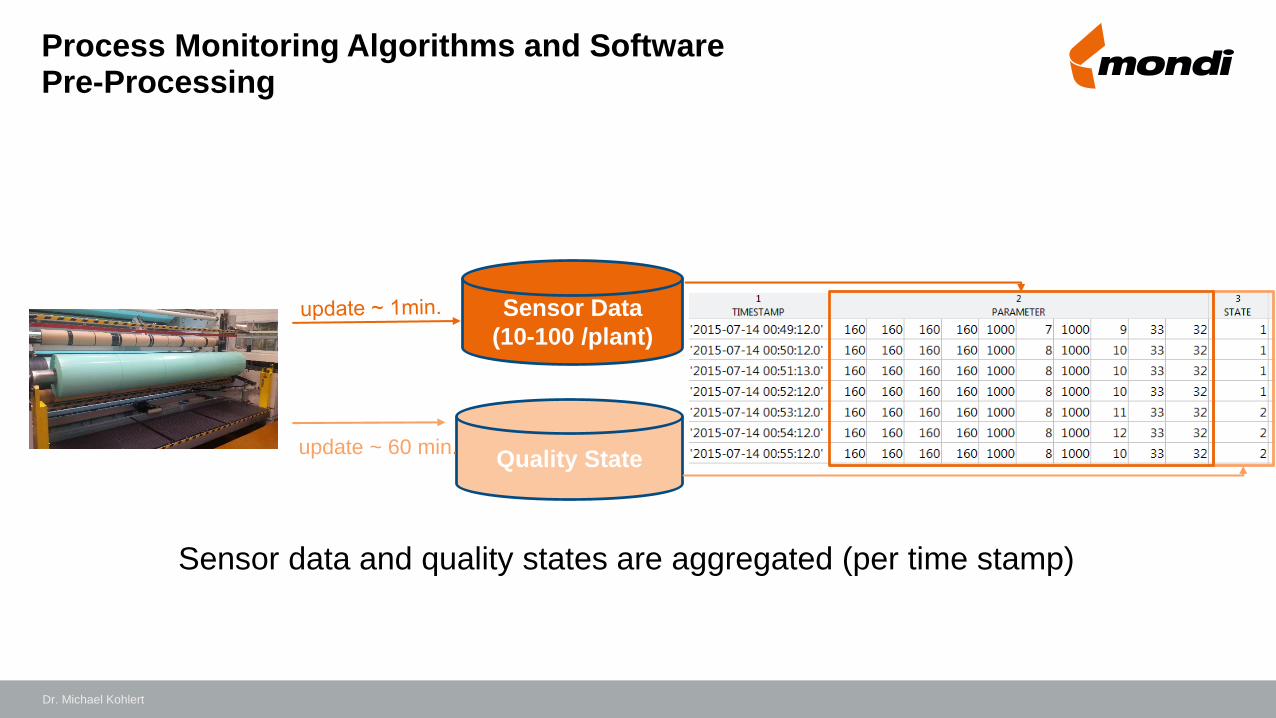
Process Monitoring Algorithms and Software Pre-Processing
Sensor data and quality states are aggregated (per time stamp)
Sensor Data
(10-100 /plant)
Quality Stateupdate ~ 60 min.
Dr. Michael Kohlert

Process Monitoring Algorithms and Software -Train a prediction model
Basic Workflow
2.
Evaluate Model
Fit Model
Choose Algorithm
Preprocess Data
Choose Model
Make Predictions
Dr. Michael Kohlert
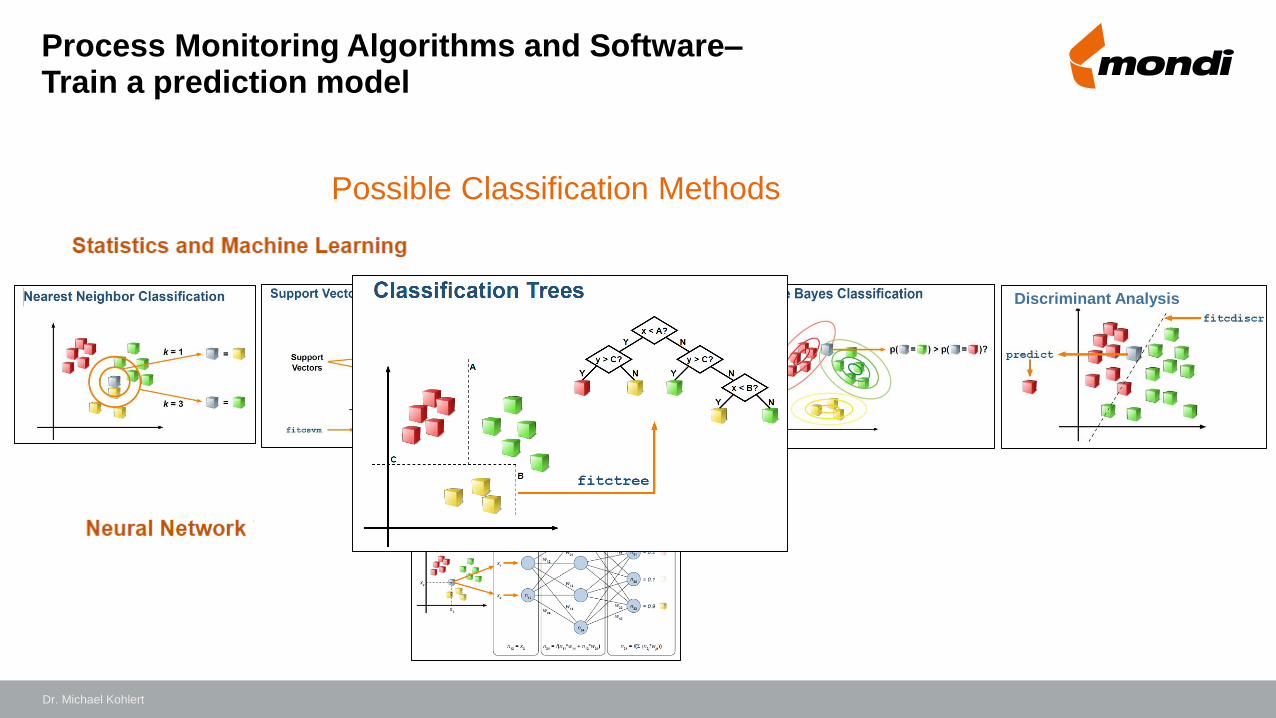
Process Monitoring Algorithms and Software–Train a prediction model
Possible Classification Methods
Discriminant Analysis
Dr. Michael Kohlert
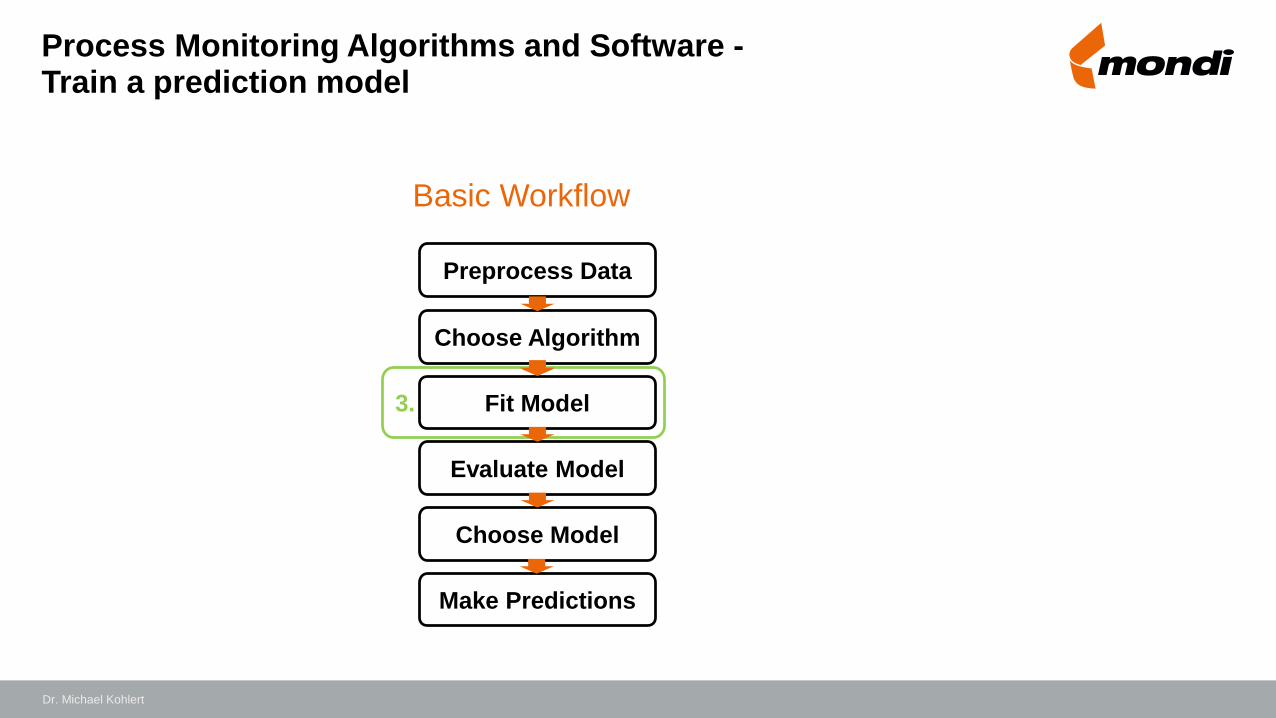
Process Monitoring Algorithms and Software -Train a prediction model
Basic Workflow
3.
Evaluate Model
Fit Model
Choose Algorithm
Preprocess Data
Choose Model
Make Predictions
Dr. Michael Kohlert
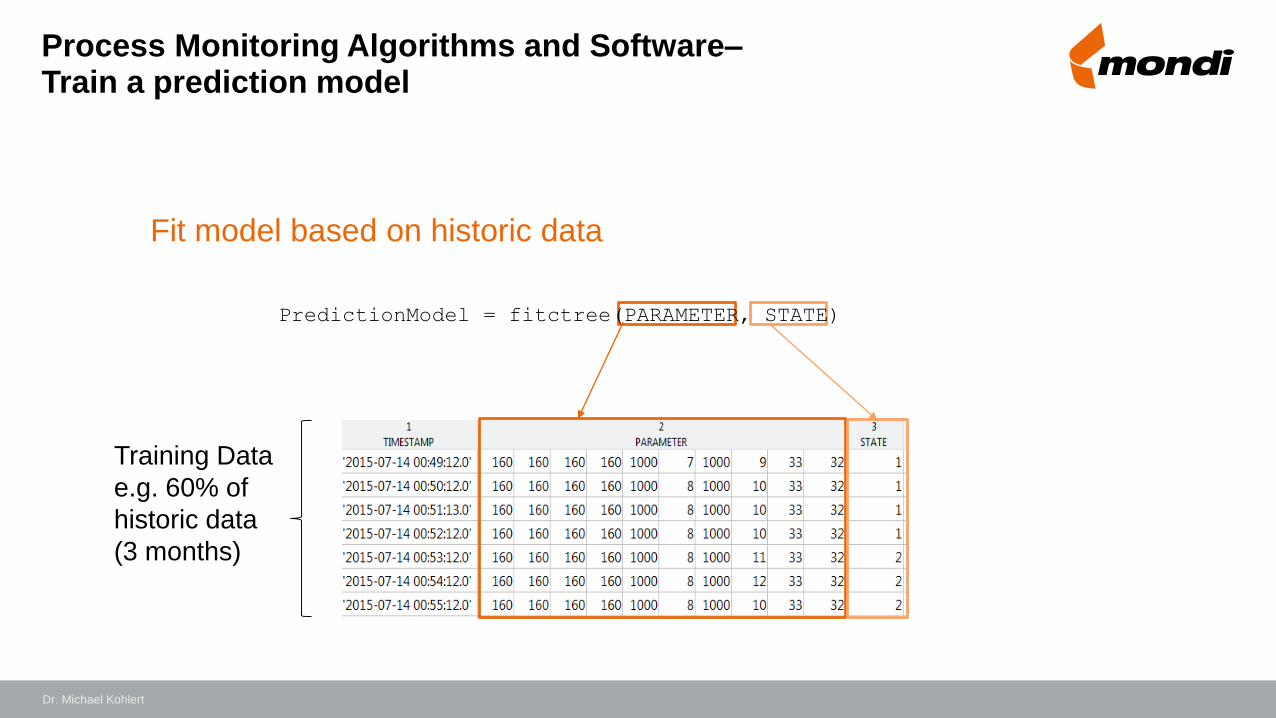
Process Monitoring Algorithms and Software–Train a prediction model
Fit model based on historic data
Training Data
e.g. 60% of
historic data
(3 months)
PredictionModel = fitctree(PARAMETER, STATE)
Dr. Michael Kohlert
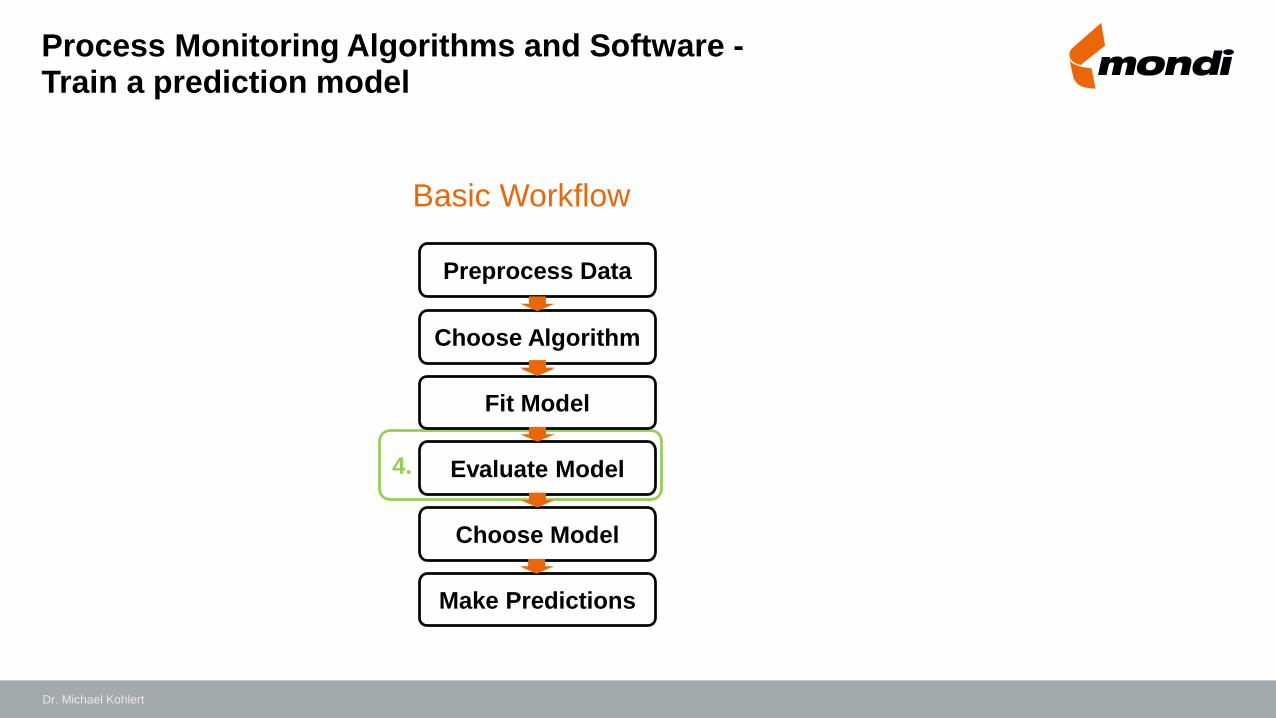
Process Monitoring Algorithms and Software -Train a prediction model
Basic Workflow
4. Evaluate Model
Fit Model
Choose Algorithm
Preprocess Data
Choose Model
Make Predictions
Dr. Michael Kohlert
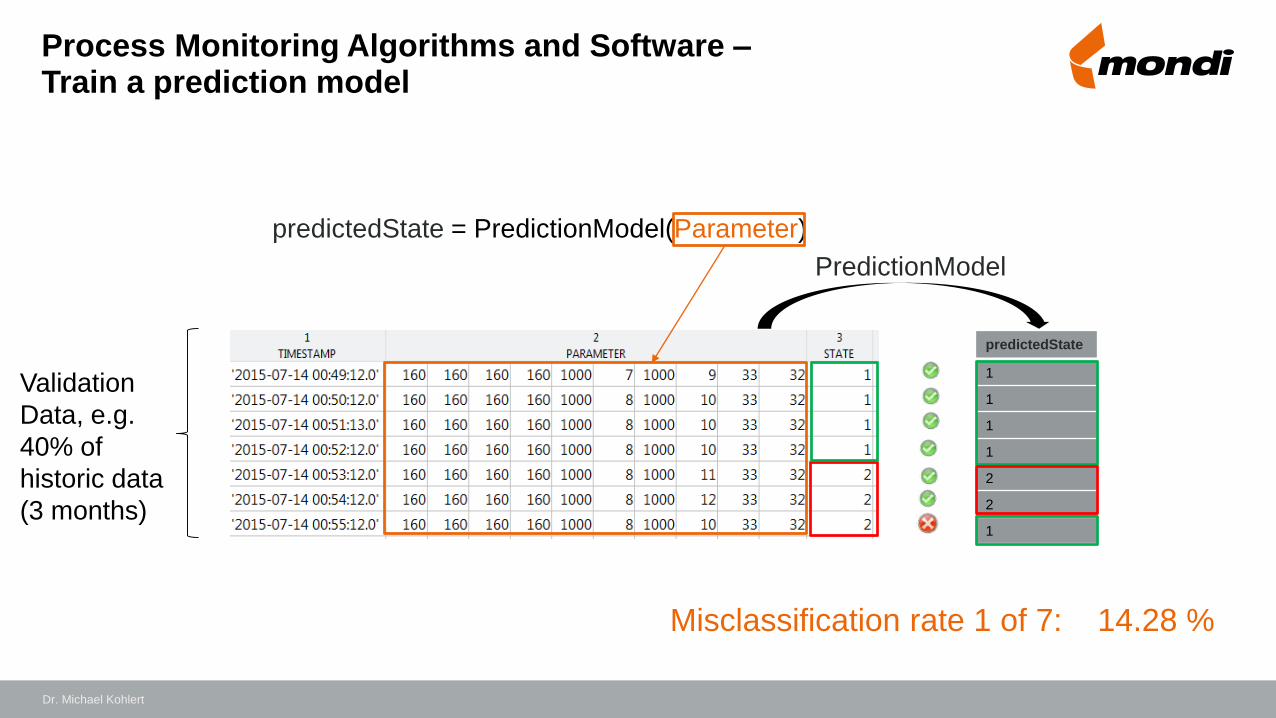
Process Monitoring Algorithms and Software –Train a prediction model
Validation
Data, e.g.
40% of
historic data
(3 months)
predictedState
1
1
1
1
2
2
1
PredictionModel
Misclassification rate 1 of 7: 14.28 %
predictedState = PredictionModel(Parameter)
Dr. Michael Kohlert
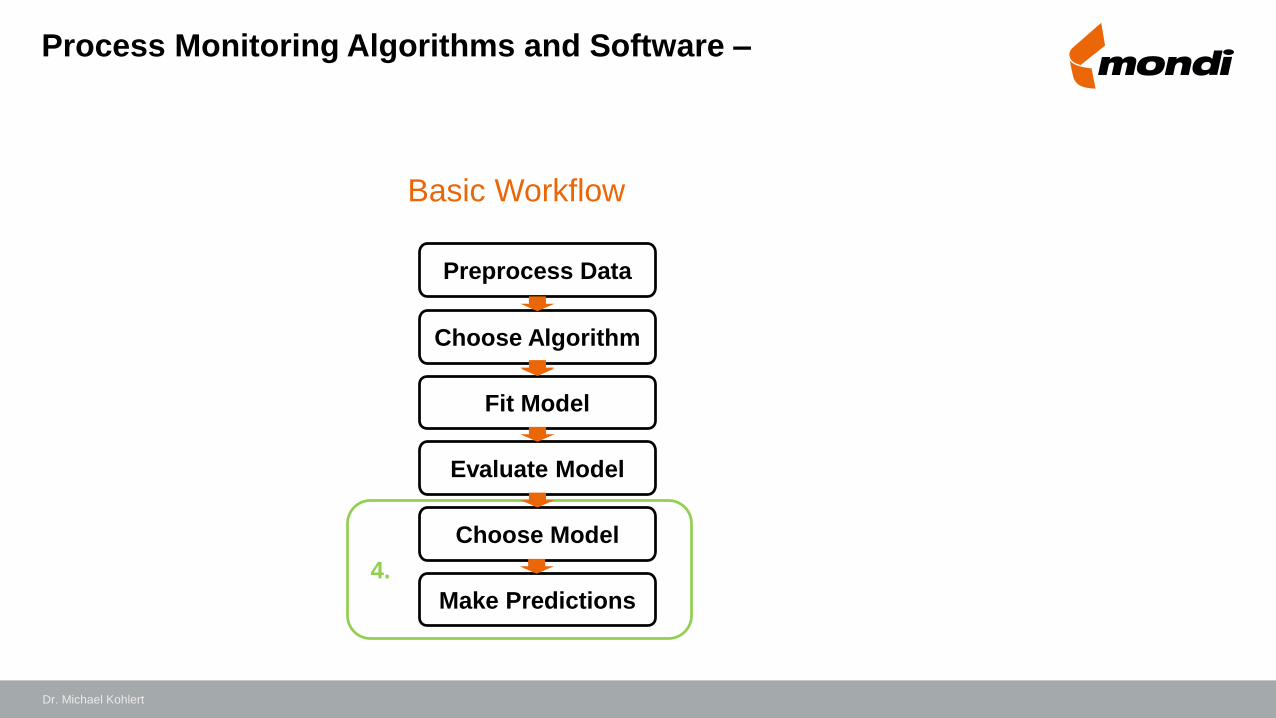
Process Monitoring Algorithms and Software –
Basic Workflow
4.
Evaluate Model
Fit Model
Choose Algorithm
Preprocess Data
Choose Model
Make Predictions
Dr. Michael Kohlert
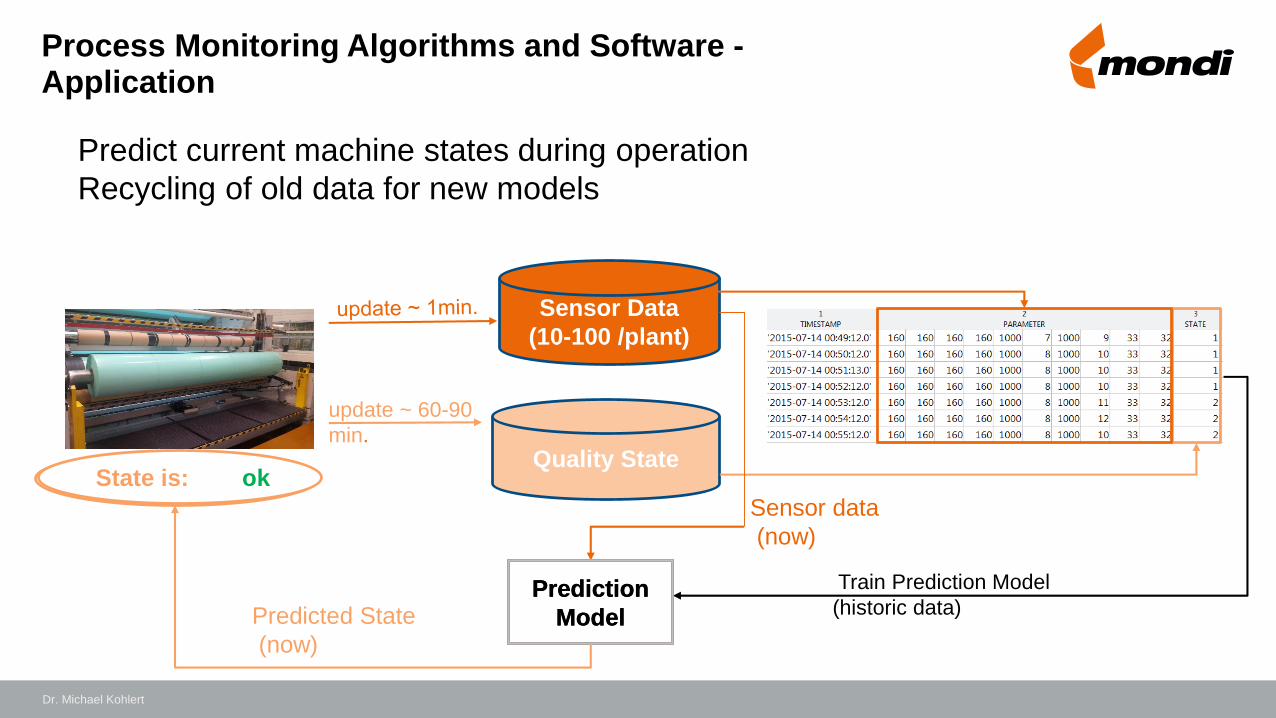
Process Monitoring Algorithms and Software -Application
Sensor Data
(10-100 /plant)
Quality State
Predict current machine states during operation
Recycling of old data for new models
Train Prediction Model
(historic data)Prediction
Model
Sensor data
(now)
Predicted State
(now)
update ~ 60-90
min.
State is: not okState is: ok
Prediction
Model
Dr. Michael Kohlert
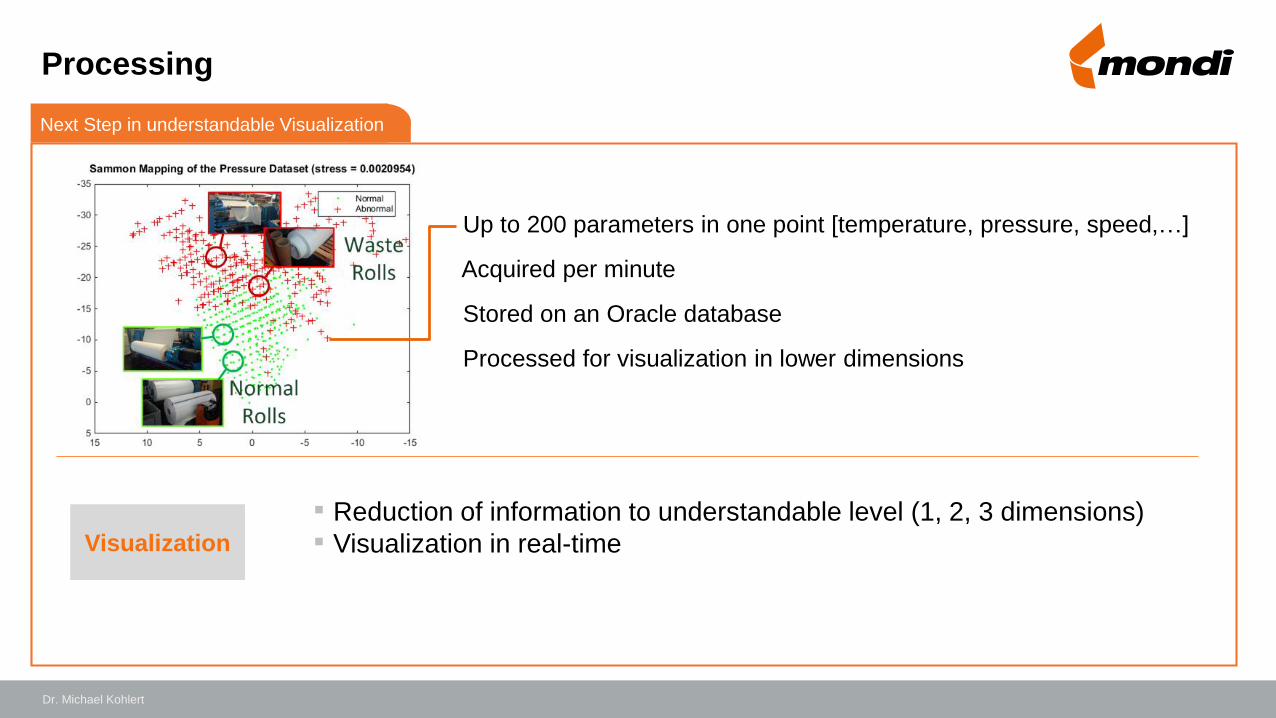
Next Step in understandable Visualization
▪ Reduction of information to understandable level (1, 2, 3 dimensions)
▪ Visualization in real-timeVisualization
Up to 200 parameters in one point [temperature, pressure, speed,…]
Acquired per minute
Stored on an Oracle database
Processed for visualization in lower dimensions
Processing
Dr. Michael Kohlert
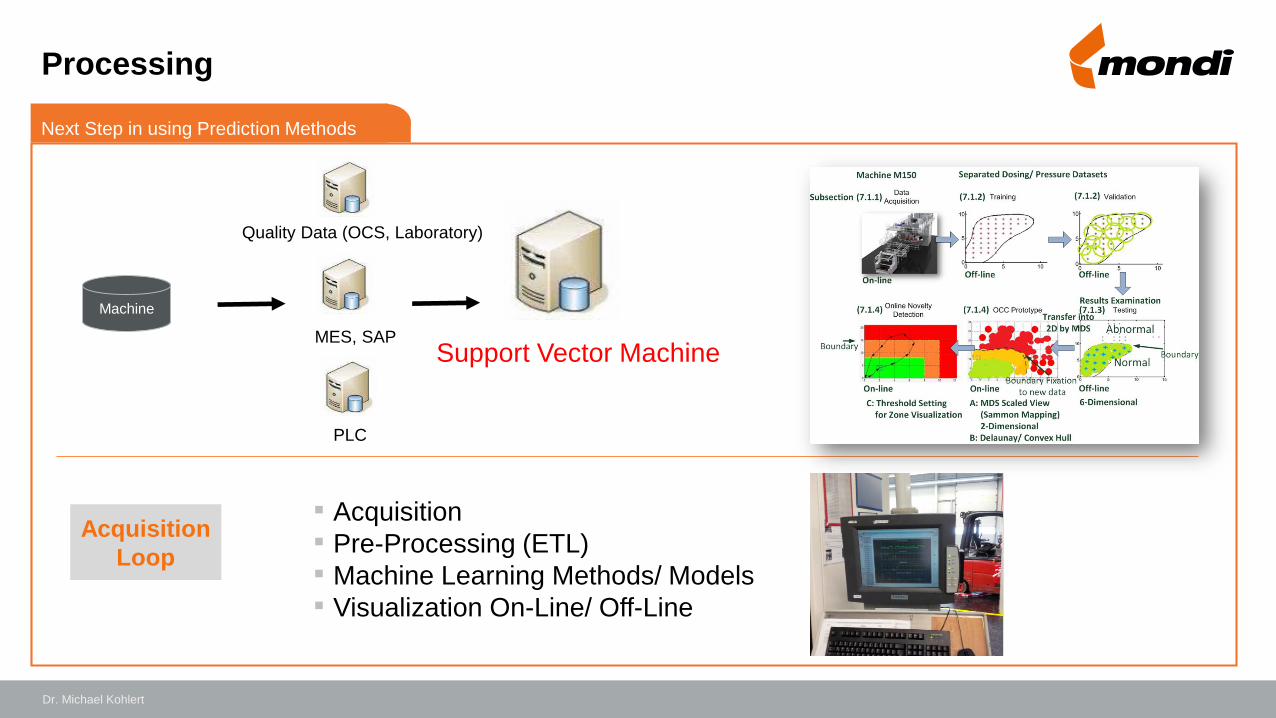
Good ProductNext Step in using Prediction Methods
Machine
PLC
Support Vector Machine
Acquisition
Loop
▪ Acquisition
▪ Pre-Processing (ETL)
▪ Machine Learning Methods/ Models
▪ Visualization On-Line/ Off-Line
Quality Data (OCS, Laboratory)
MES, SAP
Processing
Dr. Michael Kohlert
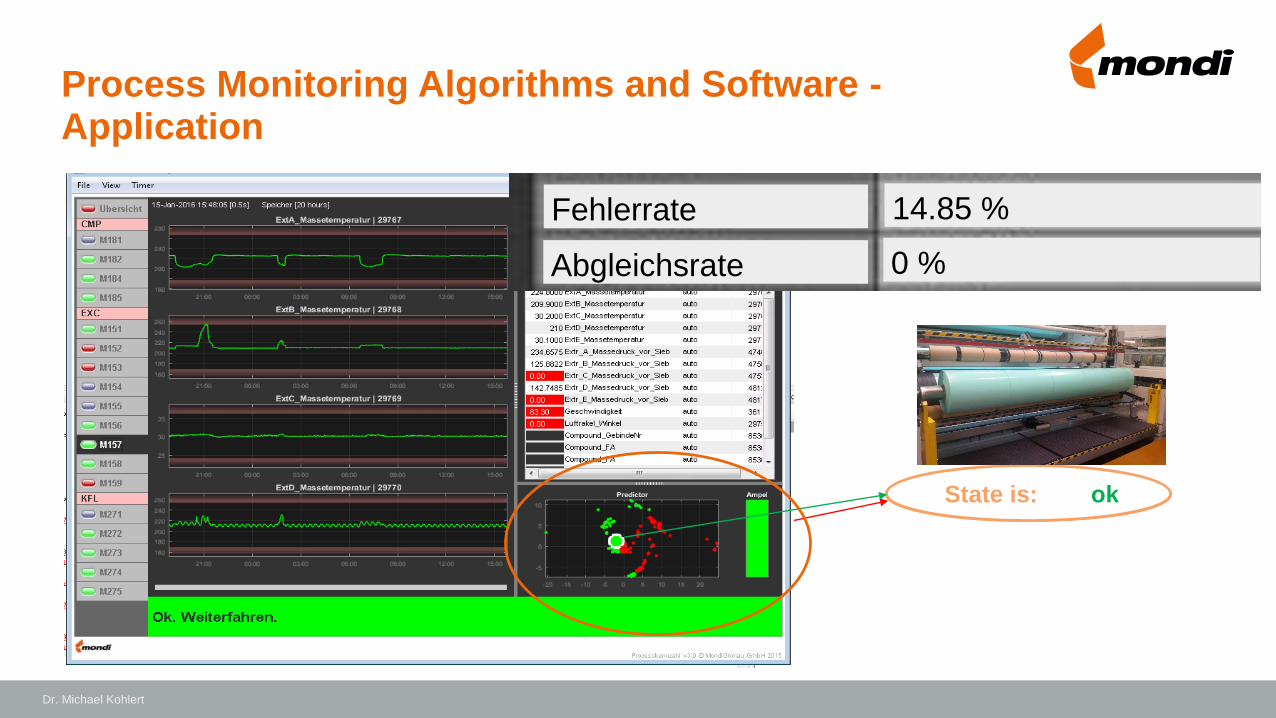
State is: not okState is: ok
Process Monitoring Algorithms and Software -Application
Fehlerrate
Abgleichsrate
14.85 %
0 %
Dr. Michael Kohlert
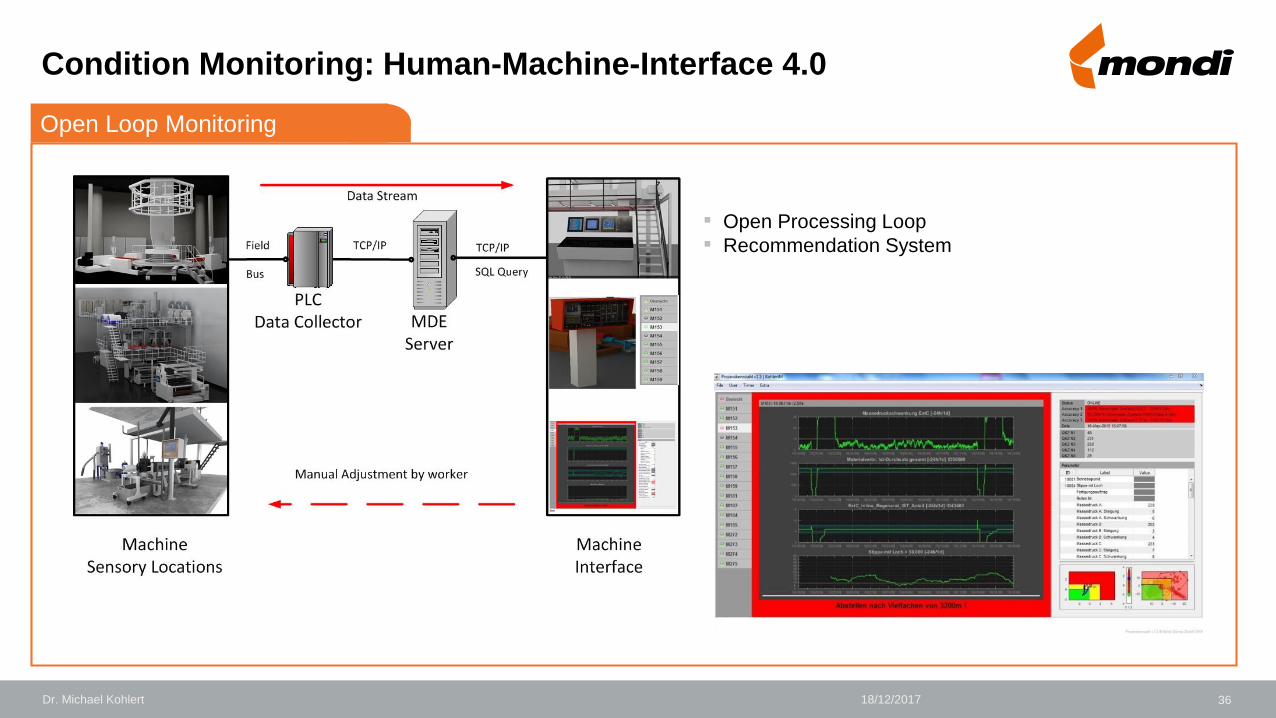
Processing Loop
▪ Open Processing Loop
▪ Recommendation System
36Dr. Michael Kohlert 18/12/2017
Condition Monitoring: Human-Machine-Interface 4.0
Open Loop Monitoring
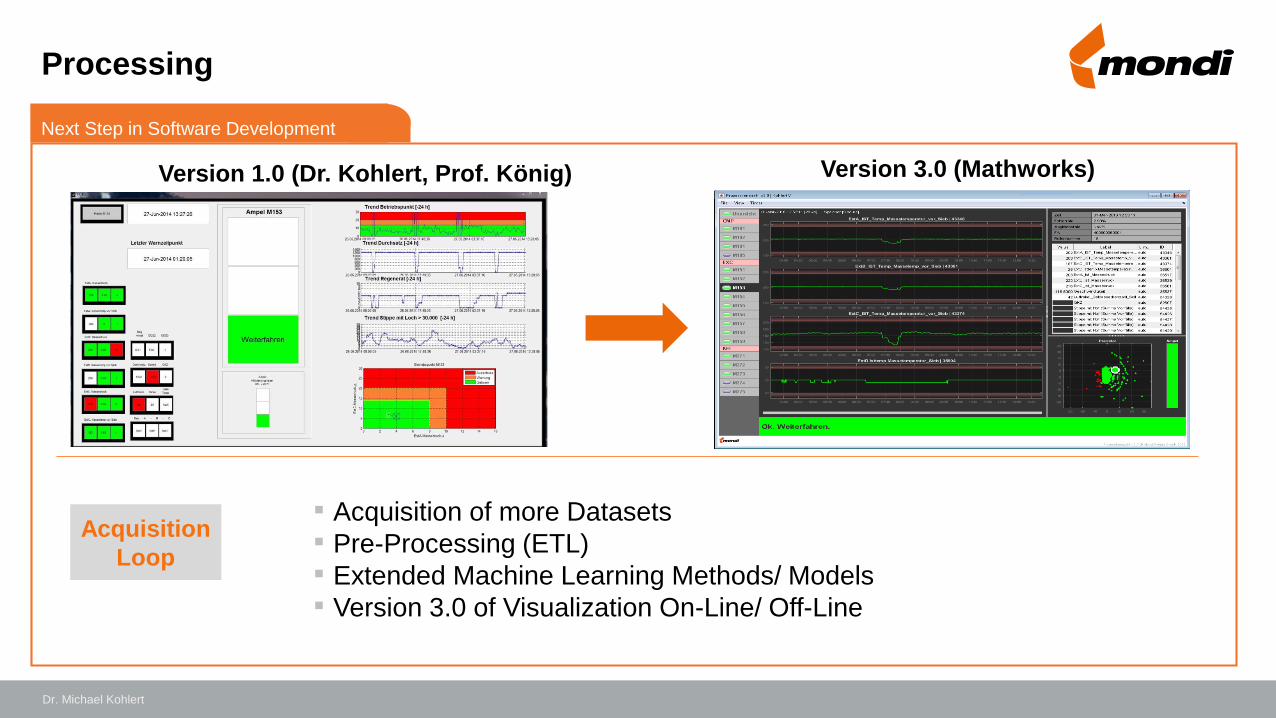
Good ProductNext Step in Software Development
Acquisition
Loop
▪ Acquisition of more Datasets
▪ Pre-Processing (ETL)
▪ Extended Machine Learning Methods/ Models
▪ Version 3.0 of Visualization On-Line/ Off-Line
Version 1.0 (Dr. Kohlert, Prof. König) Version 3.0 (Mathworks)
Processing
Dr. Michael Kohlert
3818/12/2017
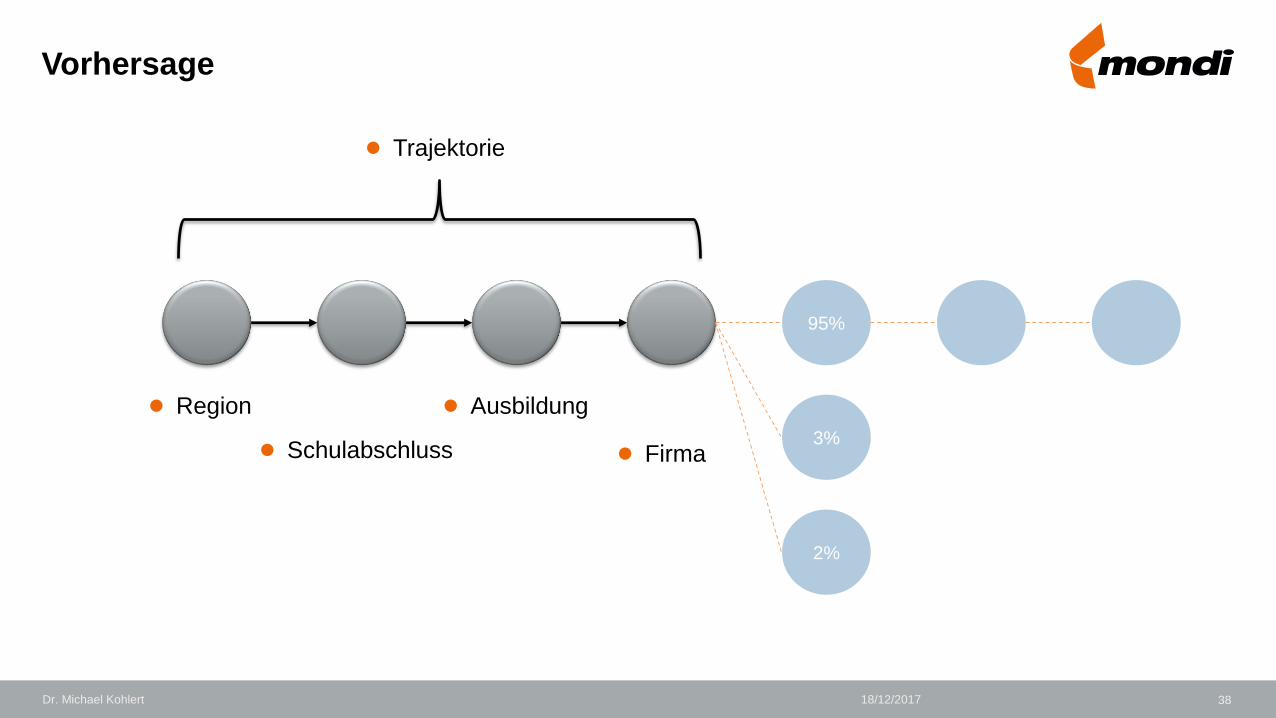
Vorhersage
95%
● Trajektorie
3%
2%
● Schulabschluss
● Region ● Ausbildung
● Firma
Dr. Michael Kohlert
3918/12/2017
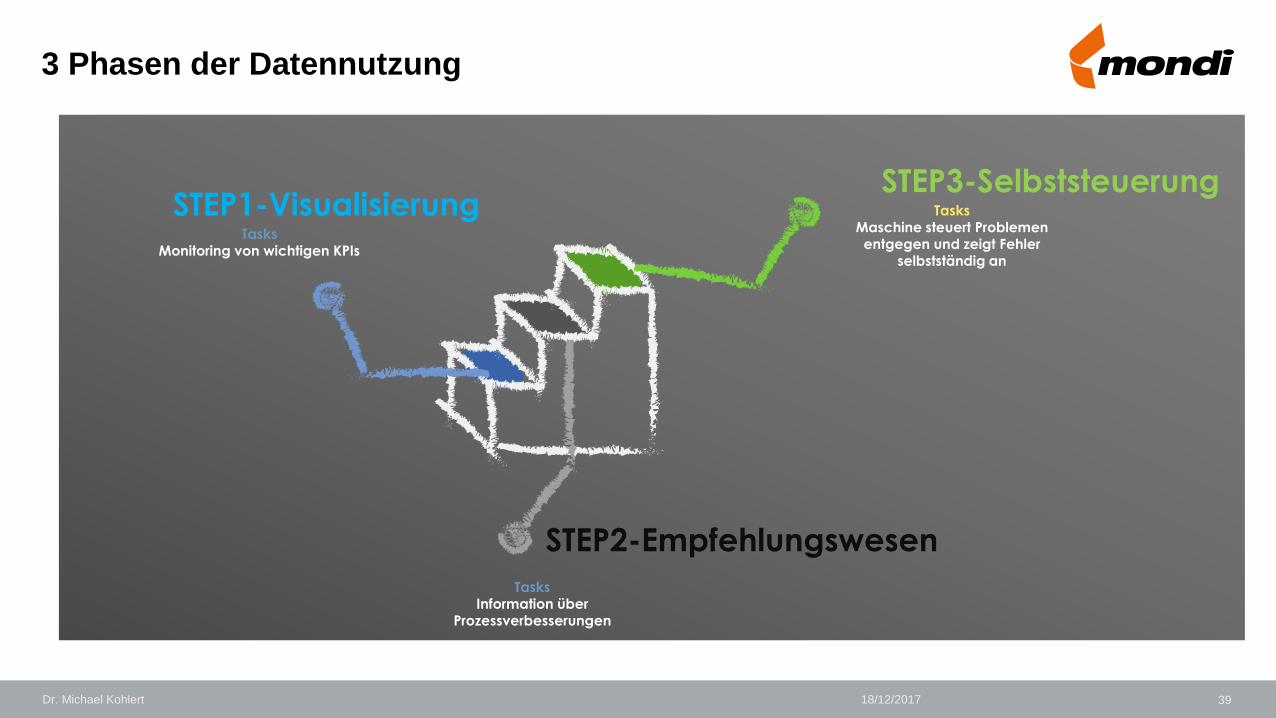
TasksMonitoring von wichtigen KPIs
STEP1-Visualisierung
TasksInformation über
Prozessverbesserungen
STEP2-Empfehlungswesen
TasksMaschine steuert Problemenentgegen und zeigt Fehler
selbstständig an
STEP3-Selbststeuerung
3 Phasen der Datennutzung
Dr. Michael Kohlert
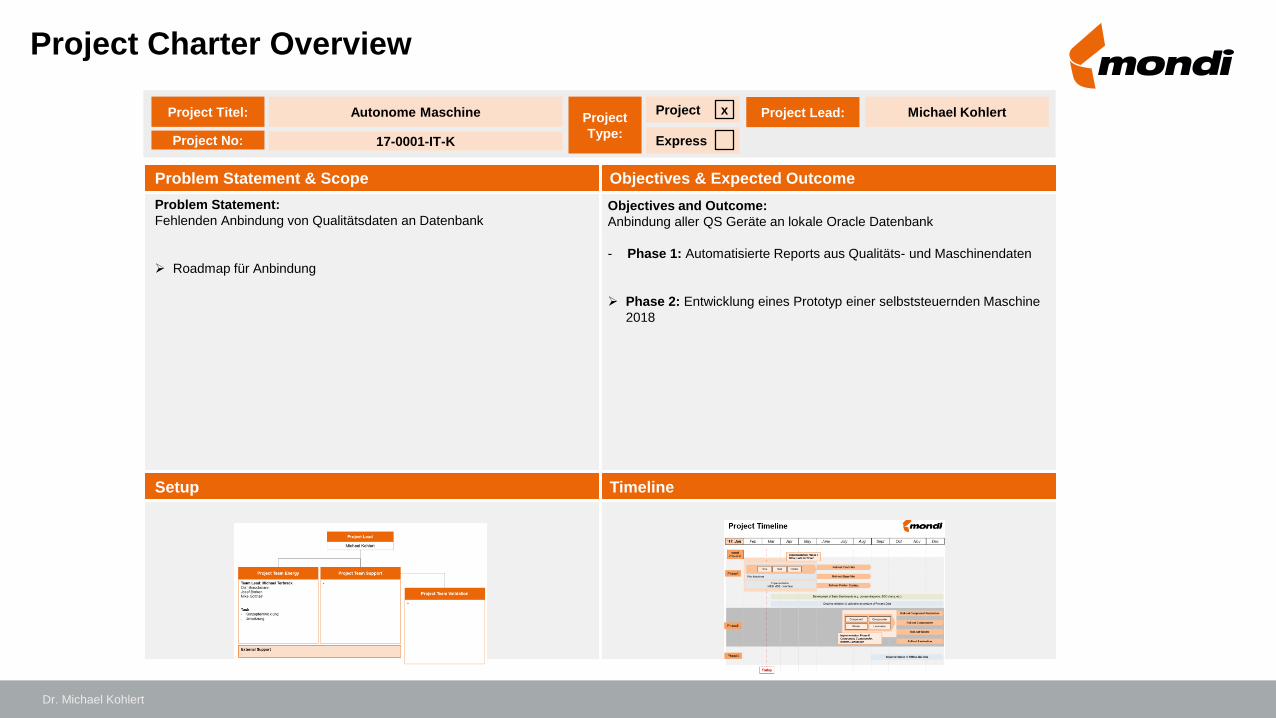
Problem Statement & Scope Objectives & Expected Outcome
Problem Statement:
Fehlenden Anbindung von Qualitätsdaten an Datenbank
Roadmap für Anbindung
Objectives and Outcome:
Anbindung aller QS Geräte an lokale Oracle Datenbank
- Phase 1: Automatisierte Reports aus Qualitäts- und Maschinendaten
Phase 2: Entwicklung eines Prototyp einer selbststeuernden Maschine
2018
Setup Timeline
Project Titel: Autonome Maschine
Project No: 17-0001-IT-K
Project
Type:Express
Project x Project Lead: Michael Kohlert
Project Charter Overview
Dr. Michael Kohlert
41
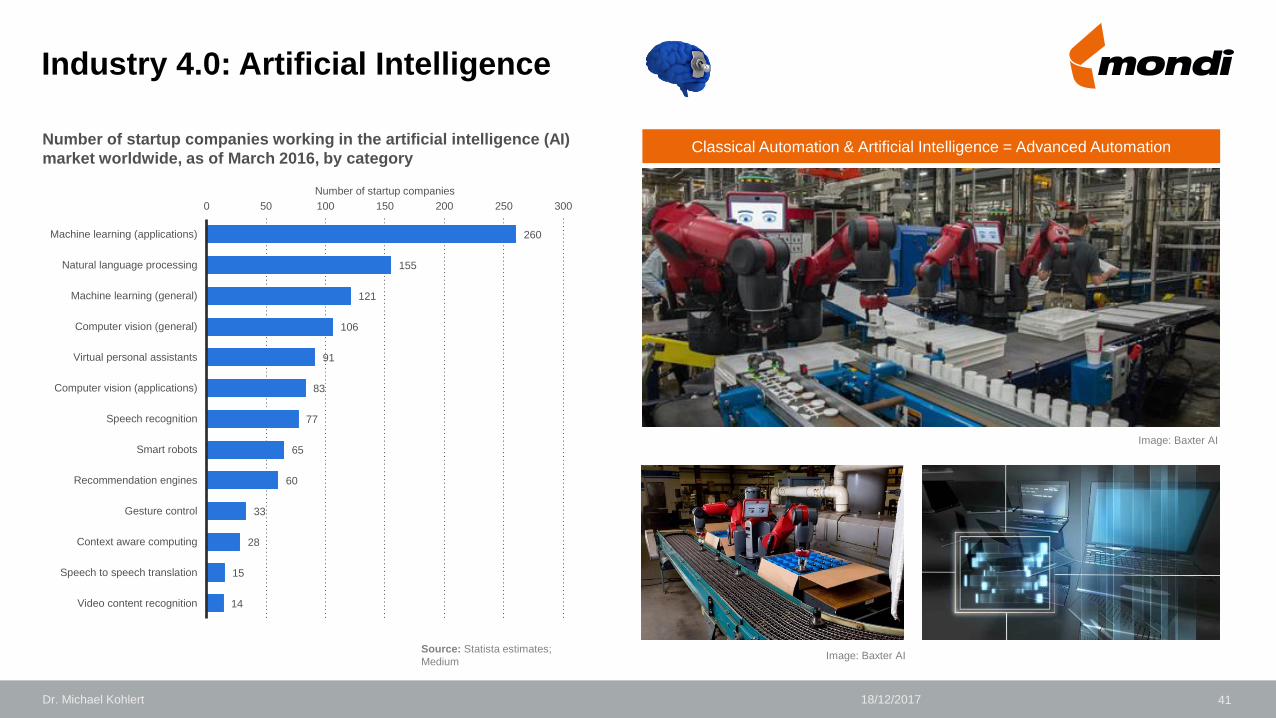
Industry 4.0: Artificial Intelligence
Image: Baxter AI
Image: Baxter AI
Classical Automation & Artificial Intelligence = Advanced Automation
260
155
121
106
91
83
77
65
60
33
28
15
14
0 50 100 150 200 250 300
Machine learning (applications)
Natural language processing
Machine learning (general)
Computer vision (general)
Virtual personal assistants
Computer vision (applications)
Speech recognition
Smart robots
Recommendation engines
Gesture control
Context aware computing
Speech to speech translation
Video content recognition
Number of startup companies
Number of startup companies working in the artificial intelligence (AI)
market worldwide, as of March 2016, by category
Source: Statista estimates;
Medium
Dr. Michael Kohlert 18/12/2017

Renewable Energy LawEnergy Net Fee
Cost Reduction4
42
2
3
4
1
Big Data1
Machine Learning
Modell
2
Prediction3
2017
kW
kW
2017
Industry 4.0: Big Data - Energy Efficiency
Dr. Michael Kohlert 18/12/2017
43
2008
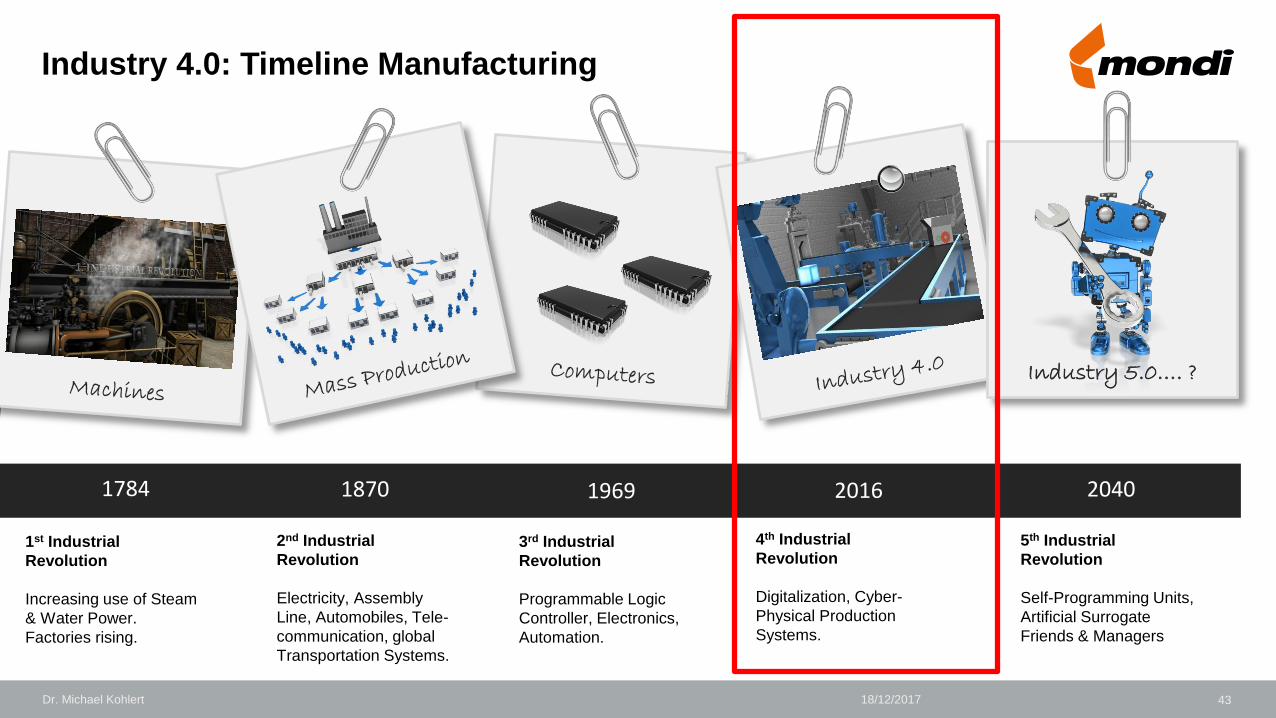
1st Industrial
Revolution
Increasing use of Steam
& Water Power.
Factories rising.
2010
3rd Industrial
Revolution
Programmable Logic
Controller, Electronics,
Automation.
2011
4th Industrial
Revolution
Digitalization, Cyber-
Physical Production
Systems.
Industry 5.0…. ?
2040
5th Industrial
Revolution
Self-Programming Units,
Artificial Surrogate
Friends & Managers
2016196918701784
Industry 4.0: Timeline Manufacturing
2nd Industrial
Revolution
Electricity, Assembly
Line, Automobiles, Tele-
communication, global
Transportation Systems.
Dr. Michael Kohlert 18/12/2017
44
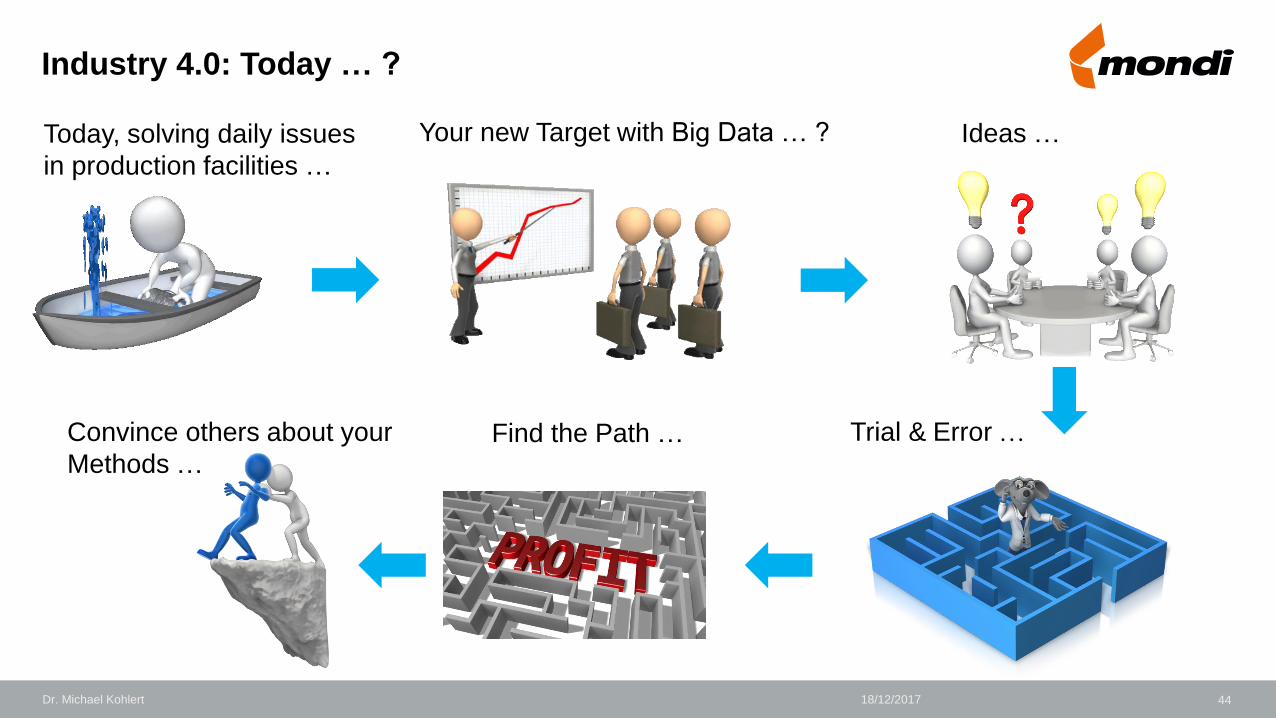
Industry 4.0: Today … ?
Your new Target with Big Data … ?Today, solving daily issues
in production facilities …
Ideas …
Convince others about your
Methods …
Trial & Error …Find the Path …
Dr. Michael Kohlert 18/12/2017
45
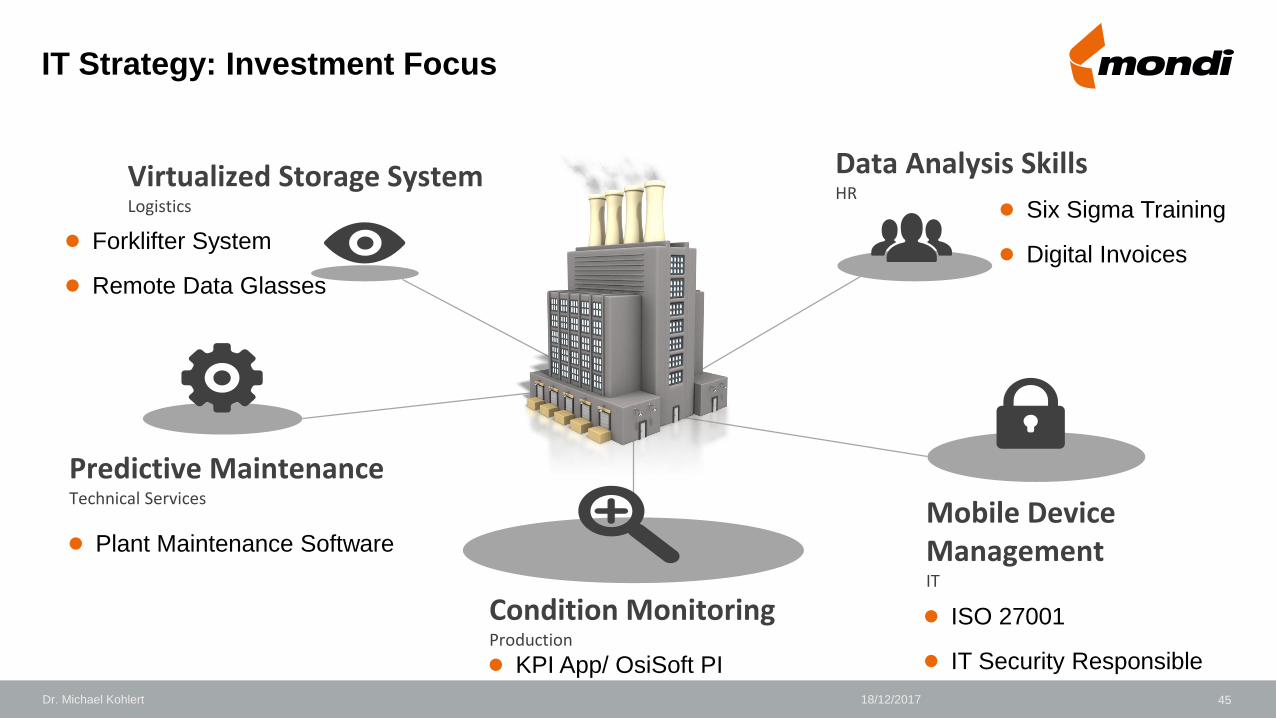
Predictive MaintenanceTechnical Services
Virtualized Storage SystemLogistics
Data Analysis SkillsHR
Mobile Device ManagementIT
Condition MonitoringProduction
IT Strategy: Investment Focus
Dr. Michael Kohlert 18/12/2017
● ISO 27001
● IT Security Responsible
● Plant Maintenance Software
● KPI App/ OsiSoft PI
● Forklifter System
● Remote Data Glasses
● Six Sigma Training
● Digital Invoices
CONCEPT
46
Dr. Michael Kohlert
Head of IT & Automation
Mondi Gronau GmbH
Jöbkesweg 11, 48599 Gronau, Germany
Tel: +49 (0) 2562 919-665
Email: [email protected]