Embed Size (px)
Citation preview
Tunable nonlinear fiber opticsusing dense noble gases
Abstimmbare nichtlineare Faseroptik mit dichten Edelgasen
July 2013
Der Naturwissenschaftlichen Fakultät
der Friedrich-Alexander-Universität Erlangen-Nürnberg
zur Erlangung des Doktorgrades Dr. rer. nat.
vorgelegt von
MOHIUDEEN AZHAR
aus Bangalore, Indien
Als Dissertation genehmigt von der Naturwissenschaftlichen Fakultät der Friedrich-Alexander-Universität Erlangen-Nürnberg
Tag der Mündlichen Prüfung 24-09-2013
Vorsitzender des Promotionsorgans: Prof. Dr. Johannes BarthGutachter: Prof. Philip St.J. Russell, D. Phil, FRS
Prof. Dr. Peter Hommelhoff
Abstract
The nonlinearity and dispersion of a material media, are the pivotal parametersinfluencing nonlinear light-matter interactions. By regulating the pressure in agas-filled hollow-core photonic crystal fiber (PCF), these two parameters can eas-ily be controlled. The choice of monoatomic noble gases as a filling media, avoidsperturbations in the form of molecular interactions like Raman-scattering. How-ever, the inherent material nonlinearity of these fiber systems is much lower thanthat of fused silica glass core fibers. The work presented in this thesis seeks outto address this issue by increasing the density of the filling medium in the hollow-core fiber – thereby offering an unrivaled, tunable nonlinear optical system.
Liquid Ar was used to fill the hollow-core of a kagomé-lattice PCF to scaleup the core material nonlinearity comparable to that of fused silica. For its ex-perimental realization, a novel cryogenic fiber system was conceived. Self-phasemodulation was observed after optical pulse propagation through a column of liq-uid Ar,
By filling a hollow-core PCF with Ar pressures of up to 110 bar, the non-linearity and dispersion of the fiber could be widely tuned. The zero dispersionwavelength could be varied from the UV to IR, resulting in nonlinear studies overvarious dispersion regimes which is in excellent agreement with numerical sim-ulations. Dispersive wave emission in the modulational instability regime wasstudied by positioning the zero dispersion wavelength close to that of the pumplaser. Gas pressure controllable modulational instability sidebands in the absenceof Raman-gain (inherent to fused silica) make this system a prospective, tunablesource of correlated photon pairs.
The goal to achieve fused silica nonlinearity was accomplished by a uniqueblend of photonics and thermodynamics. By considering the nonlinear densityvariation of room temperature Xe with pressure, supercritical Xe at 80 bar wasfilled in a fiber to attain fused silica nonlinearity. Intermodal four-wave-mixingand self focusing effects of fiber in-coupling were observed in subcritical (gaseous)Xe. The work presented here paves the path for several novel optical systems ow-ing to the unique properties of supercritical fluids.
Zusammenfassung
Nichtlinearität und Dispersion eines Materials sind die Schlüsselparameter, die dienichtlineare Wechselwirkung von Licht und Materie beeinflussen. Durch die Reg-ulierung des Drucks in einer gasgefüllten, photonischen Kristallfaser mit Hohlk-ern (engl. photonic crystal fiber, PCF) sind diese zwei Parameter leicht kon-trollierbar. Werden monoatomare Edelgase als Füllmedium gewählt, lassen sichStörungen in der Form molekularer Wechselwirkungen wie der Raman-Streuungvermeiden. Allerdings ist die inhärente Nichtlinearität des Materials dieser Faser-systeme viel geringer als die einer Faser mit Quarzglaskern. Die im Rahmendieser Abhandlung präsentierten Arbeiten gehen diese Ausgangslage heran, in-dem die Dichte des Füllmediums erhöht wird; und somit ein unübertroffenes,durchstimmbares, nichtlinear-optisches System ermöglicht wird.
Um die Materialnichtlinearität des Faserkerns auf Werte vergleichbar denenvon Quarzglas hochzuskalieren, wurde Flüssig-Argon zur Füllung des Hohlkernseiner PCF verwendet. Zur experimentellen Realisierung wurde ein neuartiges,kryogenisches Fasersystem konzipiert. Als Resultat der Pulspropagation durcheine Säule aus Flüssig-Argon wurde Selbstphasenmodulation beobachtet.
Durch das Füllen einer Hohlkern-PCF mit Argon-Drücken von bis zu 110 barkonnten die Nichtlinearität und Dispersion der Faser weitreichend abgestimmtwerden. Die Wellenlänge der Nulldispersion konnte über den gesamten Bereichvom Ultravioletten zum Infraroten variiert werden, woraus nichtlineare Studienüber verschiedene Dispersionsregime resultierten, die in exzellenter Übereinstim-mung mit numerischen Simulationen sind. Die Abstrahlung dispersiver Wellenim Regime der Modulationsinstabilitäten wurde untersucht, indem die Wellen-länge der Nulldispersion nahe bei der Pumpwellenlänge positioniert wurde. Durchden Gasdruck kontrollierbare Seitenbänder hervorgerufen durch die Modulation-sinstabilität sowie das gleichzeitige Ausbleiben der Raman-Verstärkung (inhärentin Quarzglas) machen dieses System zu einer aussichtsreichen, durchstimmbarenQuelle korrelierter Photonenpaare.
Das Ziel, Nichtlinearitäten in der Größenordnung von Quarzglas zu erreichen,wurde durch eine einzigartige Verbindung photonischer sowie thermodynamis-
cher Aspekte bewerkstelligt. Unter Berücksichtigung der nichtlinearen Dichteän-derung von Xenon bei Raumtemperatur in Abhängigkeit des Drucks wurde su-perkritisches Xenon bei 80 bar in die Faser gefüllt, um Nichtlinearitäten vergleich-bar denen von Quarzglas zu erreichen. Intermodale Vier-Wellen-Mischung sowieEffekte der Selbstfokussierung bei der Fasereinkopplung wurden in subkritischem(gasförmigem) Xenon beobachtet. Aufgrund der einzigartigen Eigenschaften su-perkritischer Fluide ebnet die hier präsentierte Arbeit den Weg für zahlreiche,neuartige optische Systeme.

To Mummy, Abba and Mothi
Contents
I Introduction 9I.1 Fundamentals of nonlinear optics . . . . . . . . . . . . . . . . . . 11
I.1.1 Maxwell equations . . . . . . . . . . . . . . . . . . . . . 11
I.1.2 Nonlinearity . . . . . . . . . . . . . . . . . . . . . . . . 12
I.1.3 Fiber Dispersion . . . . . . . . . . . . . . . . . . . . . . 14
I.1.4 Nonlinear Schrödinger equation . . . . . . . . . . . . . . 15
I.1.5 Self-phase modulation . . . . . . . . . . . . . . . . . . . 18
I.1.6 Self-steepening . . . . . . . . . . . . . . . . . . . . . . . 19
I.1.7 Temporal solitons . . . . . . . . . . . . . . . . . . . . . 20
I.1.8 Dispersive wave . . . . . . . . . . . . . . . . . . . . . . 22
I.1.9 Influence of Raman-scattering on nonlinear optics . . . . 25
I.1.10 Four-Wave-Mixing (FWM) & modulational instability (MI) 26
I.1.11 Self-focusing . . . . . . . . . . . . . . . . . . . . . . . . 28
I.1.12 Supercontinuum generation . . . . . . . . . . . . . . . . 30
I.2 Photonic Crystal Fiber (PCF) . . . . . . . . . . . . . . . . . . . . 31
I.2.1 Types of PCF . . . . . . . . . . . . . . . . . . . . . . . . 31
I.2.2 Fabrication . . . . . . . . . . . . . . . . . . . . . . . . . 32
I.2.3 Hollow-core PCF . . . . . . . . . . . . . . . . . . . . . 33
I.2.4 Solid core vs kagomé HC-PCF . . . . . . . . . . . . . . . 38
I.2.5 Preceding gas-filled HC-PCF research . . . . . . . . . . . 41
II Liquid Ar filled kagomé PCF 45II.1 Experimental Implementation . . . . . . . . . . . . . . . . . . . 45
7
8 CONTENTS
II.1.1 Kagomé fiber spliced with a multimode fiber . . . . . . . 46II.1.2 Cryogenic trap . . . . . . . . . . . . . . . . . . . . . . . 47II.1.3 Experimental results . . . . . . . . . . . . . . . . . . . . 53II.1.4 All liquid Cryotrap . . . . . . . . . . . . . . . . . . . . . 58
II.2 Theoretical Analysis . . . . . . . . . . . . . . . . . . . . . . . . 62II.2.1 Calculation of the nonlinear index (n2) of liquid Ar . . . . 63II.2.2 Calculation of the Sellmeier relation for liquid Ar . . . . 63II.2.3 Dispersion of liquid Ar in hollow-core PCF . . . . . . . . 65
II.3 Conclusion and outlook . . . . . . . . . . . . . . . . . . . . . . . 65
III High pressure Ar gas filled PCF 69III.1 Supercritical fluids . . . . . . . . . . . . . . . . . . . . . . . . . 70III.2 High pressure capable experimental setup . . . . . . . . . . . . . 73III.3 Gaseous and supercritical Ar (25-110 bar) . . . . . . . . . . . . . 75III.4 Correlated photon pairs . . . . . . . . . . . . . . . . . . . . . . . 81III.5 Conclusion and Outlook . . . . . . . . . . . . . . . . . . . . . . 82
IV Supercritical Xe filled PCF 87IV.1 Experimental setup modification . . . . . . . . . . . . . . . . . . 87IV.2 Experimental results . . . . . . . . . . . . . . . . . . . . . . . . 91
IV.2.1 Supercritical Xe 80 bar . . . . . . . . . . . . . . . . . . 91IV.2.2 Sub-critical Xe 25-35 bar . . . . . . . . . . . . . . . . . 95
IV.3 Advantages over cryotrap . . . . . . . . . . . . . . . . . . . . . . 97IV.4 Conclusion and Outlook . . . . . . . . . . . . . . . . . . . . . . 98
V Conclusions 101
A Appendix 103A.1 List of Publications . . . . . . . . . . . . . . . . . . . . . . . . . 103A.2 Instructions to operate the cryotrap . . . . . . . . . . . . . . . . 105A.3 Acknowledgments . . . . . . . . . . . . . . . . . . . . . . . . . 107
Bibliography 111
Chapter I
Introduction
The advent of lasers in the 1960s led to widespread excitement and progress in thestudy of light-matter interactions leading to the diverse field of nonlinear optics[1, 2, 3]. Exciting phenomenon like supercontinuum generation [4, 5], high powerlaser development, etc led to applications and research advancements in virtuallyall fields of science spanning from high energy physics to biomedical applications.In the quest to find ways to increase interaction lengths for light-matter interac-tions, research groups around the world used optical cavities [6] , capillaries [7] ,doped optical fibers [8] , among the many attempted solutions. These techniqueswere useful for their time, but the high losses and low material damage thresholdslimited the progress made.
The 1990s heralded the development of photonic crystal fibers (PCF) (inventedby Philip Russell) [9], that offered to revolutionize nonlinear optics. The period-ical arrangement of holes in the cladding offered a lattice structure that allowedfor customizable dispersion and enhanced nonlinearity owing to a smaller coresize. Solid core PCFs lead to the development of endlessly single-mode fibers[10], compact and inexpensive supercontinuum sources [11], frequency combs[12, 13, 14], etc. However the photonic bandgaps offered by means of an appro-priately designed cladding structure, allowed photonic bandgaps fibers to guidelight in the core-even in a hollow-core. The prospect of hollow-core photoniccrystal fibers (HC-PCF) offered long interaction lengths and excellent light-matter
9
10 CHAPTER I. INTRODUCTION
spatial overlap. Experiments like [15, 16] made use of these fibers for low powerRaman-scattering interactions. A HC-PCF with a kagomé-style cladding latticewas found to support a much broader transmission window (from UV-IR). Such abroad transmission range lead kagomé HC-PCF to be used in novel nonlinear ex-periments such as dispersive wave UV generation [17], in-fiber ionization relatedeffects [18, 19], spectral broadening for pulse compression [20], frequency combgeneration [13, 14], etc. In all these cases the material nonlinearity of the coremedium was much lower than that of glasses like (fused silica [21]). Hence mostof the above experiments required amplified pulsed lasers for initiation the vari-ous nonlinear processes. This experimental work in this thesis seeks out to addressthis very issue – to raise the material nonlinearity of a hollow-core to that of fusedsilica using dense gases or liquids. By using monoatomic noble gases, molecu-lar interactions like Raman-scattering (inherent to fused silica [22, 21]) could beavoided, enabling study of nonlinear optics without Raman-related perturbations.Pivotal parameters for nonlinear optics such as dispersion and nonlinearity couldbe tuned merely by adjusting the gas pressure in the fiber – a level of flexibility notseen before in nonlinear fiber optics. The hollow-core also means that the damagethreshold is significantly higher than fused silica fibers [23].
Chapter I begins with an introduction to nonlinear fiber optics and nonlinearphenomena relevant to this thesis. The paragraphs in italic font point to the partof the thesis where the corresponding phenomenon has been observed.
The experimental work presented in this thesis follows a chronological orderwhere the efforts to raise the material nonlinearity began with filling the core ofa HC-PCF with liquid Ar. Chapter II deals with the experimental implementationand results of liquid Ar filled HC-PCF [24].
Chapter III details the high-pressure gas-filled HC-PCF experiments. Almostall of the technical problems encountered in Chapter II were solved using thissystem. The results presented here include the ability to tune the zero dispersionwavelength from the UV to the IR by varying the gas pressure. This remarkablelevel of flexibility comes with the added advantage of the core medium being freeof Raman-scattering [25].
I.1. FUNDAMENTALS OF NONLINEAR OPTICS 11
Chapter IV is about the supercritical Xe filled HC-PCF where the goal toachieve fused silica nonlinearity in the core of a HC-PCF was achieved. Interest-ing nonlinear optical phenomenon such as intermodal four-wave-mixing and self-focusing related effects were observed. Concluding remarks and future prospectshave been outlined for each of the experimental chapters [26].
I.1 Fundamentals of nonlinear optics
I.1.1 Maxwell equations
Maxwell’s equations can be used to describe all electromagnetic phenomena in-cluding optical field propagation in optical fibers [21]. They are given by
∇×E =−∂B∂ t
(I.1a)
∇×H = J+ ∂D∂ t
(I.1b)
∇ ·D = ρ (I.1c)
∇ ·B = 0 (I.1d)
where E and H are the electric and magnetic vectors and D and B are their elec-tric and magnetic flux densities. Since free charges are mostly absent in opticalfibers, the current density J =0 and charge densityρ =0. The following relationsrelate the flux densities
D = ε0E+P (I.2a)
B = µ0H+M (I.2b)
where ε0 and µ0 are the vacuum permittivity and permeability respectively. P and
12 CHAPTER I. INTRODUCTION
M are the induced electric and magnetic polarizations. However, since opticalfibers are nonmagnetic, M = 0.
To derive the wave equation describing optical field propagation in opticalfibers, Eq. I.2a and I.2b are inserted into the Maxwell equations and the curl ofEq. I.1a is taken
∇×∇×E =1c2
∂ 2E∂ t2 −µ0
∂ 2P∂ t2 (I.3)
From vector algebra it is well know that
∇×∇×E = ∇(∇ ·E)−∇2E =−∇2E (I.4)
because ∇ · D = ε∇ · E = 0, therefore Eq. I.3 takes the form of a Helmholtzequation
∇2E+n2 (ω)ω2
c2 E = 0 (I.5)
Eq. I.5 is the wave equation for a propagating optical field E.
I.1.2 Nonlinearity
The origin of optical nonlinearity of any dielectric medium is fundamentally theresponse of the motion of the bound electrons in the media to the applied electricfield of the optical field. This motion is nonlinear. The electronic response to theoptical field can be understood from the polarization induced by electric dipolesin the medium, and is given by
P = ε0(χ(1) ·E+χ(2) ·EE+χ(3) ·EEE · · ·) (I.6)
ε0 is the vacuum permittivity and χ( j),( j = 1,2,3, · · ·) stands for the jthordersusceptibility. χ(2) vanishes for fused silica as SiO2 is a symmetric molecule.χ(2) is nonzero only for media which lack inversion symmetry at a molecular level[21]. χ(2) is associated with effects such as second harmonic generation or sum-frequency generation. Therefore, in the absence of χ(2) , χ(3) plays a dominant
I.1. FUNDAMENTALS OF NONLINEAR OPTICS 13
role in nonlinear fiber optics. The refractive index of a nonlinear medium is givenby
n(ω, I) = n(ω)+n2I (I.7)
where I represents the optical intensity and is propotional to the square of theelectric field. The first term n(ω) is the linear refractive index and the secondterm n2 represents the nonlinear refractive index which is related to the third ordersusceptibility χ(3) by [27]
n2 =3
4nε0cχ(3) (I.8)
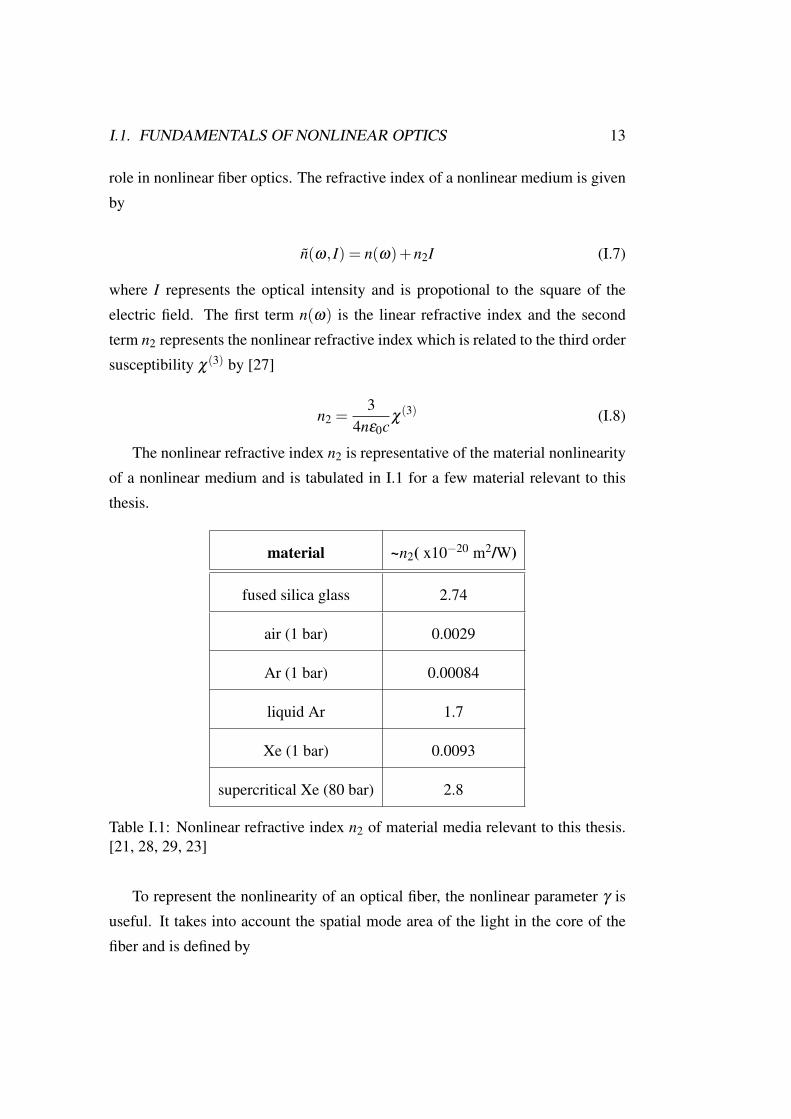
The nonlinear refractive index n2 is representative of the material nonlinearityof a nonlinear medium and is tabulated in I.1 for a few material relevant to thisthesis.
material ~n2( x10−20 m2/W)
fused silica glass 2.74
air (1 bar) 0.0029
Ar (1 bar) 0.00084
liquid Ar 1.7
Xe (1 bar) 0.0093
supercritical Xe (80 bar) 2.8
Table I.1: Nonlinear refractive index n2 of material media relevant to this thesis.[21, 28, 29, 23]
To represent the nonlinearity of an optical fiber, the nonlinear parameter γ isuseful. It takes into account the spatial mode area of the light in the core of thefiber and is defined by
14 CHAPTER I. INTRODUCTION
γ =n2ω0
cAeff(I.9)
where n2 is the material nonlinear refractive index of the core media. Aeff is theeffective modal area of of the propagating mode in the fiber core. c is the speed oflight.
Matching the n2 of a gas/liquid filled hollow-core fiber to the n2 of fused silica∼ 2.74×10⁻²⁰ m2/W is one of the main motivations of the work reported in thisthesis. Liquid Ar and supercritical Xe at 80 bar were two dense noble gas mediawhich was used in the hollow-core fibers in the work reported in this thesis.
I.1.3 Fiber Dispersion
Fiber dispersion is important for short optical pulses as it defines speed for variousspectral components given by c/n(ω). This in turn defines the phase-matchingconditions for various nonlinear processes like four-wave mixing [30] or disper-sive wave generation [31]. The chromatic dispersion is the change of linear re-fractive index with the optical frequency (Fig. I.1) and is given by n(ω). Themode-propagation constant (the wave-vector component in the direction of prop-agation) β (ω) is expanded as a Taylor series as its exact functional form is notalways known.
β (ω) = β0 +(ω −ω0)
1!β1 +
(ω −ω0)2
2!β2 +
(ω −ω0)3
3!β3 + · · · (I.10)
where β0 = β (ω0) and
β j =
∂ jβ∂ω j
ω=ω0 ,( j = 1,2,3 · · ·)
The group velocity is given by vg = 1/β1 , β1 = c/ng and the group velocitydispersion (GVD) is given by β2. β2 represents the dispersion of the group veloc-ity of the pulse and influences pulse broadening. The sign of GVD or sgn(β2) is
I.1. FUNDAMENTALS OF NONLINEAR OPTICS 15
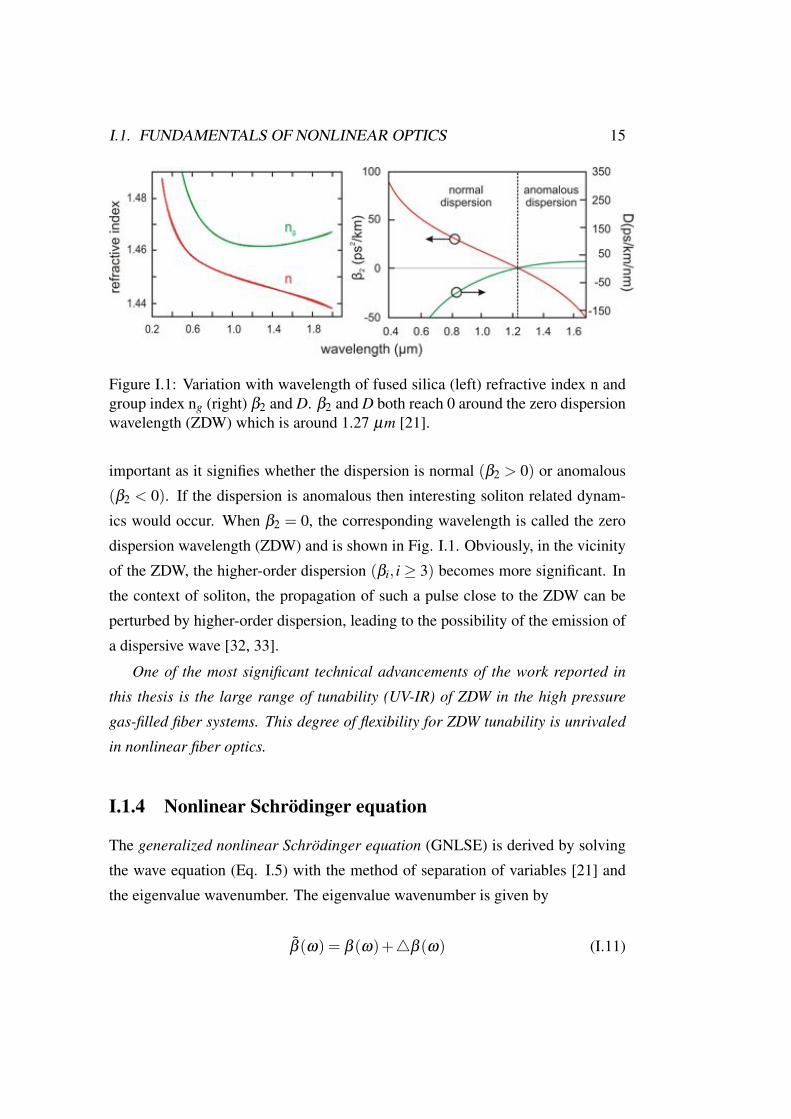
Figure I.1: Variation with wavelength of fused silica (left) refractive index n andgroup index ng (right) β2 and D. β2 and D both reach 0 around the zero dispersionwavelength (ZDW) which is around 1.27 µm [21].
important as it signifies whether the dispersion is normal (β2 > 0) or anomalous(β2 < 0). If the dispersion is anomalous then interesting soliton related dynam-ics would occur. When β2 = 0, the corresponding wavelength is called the zerodispersion wavelength (ZDW) and is shown in Fig. I.1. Obviously, in the vicinityof the ZDW, the higher-order dispersion (βi, i ≥ 3) becomes more significant. Inthe context of soliton, the propagation of such a pulse close to the ZDW can beperturbed by higher-order dispersion, leading to the possibility of the emission ofa dispersive wave [32, 33].
One of the most significant technical advancements of the work reported inthis thesis is the large range of tunability (UV-IR) of ZDW in the high pressuregas-filled fiber systems. This degree of flexibility for ZDW tunability is unrivaledin nonlinear fiber optics.
I.1.4 Nonlinear Schrödinger equation
The generalized nonlinear Schrödinger equation (GNLSE) is derived by solvingthe wave equation (Eq. I.5) with the method of separation of variables [21] andthe eigenvalue wavenumber. The eigenvalue wavenumber is given by
β (ω) = β (ω)+β (ω) (I.11)
16 CHAPTER I. INTRODUCTION
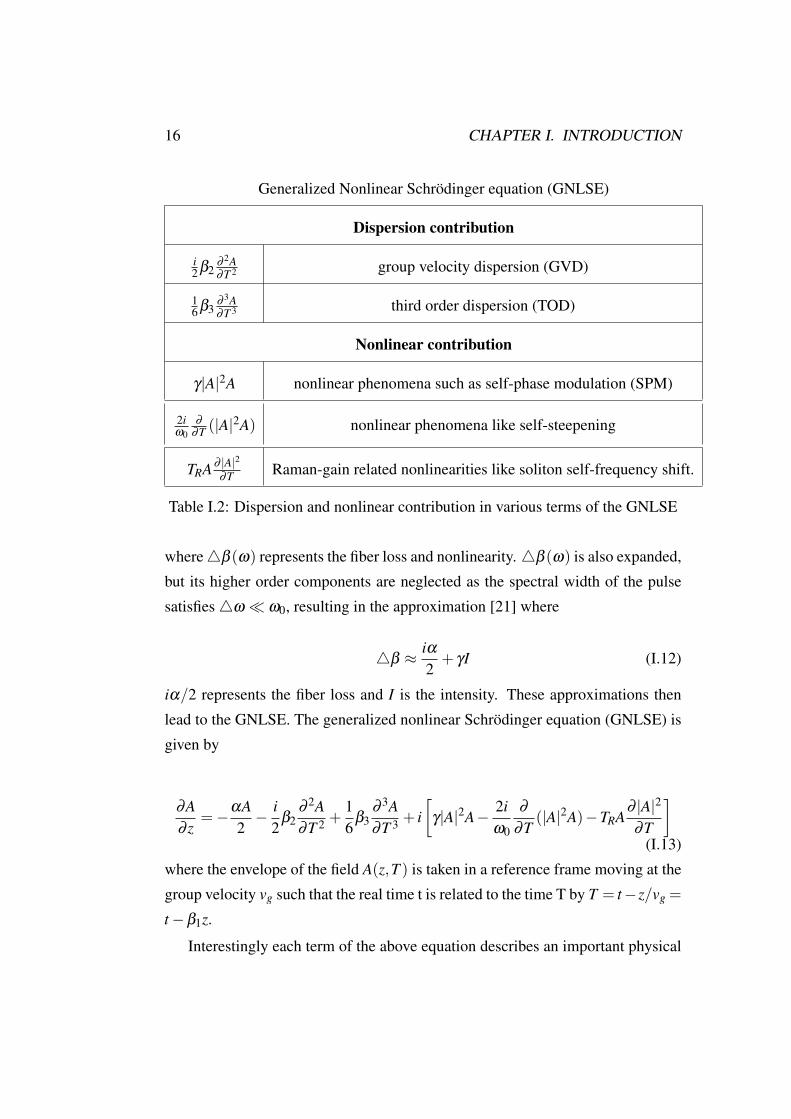
Generalized Nonlinear Schrödinger equation (GNLSE)
Dispersion contribution
i2β2
∂ 2A∂T 2 group velocity dispersion (GVD)
16β3
∂ 3A∂T 3 third order dispersion (TOD)
Nonlinear contribution
γ|A|2A nonlinear phenomena such as self-phase modulation (SPM)
2iω0
∂∂T (|A|
2A) nonlinear phenomena like self-steepening
TRA∂ |A|2∂T Raman-gain related nonlinearities like soliton self-frequency shift.
Table I.2: Dispersion and nonlinear contribution in various terms of the GNLSE
where β (ω) represents the fiber loss and nonlinearity. β (ω) is also expanded,but its higher order components are neglected as the spectral width of the pulsesatisfies ω ω0, resulting in the approximation [21] where
β ≈ iα2+ γI (I.12)
iα/2 represents the fiber loss and I is the intensity. These approximations thenlead to the GNLSE. The generalized nonlinear Schrödinger equation (GNLSE) isgiven by
∂A∂ z
=−αA2
− i2
β2∂ 2A∂T 2 +
16
β3∂ 3A∂T 3 + i
γ|A|2A− 2i
ω0
∂∂T
(|A|2A)−TRA∂ |A|2
∂T
(I.13)where the envelope of the field A(z,T ) is taken in a reference frame moving at thegroup velocity vg such that the real time t is related to the time T by T = t−z/vg =
t −β1z.
Interestingly each term of the above equation describes an important physical
I.1. FUNDAMENTALS OF NONLINEAR OPTICS 17
phenomena that the envelope can experience as the pulse is propagating alongz and is tabulated in Table I.2. TR is related to the slope of the Raman-gainof the media. This last term in the GNLSE is important, as it represents theRaman-scattering contribution that is avoided in the experiments in III, by us-ing monoatomic noble gases which have negligible Raman-scattering. In the nu-merical simulations, this Raman-contribution is “turned off” giving an excellentagreement with experimental observations. The term αA/2 represents the fiberloss.
Considering a very simplified case, where only the nonlinearity plays a role inthe propagation of the pulse, the GNLSE becomes:
∂A∂ z
= iγ|A|2A (I.14)
Both sides of the equation must have the same dimensions, which means that wecan define a scaling length LNLas
LNL =1
(γP0)(I.15)
Similarly, in the case of a pulse propagating in a purely dispersive medium, wewould have
∂A∂ z
= iβ2∂ 2A∂T 2 (I.16)
and then we could derive a scaling length for the dispersion effect as:
LD =T 2
0|β2|
(I.17)
where dispersion effect must be taken into account for pulse traveling over a dis-tance L > LD. T0 is the pulse width and P0 is the peak power of the pulse. Both LD
and LNL decrease for intense and short optical pulses. These two lengths are usefulfor characterizing the nonlinear and dispersive contribution of light-matter inter-actions. For a length of fiber L, if L LD, and L LNL then neither the dispersivenor nonlinear effects can affect a propagating pulse. If L ∼ LD and L LNL, then
18 CHAPTER I. INTRODUCTION
dispersive effects would dominate and the nonlinear effects would not play a roleand vice versa. The possibility of solitons in the anomalous dispersion regime,arise when the dispersive effects and the nonlinear effects match.
I.1.5 Self-phase modulation
When a pulse propagates over a distance that is longer that this characteristiclength LNL, then nonlinear effects become relevant. Since phase of an opticalfield with intensity I(t) is given by
φ = nk0z = (n+n2I(t))k0z (I.18)
it is clear the phase experiences a modulation which depends on the pulse itself– hence the name: self-phase modulation or SPM. This effect leads to nonlinearspectral broadening of the input pulse.
φ(t) =−n2I(t)k0z (I.19)
where n2 is the nonlinear refractive index, I(t) is the time-dependent optical in-tensity of the pulse, k0 is the wavenumber and z is the distance travelled by thepulse in the Kerr medium. The spectral broadening arises from the new frequencycomponents generated by time dependence of the phase shift. The change in in-stantaneous frequency is given by
ωi =d(∆φ)
dt=−n2
dIdt
k0z (I.20)
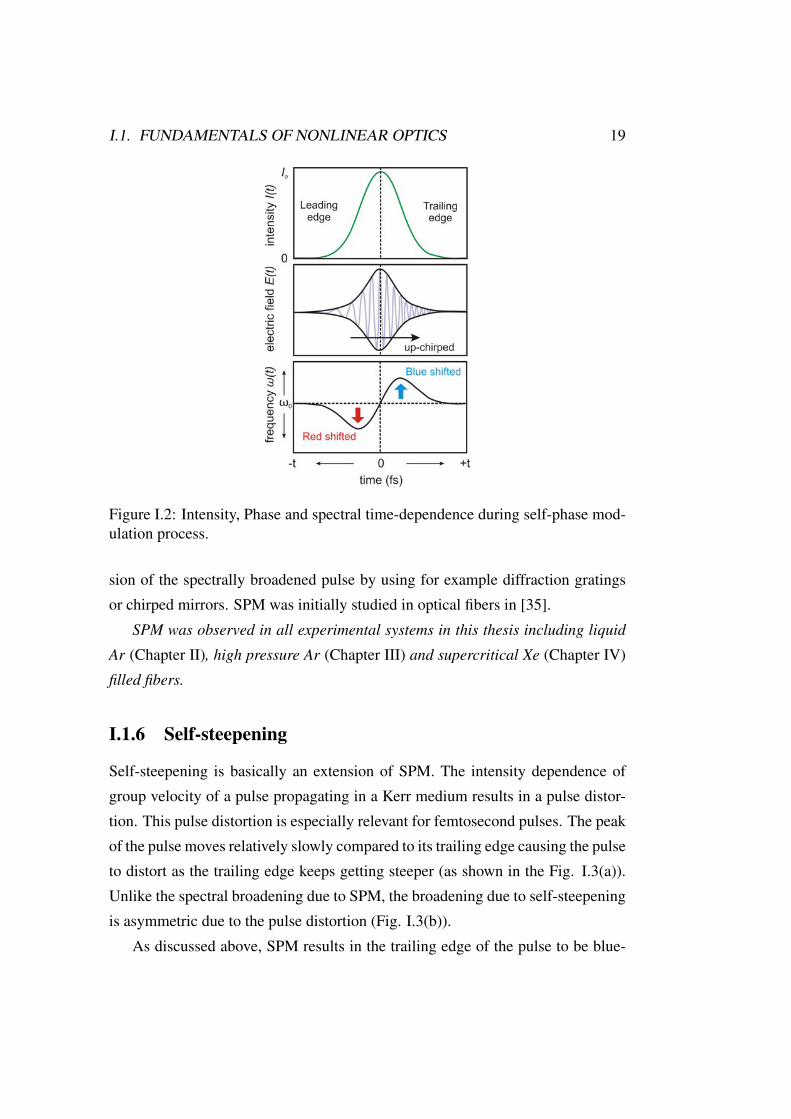
For a simple pulse shape, such as a Gaussian, one half of the pulse trailingin time would have a frequency shift toward higher frequencies (blue shifted) asdI/dt < 0. Similarly the leading half of the pulse in time, would experience a fre-quency downshift (red shift) as dI/dt > 0. Hence a time dependent phase changegives rise to new frequency shifts and spectral broadening (Fig. I.2). SPM inthe above scenario also renders the pulse up-chirped. This introduction of chirpenables SPM to be used for pulse shaping [34] appropriately tailoring the disper-
I.1. FUNDAMENTALS OF NONLINEAR OPTICS 19
Figure I.2: Intensity, Phase and spectral time-dependence during self-phase mod-ulation process.
sion of the spectrally broadened pulse by using for example diffraction gratingsor chirped mirrors. SPM was initially studied in optical fibers in [35].
SPM was observed in all experimental systems in this thesis including liquidAr (Chapter II), high pressure Ar (Chapter III) and supercritical Xe (Chapter IV)filled fibers.
I.1.6 Self-steepening
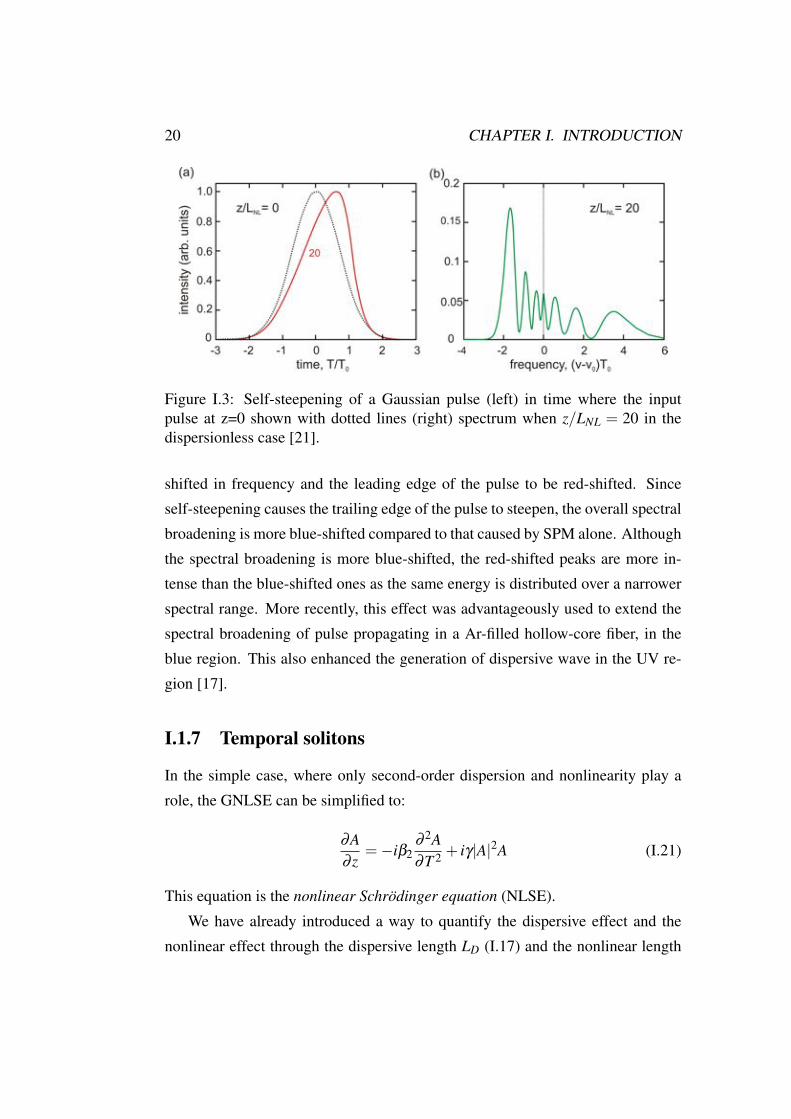
Self-steepening is basically an extension of SPM. The intensity dependence ofgroup velocity of a pulse propagating in a Kerr medium results in a pulse distor-tion. This pulse distortion is especially relevant for femtosecond pulses. The peakof the pulse moves relatively slowly compared to its trailing edge causing the pulseto distort as the trailing edge keeps getting steeper (as shown in the Fig. I.3(a)).Unlike the spectral broadening due to SPM, the broadening due to self-steepeningis asymmetric due to the pulse distortion (Fig. I.3(b)).
As discussed above, SPM results in the trailing edge of the pulse to be blue-
20 CHAPTER I. INTRODUCTION
Figure I.3: Self-steepening of a Gaussian pulse (left) in time where the inputpulse at z=0 shown with dotted lines (right) spectrum when z/LNL = 20 in thedispersionless case [21].
shifted in frequency and the leading edge of the pulse to be red-shifted. Sinceself-steepening causes the trailing edge of the pulse to steepen, the overall spectralbroadening is more blue-shifted compared to that caused by SPM alone. Althoughthe spectral broadening is more blue-shifted, the red-shifted peaks are more in-tense than the blue-shifted ones as the same energy is distributed over a narrowerspectral range. More recently, this effect was advantageously used to extend thespectral broadening of pulse propagating in a Ar-filled hollow-core fiber, in theblue region. This also enhanced the generation of dispersive wave in the UV re-gion [17].
I.1.7 Temporal solitons
In the simple case, where only second-order dispersion and nonlinearity play arole, the GNLSE can be simplified to:
∂A∂ z
=−iβ2∂ 2A∂T 2 + iγ|A|2A (I.21)
This equation is the nonlinear Schrödinger equation (NLSE).We have already introduced a way to quantify the dispersive effect and the
nonlinear effect through the dispersive length LD (I.17) and the nonlinear length
I.1. FUNDAMENTALS OF NONLINEAR OPTICS 21
LNL (Eq. I.15). When these effects balance out each other, the pulse travels with-out being modified in the time or spectral domain. This is the fundamental soliton(Fig. I.4, N=1). A solution of I.21 [36] has the form
A(z,T ) = A0sech
TT0
exp
iγA2
0z2
(I.22)
where the soliton wave-vector ksol = (γA20)/2 is independent of ω . Note that soli-
ton can only appear for one specific sign of β2. For β2 < 0 (anomalous dispersion),these are so-called bright solitons and are the type of pulse that we are referring towhen mentioning a soliton in this thesis. An intuitive approach to understandingsolitons in the anomalous dispersion regime is to consider the dispersion-inducedchirp
δωi =−dφdt
=sgn(β2)(z/LD)
(1+(z/LD)2T/T 20 )
(I.23)
This dispersion-induced chirp is negative in the anomalous dispersion regime(β2 < 0) but since SPM induces a positive chirp on the pulse (Fig. I.2). Thesecompeting effects can compensate each other, resulting in the pulse retaining itsshape, despite nonlinear and dispersive influences from the medium [37, 38]. Forthe fundamental soliton, since both nonlinear and dispersive effects exactly bal-ance each other, the ratio of the characteristic lengths LD/LNL is equal to unity.Actually, more generally, we can define the soliton order N by
N2 =LD
LNL=
(γP0T02)
|β2|(I.24)
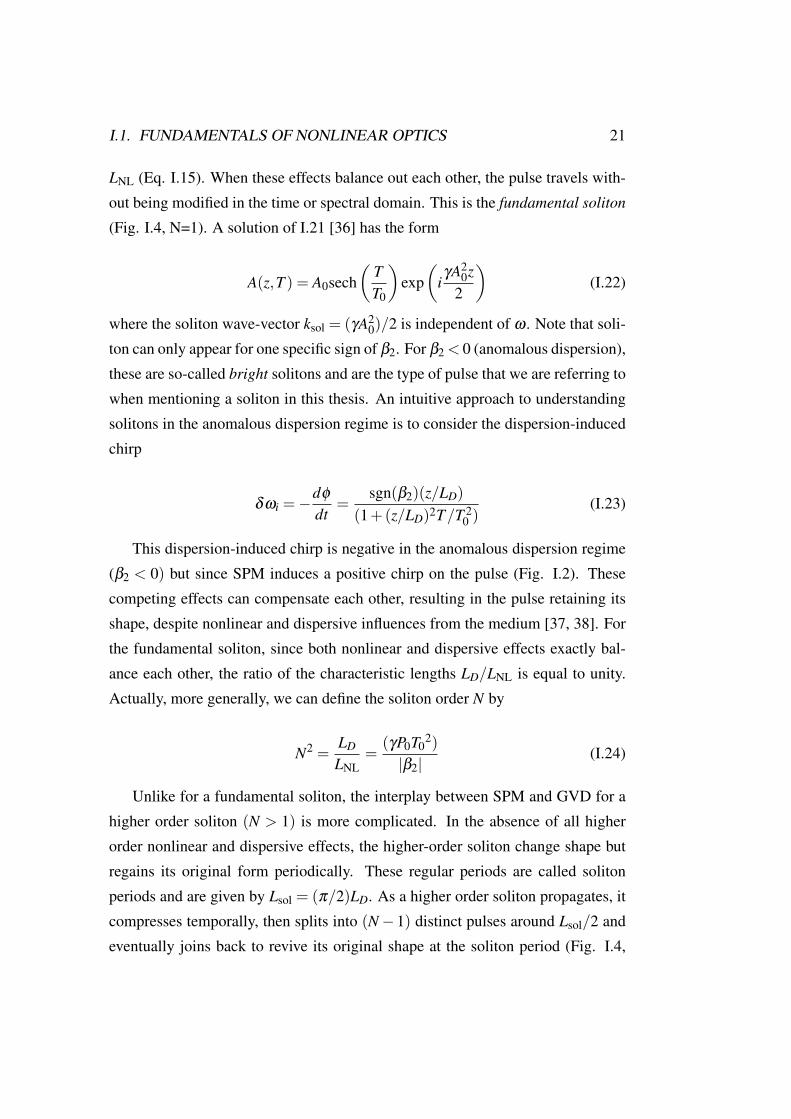
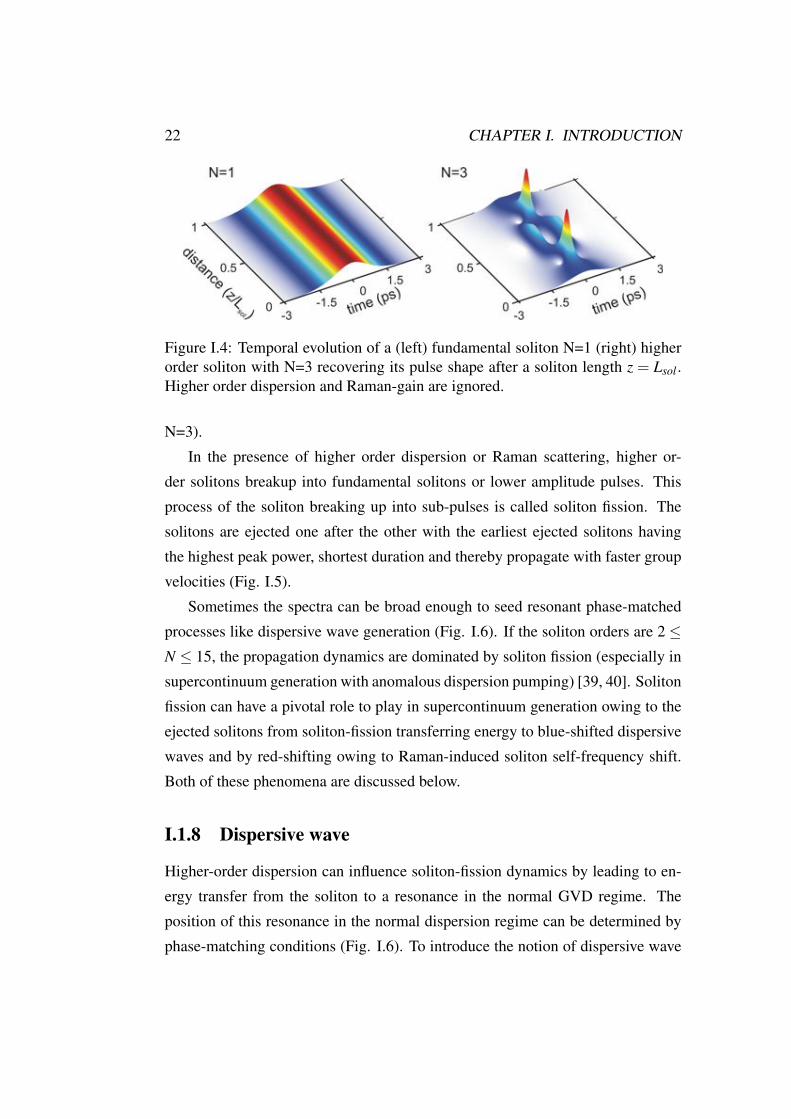
Unlike for a fundamental soliton, the interplay between SPM and GVD for ahigher order soliton (N > 1) is more complicated. In the absence of all higherorder nonlinear and dispersive effects, the higher-order soliton change shape butregains its original form periodically. These regular periods are called solitonperiods and are given by Lsol = (π/2)LD. As a higher order soliton propagates, itcompresses temporally, then splits into (N −1) distinct pulses around Lsol/2 andeventually joins back to revive its original shape at the soliton period (Fig. I.4,
22 CHAPTER I. INTRODUCTION
Figure I.4: Temporal evolution of a (left) fundamental soliton N=1 (right) higherorder soliton with N=3 recovering its pulse shape after a soliton length z = Lsol .Higher order dispersion and Raman-gain are ignored.
N=3).In the presence of higher order dispersion or Raman scattering, higher or-
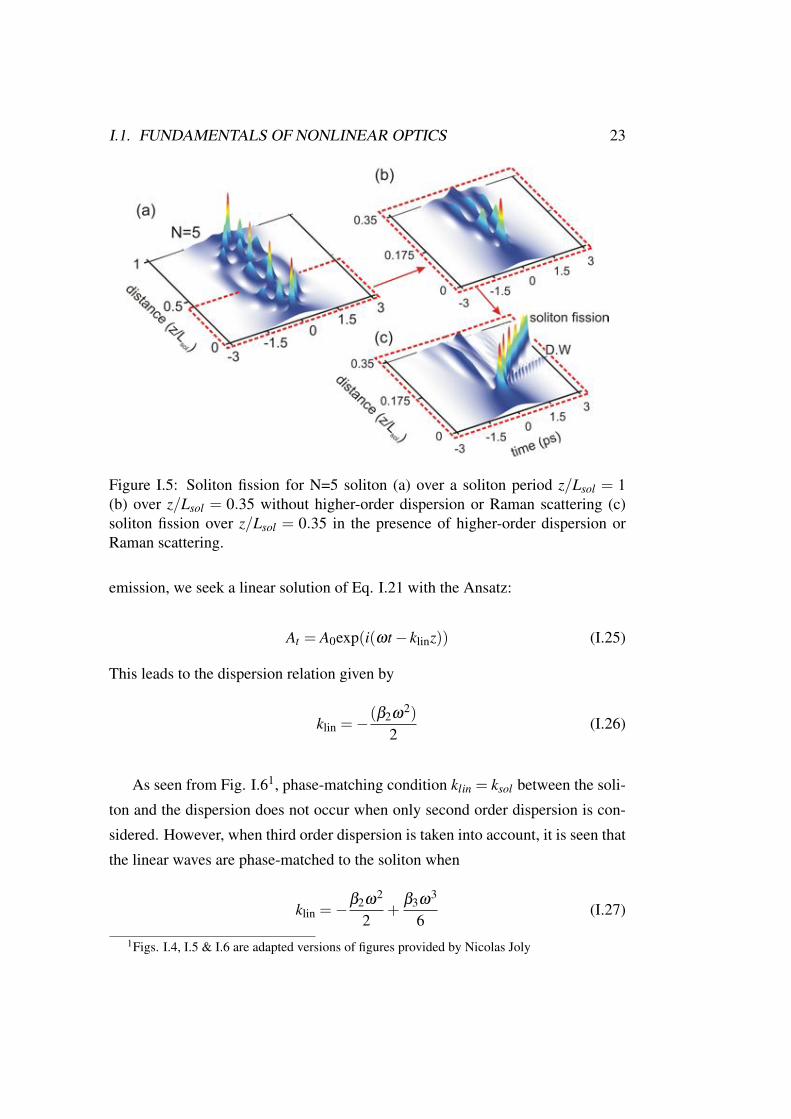
der solitons breakup into fundamental solitons or lower amplitude pulses. Thisprocess of the soliton breaking up into sub-pulses is called soliton fission. Thesolitons are ejected one after the other with the earliest ejected solitons havingthe highest peak power, shortest duration and thereby propagate with faster groupvelocities (Fig. I.5).
Sometimes the spectra can be broad enough to seed resonant phase-matchedprocesses like dispersive wave generation (Fig. I.6). If the soliton orders are 2 ≤N ≤ 15, the propagation dynamics are dominated by soliton fission (especially insupercontinuum generation with anomalous dispersion pumping) [39, 40]. Solitonfission can have a pivotal role to play in supercontinuum generation owing to theejected solitons from soliton-fission transferring energy to blue-shifted dispersivewaves and by red-shifting owing to Raman-induced soliton self-frequency shift.Both of these phenomena are discussed below.
I.1.8 Dispersive wave
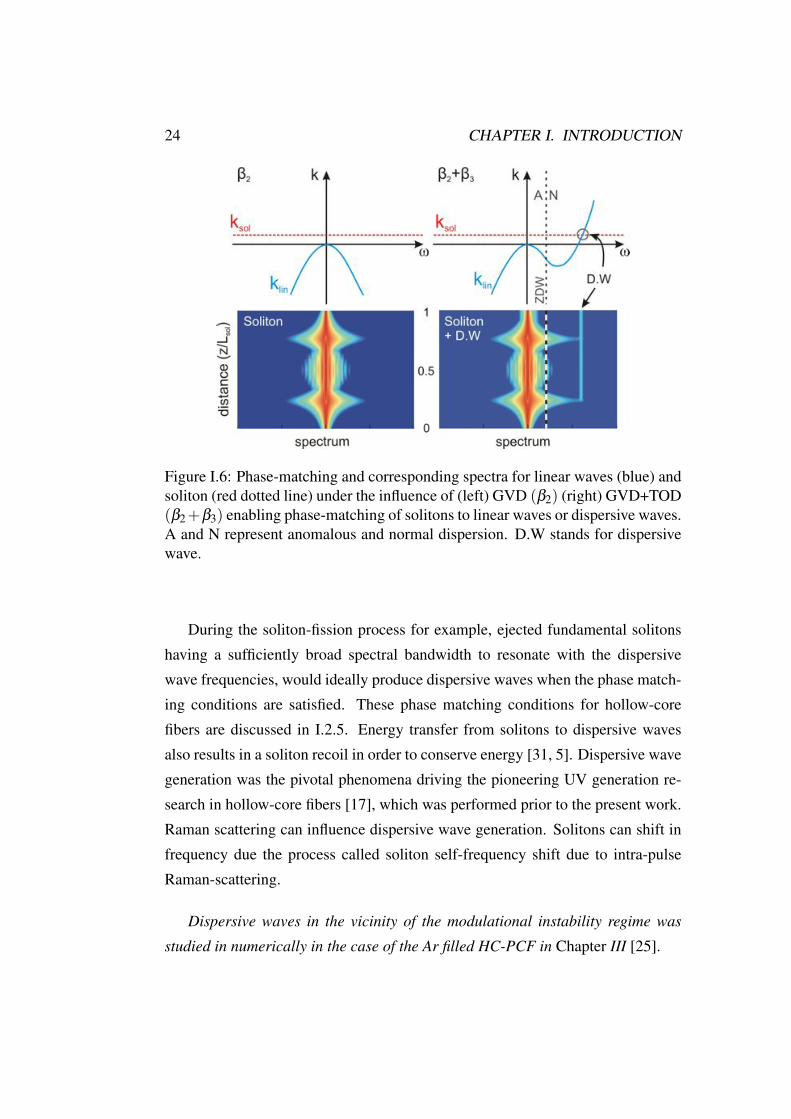
Higher-order dispersion can influence soliton-fission dynamics by leading to en-ergy transfer from the soliton to a resonance in the normal GVD regime. Theposition of this resonance in the normal dispersion regime can be determined byphase-matching conditions (Fig. I.6). To introduce the notion of dispersive wave
I.1. FUNDAMENTALS OF NONLINEAR OPTICS 23
Figure I.5: Soliton fission for N=5 soliton (a) over a soliton period z/Lsol = 1(b) over z/Lsol = 0.35 without higher-order dispersion or Raman scattering (c)soliton fission over z/Lsol = 0.35 in the presence of higher-order dispersion orRaman scattering.
emission, we seek a linear solution of Eq. I.21 with the Ansatz:
At = A0exp(i(ωt − klinz)) (I.25)
This leads to the dispersion relation given by
klin =−(β2ω2)
2(I.26)
As seen from Fig. I.61, phase-matching condition klin = ksol between the soli-ton and the dispersion does not occur when only second order dispersion is con-sidered. However, when third order dispersion is taken into account, it is seen thatthe linear waves are phase-matched to the soliton when
klin =−β2ω2
2+
β3ω3
6(I.27)
1Figs. I.4, I.5 & I.6 are adapted versions of figures provided by Nicolas Joly
24 CHAPTER I. INTRODUCTION
Figure I.6: Phase-matching and corresponding spectra for linear waves (blue) andsoliton (red dotted line) under the influence of (left) GVD (β2) (right) GVD+TOD(β2+β3) enabling phase-matching of solitons to linear waves or dispersive waves.A and N represent anomalous and normal dispersion. D.W stands for dispersivewave.
During the soliton-fission process for example, ejected fundamental solitonshaving a sufficiently broad spectral bandwidth to resonate with the dispersivewave frequencies, would ideally produce dispersive waves when the phase match-ing conditions are satisfied. These phase matching conditions for hollow-corefibers are discussed in I.2.5. Energy transfer from solitons to dispersive wavesalso results in a soliton recoil in order to conserve energy [31, 5]. Dispersive wavegeneration was the pivotal phenomena driving the pioneering UV generation re-search in hollow-core fibers [17], which was performed prior to the present work.Raman scattering can influence dispersive wave generation. Solitons can shift infrequency due the process called soliton self-frequency shift due to intra-pulseRaman-scattering.
Dispersive waves in the vicinity of the modulational instability regime wasstudied in numerically in the case of the Ar filled HC-PCF in Chapter III [25].
I.1. FUNDAMENTALS OF NONLINEAR OPTICS 25
I.1.9 Influence of Raman-scattering on nonlinear optics
Raman scattering is a significant perturbation in several nonlinear optical phenom-ena such as soliton fission, dispersive waves, etc. In the current research, the mainintention of using noble gases was to isolate this Raman-perturbation from non-linear optics. Previous research has aimed at studying collision-induced Raman-scattering in dense noble gases [41, 42]. However the ultrafast pump sources usedin the experiments reported in this thesis have a spectra which is broader thanthe Raman-shift observed in [41, 42]. Therefore Raman-scattering in noble gasesis negligible in the experiments reported in this thesis. It is useful to review themain influences of Raman scattering for a Raman-active Kerr medium that wereavoided by using monoatomic noble gases.
Soliton self-frequency shift
Solitons propagation in a Raman-active Kerr media with non-instantaneous non-linearity, undergo frequency red-shifting and pulse reshaping due to Raman effect[43, 44, 45]. This phenomenon is called soliton self-frequency shift (SSFS). Thesolitons experience continuous shift to longer wavelengths due to their spectralbandwidths overlapping with Raman gain. As the spectrum of the solitons is red-shifted, its experiences increasing GVD, its pulse width increases and this slowsdown the SSFS. SSFS is proportional to the input pulse energy and the frequencyre-shifting is higher for higher pulse energies. The rate of SSFS too is propor-tional with the pulse energy [5]. This shift in frequency of the soliton also reducesthe gain of the dispersive wave due to phase-mismatch. In the absence of Raman-scattering and higher order dispersive wave perturbations, the chances of higherorder solitons regaining their original shape after every soliton period is higher(soliton breathing) as shown in I.5(a) for an N=5. This is because the absence ofSSFS prevents the higher order solitonic components from shifting in either timeor frequency.
In the experimental and numerical analysis of our high pressure Ar filled fiberexperiments (chapter III), we found that solitons do not shift in frequency due to
26 CHAPTER I. INTRODUCTION
the absence of Raman-scattering in Ar [25].
I.1.10 Four-Wave-Mixing (FWM) & modulational instability(MI)
Four-wave-mixing (FWM) is one of the most important third order nonlinear pro-cesses for spectral broadening. It is a process by which three frequencies interactunder phase matching conditions brought about by the Kerr medium, leading tothe creation of a fourth frequency. When the initial three frequencies ω have thesame frequency, then a third harmonic is generated where ωFWM = 3ω . If allfrequencies are the same including the generated frequency, then the process iscalled degenerate FWM (DFWM) [21, 34]. If the difference of two frequencies istuned to a Raman resonance with a mode in the nonlinear medium then the FWMis referred to as coherent anti-Stokes Raman scattering (CARS). Phase match-ing of the interacting frequencies is vital to the efficiency of the FWM frequencygenerated.
In the time-domain, the instability of the temporal modulation or envelope ofthe pulse is referred to as modulational instability. For a CW pump, the MI canresult in a train of ultra-short pulses. For optical pulses too MI can cause pulse-breakup into several femtosecond solitons or pulses. These MI generated solitonstoo are influenced by Raman induced SSFS and dispersive wave generation. Thenoise in the system acts as a seed for MI. Hence the frequency components gen-erated from MI are not coherent with the pump. Processes that are not seededby noise, for example, dispersive waves that are seeded by solitons, form coher-ent spectral components. So the coherence of spectral components more or lessdepends on the soliton number of the system. If the soliton number <22 [40] ,then soliton fission is the main driving process behind the spectral componentsleading to enhanced coherence. For higher soliton orders MI would be the dom-inant process, and since it is noise seeded would be detrimental to the coherenceof the spectral components. MI is mainly influenced in the anomalous dispersionregime.
I.1. FUNDAMENTALS OF NONLINEAR OPTICS 27
In the scalar approximation of MI, two pump photons are shifted in frequencyby Ω. Therefore the generated MI sidebands are given by idler frequency ωi =
ωp −Ω and the signal frequency ωs = ωp +Ω. At MI phase matched conditions;the maximum frequency shift Ω and the spectral gain maximum are [21] given by
Ω =±
2γP0
|β2(ωp)|(I.28)
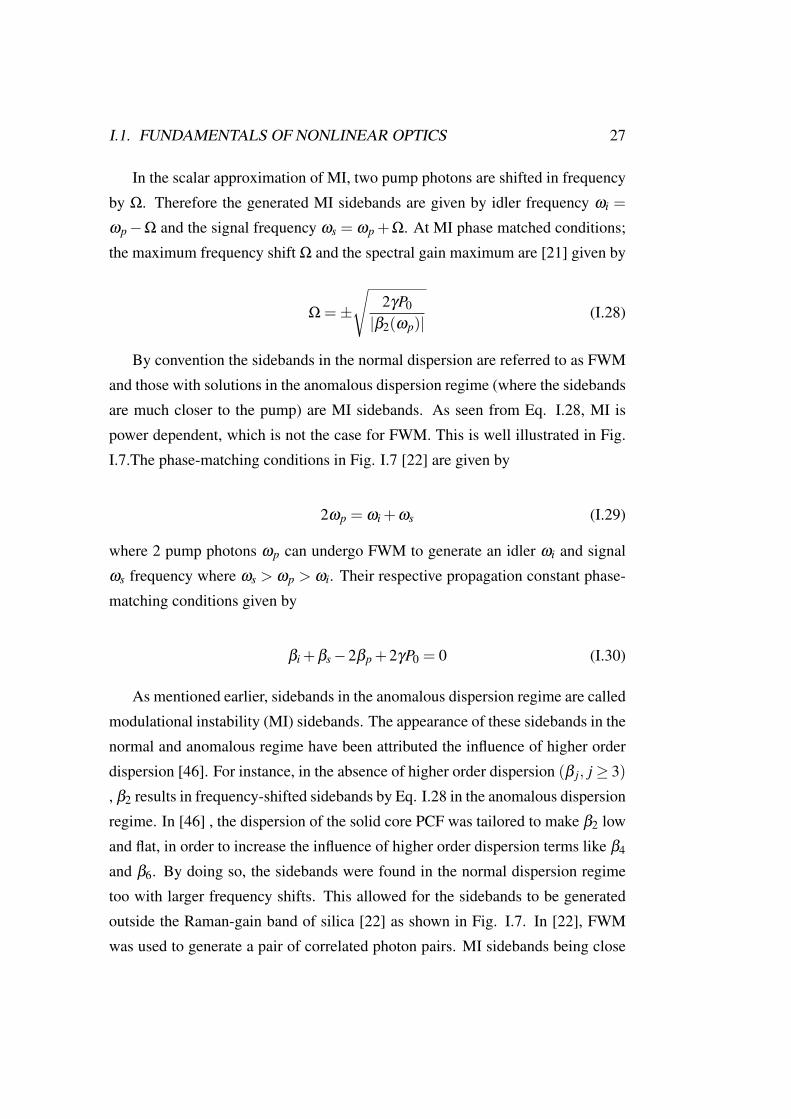
By convention the sidebands in the normal dispersion are referred to as FWMand those with solutions in the anomalous dispersion regime (where the sidebandsare much closer to the pump) are MI sidebands. As seen from Eq. I.28, MI ispower dependent, which is not the case for FWM. This is well illustrated in Fig.I.7.The phase-matching conditions in Fig. I.7 [22] are given by
2ωp = ωi +ωs (I.29)
where 2 pump photons ωp can undergo FWM to generate an idler ωi and signalωs frequency where ωs > ωp > ωi. Their respective propagation constant phase-matching conditions given by
βi +βs −2βp +2γP0 = 0 (I.30)
As mentioned earlier, sidebands in the anomalous dispersion regime are calledmodulational instability (MI) sidebands. The appearance of these sidebands in thenormal and anomalous regime have been attributed the influence of higher orderdispersion [46]. For instance, in the absence of higher order dispersion (β j, j ≥ 3), β2 results in frequency-shifted sidebands by Eq. I.28 in the anomalous dispersionregime. In [46] , the dispersion of the solid core PCF was tailored to make β2 lowand flat, in order to increase the influence of higher order dispersion terms like β4
and β6. By doing so, the sidebands were found in the normal dispersion regimetoo with larger frequency shifts. This allowed for the sidebands to be generatedoutside the Raman-gain band of silica [22] as shown in Fig. I.7. In [22], FWMwas used to generate a pair of correlated photon pairs. MI sidebands being close
28 CHAPTER I. INTRODUCTION
Figure I.7: (left) Nonlinear phase matching for FWM and MI (right) The calcu-lated MI and FWM sidebands shown along with the Raman-gain band of fusedsilica glass [22].
to the pump, overlapped with the Raman-gain band-which significantly introducesnoise via a high level of background photons. By using the appropriate dispersion,FWM sidebands were generated outside the Raman-gain band (Fig. I.7).
Wavelength tunable MI sidebands in the absence of Raman-gain band havebeen achieved in Ar-filled HC-PCF, which is reported in Chapter III.
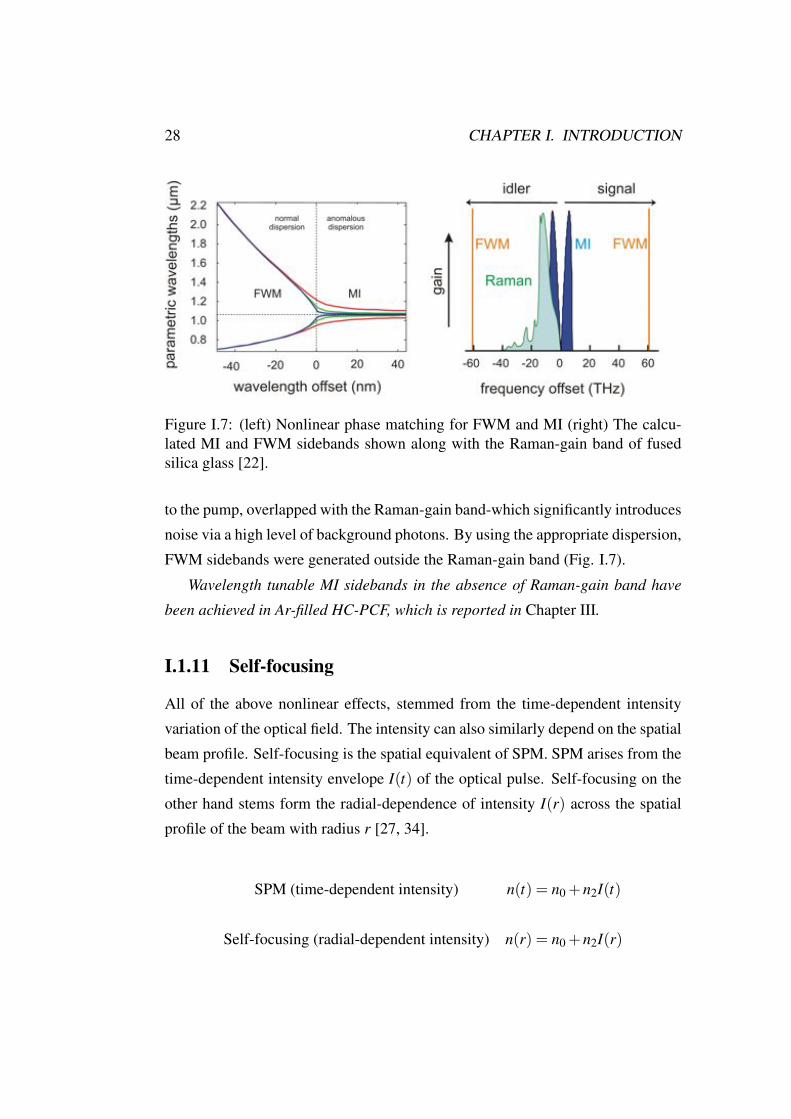
I.1.11 Self-focusing
All of the above nonlinear effects, stemmed from the time-dependent intensityvariation of the optical field. The intensity can also similarly depend on the spatialbeam profile. Self-focusing is the spatial equivalent of SPM. SPM arises from thetime-dependent intensity envelope I(t) of the optical pulse. Self-focusing on theother hand stems form the radial-dependence of intensity I(r) across the spatialprofile of the beam with radius r [27, 34].
SPM (time-dependent intensity) n(t) = n0 +n2I(t)
Self-focusing (radial-dependent intensity) n(r) = n0 +n2I(r)
I.1. FUNDAMENTALS OF NONLINEAR OPTICS 29
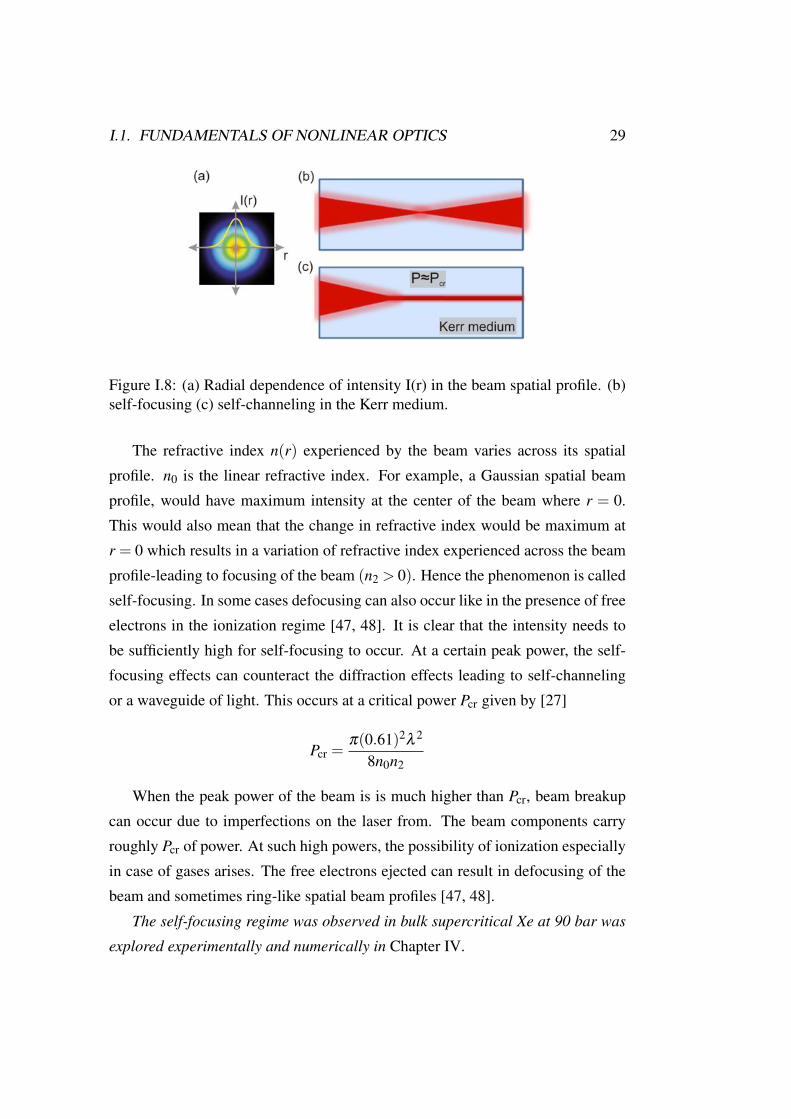
Figure I.8: (a) Radial dependence of intensity I(r) in the beam spatial profile. (b)self-focusing (c) self-channeling in the Kerr medium.
The refractive index n(r) experienced by the beam varies across its spatialprofile. n0 is the linear refractive index. For example, a Gaussian spatial beamprofile, would have maximum intensity at the center of the beam where r = 0.This would also mean that the change in refractive index would be maximum atr = 0 which results in a variation of refractive index experienced across the beamprofile-leading to focusing of the beam (n2 > 0). Hence the phenomenon is calledself-focusing. In some cases defocusing can also occur like in the presence of freeelectrons in the ionization regime [47, 48]. It is clear that the intensity needs tobe sufficiently high for self-focusing to occur. At a certain peak power, the self-focusing effects can counteract the diffraction effects leading to self-channelingor a waveguide of light. This occurs at a critical power Pcr given by [27]
Pcr =π(0.61)2λ 2
8n0n2
When the peak power of the beam is is much higher than Pcr, beam breakupcan occur due to imperfections on the laser from. The beam components carryroughly Pcr of power. At such high powers, the possibility of ionization especiallyin case of gases arises. The free electrons ejected can result in defocusing of thebeam and sometimes ring-like spatial beam profiles [47, 48].
The self-focusing regime was observed in bulk supercritical Xe at 90 bar wasexplored experimentally and numerically in Chapter IV.
30 CHAPTER I. INTRODUCTION
I.1.12 Supercontinuum generation
A combination of many of the above discussed processes gives rise to supercontin-uum spectra. SPM, FWM, MI, soliton fission, dispersive wave, SSFS are respon-sible for supercontinuum generation in PCF [5]. Supercontinuum generation wasfirst observed by Alfano in bulk glass [4]. The smaller core sizes, single-modepropagation over broad wavelength ranges and customizable dispersion, madePCF an ideal medium for supercontinuum generation [11, 9]. Ideally pumpingclose to the ZDW, leads to efficient spectral broadening. The GNLSE can be usedto numerically study supercontinuum generation. Supercontinuum generation inPCF has been studied in various dispersion regimes, with primary nonlinear pro-cesses being soliton fission [11] , FWM & MI [49] and CW pump induced MI[40].
By filling high pressure Ar gas in HC-PCFs, we observed and analyzed thecauses of supercontinuum generation in various regimes such as soliton fissionand MI initiated spectral broadening (Chapter III)
I.2. PHOTONIC CRYSTAL FIBER (PCF) 31
I.2 Photonic Crystal Fiber (PCF)
I.2.1 Types of PCF
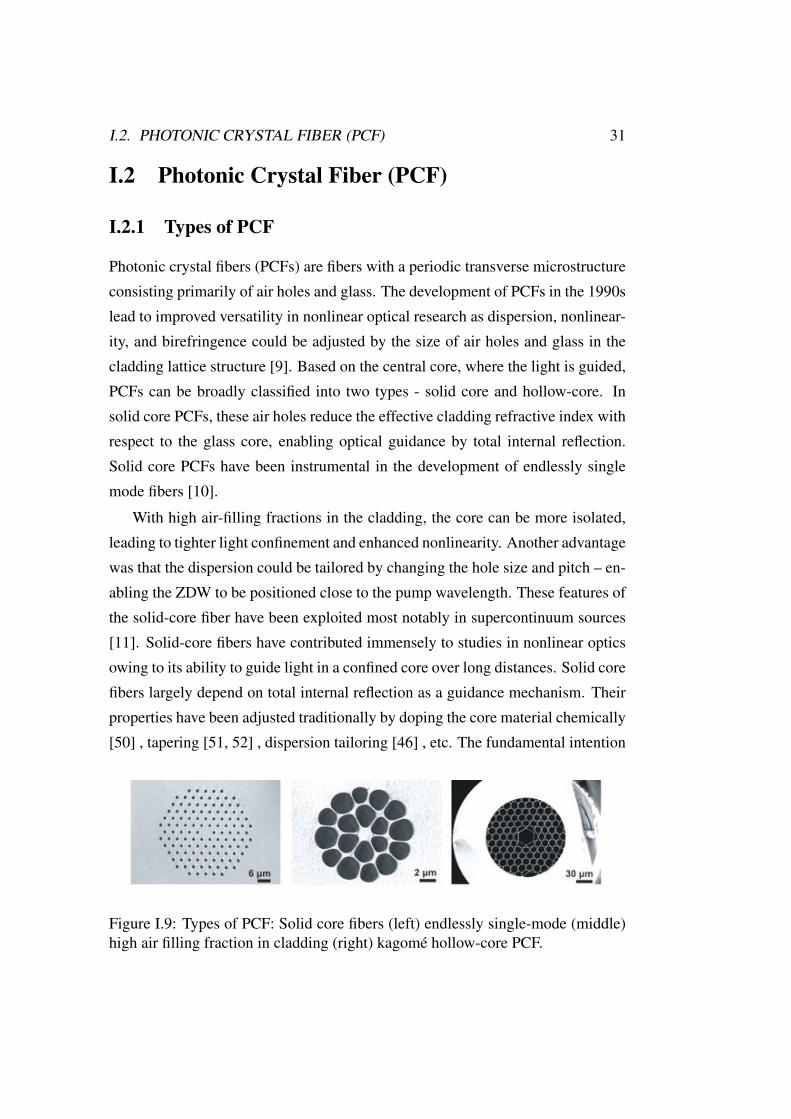
Photonic crystal fibers (PCFs) are fibers with a periodic transverse microstructureconsisting primarily of air holes and glass. The development of PCFs in the 1990slead to improved versatility in nonlinear optical research as dispersion, nonlinear-ity, and birefringence could be adjusted by the size of air holes and glass in thecladding lattice structure [9]. Based on the central core, where the light is guided,PCFs can be broadly classified into two types - solid core and hollow-core. Insolid core PCFs, these air holes reduce the effective cladding refractive index withrespect to the glass core, enabling optical guidance by total internal reflection.Solid core PCFs have been instrumental in the development of endlessly singlemode fibers [10].
With high air-filling fractions in the cladding, the core can be more isolated,leading to tighter light confinement and enhanced nonlinearity. Another advantagewas that the dispersion could be tailored by changing the hole size and pitch – en-abling the ZDW to be positioned close to the pump wavelength. These features ofthe solid-core fiber have been exploited most notably in supercontinuum sources[11]. Solid-core fibers have contributed immensely to studies in nonlinear opticsowing to its ability to guide light in a confined core over long distances. Solid corefibers largely depend on total internal reflection as a guidance mechanism. Theirproperties have been adjusted traditionally by doping the core material chemically[50] , tapering [51, 52] , dispersion tailoring [46] , etc. The fundamental intention
Figure I.9: Types of PCF: Solid core fibers (left) endlessly single-mode (middle)high air filling fraction in cladding (right) kagomé hollow-core PCF.
32 CHAPTER I. INTRODUCTION
to reduce the core diameter was to decrease its effective area hence increasing thenonlinear parameter γ (Eq. I.9).
The air-holes in the cladding lattice can also support photonic bandgaps (PBG)which prevent light from coupling into the cladding, hence enabling guidance inthe core. Unlike the prerequisite of TIR guidance, where the core refractive indexmust exceed that of the cladding, PBG guidance can support hollow fiber cores. Ahollow-core meant that fibers could now be filled with appropriate media such asgases/liquids [53, 23], for particle guidance [54, 55] and performing photosensi-tive chemical reactions efficiently [56, 57]. The PBG however offered a restrictedtransmission range. The kagomé lattice hollow-core PCF offered a much broadertransmission range extending from the UV to IR.
I.2.2 Fabrication
PCFs are usually fabricated using the as “stack-and-draw” method [9]. The fun-damental idea in this method is to scale down the original macroscopic structuredown to the microscopic dimension of the fiber. This process starts with stackingcapillaries and/or rods (of around 1 mm outer diameter and 1 m in length) in therequired structural pattern. This stack is then placed into a jacket tube-therebyforming a preform.
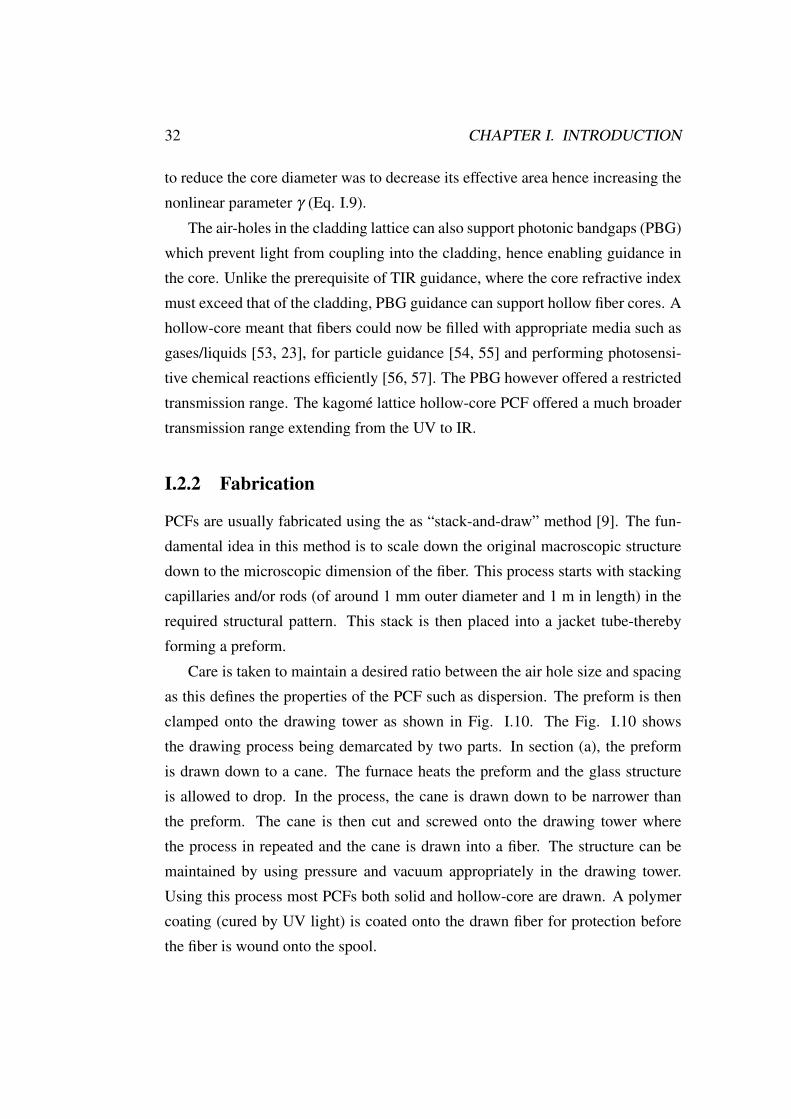
Care is taken to maintain a desired ratio between the air hole size and spacingas this defines the properties of the PCF such as dispersion. The preform is thenclamped onto the drawing tower as shown in Fig. I.10. The Fig. I.10 showsthe drawing process being demarcated by two parts. In section (a), the preformis drawn down to a cane. The furnace heats the preform and the glass structureis allowed to drop. In the process, the cane is drawn down to be narrower thanthe preform. The cane is then cut and screwed onto the drawing tower wherethe process in repeated and the cane is drawn into a fiber. The structure can bemaintained by using pressure and vacuum appropriately in the drawing tower.Using this process most PCFs both solid and hollow-core are drawn. A polymercoating (cured by UV light) is coated onto the drawn fiber for protection beforethe fiber is wound onto the spool.
I.2. PHOTONIC CRYSTAL FIBER (PCF) 33
Figure I.10: Schematic of the fiber fabrication process.The cane is drawn in sec-tion (a). The fiber is drawn by drawing the cane through sections (a) and (b).
I.2.3 Hollow-core PCF
Total internal reflection (TIR) is the primary guidance mechanism in solid corePCFs as long as the air holes in the cladding effectively reduce the cladding re-fractive index relative to the core. Traditionally in fiber optics, the mechanismof TIR meant that the hollow-core fiber was not feasible as the cladding had tohave a lower refractive index than the core. Bragg fibers were seen as a possibil-ity for a hollow-core, but their fabrications techniques were complex. Capillarieswere popular for large core sizes, but for core sizes <100 micron [23] their lossesincreased exponentially.
The guidance mechanism of PCFs via photonic band gaps in the cladding bymeans of a periodic lattice of air holes meant that certain frequencies of light couldpropagate in the core-even in a hollow-core. A hollow-core fiber guiding lighthad several advantages that could not have been possible in earlier light-matterinteraction systems. Long interaction lengths, excellent modal overlap and con-finement for light-matter interactions, high material damage threshold, dispersiontunable optical systems, to name a few of the advantages offered by the hollow-
34 CHAPTER I. INTRODUCTION
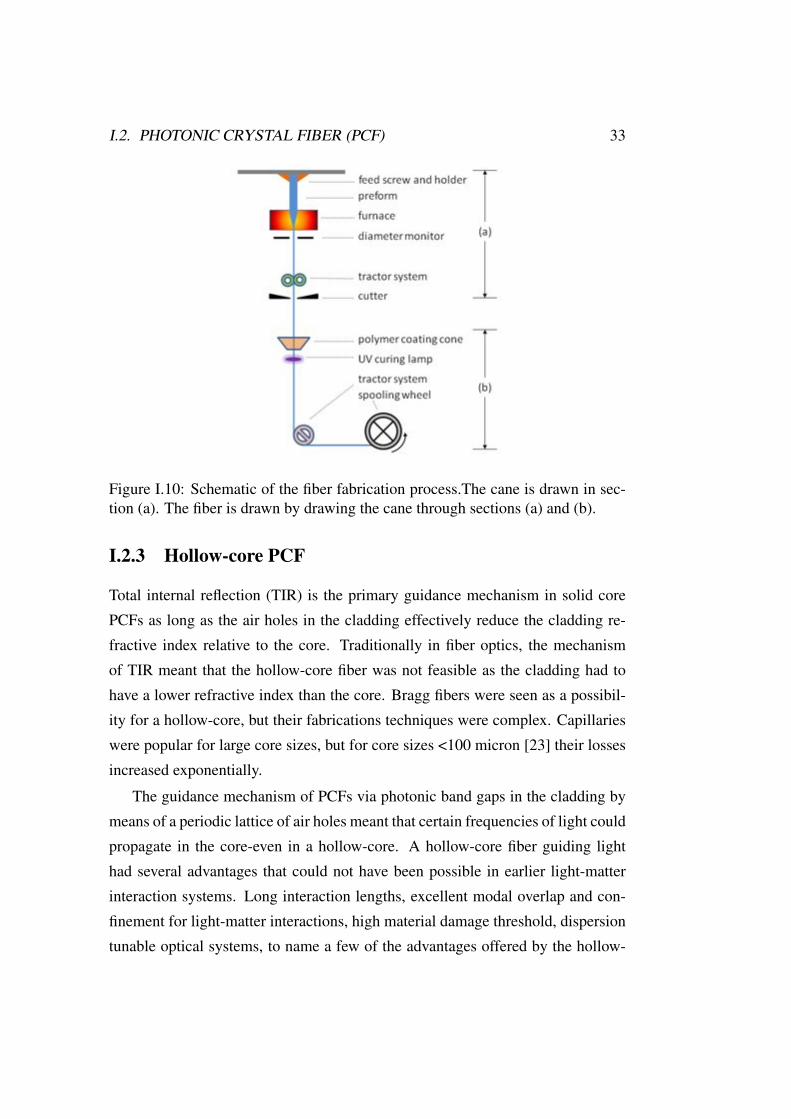
Figure I.11: SEM image of a (left) Photonic bandgap HC-PCF (right) kagoméHC-PCF.
core fibers. Hollow-core PCF (HC-PCF) is mainly categorized as being eitherphotonic bandgap or kagomé HC-PCF (Fig. I.11). They both have a hollow-corebut differ significantly in properties such as transmission window, loss, dispersionand guidance mechanisms.
Photonic bandgap HC-PCF
Photonic bandgap (PBG) HC-PCFs were the first HC-PCFs to be fabricated. Theirguidance mechanism stems from the PBGs in the cladding owing to the periodiclattice structure of air holes. Their losses are in the order of a few dB per kilome-ter (down to 1dB/km at 1550nm [58]). These fibers have restricted transmissionwavelength windows, and these can be determined by finite element modeling(FEM). Filling the fiber holes (with water for example) can shift the transmis-sion window according to the scaling law [59]. The narrow transmission windowsin PBG fibers are suitable for experiments where narrow bandwidth interactions[60, 53] are studied or where frequency components need to be filtered out inRaman-scattering experiments in which unwanted vibrational and higher orderrotational frequency components were suppressed. [16].
Kagomé HC-PCF
Kagomé hollow-core fibers offer significant advantages over the PBG fibers interms of broadband transmission. The name kagomé stems from the close resem-
I.2. PHOTONIC CRYSTAL FIBER (PCF) 35
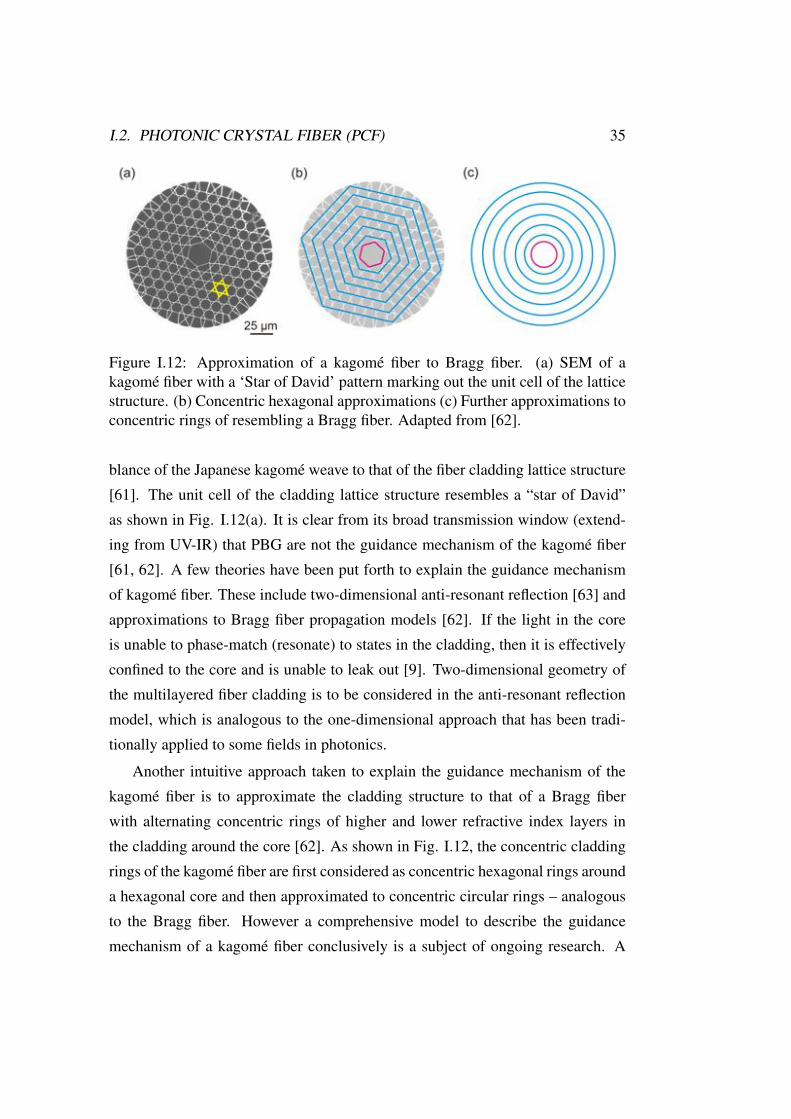
Figure I.12: Approximation of a kagomé fiber to Bragg fiber. (a) SEM of akagomé fiber with a ‘Star of David’ pattern marking out the unit cell of the latticestructure. (b) Concentric hexagonal approximations (c) Further approximations toconcentric rings of resembling a Bragg fiber. Adapted from [62].
blance of the Japanese kagomé weave to that of the fiber cladding lattice structure[61]. The unit cell of the cladding lattice structure resembles a “star of David”as shown in Fig. I.12(a). It is clear from its broad transmission window (extend-ing from UV-IR) that PBG are not the guidance mechanism of the kagomé fiber[61, 62]. A few theories have been put forth to explain the guidance mechanismof kagomé fiber. These include two-dimensional anti-resonant reflection [63] andapproximations to Bragg fiber propagation models [62]. If the light in the coreis unable to phase-match (resonate) to states in the cladding, then it is effectivelyconfined to the core and is unable to leak out [9]. Two-dimensional geometry ofthe multilayered fiber cladding is to be considered in the anti-resonant reflectionmodel, which is analogous to the one-dimensional approach that has been tradi-tionally applied to some fields in photonics.
Another intuitive approach taken to explain the guidance mechanism of thekagomé fiber is to approximate the cladding structure to that of a Bragg fiberwith alternating concentric rings of higher and lower refractive index layers inthe cladding around the core [62]. As shown in Fig. I.12, the concentric claddingrings of the kagomé fiber are first considered as concentric hexagonal rings arounda hexagonal core and then approximated to concentric circular rings – analogousto the Bragg fiber. However a comprehensive model to describe the guidancemechanism of a kagomé fiber conclusively is a subject of ongoing research. A
36 CHAPTER I. INTRODUCTION
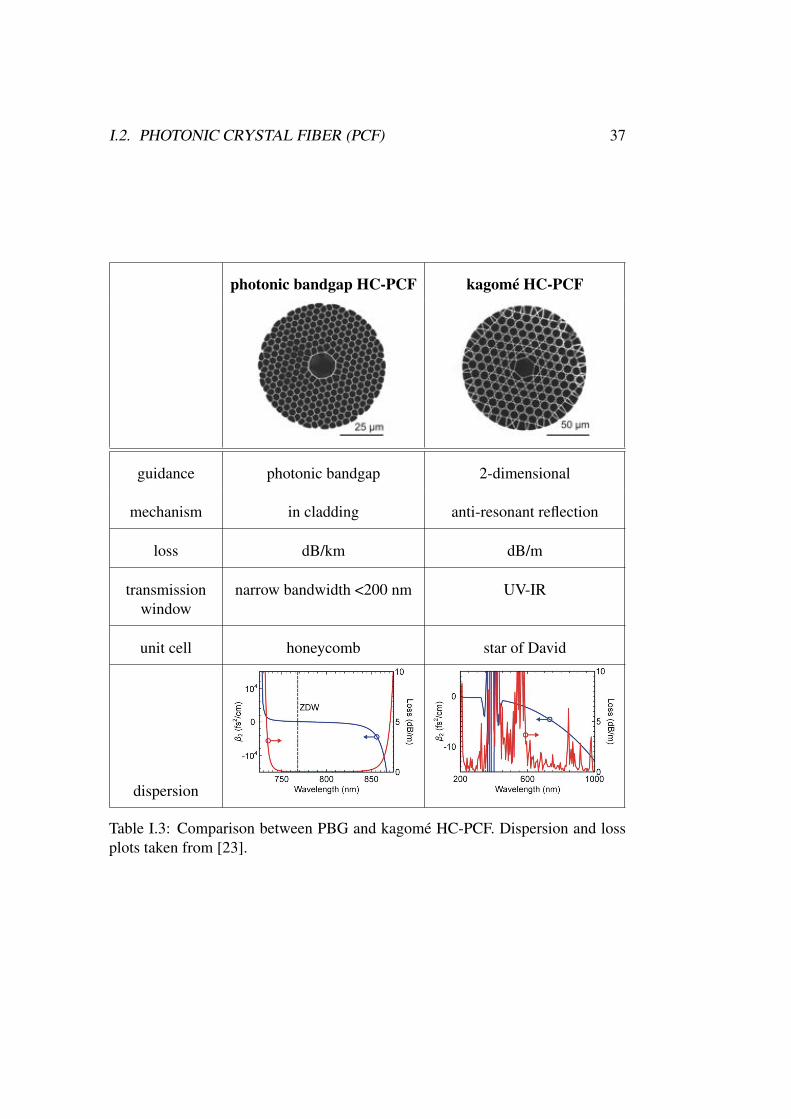
comparison between PBG and kagomé fibers is done in Table. I.3.
Dispersion
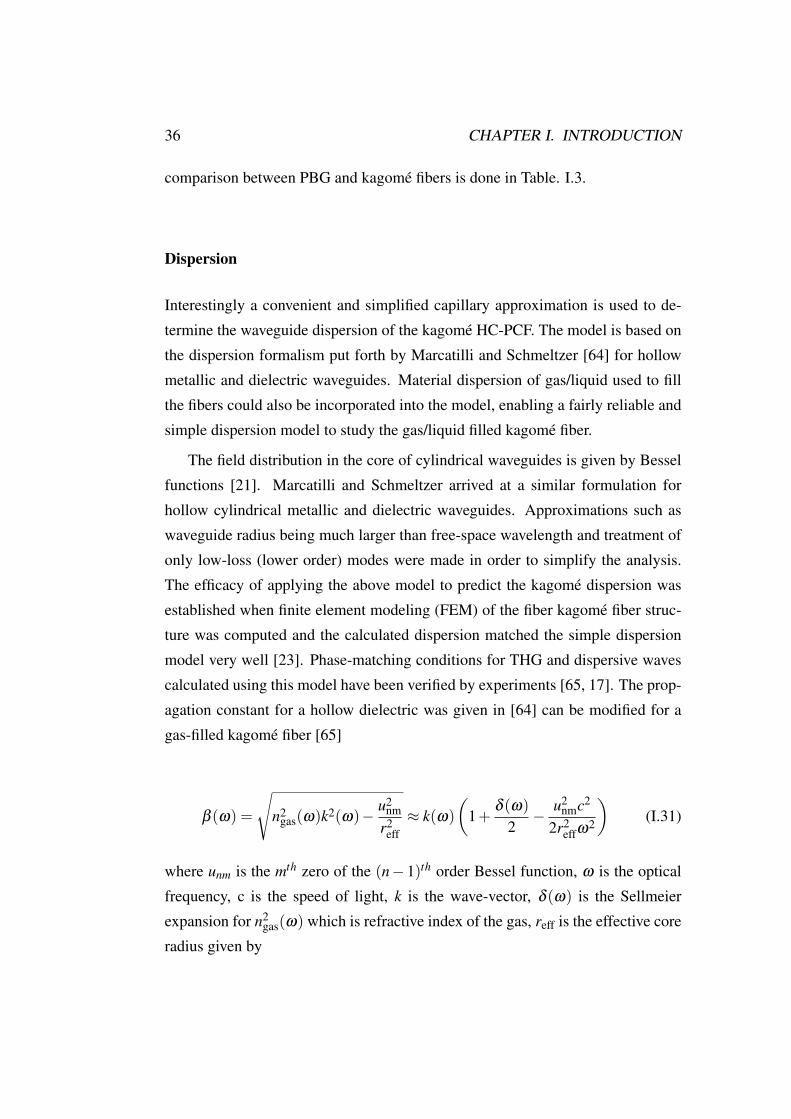
Interestingly a convenient and simplified capillary approximation is used to de-termine the waveguide dispersion of the kagomé HC-PCF. The model is based onthe dispersion formalism put forth by Marcatilli and Schmeltzer [64] for hollowmetallic and dielectric waveguides. Material dispersion of gas/liquid used to fillthe fibers could also be incorporated into the model, enabling a fairly reliable andsimple dispersion model to study the gas/liquid filled kagomé fiber.
The field distribution in the core of cylindrical waveguides is given by Besselfunctions [21]. Marcatilli and Schmeltzer arrived at a similar formulation forhollow cylindrical metallic and dielectric waveguides. Approximations such aswaveguide radius being much larger than free-space wavelength and treatment ofonly low-loss (lower order) modes were made in order to simplify the analysis.The efficacy of applying the above model to predict the kagomé dispersion wasestablished when finite element modeling (FEM) of the fiber kagomé fiber struc-ture was computed and the calculated dispersion matched the simple dispersionmodel very well [23]. Phase-matching conditions for THG and dispersive wavescalculated using this model have been verified by experiments [65, 17]. The prop-agation constant for a hollow dielectric was given in [64] can be modified for agas-filled kagomé fiber [65]
β (ω) =
n2gas(ω)k2(ω)− u2
nmr2
eff≈ k(ω)
1+
δ (ω)
2− u2
nmc2
2r2effω2
(I.31)
where unm is the mth zero of the (n− 1)th order Bessel function, ω is the opticalfrequency, c is the speed of light, k is the wave-vector, δ (ω) is the Sellmeierexpansion for n2
gas(ω) which is refractive index of the gas, reff is the effective coreradius given by
I.2. PHOTONIC CRYSTAL FIBER (PCF) 37
photonic bandgap HC-PCF kagomé HC-PCF
guidance photonic bandgap 2-dimensional
mechanism in cladding anti-resonant reflection
loss dB/km dB/m
transmissionwindow
narrow bandwidth <200 nm UV-IR
unit cell honeycomb star of David
dispersion
Table I.3: Comparison between PBG and kagomé HC-PCF. Dispersion and lossplots taken from [23].
38 CHAPTER I. INTRODUCTION
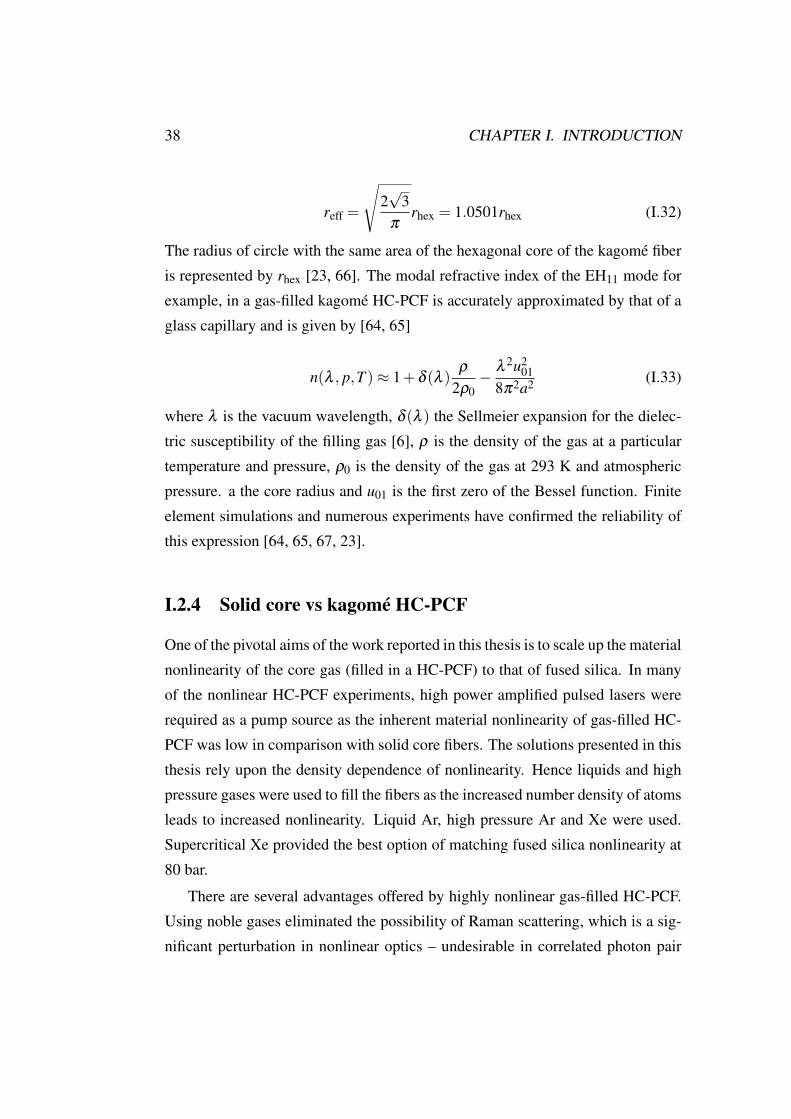
reff =
2√
3π
rhex = 1.0501rhex (I.32)
The radius of circle with the same area of the hexagonal core of the kagomé fiberis represented by rhex [23, 66]. The modal refractive index of the EH11 mode forexample, in a gas-filled kagomé HC-PCF is accurately approximated by that of aglass capillary and is given by [64, 65]
n(λ , p,T )≈ 1+δ (λ ) ρ2ρ0
−λ 2u2
018π2a2 (I.33)
where λ is the vacuum wavelength, δ (λ ) the Sellmeier expansion for the dielec-tric susceptibility of the filling gas [6], ρ is the density of the gas at a particulartemperature and pressure, ρ0 is the density of the gas at 293 K and atmosphericpressure. a the core radius and u01 is the first zero of the Bessel function. Finiteelement simulations and numerous experiments have confirmed the reliability ofthis expression [64, 65, 67, 23].
I.2.4 Solid core vs kagomé HC-PCF
One of the pivotal aims of the work reported in this thesis is to scale up the materialnonlinearity of the core gas (filled in a HC-PCF) to that of fused silica. In manyof the nonlinear HC-PCF experiments, high power amplified pulsed lasers wererequired as a pump source as the inherent material nonlinearity of gas-filled HC-PCF was low in comparison with solid core fibers. The solutions presented in thisthesis rely upon the density dependence of nonlinearity. Hence liquids and highpressure gases were used to fill the fibers as the increased number density of atomsleads to increased nonlinearity. Liquid Ar, high pressure Ar and Xe were used.Supercritical Xe provided the best option of matching fused silica nonlinearity at80 bar.
There are several advantages offered by highly nonlinear gas-filled HC-PCF.Using noble gases eliminated the possibility of Raman scattering, which is a sig-nificant perturbation in nonlinear optics – undesirable in correlated photon pair
I.2. PHOTONIC CRYSTAL FIBER (PCF) 39
sources for example. Nonlinear optics could be studies in the absence of Ramangain. A Raman active gas can also be introduced when needed, to study Raman-related phenomena like in [15, 16].
The other main advantage is the remarkable range of tunability of ZDW fromUV to IR by adjusting the pressure of noble gases between 1-150 bar. This levelof ZDW tunability is not available in the solid core fiber even by adjusting thecladding holes and pitch. Moreover the dispersion can be varied over this largewavelength range on a given piece of HC-PCF and used repeatedly – unlike in asolid core fiber where a new fiber needs to be drawn for a specific ZDW require-ment. The low and smooth dispersion profile over the transmission window of thekagomé fiber, encourages phase-matched processes such as dispersive wave gen-eration and FWM. The phase-matching conditions can be adjusted easily by gaspressure in the fiber-a feature unavailable in solid core fibers. The dispersion couldbe tuned from anomalous to normal or vice versa for a fixed laser wavelength.
Photo-darkening is a common problem in solid core fibers with a relativelylow damage threshold. HC-PCFs however do not have this problem even whenfilled with gases. This allows for soliton compression leading to optical powershigh enough to study ionization in gases. The HC-PCFs are also transparent in theUV which is not the case for fused silica.
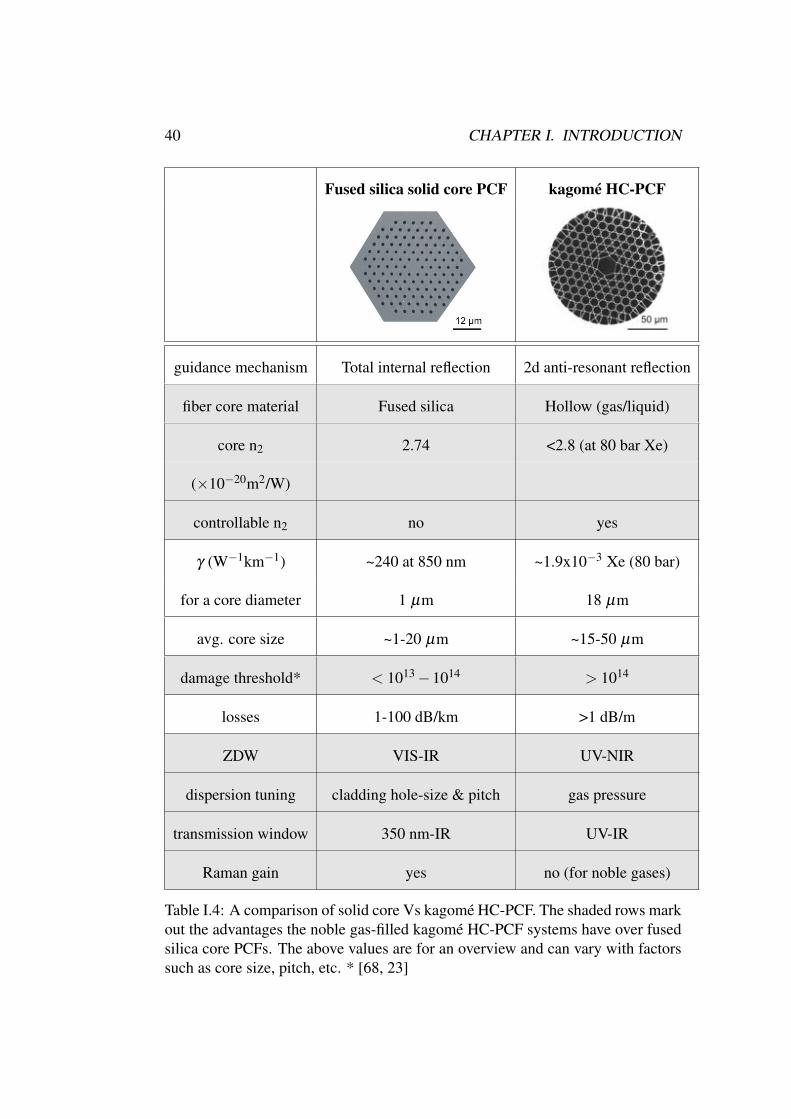
The above advantages helped us explore nonlinear fiber optics in various dis-persion regimes. However it is important to take note of the fact that kagoméHC-PCF have much higher optical loss compared to solid core fibers. In mostof the experiments reported here, relatively short lengths of kagomé fiber (<50cm) were used-hence the high fiber loss was not an experimental hinderance. Incomparison, the average core sizes of kagomé fibers are also larger. This com-promises on the nonlinear parameter γ which is a few orders of magnitude largerthan that of gas-filled HC-PCFs as [23] is inversely proportional to the effectivecore modal area. Hence by scaling up the pressure, we increase the n2 to matchthat of fused silica but not γ . Reducing the losses and the core size of the HC-PCF fiber are fabrication challenges, which when overcome, can make HC-PCF amajor competitor for solid core fibers. These comparisons are tabulated in I.4.
40 CHAPTER I. INTRODUCTION
Fused silica solid core PCF kagomé HC-PCF
guidance mechanism Total internal reflection 2d anti-resonant reflection
fiber core material Fused silica Hollow (gas/liquid)
core n2 2.74 <2.8 (at 80 bar Xe)
(×10−20m2/W)
controllable n2 no yes
γ (W−1km−1) ~240 at 850 nm ~1.9x10⁻³ Xe (80 bar)
for a core diameter 1 µm 18 µm
avg. core size ~1-20 µm ~15-50 µm
damage threshold* < 1013 −1014 > 1014
losses 1-100 dB/km >1 dB/m
ZDW VIS-IR UV-NIR
dispersion tuning cladding hole-size & pitch gas pressure
transmission window 350 nm-IR UV-IR
Raman gain yes no (for noble gases)
Table I.4: A comparison of solid core Vs kagomé HC-PCF. The shaded rows markout the advantages the noble gas-filled kagomé HC-PCF systems have over fusedsilica core PCFs. The above values are for an overview and can vary with factorssuch as core size, pitch, etc. * [68, 23]
I.2. PHOTONIC CRYSTAL FIBER (PCF) 41
I.2.5 Preceding gas-filled HC-PCF research
The research prior to the results presented in this thesis, included pioneering workconducted primarily by Nicolas Joly, Philipp Hölzer and Johannes Nold. Initialtechnical inroads and techniques developed into HC-PCF gas filling significantlyinfluenced the research presented in this thesis. Challenges such has fabrication oflow-loss kagomé, theoretical analysis, etc were overcome – leading to pioneeringexperimental results supported by rigorous theoretical analysis [65, 17, 66, 67, 19,23].
Third harmonic generation
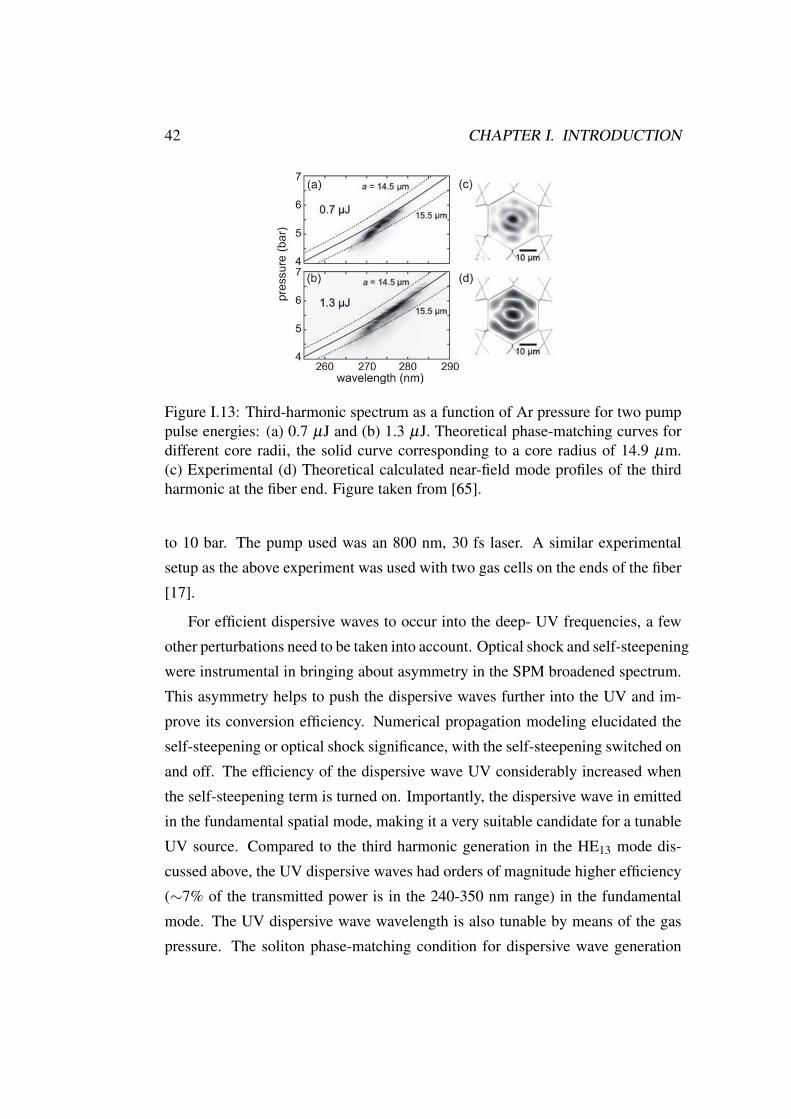
The low and smooth dispersion profile of gas-filled kagomé fibers encouragesphase matching processes such as third harmonic generation. The intrinsic anoma-lous dispersion of the kagomé fiber can be compensated by appropriate gas pres-sure, which can be regulated to tune the fiber dispersion, and hence its ability totake part in phase matching processes. 30 fs, 800 nm at 1 kHz repetition rate wasused as pump pulses were launched into a kagomé fiber with a core diameter of29.6 µm filled with Ar gas. At around 5 bar pressure of Ar, the phase-matchingconditions were satisfied wherein the pump in the HE11 mode generated its thirdharmonic in the HE13 mode. At higher powers, the Kerr nonlinearity increases thephase mismatch and in doing so the peak third harmonic frequency componentsare shifted to lower frequencies as seen in Fig. I.13 [65].
Using Xe filled HC-PCF at 25 bar, clear intermodal FWM was observedand confirmed theoretically using phase-matching calculations similar to thosein [65].
Dispersive wave UV generation
As discussed earlier, dispersive waves arise when the soliton spectral bandwidthbroadens into the normal dispersion, perturbing the soliton to shed energy as res-onant dispersive wave radiation. For this experiment, a 20 cm long kagomé PCFwith a core diameter of 29.6 µm was filled with Ar gas and varied in pressure up
42 CHAPTER I. INTRODUCTION
Figure I.13: Third-harmonic spectrum as a function of Ar pressure for two pumppulse energies: (a) 0.7 µJ and (b) 1.3 µJ. Theoretical phase-matching curves fordifferent core radii, the solid curve corresponding to a core radius of 14.9 µm.(c) Experimental (d) Theoretical calculated near-field mode profiles of the thirdharmonic at the fiber end. Figure taken from [65].
to 10 bar. The pump used was an 800 nm, 30 fs laser. A similar experimentalsetup as the above experiment was used with two gas cells on the ends of the fiber[17].
For efficient dispersive waves to occur into the deep- UV frequencies, a fewother perturbations need to be taken into account. Optical shock and self-steepeningwere instrumental in bringing about asymmetry in the SPM broadened spectrum.This asymmetry helps to push the dispersive waves further into the UV and im-prove its conversion efficiency. Numerical propagation modeling elucidated theself-steepening or optical shock significance, with the self-steepening switched onand off. The efficiency of the dispersive wave UV considerably increased whenthe self-steepening term is turned on. Importantly, the dispersive wave in emittedin the fundamental spatial mode, making it a very suitable candidate for a tunableUV source. Compared to the third harmonic generation in the HE13 mode dis-cussed above, the UV dispersive waves had orders of magnitude higher efficiency(∼7% of the transmitted power is in the 240-350 nm range) in the fundamentalmode. The UV dispersive wave wavelength is also tunable by means of the gaspressure. The soliton phase-matching condition for dispersive wave generation
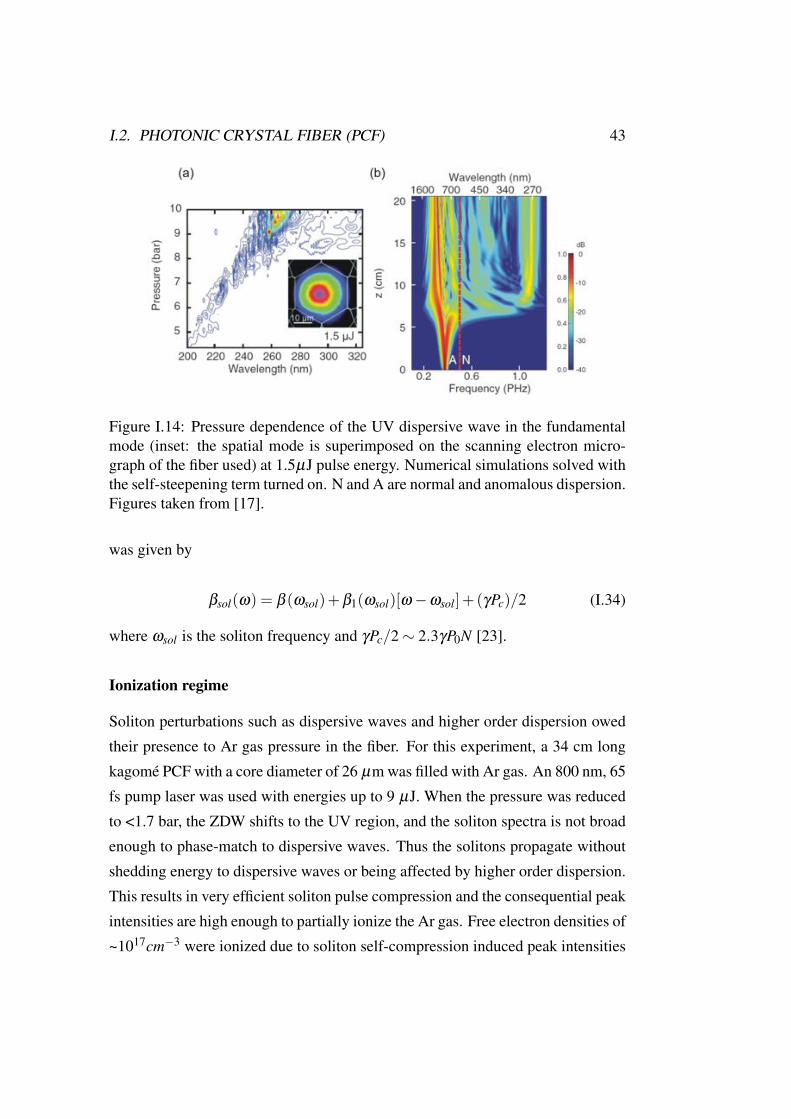
I.2. PHOTONIC CRYSTAL FIBER (PCF) 43
Figure I.14: Pressure dependence of the UV dispersive wave in the fundamentalmode (inset: the spatial mode is superimposed on the scanning electron micro-graph of the fiber used) at 1.5µJ pulse energy. Numerical simulations solved withthe self-steepening term turned on. N and A are normal and anomalous dispersion.Figures taken from [17].
was given by
βsol(ω) = β (ωsol)+β1(ωsol)[ω −ωsol]+ (γPc)/2 (I.34)
where ωsol is the soliton frequency and γPc/2 ∼ 2.3γP0N [23].
Ionization regime
Soliton perturbations such as dispersive waves and higher order dispersion owedtheir presence to Ar gas pressure in the fiber. For this experiment, a 34 cm longkagomé PCF with a core diameter of 26 µm was filled with Ar gas. An 800 nm, 65fs pump laser was used with energies up to 9 µJ. When the pressure was reducedto <1.7 bar, the ZDW shifts to the UV region, and the soliton spectra is not broadenough to phase-match to dispersive waves. Thus the solitons propagate withoutshedding energy to dispersive waves or being affected by higher order dispersion.This results in very efficient soliton pulse compression and the consequential peakintensities are high enough to partially ionize the Ar gas. Free electron densities of~1017cm−3 were ionized due to soliton self-compression induced peak intensities
44 CHAPTER I. INTRODUCTION
of 1014W/cm2. The self-compression of higher order solitons to duration of a fewoptical cycles lead to the in the release of blue-shifting solitons due to the freeelectron densities of the plasma. This unique combination of soliton dynamicsand ionization helped to observe the novel phenomenon of soliton-blue shift infrequency. Soliton blue-shifting described here is in some ways analogous toRaman-induced SSFS [45]. The numerical treatment was presented in [67, 19].
In Chapter I, the main nonlinear effects and the basics of photonic crystalfibers were discussed. The experimental implementations and results of filling aHC-PCF with dense noble gases are discussed in the following chapters.
Chapter II
Liquid Ar filled kagomé PCF
Noble gases do not exhibit any significant stimulated Raman Scattering owingto them being monoatomic. In the liquid phase, Ar has a nonlinear refractiveindex (n2) of the same order of magnitude as silica while maintaining a negligibleRaman contribution [41, 42]. This results in a novel nonlinear system, whereRaman scattering does not add to the noise of the system. Although some researchhas been done into collision induced scattering in liquid Ar [41, 42], the effect isnegligible in our case as the pump spectra is larger than the Raman frequencyshift. The path to achieve the goal of scaling up the nonlinearity of a HC-PCF tothat of fused silica, began by filling the fibers with liquid Ar. During the course ofthis work, several technical challenges such as phase transitions in the fiber core,were faced. All these technical issues were sorted out when the high-pressuregas-filled fiber system (discussed in III and IV) was developed. However theliquid Ar filling techniques developed in this work are novel and have significantlyincreased the understanding of low temperature operation in PCF experiments.Nonlinear optical effects like SPM have been observed in liquid Ar filled PCF.
II.1 Experimental Implementation
Filling a HC-PCF with a cryogenic liquid has not been attempted before. Hencea new experimental setup called cryogenic trap (cryotrap in short) had to be de-
45
46 CHAPTER II. LIQUID AR FILLED KAGOMÉ PCF
signed and manufactured after initial attempts and methods failed. The initialmethods used, are also discussed in this chapter along with an explanation as towhy they failed to transmit light through the filled fiber. In all these attempts liquidN2 is used as a coolant to achieve liquefy Ar gas temperatures since the boilingpoint of liquid N2 (77 K) is lower than that of liquid Ar (86 K at atmosphericpressure).
II.1.1 Kagomé fiber spliced with a multimode fiber
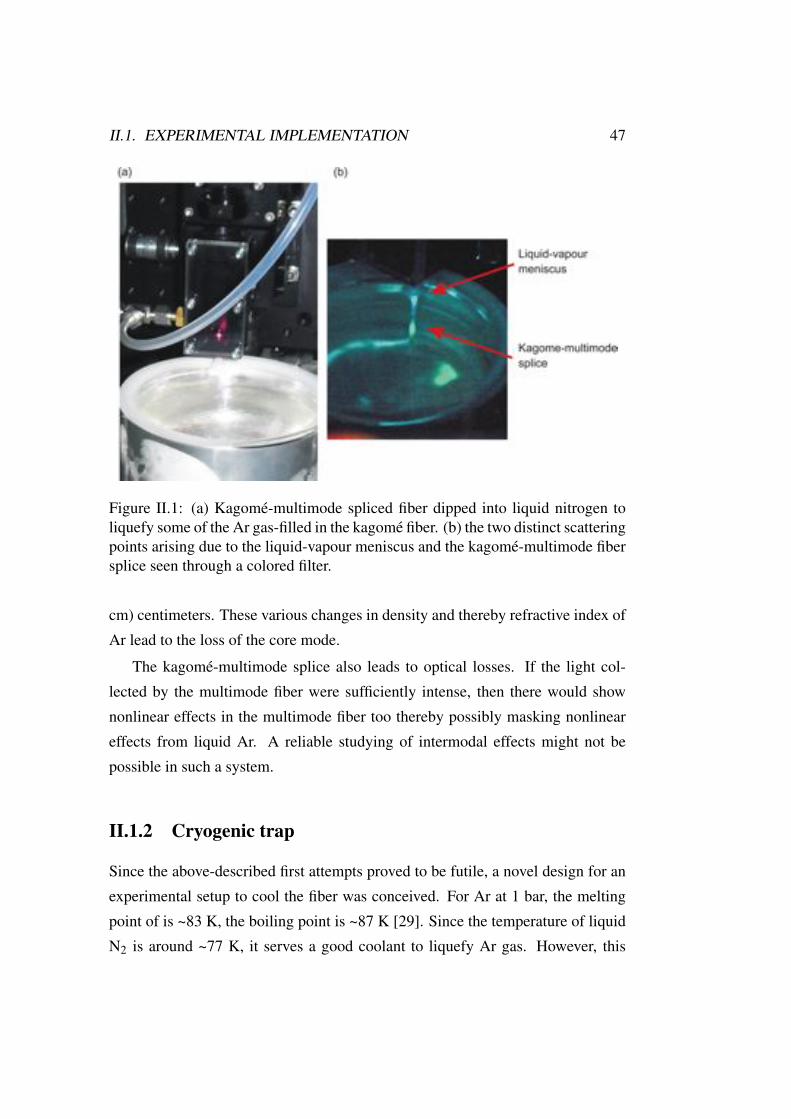
A kagomé fiber with a core diameter ~30 µm of was spliced to a standard mul-timode solid core fiber with a similar dimensions, using a fusion splicer. Trans-mission of the spliced fibers varied from 20-25% depending on the efficiency ofthe splice. The intention here was to provide a flat interface at the splice, for theliquid Ar filled in the kagomé fiber core. This flat splice interface was to effec-tively collect light that was in-coupled into the kagomé fiber. The spliced fiberwas installed vertically with the kagomé fiber serving as the in coupling end ofthe fiber (Fig. II.1). When the kagomé-multimode spliced fiber was lowered intoa liquid N2 bath, the Ar gas in the kagomé would liquefy just above the level ofliquid N2, as the boiling point of Ar (86 K) is higher than that of N2 (77 K). Liq-uid Ar was formed in a liquid column in the kagomé fiber. Formation of LiquidAr can be verified from the scattering point caused by the vapour-liquid interface.Meniscus formation due to liquids in a capillary makes this gas-liquid interfacecurved, similar to a water droplet meniscus in a capillary.
Despite several attempts, effective coupling of light into the core was not es-tablished using this method. There were a few disadvantages of this system. Sharpgradient in the core and cladding holes of the kagomé due to the correspondinggradient in density of Ar was observed. So the light propagates from a region ofrefractive index of around 1.0 (refractive index of gaseous Ar) to about 1.2 (re-fractive index of liquid Ar) through a gas-liquid interface. The kagomé could notbe lowered further into the liquid nitrogen Dewar, as solid Ar might form, lead toincreased scattering (due to crystallization) [69] and lesser optical guidance in thecore. Hence the length of liquid Ar created in the fiber was limited to a few (2-4
II.1. EXPERIMENTAL IMPLEMENTATION 47
Figure II.1: (a) Kagomé-multimode spliced fiber dipped into liquid nitrogen toliquefy some of the Ar gas-filled in the kagomé fiber. (b) the two distinct scatteringpoints arising due to the liquid-vapour meniscus and the kagomé-multimode fibersplice seen through a colored filter.
cm) centimeters. These various changes in density and thereby refractive index ofAr lead to the loss of the core mode.
The kagomé-multimode splice also leads to optical losses. If the light col-lected by the multimode fiber were sufficiently intense, then there would shownonlinear effects in the multimode fiber too thereby possibly masking nonlineareffects from liquid Ar. A reliable studying of intermodal effects might not bepossible in such a system.
II.1.2 Cryogenic trap
Since the above-described first attempts proved to be futile, a novel design for anexperimental setup to cool the fiber was conceived. For Ar at 1 bar, the meltingpoint of is ~83 K, the boiling point is ~87 K [29]. Since the temperature of liquidN2 is around ~77 K, it serves a good coolant to liquefy Ar gas. However, this
48 CHAPTER II. LIQUID AR FILLED KAGOMÉ PCF
also meant that cooling the fiber using the open Dewar filled with liquid N2 couldresult in formation of solid Ar which was undesirable. Solid Ar has a tendencyto crystallize [69] and thereby would create scattering defects in the core of thefiber. Hence the idea to fabricate a novel system to achieve this was conceived.The fabrication of the system had to be carefully thought of and a few engineeringhurdles had to be cleared. The system would still rely on liquefying Ar by coolingdown Ar gas. The following fabrication issues were resolved in the final versionof the cryotrap (Fig. II.4).
• A removable ferrule was utilized to mount the fiber into the cryotrap. Theremovable ferrule also ensured that the fiber ends could be cleaved well andclamped if required.
• The ferrule had to be uniformly cooled so as to have a homogeneous liquidAr medium in the middle of the fiber.
• Accurate temperature sensors were placed near the fiber to make sure thatthe required temperatures were actually achieved.
• Condensation on the windows of atmospheric water vapour was to be pre-vented. This was done in two ways. One was to heat the windows with10 Ω resistors. The other alternative method is purging the windows withnitrogen gas, so as to prevent water vapour from condensing.
• An appropriate insulation was implemented to conserve the liquid N2 usedas a coolant.
• The system had to be rigid enough to handle a pressure of 10 bar and lowtemperatures as low as 90 K simultaneously.
Description of Cryotrap
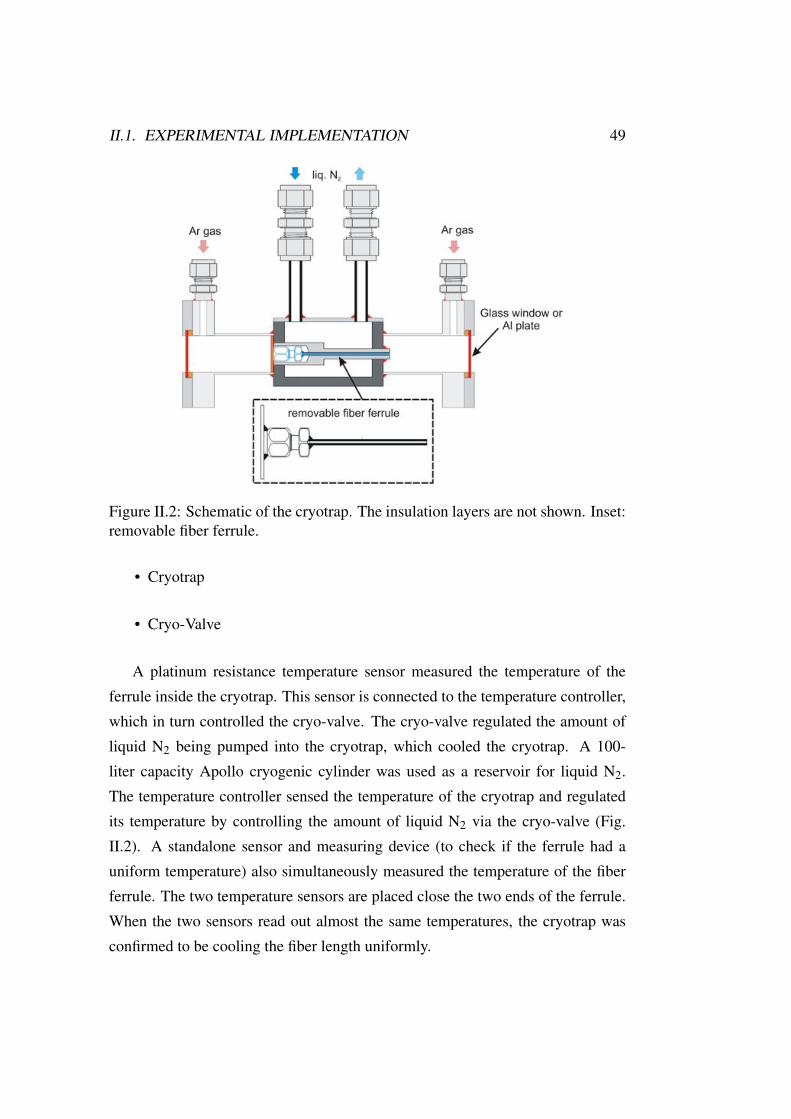
A cryotrap system was designed with the help of IMT Gmbh, Moosbach, Ger-many. It consisted of a primarily 3 parts (Fig. II.2).
• Temperature Controller
II.1. EXPERIMENTAL IMPLEMENTATION 49
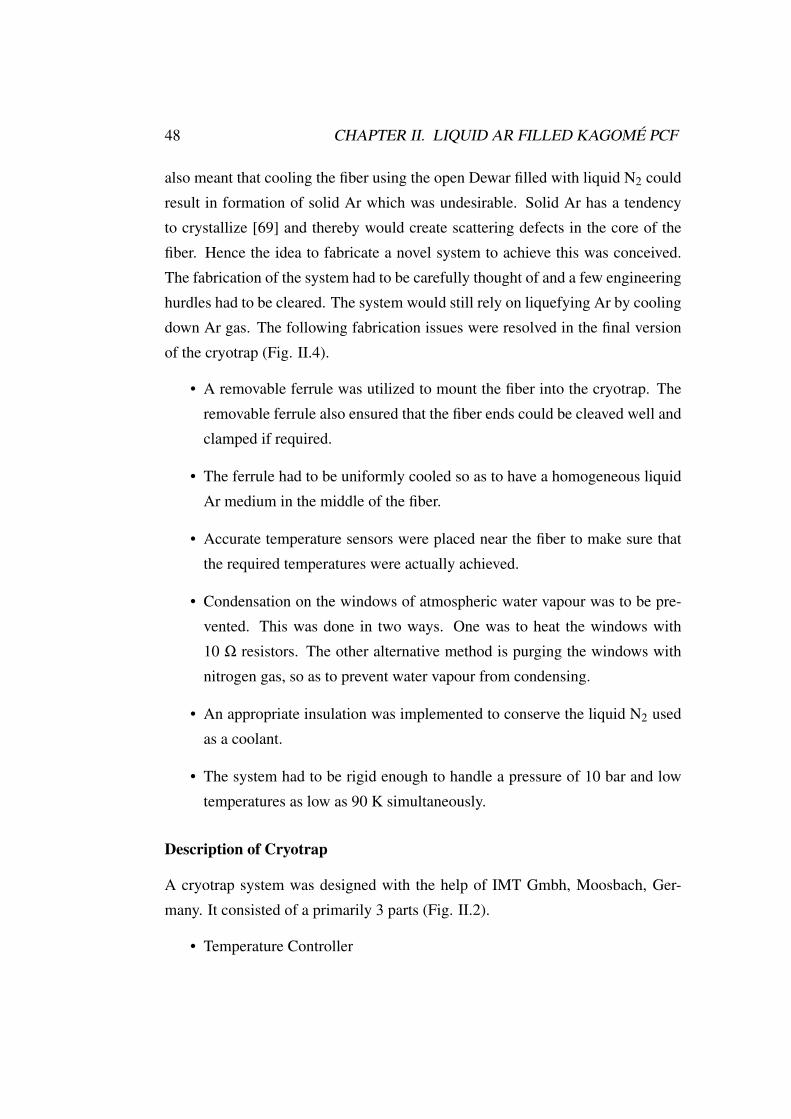
Figure II.2: Schematic of the cryotrap. The insulation layers are not shown. Inset:removable fiber ferrule.
• Cryotrap
• Cryo-Valve
A platinum resistance temperature sensor measured the temperature of theferrule inside the cryotrap. This sensor is connected to the temperature controller,which in turn controlled the cryo-valve. The cryo-valve regulated the amount ofliquid N2 being pumped into the cryotrap, which cooled the cryotrap. A 100-liter capacity Apollo cryogenic cylinder was used as a reservoir for liquid N2.The temperature controller sensed the temperature of the cryotrap and regulatedits temperature by controlling the amount of liquid N2 via the cryo-valve (Fig.II.2). A standalone sensor and measuring device (to check if the ferrule had auniform temperature) also simultaneously measured the temperature of the fiberferrule. The two temperature sensors are placed close the two ends of the ferrule.When the two sensors read out almost the same temperatures, the cryotrap wasconfirmed to be cooling the fiber length uniformly.
50 CHAPTER II. LIQUID AR FILLED KAGOMÉ PCF
Figure II.3: The three main components comprising the cryotrap system.
The cryotrap consists of a central region housing the ferrule and this regionis welded to the two gas cells on either end (Fig. II.2). The ferrule holds a 5 cmfiber, which the central region of the cryotrap cools down, uniformly to liquidAr temperatures (Fig. II.2). The ferrule is removable with the help of tweezersthrough the input window. After the 5 cm of kagomé fiber is cleaved well andloaded into the ferrule, it is secured to the body of the cryotrap by means of acouple of screws. A ferrule had the provision for a graphite ring that could beused to secure the ferrule to the fiber. Graphite was chosen, as it is a relatively softmaterial and does not clamp the fiber too hard and avoid any damage to the fiber.The window was designed to accommodate a glass window or an aluminum platewith a hole for the fiber. This choice depended on the requirement to cool the fiber.If whole length of fiber was cooled in the ferrule, then glass windows (sapphire orfused silica) were used. When only the central part of the fiber needed to be cooled(for fibers longer than the ferrule length), the aluminum plates were substituted inthe place of the glass windows. These aluminum plates have a hole in their centerto allow the fiber to pass through. The hole was then sealed off with glue. Insubsequent improvements the glue was replaced by Swagelok adaptations. Thepressure and the temperature of the Ar gas were optimized [29] , to achieve thefilling of liquid Ar in the kagomé fiber. At 10 bar Ar gas pressure and around 110
II.1. EXPERIMENTAL IMPLEMENTATION 51
K (approx. -160oC) liquid Ar formation was expected to begin.
Since the cold part of the cryotrap was welded to the two gas cells, the glasswindows get cold too, resulting in condensation of atmospheric water vapour.One of the methods to avoid this problem was to heat the windows using resis-tors attached to the two windows as the system is cooled. This resulted in moreliquid N2 being pumped into the cryotrap to compensate for the heating of thewindows. This extra pumping of liquid N2 resulted in increased vibration of thesystem, thereby affecting the in coupling of light into the fiber (placed inside thecryotrap). Warm windows and the cold interiors of the cryotrap introduced a un-desirable convection of Ar gas. The extra vibration due to the heating of windowswere avoided by introducing a N2 gas purging system to the windows to preventcondensation of atmospheric water vapour. By avoiding heating the system, thethermal stability of the system was be achieved.
Effective filling of the kagomé fiber with liquid Ar
To fill the kagomé fiber with liquid Ar at the appropriate pressure and temperature,it is important that any impurities (like water), which condense or solidify withinthe same thermodynamic regime, were eliminated. Water is eliminated at roomtemperature by securely closing all openings of the cryotrap, and subsequentlypurging the system with Ar gas. Alternatively purging and pumping out Ar gasrepeatedly eliminates the water to a great extent. Heating the cryotrap with theresistors on the windows can also help to remove any adsorbed water on the innerwalls of the system. Using fiber was mounted in the cryotrap in 2 ways:
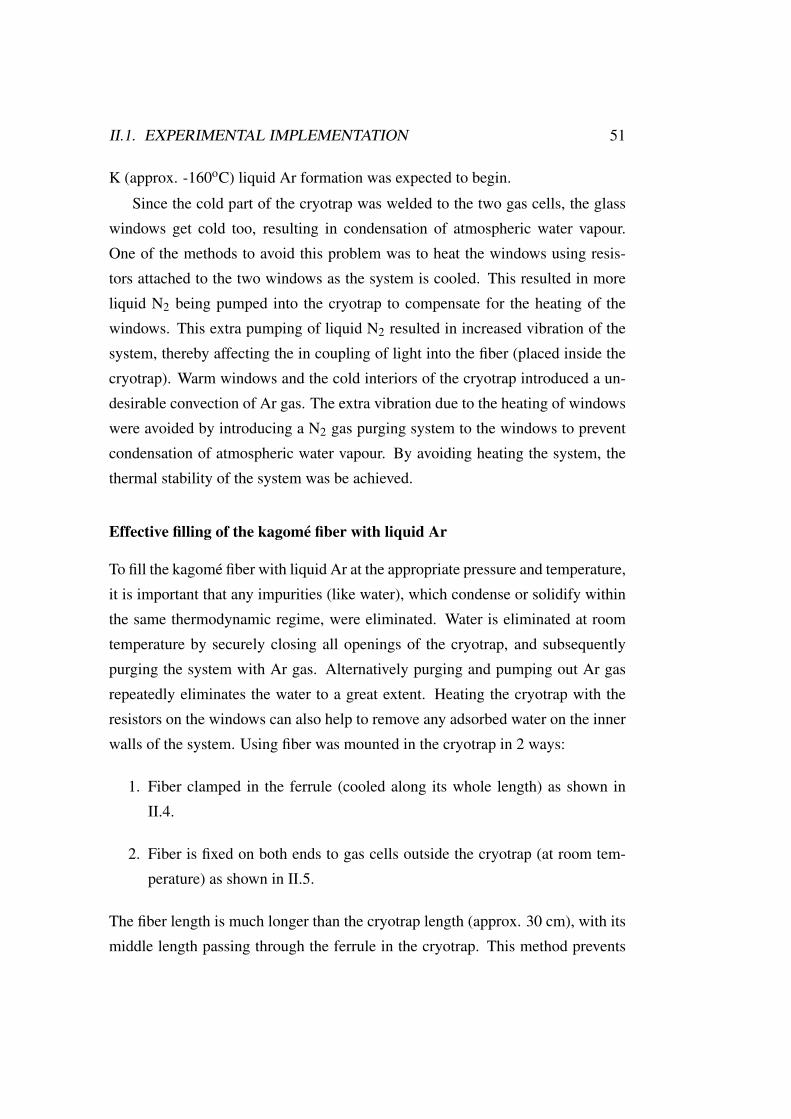
1. Fiber clamped in the ferrule (cooled along its whole length) as shown inII.4.
2. Fiber is fixed on both ends to gas cells outside the cryotrap (at room tem-perature) as shown in II.5.
The fiber length is much longer than the cryotrap length (approx. 30 cm), with itsmiddle length passing through the ferrule in the cryotrap. This method prevents
52 CHAPTER II. LIQUID AR FILLED KAGOMÉ PCF
Figure II.4: Fiber installed inside the cryotrap.
the fiber from being uniformly cooled along its length, but is better for couplinglight into the core mode of the fiber.
The first method with the fiber clamped in the ferrule was not efficient incoupling light into the core mode. Convection of Ar gas arose in the cryotrap dueto differential temperatures of the cold ferrule and the windows of the cryotrapat room temperature. Since the fiber length is almost the same as the ferrule, thethermodynamic phase transitions from gas to liquid were occurring near the incoupling end of the fiber. All these factors prevented efficient optical couplinginto the fiber.
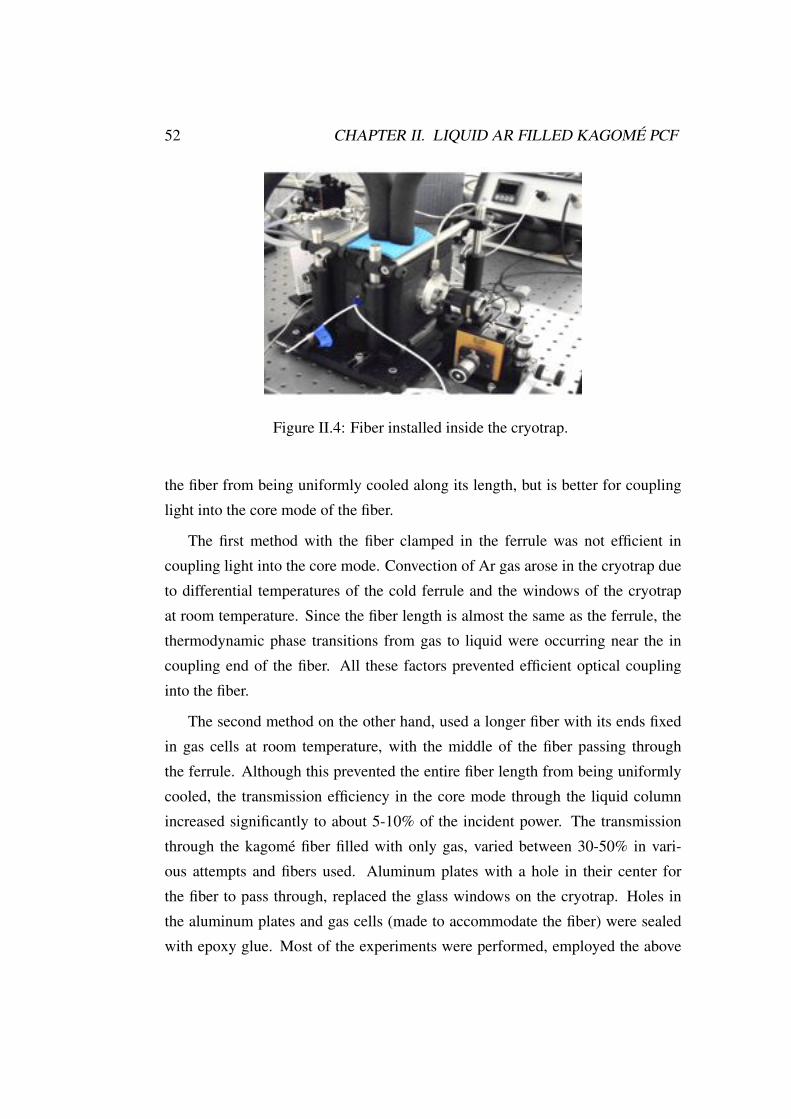
The second method on the other hand, used a longer fiber with its ends fixedin gas cells at room temperature, with the middle of the fiber passing throughthe ferrule. Although this prevented the entire fiber length from being uniformlycooled, the transmission efficiency in the core mode through the liquid columnincreased significantly to about 5-10% of the incident power. The transmissionthrough the kagomé fiber filled with only gas, varied between 30-50% in vari-ous attempts and fibers used. Aluminum plates with a hole in their center forthe fiber to pass through, replaced the glass windows on the cryotrap. Holes inthe aluminum plates and gas cells (made to accommodate the fiber) were sealedwith epoxy glue. Most of the experiments were performed, employed the above
II.1. EXPERIMENTAL IMPLEMENTATION 53
leakage prevention technique. However it was found that by connecting the gascells to the cryotrap by means of Swagelok adaption and plastic tubing/pipes (Fig.II.5), significantly increased the transmission through the liquid filled column.The reason being that the epoxy glue secured the fiber firmly, but the contractionof the fiber and cryotrap at cold temperatures caused stresses on the fiber. Thiswas evident when hollow-core SF6 glass was briefly used in system with epoxyglue. At low temperatures, the fiber was found snap and break due to contractionof various parts of the system at low temperatures. Using the transparent pipesand Swagelok adaptions, this problem was avoided as the fiber was secured onlyby magnets to the V-grooves in the gas cells and was not stressed by contractionsin the cryotrap. However, this method led to formation of liquid gas interfacesor capillary menisci, as the fiber was not uniformly cooled. Between the twomethods discussed above, the second method was most instrumental in gettingthe experimental results from a PCF filled with a liquid column.
II.1.3 Experimental results
A schematic diagram of the experimental setup is shown in Fig. II.6(b). It consistsof a 30 cm of kagomé HC-PCF (Fig. II.6(a)) connected to two gas-cells at eitherend. The fiber core is 28 µm in diameter and is first filled with Ar gas to a pressureof 6 bar. The pressure of Ar gas was kept at 6 bar in order to increase the boilingpoint of Ar to 108 K (from 87 K at 1 bar) [29]. This also ensured that liquid Arcould be condensed in the fiber.
To liquefy the gas, a section of the fiber passes through the cryotrap usingliquid N2 as coolant. Precise temperature control from ambient down to 85 Kwas possible. This unique setup is interesting for studying nonlinear effects, acentral liquid Ar section being sandwiched between two gaseous sections. Thepulse experiences a change in nonlinearity, dispersion and refractive index as itpropagates along the length of the fiber. The system was designed and optimizedso as to achieve optical guidance in the fundamental mode through the liquidAr. Diagnostics included a CCD camera, which images the near-field at the fiberoutput, and an optical spectrum analyzer.
54 CHAPTER II. LIQUID AR FILLED KAGOMÉ PCF
Figure II.5: (top) Cryotrap cooling the middle section of a 30 cm long fiber withAr gas cells at room temperature on both ends. (bottom) Transmission and lossdue to the liquid Ar column in the fiber.
For this experiment, ~160 fs long pulses coming from an amplified Ti:sapphiresystem (~800 nm) was used. Previous work has shown that the dispersion ofkagomé-lattice HC-PCF filled with gas can be accurately approximated by a filledcapillary of similar core diameter [65]. The same approach to calculate the dis-persion properties of the liquid-Ar-filled fiber [64, 65]. As the pulse propagatesthrough the system, it experienced anomalous dispersion and low nonlinearity inthe gaseous Ar section (zero-dispersion wavelength (ZDW) ~350 nm) and then amuch higher nonlinearity but normal dispersion when it enters the liquid Ar region(ZDW ~1.6 µm). Although transmission through the complete system was only~10% due to the presence of menisci between the gas/liquid phases, the spatialmode remains fundamental. The main contribution to the loss is scattering at thefirst meniscus and the residual pump power in the second gas-filled section is tooweak to cause any significant nonlinear effects.
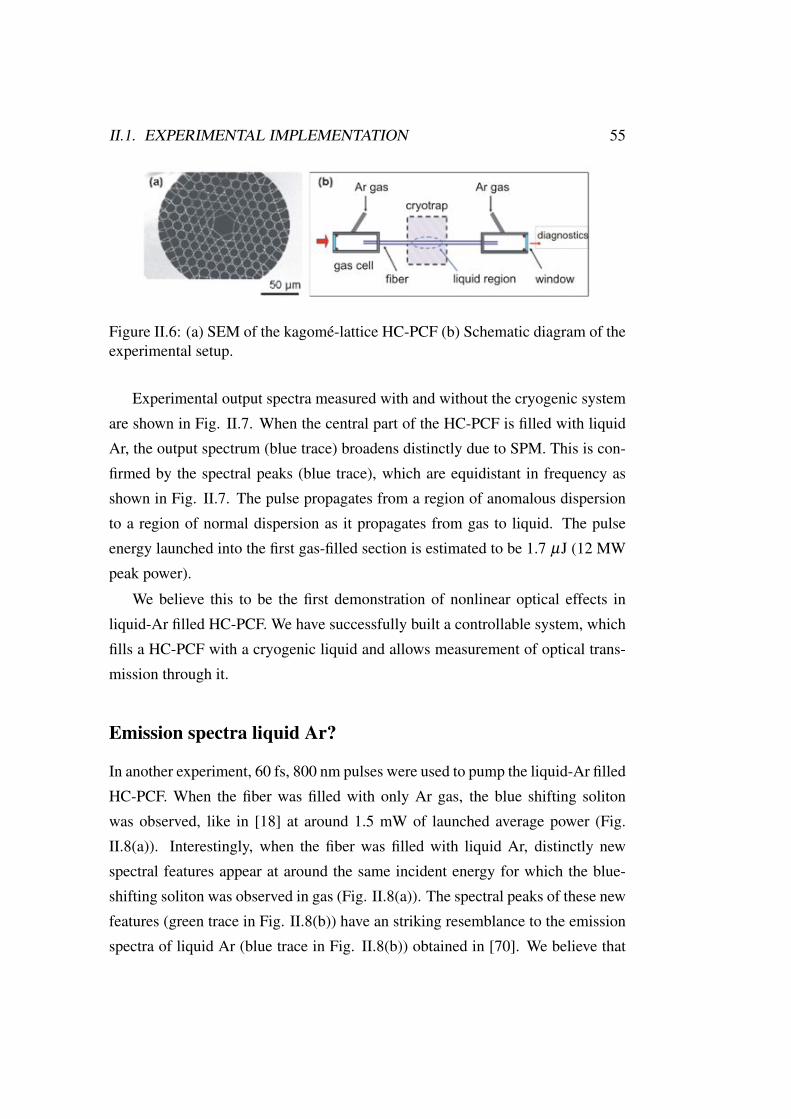
II.1. EXPERIMENTAL IMPLEMENTATION 55
Figure II.6: (a) SEM of the kagomé-lattice HC-PCF (b) Schematic diagram of theexperimental setup.
Experimental output spectra measured with and without the cryogenic systemare shown in Fig. II.7. When the central part of the HC-PCF is filled with liquidAr, the output spectrum (blue trace) broadens distinctly due to SPM. This is con-firmed by the spectral peaks (blue trace), which are equidistant in frequency asshown in Fig. II.7. The pulse propagates from a region of anomalous dispersionto a region of normal dispersion as it propagates from gas to liquid. The pulseenergy launched into the first gas-filled section is estimated to be 1.7 µJ (12 MWpeak power).
We believe this to be the first demonstration of nonlinear optical effects inliquid-Ar filled HC-PCF. We have successfully built a controllable system, whichfills a HC-PCF with a cryogenic liquid and allows measurement of optical trans-mission through it.
Emission spectra liquid Ar?
In another experiment, 60 fs, 800 nm pulses were used to pump the liquid-Ar filledHC-PCF. When the fiber was filled with only Ar gas, the blue shifting solitonwas observed, like in [18] at around 1.5 mW of launched average power (Fig.II.8(a)). Interestingly, when the fiber was filled with liquid Ar, distinctly newspectral features appear at around the same incident energy for which the blue-shifting soliton was observed in gas (Fig. II.8(a)). The spectral peaks of these newfeatures (green trace in Fig. II.8(b)) have an striking resemblance to the emissionspectra of liquid Ar (blue trace in Fig. II.8(b)) obtained in [70]. We believe that
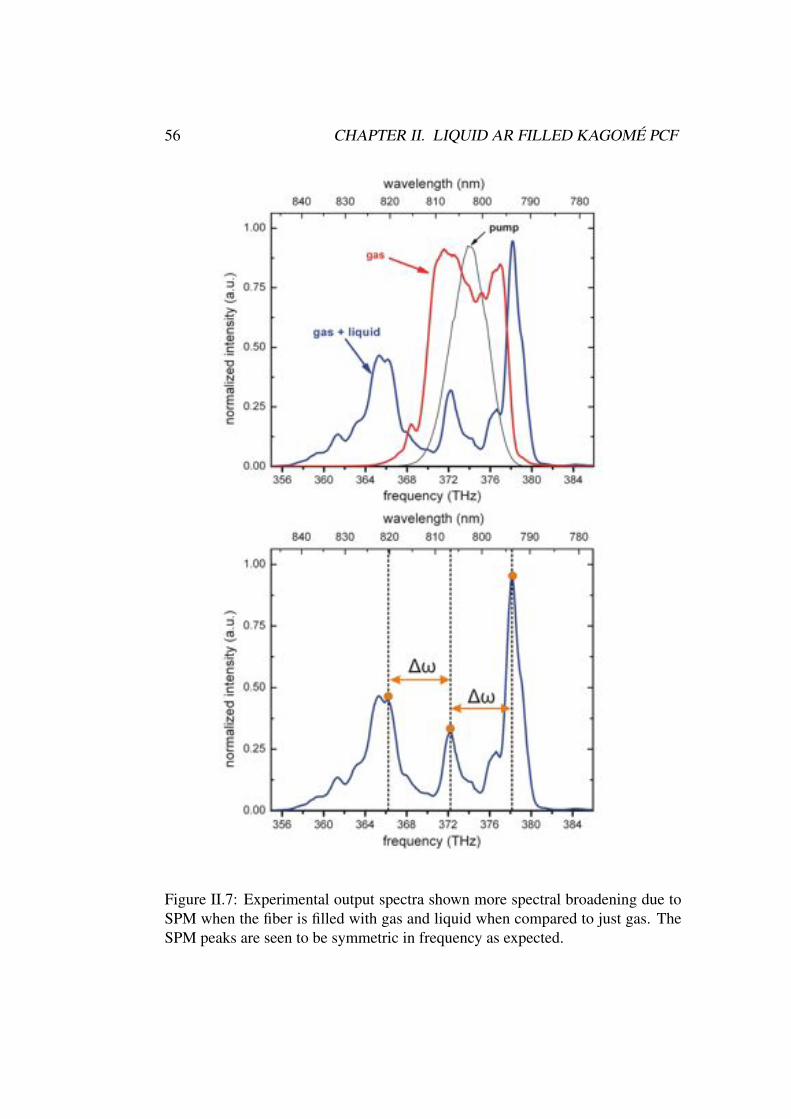
56 CHAPTER II. LIQUID AR FILLED KAGOMÉ PCF
Figure II.7: Experimental output spectra shown more spectral broadening due toSPM when the fiber is filled with gas and liquid when compared to just gas. TheSPM peaks are seen to be symmetric in frequency as expected.
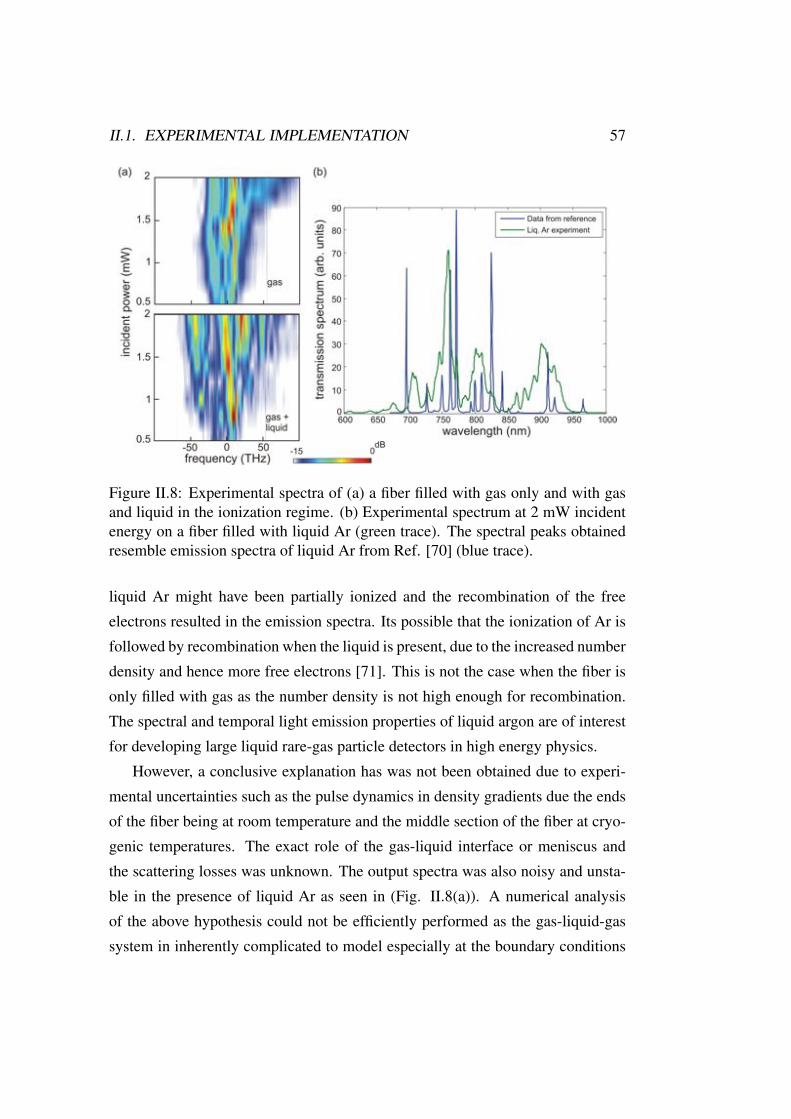
II.1. EXPERIMENTAL IMPLEMENTATION 57
Figure II.8: Experimental spectra of (a) a fiber filled with gas only and with gasand liquid in the ionization regime. (b) Experimental spectrum at 2 mW incidentenergy on a fiber filled with liquid Ar (green trace). The spectral peaks obtainedresemble emission spectra of liquid Ar from Ref. [70] (blue trace).
liquid Ar might have been partially ionized and the recombination of the freeelectrons resulted in the emission spectra. Its possible that the ionization of Ar isfollowed by recombination when the liquid is present, due to the increased numberdensity and hence more free electrons [71]. This is not the case when the fiber isonly filled with gas as the number density is not high enough for recombination.The spectral and temporal light emission properties of liquid argon are of interestfor developing large liquid rare-gas particle detectors in high energy physics.
However, a conclusive explanation has was not been obtained due to experi-mental uncertainties such as the pulse dynamics in density gradients due the endsof the fiber being at room temperature and the middle section of the fiber at cryo-genic temperatures. The exact role of the gas-liquid interface or meniscus andthe scattering losses was unknown. The output spectra was also noisy and unsta-ble in the presence of liquid Ar as seen in (Fig. II.8(a)). A numerical analysisof the above hypothesis could not be efficiently performed as the gas-liquid-gassystem in inherently complicated to model especially at the boundary conditions
58 CHAPTER II. LIQUID AR FILLED KAGOMÉ PCF
of these thermodynamical phases. A further study of these experimental spectrawould be interesting for further studying ionization regimes at thermodynamicphase-transitions in the fiber.
II.1.4 All liquid Cryotrap
Components of the system
In order to solve the problem of the gas-liquid meniscus scattering loss in the fiberusing the cryotrap, a new method had to be devised to fill the fiber. Attachingwindows to the fiber end was ruled out as the glue holding them in place wouldnot be suitable at cryogenic temperatures. Filling up a HC-PCF by immersing thefiber in the cryogenic liquid was a possible solution. For this, the fiber would needto be evacuated (to prevent any gas bubbles) and then filled directly with the givencryogenic liquid by immersing the fiber in it. A special cryogenic would be neededto be designed. With the help of the company IMT, a new cryogenic system wasdeveloped. This system offered several advantages over the cryotrap. The newsystem had several transparent glass parts, thereby enabling a visual on the fiber.The fiber would be filled from end to end, thereby filing the fiber uniformly withliquid and preventing the formation of any gas-liquid interface. Capillary actionwould also ensure that the fluid fills the fiber uniformly, just like a liquid risesin a capillary when it is immersed into the liquid. Liquid would be between thewindow and the fiber in coupling end, thereby creating no hindrances in the beamfocusing into the fiber. The system could successfully maintain the fiber immersedin the cryogenic liquid for at least half an hour in the tests. The system howeverwas not used for optical experiments due to the simultaneous development of thehigh pressure gas systems (discussed in), which enabled primary goals such asfused silica nonlinearity to be easily achieved. The cryogenic system developedis a very useful technical advancement for future low temperature experiments.
The cryogenic chamber consists of an inner fused silica cylinder (outer diam-eter 33 mm, wall thickness 4 mm) and an outer cylinder made of Duran glass(outer diameter 80 mm, wall thickness 5 mm) as in Fig. II.9. Vacuum (approx.
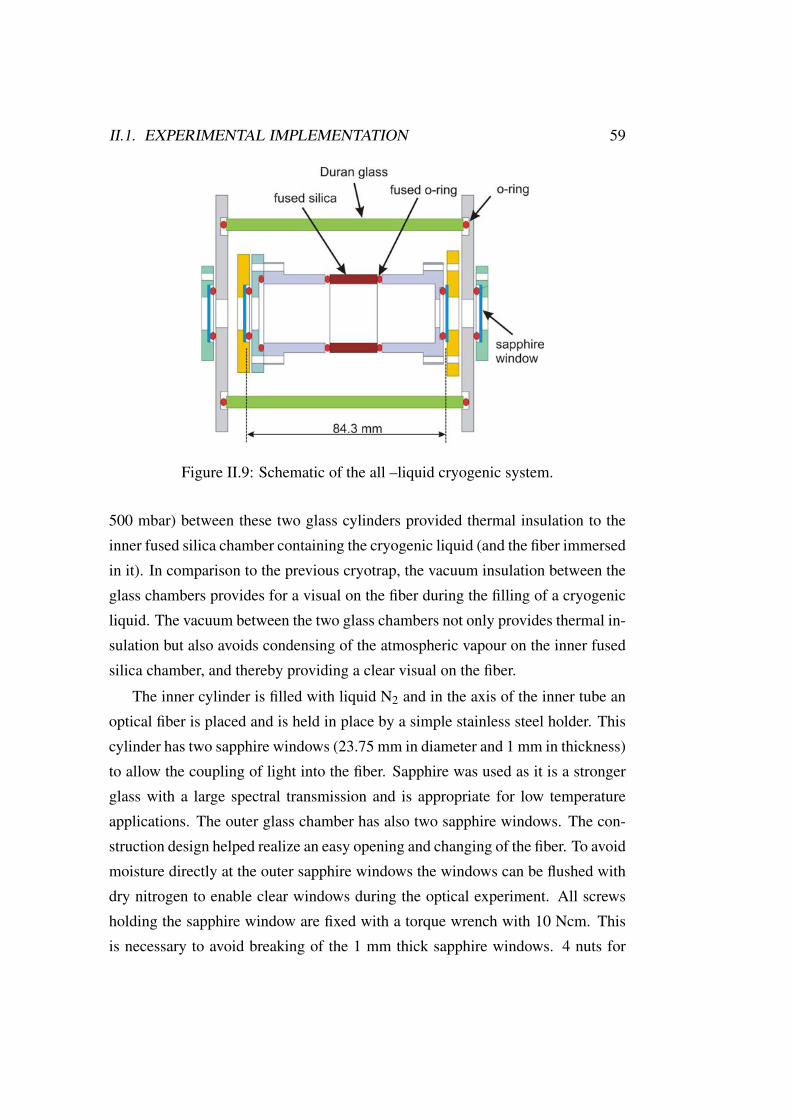
II.1. EXPERIMENTAL IMPLEMENTATION 59
Figure II.9: Schematic of the all –liquid cryogenic system.
500 mbar) between these two glass cylinders provided thermal insulation to theinner fused silica chamber containing the cryogenic liquid (and the fiber immersedin it). In comparison to the previous cryotrap, the vacuum insulation between theglass chambers provides for a visual on the fiber during the filling of a cryogenicliquid. The vacuum between the two glass chambers not only provides thermal in-sulation but also avoids condensing of the atmospheric vapour on the inner fusedsilica chamber, and thereby providing a clear visual on the fiber.
The inner cylinder is filled with liquid N2 and in the axis of the inner tube anoptical fiber is placed and is held in place by a simple stainless steel holder. Thiscylinder has two sapphire windows (23.75 mm in diameter and 1 mm in thickness)to allow the coupling of light into the fiber. Sapphire was used as it is a strongerglass with a large spectral transmission and is appropriate for low temperatureapplications. The outer glass chamber has also two sapphire windows. The con-struction design helped realize an easy opening and changing of the fiber. To avoidmoisture directly at the outer sapphire windows the windows can be flushed withdry nitrogen to enable clear windows during the optical experiment. All screwsholding the sapphire window are fixed with a torque wrench with 10 Ncm. Thisis necessary to avoid breaking of the 1 mm thick sapphire windows. 4 nuts for
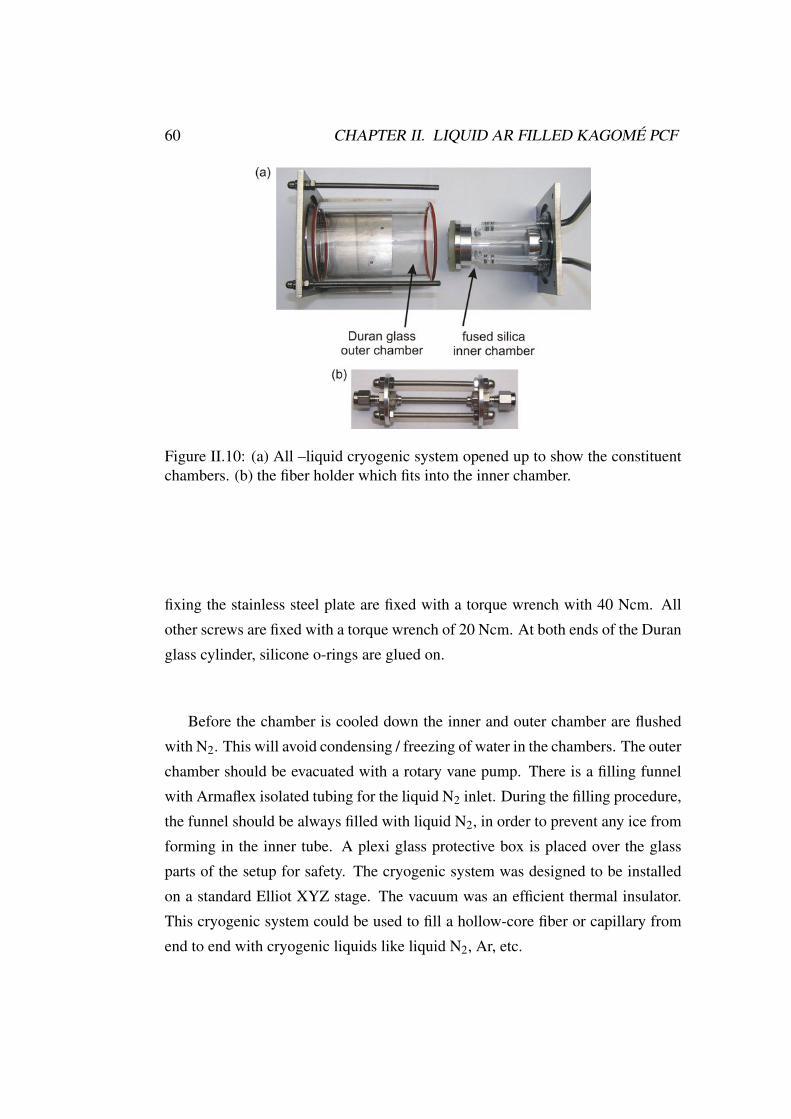
60 CHAPTER II. LIQUID AR FILLED KAGOMÉ PCF
Figure II.10: (a) All –liquid cryogenic system opened up to show the constituentchambers. (b) the fiber holder which fits into the inner chamber.
fixing the stainless steel plate are fixed with a torque wrench with 40 Ncm. Allother screws are fixed with a torque wrench of 20 Ncm. At both ends of the Duranglass cylinder, silicone o-rings are glued on.
Before the chamber is cooled down the inner and outer chamber are flushedwith N2. This will avoid condensing / freezing of water in the chambers. The outerchamber should be evacuated with a rotary vane pump. There is a filling funnelwith Armaflex isolated tubing for the liquid N2 inlet. During the filling procedure,the funnel should be always filled with liquid N2, in order to prevent any ice fromforming in the inner tube. A plexi glass protective box is placed over the glassparts of the setup for safety. The cryogenic system was designed to be installedon a standard Elliot XYZ stage. The vacuum was an efficient thermal insulator.This cryogenic system could be used to fill a hollow-core fiber or capillary fromend to end with cryogenic liquids like liquid N2, Ar, etc.
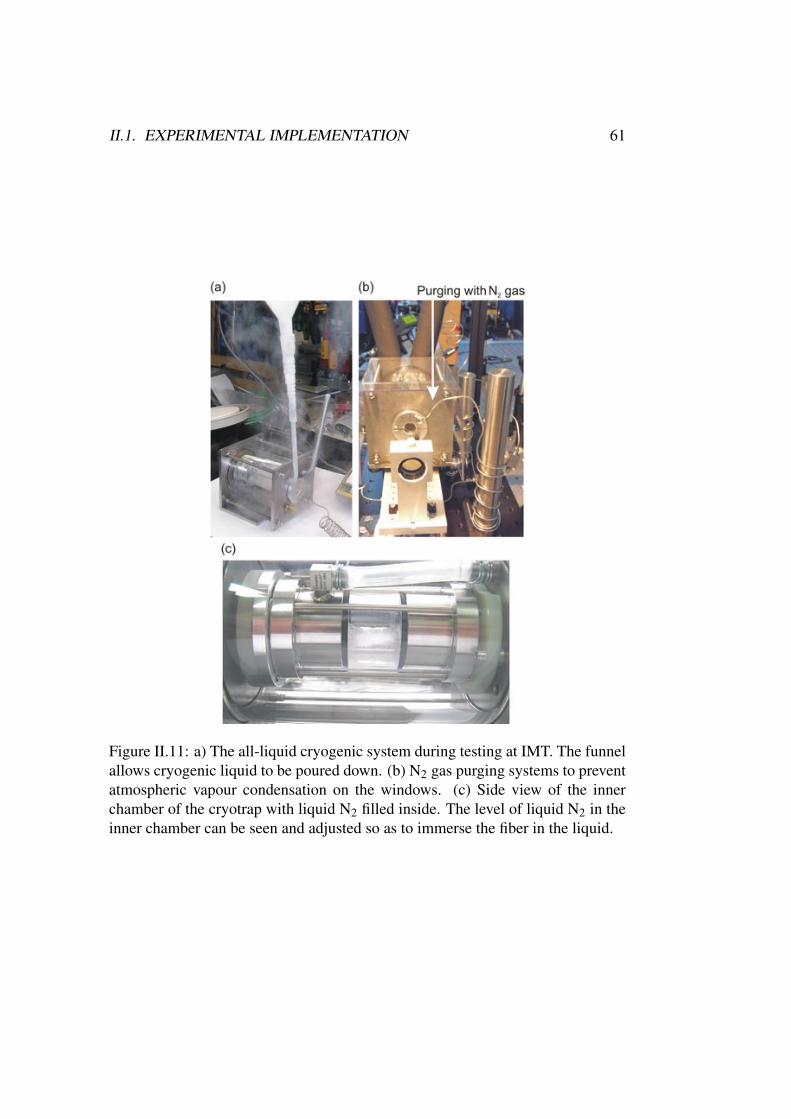
II.1. EXPERIMENTAL IMPLEMENTATION 61
Figure II.11: a) The all-liquid cryogenic system during testing at IMT. The funnelallows cryogenic liquid to be poured down. (b) N2 gas purging systems to preventatmospheric vapour condensation on the windows. (c) Side view of the innerchamber of the cryotrap with liquid N2 filled inside. The level of liquid N2 in theinner chamber can be seen and adjusted so as to immerse the fiber in the liquid.
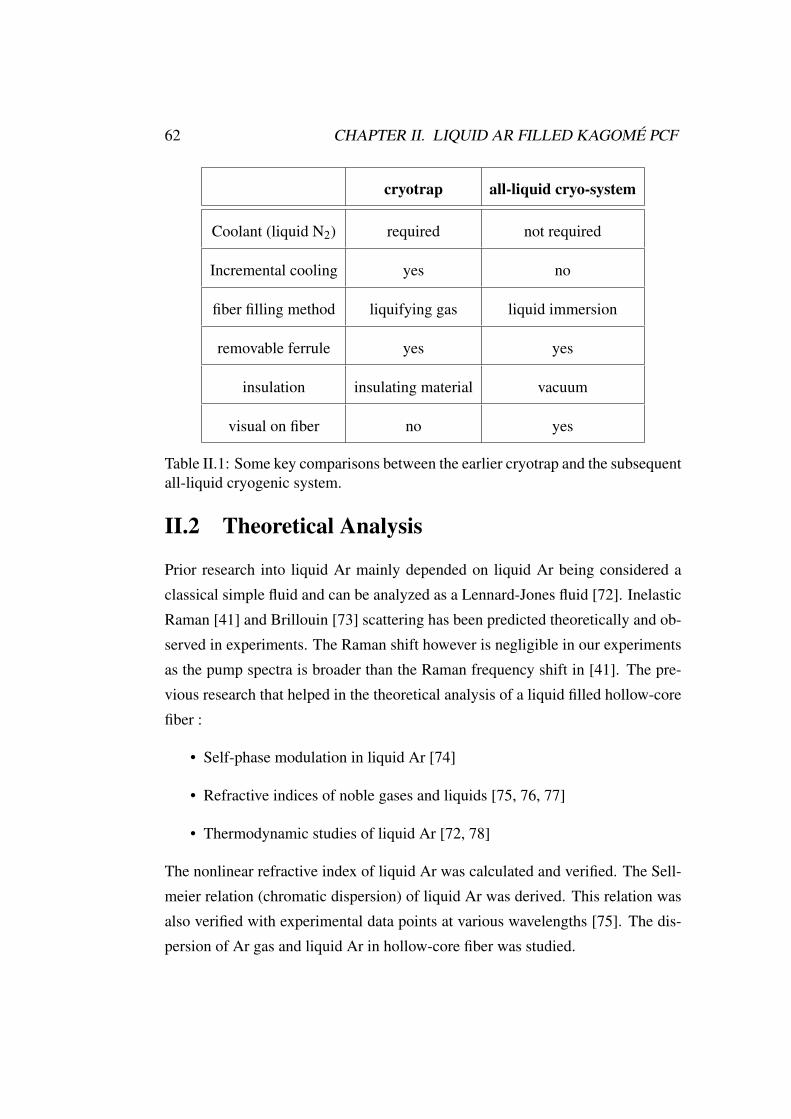
62 CHAPTER II. LIQUID AR FILLED KAGOMÉ PCF
cryotrap all-liquid cryo-system
Coolant (liquid N2) required not required
Incremental cooling yes no
fiber filling method liquifying gas liquid immersion
removable ferrule yes yes
insulation insulating material vacuum
visual on fiber no yes
Table II.1: Some key comparisons between the earlier cryotrap and the subsequentall-liquid cryogenic system.
II.2 Theoretical Analysis
Prior research into liquid Ar mainly depended on liquid Ar being considered aclassical simple fluid and can be analyzed as a Lennard-Jones fluid [72]. InelasticRaman [41] and Brillouin [73] scattering has been predicted theoretically and ob-served in experiments. The Raman shift however is negligible in our experimentsas the pump spectra is broader than the Raman frequency shift in [41]. The pre-vious research that helped in the theoretical analysis of a liquid filled hollow-corefiber :
• Self-phase modulation in liquid Ar [74]
• Refractive indices of noble gases and liquids [75, 76, 77]
• Thermodynamic studies of liquid Ar [72, 78]
The nonlinear refractive index of liquid Ar was calculated and verified. The Sell-meier relation (chromatic dispersion) of liquid Ar was derived. This relation wasalso verified with experimental data points at various wavelengths [75]. The dis-persion of Ar gas and liquid Ar in hollow-core fiber was studied.
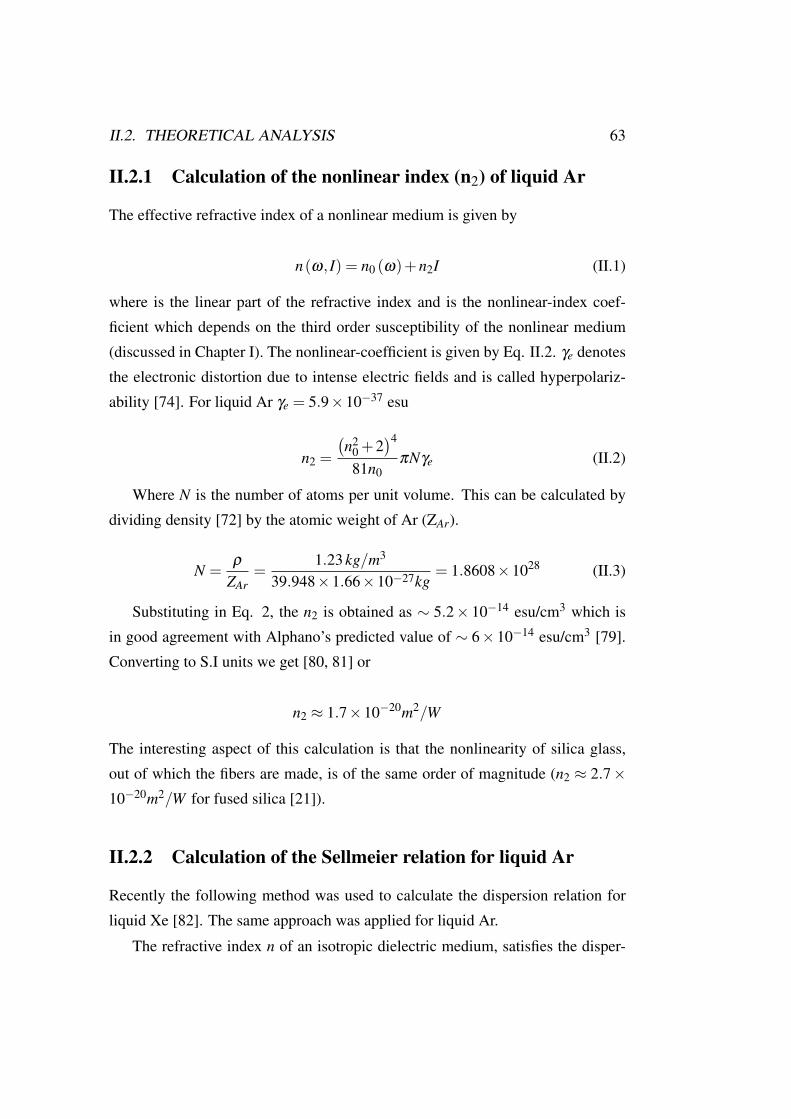
II.2. THEORETICAL ANALYSIS 63
II.2.1 Calculation of the nonlinear index (n2) of liquid Ar
The effective refractive index of a nonlinear medium is given by
n(ω, I) = n0 (ω)+n2I (II.1)
where is the linear part of the refractive index and is the nonlinear-index coef-ficient which depends on the third order susceptibility of the nonlinear medium(discussed in Chapter I). The nonlinear-coefficient is given by Eq. II.2. γe denotesthe electronic distortion due to intense electric fields and is called hyperpolariz-ability [74]. For liquid Ar γe = 5.9×10−37 esu
n2 =
n2
0 +24
81n0πNγe (II.2)
Where N is the number of atoms per unit volume. This can be calculated bydividing density [72] by the atomic weight of Ar (ZAr).
N =ρ
ZAr=
1.23 kg/m3
39.948×1.66×10−27kg= 1.8608×1028 (II.3)
Substituting in Eq. 2, the n2 is obtained as ∼ 5.2× 10⁻¹⁴ esu/cm3 which isin good agreement with Alphano’s predicted value of ∼ 6× 10⁻¹⁴ esu/cm3 [79].Converting to S.I units we get [80, 81] or
n2 ≈ 1.7×10⁻²⁰m2/W
The interesting aspect of this calculation is that the nonlinearity of silica glass,out of which the fibers are made, is of the same order of magnitude (n2 ≈ 2.7×10⁻²⁰m2/W for fused silica [21]).
II.2.2 Calculation of the Sellmeier relation for liquid Ar
Recently the following method was used to calculate the dispersion relation forliquid Xe [82]. The same approach was applied for liquid Ar.
The refractive index n of an isotropic dielectric medium, satisfies the disper-
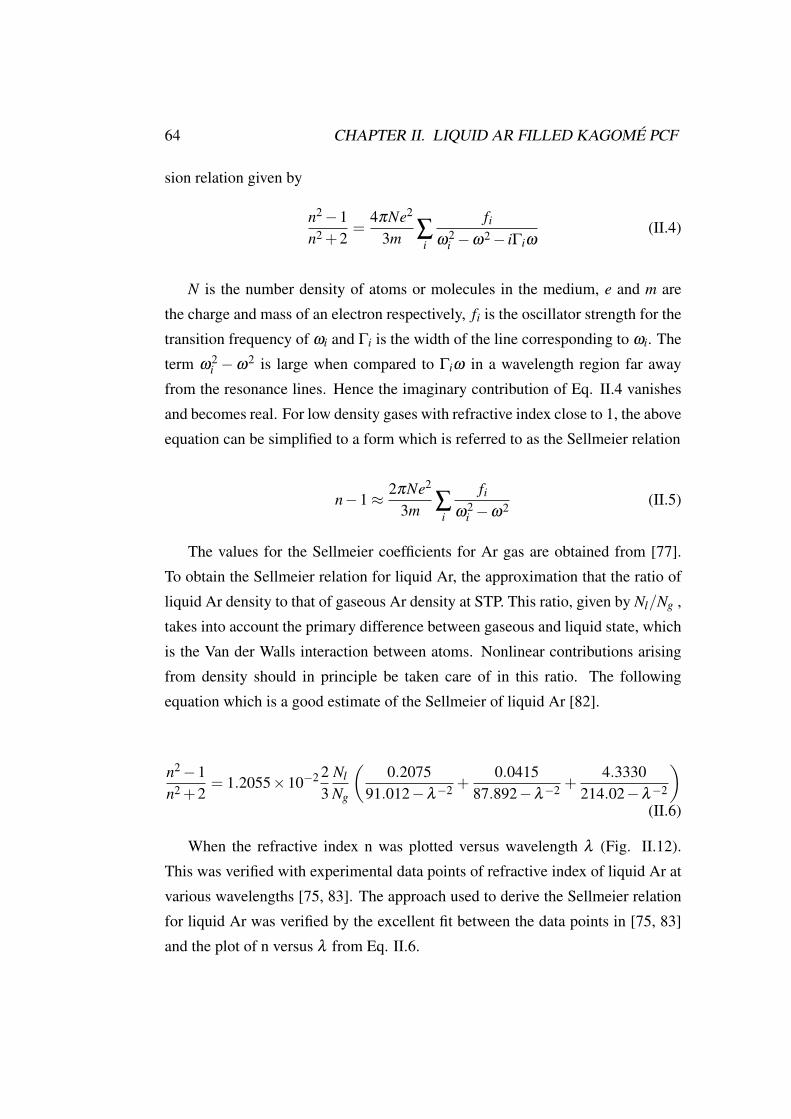
64 CHAPTER II. LIQUID AR FILLED KAGOMÉ PCF
sion relation given by
n2 −1n2 +2
=4πNe2
3m ∑i
fi
ω2i −ω2 − iΓiω
(II.4)
N is the number density of atoms or molecules in the medium, e and m arethe charge and mass of an electron respectively, fi is the oscillator strength for thetransition frequency of ωi and Γi is the width of the line corresponding to ωi. Theterm ω2
i −ω2 is large when compared to Γiω in a wavelength region far awayfrom the resonance lines. Hence the imaginary contribution of Eq. II.4 vanishesand becomes real. For low density gases with refractive index close to 1, the aboveequation can be simplified to a form which is referred to as the Sellmeier relation
n−1 ≈ 2πNe2
3m ∑i
fi
ω2i −ω2 (II.5)
The values for the Sellmeier coefficients for Ar gas are obtained from [77].To obtain the Sellmeier relation for liquid Ar, the approximation that the ratio ofliquid Ar density to that of gaseous Ar density at STP. This ratio, given by Nl/Ng ,takes into account the primary difference between gaseous and liquid state, whichis the Van der Walls interaction between atoms. Nonlinear contributions arisingfrom density should in principle be taken care of in this ratio. The followingequation which is a good estimate of the Sellmeier of liquid Ar [82].
n2 −1n2 +2
= 1.2055×10⁻² 23
Nl
Ng
0.2075
91.012−λ−2 +0.0415
87.892−λ−2 +4.3330
214.02−λ−2
(II.6)
When the refractive index n was plotted versus wavelength λ (Fig. II.12).This was verified with experimental data points of refractive index of liquid Ar atvarious wavelengths [75, 83]. The approach used to derive the Sellmeier relationfor liquid Ar was verified by the excellent fit between the data points in [75, 83]and the plot of n versus λ from Eq. II.6.
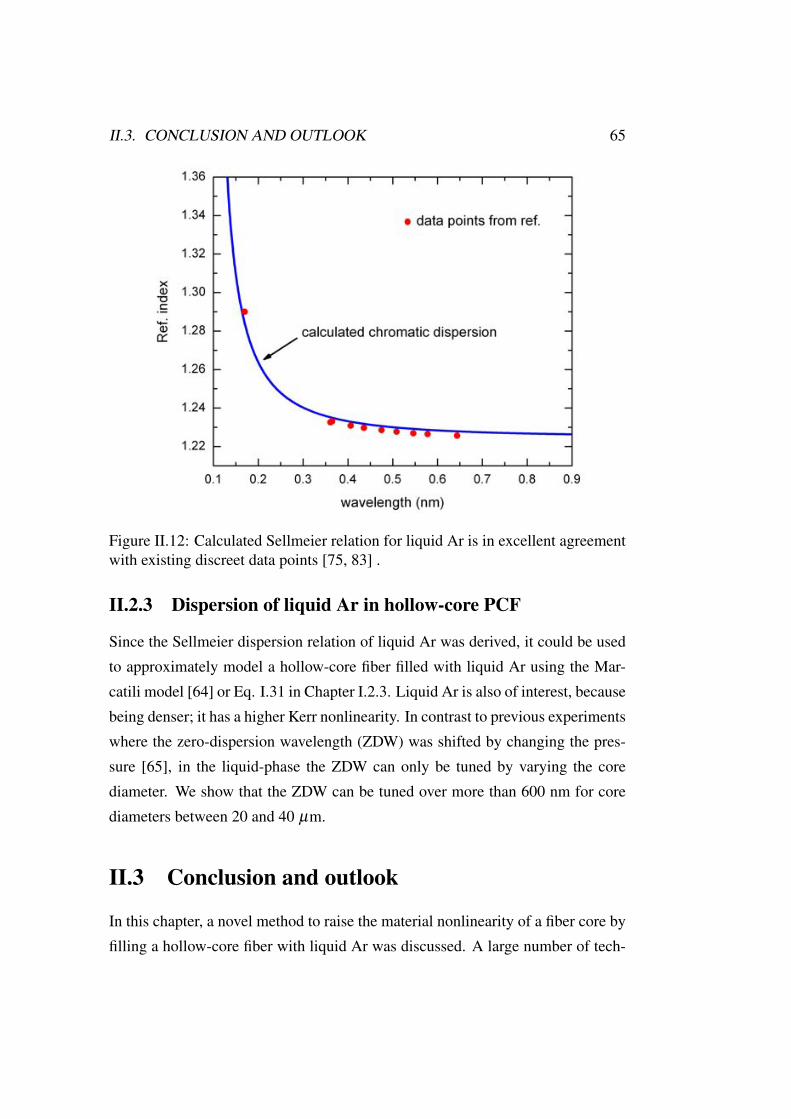
II.3. CONCLUSION AND OUTLOOK 65
Figure II.12: Calculated Sellmeier relation for liquid Ar is in excellent agreementwith existing discreet data points [75, 83] .
II.2.3 Dispersion of liquid Ar in hollow-core PCF
Since the Sellmeier dispersion relation of liquid Ar was derived, it could be usedto approximately model a hollow-core fiber filled with liquid Ar using the Mar-catili model [64] or Eq. I.31 in Chapter I.2.3. Liquid Ar is also of interest, becausebeing denser; it has a higher Kerr nonlinearity. In contrast to previous experimentswhere the zero-dispersion wavelength (ZDW) was shifted by changing the pres-sure [65], in the liquid-phase the ZDW can only be tuned by varying the corediameter. We show that the ZDW can be tuned over more than 600 nm for corediameters between 20 and 40 µm.
II.3 Conclusion and outlook
In this chapter, a novel method to raise the material nonlinearity of a fiber core byfilling a hollow-core fiber with liquid Ar was discussed. A large number of tech-
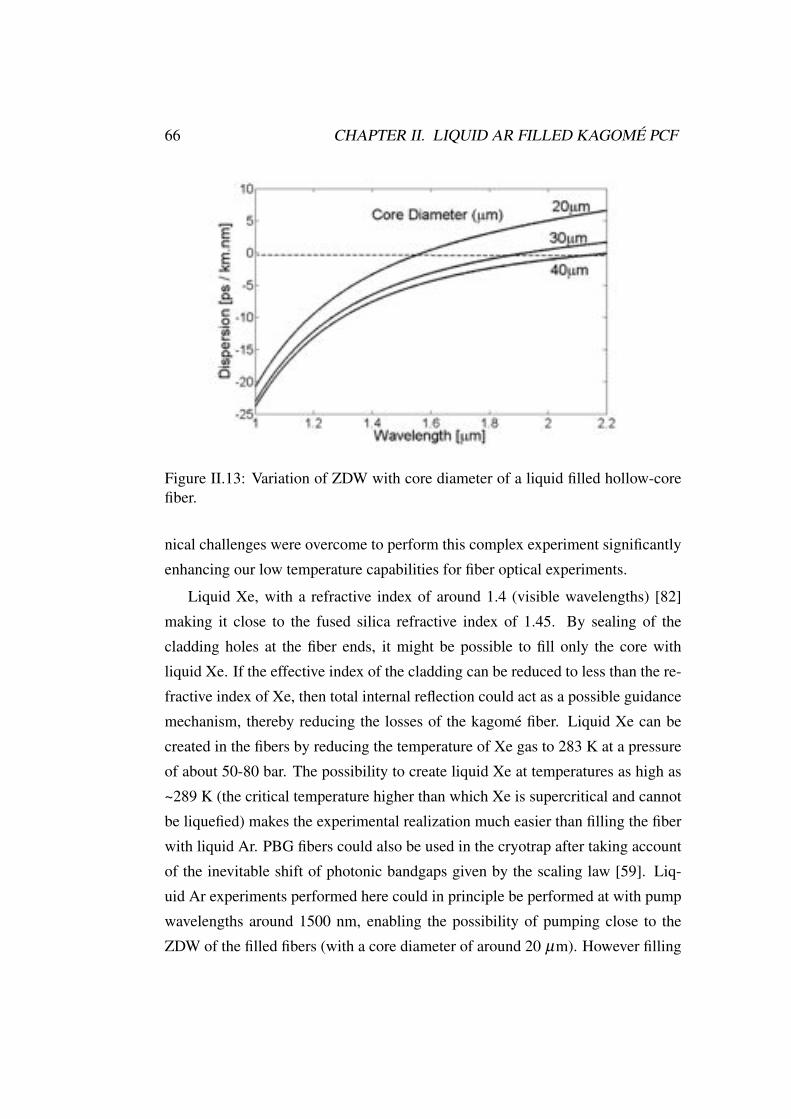
66 CHAPTER II. LIQUID AR FILLED KAGOMÉ PCF
Figure II.13: Variation of ZDW with core diameter of a liquid filled hollow-corefiber.
nical challenges were overcome to perform this complex experiment significantlyenhancing our low temperature capabilities for fiber optical experiments.
Liquid Xe, with a refractive index of around 1.4 (visible wavelengths) [82]making it close to the fused silica refractive index of 1.45. By sealing of thecladding holes at the fiber ends, it might be possible to fill only the core withliquid Xe. If the effective index of the cladding can be reduced to less than the re-fractive index of Xe, then total internal reflection could act as a possible guidancemechanism, thereby reducing the losses of the kagomé fiber. Liquid Xe can becreated in the fibers by reducing the temperature of Xe gas to 283 K at a pressureof about 50-80 bar. The possibility to create liquid Xe at temperatures as high as~289 K (the critical temperature higher than which Xe is supercritical and cannotbe liquefied) makes the experimental realization much easier than filling the fiberwith liquid Ar. PBG fibers could also be used in the cryotrap after taking accountof the inevitable shift of photonic bandgaps given by the scaling law [59]. Liq-uid Ar experiments performed here could in principle be performed at with pumpwavelengths around 1500 nm, enabling the possibility of pumping close to theZDW of the filled fibers (with a core diameter of around 20 µm). However filling
II.3. CONCLUSION AND OUTLOOK 67
the fiber from end to end uniformly with a cryogenic fluid is the main technicalchallenge of the low temperature studies performed here. The all-liquid cryotrapis a step in the direction to solving this issue. Interestingly, most problems suchas scattering loss due to meniscus formation were avoided once the high pressuregas-filled fiber was devised which significantly reduced the technical complexityof filling the fibers with dense noble gases.

68 CHAPTER II. LIQUID AR FILLED KAGOMÉ PCF
Chapter III
High pressure Ar gas filled PCF
Hollow-core photonic crystal fiber (HC-PCF) offer long interaction lengths whileavoiding beam diffraction, thus providing an effective environment for nonlinearoptics in gases [9, 23]. Kagomé-style HC-PCF [9] offers in addition broadbandtransmission with moderately low loss, features that are useful for exploring non-linear effects (such as self-phase modulation), which generate broadband opticalspectra. It also uniquely offers a smooth pressure-tunable variation of dispersionover a very wide wavelength range, providing a perfect environment for demon-strating many different nonlinear effects, such as efficient generation of tunabledeep UV light via dispersive wave generation [17] and the first observation of aplasma-related soliton blue-shift [18, 19]. In the first of these cases the zero dis-persion wavelength λ0, was placed closer to the pump wavelength so as to allowdispersive wave generation in the UV. In the second case it was pushed far into theUV so as to prevent dispersive-wave perturbations to soliton compression at 800nm [18] ; the ensuing self-compression created peak intensities as high as 1014
W/cm2, sufficient to ionize the gas.
An inherent limitation in these systems is the rather low nonlinearity pro-vided by the gas at the pressures used (<10 bar). Since the efficiency of self-compression decreases significantly with soliton order N [23], it is necessary touse short (~50 fs) and high energy (a few µJ) pump pulses. When the pressure ofthe gas used to fill the kagomé HC-PCF is increased to above 100 bar (the fibers
69
70 CHAPTER III. HIGH PRESSURE AR GAS FILLED PCF
are capable of withstanding inner pressures of at least 1000 bar), the Kerr nonlin-earity that approaches that of silica glass [25]. Uniquely, the dispersion remainslow and flat from the UV to the near-IR. These features allow exploration of arange of different nonlinear regimes at pulse energies of a few 100 nJ, withoutchanging the fiber or the pump laser. Using noble gases adds an extra twist tothe system by eliminating Raman effects, allowing us to study Kerr-related phe-nomena in the absence of perturbations such as the soliton self-frequency shift orRaman-induced noise.
III.1 Supercritical fluids
Supercritical fluids are in the thermodynamic state where phase transition betweenliquid and gaseous state cannot be distinctly made. A supercritical fluid is ob-tained when its pressure and temperature are above the critical point, which isdefined by critical temperature and pressure (Fig. III.1(a)). The critical points are(48 bar, ~150 K) for Ar, (55 bar, ~209 K) for Kr and (58 bar, ~289 K) for Xe.Among the noble gases, Xe has the most convenient critical pressure and temper-ature for experimental realization. Thereby, supercritical Xe could be studied atroom temperature, without requiring a cryogenic system as in Chapter II,[24]. Su-percritical fluids have been previously used for molecular scattering studies likeBrillouin [84] and Raman [85] scattering. Numerical predictions of the high non-linearity of Xe at the critical point have been attributed to increased light scatteringdue to critical opalescence [86]. However the experimental study of Kerr-relatedoptical phenomena in supercritical fluids remains a largely unexplored area.
Fig. III.1(b) shows the density variation of Ar with pressure at various temper-atures (shown by isotherms). Below the critical pressure and temperature (criticalpoint), Ar is in gaseous phase (shown by green isotherms). The distinction ofliquid and gaseous states can be clearly made by the phase transition line. Thenonlinearity of a medium depends on its density. Therefore the variation of gasdensity with pressure is important in the reported work.
Fig. III.2(a) shows the room temperature variation of density with pressure
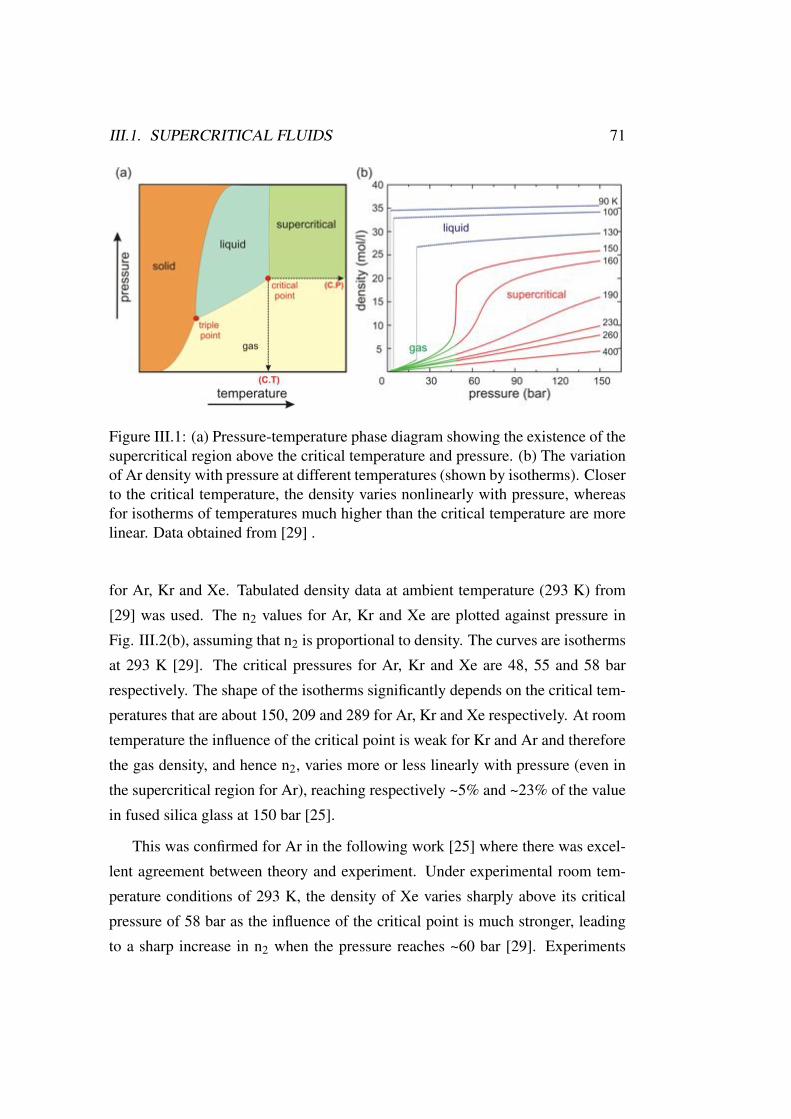
III.1. SUPERCRITICAL FLUIDS 71
Figure III.1: (a) Pressure-temperature phase diagram showing the existence of thesupercritical region above the critical temperature and pressure. (b) The variationof Ar density with pressure at different temperatures (shown by isotherms). Closerto the critical temperature, the density varies nonlinearly with pressure, whereasfor isotherms of temperatures much higher than the critical temperature are morelinear. Data obtained from [29] .
for Ar, Kr and Xe. Tabulated density data at ambient temperature (293 K) from[29] was used. The n2 values for Ar, Kr and Xe are plotted against pressure inFig. III.2(b), assuming that n2 is proportional to density. The curves are isothermsat 293 K [29]. The critical pressures for Ar, Kr and Xe are 48, 55 and 58 barrespectively. The shape of the isotherms significantly depends on the critical tem-peratures that are about 150, 209 and 289 for Ar, Kr and Xe respectively. At roomtemperature the influence of the critical point is weak for Kr and Ar and thereforethe gas density, and hence n2, varies more or less linearly with pressure (even inthe supercritical region for Ar), reaching respectively ~5% and ~23% of the valuein fused silica glass at 150 bar [25].
This was confirmed for Ar in the following work [25] where there was excel-lent agreement between theory and experiment. Under experimental room tem-perature conditions of 293 K, the density of Xe varies sharply above its criticalpressure of 58 bar as the influence of the critical point is much stronger, leadingto a sharp increase in n2 when the pressure reaches ~60 bar [29]. Experiments
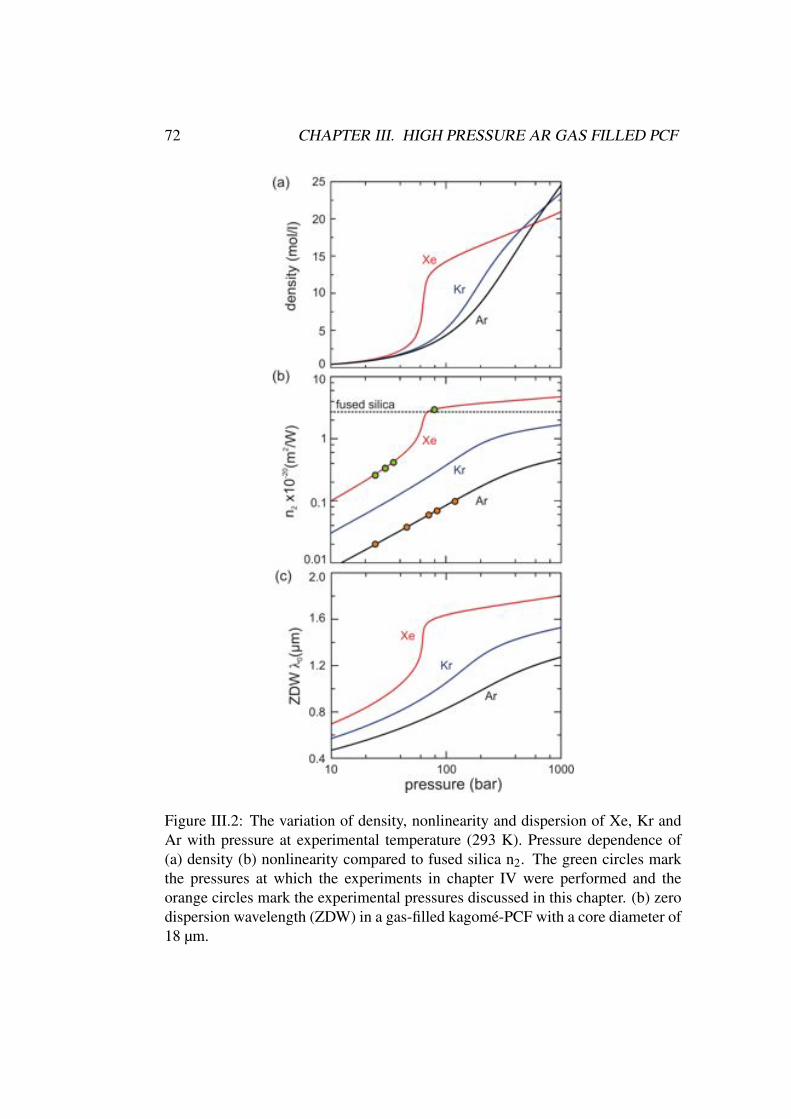
72 CHAPTER III. HIGH PRESSURE AR GAS FILLED PCF
Figure III.2: The variation of density, nonlinearity and dispersion of Xe, Kr andAr with pressure at experimental temperature (293 K). Pressure dependence of(a) density (b) nonlinearity compared to fused silica n2. The green circles markthe pressures at which the experiments in chapter IV were performed and theorange circles mark the experimental pressures discussed in this chapter. (b) zerodispersion wavelength (ZDW) in a gas-filled kagomé-PCF with a core diameter of18 µm.
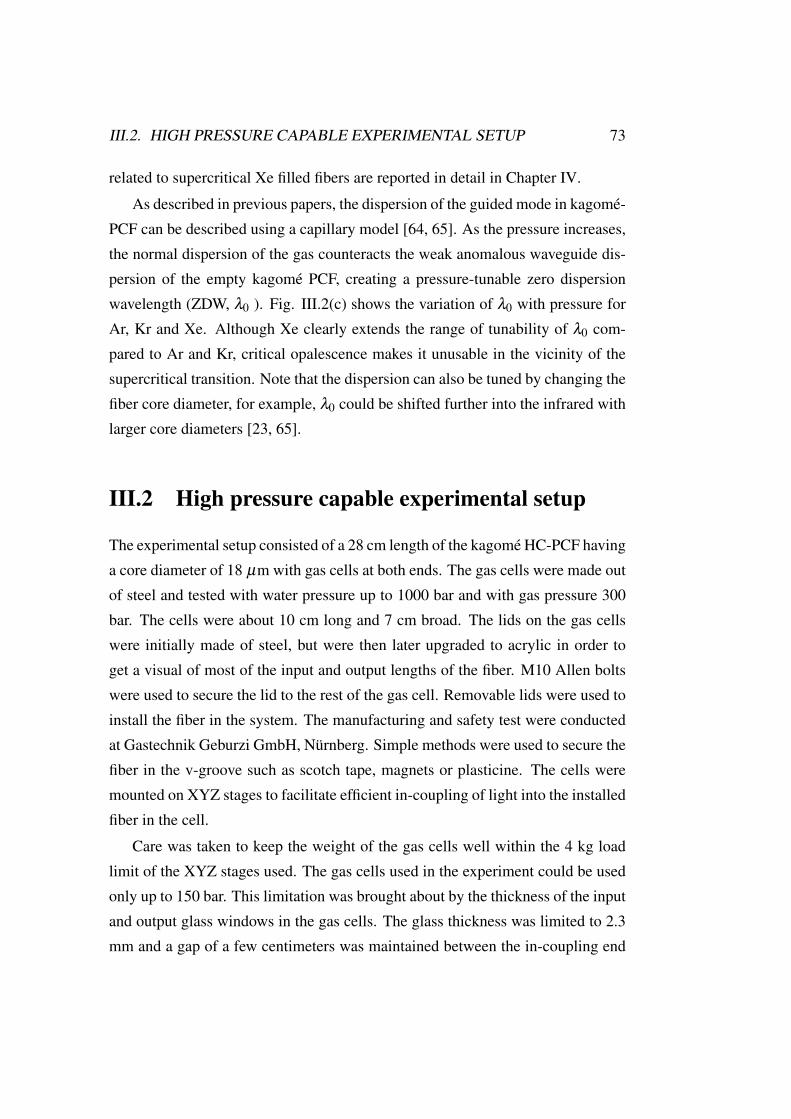
III.2. HIGH PRESSURE CAPABLE EXPERIMENTAL SETUP 73
related to supercritical Xe filled fibers are reported in detail in Chapter IV.
As described in previous papers, the dispersion of the guided mode in kagomé-PCF can be described using a capillary model [64, 65]. As the pressure increases,the normal dispersion of the gas counteracts the weak anomalous waveguide dis-persion of the empty kagomé PCF, creating a pressure-tunable zero dispersionwavelength (ZDW, λ0 ). Fig. III.2(c) shows the variation of λ0 with pressure forAr, Kr and Xe. Although Xe clearly extends the range of tunability of λ0 com-pared to Ar and Kr, critical opalescence makes it unusable in the vicinity of thesupercritical transition. Note that the dispersion can also be tuned by changing thefiber core diameter, for example, λ0 could be shifted further into the infrared withlarger core diameters [23, 65].
III.2 High pressure capable experimental setup
The experimental setup consisted of a 28 cm length of the kagomé HC-PCF havinga core diameter of 18 µm with gas cells at both ends. The gas cells were made outof steel and tested with water pressure up to 1000 bar and with gas pressure 300bar. The cells were about 10 cm long and 7 cm broad. The lids on the gas cellswere initially made of steel, but were then later upgraded to acrylic in order toget a visual of most of the input and output lengths of the fiber. M10 Allen boltswere used to secure the lid to the rest of the gas cell. Removable lids were used toinstall the fiber in the system. The manufacturing and safety test were conductedat Gastechnik Geburzi GmbH, Nürnberg. Simple methods were used to secure thefiber in the v-groove such as scotch tape, magnets or plasticine. The cells weremounted on XYZ stages to facilitate efficient in-coupling of light into the installedfiber in the cell.
Care was taken to keep the weight of the gas cells well within the 4 kg loadlimit of the XYZ stages used. The gas cells used in the experiment could be usedonly up to 150 bar. This limitation was brought about by the thickness of the inputand output glass windows in the gas cells. The glass thickness was limited to 2.3mm and a gap of a few centimeters was maintained between the in-coupling end
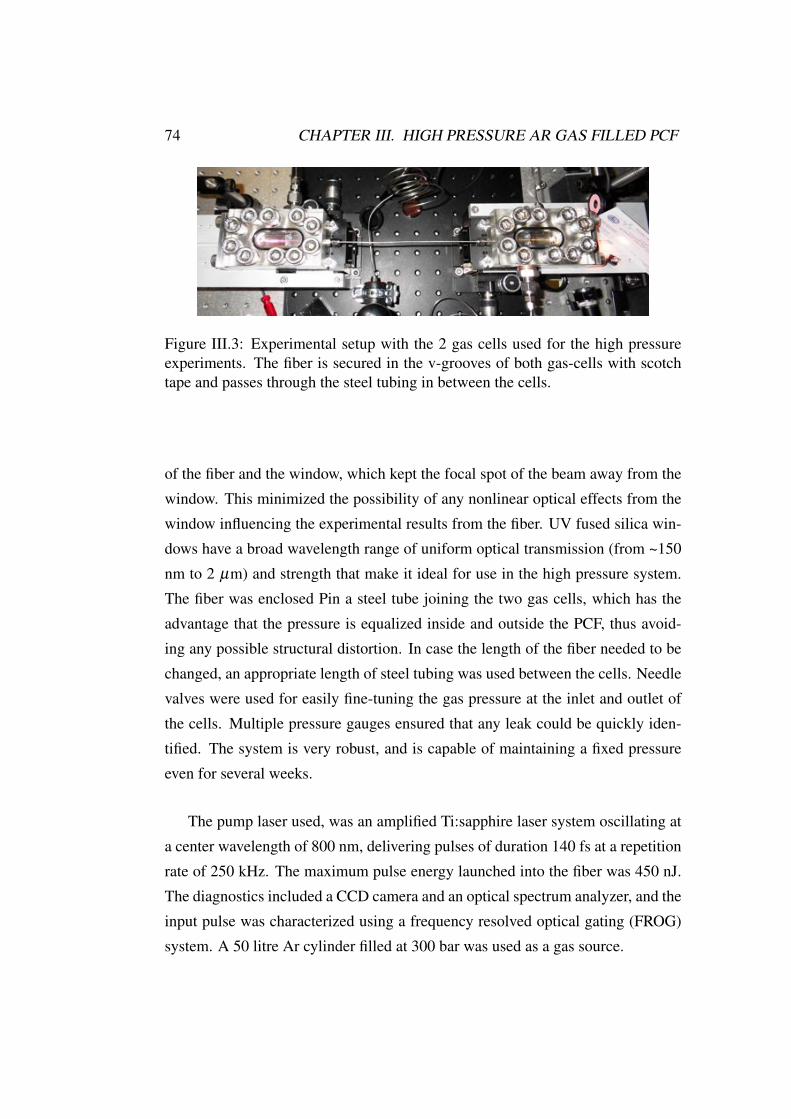
74 CHAPTER III. HIGH PRESSURE AR GAS FILLED PCF
Figure III.3: Experimental setup with the 2 gas cells used for the high pressureexperiments. The fiber is secured in the v-grooves of both gas-cells with scotchtape and passes through the steel tubing in between the cells.
of the fiber and the window, which kept the focal spot of the beam away from thewindow. This minimized the possibility of any nonlinear optical effects from thewindow influencing the experimental results from the fiber. UV fused silica win-dows have a broad wavelength range of uniform optical transmission (from ~150nm to 2 µm) and strength that make it ideal for use in the high pressure system.The fiber was enclosed Pin a steel tube joining the two gas cells, which has theadvantage that the pressure is equalized inside and outside the PCF, thus avoid-ing any possible structural distortion. In case the length of the fiber needed to bechanged, an appropriate length of steel tubing was used between the cells. Needlevalves were used for easily fine-tuning the gas pressure at the inlet and outlet ofthe cells. Multiple pressure gauges ensured that any leak could be quickly iden-tified. The system is very robust, and is capable of maintaining a fixed pressureeven for several weeks.
The pump laser used, was an amplified Ti:sapphire laser system oscillating ata center wavelength of 800 nm, delivering pulses of duration 140 fs at a repetitionrate of 250 kHz. The maximum pulse energy launched into the fiber was 450 nJ.The diagnostics included a CCD camera and an optical spectrum analyzer, and theinput pulse was characterized using a frequency resolved optical gating (FROG)system. A 50 litre Ar cylinder filled at 300 bar was used as a gas source.
III.3. GASEOUS AND SUPERCRITICAL AR (25-110 BAR) 75
III.3 Gaseous and supercritical Ar (25-110 bar)
Ar gas was the first gas to be used in our high pressure experiments. The absenceof Raman scattering, linear variation of gas density with pressure, experience withAr in previous experiments and its inexpensive cost in comparison with Xe influ-enced the decision to use Ar gas in the first experiments. The critical temperature(150 K) of Ar is much lower than the experimental operating conditions at roomtemperature. Hence the density of Ar varies linearly with pressure even in thesupercritical regime (pressures above 48 bar, which is the critical pressure for Ar).The low critical temperature also enabled very smooth tuning of fiber dispersionand nonlinearity without the influence of critical opalescence (as observed in caseof Xe in Chapter IV). This ensured that previous numerical modeling in [67, 23]could be used without considering extra scattering perturbations. Excellent agree-ment between numerical modeling 1 and experimental data was observed. Thedispersion of Ar filled PCF could also be smoothly tuned. In comparison, Xe hasa nonlinear density change with pressure owing to its critical temperature beingclose to room temperature. Hence the dispersion tuning was not as smooth as inAr. At an Ar gas pressure of 90 bar, λ0 coincides with the pump laser wavelength.At this pressure the nonlinear refractive index n2 is only one order of magnitudelower than that of pure silica. By varying the gas pressure we are able to ob-serve soliton fission, supercontinuum generation, dispersive wave emission andmodulational instability (MI) at relatively low pulse energies (~250 nJ).
The modal refractive index of the EH11 mode (azimuthal order 0, radial order1) in kagomé HC-PCF is accurately approximated by that of a glass capillary andis given by [64, 65]
n(λ , p,T )≈ 1+δ (λ ) ρ2ρ0
−λ 2u2
018π2a2 (III.1)
where λ is the vacuum wavelength, δ (λ ) the Sellmeier expansion for the dielec-tric susceptibility of the filling gas [6], ρ is the density of the gas at a particularpressure and temperature, ρ0 is the density of the gas at 293 K and atmospheric
1The numerical simulations were done by Wonkeun Chang.
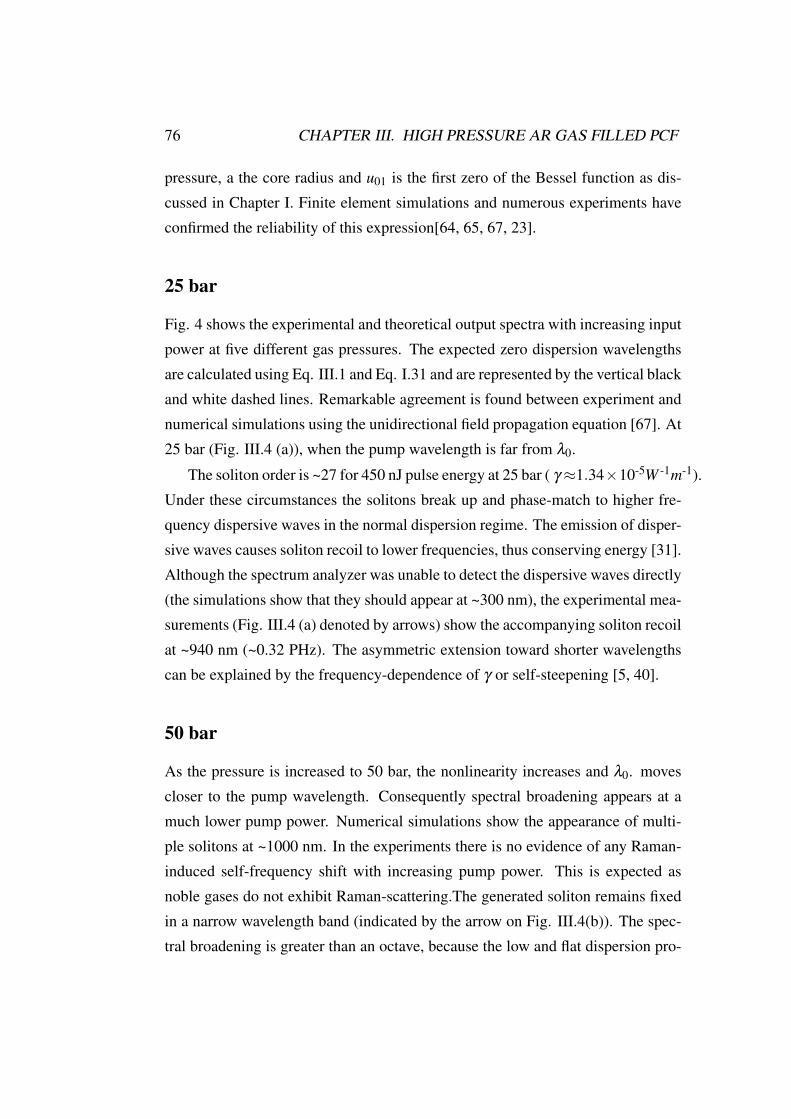
76 CHAPTER III. HIGH PRESSURE AR GAS FILLED PCF
pressure, a the core radius and u01 is the first zero of the Bessel function as dis-cussed in Chapter I. Finite element simulations and numerous experiments haveconfirmed the reliability of this expression[64, 65, 67, 23].
25 bar
Fig. 4 shows the experimental and theoretical output spectra with increasing inputpower at five different gas pressures. The expected zero dispersion wavelengthsare calculated using Eq. III.1 and Eq. I.31 and are represented by the vertical blackand white dashed lines. Remarkable agreement is found between experiment andnumerical simulations using the unidirectional field propagation equation [67]. At25 bar (Fig. III.4 (a)), when the pump wavelength is far from λ0.
The soliton order is ~27 for 450 nJ pulse energy at 25 bar ( γ ≈1.34×10⁻⁵W -1m-1).Under these circumstances the solitons break up and phase-match to higher fre-quency dispersive waves in the normal dispersion regime. The emission of disper-sive waves causes soliton recoil to lower frequencies, thus conserving energy [31].Although the spectrum analyzer was unable to detect the dispersive waves directly(the simulations show that they should appear at ~300 nm), the experimental mea-surements (Fig. III.4 (a) denoted by arrows) show the accompanying soliton recoilat ~940 nm (~0.32 PHz). The asymmetric extension toward shorter wavelengthscan be explained by the frequency-dependence of γ or self-steepening [5, 40].
50 bar
As the pressure is increased to 50 bar, the nonlinearity increases and λ0. movescloser to the pump wavelength. Consequently spectral broadening appears at amuch lower pump power. Numerical simulations show the appearance of multi-ple solitons at ~1000 nm. In the experiments there is no evidence of any Raman-induced self-frequency shift with increasing pump power. This is expected asnoble gases do not exhibit Raman-scattering.The generated soliton remains fixedin a narrow wavelength band (indicated by the arrow on Fig. III.4(b)). The spec-tral broadening is greater than an octave, because the low and flat dispersion pro-
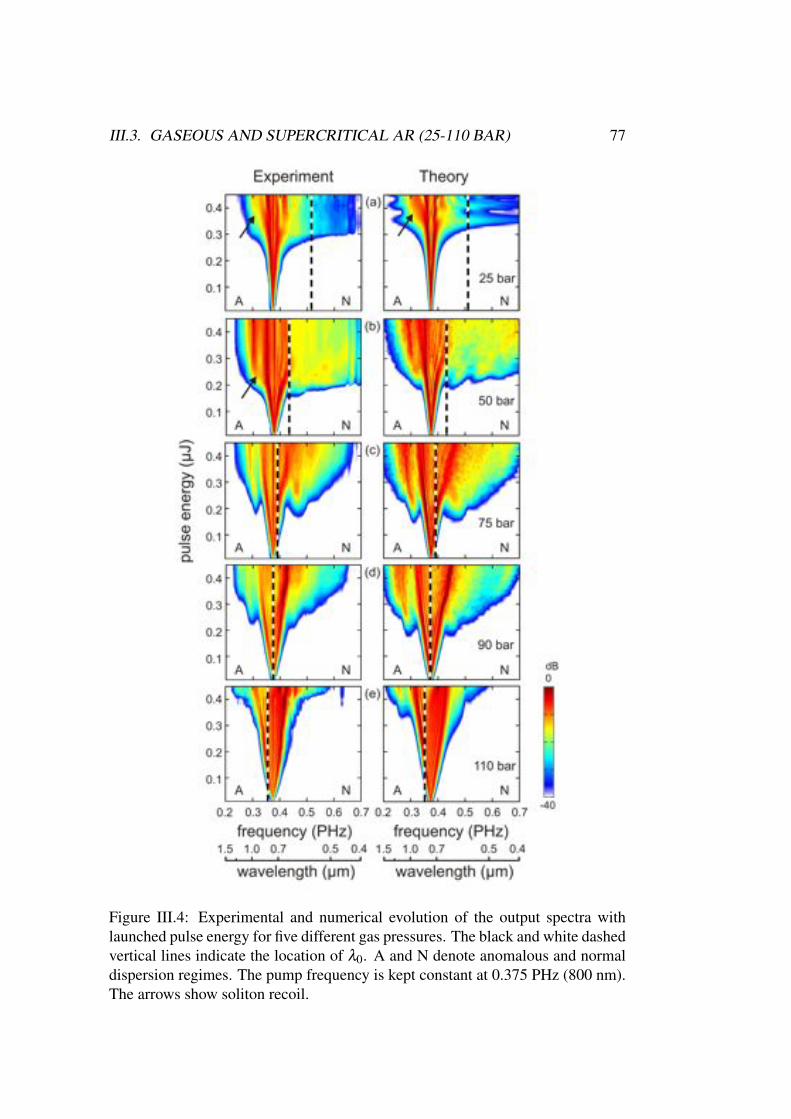
III.3. GASEOUS AND SUPERCRITICAL AR (25-110 BAR) 77
Figure III.4: Experimental and numerical evolution of the output spectra withlaunched pulse energy for five different gas pressures. The black and white dashedvertical lines indicate the location of λ0. A and N denote anomalous and normaldispersion regimes. The pump frequency is kept constant at 0.375 PHz (800 nm).The arrows show soliton recoil.
78 CHAPTER III. HIGH PRESSURE AR GAS FILLED PCF
Figure III.5: Numerical X-FROG traces at 75 bar. (a) MI bands at 170 nJ launchedpulse energy and (b) asymmetric spectrum at 250 nJ pulse energy when the dis-persive wave band overlaps with the high frequency sideband of the MI. The blackand white dashed lines indicate the position of the zero dispersion frequency c/λ0.The red curve indicates the mismatch in propagation constant β between the soli-tons and dispersive waves at a given frequency. The β mismatch is zero at thewhite circle for a soliton at the pump frequency, resulting in generation of a dis-persive wave in the normal dispersion regime. The red arrow marks the pumpfrequency.
file of the gas-filled kagomé HC-PCF (compared to solid-core systems) signifi-cantly reduces group-velocity walk-off between different frequency componentsand ensures long interaction lengths. This enhances the effectiveness of four-wave mixing as a broadening mechanism, resulting in the generation of a cascadeof sidebands, allowing it to dominate the spectral broadening process. By varyingthe gas pressure, a great variety of spectral broadening regimes, governed by pro-cesses such as soliton fission and MI, can be accessed without changing the pumplaser or the fiber. Such flexibility is unique to the PCF-based system.
75 bar
On increasing the pressure to 75 bar (Fig. III.4(c)), λ0 moves even closer to thepump wavelength and two distinct MI sidebands can be seen at pulse energy of
III.3. GASEOUS AND SUPERCRITICAL AR (25-110 BAR) 79
~200 nJ. It is curious that these sidebands appear to be asymmetrically distantfrom the pump frequency. This is caused by phase-matching of the solitons todispersive waves [5, 87] , which appear only in the normal dispersion regime, cre-ating asymmetry in the observed spectrum. Hence there is an overlap betweenMI sideband and dispersive wave in the normal dispersion regime, whilst only MIsideband is present in the anomalous dispersion regime. A simple phase-matchinganalysis between the propagation constants of solitons and linear waves confirmsthat the dispersive wave band appears at a higher frequency than the high fre-quency MI side-band [23]. This is also seen in Figs. III.5(a) & (b), which showthe results of a numerical X-FROG analysis of the signal after 28 cm of propaga-tion for launched energies of 170 and 250 nJ at 75 bar. At the lower pulse energy(Fig. III.5(a)), where the dispersive wave contribution is small, the MI sidebandsare relatively symmetric in spacing and intensity. As the energy is increased,however, the broad dispersive wave band overlaps with the high frequency MIside-band, overwhelming it (Fig. III.5(b)) and producing strong asymmetry be-tween the side-bands. Recently Droques et al. studied the interaction between aMI side-band and a dispersive wave in a solid core fiber [87]. To avoid Ramanperturbations, however, they were forced to work at low CW power levels – alimitation that is entirely absent in our PCF-based system. Of course, if required,a Raman-active gas such as hydrogen can be used if Raman effects are needed,offering yet another degree of freedom compared to existing systems.
90 bar
At 90 bar and 250 nJ pulse energy, λ0 coincides with the pump wavelength andthe sidebands are symmetric in frequency (Fig. III.4(d)). The X-FROG trace inFig. III.6(a) also shows a pair of distinct symmetric MI sidebands at zero delay.The self-phase modulation (SPM) trace in the X-FROG is distorted at a delayof ~110 fs, and we think this is due to the effects of higher order dispersion,which become important close to λ0 Using numerical simulations, we followedthe propagation of the pulse over a longer length (58.5 cm). Both the dispersivewave band (overlapping with the high frequency MI band) and the soliton regime
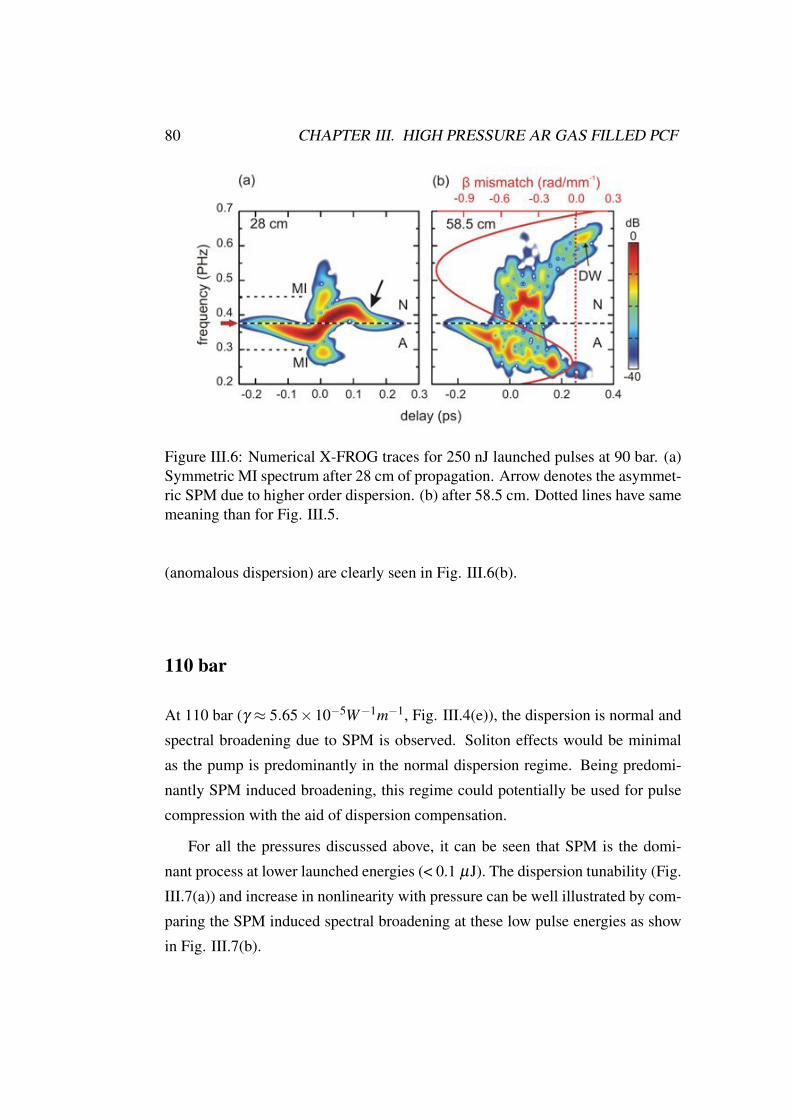
80 CHAPTER III. HIGH PRESSURE AR GAS FILLED PCF
Figure III.6: Numerical X-FROG traces for 250 nJ launched pulses at 90 bar. (a)Symmetric MI spectrum after 28 cm of propagation. Arrow denotes the asymmet-ric SPM due to higher order dispersion. (b) after 58.5 cm. Dotted lines have samemeaning than for Fig. III.5.
(anomalous dispersion) are clearly seen in Fig. III.6(b).
110 bar
At 110 bar (γ ≈ 5.65×10⁻⁵W−1m−1, Fig. III.4(e)), the dispersion is normal andspectral broadening due to SPM is observed. Soliton effects would be minimalas the pump is predominantly in the normal dispersion regime. Being predomi-nantly SPM induced broadening, this regime could potentially be used for pulsecompression with the aid of dispersion compensation.
For all the pressures discussed above, it can be seen that SPM is the domi-nant process at lower launched energies (< 0.1 µJ). The dispersion tunability (Fig.III.7(a)) and increase in nonlinearity with pressure can be well illustrated by com-paring the SPM induced spectral broadening at these low pulse energies as showin Fig. III.7(b).
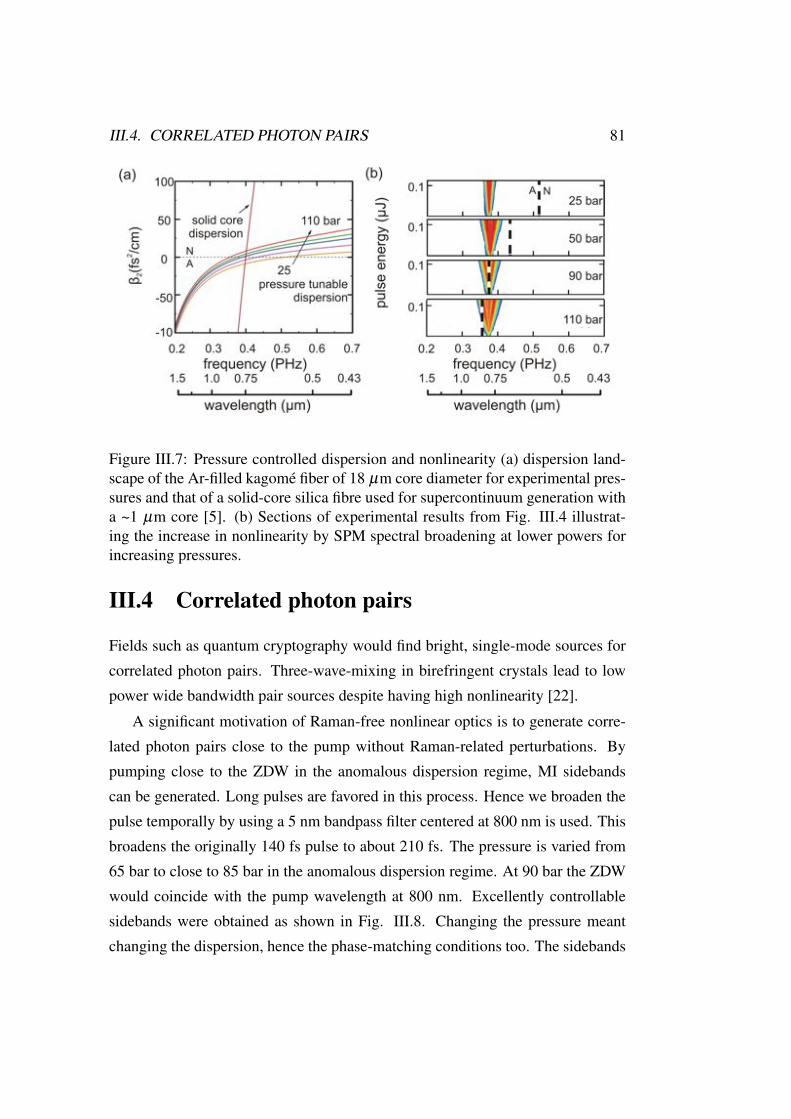
III.4. CORRELATED PHOTON PAIRS 81
Figure III.7: Pressure controlled dispersion and nonlinearity (a) dispersion land-scape of the Ar-filled kagomé fiber of 18 µm core diameter for experimental pres-sures and that of a solid-core silica fibre used for supercontinuum generation witha ~1 µm core [5]. (b) Sections of experimental results from Fig. III.4 illustrat-ing the increase in nonlinearity by SPM spectral broadening at lower powers forincreasing pressures.
III.4 Correlated photon pairs
Fields such as quantum cryptography would find bright, single-mode sources forcorrelated photon pairs. Three-wave-mixing in birefringent crystals lead to lowpower wide bandwidth pair sources despite having high nonlinearity [22].
A significant motivation of Raman-free nonlinear optics is to generate corre-lated photon pairs close to the pump without Raman-related perturbations. Bypumping close to the ZDW in the anomalous dispersion regime, MI sidebandscan be generated. Long pulses are favored in this process. Hence we broaden thepulse temporally by using a 5 nm bandpass filter centered at 800 nm is used. Thisbroadens the originally 140 fs pulse to about 210 fs. The pressure is varied from65 bar to close to 85 bar in the anomalous dispersion regime. At 90 bar the ZDWwould coincide with the pump wavelength at 800 nm. Excellently controllablesidebands were obtained as shown in Fig. III.8. Changing the pressure meantchanging the dispersion, hence the phase-matching conditions too. The sidebands
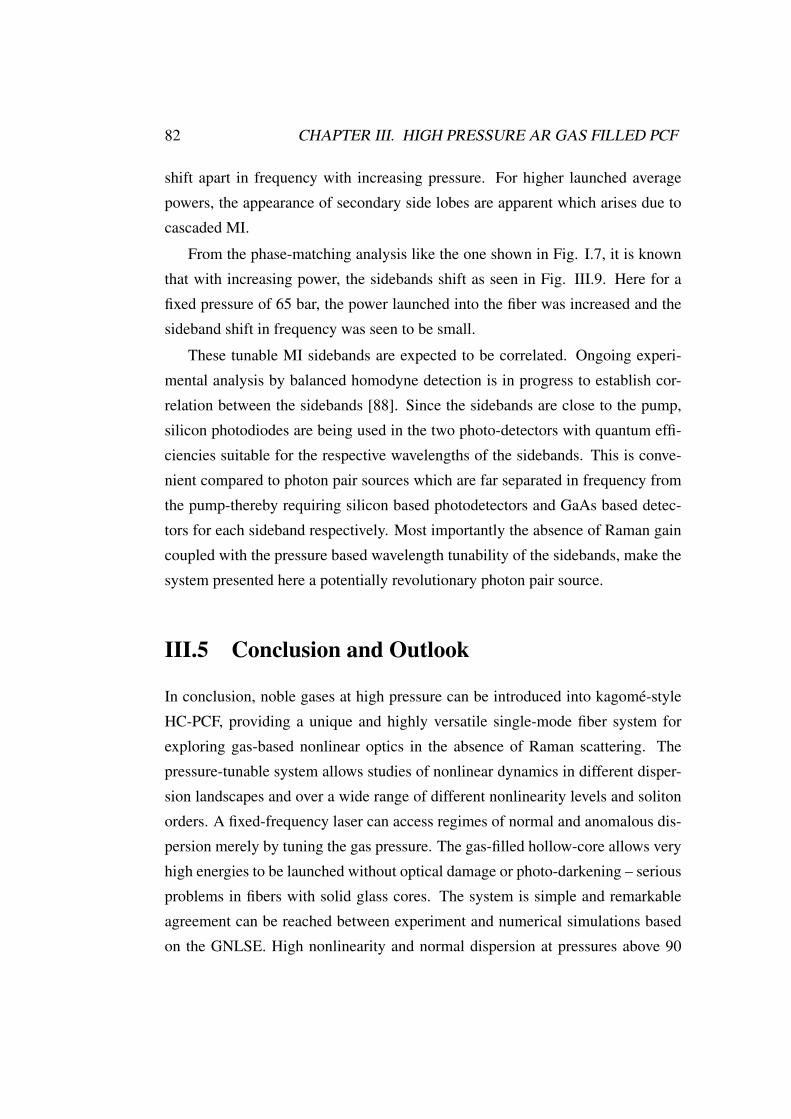
82 CHAPTER III. HIGH PRESSURE AR GAS FILLED PCF
shift apart in frequency with increasing pressure. For higher launched averagepowers, the appearance of secondary side lobes are apparent which arises due tocascaded MI.
From the phase-matching analysis like the one shown in Fig. I.7, it is knownthat with increasing power, the sidebands shift as seen in Fig. III.9. Here for afixed pressure of 65 bar, the power launched into the fiber was increased and thesideband shift in frequency was seen to be small.
These tunable MI sidebands are expected to be correlated. Ongoing experi-mental analysis by balanced homodyne detection is in progress to establish cor-relation between the sidebands [88]. Since the sidebands are close to the pump,silicon photodiodes are being used in the two photo-detectors with quantum effi-ciencies suitable for the respective wavelengths of the sidebands. This is conve-nient compared to photon pair sources which are far separated in frequency fromthe pump-thereby requiring silicon based photodetectors and GaAs based detec-tors for each sideband respectively. Most importantly the absence of Raman gaincoupled with the pressure based wavelength tunability of the sidebands, make thesystem presented here a potentially revolutionary photon pair source.
III.5 Conclusion and Outlook
In conclusion, noble gases at high pressure can be introduced into kagomé-styleHC-PCF, providing a unique and highly versatile single-mode fiber system forexploring gas-based nonlinear optics in the absence of Raman scattering. Thepressure-tunable system allows studies of nonlinear dynamics in different disper-sion landscapes and over a wide range of different nonlinearity levels and solitonorders. A fixed-frequency laser can access regimes of normal and anomalous dis-persion merely by tuning the gas pressure. The gas-filled hollow-core allows veryhigh energies to be launched without optical damage or photo-darkening – seriousproblems in fibers with solid glass cores. The system is simple and remarkableagreement can be reached between experiment and numerical simulations basedon the GNLSE. High nonlinearity and normal dispersion at pressures above 90
III.5. CONCLUSION AND OUTLOOK 83
Figure III.8: Pressure tunable (65 to 85 bar) MI sidebands at the fixed launchedaverage powers of 50, 60 and 70 mW.
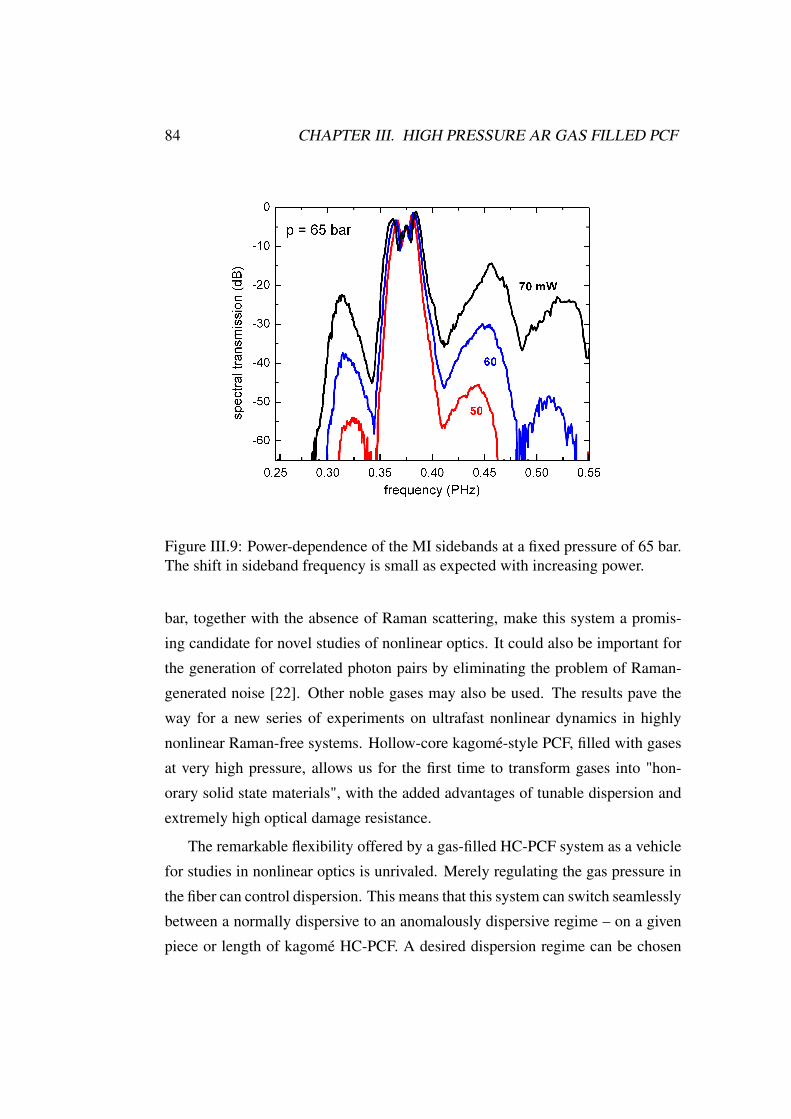
84 CHAPTER III. HIGH PRESSURE AR GAS FILLED PCF
Figure III.9: Power-dependence of the MI sidebands at a fixed pressure of 65 bar.The shift in sideband frequency is small as expected with increasing power.
bar, together with the absence of Raman scattering, make this system a promis-ing candidate for novel studies of nonlinear optics. It could also be important forthe generation of correlated photon pairs by eliminating the problem of Raman-generated noise [22]. Other noble gases may also be used. The results pave theway for a new series of experiments on ultrafast nonlinear dynamics in highlynonlinear Raman-free systems. Hollow-core kagomé-style PCF, filled with gasesat very high pressure, allows us for the first time to transform gases into "hon-orary solid state materials", with the added advantages of tunable dispersion andextremely high optical damage resistance.
The remarkable flexibility offered by a gas-filled HC-PCF system as a vehiclefor studies in nonlinear optics is unrivaled. Merely regulating the gas pressure inthe fiber can control dispersion. This means that this system can switch seamlesslybetween a normally dispersive to an anomalously dispersive regime – on a givenpiece or length of kagomé HC-PCF. A desired dispersion regime can be chosen
III.5. CONCLUSION AND OUTLOOK 85
irrespective of the laser wavelength range in the UV-IR. The system is robust asthe same length/piece of fiber has been used for experiments over several weeks.This large range of dispersion tunability is accompanied by scalable nonlinearityby virtue of gas density.
Raman scattering introduces significant perturbations to nonlinear optics. Thissystem can either “turn on” or “turn off” the Raman effect by the choice of gasused to fill the fiber. In the work reported here noble gases were used in or-der to avoid Raman scattering. However the use of Raman active gases at highpressures like H2 for example can lead to interesting studies since the Ramangain would proportionally increase with density and might result in enhanced fre-quency combs [13, 14]. An experimental setup for this experiment is being setupat the time of writing this thesis. High pressure fiber filling systems might alsolead to tunable transmission windows in PBG fibers, where the shift is given bythe scaling law [59].
Another possible post-processing application of the high pressure system canbe the adjusting the thin glass structures of a kagomé fiber lattice by selectivelyfilling holes. This could help to move the glass struts by a few nanometers andmight help in better understanding of kagomé fiber guidance mechanisms or re-ducing losses. Steep pressure gradient (up to 150 bar of pressure difference) ex-periments can also be performed as this would lead to varying nonlinearity anddispersion along the length of the fiber. Pressure gradients are expected to en-hance UV generation via dispersive wave generation [89]. The needle valves usedin these setups enable gentle flows or gradients.
The work reported here has overcome most of the technical hurdles for a highpressure system. Efforts in improving and enhancing the pressure capability ofthese systems are continuing. The simplicity, stability and remarkable flexibilityoffered by the high pressure fiber system reported here make it an unparallelednonlinear optical system.

86 CHAPTER III. HIGH PRESSURE AR GAS FILLED PCF
Chapter IV
Supercritical Xe filled PCF
The critical points are (48 bar, ~150 K) for Ar, (55 bar, ~209 K) for Kr and(58 bar, ~289 K) for Xe [29, (NIST)]. At room temperature the influence of thecritical point is weak for Kr and Ar and therefore the gas density, and hence n2 ,varies more or less linearly with pressure, reaching respectively ~5% and ~23%of the value in fused silica glass at 150 bar [25]. For Xe, the influence of thecritical point is much stronger, leading to a sharp increase in n2 when the pres-sure reaches ~60 bar [29, (NIST)] ; recent linear measurements have confirmedthis [90]. When the pressure and temperature lie above the critical point – eas-ily achievable in experiment without the need for a cryogenic system [24] – Xebecomes a supercritical fluid, (Table. IV.1) with a nonlinearity that can exceedthat of fused silica (Fig. IV.1). Theory predicts that Xe will exhibit a temporallynon-local (response times in the µsec range) nonlinearity close to the critical point[86] , due to intense scattering arising from critical opalescence (see Fig. IV.9).This regime is avoided by operating sufficiently above or below the critical point,where Xe remains transparent.
IV.1 Experimental setup modification
The experimental setup for the supercritical Xe was similar to the one usedin Chapter III but with some important modifications. Commercially availableXe cylinders are filled usually up to around 40 bar. Supercritical Xe however is
87
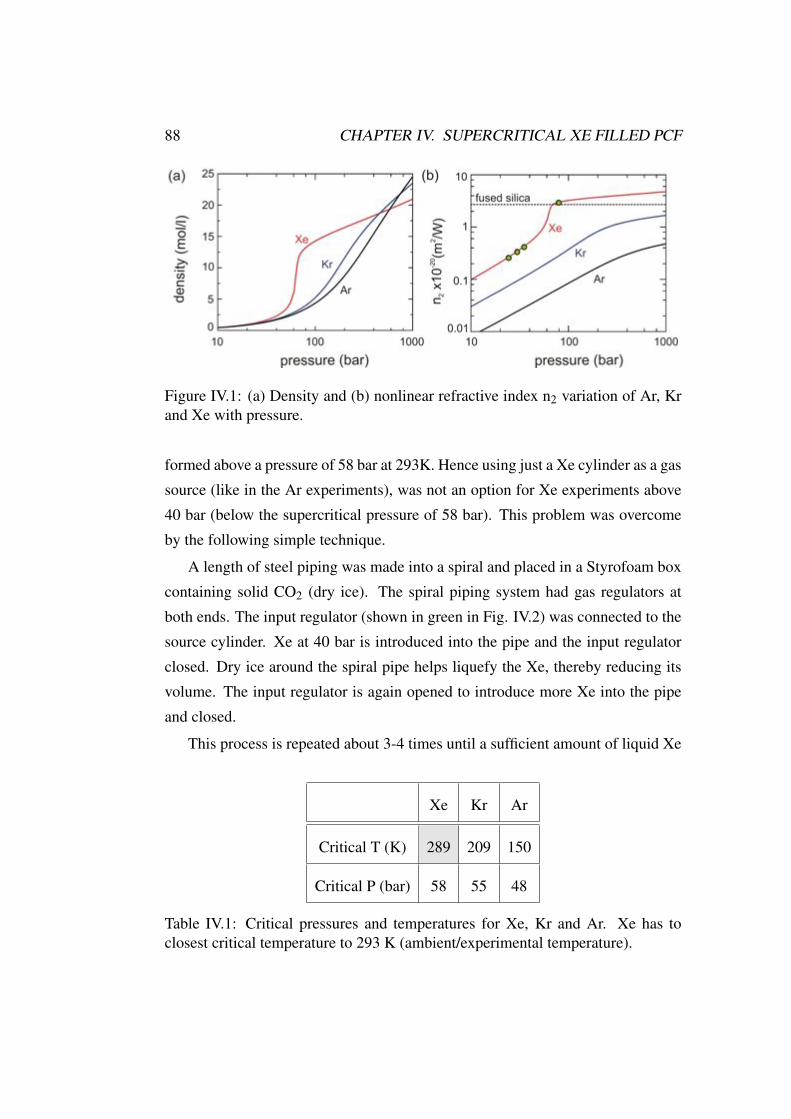
88 CHAPTER IV. SUPERCRITICAL XE FILLED PCF
Figure IV.1: (a) Density and (b) nonlinear refractive index n2 variation of Ar, Krand Xe with pressure.
formed above a pressure of 58 bar at 293K. Hence using just a Xe cylinder as a gassource (like in the Ar experiments), was not an option for Xe experiments above40 bar (below the supercritical pressure of 58 bar). This problem was overcomeby the following simple technique.
A length of steel piping was made into a spiral and placed in a Styrofoam boxcontaining solid CO2 (dry ice). The spiral piping system had gas regulators atboth ends. The input regulator (shown in green in Fig. IV.2) was connected to thesource cylinder. Xe at 40 bar is introduced into the pipe and the input regulatorclosed. Dry ice around the spiral pipe helps liquefy the Xe, thereby reducing itsvolume. The input regulator is again opened to introduce more Xe into the pipeand closed.
This process is repeated about 3-4 times until a sufficient amount of liquid Xe
Xe Kr Ar
Critical T (K) 289 209 150
Critical P (bar) 58 55 48
Table IV.1: Critical pressures and temperatures for Xe, Kr and Ar. Xe has toclosest critical temperature to 293 K (ambient/experimental temperature).
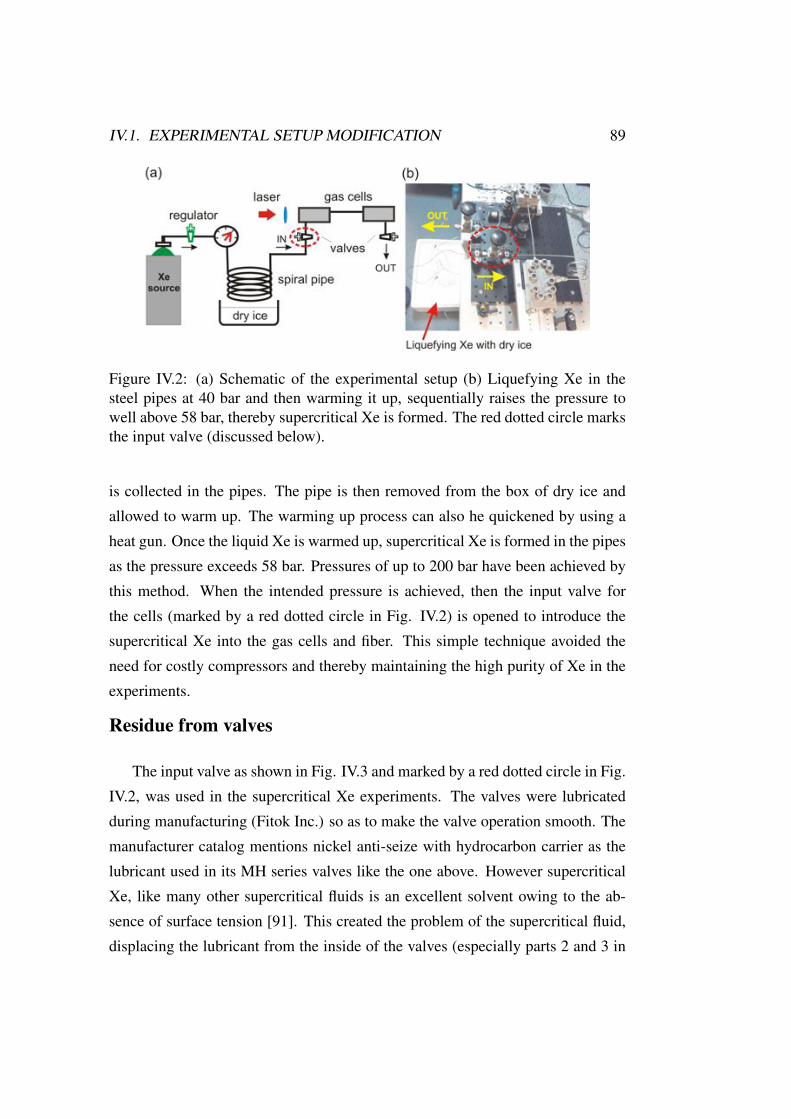
IV.1. EXPERIMENTAL SETUP MODIFICATION 89
Figure IV.2: (a) Schematic of the experimental setup (b) Liquefying Xe in thesteel pipes at 40 bar and then warming it up, sequentially raises the pressure towell above 58 bar, thereby supercritical Xe is formed. The red dotted circle marksthe input valve (discussed below).
is collected in the pipes. The pipe is then removed from the box of dry ice andallowed to warm up. The warming up process can also he quickened by using aheat gun. Once the liquid Xe is warmed up, supercritical Xe is formed in the pipesas the pressure exceeds 58 bar. Pressures of up to 200 bar have been achieved bythis method. When the intended pressure is achieved, then the input valve forthe cells (marked by a red dotted circle in Fig. IV.2) is opened to introduce thesupercritical Xe into the gas cells and fiber. This simple technique avoided theneed for costly compressors and thereby maintaining the high purity of Xe in theexperiments.
Residue from valves
The input valve as shown in Fig. IV.3 and marked by a red dotted circle in Fig.IV.2, was used in the supercritical Xe experiments. The valves were lubricatedduring manufacturing (Fitok Inc.) so as to make the valve operation smooth. Themanufacturer catalog mentions nickel anti-seize with hydrocarbon carrier as thelubricant used in its MH series valves like the one above. However supercriticalXe, like many other supercritical fluids is an excellent solvent owing to the ab-sence of surface tension [91]. This created the problem of the supercritical fluid,displacing the lubricant from the inside of the valves (especially parts 2 and 3 in
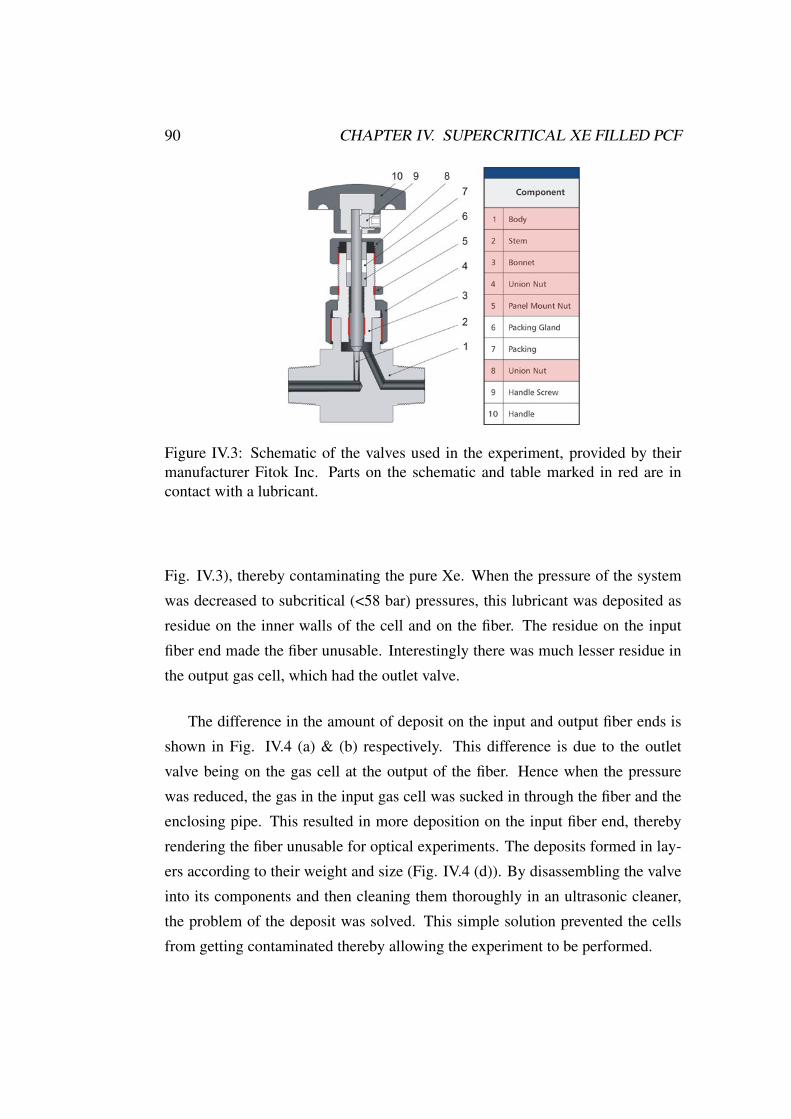
90 CHAPTER IV. SUPERCRITICAL XE FILLED PCF
Figure IV.3: Schematic of the valves used in the experiment, provided by theirmanufacturer Fitok Inc. Parts on the schematic and table marked in red are incontact with a lubricant.
Fig. IV.3), thereby contaminating the pure Xe. When the pressure of the systemwas decreased to subcritical (<58 bar) pressures, this lubricant was deposited asresidue on the inner walls of the cell and on the fiber. The residue on the inputfiber end made the fiber unusable. Interestingly there was much lesser residue inthe output gas cell, which had the outlet valve.
The difference in the amount of deposit on the input and output fiber ends isshown in Fig. IV.4 (a) & (b) respectively. This difference is due to the outletvalve being on the gas cell at the output of the fiber. Hence when the pressurewas reduced, the gas in the input gas cell was sucked in through the fiber and theenclosing pipe. This resulted in more deposition on the input fiber end, therebyrendering the fiber unusable for optical experiments. The deposits formed in lay-ers according to their weight and size (Fig. IV.4 (d)). By disassembling the valveinto its components and then cleaning them thoroughly in an ultrasonic cleaner,the problem of the deposit was solved. This simple solution prevented the cellsfrom getting contaminated thereby allowing the experiment to be performed.
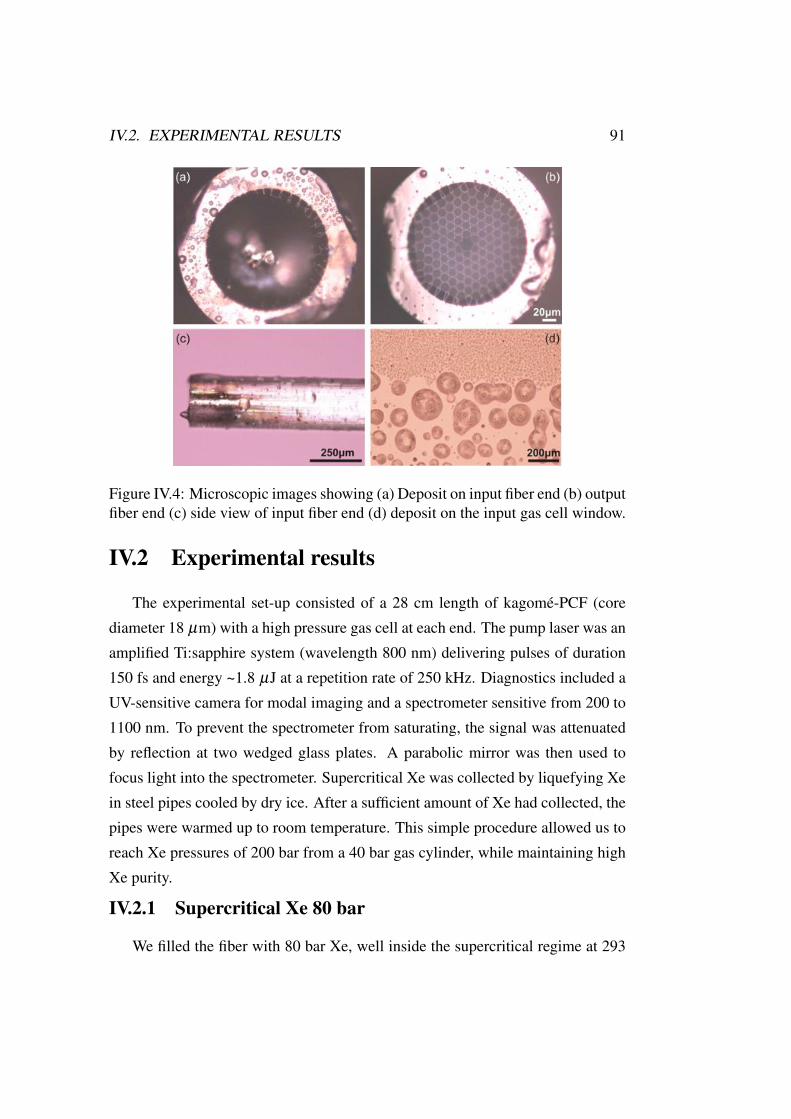
IV.2. EXPERIMENTAL RESULTS 91
Figure IV.4: Microscopic images showing (a) Deposit on input fiber end (b) outputfiber end (c) side view of input fiber end (d) deposit on the input gas cell window.
IV.2 Experimental results
The experimental set-up consisted of a 28 cm length of kagomé-PCF (corediameter 18 µm) with a high pressure gas cell at each end. The pump laser was anamplified Ti:sapphire system (wavelength 800 nm) delivering pulses of duration150 fs and energy ~1.8 µJ at a repetition rate of 250 kHz. Diagnostics included aUV-sensitive camera for modal imaging and a spectrometer sensitive from 200 to1100 nm. To prevent the spectrometer from saturating, the signal was attenuatedby reflection at two wedged glass plates. A parabolic mirror was then used tofocus light into the spectrometer. Supercritical Xe was collected by liquefying Xein steel pipes cooled by dry ice. After a sufficient amount of Xe had collected, thepipes were warmed up to room temperature. This simple procedure allowed us toreach Xe pressures of 200 bar from a 40 bar gas cylinder, while maintaining highXe purity.
IV.2.1 Supercritical Xe 80 bar
We filled the fiber with 80 bar Xe, well inside the supercritical regime at 293
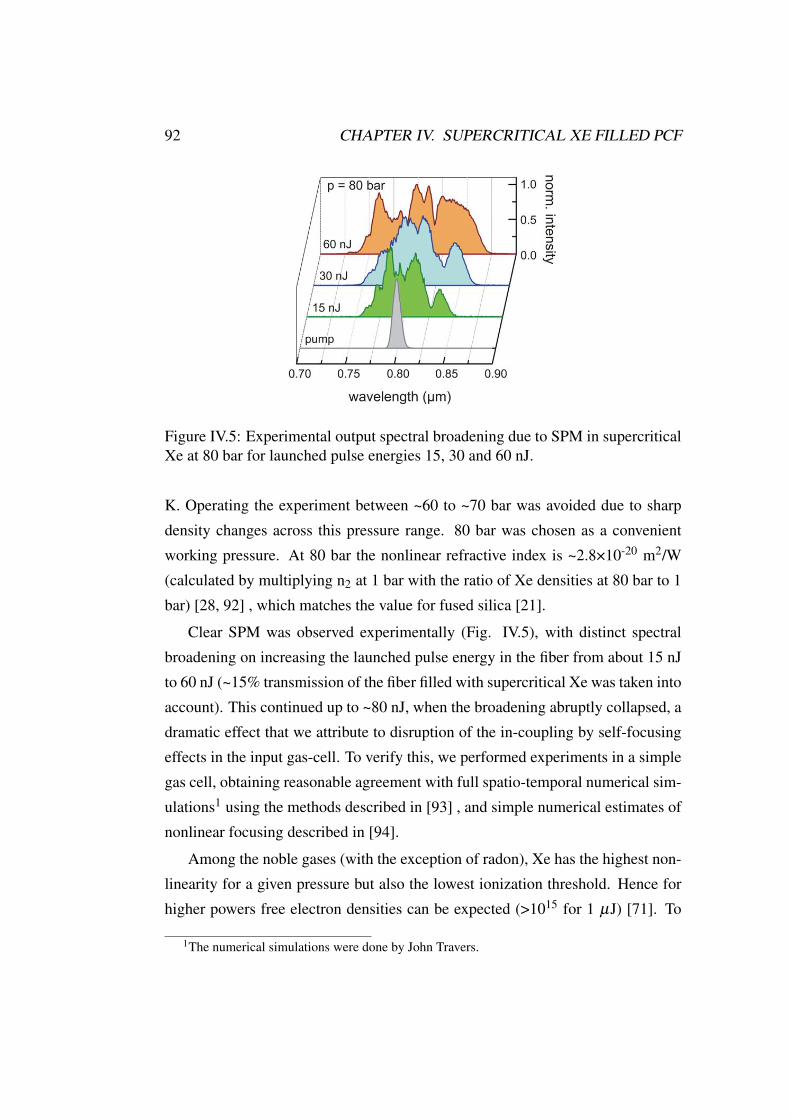
92 CHAPTER IV. SUPERCRITICAL XE FILLED PCF
Figure IV.5: Experimental output spectral broadening due to SPM in supercriticalXe at 80 bar for launched pulse energies 15, 30 and 60 nJ.
K. Operating the experiment between ~60 to ~70 bar was avoided due to sharpdensity changes across this pressure range. 80 bar was chosen as a convenientworking pressure. At 80 bar the nonlinear refractive index is ~2.8×10⁻²⁰ m2/W(calculated by multiplying n2 at 1 bar with the ratio of Xe densities at 80 bar to 1bar) [28, 92] , which matches the value for fused silica [21].
Clear SPM was observed experimentally (Fig. IV.5), with distinct spectralbroadening on increasing the launched pulse energy in the fiber from about 15 nJto 60 nJ (~15% transmission of the fiber filled with supercritical Xe was taken intoaccount). This continued up to ~80 nJ, when the broadening abruptly collapsed, adramatic effect that we attribute to disruption of the in-coupling by self-focusingeffects in the input gas-cell. To verify this, we performed experiments in a simplegas cell, obtaining reasonable agreement with full spatio-temporal numerical sim-ulations1 using the methods described in [93] , and simple numerical estimates ofnonlinear focusing described in [94].
Among the noble gases (with the exception of radon), Xe has the highest non-linearity for a given pressure but also the lowest ionization threshold. Hence forhigher powers free electron densities can be expected (>1015 for 1 µJ) [71]. To
1The numerical simulations were done by John Travers.
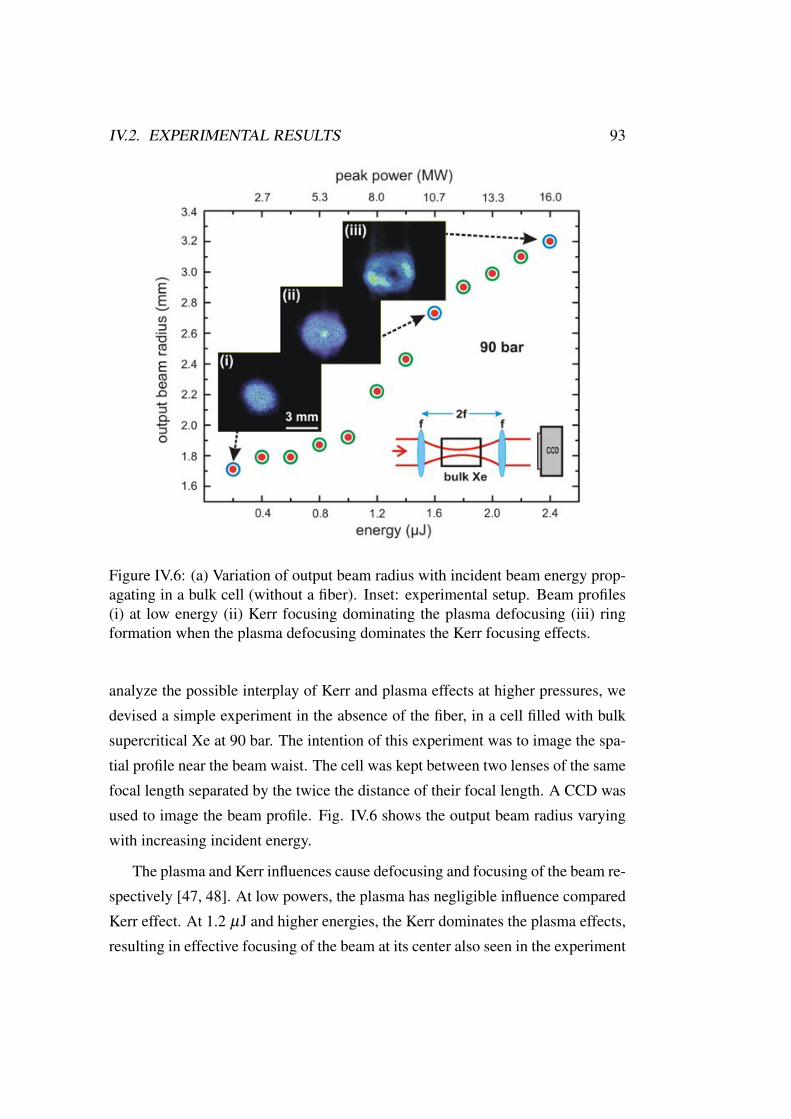
IV.2. EXPERIMENTAL RESULTS 93
Figure IV.6: (a) Variation of output beam radius with incident beam energy prop-agating in a bulk cell (without a fiber). Inset: experimental setup. Beam profiles(i) at low energy (ii) Kerr focusing dominating the plasma defocusing (iii) ringformation when the plasma defocusing dominates the Kerr focusing effects.
analyze the possible interplay of Kerr and plasma effects at higher pressures, wedevised a simple experiment in the absence of the fiber, in a cell filled with bulksupercritical Xe at 90 bar. The intention of this experiment was to image the spa-tial profile near the beam waist. The cell was kept between two lenses of the samefocal length separated by the twice the distance of their focal length. A CCD wasused to image the beam profile. Fig. IV.6 shows the output beam radius varyingwith increasing incident energy.
The plasma and Kerr influences cause defocusing and focusing of the beam re-spectively [47, 48]. At low powers, the plasma has negligible influence comparedKerr effect. At 1.2 µJ and higher energies, the Kerr dominates the plasma effects,resulting in effective focusing of the beam at its center also seen in the experiment
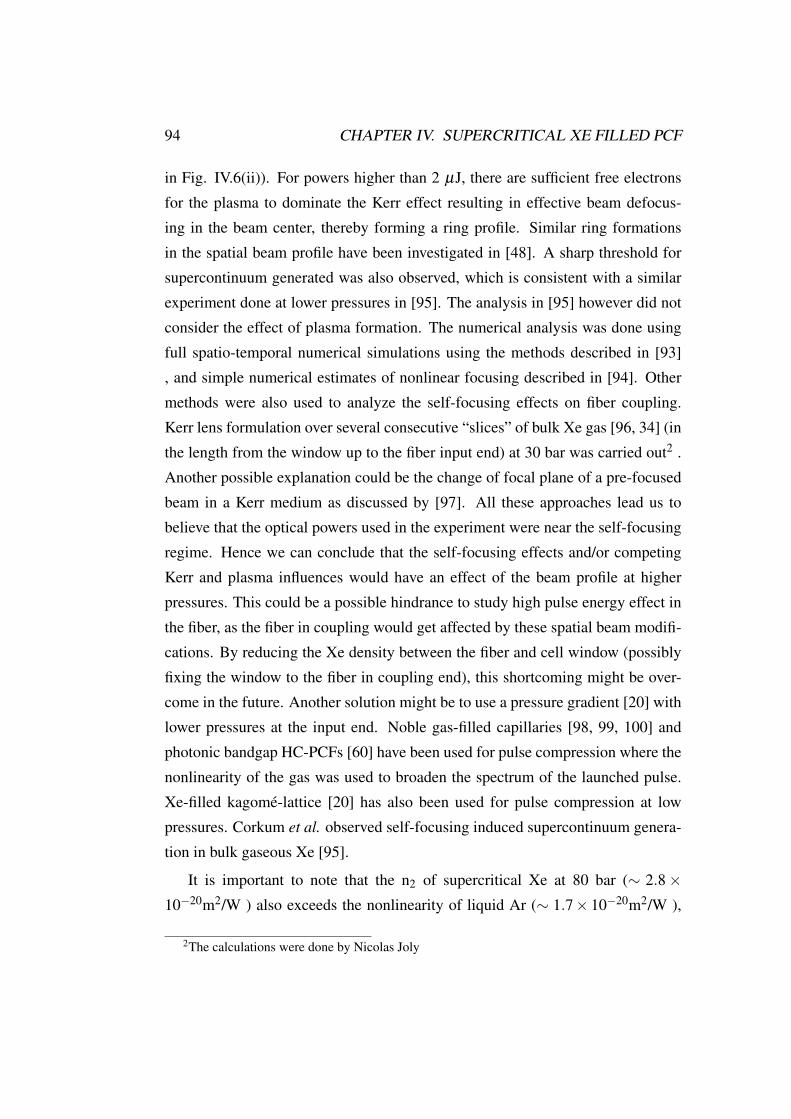
94 CHAPTER IV. SUPERCRITICAL XE FILLED PCF
in Fig. IV.6(ii)). For powers higher than 2 µJ, there are sufficient free electronsfor the plasma to dominate the Kerr effect resulting in effective beam defocus-ing in the beam center, thereby forming a ring profile. Similar ring formationsin the spatial beam profile have been investigated in [48]. A sharp threshold forsupercontinuum generated was also observed, which is consistent with a similarexperiment done at lower pressures in [95]. The analysis in [95] however did notconsider the effect of plasma formation. The numerical analysis was done usingfull spatio-temporal numerical simulations using the methods described in [93], and simple numerical estimates of nonlinear focusing described in [94]. Othermethods were also used to analyze the self-focusing effects on fiber coupling.Kerr lens formulation over several consecutive “slices” of bulk Xe gas [96, 34] (inthe length from the window up to the fiber input end) at 30 bar was carried out2 .Another possible explanation could be the change of focal plane of a pre-focusedbeam in a Kerr medium as discussed by [97]. All these approaches lead us tobelieve that the optical powers used in the experiment were near the self-focusingregime. Hence we can conclude that the self-focusing effects and/or competingKerr and plasma influences would have an effect of the beam profile at higherpressures. This could be a possible hindrance to study high pulse energy effect inthe fiber, as the fiber in coupling would get affected by these spatial beam modifi-cations. By reducing the Xe density between the fiber and cell window (possiblyfixing the window to the fiber in coupling end), this shortcoming might be over-come in the future. Another solution might be to use a pressure gradient [20] withlower pressures at the input end. Noble gas-filled capillaries [98, 99, 100] andphotonic bandgap HC-PCFs [60] have been used for pulse compression where thenonlinearity of the gas was used to broaden the spectrum of the launched pulse.Xe-filled kagomé-lattice [20] has also been used for pulse compression at lowpressures. Corkum et al. observed self-focusing induced supercontinuum genera-tion in bulk gaseous Xe [95].
It is important to note that the n2 of supercritical Xe at 80 bar (∼ 2.8 ×10⁻²⁰m2/W ) also exceeds the nonlinearity of liquid Ar (∼ 1.7× 10⁻²⁰m2/W ),
2The calculations were done by Nicolas Joly
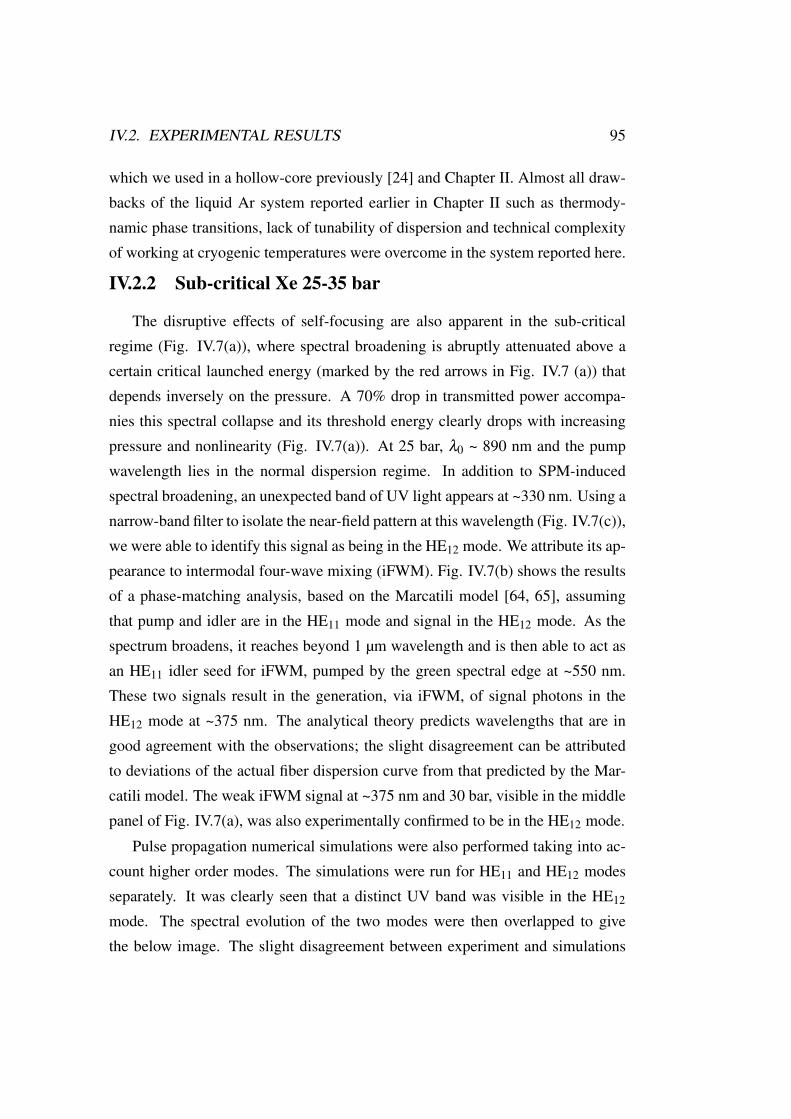
IV.2. EXPERIMENTAL RESULTS 95
which we used in a hollow-core previously [24] and Chapter II. Almost all draw-backs of the liquid Ar system reported earlier in Chapter II such as thermody-namic phase transitions, lack of tunability of dispersion and technical complexityof working at cryogenic temperatures were overcome in the system reported here.
IV.2.2 Sub-critical Xe 25-35 bar
The disruptive effects of self-focusing are also apparent in the sub-criticalregime (Fig. IV.7(a)), where spectral broadening is abruptly attenuated above acertain critical launched energy (marked by the red arrows in Fig. IV.7 (a)) thatdepends inversely on the pressure. A 70% drop in transmitted power accompa-nies this spectral collapse and its threshold energy clearly drops with increasingpressure and nonlinearity (Fig. IV.7(a)). At 25 bar, λ0 ~ 890 nm and the pumpwavelength lies in the normal dispersion regime. In addition to SPM-inducedspectral broadening, an unexpected band of UV light appears at ~330 nm. Using anarrow-band filter to isolate the near-field pattern at this wavelength (Fig. IV.7(c)),we were able to identify this signal as being in the HE12 mode. We attribute its ap-pearance to intermodal four-wave mixing (iFWM). Fig. IV.7(b) shows the resultsof a phase-matching analysis, based on the Marcatili model [64, 65], assumingthat pump and idler are in the HE11 mode and signal in the HE12 mode. As thespectrum broadens, it reaches beyond 1 µm wavelength and is then able to act asan HE11 idler seed for iFWM, pumped by the green spectral edge at ~550 nm.These two signals result in the generation, via iFWM, of signal photons in theHE12 mode at ~375 nm. The analytical theory predicts wavelengths that are ingood agreement with the observations; the slight disagreement can be attributedto deviations of the actual fiber dispersion curve from that predicted by the Mar-catili model. The weak iFWM signal at ~375 nm and 30 bar, visible in the middlepanel of Fig. IV.7(a), was also experimentally confirmed to be in the HE12 mode.
Pulse propagation numerical simulations were also performed taking into ac-count higher order modes. The simulations were run for HE11 and HE12 modesseparately. It was clearly seen that a distinct UV band was visible in the HE12
mode. The spectral evolution of the two modes were then overlapped to givethe below image. The slight disagreement between experiment and simulations
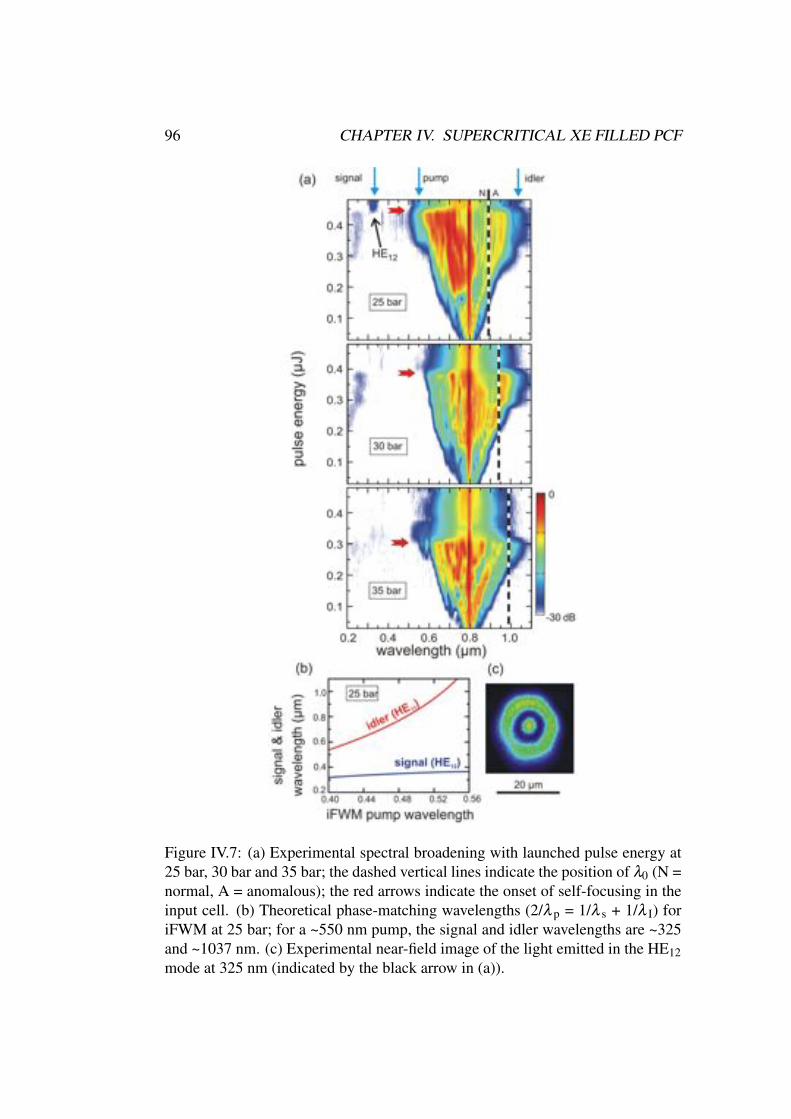
96 CHAPTER IV. SUPERCRITICAL XE FILLED PCF
Figure IV.7: (a) Experimental spectral broadening with launched pulse energy at25 bar, 30 bar and 35 bar; the dashed vertical lines indicate the position of λ0 (N =normal, A = anomalous); the red arrows indicate the onset of self-focusing in theinput cell. (b) Theoretical phase-matching wavelengths (2/λ p = 1/λ s + 1/λ I) foriFWM at 25 bar; for a ~550 nm pump, the signal and idler wavelengths are ~325and ~1037 nm. (c) Experimental near-field image of the light emitted in the HE12mode at 325 nm (indicated by the black arrow in (a)).
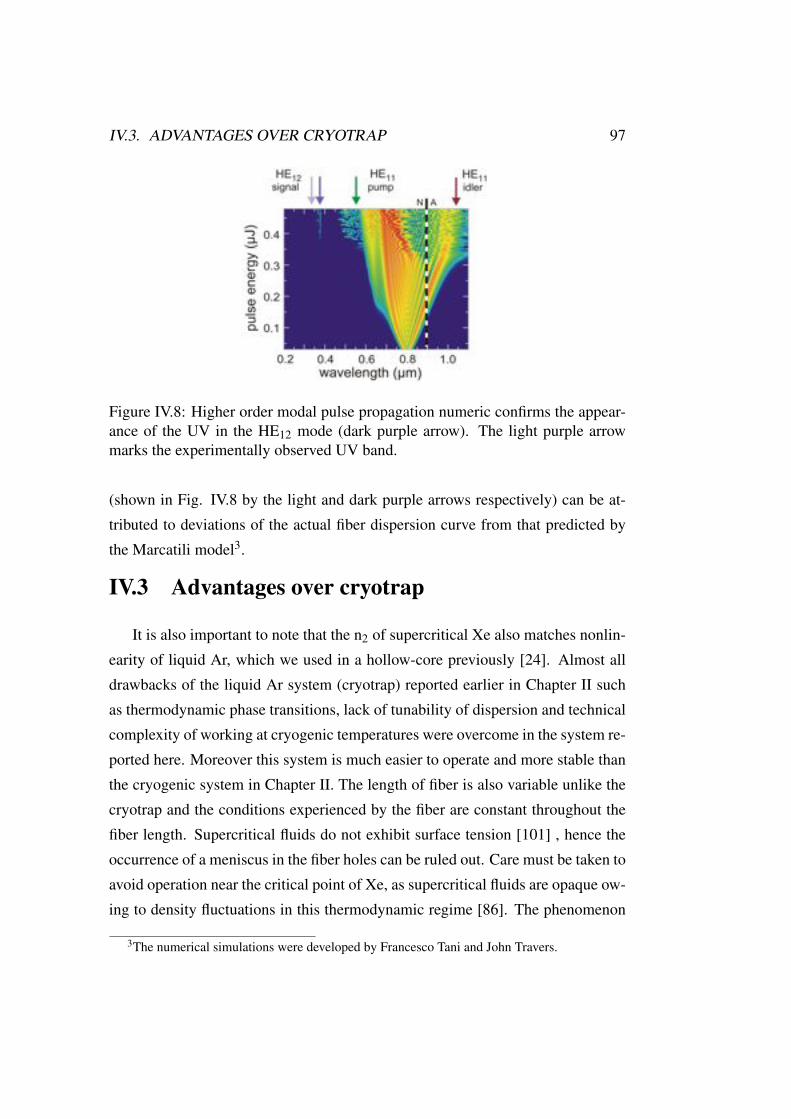
IV.3. ADVANTAGES OVER CRYOTRAP 97
Figure IV.8: Higher order modal pulse propagation numeric confirms the appear-ance of the UV in the HE12 mode (dark purple arrow). The light purple arrowmarks the experimentally observed UV band.
(shown in Fig. IV.8 by the light and dark purple arrows respectively) can be at-tributed to deviations of the actual fiber dispersion curve from that predicted bythe Marcatili model3.
IV.3 Advantages over cryotrap
It is also important to note that the n2 of supercritical Xe also matches nonlin-earity of liquid Ar, which we used in a hollow-core previously [24]. Almost alldrawbacks of the liquid Ar system (cryotrap) reported earlier in Chapter II suchas thermodynamic phase transitions, lack of tunability of dispersion and technicalcomplexity of working at cryogenic temperatures were overcome in the system re-ported here. Moreover this system is much easier to operate and more stable thanthe cryogenic system in Chapter II. The length of fiber is also variable unlike thecryotrap and the conditions experienced by the fiber are constant throughout thefiber length. Supercritical fluids do not exhibit surface tension [101] , hence theoccurrence of a meniscus in the fiber holes can be ruled out. Care must be taken toavoid operation near the critical point of Xe, as supercritical fluids are opaque ow-ing to density fluctuations in this thermodynamic regime [86]. The phenomenon
3The numerical simulations were developed by Francesco Tani and John Travers.
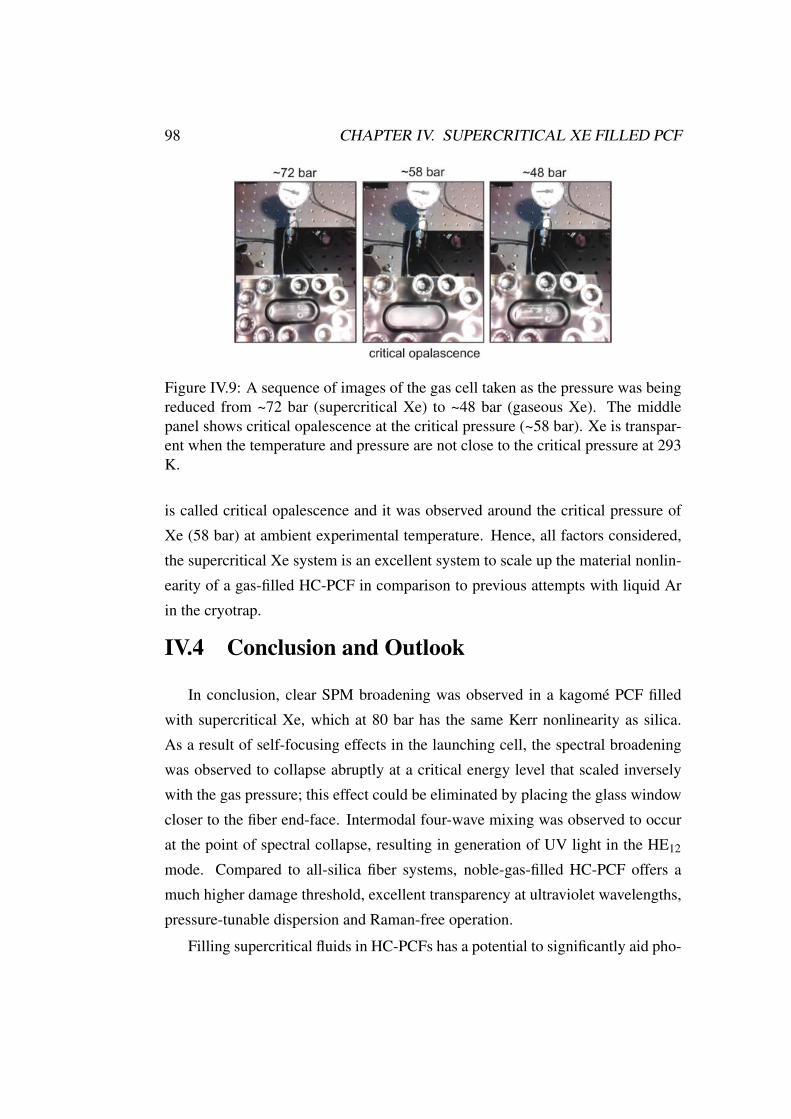
98 CHAPTER IV. SUPERCRITICAL XE FILLED PCF
Figure IV.9: A sequence of images of the gas cell taken as the pressure was beingreduced from ~72 bar (supercritical Xe) to ~48 bar (gaseous Xe). The middlepanel shows critical opalescence at the critical pressure (~58 bar). Xe is transpar-ent when the temperature and pressure are not close to the critical pressure at 293K.
is called critical opalescence and it was observed around the critical pressure ofXe (58 bar) at ambient experimental temperature. Hence, all factors considered,the supercritical Xe system is an excellent system to scale up the material nonlin-earity of a gas-filled HC-PCF in comparison to previous attempts with liquid Arin the cryotrap.
IV.4 Conclusion and Outlook
In conclusion, clear SPM broadening was observed in a kagomé PCF filledwith supercritical Xe, which at 80 bar has the same Kerr nonlinearity as silica.As a result of self-focusing effects in the launching cell, the spectral broadeningwas observed to collapse abruptly at a critical energy level that scaled inverselywith the gas pressure; this effect could be eliminated by placing the glass windowcloser to the fiber end-face. Intermodal four-wave mixing was observed to occurat the point of spectral collapse, resulting in generation of UV light in the HE12
mode. Compared to all-silica fiber systems, noble-gas-filled HC-PCF offers amuch higher damage threshold, excellent transparency at ultraviolet wavelengths,pressure-tunable dispersion and Raman-free operation.
Filling supercritical fluids in HC-PCFs has a potential to significantly aid pho-
IV.4. CONCLUSION AND OUTLOOK 99
tonics research. Supercritical fluids can have densities almost as high as liquids,yet do not exhibit surface tension – hence meniscus formation in fibers cannotoccur. These fluids can be controlled with standard gas valves (without lubri-cants) and their density can be controlled over a much larger range than liquids –thereby enabling a larger range of control of dispersion and material nonlinearityin the fiber. The lack of surface tension gives supercritical fluids the ability tooccupy inter-molecular spaces, which makes it an excellent solvent. SupercriticalCO2 for example is widely used in industry as a solvent. The solvent ability ofsupercritical Xe was seen earlier, where the lubricant of the needle valves in thesetup was dissolved and deposited in the gas cell and on the fiber. This solventability can be put to interesting applications like in [102] where the Rhodaminewas dissolved in supercritical CO2 with the help of a cosolvent like methanol. Inprinciple this can be used to coat the inner walls of a fiber with the appropriatesolute. For this the supercritical fluid would need to dissolve the required soluteusing a cosolvent if required as CO2 and Xe can only dissolve non-polar solutes,as they are non-polar molecules. The solution can then be filled into the fiberand the pressure reduced to below the critical pressure. The solute could then bedeposited on the inner walls.
Towards the final stages of experimental work, supercritical CO2 was also ob-tained paving the way for further interesting experiments such as Raman-scatteringstudies [85] or solvent related experiments. Supercritical CO2 was created merelyby placing pieces of dry ice in a specially designed gas cell and then sealed. Af-ter a few minutes at room temperature, supercritical CO2would be formed fromthe dry ice. It was also found that if left for a few weeks, the supercritical CO2
would swell the acrylic windows of the gas cell – as it is a well-known swellingagent [91]. This has been used in [102] to enable Rhodamine to seep into polymerfibers.
Using appropriate dispersion compensation techniques, the large spectral broad-ening due to SPM can be used for pulse compression [20].

100 CHAPTER IV. SUPERCRITICAL XE FILLED PCF
Chapter V
Conclusions
The technical know-how developed in this thesis has extended the capabilities ofa gas-filled HC-PCF significantly. The use of dense noble gases avoids Raman-scattering related perturbations and simultaneously scales up the material nonlin-earity of the core of gas-filled HC-PCF to a value comparable to that of fusedsilica. Interestingly a blend of seemingly disparate fields of photonics and ther-modynamics has led to the interesting results reported here.
In Chapter II, novel cryogenic systems were used to condense liquid Ar insections of kagomé HC-PCF. The system presented a unique opportunity to studynonlinear fiber optics in a liquid media sandwiched between lengths of gas inthe fiber core. SPM was observed in a kagomé HC-PCF filled partly with liquidAr. Systems to fill a cryogenic liquid throughout the length of the fiber werealso developed. Future directions in this study can make use of the possibility ofobtaining liquid Xe at ~280 K by condensing using high pressure Xe gas.
Almost all technical challenges faced in Chapter II, such as scattering lossesat gas-liquid interfaces and overall complexity of the system, were solved withthe high-pressure gas fiber systems (Chapter III). Nonlinear effects such as soli-ton fission, modulational instability and dispersive wave generation in the absenceof Raman-scattering have been observed experimentally. Excellent agreement be-tween experimental observations and numerical simulations were obtained whenthe Raman-related perturbations were ignored. Moreover a wide range of tunabil-
101
102 CHAPTER V. CONCLUSIONS
ity of ZDW from the UV to the IR was achieved – allowing the access of variousdispersion regimes, using the same length of fiber and for a given laser frequency.The nonlinearity also was proportionally scalable with gas pressure.
Chapter IV relied on a modified high pressure gas fiber system. By accessingthe supercritical properties of Xe at room temperature, a sharp density changearound the critical pressure of 58 bar helped to raise the the material nonlinearityto match (and exceed) that of fused silica. Self-focusing effects where found toaffect fiber in-coupling. More studies need to be carried out to understand thisphenomenon rigorously. Intermodal FWM was observed in subcritical Xe andexplained using multimodal phase-matching analysis.
The successful impact of the versatile high pressure gas fiber system is alreadygenerating new ideas. In just a few months after the first prototype was developed,other similar experimental setups have already been installed. For example, toexplore the possibility of enhanced Raman-gain at higher pressures of Raman-active gases [14]. Plans to implement the high pressure gas fiber systems for fiberring cavities [103] are underway.
Supercritical fluids can be exploited for the solvent abilities and used to coatthe inside of fibers with an appropriate solute when the pressure is decreased tosubcritical pressures. A potential for this functionality was seen in IV.1. Polymerfibers could use the supercritical fluid as a swelling agent for post processing[102].
The potential for further experiments with high pressure gas-filled fibers isindeed huge. By raising the nonlinearity, compact fiber-lasers could be used aspump sources rather than expensive amplified-oscillator lasers. Low loss, smallercore diameter hollow-core fibers filled with high pressure gases may prove to becompetitors to solid core fibers, with considerably enhanced versatility.
Appendix A
Appendix
A.1 List of Publications
1. M. Azhar, N. Y. Joly, J. C. Travers, and P. St. J. Russell. Nonlinear opticsin xenon-filled hollow-core PCF in high pressure and supercritical regimes.Applied Physics B, DOI:10.1007/s00340-013-5526-y:1–4, 2013
2. M. Azhar, G. K. L. Wong, W. Chang, N. Y. Joly, and P. St. J. Russell.Raman-free nonlinear optical effects in high pressure gas-filled hollow-corePCF. Optics Express, 21(4):4405–4410, February 2013.
3. M. Azhar, G. Wong, W. Chang, N. Joly, and P. St. J. Russell. Nonlinear op-tics in hollow-core photonic crystal fiber filled with liquid argon. In CLEO:Science and Innovations, OSA Technical Digest (online), page CTh4B.4.Optical Society of America, May 2012.
Conferences (oral presentation)
1. Conference on Lasers and Electro-Optics (CLEO)-Europe, Munich, Ger-many (2013).
2. Conference on Lasers and Electro-Optics (CLEO), San Jose, USA (2012).
3. Photonics 2010, Guwahati, India (2010).
103
104 APPENDIX A. APPENDIX
Workshops (poster presentation)
1. International workshop on light-matter interaction, Porquerolles, France (2012).
2. Nonlinear optics and complexity in PCF and nanostructures, Erice, Italy(2011).
Awards
Optical Society of America Best Student paper award at Photonics 2010, Guwa-hati, India.
A.2. INSTRUCTIONS TO OPERATE THE CRYOTRAP 105
A.2 Instructions to operate the cryotrap
Starting the cryotrap
1. Check if the liquid N2 cylinder is filled
2. Install the cryo-valve with the insulated tube to the liquid N2 cylinder liquidoutlet.
3. The insulated tube is then connected to the liquid N2 inlet of the cryotrap.The tube must be clean and dry-otherwise frozen particles might affect thetemperature controlling system. Preferably purge with gaseous N2.
4. Attach the silicone tube to the output of the cryotrap.
5. Connect the cryo-valve plug and the PT100 temperature sensor plug to thetemperature controller.
6. Connect the temperature controller unit to 230 V ac power supply and turnon.
7. Open the valve on the liquid N2 cylinder to let the liquid N2 flow into thecryotrap when the cryo-valve is active (the red LED on the cryo-valve wirewould turn and is accompanied by a characteristic sound of the valve open-ing).
8. The temperature controller stores the last parameter setting and also the lastset temperature. This last set temperature is shown on the display (green),the actual temperature is shown on the display in red numbers. The tem-perature can be changed in the following way: press key “P”, change thetemperature with the arrow up, arrow down key and confirm the tempera-ture by pressing the key “P” again. The newly set temperature is displayedin green numbers.
106 APPENDIX A. APPENDIX
Caution
1. Do not disturb the tube between the liquid N2 cylinder and the cryotrapwhen the system is cooled down. The tube becomes brittle when cold, andmight break if disturbed.
2. Check that the PT100 sensor is well fitted in the cryotrap. This is vital foraccurate functioning of the temperature controller.
3. The output pipe for the gaseous N2 must not have a blockage.
4. The exhaust N2 must be safely released to the outside environment to pre-vent oxygen depletion within the confines of the lab.
Switching off the system
1. Close the valve on the liquid N2 cylinder to shut off the supply of liquid N2.
2. Switch off the temperature controller.
3. Wait until the entire system is warmed up to disassemble the setup if needed.
A.3. ACKNOWLEDGMENTS 107
A.3 Acknowledgments
A few years back Prof. Russell gave me the opportunity to work for one of thebest fiber optics research groups in the world. It is an opportunity for which I shallforever be indebted to him. I admire the sheer “audacity” of some of his ideas andhis guidance in helping to achieve them. I am most grateful to him for a wonderfulexperience, from giving me a challenging project to standing by me during sometough times – eventually helping me achieve and even exceed the goals we set offto accomplish. Thank you Philip.
Prof. Nicolas Joly, merci beaucoup. His suggestions and ideas have had amajor impact on this thesis. His patience and support during the past few yearsmeant a lot to me – thanks Nick. Many years from now, I can imagine him cheer-fully narrating the story of how his new Indian student saw his first snowfall whilein his office. And don’t challenge him to a badminton match – he will beat you!Gordon Wong too helped me greatly during the course of my PhD. It was a plea-sure having the many scientific discussion we had. I am also grateful to WonkeunChang and John Travers for their ideas and numerical simulations. John and metried our best to educate the Germans about the nuances of cricket (und dessenUnterschiede zu Crockett).
Philipp Hölzer, Amir Abdolvand, KaFai Mak, Michael Schmidberger, FrancescoTani, Barbara Trabold, Martin Finger and Federico Belli provided an excellentenvironment in the lab, though their ideas, encouragement, lab music and the oc-casional stray UV beam. Thank you Martin Butryn for helping me out with thelasers. My office colleagues, Sarah, Thang, Nicolai and Patrick made great com-pany. It is a joy to see the whole office graduating in the same year. I wouldlike to thank Xiaoming Xi, Stan, Ana Cubillias, Anna Butsch, Tijmen Euser,Oliver Schmidt, Ralf Keding, Basti, Stan, Fehim, Jimmy, Alexey, Johannes, DavidNovoa, Alessio Stefani and Michael Frosz. Among the former members I wouldlike to thank Martin Garbos, Marta Ziemienczuk, Andreas Walser, Silke Ramler,Howard Lee, Johannes Nold and Sebastian Stark. Colleagues at the Russell Divi-sion came from all parts of the world and it was an honour to work with such afine group of scientists.
108 APPENDIX A. APPENDIX
I have to thank Heike Schwender for her immense help in my first few weeks inGermany and for being the first of my many friends in Germany. Bettina Schwen-der is a great help as she is so efficient with all the administrative aspects. Abig dhanyavaad to my compatriots at the MPL Hemant Tyagi, Nitin Jain, BharatNavalpakkam and Samudra Roy for the great times.
I am also most grateful to Erwin Strigl from IMT Moosbach and Klaus Geburtzifrom Geburtzi Gastechnik Nürnberg for their invaluable help in manufacturing thecryo-trap and high pressure systems. I have met wonderful people from severalcountries during my stay in Germany. It has been an unforgettable last few years,rich with fascinating experiences. Thank you to all the friends who made my stayin Germany memorable and absolutely wunderbar!
Several important people have helped me throughout my career. Prof. Srini-vasan, Hema Ramachandran and Andal Narayan gave me an excellent start in thefield of experimental optics at Raman Research Institute, Bangalore, India. MyFIMSc classmates who were an excellent peer group and are now working in labsaround the world.
It is not easy when your family is spread over three continents. I am gratefulto Mummy, Abba and Mothi for being there for me all these years. This thesis isdedicated to them.
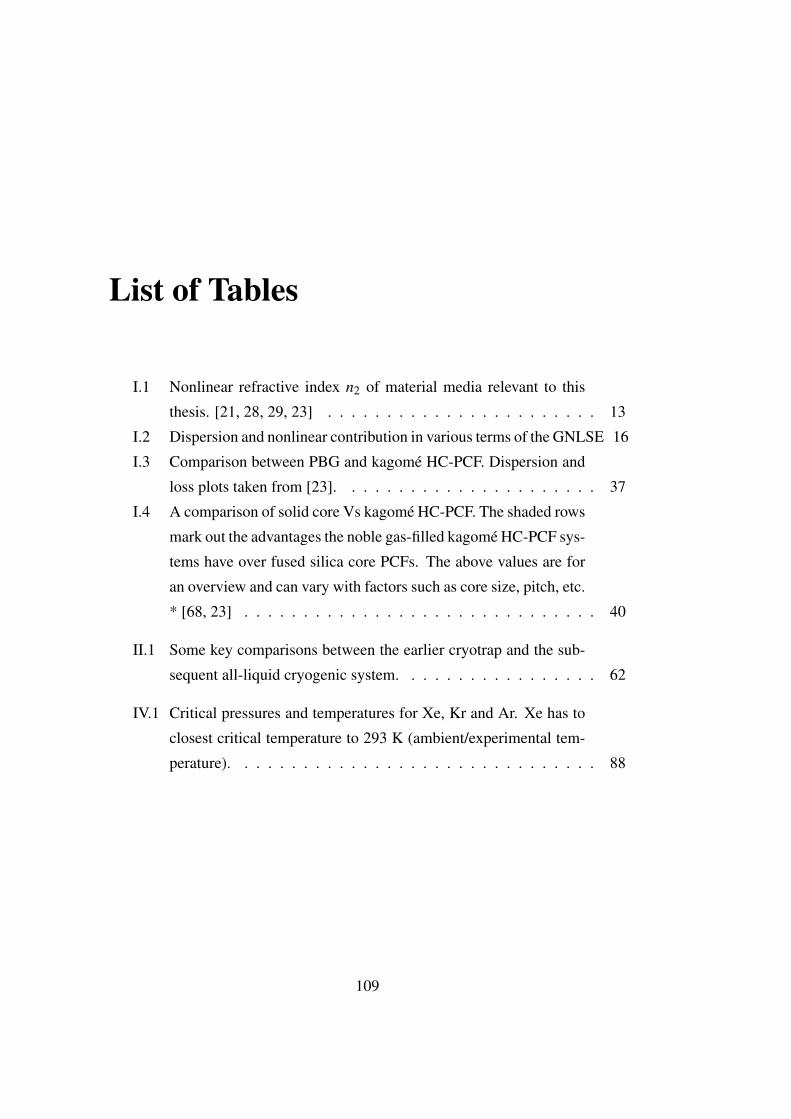
List of Tables
I.1 Nonlinear refractive index n2 of material media relevant to thisthesis. [21, 28, 29, 23] . . . . . . . . . . . . . . . . . . . . . . . 13
I.2 Dispersion and nonlinear contribution in various terms of the GNLSE 16I.3 Comparison between PBG and kagomé HC-PCF. Dispersion and
loss plots taken from [23]. . . . . . . . . . . . . . . . . . . . . . 37I.4 A comparison of solid core Vs kagomé HC-PCF. The shaded rows
mark out the advantages the noble gas-filled kagomé HC-PCF sys-tems have over fused silica core PCFs. The above values are foran overview and can vary with factors such as core size, pitch, etc.* [68, 23] . . . . . . . . . . . . . . . . . . . . . . . . . . . . . . 40
II.1 Some key comparisons between the earlier cryotrap and the sub-sequent all-liquid cryogenic system. . . . . . . . . . . . . . . . . 62
IV.1 Critical pressures and temperatures for Xe, Kr and Ar. Xe has toclosest critical temperature to 293 K (ambient/experimental tem-perature). . . . . . . . . . . . . . . . . . . . . . . . . . . . . . . 88
109

110 LIST OF TABLES
Bibliography
[1] P. A. Franken, A. E. Hill, C. W. Peters, and G. Weinreich. Generation ofoptical harmonics. Physical Review Letters, 7(4):118–119, August 1961.
[2] J. A. Armstrong, N. Bloembergen, J. Ducuing, and P. S. Pershan. Inter-actions between light waves in a nonlinear dielectric. Physical Review,127(6):1918–1939, September 1962.
[3] N. Bloembergen. Nonlinear optics: past, present, and future. IEEE Journalof Selected Topics in Quantum Electronics, 6(6):876–880, 2000.
[4] R. R. Alfano and S. L. Shapiro. Emission in the region 4000 to 7000 Å viafour-photon coupling in glass. Physical Review Letters, 24(11):584–587,March 1970.
[5] J. M. Dudley and S Coen. Supercontinuum generation in photonic crystalfiber. Reviews of Modern Physics, 78(4):1135–1184, October 2006.
[6] A. E. Siegman. Laser beams and resonators: Beyond the 1960s. IEEEJournal of Selected Topics in Quantum Electronics, 6(6):1389–1399, 2000.
[7] J. A. Harrington. A review of IR transmitting, hollow waveguides. Fiberand Integrated Optics, 19(3):211–227, 2000.
[8] S. B. Poole, D. N. Payne, R. J. Mears, M. E. Fermann, and R. Laming.Fabrication and characterization of low-loss optical fibers containing rare-earth ions. Journal of Lightwave Technology, 4(7):870–876, 1986.
111
112 BIBLIOGRAPHY
[9] P. St. J. Russell. Photonic-crystal fibers. Journal of Lightwave Technology,24(12):4729–4749, December 2006.
[10] T. A. Birks, J. C. Knight, and P. St. J. Russell. Endlessly single-modephotonic crystal fiber. Optics Letters, 22(13):961–963, July 1997.
[11] J. K. Ranka, R. S. Windeler, and A. J. Stentz. Visible continuum generationin air-silica microstructure optical fibers with anomalous dispersion at 800nm. Optics Letters, 25(1):25–27, January 2000.
[12] A. V. Husakou and J. Herrmann. Frequency comb generation by four-wave mixing in a multicore photonic crystal fiber. Applied Physics Letters,83(19):3867–3869, November 2003.
[13] F. Couny, F. Benabid, P. J. Roberts, P. S. Light, and M. G. Raymer. Gen-eration and photonic guidance of multi-octave optical-frequency combs.Science, 318(5853):1118–1121, November 2007. PMID: 18006741.
[14] A. Abdolvand, A. M. Walser, M. Ziemienczuk, T. Nguyen, and P. St. J.Russell. Generation of a phase-locked raman frequency comb in gas-filled hollow-core photonic crystal fiber. Optics Letters, 37(21):4362–4364,November 2012.
[15] F. Benabid, J. C. Knight, G. Antonopoulos, and P. St. J. Russell. Stimulatedraman scattering in hydrogen-filled hollow-core photonic crystal fiber. Sci-ence, 298(5592):399–402, October 2002. PMID: 12376698.
[16] A. Abdolvand, A. Nazarkin, A. V. Chugreev, C. F. Kaminski, andP. St. J. Russell. Solitary pulse generation by backward raman scatter-ing in hydrogen-filled photonic crystal fibers. Physical Review Letters,103(18):183902, October 2009.
[17] N. Y. Joly, J. Nold, W. Chang, P. Hölzer, A. Nazarkin, G. K. L. Wong,F. Biancalana, and P. St.J. Russell. Bright spatially coherent wavelength-tunable deep-UV laser source using an ar-filled photonic crystal fiber. Phys-ical Review Letters, 106(20):203901, May 2011.
BIBLIOGRAPHY 113
[18] P. Hölzer, W. Chang, J. C. Travers, A. Nazarkin, J. Nold, N. Y. Joly, M. F.Saleh, F. Biancalana, and P. St. J. Russell. Femtosecond nonlinear fiberoptics in the ionization regime. Physical Review Letters, 107(20):203901,November 2011.
[19] M. F. Saleh, W. Chang, P. Hölzer, A. Nazarkin, J. C. Travers, N. Y. Joly,P. St. J. Russell, and F. Biancalana. Theory of photoionization-inducedblueshift of ultrashort solitons in gas-filled hollow-core photonic crystalfibers. Physical Review Letters, 107(20):203902, November 2011.
[20] O. H. Heckl, C. J. Saraceno, C. R. E. Baer, T. Südmeyer, Y. Y. Wang,Y. Cheng, F. Benabid, and U. Keller. Temporal pulse compression in axenon-filled kagome-type hollow-core photonic crystal fiber at high aver-age power. Optics Express, 19(20):19142–19149, September 2011.
[21] G. P Agrawal. Nonlinear fiber optics. Academic Press, 4th edition, 2006.
[22] J. Rarity, J. Fulconis, J. Duligall, W. Wadsworth, and P. St. J. Russell.Photonic crystal fiber source of correlated photon pairs. Optics Express,13(2):534–544, January 2005.
[23] J. C. Travers, W. Chang, J. Nold, N. Y. Joly, and P. St. J. Russell. Ultrafastnonlinear optics in gas-filled hollow-core photonic crystal fibers [invited].Journal of the Optical Society of America B, 28(12):A11–A26, December2011.
[24] M. Azhar, G. Wong, W. Chang, N. Joly, and P. St. J. Russell. Nonlinear op-tics in hollow-core photonic crystal fiber filled with liquid argon. In CLEO:Science and Innovations, OSA Technical Digest (online), page CTh4B.4.Optical Society of America, May 2012.
[25] M. Azhar, G. K. L. Wong, W. Chang, N. Y. Joly, and P. St. J. Russell.Raman-free nonlinear optical effects in high pressure gas-filled hollow corePCF. Optics Express, 21(4):4405–4410, February 2013.
114 BIBLIOGRAPHY
[26] M. Azhar, N. Y. Joly, J. C. Travers, and P. St. J. Russell. Nonlinear opticsin xenon-filled hollow-core PCF in high pressure and supercritical regimes.Applied Physics B, 10.1007/s00340-013-5526-y:1–4.
[27] R. W. Boyd. Nonlinear Optics. Acad. Press, 2003.
[28] H. J. Lehmeier, W. Leupacher, and A. Penzkofer. Nonresonant third or-der hyperpolarizability of rare gases and n2 determined by third harmonicgeneration. Optics Communications, 56(1):67–72, November 1985.
[29] E.W. Lemmon, M.O. McLinden, and D.G. Friend. Thermophysical proper-ties of fluid systems. NIST Chemistry WebBook, NIST Standard ReferenceDatabase Number 69. Eds. P.J. Linstrom and W.G. Mallard, National In-stitute of Standards and Technology, Gaithersburg MD, 20899.
[30] R. H. Stolen. Phase-matched-stimulated four-photon mixing in silica-fiberwaveguides. IEEE Journal of Quantum Electronics, 11(3):100–103, 1975.
[31] N. Akhmediev and M. Karlsson. Cherenkov radiation emitted by solitonsin optical fibers. Physical Review A, 51(3):2602–2607, March 1995.
[32] D. V. Skryabin, F. Luan, J. C. Knight, and P. St. J. Russell. Soli-ton self-frequency shift cancellation in photonic crystal fibers. Science,301(5640):1705–1708, September 2003. PMID: 14500977.
[33] F. Biancalana, D. V. Skryabin, and A. V. Yulin. Theory of the soliton self-frequency shift compensation by the resonant radiationin photonic crystalfibers. Physical Review E, 70(1):016615, July 2004.
[34] F. Träger, editor. Springer Handbook of Lasers and Optics. Springer, 2nded. 2012 edition, May 2012.
[35] R. H. Stolen and Chinlon Lin. Self-phase-modulation in silica opticalfibers. Physical Review A, 17(4):1448–1453, April 1978.
BIBLIOGRAPHY 115
[36] V. E. Zakharov and A. B. Shabat. Integration of nonlinear equations ofmathematical physics by the method of inverse scattering. II. FunctionalAnalysis and Its Applications, 13(3):166–174, July 1979.
[37] A. Hasegawa and F. Tappert. Transmission of stationary nonlinear opticalpulses in dispersive dielectric fibers. II. normal dispersion. Applied PhysicsLetters, 23(4):171–172, August 1973.
[38] L. F. Mollenauer, R. H. Stolen, J. P. Gordon, and W. J. Tomlinson. Extremepicosecond pulse narrowing by means of soliton effect in single-mode op-tical fibers. Optics Letters, 8(5):289–291, May 1983.
[39] J. Herrmann, U. Griebner, N. Zhavoronkov, A. Husakou, D. Nickel, J. C.Knight, W. J. Wadsworth, P. St. J. Russell, and G. Korn. Experimentalevidence for supercontinuum generation by fission of higher-order solitonsin photonic fibers. Physical Review Letters, 88(17):173901, April 2002.
[40] J. C. Travers. Blue extension of optical fibre supercontinuum generation.Journal of Optics, 12(11):113001, November 2010.
[41] P. A. Fleury and J. P. McTague. Effects of molecular interactions onlight scattering by simple fluids. Optics Communications, 1(4):164–166,September 1969.
[42] M. Zoppi and G. Spinelli. Interaction-induced translational raman scatter-ing of liquid argon: The spectral moments. Physical Review A, 33(2):939–945, February 1986.
[43] E. M. Dianov, A. Ia Karasik, P. V. Mamyshev, A. M. Prokhorov, and V. N.Serkin. Stimulated-raman conversion of multisoliton pulses in quartz opti-cal fibers. ZhETF Pisma Redaktsiiu, 41:242–244, March 1985.
[44] F. M. Mitschke and L. F. Mollenauer. Discovery of the soliton self-frequency shift. Optics Letters, 11(10):659–661, October 1986.
116 BIBLIOGRAPHY
[45] J. P. Gordon. Theory of the soliton self-frequency shift. Optics Letters,11(10):662–664, October 1986.
[46] W. H. Reeves, D. V. Skryabin, F. Biancalana, J. C. Knight, P. St. J. Russell,F. G. Omenetto, A. Efimov, and A. J. Taylor. Transformation and control ofultra-short pulses in dispersion-engineered photonic crystal fibres. Nature,424(6948):511–515, July 2003. PMID: 12891348.
[47] S.L. Chin, N. Akozbek, A. Proulx, S. Petit, and C.M. Bowden. Transversering formation of a focused femtosecond laser pulse propagating in air.Optics Communications, 188(1–4):181–186, February 2001.
[48] T. D. Grow, A. A. Ishaaya, L. T. Vuong, A. L. Gaeta, N. Gavish, andG. Fibich. Collapse dynamics of super-gaussian beams. Optics Express,14(12):5468–5475, June 2006.
[49] W. Wadsworth, N. Joly, J. Knight, T. Birks, F. Biancalana, and P. Russell.Supercontinuum and four-wave mixing with q-switched pulses in endlesslysingle-mode photonic crystal fibres. Optics Express, 12(2):299–309, Jan-uary 2004.
[50] T. Sun, G. Kai, Z. Wang, S. Yuan, and X. Dong. Enhanced nonlinearityin photonic crystal fiber by germanium doping in the core region. ChineseOptics Letters, 06(02):93.
[51] S. Leon-Saval, T. Birks, W. Wadsworth, P. St. J. Russell, and M. Mason. Su-percontinuum generation in submicron fibre waveguides. Optics Express,12(13):2864–2869, June 2004.
[52] S. P. Stark, A. Podlipensky, N. Y. Joly, and P. St. J. Russell. Ultraviolet-enhanced supercontinuum generation in tapered photonic crystal fiber.Journal of the Optical Society of America B, 27(3):592–598, March 2010.
[53] A. R. Bhagwat and A. L. Gaeta. Nonlinear optics in hollow-core photonicbandgap fibers. Optics Express, 16(7):5035, March 2008.
BIBLIOGRAPHY 117
[54] F. Benabid, J. Knight, and P. St. J. Russell. Particle levitation and guidancein hollow-core photonic crystal fiber. Optics Express, 10(21):1195–1203,October 2002.
[55] O. A. Schmidt, M. K. Garbos, T. G. Euser, and P. St. J. Russell. Recon-figurable optothermal microparticle trap in air-filled hollow-core photoniccrystal fiber. Physical Review Letters, 109(2):024502, July 2012.
[56] J. S. Y. Chen. Nanochemistry and Sensing in Photonic Crystal Fibers. PhDthesis, 2012.
[57] M. Schmidt, A. M. Cubillas, N. Taccardi, T. G. Euser, T. Cremer, F. Maier,H. P. Steinrück, P. St. J. Russell, P. Wasserscheid, and B. J. M. Etzold.Chemical and (photo)-catalytical transformations in photonic crystal fibers.ChemCatChem, 5(3):641–650, 2013.
[58] P. Roberts, F. Couny, H. Sabert, B. Mangan, D. Williams, L. Farr, M. Ma-son, A. Tomlinson, T. Birks, J. Knight, and P. St. J. Russell. Ultimate lowloss of hollow-core photonic crystal fibres. Optics Express, 13(1):236–244,January 2005.
[59] T. Birks, D. Bird, T. Hedley, J. Pottage, and P. St. J. Russell. Scaling lawsand vector effects in bandgap-guiding fibres. Optics Express, 12(1):69–74,January 2004.
[60] D. Ouzounov, C. Hensley, A. L. Gaeta, N. Venkateraman, M. Gallagher,and K. Koch. Soliton pulse compression in photonic band-gap fibers. Op-tics Express, 13(16):6153–6159, August 2005.
[61] F. Couny, F. Benabid, and P. S. Light. Large-pitch kagome-structuredhollow-core photonic crystal fiber. Optics Letters, 31(24):3574–3576, De-cember 2006.
[62] G. J. Pearce, G. S. Wiederhecker, C. G. Poulton, S. Burger, and P. St. J.Russell. Models for guidance in kagome-structured hollow-core photoniccrystal fibres. Optics Express, 15(20):12680–12685, October 2007.
118 BIBLIOGRAPHY
[63] J. L. Archambault, R.J. Black, S. Lacroix, and J. Bures. Loss calculationsfor antiresonant waveguides. Journal of Lightwave Technology, 11(3):416–423, 1993.
[64] E. A. J. Marcatili and R. A. Schmeltzer. Hollow metallic and dielectricwaveguides for long distance optical transmission and lasers. Bell Syst.Tech. J., 43:1783–1809, 1964.
[65] J. Nold, P. Hölzer, N. Y. Joly, G. K. L. Wong, A. Nazarkin, A. Podlipensky,M. Scharrer, and P. St. J. Russell. Pressure-controlled phase matching tothird harmonic in ar-filled hollow-core photonic crystal fiber. Optics Let-ters, 35(17):2922–2924, September 2010.
[66] P. Hölzer. Nonlinear Fiber Optics in Gases and Dilute Plasmas. PhD thesis,2012.
[67] W. Chang, A. Nazarkin, J. C. Travers, J. Nold, P. Hölzer, N. Y. Joly, andP. St. J. Russell. Influence of ionization on ultrafast gas-based nonlinearfiber optics. Optics Express, 19(21):21018, October 2011.
[68] B. Chimier, O. Utéza, N. Sanner, M. Sentis, T. Itina, P. Lassonde, F. Lé-garé, F. Vidal, and J. C. Kieffer. Damage and ablation thresholds of fused-silica in femtosecond regime. Physical Review B, 84(9):094104, September2011.
[69] I. Lefkowitz, K. Kramer, M. A. Shields, and Gerald L. Pollack. Dielectricand optical properties of crystalline argon. Journal of Applied Physics,38(12):4867–4873, November 1967.
[70] T. Heindl, T. Dandl, A. Fedenev, M. Hofmann, R. Krücken, L. Oberauer,W. Potzel, J. Wieser, and A. Ulrich. Table-top setup for investigatingthe scintillation properties of liquid argon. Journal of Instrumentation,6(02):P02011, February 2011.
[71] G. L. Yudin and M. Y. Ivanov. Nonadiabatic tunnel ionization: Lookinginside a laser cycle. Physical Review A, 64(1):013409, June 2001.
BIBLIOGRAPHY 119
[72] A. A. Vasserman and V. A. Rabinovich. The calculation of the ther-modynamic properties of liquid argon. Journal of Engineering Physics,13(2):106–113, August 1967.
[73] P. A. Fleury and J. P. Boon. Brillouin scattering in simple liquids: Argonand neon. Physical Review, 186(1):244, October 1969.
[74] R. R. Alfano and S. L. Shapiro. Direct distortion of electronic cloudsof rare-gas atoms in intense electric fields. Physical Review Letters,24(22):1217, June 1970.
[75] A. C. Sinnock and B. L. Smith. Refractive indices of the condensed inertgases. Physical Review, 181(3):1297, May 1969.
[76] A. Dalgarno and A. E. Kingston. The refractive indices and verdet con-stants of the inert gases. Proceedings of the Royal Society of London.Series A, Mathematical and Physical Sciences, 259(1298):424–431, De-cember 1960. ArticleType: research-article / Full publication date: Dec.29, 1960.
[77] A. Bideau-Mehu, Y. Guern, R. Abjean, and A. Johannin-Gilles. Measure-ment of refractive indices of neon, argon, krypton and xenon in the 253.7-140.4 nm wavelength range. dispersion relations and estimated oscillatorstrengths of the resonance lines. Journal of Quantitative Spectroscopy andRadiative Transfer, 25(5):395–402, May 1981.
[78] M. Henderson. Phase diagram and pV isotherms of argon. The Journal ofChemical Physics, 51(12):5420, 1969.
[79] R. R. Alfano. The Supercontinuum Laser Source. Springer Sci-ence+Business Media, Inc., [New York], 2006.
[80] M. Sheik-Bahae, A.A. Said, T.-H. Wei, D.J. Hagan, and E.W. Van Stry-land. Sensitive measurement of optical nonlinearities using a single beam.Quantum Electronics, IEEE Journal of, 26(4):760–769, 1990.
120 BIBLIOGRAPHY
[81] J. P. McTague, C.H. Lin, T.K. Gustafson, and R.Y. Chiao. The observationof filaments in liquid argon. Physics Letters A, 32(2):82–83, June 1970.
[82] A. Hitachi, V. Chepel, M. I. Lopes, and V. N. Solovov. New approach to thecalculation of the refractive index of liquid and solid xenon. The Journalof Chemical Physics, 123(23):234508, December 2005. PMID: 16392932.
[83] F. Sauli. Instrumentation in high energy physics. World Scientific, 1993.
[84] D. Eden and H. L. Swinney. Optical heterodyne studies of brillouin scat-tering in xenon near the critical point. Optics Communications, 10(2):191–194, February 1974.
[85] S. M. Howdle, K. Stanley, V. K. Popov, and V. N. Bagratashvili. Canhigh-pressure raman spectroscopy be simplified? a microscale optical-fibercapillary cell for the study of supercritical fluids. Applied Spectroscopy,48(2):214–218, February 1994.
[86] R. McGraw. Light scattering and nonlinear optical response near a criticalpoint. Physical Review A, 42(4):2235–2247, August 1990.
[87] M. Droques, B. Barviau, A. Kudlinski, M. Taki, A. Boucon, T. Sylvestre,and A. Mussot. Symmetry-breaking dynamics of the modulational insta-bility spectrum. Optics Letters, 36(8):1359–1361, April 2011.
[88] H. Hansen, T. Aichele, C. Hettich, P. Lodahl, A. I. Lvovsky, J. Mlynek, andS. Schiller. Ultrasensitive pulsed, balanced homodyne detector: applica-tion to time-domain quantum measurements. Optics Letters, 26(21):1714–1716, November 2001.
[89] K. F. Mak, J. C. Travers, P. Hölzer, N. Y. Joly, and P. St. J. Russell. Tunablevacuum-UV to visible ultrafast pulse source based on gas-filled kagome-PCF. Optics Express, 21(9):10942–10953, May 2013.
BIBLIOGRAPHY 121
[90] K. E. Lynch-Klarup, E. D. Mondloch, M. G. Raymer, D. Arrestier,F. Gerome, and F. Benabid. Supercritical xenon-filled hollow-core pho-tonic bandgap fiber. Optics Express, 21(11):13726–13732, June 2013.
[91] J. McHardy and S. P. Sawan. Supercritical Fluid Cleaning: Fundamentals,Technology and Applications. William Andrew, December 2008.
[92] C. Bree, A. Demircan, and G. Steinmeyer. Method for computing the non-linear refractive index via keldysh theory. IEEE Journal of Quantum Elec-tronics, 46(4):433–437, 2010.
[93] A. Couairon, E. Brambilla, T. Corti, D. Majus, O. de J. Ramirez-Gongora,and M. Kolesik. Practitioner’s guide to laser pulse propagation models andsimulation. The European Physical Journal Special Topics, 199(1):5–76,November 2011.
[94] V. P. Kandidov, V. Yu Fedorov, O. V. Tverskoi, O. G. Kosareva, and S. L.Chin. Intensity clamping in the filament of femtosecond laser radiation.Quantum Electronics, 41(4):382, April 2011.
[95] P. B. Corkum, Claude Rolland, and T. Srinivasan-Rao. Supercontinuumgeneration in gases. Physical Review Letters, 57(18):2268–2271, Novem-ber 1986.
[96] J. Herrmann. Theory of kerr-lens mode locking: role of self-focusingand radially varying gain. Journal of the Optical Society of America B,11(3):498–512, March 1994.
[97] J. H. Marburger. Self-focusing: Theory. Progress in Quantum Electronics,4, Part 1:35–110, April 1975.
[98] A. Suda, M. Hatayama, K. Nagasaka, and K. Midorikawa. Generation ofsub-10-fs, 5-mJ-optical pulses using a hollow fiber with a pressure gradient.Applied Physics Letters, 86(11):111116–111116–3, March 2005.
122 BIBLIOGRAPHY
[99] M. Nisoli, S. De Silvestri, O. Svelto, R. Szipöcs, K. Ferencz, Ch. Spiel-mann, S. Sartania, and F. Krausz. Compression of high-energy laser pulsesbelow 5 fs. Optics Letters, 22(8):522–524, April 1997.
[100] S. Hädrich, H. Carstens, J. Rothhardt, J. Limpert, and A. Tünnermann.Multi-gigawatt ultrashort pulses at high repetition rate and average powerfrom two-stage nonlinear compression. Optics Express, 19(8):7546–7552,April 2011.
[101] E. Kiran and Johanna M. H. Levelt Sengers, editors. Supercritical Fluids:Fundamentals for Application (Nato Science Series E:. Springer, 1994edition, June 1994.
[102] C. Zhao, J. B. Wang, I. Tabata, and T. Hori. Solubility of rhodamine bin supercritical carbon dioxide fluids with or without cosolvent. AdvancedMaterials Research, 332-334:146–151, September 2011.
[103] M. Schmidberger, W. Chang, P. St. J. Russell, and N. Y. Joly. Influence oftiming jitter on nonlinear dynamics of a photonic crystal fiber ring cavity.Optics Letters, 37(17):3576–3578, September 2012.


![Mixed Integer Nonlinear Optimization Models for the ... · rst of these mathematical models is the mixed integer nonlinear optimization formulation presented in [12]. From this formulation](https://img.pdfslide.org/doc/110x75/5f1a1ca06d1dc454fb018b97/mixed-integer-nonlinear-optimization-models-for-the-rst-of-these-mathematical.jpg)