Embed Size (px)
Citation preview
Bericht 2020/2021 1
BIODIESEL & CO.2020/2021REPORT ON PROGRESS ANDFUTURE PROSPECTS – EXCERPTFROM THE UFOP ANNUAL REPORT
UNION ZUR FÖRDERUNG VON OEL- UND PROTEINPFLANZEN E.V.
3
Editor:
Dieter Bockey, UFOP ([email protected])
Published by:
UNION ZUR FÖRDERUNG VON
OEL- UND PROTEINPFLANZEN E. V. (UFOP)
Claire-Waldoff-Straße 7 · 10117 Berlin
[email protected] · www.ufop.de
Title:
Milos Muller/Shutterstock.com
BIODIESEL & CO.2020/2021REPORT ON PROGRESS ANDFUTURE PROSPECTS – EXCERPTFROM THE UFOP ANNUAL REPORT
UNION ZUR FÖRDERUNG VON OEL- UND PROTEINPFLANZEN E.V.
4 5Biodiesel Report 2020/2021 Table of contents
TABLE OF CONTENTS
Biodiesel & Co. ....................................................................................................................6
UFOP Expert Commission for biofuels and renewable resources .............................................16
RED III policy paper ..................................................................................................................18
“Fit for 55” – The package of proposals by the EU commission ............................................20
Tabular annex ...................................................................................................................26
Biofuels (Tab. 1 – 10).................................................................................................................................27
Biofuel mandates (Tab. 11 – 12 a – v) ........................................................................................................37
Tables of the German Federal Office for Agriculture and Food (Tab. 13 – 19)..........................................44
LIST OF FIGURES IN THE REPORTFigures
1 Energy provision from renewable Energy sources (2019) .........................................................................7
2 Details of the national greenhouse gas quotas in the transport sector ......................................................8
3 Regulation on the GHG quota in the BlmSchG Draft, request, resolution ..................................................9
4 Market development and raw material composition of biodiesel/HVO ....................................................10
5 GHG mandates in Sweden (% GHG) ..........................................................................................................10
6 GHG quota increase from 4 to 6 % and higher possible with technology openness ................................ 11
7 Sector targets of the Federal Climate Protection Act (incl. additional reduction goals) ...........................12
8 The “Fit for 55” package of proposals of the European Commission of 14 July 2021 ..............................13
9 Matrix of the emission reduction targets in the innovation and investment dilemma .............................15
Biodiesel & Co.6 7Biodiesel Report 2020/2021
Biod
iese
l & C
o.On 12 December, 2018, the European Commission published the revised version of its Renewable Energy Directive (2018/2001/EC) – RED II. It stipulated a deadline of 30 June, 2021 for the EU member states to incorporate the new directive into national law.
Article 36 of the directive expressly requires the member states to have implemented all necessary legal and administrative provisions by this date and to communicate to the EU Commis-sion the wording of such provisions without undue delay – at least that’s the “theory”. Not one member state fulfilled the requirements during the period under review. Not least because the EU Commission itself had failed to publish on time all the requisite delegated legal acts as a prerequisite for adapting the certification systems and for the re-authorisation thereof, or rather for the amendment of the locally required sustaina-bility ordinances. The first-time inclusion of solid biomass for generating energy and biogas, with the addition of heat and electricity production, has effectively increased in parallel the complexity of the certification backdrop, as well as the number of companies subject to mandatory certification and documen-tation requirements. This is a synopsis of the background to the regulation, which shaped the UFOP activities in biofuel policy during the period under review.
GHG quota to increase to 25% by 2030 But it did all work out in the end. The law on the further devel-opment of the 2030 GHG quota announced by the German Federal Government in the coalition agreement was adopted by the Bundestag in late May 2021. This decision was preceded by a discussion that had been dominated by severe criticism over the bill presented by the Federal Environment Ministry in 2020. The bill had not been agreed with the responsible federal ministries in the Federal Government. It can have been nothing more than an experimental move, since this is the only way to have interpreted the proposed “raising” of the GHG quota (6% by 2025 and 7.25% from 2026 to 2030), as well as the reduction scenario for the cap on biofuels from cultivated biomass (as of 2030: 3.2% to ultimately 2.7% as of 2027). The reaction of the biofuel industry associations (BDBe, VDB and UFOP), which attracted a great deal of media attention, was just as strong. The bill was considered to lack fortitude, the observation being that the Federal Ministry for the Environment is clearly bowing out of climate protection in terms of its transport strategy. In addition, the proportion of fuels from renewable sources would supposedly even fall in the next few years, the result being that the current population of almost 58 million petrol and diesel vehicles would be contributing practically zero to the climate protection offensive. The UFOP repeatedly made reference to the time factor relevant to meeting the climate protection targets for 2030. The climate protection measures, particularly in the transport sector, would therefore have
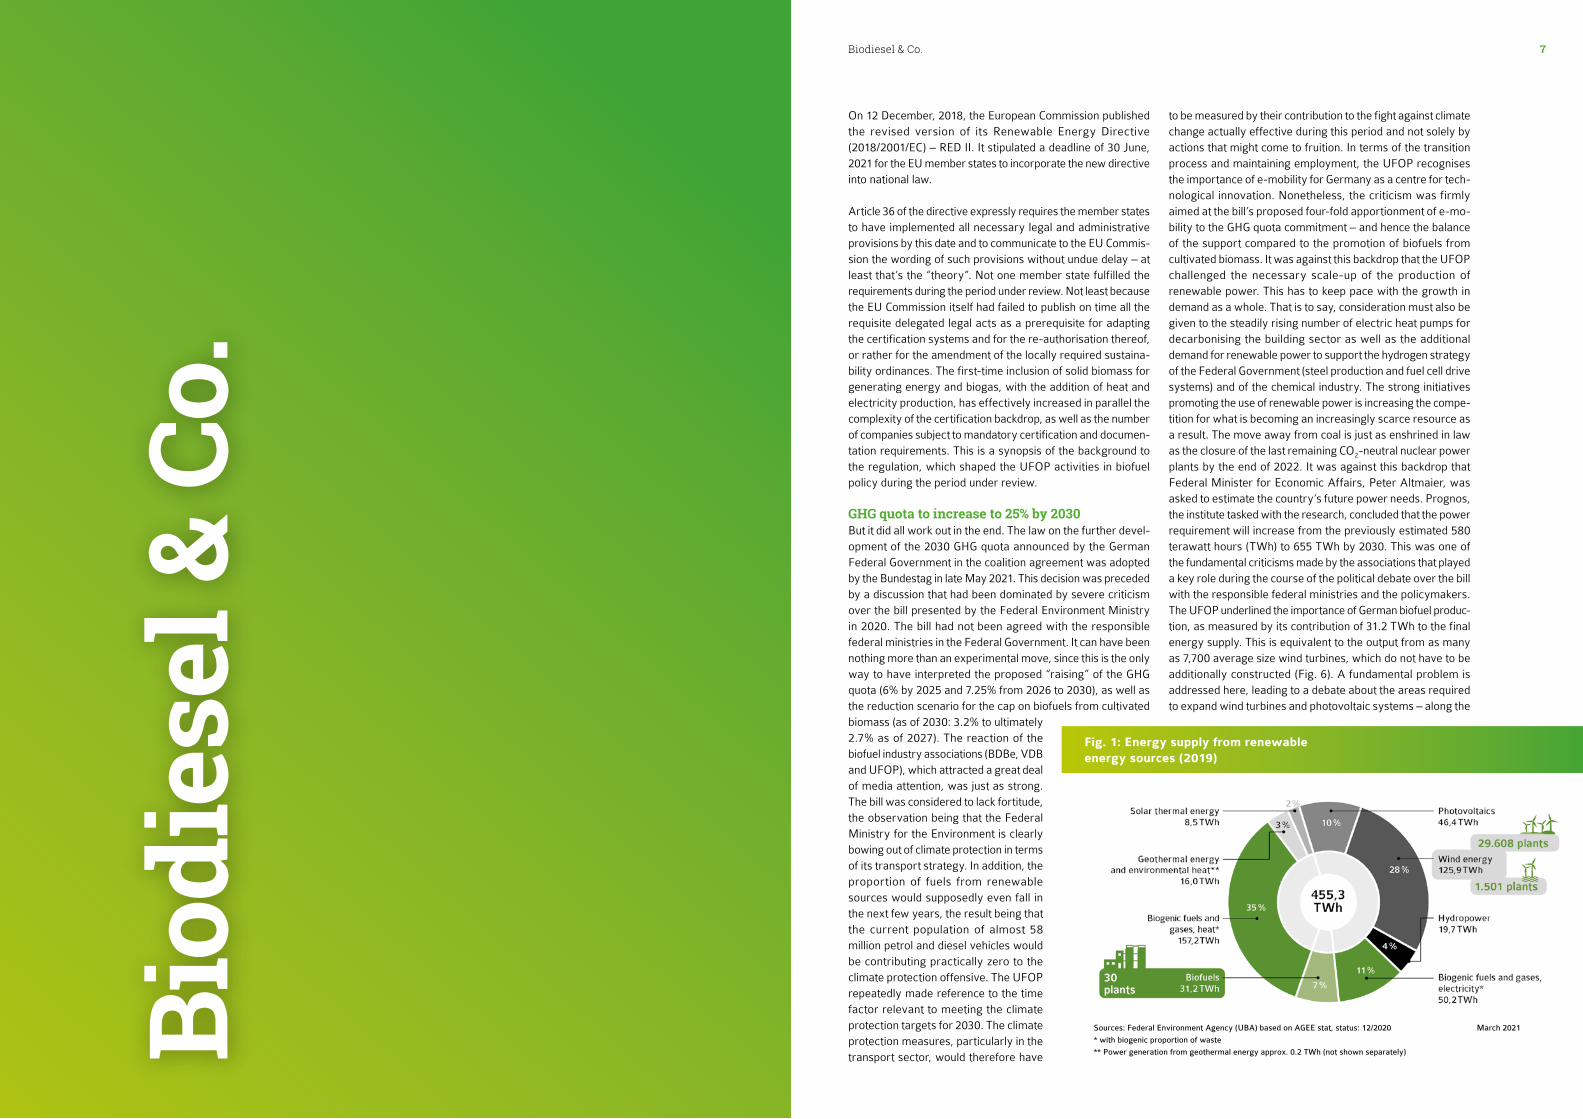
to be measured by their contribution to the fight against climate change actually effective during this period and not solely by actions that might come to fruition. In terms of the transition process and maintaining employment, the UFOP recognises the importance of e-mobility for Germany as a centre for tech-nological innovation. Nonetheless, the criticism was firmly aimed at the bill’s proposed four-fold apportionment of e-mo-bility to the GHG quota commitment – and hence the balance of the support compared to the promotion of biofuels from cultivated biomass. It was against this backdrop that the UFOP challenged the necessary scale-up of the production of renewable power. This has to keep pace with the growth in demand as a whole. That is to say, consideration must also be given to the steadily rising number of electric heat pumps for decarbonising the building sector as well as the additional demand for renewable power to support the hydrogen strategy of the Federal Government (steel production and fuel cell drive systems) and of the chemical industry. The strong initiatives promoting the use of renewable power is increasing the compe-tition for what is becoming an increasingly scarce resource as a result. The move away from coal is just as enshrined in law as the closure of the last remaining CO2-neutral nuclear power plants by the end of 2022. It was against this backdrop that Federal Minister for Economic Affairs, Peter Altmaier, was asked to estimate the country’s future power needs. Prognos, the institute tasked with the research, concluded that the power requirement will increase from the previously estimated 580 terawatt hours (TWh) to 655 TWh by 2030. This was one of the fundamental criticisms made by the associations that played a key role during the course of the political debate over the bill with the responsible federal ministries and the policymakers. The UFOP underlined the importance of German biofuel produc-tion, as measured by its contribution of 31.2 TWh to the final energy supply. This is equivalent to the output from as many as 7,700 average size wind turbines, which do not have to be additionally constructed (Fig. 6). A fundamental problem is addressed here, leading to a debate about the areas required to expand wind turbines and photovoltaic systems – along the
Fig. 1: Energy supply from renewable energy sources (2019)
Sources: Federal Environment Agency (UBA) based on AGEE stat, status: 12/2020 March 2021
* with biogenic proportion of waste
** Power generation from geothermal energy approx. 0.2 TWh (not shown separately)
Biodiesel & Co.8 9Biodiesel Report 2020/2021
same lines as the discussion over the production of raw materials for biofuels. Opposition in the rural areas and among environmental groups (against offshore farms as well) is testimony to the fact that the willingness of many to accom-modate such structures has almost reached its limit. Estimates of potential, such as those of the German Institute for Economic Research (DIW), for a self-supporting strategy to produce renewable power covering demand are inconsistent with the reality of a climate protection policy which is under mounting pressure to act in time. There is also the equally difficult challenge of expanding the electricity lines. This concerns not only the nationwide lines, but also expansion that could be required at regional level to reinforce the grids if the number of battery charging stations, heat pumps and so on to be installed continue to rise. In light of the challenge presented by the climate change policy of limiting global warming to 1.5 degrees by 2030, biofuel associations have always argued for an openness to new technologies and for an overall strategy (including the position of the Bundesverbandes Bioenergie e. V. (German BioEnergy Association) on the Federal Government’s bill on the further development of the greenhouse gas reduction quota: www.ufop.de/pp0321 in German).
The UFOP regards this understanding as essential, particularly in the transport sector, to meeting the ambitious climate protec-tion targets by 2030 by utilising all the sustainable, renewable energy sources and energy carriers available. Taking this energy policy global does and will continue to play a crucial role in achieving this aim. This means importing sustaina-ble-status-certified biomass raw materials, biofuels, e-fuels, hydrogen and renewable power, as well as sustainability certi-fication in battery production. These aspects were discussed in connection with the Government bill presented at the end of December 2020 that has been substantially amended. In further parliamentary procedures, the Committee on the Envi-ronment of the Bundestag consulted the trade associations and then decided on additional improvements. These were later to become the basis of the final discussions.
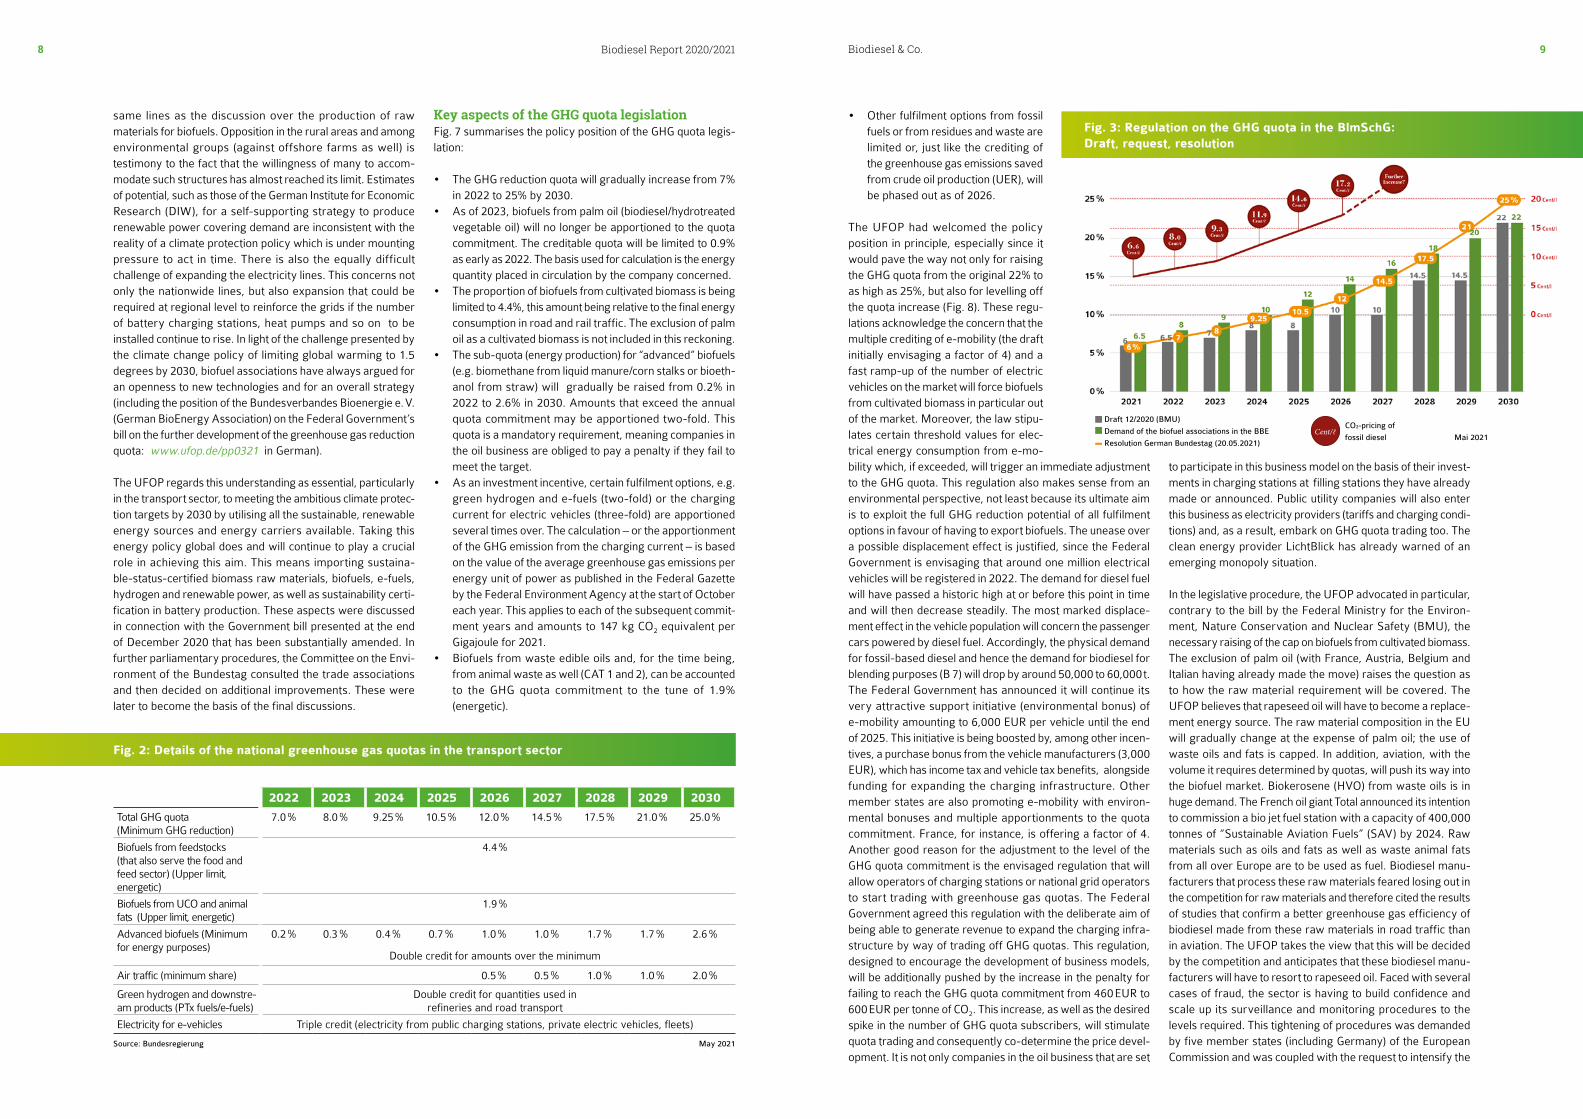
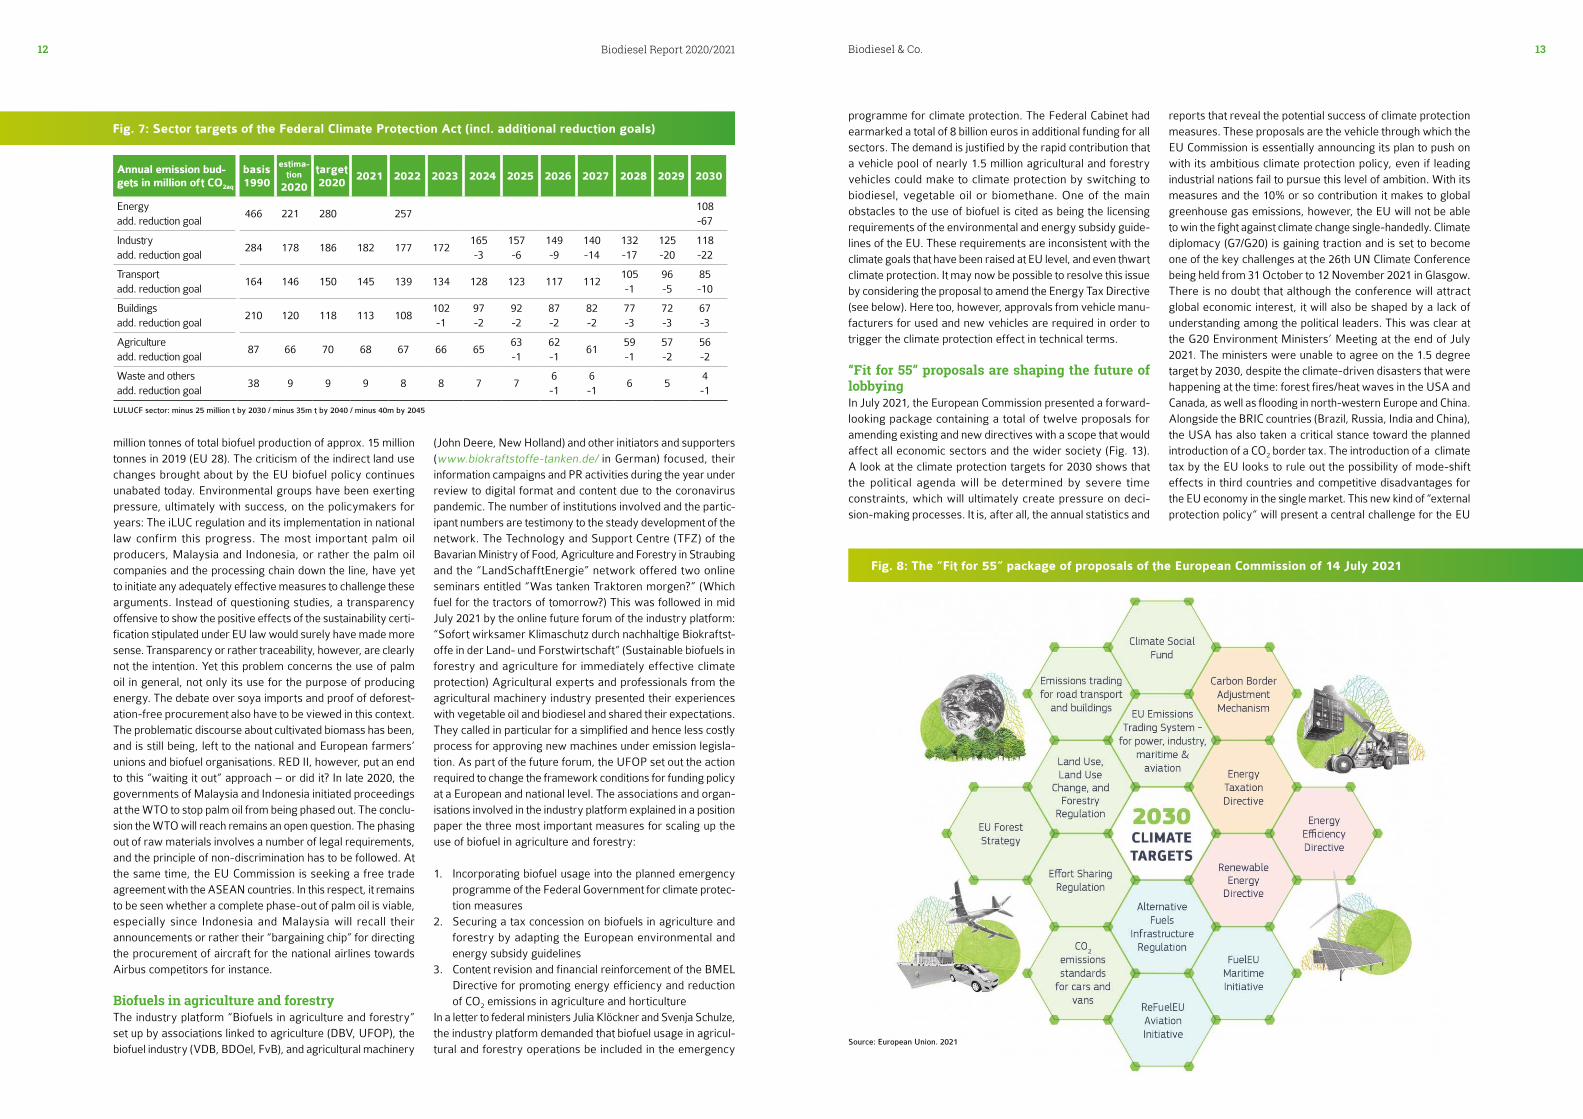
Key aspects of the GHG quota legislationFig. 7 summarises the policy position of the GHG quota legis-lation:
• The GHG reduction quota will gradually increase from 7% in 2022 to 25% by 2030.
• As of 2023, biofuels from palm oil (biodiesel/hydrotreated vegetable oil) will no longer be apportioned to the quota commitment. The creditable quota will be limited to 0.9% as early as 2022. The basis used for calculation is the energy quantity placed in circulation by the company concerned.
• The proportion of biofuels from cultivated biomass is being limited to 4.4%, this amount being relative to the final energy consumption in road and rail traffic. The exclusion of palm oil as a cultivated biomass is not included in this reckoning.
• The sub-quota (energy production) for “advanced” biofuels (e.g. biomethane from liquid manure/corn stalks or bioeth-anol from straw) will gradually be raised from 0.2% in 2022 to 2.6% in 2030. Amounts that exceed the annual quota commitment may be apportioned two-fold. This quota is a mandatory requirement, meaning companies in the oil business are obliged to pay a penalty if they fail to meet the target.
• As an investment incentive, certain fulfilment options, e.g. green hydrogen and e-fuels (two-fold) or the charging current for electric vehicles (three-fold) are apportioned several times over. The calculation – or the apportionment of the GHG emission from the charging current – is based on the value of the average greenhouse gas emissions per energy unit of power as published in the Federal Gazette by the Federal Environment Agency at the start of October each year. This applies to each of the subsequent commit-ment years and amounts to 147 kg CO2 equivalent per Gigajoule for 2021.
• Biofuels from waste edible oils and, for the time being, from animal waste as well (CAT 1 and 2), can be accounted to the GHG quota commitment to the tune of 1.9% (energetic).
• Other fulfilment options from fossil fuels or from residues and waste are limited or, just like the crediting of the greenhouse gas emissions saved from crude oil production (UER), will be phased out as of 2026.
The UFOP had welcomed the policy position in principle, especially since it would pave the way not only for raising the GHG quota from the original 22% to as high as 25%, but also for levelling off the quota increase (Fig. 8). These regu-lations acknowledge the concern that the multiple crediting of e-mobility (the draft initially envisaging a factor of 4) and a fast ramp-up of the number of electric vehicles on the market will force biofuels from cultivated biomass in particular out of the market. Moreover, the law stipu-lates certain threshold values for elec-trical energy consumption from e-mo-bility which, if exceeded, will trigger an immediate adjustment to the GHG quota. This regulation also makes sense from an environmental perspective, not least because its ultimate aim is to exploit the full GHG reduction potential of all fulfilment options in favour of having to export biofuels. The unease over a possible displacement effect is justified, since the Federal Government is envisaging that around one million electrical vehicles will be registered in 2022. The demand for diesel fuel will have passed a historic high at or before this point in time and will then decrease steadily. The most marked displace-ment effect in the vehicle population will concern the passenger cars powered by diesel fuel. Accordingly, the physical demand for fossil-based diesel and hence the demand for biodiesel for blending purposes (B 7) will drop by around 50,000 to 60,000 t. The Federal Government has announced it will continue its very attractive support initiative (environmental bonus) of e-mobility amounting to 6,000 EUR per vehicle until the end of 2025. This initiative is being boosted by, among other incen-tives, a purchase bonus from the vehicle manufacturers (3,000 EUR), which has income tax and vehicle tax benefits, alongside funding for expanding the charging infrastructure. Other member states are also promoting e-mobility with environ-mental bonuses and multiple apportionments to the quota commitment. France, for instance, is offering a factor of 4. Another good reason for the adjustment to the level of the GHG quota commitment is the envisaged regulation that will allow operators of charging stations or national grid operators to start trading with greenhouse gas quotas. The Federal Government agreed this regulation with the deliberate aim of being able to generate revenue to expand the charging infra-structure by way of trading off GHG quotas. This regulation, designed to encourage the development of business models, will be additionally pushed by the increase in the penalty for failing to reach the GHG quota commitment from 460 EUR to 600 EUR per tonne of CO2. This increase, as well as the desired spike in the number of GHG quota subscribers, will stimulate quota trading and consequently co-determine the price devel-opment. It is not only companies in the oil business that are set
to participate in this business model on the basis of their invest-ments in charging stations at filling stations they have already made or announced. Public utility companies will also enter this business as electricity providers (tariffs and charging condi-tions) and, as a result, embark on GHG quota trading too. The clean energy provider LichtBlick has already warned of an emerging monopoly situation.
In the legislative procedure, the UFOP advocated in particular, contrary to the bill by the Federal Ministry for the Environ-ment, Nature Conservation and Nuclear Safety (BMU), the necessary raising of the cap on biofuels from cultivated biomass. The exclusion of palm oil (with France, Austria, Belgium and Italian having already made the move) raises the question as to how the raw material requirement will be covered. The UFOP believes that rapeseed oil will have to become a replace-ment energy source. The raw material composition in the EU will gradually change at the expense of palm oil; the use of waste oils and fats is capped. In addition, aviation, with the volume it requires determined by quotas, will push its way into the biofuel market. Biokerosene (HVO) from waste oils is in huge demand. The French oil giant Total announced its intention to commission a bio jet fuel station with a capacity of 400,000 tonnes of “Sustainable Aviation Fuels” (SAV) by 2024. Raw materials such as oils and fats as well as waste animal fats from all over Europe are to be used as fuel. Biodiesel manu-facturers that process these raw materials feared losing out in the competition for raw materials and therefore cited the results of studies that confirm a better greenhouse gas efficiency of biodiesel made from these raw materials in road traffic than in aviation. The UFOP takes the view that this will be decided by the competition and anticipates that these biodiesel manu-facturers will have to resort to rapeseed oil. Faced with several cases of fraud, the sector is having to build confidence and scale up its surveillance and monitoring procedures to the levels required. This tightening of procedures was demanded by five member states (including Germany) of the European Commission and was coupled with the request to intensify the
2022 2023 2024 2025 2026 2027 2028 2029 2030
Total GHG quota (Minimum GHG reduction)
7.0 % 8.0 % 9.25 % 10.5 % 12.0 % 14.5 % 17.5 % 21.0 % 25.0 %
Biofuels from feedstocks (that also serve the food and feed sector) (Upper limit, energetic)
4.4 %
Biofuels from UCO and animal fats (Upper limit, energetic)
1.9 %
Advanced biofuels (Minimum for energy purposes)
0.2 % 0.3 % 0.4 % 0.7 % 1.0 % 1.0 % 1.7 % 1.7 % 2.6 %
Double credit for amounts over the minimum
Air traffic (minimum share) 0.5 % 0.5 % 1.0 % 1.0 % 2.0 %
Green hydrogen and downstre-am products (PTx fuels/e-fuels)
Double credit for quantities used in refineries and road transport
Electricity for e-vehicles Triple credit (electricity from public charging stations, private electric vehicles, fleets)
Source: Bundesregierung May 2021
Draft 12/2020 (BMU)
Demand of the biofuel associations in the BBE
Resolution German Bundestag (20.05.2021)
Cent/ℓ CO2-pricing of
fossil diesel Mai 2021
Fig. 2: Details of the national greenhouse gas quotas in the transport sector
Fig. 3: Regulation on the GHG quota in the BlmSchG:Draft, request, resolution
Biodiesel & Co.10 11Biodiesel Report 2020/2021
supervisory obligations of the member states and also to establish an EU database and a supervisory body for moni-toring the reporting processes. This initiative came about as a result of imports to which palm oil had been added.
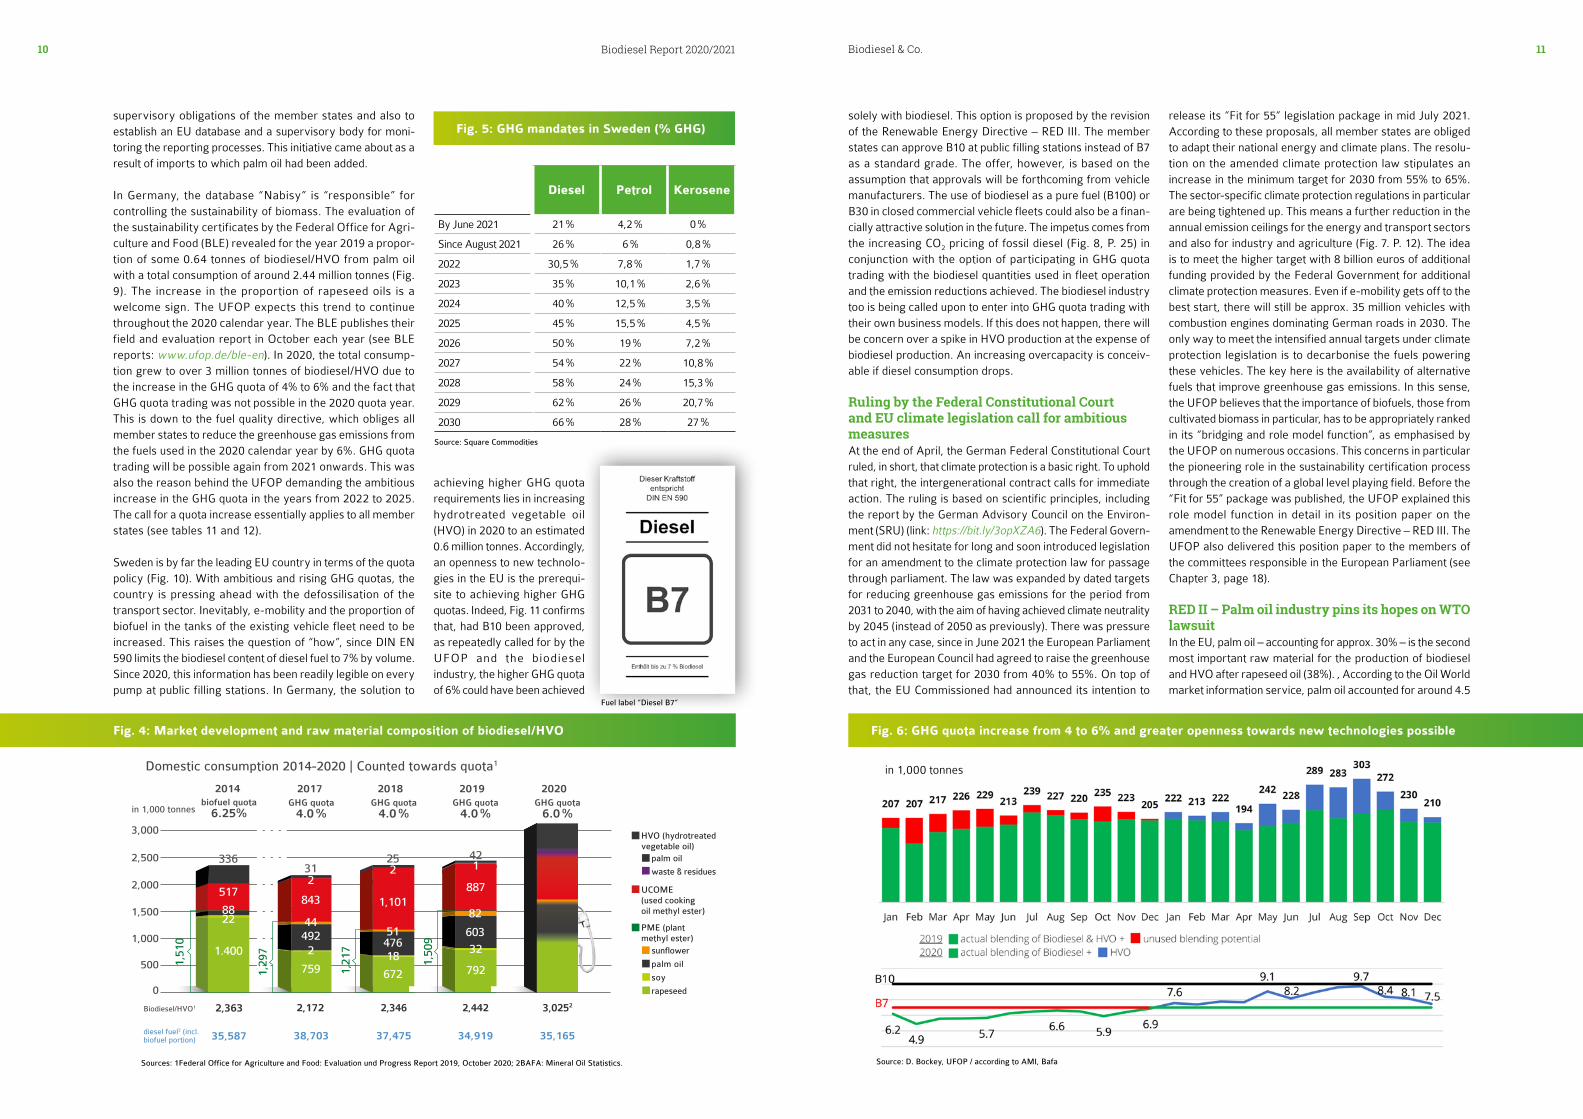
In Germany, the database “Nabisy” is “responsible” for controlling the sustainability of biomass. The evaluation of the sustainability certificates by the Federal Office for Agri-culture and Food (BLE) revealed for the year 2019 a propor-tion of some 0.64 tonnes of biodiesel/HVO from palm oil with a total consumption of around 2.44 million tonnes (Fig. 9). The increase in the proportion of rapeseed oils is a welcome sign. The UFOP expects this trend to continue throughout the 2020 calendar year. The BLE publishes their field and evaluation report in October each year (see BLE reports: www.ufop.de/ble-en). In 2020, the total consump-tion grew to over 3 million tonnes of biodiesel/HVO due to the increase in the GHG quota of 4% to 6% and the fact that GHG quota trading was not possible in the 2020 quota year. This is down to the fuel quality directive, which obliges all member states to reduce the greenhouse gas emissions from the fuels used in the 2020 calendar year by 6%. GHG quota trading will be possible again from 2021 onwards. This was also the reason behind the UFOP demanding the ambitious increase in the GHG quota in the years from 2022 to 2025. The call for a quota increase essentially applies to all member states (see tables 11 and 12).
Sweden is by far the leading EU country in terms of the quota policy (Fig. 10). With ambitious and rising GHG quotas, the country is pressing ahead with the defossilisation of the transport sector. Inevitably, e-mobility and the proportion of biofuel in the tanks of the existing vehicle fleet need to be increased. This raises the question of “how”, since DIN EN 590 limits the biodiesel content of diesel fuel to 7% by volume. Since 2020, this information has been readily legible on every pump at public filling stations. In Germany, the solution to
achieving higher GHG quota requirements lies in increasing hydrotreated vegetable oil (HVO) in 2020 to an estimated 0.6 million tonnes. Accordingly, an openness to new technolo-gies in the EU is the prerequi-site to achieving higher GHG quotas. Indeed, Fig. 11 confirms that, had B10 been approved, as repeatedly called for by the UFOP and the biodiesel industry, the higher GHG quota of 6% could have been achieved
solely with biodiesel. This option is proposed by the revision of the Renewable Energy Directive – RED III. The member states can approve B10 at public filling stations instead of B7 as a standard grade. The offer, however, is based on the assumption that approvals will be forthcoming from vehicle manufacturers. The use of biodiesel as a pure fuel (B100) or B30 in closed commercial vehicle fleets could also be a finan-cially attractive solution in the future. The impetus comes from the increasing CO2 pricing of fossil diesel (Fig. 8, P. 25) in conjunction with the option of participating in GHG quota trading with the biodiesel quantities used in fleet operation and the emission reductions achieved. The biodiesel industry too is being called upon to enter into GHG quota trading with their own business models. If this does not happen, there will be concern over a spike in HVO production at the expense of biodiesel production. An increasing overcapacity is conceiv-able if diesel consumption drops.
Ruling by the Federal Constitutional Court and EU climate legislation call for ambitious measuresAt the end of April, the German Federal Constitutional Court ruled, in short, that climate protection is a basic right. To uphold that right, the intergenerational contract calls for immediate action. The ruling is based on scientific principles, including the report by the German Advisory Council on the Environ-ment (SRU) (link: https://bit.ly/3opXZA6). The Federal Govern-ment did not hesitate for long and soon introduced legislation for an amendment to the climate protection law for passage through parliament. The law was expanded by dated targets for reducing greenhouse gas emissions for the period from 2031 to 2040, with the aim of having achieved climate neutrality by 2045 (instead of 2050 as previously). There was pressure to act in any case, since in June 2021 the European Parliament and the European Council had agreed to raise the greenhouse gas reduction target for 2030 from 40% to 55%. On top of that, the EU Commissioned had announced its intention to
release its “Fit for 55” legislation package in mid July 2021. According to these proposals, all member states are obliged to adapt their national energy and climate plans. The resolu-tion on the amended climate protection law stipulates an increase in the minimum target for 2030 from 55% to 65%. The sector-specific climate protection regulations in particular are being tightened up. This means a further reduction in the annual emission ceilings for the energy and transport sectors and also for industry and agriculture (Fig. 7. P. 12). The idea is to meet the higher target with 8 billion euros of additional funding provided by the Federal Government for additional climate protection measures. Even if e-mobility gets off to the best start, there will still be approx. 35 million vehicles with combustion engines dominating German roads in 2030. The only way to meet the intensified annual targets under climate protection legislation is to decarbonise the fuels powering these vehicles. The key here is the availability of alternative fuels that improve greenhouse gas emissions. In this sense, the UFOP believes that the importance of biofuels, those from cultivated biomass in particular, has to be appropriately ranked in its “bridging and role model function”, as emphasised by the UFOP on numerous occasions. This concerns in particular the pioneering role in the sustainability certification process through the creation of a global level playing field. Before the “Fit for 55” package was published, the UFOP explained this role model function in detail in its position paper on the amendment to the Renewable Energy Directive – RED III. The UFOP also delivered this position paper to the members of the committees responsible in the European Parliament (see Chapter 3, page 18).
RED II – Palm oil industry pins its hopes on WTO lawsuit In the EU, palm oil – accounting for approx. 30% – is the second most important raw material for the production of biodiesel and HVO after rapeseed oil (38%). , According to the Oil World market information service, palm oil accounted for around 4.5
25
672
1847651
231
843
759
249244
2
42
887
792
32603
82
1336
517
2288
2,500
2,000
3,000
1,500
1,000
500
0
in 1,000 tonnes
Biodiesel/HVO1
diesel fuel2 (incl. biofuel portion)
Sources: 1Federal Office for Agriculture and Food: Evaluation und Progress Report 2019, October 2020; 2BAFA: Mineral Oil Statistics.
37,475
2,3462,172
38,703 34,919
2,442
35,165
3,02522,363
35,587
Market development and raw material composition of biodiesel/HVODomestic consumption 2014-2020 | Counted towards quota1
soy
rapeseed
palm oil
sunflower
PME (plant methyl ester)
UCOME (used cooking oil methyl ester)
HVO (hydrotreated vegetable oil)
palm oil
waste & residues
2018GHG quota
4.0 %
2017GHG quota
4.0 %
2019GHG quota
4.0 %
2020GHG quota
6.0 %
2014biofuel quota
6.25%
1,21
7
1,101
1,29
7
1,50
9
1,51
0
1.400
Fig. 4: Market development and raw material composition of biodiesel/HVO
Diesel Petrol Kerosene
By June 2021 21 % 4,2 % 0 %
Since August 2021 26 % 6 % 0,8 %
2022 30,5 % 7,8 % 1,7 %
2023 35 % 10,1 % 2,6 %
2024 40 % 12,5 % 3,5 %
2025 45 % 15,5 % 4,5 %
2026 50 % 19 % 7,2 %
2027 54 % 22 % 10,8 %
2028 58 % 24 % 15,3 %
2029 62 % 26 % 20,7 %
2030 66 % 28 % 27 %
Source: Square Commodities
Fuel label “Diesel B7”
Fig. 6: GHG quota increase from 4 to 6% and greater openness towards new technologies possible
Fig. 5: GHG mandates in Sweden (% GHG)
in 1,000 tonnes
Sources: 1Federal Office for Agriculture and Food: Evaluation und Progress Report 2019, October 2020; 2BAFA: Mineral Oil Statistics. Source: D. Bockey, UFOP / according to AMI, Bafa
Biodiesel & Co.12 13Biodiesel Report 2020/2021
million tonnes of total biofuel production of approx. 15 million tonnes in 2019 (EU 28). The criticism of the indirect land use changes brought about by the EU biofuel policy continues unabated today. Environmental groups have been exerting pressure, ultimately with success, on the policymakers for years: The iLUC regulation and its implementation in national law confirm this progress. The most important palm oil producers, Malaysia and Indonesia, or rather the palm oil companies and the processing chain down the line, have yet to initiate any adequately effective measures to challenge these arguments. Instead of questioning studies, a transparency offensive to show the positive effects of the sustainability certi-fication stipulated under EU law would surely have made more sense. Transparency or rather traceability, however, are clearly not the intention. Yet this problem concerns the use of palm oil in general, not only its use for the purpose of producing energy. The debate over soya imports and proof of deforest-ation-free procurement also have to be viewed in this context. The problematic discourse about cultivated biomass has been, and is still being, left to the national and European farmers’ unions and biofuel organisations. RED II, however, put an end to this “waiting it out” approach – or did it? In late 2020, the governments of Malaysia and Indonesia initiated proceedings at the WTO to stop palm oil from being phased out. The conclu-sion the WTO will reach remains an open question. The phasing out of raw materials involves a number of legal requirements, and the principle of non-discrimination has to be followed. At the same time, the EU Commission is seeking a free trade agreement with the ASEAN countries. In this respect, it remains to be seen whether a complete phase-out of palm oil is viable, especially since Indonesia and Malaysia will recall their announcements or rather their “bargaining chip” for directing the procurement of aircraft for the national airlines towards Airbus competitors for instance.
Biofuels in agriculture and forestryThe industry platform “Biofuels in agriculture and forestry” set up by associations linked to agriculture (DBV, UFOP), the biofuel industry (VDB, BDOel, FvB), and agricultural machinery
(John Deere, New Holland) and other initiators and supporters (www.biokraftstoffe-tanken.de/ in German) focused, their information campaigns and PR activities during the year under review to digital format and content due to the coronavirus pandemic. The number of institutions involved and the partic-ipant numbers are testimony to the steady development of the network. The Technology and Support Centre (TFZ) of the Bavarian Ministry of Food, Agriculture and Forestry in Straubing and the “LandSchafftEnergie” network offered two online seminars entitled “Was tanken Traktoren morgen?” (Which fuel for the tractors of tomorrow?) This was followed in mid July 2021 by the online future forum of the industry platform: “Sofort wirksamer Klimaschutz durch nachhaltige Biokraftst-offe in der Land- und Forstwirtschaft” (Sustainable biofuels in forestry and agriculture for immediately effective climate protection) Agricultural experts and professionals from the agricultural machinery industry presented their experiences with vegetable oil and biodiesel and shared their expectations. They called in particular for a simplified and hence less costly process for approving new machines under emission legisla-tion. As part of the future forum, the UFOP set out the action required to change the framework conditions for funding policy at a European and national level. The associations and organ-isations involved in the industry platform explained in a position paper the three most important measures for scaling up the use of biofuel in agriculture and forestry:
1. Incorporating biofuel usage into the planned emergency programme of the Federal Government for climate protec-tion measures
2. Securing a tax concession on biofuels in agriculture and forestry by adapting the European environmental and energy subsidy guidelines
3. Content revision and financial reinforcement of the BMEL Directive for promoting energy efficiency and reduction of CO2 emissions in agriculture and horticulture
In a letter to federal ministers Julia Klöckner and Svenja Schulze, the industry platform demanded that biofuel usage in agricul-tural and forestry operations be included in the emergency
programme for climate protection. The Federal Cabinet had earmarked a total of 8 billion euros in additional funding for all sectors. The demand is justified by the rapid contribution that a vehicle pool of nearly 1.5 million agricultural and forestry vehicles could make to climate protection by switching to biodiesel, vegetable oil or biomethane. One of the main obstacles to the use of biofuel is cited as being the licensing requirements of the environmental and energy subsidy guide-lines of the EU. These requirements are inconsistent with the climate goals that have been raised at EU level, and even thwart climate protection. It may now be possible to resolve this issue by considering the proposal to amend the Energy Tax Directive (see below). Here too, however, approvals from vehicle manu-facturers for used and new vehicles are required in order to trigger the climate protection effect in technical terms.
“Fit for 55” proposals are shaping the future of lobbying In July 2021, the European Commission presented a forward-looking package containing a total of twelve proposals for amending existing and new directives with a scope that would affect all economic sectors and the wider society (Fig. 13). A look at the climate protection targets for 2030 shows that the political agenda will be determined by severe time constraints, which will ultimately create pressure on deci-sion-making processes. It is, after all, the annual statistics and
reports that reveal the potential success of climate protection measures. These proposals are the vehicle through which the EU Commission is essentially announcing its plan to push on with its ambitious climate protection policy, even if leading industrial nations fail to pursue this level of ambition. With its measures and the 10% or so contribution it makes to global greenhouse gas emissions, however, the EU will not be able to win the fight against climate change single-handedly. Climate diplomacy (G7/G20) is gaining traction and is set to become one of the key challenges at the 26th UN Climate Conference being held from 31 October to 12 November 2021 in Glasgow. There is no doubt that although the conference will attract global economic interest, it will also be shaped by a lack of understanding among the political leaders. This was clear at the G20 Environment Ministers’ Meeting at the end of July 2021. The ministers were unable to agree on the 1.5 degree target by 2030, despite the climate-driven disasters that were happening at the time: forest fires/heat waves in the USA and Canada, as well as flooding in north-western Europe and China. Alongside the BRIC countries (Brazil, Russia, India and China), the USA has also taken a critical stance toward the planned introduction of a CO2 border tax. The introduction of a climate tax by the EU looks to rule out the possibility of mode-shift effects in third countries and competitive disadvantages for the EU economy in the single market. This new kind of “external protection policy” will present a central challenge for the EU
Annual emission bud-gets in million of t CO2aq
basis 1990
estima-tion
2020
target 2020
2021 2022 2023 2024 2025 2026 2027 2028 2029 2030
Energy add. reduction goal
466 221 280 257108 -67
Industry add. reduction goal
284 178 186 182 177 172165 -3
157 -6
149 -9
140 -14
132 -17
125 -20
118 -22
Transport add. reduction goal
164 146 150 145 139 134 128 123 117 112105 -1
96 -5
85 -10
Buildings add. reduction goal
210 120 118 113 108102 -1
97 -2
92 -2
87 -2
82 -2
77-3
72-3
67-3
Agriculture add. reduction goal
87 66 70 68 67 66 6563 -1
62-1
6159-1
57-2
56-2
Waste and others add. reduction goal
38 9 9 9 8 8 7 76 -1
6 -1
6 54 -1
LULUCF sector: minus 25 million t by 2030 / minus 35m t by 2040 / minus 40m by 2045
Fig. 7: Sector targets of the Federal Climate Protection Act (incl. additional reduction goals)
Fig. 8: The “Fit for 55” package of proposals of the European Commission of 14 July 2021
Source: European Union. 2021
Biodiesel & Co.14 15Biodiesel Report 2020/2021
if it wants to achieve the goals of job security and prosperity, alongside the required level of public acceptance for climate protection measures in Europe.
One key element of the package is the proposal to further develop the emissions trading system. The price development in the first half of 2021 and the rapid increase to approx. 57 EUR/ t CO2 are testimony to the price-elastic nature of this system. Accordingly, the price rise also reveals the corre-sponding effects since the EU commission’s proposal involves expanding emissions trading to shipping, road traffic and heating fuels (buildings). Due to the different levels of abatement costs for reducing greenhouse gas emissions, a differentiation by sector ought to be established or such systems, which are already in place, continued. The German emissions trading system is expected to be integrated into the EU emissions trading system in 2026. Otherwise, there would be a double pricing of fossil energy sources. The consequences for the federal government budget (loss of revenues) will then, without a doubt, be the subject of intense debate. Logically, the European Effort Sharing Regulation has to be amended. The sector-spe-cific climate protection targets laid down in climate protection legislation in Germany need to be readjusted to equally ambitious levels in all member states. Under the proposal, the climate protection requirement for Germany, Luxembourg, Sweden, Finland and Denmark will be raised from 38% to 50%. For France, the target is to be increased to 47.5%. In addition, the Eastern European member states will be increasingly called upon to fulfil their responsibilities: Hungary and Poland will be required to meet higher targets of 18.7% and 17.7% respec-tively. The proposal to revise the Energy Tax Directive makes provisions for a harmonising of the tax base across Europe. The energy tax will be implemented for all energy sources based on their energy content (EUR/ Gigajoule). The draft directive proposes minimum taxation rates (see Chapter 4, page 20). Due to the high level of taxation in Germany, there is unlikely to be any need for adjustment. The UFOP welcomes the fact that, under the proposal, a compensation effect will come in the form of reduced rates of taxation for biofuels in agriculture, including for biofuels from cultivated biomass. Accordingly, the EU is evidently no longer against continuing the authorisation of member states for the tax concession from biofuels in agriculture and forestry. It should be borne in mind, however, that the usable quantities fall below the cap of 4.4% on biofuels from cultivated biomass. Therefore, it falls to the market to decide which biofuel quantities will be used in which sectors. The proposal will also harmonise the tax concessions on fossil diesel. This will certainly become the subject of intense negotiations and present a major obstacle to achieving a compromise, as it has done in the past. This is because in terms of taxation, regulations affecting member states directly can be decided only unanimously by the Council of Finance Ministers. Under the Green Deal, the EU Commission had announced that this very situation would change, yet failed to put forward any proposal to accelerate the agreement process in the Council of Finance Ministers.
Amendment to RED (RED III)The Renewable Energy Directive performs two primary functions: It defines which energy sources are considered
“renewable” when sustainability is taken into account and, in the case of biofuels – differentiated by types of raw materials – sets out the so-called caps on biofuels from cultivated biomass and waste material, as well as binding targets for the propor-tion of renewable power in the European power mix. The EU’s goal of achieving climate neutrality by 2050 requires all member states to dramatically ramp up their production capacities for renewable energies. The rules concerning the most important bio and alternative fuels: • Further raising of the target for the share of renewable
energies in the gross final energy consumption from 32% to 40% by 2030.
• The transport sector is under an obligation to reduce green-house gas emissions by at least 13% by the year 2030.
• The sub-quota for energy production from progressive biofuels (Appendix IX, Part A: Straw, etc.) is at least 0.2% in 2022, 0.5% in 2025 and 2.2% in 2030.
• The introduction of a target of 2.6% for Renewable Fuels of Non-Biological Origin – RFNBO (synthetic fuels, e-Fuels) in 2030 is new.
• Biofuels from waste products (Appendix IX, Part B: Waste oils and fats) are limited to 1.7% max. (energy production) without the national increase option.
• With the cap on biofuels from cultivated biomass, the limit remains at 7% (implementation at national level: consump-tion rate of biofuels in 2020 + max. 1%).
• Offsetting the power from renewable energy sources against the quota (as in Germany).
• There are no multiple creditings in road traffic. • Biofuels whose cultivation pose a high risk of change to
land use (high iLUC – palm oil) are being frozen at the consumption level in the year 2019 for the respective member state – to be excluded by 2030 at the latest.
• The option of the introduction of the GHG quota regulation and the offsetting of renewable energy for quota trading being open to all member states is a new development. The regulation on the GHG quota introduced in Germany will be adopted as a result. Referring to the experiences available in Germany, the UFOP had repeatedly criticised the policymakers and the EU Commission for this amendment.
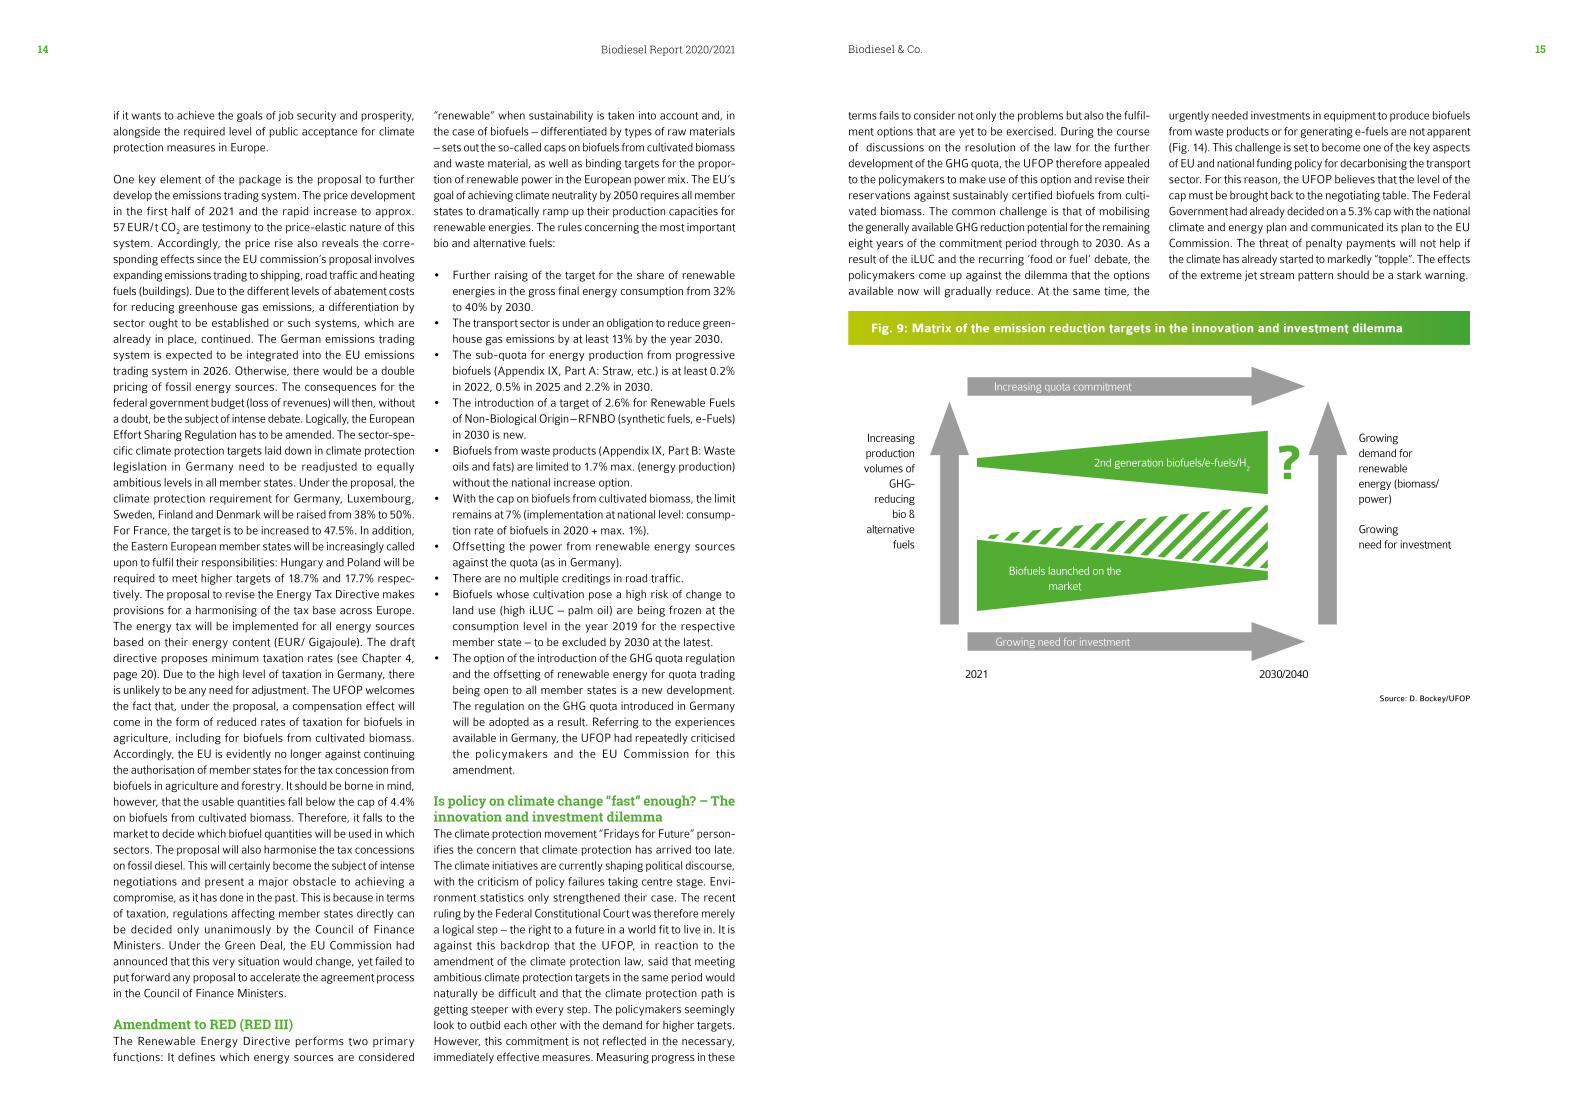
Is policy on climate change “fast” enough? – The innovation and investment dilemmaThe climate protection movement “Fridays for Future” person-ifies the concern that climate protection has arrived too late. The climate initiatives are currently shaping political discourse, with the criticism of policy failures taking centre stage. Envi-ronment statistics only strengthened their case. The recent ruling by the Federal Constitutional Court was therefore merely a logical step – the right to a future in a world fit to live in. It is against this backdrop that the UFOP, in reaction to the amendment of the climate protection law, said that meeting ambitious climate protection targets in the same period would naturally be difficult and that the climate protection path is getting steeper with every step. The policymakers seemingly look to outbid each other with the demand for higher targets. However, this commitment is not reflected in the necessary, immediately effective measures. Measuring progress in these
terms fails to consider not only the problems but also the fulfil-ment options that are yet to be exercised. During the course of discussions on the resolution of the law for the further development of the GHG quota, the UFOP therefore appealed to the policymakers to make use of this option and revise their reservations against sustainably certified biofuels from culti-vated biomass. The common challenge is that of mobilising the generally available GHG reduction potential for the remaining eight years of the commitment period through to 2030. As a result of the iLUC and the recurring ‘food or fuel’ debate, the policymakers come up against the dilemma that the options available now will gradually reduce. At the same time, the
urgently needed investments in equipment to produce biofuels from waste products or for generating e-fuels are not apparent (Fig. 14). This challenge is set to become one of the key aspects of EU and national funding policy for decarbonising the transport sector. For this reason, the UFOP believes that the level of the cap must be brought back to the negotiating table. The Federal Government had already decided on a 5.3% cap with the national climate and energy plan and communicated its plan to the EU Commission. The threat of penalty payments will not help if the climate has already started to markedly “topple”. The effects of the extreme jet stream pattern should be a stark warning.
Fig. 9: Matrix of the emission reduction targets in the innovation and investment dilemma
Increasing production volumes of
GHG- reducing
bio & alternative
fuels
?Growing demand for renewable energy (biomass/power)
Growing need for investment
2021 2030/2040
Biofuels launched on the market
2nd generation biofuels/e-fuels/H2
Growing need for investment
Increasing quota commitment
Source: D. Bockey/UFOP
16 17Biodiesel Report 2020/2021 Expert Commission
UFOP EXPERT COMMISSION FOR BIOFUELS AND RENEWABLE RESOURCESThe joint meeting of the UFOP expert commission with the Fuels Joint Research Group (FJRG) in Radebeul planned last year had to be postponed again due to the pandemic and was finally held virtually.
The web conference started with a presentation by Dieter Bockey, UFOP, on the background to and the status of the legislative procedure for amending the Renewable Energy Directive (2018/2001/EU) – RED II. In September 2020, the Federal Ministry for the Environment submitted a first draft, which had not been agreed with the other federal departments responsible. The strong criticism made by the UFOP together with other organisations in the biofuel industry then led to significant improvements, especially in the quota level and the so-called cap on biofuels from cultivated biomass. The raising of the GHG quota to 25% by the year 2030 (see Chapter 3.1) led to the discussion about how this obligation can be fulfilled, and not only by scaling up e-mobility but also specifically through the use of biofuels. The question of the so-called "blend wall" was also discussed once again. The background to this is the limit on the admixture of biodiesel to max. 7 volume percent in accordance with the European standard for diesel fuel (DIN EN 590, B7). At the same time, a standard for the admixture of 10% biodiesel (B 10) was agreed at European level, as well as the option for using B 20 or B 30 in closed vehicle fleets, likewise based on existing European standards. Therefore, research topics on possible negative interactions between biodiesel and fossil fuel components, as well as additives, are the subject of projects funded by the UFOP as part of joint initiatives. The aim is to approve new vehicles and stock vehicles as a prerequisite for marketing.
Final report on the project: Development of on-board sensor The development of an on-board sensor was the subject matter of a research project spanning several years by the Coburg University of Applied Sciences. In presenting the final report, co-author Martin Unglert emphasised how an understanding of fuel ageing is an important aspect for adding more rapeseed oil methyl ester (RME) to blends with other new regenerative fuels (HVO/OME) in the future in order to ensure stable fuel formulations. Ageing products were explained using liquid chromatograph coupled with high-resolution mass spectrom-etry. This process also permits a structural analysis of the compounds through MS/MS experiments. During the investi-gations into RME, for example, a limiting of the oxidation process was observed. In the study, the structure of short-chained ageing products was also identified. These products and other
results of the investigations provide the basis for being able to identify the ageing process in a vehicle's fuel tank using a sensor system. For a future emission reduction and sedi-ment-free operation, an on-board sensor can make an important contribution to identifying the fuel composition and the degree of ageing, especially with new renewable fuels.
The on-board sensor presented is based on near-infrared spec-troscopy and the measurement of relative permittivity. It is able to detect the FAME quota, the proportion of aromates and the hydrocarbons. It also uses three parameters (acid number, density and oxidation index) to detect chemical changes after the induction time. The sensor developed in this project permits the detection of ageing. In the future, it will be able to support emission-reduced operation by determining the compo-sition of the fuel. As far as the UFOP is concerned, these sensors now have to be tested in vehicle operation.
The report is avlailable: www.ufop.de / f i les /4116 /018 8 /078 4 /UFOP_1724 _Abschlussbericht_OWI-TAC_en_021020.pdf.
Final report on the project: Fuels for PHEV vehiclesPresenting the report, Sebastian Feldhoff from Öl-Wärme-In-stitut GmbH (OWI) emphasised the various practices involved in using plug-in hybrid vehicles (PHEV). If these vehicles are used only for short distances and charged on a regular basis, it is possible for the fuel to remain in the tank for a prolonged period. During this time, fuel undergoes ageing processes that impact the fuel's properties and hence lead to unwanted inter-actions with fuel-carrying components. The joint research project funded by the UFOP and Forschungsvereinigung Verbrennungskraftmaschinen e.V. (Research Association for Combustion Engines((FVV) involved examining fuel ageing phenomena and hardware interaction processes. The fuel mix used for the project comprised 21 diesel fuels and 14 petrol fuels that were stored under PHEV-relevant framework condi-tions for up to nine months. In addition, hardware components such as injectors, hoses and filters, which were filled with selected fuel specimens, were stored under similar conditions in order to examine the possible impacts on the function caused by fuel ageing within the components.
The project results show two key long-term effects. First, diesel fuels undergo oxidative and non-oxidative ageing processes. The critical parameters here are acid number, peroxide number and oxidation stability; these lead to turbidity and
sedimentation. Regarding blends with biodiesel, the quality of both the fossil diesel fuel and the biodiesel can be the reason for the instability of the fuel mixture. The use of stabilising additives can slow the fuel ageing process. Second, the results of the petrol fuels revealed that the boiling characteristics of all tested fuels change during the period of storage. In addition, spectometric data point to a change in the molecular compo-sition of the tested benzine fuels over time, which can be linked to the ageing processes.
The second part of the project focussed on the hardware effects. Mr. Feldhoff emphasised that the examined fuel lines, filters and pumps are only slightly impacted by the long-term storage of fuels in these components. In contrast, tests carried out on the injectors showed that their opening response and flow rate can be affected by sedimentation processes. Other tests with potential fuel components for the future on cold starting ability and emission behaviour with aged fuels, as well as with possibly pre-aged injection components were recommended.
The report is avlailable: www.ufop.de/english/bio-fuels/project-reports-biodies-el-and-engine/.
Prof. Dr. Ing. Peter Pickel, John Deere, reported on the status of the MuSt5-Trak project (see also to the right). The aim of the project is to adapt the Tier V engine for use with diesel, biodiesel and vegetable oil fuel. He explained the necessary modifications to the exhaust gas aftertreatment process (including urea injection for reducing nitrous oxides) and to the engine management system. Prof. Pickel described the particular challenges of complying with the legally prescribed exhaust gas emission levels, engine lubrication, cold start behaviour, engine power/efficiency and the combination of the various fuels in the on-board management system. This requires the intelligent linking of the sensors used in series engines, among other things, for the fuel or injection quanti-ties and pump fault detection, for instance. Measurements using various fuel mixtures are currently ongoing in the field and on test benches with a view to validating fuel detection in the real world.
The tests also examine emissions in vehicle operation
(PEMS – Portable Emission Measurement System). The results of the BMEL/FNR-funded project were presented on 12 August 2021. The UFOF supported this project as part of the public relations exercise by giving a presentation on the status of the industry platform "Biofuels in agriculture and forestry" during International Green Week 2020.
Social perception of technological developmentsThe UFOP has promoted and continues to promote numerous projects with a practical emphasis that are aligned close to the market This does of course require that the scientific results are communicated in the most effective way possible. Prof. Josef Löffl, Technical University of Ostwestfalen-Lippe, therefore centred his presentation around the social perception of tech-nological developments. He gave both an insight into and an overview of the challenges involved in science communication and illustrated how the situation has been further compounded by digital media. One factor is the influence on public opinion through the formation of groups, i.e. the systematic and coor-dinated multiplication of information and the reinforcement effects that result. Prof. Löffl explained the role played by the media using the spread of rumours as an example. If, for instance, news about price trends is made to look "interesting" or this is linked to information already in the public domain.
UFOP project proposalMulti-fuel tractor level V ("MuSt5-Trak")
Project support: John Deere GmbH & Co. KG, Mannheim
Duration: March 2018 to February 2021
The project involves developing an engine model that is able to reliably detect fuel and automatically optimise the engine setting for use of various vegetable oil fuels and diesel fuels, or rather the mixtures thereof. The fuel detection system and automated engine setting are to be realised using existing sensors in the engine, exhaust gas treatment systems or other vehicle sensors (exhaust gas temperature, injection quantity, etc.)and implemented on a real tractor and their functionality validated under real operating conditions. The aim is to establish whether an adequately reliable fuel detection system can be realised without additional sensors.
18 19Biodiesel Report 2020/2021 RED III policy paper
RED III POLICY PAPER UFOP policy paper for the amendment of the Renewable Energy Sources Directive (2018/2001/EG) – RED III - sustainable biofuels from cultivated biomass are part of it!
1. Sustainable biofuels from cultivated biomass in a globally networked bioeconomy
In globally networked flows of agricultural raw materials and products, biofuels have a special role model function. This was and is the subject of intense political debates about the sustainability requirements and their documentation as a prerequisite for crediting them against quota obligations and thus for market access. The “drivers” are the EU targets for climate protection by 2030 and the achievement of climate neutrality by 2050 at the latest. Sustainable and greenhouse gas-optimised biofuels are currently and in the medium term the option introduced on the market as a contribution to climate protection in North and South America as well as Asia. In these regions they are also expressly a control instrument for the income-supporting supply and price development for agriculture.
The legal requirements anchored in EU law must also be implemented in third countries, including the certification systems approved by the EU Commission. This refers to the steadily tightened and expanded regulations of the European Union (RED II 2018/2001/EC) for the verification of a sustainable value chain from the field or the plantation to the companies in the mineral oil industry. The access authorisation for the market is granted with the sustainability certificate. The declared amount of biofuel can then be offset against the company-specific energy quota obligation, in Germany or Sweden against the greenhouse gas reduction obligation. This legally prescribed certification or verification chain only exists in this form for biofuels.
The introduction of the CO2 footprint for agricultural products is being discussed in a very critical and demanding manner, not least because society is becoming more aware of global climate change and its consequences. Above all, the younger generation urges the public to act: Framework conditions and consumer behaviour must change, because time is running out. It now depends on how this period is used.
The commitment to climate protection policy can be seen in concrete terms in the national legislation of the member states and the sector-specific targets anchored there, which are to be met by 2030. However, politicians must also resolve the issue of avoiding the relocation of negative environmental effects to third countries. So-called „carbon leakage effects“ are avoided with biofuels as a result of sustainability certification. The following applies to all biofuel origins: market access is linked to proof of a specific greenhouse gas reduction for the end product. In Germany, the introduction of the greenhouse gas quota instead of an energy quota obligation has led to a market- and demand-driven efficiency competition.
Indirect land use effects cannot be proven with regard to the cause and effect relationship in relation to the specific area. This finding confirms the long and ineffective “iLUC discussion” on biofuels. In contrast, the expansion of cultivated areas at the expense of the biotopes necessary for biodiversity and climate protection as a result of the overall global increase in demand for agricultural raw materials is undisputed. The main triggers are the flow of raw materials towards Asia and, in particular, the demand from China, which has been boosted by an increase in purchasing power.
The heads of government of the EU-27 set the framework and pressure for action with the resolution of December 2020, in which the EU climate protection target for 2030 was raised from 40% to at least 55%. The EU climate law is the first tangible result of the transformation process to be accelerated with the Green Deal, which will include all areas of life and the economy.
The EU Commission has made it clear that the EU is going ahead with climate protection, even if not all industrialised countries follow this level of ambition. Ecological extensification is announced for agriculture, but this will be combined with an opening for the approval of innovative methods in plant breeding. It seems that the important argument of the gain in time that can be achieved in the development of crops adapted to climate change is recognised. New breeding technologies such as CRISPR/Cas9 & Targeted Genome Editing are used in third countries. The raw materials are grown and marketed for food and non-food purposes. A policy that is balanced in terms of practical constraints and arguments is now urgently required.
Agriculture is directly affected by climate change. A relocation of production facilities, as is the case with other branches of industry, is of course not possible. This is why agriculture is standing up to the challenges of ambitious climate protection in adapting production systems. The sustainability requirements anchored in RED II are guidelines and provide direction – also for third countries, but so far „only“ for cultivated biomass with the purpose of using biofuels in the EU.
The short-term amendment of the RED II announced in the package of measures for the Green Deal again offers the option of designing an internationally effective “level playing field” for global competition appropriately and fairly. The German Advisory Council on Global Change (WGBU) has recognised this and made the following recommendation: „Sustainability standards, as they already apply to the promotion of bioenergy and biofuels, should be extended to other uses of biomass“1.
The regulations anchored in EU laws for sustainability certification for liquid and in future also for gaseous and solid biomass sources are immediately effective and open up the possibility of on-site inspections by the responsible bodies. These regulations are therefore more effective than corresponding regulations in trade agreements for compliance with the Sustainable Development Goals (SDGs). The WTO proceedings initiated by the governments of Malaysia and Indonesia against the decision of the EU to restrict the use of palm oil with the implementation of RED II are clear evidence.
2. Thinking and evaluating system services of innovations and value chains holistically
The supply of sustainably produced protein for animal and human nutrition is a central challenge. The EU‘s large protein deficit in protein feed has repeatedly been confirmed by the EU Commission and can be seen from the quantities imported from third countries. Soy, in particular, has been the subject of criticism and has repeatedly been the plaything of economic interests between the governments (USA/China) and the EU. This also affects the EU‘s security of supply and, associated with it, the question of improving the EU‘s own production of protein plants.
Improving the security of supply with feed protein produced sustainably in the EU must therefore be the basis for justifying the further eligibility of biofuels made from cultivated biomass. Flowering plants such as rapeseed or sunflowers have the potential to make a noticeable and valuable contribution in connection with the expansion of crop rotations with grain legumes. The absence of genetic engineering is a unique selling point of these crops, which, as a result of the labelling of products made from milk, eggs, etc., also leads to a „regional link“. The sustainability certification for the use of biofuels creates the necessary transparency according to origin and greenhouse gas efficiency, in line with the EU Commission‘s farm-to-fork strategy.
In recital (116), RED II provides for the greenhouse gas emissions caused by production and use to be split between biofuel and
protein components (allocation). However, the greenhouse gas-reducing substitution effect is not taken into account. This arises by avoiding cultivation in third countries and importing soy, for example, if cultivated biomass from European cultivation such as rapeseed or sunflowers are processed for biofuel production. With the production of GMO-free feed protein, the land pressure in the exporting countries is reduced. That would be a positive „iLUC effect“.
If this substitution effect were recognised, the domestic or European raw material cultivation – this also includes the production of bioethanol from grain – would properly enter the greenhouse gas competition. With this approach, not only competitiveness, but also added value for agriculture and thus the expansion of crop rotations would be strengthened and promoted, also in line with the farm-to-fork strategy.
The products created in the supply chain are sustainably certified. This is not only the biofuel or feed content of the processed raw materials, but all by-products such as glycerine, for example. This approach would therefore also serve as a model for third countries. Because in order to be able to fulfil the internationally binding goals of the Paris Climate Protection Agreement, the signatory states must develop analogue and globally binding sustainability concepts, the basis of which must be transparent and comprehensible evidence of greenhouse gas reduction. It is now about the „path“ to be standardised to the climate protection contribution to be taken into account.
UFOP therefore calls on politicians to develop these options and approaches holistically together with business so that sustainable biofuel production from cultivated biomass can continue to play an important role as a model of a networked and sustainably oriented bioeconomy strategy in the future. This approach also improves acceptance in agriculture and society.
1) Source: Land turn in the Anthropocene: From competition to integration https://www.wbgu.de/de/publikationen/publikation/landwende
20 21Biodiesel Report 2020/2021 “FIT FOR 55”
“FIT FOR 55” – THE PACKAGE OF PROPOSALS BY THE EU COMMISSION Overview of the proposals and the planned core provisions
On 14/07/2021, the European Commission presented a forward-looking package of proposals for amending existing and new directives that will affect all economic sectors and the wider society. These measures are essentially a logical consequence of the targets set by the EU climate legislation accepted by the European Parliament and the EU Council which came into force at the end of June 2021, which saw an increase in the EU climate protection target from 40% to 55%.
Over the next one to two years, these proposals will shape the political agenda not only in Brussels, but also and especially in the member states. Every single one of the proposals has to pass through the voting procedure between EU Parliament and EU Council, thus constituting a trilogue process, before then – as a result of the national legislative procedure – going through a notification procedure for implementation.
Time is a very scarce commodity in this process, as these measures need to be transposed into national law at the earliest possible stage as a prerequisite to being able to meet the EU climate protection target within the commitment period through to 2030 and ultimately climate neutrality by 2050 at the latest. In light of the experience garnered with the reform of the CAP, the EU Commission should therefore limit itself to its role as facilitator from the outset.
These proposals are the vehicle through which the EU Commis-sion is essentially announcing its plan to push on with its ambitious climate protection policy, even if leading industrial nations fail to pursue this level of ambition. With these measures and the 10% or so contribution it makes to global greenhouse gas emissions, however, the EU will not be able to win the fight against climate change single-handedly. Climate diplomacy (G7/G20) is gaining traction and is set to become one of the key challenges at the 26th UN Climate Conference being held from 31 October to 12 November 2021 in Glasgow. There is no doubt that the conference will attract global economic interest. Alongside the BRIC countries, the USA for example, has also positioned itself critically for the planned introduction of a CO2 border tax. The EU wants to rule out the possibility of carbon leakage in third countries and competitive disadvan-tages for the EU economy. The “external protection policy” will present a key challenge if the aims of job security and prosperity and the associated required level of public accept-ance in the EU are to be achieved.
The proposals made by the EU Commission:
1. Revision of existing directives/regulations:• EU Emissions Trading System• Regulation on land use and forestry (LULUCF)• Effort Sharing Regulation• Renewable Energy Directive – RED III• Energy Efficiency Directive• Alternative Fuels Infrastructure Directive• Directive on emissions performance standards for
passenger cars and• light commercial vehicles• Energy Taxation Directive
2. New draft directives/regulations:• EU Forest Strategy• Carbon Border Adjustment Mechanism• Social Climate Fund• ReFuelEU Aviation• FuelEU Maritime
THE KEY PROPOSALSARE BRIEFLY EXPLAINED ANDCOMMENTED:
1. EU Emissions Trading System (ETS)The advancement of the emission trading system is a central strategic approach to accelerating the implementation of climate protection measures in organisations by increasing the cost of the emission rights that the approximately 12,000 affected companies in the EU (fossil power stations, cement industry, fertiliser industry, refineries, steel works) have to purchase. At less than 10 euro/tonne of CO2, the certificates have been comparatively inexpensive until now. In addition, free certificates used to be issued to the affected industrial companies. This free issuing is set to be reduced step-by-step. The speed of the market reaction to certificates/emission rights becoming increasingly scarce is shown by the current development (EUA quotation of 01/07/21 – EUA (European Union Allowance = emission right) of the CO2 price, with a steep rise to approx. 57 EUR/t CO2. The costs will be passed on to the customer by factoring them into the price of steel or coal (coal-fired electricity from plants for ensuring grid stability), for example.
A high CO2 price will accelerate the shut-down of the coal-fired power plants for economic reasons, according to those who advocate this measure. However, it should be noted that the increase in demand due to the advancement of e-mobility (approx. 1 million in 2022), heat pumps (approx. 5 million), hydrogen (electrolysis), etc., is not being matched by any adequate increase in wind power and photovoltaic systems. Because of its role in ensuring grid stability, the Federal Network Agency for coal-fired power generation stations is therefore not being “discharged” from the network, especially since the last nuclear power stations need to be decommis-sioned in 2022. Securing grid stability, particularly in the event of a wind and solar lull, will have an impact on the price of electricity for all consumer groups if these power stations have to be brought online. It is for this reason that the Federal Minister for Economic Affairs recently met the request to publish the results of the Prognos study conducted to estimate the medium-term rise in demand: currently approx. 580 by 2030: 645 to 665 terawatt hours.
The CO2 pricing is correspondingly adding to the cost of steel and fertiliser production in the EU, while impacting is ability to compete internationally at the same time. The use of hydrogen from renewable power in order to meet climate protection requirements is an equally expensive option. The steel industry is therefore calling for a “quota regulation” for climate-neutral steel. This example clearly shows the balancing act that will ultimately lead to mandatory price increases in many products (construction steel, steel for the automotive industry, etc.) or resources (fossil fuels as a consequence of the national CO2 pricing) for agriculture.
The EU Commission’s proposal involves expanding emissions trading to shipping, road traffic and heating fuels (buildings), although in separate “systems” due to the differing greenhouse reduction costs. The idea is not only to prevent the “carbon leakage” of GHG reduction to other sectors, but also to continue the differentiation by “sectors” (see also the climate protection legislation) for the time being.
The pricing is impacting household income and is therefore the subject matter of regulations for a social climate fund to be drawn up at the same time. The “yellow vest protests” in France are testimony to the speed at which climate protection measures can lead to public criticism.
2. Social Climate FundThe negative effects on household income described are to be compensated as far as possible by setting up a social climate fund. The focus will be on low-income households. However, a distinction is made between the member states based on economic strength. The EU’s funding for scaling up climate action must therefore also be geared towards meeting this criterion. In this respect, the funding framework in Germany for e-mobility is no benchmark for the “poorer” member states. This is evident from looking at the distribution of e-vehicle charging stations in the member states: 70% of charging stations are located in just three member states. At least 50% of the income generated by emissions trading is to go into the new social climate fund.
3. Effort Sharing RegulationAs a logical consequence of the EU climate protection target being raised to 55%, an equally ambitious adaptation to the effort sharing regulation is likewise required. Implemented at national level, the adaptation will concern the following sectors: agricul-ture, transport, buildings and waste, which account for approxi-mately 60% of European GHG emissions. Based again on the existing assessment criteria of “capacity”, the proposal involves increased binding targets for all member states. The most important of these criteria is their economic power (gross domestic product – GDP). In Germany: increase from 38% to 50%. The following countries are also required to meet this target: Luxem-bourg, Sweden, Finland and Denmark, while France: 47.5%. Eastern European countries such as Hungary and Poland will also be called upon to reach their respective higher targets: Increase from 7% to 18.7% and 17.7% respectively.
This is the backdrop against which the German Federal Govern-ment, as part of the revision to the climate protection targets as of 2030 enforced by the ruling of the Federal Constitutional Court, simultaneously tightened up their own sector-specific targets (reduction in the annual emission limits) by 2030.
4. Regulation on land use and forestry (LULUCF)This regulation compels every EU country to ensure that emissions from these sectors are compensated by CO2 removals from the atmosphere (the so-called “No Debit” rule). For carbon sinks, the proposal states a target of 310 million tonnes of CO2 for the EU as a whole from the year 2026 and, consequently a reduction target for Germany of approx. 25 million tonnes of CO2 per annum. However, this target fails to consider the apparent consequences of climate change. The aridity and the associated large-scale impact on dried forest land call for a regionally adjusted manage-ment of resources or re-forestation. Forests are not able to perform the required sink function. The opposite could hold true in the future. The EU Commission also proposes that as of 2031, the emissions from LULUCF and agriculture are to be balanced jointly (“AFOLU”: Agriculture, Forestry and Other Land Use) coupled with the objective of the AFOLU sector being climate-neu-tral by 2035 and having negative emissions thereafter. In this regard, “carbon farming” will be key. The EU leaves unanswered the question of how, in arable farming, carbon can be verifiably and permanently absorbed from the atmosphere, although this goal is being also pursued with the “Farm to Fork” strategy.
5. Carbon Border Adjustment MechanismThe proposal for a CO2 border tax (Carbon Border Adjustment Mechanism, CBAM) is intended to protect European industry from unfair competition by raising the price of imports, of steel or fertiliser for example, based on their carbon footprint (levy) and granting relief for the export of relevant commodities. The long drawn-out critical discussion between industry, EU Commission and EU Parliament on the question of whether emission certificates will continue to be provided free-of-charge as compensation, and if so, until when, goes on and is even being stepped up. This compensatory measure, however, is inconsistent with WTO law (non-discrimination principle) and has therefore been considered discriminatory by some govern-ments (Brazil, South Africa, India and China).
22 23Biodiesel Report 2020/2021 “FIT FOR 55”
regarded this draft as ban through the back door. Given the economic importance of this sector (income, jobs & tax revenues) and the fact that combustion engines will continue to play a key role globally, it is necessary to question whether the EU Commission is deliberately trying to bring about carbon leakage discussed under the other proposals.
10. ReFuelEU Aviation – Sustainable Aviation FuelsThe aim of the proposal is a commitment to gradually reduce aircraft emissions through the increased use of Sustainable Aviation Fuels (SAF). This is to be achieved by raising the blending proportion of SAF in kerosene: at least 2% and 5% in 2025 and 2030 respectively, and ultimately 63% in 2050. The proposal encourages the use of synthetic kerosene from renewable power, along with bio-kerosene from raw materials from Annex IX Part A (progressive biofuels from straw, etc.) and Part B (biofuels from waste oils and waste animal fats). Raw materials from cultivated biomass are expressly ruled out to prevent any further increase in the competition in the food and animal feed markets. In this context, the proposal regards the environmental advantage of biofuels from cultivated biomass as “limited”. Under the proposal, all aircrafts departing from any airport within the EU have to be fuelled with a blend of kerosene and SAF. Consequently, ticket prices will increase because the SAF proportion is more expensive – kerosene accounts for around 25% of the operating costs. On the other hand, the EU is expecting the gradual increase to achieve scaling effects if production volumes are ramped up. The practical implementation of the monitoring procedure and veri-fications of physical usage and sustainability will present a challenge. These issues were discussed in detail during the consultation process.
11. FuelEU Maritime – Sustainable Shipping FuelsThis regulation proposal sets out common rules for limiting the greenhouse gas intensity of the energy (fuels and shore power) used on-board ships (freight or passenger ships) that sail into ports in member states, stop off and sail out again. The proposal provides for an obligation to use the shore power supply in the port (mandatory from 01/2030) or “zero emission technolo-gies” for generating power on-board. The average annual greenhouse gas intensity of the energy consumed on-board a ship must not exceed specific thresholds during a particular reporting period. The basis is a reference value, which is to be reduced by the following percentages: -2% as of 1 January 2025; -6% as of 1 January 2030; -13% as of 1 January 2035; -26% as of 1 January 2040; -59 % as of 1 January 2045; -75%
as of 1 January 2050. This is based on an extensive control and monitoring system that the shipowners have to implement. Where biofuels are used, the emission factors and the calcu-lation formula defined in the Renewable Energy Directive (RED II) are to be applied. Biofuels from cultivated biomass (food and feed crops), however, are not taken into account.
12. Energy Efficiency DirectiveThe proposed regulation sets out more ambitious targets for reducing energy consumption at EU level. The obligation of member states to save energy is doubled, and the public sector’s commitment is increased with the requirement to renovate the energy systems in at least 3% of its existing buildings. The EU Commission is expecting this to create jobs and reduce costs for the taxpayer due to the lower energy consumption.
ASSESSMENT BY UFOP:
With its package of proposals, the EU Commission is writing the script for climate policy in the years to come. Although the allocation of roles at the institutions is indeed clear, the voting process will be measured by the existence of a comparable political will at national level to accept the new regulations and implement them in the fastest possible time. The issues surrounding the implementation of the Renewable Energy Directive (RED II) already evidence that there are doubts among member states. Only a small number of member states met the deadline of the end of June 2021. In view of the proposals, the national energy and climate plans presented to the EU Commission by the member states in late 2020 will have to be adapted immediately.
However, the EU Commission has not followed up on its announcement to adapt the voting procedure for important legal regulations from unanimity to a qualified majority. This concerns in particular the tax regulations and the proposal for the regulation to change the energy tax system.
The EU Commission has ignored consumer acceptance completely. The EU Commission does not make any proposals as to how to persuade the general public to buy into this increasingly fast-paced transformation path. This “deficiency” can not only be observed in Germany, for example, with the civil protests against wind turbines, but will also be evident in the future when the infla-tion-driving effect of these proposals is a burden on the wallets of each and every individual. The comparatively “harmless” yellow vest protests in France should serve as a a warning.
The measure aims to encourage companies in third countries to increase climate action in their production facilities (level adjustment) and prevent carbon leakage effects by relocating factories to third countries with less stringent climate regula-tions or making new investments there. The introduction of the carbon tax will compel the EU Commission to generate revenue to finance the social fund and climate protection measures, and also to repay the debt incurred by the creating of the “EU Recovery Fund”.
6. Renewable Energy Directive (RED III)The Renewable Energy Directive performs two primary functions: it defines which energy sources are considered “renewable” when sustainability is taken into account and, in the case of biofuels – differentiated by types of raw materials – sets out the so-called caps on biofuels from cultivated biomass and waste material, and stipulates binding targets for the propor-tion of renewable power in the European power mix. The EU’s goal of achieving climate neutrality by 2050 requires all member states to dramatically ramp up their production capacities for renewable energies. In 2018, the EU set itself the goal of increasing the proportion of renewable energies in the European energy mix from currently around 20% to 32% by 2030.
The most important rules affecting biofuels/alternative fuels:• Further raising of the target for the share of renewable
energies in gross final energy consumption from 32% to 40% in 2030. The transport sector is under an obligation to reduce greenhouse gas emissions by at least 13% by 2030. The sub-quota for energy production from progres-sive biofuels (Appendix IX, Part A, Straw, etc.) is at least: 0.2% in 2022, 0.5% in 2025, 2.2% in 2030
• The introduction of a target of 2.6% for Renewable Fuels of Non Biological Origin – RFNBO (synthetic fuels, e-Fuels) in 2030 is a new development.
• With the cap on biofuels from cultivated biomass, the limit remains in place at national level (essentially max. 7%): consumption rate in 2020 + max. 1%).
• Biofuels which pose a high risk of change to land use (high iLUC – palm oil) are being frozen at the consumption level in 2019 for the respective member state – to be phased out by 2030 at the latest.
• The option of the introduction of the GHG quota regulation and the offsetting of renewable energy for quota trading being open to all member states is a new development. The regulation on the GHG quota introduced in Germany will be adopted as a result.
• In this respect, it is important for biodiesel that the Fuel Quality Directive is also amended to allow B7 as a protected variety, thereby creating the option for the first time.
7. Energy Tax DirectiveThis proposal to revise and restructure energy taxation pursues the aim of essentially taxing all energy sources based on their energy content (EUR/Gigajoule). The volume-based taxation in place until now (EUR/l) is being abolished, as is the differ-ence in the level of taxation based on a ten-year adjustment phase. For Germany, this means that the difference in the level of taxation on diesel and petrol will be abolished.
In Annex I, the draft directive provides for a base value for minimum taxation, differentiated by fuel type and sector of use (general and reduced, e.g. agriculture), which will be followed by increase steps for the minimum tax rate to be reached in 2030 (see tables in the appendix). As Table 2 shows, a minimum tax rate is to be introduced for diesel fuel in the agricultural sector, which will replace the expiring authority of the member states to exempt “energy commodities” (fuels and combustibles) from taxation (tax rate “0”).
Crucially, it should be noted that the “spirit” of the Green Deal to abolish environmentally harmful “fossil” subsidies is apparent. However, the EU Commission has not delivered on its announce-ment to accelerate the voting procedure in the EU. This directive therefore has to be adopted unanimously. Given the impor-tance of these regulations for national budgets, an extremely difficult voting process is expected. However, this cannot be swept under the carpet like the last proposal made by the EU Commission in 2015 (draft presented in 2011). This directive is at the heart of the Green Deal for climate protection and a number of compromises over accompanying measures are likely to be required to alleviate tensions and achieve a consensus.
8.Alternative Fuels Infrastructure DirectiveBy updating this directive from 2014, the EU Commission’s intention is to accelerate the expansion of infrastructure for alternative fuels (hydrogen, bio-LNG, alternative marine and aviation fuels, etc.) and the charging infrastructure, appropri-ately designed (charging speed) for vehicles (passenger cars, commercial vehicles). The aim is an EU-wide network of charging stations, since so far 70% of all stations have been located in just three member states. This is halting the expansion of e-mobility and the level of acceptance among consumers who should be increasingly moving over to electric vehicles. The European Commission has already announced that it intends to increase the number of electric charging stations to one million by 2025 and to three million by 2030.
The proposal also envisages mandatory national targets for the expansion of an adequate infrastructure for alternative fuels for road vehicles, ships and aircrafts in the EU. It defines common technical specifications and requirements for user information, data provisioning and payment requests for the infrastructure for alternative fuels. The draft therefore contains regulations for the national political framework to be estab-lished by the member states and, at the same time,introduces a reporting mechanism designed to encourage cooperation and guarantee solid progress tracking.
9. Directive on emissions performance standards for passenger cars and light commercial vehiclesThe main proposal, which is currently also shaping opinion in the vehicle industry as a whole, is the regulation that would allow only “emission-free” passenger cars to be registered from 2035. With the proposal, the EU Commission is effec-tively setting a date for the phase-out of the combustion engine. The EU Commission draft for a Euro 7 emissions standard should also be seen in this context. The automotive industry
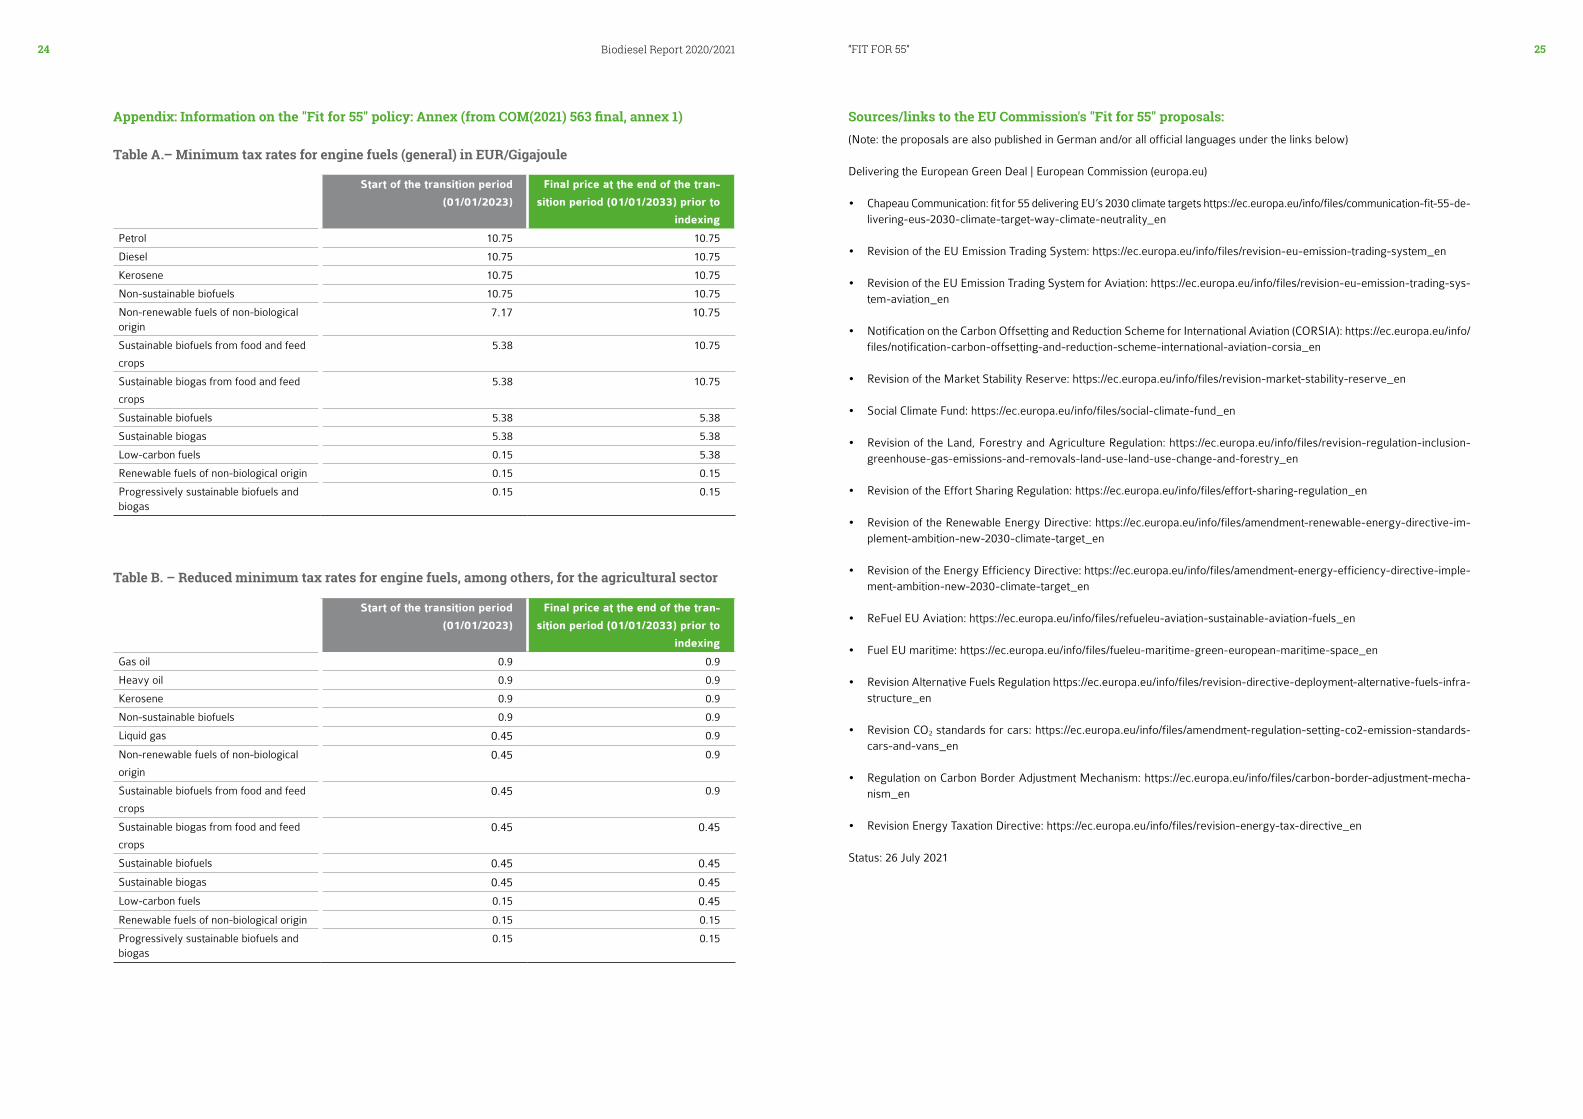
24 25Biodiesel Report 2020/2021
Appendix: Information on the "Fit for 55" policy: Annex (from COM(2021) 563 final, annex 1)
Table A.– Minimum tax rates for engine fuels (general) in EUR/Gigajoule
Start of the transition period
(01/01/2023)
Final price at the end of the tran-
sition period (01/01/2033) prior to
indexing
Petrol 10.75 10.75
Diesel 10.75 10.75
Kerosene 10.75 10.75
Non-sustainable biofuels 10.75 10.75
Non-renewable fuels of non-biological origin
7.17 10.75
Sustainable biofuels from food and feed
crops
5.38 10.75
Sustainable biogas from food and feed
crops
5.38 10.75
Sustainable biofuels 5.38 5.38
Sustainable biogas 5.38 5.38
Low-carbon fuels 0.15 5.38
Renewable fuels of non-biological origin 0.15 0.15
Progressively sustainable biofuels and biogas
0.15 0.15
Start of the transition period
(01/01/2023)
Final price at the end of the tran-
sition period (01/01/2033) prior to
indexing
Gas oil 0.9 0.9
Heavy oil 0.9 0.9
Kerosene 0.9 0.9
Non-sustainable biofuels 0.9 0.9
Liquid gas 0.45 0.9
Non-renewable fuels of non-biological
origin
0.45 0.9
Sustainable biofuels from food and feed
crops
0.45 0.9
Sustainable biogas from food and feed
crops
0.45 0.45
Sustainable biofuels 0.45 0.45
Sustainable biogas 0.45 0.45
Low-carbon fuels 0.15 0.45
Renewable fuels of non-biological origin 0.15 0.15
Progressively sustainable biofuels and biogas
0.15 0.15
Sources/links to the EU Commission's "Fit for 55" proposals:(Note: the proposals are also published in German and/or all official languages under the links below)
Delivering the European Green Deal | European Commission (europa.eu)
• Chapeau Communication: fit for 55 delivering EU’s 2030 climate targets https://ec.europa.eu/info/files/communication-fit-55-de-livering-eus-2030-climate-target-way-climate-neutrality_en
• Revision of the EU Emission Trading System: https://ec.europa.eu/info/files/revision-eu-emission-trading-system_en
• Revision of the EU Emission Trading System for Aviation: https://ec.europa.eu/info/files/revision-eu-emission-trading-sys-tem-aviation_en
• Notification on the Carbon Offsetting and Reduction Scheme for International Aviation (CORSIA): https://ec.europa.eu/info/files/notification-carbon-offsetting-and-reduction-scheme-international-aviation-corsia_en
• Revision of the Market Stability Reserve: https://ec.europa.eu/info/files/revision-market-stability-reserve_en
• Social Climate Fund: https://ec.europa.eu/info/files/social-climate-fund_en
• Revision of the Land, Forestry and Agriculture Regulation: https://ec.europa.eu/info/files/revision-regulation-inclusion-greenhouse-gas-emissions-and-removals-land-use-land-use-change-and-forestry_en
• Revision of the Effort Sharing Regulation: https://ec.europa.eu/info/files/effort-sharing-regulation_en
• Revision of the Renewable Energy Directive: https://ec.europa.eu/info/files/amendment-renewable-energy-directive-im-plement-ambition-new-2030-climate-target_en
• Revision of the Energy Efficiency Directive: https://ec.europa.eu/info/files/amendment-energy-efficiency-directive-imple-ment-ambition-new-2030-climate-target_en
• ReFuel EU Aviation: https://ec.europa.eu/info/files/refueleu-aviation-sustainable-aviation-fuels_en
• Fuel EU maritime: https://ec.europa.eu/info/files/fueleu-maritime-green-european-maritime-space_en
• Revision Alternative Fuels Regulation https://ec.europa.eu/info/files/revision-directive-deployment-alternative-fuels-infra-structure_en
• Revision CO2 standards for cars: https://ec.europa.eu/info/files/amendment-regulation-setting-co2-emission-standards-cars-and-vans_en
• Regulation on Carbon Border Adjustment Mechanism: https://ec.europa.eu/info/files/carbon-border-adjustment-mecha-nism_en
• Revision Energy Taxation Directive: https://ec.europa.eu/info/files/revision-energy-tax-directive_en
Status: 26 July 2021
Table B. – Reduced minimum tax rates for engine fuels, among others, for the agricultural sector
“FIT FOR 55”
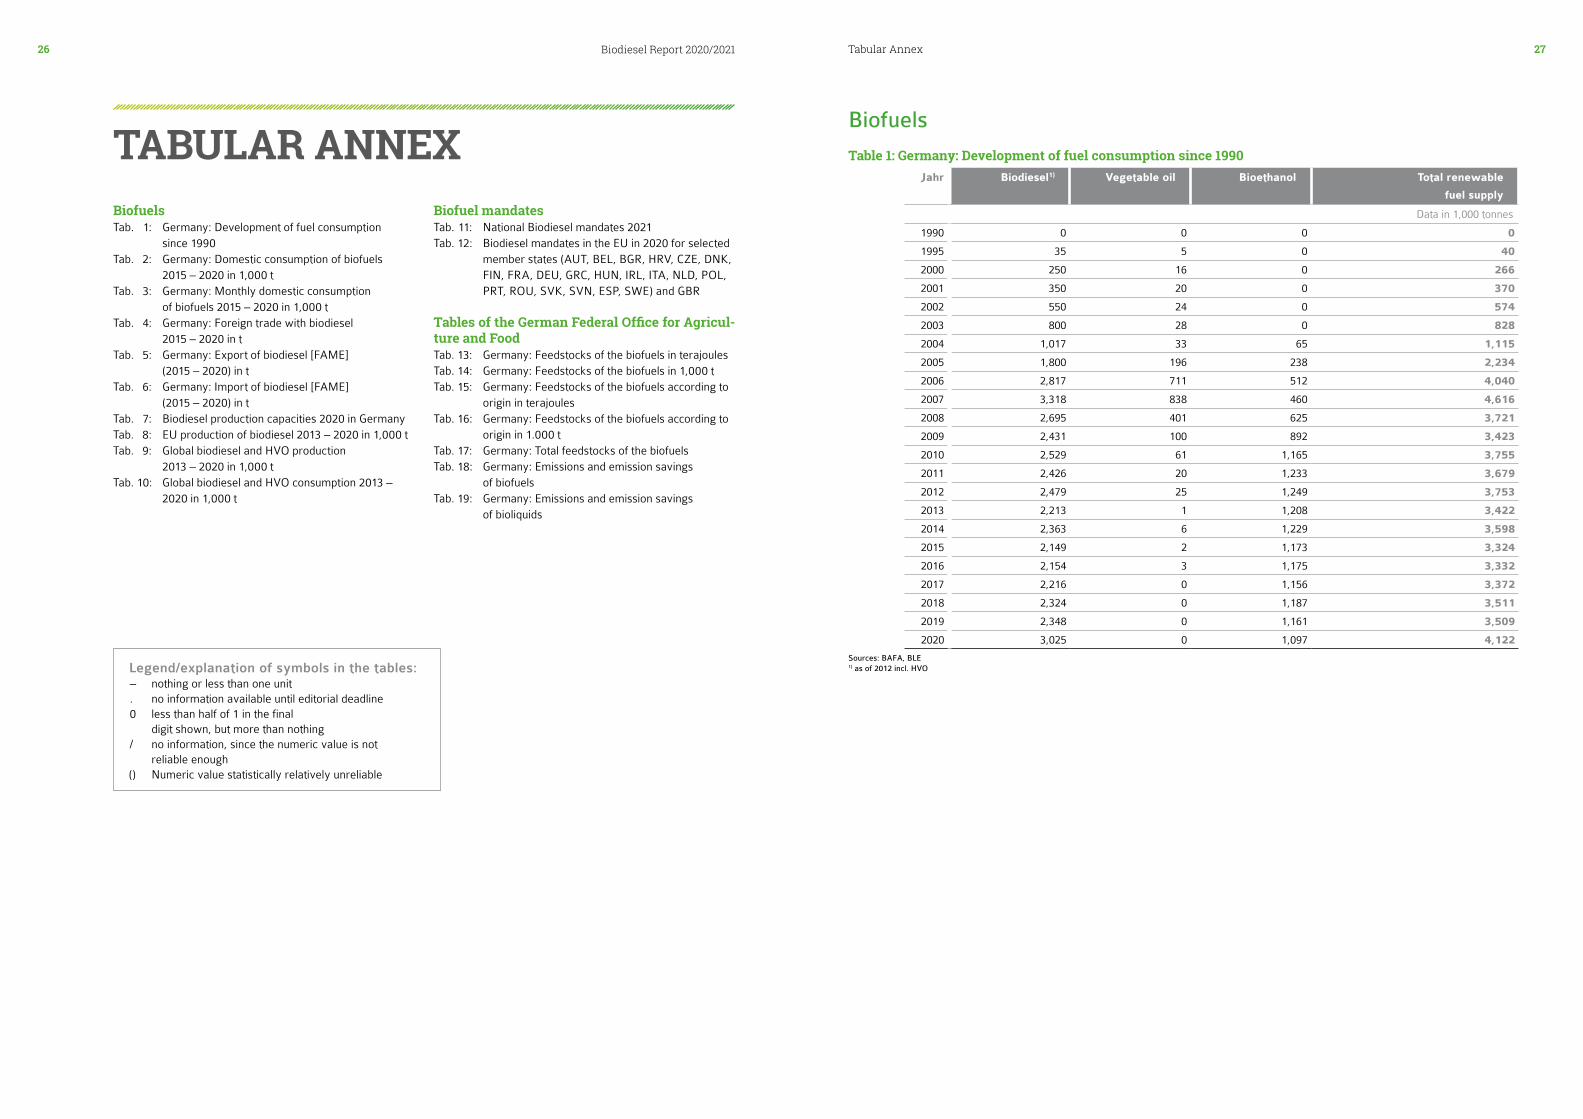
2726 Biodiesel Report 2020/2021 Tabular Annex
TABULAR ANNEXBiofuelsTab. 1: Germany: Development of fuel consumption
since 1990Tab. 2: Germany: Domestic consumption of biofuels
2015 – 2020 in 1,000 tTab. 3: Germany: Monthly domestic consumption
of biofuels 2015 – 2020 in 1,000 tTab. 4: Germany: Foreign trade with biodiesel
2015 – 2020 in tTab. 5: Germany: Export of biodiesel [FAME]
(2015 – 2020) in t Tab. 6: Germany: Import of biodiesel [FAME]
(2015 – 2020) in t Tab. 7: Biodiesel production capacities 2020 in GermanyTab. 8: EU production of biodiesel 2013 – 2020 in 1,000 tTab. 9: Global biodiesel and HVO production
2013 – 2020 in 1,000 tTab. 10: Global biodiesel and HVO consumption 2013 –
2020 in 1,000 t
Biofuel mandatesTab. 11: National Biodiesel mandates 2021Tab. 12: Biodiesel mandates in the EU in 2020 for selected
member states (AUT, BEL, BGR, HRV, CZE, DNK, FIN, FRA, DEU, GRC, HUN, IRL, ITA, NLD, POL, PRT, ROU, SVK, SVN, ESP, SWE) and GBR
Tables of the German Federal Office for Agricul-ture and FoodTab. 13: Germany: Feedstocks of the biofuels in terajoulesTab. 14: Germany: Feedstocks of the biofuels in 1,000 tTab. 15: Germany: Feedstocks of the biofuels according to
origin in terajoulesTab. 16: Germany: Feedstocks of the biofuels according to
origin in 1.000 tTab. 17: Germany: Total feedstocks of the biofuelsTab. 18: Germany: Emissions and emission savings
of biofuelsTab. 19: Germany: Emissions and emission savings
of bioliquids
Legend/explanation of symbols in the tables:– nothing or less than one unit. no information available until editorial deadline0 less than half of 1 in the final digit shown, but more than nothing/ no information, since the numeric value is not
reliable enough() Numeric value statistically relatively unreliable
Table 1: Germany: Development of fuel consumption since 1990Jahr Biodiesel1) Vegetable oil Bioethanol Total renewable
fuel supply
Data in 1,000 tonnes
1990 0 0 0 0
1995 35 5 0 40
2000 250 16 0 266
2001 350 20 0 370
2002 550 24 0 574
2003 800 28 0 828
2004 1,017 33 65 1,115
2005 1,800 196 238 2,234
2006 2,817 711 512 4,040
2007 3,318 838 460 4,616
2008 2,695 401 625 3,721
2009 2,431 100 892 3,423
2010 2,529 61 1,165 3,755
2011 2,426 20 1,233 3,679
2012 2,479 25 1,249 3,753
2013 2,213 1 1,208 3,422
2014 2,363 6 1,229 3,598
2015 2,149 2 1,173 3,324
2016 2,154 3 1,175 3,332
2017 2,216 0 1,156 3,372
2018 2,324 0 1,187 3,511
2019 2,348 0 1,161 3,509
2020 3,025 0 1,097 4,122
Sources: BAFA, BLE1) as of 2012 incl. HVO
Biofuels
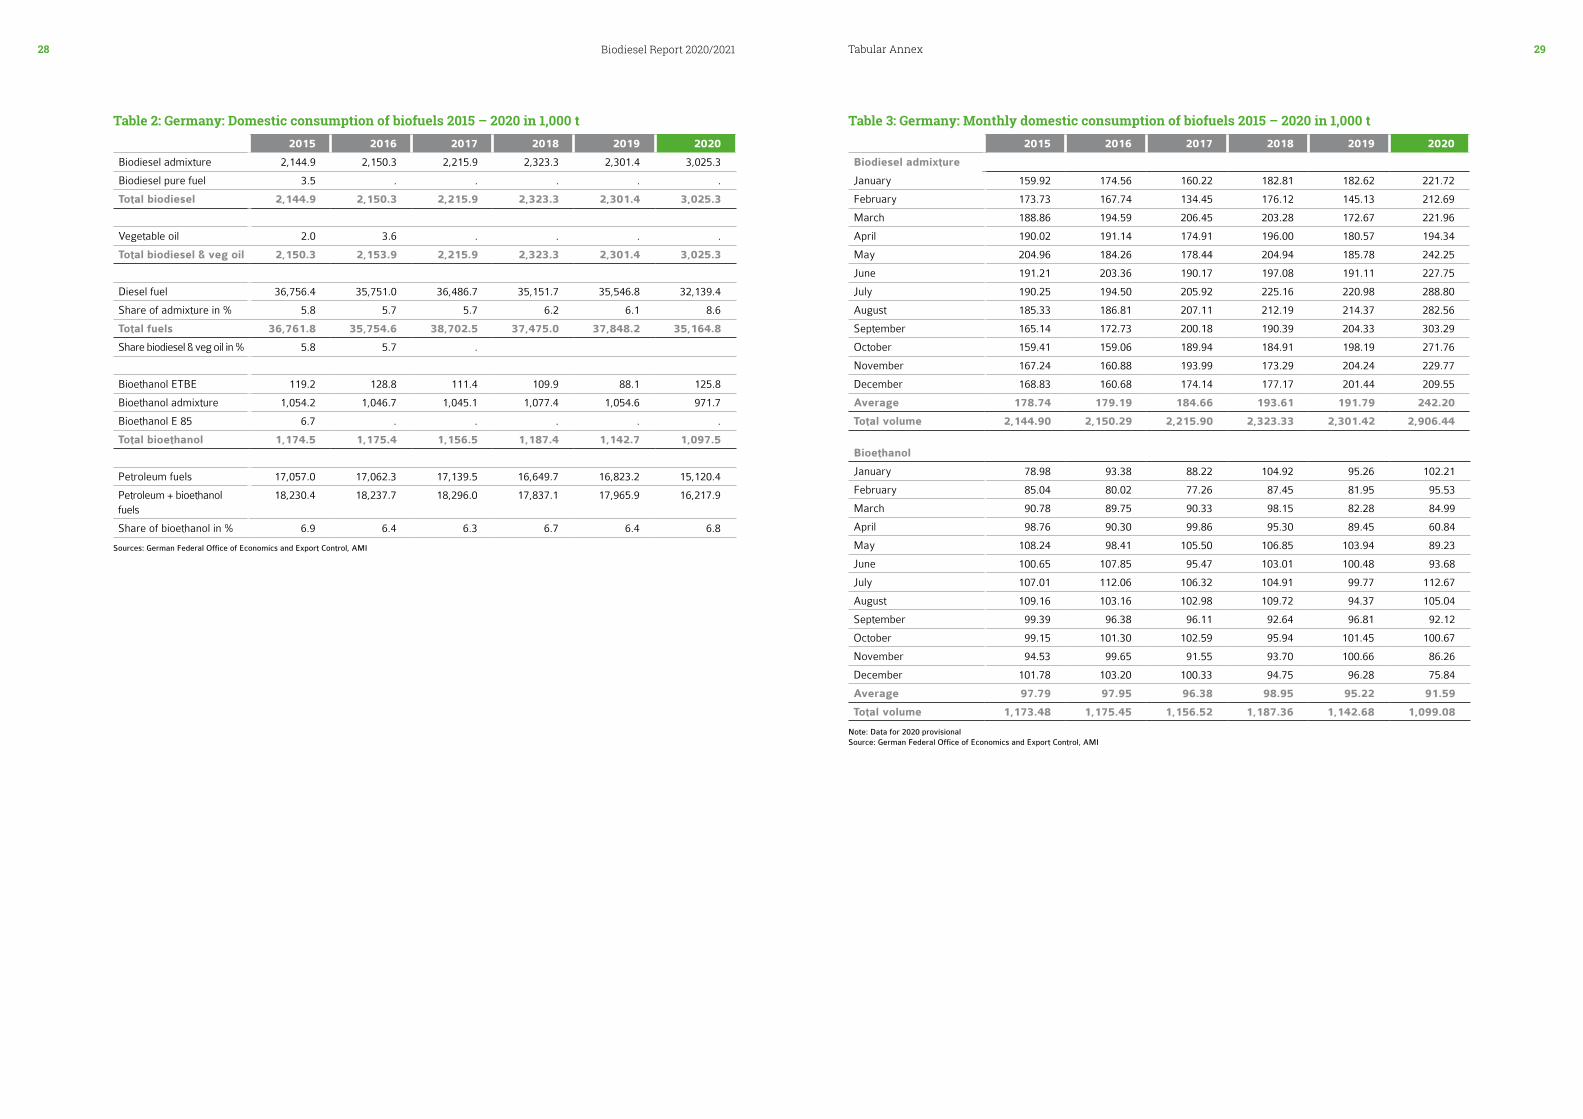
Tabular Annex28 29Biodiesel Report 2020/2021
Table 2: Germany: Domestic consumption of biofuels 2015 – 2020 in 1,000 t2015 2016 2017 2018 2019 2020
Biodiesel admixture 2,144.9 2,150.3 2,215.9 2,323.3 2,301.4 3,025.3
Biodiesel pure fuel 3.5 . . . . .
Total biodiesel 2,144.9 2,150.3 2,215.9 2,323.3 2,301.4 3,025.3
Vegetable oil 2.0 3.6 . . . .
Total biodiesel & veg oil 2,150.3 2,153.9 2,215.9 2,323.3 2,301.4 3,025.3
Diesel fuel 36,756.4 35,751.0 36,486.7 35,151.7 35,546.8 32,139.4
Share of admixture in % 5.8 5.7 5.7 6.2 6.1 8.6
Total fuels 36,761.8 35,754.6 38,702.5 37,475.0 37,848.2 35,164.8
Share biodiesel & veg oil in % 5.8 5.7 .
Bioethanol ETBE 119.2 128.8 111.4 109.9 88.1 125.8
Bioethanol admixture 1,054.2 1,046.7 1,045.1 1,077.4 1,054.6 971.7
Bioethanol E 85 6.7 . . . . .
Total bioethanol 1,174.5 1,175.4 1,156.5 1,187.4 1,142.7 1,097.5
Petroleum fuels 17,057.0 17,062.3 17,139.5 16,649.7 16,823.2 15,120.4
Petroleum + bioethanol fuels
18,230.4 18,237.7 18,296.0 17,837.1 17,965.9 16,217.9
Share of bioethanol in % 6.9 6.4 6.3 6.7 6.4 6.8
Sources: German Federal Office of Economics and Export Control, AMI
Table 3: Germany: Monthly domestic consumption of biofuels 2015 – 2020 in 1,000 t2015 2016 2017 2018 2019 2020
Biodiesel admixture
January 159.92 174.56 160.22 182.81 182.62 221.72
February 173.73 167.74 134.45 176.12 145.13 212.69
March 188.86 194.59 206.45 203.28 172.67 221.96
April 190.02 191.14 174.91 196.00 180.57 194.34
May 204.96 184.26 178.44 204.94 185.78 242.25
June 191.21 203.36 190.17 197.08 191.11 227.75
July 190.25 194.50 205.92 225.16 220.98 288.80
August 185.33 186.81 207.11 212.19 214.37 282.56
September 165.14 172.73 200.18 190.39 204.33 303.29
October 159.41 159.06 189.94 184.91 198.19 271.76
November 167.24 160.88 193.99 173.29 204.24 229.77
December 168.83 160.68 174.14 177.17 201.44 209.55
Average 178.74 179.19 184.66 193.61 191.79 242.20
Total volume 2,144.90 2,150.29 2,215.90 2,323.33 2,301.42 2,906.44
Bioethanol
January 78.98 93.38 88.22 104.92 95.26 102.21
February 85.04 80.02 77.26 87.45 81.95 95.53
March 90.78 89.75 90.33 98.15 82.28 84.99
April 98.76 90.30 99.86 95.30 89.45 60.84
May 108.24 98.41 105.50 106.85 103.94 89.23
June 100.65 107.85 95.47 103.01 100.48 93.68
July 107.01 112.06 106.32 104.91 99.77 112.67
August 109.16 103.16 102.98 109.72 94.37 105.04
September 99.39 96.38 96.11 92.64 96.81 92.12
October 99.15 101.30 102.59 95.94 101.45 100.67
November 94.53 99.65 91.55 93.70 100.66 86.26
December 101.78 103.20 100.33 94.75 96.28 75.84
Average 97.79 97.95 96.38 98.95 95.22 91.59
Total volume 1,173.48 1,175.45 1,156.52 1,187.36 1,142.68 1,099.08
Note: Data for 2020 provisional Source: German Federal Office of Economics and Export Control, AMI
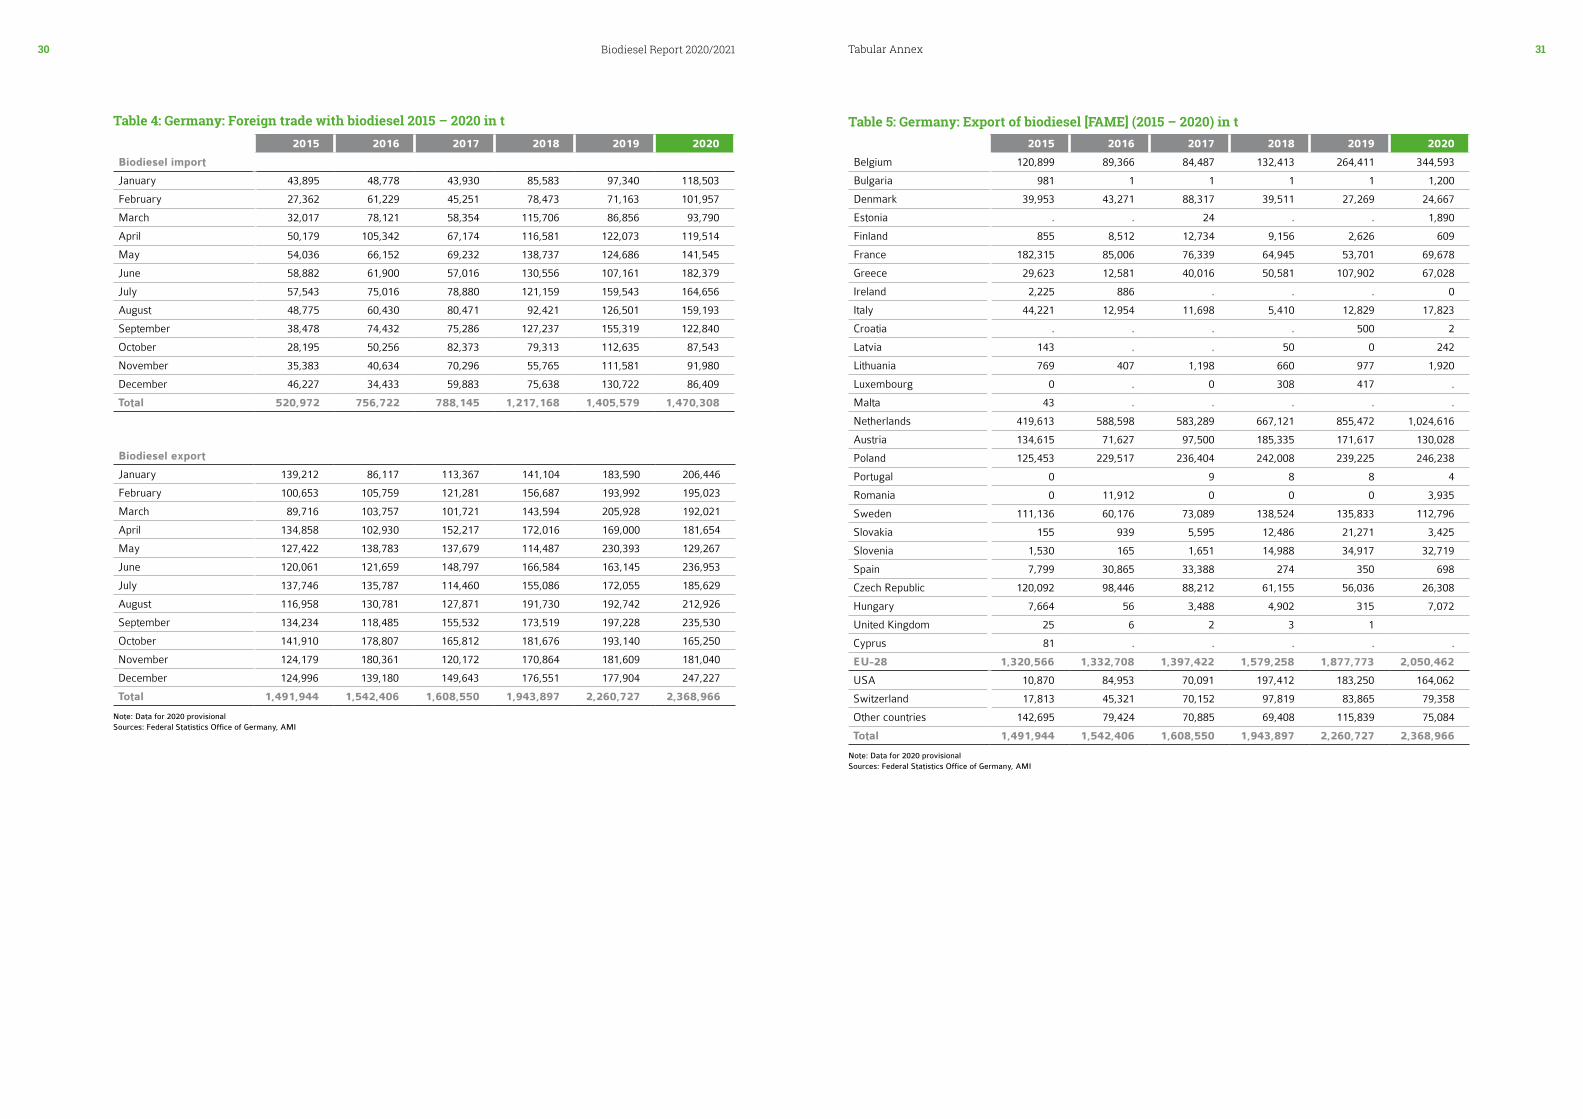
Tabular Annex30 31Biodiesel Report 2020/2021
Table 4: Germany: Foreign trade with biodiesel 2015 – 2020 in t2015 2016 2017 2018 2019 2020
Biodiesel import
January 43,895 48,778 43,930 85,583 97,340 118,503
February 27,362 61,229 45,251 78,473 71,163 101,957
March 32,017 78,121 58,354 115,706 86,856 93,790
April 50,179 105,342 67,174 116,581 122,073 119,514
May 54,036 66,152 69,232 138,737 124,686 141,545
June 58,882 61,900 57,016 130,556 107,161 182,379
July 57,543 75,016 78,880 121,159 159,543 164,656
August 48,775 60,430 80,471 92,421 126,501 159,193
September 38,478 74,432 75,286 127,237 155,319 122,840
October 28,195 50,256 82,373 79,313 112,635 87,543
November 35,383 40,634 70,296 55,765 111,581 91,980
December 46,227 34,433 59,883 75,638 130,722 86,409
Total 520,972 756,722 788,145 1,217,168 1,405,579 1,470,308
Biodiesel export
January 139,212 86,117 113,367 141,104 183,590 206,446
February 100,653 105,759 121,281 156,687 193,992 195,023
March 89,716 103,757 101,721 143,594 205,928 192,021
April 134,858 102,930 152,217 172,016 169,000 181,654
May 127,422 138,783 137,679 114,487 230,393 129,267
June 120,061 121,659 148,797 166,584 163,145 236,953
July 137,746 135,787 114,460 155,086 172,055 185,629
August 116,958 130,781 127,871 191,730 192,742 212,926
September 134,234 118,485 155,532 173,519 197,228 235,530
October 141,910 178,807 165,812 181,676 193,140 165,250
November 124,179 180,361 120,172 170,864 181,609 181,040
December 124,996 139,180 149,643 176,551 177,904 247,227
Total 1,491,944 1,542,406 1,608,550 1,943,897 2,260,727 2,368,966
Note: Data for 2020 provisional Sources: Federal Statistics Office of Germany, AMI
Table 5: Germany: Export of biodiesel [FAME] (2015 – 2020) in t2015 2016 2017 2018 2019 2020
Belgium 120,899 89,366 84,487 132,413 264,411 344,593
Bulgaria 981 1 1 1 1 1,200
Denmark 39,953 43,271 88,317 39,511 27,269 24,667
Estonia . . 24 . . 1,890
Finland 855 8,512 12,734 9,156 2,626 609
France 182,315 85,006 76,339 64,945 53,701 69,678
Greece 29,623 12,581 40,016 50,581 107,902 67,028
Ireland 2,225 886 . . . 0
Italy 44,221 12,954 11,698 5,410 12,829 17,823
Croatia . . . . 500 2
Latvia 143 . . 50 0 242
Lithuania 769 407 1,198 660 977 1,920
Luxembourg 0 . 0 308 417 .
Malta 43 . . . . .
Netherlands 419,613 588,598 583,289 667,121 855,472 1,024,616
Austria 134,615 71,627 97,500 185,335 171,617 130,028
Poland 125,453 229,517 236,404 242,008 239,225 246,238
Portugal 0 9 8 8 4
Romania 0 11,912 0 0 0 3,935
Sweden 111,136 60,176 73,089 138,524 135,833 112,796
Slovakia 155 939 5,595 12,486 21,271 3,425
Slovenia 1,530 165 1,651 14,988 34,917 32,719
Spain 7,799 30,865 33,388 274 350 698
Czech Republic 120,092 98,446 88,212 61,155 56,036 26,308
Hungary 7,664 56 3,488 4,902 315 7,072
United Kingdom 25 6 2 3 1
Cyprus 81 . . . . .
EU-28 1,320,566 1,332,708 1,397,422 1,579,258 1,877,773 2,050,462
USA 10,870 84,953 70,091 197,412 183,250 164,062
Switzerland 17,813 45,321 70,152 97,819 83,865 79,358
Other countries 142,695 79,424 70,885 69,408 115,839 75,084
Total 1,491,944 1,542,406 1,608,550 1,943,897 2,260,727 2,368,966
Note: Data for 2020 provisionalSources: Federal Statistics Office of Germany, AMI
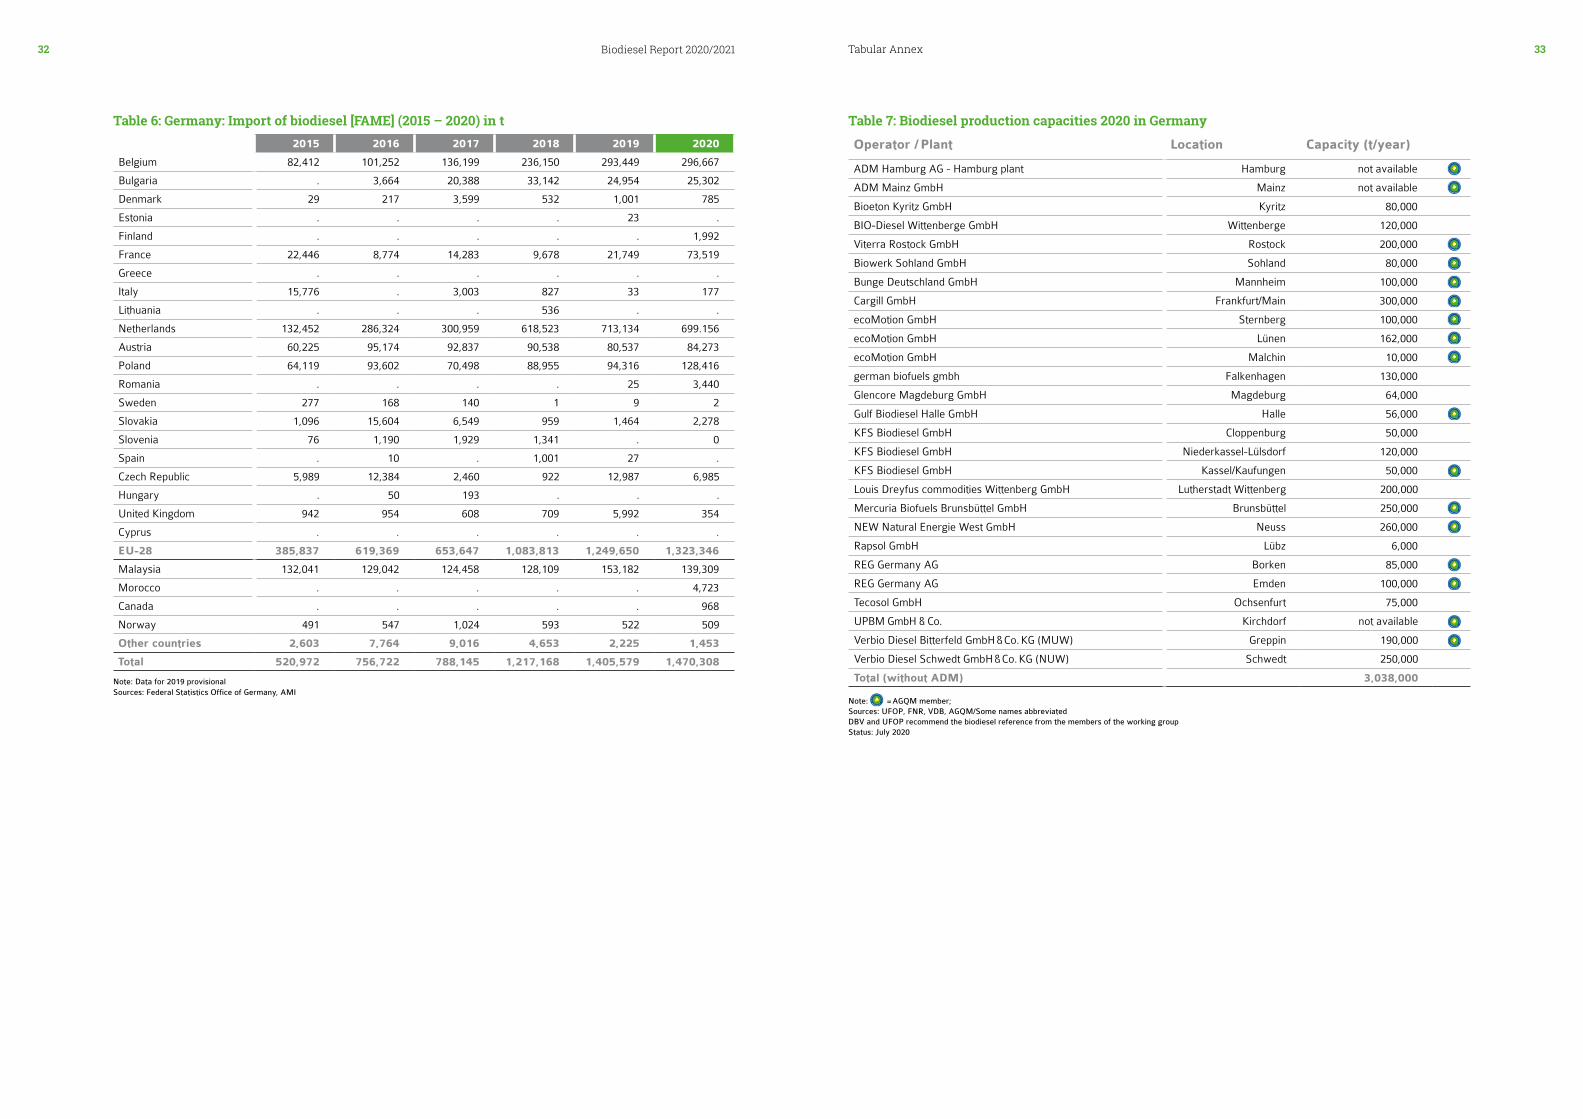
Tabular Annex32 33Biodiesel Report 2020/2021
Table 6: Germany: Import of biodiesel [FAME] (2015 – 2020) in t2015 2016 2017 2018 2019 2020
Belgium 82,412 101,252 136,199 236,150 293,449 296,667
Bulgaria . 3,664 20,388 33,142 24,954 25,302
Denmark 29 217 3,599 532 1,001 785
Estonia . . . . 23 .
Finland . . . . . 1,992
France 22,446 8,774 14,283 9,678 21,749 73,519
Greece . . . . . .
Italy 15,776 . 3,003 827 33 177
Lithuania . . . 536 . .
Netherlands 132,452 286,324 300,959 618,523 713,134 699.156
Austria 60,225 95,174 92,837 90,538 80,537 84,273
Poland 64,119 93,602 70,498 88,955 94,316 128,416
Romania . . . . 25 3,440
Sweden 277 168 140 1 9 2
Slovakia 1,096 15,604 6,549 959 1,464 2,278
Slovenia 76 1,190 1,929 1,341 . 0
Spain . 10 . 1,001 27 .
Czech Republic 5,989 12,384 2,460 922 12,987 6,985
Hungary . 50 193 . . .
United Kingdom 942 954 608 709 5,992 354
Cyprus . . . . . .
EU-28 385,837 619,369 653,647 1,083,813 1,249,650 1,323,346
Malaysia 132,041 129,042 124,458 128,109 153,182 139,309
Morocco . . . . . 4,723
Canada . . . . . 968
Norway 491 547 1,024 593 522 509
Other countries 2,603 7,764 9,016 4,653 2,225 1,453
Total 520,972 756,722 788,145 1,217,168 1,405,579 1,470,308
Note: Data for 2019 provisionalSources: Federal Statistics Office of Germany, AMI
Table 7: Biodiesel production capacities 2020 in Germany
Operator / Plant Location Capacity (t/year)
ADM Hamburg AG - Hamburg plant Hamburg not available
ADM Mainz GmbH Mainz not available
Bioeton Kyritz GmbH Kyritz 80,000
BIO-Diesel Wittenberge GmbH Wittenberge 120,000
Viterra Rostock GmbH Rostock 200,000
Biowerk Sohland GmbH Sohland 80,000
Bunge Deutschland GmbH Mannheim 100,000
Cargill GmbH Frankfurt/Main 300,000
ecoMotion GmbH Sternberg 100,000
ecoMotion GmbH Lünen 162,000
ecoMotion GmbH Malchin 10,000
german biofuels gmbh Falkenhagen 130,000
Glencore Magdeburg GmbH Magdeburg 64,000
Gulf Biodiesel Halle GmbH Halle 56,000
KFS Biodiesel GmbH Cloppenburg 50,000
KFS Biodiesel GmbH Niederkassel-Lülsdorf 120,000
KFS Biodiesel GmbH Kassel/Kaufungen 50,000
Louis Dreyfus commodities Wittenberg GmbH Lutherstadt Wittenberg 200,000
Mercuria Biofuels Brunsbüttel GmbH Brunsbüttel 250,000
NEW Natural Energie West GmbH Neuss 260,000
Rapsol GmbH Lübz 6,000
REG Germany AG Borken 85,000
REG Germany AG Emden 100,000
Tecosol GmbH Ochsenfurt 75,000
UPBM GmbH & Co. Kirchdorf not available
Verbio Diesel Bitterfeld GmbH & Co. KG (MUW) Greppin 190,000
Verbio Diesel Schwedt GmbH & Co. KG (NUW) Schwedt 250,000
Total (without ADM) 3,038,000
Note: = AGQM member; Sources: UFOP, FNR, VDB, AGQM/Some names abbreviatedDBV and UFOP recommend the biodiesel reference from the members of the working groupStatus: July 2020
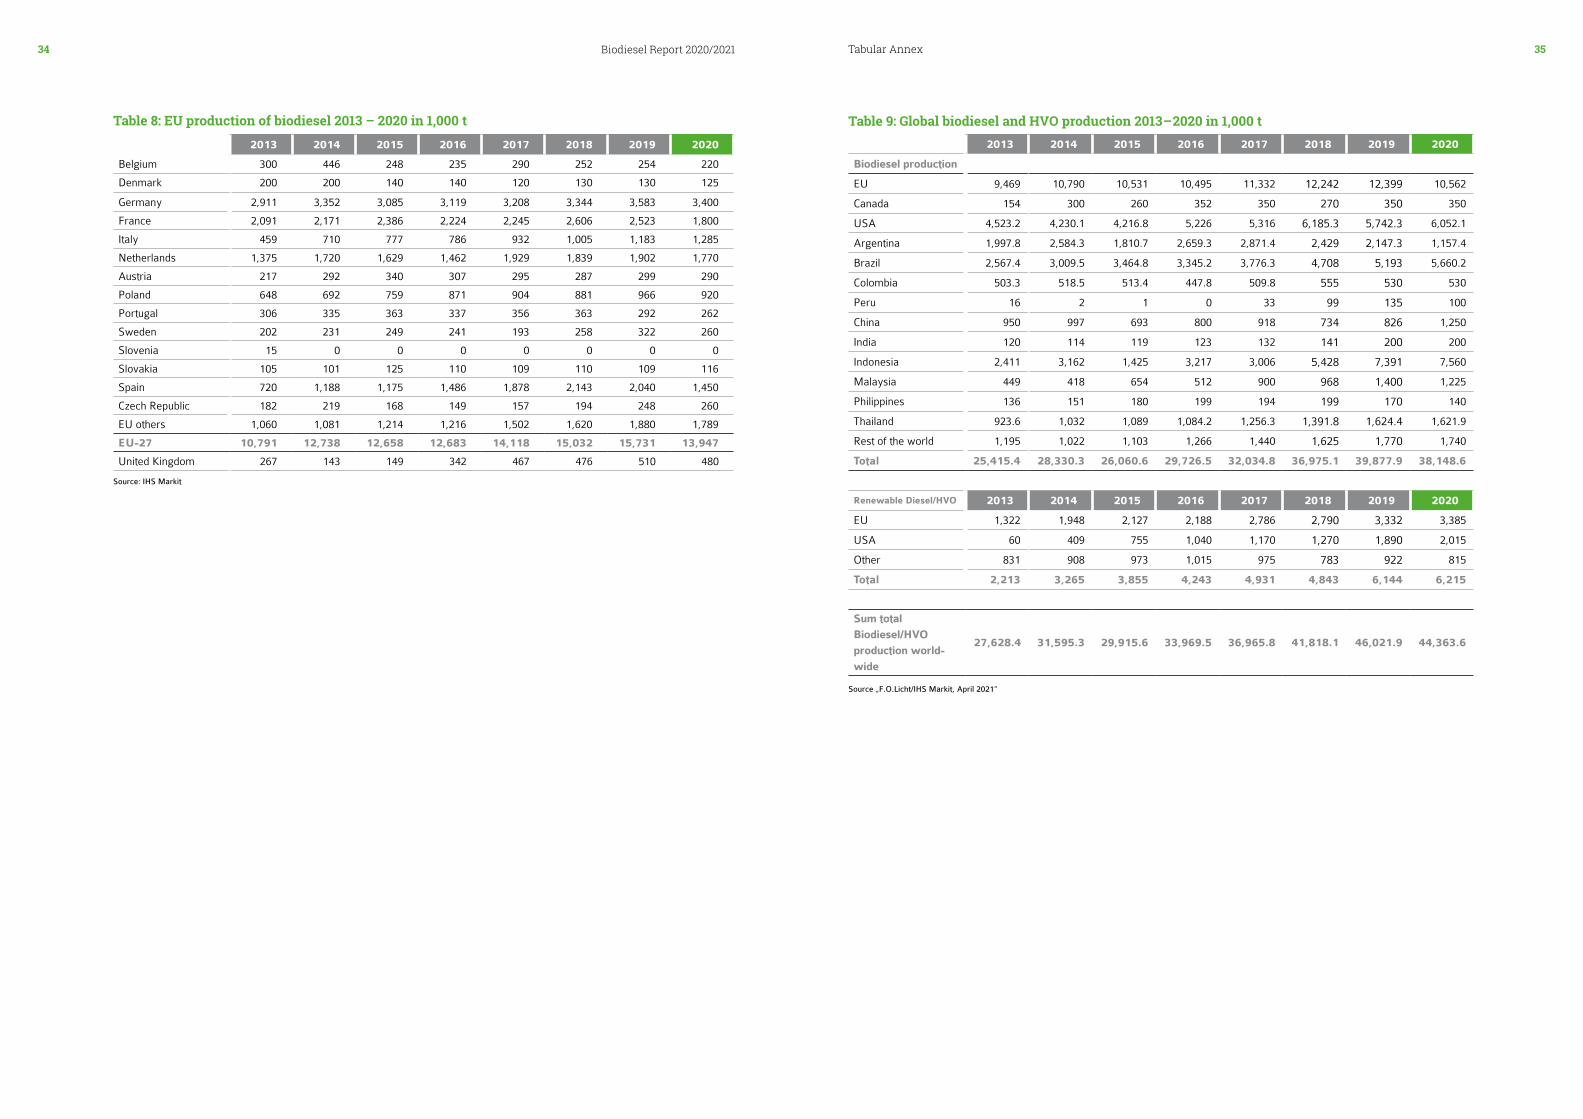
Tabular Annex34 35Biodiesel Report 2020/2021
Table 8: EU production of biodiesel 2013 – 2020 in 1,000 t
Source: IHS Markit
2013 2014 2015 2016 2017 2018 2019 2020
Belgium 300 446 248 235 290 252 254 220
Denmark 200 200 140 140 120 130 130 125
Germany 2,911 3,352 3,085 3,119 3,208 3,344 3,583 3,400
France 2,091 2,171 2,386 2,224 2,245 2,606 2,523 1,800
Italy 459 710 777 786 932 1,005 1,183 1,285
Netherlands 1,375 1,720 1,629 1,462 1,929 1,839 1,902 1,770
Austria 217 292 340 307 295 287 299 290
Poland 648 692 759 871 904 881 966 920
Portugal 306 335 363 337 356 363 292 262
Sweden 202 231 249 241 193 258 322 260
Slovenia 15 0 0 0 0 0 0 0
Slovakia 105 101 125 110 109 110 109 116
Spain 720 1,188 1,175 1,486 1,878 2,143 2,040 1,450
Czech Republic 182 219 168 149 157 194 248 260
EU others 1,060 1,081 1,214 1,216 1,502 1,620 1,880 1,789
EU-27 10,791 12,738 12,658 12,683 14,118 15,032 15,731 13,947
United Kingdom 267 143 149 342 467 476 510 480
2013 2014 2015 2016 2017 2018 2019 2020
Biodiesel production
EU 9,469 10,790 10,531 10,495 11,332 12,242 12,399 10,562
Canada 154 300 260 352 350 270 350 350
USA 4,523.2 4,230.1 4,216.8 5,226 5,316 6,185.3 5,742.3 6,052.1
Argentina 1,997.8 2,584.3 1,810.7 2,659.3 2,871.4 2,429 2,147.3 1,157.4
Brazil 2,567.4 3,009.5 3,464.8 3,345.2 3,776.3 4,708 5,193 5,660.2
Colombia 503.3 518.5 513.4 447.8 509.8 555 530 530
Peru 16 2 1 0 33 99 135 100
China 950 997 693 800 918 734 826 1,250
India 120 114 119 123 132 141 200 200
Indonesia 2,411 3,162 1,425 3,217 3,006 5,428 7,391 7,560
Malaysia 449 418 654 512 900 968 1,400 1,225
Philippines 136 151 180 199 194 199 170 140
Thailand 923.6 1,032 1,089 1,084.2 1,256.3 1,391.8 1,624.4 1,621.9
Rest of the world 1,195 1,022 1,103 1,266 1,440 1,625 1,770 1,740
Total 25,415.4 28,330.3 26,060.6 29,726.5 32,034.8 36,975.1 39,877.9 38,148.6
Renewable Diesel/HVO 2013 2014 2015 2016 2017 2018 2019 2020
EU 1,322 1,948 2,127 2,188 2,786 2,790 3,332 3,385
USA 60 409 755 1,040 1,170 1,270 1,890 2,015
Other 831 908 973 1,015 975 783 922 815
Total 2,213 3,265 3,855 4,243 4,931 4,843 6,144 6,215
Sum total Biodiesel/HVO production world-wide
27,628.4 31,595.3 29,915.6 33,969.5 36,965.8 41,818.1 46,021.9 44,363.6
Source „F.O.Licht/IHS Markit, April 2021“
Table 9: Global biodiesel and HVO production 2013 – 2020 in 1,000 t
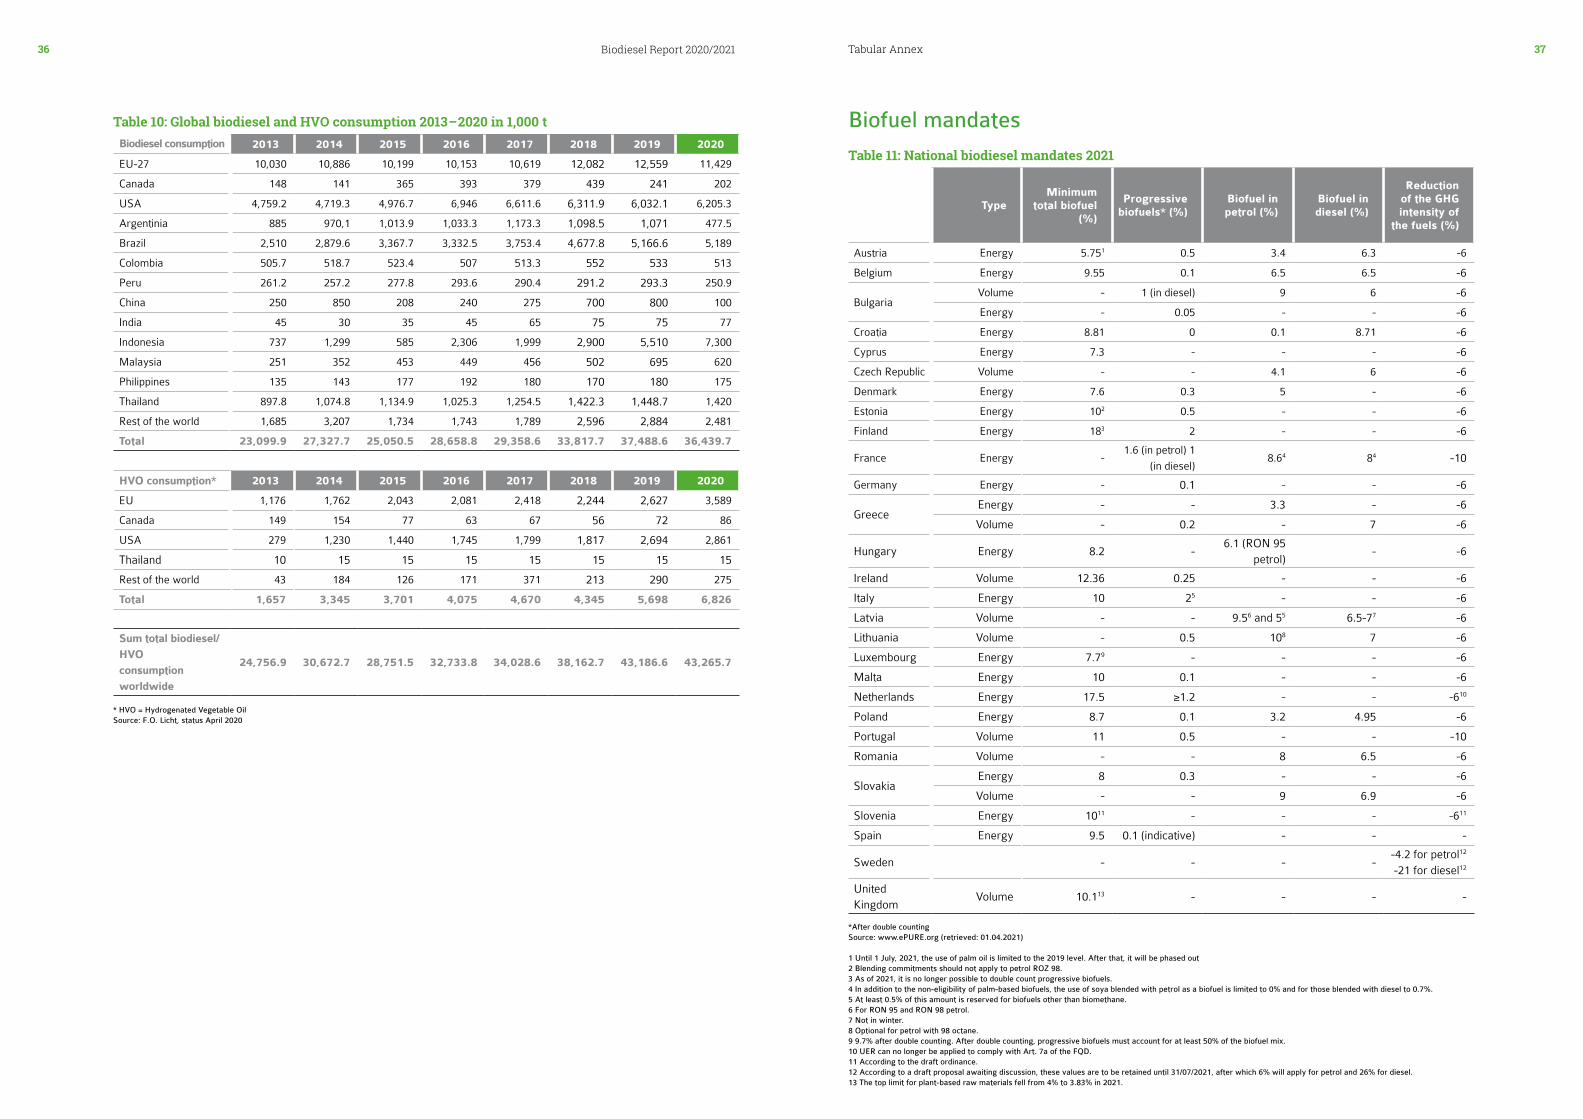
Tabular Annex36 37Biodiesel Report 2020/2021
Biodiesel consumption 2013 2014 2015 2016 2017 2018 2019 2020
EU-27 10,030 10,886 10,199 10,153 10,619 12,082 12,559 11,429
Canada 148 141 365 393 379 439 241 202
USA 4,759.2 4,719.3 4,976.7 6,946 6,611.6 6,311.9 6,032.1 6,205.3
Argentinia 885 970,1 1,013.9 1,033.3 1,173.3 1,098.5 1,071 477.5
Brazil 2,510 2,879.6 3,367.7 3,332.5 3,753.4 4,677.8 5,166.6 5,189
Colombia 505.7 518.7 523.4 507 513.3 552 533 513
Peru 261.2 257.2 277.8 293.6 290.4 291.2 293.3 250.9
China 250 850 208 240 275 700 800 100
India 45 30 35 45 65 75 75 77
Indonesia 737 1,299 585 2,306 1,999 2,900 5,510 7,300
Malaysia 251 352 453 449 456 502 695 620
Philippines 135 143 177 192 180 170 180 175
Thailand 897.8 1,074.8 1,134.9 1,025.3 1,254.5 1,422.3 1,448.7 1,420
Rest of the world 1,685 3,207 1,734 1,743 1,789 2,596 2,884 2,481
Total 23,099.9 27,327.7 25,050.5 28,658.8 29,358.6 33,817.7 37,488.6 36,439.7
HVO consumption* 2013 2014 2015 2016 2017 2018 2019 2020
EU 1,176 1,762 2,043 2,081 2,418 2,244 2,627 3,589
Canada 149 154 77 63 67 56 72 86
USA 279 1,230 1,440 1,745 1,799 1,817 2,694 2,861
Thailand 10 15 15 15 15 15 15 15
Rest of the world 43 184 126 171 371 213 290 275
Total 1,657 3,345 3,701 4,075 4,670 4,345 5,698 6,826
Sum total biodiesel/HVO consumption worldwide
24,756.9 30,672.7 28,751.5 32,733.8 34,028.6 38,162.7 43,186.6 43,265.7
* HVO = Hydrogenated Vegetable Oil Source: F.O. Licht, status April 2020
Table 10: Global biodiesel and HVO consumption 2013 – 2020 in 1,000 t
Table 11: National biodiesel mandates 2021
Biofuel mandates
TypeMinimum
total biofuel (%)
Progressive biofuels* (%)
Biofuel in petrol (%)
Biofuel in diesel (%)
Reduction of the GHG intensity of
the fuels (%)
Austria Energy 5.751 0.5 3.4 6.3 -6
Belgium Energy 9.55 0.1 6.5 6.5 -6
BulgariaVolume - 1 (in diesel) 9 6 -6
Energy - 0.05 - - -6
Croatia Energy 8.81 0 0.1 8.71 -6
Cyprus Energy 7.3 - - - -6
Czech Republic Volume - - 4.1 6 -6
Denmark Energy 7.6 0.3 5 - -6
Estonia Energy 102 0.5 - - -6
Finland Energy 183 2 - - -6
France Energy -1.6 (in petrol) 1
(in diesel)8.64 84 -10
Germany Energy - 0.1 - - -6
GreeceEnergy - - 3.3 - -6
Volume - 0.2 - 7 -6
Hungary Energy 8.2 -6.1 (RON 95
petrol)- -6
Ireland Volume 12.36 0.25 - - -6
Italy Energy 10 25 - - -6
Latvia Volume - - 9.56 and 55 6.5-77 -6
Lithuania Volume - 0.5 108 7 -6
Luxembourg Energy 7.79 - - - -6
Malta Energy 10 0.1 - - -6
Netherlands Energy 17.5 ≥1.2 - - -610
Poland Energy 8.7 0.1 3.2 4.95 -6
Portugal Volume 11 0.5 - - -10
Romania Volume - - 8 6.5 -6
SlovakiaEnergy 8 0.3 - - -6
Volume - - 9 6.9 -6
Slovenia Energy 1011 - - - -611
Spain Energy 9.5 0.1 (indicative) - - -
Sweden - - - --4.2 for petrol12 -21 for diesel12
United Kingdom
Volume 10.113 - - - -
*After double countingSource: www.ePURE.org (retrieved: 01.04.2021)
1 Until 1 July, 2021, the use of palm oil is limited to the 2019 level. After that, it will be phased out2 Blending commitments should not apply to petrol ROZ 98.3 As of 2021, it is no longer possible to double count progressive biofuels.4 In addition to the non-eligibility of palm-based biofuels, the use of soya blended with petrol as a biofuel is limited to 0% and for those blended with diesel to 0.7%.5 At least 0.5% of this amount is reserved for biofuels other than biomethane.6 For RON 95 and RON 98 petrol.7 Not in winter.8 Optional for petrol with 98 octane.9 9.7% after double counting. After double counting, progressive biofuels must account for at least 50% of the biofuel mix.10 UER can no longer be applied to comply with Art. 7a of the FQD.11 According to the draft ordinance.12 According to a draft proposal awaiting discussion, these values are to be retained until 31/07/2021, after which 6% will apply for petrol and 26% for diesel.13 The top limit for plant-based raw materials fell from 4% to 3.83% in 2021.
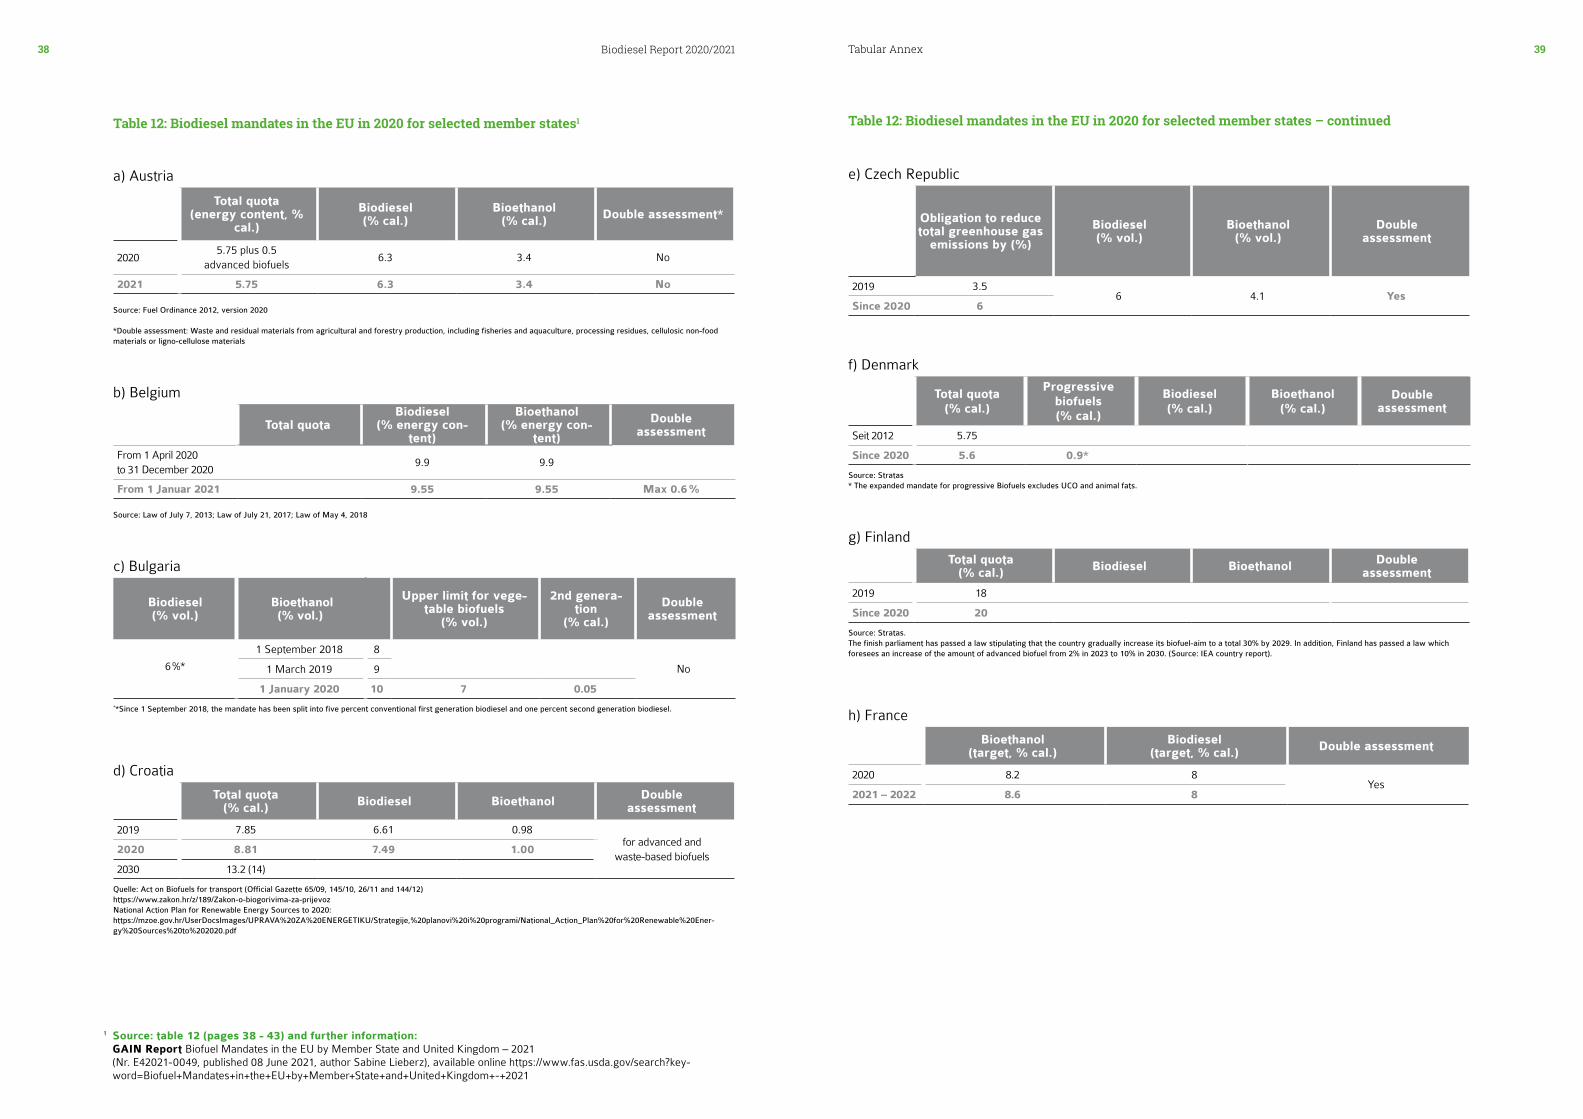
Tabular Annex38 39Biodiesel Report 2020/2021
b) Belgium
Total quota Biodiesel
(% energy con-tent)
Bioethanol(% energy con-
tent)
Double assessment
From 1 April 2020 to 31 December 2020
9.9 9.9
From 1 Januar 2021 9.55 9.55 Max 0.6 % Source: Law of July 7, 2013; Law of July 21, 2017; Law of May 4, 2018
a) Austria
Total quota (energy content, %
cal.)
Biodiesel(% cal.)
Bioethanol(% cal.) Double assessment*
20205.75 plus 0.5
advanced biofuels6.3 3.4 No
2021 5.75 6.3 3.4 No Source: Fuel Ordinance 2012, version 2020
*Double assessment: Waste and residual materials from agricultural and forestry production, including fisheries and aquaculture, processing residues, cellulosic non-food materials or ligno-cellulose materials
c) Bulgaria
Biodiesel (% vol.)
Bioethanol (% vol.)
Upper limit for vege-table biofuels
(% vol.)
2nd genera-tion
(% cal.)
Double assessment
1 September 2018 8
No6 %* 1 March 2019 9
1 January 2020 10 7 0.05**Since 1 September 2018, the mandate has been split into five percent conventional first generation biodiesel and one percent second generation biodiesel.
Source: table 12 (pages 38 - 43) and further information: GAIN Report Biofuel Mandates in the EU by Member State and United Kingdom – 2021 (Nr. E42021-0049, published 08 June 2021, author Sabine Lieberz), available online https://www.fas.usda.gov/search?key-word=Biofuel+Mandates+in+the+EU+by+Member+State+and+United+Kingdom+-+2021
1
Table 12: Biodiesel mandates in the EU in 2020 for selected member states1
d) Croatia
Total quota (% cal.) Biodiesel Bioethanol Double
assessment
2019 7.85 6.61 0.98for advanced and
waste-based biofuels2020 8.81 7.49 1.00
2030 13.2 (14)
Quelle: Act on Biofuels for transport (Official Gazette 65/09, 145/10, 26/11 and 144/12) https://www.zakon.hr/z/189/Zakon-o-biogorivima-za-prijevoz National Action Plan for Renewable Energy Sources to 2020: https://mzoe.gov.hr/UserDocsImages/UPRAVA%20ZA%20ENERGETIKU/Strategije,%20planovi%20i%20programi/National_Action_Plan%20for%20Renewable%20Ener-gy%20Sources%20to%202020.pdf
Table 12: Biodiesel mandates in the EU in 2020 for selected member states – continued
g) Finland
Total quota (% cal.) Biodiesel Bioethanol Double
assessment
2019 18
Since 2020 20
Source: Stratas. The finish parliament has passed a law stipulating that the country gradually increase its biofuel-aim to a total 30% by 2029. In addition, Finland has passed a law which foresees an increase of the amount of advanced biofuel from 2% in 2023 to 10% in 2030. (Source: IEA country report).
f) Denmark
Total quota (% cal.)
Progressive biofuels (% cal.)
Biodiesel (% cal.)
Bioethanol (% cal.)
Double assessment
Seit 2012 5.75
Since 2020 5.6 0.9*
Source: Stratas * The expanded mandate for progressive Biofuels excludes UCO and animal fats.
e) Czech Republic
Obligation to reduce total greenhouse gas
emissions by (%)
Biodiesel(% vol.)
Bioethanol(% vol.)
Double assessment
2019 3.56 4.1 Yes
Since 2020 6
h) France
Bioethanol(target, % cal.)
Biodiesel(target, % cal.) Double assessment
2020 8.2 8Yes
2021 – 2022 8.6 8
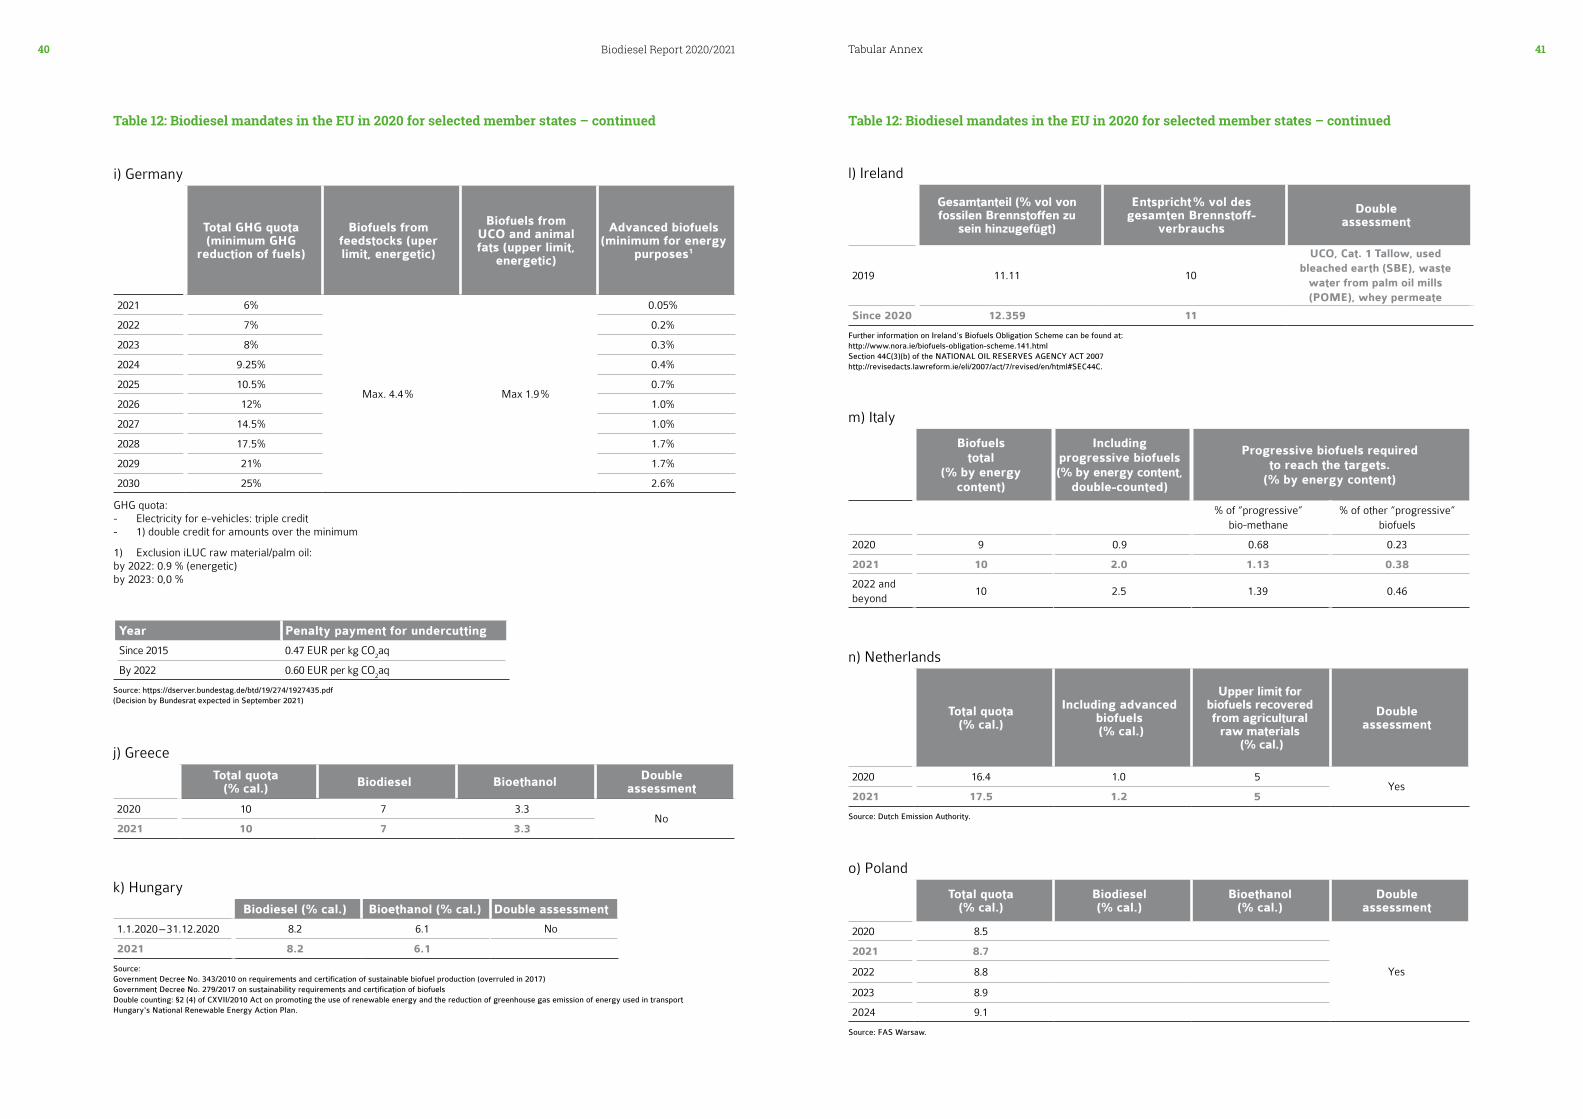
Tabular Annex40 41Biodiesel Report 2020/2021
Table 12: Biodiesel mandates in the EU in 2020 for selected member states – continued
j) Greece
Total quota (% cal.) Biodiesel Bioethanol Double
assessment
2020 10 7 3.3No
2021 10 7 3.3
Year Penalty payment for undercutting
Since 2015 0.47 EUR per kg CO2aq
By 2022 0.60 EUR per kg CO2aq
Source: https://dserver.bundestag.de/btd/19/274/1927435.pdf (Decision by Bundesrat expected in September 2021)
k) Hungary
Biodiesel (% cal.) Bioethanol (% cal.) Double assessment
1.1.2020 – 31.12.2020 8.2 6.1 No
2021 8.2 6.1
Source: Government Decree No. 343/2010 on requirements and certification of sustainable biofuel production (overruled in 2017) Government Decree No. 279/2017 on sustainability requirements and certification of biofuels Double counting: §2 (4) of CXVII/2010 Act on promoting the use of renewable energy and the reduction of greenhouse gas emission of energy used in transport Hungary's National Renewable Energy Action Plan.
i) Germany
Total GHG quota (minimum GHG
reduction of fuels)
Biofuels from feedstocks (uper limit, energetic)
Biofuels from UCO and animal fats (upper limit,
energetic)
Advanced biofuels (minimum for energy
purposes1
2021 6%
Max. 4.4 % Max 1.9 %
0.05%
2022 7% 0.2%
2023 8% 0.3%
2024 9.25% 0.4%
2025 10.5% 0.7%
2026 12% 1.0%
2027 14.5% 1.0%
2028 17.5% 1.7%
2029 21% 1.7%
2030 25% 2.6%
GHG quota: - Electricity for e-vehicles: triple credit - 1) double credit for amounts over the minimum
1) Exclusion iLUC raw material/palm oil: by 2022: 0.9 % (energetic) by 2023: 0,0 %
Table 12: Biodiesel mandates in the EU in 2020 for selected member states – continued
n) Netherlands
Total quota (% cal.)
Including advanced biofuels (% cal.)
Upper limit forbiofuels recoveredfrom agricultural
raw materials (% cal.)
Double assessment
2020 16.4 1.0 5Yes
2021 17.5 1.2 5
Source: Dutch Emission Authority.
m) Italy
Biofuelstotal
(% by energycontent)
Including progressive biofuels(% by energy content,
double-counted)
Progressive biofuels required to reach the targets.
(% by energy content)
% of “progressive”bio-methane
% of other “progressive”biofuels
2020 9 0.9 0.68 0.23
2021 10 2.0 1.13 0.38
2022 and beyond
10 2.5 1.39 0.46
l) Ireland
Gesamtanteil (% vol von fossilen Brennstoffen zu
sein hinzugefügt)
Entspricht % vol des gesamten Brennstoff-
verbrauchs
Double assessment
2019 11.11 10
UCO, Cat. 1 Tallow, usedbleached earth (SBE), waste
water from palm oil mills(POME), whey permeate
Since 2020 12.359 11
Further information on Ireland’s Biofuels Obligation Scheme can be found at: http://www.nora.ie/biofuels-obligation-scheme.141.html Section 44C(3)(b) of the NATIONAL OIL RESERVES AGENCY ACT 2007 http://revisedacts.lawreform.ie/eli/2007/act/7/revised/en/html#SEC44C.
o) Poland
Total quota (% cal.)
Biodiesel(% cal.)
Bioethanol(% cal.)
Double assessment
2020 8.5
Yes
2021 8.7
2022 8.8
2023 8.9
2024 9.1
Source: FAS Warsaw.
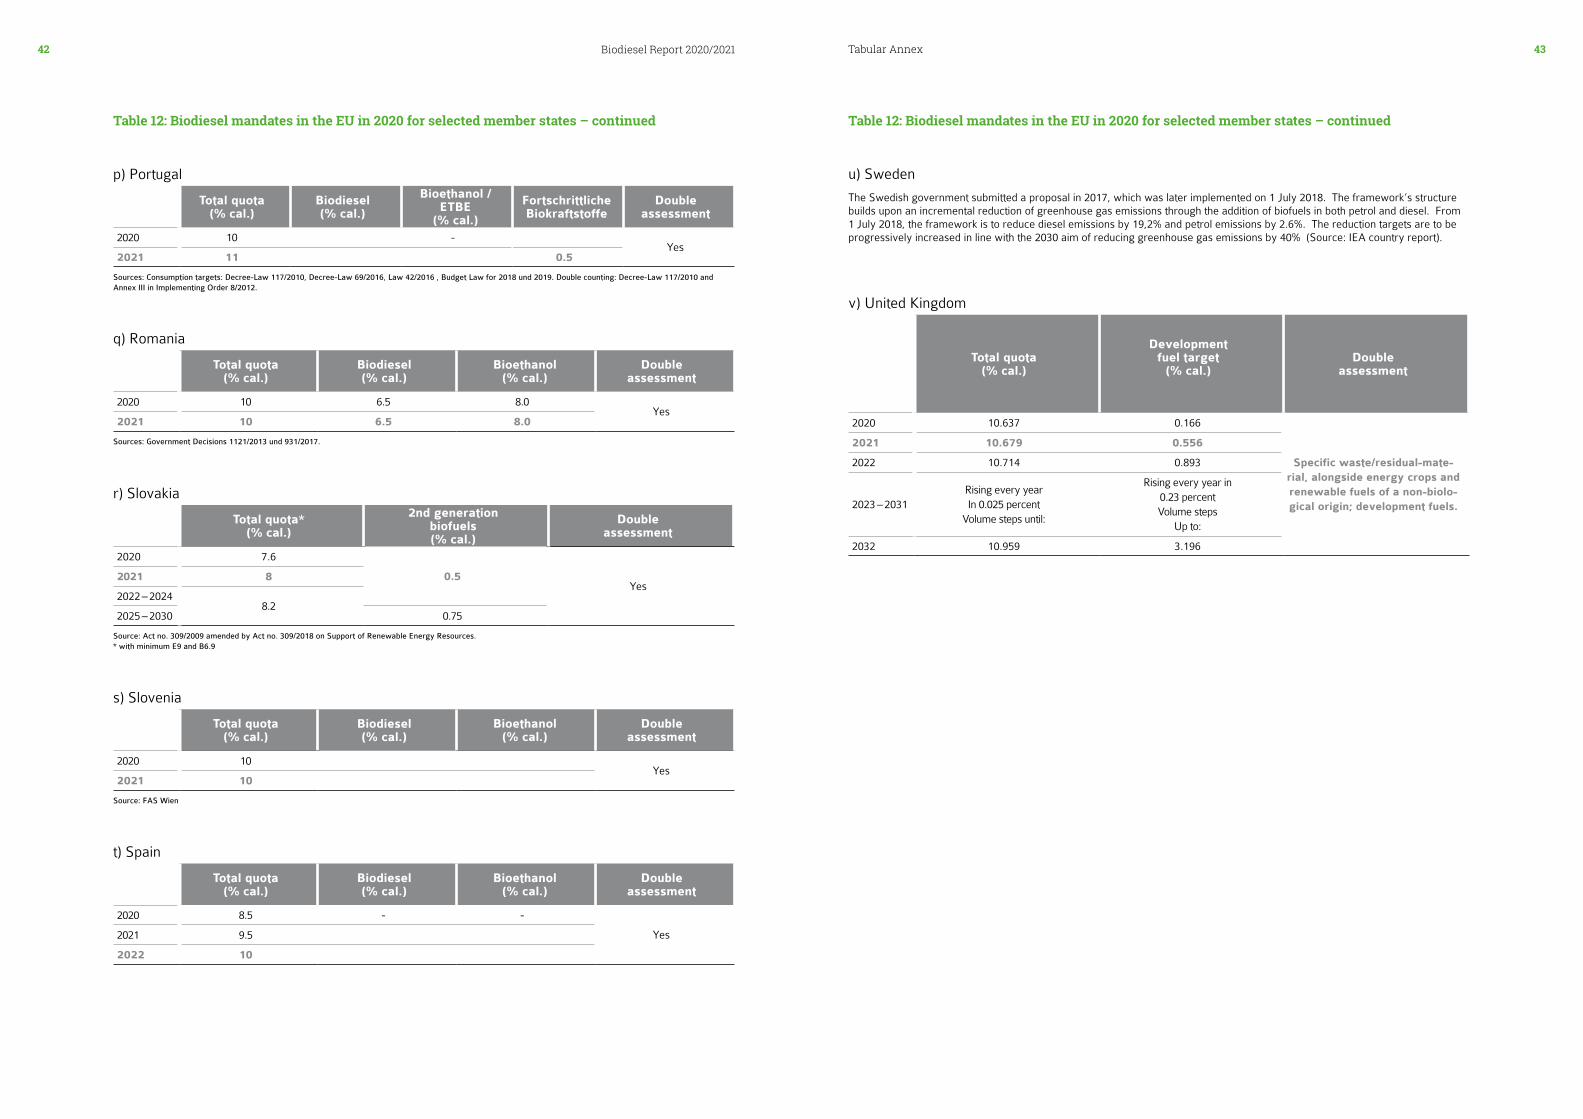
Tabular Annex42 43Biodiesel Report 2020/2021
Table 12: Biodiesel mandates in the EU in 2020 for selected member states – continued
p) Portugal
Total quota (% cal.)
Biodiesel(% cal.)
Bioethanol / ETBE
(% cal.)
Fortschrittliche Biokraftstoffe
Double assessment
2020 10 -Yes
2021 11 0.5
Sources: Consumption targets: Decree-Law 117/2010, Decree-Law 69/2016, Law 42/2016 , Budget Law for 2018 und 2019. Double counting: Decree-Law 117/2010 and Annex III in Implementing Order 8/2012.
q) Romania
Total quota (% cal.)
Biodiesel(% cal.)
Bioethanol(% cal.)
Double assessment
2020 10 6.5 8.0Yes
2021 10 6.5 8.0
Sources: Government Decisions 1121/2013 und 931/2017.
s) Slovenia
Total quota (% cal.)
Biodiesel(% cal.)
Bioethanol(% cal.)
Double assessment
2020 10Yes
2021 10
Source: FAS Wien
r) Slovakia
Total quota* (% cal.)
2nd generation biofuels(% cal.)
Double assessment
2020 7.6
0.5Yes
2021 8
2022 – 20248.2
2025 – 2030 0.75
Source: Act no. 309/2009 amended by Act no. 309/2018 on Support of Renewable Energy Resources. * with minimum E9 and B6.9
t) Spain
Total quota (% cal.)
Biodiesel(% cal.)
Bioethanol(% cal.)
Double assessment
2020 8.5 - -
Yes2021 9.5
2022 10
Table 12: Biodiesel mandates in the EU in 2020 for selected member states – continued
v) United Kingdom
Total quota (% cal.)
Development fuel target
(% cal.)Double
assessment
2020 10.637 0.166
Specific waste/residual-mate-rial, alongside energy crops and renewable fuels of a non-biolo-gical origin; development fuels.
2021 10.679 0.556
2022 10.714 0.893
2023 – 2031Rising every year In 0.025 percent
Volume steps until:
Rising every year in0.23 percentVolume steps
Up to:
2032 10.959 3.196
u) Sweden
The Swedish government submitted a proposal in 2017, which was later implemented on 1 July 2018. The framework’s structure builds upon an incremental reduction of greenhouse gas emissions through the addition of biofuels in both petrol and diesel. From 1 July 2018, the framework is to reduce diesel emissions by 19,2% and petrol emissions by 2.6%. The reduction targets are to be progressively increased in line with the 2030 aim of reducing greenhouse gas emissions by 40% (Source: IEA country report).
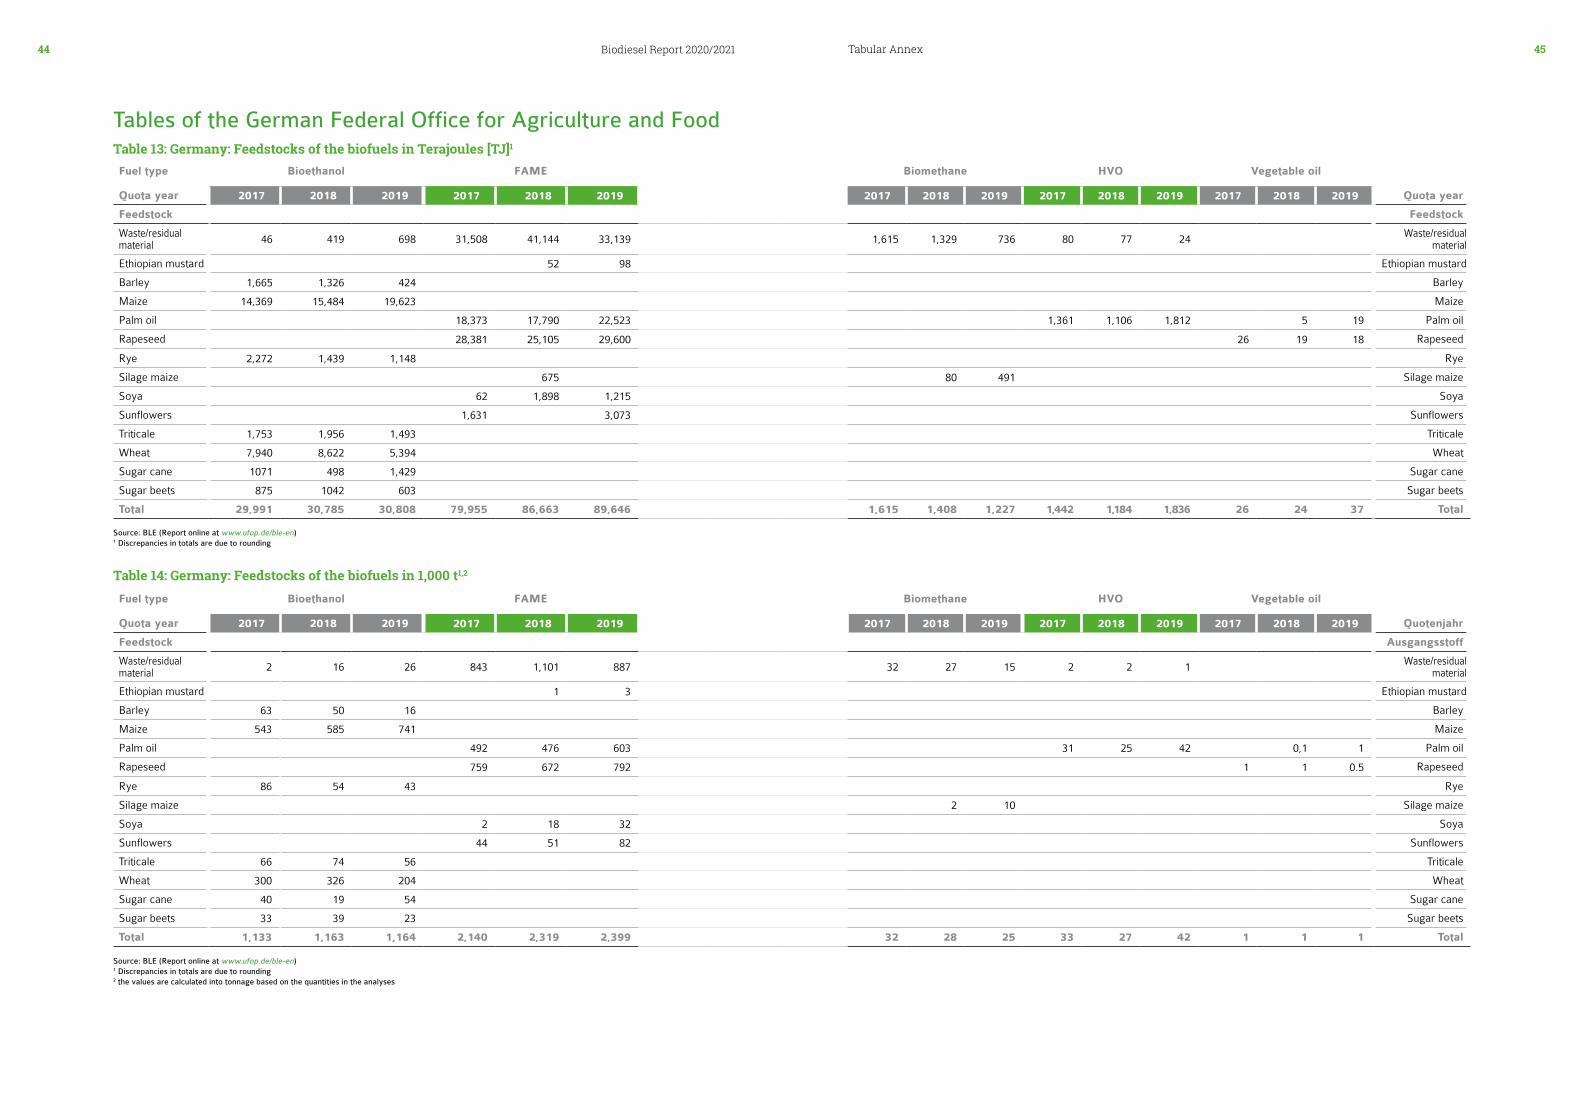
Tabular Annex44 45Biodiesel Report 2020/2021
Fuel type Bioethanol FAME Biomethane HVO Vegetable oil
Quota year 2017 2018 2019 2017 2018 2019 2017 2018 2019 2017 2018 2019 2017 2018 2019 Quota year
Feedstock Feedstock
Waste/residual material 46 419 698 31,508 41,144 33,139 1,615 1,329 736 80 77 24 Waste/residual
material
Ethiopian mustard 52 98 Ethiopian mustard
Barley 1,665 1,326 424 Barley
Maize 14,369 15,484 19,623 Maize
Palm oil 18,373 17,790 22,523 1,361 1,106 1,812 5 19 Palm oil
Rapeseed 28,381 25,105 29,600 26 19 18 Rapeseed
Rye 2,272 1,439 1,148 Rye
Silage maize 675 80 491 Silage maize
Soya 62 1,898 1,215 Soya
Sunflowers 1,631 3,073 Sunflowers
Triticale 1,753 1,956 1,493 Triticale
Wheat 7,940 8,622 5,394 Wheat
Sugar cane 1071 498 1,429 Sugar cane
Sugar beets 875 1042 603 Sugar beets
Total 29,991 30,785 30,808 79,955 86,663 89,646 1,615 1,408 1,227 1,442 1,184 1,836 26 24 37 Total
Fuel type Bioethanol FAME Biomethane HVO Vegetable oil
Quota year 2017 2018 2019 2017 2018 2019 2017 2018 2019 2017 2018 2019 2017 2018 2019 Quotenjahr
Feedstock Ausgangsstoff
Waste/residual material 2 16 26 843 1,101 887 32 27 15 2 2 1 Waste/residual
material
Ethiopian mustard 1 3 Ethiopian mustard
Barley 63 50 16 Barley
Maize 543 585 741 Maize
Palm oil 492 476 603 31 25 42 0,1 1 Palm oil
Rapeseed 759 672 792 1 1 0.5 Rapeseed
Rye 86 54 43 Rye
Silage maize 2 10 Silage maize
Soya 2 18 32 Soya
Sunflowers 44 51 82 Sunflowers
Triticale 66 74 56 Triticale
Wheat 300 326 204 Wheat
Sugar cane 40 19 54 Sugar cane
Sugar beets 33 39 23 Sugar beets
Total 1,133 1,163 1,164 2,140 2,319 2,399 32 28 25 33 27 42 1 1 1 Total
Table 14: Germany: Feedstocks of the biofuels in 1,000 t1,2
Tables of the German Federal Office for Agriculture and FoodTable 13: Germany: Feedstocks of the biofuels in Terajoules [TJ]1
Source: BLE (Report online at www.ufop.de/ble-en)1 Discrepancies in totals are due to rounding2 the values are calculated into tonnage based on the quantities in the analyses
Source: BLE (Report online at www.ufop.de/ble-en)1 Discrepancies in totals are due to rounding
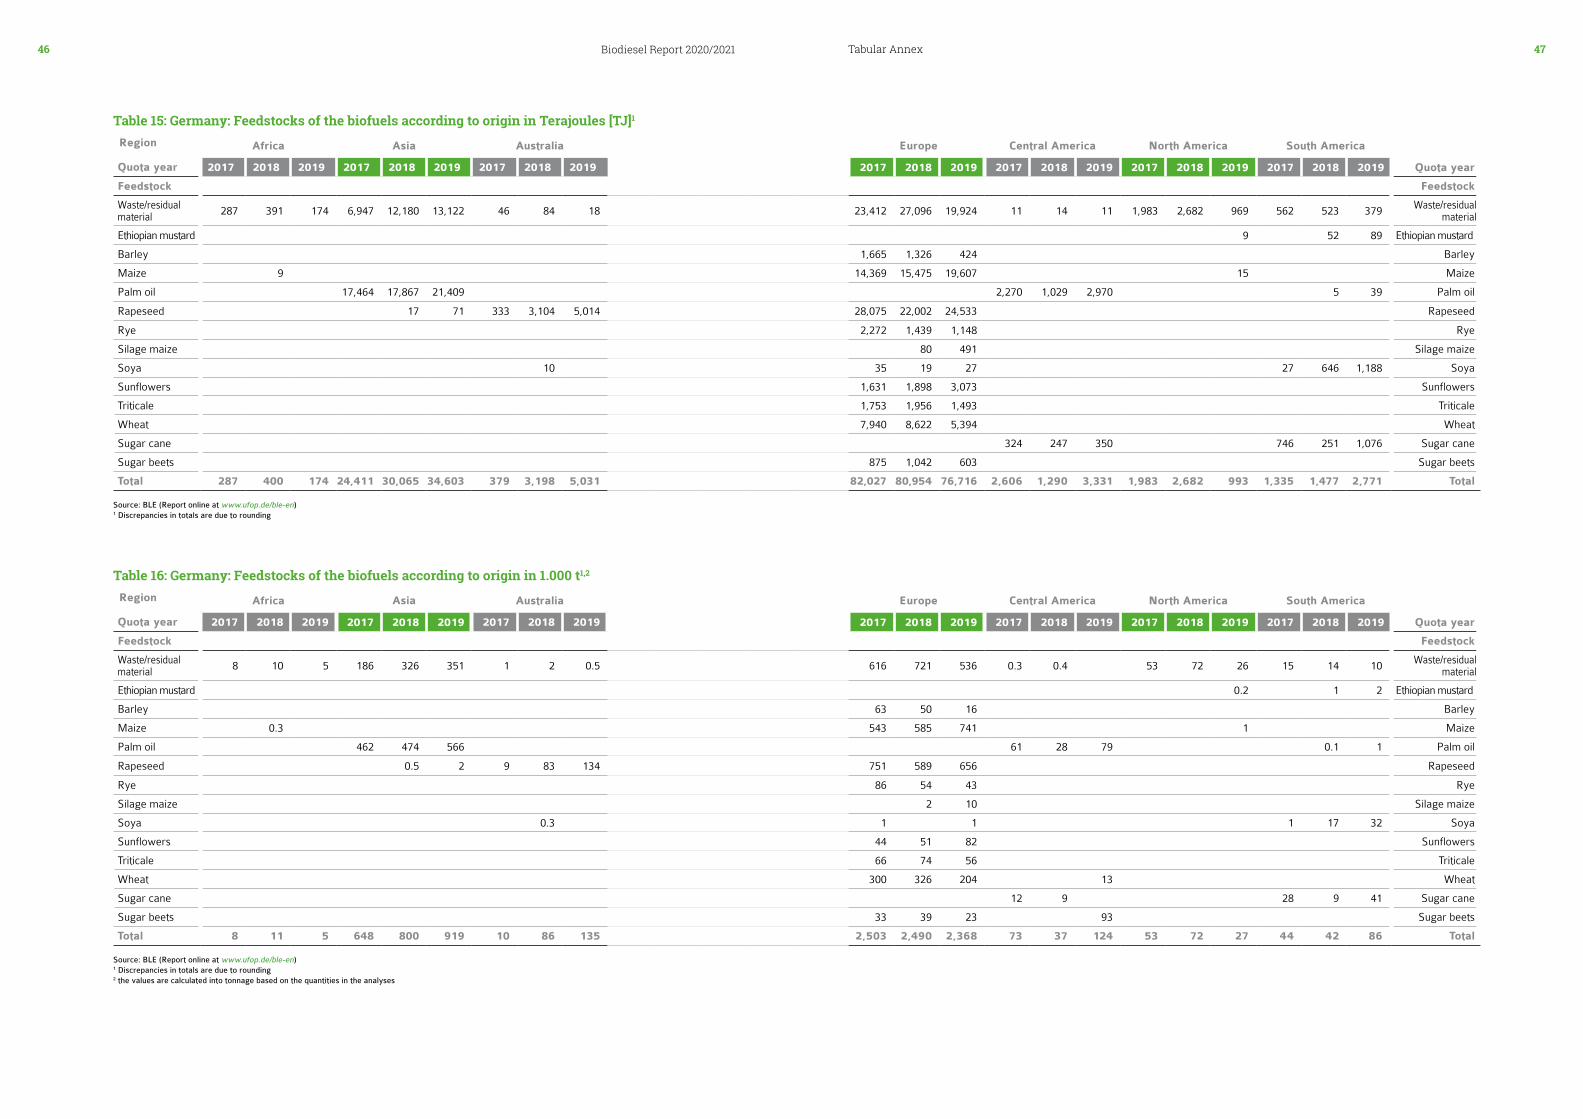
Tabular Annex46 47Biodiesel Report 2020/2021
Region Africa Asia Australia Europe Central America North America South America
Quota year 2017 2018 2019 2017 2018 2019 2017 2018 2019 2017 2018 2019 2017 2018 2019 2017 2018 2019 2017 2018 2019 Quota year
Feedstock Feedstock
Waste/residual material 287 391 174 6,947 12,180 13,122 46 84 18 23,412 27,096 19,924 11 14 11 1,983 2,682 969 562 523 379 Waste/residual
material
Ethiopian mustard 9 52 89 Ethiopian mustard
Barley 1,665 1,326 424 Barley
Maize 9 14,369 15,475 19,607 15 Maize
Palm oil 17,464 17,867 21,409 2,270 1,029 2,970 5 39 Palm oil
Rapeseed 17 71 333 3,104 5,014 28,075 22,002 24,533 Rapeseed
Rye 2,272 1,439 1,148 Rye
Silage maize 80 491 Silage maize
Soya 10 35 19 27 27 646 1,188 Soya
Sunflowers 1,631 1,898 3,073 Sunflowers
Triticale 1,753 1,956 1,493 Triticale
Wheat 7,940 8,622 5,394 Wheat
Sugar cane 324 247 350 746 251 1,076 Sugar cane
Sugar beets 875 1,042 603 Sugar beets
Total 287 400 174 24,411 30,065 34,603 379 3,198 5,031 82,027 80,954 76,716 2,606 1,290 3,331 1,983 2,682 993 1,335 1,477 2,771 Total
Region Africa Asia Australia Europe Central America North America South America
Quota year 2017 2018 2019 2017 2018 2019 2017 2018 2019 2017 2018 2019 2017 2018 2019 2017 2018 2019 2017 2018 2019 Quota year
Feedstock Feedstock
Waste/residual material 8 10 5 186 326 351 1 2 0.5 616 721 536 0.3 0.4 53 72 26 15 14 10 Waste/residual
material
Ethiopian mustard 0.2 1 2 Ethiopian mustard
Barley 63 50 16 Barley
Maize 0.3 543 585 741 1 Maize
Palm oil 462 474 566 61 28 79 0.1 1 Palm oil
Rapeseed 0.5 2 9 83 134 751 589 656 Rapeseed
Rye 86 54 43 Rye
Silage maize 2 10 Silage maize
Soya 0.3 1 1 1 17 32 Soya
Sunflowers 44 51 82 Sunflowers
Triticale 66 74 56 Triticale
Wheat 300 326 204 13 Wheat
Sugar cane 12 9 28 9 41 Sugar cane
Sugar beets 33 39 23 93 Sugar beets
Total 8 11 5 648 800 919 10 86 135 2,503 2,490 2,368 73 37 124 53 72 27 44 42 86 Total
Table 15: Germany: Feedstocks of the biofuels according to origin in Terajoules [TJ]1
Source: BLE (Report online at www.ufop.de/ble-en)1 Discrepancies in totals are due to rounding
Source: BLE (Report online at www.ufop.de/ble-en)1 Discrepancies in totals are due to rounding2 the values are calculated into tonnage based on the quantities in the analyses
Table 16: Germany: Feedstocks of the biofuels according to origin in 1.000 t1,2
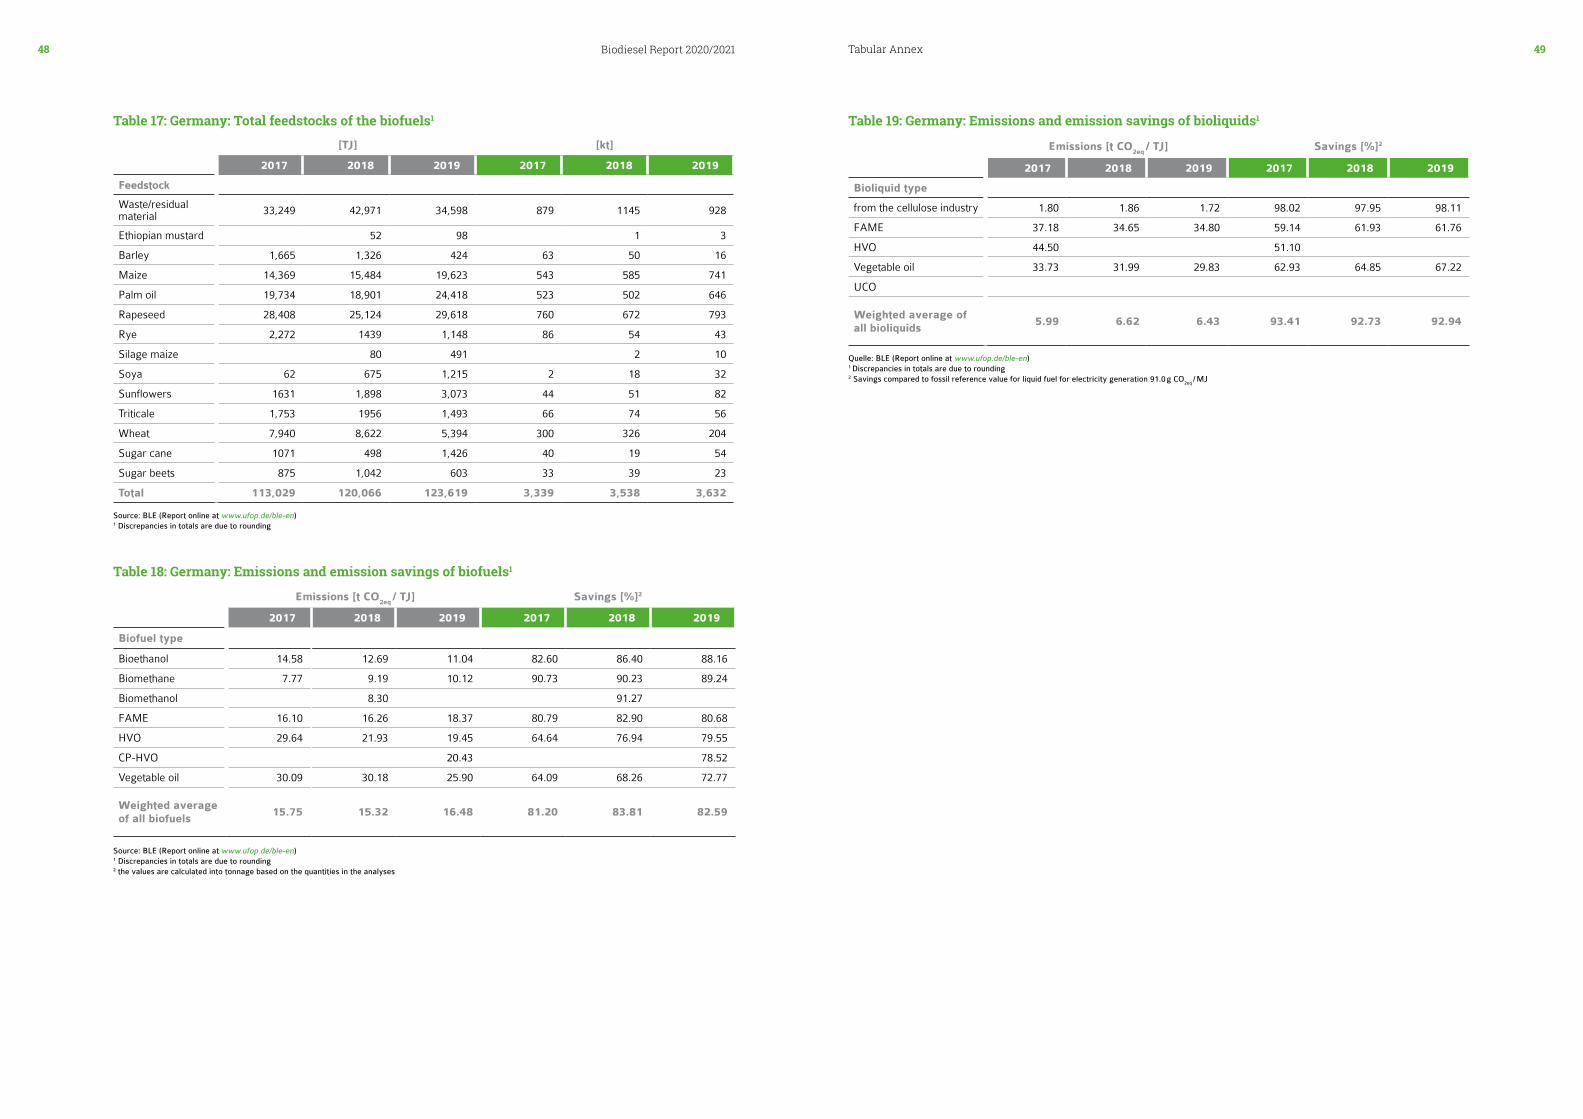
Tabular Annex48 49Biodiesel Report 2020/2021
Emissions [t CO2eq
/ TJ] Savings [%]2
2017 2018 2019 2017 2018 2019
Biofuel type
Bioethanol 14.58 12.69 11.04 82.60 86.40 88.16
Biomethane 7.77 9.19 10.12 90.73 90.23 89.24
Biomethanol 8.30 91.27
FAME 16.10 16.26 18.37 80.79 82.90 80.68
HVO 29.64 21.93 19.45 64.64 76.94 79.55
CP-HVO 20.43 78.52
Vegetable oil 30.09 30.18 25.90 64.09 68.26 72.77
Weighted average of all biofuels
15.75 15.32 16.48 81.20 83.81 82.59
Table 18: Germany: Emissions and emission savings of biofuels1
Table 17: Germany: Total feedstocks of the biofuels1
[TJ] [kt]
2017 2018 2019 2017 2018 2019
Feedstock
Waste/residual material 33,249 42,971 34,598 879 1145 928
Ethiopian mustard 52 98 1 3
Barley 1,665 1,326 424 63 50 16
Maize 14,369 15,484 19,623 543 585 741
Palm oil 19,734 18,901 24,418 523 502 646
Rapeseed 28,408 25,124 29,618 760 672 793
Rye 2,272 1439 1,148 86 54 43
Silage maize 80 491 2 10
Soya 62 675 1,215 2 18 32
Sunflowers 1631 1,898 3,073 44 51 82
Triticale 1,753 1956 1,493 66 74 56
Wheat 7,940 8,622 5,394 300 326 204
Sugar cane 1071 498 1,426 40 19 54
Sugar beets 875 1,042 603 33 39 23
Total 113,029 120,066 123,619 3,339 3,538 3,632
Source: BLE (Report online at www.ufop.de/ble-en)1 Discrepancies in totals are due to rounding
Source: BLE (Report online at www.ufop.de/ble-en)1 Discrepancies in totals are due to rounding2 the values are calculated into tonnage based on the quantities in the analyses
Emissions [t CO2eq
/ TJ] Savings [%]2
2017 2018 2019 2017 2018 2019
Bioliquid type
from the cellulose industry 1.80 1.86 1.72 98.02 97.95 98.11
FAME 37.18 34.65 34.80 59.14 61.93 61.76
HVO 44.50 51.10
Vegetable oil 33.73 31.99 29.83 62.93 64.85 67.22
UCO
Weighted average of all bioliquids
5.99 6.62 6.43 93.41 92.73 92.94
Quelle: BLE (Report online at www.ufop.de/ble-en)1 Discrepancies in totals are due to rounding2 Savings compared to fossil reference value for liquid fuel for electricity generation 91.0 g CO
2eq / MJ
Table 19: Germany: Emissions and emission savings of bioliquids1

Published by:
UNION ZUR FÖRDERUNG VON
OEL- UND PROTEINPFLANZEN E. V. (UFOP)
Claire-Waldoff-Straße 7 · 10117 Berlin
[email protected] · www.ufop.de