Embed Size (px)
Citation preview
1
UNIVERSAL HEALTH COVERAGE IN MALAYSIA: ISSUES AND CHALLENGES
Ng Chiu Wan, Noran Naqiah Mohd Hairi, Ng Chirk Jenn, Adeeba Kamarulzaman
Faculty of Medicine
University of Malaya
Abstract
Socioeconomic development in Malaysia, over the past few decades, has led to the
improvement and expansion of the public healthcare system. This system has provided
universal access to a low-priced package of comprehensive health care leading Malaysia to
claim to have achieved universal health coverage (UHC). However, the Malaysian health
landscape is changing rapidly. Provision of private care has grown especially in large urban
towns, mainly in response to public demand. Thus far, private care has been predominantly
bought and utilised by the rich but because of differentials in quality of care between the
public and private sector, unabated expansion of the private health sector has the potential to
adversely affect universal access to care. This effect may be accentuated in the coming years
by demographic changes in the country specifically by the ageing of the population. This
paper is intended to highlight challenges to UHC in Malaysia in the face of the changing
health landscape in the country and to offer some suggestions as to how these challenges can
be met.
2
INTRODUCTION
Socioeconomic development in Malaysia, over the past few decades, has brought about
significant improvement in the general health status of the population. This has been partly
due to sustained investment into social infrastructure such as schools and health facilities
throughout the land. In particular, the country’s public healthcare system has been gradually
improved upon. The modern public healthcare system has wide geographical coverage and
provides comprehensive care at minimal fees to the country’s citizens. As a result, Malaysia
can lay claim to have achieved universal health coverage (UHC), the ultimate health system
goal and one of the forerunning contenders for a global development health goal post-2015.
However, the Malaysian health landscape is changing rapidly. Despite progressive upgrading
of the public healthcare system, demand for private care has increased over the years,
partially brought about by the same improvement in socioeconomic circumstance that
resulted in development of the public healthcare system and partially by the changing
political economy in the country. In spite of these changes, current evidence points to the
continued maintenance of UHC in Malaysia (Health Policy Research Associates et al., 2013).
Nonetheless, unabated expansion of the private health sector has the potential to adversely
affect universal access to care. This is due to several inherent characteristics in the provision
of private health care including the imposition of high user fees and mal-distribution of
private facilities favouring affluent urban areas. These unwanted effects may be accentuated
in the coming years by demographic changes in the country specifically by the ageing of the
population.
This paper is intended to highlight challenges to UHC in Malaysia in the face of the changing
health landscape in the country and to offer some suggestions as to how these challenges can
be met.
UNIVERSAL HEALTH COVERAGE IN MALAYSIA
A country is said to have achieved UHC “when the whole population of a country has access
to good quality services according to needs and preferences, regardless of income levels,
social status, or residency” and when the country adopts policies “which incorporates
objectives of equity in payments (where the rich pays more than the poor), financial
protection (where people should not become poor as a result of using health care) and equity
in access or utilisation (where care received is according to need rather than ability to pay)”
(Gilson et al., 2007). In short, UHC is achieved when access to a comprehensive package of
health care is made available to the entire population using public sources of financing
without burdening the poor.
Malaysia is an example of a middle income country with a long established public healthcare
system providing universal access to a comprehensive package of health care services
financed mainly through general taxation. The public system has gradually expanded over
the years and by 2012, the network of public healthcare facilities included 147 public
hospitals and special medical institutions (with 42,707 beds) and 3,034 static health clinics
(Ministry of Health Malaysia, 2013a). Services provided by these government owned
facilities are heavily subsidised such that annual cost recovery is estimated to be only
between 3% and 5% (Rohaizat, 2004). Historically, the public healthcare system has been
3
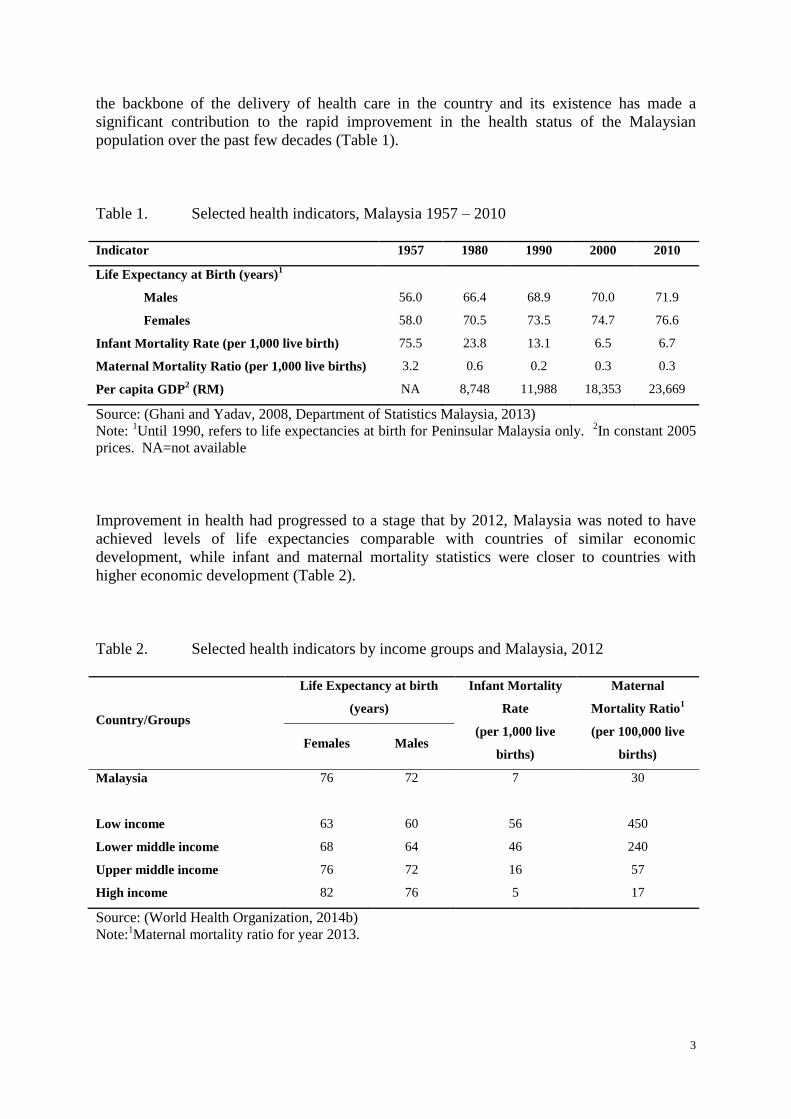
the backbone of the delivery of health care in the country and its existence has made a
significant contribution to the rapid improvement in the health status of the Malaysian
population over the past few decades (Table 1).
Table 1. Selected health indicators, Malaysia 1957 – 2010
Indicator 1957 1980 1990 2000 2010
Life Expectancy at Birth (years)1
Males 56.0 66.4 68.9 70.0 71.9
Females 58.0 70.5 73.5 74.7 76.6
Infant Mortality Rate (per 1,000 live birth) 75.5 23.8 13.1 6.5 6.7
Maternal Mortality Ratio (per 1,000 live births) 3.2 0.6 0.2 0.3 0.3
Per capita GDP2 (RM) NA 8,748 11,988 18,353 23,669
Source: (Ghani and Yadav, 2008, Department of Statistics Malaysia, 2013)
Note: 1Until 1990, refers to life expectancies at birth for Peninsular Malaysia only.
2In constant 2005
prices. NA=not available
Improvement in health had progressed to a stage that by 2012, Malaysia was noted to have
achieved levels of life expectancies comparable with countries of similar economic
development, while infant and maternal mortality statistics were closer to countries with
higher economic development (Table 2).
Table 2. Selected health indicators by income groups and Malaysia, 2012
Country/Groups
Life Expectancy at birth
(years)
Infant Mortality
Rate
(per 1,000 live
births)
Maternal
Mortality Ratio1
(per 100,000 live
births) Females Males
Malaysia 76 72 7 30
Low income 63 60 56 450
Lower middle income 68 64 46 240
Upper middle income 76 72 16 57
High income 82 76 5 17
Source: (World Health Organization, 2014b)
Note:1Maternal mortality ratio for year 2013.
4
Although there has been a long presence of private provision of health care in the country,
early private practitioners were mainly either providers of traditional health care or doctors
practising in single doctor clinics. Sustained rapid development of the private health sector
started only in the 1980’s and this was more apparent in the hospital sector (Chee, 2008). In
1980, there were 50 private hospitals in the entire country which provided only 1,171 beds or
5.8% of the total hospital beds (Ministry of Health Malaysia, 1982). Since then, the numbers
of private hospital beds have increased at a much faster pace than beds in public hospitals
such that by 2012, the 209 private hospitals contributed 32.0% of total hospital beds in the
country (Ministry of Health Malaysia, 2013a). This rapid development of the private health
sector came about because of several factors, one of which was efforts by the government to
increase private participation in the country’s economy among others to reduce presence of
the government in the economy and also to lower the level and scope of public spending
(Barraclough, 1999). The advent of the 1997 Asian financial crisis also saw health tourism
being promoted as a means of survival for existing private hospitals and later as a means of
bringing in foreign revenue to the country (Chee, 2007). Over time as Malaysia’s economy
improved, higher demand for private care also came from the increasingly affluent and
discerning society (Chee and Barraclough, 2007).
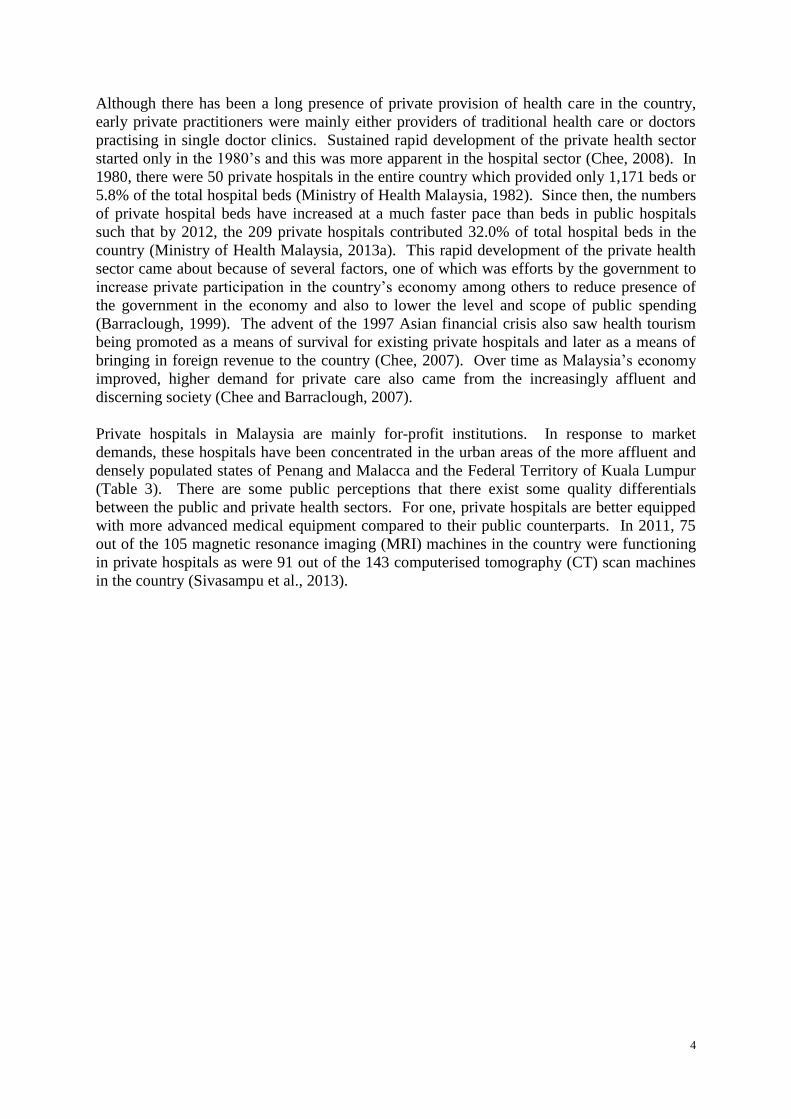
Private hospitals in Malaysia are mainly for-profit institutions. In response to market
demands, these hospitals have been concentrated in the urban areas of the more affluent and
densely populated states of Penang and Malacca and the Federal Territory of Kuala Lumpur
(Table 3). There are some public perceptions that there exist some quality differentials
between the public and private health sectors. For one, private hospitals are better equipped
with more advanced medical equipment compared to their public counterparts. In 2011, 75
out of the 105 magnetic resonance imaging (MRI) machines in the country were functioning
in private hospitals as were 91 out of the 143 computerised tomography (CT) scan machines
in the country (Sivasampu et al., 2013).
5
Table 3. Distribution of private and public acute care hospital beds in Malaysia, 2010
Population
Estimates (‘000)
No. of Public
Hospitals
No. of Public
Hospital Beds
Public hospital beds:
100,000 population
No. of Private
Hospitals
No. of Private
Hospital Beds
Private hospital beds:
100,000 population
Perlis 232 1 404 174.14 0 0 0.00
Kedah 1,948 9 2,350 120.64 10 542 27.82
Penang 1,561 6 1,939 124.22 23 2,135 136.77
Perak 2,353 14 3,470 147.47 15 988 41.99
Selangor1 5,535 12 4,797 86.67 48 2,836 51.24
K. Lumpur 1,675 4 4,137 246.99 37 2,859 170.69
N. Sembilan 1,021 6 1,527 149.56 8 428 41.92
Malacca 821 3 1,006 122.53 4 690 84.04
Johore 3,348 11 3,609 107.80 30 1,111 33.18
Pahang 1,501 10 1,907 127.05 7 204 13.59
Terengganu 1,036 6 1,342 129.54 1 20 1.93
Kelantan 1,540 10 2,399 155.78 3 162 10.52
Sabah2 3,294 22 3,962 120.28 5 165 5.01
Sarawak 2,471 20 3,407 137.88 12 465 18.82
Malaysia 28,334 134 36,256 127.96 203 12,605 44.49
Source: derived from (Department of Statistics Malaysia, 2010) and (Sivasampu et al., 2013).
Note: 1Including Federal Territory of Putrajaya.
2Including Federal Territory of Labuan.
6
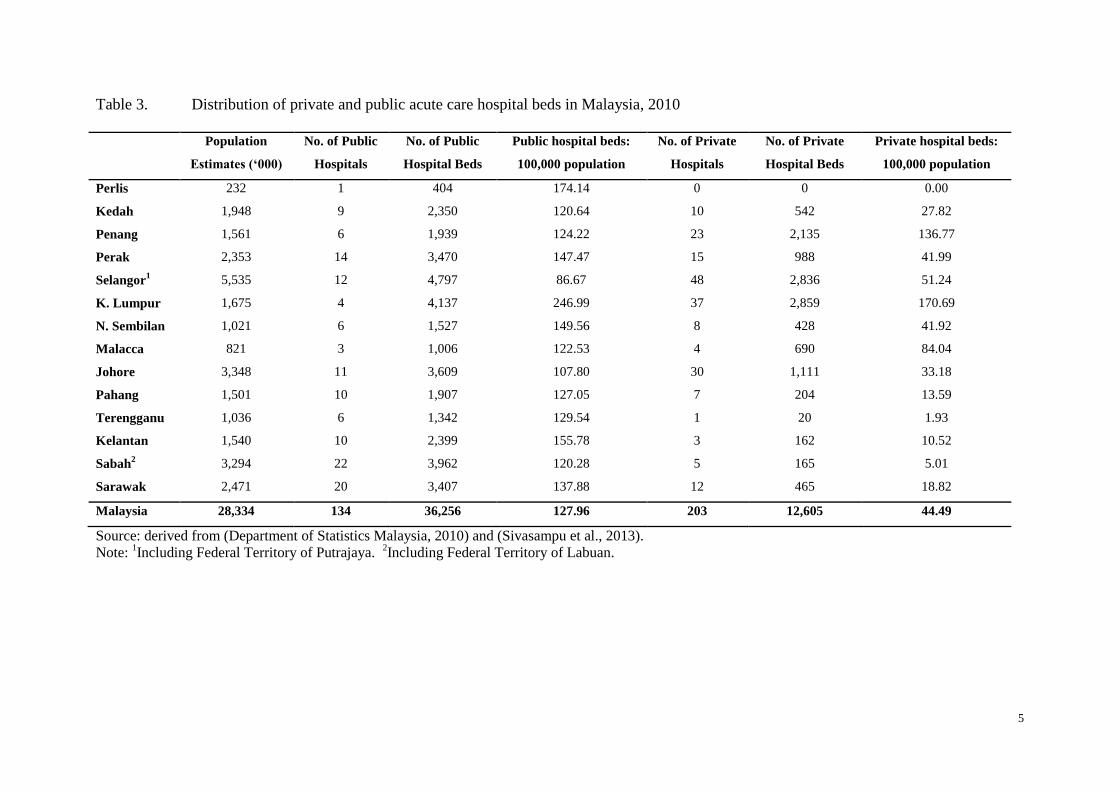
Another instance of perceived quality differentials between the public and private health
relates to the distribution of medical specialists. Currently there are more doctors practising
in the public sector (Figure 1). However, the distribution of specialists in several clinical
disciplines favours the private sector (Table 4). This situation may be related to the higher
remuneration that these specialists can obtain in the private sector.
Figure 1. Distribution of actively practicing doctors in the public and private sectors,
Malaysia
Source: (Ministry of Health Malaysia, 1991, Ministry of Health Malaysia, 1996, Ministry of Health
Malaysia, 2007, Ministry of Health Malaysia, 2012)
Table 4. Shares of selected medical specialists in the private health sector, Malaysia
2011
Medical Specialists total % in private sector
Psychiatrists 234 20.51
Anaesthetists 685 44.38
General surgeons 557 46.50
Vascular surgeons 19 47.37
Hepatobiliary surgeons 30 40.00
Colorectal surgeons 30 76.67
Obstetricians & Gynaecologists 839 61.02
Breast surgeons 7 57.14
Oncologists 67 56.72
Source: (Sivasampu et al., 2013)
0.00%
10.00%
20.00%
30.00%
40.00%
50.00%
60.00%
70.00%
0
2,000
4,000
6,000
8,000
10,000
12,000
14,000
1990 1995 2000 2005 2010
Do
cto
rs in
pri
vate
sec
tor
as %
of
tota
l n
um
ber
of
do
cto
rs
Nu
mb
er o
f d
oct
ors
public private Private doctors as % of total number of doctors
7
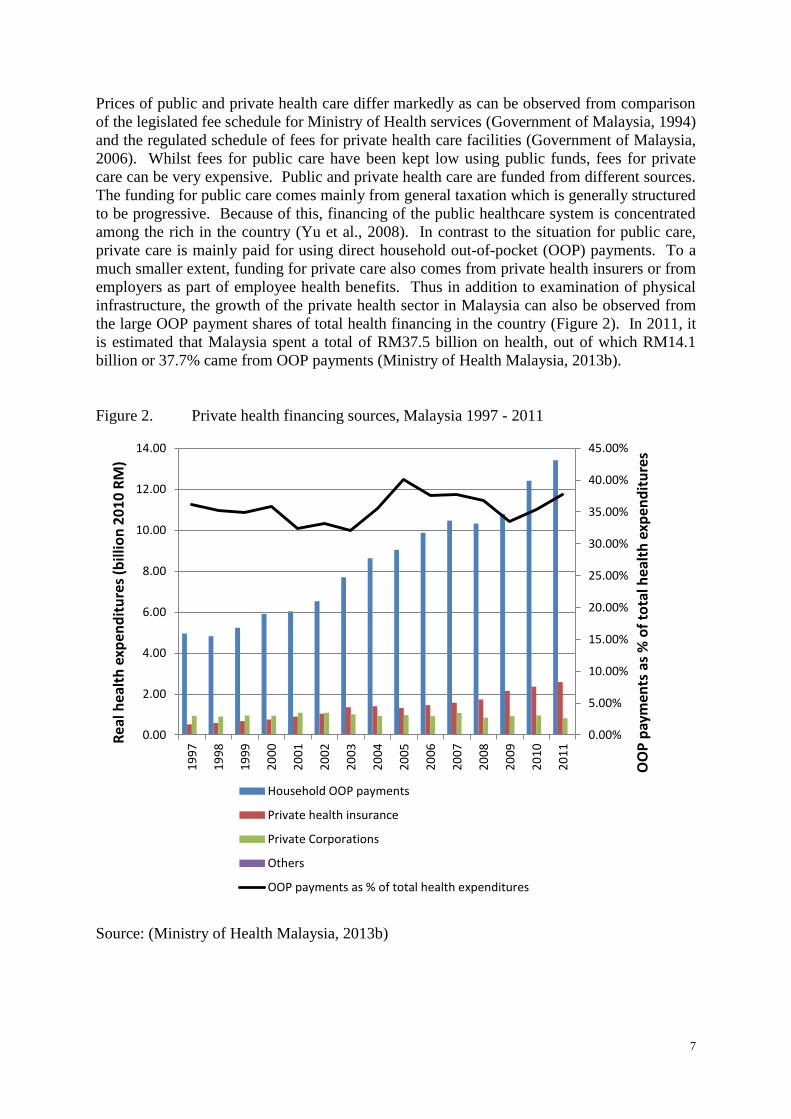
Prices of public and private health care differ markedly as can be observed from comparison
of the legislated fee schedule for Ministry of Health services (Government of Malaysia, 1994)
and the regulated schedule of fees for private health care facilities (Government of Malaysia,
2006). Whilst fees for public care have been kept low using public funds, fees for private
care can be very expensive. Public and private health care are funded from different sources.
The funding for public care comes mainly from general taxation which is generally structured
to be progressive. Because of this, financing of the public healthcare system is concentrated
among the rich in the country (Yu et al., 2008). In contrast to the situation for public care,
private care is mainly paid for using direct household out-of-pocket (OOP) payments. To a
much smaller extent, funding for private care also comes from private health insurers or from
employers as part of employee health benefits. Thus in addition to examination of physical
infrastructure, the growth of the private health sector in Malaysia can also be observed from
the large OOP payment shares of total health financing in the country (Figure 2). In 2011, it
is estimated that Malaysia spent a total of RM37.5 billion on health, out of which RM14.1
billion or 37.7% came from OOP payments (Ministry of Health Malaysia, 2013b).
Figure 2. Private health financing sources, Malaysia 1997 - 2011
Source: (Ministry of Health Malaysia, 2013b)
0.00%
5.00%
10.00%
15.00%
20.00%
25.00%
30.00%
35.00%
40.00%
45.00%
0.00
2.00
4.00
6.00
8.00
10.00
12.00
14.00
19
97
19
98
19
99
20
00
20
01
20
02
20
03
20
04
20
05
20
06
20
07
20
08
20
09
20
10
20
11
OO
P p
aym
ents
as
% o
f to
tal h
ealt
h e
xpen
dit
ure
s
Rea
l hea
lth
exp
end
itu
res
(bill
ion
20
10
RM
)
Household OOP payments
Private health insurance
Private Corporations
Others
OOP payments as % of total health expenditures
8
Direct household OOP payments for health are the least equitable manner of paying for
health care and has been the main health financing concern for countries pursuing the goal of
UHC (World Health Organization, 2010, World Health Organization, 2014a). OOP
payments for health require the ill to have sufficient money on hand at the point of needing
care or else they may have to forgo needed care (Wagstaff, 2008, Wagstaff and van
Doorslaer, 2003, Xu et al., 2007). This money may come from household savings,
borrowings or even sales of household assets (Whitehead et al., 2001). Thus it can be seen
that household welfare, especially for the poor, may be negatively affected by OOP payments
in the short or long-term or both. This comes from the assumption that payments for most
health care, at least for the poor, are non-discretionary and can lead to immediate reduction in
resources for other goods and services, including essential items such as food and housing.
Borrowings and sales of economically productive assets can also affect long-term household
welfare (Russell and Gilson, 2006). Thus from a welfare standpoint, poor households need to
be protected from making excessive OOP payments for health.
Higher OOP payment shares in a country’s overall financing mix have been shown to have
higher negative welfare impact on the country’s households especially poorer ones (Xu et al.,
2007). It has been estimated that only when the country’s OOP payment share drops below
15 to 20% of total health expenditures that household financial catastrophe caused by such
payments can drop to negligible levels (Xu et al., 2010). Despite this conventional wisdom,
evidence from Malaysia has shown that good financial risk protection for health can co-exist
with high levels of OOP health payments.
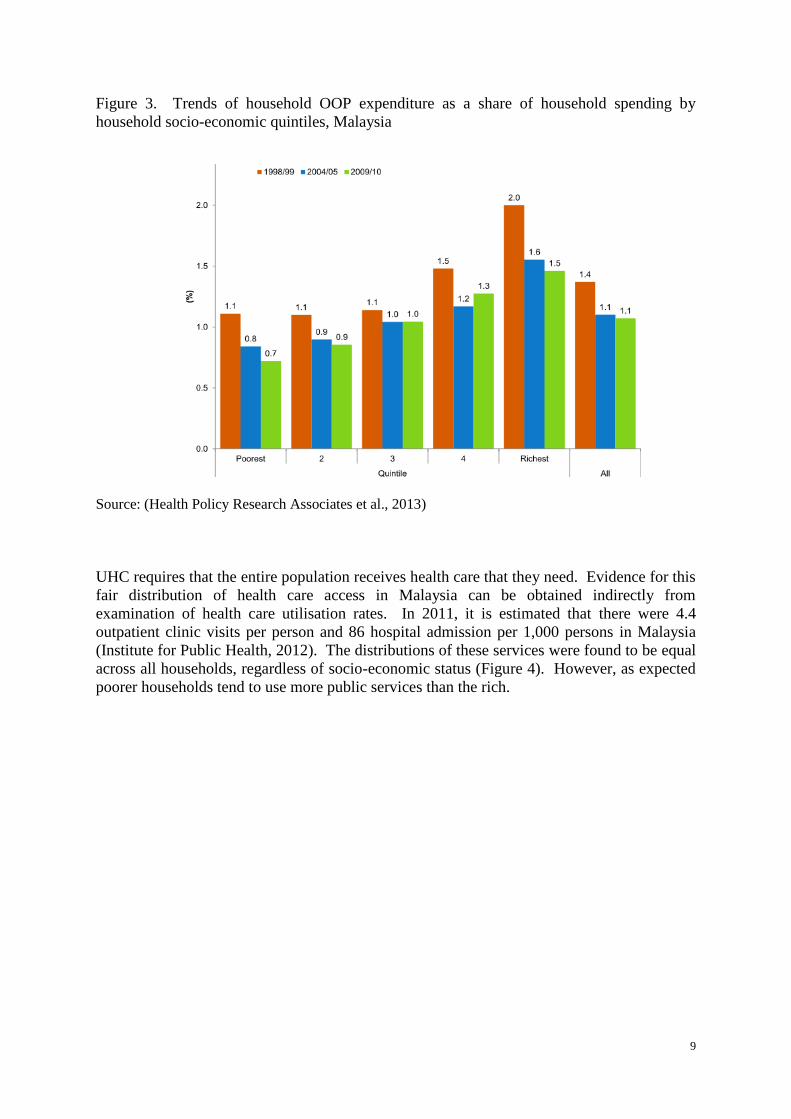
Although at the national level, more than a third of the total health expenditures come from
OOP payments, this mode of health payment only make up a small component of total
expenditures for an average household in the country (Figure 3). Overall, the OOP shares of
household consumption have been falling from 1.4% in 1998 to 1.1% in 2009. As a result of
the low household OOP payment burdens, few households in Malaysia incur health payments
that can be deemed catastrophic to their welfare. In 2009, it has been estimated that less than
2% of households incurred health payments exceeding 10% of the total household
consumption (Health Policy Research Associates et al., 2013). This catastrophic level has
been shown to be the lowest among 18 Asia Pacific economies, including Taiwan and Hong
Kong. In addition, richer households appear to have higher OOP payment shares than poorer
households and thus households which did incur catastrophic OOP payment shares were
found to be concentrated among the richer households. Some households in the country had
been impoverished because of medical payments but the numbers are small. In 2009, about
0.3% of households had been impoverished in this manner (Health Policy Research
Associates et al., 2013).
9
Figure 3. Trends of household OOP expenditure as a share of household spending by
household socio-economic quintiles, Malaysia
Source: (Health Policy Research Associates et al., 2013)
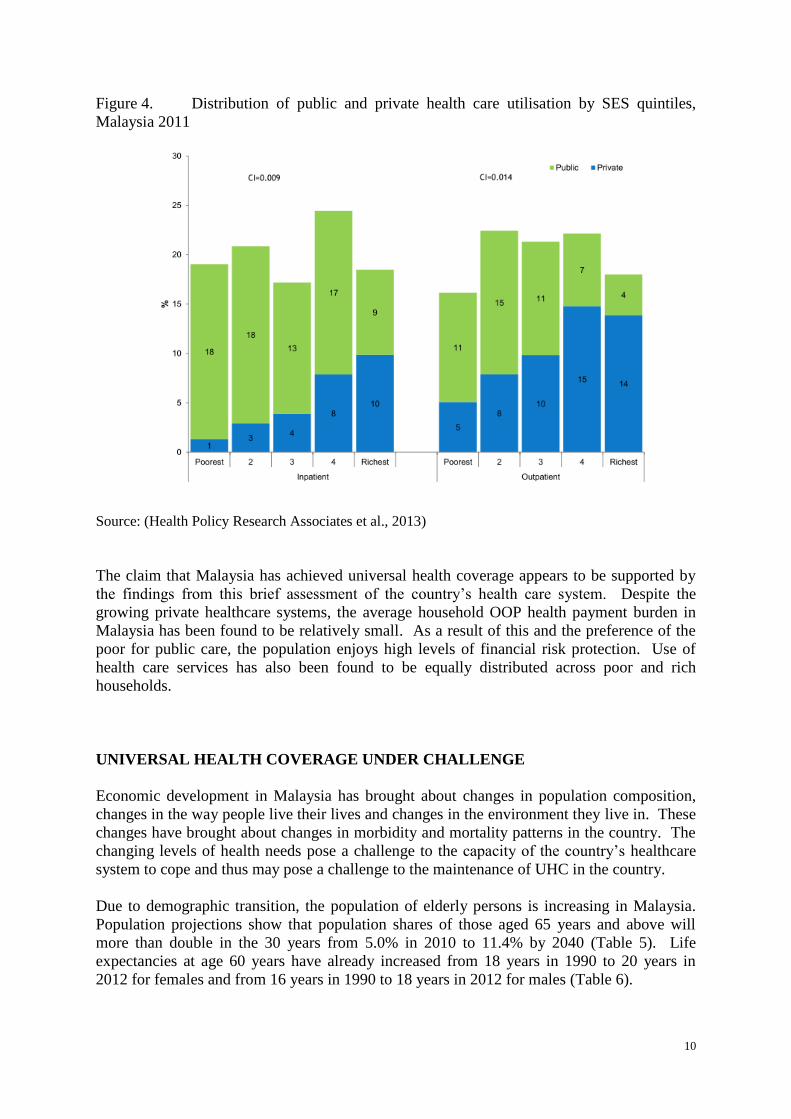
UHC requires that the entire population receives health care that they need. Evidence for this
fair distribution of health care access in Malaysia can be obtained indirectly from
examination of health care utilisation rates. In 2011, it is estimated that there were 4.4
outpatient clinic visits per person and 86 hospital admission per 1,000 persons in Malaysia
(Institute for Public Health, 2012). The distributions of these services were found to be equal
across all households, regardless of socio-economic status (Figure 4). However, as expected
poorer households tend to use more public services than the rich.
10
Figure 4. Distribution of public and private health care utilisation by SES quintiles,
Malaysia 2011
Source: (Health Policy Research Associates et al., 2013)
The claim that Malaysia has achieved universal health coverage appears to be supported by
the findings from this brief assessment of the country’s health care system. Despite the
growing private healthcare systems, the average household OOP health payment burden in
Malaysia has been found to be relatively small. As a result of this and the preference of the
poor for public care, the population enjoys high levels of financial risk protection. Use of
health care services has also been found to be equally distributed across poor and rich
households.
UNIVERSAL HEALTH COVERAGE UNDER CHALLENGE
Economic development in Malaysia has brought about changes in population composition,
changes in the way people live their lives and changes in the environment they live in. These
changes have brought about changes in morbidity and mortality patterns in the country. The
changing levels of health needs pose a challenge to the capacity of the country’s healthcare
system to cope and thus may pose a challenge to the maintenance of UHC in the country.
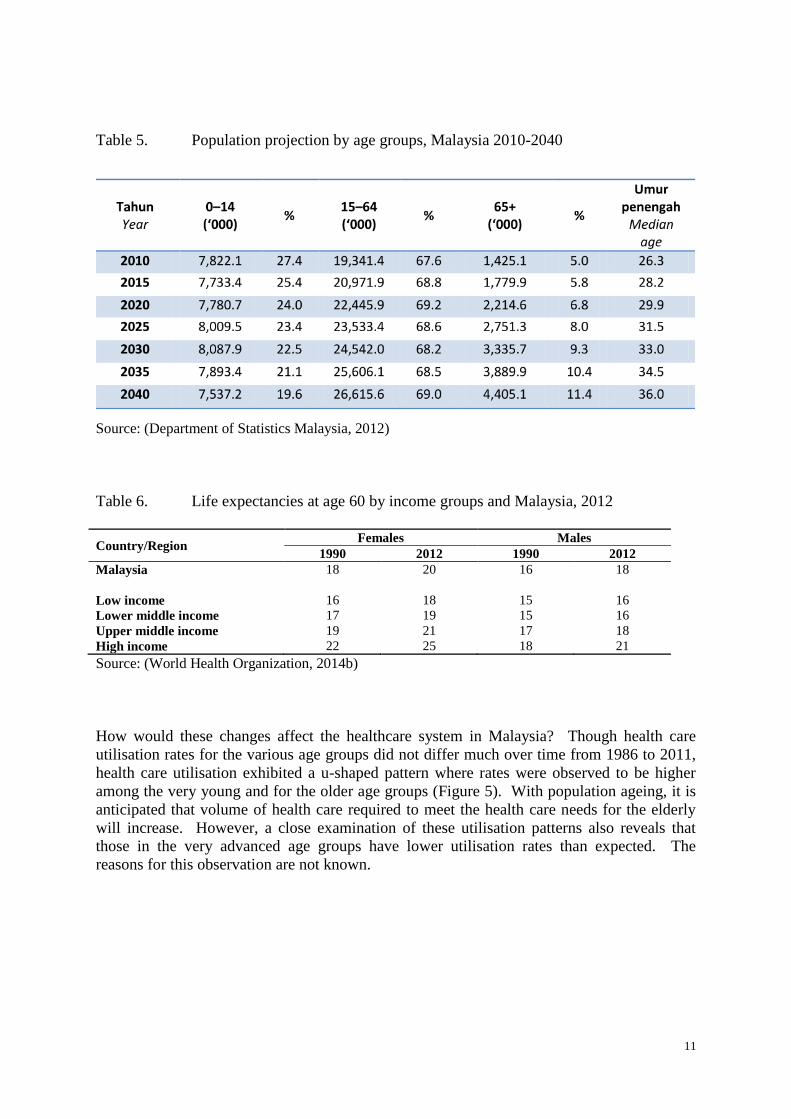
Due to demographic transition, the population of elderly persons is increasing in Malaysia.
Population projections show that population shares of those aged 65 years and above will
more than double in the 30 years from 5.0% in 2010 to 11.4% by 2040 (Table 5). Life
expectancies at age 60 years have already increased from 18 years in 1990 to 20 years in
2012 for females and from 16 years in 1990 to 18 years in 2012 for males (Table 6).
11
Table 5. Population projection by age groups, Malaysia 2010-2040
Source: (Department of Statistics Malaysia, 2012)
Table 6. Life expectancies at age 60 by income groups and Malaysia, 2012
Country/Region Females Males
1990 2012 1990 2012
Malaysia 18 20 16 18
Low income 16 18 15 16
Lower middle income 17 19 15 16
Upper middle income 19 21 17 18
High income 22 25 18 21
Source: (World Health Organization, 2014b)
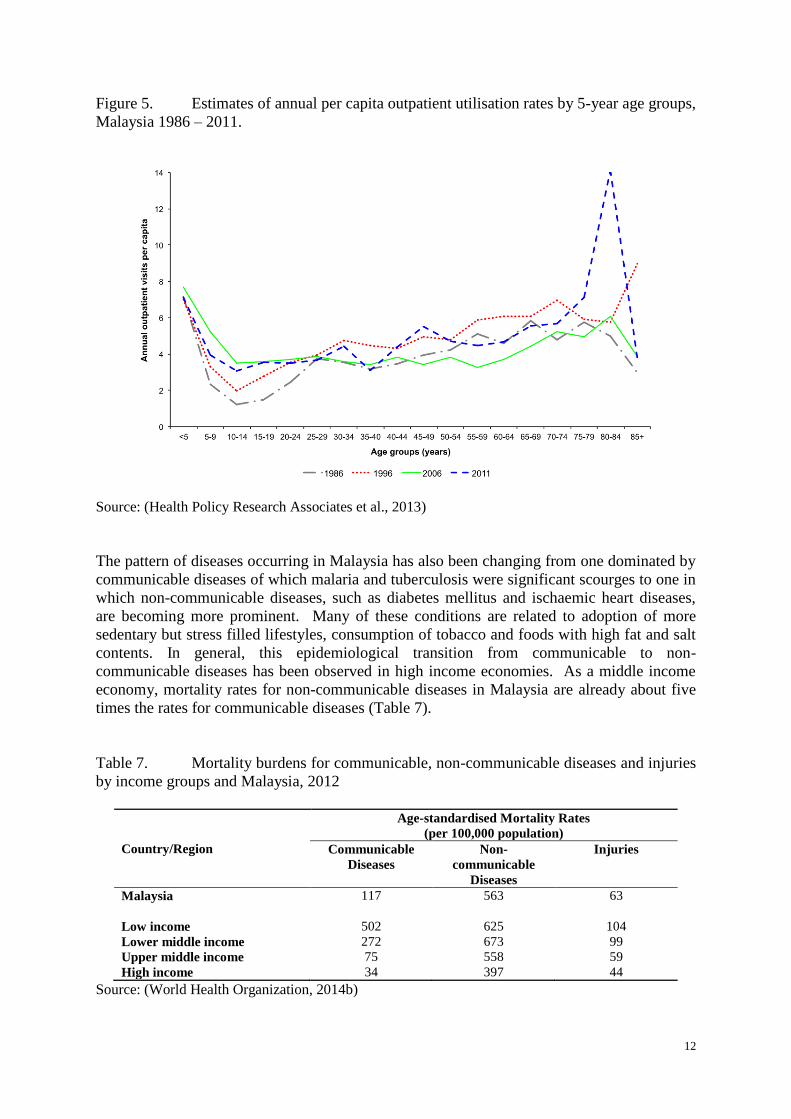
How would these changes affect the healthcare system in Malaysia? Though health care
utilisation rates for the various age groups did not differ much over time from 1986 to 2011,
health care utilisation exhibited a u-shaped pattern where rates were observed to be higher
among the very young and for the older age groups (Figure 5). With population ageing, it is
anticipated that volume of health care required to meet the health care needs for the elderly
will increase. However, a close examination of these utilisation patterns also reveals that
those in the very advanced age groups have lower utilisation rates than expected. The
reasons for this observation are not known.
12
Figure 5. Estimates of annual per capita outpatient utilisation rates by 5-year age groups,
Malaysia 1986 – 2011.
Source: (Health Policy Research Associates et al., 2013)
The pattern of diseases occurring in Malaysia has also been changing from one dominated by
communicable diseases of which malaria and tuberculosis were significant scourges to one in
which non-communicable diseases, such as diabetes mellitus and ischaemic heart diseases,
are becoming more prominent. Many of these conditions are related to adoption of more
sedentary but stress filled lifestyles, consumption of tobacco and foods with high fat and salt
contents. In general, this epidemiological transition from communicable to non-
communicable diseases has been observed in high income economies. As a middle income
economy, mortality rates for non-communicable diseases in Malaysia are already about five
times the rates for communicable diseases (Table 7).
Table 7. Mortality burdens for communicable, non-communicable diseases and injuries
by income groups and Malaysia, 2012
Country/Region
Age-standardised Mortality Rates
(per 100,000 population)
Communicable
Diseases
Non-
communicable
Diseases
Injuries
Malaysia 117 563 63
Low income 502 625 104
Lower middle income 272 673 99
Upper middle income 75 558 59
High income 34 397 44
Source: (World Health Organization, 2014b)
13
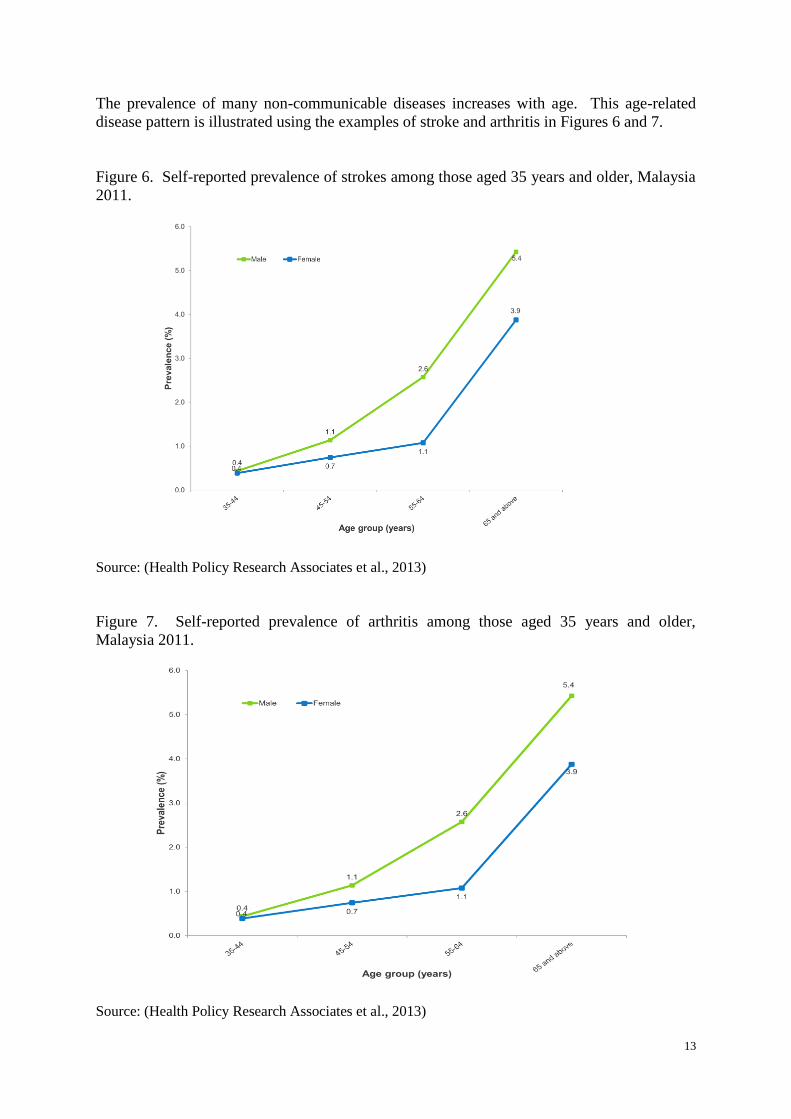
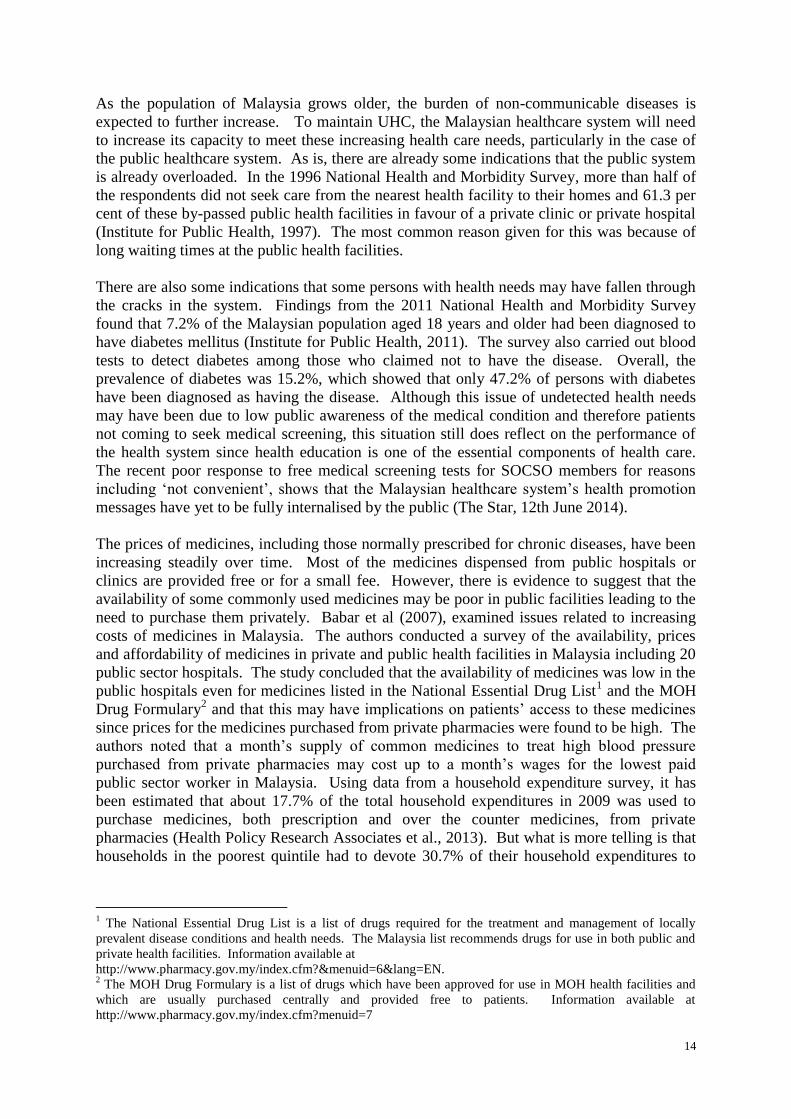
The prevalence of many non-communicable diseases increases with age. This age-related
disease pattern is illustrated using the examples of stroke and arthritis in Figures 6 and 7.
Figure 6. Self-reported prevalence of strokes among those aged 35 years and older, Malaysia
2011.
Source: (Health Policy Research Associates et al., 2013)
Figure 7. Self-reported prevalence of arthritis among those aged 35 years and older,
Malaysia 2011.
Source: (Health Policy Research Associates et al., 2013)
14
As the population of Malaysia grows older, the burden of non-communicable diseases is
expected to further increase. To maintain UHC, the Malaysian healthcare system will need
to increase its capacity to meet these increasing health care needs, particularly in the case of
the public healthcare system. As is, there are already some indications that the public system
is already overloaded. In the 1996 National Health and Morbidity Survey, more than half of
the respondents did not seek care from the nearest health facility to their homes and 61.3 per
cent of these by-passed public health facilities in favour of a private clinic or private hospital
(Institute for Public Health, 1997). The most common reason given for this was because of
long waiting times at the public health facilities.
There are also some indications that some persons with health needs may have fallen through
the cracks in the system. Findings from the 2011 National Health and Morbidity Survey
found that 7.2% of the Malaysian population aged 18 years and older had been diagnosed to
have diabetes mellitus (Institute for Public Health, 2011). The survey also carried out blood
tests to detect diabetes among those who claimed not to have the disease. Overall, the
prevalence of diabetes was 15.2%, which showed that only 47.2% of persons with diabetes
have been diagnosed as having the disease. Although this issue of undetected health needs
may have been due to low public awareness of the medical condition and therefore patients
not coming to seek medical screening, this situation still does reflect on the performance of
the health system since health education is one of the essential components of health care.
The recent poor response to free medical screening tests for SOCSO members for reasons
including ‘not convenient’, shows that the Malaysian healthcare system’s health promotion
messages have yet to be fully internalised by the public (The Star, 12th June 2014).
The prices of medicines, including those normally prescribed for chronic diseases, have been
increasing steadily over time. Most of the medicines dispensed from public hospitals or
clinics are provided free or for a small fee. However, there is evidence to suggest that the
availability of some commonly used medicines may be poor in public facilities leading to the
need to purchase them privately. Babar et al (2007), examined issues related to increasing
costs of medicines in Malaysia. The authors conducted a survey of the availability, prices
and affordability of medicines in private and public health facilities in Malaysia including 20
public sector hospitals. The study concluded that the availability of medicines was low in the
public hospitals even for medicines listed in the National Essential Drug List1 and the MOH
Drug Formulary2 and that this may have implications on patients’ access to these medicines
since prices for the medicines purchased from private pharmacies were found to be high. The
authors noted that a month’s supply of common medicines to treat high blood pressure
purchased from private pharmacies may cost up to a month’s wages for the lowest paid
public sector worker in Malaysia. Using data from a household expenditure survey, it has
been estimated that about 17.7% of the total household expenditures in 2009 was used to
purchase medicines, both prescription and over the counter medicines, from private
pharmacies (Health Policy Research Associates et al., 2013). But what is more telling is that
households in the poorest quintile had to devote 30.7% of their household expenditures to
1 The National Essential Drug List is a list of drugs required for the treatment and management of locally
prevalent disease conditions and health needs. The Malaysia list recommends drugs for use in both public and
private health facilities. Information available at
http://www.pharmacy.gov.my/index.cfm?&menuid=6&lang=EN. 2 The MOH Drug Formulary is a list of drugs which have been approved for use in MOH health facilities and
which are usually purchased centrally and provided free to patients. Information available at
http://www.pharmacy.gov.my/index.cfm?menuid=7
15
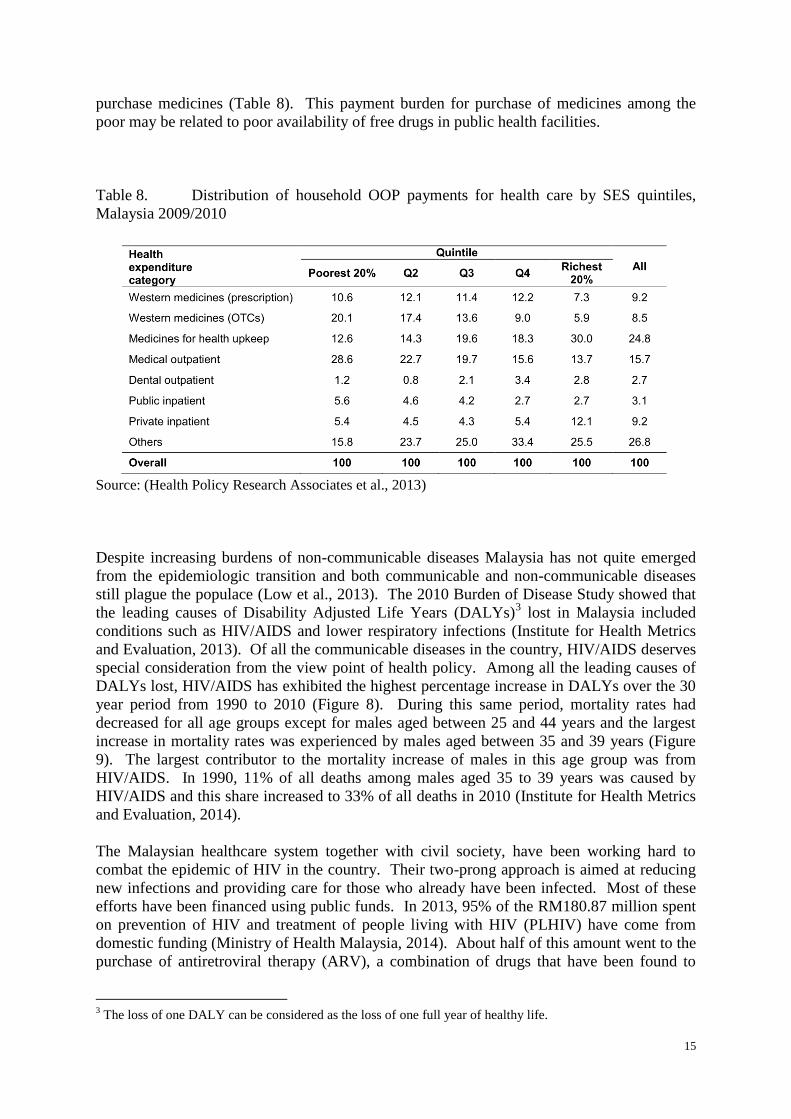
purchase medicines (Table 8). This payment burden for purchase of medicines among the
poor may be related to poor availability of free drugs in public health facilities.
Table 8. Distribution of household OOP payments for health care by SES quintiles,
Malaysia 2009/2010
Source: (Health Policy Research Associates et al., 2013)
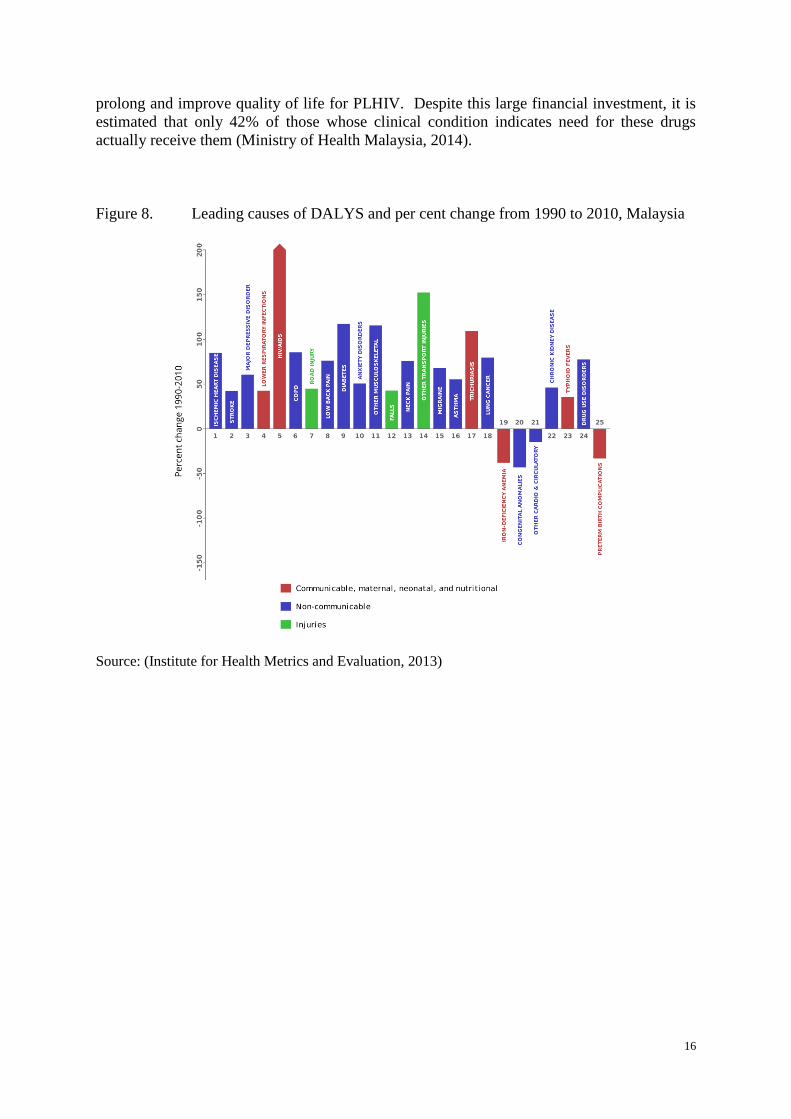
Despite increasing burdens of non-communicable diseases Malaysia has not quite emerged
from the epidemiologic transition and both communicable and non-communicable diseases
still plague the populace (Low et al., 2013). The 2010 Burden of Disease Study showed that
the leading causes of Disability Adjusted Life Years (DALYs)3 lost in Malaysia included
conditions such as HIV/AIDS and lower respiratory infections (Institute for Health Metrics
and Evaluation, 2013). Of all the communicable diseases in the country, HIV/AIDS deserves
special consideration from the view point of health policy. Among all the leading causes of
DALYs lost, HIV/AIDS has exhibited the highest percentage increase in DALYs over the 30
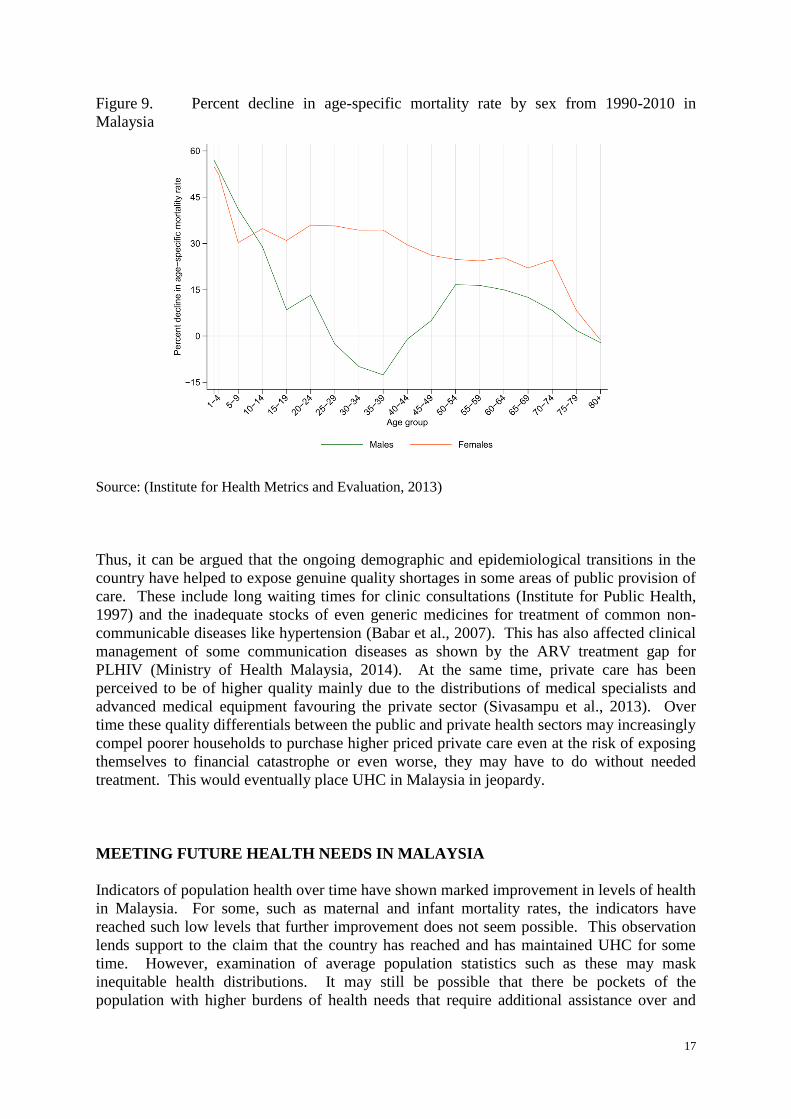
year period from 1990 to 2010 (Figure 8). During this same period, mortality rates had
decreased for all age groups except for males aged between 25 and 44 years and the largest
increase in mortality rates was experienced by males aged between 35 and 39 years (Figure
9). The largest contributor to the mortality increase of males in this age group was from
HIV/AIDS. In 1990, 11% of all deaths among males aged 35 to 39 years was caused by
HIV/AIDS and this share increased to 33% of all deaths in 2010 (Institute for Health Metrics
and Evaluation, 2014).
The Malaysian healthcare system together with civil society, have been working hard to
combat the epidemic of HIV in the country. Their two-prong approach is aimed at reducing
new infections and providing care for those who already have been infected. Most of these
efforts have been financed using public funds. In 2013, 95% of the RM180.87 million spent
on prevention of HIV and treatment of people living with HIV (PLHIV) have come from
domestic funding (Ministry of Health Malaysia, 2014). About half of this amount went to the
purchase of antiretroviral therapy (ARV), a combination of drugs that have been found to
3 The loss of one DALY can be considered as the loss of one full year of healthy life.
16
prolong and improve quality of life for PLHIV. Despite this large financial investment, it is
estimated that only 42% of those whose clinical condition indicates need for these drugs
actually receive them (Ministry of Health Malaysia, 2014).
Figure 8. Leading causes of DALYS and per cent change from 1990 to 2010, Malaysia
Source: (Institute for Health Metrics and Evaluation, 2013)
17
Figure 9. Percent decline in age-specific mortality rate by sex from 1990-2010 in
Malaysia
Source: (Institute for Health Metrics and Evaluation, 2013)
Thus, it can be argued that the ongoing demographic and epidemiological transitions in the
country have helped to expose genuine quality shortages in some areas of public provision of
care. These include long waiting times for clinic consultations (Institute for Public Health,
1997) and the inadequate stocks of even generic medicines for treatment of common non-
communicable diseases like hypertension (Babar et al., 2007). This has also affected clinical
management of some communication diseases as shown by the ARV treatment gap for
PLHIV (Ministry of Health Malaysia, 2014). At the same time, private care has been
perceived to be of higher quality mainly due to the distributions of medical specialists and
advanced medical equipment favouring the private sector (Sivasampu et al., 2013). Over
time these quality differentials between the public and private health sectors may increasingly
compel poorer households to purchase higher priced private care even at the risk of exposing
themselves to financial catastrophe or even worse, they may have to do without needed
treatment. This would eventually place UHC in Malaysia in jeopardy.
MEETING FUTURE HEALTH NEEDS IN MALAYSIA
Indicators of population health over time have shown marked improvement in levels of health
in Malaysia. For some, such as maternal and infant mortality rates, the indicators have
reached such low levels that further improvement does not seem possible. This observation
lends support to the claim that the country has reached and has maintained UHC for some
time. However, examination of average population statistics such as these may mask
inequitable health distributions. It may still be possible that there be pockets of the
population with higher burdens of health needs that require additional assistance over and
18
above that provided to the rest of the population. The root causes of these health differentials
would need to be understood and assistance programmes carefully designed to ensure that
these vulnerable populations can reach their health potentials. Identification of these groups
with higher health needs require examination not of average health indicators but
distributions of these indicators in the population such as by gender, age groups, urban rural
residence, ethnic groups, educational groups and income groups. Unfortunately, such
information is not always available in the public domain although government agencies are
known to collect most of the information routinely. There needs to be greater sharing of
information between such data collection agencies and the public, including the research
community. Improvement in the health of vulnerable population groups should be a shared
responsibility between the government and society in general. One of the first steps to
accomplish this task is to allow transparency and sharing of information so that assistance can
be targeted to those who need it more.
Examination of distributions in health has often shown differentials in life expectancies and
certain health indicators favouring females over males. These unequal health patterns have
been customarily accepted as the norm and have often been attributed to the physiological
and anatomical differences between males and females. However, it can be argued that these
differentials can be partially ameliorated if the healthcare system had been made more ‘men-
friendly’ (Tong et al., 2011). The current public health care set-up caters predominantly to
women leading men reluctant to seek care even though they have recognised health needs.
This examination of unequal health distributions from the perspective of social determinants
of health may also be beneficial in other circumstances to improve access to needed care for
all.
Although population ageing has received some recognition in Malaysia, the health response
to this phenomenon has been mostly focused on curative aspects of the diseases of the
elderly. Successive economic development plans have indicated expansion of geriatric care
programmes in the public healthcare sector. However, more needs to be done for the elderly
living in the community, often alone and without family support. Rapid economic
development in the country has led to urbanisation of the population where the young migrate
to urban centres for employment leaving their elderly parents behind in the villages. Hairi et
al (2010) examined a group of community dwelling elderly in a rural setting in Malaysia and
found levels of physical and functional disabilities that were higher than levels found in
developed countries. These elders will require higher levels of assistance in daily living that
is currently made available now. Culturally, institutional living may not be the answer in our
society. If so, steps need to be taken now to examine alternative living arrangements for
them. Provision of community support for the elderly would need to take a higher priority
than is currently the case. In addition to the direct needs of the elderly, shared societal
responsibility also indicates the need for respite care support for care givers of the elderly.
The Malaysian public healthcare system has been credited to have brought about UHC in the
country. However, the system’s capacity to cope, in the face of an ageing society with its
double burden of communicable and non-communicable diseases, has been called to
question. It is obvious that the country would need to invest more into the public system than
is currently the case. In 2011, public sources of financing made up only 2.25% of GDP or
6.62% of general government expenditures (Ministry of Health Malaysia, 2013b). If the
public system is to be the sole provider of care in the country, the quantum of this investment
will need to be very much higher. However, the 10th
Malaysia Plan included a call for greater
development of the private health sector, albeit as an avenue for enhanced national economic
19
growth, and that there should be “greater collaboration between the public and private
healthcare systems to allow effective delivery, greater efficiency and affordable costs” with
an element of cost-sharing between patients and the government (Malaysia, 2010). With
higher fees in the private sector, this would effectively translate to a dual healthcare system
with a public health system which provides lower quality care for the poor and a better
quality private health system catering mainly to the demands of the rich. The crux of the
issue here is the question of what should be included in the package of health care services
which is understood to be the entitlement of all in Malaysia under UHC. If it can be shown
that the public healthcare system has indeed made such a package universally available then
it can be argued that this two-tier system will not compromise UHC since the private system
is merely providing services that are over and above the agreed upon minimum package
already available to all. Unfortunately, the contents of this ‘package of services’ have not
been openly debated in Malaysia. Perhaps, it is time that such a debate should now be held.
This public debate should also include discussion of acceptable levels of public private
provision of care in Malaysia. As seen in this brief paper, development of these two sectors
may not progress in a synergistic manner. Expansion of one sector may be at the expense of
the other. If a health system dominated by private sector providers is deemed socially
acceptable, then there are some merits to the recommendation of a social health insurance
system for Malaysia as envisaged under the 1Care for 1Malaysia proposal by the Ministry of
Health (Ministry of Health Malaysia, 2009). The existence of a government controlled social
insurance fund to reimburse health care consumed by the population can supplement and
strengthen existing regulation of the private sector. Social health insurance can thus be
thought of as an additional source of funding with less equity issues as OOP payments and
can be used to improve public delivery of care without excessive government investments.
At this point in time it is not certain whether the proposed social health insurance scheme
would prove to be more equitable than the current taxation-based one as this is heavily
dependent on the contribution rates, co-payments and benefit entitlements which have not
been released.
CONCLUSION
Malaysia is a country where UHC has purportedly been long achieved through an extensive
public healthcare system providing near-free comprehensive health care financed through
general taxation. This public system is facing challenges partially arising from demographic
and epidemiological changes in the country and partially from the expansion of private
provision of care. Further improvement of the public system and maintenance of universal
access to health care in the country will require public debate and consensus as to the future
structure and organisation of the healthcare system.
20
References
BABAR, Z. U. D., IBRAHIM, M. I. M., SINGH, H., BUKAHRI, N. I. & CREESE, A. 2007.
Evaluating Drug Prices, Availability, Affordability, and Price Components:
Implications for Access to Drugs in Malaysia. PLoS Med, 4, e82.
BARRACLOUGH, S. 1999. Constraints on the retreat from a welfare-orientated approach to
public health care in Malaysia. Health Policy, 47, 53-67.
CHEE, H. L. 2007. Medical Tourism in Malaysia: International Movement of Healthcare
Consumers and the Commodification of Healthcare. Working Paper Series No. 83.
Singapore: Asia Research Institute.
CHEE, H. L. 2008. Ownership, control, and contention: Challenges for the future of
healthcare in Malaysia. Social Science & Medicine, 66, 2145-2156.
CHEE, H. L. & BARRACLOUGH, S. 2007. The growth of corporate health care in
Malaysia. In: CHEE, H. L. & BARRACLOUGH, S. (eds.) Health Care in Malaysia:
The dynamics of provision, financing and access. New York: Routledge.
DEPARTMENT OF STATISTICS MALAYSIA 2010. Population Distribution and Basic
Demographic Characteristics 2010. Putrajaya: Department of Statistics, Malaysia.
DEPARTMENT OF STATISTICS MALAYSIA 2012. Population Projections. Malaysia.
2010-2040. Putrajaya: Department of Statistics, Malaysia.
DEPARTMENT OF STATISTICS MALAYSIA 2013. Malaysian Economic Statistics Time
Series 2013, Putrajaya, Department of Statistics, Malaysia.
GHANI, S. N. & YADAV, H. 2008. Health Care in Malaysia, Kuala Lumpur, University of
Malaya Press.
GILSON, L., DOHERTY, J., LOEWENSON, R. & FRANCIS, V. 2007. Challenging
inequity through health systems. WHO Commission on the Social Determinants of
Health.
GOVERNMENT OF MALAYSIA 1994. Fees (Medical Order) (Amendment) of the Fees Act
1951. Kuala Lumpur: National Printers Malaysia Bhd.
GOVERNMENT OF MALAYSIA 2006. The Private Healthcare Facilities and Services
(Private Hospitals and Other Private Healthcare Facilities) Regulations 2006 [P.U.
(A) 138/2006] Kuala Lumpur: National Printers Malaysia Bhd.
HAIRI, N., BULGIBA, A., CUMMING, R., NAGANATHAN, V. & MUDLA, I. 2010.
Prevalence and correlates of physical disability and functional limitation among
community dwelling older people in rural Malaysia, a middle income country. BMC
Public Health, 10, 492.
HEALTH POLICY RESEARCH ASSOCIATES, INSITUTE FOR HEALTH SYSTEMS
RESEARCH & INSITUTE FOR HEALTH POLICY 2013. Malaysia Health Care
Demand Analysia. Inequalities in Healthcare Demand & Simulation of Trends and
Impact of Potential Changes in Healthcare Spending. Kuala Lumpur: Institute for
Health Systems Research.
INSTITUTE FOR HEALTH METRICS AND EVALUATION. 2013. Global Burden of
Disease Profile for Malaysia [Online]. Seattle, Washington: IHME. Available:
http://www.healthdata.org/sites/default/files/files/country_profiles/GBD/ihme_gbd_co
untry_report_malaysia.pdf [Accessed 13th June 2014].
INSTITUTE FOR HEALTH METRICS AND EVALUATION. 2014. Global Burden of
Disease Cause Patterns. Data Visualisations [Online]. Available:
http://vizhub.healthdata.org/gbd-cause-patterns/ [Accessed 19th June 2014].
21
INSTITUTE FOR PUBLIC HEALTH 1997. National Health and Morbidity Survey 1996.
Volume 3: Recent Illness/Injury, Health Seeking Behaviour and Out-of-pocket Health
Care Expenditure. Kuala Lumpur: Ministry of Health, Malaysia.
INSTITUTE FOR PUBLIC HEALTH 2011. National Health Morbidity Survey 2011.
Volume 2: Non-communicable diseases. Kuala Lumpur: Ministry of Health,
Malaysia.
INSTITUTE FOR PUBLIC HEALTH 2012. National Health Morbidity Survey 2011.
Volume 3: Health Care Demand and Out-of-pocket Expenditures. Kuala Lumpur:
Ministry of Health, Malaysia.
LOW, W. Y., NG, C. J., NG, C. W., CHOO, W. Y. & TONG, W. T. 2013. Learning from the
past: changing policies concerning the double disease burden in Malaysia. In:
LEWIS, M. J. & MACPHERSON, K. L. (eds.) Health Transitions and the Double
Burden in Asia and Pacific. Kuala Lumpur: Routledge.
MALAYSIA 2010. Tenth Malaysia Plan 2011 - 2015. Putrajaya: Government of Malaysia.
MINISTRY OF HEALTH MALAYSIA 1982. Annual Report 1981. Kuala Lumpur: Ministry
of Health, Malaysia.
MINISTRY OF HEALTH MALAYSIA 1991. Annual Report 1990. Kuala Lumpur: Ministry
of Health, Malaysia.
MINISTRY OF HEALTH MALAYSIA 1996. Annual Report 1995. Kuala Lumpur: Ministry
of Health, Malaysia.
MINISTRY OF HEALTH MALAYSIA 2007. Annual Report 2006. Putrajaya: Ministry of
Health, Malaysia.
MINISTRY OF HEALTH MALAYSIA 2009. Concept Paper. 1Care for 1Malaysia.
Restructuring the Malaysian Health System. Putrajaya: Ministry of Health, Malaysia.
MINISTRY OF HEALTH MALAYSIA 2012. Annual Report 2011. Putrajaya: Ministry of
Health, Malaysia.
MINISTRY OF HEALTH MALAYSIA 2013a. Health Indicators 2013. Putrajaya: Ministry
of Health, Malaysia.
MINISTRY OF HEALTH MALAYSIA 2013b. Malaysia National Health Accounts. Health
Expenditure Report (1997-2011). Putrajaya: Ministry of Health, Malaysia.
MINISTRY OF HEALTH MALAYSIA 2014. Country response to HIV/AIDS. Malaysia
2014. Putrajaya: Ministry of Health, Malaysia.
ROHAIZAT, Y. 2004. Financing Health Care in Malaysia: Safety Net for the Disadvantaged
Groups including Pensioners, Elderly People, the Poor and the Disabled. NCD
Malaysia, 3, 43-46.
RUSSELL, S. & GILSON, L. 2006. Are health services protecting the livelihoods of the
urban poor in Sri Lanka? Findings from two low-income areas of Colombo. Social
Science & Medicine, 63, 1732-1744.
SIVASAMPU, S., ARUNAH, C., KAMILAH, D., FATIHAH, M., GOH, P. P. & HISHAM,
A. N. (eds.) 2013. National Healthcare Establishment and Workforce Statistics
(Hospital) 2011, Kuala Lumpur: National Clinical Research Centre.
THE STAR 12th June 2014. 1.7 million shun health checks
TONG, S. F., HO, C. & TAN, H. M. 2011. Managing the aging man in Asia: a review. Int J
Urol, 18, 32-42.
WAGSTAFF, A. 2008. Measuring Financial Protection in Health. Policy Research Working
Paper 4554 Washington DC: The World Bank.
WAGSTAFF, A. & VAN DOORSLAER, E. 2003. Catastrophe and impoverishment in
paying for health care: with applications to Vietnam 1993-1998. Health Econ, 12,
921-34.
22
WHITEHEAD, M., DAHLGREN, G. & EVANS, T. 2001. Equity and health sector reforms:
can low-income countries escape the medical poverty trap? The Lancet, 358, 833-836.
WORLD HEALTH ORGANIZATION 2010. World Health Report 2010. Financing for
universal coverage. Geneva: World Health Organisation.
WORLD HEALTH ORGANIZATION 2014a. Making fair choices on the path to universal
health coverage. Final report of the WHO Consultative Group on Equity and
Universal Health Coverage. Geneva: World Health Organization.
WORLD HEALTH ORGANIZATION 2014b. World Health Statistics 2014. Geneva: World
Health Organization.
XU, K., EVANS, D. B., CARRIN, G., AGUILAR-RIVERA, A. M., MUSGROVE, P. &
EVANS, T. 2007. Protecting households from catastrophic health spending. Health
Aff (Millwood), 26, 972-83.
XU, K., SAKSENA, P., JOWETT, M., INDIKADAHENA, C., KUTZIN, J. & EVANS, D.
2010. Exploring the thresholds of health expenditures for protection against financial
risk. World Health Report 2010. Background paper no.19. Geneva: World Health
Organisation.
YU, C. P., WHYNES, D. K. & SACH, T. H. 2008. Equity in health care financing: The case
of Malaysia. Int J Equity Health, 7, 15.