Embed Size (px)
Citation preview
Unravelling the role of RIM proteins in synaptic transmission: RIM1a tunes Ca2+ channel subtype
contribution to neurotransmitter release
Dissertation
zur Erlangung des Doktorgrades (PhD)
der Medizinischen Fakultät
der Rheinischen Friedrich-Wilhelms-Universität
Bonn
Sara Ferrando Colomer
aus Canals, Spanien
2019

Angefertigt mit der Genehmigung
der Medizinischen Fakultät der Universität Bonn
1. Gutachter: Prof. Dr. med. Dirk Dietrich
2. Gutachter: Prof. Dr. María Luz Montesinos Gutiérrez
Tag der Mündlichen Prüfung: 12. April 2019
Aus der Klinik und Poliklinik für Neurochirurgie
Direktor: Prof. Dr. med. Hartmut Vatter

To the people who I loved, love and will love

I
INDEX
List of abbreviations ....................................................................................................................... IV
1 Introduction ............................................................................................................................... 1
1.1 Synaptic computation ...................................................................................................... 1 1.2 Presynaptic mechanisms of synaptic transmission ......................................................... 3
1.2.1 Quantal nature of synaptic transmission ............................................................ 3 1.2.2 Presynaptic Ca2+ mediates synaptic transmission .............................................. 5 1.2.3 Synaptic plasticity ............................................................................................... 7 1.2.4 Scenario for synaptic transmission: the presynaptic active zone ....................... 9
1.3 Voltage-gated Ca2+ channels ........................................................................................ 11 1.3.1 Presynaptic Ca2+ channel subtypes: Structure and function ............................ 11 1.3.2 VGCCs mediating neurotransmitter release: P/Q-type and N-type .................. 12
1.4 RIM protein family ......................................................................................................... 13 1.4.1 Large RIM isoforms: RIM1a/b and RIM2a/b .................................................... 14 1.4.2 Small RIM isoforms: RIM3g and RIM4g ............................................................ 18
1.5 Hippocampal Schaffer collaterals as a model of central synapses ............................... 19 1.5.1 Anatomy of the hippocampal formation ............................................................ 19 1.5.2 Function of the hippocampal formation ............................................................ 21
1.6 Aim of the study ............................................................................................................ 22
2 Materials and methods ........................................................................................................... 24
2.1 Animals ......................................................................................................................... 24 2.1.1 Species ............................................................................................................. 24 2.1.2 Slice preparation ............................................................................................... 24
2.2 Solutions ....................................................................................................................... 25 2.2.1 Incubation/perfusion solutions .......................................................................... 25 2.2.2 Patch-clamp recording solutions ...................................................................... 26 2.2.3 Ca2+ imaging solutions ...................................................................................... 27
2.3 Chemicals and reagents ............................................................................................... 27 2.4 Field excitatory postsynaptic potentials ........................................................................ 28
2.4.1 Setup ................................................................................................................ 29 2.4.2 Electrodes ......................................................................................................... 31
II
2.4.3 Experimental procedure ................................................................................... 31 2.4.4 Analysis of fEPSPs ........................................................................................... 33
2.5 Evoked excitatory postsynaptic currents ....................................................................... 34 2.5.1 Setup ................................................................................................................ 34 2.5.2 Electrode .......................................................................................................... 35 2.5.3 Experimental procedure ................................................................................... 35 2.5.4 Analysis ............................................................................................................ 35
2.6 Miniature excitatory postsynaptic currents .................................................................... 36 2.6.1 Experimental procedure ................................................................................... 36 2.6.2 mEPSCs detection and analysis ...................................................................... 36
2.7 Presynaptic Ca2+ imaging in the Schaffer collaterals .................................................... 37 2.7.1 Loading of AM ester Ca2+ indicator dye into Schaffer collaterals ..................... 37 2.7.2 Setup ................................................................................................................ 38 2.7.3 Electrodes ......................................................................................................... 40 2.7.4 Experimental procedure ................................................................................... 40 2.7.5 Aperture ............................................................................................................ 41 2.7.6 Analysis of presynaptic Ca2+ transients ............................................................ 41
2.8 NMDAR-mediated EPSCs, IPSCs, and mIPSCs recordings in hippocampal cell
cultures ...................................................................................................................................... 42 2.8.1 Release probability as determined by progressive block of NMDA synaptic
currents ......................................................................................................................... 42 2.8.2 Time course of release rate as determined by deconvolution .......................... 42
3 Results ..................................................................................................................................... 44
3.1 Impaired neurotransmitter release in RIM1a-deficient synapses ................................. 44 3.1.1 Unaltered spontaneous release in RIM1a KO and RIM4 KO mice .................. 44 3.1.2 Altered short-term synaptic plasticity in RIM1α KO mice .................................. 46
3.2 The Ca2+ signal at the release machinery Ca2+ sensor is tuned by RIM1a ................... 48 3.2.1 Mathematical approach to analyze the Ca2+ signal at the release machinery
Ca2+ sensor ................................................................................................................... 48 3.2.2 fEPSPs Cgtx relative inhibition in WT and RIM1a KO mice ............................. 52 3.2.3 fEPSPs Agatx relative inhibition in WT and RIM1a KO mice ........................... 55 3.2.4 Ca2+ signal operating the Ca2+ sensor of release: increased P/Q-type VGCC
contribution to the [Ca2+]local in RIM1a KO mice ............................................................ 57 3.2.5 Ca2+ signal operating the Ca2+ sensor of release in RIM3 KO and RIM4 KO mice 61
3.3 Slightly decelerated fast neurotransmitter release in RIM1α KO mice .......................... 64

III
3.4 Unaltered distance between Ca2+ source and Ca2+ sensor in RIM1a KO mice ............ 66 3.5 Equivalent Cgtx effect on fEPSPs and EPSCs ............................................................. 67 3.6 Unaltered Cgtx sensitivity of transmitter release in cDKO mice .................................... 70 3.7 Differential contribution of VGCC to Ca2+ entry in RIM1a KO mice .............................. 73 3.8 Assessing release properties in cultured cells expressing RIM-GFP fusion protein ..... 77
3.8.1 Assessing Pr using pharmacological blockade of synaptically activated
NMDARs by the use-dependent blocker MK-801 ......................................................... 78 3.8.2 IPSCs deconvolution approach ........................................................................ 79
4 Discussion ............................................................................................................................... 81
5 Abstract .................................................................................................................................... 95
6 List of figures .......................................................................................................................... 98
7 Bibliography .......................................................................................................................... 100
8 Acknowledgement ................................................................................................................ 110
IV
List of abbreviations
Agatx w-agatoxin IVA
AM acetoxymethyl
AMPAR AMPA receptor
AP action potential
AZ active zone
[Ca2+]e extracellular Ca2+ concentration
[Ca2+]i intracellular Ca2+ concentration
CCD charge-coupled device
cDKO conditional double knockout
Cdk5 cyclin-dependent kinase 5
Cgtx w-conotoxin GVIA
CNQX 6-cyano-7-nitroquinoxaline-2,3-dione
CNS central nervous system
D-APV D-2-amino-5-phosphonopentanoic acid
DF peak fluorescence
DIV day in vitro
DMSO dimethyl sulfoxide
DG dentate gyrus
EC entorhinal cortex
EPP end-plate potential
EPSC excitatory postsynaptic current
F fluorescence
fEPSP field excitatory postsynaptic potential
HBC 2-hydroxypropyl-b-cylcodextrin
HEPES ACSF HEPES-buffered artificial cerebrospinal fluid
HVA high-voltage activated
iCa individual Ca2+ channel current
V
ICa total Ca2+ entry
IEI inter-event interval
IPSC inhibitory postsynaptic current
KO knockout
LTP long-term plasticity
LVA low-voltage activated
m quantal content
mACSF modified artificial cerebrospinal fluid
mEPSC miniature excitatory postsynaptic current
mIPSC miniature inhibitory postsynaptic current
mPSP miniature postsynaptic potential
n number of releasable vesicles
NMDAR NMDA receptor
NMJ neuromuscular junction
pEPSP population excitatory postsynaptic potential
PPF paired-pulse facilitation
Pr synaptic release probability
PSP postsynaptic potential
pSpike population spike
Pves vesicular release probability
q quantal amplitude or quantal size
Ra access resistance
RIM Rab3-interacting molecule
RIM-BP RIM-binding protein
RRP readily-releasable pool
sACSF standard artificial cerebrospinal fluid
Sc-CA1 Schaffer collaterals to CA1 synapses
SD standard deviation
STP short-term plasticity
SV synaptic vesicle
Syt1 Synaptotagmin-1
Syt7 Synaptotagmin-7

VI
t time constant of decay
TTX tetrodotoxin
VGCC voltage-gated Ca2+ channel
WT wild-type
4-AP 4-Aminopyridine
1
1 Introduction
1.1 Synaptic computation
Hypothesized by Santiago Ramón y Cajal in 1888 (Ramón y Cajal, 1888) and
confirmed in the 1950s with the development of the electron microscope (Palay and
Palade, 1955), it is established that neurons are individual entities creating the
complexity of the brain. In the nervous system, neurons communicate to each other
via synapses. Two main modalities of neural communication co-exist: electrical and
chemical. Electrical synapses are direct connections between neural cells by gap
junctions, whereas chemical synapses convey information between two adjacent
neurons by the release of chemicals, called neurotransmitters. Electrical synapses,
also called gap junctions, are important for glial cells communication as well as
synchronization and rhythmicity in neural circuits. Nevertheless, the most prominent
route of communication between neurons is chemical synaptic transmission.
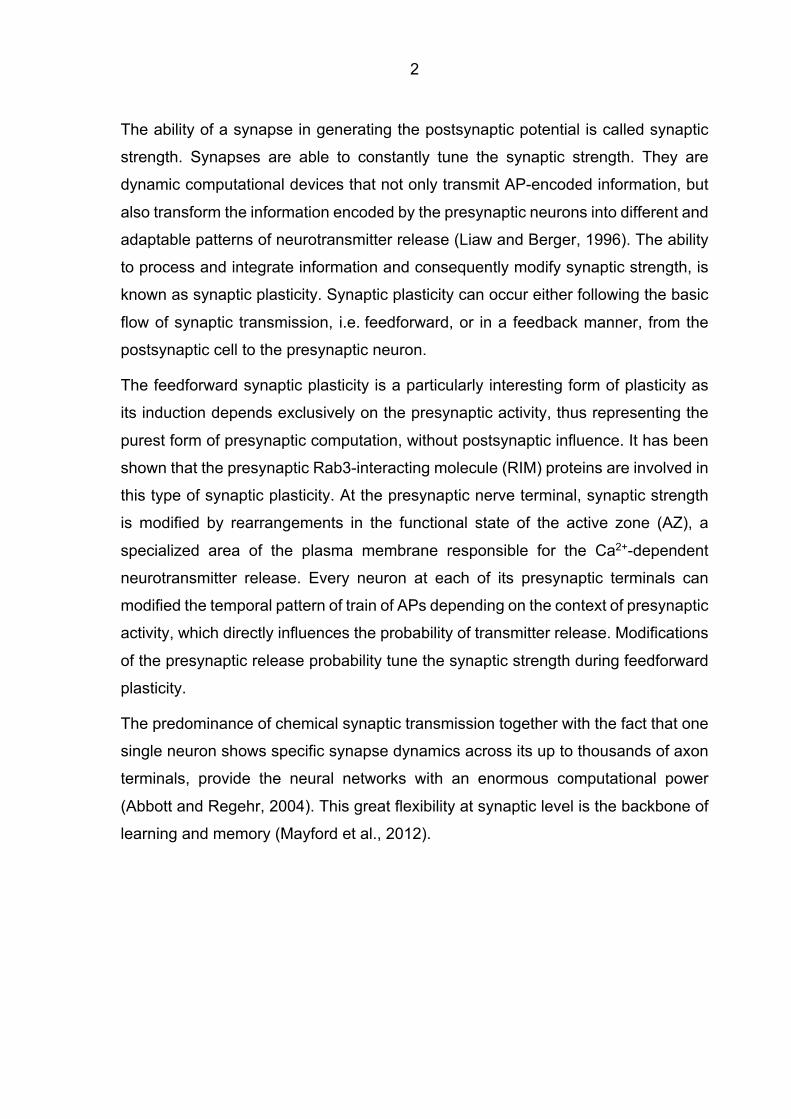
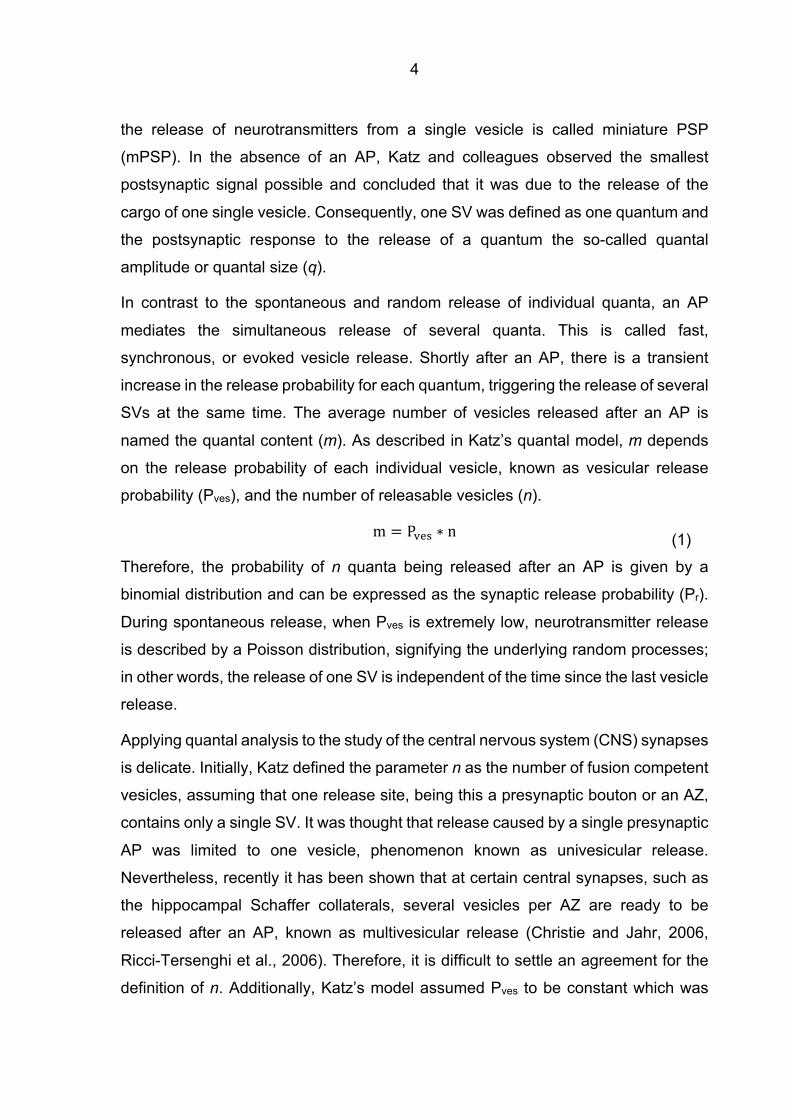
In a typical chemical synapse, synaptic transmission implies the transmission of
information from the presynaptic neuron to the postsynaptic cell, through the
synaptic cleft (Figure 1.1). Briefly, chemical synaptic transmission can be explained
in five steps:
1. An action potential (AP) in the presynaptic neuron reaches the axon terminal.
2. At the presynaptic nerve terminal, voltage-gated Ca2+ channels (VGCC) open.
3. Ca2+ binds to Ca2+ sensors located at the synaptic vesicles (SV). The SVs,
which contain neurotransmitter molecules, fuse with the plasma membrane,
releasing the chemicals.
4. Those neurotransmitters bind to specific receptors located at the postsynaptic
cell.
5. The binding to the receptors opens ion channels causing the postsynaptic
potential.
2
The ability of a synapse in generating the postsynaptic potential is called synaptic
strength. Synapses are able to constantly tune the synaptic strength. They are
dynamic computational devices that not only transmit AP-encoded information, but
also transform the information encoded by the presynaptic neurons into different and
adaptable patterns of neurotransmitter release (Liaw and Berger, 1996). The ability
to process and integrate information and consequently modify synaptic strength, is
known as synaptic plasticity. Synaptic plasticity can occur either following the basic
flow of synaptic transmission, i.e. feedforward, or in a feedback manner, from the
postsynaptic cell to the presynaptic neuron.
The feedforward synaptic plasticity is a particularly interesting form of plasticity as
its induction depends exclusively on the presynaptic activity, thus representing the
purest form of presynaptic computation, without postsynaptic influence. It has been
shown that the presynaptic Rab3-interacting molecule (RIM) proteins are involved in
this type of synaptic plasticity. At the presynaptic nerve terminal, synaptic strength
is modified by rearrangements in the functional state of the active zone (AZ), a
specialized area of the plasma membrane responsible for the Ca2+-dependent
neurotransmitter release. Every neuron at each of its presynaptic terminals can
modified the temporal pattern of train of APs depending on the context of presynaptic
activity, which directly influences the probability of transmitter release. Modifications
of the presynaptic release probability tune the synaptic strength during feedforward
plasticity.
The predominance of chemical synaptic transmission together with the fact that one
single neuron shows specific synapse dynamics across its up to thousands of axon
terminals, provide the neural networks with an enormous computational power
(Abbott and Regehr, 2004). This great flexibility at synaptic level is the backbone of
learning and memory (Mayford et al., 2012).
3
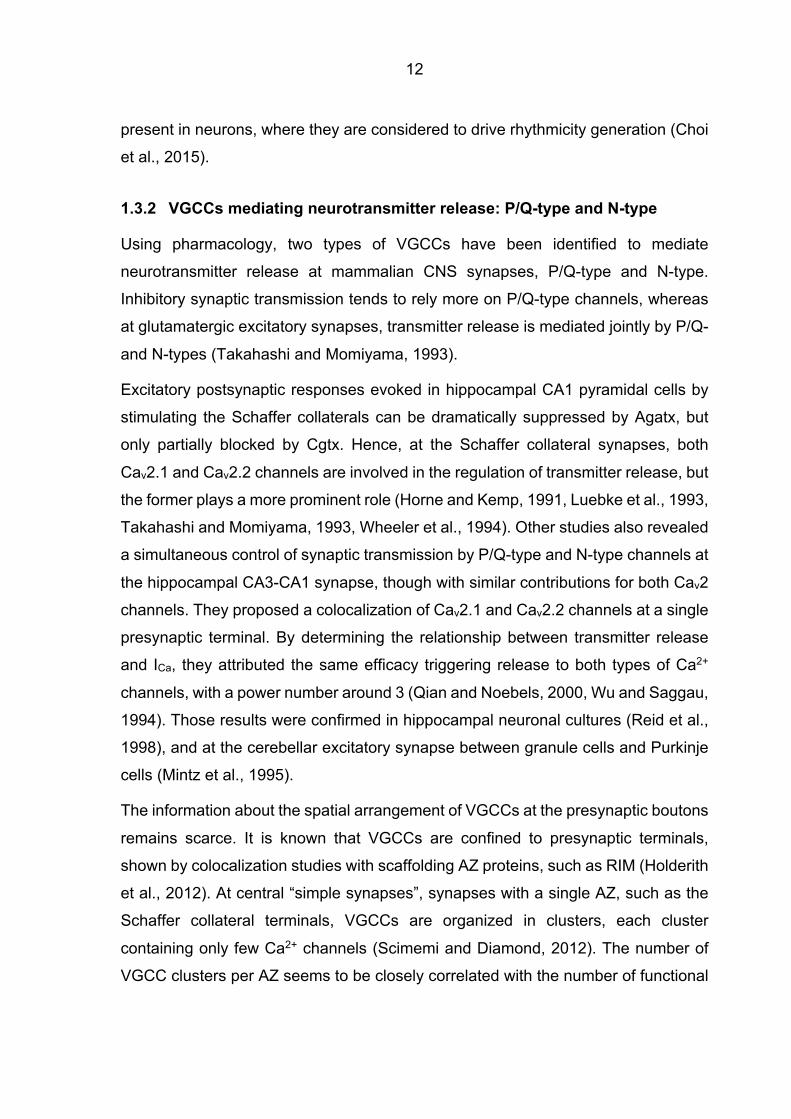
Figure 1.1 Structure of a chemical synapse. (A) Electron micrograph of a presynaptic terminal onto a postsynaptic neuron (Milovanovic and De Camilli, 2017). (B) Schematic drawing of a synapse illustrating the presynaptic neuron, the active zone, specialized area of the plasma membrane responsible for synaptic vesicle exocytosis, and the postsynaptic cell.
1.2 Presynaptic mechanisms of synaptic transmission
Based on the modernist principle of “form follows function”, which states that the
shape of an object relates to its purpose, we study the functional aspects of synaptic
transmission first, focusing on the physiology of neurotransmitter release and later,
exploring the structure of the AZ in detail.
Speed, efficiency, and flexibility are hallmarks of synaptic transmission. Those
characteristics are, in part, due to the high degree of temporal and spatial
coordination of Ca2+-triggering SV exocytosis at the presynaptic terminal.
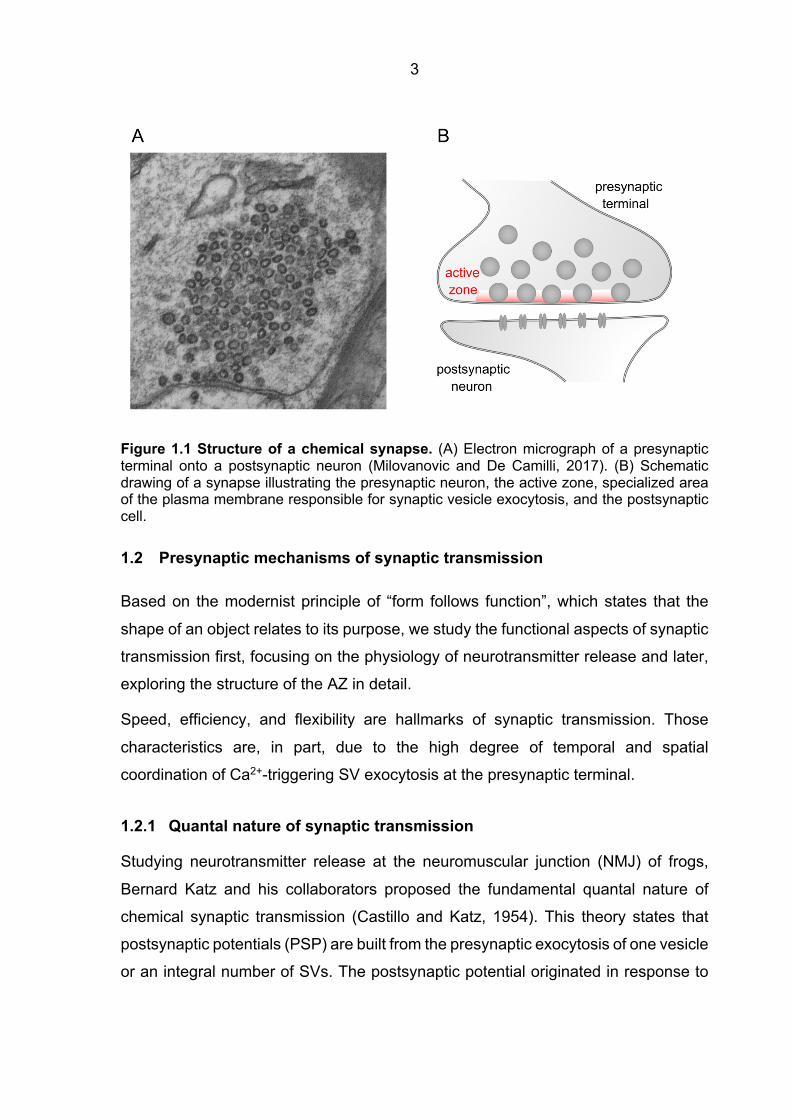
1.2.1 Quantal nature of synaptic transmission
Studying neurotransmitter release at the neuromuscular junction (NMJ) of frogs,
Bernard Katz and his collaborators proposed the fundamental quantal nature of
chemical synaptic transmission (Castillo and Katz, 1954). This theory states that
postsynaptic potentials (PSP) are built from the presynaptic exocytosis of one vesicle
or an integral number of SVs. The postsynaptic potential originated in response to
4
the release of neurotransmitters from a single vesicle is called miniature PSP
(mPSP). In the absence of an AP, Katz and colleagues observed the smallest
postsynaptic signal possible and concluded that it was due to the release of the
cargo of one single vesicle. Consequently, one SV was defined as one quantum and
the postsynaptic response to the release of a quantum the so-called quantal
amplitude or quantal size (q).
In contrast to the spontaneous and random release of individual quanta, an AP
mediates the simultaneous release of several quanta. This is called fast,
synchronous, or evoked vesicle release. Shortly after an AP, there is a transient
increase in the release probability for each quantum, triggering the release of several
SVs at the same time. The average number of vesicles released after an AP is
named the quantal content (m). As described in Katz’s quantal model, m depends
on the release probability of each individual vesicle, known as vesicular release
probability (Pves), and the number of releasable vesicles (n).
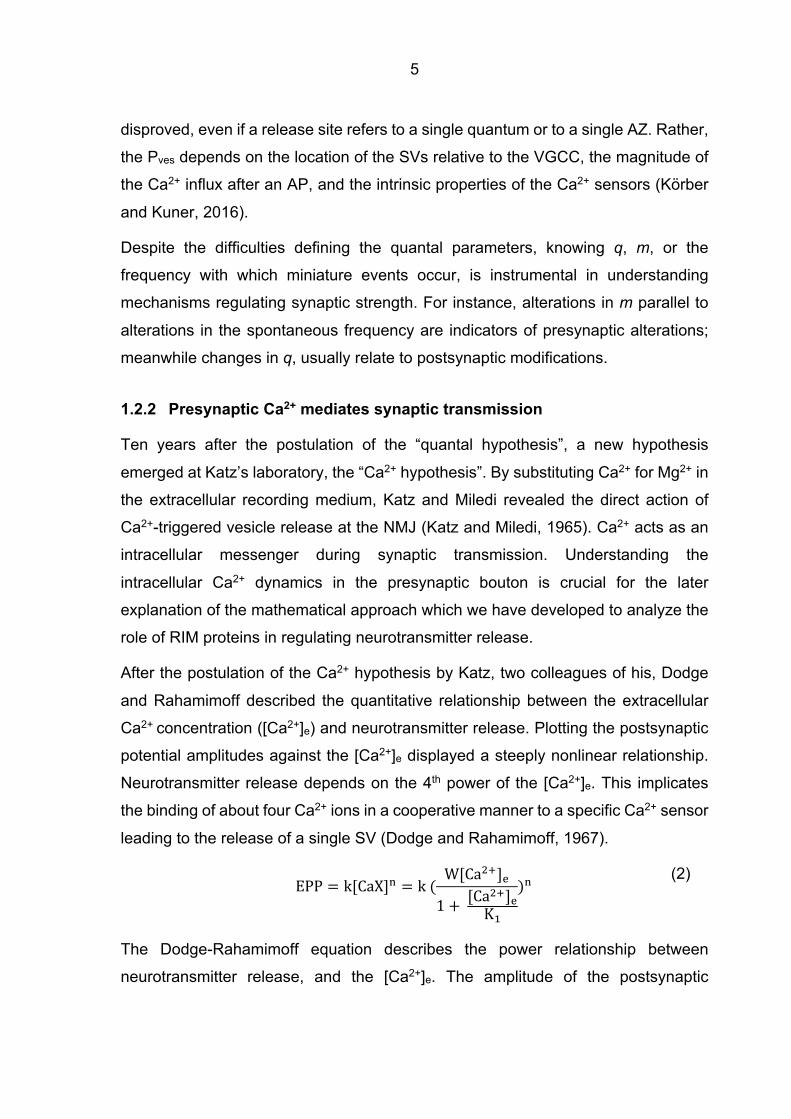
m = P$%& ∗ n (1) Therefore, the probability of n quanta being released after an AP is given by a
binomial distribution and can be expressed as the synaptic release probability (Pr).
During spontaneous release, when Pves is extremely low, neurotransmitter release
is described by a Poisson distribution, signifying the underlying random processes;
in other words, the release of one SV is independent of the time since the last vesicle
release.
Applying quantal analysis to the study of the central nervous system (CNS) synapses
is delicate. Initially, Katz defined the parameter n as the number of fusion competent
vesicles, assuming that one release site, being this a presynaptic bouton or an AZ,
contains only a single SV. It was thought that release caused by a single presynaptic
AP was limited to one vesicle, phenomenon known as univesicular release.
Nevertheless, recently it has been shown that at certain central synapses, such as
the hippocampal Schaffer collaterals, several vesicles per AZ are ready to be
released after an AP, known as multivesicular release (Christie and Jahr, 2006,
Ricci-Tersenghi et al., 2006). Therefore, it is difficult to settle an agreement for the
definition of n. Additionally, Katz’s model assumed Pves to be constant which was
5
disproved, even if a release site refers to a single quantum or to a single AZ. Rather,
the Pves depends on the location of the SVs relative to the VGCC, the magnitude of
the Ca2+ influx after an AP, and the intrinsic properties of the Ca2+ sensors (Körber
and Kuner, 2016).
Despite the difficulties defining the quantal parameters, knowing q, m, or the
frequency with which miniature events occur, is instrumental in understanding
mechanisms regulating synaptic strength. For instance, alterations in m parallel to
alterations in the spontaneous frequency are indicators of presynaptic alterations;
meanwhile changes in q, usually relate to postsynaptic modifications.
1.2.2 Presynaptic Ca2+ mediates synaptic transmission
Ten years after the postulation of the “quantal hypothesis”, a new hypothesis
emerged at Katz’s laboratory, the “Ca2+ hypothesis”. By substituting Ca2+ for Mg2+ in
the extracellular recording medium, Katz and Miledi revealed the direct action of
Ca2+-triggered vesicle release at the NMJ (Katz and Miledi, 1965). Ca2+ acts as an
intracellular messenger during synaptic transmission. Understanding the
intracellular Ca2+ dynamics in the presynaptic bouton is crucial for the later
explanation of the mathematical approach which we have developed to analyze the
role of RIM proteins in regulating neurotransmitter release.
After the postulation of the Ca2+ hypothesis by Katz, two colleagues of his, Dodge
and Rahamimoff described the quantitative relationship between the extracellular
Ca2+ concentration ([Ca2+]e) and neurotransmitter release. Plotting the postsynaptic
potential amplitudes against the [Ca2+]e displayed a steeply nonlinear relationship.
Neurotransmitter release depends on the 4th power of the [Ca2+]e. This implicates
the binding of about four Ca2+ ions in a cooperative manner to a specific Ca2+ sensor
leading to the release of a single SV (Dodge and Rahamimoff, 1967).
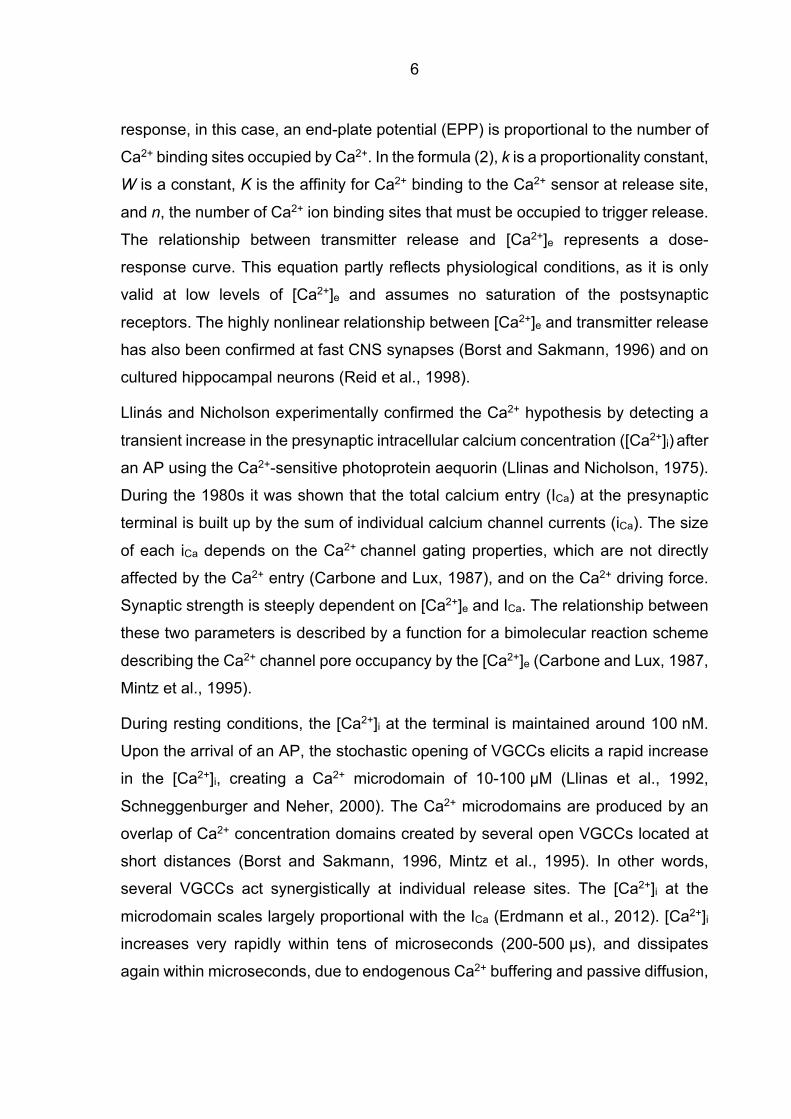
EPP = k[CaX]0 = k(
W[Ca45]%
1 +[Ca45]%K9
)0 (2)
The Dodge-Rahamimoff equation describes the power relationship between
neurotransmitter release, and the [Ca2+]e. The amplitude of the postsynaptic
6
response, in this case, an end-plate potential (EPP) is proportional to the number of
Ca2+ binding sites occupied by Ca2+. In the formula (2), k is a proportionality constant,
W is a constant, K is the affinity for Ca2+ binding to the Ca2+ sensor at release site,
and n, the number of Ca2+ ion binding sites that must be occupied to trigger release.
The relationship between transmitter release and [Ca2+]e represents a dose-
response curve. This equation partly reflects physiological conditions, as it is only
valid at low levels of [Ca2+]e and assumes no saturation of the postsynaptic
receptors. The highly nonlinear relationship between [Ca2+]e and transmitter release
has also been confirmed at fast CNS synapses (Borst and Sakmann, 1996) and on
cultured hippocampal neurons (Reid et al., 1998).
Llinás and Nicholson experimentally confirmed the Ca2+ hypothesis by detecting a
transient increase in the presynaptic intracellular calcium concentration ([Ca2+]i) after
an AP using the Ca2+-sensitive photoprotein aequorin (Llinas and Nicholson, 1975).
During the 1980s it was shown that the total calcium entry (ICa) at the presynaptic
terminal is built up by the sum of individual calcium channel currents (iCa). The size
of each iCa depends on the Ca2+ channel gating properties, which are not directly
affected by the Ca2+ entry (Carbone and Lux, 1987), and on the Ca2+ driving force.
Synaptic strength is steeply dependent on [Ca2+]e and ICa. The relationship between
these two parameters is described by a function for a bimolecular reaction scheme
describing the Ca2+ channel pore occupancy by the [Ca2+]e (Carbone and Lux, 1987,
Mintz et al., 1995).
During resting conditions, the [Ca2+]i at the terminal is maintained around 100 nM.
Upon the arrival of an AP, the stochastic opening of VGCCs elicits a rapid increase
in the [Ca2+]i, creating a Ca2+ microdomain of 10-100 µM (Llinas et al., 1992,
Schneggenburger and Neher, 2000). The Ca2+ microdomains are produced by an
overlap of Ca2+ concentration domains created by several open VGCCs located at
short distances (Borst and Sakmann, 1996, Mintz et al., 1995). In other words,
several VGCCs act synergistically at individual release sites. The [Ca2+]i at the
microdomain scales largely proportional with the ICa (Erdmann et al., 2012). [Ca2+]i
increases very rapidly within tens of microseconds (200-500 µs), and dissipates
again within microseconds, due to endogenous Ca2+ buffering and passive diffusion,
7
allowing fast termination of the transmitter release. The short time lag between the
ICa and the transmitter release, known as synaptic delay, suggests that only vesicles
located near the Ca2+ source will undergo fusion. The coupling between Ca2+ source
and Ca2+ sensor is a key factor determining the speed and efficacy of synaptic
transmission.
Due to the nature of the Ca2+ signal at the presynaptic terminal, Ca2+ sensors
triggering neurotransmitter release must have specific characteristics. They have to
be located within the Ca2+ microdomain, present low affinity for Ca2+ and must have
fast kinetics, to account for the speed of transmitter release, as well as high
cooperativity. In 1992, Synaptotagmin-1 (Syt1) was identified as the major Ca2+
sensor for fast neurotransmitter release at the central synapse (Brose et al., 1992,
Geppert et al., 1994). Synaptotagmins constitute a family of transmembrane proteins
associated with SVs. They consist of two cytoplasmic Ca2+ binding domains: C2A
and C2B, which bind several Ca2+ ions with an intrinsic low affinity. The binding of
Ca2+ to both C2 domains is crucial for a properly evoked synaptic transmission
(Fernandez-Chacon et al., 2001, Mackler et al., 2002). Moreover, Syt1 mediates
Ca2+-dependent SV exocytosis by binding directly to the fusion machinery.
Therefore, Syt1 serves as an essential player for the synchronization of Ca2+ entry
and release during fast synaptic transmission (Südhof, 2013). Although Syt1 is the
principal Ca2+-sensor for synchronous transmitter release, other synaptotagmins, as
Syt2 and Syt9, also mediate fast synaptic transmission at central synapses (Xu et
al., 2007).
The high cooperativity of the Ca2+ sensors during an AP makes synaptic strength
extremely sensitive to modulation by changes in the [Ca2+]i . Small changes in the
ICa, for instance, a reduction by the usage of specific VGCC blockers, will have a
larger impact on the synaptic strength, as we can anticipate from the simple power-
law-description of the Ca2+-dependence of release, being approximated by (ICa)n.
1.2.3 Synaptic plasticity
As aforementioned, the ability of the synapses to modify synaptic strength in
response to activity is known as synaptic plasticity. The activity-dependent changes
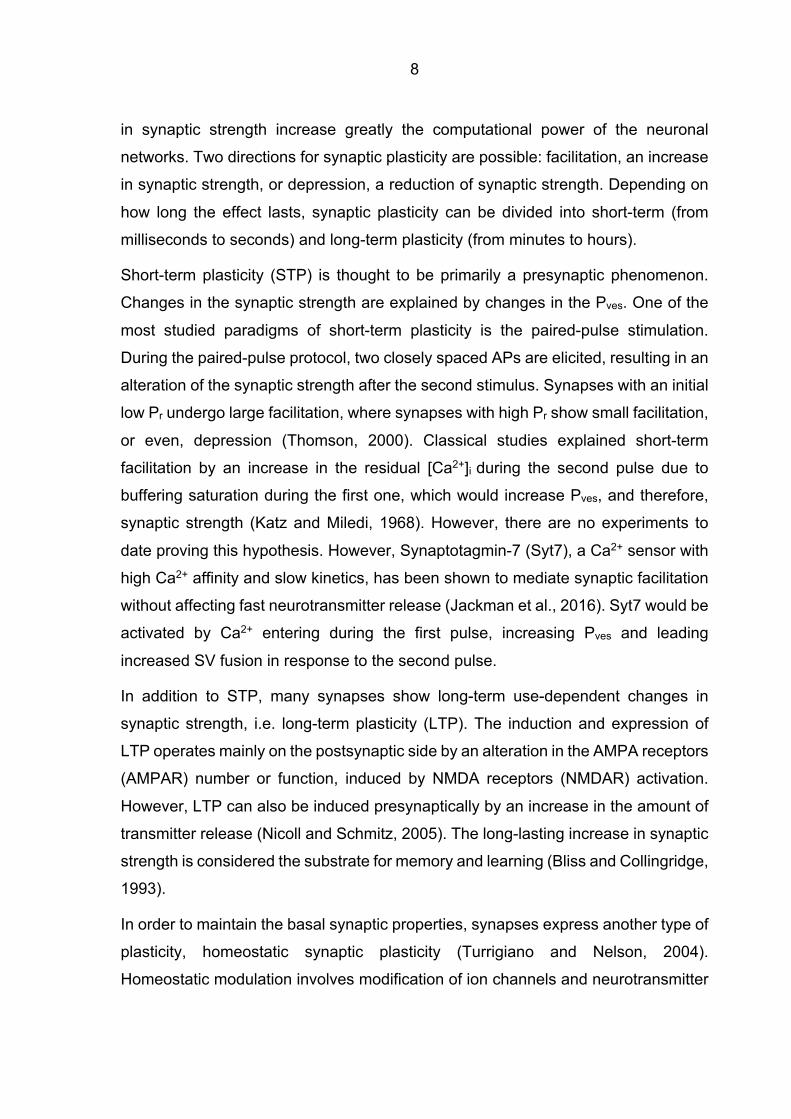
8
in synaptic strength increase greatly the computational power of the neuronal
networks. Two directions for synaptic plasticity are possible: facilitation, an increase
in synaptic strength, or depression, a reduction of synaptic strength. Depending on
how long the effect lasts, synaptic plasticity can be divided into short-term (from
milliseconds to seconds) and long-term plasticity (from minutes to hours).
Short-term plasticity (STP) is thought to be primarily a presynaptic phenomenon.
Changes in the synaptic strength are explained by changes in the Pves. One of the
most studied paradigms of short-term plasticity is the paired-pulse stimulation.
During the paired-pulse protocol, two closely spaced APs are elicited, resulting in an
alteration of the synaptic strength after the second stimulus. Synapses with an initial
low Pr undergo large facilitation, where synapses with high Pr show small facilitation,
or even, depression (Thomson, 2000). Classical studies explained short-term
facilitation by an increase in the residual [Ca2+]i during the second pulse due to
buffering saturation during the first one, which would increase Pves, and therefore,
synaptic strength (Katz and Miledi, 1968). However, there are no experiments to
date proving this hypothesis. However, Synaptotagmin-7 (Syt7), a Ca2+ sensor with
high Ca2+ affinity and slow kinetics, has been shown to mediate synaptic facilitation
without affecting fast neurotransmitter release (Jackman et al., 2016). Syt7 would be
activated by Ca2+ entering during the first pulse, increasing Pves and leading
increased SV fusion in response to the second pulse.
In addition to STP, many synapses show long-term use-dependent changes in
synaptic strength, i.e. long-term plasticity (LTP). The induction and expression of
LTP operates mainly on the postsynaptic side by an alteration in the AMPA receptors
(AMPAR) number or function, induced by NMDA receptors (NMDAR) activation.
However, LTP can also be induced presynaptically by an increase in the amount of
transmitter release (Nicoll and Schmitz, 2005). The long-lasting increase in synaptic
strength is considered the substrate for memory and learning (Bliss and Collingridge,
1993).
In order to maintain the basal synaptic properties, synapses express another type of
plasticity, homeostatic synaptic plasticity (Turrigiano and Nelson, 2004).
Homeostatic modulation involves modification of ion channels and neurotransmitter
9
receptors expression on the postsynaptic side, as well as changes in
neurotransmitter release on the presynaptic side, via retrograde signalling.
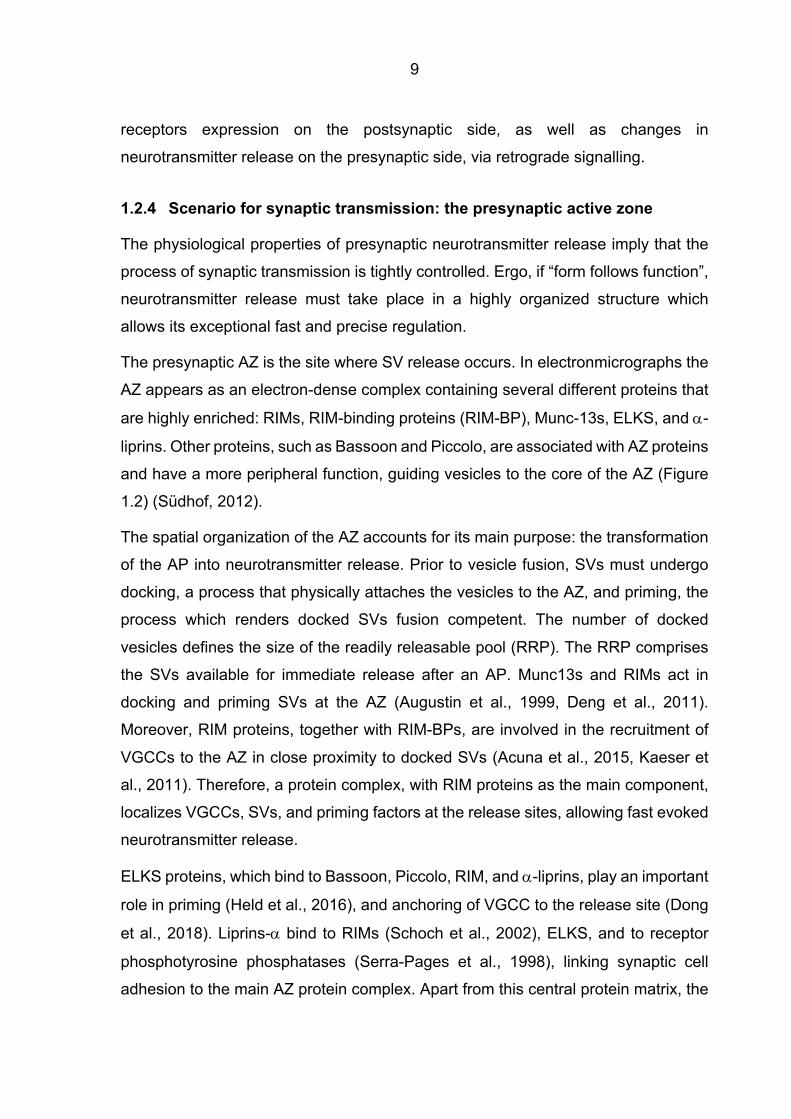
1.2.4 Scenario for synaptic transmission: the presynaptic active zone
The physiological properties of presynaptic neurotransmitter release imply that the
process of synaptic transmission is tightly controlled. Ergo, if “form follows function”,
neurotransmitter release must take place in a highly organized structure which
allows its exceptional fast and precise regulation.
The presynaptic AZ is the site where SV release occurs. In electronmicrographs the
AZ appears as an electron-dense complex containing several different proteins that
are highly enriched: RIMs, RIM-binding proteins (RIM-BP), Munc-13s, ELKS, and a-
liprins. Other proteins, such as Bassoon and Piccolo, are associated with AZ proteins
and have a more peripheral function, guiding vesicles to the core of the AZ (Figure
1.2) (Südhof, 2012).
The spatial organization of the AZ accounts for its main purpose: the transformation
of the AP into neurotransmitter release. Prior to vesicle fusion, SVs must undergo
docking, a process that physically attaches the vesicles to the AZ, and priming, the
process which renders docked SVs fusion competent. The number of docked
vesicles defines the size of the readily releasable pool (RRP). The RRP comprises
the SVs available for immediate release after an AP. Munc13s and RIMs act in
docking and priming SVs at the AZ (Augustin et al., 1999, Deng et al., 2011).
Moreover, RIM proteins, together with RIM-BPs, are involved in the recruitment of
VGCCs to the AZ in close proximity to docked SVs (Acuna et al., 2015, Kaeser et
al., 2011). Therefore, a protein complex, with RIM proteins as the main component,
localizes VGCCs, SVs, and priming factors at the release sites, allowing fast evoked
neurotransmitter release.
ELKS proteins, which bind to Bassoon, Piccolo, RIM, and a-liprins, play an important
role in priming (Held et al., 2016), and anchoring of VGCC to the release site (Dong
et al., 2018). Liprins-a bind to RIMs (Schoch et al., 2002), ELKS, and to receptor
phosphotyrosine phosphatases (Serra-Pages et al., 1998), linking synaptic cell
adhesion to the main AZ protein complex. Apart from this central protein matrix, the
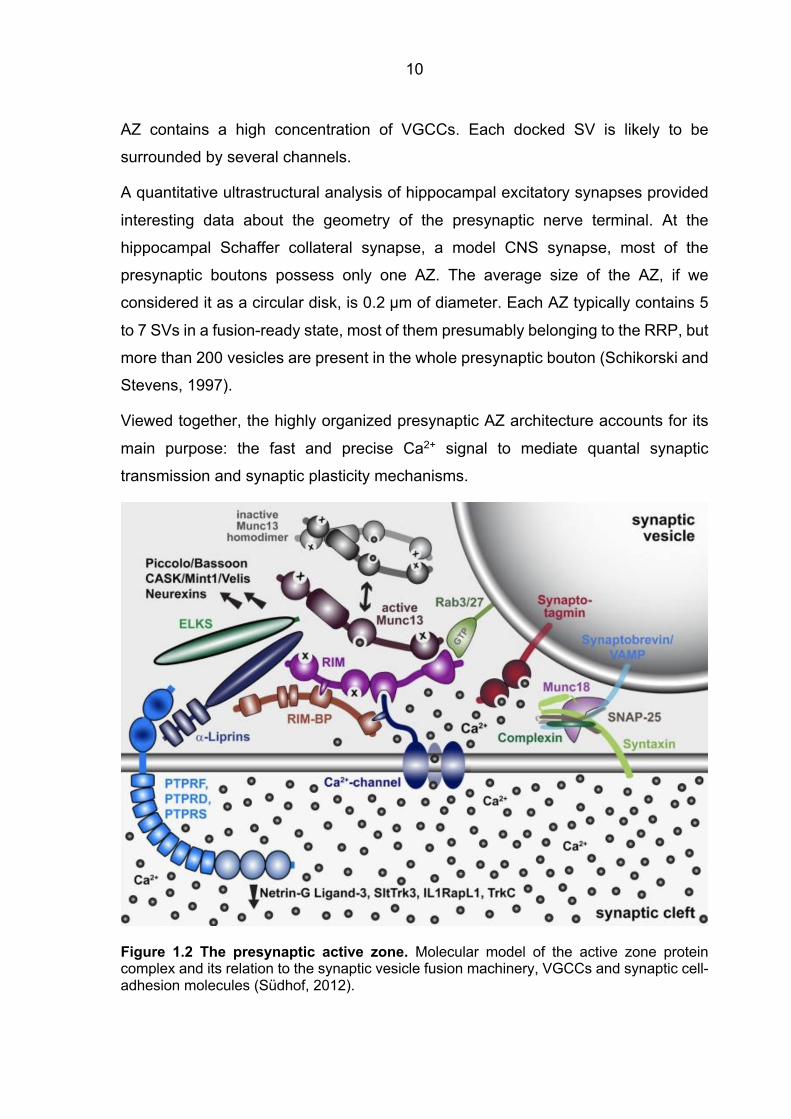
10
AZ contains a high concentration of VGCCs. Each docked SV is likely to be
surrounded by several channels.
A quantitative ultrastructural analysis of hippocampal excitatory synapses provided
interesting data about the geometry of the presynaptic nerve terminal. At the
hippocampal Schaffer collateral synapse, a model CNS synapse, most of the
presynaptic boutons possess only one AZ. The average size of the AZ, if we
considered it as a circular disk, is 0.2 µm of diameter. Each AZ typically contains 5
to 7 SVs in a fusion-ready state, most of them presumably belonging to the RRP, but
more than 200 vesicles are present in the whole presynaptic bouton (Schikorski and
Stevens, 1997).
Viewed together, the highly organized presynaptic AZ architecture accounts for its
main purpose: the fast and precise Ca2+ signal to mediate quantal synaptic
transmission and synaptic plasticity mechanisms.
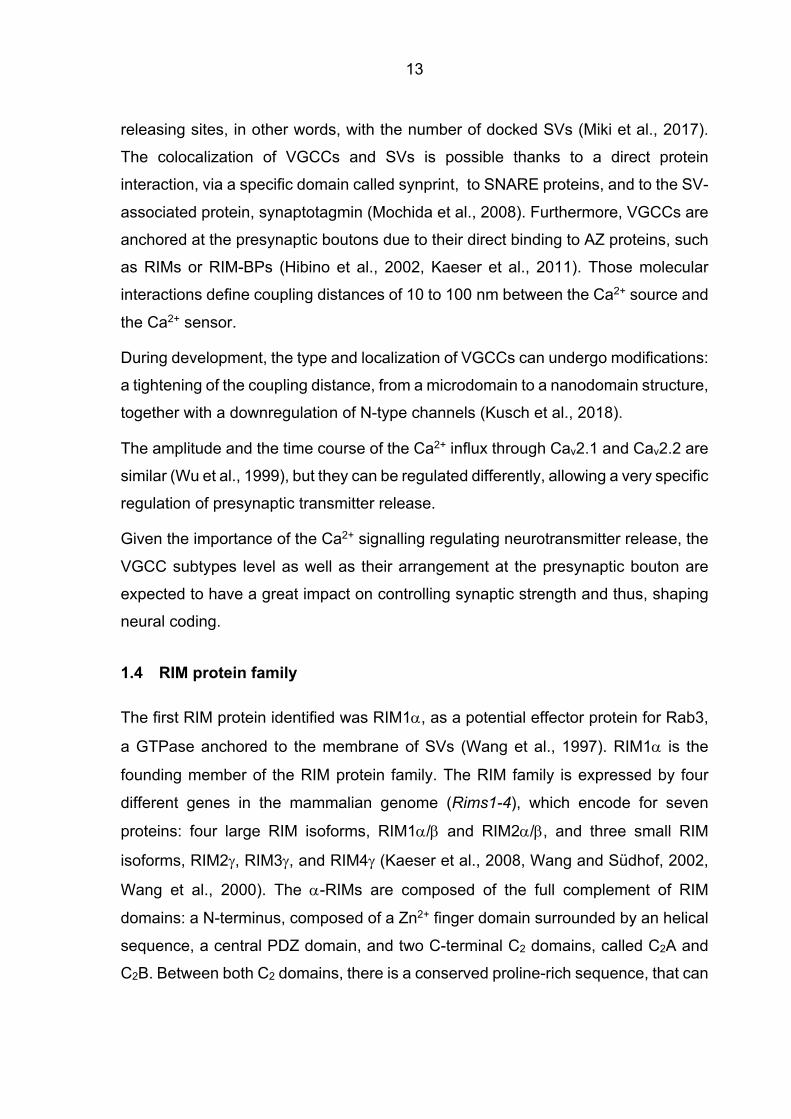
Figure 1.2 The presynaptic active zone. Molecular model of the active zone protein complex and its relation to the synaptic vesicle fusion machinery, VGCCs and synaptic cell-adhesion molecules (Südhof, 2012).
11
1.3 Voltage-gated Ca2+ channels
VGCCs convert electrical signals into intracellular signals, initiating many
physiological processes, such as neurotransmitter release. VGCCs at the
presynaptic terminal are tightly coupled to SVs, where the Ca2+ sensors are located.
The synaptic strength is dependent on the type and the density of the VGCCs as
well as on their distance to the docked SVs. Type, density, and location of VGCCs
tunes directly the Pves (Eggermann et al., 2011, Meinrenken et al., 2002).
1.3.1 Presynaptic Ca2+ channel subtypes: Structure and function
VGCCs are multi-subunit complexes of a principal pore-forming a1 subunit,
associated with an a2d subunit, an intracellular b subunit and, in some cases, a
transmembrane g subunit. The main subunit a1 contains four domains, each of which
contains six transmembrane segments (S1-S6). The S1-S4 segments of each
domain act as voltage sensors (Dunlap et al., 1995).
VGCCs have been classified in three families based on the a1 subunit. Two families
of high-voltage activated (HVA) Ca2+ channels, the Cav1 and the Cav2, and one
family of low-voltage activated (LVA) Ca2+ channels, Cav3. The Cav1 or L-type
channels are expressed in dendritic spines, where they contribute to synaptic input
integration (Bean, 1989), and can be blocked by dihydropyridines (Reuter, 1983).
The Cav2 family initiates synaptic transmission (Catterall, 2000), i.e. it is responsible
for the Ca2+ entry at presynaptic terminals triggering transmitter release. It is
subdivided into Cav2.1 or P/Q-type, Cav2.2 or N-type, and Cav2.3 or R-type
channels. The Cav2 channels are regulated by a direct interaction with G proteins
and SNARE proteins, which themselves are regulated by protein phosphorylation
pathways, and also by direct binding of Ca2+/calmodulin (Hille, 1994, Lee et al.,
1999). They activate and inactivate rapidly, accounting for the speed of synaptic
transmission (Augustine et al., 1985). The Cav2.1 or P/Q-type channels are sensitive
to the funnel web spider (Agelenopsis aperta) toxin w-agatoxin IVA (Agatx) (Mintz et
al., 1992). The Cav2.2 or N-type channels are blocked by the cone snail (Conus
geographus) peptide w-conotoxin GVIA (Cgtx) (Kamiya et al., 1988). The Cav3 or T-
type Ca2+ channels get activated at more negative membrane potentials, and are
12
present in neurons, where they are considered to drive rhythmicity generation (Choi
et al., 2015).
1.3.2 VGCCs mediating neurotransmitter release: P/Q-type and N-type
Using pharmacology, two types of VGCCs have been identified to mediate
neurotransmitter release at mammalian CNS synapses, P/Q-type and N-type.
Inhibitory synaptic transmission tends to rely more on P/Q-type channels, whereas
at glutamatergic excitatory synapses, transmitter release is mediated jointly by P/Q-
and N-types (Takahashi and Momiyama, 1993).
Excitatory postsynaptic responses evoked in hippocampal CA1 pyramidal cells by
stimulating the Schaffer collaterals can be dramatically suppressed by Agatx, but
only partially blocked by Cgtx. Hence, at the Schaffer collateral synapses, both
Cav2.1 and Cav2.2 channels are involved in the regulation of transmitter release, but
the former plays a more prominent role (Horne and Kemp, 1991, Luebke et al., 1993,
Takahashi and Momiyama, 1993, Wheeler et al., 1994). Other studies also revealed
a simultaneous control of synaptic transmission by P/Q-type and N-type channels at
the hippocampal CA3-CA1 synapse, though with similar contributions for both Cav2
channels. They proposed a colocalization of Cav2.1 and Cav2.2 channels at a single
presynaptic terminal. By determining the relationship between transmitter release
and ICa, they attributed the same efficacy triggering release to both types of Ca2+
channels, with a power number around 3 (Qian and Noebels, 2000, Wu and Saggau,
1994). Those results were confirmed in hippocampal neuronal cultures (Reid et al.,
1998), and at the cerebellar excitatory synapse between granule cells and Purkinje
cells (Mintz et al., 1995).
The information about the spatial arrangement of VGCCs at the presynaptic boutons
remains scarce. It is known that VGCCs are confined to presynaptic terminals,
shown by colocalization studies with scaffolding AZ proteins, such as RIM (Holderith
et al., 2012). At central “simple synapses”, synapses with a single AZ, such as the
Schaffer collateral terminals, VGCCs are organized in clusters, each cluster
containing only few Ca2+ channels (Scimemi and Diamond, 2012). The number of
VGCC clusters per AZ seems to be closely correlated with the number of functional
13
releasing sites, in other words, with the number of docked SVs (Miki et al., 2017).
The colocalization of VGCCs and SVs is possible thanks to a direct protein
interaction, via a specific domain called synprint, to SNARE proteins, and to the SV-
associated protein, synaptotagmin (Mochida et al., 2008). Furthermore, VGCCs are
anchored at the presynaptic boutons due to their direct binding to AZ proteins, such
as RIMs or RIM-BPs (Hibino et al., 2002, Kaeser et al., 2011). Those molecular
interactions define coupling distances of 10 to 100 nm between the Ca2+ source and
the Ca2+ sensor.
During development, the type and localization of VGCCs can undergo modifications:
a tightening of the coupling distance, from a microdomain to a nanodomain structure,
together with a downregulation of N-type channels (Kusch et al., 2018).
The amplitude and the time course of the Ca2+ influx through Cav2.1 and Cav2.2 are
similar (Wu et al., 1999), but they can be regulated differently, allowing a very specific
regulation of presynaptic transmitter release.
Given the importance of the Ca2+ signalling regulating neurotransmitter release, the
VGCC subtypes level as well as their arrangement at the presynaptic bouton are
expected to have a great impact on controlling synaptic strength and thus, shaping
neural coding.
1.4 RIM protein family
The first RIM protein identified was RIM1a, as a potential effector protein for Rab3,
a GTPase anchored to the membrane of SVs (Wang et al., 1997). RIM1a is the
founding member of the RIM protein family. The RIM family is expressed by four
different genes in the mammalian genome (Rims1-4), which encode for seven
proteins: four large RIM isoforms, RIM1a/b and RIM2a/b, and three small RIM
isoforms, RIM2g, RIM3g, and RIM4g (Kaeser et al., 2008, Wang and Südhof, 2002,
Wang et al., 2000). The a-RIMs are composed of the full complement of RIM
domains: a N-terminus, composed of a Zn2+ finger domain surrounded by an helical
sequence, a central PDZ domain, and two C-terminal C2 domains, called C2A and
C2B. Between both C2 domains, there is a conserved proline-rich sequence, that can
14
bind to SH3-domains. b-RIMs are identical to a-RIMs but lack the Rab3-binding part
of the N-terminal Zn2+ finger in RIM1b and the whole Zn2+ finger domain in RIM2b.
The g isoforms consist only of the C-terminal C2B domain and a specific N-terminal
sequence. The C2 domains of RIM proteins are considered atypical because they do
not bind to Ca2+ (Figure 1.3 A). The RIM protein family is primarily expressed in the
brain, and was first described to play a potential role in exocytosis (Wang et al.,
1997).
1.4.1 Large RIM isoforms: RIM1a/b and RIM2a/b
a/b-RIMs are scaffolding proteins located at the matrix of the presynaptic AZ. Studies
in C.elegans and mice proposed an active role for the large RIM proteins regulating
presynaptic vesicle exocytosis (Gracheva et al., 2008, Wang et al., 1997). Through
multiple molecular interactions with other AZ proteins as well as proteins located on
the SVs, a/b-RIMs may control several aspects of neurotransmitter release.
RIM1 and RIM2 proteins are highly homologous, present similar expression patterns,
and are exceptionally polymorphic due to extensive alternative splicing.
Nevertheless, RIM1 isoforms are the most abundant RIM proteins (Wang et al.,
1997). Studies on cultured hippocampal neurons and at the Calyx of Held synapse,
a large CNS model synapse, showed a redundancy of both RIM1 and RIM2 in their
presynaptic function (Han et al., 2015, Kaeser et al., 2012). Both isoforms encoded
by Rims1, RIM1a and RIM1b, display overlapping expression patterns, while their
redundant effect on synaptic transmission concerns only a few basic processes,
most likely due to their different N-terminal domain (Kaeser et al., 2008).
1.4.1.1 Biochemical interactions of a/b-RIMs and their physiological implications
Due to their multidomain structure, the large RIM proteins can engage in multiple
protein-protein interactions which are most likely crucial for their function regulating
neurotransmitter release.
The helical sequence of the N-terminal domain present in the a-RIMs but absent in
the RIM1b isoform, binds to the GTP-binding protein Rab3, which is associated to
15
the SVs, thus, linking RIM to SVs. The N-terminal Zn2+ finger binds to the C2A domain
of Munc13. The binding of RIM to Munc13, disrupts the Munc13 homodimer, thus
activating Munc13 (Deng et al., 2011). Munc13 itself mediates SVs priming by
changing the conformation of syntaxin, a member of the fusion release machinery.
Likely, RIM’s function during the priming process consists in the activation of
Munc13. Noteworthy is the fact that in RIM1a deficient mice, Munc13-1 expression
levels are reduced by approximately 60% (Schoch et al., 2002). Taken together, RIM
forms a tripartite complex with Rab3 and Munc13 via the N-terminal domain, which
is involved in priming, i.e. maintaining SVs in a release-ready state, which potentially
impacts synaptic plasticity. Located at the large linker sequence between the Zn2+
finger and the PDZ domain, there is a phosphorylation site, the S413, which its PKA-
dependent phosphorylation induces its binding to 14-3-3 adaptor proteins (Simsek-
Duran et al., 2004). The central PDZ domain binds directly to the C-terminal of
another AZ protein, ELKS, which itself binds to Bassoon, Piccolo, and a-liprins,
assuring a tight macromolecular complex at the AZ, and its connection with more
distal areas of the presynaptic bouton. Furthermore, the central PDZ domain binds
directly to the C-terminal of the P/Q-type and N-type VGCCs. This interaction tethers
VGCCs to SVs, which is essential for localizing Ca2+ entry at the AZ (Han et al.,
2011, Kaeser et al., 2011). The proline-rich motif, located between the two C2
domains, binds to the SH3 domains of the RIM-BPs (Hibino et al., 2002). At the same
time, RIM-BPs interact directly with L-type, N-type, and P/Q-type VGCCs (Hibino et
al., 2002). The simultaneous binding of RIM-BP to VGCCs, constitutes an alternative
link between RIM proteins and Ca2+ channels. The direct and indirect interactions of
RIMs with VGCCs are important for maintaining sufficient and localized Ca2+ entry
to trigger fast SV release. Additionally, the RIM C2B-domain, present in all RIM
isoforms, binds to the b subunit of the VGCCs, exerting a suppression in their
inactivation (Kiyonaka et al., 2007, Uriu et al., 2010). Liprins-a, which bind to
receptors at the presynaptic membrane, also bind to the C2B-domain of RIM proteins
(Schoch et al., 2002). Recently, the C2B-domain of RIM proteins has also been
shown to interact with the phospholipid PIP2 (De Jong et al., 2018). Apart from the
interactions of RIM with other molecules, crystallography analysis has documented
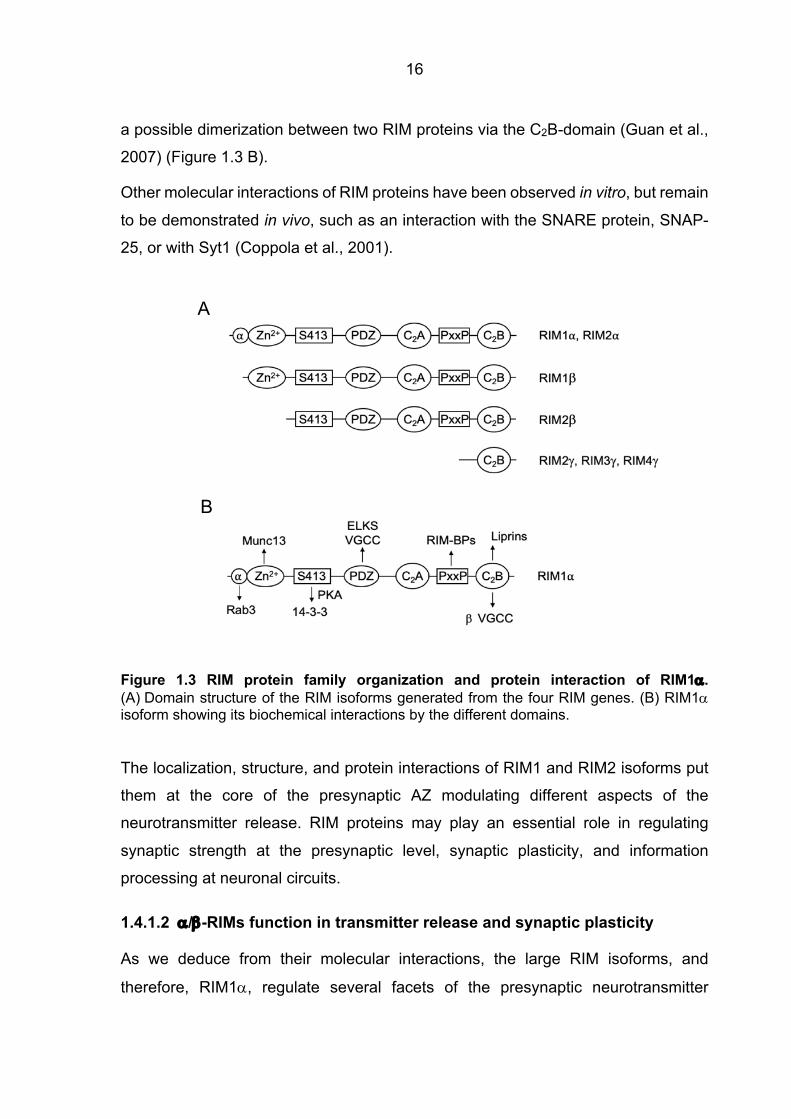
16
a possible dimerization between two RIM proteins via the C2B-domain (Guan et al.,
2007) (Figure 1.3 B).
Other molecular interactions of RIM proteins have been observed in vitro, but remain
to be demonstrated in vivo, such as an interaction with the SNARE protein, SNAP-
25, or with Syt1 (Coppola et al., 2001).
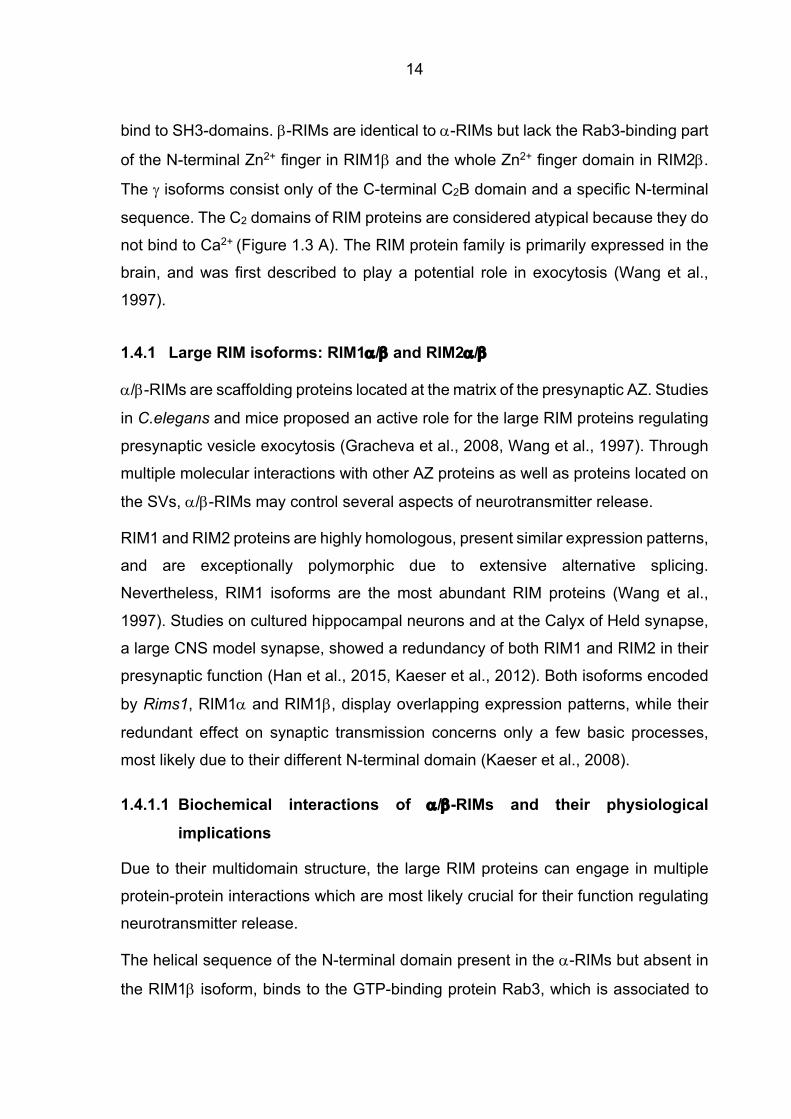
Figure 1.3 RIM protein family organization and protein interaction of RIM1a. (A) Domain structure of the RIM isoforms generated from the four RIM genes. (B) RIM1a isoform showing its biochemical interactions by the different domains.
The localization, structure, and protein interactions of RIM1 and RIM2 isoforms put
them at the core of the presynaptic AZ modulating different aspects of the
neurotransmitter release. RIM proteins may play an essential role in regulating
synaptic strength at the presynaptic level, synaptic plasticity, and information
processing at neuronal circuits.
1.4.1.2 a/b-RIMs function in transmitter release and synaptic plasticity
As we deduce from their molecular interactions, the large RIM isoforms, and
therefore, RIM1a, regulate several facets of the presynaptic neurotransmitter
A A
B
17
release. The constitutive and conditional genetic ablation of the different RIM
isoforms, knockout (KO), in animal models, has facilitated the study of the RIM
function in synaptic transmission. The ablation of RIM isoforms demonstrated a role
for RIM proteins coregulating Ca2+ channel transmitter release coupling, and the
RRP size. Several studies revealed a strong reduction of the synaptic transmitter
output, without altering the ultrastructure of the presynapse (Calakos et al., 2004,
Han et al., 2011, Kaeser et al., 2011, Schoch et al., 2002). The loss of RIM1/2
isoforms produced a decreased presynaptic ICa in cultured hippocampal neurons
(Kaeser et al., 2011), at cerebellar granule cells (Kintscher et al., 2013), and at the
Calyx of Held (Han et al., 2011), probably due to a decreased VGCC density at the
release site. Quantitative immunofluorescence showed a 40% decrease in P/Q-type
VGCC level in conditional double RIM1/2 knockout (cDKO) synapses (Kaeser et al.,
2011). At the Calyx of Held, the amplitude of the [Ca2+]i transient at the Ca2+ sensor,
estimated using release kinetics and Ca2+ uncaging data, was slightly decreased
(Han et al., 2011). This result is consistent with a weaker coupling between Ca2+
channels and Ca2+ sensor in RIM1/2 cDKO synapses, obtained by the analysis of
Ca2+ chelators effect on transmitter release (Kaeser et al., 2011). The Ca2+
dependence of SV release was suggested to be normal at RIM1a KO autaptic
neurons (Calakos et al., 2004). In contrast, Ca2+ responsiveness of release was
decreased at RIM1/2 cDKO synapses, which indicated an unchanged Ca2+
cooperativity (Kaeser et al., 2011). This suggests that the large RIM isoforms enable
fast and synchronous triggering of transmitter release. At several synapse types
investigated, a reduction in the size of the RRP, was shown, implying an impairment
in priming (Calakos et al., 2004, Fernandez-Busnadiego et al., 2013, Han et al.,
2011, Kaeser et al., 2011). The ablation of RIM1a increased the paired-pulse
facilitation (PPF), a form of short-term synaptic plasticity, at the hippocampal CA3-
CA1 synapses, indicating a decrease Pr (Schoch et al., 2002). Pves was also
decreased at the RIM deficient Calyx of Held synapse, but in a much lesser extent
(Han et al., 2011).
RIM proteins play different roles at different excitatory synapse types. As shown
above, at the hippocampal Schaffer collateral synapses, RIM proteins are essential
for basic neurotransmitter release and short-term plasticity. However, the induction
18
of NMDAR-dependent LTP present at those synapses does not required RIM
(Schoch et al., 2002), although is essential for the maintenance of the LTP (Huang
et al., 2005). At the hippocampal mossy fibers of RIM deficient mice PKA-dependent
presynaptic LTP was completely abolished (Castillo et al., 2002). In addition to the
involvement of RIM proteins in short-term and long-term synaptic plasticity, RIM has
been found to mediate presynaptic homeostatic plasticity by the modulation of the
RRP at the Drosophila NMJ (Müller et al., 2012).
The large RIM isoforms control the Ca2+-mediated SV exocytosis and the size of the
RRP, via their multiple interactions at the AZ, which impact synaptic strength and
synaptic plasticity. Those abnormalities in basic transmitter release and synaptic
plasticity are reflected in memory and learning deficits in RIM1a KO mice (Powell et
al., 2004).
1.4.2 Small RIM isoforms: RIM3g and RIM4g
Albeit much is known about the large RIM isoforms, the small isoforms are the “great
unknown” of the RIM protein family. As previously mentioned, RIM3 and RIM4, are
composed only of the RIM-specific C-terminal C2B domain and varying
N sequences. As the a and b isoforms, g-RIMs are also mainly expressed in the
brain, where they present a broader subcellular expression pattern. g-RIMs are
components of the presynaptic and postsynaptic cytomatrix, and can also be found
in dendrites and in the soma (Alvarez-Baron et al., 2013). The first studies
investigating the physiological functions of the g isoforms, suggested that, as a/b-
RIMs, they bind to VGCCs modulating their opening by suppressing their
inactivation, and sustaining presynaptic Ca2+ influx (Uriu et al., 2010). Furthermore,
RIM3 and RIM4 seem to be important for the development of normal neuronal
arborization of the dendritic tree (Alvarez-Baron et al., 2013). Newly generated
constitutive RIM4 KO mice show a strong motor phenotype, which could be
reproduced by the specific loss of RIM4 at the Purkinje cells (unpublished data).
From those data, we can hypothesize a wider role for the g-RIMs compared to a-
RIMs. The function of RIM3 and RIM4 putatively varies depending on the brain
region and subcellular compartment in which they are expressed.
19
1.5 Hippocampal Schaffer collaterals as a model of central synapses
With his wondrous drawings in 1899 Santiago Ramón y Cajal revealed the elegant
anatomy and circuitry of the hippocampus (Figure 1.4 B). This fascinating brain
structure has awakened the interest of scientists since distant times. Already in the
16th century, the hippocampus was first described and named after its resemblance
with the seahorse. Nowadays, the hippocampus is one of the most investigated
structures in the brain and its role in consolidation of information and spatial memory
is well stablished (Martin and Clark, 2007).
For several reasons, we have selected the hippocampal Schaffer collateral
synapses, the synapse between the axon collaterals given off by CA3 pyramidal
neurons and the CA1 pyramidal cells, as a model synapse. First, the Schaffer
collaterals represent a typical ubiquitous small central synaptic terminal, where Ca2+-
dependent transmitter release is mediated by P/Q- type and N-type VCGGs (Horne
and Kemp, 1991, Luebke et al., 1993, Takahashi and Momiyama, 1993, Wheeler et
al., 1994). Second, the highly organized laminar arrangement of neurons in the
hippocampus makes it an ideal structure for field potential recordings (Johnston and
Wu, 1995). Third, the Schaffer collateral synapses are facilitating synapses which
can convey short- and long-term changes of synaptic strength. Last but not least,
there is a large body of previous reports on this synapse, ensuring comparability with
other findings in the field.
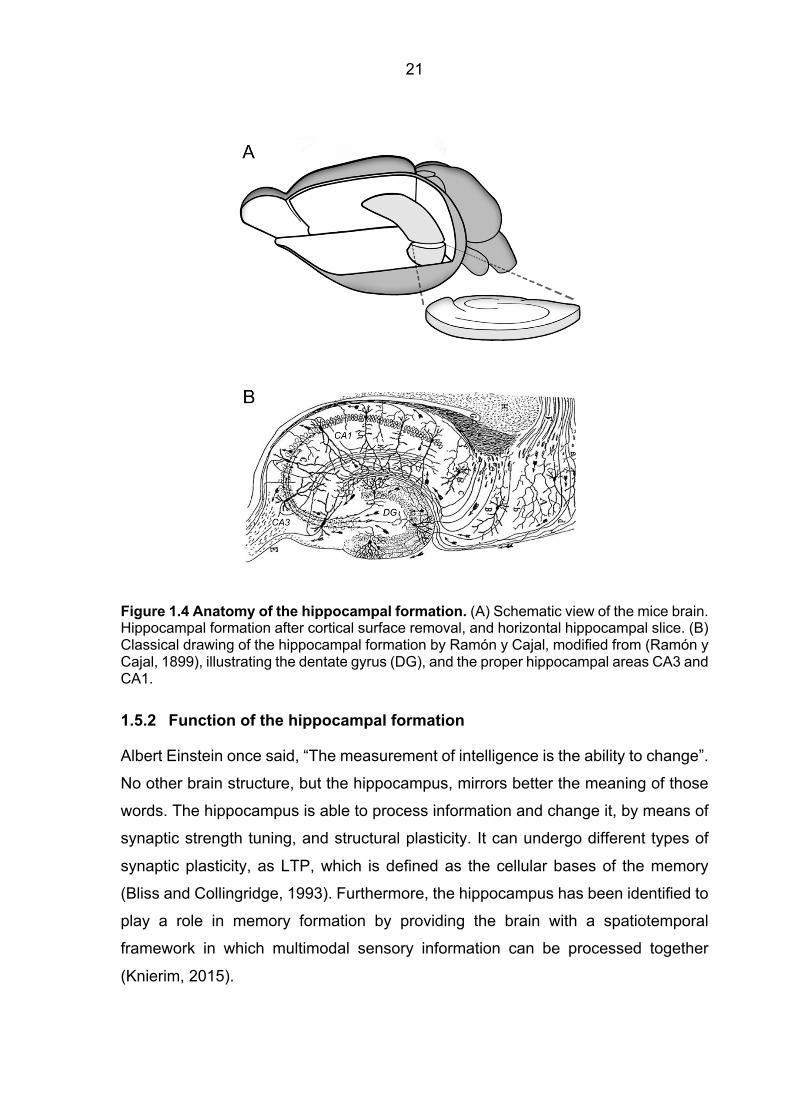
1.5.1 Anatomy of the hippocampal formation
The brain contains two hippocampi, one in each medial temporal lobe (Figure 1.4 A).
The hippocampus belongs functionally to the limbic system. It is one of several
regions of a functional system called the hippocampal formation. Other regions of
the hippocampal formation are the dentate gyrus (DG), the subiculum, and the
entorhinal cortex (EC). The hippocampus proper has three subdivisions: CA3, CA2,
and CA1; CA stands for the term “cornu ammonis” or “Ammon’s horn”. Moreover,
the hippocampus proper presents a depth-wise laminar organization shaped by
several layers. The stratum oriens is the deepest layer and contains the basal
dendrites of the pyramidal neurons. The stratum pyramidale is formed by the cell
20
bodies of the excitatory pyramidal cells and few interneurons. The stratum radiatum
is located above the stratum pyramidale and contains many subtypes of interneurons
as well as the Schaffer collateral axons, which are the projection forward from CA3
to CA1. The most superficial layer of the hippocampus is the stratum lacunosum-
moleculare, where CA1 neuronal dendrites receive direct input from the EC.
The hippocampal formation presents a unique set of unidirectional, excitatory
pathways. The main input of the hippocampus comes from the EC, which projects
to the DG, to CA3, and to CA1, via the perforant path. The principal cells of the DG,
the granule cells, project to the CA3 pyramidal cells via mossy fibers projections.
The pyramidal cells of the CA3 region project via the Schaffer collateral axons to the
CA1 pyramidal cells as their major input. CA1 pyramidal neurons project to the
subiculum, and together, with the subiculum, connect to the deep layer of the EC,
closing the hippocampal processing loop (Andersen et al., 2007).
21
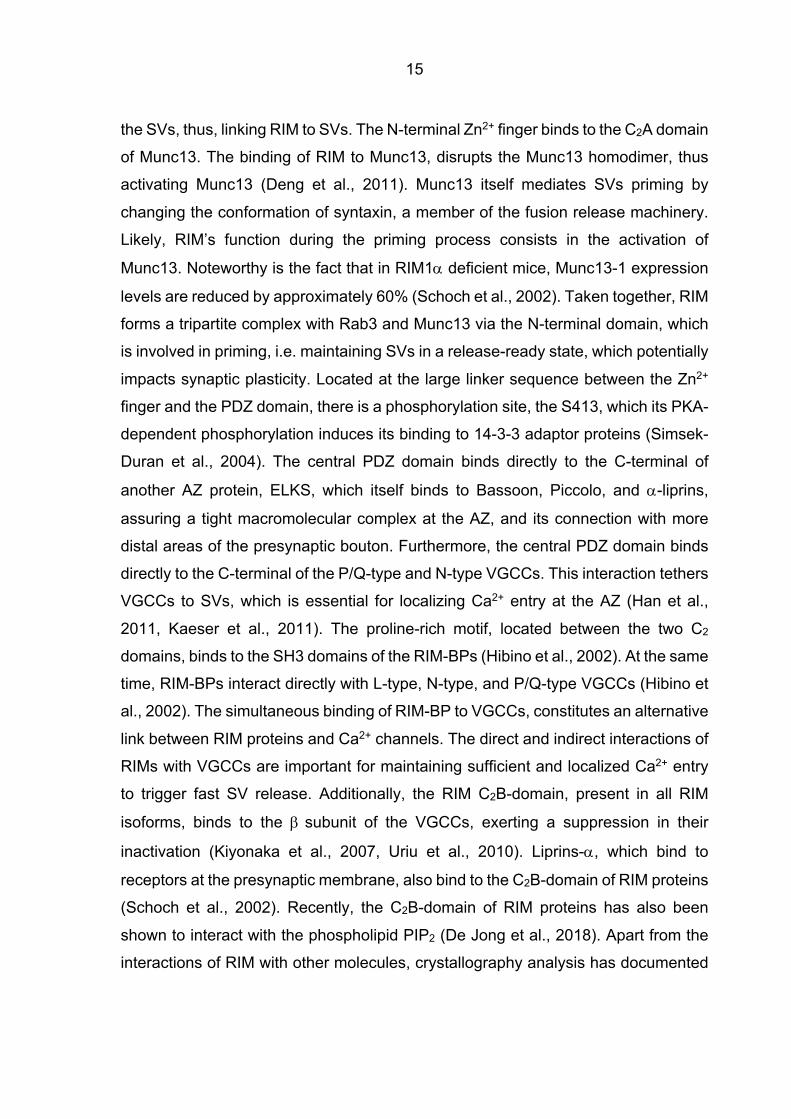
Figure 1.4 Anatomy of the hippocampal formation. (A) Schematic view of the mice brain. Hippocampal formation after cortical surface removal, and horizontal hippocampal slice. (B) Classical drawing of the hippocampal formation by Ramón y Cajal, modified from (Ramón y Cajal, 1899), illustrating the dentate gyrus (DG), and the proper hippocampal areas CA3 and CA1.
1.5.2 Function of the hippocampal formation
Albert Einstein once said, “The measurement of intelligence is the ability to change”.
No other brain structure, but the hippocampus, mirrors better the meaning of those
words. The hippocampus is able to process information and change it, by means of
synaptic strength tuning, and structural plasticity. It can undergo different types of
synaptic plasticity, as LTP, which is defined as the cellular bases of the memory
(Bliss and Collingridge, 1993). Furthermore, the hippocampus has been identified to
play a role in memory formation by providing the brain with a spatiotemporal
framework in which multimodal sensory information can be processed together
(Knierim, 2015).
22
1.6 Aim of the study
Presynaptic terminals perform computational tasks by converting trains of APs into
adaptable patterns of transmitter release. The composition and state of the AZ
determines release probability and availability of SVs for release which is important
for the temporal pattern of transmitter release (STP) and the electrical impact on the
postsynaptic neurons. At the AZ, VGCCs are located near SVs allowing for fast
neurotransmitter release. Among the AZ proteins, the large RIM isoform, RIM1a is
a candidate to play a crucial role in synaptic computation; thus, RIM1a is necessary
for synaptic plasticity as well as for maintaining presynaptic VGCC density and
docked SVs. The ablation of RIM1α leads to a strong reduction of synaptic output
and impaired short-term synaptic plasticity. Further studies are warranted to
elucidate if these alterations are caused by a lack of docked SVs or by a decrease
in the [Ca2+]i operating the Ca2+ sensor, which would impact temporal release
properties and thus, synaptic computation.
The main goal of this project was to increase knowledge about the role of three
members of the RIM protein family, RIM1α, RIM3, and RIM4 as modulators of fast
synaptic transmission, and their possible function in synaptic computation. By the
selective deletion of the individual RIM isoforms together with electrophysiological
recordings, and Ca2+ imaging, we aimed to analyze the functional role of RIM1α in
controlling the Ca2+ signal mediating neurotransmitter release, and to examine the
potential role of RIM3 and RIM4 in synaptic transmission, and the underlying
mechanisms.
To pursue our main goal, we addressed the following aims:
Aim 1: Determine if ablation of RIM1α, RIM3, and RIM4 alters the number of
functional synapses by quantifying the mean frequency of miniature excitatory
postsynaptic currents (mEPSC).
Aim 2: Explore the nature of the AP-evoked Ca2+ microdomain at the presynaptic
release machinery. We performed a mathematical approach based on field potential
recordings which allowed us to precisely investigate the AP-evoked Ca2+ signal at
the AZ. We quantitatively estimated Ca2+ binding parameters of the release
23
machinery, such as apparent Ca2+ affinity and cooperativity, relative release
probability, and relative contribution of different types of presynaptic VGCCs to
transmitter release.
Aim 3: Examine the effect of RIM1α, RIM3, and RIM4 deletion on short-term synaptic
plasticity.
Aim 4: Assess the role of RIM1α in regulating the presynaptic Ca2+ entry at the
Schaffer collaterals.
Performing those experiments helped us getting a better understanding of the role
of three members of the RIM protein family, RIM1α, RIM3, and RIM4, in the
regulation of the presynaptic release machinery and therefore, in regulating
neurotransmitter release. We investigated the Ca2+ signal built up at the AZ by
quantifying Ca2+ binding parameters, relative Pves, and the contribution of the
different VGCC subtypes to synaptic transmission. In summary, we expected to shed
new light on the function of RIM1α, RIM3, and RIM4 regarding basic neurotransmitter
release, the relationship of this function to synaptic plasticity, and its possible
implication in presynaptic computation.
24
2 Materials and methods
2.1 Animals
2.1.1 Species
To investigate the role of RIM proteins in synaptic transmission, experiments were
performed on male and female RIM1a+/+, RIM1a-/- (RIM1a KO) (Schoch et al., 2002),
RIM3g+/+, RIM3g-/- (RIM3 KO) (Picher et al., 2017), RIM4g+/+, RIM4g-/- (RIM4 KO)
(unpublished), Et(iCre)-tdTomato-cDKO (see 2.4.3.4), and C57BL/6 mice, with an
age range of six to eight weeks. KO mice, for RIM3 and RIM4, were newly generated
in collaboration with Prof. Dr. Susanne Schoch-McGovern (unpublished data).
RIM1a KO mice are viable, fertile and do not show an overt phenotype (Schoch et
al., 2002). We found that both, RIM3 KO and RIM4 KO animals, are also viable and
fertile, but the latter one displays a strong motor phenotype (unpublished data). All
procedures were performed in accordance with the guidelines of the Bonn University
Medical School Care Committee. Mice were kept in an animal facility, with water and
food provided ad libitum, and under the control of an alternating 12-hour light or dark
cycle.
2.1.2 Slice preparation
For the preparation of acute brain slices, mice were anesthetized using Isoflurane
(Abbot, Chicago, IL, USA) and decapitated with a small rodent guillotine (DCAPS,
World Precision Instruments, Sarasota, FL, USA). The brain was rapidly removed
and transferred to ice-cold, high sucrose, oxygenated bicarbonate modified artificial
cerebrospinal fluid (mACSF) (see 2.2.1). Straightaway, it was dissected on a cooled,
mACSF filled metal dish. First, the forebrain and the cerebellum were cut off along
the coronal plane. Then, the two hemispheres were separated along the longitudinal
fissure. Finally, a slight piece of the cortex was removed along the rostral-caudal
25
axis. Both hemispheres were glued to the vibratome tissue holder by the cortex side.
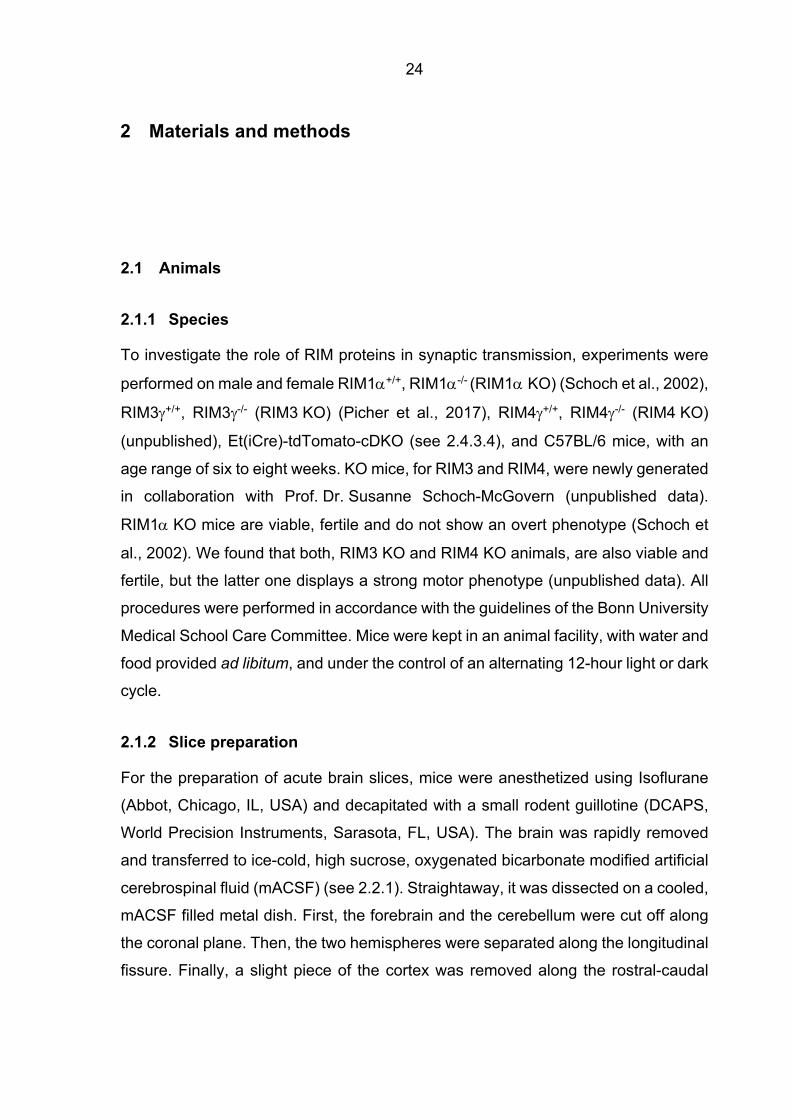
Either 300 (for field potential recordings in the submerged chamber, patch clamp
recordings, and Ca2+ imaging) or 500 µm (for field potential recordings in the
interface chamber) thick horizontal hippocampal slices were prepared with a
vibratome (Microm, HM650V, Thermo Fisher Scientific, Waltham, MA, USA) (Figure
2.1) Afterward, the slices were incubated in mACSF for 30 minutes at 35 °C in a
water bath (WNB 22, Memmert GmbH and Co. KG, Schwabach, Germany).
Subsequently, the brain slices were stored at room temperature (22-24 °C) in
oxygenated bicarbonate standard artificial cerebrospinal fluid (sACSF) (see 2.2.1).
Figure 2.1 Horizontal hippocampal slicing procedure. The sequence of steps during slicing the brain in order to obtain horizontal hippocampal slices: removal of the brain from the skull, separation of both hemispheres and coronal cut of the forebrain and the cerebellum, and slicing along the rostral-caudal axis.
2.2 Solutions
2.2.1 Incubation/perfusion solutions
During slice preparation, the slices were stored in mACSF containing (in mM):
87 NaCl, 2.5 KCl, 1.25 NaH2PO4, 7 MgCl2, 0.5 CaCl2, 25 NaHCO3, 25 glucose, and
75 sucrose (pH 7.4) (95% O2, 5% CO2). Afterward, they were stored with sACSF
containing (in mM): 124 NaCl, 3 KCl, 1.25 NaH2PO4, 2 MgCl2, 2 CaCl2, 26 NaHCO3,
and 10 glucose (pH 7.4) (95% O2, 5% CO2).
For recordings of field excitatory postsynaptic potentials (fEPSP), patch-clamp
recordings, and Ca2+ imaging, slices were transferred to a submerged chamber and
continuously perfused (1-2 ml/min) with sACSF at room temperature, except for
when the [Ca2+]e was altered (see below).
For fEPSPs recordings at physiological temperature, slices were alternatively
transferred to a Haas-type interface chamber and perfused (2-3 ml/min) with
26
oxygenated bicarbonate ACSF at 35 °C (35 °C ACSF) containing (in mM): 125 NaCl,
3 KCl, 1.25 NaH2PO4, 2 MgCl2, 2 CaCl2, 20.3 NaHCO3, and 12 glucose (pH 7.4)
(95% O2, 5% CO2), unless the [Ca2+]e was modified (see below).
In order to prepare extracellular solutions containing different Ca2+
concentrations, for Ca2+ concentrations lower than 4 mM, the Mg2+ concentration
of the ACSF was adjusted to maintain the total concentration of these two divalent
cations at 4 mM. For extracellular solutions containing 4 mM Ca2+, the
concentration of Mg2+ was lowered to 0.1 mM and 25 µM D-2-amino-5-
phosphonopentanoic acid (D-APV) was added to limit the activation of NMDAR.
We used a HEPES-buffered artificial cerebrospinal fluid (HEPES ACSF) to reliably
avoid any precipitation of Ca2+ when using [Ca2+]e of 10 and 20 mM. Ten mM Ca2+
HEPES ACSF contained (in mM): 133 NaCl, 3 KCl, 1 MgCl2, 10 CaCl2, 8 glucose,
7 HEPES, and 0.025 D-APV (pH 7.4, NaOH). Twenty mM Ca2+ HEPES ACSF
contained (in mM): 120 NaCl, 3 KCl, 1 MgCl2, 20 CaCl2, 5 glucose, 6 HEPES,
0.025 D-APV (pH 7.4, NaOH) (Erdmann et al., 2012).
For recordings in cultured hippocampal neurons, the extracellular solution contained
(in mM): 140 NaCl, 5 KCl, 2 MgCl2, 2 CaCl2, 10 glucose, and 10 HEPES (pH 7.4,
NaOH).
2.2.2 Patch-clamp recording solutions
For evoked excitatory postsynaptic currents (EPSC) and mEPSCs recordings in
hippocampal slices, the recording pipette solution contained (in mM): 130 K-
Gluconate, 4 NaCl, 5 KCl, 0.5 MgCl2, 4 Na2ATP, 10 HEPES, and 0.1 EGTA (pH 7.3,
KOH).
For NMDAR-mediated EPSCs recordings in hippocampal cultured cells, the pipette
solution contained (in mM): 95 Cs-methanesulfonate, 4 NaCl, 2 MgATP,
0.4 NaGTP, 10 phosphocreatine-Na, 10 HEPES, 5 EGTA, 5 QX-314 chloride, and
25 tetraethylammonium (TEA) (pH 7.3, CsOH).
For evoked inhibitory postsynaptic currents (IPSC) and miniature inhibitory
postsynaptic currents (mIPSC) recordings in cultured hippocampal cells, the pipette
27
solution contained (in mM): 90 K-Gluconate, 4 NaCl, 45 KCl, 0.5 MgCl2, 4 Na2ATP,
10 HEPES, 0.1 EGTA, and 5 QX-314 chloride (pH 7.3, KOH).
2.2.3 Ca2+ imaging solutions
For imaging of intraterminal Ca2+ transients, 50 µg cell-permeant Mg2+ Green (Mg-
Green) acetoxymethyl (AM) dye (Thermo Fisher Scientific, Waltham, MA, USA) were
dissolved in 50 µl of dimethyl sulfoxide (DMSO; SIGMA, St. Louis, Missouri, USA)
containing 25% pluronic F-127 (SIGMA, St. Louis, MO, USA) (the stock solution was
prepared with 250 mg of pluronic F-127 dissolved in 1 ml of DMSO). The solution
was vortexed for 30 seconds and sonicated for five minutes. 450 µl of sACSF were
added to this solution. The labeling solution, which contains Mg-Green AM,
DMSO/pluronic and sACSF, was vortexed, sonicated, filtered, and kept on ice.
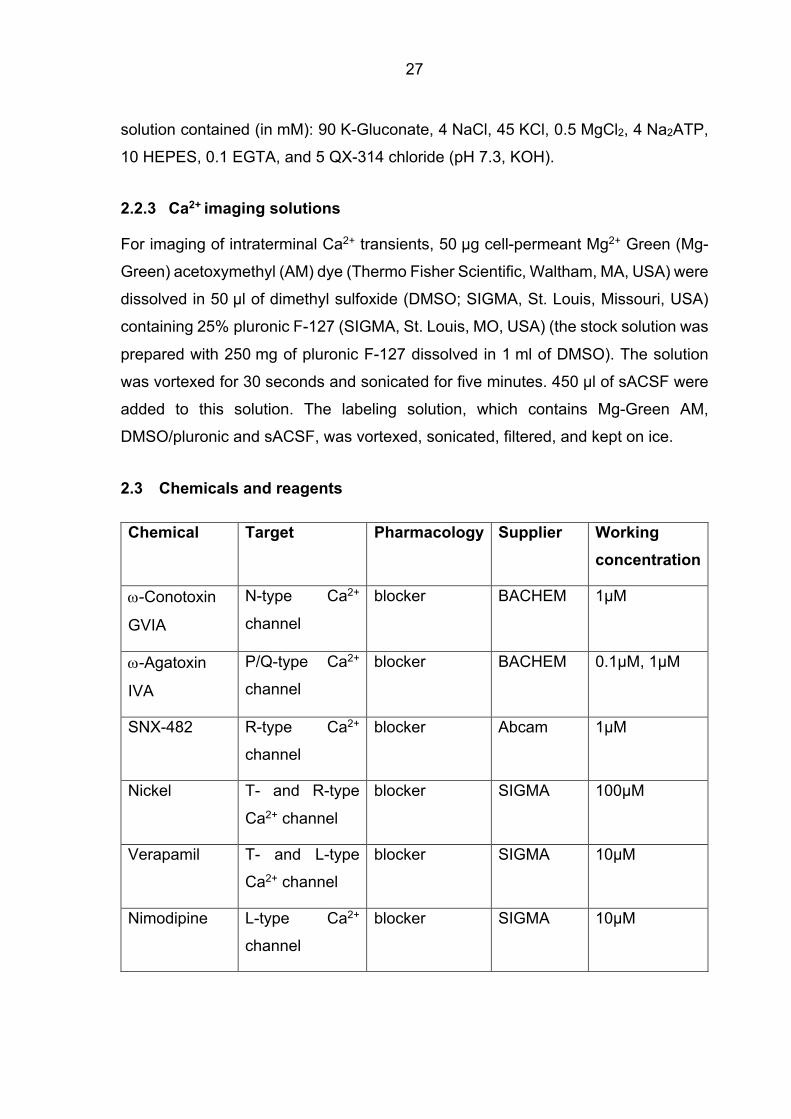
2.3 Chemicals and reagents
Chemical Target Pharmacology Supplier Working concentration
w-Conotoxin
GVIA
N-type Ca2+
channel
blocker BACHEM 1µM
w-Agatoxin
IVA
P/Q-type Ca2+
channel
blocker BACHEM 0.1µM, 1µM
SNX-482 R-type Ca2+
channel
blocker Abcam 1µM
Nickel T- and R-type
Ca2+ channel
blocker SIGMA 100µM
Verapamil T- and L-type
Ca2+ channel
blocker SIGMA 10µM
Nimodipine L-type Ca2+
channel
blocker SIGMA 10µM
28
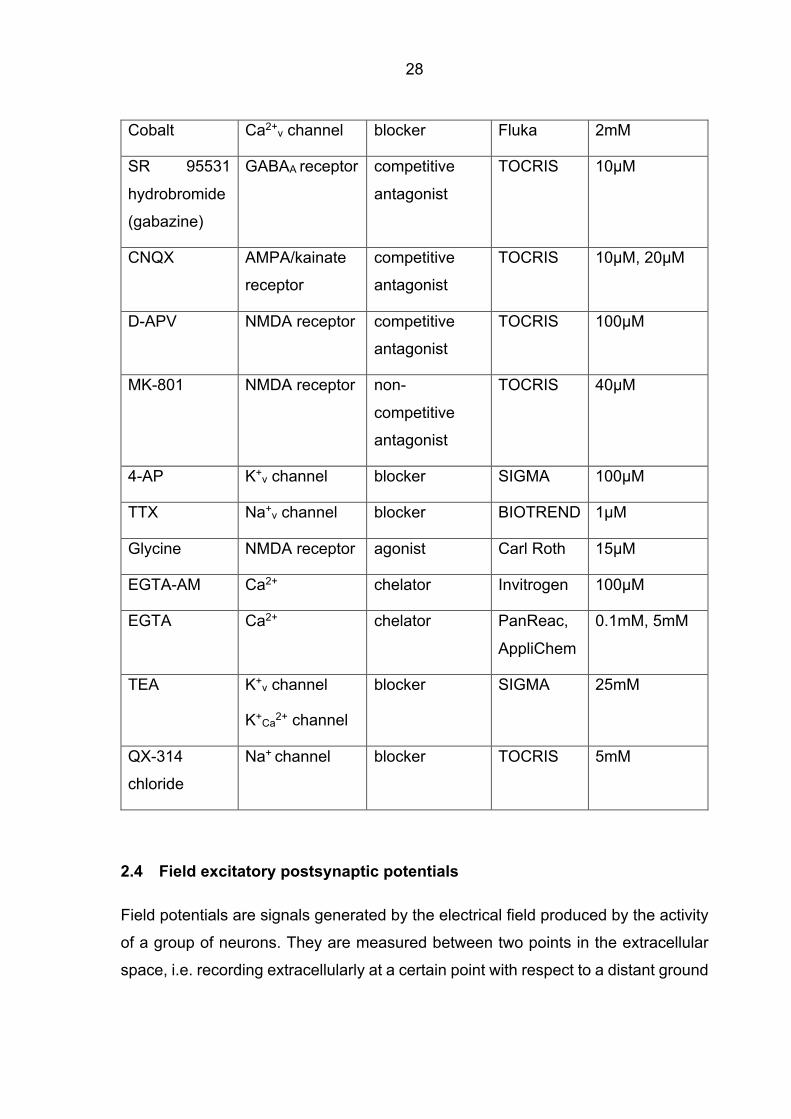
Cobalt Ca2+v channel blocker Fluka 2mM
SR 95531
hydrobromide
(gabazine)
GABAA receptor competitive
antagonist
TOCRIS 10µM
CNQX AMPA/kainate
receptor
competitive
antagonist
TOCRIS 10µM, 20µM
D-APV NMDA receptor competitive
antagonist
TOCRIS 100µM
MK-801 NMDA receptor non-
competitive
antagonist
TOCRIS 40µM
4-AP K+v channel blocker SIGMA 100µM
TTX Na+v channel blocker BIOTREND 1µM
Glycine NMDA receptor agonist Carl Roth 15µM
EGTA-AM Ca2+ chelator Invitrogen 100µM
EGTA Ca2+ chelator PanReac,
AppliChem
0.1mM, 5mM
TEA K+v channel
K+Ca2+ channel
blocker SIGMA 25mM
QX-314
chloride
Na+ channel blocker TOCRIS 5mM
2.4 Field excitatory postsynaptic potentials
Field potentials are signals generated by the electrical field produced by the activity
of a group of neurons. They are measured between two points in the extracellular
space, i.e. recording extracellularly at a certain point with respect to a distant ground
29
electrode. Extracellular field potentials are used to infer the activity of a neuronal
population evoked by a synchronous synaptic input, for example, through stimulation
of an afferent pathway.
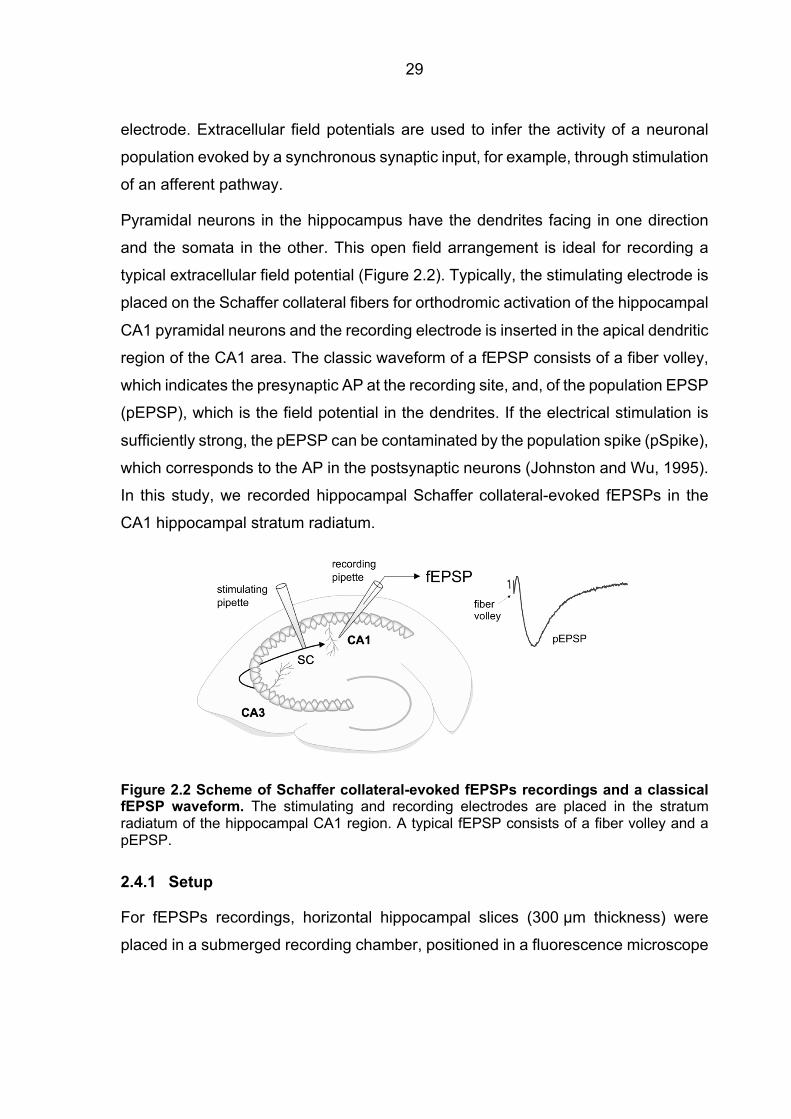
Pyramidal neurons in the hippocampus have the dendrites facing in one direction
and the somata in the other. This open field arrangement is ideal for recording a
typical extracellular field potential (Figure 2.2). Typically, the stimulating electrode is
placed on the Schaffer collateral fibers for orthodromic activation of the hippocampal
CA1 pyramidal neurons and the recording electrode is inserted in the apical dendritic
region of the CA1 area. The classic waveform of a fEPSP consists of a fiber volley,
which indicates the presynaptic AP at the recording site, and, of the population EPSP
(pEPSP), which is the field potential in the dendrites. If the electrical stimulation is
sufficiently strong, the pEPSP can be contaminated by the population spike (pSpike),
which corresponds to the AP in the postsynaptic neurons (Johnston and Wu, 1995).
In this study, we recorded hippocampal Schaffer collateral-evoked fEPSPs in the
CA1 hippocampal stratum radiatum.
Figure 2.2 Scheme of Schaffer collateral-evoked fEPSPs recordings and a classical fEPSP waveform. The stimulating and recording electrodes are placed in the stratum radiatum of the hippocampal CA1 region. A typical fEPSP consists of a fiber volley and a pEPSP.
2.4.1 Setup
For fEPSPs recordings, horizontal hippocampal slices (300 µm thickness) were
placed in a submerged recording chamber, positioned in a fluorescence microscope
30
(ECLIPSE E600FN, Nikon, Shinagawa, Tokyo, Japan). Slices were perfused with
sACSF or HEPES ACSF containing different Ca2+ concentrations.
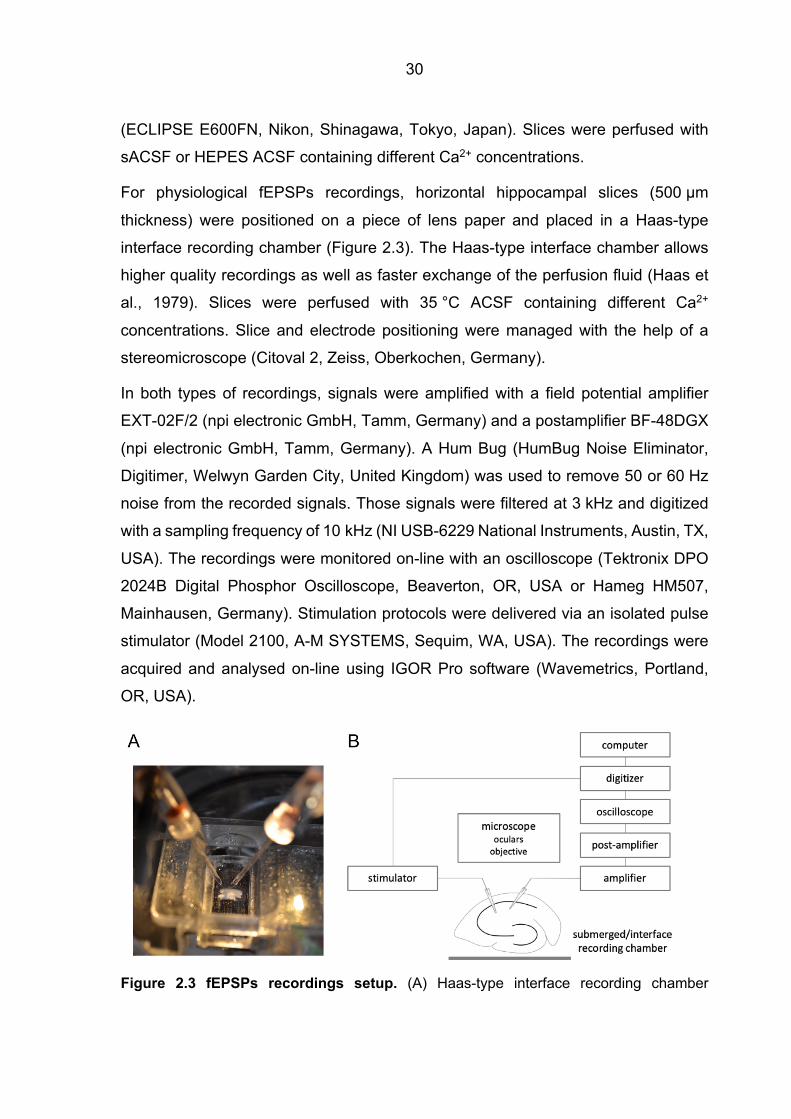
For physiological fEPSPs recordings, horizontal hippocampal slices (500 µm
thickness) were positioned on a piece of lens paper and placed in a Haas-type
interface recording chamber (Figure 2.3). The Haas-type interface chamber allows
higher quality recordings as well as faster exchange of the perfusion fluid (Haas et
al., 1979). Slices were perfused with 35 °C ACSF containing different Ca2+
concentrations. Slice and electrode positioning were managed with the help of a
stereomicroscope (Citoval 2, Zeiss, Oberkochen, Germany).
In both types of recordings, signals were amplified with a field potential amplifier
EXT-02F/2 (npi electronic GmbH, Tamm, Germany) and a postamplifier BF-48DGX
(npi electronic GmbH, Tamm, Germany). A Hum Bug (HumBug Noise Eliminator,
Digitimer, Welwyn Garden City, United Kingdom) was used to remove 50 or 60 Hz
noise from the recorded signals. Those signals were filtered at 3 kHz and digitized
with a sampling frequency of 10 kHz (NI USB-6229 National Instruments, Austin, TX,
USA). The recordings were monitored on-line with an oscilloscope (Tektronix DPO
2024B Digital Phosphor Oscilloscope, Beaverton, OR, USA or Hameg HM507,
Mainhausen, Germany). Stimulation protocols were delivered via an isolated pulse
stimulator (Model 2100, A-M SYSTEMS, Sequim, WA, USA). The recordings were
acquired and analysed on-line using IGOR Pro software (Wavemetrics, Portland,
OR, USA).
Figure 2.3 fEPSPs recordings setup. (A) Haas-type interface recording chamber
31
containing a hippocampal slice and the stimulating and recording electrodes. (B) Scheme of the fEPSPs recordings setup: a fEPSP potential amplifier was used to detect the electrical signal, and an isolated pulse stimulator was used to elicit the fEPSPs.
2.4.2 Electrodes
One mm thick glass capillaries (GB150F-8P, Science Products, Hofheim, Germany)
were used to pull pipettes for stimulation (pipette resistance ~ 1-2 MW) and for
recording (pipette resistance ~ 4-5 MW). The glass capillaries were pulled using a
vertical puller (Model PP-830, Narishige, Setagaya, Tokyo, Japan). Stimulating and
recording pipettes were filled with ACSF solution and placed in the stratum radiatum
of the hippocampal CA1 region.
2.4.3 Experimental procedure
Schaffer collateral-evoked fEPSPs were measured in a submerged or Haas-type
interface recording chamber. In the latter case, slices were incubated for one hour
before the start of the measurement. To evoke fEPSPs, Schaffer collaterals were
stimulated with current pulses of 200 µs duration and the stimulation intensity was
adjusted to elicit maximal fEPSPs amplitude. The stimulation protocol was delivered
every 30 seconds.
2.4.3.1 Fractional release Ca2+ curves
fEPSPs at the CA3-CA1 synapses were recorded in RIM1a KO, RIM3 KO,
RIM4 KO, and wild-type (WT) mice. In each experiment, the slices were perfused
with ACSF containing one of the different Ca2+ concentrations (in mM): 0.8, 1, 1.5,
2, 4, 10, or 20.
After 30 minutes of stable fEPSPs amplitude, one specific Ca2+ channel blocker
diluted in the ACSF was bath-applied until a steady-state of the blocking effect was
reached. 1 µM of Cgtx was applied for approx. 25 minutes. Agatx was applied for
10 minutes at 1 µM, followed by 20 minutes at 0.1 µM. Additionally, we evaluated
the effect of the GABAA receptor inhibition on the excitatory synaptic transmission
by bath-application of gabazine. The effect of 1 µM Cgtx on the fEPSPs amplitude
was found to be similar in the presence and in the absence of 10 µM gabazine.
Consequently, we performed further experiments without gabazine.
32
2.4.3.2 Paired-pulse facilitation
PPF was evaluated in RIM1a KO, RIM3 KO, RIM4 KO, and WT mice. The
stimulation protocol consisted of two pulses of 200 µs with a 40 ms inter-stimulus
interval.
2.4.3.3 Effect of the Ca2+ chelator EGTA-AM
The effect of the Ca2+ chelator EGTA on Schaffer collateral-evoked fEPSPs was
analyzed in RIM1a KO and WT mice. We used a cell-permeable version of EGTA,
EGTA-AM. The slices were perfused with sACSF. After 30 minutes of stable fEPSPs
amplitude, 100 µM EGTA-AM was bath-applied for 15 minutes in the presence of
175 µM probenecid (Probenecid water soluble, Thermo Fisher Scientific, Waltham,
MA, USA), 70 µM 2-hydroxypropyl-b-cylcodextrin (HBC; SIGMA, St. Louis, MO,
USA) and 0.1% DMSO containing 20% pluronic F-127. In order to avoid foam
formation, the Ca2+ chelator solution was not gassed with O2/CO2 during the bath-
application. The sACSF used to prepare this solution was carbogen-saturated
(95% O2, 5% CO2) before application, assuring a proper pH buffering via the sodium
bicarbonate. EGTA-AM was initially dissolved in DMSO 20% pluronic, as stock
solution and diluted with sACSF by a factor of 1000 to its final concentration before
each experiment.
2.4.3.4 Effect of Cgtx on Et(iCre)-tdTomato-cDKO
To target RIM1ab and RIM2abg deletion selectively to Schaffer collateral pathway,
we employed a mouse line expressing Cre recombinase under a specific promoter
of CA3 pyramidal cells (Et-iCre). The mouse strain used for this research project,
B6(129S)-Et(icre)21614Rdav/J, RRID:MMRRC_034580-MU, was obtained from the
Mutant Mouse Resource and Research Center (MMRRC) at University of Missouri,
an NIH-funded strain repository, and was donated to the MMRRC by Ronald L Davis,
The Scripps Research Institute. Paul Overbeek, Ph.D., Baylor College of Medicine.
The lab of Prof. Dr. Susanne Schoch initially crossed this line to a Cre-reporter line
which expresses tdTomato. Subsequently, they crossed the et(iCre)-tdTomato line
to the cDKO RIM1abfl/fl and RIM2abgfl/fl mouse line (Kaeser et al., 2011) generating
the Et(iCre)-tdTomato-cDKO. fEPSPs at the Schaffer collateral pathway were
33
recorded from Cre recombinase negative mice, which retain RIM expression, and
from Cre recombinase positive mice, referred to as cDKO mice. The slices were
perfused with sACSF and after 30 minutes of stable fEPSPs, 1 µM of Cgtx was
applied for approx. 25 minutes.
2.4.4 Analysis of fEPSPs
Data were analyzed with built-in and custom-made macros in IGOR Pro and Excel
(Microsoft, Redmond, Washington, USA).
2.4.4.1 Fractional release Ca2+ curves
The maximal amplitude of the fEPSPs in the dendrites was measured. The amplitude
of fEPSPs was calculated from the baseline immediately preceding the stimulation
to the maximum negative deflection. The fractional fEPSPs amplitude remaining
after the Ca2+ channel blocker application was calculated with the following formula:
frac. fEPSPampl. (%) = C
fEPSPDEFGHIJEKLGfEPSPMH0FIHN
O ∗ 100 (3)
fEPSPcontrol and fEPSPCgtx or AgaTx maximum amplitudes were calculated from
averaging 20 fEPSPs traces prior to and after toxin application, respectively. The
fractional fEPSPs amplitudes, remaining after toxin application, were plotted against
the relative changes in the local Ca2+ concentration reached at the release sensor
during an AP (see 3.2.1).
2.4.4.2 Paired-pulse facilitation
The maximal amplitudes of both fEPSPs were calculated from the baselines
immediately preceding each stimulation pulse. The paired-pulse ratio was calculated
by the formula:
PPF(%) = RfEPSP4fEPSP9
S ∗ 100 (4)
fEPSP1 and fEPSP2 maximum amplitudes were calculated from averaging twenty
fEPSPs traces.

34
2.4.4.3 Effect of EGTA-AM
The maximal amplitude of fEPSPs was calculated from the baseline immediately
preceding the stimulation. The fractional fEPSP amplitude remaining after EGTA-
AM application was calculated with the following formula:
frac. fEPSPampl. (%) = RfEPSPTULJfEPSPMH0FIHN
S ∗ 100 (5)
fEPSPcontrol maximum amplitudes were calculated from averaging 20 fEPSPs traces
right before the Ca2+ chelator application. fEPSPEGTA amplitudes were calculated
20 minutes after the start of the EGTA-AM perfusion and averaging 10 fEPSPs
traces.
2.4.4.4 Analysis of fEPSPs kinetics
We evaluated three parameters: the delay of the release, which is the time between
the peak of the presynaptic fiber volley and the 20% maximum fEPSPs amplitude;
the 20-80% fEPSPs rise time, and the tau of the fEPSPs decay phase. Schaffer
collateral-evoked fEPSPs kinetics was evaluated in RIM1a KO and WT mice under
2, 4, and 20 mM [Ca2+]e.
2.5 Evoked excitatory postsynaptic currents
We evaluated the effect of Cgtx on EPSC recorded from CA1 hippocampal pyramidal
neurons.
2.5.1 Setup
For EPSCs recordings, horizontal hippocampal slices (300 µm thickness) were
placed in a submerged recording chamber, and positioned in a fluorescence
microscope (ECLIPSE E600FN, Nikon, Shinagawa, Tokyo, Japan). Signals were
amplified with a patch clamp amplifier EPC 7 (Heka, Holliston, MA, USA) and a
postamplifier BF-48DGX (npi electronic GmbH, Tamm, Germany). Signals were
filtered at 1 kHz and digitized with a sampling frequency of 10 kHz (NI USB-6229
National Instruments, Austin, TX, USA). Recordings were monitored on-line with an
oscilloscope (Tektronix DPO 2024B Digital Phosphor Oscilloscope, Beaverton,
35
Oregon, USA). Stimulation was delivered via an isolated pulse stimulator (Model
2100, A-M SYSTEMS, Sequim, WA, USA). The recordings were operated using
IGOR Pro software.
2.5.2 Electrode
One mm thick glass capillaries were used to pull pipettes for stimulation, as for
fEPSPs recordings, and for recording (pipette resistance approx. 5-6 MW). The glass
capillaries were pulled using a vertical puller. The stimulating pipette was filled with
ACSF and the recording pipette was filled with intracellular solution (see 2.2.2). The
stimulating pipette was placed in the stratum radiatum of the hippocampal CA1
region.
2.5.3 Experimental procedure
EPSCs were recorded from RIM1a KO slices, while perfusing 1 mM [Ca2+]e, and
from WT slices, while perfusing 2 mM [Ca2+]e. The sACSF contained 10 µM of
gabazine. Whole-cell patch-clamp recordings were performed in CA1 pyramidal cells
at room temperature. Cells were held at -70 mV.
During the whole-cell patch-clamp technique, under visual control, the recording
pipette was positioned close to the optically selected CA1 pyramidal cell. A tight seal,
at least 1 GW, was formed between the cell and the patch electrode. The membrane
was ruptured by suction so that the glass electrode provides a low-resistance access
to the cell. The access resistance (Ra) was monitored during the entire duration of
the recording. Cells were discarded when Ra values were larger than 20 MW. EPSC
were elicited by Schaffer collateral stimulation placing the stimulating electrode in
the stratum radiatum of the CA1 region. Stimulation pulses of 200 µs and an intensity
adjusted to elicit maximal amplitude, were delivered every 15 seconds. After 20
minutes stable EPSC amplitude 1 µM of Cgtx was applied.
2.5.4 Analysis
The effect of Cgtx on EPSC was analyzed with built-in and custom-made macros in
IGOR Pro. The maximal amplitude of EPSCs was calculated from the baseline
36
immediately preceding the stimulation. The fractional EPSCs amplitude remaining
after the Cgtx, was calculated with the following formula:
frac. EPSCampl. (%) = R
EPSCDEFGEPSCMH0FIHN
S ∗ 100 (6)
EPSCcontrol and EPSCCgtx maximum amplitudes were calculated from averaging 20
EPSC traces prior to and after toxin application, respectively.
2.6 Miniature excitatory postsynaptic currents
Due to the stochastic nature of neurotransmitter release, single synaptic vesicles
can be released in the absence of presynaptic activity. The release of one single
quantum generates a miniature postsynaptic current, for instance, a mEPSC.
mEPSCs are detected in the presence of a voltage-gated Na+ channel blocker,
tetrodotoxin (TTX), which inhibits neuronal firing.
2.6.1 Experimental procedure
mEPSCs were recorded in RIM1a KO, RIM4 KO, and WT mice. The setup and
recording electrode used for mEPSCs recordings were the same as for EPSCs. The
slices were perfused with sACSF containing 10 µM of gabazine and 1 µM of TTX.
Whole-cell patch-clamp recordings were performed in CA1 pyramidal cells at room
temperature. Cells were held at -70 mV. The cell Ra was monitored during the whole
experiment and cells were discarded if the values were larger than 20 MW. mEPSCs
were recorded for 10-second cycles, with one-second pauses in between, for
20 minutes maximum.
2.6.2 mEPSCs detection and analysis
mEPSCs offline detection and analysis were performed using AxoGraph software
(Axon Instruments, Foster City, CA, USA). mEPSC events were detected
automatically by an optimally scaled template. The template function had an
idealized synaptic event width and time course consisting of an exponential rise and
decay. The template was generated by averaging 10 mEPSCs selected initially by
eye. A detection criterion or threshold was calculated based on the template scaling
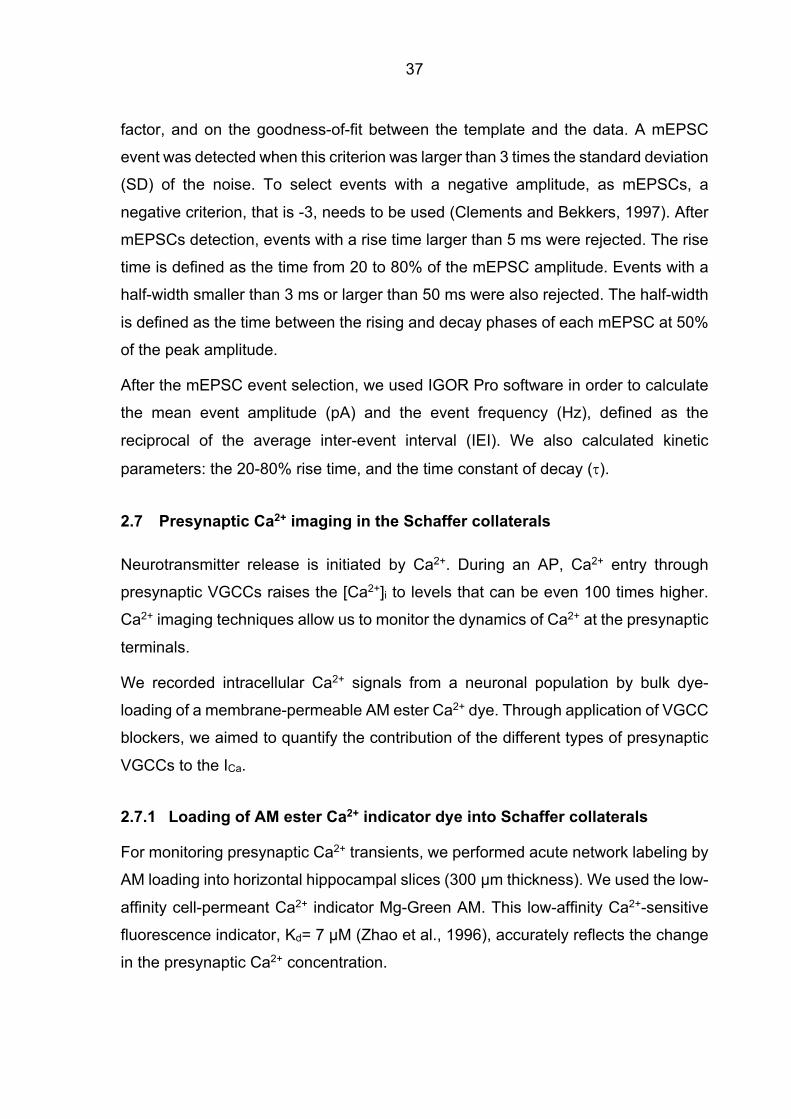
37
factor, and on the goodness-of-fit between the template and the data. A mEPSC
event was detected when this criterion was larger than 3 times the standard deviation
(SD) of the noise. To select events with a negative amplitude, as mEPSCs, a
negative criterion, that is -3, needs to be used (Clements and Bekkers, 1997). After
mEPSCs detection, events with a rise time larger than 5 ms were rejected. The rise
time is defined as the time from 20 to 80% of the mEPSC amplitude. Events with a
half-width smaller than 3 ms or larger than 50 ms were also rejected. The half-width
is defined as the time between the rising and decay phases of each mEPSC at 50%
of the peak amplitude.
After the mEPSC event selection, we used IGOR Pro software in order to calculate
the mean event amplitude (pA) and the event frequency (Hz), defined as the
reciprocal of the average inter-event interval (IEI). We also calculated kinetic
parameters: the 20-80% rise time, and the time constant of decay (t).
2.7 Presynaptic Ca2+ imaging in the Schaffer collaterals
Neurotransmitter release is initiated by Ca2+. During an AP, Ca2+ entry through
presynaptic VGCCs raises the [Ca2+]i to levels that can be even 100 times higher.
Ca2+ imaging techniques allow us to monitor the dynamics of Ca2+ at the presynaptic
terminals.
We recorded intracellular Ca2+ signals from a neuronal population by bulk dye-
loading of a membrane-permeable AM ester Ca2+ dye. Through application of VGCC
blockers, we aimed to quantify the contribution of the different types of presynaptic
VGCCs to the ICa.
2.7.1 Loading of AM ester Ca2+ indicator dye into Schaffer collaterals
For monitoring presynaptic Ca2+ transients, we performed acute network labeling by
AM loading into horizontal hippocampal slices (300 µm thickness). We used the low-
affinity cell-permeant Ca2+ indicator Mg-Green AM. This low-affinity Ca2+-sensitive
fluorescence indicator, Kd= 7 µM (Zhao et al., 1996), accurately reflects the change
in the presynaptic Ca2+ concentration.
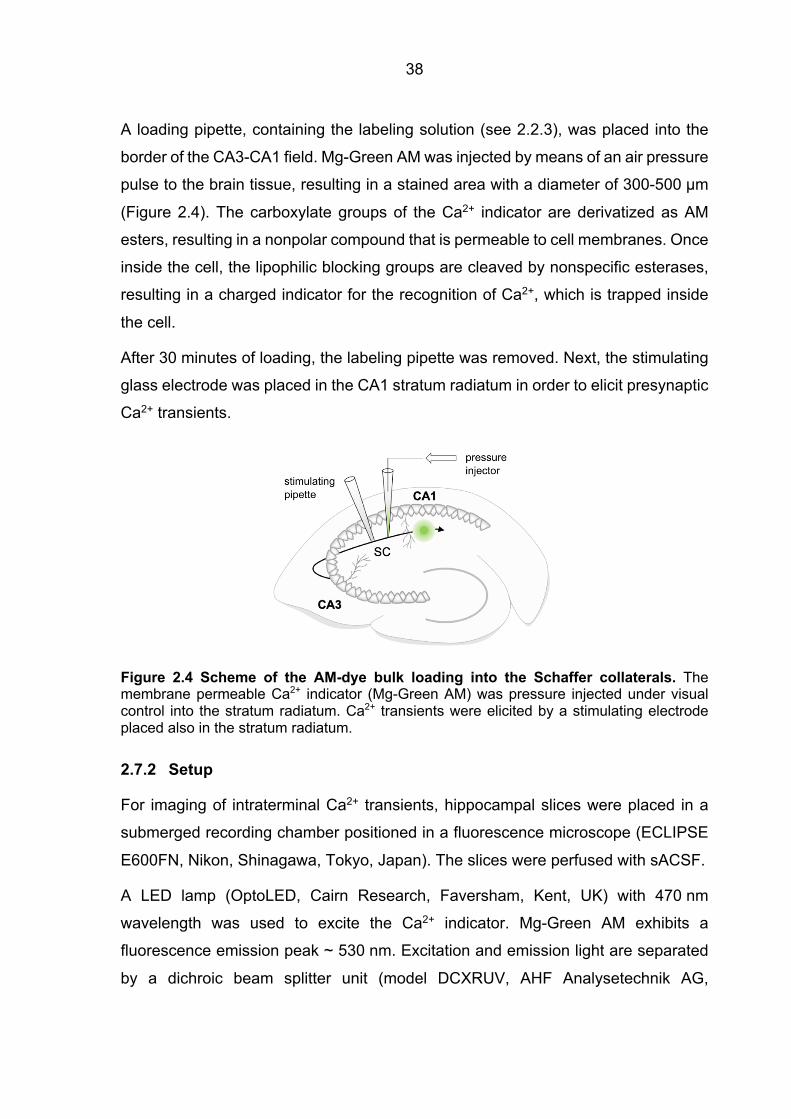
38
A loading pipette, containing the labeling solution (see 2.2.3), was placed into the
border of the CA3-CA1 field. Mg-Green AM was injected by means of an air pressure
pulse to the brain tissue, resulting in a stained area with a diameter of 300-500 µm
(Figure 2.4). The carboxylate groups of the Ca2+ indicator are derivatized as AM
esters, resulting in a nonpolar compound that is permeable to cell membranes. Once
inside the cell, the lipophilic blocking groups are cleaved by nonspecific esterases,
resulting in a charged indicator for the recognition of Ca2+, which is trapped inside
the cell.
After 30 minutes of loading, the labeling pipette was removed. Next, the stimulating
glass electrode was placed in the CA1 stratum radiatum in order to elicit presynaptic
Ca2+ transients.
Figure 2.4 Scheme of the AM-dye bulk loading into the Schaffer collaterals. The membrane permeable Ca2+ indicator (Mg-Green AM) was pressure injected under visual control into the stratum radiatum. Ca2+ transients were elicited by a stimulating electrode placed also in the stratum radiatum.
2.7.2 Setup
For imaging of intraterminal Ca2+ transients, hippocampal slices were placed in a
submerged recording chamber positioned in a fluorescence microscope (ECLIPSE
E600FN, Nikon, Shinagawa, Tokyo, Japan). The slices were perfused with sACSF.
A LED lamp (OptoLED, Cairn Research, Faversham, Kent, UK) with 470 nm
wavelength was used to excite the Ca2+ indicator. Mg-Green AM exhibits a
fluorescence emission peak ~ 530 nm. Excitation and emission light are separated
by a dichroic beam splitter unit (model DCXRUV, AHF Analysetechnik AG,
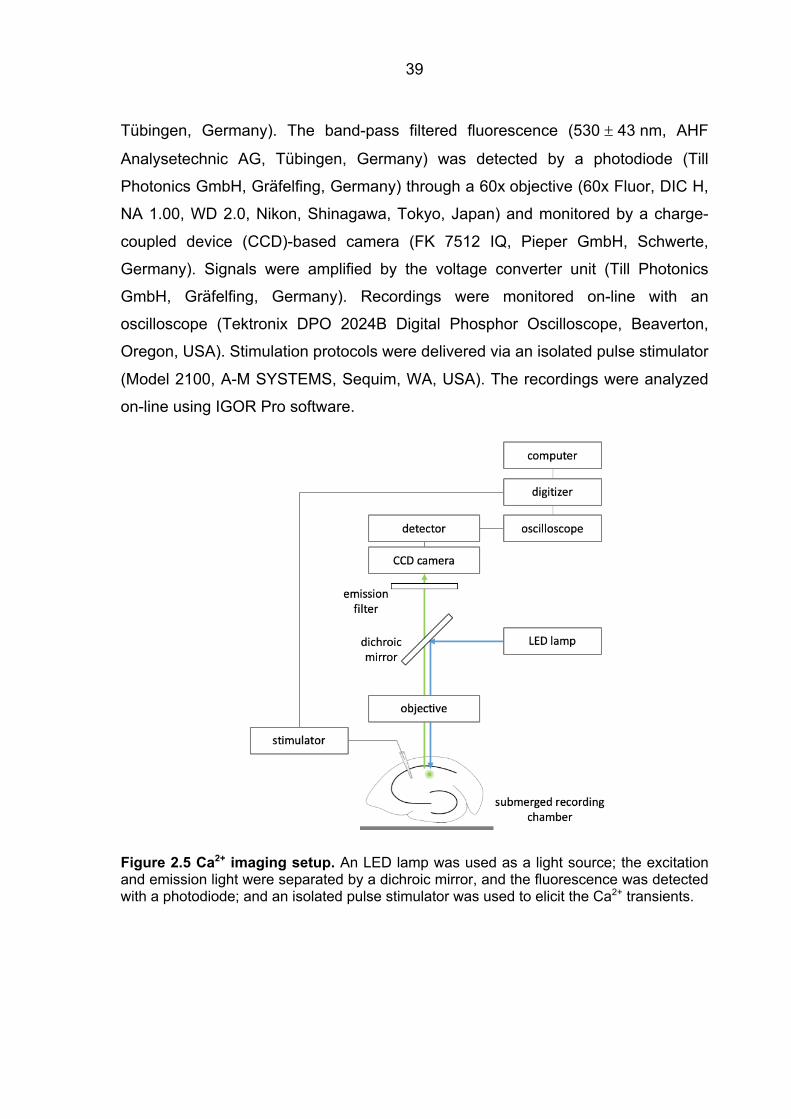
39
Tübingen, Germany). The band-pass filtered fluorescence (530 ± 43 nm, AHF
Analysetechnic AG, Tübingen, Germany) was detected by a photodiode (Till
Photonics GmbH, Gräfelfing, Germany) through a 60x objective (60x Fluor, DIC H,
NA 1.00, WD 2.0, Nikon, Shinagawa, Tokyo, Japan) and monitored by a charge-
coupled device (CCD)-based camera (FK 7512 IQ, Pieper GmbH, Schwerte,
Germany). Signals were amplified by the voltage converter unit (Till Photonics
GmbH, Gräfelfing, Germany). Recordings were monitored on-line with an
oscilloscope (Tektronix DPO 2024B Digital Phosphor Oscilloscope, Beaverton,
Oregon, USA). Stimulation protocols were delivered via an isolated pulse stimulator
(Model 2100, A-M SYSTEMS, Sequim, WA, USA). The recordings were analyzed
on-line using IGOR Pro software.
Figure 2.5 Ca2+ imaging setup. An LED lamp was used as a light source; the excitation and emission light were separated by a dichroic mirror, and the fluorescence was detected with a photodiode; and an isolated pulse stimulator was used to elicit the Ca2+ transients.
40
2.7.3 Electrodes
One mm thick glass capillaries were used to pull pipettes for loading (pipette
resistance ~ 4-5 MW) and stimulation (pipette resistance ~ 1-2 MW). The glass
capillary was pulled using a vertical puller. The loading pipette was filled with the
labeling solution and the stimulating pipette with sACSF.
2.7.4 Experimental procedure
Presynaptic Ca2+ transients at hippocampal CA3-CA1 synapses were measured in
a submerged recording chamber. In order to evoke AP-mediated Ca2+ transients,
the stimulating electrode was placed in the stratum radiatum of the hippocampal CA1
region, parallel to the Schaffer collaterals. Stimulation was carried out with 200 µs
current pulses and the stimulation intensity was adjusted to evoke a maximal
increase in fluorescence intensity. The stimulation protocol was delivered every
30 seconds.
Presynaptic Ca2+ transients were recorded in RIM1a KO and WT mice. The slices
were perfused with sACSF or sACSF without NaH2PO4, in case of posterior Ni2+
application, in the presence of 10 µM 6-cyano-7-nitroquinoxaline-2,3-dione (CNQX).
After 30 minutes of stable presynaptic Ca2+ transients, specific VGCC blockers
diluted in sACSF, containing 10 µM CNQX, were bath-applied until a steady-state of
the blocking effect was reached.
The following Ca2+ channel blockers were individually bath-applied: 1 µM Cgtx, for
approx. 25 minutes; 1 µM Agatx, for 10 minutes and 0.1 µM for 20 minutes; 1 µM
SNX-482, a specific R-type VGCC blocker, for 10 minutes and 0.1 µM for
20 minutes. In order to elucidate the nature of the Cgtx-Agatx-insensitive Ca2+
transient fraction, the slices were simultaneously perfused with 100 µM Ni2+ and
10 µM verapamil. Those slices were initially preincubated for one hour in sACSF
containing 2 µM Cgtx and 2 µM Agatx.
The collective contribution of the different presynaptic VGCCs to the AP-induced
Ca2+ transients was evaluated by the combined bath-application of the VGCC toxins
for 20 minutes: 1 µM Cgtx, 1 µM Agatx (0.1 µM for the last 10 minutes), 0.5 µM SNX-
482, 100 µM Ni2+, 10 µM verapamil, and 10 µM nimodipine, a specific L-type VGCC
41
blocker. All drugs were dissolved as stock solutions and diluted with sACSF at least
by a factor of 100 to final concentrations before each experiment. All VGCC blockers
were dissolved in water, except nimodipine, which was dissolved in DMSO.
2.7.5 Aperture
We defined a small imaging region, at least 500 µm from the injection site, where
Mg-Green AM-labeled presynaptic buttons from Schaffer collaterals were located.
The aperture was adjusted in order to get an imaging region of approximately 20 µm
x 20 µm. For monitoring presynaptic Ca2+ transients, the aperture was positioned in
front of the stimulation pipette. The aperture, the focal plane, and the stimulating
electrode position were visually adjusted for each experiment to obtain best Ca2+
signal conditions.
2.7.6 Analysis of presynaptic Ca2+ transients
Data were analyzed with built-in and custom-made macros in IGOR Pro and Excel.
Data in each experiment were normalized to the baseline before light excitation. The
amplitude of the AP-evoked Ca2+ transients was expressed as the ratio of the
difference between the peak fluorescence (DF) and the baseline fluorescence (F).
The maximal amplitude of the Ca2+ transients was measured (DF/F). The amplitude
was calculated from the baseline immediately preceding the start of the transient.
The fractional Ca2+ transient amplitude remaining after the VGCC blocker application
was calculated with the following formula:
frac.DF/F(%) = RDF/FWNHMX%IDF/FMH0FIHN
S ∗ 100 (7)
DF/Fcontrol and DF/Fblocker maximum amplitudes were calculated from averaging
20 Ca2+ transients prior to and after toxin application, respectively. The reduction of
the ICa by Ni2+ and verapamil was quantified by subtracting to 1 the Cgtx-sensitive
and Agatx-sensitive fractions and multiplying by the effect of the Ni2+ and verapamil
on the remaining Cgtx-Agatx-insensitive Ca2+ transients.
42
2.8 NMDAR-mediated EPSCs, IPSCs, and mIPSCs recordings in hippocampal cell cultures
Primary hippocampal neuronal cultures were prepared from new-born pups of
RIM1/2 cDKO according to standard protocols (Zürner et al., 2011). The
transductions were performed at 3-4 days in vitro (DIV) using lentiviruses expressing
a non-active Cre-recombinase, an active Cre-recombinase, or a GFP-tagged active
Cre-recombinase (Kaeser et al., 2011). Primary cultures and lentiviral particles were
provided by Prof. Dr. Susanne Schoch’s lab.
Whole-cell patch-clamp recordings were performed in cultured hippocampal neurons
at DIV 14-16. The same setup as for EPSCs and mEPSCs recordings, was used.
The recording pipettes had a resistance of 4-5 MW, and they were filled with
intracellular solution (see 2.2.2).
2.8.1 Release probability as determined by progressive block of NMDA synaptic currents
For NMDAR-mediated EPSCs recordings, 10 µM gabazine and 20 µM CNQX were
added to the extracellular solution (see 2.2.1). Cells were held at +40 mV, in order
to remove the voltage-dependent block by Mg2+. APs in presynaptic neurons were
elicited with a concentric bipolar focal stimulation electrode. The stimulation was
carried out with 200-400 µs current pulses and delivered every 10 seconds. The
stimulation strength was adjusted in order to elicit the maxim amplitude of the
NMDAR-mediated EPSCs. The stimulation protocol was conducted for 5 to
10 minutes in order to obtain a baseline response. Afterwards, the stimulation was
halted for five minutes, while 40 µM of MK-801 was added via bath-application and
the MK-801 concentration equilibrated through the coverslip. The stimulation was
resumed after those five minutes and the NMDAR-mediated EPSCs were recorded
in the continuous presence of MK-801 until a steady-state was reached.
2.8.2 Time course of release rate as determined by deconvolution
In order to obtain the time course of the release rate, IPSCs and mIPSCs were
recorded in the same cultured hippocampal neuron. 10 µM CNQX and 50 µM D-APV
43
were added to the extracellular solution (see 2.2.1). Cells were held at -80 mV.
IPSCs were elicited by a concentric bipolar focal electrode. A single stimulation
pulse, of 200-400 µs, was delivered every 15 seconds. After recording 20 IPSCs,
1 µM TTX was added to the extracellular solution in order to record mIPSCs. Five
minutes after the start of the TTX perfusion, mIPSCs were recorded for 10-second
cycles, with one-second pauses in between, for 20 minutes maximum.
In order to perform the IPSCs deconvolution, on one hand, mIPSCs were offline
detected as described for mEPSCs in CA1 pyramidal cells (see 2.6.2), and all
selected events were used to create an average mIPSC. And on the other hand,
from the 20 recorded IPSCs, an average IPSC response was calculated.
The deconvolution approach was executed using the IGOR Pro software.
44
3 Results
3.1 Impaired neurotransmitter release in RIM1a-deficient synapses
Many modulators of synaptic transmission, such as AZ proteins, influence the
synaptic strength, and therefore, synaptic plasticity. The temporal pattern of
neurotransmitter release can be modulated by the basal Pr and by the number of
SVs available for release at the nerve terminal. As AZ proteins, we expected RIM
proteins to modulate at presynaptic level fast synaptic transmission. We evaluated
RIM1a‘s function, shown to be essential for maintaining Pr and for regulating release
during STP (Schoch et al., 2002), and RIM4.
3.1.1 Unaltered spontaneous release in RIM1a KO and RIM4 KO mice
To elucidate if the ablation of the RIM isoforms altered synaptic transmission at the
presynaptic or at the postsynaptic level, we first performed in WT, RIM1a KO, and
RIM4 KO mice, whole-cell patch clamp recordings of CA1 pyramidal cells.
Measurements of mEPSCs showed that the amplitude of the miniature events did
not differ between WT and RIM1a KO mice, indicating an unchanged quantal size,
i.e. intact postsynaptic responsiveness to the neurotransmitter release. The overall
frequency of mEPSCs in RIM1a KO was unchanged, although there was a trend
towards a decreased frequency. The cumulative distribution of the mEPSC events
revealed a decreased number of mEPSCs with a shorter IEI (Figure 3.1). These
results support the idea that the deficit in synaptic output observed previously in
RIM1a KO mice is not due to a deficit in the synapse number, nor in the postsynaptic
response. The decreased synaptic output observed during AP-mediated
neurotransmitter release is likely due to a lower Pves or a decrease in the availability
of SVs for release. Although Pves and the number of release-ready state SVs are
involved in any form of neurotransmitter release, the mechanisms regulating evoked
release may differ from the mechanisms regulating spontaneous release.
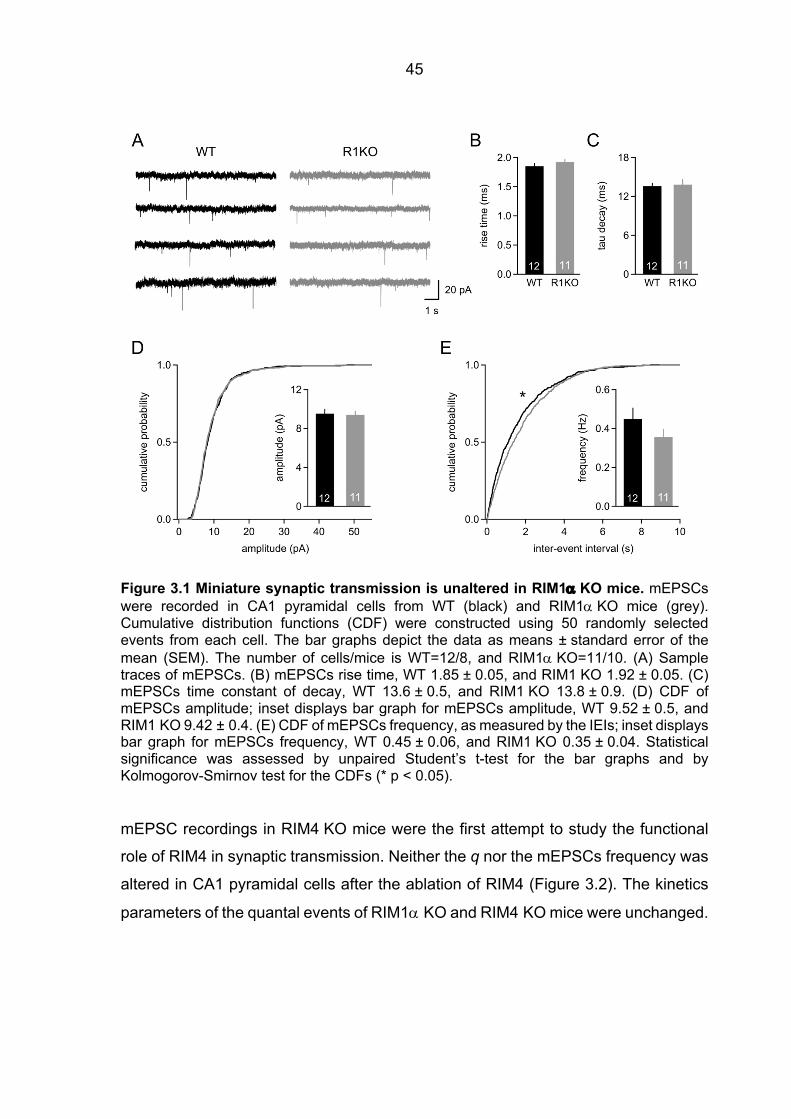
45
Figure 3.1 Miniature synaptic transmission is unaltered in RIM1a KO mice. mEPSCs were recorded in CA1 pyramidal cells from WT (black) and RIM1a KO mice (grey). Cumulative distribution functions (CDF) were constructed using 50 randomly selected events from each cell. The bar graphs depict the data as means ± standard error of the mean (SEM). The number of cells/mice is WT=12/8, and RIM1a KO=11/10. (A) Sample traces of mEPSCs. (B) mEPSCs rise time, WT 1.85 ± 0.05, and RIM1 KO 1.92 ± 0.05. (C) mEPSCs time constant of decay, WT 13.6 ± 0.5, and RIM1 KO 13.8 ± 0.9. (D) CDF of mEPSCs amplitude; inset displays bar graph for mEPSCs amplitude, WT 9.52 ± 0.5, and RIM1 KO 9.42 ± 0.4. (E) CDF of mEPSCs frequency, as measured by the IEIs; inset displays bar graph for mEPSCs frequency, WT 0.45 ± 0.06, and RIM1 KO 0.35 ± 0.04. Statistical significance was assessed by unpaired Student’s t-test for the bar graphs and by Kolmogorov-Smirnov test for the CDFs (* p < 0.05).
mEPSC recordings in RIM4 KO mice were the first attempt to study the functional
role of RIM4 in synaptic transmission. Neither the q nor the mEPSCs frequency was
altered in CA1 pyramidal cells after the ablation of RIM4 (Figure 3.2). The kinetics
parameters of the quantal events of RIM1a KO and RIM4 KO mice were unchanged.
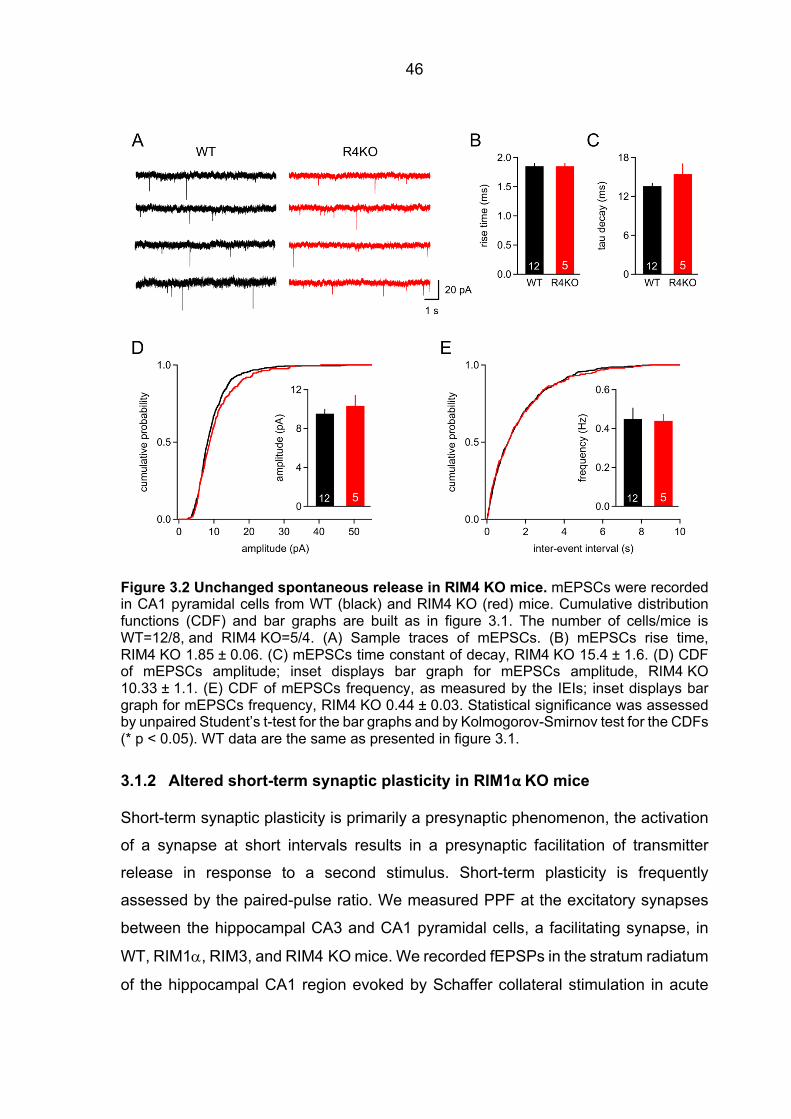
46
Figure 3.2 Unchanged spontaneous release in RIM4 KO mice. mEPSCs were recorded in CA1 pyramidal cells from WT (black) and RIM4 KO (red) mice. Cumulative distribution functions (CDF) and bar graphs are built as in figure 3.1. The number of cells/mice is WT=12/8, and RIM4 KO=5/4. (A) Sample traces of mEPSCs. (B) mEPSCs rise time, RIM4 KO 1.85 ± 0.06. (C) mEPSCs time constant of decay, RIM4 KO 15.4 ± 1.6. (D) CDF of mEPSCs amplitude; inset displays bar graph for mEPSCs amplitude, RIM4 KO 10.33 ± 1.1. (E) CDF of mEPSCs frequency, as measured by the IEIs; inset displays bar graph for mEPSCs frequency, RIM4 KO 0.44 ± 0.03. Statistical significance was assessed by unpaired Student’s t-test for the bar graphs and by Kolmogorov-Smirnov test for the CDFs (* p < 0.05). WT data are the same as presented in figure 3.1.
3.1.2 Altered short-term synaptic plasticity in RIM1α KO mice
Short-term synaptic plasticity is primarily a presynaptic phenomenon, the activation
of a synapse at short intervals results in a presynaptic facilitation of transmitter
release in response to a second stimulus. Short-term plasticity is frequently
assessed by the paired-pulse ratio. We measured PPF at the excitatory synapses
between the hippocampal CA3 and CA1 pyramidal cells, a facilitating synapse, in
WT, RIM1a, RIM3, and RIM4 KO mice. We recorded fEPSPs in the stratum radiatum
of the hippocampal CA1 region evoked by Schaffer collateral stimulation in acute
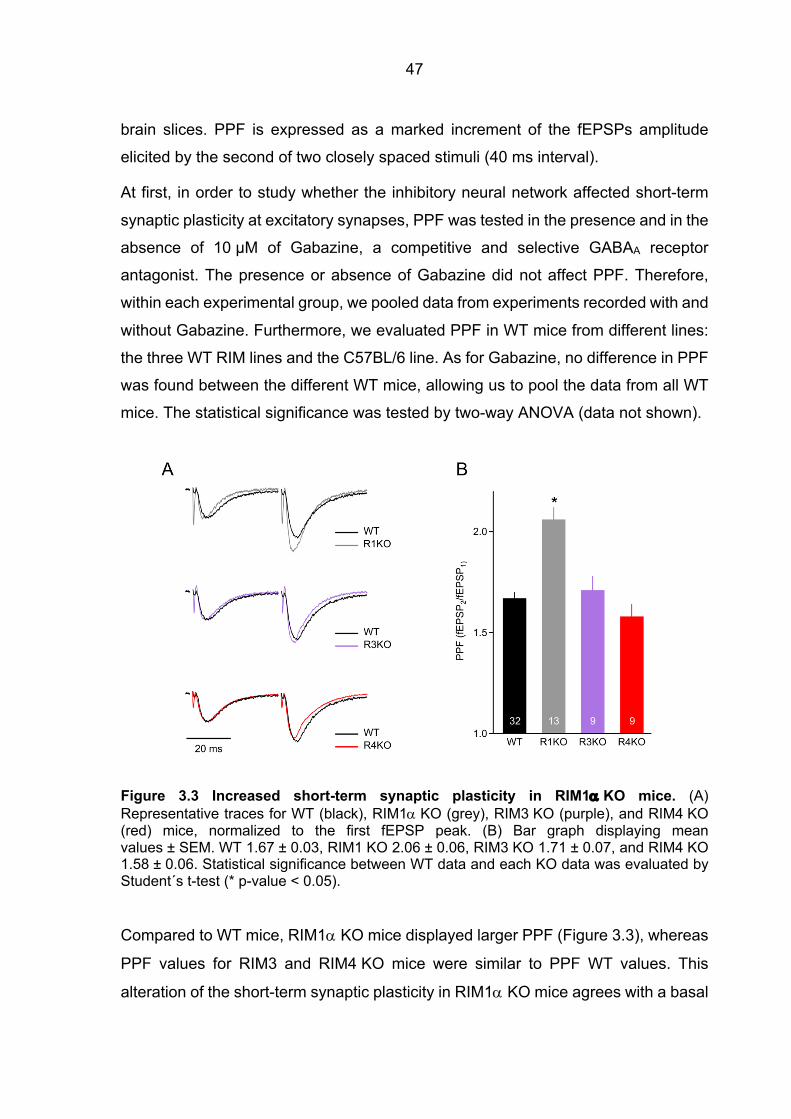
47
brain slices. PPF is expressed as a marked increment of the fEPSPs amplitude
elicited by the second of two closely spaced stimuli (40 ms interval).
At first, in order to study whether the inhibitory neural network affected short-term
synaptic plasticity at excitatory synapses, PPF was tested in the presence and in the
absence of 10 µM of Gabazine, a competitive and selective GABAA receptor
antagonist. The presence or absence of Gabazine did not affect PPF. Therefore,
within each experimental group, we pooled data from experiments recorded with and
without Gabazine. Furthermore, we evaluated PPF in WT mice from different lines:
the three WT RIM lines and the C57BL/6 line. As for Gabazine, no difference in PPF
was found between the different WT mice, allowing us to pool the data from all WT
mice. The statistical significance was tested by two-way ANOVA (data not shown).
Figure 3.3 Increased short-term synaptic plasticity in RIM1a KO mice. (A) Representative traces for WT (black), RIM1a KO (grey), RIM3 KO (purple), and RIM4 KO (red) mice, normalized to the first fEPSP peak. (B) Bar graph displaying mean values ± SEM. WT 1.67 ± 0.03, RIM1 KO 2.06 ± 0.06, RIM3 KO 1.71 ± 0.07, and RIM4 KO 1.58 ± 0.06. Statistical significance between WT data and each KO data was evaluated by Student´s t-test (* p-value < 0.05).
Compared to WT mice, RIM1a KO mice displayed larger PPF (Figure 3.3), whereas
PPF values for RIM3 and RIM4 KO mice were similar to PPF WT values. This
alteration of the short-term synaptic plasticity in RIM1a KO mice agrees with a basal
48
lower Pr. It is unclear whether this alteration is primarily due to an altered Pves, to a
disturbed signalling of Syt7, or to a decrease in the very Ca2+concentration operating
the Ca2+ sensor of release.
3.2 The Ca2+ signal at the release machinery Ca2+ sensor is tuned by RIM1a
In order to elucidate the origin of the impaired neurotransmitter release in RIM1a KO
mice as well as to shed light in a putative role for RIM3 and RIM4 controlling
neurotransmitter release at the presynaptic level, we examined the Ca2+ signal built
at the Ca2+ microdomain near docked SVs after an AP. Using fEPSP recordings and
specific VGCC blockers as experimental components, and the simple power-law-
description of the Ca2+-dependence of release, being approximated by (ICa)n, as
theoretical background, we developed a novel approach which promised to be of
general use in assessing several aspects of the AP-mediated presynaptic Ca2+
signal, like the relative contribution of the different VGCC types to neurotransmitter
release, the Ca2+-binding parameters to the Ca2+ sensors located at the release
machinery, as the Ca2+ affinity and the Ca2+ cooperativity, and the relative Pves.
3.2.1 Mathematical approach to analyze the Ca2+ signal at the release machinery Ca2+ sensor
As extensively explained during the introduction, the steep Ca2+ cooperativity during
an AP makes synaptic transmission extremely sensitive to changes in the Ca2+
concentration at the release site ([Ca2+]local).
Our mathematical approach built upon the fact that AP-induced Ca2+ binding to the
Ca2+ sensor of the release machinery can be brought near to saturation when
perfusing high [Ca2+]e. This scenario of “near-saturation” of Ca2+ sensors renders
synaptic transmission insensitive to partial reduction of ICa (Wheeler et al., 1994).
We employed fEPSP amplitudes from recordings at the Schaffer collaterals to CA1
pyramidal neuron (Sc-CA1) synapses as a readout for transmitter release. To alter
the [Ca2+]local, we perfused a wide range of different [Ca2+]e and used specific VGCC
blockers, Cgtx and Agatx, which reduce ICa to a certain and constant fraction. After
VGCC toxin application, we could quantify the resulting relative decrease on the
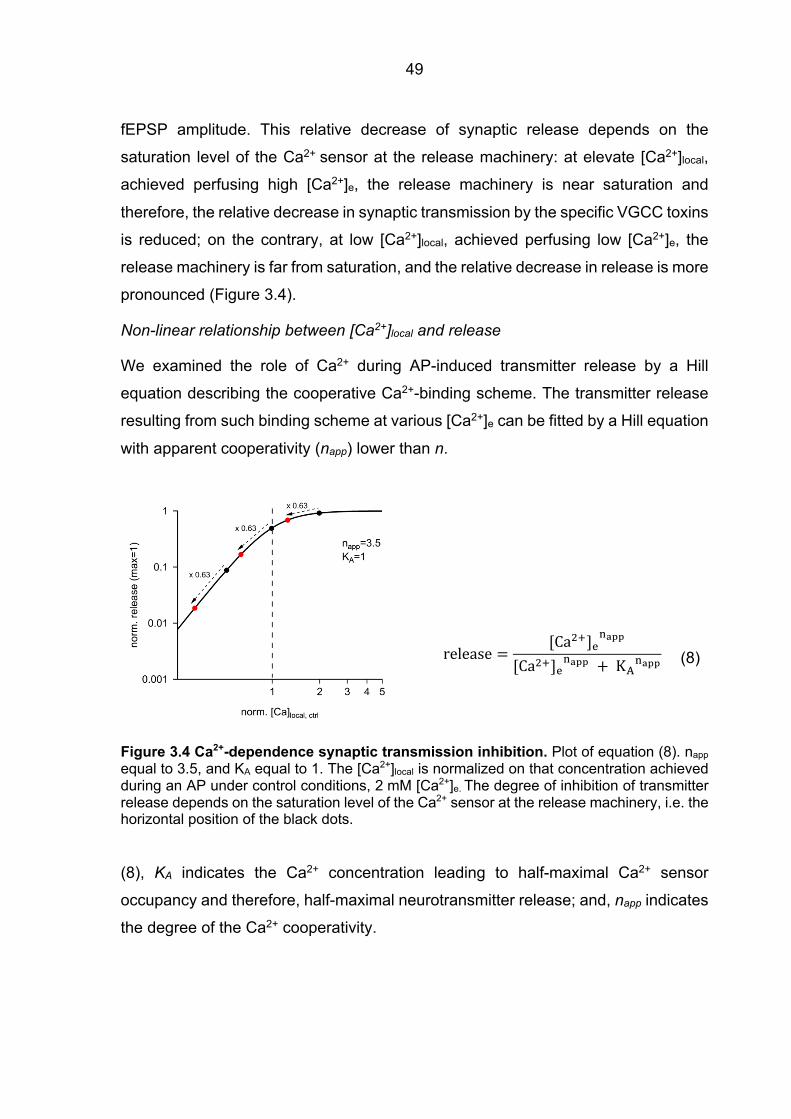
49
fEPSP amplitude. This relative decrease of synaptic release depends on the
saturation level of the Ca2+ sensor at the release machinery: at elevate [Ca2+]local,
achieved perfusing high [Ca2+]e, the release machinery is near saturation and
therefore, the relative decrease in synaptic transmission by the specific VGCC toxins
is reduced; on the contrary, at low [Ca2+]local, achieved perfusing low [Ca2+]e, the
release machinery is far from saturation, and the relative decrease in release is more
pronounced (Figure 3.4).
Non-linear relationship between [Ca2+]local and release
We examined the role of Ca2+ during AP-induced transmitter release by a Hill
equation describing the cooperative Ca2+-binding scheme. The transmitter release
resulting from such binding scheme at various [Ca2+]e can be fitted by a Hill equation
with apparent cooperativity (napp) lower than n.
Figure 3.4 Ca2+-dependence synaptic transmission inhibition. Plot of equation (8). napp equal to 3.5, and KA equal to 1. The [Ca2+]local is normalized on that concentration achieved during an AP under control conditions, 2 mM [Ca2+]e. The degree of inhibition of transmitter release depends on the saturation level of the Ca2+ sensor at the release machinery, i.e. the horizontal position of the black dots.
(8), KA indicates the Ca2+ concentration leading to half-maximal Ca2+ sensor
occupancy and therefore, half-maximal neurotransmitter release; and, napp indicates
the degree of the Ca2+ cooperativity.
release =[Ca45]%
0[\\
[Ca45]%0[\\ +KJ0[\\
(8)
50
Estimation of [Ca2+]local by means of [Ca2+]e and ICa
To estimate normalized ICa from the [Ca2+]e, we employed a calibration procedure
based on several previous measurements of ICa through VGCCs. ICa is well fitted by
a function for a bimolecular reaction scheme describing the Ca2+ channel pore
occupancy by the [Ca2+]e with a KD, dissociation constant of the Ca2+ binding site,
being 3.3 mM (Carbone and Lux, 1987, Erdmann et al., 2012, Mintz et al., 1995).
norm. IDK =
2.7 ∗ [Ca45]%([Ca45]% + 3.3)
(9)
Changes in the ICa, by changes in the [Ca2+]e, must be converted into the respective
relative changes of the [Ca2+]local. Previous studies showed that the [Ca2+]local is over
a large range of conditions proportional to the ICa (Erdmann et al., 2012); therefore,
the output of equation (9), sufficiently describes relative changes in the [Ca2+]local at
the release sensor. Consequently, we could rewrite equation
(8) in terms of normalized ICa or, directly, normalized [Ca2+]local.
release =norm. [Ca45]NHMKN
0[\\
norm. [Ca45]NHMKN0[\\ + (b ∗ norm. KJ)0[\\
(10)
In equation (10), the previous parameter KA was separated in two factors: b and
norm. KA. As a whole, the element (b *normalized KA) states how much the [Ca2+]local
has to be increased with respect to the condition of 2 mM [Ca2+]e in order to achieve
half-maximal occupancy of the Ca2+ sensor. The factor norm. KA reports changes in
the biochemical affinity of the Ca2+ sensor, and the factor b, changes in the [Ca2+]local
seen by the Ca2+ sensor. The factor b indicates modifications of [Ca2+]local which can
be caused by an alteration in the number of tethered VGCCs at the release site or
in their distance relative to the docked SVs where the Ca2+ sensors are located. (The
distinction between norm. KA and b is a key consideration during the analysis of our
data).
VGCCs mediating neurotransmitter release: P/Q-type and N-type
At the Sc-CA1 synapses, neurotransmitter release is mainly mediated by two types
of VGCCs: P/Q-type and N-type. In other words, the ICa at those synapses relies on
the contribution of the P/Q-type VGCCs (fraction P) and the contribution of the N-
51
type VGCCs (fraction N). As we could not discard completely the possibility of other
types of VGCCs contributing to the ICa at the Schaffer collaterals, apart from P and
N, a possible contribution of remaining VGCCs, which are not blocked by Agatx
neither Cgtx, had to be taken into account. This contributing factor was defined as
fraction R (remaining VGCCs). To reflect that each VGCC subtype is contributing a
certain fraction to the ICa we defined:
P + N + R = 1 (11) Consequently, we could re-express equation (10) as:
release =
((P + N + R) ∗ norm. [Ca45]NHMKN)0[\\((P + N + R) ∗ norm. [Ca45]NHMKN)0[\\ + (b ∗ norm. KJ)0[\\
(12)
Inhibitory effect on Sc-CA1 fEPSPs caused by Cgtx and Agatx
We employed as a readout of neurotransmitter release, fEPSP recordings. After
VGCC toxin application (Cgtx or Agatx), we could quantify the resulting relative
decrease of the fEPSP amplitude. In the presence of Cgtx, the specific N-type VGCC
blocker, the ICa, and ergo [Ca2+]local, is explained by the contribution of P/Q-type
VGCCs and the contribution of Cgtx-Agatx-insensitive channels:
norm. IDK(Cgtx) = (P + R) ∗ norm. IDK (13)
The resulting fractional relative release in the presence of Cgtx, given by diving the
release in the presence of Cgtx by the release prior to toxin application, can be
expressed as:
fract. rel. Cgtx
=((P + R) ∗ norm. [Ca45]NHMKN)0[\\
((P + R) ∗ norm. [Ca45]NHMKN)0[\\ + (b ∗ norm. KJ)0[\\
/((P + N + R) ∗ norm. [Ca45]NHMKN)0[\\
((P + N + R) ∗ norm. [Ca45]NHMKN)0[\\ + (b ∗ norm. KJ)0[\\
=((P + R) ∗ norm. [Ca45]NHMKN)0[\\ + ((P + R) ∗ (b ∗ norm. KJ))0[\\
((P + R) ∗ norm. [Ca45]NHMKN)0[\\ + (b ∗ norm. KJ)0[\\
(14)
52
Similarly, in the presence of Agatx, the specific P/Q-type VGCC blocker, the ICa is
explained by the contribution of the N-type VGCCs and the contribution of Cgtx-
Agatx-insensitive channels:
norm. IDK(AgaTx) = (N + R) ∗ norm. IDK = (1 − P) ∗ norm. IDK (15)
Accordingly, the fEPSP fractional release after Agatx application is expressed as:
fract. rel. Agatx
=((1 − P) ∗ norm. [Ca45]NHMKN)0[\\ + ((1 − P) ∗ (b ∗ norm. KJ))0[\\
((1 − P) ∗ norm. [Ca45]NHMKN)0[\\ + (b ∗ norm. KJ)0[\\
(16)
A particular advantage of our approach is that allowed us to study the release
machinery at different degrees of Ca2+ binding induced by elevating the [Ca2+]e while
at the same time circumventing the problems associated with different divalent cation
concentrations such as changes in the number of axons stimulated. This is achieved
because all the measurements were based on quantifying the relative inhibition of
release and not absolute fEPSP amplitudes.
3.2.2 fEPSPs Cgtx relative inhibition in WT and RIM1a KO mice
We measured the reduction of Sc-CA1 fEPSPs amplitude by Cgtx under seven
different [Ca2+]e: 0.8, 1, 1.5, 2, 4, 10, and 20 mM, in WT and RIM1a KO mice, in a
submerged recording chamber. As synaptic responses in RIM1a KO mice are small,
particularly when perfusing low [Ca2+]e, the effect of Cgtx on fEPSPs while perfusing
1 mM [Ca2+]e, was tested at 35 °C in the Haas-type interface chamber which yields
a better signal-to-noise ratio. We performed control experiments, in WT mice and
perfusing 2 mM [Ca2+]e, in order to test the effect of the different recording chambers
on the Cgtx-induced fEPSP inhibition. The fractional fEPSP amplitude after Cgtx
application was 44.5% ± 1.41 (mean ± SEM) (n=33) in the submerged chamber, and
47.3% ± 5.04 (n=5) in the interface chamber. These control experiments (data not
shown) revealed no difference between recording chambers (statistical significance
evaluated by Student’s t-test, p-value > 0.05). Recordings in lower [Ca2+]e (0.8 mM)
were not performed in RIM1a KO mice.
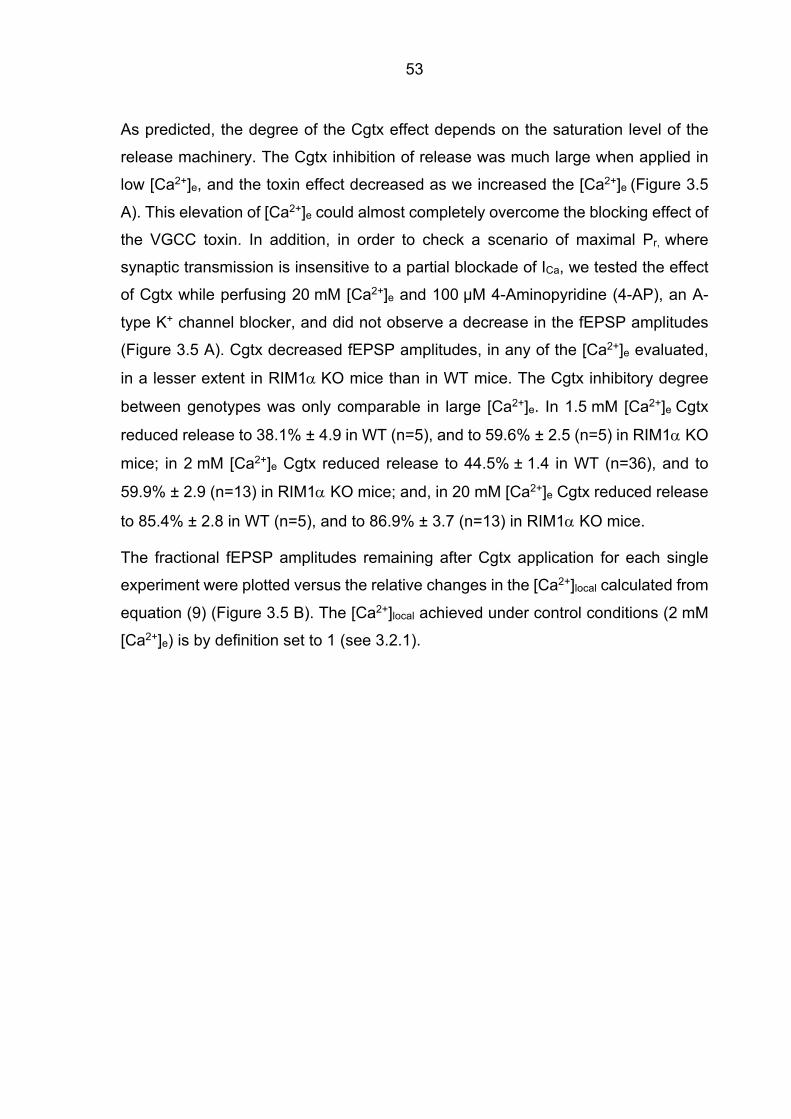
53
As predicted, the degree of the Cgtx effect depends on the saturation level of the
release machinery. The Cgtx inhibition of release was much large when applied in
low [Ca2+]e, and the toxin effect decreased as we increased the [Ca2+]e (Figure 3.5
A). This elevation of [Ca2+]e could almost completely overcome the blocking effect of
the VGCC toxin. In addition, in order to check a scenario of maximal Pr, where
synaptic transmission is insensitive to a partial blockade of ICa, we tested the effect
of Cgtx while perfusing 20 mM [Ca2+]e and 100 µM 4-Aminopyridine (4-AP), an A-
type K+ channel blocker, and did not observe a decrease in the fEPSP amplitudes
(Figure 3.5 A). Cgtx decreased fEPSP amplitudes, in any of the [Ca2+]e evaluated,
in a lesser extent in RIM1a KO mice than in WT mice. The Cgtx inhibitory degree
between genotypes was only comparable in large [Ca2+]e. In 1.5 mM [Ca2+]e Cgtx
reduced release to 38.1% ± 4.9 in WT (n=5), and to 59.6% ± 2.5 (n=5) in RIM1a KO
mice; in 2 mM [Ca2+]e Cgtx reduced release to 44.5% ± 1.4 in WT (n=36), and to
59.9% ± 2.9 (n=13) in RIM1a KO mice; and, in 20 mM [Ca2+]e Cgtx reduced release
to 85.4% ± 2.8 in WT (n=5), and to 86.9% ± 3.7 (n=13) in RIM1a KO mice.
The fractional fEPSP amplitudes remaining after Cgtx application for each single
experiment were plotted versus the relative changes in the [Ca2+]local calculated from
equation (9) (Figure 3.5 B). The [Ca2+]local achieved under control conditions (2 mM
[Ca2+]e) is by definition set to 1 (see 3.2.1).
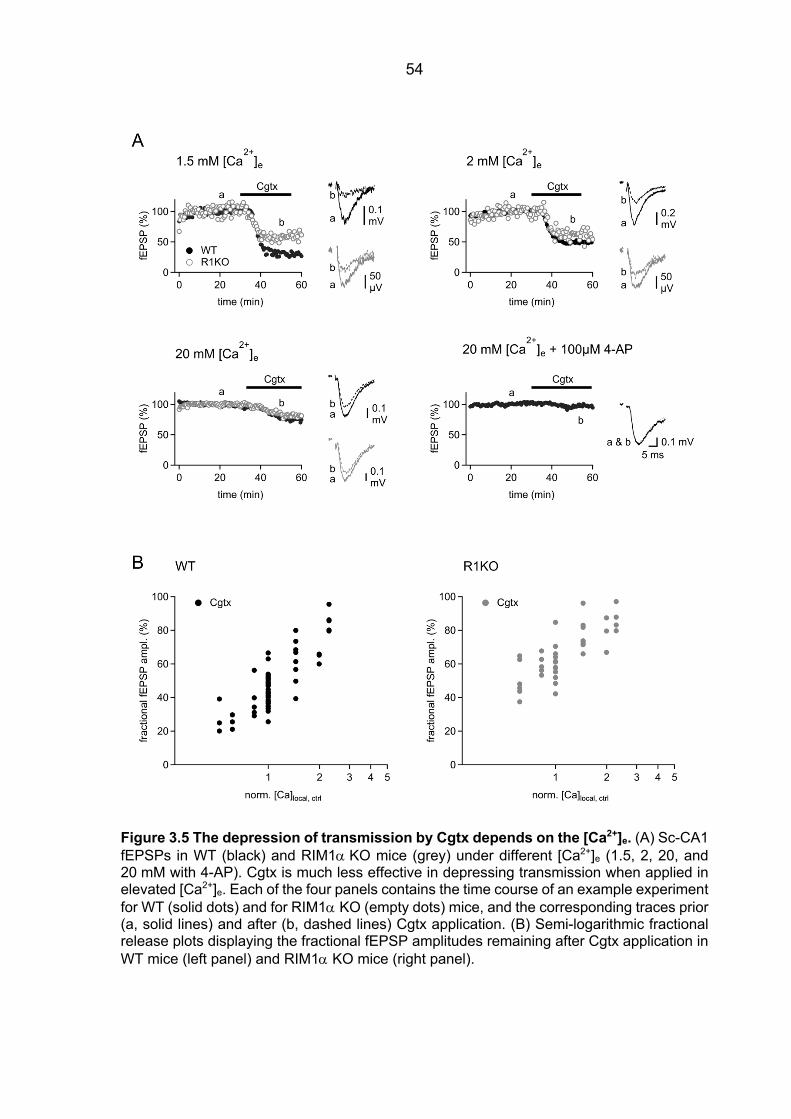
54
Figure 3.5 The depression of transmission by Cgtx depends on the [Ca2+]e. (A) Sc-CA1 fEPSPs in WT (black) and RIM1a KO mice (grey) under different [Ca2+]e (1.5, 2, 20, and 20 mM with 4-AP). Cgtx is much less effective in depressing transmission when applied in elevated [Ca2+]e. Each of the four panels contains the time course of an example experiment for WT (solid dots) and for RIM1a KO (empty dots) mice, and the corresponding traces prior (a, solid lines) and after (b, dashed lines) Cgtx application. (B) Semi-logarithmic fractional release plots displaying the fractional fEPSP amplitudes remaining after Cgtx application in WT mice (left panel) and RIM1a KO mice (right panel).
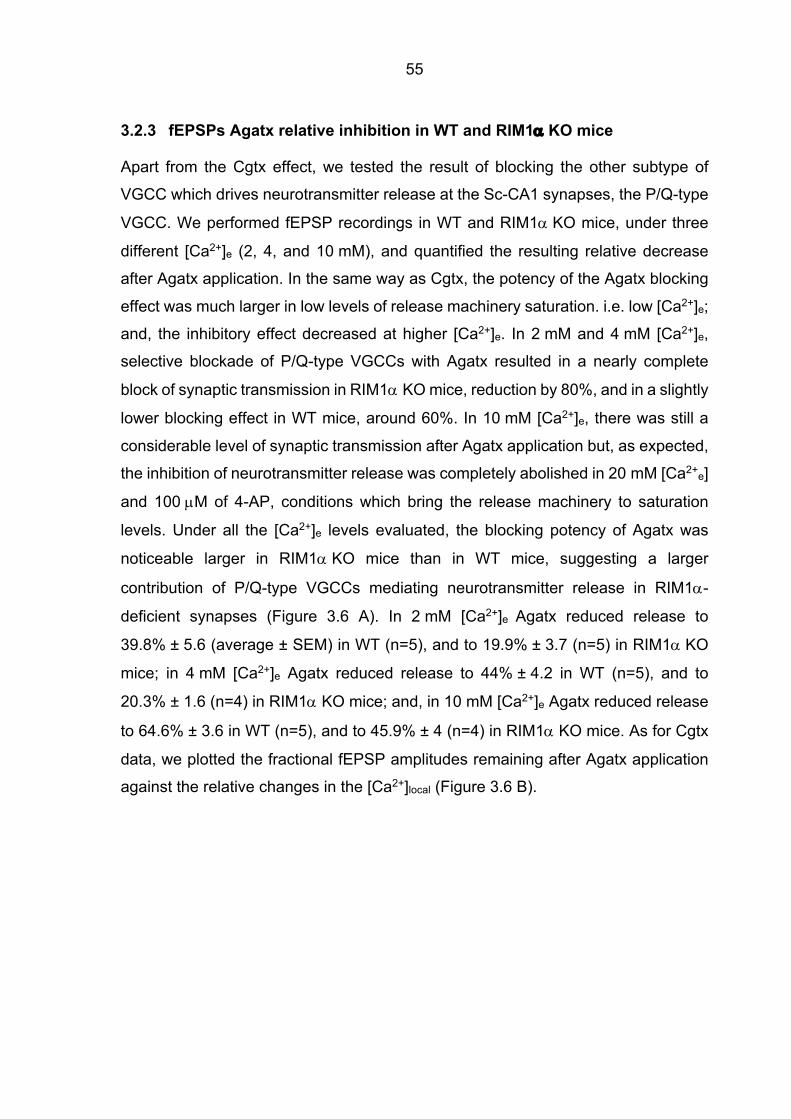
55
3.2.3 fEPSPs Agatx relative inhibition in WT and RIM1a KO mice
Apart from the Cgtx effect, we tested the result of blocking the other subtype of
VGCC which drives neurotransmitter release at the Sc-CA1 synapses, the P/Q-type
VGCC. We performed fEPSP recordings in WT and RIM1a KO mice, under three
different [Ca2+]e (2, 4, and 10 mM), and quantified the resulting relative decrease
after Agatx application. In the same way as Cgtx, the potency of the Agatx blocking
effect was much larger in low levels of release machinery saturation. i.e. low [Ca2+]e;
and, the inhibitory effect decreased at higher [Ca2+]e. In 2 mM and 4 mM [Ca2+]e,
selective blockade of P/Q-type VGCCs with Agatx resulted in a nearly complete
block of synaptic transmission in RIM1a KO mice, reduction by 80%, and in a slightly
lower blocking effect in WT mice, around 60%. In 10 mM [Ca2+]e, there was still a
considerable level of synaptic transmission after Agatx application but, as expected,
the inhibition of neurotransmitter release was completely abolished in 20 mM [Ca2+e]
and 100 µM of 4-AP, conditions which bring the release machinery to saturation
levels. Under all the [Ca2+]e levels evaluated, the blocking potency of Agatx was
noticeable larger in RIM1a KO mice than in WT mice, suggesting a larger
contribution of P/Q-type VGCCs mediating neurotransmitter release in RIM1a-
deficient synapses (Figure 3.6 A). In 2 mM [Ca2+]e Agatx reduced release to
39.8% ± 5.6 (average ± SEM) in WT (n=5), and to 19.9% ± 3.7 (n=5) in RIM1a KO
mice; in 4 mM [Ca2+]e Agatx reduced release to 44% ± 4.2 in WT (n=5), and to
20.3% ± 1.6 (n=4) in RIM1a KO mice; and, in 10 mM [Ca2+]e Agatx reduced release
to 64.6% ± 3.6 in WT (n=5), and to 45.9% ± 4 (n=4) in RIM1a KO mice. As for Cgtx
data, we plotted the fractional fEPSP amplitudes remaining after Agatx application
against the relative changes in the [Ca2+]local (Figure 3.6 B).
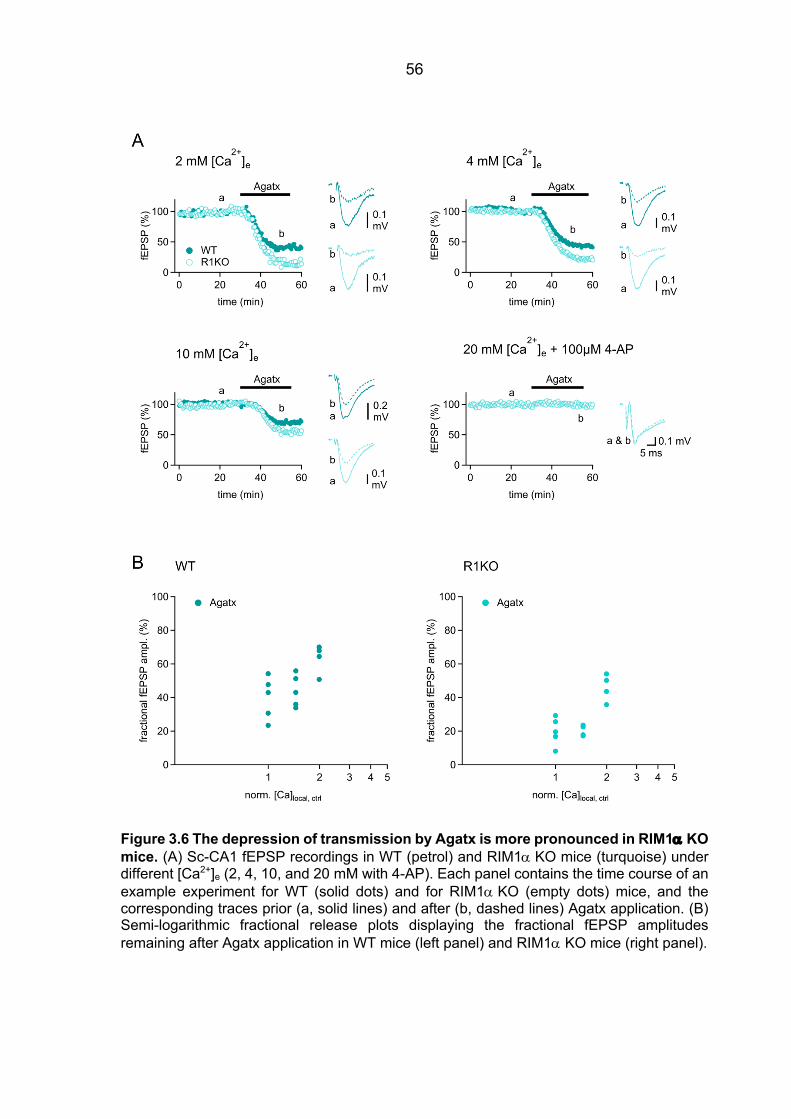
56
Figure 3.6 The depression of transmission by Agatx is more pronounced in RIM1a KO mice. (A) Sc-CA1 fEPSP recordings in WT (petrol) and RIM1a KO mice (turquoise) under different [Ca2+]e (2, 4, 10, and 20 mM with 4-AP). Each panel contains the time course of an example experiment for WT (solid dots) and for RIM1a KO (empty dots) mice, and the corresponding traces prior (a, solid lines) and after (b, dashed lines) Agatx application. (B) Semi-logarithmic fractional release plots displaying the fractional fEPSP amplitudes remaining after Agatx application in WT mice (left panel) and RIM1a KO mice (right panel).
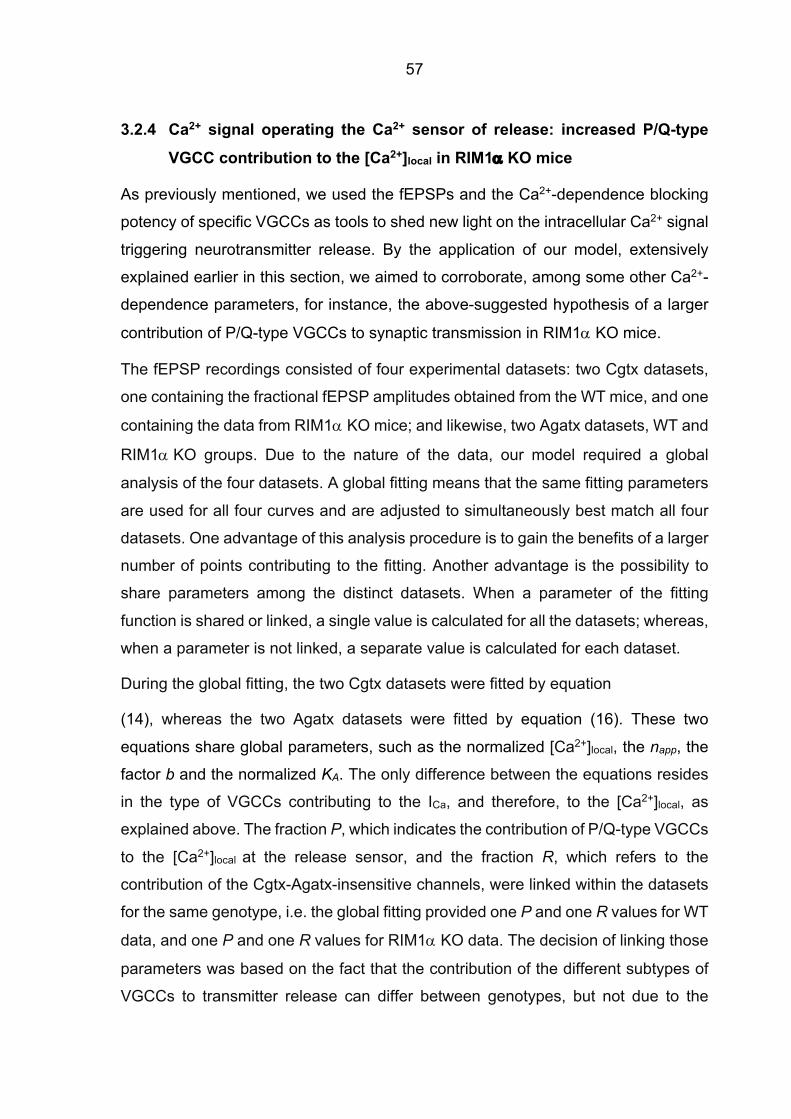
57
3.2.4 Ca2+ signal operating the Ca2+ sensor of release: increased P/Q-type VGCC contribution to the [Ca2+]local in RIM1a KO mice
As previously mentioned, we used the fEPSPs and the Ca2+-dependence blocking
potency of specific VGCCs as tools to shed new light on the intracellular Ca2+ signal
triggering neurotransmitter release. By the application of our model, extensively
explained earlier in this section, we aimed to corroborate, among some other Ca2+-
dependence parameters, for instance, the above-suggested hypothesis of a larger
contribution of P/Q-type VGCCs to synaptic transmission in RIM1a KO mice.
The fEPSP recordings consisted of four experimental datasets: two Cgtx datasets,
one containing the fractional fEPSP amplitudes obtained from the WT mice, and one
containing the data from RIM1a KO mice; and likewise, two Agatx datasets, WT and
RIM1a KO groups. Due to the nature of the data, our model required a global
analysis of the four datasets. A global fitting means that the same fitting parameters
are used for all four curves and are adjusted to simultaneously best match all four
datasets. One advantage of this analysis procedure is to gain the benefits of a larger
number of points contributing to the fitting. Another advantage is the possibility to
share parameters among the distinct datasets. When a parameter of the fitting
function is shared or linked, a single value is calculated for all the datasets; whereas,
when a parameter is not linked, a separate value is calculated for each dataset.
During the global fitting, the two Cgtx datasets were fitted by equation
(14), whereas the two Agatx datasets were fitted by equation (16). These two
equations share global parameters, such as the normalized [Ca2+]local, the napp, the
factor b and the normalized KA. The only difference between the equations resides
in the type of VGCCs contributing to the ICa, and therefore, to the [Ca2+]local, as
explained above. The fraction P, which indicates the contribution of P/Q-type VGCCs
to the [Ca2+]local at the release sensor, and the fraction R, which refers to the
contribution of the Cgtx-Agatx-insensitive channels, were linked within the datasets
for the same genotype, i.e. the global fitting provided one P and one R values for WT
data, and one P and one R values for RIM1a KO data. The decision of linking those
parameters was based on the fact that the contribution of the different subtypes of
VGCCs to transmitter release can differ between genotypes, but not due to the
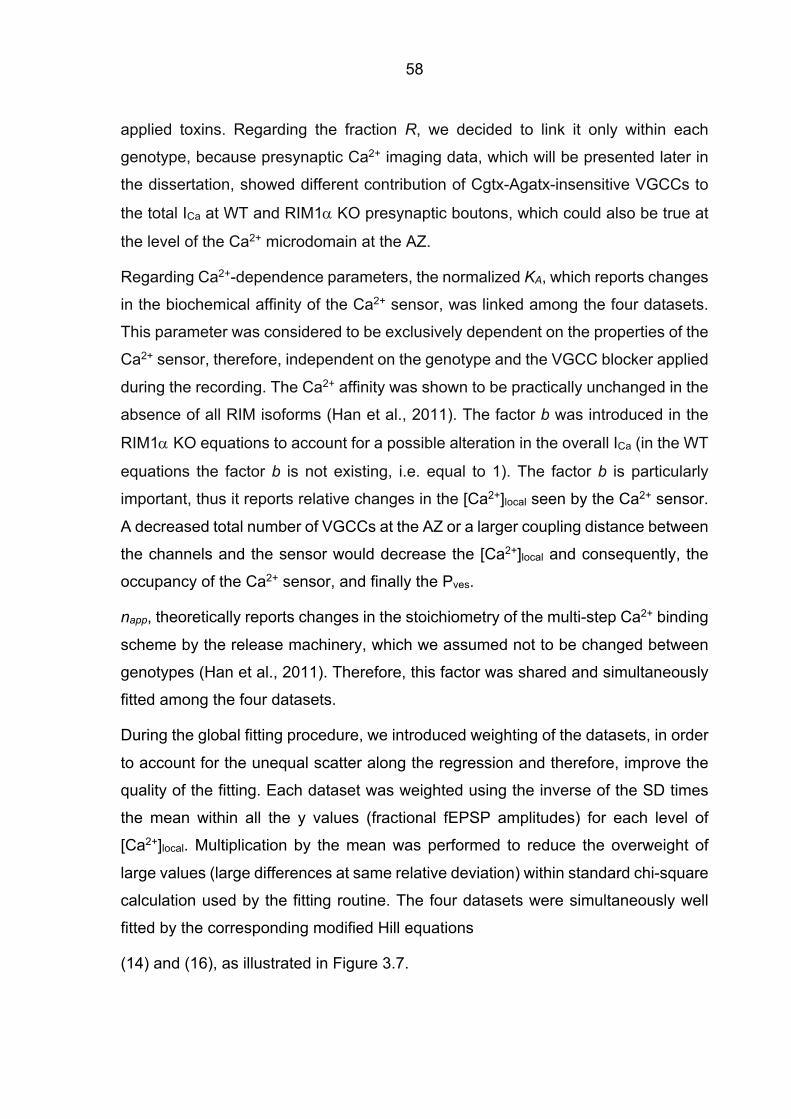
58
applied toxins. Regarding the fraction R, we decided to link it only within each
genotype, because presynaptic Ca2+ imaging data, which will be presented later in
the dissertation, showed different contribution of Cgtx-Agatx-insensitive VGCCs to
the total ICa at WT and RIM1a KO presynaptic boutons, which could also be true at
the level of the Ca2+ microdomain at the AZ.
Regarding Ca2+-dependence parameters, the normalized KA, which reports changes
in the biochemical affinity of the Ca2+ sensor, was linked among the four datasets.
This parameter was considered to be exclusively dependent on the properties of the
Ca2+ sensor, therefore, independent on the genotype and the VGCC blocker applied
during the recording. The Ca2+ affinity was shown to be practically unchanged in the
absence of all RIM isoforms (Han et al., 2011). The factor b was introduced in the
RIM1a KO equations to account for a possible alteration in the overall ICa (in the WT
equations the factor b is not existing, i.e. equal to 1). The factor b is particularly
important, thus it reports relative changes in the [Ca2+]local seen by the Ca2+ sensor.
A decreased total number of VGCCs at the AZ or a larger coupling distance between
the channels and the sensor would decrease the [Ca2+]local and consequently, the
occupancy of the Ca2+ sensor, and finally the Pves.
napp, theoretically reports changes in the stoichiometry of the multi-step Ca2+ binding
scheme by the release machinery, which we assumed not to be changed between
genotypes (Han et al., 2011). Therefore, this factor was shared and simultaneously
fitted among the four datasets.
During the global fitting procedure, we introduced weighting of the datasets, in order
to account for the unequal scatter along the regression and therefore, improve the
quality of the fitting. Each dataset was weighted using the inverse of the SD times
the mean within all the y values (fractional fEPSP amplitudes) for each level of
[Ca2+]local. Multiplication by the mean was performed to reduce the overweight of
large values (large differences at same relative deviation) within standard chi-square
calculation used by the fitting routine. The four datasets were simultaneously well
fitted by the corresponding modified Hill equations
(14) and (16), as illustrated in Figure 3.7.
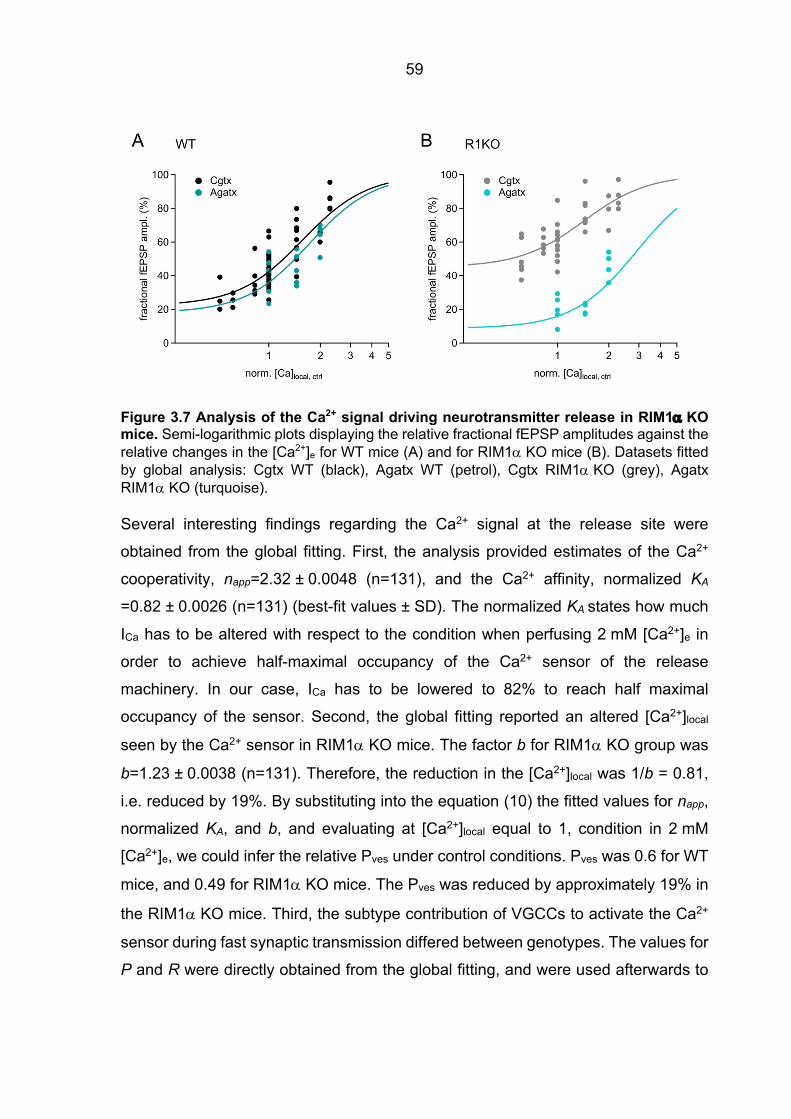
59
Figure 3.7 Analysis of the Ca2+ signal driving neurotransmitter release in RIM1a KO mice. Semi-logarithmic plots displaying the relative fractional fEPSP amplitudes against the relative changes in the [Ca2+]e for WT mice (A) and for RIM1a KO mice (B). Datasets fitted by global analysis: Cgtx WT (black), Agatx WT (petrol), Cgtx RIM1a KO (grey), Agatx RIM1a KO (turquoise). Several interesting findings regarding the Ca2+ signal at the release site were
obtained from the global fitting. First, the analysis provided estimates of the Ca2+
cooperativity, napp=2.32 ± 0.0048 (n=131), and the Ca2+ affinity, normalized KA
=0.82 ± 0.0026 (n=131) (best-fit values ± SD). The normalized KA states how much
ICa has to be altered with respect to the condition when perfusing 2 mM [Ca2+]e in
order to achieve half-maximal occupancy of the Ca2+ sensor of the release
machinery. In our case, ICa has to be lowered to 82% to reach half maximal
occupancy of the sensor. Second, the global fitting reported an altered [Ca2+]local
seen by the Ca2+ sensor in RIM1a KO mice. The factor b for RIM1a KO group was
b=1.23 ± 0.0038 (n=131). Therefore, the reduction in the [Ca2+]local was 1/b = 0.81,
i.e. reduced by 19%. By substituting into the equation (10) the fitted values for napp,
normalized KA, and b, and evaluating at [Ca2+]local equal to 1, condition in 2 mM
[Ca2+]e, we could infer the relative Pves under control conditions. Pves was 0.6 for WT
mice, and 0.49 for RIM1a KO mice. The Pves was reduced by approximately 19% in
the RIM1a KO mice. Third, the subtype contribution of VGCCs to activate the Ca2+
sensor during fast synaptic transmission differed between genotypes. The values for
P and R were directly obtained from the global fitting, and were used afterwards to
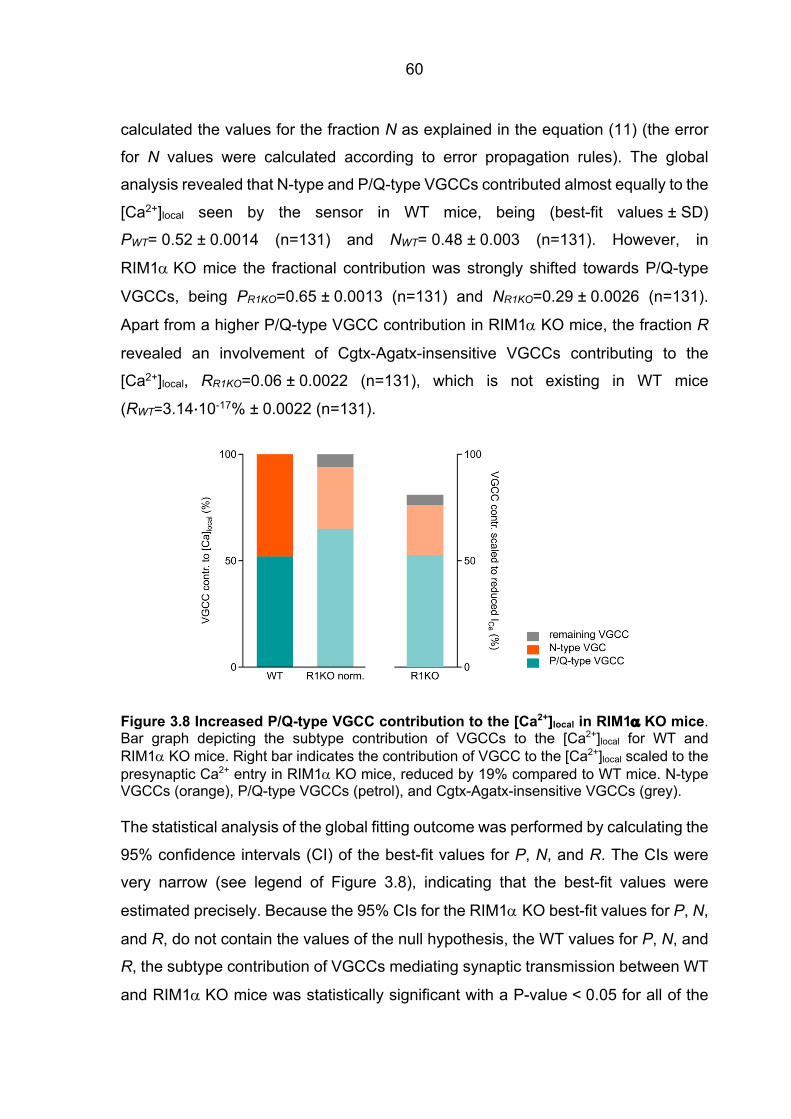
60
calculated the values for the fraction N as explained in the equation (11) (the error
for N values were calculated according to error propagation rules). The global
analysis revealed that N-type and P/Q-type VGCCs contributed almost equally to the
[Ca2+]local seen by the sensor in WT mice, being (best-fit values ± SD)
PWT= 0.52 ± 0.0014 (n=131) and NWT= 0.48 ± 0.003 (n=131). However, in
RIM1a KO mice the fractional contribution was strongly shifted towards P/Q-type
VGCCs, being PR1KO=0.65 ± 0.0013 (n=131) and NR1KO=0.29 ± 0.0026 (n=131).
Apart from a higher P/Q-type VGCC contribution in RIM1a KO mice, the fraction R
revealed an involvement of Cgtx-Agatx-insensitive VGCCs contributing to the
[Ca2+]local, RR1KO=0.06 ± 0.0022 (n=131), which is not existing in WT mice
(RWT=3.14·10-17% ± 0.0022 (n=131).
Figure 3.8 Increased P/Q-type VGCC contribution to the [Ca2+]local in RIM1a KO mice. Bar graph depicting the subtype contribution of VGCCs to the [Ca2+]local for WT and RIM1a KO mice. Right bar indicates the contribution of VGCC to the [Ca2+]local scaled to the presynaptic Ca2+ entry in RIM1a KO mice, reduced by 19% compared to WT mice. N-type VGCCs (orange), P/Q-type VGCCs (petrol), and Cgtx-Agatx-insensitive VGCCs (grey). The statistical analysis of the global fitting outcome was performed by calculating the
95% confidence intervals (CI) of the best-fit values for P, N, and R. The CIs were
very narrow (see legend of Figure 3.8), indicating that the best-fit values were
estimated precisely. Because the 95% CIs for the RIM1a KO best-fit values for P, N,
and R, do not contain the values of the null hypothesis, the WT values for P, N, and
R, the subtype contribution of VGCCs mediating synaptic transmission between WT
and RIM1a KO mice was statistically significant with a P-value < 0.05 for all of the
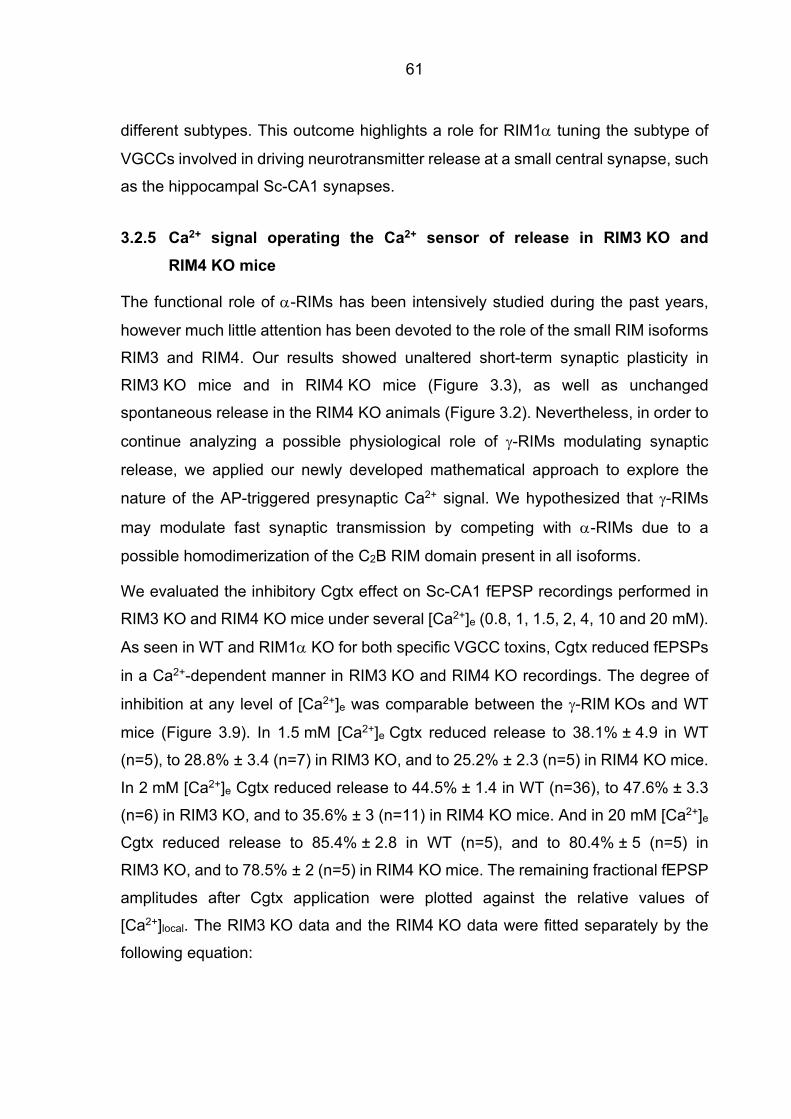
61
different subtypes. This outcome highlights a role for RIM1a tuning the subtype of
VGCCs involved in driving neurotransmitter release at a small central synapse, such
as the hippocampal Sc-CA1 synapses.
3.2.5 Ca2+ signal operating the Ca2+ sensor of release in RIM3 KO and RIM4 KO mice
The functional role of a-RIMs has been intensively studied during the past years,
however much little attention has been devoted to the role of the small RIM isoforms
RIM3 and RIM4. Our results showed unaltered short-term synaptic plasticity in
RIM3 KO mice and in RIM4 KO mice (Figure 3.3), as well as unchanged
spontaneous release in the RIM4 KO animals (Figure 3.2). Nevertheless, in order to
continue analyzing a possible physiological role of g-RIMs modulating synaptic
release, we applied our newly developed mathematical approach to explore the
nature of the AP-triggered presynaptic Ca2+ signal. We hypothesized that g-RIMs
may modulate fast synaptic transmission by competing with a-RIMs due to a
possible homodimerization of the C2B RIM domain present in all isoforms.
We evaluated the inhibitory Cgtx effect on Sc-CA1 fEPSP recordings performed in
RIM3 KO and RIM4 KO mice under several [Ca2+]e (0.8, 1, 1.5, 2, 4, 10 and 20 mM).
As seen in WT and RIM1a KO for both specific VGCC toxins, Cgtx reduced fEPSPs
in a Ca2+-dependent manner in RIM3 KO and RIM4 KO recordings. The degree of
inhibition at any level of [Ca2+]e was comparable between the g-RIM KOs and WT
mice (Figure 3.9). In 1.5 mM [Ca2+]e Cgtx reduced release to 38.1% ± 4.9 in WT
(n=5), to 28.8% ± 3.4 (n=7) in RIM3 KO, and to 25.2% ± 2.3 (n=5) in RIM4 KO mice.
In 2 mM [Ca2+]e Cgtx reduced release to 44.5% ± 1.4 in WT (n=36), to 47.6% ± 3.3
(n=6) in RIM3 KO, and to 35.6% ± 3 (n=11) in RIM4 KO mice. And in 20 mM [Ca2+]e
Cgtx reduced release to 85.4% ± 2.8 in WT (n=5), and to 80.4% ± 5 (n=5) in
RIM3 KO, and to 78.5% ± 2 (n=5) in RIM4 KO mice. The remaining fractional fEPSP
amplitudes after Cgtx application were plotted against the relative values of
[Ca2+]local. The RIM3 KO data and the RIM4 KO data were fitted separately by the
following equation:
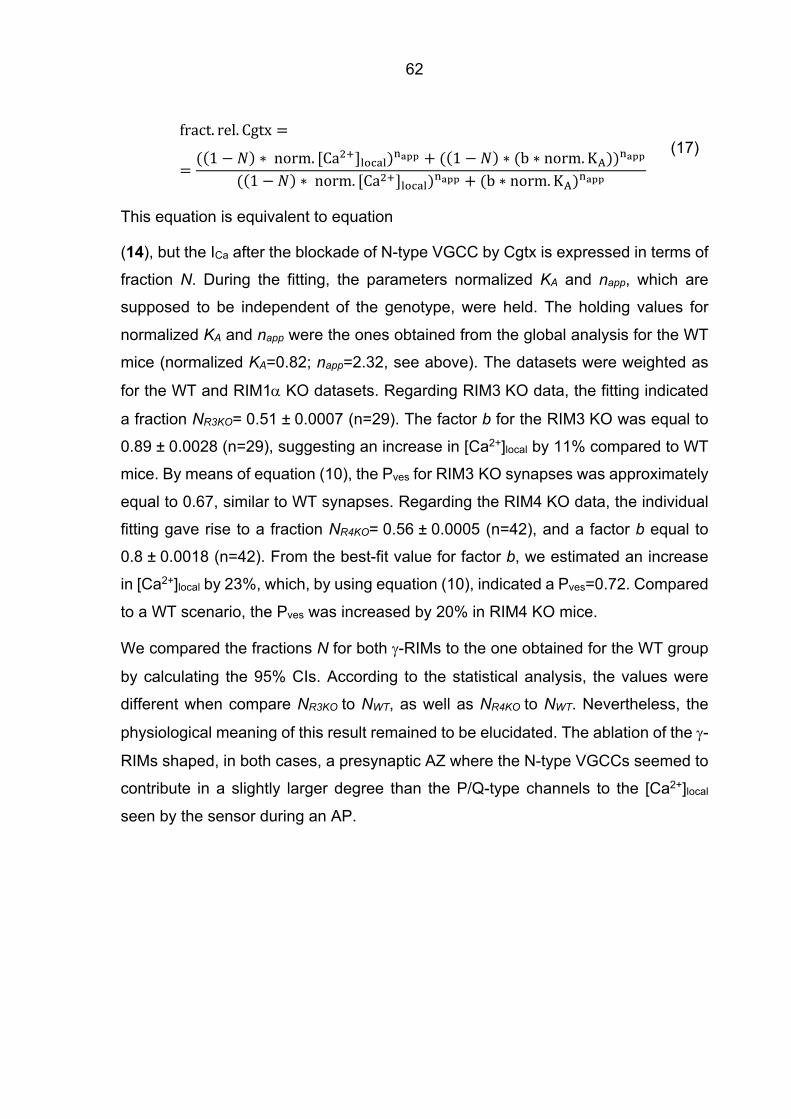
62
fract. rel. Cgtx =
=((1 − 𝑁) ∗ norm. [Ca45]NHMKN)0[\\ + ((1 − 𝑁) ∗ (b ∗ norm. KJ))0[\\
((1 − 𝑁) ∗ norm. [Ca45]NHMKN)0[\\ + (b ∗ norm. KJ)0[\\
(17)
This equation is equivalent to equation
(14), but the ICa after the blockade of N-type VGCC by Cgtx is expressed in terms of
fraction N. During the fitting, the parameters normalized KA and napp, which are
supposed to be independent of the genotype, were held. The holding values for
normalized KA and napp were the ones obtained from the global analysis for the WT
mice (normalized KA=0.82; napp=2.32, see above). The datasets were weighted as
for the WT and RIM1a KO datasets. Regarding RIM3 KO data, the fitting indicated
a fraction NR3KO= 0.51 ± 0.0007 (n=29). The factor b for the RIM3 KO was equal to
0.89 ± 0.0028 (n=29), suggesting an increase in [Ca2+]local by 11% compared to WT
mice. By means of equation (10), the Pves for RIM3 KO synapses was approximately
equal to 0.67, similar to WT synapses. Regarding the RIM4 KO data, the individual
fitting gave rise to a fraction NR4KO= 0.56 ± 0.0005 (n=42), and a factor b equal to
0.8 ± 0.0018 (n=42). From the best-fit value for factor b, we estimated an increase
in [Ca2+]local by 23%, which, by using equation (10), indicated a Pves=0.72. Compared
to a WT scenario, the Pves was increased by 20% in RIM4 KO mice.
We compared the fractions N for both g-RIMs to the one obtained for the WT group
by calculating the 95% CIs. According to the statistical analysis, the values were
different when compare NR3KO to NWT, as well as NR4KO to NWT. Nevertheless, the
physiological meaning of this result remained to be elucidated. The ablation of the g-
RIMs shaped, in both cases, a presynaptic AZ where the N-type VGCCs seemed to
contribute in a slightly larger degree than the P/Q-type channels to the [Ca2+]local
seen by the sensor during an AP.
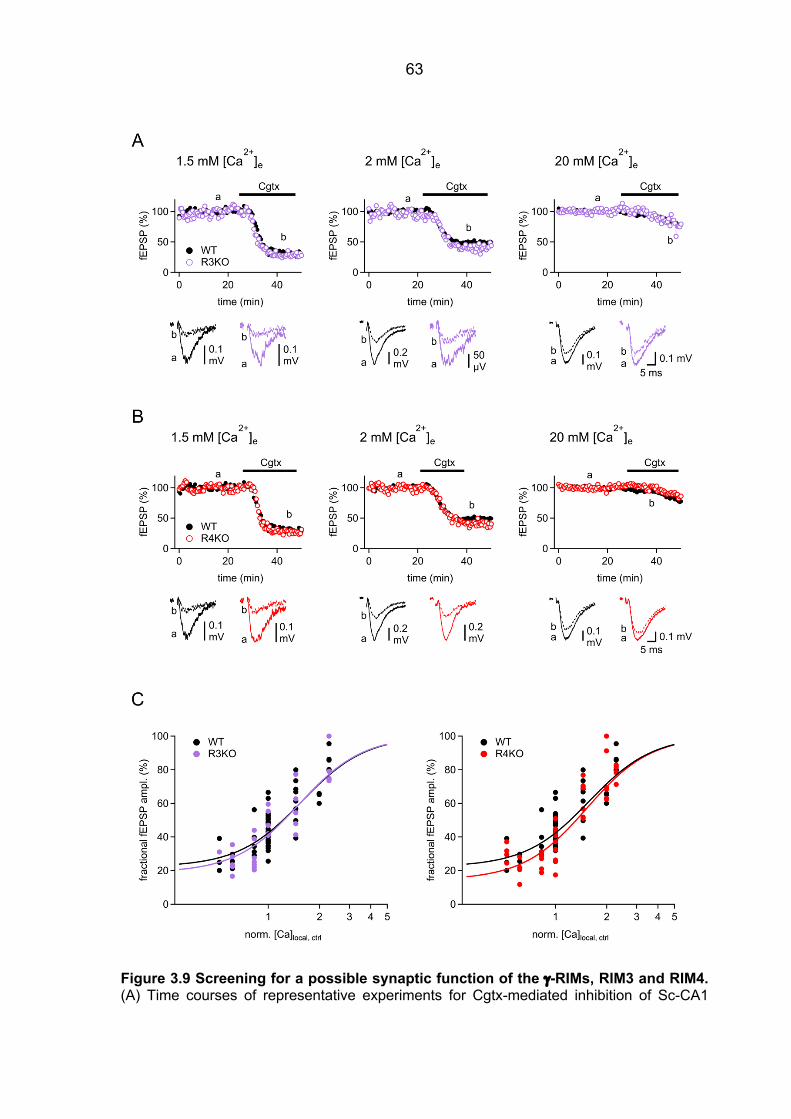
63
Figure 3.9 Screening for a possible synaptic function of the g-RIMs, RIM3 and RIM4. (A) Time courses of representative experiments for Cgtx-mediated inhibition of Sc-CA1
64
fEPSP recordings in WT (black, solid dots) and in RIM3 KO (purple, empty dots) mice, under several [Ca2+]e (1.5, 2, and 20 mM). Insets display fEPSP traces before (a, solid line) and after (b, dashed line) blocker application. (B) Representative experiments for WT (black, solid dots) and RIM4 KO (red, empty dots) mice depicted as RIM3 KO data. (C) Fractional release curves calculated from the fractional fEPSP amplitudes remaining after application of Cgtx. Data fitted not simultaneously by equation (14), WT data (black), RIM3 KO data (purple), and RIM4 KO data (red).
3.3 Slightly decelerated fast neurotransmitter release in RIM1α KO mice
The above data showed that in the absence of RIM1a, there was a strong shift in
the relative contribution of the different subtypes of VGCCs to the [Ca2+]local, together
with a slight reduction in the [Ca2+]local, which translated into a decreased Pves, and
an altered short-term synaptic plasticity. A decreased [Ca2+]local, which would impact
temporal release properties, could be reflected in the kinetics of release. We
focussed this kinetics analysis on RIM1a KO mice as they show a clearly altered
transmitter release. Our data and previous publications revealed decreased Pves,
decreased Pr, and enhanced PPF in the absence of RIM1a (Schoch et al., 2002)
We measured three different kinetic parameters of release: the synaptic delay, the
20-80% rise time, and the time constant of the decay phase. We analyzed the
kinetics of fEPSPs recorded in WT mice and RIM1a KO mice in several [Ca2+]e
(Figure 3.10). The kinetics parameters did not significantly differ.
We quantified the synaptic delay as the time from the peak of the fiber volley, which
indicates the occurrence of the presynaptic AP, to the 20% of the fEPSP amplitude.
The synaptic delay is shaped by the kinetics of the ICa and the kinetics of the Ca2+
binding to the release machinery as well as the vesicular fusion process and the
opening of postsynaptic glutamate receptors. RIM1a KO mice displayed a slightly,
although not significant, larger delay in the latency of the Ca2+-induced release,
which, as in WT mice, decreased by elevating the [Ca2+]e. Second, we assessed the
kinetics of the fEPSPs: the 20-80% rise time, and the tau of the decay phase,
obtained by a single exponential fitting. The rise time tended to be larger in
RIM1a KO mice, suggesting a slightly decelerated release. This difference between
genotypes was overcome by increasing ICa. The tau of the decay seemed to be
constant among the different [Ca2+]e in RIM1a KO mice suggesting that the release
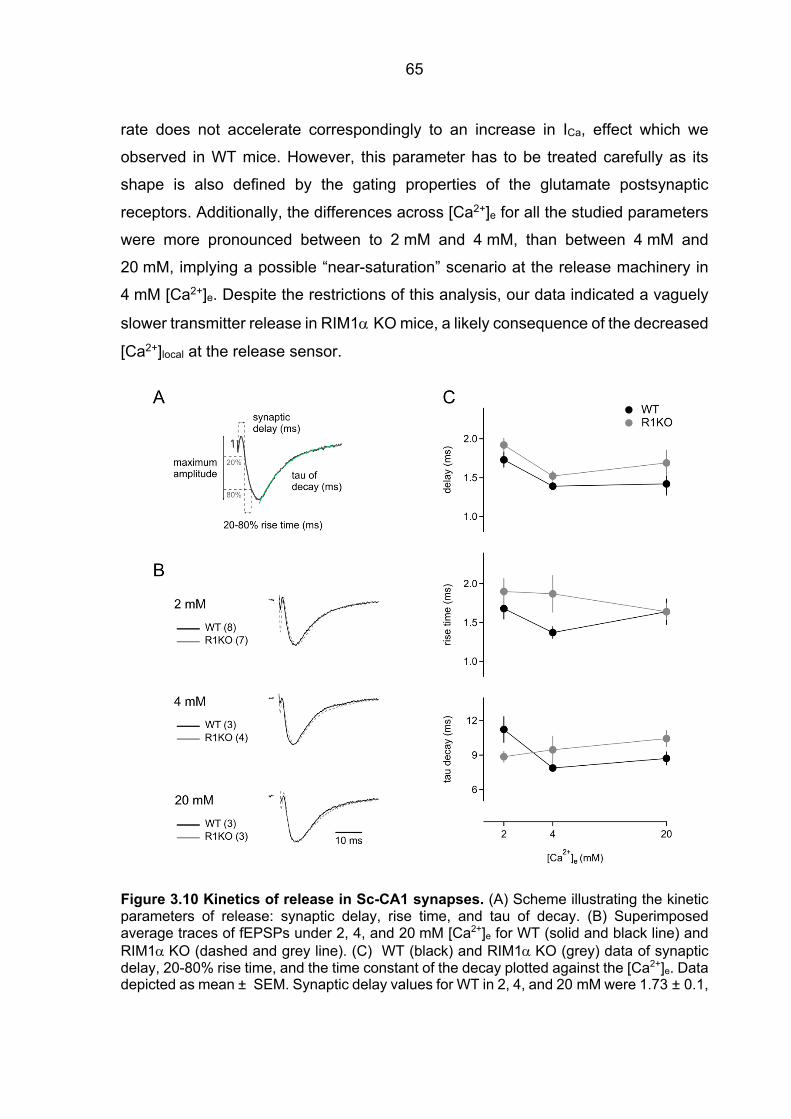
65
rate does not accelerate correspondingly to an increase in ICa, effect which we
observed in WT mice. However, this parameter has to be treated carefully as its
shape is also defined by the gating properties of the glutamate postsynaptic
receptors. Additionally, the differences across [Ca2+]e for all the studied parameters
were more pronounced between to 2 mM and 4 mM, than between 4 mM and
20 mM, implying a possible “near-saturation” scenario at the release machinery in
4 mM [Ca2+]e. Despite the restrictions of this analysis, our data indicated a vaguely
slower transmitter release in RIM1a KO mice, a likely consequence of the decreased
[Ca2+]local at the release sensor.
Figure 3.10 Kinetics of release in Sc-CA1 synapses. (A) Scheme illustrating the kinetic parameters of release: synaptic delay, rise time, and tau of decay. (B) Superimposed average traces of fEPSPs under 2, 4, and 20 mM [Ca2+]e for WT (solid and black line) and RIM1a KO (dashed and grey line). (C) WT (black) and RIM1a KO (grey) data of synaptic delay, 20-80% rise time, and the time constant of the decay plotted against the [Ca2+]e. Data depicted as mean ± SEM. Synaptic delay values for WT in 2, 4, and 20 mM were 1.73 ± 0.1,
66
1.39 ± 0.05, and 1.42 ± 0.15, respectively; and for RIM1a KO 1.92 ± 0.09, 1.52 ± 0.07, and 1.69 ± 0.17. Rise time values for WT in 2, 4, and 20 mM were 1.68 ± 0.14, 1.37 ± 0.08, and 1.64 ± 0.17, respectively; and for RIM1a KO 1.9 ± 0.17, 1.87 ± 0.24, and 1.64 ± 0.11. Tau of decay values for WT in 2, 4, and 20 mM were 11.2 ± 1.14, 7.8 ± 0.08, and 8.7 ± 0.6, respectively; and for RIM1a KO 8.86 ± 0.5, 9.46 ± 1.22, and 10.43 ± 0.72. Statistical significance for every kinetics parameter was tested within each [Ca2+]e by Student’s t-test, P-values > 0.05.
3.4 Unaltered distance between Ca2+ source and Ca2+ sensor in RIM1a KO mice
The [Ca2+]local built up close to the RRP in response to an AP is a function of the
distance between VGCCs and SVs. An altered coupling distance between the Ca2+
source and the Ca2+ sensor, could also explain the decreased in the [Ca2+]local
observed in RIM1a KO mice.
To test for a decreased coupling distance between VGCCs and SVs, we measured
the reduction of transmitter release by the slow Ca2+ buffer, EGTA-AM. EGTA at
presynaptic terminals reduces transmitter release by capturing Ca2+ ions originated
from remote VGCCs. We measured fEPSPs at the Sc-CA1 synapses in WT and
RIM1a KO mice and measured the inhibition by the slow Ca2+ chelator. In both
genotypes, the EGTA-dependent Ca2+ chelation reduced transmitter release
significantly, but little, indicating a tight coupling between VGCCs and SVs at the
presynaptic AZs of the CA3 pyramidal cells. At WT synapses, EGTA-AM reduced
fEPSPs by 23% ± 3.42 (n=6), and at RIM1a KO synapses to a similar degree, by
17% ± 1.18 (n=6) (Figure 3.11).
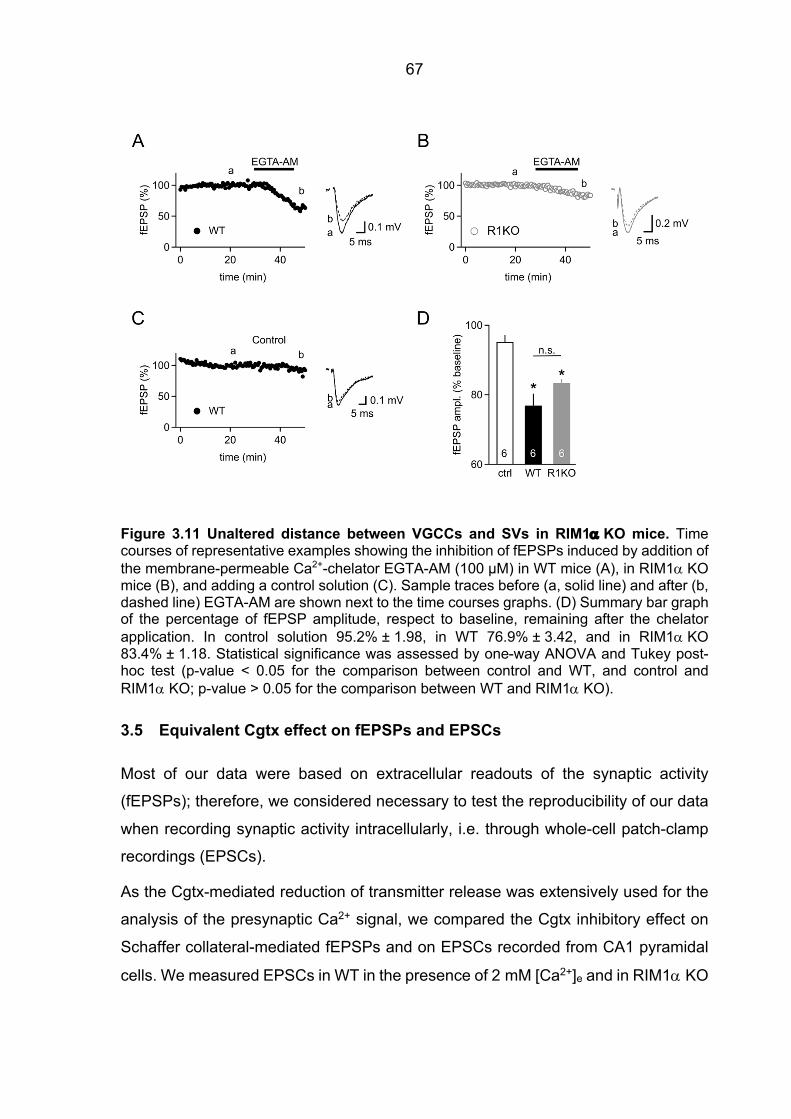
67
Figure 3.11 Unaltered distance between VGCCs and SVs in RIM1a KO mice. Time courses of representative examples showing the inhibition of fEPSPs induced by addition of the membrane-permeable Ca2+-chelator EGTA-AM (100 µM) in WT mice (A), in RIM1a KO mice (B), and adding a control solution (C). Sample traces before (a, solid line) and after (b, dashed line) EGTA-AM are shown next to the time courses graphs. (D) Summary bar graph of the percentage of fEPSP amplitude, respect to baseline, remaining after the chelator application. In control solution 95.2% ± 1.98, in WT 76.9% ± 3.42, and in RIM1a KO 83.4% ± 1.18. Statistical significance was assessed by one-way ANOVA and Tukey post-hoc test (p-value < 0.05 for the comparison between control and WT, and control and RIM1a KO; p-value > 0.05 for the comparison between WT and RIM1a KO).
3.5 Equivalent Cgtx effect on fEPSPs and EPSCs
Most of our data were based on extracellular readouts of the synaptic activity
(fEPSPs); therefore, we considered necessary to test the reproducibility of our data
when recording synaptic activity intracellularly, i.e. through whole-cell patch-clamp
recordings (EPSCs).
As the Cgtx-mediated reduction of transmitter release was extensively used for the
analysis of the presynaptic Ca2+ signal, we compared the Cgtx inhibitory effect on
Schaffer collateral-mediated fEPSPs and on EPSCs recorded from CA1 pyramidal
cells. We measured EPSCs in WT in the presence of 2 mM [Ca2+]e and in RIM1a KO
68
mice in 1 mM [Ca2+]e and compared them to our previous estimates of Cgtx inhibition
of fEPSPs. The reduction of synaptic transmission by Cgtx was equivalent between
field potential and single cell recordings in both genotypes. In WT mice, 1 µM of Cgtx
reduced fEPSPs amplitude to 44.5% ± 1.39 (n=36), and EPSCs amplitude to
42.1% ± 4.06 (n=4). In RIM1a KO, generally less sensitive to the specific N-type
VGCC, Cgtx reduced synaptic activity measured extracellularly to 50.4% ± 4.07
(n=6), and to 62.6% ± 3.38 (n=5), when it was measured from a single cell. We
quantified the degree of inhibition from average EPSC traces before and after drug
application; in the case of RIM1a KO EPSCs, both average traces, prior to and after
toxin, were a mixed population of successful EPSCs and failures, due to the reduced
synaptic transmitter output inherent to RIM1a KO phenotype and emphasized by the
low [Ca2+]e (i.e. 1 mM). We illustrated the effect of Cgtx on RIM1a KO EPSCs (Figure
3.12 D) by showing the increase in the number of failures upon Cgtx application.
These results strongly support the validity of our extracellular recordings data, which
give us the advantage of recording large numbers of neurons simultaneously, to infer
knowledge about individual neuron synaptic transmission mechanisms.
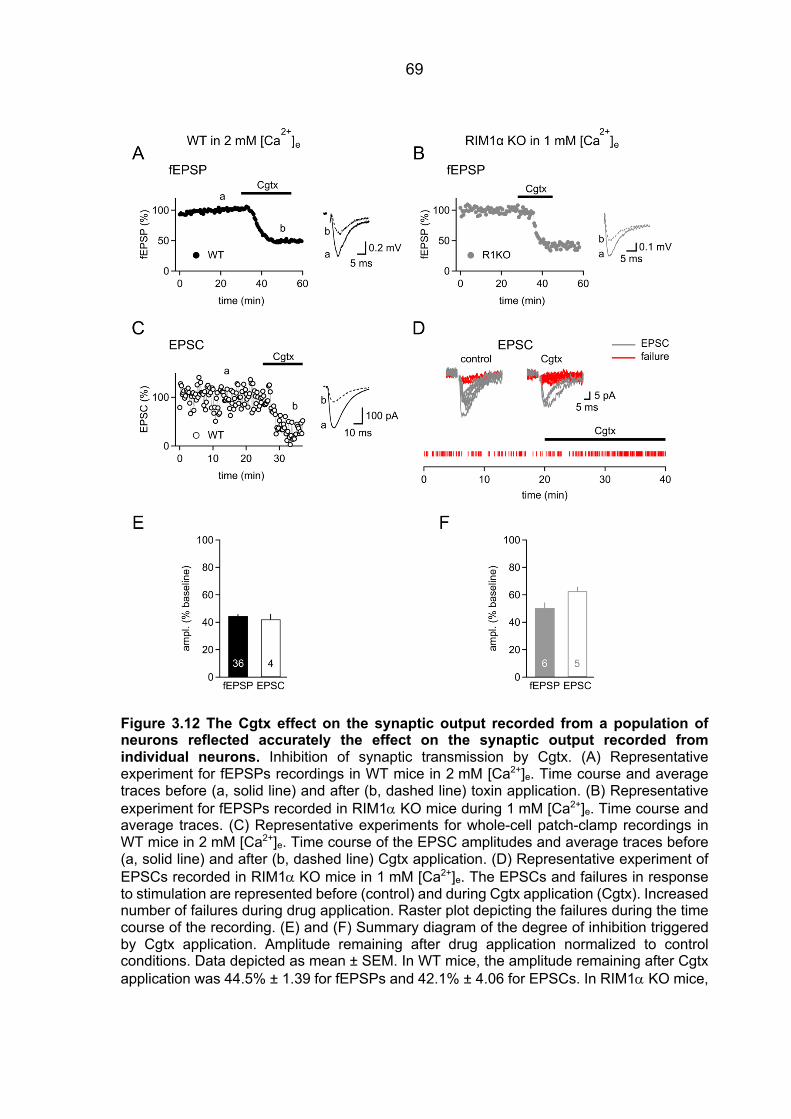
69
Figure 3.12 The Cgtx effect on the synaptic output recorded from a population of neurons reflected accurately the effect on the synaptic output recorded from individual neurons. Inhibition of synaptic transmission by Cgtx. (A) Representative experiment for fEPSPs recordings in WT mice in 2 mM [Ca2+]e. Time course and average traces before (a, solid line) and after (b, dashed line) toxin application. (B) Representative experiment for fEPSPs recorded in RIM1a KO mice during 1 mM [Ca2+]e. Time course and average traces. (C) Representative experiments for whole-cell patch-clamp recordings in WT mice in 2 mM [Ca2+]e. Time course of the EPSC amplitudes and average traces before (a, solid line) and after (b, dashed line) Cgtx application. (D) Representative experiment of EPSCs recorded in RIM1a KO mice in 1 mM [Ca2+]e. The EPSCs and failures in response to stimulation are represented before (control) and during Cgtx application (Cgtx). Increased number of failures during drug application. Raster plot depicting the failures during the time course of the recording. (E) and (F) Summary diagram of the degree of inhibition triggered by Cgtx application. Amplitude remaining after drug application normalized to control conditions. Data depicted as mean ± SEM. In WT mice, the amplitude remaining after Cgtx application was 44.5% ± 1.39 for fEPSPs and 42.1% ± 4.06 for EPSCs. In RIM1a KO mice,
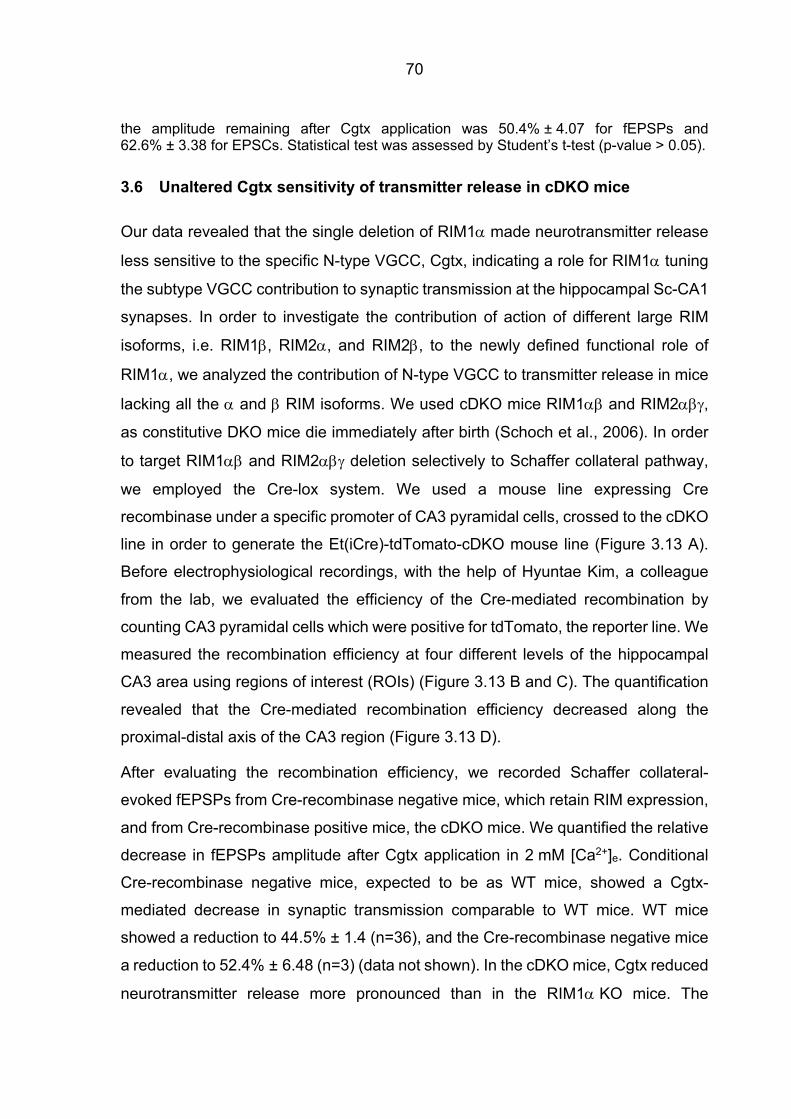
70
the amplitude remaining after Cgtx application was 50.4% ± 4.07 for fEPSPs and 62.6% ± 3.38 for EPSCs. Statistical test was assessed by Student’s t-test (p-value > 0.05).
3.6 Unaltered Cgtx sensitivity of transmitter release in cDKO mice
Our data revealed that the single deletion of RIM1a made neurotransmitter release
less sensitive to the specific N-type VGCC, Cgtx, indicating a role for RIM1a tuning
the subtype VGCC contribution to synaptic transmission at the hippocampal Sc-CA1
synapses. In order to investigate the contribution of action of different large RIM
isoforms, i.e. RIM1b, RIM2a, and RIM2b, to the newly defined functional role of
RIM1a, we analyzed the contribution of N-type VGCC to transmitter release in mice
lacking all the a and b RIM isoforms. We used cDKO mice RIM1ab and RIM2abg,
as constitutive DKO mice die immediately after birth (Schoch et al., 2006). In order
to target RIM1ab and RIM2abg deletion selectively to Schaffer collateral pathway,
we employed the Cre-lox system. We used a mouse line expressing Cre
recombinase under a specific promoter of CA3 pyramidal cells, crossed to the cDKO
line in order to generate the Et(iCre)-tdTomato-cDKO mouse line (Figure 3.13 A).
Before electrophysiological recordings, with the help of Hyuntae Kim, a colleague
from the lab, we evaluated the efficiency of the Cre-mediated recombination by
counting CA3 pyramidal cells which were positive for tdTomato, the reporter line. We
measured the recombination efficiency at four different levels of the hippocampal
CA3 area using regions of interest (ROIs) (Figure 3.13 B and C). The quantification
revealed that the Cre-mediated recombination efficiency decreased along the
proximal-distal axis of the CA3 region (Figure 3.13 D).
After evaluating the recombination efficiency, we recorded Schaffer collateral-
evoked fEPSPs from Cre-recombinase negative mice, which retain RIM expression,
and from Cre-recombinase positive mice, the cDKO mice. We quantified the relative
decrease in fEPSPs amplitude after Cgtx application in 2 mM [Ca2+]e. Conditional
Cre-recombinase negative mice, expected to be as WT mice, showed a Cgtx-
mediated decrease in synaptic transmission comparable to WT mice. WT mice
showed a reduction to 44.5% ± 1.4 (n=36), and the Cre-recombinase negative mice
a reduction to 52.4% ± 6.48 (n=3) (data not shown). In the cDKO mice, Cgtx reduced
neurotransmitter release more pronounced than in the RIM1a KO mice. The
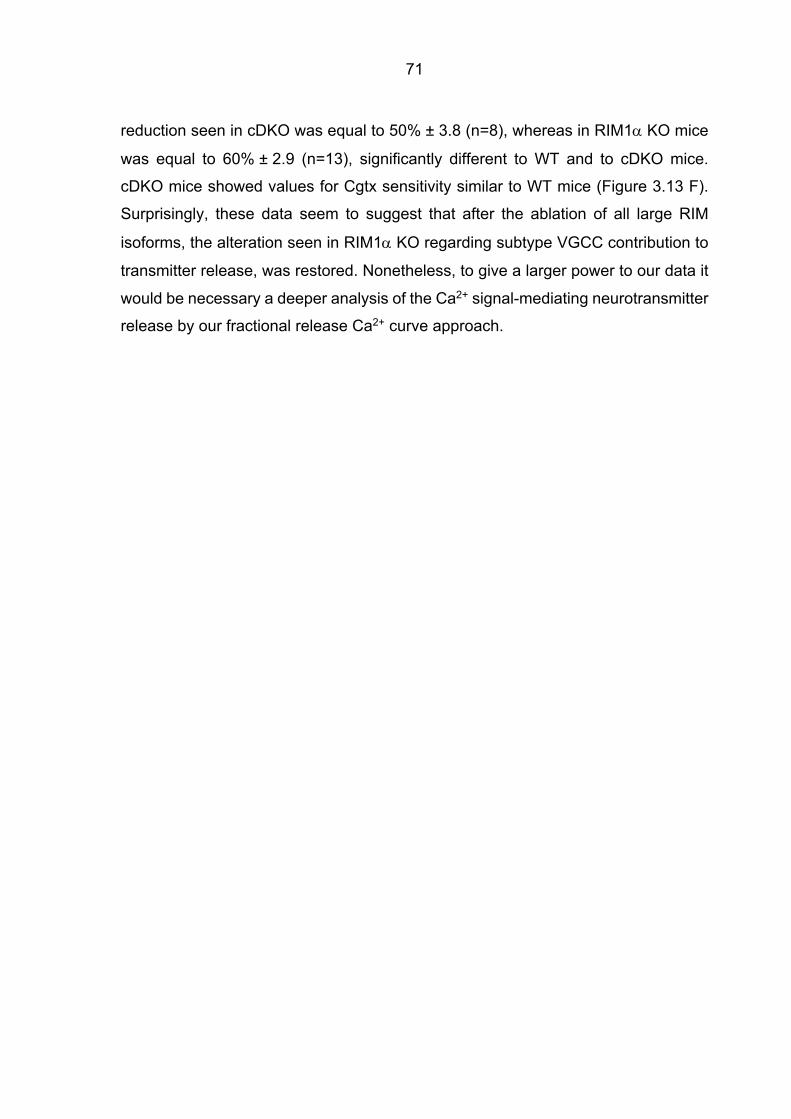
71
reduction seen in cDKO was equal to 50% ± 3.8 (n=8), whereas in RIM1a KO mice
was equal to 60% ± 2.9 (n=13), significantly different to WT and to cDKO mice.
cDKO mice showed values for Cgtx sensitivity similar to WT mice (Figure 3.13 F).
Surprisingly, these data seem to suggest that after the ablation of all large RIM
isoforms, the alteration seen in RIM1a KO regarding subtype VGCC contribution to
transmitter release, was restored. Nonetheless, to give a larger power to our data it
would be necessary a deeper analysis of the Ca2+ signal-mediating neurotransmitter
release by our fractional release Ca2+ curve approach.
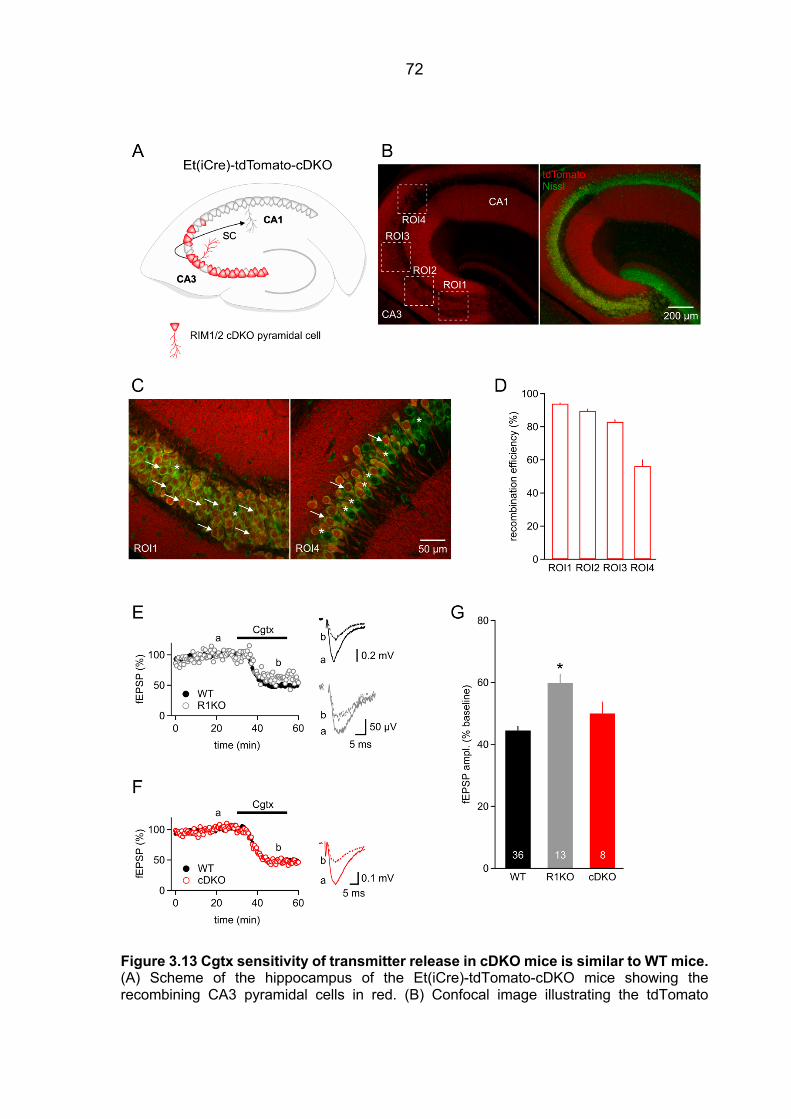
72
Figure 3.13 Cgtx sensitivity of transmitter release in cDKO mice is similar to WT mice. (A) Scheme of the hippocampus of the Et(iCre)-tdTomato-cDKO mice showing the recombining CA3 pyramidal cells in red. (B) Confocal image illustrating the tdTomato
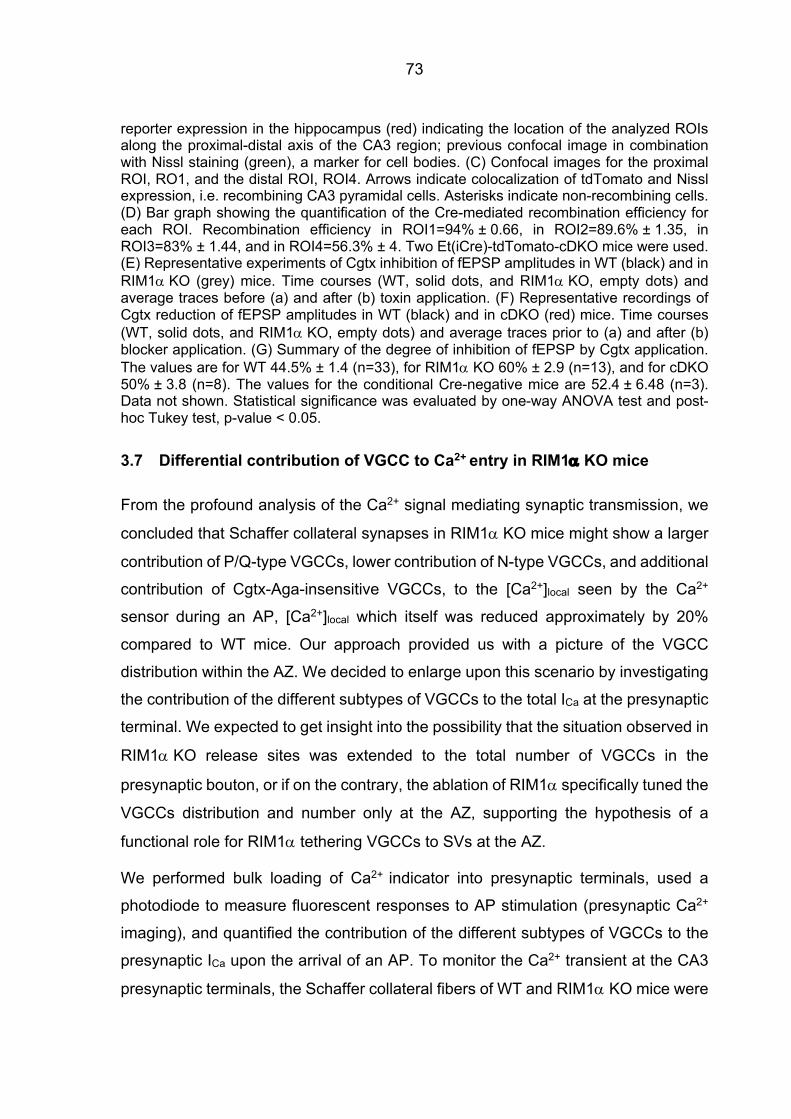
73
reporter expression in the hippocampus (red) indicating the location of the analyzed ROIs along the proximal-distal axis of the CA3 region; previous confocal image in combination with Nissl staining (green), a marker for cell bodies. (C) Confocal images for the proximal ROI, RO1, and the distal ROI, ROI4. Arrows indicate colocalization of tdTomato and Nissl expression, i.e. recombining CA3 pyramidal cells. Asterisks indicate non-recombining cells. (D) Bar graph showing the quantification of the Cre-mediated recombination efficiency for each ROI. Recombination efficiency in ROI1=94% ± 0.66, in ROI2=89.6% ± 1.35, in ROI3=83% ± 1.44, and in ROI4=56.3% ± 4. Two Et(iCre)-tdTomato-cDKO mice were used. (E) Representative experiments of Cgtx inhibition of fEPSP amplitudes in WT (black) and in RIM1a KO (grey) mice. Time courses (WT, solid dots, and RIM1a KO, empty dots) and average traces before (a) and after (b) toxin application. (F) Representative recordings of Cgtx reduction of fEPSP amplitudes in WT (black) and in cDKO (red) mice. Time courses (WT, solid dots, and RIM1a KO, empty dots) and average traces prior to (a) and after (b) blocker application. (G) Summary of the degree of inhibition of fEPSP by Cgtx application. The values are for WT 44.5% ± 1.4 (n=33), for RIM1a KO 60% ± 2.9 (n=13), and for cDKO 50% ± 3.8 (n=8). The values for the conditional Cre-negative mice are 52.4 ± 6.48 (n=3). Data not shown. Statistical significance was evaluated by one-way ANOVA test and post-hoc Tukey test, p-value < 0.05.
3.7 Differential contribution of VGCC to Ca2+ entry in RIM1a KO mice
From the profound analysis of the Ca2+ signal mediating synaptic transmission, we
concluded that Schaffer collateral synapses in RIM1a KO mice might show a larger
contribution of P/Q-type VGCCs, lower contribution of N-type VGCCs, and additional
contribution of Cgtx-Aga-insensitive VGCCs, to the [Ca2+]local seen by the Ca2+
sensor during an AP, [Ca2+]local which itself was reduced approximately by 20%
compared to WT mice. Our approach provided us with a picture of the VGCC
distribution within the AZ. We decided to enlarge upon this scenario by investigating
the contribution of the different subtypes of VGCCs to the total ICa at the presynaptic
terminal. We expected to get insight into the possibility that the situation observed in
RIM1a KO release sites was extended to the total number of VGCCs in the
presynaptic bouton, or if on the contrary, the ablation of RIM1a specifically tuned the
VGCCs distribution and number only at the AZ, supporting the hypothesis of a
functional role for RIM1a tethering VGCCs to SVs at the AZ.
We performed bulk loading of Ca2+ indicator into presynaptic terminals, used a
photodiode to measure fluorescent responses to AP stimulation (presynaptic Ca2+
imaging), and quantified the contribution of the different subtypes of VGCCs to the
presynaptic ICa upon the arrival of an AP. To monitor the Ca2+ transient at the CA3
presynaptic terminals, the Schaffer collateral fibers of WT and RIM1a KO mice were
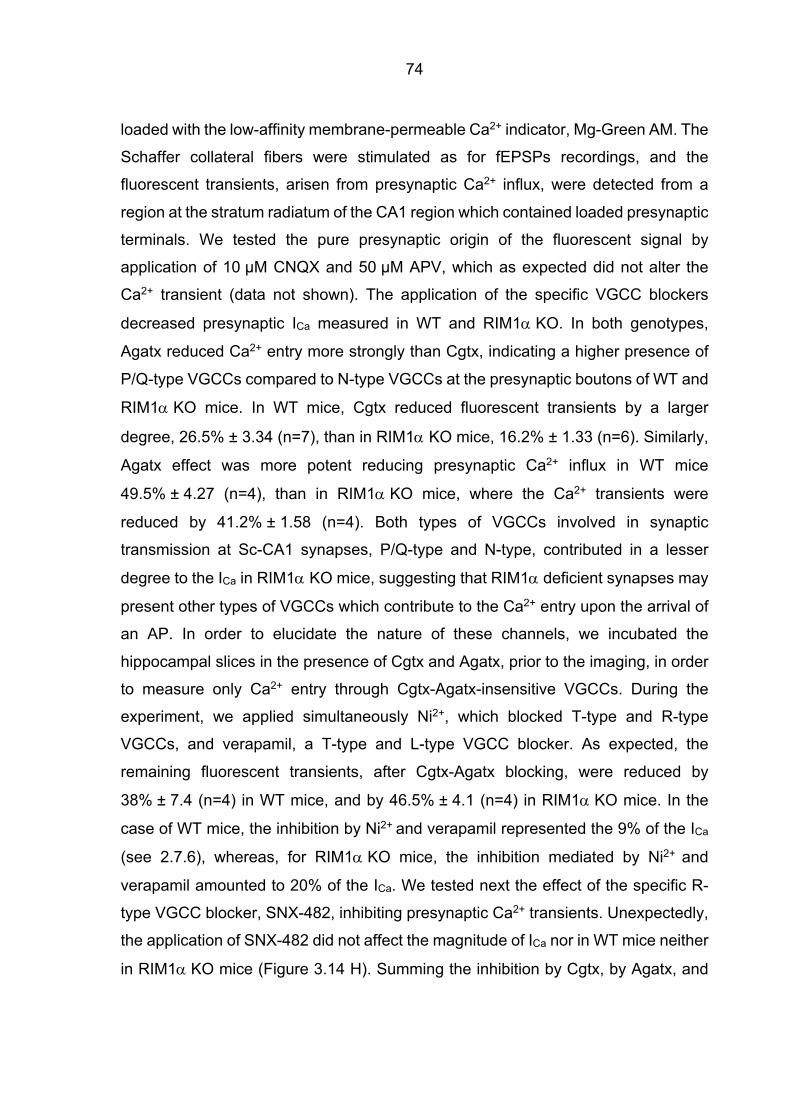
74
loaded with the low-affinity membrane-permeable Ca2+ indicator, Mg-Green AM. The
Schaffer collateral fibers were stimulated as for fEPSPs recordings, and the
fluorescent transients, arisen from presynaptic Ca2+ influx, were detected from a
region at the stratum radiatum of the CA1 region which contained loaded presynaptic
terminals. We tested the pure presynaptic origin of the fluorescent signal by
application of 10 µM CNQX and 50 µM APV, which as expected did not alter the
Ca2+ transient (data not shown). The application of the specific VGCC blockers
decreased presynaptic ICa measured in WT and RIM1a KO. In both genotypes,
Agatx reduced Ca2+ entry more strongly than Cgtx, indicating a higher presence of
P/Q-type VGCCs compared to N-type VGCCs at the presynaptic boutons of WT and
RIM1a KO mice. In WT mice, Cgtx reduced fluorescent transients by a larger
degree, 26.5% ± 3.34 (n=7), than in RIM1a KO mice, 16.2% ± 1.33 (n=6). Similarly,
Agatx effect was more potent reducing presynaptic Ca2+ influx in WT mice
49.5% ± 4.27 (n=4), than in RIM1a KO mice, where the Ca2+ transients were
reduced by 41.2% ± 1.58 (n=4). Both types of VGCCs involved in synaptic
transmission at Sc-CA1 synapses, P/Q-type and N-type, contributed in a lesser
degree to the ICa in RIM1a KO mice, suggesting that RIM1a deficient synapses may
present other types of VGCCs which contribute to the Ca2+ entry upon the arrival of
an AP. In order to elucidate the nature of these channels, we incubated the
hippocampal slices in the presence of Cgtx and Agatx, prior to the imaging, in order
to measure only Ca2+ entry through Cgtx-Agatx-insensitive VGCCs. During the
experiment, we applied simultaneously Ni2+, which blocked T-type and R-type
VGCCs, and verapamil, a T-type and L-type VGCC blocker. As expected, the
remaining fluorescent transients, after Cgtx-Agatx blocking, were reduced by
38% ± 7.4 (n=4) in WT mice, and by 46.5% ± 4.1 (n=4) in RIM1a KO mice. In the
case of WT mice, the inhibition by Ni2+ and verapamil represented the 9% of the ICa
(see 2.7.6), whereas, for RIM1a KO mice, the inhibition mediated by Ni2+ and
verapamil amounted to 20% of the ICa. We tested next the effect of the specific R-
type VGCC blocker, SNX-482, inhibiting presynaptic Ca2+ transients. Unexpectedly,
the application of SNX-482 did not affect the magnitude of ICa nor in WT mice neither
in RIM1a KO mice (Figure 3.14 H). Summing the inhibition by Cgtx, by Agatx, and
75
by Ni2+ and verapamil, arithmetically a small proportion of Ca2+ signal remained still
unblocked, 15% in WT and 23% in RIM1a KO mice. When we applied
simultaneously all the VGCC blockers, Ca2+ transients measured in WT mice were
nearly abolished (Figure 3.14 I). Our Ca2+ imaging data revealed significant
alterations in the Cgtx-sensitive fractions and in the Ni2+/verapamil-sensitive
fractions between WT and RIM1a KO mice. Compelling, this data pointed out a
scenario wherein the absence of RIM1a less Ca2+ entry occurred through P/Q-type
and N-type VGCCs, and more through, possibly, T-type or L-type VGCCs. The shift
towards a neurotransmitter release mediated in a larger degree by P/Q-type VGCCs
observed RIM1a KO mice was not due to a higher presence of these subtype of
channels at the presynaptic terminal.
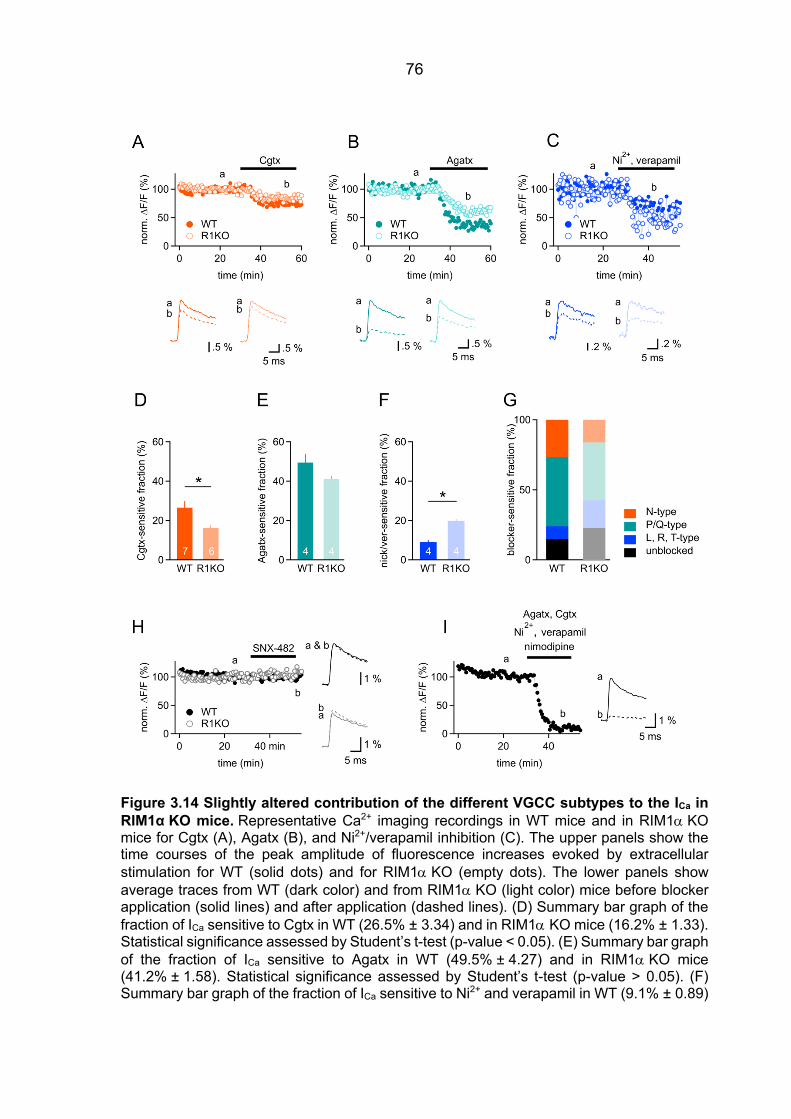
76
Figure 3.14 Slightly altered contribution of the different VGCC subtypes to the ICa in RIM1α KO mice. Representative Ca2+ imaging recordings in WT mice and in RIM1a KO mice for Cgtx (A), Agatx (B), and Ni2+/verapamil inhibition (C). The upper panels show the time courses of the peak amplitude of fluorescence increases evoked by extracellular stimulation for WT (solid dots) and for RIM1a KO (empty dots). The lower panels show average traces from WT (dark color) and from RIM1a KO (light color) mice before blocker application (solid lines) and after application (dashed lines). (D) Summary bar graph of the fraction of ICa sensitive to Cgtx in WT (26.5% ± 3.34) and in RIM1a KO mice (16.2% ± 1.33). Statistical significance assessed by Student’s t-test (p-value < 0.05). (E) Summary bar graph of the fraction of ICa sensitive to Agatx in WT (49.5% ± 4.27) and in RIM1a KO mice (41.2% ± 1.58). Statistical significance assessed by Student’s t-test (p-value > 0.05). (F) Summary bar graph of the fraction of ICa sensitive to Ni2+ and verapamil in WT (9.1% ± 0.89)
77
and in RIM1a KO mice (19.8% ± 0.87). Statistical significance assessed by Student’s t-test (p-value < 0.05). (G) Summary bar graph depicting the subtype contribution of VGCCs to the ICa. Unblocked Ca2+ signal in WT 15%, and in RIM1a KO mice 23%. (H) Representative example of SNX-482 presynaptic Ca2+ transients’ inhibition. Time courses for WT (solid dots) and for RIM1a KO (empty dots), and average traces from WT (black) and from RIM1a KO (grey) before (solid line) and after (dashed line) application of the specific R-type VGCC blocker. Three experiments were performed in WT mice with an average remaining Ca2+ signal equal to 104.6% ± 2.8, and one experiment in RIM1a KO mice with 108.7% remaining signal. (I) Ca2+ signal inhibition by simultaneous application of Cgtx, Agatx, Ni2+, verapamil, and nimodipine, a specific L-type VGCC blocker. Time course and average traces before (solid line) and after (dashed line) cocktail blocker application for a representative experiment performed in WT mice.
3.8 Assessing release properties in cultured cells expressing RIM-GFP fusion protein
Our laboratory, in collaboration with Prof. Schoch’s lab, aims to elucidate the role of
the RIM protein family regulating neurotransmitter release from different
perspectives. To do so, we take advantage of distinct experimental models
depending on the specific research question. For instance, the experiments
presented in this dissertation were performed in acute hippocampal slices, however,
sometimes it is more suitable to use other types of model systems, such as cell
cultures. In a shared project, we assessed the release properties of transduced
hippocampal cell cultures in order to evaluate the impact of a GFP-labeled Cre-
recombinase lentivirus on transmitter release.
The following part of the results is less complete and partly contains data being to
some degree still preliminary. This subsection exemplifies and documents the
establishment of techniques in the lab. In order to evaluate transmitter release in
RIM1/2 cDKO cultured hippocampal neurons transduced with RIM1a-GFP fusion
protein, we performed electrophysiological recordings in primary hippocampal
neuronal cultures transduced with lentiviruses expressing a non-active Cre-
recombinase, an active Cre-recombinase, or a GFP-tagged active Cre-recombinase.
We attempted to evaluated neurotransmitter release properties by means of two
different procedures. On one hand, estimation of Pr by the progressive block of
NMDA synaptic currents; and, on the other hand, assessment of the time course of
the release rate by the deconvolution of IPSCs.
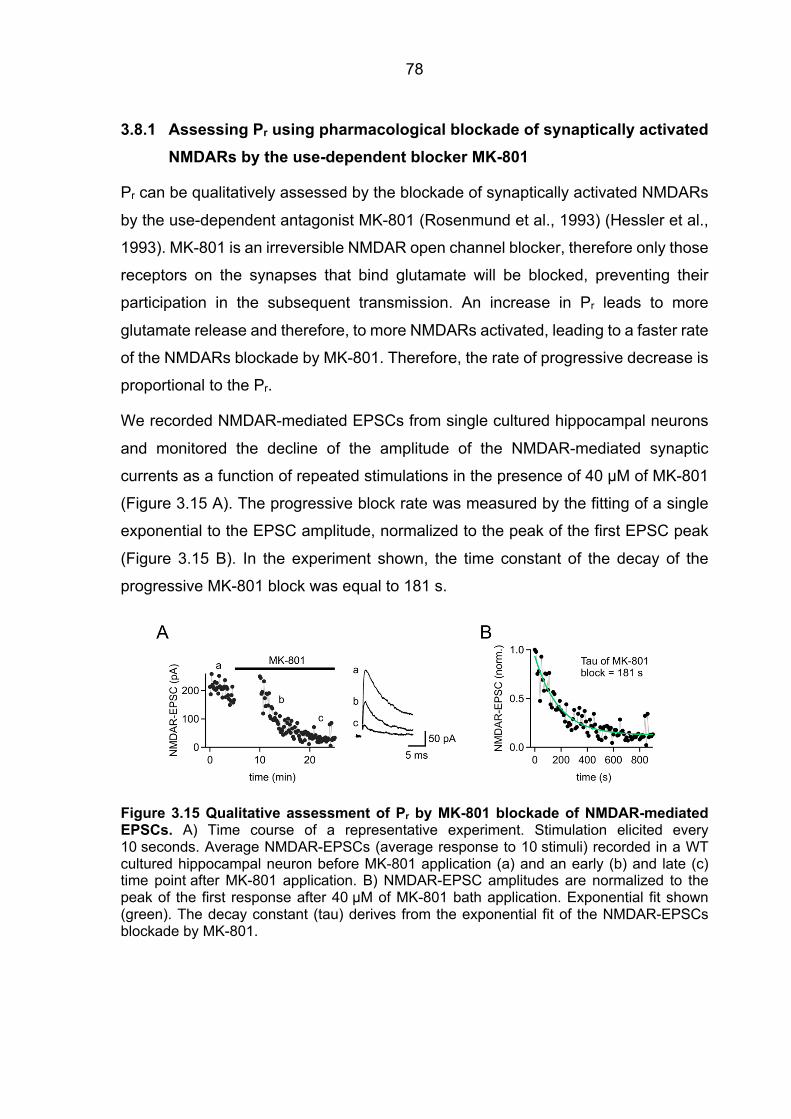
78
3.8.1 Assessing Pr using pharmacological blockade of synaptically activated NMDARs by the use-dependent blocker MK-801
Pr can be qualitatively assessed by the blockade of synaptically activated NMDARs
by the use-dependent antagonist MK-801 (Rosenmund et al., 1993) (Hessler et al.,
1993). MK-801 is an irreversible NMDAR open channel blocker, therefore only those
receptors on the synapses that bind glutamate will be blocked, preventing their
participation in the subsequent transmission. An increase in Pr leads to more
glutamate release and therefore, to more NMDARs activated, leading to a faster rate
of the NMDARs blockade by MK-801. Therefore, the rate of progressive decrease is
proportional to the Pr.
We recorded NMDAR-mediated EPSCs from single cultured hippocampal neurons
and monitored the decline of the amplitude of the NMDAR-mediated synaptic
currents as a function of repeated stimulations in the presence of 40 µM of MK-801
(Figure 3.15 A). The progressive block rate was measured by the fitting of a single
exponential to the EPSC amplitude, normalized to the peak of the first EPSC peak
(Figure 3.15 B). In the experiment shown, the time constant of the decay of the
progressive MK-801 block was equal to 181 s.
Figure 3.15 Qualitative assessment of Pr by MK-801 blockade of NMDAR-mediated EPSCs. A) Time course of a representative experiment. Stimulation elicited every 10 seconds. Average NMDAR-EPSCs (average response to 10 stimuli) recorded in a WT cultured hippocampal neuron before MK-801 application (a) and an early (b) and late (c) time point after MK-801 application. B) NMDAR-EPSC amplitudes are normalized to the peak of the first response after 40 µM of MK-801 bath application. Exponential fit shown (green). The decay constant (tau) derives from the exponential fit of the NMDAR-EPSCs blockade by MK-801.
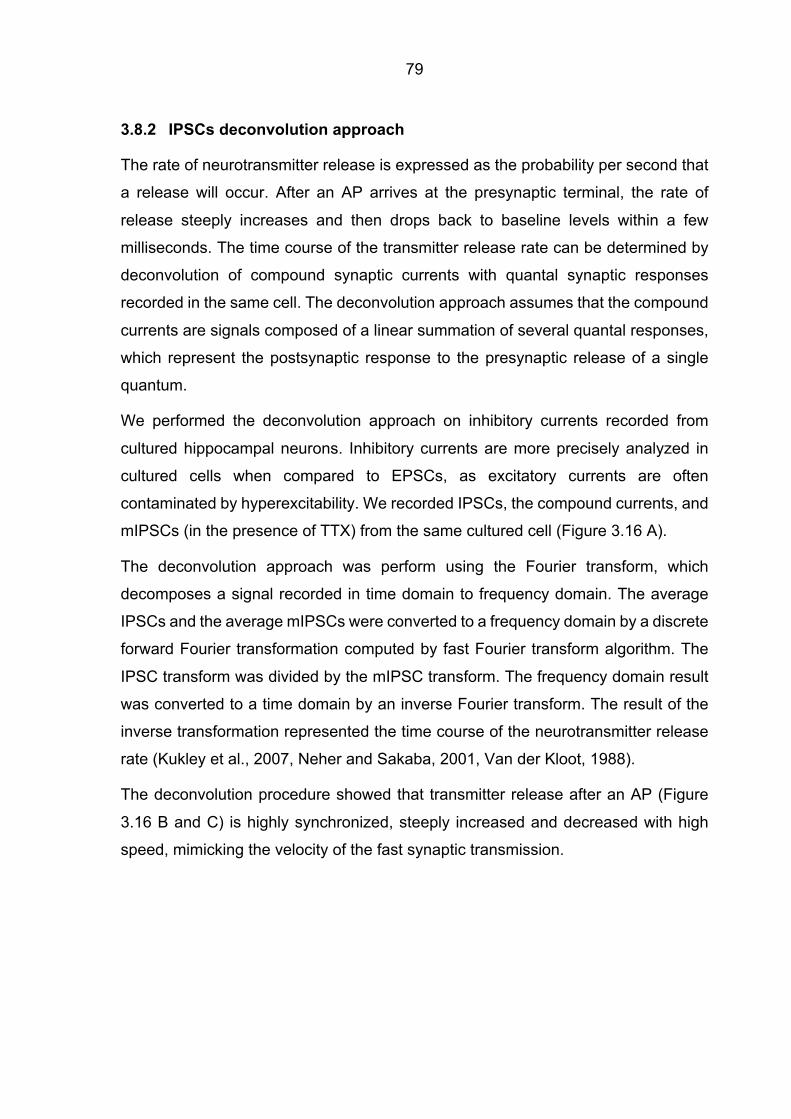
79
3.8.2 IPSCs deconvolution approach
The rate of neurotransmitter release is expressed as the probability per second that
a release will occur. After an AP arrives at the presynaptic terminal, the rate of
release steeply increases and then drops back to baseline levels within a few
milliseconds. The time course of the transmitter release rate can be determined by
deconvolution of compound synaptic currents with quantal synaptic responses
recorded in the same cell. The deconvolution approach assumes that the compound
currents are signals composed of a linear summation of several quantal responses,
which represent the postsynaptic response to the presynaptic release of a single
quantum.
We performed the deconvolution approach on inhibitory currents recorded from
cultured hippocampal neurons. Inhibitory currents are more precisely analyzed in
cultured cells when compared to EPSCs, as excitatory currents are often
contaminated by hyperexcitability. We recorded IPSCs, the compound currents, and
mIPSCs (in the presence of TTX) from the same cultured cell (Figure 3.16 A).
The deconvolution approach was perform using the Fourier transform, which
decomposes a signal recorded in time domain to frequency domain. The average
IPSCs and the average mIPSCs were converted to a frequency domain by a discrete
forward Fourier transformation computed by fast Fourier transform algorithm. The
IPSC transform was divided by the mIPSC transform. The frequency domain result
was converted to a time domain by an inverse Fourier transform. The result of the
inverse transformation represented the time course of the neurotransmitter release
rate (Kukley et al., 2007, Neher and Sakaba, 2001, Van der Kloot, 1988).
The deconvolution procedure showed that transmitter release after an AP (Figure
3.16 B and C) is highly synchronized, steeply increased and decreased with high
speed, mimicking the velocity of the fast synaptic transmission.
80
Figure 3.16 IPSCs deconvolution approach. A) Left, superposition of average IPSC trace from 20 traces, and re-convolution (green) of estimated release rate with mIPSC. Right, average mIPSC from 240 miniature events. B) Time course of the IPSC (upper panel) and of the estimated release rate (quanta per s) from experiment showed in A. C) Estimated release rate from panel B with single exponential fit to the decay phase (green).
81
4 Discussion
Synaptic transmission is extremely fast, tightly regulated, and, at the same time,
incredibly plastic, due to, in part, the rapid and spatially restricted presynaptic Ca2+
signal at the release sites. The large members of the RIM protein family, a/b-RIMs,
serve as multifunctional regulators of synaptic transmission by recruiting VGCCs and
release-ready state SVs at the presynaptic AZ (Han et al., 2011, Kaeser et al., 2011).
A putative role of the small RIM isoforms, g-RIMs, controlling presynaptic
neurotransmitter release has only begun to be addressed (Alvarez-Baron et al.,
2013, Uriu et al., 2010). By means of a newly developed approach based on a Hill
equation describing the cooperative Ca2+-binding scheme, electrophysiological
recordings, and Ca2+ imaging data, we investigated how the main large RIM protein,
RIM1a, a known component of the presynaptic structural scaffold, and two small
RIMs, RIM3 and RIM4, regulate the functionality of the SV-release machinery and
its impact on synaptic transmission and short-term plasticity.
Our data not only are in accordance with previous findings regarding the functional
role of a-RIMs but also challenge a previous assumption by showing that RIM
proteins differentially control the VGCC subtypes driving synaptic transmission. Five
different conclusions can be drawn from our data. First, RIM1a and RIM4 proteins
are not essential for normal miniature release. Second, RIM1a is necessary for
normal VGCC abundance and localization at the release site, and therefore essential
for maintaining sufficient [Ca2+]local.Third, our study defined a key feature of RIM1a
determining the presynaptic subtype VGCC contribution to the [Ca2+]local, and
therefore to transmitter release, in a small model CNS synapse. The presence of
RIM1a is required to maintain the prominent contribution of N-type VGCCs to
synaptic transmission. Fourth, RIM1a is essential for a normal Pves, and
consequently, contributes to the regulation of short-term synaptic plasticity. Fifth, the
results presented here suggested a possible small presynaptic role for g-RIMs
82
regulating synaptic transmission by an antagonistic mechanism with the large RIM
isoforms. Taken together, my study highlights a novel function of RIM1a tuning the
VGCC subtype level at the presynaptic release site, and a putative role for the g-
RIMs regulating synaptic transmission.
RIM proteins are not essential for spontaneous release
As expected, our data showed an unaltered mEPSCs amplitude in RIM1a KO, and
RIM4 KO mice indicating normal postsynaptic responsiveness to quantal release
(Figure 3.1 and Figure 3.2). Conditional deletion of all the large RIM isoforms (Deng
et al., 2011), deletion of RIM1a/b or RIM2a/b (Kaeser et al., 2012), single deletion
of RIM1a (Calakos et al., 2004, Kaeser et al., 2008), and knockdown of RIM4
(Alvarez-Baron et al., 2013) on cultured hippocampal neurons also demonstrated an
unchanged quantal size upon alteration of RIM proteins.
In the absence of RIM1a, although it did not reach level of significance, the mean
mEPSCs frequency tended to be lower, as reported previously in autaptic cultured
hippocampal neurons (Calakos et al., 2004). Our data suggested a specific loss of
mEPSC events which occur with a shorter IEI distance (Figure 3.1). This observation
could be explained by a decreased Pves during miniature release, by a lower number
of release-ready state vesicles, or by a decreased number of synaptic connections.
Prior research suggested a slightly larger decrease in inhibitory miniature events
upon ablation of RIM1a, emphasized by the removal of the other RIM1 isoform,
RIM1b (Kaeser et al., 2008). Deletion of both isoforms encoded by the Rims1 gene,
RIM1a and RIM1b, dramatically decreased excitatory and inhibitory miniature
currents suggesting redundancy in the function of RIM1 isoforms (Kaeser et al.,
2012, Kaeser et al., 2008). The effect of RIM1a removal on excitatory spontaneous
release at the hippocampal CA3-CA1 synapses has not been investigated before.
Based on previous research, the weakness of the effect on mEPSCs frequency
observed in RIM1a KO mice was likely due to a compensatory effect by other large
RIM isoforms, such as RIM1b and RIM2a/b (Han et al., 2015, Kaeser et al., 2012,
Kaeser et al., 2008). a/b-RIMs redundantly would regulate spontaneous release.
83
These data support the idea that the strong effect seen in synaptic strength in
RIM1a KO mice is solely due to a decrease in Pr or a decreased number of SVs
available for release.
In RIM4 KO deficient mice, mEPSC frequency was unchanged compared to WT.
However, knockdown of RIM4 resulted in a markedly reduced mEPSC frequency in
cultured hippocampal neurons, which was explained by a decrease in the number of
functional synaptic contacts (Alvarez-Baron et al., 2013). The discrepancy between
our results and those of the prior study may be due to the difference of the
experimental model, and the expression pattern and expression level of RIM4 in vitro
and in vivo. RIM4 may play different roles depending on the synapse type, as it has
been reported for other AZ proteins, such as RIM1a (Mittelstaedt et al., 2010).
RIM1a controls the availability of VGCCs at the release site maintaining the release-
inducing Ca2+ signal
Ca2+-mediated neurotransmitter release upon the arrival of an AP happens in an
extremely fast manner. The efficacy of release depends on the density, the
positioning, and the modulation of the VGCCs. The molecular mechanisms for
setting the levels of the VGCCs and their organization within the AZ are only partly
understood. Proteins located at the presynaptic release sites, such as RIM1a, have
been identified to recruit and modulate presynaptic VGCCs (Kaeser et al., 2011,
Kiyonaka et al., 2007).
Estimates of the coupling distance between VGCCs and SVs are based on the
inhibitory effect of exogenous Ca2+ chelators on neurotransmitter release. In general,
fast synaptic transmission is slightly sensitive to kinetically slow intracellular Ca2+
chelators, such as EGTA, due to the great speed of the process and the short
distance, on the nanoscale range, between the VGCCs and the vesicle fusion
machinery. Thus, EGTA only interferes with the contribution of remote channels to
release. The effect of the Ca2+ chelator EGTA-AM on Schaffer collaterals-evoked
fEPSPs revealed an overall unchanged coupling distance between those remote
VGCCs and the docked SVs in RIM1a KO mice compared to WT mice. Besides,
84
based on the profound analysis of the Ca2+ signal driving release, our results
revealed a decrease of 20% in the [Ca2+]local seen by the Ca2+ sensor of release.
The level of Ca2+ saturation of the release machinery influences the inhibitory degree
of the Ca2+ buffer on neurotransmitter release. If there is low [Ca2+]local at the Ca2+
sensor, release is more sensitive to further reduction in Ca2+. During the EGTA-AM
experiments, we recorded fEPSPs in 2 mM [Ca2+]e, i.e. control conditions, in WT and
RIM1a KO mice. We did not compensate for the decreased [Ca2+]local estimated for
the RIM1a KO synapses. Due to the lower [Ca2+]local at RIM1a KO terminals, we
expected larger EGTA sensitivity compared to WT mice. However, in contrast, we
observed a tendency to lower sensitivity to the Ca2+ chelator. The difference in EGTA
sensitivity between WT and RIM1a KO would have been even larger after
compensating for the decrease in [Ca2+]local estimated for the RIM1a KO mice. In
light of all this, we hypothesize that in the absence of RIM1a there is a loss of remote
VGCCs normally contributing to release.
At first glance, our Ca2+ buffer data were unexpected, as prior research reported a
stronger sensitivity of the Ca2+-triggered release to EGTA-AM in RIM1/2 cDKO
cultured hippocampal neurons compared to control (Kaeser et al., 2011). The
authors proposed that the observed higher EGTA sensitivity in the RIM1/2 cDKO
neurons was a consequence of a larger coupling distance between VGCCs and SVs.
However, another explanation for these results would be a decreased number of
VGCCs driving synaptic transmission, as explained above. Indeed, several studies
indicated the decrease in the ICa after ablation of RIM proteins (Han et al., 2011,
Kaeser et al., 2011, Kintscher et al., 2013).
The Ca2+ concentration built up around the Ca2+ sensor is defined by the number of
VGCCs and their location. As aforementioned, we observed a reduction by 20% in
the [Ca2+]local in RIM1a KO mice. This result is consistent with a previous finding in
the Calyx of Held. By comparison of synaptic data and Ca2+ uncaging data, this study
estimated a decrease by 25% in the transient [Ca2+]local at RIM1/2 cDKO synapses
(Han et al., 2011). It seems plausible that after the removal of RIM proteins, other
components of the presynaptic AZ, such as RIM-BPs, mediate Ca2+ entry. A direct
interaction between RIM-BPs, whose expression levels were not altered upon
85
RIM1a deletion (Schoch et al., 2002), and different subtype of VGCCs, P/Q-type, N-
type, and L-type, has been reported (Hibino et al., 2002). Taking together our results
and the previous literature, the most plausible explanation for the RIM1a KO
phenotype is the presence of fewer VGCCs located at the release site. Another
possible mechanism for RIM1a in normally supporting sufficient [Ca2+]local involves
the direct modulation of the VGCCs. It has been hypothesized that the C2B domain
of RIM1a interacts with the b subunit of the VGCCs suppressing voltage-dependent
inactivation, and therefore, sustaining Ca2+ influx (Kiyonaka et al., 2007). However,
no further studies could prove that the loss of this modulation contributes to the
impaired Ca2+ entry in RIM-deficient mice.
To prove a lower density of VGCCs at RIM1a KO synaptic terminals, we would need
to measure the presynaptic ICa. The Ca2+ signal analyzed during our Ca2+ imaging
experiments arose from an unknown and probably variable population of synapses.
Therefore, this approach does not allow to quantify or compare absolute values of
presynaptic Ca2+ entry. To do so, and therefore, to be able to state a reduced
presynaptic Ca2+ influx in RIM1a KO mice, it would be necessary to quantify the AP-
evoked Ca2+ transient at single presynaptic boutons as performed previously at
cerebellar parallel fibers (Kintscher et al., 2013).
Shift towards P/Q-type VGCC contribution to the [Ca2+]local in the absence of RIM1a
Preceding studies estimated the contribution of the different subtypes of VGCCs to
the presynaptic Ca2+ entry that precedes synaptic transmission. The mathematical
approach applied to investigate the Ca2+ signal mediating neurotransmitter release
is beyond previous research, thus allowed us to estimate the contribution of the
different subtypes of VGCCs, not to the presynaptic ICa, but to the [Ca2+]local seen by
the Ca2+ sensor, as we extensively explained during the results section. The relative
contribution of the different VGCC subtypes to the ICa and to the [Ca2+]local may differ.
The relative contribution of the VGCC subtypes to the [Ca2+]local is dependent on the
number and the specific position of the VGCCs relative to the SVs, where the Ca2+
sensors for release are located.
86
In comparison to results of previous studies, the selective blockade of N-type VGCCs
by Cgtx resulted in a wide range of inhibition potency of synaptic transmission at the
Schaffer collateral synapses. The inhibition values by Cgtx, and therefore, the
estimated relative contribution of the N-type VGCCs to release, ranged from
reductions of synaptic transmission by 30% (Takahashi and Momiyama, 1993) to
reductions by approximately 50% (Ahmed and Siegelbaum, 2009, Horne and Kemp,
1991, Wheeler et al., 1994), or even synaptic transmission inhibition by 70% (Luebke
et al., 1993, Wu and Saggau, 1994). The contribution of N-type and P/Q-type VGCCs
to synaptic transmission estimated from our approach, NWT=52% and PWT=48%, are
consistent with previous reported values. The discrepancy observed in the literature
could be attributed to the Ca2+-dependence of the blocking potency of the toxin,
which depends on the saturation level of the release machinery. Unfortunately, this
idea is difficult to validate due to the lack of evidences in the reports to state different
levels of occupancy of the Ca2+ sensor.
The former estimations of the contribution of the different VGCC subtypes to synaptic
transmission were based on the inhibitory effect on the Ca2+ entry, but as explained
above, the relative VGCC subtype contribution to total ICa may not reflect the relative
contribution to the [Ca2+]local, which ultimately drives neurotransmitter release.
In order to estimate more precisely the different VGCC subtype contribution to the
synaptic transmission, an approach to estimate the relative contribution to the
[Ca2+]local was needed. Moreover, our experimental approach integrated the study of
the release machinery at different levels of Ca2+ saturation, by altering [Ca2+]e, and
took advantage of a global analysis, i.e. the combination of data from different
scenarios of the release machinery in different genetic backgrounds.
Up to now, prior research suggested that the removal of the large RIM isoforms
decreased ICa, however the relative contribution of the different VGCC subtypes has
not been evaluated. We analyzed the subtype contribution at a small central
synapse, the Schaffer collateral synapse, where release is mediated by the joint
actions of P/Q- and N-type VGCCs. Our global analysis of the fractional release after
Cgtx and Agatx application revealed that the presynaptic scaffolding protein RIM1a
specifically tunes the contribution of N-type VGCCs to synaptic transmission. We
87
observed similar contribution of P/Q- and N-type VGCCs, 52% and 48%,
respectively, to the [Ca2+]local mediating neurotransmitter release at WT Schaffer
collateral synapses. However, in RIM1a KO synapses, there was a shift to the P/Q-
type population as the predominant Ca2+ source to the [Ca2+]local. The estimated
relative contribution of P/Q-type VGCCs was 65%, whereas the N-type contribution
was 29%.
The shifting of the reliance of neurotransmitter release towards P/Q-type VGCC in
RIM1a KO mice suggests a preferential tethering of N-type VGCCs at the release
site by RIM1a. On one hand, in a WT scenario, the density, and localization of both
subtypes of VGCCs, N-type and P/Q-type, are regulated by several AZ proteins. It
was reported that the presynaptic protein Bassoon, via its interaction with RIM-BP,
functions in specifically localizing P/Q-type VGCCs at the AZ (Davydova et al.,
2014). Moreover, another AZ protein, Munc13-3, was recently identified as a
regulator of the positioning of P/Q-type VGCCs in the cerebellar parallel fiber to
Purkinje neuron synapse (Kusch et al., 2018). On the other hand, in a RIM1a-
deficient scenario, other presynaptic AZ proteins, such as RIM-BP, may play a larger
role in controlling the VGCC subtype contribution. As we pointed out earlier, our
results revealed that in the absence of RIM1a there may be fewer VGCCs at the
release site. The removal of RIM1a may affects only N-type subtype, or P/Q- and N-
types, thus RIM proteins interact directly with both VGCCs. In any case, the [Ca2+]local
is decreased, leading to a lower [Ca2+]local, and the relative contribution changes
towards P/Q-type in the absence of RIM1a because, as mentioned earlier, other AZ
proteins still present at the AZ, such as RIM-BP, would preferentially attach them.
The scenario observed in RIM1a KO mice would be the result of a preferential
tethering of N-type VGCCs by RIM1a, and the preference of other AZ proteins, which
interact with both subtypes, recruiting P/Q-type VGCCs.
A potential molecular mechanism to explain the specific tethering of the N-type
VGCCs by RIM1a involves a specific region of the Cav2.2 pore forming a1 subunit
known as the synaptic protein interaction (synprint) region. RIM1a interacts with the
C-terminal of the a1 subunit of P/Q-type and N-type VGCC, but moreover, RIM1a
has been suggested to interact with the synprint region of the N-type VGCCs
88
(Coppola et al., 2001). This additional interaction between RIM1a and the N-type
VGCCs could explain the preferential tethering of N-type VGCCs by RIM1a.
Furthermore, it has been reported that the N-type VGCCs are a cyclin-dependent
kinase 5 (Cdk5) substrate. Phosphorylation of the N-type VGCC by Cdk5, which
modulates the interaction between the channel and RIM1a, increases Ca2+ influx,
facilitating neurotransmitter release (Su et al., 2012). According to this, a specific
modulation of N-type VGCCs can boost Ca2+ entry through this VGCC subtype,
rendering N-type VGCCs more efficient triggering release even if they are not tighter
coupled to the SVs. This idea opens the possibility for a scenario where the N-type
VGCCs attached to RIM1a are more efficient in triggering release due to their
regulation, and not because they are closer to the SVs. In the absence of RIM1a,
the N-type VGCC loosely coupled to the release machinery would lose influence on
the [Ca2+]local and consequently the P/Q-type VGCC contribution to the [Ca2+]local,
would increase, via interactions with other AZ proteins, which may tether
preferentially P/Q-type VGCCs. Moreover, the remote N-type VGCCs would
disappear from the release site changing the spatiotemporal profile of the
presynaptic VGCC domain. The slightly lower EGTA-AM sensitivity observed in our
recordings, although it seemed only a trend, it would be in agreement with the loss
of the remote N-type VGCC in the absence of RIM1a.
In summary, our data strongly implies an important role of RIM1a specifically
controlling the contribution of N-type VGCCs to synaptic transmission. RIM1a could
shorten the distance between the N-type VGCC and the release site or specifically
regulate the N-type channels, maybe via the interaction with the N-type VGCC
synprint region. Future analysis will be needed to shed light on the postulated
mechanism behind this specificity. Moreover, to support our findings it would be
interesting to analyze the regulation of the expression of the different VGCC
subtypes in the absence of RIM1a as well as the position of the different VGCC
subtypes in the presynaptic terminals.
89
Restoration of normal VGCC subtype contribution to the [Ca2+]local after a/b-RIMs
removal
Why does the deletion of one RIM isoform, RIM1a, which has a partial effect on
basic neurotransmitter release due to its redundancy with other RIM isoforms, tune
the subtype VGCC contribution to [Ca2+]local? In an attempt to address this question,
we analyzed the specific blockade of N-type VGCC by Cgtx in mice lacking all the
large RIM isoforms, i.e. RIM1a/b and RIM2a/b, specifically at Schaffer collateral
synapses. Unexpectedly, the decrease of release by Cgtx in the RIM1/2 cDKO mice
was similar to the one observed in WT mice, suggesting a restoration of the
RIM1a KO phenotype after the removal of all large RIM isoforms. The observed
difference in the inhibitory effect cannot be explained only by the inability to virally
transduce all CA3 pyramidal cells. With our recombination efficiency (80%), we
expected a decrease by Cgtx to approximately 57%, but we observed a larger
degree of inhibition, a reduction to 50%. Noteworthy to mention is that a more
suitable approach than the extracellular stimulation applied in these experiments
would increase the trust in this result. The use of adeno-associated virus driving
bicistronic expression of both channelrhodopsin and RIM1/2 deletion would allow the
optical stimulation of only those fibers where the large RIM proteins were not
expressed.
RIM1 and RIM2 isoforms exhibit different degrees of redundancy for different
processes during neurotransmitter release (Kaeser et al., 2012, Kaeser et al., 2008).
While all large RIM proteins mainly present the same structural domains, it is
possible that through several cellular mechanisms, such as phosphorylation and
ubiquitination, they differentially mediate several aspects of neurotransmitter
release, such as the novel role defined for RIM1a enhancing N-type VGCC
contribution to synaptic transmission. In a RIM1a KO scenario, other RIM isoforms
may not recruit N-type VGCC to the release site, decreasing their relative
contribution to synaptic transmission, meantime they interact with other AZ proteins
enhancing the contribution of P/Q-type VGCCs. In a cDKO scenario, the remaining
AZ proteins are maybe differentially regulated and recruit VGCCs to the release site
in a different manner, restoring control VGCC subtypes relative contribution.
90
Nevertheless, to give a larger power to our Sc-CA1 specific cDKO data we would
need to improve the technical approach as well as perform a deeper analysis of the
Ca2+ signal-mediating neurotransmitter release by means of our fractional release
Ca2+ curve approach.
Ca2+ sensitivity of release in RIM1a KO mice
The distance between VGCCs and the vesicle fusion machinery, the magnitude of
the [Ca2+]local, and the intrinsic Ca2+ sensitivity, i.e. intrinsic properties of the Ca2+
sensor of release, have a great impact on controlling the speed and efficacy of
release.
The analysis of the release kinetics, although the data are not significantly different
maybe due to small sample size, suggested a trend towards a decelerated fast
neurotransmitter release in RIM1a KO mice. The slowdown of release could be
explained by the decrease in [Ca2+]local, which would affect Pves and the temporal
pattern of transmitter release. The kinetics parameters, such as the synaptic delay,
the rise time, or the decay, become faster upon increasing Ca2+ influx. Deficits on
neurotransmitter release due to impaired Ca2+ entry can be overcome by increasing
[Ca2+]e. If the kinetics deficits observed in RIM1a KO mice are solely due to
alterations in the Ca2+ entry, increasing the [Ca2+]e would restore the kinetics. The
release kinetics in RIM1a KO mice in high [Ca2+]e should behave as the kinetics in
WT mice in control conditions, i.e. 2 mM [Ca2+]e. In RIM1a KO mice we observed a
decrease by 20% in the Ca2+ entry, thus increasing [Ca2+]e from 2 to 4 mM, which
increases Ca2+ entry by practically 50%, should overcome the slower release
observed in RIM1a KO mice. This would indicate that the neurotransmitter release
deficits seen in RIM1a KO mice originate only from Ca2+ deficits. If the kinetics
parameters are not completely restored by increasing Ca2+ entry, the release deficits
in RIM1a KO are a consequence of a simultaneous deficit in Ca2+, and alterations at
the release machinery, as a decrease in the number of release-ready state SVs.
The synaptic delay becomes shorter when increasing [Ca2+]e from 2 to 4 mM, but
not from 4 to 20 mM. The rise time behaves similar in 2 and 4 mM [Ca2+]e, but
91
becomes faster in 20 mM. The tau of decay seems to be constant among the
different [Ca2+]e in RIM1a KO mice suggesting that the release does not accelerate
correspondingly to an increase Ca2+ entry. Taken together, it seems that the kinetics
parameters cannot be restored solely by increasing Ca2+ entry, which implies that
the deficits in neurotransmitter release observed in RIM1a KO mice are due to an
impaired Ca2+ entry together with an alteration in the RRP size.
RIM1a regulates release probability and short-term synaptic plasticity
Our findings indicate that the primary cause for the reduced Pves in RIM1a KO mice
estimated from the fractional release Ca2+ curves, similar to previously published
values (Han et al., 2011), was the reduction in the [Ca2+]local. The stronger reduction
in Pr and synaptic strength observed upon ablation of RIM proteins (Calakos et al.,
2004, Han et al., 2011, Kaeser et al., 2011, Schoch et al., 2002) could be explained
as a functional consequence of the reduced Pves and a simultaneous reduced RRP
size (Calakos et al., 2004, Fernandez-Busnadiego et al., 2013, Han et al., 2011,
Kaeser et al., 2011). Up to now, the size of the RRP in RIM-deficient mice has been
addressed by electrophysiological techniques and transmission electron
tomography. The reports indicated a strong reduction in the RRP size upon the
removal of RIM1a in autaptic neurons (Calakos et al., 2004), and in RIM1/2 cDKO
cultured hippocampal neurons and at the Calyx of Held (Han et al., 2011, Kaeser et
al., 2011). The estimated reduction in the [Ca2+]local for RIM1a KO presynaptic
terminals, calculated by the fractional release Ca2+ curves, and a decrease in the
RRP size would account for the strong reduction in AP-mediated neurotransmitter
release.
Short term synaptic plasticity, considered mainly a presynaptic phenomenon, implies
the processing and integration of information into adaptable patterns of release. We
observed an increased PPF upon ablation of RIM1a. The classical explanation for
an increased PPF involves a decreased Pves due to the reduction in the [Ca2+]local.
However, another interesting idea arises after recently a specific Ca2+ sensor
mediating facilitation, Syt7, was reported (Jackman et al., 2016). The deletion of
92
RIM1a could alter the function of Syt7 at the SVs, with an increased influence of
Syt7 molecules, located on the plasma membrane, which would increase facilitation.
This idea brings up new questions: How is the expression of the different Ca2+
sensors regulated? Is it possible that in the absence of RIM1a there is a decrease
in the number of Syt1 molecules, altering fast synaptic transmission, and at the same
time, an increase in the number of Syt7 molecules, increasing facilitation? A more
detailed evaluation of the nature of the Ca2+ sensors after removal of RIM1a would
be needed to get a deeper understanding of the functional importance of RIM1a
regulating basic neurotransmitter release and the temporal pattern of release upon
repetitive stimulations.
The impact of the larger P/Q-type VGCC contribution to the [Ca2+]local on Pr and
synaptic transmission is difficult to resolve, as the magnitude and the time course of
the Ca2+ influx through different VGCC subtypes is similar. Previous studies have
shown the influence of differential VGCC subtype recruitment on Pr by expressing
N-type VGCC in P/Q-type-mediated synaptic transmission synapses, like the mature
Calyx of Held (Inchauspe et al., 2007) . Further studies are warranted to elucidate a
functional outcome of the shift towards P/Q-type VGCCs observed in RIM1a KO
mice. In summary, the decrease of Pr and the enhanced PPF observed in RIM1a KO
mice are likely to be the consequence of a decrease [Ca2+]local in combination with a
decreased number of docked SVs at the presynaptic AZ.
Functional antagonism of a/b-RIMs by g-RIMs
It has been suggested that g-RIMs, as well as a-RIMs, bind directly to the b subunit
of the VGCCs and modulate their opening times, although in a much less efficient
manner than a-RIMs. Moreover, a competition between a-RIMs and g-RIMs in
binding to the b subunit of the VGCCs was shown to impact SVs docking (Uriu et al.,
2010). Based on previous literature, the broader subcellular localization pattern of
the g-RIMs (Alvarez-Baron et al., 2013), the high homology of the RIM C2B domain
present in all RIM isoforms, and the partial overlap of known binding partners of g-
RIMs with those of a-RIMs (Wang and Südhof, 2002), we initially hypothesized that
93
g-RIMs modulate synaptic release by competing with a-RIMs and impact a-RIMs’
role in synaptic transmission. The results from the RIM4 KO fractional release Ca2+
curve suggests an opposite scenario to the one observed in RIM1a KO mice. After
the removal of RIM4, the estimated Ca2+ entry and Pves were increased, and the N-
type VGCCs contributed to a larger extent to the [Ca2+]local compared to control
conditions. The effect on release after RIM3 ablation follows the same tendency as
the RIM4 effect but in a less pronounced manner.
Several mechanisms could explain a functional antagonism between RIM1a and g-
RIMs. g-RIMs could block slots of RIM1a at the presynaptic AZ and thereby interfere
with the interaction of RIM1a and other AZ proteins altering the proper functionality
of RIM1a mediating neurotransmitter release. g-RIMs could act as quenchers,
sequestering RIM1a binding partners. They could compete with RIM1a binding to
the b subunit of the VGCC and lower the precise localization of SVs at the release
site. Another mechanism would involve the heterodimerization between the C2B
domains of RIM1a and g-RIMs (Guan et al., 2007). In this last situation, the
dimerization would change the structure of RIM1a rendering the protein less efficient
to interact with other AZ proteins, like Munc13 or RIM-BP, directly to the VGCCs or
to Rab3, located at the SVs.
In all of the above-mentioned scenarios, the function of RIM1a in regulating SV
exocytosis at the AZ would be affected, thus hampering neurotransmitter release.
The removal of g-RIMs would give RIM1a more control over presynaptic function. In
the absence of g-RIMs we would expect a larger ICa, a shift towards N-type VGCC
contribution to the [Ca2+]local, increased [Ca2+]local and Pves, increased RRP size, and
decreased PPF. Our results from the RIM3 KO and RIM4 KO fractional release Ca2+
curves, and the PPF analysis partly reflected this scenario, suggesting a putative
functional antagonism of the large RIM isoforms, such as RIM1a, by the small RIM
isoforms. Nevertheless, the g-RIM KO fractional release Ca2+ curves data should be
treated with care, as they would require to be verified by the application of the
specific P/Q-type VGCC as well as a global analysis of the data. Further studies to
investigate the Ca2+ entry, the Pr, the arrangement of SVs at the release site, and
94
the implications in different synaptic plasticity mechanisms, would be warranted to
elucidate the possible role of the small RIM isoforms regulating presynaptic
neurotransmitter release.
Outlook
The current study identified a novel function for the presynaptic AZ protein RIM1a
namely enhancing the contribution of the N-type VGCCs to synaptic transmission,
and a possible antagonistic mechanism between RIM1a and the small RIM isoforms,
RIM3 and RIM4.
What are the mechanisms through which RIM1a enhances specifically the N-type
VGCC contribution to neurotransmitter release? Is it due to an emphasized physical
interaction or through a direct regulatory mechanisms of the N-type VGCCs? And,
in any of both possibilities, what would be the underlying molecular mechanisms? Is
the expression or trafficking of N-type VGCC to the release sites regulated by
RIM1a? Would an additional insertion of N-type VGCCs in the absence of RIM1a
restore normal synaptic transmission? This last idea is difficult to test because the
overexpression of the pore-forming a subunit, although not the specific N-type, failed
to change synaptic VGCC abundance or function at the release site (Hoppa et al.,
2012).
Are the Ca2+ sensors triggering neurotransmitter release altered in the absence of
RIM proteins? How does RIM1a regulate short-term synaptic plasticity? And, how
would alterations in the temporal pattern of release upon ablation of RIM1a affect
information processing and presynaptic computation? What are the molecular
mechanisms behind the possible functional antagonism of RIM1a function by g-
RIMs?
95
5 Abstract
Synaptic transmission is extremely fast and tightly regulated due to the rapid and
spatially restricted Ca2+ signal at the presynaptic AZ. At the AZ, VGCCs are kept in
close proximity to SVs allowing fast and reliable neurotransmitter release. The
composition and state of the presynaptic AZ determine Pr, by influencing Pves and
the availability of SVs for release, determinants of the synaptic strength. The large
RIM proteins, such as RIM1a, are considered the main scaffolding components of
the AZ due to their multiple interactions with other AZ proteins as well as with VGCCs
and SVs. RIM1a plays a crucial role in the regulation of synaptic transmission by
maintaining sufficient and localized Ca2+ entry and by maintaining SVs in a release-
ready state. The ablation of RIM1α leads to a strong reduction of synaptic output
(~40%). The mechanisms by which RIM1a regulates synaptic strength are still not
precisely known. It remains unclear whether the alterations in release observed in
RIM1a KO mice are caused by a lack of docked SVs or by a decrease in the
[Ca2+]local operating the Ca2+ sensor, which would impact directly Pves. To evaluate
the role of RIM1a in synaptic transmission is essential to get a better understanding
on its function regulating different aspects of the release-inducing Ca2+ signal, such
as VGCC trafficking, tethering, or VGCC subtype specificity. Apart from the large
RIM isoforms, the small RIM isoforms RIM3 and RIM4, which consist only of the RIM
C-terminal C2B domain, may play a role in synaptic transmission due to their broader
subcellular localization pattern, the high homology of the RIM C2B domain, and the
partial overlap of binding partners with those of RIM1a.
Through electrophysiological recordings and Ca2+ imaging data, we investigated the
role of RIM1a, RIM3, and RIM4 regulating neurotransmitter release properties and
its impact on short-term synaptic plasticity. We developed a mathematical approach,
based on a Hill equation describing the cooperative Ca2+-binding scheme, to
quantitatively analyze the Ca2+-dependence of the inhibitory effect on Schaffer-
96
collateral fEPSPs caused by specific VGCC blockers, Cgtx and Agatx, and infer the
degree of Ca2+ binding to the sensor in the presence and absence of the RIM
proteins. This analysis revealed for the first time that the [Ca2+]local and the Pves are
reduced by ~20% in RIM1α KO mice indicating that the remaining reduction in
synaptic output is caused by a lack of releasable vesicles. Interestingly, the subtype
contribution of the VGCCs to activate the Ca2+ sensor also differed: while N- and
P/Q-type VGCCs equally contributed to the activation of the Ca2+ sensor (52%, 48%)
in WT mice, the fractional contribution was strongly shifted towards P/Q-type VGCCs
in KO mice (65%, 29%). This scenario favor the view that RIM1α deletion decreases
synaptic strength by reducing the number of releasable SVs and altering the release-
inducing Ca2+ signal by a distorted channel-vesicle geometry or by an altered
specific N-type VGCC regulation, which causes a decrease in Pr, affecting synaptic
strength. The removal of the g-RIMs affected release properties in a lesser extent as
RIM1a ablation. We observed in RIM4 KO data a tendency towards an opposite
scenario to the one observed in RIM1a KO mice. The [Ca2+]local and the Pves were
slightly increased in concert with a shift towards N-type VGCC contribution to the
[Ca2+]local. Our data pointed out to a novel function for RIM1a specifically enhancing
the contribution of N-type VGCC to synaptic transmission, and a possible small
presynaptic role for RIM4 regulating synaptic transmission by an antagonistic
mechanism with RIM1a.
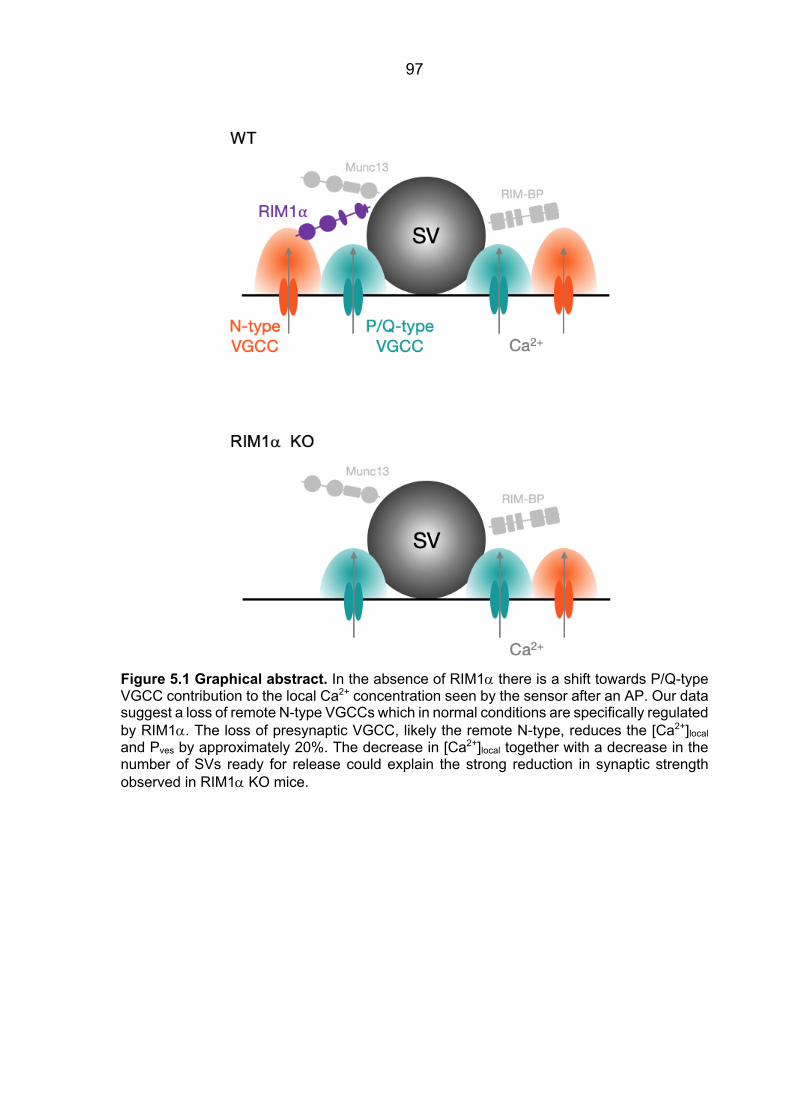
97
Figure 5.1 Graphical abstract. In the absence of RIM1a there is a shift towards P/Q-type VGCC contribution to the local Ca2+ concentration seen by the sensor after an AP. Our data suggest a loss of remote N-type VGCCs which in normal conditions are specifically regulated by RIM1a. The loss of presynaptic VGCC, likely the remote N-type, reduces the [Ca2+]local and Pves by approximately 20%. The decrease in [Ca2+]local together with a decrease in the number of SVs ready for release could explain the strong reduction in synaptic strength observed in RIM1a KO mice.
98
6 List of figures
Figure 1.1 Structure of a chemical synapse ............................................................. 3
Figure 1.2 Presynaptic active zone ........................................................................ 10
Figure 1.3 RIM protein family organization and protein interaction of RIM1a ......... 16
Figure 1.4 Anatomy of the hippocampal formation ................................................. 21
Figure 2.1 Horizontal hippocampal slicing procedure ............................................. 25
Figure 2.2 Scheme of Schaffer collateral-evoked fEPSPs recordings and a classical
fEPSP waveform .................................................................................................... 29
Figure 2.3 fEPSPs recordings setup ...................................................................... 30
Figure 2.4 Scheme of the AM-dye bulk loading into the Schaffer collaterals ......... 38
Figure 2.5 Ca2+ imaging setup ................................................................................ 39
Figure 3.1 Miniature synaptic transmission is unaltered in RIM1a KO mice .......... 45
Figure 3.2 Unchanged spontaneous release in RIM4 KO mice ............................. 46
Figure 3.3 Increased short-term synaptic plasticity in RIM1a KO mice .................. 47
Figure 3.4 Ca2+-dependence synaptic transmission inhibition ................................ 49
Figure 3.5 The depression of transmission by Cgtx depends on the [Ca2+]e .......... 54
Figure 3.6 The depression of transmission by Agatx is more pronounced in
RIM1a KO mice ...................................................................................................... 56
Figure 3.7 Analysis of the Ca2+ signal driving neurotransmitter release in RIM1a KO
mice ........................................................................................................................ 59
Figure 3.8 Increased P/Q-type VGCC contribution to the [Ca2+]local in RIM1a KO mice
................................................................................................................................ 60
Figure 3.9 Screening for a possible synaptic function of the g-RIMs, RIM3 and RIM4
................................................................................................................................ 63
Figure 3.10 Kinetics of release in Sc-CA1 synapses .............................................. 65
Figure 3.11 Unaltered distance between VGCCs and SVs in RIM1a KO mice. ..... 67
99
Figure 3.12 The Cgtx effect on the synaptic output recorded from a population of
neurons reflected accurately the effect on the synaptic output recorded from
individual neurons ................................................................................................... 69
Figure 3.13 Cgtx sensitivity of transmitter release in cDKO mice is similar to WT mice
................................................................................................................................ 72
Figure 3.14 Slightly altered contribution of the different VGCC subtypes to the ICa in
RIM1α KO mice ...................................................................................................... 76
Figure 3.15 Qualitative assessment of Pr by MK-801 blockade of NMDAR-mediated
EPSCs .................................................................................................................... 78
Figure 3.16 IPSCs deconvolution approach ........................................................... 80
Figure 5.1 Graphical abstract ................................................................................. 97
100
7 Bibliography
Abbott L F, Regehr W G. Synaptic computation. Nature 2004; 431: 796-803 Acuna C, Liu X, Su T C, Acuna C, Liu X, Gonzalez A, Su T C. RIM-BPs Mediate Tight Coupling of Action Potentials Article RIM-BPs Mediate Tight Coupling of Action Potentials to Ca2+ -Triggered Neurotransmitter Release. Neuron 2015; 87: 1234-1247 Ahmed M S, Siegelbaum S A. Recruitment of N-Type Ca2+ channels during LTP enhances low release efficacy of hippocampal CA1 perforant path synapses. Neuron 2009; 63: 372-385 Alvarez-Baron E, Michel K, Mittelstaedt T, Opitz T, Schmitz F, Beck H, Dietrich D, Becker A J, Schoch S. RIM3 and RIM4 are key regulators of neuronal arborization. The Journal of Neuroscience 2013; 33: 824-839 Andersen P, Morris R, Amaral D, Bliss T, O'Keefe J. The hippocampus book. New York, Oxford University Press. 2007 Augustin I, Rosenmund C, Sudhof T C, Brose N. Munc13-1 is essential for fusion competence of glutamatergic synaptic vesicles. Nature 1999; 400: 457-561 Augustine G J, Charlton M P, Smith S J. Calcium entry and transmitter release at voltage-clamped nerve terminals of squid. Journal of Physiology 1985; 367: 163-181 Bean B P. Classes of calcium channels in vertebrate cells. Annual review of physiology 1989; 51: 367-384 Bliss T V, Collingridge G L. A synaptic model of memory: long-term potentiation in the hippocampus. Nature 1993; 361: 31-39 Borst J G G, Sakmann B. Calcium influx and transmitter release in a fast CNS synapse. Nature 1996; 383: 431-434 Brose N, Petrenko A G, Sudhof T C, Jahn R. Synaptotagmin: a calcium sensor on the synaptic vesicle surface. Science 1992; 256: 1021-1025
101
Calakos N, Schoch S, Südhof T C, Malenka R C. Multiple roles for the active zone protein RIM1alpha in late stages of neurotransmitter release. Neuron 2004; 42: 889-896 Carbone E, Lux H D. Kinetics and selectivity of a low-voltage-activated calcium current in chick and rat sensory neurons. Journal of Physiology 1987; 386: 547-570 Castillo J, Katz B. Quantal components of the end-plate potential. Journal of Physiology 1954; 124: 560-573 Castillo P E, Schoch S, Schmitz F, Sudhof T C, Malenka R C. RIM1alpha is required for presynaptic long-term potentiation. Nature 2002; 415: 327-330 Catterall W A. Structure and regulation of voltage-gated Ca2+ channels. Annu Rev Cell Dev Biol 2000; 16: 521-555 Choi S, Yu E, Lee S, Llinas R R. Altered thalamocortical rhythmicity and connectivity in mice lacking Cav3.1 T-type Ca2+ channels in unconsciousness. Proceedings of the National Academy of Sciences 2015; 112: 7839-7844 Christie J M, Jahr C E. Multivesicular Release at Schaffer Collateral–CA1 Hippocampal Synapses. The Journal of Neuroscience 2006; 26: 210-216 Clements J D, Bekkers J M. Detection of spontaneous synaptic events with an optimally scaled template. Biophysical Journal 1997; 73: 220-229 Coppola T, Magnin-Lüthi S, Perret-Menoud V, Gattesco S, Schiavo G, Regazzi R. Direct Interaction of the Rab3 Effector RIM with Ca2+ Channels, SNAP-25, and Synaptotagmin. Journal of Biological Chemistry 2001; 276: 32756-32762 Davydova D, Marini C, King C, Klueva J, Bischof F, Romorini S, Montenegro-Venegas C, Heine M, Schneider R, Schroder M S, Altrock W D, Henneberger C, Rusakov D A, Gundelfinger E D, Fejtova A. Bassoon specifically controls presynaptic P/Q-type Ca2+ channels via RIM-binding protein. Neuron 2014; 82: 181-194 De Jong A, Roggero M, Ho R, Wong Y, Brautigam A, Rizo J, Kaeser P S. RIM C2B Domains Target Presynaptic Active Zone Functions to PIP2-Containing Membranes. Neuron 2018; 98: 335-349 Deng L, Kaeser P S, Xu W, Südhof T C. RIM proteins activate vesicle priming by reversing autoinhibitory homodimerization of Munc13. Neuron 2011; 69: 317-331
102
Dodge F A, Rahamimoff R. Co-operative action of calcium ions in transmitter release at the neuromuscular junction. Journal of Physiology 1967; 193: 419-432 Dong W, Radulovic T, Goral R O, Thomas C, Suarez Montesinos M, Guerrero-Given D, Hagiwara A, Putzke T, Hida Y, Abe M, Sakimura K, Kamasawa N, Ohtsuka T, Young S M. CAST/ELKS Proteins Control Voltage-Gated Ca2+ Channel Density and Synaptic Release Probability at a Mammalian Central Synapse Cell Reports 2018; 24: 284-293 Dunlap K, Luebke J I, Turner T J. Exocytotic Ca2+ channels in mammalian central neurons. Trends in Neurosciences 1995; 18: 89-98 Eggermann E, Bucurenciu I, Goswami S P, Jonas P. Nanodomain coupling between Ca2+ channels and sensors of exocytosis at fast mammalian synapses. Nature Review Neuroscience 2011; 13: 7-21 Erdmann E, Rupprecht V, Matthews E, Kukley M, Schoch S, Dietrich D. Depression of release by mGluR8 alters Ca2+ dependence of release machinery. Cerebral Cortex 2012; 22: 1498-1509 Fernandez-Busnadiego R, Asano S, Oprisoreanu A M, Sakata E, Doengi M, Kochovski Z, Zurner M, Stein V, Schoch S, Baumeister W, Lucic V. Cryo-electron tomography reveals a critical role of RIM1alpha in synaptic vesicle tethering. Journal of Cell Biology 2013; 201: 725-740 Fernandez-Chacon R, Konigstorfer A, Gerber S H, Garcia J, Matos M F, Stevens C F, Brose N, Rizo J, Rosenmund C, Sudhof T C. Synaptotagmin I functions as a calcium regulator of release probability. Nature 2001; 410: 41-49 Geppert M, Goda Y, Hammer R E, Li C, Rosahi T W, Stevens C F, Südhof T C. Synaptotagmin I: A Major Ca2+ Sensor for Transmitter Release at a Central Synapse. Cell 1994; 79: 717-727 Gracheva E O, Hadwiger G, Nonet M L, Richmond J E. Direct interactions between C. elegans RAB-3 and Rim provide a mechanism to target vesicles to the presynaptic density. Neuroscience Letters 2008; 444: 137-142 Guan R, Dai H, Tomchick D R, Dulubova I, Machius M, Sudhof T C, Rizo J. Crystal structure of the RIM1alpha C2B domain at 1.7 A resolution. Biochemistry 2007; 46: 8988-8998 Haas H L, Schaerer B, Vosmansky M. A simple perfusion chamber for the study of nervous tissue slices in vitro. Journal of Neuroscience Methods 1979; 1: 323-325
103
Han Y, Babai N, Kaeser P S, Südhof T C, Schneggenburger R. RIM1 and RIM2 redundantly determine Ca2+ channel density and readily releasable pool size at a large hindbrain synapse. Journal of Neurophysiology 2015; 113: 255-263 Han Y, Kaeser P S, Südhof T C, Schneggenburger R. RIM Determines Ca2+ Channel Density and Vesicle Docking at the Presynaptic Active Zone. Neuron 2011; 69: 304-316 Held R G, Liu C, Kaeser P S. ELKS controls the pool of readily releasable vesicles at excitatory synapses through its N-terminal coiled-coil domains. eLife 2016; 5: 1-20 Hessler N a, Shirke a M, Malinow R. The probability of transmitter release at a mammalian central synapse. Nature 1993; 366: 569-572 Hibino H, Pironkova R, Onwumere O, Vologodskaia M, Hudspeth A J, Lesage F. RIM binding proteins (RBPs) couple Rab3-interacting molecules (RIMs) to voltage-gated Ca2+ channels. Neuron 2002; 34: 411-423 Hille B. Modulation of ion-channel function by G-protein-coupled receptors. Trends in Neurosciences 1994; 17: 531-536 Holderith N, Lorincz A, Katona G, Rózsa B, Kulik A, Watanabe M, Nusser Z. Release probability of hippocampal glutamatergic terminals scales with the size of the active zone. Nature Neuroscience 2012; 15: 988-997 Hoppa M B, Lana B, Margas W, Dolphin A C, Ryan T A. alpha2delta expression sets presynaptic calcium channel abundance and release probability. Nature 2012; 486: 122-125 Horne A L, Kemp J A. The effect of w-conotoxin GVIA on synaptic transmission within the nucleus accumbens and hippocampus of the rat in vitro. British Journal of Pharmacology 1991; 103: 1733-1739 Huang Y Y, Zakharenko S S, Schoch S, Kaeser P S, Janz R, Sudhof T C, Siegelbaum S A, Kandel E R. Genetic evidence for a protein-kinase-A-mediated presynaptic component in NMDA-receptor-dependent forms of long-term synaptic potentiation. Proceedings of the National Academy of Sciences 2005; 102: 9365-9370 Inchauspe C G, Forsythe I D, Uchitel O D. Changes in synaptic transmission properties due to the expression of N-type calcium channels at the calyx of Held
104
synapse of mice lacking P/Q-type calcium channels. Journal of Physiology 2007; 584: 835-851 Jackman S L, Turecek J, Belinsky J E, Regehr W G. The calcium sensor synaptotagmin 7 is required for synaptic facilitation. Nature 2016; 529: 88-91 Johnston D, Wu S. Foundations of cellular neurophysiology. Cambridge, Massachusetts, The MIT Press. 1995 Kaeser P S, Deng L, Fan M, Sudhof T C. RIM genes differentially contribute to organizing presynaptic release sites. Proceedings of the National Academy of Sciences 2012; 109: 11830-11835 Kaeser P S, Deng L, Wang Y, Dulubova I, Liu X, Rizo J, Südhof T C. RIM proteins tether Ca2+ channels to presynaptic active zones via a direct PDZ-domain interaction. Cell 2011; 144: 282-295 Kaeser P S, Kwon H B, Chiu C Q, Deng L, Castillo P E, Sudhof T C. RIM1alpha and RIM1beta are synthesized from distinct promoters of the RIM1 gene to mediate differential but overlapping synaptic functions. The Journal of Neuroscience 2008; 28: 13435-13447 Kamiya H, Sawada S, Yamamoto C. Synthetic o-conotoxin blocks synaptic transmission in the hippocampus in vitro. Neuroscience Letters 1988; 91: 84-88 Katz B, Miledi R. The effects of calcium on acetylcholine release from motor nerve terminals. Proceedings of the Royal Society B 1965; 161: 496-503 Katz B, Miledi R. The role of calcium in neuromuscular facilitation. Journal of Physiology 1968; 195: 481-492 Kintscher M, Wozny C, Johenning F W, Schmitz D, Breustedt J. Role of RIM1alpha in short- and long-term synaptic plasticity at cerebellar parallel fibres. Nature Communications 2013; 4 Kiyonaka S, Wakamori M, Miki T, Uriu Y, Nonaka M, Bito H, Beedle A M, Mori E, Hara Y, De Waard M, Kanagawa M, Itakura M, Takahashi M, Campbell K P, Mori Y. RIM1 confers sustained activity and neurotransmitter vesicle anchoring to presynaptic Ca2+ channels. Nature Neuroscience 2007; 10: 691-701 Knierim J J. The hippocampus. Current Biology 2015; 25: 1116-1121
105
Körber C, Kuner T. Molecular Machines Regulating the Release Probability of Synaptic Vesicles at the Active Zone. Frontiers Synaptic Neuroscience 2016; 8 Kukley M, Capetillo-Zarate E, Dietrich D. Vesicular glutamate release from axons in white matter. Nature Neuroscience 2007; 10: 311-320 Kusch V, Bornschein G, Loreth D, Bank J, Jordan J, Baur D, Watanabe M, Kulik A, Heckmann M, Eilers J, Schmidt H. Munc13-3 Is Required for the Developmental Localization of Ca2+ Channels to Active Zones and the Nanopositioning of Cav2.1 Near Release Sensors. Cell Reports 2018; 22: 1965-1973 Lee A, Wong S T, Gallagher D, Li B, Storm D R, Scheuer T, Catterall W A. Ca2+/calmodulin binds to and modulates P/Q-type calcium channels. Nature 1999; 399: 155-159 Liaw J-s, Berger T W. Dynamic Synapse: A New Concept of Neural Representation and Computation. Hippocampus 1996; 6: 591-600 Llinas R, Nicholson C. Calcium Role in Depolarization-Secretion Coupling : An Aequorin Study in Squid Giant Synapse. Proceedings of the National Academy of Sciences 1975; 72: 187-190 Llinas R, Sugimori M, Silver R B. Microdomains of High Calcium Concentration in a Presynaptic Terminal. Science 1992; 256: 677-680 Luebke J I, Dunlap K, Turner T J. Multiple calcium channel types control glutamatergic synaptic transmission in the hippocampus. Neuron 1993; 11: 895-902 Mackler J M, Drummond J A, Loewen C A, Robinson I M, Reist N E. The C2B Ca2+-binding motif of synaptotagmin is required for synaptic transmission in vivo. Nature 2002; 418: 340-344 Martin S J, Clark R E. The rodent hippocampus and spatial memory: from synapses to systems. Cell Molecular Life Science 2007; 64: 401-431 Mayford M, Siegelbaum S A, Kandel E R. Synapses and Memory Storage. Cold Spring Harbor Laboratory Press. 2012 Meinrenken C J, Borst J G, Sakmann B. Calcium secretion coupling at calyx of Held governed by nonuniform channel-vesicle topography. The Journal of Neuroscience 2002; 22: 1648-16467
106
Miki T, Kaufmann W A, Malagon G, Gomez L, Tabuchi K, Watanabe M, Shigemoto R, Marty A. Numbers of presynaptic Ca2+ channel clusters match those of functionally defined vesicular docking sites in single central synapses. Proceedings of the National Academy of Sciences 2017; 114: E5246-E5255 Milovanovic D, De Camilli P. Synaptic Vesicle Clusters at Synapses: A Distinct Liquid Phase? Neuron 2017; 93: 995-1002 Mintz I M, Sabatini B L, Regehr W G. Calcium Control of Transmitter Release at a Cerebellar Synapse. Neuron 1995; 15: 675-688 Mintz I M, Venema V J, Swiderek K M, Lee T D, Bean B P, Adams M E. P-type calcium channels blocked by the spider toxin omega-Aga-IVA. Nature 1992; 355: 827-829 Mittelstaedt T, Alvarez-Baron E, Schoch S. RIM proteins and their role in synapse function. Biological Chemistry 2010; 391: 599-606 Mochida S, Few A P, Scheuer T, Catterall W A. Regulation of Presynaptic Cav2.1 Channels by Ca2+ Sensor Proteins Mediates Short-Term Synaptic Plasticity. Neuron 2008; 57: 210-216 Müller M, Yin Liu K S, Sigrist S J, Davis G W. RIM Controls Homeostatic Plasticity through Modulation of the Readily-Releasable Vesicle Pool. The Journal of Neuroscience 2012; 32: 16574-16585 Neher E, Sakaba T. Combining Deconvolution and Noise Analysis for the Estimation of Transmitter Release Rates at the Calyx of Held. The Journal of Neuroscience 2001; 21 Nicoll R A, Schmitz D. Synaptic plasticity at hippocampal mossy fibre synapses. Nature Review Neuroscience 2005; 6: 863-876 Palay S L, Palade G E. The fine structure of neurons. Public Health 1955; 1 Picher M M, Opris A-m, Martina M. Rab Interacting Molecules 2 and 3 Directly Interact with the Pore-Forming CaV1.3 Ca2+ Channel Subunit and Promote Its Membrane Expression. Frontiers Cell Neuroscience 2017; 11: 1-11 Powell C M, Schoch S, Monteggia L, Barrot M, Matos M F, Feldmann N, Sudhof T C, Nestler E J. The presynaptic active zone protein RIM1alpha is critical for normal learning and memory. Neuron 2004; 42: 143-153
107
Qian J, Noebels J L. Presynaptic Ca2+ influx at a mouse central synapse with Ca2+ channel subunit mutations. The Journal of Neuroscience 2000; 20: 163-170 Ramón y Cajal S. Sobre las fibras nerviosas de la capa molecular del cerebelo. Revista trimestral de Histología Normal y Patológica 1888: 32-63 Ramón y Cajal S. Textura del sistema nervioso del hombre y de los vertebrados. Revista trimestral de Histología Normal y Patológica 1899; 35: 1-20 Reid C A, Bekkers J M, Clements J D. N- and P/Q-type Ca2+ channels mediate transmitter release with a similar cooperativity at rat hippocampal autapses. The Journal of Neuroscience 1998; 18: 2849-2855 Reuter H. Calcium channel modulation by neurotransmitters, enzymes and drugs. Nature 1983; 301: 569-574 Ricci-Tersenghi F, Minneci F, Sola E, Cherubini E, Maggi L. Multivesicular release at developing Schaffer collateral-CA1 synapses: an analytic approach to describe experimental data. Journal of Neurophysiology 2006; 96: 15-26 Rosenmund C, Clements J D, Westbrook G L. Nonuniform probability of glutamate release at a hippocampal synapse. Science 1993; 262: 754-757 Schikorski T, Stevens C F. Quantitative Ultrastructural Analysis of Hippocampal Excitatory Synapses. The Journal of Neuroscience 1997; 17: 5858-5867 Schneggenburger R, Neher E. Intracellular calcium dependence of transmitter release rates at a fast central synapse. Nature 2000; 406: 889-893 Schoch S, Castillo P E, Jo T, Mukherjee K, Geppert M, Wang Y, Schmitz F, Malenka R C, Südhof T C. RIM1α forms a protein scaffold for regulating neurotransmitter release at the active zone. Nature 2002; 415: 321-326 Schoch S, Mittelstaedt T, Kaeser P S, Padgett D, Feldmann N, Chevaleyre V, Castillo P E, Hammer R E, Han W, Schmitz F, Lin W, Südhof T C. Redundant functions of RIM1alpha and RIM2alpha in Ca2+-triggered neurotransmitter release. The EMBO journal 2006; 25: 5852-5863 Scimemi A, Diamond J S. The number and organization of Ca2+ channels in the active zone shapes neurotransmitter release from Schaffer collateral synapses. The Journal of Neuroscience 2012; 32: 18157-18176
108
Serra-Pages C, Medley Q G, Tang M, Hart A, Streuli M. Liprins, a family of LAR transmembrane protein-tyrosine phosphatase-interacting proteins. Journal of Biological Chemistry 1998; 273: 15611-15620 Simsek-Duran F, Linden D J, Lonart G. Adapter protein 14-3-3 is required for a presynaptic form of LTP in the cerebellum. Nature Neuroscience 2004; 7: 1296-1298 Su S C, Seo J, Pan J Q, Samuels B A, Rudenko A, Ericsson M, Neve R L, Yue D T, Tsai L H. Regulation of N-type Voltage-Gated Calcium Channels and Presynaptic Function by Cyclin-Dependent Kinase 5. Neuron 2012; 75: 675-687 Südhof T C. The presynaptic active zone. Neuron 2012; 75: 11-25 Südhof T C. A molecular machine for neurotransmitter release: synaptotagmin and beyond. Nature Medicine 2013; 19: 1227-1231 Takahashi T, Momiyama A. Different types of calcium channels mediate central synaptic transmission. Nature 1993; 366: 156-158 Thomson A M. Facilitation, augmentation and potentiation at central synapses. Trends Neuroscience 2000; 23: 305-312 Turrigiano G G, Nelson S B. Homeostatic plasticity in the developing nervous system. Nature Review Neuroscience 2004; 5: 97-107 Uriu Y, Kiyonaka S, Miki T, Yagi M, Akiyama S, Mori E, Nakao A, Beedle A M, Campbell K P, Wakamori M, Mori Y. Rab3-interacting molecule gamma isoforms lacking the Rab3-binding domain induce long lasting currents but block neurotransmitter vesicle anchoring in voltage-dependent P/Q-type Ca2+ channels. The Journal of biological chemistry 2010; 285: 21750-21767 Van der Kloot W. Estimating the timing of quantal releases during end-plate currents at the frog neuromuscular junction. The Journal of Physiology 1988; 402: 595-603 Wang Y, Okamoto M, Schmitz F, Hofmann K, Südhof T C. Rim is a putative Rab3 effector in regulating synaptic-vesicle fusion. Nature 1997; 388: 593-598 Wang Y, Südhof T C. Genomic definition of RIM proteins: Evolutionary amplification of a family of synaptic regulatory proteins. Genomics 2002; 81: 126-137
109
Wang Y, Sugita S, Südhof T C. The RIM/NIM family of neuronal C2domain proteins: Interactions with Rab3 and a new class of Src homology 3 domain proteins. Journal of Biological Chemistry 2000; 275: 20033-20044 Wheeler D, Randall A, Tsien R. Roles of N-type and Q-type Ca2+ channels in supporting hippocampal synaptic transmission. Science 1994; Wu L G, Saggau P. Pharmacological identification of two types of presynaptic voltage-dependent calcium channels at CA3-CA1 synapses of the hippocampus. The Journal of Neuroscience 1994; 14: 5613-5622 Wu L G, Westenbroek R E, Borst J G, Catterall W a, Sakmann B. Calcium channel types with distinct presynaptic localization couple differentially to transmitter release in single calyx-type synapses. The Journal of Neuroscience 1999; 19: 726-736 Xu J, Mashimo T, Sudhof T C. Synaptotagmin-1, -2, and -9: Ca2+ sensors for fast release that specify distinct presynaptic properties in subsets of neurons. Neuron 2007; 54: 567-581 Zhao M, Hollingworth S, Baylor S M. Properties of tri- and tetracarboxylate Ca2+indicators in frog skeletal muscle fibers. Biophysical Journal 1996; 70: 896-916 Zürner M, Mittelstaedt T, tom Dieck S, Becker A, Schoch S. Analyses of the spatiotemporal expression and subcellular localization of liprin-α proteins. Journal of Comparative Neurology 2011; 519: 3019-3039

110
8 Acknowledgement
I would like to extend great gratitude towards my supervisors Prof. Dirk Dietrich and
Prof. Susanne Schoch for the constant guidance, support, and encouragement.
Thank you for the interesting discussions and advice, which gave me the opportunity
for continuously learning.
I especially would like to thank my second supervisor Prof. Maria Luz Montesinos
for her invaluable and selfless collaboration. Thank you for showing me that there
are many different ways of being a great scientist.
I cordially thank Prof. Christian Henneberger for kindly agreeing to be part of my PhD
committee thesis.
Finally, I would like to thank everyone in the lab, past and present members, for
helping me grow as a scientist, but even more importantly, as a person.
And to the rest of the people I am thankful to (many…!), I will tell them with spoken
words and beer in hand. There are not enough pages in any thesis to express my
most sincere gratitude to them.


![des patientenbezogenen Medikationsplans (RIM-MP) · RIM-MP 1.2, 16.12.2014 4 1 Einleitung In der Spezifikation des „patientenbezogenen Medikationsplans“ [1] sind die Datenfelder](https://img.pdfslide.org/doc/110x75/5e0e70319e84bb36366e3762/des-patientenbezogenen-medikationsplans-rim-mp-rim-mp-12-16122014-4-1-einleitung.jpg)