Embed Size (px)
Citation preview
Xenosialitis modulates the function of the Alzheimer’s disease associated SIGLEC3 in
human THP1 macrophages
Dissertation
zur
Erlangung des Doktorgrades (Dr. rer. nat.) der
Mathematisch-Naturwissenschaftlichen Fakultät der
Rheinischen Friedrich-Wilhelms-Universität Bonn
vorgelegt von
Mona Ann Mathews
aus
Chennai, Indien
Bonn, November 2016
Angefertigt mit Genehmigung der Mathematisch-Naturwissenschaftlichen Fakultät
der Rheinischen Friedrich-Wilhelms-Universität Bonn
1. Gutachter: Prof. Dr. Harald Neumann
2. Gutachter: Prof. Dr. Walter Witke
Tag der Promotion: 10.04.2017
Erscheinungsjahr: 2018
i
Contents
Abbreviations .............................................................................................................. iv
1. Introduction ........................................................................................................... 1
1.1 Microglia: characteristics and functions .............................................................. 1
1.2 Microglia in AD .................................................................................................... 4
1.3 Immune receptors in health and disease ............................................................ 7
1.4 Sialic acids .......................................................................................................... 9
1.5 Aim of Study ...................................................................................................... 13
2. Materials and Methods ........................................................................................ 15
2.1 Materials ........................................................................................................... 15
2.1.1 Cell lines .................................................................................................... 15
2.1.2 Chemicals and Reagents ........................................................................... 15
2.1.3 Growth factors and Cytokines .................................................................... 19
2.1.4 Buffers and Solutions ................................................................................. 19
2.1.5 Kits ............................................................................................................. 20
2.1.6 Media ......................................................................................................... 20
2.1.7 Consumable supplies ................................................................................. 22
2.1.8 Technical equipment .................................................................................. 23
2.1.9 Software ..................................................................................................... 25
2.2 Methods ........................................................................................................ 25
2.2.1 Culture of induced pluripotent stem cells ................................................... 25
2.2.2 Generation of induced pluripotent stem cell derived microglial cell lines
(iPSdM) ............................................................................................................... 25
2.2.3 Proliferation assay for iPSdM ..................................................................... 26
2.2.4 Immunocytochemical analysis for microglial markers ................................ 27
2.2.5 Culture of THP1 monocytes and macrophages ......................................... 27
2.2.6 Sialic acid feeding and chronic amyloid β exposure - experimental setup . 28
2.2.7 HPLC ......................................................................................................... 29
2.2.8 RNA sequencing analysis .......................................................................... 30
2.2.9 Flow cytometry analyses ............................................................................ 30
2.2.10 Western Blot ............................................................................................ 32
2.2.11 ROS production analysis by DHE staining ............................................... 33
2.2.12 Phagocytosis assay ................................................................................. 34
2.2.13 Real time PCR ......................................................................................... 34
2.2.14 Statistics ................................................................................................... 35
3. Results ................................................................................................................ 36
3.1 Developing human microglia from iPS cells as an in vitro model to study
SIGLEC3 ................................................................................................................. 36
3.2 Characterizing microglial cells obtained from human iPS cells ......................... 39
3.2.1 Immunocytochemical analysis ................................................................... 39
3.2.2 Proliferative capacity .................................................................................. 39
3.3 THP1 macrophages as human in vitro model to study SIGLEC3 ..................... 40
3.4 Influence of sialic acids on functions of THP1 macrophages ............................ 42
3.4.1 Incorporation of Neu5Ac and Neu5Gc into the cellular glycocalyx of THP1
macrophages ...................................................................................................... 42
3.4.2 Incorporated Neu5Gc causes broad cellular dysregulation ....................... 44
3.4.3 Incorporated sialic acids can bind SIGLEC3 and chronic treatment with Aβ
increases binding to SIGLEC3 ............................................................................ 45
3.4.4 Neu5Gc bound to inhibitory receptor SIGLEC3 does not propagate
inhibitory signaling .............................................................................................. 47
3.4.5 SIGLEC3 knockout but not Neu5Gc incorporation during chronic exposure
to Aβ downregulates cellular metabolism ........................................................... 49
3.4.6 Neu5Gc incorporation but not SIG3 KO induces apoptosis ....................... 49
3.4.7 Neu5Gc in combination with Aβ treatment induces molecules of activatory
pathways ............................................................................................................. 51
3.4.8 Neu5Gc incorporation but not SIG3 KO or chronic treatment with Aβ
causes radical bursts. ......................................................................................... 51
3.4.9 Neu5Gc incorporation, loss of SIGLEC3 or chronic Aβ exposure influence
phagocytic capacity of macrophages .................................................................. 53
3.4.10 Neu5Gc induces transcription of complement cascade molecules .......... 55
3.4.11 TREM2 expression is induced by chronic treatment with Aβ in WT cells
and drastically reduced in SIG3 KO cells. ........................................................... 57
4. Discussion ........................................................................................................... 59
4.1 Functions of microglia and their contribution to LOAD .................................. 59
4.1.1 Microglia in health and disease .................................................................. 59
4.1.2 Inflammation in LOAD ................................................................................ 61
4.2 Sialic acids and SIGLECs ................................................................................. 61
4.3 Microglial cells as a human model system to study xenosialitis in LOAD ......... 63
4.3.1 Microglial cells as a human model system ................................................. 63
4.3.2 Influence of Neu5Gc on immune cell functions .......................................... 65
4.4 A hypothesis on the associations between LOAD incidence, xenosialitis and
SIGLEC3 ................................................................................................................. 71
5. Summary ............................................................................................................. 75
6. References .......................................................................................................... 77
Acknowledgements / Danksagung ............................................................................. 87
Declaration / Erklärung ............................................................................................... 88
iv
Abbreviations
Aβ Amyloid-β
AD Alzheimer’s disease
ALS Amyotrophic lateral sclerosis
APOE Apolipoprotein E
BDNF Brain derived neurotrophic factor
BSA Bovine serum albumin
nbAβ non-biotinylated Aβ
CD Cluster of differentiation
cDNA Complementary Deoxyribonucleic acid
CNS Central nervous system
CR1 complement receptor 1
CR3 complement receptor 3
Cy Cyanine
DAPI 4',6-diamidino-2-phenylindole
DMSO Dimethyl sulfoxide
dNTP deoxyribonucleotide
EBs Embryoid bodies
EDTA Ethylenediaminetetraacetic acid
FCS Fetal calf serum
FGF Fibroblast growth factor
Fn Fibronectin
GAPDH Glyceraldehyde 3-phosphate dehydrogenase
GDNF Glial cell-line derived neurotrophic factors
GM-CSF Granulocyte-macrophage colony stimulating factor
GWAS Genome wide association study
IBA-1 Ionized calcium binding adaptor molecule 1
Ig Immunoglobulin
IgC2 Immunoglobulin C2-type
IgV Immunoglobulin V-like
IFN Interferon
IL Interleukin
iPS cells Induced pluripotent stem cells
iPSdM Induced pluripotent stem cell derived microglia
ITAM Immunoreceptor tyrosine-based activation motif
ITIM Immunoreceptor tyrosine-based inhibitory motif
KO/SR Knockout serum replacement
LOAD Late onset Alzheimer’s disease
LPS Lipopolysaccharide
Lm Laminin
M-CSF Macrophage colony stimulating factor
MEF Murine embryonic fibroblasts
NEAA Non-essential amino acids
Neu5Ac Acetylated neuraminic/sialic acid
Neu5Gc Glycosylated neuraminic/sialic acid
NGS Normal goat serum
NO Nitric oxide
PBS Phosphate Buffer Solution
PCR Polymerase chain reaction
PE Phycoerythrin
PFA Paraformaldehyde
PLL Poly-L-Lysine
PLO Poly-L-Ornithine
PMA Phorbol 12-myristate 13-acetate
PNS Peripheral nervous system
Rh Recombinant human
RNA Ribonucleic acid
ROS Reactive oxygen species
RT Reverse transcription
SHP Src homology region 2 domain-containing phosphatase
SIGLECs Sialic acid binding Ig-like lectins
TA Annealing temperature
TBE Tris/Borate/EDTA
TGF Transforming growth factor
TLR Toll-like receptor
TNF Tumor necrosis factor
WT Wildtype
Introduction
13
1. Introduction
Humans enjoy a unique dominance over plants and animals. This dominance
advanced with the development of a complex and adaptive central nervous system
(CNS). CNS, comprising of the brain and spinal cord, is vital for integration and
processing of information to achieve coordinated functioning of an organism. The
human brain is a complex organ made up of two major cells types; neurons and glia.
Neurons are considered to be the building blocks of the CNS and therefore
degeneration of neurons leads to gross impairment. A physiological state would
require homeostasis of the 1011 neuronal cells regulated by upto 10-50 times more
numbers of glial cells, followed by cooperative functioning between nervous systems
and motor coordination. However, several factors could lead to degeneration of
neurons. Neurodegeneration can be caused by external factors such as trauma and
pathogens or internal factors such as misfolded proteins, genetic mutations or
inappropriate functioning of supportive cells in the CNS - such as microglia,
astrocytes or oligodendrocytes. Microglia in particular have already been implicated
as key players in brain injury as well as disease by several researchers (reviewed by
Kreutzberg 1996)(Kettenmann et al. 2011) Understanding the factors involved in
neurodegeneration on a cellular level is necessary to develop successful therapies
against neurodegenerative diseases.
1.1 Microglia: characteristics and functions
Microglia, the smallest of the glial cells, are distributed in the brain and spinal cord
and account for 20 % of the total population of glial cells in the CNS (Kreutzberg
1996). The origin of microglia has been recently confirmed by the group led of Florent
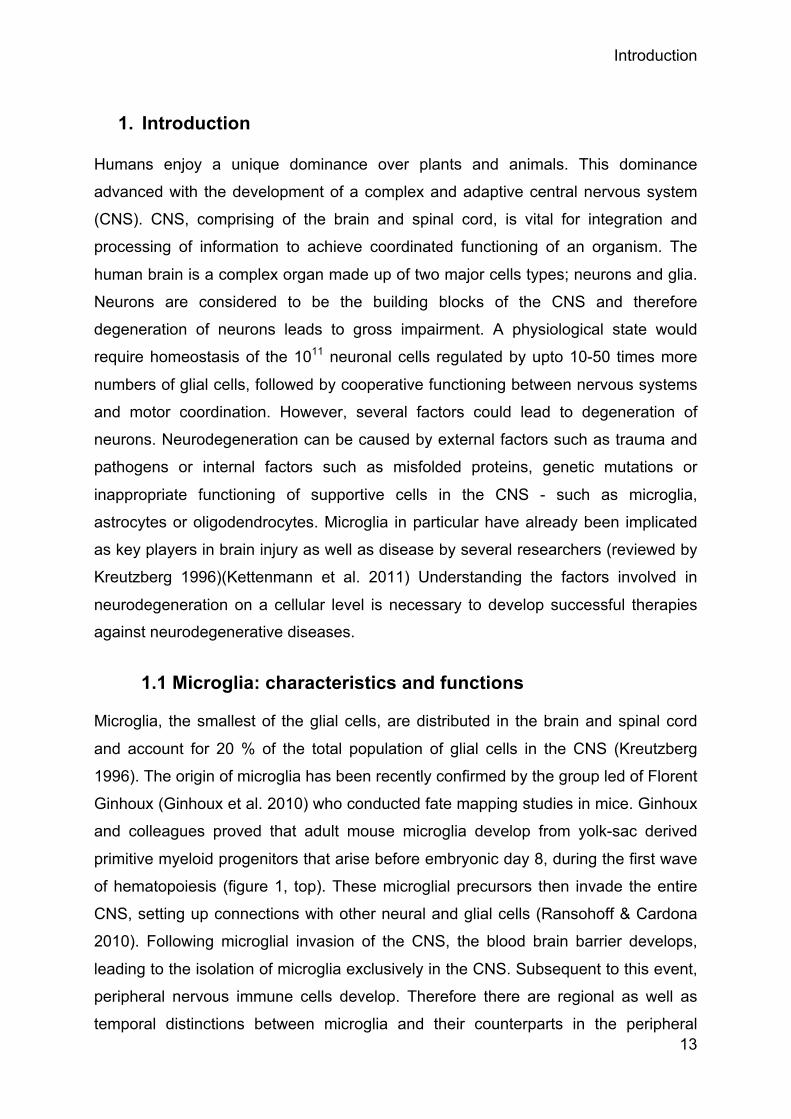
Ginhoux (Ginhoux et al. 2010) who conducted fate mapping studies in mice. Ginhoux
and colleagues proved that adult mouse microglia develop from yolk-sac derived
primitive myeloid progenitors that arise before embryonic day 8, during the first wave
of hematopoiesis (figure 1, top). These microglial precursors then invade the entire
CNS, setting up connections with other neural and glial cells (Ransohoff & Cardona
2010). Following microglial invasion of the CNS, the blood brain barrier develops,
leading to the isolation of microglia exclusively in the CNS. Subsequent to this event,
peripheral nervous immune cells develop. Therefore there are regional as well as
temporal distinctions between microglia and their counterparts in the peripheral
2
nervous system (PNS). The immune cells of the PNS include among others,
monocytes and macrophages. These cell types arise from the second wave of
hematopoiesis, namely - the definitive hematopoiesis (figure 1, bottom).
Figure 1: Origins of microglia and macrophages. Microglial cells develop during the
first wave of hematopoiesis (primitive) around embryonic day 7.5, in mice. The primitive microglia
invade the CNS prior to formation of blood-brain barrier. After which, they mature into the final cell
type in the company of neural cell types (top). Macrophages and monocytes develop during the
second wave of hematopoiesis (definitive) around embryonic day 12.5, in mice. These cells
represent the first immune effector cells of the PNS (bottom).
Therefore, microglia are considered to be the only resident immune cells of the CNS,
while peripheral immune cells are visitors that may temporarily support microglia in
immune responses during pathogenesis. While microglial and their peripheral
counterparts partially differ in their origins, the final cell types are rather
indistinguishable. Both microglia and macrophages are immune reactive cells which
express a comparable array of receptors and functional characteristics. Under
3
physiological conditions microglia actively survey the CNS to maintain homeostasis
(Nimmerjahn et al. 2005). Other physiological functions include synaptic pruning
during development and extracellular signaling via cytokines and chemokines to
contact other cell types in the CNS which help maintain homeostasis (Tremblay et al.
2010). Therefore, microglia are involved in many aspects of brain functioning and are
required to maintain a healthy environment for neuronal signaling. During
development microglia are directed by chemical cues to trim excess neuronal
synapses in order to fine tune connections in the CNS. After development, when
stimulated by chemo- or cytokines from apoptotic cells, microglia phagocytose debris
and maintain homeostasis. Besides physiological functions, these cells play a
defensive role in immune-compromised conditions such as infectious attack or
trauma to the CNS (Kreutzberg 1996). Therefore, they are regarded to be immune
effector cells of the CNS.
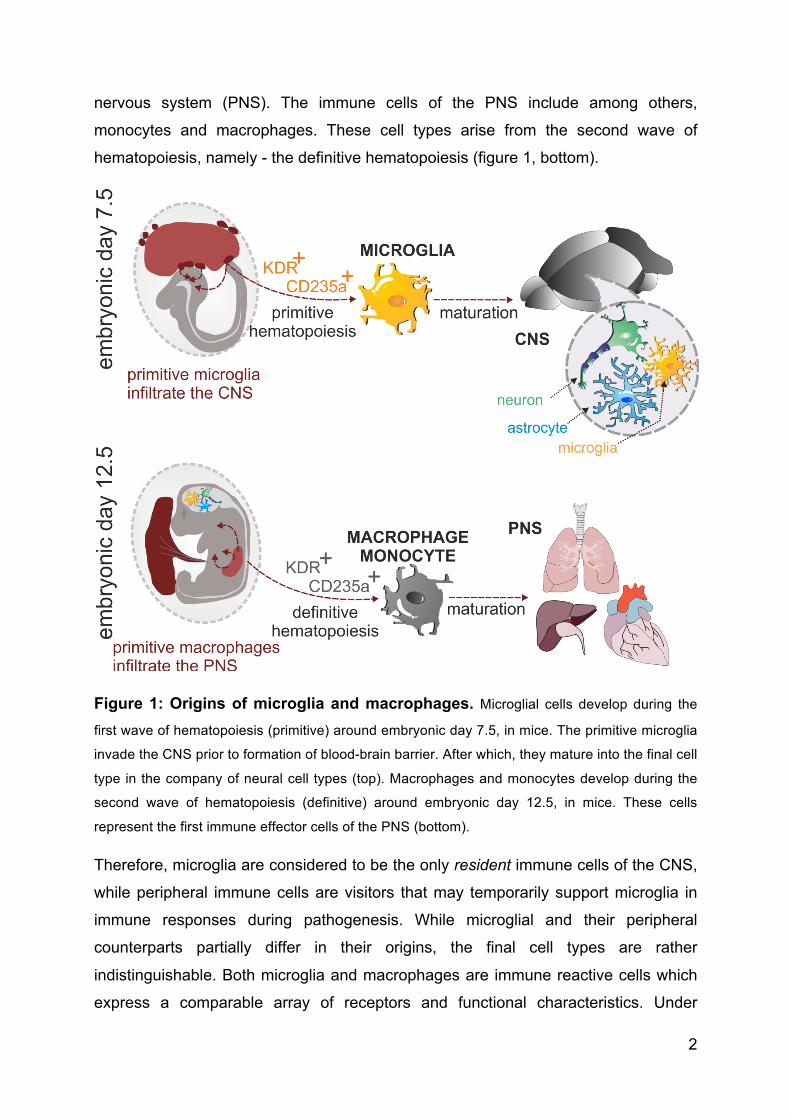
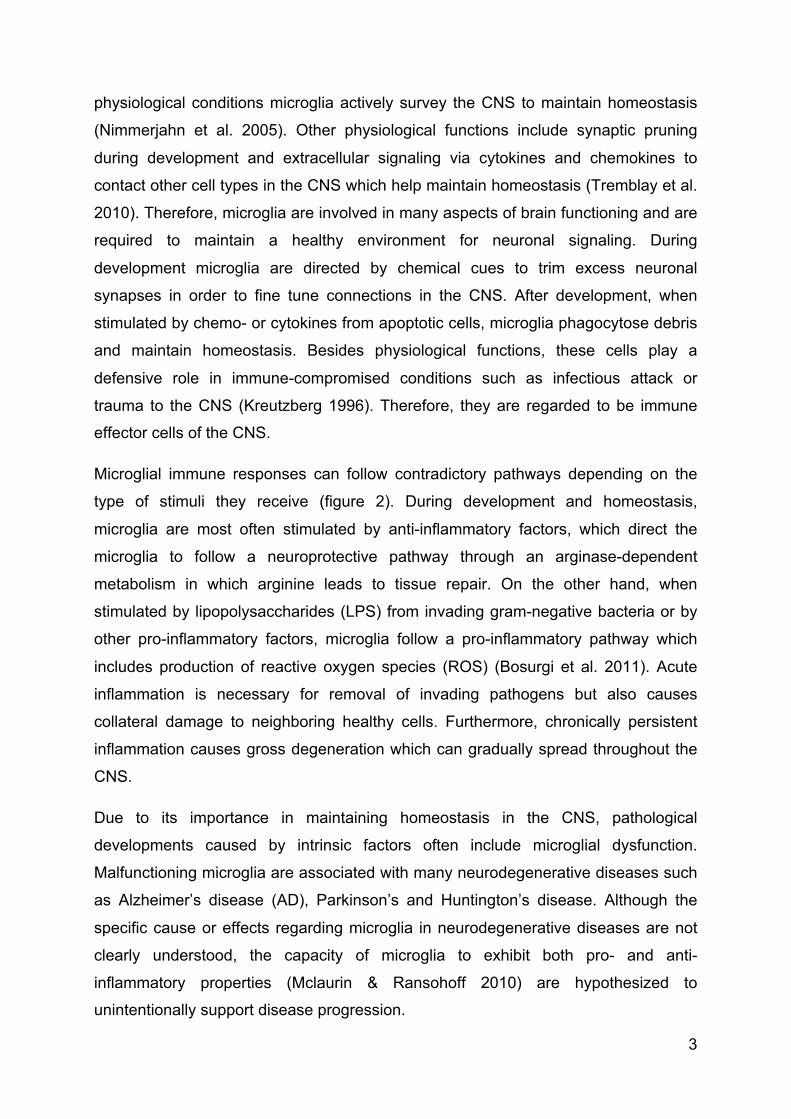
Microglial immune responses can follow contradictory pathways depending on the
type of stimuli they receive (figure 2). During development and homeostasis,
microglia are most often stimulated by anti-inflammatory factors, which direct the
microglia to follow a neuroprotective pathway through an arginase-dependent
metabolism in which arginine leads to tissue repair. On the other hand, when
stimulated by lipopolysaccharides (LPS) from invading gram-negative bacteria or by
other pro-inflammatory factors, microglia follow a pro-inflammatory pathway which
includes production of reactive oxygen species (ROS) (Bosurgi et al. 2011). Acute
inflammation is necessary for removal of invading pathogens but also causes
collateral damage to neighboring healthy cells. Furthermore, chronically persistent
inflammation causes gross degeneration which can gradually spread throughout the
CNS.
Due to its importance in maintaining homeostasis in the CNS, pathological
developments caused by intrinsic factors often include microglial dysfunction.
Malfunctioning microglia are associated with many neurodegenerative diseases such
as Alzheimer’s disease (AD), Parkinson’s and Huntington’s disease. Although the
specific cause or effects regarding microglia in neurodegenerative diseases are not
clearly understood, the capacity of microglia to exhibit both pro- and anti-
inflammatory properties (Mclaurin & Ransohoff 2010) are hypothesized to
unintentionally support disease progression.
4
Figure 2: Contrasting microglial responses. The immune response elicited by microglial
cells depends on the type of stimuli they receive. Stimuli from anti-inflammatory factors elicit a
neuroprotective response (left) with the production of neurotrophic growth factors such as BDNF
and GDNF. While stimuli from invading bacteria and other pathogens elicit a pro-inflammatory
response (right) characterized by the production of radicals and pro-inflammatory cytokines.
BDNF - brain derived neurotrophic factor; GDNF - glial cell line derived neurotrophic factor; IFN -
interferon; IL - interleukin; LPS - lipopolysaccharide; M-CSF - macrophage colony stimulating
factor; NO - nitric oxide; ROS - reactive oxygen species; SIGLEC - sialic acid binding
immunoglobulin-like lectin; TGF - transforming growth factor; TLR - toll like receptor; TNF - tumor
necrosis factor.
1.2 Microglia in AD
Microglial cells are a major source for radical and pro-inflammatory cytokine
production in the CNS, which could lead to neuroinflammation. Since inflammation is
a critical feature of AD, the contribution of microglia to AD onset and progression is in
the focus of AD research (Heppner et al. 2015). AD brains develop widespread
cortical atrophy leading to cognitive disabilities and memory loss. Pathological
features include presence of amyloid plaques and neurofibrillary tangles. The former
are dense, insoluble deposits of amyloid-β (Aβ) peptides accumulated in the
extracellular space, while the latter refers to aggregates of microtubule-associated
protein tau which are hyperphosphorylated and accumulate intracellularly in neurons
(figure 3).
5
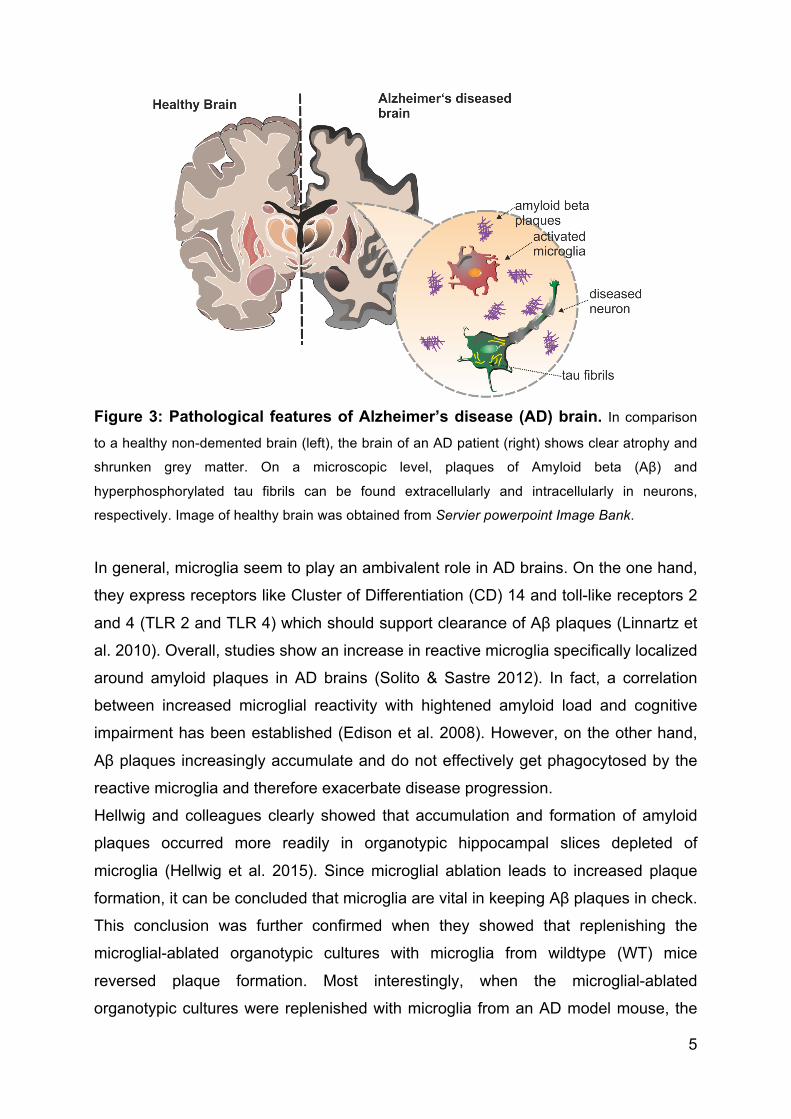
Figure 3: Pathological features of Alzheimer’s disease (AD) brain. In comparison
to a healthy non-demented brain (left), the brain of an AD patient (right) shows clear atrophy and
shrunken grey matter. On a microscopic level, plaques of Amyloid beta (Aβ) and
hyperphosphorylated tau fibrils can be found extracellularly and intracellularly in neurons,
respectively. Image of healthy brain was obtained from Servier powerpoint Image Bank.
In general, microglia seem to play an ambivalent role in AD brains. On the one hand,
they express receptors like Cluster of Differentiation (CD) 14 and toll-like receptors 2
and 4 (TLR 2 and TLR 4) which should support clearance of Aβ plaques (Linnartz et
al. 2010). Overall, studies show an increase in reactive microglia specifically localized
around amyloid plaques in AD brains (Solito & Sastre 2012). In fact, a correlation
between increased microglial reactivity with hightened amyloid load and cognitive
impairment has been established (Edison et al. 2008). However, on the other hand,
Aβ plaques increasingly accumulate and do not effectively get phagocytosed by the
reactive microglia and therefore exacerbate disease progression.
Hellwig and colleagues clearly showed that accumulation and formation of amyloid
plaques occurred more readily in organotypic hippocampal slices depleted of
microglia (Hellwig et al. 2015). Since microglial ablation leads to increased plaque
formation, it can be concluded that microglia are vital in keeping Aβ plaques in check.
This conclusion was further confirmed when they showed that replenishing the
microglial-ablated organotypic cultures with microglia from wildtype (WT) mice
reversed plaque formation. Most interestingly, when the microglial-ablated
organotypic cultures were replenished with microglia from an AD model mouse, the
6
Aβ plaques formation was once again increased (Hellwig et al. 2015). These results
suggest that the functional capabilities of microglia in an AD model are diminished
possibly due to chronic reactivity to fibrillary Aβ. While healthy microglia as well as
microglia in the early stages of amyloid formation are still capable of phagocytosing
the plaques, microglia chronically exposed to the ever increasing plaque load lose
their ability to effectively phagocytose Aβ plaques.
In addition to faulty phagocytosis of Aβ by microglial cells, radical production by
microglia has also been described as a feature of AD (Perry 2002, Ansari et al., 2010
and Zhang et al., 2013). Studies on post-mortem AD brains as well as AD mouse
models describe increased radical production in comparison to healthy controls.
Although, the full contribution of radical damage towards neurodegeneration with
respect to AD was initially controversial, studies now describe neuroinflammation as
a constitutive event in AD brains (Solito et al., 2012, Heneka et al., 2015).
Neuroinflammation is a result of chronic up regulation of pro-inflammatory factors and
radical bursts by reactive astrocytes and microglia. In fact, microgliosis has been
identified in AD irrespective of the presence of Aβ plaques (Edison et al.
2008)(Yokokura et al. 2011)(Varnum & Ikezu 2012). Therefore, publications
describing radical bursts upon treatment with Aβ must be viewed critically. Studies
which claim that Aβ causes neuronal damage due to the induction of pro-
inflammation make use of high concentrations of Aβ (Milton et al. 2008)(Parajuli et al.
2013). However, these studies do not appropriately mirror the in vivo environment of
AD onset since Aβ accumulation is a slow and gradual process.
Furthermore, studies which attribute the onset of AD solely to Aβ accumulation no
longer hold relevance in view of the recent discovery of AD risk alleles through
genome-wide association studies (GWAS). Late onset AD (LOAD) was previously
considered to occur spontaneously, as a consequence of several external factors in
combination with aging. In 2010, a new breakthrough in LOAD research was brought
about by GWA). GWAS identified associations between polymorphisms of several
novel genes with LOAD (Hollingworth et al. 2011)(Naj et al. 2011)(Shi et al. 2012).
Among these, of particular interest in this project, is an immune-related gene- sialic-
acid binding immunoglobulin-like lectin 3 (SIGLEC3).
7
1.3 Immune receptors in health and disease
SIGLEC3 encodes a protein expressed on the surface of immune cells and plays a
role in the innate immune system. SIGLEC3, also known as CD33, binds sialylated
molecules and signals via intracellular immunoreceptor tyrosine-based inhibitory
motifs (ITIM). Ligand binding facilitates phosphorylation of the receptors’ intracellular
tyrosine by Src kinase. Phosphorylated tyrosine serves as a docking site for tyrosine
phosphatases such as Src homology region 2 domain-containing phosphatase-1
(SHP-1) which in turn dephosphorylate downstream molecules of the activatory
signaling pathway. By this way, SIGLEC3 can modulate the downstream molecules
of activation receptors, such as triggering receptor expressed on myeloid cells 2
(TREM2), to gradually dampen activation/inflammation and maintain homeostasis
(figure 4) (reviewed in Linnartz-Gerlach et al. 2014).
Therefore, SIGLEC3 modulates cellular activation and serves to fine tune the cellular
response to stimuli. SIGLEC3 is primarily expressed on cells of myeloid lineage.
Therefore, microglia are the only resident immune cells in the CNS which express
this receptor. Taking into account the association between polymorphisms of CD33
and LOAD, the hypothesis of microglial activities contributing to disease progression
is gaining interest. While the polymorphism rs3865444C of SIGLEC3 has been
associated with increased LOAD risk, the polymorphism rs12459419T has been
recently identified to be protective against LOAD onset (Griciuc et al. 2013).
The final gene of interest in this project having polymorphisms associated with AD is
trem2. TREM2, as the name suggests, is expressed on myeloid type cells such as
microglia and macrophages. TREM2 in association with the intracellular activatory
receptor DAP12 can mediate phagocytosis of apoptotic neurons without
inflammation. GWAS have identified a rare missense mutation in the gene encoding
TREM2, called the R47H substitution (Wang et al. 2015)(Colonna & Wang 2016).
Recent studies have identified that the R47H mutation reduces the binding ability of
TREM2, hindering phagocytosis and therefore perhaps allowing Aβ to accumulate
(Wang et al., 2015). APOE has been described to be a ligand of TREM2 which can
bind Aβ. However, when the binding affinity of TREM2 to its ligand is compromised,
the delivered Aβ cannot be consequently phagocytosed.
8
All in all, polymorphisms of several genes have been associated with increased
LOAD risk. Interestingly, a high number of these genes are transcribed in immune
cells. The compromised ability to phagocytose when faced with Aβ plaques seems to
be a repeated facet of LOAD risk. Both proteins described above; SIGLEC3 and
TREM2 are involved in immune response by modulating phagocytosis. Therefore, an
event of Aβ accumulation by the malfunctioning of one or more of these genes is
highly possible.
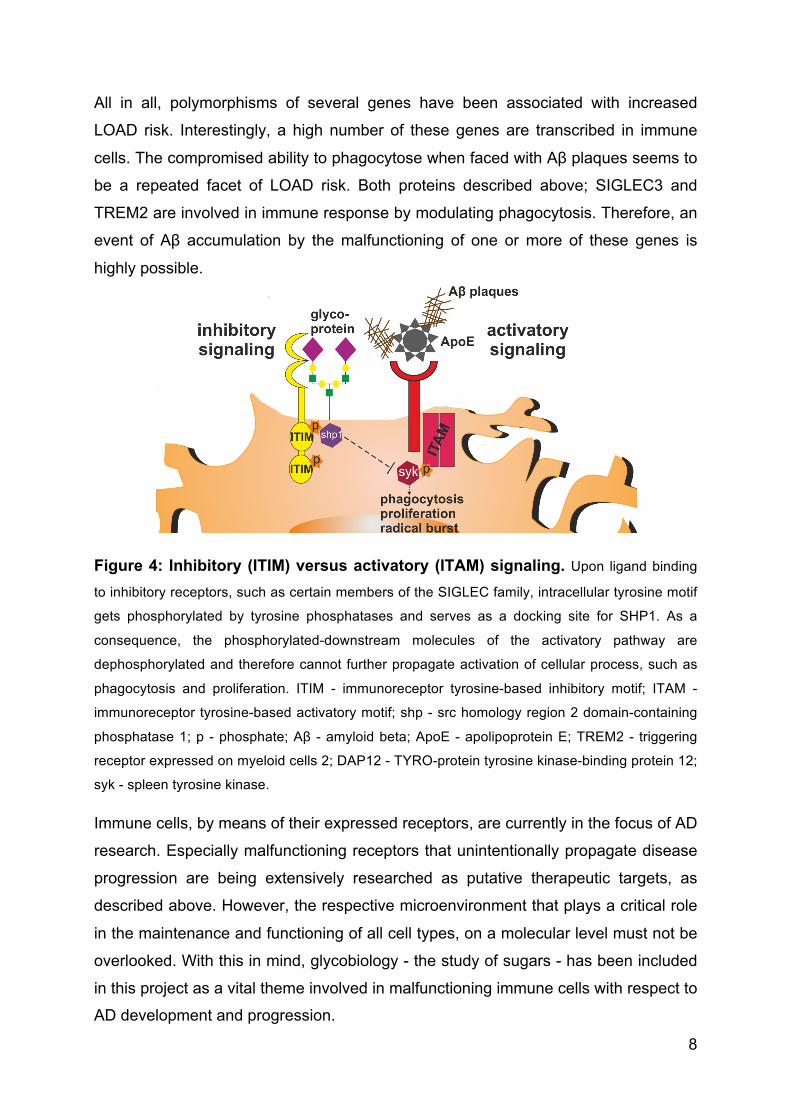
Figure 4: Inhibitory (ITIM) versus activatory (ITAM) signaling. Upon ligand binding
to inhibitory receptors, such as certain members of the SIGLEC family, intracellular tyrosine motif
gets phosphorylated by tyrosine phosphatases and serves as a docking site for SHP1. As a
consequence, the phosphorylated-downstream molecules of the activatory pathway are
dephosphorylated and therefore cannot further propagate activation of cellular process, such as
phagocytosis and proliferation. ITIM - immunoreceptor tyrosine-based inhibitory motif; ITAM -
immunoreceptor tyrosine-based activatory motif; shp - src homology region 2 domain-containing
phosphatase 1; p - phosphate; Aβ - amyloid beta; ApoE - apolipoprotein E; TREM2 - triggering
receptor expressed on myeloid cells 2; DAP12 - TYRO-protein tyrosine kinase-binding protein 12;
syk - spleen tyrosine kinase.
Immune cells, by means of their expressed receptors, are currently in the focus of AD
research. Especially malfunctioning receptors that unintentionally propagate disease
progression are being extensively researched as putative therapeutic targets, as
described above. However, the respective microenvironment that plays a critical role
in the maintenance and functioning of all cell types, on a molecular level must not be
overlooked. With this in mind, glycobiology - the study of sugars - has been included
in this project as a vital theme involved in malfunctioning immune cells with respect to
AD development and progression.
9
1.4 Sialic acids
Previous studies (Samraj et al., 2014, Ma et al., 2016) have already reiterated the
influence that different types of sugars or sialic acids have on the functioning of
various cell types, including, immune cells. In fact, it is now known that the
incorporation of a foreign sialic acid can lead to inflammation called “xenosialitis”
(Samraj et al. 2015). Therefore, the fact of developing chronic inflammation, a
hallmark of AD, which could be caused by xenosialitis is a topic worth investigating
further. To first understand the depths of the influence sugars have on our cells, their
molecular and structural characteristics must be studied.
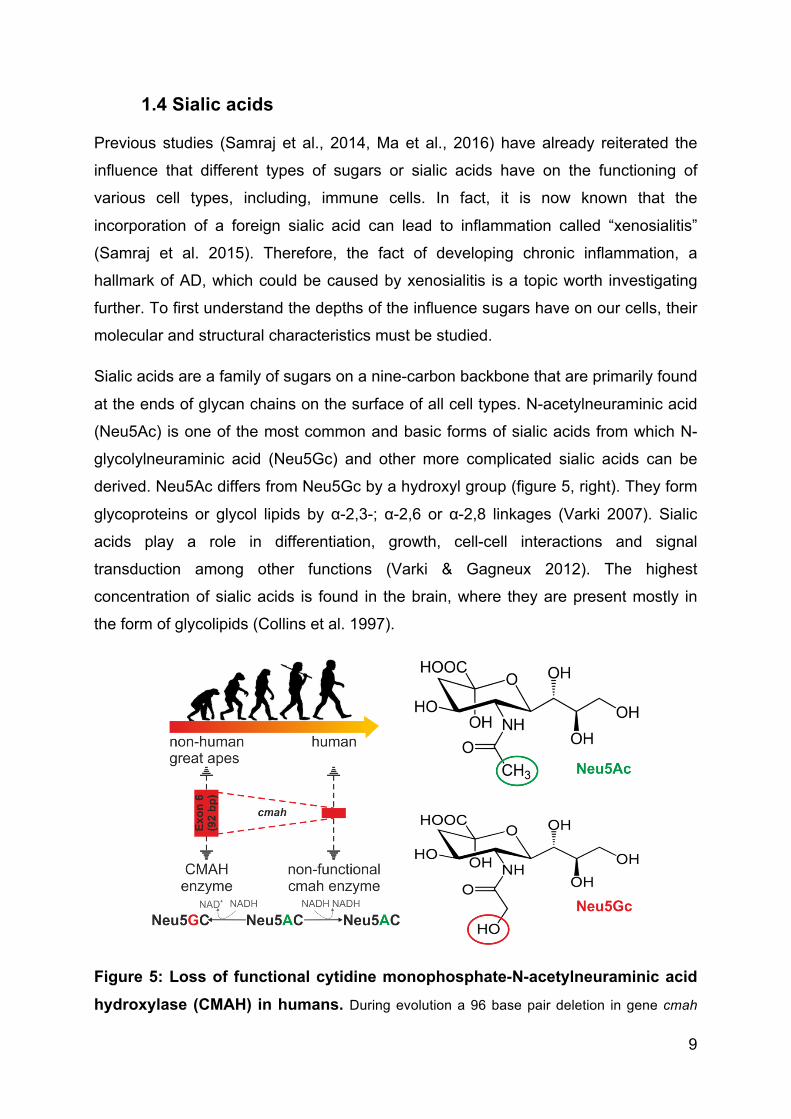
Sialic acids are a family of sugars on a nine-carbon backbone that are primarily found
at the ends of glycan chains on the surface of all cell types. N-acetylneuraminic acid
(Neu5Ac) is one of the most common and basic forms of sialic acids from which N-
glycolylneuraminic acid (Neu5Gc) and other more complicated sialic acids can be
derived. Neu5Ac differs from Neu5Gc by a hydroxyl group (figure 5, right). They form
glycoproteins or glycol lipids by α-2,3-; α-2,6 or α-2,8 linkages (Varki 2007). Sialic
acids play a role in differentiation, growth, cell-cell interactions and signal
transduction among other functions (Varki & Gagneux 2012). The highest
concentration of sialic acids is found in the brain, where they are present mostly in
the form of glycolipids (Collins et al. 1997).
Figure 5: Loss of functional cytidine monophosphate-N-acetylneuraminic acid hydroxylase (CMAH) in humans. During evolution a 96 base pair deletion in gene cmah
10
resulted in humans being the only higher mammals to lack the ability to convert N-
acetylneuraminic (Neu5Ac) acid to N-glycolylneuraminic acid (Neu5Gc) (left). NAD+ / NADH –
nicotinamide adenine dinucleotide. Neu5Ac can by hydrolyzed to give rise to Neu5Gc. Therefore
the two sialic acids differ by a single oxygen atom (right). Structural images of Neu5Ac and
Neu5Gc were modified from Wikipedia.
Interestingly, sialic acids are found in the midst of an evolutionary race between
vertebrates, which use these sialic acids to fine tune immune responses, and
pathogens, which hijack host sialic acids to avoid immune response of the latter
(reviewed by Varki 2007). The most notable evolutionary change with regards to
sialic acids is the frame shift mutation in the cytidine monophosphate N-
acetylneuraminic acid hydroxylase (CMAH) gene caused by a 96-base pair deletion
of exon 5 (Padler-Karavani, Hurtado-Ziola, et al. 2013). As a result, Neu5Ac cannot
be converted to Neu5Gc (figure 5, left). Therefore, humans experienced a loss of
Neu5Gc and accumulation of Neu5Ac and consequently, a change in several
receptors which have evolved to recognize these sialic acids. These receptors have
evolved to recognize specific types or forms of sialic acids in an attempt to fine tune
immune responses (Varki 2010). Therefore, sialic acids that cover most proteins and
lipids on the cell surface and their corresponding receptors are emerging as
important structures in human physiology. SIGLECS are one such receptor family
that is found primarily on the surface of immune cells and oligodendrocytes. The
above described SIGLEC3 is a member of the SIGLEC family, with inhibitory
signaling capacity in humans.
Humans evolved to not produce Neu5Gc as an attempt to avoid pathogen infiltration
using molecular mimicry. However, several studies have shown individuals to have
antibodies against Neu5Gc (Padler-Karavani et al., 2013). In fact, Neu5Gc has been
found in cancer tissue as well as in embryonic tissue. Naturally, the question arises -
Where does this Neu5Gc originate from? Studies by Bardor and colleagues (Bardor
et al., 2005) have extensively shown that Neu5Gc can be incorporated from
metabolism by micropinocytosis or endocytosis. Since the uptake of the sialic acids
occur in a non-receptor mediated manner, both sialic acids are pino-/ endocytosed in
a non-biased manner. Neu5Ac and Neu5Gc enter the cell, either as free sialic acids
or on glycoproteins. Sialic acids on proteins are first separated by lysosomal
sialidases and then placed onto new proteins by sialyltransferases. The newly built
glycoproteins are then transported to the cell surface to form a part of the glycocalyx
11
(figure 6). Once Neu5Ac and Neu5Gc are part of the glycocalyx, they are open for
receptor binding (or rather mis-binding) leading to a malfunctioning of receptors that
depend on sialic acids as endogenous ligands. The previously described SIGLEC 3
is a member of the family of inhibitory SIGLEC receptors and as explained, binds
sialic acid. Therefore, it can be postulated that incorporation of foreign sialic acids
may negatively influence the binding and functioning of a sialic acid-binding receptor
such as SIGLEC3. Considering correlation between SIGLEC3 and LOAD, by
extension, it could be hypothesized that sialic acids may play a role in either LOAD
development or progression.
Therefore, this thesis focuses on the all-encompassing idea that incorporated sialic
acids may influence the functioning of LOAD associated receptors which in turn may
be causative or supportive of the neurodegenerative diseases. With this in mind, the
concept followed in this project was to identify the influence of foreign sialic acids
(Neu5Gc) in comparison to native sialic acids (Neu5Ac) on several typical aspects of
microglia functioning. In order to mimic a pre-clinical AD environment, the cells were
additionally exposed to nanomolar concentrations of Aβ. The Aβ concentration for
this project was intentionally selected to be upto 10 times lower than described in
previous publications (Milton et al. 2008; Parajuli et al. 2013), to serve as part of the
cellular environment rather than to be a strong stimulation. Several read outs such as
phagocytosis capacity, proliferative and apoptotic rate, reactive oxygen species
(ROS) production and many more have been extensively studied. These studies
could help identify the underlying cause of chronic inflammation as found in AD.
12
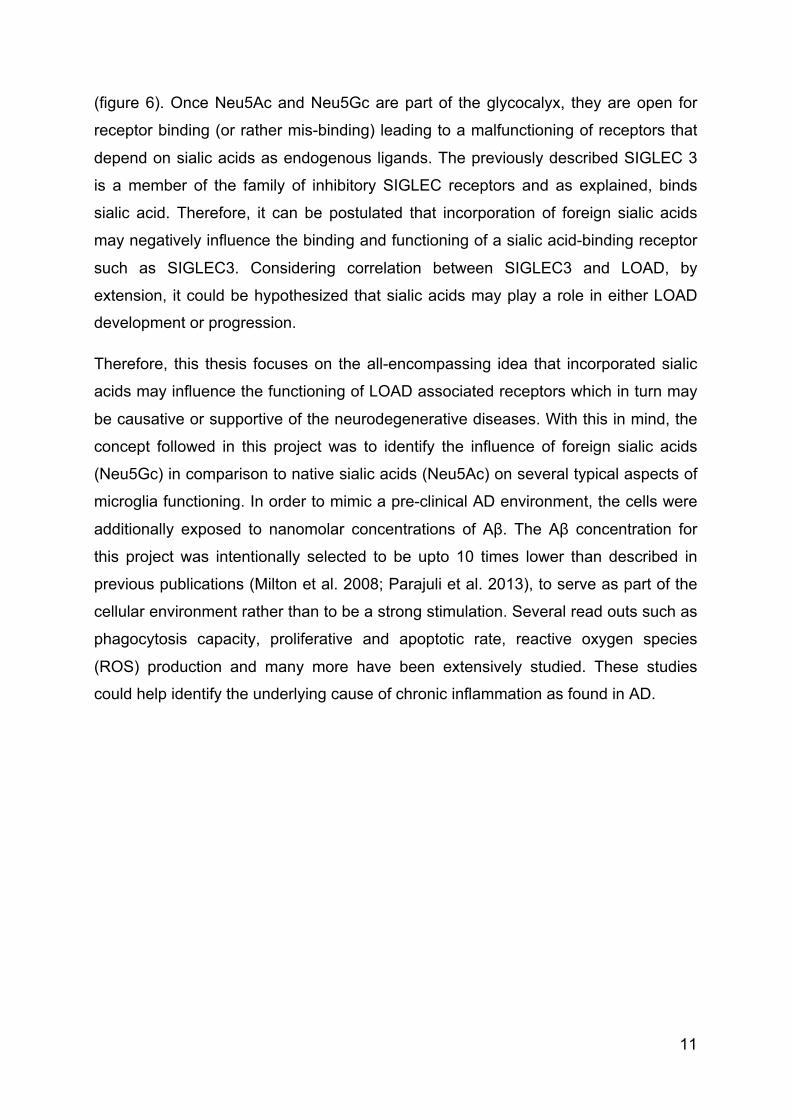
Figure 6: Mechanism of Neu5Gc incorporation. Neu5Gc can be metabolically
incorporated in to the cell surface glycocalyx. Neu5Ac as well as Neu5Gc are taken up by pino- or
endocytosis, as free sialic acids or in the form of glycoproteins. Once engulfed, the sialic acid-
bound glycoprotein is modified by means of lysosomal sialidases and sialyl transferases. The
final product is re-introduced on the cell surface glycocalyx, where the sialic acids are exposed
and available for receptor binding. Lectin family of receptors such as SIGLECs are capable of
binding sialic acids.
13
1.5 Aim of Study
Chronic inflammation is an undisputed feature of late onset Alzheimer’s disease
(LOAD). Activated microglia,found around amyloid beta (Aβ) plaques are implicated
as the source of inflammation. However they are incapable of efficiently
phagocytosing the plaques and therefore lead to Aβ accumulation. The molecular
mechanisms responsible for this ambivalent and ultimately neurodestructive behavior
of microglia remains elusive. Studies show that the deposition of Aβ occurs in
demented as well as non-demented individuals. Therefore, deposition of Aβ is not
solely responsible for disease onset nevertheless accumulation of Aβ plaques
possibly exacerbates LOAD progression. Furthermore, Genome-wide association
studies (GWAS) have identified polymorphisms of several genes, including SIGLEC3
and TREM2 found on microglia, which increase LOAD risk. Both proteins are
involved either directly or indirectly with maintenance of homeostasis and
phagocytosis. Therefore, it is conceivable that dysregulation of these proteins could
cause inflammation and faulty phagocytosis as seen in LAOD patients.
The objective of this project was to establish a human microglial model system to
study SIGLEC3 signaling and SIGLEC3 receptor interaction with sialic acids in AD
pathology. A human model system is critical since SIGLEC3 is highly species specific
and therefore cannot be studied in animal models. As such, a protocol to differentiate
microglia (iPSdM) from induced pluripotent stem (iPS) cells was optimized in the
scope of this thesis. However, the cell numbers obtained were limited and hindered
the extent of biochemical and functional analysis that could be performed. Therefore,
THP1 human monocyte-derived macrophage cell line was used as a surrogate
human model system to study the role of SIGLEC3 signaling. In this regard, the
influence of an immunogenic sialic acid - Neu5Gc in comparison to sialic acid -
Neu5Ac, serving as a ligand to SIGLEC3, on macrophage functions was analyzed.
Furthermore, in order to mimic the environment of an AD brain on a molecular level,
macrophages were also chronically treated with nanomolar concentrations of Aβ. The
overall hypothesis of this thesis involves the comprehensive idea that chronic
inflammation occurs as a result of persistently activated microglia due to improper
SIGLEC3 signaling caused by Neu5Gc. The chronically malfunctioning microglia
exacerbates neurodegeneration and elicits an inappropriate response to Aβ
14
deposition. Overall, this thesis aims at determining the underlying molecular
mechanisms preceding clinically diagnosed LOAD.
74
2. Materials and Methods
2.1 Materials 2.1.1 Cell lines
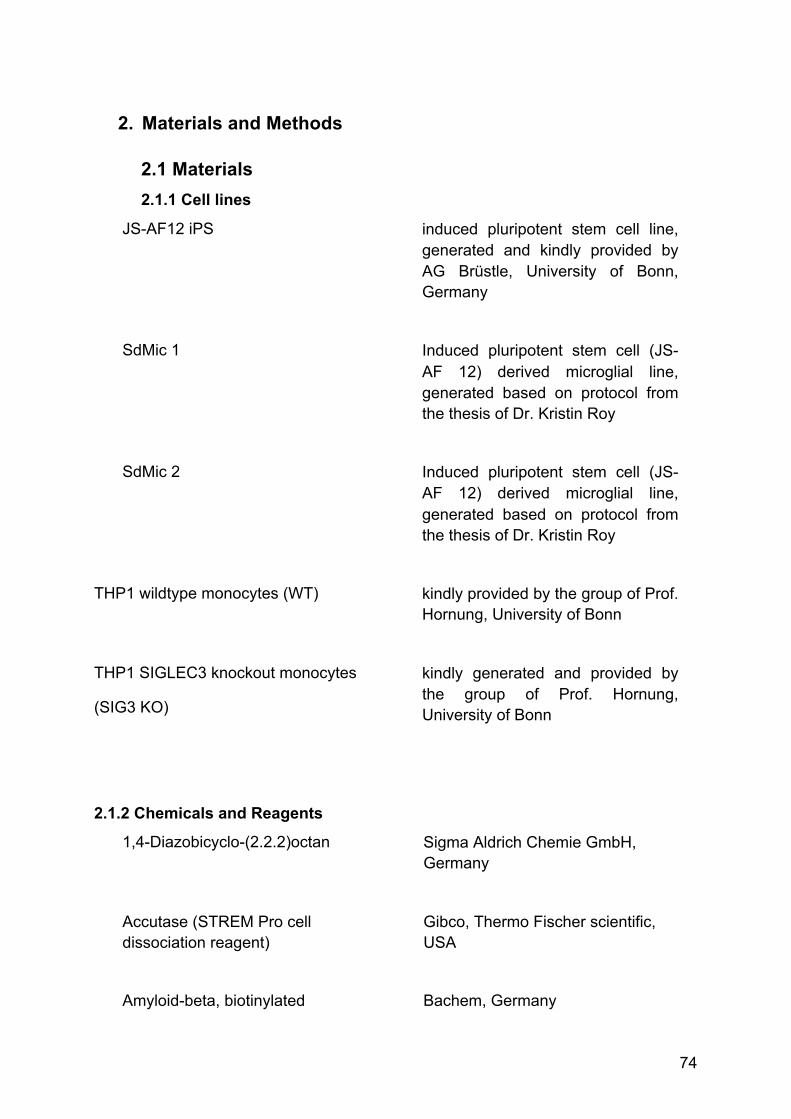
JS-AF12 iPS induced pluripotent stem cell line, generated and kindly provided by AG Brüstle, University of Bonn, Germany
SdMic 1 Induced pluripotent stem cell (JS-AF 12) derived microglial line, generated based on protocol from the thesis of Dr. Kristin Roy
SdMic 2 Induced pluripotent stem cell (JS-AF 12) derived microglial line, generated based on protocol from the thesis of Dr. Kristin Roy
THP1 wildtype monocytes (WT) kindly provided by the group of Prof. Hornung, University of Bonn
THP1 SIGLEC3 knockout monocytes
(SIG3 KO)
kindly generated and provided by the group of Prof. Hornung, University of Bonn
2.1.2 Chemicals and Reagents
1,4-Diazobicyclo-(2.2.2)octan Sigma Aldrich Chemie GmbH, Germany
Accutase (STREM Pro cell dissociation reagent)
Gibco, Thermo Fischer scientific, USA
Amyloid-beta, biotinylated Bachem, Germany
16
Amyloid-beta, non-biotinylated Peptide speciality laboratories, Germany
Apo-transferrin, Human Sigma Aldrich Chemie GmbH, Germany
Apo-transferrin, Bovine Sigma Aldrich Chemie GmbH, Germany
Aqua Poly/Mount Polysciences Inc, USA
β-Mercaptoethanol Gibco, Thermo Fischer scientific, USA
B27 supplement (50x) Gibco, Thermo Fischer scientific, USA
Bovine serum albumin Sigma Aldrich Chemie GmbH, Germany
Collagenase , type IV Gibco, Thermo Fischer scientific, USA
Chicken serum Gibco, Thermo Fischer scientific, USA
ddH2O Filtered and autoclaved in-house
D-(+)-Glucose solution (45 %) Sigma Aldrich Chemie GmbH, Germany
DiI, cell tracker Life technologies, USA
Dihydroethidium (DHE) Thermo Fischer scientific, USA
17
Dimethyl sulfoxide Carl Roth GmbH & Co KG,, Germany
DMEM/F12 (1:1) with L-glutamine and 15 mM HEPES
Gibco, Thermo Fischer scientific, USA
EDTA Carl Roth GmbH & Co KG,, Germany
Ethanol Carl Roth GmbH & Co KG, Germany
Fluoresbrite Polychromatic Red microspheres 1.0 µm
Polysciences Incorporated, Germany
Fibronectin from bovine plasma Sigma Aldrich Chemie GmbH, Germany
Fibronectin 0.1 % solution Sigma Aldrich Chemie GmbH, Germany
Fetal calf serum Gibco, Thermo Fischer scientific, USA
Geltrex Thermo Fischer scientific, USA
Knockout serum replacement Gibco, Thermo Fischer scientific, USA
Laminin Sigma Aldrich Chemie GmbH, Germany
L-Glutamine (200 mM) Gibco, Thermo Fischer scientific, USA
LPS Invivogen, USA
18
Non-essential amino acids (10 mM) Gibco, Thermo Fischer scientific, USA
N2 supplement (100x) Gibco, Thermo Fischer scientific, USA
Normal goat serum Sigma Aldrich Chemie GmbH, Germany
Paraformaldehyde Merck Millipore, Germany
PBS Gibco, Thermo Fischer scientific, USA
Penicillin/Streptomycin Gibco, Thermo Fischer scientific, USA
Phorbol 12-myristate 13-acetate
Sigma Aldrich Chemie GmbH, Germany
Poly-L-Lysine Sigma Aldrich Chemie GmbH, Germany
Poly-L-Ornithin Sigma Aldrich Chemie GmbH, Germany
ROCK Inhibitor Y-27632 Merck Millipore, Germany
RPMI medium 1640 Thermo Fischer scientific, USA
Sodium pyruvate (100 mM) Gibco, Thermo Fischer scientific, USA
TritonX Sigma Aldrich Chemie GmbH, Germany
19
Trypsin (0.25 %) Gibco, Thermo Fischer scientific, USA
2.1.3 Growth factors and Cytokines
Recombinant human fibroblast growth factor 2 (rhFGF2)
R&D Systems GmbH, Wiesbaden, Germany
Recombinant human (rh) IL 34 Biolegend,BIOZOL, Germany
Recombinant human Macrophage colony stimulation factors (rhMCSF)
R&D systems, USA
2.1.4 Buffers and Solutions
4 % Paraformaldehyde 4 g Paraformaldehyde in 100 ml 1x PBS
10x Bovine serum albumin 10 g BSA in 100 ml 1 x PBS
10x TBE 108 g Tris
55 g boric acid
40 ml 0.5 EDTA
ad 1 l aqua bidest.
EDTA 46.53 g EDTA
170 ml aqua bidest.
adjust pH 8.5 with 5 M NaOH
ad 250 ml aqua bidest.
MES SDS running buffer for western blot
Novex, Life Technologies, USA
20
Poly-L-Lysine (5 µg/ml) 5 µg in 1 ml aqua dest.
Poly-L-Ornithin (0.01 mg/ml) 9.2745 g boric acid ad 1 l aqua bi-destilled
100 mg Poly-L-Ornithin
Restore Plus western blot stripping buffer
Thermo Fischer scientific, USA
Saccharose, 30 % 30 % saccharose 0.1 % sodium azide
add 500 ml PBS
Transfer buffer for western blot Novex, Life Technologies, USA
Tris buffer, 0.2 mM pH 8.5 24.765 g in 150 ml aqua bidest.
adjust pH
2.1.5 Kits
RNeasy Mini Kit Qiagen
SuperScript First-Strand Synthesis Systme
Invitrogen
Blood and tissue kit Qiagen
2.1.6 Media
B27 differentiation medium
APEL medium (StemCell technologies)
2 % B27
20 ng/ml rhFGF2
5 µg/ml fibronectin
21
freezing medium 50 % KO-SR
40 % medium
10 % DMSO
iPS-differentiation medium
DMEM/F12 (1:1) with L-glutamine with HEPES (15 mM)
20 % knockout serum replacement
0.1 mM NEAA
0.1 mM L-glutamine
N2 differentiation medium
APEL medium (StemCell technologies)
1 % N2 supplement
20 ng/ml rhFGF2
10 ng/ml laminin
N2 medium DMEM/F12 (1:1) with L-glutamine with HEPES (15 mM)
1 % N2 supplement
0.5 mM L-glutamine
5.3 µg/ml D-glucose
100 µg/ml penicillin/streptomycin
TESR-E8 medium Stem cell technologies
THP1 medium for monocyte culture
RPMI medium1640 (500 ml)
1 % chicken serum
1 % sodium pyruvate
1 % L-glutamine
1 % penicillin/streptomycin
22
1 % N2 supplement
THP1 experimentation medium
RPMI medium1640 (500 ml)
1 % sodium pyruvate
1 % L-glutamine
1 % penicillin/streptomycin
1 % N2 supplement
2.1.7 Consumable supplies
6-well Tissue Culture Plate Cellstar, Greiner Bio One, Germany
96-well optical bottom plates Thermo Fischer scientific, USA
Bacterial dishes (100 mm) Corning incorporated, USA
Cell Scraper Sigma Aldrich Chemie GmbH, Germany
Cryovials (2 ml) Sarstedt Ag & CoKG, Germany
Falcon tubes (15 ml) Cellstar, Greiner Bio One, Frickenhausen, Germany
Falcon tubes (50 ml) Sarstedt Ag & CoKG, Germany
Filtropur (0.25 µm, 0.4 µm) Sarstedt Ag & CoKG, Germany
Graduate pipette Tipps (10 µl, 100 µl, 1000 µl)
Starlab GmbH, Ahrensburg, Germany
Lab-Tek Chamber Slide w/ Cover Permanox Slide Sterile 4
Thermo Fischer scientific, USA
23
Well
Microscope cover glasses P. Marienfeld GmbH, Germany
Needles Sterican, Braun Meisungen AG, Germany
Nitrile gloves Meditrade, Germany
Pasteur pipettes Brand GmbH & Co KG, , Germany
Pipettes (5 ml, 10 ml, 25 ml) Corning incorporated, USA
Safe-seal micro tubes (0.5 ml, 1.5 ml, 2 ml)
Sarstedt Ag & Co KG, Germany
Syringes (5 ml, 10 ml) Omnifix, Braun Meisungen AG, Germany
Tissue Culture Dishes (35 mm, 60 mm, 100 mm)
Sarstedt Inc., USA
Tissue Culture Flask (75 cm3, 25 cm3)
Sarstedt Inc., USA
Vacuum driven disposable bottle top filter
Merck Millipore, Germany
2.1.8 Technical equipment
- 20°C freezer Liebherr, Switzerland
+ 4°C fridge Liebherr, Switzerland
24
BD FacsCalibur BD Biosciences, USA
BD FacsCanto II BD Biosciences, USA
Cell MateII (pipette boy) Thermo Fisher Scientific Inc., USA
Eppendorf Mastercycler epgradient S Eppendorf
Hera cell 150 (incubator) Heraeus Holding GmbH, Germany
Hera freeze (- 80°C freezer) Heraeus Holding GmbH, Germany
Hera safe (laminar-air flow
workbench)
Kendro Laboratory Products
GmbH, Germany
Mefaguge1.0R (centrifuge) Heraeus Holding GmbH, Germany
Microscopes Carl Zeiss AG, Germany
HBO 50/AC
Axiovert200M
ImagerZ1
Micropipettes (10µl, 100µl, 1000µl) Eppendorf AG, Germany
Systec D-150 (autoclave) Systec GmbH, Germany
25
Thermomixer compact Eppendorf AG, Germany
Water bath WB/OB7-45 Memmert GmbH & CoKG, Germany
2.1.9 Software
BD CellQuest Pro BD Biosciences, USA
BD FACS Diva BD Biosciences, USA
FlowJo FlowJo LLC, USA
Fluoview ver.3.1 Olympus corporation
ImageJ NIH, USA
ImageLab Bio-Rad, Germany
Olympus FluoView1.4 Olympus, Germany
SPSS SPSS Inc., USA
Wallac Envision manager PerkinElmer, USA
2.2 Methods
2.2.1 Culture of induced pluripotent stem cells
Induced pluripotent stem (iPS) cells were cultured on a layer of geltrex matrix in
TESR-E8 medium. The iPS cells grow in colonies and when the colonies covered
about 70% of the surface, they were passaged using accutase. For passaging,
colonies were treated with accutase for 3 minutes. The detached single cells were
collected in a falcon tube and centrifuged at 1000 rpm, for 3 minutes. The cell pellet
was resuspended in fresh TESR-E8 medium and plated onto a new matrix-coated
culture plate in the presence of 10 µM ROCK inhibitor for the first 24 hours after
passaging. After 24 hours, medium containing ROCK inhibitor was replaced with
fresh pre-warmed TESR-E8 medium.
2.2.2 Generation of induced pluripotent stem cell derived microglial cell lines (iPSdM)
26
Differentiation was initiated by detaching intact colonies using 1 mg/ml collagenase.
The colonies were centrifuged at 1000 rpm, for 3 minutes and the supernatant was
discarded. The cell pellet was very gently resuspended, to maintain the colonies
intact, in iPS-differentiation medium and placed in non-adherent bacterial culture
dishes to support 3-D formation of embryoid bodies (EBs). The EBs were maintained
in suspension culture for eight days. On the final day of suspension culture, a few
EBs were analyzed for the expression of KDR (1:5, anti-human KDR-FITC) and
CD235a (1:50, anti-human CD235a-APC) positive cells, by flow cytometry. The
remaining EBs were then plated onto PLO/Fn coated culture dishes in B27
differentiation medium (section 2.1.6) and maintained for 14 days, with media
changes as necessary. For the first two days in B27 differentiation media, the
differentiating cells were stimulated with 50 ng/ml IL-34. The culture media was then
switched to N2 differentiation (section 2.1.6), for a further 10 days. For the first two
days in N2 differentiation media, the differentiating cells were stimulated with 50
ng/ml IL-34. Finally, the cells were cultured in N2 medium without supplementation.
The differentiation plates were supplied with fresh N2 medium as necessary and
maintained in culture until the appearance of microglia was observed. Microglia were
morphologically identified as round-shiny cells with a size of 30 - 40 µm. At the
appearance of a few round-shiny cells, the differentiation plate was stimulated for 48
hours with IL-34 (100 ng/ml) to support the expansion of the cells of interest. Once
several thousand cells appear, the round-shiny cells can be manually isolated with
the help of a micropipette and bright-field microscope under a sterile, horizontal
hood.
All analyses were carried out on PLL-coated 96-well optical-bottom plates and using
confocal microscopy. The morphologically identifiable round-shiny microglial cells
were manually isolated from the differentiation plate using a micropipette. The
isolated cells were distributed in a 96-well plate and stimulated with IL-34 (100 ng/ml)
for the first 24 hours after isolation
2.2.3 Proliferation assay for iPSdM
Proliferative capacity of cells was analyzed by measuring the incorporation of Ki67.
The cells were fixed for 10 minutes by 4 % PFA followed by washing and blocking in
10 % BSA supplemented with 0.5 % NGS and 0.1 % Triton-X-100, for 60 minutes at
room temperature. After blocking, the cells were co-stained overnight with primary
27
antibodies against Ki67 and IBA-1, at 4 °C (table 1). Cells were then stained with
corresponding secondary antibodies (table 1) for 2 hours at room temperature,
protected from light. Finally, the nuclei of the cells were stained with 1:10,000 DAPI
for 30 seconds. After washing three times in 1x PBS, cells were stored in 1x PBS and
imaged immediately by confocal microscopy. Analyses were performed using ImageJ
software.
2.2.4 Immunocytochemical analysis for microglial markers
The isolated microglial cells were placed a 96-well optical bottomed plate and fixed
with 4 % PFA for 10 minutes. Following fixation, cells were blocked for 60 minutes at
room temperature with 10 % BSA supplemented with 5 % NGS and 0.1 % Triton-X-
100. The primary antibodies were added overnight at 4 °C (table 1). Respective
secondary antibodies were stained for 2 hours at room temperature, protected from
light (table 1). Cells were then kept in 1x PBS and imaged immediately by confocal
microscopy. Analyses were performed using ImageJ software.
Table 1: Antibodies for immunocytochemical analysis of iPS-derived microglia
Primary antibody (concentration) Secondary antibody
(concentration)
CD11b (5 µg/ml)
BD biosciences, 553307
PE anti-rat (5 µg/ml)
TREM2 (5 µg/ml)
R&D systems, mab1828
PE anti-mouse (5 µg/ml)
Ki67 (1:100)
Millipore, AB9260
PE anti-rabbit (5 µg/ml)
IBA-1 (1:500)
Wako, 019-19741
PE anti-rabbit (5 µg/ml)
2.2.5 Culture of THP1 monocytes and macrophages
Wildtype (WT) as well as SIGLEC3 Knockout (SIG3 KO) THP1 monocytes were
generously contributed by Prof. Hornung (University of Bonn). SIG3 KO cells were
obtained by crispr-cas9 technology, causing a four base pair deletion in Exon 3 (base
pair 566 to base pair 569). The deletion disrupts translation of the modified gene into
28
a functional protein. The SIG3 KO cells are a 100 % devoid of functional protein
SIGLEC3.
Monocytes were obtained in RPMI medium supplemented with 10 % FCS, 2 mM L-
glutamine, 1 mM sodium pyruvate and 100 µg/ml penicillin/streptomycin. However,
further culturing was performed in modified medium adapted to contain only
acetylated sialic acids (human-like). For this purpose, culturing was carried out in
RPMI medium supplemented with 1 % Chicken Serum, 0.2 mM L-glutamine, 1 mM
sodium pyruvate, 100 µg/ml penicillin/streptomycin and 1 % N2 supplement.
Experimentation was performed on monocyte-derived macrophages. THP1
macrophages were obtained from monocytes by plating a defined number of cells in
culture plates with 10 ng/ml PMA, for 48 hours. After 48 hours, PMA is washed out of
the culture by washing cells three times with sterile PBS. Washed cells were then
cultured in respective sialic-acid containing medium, as described below.
2.2.6 Sialic acid feeding and chronic amyloid β exposure - experimental setup
For experimentation, monocyte-derived macrophages were cultured in THP1
experimentation containing 0.2 mM L-glutamine, 1 mM sodium pyruvate, 1 % N2
supplement and 100 µg/ml penicillin/streptomycin. As controls, cells were cultured in
THP1 experimentation medium without sialic acid supplementation (SDm). Samples
include culturing cells in THP1 experimentation medium supplemented with either 6
µM Neu5Ac (ACm) or 6 µM Neu5Gc (GCm). Both Neu5Ac and Neu5Gc were
delivered to the cells in the form of protein-bound sialic acid. Appropriate
concentration of apo-transferrin bound Neu5Ac and apo-transferrin bound Neu5Gc
were supplemented in the cell culture to obtain a final concentration of 6 µM Neu5Ac
or 6 µM Neu5Gc, respectively. Fresh medium was exchanged every alternative day
for a total of 6 days.
Additionally, a day after having started the sialic acid supplementation, cells were
either left untreated or treated with 0.25 µM non-biotinylated amyloid β (nbAβ).
Chronic exposure was achieved by adding Aβ every day, until day 6. On day 6,
respective experiment was performed.
Preparation of Aβ, for chronic treatment was performed as follows. The non-
biotinylated Aβ was commercially obtained from Peptide specialty laboratories in the
form of lyophilized powder. Lyophilized Aβ was resuspended in sterile water to a
29
concentration of 1100 µM and stored at -20°C. Before addition to the cell culture, Aβ
was incubated at 37°C for 7 days with vortexing every day for 2 - 3 minutes. Pre-
incubated Aβ was then diluted to 100 µM in sterile water and stored as aliquots at -
20°C. Aliquots were thawn and vortexed prior to use in cell culture.
Table 2: Experimental Setup for sialic acid feeding and chronic Aβ treatment
day x - 2 differentiate monocytes into macrophages by 10 ng/ml PMA treatment for 48
hours
day 0 wash out PMA and culture cells in respective sialic-acid supplemented medium
(SDm, ACm or GCm)
day 1 untreated or 0.25 µM nbAβ
day 2 media change with respective sialic acid supplementation,
untreated or 0.25 µM nbAβ
day 3 media change with respective sialic acid supplementation,
untreated or 0.25 µM nbAβ
day 4 media change with respective sialic acid supplementation,
untreated or 0.25 µM nbAβ
day 5 media change with respective sialic acid supplementation,
untreated or 0.25 µM nbAβ
day 6 Experimentation
2.2.7 HPLC
The incorporation of Neu5Ac and Neu5Gc from the respective supplemented
medium was analyzed by xCGE-LIF (multiplexed capillary gel electrophoresis with
laser-induced fluorescence detection) and Flow cytometry.
For xCGE-LIF analyses, 5 x 10⁵ cells were seeded per well of a 6-well plate. One
well was seeded per condition, as described in table 2. On day 6, cells were scraped
and pelleted by centrifugation at 1300 rpm, for 3 minutes. Supernatant was discarded
and the pellets were resuspended in 200 µl RIPA buffer containing 2 µl HALT
protease-phosphatase inhibitor cocktail. The cell suspensions were stored at -80°C
30
till analysis. Three repeats of the above described procedure were performed. xCGE-
LIF analysis was performed in cooperation with collaborators at the Max Planck
Institute for Dynamics of Complex Technical Systems, Magdeburg. In short, the
precipitated proteins were concentrated by affinity-solid phase extraction and
separated on a 2-D gel electrophoresis system. The bands were then cut out and the
N-glycan structures were extracted from the gel, in water by PNGase F enzyme
activity. The extracted N-glycans were then fluorescently labeled with APTS (9-
aminopyrene-1,4,6 trisulfonic acid) and run on a UPLC system to detect the Neu5Ac
and Neu5Gc present on the N-glycan structures.
2.2.8 RNA sequencing analysis
RNA sequencing analysis of samples from cells cultured in SDm, ACm and GCm
were performed by the group of Prof. Joachim Schultze (University of Bonn, Limes).
After the six day culture (table 2), each sample was centrifuged to obtain cell pellets.
Cell pellets were then resuspended in 1 ml Qiazol each and stored at -80°C before
RNA extraction, measurement and analysis. RNA sequencing was performed for the
three out of four individual samples with the highest quality, as measured using
TapeStation. In short, template libraries were made from double stranded cDNA
molecules obtained from total RNA. Further downstream processing and analysis
were performed as described by the following publications; (Fujita et al.
2011)(Trapnell et al. 2009)(Trapnell et al. 2010)(Langmead et al. 2009) and (Trapnell
et al. 2012).
2.2.9 Flow cytometry analyses
Cell numbers and antibodies used are specific to each experiment as described in
table 3.
For flow cytometry analysis of Neu5Gc incorporation, chicken polyclonal antibody
directed against Neu5Gc was used. 1 x 10⁶ cells were seeded per well of a 6-well
plate, one 6-well plate was seeded per cell line (WT and SIG3 KO). On
experimentation day, cells were scraped and pelleted by centrifugation at 1300 rpm,
for 3 minutes. The pellets were resuspended in diluent buffer with or without 1:500
Neu5Gc antibody, as provided by the manufacturer. Primary antibody staining was
performed at room temperature for 1.5 hours. Cells were washed by centrifugation. A
secondary antibody, biotin anti-chicken (5 µg/ml) was added for 45 minutes, on ice.
31
Cells were washed by centrifugation. A fluorescently labeled tertiary antibody, PE-
streptavidin (5µg/ml) was added for 30 minutes on ice, protected from light. Relative
fluorescence intensity was measured by Flow cytometry and analyses were
performed using FlowJo software.
For calculating cis-bound SIGLEC3 as well as surface marker analysis, 1 x 10⁶
cells were seeded per well of a 6-well plate. One 6-well plate was seeded per cell line
(WT and SIG3 KO). On experiment day, macrophages were washed once with sterile
1x PBS to remove debris. Cells were then detached from culture plates using cell
scrapers and pelleted by centrifugation at 1300 rpm, for 3 minutes. Cell pellets were
resuspended in 1x PBS and respective primary antibody was added (table 3). Cells
were stained with primary antibody for 1 hour, on ice. Samples were then washed by
centrifugation with 1x PBS. After washing, samples were resuspended in 1x PBS and
respective secondary antibody for 30 minutes, on ice and protected from light.
Finally, the cells were washed by centrifugation and resuspended in 200 µl 1x PBS,
measured by FACS calibur and analyzed using FlowJo software.
Apoptosis assay was performed to find the apoptotic rate of cells under the different
culture conditions. Apoptosis assay was performed on monocytes and not
macrophages. Apoptosis was measured by staining with Annexin V antibody. 5 x 10⁵
monocytes were seeded in a 25 cm3 culture flask. On experiment day, cells were
pelleted by centrifugation at 1300 rpm, for 3 minutes. Pellets were resuspended in
100 µl of freshly made 1x binding buffer (diluted from the stock of 10 x binding buffer:
0.1 M HEPES, pH7.4, 1.4 M NaCl, 25 mM CaCl2). Cells were once again pelleted by
centrifugation. Supernatant was discarded and pellet was resuspended in 100 µl 1x
binding buffer containing 2.5 µl Annexin V antibody, per sample. Incubation with
primary antibody was carried out for 15 minutes at room temperature. Cells were
then washed in 1x binding buffer, by centrifugation as described above. Cells were
resuspended in 100 µl 1x binding buffer containing 1:500 PE-streptavidin, per sample
for 30 minutes on ice, protected from light. Cells were washed in 1x binding buffer, by
centrifugation as described above and fluorescence intensity was measured by Flow
cytometry and data was analyzed by FlowJo software.
Table 3: Antibody list for Flow cytometry analysis
Experiment Primary antibody (concentration) Secondary antibody
32
(corresponding result
section)
(concentration)
Neu5Gc incorporation polyclonal chicken anti-Neu5Gc (1:500);
Biotin anti-chicken (5 µg/ml)
PE streptavidin
cis-bound SIGLEC3
detection
mouse anti-SIGLEC3, clone WM53 (5
µg/ml)
mouse anti-SIGLEC3, clone HIM3-4 (5
µg/ml)
PE anti-mouse
Apoptosis assay biotinylated anti-Annexin V (1:50) PE streptavidin
2.2.10 Western Blot
1 x 10⁶ cells were seeded per well of a 6-well plate, per cell line (WT and SIG3 KO).
Cells were treated as described in table 2. On the day of experimentation, cells were
detached using cell scraper and pelleted by centrifugation. Each pellet was
resuspended in 100 µl RIPA buffer containing 2 µl HALT proteases and
phosphatases cocktail. Samples were incubated on ice for 1 hour and cellular debris
was removed by centrifugation at 12000 rpm, for 15 minutes. Supernatant containing
whole cell lysate was used to immunoprecipitate specific proteins for further analysis
as described in table 4. Proteins were immunoprecipitated using either protein A or
protein G dynabeads (ThermoFischer), per manufacturer’s protocol. After
immunoprecipitation of the protein-of-interest, LDS loading buffer was added to the
samples and heated for 10 minutes at 75 °C. Samples were directly loaded from the
heating block, onto 10 % BIS-TRIS SDS PAGE and run in standard MES running
buffer at 130 volts for 1.5 hours. Proteins were then transferred from the gel onto
activated nitrocellulose blots in transfer buffer (40 ml 20x-NuPAGE transfer buffer
diluted in 80 ml methanol and 680 ml ddH2O) for 1 hour at 380 mA. Blots were then
blocked for 1 hour in TBST and stained overnight with first primary antibody diluted in
TBST, at 4 °C (table 4). After overnight incubation, blots were washed three times for
a total of 15 minutes in TBST. Blots were then incubated with respective secondary
antibody (1:10,000) for 1 hour at room temperature followed by washing in TBST as
described above (table 4). In some cases, a tertiary antibody was required – as
described in table 4 – for which the stained procedure was carried out similar to that
of the secondary antibody. After incubation with HRP-coupled antibody, the blots
33
were visualized using Super Signal Pico kit, per manufacturer’s protocol. Bands were
detected using BioRad ChemiDoc XRS+ Molecular Imager and analyzed by
ImageLab software. Blots were then striped off antibodies by rotating in striping buffer
for 30 minutes at room temperature, washed for 15 minutes and blocked for 1 hour,
in TBST. Following blocking, blots were stained in second primary antibody, as
described in table 4. In general, the second primary antibody was the same as the
antibody used for immunoprecipitation. This procedure was performed to normalize
the first protein that was stained for, due to the lack of housekeeping protein for
normalization. Secondary antibody staining, and if necessary tertiary antibody
staining, was performed as described above.
Table 4: Antibody list for Western blot analysis
Experiment
(corresponding
result section)
Antibody for
immunoprecipitation
(concentration)
1st and 2nd primary
antibody
(concentration)
secondary and
tertiary antibody
(concentration)
SHP1 recruitment
to SIGLEC3
mouse anti-SIGLEC 3,
clone HIM3-4 (5 µg/ml)
mouse anti-SHP1 (2.5
µg/ml)
mouse anti-SIGLEC3,
clone HIM3-4 (1 µg/ml)
2ry ab: biotin anti-
mouse (1 µg/ml);
3ry ab: HRP
streptavidin
(1 µg/ml)
phosphoERK
detection
Total ERK (1:500) phosphoERK (1:1000)
TotalERK (1:1000)
HRP anti-rabbit
(1 µg/ml)
2.2.11 ROS production analysis by DHE staining
Production of reactive oxygen species (ROS) was measured by DHE incorporation
and detected using Flow cytometry. WT and SIG3 KO cells were seeded at a density
of 70,000 cells per chamber onto 4 chambers of a chamber slide, per cell line. On
day of experimentation, all chambers were treated with DHE (1:1000) in KREBS-
HEPES buffer for 15 minutes, protected from light. Cells were then immediately
washed twice with 1x PBS and fixed using 4 % PFA and mouted with Mowiol-488.
Slides were stored at 4 °C and imaged within 24 hours of staining by confocal
microscopy. Triplicate images were taken per condition and analyzed using ImageJ
34
software. Area and integrated density of each image was measured, as well as mean
fluorescence intensity of background. Normalized fluorescence intensity per image
was calculated as follows:
Area * Mean fluorescence intensity (background) – integrated density
Values obtained were normalized to the WT SDm untreated condition for each
experiment. Data was obtained in collaboration with and is described in the Master
thesis of Omar Mossad.
2.2.12 Phagocytosis assay
Phagocytic capacity of cells was analyzed by the intake of fluorescently labeled
biotinylated Aβ. Macrophages were seeded at a density of 70,000 cells per well on 4-
well chamber slides. After culture of macrophages under the respective conditions,
cells were treated with biotinylated fibril Aβ for 1.5 hours at 37°C. After incubation,
cells were gently washed twice with sterile 1x PBS and fixed for 10 minutes with 4 %
PFA. After fixing, cells were washed with 1x PBS and blocked in 10 % BSA
containing 5 % NGS and 0.1 % Triton-X-100. Cells were then stained with primary
antibody against CD11b (rat anti-human CD11b, 5 µg/ml), overnight at 4 °C. On the
next day, cells were washed twice with 1x PBS and incubated in secondary antibody
Alexa fluor-488 anti-rat (1:500) and Cy3-streptavidin (1:500) for 90 minutes at room
temperature, protected from light. Cells were washed twice with 1x PBS and mounted
using Mowiol 488. Slides were stored at 4 °C till imaging. Imaging was performed
using Confocal microscopy. Five images were taken per condition and analyzed
using ImageJ software. Total number of cells and the number of cells with
internalized Aβ were counted. Phagocytic rate was calculated as a ratio of phagocytic
cells normalized to the total cell number per image.
2.2.13 Real time PCR
Gene transcription of complement component 3 (c3) and complement component 1q
(c1q), was analyzed by real-time PCR. 5 x 10⁵ cells were seeded per well of a 6-well
plate. One well was seeded per condition and per cell line as described in table 2. On
day of experimentation, cells were detached by scraping and pelleted by
centrifugation at 1300 rpm, for 3 minutes. The pellets were then resuspended in 1 ml
Qiazol and RNA was isolated by the classical chloroform-phenol technique. Isolated
RNA was transcribed into cDNA by Superscript reverse transcriptase III. The
35
obtained cDNA was measured for impurities by 230/260 and 280/260 values using
Nanodrop 1000. 100 ng of cDNA, per sample, was run as triplicates with respective
primers (table 5), SYBRgreen and at annealing temperature 60 °C, to obtain Ct
values. Obtained values were calculated using the standard ΔΔCt method. All values
were normalized to the housekeeping gene gapdh. Data was obtained in
collaboration with and is described in the Master thesis of Omar Mossad.
Table 5: Antibody list for Western blot analysis
gene forward sequence reverse sequence
c1q GCCCCGCAGTGGCAAGTTCA ACCTTCTGTGCACGCTCCCG
c3 GAGGTCATAGTGGAGCCTACA GGTTAGAGACTGCACAGTGTC
gapdh CTGCACCACCAACTGCTTAG TTCAGCTCAGGGATGACCTT
2.2.14 Statistics
All experiments were repeated at least 3 times and obtained data was checked for
statistically significant differences using SPSS software by ANOVA test with
Bonferroni correction. Significance was illustrated as * (p ≤ 0.05), ** (p ≤ 0.01), *** (p
≤ 0.001) and n.s (not significant).
74
3. Results
3.1 Developing human microglia from iPS cells as an in vitro model to study SIGLEC3
The study of human microglia under healthy as well as pathological conditions
requires a stable supply of microglia for functional and biochemical analysis.
Limitations in number of primary microglia and abnormal alterations in primary
microglial cell lines obtained by viral transduction hinder these analyses. Therefore, a
differentiation protocol to obtain microglial cell lines from iPS cells was performed
based on the protocol from Beutner and colleagues (Beutner et al. 2010), which
describes differentiation of mouse microglial lines from mouse embryonic stem cells.
A healthy iPS cell line, JS-AF12 was used to obtain Stem cell-derived microglial
(SdMic) lines 1 and 2 (SdMic 1 and SdMic 2), which represent microglia in healthy
individuals. The differentiation procedure of SdMic lines was performed as described
in the Doctoral thesis of Dr. Kristin Roy (Roy 2012).
The derived SdMic lines proved to be genetically instable. The instability of these
lines was confirmed by increased chromosomal numbers in SdMic1 and SdMic2 in
comparison to the JA-AF12 iPS cells from which they were generated (figure 7A).
While the iPS cell line carried on average 46 chromosomes (46 ± 2.5) as expected
for human material, microglial lines SdMic1 and SdMic2 carried 55 ± 2.3 and 53 ± 2.8
chromosomes, respectively. Furthermore, SNP analysis of both microglial lines
showed erroneous results as seen in figure 7B, in comparison to the iPS line JS-
AF12 from which they were generated.
Therefore, an attempt to develop genetically stable and reproducible microglial cells
was made in the scope of this thesis and is described below.
Contrary to the previously described protocol, iPS cells (JS-AF 12) were cultured on
a basement membrane matrix; namely Geltrex. All steps of the differentiation protocol
are illustrated in figure 7C. The stem cells, cultured in TESR-E8 medium, formed
colonies (figure 7C-1). The EBs formed were between 200 and 300 µM in size
(figure7C-2) and were a combination of ectodermal, endodermal and mesodermal
tissue as described in literature (schematic image, figure 7C-3). On the final day of
37
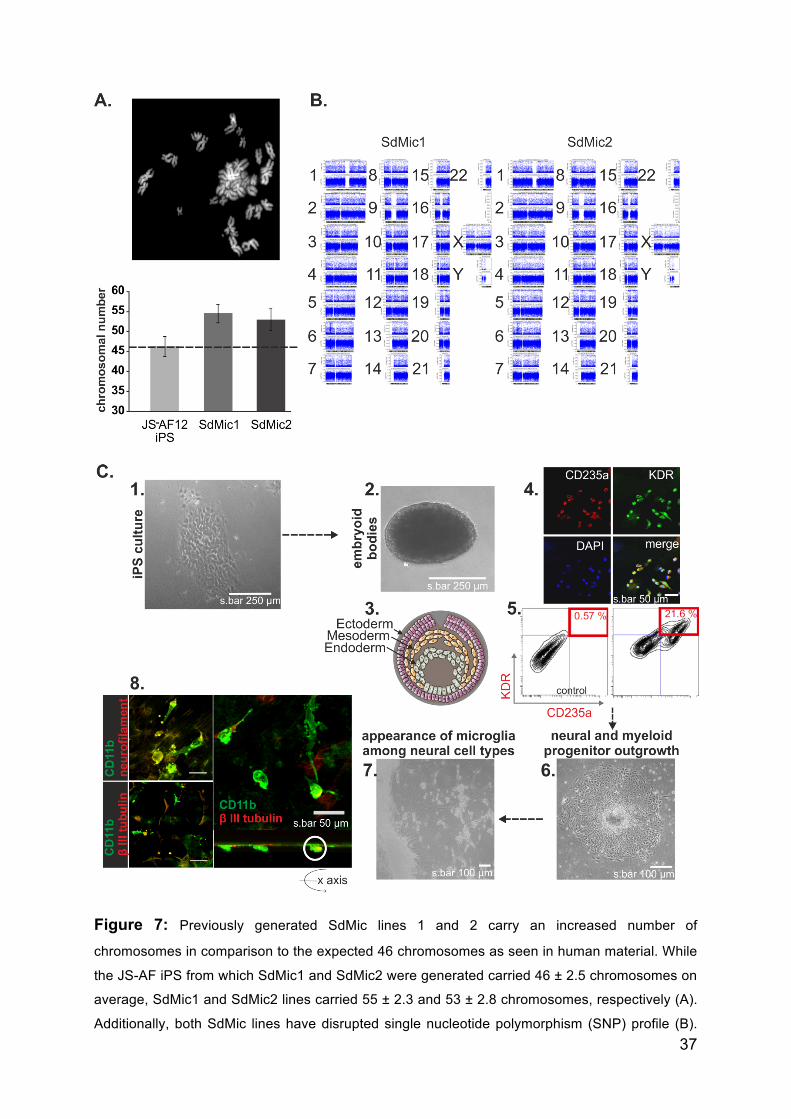
Figure 7: Previously generated SdMic lines 1 and 2 carry an increased number of
chromosomes in comparison to the expected 46 chromosomes as seen in human material. While
the JS-AF iPS from which SdMic1 and SdMic2 were generated carried 46 ± 2.5 chromosomes on
average, SdMic1 and SdMic2 lines carried 55 ± 2.3 and 53 ± 2.8 chromosomes, respectively (A).
Additionally, both SdMic lines have disrupted single nucleotide polymorphism (SNP) profile (B).
38
Modified protocol to obtain proliferative induced pluripotent stem cell derived microglia (iPSdM)
(C) includes culturing of stem cells on a matrix-layer (C, 1) and developing embryoid bodies (C,
2), consisting of all three germ layers (representative image C,3) that are double positive for KDR
and CD235a, as seen by immunocytochemical staining (C, 4; representative image of at least 3
independent experiments) and flow cytometry analysis (C, 5). On average, 21.6 % ± 0.5 % of EBs
were positively co-stained for KDR and CD235a (C, 5). Development of neural and myeloid
progenitors out of the EBs was supported (C, 6) and further differentiation into final cell types was
initiated (C, 7). The differentiated microglia were positive for marker CD11b and were found
among β-III-tubulin and neurofilament positive neural cell types. When rotated on the x-axis, a
phagocytic microglia with internalized β-III-tubulin particles can be observed.
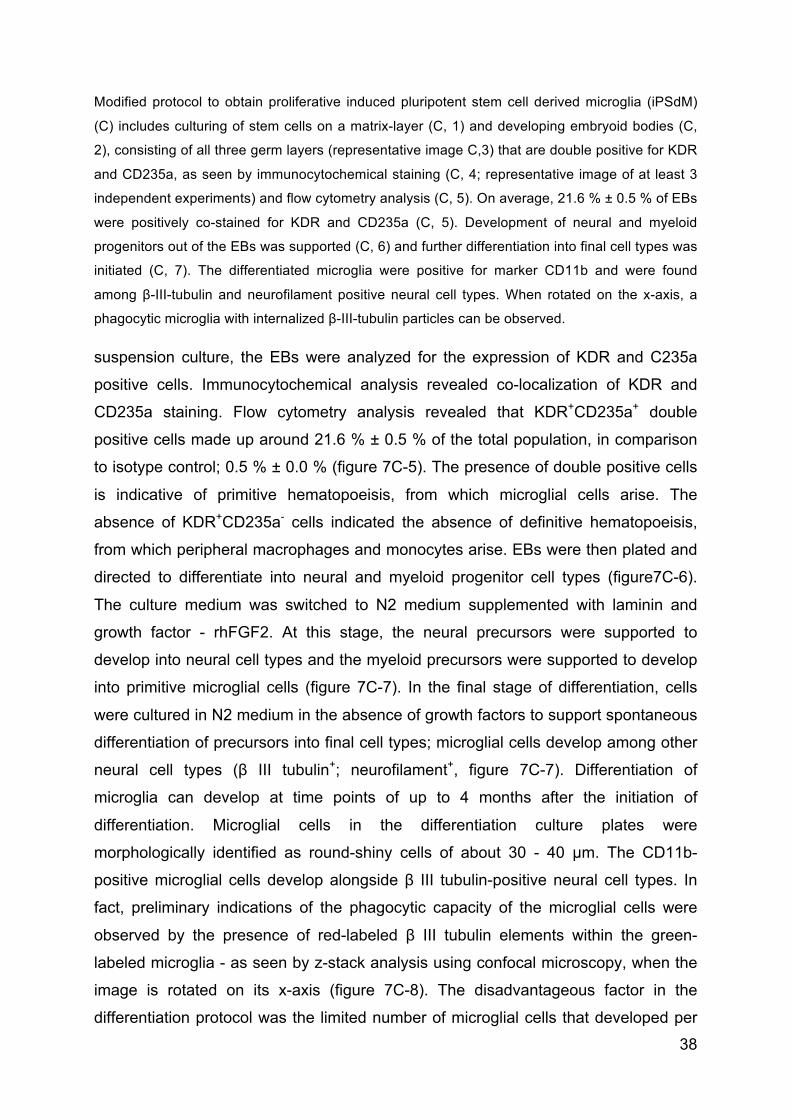
suspension culture, the EBs were analyzed for the expression of KDR and C235a
positive cells. Immunocytochemical analysis revealed co-localization of KDR and
CD235a staining. Flow cytometry analysis revealed that KDR+CD235a+ double
positive cells made up around 21.6 % ± 0.5 % of the total population, in comparison
to isotype control; 0.5 % ± 0.0 % (figure 7C-5). The presence of double positive cells
is indicative of primitive hematopoeisis, from which microglial cells arise. The
absence of KDR+CD235a- cells indicated the absence of definitive hematopoeisis,
from which peripheral macrophages and monocytes arise. EBs were then plated and
directed to differentiate into neural and myeloid progenitor cell types (figure7C-6).
The culture medium was switched to N2 medium supplemented with laminin and
growth factor - rhFGF2. At this stage, the neural precursors were supported to
develop into neural cell types and the myeloid precursors were supported to develop
into primitive microglial cells (figure 7C-7). In the final stage of differentiation, cells
were cultured in N2 medium in the absence of growth factors to support spontaneous
differentiation of precursors into final cell types; microglial cells develop among other
neural cell types (β III tubulin+; neurofilament+, figure 7C-7). Differentiation of
microglia can develop at time points of up to 4 months after the initiation of
differentiation. Microglial cells in the differentiation culture plates were
morphologically identified as round-shiny cells of about 30 - 40 µm. The CD11b-
positive microglial cells develop alongside β III tubulin-positive neural cell types. In
fact, preliminary indications of the phagocytic capacity of the microglial cells were
observed by the presence of red-labeled β III tubulin elements within the green-
labeled microglia - as seen by z-stack analysis using confocal microscopy, when the
image is rotated on its x-axis (figure 7C-8). The disadvantageous factor in the
differentiation protocol was the limited number of microglial cells that developed per
39
EB. A rough estimate of a few thousand microglial cells per EB can be assumed. This
disadvantage limits the extent of molecular analysis that can be performed.
Nevertheless, increased microglial cell numbers possibly might be obtained by up-
scaling the EB seeding procedure.
3.2 Characterizing microglial cells obtained from human iPS cells
The generated microglial cells were named as induced pluripotent stem cell derived
microglial cells 9 (iPSdM9). The microglial cells iPSdM9 were characterized based on
proliferation rate and expression of typical microglial surface markers. Due to the
limited cell numbers, the characterizations were performed in 96-well optical bottom
plates as described in the materials and methods (sections 2.2.3 and 2.2.4).
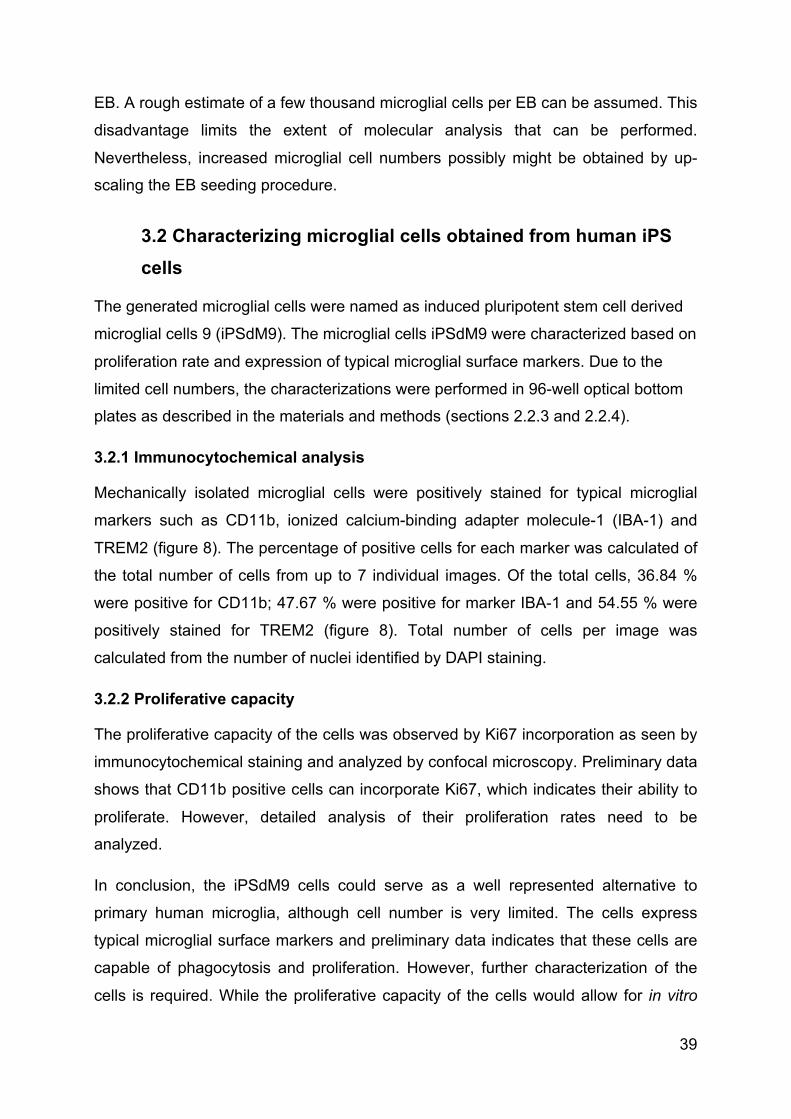
3.2.1 Immunocytochemical analysis
Mechanically isolated microglial cells were positively stained for typical microglial
markers such as CD11b, ionized calcium-binding adapter molecule-1 (IBA-1) and
TREM2 (figure 8). The percentage of positive cells for each marker was calculated of
the total number of cells from up to 7 individual images. Of the total cells, 36.84 %
were positive for CD11b; 47.67 % were positive for marker IBA-1 and 54.55 % were
positively stained for TREM2 (figure 8). Total number of cells per image was
calculated from the number of nuclei identified by DAPI staining.
3.2.2 Proliferative capacity
The proliferative capacity of the cells was observed by Ki67 incorporation as seen by
immunocytochemical staining and analyzed by confocal microscopy. Preliminary data
shows that CD11b positive cells can incorporate Ki67, which indicates their ability to
proliferate. However, detailed analysis of their proliferation rates need to be
analyzed.
In conclusion, the iPSdM9 cells could serve as a well represented alternative to
primary human microglia, although cell number is very limited. The cells express
typical microglial surface markers and preliminary data indicates that these cells are
capable of phagocytosis and proliferation. However, further characterization of the
cells is required. While the proliferative capacity of the cells would allow for in vitro
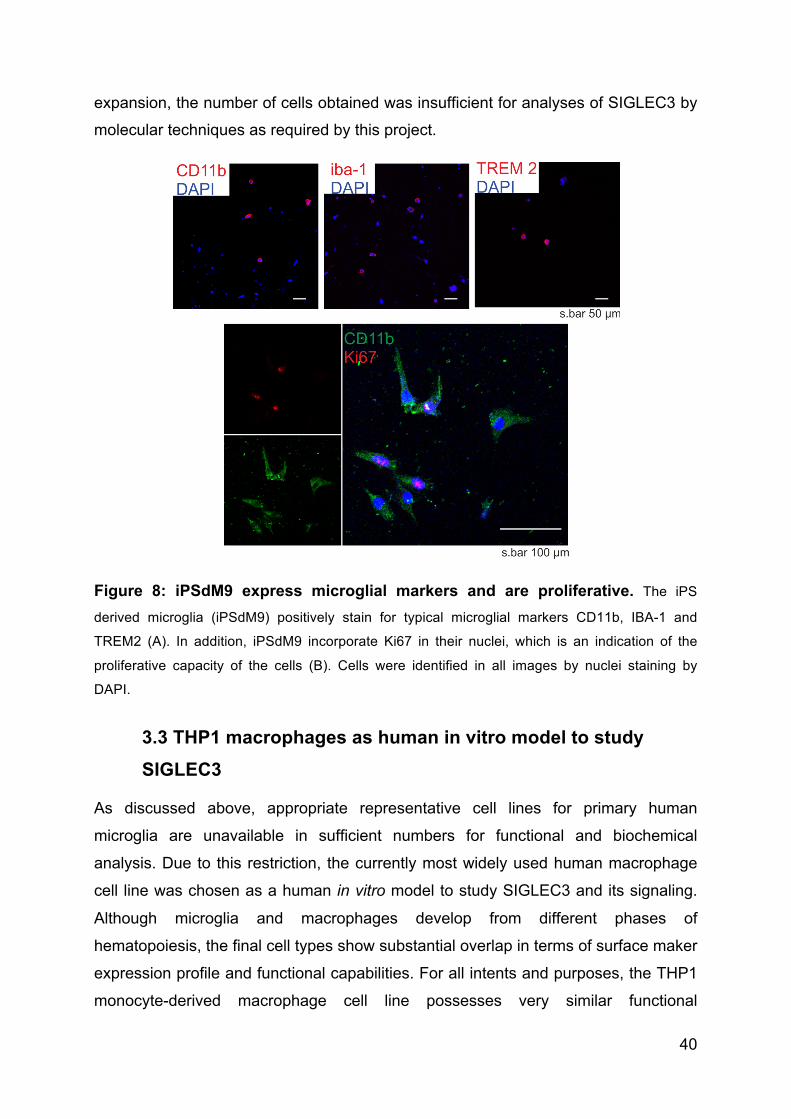
40
expansion, the number of cells obtained was insufficient for analyses of SIGLEC3 by
molecular techniques as required by this project.
Figure 8: iPSdM9 express microglial markers and are proliferative. The iPS
derived microglia (iPSdM9) positively stain for typical microglial markers CD11b, IBA-1 and
TREM2 (A). In addition, iPSdM9 incorporate Ki67 in their nuclei, which is an indication of the
proliferative capacity of the cells (B). Cells were identified in all images by nuclei staining by
DAPI.
3.3 THP1 macrophages as human in vitro model to study SIGLEC3
As discussed above, appropriate representative cell lines for primary human
microglia are unavailable in sufficient numbers for functional and biochemical
analysis. Due to this restriction, the currently most widely used human macrophage
cell line was chosen as a human in vitro model to study SIGLEC3 and its signaling.
Although microglia and macrophages develop from different phases of
hematopoiesis, the final cell types show substantial overlap in terms of surface maker
expression profile and functional capabilities. For all intents and purposes, the THP1
monocyte-derived macrophage cell line possesses very similar functional
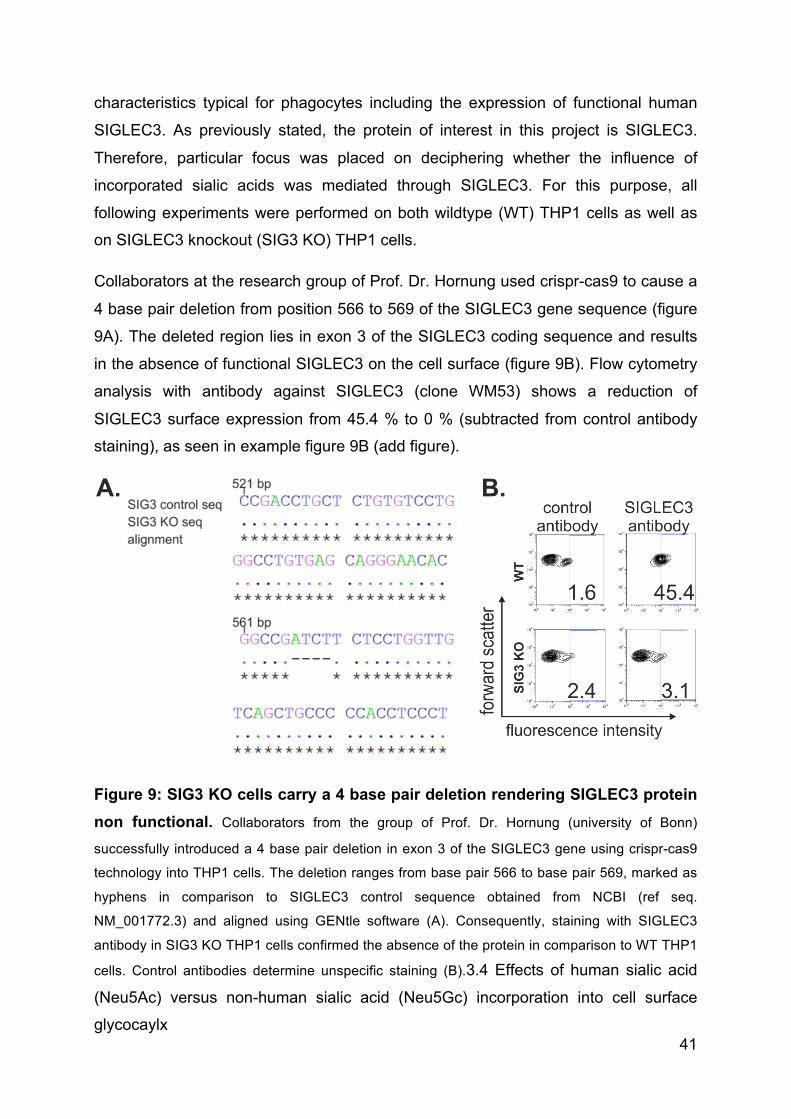
41
characteristics typical for phagocytes including the expression of functional human
SIGLEC3. As previously stated, the protein of interest in this project is SIGLEC3.
Therefore, particular focus was placed on deciphering whether the influence of
incorporated sialic acids was mediated through SIGLEC3. For this purpose, all
following experiments were performed on both wildtype (WT) THP1 cells as well as
on SIGLEC3 knockout (SIG3 KO) THP1 cells.
Collaborators at the research group of Prof. Dr. Hornung used crispr-cas9 to cause a
4 base pair deletion from position 566 to 569 of the SIGLEC3 gene sequence (figure
9A). The deleted region lies in exon 3 of the SIGLEC3 coding sequence and results
in the absence of functional SIGLEC3 on the cell surface (figure 9B). Flow cytometry
analysis with antibody against SIGLEC3 (clone WM53) shows a reduction of
SIGLEC3 surface expression from 45.4 % to 0 % (subtracted from control antibody
staining), as seen in example figure 9B (add figure).
Figure 9: SIG3 KO cells carry a 4 base pair deletion rendering SIGLEC3 protein non functional. Collaborators from the group of Prof. Dr. Hornung (university of Bonn)
successfully introduced a 4 base pair deletion in exon 3 of the SIGLEC3 gene using crispr-cas9
technology into THP1 cells. The deletion ranges from base pair 566 to base pair 569, marked as
hyphens in comparison to SIGLEC3 control sequence obtained from NCBI (ref seq.
NM_001772.3) and aligned using GENtle software (A). Consequently, staining with SIGLEC3
antibody in SIG3 KO THP1 cells confirmed the absence of the protein in comparison to WT THP1
cells. Control antibodies determine unspecific staining (B).3.4 Effects of human sialic acid
(Neu5Ac) versus non-human sialic acid (Neu5Gc) incorporation into cell surface
glycocaylx
42
3.4 Influence of sialic acids on functions of THP1 macrophages
3.4.1 Incorporation of Neu5Ac and Neu5Gc into the cellular glycocalyx of THP1 macrophages
As described under the methods section, experiments were performed on THP1 cells
cultured in either Neu5Ac containing-medium (ACm) or Neu5Gc-containing medium
(GCm). As control, cells were cultured in medium lacking additional sialic acids -
named as sialic acid depleted medium (SDm). THP1 macrophage cells were cultured
in GCm to mimic the cellular and molecular environment in which non-human sialic
acids, metabolically incorporated through consumption of red meat and milk
products, could accumulate and consequently affect SIGLEC3 function.
First, incorporation of Neu5Gc into the cell surface glycocalyx of THP1 macrophages
was analysed. The macrophages cultured in either ACm or GCm incorporated either
Neu5Ac alone or a combination of Neu5Ac and Neu5Gc, respectively. These results
were obtained by flow cytometry analysis and xCGE-LIF technique, as described
below.
Flow cytometry analysis of Neu5Gc. THP1 WT as well as SIG3 KO cells cultured
in GCm were positively stained for Neu5Gc (16.4 % ± 0.85 %). On the other hand,
when both cell lines were cultured exclusively in ACm, no Neu5Gc staining was
visible (2.1 %) in comparison to secondary antibody controls (1.5 %, representative
image in figure 10A). Chronic exposure to fibrillary Alzheimer disease associated
amyloid- β (Aβ) to cells significantly increased the appearance of Neu5Gc on the cell
surface for both WT and SIG3 KO cells to 39.7 % ± 1.5 % and 24.9 % ± 1.3 %
respectively, in comparison to untreated WT and SIG3 KO cells at 16.0 % ± 0.9 %
and 12.7 % ± 1.7 %, respectively (figure 10B).
The comparable expression of Neu5Gc in both WT and SIG3 KO in untreated cells
indicates that SIGLEC3 does not influence the uptake and incorporation of this
glycan. However, Neu5Gc staining significantly increased when both cell types was
chronically exposed to low concentrations of Aβ. While SIG3 KO cells chronically
treated with Aβ tended to incorporate lower levels of Neu5Gc, the difference was
insignificant compared to WT cells chronically treated with Aβ.
43
XCGE-LIF analysis. While flow cytometry data detects total Neu5Gc on the cell
surface, a second technique – xCGE-LIF was performed to identify the presence of
Neu5Gc incorporated exclusively in total proteins. Collaborators from the group of Dr.
Erdmann Rapp (MPI-DCTS, Magdeburg) confirmed the above mentioned flow
cytometry results using the advanced xCGE-LIF technique (representative image,
figure 10C). Total proteins extracted from cells cultured in either ACm or GCm were
analyzed for the presence of Neu5Ac or Neu5Gc sugars. The former expressed 100
% ± 0.0 % Neu5Ac while the latter sample carried 1.2 % ± 0.0 % of Neu5Gc and 98.8
% ± 0.0 % of Neu5Ac sugars, (figure 10D).
Therefore, it can be concluded that Neu5Gc is effectively taken up by the
macrophages and expressed on the cell surface. Neu5Gc found on the cell-surface
glycocalyx can be available as a ligand for sialic-acid binding receptors. The
discrepancies in the percentages of Neu5Gc expression between flow cytometry data
and xCGE-LIF data can be explained by the fact that exclusively protein-bound
Neu5Gc is measured in the latter case. Therefore it is vital to repeat the xCGE-LIF
analysis to detect Neu5Gc on total lipid content to obtain overall quantities.
Nevertheless, despite modest percentages of Neu5Gc incorporation, it is sufficient to
cause disruption in several cellular processes as seen by RNA sequencing analysis
described in section 3.4.2.
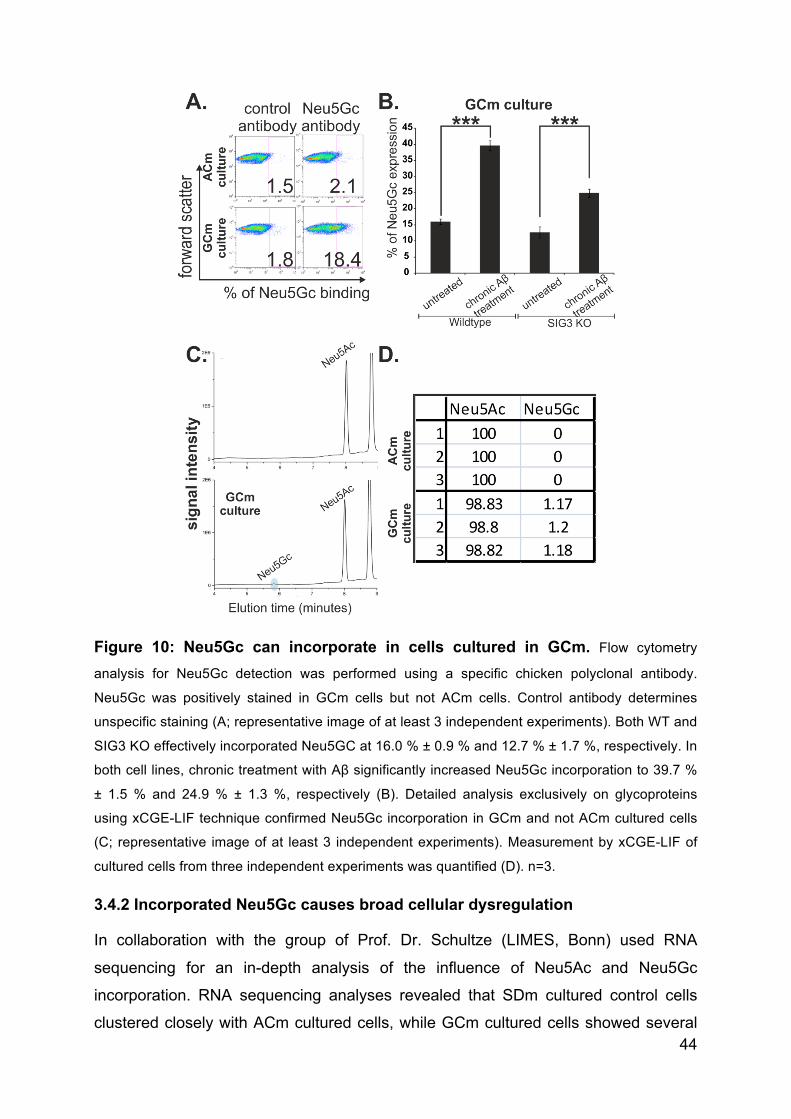
44
Figure 10: Neu5Gc can incorporate in cells cultured in GCm. Flow cytometry
analysis for Neu5Gc detection was performed using a specific chicken polyclonal antibody.
Neu5Gc was positively stained in GCm cells but not ACm cells. Control antibody determines
unspecific staining (A; representative image of at least 3 independent experiments). Both WT and
SIG3 KO effectively incorporated Neu5GC at 16.0 % ± 0.9 % and 12.7 % ± 1.7 %, respectively. In
both cell lines, chronic treatment with Aβ significantly increased Neu5Gc incorporation to 39.7 %
± 1.5 % and 24.9 % ± 1.3 %, respectively (B). Detailed analysis exclusively on glycoproteins
using xCGE-LIF technique confirmed Neu5Gc incorporation in GCm and not ACm cultured cells
(C; representative image of at least 3 independent experiments). Measurement by xCGE-LIF of
cultured cells from three independent experiments was quantified (D). n=3.
3.4.2 Incorporated Neu5Gc causes broad cellular dysregulation
In collaboration with the group of Prof. Dr. Schultze (LIMES, Bonn) used RNA
sequencing for an in-depth analysis of the influence of Neu5Ac and Neu5Gc
incorporation. RNA sequencing analyses revealed that SDm cultured control cells
clustered closely with ACm cultured cells, while GCm cultured cells showed several
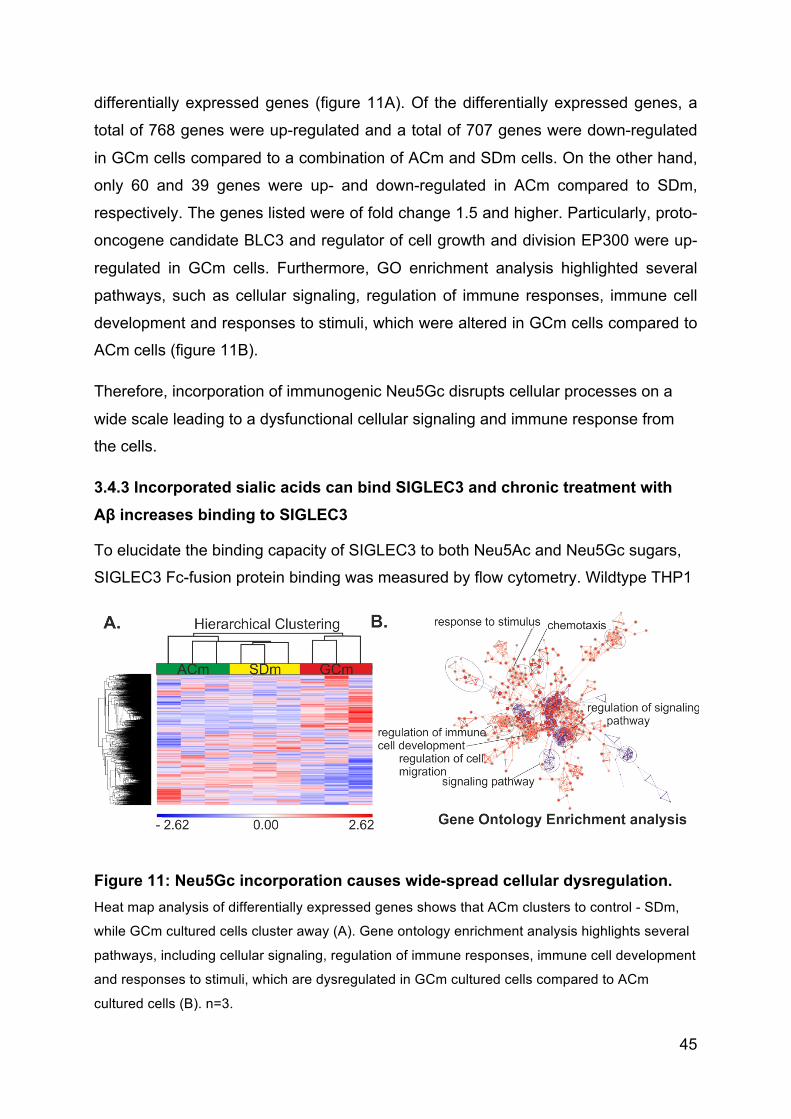
45
differentially expressed genes (figure 11A). Of the differentially expressed genes, a
total of 768 genes were up-regulated and a total of 707 genes were down-regulated
in GCm cells compared to a combination of ACm and SDm cells. On the other hand,
only 60 and 39 genes were up- and down-regulated in ACm compared to SDm,
respectively. The genes listed were of fold change 1.5 and higher. Particularly, proto-
oncogene candidate BLC3 and regulator of cell growth and division EP300 were up-
regulated in GCm cells. Furthermore, GO enrichment analysis highlighted several
pathways, such as cellular signaling, regulation of immune responses, immune cell
development and responses to stimuli, which were altered in GCm cells compared to
ACm cells (figure 11B).
Therefore, incorporation of immunogenic Neu5Gc disrupts cellular processes on a
wide scale leading to a dysfunctional cellular signaling and immune response from
the cells.
3.4.3 Incorporated sialic acids can bind SIGLEC3 and chronic treatment with Aβ increases binding to SIGLEC3
To elucidate the binding capacity of SIGLEC3 to both Neu5Ac and Neu5Gc sugars,
SIGLEC3 Fc-fusion protein binding was measured by flow cytometry. Wildtype THP1
Figure 11: Neu5Gc incorporation causes wide-spread cellular dysregulation. Heat map analysis of differentially expressed genes shows that ACm clusters to control - SDm,
while GCm cultured cells cluster away (A). Gene ontology enrichment analysis highlights several
pathways, including cellular signaling, regulation of immune responses, immune cell development
and responses to stimuli, which are dysregulated in GCm cultured cells compared to ACm
cultured cells (B). n=3.
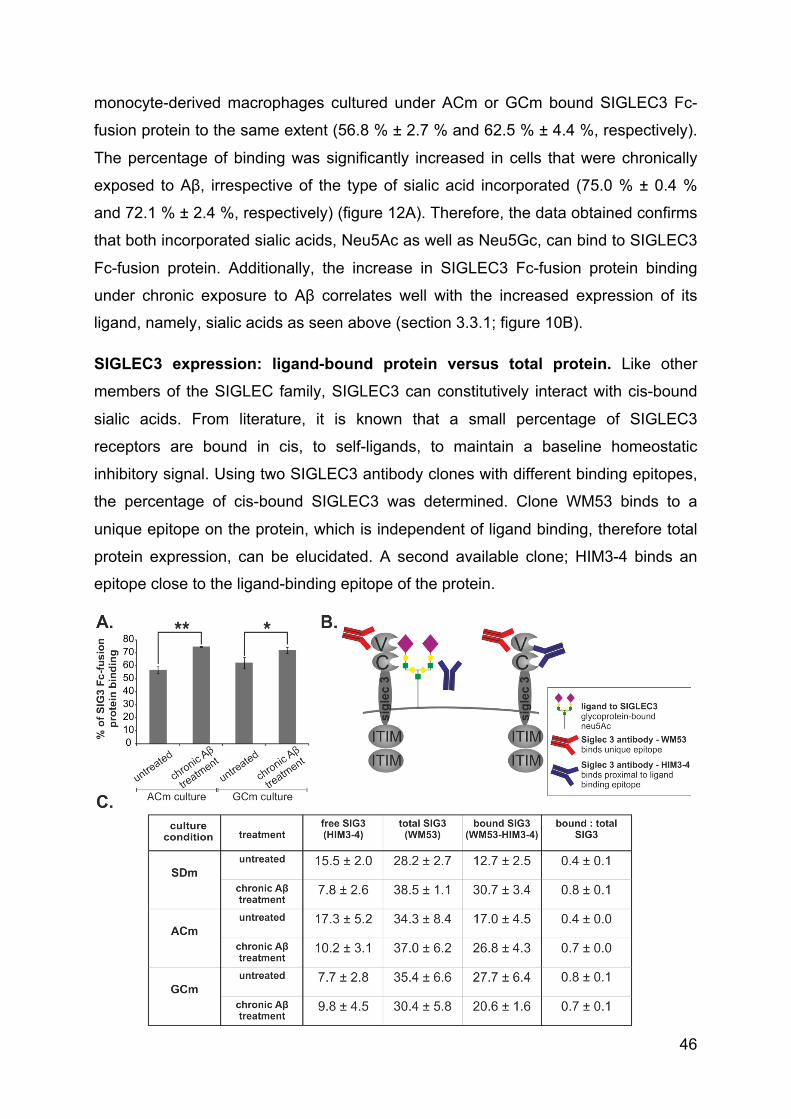
46
monocyte-derived macrophages cultured under ACm or GCm bound SIGLEC3 Fc-
fusion protein to the same extent (56.8 % ± 2.7 % and 62.5 % ± 4.4 %, respectively).
The percentage of binding was significantly increased in cells that were chronically
exposed to Aβ, irrespective of the type of sialic acid incorporated (75.0 % ± 0.4 %
and 72.1 % ± 2.4 %, respectively) (figure 12A). Therefore, the data obtained confirms
that both incorporated sialic acids, Neu5Ac as well as Neu5Gc, can bind to SIGLEC3
Fc-fusion protein. Additionally, the increase in SIGLEC3 Fc-fusion protein binding
under chronic exposure to Aβ correlates well with the increased expression of its
ligand, namely, sialic acids as seen above (section 3.3.1; figure 10B).
SIGLEC3 expression: ligand-bound protein versus total protein. Like other
members of the SIGLEC family, SIGLEC3 can constitutively interact with cis-bound
sialic acids. From literature, it is known that a small percentage of SIGLEC3
receptors are bound in cis, to self-ligands, to maintain a baseline homeostatic
inhibitory signal. Using two SIGLEC3 antibody clones with different binding epitopes,
the percentage of cis-bound SIGLEC3 was determined. Clone WM53 binds to a
unique epitope on the protein, which is independent of ligand binding, therefore total
protein expression, can be elucidated. A second available clone; HIM3-4 binds an
epitope close to the ligand-binding epitope of the protein.
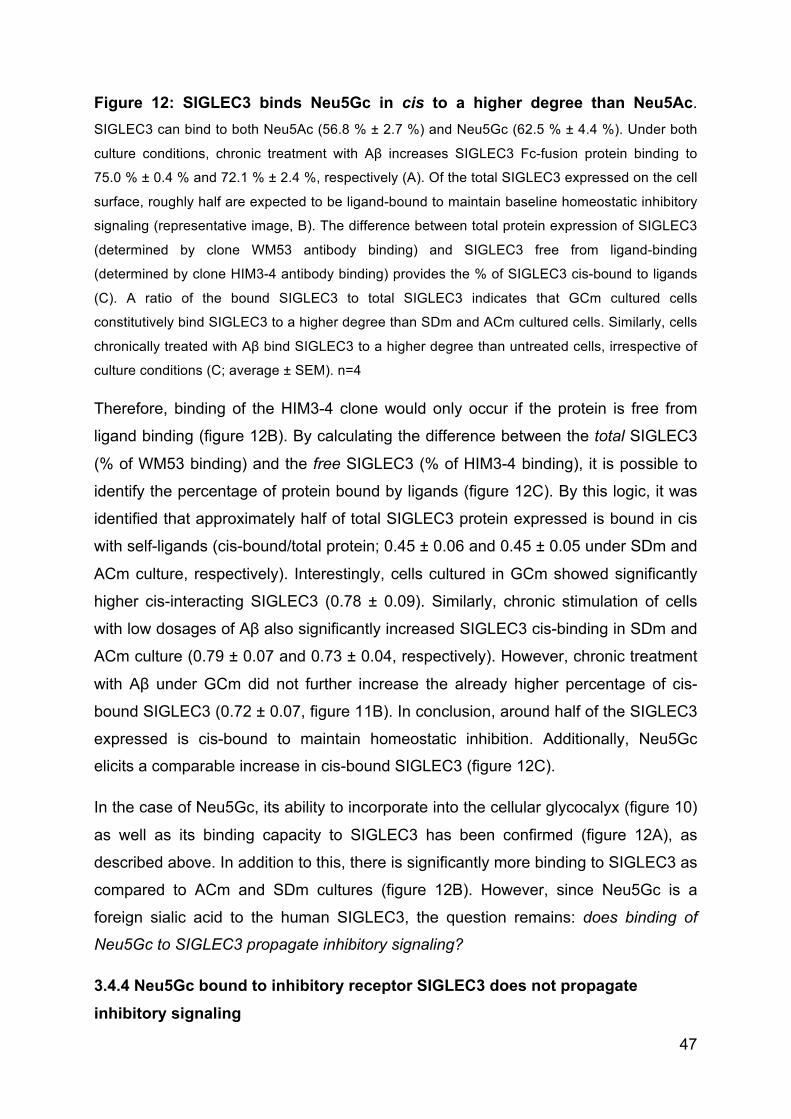
47
Figure 12: SIGLEC3 binds Neu5Gc in cis to a higher degree than Neu5Ac. SIGLEC3 can bind to both Neu5Ac (56.8 % ± 2.7 %) and Neu5Gc (62.5 % ± 4.4 %). Under both
culture conditions, chronic treatment with Aβ increases SIGLEC3 Fc-fusion protein binding to
75.0 % ± 0.4 % and 72.1 % ± 2.4 %, respectively (A). Of the total SIGLEC3 expressed on the cell
surface, roughly half are expected to be ligand-bound to maintain baseline homeostatic inhibitory
signaling (representative image, B). The difference between total protein expression of SIGLEC3
(determined by clone WM53 antibody binding) and SIGLEC3 free from ligand-binding
(determined by clone HIM3-4 antibody binding) provides the % of SIGLEC3 cis-bound to ligands
(C). A ratio of the bound SIGLEC3 to total SIGLEC3 indicates that GCm cultured cells
constitutively bind SIGLEC3 to a higher degree than SDm and ACm cultured cells. Similarly, cells
chronically treated with Aβ bind SIGLEC3 to a higher degree than untreated cells, irrespective of
culture conditions (C; average ± SEM). n=4
Therefore, binding of the HIM3-4 clone would only occur if the protein is free from
ligand binding (figure 12B). By calculating the difference between the total SIGLEC3
(% of WM53 binding) and the free SIGLEC3 (% of HIM3-4 binding), it is possible to
identify the percentage of protein bound by ligands (figure 12C). By this logic, it was
identified that approximately half of total SIGLEC3 protein expressed is bound in cis
with self-ligands (cis-bound/total protein; 0.45 ± 0.06 and 0.45 ± 0.05 under SDm and
ACm culture, respectively). Interestingly, cells cultured in GCm showed significantly
higher cis-interacting SIGLEC3 (0.78 ± 0.09). Similarly, chronic stimulation of cells
with low dosages of Aβ also significantly increased SIGLEC3 cis-binding in SDm and
ACm culture (0.79 ± 0.07 and 0.73 ± 0.04, respectively). However, chronic treatment
with Aβ under GCm did not further increase the already higher percentage of cis-
bound SIGLEC3 (0.72 ± 0.07, figure 11B). In conclusion, around half of the SIGLEC3
expressed is cis-bound to maintain homeostatic inhibition. Additionally, Neu5Gc
elicits a comparable increase in cis-bound SIGLEC3 (figure 12C).
In the case of Neu5Gc, its ability to incorporate into the cellular glycocalyx (figure 10)
as well as its binding capacity to SIGLEC3 has been confirmed (figure 12A), as
described above. In addition to this, there is significantly more binding to SIGLEC3 as
compared to ACm and SDm cultures (figure 12B). However, since Neu5Gc is a
foreign sialic acid to the human SIGLEC3, the question remains: does binding of
Neu5Gc to SIGLEC3 propagate inhibitory signaling?
3.4.4 Neu5Gc bound to inhibitory receptor SIGLEC3 does not propagate inhibitory signaling
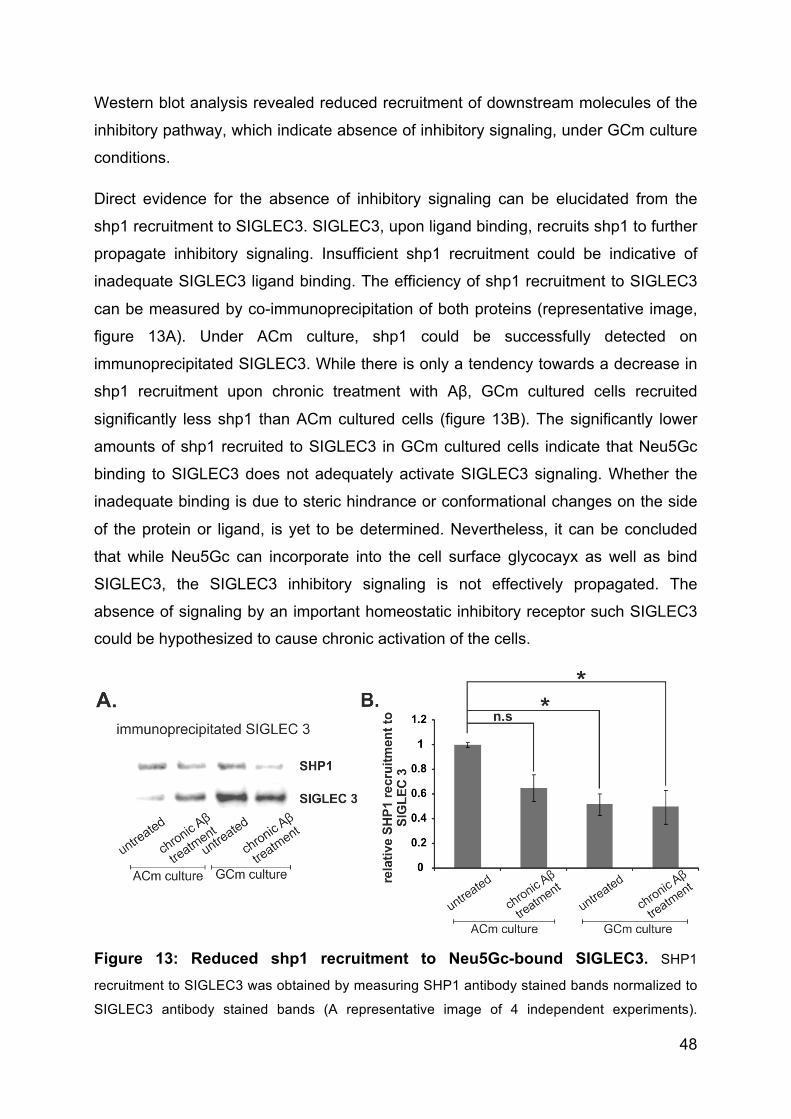
48
Western blot analysis revealed reduced recruitment of downstream molecules of the
inhibitory pathway, which indicate absence of inhibitory signaling, under GCm culture
conditions.
Direct evidence for the absence of inhibitory signaling can be elucidated from the
shp1 recruitment to SIGLEC3. SIGLEC3, upon ligand binding, recruits shp1 to further
propagate inhibitory signaling. Insufficient shp1 recruitment could be indicative of
inadequate SIGLEC3 ligand binding. The efficiency of shp1 recruitment to SIGLEC3
can be measured by co-immunoprecipitation of both proteins (representative image,
figure 13A). Under ACm culture, shp1 could be successfully detected on
immunoprecipitated SIGLEC3. While there is only a tendency towards a decrease in
shp1 recruitment upon chronic treatment with Aβ, GCm cultured cells recruited
significantly less shp1 than ACm cultured cells (figure 13B). The significantly lower
amounts of shp1 recruited to SIGLEC3 in GCm cultured cells indicate that Neu5Gc
binding to SIGLEC3 does not adequately activate SIGLEC3 signaling. Whether the
inadequate binding is due to steric hindrance or conformational changes on the side
of the protein or ligand, is yet to be determined. Nevertheless, it can be concluded
that while Neu5Gc can incorporate into the cell surface glycocayx as well as bind
SIGLEC3, the SIGLEC3 inhibitory signaling is not effectively propagated. The
absence of signaling by an important homeostatic inhibitory receptor such SIGLEC3
could be hypothesized to cause chronic activation of the cells.
Figure 13: Reduced shp1 recruitment to Neu5Gc-bound SIGLEC3. SHP1
recruitment to SIGLEC3 was obtained by measuring SHP1 antibody stained bands normalized to
SIGLEC3 antibody stained bands (A representative image of 4 independent experiments).
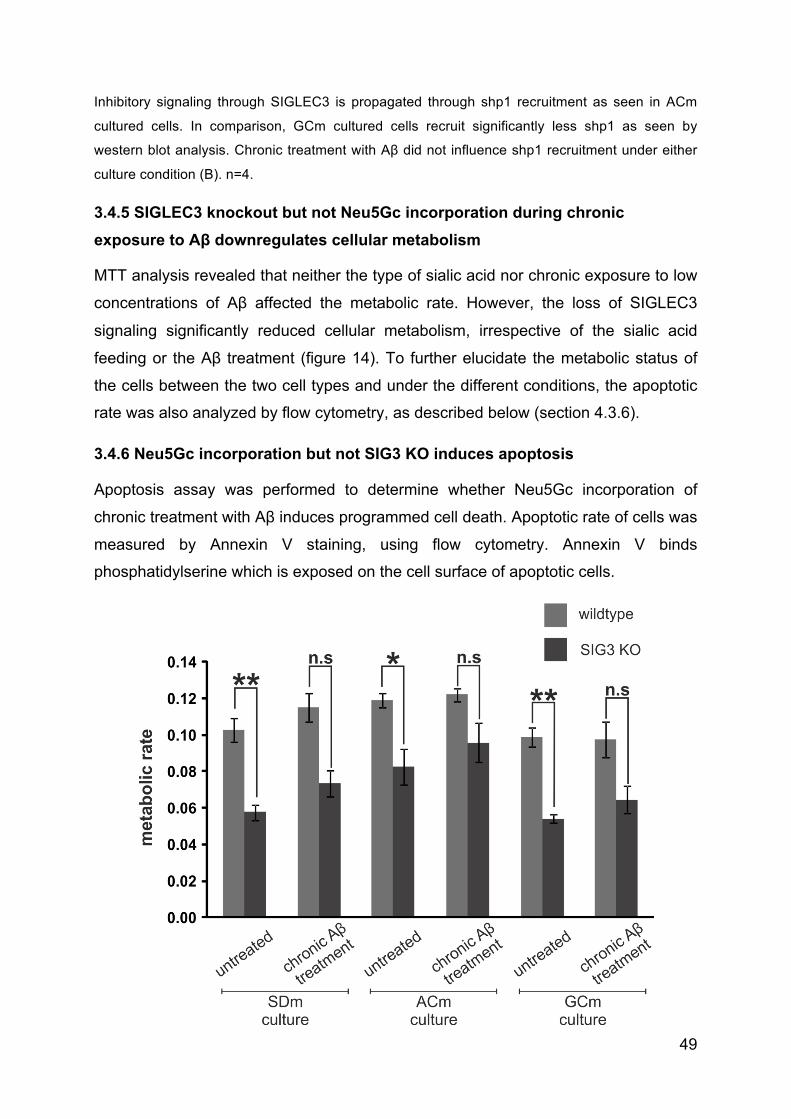
49
Inhibitory signaling through SIGLEC3 is propagated through shp1 recruitment as seen in ACm
cultured cells. In comparison, GCm cultured cells recruit significantly less shp1 as seen by
western blot analysis. Chronic treatment with Aβ did not influence shp1 recruitment under either
culture condition (B). n=4.
3.4.5 SIGLEC3 knockout but not Neu5Gc incorporation during chronic exposure to Aβ downregulates cellular metabolism
MTT analysis revealed that neither the type of sialic acid nor chronic exposure to low
concentrations of Aβ affected the metabolic rate. However, the loss of SIGLEC3
signaling significantly reduced cellular metabolism, irrespective of the sialic acid
feeding or the Aβ treatment (figure 14). To further elucidate the metabolic status of
the cells between the two cell types and under the different conditions, the apoptotic
rate was also analyzed by flow cytometry, as described below (section 4.3.6).
3.4.6 Neu5Gc incorporation but not SIG3 KO induces apoptosis
Apoptosis assay was performed to determine whether Neu5Gc incorporation of
chronic treatment with Aβ induces programmed cell death. Apoptotic rate of cells was
measured by Annexin V staining, using flow cytometry. Annexin V binds
phosphatidylserine which is exposed on the cell surface of apoptotic cells.
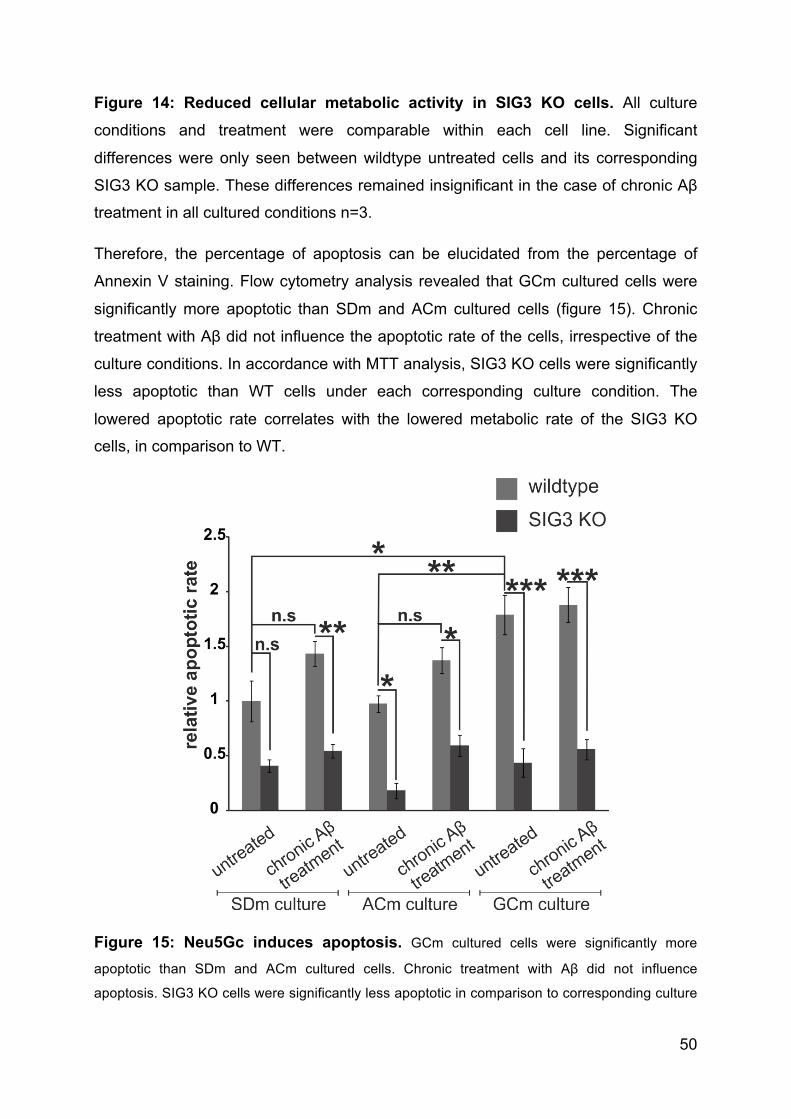
50
Figure 14: Reduced cellular metabolic activity in SIG3 KO cells. All culture
conditions and treatment were comparable within each cell line. Significant
differences were only seen between wildtype untreated cells and its corresponding
SIG3 KO sample. These differences remained insignificant in the case of chronic Aβ
treatment in all cultured conditions n=3.
Therefore, the percentage of apoptosis can be elucidated from the percentage of
Annexin V staining. Flow cytometry analysis revealed that GCm cultured cells were
significantly more apoptotic than SDm and ACm cultured cells (figure 15). Chronic
treatment with Aβ did not influence the apoptotic rate of the cells, irrespective of the
culture conditions. In accordance with MTT analysis, SIG3 KO cells were significantly
less apoptotic than WT cells under each corresponding culture condition. The
lowered apoptotic rate correlates with the lowered metabolic rate of the SIG3 KO
cells, in comparison to WT.
Figure 15: Neu5Gc induces apoptosis. GCm cultured cells were significantly more
apoptotic than SDm and ACm cultured cells. Chronic treatment with Aβ did not influence
apoptosis. SIG3 KO cells were significantly less apoptotic in comparison to corresponding culture
51
condition in WT cells, except in SDm untreated cells. Apoptotic rate of SIG3 KO cells remained
unchanged, irrespective of sialic-acid feeding and chronic treatment with Aβ. n=3.
3.4.7 Neu5Gc in combination with Aβ treatment induces molecules of activatory pathways
Indirect evidence of absent inhibitory signaling was obtained by detecting the
phosphorylation status of the downstream activatory molecule ERK (extracellular
signal regulated kinases) at 42 and 44 kDa, normalized to total ERK protein
immunoprecipitated (figure 16A). Increase in phosphorylated ERK (pERK) in ratio to
total ERK (tERK) indicates increased activation of the cells. THP1 WT cells cultured
under GCm conditions showed a tendency towards increased phosphorylated ERK in
comparison to ACm cells. However, the GCm induced increase was not significant.
Similarly, chronic Aβ exposure in ACm cultured cells was also insufficient to induce
significant phosphorylation of ERK. Interestingly, a combination of GCm culture and
chronic Aβ exposure significantly up regulated the phosphorylation of ERK. This up
regulation was comparable to the increased ERK phosphorylation seen in SIG3 KO
cells under all culture conditions (figure 16B).
3.4.8 Neu5Gc incorporation but not SIG3 KO or chronic treatment with Aβ causes radical bursts.
Reactive oxygen species (ROS) production was analyzed to assess the radical
production under the different sialic acid feeding conditions. SDm and ACm cultured
cells produced comparable amounts of ROS, as measured by DHE staining. In
comparison to SDm and ACm cells, GCm cultured cells produced significantly higher
quantities of ROS. However, chronic Aβ exposure did not induce ROS production
under any culture condition (figure 17).
It is crucial to indicate that while cells chronically exposed to Aβ under SDm and
ACm conditions are not in a pro-inflammatory status; phagocytosis could still be
induced, as shown in the data below (section 4.3.9). In the case of SIG3 KO cells,
absence of inhibitory signaling did not induce ROS production. SIG3 KO cells
produced comparable quantities of ROS irrespective of the type of sialic acid feeding
and chronic treatment with Aβ. Therefore, Neu5Gc induced ROS production cannot
be propagated in the absence of SIGLEC3.
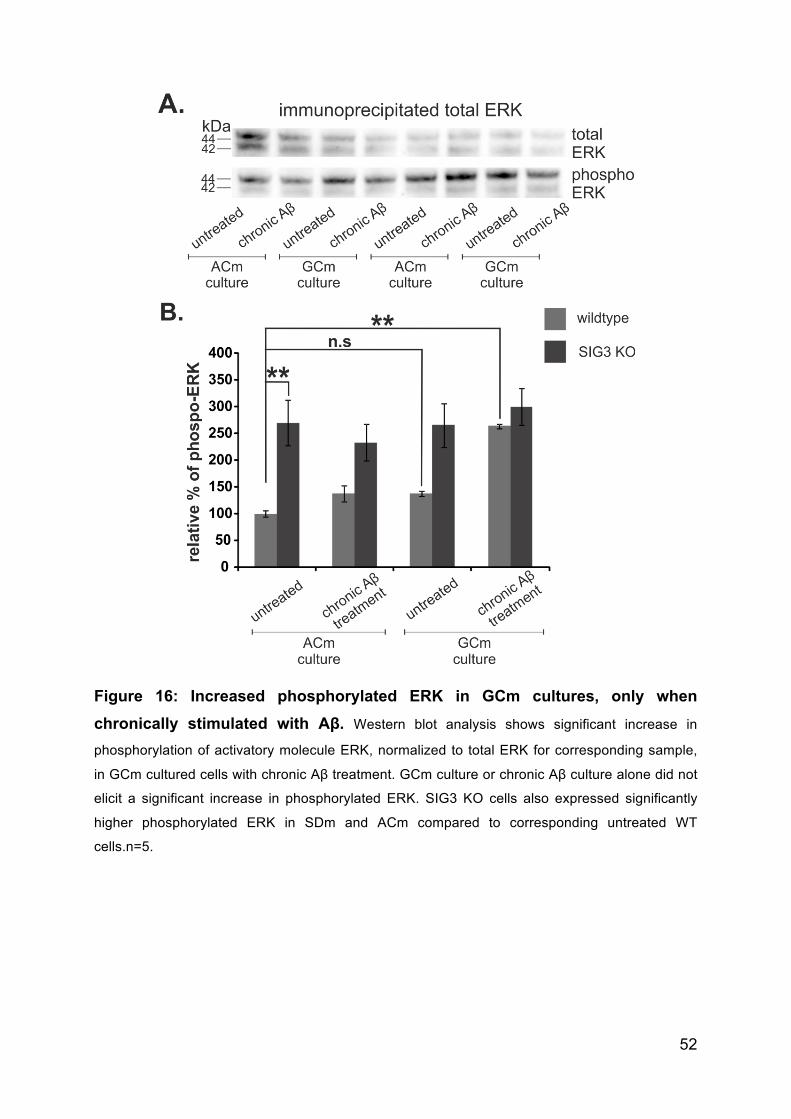
52
Figure 16: Increased phosphorylated ERK in GCm cultures, only when chronically stimulated with Aβ. Western blot analysis shows significant increase in
phosphorylation of activatory molecule ERK, normalized to total ERK for corresponding sample,
in GCm cultured cells with chronic Aβ treatment. GCm culture or chronic Aβ culture alone did not
elicit a significant increase in phosphorylated ERK. SIG3 KO cells also expressed significantly
higher phosphorylated ERK in SDm and ACm compared to corresponding untreated WT
cells.n=5.
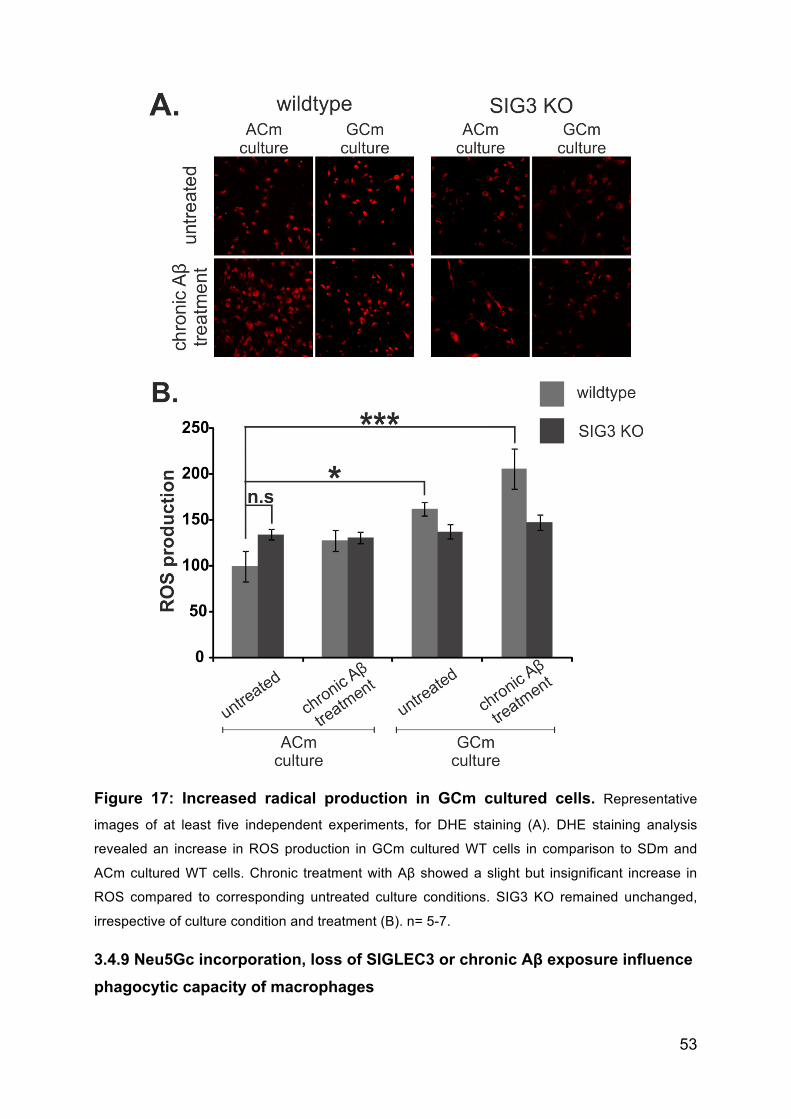
53
Figure 17: Increased radical production in GCm cultured cells. Representative
images of at least five independent experiments, for DHE staining (A). DHE staining analysis
revealed an increase in ROS production in GCm cultured WT cells in comparison to SDm and
ACm cultured WT cells. Chronic treatment with Aβ showed a slight but insignificant increase in
ROS compared to corresponding untreated culture conditions. SIG3 KO remained unchanged,
irrespective of culture condition and treatment (B). n= 5-7.
3.4.9 Neu5Gc incorporation, loss of SIGLEC3 or chronic Aβ exposure influence phagocytic capacity of macrophages
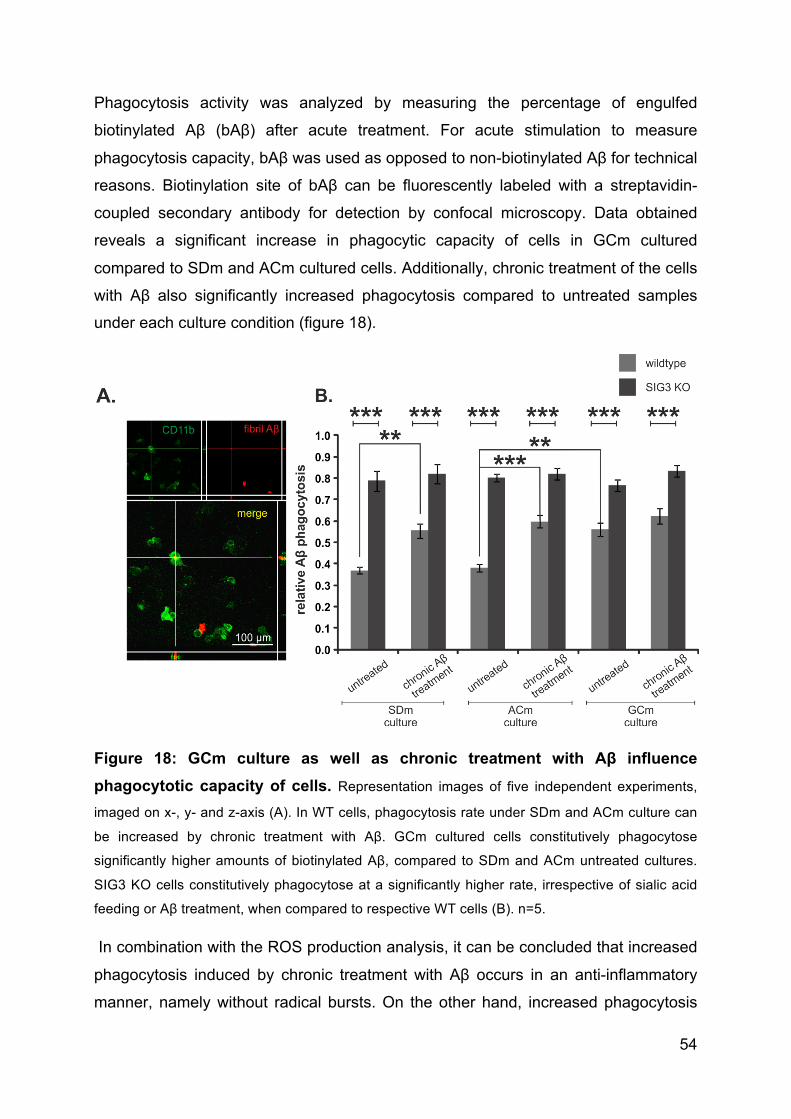
54
Phagocytosis activity was analyzed by measuring the percentage of engulfed
biotinylated Aβ (bAβ) after acute treatment. For acute stimulation to measure
phagocytosis capacity, bAβ was used as opposed to non-biotinylated Aβ for technical
reasons. Biotinylation site of bAβ can be fluorescently labeled with a streptavidin-
coupled secondary antibody for detection by confocal microscopy. Data obtained
reveals a significant increase in phagocytic capacity of cells in GCm cultured
compared to SDm and ACm cultured cells. Additionally, chronic treatment of the cells
with Aβ also significantly increased phagocytosis compared to untreated samples
under each culture condition (figure 18).
Figure 18: GCm culture as well as chronic treatment with Aβ influence phagocytotic capacity of cells. Representation images of five independent experiments,
imaged on x-, y- and z-axis (A). In WT cells, phagocytosis rate under SDm and ACm culture can
be increased by chronic treatment with Aβ. GCm cultured cells constitutively phagocytose
significantly higher amounts of biotinylated Aβ, compared to SDm and ACm untreated cultures.
SIG3 KO cells constitutively phagocytose at a significantly higher rate, irrespective of sialic acid
feeding or Aβ treatment, when compared to respective WT cells (B). n=5.
In combination with the ROS production analysis, it can be concluded that increased
phagocytosis induced by chronic treatment with Aβ occurs in an anti-inflammatory
manner, namely without radical bursts. On the other hand, increased phagocytosis
55
induced by culturing cells in Neu5Gc containing medium occurs in a pro-inflammatory
manner, namely accompanied by radical bursts. SIG3 KO cells constitutively
phagocytose significantly higher amounts, when acutely stimulated with Aβ, in
comparison to WT cells cultured under the same conditions. Type of sialic acid
culture as well as chronic treatment with low concentrations Aβ did not influence the
phagocytic capacity of SIG3 KO cells.
3.4.10 Neu5Gc induces transcription of complement cascade molecules
Previous studies have identified an increased activity of classical complement
cascade components in LAOD patients. Since induction of the classical complement
cascade can modulate phagocytosis, gene transcription of components c1q and c3
were analyzed to determine whether they correlate with the increased phagocytosis
seen in GCm cultured cells (section 4.3.9). While gene transcription of c1q is
exclusively found in the induction of classical complement cascade, transcription of
c3 occurs in all complement cascades (classical, lectin and alternative complement
cascades).
Real time PCR analysis revealed increase in transcription of classical complement
components exclusively in GCm cultured cells (figure 19). Both components only
showed significant differences between ACm and Gcm cultured cells. GCm cultured
WT cells transcribed significantly higher amounts of c1q and c3 than ACm cultured
WT cells. On the other hand, SIG3 KO cells showed a tendency for reduced
transcription of both factors in comparison to WT THP1 cells (figure 19). No
significant differences in transcription were observed in SIG3 KO cells among the
different culture conditions as well as treatments for c3 transcription (figure 19A). In
the case of c1q transcription in SIG3 KO cells, while a tendency for increased
transcription was observed after chronic treatment with Aβ, these differences were
insignificant (figure 19B).
Therefore, induction of complement cascade molecules correlate with increased
phagocytosis seen in GCm cultured cells. To determine whether the increased
phagocytosis in GCm cultured cells is indeed mediated through the classical
complement pathway, inhibition studies using antibodies blocking complement
receptor 3 (CR3) must be performed (preliminary data in section 4). While increased
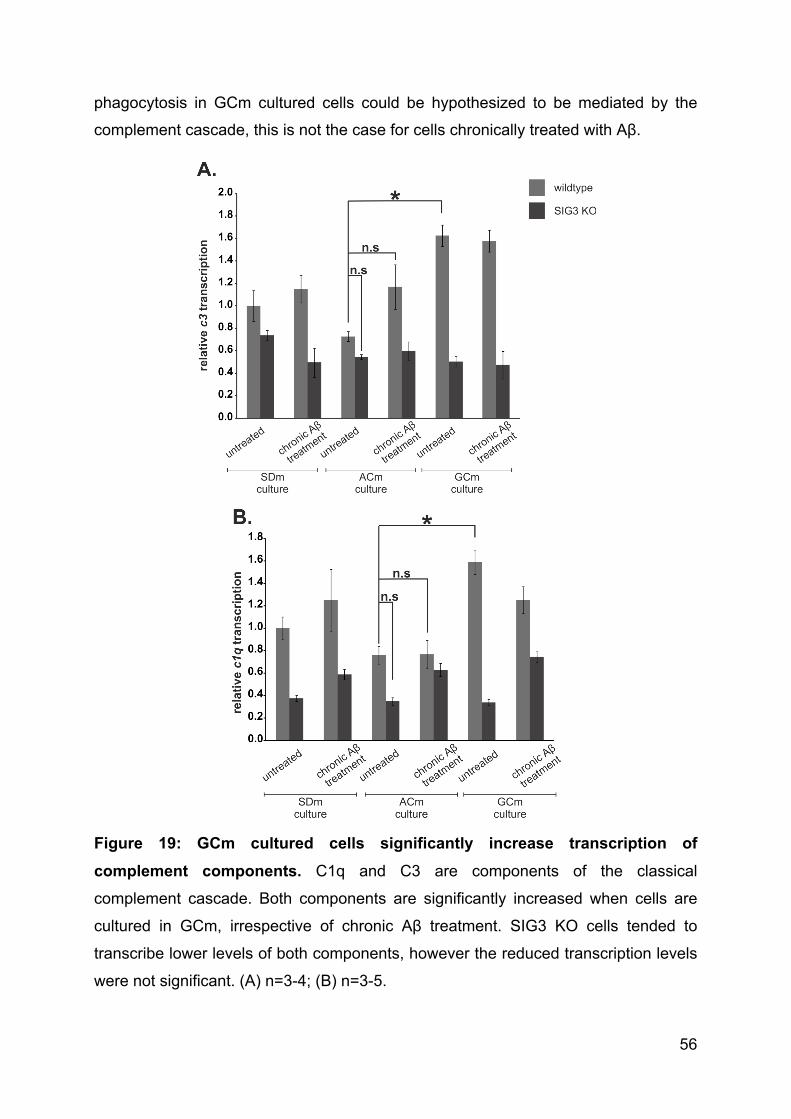
56
phagocytosis in GCm cultured cells could be hypothesized to be mediated by the
complement cascade, this is not the case for cells chronically treated with Aβ.
Figure 19: GCm cultured cells significantly increase transcription of complement components. C1q and C3 are components of the classical
complement cascade. Both components are significantly increased when cells are
cultured in GCm, irrespective of chronic Aβ treatment. SIG3 KO cells tended to
transcribe lower levels of both components, however the reduced transcription levels
were not significant. (A) n=3-4; (B) n=3-5.
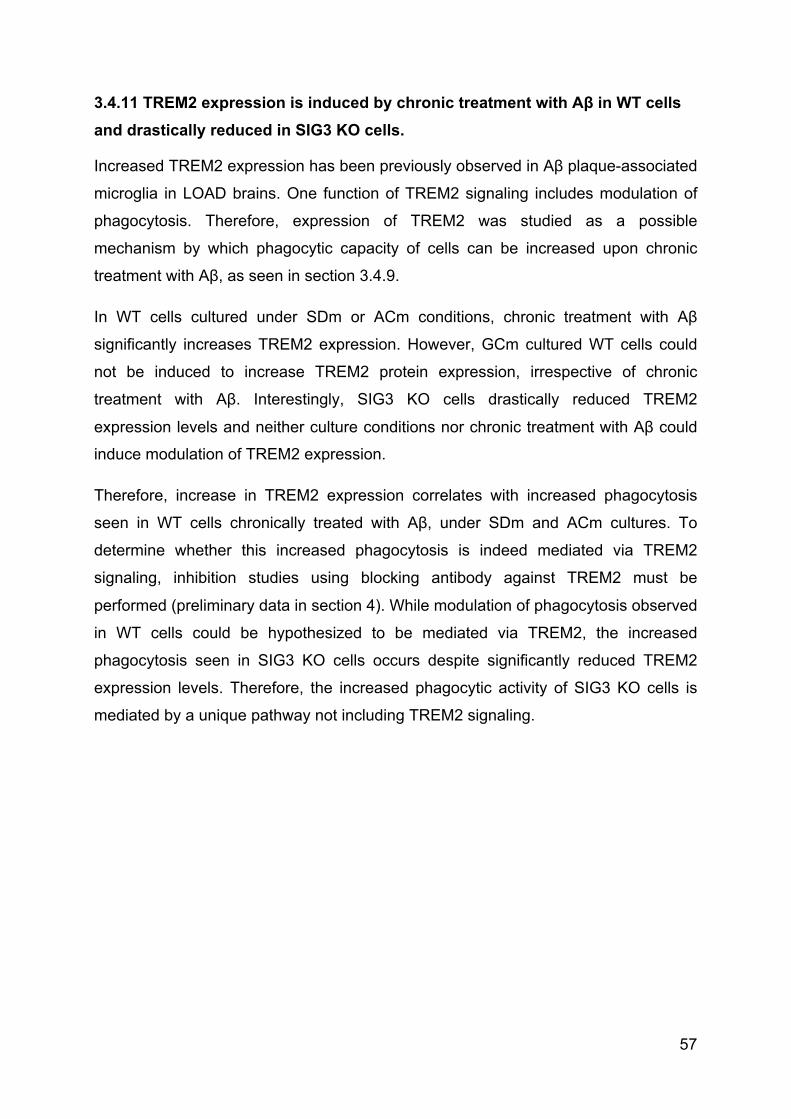
57
3.4.11 TREM2 expression is induced by chronic treatment with Aβ in WT cells and drastically reduced in SIG3 KO cells.
Increased TREM2 expression has been previously observed in Aβ plaque-associated
microglia in LOAD brains. One function of TREM2 signaling includes modulation of
phagocytosis. Therefore, expression of TREM2 was studied as a possible
mechanism by which phagocytic capacity of cells can be increased upon chronic
treatment with Aβ, as seen in section 3.4.9.
In WT cells cultured under SDm or ACm conditions, chronic treatment with Aβ
significantly increases TREM2 expression. However, GCm cultured WT cells could
not be induced to increase TREM2 protein expression, irrespective of chronic
treatment with Aβ. Interestingly, SIG3 KO cells drastically reduced TREM2
expression levels and neither culture conditions nor chronic treatment with Aβ could
induce modulation of TREM2 expression.
Therefore, increase in TREM2 expression correlates with increased phagocytosis
seen in WT cells chronically treated with Aβ, under SDm and ACm cultures. To
determine whether this increased phagocytosis is indeed mediated via TREM2
signaling, inhibition studies using blocking antibody against TREM2 must be
performed (preliminary data in section 4). While modulation of phagocytosis observed
in WT cells could be hypothesized to be mediated via TREM2, the increased
phagocytosis seen in SIG3 KO cells occurs despite significantly reduced TREM2
expression levels. Therefore, the increased phagocytic activity of SIG3 KO cells is
mediated by a unique pathway not including TREM2 signaling.
58
Figure 20: Trem2 protein expression is not inducible in GCm cultured cells and drastically reduced in SIG3 KO cells. TREM2 protein expression was inducible
upon chronic treatment with Aβ, when WT cells were cultured in SDm or ACm
conditions. However, GCm cultured WT cells were incapable of increasing TREM2
expression, when chronically treated with Aβ. SIG3 KO cells significantly reduced
TREM2 expression in comparison to WT in corresponding samples, irrespective of
culture conditions or Aβ treatment. n=5.
74
4. Discussion
Evolution of the modern man began with the first member of the genus Homo over
2.5 million years ago. Over the numerous species ranging from Homo habilis to
modern man, several crucial evolutionary changes occurred to ensure survival
against external factors like climate and predators (Noonan 2010). In addition to
physical changes in the skeletal and nervous system, vital changes in the immune
system also occurred (Abi-Rached et al. 2011). Around 2 million years ago, one such
crucial change occurred exclusively in members of the genus Homo at the molecular
level, namely a 92 base pair deletion in exon 6 of the gene cmah (Chou et al.
1998)(Varki 2001). The enzyme CMAH is responsible for hydrolyzing acetylated sialic
acid (Neu5Ac) to produce glycosylated sialic acid (Neu5Gc). Taken together, the
development of a complex CNS as well as a robust immune system led to a thriving
species of humans that are continually evolving to this day. The immune system,
including phagocytes such as macrophages in PNS and microglia in the CNS are
crucial in defending the host against infections. Microglia in the CNS maintain
homeostasis and therefore are vital in supporting co-ordinated functioning of the
host.
4.1 Functions of microglia and their contribution to LOAD
4.1.1 Microglia in health and disease
Microglia are the only resident immune cells of the immune-privileged CNS. Being
the primary-response team to protect the CNS, microglia express specialized
receptors that are useful in detecting chemical imbalances or changes indicative of
various stimuli ranging from dangerous pathogenic invasion to routine synaptic
pruning. In the case of the former, microglia are stimulated towards a pro-
inflammatory state. Pro-inflammatory status refers to the state at which microglia can
effectively proliferate, migrate to site-of-infection and destroy invading pathogens by
phagocytosis and radical bursts. Radicals such as reactive oxygen species (ROS) or
reactive nitrogen species (RNS), among others, are a necessary by-product of pro-
inflammation upon stimuli with pathogen-associated molecular patterns (PAMPs). In
addition to destroying pathogens, radical bursts also cause collateral damage to
neighbouring host cells. However, production of radicals is often a fast and transient
event and therefore collateral damage to host cells is highly localized and limited.
60
Besides host defense, maintenance of homeostasis by phagocytosing apoptotic cells
and synaptic pruning are by far some of the most important responsibilities of
microglia (Maderna & Godson 2003)(Tremblay et al. 2010). Synaptic pruning during
development as well as in the adult CNS can be mediated by anti-inflammatory
phagocytosis without radical damage to neighbouring cells (Michelucci et al.
2009)(Paolicelli et al. 2011)(Bilimoria & Stevens 2015)(Wu et al. 2016). In addition,
immune cells in this state can release neuroprotective factors such as BDNF, GDNF
and TGFβ. Taken together, microglia perform numerous and complex functions,
which are sensitively balanced in order to maintain homeostasis and provide immune
defense.
Therefore, an imbalance in the sensitive signaling of microglia can lead to a
disproportionate response resulting in chronic inflammation and neurodegeneration
(Bradshaw et al. 2013)(Brown & Neher 2014)(Bodea et al. 2014).
In the case of AD, the most obvious pathological features found in post-mortem AD
brains are extracellularly accumulated Aβ plaques and intracellularly accumulated tau
proteins. However, studies show that AD patients with clinically diagnosed dementia
as well as age-matched non-demented controls both have Aβ deposits (Coria et al.
1993)(Esparza et al. 2014). The critical difference between AD patients and control
individuals lie with the plaque morphology/density and their associated glial cells.
Post-mortem studies show that an AD brain has a higher plaque coverage and
severe microgliosis and astrogliosis proximal to plaques, in comparison to a non-
demented brain (Esparza et al. 2014). For this reason, the molecular environment in
a pre-clinical AD brain must be intensively studied to identify the initial source of
inflammation. Decades before cognitive deficits begin to manifest in an AD patient,
molecular events occur, that distinguish a potential AD brain from non-demented
control. One such event is the upregulation of the classical complement pathway
(Hong et al. 2016)(reviewed by Tosto & Reitz 2013). This association is further
substantiated by genome-wide association studies (GWAS) that have identified
complement receptor 1 (CR1) as a risk factor for LOAD (Hollingworth et al.
2011)(reviewed by Tosto & Reitz 2013).
In addition, inflammation is also found in early stages of LOAD. Microglia are
considered as one of the primary sources of inflammation in the CNS (Streit
2004)(Ridolfi et al. 2013)(reviewed by Doens et al. 2014)(Malik et al. 2015).
61
4.1.2 Inflammation in LOAD
Neuroinflammation is widely accepted as the cause leading to degeneration of
neurons. Microgliosis has been found to be a pathological feature of AD, along with
Aβ plaques (Solito & Sastre 2012)(Herber et al. 2007). However, studies which
indicate that Aβ can induce inflammation should be critically viewed due to the
technicalities behind the experimental setups. On the one hand, several studies load
high quantities, above biological levels, of fibrillary Aβ to elicit a pro-inflammatory
stimuli (Milton et al. 2008)(Parajuli et al. 2013). On the other hand, several studies
use cellular or animal models that do not fully represent the array of human specific
receptors or ligands (Milton et al. 2008)(Parajuli et al. 2013)(Chin 2011). Therefore,
attention must be paid to the experimental setup as well as model system used to
study the source of inflammation that exacerbates LOAD pathology.
The typical microglial characteristic functions were studied in this thesis to elucidate
the possible pathways that lead to pre-clinical inflammation. To fully understand the
microenvironment of microglial cells, their receptors and ligands must be taken into
account. One feature that is unique to human cells are their sialic acid composition.
4.2 Sialic acids and SIGLECs
A single sialic acid molecule, termed by the swedish biochemist Gunnar Blix in 1952
(Blix et al. 1952), is a glycan monomer in its most basic form. Although small and
seemingly irrelevant, sialic acids are vital molecules with several functions among all
eukaryotes (Varki & Gagneux 2012)(Rachmilewitz 2010). Mammalian cells utilize the
sialic acids in their multifarious combinations and conformations to communicate and
maintain homeostasis. Studies have attributed reduced neurotoxicity by radicals and
increased life span to sialic acids and their binding to receptors (Claude et al. 2013;
Schwarz, Pearce, et al. 2015)(Schwarz, Springer, et al. 2015). This sensitive
signaling through sialic acids has been hijacked by pathogens to evade host immune
response upon infection by molecular mimicry (Doxey & McConkey 2013). Sialic
acids and their receptors are perenially in an evolutionary race to overcome
pathogen mimicry and improve upon host immune defence (Wang et al.
2012)(Padler-Karavani, Tremoulet, et al. 2013). Protection against zoonotic diseases
has been hypothesized as one of the main criteria for the loss of CMAH enzyme
functionality specifically in humans (reviewed by Varki 2001).
62
The loss of Neu5Gc as a native ligand to human sialic-acid binding receptors led to a
desensitization of these receptors to Neu5Gc and a preference towards Neu5Ac
(Blixt et al. 2003)(Padler-Karavani, Hurtado-Ziola, et al. 2013). One such family of
sialic acid binding receptors include SIGLECs. The majority of SIGLECs, called
CD33-related SIGLECs, are rapidly evolving and differ from species to species. One
clear example of species differences among CD33-related SIGLECs can be seen in
the receptor SIGLEC3. Human SIGLEC3 (hSIGLEC3) carries two intracellular
tyrosine-based inhibitory motifs. The tyrosine-based inhibitory motifs (ITIM and ITIM-
like), by which hSIGLEC3 signals, can propagate an inhibitory signaling cascade
which modulates activatory signaling pathways. On the other hand, mouse SIGLEC3
(mSIGLEC3) carries a single ITIM-like domain intracellularly and additionally carreis
a positively charged residue in the transmembrane region. The positively charged
residue is a putative association site for the activatory protein DAP12. Therefore, it
can be assumed that mSIGLEC3 could propagate activatory signaling pathways
(Crocker et al. 2007). This high variability in the family of SIGLECs among mammals
hints at the sensitivity towards and complexity of their preferential ligands, namely
sialic acids (Padler-Karavani et al. 2014).
Although humans are incapable of producing Neu5Gc from Neu5Ac, several studies
have shown trace evidence of Neu5Gc found in human cancer tissue and fetal tissue
as well as antibodies against Neu5Gc in the blood stream (Malykh et al.
2001)(Tangvoranuntakul et al. 2003)(Hedlund et al. 2007). However, the non-human
immunogenic sialic acid elicits an immune reaction in response to Neu5Gc, called
xenosialitis (Bergfeld et al. 2012)(Samraj et al. 2015). Xenosialitis leads to
inflammation and exacerbation of vascular pathology.
The source of immunogenic Neu5Gc in human tissue was found to be metabolic
incorporation from diet (Bardor et al. 2005)(figure 6). Once exposed on the cellular
glycocalyx, sialic acids are available as ligands to sialic acid binding receptors.
Futhermore, due to the desensitization of the human system to Neu5Gc, this sialic
acid is rather resistent to enzymatic turnover by human sialidases, leading to an
accumulation on cells when a persistent source is available (Taguchi et al.
2015)(Davies et al. 2012). Therefore, Neu5Gc could be hypothesized to disrupt
cellular homeostasis. This possibility is of interest with respect to LOAD for two
reasons; first, Neu5Gc has been proven to elicit an immune response and therefore
63
cause inflammation (Samraj et al. 2015). Second, sialic acids including Neu5Ac and
Neu5Gc are ligands to the inhibitory receptor SIGLEC3. Polymorphisms of SIGLEC3
have been associated to LOAD by GWAS (Hollingworth et al. 2011). Furthermore,
while xenosialitis has been implicated in cancer progression (Malykh et al.
2001)(Samraj et al. 2015), autoimmune hypothyridism (Eleftheriou et al. 2014) and
infertility (Ma et al. 2016), the inflammatory response to Neu5Gc in the brain -
particularly in terms of neurodegenerative diseases remains unresolved.
4.3 Microglial cells as a human model system to study xenosialitis in LOAD
Since extensive species differences exist, this report primarily aims at maintaining a
“human-like” culture model. Cells were cultured in either serum-deficient medium
(SDm) or Neu5Ac-supplemented medium (Acm) as controls which represent a
human native sialic acid environment. In parallel, cells were treated with Neu5Gc-
supplemented medium (GCm), to study the influence of Neu5Gc incorporation on
immune cell functions. Finally, to mimic the early environment preceding clinically
confirmed AD, cells were chronically exposed to nanomolar concentrations of Aβ.
The concentration of Aβ used for chronic treatment was intentially chosen to be
dramatically lower than typically used in studies with regards to AD research.
Previous studies which describe an inflammatory response from immune cells in
response to Aβ use concentrations of 2.5 µM (Milton et al. 2008), 5 µM (Parajuli et al.
2013) and above. However, early in disease onset, Aβ is not present as highly
concentrated wide-spread plaques but rather deposited as puncta in the form of
monomers or oligomers (Hong et al. 2016).
4.3.1 Microglial cells as a human model system
The first aim of this project was to establish a stable and proliferative human
microglial cell line as a human specific model system cultured in serum-free medium.
To this end, human induced pluripotent stem (iPS) cells were differentiated into a
microglial cell line (SdMic1 and SdMic2). However, the obtained lines proved to be
genetically instable. Karyotyping studies indicated that the microglial lines carried
increased chromosomal numbers in comparison to the iPS cells from which they
were generated. Further analysis with techniques such as fluorescence in situ
hybridization (FISH) could help identify the specific chromosomes that have been
64
duplicated. Although the discrepancies in chromosomes were not specifically
identified, previous publications have also described instabilities in iPS cultures and
their derivatives (Mayshar et al. 2010)(Varela et al. 2012). Further confirmation of
genetic instability of SdMic lines was observed from SNP analysis. The abberent
reads can be attributed to the increased chromosomal numbers of the cell lines.
Therefore, while the SdMic lines were proliferative and could be easily expanded for
molecular studies, the genetic instability made them an inadequate model system. In
order to obtain genetically stable microglial cells, optimizations to the previously
described protocol were made by including quality controls such as routine in-house
STR analysis runs (Cooper et al. 2007). Further optimizations included culturing stem
cells on a matrix layer and screening for KDR+CD235a+ population in the embryonic
body (EB) stage. The percentage of double positive cells represents the embryonic
hematopoiesis population which is known to give rise exclusively to microglial cells of
the CNS (Ginhoux et al. 2010). In addition, stimulation of myeloid progenitors and
microglial precursors by IL34 and MCSF aimed at supporting their development. The
obtained microglial cells (iPSdM9) were positively indentified as microglia by their
heritage (namely KDR+CD235a+ population) and the expression of typical markers
such as IBA-1, CD11b and TREM2. Of all the cells identified by DAPI staining, only a
modest population was positive for the above mentioned markers. This non-
homogenous population is due to the low microglial cell numbers obtained in the
differentiation plates. The few thousand microglia harvested were manually picked
using a micropipette and therefore other cells types besides microglia were also
present. Since the microglia are not highly proliferative, they do not easily overgrow
the other cell types to develop a homogenous cell line. Further optimization is
required to obtain higher quantities of microglia that could represent an in vitro
human model system, sufficient for molecular studies. Limitations of low cell numbers
can be overcome by upscaling the differentiation, however, efficiency of
differentiation could be bettered by increasing the proportion of KDR+CD235a+
population in the EB stage, for example by activating wnt pathway. While direct
differentiation from stem cells to microglial cells is the most efficient option, the
disadvantage includes the absence of neural input during microglial maturity that
occurs in vivo. By including an EB development stage, both neural and myeloid
progenitors develop in the same environment. Neuronal and astrocyte cell types are
found in the differentiation plate alongside microglial cells. The cross-talk between
65
microglia and its neighboring neural cell types can provide vital signals to mature
microglial cells. Finally, increased stimulation of colony stimulation factor receptor is a
potential target to improve microglial proliferation.
4.3.2 Influence of Neu5Gc on immune cell functions
Validation of experimental setup
Due to limitations in cell numbers of iPSdM9 microglial cells, THP1 monocyte-derived
macrophages were substituted as a human model system to study the influence of
incorporated Neu5Gc on immune cell functions in general, and SIGLEC3 signaling in
particular. THP1 cells express surface markers typically found in both microglia and
macrophages and well represents the human species specific immune cell type. The
capability of human cells to metabolically incorporate Neu5Gc has been previously
shown by publications and was further confirmed in this thesis (Tangvoranuntakul et
al. 2003)(Bardor et al. 2005). Presence of Neu5Gc on the cell surface after culturing
in GCm was confirmed by flow cytometry analysis using a specific anti-Neu5Gc
antibody. Furthermore, chronic treatment of cells with Aβ significantly increased the
detection of Neu5Gc on the cell surface. This indicates that the Aβ treatment was
identified by the immune cells, which respond by increasing the sialic acids on the
cell surface. Of the total Neu5Gc incorporated, xCGE-LIF identified that around 1 %
was present in the form of glycoproteins (section 3.4.1). Therefore, it can be
assumed that the majority of Neu5Gc is present in the form of glycolipids. The fact
the sialic acids are primarily found onon glycolipids has been previously described by
Schnaar and colleagues (Schnaar et al. 2014). Nevertheless, Neu5Gc isolated from
glycolipids must also be measured by xCGE-LIF for confirmation. The incorporated
Neu5Gc was shown to cause wide-scale dysregulation of several immune processes.
RNA sequencing identified that over 1400 genes were differentially expressed in
GCm cultured cells in combined comparison to SDm and ACm cultured cells.
Interestingly, the pathways that were highlighted as being dysregulated include cell
signaling, regulation of immune responses, regulation of response to stimuli and
migration (section 3.4.2). This dysregulation found in GCm cultured immune cells
indicates a proinflammatory phenotype, which is appreciable when compared to
studies describing xenosialitis caused by Neu5Gc.
RNA sequencing established that Neu5Gc incorporation pushed immune cells
towards a proinflammatory phenotype. Therefore, the question arose; Which
66
pathways mediate the negative effects of Neu5Gc? Since Neu5Gc is a monosialic
acid, the sialic acid binding receptor SIGLEC3 came into focus. Most interestingly,
polymorphisms of SIGLEC3 have been associated with LOAD. Although Neu5Gc is
no longer a native human sialic acid, SIGLEC3 can bind Neu5Gc (Blixt et al. 2003).
The capacity of SIGLEC3 to bind Neu5Gc was further confirmed in this thesis by flow
cytometry analysis using SIGLEC3 Fc-fusion protein. SIGLEC3 Fc-fusion protein
could bind both ACm and GCm cultured cells to the same extent. Binding of the Fc-
fusion protein was futher increased when the cells were chronically treated with Aβ,
in both ACm and GCm culture conditions (section 3.4.3). This data correlates well
with the increased Neu5Gc detection in cells chronically treated with Aβ, in
comparison to control cells (section 3.4.1). Therefore, an increase in ligands on the
cell surface leads to an increase in protein binding.
Influence of Neu5Gc on SIGLEC3 signaling
Inhibitory receptors of the SIGLEC family and their downstream signaling are
important in maintaining homeostasis (Johnson et al. 2013)(reviewed by Linnartz et
al. 2010). SIGLECs are known to bind sialic acids on their own cell surface by means
of so-called cis interactions (Crocker et al. 2007). SIGLECs bound in cis maintain
homeostasis by propagating a baseline inhibition signal. In this thesis, the
percentage of cis interacting SIGLEC3 was identified by taking advantage of the
various SIGLEC3 antibodies available. Two clones of SIGLEC3 antibodies bind at
two different epitopes; clone WM53 binds at a unique epitope that is not obstructed
irrespective of ligand binding to SIGLEC3 and HIM3-4 clone binds an epitope that is
proximal to ligand-binding epitope and therefore, can only bind if the protein is not
ligand bound. Therefore, the clone WM53 determines the total SIGLEC3 while the
clone HIM3-4 determines unbound / free SIGLEC3. By subtracting the total SIGLEC3
from free SIGLEC3 (WM53 - HIM3-4), the percentage of cells with cis-interacting
SIGLEC3 can be calculated. For further detail, the ratio between bound to total
SIGLEC3 was calculated. Increase of SIGLEC3 bound to ligand would indicate an
increase in inhibitory signaling. While SDm and ACm cultured untreated cells
exhibited comparable ratios of cis-bound SIGLEC, these ratios significantly increased
in both cases when chronically treated with Aβ (section 3.4.3). An increase in
inhibitory signaling upon Aβ treatment could indicate an attempt to modulate the
activation of the cell upon stimulation. GCm cultured cells constitutively exhibited
67
more bound SIGLEC3, which was not further increased upon binding to Aβ (section
3.4.3). By similar logic, the cells could also be increasing SIGLEC3 signaling to
modulate cellular activation. However, in the case of GCm cultured cells, two more
possibilities should be taken into consideration. First, since human sialidases are
incapable of efficiently turning over Neu5Gc, the SIGLEC3 could simply be
persistently bound due to the continual presence of the sialic acid. Since Neu5Gc-
bound SIGLEC3 does not propagate inhibitory signaling (section 3.4.4), the second
possibility could be an increase in SIGLEC3 binding to compensate for the lack of
downstream SIGLEC3 signaling by the inappropriate binding of Neu5GC.
Downstream signaling of SIGLEC3 was determined by the recruitment of SHP1 to
the protein. Co-immunoprecipitation of SIGLEC3 and SHP1 determined that
significantly less SHP1 was recruited in the case of GCm cultured cells (section
3.4.4). Insufficient recruitment of SHP1 indicates that SIGLEC3 inhibitory signaling is
not propagated when Neu5Gc is incorporated. In conclusion, SIGLEC3 Fc-fusion
protein analysis confirms that Neu5Gc can bind SIGLEC3 but western blot analysis
determines that this binding does not propagate an inhibitory signaling due to a
reduced recuitment of the downstream molecule, SHP1.
Upon identification of dysregulated SIGLEC3 signaling due to Neu5Gc, a SIGLEC3
knockout (SIG3 KO) cell line was introduced as a control in comparison to wildtype
(WT) cells. Differences observed between ACm cultured WT cells and GCm cultured
WT cells could be compared to the respective SIG3 KO cells to determine whether
presence of SIGLEC3 attenuates or exacerbates these differences.
Influence of Neu5Gc on functional characteristics of macrophages
First, all samples were tested for their metabolic activity by MTT assay. The
metabolic rate was not altered within the cell type, among the different culture and
treatment conditions. However, cells of each SIG3 KO culture condition exhibited
significantly less metabolism than their corresponding WT samples (section 3.4.5).
The fact that the metabolism was also decreased in the control culture conditions, in
SIG3 KO cells compared to WT cells, indicates a genotype specific connection. SIG3
KO cells could be downregulating metabolic processes as a compensation
mechanism to the loss of an important homeostatic inhibitory signaling pathway.
68
However, analysis by RNA sequencing are required for further insights to the
activatory status of the SIG3 KO cells.
Functional read outs studied in the two cell lines (WT and SIG3 KO), under the
different culture conditions (table 1) included apoptosis assay, phosphorylation of
ERK, production of ROS, phagocytosis assay, quantitative real time PCR for
complement components and surface marker analysis of LOAD-associated TREM2.
In confirmation with RNA sequencing analysis, all functional read outs indicated that
GCm cultured cells were more activated than control cells. Incorporation of Neu5Gc
in WT cells significantly increased apoptosis, while chronic treatment with Aβ tended
to increase apoptosis rate, this tendency remained insignificant. Most interestingly,
SIG3 KO cells did not modulate their apoptosis rates, irrespective of culture
conditions and treatments. Therefore, knockout out SIGLEC3 rescues the cells from
Neu5Gc induced apoptosis (section 3.4.6). An indirect measurement of SIGLEC3
signaling was obtained by detecting the phosphorylation status of downstream
activatory molecule, ERK. ERK phosphorylation indicates propagation of an
activatory signal. Although, it must be noted that several activation pathways can
lead to activatory signaling. However, ERK is a strong candidate downstream of the
activatory pathway that could be modulated by SHP1 of the SIGLEC3 inhibitory
pathway (figure 4). Chronic treatment of ACm cultured WT cells was not sufficient to
increase ERK phosphorylation. Similarly, GCm culture of WT cells in untreated
condition was also insufficient for inducing phosphorylation of ERK. However, a
combination of GCm culture and chronic treatment with Aβ significantly increased the
phosphorylation of ERK in WT cells. In the case of SIG3 KO cells, phosphorylated
ERK was constitutively increased in ACm cultured cells (section 3.4.7). Since loss of
SIGLEC3 signaling elicits an increase in ERK phosphorylation, this outcome further
supports the statement above, which claims that ERK is a strong candidate that can
be modulated via SIGLEC3 signaling. As seen in apoptosis assay, phosphorylation of
ERK could also not be modulated by culture conditions or treatments in SIG3 KO
cells. While the differences between GCm WT and GCm SIG3 KO cells were not
significant, a significant difference in ACm culture condition was seen. One of the
most critical read outs is the measurement for the production of ROS. Production of
ROS is toxic to cells and chronic production can cause wide-spread cellular damage
and ultimately neurodegeneration. Fitting with the activated status of GCm cultured
69
WT cells, Neu5Gc incorporation significantly increased ROS production in
comparison to ACm cultured WT cells. Most interestingly, chronic treatement with Aβ
in ACm cultured WT cells did not induce an increase in ROS production. This data is
in contrast to several publications which utilise high concentrations of fibrillary Aβ to
elicit a proinflammatory response. In this thesis, the concentration of Aβ that has
been used was intentially chosen to be minimal, yet chronic. Although chronic
treatment in this sample did not elicit increased ROS, cells were nevertheless
stimulated to upregulate phagocytosis upon stimulation (as further described below
and in section 3.4.9), which indicates an appropriate immune response. Chronic
treatment in GCm cultured WT cells produced comparable quatities of ROS as
untreated cells under the same condition. The SIG3 KO cells were once again stable
in ROS production across all culture conditions and treatments (section 3.4.8).
Therefore, loss of SIGLEC3 signaling attenuated the detrimental effects of Neu5Gc
incorporation. Although chronic treatment of ACm cultured WT cells did not increase
the production of ROS, this does not indicate that the cells cannot be activated upon
stimulation. On the contrary, acute stimulation of cells with high concentrations of Aβ
did elicit a phagocytic response. This increase in phagocytosis occurs in an anti-
inflammatory manner, namely in the absence of ROS. Only the WT cells cultured in
GCm were phagocytic in a proinflammatory manner and acute stimulation with high
quantities of Aβ did not induce an increase in phagocytosis. The inability of GCm
cultured WT cells to appropriately respond to stimulation, along with the
consititutively high production of ROS further confirms the detrimental effects of
Neu5Gc incorporation. Interestingly, the benefits of the lack of SIGLEC3 signaling
was furthered by their consitutively high phagocytosis capacity. Interestingly, SIG3
KO cells were significantly more phagocytic than WT cells under any culture
condition or treatment (section 3.4.9). The high phagocytosis capacity of SIG3 KO
cells, along with their capacity to inhibit ROS production in the presence of Neu5Gc,
speaks volumes for the beneficial effects of knocking out SIGLEC3 signaling to
attentuate its association with AD risk.
Phagocytosis is an important function of immune cells that is lacking in LOAD and
chronic activation is a feature that is in excess. Increased activity of the classical
complement cascade has been previously identified in models for AD. Therefore, the
influence of Neu5Gc on components of the classical complement pathways came
into focus. To this end, quantitative real time PCR analysis of the complement
70
components c1q and c3 were carried out. C1q is the initiator component of, and
exclusive to the classical complement cascade. On the other hand, C3 is a central
component upon which the classical, the lectin as well as the alternative complement
cascades merge. Transcriptions of both C1q as well as C3 were significantly
increased in GCm cultured WT cells, in comparison to ACm cultured WT cells. SDm
cultured WT cells tended to be comparable to ACm cultured WT cells albeit without
significant differences. Therefore, Neu5Gc could be interpreted as stimulation for the
classical complement pathway in LOAD. The SIG3 KO cells tended to transcribe
lower quantities of both c1q and c3 components than WT cells of the corresponding
culture condition and treatment. Nevertheless, as seen before, Neu5Gc could not
induce an increase in c1q or c3 transcription in SIG3 KO cells (section 3.4.10).
Chronic treatment with Aβ did not induce significant differences in either cell line or
culture conditions. However, chronic treatment with Aβ exclusively modulated the
next read out, namely TREM2 surface marker expression. Modulation of TREM2
surface marker expression has been extensively studied with respect to Aβ plaques
and by association to LOAD. TREM2 is of particular interest since downstream
signaling of TREM2 mediates phagocytosis (figure 4). Microglial cells that are
proximal to plaques notoriously upregulate TREM2 expression although the cells are
not phagocytically active enough to clear away the Aβ plaques. Conversely, microglia
distal to plaques have less TREM2 expression on the cell surface. Several
publications emphasize on the importance of functional TREM2 to cope with Aβ
plaque clearance in LOAD (Wang et al. 2015)(Yeh et al. 2016). Furthermore, GWAS
have associated mutations in TREM2 with increased LOAD risk (Guerreiro et al.
2013). Most interestingly, a recent paper by Chan and colleagues have identified that
SIGLEC3 can modulate TREM2 expression (Chan et al. 2015a), which can be critical
considering the dysregulation of SIGLEC3 signaling in the presence of Neu5Gc. In
this thesis, TREM2 surface marker expression was found to be significantly
upregulated in SDm and ACm cultured WT cells, only when chronically treated with
Aβ. On the other hand, WT cells cultured in GCm could not increase TREM2
expression upon chronic treatment with Aβ. The incapability to respond to the
presence of Aβ further confirms the dysregulated immune cell response to stimuli in
the presence of Neu5Gc. The positive correlation between SIGLEC3 and TREM2
(Chan et al. 2015b) was confirmed by the significantly lower expression of TREM2 in
all SIG3 KO culture and treatment conditions (section 3.4.11). While knocking out
71
SIGLEC3 proved to be beneficial in all read outs described above, the drastic
reduction in TREM2 could be a critical point to consider when developing therapies.
4.4 A hypothesis on the associations between LOAD incidence, xenosialitis and SIGLEC3
Based on the cummulative results described above, I present a hypothesis that aims
at explaining the influence of xenosialitis and SIGLEC3 signaling on LOAD incidence.
Studies supported by the World Health Organization (WHO) show a clear tendency
towards increased LOAD deaths in populations of industralized countries over
populations in the asian and african continents (www.worldlifeexpectancy.com). Data
obtained were appropriately standardized to age, and therefore improvements in
health care and increased life expectancy have not artifically influenced this data.
One major difference among the various nations is diet. Studies show that following a
mediterranean diet decreases LOAD risk (as reviewed by (Lin & Scott 2012)),
however, a western diet causes chronic glial activation (Graham et al. 2016). Glial
activation leading to chronic inflammation is a well documented feature of LOAD (Lull
& Block 2011)(Doens et al. 2014). A western diet is defined as being rich in red meat
and milk products and is a source of xenosialitis-inducing Neu5Gc sialic acids
(Philpott, Tom (April 5, 2011). "The American diet in one chart, with lots of fats and
sugars". Industrial Agriculture. Grist. Retrieved December 1, 2011.). Therefore, this
hypothesis suggests that western diet driven xenosialitis causes inflammation in
general, and dysfunctional SIGLEC3 signaling in particular, to increase LOAD risk.
LOAD risk is only higher in caucasian populations expressing full length SIGLEC3.
This data reiterates the fact that full length SIGLEC3 only exacerbates LOAD in
western diet environment, which is a source of Neu5Gc. Since asians and africans do
not follow a strict western diet, the dietary supply of Neu5Gc is low and inconsistent.
SIGLEC3 variants can either be beneficial or detrimental depending on the
populations in which they are expressed. There are two isoforms of SIGLEC3; full
length isoform, like the name mentions is the long version of SIGLEC3 as previously
described in this thesis, and exon2 spliced isoform which lacks the sialic acid binding
domain (Hernández-Caselles et al. 2006)(Malik et al. 2013). Therefore, exon2 spliced
SIGLEC3 cannot mediate inhibitory signaling. Interestingly, the well documented risk
allele of SIGLEC3 leads to transcription ratios of 9:1 in favor of full length SIGLEC3
isoform. On the other hand, the so-called protective allele modifies the ratio of
72
expression of SIGLEC3 isoforms full length and exon2 spliced to 7:3, respectively
(Schwarz, Springer, et al. 2015). In conclusion, the expression of a functional full
length version of SIGLEC3 at a higher degree is detrimental in comparison to exon2
spliced SIGLEC3. Researchers in the field interpret this outcome as follows - loss or
reduction of SIGLEC3 signaling causes increased phagocytic removal of Aβ and
ultimately lowers LOAD risk (as reviewed by (Angata 2014)). Intriguingly, the overall
expression of full length SIGLEC3 is higher in humans than in our closest relatives,
chimpanzees and bonobos. This upregulation of the homeostatic receptor is unique
to the members of the genus Homo. In addition, the protective SIGLEC3 allele is
uniquely found only in modern humans, being absent in our ancestors of the same
genus (Schwarz, Springer, et al. 2015). Therefore, the onset of SIGLEC3 protective
allele is a rather recent event that arose out of necessity. The incidence of protective
allele is highest in the Caucasian populations that consume western diet (figure 21)
and is least prevalent in Asian and African populations. Therefore, the association
between western diet derived Neu5Gc detrimentally affecting SIGLEC3 signaling to
increase LOAD risk could have been the eminent trigger that supported the
emergence of the protective allele of SIGLEC3.
In conclusion, the inflammatory effects of Neu5Gc, which is already linked to cancer
progression, could also be the initiator of chronic activation and dysregulated immune
responses in microglial cells. The malfunctioning inhibitory SIGLEC3 may further
exacerbate disease progression leading to imbalances in homeostasis and a
persistent pathological environment. Malfunctioning microglia cannot respond to
stimuli such as Aβ, which accumulate into plaques when left unchecked (figure 22).
Understanding the role of all components from a molecular level to a pandemic level
is crucial for the development of therapies that would hinder disease progression,
outside of genetic susceptibilities. On a final note, all data point towards the benefits
of a diet low in red meat and milk products. Such a dietary recommendation is
already in place as supplement to medication in the case of rheumatoid arthritis, and
should be sincerely considered for clinically diagnosed LOAD patients.
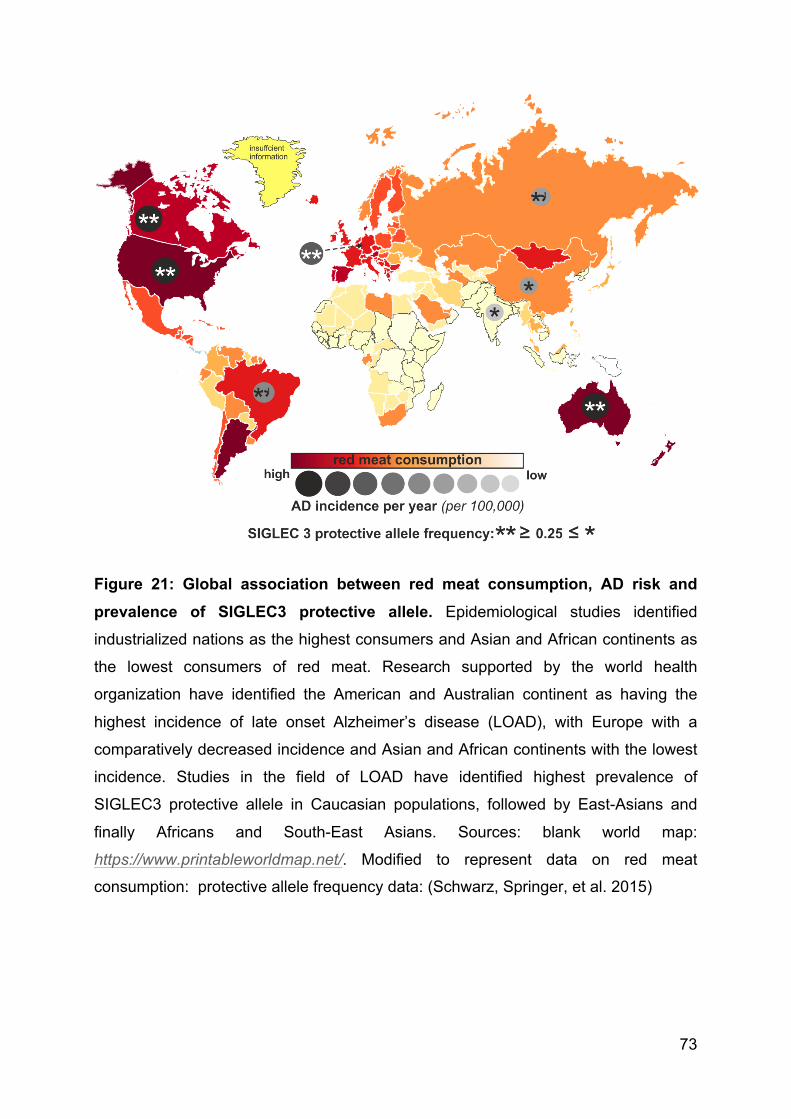
73
Figure 21: Global association between red meat consumption, AD risk and prevalence of SIGLEC3 protective allele. Epidemiological studies identified
industrialized nations as the highest consumers and Asian and African continents as
the lowest consumers of red meat. Research supported by the world health
organization have identified the American and Australian continent as having the
highest incidence of late onset Alzheimer’s disease (LOAD), with Europe with a
comparatively decreased incidence and Asian and African continents with the lowest
incidence. Studies in the field of LOAD have identified highest prevalence of
SIGLEC3 protective allele in Caucasian populations, followed by East-Asians and
finally Africans and South-East Asians. Sources: blank world map:
https://www.printableworldmap.net/. Modified to represent data on red meat
consumption: protective allele frequency data: (Schwarz, Springer, et al. 2015)
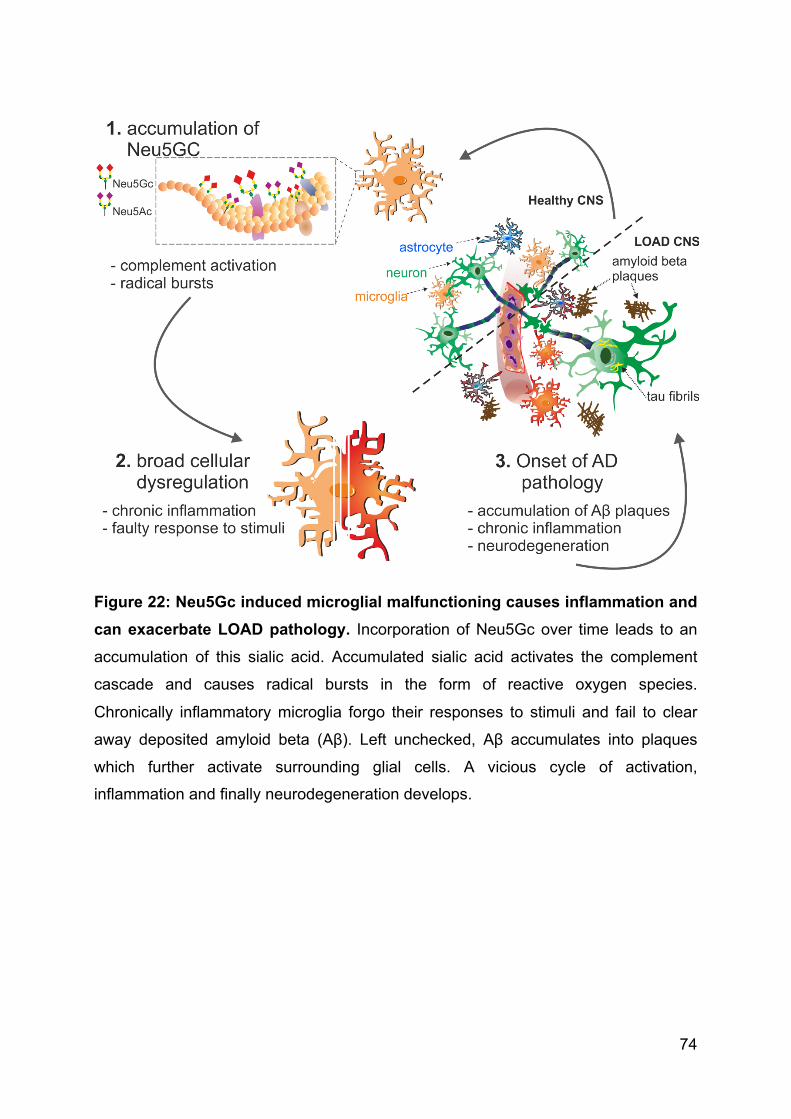
74
Figure 22: Neu5Gc induced microglial malfunctioning causes inflammation and can exacerbate LOAD pathology. Incorporation of Neu5Gc over time leads to an
accumulation of this sialic acid. Accumulated sialic acid activates the complement
cascade and causes radical bursts in the form of reactive oxygen species.
Chronically inflammatory microglia forgo their responses to stimuli and fail to clear
away deposited amyloid beta (Aβ). Left unchecked, Aβ accumulates into plaques
which further activate surrounding glial cells. A vicious cycle of activation,
inflammation and finally neurodegeneration develops.
74
5. Summary
Neuroinflammation and complement activation is believed to occur decades before
clinical diagnosis of late onset Alzheimer’s disease (LOAD). This project aimed to
clarify the molecular environment that might modulate microglial activation prior to
clinical diagnosis of LOAD. A human model system was used to study the human
species-specific receptor sialic acid binding immunoglobulin-type lectin 3 (SIGLEC3)
that has been associated with LOAD. SIGLEC3 can bind acetylated as well as
glycosylated sialic acid (Neu5Ac and Neu5Gc, respectively). Neu5Gc cannot be
produced by humans, but is metabolically incorporated in human cells after
consumption of red meat or dairy products. Neu5Gc is known to cause xenosialitis,
which involves an immune reaction in response to Neu5Gc incorporation.
First, human microglial cells (iPSdM9) were successfully differentiated from induced
pluripotent stem (iPS) cells as a potential human model system to study SIGLEC3.
Data indicate that the iPSdM9 microglial cells are capable of phagocytosis and
proliferation. Furthermore, iPSdM9 cells positively express typical surface markers,
namely IBA-1, TREM2 and CD11b. However, the limited cell numbers obtained
hindered their use as a model system for molecular studies. For this reason, THP1
monocyte-derived macrophages were used as a surrogate human model system to
study the role of SIGLEC3.
Effective incorporation of Neu5Gc into the THP1 macrophages by medium
supplementation was confirmed by flow cytometry and xCGE-LIF analysis. RNA
sequencing analysis established that incorporated Neu5Gc caused broad cellular
dysregulation in comparison to cells cultured in Neu5Ac-supplemented medium, with
more than 1400 differentially expressed genes. The particular pathways affected
include cellular signaling, regulation of immune responses, immune cell development
and responses to stimuli. While flow cytometry analysis using SIGLEC3 Fc-fusion
proteins confirmed SIGLEC3 binding to Neu5Gc, western blot data determined that
inhibitory signaling by SIGLEC3 was not effectively propagated. Therefore, Neu5Gc
induced disruption of homeostatic SIGLEC3 signaling was hypothesized to cause
malfunctioning of immune cells.
THP1 macrophages cultured in Neu5Ac-supplemented medium responded to Aβ
treatment by increasing phagocytosis in a non-inflammatory manner. However, the
76
cells cultured in Neu5Gc-supplemented medium constitutively exhibited higher
phagocytosis, accompanied by reactive oxygen species production. Furthermore, Aβ
treatment of these cells did not increase phagocytosis, hinting at the dysfunctional
immune response of cells carrying incorporated Neu5Gc. Additionally, real-time PCR
analysis of classical complement cascade components revealed increased
transcription of the complement components - c1q and c3, in cells cultured in
Neu5Gc-supplemented medium. Taken together, Neu5Gc culture causes constitutive
activation of macrophages. Interestingly, knocking out SIGLEC3 attenuates the
Neu5Gc induced inflammatory characteristics but maintains increased phagocytosis
upon Aβ treatment.
In conclusion, food-derived Neu5Gc is a possible candidate as an initiator for pre-
clinical microglial dysfunction. Neu5Gc disrupts microglial immune responses and
chronically induces radical production. Knocking out SIGLEC3 attenuates Neu5Gc
induced inflammation and provides a possible therapeutic target against LOAD
onset.
77
6. References
Abi-Rached, L. et al., 2011. The Shaping of Modern Human Immune Systems by
Multiregional Admixture with Archaic Humans. Science, 334(6052), pp.89–94.
Angata, T., 2014. Associations of genetic polymorphisms of Siglecs with human
diseases. Glycobiology, 24(9), pp.785–793.
Bardor, M. et al., 2005. Mechanism of uptake and incorporation of the non-human
sialic acid N-glycolylneuraminic acid into human cells. Journal of Biological
Chemistry, 280(6), pp.4228–4237.
Bergfeld, A.K. et al., 2012. Metabolism of vertebrate amino sugars with N-glycolyl
groups: Elucidating the intracellular fate of the non-human sialic acid N-
glycolylneuraminic acid. Journal of Biological Chemistry, 287(34), pp.28865–
28881.
Beutner, C. et al., 2010. Generation of microglial cells from mouse embryonic stem
cells. Nature protocols, 5(9), pp.1481–1494. Available at:
http://dx.doi.org/10.1038/nprot.2010.90.
Bilimoria, P.M. & Stevens, B., 2015. Microglia function during brain development:
New insights from animal models. Brain Research, 1617, pp.7–17.
Blix, F.G., Svennerholm, L. & Werner, I., 1952. The isolation of chondrosamine from
gangliosides and from submaxillary mucin. Acta Chem. Scand., 6, pp.358–362.
Available at: http://actachemscand.dk/pdf/acta_vol_06_p0358-0362.pdf.
Blixt, O. et al., 2003. Sialoside specificity of the siglec family assessed using novel
multivalent probes: Identification of potent inhibitors of myelin-associated
glycoprotein. Journal of Biological Chemistry, 278(33), pp.31007–31019.
Bodea, L.-G. et al., 2014. Neurodegeneration by Activation of the Microglial
Complement-Phagosome Pathway. Journal of Neuroscience, 34(25), pp.8546–
8556. Available at:
http://www.ncbi.nlm.nih.gov/pubmed/24948809%5Cnhttp://www.jneurosci.org/cgi
/doi/10.1523/JNEUROSCI.5002-13.2014.
Bosurgi, L., Manfredi, A. a & Rovere-Querini, P., 2011. Macrophages in injured
skeletal muscle: a perpetuum mobile causing and limiting fibrosis, prompting or
restricting resolution and regeneration. Frontiers in immunology, 2(November),
78
p.62.
Bradshaw, E.M. et al., 2013. CD33 Alzheimer’s disease locus: altered monocyte
function and amyloid biology. Nature Neuroscience, 16(7), pp.848–850.
Available at: http://www.nature.com/neuro/journal/v16/n7/full/nn.3435.html.
Brown, G.C. & Neher, J.J., 2014. Microglial phagocytosis of live neurons. Nature
Publishing Group, 15(4), pp.209–216. Available at:
http://dx.doi.org/10.1038/nrn3710%5Cnpapers2://publication/doi/10.1038/nrn371
0.
Chan, G. et al., 2015a. CD33 modulates TREM2: convergence of Alzheimer loci.
Nature Neuroscience, 18(11), pp.1556–1558. Available at:
http://www.nature.com/neuro/journal/v18/n11/full/nn.4126.html%5Cnhttp://www.n
ature.com/neuro/journal/v18/n11/pdf/nn.4126.pdf.
Chan, G. et al., 2015b. CD33 modulates TREM2: convergence of Alzheimer loci.
Nature Neuroscience, 18(11), pp.1556–1558. Available at:
http://www.nature.com/neuro/journal/v18/n11/full/nn.4126.html%5Cnhttp://www.n
ature.com/neuro/journal/v18/n11/pdf/nn.4126.pdf.
Chin, J., 2011. Selecting a Mouse Model of Alzheimer’s Disease. In E. D. Roberson,
ed. Alzheimer’s Disease and Frontotemporal Dementia: Methods and Protocols.
Totowa, NJ: Humana Press, pp. 169–189. Available at:
http://dx.doi.org/10.1007/978-1-60761-744-0_13.
Chou, H.-H. et al., 1998. A mutation in human CMP-sialic acid hydroxylase occurred
after the Homo-Pan divergence. Proceedings of the National Academy of
Sciences of the United States of America, 95(20), pp.11751–11756.
Claude, J. et al., 2013. Microglial CD33-related Siglec-E inhibits neurotoxicity by
preventing the phagocytosis-associated oxidative burst. The Journal of
neuroscience : the official journal of the Society for Neuroscience, 33(46),
pp.18270–6. Available at:
http://www.pubmedcentral.nih.gov/articlerender.fcgi?artid=3828472&tool=pmcen
trez&rendertype=abstract.
Collins, B.E. et al., 1997. Products : Sialic Acid Specificity of Myelin-associated
Glycoprotein Binding Sialic Acid Specificity of Myelin-associated Glycoprotein
Binding *.
79
Colonna, M. & Wang, Y., 2016. TREM2 variants: new keys to decipher Alzheimer
disease pathogenesis. Nature Reviews. Neuroscience, 17(4), pp.201–7.
Available at:
http://www.nature.com/doifinder/10.1038/nrn.2016.7%5Cnhttp://www.ncbi.nlm.ni
h.gov/pubmed/26911435.
Cooper, J.K. et al., 2007. Species identification in cell culture: a two-pronged
molecular approach. In vitro cellular & developmental biology. Animal, 43,
pp.344–351.
Coria, F. et al., 1993. The cellular pathology associated with Alzheimer β-amyloid
deposits in non-demented aged individuals. Neuropathology and Applied
Neurobiology, 19(3), pp.261–268. Available at: http://dx.doi.org/10.1111/j.1365-
2990.1993.tb00436.x.
Crocker, P.R., Paulson, J.C. & Varki, A., 2007. Siglecs and their roles in the immune
system. Nat Rev Immunol, 7(4), pp.255–266. Available at:
http://dx.doi.org/10.1038/nri2056.
Davies, L.R.L. et al., 2012. Metabolism of vertebrate amino sugars with N-glycolyl
groups: Resistance of ??2-8-linked N-glycolylneuraminic acid to enzymatic
cleavage. Journal of Biological Chemistry, 287(34), pp.28917–28931.
Doens, D. et al., 2014. Microglia receptors and their implications in the response to
amyloid β for Alzheimer’s disease pathogenesis. Journal of Neuroinflammation,
11(1), p.48. Available at:
http://jneuroinflammation.biomedcentral.com/articles/10.1186/1742-2094-11-48.
Doxey, A.C. & McConkey, B.J., 2013. Prediction of molecular mimicry candidates in
human pathogenic bacteria. Virulence, 4(6), pp.453–66. Available at:
http://www.ncbi.nlm.nih.gov/pubmed/23715053.
Edison, P. et al., 2008. Microglia, amyloid, and cognition in Alzheimer’s disease: An
[11C](R)PK11195-PET and [11C]PIB-PET study. Neurobiology of disease, 32(3),
pp.412–9.
Eleftheriou, P. et al., 2014. Prevalence of anti-Neu5Gc antibodies in patients with
hypothyroidism. BioMed Research International, 2014.
Esparza, T.J. et al., 2014. NIH Public Access. Pathology, 73(1), pp.104–119.
Fujita, P.A. et al., 2011. The UCSC genome browser database: Update 2011. Nucleic
80
Acids Research, 39(SUPPL. 1), pp.876–882.
Ginhoux, F. et al., 2010. Fate mapping analysis reveals that adult microglia derive
from primitive macrophages. Science (New York, N.Y.), 330(6005), pp.841–5.
Graham, L.C. et al., 2016. Chronic consumption of a western diet induces robust glial
activation in aging mice and in a mouse model of Alzheimer’s disease. Scientific
reports, 6(February), p.21568. Available at:
http://www.nature.com/srep/2016/160218/srep21568/full/srep21568.html.
Griciuc, A. et al., 2013. Alzheimer’s disease risk gene cd33 inhibits microglial uptake
of amyloid beta. Neuron, 78(4), pp.631–643. Available at:
http://dx.doi.org/10.1016/j.neuron.2013.04.014.
Guerreiro, R. et al., 2013. TREM-2 variants in AD. , 368(2), pp.117–127.
Hedlund, M. et al., 2007. N-glycolylneuraminic acid deficiency in mice: implications
for human biology and evolution. Molecular and Cellular Biology, 27(12),
pp.4340–4346. Available at:
http://www.ncbi.nlm.nih.gov/entrez/query.fcgi?cmd=Retrieve&db=PubMed&dopt
=Citation&list_uids=17420276.
Hellwig, S. et al., 2015. Forebrain microglia from wild-type but not adult 5xFAD mice
prevent amyloid-β plaque formation in organotypic hippocampal slice cultures.
Scientific reports, 5(April), p.14624. Available at:
http://www.pubmedcentral.nih.gov/articlerender.fcgi?artid=4586757&tool=pmcen
trez&rendertype=abstract.
Heppner, F.L., Ransohoff, R.M. & Becher, B., 2015. Immune attack: the role of
inflammation in Alzheimer disease. Nat Rev Neurosci, 16(6), pp.358–372.
Available at: http://dx.doi.org/10.1038/nrn3880.
Herber, D.L. et al., 2007. Microglial Activation is Required for A$β$ Clearance After
Intracranial Injection of Lipopolysaccharide in APP Transgenic Mice. Journal of
Neuroimmune Pharmacology, 2(2), pp.222–231. Available at:
http://dx.doi.org/10.1007/s11481-007-9069-z.
Hernández-Caselles, T. et al., 2006. A study of CD33 (SIGLEC-3) antigen expression
and function on activated human T and NK cells: two isoforms of CD33 are
generated by alternative splicing. Journal of Leukocyte Biology , 79(1), pp.46–
58. Available at: http://www.jleukbio.org/content/79/1/46.abstract.
81
Hollingworth, P. et al., 2011. Europe PMC Funders Group Europe PMC Funders
Author Manuscripts Europe PMC Funders Author Manuscripts Common variants
in ABCA7 , MS4A6A / MS4A4E , EPHA1 , CD33 and CD2AP are associated with
Alzheimer ’ s disease. , 43(5), pp.429–435.
Hong, S. et al., 2016. Complement and microglia mediate early synapse loss in
Alzheimer mouse models. Science (New York, N.Y.), 352(6286), pp.712–6.
Available at: http://www.ncbi.nlm.nih.gov/pubmed/27033548.
Johnson, D.J. et al., 2013. Shp1 regulates T cell homeostasis by limiting IL-4 signals.
The Journal of experimental medicine, 210(7), pp.1419–31. Available at:
http://www.ncbi.nlm.nih.gov/pubmed/23797092.
Kettenmann, H. et al., 2011. Physiology of Microglia. Physiological Reviews, 91(2),
p.461 LP-553. Available at:
http://physrev.physiology.org/content/91/2/461.abstract.
Kreutzberg, G.W., 1996. Microglia: a sensor for pathological events in the CNS.
Trends in neurosciences, 19(8), pp.312–8.
Langmead, B. et al., 2009. 2C- Ultrafast and memory-efficient alignment of short
DNA sequences to the human genome. Genome Biol., 10(3), p.R25.
Lin, G.G. & Scott, J.G., 2012. NIH Public Access. , 100(2), pp.130–134.
Linnartz-Gerlach, B., Mathews, M. & Neumann, H., 2014. Sensing the neuronal
glycocalyx by glial sialic acid binding immunoglobulin-like lectins. Neuroscience,
275.
Linnartz, B., Wang, Y. & Neumann, H., 2010. Microglial immunoreceptor tyrosine-
based activation and inhibition motif signaling in neuroinflammation. International
journal of Alzheimer’s disease, 2010.
Lull, M.E. & Block, M.L., 2011. NIH Public Access. October, 7(4), pp.354–365.
Ma, F. et al., 2016. A Mouse Model for Dietary Xenosialitis: ANTIBODIES TO
XENOGLYCAN CAN REDUCE FERTILITY. The Journal of biological chemistry,
291(35), pp.18222–31. Available at:
http://www.jbc.org/cgi/content/long/M116.739169v1 [Accessed October 28,
2016].
Maderna, P. & Godson, C., 2003. Phagocytosis of apoptotic cells and the resolution
82
of inflammation. Biochimica et Biophysica Acta - Molecular Basis of Disease,
1639(3), pp.141–151.
Malik, M. et al., 2013. CD33 Alzheimer’s risk-altering polymorphism, CD33
expression, and exon 2 splicing. The Journal of neuroscience : the official journal
of the Society for Neuroscience, 33(33), pp.13320–5. Available at:
http://www.pubmedcentral.nih.gov/articlerender.fcgi?artid=3742922&tool=pmcen
trez&rendertype=abstract.
Malik, M. et al., 2015. Genetics ignite focus on microglial inflammation in Alzheimer’s
disease. Molecular Neurodegeneration, 10(1), p.52. Available at:
http://www.pubmedcentral.nih.gov/articlerender.fcgi?artid=4595327&tool=pmcen
trez&rendertype=abstract.
Malykh, Y.N., Schauer, R. & Shaw, L., 2001. N-Glycolylneuraminic acid in human
tumours. Biochimie, 83(7), pp.623–634.
Mayshar, Y. et al., 2010. Identification and Classification of Chromosomal
Aberrations in Human Induced Pluripotent Stem Cells. Stem Cell, 7(4), pp.521–
531. Available at:
http://dx.doi.org/10.1016/j.stem.2010.07.017%5Cnpapers2://publication/doi/10.1
016/j.stem.2010.07.017.
Mclaurin, J. & Ransohoff, R., 2010. com mu n i t y co r n e r Microglial pilgrimage to
the brain. , 152(1999), pp.1380–1381.
Michelucci, A. et al., 2009. Characterization of the microglial phenotype under
specific pro-inflammatory and anti-inflammatory conditions: Effects of oligomeric
and fibrillar amyloid-?? Journal of Neuroimmunology, 210(1–2), pp.3–12.
Milton, R.H. et al., 2008. CLIC1 Function Is Required for -Amyloid-Induced
Generation of Reactive Oxygen Species by Microglia. Journal of Neuroscience,
28(45), pp.11488–11499. Available at:
http://www.jneurosci.org/cgi/doi/10.1523/JNEUROSCI.2431-08.2008.
Naj, A.C. et al., 2011. Common variants in MS4A4/MS4A6E, CD2uAP, CD33, and
EPHA1 are associated with late-onset Alzheimer’s disease Adam. Nature
genetics, 43(5), pp.436–441.
Nimmerjahn, A., Kirchhoff, F. & Helmchen, F., 2005. Resting microglial cells are
highly dynamic surveillants of brain parenchyma in vivo. Science (New York,
83
N.Y.), 308(5726), pp.1314–8.
Noonan, J.P., 2010. Neanderthal genomics and the evolution of modern humans
Neanderthal genomics and the evolution of modern humans. Genome, 20,
pp.547–553.
Padler-Karavani, V., Tremoulet, A.H., et al., 2013. A Simple Method for Assessment
of Human Anti-Neu5Gc Antibodies Applied to Kawasaki Disease. PLoS ONE,
8(3).
Padler-Karavani, V. et al., 2014. Rapid evolution of binding specificities and
expression patterns of inhibitory CD33-related Siglecs in primates. FASEB
Journal, 28(3), pp.1280–1293.
Padler-Karavani, V., Hurtado-Ziola, N., et al., 2013. Rapid evolution of binding
specificities and expression patterns of inhibitory CD33-related Siglecs in
primates. FASEB journal : official publication of the Federation of American
Societies for Experimental Biology, pp.1–14.
Paolicelli, R.C. et al., 2011. Synaptic Pruning by Microglia Is Necessary for Normal
Brain Development. Science, 333(6048), p.1456 LP-1458. Available at:
http://science.sciencemag.org/content/333/6048/1456.abstract.
Parajuli, B. et al., 2013. Oligomeric amyloid β induces IL-1β processing via
production of ROS: implication in Alzheimer’s disease. Cell death & disease, 4,
p.e975. Available at:
http://www.pubmedcentral.nih.gov/articlerender.fcgi?artid=3877570&tool=pmcen
trez&rendertype=abstract.
Rachmilewitz, J., 2010. Glycosylation: an intrinsic sign of “Danger.” Self/Nonself,
1(3), pp.250–254.
Ransohoff, R.M. & Cardona, A.E., 2010. The myeloid cells of the central nervous
system parenchyma. Nature, 468(7321), pp.253–62.
Ridolfi, E. et al., 2013. The Role of the Innate Immune System in Alzheimer’s
Disease and Frontotemporal Lobar Degeneration: An Eye on Microglia. Clinical
and Developmental Immunology, 2013, p.10.1155/2013/939786.
Roy, K., 2012. Establishment of microglial precursors derived from human induced
pluripotent stem cells to model SOD1-mediated amyotrophic lateral sclerosis. ,
(August).
84
Samraj, A.N. et al., 2015. A red meat-derived glycan promotes inflammation and
cancer progression. Proceedings of the National Academy of Sciences of the
United States of America, 112(2), pp.542–7. Available at:
http://www.pubmedcentral.nih.gov/articlerender.fcgi?artid=4299224&tool=pmcen
trez&rendertype=abstract.
Schnaar, R.L., Gerardy-Schahn, R. & Hildebrandt, H., 2014. Sialic acids in the brain:
gangliosides and polysialic acid in nervous system development, stability,
disease, and regeneration. Physiological reviews, 94, pp.461–518. Available at:
http://www.ncbi.nlm.nih.gov/pubmed/24692354.
Schwarz, F., Springer, S.A., et al., 2015. Human-specific derived alleles of CD33 and
other genes protect against postreproductive cognitive decline. Proceedings of
the National Academy of Sciences, (April 2016), p.201517951. Available at:
http://www.pnas.org/lookup/doi/10.1073/pnas.1517951112%5Cnpapers3://public
ation/doi/10.1073/pnas.1517951112.
Schwarz, F., Pearce, O.M.T., et al., 2015. Siglec receptors impact mammalian
lifespan by modulating oxidative stress. eLife, 4, pp.1–19.
Shi, H. et al., 2012. Genetic variants influencing human aging from late-onset
Alzheimer’s disease (LOAD) genome-wide association studies (GWAS).
Neurobiology of Aging, 33(8).
Solito, E. & Sastre, M., 2012. Microglia function in Alzheimer’s disease. Frontiers in
pharmacology, 3(February), p.14.
Streit, W.J., 2004. Microglia and Alzheimer’s disease pathogenesis. Journal of
Neuroscience Research, 77(1), pp.1–8.
Taguchi, R. et al., 2015. Preferential Accumulation of 14C-N-Glycolylneuraminic Acid
over 14C-N-Acetylneuraminic Acid in the Rat Brain after Tail Vein Injection. Plos
One, 10(6), p.e0131061. Available at:
http://dx.plos.org/10.1371/journal.pone.0131061.
Tangvoranuntakul, P. et al., 2003. Human uptake and incorporation of an
immunogenic nonhuman dietary sialic acid. Proc Natl Acad Sci U S A, 100(21),
pp.12045–12050. Available at:
http://www.ncbi.nlm.nih.gov/pmc/articles/PMC218710/pdf/10012045.pdf.
Tosto, G. & Reitz, C., 2013. Genome-wide association studies in Alzheimer’s
85
disease: A review topical collection on dementia. Current Neurology and
Neuroscience Reports, 13(10).
Trapnell, C. et al., 2012. Differential gene and transcript expression analysis of RNA-
seq experiments with TopHat and Cufflinks. Nat. Protocols, 7(3), pp.562–578.
Available at: http://dx.doi.org/10.1038/nprot.2012.016.
Trapnell, C. et al., 2010. Transcript assembly and quantification by RNA-Seq reveals
unannotated transcripts and isoform switching during cell differentiation. Nature
Biotechnology, 28(5), pp.511–515. Available at:
http://www.nature.com/nbt/journal/v28/n5/full/nbt.1621.html%5Cnhttp://www.natu
re.com/nbt/journal/v28/n5/pdf/nbt.1621.pdf.
Trapnell, C., Pachter, L. & Salzberg, S.L., 2009. TopHat: Discovering splice junctions
with RNA-Seq. Bioinformatics, 25(9), pp.1105–1111.
Tremblay, M.-È., Lowery, R.L. & Majewska, A.K., 2010. Microglial interactions with
synapses are modulated by visual experience. PLoS biology, 8(11), p.e1000527.
Varela, C. et al., 2012. Reccurent genomic instability of chromosome 1q in neural
derivatives of human embryonic stem cells. , 122(2), pp.2–7.
Varki, A., 2010. Colloquium paper: uniquely human evolution of sialic acid genetics
and biology. Proceedings of the National Academy of Sciences of the United
States of America, 107 Suppl, pp.8939–46.
Varki, A., 2007. Glycan-based interactions involving vertebrate sialic-acid-recognizing
proteins. , 446(April), pp.1023–1029.
Varki, A., 2001. Loss of N-glycolylneuraminic acid in humans: Mechanisms,
consequences, and implications for hominid evolution. American journal of
physical anthropology, Suppl 33, pp.54–69.
Varki, A. & Gagneux, P., 2012. Multifarious roles of sialic acids in immunity. , 1253,
pp.16–36.
Varnum, M.M. & Ikezu, T., 2012. The classification of microglial activation
phenotypes on neurodegeneration and regeneration in alzheimer’s disease
brain. Archivum Immunologiae et Therapiae Experimentalis, 60(4), pp.251–266.
Wang, X. et al., 2012. Specific inactivation of two immunomodulatory SIGLEC genes
during human evolution. Proceedings of the National Academy of Sciences,
86
109(25), pp.9935–9940.
Wang, Y. et al., 2015. TREM2 lipid sensing sustains the microglial response in an
Alzheimer’s disease model. Cell, 160(6), pp.1061–1071. Available at:
http://dx.doi.org/10.1016/j.cell.2015.01.049.
Wu, Y. et al., 2016. Microglia: Dynamic Mediators of Synapse Development and
Plasticity. Trends in Immunology, 36(10), pp.605–613. Available at:
http://dx.doi.org/10.1016/j.it.2015.08.008.
Yeh, F.L. et al., 2016. TREM2 Binds to Apolipoproteins, Including APOE and
CLU/APOJ, and Thereby Facilitates Uptake of Amyloid-Beta by Microglia.
Neuron, 91(2), pp.328–40. Available at:
http://linkinghub.elsevier.com/retrieve/pii/S0896627316302926%5Cnhttp://www.
ncbi.nlm.nih.gov/pubmed/27477018.
Yokokura, M. et al., 2011. In vivo changes in microglial activation and amyloid
deposits in brain regions with hypometabolism in Alzheimer’s disease. European
Journal of Nuclear Medicine and Molecular Imaging, 38(2), pp.343–351.
Available at: http://dx.doi.org/10.1007/s00259-010-1612-0.

87
Acknowledgements / Danksagung
I would like to extend much gratitude towards Prof. Harald Neumann for accepting
me as part of his research team and guiding me through this fascinating project. I
appreciate every moment of success as well as failure with which came the
opportunity to learn and grow. I would like to also thank my second supervisor, Prof.
Walter Witke for his positive involvement and insights into my PhD project. I am very
grateful to Dr. Heike Weighardt and Prof. Bovier, who both graciously accepted to
execute their duties as third and fourth members of my examination committee.
Special thanks go out to all the members in the Institute of Reconstructive
Neurobiology, especially the AG Neumann family. I enjoyed every moment of my
time as part of the group both inside and outside of the lab. I will always appreciate
the wonderful friendship of Rita Jietou, Jessica Reinartz, Janine Claude, Marcus
Grobe-Einsler and Johannes Ackermann. I am grateful for the memories and support
from Dr. Liviu Bodea and Dr. Gabriela Bodea, Dr. Anahita Shahraz, Dr. Bettina
Linnartz-Gerlach, Dr. Jens Kopatz, Dr. Ichiro Nozaki, Christine Schuy, Ozkan Is,
Omar Mossad, Sharon Stursburg, Sevgi Cengiz and many more.
Most importantly, I am ever grateful and appreciative of my supportive partner, Dr.
Jesuthas Ajendra and his loving family. I extend my utmost gratitude, love and
wishes to my own family to whom I owe every milestone that I have achieved so far.
Especially, to my mother, Meena Mathews and sister Liza Mathews-Ram, thank you
for supporting me every step of the way.
88
Declaration / Erklärung
I, Mona Ann Mathews, hereby confirm that this work submitted is my own. This thesis
has been written independently, and with no other sources or aids than stated. The
presented thesis has not been submitted to another university and I have not applied
for a doctorate procedure so far.
Hiermit versichere ich, dass die vorgelegte Arbeit - abgesehen von den ausdrücklich
bezeichneten Hilfsmitteln - persönlich, selbständig und ohne Benutzung anderer als
der angegebenen Hilfsmittel angefertigt wurde. Aus anderen Quellen direkt oder
indirekt übernommene Daten und Konzepte sind unter Angabe der Quelle kenntlich
gemacht worden.
Die vorliegende Arbeit wurde an keiner anderen Hochschule als Dissertation
eingereicht. Ich habe früher noch keinen Promotionsversuch unternommen.
Bonn, November 2016
Mona Ann Mathews

![Fakultät für Sport- und Gesundheitswissenschaften Name der ... · neurological disease, such as dementia of the Alzheimer’s type [9-12] or stroke [13-15]. Since activities of](https://img.pdfslide.org/doc/110x75/6065de5b7a51385c7c118574/fakultt-fr-sport-und-gesundheitswissenschaften-name-der-neurological-disease.jpg)