Embed Size (px)
Citation preview
Yeast and plant cells as biofactories for recombinant
proteins: evaluation of novel expression and
downstream processing strategies
Von der Fakultät für Mathematik, Informatik und Naturwissenschaften der
Rheinisch-Westfälischen Technischen Hochschule Aachen zur Erlangung des
akademischen Grades eines Doktors der Naturwissenschaften
genehmigte Dissertation
vorgelegt von
Diplom-Biologe
Jürgen Drossard
aus Köln
Berichter: Universitätsprofessor Dr. rer. nat. F. Kreuzaler
Professor J. E. Shively, PhD
Tag der mündlichen Prüfung: 18. August 2000

Parts of this thesis have been published:
Hellwig, S., Robin, F., Drossard, J., Raven, N.P., Vaquero-Martin, C., Shively, J.E. and
Fischer, R. (1999) Production of carcinoembryonic antigen (CEA) N-A3 domain in Pichia
pastoris by fermentation. Biotechnol Appl Bioc, 30, 267-75.
Vaquero, C., Sack, M., Chandler, J., Drossard, J., Schuster, F., Monecke, M., Schillberg, S.
and Fischer, R. (1999) Transient expression of a tumor-specific single-chain fragment and a
chimeric antibody in tobacco leaves. Proc Natl Acad Sci USA, 96, 11128-11133.

I TABLE OF CONTENTS
TABLE OF CONTENTS
I INTRODUCTION.................................................................................................. I
I.1 From applied microbiology towards molecular biotechnology ...........................................................1
I.2 Recombinant antibodies..........................................................................................................................3
I.3 Expression systems for recombinant antibodies ...................................................................................4
I.3.1 Bacteria ............................................................................................................................................4
I.3.2 Yeast ................................................................................................................................................4
I.3.3 Plants................................................................................................................................................7
I.4 Downstream processing ........................................................................................................................11
I.5 This thesis ...............................................................................................................................................16
I.6 Overview of the workprogramme ........................................................................................................18
I.6.1 “Processing technology” project ....................................................................................................18
I.6.2 “Molecular Farming” project .........................................................................................................18
I.6.2.1 N-A3 antigen.............................................................................................................................18
I.6.2.2 scFvT84.66................................................................................................................................19
II MATERIALS AND METHODS.......................................................................... 20
II.1 Materials.................................................................................................................................................20
II.1.1 Chemicals and consumables ..........................................................................................................20
II.1.2 Chromatography columns and adsorbents .....................................................................................20
II.1.3 Media, stock solutions and buffers.................................................................................................20
II.1.4 Enzymes and kits ...........................................................................................................................20
II.1.5 Antibodies, antigens and antisera...................................................................................................21
II.1.6 Synthetic oligonucleotides .............................................................................................................21
II.1.7 Plasmid vectors ..............................................................................................................................21
II.1.8 Recipients for recombinant DNA...................................................................................................21
II.1.9 Animals ..........................................................................................................................................22
II.2 Cultivation conditions ...........................................................................................................................22
II TABLE OF CONTENTS
II.3 DNA techniques..................................................................................................................................... 22
II.3.1 Isolation of plasmid DNA from E.coli .......................................................................................... 22
II.3.2 Isolation of total DNA from P.pastoris ......................................................................................... 23
II.3.3 PCI-extraction and precipitation of DNA...................................................................................... 23
II.3.4 DNA restriction ............................................................................................................................. 23
II.3.5 Agarose gel electrophoresis........................................................................................................... 24
II.3.6 Ligation of DNA fragments .......................................................................................................... 24
II.3.7 PCR ............................................................................................................................................... 24
II.3.8 Sequencing .................................................................................................................................... 25
II.3.9 Transformation and selection ........................................................................................................ 25
II.4 Protein analysis tools ............................................................................................................................ 27
II.4.1 PAGE and IEF............................................................................................................................... 27
II.4.2 Protein blotting.............................................................................................................................. 28
II.4.3 Removal of N-linked glycans........................................................................................................ 28
II.4.4 Crystallization ............................................................................................................................... 28
II.4.5 ELISA ........................................................................................................................................... 29
II.4.5.1 Determination of IgY titer in egg yolk ..................................................................................... 29
II.4.5.2 Assay for N-A3......................................................................................................................... 29
II.4.5.3 Assay for scFvT84.66............................................................................................................... 30
II.4.5.4 Competition ELISA.................................................................................................................. 30
II.4.6 Real-time biomolecular interaction analysis (BIA)....................................................................... 30
II.4.7 Mass spectrometry......................................................................................................................... 30
II.5 Production of IgY-antisera .................................................................................................................. 32
II.6 Expressor strain selection..................................................................................................................... 33
II.7 Fermentation ......................................................................................................................................... 34
II.8 Recombinant protein purification ....................................................................................................... 35
II.8.1 Sample pre-treatment .................................................................................................................... 35
II.8.2 Ultrafiltration and buffer exchange ............................................................................................... 36
II.8.3 Chromatography............................................................................................................................ 36
II.8.3.1 Modes of chromatography........................................................................................................ 36
III RESULTS ..........................................................................................................38
III.1 Purification of scFv4813 expressed in P.pastoris ........................................................................... 38
III.1.1 Shake-flask expression and purification........................................................................................ 38
III.1.2 Fermentation and expanded bed IMAC......................................................................................... 45
III.1.3 Intermediate purification by cation exchange chromatography..................................................... 52
III TABLE OF CONTENTS
III.1.4 Final purification and analysis .......................................................................................................54
III.1.5 Crystallization ................................................................................................................................62
III.2 Contributions to the “Molecular Farming” project ......................................................................65
III.2.1 Production of CEA N-A3 hybrid protein in P.pastoris ..................................................................65
III.2.1.1 Small-scale purification........................................................................................................66
III.2.1.2 Production of N-A3 specific IgY antibodies ........................................................................68
III.2.1.3 Purification of N-A3 from P.pastoris fermentation broth ....................................................69
III.2.1.4 Analysis of purified N-A3 ....................................................................................................72
III.2.1.5 Modification of the N-A3 cDNA expression construct ........................................................78
III.2.2 Expression of scFvT84.66 in different host systems......................................................................82
III.2.2.1 Purification of scFv48.66 transiently expressed in SR-1 leaves...........................................83
III.2.2.2 Selection of scFvT84.66 expressing P.pastoris clones.........................................................85
III.2.2.3 Expression of vacuole-targeted scFvT84-66 in BY-2 cells ..................................................87
III.2.2.4 Fermentation, IMAC purification and analysis ....................................................................88
IVCONCLUSIONS AND PERSPECTIVES........................................................... 96
IV.1 The expression systems.....................................................................................................................96
IV.2 Downstream processing....................................................................................................................99
IV.3 Application of affinity purified recombinant proteins from yeast and plant cells ....................101
V SUMMARY...................................................................................................... 102
VI REFERENCES ............................................................................................... 104
VII ABBREVIATIONS ......................................................................................... 117

INTRODUCTION 1
I Introduction
I.1 From applied microbiology towards molecular biotechnology
Biotechnology is “applied biological science (as recombinant DNA technology)”. This
definition, cited from Webster’s New Encyclopedic Dictionary, 1996 edition, describes the
creation of a technological “bridge” between traditional applied microbiology, used for the
generation of products valuable for humans, and the genetic engineering tools developed
within the last decades. “Traditional” biotechnology gradually developed over thousands of
years and is evident in our daily life in foods, like bread, yogurt, beer and wine, as well as
basic chemicals like glycerol, acetone and citric acid, numerous technical enzymes, amino
acids and antibiotics. “Molecular” biotechnology, on the other hand, is an emerging field of
science and industry, although tremendous progress has been achieved in the last two decades
between, for example, the first expression of a recombinant plasmid in bacteria (Cohen et al.,
1973) and the market release of genetically engineered tomato (Kramer and Redenbaugh,
1994).
Genetic engineering is the basis of molecular biotechnology. Keywords like cDNA
synthesis (Gubler and Hoffman, 1983), DNA sequencing (Sanger et al., 1977), PCR (Mullis
and Faloona, 1987; Saiki et al., 1985) and phage display (Smith, 1985) describe an arbitrary
selection of enabling technologies that were turned from pioneering new concepts in basic
research into standard tools for the routine genetic manipulation of pro- and eucaryotic
organisms within just a few years. However, the field of molecular biotechnology covers a
much broader spectrum of molecular biology and neighboring scientific disciplines.
Molecular biotechnology includes microbiology, cell biology, protein engineering, process
technology for fermentation and purification, analytical biochemistry, immunology, molecular
medicine, pharmacology, bioinformatics and ecology. Additionally, business management,
marketing and intellectual property issues are the basis of the biotechnology economy,
without which the highly cost-intensive research and development could not be realized.
With very few exceptions, molecular biotechnology is always associated with proteins.
Almost any genetic engineering will have an impact on the protein pool in a transgenic
organism, regardless of whether the aim of the manipulation is to introduce a recombinant
protein for heterologous expression and subsequent purification, or to confer new or altered
qualities on the organism. Examples of the latter approach range from microbes optimized for
2 INTRODUCTION
production of single cell protein for human consumption or animal feed (Windass et al.,
1980), raw material conversion (Wong et al., 1988) and biodegradation (Winter et al., 1989),
enhanced capabilities for nitrogen fixation (Bosworth et al., 1994) or insecticidal activity
(Schuler et al., 1998) over plants with increased pathogen resistance (Baulcombe, 1996;
Cornelissen and Melchers, 1993; Voss et al., 1995; Zimmermann et al., 1998), herbicide
resistance (Botterman and Leemans, 1988; De Block et al., 1987; Dhalluin et al., 1990), stress
tolerance (Allen, 1995; Bartels and Nelson, 1994), improved CO2 fixation (Lipka et al.,
1999), nutritional quality (Kjemtrup et al., 1994; Nordlee et al., 1996; Zheng et al., 1995) or
flower color (Meyer et al., 1987) to transgenic animals for medical research or breeding
(Adams and Cory, 1991; Keffer et al., 1991; Pursel et al., 1989; Wilmut et al., 1997).
With the advance of genetic engineering and the development of heterologous protein
expression systems some of the major obstacles for production of commercially relevant
proteins have been eliminated. Firstly, the possibility to select source organisms other than the
“natural” ones can result in higher expression levels, easier purification, lower production
costs or increased safety. Secondly, the proteins themselves can be engineered with regard to
amino acid composition, improved enzymatic activity, specificity or stability. Engineered
and/or heterologously expressed proteins for industrial use include a variety of bulk enzymes
like amylases (Innis et al., 1985; Pen et al., 1992), lipases (Bjorkling et al., 1991) isomerases
(Dekker et al., 1992) and proteases (Flamm, 1991), and important tools for molecular
biotechnology itself, like restriction enzymes (Brooks et al., 1991), reverse transcriptase (Roth
et al., 1985) or Protein A (Colbert et al., 1984).
Probably the most important, most challenging and most cost-intensive field in molecular
biotechnology is the production of recombinant proteins for use in medicine. Human
(pro)insulin produced in E.coli (Johnson, 1983) was the first recombinant therapeutic protein
to be commercialized and approved for clinical use and is still a paradigm during public
discussion of the benefits of genetic engineering for human health. Today, a significant
portion of protein therapeutics is produced in heterologous systems, including hormones,
cytokines, enzymes, blood products and vaccines (Buckel, 1996; Emans and Fischer, in
press). In many of these cases, an adequate supply of these proteins from “natural” sources is
associated with tremendous costs and often technically infeasible. A good example of this
case are recombinant antibodies (rAbs), as they are multipurpose proteins that can be used in
medicine, chemistry and agriculture. Moreover, they provide one of the fastest growing
biotechnology markets of the last decade.
INTRODUCTION 3
I.2 Recombinant antibodies
Monoclonal antibodies (mAbs) are extremely useful tools in medicine, biology and
biochemistry because of their binding specificity and stability both in vivo and in vitro.
Antibodies generated by hybridoma technology are widely used in medical research and
disease diagnosis. However, few mouse monoclonal antibodies have been licensed for human
use, mainly because murine monoclonal antibodies stimulate the production of the human
anti-mouse antibody (HAMA) response when administered to patients (Hasholzner et al.,
1997). The combination of hybridoma technology and recombinant DNA technology
ameliorated this situation by their use to develop chimeric or CDR-grafted rAbs (Adair and
Bright, 1995, Jones et al., 1986; Morrison et al., 1984) which resemble human antibodies,
thereby reducing the HAMA response. In chimeric rAbs, the murine monoclonal constant
domains are replaced with the human counterpart and in CDR-grafted humanized rAbs
complementarity determining regions (CDR’s) of murine origin are incorporated into a
scaffold of human variable light- and heavy-chain framework regions.
Advances in antibody engineering allow the expression of full-size antibody molecules,
various rAb fragments and fusion proteins (Winter and Milstein, 1991), broadening the
possible range of applications. Improvement in heterologous gene expression (Plueckthun,
1991; Skerra, 1993) and the development of phage display (Clackson et al., 1991; Griffiths et
al., 1994; McCafferty et al., 1990) have made it possible to design and express rAbs specific
for almost any molecule and to improve their performance. The recombinant antibody
fragment most commonly used in research and therapy is the single chain antibody fragment
(scFv) (Huston et al., 1988; Skerra and Plueckthun, 1988). In scFvs, the heavy and light chain
variable domains of an antibody are fused into a single polypeptide chain by a flexible peptide
linker. This stabilizes the protein and ensures the equal expression of both regions in
heterologous organisms however, the bivalency of the full-size antibody is lost. While most
scFvs are monomeric, some can form higher molecular weight species, including dimers. This
tendency to dimerize has been exploited to create bivalent or bispecific diabodies (Holliger et
al., 1997; Perisic et al., 1994; Plueckthun and Pack, 1997) and triabodies (Iliades et al., 1997).
Recombinant antibodies are being used to target a wide variety of antigens important in
disease diagnosis and treatment. These therapeutic rAbs include scFvs directed against tumor
antigens that deliver agents like enzymes, toxins, cytokines or isotopes to the tumor for cancer
treatment (Cai and Garen, 1997; Cho et al., 1997; Hu et al., 1996; Pietersz et al., 1998; Schier
et al., 1996; Wu et al., 1996). All these recombinant antibodies can be made by modular
4 INTRODUCTION
assembly of scFvs and other molecules and are produced and purified from bacterial and
mammalian expression systems. The emerging clinical uses for therapeutic rAbs have created
a demand for bulk quantities of functional, active recombinant proteins. As a result,
alternatives to expression in microbes and animal cells are desirable. This particularly applies
to rAbs used in bioprocessing, therapy or diagnosis, which have become one of the major
biotechnology markets in recent years.
I.3 Expression systems for recombinant antibodies
I.3.1 Bacteria
Like most recombinant proteins, rAbs were initially expressed in E.coli (Winter and Milstein,
1991). However, the inherent limitations of heterologous expression of eucaryotic proteins in
procaryotes (Olins and Lee, 1993; Pen, 1996) prompted a search for more suitable hosts.
Among the most restrictive of these limitations is the inability of bacteria to carry out many of
the co- or post-translational modifications that many eucaryotic proteins require for activity.
These include the correct assembly and folding of complex, multimeric proteins and protein
glycosylation. The absence of a suitable processing pathway in bacteria often leads to
misfolded, inactive or unstable recombinant proteins if expressed in the cytosol or secreted to
the periplasm. Additionally, recombinant proteins are frequently deposited within the
bacterial cell in a denatured form as insoluble inclusion bodies. These proteins require
extensive in vitro solubilization and refolding procedures that are associated with considerable
cost and reduction of yield. Finally, co-purified bacterial endotoxins may be difficult to
remove from the target protein preparation and increase downstream processing costs even
more.
I.3.2 Yeast
Yeast combines the advantages of bacterial systems, such as rapid growth, scalability by
fermentation, low media cost and relative ease of genetic manipulation, with its ability to
conduct many eucaryotic protein modifications (Eckart and Bussineau, 1996). Initially
Saccharomyces cerevisiae was the production system of choice (Sleep et al., 1991), but this
position has today been taken by methylotrophic yeast, in particular Pichia pastoris (Higgins
and Cregg, 1998; Hollenberg and Gellissen, 1997; Romanos et al., 1992).
INTRODUCTION 5
The first key advantage of P.pastoris over S.cerevisiae is its suitability for high cell density
fermentations resulting in a final dry cell weight of >100g/L without the risk of accumulation
of toxic levels of ethanol as seen with S.cerevisiae. In many cases, there is a direct correlation
between cell mass and the overall yield of recombinant protein. Therefore, in a simple batch
or a fed-batch fermentation strategy, the possibility to build up high cell densities is desirable
(Cregg, 1999).
The second key advantage of P.pastoris is the presence of a tightly regulated, inducible
promoter that can be used to drive recombinant protein expression. As a methylotrophic yeast,
P.pastoris can utilize methanol as its sole carbon source. The first stage of methanol
metabolism is its oxidation to formaldehyde by the enzyme alcohol oxidase (AOX). There are
two P.pastoris genes for alcohol oxidase (aox1 and aox2), with the respective protein
products showing >90% sequence identity (Cregg et al., 1989). The vast majority of AOX in
the cell, however, is provided by the aox1 gene. Driven by the AOX1-promoter, AOX1
mRNA levels reach 5% of the total poly(A)+ RNA in methanol-grown P.pastoris (Cregg et
al., 1989) and the AOX1 enzyme constitutes up to 30% of total soluble protein. If grown
using an alternative carbon source, such as glycerol, the AOX1 promoter is tightly repressed.
Therefore, if a recombinant protein is to be expressed under the control of the AOX1
promoter, a common expression strategy is to first accumulate high cell mass, by using
glycerol as the carbon source, and then to switch to methanol, which induces recombinant
protein expression. Using this strategy, high levels of recombinant protein can be rapidly
accumulated, typically within 24h to 120h. This is an advantage when expressing recombinant
proteins that are toxic for the yeast cells, and may also improve the yield of other proteins
because of the short term exposure to proteases or environmental effects, like low pH.
A variety of P.pastoris expression vectors harboring the AOX1 promoter and flanking
sequences have been commercialized by Invitrogen (Groningen, The Netherlands). All are
designed to allow integration of the foreign gene into the P.pastoris genome by homologous
recombination, either in the histidinol dehydrogenase (his4) or the aox1 locus (Sreekrishna et
al., 1997). Their differences lie in the targeting of the recombinant protein for intracellular
expression or secretion into the medium and also in the manner of integration of the
expression cassette into the genome, which results in different methanol utilization
phenotypes (Sreekrishna et al., 1997). Alternatively, expression vectors containing the
constitutive glyceraldehyde 3-phosphate dehydrogenase (GAP) promoter are available, but
are less widely used (Waterham et al., 1997).
6 INTRODUCTION
High levels of heterologous protein production have been reported in P. pastoris (Higgins
and Cregg, 1998), which have reached 12 g/L for intracellular expression of tetanus toxin
fragment C (Clare et al., 1991), and 2.5 g/L for a secreted bacterial �-amylase (Paifer et al.,
1994). Various proteins of therapeutic relevance have been expressed in P.pastoris
(Hollenberg and Gellissen, 1997; Sreekrishna and Kropp, 1996) including several scFv
fragments with expression levels up to 1.2g/L (Freyre et al., 2000). Despite these advantages,
there are limitations of the P.pastoris expression system. Although similar to higher
eucaryotic organisms, the posttranslational protein modification pathway in P.pastoris is not
identical, most notably signal sequence cleavage and glycosylation differ between P.pastoris
and mammals (Cregg, 1999; Eckart and Bussineau, 1996). In most cases, use of the “original”
secretion signals of eucaryotic proteins for expression in P.pastoris is ineffective. Therefore,
the S.cerevisiae �-mating factor prepro leader sequence is included in the commercially
available expression vectors designed for protein secretion into the medium. Although
efficient secretion is reported for most proteins using this leader peptide, there is considerable
evidence for the generation of heterogeneous amino termini in expressed proteins during
signal peptide cleavage by P.pastoris with possible consequences on protein folding, activity
and stability. P.pastoris performs N- and O-linked glycosylation of heterologous proteins
(Goochee et al., 1991). As is typical for lower eucaryotes, the N-glycan chains are of the high
mannose type, in P.pastoris the most common ones being Man8-9GlcNAc2 (Montesino et al.,
1998). This is in contrast to higher eucaryotes where complex or hybrid glycans are the most
abundant. Hyperglycosylation, the addition of long outer mannose chains (typically 50-100
residues in length) often performed by S.cerevisiae (Grinna and Tschopp, 1989) is less
common in P.pastoris, but does occur (Scorer et al., 1993). Additionally, while the
recognition sequences for N-linked glycosylation appear to be identical between P.pastoris
and higher eucaryotes (Asn-X-Ser/Thr), little is known about the P.pastoris target sites for
O-glycosylation. It has been shown that a significant portion of human IGF-1, non-
glycosylated in humans, is O-glycosylated when expressed in P.pastoris (Brierley, 1998).
Both the signal peptide cleavage problems and the differences in glycosylation may have
consequences for the therapeutic use of recombinant proteins expressed in P.pastoris. Beside
these limitations, there are technical challenges associated with P.pastoris expression
including low transformation efficiency, the labor-intensive screening to identify highly
expressing clones, and proteolytic protein degradation.
INTRODUCTION 7
I.3.3 Plants
Transgenic plants were first described as an expression system for rAbs in 1989 (Hiatt et al.,
1989). Today, expression of full-size antibodies and a large variety of rAb fragments in
tobacco and other plant species is a standard method in molecular biotechnology. The
advantages of plants over bacterial or mammalian production systems have been reviewed
(Hiatt and Mostov, 1992; Whitelam et al., 1993). In particular, the capability of plant cells to
synthesize, process and target large, complex mammalian proteins in a manner very similar to
their natural hosts makes them an attractive alternative for rAb production. Functional full-
size antibodies (De Wilde et al., 1996; Duering et al., 1990; Ma et al., 1994; Voss et al.,
1995), Fab fragments (De Neve et al., 1993), scFv (Artsaenko et al., 1995; Fiedler et al.,
1997; Firek et al., 1993; Tavladoraki et al., 1993) bispecific antibody fragments (Fischer et
al., 1999b) or membrane bound rAbs (Schillberg et al., in press) can be expressed in leaves
and seeds of plants without loss of binding specificity or affinity compared to the parental
mAb.
Transgene expression in plants is often performed through the use of strong constitutive
promoters, in particular the cauliflower mosaic virus (CaMV) 35S promoter and its
derivatives (Benfey and Chua, 1990; Kay et al., 1987). Recombinant protein expression
driven by this promoter and adequate control and targeting elements generally reaches levels
of 0.01-0.1% of total extractable protein (van Engelen et al., 1994), but significantly higher
expression levels have also been reported (Artsaenko et al., 1998; Phillips et al., 1997).
However, there is search for alternatives to this promoter, mainly because the viral origin of
the 35S promoter and its constitutive activity may trigger gene silencing (Taylor, 1997) and
its activity in mature plant tissue is reduced. Additionally, it may be advantageous for protein
stability and/or downstream processing if recombinant proteins are expressed in a tissue- (e.g.
in seeds or storage organs) or time-specific (e.g. by the use of inducible promoters) manner. A
wound-inducible defense-gene derived promoter (Cramer and Weissenborn, 1997) and a
chimeric octopine/mannopine synthase promoter (Ni et al., 1995) are among the “new”
promoter candidates for recombinant protein expression in plants, and several tissue-specific
promoters have been identified (Fiedler and Conrad, 1995; Russell and Fromm, 1997). Effort
has been invested in the improvement of transcript stability, translational enhancement with
viral sequences and optimization of codon usage to meet the plant pattern (Gallie, 1998).
Recombinant protein accumulation and stability can be optimized by exploiting the protein
sorting and targeting mechanisms of plant cells. As the cytosol appears to be an inappropriate
8 INTRODUCTION
location for plant-expressed rAbs because of very low yields of functional protein, a variety of
targeting signals, both from plant and mammalian origin, have been evaluated. Directing the
target proteins to the secretory pathway using either plant (e.g. chalcone synthetase) or animal
(e.g. mouse IgG) leader peptides, results in their accumulation in the intercellular space
beneath the cell wall (apoplast), from where correctly processed, active rAbs can be
recovered. Targeting rAbs for retention in the endoplasmic reticulum (ER) using the KDEL-
motif (Schouten et al., 1996) significantly increased yields. Compared to expression via the
secretory pathway, ER retention can give 10 to 100 fold higher rAb accumulation (Conrad et
al., 1998). ScFv targeted to the ER also retain their antigen binding specificity and affinity
and additionally, transgenic plant leaves expressing ER retained scFvs can be dried and stored
for more than three weeks without losses of antigen binding activity or specificity (Fiedler et
al., 1997). Other possible target organelles for rAb expression include plastids and vacuoles
(Moloney and Holbrook, 1997) and additionally, plants offer the possibility to utilize the
plastom as a target for foreign DNA integration (Staub et al., 2000).
The most common methods used to deliver genes to plants are viral vectors (Scholthof et
al., 1996), biolistic transformation (Christou, 1993), protoplast electroporation (Fromm et al.,
1985) and Agrobacterium-mediated gene transfer (Hooykaas and Schilperoort, 1992; Koncz
and Schell, 1986; Zambryski, 1992; Zambryski et al., 1983).
The Agrobacterium-approach makes use of the ability of this plant pathogen to excise
segments of DNA (the T-DNA) located on its Ti-plasmid and transfer them into susceptible,
wounded plant cells, where the transferred DNA is integrated into the nuclear genome. The
T-DNA contains genes for opine and phytohormone biosynthesis and the “natural” symptom
of agroinfection is crown gall disease. Of the T-DNA, only the “border” sequences are
necessary for DNA transfer, while the other required gene products are encoded by the vir-
genes located on the non-transferred part of the plasmid. The DNA between these border
sequences can be replaced with the gene(s) of interest without affecting the functionality of
the system. For transformation, the gene of interest and a suitable marker gene (e.g. nptII or
bar) are cloned into a shuttle vector suitable for propagation in E.coli and Agrobacterium. The
Agrobacterium itself delivers both the target gene and the selectable marker into the host cell
genome, when incubated together with appropriate recipient tissue, usually leaf-discs.
Transformation is followed by selection for cells with stably integrated copies of the foreign
DNA by incubating the leaf-discs under selective pressure, and plants are regenerated from
shoots that develop from transgenic, antibiotic-resistant cells around the explant at the cut
INTRODUCTION 9
surface. This ability to regenerate whole plants from callus cells varies between plant species
and straightforward regeneration is one of the main reasons why N.tabacum is widely used as
model system for transgene expression in plants. Two important variations of the
Agrobacterium mediated gene transfer method are the utilization of callus or suspension
culture cells as DNA recipients (An, 1985) and the development of a transient transgene
expression system based on the vacuum-infiltration of leaves (Kapila et al., 1996).
For many years it was generally accepted that Agrobacteria do not infect
monocotyledonous plants, which includes important crop species like rice, wheat and maize.
Additionally, some plant species respond to Agrobacterium-infection with necrosis or other
defense mechanisms. In the meantime it has been demonstrated that, with careful strain
selection and genetic modification of the bacteria, these barriers can be overcome at least in a
laboratory environment (Hiei et al., 1994; Ishida et al., 1996), but biolistic transformation is
used as an alternative for transformation of recalcitrant plants. Viral vectors seem to provide
the maximum yields of recombinant proteins in transient expression (Porta and Lomonossoff,
1996).
Stable transformation of plants is time consuming and it can take 3 to 9 months to have
plants available for testing the function and characteristics of the expressed protein. This
investment can be made more secure by testing the constructs and protein expression first,
using transient expression. Initial problems can be identified and solved so that the likelihood
of regenerating the desired transgenic line is significantly improved. Transient expression by
Agrobacterium-infiltration can be routinely used as a simple, reliable test for the gene
construct designed for stable transformation (Vaquero et al., 1999).
Another alternative to the time-consuming generation of stably transformed intact plants is
the utilization of plant cell suspension cultures as biofactories for rAb expression (Fischer et
al., 1999a). Of the various systems used for the in vitro cultivation of plant cells, such as hairy
roots (Hilton and Rhodes, 1990), immobilized cells (Archambault, 1991) and free cell
suspensions (Kieran et al., 1997), the latter is generally regarded to be the most suitable for
large-scale applications in the biotechnology industry (Schlatmann et al., 1996; Wen, 1995).
A number of plant species has been used for generation and propagation of cell suspension
cultures, ranging from model systems like Arabidopsis (Desikan et al., 1996) over
Catharanthus (Van Der Heijden et al., 1989) and Taxus (Seki et al., 1997), to important
monocot or dicot crop plants like rice (Chen et al., 1994), soybean (Hoehl et al., 1988), alfalfa
(Daniell and Edwards, 1995) and tobacco (Nagata et al., 1992). Compared to the more
10 INTRODUCTION
conventional expression systems like bacteria, yeast and mammalian cell cultures, the number
of applications is still relatively small (Kieran et al., 1997), and most applications of plant cell
suspension cultures in biotechnology are aimed at the production of naturally occurring
secondary metabolites, including important anti-tumor agents like taxol (Seki et al., 1997),
but not at recombinant proteins.
Plant cell suspensions are normally derived from calli cultivated on solidified medium.
Transfer of friable callus clumps to liquid medium and agitation on rotary shakers or in
fermenters results in cultures of single cells or small aggregates of <10-20 cells. If a
homogenous culture can be generated and maintained, in principle the fermentation of plant
cells requires quite similar techniques and equipment as those for the fermentation of lower
eucaryotes, although they are not comparable in terms of generation times, obtainable cell
densities and nutritional requirements. It is possible to cultivate plant cell suspensions using
conventional fermenter equipment with minor adjustments and to apply standard modes like
batch, fed-batch, perfusion and continuous fermentation (Hooker et al., 1990; Schlatmann et
al., 1996; ten Hoopen et al., 1992). Large-scale fermentations up to a volume of 100,000L
have been successfully performed. The limitations of plant cell compared to microbial
fermentation are related to poor growth rates, relatively low production rates of secondary
metabolites, somaclonal variation and silencing, inhibition of product formation at high cell
densities leading to a low volumetric productivity, formation of aggregates and wall growth
and, at least for some species, shear-sensitivity of the cells (Offringa et al., 1990; Schlatmann
et al., 1996; Yu et al., 1996). Some of these problems have been addressed by improved
fermenter design and agitation conditions (Boehme et al., 1997; Doran, 1993) as well as
optimization of nutrient supply (Boehme et al., 1997; Doran, 1993; Sakamoto et al., 1993;
Sato et al., 1996). Others depend on the plant species used and on a careful selection of the
callus cell lines with respect to product formation, growth characteristics and genetic stability.
The N.tabacum BY-2 cell line (Nagata et al., 1992), due to its exceptionally short generation
time, ease of transformation and reduced alkaloid contents, seems to be particularly suited for
plant cell based recombinant protein production, provided expression levels comparable to
existing hosts can be achieved.
When clinical use of plant-derived recombinant proteins is intended, their production using
suspension cells under defined, controllable and sterile conditions with straightforward
purification protocols may be advantageous. The advantages of intact plants lie in the huge
INTRODUCTION 11
biomass-buildup in field, the low cultivation costs and the easy storage and distribution of
transgenic seed material.
I.4 Downstream processing
Biotechnological processes can be divided into an “upstream” part (the genetic engineering),
the production itself (e.g. microbial fermentation or cultivation of plants on the field), and a
“downstream” part, in the case of a recombinant protein the whole process from extraction
and purification over quality control to final product formulation. If a recombinant protein is
expressed for research purposes the most labor- and cost-intensive part of the project normally
lies in the “upstream” tasks, like cloning, design of expression vectors, sequencing,
transformation and selection. Once a suitable expressor strain or plant line is available, it is
often sufficient to visualize expression of the recombinant protein, monitor its activity, study
its biological effects on the host or follow transmission of the transgene to the progeny. If
purification is desired, isolation of microgram to low milligram quantities is performed from a
few plants or shake-flask cultures for biochemical analysis, the immunization of animals to
obtain antisera or for structure elucidation. Recovery (in % of the contents in the raw
material) is normally not a concern.
This situation changes dramatically if commercialization of a purified recombinant protein
is desired. Although for obvious reasons there is little published data available on the process
economics of commercial recombinant protein production (Datar et al., 1993), it is estimated
that the “downstream” part of the process can, in the case of a therapeutic protein, account for
more than 80% of the production costs, partly because of the strict regulations associated with
“cGLP” and “cGMP” production (Walter et al., 1998) but, equally importantly, because of the
scale on which these processes are performed (Davis, 1998). As one example: under
laboratory conditions the use of “Good” buffers (HEPES, MES, PIPES etc.) may be
acceptable when balancing their benefits with their purchase costs. In large-scale production,
these will normally have to be replaced by inexpensive substances like acetate or phosphate
salts. Other factors for the design of a purification scheme include the influence of percentage
recovery on the unit price of the final product and the high degree of purity required for any
therapeutic protein. Finally, many of the standard procedures for laboratory-scale protein
extraction and purification will, for technical or financial reasons, not be applicable in large-
scale processes. In a competitive market situation, constant pressure to reduce downstream
processing costs will therefore exist with particular consequences on the development of
12 INTRODUCTION
purification strategies (Spalding, 1991). To address these problems, the scale-up capabilities
of purification protocols should be investigated and improved as early as possible, preferably
already when moving from expression studies to small- or pilot-scale protein production
(Sofer, 1998). Due to the high investment cost and the long, complex approval procedure by
authorities like the US Food and Drug Administration (FDA), established large-scale
purification protocols for biopharmaceuticals will often have to be maintained even if new
developments would have significant advantages. A particular challenge is the design of a
purification scheme for a recombinant protein produced in a novel expression system.
Liquid chromatography is the core of preparative protein purification, and all
supplementary procedures like extraction, centrifugation, ultrafiltration, and dialysis serve to
condition the protein solution for chromatography. A series of chromatographic steps, usually
termed as capture, intermediate purification and polishing, making use of different intrinsic
features of proteins, is usually required to achieve sufficient separation of the target from
contaminants (Freitag and Horvath, 1996). Common modes of biochromatography include ion
exchange chromatography (IEX), affinity chromatography (AC), hydrophobic interaction
chromatography (HIC), gel filtration (GF) and, to a limited extent, reversed phase
chromatography (RP). Method development involves selection between these modes, their
arrangement in a suitable order and evaluation of their efficacy while taking into
consideration the limitations of the target protein like incompatibility with organic solvents,
susceptibility to proteolysis and oxidation and loss of activity outside a certain pH and
temperature range. An advantage of working with recombinant proteins is the availability of
sequence information that can lead to a prediction of the protein’s chromatographic behavior.
Depending on the host system and the design of the expression vector, downstream
processing of recombinant proteins starts either – in the case of secreted proteins – with the
collection of the fermentation supernatant or with the extraction of soluble proteins from the
cell body. If the target protein is located extracellularly, cell and debris removal is simplified
and the raw material for purification contains fewer, better defined contaminating proteins
compared to whole cell extracts, even if the growth medium was supplemented with
proteinaceous additives like fetal calf serum or yeast extract. However, the target protein may
be highly dilute and large amounts of inorganic salts and buffering media components may be
present, limiting the choice of the capture chromatographic step unless further dilution with
water or other pre-treatment is acceptable. Extraction of total soluble protein from the cell, on
the other side, leads to a highly complex mixture of recombinant and host-specific
INTRODUCTION 13
biomolecules including proteins, nucleic acids, lipids, and secondary metabolites. High-speed
centrifugation followed by filtration of an extract through a 0.2-0.4µm filter is usually
necessary to prevent clogging of column frits during feed application and even then, viscosity
caused mainly by nucleic acids may lead to high backpressure in the chromatography system
and require the use of expensive high-pressure pumps, columns and media, which may be a
major investment when large volumes have to be processed in the initial stages of
purification. An additional problem is the liberation of proteases from subcellular
compartments during the extraction that may lead to rapid degradation of the target protein.
These examples show that the major difficulties in protein purification arise early in the
process, and the focus of process development therefore will often be to improve the initial
extraction and capture steps. Intermediate and final purification may be complex and require
significant method development, but show less differences between small- and large scale
applications.
When working on a laboratory scale, well-established procedures are available to reduce
the problems of initial protein purification. Selective salting-out by ammonium sulfate or
other structure-forming salts is often used to separate proteins from cell debris and reduce
contamination with nucleic acids, lipids and small organic or inorganic compounds as well as
to reduce volume by redissolving the sedimented precipitate in a small amount of a suitable
buffer. Addition of nucleases for viscosity reduction, protease inhibitors for protection against
proteolytic attack and other stabilizing agents for protection against oxidation or other adverse
environmental effects are common practices. The resulting conditioned extract, usually
having a volume of a few milliliters, can then, if necessary, be further prepared for
chromatography by centrifugation, filtration and dialysis. Nucleases and protease inhibitors,
however, are too expensive for large-scale use and precipitation would require large amounts
of ammonium sulfate and centrifuge capacity, contributing significantly to the process costs
and generating large volumes of high-salt, corrosive waste. Therefore, instead of manipulating
the crude extract, increasing the specificity of the capture step and reducing processing time to
minimize exposure of the target protein to adverse conditions is the method of choice (Labrou
and Clonis, 1994). Besides technical improvements in existing techniques like continuous
centrifugation, tangential flow filtration and fast-flow chromatography media, two novel tools
used to achieve this goal are affinity tags and expanded bed adsorption.
Affinity tags are short peptide sequences genetically fused to a target protein. Provided
correct translation and accessibility within the three-dimensional structure of the protein,
14 INTRODUCTION
these tags offer “handles” to remove the protein of interest specifically out of a complex
mixture of host proteins in a single step by affinity chromatography (Holliger et al., 1997;
Nilsson et al., 1997; Nygren et al., 1994). Several of these tags are now commercially
available, but the most widely used is the “His6-tag”, i.e. six consecutive histidine residues
genetically fused to the N- or C-terminus of the protein of interest that allow purification by
immobilized metal-ion affinity chromatography (IMAC) (Casey et al., 1995; Freyre et al.,
2000; Lindner et al., 1992; Mueller et al., 1998; Porath et al., 1975; Skerra et al., 1991; Wang
et al., 1994). For this technique, a metal chelating ligand, e.g. iminodiacetic acid (IDA) or
nitrilotriacetic acid (NTA) is immobilized on a suitable chromatography matrix and “charged”
with transition metal ions leaving one or more co-ordination sites of the ion free for
interaction with the analyte. Under suitable conditions, histidine residues on proteins interact
specifically with these ions. A stretch of histidines like in the His6-tag, rarely present in native
proteins, will bind to the ligand tightly enough to allow quantitative capture of the target
molecule from a complex feed stream and separation from co-adsorbed contaminants with
step-gradient elution, usually by competitive binding of imidazole or by acidification.
IMAC, although less specific than other affinity chromatography methods like Protein A-
or Protein G-based purification of full-size antibodies or immunoaffinity techniques, has the
advantage of offering a group-specific affinity capture step at relatively low media cost. In
contrast to proteins or peptides used as affinity ligands, the reactive groups used in IMAC
media are small, unaffected by proteases present in the column feed and can be subjected to
harsh cleaning in place (CIP) procedures. A potential problem is the presence of leached
metal ions in the eluate, but if IMAC is used as the capture chromatographic step, they can be
removed in the later stages of the purification process. It has been demonstrated that a His6-
tag can be used for facilitated purification of a therapeutically relevant recombinant protein
without affecting folding, activity and biodistribution (Casey et al., 1995). Therefore, removal
of the tag from the purified protein is normally not necessary, although recently a method for
efficient removal of N-terminal His-tags has been described (Pedersen et al., 1999). While
originally developed for bacterial expression systems, His6-tags today are also widely used
with other expression hosts, notably yeast. However, very few reports are available for IMAC
of recombinant proteins from plant extracts (Mejare et al., 1998).
Expanded bed adsorption (EBA) is a novel chromatographic technique designed for use in
preparative protein purification to address the problems of handling large volumes of
particulate raw materials in the initial purification step. As mentioned above, traditional
INTRODUCTION 15
packed bed chromatography inevitably requires a high degree of clarification of the column
feed, involving laborious and expensive centrifugation and microfiltration steps. Batch
adsorption and fluidized bed adsorption (Gailliot et al., 1990) have been utilized as
alternatives to packed bed chromatography in industrial biotechnology. However, as single-
stage adsorption procedures, these techniques were inferior to packed bed chromatography
with respect to resolution, recovery and productivity. The aim in the development of EBA
was therefore to combine the advantages of batch- or fluidized bed-methods with the superior
adsorption characteristics of packed bed columns by a novel design of matrix particles, flow
distribution devices and columns. The theoretical background of column chromatography and
hydrodynamic properties of EBA have been extensively reviewed (Chang and Chase, 1994;
Chase, 1994; De Luca et al., 1994; Hjorth et al., 1995).
In conventional packed bed chromatography, the medium is positioned between two
column end pieces or adapters equipped with frits or fine-mesh nets to keep the adsorbent
particles in place. During packing of the column, the medium is sedimented and compressed
to a degree dependent on the matrix material and the applied pressure, and once the packing is
finished, the final bed height will be maintained throughout the lifetime of the column by
fixing the adapters directly onto the surfaces of the bed. In contrast, there is no “packing”
procedure for EBA columns. The medium is allowed to settle on a bottom end piece with a
distributor plate ensuring plug flow throughout the cross-sectional area of the column and a
course net that supports the particles. Above the upper bed surface there is a large headspace
filled with buffer before a movable adapter piece seals the column tube. When a liquid is
pumped through the bottom end piece in an upward direction, the adsorbent bed expands in
height to a degree dependent on the particle density, viscosity of the liquid and the flow rate
applied. EBA media are composed of dense (usually 1.2-1.6g/mL), relatively large (mean
diameter ca. 100-300µm) spherical particles. Their high density prevents the beads from being
carried out of the column or against the upper adapter net by the lifting liquid flow when
operated at the recommended linear flowrates of ca. 200-400cm/h. The high particle density is
often achieved by using a quartz or glass core surrounded by an agarose surface carrying the
reactive groups. Some manufacturers like Pharmacia (STREAMLINE media) compose their
EBA media of particles with a Gaussian distribution of size and density within the limits
mentioned above, contributing to the stability of the expanded bed by reducing axial
dispersion. A correctly expanded bed will appear almost stationary with a height of about 2 to
16 INTRODUCTION
4 times the sedimented bed height and the individual adsorbent particles exhibiting small,
circular movements but no turbulence or channeling.
If a particulate feedstream is applied to a stably expanded bed, the particles (cells, debris,
aggregates etc.) will pass through the large interstitial space between the adsorbent beads and
leave the column through the upper adapter, while adsorption of the target molecules to the
active surface groups can take place. A prerequisite is that the particles are small enough not
to block the column inlet and outlet. Additionally, the increase in viscosity normally occurring
during feed application may require reduction of the flowrate to prevent destabilization of the
expanded bed or carry-over of the adsorbent. When the feedstock has passed through the
column, a washing step in upward flow is performed until the effluent is particle free and, if
the run is monitored, until UV- pH- or conductivity signals return to the baseline. Elution can
then be performed either in “packed bed mode” after reversing the flow direction and
lowering the upper adapter to the sedimented bed surface or in expanded bed mode using
upward flow, but positioning the upper adapter immediately above the bed surface to reduce
void volume.
With the exception of gel filtration, all modes of biochromatography are, in principle,
applicable for EBA. However, the majority of publications in this field describe the use of ion
exchange media (Chang and Chase, 1996; Hansson et al., 1994). Of the common affinity
methods, Protein A based IgG purification has been successfully performed with EBA (Chase
and Draeger, 1992; Fahrner et al., 1999) and recently, the first reports describing IMAC in
expanded bed mode have been published (Clemmitt and Chase, 2000; Hellwig et al., 1999;
Willoughby et al., 1999). Raw material for EBA is mostly produced by fermentation or cell
culture, including bacterial fermentation broth (Hansson et al., 1994), cell homogenate
(Clemmitt and Chase, 2000) and renatured inclusion bodies (Frej, 1996), yeast fermentation
broth (Hellwig et al., 1999) and cell homogenate (Chang and Chase, 1996) as well as
mammalian (Batt et al., 1995) or hybridoma (Thommes et al., 1996) cell culture broth. No
reports exist to-date concerning EBA of plant cell extracts, suspension cell supernatants or
homogenates.
I.5 This thesis
The aim of this thesis was to develop and evaluate novel strategies, in particular the
combination of IMAC and EBA, for capture of recombinant proteins of pharmaceutical
interest from P.pastoris fermentation broth and tobacco cell suspension cultures with
INTRODUCTION 17
emphasis on their scale-up capabilities. Comparative analysis of the advantages and
limitations of the different expression systems was to contribute to the assessment of the
possibilities to utilize plants as biofactories for recombinant protein production.
Work for this thesis was performed in the context of two EU-funded shared cost research
projects aimed at the development of novel expression systems and purification strategies for
recombinant diagnostic or therapeutic proteins:
a) “Processing technology for recovery of recombinant antibody produced in crop plants“
(FAIR-CT 96 1039, funding period 1996-1999) was aimed at the development of novel
peptide affinity ligands for capture of the target proteins. To allow the evaluation of the
newly developed ligands, >500mg of a follicle stimulating hormone (FSH) specific,
His6-tagged scFv was to be purified from transgenic P.pastoris fermentation broth and
delivered to the partners for screening of peptide libraries, “spiking” of plant extracts
and as a standard. Furthermore, an equal amount of highly pure scFv was to be prepared
for structure elucidation by X-ray crystallography.
b) “Production of recombinant diagnostic and therapeutic antibodies by Molecular
Farming” (FAIR-CT 96 3110, funding period 1998-2001) investigates the scientific and
technical parameters to obtain new crop varieties (tobacco, pea, wheat and rice) suitable
for production of pharmaceutical recombinant proteins. One of the target proteins is the
monoclonal antibody T84.66 (Neumaier et al., 1985) that binds with high affinity and
specificity to the A3-domain of carcinoembryonic antigen (CEA), an important and
well-described human tumor cell marker (Gold and Freedman, 1965; Hammarstrom,
1999; Hefta et al., 1992; Shively and Beatty, 1985). Derivatives of this antibody have
been generated (mouse-human chimeric full-size rAb, scFv, diabody, scFv-IL2 fusion
protein). For this thesis, the scFvT84.66 was to be expressed in P.pastoris and
N.tabacum BY-2 suspension cells. After development of a purification strategy using
small-scale expression in shake-flasks, this strategy was to be transferred and evaluated
for purification of the scFv from P.pastoris fermentation supernatant as well as extracts
from fermenter-grown BY-2 cells. ScFvT84.66 was also to be expressed in and purified
from E.coli (to obtain purified protein for chicken immunization) and tobacco leaves
(transient expression for rapid testing of the plant expression construct and the
recombinant protein). The antigen to the T84.66 derivatives used in the “Molecular
Farming” project is a hybrid protein (N-A3) composed of the N- and the A3-domain of
human CEA (You et al., 1998). This antigen, bearing an N-terminal His6-tag, was to be
18 INTRODUCTION
purified from P.pastoris fermentation broth - using expanded bed IMAC as the capture
step - and N-A3 specific IgY antisera were to be prepared from egg yolks of immunized
chickens. Additionally, several modifications were to be introduced into the expression
construct (see workprogramme below) to increase expression levels and stability.
I.6 Overview of the workprogramme
I.6.1 “Processing technology” project
� shake-flask level expression of the FSH-specific scFv48.13 in P.pastoris
� development of a purification strategy using packed-bed chromatography
� fermentation (5L working volume)
� capture from fermentation supernatant using EBA
� further purification to yield homogenous product
� detailed analysis of the purified scFv and initiation of crystallization experiments
I.6.2 “Molecular Farming” project
I.6.2.1 N-A3 antigen
� shake-flask expression and purification of N-A3 (bearing an N-terminal His6-tag) from
an existing P.pastoris clone
� chicken immunization with the purified protein and extraction of IgY antisera from egg
yolk
� fermentation (5L working volume)
� purification and analysis from fermentation broth using EBA as the capturing step
� modification of the N-A3 gene construct by SOE-PCR to eliminate an internal BglII
restriction site
� subcloning of the construct into a modified pPIC9K expression to generate a C-terminal
His6-tag
� P.pastoris transformation and expressor strain selection
INTRODUCTION 19
� fermentation and purification of N-A3 as described above
I.6.2.2 scFvT84.66
� bacterial expression and purification of scFvT84.66
� immunization of chicken with purified scFvT84.66 and isolation of IgY antisera
� purification and analysis of transiently expressed scFvT84.66 from tobacco leaves
� subcloning of scFvT84.66 cDNA into pPIC9K expression vector
� P.pastoris expression and purification (shake-flask and fermenter)
� transformation of BY-2 cells with vacuole-targeted scFvT84.66
� expressor strain selection
� small scale purification and analysis
� plant cell fermentation and purification based on expanded bed chromatography
20 MATERIALS AND METHODS
II Materials and methods
II.1 Materials
II.1.1 Chemicals and consumables
Unless otherwise stated, laboratory chemicals were purchased from ICN (Eschwege), Merck
(Darmstadt), Sigma (Deisenhofen) or Pierce (Rockford, IL, USA) and were of the highest
grade available. All cell culture media and additives were of “plant cell culture tested” grade
and purchased from Sigma. Consumables were purchased from Greiner (Solingen),
Eppendorf (Hamburg), Pall Filtron (Karlsruhe), Schott Glaswerke (Mainz), Whatman
(Maidstone, England), Millipore (Eschborn) and Roth (Karlsruhe).
II.1.2 Chromatography columns and adsorbents
Prepacked columns were supplied by Amersham-Pharmacia Biotech (Freiburg), self-pack
columns by Amersham-Pharmacia or Kronlab (Sinsheim) and bulk chromatography
adsorbents by Amersham-Pharmacia, Perseptive Biosystems (Freiburg) or BioProcessing
(Consett, Co. Durham, England).
II.1.3 Media, stock solutions and buffers
Standard media and buffers were prepared according to standard procedures (Ausubel et al.,
1998; Coligan et al., 1998; Sambrook et al., 1996) using deionized water and sterilized by
autoclaving (25min/121°C/2bar). Heat-sensitive components, such as antibiotics, were
prepared as stock solutions, filter-sterilized (0.2µm) and added to the medium/buffer after
cooling to 50°C. Plant cell culture media and chromatography buffers were prepared with
ultrapure water (R=18.3M�cm-1). Recipes for media and buffers are listed in context with the
respective method. If a percentage is given for a component in media or buffer recipes (e.g.
10% NaCl), it describes a weight per volume (w/v) ratio, unless otherwise indicated.
II.1.4 Enzymes and kits
Unless otherwise stated, enzymes for DNA manipulation were purchased from New England
Biolabs (Schwalbach) or Boehringer (Mannheim). Kits for plasmid DNA purification and
DNA extraction from agarose gels were from Qiagen (Hilden).
MATERIALS AND METHODS 21
II.1.5 Antibodies, antigens and antisera
The murine monoclonal antibodies T84.66, T84.12 and T84.1 as well as the human full-length
CEA and the unmodified CEA N-A3 clone were kind gifts from Dr. John E. Shively
(Beckman Research Institute of the City of Hope, Duarte, CA, USA). The FSH-specific
scFv4813 cDNA was provided by Dr. Paul van der Logt (Unilever Research, Bedford,
England). Enzyme-labeled secondary antibodies were purchased from Dianova (Hamburg),
the �-His-tag antibody from Qiagen. Monoclonal �-c-myc antibody was purified from a 9E10
hybridoma cell line (Evan et al., 1985). IgY antisera against scFvT84.66 or N-A3 were raised
in chicken as part of this thesis.
II.1.6 Synthetic oligonucleotides
Oligonucleotides for use in DNA-sequencing or SOE-PCR were purchased from MWG
Biotech (Ebersberg).
� 5’-NA3: 5’ - CTG CCA TGG GTA AGC TCA CTA TTG AAT CC - 3’� 3’-NA3: 5’ - CGC GTC GAC ATA GAG GAC ATC CAG GGT - 3’� NA3Bgl (-): 5’ - CTT CAT TCA CAA GGT CTG ACT TTA TG - 3’� NA3Bgl (+): 5’ - CAT AAA GTC AGA CCT TGT GAA TGA AG - 3’� PICforwd: 5’ – TAC TAT TGC CAG CAT TGC TGC - 3’� PICbackwd: 5’ – GGC AAA TGG CAT TCT GAC ATC – 3’� Aoxfive: 5’ – GAC TGG TTC CAA TTG ACA AGC – 3’� univers: 5’ – GTT GTA AAA CGA CGG CCA GT - 3’� reverse: 5’ – ACA CAG GAA ACA GCT ATG AC – 3’
II.1.7 Plasmid vectors
� pUC18 (Pharmacia)� pGEM3 (Promega, Mannheim))� pET22b (Novagen, Madison, WI, USA)� pPIC9K (Invitrogen)� pSS (Voss et al., 1995)
II.1.8 Recipients for recombinant DNA
� E.coli DH5� (Ausubel et al., 1998)
� E.coli BL21 (Invitrogen)
� A.tumefaciens GV3101 (Koncz and Schell, 1986)
� P.pastoris strain GS115 (Invitrogen)
� N.tabacum cv. SR1 plants
� N.tabacum cv. BY-2 suspension cells (Nagata et al., 1992)
22 MATERIALS AND METHODS
II.1.9 Animals
Polyclonal IgY-antisera were raised in adult, female, brown „Leghorn“-chicken under
approval of the “Regierungspräsidium des Landes NRW” (RP-Nr.: 23.203.2 AC 12, 21/95).
II.2 Cultivation conditions
E.coli cells were grown at 37°C either in liquid LB medium (1.0% peptone, 0.5% yeast
extract, 1.0% NaCl; pH7.0) in a shaker incubator at 225rpm, or on agar-solidified (1.5%) LB-
plates. For long-term storage, 600µL of an overnight (ON) liquid culture was mixed with an
equal volume of 40% (v/v) glycerol and stored at –80°C°. A.tumefaciens cells were cultivated
and stored as above except that YEB medium was used (0.5% nutrient broth, 0.1% yeast
extract, 0.1% tryptone, 0.1% sucrose) and the cultivation temperature was 28°C.
P.pastoris cells were grown in baffled Erlenmeyer flasks at 30°C either in liquid YPD
medium (2.0% peptone, 1.0% yeast extract, 2% dextrose) in a shaker incubator at 250rpm or
on agar-solidified (1.5%) YPD-plates. For long-term storage, 600µL of an ON liquid culture
were mixed with an equal volume of 40% (v/v) glycerol and stored at –80°C°.
N.tabacum cv. SR1 plants were grown in a greenhouse in DE73 standard soil at 24°C
under supplementary illumination (4000Lux, 16h photoperiod). N.tabacum cv. BY-2
suspension cells and calli were grown in MSMO medium (4.4g/L MSMO salts, 0.6mg/L
thiamin/HCl, 0.2mg/L 2,4-D, 0.2g/L KH2PO4, 30g/L sucrose). Liquid medium was adjusted
to pH5.2, while medium solidified with 0.8% agar was adjusted to pH5.8. Both suspension
cells and calli were cultivated at 26°C in the dark. Suspension cells were sub-cultured weekly
using a 2% (v/v) inoculum while pinpoint-sized clumps of callus cells were transferred to
fresh plates monthly.
II.3 DNA techniques
All work with recombinant DNA and genetically modified organisms was performed in
accordance with “S1” safety regulations and was approved by the “Regierungspräsidium des
Landes NRW” (AZ 521-K-1-8/98: AI3-04/1/0866/88 (S1) and 55.8867/-4/93 (greenhouses)).
II.3.1 Isolation of plasmid DNA from E.coli
Minipreparations (<10µg) of plasmid DNA were performed either by the TELT method (He
et al., 1990) or using Qiagen mini-prep kit. For larger amounts (up to 500µg) Qiagen P500
MATERIALS AND METHODS 23
columns were used. DNA concentration and purity were determined by agarose gel
electrophoresis or spectrophotometry.
II.3.2 Isolation of total DNA from P.pastoris
Total DNA was isolated from P.pastoris clones after spheroblasting of the cells. Therefore,
the cells were grown in MDH medium (1.34% YNB, 2% (w/v) dextrose, 0.004% (w/v)
histidine) at 30°C to an OD600nm of 10 in a shaker incubator at 250rpm. After collection by
centrifugation (1500 x g, 5min, RT) and washing with sterile milliQ water the cells were
resuspended in 2mL SCED buffer (1M sorbitol, 10mM sodium citrate, 10mM EDTA, 10mM
DTT, pH7.5) and 0.25mg of Zymolyase added. After incubation at 37°C for 50min, 2mL of
1% (w/v) SDS were added and the incubation continued on ice for 5min. 1.5mL of 5M
potassium acetate pH8.9 were added and the supernatant collected after centrifugation
(10min, 10,000 x g, 4°C). DNA was then precipitated by addition of 2 volumes of ethanol,
incubation at RT for 15min and centrifugation (20min, 10,000 x g, 4°C). The pellet was
resuspended in 0.7mL of TE buffer (10mM Tris-Cl, 1mM EDTA, pH7.4) and PCI extraction
(II.3.3) performed.
II.3.3 PCI-extraction and precipitation of DNA
DNA preparations were separated from proteins or other contaminants by
phenol/chloroform/isoamylalcohol (PCI) extraction. The sample was mixed with an equal
volume of PCI (25:24:1), vortexed and spun in an Eppendorf centrifuge (5min/13,000 x
g/RT). The aqueous phase was removed, mixed with an equal volume of CI (24:1) and
centrifuged as above. For DNA precipitation, the aqueous phase of the second extraction was
mixed with 0.1 volumes of 3M sodium acetate (pH5.2) and 2.5 volumes of ethanol and
incubated at –20°C for 15min. The DNA was sedimented by centrifugation and the
supernatant aspirated. The pellet was washed with 500µL of 70% (v/v) ethanol, air-dried for
10min and then resuspended in sterile ultrapure water.
II.3.4 DNA restriction
DNA restrictions were performed in the buffer supplied with the restriction enzyme and in
accordance with the supplier’s recommendations for temperature and duration of the
digestions. Double digestions with different enzymes were done in one reaction wherever
possible. 3U of the respective enzyme was used per µg of DNA. Restricted mini-prep plasmid
24 MATERIALS AND METHODS
DNA was incubated (10min, 37°C) with 10µg of heat-stable RNAse A after completion of the
restriction. Reactions were stopped by freezing at –20°C until further processing.
II.3.5 Agarose gel electrophoresis
Analytical as well as preparative gel electrophoresis of double-stranded DNA fragments was
performed as described (Sambrook et al., 1996) in 0.8-1.5% agarose gels supplemented with
ethidium bromide (0.1µg/mL). For determination of fragment size and concentration
estimation a defined amount of marker DNA was included. Bands were visualized using a UV
transilluminator at 302nm. In preparative electrophoresis, the desired fragment was excised
with a sterile scalpel and the DNA isolated from the gel using the “Qiaex gel extraction kit”
(Qiagen).
II.3.6 Ligation of DNA fragments
DNA ligations were carried out in a total volume of 20µL. The insert:vector molar ratio was
adjusted to 3:1 (“sticky ends”) or 10:1 (“blunt ends”) in 1 x T4 ligase buffer. 0.1U and 1U of
T4 ligase, respectively, were added. The reactions were incubated ON at 15°C. Ligated DNA
was precipitated, washed with 70% ethanol, resuspended in 10µL of sterile ultrapure water
and stored at –20°C.
II.3.7 PCR
The “gene splicing by overlap extension” (SOE) PCR technique was used for the removal of
an undesired BglII restriction site within the cDNA encoding the N-A3 protein. This
restriction site prohibited the linearization of the pPIC9/NA3 plasmid vector by BglII
digestion prior to P.pastoris transformation.
First, two reaction mixes were prepared, each containing 1µL of a pPIC9-plasmid (1µg/µL,
diluted 1:1000 with sterile milliQ water) harboring the original N-A3 cDNA construct
(prepared by Dr. Carmen Vaquero, RWTH Aachen, Institute for Biology I), with an N-
terminal His6-tag and a BglII restriction site within the N-A3 gene. 47µL of a reaction
mastermix containing 20µl 10 x polymerase buffer, 20µl dNTPs, 1µl of high-fidelity Taq-
polymerase (4U/µL) and 147µL sterile milliQ water (prepared for 4 reactions) were then
added. Overlapping fragments of the N-A3 gene were independently amplified (95°C, 5min //
30 cycles of 95°C, 1min / 55°C, 1min / 68°C, 1min // 68°C, 5min) after addition of 2µL of
primer combinations (5’-NA3 / NA3Bgl (-) and 3’-NA3 / NA3Bgl (+)), respectively.
MATERIALS AND METHODS 25
After analytical agarose gel electrophoresis to verify successful amplification of the gene
fragments, 1µL each of the amplified fragments, diluted 1:100 with sterile milliQ water, were
mixed with 46µL of the reaction mastermix described above and a PCR was performed
(95°C, 5min // 5 cycles of 95°C, 1min / 38°C, 3min / 68°C, 2min) without addition of primers
to allow annealing of the fragments. Finally, the reaction was heated to 95°C for 2min, 1µL
each of 5’-NA3 and 3’-NA3 primers were added and the annealed fragments amplified by
another PCR reaction (25 cycles of 95°C, 1min / 55°C, 1min / 68°C, 1min followed by a final
extension at 68°C for 5min). The reaction product was examined by analytical agarose gel
electrophoresis.
PCR was also used to verify the presence of the target gene in transformed P.pastoris
clones. Reaction conditions and primers used will be given in the context of the respective
results.
II.3.8 Sequencing
The correct nucleotide sequence of cDNA fragments and expression constructs was verified
by non-radioactive cycle sequencing using fluorescein-endlabelled PCR primers. Extension
reactions were terminated by incorporation of ddNTPs.
For the PCR reactions, 1.5µL of the respective termination mix (1.25mM of each dNTP
plus 1.25mM of one of the four ddNTPs) were pipetted into PCR reaction tubes. 4.5µL of
sequencing mastermix (2µL 10 x Taq DNA polymerase buffer, 2U Taq polymerase, 1µg
plasmid-DNA, 2.5pM of each of the respective primers, 1µL DMSO, ultrapure H2O ad 20µL)
were added to each of the tubes and overlaid with a drop of PCR oil. After incubation in a
PCR thermocycler (initial denaturation 4min/94°C, followed by 35 cycles of annealing
(20sec/50°C), extension (30s/72°C) and denaturation (20s/95°C)) the reactions were stopped
by adding 3µL of stop buffer to each tube. The products were frozen at –20°C and subjected
to standard DNA sequencing.
II.3.9 Transformation and selection
E.coli was transformed by the heat-shock method as described (Hanahan, 1985). Heat-shock
competent cells were prepared from 250mL of a log-phase culture (OD600 = 0.5) in LB
medium. After sedimentation (10min/2000 x g/4°C) the cell pellet was resuspended in 75mL
ice-cold TfBI (30mM KCH2COO-, 50mM MnCl, 100mM RbCl, 10mM CaCl2, 15% (v/v)
glycerol; pH5.8). The suspension was incubated on ice for 10min, the cells sedimented as
26 MATERIALS AND METHODS
above and the pellet resuspended in 10mL ice-cold TfBII (10mM MOPS, 75mM CaCl2,
10mM RbCl, 15% (v/v) glycerol; pH6.8). Aliquots of 200µL were shock-frozen in liquid N2
and stored at –80°C.
For transformation, an aliquot of competent cells was thawed on ice, mixed with 100ng of
plasmid DNA and incubated on ice for 30min followed by 2min at 42°C and another 2min on
ice. The cells were then incubated on an orbital shaker (1h/200rpm/37°C) in LB medium and
subsequently plated on LB agar supplemented with ampicillin (100µg/mL) for selection of
recombinant clones.
A.tumefaciens transformation was performed as described (Hoefgen and Willmitzer, 1988).
Competent cells were prepared from a 50mL culture (OD600 = 0.9) in YEB medium
supplemented with 100µg/mL of rifampicin and 25µg/mL of kanamycin (YEBRif, Km). The
cells were sedimented (10min/2000 x g/4°C) and the pellet resuspended in 20mL TE buffer
(10mM Tris/Cl, 1mM EDTA; pH7.6). After a second sedimentation as above the cells were
resuspended in 5mL YEBRif medium. Aliquots of 500µL were shock-frozen in liquid N2 and
stored at –80°C.
For transformation, an aliquot of competent cells was thawed on ice, mixed with 2µg of
plasmid DNA and incubated for 5min in liquid N2, then for 5min at 37°C. One mL of YEB
medium was added and the cells were incubated in a 28°C waterbath for 3h. For recombinant
clone selection, 200µL aliquots were plated on YEBRif, Km agar supplemented with 100µg/mL
of carbenicillin (YEBRif,Km,Cb) and incubated for 48-72h at 28°C.
P.pastoris strain GS115 was transformed by electroporation (Scorer et al., 1994). The
plasmid vector was linearized to increase integration into the P.pastoris genome through
recombination events. After digestion and PCI extraction, the concentration of the linearized
plasmid DNA was determined by UV-VIS spectroscopy at 260nm.
Competent cells were prepared before use from 100mL cultures (OD600 = 1.5). Cells were
sedimented by centrifugation (5min/3000 x g/4°C) and the pellet sequentially resuspended in
100mL, then 50mL of ice-cold ultrapure water, then 5mL and, finally, 0.25mL of ice-cold 1M
sorbitol with sedimentation as above between the individual steps. The electrocompetent cells
were then kept on ice.
For transformation, 80µL of electrocompetent cells were mixed with 20µg of linearized
plasmid DNA, transferred to a prechilled 0.2cm electroporation cuvette and incubated on ice
for 5min. The cells were electroporated (1.5kV/25µF/200�) and 1mL of ice-cold 1M sorbitol
MATERIALS AND METHODS 27
was added. 100µL aliquots were plated on 1.5% MD (1.34% YNB, 4 x 10⁻⁵% biotin, 2%
dextrose) agar for selection of histidine-prototroph clones. The plates were incubated at 28°C
until colonies appeared ( ~ 2 – 4-days).
N.tabacum cv. BY-2 cells were transformed by cocultivation with recombinant
A.tumefaciens (An, 1985). 3mL of a 3 day postinoculation BY-2 culture (II.2) in the log
phase of growth were mixed in an empty Petri dish (��5cm) with 150µL of an ON culture
(II.2) of recombinant A.tumefaciens (see above). After 3d of incubation in the dark at 24°C,
the cells were transferred to centrifuge tubes and sedimented (3min/100 x g/RT). The
supernatant was removed and the sedimented cells washed with 10mL MS medium. After
three cycles of sedimentation and washing in MS, the cells were resuspended in an equal
volume of MS medium and 200µL aliquots were plated on MS agar supplemented with
75µg/mL kanamycin and 250µg/mL cefotaxime. The plates were incubated in the dark at
24°C. Pinpoint-sized clumps of kanamycin-resistant cells were visible after 20-25 days and
were transferred to fresh plates containing the same medium and cultivation continued until
sufficient cell material for screening was available.
For transient expression in N.tabacum cv. SR1, leaves were vacuum-infiltrated as described
(Kapila et al., 1996). Briefly, harvested young leaves of uniform size (approximately 12cm
long) were submerged in a suspension of recombinant A.tumefaciens in a vacuum desiccator.
Vacuum was applied to a final pressure of 40-60mbar. After 15min, abrupt release of the
vacuum facilitated bacterial penetration into the intercellular space. The infiltrated leaves
were rinsed with water and incubated, adaxial side down, on wet Whatman paper in saran-
wrapped trays for 60h (23°C/16h photoperiod) before analysis.
II.4 Protein analysis tools
II.4.1 PAGE and IEF
Proteins were electrophoretically separated by SDS-PAGE as described previously (Laemmli,
1970). Before loading, the samples were boiled in 4 x SDS sample buffer (Roth) for 5min. A
Mini Protean II system (BioRad) and self-cast 12% gels were used if the proteins were
subjected to Coomassie-staining or blotting after separation (200V/45min). When high
sensitivity staining was desired, proteins were pherographed using a Phast system and precast
12% Phast gels with subsequent silver staining. For isoelectric focusing, Phast IEF gels (pH
28 MATERIALS AND METHODS
3-9) were used and silver-stained. Electrophoresis and staining procedures using the Phast
system were according to protocols supplied by the manufacturer (Pharmacia).
II.4.2 Protein blotting
For specific detection of the target protein band in a sample separated by SDS-PAGE, the
proteins were electrophoretically transferred onto a nitrocellulose membrane (Towbin et al.,
1979) using the Mini Protean II tank blot device (BioRad). After incubation (30min/RT) of
the membrane in blocking buffer (5% BSA in PBST), the protein band of interest was
visualized by sequential incubation (1h/RT) with dilutions of either affinity-tag specific mAb
(1:5,000) or IgY antibodies (1:1,000) raised against the target protein, followed by species-
specific AP-labeled secondary antibodies (1:5,000). Dilutions were prepared in blocking
buffer. Substrate for the AP-reaction was NBT/BCIP (Pierce).
The detection protocol described above was also used for expression screening of
recombinant P.pastoris clones blotted onto nitrocellulose (II.6).
II.4.3 Removal of N-linked glycans
For removal of N-linked glycan chains from purified P.pastoris-expressed N-A3 hybrid
protein, the “N-glycosidase F deglycosylation Kit” from Boehringer (Mannheim) was used
according to manufacturer’s instructions. Briefly, 5µL of denaturation buffer (containing
sodium phosphate, ionic detergent and 1% DTT) were added to 5µL of protein sample and
incubated for 3min at 95°C. Then, 10µL of reaction buffer (containing sodium phosphate and
nonionic detergent) and 10µL (2.5U) of PNGase F were added and the mix incubated at 37°C
for 60min. SDS-PAGE of the digested glycoprotein was then performed as described (II.4.1).
II.4.4 Crystallization
Initial crystallization experiments were carried out with purified scFv4813 using the “Crystal
screen” kit (Hampton Research, Laguna Niguel, CA, USA). Briefly, purified protein was
concentrated to a final concentration of approximately 15mg/mL using Nanosep concentrators
(10kD cut-off, Pall Filtron). The retentate was dialyzed against 10mM MES, 2mM DTT,
0.5mM EDTA pH6.0. 1.5µL of concentrated protein solution was then pipetted to the center
of a siliconized, round glass coverslip (�22mm) and 1.5µL of the respective buffer supplied
with the kit added and mixed. 1mL of the respective buffer was pipetted into a well of a 24-
well tissue culture plate and the inverted coverslip placed over this reservoir and sealed with
MATERIALS AND METHODS 29
silicon grease, so that a hanging drop of protein/buffer mix was formed. This procedure was
repeated for all buffers supplied with the kit. Two sets of plates were prepared, and one set
was incubated at room temperature, the other one at 4°C. The plates were screened daily
using a binocular microscope.
II.4.5 ELISA
Several different ELISA procedures were used for detection and quantification of functional
recombinant proteins in fermentation brutish or cell protein extracts and for analysis of
purified products. All variants were carried out in 96-well microtiter plates (M129B, Greiner).
Standard buffers included coating buffer (CB: 15mM Na2CO3, 35mM NaHCO3; pH9.6),
blocking buffer (BB: 1%BSA in PBST; pH7.4), enzyme-labeled-antibody buffer (ELAB: 2%
PVP, 0.2% BSA, 0.02% (v/v) Tween20 in PBS; pH7.4) and substrate buffer (SB: 0.1M
diethanolamine, 1mM MgCl2; pH9.8). All secondary antibodies were diluted 1:5,000 in
ELAB. The AP-substrate pNPP (Sigma) was used at 1mg/mL in SB and the substrate
turnover quantified by measuring absorption at 405nm. All incubations were carried out for
1h at 37°C, all reaction volumes were 100µL except the blocking steps (150µL). Between the
incubations, the plates were washed three times with PBST.
II.4.5.1 Determination of IgY titer in egg yolk
ELISA plates were coated with purified antigen (1µg/mL in CB). After blocking of free
binding sites by incubation with BB, serial dilutions of the yolk (1:500 – 1:256,000 in PBS)
were added and bound IgY was detected using Fc�-specific RACAP antibodies and NBT/BCIP
substrate.
II.4.5.2 Assay for N-A3
Purified �-N-A3 IgY were adsorbed to the ELISA plate diluted 1:1000 in CB. After blocking
of free binding sites by incubation with BB, serial dilutions of samples containing N-A3
protein in PBST were added. Bound N-A3 was detected by incubation with mAb T84.66
(25ng/mL in PBST) followed by Fc�-specific GAMAP and NBT/BCIP substrate. For screening
of multiple P.pastoris small-scale cultures, clarified supernatants were directly adsorbed to
the plates diluted 1:200 in CP. Detection was then performed as described above.
Direct coating of N-A3 dilutions in CB to ELISA plates followed by blocking with BB,
probing with mAb T84.66 and visualization as described above was performed for
determination of the reactivity of purified N-A3 against mAb T84.66.
30 MATERIALS AND METHODS
II.4.5.3 Assay for scFvT84.66
Purified N-A3 protein (1mg/mL, diluted 1:1000 in CB) was adsorbed to the plate diluted
1:1000 in CB. After blocking of free binding sites by incubation with BB, serial dilutions of
samples containing scFvT84.66 were added. Bound scFvT84.66 was detected either by
incubation with affinity-tag specific mAb (�-His6 or �-c-myc, diluted 1:5000 in PBST)
followed by Fc�-specific GAMAP or by incubation with a-scFvT84.66 IgY followed by Fc�-
specific RACAP and NBT/BCIP substrate reaction.
II.4.5.4 Competition ELISA
Purified N-A3 protein was adsorbed to a plate at a concentration of 50ng/mL and free binding
sites blocked with BB. The samples to be analyzed were serially diluted in PBST in
siliconized microtiter plates. All dilutions were supplemented with mAb T84.66 to a final
concentration of 25ng/mL and transferred to the N-A3-coated ELISA plate. Bound mAb
T84.66 was detected by incubation with Fc�-specific GAMAP and NBT/BCIP substrate
reaction.
II.4.6 Real-time biomolecular interaction analysis (BIA)
As all recombinant proteins under investigation contained His6-tags, BIA using a BiaCore
2000 instrument in combination with a Ni-NTA sensor chip was performed for selection of
expressor strains as well as for monitoring fermentations and protein purification. For
detection of His6-tagged proteins in fermentation brutish or purification intermediates, the
samples were diluted 1:20 in HBS buffer (10mM HEPES, 150mM NaCl, 0.005% (v/v)
Tween20). The Ni-NTA sensor chip was charged with Ni++ by injecting 10µL of loading
buffer (HBS containing 500µM NiCl2) and 20µL of diluted sample was injected. The binding
of sample components to the sensor chip surface was displayed as “resonance units” (RU).
The cycle was completed by injecting 5µL of HBS buffer containing 350mM EDTA to strip
metal ions and bound proteins off the surface and was followed by re-charging with Ni++ as
described above. Flowrate for all steps was 10µL/min. Variations of this standard protocol are
indicated in the respective figure legends.
II.4.7 Mass spectrometry
Tryptic digests of proteins after in-gel reduction, alkylation and digestion were analyzed by
liquid chromatography electrospray ionization mass spectrometry. SDS-PAGE of the target
protein was performed as described above. After Coomassie-staining, the protein band of
MATERIALS AND METHODS 31
interest was excised out of the gel, the gel slice cut into small pieces and transferred to an
Eppendorf tube. The gel pieces were covered with destaining solution (200mM NH4HCO3 in
50% (v/v) CH3CN) and incubated at 30°C for 40min with vortexing after 20min. After
complete destaining, the supernatant was discarded and the gel sample dried in a speed-vac.
The dried sample was submerged in freshly prepared reducing buffer (100mM NH4HCO3,
100mM DTT) and incubated at 56°C for 1h. The supernatant was removed, a four-fold
volume excess (as compared to the original volume of reducing buffer) of fresh-prepared
alkylating solution (100mM iodoacetic acid) added and the reaction was incubated in the dark
at RT for 30min. The supernatant was removed, the gel pieces washed twice with 100µL of
200mM NH4HCO3 and dehydrated with 100µL CH3CN. The acetonitrile was removed and
the gel pieces re-swollen by incubating with 50µL of 200mM NH4HCO3 for 15min.
Dehydrating and re-swelling of the gel pieces was repeated, followed by drying of the pieces
in a speed-vac. The pieces were re-swollen by adding 10µL of digestion buffer (trypsin stock
solution (100ng/µL in 1mM HCl) diluted with an equal volume of 200mM NH4HCO3),
incubating for 5min, adding 20µL of 200mM NH4HCO3 and incubating for another 5min.
After re-swelling, the supernatant was removed, the gel pieces covered with 20µL of 200mM
NH4HCO3 and incubated ON at 30°C. The digestion reaction was quenched by adding 0.1
volumes of 10% TFA and the supernatant removed and saved. The gel pieces were covered
with 100µL of extraction buffer (0.1% (v/v) TFA in 60% CH3CN) and incubated at 30°C for
40min with vortexing after 20min. The supernatant was removed and combined with the
supernatant mentioned above. The extraction step was repeated and the volume of the
combined supernatants reduced to 20µL in a speed-vac.
Liquid chromatography mass spectrometry (LC/MS/MS) analyses were performed using an
Apple Macintosh controlled microcapillary HPLC system developed at the City of Hope
National Medical Center (Duarte, CA, USA) (Davis and Lee, 1998). The standard gradient
was from 2 to 92% MS buffer B (90% acetonitrile, 0.0014% TFA) over 120 min using low
TFA buffers at 50 psi. Sample injection was performed at 1500 psi for 2 min followed by
10min washing at high pressure with buffer A (0.02% TFA) for desalting and removal of
contaminating components. Prior to the injection of the preformed gradient the system
pressure was reduced to 50 psi over 1 min. The 150 µm i.d. x 350 µm o.d. on-line microspray
needles were pulled using a laser-based micropipette puller (Sutter) to a terminal ID of
approximately 5 µm. The tip was packed at 4000 psi using 5 µm C18 beads (Zorbax) as
previously described by Davis et al. (Davis and Lee, 1998). The packed tip was connected to a
32 MATERIALS AND METHODS
75 µm ID x 350 µm OD transfer line using a PEEK capillary Tee (Valco) and graphite
ferrules. A 0.3 mm gold wire was introduced through the off-axis inlet to apply the
electrospray potential. All mass spectral analyses were performed using a Finnigan LCQ
iontrap mass spectrometer (Thermoquest) equipped with a custom microspray interface. The
LCQ was operated under Automatic Gain Control (AGC) and enabled dynamic exclusion in
the Navigator view. The AGC targets were: Full MS 5x10⁷, MSn 2x10⁷ and Zoom MS
2.55x10⁶. The default maximum injection time was 500 ms with a single microscan count.
II.5 Production of IgY-antisera
All animal experimentation was approved by the “Regierungspräsidium des Landes NRW”
(RP-Nr.: 23.203.2 AC 12, 21/95) and were supervised by Dr. Hirsch, the biological safety
officer of the Institute for Biology I at the RWTH Aachen.
Initial chicken immunizations were performed with 100µg of purified antigen in PBS
emulsified with an equal volume of complete Freund’s adjuvant (GibcoBRL, Eggenstein).
Two 500µL aliquots of this emulsion were injected intramuscularly into the breast. Three and
six weeks after the initial immunization, injections were repeated as above, except that
incomplete Freund’s adjuvant (GibcoBRL) was used. 10 days after the second immunization,
eggs from the immunized chicken were collected and the specific IgY antibody titer
determined by ELISA.
IgY antibodies were purified from egg-yolk by repeated precipitation with PEG-6000 as
described (Polson et al., 1985). All centrifugations were at 20,000 x g for 20min at 4°C. The
yolk sacs were collected, washed with cold tap water, the yolk volume determined and four
volumes of cold PBS added. 3.5% of solid PEG-6000 was added and stirred until dissolved.
After centrifugation the supernatant was filtered through Miracloth and Whatman 3M paper,
8.5% of PEG-6000 was added and re-centrifuged. The pellet was resuspended in 2.5-fold the
original yolk volume of PBS, treated with 12% PEG-6000 and recentrifuged. The pellet was
resuspended in 0.25-fold the original yolk volume of PBS containing 0.02% NaN3, treated
with 50% (v/v) ice-cold ethanol and centrifuged again to remove all PEG-6000. The
supernatant containing the purified IgY antibodies was filter-sterilized and stored in aliquots
at –20°C.
MATERIALS AND METHODS 33
II.6 Expressor strain selection
The different expression systems used in this thesis required different approaches for the
selection of suitable expressor strains.
E.coli: Ampicillin-resistant clones (II.3.9) of E.coli BL21 or ER2566 transformed with the
vector constructs described (II.1.7) were used to inoculate 3mL cultures in LBA-medium.
After induction with 1mM IPTG, the culture supernatants were analyzed for the presence of
His6-tagged recombinant proteins by BIA using Ni-NTA sensor chips while total protein
extracts were prepared from the sedimented cells and analyzed by SDS-PAGE and Western
blot.
P.pastoris: After initial screening for histidine-prototrophy as described (II.3.9), several
selection strategies were tested to identify high-expressing recombinant clones. G418-
selection was performed by patching single histidine-prototroph clones to YPD agar
containing increasing G418 (Invitrogen) concentrations (0.25, 0.5, 1.0 and 2.0mg/mL) and
incubating the plates at 30°C for 3-5 days.
Alternatively, histidine-prototroph clones (II.3.9) were patched onto MD agar and
incubated at 30°C until colonies appeared. A replica of the plate was generated by blotting the
colonies onto a nitrocellulose membrane. The membrane was then incubated, yeast cells
facing upward, on MD agar with a methanol-saturated piece of Whatman paper placed inside
the lid of the Petri dish to induce recombinant protein expression. After 3 days, the membrane
was repeatedly rinsed with PBST to remove all yeast cells and then developed as described.
Clones that were either hyper-resistant against G418 or gave the most intense signals in the
dot blot were then used to inoculate 10mL of BMGY medium (1% yeast extract, 2% peptone,
1.34% yeast nitrogen base, 4 x 10⁻⁵% biotin, 1% (v/v) glycerol in 100mM potassium
phosphate buffer pH6.0) in 50mL Falcon tubes. After 24h of incubation at 30°C and 250rpm,
the cells were sedimented (3min/3000 x g/RT) and resuspended in 5mL BMMY medium
(BMGY with the glycerol replaced by 4% (v/v) methanol). Incubation was continued for
48-72h, 0.5% (v/v) of methanol was added every 24h. Samples were taken every 12h and
analyzed for recombinant protein content. Shake-flask cultivation of recombinant P.pastoris
clones in baffled 1L Erlenmeyer flasks was performed to obtain enough material for
purification method development. Therefore, 190mL of BMGY medium were inoculated with
a 10mL preculture. After 24h of incubation as described the cells were collected, resuspended
34 MATERIALS AND METHODS
in 100mL of BMMY and the incubation continued for 48-72h. Supernatant was then
harvested and stored at 4°C until further processing.
N.tabacum cv. BY-2: After selection of kanamycin-resistant clones (II.3.9), callus cells
were grown on selective agar medium until sufficient cell mass (approximately 0.5g) was
available. Total soluble protein was then extracted as described and the extracts analyzed by
western blotting or ELISA.
II.7 Fermentation
For preparative scale purification of recombinant proteins, selected P.pastoris and BY-2
strains were grown in a 5L (working volume) stirred tank reactor (Biobench 7, Applikon,
Schiedam, The Netherlands).
P.pastoris fermentations: 4L of basal salts medium (4.25mL/L ortho-phosphoric acid,
9.4mM MgSO4, 1mM CaSO2, 16.4mM K2SO4, 11.4mM KOH, 50 ml/L glycerol) were
sterilized inside the reactor. NH4OH (28 % w/v) was used as pH control agent and nitrogen
source. 4.35 ml/L PTM1 trace salts (Invitrogen) were added after sterilization. Fermentations
were inoculated with 350 ml of an overnight preculture in BMGY. Temperature was
maintained at 30°C. Agitation was provided by three 6-bladed Rushton impellers of 1/3rd the
vessel diameter, operating at 1000 rpm. Aeration was constant at 2LL-1min-1. pH was
maintained at 6.0 during growth phase. In one fermentation a glycerol fed-batch phase was
carried out, in which biomass was bulked up to the desired level prior to induction using a
50 % glycerol feed containing 12 ml/L of Ptm1 trace salts. During induction, which was
carried out by feeding pure methanol (containing 12 ml/L of PTM1 trace salts) at various feed
rates to the fermenter, pH was maintained at 4.0. Induction was maintained for approximately
48 hours before harvesting. Alternatively, fermentations were carried out in BMGY medium
at pH6.0 with the other parameters unchanged.
N.tabacum BY-2 cell fermentations were carried out in the same fermenter but using a
different impeller type at 100rpm to minimize shear stress on the suspension cells.
Fermentation media were identical to those described for shake-flask cultivation, temperature
was maintained at 26°C and pH at 5.8. Inoculum size was 500mL of a densely grown, 7 days
old shake-flask culture. The fermentations were performed for 7-12 days.
MATERIALS AND METHODS 35
II.8 Recombinant protein purification
II.8.1 Sample pre-treatment
E.coli: Depending on the expression vector and host strain used, scFvT84.66 was either
stored intracellularly as cytoplasmic inclusion bodies or released into the culture supernatant.
For inclusion body purification, cells were lysed and the inclusion bodies resuspended in 8M
urea, 10mM Tris/Cl, 100mM NaH2PO4 for IMAC. Culture supernatants containing the
recombinant proteins were adjusted to 10mM phosphate, 1M NaCl pH7.4 before IMAC.
P.pastoris: The use of the pPIC9K expression vector containing the a-factor secretion
signal directed release of the recombinant protein into the culture supernatant. After harvest,
the crude supernatant was adjusted to 10mM phosphate, 1M NaCl pH7.4. Bulk cell mass was
removed by centrifugation (20min/ 8000 x g/4°C). For small-scale purification (<100mL) on
packed-bed columns, the supernatant was re-centrifuged (30min/35,000 x g/4°C). The 2nd
supernatant was passed through a 0.2µm-filter before loading onto the column. For pilot-scale
purification’s using expanded bed chromatography, the supernatant of the 1st centrifugation
was used directly.
N.tabacum: For the purification of transiently expressed scFvT84.66 in SR1-leaves,
infiltrated leaves were ground to a fine powder in liquid nitrogen using a mortar and pestle.
Soluble protein was extracted with 2mL of extraction buffer (200mM Tris/Cl, 1M NaCl, 0.1%
Tween20; pH7.5) per gram leaf material. After two rounds of centrifugation (30min/20,000 x
g/4°C) the supernatant was decanted through three layers of Miracloth and filtered (0.2µm)
before loading onto a packed bed column.
Transgenic BY-2 cells were harvested by vacuum filtration of the cell suspension through
three layers of Miracloth. The cell cake was resuspended in one volume (v/w) of cold
extraction buffer (50mM phosphate, 1M NaCl, 0.1% (v/v) Tween 20, 10mM imidazole
pH7.5). Total soluble protein was extracted either by sonication (1min/80W/0.5s pulse time)
in a chilled sonication vessel or by grinding in a Waring blender (3 x 15s/high-speed
setting/4°C). For packed bed chromatography, cell debris was removed by two rounds of
centrifugation (30min/35,000 x g/4°C) and the supernatant was filtered through Miracloth and
a 0.2µm-filter. For expanded bed chromatography, bulk cell mass was removed by
centrifugation (20min/8000 x g/4°C), the supernatant passed through Miracloth and directly
used.
36 MATERIALS AND METHODS
II.8.2 Ultrafiltration and buffer exchange
Concentration of small samples was performed in a centrifuge using NanoSep or MicroSep
concentrators (Pall Filtron). Larger samples were concentrated in a stirred cell (Millipore)
under N2 pressure (6bar). In all cases, membranes with a 10kDa cut-off were used.
Buffer exchange between chromatographic steps or after purification was performed by on-
line dialysis using a VariPermL module (Omnichrom). Therefore, the hollow-fiber module
(5kDa cut-off) was inserted between the column outlet and the chromatography system’s UV
and conductivity flow cells. During elution of proteins from the column through the fibers at a
flowrate of up to 5mL/min, a reverse flow of the “target buffer” through the outer space of the
module was generated by using a peristaltic pump set to 25mL/min. Buffer exchange was
verified by conductivity monitoring.
II.8.3 Chromatography
Depending on the source of the recombinant proteins and their properties, two- or three-step
chromatographic protocols were developed for purification. In all cases, IMAC was used as
the capture step and GF for “polishing”. If necessary, an intermediate ion-exchange step was
included in the protocol. A general description of the chromatographic procedures is given in
this section, modification or adjustments for the respective recombinant protein are described
in context with the presentation of the results. To facilitate comparison between
chromatographic procedures using columns of different geometry, linear (cm/h) instead of
volumetric (mL/min) flowrates and the units column volume (CV, for packed bed columns) or
sedimented bed volume (SBV, for expanded bed columns) instead of absolute volumes are
indicated where suitable.
II.8.3.1 Modes of chromatography
Expanded bed chromatography was used for initial IMAC purification of recombinant
proteins from samples >500mL. This technique is designed to allow application of partially
clarified culture supernatants and extracts or even unclarified fermentation broth onto the
column. 75mL of IMAC medium (Streamline Chelating, Pharmacia) were suspended in a
2fold volume of loading buffer (PBS, 850mM NaCl pH7.4) and filled into an expanded bed
column (Streamline25, 2.5 x 100cm, Pharmacia) giving a sedimented bed height of 15cm. The
top adapter of the column was set to 70cm. A peristaltic pump was connected to the column
and the subsequent steps of the protocol were carried out using an upward linear flow rate of
MATERIALS AND METHODS 37
250cm/h (20.4mL/min). The bed was first expanded with approximately 10 SBV of loading
buffer, resulting in a 2.5fold increase in bed height to 38cm. When visual examination of the
column revealed a stabilized bed with no turbulence or channeling and a sharp interface
between medium and overhead space, the column was charged with Ni++-ions by applying 3
SBV of 100mM NiSO4. After re-equilibration with 10 SBV of loading buffer, the sample was
loaded and the flowthrough collected and routinely directly analyzed using the BiaCore
system equipped with a Ni-NTA sensor chip. The column was washed with loading buffer
until the flowthrough appeared clear and particle free (10-20 SBV depending on the sample).
The bed was allowed to settle, the adapter adjusted to the top of the sedimented bed and the
column connected to an Äkta Purifier 100 chromatography system for step-gradient elution of
bound proteins and UV-monitoring under downward flow. Using loading buffer at a linear
flow rate of 75cm/h, washing of the column was continued until the UV-baseline was stable,
then elution was performed in a two-step gradient with loading buffer containing 25mM and
250mM of imidazole, respectively. Optionally, a VaripermL online-desalting module was
inserted between the column outlet and the detector and buffer exchange performed as
described. Eluate was collected and analyzed. Alternatively, elution was performed in
expanded bed mode using upward flow at 75cm/h. After elution, a CIP protocol was
performed in expanded mode to regenerate and sanitize the column.
Conventional chromatography in packed bed columns was used for all intermediate and
polishing steps as well as for initial purification of samples <500mL. IMAC, cation- and
anion exchange and gel filtration were the methods used depending on the properties of the
respective sample. All packed bed chromatography was performed using an Äkta Explorer
10XT or an Äkta Purifier 100 chromatography system (Pharmacia).
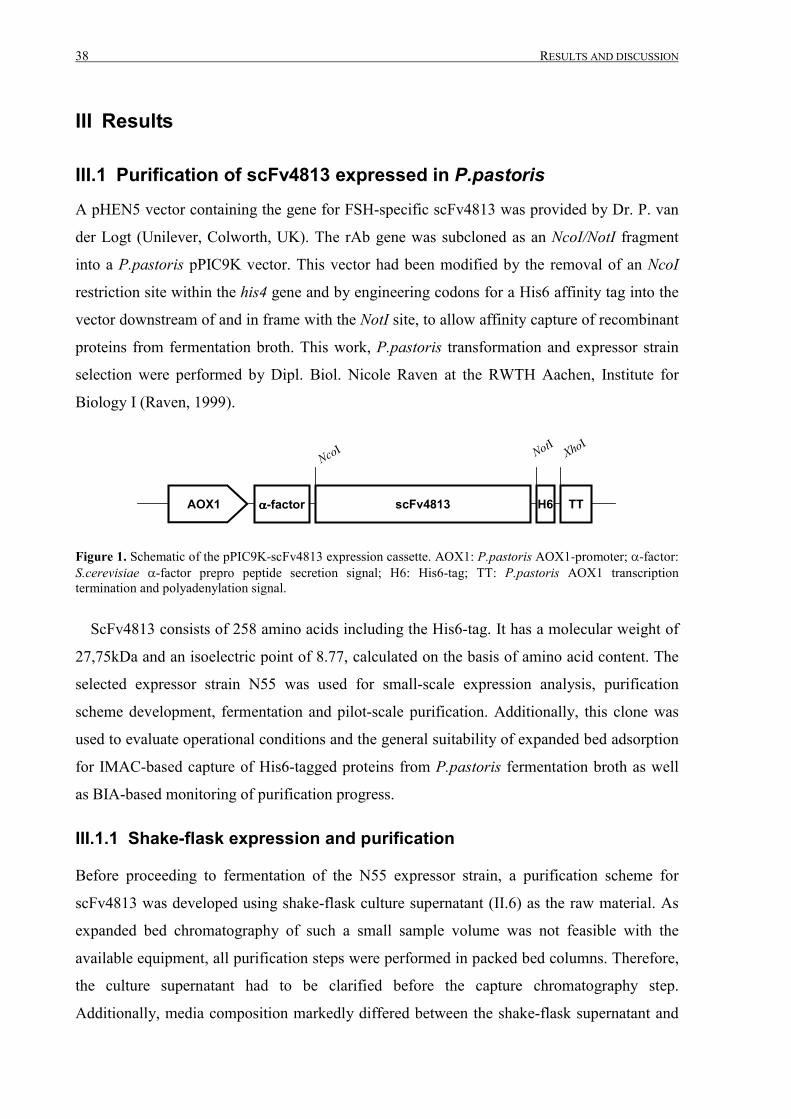
38 RESULTS AND DISCUSSION
III Results
III.1 Purification of scFv4813 expressed in P.pastoris
A pHEN5 vector containing the gene for FSH-specific scFv4813 was provided by Dr. P. van
der Logt (Unilever, Colworth, UK). The rAb gene was subcloned as an NcoI/NotI fragment
into a P.pastoris pPIC9K vector. This vector had been modified by the removal of an NcoI
restriction site within the his4 gene and by engineering codons for a His6 affinity tag into the
vector downstream of and in frame with the NotI site, to allow affinity capture of recombinant
proteins from fermentation broth. This work, P.pastoris transformation and expressor strain
selection were performed by Dipl. Biol. Nicole Raven at the RWTH Aachen, Institute for
Biology I (Raven, 1999).
AOX1 TT����-factor scFv4813 H6
NotINcoI XhoI
Figure 1. Schematic of the pPIC9K-scFv4813 expression cassette. AOX1: P.pastoris AOX1-promoter; �-factor:S.cerevisiae �-factor prepro peptide secretion signal; H6: His6-tag; TT: P.pastoris AOX1 transcriptiontermination and polyadenylation signal.
ScFv4813 consists of 258 amino acids including the His6-tag. It has a molecular weight of
27,75kDa and an isoelectric point of 8.77, calculated on the basis of amino acid content. The
selected expressor strain N55 was used for small-scale expression analysis, purification
scheme development, fermentation and pilot-scale purification. Additionally, this clone was
used to evaluate operational conditions and the general suitability of expanded bed adsorption
for IMAC-based capture of His6-tagged proteins from P.pastoris fermentation broth as well
as BIA-based monitoring of purification progress.
III.1.1 Shake-flask expression and purification
Before proceeding to fermentation of the N55 expressor strain, a purification scheme for
scFv4813 was developed using shake-flask culture supernatant (II.6) as the raw material. As
expanded bed chromatography of such a small sample volume was not feasible with the
available equipment, all purification steps were performed in packed bed columns. Therefore,
the culture supernatant had to be clarified before the capture chromatography step.
Additionally, media composition markedly differed between the shake-flask supernatant and
RESULTS AND DISCUSSION 39
fermentation broth. P.pastoris fermentation medium consists mainly of inorganic salts (see
II.7). In contrast, shake flask media contain high amounts of the undefined proteinaceous
additives, peptone and yeast extract (see II.6). These additives create a complex starting
material for protein purification if they are not completely metabolized during cultivation.
However, apart from these differences, the small-scale purification procedure was to be
designed to permit scale-up without major modifications. Therefore chromatography media
with identical functional groups were chosen for both small- and large-scale applications, no
protease inhibitors or other expensive reagents were added and simple, inexpensive
chromatography buffers were selected. For the same reason, no preconcentration steps like
ammonium sulfate precipitation were included in the protocol.
The properties of scFv4813, notably the high pI of 8.77 and the presence of the His6-tag
suggested the use of either CEX or IMAC as the capture step. The advantages of CEX lie in
the lower media and buffer costs and the simplicity and robustness of the method, while
IMAC as a group-specific affinity technique offers higher specificity. IMAC was selected
principally because of its intended use in an expanded bed process. While elution of the target
protein from an IMAC medium is normally performed using a step gradient (pH-shift or
addition of a competitor like imidazole), ion exchange chromatography requires linear pH or
salt gradients to achieve high resolution. Linear gradients, however, are not frequently used in
IMAC for technical reasons. Additionally, to facilitate binding to an ion exchange resin, the
crude fermentation broth or extract will usually have to be diluted 2-4 fold (depending on the
particular application) with water to reduce conductivity. As EBA is a relatively slow
procedure with linear flow rates of 200-300cm/h, increasing the feed volume adds
significantly to the overall process time and reduces productivity. Therefore, with a His6-tag
present in scFv4813, IMAC was chosen as the capture step while CEX was applied in the 2nd
step for further purification of the target protein from an enriched fraction.
The culture supernatant was clarified and conditioned as described (II.8.1). For IMAC, high
NaCl concentrations are regularly included in feed, running and elution buffers to increase
binding specificity by suppressing ionic interactions between sample components and the
charged iminodiacetic ligand groups of the adsorbent. Addition of NaCl to the culture
supernatant to a final concentration of 1M and the pH-shift from 6.0 to 7.4 did not cause any
visible precipitation in the sample. One hundred milliliters of the supernatant were then
applied to a packed-bed IMAC column that had been charged with Ni++ and equilibrated with
10CV of loading buffer. After sample application, a washing step of 2.5CV with running
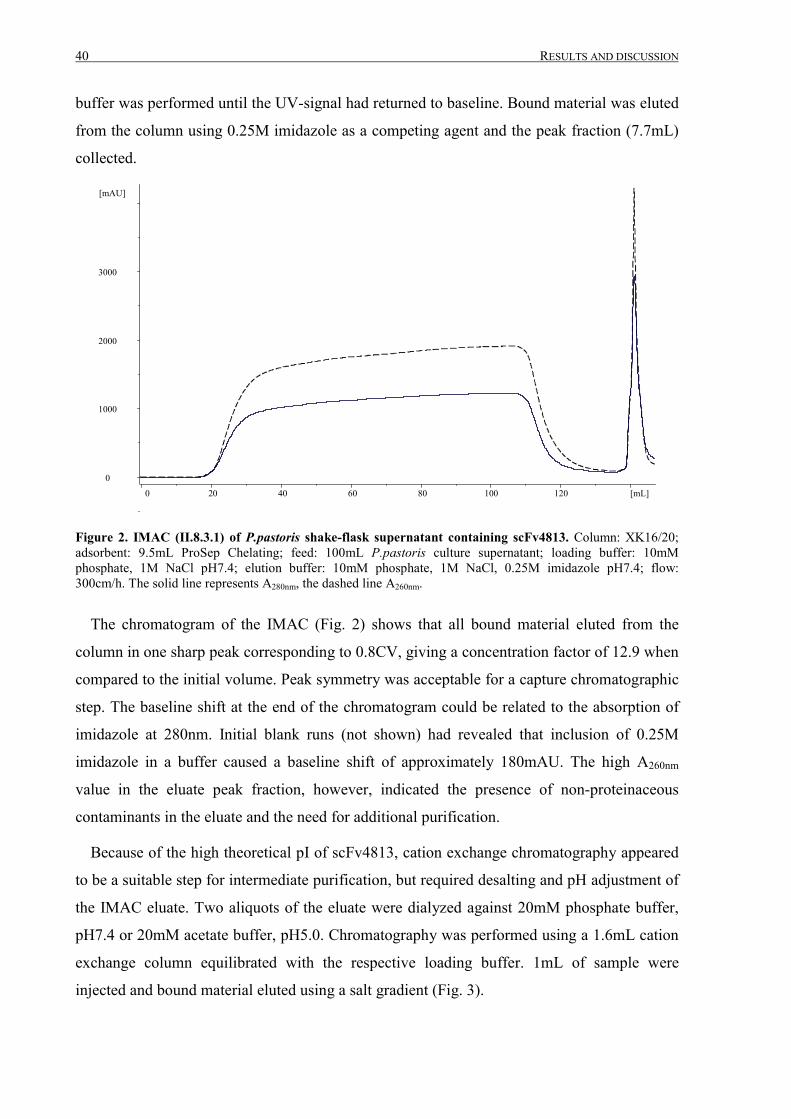
40 RESULTS AND DISCUSSION
buffer was performed until the UV-signal had returned to baseline. Bound material was eluted
from the column using 0.25M imidazole as a competing agent and the peak fraction (7.7mL)
collected.
0
1000
2000
3000
[mAU]
0 20 40 60 80 100 120 [mL]
Figure 2. IMAC (II.8.3.1) of P.pastoris shake-flask supernatant containing scFv4813. Column: XK16/20;adsorbent: 9.5mL ProSep Chelating; feed: 100mL P.pastoris culture supernatant; loading buffer: 10mMphosphate, 1M NaCl pH7.4; elution buffer: 10mM phosphate, 1M NaCl, 0.25M imidazole pH7.4; flow:300cm/h. The solid line represents A280nm, the dashed line A260nm.
The chromatogram of the IMAC (Fig. 2) shows that all bound material eluted from the
column in one sharp peak corresponding to 0.8CV, giving a concentration factor of 12.9 when
compared to the initial volume. Peak symmetry was acceptable for a capture chromatographic
step. The baseline shift at the end of the chromatogram could be related to the absorption of
imidazole at 280nm. Initial blank runs (not shown) had revealed that inclusion of 0.25M
imidazole in a buffer caused a baseline shift of approximately 180mAU. The high A260nm
value in the eluate peak fraction, however, indicated the presence of non-proteinaceous
contaminants in the eluate and the need for additional purification.
Because of the high theoretical pI of scFv4813, cation exchange chromatography appeared
to be a suitable step for intermediate purification, but required desalting and pH adjustment of
the IMAC eluate. Two aliquots of the eluate were dialyzed against 20mM phosphate buffer,
pH7.4 or 20mM acetate buffer, pH5.0. Chromatography was performed using a 1.6mL cation
exchange column equilibrated with the respective loading buffer. 1mL of sample were
injected and bound material eluted using a salt gradient (Fig. 3).
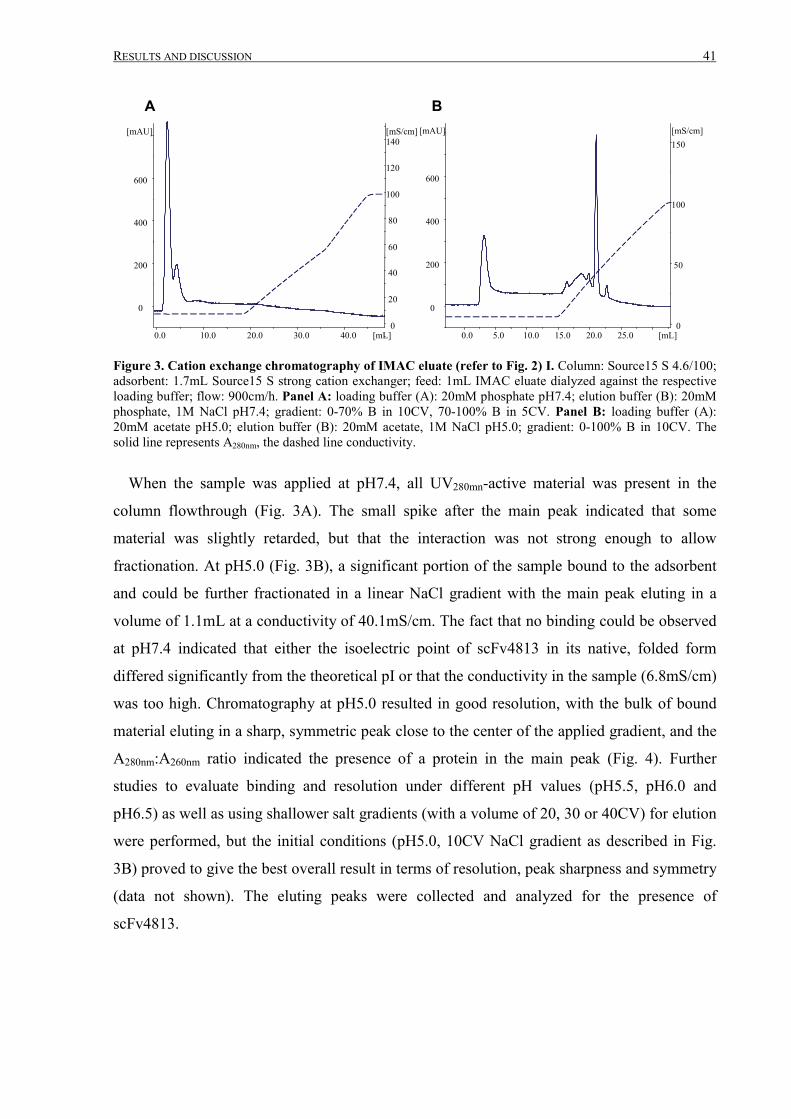
RESULTS AND DISCUSSION 41
0
200
400
600
[mAU]
0
20
40
60
80
100
120
140[mS/cm]
0.0 10.0 20.0 30.0 40.0 [mL]
0
200
400
600
[mAU]
0
50
100
150[mS/cm]
0.0 5.0 10.0 15.0 20.0 25.0 [mL]
A B
Figure 3. Cation exchange chromatography of IMAC eluate (refer to Fig. 2) I. Column: Source15 S 4.6/100;adsorbent: 1.7mL Source15 S strong cation exchanger; feed: 1mL IMAC eluate dialyzed against the respectiveloading buffer; flow: 900cm/h. Panel A: loading buffer (A): 20mM phosphate pH7.4; elution buffer (B): 20mMphosphate, 1M NaCl pH7.4; gradient: 0-70% B in 10CV, 70-100% B in 5CV. Panel B: loading buffer (A):20mM acetate pH5.0; elution buffer (B): 20mM acetate, 1M NaCl pH5.0; gradient: 0-100% B in 10CV. Thesolid line represents A280nm, the dashed line conductivity.
When the sample was applied at pH7.4, all UV280mn-active material was present in the
column flowthrough (Fig. 3A). The small spike after the main peak indicated that some
material was slightly retarded, but that the interaction was not strong enough to allow
fractionation. At pH5.0 (Fig. 3B), a significant portion of the sample bound to the adsorbent
and could be further fractionated in a linear NaCl gradient with the main peak eluting in a
volume of 1.1mL at a conductivity of 40.1mS/cm. The fact that no binding could be observed
at pH7.4 indicated that either the isoelectric point of scFv4813 in its native, folded form
differed significantly from the theoretical pI or that the conductivity in the sample (6.8mS/cm)
was too high. Chromatography at pH5.0 resulted in good resolution, with the bulk of bound
material eluting in a sharp, symmetric peak close to the center of the applied gradient, and the
A280nm:A260nm ratio indicated the presence of a protein in the main peak (Fig. 4). Further
studies to evaluate binding and resolution under different pH values (pH5.5, pH6.0 and
pH6.5) as well as using shallower salt gradients (with a volume of 20, 30 or 40CV) for elution
were performed, but the initial conditions (pH5.0, 10CV NaCl gradient as described in Fig.
3B) proved to give the best overall result in terms of resolution, peak sharpness and symmetry
(data not shown). The eluting peaks were collected and analyzed for the presence of
scFv4813.
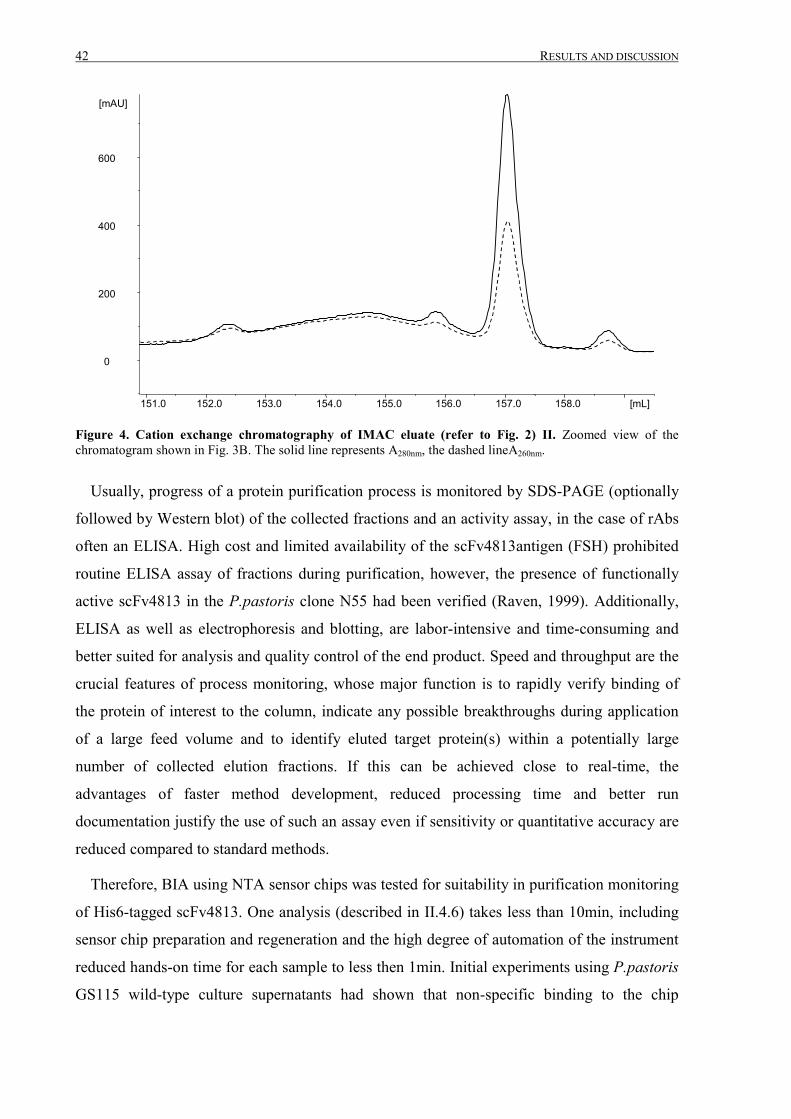
42 RESULTS AND DISCUSSION
0
200
400
600
[mAU]
151.0 152.0 153.0 154.0 155.0 156.0 157.0 158.0 [mL]
Figure 4. Cation exchange chromatography of IMAC eluate (refer to Fig. 2) II. Zoomed view of thechromatogram shown in Fig. 3B. The solid line represents A280nm, the dashed lineA260nm.
Usually, progress of a protein purification process is monitored by SDS-PAGE (optionally
followed by Western blot) of the collected fractions and an activity assay, in the case of rAbs
often an ELISA. High cost and limited availability of the scFv4813antigen (FSH) prohibited
routine ELISA assay of fractions during purification, however, the presence of functionally
active scFv4813 in the P.pastoris clone N55 had been verified (Raven, 1999). Additionally,
ELISA as well as electrophoresis and blotting, are labor-intensive and time-consuming and
better suited for analysis and quality control of the end product. Speed and throughput are the
crucial features of process monitoring, whose major function is to rapidly verify binding of
the protein of interest to the column, indicate any possible breakthroughs during application
of a large feed volume and to identify eluted target protein(s) within a potentially large
number of collected elution fractions. If this can be achieved close to real-time, the
advantages of faster method development, reduced processing time and better run
documentation justify the use of such an assay even if sensitivity or quantitative accuracy are
reduced compared to standard methods.
Therefore, BIA using NTA sensor chips was tested for suitability in purification monitoring
of His6-tagged scFv4813. One analysis (described in II.4.6) takes less than 10min, including
sensor chip preparation and regeneration and the high degree of automation of the instrument
reduced hands-on time for each sample to less then 1min. Initial experiments using P.pastoris
GS115 wild-type culture supernatants had shown that non-specific binding to the chip
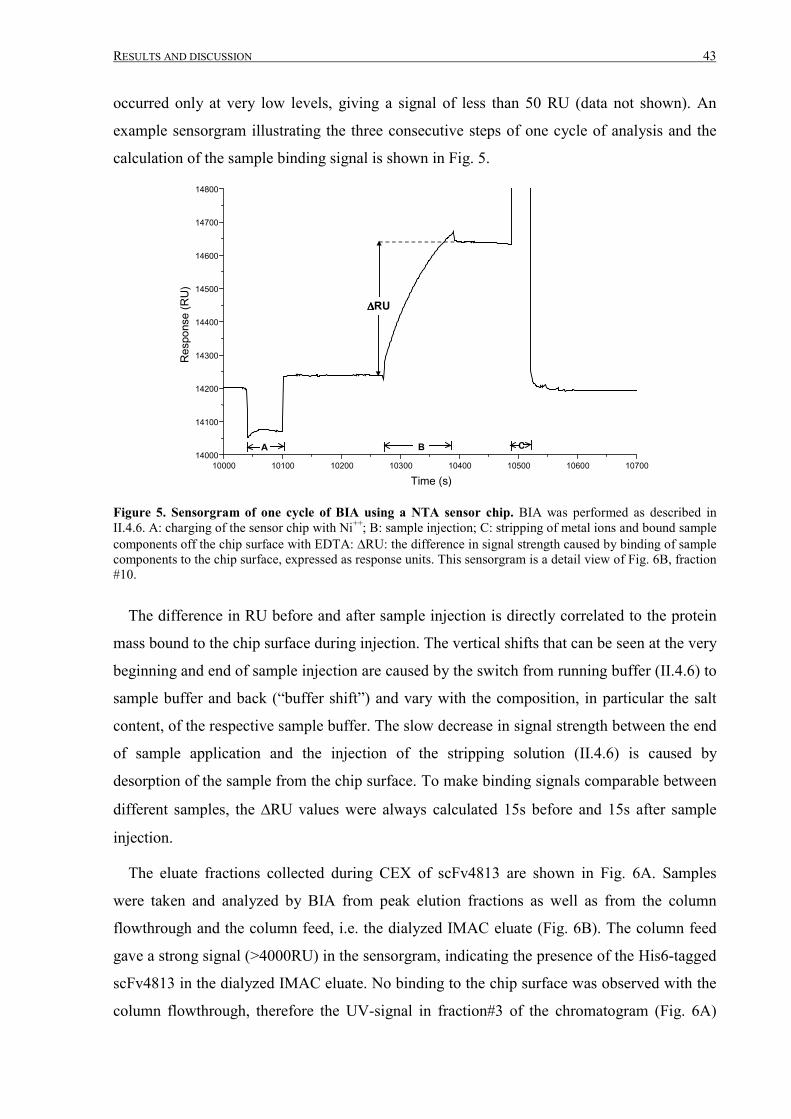
RESULTS AND DISCUSSION 43
occurred only at very low levels, giving a signal of less than 50 RU (data not shown). An
example sensorgram illustrating the three consecutive steps of one cycle of analysis and the
calculation of the sample binding signal is shown in Fig. 5.
10000 10100 10200 10300 10400 10500 10600 1070014000
14100
14200
14300
14400
14500
14600
14700
14800R
espo
nse
(RU
)
Time (s)
����RU
A B C
Figure 5. Sensorgram of one cycle of BIA using a NTA sensor chip. BIA was performed as described inII.4.6. A: charging of the sensor chip with Ni++; B: sample injection; C: stripping of metal ions and bound samplecomponents off the chip surface with EDTA: �RU: the difference in signal strength caused by binding of samplecomponents to the chip surface, expressed as response units. This sensorgram is a detail view of Fig. 6B, fraction#10.
The difference in RU before and after sample injection is directly correlated to the protein
mass bound to the chip surface during injection. The vertical shifts that can be seen at the very
beginning and end of sample injection are caused by the switch from running buffer (II.4.6) to
sample buffer and back (“buffer shift”) and vary with the composition, in particular the salt
content, of the respective sample buffer. The slow decrease in signal strength between the end
of sample application and the injection of the stripping solution (II.4.6) is caused by
desorption of the sample from the chip surface. To make binding signals comparable between
different samples, the �RU values were always calculated 15s before and 15s after sample
injection.
The eluate fractions collected during CEX of scFv4813 are shown in Fig. 6A. Samples
were taken and analyzed by BIA from peak elution fractions as well as from the column
flowthrough and the column feed, i.e. the dialyzed IMAC eluate (Fig. 6B). The column feed
gave a strong signal (>4000RU) in the sensorgram, indicating the presence of the His6-tagged
scFv4813 in the dialyzed IMAC eluate. No binding to the chip surface was observed with the
column flowthrough, therefore the UV-signal in fraction#3 of the chromatogram (Fig. 6A)
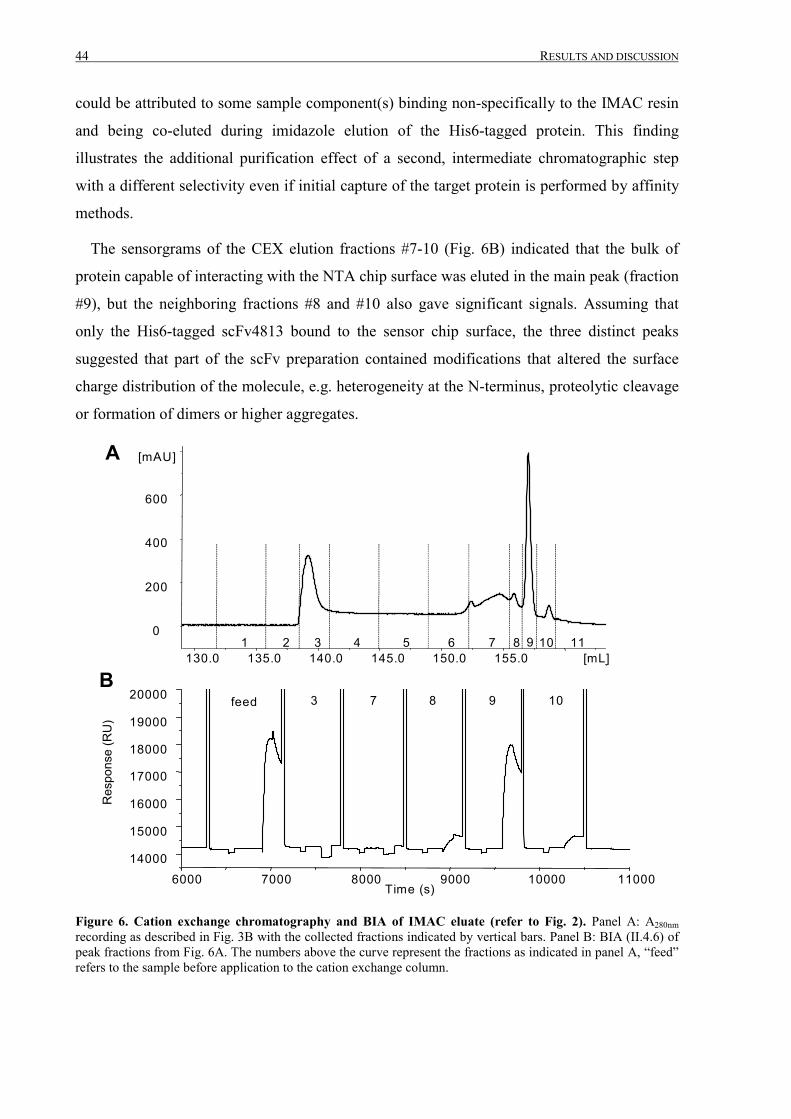
44 RESULTS AND DISCUSSION
could be attributed to some sample component(s) binding non-specifically to the IMAC resin
and being co-eluted during imidazole elution of the His6-tagged protein. This finding
illustrates the additional purification effect of a second, intermediate chromatographic step
with a different selectivity even if initial capture of the target protein is performed by affinity
methods.
The sensorgrams of the CEX elution fractions #7-10 (Fig. 6B) indicated that the bulk of
protein capable of interacting with the NTA chip surface was eluted in the main peak (fraction
#9), but the neighboring fractions #8 and #10 also gave significant signals. Assuming that
only the His6-tagged scFv4813 bound to the sensor chip surface, the three distinct peaks
suggested that part of the scFv preparation contained modifications that altered the surface
charge distribution of the molecule, e.g. heterogeneity at the N-terminus, proteolytic cleavage
or formation of dimers or higher aggregates.
110006000 7000 8000 9000 1000014000
15000
16000
17000
18000
19000
20000
Res
pons
e (R
U)
Time (s)
0
200
400
600
[mAU]
130.0 135.0 140.0 145.0 150.0 155.0 [mL]1 2 3 4 5 6 7 8 9 10 11
feed 3 7 8 9 10
A
B
Figure 6. Cation exchange chromatography and BIA of IMAC eluate (refer to Fig. 2). Panel A: A280nmrecording as described in Fig. 3B with the collected fractions indicated by vertical bars. Panel B: BIA (II.4.6) ofpeak fractions from Fig. 6A. The numbers above the curve represent the fractions as indicated in panel A, “feed”refers to the sample before application to the cation exchange column.
RESULTS AND DISCUSSION 45
The results described above demonstrated that scFv4813 could be efficiently captured and
recovered from clarified, conditioned P.pastoris culture supernatant by IMAC and that CEX
at pH5.0 was suitable as an intermediate purification step for removal of impurities in the
IMAC eluate resulting from non-specific binding to the IMAC resin. Peak shape and
distribution in the CEX chromatogram together with the BIA data indicated a relatively high
degree of purity of the target protein in the elution fractions, but also heterogeneity.
Additionally, BIA using NTA sensor chips proved to be suitable for monitoring purification.
III.1.2 Fermentation and expanded bed IMAC
Before IMAC-capture of scFv4813 from fermentation broth by EBA, trial experiments were
performed with the Streamline25 column and the Streamline Chelating resin to evaluate the
performance of column and adsorbent under different conditions, especially when challenged
with a highly particulate feedstream. These experiments used raw material from fermentations
not dedicated to recombinant protein production, but to media optimization or testing of
fermenter accessories. This part of the work was done in co-operation with Dipl. Biol.
Stephan Hellwig (RWTH Aachen, Institute for Biology I).
P.pastoris fermentation broth differed in three important parameters relevant for
downstream processing from shake-flask supernatants:
� cell density: while P.pastoris shake-flask cultivation resulted in a wet cell weight of
approximately 60g/L, fermentation brutish contained 300-400g wet weight
(corresponding to 7.5-10% dry weight) of yeast cells per liter (Hellwig, 2000),
depending on the inoculum size and length of the induction phase;
� media composition: P.pastoris fermentation medium (II.7) as recommended by Invitrogen
contains high amounts of inorganic salts that might interfere with the capture
chromatographic step;
� antifoam: an antifoaming agent (silicon polymer, Sigma) was used in P.pastoris
fermentations to avoid excessive frothing. Addition of antifoam was controlled by a
sensor in the fermenter and up to 30mL were used during a 5L P.pastoris fermentation
(Dipl. Ing. Mario Henke, RWTH Aachen, Institute for Biology I; personal
communication)
Attempts to clarify fermentation broth for capture chromatography in packed bed mode had
revealed that even after high-speed centrifugation (as described in II.8.1) application of the
46 RESULTS AND DISCUSSION
supernatant to a packed bed column led to a rapid increase in system back-pressure.
Tangential flow filtration was assessed as an additional clarification step to solve this problem
but proved to be ineffective since filtrate flow was unacceptably slow (<5mL/min using a
700cm2 membrane cassette with a pore size of 0.2µm). A possible explanation was the
presence of antifoam in the supernatant, since silicon polymers may form a layer on the
membrane surface that prevents unhindered passage of liquid through the pores (Pall Filtron,
personal communication). An additional technical complication was precipitation of salts
from the clarified supernatant after pH adjustment from 4.0 to 7.5 for IMAC, which
frequently occurred with a considerable delay, i.e. during sample application to the column.
Taken together, these sample characteristics prompted evaluation of EBA for the capture step.
The EBA column used in these experiments had an inner diameter of 2.5cm (cross-
sectional area 4.9cm) and a height of 100cm. The upper adapter could be manually adjusted.
Both the upper and lower adapters were equipped with flow distributors to ensure even flow
of liquid throughout the cross-sectional area and nets to prevent the resin particles from being
washed out of the column. The adsorbent height was 15cm, corresponding to 73.6mL of resin.
Blank runs using loading buffer (II.8.3.1) were performed at RT at different flow rates to
examine the hydrodynamic properties of the expanded bed.
Table 1. Expansion of Streamline Chelating resin at different flow velocities
flow rate (mL) linear flow (cm/h) bed height (cm) expansion (h/h0) 0 0 15.0 1.0 8.2 100 22.2 1.5 12.3 150 26.8 1.8 16.4 200 30.8 2.1 20.5 250 34.9 2.3 24.5 300 39.0 2.6
The degree of expansion at different flow rates was reproducible (<1% variation in bed
height) over the flow rate range tested. When the flow was started, stabilization of the
adsorbent at the final expanded bed height was achieved after approximately 15-20min of
equilibration and moderate changes in flow velocity (+/- 50cm/h) resulted in re-stabilization
of the bed after less than 2min. Visual inspection of the expanded bed revealed only small
circular movements of the individual particles and a sharp interface between bed surface and
headspace. No back-mixing of particles, channeling caused by uneven flow throughout the
cross-sectional area of the column inlet or pulsation caused by the peristaltic pump was
observed.
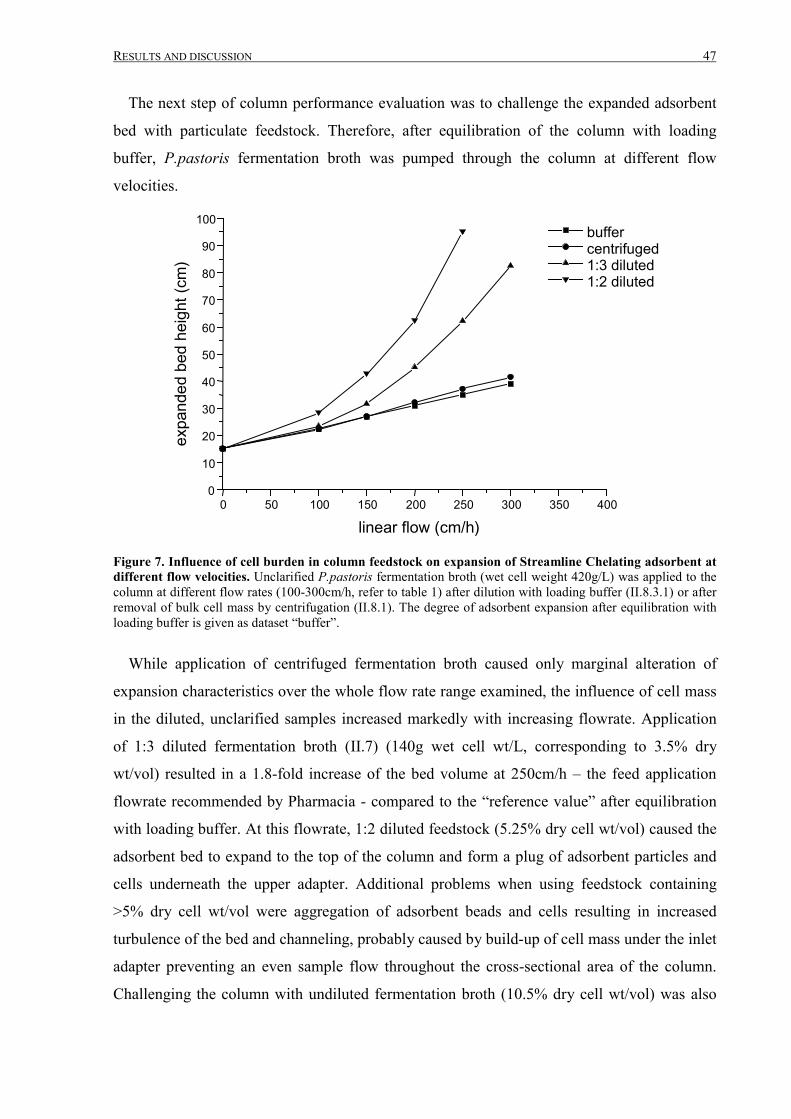
RESULTS AND DISCUSSION 47
The next step of column performance evaluation was to challenge the expanded adsorbent
bed with particulate feedstock. Therefore, after equilibration of the column with loading
buffer, P.pastoris fermentation broth was pumped through the column at different flow
velocities.
0 50 100 150 200 250 300 350 4000
10
20
30
40
50
60
70
80
90
100 buffer centrifuged 1:3 diluted 1:2 diluted
expa
nded
bed
hei
ght (
cm)
linear flow (cm/h)
Figure 7. Influence of cell burden in column feedstock on expansion of Streamline Chelating adsorbent atdifferent flow velocities. Unclarified P.pastoris fermentation broth (wet cell weight 420g/L) was applied to thecolumn at different flow rates (100-300cm/h, refer to table 1) after dilution with loading buffer (II.8.3.1) or afterremoval of bulk cell mass by centrifugation (II.8.1). The degree of adsorbent expansion after equilibration withloading buffer is given as dataset “buffer”.
While application of centrifuged fermentation broth caused only marginal alteration of
expansion characteristics over the whole flow rate range examined, the influence of cell mass
in the diluted, unclarified samples increased markedly with increasing flowrate. Application
of 1:3 diluted fermentation broth (II.7) (140g wet cell wt/L, corresponding to 3.5% dry
wt/vol) resulted in a 1.8-fold increase of the bed volume at 250cm/h – the feed application
flowrate recommended by Pharmacia - compared to the “reference value” after equilibration
with loading buffer. At this flowrate, 1:2 diluted feedstock (5.25% dry cell wt/vol) caused the
adsorbent bed to expand to the top of the column and form a plug of adsorbent particles and
cells underneath the upper adapter. Additional problems when using feedstock containing
>5% dry cell wt/vol were aggregation of adsorbent beads and cells resulting in increased
turbulence of the bed and channeling, probably caused by build-up of cell mass under the inlet
adapter preventing an even sample flow throughout the cross-sectional area of the column.
Challenging the column with undiluted fermentation broth (10.5% dry cell wt/vol) was also
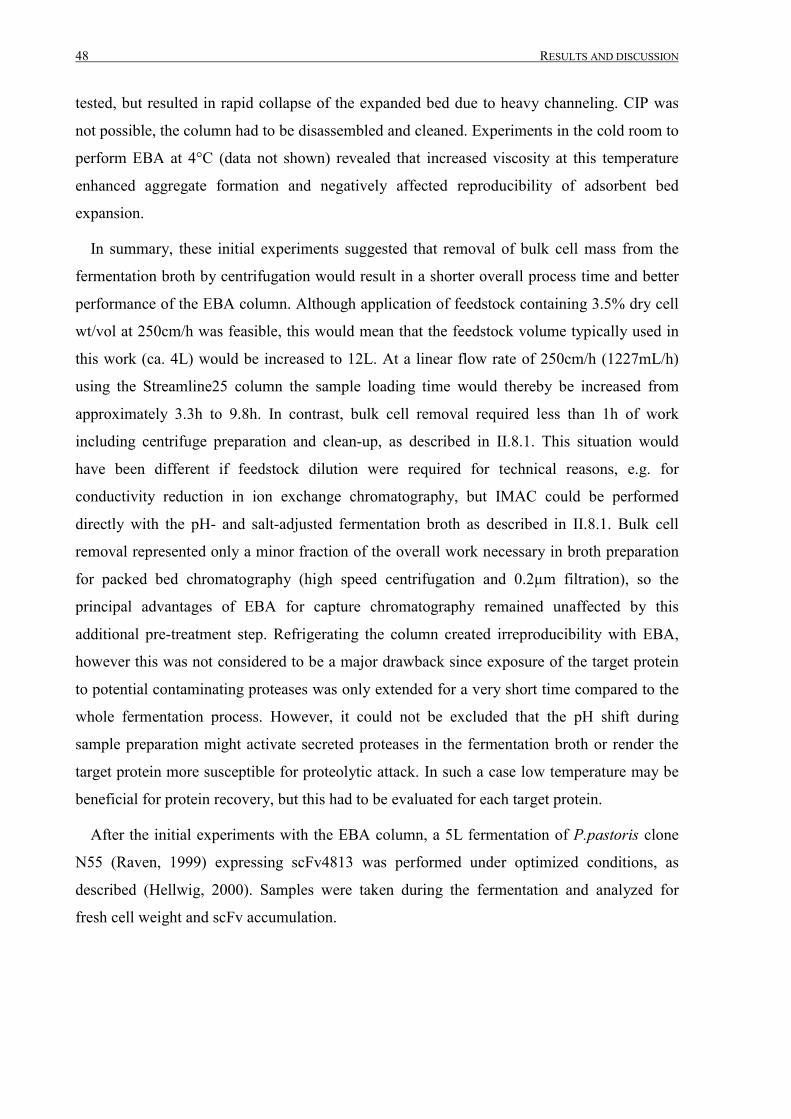
48 RESULTS AND DISCUSSION
tested, but resulted in rapid collapse of the expanded bed due to heavy channeling. CIP was
not possible, the column had to be disassembled and cleaned. Experiments in the cold room to
perform EBA at 4°C (data not shown) revealed that increased viscosity at this temperature
enhanced aggregate formation and negatively affected reproducibility of adsorbent bed
expansion.
In summary, these initial experiments suggested that removal of bulk cell mass from the
fermentation broth by centrifugation would result in a shorter overall process time and better
performance of the EBA column. Although application of feedstock containing 3.5% dry cell
wt/vol at 250cm/h was feasible, this would mean that the feedstock volume typically used in
this work (ca. 4L) would be increased to 12L. At a linear flow rate of 250cm/h (1227mL/h)
using the Streamline25 column the sample loading time would thereby be increased from
approximately 3.3h to 9.8h. In contrast, bulk cell removal required less than 1h of work
including centrifuge preparation and clean-up, as described in II.8.1. This situation would
have been different if feedstock dilution were required for technical reasons, e.g. for
conductivity reduction in ion exchange chromatography, but IMAC could be performed
directly with the pH- and salt-adjusted fermentation broth as described in II.8.1. Bulk cell
removal represented only a minor fraction of the overall work necessary in broth preparation
for packed bed chromatography (high speed centrifugation and 0.2µm filtration), so the
principal advantages of EBA for capture chromatography remained unaffected by this
additional pre-treatment step. Refrigerating the column created irreproducibility with EBA,
however this was not considered to be a major drawback since exposure of the target protein
to potential contaminating proteases was only extended for a very short time compared to the
whole fermentation process. However, it could not be excluded that the pH shift during
sample preparation might activate secreted proteases in the fermentation broth or render the
target protein more susceptible for proteolytic attack. In such a case low temperature may be
beneficial for protein recovery, but this had to be evaluated for each target protein.
After the initial experiments with the EBA column, a 5L fermentation of P.pastoris clone
N55 (Raven, 1999) expressing scFv4813 was performed under optimized conditions, as
described (Hellwig, 2000). Samples were taken during the fermentation and analyzed for
fresh cell weight and scFv accumulation.
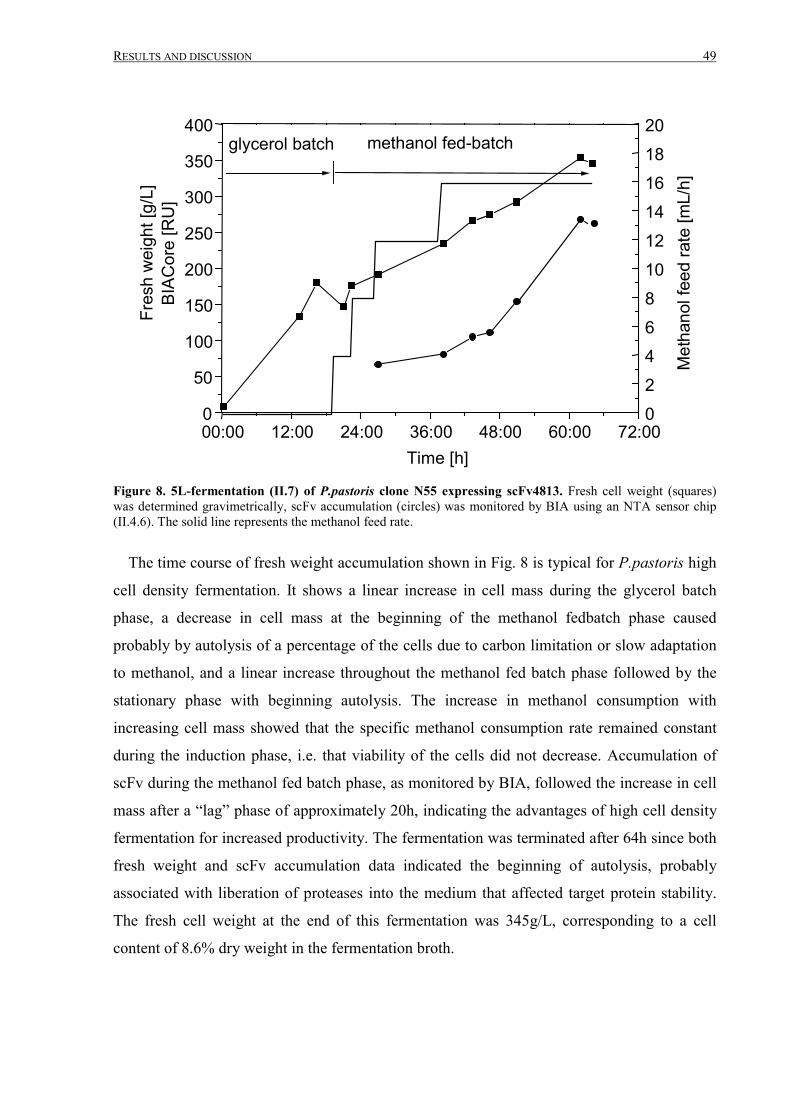
RESULTS AND DISCUSSION 49
00:00 12:00 24:00 36:00 48:00 60:00 72:000
50
100
150
200
250
300
350
400 methanol fed-batchglycerol batch
Fres
h w
eigh
t [g/
L]BI
ACor
e [R
U]
Time [h]
02468101214161820
Met
hano
l fee
d ra
te [m
L/h]
Figure 8. 5L-fermentation (II.7) of P.pastoris clone N55 expressing scFv4813. Fresh cell weight (squares)was determined gravimetrically, scFv accumulation (circles) was monitored by BIA using an NTA sensor chip(II.4.6). The solid line represents the methanol feed rate.
The time course of fresh weight accumulation shown in Fig. 8 is typical for P.pastoris high
cell density fermentation. It shows a linear increase in cell mass during the glycerol batch
phase, a decrease in cell mass at the beginning of the methanol fedbatch phase caused
probably by autolysis of a percentage of the cells due to carbon limitation or slow adaptation
to methanol, and a linear increase throughout the methanol fed batch phase followed by the
stationary phase with beginning autolysis. The increase in methanol consumption with
increasing cell mass showed that the specific methanol consumption rate remained constant
during the induction phase, i.e. that viability of the cells did not decrease. Accumulation of
scFv during the methanol fed batch phase, as monitored by BIA, followed the increase in cell
mass after a “lag” phase of approximately 20h, indicating the advantages of high cell density
fermentation for increased productivity. The fermentation was terminated after 64h since both
fresh weight and scFv accumulation data indicated the beginning of autolysis, probably
associated with liberation of proteases into the medium that affected target protein stability.
The fresh cell weight at the end of this fermentation was 345g/L, corresponding to a cell
content of 8.6% dry weight in the fermentation broth.
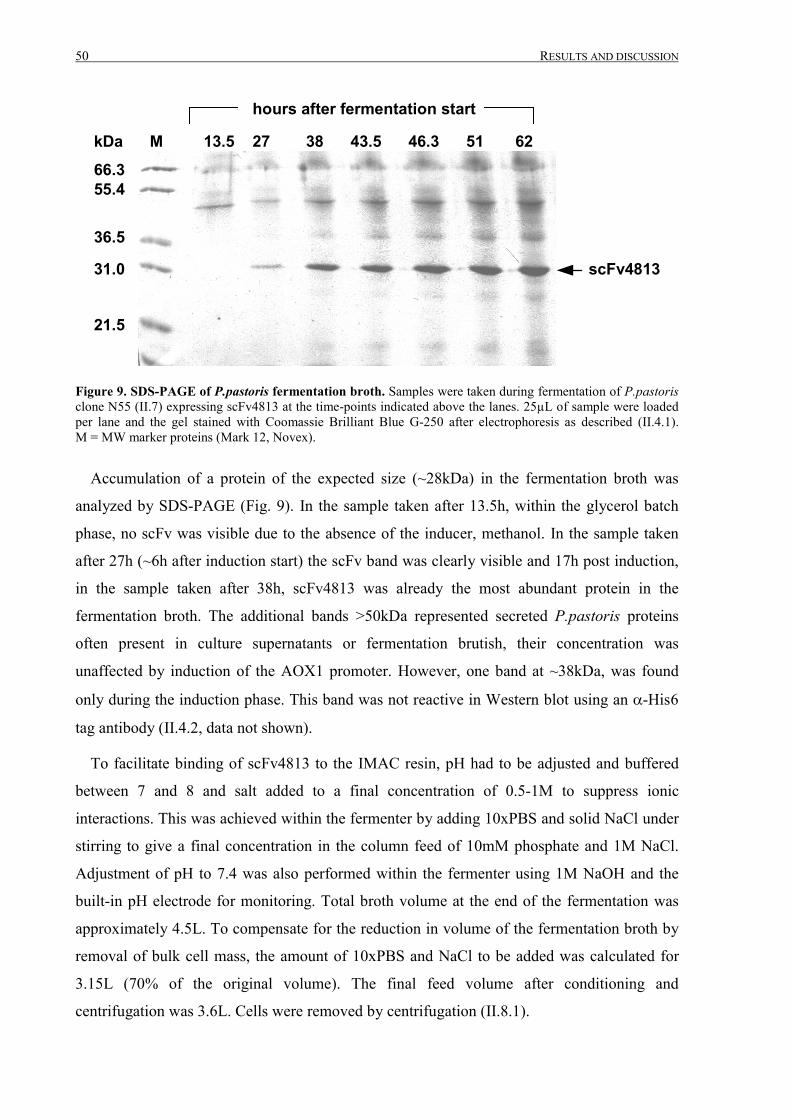
50 RESULTS AND DISCUSSION
M 13.5 27 38 43.5 46.3 51 62
66.3 55.4
36.5
31.0
21.5
kDa
scFv4813
hours after fermentation start
Figure 9. SDS-PAGE of P.pastoris fermentation broth. Samples were taken during fermentation of P.pastorisclone N55 (II.7) expressing scFv4813 at the time-points indicated above the lanes. 25µL of sample were loadedper lane and the gel stained with Coomassie Brilliant Blue G-250 after electrophoresis as described (II.4.1).M = MW marker proteins (Mark 12, Novex).
Accumulation of a protein of the expected size (~28kDa) in the fermentation broth was
analyzed by SDS-PAGE (Fig. 9). In the sample taken after 13.5h, within the glycerol batch
phase, no scFv was visible due to the absence of the inducer, methanol. In the sample taken
after 27h (~6h after induction start) the scFv band was clearly visible and 17h post induction,
in the sample taken after 38h, scFv4813 was already the most abundant protein in the
fermentation broth. The additional bands >50kDa represented secreted P.pastoris proteins
often present in culture supernatants or fermentation brutish, their concentration was
unaffected by induction of the AOX1 promoter. However, one band at ~38kDa, was found
only during the induction phase. This band was not reactive in Western blot using an �-His6
tag antibody (II.4.2, data not shown).
To facilitate binding of scFv4813 to the IMAC resin, pH had to be adjusted and buffered
between 7 and 8 and salt added to a final concentration of 0.5-1M to suppress ionic
interactions. This was achieved within the fermenter by adding 10xPBS and solid NaCl under
stirring to give a final concentration in the column feed of 10mM phosphate and 1M NaCl.
Adjustment of pH to 7.4 was also performed within the fermenter using 1M NaOH and the
built-in pH electrode for monitoring. Total broth volume at the end of the fermentation was
approximately 4.5L. To compensate for the reduction in volume of the fermentation broth by
removal of bulk cell mass, the amount of 10xPBS and NaCl to be added was calculated for
3.15L (70% of the original volume). The final feed volume after conditioning and
centrifugation was 3.6L. Cells were removed by centrifugation (II.8.1).
RESULTS AND DISCUSSION 51
The EBA column was equilibrated as described above and the 3.6L of fermentation
supernatant loaded at a linear flow rate of 250cm/h. Samples of the flowthrough were taken in
regular intervals and analyzed by BIA. No specific binding to the NTA sensor chip could be
detected in the flowthrough indicating that the His6-tagged scFv4813 was efficiently retained
by the EBA adsorbent (data not shown). After feed application and washing with 10CV of
loading buffer the flow was arrested, the adsorbent bed allowed to settle and the upper adapter
lowered to the surface of the settled bed. The column was disconnected from the peristaltic
pump and connected to an Äkta Purifier chromatography system to allow step-gradient
elution and UV-monitoring. An in-line dialysis hollow fiber module with an exclusion limit of
5kDa was connected between the column outlet and UV- monitor to allow buffer exchange of
the eluate against loading buffer for subsequent cation exchange chromatography (50mM
acetate, pH5.0).
0
200
400
600
[mAU]
0
20
40
60
80
[%B]
-100 0 100 200 300 400 500 [mL]
Figure 10. Packed bed elution of scFv4813 after EBA capture chromatography (II.8.3.1). Column:Streamline25; adsorbent: 73.8mL of Streamline Chelating; wash buffer: 10mM phosphate, 1M NaCl pH7.4;elution buffer (“B”): 10mM phosphate, 1M NaCl, 0.25M imidazole pH 7.4; exchange buffer (in dialysismodule): 50mM acetate pH5.0; gradient step I: 0-5%B; gradient step II: 10-100%B; flow: 5mL/min. The solidline represents A280nm. The dashed line A260nm and the dotted line the concentration of buffer “B”.
Bound material eluted in a single peak when buffer containing 250mM imidazole was
applied to the column (Fig. 10). The gradient step from 0-5%B shown in Fig. 10 was
performed to remove weakly bound contaminants from the column using a low concentration
of competitor (12.5mM), but the shape and width of the UV-peak appearing at this imidazole
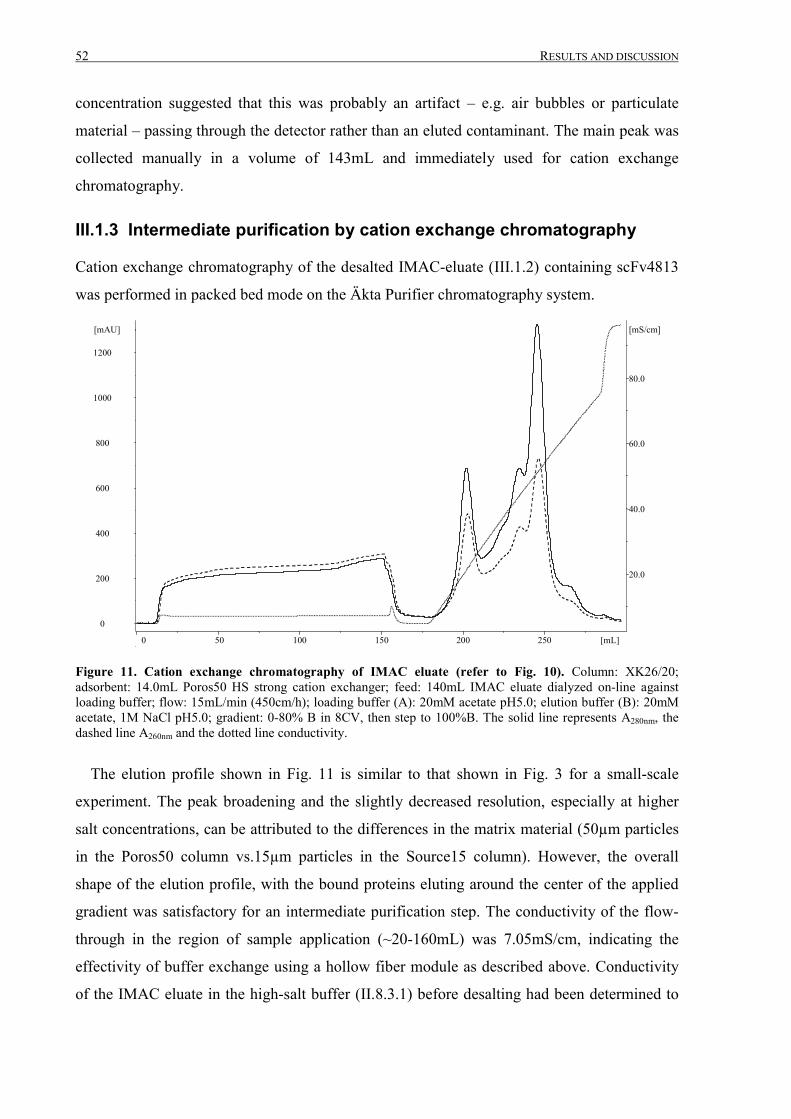
52 RESULTS AND DISCUSSION
concentration suggested that this was probably an artifact – e.g. air bubbles or particulate
material – passing through the detector rather than an eluted contaminant. The main peak was
collected manually in a volume of 143mL and immediately used for cation exchange
chromatography.
III.1.3 Intermediate purification by cation exchange chromatography
Cation exchange chromatography of the desalted IMAC-eluate (III.1.2) containing scFv4813
was performed in packed bed mode on the Äkta Purifier chromatography system.
0
200
400
600
800
1000
1200
[mAU]
20.0
40.0
60.0
80.0
[mS/cm]
0 50 100 150 200 250 [mL]
Figure 11. Cation exchange chromatography of IMAC eluate (refer to Fig. 10). Column: XK26/20;adsorbent: 14.0mL Poros50 HS strong cation exchanger; feed: 140mL IMAC eluate dialyzed on-line againstloading buffer; flow: 15mL/min (450cm/h); loading buffer (A): 20mM acetate pH5.0; elution buffer (B): 20mMacetate, 1M NaCl pH5.0; gradient: 0-80% B in 8CV, then step to 100%B. The solid line represents A280nm, thedashed line A260nm and the dotted line conductivity.
The elution profile shown in Fig. 11 is similar to that shown in Fig. 3 for a small-scale
experiment. The peak broadening and the slightly decreased resolution, especially at higher
salt concentrations, can be attributed to the differences in the matrix material (50µm particles
in the Poros50 column vs.15µm particles in the Source15 column). However, the overall
shape of the elution profile, with the bound proteins eluting around the center of the applied
gradient was satisfactory for an intermediate purification step. The conductivity of the flow-
through in the region of sample application (~20-160mL) was 7.05mS/cm, indicating the
effectivity of buffer exchange using a hollow fiber module as described above. Conductivity
of the IMAC eluate in the high-salt buffer (II.8.3.1) before desalting had been determined to
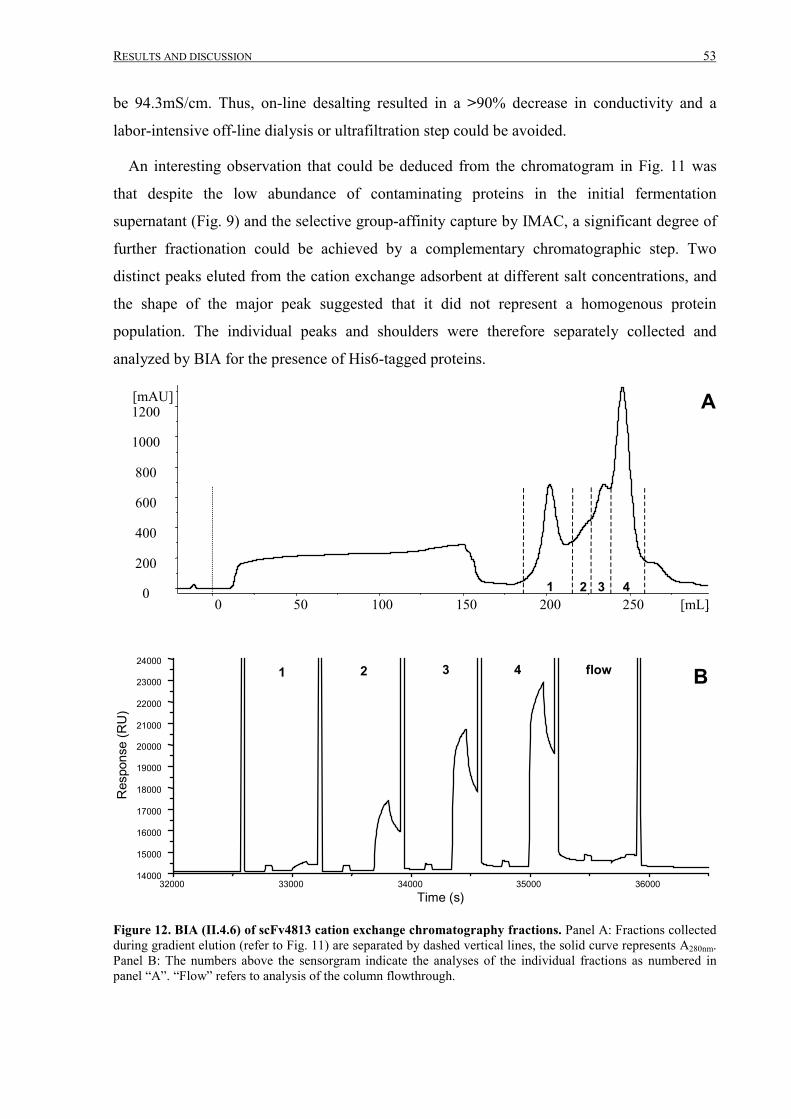
RESULTS AND DISCUSSION 53
be 94.3mS/cm. Thus, on-line desalting resulted in a >90% decrease in conductivity and a
labor-intensive off-line dialysis or ultrafiltration step could be avoided.
An interesting observation that could be deduced from the chromatogram in Fig. 11 was
that despite the low abundance of contaminating proteins in the initial fermentation
supernatant (Fig. 9) and the selective group-affinity capture by IMAC, a significant degree of
further fractionation could be achieved by a complementary chromatographic step. Two
distinct peaks eluted from the cation exchange adsorbent at different salt concentrations, and
the shape of the major peak suggested that it did not represent a homogenous protein
population. The individual peaks and shoulders were therefore separately collected and
analyzed by BIA for the presence of His6-tagged proteins.
0
200
400
600
800
1000
1200[mAU]
0 50 100 150 200 250 [mL]1 2 3 4
32000 33000 34000 35000 3600014000
15000
16000
17000
18000
19000
20000
21000
22000
23000
24000
Res
pons
e (R
U)
Time (s)
1 2 3 4 flow
A
B
Figure 12. BIA (II.4.6) of scFv4813 cation exchange chromatography fractions. Panel A: Fractions collectedduring gradient elution (refer to Fig. 11) are separated by dashed vertical lines, the solid curve represents A280nm.Panel B: The numbers above the sensorgram indicate the analyses of the individual fractions as numbered inpanel “A”. “Flow” refers to analysis of the column flowthrough.
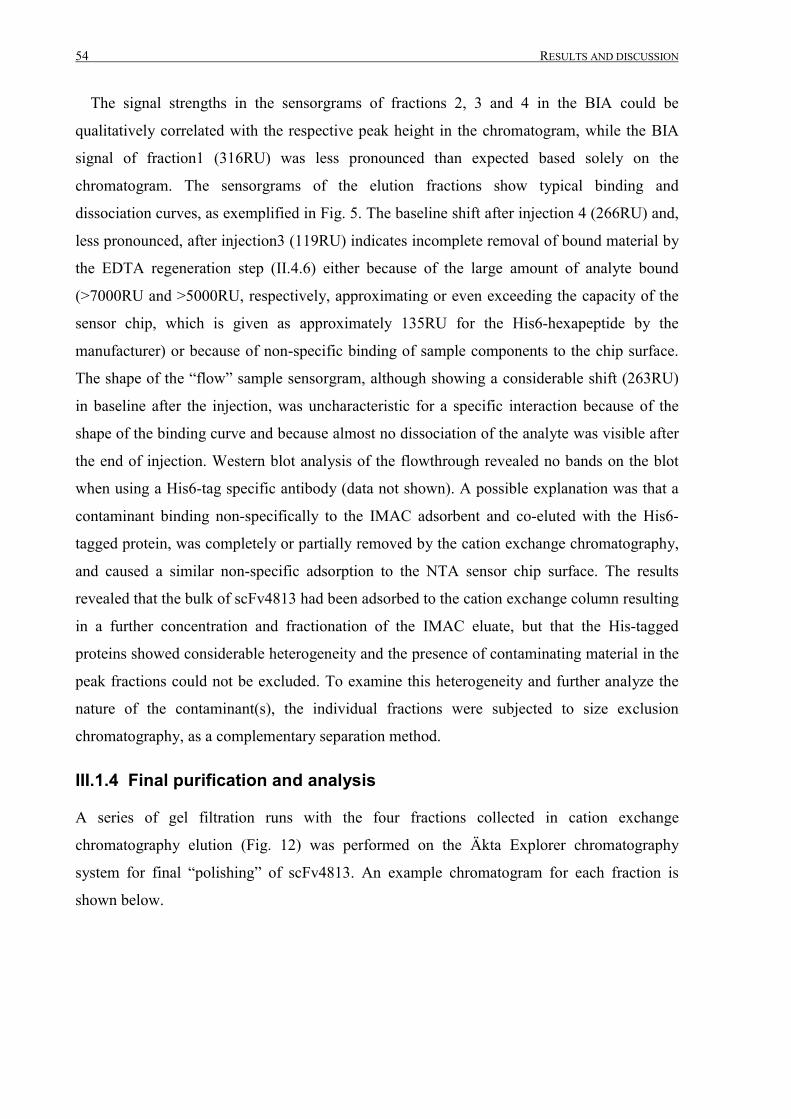
54 RESULTS AND DISCUSSION
The signal strengths in the sensorgrams of fractions 2, 3 and 4 in the BIA could be
qualitatively correlated with the respective peak height in the chromatogram, while the BIA
signal of fraction1 (316RU) was less pronounced than expected based solely on the
chromatogram. The sensorgrams of the elution fractions show typical binding and
dissociation curves, as exemplified in Fig. 5. The baseline shift after injection 4 (266RU) and,
less pronounced, after injection3 (119RU) indicates incomplete removal of bound material by
the EDTA regeneration step (II.4.6) either because of the large amount of analyte bound
(>7000RU and >5000RU, respectively, approximating or even exceeding the capacity of the
sensor chip, which is given as approximately 135RU for the His6-hexapeptide by the
manufacturer) or because of non-specific binding of sample components to the chip surface.
The shape of the “flow” sample sensorgram, although showing a considerable shift (263RU)
in baseline after the injection, was uncharacteristic for a specific interaction because of the
shape of the binding curve and because almost no dissociation of the analyte was visible after
the end of injection. Western blot analysis of the flowthrough revealed no bands on the blot
when using a His6-tag specific antibody (data not shown). A possible explanation was that a
contaminant binding non-specifically to the IMAC adsorbent and co-eluted with the His6-
tagged protein, was completely or partially removed by the cation exchange chromatography,
and caused a similar non-specific adsorption to the NTA sensor chip surface. The results
revealed that the bulk of scFv4813 had been adsorbed to the cation exchange column resulting
in a further concentration and fractionation of the IMAC eluate, but that the His-tagged
proteins showed considerable heterogeneity and the presence of contaminating material in the
peak fractions could not be excluded. To examine this heterogeneity and further analyze the
nature of the contaminant(s), the individual fractions were subjected to size exclusion
chromatography, as a complementary separation method.
III.1.4 Final purification and analysis
A series of gel filtration runs with the four fractions collected in cation exchange
chromatography elution (Fig. 12) was performed on the Äkta Explorer chromatography
system for final “polishing” of scFv4813. An example chromatogram for each fraction is
shown below.
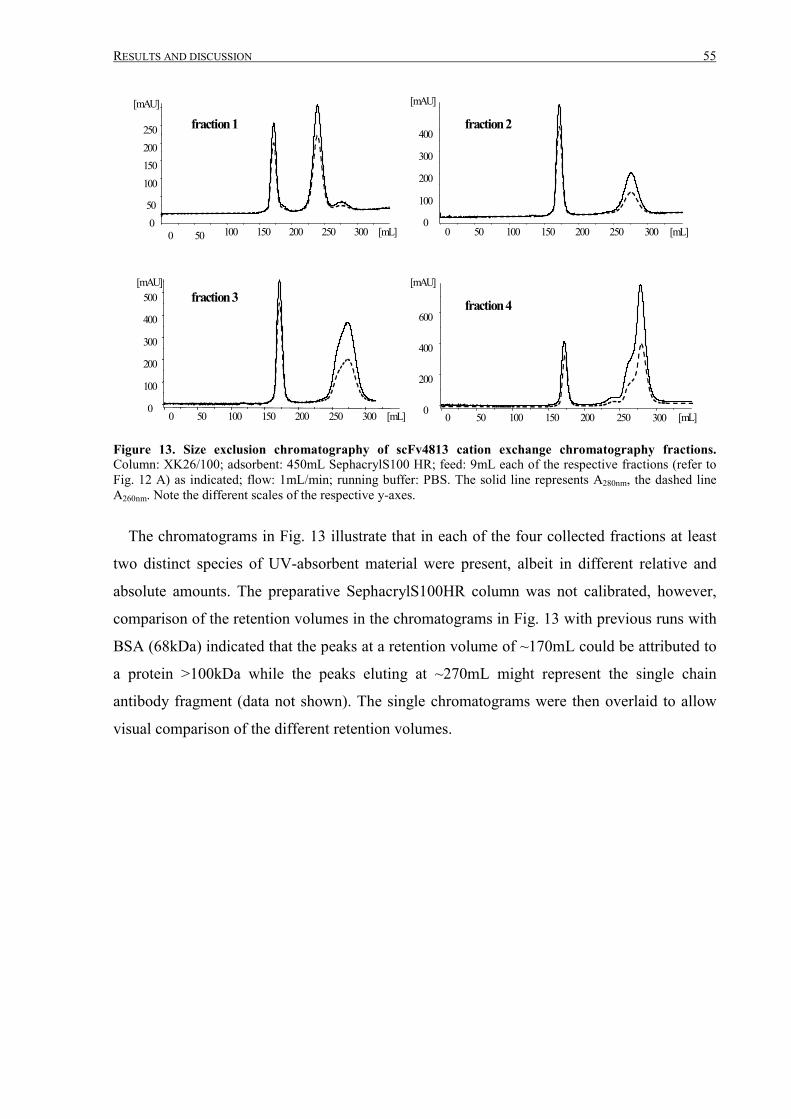
RESULTS AND DISCUSSION 55
0 50
100150200250
[mAU]
0 50 100 150 200 250 300 [mL]
fraction 1
0
100
200
300
400
[mAU]
0 50 100 150 200 250 300 [mL]
0
100
200
300
400
500[mAU]
0 50 100 150 200 250 300 [mL] 0
200
400
600
[mAU]
0 50 100 150 200 250 300 [mL]
fraction 2
fraction 4fraction 3
Figure 13. Size exclusion chromatography of scFv4813 cation exchange chromatography fractions.Column: XK26/100; adsorbent: 450mL SephacrylS100 HR; feed: 9mL each of the respective fractions (refer toFig. 12 A) as indicated; flow: 1mL/min; running buffer: PBS. The solid line represents A280nm, the dashed lineA260nm. Note the different scales of the respective y-axes.
The chromatograms in Fig. 13 illustrate that in each of the four collected fractions at least
two distinct species of UV-absorbent material were present, albeit in different relative and
absolute amounts. The preparative SephacrylS100HR column was not calibrated, however,
comparison of the retention volumes in the chromatograms in Fig. 13 with previous runs with
BSA (68kDa) indicated that the peaks at a retention volume of ~170mL could be attributed to
a protein >100kDa while the peaks eluting at ~270mL might represent the single chain
antibody fragment (data not shown). The single chromatograms were then overlaid to allow
visual comparison of the different retention volumes.
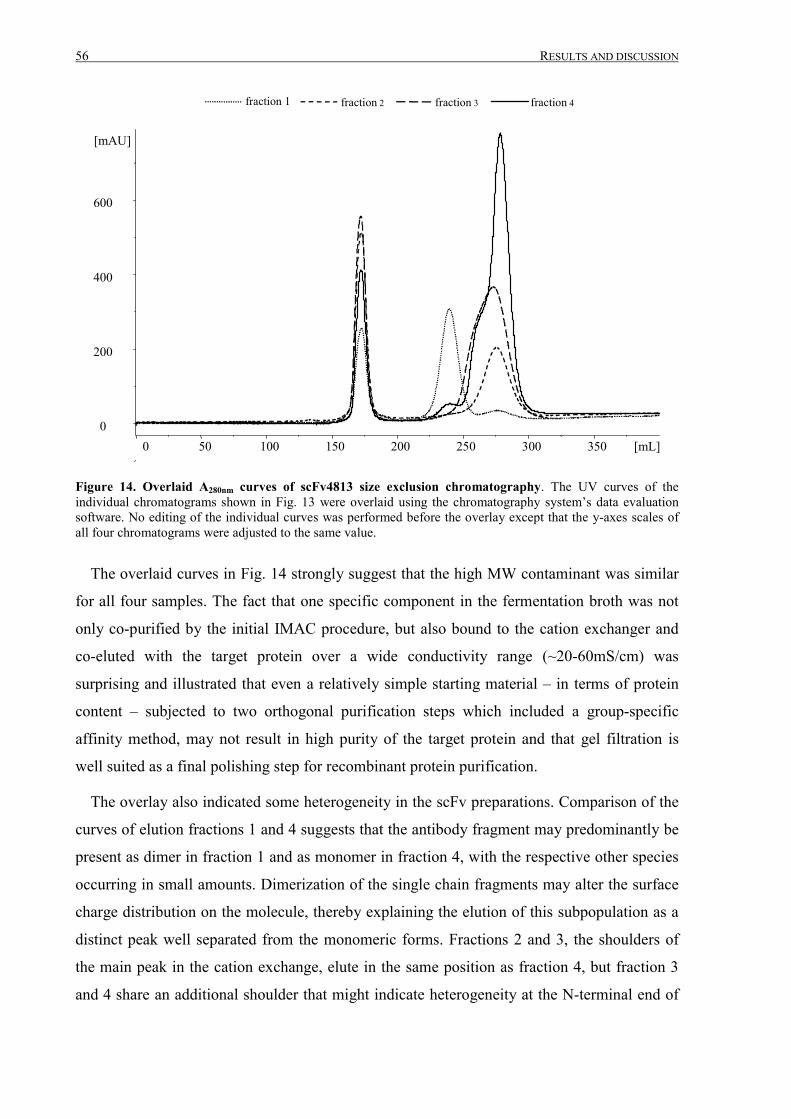
56 RESULTS AND DISCUSSION
fraction 1 fraction 2 fraction 3 fraction 4
0
200
400
600
[mAU]
0 50 100 150 200 250 300 350 [mL]
Figure 14. Overlaid A280nm curves of scFv4813 size exclusion chromatography. The UV curves of theindividual chromatograms shown in Fig. 13 were overlaid using the chromatography system’s data evaluationsoftware. No editing of the individual curves was performed before the overlay except that the y-axes scales ofall four chromatograms were adjusted to the same value.
The overlaid curves in Fig. 14 strongly suggest that the high MW contaminant was similar
for all four samples. The fact that one specific component in the fermentation broth was not
only co-purified by the initial IMAC procedure, but also bound to the cation exchanger and
co-eluted with the target protein over a wide conductivity range (~20-60mS/cm) was
surprising and illustrated that even a relatively simple starting material – in terms of protein
content – subjected to two orthogonal purification steps which included a group-specific
affinity method, may not result in high purity of the target protein and that gel filtration is
well suited as a final polishing step for recombinant protein purification.
The overlay also indicated some heterogeneity in the scFv preparations. Comparison of the
curves of elution fractions 1 and 4 suggests that the antibody fragment may predominantly be
present as dimer in fraction 1 and as monomer in fraction 4, with the respective other species
occurring in small amounts. Dimerization of the single chain fragments may alter the surface
charge distribution on the molecule, thereby explaining the elution of this subpopulation as a
distinct peak well separated from the monomeric forms. Fractions 2 and 3, the shoulders of
the main peak in the cation exchange, elute in the same position as fraction 4, but fraction 3
and 4 share an additional shoulder that might indicate heterogeneity at the N-terminal end of
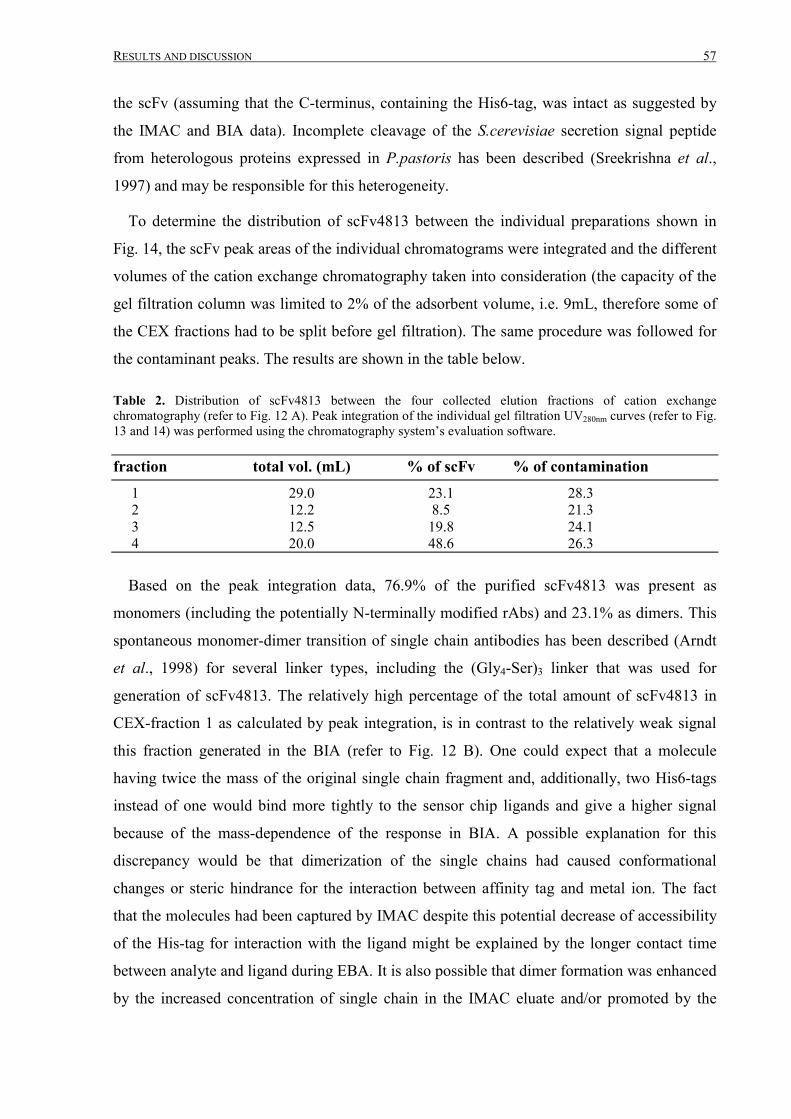
RESULTS AND DISCUSSION 57
the scFv (assuming that the C-terminus, containing the His6-tag, was intact as suggested by
the IMAC and BIA data). Incomplete cleavage of the S.cerevisiae secretion signal peptide
from heterologous proteins expressed in P.pastoris has been described (Sreekrishna et al.,
1997) and may be responsible for this heterogeneity.
To determine the distribution of scFv4813 between the individual preparations shown in
Fig. 14, the scFv peak areas of the individual chromatograms were integrated and the different
volumes of the cation exchange chromatography taken into consideration (the capacity of the
gel filtration column was limited to 2% of the adsorbent volume, i.e. 9mL, therefore some of
the CEX fractions had to be split before gel filtration). The same procedure was followed for
the contaminant peaks. The results are shown in the table below.
Table 2. Distribution of scFv4813 between the four collected elution fractions of cation exchangechromatography (refer to Fig. 12 A). Peak integration of the individual gel filtration UV280nm curves (refer to Fig.13 and 14) was performed using the chromatography system’s evaluation software.
fraction total vol. (mL) % of scFv % of contamination 1 29.0 23.1 28.3 2 12.2 8.5 21.3 3 12.5 19.8 24.1 4 20.0 48.6 26.3
Based on the peak integration data, 76.9% of the purified scFv4813 was present as
monomers (including the potentially N-terminally modified rAbs) and 23.1% as dimers. This
spontaneous monomer-dimer transition of single chain antibodies has been described (Arndt
et al., 1998) for several linker types, including the (Gly4-Ser)3 linker that was used for
generation of scFv4813. The relatively high percentage of the total amount of scFv4813 in
CEX-fraction 1 as calculated by peak integration, is in contrast to the relatively weak signal
this fraction generated in the BIA (refer to Fig. 12 B). One could expect that a molecule
having twice the mass of the original single chain fragment and, additionally, two His6-tags
instead of one would bind more tightly to the sensor chip ligands and give a higher signal
because of the mass-dependence of the response in BIA. A possible explanation for this
discrepancy would be that dimerization of the single chains had caused conformational
changes or steric hindrance for the interaction between affinity tag and metal ion. The fact
that the molecules had been captured by IMAC despite this potential decrease of accessibility
of the His-tag for interaction with the ligand might be explained by the longer contact time
between analyte and ligand during EBA. It is also possible that dimer formation was enhanced
by the increased concentration of single chain in the IMAC eluate and/or promoted by the
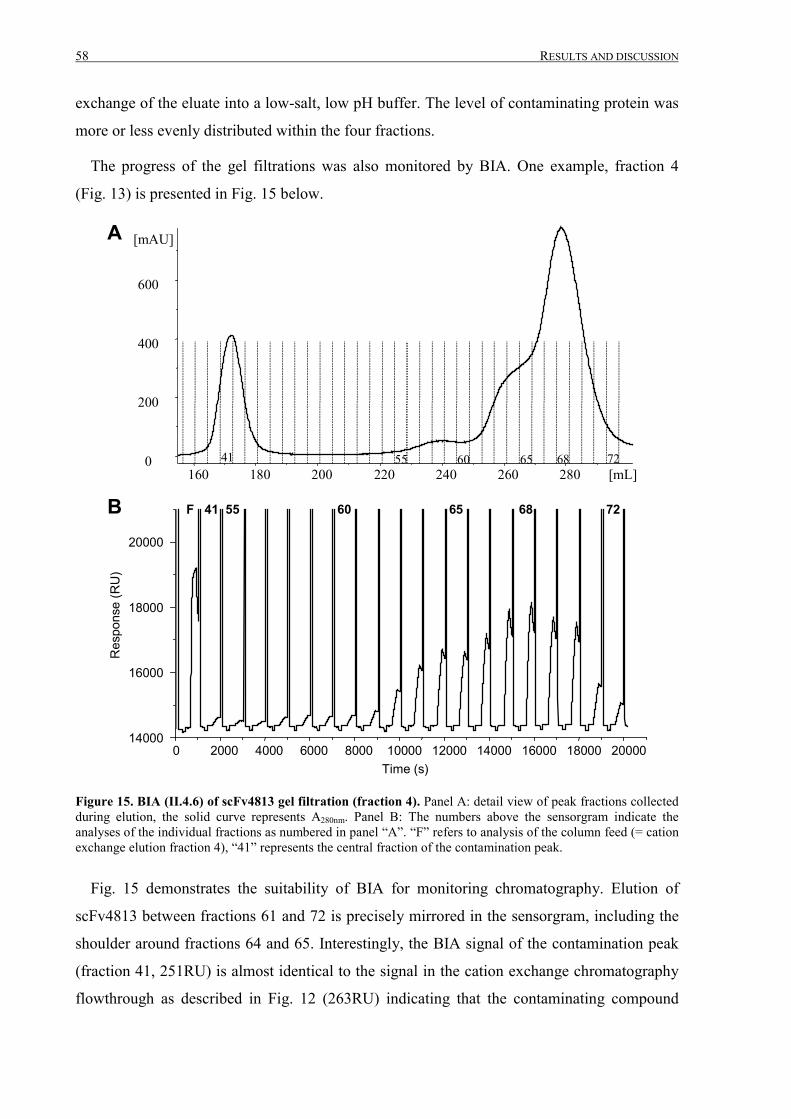
58 RESULTS AND DISCUSSION
exchange of the eluate into a low-salt, low pH buffer. The level of contaminating protein was
more or less evenly distributed within the four fractions.
The progress of the gel filtrations was also monitored by BIA. One example, fraction 4
(Fig. 13) is presented in Fig. 15 below.
0
200
400
600
[mAU]
160 180 200 220 240 260 280 [mL]41 55 60 65 68 72
0 2000 4000 6000 8000 10000 12000 14000 16000 18000 2000014000
16000
18000
20000
Res
pons
e (R
U)
F 41 55 60 65 68 72
Time (s)
A
B
Figure 15. BIA (II.4.6) of scFv4813 gel filtration (fraction 4). Panel A: detail view of peak fractions collectedduring elution, the solid curve represents A280nm. Panel B: The numbers above the sensorgram indicate theanalyses of the individual fractions as numbered in panel “A”. “F” refers to analysis of the column feed (= cationexchange elution fraction 4), “41” represents the central fraction of the contamination peak.
Fig. 15 demonstrates the suitability of BIA for monitoring chromatography. Elution of
scFv4813 between fractions 61 and 72 is precisely mirrored in the sensorgram, including the
shoulder around fractions 64 and 65. Interestingly, the BIA signal of the contamination peak
(fraction 41, 251RU) is almost identical to the signal in the cation exchange chromatography
flowthrough as described in Fig. 12 (263RU) indicating that the contaminating compound
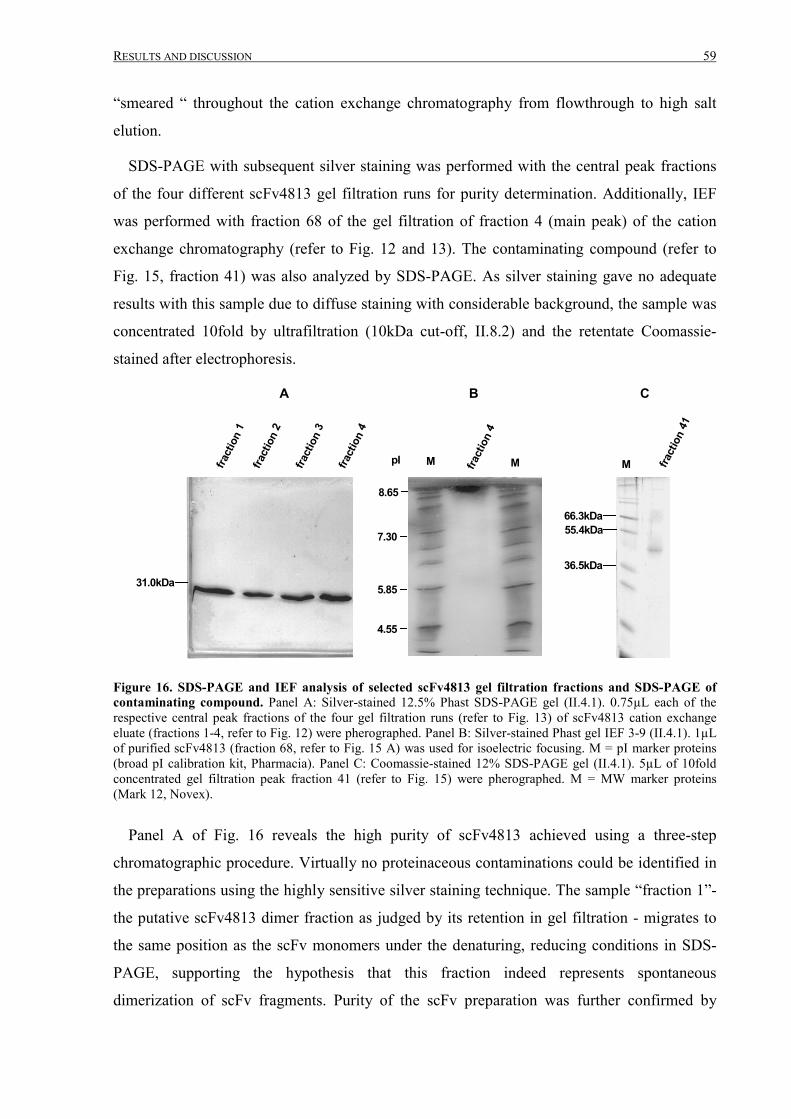
RESULTS AND DISCUSSION 59
“smeared “ throughout the cation exchange chromatography from flowthrough to high salt
elution.
SDS-PAGE with subsequent silver staining was performed with the central peak fractions
of the four different scFv4813 gel filtration runs for purity determination. Additionally, IEF
was performed with fraction 68 of the gel filtration of fraction 4 (main peak) of the cation
exchange chromatography (refer to Fig. 12 and 13). The contaminating compound (refer to
Fig. 15, fraction 41) was also analyzed by SDS-PAGE. As silver staining gave no adequate
results with this sample due to diffuse staining with considerable background, the sample was
concentrated 10fold by ultrafiltration (10kDa cut-off, II.8.2) and the retentate Coomassie-
stained after electrophoresis.
fract
ion
1fra
ctio
n 2
fract
ion
3
fract
ion
4
31.0kDa
55.4kDa
36.5kDa
fract
ion
4
M M fract
ion
41
pI
8.65
7.30
5.85
4.55
66.3kDa
M
A B C
Figure 16. SDS-PAGE and IEF analysis of selected scFv4813 gel filtration fractions and SDS-PAGE ofcontaminating compound. Panel A: Silver-stained 12.5% Phast SDS-PAGE gel (II.4.1). 0.75µL each of therespective central peak fractions of the four gel filtration runs (refer to Fig. 13) of scFv4813 cation exchangeeluate (fractions 1-4, refer to Fig. 12) were pherographed. Panel B: Silver-stained Phast gel IEF 3-9 (II.4.1). 1µLof purified scFv4813 (fraction 68, refer to Fig. 15 A) was used for isoelectric focusing. M = pI marker proteins(broad pI calibration kit, Pharmacia). Panel C: Coomassie-stained 12% SDS-PAGE gel (II.4.1). 5µL of 10foldconcentrated gel filtration peak fraction 41 (refer to Fig. 15) were pherographed. M = MW marker proteins(Mark 12, Novex).
Panel A of Fig. 16 reveals the high purity of scFv4813 achieved using a three-step
chromatographic procedure. Virtually no proteinaceous contaminations could be identified in
the preparations using the highly sensitive silver staining technique. The sample “fraction 1”-
the putative scFv4813 dimer fraction as judged by its retention in gel filtration - migrates to
the same position as the scFv monomers under the denaturing, reducing conditions in SDS-
PAGE, supporting the hypothesis that this fraction indeed represents spontaneous
dimerization of scFv fragments. Purity of the scFv preparation was further confirmed by
60 RESULTS AND DISCUSSION
isoelectric focusing as shown in Fig. 16, panel B. No protein bands are visible over the pH
range 3-9 except the single band of scFv4813 located, as expected by the high IEP of 8.77, at
the very cationic end of the gradient.
The contaminating protein that was present throughout the scFv4813 purification procedure
until it was separated from the target protein by gel filtration is visualized in panel C. This
protein appeared as a much weaker band in the Coomassie stained gel than expected
according to its UV signal strength in gel filtration (refer to Fig. 15) and extensive “smearing”
is visible on the gel. Similar observations were made with a highly glycosylated recombinant
protein expressed in P.pastoris in the context of this thesis (see III.2.3 below) and problems
with detection of highly glycosylated proteins with standard protein gel staining methods have
been described (Gradilone et al., 1998). It may be speculated that the contamination was a
(hyper)glycosylated secreted native P.pastoris protein possibly associated with some colored
compound or co-factor, since the IMAC- as well as cation exchange eluates were colored light
green, and this color was still visible in the contamination fraction after gel filtration, while
the scFv fractions were perfectly clear. The retention volume of the contaminating compound
in gel filtration indicated that the protein band visible at ~45kDa in SDS-PAGE represented a
subunit of an oligomeric protein.
As a portion of the purified scFv 4813 (fraction 68 of the “fraction 4” gel filtration, refer to
Fig. 15 A and 16 A,B) was used for crystallization experiments, a final assay for purity and
integrity of the scFv was performed by analytical gel filtration. This experiment was
performed after four weeks of storage of the purified protein at 4°C.
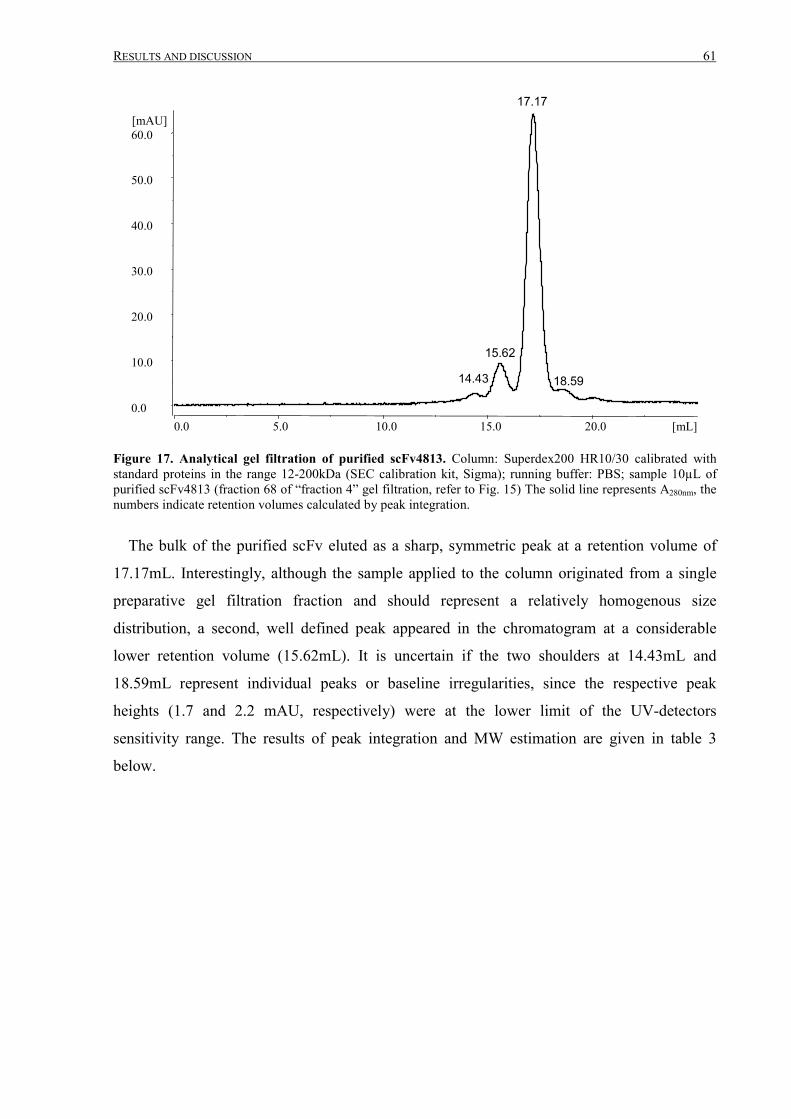
RESULTS AND DISCUSSION 61
0.0
10.0
20.0
30.0
40.0
50.0
60.0[mAU]
0.0 5.0 10.0 15.0 20.0 [mL]
14.43
15.62
17.17
18.59
Figure 17. Analytical gel filtration of purified scFv4813. Column: Superdex200 HR10/30 calibrated withstandard proteins in the range 12-200kDa (SEC calibration kit, Sigma); running buffer: PBS; sample 10µL ofpurified scFv4813 (fraction 68 of “fraction 4” gel filtration, refer to Fig. 15) The solid line represents A280nm, thenumbers indicate retention volumes calculated by peak integration.
The bulk of the purified scFv eluted as a sharp, symmetric peak at a retention volume of
17.17mL. Interestingly, although the sample applied to the column originated from a single
preparative gel filtration fraction and should represent a relatively homogenous size
distribution, a second, well defined peak appeared in the chromatogram at a considerable
lower retention volume (15.62mL). It is uncertain if the two shoulders at 14.43mL and
18.59mL represent individual peaks or baseline irregularities, since the respective peak
heights (1.7 and 2.2 mAU, respectively) were at the lower limit of the UV-detectors
sensitivity range. The results of peak integration and MW estimation are given in table 3
below.
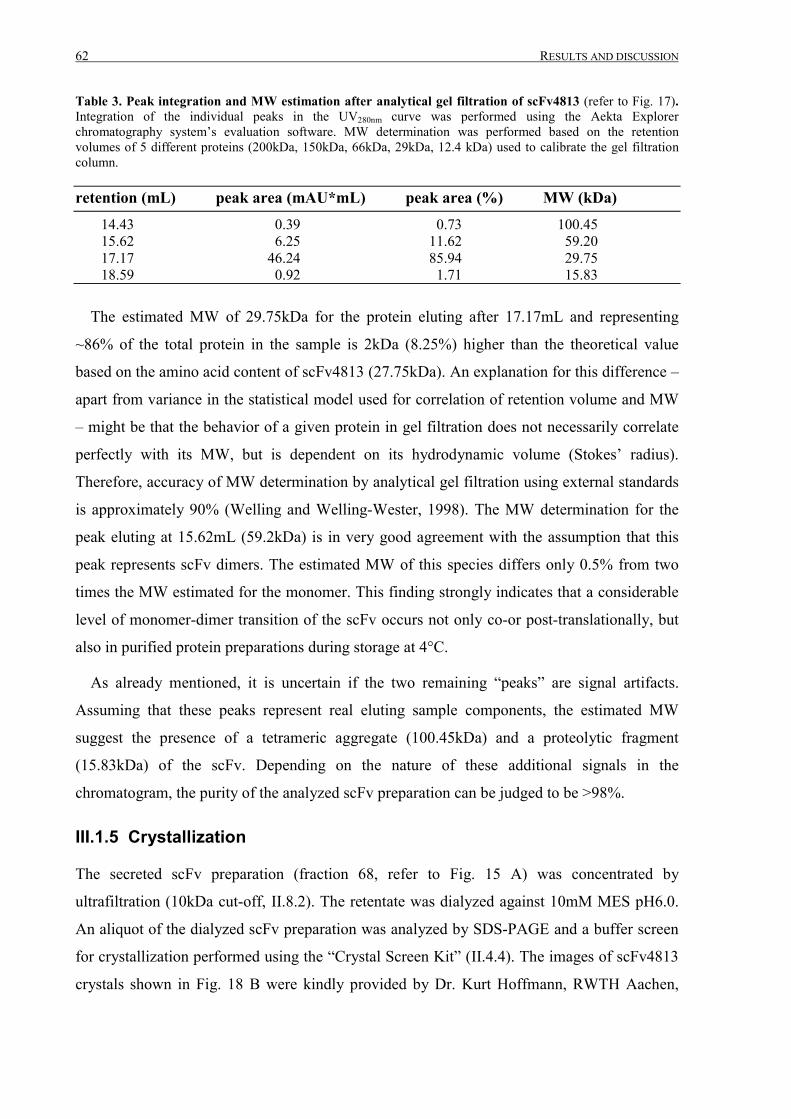
62 RESULTS AND DISCUSSION
Table 3. Peak integration and MW estimation after analytical gel filtration of scFv4813 (refer to Fig. 17).Integration of the individual peaks in the UV280nm curve was performed using the Aekta Explorerchromatography system’s evaluation software. MW determination was performed based on the retentionvolumes of 5 different proteins (200kDa, 150kDa, 66kDa, 29kDa, 12.4 kDa) used to calibrate the gel filtrationcolumn.
retention (mL) peak area (mAU*mL) peak area (%) MW (kDa) 14.43 0.39 0.73 100.45 15.62 6.25 11.62 59.20 17.17 46.24 85.94 29.75 18.59 0.92 1.71 15.83
The estimated MW of 29.75kDa for the protein eluting after 17.17mL and representing
~86% of the total protein in the sample is 2kDa (8.25%) higher than the theoretical value
based on the amino acid content of scFv4813 (27.75kDa). An explanation for this difference –
apart from variance in the statistical model used for correlation of retention volume and MW
– might be that the behavior of a given protein in gel filtration does not necessarily correlate
perfectly with its MW, but is dependent on its hydrodynamic volume (Stokes’ radius).
Therefore, accuracy of MW determination by analytical gel filtration using external standards
is approximately 90% (Welling and Welling-Wester, 1998). The MW determination for the
peak eluting at 15.62mL (59.2kDa) is in very good agreement with the assumption that this
peak represents scFv dimers. The estimated MW of this species differs only 0.5% from two
times the MW estimated for the monomer. This finding strongly indicates that a considerable
level of monomer-dimer transition of the scFv occurs not only co-or post-translationally, but
also in purified protein preparations during storage at 4°C.
As already mentioned, it is uncertain if the two remaining “peaks” are signal artifacts.
Assuming that these peaks represent real eluting sample components, the estimated MW
suggest the presence of a tetrameric aggregate (100.45kDa) and a proteolytic fragment
(15.83kDa) of the scFv. Depending on the nature of these additional signals in the
chromatogram, the purity of the analyzed scFv preparation can be judged to be >98%.
III.1.5 Crystallization
The secreted scFv preparation (fraction 68, refer to Fig. 15 A) was concentrated by
ultrafiltration (10kDa cut-off, II.8.2). The retentate was dialyzed against 10mM MES pH6.0.
An aliquot of the dialyzed scFv preparation was analyzed by SDS-PAGE and a buffer screen
for crystallization performed using the “Crystal Screen Kit” (II.4.4). The images of scFv4813
crystals shown in Fig. 18 B were kindly provided by Dr. Kurt Hoffmann, RWTH Aachen,
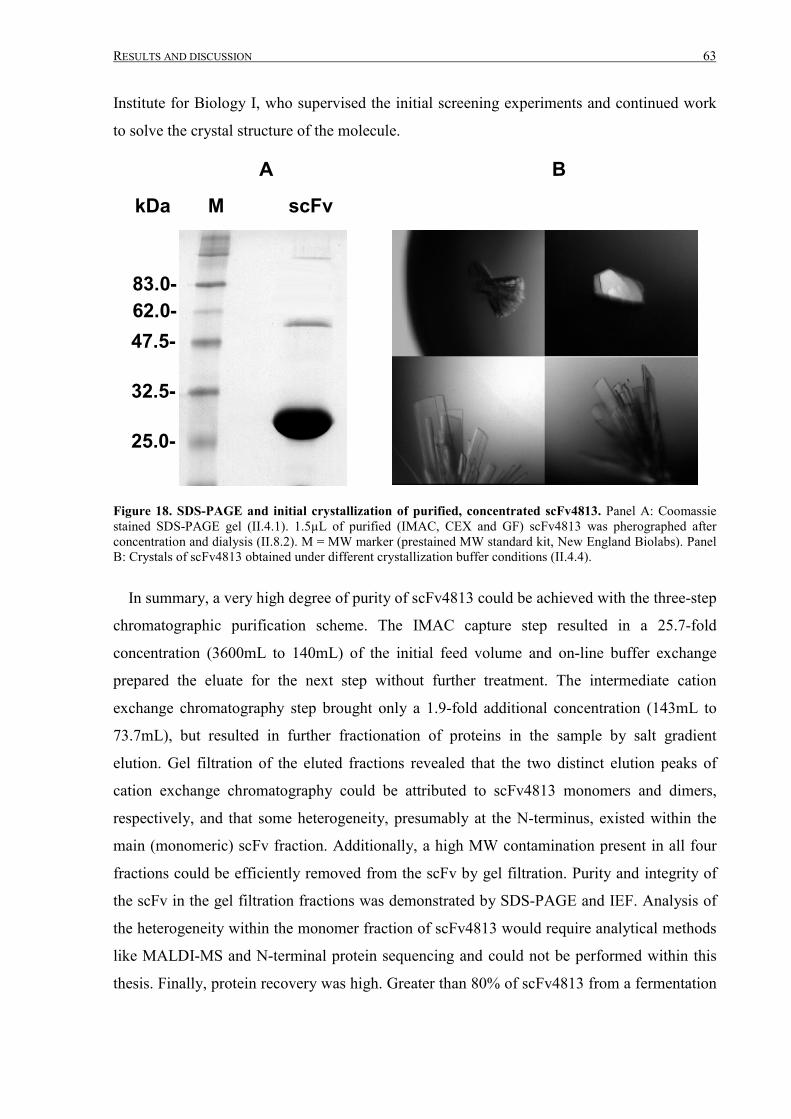
RESULTS AND DISCUSSION 63
Institute for Biology I, who supervised the initial screening experiments and continued work
to solve the crystal structure of the molecule.
A B
M scFvkDa
83.0-62.0-47.5-
32.5-
25.0-
Figure 18. SDS-PAGE and initial crystallization of purified, concentrated scFv4813. Panel A: Coomassiestained SDS-PAGE gel (II.4.1). 1.5µL of purified (IMAC, CEX and GF) scFv4813 was pherographed afterconcentration and dialysis (II.8.2). M = MW marker (prestained MW standard kit, New England Biolabs). PanelB: Crystals of scFv4813 obtained under different crystallization buffer conditions (II.4.4).
In summary, a very high degree of purity of scFv4813 could be achieved with the three-step
chromatographic purification scheme. The IMAC capture step resulted in a 25.7-fold
concentration (3600mL to 140mL) of the initial feed volume and on-line buffer exchange
prepared the eluate for the next step without further treatment. The intermediate cation
exchange chromatography step brought only a 1.9-fold additional concentration (143mL to
73.7mL), but resulted in further fractionation of proteins in the sample by salt gradient
elution. Gel filtration of the eluted fractions revealed that the two distinct elution peaks of
cation exchange chromatography could be attributed to scFv4813 monomers and dimers,
respectively, and that some heterogeneity, presumably at the N-terminus, existed within the
main (monomeric) scFv fraction. Additionally, a high MW contamination present in all four
fractions could be efficiently removed from the scFv by gel filtration. Purity and integrity of
the scFv in the gel filtration fractions was demonstrated by SDS-PAGE and IEF. Analysis of
the heterogeneity within the monomer fraction of scFv4813 would require analytical methods
like MALDI-MS and N-terminal protein sequencing and could not be performed within this
thesis. Finally, protein recovery was high. Greater than 80% of scFv4813 from a fermentation
64 RESULTS AND DISCUSSION
broth containing ~40mg recombinant protein/L could be recovered, estimated by evaluation
of band intensities in Coomassie stained gels and Bradford assays (data not shown).
Based on the data generated during this purification strategy development, some
modifications of the protocol described in detail above may be incorporated for future
purification of scFv4813. The cation exchange chromatography had revealed that no
contaminating proteins were separated from the scFv within the salt gradient elution. This
linear gradient might therefore be replaced by a step gradient. Thereby, while maintaining the
separation of contaminants that do not bind to the adsorbent, the elution volume of the target
protein could be significantly reduced. This in turn means that less time-consuming gel
filtrations would have to be performed.
Evaluation of the strategy developed for scFv 4813 purification showed that use of EBA for
initial capture chromatography significantly reduced time and labor for sample pre-treatment,
although the fermentation broth of the high cell density P.pastoris fermentation could not be
applied to the column without bulk cell mass removal by centrifugation. The principle
advantage of EBA was that neither high-speed centrifugation nor microfiltration steps had to
be included in the feed preparation procedures. Further advantage was that CIP of the EBA
column could be performed simply and efficiently with 1M NaOH/1M NaCl in expanded bed
mode and that problems with increasing back-pressure and column clogging, that often occur
when using conventional packed bed columns, were avoided. To further increase the
performance of the column, the adapter nets at the column inlet and outlet as well as the flow
distributor plate at the outlet were removed, since a slow but significant build-up of
particulate material was observed underneath these parts during feed application. In the case
of the inlet (bottom) net, this might lead to channeling of the adsorbent due to uneven flow of
the feedstream. Build-up of a “plug” of material at the upper end of the column would prevent
free efflux of particles from the column with the potential risk of fouling of residual cells in
the column. As a consequence of removal of the inlet adapter net, elution of bound material
was performed in expanded bed mode to prevent adsorbent from being washed out of the
column under reversed flow conditions. Subsequent purifications of scFv4813 with elution in
expanded mode gave a marginal increase in elution volume (data not shown) which was
balanced by increased adsorbent bed stability and more straightforward CIP. For capture
chromatography methods other than IMAC, in particular ion exchange, elution in expanded
bed mode may have additional benefits. Flow reversal, as is performed during packed bed
mode elution, is generally not recommended procedure in ion exchange chromatography, for
RESULTS AND DISCUSSION 65
separation of weak and strong binding analytes along the length of the column during feed
application is lost and resolution significantly decreases.
Throughout purification, monitoring was performed by BIA, avoiding the time-consuming
analytical methods such as SDS-PAGE or ELISA. Although not a functional assay when
using the NTA sensor chip, BIA was reliable for monitoring secreted protein expression and
purification from P.pastoris fermentation broth, since non-specific binding occurred only at a
minor degree and the fractions containing the His6-tagged target proteins could be securely
identified. Each of the four flow cells of a sensor chip could be used for >100 cycles of
analysis without significant loss in binding capacity or reproducibility, indicating that BIA
was economically attractive. The automation of analysis using the BiaCore instrument
permitted routine analysis of chromatography fractions in parallel to the purification process
and this short analysis time significantly accelerated purification. Feed conditioning, cell
removal, expanded bed IMAC and cation exchange chromatography could be routinely
performed within one day.
III.2 Contributions to the “Molecular Farming” project
The second part of this thesis work was performed within an ongoing EU-research project to
evaluate the potential of plants and plant suspension cells as source for therapeutic rAb
fragments and fusion proteins.
III.2.1 Production of CEA N-A3 hybrid protein in P.pastoris
A major hurdle for work with CEA-specific antibodies is the limited availability and the cost
of the native antigen, CEA. This problem was solved by the construction and expression of a
hybrid protein comprising the N- and the A3-domain of CEA in P.pastoris (You et al., 1998).
The affinity constant for the interaction of mAb T84.66, the parental antibody used to
generate anti-CEA rAbs in this project was determined to be 2.2 x 10¹⁰M-1 with N-A3
compared to 5.8 x 10¹⁰M-1 for the T84.66/CEA interaction (You et al., 1998).
To obtain sufficient amounts of N-A3 for screening and analyses throughout the
“Molecular Farming” project, the protein was purified from high cell density P.pastoris
fermentation broth applying the EBA-IMAC capture strategy, as developed with the FSH-
specific scFv4813 (III.1). The N-A3 gene was cloned into the pPIC9K expression vector after
fusion of a His6-tag to the N-terminus. This work as well as P.pastoris transformation,
screening and expressor strain selection was performed as part of a diploma thesis at the
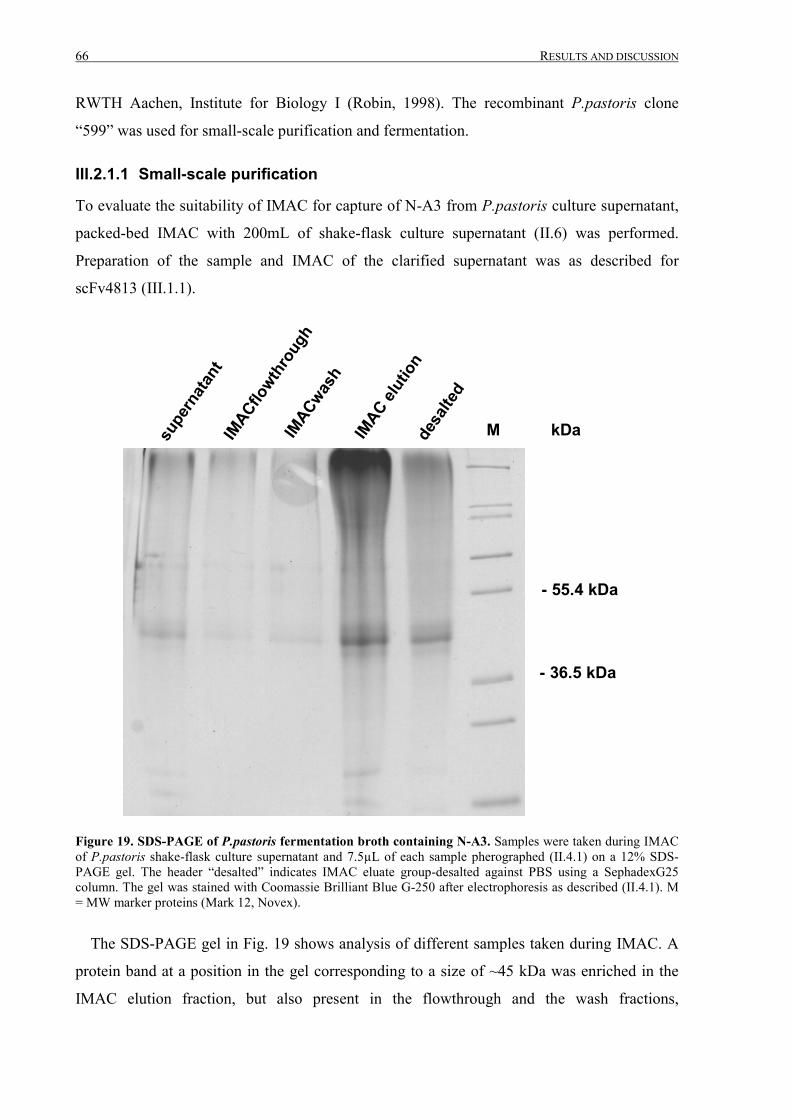
66 RESULTS AND DISCUSSION
RWTH Aachen, Institute for Biology I (Robin, 1998). The recombinant P.pastoris clone
“599” was used for small-scale purification and fermentation.
III.2.1.1 Small-scale purification
To evaluate the suitability of IMAC for capture of N-A3 from P.pastoris culture supernatant,
packed-bed IMAC with 200mL of shake-flask culture supernatant (II.6) was performed.
Preparation of the sample and IMAC of the clarified supernatant was as described for
scFv4813 (III.1.1).
- 36.5 kDa
- 55.4 kDa
supe
rnat
ant
IMACflo
wthro
ugh
IMACwas
hIM
AC elut
ion
desa
lted
M kDa
Figure 19. SDS-PAGE of P.pastoris fermentation broth containing N-A3. Samples were taken during IMACof P.pastoris shake-flask culture supernatant and 7.5µL of each sample pherographed (II.4.1) on a 12% SDS-PAGE gel. The header “desalted” indicates IMAC eluate group-desalted against PBS using a SephadexG25column. The gel was stained with Coomassie Brilliant Blue G-250 after electrophoresis as described (II.4.1). M= MW marker proteins (Mark 12, Novex).
The SDS-PAGE gel in Fig. 19 shows analysis of different samples taken during IMAC. A
protein band at a position in the gel corresponding to a size of ~45 kDa was enriched in the
IMAC elution fraction, but also present in the flowthrough and the wash fractions,
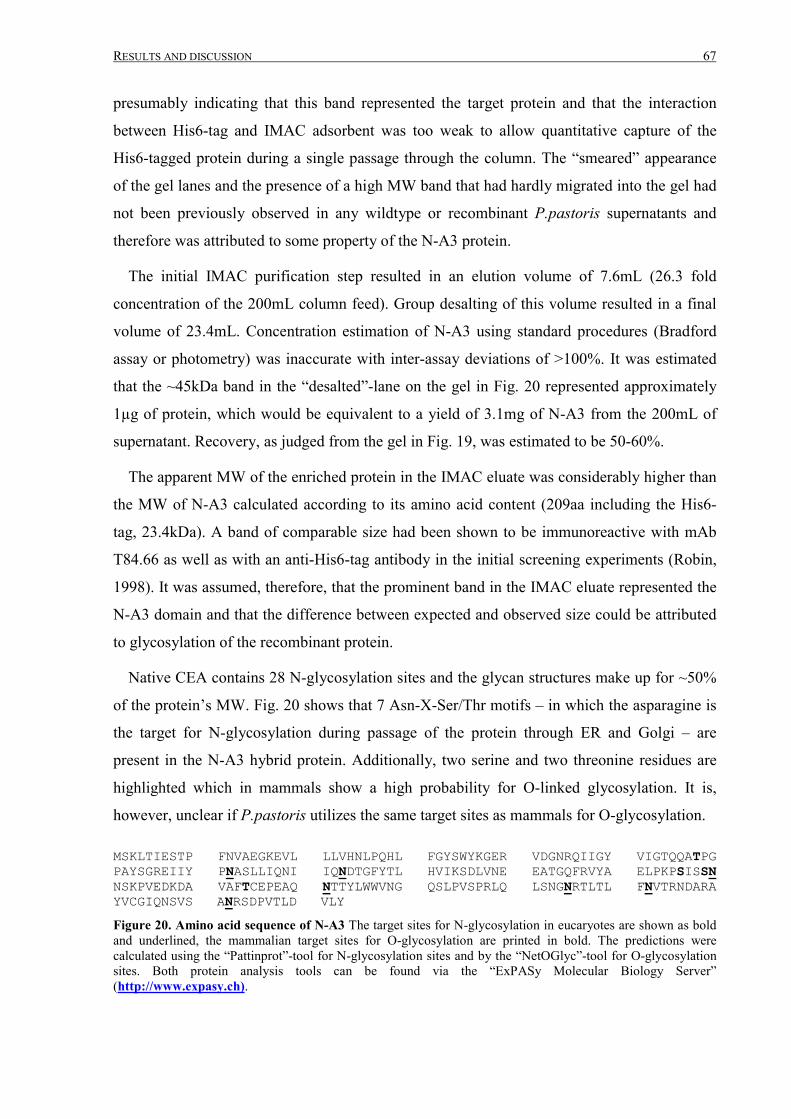
RESULTS AND DISCUSSION 67
presumably indicating that this band represented the target protein and that the interaction
between His6-tag and IMAC adsorbent was too weak to allow quantitative capture of the
His6-tagged protein during a single passage through the column. The “smeared” appearance
of the gel lanes and the presence of a high MW band that had hardly migrated into the gel had
not been previously observed in any wildtype or recombinant P.pastoris supernatants and
therefore was attributed to some property of the N-A3 protein.
The initial IMAC purification step resulted in an elution volume of 7.6mL (26.3 fold
concentration of the 200mL column feed). Group desalting of this volume resulted in a final
volume of 23.4mL. Concentration estimation of N-A3 using standard procedures (Bradford
assay or photometry) was inaccurate with inter-assay deviations of >100%. It was estimated
that the ~45kDa band in the “desalted”-lane on the gel in Fig. 20 represented approximately
1µg of protein, which would be equivalent to a yield of 3.1mg of N-A3 from the 200mL of
supernatant. Recovery, as judged from the gel in Fig. 19, was estimated to be 50-60%.
The apparent MW of the enriched protein in the IMAC eluate was considerably higher than
the MW of N-A3 calculated according to its amino acid content (209aa including the His6-
tag, 23.4kDa). A band of comparable size had been shown to be immunoreactive with mAb
T84.66 as well as with an anti-His6-tag antibody in the initial screening experiments (Robin,
1998). It was assumed, therefore, that the prominent band in the IMAC eluate represented the
N-A3 domain and that the difference between expected and observed size could be attributed
to glycosylation of the recombinant protein.
Native CEA contains 28 N-glycosylation sites and the glycan structures make up for ~50%
of the protein’s MW. Fig. 20 shows that 7 Asn-X-Ser/Thr motifs – in which the asparagine is
the target for N-glycosylation during passage of the protein through ER and Golgi – are
present in the N-A3 hybrid protein. Additionally, two serine and two threonine residues are
highlighted which in mammals show a high probability for O-linked glycosylation. It is,
however, unclear if P.pastoris utilizes the same target sites as mammals for O-glycosylation.
MSKLTIESTP FNVAEGKEVL LLVHNLPQHL FGYSWYKGER VDGNRQIIGY VIGTQQATPGPAYSGREIIY PNASLLIQNI IQNDTGFYTL HVIKSDLVNE EATGQFRVYA ELPKPSISSNNSKPVEDKDA VAFTCEPEAQ NTTYLWWVNG QSLPVSPRLQ LSNGNRTLTL FNVTRNDARAYVCGIQNSVS ANRSDPVTLD VLY
Figure 20. Amino acid sequence of N-A3 The target sites for N-glycosylation in eucaryotes are shown as boldand underlined, the mammalian target sites for O-glycosylation are printed in bold. The predictions werecalculated using the “Pattinprot”-tool for N-glycosylation sites and by the “NetOGlyc”-tool for O-glycosylationsites. Both protein analysis tools can be found via the “ExPASy Molecular Biology Server”(http://www.expasy.ch).
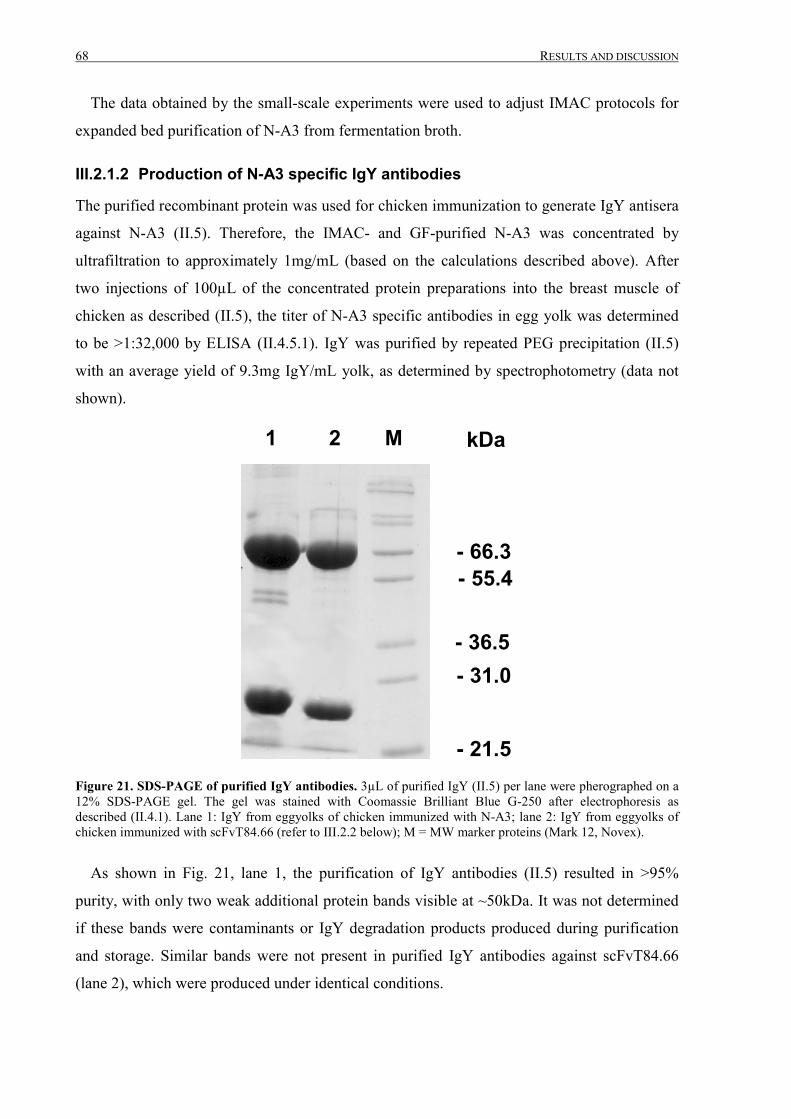
68 RESULTS AND DISCUSSION
The data obtained by the small-scale experiments were used to adjust IMAC protocols for
expanded bed purification of N-A3 from fermentation broth.
III.2.1.2 Production of N-A3 specific IgY antibodies
The purified recombinant protein was used for chicken immunization to generate IgY antisera
against N-A3 (II.5). Therefore, the IMAC- and GF-purified N-A3 was concentrated by
ultrafiltration to approximately 1mg/mL (based on the calculations described above). After
two injections of 100µL of the concentrated protein preparations into the breast muscle of
chicken as described (II.5), the titer of N-A3 specific antibodies in egg yolk was determined
to be >1:32,000 by ELISA (II.4.5.1). IgY was purified by repeated PEG precipitation (II.5)
with an average yield of 9.3mg IgY/mL yolk, as determined by spectrophotometry (data not
shown).
1 2 M kDa
- 66.3- 55.4
- 36.5- 31.0
- 21.5Figure 21. SDS-PAGE of purified IgY antibodies. 3µL of purified IgY (II.5) per lane were pherographed on a12% SDS-PAGE gel. The gel was stained with Coomassie Brilliant Blue G-250 after electrophoresis asdescribed (II.4.1). Lane 1: IgY from eggyolks of chicken immunized with N-A3; lane 2: IgY from eggyolks ofchicken immunized with scFvT84.66 (refer to III.2.2 below); M = MW marker proteins (Mark 12, Novex).
As shown in Fig. 21, lane 1, the purification of IgY antibodies (II.5) resulted in >95%
purity, with only two weak additional protein bands visible at ~50kDa. It was not determined
if these bands were contaminants or IgY degradation products produced during purification
and storage. Similar bands were not present in purified IgY antibodies against scFvT84.66
(lane 2), which were produced under identical conditions.
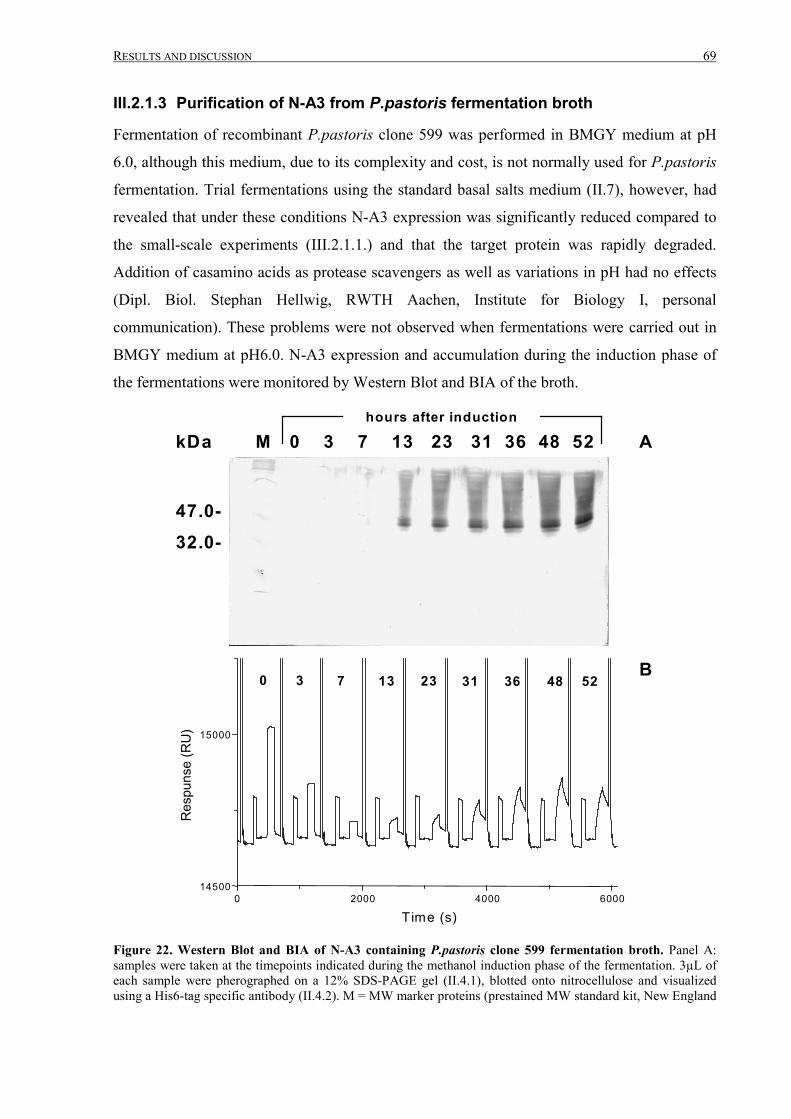
RESULTS AND DISCUSSION 69
III.2.1.3 Purification of N-A3 from P.pastoris fermentation broth
Fermentation of recombinant P.pastoris clone 599 was performed in BMGY medium at pH
6.0, although this medium, due to its complexity and cost, is not normally used for P.pastoris
fermentation. Trial fermentations using the standard basal salts medium (II.7), however, had
revealed that under these conditions N-A3 expression was significantly reduced compared to
the small-scale experiments (III.2.1.1.) and that the target protein was rapidly degraded.
Addition of casamino acids as protease scavengers as well as variations in pH had no effects
(Dipl. Biol. Stephan Hellwig, RWTH Aachen, Institute for Biology I, personal
communication). These problems were not observed when fermentations were carried out in
BMGY medium at pH6.0. N-A3 expression and accumulation during the induction phase of
the fermentations were monitored by Western Blot and BIA of the broth.
0 2000 4000 600014500
15000
Res
puns
e (R
U)
T ime (s)
M 0 3 7 13 23 31 36 48 52hours after induction
0 3 7 13 23 31 36 48 52
A
B
kDa
47.0-32.0-
Figure 22. Western Blot and BIA of N-A3 containing P.pastoris clone 599 fermentation broth. Panel A:samples were taken at the timepoints indicated during the methanol induction phase of the fermentation. 3µL ofeach sample were pherographed on a 12% SDS-PAGE gel (II.4.1), blotted onto nitrocellulose and visualizedusing a His6-tag specific antibody (II.4.2). M = MW marker proteins (prestained MW standard kit, New England
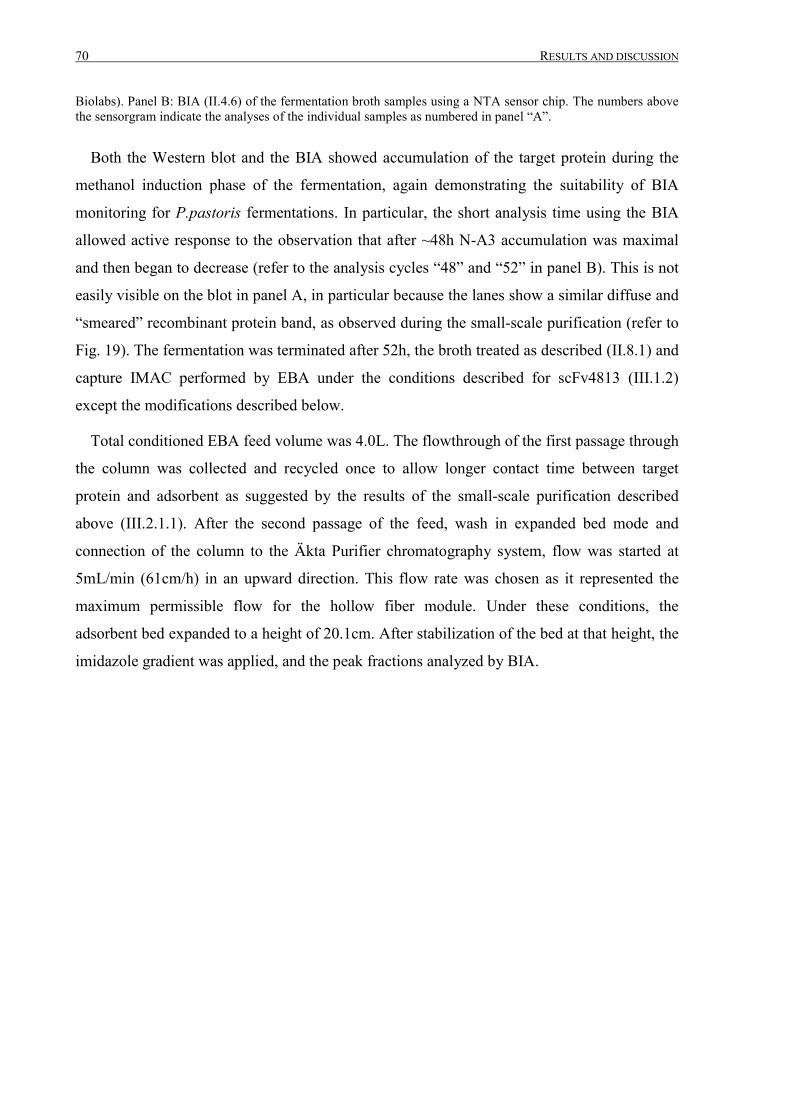
70 RESULTS AND DISCUSSION
Biolabs). Panel B: BIA (II.4.6) of the fermentation broth samples using a NTA sensor chip. The numbers abovethe sensorgram indicate the analyses of the individual samples as numbered in panel “A”.
Both the Western blot and the BIA showed accumulation of the target protein during the
methanol induction phase of the fermentation, again demonstrating the suitability of BIA
monitoring for P.pastoris fermentations. In particular, the short analysis time using the BIA
allowed active response to the observation that after ~48h N-A3 accumulation was maximal
and then began to decrease (refer to the analysis cycles “48” and “52” in panel B). This is not
easily visible on the blot in panel A, in particular because the lanes show a similar diffuse and
“smeared” recombinant protein band, as observed during the small-scale purification (refer to
Fig. 19). The fermentation was terminated after 52h, the broth treated as described (II.8.1) and
capture IMAC performed by EBA under the conditions described for scFv4813 (III.1.2)
except the modifications described below.
Total conditioned EBA feed volume was 4.0L. The flowthrough of the first passage through
the column was collected and recycled once to allow longer contact time between target
protein and adsorbent as suggested by the results of the small-scale purification described
above (III.2.1.1). After the second passage of the feed, wash in expanded bed mode and
connection of the column to the Äkta Purifier chromatography system, flow was started at
5mL/min (61cm/h) in an upward direction. This flow rate was chosen as it represented the
maximum permissible flow for the hollow fiber module. Under these conditions, the
adsorbent bed expanded to a height of 20.1cm. After stabilization of the bed at that height, the
imidazole gradient was applied, and the peak fractions analyzed by BIA.

RESULTS AND DISCUSSION 71
0
200
400
600
800
[m A U ]
0
20
40
60
80
[% B]
0 50 100 150 200 250 300 [m L]
7000 7500 8000 8500 900014500
14600
14700
14800
14900
15000
15100
15200
Res
pons
e (R
U)
T im e (s)
1 2 3 4
A
B
Figure 23. Elution profile and BIA of N-A3 capture from P.pastoris fermentation broth by expanded bedIMAC. Panel A: chromatogram of expanded mode elution of bound material from IMAC adsorbent after on-linedialysis (II.8.2). Column: Streamline25; adsorbent: 73.8mL of Streamline Chelating; wash buffer: 10mMphosphate, 1M NaCl pH7.4; elution buffer (“B”): 10mM phosphate, 1M NaCl, 0.25M imidazole pH 7.4;exchange buffer (in dialysis module): PBS pH7.4; gradient step I: 0-10%B; gradient step II: 10-100%B; flow:5mL/min. The solid line represents A280nm, the dashed line A260nm and the dotted line the concentration of buffer“B”. Panel B: Sensorgram showing analysis of fermentation broth, column flowthrough and collected elutionfractions. Numbering of samples: 1 = fermentation broth after 52h of induction (refer to Fig. 22); 2 =flowthrough after recycling; 3 = collected peak (75–175mL in panel A) of 25mM imidazole elution step; 4 =collected peak (250–350mL in panel A) of 250mM imidazole elution step. Samples 1-3 were diluted 1:20,sample 4 1:200 in HBS.
The sensorgram in Fig. 23B indicated that His6-tagged proteins are quantitatively removed
from the feed after two passages through the column (sample 2). Some bound material is
eluted with the 25mM imidazole gradient step. However, comparison of the signals in the
feed (sample 1) and the 25mM imidazole elution step (sample 3), must allow for the
concentration factor of 40 (4000mL of feed vs. 100mL of eluate). Although no quantitative
72 RESULTS AND DISCUSSION
calculations were attempted using the BIA data, the signal strength allows the estimation that
less than 5% of bound material eluted in this 25mM imidazole gradient step.
It was surprising that, although elution was carried out in expanded bed mode, the peak
fraction volume of the 250mM imidazole elution step was only 100mL, significantly less than
the 143mL obtained for packed bed elution of scFv4813 (III.1.2). This finding can be partly
attributed to the low flow rate used in the elution step and to the removal of some weakly
bound material in the 25mM imidazole step. However, the difference in feedstock
composition may have been a major contributing factor. The feedstock of the N-A3
fermentation as well as flowthrough and elution fractions were devoid of the green color that
was observed during purification of scFv4813 (III.1). As described, the unknown contaminant
that caused this color had a strong tendency to non-specifically bind to several
chromatography adsorbents including the Streamline Chelating resin. The absence of this
contamination may have led to elution of the specifically bound proteins in a sharper peak
with reduced volume.
The collected peak fraction of the 250mM imidazole elution was concentrated by
ultrafiltration (II.8.2) to a final volume of 8mL and subjected to gel filtration (XK26/100
column containing 450mL SephacrylS100 HR; flowrate: 1mL/min; buffer: PBS). The single
eluting peak was collected (28.3mL) and the presence of His6-tagged proteins verified by
BIA (data not shown).
III.2.1.4 Analysis of purified N-A3
An aliquot of the peak fraction collected after gel filtration of recombinant N-A3 was used for
removal of N-linked glycans by treatment with PNGase F (II.4.3).
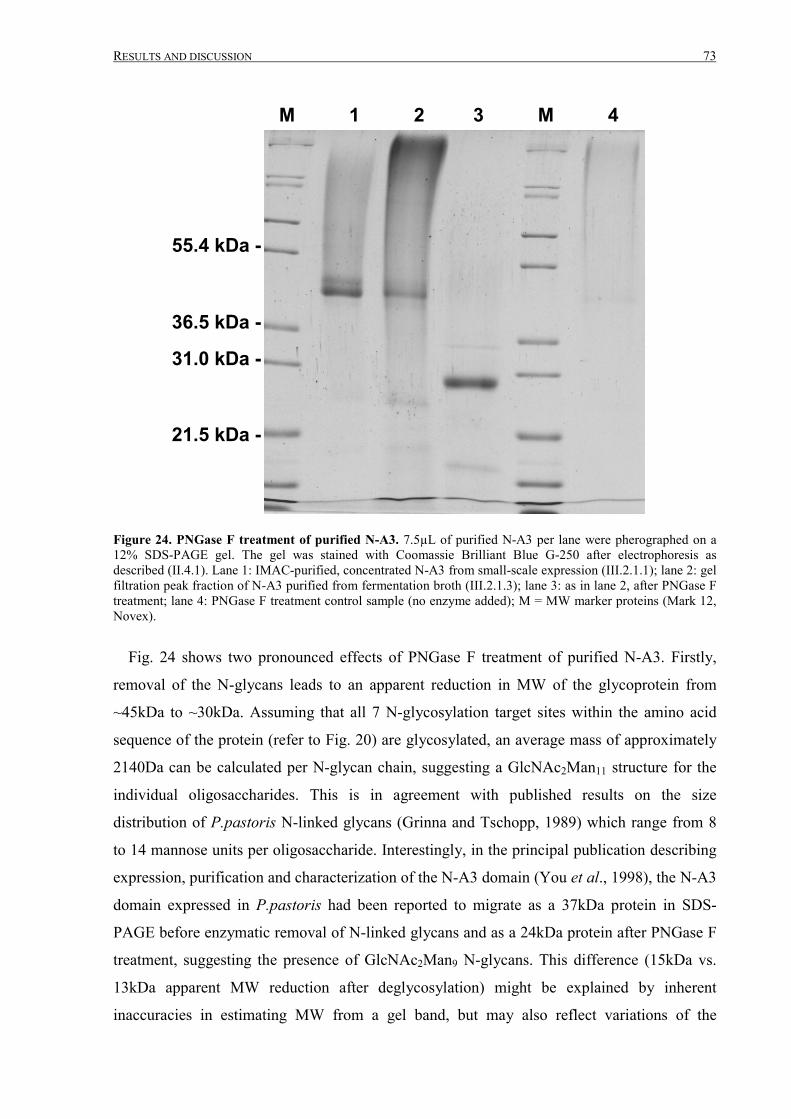
RESULTS AND DISCUSSION 73
M 1 2 3 M 4
31.0 kDa -
36.5 kDa -
55.4 kDa -
21.5 kDa -
Figure 24. PNGase F treatment of purified N-A3. 7.5µL of purified N-A3 per lane were pherographed on a12% SDS-PAGE gel. The gel was stained with Coomassie Brilliant Blue G-250 after electrophoresis asdescribed (II.4.1). Lane 1: IMAC-purified, concentrated N-A3 from small-scale expression (III.2.1.1); lane 2: gelfiltration peak fraction of N-A3 purified from fermentation broth (III.2.1.3); lane 3: as in lane 2, after PNGase Ftreatment; lane 4: PNGase F treatment control sample (no enzyme added); M = MW marker proteins (Mark 12,Novex).
Fig. 24 shows two pronounced effects of PNGase F treatment of purified N-A3. Firstly,
removal of the N-glycans leads to an apparent reduction in MW of the glycoprotein from
~45kDa to ~30kDa. Assuming that all 7 N-glycosylation target sites within the amino acid
sequence of the protein (refer to Fig. 20) are glycosylated, an average mass of approximately
2140Da can be calculated per N-glycan chain, suggesting a GlcNAc2Man11 structure for the
individual oligosaccharides. This is in agreement with published results on the size
distribution of P.pastoris N-linked glycans (Grinna and Tschopp, 1989) which range from 8
to 14 mannose units per oligosaccharide. Interestingly, in the principal publication describing
expression, purification and characterization of the N-A3 domain (You et al., 1998), the N-A3
domain expressed in P.pastoris had been reported to migrate as a 37kDa protein in SDS-
PAGE before enzymatic removal of N-linked glycans and as a 24kDa protein after PNGase F
treatment, suggesting the presence of GlcNAc2Man9 N-glycans. This difference (15kDa vs.
13kDa apparent MW reduction after deglycosylation) might be explained by inherent
inaccuracies in estimating MW from a gel band, but may also reflect variations of the
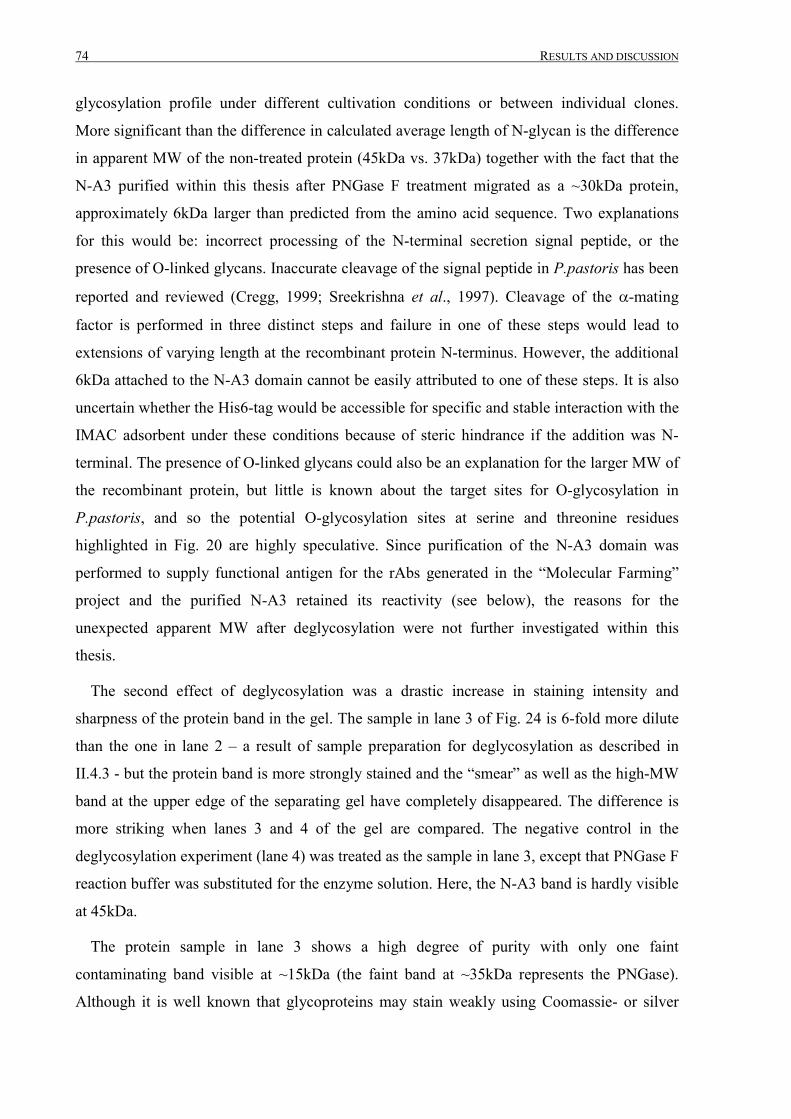
74 RESULTS AND DISCUSSION
glycosylation profile under different cultivation conditions or between individual clones.
More significant than the difference in calculated average length of N-glycan is the difference
in apparent MW of the non-treated protein (45kDa vs. 37kDa) together with the fact that the
N-A3 purified within this thesis after PNGase F treatment migrated as a ~30kDa protein,
approximately 6kDa larger than predicted from the amino acid sequence. Two explanations
for this would be: incorrect processing of the N-terminal secretion signal peptide, or the
presence of O-linked glycans. Inaccurate cleavage of the signal peptide in P.pastoris has been
reported and reviewed (Cregg, 1999; Sreekrishna et al., 1997). Cleavage of the �-mating
factor is performed in three distinct steps and failure in one of these steps would lead to
extensions of varying length at the recombinant protein N-terminus. However, the additional
6kDa attached to the N-A3 domain cannot be easily attributed to one of these steps. It is also
uncertain whether the His6-tag would be accessible for specific and stable interaction with the
IMAC adsorbent under these conditions because of steric hindrance if the addition was N-
terminal. The presence of O-linked glycans could also be an explanation for the larger MW of
the recombinant protein, but little is known about the target sites for O-glycosylation in
P.pastoris, and so the potential O-glycosylation sites at serine and threonine residues
highlighted in Fig. 20 are highly speculative. Since purification of the N-A3 domain was
performed to supply functional antigen for the rAbs generated in the “Molecular Farming”
project and the purified N-A3 retained its reactivity (see below), the reasons for the
unexpected apparent MW after deglycosylation were not further investigated within this
thesis.
The second effect of deglycosylation was a drastic increase in staining intensity and
sharpness of the protein band in the gel. The sample in lane 3 of Fig. 24 is 6-fold more dilute
than the one in lane 2 – a result of sample preparation for deglycosylation as described in
II.4.3 - but the protein band is more strongly stained and the “smear” as well as the high-MW
band at the upper edge of the separating gel have completely disappeared. The difference is
more striking when lanes 3 and 4 of the gel are compared. The negative control in the
deglycosylation experiment (lane 4) was treated as the sample in lane 3, except that PNGase F
reaction buffer was substituted for the enzyme solution. Here, the N-A3 band is hardly visible
at 45kDa.
The protein sample in lane 3 shows a high degree of purity with only one faint
contaminating band visible at ~15kDa (the faint band at ~35kDa represents the PNGase).
Although it is well known that glycoproteins may stain weakly using Coomassie- or silver
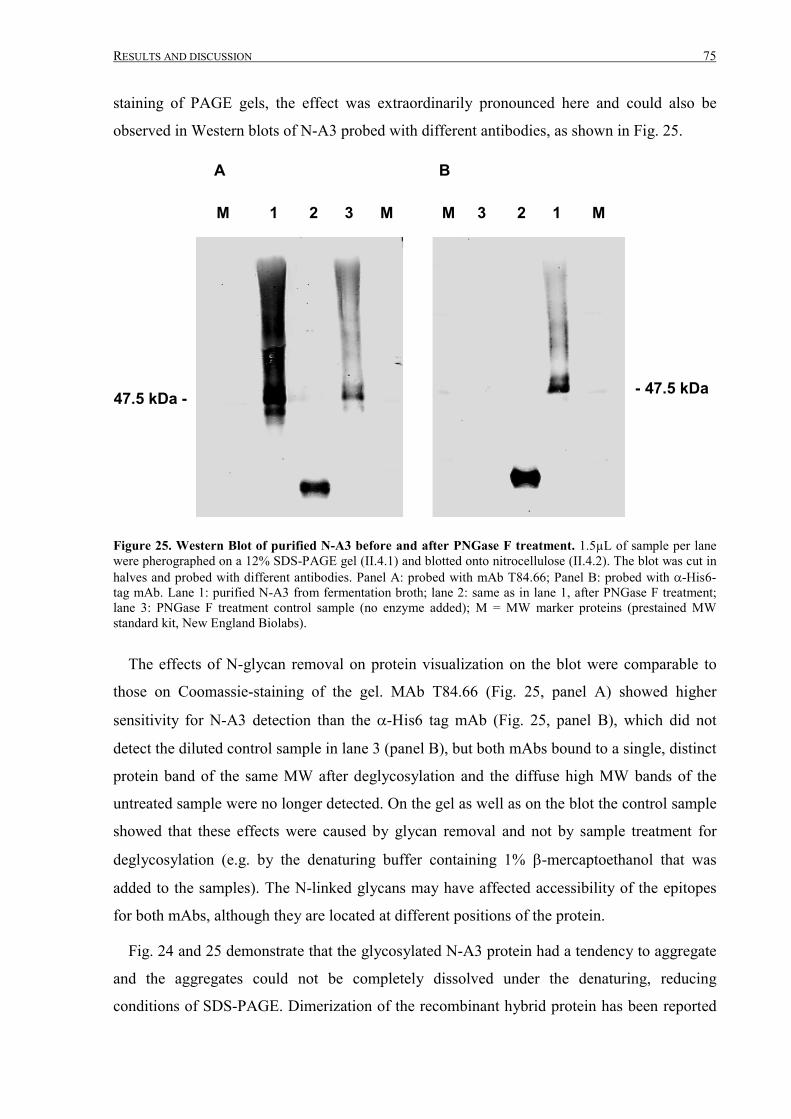
RESULTS AND DISCUSSION 75
staining of PAGE gels, the effect was extraordinarily pronounced here and could also be
observed in Western blots of N-A3 probed with different antibodies, as shown in Fig. 25.
M 1 2 3 M M 3 2 1 M
- 47.5 kDa
A B
47.5 kDa -
Figure 25. Western Blot of purified N-A3 before and after PNGase F treatment. 1.5µL of sample per lanewere pherographed on a 12% SDS-PAGE gel (II.4.1) and blotted onto nitrocellulose (II.4.2). The blot was cut inhalves and probed with different antibodies. Panel A: probed with mAb T84.66; Panel B: probed with �-His6-tag mAb. Lane 1: purified N-A3 from fermentation broth; lane 2: same as in lane 1, after PNGase F treatment;lane 3: PNGase F treatment control sample (no enzyme added); M = MW marker proteins (prestained MWstandard kit, New England Biolabs).
The effects of N-glycan removal on protein visualization on the blot were comparable to
those on Coomassie-staining of the gel. MAb T84.66 (Fig. 25, panel A) showed higher
sensitivity for N-A3 detection than the �-His6 tag mAb (Fig. 25, panel B), which did not
detect the diluted control sample in lane 3 (panel B), but both mAbs bound to a single, distinct
protein band of the same MW after deglycosylation and the diffuse high MW bands of the
untreated sample were no longer detected. On the gel as well as on the blot the control sample
showed that these effects were caused by glycan removal and not by sample treatment for
deglycosylation (e.g. by the denaturing buffer containing 1% �-mercaptoethanol that was
added to the samples). The N-linked glycans may have affected accessibility of the epitopes
for both mAbs, although they are located at different positions of the protein.
Fig. 24 and 25 demonstrate that the glycosylated N-A3 protein had a tendency to aggregate
and the aggregates could not be completely dissolved under the denaturing, reducing
conditions of SDS-PAGE. Dimerization of the recombinant hybrid protein has been reported
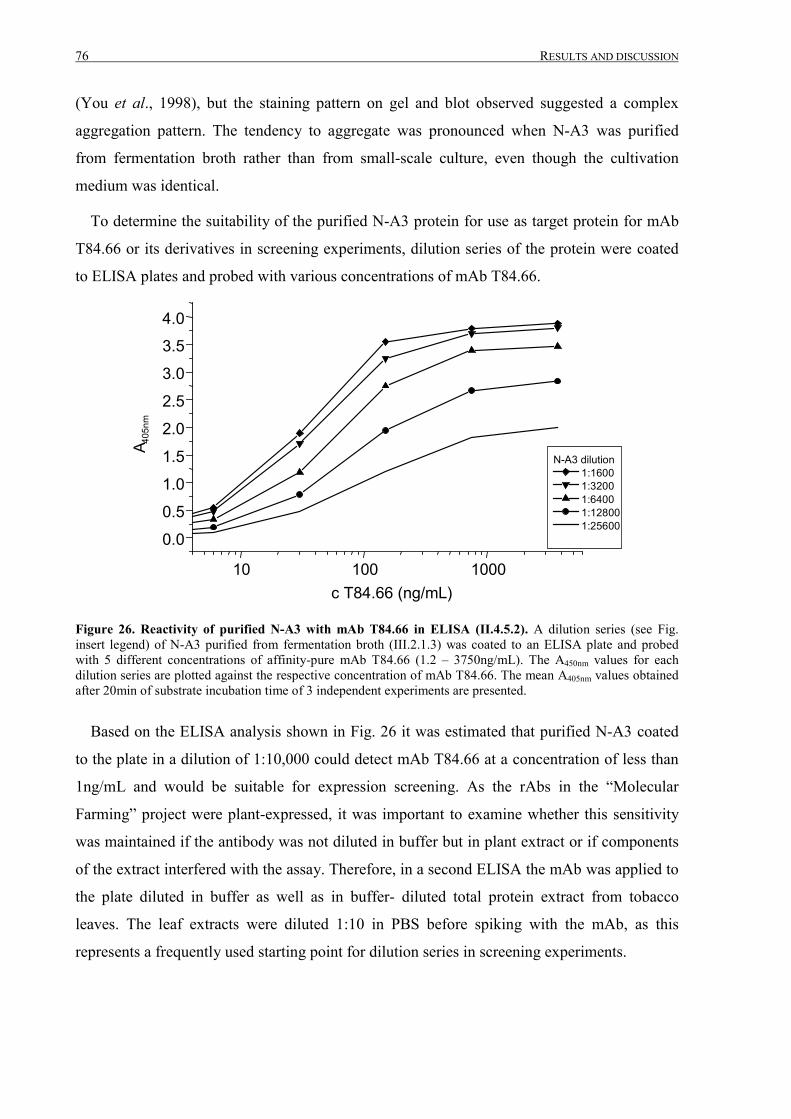
76 RESULTS AND DISCUSSION
(You et al., 1998), but the staining pattern on gel and blot observed suggested a complex
aggregation pattern. The tendency to aggregate was pronounced when N-A3 was purified
from fermentation broth rather than from small-scale culture, even though the cultivation
medium was identical.
To determine the suitability of the purified N-A3 protein for use as target protein for mAb
T84.66 or its derivatives in screening experiments, dilution series of the protein were coated
to ELISA plates and probed with various concentrations of mAb T84.66.
10 100 1000
0.0
0.5
1.0
1.5
2.0
2.5
3.0
3.5
4.0
N-A3 dilution 1:1600 1:3200 1:6400 1:12800 1:25600
A 405
nm
c T84.66 (ng/mL)
Figure 26. Reactivity of purified N-A3 with mAb T84.66 in ELISA (II.4.5.2). A dilution series (see Fig.insert legend) of N-A3 purified from fermentation broth (III.2.1.3) was coated to an ELISA plate and probedwith 5 different concentrations of affinity-pure mAb T84.66 (1.2 – 3750ng/mL). The A450nm values for eachdilution series are plotted against the respective concentration of mAb T84.66. The mean A405nm values obtainedafter 20min of substrate incubation time of 3 independent experiments are presented.
Based on the ELISA analysis shown in Fig. 26 it was estimated that purified N-A3 coated
to the plate in a dilution of 1:10,000 could detect mAb T84.66 at a concentration of less than
1ng/mL and would be suitable for expression screening. As the rAbs in the “Molecular
Farming” project were plant-expressed, it was important to examine whether this sensitivity
was maintained if the antibody was not diluted in buffer but in plant extract or if components
of the extract interfered with the assay. Therefore, in a second ELISA the mAb was applied to
the plate diluted in buffer as well as in buffer- diluted total protein extract from tobacco
leaves. The leaf extracts were diluted 1:10 in PBS before spiking with the mAb, as this
represents a frequently used starting point for dilution series in screening experiments.
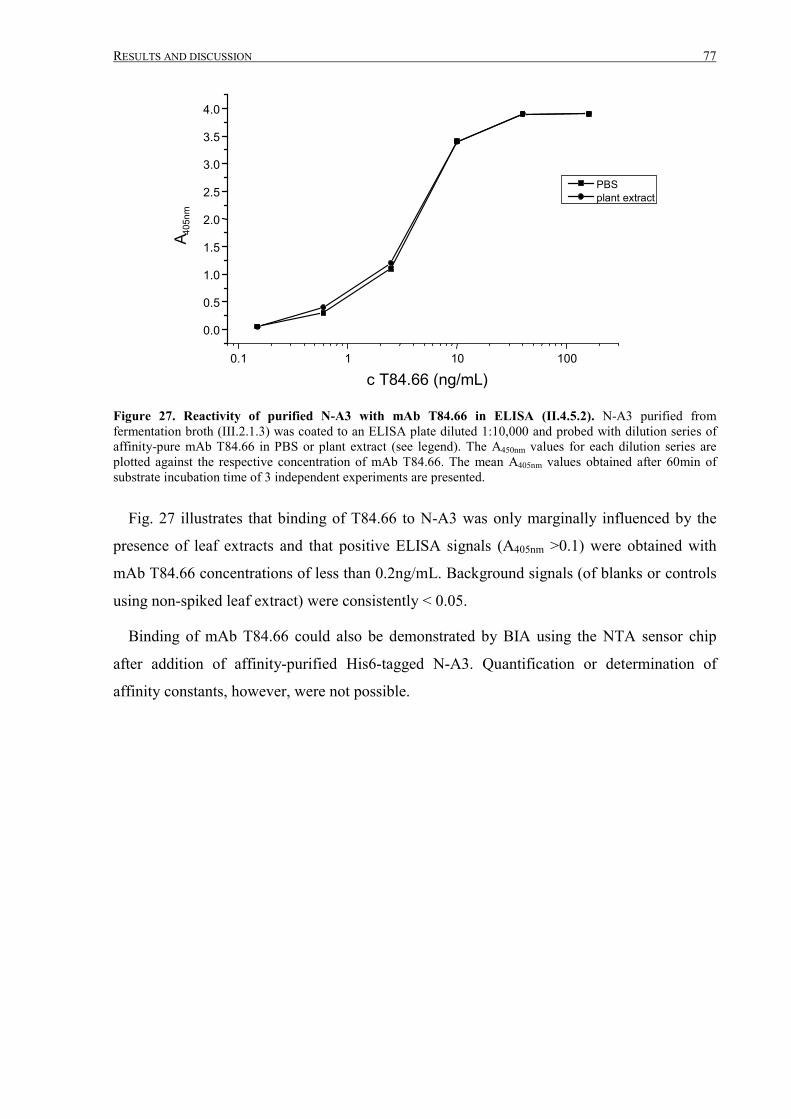
RESULTS AND DISCUSSION 77
0.1 1 10 100
0.0
0.5
1.0
1.5
2.0
2.5
3.0
3.5
4.0
PBS plant extract
A 405
nm
c T84.66 (ng/mL)
Figure 27. Reactivity of purified N-A3 with mAb T84.66 in ELISA (II.4.5.2). N-A3 purified fromfermentation broth (III.2.1.3) was coated to an ELISA plate diluted 1:10,000 and probed with dilution series ofaffinity-pure mAb T84.66 in PBS or plant extract (see legend). The A450nm values for each dilution series areplotted against the respective concentration of mAb T84.66. The mean A405nm values obtained after 60min ofsubstrate incubation time of 3 independent experiments are presented.
Fig. 27 illustrates that binding of T84.66 to N-A3 was only marginally influenced by the
presence of leaf extracts and that positive ELISA signals (A405nm >0.1) were obtained with
mAb T84.66 concentrations of less than 0.2ng/mL. Background signals (of blanks or controls
using non-spiked leaf extract) were consistently < 0.05.
Binding of mAb T84.66 could also be demonstrated by BIA using the NTA sensor chip
after addition of affinity-purified His6-tagged N-A3. Quantification or determination of
affinity constants, however, were not possible.
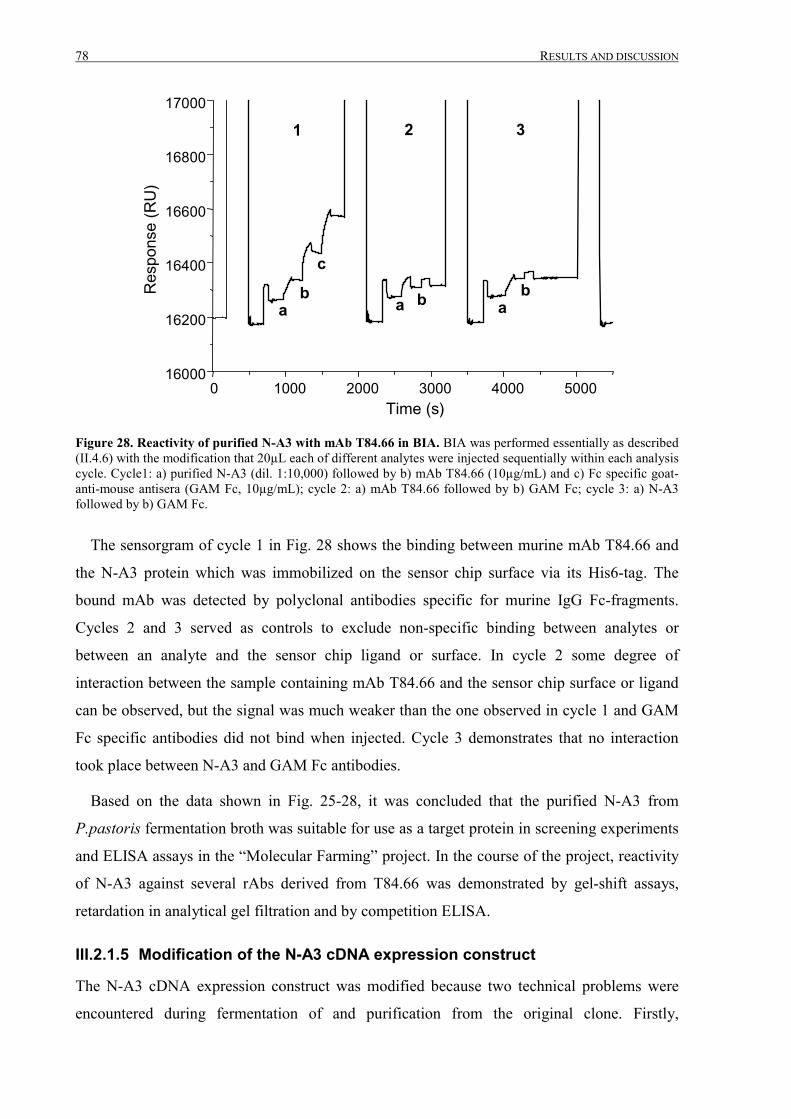
78 RESULTS AND DISCUSSION
0 1000 2000 3000 4000 500016000
16200
16400
16600
16800
17000
Res
pons
e (R
U)
Time (s)
1 2 3
ab
c
a b ab
Figure 28. Reactivity of purified N-A3 with mAb T84.66 in BIA. BIA was performed essentially as described(II.4.6) with the modification that 20µL each of different analytes were injected sequentially within each analysiscycle. Cycle1: a) purified N-A3 (dil. 1:10,000) followed by b) mAb T84.66 (10µg/mL) and c) Fc specific goat-anti-mouse antisera (GAM Fc, 10µg/mL); cycle 2: a) mAb T84.66 followed by b) GAM Fc; cycle 3: a) N-A3followed by b) GAM Fc.
The sensorgram of cycle 1 in Fig. 28 shows the binding between murine mAb T84.66 and
the N-A3 protein which was immobilized on the sensor chip surface via its His6-tag. The
bound mAb was detected by polyclonal antibodies specific for murine IgG Fc-fragments.
Cycles 2 and 3 served as controls to exclude non-specific binding between analytes or
between an analyte and the sensor chip ligand or surface. In cycle 2 some degree of
interaction between the sample containing mAb T84.66 and the sensor chip surface or ligand
can be observed, but the signal was much weaker than the one observed in cycle 1 and GAM
Fc specific antibodies did not bind when injected. Cycle 3 demonstrates that no interaction
took place between N-A3 and GAM Fc antibodies.
Based on the data shown in Fig. 25-28, it was concluded that the purified N-A3 from
P.pastoris fermentation broth was suitable for use as a target protein in screening experiments
and ELISA assays in the “Molecular Farming” project. In the course of the project, reactivity
of N-A3 against several rAbs derived from T84.66 was demonstrated by gel-shift assays,
retardation in analytical gel filtration and by competition ELISA.
III.2.1.5 Modification of the N-A3 cDNA expression construct
The N-A3 cDNA expression construct was modified because two technical problems were
encountered during fermentation of and purification from the original clone. Firstly,
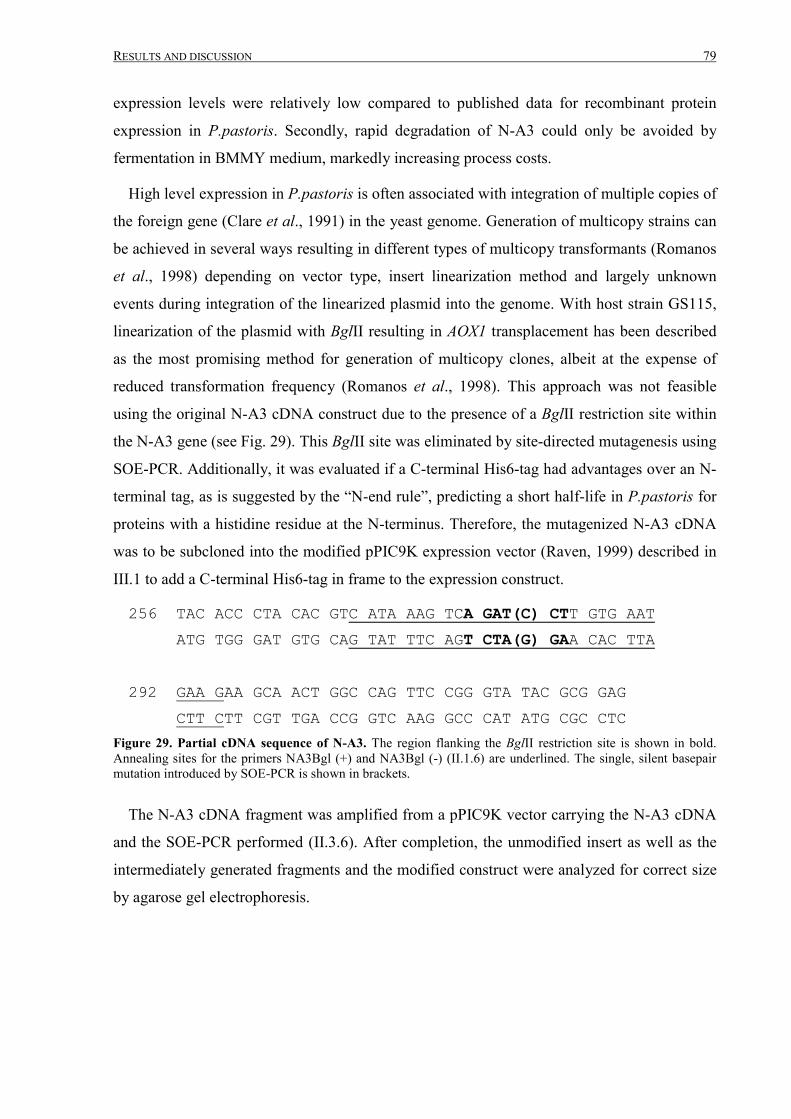
RESULTS AND DISCUSSION 79
expression levels were relatively low compared to published data for recombinant protein
expression in P.pastoris. Secondly, rapid degradation of N-A3 could only be avoided by
fermentation in BMMY medium, markedly increasing process costs.
High level expression in P.pastoris is often associated with integration of multiple copies of
the foreign gene (Clare et al., 1991) in the yeast genome. Generation of multicopy strains can
be achieved in several ways resulting in different types of multicopy transformants (Romanos
et al., 1998) depending on vector type, insert linearization method and largely unknown
events during integration of the linearized plasmid into the genome. With host strain GS115,
linearization of the plasmid with BglII resulting in AOX1 transplacement has been described
as the most promising method for generation of multicopy clones, albeit at the expense of
reduced transformation frequency (Romanos et al., 1998). This approach was not feasible
using the original N-A3 cDNA construct due to the presence of a BglII restriction site within
the N-A3 gene (see Fig. 29). This BglII site was eliminated by site-directed mutagenesis using
SOE-PCR. Additionally, it was evaluated if a C-terminal His6-tag had advantages over an N-
terminal tag, as is suggested by the “N-end rule”, predicting a short half-life in P.pastoris for
proteins with a histidine residue at the N-terminus. Therefore, the mutagenized N-A3 cDNA
was to be subcloned into the modified pPIC9K expression vector (Raven, 1999) described in
III.1 to add a C-terminal His6-tag in frame to the expression construct.
256 TAC ACC CTA CAC GTC ATA AAG TCA GAT(C) CTT GTG AAT ATG TGG GAT GTG CAG TAT TTC AGT CTA(G) GAA CAC TTA
292 GAA GAA GCA ACT GGC CAG TTC CGG GTA TAC GCG GAG
CTT CTT CGT TGA CCG GTC AAG GCC CAT ATG CGC CTCFigure 29. Partial cDNA sequence of N-A3. The region flanking the BglII restriction site is shown in bold.Annealing sites for the primers NA3Bgl (+) and NA3Bgl (-) (II.1.6) are underlined. The single, silent basepairmutation introduced by SOE-PCR is shown in brackets.
The N-A3 cDNA fragment was amplified from a pPIC9K vector carrying the N-A3 cDNA
and the SOE-PCR performed (II.3.6). After completion, the unmodified insert as well as the
intermediately generated fragments and the modified construct were analyzed for correct size
by agarose gel electrophoresis.
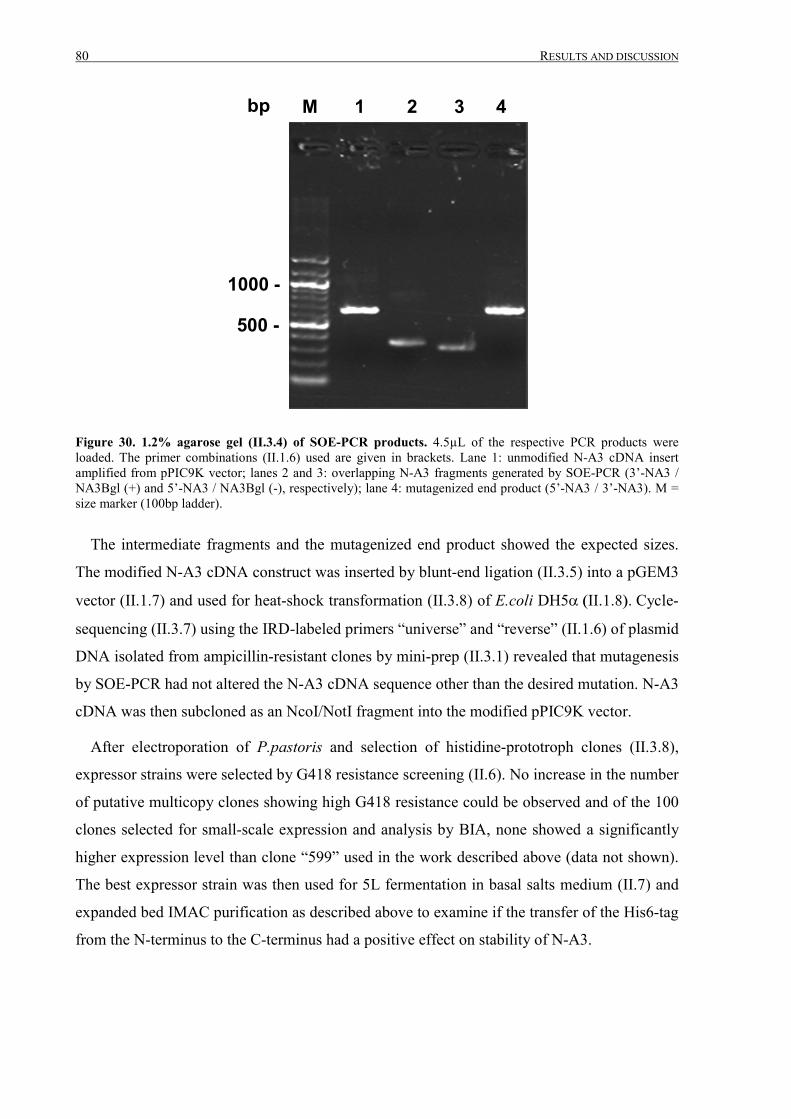
80 RESULTS AND DISCUSSION
M 1 2 3 4bp
1000 -
500 -
Figure 30. 1.2% agarose gel (II.3.4) of SOE-PCR products. 4.5µL of the respective PCR products wereloaded. The primer combinations (II.1.6) used are given in brackets. Lane 1: unmodified N-A3 cDNA insertamplified from pPIC9K vector; lanes 2 and 3: overlapping N-A3 fragments generated by SOE-PCR (3’-NA3 /NA3Bgl (+) and 5’-NA3 / NA3Bgl (-), respectively); lane 4: mutagenized end product (5’-NA3 / 3’-NA3). M =size marker (100bp ladder).
The intermediate fragments and the mutagenized end product showed the expected sizes.
The modified N-A3 cDNA construct was inserted by blunt-end ligation (II.3.5) into a pGEM3
vector (II.1.7) and used for heat-shock transformation (II.3.8) of E.coli DH5�����������Cycle-
sequencing (II.3.7) using the IRD-labeled primers “universe” and “reverse” (II.1.6) of plasmid
DNA isolated from ampicillin-resistant clones by mini-prep (II.3.1) revealed that mutagenesis
by SOE-PCR had not altered the N-A3 cDNA sequence other than the desired mutation. N-A3
cDNA was then subcloned as an NcoI/NotI fragment into the modified pPIC9K vector.
After electroporation of P.pastoris and selection of histidine-prototroph clones (II.3.8),
expressor strains were selected by G418 resistance screening (II.6). No increase in the number
of putative multicopy clones showing high G418 resistance could be observed and of the 100
clones selected for small-scale expression and analysis by BIA, none showed a significantly
higher expression level than clone “599” used in the work described above (data not shown).
The best expressor strain was then used for 5L fermentation in basal salts medium (II.7) and
expanded bed IMAC purification as described above to examine if the transfer of the His6-tag
from the N-terminus to the C-terminus had a positive effect on stability of N-A3.
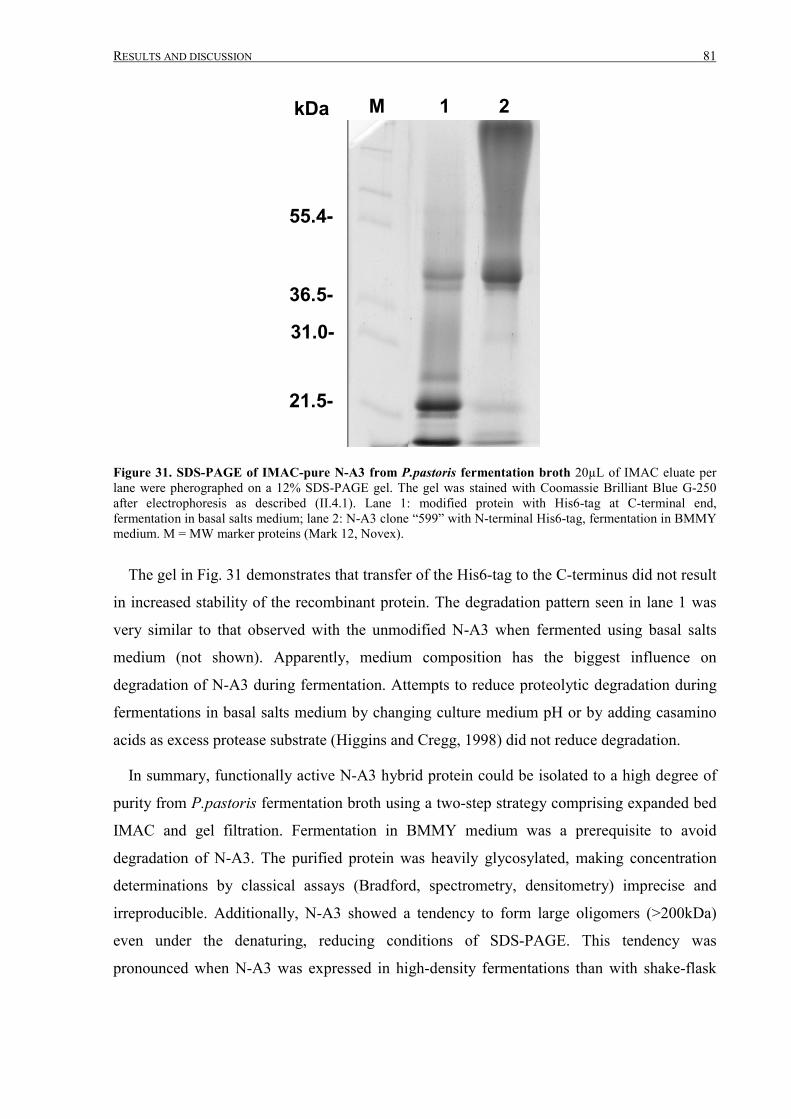
RESULTS AND DISCUSSION 81
M 1 2kDa
55.4-
36.5-
31.0-
21.5-
Figure 31. SDS-PAGE of IMAC-pure N-A3 from P.pastoris fermentation broth 20µL of IMAC eluate perlane were pherographed on a 12% SDS-PAGE gel. The gel was stained with Coomassie Brilliant Blue G-250after electrophoresis as described (II.4.1). Lane 1: modified protein with His6-tag at C-terminal end,fermentation in basal salts medium; lane 2: N-A3 clone “599” with N-terminal His6-tag, fermentation in BMMYmedium. M = MW marker proteins (Mark 12, Novex).
The gel in Fig. 31 demonstrates that transfer of the His6-tag to the C-terminus did not result
in increased stability of the recombinant protein. The degradation pattern seen in lane 1 was
very similar to that observed with the unmodified N-A3 when fermented using basal salts
medium (not shown). Apparently, medium composition has the biggest influence on
degradation of N-A3 during fermentation. Attempts to reduce proteolytic degradation during
fermentations in basal salts medium by changing culture medium pH or by adding casamino
acids as excess protease substrate (Higgins and Cregg, 1998) did not reduce degradation.
In summary, functionally active N-A3 hybrid protein could be isolated to a high degree of
purity from P.pastoris fermentation broth using a two-step strategy comprising expanded bed
IMAC and gel filtration. Fermentation in BMMY medium was a prerequisite to avoid
degradation of N-A3. The purified protein was heavily glycosylated, making concentration
determinations by classical assays (Bradford, spectrometry, densitometry) imprecise and
irreproducible. Additionally, N-A3 showed a tendency to form large oligomers (>200kDa)
even under the denaturing, reducing conditions of SDS-PAGE. This tendency was
pronounced when N-A3 was expressed in high-density fermentations than with shake-flask
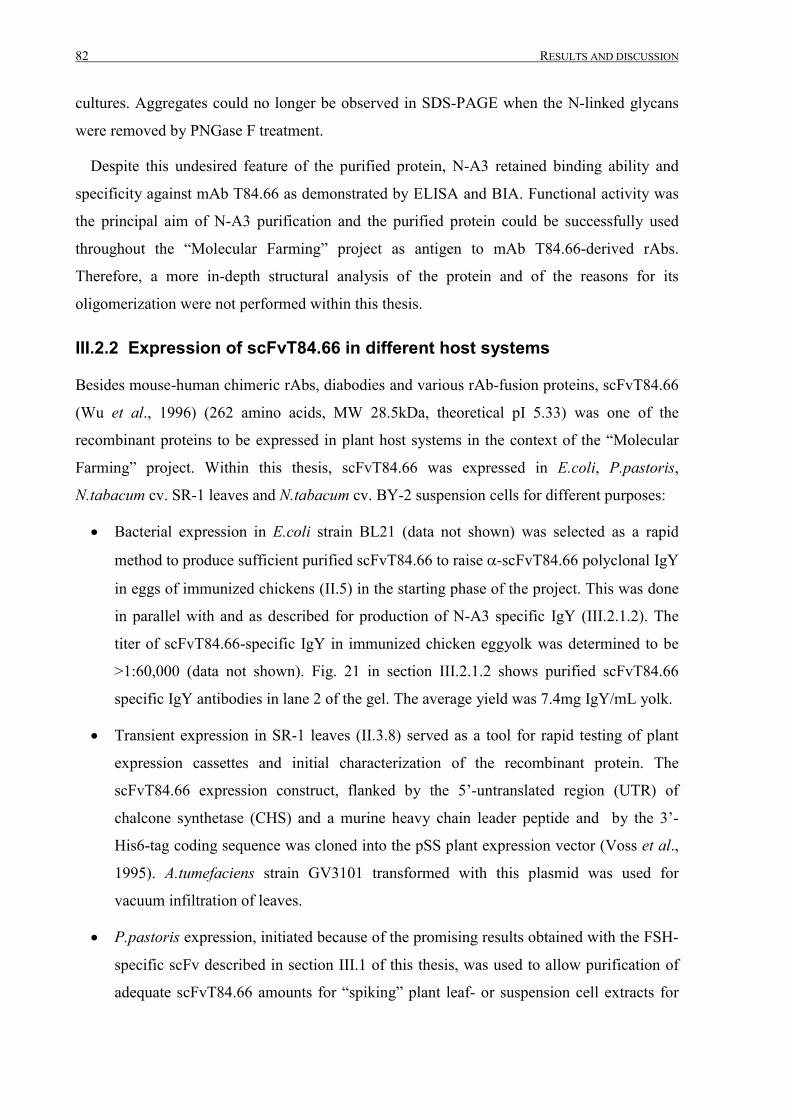
82 RESULTS AND DISCUSSION
cultures. Aggregates could no longer be observed in SDS-PAGE when the N-linked glycans
were removed by PNGase F treatment.
Despite this undesired feature of the purified protein, N-A3 retained binding ability and
specificity against mAb T84.66 as demonstrated by ELISA and BIA. Functional activity was
the principal aim of N-A3 purification and the purified protein could be successfully used
throughout the “Molecular Farming” project as antigen to mAb T84.66-derived rAbs.
Therefore, a more in-depth structural analysis of the protein and of the reasons for its
oligomerization were not performed within this thesis.
III.2.2 Expression of scFvT84.66 in different host systems
Besides mouse-human chimeric rAbs, diabodies and various rAb-fusion proteins, scFvT84.66
(Wu et al., 1996) (262 amino acids, MW 28.5kDa, theoretical pI 5.33) was one of the
recombinant proteins to be expressed in plant host systems in the context of the “Molecular
Farming” project. Within this thesis, scFvT84.66 was expressed in E.coli, P.pastoris,
N.tabacum cv. SR-1 leaves and N.tabacum cv. BY-2 suspension cells for different purposes:
Bacterial expression in E.coli strain BL21 (data not shown) was selected as a rapid
method to produce sufficient purified scFvT84.66 to raise �-scFvT84.66 polyclonal IgY
in eggs of immunized chickens (II.5) in the starting phase of the project. This was done
in parallel with and as described for production of N-A3 specific IgY (III.2.1.2). The
titer of scFvT84.66-specific IgY in immunized chicken eggyolk was determined to be
>1:60,000 (data not shown). Fig. 21 in section III.2.1.2 shows purified scFvT84.66
specific IgY antibodies in lane 2 of the gel. The average yield was 7.4mg IgY/mL yolk.
Transient expression in SR-1 leaves (II.3.8) served as a tool for rapid testing of plant
expression cassettes and initial characterization of the recombinant protein. The
scFvT84.66 expression construct, flanked by the 5’-untranslated region (UTR) of
chalcone synthetase (CHS) and a murine heavy chain leader peptide and by the 3’-
His6-tag coding sequence was cloned into the pSS plant expression vector (Voss et al.,
1995). A.tumefaciens strain GV3101 transformed with this plasmid was used for
vacuum infiltration of leaves.
P.pastoris expression, initiated because of the promising results obtained with the FSH-
specific scFv described in section III.1 of this thesis, was used to allow purification of
adequate scFvT84.66 amounts for “spiking” plant leaf- or suspension cell extracts for
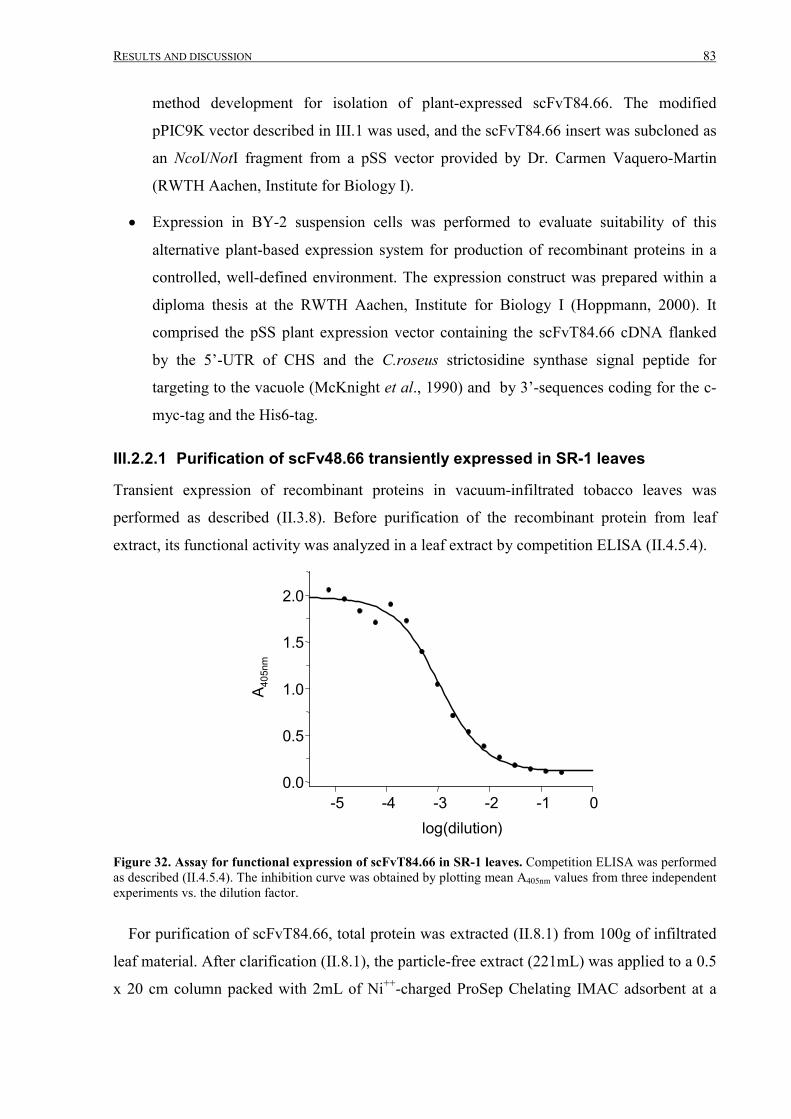
RESULTS AND DISCUSSION 83
method development for isolation of plant-expressed scFvT84.66. The modified
pPIC9K vector described in III.1 was used, and the scFvT84.66 insert was subcloned as
an NcoI/NotI fragment from a pSS vector provided by Dr. Carmen Vaquero-Martin
(RWTH Aachen, Institute for Biology I).
Expression in BY-2 suspension cells was performed to evaluate suitability of this
alternative plant-based expression system for production of recombinant proteins in a
controlled, well-defined environment. The expression construct was prepared within a
diploma thesis at the RWTH Aachen, Institute for Biology I (Hoppmann, 2000). It
comprised the pSS plant expression vector containing the scFvT84.66 cDNA flanked
by the 5’-UTR of CHS and the C.roseus strictosidine synthase signal peptide for
targeting to the vacuole (McKnight et al., 1990) and by 3’-sequences coding for the c-
myc-tag and the His6-tag.
III.2.2.1 Purification of scFv48.66 transiently expressed in SR-1 leaves
Transient expression of recombinant proteins in vacuum-infiltrated tobacco leaves was
performed as described (II.3.8). Before purification of the recombinant protein from leaf
extract, its functional activity was analyzed in a leaf extract by competition ELISA (II.4.5.4).
-5 -4 -3 -2 -1 00.0
0.5
1.0
1.5
2.0
log(dilution)
A 405
nm
Figure 32. Assay for functional expression of scFvT84.66 in SR-1 leaves. Competition ELISA was performedas described (II.4.5.4). The inhibition curve was obtained by plotting mean A405nm values from three independentexperiments vs. the dilution factor.
For purification of scFvT84.66, total protein was extracted (II.8.1) from 100g of infiltrated
leaf material. After clarification (II.8.1), the particle-free extract (221mL) was applied to a 0.5
x 20 cm column packed with 2mL of Ni++-charged ProSep Chelating IMAC adsorbent at a
84 RESULTS AND DISCUSSION
flow rate of 600cm/h. After sample application and washing with 5CV of binding buffer
(10mM phosphate, 1M NaCl pH7.4), a two-step gradient elution was performed with 2CV of
binding buffer containing 25mM imidazole followed by 2CV of binding buffer containing
250mM of imidazole. UV-absorbent fractions were collected and analyzed by SDS-PAGE
and Western Blot.
scFvT84.66
1 2 3 4 5 6 1 2 3 4 5 6A B
Figure 33. IMAC-purification (II.8.3.1) of scFvT84.66 transiently expressed in SR-1 leaves. 10µL of sampleper lane were pherographed on a 12% SDS-PAGE gel (II.4.1). Panel A: the gel was stained with CoomassieBrilliant Blue G-250 after electrophoresis (II.4.1). Panel B: the proteins were blotted onto nitrocellulose anddetection performed with �-His6-tag antibody (II.4.2). Lane 1: clarified extract from vacuum-infiltrated tobaccoSR-1 leaves (II.8.1); lane 2: column flowthrough; lane 3: wash; lane 4: 25mM imidazole elution; lanes 5 and 6:250mM imidazole elution (two consecutive 2mL fractions).
Fig. 33 shows the efficient capture of scFvT84.66 from leaf extract by IMAC. The target
protein was enriched in the 250mM imidazole elution fractions, although the increase in
signal in the Western Blot (panel B) was less pronounced than expected from the feed : eluate
volume ratio. No His6-tagged protein could be detected in the column flowthrough and wash,
and only a minor portion of the target protein eluted in the 25mM imidazole step, while a
considerable amount of weakly bound material was removed from the column by this
imidazole concentration. Obviously, a number of proteins present in the plant extract bound
weakly to the adsorbent with possible consequences on its binding capacity. This non-specific
binding was also observed when attempting to monitor the purification by BIA. Injection of
extract from infiltrated leaves or non-treated leaves on the NTA sensor chip resulted in
indistinguishable binding curves and baseline shifts >2000 RU which could not be attributed
to specific binding of His6-tagged protein (data not shown). Similar results were obtained
with BY-2 extracts, so BIA was judged to be not suitable for direct analysis of plant-
expressed His6-tagged proteins.
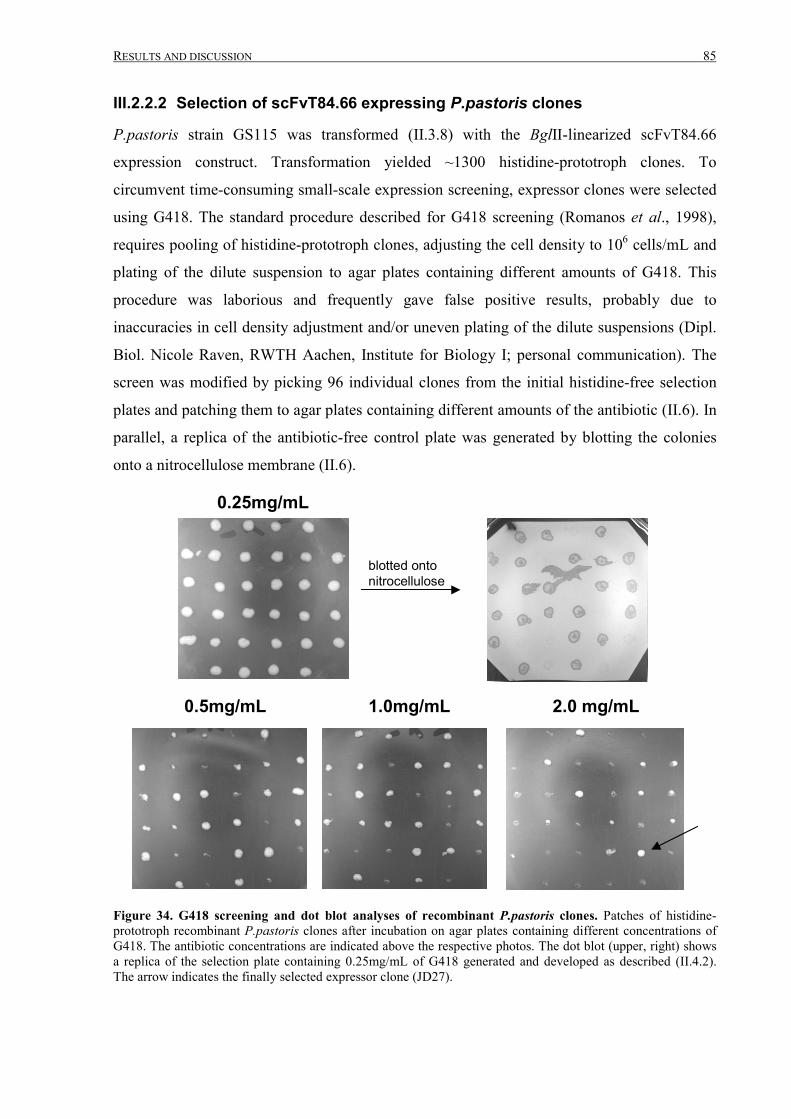
RESULTS AND DISCUSSION 85
III.2.2.2 Selection of scFvT84.66 expressing P.pastoris clones
P.pastoris strain GS115 was transformed (II.3.8) with the BglII-linearized scFvT84.66
expression construct. Transformation yielded ~1300 histidine-prototroph clones. To
circumvent time-consuming small-scale expression screening, expressor clones were selected
using G418. The standard procedure described for G418 screening (Romanos et al., 1998),
requires pooling of histidine-prototroph clones, adjusting the cell density to 106 cells/mL and
plating of the dilute suspension to agar plates containing different amounts of G418. This
procedure was laborious and frequently gave false positive results, probably due to
inaccuracies in cell density adjustment and/or uneven plating of the dilute suspensions (Dipl.
Biol. Nicole Raven, RWTH Aachen, Institute for Biology I; personal communication). The
screen was modified by picking 96 individual clones from the initial histidine-free selection
plates and patching them to agar plates containing different amounts of the antibiotic (II.6). In
parallel, a replica of the antibiotic-free control plate was generated by blotting the colonies
onto a nitrocellulose membrane (II.6).
0.25mg/mL
0.5mg/mL 1.0mg/mL 2.0 mg/mL
blotted ontonitrocellulose
Figure 34. G418 screening and dot blot analyses of recombinant P.pastoris clones. Patches of histidine-prototroph recombinant P.pastoris clones after incubation on agar plates containing different concentrations ofG418. The antibiotic concentrations are indicated above the respective photos. The dot blot (upper, right) showsa replica of the selection plate containing 0.25mg/mL of G418 generated and developed as described (II.4.2).The arrow indicates the finally selected expressor clone (JD27).
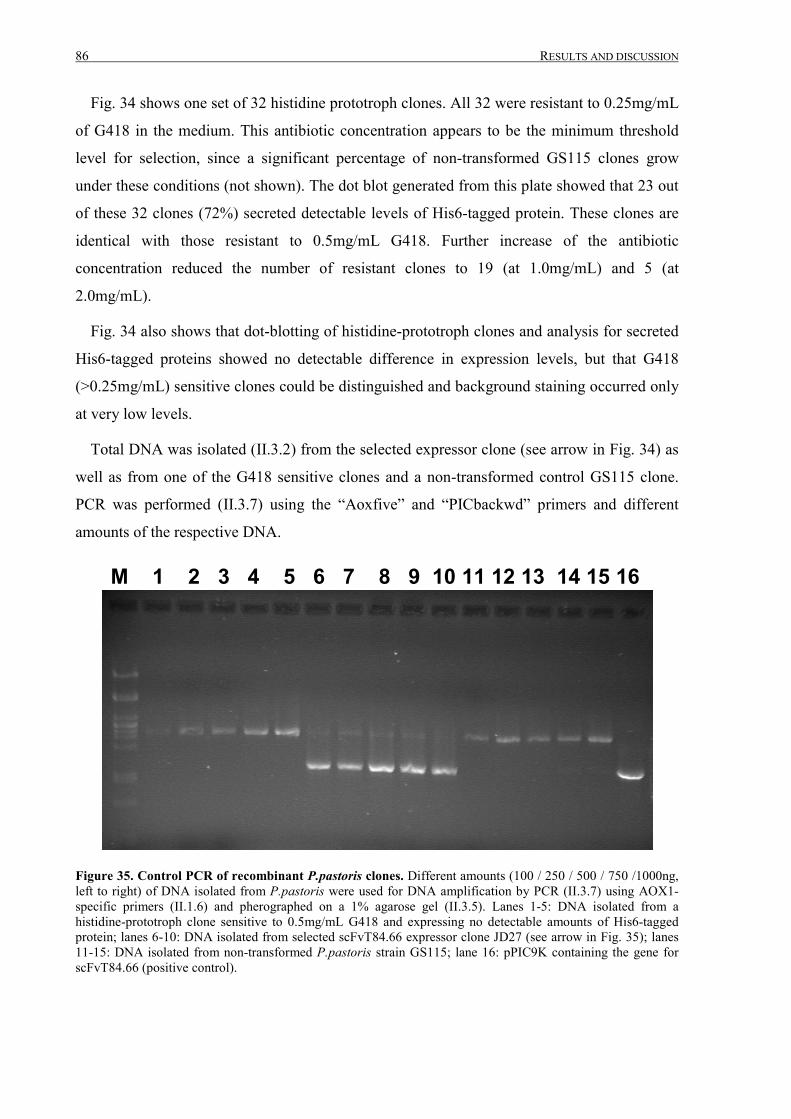
86 RESULTS AND DISCUSSION
Fig. 34 shows one set of 32 histidine prototroph clones. All 32 were resistant to 0.25mg/mL
of G418 in the medium. This antibiotic concentration appears to be the minimum threshold
level for selection, since a significant percentage of non-transformed GS115 clones grow
under these conditions (not shown). The dot blot generated from this plate showed that 23 out
of these 32 clones (72%) secreted detectable levels of His6-tagged protein. These clones are
identical with those resistant to 0.5mg/mL G418. Further increase of the antibiotic
concentration reduced the number of resistant clones to 19 (at 1.0mg/mL) and 5 (at
2.0mg/mL).
Fig. 34 also shows that dot-blotting of histidine-prototroph clones and analysis for secreted
His6-tagged proteins showed no detectable difference in expression levels, but that G418
(>0.25mg/mL) sensitive clones could be distinguished and background staining occurred only
at very low levels.
Total DNA was isolated (II.3.2) from the selected expressor clone (see arrow in Fig. 34) as
well as from one of the G418 sensitive clones and a non-transformed control GS115 clone.
PCR was performed (II.3.7) using the “Aoxfive” and “PICbackwd” primers and different
amounts of the respective DNA.
M 1 2 3 4 5 6 7 8 9 10 11 12 13 14 15 16
Figure 35. Control PCR of recombinant P.pastoris clones. Different amounts (100 / 250 / 500 / 750 /1000ng,left to right) of DNA isolated from P.pastoris were used for DNA amplification by PCR (II.3.7) using AOX1-specific primers (II.1.6) and pherographed on a 1% agarose gel (II.3.5). Lanes 1-5: DNA isolated from ahistidine-prototroph clone sensitive to 0.5mg/mL G418 and expressing no detectable amounts of His6-taggedprotein; lanes 6-10: DNA isolated from selected scFvT84.66 expressor clone JD27 (see arrow in Fig. 35); lanes11-15: DNA isolated from non-transformed P.pastoris strain GS115; lane 16: pPIC9K containing the gene forscFvT84.66 (positive control).
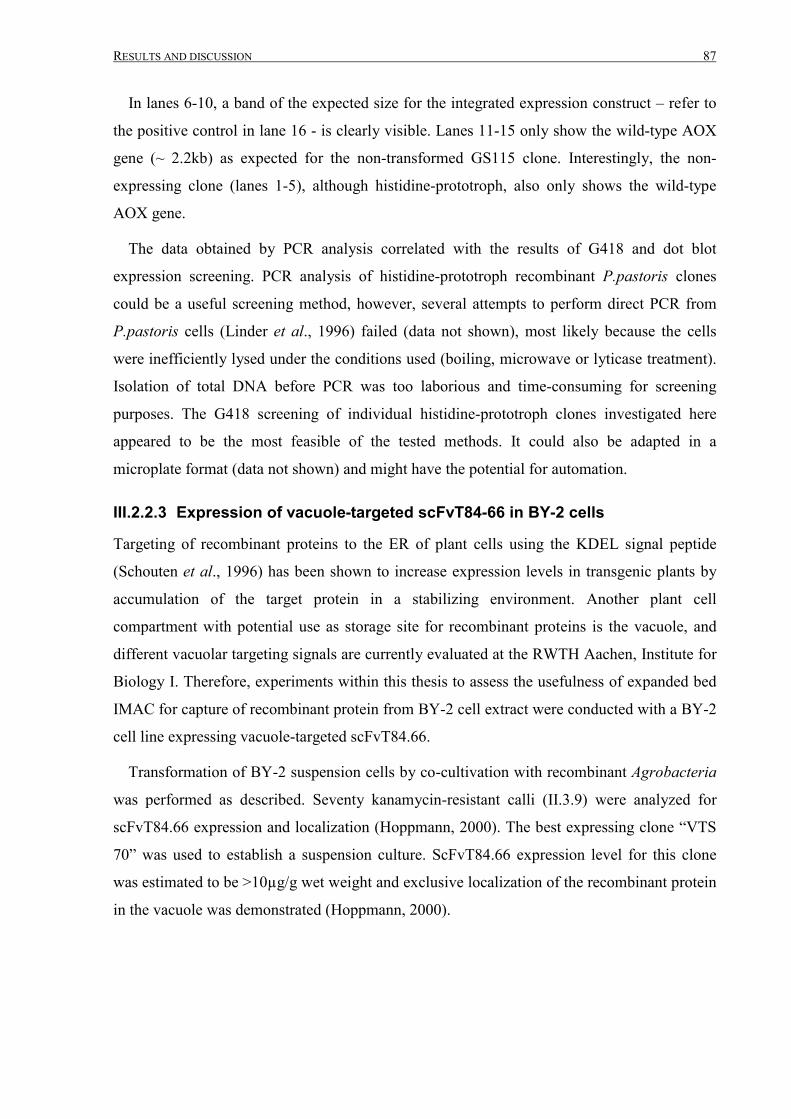
RESULTS AND DISCUSSION 87
In lanes 6-10, a band of the expected size for the integrated expression construct – refer to
the positive control in lane 16 - is clearly visible. Lanes 11-15 only show the wild-type AOX
gene (~ 2.2kb) as expected for the non-transformed GS115 clone. Interestingly, the non-
expressing clone (lanes 1-5), although histidine-prototroph, also only shows the wild-type
AOX gene.
The data obtained by PCR analysis correlated with the results of G418 and dot blot
expression screening. PCR analysis of histidine-prototroph recombinant P.pastoris clones
could be a useful screening method, however, several attempts to perform direct PCR from
P.pastoris cells (Linder et al., 1996) failed (data not shown), most likely because the cells
were inefficiently lysed under the conditions used (boiling, microwave or lyticase treatment).
Isolation of total DNA before PCR was too laborious and time-consuming for screening
purposes. The G418 screening of individual histidine-prototroph clones investigated here
appeared to be the most feasible of the tested methods. It could also be adapted in a
microplate format (data not shown) and might have the potential for automation.
III.2.2.3 Expression of vacuole-targeted scFvT84-66 in BY-2 cells
Targeting of recombinant proteins to the ER of plant cells using the KDEL signal peptide
(Schouten et al., 1996) has been shown to increase expression levels in transgenic plants by
accumulation of the target protein in a stabilizing environment. Another plant cell
compartment with potential use as storage site for recombinant proteins is the vacuole, and
different vacuolar targeting signals are currently evaluated at the RWTH Aachen, Institute for
Biology I. Therefore, experiments within this thesis to assess the usefulness of expanded bed
IMAC for capture of recombinant protein from BY-2 cell extract were conducted with a BY-2
cell line expressing vacuole-targeted scFvT84.66.
Transformation of BY-2 suspension cells by co-cultivation with recombinant Agrobacteria
was performed as described. Seventy kanamycin-resistant calli (II.3.9) were analyzed for
scFvT84.66 expression and localization (Hoppmann, 2000). The best expressing clone “VTS
70” was used to establish a suspension culture. ScFvT84.66 expression level for this clone
was estimated to be >10µg/g wet weight and exclusive localization of the recombinant protein
in the vacuole was demonstrated (Hoppmann, 2000).
88 RESULTS AND DISCUSSION
III.2.2.4 Fermentation, IMAC purification and analysis
The selected scFvT84.66 clones JD27 (P.pastoris) and VTS70 (BY-2) were used for shake-
flask cultivation. P.pastoris culture supernatant and BY-2 total soluble protein extract were
analyzed for scFvT84.66 expression by Western Blot.
1 2 3 M
- 32.5
- 47.5
- 25.0
kDa
Figure 36. Expression of scFvT84.66 in P.pastoris and BY-2. 7.5µL of sample per lane were pherographed ona 12% SDS-PAGE gel (II.4.1) and subsequently blotted onto nitrocellulose (II.4.1). Detection of scFvT84.66 onthe blot was performed with �-His6 tag antibody as described (II.4.2). Lane 1: P.pastoris clone JD27 (III.2.2.2),shake-flask culture supernatant; lane 2: BY-2 clone VTS70, total soluble protein extract (TSP); lane 3: non-transformed BY-2, TSP. M = MW marker proteins (prestained MW standard kit, New England Biolabs).
Surprisingly, two prominent bands of approximately the expected size for scFvT84.66 as
well a variety of additional bands were visible in the P.pastoris culture supernatant (lane 1),
indicating heterogeneity of the expressed recombinant protein as well as fragmentation,
possibly caused by proteolysis. The BY-2 protein extract (lane 2) showed only one distinct
band of the expected size, the slightly higher apparent MW compared to the P.pastoris-
expressed scFv could be attributed to the presence of the C-terminal c-myc-tag. Two of the
additional higher MW bands visible in lane 2 represented plant proteins, as they were present
in the wild-type BY-2 extract (lane 3).
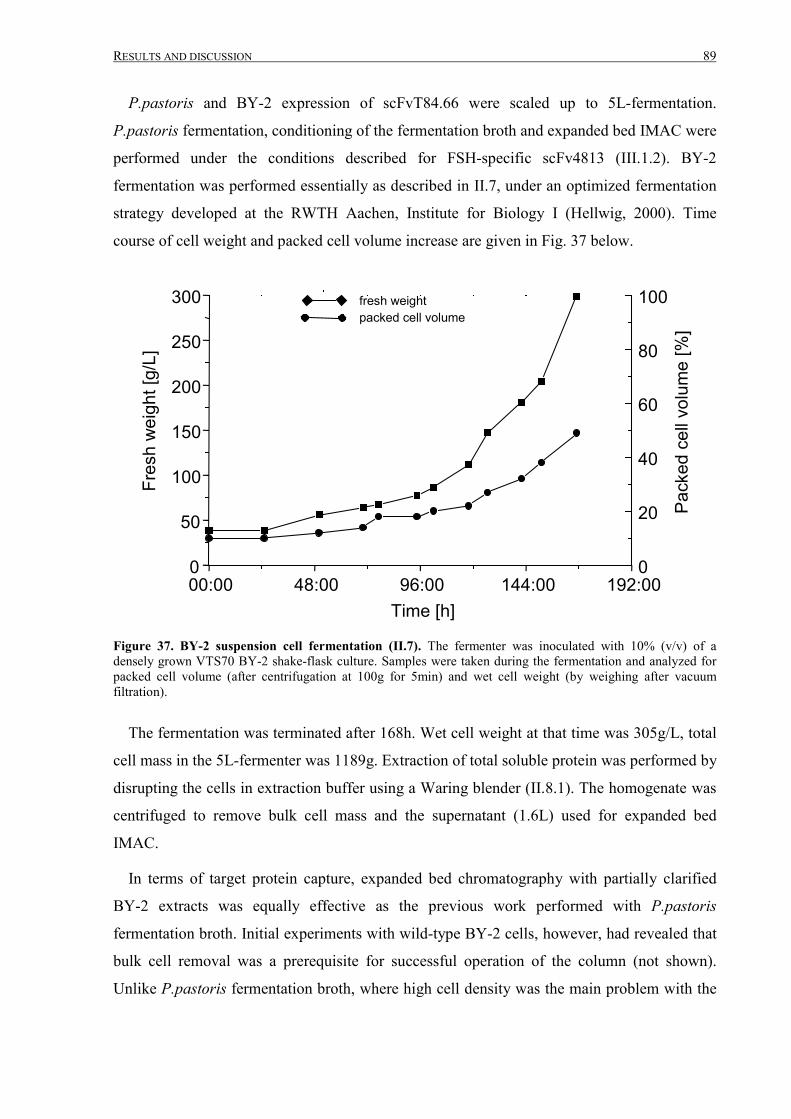
RESULTS AND DISCUSSION 89
P.pastoris and BY-2 expression of scFvT84.66 were scaled up to 5L-fermentation.
P.pastoris fermentation, conditioning of the fermentation broth and expanded bed IMAC were
performed under the conditions described for FSH-specific scFv4813 (III.1.2). BY-2
fermentation was performed essentially as described in II.7, under an optimized fermentation
strategy developed at the RWTH Aachen, Institute for Biology I (Hellwig, 2000). Time
course of cell weight and packed cell volume increase are given in Fig. 37 below.
00:00 48:00 96:00 144:00 192:00
Fres
h w
eigh
t [g/
L]
Time [h]
20
40
60
80
100
0
50
100
150
200
250
300
0
Pack
ed c
ell v
olum
e [%
]
fresh weightpacked cell volume
Figure 37. BY-2 suspension cell fermentation (II.7). The fermenter was inoculated with 10% (v/v) of adensely grown VTS70 BY-2 shake-flask culture. Samples were taken during the fermentation and analyzed forpacked cell volume (after centrifugation at 100g for 5min) and wet cell weight (by weighing after vacuumfiltration).
The fermentation was terminated after 168h. Wet cell weight at that time was 305g/L, total
cell mass in the 5L-fermenter was 1189g. Extraction of total soluble protein was performed by
disrupting the cells in extraction buffer using a Waring blender (II.8.1). The homogenate was
centrifuged to remove bulk cell mass and the supernatant (1.6L) used for expanded bed
IMAC.
In terms of target protein capture, expanded bed chromatography with partially clarified
BY-2 extracts was equally effective as the previous work performed with P.pastoris
fermentation broth. Initial experiments with wild-type BY-2 cells, however, had revealed that
bulk cell removal was a prerequisite for successful operation of the column (not shown).
Unlike P.pastoris fermentation broth, where high cell density was the main problem with the
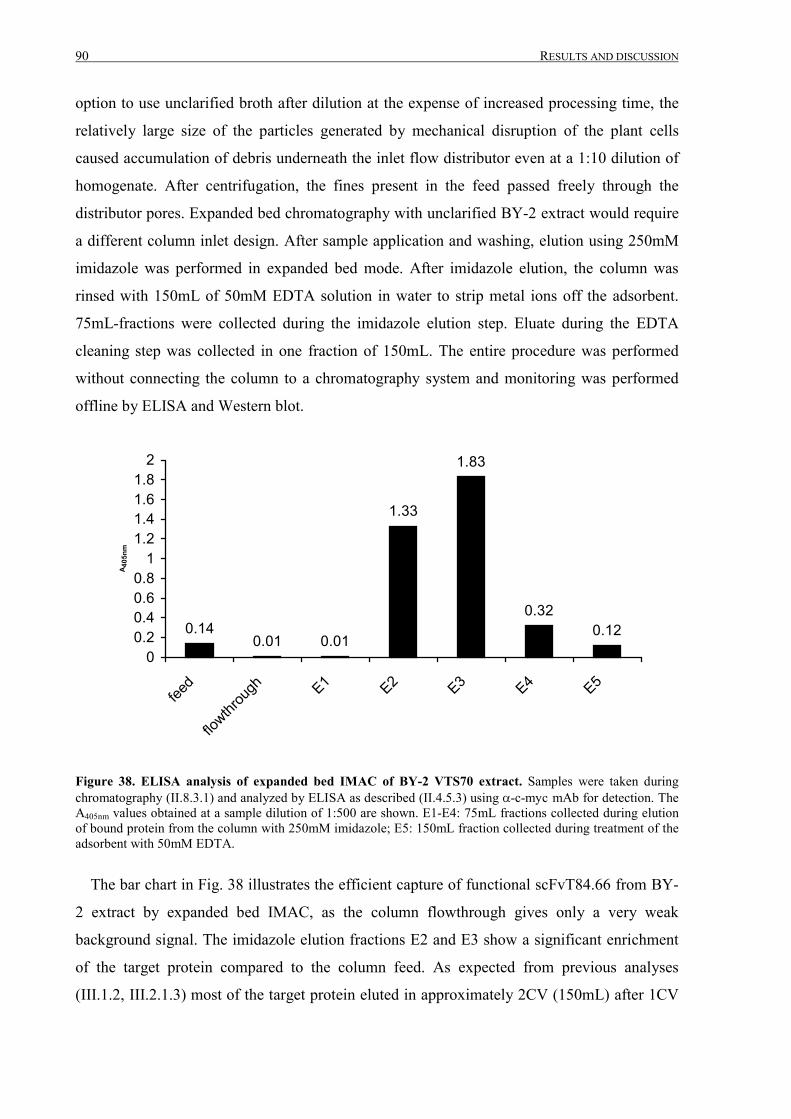
90 RESULTS AND DISCUSSION
option to use unclarified broth after dilution at the expense of increased processing time, the
relatively large size of the particles generated by mechanical disruption of the plant cells
caused accumulation of debris underneath the inlet flow distributor even at a 1:10 dilution of
homogenate. After centrifugation, the fines present in the feed passed freely through the
distributor pores. Expanded bed chromatography with unclarified BY-2 extract would require
a different column inlet design. After sample application and washing, elution using 250mM
imidazole was performed in expanded bed mode. After imidazole elution, the column was
rinsed with 150mL of 50mM EDTA solution in water to strip metal ions off the adsorbent.
75mL-fractions were collected during the imidazole elution step. Eluate during the EDTA
cleaning step was collected in one fraction of 150mL. The entire procedure was performed
without connecting the column to a chromatography system and monitoring was performed
offline by ELISA and Western blot.
0.140.01 0.01
1.33
1.83
0.320.12
00.20.40.60.8
11.21.41.61.8
2
feed
flowthr
ough E1 E2 E3 E4 E5
A 405
nm
Figure 38. ELISA analysis of expanded bed IMAC of BY-2 VTS70 extract. Samples were taken duringchromatography (II.8.3.1) and analyzed by ELISA as described (II.4.5.3) using �-c-myc mAb for detection. TheA405nm values obtained at a sample dilution of 1:500 are shown. E1-E4: 75mL fractions collected during elutionof bound protein from the column with 250mM imidazole; E5: 150mL fraction collected during treatment of theadsorbent with 50mM EDTA.
The bar chart in Fig. 38 illustrates the efficient capture of functional scFvT84.66 from BY-
2 extract by expanded bed IMAC, as the column flowthrough gives only a very weak
background signal. The imidazole elution fractions E2 and E3 show a significant enrichment
of the target protein compared to the column feed. As expected from previous analyses
(III.1.2, III.2.1.3) most of the target protein eluted in approximately 2CV (150mL) after 1CV
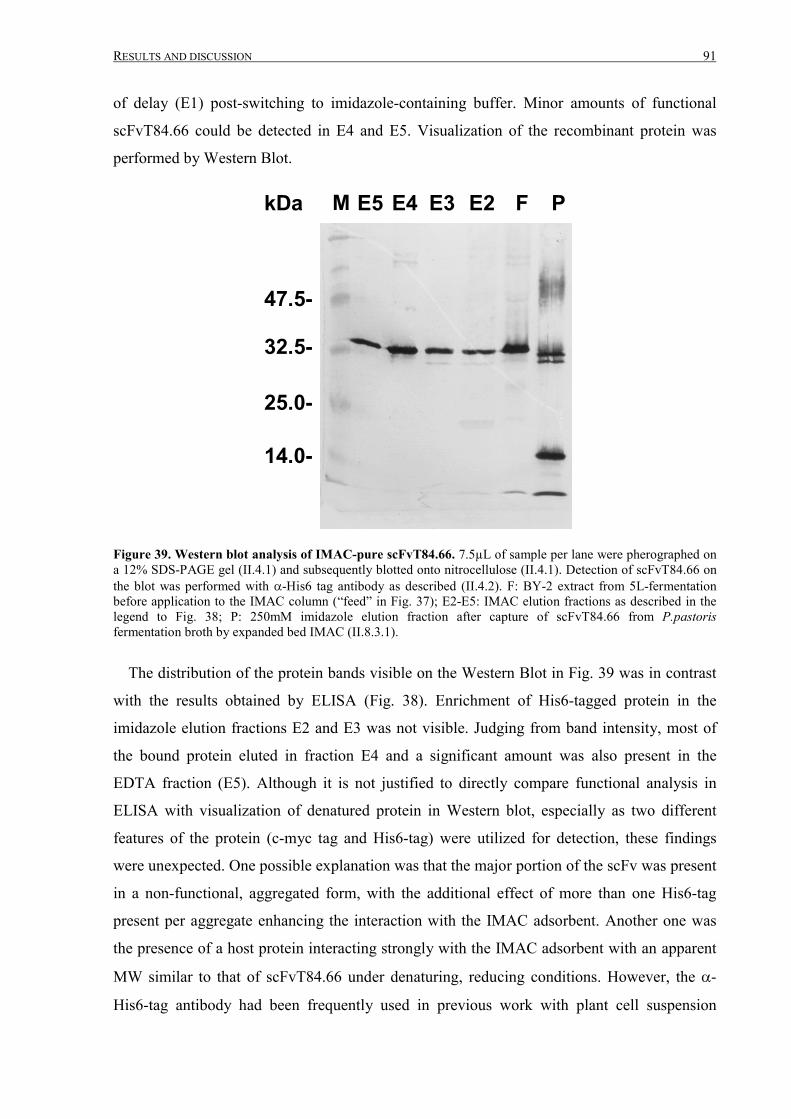
RESULTS AND DISCUSSION 91
of delay (E1) post-switching to imidazole-containing buffer. Minor amounts of functional
scFvT84.66 could be detected in E4 and E5. Visualization of the recombinant protein was
performed by Western Blot.
MkDa
47.5-
25.0-
32.5-
14.0-
E4 E3 E2 F PE5
Figure 39. Western blot analysis of IMAC-pure scFvT84.66. 7.5µL of sample per lane were pherographed ona 12% SDS-PAGE gel (II.4.1) and subsequently blotted onto nitrocellulose (II.4.1). Detection of scFvT84.66 onthe blot was performed with �-His6 tag antibody as described (II.4.2). F: BY-2 extract from 5L-fermentationbefore application to the IMAC column (“feed” in Fig. 37); E2-E5: IMAC elution fractions as described in thelegend to Fig. 38; P: 250mM imidazole elution fraction after capture of scFvT84.66 from P.pastorisfermentation broth by expanded bed IMAC (II.8.3.1).
The distribution of the protein bands visible on the Western Blot in Fig. 39 was in contrast
with the results obtained by ELISA (Fig. 38). Enrichment of His6-tagged protein in the
imidazole elution fractions E2 and E3 was not visible. Judging from band intensity, most of
the bound protein eluted in fraction E4 and a significant amount was also present in the
EDTA fraction (E5). Although it is not justified to directly compare functional analysis in
ELISA with visualization of denatured protein in Western blot, especially as two different
features of the protein (c-myc tag and His6-tag) were utilized for detection, these findings
were unexpected. One possible explanation was that the major portion of the scFv was present
in a non-functional, aggregated form, with the additional effect of more than one His6-tag
present per aggregate enhancing the interaction with the IMAC adsorbent. Another one was
the presence of a host protein interacting strongly with the IMAC adsorbent with an apparent
MW similar to that of scFvT84.66 under denaturing, reducing conditions. However, the �-
His6-tag antibody had been frequently used in previous work with plant cell suspension
92 RESULTS AND DISCUSSION
extracts, and crossreactivity with host proteins in wild-type or transgenic lines had always
followed the pattern as presented in Fig. 36, lane3. Therefore, if a co-purified host protein was
the reason for the unexpected results, it could be assumed that it was associated with the
introduction of the transgene into the plant cell genome.
ScFvT84.66 from P.pastoris fermentation broth (“P” in Fig. 39) had apparently undergone
significant degradation, visible as a prominent band at ~15kDa. A band of this size had also
been found in Western blot analysis of shake-flask supernatant (Fig. 36), but in much smaller
amounts. As seen with shake- flask supernatant analysis, two distinct bands reactive with �-
His6-tag antibody appeared on the blot corresponding to an apparent MW of ~30kDa, as
expected for scFvT84.66.
Although expanded bed IMAC for capture of the target protein had been successful in
removing the target protein from fermentation broth and plant cell extract, the results
presented above suggested a more detailed analysis of the partially purified protein before
further purification. Several of the samples shown in Fig. 39 were dialyzed against
bicarbonate buffer, vacuum-dried and analyzed by LC-MS/MS after in-gel tryptic digestion.
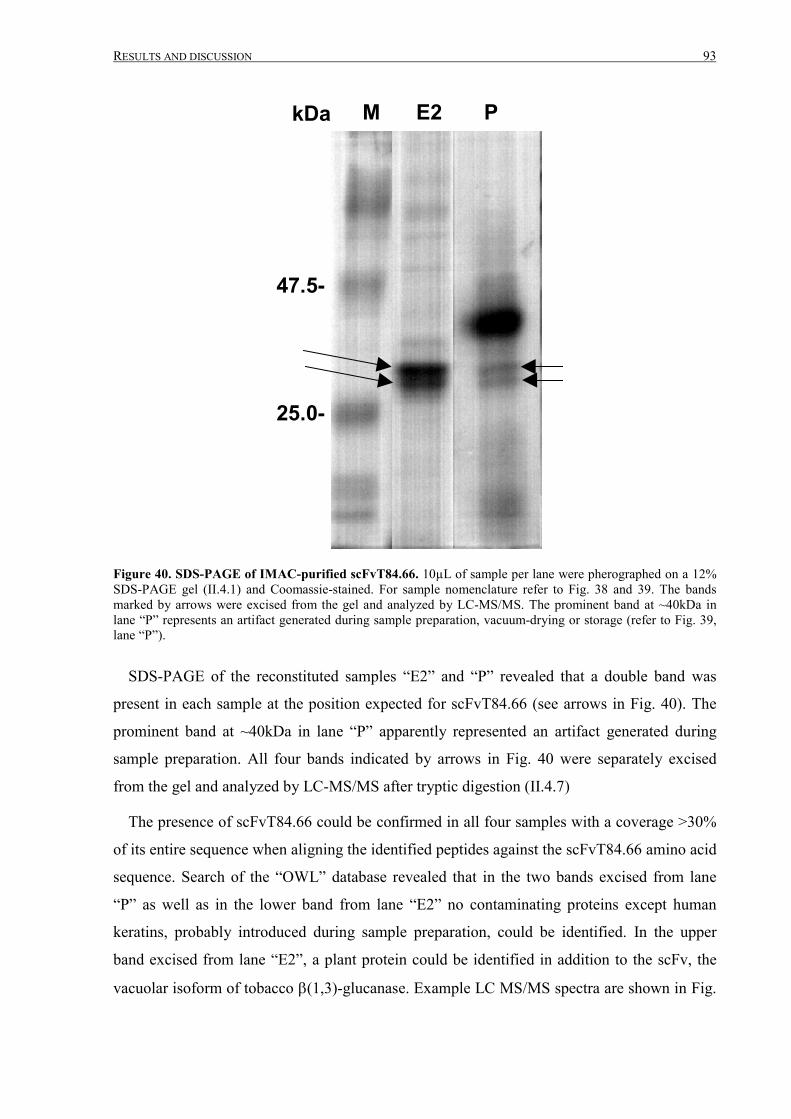
RESULTS AND DISCUSSION 93
M E2 PkDa
25.0-
47.5-
Figure 40. SDS-PAGE of IMAC-purified scFvT84.66. 10µL of sample per lane were pherographed on a 12%SDS-PAGE gel (II.4.1) and Coomassie-stained. For sample nomenclature refer to Fig. 38 and 39. The bandsmarked by arrows were excised from the gel and analyzed by LC-MS/MS. The prominent band at ~40kDa inlane “P” represents an artifact generated during sample preparation, vacuum-drying or storage (refer to Fig. 39,lane “P”).
SDS-PAGE of the reconstituted samples “E2” and “P” revealed that a double band was
present in each sample at the position expected for scFvT84.66 (see arrows in Fig. 40). The
prominent band at ~40kDa in lane “P” apparently represented an artifact generated during
sample preparation. All four bands indicated by arrows in Fig. 40 were separately excised
from the gel and analyzed by LC-MS/MS after tryptic digestion (II.4.7)
The presence of scFvT84.66 could be confirmed in all four samples with a coverage >30%
of its entire sequence when aligning the identified peptides against the scFvT84.66 amino acid
sequence. Search of the “OWL” database revealed that in the two bands excised from lane
“P” as well as in the lower band from lane “E2” no contaminating proteins except human
keratins, probably introduced during sample preparation, could be identified. In the upper
band excised from lane “E2”, a plant protein could be identified in addition to the scFv, the
vacuolar isoform of tobacco �(1,3)-glucanase. Example LC MS/MS spectra are shown in Fig.
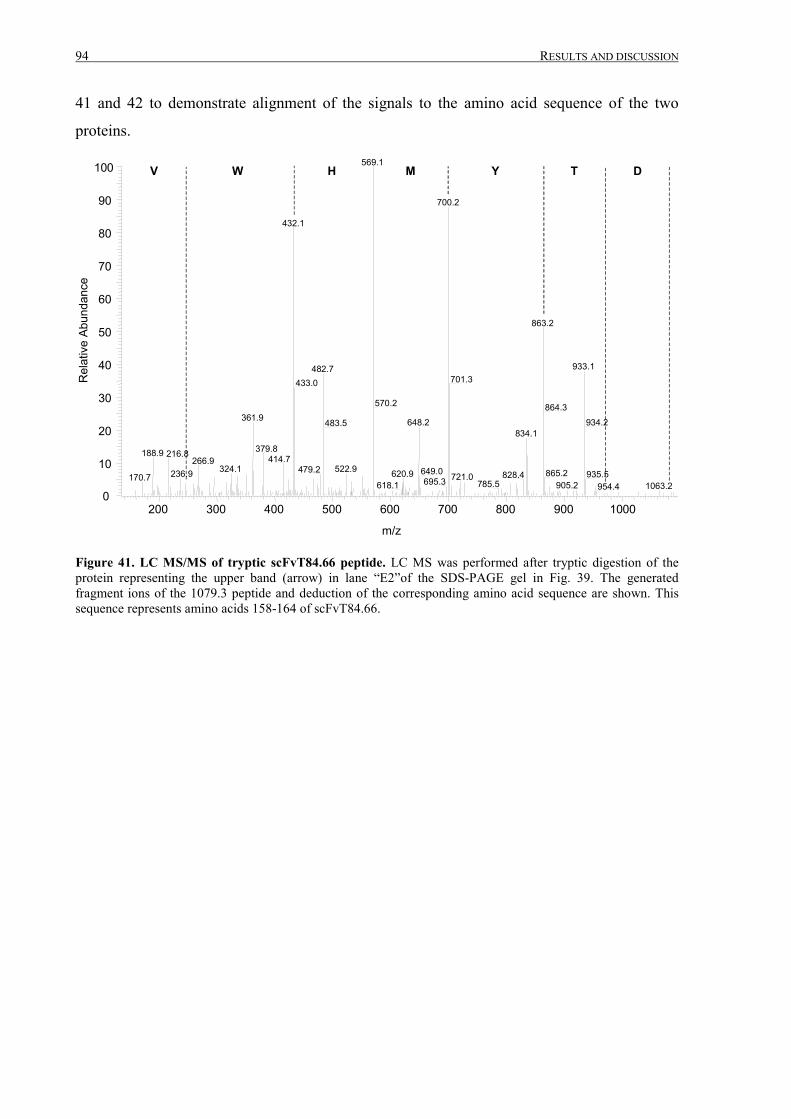
94 RESULTS AND DISCUSSION
41 and 42 to demonstrate alignment of the signals to the amino acid sequence of the two
proteins.
200 300 400 500 600 700 800 900 1000
m/z
0
10
20
30
40
50
60
70
80
90
100
Rel
ativ
e Ab
unda
nce
569.1
700.2
432.1
863.2
933.1482.7701.3433.0
570.2 864.3361.9 934.2648.2483.5
834.1
379.8188.9 216.8 414.7266.9324.1 522.9479.2 649.0 865.2236.9 620.9 935.5828.4721.0170.7 695.3 785.5 905.2618.1 1063.2954.4
W DV H TYM
Figure 41. LC MS/MS of tryptic scFvT84.66 peptide. LC MS was performed after tryptic digestion of theprotein representing the upper band (arrow) in lane “E2”of the SDS-PAGE gel in Fig. 39. The generatedfragment ions of the 1079.3 peptide and deduction of the corresponding amino acid sequence are shown. Thissequence represents amino acids 158-164 of scFvT84.66.
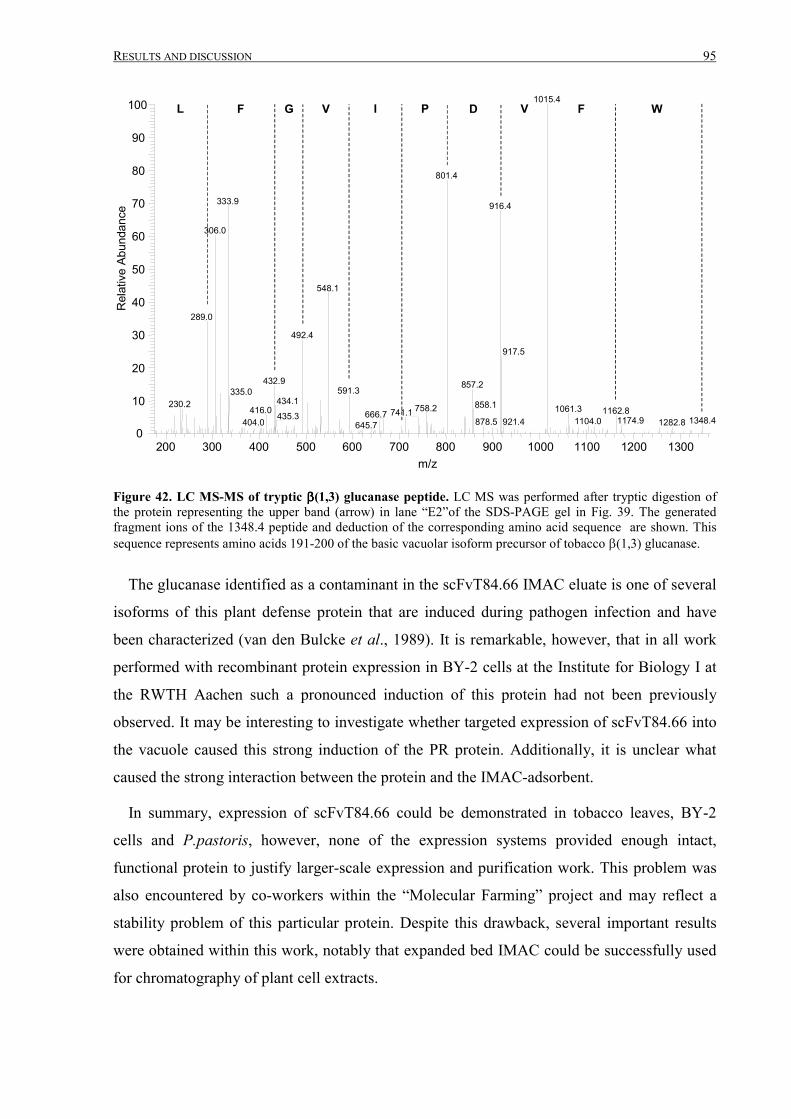
RESULTS AND DISCUSSION 95
200 300 400 500 600 700 800 900 1000 1100 1200 1300m/z
0
10
20
30
40
50
60
70
80
90
100R
elat
ive
Abun
danc
e
1015.4
801.4
333.9 916.4
306.0
548.1
289.0
492.4
917.5
432.9 857.2591.3335.0
434.1230.2 858.1758.2 1061.3416.0 1162.8741.1666.7435.3 1174.9 1348.41104.0921.4878.5404.0 1282.8645.7
L F G V I D VP F W
Figure 42. LC MS-MS of tryptic ����(1,3) glucanase peptide. LC MS was performed after tryptic digestion ofthe protein representing the upper band (arrow) in lane “E2”of the SDS-PAGE gel in Fig. 39. The generatedfragment ions of the 1348.4 peptide and deduction of the corresponding amino acid sequence are shown. Thissequence represents amino acids 191-200 of the basic vacuolar isoform precursor of tobacco �(1,3) glucanase.
The glucanase identified as a contaminant in the scFvT84.66 IMAC eluate is one of several
isoforms of this plant defense protein that are induced during pathogen infection and have
been characterized (van den Bulcke et al., 1989). It is remarkable, however, that in all work
performed with recombinant protein expression in BY-2 cells at the Institute for Biology I at
the RWTH Aachen such a pronounced induction of this protein had not been previously
observed. It may be interesting to investigate whether targeted expression of scFvT84.66 into
the vacuole caused this strong induction of the PR protein. Additionally, it is unclear what
caused the strong interaction between the protein and the IMAC-adsorbent.
In summary, expression of scFvT84.66 could be demonstrated in tobacco leaves, BY-2
cells and P.pastoris, however, none of the expression systems provided enough intact,
functional protein to justify larger-scale expression and purification work. This problem was
also encountered by co-workers within the “Molecular Farming” project and may reflect a
stability problem of this particular protein. Despite this drawback, several important results
were obtained within this work, notably that expanded bed IMAC could be successfully used
for chromatography of plant cell extracts.
96 CONCLUSIONS AND PERSPECTIVES
IV Conclusions and perspectivesDemands of bulk quantities of pure, active recombinant proteins for applications ranging from
high-throughput drug screening over plasma proteins, healthcare and diagnostic products to
therapeutics are rapidly increasing. This is the driving force behind the ongoing search for
alternative expression hosts to supplement or substitute for the “classical” bacterial systems
like E.coli or B.subtilis. In parallel, the “downstream processing” strategies for the
purification of these proteins need to be adapted to the novel host systems and constantly
optimized to allow cost-effective production in a competitive market situation.
The focus of this thesis was to evaluate and implement new developments in downstream
processing technologies to two particularly interesting novel hosts for recombinant protein
production: the methylotrophic yeast P.pastoris and plants, exemplified by N.tabacum. Three
different proteins of interest, namely two murine scFv antibody fragments and one highly
glycosylated hybrid protein assembled from domains of a human colon cell surface protein
were purified from fermentation broth of transformed P.pastoris. In addition, one of the scFv
was expressed in and purified from transiently transformed tobacco leaves, as well as stably
transformed N.tabacum BY-2 suspension cells.
IV.1 The expression systems
It is clear that P.pastoris is one of the most powerful expression systems for recombinant
proteins to-date in terms of expression levels. The complete system including different yeast
strains and a variety of vectors for intra- and extracellular expression is established and
commercially distributed. Published expression levels for recombinant proteins range up to
12g/L (Clare et al., 1991). In a recent publication, expression of a CEA-specific scFv
fragment with potential therapeutic value at a level of 1.2g/L has been reported (Freyre et al.,
2000). Although the expression levels obtained with the P.pastoris clones used in this thesis
were below these values, it was possible to isolate more than 100mg of highly pure, active
FSH-specific scFv fragments from a single 5L fermentation using a straightforward
purification protocol (III.1) developed within this thesis. A recovery >80% and the fact that
the scFv could be used for crystallization studies without further treatment illustrated the
efficiency of the purification strategy.
The purification of the N-A3 hybrid protein (III.2.1) was equally straightforward, giving a
good example for an application where the rapid, economic production of an assay component
CONCLUSIONS AND PERSPECTIVES 97
for screening purposes was more important than achieving high purity and homogeneity of the
end product. In this case, the level of purity of the target protein was defined by its
performance in the respective applications, and despite ambiguities encountered during
analysis of the purified N-A3 from P.pastoris fermentation broth, the protein proved to be a
reliable tool for ELISA assays in the ongoing “Molecular Farming” research project.
Work in this thesis also highlighted some of the limitations of the P.pastoris expression
system. Although expressed in the same strain and using the same expression vector
backbone, the purified N-A3 protein showed remarkable differences from that originally
described (You et al., 1998). Analysis indicated (III.2.1.4) that the protein tended to form
aggregates and the apparent MW of the deglycosylated monomer was more than 6kDa higher
than expected. Inaccuracies in the signal peptide cleavage may account for the size difference,
although the amino acid sequences essential for correct cleavage of the leader were present in
the expression construct used. Similar findings have been reported previously (Sreekrishna et
al., 1997). It can be speculated that protein aggregation might be attributed to the high cell
density fermentation strategy.
A further drawback during work with the N-A3 protein was that fermentations had to be
carried out in BMGY medium instead of the standard basal salt fermentation medium to
obtain satisfactory amounts of intact recombinant protein, adding significant cost to the
process. Additionally, expression levels obtained by high cell density fermentation were not
significantly higher than those obtained by shake-flask cultivation, again at significantly
higher equipment and labor cost. These problems could not be eliminated by modification of
the expression construct (III.2.1.5). If these problems were related to proteolytic degradation,
as also observed with scFvT84.66 in this work (III.2.2.4), use of a protease-deficient
P.pastoris strain could be an alternative, but a strong interdependence exists within the
compound system of host strain, expression vector, restriction site used for vector
linearization and transformation method in Pichia expression. Turning one “switch” in this
system will affect the others, e.g. a different host strain may require a different mode of vector
linearization, which, in turn, requires a different transformation method for optimal efficiency
with consequences for preferred integration site, Mut-phenotype or frequency of multicopy
transformants. Adjusting these single factors would require a considerable amount of time and
screening effort, compromising the original intention of rapid recombinant product delivery.
Screening of P.pastoris transformants for highly expressing “jackpot clones”, usually
multicopy recombinant strains, is not a straightforward process. With the host
98 CONCLUSIONS AND PERSPECTIVES
strain/expression vector system used in this thesis, the process starts with selection for
histidine-prototrophy, but this will result in a significant number of false-positive histidine-
prototroph clones without integration of the transgene. One or more additional selection
step(s) are therefore required. A variety of techniques is available for multicopy clone
selection (Romanos et al., 1998) but the results may be ambiguous, and some require isolation
of total DNA from recombinant clones which is too laborious for routine screening. G418
analysis by patching single clones onto plates containing increasing amounts of the antibiotic
as described (III.2.2.2) may be a suitable method since it offers the potential for automation
using microtiter plates and robotic devices for colony picking. It has been reported, however,
that clones containing more than ~7 copies of the transgene can not be identified with this
method.
Other drawbacks of the Pichia system include the high amounts of plasmid DNA required
for transformation combined with low transformation levels using BglII linearized DNA
(III.2.2.2), the differences in N-glycan structures between yeast and higher eukaryotes
(Montesino et al., 1998) and the need for methanol induction of recombinant protein
expression, which may be regarded a safety hazard especially when performing large scale
fermentations.
The potential benefits and advantages of plants as expression system for recombinant
proteins have been pointed out in the introduction to this thesis (I.1.3). Expression of
scFvT84.66 as described in sections III.2.2.1 and III.2.2.3 did not result in satisfactory yields
of recombinant protein, but this particular protein could also be expressed in P.pastoris only
in low amounts and with a significant amount of degradation, indicating the need for
optimization in the “upstream”, genetic engineering part of the process by evaluating
transcriptional or translational problems. It is clear that average expression levels of
recombinant proteins in plants have to be significantly increased to make this system
competitive for commercial production, although several examples for commercialization or
clinical evaluation of plant-expressed proteins have been reviewed (Fischer et al., 2000).
Provided that this can be achieved in the near future, the versatility of plant-based expression
will be its biggest advantage over competing alternative hosts. No other system can cover
such broad spectrum of applications ranging from transient expression of functional protein
by Agrobacterium-infiltration (III.2.2.1) or by viral vectors, over growth in the field for large-
scale extraction and purification or delivery of a recombinant therapeutic by the plant itself
CONCLUSIONS AND PERSPECTIVES 99
(“oral vaccination”) to callus and cell suspension cultures (III.2.2.3) for protein production in
a controlled, well-defined environment.
IV.2 Downstream processing
It is not far fetched to state that expanded bed adsorption chromatography (EBA) is one of the
most important new concepts in industrial bioprocessing in the last decades. Depending on the
properties of the respective feedstock, one or several unit operations, the building blocks of a
downstream process, can be completely eliminated, and as downstream processing represents
the most cost-intensive part of recombinant protein production, improvements in this area will
drastically reduce overall costs.
In its principal form, EBA is performed using unclarified feedstock, e.g. bacteria or yeast
fermentation broth (Chang and Chase, 1996; Hansson et al., 1994). However, the majority of
capture chromatographic procedures described for EBA is performed by ion exchange
methods, therefore the feedstock is usually diluted with low-salt buffer to reduce conductivity,
leading to a parallel decrease in cell burden and viscosity. The situation is different when
affinity capture methods are used, as in this thesis. Dilution of the feed is not necessarily a
part of sample preparation, and the relatively slow process of EBA prohibits more than
essentially necessary expansion of the feed volume. It was found that high cell density
P.pastoris fermentation broth as well as BY-2 cell extract could not be applied directly to the
column, in part because of overexpansion of the bed but more importantly because of
blocking the column inlet and outlet with clumps of cells or debris. Removal of bulk cell mass
by brief centrifugation was more effective than dilution of the feed, and the most time-
consuming step in sample preparation for packed bed chromatography, namely high-speed
centrifugation or cross-flow filtration, could still be circumvented. Larger volumes of
fermentation supernatant (>10L) could be efficiently prepared for EBA by using a continuous
centrifuge (CARR P6). However, the blocking effect of cell debris at the column inlet was a
potential problem. Improvements in EBA column design, e.g. the injection of the feedstream
from the side of the column into a stirred zone of the expanded bed without the need to pass
through a flow distributor, as introduced by one manufacturer may significantly improve
column performance. Another potential area of improvement is the development of media
with higher density, allowing higher linear flowrates without carryover of the adsorbent
beads. However, it will need to be evaluated how higher linear flow rates affect dynamic
capacities of the adsorbents (Anspach et al., 1999). A very promising application for EBA is
100 CONCLUSIONS AND PERSPECTIVES
its use in continuous fermentation strategies, where high cell densities are not accumulated.
Using carefully designed pumping and mixing devices and sterile connectors, it may be
possible to integrate the first purification step in-line with the fermentation and, by switching
between different EBA columns, continuously remove the target protein from the spent
medium.
After initial experiments, elution of the bound proteins was performed not in packed, but in
expanded mode with no detrimental effects on column performance or elution volume. This is
in agreement with previously published results (Fahrner et al., 1999), circumventing the time-
consuming bed settlement and adapter adjustment step and also facilitating CIP.
All His6-tagged proteins expressed within this thesis could be efficiently captured from
both P.pastoris fermentation broth and BY-2 extracts by EBA, either in one passage
(scFv48.13 and scfvT84.66) or after recycling of the feed. The IMAC eluate could be
conditioned for the subsequent chromatographic step by on-line buffer exchange using a
hollow fiber module, thereby eliminating the need for a time-consuming dialysis or group
desalting step.
With P.pastoris fermentation broth, the progress of the purification could be monitored
almost in real-time by BIA using NTA sensor-chips. This provided a substantial advantage
over off-line methods like electrophoresis or ELISA and could also be applied in fermentation
monitoring as well as analysis of fractions during further purification steps following capture
IMAC. Unfortunately, this monitoring was not possible with plant extracts due to high
background signals.
The combination of EBA with an affinity technique proved to be a very efficient capture
step for enrichment of the target protein from a crude extract or fermentation broth. Affinity
chromatography early in the purification process offers the best chance to minimize damage
caused by proteolytic activity in the raw material. Classical immunoaffinity methods like
Protein A-based purification of antibodies have been adapted for IMAC (Fahrner et al., 1999;
Thommes et al., 1996). However, the use of proteinaceous affinity ligands in EBA may be
limited by the nature of the feedstock. Without rigorous CIP, residual debris on the adsorbent
surface may quickly lead to fouling of the media, and commonly used efficient CIP protocols
often include reagents incompatible with protein ligands, e.g. prolonged incubation with 1M
NaOH. Small, robust synthetic ligands created with the aid of molecular design and
combinatorial chemistry (Teng et al., 2000) may replace protein-based affinity ligands in the
CONCLUSIONS AND PERSPECTIVES 101
future, eventually resulting in the routine design of a suitable ligand for purification of a
protein in parallel to its own design e.g. by rational drug design approaches. Today, group
specific ligands like IDA or NTA are an attractive alternative. Currently, IMAC is the most
widely used group specific affinity technique, and the His6-tag is the only affinity fusion tag
approved by the FDA for use in pharmaceutical protein production.
IV.3 Application of affinity purified recombinant proteins from yeastand plant cells
The two single-chain antibody fragments investigated within this thesis for expression and
purification from alternative host systems represent two important applications for
recombinant proteins in the pharmaceutical area. RAbs for diagnostic use, exemplified by the
FSH-specific scFv4813, are required in large amounts and have to meet high quality
standards, but are subject to less stringent regulation than therapeutic rAbs. High-level
expression and straightforward purification make P.pastoris a very attractive system for these
diagnostic agents. The same applies to recombinant proteins expressed for use in basic
research, structural analyses (as shown for scFv4813) or high throughput screening.
RAbs with the potential for clinical applications, e.g. the CEA-specific scFvT84.66, may be
better suited for expression in a higher eucaryotic host system like plants or plant suspension
cells, because plants utilize very similar pathways of protein synthesis, folding and post-
translational modifications to animals. Inherent advantages of plants over transgenic animals
or mammalian cell cultures for the production of therapeutics for use in humans are the
absence of blood-borne pathogens or oncogenic DNA sequences.
The methylotrophic yeast P.pastoris as well as plants and plant suspension cells represent
promising alternative expression systems for the commercial production of bulk quantities of
functional recombinant proteins. A prerequisite for establishing these novel host systems in a
competitive market situation is the integration of straightforward, inexpensive downstream
processing technologies, tailored to meet the requirements of the respective expression
system, into the production process.
102 SUMMARY
V SummaryThe aim of this thesis was to evaluate the applicability of several novel developments in
protein purification and analysis technologies - in particular expanded bed adsorption (EBA),
immobilized metal ion affinity chromatography (IMAC) and biomolecular interaction analysis
(BIA) – for recombinant protein production from yeast and tobacco. These technologies were
successfully combined into strategies for efficient isolation of three different His6-tagged
recombinant proteins from crude fermentation broth or cell extract with special emphasis on
scalability and cost-effectiveness.
The diagnostic FSH-specific scFv4813 was purified from P.pastoris fermentation broth
with a recovery rate >80% by three chromatographic steps starting with expanded bed
IMAC followed by cation exchange chromatography and gel filtration. Fermentation
broth could be applied to the EBA column after bulk cell mass removal without high-
speed centrifugation or cross-flow filtration. The subsequent purification steps revealed
some heterogeneity in the scFv preparation, presumably caused by incorrect signal
peptide cleavage. Analysis of the purified scFv4813 by SDS-PAGE, IEF and analytical
gel filtration revealed that purity was >98%, and the protein could be crystallized.
Fermentation and purification were monitored in real-time by BIA, and the target
protein could by reliably tracked throughout the process.
Purification of the highly glycosylated CEA N-A3 hybrid protein was performed from
P.pastoris fermentation broth in a two-step process (expanded bed IMAC followed by
gel filtration). Purified N-A3 retained binding ability and specificity against mAb
T84.66, as demonstrated by ELISA and BIA. Chickens were immunized with purified
N-A3 and IgY antibodies isolated from eggyolk. The influence of N- or C-terminal
location of the His6-tag as well as fermentation conditions on recovery, stability and
aggregation of N-A3 was assessed. PNGaseF treatment of the purified protein followed
by SDS-PAGE and Western Blot revealed an average size of 2140Da for the N-glycan
chains, suggesting a GlcNAc2Man11 structure. Deglycosylated N-A3 showed a 6kDa
deviation from the expected size, indicating either O-glycosylation or N-terminal
heterogeneity.
The CEA-specific scFvT84.66 was isolated by IMAC from Agrobacterium-infiltrated
tobacco leaves, stably transformed tobacco BY-2 suspension cells and P.pastoris
fermentation broth. Reactivity of scFvT84.66 against N-A3 and suitability of IMAC for
SUMMARY 103
its initial purification could be rapidly verified using transient expression in tobacco
leaves. An improved G418 screening protocol for selection of recombinant P.pastoris
clones was established and the scFv purified from P.pastoris fermentation broth by
expanded bed IMAC. BY-2 suspension cells were transformed by co-cultivation with
recombinant Agrobacteria with a scFvT84.66 expression construct bearing the C.roseus
strictosidine synthase leader peptide for targeting the recombinant protein to the
vacuole. Expanded bed IMAC was successfully introduced as a novel method for
capture of recombinant proteins from plant cell extract. IMAC-purified scFvT84.66
from transgenic P.pastoris and BY-2 cells was analyzed by SDS-PAGE, Western Blot,
ELISA and LC MS/MS. The P.pastoris-expressed scFvT84.66 showed proteolytic
degradation and, additionally, heterogeneity in the full-length product. LC MS/MS of
the plant expressed, IMAC purified scFvT84.66 revealed co-purification of a plant
defense protein, the vacuolar isoform of tobacco �(1,3)-glucanase.
In summary, the aims of this thesis were achieved by the expression and downstream
processing of recombinant therapeutic proteins from P.pastoris fermentation broth and
N.tabacum BY-2 suspension cells. This demonstration of the use of yeast and plant cells as
biofactories for the production of therapeutic proteins is an important step towards the
commercial exploitation of Molecular Farming.
104 REFERENCES
VI ReferencesAdair, J.R. and Bright, S.M. (1995) Progress with humanized antibodies - an update. Exp Opin Invest
Drugs, 4, 863-870.
Adams, J.M. and Cory, S. (1991) Transgenic models of tumor development. Science, 254, 1161-7.
Allen, R.D. (1995) Dissection of oxidative stress tolerance using transgenic plants. Plant Physiol, 107,
1049-1054.
An, G. (1985) High efficiency transformation of cultured tobacco cells. Plant Physiol, 79, 568-570.
Anspach, F.B., Curbelo, D., Hartmann, R., Garke, G. and Deckwer, W.D. (1999) Expanded-bed
chromatography in primary protein purification. J Chromatogr, 865, 129-44.
Archambault, J. (1991) Large-scale (20 l) culture of surface-immobilized Catharanthus roseus cells.
Enzyme Microb Technol, 13, 882-92.
Arndt, K.M., Mueller, K.M. and Plueckthun, A. (1998) Factors influencing the dimer to monomer
transition of an antibody single-chain Fv fragment. Biochemistry, 37, 12918-26.
Artsaenko, O., Kettig, B., Fiedler, U., Conrad, U. and Duering, K. (1998) Potato tubers as a biofactory
for recombinant antibodies. Mol Breeding, 4, 313-319.
Artsaenko, O., Peisker, M., zur Nieden, U., Fiedler, U., Weiler, E.W., Muentz, K. and Conrad, U.
(1995) Expression of a single-chain Fv antibody against abscisic acid creates a wilty phenotype in
transgenic tobacco. Plant J, 8, 745-750.
Ausubel, F.M., Brent, R. and Kingston, R.E. (1998) Current Protocols in Molecular Biology. Wiley
Interscience, New York.
Bartels, D. and Nelson, D. (1994) Approaches to improve stress tolerance using molecular studies.
Plant Cell Environ, 17, 659-667.
Batt, B.C., Yabannavar, V.M. and Singh, V. (1995) Expanded bed adsorption process for protein
recovery from whole mammalian cell culture broth. Bioseparation, 5, 41-52.
Baulcombe, D.C. (1996) Mechanisms of pathogen-derived resistance to viruses in transgenic plants.
Plant Cell, 8, 1833-1844.
Benfey, P.N. and Chua, N.-H. (1990) The cauliflower mosaic virus 35S promoter: combinatorial
regulation of transcription in plants. Science, 250, 959-966.
Bjorkling, F., Godtfredsen, S.E. and Kirk, O. (1991) The future impact of industrial lipases. Trends
Biotechnol, 9, 360-363.
Boehme, C., Schroeder, M.B., Jung-Heiliger, H. and Lehmann, J. (1997) Plant cell suspension culture
in a bench-scale fermenter with a newly designed membrane stirrer for bubble-free aeration. Appl
Microbiol Biot, 48, 149-154.
Bosworth, A.H., Williams, M.K., Albrecht, K.A., Kwiatkowski, R., Beynon, J., Hankinson, T.R., Ronson,
C.W., Cannon, F., Wacek, T.J. and Triplett, E.W. (1994) Alfalfa yield response to inoculation with
recombinant strains of Rhizobium meliloti with an extra copy of dctABD and/or modified nifA
expression. Appl Environ Microbiol, 60, 3815-32.
Botterman, J. and Leemans, J. (1988) Engineering herbicide resistance in plants. Trends Genet, 4,
219-222.
REFERENCES 105
Brierley, R.A. (1998) Secretion of recombinant human insulin-like growth factor I. In Higgins, D.R. and
Cregg, J.M. (eds.), Pichia Protocols. Humana Press, Totowa, NJ, pp. 149-177.
Brooks, J.E., Nathan, P.D., Landry, D., Sznyter, L.A., Waite-Rees, P., Ives, C.L., Moran, L.S., Slatko,
B.E. and Benner, J.S. (1991) Characterization of the cloned BamHI restriction modification system: its
nucleotide sequence, properties of the methylase, and expression in heterologous hosts. Nucleic
Acids Res, 19, 841-50.
Buckel, P. (1996) Recombinant proteins for therapy. Trends Pharmacol Sci, 17, 450-6.
Cai, X. and Garen, A. (1997) Comparison of fusion phage libraries displaying VH or single-chain Fv
antibody fragments derived from the antibody repertoire of a vaccinated melanoma patient as a source
of melanoma-specific targeting molecules. P Natl Acad Sci USA, 94, 9261-6.
Casey, J.L., Keep, P.A., Chester, K.A., Robson, L., Hawkins, R.E. and Begent, R.H. (1995)
Purification of bacterially expressed single chain Fv antibodies for clinical applications using metal
chelate chromatography. J Immunol Methods, 179, 105-16.
Chang, Y.K. and Chase, H.A. (1994) Expanded bed adsorption for the direct extraction of proteins. In
Pyle, D.L. (ed.) Separations for biotechnology. Royal Society of Chemistry, Cambridge, Vol. 3, pp.
106-112.
Chang, Y.K. and Chase, H.A. (1996) Ion exchange purification of G6PDH from unclarified yeast cell
homogenates using expanded bed adsorption. Biotechnol Bioeng, 49, 204-216.
Chase, H.A. (1994) Purification of proteins by adsorption chromatography in expanded beds. Trends
Biotechnol, 12, 296-303.
Chase, H.A. and Draeger, N.M. (1992) Affinity purification of proteins using expanded beds. J
Chromatogr, 597, 129-45.
Chen, M.H., Liu, L.F., Chen, Y.R., Wu, H.K. and Yu, S.M. (1994) Expression of alpha-amylases,
carbohydrate metabolism, and autophagy in cultured rice cells is coordinately regulated by sugar
nutrient. Plant J, 6, 625-636.
Cho, B.K., Roy, E.J., Patrick, T.A. and Kranz, D.M. (1997) Single-chain Fv/folate conjugates mediate
efficient lysis of folate-receptor-positive tumor cells. Bioconjugate Chem, 8, 338-46.
Christou, P. (1993) Particle gun-mediated transformation. Curr Opin Biotech, 4, 135-141.
Clackson, T., Hoogenboom, H.R., Griffiths, A.D. and Winter, G. (1991) Making antibody fragments
using phage display libraries. Nature, 352, 624-628.
Clare, J.J., Rayment, F.B., Ballantine, S.P., Sreekrishna, K. and Romanos, M.A. (1991) High-level
expression of tetanus toxin fragment C in Pichia pastoris strains containing multiple tandem
integrations of the gene. Bio/Technology, 9, 455-460.
Clemmitt, R.H. and Chase, H.A. (2000) Facilitated downstream processing of a histidine-tagged
protein from unclarified E.coli homogenates using immobilized metal affinity expanded-bed adsorption.
Biotechnol Bioeng, 67, 206-16.
Cohen, S.N., Chang, A.C., Boyer, H.W. and Helling, R.B. (1973) Construction of biologically functional
bacterial plasmids in vitro. Proc Natl Acad Sci USA, 70, 3240-4.
Colbert, D., Anilionis, A., Gelep, P., Farley, J. and Breyer, R. (1984) Molecular organization of the
protein A gene and its expression in recombinant host organisms. J Biol Response Mod, 3, 255-9.
106 REFERENCES
Coligan, J.E., Kruisbeek, A.M. and Margulies, D.H. (1998) Current Protocols in Immunology. Wiley
Interscience, New York.
Conrad, U., Fiedler, U., Artsaenko, O. and Phillips, J. (1998) High-level and stable accumulation of
single-chain Fv antibodies in plant storage organs. J Plant Physiol, 708-711.
Cornelissen, B.J.C. and Melchers, L.S. (1993) Strategies for control of fungal diseases with transgenic
plants. Plant Physiol, 101, 709-712.
Cramer, C.L. and Weissenborn, D.L. (1997) , United States Patent #5,670,349.
Cregg, J. (1999) Expression in the methylotrophic yeast Pichia pastoris. In Fernandez, J. and Hoeffler,
J. (eds.), Gene expression systems: Using nature for the art of expression. Academic Press, San
Diego, CA, pp. 158-184.
Cregg, J.M., Madden, K.R., Barringer, K.J., Thill, G.P. and Stillman, C.A. (1989) Functional
characterization of the two alcohol oxidase genes from the yeast Pichia pastoris. Mol Cell Biol, 9,
1316-1323.
Daniell, T. and Edwards, R. (1995) Changes in protein methylation associated with the elicitation
response in cell cultures of alfalfa (Medicago sativa L.). FEBS Lett, 360, 57-61.
Datar, R.V., Cartwright, T. and Rosen, C.G. (1993) Process economics of animal cell and bacterial
fermentations: a case study analysis of tissue plasminogen activator. Bio/Technology, 11, 349-57.
Davis, C.J.A. (1998) Large-scale chromatography: design and operation. In Subramanian, G. (ed.)
Bioseparation and Bioprocessing. Wiley-VCH, Weinheim, Vol. I, pp. 125-143.
Davis, M.T. and Lee, T.D. (1998) Rapid protein identification using a microscale electrospray LC/MS
system on an ion trap mass spectrometer. J Am Soc Mass Spectrom, 9, 194-201.
De Block, M., Botterman, J., Vandewiele, M., Dockx, J., Thoen, C., Gossele, V., Movva, N.R.,
Thompson, C., Van Montagu, M. and Leemans, J. (1987) Engineering herbicide resistance in plants
by expression of a detoxifying enzyme. EMBO J, 6, 2513-2518.
De Luca, L., Hellenbroich, D., Titchener-Hooker, N.J. and Chase, H.A. (1994) A study of the
expansion characteristics and transient behaviour of expanded beds of adsorbent particles suitable for
bioseparations. Bioseparation, 4, 311-318.
De Neve, M., De Loose, M., Jacobs, A., Van Houdt, H., Kaluza, B., Weidle, U., Van Montagu, M. and
Depicker, A. (1993) Assembly of an antibody and its derived antibody fragments in Nicotiana and
Arabidopsis. Transgenic Res, 2, 227-237.
De Wilde, C., De Neve, M., De Rycke, R., Bruyns, A.M., De Jaeger, G., Van Montagu, M., Depicker,
A. and Engler, G. (1996) Intact antigen-binding MAK33 antibody and Fab fragment accumulate in
intercellular spaces of Arabidopsis thaliana. Plant Sci, 114, 233-241.
Dekker, K., Sugiura, A., Yamagata, H., Sakaguchi, K. and Udaka, S. (1992) Efficient production of
thermostable Thermus thermophilus xylose isomerase in Escherichia coli and Bacillus brevis. Appl
Microbiol Biotechnol, 36, 727-32.
Desikan, R., Hancock, J.T., Neill, S.J., Coffey, M.J. and Jones, O.T. (1996) Elicitor-induced generation
of active oxygen in suspension cultures of Arabidopsis thaliana. Biochem Soc Trans, 24, 199S.
Dhalluin, K., Botterman, J. and De Greef, W. (1990) Engineering of Herbicide-Resistant Alfalfa and
Evaluation Under Field Conditions. Crop Sci, 30, 866-871.
REFERENCES 107
Doran, P. (1993) Design of reactors for plant cells and organs. Adv Biochem Eng, 48, 115-168.
Duering, K., Hippe, S., Kreuzaler, F. and Schell, J. (1990) Synthesis and self-assembly of a functional
monoclonal antibody in transgenic Nicotiana tabacum. Plant Mol Biol, 15, 281-293.
Eckart, M.R. and Bussineau, C.M. (1996) Quality and authenticity of heterologous proteins
synthesized in yeast. Curr Opin Biotech, 7, 525-530.
Emans, N. and Fischer, R. (in press) Molecular farming of pharmaceutical proteins. Transgenic Res.
Evan, G.I., Lewis, G.K., Ramsay, G. and Bishop, J.M. (1985) Isolation of monoclonal antibodies
specific for human c-myc proto-oncogene product. Mol Cell Biol, 5, 3610-6.
Fahrner, R.L., Blank, G.S. and Zapata, G.A. (1999) Expanded bed protein A affinity chromatography of
a recombinant humanized monoclonal antibody: process development, operation, and comparison
with a packed bed method. J Biotechnol, 75, 273-280.
Fiedler, U. and Conrad, U. (1995) High-level production and long-term storage of engineered
antibodies in transgenic tobacco seeds. Bio/Technology, 13, 1090-1093.
Fiedler, U., Philips, J., Artsaenko, O. and Conrad, U. (1997) Optimisation of scFv antibody production
in transgenic plants. Immunotechnology, 3, 205-216.
Firek, S., Draper, J., Owen, M.R.L., Gandecha, A., Cockburn, B. and Whitelam, G.C. (1993) Secretion
of a functional single-chain Fv protein in transgenic tobacco plants and cell suspension cultures. Plant
Mol Biol, 23, 861-870.
Fischer, R., Hoffmann, K., Schillberg, S. and Emans, N. (2000) Antibody production by molecular
farming in plants. J Biol Regul Homeost Agents, 14, 83-92.
Fischer, R., Liao, Y.-C. and Drossard, J. (1999a) Affinity-purification of a TMV-specific recombinant
full-size antibody from a transgenic tobacco suspension culture. J Immunol Methods, 226, 1-10.
Fischer, R., Schumann, D., Zimmermann, S., Drossard, J., Sack, M. and Schillberg, S. (1999b)
Expression and characterization of bispecific single-chain Fv fragments produced in transgenic plants.
Eur J Biochem, 262, 810-816.
Flamm, E.L. (1991) How FDA approved chymosin: a case history. Bio/Technology, 9, 349-51.
Freitag, R. and Horvath, C. (1996) Chromatography in the downstream processing of biotechnological
products. Adv Biochem Eng Biotechnol, 53, 17-59.
Frej, A.-K.B. (1996) Expanded bed adsorption for recovery of renatured human interleukin 8 from
Escherichia coli inclusion bodies. Bioseparation, 6, 265-271.
Freyre, F.M., Vazquez, J.E., Ayala, M., Canaan-Haden, L., Bell, H., Rodriguez, I., Gonzalez, A.,
Cintado, A. and Gavilondo, J.V. (2000) Very high expression of an anti-carcinoembryonic antigen
single chain Fv antibody fragment in the yeast Pichia pastoris. J Biotechnol, 76, 157-63.
Fromm, M., Callis, J., Taylor, L.P. and Walbot, V. (1985) Electroporation of DNA and RNA into plant
protoplasts. Methods Enzymol, 153, 351-366.
Gailliot, F.P., Gleason, C., Wilson, J.J. and Zwarick, J. (1990) Fluidized bed adsorption for whole broth
extraction. Biotechnol Prog, 6, 370-5.
Gallie, D. (1998) Controlling gene expression in transgenics. Curr Opin Plant Biol, 1, 166-172.
Gold, P. and Freedman, S.O. (1965) Specific carcinoembryonic antigens of the human digestive
system. J Exp Med, 122, 467-81.
108 REFERENCES
Goochee, C.F., Gramer, M.J., Andersen, D.C., Bahr, J.B. and Rasmussen, J.R. (1991) The
oligosaccharides of glycoproteins: bioprocess factors affecting oligosaccharide structure and their
effect on glycoprotein properties. Bio/Technology, 9, 1347-1355.
Gradilone, S.A., Arranz, S.E. and Cabada, M.O. (1998) Detection of highly glycosylated proteins in
polyacrylamide gels. Anal Biochem, 261, 224-7.
Griffiths, A.D., Williams, S.C., Hartley, O., Tomlinson, I.M., Waterhouse, P., Crosby, W.L.,
Kontermann, R.E., Jones, P.T., Low, N.M., Allison, T.J., Prospero, T.D., Hoogenboom, H.R., Nissim,
A., Cox, J.P.L., Harrison, J.L., Zaccolo, M., Gherardi, E. and Winter, G. (1994) Isolation of high affinity
human antibodies directly from large synthetic repertoires. EMBO J, 13, 3245-3260.
Grinna, L.S. and Tschopp, J.F. (1989) Size distribution and general structural features of N-linked
oligosaccharides from the methylotrophic yeast Pichia pastoris. Yeast, 5, 107-115.
Gubler, U. and Hoffman, B.J. (1983) A simple and very efficient method for generating cDNA libraries.
Gene, 25, 263-9.
Hammarstrom, S. (1999) The carcinoembryonic antigen (CEA) family: structures, suggested functions
and expression in normal and malignant tissues. Semin Cancer Biol, 9, 67-81.
Hanahan, D. (1985) Techniques for transformation of E.coli. In Glover, D.M. (ed.) DNA cloning: A
practical approach. IRL press.
Hansson, M., Stahl, S., Hjorth, R., Uhlen, M. and Moks, T. (1994) Single-step recovery of a secreted
recombinant protein by expanded bed adsorption. Bio/Technology, 12, 285-8.
Hasholzner, U., Stieber, P., Meier, W. and Lamerz, R. (1997) Value of HAMA--determination in clinical
practice--an overview. Anticancer Res, 17, 3055-8.
He, M., Wilde, A. and Kaderbha, I. (1990) A simple single-step procedure for small-scale preparation
of Escherichia coli plasmids. Nucleic Acids Res, 18, 1660.
Hefta, L.J., Chen, F.S., Ronk, M., Sauter, S.L., Sarin, V., Oikawa, S., Nakazato, H., Hefta, S. and
Shively, J.E. (1992) Expression of carcinoembryonic antigen and its predicted immunoglobulin- like
domains in HeLa cells for epitope analysis. Cancer Res, 52, 5647-55.
Hellwig, S. (2000) Entwicklung von Fermentationsprozessen zur Produktion rekombinanter
Antikoerperfragmente in Pichia pastoris und Nicotiana tabacum. Doktorarbeit, Institut fuer Biologie I
RWTH Aachen.
Hellwig, S., Robin, F., Drossard, J., Raven, N.P., Vaquero-Martin, C., Shively, J.E. and Fischer, R.
(1999) Production of carcinoembryonic antigen (CEA) N-A3 domain in Pichia pastoris by fermentation.
Biotechnol Appl Bioc, 30, 267-75.
Hiatt, A., Cafferkey, R. and Bowdish, K. (1989) Production of antibodies in transgenic plants. Nature,
342, 76-78.
Hiatt, A. and Mostov, K. (1992) Assembly of multimeric proteins in plant cells: characteristics and uses
of plant-derived antibodies. In Hiatt, A. (ed.) Transgenic Plants: Fundamentals and Applications.
Marcel Dekker Inc., New York, pp. 221-236.
Hiei, Y., Ohta, S., Komari, T. and Kumashiro, T. (1994) Efficient transformation of rice (Oryza sativa L.)
mediated by Agrobacterium and sequence analysis of the boundaries of the T-DNA. Plant J, 6, 271-
282.
REFERENCES 109
Higgins, D.R. and Cregg, J.M. (1998) Introduction to Pichia pastoris. In Higgins, D.R. and Cregg, J.M.
(eds.), Pichia Protocols. Humana Press, Totowa, NJ, pp. 1-15.
Hilton, M.G. and Rhodes, M.J. (1990) Growth and hyoscyamine production of 'hairy root' cultures of
Datura stramonium in a modified stirred tank reactor. Appl Microbiol Biotechnol, 33, 132-8.
Hjorth, R., Kampe, S. and Carlsson, M. (1995) Analysis of some operating parameters of novel
adsorbents for recovery of proteins in expanded beds. Bioseparation, 5, 217-223.
Hoefgen, R. and Willmitzer, L. (1988) Storage of competent cells for Agrobacterium transformation.
Nucleic Acids Res, 16, 9877.
Hoehl, U., Upmeier, B. and Barz, W. (1988) Growth and nicotinate biotransformation in batch cultured
and airlift fermenter grown soybean cell suspension cultures. Appl Microbiol Biotechnol, 28, 319-323.
Hollenberg, C.P. and Gellissen, G. (1997) Production of recombinant proteins by methylotrophic
yeasts. Curr Opin Biotechnol, 8, 554-60.
Holliger, P., Wing, M., Pound, J.D., Bohlen, H. and Winter, G. (1997) Retargeting serum
immunoglobulin with bispecific diabodies. Nat Biotechnol, 15, 632-6.
Hooker, B.S., Lee, J.M. and An, G. (1990) Cultivation of plant cells in a stirred tank reactor. Biotechnol
Bioeng, 35, 296-304.
Hooykaas, P.J.J. and Schilperoort, R.A. (1992) Agrobacterium and plant genetic engineering. Plant
Mol Biol, 19, 15-38.
Hoppmann, V. (2000) Targeting von rekombinanten Antikoerperfragmenten in unterschiedliche
Kompartimente der Pflanzenzelle. Diplomarbeit, Institut fuer Biologie I, RWTH Aachen.
Hu, S., Shively, L., Raubitschek, A., Sherman, M., Williams, L.E., Wong, J.Y., Shively, J.E. and Wu,
A.M. (1996) Minibody: A novel engineered anti-carcinoembryonic antigen antibody fragment (single-
chain Fv-CH3) which exhibits rapid, high-level targeting of xenografts. Cancer Res, 56, 3055-61.
Huston, J.S., Levinson, D., Mudgett, H.M., Tai, M.S., Novotny, J., Margolies, M.N., Ridge, R.J.,
Bruccoleri, R.E., Haber, E., Crea, R. and Opperman, H. (1988) Protein engineering of antibody binding
sites: recovery of specific activity in an anti-digoxin single-chain Fv analogue produced in Escherichia
coli. Proc Natl Acad Sci USA, 85, 5879-83.
Iliades, P., Kortt, A.A. and Hudson, P.J. (1997) Triabodies: single chain Fv fragments without a linker
form trivalent trimers. FEBS Lett, 409, 437-41.
Innis, M.A., Holland, M.J., McCabe, P.C., Cole, G.E., Wittman, V.P., Tal, R., Watt, K.W.K., Gelfand,
D.H., Holland, J.P. and Meade, J.H. (1985) Expression, glycosylation and secretion of an Aspergillus
glucoamylase by Saccharomyces cerevisiae. Science, 228, 21-26.
Ishida, Y., Saito, H., Ohta, S., Hiei, Y., Komari, T. and Kumashiro, T. (1996) High efficiency
transformation of maize (Zea mays L.) mediated by Agrobacterium tumefaciens. Nat Biotech, 14, 745-
750.
Johnson, I.S. (1983) Human insulin from recombinant DNA technology. Science, 219, 632-7.
Jones, P.T., Dear, P.H., Foote, J., Neuberger, M.S. and Winter, G. (1986) Replacing the
complementarity-determining regions in a human antibody with those from a mouse. Nature, 321, 522-
525.
110 REFERENCES
Kapila, J., De Rycke, R., Van Montagu, M. and Angenom, G. (1996) An Agrobacterium-mediated
transient gene expression system for intact leaves. Plant Sci, 122, 101-108.
Kay, R., Chan, A., Daly, M. and McPherson, J. (1987) Duplication of CaMV 35S promoter sequences
creates a strong enhancer for plant genes. Science, 236, 1299-1302.
Keffer, J., Probert, L., Cazlaris, H., Georgopoulos, S., Kaslaris, E., Kioussis, D. and Kollias, G. (1991)
Transgenic mice expressing human tumour necrosis factor: a predictive genetic model of arthritis.
EMBO J, 10, 4025-31.
Kieran, P.M., MacLoughlin, P.F. and Malone, D.M. (1997) Plant cell suspension cultures: some
engineering considerations. J Biotechnol, 59, 39-52.
Kjemtrup, S., Herman, E.M. and Chrispeels, M.J. (1994) Correct post-translational modification and
stable vacuolar accumulation of phytohemagglutinin engineered to contain multiple methionine
residues. Eur J Biochem, 226, 385-91.
Koncz, C. and Schell, J. (1986) The promoter of TL-DNA gene 5 controls the tissue specific
expression of chimeric genes carried by a novel type of Agrobacterium binary vector. Mol Gen Genet,
204, 383-396.
Kramer, M.G. and Redenbaugh, K. (1994) Commercialization of a tomato with an antisense
polygalacturonase gene: The FLAVR SAVR-TM tomato story. Euphytica, 79, 293-297.
Labrou, N. and Clonis, Y.D. (1994) The affinity technology in downstream processing. J Biotechnol,
36, 95-119.
Laemmli, U.K. (1970) Cleavage of structural proteins during the assembly of the head of
bacteriophage T4. Nature, 227, 680-685.
Linder, S., Schliwa, M. and Kube-Granderath, E. (1996) Direct PCR screening of Pichia pastoris
clones. Biotechniques, 20, 980-982.
Lindner, P., Guth, B., Wuelfing, C., Krebber, C., Steipe, B., Mueller, F. and Plueckthun, A. (1992)
Purification of native proteins from the cytoplasm and periplasm of Escherichia coli using IMAC and
histidine tails: a comparison of proteins and protocols. Methods: A companion to methods in
enzymology, 4, 41-56.
Lipka, V., R.E., H., Rademacher, T., Li, J., Hirsch, H.-J. and Kreuzaler, F. (1999) Solanum tuberosum
double transgenic expressing phosphoenolpyruvate carboxylase and NADP-malic enzyme display
reduced electron requirement for CO2 fixation. Plant Sci, 144, 93-105.
Ma, J.K., Lehner, T., Stabila, P., Fux, C.I. and Hiatt, A. (1994) Assembly of monoclonal antibodies with
IgG1 and IgA heavy chain domains in transgenic tobacco plants. Eur J Immunol, 24, 131-8.
McCafferty, J., Griffiths, A.D., Winter, G. and Chiswell, D.J. (1990) Phage antibodies: filamentous
phage displaying antibody variable domains. Nature, 348, 552-554.
McKnight, T.D., Roessner, C.A., Devagupta, R., Scott, A.I. and Nessler, C.L. (1990) Nucleotide
sequence of a cDNA encoding the vacuolar protein strictosidine synthase from Catharanthus roseus.
Nucleic Acids Res, 18, 4939.
Mejare, M., Lilius, G. and Bulow, L. (1998) Evaluation of genetically attached histidine affinity tails for
purification of lactate dehydrogenase from transgenic tobacco. Plant Sci, 134, 103-114.
REFERENCES 111
Meyer, P., Heidmann, I., Forkmann, G. and Saedler, H. (1987) A new petunia flower colour generated
by transformation of a mutant with a maize gene. Nature, 330, 677-8.
Moloney, M.M. and Holbrook, L.A. (1997) Subcellular targeting and purification of recombinant
proteins in plant production systems. Biotechnol Genet Eng Rev, 14, 321-36.
Montesino, R., Garcia, R., Quintero, O. and Cremata, J.A. (1998) Variation in N-linked oligosaccharide
structures on heterologous proteins secreted by the methylotrophic yeast Pichia pastoris. Protein
Expres Purif, 14, 197-207.
Morrison, S.L., Johnson, M.J., Herzenberg, L.A. and Oi, V.T. (1984) Chimeric human antibody
molecules: mouse antigen-binding domains with human constant region domains. Proc Natl Acad Sci
USA, 81, 6851-6855.
Mueller, K.M., Arndt, K.M., Bauer, K. and Plueckthun, A. (1998) Tandem immobilized metal-ion affinity
chromatography/immunoaffinity purification of His-tagged proteins--evaluation of two anti-His-tag
monoclonal antibodies. Anal Biochem, 259, 54-61.
Mullis, K.B. and Faloona, F.A. (1987) Specific synthesis of DNA in vitro via a polymerase-catalyzed
chain reaction. Methods Enzymol, 155, 335-50.
Nagata, T., Nemoto, Y. and Hasezawa, S. (1992) Tobacco BY-2 cell line as the "HeLa" cell in the cell
biology of higher plants. Intern Rev Cytol, 132, 1-30.
Neumaier, M., Fenger, U. and Wagener, C. (1985) Monoclonal antibodies for carcinoembryonic
antigen (CEA) as a model system: identification of two novel CEA-related antigens in meconium and
colorectal carcinoma tissue by Western blots and differential immunoaffinity chromatography. J
Immunol, 135, 3604-9.
Ni, M., Cui, D., Einstein, J., Narasimhulu, S., Vergara, C.E. and Gelvin, S.B. (1995) Strength and
tissue specificity of chimeric promoters derived from the octopine and mannopine synthase genes.
Plant J, 7, 661-676.
Nilsson, J., Stahl, S., Lundeberg, J., Uhlen, M. and Nygren, P.-A. (1997) Affinity fusion strategies for
detection, purification and immobilization of recombinant proteins. Protein Expres Purif, 11, 1-16.
Nordlee, J.A., Taylor, S.L., Townsend, J.A., Thomas, L.A. and Bush, R.K. (1996) Identification of a
Brazil-nut allergen in transgenic soybeans. N Engl J Med, 334, 688-92.
Nygren, P.A., Stahl, S. and Uhlen, M. (1994) Engineering proteins to facilitate bioprocessing. Trends
Biotechnol, 12, 184-8.
Offringa, R., de Groot, M.J.A., Haagsman, H.J., Does, M.P., van den Elzen, P.J.M. and Hooykaas,
P.J.J. (1990) Extrachromosomal homologous recombination and gene targeting in plant cells after
Agrobacterium mediated transformation. EMBO J., 9, 3077-3084.
Olins, P.O. and Lee, S.C. (1993) Recent advances in heterologous gene expression in Escherichia
coli. Curr Opin Biotechnol, 4, 520-525.
Paifer, E., Margolles, E., Cremata, J., Montesino, R., Herrera, L. and Delgado, J.M. (1994) Efficient
expression and secretion of recombinant alpha amylase in Pichia pastoris using two different signal
sequences. Yeast, 10, 1415-9.
112 REFERENCES
Pedersen, J., Lauritzen, C., Thorup Madsen, M. and Weis Dahl, S. (1999) Removal of N-terminal
polyhistidine tags from recombinant proteins using engineered aminopeptidases. Protein Expres Purif,
15, 389-400.
Pen, J. (1996) Comparison of host systems for the production of recombinant proteins. In Owen,
M.R.L. and Pen, J. (eds.), Transgenic plants: a production system for industrial and pharmaceutical
proteins. Wiley, Chichester, pp. 149-168.
Pen, J., Molendijk, L., Quax, W.J., Sijmons, P.C., van Ooyen, A.J., van den Elzen, P.J., Rietveld, K.
and Hoekema, A. (1992) Production of active Bacillus licheniformis alpha-amylase in tobacco and its
application in starch liquefaction. Bio/Technology, 10, 292-6.
Perisic, O., Webb, P.A., Holliger, P., Winter, G. and Williams, R.L. (1994) Crystal structure of a
diabody, a bivalent antibody fragment. Structure, 2, 1217-1226.
Phillips, J., Artsaenko, O., Fiedler, U., Horstmann, C., Mock, H.P., Muentz, K. and Conrad, U. (1997)
Seed-specific immunomodulation of abscisic acid activity induces a developmental switch. EMBO J,
16, 4489-96.
Pietersz, G.A., Patrick, M.R. and Chester, K.A. (1998) Preclinical characterization and in vivo imaging
studies of an engineered recombinant technetium-99m-labeled metallothionein-containing anti-
carcinoembryonic antigen single-chain antibody. J Nucl Med, 39, 47-56.
Plueckthun, A. (1991) Antibody engineering. Curr Opin Biotechnol, 2, 238-246.
Plueckthun, A. and Pack, P. (1997) New protein engineering approaches to multivalent and bispecific
antibody fragments. Immunotechnology, 3, 83-105.
Polson, A., Coetzer, T., Kruger, J., von Maltzahn, E. and van der Merwe, K.J. (1985) Improvements in
the isolation of IgY from the yolks of eggs laid by immunized hens. Immunol Invest, 14, 323-7.
Porath, J., Carlsson, J., Olsson, I. and Belfrage, G. (1975) Metal chelate affinity chromatography, a
new approach to protein fractionation. Nature, 258, 598-9.
Porta, C. and Lomonossoff, G.P. (1996) Use of viral replicons for the expression of genes in plants.
Mol Biotechnol, 5, 209-21.
Pursel, V.G., Pinkert, C.A., Miller, K.F., Bolt, D.J., Campbell, R.G., Palmiter, R.D., Brinster, R.L. and
Hammer, R.E. (1989) Genetic engineering of livestock. Science, 244, 1281-8.
Raven, N. (1999) Vergleichende Expression rekombinanter Einzelketten-Antikoerper (scFv) in E.coli,
P.pastoris und Pflanzenzellen. Diplomarbeit, Institut fuer Biologie I, RWTH Aachen.
Robin, F. (1998) Expression of the carcinoembryonic antigen NA3 domain and its related single-chain
Fv antibody T84.66 in the yeast Pichia pastoris. Diplomarbeit, Institut fuer Biologie I, RWTH Aachen.
Romanos, M., Scorer, C., Sreekrishna, K. and Clare, J. (1998) The generation of multicopy
recombinant strains. In Higgins, D.R. and Cregg, J.M. (eds.), Pichia Protocols. Humana Press,
Totowa, NJ, pp. 55-72.
Romanos, M.A., Scorer, C.A. and Clare, J.J. (1992) Foreign gene expression in yeast: a review.
Yeast, 8, 423-88.
Roth, M.J., Tanese, N. and Goff, S.P. (1985) Purification and characterization of murine retroviral
reverse transcriptase expressed in Escherichia coli. J Biol Chem, 260, 9326-35.
REFERENCES 113
Russell, D.A. and Fromm, M.E. (1997) Tissue-specific expression in transgenic maize of four
endosperm promoters from maize and rice. Transgenic Res, 6, 157-168.
Saiki, R.K., Scharf, S., Faloona, F., Mullis, K.B., Horn, G.T., Erlich, H.A. and Arnheim, N. (1985)
Enzymatic amplification of beta-globin genomic sequences and restriction site analysis for diagnosis of
sickle cell anemia. Science, 230, 1350-4.
Sakamoto, K., Iida, K., Sawamura, K., Hajiro, K., Asada, Y., Yoshikawa, T. and Furuya, T. (1993)
Effects of Nutrients On Anthocyanin Production in Cultured Cells of Aralia cordata. Phytochemistry,
33, 357-360.
Sambrook, J., Fritsch, E.F. and Maniatis, T. (1996) Molecular Cloning - A Laboratory Manual. Cold
Spring Harbor Laboratory, New York.
Sanger, F., Nicklen, S. and Coulson, A.R. (1977) DNA sequencing with chain-terminating inhibitors.
Proc Natl Acad Sci USA, 74, 5463-5467.
Sato, K., Nakayama, M. and Shigeta, J. (1996) Culturing conditions affecting the production of
anthocyanin in suspended cell cultures of strawberry. Plant Sci, 113, 91-98.
Schier, R., McCall, A., Adams, G.P., Marshall, K.W., Merritt, H., Yim, M., Crawford, R.S., Weiner, L.M.,
Marks, C. and Marks, J.D. (1996) Isolation of picomolar affinity anti-c-erbB-2 single-chain Fv by
molecular evolution of the complementarity determining regions in the center of the antibody binding
site. J Mol Biol, 263, 551-67.
Schillberg, S., Zimmermann, S., Findlay, K. and Fischer, R. (in press) Plasma membrane display of
anti-viral single chain Fv fragments confers resistance to tobacco mosaic virus. Mol Breeding.
Schlatmann, J.E., ten Hoopen, H.J.G. and Heijnen, J.J. (1996) Large-Scale Production of Secondary
Metabolites by Plant Cell Cultures. In DiCosmo, F. and Misawa, M. (eds.), Plant Cell Culture
Secondary Metabolism: Toward Industrial Application. CRC Press, Boca Raton.
Scholthof, H.B., Scholthof, K.-B.G. and Jackson, A.O. (1996) Plant virus gene vectors for transient
expression of foreign proteins in plants. Annu Rev Phytopathol, 34, 299-323.
Schouten, A., Roosien, J., van Engelen, F.A., de Jong, G.A.M., Borst-Vrenssen, A.W.M., Zilverentant,
J.F., Bosch, D., Stiekema, W.J., Gommers, F.J., Schots, A. and Bakker, J. (1996) The C-terminal
KDEL sequence increases the expression level of a single-chain antibody designed to be targeted to
both the cytosol and the secretory pathway in transgenic tobacco. Plant Mol Biol, 30, 781-793.
Schuler, T.H., Poppy, G.M., Kerry, B.R. and Denholm, I. (1998) Insect-resistant transgenic plants.
Trends Biotechnol, 16, 168-175.
Scorer, C.A., Buckholz, R.G., Clare, J.J. and Romanos, M.A. (1993) The intracellular production and
secretion of HIV-1 envelope protein in the methylotrophic yeast Pichia pastoris. Gene, 136, 111-119.
Scorer, C.A., Clare, J.J., McCombie, W.R., Romanos, M.A. and Sreekrishna, K. (1994) Rapid
selection using G418 of high copy number transformants of Pichia pastoris for high-level foreign gene
expression. Bio/Technology, 12, 181-184.
Seki, M., Ohzora, C., Takeda, M. and Furusaki, S. (1997) Taxol (Paclitaxel) production using free and
immobilized cells of Taxus cuspidata. Biotechnol Bioeng, 53, 214-219.
Shively, J.E. and Beatty, J.D. (1985) CEA-related antigens: molecular biology and clinical significance.
Crit Rev Oncol Hematol, 2, 355-99.
114 REFERENCES
Skerra, A. (1993) Bacterial expression of immunoglobulin fragments. Curr Opin Immunol, 5, 256-262.
Skerra, A., Pfitzinger, I. and Plueckthun, A. (1991) The functional expression of antibody Fv fragments
in Escherichia coli: improved vectors and a generally applicable purification technique.
Bio/Technology, 9, 273-8.
Skerra, A. and Plueckthun, A. (1988) Assembly of functional immunoglobulin Fv fragment in
Escherichia coli. Science, 240, 1038-1040.
Sleep, D., Belfield, G.P., Ballance, D.J., Steven, J., Jones, S., Evans, L.R., Moir, P.D. and Goodey,
A.R. (1991) Saccharomyces cerevisiae strains that overexpress heterologous proteins.
Bio/Technology, 9, 183-187.
Smith, G.P. (1985) Filamentous fusion phage: novel expression vectors that display cloned antigens
on the virion surface. Science, 228, 1315-1317.
Sofer, G. (1998) Validation issues in chromatographic processes. In Subramanian, G. (ed.)
Bioseparation and Bioprocessing. Wiley-VCH, Weinheim, Vol. I, pp. 497-511.
Spalding, B.J. (1991) Downstream processing: key to slashing production costs 100 fold.
Bio/Technology, 9, 229.
Sreekrishna, K., Brankamp, R.G., Kropp, K.E., Blankenship, D.T., Tsay, J.T., Smith, P.L., Wierschke,
J.D., Subramaniam, A. and Birkenberger, L.A. (1997) Strategies for optimal synthesis and secretion of
heterologous proteins in the methylotrophic yeast Pichia pastoris. Gene, 190, 55-62.
Sreekrishna, K. and Kropp, K.E. (1996) Pichia pastoris. In Wolf, K. (ed.) Nonconventional Yeasts in
Biotechnology: A Handbook. Springer Verlag, Berlin, pp. 203-253.
Staub, J.M., Garcia, B., Graves, J., Hajdukiewicz, P.T., Hunter, P., Nehra, N., Paradkar, V., Schlittler,
M., Carroll, J.A., Spatola, L., Ward, D., Ye, G. and Russell, D.A. (2000) High-yield production of a
human therapeutic protein in tobacco chloroplasts. Nat Biotechnol, 18, 333-338.
Tavladoraki, P., Benvenuto, E., Trinca, S., De Martinis, D. and Galeffi, P. (1993) Transgenic plants
expressing a functional single-chain Fv antibody are specifically protected from virus attack. Nature,
366, 469-472.
Taylor, C.B. (1997) Comprehending cosuppression. Plant Cell, 9, 1245-1249.
ten Hoopen, H.J.G., van Gulik, W.M. and Heijnen, J.J. (1992) Continuous culture of suspended plant
cells. In Vitro Cell Dev B, 28, 115-120.
Teng, S.F., Sproule, K., Husain, A. and Lowe, C.R. (2000) Affinity chromatography on immobilized
biomimetic ligands. Synthesis, immobilization and chromatographic assessment of an immunoglobulin
G-binding ligand. J Chromatogr, 740, 1-15.
Thommes, J., Bader, A., Halfar, M., Karau, A. and Kula, M.R. (1996) Isolation of monoclonal
antibodies from cell containing hybridoma broth using a protein A coated adsorbent in expanded beds.
J Chromatogr, 752, 111-22.
Towbin, H., Staehelin, T. and Gordon, J. (1979) Electrophoretic transfer of proteins from
polyacrylamide gels to nitrocellulose sheets: procedure and some applications. Proc Natl Acad Sci
USA, 76, 4350-4354.
REFERENCES 115
van den Bulcke, M., Bauw, G., Castresana, C., van Montagu, M. and Vandekerckhove, J. (1989)
Characterization of vacuolar and extracellular �(1,3)-glucanases of tobacco: Evidence for a strictly
compartmentalized plant defense system. Proc Natl Acad Sci USA, 86, 2673-2677.
Van Der Heijden, R., Verpoorte, R. and Ten Hoopen, H.J.G. (1989) Cell and Tissue Cultures of
Catharanthus roseus L. G. Don a Literature Survey. Plant Cell Tiss Org, 18, 231-280.
van Engelen, F.A., Schouten, A., Molthoff, J.W., Roosien, J., Salinas, J., Dirkse, W.G., Schots, A.,
Bakker, J., Gommers, F.J., Jongsma, M.A. and et al. (1994) Coordinate expression of antibody subunit
genes yields high levels of functional antibodies in roots of transgenic tobacco. Plant Mol Biol, 26,
1701-1710.
Vaquero, C., Sack, M., Chandler, J., Drossard, J., Schuster, F., Monecke, M., Schillberg, S. and
Fischer, R. (1999) Transient expression of a tumor-specific single-chain fragment and a chimeric
antibody in tobacco leaves. Proc Natl Acad Sci USA, 96, 11128-11133.
Voss, A., Niersbach, M., Hain, R., Hirsch, H.J., Liao, Y.C., Kreuzaler, F. and Fischer, R. (1995)
Reduced virus infectivity in N.tabacum secreting a TMV-specific full-size antibody. Mol Breeding, 1,
39-50.
Walter, J.K., Nothelfer, F. and Werz, W. (1998) Validation of viral safety for pharmaceutical proteins. In
Subramanian, G. (ed.) Bioseparation and Bioprocessing. Wiley-VCH, Weinheim, Vol. I, pp. 465-496.
Wang, M.-Y., Bentley, W.E. and Vakharia, V. (1994) Purification of a recombinant protein produced in
a baculovirus expression system by immobilized metal affinity chromatography. Biotechnol Bioeng, 43,
349-356.
Waterham, H.R., Digan, M.E., Koutz, P.J., Lair, S.L. and Cregg, J.M. (1997) Isolation of the Pichia
pastoris glyceraldehyde-3-phosphate dehydrogenase gene and regulation and use of its promoter.
Gene, 186, 37-44.
Welling, G.W. and Welling-Wester, S. (1998) Size-exclusion, high-performance liquid chromatography
of proteins. In Oliver, R.W.A. (ed.) HPLC of Macromolecules - A Practical Approach. Oxford University
Press, New York, pp. 45-62.
Wen, W.S. (1995) Bioprocessing technology for plant cell suspension cultures. Appl Biochem Biotech,
50, 189-216.
Whitelam, G.C., Cockburn, B., Gandecha, A.R. and Owen, M.R.L. (1993) Heterologous protein
production in transgenic plants. Biotechnol Genet Eng Rev, 11, 1-29.
Willoughby, N.A., Kirschner, T., Smith, M.P., Hjorth, R. and Titchener-Hooker, N.J. (1999) Immobilised
metal ion affinity chromatography purification of alcohol dehydrogenase from baker's yeast using an
expanded bed adsorption system. J Chromatogr, 840, 195-204.
Wilmut, I., Schnieke, A.E., McWhir, J., Kind, A.J. and Campbell, K.H. (1997) Viable offspring derived
from fetal and adult mammalian cells. Nature, 385, 810-3.
Windass, J.D., Worsey, M.J., Pioli, E.M., Pioli, D., Barth, P.T., Atherton, K.T., Dart, E.C., Byrom, D.,
Powell, K. and Senior, P.J. (1980) Improved conversion of methanol to single-cell protein by
Methylophilus methylotrophus. Nature, 287, 396-401.
Winter, G. and Milstein, C. (1991) Man-made antibodies. Nature, 349, 293-299.
116 REFERENCES
Winter, R.B., Yen, K.-M. and Ensley, B.D. (1989) Efficient degradation of trichloroethylene by a
recombinant Escherichia coli. Bio/Technology, 7, 282-285.
Wong, W.K.R., Curry, C., Parekh, R.S., Parekh, S.R., Wayman, M., Davies, R.W., Kilburn, D.G. and
Skipper, N. (1988) Wood hydrolysis by Cellulomonas fimi endoglucanase and exoglucanase
coexpressed as secreted enzymes in Saccharomyces cerevisiae. Bio/Technology, 6, 713-719.
Wu, A.M., Chen, W., Raubitschek, A., Williams, L.E., Neumaier, M., Fischer, R., Hu, S.Z., Odom-
Maryon, T., Wong, J.Y. and Shively, J.E. (1996) Tumor localization of anti-CEA single-chain Fvs:
improved targeting by non-covalent dimers. Immunotechnology, 2, 21-36.
You, Y.H., Hefta, L.J., Yazaki, P.J., Wu, A.M. and Shively, J.E. (1998) Expression, purification, and
characterization of a two domain carcinoembryonic antigen minigene (N-A3) in Pichia pastoris. The
essential role of the N-domain. Anticancer Res, 18, 3193-201.
Yu, S., Kwok, K.H. and Doran, P.M. (1996) Effect of sucrose, exogenous product concentration, and
other culture conditions on growth and steroidal alkaloid production by Solanum aviculare hairy roots.
Enzyme Microb Tech, 18, 238-243.
Zambryski, P. (1992) Chronicles from the Agrobacterium-plant cell DNA transfer story. Annu Rev Plant
Physiol Plant Mol Biol, 43, 465-490.
Zambryski, P., Joos, H., Genetello, C., van Montagu, M. and Schell, J. (1983) Ti-plasmid vector for
introduction of DNA into plant cells without altering their normal regeneration capacity. EMBO J, 2,
2143-2150.
Zheng, Z., Sumi, K., Tanaka, K. and Murai, N. (1995) The bean seed storage protein beta-phaseolin is
synthesized, processed, and accumulated in the vacuolar type-II protein bodies of transgenic rice
endosperm. Plant Physiol, 109, 777-786.
Zimmermann, S., Schillberg, S., Liao, Y.-C. and Fischer, R. (1998) Intracellular expression of TMV-
specific single-chain Fv fragments leads to improved virus resistance in Nicotiana tabacum. Mol
Breeding, 4, 369-379.
ABBREVIATIONS 117
VII Abbreviations°C degrees Celsius� “anti”A absorbanceaa amino acid(s)Ab antibodyAC affinity chromatographyAEX anion exchange chromatographyAmpR ampicillin-resistentAOX alcohol oxidaseAsn asparagineBB blocking bufferBCIP 5-bromo-4-chloro-3-indolyl phosphateBIA biomolecular interaction analysisBSA bovine serum albuminCaMV Cauliflower mosaic virusCb CarbenicillinCB coating bufferCDR complementarity determining regionCEA carcinoembryonic antigenCEX cation exchange chromatographycGLP current good laboratory practicecGMP current good manufacturing practiceCIP cleaning in placeCV column volume(s)DMSO dimethylsulfoxideDNA desoxyribonucleic acidDTT dithiothreitolEBA expanded bed adsorptionEDTA ethylenediaminetetraacetic acidELAB enzyme-labelled antibody bufferELISA enzyme-linked immunosorbent assayER endoplasmic reticulumESI electrospray ionizationEU European UnionFc “Fragment crystallizable”FSH follicle-stimulating hormoneg acceleration of gravity (9.8m/s)GAM goat-anti-mouse (antibodies)GAP glyceraldehyde-3-phosphateGF gel filtrationGlcNAc N-acetyl-glucosamineh hour(s)HAMA human anti mouse antibodyHBS Hepes buffered salineHIC hydrophobic interaction chromatographyHis histidineHPLC high pressure liquid chromatographyi.d. inner diameterIDA iminodiacetic acidIEF isoelectric focussingIEX ion exchange chromatographyIg immunoglobulinIMAC immobilized metal ion affinity chromatographyIPTG isopropylthiogalactosidekDa kilodaltonKm KanamycinL liter(s)
118 ABBREVIATIONS
LBA Luria broth with ampicillinLC liquid chromatographyM molarity (mol/L)mAb monoclonal antibodyMALDI matrix assisted laser desorption ionizationMan mannosemin minute(s)mRNA messenger ribonucleic acidMS mass spectrometryMSMO Murashige and Skoog medium with minimal organicsMW molecular weightm/z mass to charge ratioNBT nitro blue tetrazoliumNTA N-nitrilotriacetic acidOD optical densityo.d. outer diameterPAGE polyacrylamide gel electrophoresispAb polyclonal antibodyPBS phosphate buffered salinePBST phosphate buffered saline containing 0.05% Tween20PCI phenol/chloroform/isoamylalcoholPCR polymerase chain reactionPEG polyethyleneglycolpI isoelectric pointPNGase peptide-N-glycosidasePNPP para-nitrophenylphosphatepsi pounds per square inchPVP polyvinylpyrrolidonerAb recombinant antibodyRAC rabbit-anti-chicken (antibodies)Rif RifampicinRP reversed phase chromatographyrpm rotations per minuteRT room temperatureRU response unitsSB substrate bufferSBV sedimented bed volume(s)scFv “single chain Fragment variable”SDS sodium dodecylsulfateSEC size exclusion chromatographySer serineSOE splicing by overlap extensionTaq Thermus aquaticusTFA trifluoroacetic acidThr threonineTris trishydroxymethylaminomethaneU unitUV ultravioletV Voltv/v volume per volumev/w volume per weightw/v weight per volumeYNB yeast nitrogen base
Acknowledgements
I am grateful to
� Prof. Dr. Fritz Kreuzaler for giving me the opportunity to work at the Institut für
Biologie I, RWTH Aachen
� Prof. John E. Shively, PhD for reviewing the thesis and for allowing me to do the mass
spectrometry experiments during a brief stay at the Beckman Research Institute of the
City of Hope National Medical Center, Duarte, CA, USA
� my mentor, PD Dr. Rainer Fischer, for his constant support and friendship over the past
seven years
� Neil J. Emans for critical proofreading of the manuscript and for coffee, cigarettes and
discussions at the smokers’ refuge
� Detlef Schumann for his hospitality during my stay in Los Angeles, his assistance in the
(futile) pursuit of the knitted hooded sweater and the brainstorming sessions before our
oral PhD exams
� all coworkers in Dr. Fischer’s “antibody group”, notably Stefan Schillberg, Sabine
Zimmermann, the CEA-team (Markus Sack, Flora Schuster, Carmen Vaquero-Martin),
the Pichia-people (Stephan Hellwig, Mario Henke, Nicole Raven) and Verena
Hoppmann for the pSSH1-scFvT84.66-VTS plant expression vector
� the technical staff of the Institute, in particular Mr. Debye and his team at the workshop
and, of course, to my wife Beatrice and my daughter Jacqueline for their love, understanding
and patience, without which I’d never have made it. I�U!

Lebenslauf
Name: Jürgen Drossard
Geburtsdatum/-ort: 23. Mai 1959, Köln
Staatsangehörigkeit: deutsch
Familienstand: verheiratet, ein Kind
Schulbildung: 1965 - 1968 Grundschule in Aachen
1968 - 1977 Couvengymnasium Aachen
1982 - 1984 Abendgymnasium Aachen
Juni 1984 Abitur
Studium (RWTH Aachen):1984 – 1987 Geschichte, Pol.Wiss., VWL
1987 – 1996 Biologie
03/95 – 06/96 Diplomarbeit
22. Juni 1996 Diplom
Prüfungsfächer: Molekularbiologie (Prof. Kreuzaler)
Mikrobiologie (Prof. Wolf)
Pflanzenphysiologie (Prof. Grambow)
Organische Chemie (Prof. Höcker)
Titel der Diplomarbeit: Produktion und Charakterisierung von rekombinanten Antikörpernaus Pflanzenzellkulturen (Institut für Biologie I, Prof. Kreuzaler)
seit Juli 1996 Promotion
Berufstätigkeit:1978 – 1980 Ausbildung zum Bürokaufmann
1981 – 1991 freiberufliche selbständige Tätigkeit
seit Juli 1996 wissenschaftlicher Angestellter am
Institut für Biologie I
Aachen, im August 2000