Laser-assisted fluorescence microscopy for measuring cellmembrane dynamics
Herbert Schneckenburger,a,b Michael Wagner,a Martina Kretzschmar,a Wolfgang S. L. Strauss b
and Reinhard Sailer b
a Fachhochschule Aalen, Institut für Angewandte Forschung, Beethovenstr. 1, 73430 Aalen,Germany
b Institut für Lasertechnologien in der Medizin und Messtechnik an der Universität Ulm,Helmholtzstr. 12, 89081 Ulm, Germany
Received 5th January 2004, Accepted 17th May 2004First published as an Advance Article on the web 28th May 2004
Membranes of living cells are characterized by laser-assisted fluorescence microscopy, in particular a combinationof microspectrofluorometry, total internal reflection fluorescence microscopy (TIRFM), fluorescence lifetimeimaging (FLIM) and Förster resonance energy transfer (FRET) spectroscopy. The generalized polarization (GP,characterizing a spectral shift which depends on the phase of membrane lipids) as well as the effective fluorescencelifetime (τeff) of the membrane marker laurdan were revealed to be appropriate parameters for membrane stiffnessand fluidity. GP decreased with temperature, but increased during cell growth and was always higher for the plasmamembrane than for intracellular membranes. Microdomains of different fluorescence lifetimes τeff were observedat temperatures above 30 �C and disappeared during cell aging. Non-radiative energy transfer was used to detectlaurdan selectively in close proximity to a molecular acceptor (DiI) and may present a possibility for measuringmembrane dynamics in specific microenvironments.
IntroductionFluorescence techniques are widespread in the field ofbiomedical diagnostics,1,2 since in addition to some intrinsicfluorophores 3–5 numerous dyes for staining cell nuclei,membranes or subcellular organelles as well as for probing ionconcentrations, pH values or membrane potentials havebecome available.6,7 In addition, green fluorescent proteins(GFPs) and their mutants are used for site-specific trackingof living cells or organisms.8,9 Fluorescence microscopyis probably the most commonly used method, which isincreasingly combined with laser excitation.
In comparison with conventional light sources, lasersoffer several advantages: (1) coherence, which is used forinterferometry or holography; (2) focusing abilities to adiffraction limited spot with a radius r = 0.61 λ/A with λ corre-sponding to the wavelength of radiation and A to the numericalaperture of the focusing lens, e.g. microscope objective lens; (3)high spectral resolution of 10�5 nm ≤ ∆λ ≤ 1 nm; (4) hightemporal resolution with pulse widths of 4 fs ≤ ∆t ≤ 20 ns.
Generally, wide field fluorescence microscopy and (con-focal 10 or multiphoton 11,12) laser scanning microscopy areimportant, both permitting high spatial, spectral and temporalresolution, when monochromatic laser light is focused to themicrometer or sub-micrometer range. The present articleis focused on applications of wide-field microscopy to thefluorescent membrane marker laurdan including micro-spectrofluorometry, total internal reflection fluorescencemicroscopy (TIRFM), fluorescence lifetime imaging (FLIM)and Förster resonance energy transfer spectroscopy (FRET).Time-resolving (nanosecond and subnanosecond) techniquesare emphasized, since the fluorescence lifetime of a moleculemay be sensitive to its microenvironment and gives thereforevaluable information on its molecular or cellular interactions.The fluorescence lifetime τ can be described as the reciprocalof the sum of all rates ki deactivating an excited molecular state,in particular the rate of fluorescence (kF) and the rates ofnon-radiative transitions, e.g. internal conversion (kIC), singlet–triplet intersystem crossing (kISC) and energy transfer toadjacent molecules (kET) according to 2
Therefore, τ is sensitive to changes of internal conversiondue to specific molecular interactions or to intermolecularenergy transfer.
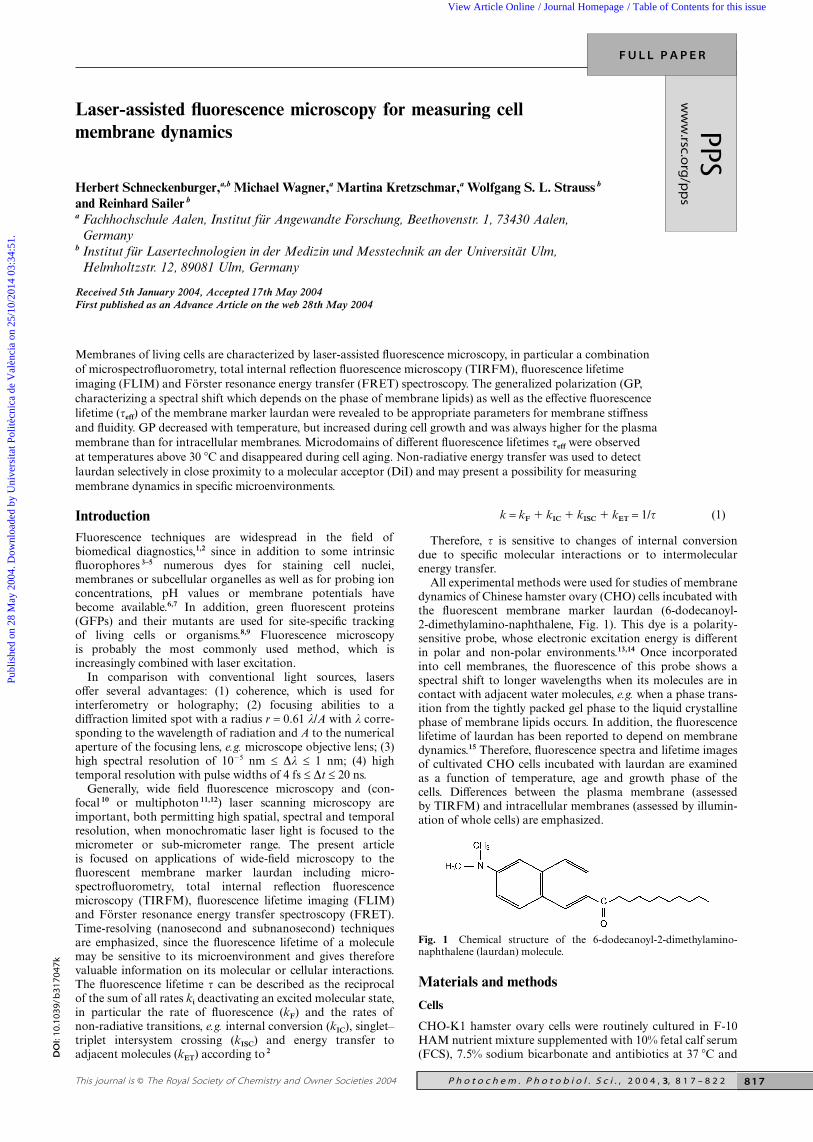
All experimental methods were used for studies of membranedynamics of Chinese hamster ovary (CHO) cells incubated withthe fluorescent membrane marker laurdan (6-dodecanoyl-2-dimethylamino-naphthalene, Fig. 1). This dye is a polarity-sensitive probe, whose electronic excitation energy is differentin polar and non-polar environments.13,14 Once incorporatedinto cell membranes, the fluorescence of this probe shows aspectral shift to longer wavelengths when its molecules are incontact with adjacent water molecules, e.g. when a phase trans-ition from the tightly packed gel phase to the liquid crystallinephase of membrane lipids occurs. In addition, the fluorescencelifetime of laurdan has been reported to depend on membranedynamics.15 Therefore, fluorescence spectra and lifetime imagesof cultivated CHO cells incubated with laurdan are examinedas a function of temperature, age and growth phase of thecells. Differences between the plasma membrane (assessedby TIRFM) and intracellular membranes (assessed by illumin-ation of whole cells) are emphasized.
Materials and methods
Cells
CHO-K1 hamster ovary cells were routinely cultured in F-10HAM nutrient mixture supplemented with 10% fetal calf serum(FCS), 7.5% sodium bicarbonate and antibiotics at 37 �C and
k = kF � kIC � kISC � kET = 1/τ (1)
Fig. 1 Chemical structure of the 6-dodecanoyl-2-dimethylamino-naphthalene (laurdan) molecule.
DO
I:1
0.1
03
9/ b
31
70
47
k
817This journal is © The Royal Society of Chemistry and Owner Societies 2004 P h o t o c h e m . P h o t o b i o l . S c i . , 2 0 0 4 , 3, 8 1 7 – 8 2 2
Publ
ishe
d on
28
May
200
4. D
ownl
oade
d by
Uni
vers
itat P
olitè
cnic
a de
Val
ènci
a on
25/
10/2
014
03:3
4:51
. View Article Online / Journal Homepage / Table of Contents for this issue
5% CO2. After seeding of 150 cells mm�2, cells were grownon microscope object slides for either 24 or 48 h prior toincubation for 60 min with 8 µM laurdan diluted in culturemedium. After a growth period of 48 h a sub-confluent cellmonolayer was obtained, whereas individual cells and smallcell clusters were predominant after 24 h. After incubation cellswere rinsed with PBS and measured in an open aluminiumchamber at variable temperatures ranging from 24 to 41 �Cusing a 63×/0.90 water immersion objective lens. The chamber(filled with a layer of 2–3 mm PBS) contained a pair ofhigh-power resistors for heating as well as a calibratedthermocouple which was controlled by a microprocessor andplaced in close vicinity to the measured part of the sample.Measurements were performed with two groups of subcultures(SC): SC 12–23 (‘young cells’) and SC 35–38 (‘aged cells’).Measurements which are not further specified, were carried outwith SC 12–23.
For energy transfer (FRET) measurements in the plasmamembrane, cells were coincubated for 10 min with laurdan(8 µM) and DiI (1,1�-dioctadecyl-3,3,3�,3�-tetramethyl-indo-carbocyanine perchlorate; 2, 4 or 8 µM), which has also beendescribed as a membrane marker.16 The short incubation timein this case was optimized for the detection of DiI fluorescencein the plasma membrane. Cells incubated solely with laurdanwere used as a reference.
Microspectrofluorometry
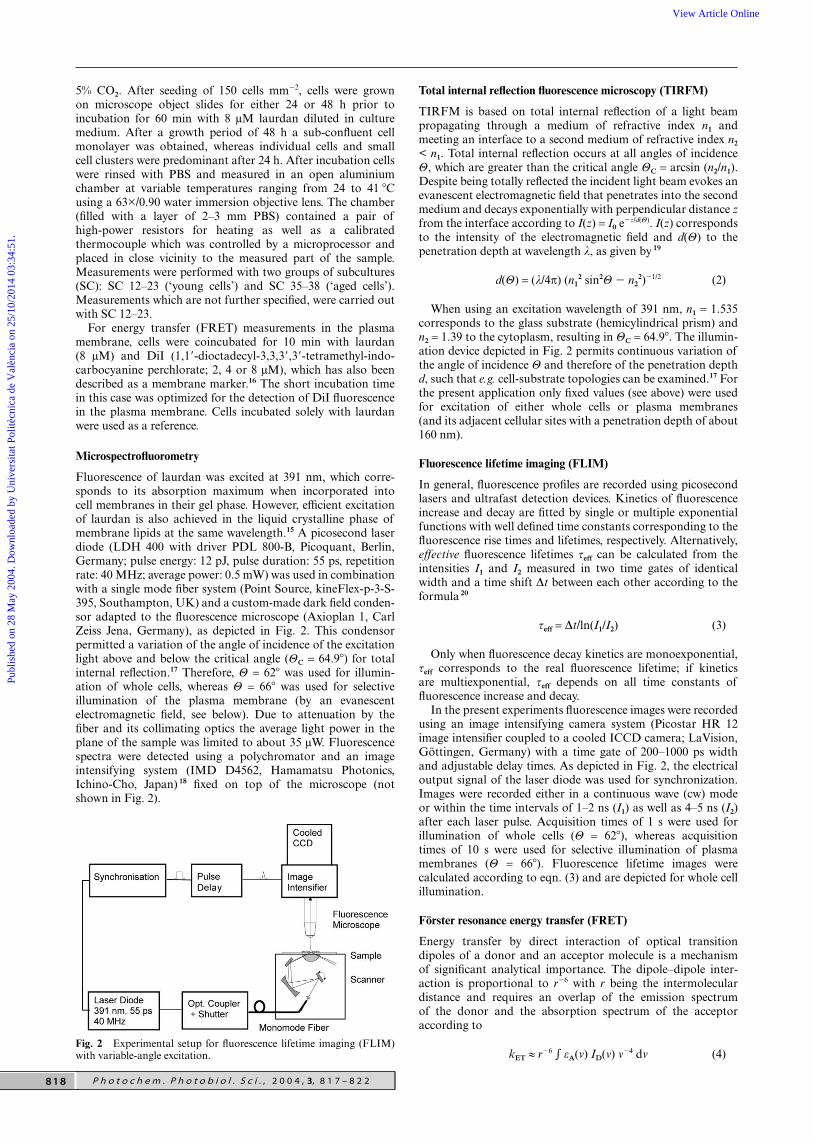
Fluorescence of laurdan was excited at 391 nm, which corre-sponds to its absorption maximum when incorporated intocell membranes in their gel phase. However, efficient excitationof laurdan is also achieved in the liquid crystalline phase ofmembrane lipids at the same wavelength.15 A picosecond laserdiode (LDH 400 with driver PDL 800-B, Picoquant, Berlin,Germany; pulse energy: 12 pJ, pulse duration: 55 ps, repetitionrate: 40 MHz; average power: 0.5 mW) was used in combinationwith a single mode fiber system (Point Source, kineFlex-p-3-S-395, Southampton, UK) and a custom-made dark field conden-sor adapted to the fluorescence microscope (Axioplan 1, CarlZeiss Jena, Germany), as depicted in Fig. 2. This condensorpermitted a variation of the angle of incidence of the excitationlight above and below the critical angle (ΘC = 64.9�) for totalinternal reflection.17 Therefore, Θ = 62� was used for illumin-ation of whole cells, whereas Θ = 66� was used for selectiveillumination of the plasma membrane (by an evanescentelectromagnetic field, see below). Due to attenuation by thefiber and its collimating optics the average light power in theplane of the sample was limited to about 35 µW. Fluorescencespectra were detected using a polychromator and an imageintensifying system (IMD D4562, Hamamatsu Photonics,Ichino-Cho, Japan) 18 fixed on top of the microscope (notshown in Fig. 2).
Fig. 2 Experimental setup for fluorescence lifetime imaging (FLIM)with variable-angle excitation.
Total internal reflection fluorescence microscopy (TIRFM)
TIRFM is based on total internal reflection of a light beampropagating through a medium of refractive index n1 andmeeting an interface to a second medium of refractive index n2
< n1. Total internal reflection occurs at all angles of incidenceΘ, which are greater than the critical angle ΘC = arcsin (n2/n1).Despite being totally reflected the incident light beam evokes anevanescent electromagnetic field that penetrates into the secondmedium and decays exponentially with perpendicular distance zfrom the interface according to I(z) = I0 e
�z/d(Θ). I(z) correspondsto the intensity of the electromagnetic field and d(Θ) to thepenetration depth at wavelength λ, as given by 19
When using an excitation wavelength of 391 nm, n1 = 1.535corresponds to the glass substrate (hemicylindrical prism) andn2 = 1.39 to the cytoplasm, resulting in ΘC = 64.9�. The illumin-ation device depicted in Fig. 2 permits continuous variation ofthe angle of incidence Θ and therefore of the penetration depthd, such that e.g. cell-substrate topologies can be examined.17 Forthe present application only fixed values (see above) were usedfor excitation of either whole cells or plasma membranes(and its adjacent cellular sites with a penetration depth of about160 nm).
Fluorescence lifetime imaging (FLIM)
In general, fluorescence profiles are recorded using picosecondlasers and ultrafast detection devices. Kinetics of fluorescenceincrease and decay are fitted by single or multiple exponentialfunctions with well defined time constants corresponding to thefluorescence rise times and lifetimes, respectively. Alternatively,effective fluorescence lifetimes τeff can be calculated from theintensities I1 and I2 measured in two time gates of identicalwidth and a time shift ∆t between each other according to theformula 20
Only when fluorescence decay kinetics are monoexponential,τeff corresponds to the real fluorescence lifetime; if kineticsare multiexponential, τeff depends on all time constants offluorescence increase and decay.
In the present experiments fluorescence images were recordedusing an image intensifying camera system (Picostar HR 12image intensifier coupled to a cooled ICCD camera; LaVision,Göttingen, Germany) with a time gate of 200–1000 ps widthand adjustable delay times. As depicted in Fig. 2, the electricaloutput signal of the laser diode was used for synchronization.Images were recorded either in a continuous wave (cw) modeor within the time intervals of 1–2 ns (I1) as well as 4–5 ns (I2)after each laser pulse. Acquisition times of 1 s were used forillumination of whole cells (Θ = 62�), whereas acquisitiontimes of 10 s were used for selective illumination of plasmamembranes (Θ = 66�). Fluorescence lifetime images werecalculated according to eqn. (3) and are depicted for whole cellillumination.
Förster resonance energy transfer (FRET)
Energy transfer by direct interaction of optical transitiondipoles of a donor and an acceptor molecule is a mechanismof significant analytical importance. The dipole–dipole inter-action is proportional to r�6 with r being the intermoleculardistance and requires an overlap of the emission spectrumof the donor and the absorption spectrum of the acceptoraccording to
d(Θ) = (λ/4π) (n12 sin2Θ � n2
2)�1/2 (2)
τeff = ∆t/ln(I1/I2) (3)
kET ≈ r�6 � εA(ν) ID(ν) ν�4 dν (4)
818 P h o t o c h e m . P h o t o b i o l . S c i . , 2 0 0 4 , 3, 8 1 7 – 8 2 2
Publ
ishe
d on
28
May
200
4. D
ownl
oade
d by
Uni
vers
itat P
olitè
cnic
a de
Val
ènci
a on
25/
10/2
014
03:3
4:51
. View Article Online
with kET being the rate of energy transfer, εA(ν) the molarextinction coefficient of the acceptor, ID(ν) the flux of emittedphotons of the donor and ν the frequency of radiation. Light isabsorbed by the donor and emitted by the acceptor, whereas theintermolecular energy transfer is non-radiative.
The principle of this so-called Förster mechanism 21 isexemplified in Fig. 3 (upper part) for the donor–acceptor pairlaurdan DiI. The emission spectrum of laurdan and theabsorption spectrum of DiI are depicted in the lower part ofthis figure. The spectral overlap indicates that the conditionof resonance is fairly fulfilled. Since FRET is limited to inter-molecular distances of a few nanometers, the method may beused to probe a donor species in close vicinity of an acceptormolecule or to quantify donor–acceptor interactions.
Energy transfer rates can be determined from stationary aswell as from time-resolved fluorescence measurements. In thefirst case, the photon fluxes of donor (ID) and acceptor (IA)fluorescence are measured, and the ratio
can be calculated, assuming that the energy transfer rate kET
is proportional to acceptor concentration,22 and that thefluorescence quantum yields ηD and ηA of donor and acceptormolecules as well as the fluorescence lifetime τ of the donor areknown. Another possibility of calculating kET is time-resolvedfluorescence spectroscopy. If the fluorescence lifetime of adonor species is measured in the presence (lifetime τ) and in theabsence (lifetime τ0) of an acceptor, the energy transfer rate kET
can be determined [considering eqn. (1)] by
Since kET depends on concentration of the acceptor species,increasing concentrations of DiI were used (see above).
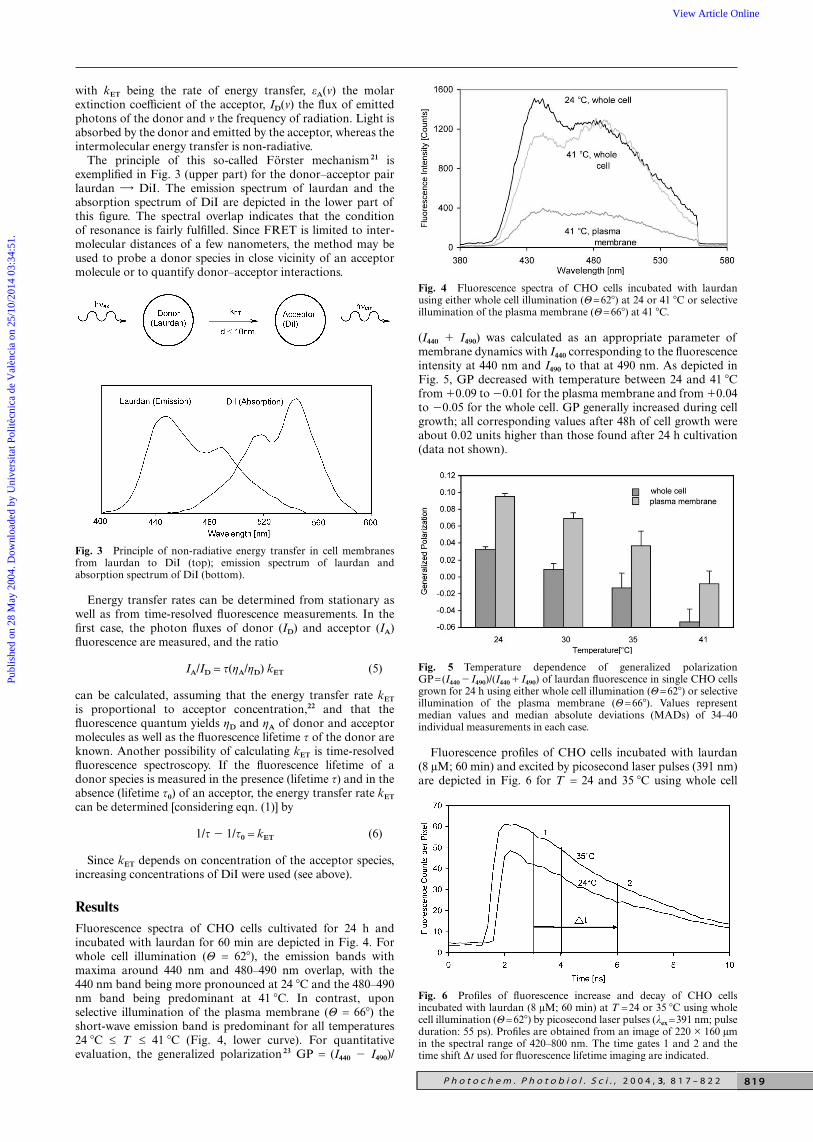
ResultsFluorescence spectra of CHO cells cultivated for 24 h andincubated with laurdan for 60 min are depicted in Fig. 4. Forwhole cell illumination (Θ = 62�), the emission bands withmaxima around 440 nm and 480–490 nm overlap, with the440 nm band being more pronounced at 24 �C and the 480–490nm band being predominant at 41 �C. In contrast, uponselective illumination of the plasma membrane (Θ = 66�) theshort-wave emission band is predominant for all temperatures24 �C ≤ T ≤ 41 �C (Fig. 4, lower curve). For quantitativeevaluation, the generalized polarization 23 GP = (I440 � I490)/
Fig. 3 Principle of non-radiative energy transfer in cell membranesfrom laurdan to DiI (top); emission spectrum of laurdan andabsorption spectrum of DiI (bottom).
IA/ID = τ(ηA/ηD) kET (5)
1/τ � 1/τ0 = kET (6)
(I440 � I490) was calculated as an appropriate parameter ofmembrane dynamics with I440 corresponding to the fluorescenceintensity at 440 nm and I490 to that at 490 nm. As depicted inFig. 5, GP decreased with temperature between 24 and 41 �Cfrom �0.09 to �0.01 for the plasma membrane and from �0.04to �0.05 for the whole cell. GP generally increased during cellgrowth; all corresponding values after 48h of cell growth wereabout 0.02 units higher than those found after 24 h cultivation(data not shown).
Fluorescence profiles of CHO cells incubated with laurdan(8 µM; 60 min) and excited by picosecond laser pulses (391 nm)are depicted in Fig. 6 for T = 24 and 35 �C using whole cell
Fig. 4 Fluorescence spectra of CHO cells incubated with laurdanusing either whole cell illumination (Θ=62�) at 24 or 41 �C or selectiveillumination of the plasma membrane (Θ=66�) at 41 �C.
Fig. 5 Temperature dependence of generalized polarizationGP= (I440 � I490)/(I440 � I490) of laurdan fluorescence in single CHO cellsgrown for 24 h using either whole cell illumination (Θ=62�) or selectiveillumination of the plasma membrane (Θ=66�). Values representmedian values and median absolute deviations (MADs) of 34–40individual measurements in each case.
Fig. 6 Profiles of fluorescence increase and decay of CHO cellsincubated with laurdan (8 µM; 60 min) at T =24 or 35 �C using wholecell illumination (Θ=62�) by picosecond laser pulses (λex =391 nm; pulseduration: 55 ps). Profiles are obtained from an image of 220 × 160 µmin the spectral range of 420–800 nm. The time gates 1 and 2 and thetime shift ∆t used for fluorescence lifetime imaging are indicated.
819P h o t o c h e m . P h o t o b i o l . S c i . , 2 0 0 4 , 3, 8 1 7 – 8 2 2
Publ
ishe
d on
28
May
200
4. D
ownl
oade
d by
Uni
vers
itat P
olitè
cnic
a de
Val
ènci
a on
25/
10/2
014
03:3
4:51
. View Article Online
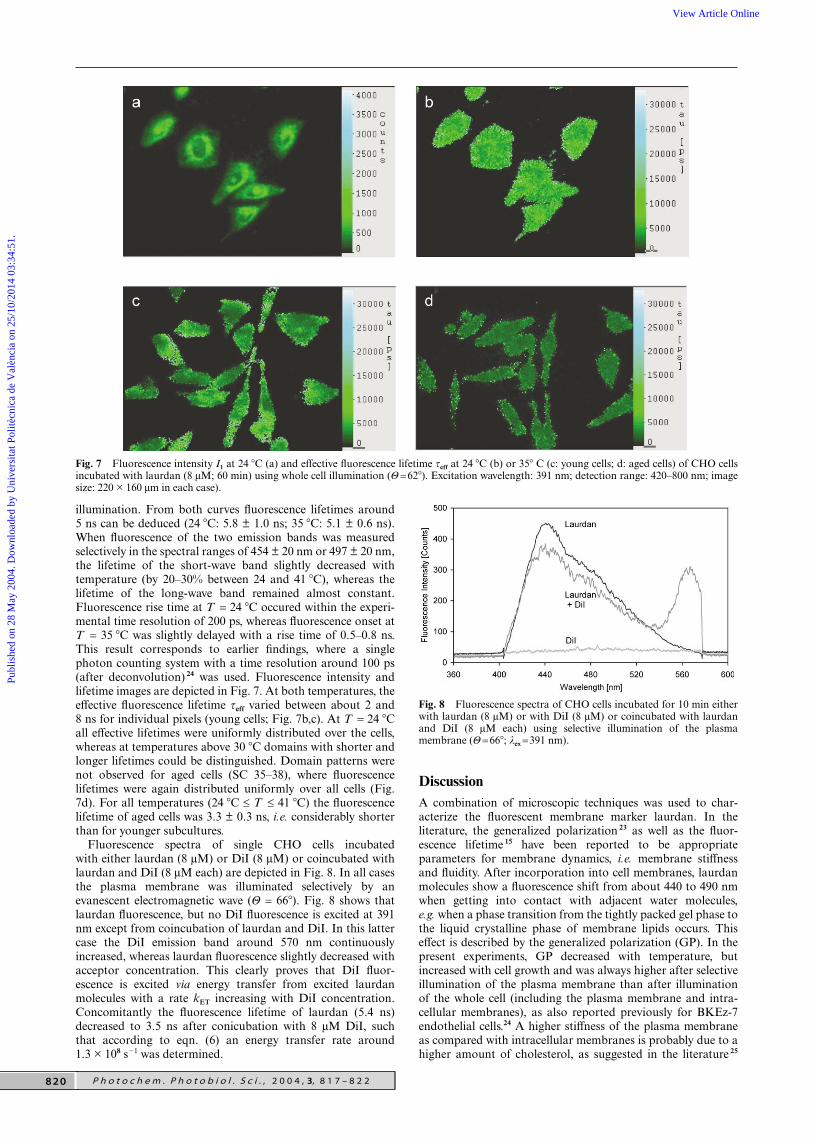
Fig. 7 Fluorescence intensity I1 at 24 �C (a) and effective fluorescence lifetime τeff at 24 �C (b) or 35� C (c: young cells; d: aged cells) of CHO cellsincubated with laurdan (8 µM; 60 min) using whole cell illumination (Θ=62�). Excitation wavelength: 391 nm; detection range: 420–800 nm; imagesize: 220 × 160 µm in each case).
illumination. From both curves fluorescence lifetimes around5 ns can be deduced (24 �C: 5.8 ± 1.0 ns; 35 �C: 5.1 ± 0.6 ns).When fluorescence of the two emission bands was measuredselectively in the spectral ranges of 454 ± 20 nm or 497 ± 20 nm,the lifetime of the short-wave band slightly decreased withtemperature (by 20–30% between 24 and 41 �C), whereas thelifetime of the long-wave band remained almost constant.Fluorescence rise time at T = 24 �C occured within the experi-mental time resolution of 200 ps, whereas fluorescence onset atT = 35 �C was slightly delayed with a rise time of 0.5–0.8 ns.This result corresponds to earlier findings, where a singlephoton counting system with a time resolution around 100 ps(after deconvolution) 24 was used. Fluorescence intensity andlifetime images are depicted in Fig. 7. At both temperatures, theeffective fluorescence lifetime τeff varied between about 2 and8 ns for individual pixels (young cells; Fig. 7b,c). At T = 24 �Call effective lifetimes were uniformly distributed over the cells,whereas at temperatures above 30 �C domains with shorter andlonger lifetimes could be distinguished. Domain patterns werenot observed for aged cells (SC 35–38), where fluorescencelifetimes were again distributed uniformly over all cells (Fig.7d). For all temperatures (24 �C ≤ T ≤ 41 �C) the fluorescencelifetime of aged cells was 3.3 ± 0.3 ns, i.e. considerably shorterthan for younger subcultures.
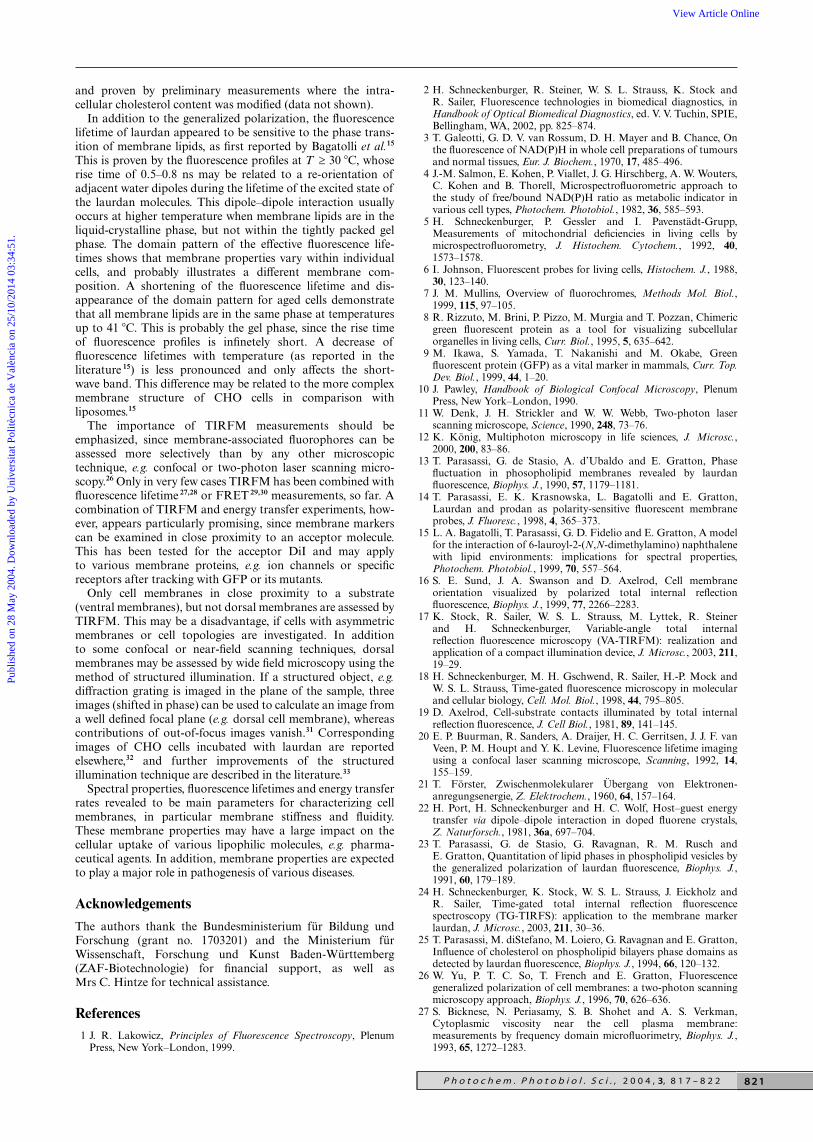
Fluorescence spectra of single CHO cells incubatedwith either laurdan (8 µM) or DiI (8 µM) or coincubated withlaurdan and DiI (8 µM each) are depicted in Fig. 8. In all casesthe plasma membrane was illuminated selectively by anevanescent electromagnetic wave (Θ = 66�). Fig. 8 shows thatlaurdan fluorescence, but no DiI fluorescence is excited at 391nm except from coincubation of laurdan and DiI. In this lattercase the DiI emission band around 570 nm continuouslyincreased, whereas laurdan fluorescence slightly decreased withacceptor concentration. This clearly proves that DiI fluor-escence is excited via energy transfer from excited laurdanmolecules with a rate kET increasing with DiI concentration.Concomitantly the fluorescence lifetime of laurdan (5.4 ns)decreased to 3.5 ns after conicubation with 8 µM DiI, suchthat according to eqn. (6) an energy transfer rate around1.3 × 108 s�1 was determined.
DiscussionA combination of microscopic techniques was used to char-acterize the fluorescent membrane marker laurdan. In theliterature, the generalized polarization 23 as well as the fluor-escence lifetime 15 have been reported to be appropriateparameters for membrane dynamics, i.e. membrane stiffnessand fluidity. After incorporation into cell membranes, laurdanmolecules show a fluorescence shift from about 440 to 490 nmwhen getting into contact with adjacent water molecules,e.g. when a phase transition from the tightly packed gel phase tothe liquid crystalline phase of membrane lipids occurs. Thiseffect is described by the generalized polarization (GP). In thepresent experiments, GP decreased with temperature, butincreased with cell growth and was always higher after selectiveillumination of the plasma membrane than after illuminationof the whole cell (including the plasma membrane and intra-cellular membranes), as also reported previously for BKEz-7endothelial cells.24 A higher stiffness of the plasma membraneas compared with intracellular membranes is probably due to ahigher amount of cholesterol, as suggested in the literature 25
Fig. 8 Fluorescence spectra of CHO cells incubated for 10 min eitherwith laurdan (8 µM) or with DiI (8 µM) or coincubated with laurdanand DiI (8 µM each) using selective illumination of the plasmamembrane (Θ=66�; λex =391 nm).
820 P h o t o c h e m . P h o t o b i o l . S c i . , 2 0 0 4 , 3, 8 1 7 – 8 2 2
Publ
ishe
d on
28
May
200
4. D
ownl
oade
d by
Uni
vers
itat P
olitè
cnic
a de
Val
ènci
a on
25/
10/2
014
03:3
4:51
. View Article Online
and proven by preliminary measurements where the intra-cellular cholesterol content was modified (data not shown).
In addition to the generalized polarization, the fluorescencelifetime of laurdan appeared to be sensitive to the phase trans-ition of membrane lipids, as first reported by Bagatolli et al.15
This is proven by the fluorescence profiles at T ≥ 30 �C, whoserise time of 0.5–0.8 ns may be related to a re-orientation ofadjacent water dipoles during the lifetime of the excited state ofthe laurdan molecules. This dipole–dipole interaction usuallyoccurs at higher temperature when membrane lipids are in theliquid-crystalline phase, but not within the tightly packed gelphase. The domain pattern of the effective fluorescence life-times shows that membrane properties vary within individualcells, and probably illustrates a different membrane com-position. A shortening of the fluorescence lifetime and dis-appearance of the domain pattern for aged cells demonstratethat all membrane lipids are in the same phase at temperaturesup to 41 �C. This is probably the gel phase, since the rise timeof fluorescence profiles is infinetely short. A decrease offluorescence lifetimes with temperature (as reported in theliterature 15) is less pronounced and only affects the short-wave band. This difference may be related to the more complexmembrane structure of CHO cells in comparison withliposomes.15
The importance of TIRFM measurements should beemphasized, since membrane-associated fluorophores can beassessed more selectively than by any other microscopictechnique, e.g. confocal or two-photon laser scanning micro-scopy.26 Only in very few cases TIRFM has been combined withfluorescence lifetime 27,28 or FRET 29,30 measurements, so far. Acombination of TIRFM and energy transfer experiments, how-ever, appears particularly promising, since membrane markerscan be examined in close proximity to an acceptor molecule.This has been tested for the acceptor DiI and may applyto various membrane proteins, e.g. ion channels or specificreceptors after tracking with GFP or its mutants.
Only cell membranes in close proximity to a substrate(ventral membranes), but not dorsal membranes are assessed byTIRFM. This may be a disadvantage, if cells with asymmetricmembranes or cell topologies are investigated. In additionto some confocal or near-field scanning techniques, dorsalmembranes may be assessed by wide field microscopy using themethod of structured illumination. If a structured object, e.g.diffraction grating is imaged in the plane of the sample, threeimages (shifted in phase) can be used to calculate an image froma well defined focal plane (e.g. dorsal cell membrane), whereascontributions of out-of-focus images vanish.31 Correspondingimages of CHO cells incubated with laurdan are reportedelsewhere,32 and further improvements of the structuredillumination technique are described in the literature.33
Spectral properties, fluorescence lifetimes and energy transferrates revealed to be main parameters for characterizing cellmembranes, in particular membrane stiffness and fluidity.These membrane properties may have a large impact on thecellular uptake of various lipophilic molecules, e.g. pharma-ceutical agents. In addition, membrane properties are expectedto play a major role in pathogenesis of various diseases.
Acknowledgements
The authors thank the Bundesministerium für Bildung undForschung (grant no. 1703201) and the Ministerium fürWissenschaft, Forschung und Kunst Baden-Württemberg(ZAF-Biotechnologie) for financial support, as well asMrs C. Hintze for technical assistance.
References1 J. R. Lakowicz, Principles of Fluorescence Spectroscopy, Plenum
Press, New York–London, 1999.
2 H. Schneckenburger, R. Steiner, W. S. L. Strauss, K. Stock andR. Sailer, Fluorescence technologies in biomedical diagnostics, inHandbook of Optical Biomedical Diagnostics, ed. V. V. Tuchin, SPIE,Bellingham, WA, 2002, pp. 825–874.
3 T. Galeotti, G. D. V. van Rossum, D. H. Mayer and B. Chance, Onthe fluorescence of NAD(P)H in whole cell preparations of tumoursand normal tissues, Eur. J. Biochem., 1970, 17, 485–496.
4 J.-M. Salmon, E. Kohen, P. Viallet, J. G. Hirschberg, A. W. Wouters,C. Kohen and B. Thorell, Microspectrofluorometric approach tothe study of free/bound NAD(P)H ratio as metabolic indicator invarious cell types, Photochem. Photobiol., 1982, 36, 585–593.
5 H. Schneckenburger, P. Gessler and I. Pavenstädt-Grupp,Measurements of mitochondrial deficiencies in living cells bymicrospectrofluorometry, J. Histochem. Cytochem., 1992, 40,1573–1578.
6 I. Johnson, Fluorescent probes for living cells, Histochem. J., 1988,30, 123–140.
7 J. M. Mullins, Overview of fluorochromes, Methods Mol. Biol.,1999, 115, 97–105.
8 R. Rizzuto, M. Brini, P. Pizzo, M. Murgia and T. Pozzan, Chimericgreen fluorescent protein as a tool for visualizing subcellularorganelles in living cells, Curr. Biol., 1995, 5, 635–642.
9 M. Ikawa, S. Yamada, T. Nakanishi and M. Okabe, Greenfluorescent protein (GFP) as a vital marker in mammals, Curr. Top.Dev. Biol., 1999, 44, 1–20.
10 J. Pawley, Handbook of Biological Confocal Microscopy, PlenumPress, New York–London, 1990.
11 W. Denk, J. H. Strickler and W. W. Webb, Two-photon laserscanning microscope, Science, 1990, 248, 73–76.
12 K. König, Multiphoton microscopy in life sciences, J. Microsc.,2000, 200, 83–86.
13 T. Parasassi, G. de Stasio, A. d’Ubaldo and E. Gratton, Phasefluctuation in phosopholipid membranes revealed by laurdanfluorescence, Biophys. J., 1990, 57, 1179–1181.
14 T. Parasassi, E. K. Krasnowska, L. Bagatolli and E. Gratton,Laurdan and prodan as polarity-sensitive fluorescent membraneprobes, J. Fluoresc., 1998, 4, 365–373.
15 L. A. Bagatolli, T. Parasassi, G. D. Fidelio and E. Gratton, A modelfor the interaction of 6-lauroyl-2-(N,N-dimethylamino) naphthalenewith lipid environments: implications for spectral properties,Photochem. Photobiol., 1999, 70, 557–564.
16 S. E. Sund, J. A. Swanson and D. Axelrod, Cell membraneorientation visualized by polarized total internal reflectionfluorescence, Biophys. J., 1999, 77, 2266–2283.
17 K. Stock, R. Sailer, W. S. L. Strauss, M. Lyttek, R. Steinerand H. Schneckenburger, Variable-angle total internalreflection fluorescence microscopy (VA-TIRFM): realization andapplication of a compact illumination device, J. Microsc., 2003, 211,19–29.
18 H. Schneckenburger, M. H. Gschwend, R. Sailer, H.-P. Mock andW. S. L. Strauss, Time-gated fluorescence microscopy in molecularand cellular biology, Cell. Mol. Biol., 1998, 44, 795–805.
19 D. Axelrod, Cell-substrate contacts illuminated by total internalreflection fluorescence, J. Cell Biol., 1981, 89, 141–145.
20 E. P. Buurman, R. Sanders, A. Draijer, H. C. Gerritsen, J. J. F. vanVeen, P. M. Houpt and Y. K. Levine, Fluorescence lifetime imagingusing a confocal laser scanning microscope, Scanning, 1992, 14,155–159.
21 T. Förster, Zwischenmolekularer Übergang von Elektronen-anregungsenergie, Z. Elektrochem., 1960, 64, 157–164.
22 H. Port, H. Schneckenburger and H. C. Wolf, Host–guest energytransfer via dipole–dipole interaction in doped fluorene crystals,Z. Naturforsch., 1981, 36a, 697–704.
23 T. Parasassi, G. de Stasio, G. Ravagnan, R. M. Rusch andE. Gratton, Quantitation of lipid phases in phospholipid vesicles bythe generalized polarization of laurdan fluorescence, Biophys. J.,1991, 60, 179–189.
24 H. Schneckenburger, K. Stock, W. S. L. Strauss, J. Eickholz andR. Sailer, Time-gated total internal reflection fluorescencespectroscopy (TG-TIRFS): application to the membrane markerlaurdan, J. Microsc., 2003, 211, 30–36.
25 T. Parasassi, M. diStefano, M. Loiero, G. Ravagnan and E. Gratton,Influence of cholesterol on phospholipid bilayers phase domains asdetected by laurdan fluorescence, Biophys. J., 1994, 66, 120–132.
26 W. Yu, P. T. C. So, T. French and E. Gratton, Fluorescencegeneralized polarization of cell membranes: a two-photon scanningmicroscopy approach, Biophys. J., 1996, 70, 626–636.
27 S. Bicknese, N. Periasamy, S. B. Shohet and A. S. Verkman,Cytoplasmic viscosity near the cell plasma membrane:measurements by frequency domain microfluorimetry, Biophys. J.,1993, 65, 1272–1283.
821P h o t o c h e m . P h o t o b i o l . S c i . , 2 0 0 4 , 3, 8 1 7 – 8 2 2
Publ
ishe
d on
28
May
200
4. D
ownl
oade
d by
Uni
vers
itat P
olitè
cnic
a de
Val
ènci
a on
25/
10/2
014
03:3
4:51
. View Article Online
28 H. Schneckenburger, K. Stock, M. Lyttek, W. S. L. Strauss andR. Sailer, Fluorescence lifetime imaging (FLIM) of rhodamine 123in living cells, Photochem. Photobiol. Sci., 2004, 3, 127–131.
29 T. P. Burghardt and D. Axelrod, Total internal reflection study ofenergy transfer in surface-absorbed and dissolved bovine serumalbumin, Biochemistry, 1983, 22, 979–985.
30 A. S. Curtis, Cell reactions with biomaterials: the microscopies, Eur.Cell Mater., 2001, 1, 59–65.
31 M. A. A. Neil, R. Juskaitis and T. Wilson, Method of obtaining
optical sectioning by structured light in a conventional microscope,Opt. Lett., 1997, 22, 1905–1907.
32 H. Schneckenburger, Optical Microscopy, in Lasers and CurrentOptical Techniques in Biology, ed. G. Palumbo and R. Pratesi,Comprehensive Series in Photosciences, Royal Society of Chemistry,Cambridge, 2004, vol. 5, pp. 331–355.
33 R. Heintzmann, T. M. Jovin and C. Cremer, Saturated patternedexcitation microscopy – a concept for optical resolution improve-ment, J. Opt. Soc. Am. A, 2002, 19, 1599–1609.
822 P h o t o c h e m . P h o t o b i o l . S c i . , 2 0 0 4 , 3, 8 1 7 – 8 2 2
Publ
ishe
d on
28
May
200
4. D
ownl
oade
d by
Uni
vers
itat P
olitè
cnic
a de
Val
ènci
a on
25/
10/2
014
03:3
4:51
. View Article Online
Recommended


![Atomic Force Microscopy of Bacillus subtilisgebeshuber/Diplomathesis_AFM_of...Figure 4: Fluorescence induced by UV-radiation of different sized CdSe quantum dots[10]. They confine](https://img.pdfslide.org/doc/110x75/5f0e4db87e708231d43e9681/atomic-force-microscopy-of-bacillus-gebeshuberdiplomathesisafmof-figure-4.jpg)