www.fromdual.com
1 / 24
MySQL Performance Tuning
DOAG 2013 Datenbank
14. Mai 2013, Düsseldorf
Oli SennhauserSenior MySQL Berater, FromDual GmbH

www.fromdual.com
2 / 24
Über FromDual GmbH
● FromDual bietet neutral und unabhängig:● Beratung für MySQL● Support für MySQL und Galera Cluster● Remote-DBA Dienstleistungen für MySQL● MySQL Schulungen
● Oracle Silver Partner (OPN)
www.fromdual.com
www.fromdual.com
3 / 24
Inhalt
HA Solutions
➢ Read scale-out➢ Replication set-up for HA➢ Active/passive fail-over➢ MySQL Cluster➢ Replication Cluster➢ Storage-Engine-Replication
MySQL Performance Tuning mit System-Variablen
➢ Performance Tuning Hebel➢ MySQL System Variablen➢ MySQL Status Variablen➢ MySQL Architektur➢ Speicherbelegung➢ Session Variablen➢ Globale Variablen➢ MyISAM Variablen➢ InnoDB Variablen➢ Monitoring➢ Informationen
www.fromdual.com
4 / 24
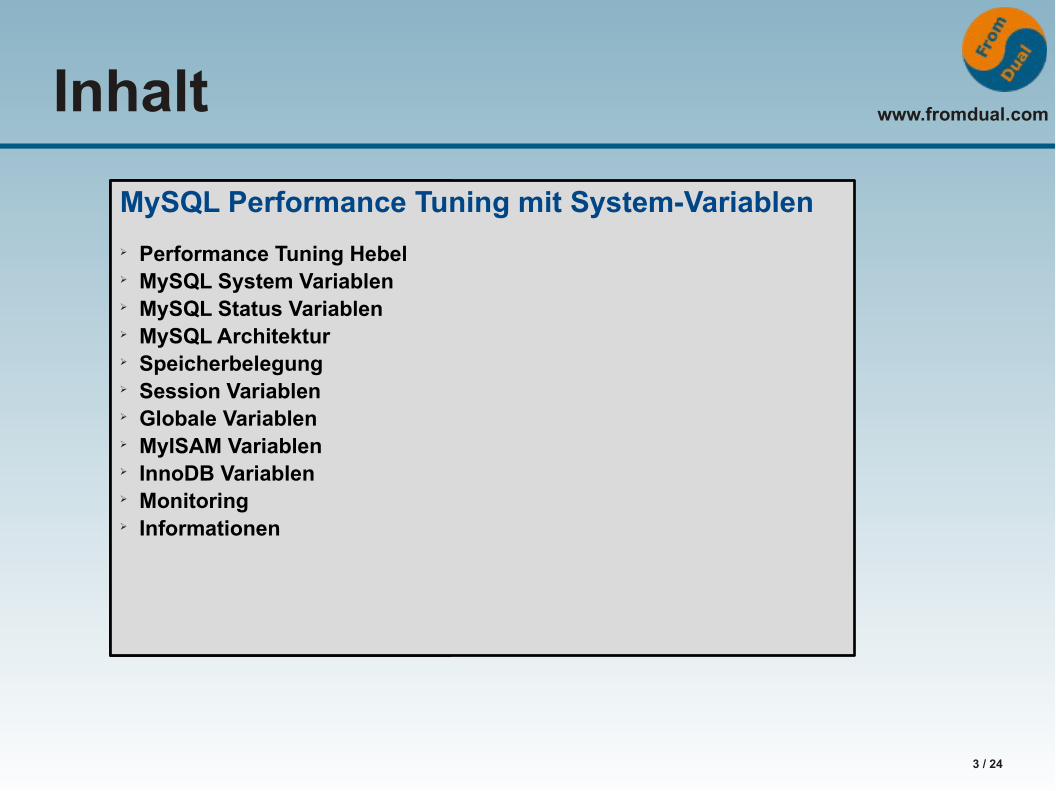
Performance Tuning Hebel
www.fromdual.com
5 / 24
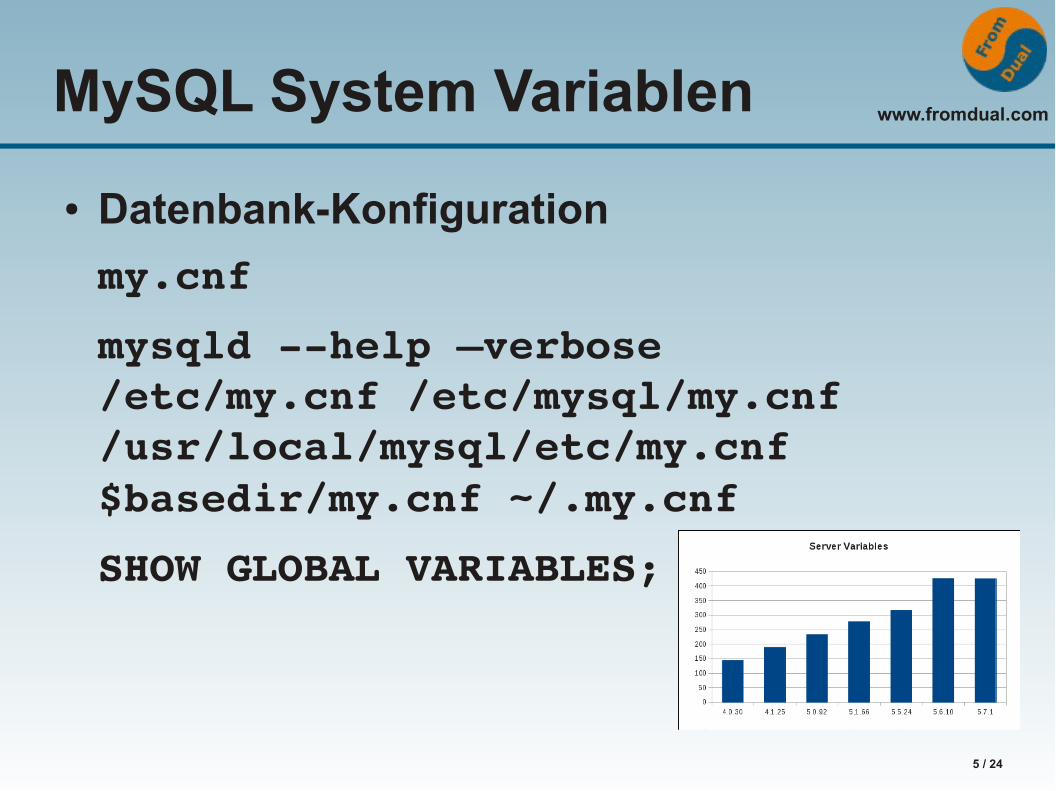
MySQL System Variablen
● Datenbank-Konfiguration
my.cnf
mysqld help –verbose/etc/my.cnf /etc/mysql/my.cnf /usr/local/mysql/etc/my.cnf $basedir/my.cnf ~/.my.cnf
SHOW GLOBAL VARIABLES;
www.fromdual.com
6 / 24
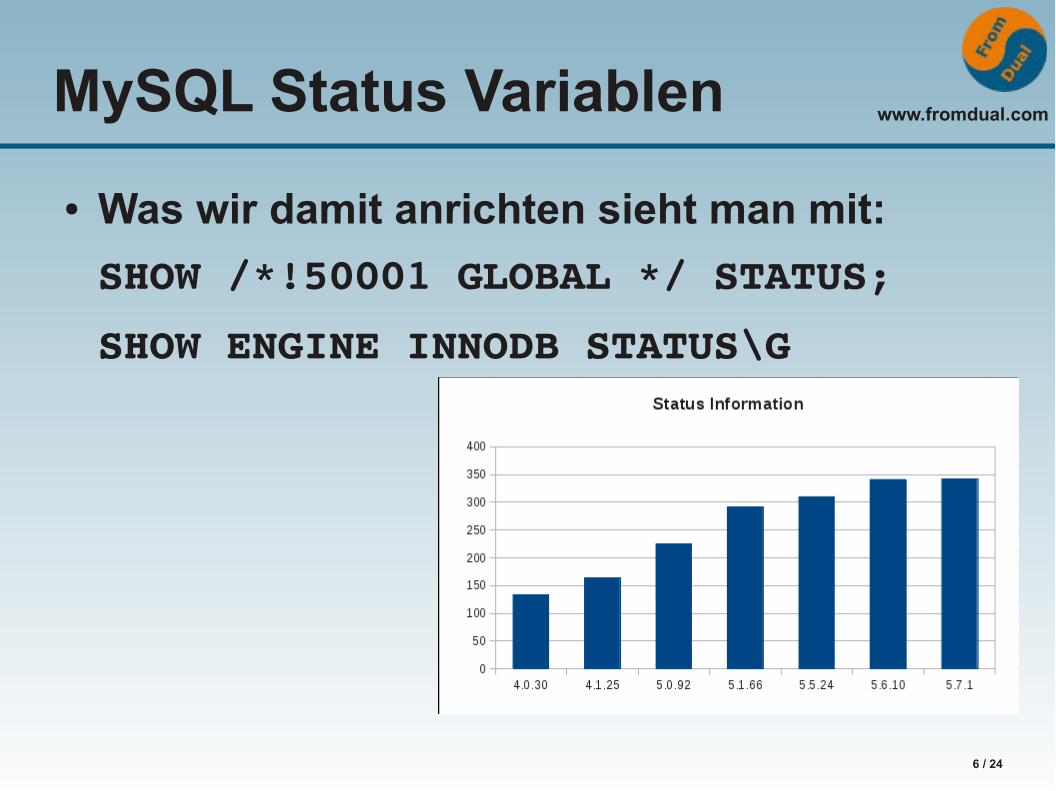
MySQL Status Variablen
● Was wir damit anrichten sieht man mit:
SHOW /*!50001 GLOBAL */ STATUS;
SHOW ENGINE INNODB STATUS\G
www.fromdual.com
7 / 24
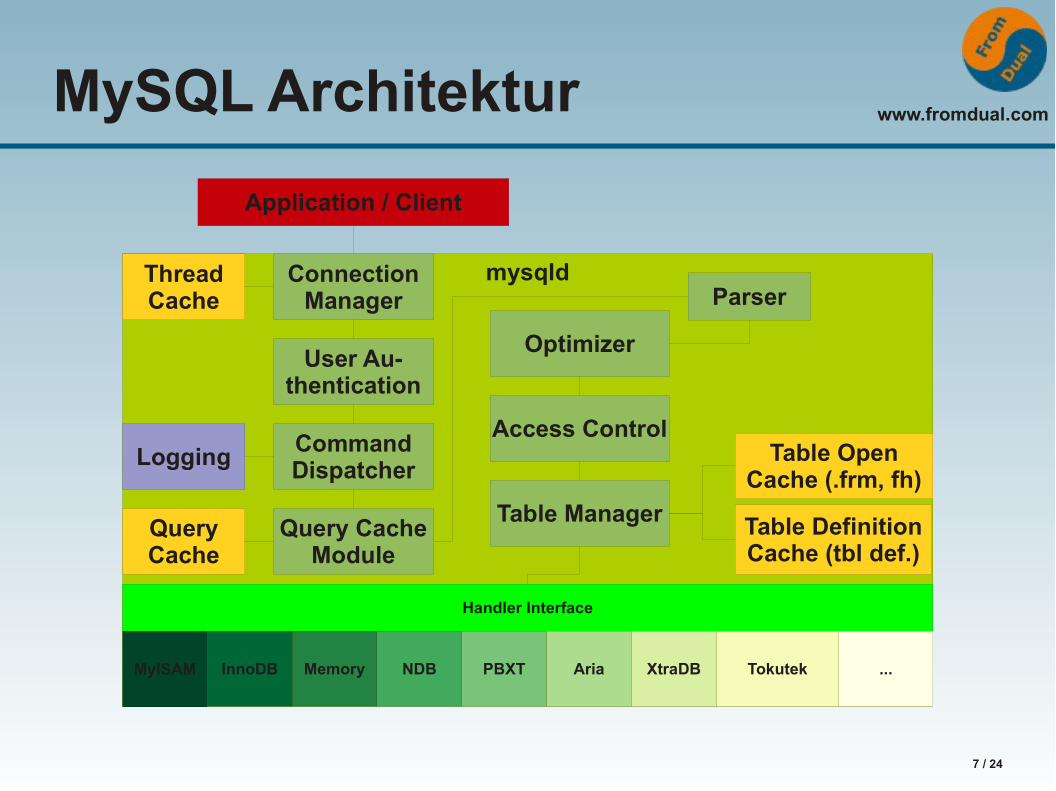
MySQL Architektur
mysqld
Application / Client
ThreadCache
ConnectionManager
User Au-thentication
CommandDispatcherLogging
Query CacheModule
QueryCache
Parser
Optimizer
Access Control
Table Manager
Table OpenCache (.frm, fh)
Table DefinitionCache (tbl def.)
Handler Interface
MyISAM Memory NDB PBXTInnoDB ...Aria XtraDB Tokutek
www.fromdual.com
8 / 24
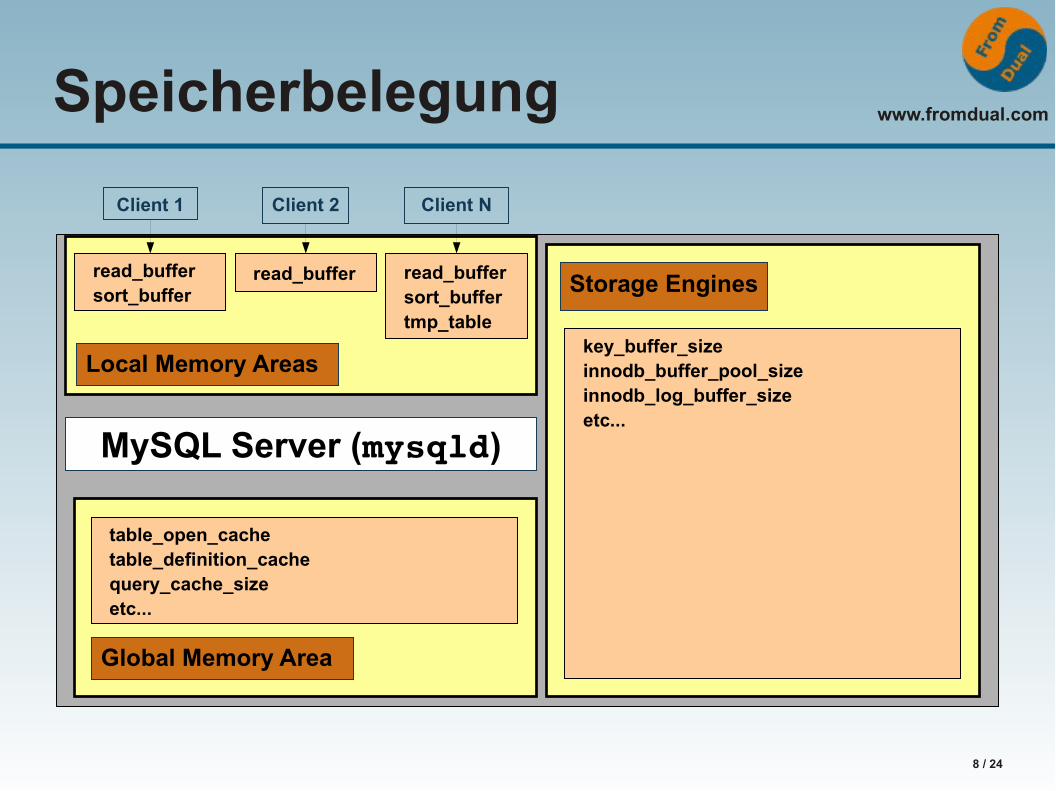
Speicherbelegung
Storage Engines
MySQL Server (mysqld)
Client 2 Client N
Local Memory Areas
Client 1
read_buffersort_buffertmp_table
read_bufferread_buffersort_buffer
table_open_cachetable_definition_cachequery_cache_sizeetc...
Global Memory Area
key_buffer_sizeinnodb_buffer_pool_sizeinnodb_log_buffer_sizeetc...
www.fromdual.com
9 / 24
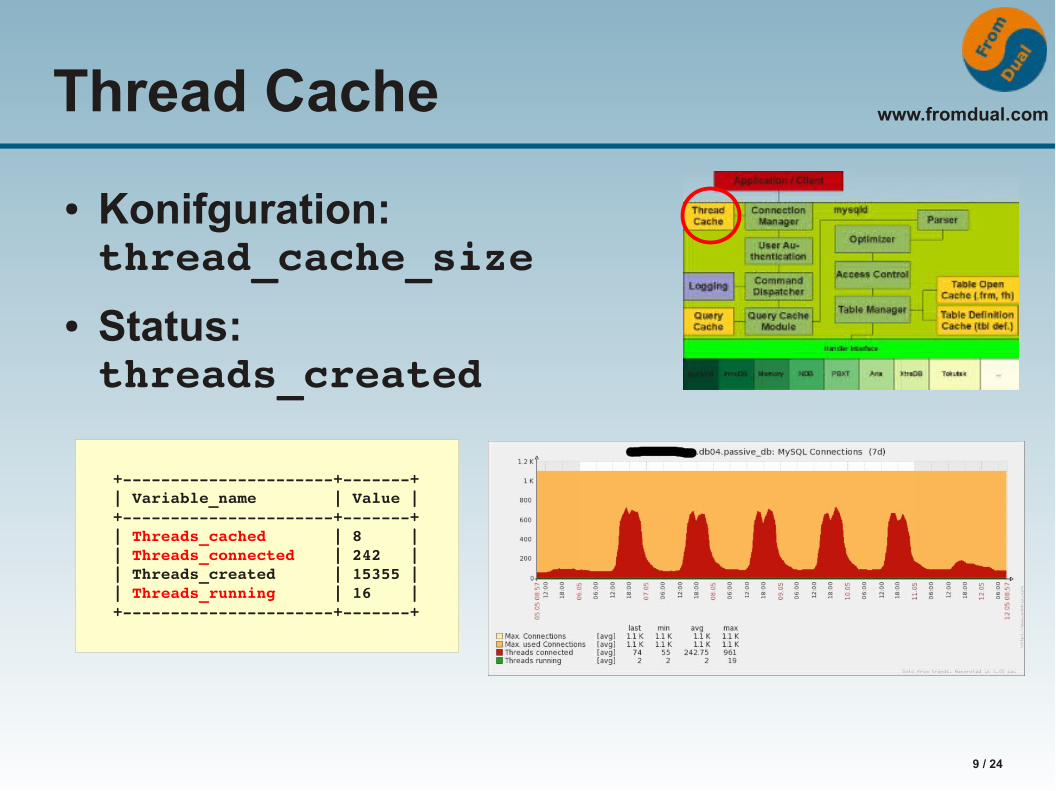
Thread Cache
● Konifguration: thread_cache_size
● Status: threads_created
+++| Variable_name | Value |+++| Threads_cached | 8 || Threads_connected | 242 || Threads_created | 15355 || Threads_running | 16 |+++
www.fromdual.com
10 / 24
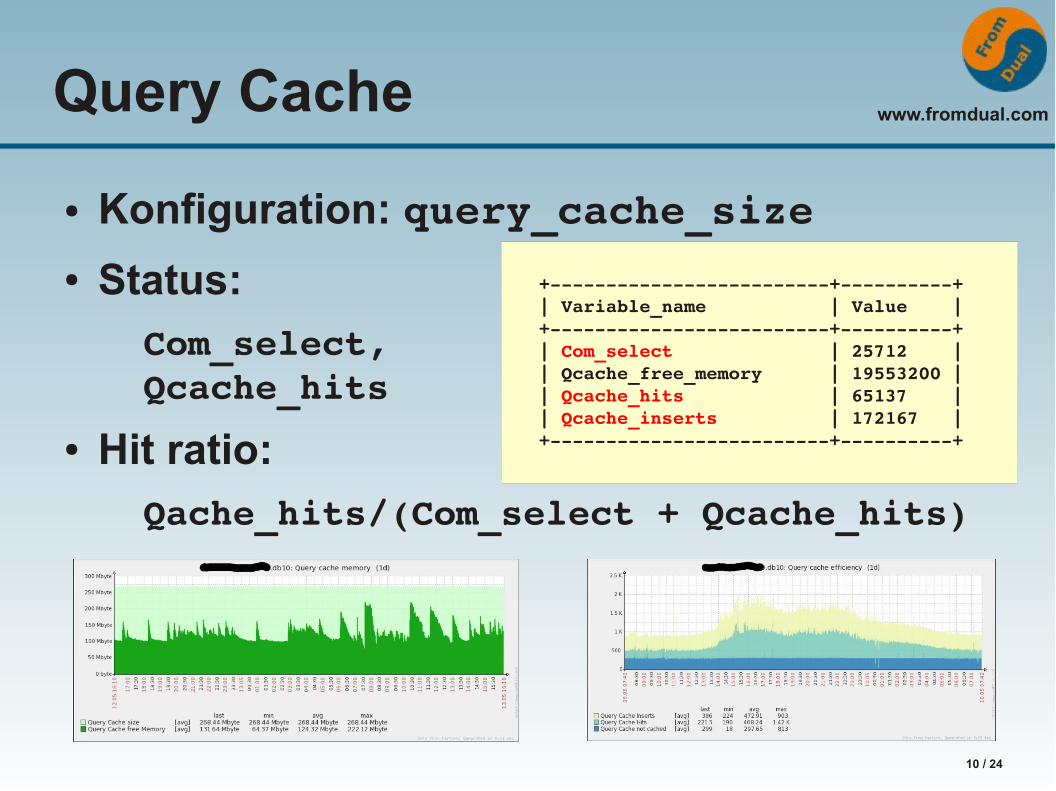
Query Cache
● Konfiguration: query_cache_size● Status:
Com_select,Qcache_hits
● Hit ratio:
Qache_hits/(Com_select + Qcache_hits)
+++| Variable_name | Value |+++| Com_select | 25712 || Qcache_free_memory | 19553200 || Qcache_hits | 65137 || Qcache_inserts | 172167 |+++
www.fromdual.com
11 / 24
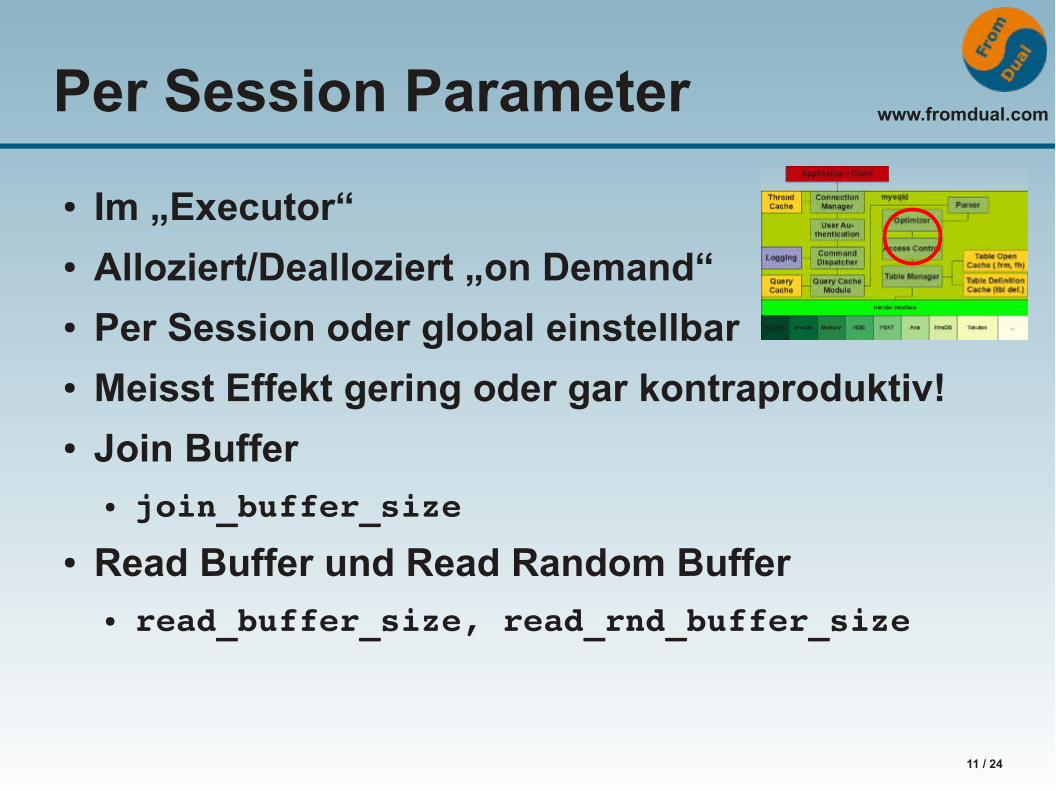
Per Session Parameter
● Im „Executor“● Alloziert/Dealloziert „on Demand“● Per Session oder global einstellbar● Meisst Effekt gering oder gar kontraproduktiv!● Join Buffer
● join_buffer_size
● Read Buffer und Read Random Buffer● read_buffer_size, read_rnd_buffer_size
www.fromdual.com
12 / 24
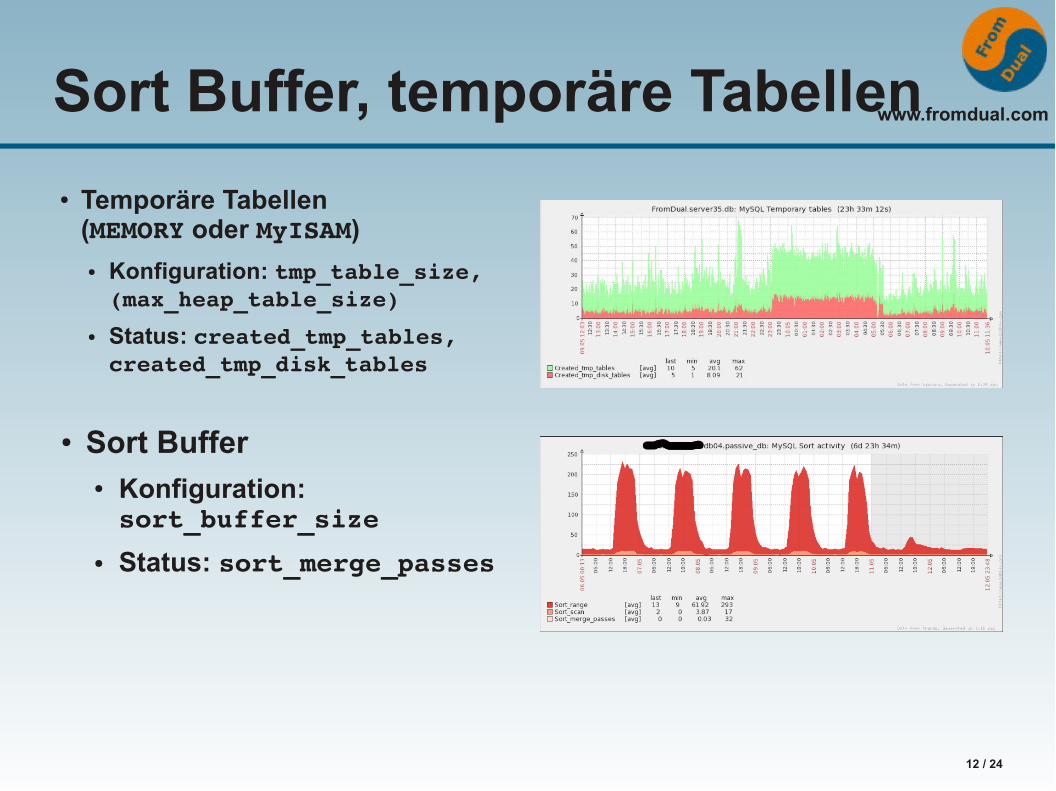
Sort Buffer, temporäre Tabellen
● Temporäre Tabellen(MEMORY oder MyISAM)
● Konfiguration: tmp_table_size,(max_heap_table_size)
● Status: created_tmp_tables,created_tmp_disk_tables
● Sort Buffer● Konfiguration: sort_buffer_size
● Status: sort_merge_passes
www.fromdual.com
13 / 24
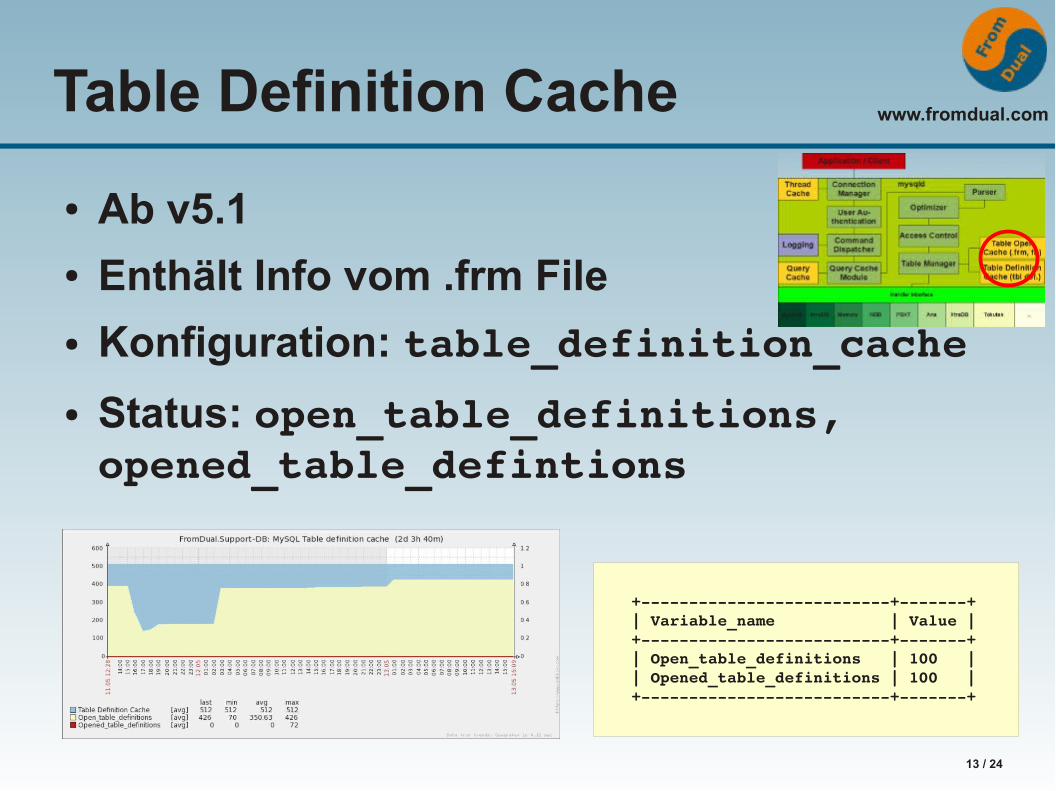
Table Definition Cache
● Ab v5.1● Enthält Info vom .frm File
● Konfiguration: table_definition_cache
● Status: open_table_definitions, opened_table_defintions
+++| Variable_name | Value |+++| Open_table_definitions | 100 || Opened_table_definitions | 100 |+++
www.fromdual.com
14 / 24
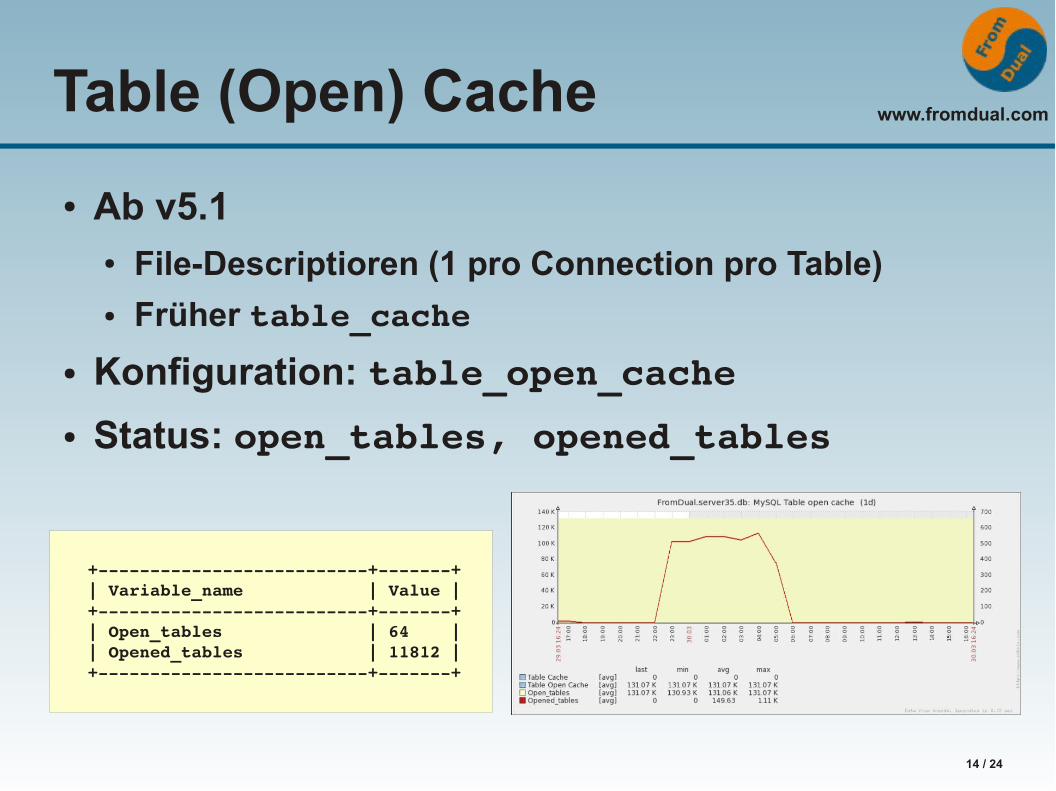
Table (Open) Cache
● Ab v5.1● File-Descriptioren (1 pro Connection pro Table)● Früher table_cache
● Konfiguration: table_open_cache
● Status: open_tables, opened_tables
+++| Variable_name | Value |+++| Open_tables | 64 || Opened_tables | 11812 |+++
www.fromdual.com
15 / 24
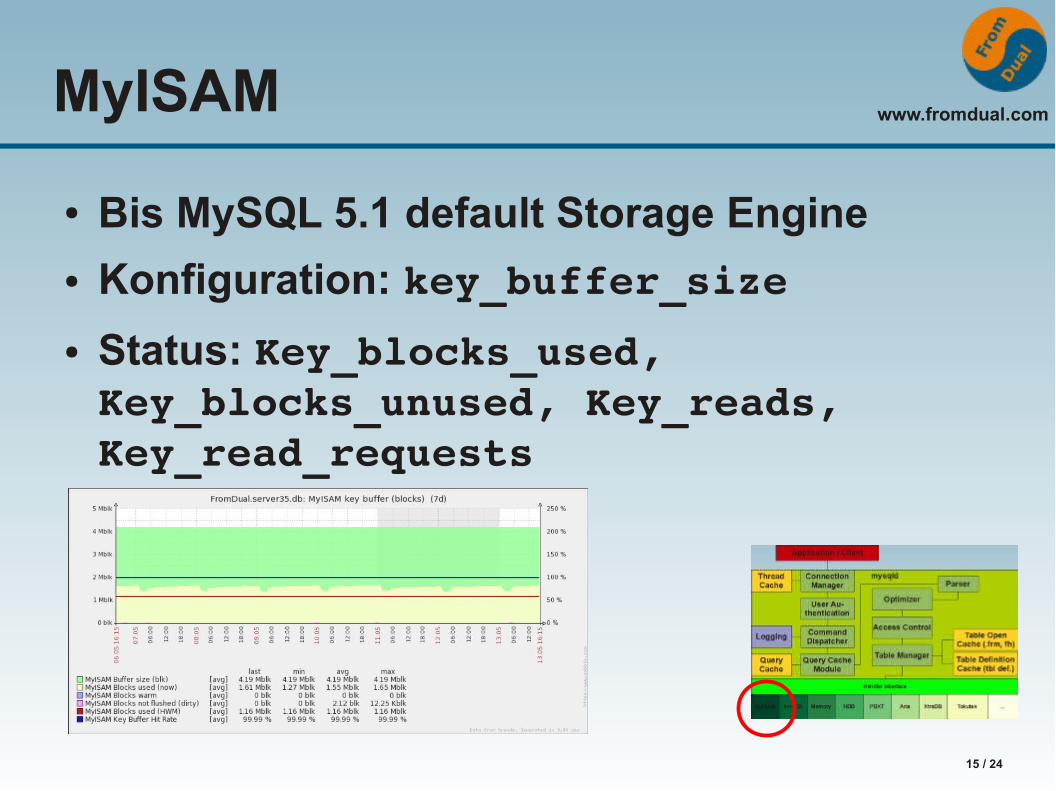
MyISAM
● Bis MySQL 5.1 default Storage Engine
● Konfiguration: key_buffer_size
● Status: Key_blocks_used, Key_blocks_unused, Key_reads, Key_read_requests
www.fromdual.com
16 / 24
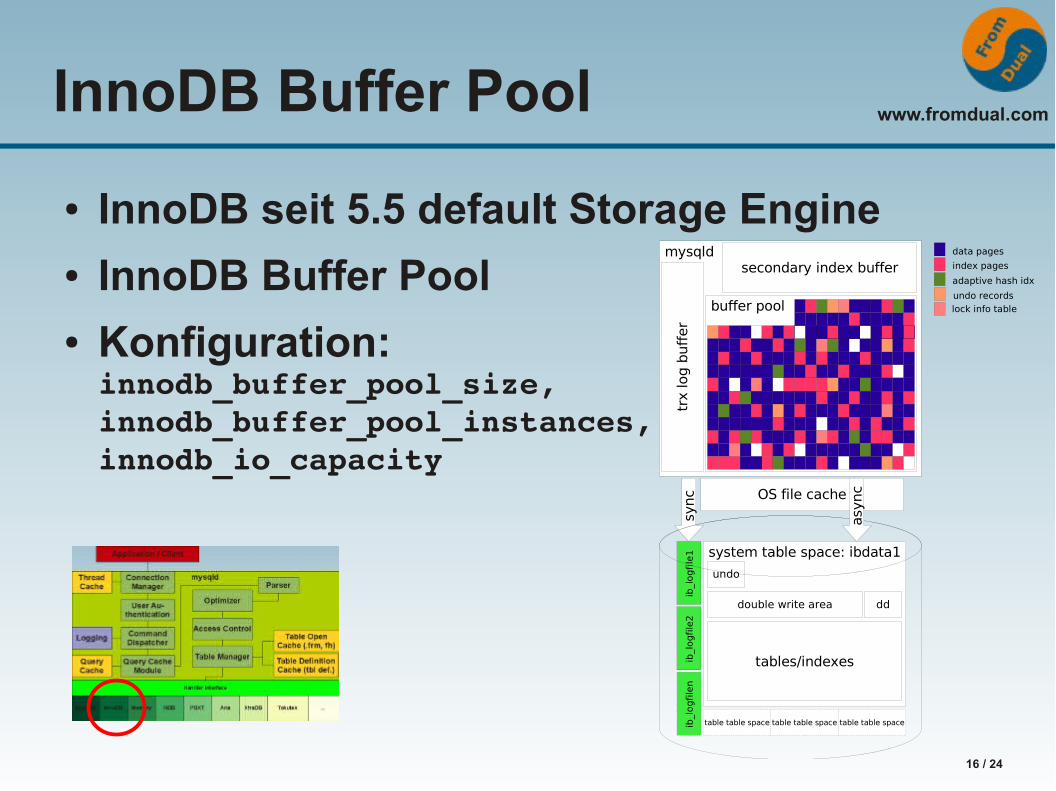
InnoDB Buffer Pool
● InnoDB seit 5.5 default Storage Engine● InnoDB Buffer Pool● Konfiguration:innodb_buffer_pool_size,innodb_buffer_pool_instances,innodb_io_capacity
mysqld
system table space: ibdata1
table table space table table spacetable table space
ib_l
ogfi
le1
ib_l
ogfi
le2
ib_l
ogfi
len
undo
double write area
tables/indexes
dd
OS file cache
sync
asy
nc
buffer pool
secondary index buffer
trx
log b
uff
er
data pages
index pages
adaptive hash idx
undo recordslock info table
www.fromdual.com
17 / 24
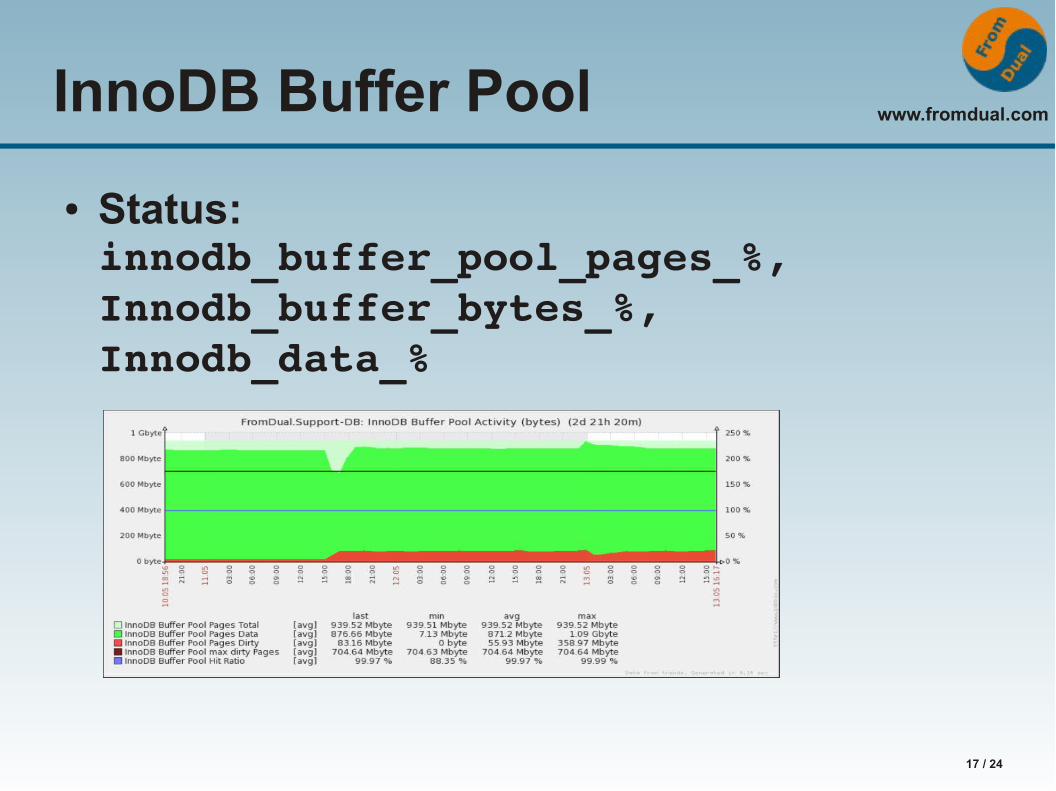
InnoDB Buffer Pool
● Status:innodb_buffer_pool_pages_%, Innodb_buffer_bytes_%,Innodb_data_%
www.fromdual.com
18 / 24
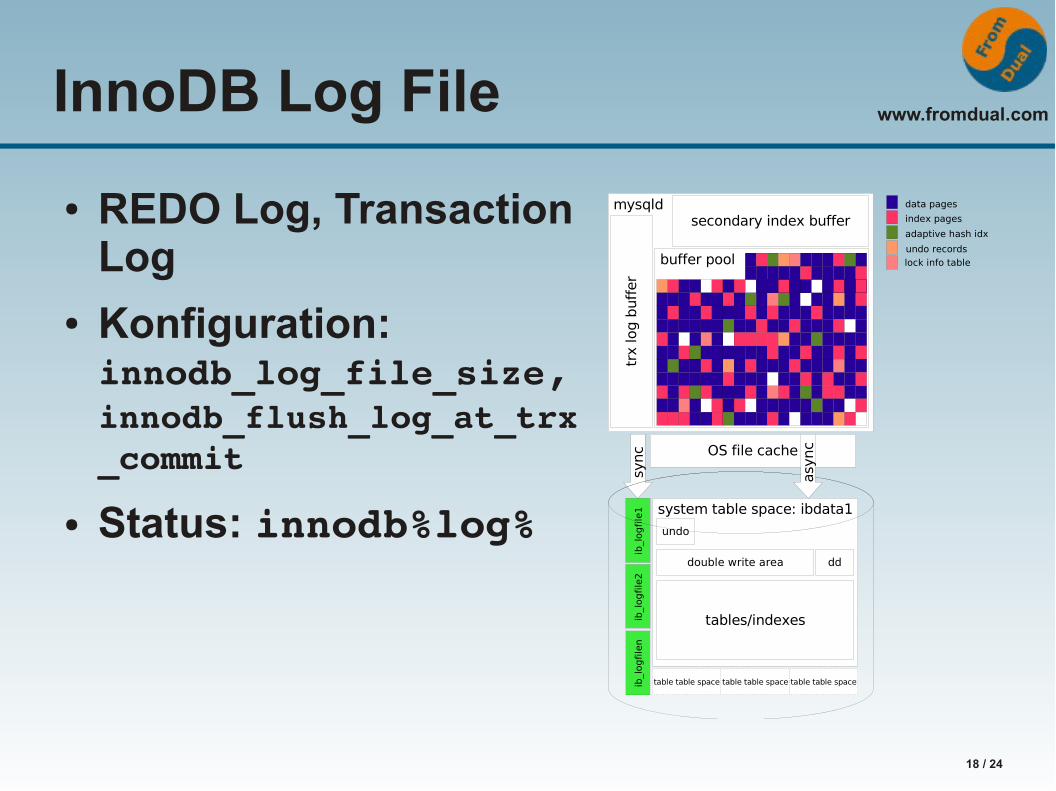
InnoDB Log File
● REDO Log, Transaction Log
● Konfiguration: innodb_log_file_size, innodb_flush_log_at_trx_commit
● Status: innodb%log%
mysqld
system table space: ibdata1
table table space table table spacetable table space
ib_l
og
file
1ib
_log
file
2ib
_log
file
n
undo
double write area
tables/indexes
dd
OS file cache
sync
asy
nc
buffer pool
secondary index buffer
trx
log b
uff
er
data pages
index pages
adaptive hash idx
undo records
lock info table
www.fromdual.com
19 / 24
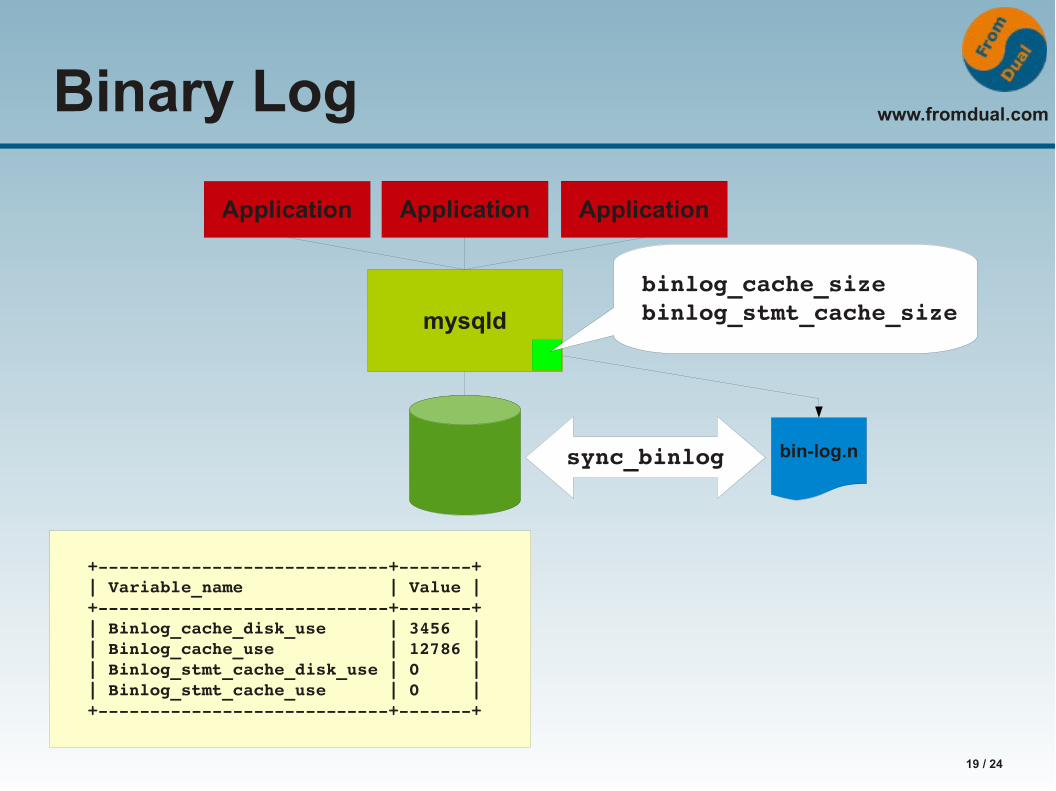
Binary Log
Application ApplicationApplication
mysqld
bin-log.n
binlog_cache_sizebinlog_stmt_cache_size
sync_binlog
+++| Variable_name | Value |+++| Binlog_cache_disk_use | 3456 || Binlog_cache_use | 12786 || Binlog_stmt_cache_disk_use | 0 || Binlog_stmt_cache_use | 0 |+++
www.fromdual.com
20 / 24
Monitoring
● Von Hand:● SHOW GLOBAL STATUS;● SHOW ENGINE INNODB STATUS\G● Performance Schema (P_S, >= v5.5)
● Irgend ein graphisches Monitoring Tool...
www.fromdual.com
21 / 24
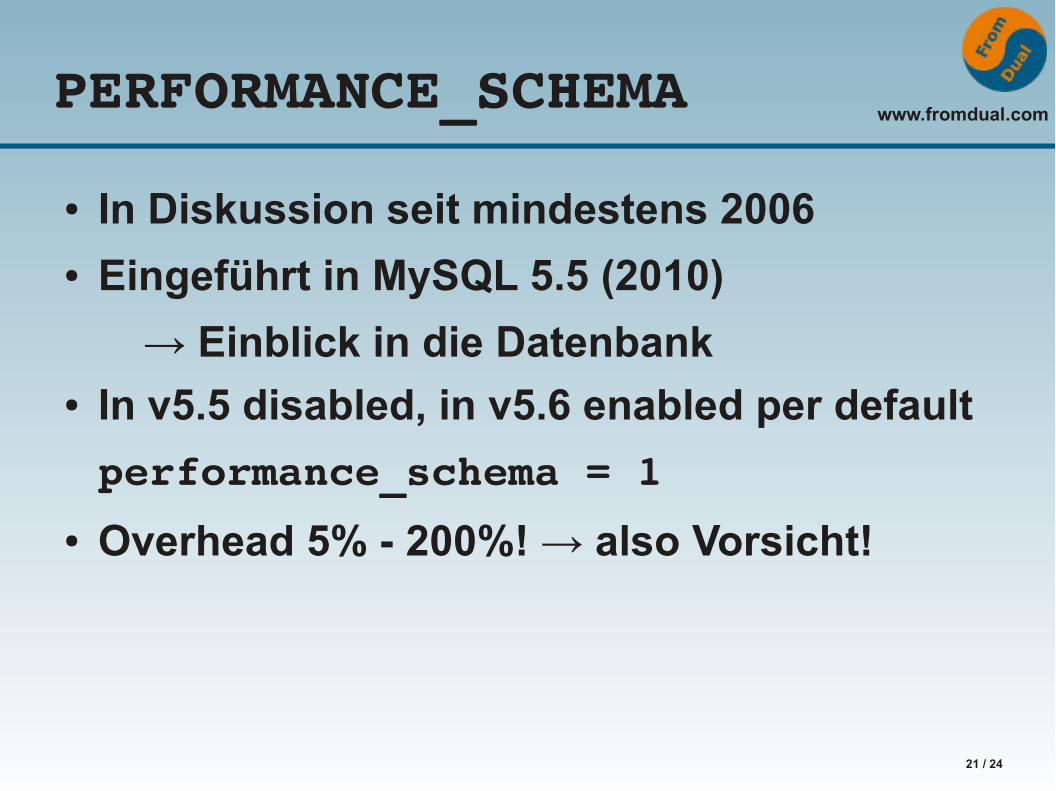
PERFORMANCE_SCHEMA
● In Diskussion seit mindestens 2006● Eingeführt in MySQL 5.5 (2010)
→ Einblick in die Datenbank● In v5.5 disabled, in v5.6 enabled per default
performance_schema = 1● Overhead 5% - 200%! → also Vorsicht!
www.fromdual.com
22 / 24
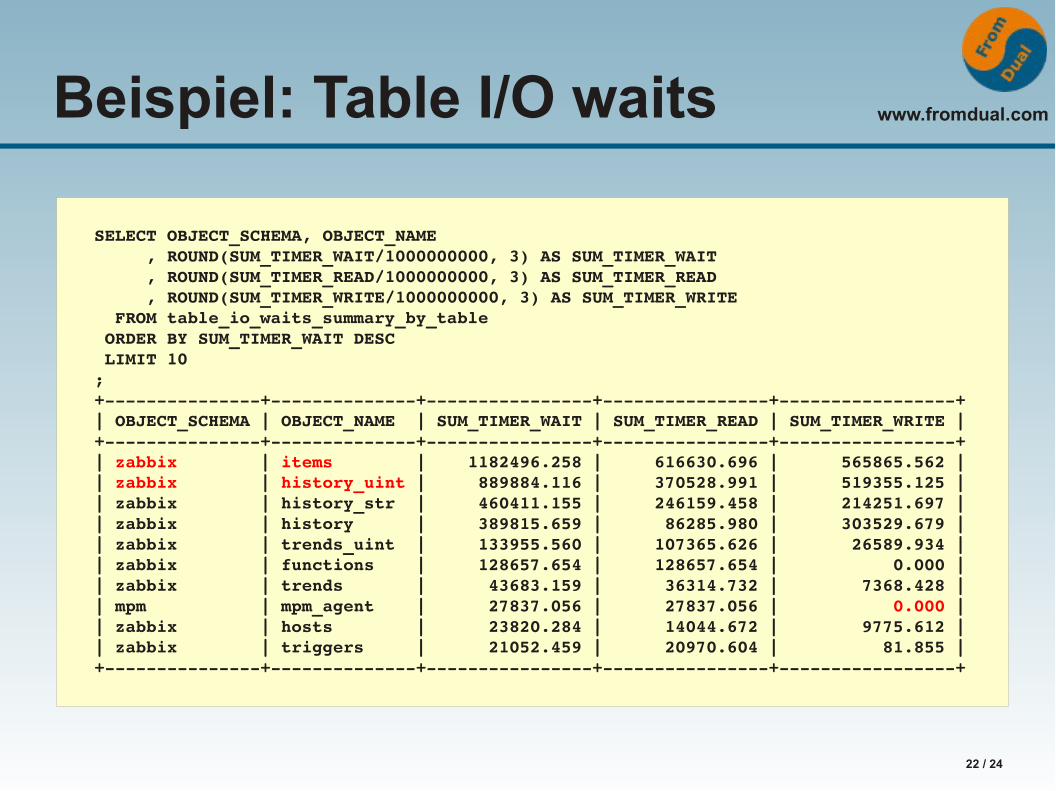
Beispiel: Table I/O waits
SELECT OBJECT_SCHEMA, OBJECT_NAME , ROUND(SUM_TIMER_WAIT/1000000000, 3) AS SUM_TIMER_WAIT , ROUND(SUM_TIMER_READ/1000000000, 3) AS SUM_TIMER_READ , ROUND(SUM_TIMER_WRITE/1000000000, 3) AS SUM_TIMER_WRITE FROM table_io_waits_summary_by_table ORDER BY SUM_TIMER_WAIT DESC LIMIT 10;++++++| OBJECT_SCHEMA | OBJECT_NAME | SUM_TIMER_WAIT | SUM_TIMER_READ | SUM_TIMER_WRITE |++++++| zabbix | items | 1182496.258 | 616630.696 | 565865.562 || zabbix | history_uint | 889884.116 | 370528.991 | 519355.125 || zabbix | history_str | 460411.155 | 246159.458 | 214251.697 || zabbix | history | 389815.659 | 86285.980 | 303529.679 || zabbix | trends_uint | 133955.560 | 107365.626 | 26589.934 || zabbix | functions | 128657.654 | 128657.654 | 0.000 || zabbix | trends | 43683.159 | 36314.732 | 7368.428 || mpm | mpm_agent | 27837.056 | 27837.056 | 0.000 || zabbix | hosts | 23820.284 | 14044.672 | 9775.612 || zabbix | triggers | 21052.459 | 20970.604 | 81.855 |++++++
www.fromdual.com
23 / 24
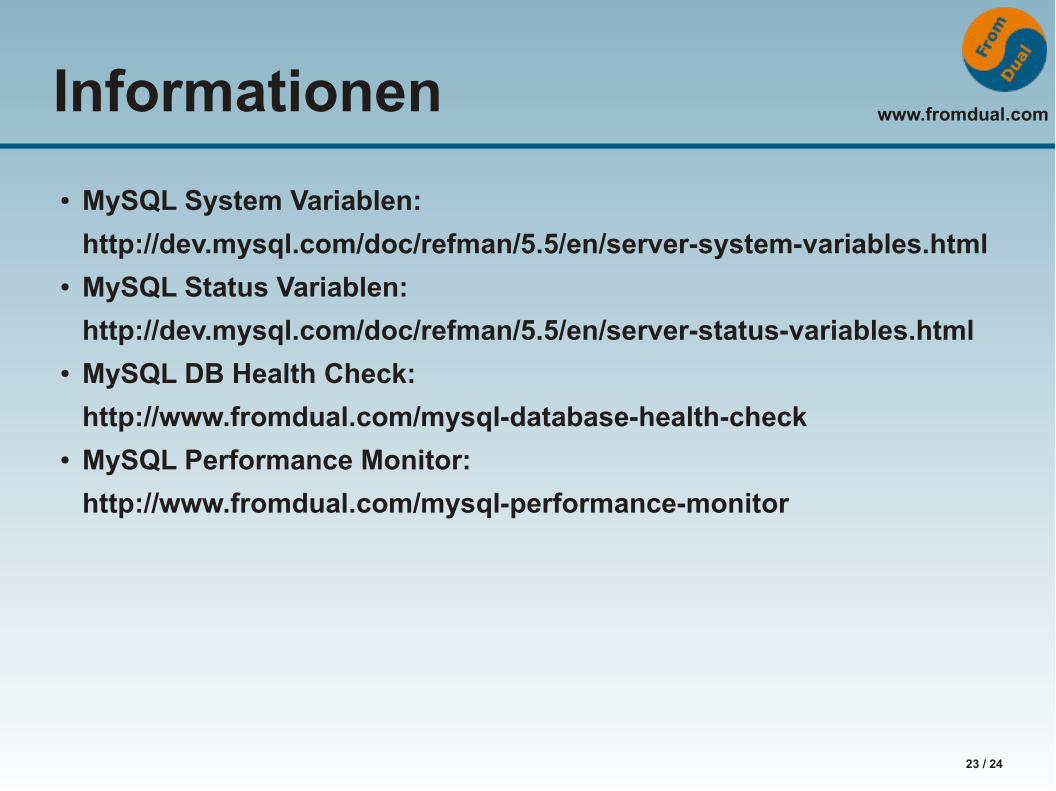
Informationen
● MySQL System Variablen:
http://dev.mysql.com/doc/refman/5.5/en/server-system-variables.html● MySQL Status Variablen:
http://dev.mysql.com/doc/refman/5.5/en/server-status-variables.html● MySQL DB Health Check:
http://www.fromdual.com/mysql-database-health-check● MySQL Performance Monitor:
http://www.fromdual.com/mysql-performance-monitor

www.fromdual.com
24 / 24
Q & A
Fragen ?
Diskussion?
Wir haben Zeit für ein Performance Audit...!
● FromDual bietet neutral und unabhängig:● Beratung
● Remote-DBA
● Support für MySQL und Galera Cluster
● Schulung
www.fromdual.com/presentations
Recommended