1
Regulation of Insulin Receptor Pathway and Glucose Metabolism by CD36 Signaling
Dmitri Samovski1, Pallavi Dhule
1, Terri Pietka
1, Miriam Jacome-Sosa
1, Eric Penrose
1, Ni-
Huiping Son4, Robert C. Flynn
5, Kooresh I. Shoghi
2, Krzysztof L. Hyrc
3, Ira J. Goldberg
4, Eric
R. Gamazon6 and Nada A. Abumrad
1
1Departments of Medicine and Cell Biology,
2Department of Radiology,
3Alafi Neuroimaging
Laboratory, Hope Center for Neurological Disorders, Washington University, St. Louis, MO,
4Division of Endocrinology, Diabetes and Metabolism, New York University School of
Medicine, New York, NY, 5Department of Surgery and
6Division of Genetic Medicine,
Department of Medicine, Vanderbilt University, Nashville, TN
Running title: CD36 regulation of insulin signaling
Word Count: 3,722. Tables: 0 Figures: 8
Supplement: Figures: 4 Tables: 3
Address correspondence to:
Dmitri Samovski
314-362-2509
Department of Medicine
P.O. Box 8031
Washington University
St Louis MO 63110
or
Nada A Abumrad
314-747-0348
Department of Medicine
P.O. Box 8031
Washington University
St Louis MO 63110
Page 1 of 45 Diabetes
Diabetes Publish Ahead of Print, published online May 10, 2018
2
ABSTRACT
During reduced energy intake, skeletal muscle maintains homeostasis by rapidly suppressing
insulin-stimulated glucose utilization. Loss of this adaptation is observed with deficiency of the
fatty acid transporter CD36. A similar loss is also characteristic of the insulin resistant state
where CD36 is dysfunctional. To elucidate what links CD36 to muscle glucose utilization we
examined whether CD36 signaling might influence insulin action. First, we show that CD36
deletion specific to skeletal muscle reduces expression of insulin signaling and glucose
metabolism genes. It decreases muscle ceramides but impairs glucose disposal during a meal.
Second, in primary-derived human myotubes depletion of CD36 suppresses insulin signaling and
the mechanism is shown to involve functional CD36 interaction with the insulin receptor (IR).
CD36 promotes tyrosine phosphorylation of IR by the Fyn kinase, enhances IR recruitment of
P85 and downstream signaling. Third, pretreatment for 15 minutes with saturated fatty acids
suppresses CD36-Fyn enhancement of IR phosphorylation, while unsaturated fatty acids are
neutral or stimulatory. These findings define mechanisms important for muscle glucose
metabolism and optimal insulin responsiveness. Potential human relevance is suggested by GWA
RNA-Seq data that associate genetically determined low muscle CD36 expression to incidence
of diabetes type 2.
Page 2 of 45Diabetes
3
CD36 (SR-B2) has high affinity for long-chain fatty acids (FA) and facilitates tissue FA uptake
in rodents (1; 2) and humans (3; 4). The protein also transduces signaling initially documented to
mediate its role in immunity and atherosclerosis (5-7). However, accumulating evidence supports
importance of CD36 signaling in regulating metabolic pathways such as FA oxidation (8), fatty
taste perception (9; 10), eicosanoid formation (11), chylomicron production (12) etc.
CD36 is important for muscle metabolic adaptation (7). In wildtype mice, fasting causes muscle
to reduce glucose utilization while in CD36-/-
mice muscle glucose utilization persists despite
high circulating FA causing hypoglycemia and increasing risk of sudden death (13). During
exercise CD36-/-
mice have accelerated depletion of glycogen stores and fail to increase muscle
FA oxidation (14). Also, beneficial changes in substrate utilization and muscle performance
induced by exercise training are not observed in CD36-/-
mice (15).
The mechanisms associating CD36 to regulation of muscle glucose metabolism are unknown.
CD36 signaling was shown to regulate FA oxidation by directly modulating AMPK activation
(8; 14). We examined whether it might influence insulin action on muscle glucose utilization.
Using a mouse with conditional deletion of CD36 in muscle and primary-derived human
myotubes, we show that CD36 regulates insulin stimulation of glucose metabolism. CD36
interacts with the insulin receptor (IR) and augments its insulin-induced phosphorylation by the
kinase Fyn. Saturated FA rapidly dissociate Fyn reversing transducing pathway inhibition. The
findings provide insight into mechanisms important for optimal muscle insulin responsiveness.
METHODS
Reagents: Chemicals were from Sigma-Aldrich (St. Louis), pRK5 c-Fyn plasmid, a gift from
Filippo Giancotti (16) was from Addgene (plasmid #16032). Sources for antibodies are listed in
Table S1.
Page 3 of 45 Diabetes
4
Generation of skeletal muscle-specific CD36-/- mice: C57BL/6 Cd36-floxed (Cd36
fl/fl) mice
(17) were crossed with mice expressing tetracycline-controlled human skeletal actin (HSA-rtTA)
Cre (18) for more than five generations. Skeletal muscle Cd36 deletion (smCd36-/-
) was induced
by giving 8-week old Cre-positive and Cre-negative (CD36fl/fl
) mice one intraperitoneal
doxycycline injection (100mg/kg) then doxycycline (2g/L) in drinking water for 7 days followed
by a washout period of >7days. The mice were used for studies between 10-18 weeks a range
that includes mice fed high fat diet (HFD) for 5 weeks (Surwit, D12331, Research Diets). Male
mice were used for most studies unless indicated but key findings on muscle insulin signaling
and glucose disposal were reproduced in females. Combined male/female data are presented as
indicated.
Intragastric Palm oil and glucose tolerance test: Palm kernel oil, blended at 57oC 1:1 with
fat-free milk, or milk (vehicle) was administered to 10-15 weeks old mice intragastrically
(200µL/mouse) after a 16h fast. Two hours later, glucose (2g/kg) was given intraperitoneally and
its clearance monitored in tail blood.
Cells and treatments: Human Skeletal Muscle Myotubes (HSMMs, Lonza), cultured and
differentiated per Lonza’s instructions, were treated with Lipofectamine RNAiMAX and
20nmol/L of CD36 [Ambion, siRNA s2647 (siCD36_1), siRNA s2646 (siCD36_2)] or non-
specific siRNAs, and used 72h after transfection. CHO cells with stable expression of human
insulin receptor (IR) and human CD36 (CHO/IR/CD36) and CHO/IR vector controls (11) were
transiently transfected where indicated (Lipofectamine LTX; Life Technologies) and used 48h
later. C2C12 myoblasts were cultured and differentiated as previously (8). Unless indicated,
before studies all cells were serum-starved (16h) in low-glucose DMEM with 2mmol/L L-
Page 4 of 45Diabetes
5
glutamine, 100µmol/L MEM nonessential amino acids, 100units/mL penicillin, and 100µg/mL
streptomycin. All FAs were added with BSA (2:1) for 15min before insulin.
Quantitative real-time PCR (qPCR): RNA (TRIzol, Invitrogen) was subjected to cDNA
reverse transcription and qRT-PCR (ABI Prism 7000; Applied Biosystems) using Power SYBR
Green PCR Master Mix and a 7500 Fast Real-Time PCR System (Applied Biosystems).
Values (∆∆CT) were normalized to 36B4 expression. Primers are listed in Table S2.
Glucose metabolism: Glycolysis in HSMM and CHO cells was measured using Seahorse XF96
(Agilent) following the manufacturer’s protocols. Cells were seeded (3.4X10⁴cells/well) in XF96
microplates and switched 24h later to serum-free medium (16h) before experiments. For muscle
explants, mice were euthanized by CO2 and dissected diaphragms placed in warm (370C)
Seahorse XF medium with 2mM l-glutamine, 1mM sodium pyruvate, and 10mM glucose.
Sections (~2×2×1 mm) were transferred into XF24 islet capture microplates, seeded using islet
capture screens and processed (19).
For glucose uptake (20) Cells were incubated with 1µCi/ml 2deoxy-D-[3H]glucose (2DG) in
PBS and 0.1mM 2DG, then washed with cold PBS containing 20mM 2DG, solubilized in 1%
SDS and counted (TriCarb 1600 TR, Packard). For glycogen (21), cells were incubated with D-
[3H] glucose (1µCi/ml) and 100nM insulin in PBS plus 0.2% BSA and 10mM glucose. Carrier
glycogen in NaOH was added to lysates (35% w/v) before boiling (30min, 950C) and ethanol
(95%) precipitation (-200C). After centrifugation (12,000G, 10min), ethanol-washed water-
resuspended pellets were counted. Wheat germ agglutinin (WGA) staining adjusted for cell
number (22).
Lipids: Ceramides (Cer) and diacylglycerols (DAG) were measured by the Biomolecular
Page 5 of 45 Diabetes
6
Analysis Core at Washington University by liquid chromatography-tandem mass spectroscopy as
previously described (23). Muscles were homogenized in PBS (weight:volume:1:4) and 50µL
homogenates plus internal standards (Cer 17:0 and DAG 15:0-15:0) lipid extracted. Peak area
ratios of analytes to internal standards were used for analysis.
Plasma and muscle TGs were measured using L-Type Triglyceride M kit and HR Series NEFA-
HR(2) kit from Wako Diagnostics.
Positron emission tomography (PET): PET imaging of fed mice used [18
F]-deoxyglucose
(FDG) to assess glucose metabolism (24). Uptake/transport of tracer was visualized and
quantified by summing uptake kinetics up to 60min post-tracer injection.
Histology: Tissue sections were processed as previously (25). Slides were scanned (Nanozoomer
2.0 HT (Hamamatsu, Bridgewater, NJ) and images analyzed to yield muscle cross-sectional area
using Visiomorph (Broomfield, CO).
Proximity ligation assay (PLA): For PLA (Duolink In Situ Hybridization kit, Sigma-Aldrich)
cells on coverslips were incubated with/without insulin, PBS-washed, fixed with ice-cold
methanol (-200C, 20min) and blocked (1h) in PBS with 0.05% Tween 20, 1% BSA and 5% goat
serum. After incubation 16h with goat anti-CD36 (R&D Systems) and rabbit anti-IRβ (Cell
Signaling) antibodies, processing followed manufacturer’s instructions. For tissues, formalin-
fixed paraffin-sections were deparaffinized and processed as above. Imaging used Nikon Eclipse
TE2000-U, a Photometrics Coolsnap cf camera and MetaMorph 6.2r6 (Molecular Devices).
Co-immunoprecipitation (co-IP) and immunofluorescence: Tissues and cells were lysed (30-
60min) in ice-cold buffer (20mM Tris-HCL, pH 7.5, 150mM NaCL, 1% Triton X-100, 60mM
octyl β-D-glucopyranoside, 200µM sodium orthovanadate, 50mM NaF, 1mM PMSF, and
1.0µg/ml protease inhibitor mix) and cleared lysates (10,000 g for 10min) assayed for protein
Page 6 of 45Diabetes
7
content (BCA 23225, Pierce Biotech). For IP, cells or tissues were lysed in IP buffer containing
1% Anapoe-C12E8 (Anatrace), 0.1% Triton X-100, 150mM NaCl, 5 mM MgCl2, and 25mM
HEPES, pH 7.5 with phosphatase and protease inhibitors. Primary antibodies or isotype-matched
IgG, prebound (30min) to Dynabeads® protein G magnetic beads (ThermoFisher Scientific)
were incubated overnight (4°C) with equal lysate proteins, washed with cold IP buffer and boiled
(5min) in SDS sample buffer. Immunofluorescent microscopy was performed as in (8).
In-cell-western: Cells in black-walled 96-well microplates (Corning) at confluence were serum-
starved, treated as indicated then fixed with 3% paraformaldehyde and blocked (1h, PBS
containing 0.05% Tween 20, 1% BSA and 5% goat serum). Incubation (16h) with monoclonal
anti-pAKT(S) antibody (Cell Signaling) was followed by washing (PBS, Tween 0.05%),
incubation (60min) with HRP-anti-rabbit antibody, washing, then incubation (30min, room
temperature) with 3,3′,5,5′-Tetramethylbenzidine liquid substrate (TMB; Sigma) before adding
1N NaOH and reading absorbance at 450nM. To normalize signals, cells were incubated (60min)
with WGA Alexa Fluor 680 (Invitrogen), rinsed (PBS) and fluorescence measured at 700nM (LI-
COR). Backgrounds for TMB (primary antibody omitted) and WGA Alexa-680 staining (WGA
omitted) were subtracted from the data.
RESULTS
CD36 deletion in skeletal muscle: We generated a mouse with skeletal muscle specific CD36
deletion (smCd36-/-
) using tetracycline-inducible rtTa-HSA Cre (18). Adult (8 week) Cre-
positive and floxed controls were doxycycline-treated (detailed under Methods) and used after a
minimum 7-day washout period. Muscle CD36 expression was assayed for all cohorts.
Typically, CD36 mRNA (Fig.1A) and protein (Fig. 1B) was reduced by 50-60% in the oxidative
(slow-twitch) diaphragm and the metabolically mixed (slow and fast twitch fibers)
Page 7 of 45 Diabetes
8
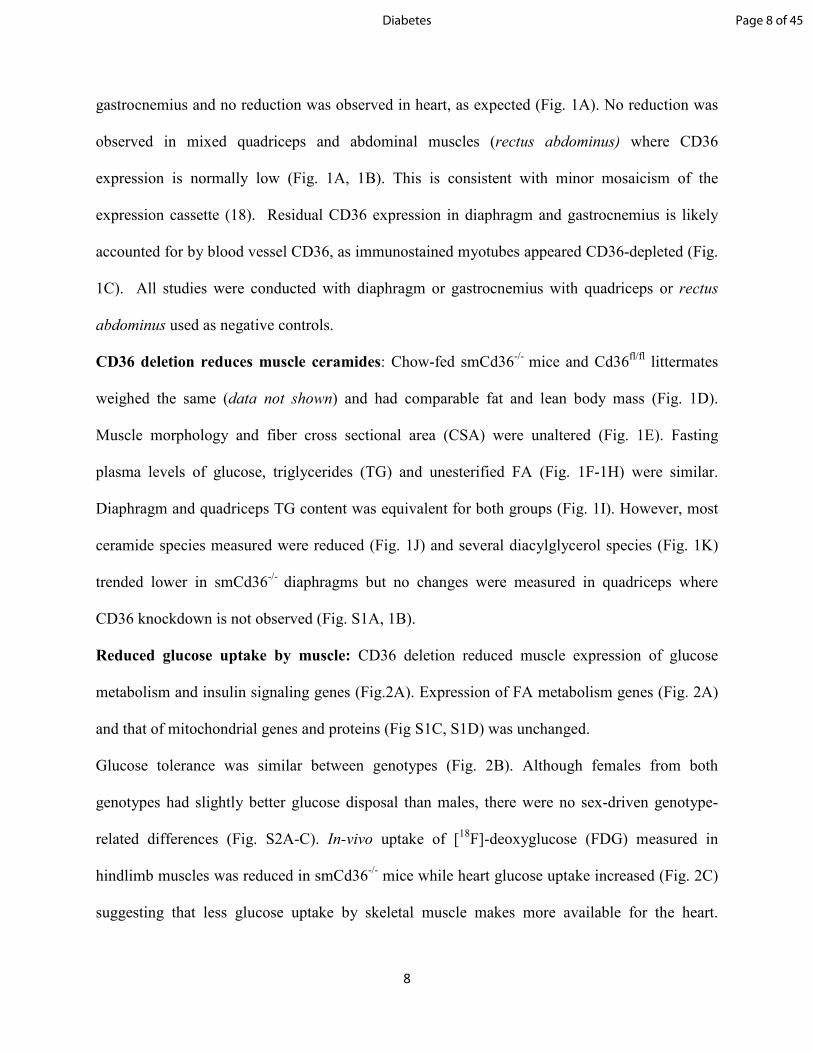
gastrocnemius and no reduction was observed in heart, as expected (Fig. 1A). No reduction was
observed in mixed quadriceps and abdominal muscles (rectus abdominus) where CD36
expression is normally low (Fig. 1A, 1B). This is consistent with minor mosaicism of the
expression cassette (18). Residual CD36 expression in diaphragm and gastrocnemius is likely
accounted for by blood vessel CD36, as immunostained myotubes appeared CD36-depleted (Fig.
1C). All studies were conducted with diaphragm or gastrocnemius with quadriceps or rectus
abdominus used as negative controls.
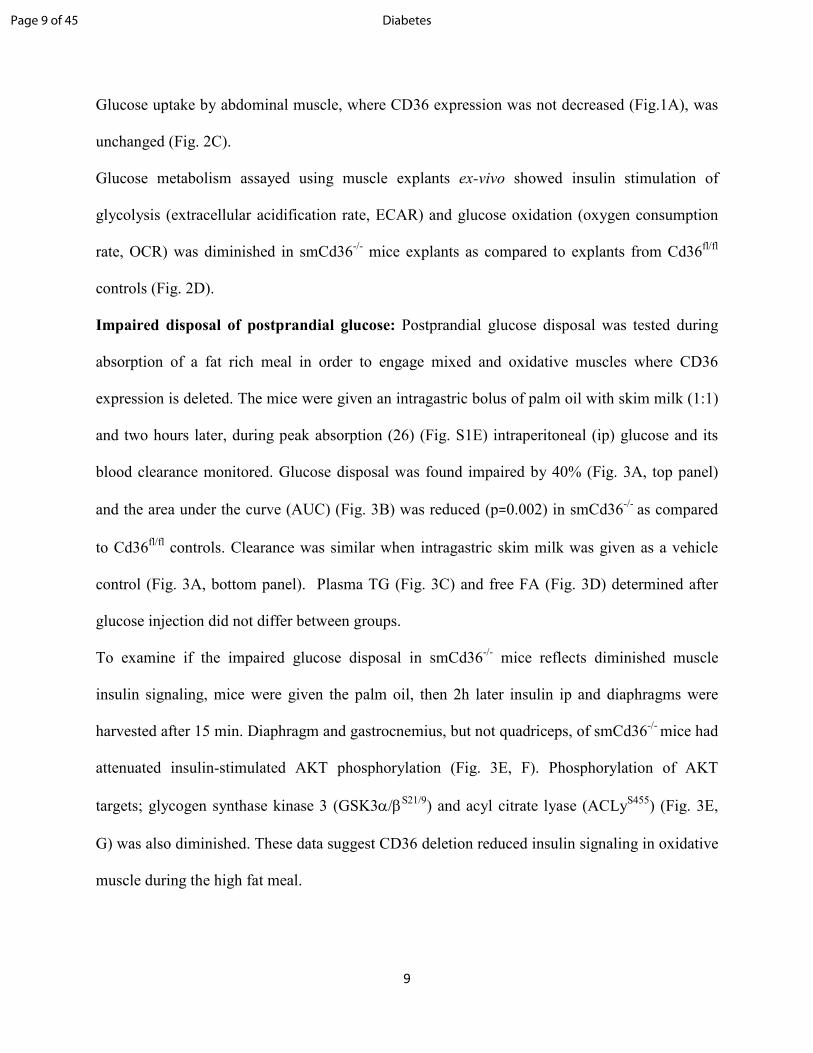
CD36 deletion reduces muscle ceramides: Chow-fed smCd36-/-
mice and Cd36fl/fl
littermates
weighed the same (data not shown) and had comparable fat and lean body mass (Fig. 1D).
Muscle morphology and fiber cross sectional area (CSA) were unaltered (Fig. 1E). Fasting
plasma levels of glucose, triglycerides (TG) and unesterified FA (Fig. 1F-1H) were similar.
Diaphragm and quadriceps TG content was equivalent for both groups (Fig. 1I). However, most
ceramide species measured were reduced (Fig. 1J) and several diacylglycerol species (Fig. 1K)
trended lower in smCd36-/-
diaphragms but no changes were measured in quadriceps where
CD36 knockdown is not observed (Fig. S1A, 1B).
Reduced glucose uptake by muscle: CD36 deletion reduced muscle expression of glucose
metabolism and insulin signaling genes (Fig.2A). Expression of FA metabolism genes (Fig. 2A)
and that of mitochondrial genes and proteins (Fig S1C, S1D) was unchanged.
Glucose tolerance was similar between genotypes (Fig. 2B). Although females from both
genotypes had slightly better glucose disposal than males, there were no sex-driven genotype-
related differences (Fig. S2A-C). In-vivo uptake of [18
F]-deoxyglucose (FDG) measured in
hindlimb muscles was reduced in smCd36-/-
mice while heart glucose uptake increased (Fig. 2C)
suggesting that less glucose uptake by skeletal muscle makes more available for the heart.
Page 8 of 45Diabetes
9
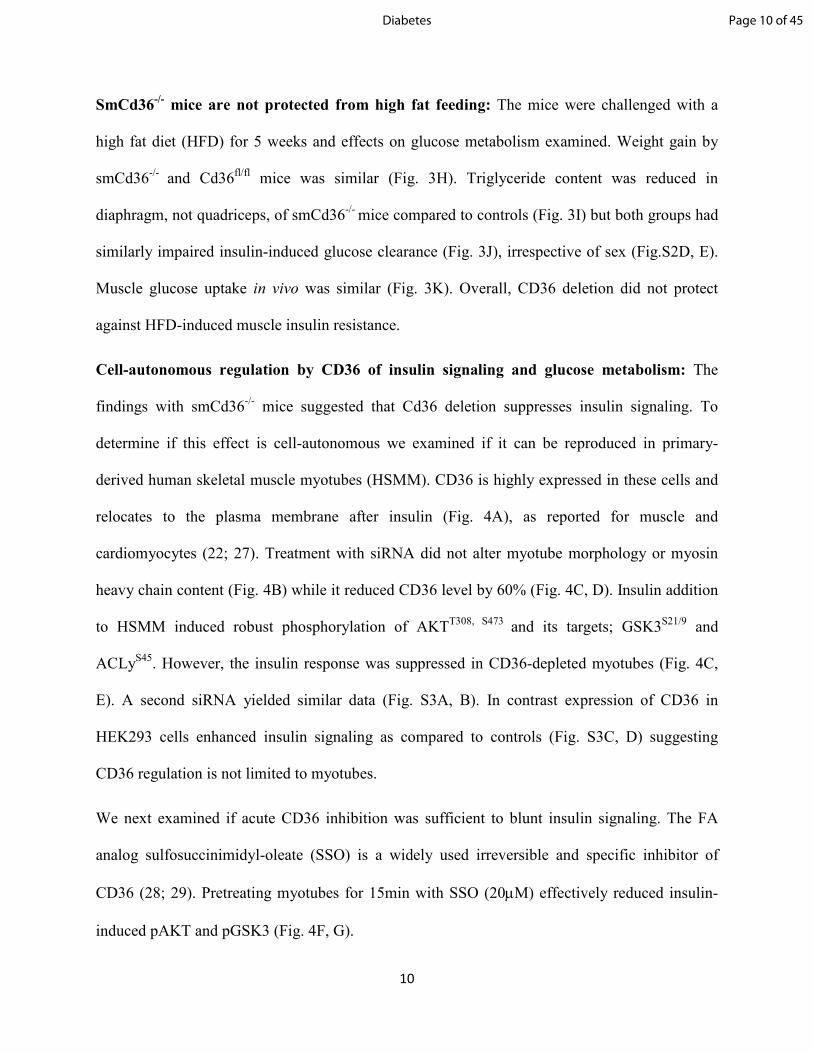
Glucose uptake by abdominal muscle, where CD36 expression was not decreased (Fig.1A), was
unchanged (Fig. 2C).
Glucose metabolism assayed using muscle explants ex-vivo showed insulin stimulation of
glycolysis (extracellular acidification rate, ECAR) and glucose oxidation (oxygen consumption
rate, OCR) was diminished in smCd36-/-
mice explants as compared to explants from Cd36fl/fl
controls (Fig. 2D).
Impaired disposal of postprandial glucose: Postprandial glucose disposal was tested during
absorption of a fat rich meal in order to engage mixed and oxidative muscles where CD36
expression is deleted. The mice were given an intragastric bolus of palm oil with skim milk (1:1)
and two hours later, during peak absorption (26) (Fig. S1E) intraperitoneal (ip) glucose and its
blood clearance monitored. Glucose disposal was found impaired by 40% (Fig. 3A, top panel)
and the area under the curve (AUC) (Fig. 3B) was reduced (p=0.002) in smCd36-/-
as compared
to Cd36fl/fl
controls. Clearance was similar when intragastric skim milk was given as a vehicle
control (Fig. 3A, bottom panel). Plasma TG (Fig. 3C) and free FA (Fig. 3D) determined after
glucose injection did not differ between groups.
To examine if the impaired glucose disposal in smCd36-/-
mice reflects diminished muscle
insulin signaling, mice were given the palm oil, then 2h later insulin ip and diaphragms were
harvested after 15 min. Diaphragm and gastrocnemius, but not quadriceps, of smCd36-/-
mice had
attenuated insulin-stimulated AKT phosphorylation (Fig. 3E, F). Phosphorylation of AKT
targets; glycogen synthase kinase 3 (GSK3α/βS21/9
) and acyl citrate lyase (ACLyS455
) (Fig. 3E,
G) was also diminished. These data suggest CD36 deletion reduced insulin signaling in oxidative
muscle during the high fat meal.
Page 9 of 45 Diabetes
10
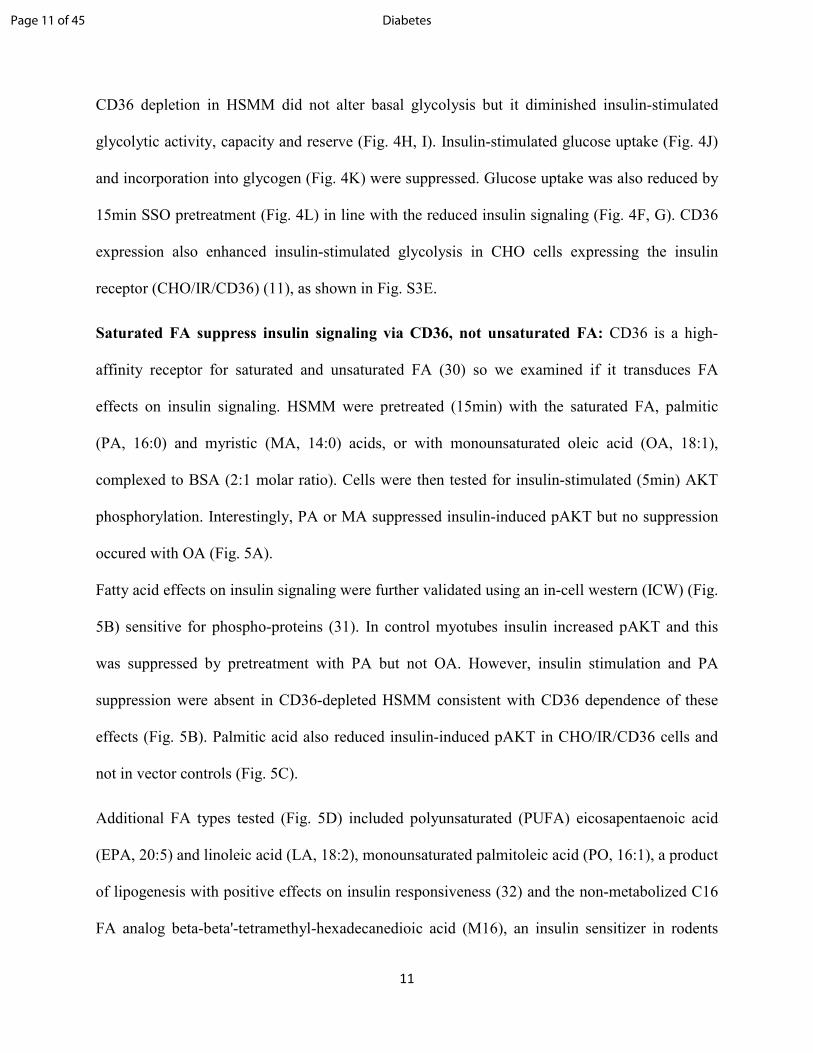
SmCd36-/- mice are not protected from high fat feeding: The mice were challenged with a
high fat diet (HFD) for 5 weeks and effects on glucose metabolism examined. Weight gain by
smCd36-/-
and Cd36fl/fl
mice was similar (Fig. 3H). Triglyceride content was reduced in
diaphragm, not quadriceps, of smCd36-/-
mice compared to controls (Fig. 3I) but both groups had
similarly impaired insulin-induced glucose clearance (Fig. 3J), irrespective of sex (Fig.S2D, E).
Muscle glucose uptake in vivo was similar (Fig. 3K). Overall, CD36 deletion did not protect
against HFD-induced muscle insulin resistance.
Cell-autonomous regulation by CD36 of insulin signaling and glucose metabolism: The
findings with smCd36-/-
mice suggested that Cd36 deletion suppresses insulin signaling. To
determine if this effect is cell-autonomous we examined if it can be reproduced in primary-
derived human skeletal muscle myotubes (HSMM). CD36 is highly expressed in these cells and
relocates to the plasma membrane after insulin (Fig. 4A), as reported for muscle and
cardiomyocytes (22; 27). Treatment with siRNA did not alter myotube morphology or myosin
heavy chain content (Fig. 4B) while it reduced CD36 level by 60% (Fig. 4C, D). Insulin addition
to HSMM induced robust phosphorylation of AKTT308, S473
and its targets; GSK3S21/9
and
ACLyS45
. However, the insulin response was suppressed in CD36-depleted myotubes (Fig. 4C,
E). A second siRNA yielded similar data (Fig. S3A, B). In contrast expression of CD36 in
HEK293 cells enhanced insulin signaling as compared to controls (Fig. S3C, D) suggesting
CD36 regulation is not limited to myotubes.
We next examined if acute CD36 inhibition was sufficient to blunt insulin signaling. The FA
analog sulfosuccinimidyl-oleate (SSO) is a widely used irreversible and specific inhibitor of
CD36 (28; 29). Pretreating myotubes for 15min with SSO (20µM) effectively reduced insulin-
induced pAKT and pGSK3 (Fig. 4F, G).
Page 10 of 45Diabetes
11
CD36 depletion in HSMM did not alter basal glycolysis but it diminished insulin-stimulated
glycolytic activity, capacity and reserve (Fig. 4H, I). Insulin-stimulated glucose uptake (Fig. 4J)
and incorporation into glycogen (Fig. 4K) were suppressed. Glucose uptake was also reduced by
15min SSO pretreatment (Fig. 4L) in line with the reduced insulin signaling (Fig. 4F, G). CD36
expression also enhanced insulin-stimulated glycolysis in CHO cells expressing the insulin
receptor (CHO/IR/CD36) (11), as shown in Fig. S3E.
Saturated FA suppress insulin signaling via CD36, not unsaturated FA: CD36 is a high-
affinity receptor for saturated and unsaturated FA (30) so we examined if it transduces FA
effects on insulin signaling. HSMM were pretreated (15min) with the saturated FA, palmitic
(PA, 16:0) and myristic (MA, 14:0) acids, or with monounsaturated oleic acid (OA, 18:1),
complexed to BSA (2:1 molar ratio). Cells were then tested for insulin-stimulated (5min) AKT
phosphorylation. Interestingly, PA or MA suppressed insulin-induced pAKT but no suppression
occured with OA (Fig. 5A).
Fatty acid effects on insulin signaling were further validated using an in-cell western (ICW) (Fig.
5B) sensitive for phospho-proteins (31). In control myotubes insulin increased pAKT and this
was suppressed by pretreatment with PA but not OA. However, insulin stimulation and PA
suppression were absent in CD36-depleted HSMM consistent with CD36 dependence of these
effects (Fig. 5B). Palmitic acid also reduced insulin-induced pAKT in CHO/IR/CD36 cells and
not in vector controls (Fig. 5C).
Additional FA types tested (Fig. 5D) included polyunsaturated (PUFA) eicosapentaenoic acid
(EPA, 20:5) and linoleic acid (LA, 18:2), monounsaturated palmitoleic acid (PO, 16:1), a product
of lipogenesis with positive effects on insulin responsiveness (32) and the non-metabolized C16
FA analog beta-beta'-tetramethyl-hexadecanedioic acid (M16), an insulin sensitizer in rodents
Page 11 of 45 Diabetes
12
(33). In CHO/IR/CD36 cells, 15min pretreatment with EPA and LA did not alter insulin-
stimulated phosphorylation of AKT or ACLy while PO, OA and M16 enhanced phosphorylation
and PA, as before was inhibitory (Fig. 5D). These data show CD36 mediates differential effects
of FA on insulin signaling, negative for PA and MA and positive for PO, OA and M16.
CD36 enhances tyrosine phosphorylation of IR: Insulin signaling is initiated by tyrosine
phosphorylation of IR. CD36 signal transduction involves interaction with specific signaling
protein clusters (5; 8-10) so we explored whether CD36 might functionally interact with IR.
Immunoprecipitates (IPs) of IRβ, the regulatory IR subunit, from CHO/IR/CD36 cells pulled
down CD36 (Fig. 6A) and conversely CD36 IPs pulled down IRβ (Fig. 6B). Proximity ligation
assays for in situ visualization of protein interaction (34) showed the typical amplification
patterns suggestive of CD36-IRβ proximity (Fig. 6C).
CD36 expression enhanced insulin-induced tyrosine phosphorylation of IRβ and recruitment of
the PI3K catalytic subunit P85 (Fig. 6D) supporting functional relevance of the CD36-IR
interaction. We also examined whether CD36 interacts with IRβ in vivo. Immunoprecipitates of
IRβ from mice gastrocnemius and quadriceps muscles pulled down CD36, consistent with
interaction (Fig. 6E) and further validation was obtained using PLA, which showed the
amplification pattern expected for interacting proteins (Fig. 6F).
Fyn recruited by CD36 phosphorylates IR: The mechanism for CD36 effect on IR
phosphorylation was investigated next. Src tyrosine kinases mediate most CD36 signaling and
Fyn in particular was implicated in its metabolic effects (8; 35). Insulin treatment of CHO/IR
cells transiently transfected with Fyn resulted in recovery of more phosphorylated IRβ (Fig. 7A).
In contrast, IRβ phosphorylation was enhanced even without insulin when CHO/IR stably
expressed CD36 (Fig. 7A), suggesting that some of the overexpressed Fyn was IRβ-associated.
Page 12 of 45Diabetes
13
In addition, more pIRβ was measured in these cells when insulin was added (Fig. 7A, 7B). These
data suggested that Fyn phosphorylates IRβ and that CD36 recruits Fyn to the insulin receptor.
Consistent with this, insulin treatment or CD36 expression each recruited Fyn to the plasma
membrane (Fig. 7C) and cells expressing CD36 and Fyn showed extensive insulin-stimulated co-
localization of Fyn and IRβ (Fig. 7C bottom).
Saturated FA dissociate Fyn from IR: We showed in Figure 5 that saturated FA inhibit CD36
action to enhance insulin signaling so we examined how palmitic acid impacts Fyn
phosphorylation of IRβ with/without insulin. CD36 IPs from CHO/IR/CD36 cells treated with
insulin contained pFynY416
(Fig.7D), but pFynY416
was absent in IPs of cells pretreated (15min)
with PA. These data suggested insulin promotes interaction of activated Fyn with CD36 and this
is disrupted by PA (Fig. 7D, 7E). Similarly, PA pretreatment abolished Fyn recovery in IPs of
IRβ from C2C12 myotubes, which express high endogenous IRβ (Fig. 7F, 7G).
To further test Fyn’s mediation of CD36’s effect on insulin signaling, we used CHO/IR cells
stably expressing the CD36 mutant CD36K/A (11; 25). The C-terminal cytosolic segment of
CD36 is required for Fyn-mediated effects and this mutant has two C-terminal lysines
substitution with alanine that impair CD36-induced Fyn signaling (11; 25). Cells expressing
CD36K/A as compared to native CD36 had diminished insulin signaling (Fig. 8A, B) and
reduced insulin’s ability to activate Fyn and phosphorylate IRβ (Fig. 8C, D). CD36K/A cells also
did not show insulin stimulation of glycolysis (Fig. 8E). Together the data in Figs 7 and 8
suggest that insulin induces CD36-Fyn phosphorylation of IRβ further stimulating glucose
utilization. In contrast, PA dissociates the Fyn-CD36-IRβ complex, reducing IRβ
phosphorylation and insulin-stimulated glucose metabolism (Fig. 8F).
Page 13 of 45 Diabetes
14
Low muscle CD36 expression associates with insulin resistance and type 2 diabetes (T2D)
in humans: To explore potential human relevance of current findings, we examined if
genetically-determined CD36 expression associates with incidence of insulin resistance or T2D.
We applied PrediXcan analysis to a “discovery” cohort of 4,702 patients from Vanderbilt
University’s BioVU genomic resource. We found significant associations, p-values 10-3
to 10-7
,
between the genetic component of muscle CD36 expression and disease status. Notably,
decreased CD36 expression in muscle associated with increased risk of T2D (Table S3).
A similar analysis used the GWAS summary statistics data from the MAGIC Consortium.
Decreased CD36 expression was found to associate with higher HOMA-IR or insulin resistance
(p=0.03) (Fig. S4A). Furthermore, SNPs within the cis region of CD36 (+/- 1MB of transcription
start site) showed a distribution of p-values significantly different from that expected by chance
(Fig. S4A). This gene region, from which gene expression estimation was generated, contains the
rs17236824 variant that was highly significant for association with HOMA-IR (Fig. S4B). These
data linked genetically-reduced CD36 expression with incidence of insulin resistance or T2D.
DISCUSSION
Major findings of this study are that the FA transporter CD36, which facilitates muscle FA
uptake and oxidation, also enhances insulin action to stimulate muscle glucose utilization. CD36
functionally interacts with IR to enhance its phosphorylation, P85 recruitment and downstream
signaling to promote glucose metabolism. These findings show that metabolic actions of CD36
are more complex than would be expected from its FA uptake function. We previously reported
that CD36 signaling regulates oxidation of exogenous FA during fasting by modulating AMPK
activation (8). Here we show that CD36 influences postprandial glucose metabolism by
Page 14 of 45Diabetes
15
modulating insulin action. This dual role of CD36 signaling would influence energy adaptation
and homeostasis.
The conditional deletion of CD36 in skeletal muscle showed that CD36 is required for optimal
insulin stimulation of glucose metabolism. The systemic phenotype of the smCd36-/-
was subtle,
likely a limitation of the mosaic effect of the deletion. Still, this mouse provided opportunity to
compare glucose metabolism in muscles with and without CD36 depletion from the same animal.
We could document specific effect of Cd36 deletion to reduce ceramides and expression of genes
of insulin and glucose metabolism. We also showed in-vivo diminished glucose uptake by
muscle and ex-vivo with muscle explants, reduced insulin-stimulated glycolysis and glucose
oxidation. Together with the findings in myotubes and CHO/IR cells these data provide strong
support for physiological regulation of the IR pathway by CD36 signaling.
Sensitivity of the CD36-IR interaction to inhibition by saturated FA, especially palmitate, might
be relevant to muscle glucose sparing as palmitate, the main product of lipogenesis, is
preferentially stored as triglycerides by adipose tissue and released during fasting or exercise
(36). These data suggest that PA might feedback in adipose tissue to limit lipogenesis by
suppressing glucose uptake and in muscle they provide mechanistic insight into the glucose-FA
cycle. This cycle initially proposed that FA metabolites inhibit muscle glucose utilization (37).
Our data implicate membrane signaling as a major FA inhibition site consistent with a primary
role of membrane glucose transport (38; 39). Saturated and unsaturated FAs transduce markedly
different CD36-mediated signaling (8; 35) but the mechanisms for the differential effects are
unclear. They might involve differential FA effects on CD36 localization in plasma membrane
subdomains or restrictive properties of the lipid transport tunnel identified inside CD36 (40).
CD36 regulation of IR (Fig. 8) and of AMPK (8) might explain CD36 influence on muscle fuel
Page 15 of 45 Diabetes

16
choice between FA and glucose. However, the mechanistic details of how this is accomplished
including downstream effects on transporter translocation, nutrient intracellular trafficking and
targeting to mitochondria (41-44), remain to be elucidated.
Our findings support beneficial homeostatic role of muscle CD36. The associations identified
between genetically-determined low CD36 and insulin resistance (HOMA-IR) and T2D (Table
S3, Fig. S4) are consistent with this, although they are likely to reflect complex causality.
Genetic CD36 variants are relatively common and often impact CD36 expression (45; 46). These
variants have been associated with risk of metabolic syndrome (47) and diabetes mellitus, or
insulin resistance (48; 49). Dysfunctional interaction of CD36 with IR, Fyn and P85 might
contribute to its role in the etiology of metabolic disease.
Page 16 of 45Diabetes
17
Author Contributions: Author Contributions: DS designed experiments, obtained and
analyzed data and wrote the manuscript. PD conducted experiments and data analysis with help
from TP, MJS, NHS, KIS and RF. EP performed animal breeding and genotyping. KLH
conducted histological analysis. ERG analyzed human genetic data. IJG reviewed the
manuscript. NAA designed experiments, analyzed data and wrote the manuscript.
Acknowledgments: We thank Dr. Jacob Bar-Tana (Hebrew University, Jerusalem) for the M16
and Meghan Lam for technical support. This study was supported by NIH grants R01 DK33301,
R01 DK111175 and by pilot and feasibility awards to DS from P30-DK056341 (Nutrition
Obesity Research Center), P30-DK020579 (Diabetes Research Center), and Longer Life
Foundation. This work was also supported by the Hope Center Alafi Neuroimaging Laboratory
and NIH Shared Instrumentation Grant (S10 RR027552). DS and NAA are the guarantors of this
work and, as such, had full access to all the data in the study and take responsibility for the
integrity of the data and the accuracy of the data analysis.
Study approval: All protocols for animal experiments were approved by the Animal Studies
Committee of Washington University.
Statistics: Analyses were performed with GraphPad Prism 7.2 software (GraphPad Software).
Unpaired 2-tailed Student’s t tests and 2-way ANOVA, with Bonferroni’s correction for multiple
comparisons, were used as appropriate. Data are presented as the means ± SE unless otherwise
indicated. A P value of less than 0.05 was considered significant.
Conflict of interest: The authors declare no conflicts of interest.
Page 17 of 45 Diabetes
18
References
1. Coburn CT, Knapp FF, Jr., Febbraio M, Beets AL, Silverstein RL, Abumrad NA: Defective
uptake and utilization of long chain fatty acids in muscle and adipose tissues of CD36 knockout
mice. J Biol Chem 2000;275:32523-32529
2. Glatz JF, Luiken JJ, Bonen A: Membrane fatty acid transporters as regulators of lipid
metabolism: implications for metabolic disease. Physiol Rev 2010;90:367-417
3. Hames KC, Vella A, Kemp BJ, Jensen MD: Free fatty acid uptake in humans with CD36
deficiency. Diabetes 2014;63:3606-3614
4. Tanaka T, Nakata T, Oka T, Ogawa T, Okamoto F, Kusaka Y, et al.: Defect in human
myocardial long-chain fatty acid uptake is caused by FAT/CD36 mutations. J Lipid Res
2001;42:751-759
5. Silverstein RL, Febbraio M: CD36, a scavenger receptor involved in immunity, metabolism,
angiogenesis, and behavior. Sci Signal 2009;2:re3
6. Kazerounian S, Duquette M, Reyes MA, Lawler JT, Song K, Perruzzi C, et al.: Priming of the
vascular endothelial growth factor signaling pathway by thrombospondin-1, CD36, and spleen
tyrosine kinase. Blood 2011;117:4658-4666
7. Abumrad NA, Goldberg IJ: CD36 actions in the heart: Lipids, calcium, inflammation, repair
and more? Biochim Biophys Acta 2016;1861:1442-1449
8. Samovski D, Sun J, Pietka T, Gross RW, Eckel RH, Su X, et al.: Regulation of AMPK
activation by CD36 links fatty acid uptake to beta-oxidation. Diabetes 2015;64:353-359
9. Laugerette F, Passilly-Degrace P, Patris B, Niot I, Febbraio M, Montmayeur J-P, et al.: CD36
involvement in orosensory detection of dietary lipids, spontaneous fat preference, and digestive
secretions. The Journal of clinical investigation 2005;115:3177-3184
10. Besnard P, Passilly-Degrace P, Khan NA: Taste of Fat: A Sixth Taste Modality? Physiol Rev
2016;96:151-176
11. Kuda O, Jenkins CM, Skinner JR, Moon SH, Su X, Gross RW, et al.: CD36 protein is
involved in store-operated calcium flux, phospholipase A2 activation, and production of
prostaglandin E2. Journal of Biological Chemistry 2011;286:17785-17795
12. Abumrad NA, Davidson NO: Role of the gut in lipid homeostasis. Physiol Rev
2012;92:1061-1085
13. Pietka TA, Sulkin MS, Kuda O, Wang W, Zhou D, Yamada KA, et al.: CD36 Protein
Influences Myocardial Ca2+ Homeostasis and Phospholipid Metabolism: CONDUCTION
Page 18 of 45Diabetes
19
ANOMALIES IN CD36-DEFICIENT MICE DURING FASTING. The Journal of biological
chemistry 2012;287:38901-38912
14. McFarlan JT, Yoshida Y, Jain SS, Han XX, Snook LA, Lally J, et al.: In vivo, fatty acid
translocase (CD36) critically regulates skeletal muscle fuel selection, exercise performance, and
training-induced adaptation of fatty acid oxidation. The Journal of biological chemistry
2012;287:23502-23516
15. Manio MCC, Matsumura S, Masuda D, Inoue K: CD36 is essential for endurance
improvement, changes in whole-body metabolism, and efficient PPAR-related transcriptional
responses in the muscle with exercise training. Physiol Rep 2017;5
16. Mariotti A, Kedeshian PA, Dans M, Curatola AM, Gagnoux-Palacios L, Giancotti FG: EGF-
R signaling through Fyn kinase disrupts the function of integrin alpha6beta4 at
hemidesmosomes: role in epithelial cell migration and carcinoma invasion. J Cell Biol
2001;155:447-458
17. Cifarelli V, Ivanov S, Xie Y, Son NH, Saunders BT, Pietka TA, et al.: CD36 deficiency
impairs the small intestinal barrier and induces subclinical inflammation in mice. Cell Mol
Gastroenterol Hepatol 2017;3:82-98
18. McCarthy JJ, Srikuea R, Kirby TJ, Peterson CA, Esser KA: Inducible Cre transgenic mouse
strain for skeletal muscle-specific gene targeting. Skelet Muscle 2012;2:8
19. Shintaku J, Guttridge DC: Analysis of Aerobic Respiration in Intact Skeletal Muscle Tissue
by Microplate-Based Respirometry. Methods Mol Biol 2016;1460:337-343
20. Kozma J, Bartok G, Szentirmai A: Fructose-2,6-bisphosphate level and beta-lactam
formation in Penicillium chrysogenum. J Basic Microbiol 1993;33:27-34
21. Fleig WE, Nother-Fleig G, Steudter S, Enderle D, Ditschuneit H: Regulation of insulin
binding and glycogenesis by insulin and dexamethasone in cultured rat hepatocytes. Biochimica
et biophysica acta 1985;847:352-361
22. Samovski D, Su X, Xu Y, Abumrad NA, Stahl PD: Insulin and AMPK regulate FA
translocase/CD36 plasma membrane recruitment in cardiomyocytes via Rab GAP AS160 and
Rab8a Rab GTPase. J Lipid Res 2012;53:709-717
23. Fan M, Sidhu R, Fujiwara H, Tortelli B, Zhang J, Davidson C, et al.: Identification of
Niemann-Pick C1 disease biomarkers through sphingolipid profiling. J Lipid Res 2013;54:2800-
2814
24. Burkart EM, Sambandam N, Han X, Gross RW, Courtois M, Gierasch CM, et al.: Nuclear
receptors PPARbeta/delta and PPARalpha direct distinct metabolic regulatory programs in the
mouse heart. J Clin Invest 2007;117:3930-3939
Page 19 of 45 Diabetes
20
25. Sundaresan S, Shahid R, Riehl TE, Chandra R, Nassir F, Stenson WF, et al.: CD36-
dependent signaling mediates fatty acid-induced gut release of secretin and cholecystokinin. The
FASEB Journal 2013;27:1191-1202
26. Drover VA, Ajmal M, Nassir F, Davidson NO, Nauli AM, Sahoo D, et al.: CD36 deficiency
impairs intestinal lipid secretion and clearance of chylomicrons from the blood. J Clin Invest
2005;115:1290-1297
27. Luiken JJ, Dyck DJ, Han XX, Tandon NN, Arumugam Y, Glatz JF, et al.: Insulin induces the
translocation of the fatty acid transporter FAT/CD36 to the plasma membrane. American journal
of physiology 2002;282:E491-495
28. Harmon CM, Abumrad NA: Binding of sulfosuccinimidyl fatty acids to adipocyte membrane
proteins: isolation and amino-terminal sequence of an 88-kD protein implicated in transport of
long-chain fatty acids. J Membr Biol 1993;133:43-49
29. Coort SL, Willems J, Coumans WA, van der Vusse GJ, Bonen A, Glatz JF, et al.: Sulfo-N-
succinimidyl esters of long chain fatty acids specifically inhibit fatty acid translocase
(FAT/CD36)-mediated cellular fatty acid uptake. Mol Cell Biochem 2002;239:213-219
30. Pepino MY, Kuda O, Samovski D, Abumrad NA: Structure-function of CD36 and
importance of fatty acid signal transduction in fat metabolism. Annu Rev Nutr 2014;34:281-303
31. Aguilar HN, Zielnik B, Tracey CN, Mitchell BF: Quantification of rapid Myosin regulatory
light chain phosphorylation using high-throughput in-cell Western assays: comparison to
Western immunoblots. PLoS One 2010;5:e9965-e9965
32. Mozaffarian D, Cao H, King IB, Lemaitre RN, Song X, Siscovick DS, et al.: Circulating
palmitoleic acid and risk of metabolic abnormalities and new-onset diabetes. Am J Clin Nutr
2010;92:1350-1358
33. Kalderon B, Mayorek N, Ben-Yaacov L, Bar-Tana J: Adipose tissue sensitization to insulin
induced by troglitazone and MEDICA 16 in obese Zucker rats in vivo. Am J Physiol Endocrinol
Metab 2003;284:E795-803
34. Soderberg O, Leuchowius KJ, Gullberg M, Jarvius M, Weibrecht I, Larsson LG, et al.:
Characterizing proteins and their interactions in cells and tissues using the in situ proximity
ligation assay. Methods 2008;45:227-232
35. El-Yassimi A, Hichami A, Besnard P, Khan NA: Linoleic acid induces calcium signaling,
Src kinase phosphorylation, and neurotransmitter release in mouse CD36-positive gustatory
cells. Journal of biological chemistry 2008;283:12949-12959
36. Mittendorfer B, Liem O, Patterson BW, Miles JM, Klein S: What does the measurement of
whole-body fatty acid rate of appearance in plasma by using a fatty acid tracer really mean?
Diabetes 2003;52:1641-1648
Page 20 of 45Diabetes
21
37. Randle PJ: Regulatory interactions between lipids and carbohydrates: the glucose fatty acid
cycle after 35 years. Diabetes Metab Rev 1998;14:263-283
38. Hue L, Taegtmeyer H: The Randle cycle revisited: a new head for an old hat. Am J Physiol
Endocrinol Metab 2009;297:E578-591
39. Roden M, Price TB, Perseghin G, Petersen KF, Rothman DL, Cline GW, et al.: Mechanism
of free fatty acid-induced insulin resistance in humans. J Clin Invest 1996;97:2859-2865
40. Neculai D, Schwake M, Ravichandran M, Zunke F, Collins RF, Peters J, et al.: Structure of
LIMP-2 provides functional insights with implications for SR-BI and CD36. Nature
2013;504:172-176
41. Glatz JF, Luiken JJ: From fat to FAT (CD36/SR-B2): Understanding the regulation of
cellular fatty acid uptake. Biochimie 2017;136:21-26
42. Jaldin-Fincati JR, Pavarotti M, Frendo-Cumbo S, Bilan PJ, Klip A: Update on GLUT4
Vesicle Traffic: A Cornerstone of Insulin Action. Trends Endocrinol Metab 2017;28:597-611
43. Campbell SE, Tandon NN, Woldegiorgis G, Luiken JJ, Glatz JF, Bonen A: A novel function
for fatty acid translocase (FAT)/CD36: involvement in long chain fatty acid transfer into the
mitochondria. J Biol Chem 2004;279:36235-36241
44. Yoshida Y, Jain SS, McFarlan JT, Snook LA, Chabowski A, Bonen A: Exercise- and
training-induced upregulation of skeletal muscle fatty acid oxidation are not solely dependent on
mitochondrial machinery and biogenesis. J Physiol 2013;591:4415-4426
45. Ghosh A, Murugesan G, Chen K, Zhang L, Wang Q, Febbraio M, et al.: Platelet CD36
surface expression levels affect functional responses to oxidized LDL and are associated with
inheritance of specific genetic polymorphisms. Blood 2011;117:6355-6366
46. Love-Gregory L, Kraja AT, Allum F, Aslibekyan S, Hedman AK, Duan Y, et al.: Higher
chylomicron remnants and LDL particle numbers associate with common CD36 SNPs and DNA
methylation sites that reduce CD36 expression. Journal of lipid research 2016;
47. Avery CL, He Q, North KE, Ambite JL, Boerwinkle E, Fornage M, et al.: A phenomics-
based strategy identifies loci on APOC1, BRAP, and PLCG1 associated with metabolic
syndrome phenotype domains. PLoS Genet 2011;7:e1002322
48. Corpeleijn E, van der Kallen CJ, Kruijshoop M, Magagnin MG, de Bruin TW, Feskens EJ, et
al.: Direct association of a promoter polymorphism in the CD36/FAT fatty acid transporter gene
with Type 2 diabetes mellitus and insulin resistance. Diabet Med 2006;23:907-911
49. Lepretre F, Vasseur F, Vaxillaire M, Scherer PE, Ali S, Linton K, et al.: A CD36 nonsense
mutation associated with insulin resistance and familial type 2 diabetes. Hum Mutat 2004;24:104
Page 21 of 45 Diabetes
22
FIGURE LEGENDS:
Figure 1: Characterization of the mouse with conditional muscle CD36 deletion
A: Induction of skeletal muscle specific CD36 deletion (smCd36-/-
) using the HSA-rtTA Cre
reduced Cd36 gene expression in the predominantly slow-twitch oxidative diaphragm (Dia) and
in the mixed (slow-fast twitch, oxidative-glycolytic) gastrocnemius (Gastro) but not in the mixed
quadriceps (Quad), or abdominal muscle (rectus abdominus, Abdom). CD36 expression in the
heart as expected was not reduced. Tissues were obtained from smCd36-/-
and floxed littermate
controls (Cd36fl/fl
). All mice were given doxycycline, followed by a 7 day washout period (see
Methods for details). Cd36 gene expression by qPCR was normalized to 36B4 and to Cd36 in
gastrocnemius of Cd36fl/fl
mice set as 1. **p<0.01, n=3-4/genotype, males.
B: Representative western blots showing reduced CD36 protein in diaphragm but not in
quadriceps muscle. Graph: means ± SE of CD36/b-actin expression, n=3/genotype, males.
C: Immunostaining of CD36 in gastrocnemius sections of Cd36fl/fl
and smCd36-/-
mice showing
CD36 depletion in muscle fibers of smCd36-/-
. Representative images of 5-6 fields,
n=3/genotype, males.
D: Body composition of Cd36fl/fl
and smCd36-/-
mice. Shown are means ± SE of fat and lean
mass, n=4/genotype, males.
E: Muscle cross-sectional area (CSA) for Cd36fl/fl
and smCd36-/-
mice: H&E stained
gastrocnemius sections were scanned and analyzed. Representative areas are shown (scale bar-
100µm). Graph shows means ± SE of 228 individual muscle fibers for Cd36fl/fl
and 359 for
smCd36-/-
, n=3/genotype, males.
F-H: Fasting plasma levels of free FA, glucose and TG in CD36fl/fl
and smCD36-/-
mice. Shown
are means ± SE, n=4-8/genotype (3-4 females, 4-5 males).
I: Diaphragm (Dia) and quadriceps (Quad) TG content (means ± SE), n=3/genotype, males.
Page 22 of 45Diabetes
23
J: Reduced muscle content of ceramide species in diaphragm of smCd36-/-
mice: The decrease
correlates with CD36 knockdown and is not observed in quadriceps (Fig. S1A). **p<0.01,
n=4/genotype, males.
K: Diacylglycerol species in diaphragm (see also Fig. S1B). n=4/genotype, males.
Figure 2: Muscle CD36 deletion alters glucose metabolism in-vivo
A: Cd36 deficiency in gastrocnemius reduced expression of genes for insulin signaling (insulin
receptor substrate-1, IRS1, phosphatidylinositol 3-kinase regulatory alpha, PI3KR1) and
glucose metabolism (hexokinase, HK, phosphofructokinase-2, PFK2, pyruvate dehydrogenase
B1, PDHB1, aldolase A, ALDOA, ATP citrate lyase, ACLy) while pyruvate dehydrogenase
kinase 4, PDK4 and forkhead box O1, FoxO1, increased. FA metabolism genes were unchanged
(FA transport protein 1, FATP1, carnitine palmitoyl transferase 2, CPT2, FA binding protein 3,
FABP3. Mitochondrial genes (Cox2, Porin1, CPT1B) (Fig. S1C) and protein levels of electron
transfer chain complexes (C1-C5) (Fig. S1D) were also unaltered. Gene expression by qPCR and
normalized to 36B4. Shown are means ± SE, n=7-14 mice per genotype, males, ***p<0.001,
**p<0.01, *p<0.05 compared to Cd36fl/fl
mice.
B: Glucose disposal is not affected by muscle CD36 depletion: Intraperitoneal glucose tolerance
test (ipGTT) for Cd36fl/fl
and smCd36-/-
mice (n=7/genotype, 4 males and 3 females). Shown are
means ± SE of glucose as % of basal level. (See also Fig. S2A-C).
C: [18
F]-2-fluoro-2-deoxy-D-glucose (FDG) uptake is suppressed in hindlimb muscle but not in
heart or abdominal muscle of smCd36-/-
mice as compared to Cd36fl/fl
. Data are percentages of
injected dose per organ (%ID) shown as means ± SE of cumulative tracer uptake at 60 min.
n=4/genotype, females.
D: Insulin-stimulated glucose oxidation and glycolysis is suppressed in diaphragm explants from
smCd36-/-
mice. Glucose oxidation and glycolysis were assayed by Seahorse XF24. Shown are
means ± SE of area under the curve (AUC), n=3/genotype, males, 5 technical replicates.
**p<0.01 and *p<0.05 compared to Cd36fl/fl
.
Figure 3: Skeletal muscle CD36 is important for postprandial glucose disposal
A: Glucose disposal after a fatty meal is impaired in smCd36-/-
mice: Cd36fl/fl
and smCd36-/-
mice were given intragastric palm oil (1:1 with skim milk) or skim milk (vehicle). Glucose was
Page 23 of 45 Diabetes
24
administered ip 2 h later and glucose disposal measured in tail blood. Shown are means ± SE of
% change in glucose related to level before ip glucose injection (n=6-8/genotype). **p<0.01 and
*p<0.05 compared to Cd36fl/fl
controls, n=6-8/genotype, 1-2 females, 6 males.
B: AUC for glucose disposal in mice given palm oil: means ± SE.
C, D: Plasma TG and FFA in mice after palm oil feeding. Cd36fl/fl
(n=6, 3 males and 3 females)
and smCd36-/-
(n=8, 5 males and 3 females) mice were given intragastric palm oil or skim milk
(vehicle), followed 2 h later by glucose ip and blood collection. Shown are means ± SE of
plasma TG and free FA.
E: Muscle insulin signaling after a fatty meal is impaired in smCd36-/-
mice: Representative
immunoblots of diaphragm and gastrocnemius muscle from Cd36fl/fl
and smCd36-/-
mice: Mice
were given palm oil as in A, followed 2 h later by ip insulin and tissues harvested after 15 min.
F-G: Quantification of pAKT in diaphragm, gastrocnemius and quadriceps (F) and of pGSK3
and pACLy in diaphragm (G): n=4-5/genotype, 2-3 males, 2 females. *p<0.05 compared to
Cd36fl/fl
controls.
H-K: Muscle CD36 knockdown does not protect against high fat diet (HFD)-induced insulin
resistance: H: Weight gain at the end of 5 weeks of chow or HFD feeding. Groups were initially
weight-matched. n=4/diet/genotype, males, ***p<0.001. Weight on HFD compared to Chow
controls. Shown are means ±SE.
I: Triglyceride (TG) content of diaphragm (Dia) and quadriceps (Quad): Shown are means ± SE.
n=4/genotype, males, *p<0.05 compared to Cd36fl/fl
controls.
J: Ip insulin tolerance test (ITT) for Cd36fl/fl
and smCd36-/-
mice: Mice fasted for 4h were given
0.75IU/kg insulin and blood glucose monitored. Shown are means ± SE of glucose as % of basal
before insulin. n=4/genotype, males, representative of 2 experiments. (See also Fig.S2D, E).
K: [18
F]-FDG uptake is similar in hindlimb and heart of Cd36fl/fl
and smCd36-/-
mice fed HFD:
Shown are means ± SE of organ tracer uptake at 60 min, expressed as % of injected dose per
organ (%ID). n=4 /genotype, males, representative of 2 experiments.
Figure 4: CD36 modulates insulin signaling in human skeletal muscle myotubes (HSMM)
A: Insulin induces membrane CD36 translocation in differentiated HSMM: Myotubes serum-
starved for 16h were incubated with or without insulin (100nM, 15min) and processed for
Page 24 of 45Diabetes
25
immunostaining: Red: mouse monoclonal anti-CD36. Blue: DAPI (nuclei). Images are
representative of multiple fields from 3 experiments.
B: Representative bright-field images of differentiated myotubes after treatment with CD36-
targeted siRNA (siCD36-1) or with a nonspecific control siRNA (siC): Western blot shows
expression of myosin heavy-chain and b-actin in siC and siCD36 myotubes, representative of
two experiments.
C: CD36 depletion decreases insulin signaling in myotubes: Immunoblot showing insulin
signaling in siC and siCD36 HSMM: Insulin (100nM) was added for 5 min. Blots were probed
for CD36, phospho-AKTT308, S473
, total AKT, phospho-GSK3 α/βS21/9
(pGSK3), pACLyS455
and
b-actin. Blot representative of 4 experiments.
D: Quantification of CD36 knockdown normalized to b-actin: Shown are means ±SE of 5
experiments, as % of siC. ***p<0.001
E: Quantification of insulin-induced pAKTT308, S473
, pGSK3βS21/9
(bottom band) and pACLy S455
:
Shown are means±SE of fold change compared to insulin-treated siC myotubes. n=4
experiments, *p<0.05, **p<0.01.
F: Acute CD36 inhibition by SSO suppresses insulin signaling: HSMM were serum-starved and
incubated with or without SSO (20µM, 15 min) followed by insulin as in C. Immunoblots of cell
lysates (triplicates from different wells), representative of two experiments.
G. Quantification of insulin-induced pAKT T308
and pGSK3β S21/9
with or without SSO: Shown
are means ± SE from 2 experiments with triplicate samples, *p<0.05, **p<0.01, versus controls
(no SSO).
H: Glycolysis was measured (Seahorse XF96 analyzer) from the extracellular acidification rate
(ECAR) in siCD36 or siC HSMM. The following were added when indicated: A) glucose +
insulin; B) oligomycin; C) 2-deoxyglucose. Shown are means ± SE of 32 wells from one
experiment representative of two more.
I: Means ± SE of glycolytic measurements from three experiments, ***p<0.001, *p<0.05
compared to respective unstimulated siC.
J: CD36 depletion suppresses insulin-induced glucose uptake: siCD36 or siC HSMMs were
incubated (60 min) with 0.1mM 2deoxy-D-[3H]glucose (1µCi/ml) in PBS in presence or absence
of insulin. Disintegrations per minute (DPM) were normalized by wheat-germ-agglutinin (WGA)
staining. Shown are means ± SE of 4 experiments, **p<0.01 versus untreated siC.
Page 25 of 45 Diabetes
26
K: CD36 depletion suppresses insulin-induced glycogen synthesis. siCD36 and siC HSMMs
were incubated (2.5 or 5h) with 3H glucose (1µCi/ml) in presence or absence of insulin. Insulin-
induced fold change in radiolabel incorporation, normalized by WGA staining, is shown. Means
± SE of 3 experiments, 3-5 replicates per experiment, **p<0.01 compared to siC.
L: SSO (as in F) inhibits glucose uptake by HSMM. Shown are means ± SE of 3 experiments,
**p<0.01 compared to untreated controls, #p<0.05 compared to insulin-treated controls.
Figure 5: CD36 mediates FA effects on insulin signaling in myotubes
A: Saturated myristic and palmitic acids, but not monounsaturated oleic acid suppress insulin
signaling: Top - HSMM were incubated 15min with oleic, palmitic or myristic acids (OA, PA
or MA; 200µM at 2:1 BSA), followed by addition of insulin (100nM, 5 min). Cells were lysed,
and pAKT(S) and b-actin detected by immunoblotting. Data are representative of two
experiments. Bottom: HSMM were incubated with different MA concentrations followed by
insulin, lysed and immunoblotted. Data are representative of two experiments.
B: CD36 mediates suppression of insulin signaling by PA. In-Cell-Western (ICW) showing
effect of CD36 depletion on insulin signaling with and without FA. HSMM were incubated with
OA or PA (2:1 BSA, 200µM, 15 min) followed by incubation with insulin (100nM, 5min),
fixation and processing for ICW. pAKT S473
quantification normalized by WGA staining. Shown
are means ± SE, n=24 samples per condition, representative of 3 experiments, ***p<0.001
versus no insulin, ###
p<0.001 versus insulin-treated siC.
C: CD36/IR/CD36 (CD36+) or V control CHO/IR cells, were incubated with PA followed by
insulin, fixed and processed for ICW. Graph shows pAKTS473
quantification normalized by
WGA staining. Shown are means± SE, n=24 samples per condition, representative of 2
experiments, **p<0.01 versus insulin-stimulated +CD36 cells.
D: Unsaturated FA do not suppress insulin signaling. Vector or CD36+ CHO cells were treated
with eicosapentaenoic (EPA), palmitoleic (PO), MEDICA16 (M16), oleic (OA), palmitic (PA) or
linoleic (LA) acids, followed by insulin (100nM, 5 min). Cells were lysed and immunoblotted as
indicated. Data are representative of two experiments.
E: Schematic summary of key steps in regulation of glucose metabolism by insulin: Activation
of insulin receptor (IR) leads to Akt phosphorylation and enhanced glucose uptake. Insulin
induces phosphorylation of glycogen synthase kinase 3 (GSK3), which promotes glycogen
synthesis. Glucose metabolized via glycolysis can be further oxidized in the citric acid cycle.
Page 26 of 45Diabetes
27
Insulin signaling also promotes FA synthesis by enhancing phosphorylation of the key lipogenic
enzyme ATP-citrate lyase (ACLy), which converts citrate to cytosolic acetyl-CoA.
Figure 6: CD36 interacts with IRββββ and enhances its tyrosine phosphorylation
A-B: CD36 and IRβ co-immunoprecipitate. A: CHO/IR/CD36 cells (+CD36) or empty vector
controls (V) were lysed and equal concentrations of lysate protein used to IP insulin receptor β
subunit (IRβ). B: Reciprocal IP using anti-CD36 antibody. Data are representative of 3
experiments.
C: CHO/IR/CD36+ cells were stained and processed for PLA. CD36-only staining (no anti-IRβ
antibody) was used as negative control. Nuclei were visualized by DAPI (blue). Data are
representative of 3 experiments.
D: CD36 expression facilitates IRβ tyrosine phosphorylation and P85 recruitment: Vector or
CD36+ cells were incubated with or without insulin (100nM, 5 min) and lysed. Equal lysate
protein was used to IP IRβ, and IPs were probed for pY100 (pIRβ), P85 and IRβ. Quantification
of insulin-induced pIRβ/IRβ, data are means±SE from 3 experiments, *p<0.05.
E: Equal amounts of lysate protein (3.5mg/sample) from gastrocnemius and quadriceps muscles
were subjected to IRβ IP and resolved by SDS-PAGE. The IPs were immunoblotted for CD36
and IRβ. Data are representative of two experiments.
F: Proximity ligation assay of gastrocnemius paraffin-embedded sections stained with anti-CD36
and anti-IRβ antibodies. Combined CD36 and IRβ staining resulted in appearance of typical
punctate patterns of amplified DNA. Non-specific IgGs, isotype-matched to CD36 and IRβ
antibodies, were used as negative controls. Images are representative of 3 mice.
Figure 7: CD36 facilitates Fyn recruitment to plasma membrane and interaction with IRββββ
A-B: Combined Fyn and CD36 expression enhances insulin-stimulated IRβ phosphorylation.
CHO/IR+CD36 or vector control (V) cells were transiently transfected with or without Fyn.
Cells were incubated with or without insulin (100nM, 5min), lysed and equal cell lysate protein
used to IP IRβ. Data are representative of three experiments.
C: Top panel: V or CD36+ CHO/IR cells transiently transfected with Fyn, were incubated with
or without insulin, fixed and stained with anti-Fyn antibody. Bottom panel: CD36+ cells
Page 27 of 45 Diabetes
28
transiently transfected with Fyn were incubated with insulin, fixed and imaged for Fyn and IRβ.
Image shows overlay between IRβ (red) and Fyn (green). Image magnification shows distinct
punctate yellow structures, suggesting IRβ-Fyn colocalization. Data are representative of two
experiments.
D- E: Palmitic acid (PA) suppresses Fyn association with CD36 and IRβ. CD36+ or (V) CHO/IR
cells were pre-incubated with PA (200µM, 2:1 BSA, 15 min) then with insulin (100nM, 5 min),
and lysates used to IP CD36. Resolved IPs and inputs were immunoblotted for CD36, Fyn, and
pFynY416
.
F-G: Differentiated C2C12 myotubes, treated as in D, were processed for IP of IRβ and IPs were
probed for IRβ and Fyn. Data are representative of 2 experiments.
Figure 8: C-terminal CD36 mutation suppresses IRββββ-Fyn interaction and blunts insulin
signaling
A: CHO/IR/CD36 and CHO/IR/CD36K/A cells were incubated with insulin and cell lysates
immunoblotted for the indicated proteins. Data are representative of two experiments.
B: CHO/IR/CD36 and CHO/IR/CD36K/A cells were incubated with or without insulin, fixed
and processed for in-cell western (ICW). Quantification of pAKT S473
normalized by WGA.
Shown are means ± SE of 24 samples per condition, representative of three experiments,
***p<0.001, versus +CD36.
C-D: +CD36 and +CD36 K/A cells were incubated with or without insulin (100nM, 5min), lysed
and lysates used for IP of IRβ. IP (C) and cell lysates (D) were immunoblotted as indicated. Data
are representative of 2 experiments.
E: Insulin-induced glycolysis is reduced in the CD36 K/A mutant. ECAR was measured in
+CD36 and +CD36 K/A cells. The following compounds were added when indicated: A)
glucose/ glucose +insulin; B) oligomycin; C) 2-deoxyglucose. Shown are means ± SE of 32
wells from one experiment representative of two more.
F: Proposed mechanism for regulation of glucose metabolism by CD36 and FA: Left Panel:
Insulin stimulates insulin receptor (IR) signaling and Akt phosphorylation to drive glucose
uptake and utilization. CD36 association with IR promotes Fyn recruitment to IR to increase its
tyrosine phosphorylation (pY). This enhances IR signaling and muscle glucose utilization. Right
Panel: Saturated FA (SFA) trigger Fyn dissociation from CD36 and IR, reducing IR
phosphorylation and signaling and diminishing glucose uptake. Thus, CD36 enhances glucose
Page 28 of 45Diabetes

29
metabolism in skeletal muscle and its SFA sensing spares glucose, when both FA and glucose
are available.
Page 29 of 45 Diabetes
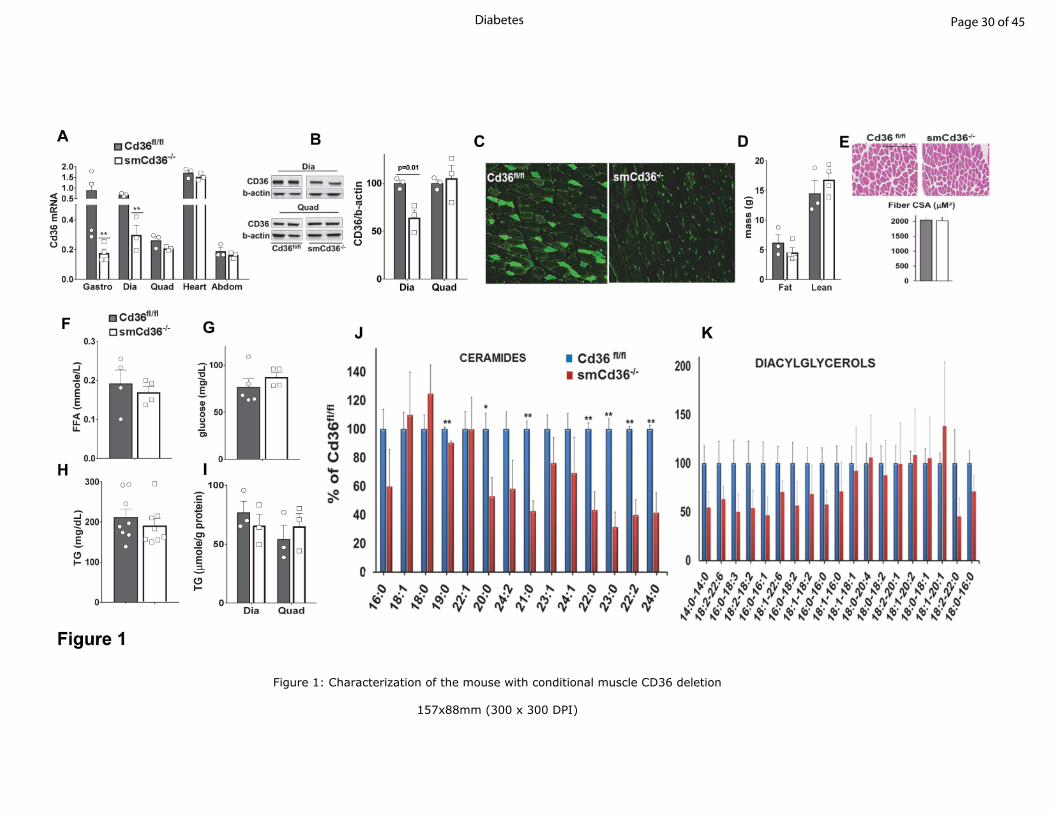
Figure 1: Characterization of the mouse with conditional muscle CD36 deletion
157x88mm (300 x 300 DPI)
Page 30 of 45Diabetes
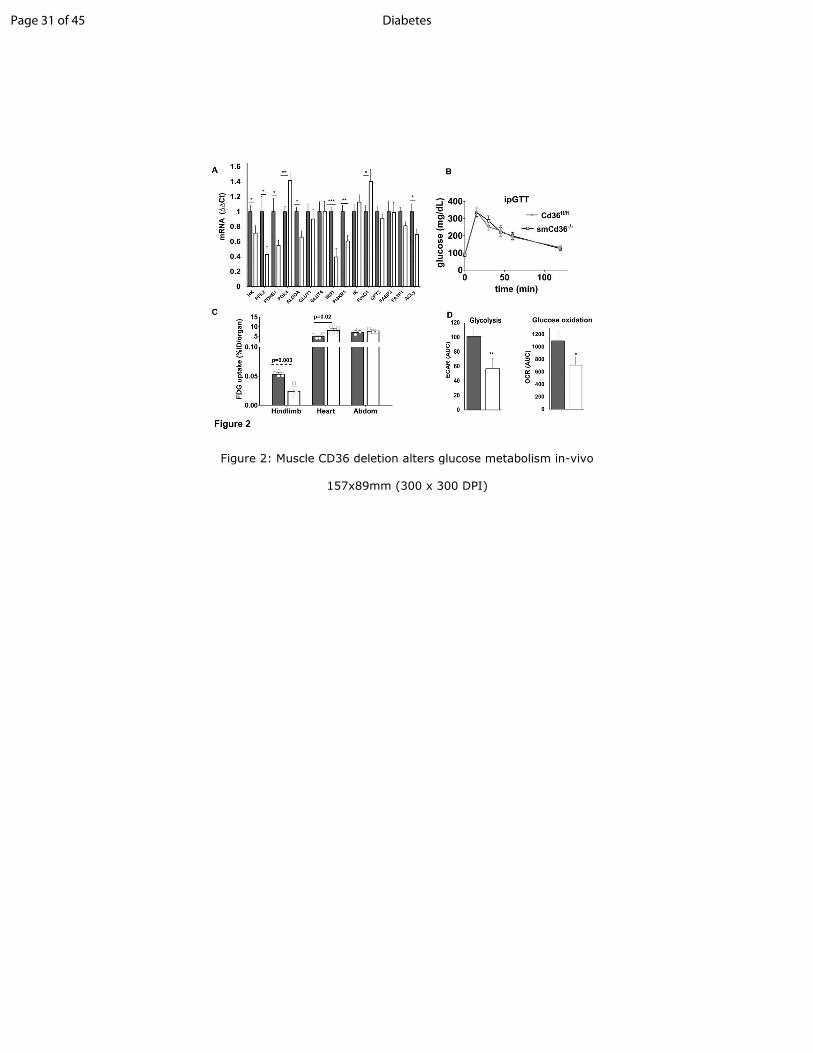
Figure 2: Muscle CD36 deletion alters glucose metabolism in-vivo
157x89mm (300 x 300 DPI)
Page 31 of 45 Diabetes
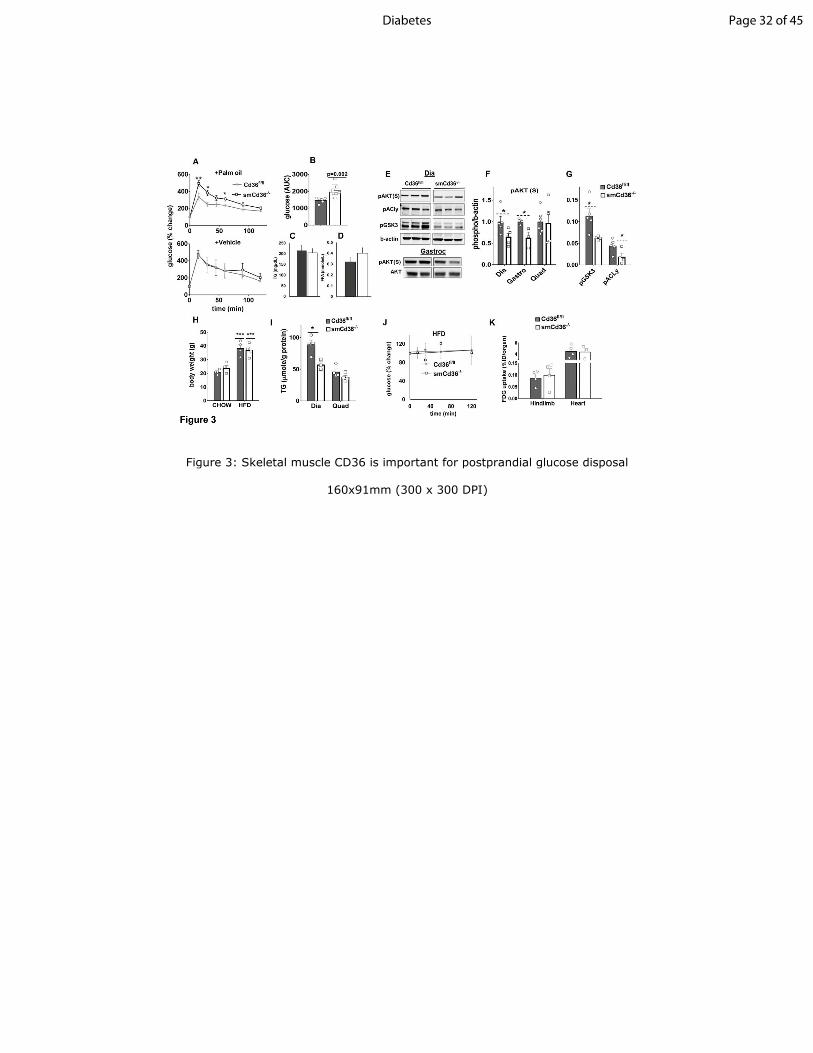
Figure 3: Skeletal muscle CD36 is important for postprandial glucose disposal
160x91mm (300 x 300 DPI)
Page 32 of 45Diabetes
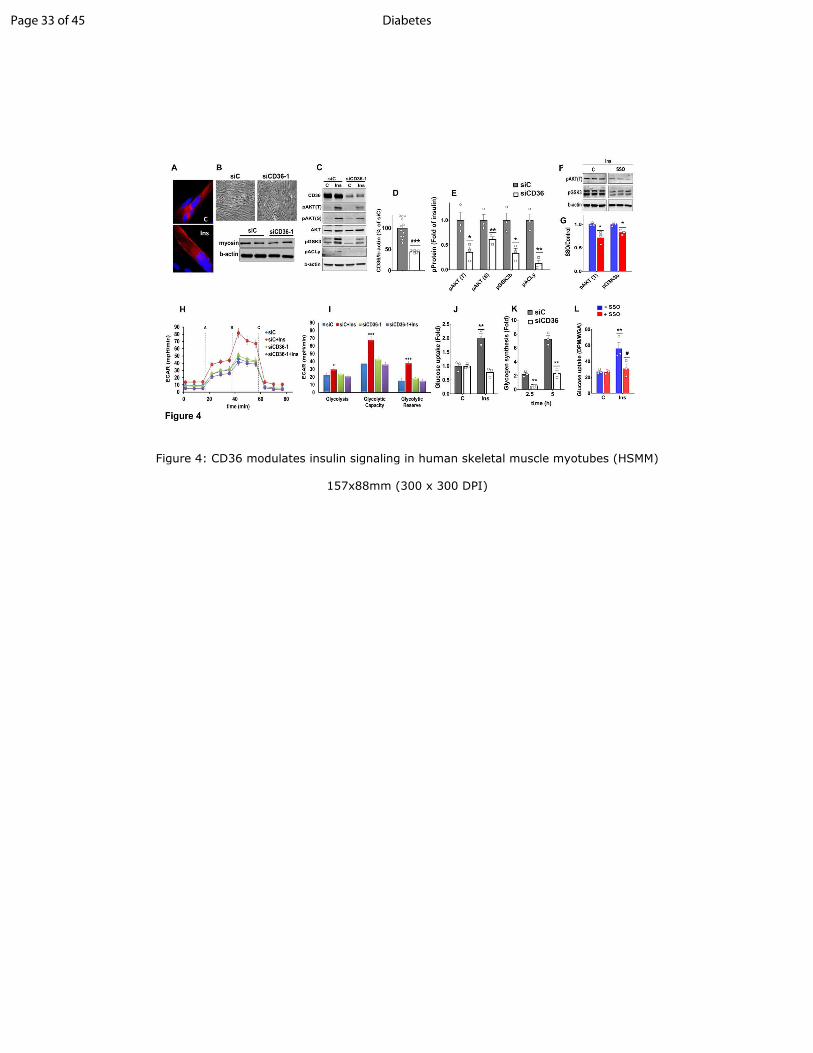
Figure 4: CD36 modulates insulin signaling in human skeletal muscle myotubes (HSMM)
157x88mm (300 x 300 DPI)
Page 33 of 45 Diabetes
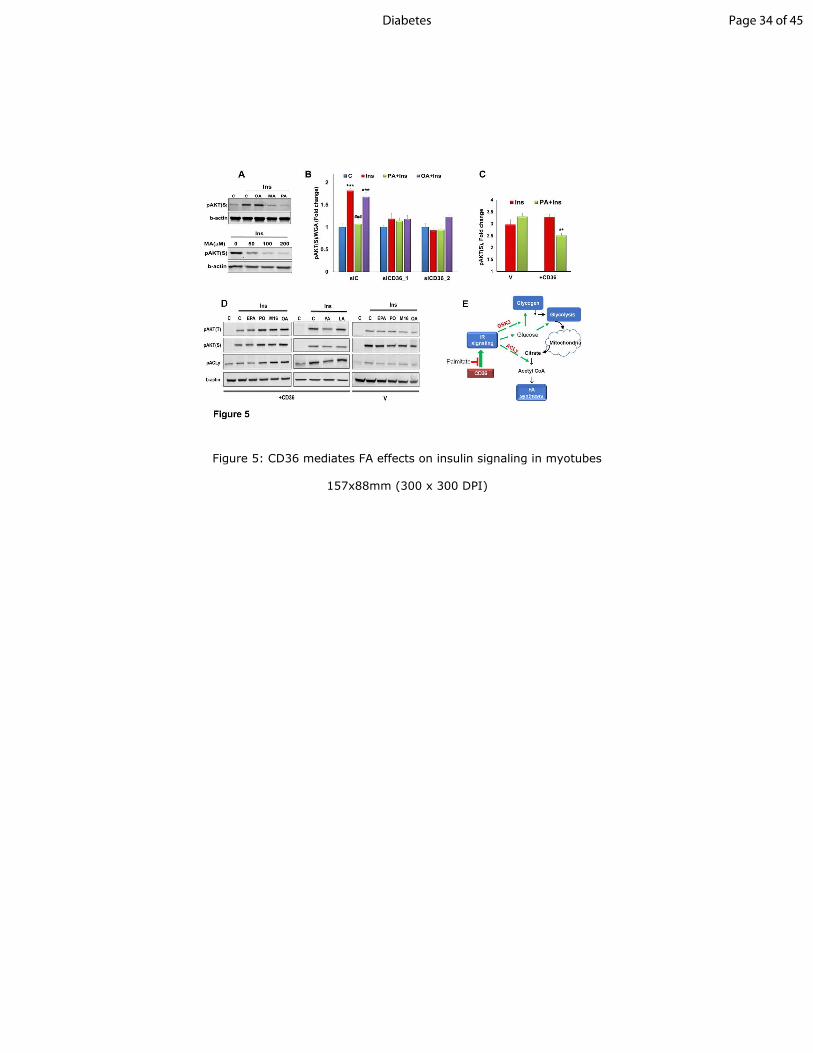
Figure 5: CD36 mediates FA effects on insulin signaling in myotubes
157x88mm (300 x 300 DPI)
Page 34 of 45Diabetes
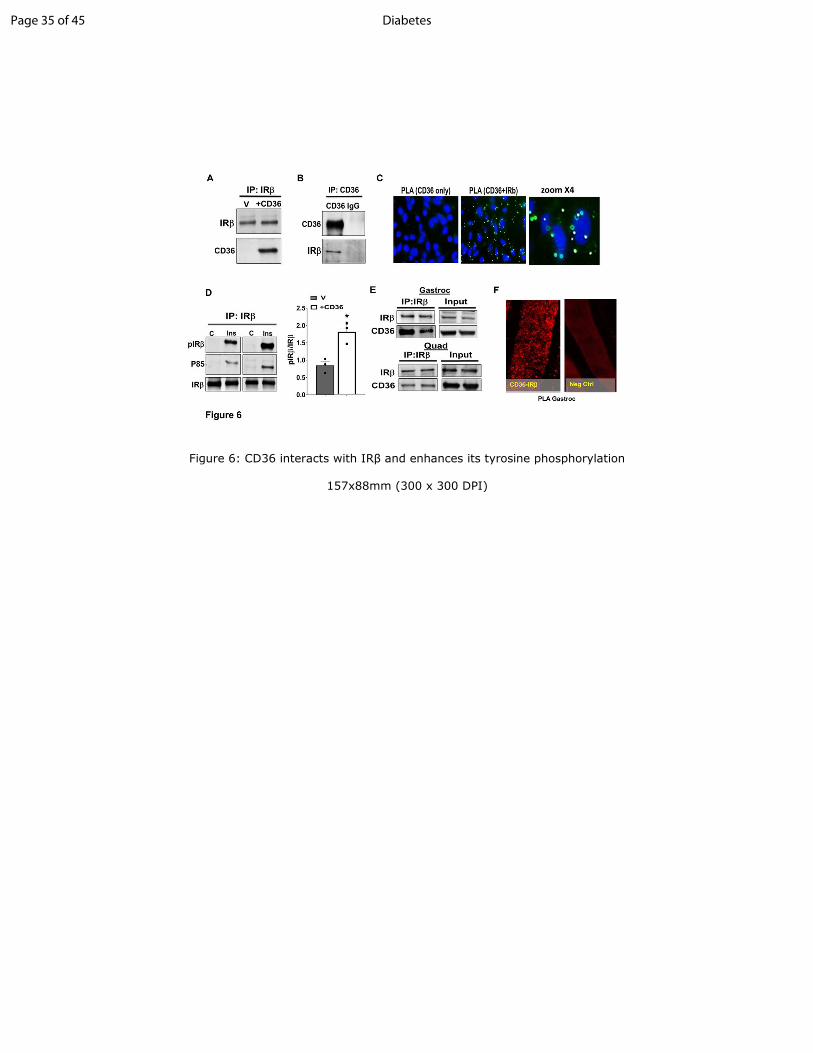
Figure 6: CD36 interacts with IRβ and enhances its tyrosine phosphorylation
157x88mm (300 x 300 DPI)
Page 35 of 45 Diabetes
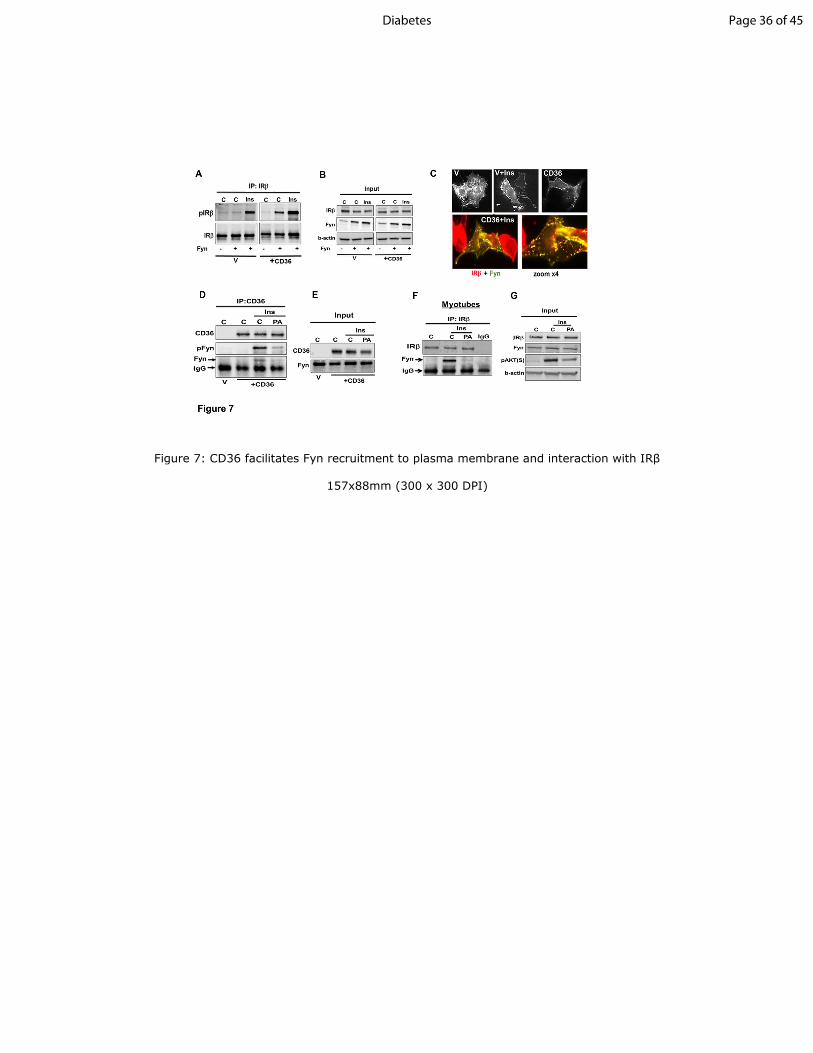
Figure 7: CD36 facilitates Fyn recruitment to plasma membrane and interaction with IRβ
157x88mm (300 x 300 DPI)
Page 36 of 45Diabetes
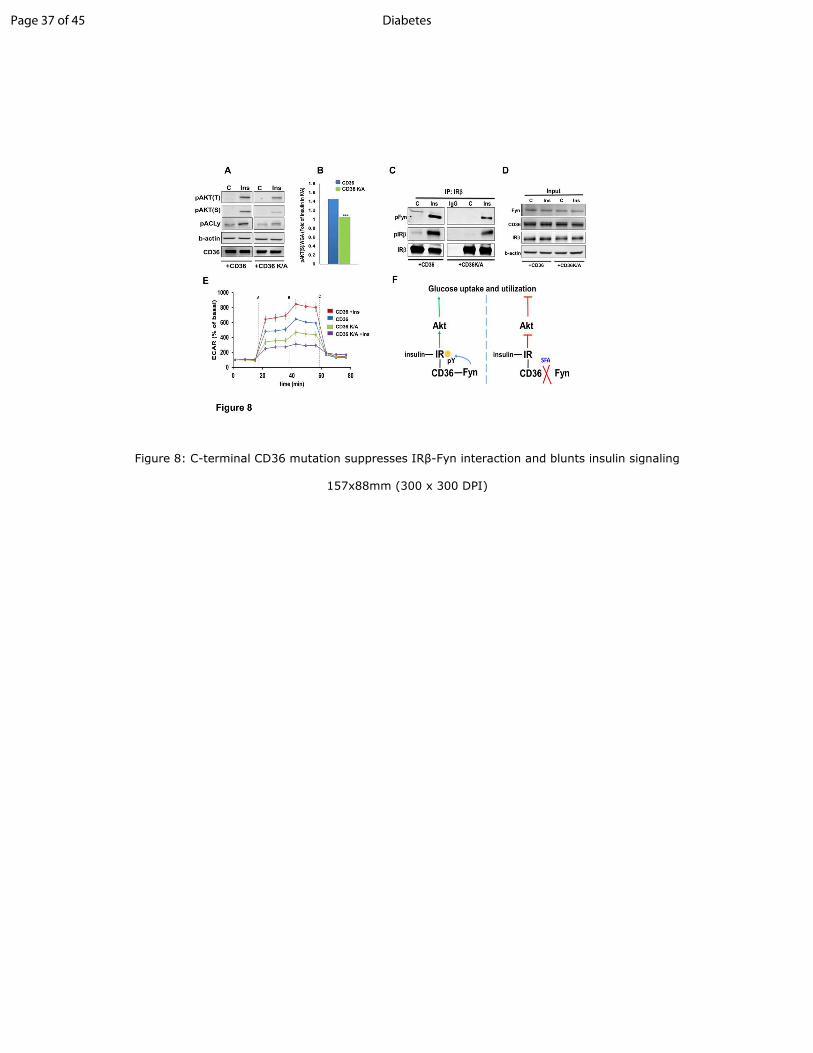
Figure 8: C-terminal CD36 mutation suppresses IRβ-Fyn interaction and blunts insulin signaling
157x88mm (300 x 300 DPI)
Page 37 of 45 Diabetes
SUPPLEMENTAL MATERIAL
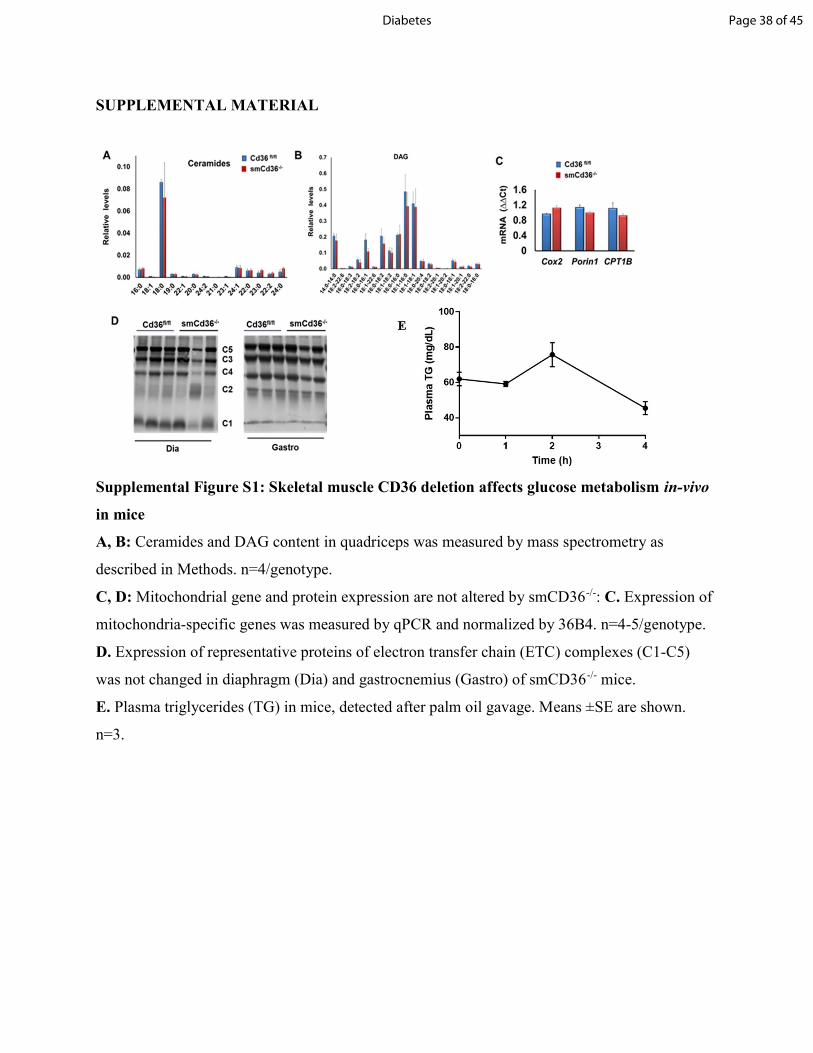
Supplemental Figure S1: Skeletal muscle CD36 deletion affects glucose metabolism in-vivo in mice A, B: Ceramides and DAG content in quadriceps was measured by mass spectrometry as described in Methods. n=4/genotype. C, D: Mitochondrial gene and protein expression are not altered by smCD36-/-: C. Expression of mitochondria-specific genes was measured by qPCR and normalized by 36B4. n=4-5/genotype. D. Expression of representative proteins of electron transfer chain (ETC) complexes (C1-C5) was not changed in diaphragm (Dia) and gastrocnemius (Gastro) of smCD36-/- mice. E. Plasma triglycerides (TG) in mice, detected after palm oil gavage. Means ±SE are shown. n=3.
Page 38 of 45Diabetes
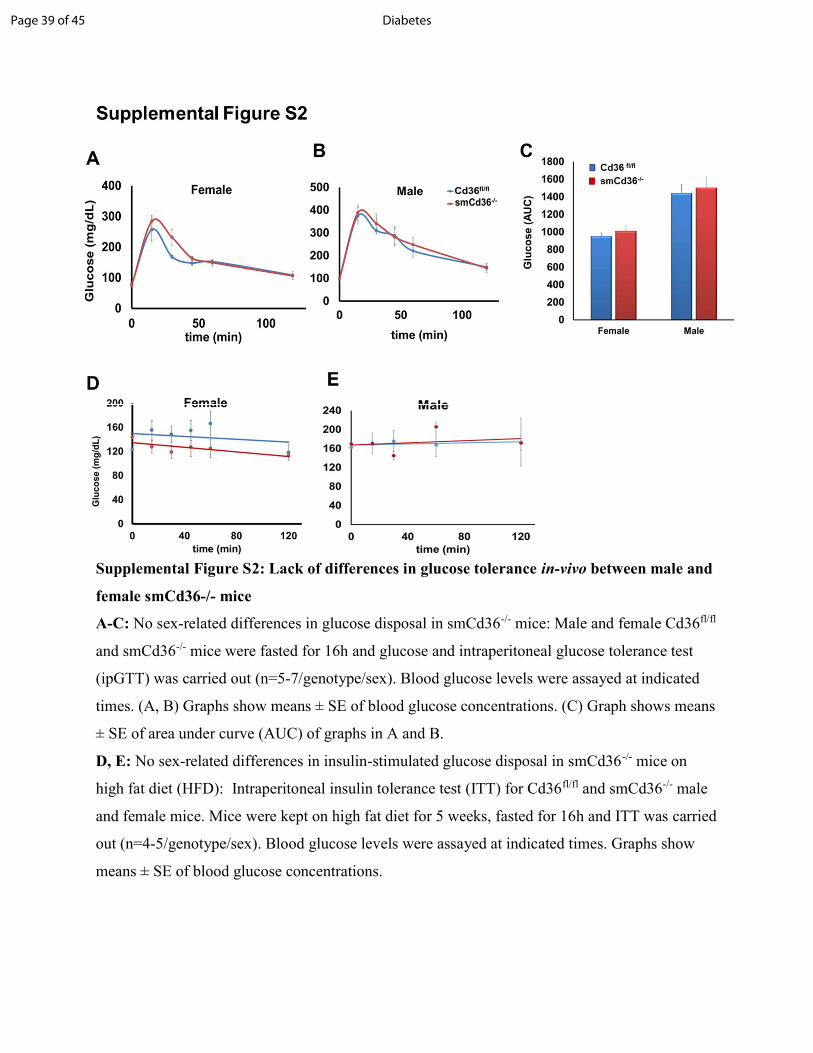
Supplemental Figure S2: Lack of differences in glucose tolerance in-vivo between male and female smCd36-/- mice A-C: No sex-related differences in glucose disposal in smCd36-/- mice: Male and female Cd36fl/fl and smCd36-/- mice were fasted for 16h and glucose and intraperitoneal glucose tolerance test (ipGTT) was carried out (n=5-7/genotype/sex). Blood glucose levels were assayed at indicated times. (A, B) Graphs show means ± SE of blood glucose concentrations. (C) Graph shows means ± SE of area under curve (AUC) of graphs in A and B. D, E: No sex-related differences in insulin-stimulated glucose disposal in smCd36-/- mice on high fat diet (HFD): Intraperitoneal insulin tolerance test (ITT) for Cd36fl/fl and smCd36-/- male and female mice. Mice were kept on high fat diet for 5 weeks, fasted for 16h and ITT was carried out (n=4-5/genotype/sex). Blood glucose levels were assayed at indicated times. Graphs show means ± SE of blood glucose concentrations.
Page 39 of 45 Diabetes
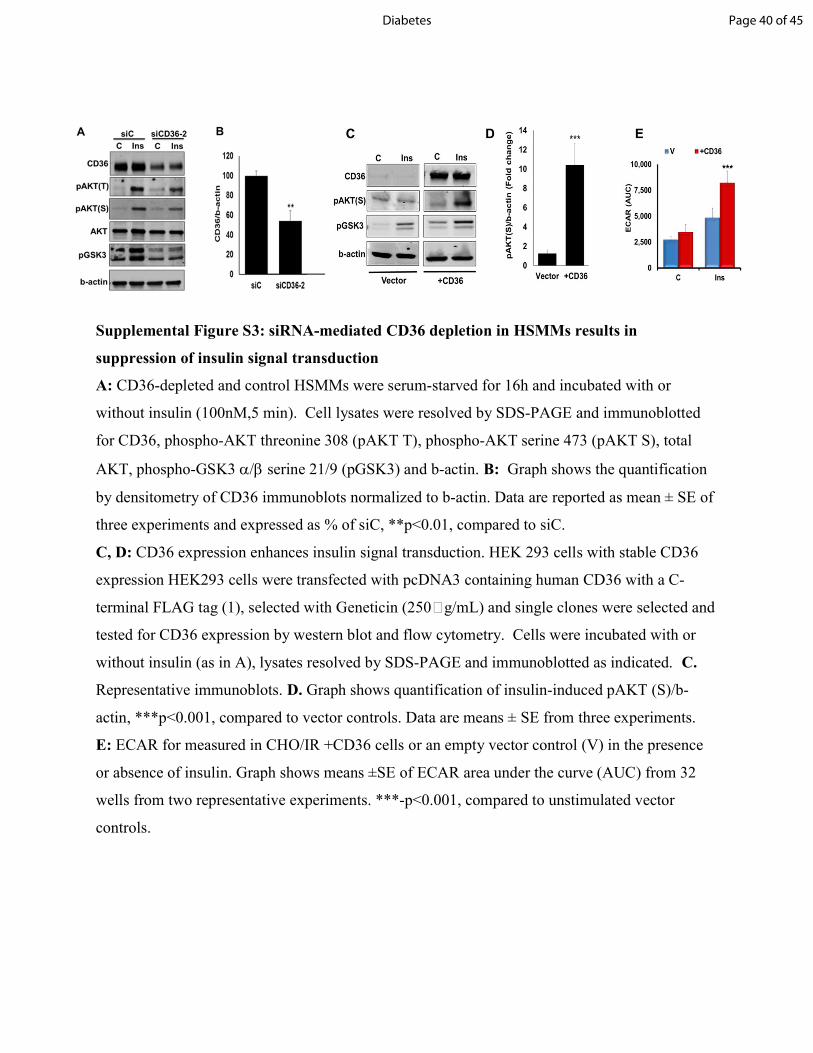
Supplemental Figure S3: siRNA-mediated CD36 depletion in HSMMs results in suppression of insulin signal transduction A: CD36-depleted and control HSMMs were serum-starved for 16h and incubated with or without insulin (100nM,5 min). Cell lysates were resolved by SDS-PAGE and immunoblotted for CD36, phospho-AKT threonine 308 (pAKT T), phospho-AKT serine 473 (pAKT S), total AKT, phospho-GSK3 serine 21/9 (pGSK3) and b-actin. B: Graph shows the quantification by densitometry of CD36 immunoblots normalized to b-actin. Data are reported as mean ± SE of three experiments and expressed as % of siC, **p<0.01, compared to siC. C, D: CD36 expression enhances insulin signal transduction. HEK 293 cells with stable CD36 expression HEK293 cells were transfected with pcDNA3 containing human CD36 with a C-terminal FLAG tag (1), selected with Geneticin (250g/mL) and single clones were selected and tested for CD36 expression by western blot and flow cytometry. Cells were incubated with or without insulin (as in A), lysates resolved by SDS-PAGE and immunoblotted as indicated. C. Representative immunoblots. D. Graph shows quantification of insulin-induced pAKT (S)/b-actin, ***p<0.001, compared to vector controls. Data are means ± SE from three experiments. E: ECAR for measured in CHO/IR +CD36 cells or an empty vector control (V) in the presence or absence of insulin. Graph shows means ±SE of ECAR area under the curve (AUC) from 32 wells from two representative experiments. ***-p<0.001, compared to unstimulated vector controls.
Page 40 of 45Diabetes
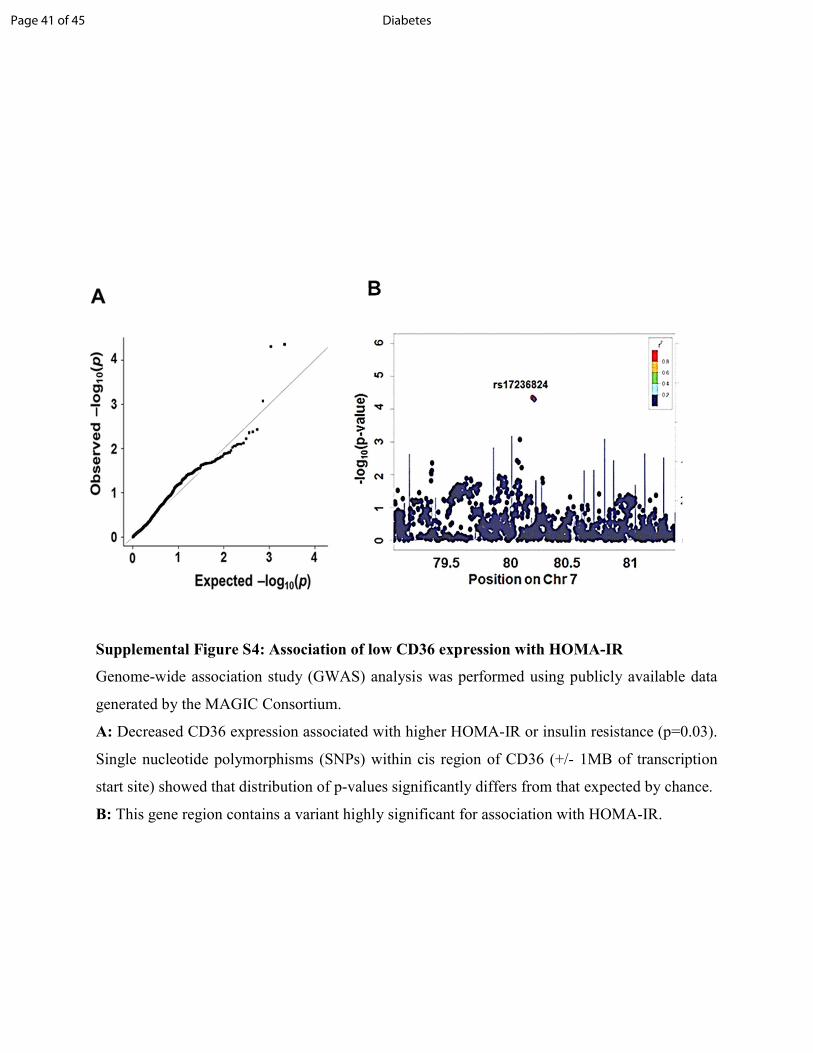
Supplemental Figure S4: Association of low CD36 expression with HOMA-IR Genome-wide association study (GWAS) analysis was performed using publicly available data generated by the MAGIC Consortium. A: Decreased CD36 expression associated with higher HOMA-IR or insulin resistance (p=0.03). Single nucleotide polymorphisms (SNPs) within cis region of CD36 (+/- 1MB of transcription start site) showed that distribution of p-values significantly differs from that expected by chance. B: This gene region contains a variant highly significant for association with HOMA-IR.
Page 41 of 45 Diabetes

Table S1: Primary Antibodies Name of Antibody Vendor Cat. Number Goat anti-human CD36 R&D Systems AF1955 Goat anti-mouse CD36 R&D Systems AF2519 mouse anti-human CD36 [FA6-152] Abcam ab17044 Rabbit anti-Insulin Receptor Beta Cell Signaling 3025 Mouse anti-Insulin Receptor Beta Cell Signaling 3020 Mouse anti-pTyr 100 Cell Signaling 94115 Rabbit anti-Src Santa Cruz Biotechnology sc-2 Rabbit anti-pSrc (Y416) Cell Signaling 6943 Mouse anti-b-actin Santa Cruz Biotechnology sc-47778 Mouse anti-AKT(pan) (40D4) Cell Signaling 2920 Rabbit anti-pAKT(S473) Cell Signaling 4060 Rabbit anti-pAKT(T308) Cell Signaling 13038 Rabbit anti- pATP-Citrate Lyase (S455) Cell Signaling 4331 Rabbit anti-PI3 Kinase (P85) Cell Signaling 4292 Rabbit anti-pGSK3 (S21/9) Cell Signaling 9331 Mitochondrial Antibody Cocktail Abcam ab110413
Page 42 of 45Diabetes
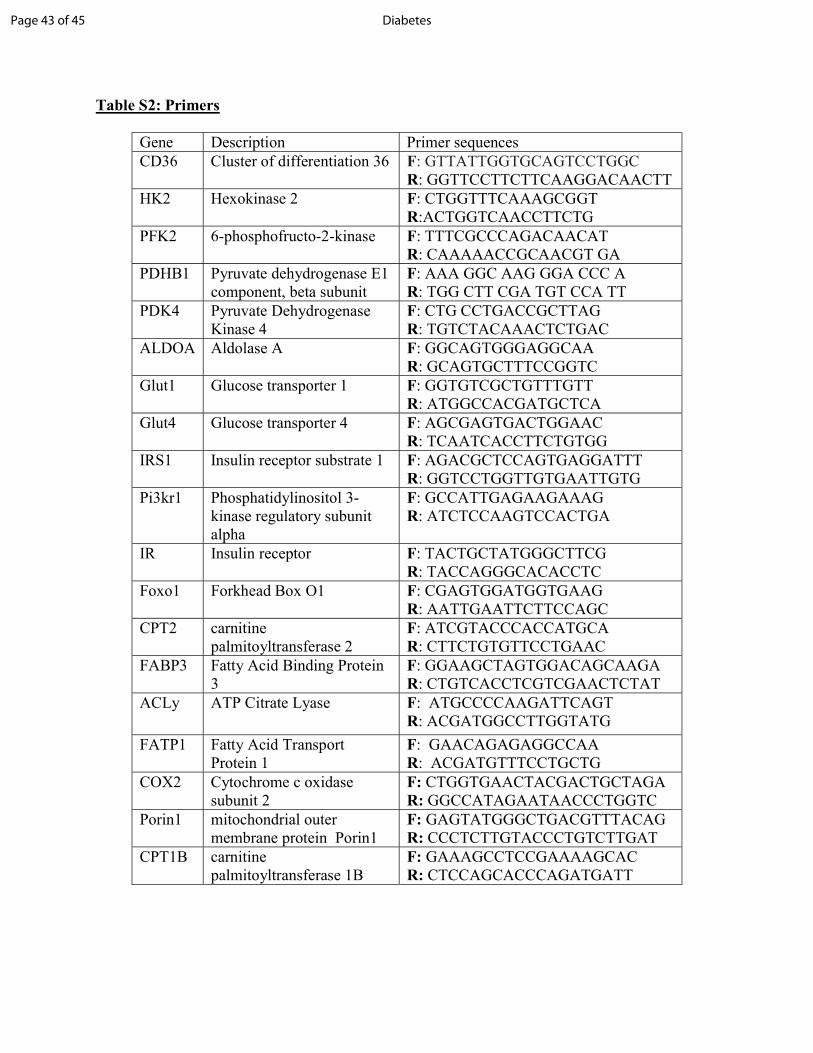
Table S2: Primers Gene Description Primer sequences CD36 Cluster of differentiation 36 F: GTTATTGGTGCAGTCCTGGC
R: GGTTCCTTCTTCAAGGACAACTT HK2 Hexokinase 2 F: CTGGTTTCAAAGCGGT
R:ACTGGTCAACCTTCTG PFK2 6-phosphofructo-2-kinase F: TTTCGCCCAGACAACAT
R: CAAAAACCGCAACGT GA PDHB1 Pyruvate dehydrogenase E1
component, beta subunit F: AAA GGC AAG GGA CCC A R: TGG CTT CGA TGT CCA TT
PDK4 Pyruvate Dehydrogenase Kinase 4
F: CTG CCTGACCGCTTAG R: TGTCTACAAACTCTGAC
ALDOA Aldolase A F: GGCAGTGGGAGGCAA R: GCAGTGCTTTCCGGTC
Glut1 Glucose transporter 1 F: GGTGTCGCTGTTTGTT R: ATGGCCACGATGCTCA
Glut4 Glucose transporter 4 F: AGCGAGTGACTGGAAC R: TCAATCACCTTCTGTGG
IRS1 Insulin receptor substrate 1 F: AGACGCTCCAGTGAGGATTT R: GGTCCTGGTTGTGAATTGTG
Pi3kr1 Phosphatidylinositol 3-kinase regulatory subunit alpha
F: GCCATTGAGAAGAAAG R: ATCTCCAAGTCCACTGA
IR Insulin receptor F: TACTGCTATGGGCTTCG R: TACCAGGGCACACCTC
Foxo1 Forkhead Box O1 F: CGAGTGGATGGTGAAG R: AATTGAATTCTTCCAGC
CPT2 carnitine palmitoyltransferase 2
F: ATCGTACCCACCATGCA R: CTTCTGTGTTCCTGAAC
FABP3 Fatty Acid Binding Protein 3
F: GGAAGCTAGTGGACAGCAAGA R: CTGTCACCTCGTCGAACTCTAT
ACLy ATP Citrate Lyase F: ATGCCCCAAGATTCAGT R: ACGATGGCCTTGGTATG
FATP1 Fatty Acid Transport Protein 1
F: GAACAGAGAGGCCAA R: ACGATGTTTCCTGCTG
COX2 Cytochrome c oxidase subunit 2
F: CTGGTGAACTACGACTGCTAGA R: GGCCATAGAATAACCCTGGTC
Porin1 mitochondrial outer membrane protein Porin1
F: GAGTATGGGCTGACGTTTACAG R: CCCTCTTGTACCCTGTCTTGAT
CPT1B carnitine palmitoyltransferase 1B
F: GAAAGCCTCCGAAAAGCAC R: CTCCAGCACCCAGATGATT
Page 43 of 45 Diabetes
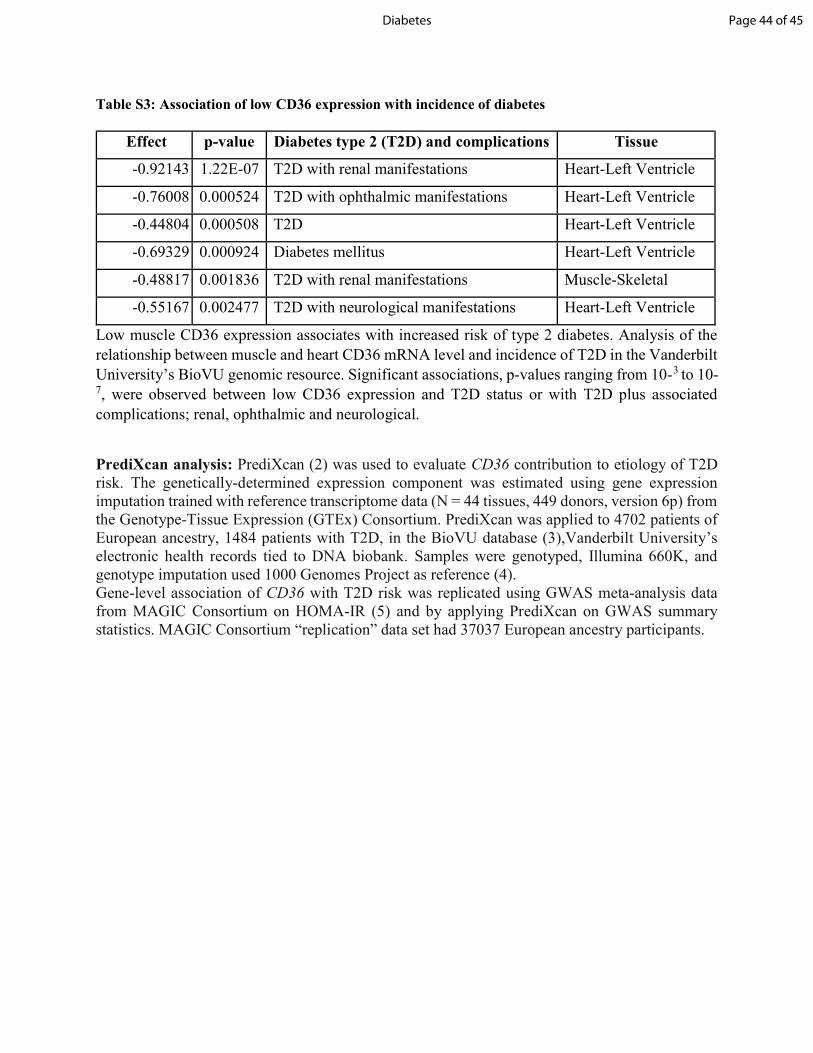
Table S3: Association of low CD36 expression with incidence of diabetes
Low muscle CD36 expression associates with increased risk of type 2 diabetes. Analysis of the relationship between muscle and heart CD36 mRNA level and incidence of T2D in the Vanderbilt University’s BioVU genomic resource. Significant associations, p-values ranging from 10-3 to 10-7, were observed between low CD36 expression and T2D status or with T2D plus associated complications; renal, ophthalmic and neurological. PrediXcan analysis: PrediXcan (2) was used to evaluate CD36 contribution to etiology of T2D risk. The genetically-determined expression component was estimated using gene expression imputation trained with reference transcriptome data (N = 44 tissues, 449 donors, version 6p) from the Genotype-Tissue Expression (GTEx) Consortium. PrediXcan was applied to 4702 patients of European ancestry, 1484 patients with T2D, in the BioVU database (3),Vanderbilt University’s electronic health records tied to DNA biobank. Samples were genotyped, Illumina 660K, and genotype imputation used 1000 Genomes Project as reference (4). Gene-level association of CD36 with T2D risk was replicated using GWAS meta-analysis data from MAGIC Consortium on HOMA-IR (5) and by applying PrediXcan on GWAS summary statistics. MAGIC Consortium “replication” data set had 37037 European ancestry participants.
Effect p-value Diabetes type 2 (T2D) and complications Tissue -0.92143 1.22E-07 T2D with renal manifestations Heart-Left Ventricle -0.76008 0.000524 T2D with ophthalmic manifestations Heart-Left Ventricle -0.44804 0.000508 T2D Heart-Left Ventricle -0.69329 0.000924 Diabetes mellitus Heart-Left Ventricle -0.48817 0.001836 T2D with renal manifestations Muscle-Skeletal -0.55167 0.002477 T2D with neurological manifestations Heart-Left Ventricle
Page 44 of 45Diabetes
Supplemental References
1. Tao N, Wagner SJ, Lublin DM: CD36 is palmitoylated on both N- and C-terminal cytoplasmic tails. J Biol Chem 1996;271:22315-22320 2. Gamazon ER, Wheeler HE, Shah KP, Mozaffari SV, Aquino-Michaels K, Carroll RJ, et al.: A gene-based association method for mapping traits using reference transcriptome data. Nat Genet 2015;47:1091-1098 3. Roden DM, Pulley JM, Basford MA, Bernard GR, Clayton EW, Balser JR, et al.: Development of a large-scale de-identified DNA biobank to enable personalized medicine. Clin Pharmacol Ther 2008;84:362-369 4. Genomes Project C, Auton A, Brooks LD, Durbin RM, Garrison EP, Kang HM, et al.: A global reference for human genetic variation. Nature 2015;526:68-74 5. Dupuis J, Langenberg C, Prokopenko I, Saxena R, Soranzo N, Jackson AU, et al.: New genetic loci implicated in fasting glucose homeostasis and their impact on type 2 diabetes risk. Nat Genet 2010;42:105-116
Page 45 of 45 Diabetes
Recommended