Fachtagung “Experimentelle Strömungsmechanik”5. – 7. September 2017, Karlsruhe
Untersuchungen zur Fluid-Struktur-Interaktion einer luftgestütztenHalbkugelmembran unter turbulenter Zuströmung
Studies on the Fluid-Structure Interaction of a Pressurized Membranous He-misphere in Turbulent Flow
Jens Nikolas Wood, Michael BreuerHelmut-Schmidt-UniversitätProfessur für StrömungsmechanikHolstenhofweg 8522043 HamburgE-Mail: [email protected], [email protected]
Fluid-Struktur-Interaktion, Membranstruktur, turbulente Strömung, Particle-Image-Velocime-try, Digitale Bildkorrelation
Fluid-structure interaction, membranous structures, turbulent flow, particle-image-velocimetry,digital-image correlation
Abstract
In modern civil engineering the application of light-weight membranous structures is growingdue to their high grade of spatial flexibility. This raises important issues in order to ensure thesafe operation of this type of building such as the response of the flexible structure to windloads. The present study contributes to this challanging topic by investigating the fluid-struc-ture interaction (FSI) of a flexible thin-walled membranous hemispherical structure exposedto turbulent flow. Three Reynolds numbers (50,000, 75,000 and 100,000) are chosen to ex-amine the interaction between the flow field and the pressurized membrane in a subsonicwind tunnel. As a reference the flow field around a rigid hemisphere is measured under iden-tical conditions. The experiments are carried out by utilizing particle-image-velocimetry (PIV)for the flow field and high-speed digital-image correlation (DIC) measurements for the defor-mation of the unsteady structure excitations. Furthermore, constant-temperature anemome-try (CTA) is applied to deternime the velocity spectrum at predefined points close to the sur-face of the membranous structure. An analysis of the comprehensive data sets for the fluidflow and the displacements of the structure leads to the characterization of the behavior ofthe flexible structure under changing flow conditions.
Introduction
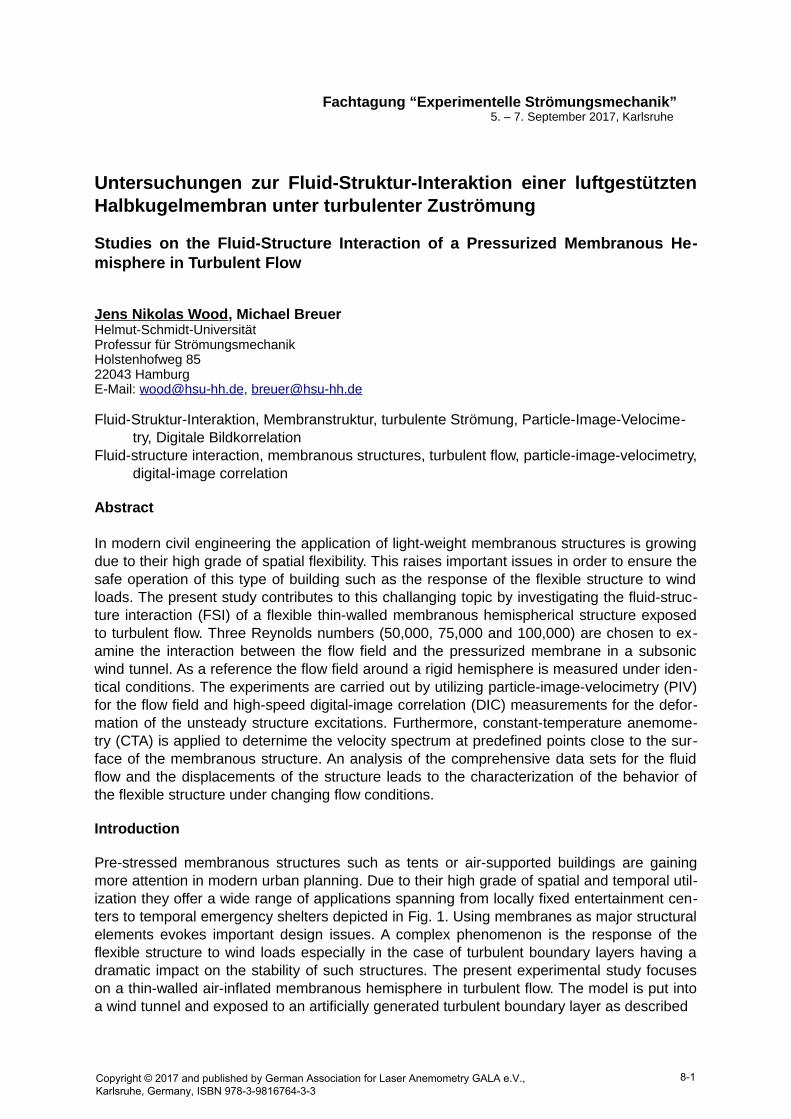
Pre-stressed membranous structures such as tents or air-supported buildings are gainingmore attention in modern urban planning. Due to their high grade of spatial and temporal util-ization they offer a wide range of applications spanning from locally fixed entertainment cen-ters to temporal emergency shelters depicted in Fig. 1. Using membranes as major structuralelements evokes important design issues. A complex phenomenon is the response of theflexible structure to wind loads especially in the case of turbulent boundary layers having adramatic impact on the stability of such structures. The present experimental study focuseson a thin-walled air-inflated membranous hemisphere in turbulent flow. The model is put intoa wind tunnel and exposed to an artificially generated turbulent boundary layer as described
Copyright © 2017 and published by German Association for Laser Anemometry GALA e.V., Karlsruhe, Germany, ISBN 978-3-9816764-3-3
8-1
(a) Entertainment Center (Astana)¹ (b) uLites emergency shelter project²
Fig. 1: Various applications of pre-stressed membranous tents and inflatable structures.
by Wood and Breuer (2015, 2016) and Wood et al. (2016). Comprehensive particle-image-velocimetry (PIV) measurements of the flow field and digital-image correlation (DIC) meas-urements are carried out to characterize the fluid-structure interaction between the excitedstructure and the turbulent flow field. The results are compared with the flow around a rigidmodel of identical dimensions at Reynolds numbers of Re = 50,000, 75,000 and 100,000.Furthermore, constant-temperature anemometry is used to determine the velocity spectra atspecific points close to the surface of the hemisphere. These are brought into correlation withthe oscillation of the structure to find characteristic frequencies that are used to explain thecomplex interaction process.
Experimental Setup
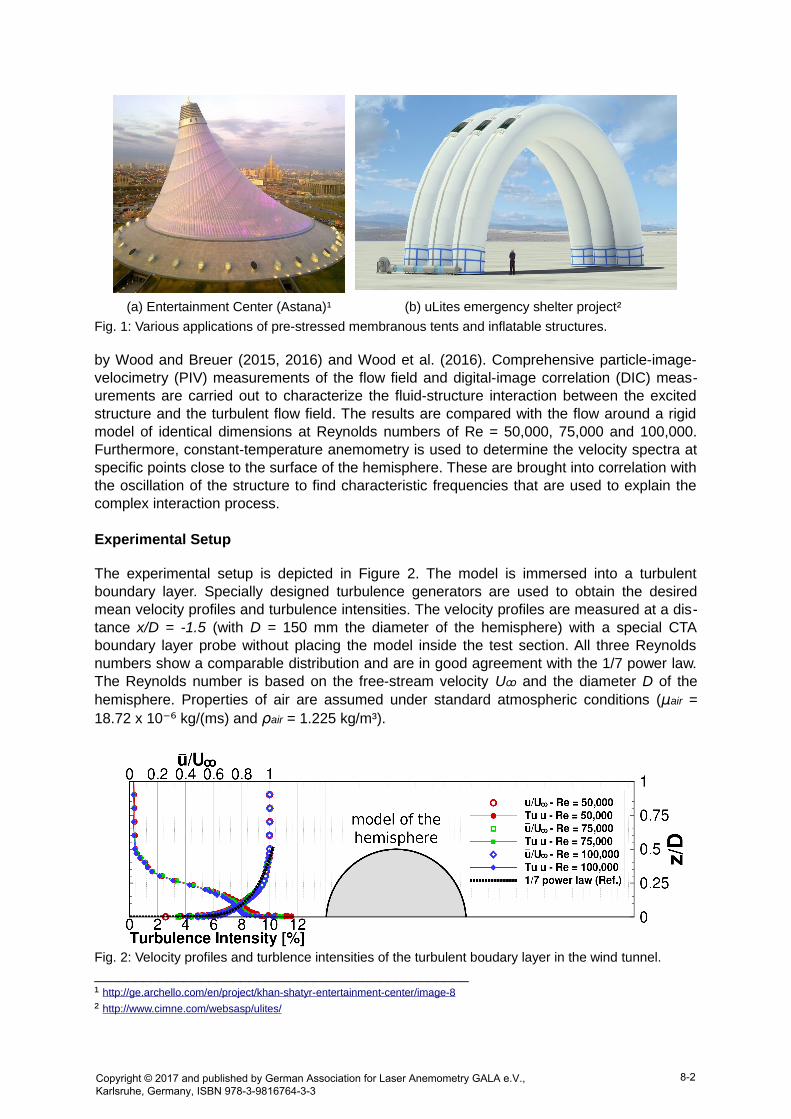
The experimental setup is depicted in Figure 2. The model is immersed into a turbulentboundary layer. Specially designed turbulence generators are used to obtain the desiredmean velocity profiles and turbulence intensities. The velocity profiles are measured at a dis-tance x/D = -1.5 (with D = 150 mm the diameter of the hemisphere) with a special CTAboundary layer probe without placing the model inside the test section. All three Reynoldsnumbers show a comparable distribution and are in good agreement with the 1/7 power law.The Reynolds number is based on the free-stream velocity Uꝏ and the diameter D of thehemisphere. Properties of air are assumed under standard atmospheric conditions (μair =18.72 x 10⁻⁶ kg/(ms) and ρair = 1.225 kg/m³).
Fig. 2: Velocity profiles and turblence intensities of the turbulent boudary layer in the wind tunnel.______________________________________________¹ http://ge.archello.com/en/project/khan-shatyr-entertainment-center/image-8
² http://www.cimne.com/websasp/ulites/
Copyright © 2017 and published by German Association for Laser Anemometry GALA e.V., Karlsruhe, Germany, ISBN 978-3-9816764-3-3
8-2
The model of the flexible hemisphere is made of silicone with an average thickness of thewall t=0.16 mm consisting of a total mass of 12.44 g. A detailed description of the materialproperties is given in Wood and Breuer (2016).
Table 1: Properties of the turbulent boundary layer at the Reynolds numbers investigated.
Reynolds number 50,000 75,000 100,000
free-stream velocity Uꝏ 5.14 m/s 7.64 m/s 10.24 m/s
max. turbulence level in boundary layer 11.5 % 10.8 % 10.1 %
Measurement Equipment used for Fluid-Structure Interaction
To capture the coupled problem of the flexible membrane under wind loads, serveral measu-rement techniques are used. The flow field is measured by a high-spatial resolution mono-PIV setup using a CCD camera with 29MP at a maximum sampling rate of 1.67 fps. The re-solution is capable to resolve small-scale turbulence at larger camera distances. This offersthe advantage of a large evaluation area without chaning the camera position too often. Eachmeasurement contains 1500 double-images. The post-processing is carried out on a Nyquistgrid with a spot dimension set to 24 x 24 pixel which translates to a cell size of 1.52 mm x1.52 mm. DEHS is used as seeding medium and is atomized at the receiver of the wind tun-nel.The three-dimensional structure deformations are measured by a high-speed camera systemin a steroscopic setup based on a digital-image correlation algorithm. The frame rate is set to250 fps at an image resolution of 1503 x 996 pixels. Each data set contains 5611 images.Additionally, a standard hot-film probe is applied to determine the velocity spectra at specificmonitoring points close to the surface of the flexible hemisphere at a rate of 2000 Hz. Fur-thermore, a dynamic pressure transducer is utilized to measure the gauge pressure insidethe model which has to be brought up to stabilize the membrane against the wind loads. Foreach Reynolds number a different pressurization is appied (ΔpFSI1 = 19 Pa (Re = 50,000),ΔpFSI2 = 34 Pa (Re = 75,000) and ΔpFSI3 = 43 Pa (Re = 100,000)) to maintain the hemispheri-cal shape.
Results
Unsteady flow field in the wake region
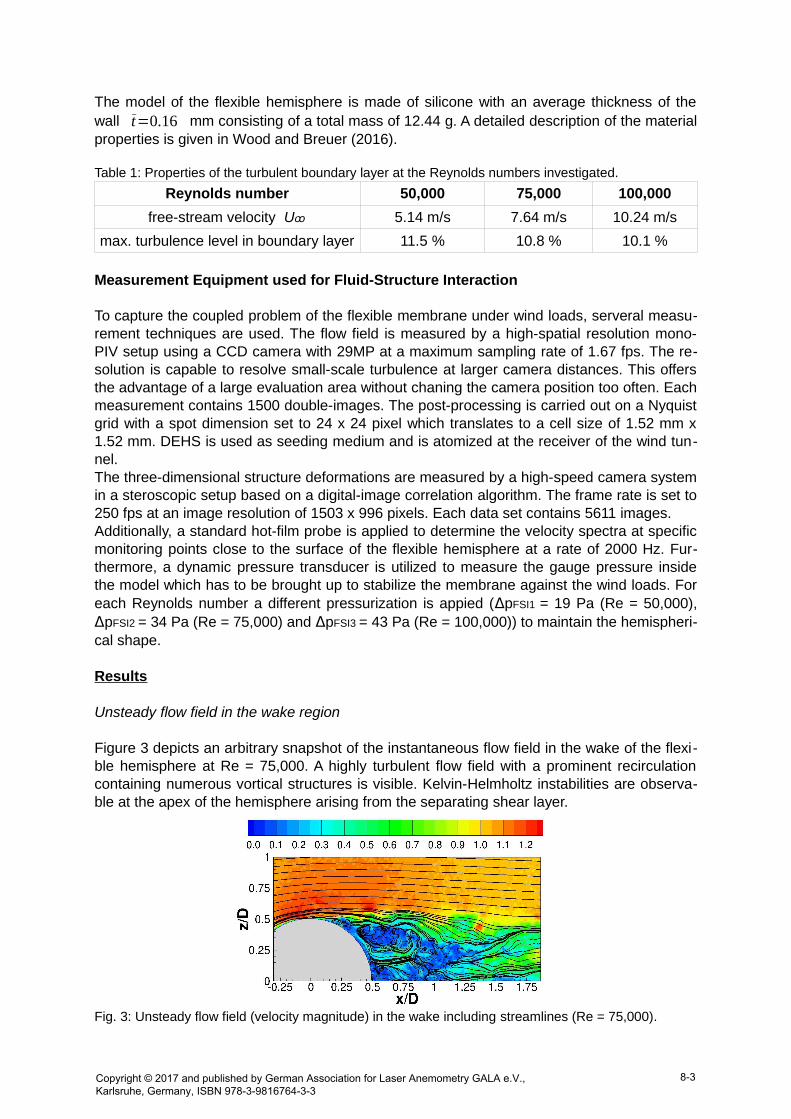
Figure 3 depicts an arbitrary snapshot of the instantaneous flow field in the wake of the flexi-ble hemisphere at Re = 75,000. A highly turbulent flow field with a prominent recirculationcontaining numerous vortical structures is visible. Kelvin-Helmholtz instabilities are observa-ble at the apex of the hemisphere arising from the separating shear layer.
Fig. 3: Unsteady flow field (velocity magnitude) in the wake including streamlines (Re = 75,000).
Copyright © 2017 and published by German Association for Laser Anemometry GALA e.V., Karlsruhe, Germany, ISBN 978-3-9816764-3-3
8-3
Time-averaged flow field
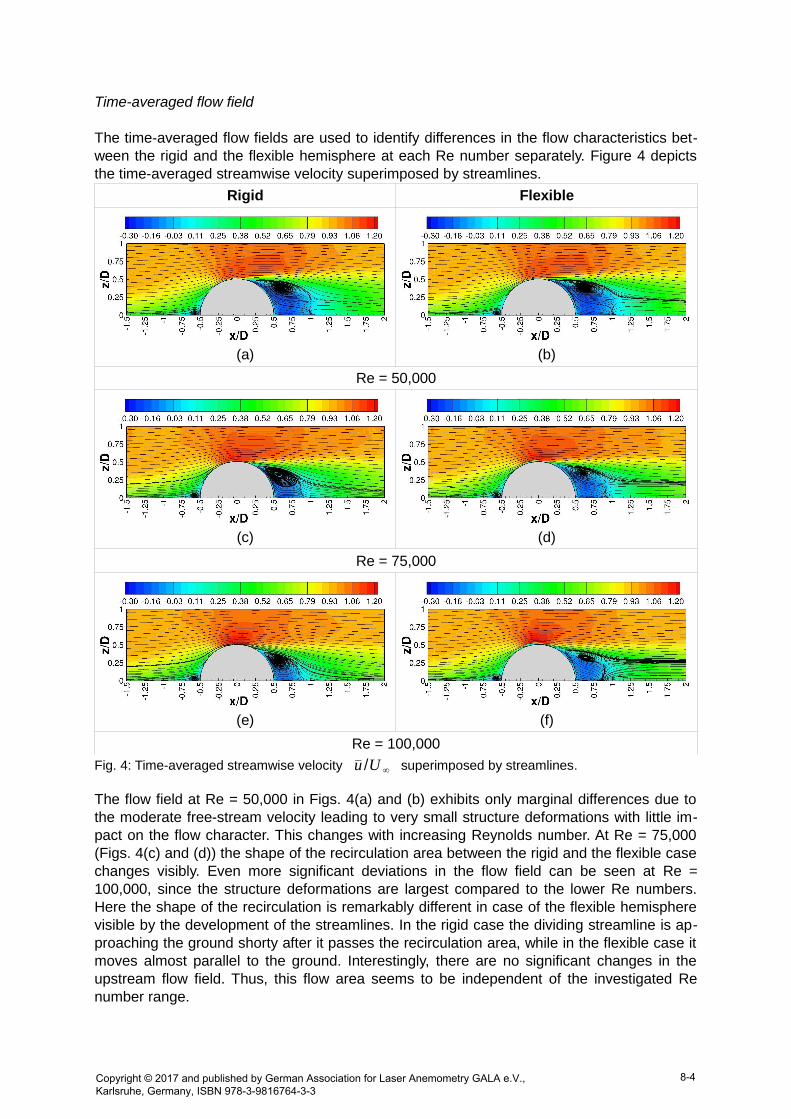
The time-averaged flow fields are used to identify differences in the flow characteristics bet-ween the rigid and the flexible hemisphere at each Re number separately. Figure 4 depictsthe time-averaged streamwise velocity superimposed by streamlines.
Rigid Flexible
(a) (b)
Re = 50,000
(c) (d)
Re = 75,000
(e) (f)
Re = 100,000
Fig. 4: Time-averaged streamwise velocity u /U∞ superimposed by streamlines.
The flow field at Re = 50,000 in Figs. 4(a) and (b) exhibits only marginal differences due tothe moderate free-stream velocity leading to very small structure deformations with little im-pact on the flow character. This changes with increasing Reynolds number. At Re = 75,000(Figs. 4(c) and (d)) the shape of the recirculation area between the rigid and the flexible casechanges visibly. Even more significant deviations in the flow field can be seen at Re =100,000, since the structure deformations are largest compared to the lower Re numbers.Here the shape of the recirculation is remarkably different in case of the flexible hemispherevisible by the development of the streamlines. In the rigid case the dividing streamline is ap-proaching the ground shorty after it passes the recirculation area, while in the flexible case itmoves almost parallel to the ground. Interestingly, there are no significant changes in theupstream flow field. Thus, this flow area seems to be independent of the investigated Renumber range.
Copyright © 2017 and published by German Association for Laser Anemometry GALA e.V., Karlsruhe, Germany, ISBN 978-3-9816764-3-3
8-4
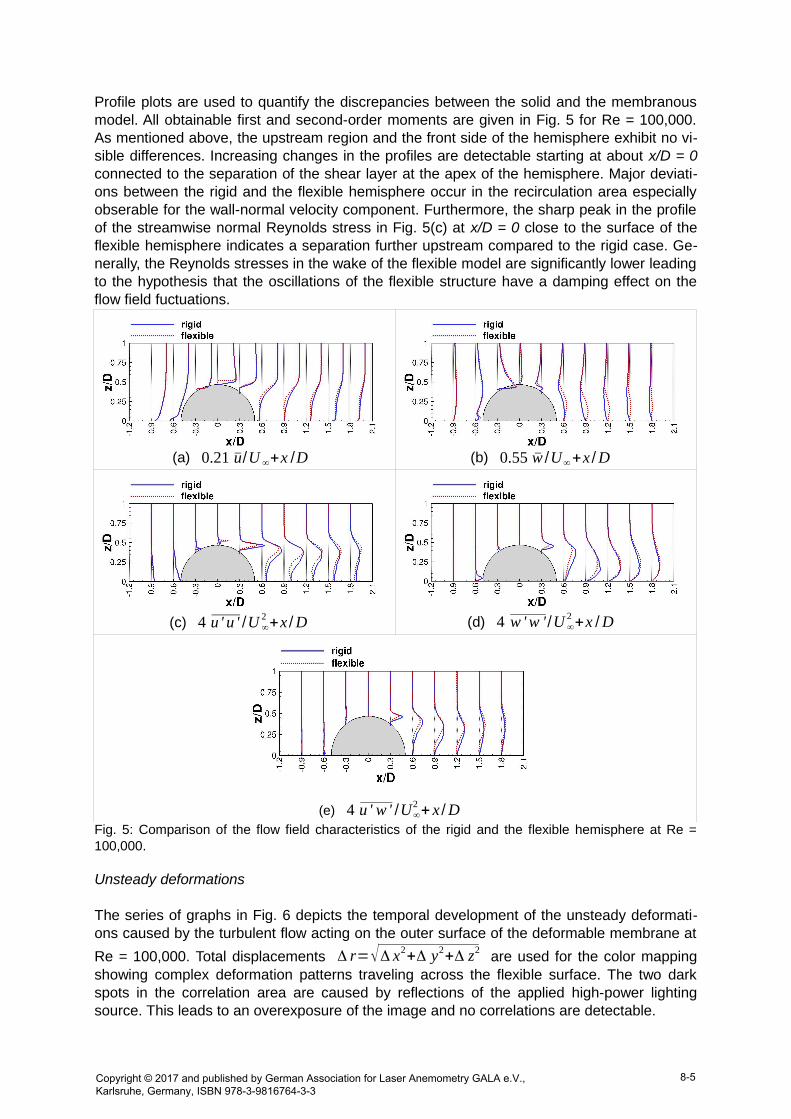
Profile plots are used to quantify the discrepancies between the solid and the membranousmodel. All obtainable first and second-order moments are given in Fig. 5 for Re = 100,000.As mentioned above, the upstream region and the front side of the hemisphere exhibit no vi-sible differences. Increasing changes in the profiles are detectable starting at about x/D = 0connected to the separation of the shear layer at the apex of the hemisphere. Major deviati-ons between the rigid and the flexible hemisphere occur in the recirculation area especiallyobserable for the wall-normal velocity component. Furthermore, the sharp peak in the profileof the streamwise normal Reynolds stress in Fig. 5(c) at x/D = 0 close to the surface of theflexible hemisphere indicates a separation further upstream compared to the rigid case. Ge-nerally, the Reynolds stresses in the wake of the flexible model are significantly lower leadingto the hypothesis that the oscillations of the flexible structure have a damping effect on theflow field fuctuations.
(a) 0.21 u/U ∞+x /D (b) 0.55 w /U∞+x /D
(c) 4 u ' u ' /U ∞2 +x /D (d) 4 w 'w ' /U∞
2 +x /D
(e) 4 u ' w ' /U∞2 + x /D
Fig. 5: Comparison of the flow field characteristics of the rigid and the flexible hemisphere at Re =100,000.
Unsteady deformations
The series of graphs in Fig. 6 depicts the temporal development of the unsteady deformati-ons caused by the turbulent flow acting on the outer surface of the deformable membrane at
Re = 100,000. Total displacements Δ r=√Δ x2+Δ y2+Δ z2are used for the color mapping
showing complex deformation patterns traveling across the flexible surface. The two darkspots in the correlation area are caused by reflections of the applied high-power lightingsource. This leads to an overexposure of the image and no correlations are detectable.
Copyright © 2017 and published by German Association for Laser Anemometry GALA e.V., Karlsruhe, Germany, ISBN 978-3-9816764-3-3
8-5
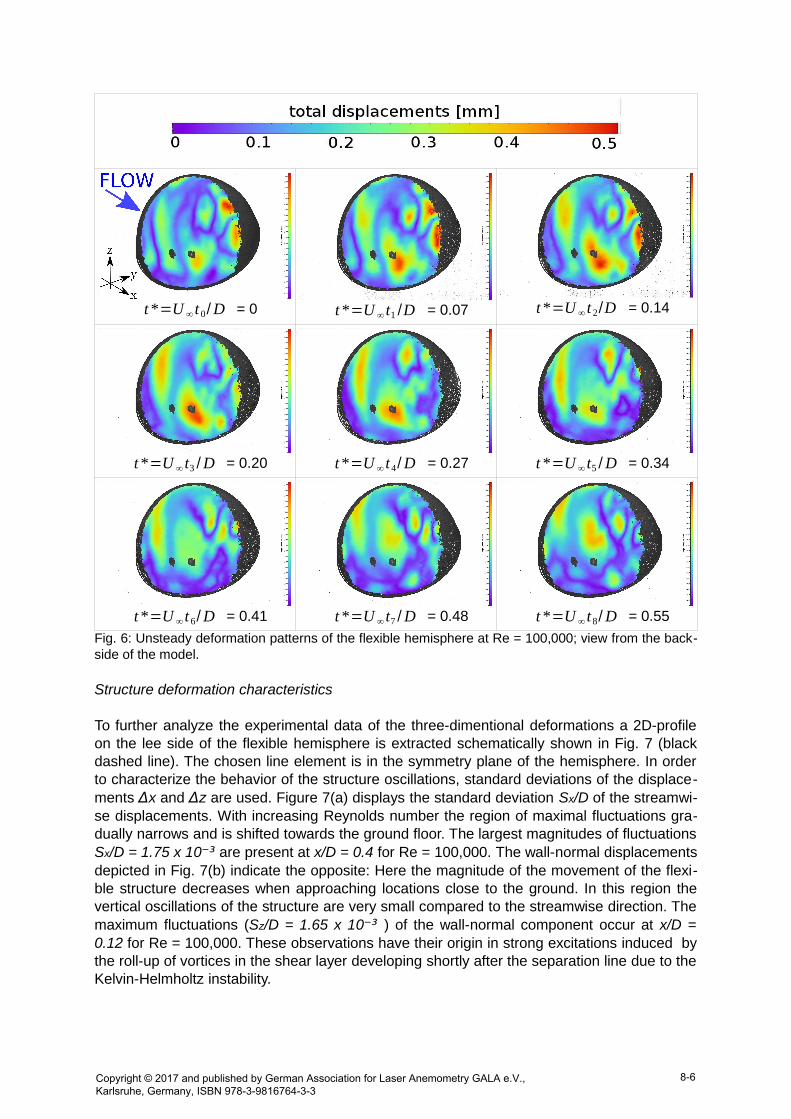
t*=U ∞ t 0/D = 0 t*=U ∞ t1 /D = 0.07 t*=U ∞ t 2/D = 0.14
t*=U ∞ t3 /D = 0.20 t*=U ∞ t 4/D = 0.27 t *=U ∞ t5 /D = 0.34
t*=U ∞ t 6/D = 0.41 t *=U ∞ t7 /D = 0.48 t *=U ∞ t8/D = 0.55
Fig. 6: Unsteady deformation patterns of the flexible hemisphere at Re = 100,000; view from the back-side of the model.
Structure deformation characteristics
To further analyze the experimental data of the three-dimentional deformations a 2D-profileon the lee side of the flexible hemisphere is extracted schematically shown in Fig. 7 (blackdashed line). The chosen line element is in the symmetry plane of the hemisphere. In orderto characterize the behavior of the structure oscillations, standard deviations of the displace-ments Δx and Δz are used. Figure 7(a) displays the standard deviation Sx/D of the streamwi-se displacements. With increasing Reynolds number the region of maximal fluctuations gra-dually narrows and is shifted towards the ground floor. The largest magnitudes of fluctuationsSx/D = 1.75 x 10⁻³ are present at x/D = 0.4 for Re = 100,000. The wall-normal displacementsdepicted in Fig. 7(b) indicate the opposite: Here the magnitude of the movement of the flexi-ble structure decreases when approaching locations close to the ground. In this region thevertical oscillations of the structure are very small compared to the streamwise direction. Themaximum fluctuations (Sz/D = 1.65 x 10⁻³ ) of the wall-normal component occur at x/D =0.12 for Re = 100,000. These observations have their origin in strong excitations induced bythe roll-up of vortices in the shear layer developing shortly after the separation line due to theKelvin-Helmholtz instability.
Copyright © 2017 and published by German Association for Laser Anemometry GALA e.V., Karlsruhe, Germany, ISBN 978-3-9816764-3-3
8-6
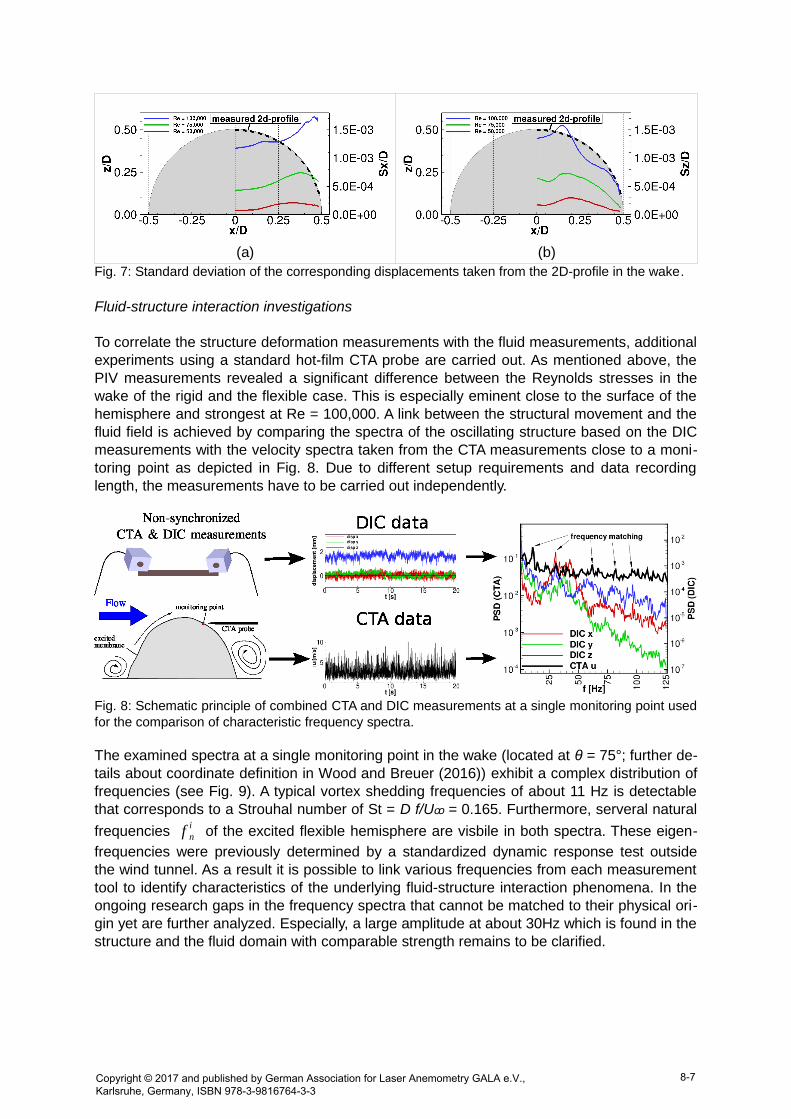
(a) (b)Fig. 7: Standard deviation of the corresponding displacements taken from the 2D-profile in the wake.
Fluid-structure interaction investigations
To correlate the structure deformation measurements with the fluid measurements, additionalexperiments using a standard hot-film CTA probe are carried out. As mentioned above, thePIV measurements revealed a significant difference between the Reynolds stresses in thewake of the rigid and the flexible case. This is especially eminent close to the surface of thehemisphere and strongest at Re = 100,000. A link between the structural movement and thefluid field is achieved by comparing the spectra of the oscillating structure based on the DICmeasurements with the velocity spectra taken from the CTA measurements close to a moni-toring point as depicted in Fig. 8. Due to different setup requirements and data recordinglength, the measurements have to be carried out independently.
Fig. 8: Schematic principle of combined CTA and DIC measurements at a single monitoring point usedfor the comparison of characteristic frequency spectra.
The examined spectra at a single monitoring point in the wake (located at θ = 75°; further de-tails about coordinate definition in Wood and Breuer (2016)) exhibit a complex distribution offrequencies (see Fig. 9). A typical vortex shedding frequencies of about 11 Hz is detectablethat corresponds to a Strouhal number of St = D f/U ꝏ = 0.165. Furthermore, serveral natural
frequencies f ni of the excited flexible hemisphere are visbile in both spectra. These eigen-
frequencies were previously determined by a standardized dynamic response test outsidethe wind tunnel. As a result it is possible to link various frequencies from each measurementtool to identify characteristics of the underlying fluid-structure interaction phenomena. In theongoing research gaps in the frequency spectra that cannot be matched to their physical ori-gin yet are further analyzed. Especially, a large amplitude at about 30Hz which is found in thestructure and the fluid domain with comparable strength remains to be clarified.
Copyright © 2017 and published by German Association for Laser Anemometry GALA e.V., Karlsruhe, Germany, ISBN 978-3-9816764-3-3
8-7
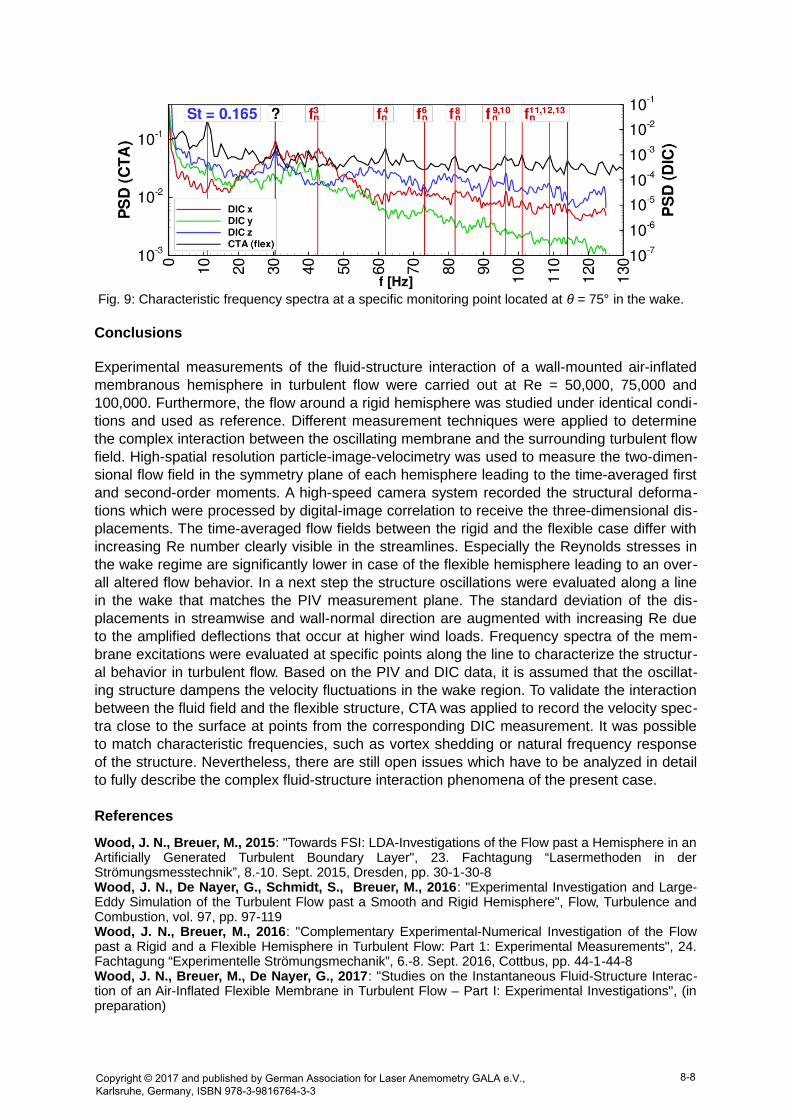
Fig. 9: Characteristic frequency spectra at a specific monitoring point located at θ = 75° in the wake.
Conclusions
Experimental measurements of the fluid-structure interaction of a wall-mounted air-inflatedmembranous hemisphere in turbulent flow were carried out at Re = 50,000, 75,000 and100,000. Furthermore, the flow around a rigid hemisphere was studied under identical condi-tions and used as reference. Different measurement techniques were applied to determinethe complex interaction between the oscillating membrane and the surrounding turbulent flowfield. High-spatial resolution particle-image-velocimetry was used to measure the two-dimen-sional flow field in the symmetry plane of each hemisphere leading to the time-averaged firstand second-order moments. A high-speed camera system recorded the structural deforma-tions which were processed by digital-image correlation to receive the three-dimensional dis-placements. The time-averaged flow fields between the rigid and the flexible case differ withincreasing Re number clearly visible in the streamlines. Especially the Reynolds stresses inthe wake regime are significantly lower in case of the flexible hemisphere leading to an over-all altered flow behavior. In a next step the structure oscillations were evaluated along a linein the wake that matches the PIV measurement plane. The standard deviation of the dis-placements in streamwise and wall-normal direction are augmented with increasing Re dueto the amplified deflections that occur at higher wind loads. Frequency spectra of the mem-brane excitations were evaluated at specific points along the line to characterize the structur-al behavior in turbulent flow. Based on the PIV and DIC data, it is assumed that the oscillat-ing structure dampens the velocity fluctuations in the wake region. To validate the interactionbetween the fluid field and the flexible structure, CTA was applied to record the velocity spec-tra close to the surface at points from the corresponding DIC measurement. It was possibleto match characteristic frequencies, such as vortex shedding or natural frequency responseof the structure. Nevertheless, there are still open issues which have to be analyzed in detailto fully describe the complex fluid-structure interaction phenomena of the present case.
References
Wood, J. N., Breuer, M., 2015: "Towards FSI: LDA-Investigations of the Flow past a Hemisphere in anArtificially Generated Turbulent Boundary Layer", 23. Fachtagung “Lasermethoden in derStrömungsmesstechnik”, 8.-10. Sept. 2015, Dresden, pp. 30-1-30-8Wood, J. N., De Nayer, G., Schmidt, S., Breuer, M., 2016: "Experimental Investigation and Large-Eddy Simulation of the Turbulent Flow past a Smooth and Rigid Hemisphere", Flow, Turbulence andCombustion, vol. 97, pp. 97-119Wood, J. N., Breuer, M., 2016: "Complementary Experimental-Numerical Investigation of the Flowpast a Rigid and a Flexible Hemisphere in Turbulent Flow: Part 1: Experimental Measurements", 24.Fachtagung “Experimentelle Strömungsmechanik”, 6.-8. Sept. 2016, Cottbus, pp. 44-1-44-8Wood, J. N., Breuer, M., De Nayer, G., 2017: "Studies on the Instantaneous Fluid-Structure Interac-tion of an Air-Inflated Flexible Membrane in Turbulent Flow – Part I: Experimental Investigations", (inpreparation)
Copyright © 2017 and published by German Association for Laser Anemometry GALA e.V., Karlsruhe, Germany, ISBN 978-3-9816764-3-3
8-8
Recommended