Embed Size (px)
Citation preview

Der Weltwirtschaft zu stärkerem Wachstum verhelfen – Die Rolle
des Euro-Raums und Deutschlands
Christian Kastrop Direktor, Economics Department
24th November 2014 OECD Berlin Centre
OECD Economic Outlook
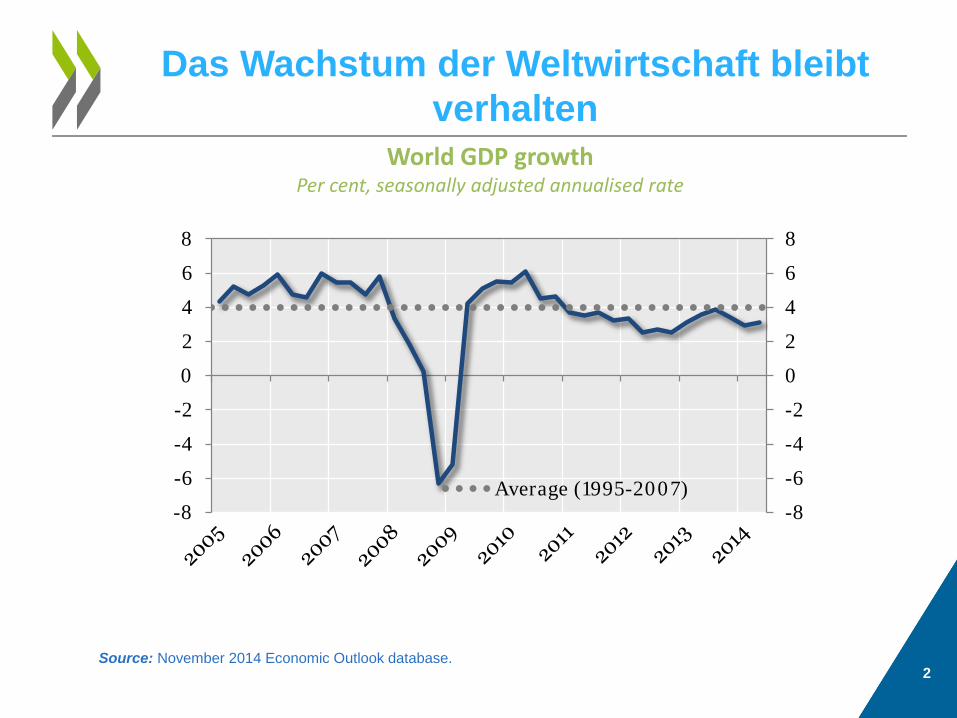
Das Wachstum der Weltwirtschaft bleibt verhalten
2
World GDP growth
Per cent, seasonally adjusted annualised rate
Source: November 2014 Economic Outlook database.
-8
-6
-4
-2
0
2
4
6
8
-8
-6
-4
-2
0
2
4
6
8
Average (1995-2007)
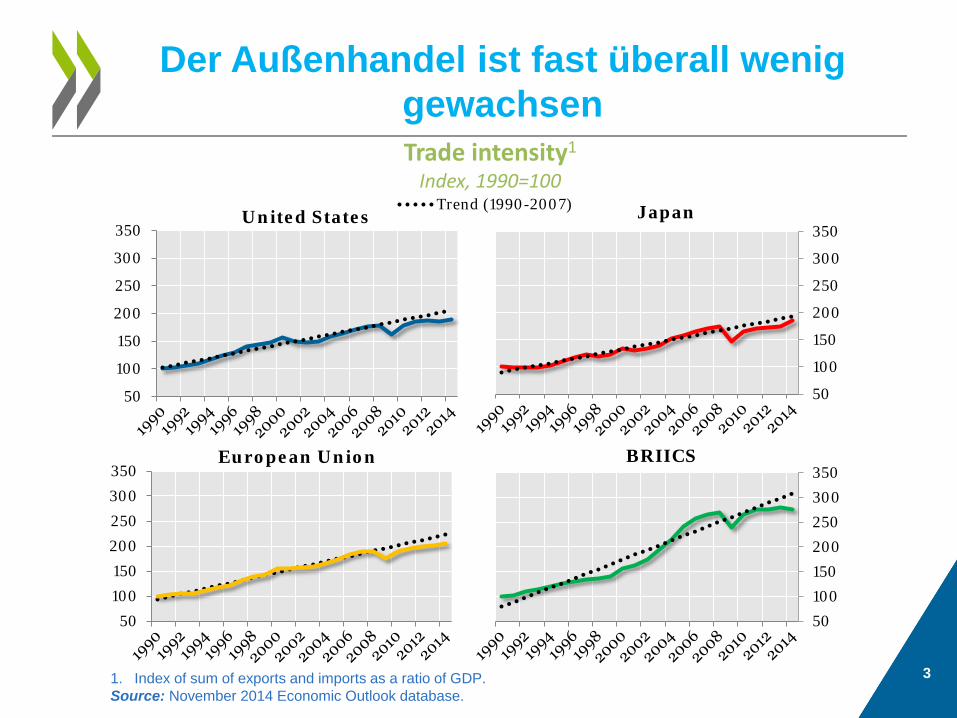
Der Außenhandel ist fast überall wenig gewachsen
3
Trade intensity1
Index, 1990=100
50
100
150
200
250
300
350United States
Trend (1990-2007)
50
100
150
200
250
300
350Japan
50
100
150
200
250
300
350European Union
50100150200250300350
BRIICS
1. Index of sum of exports and imports as a ratio of GDP. Source: November 2014 Economic Outlook database.
4
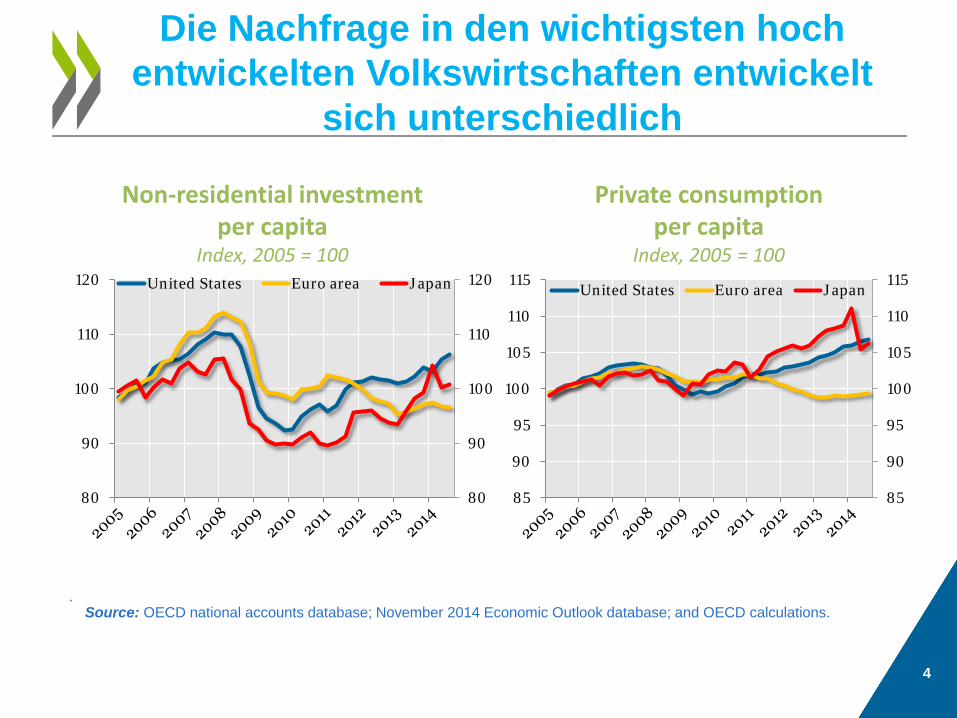
Die Nachfrage in den wichtigsten hoch entwickelten Volkswirtschaften entwickelt
sich unterschiedlich
.
Non-residential investment per capita
Index, 2005 = 100
Private consumption per capita
Index, 2005 = 100
80
90
100
110
120
80
90
100
110
120 United States Euro area Japan
85
90
95
100
105
110
115
85
90
95
100
105
110
115United States Euro area Japan
Source: OECD national accounts database; November 2014 Economic Outlook database; and OECD calculations.
5
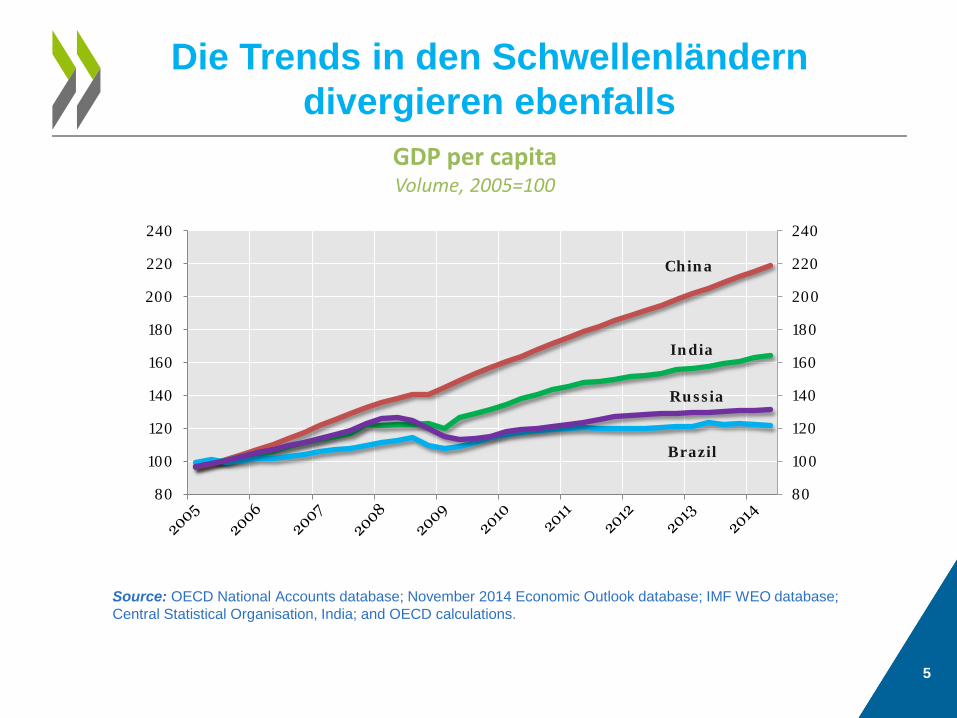
Die Trends in den Schwellenländern divergieren ebenfalls
.
GDP per capita Volume, 2005=100
80
100
120
140
160
180
200
220
240
80
100
120
140
160
180
200
220
240
China
India
Brazil
Russia
Source: OECD National Accounts database; November 2014 Economic Outlook database; IMF WEO database; Central Statistical Organisation, India; and OECD calculations.
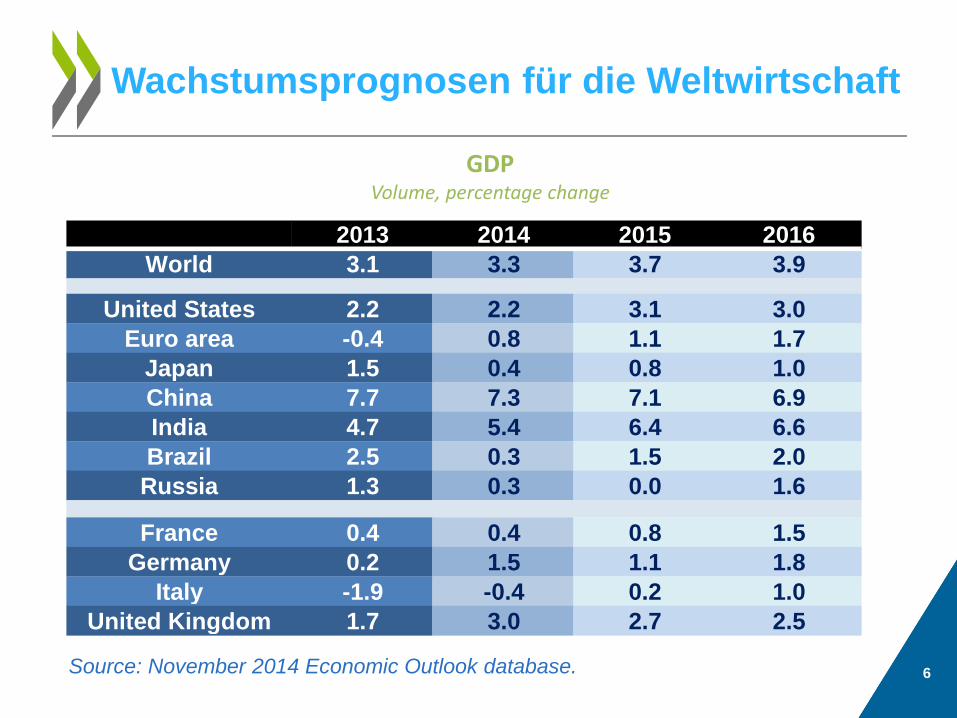
Wachstumsprognosen für die Weltwirtschaft
GDP Volume, percentage change
6 Source: November 2014 Economic Outlook database.
Column1 2013 2014 2015 2016World 3.1 3.3 3.7 3.9
United States 2.2 2.2 3.1 3.0Euro area -0.4 0.8 1.1 1.7
Japan 1.5 0.4 0.8 1.0China 7.7 7.3 7.1 6.9India 4.7 5.4 6.4 6.6Brazil 2.5 0.3 1.5 2.0Russia 1.3 0.3 0.0 1.6
France 0.4 0.4 0.8 1.5Germany 0.2 1.5 1.1 1.8
Italy -1.9 -0.4 0.2 1.0United Kingdom 1.7 3.0 2.7 2.5
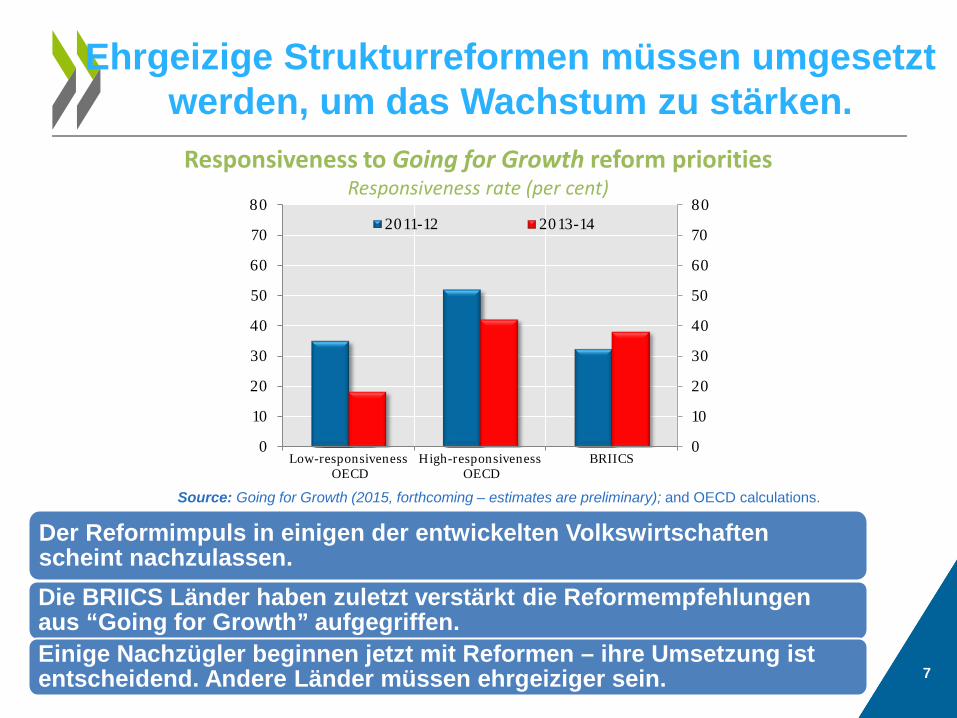
Ehrgeizige Strukturreformen müssen umgesetzt werden, um das Wachstum zu stärken.
Der Reformimpuls in einigen der entwickelten Volkswirtschaften scheint nachzulassen. Die BRIICS Länder haben zuletzt verstärkt die Reformempfehlungen aus “Going for Growth” aufgegriffen. Einige Nachzügler beginnen jetzt mit Reformen – ihre Umsetzung ist entscheidend. Andere Länder müssen ehrgeiziger sein. 7
Responsiveness to Going for Growth reform priorities Responsiveness rate (per cent)
Source: Going for Growth (2015, forthcoming – estimates are preliminary); and OECD calculations.
0
10
20
30
40
50
60
70
80
0
10
20
30
40
50
60
70
80
Low-responsiveness OECD
High-responsiveness OECD
BRIICS
2011-12 2013-14
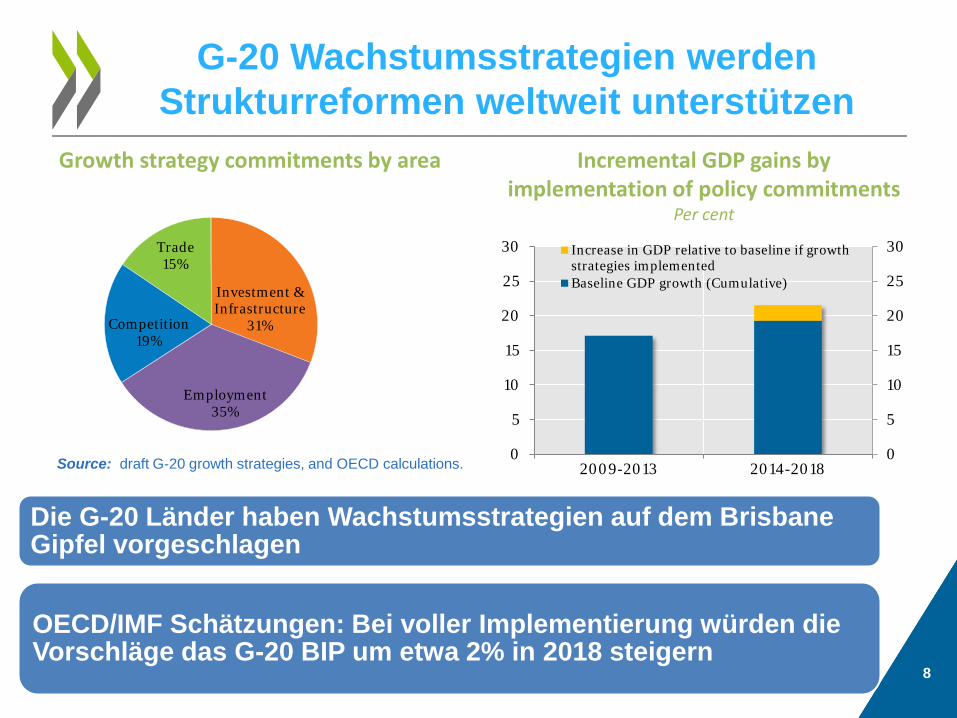
G-20 Wachstumsstrategien werden Strukturreformen weltweit unterstützen
Die G-20 Länder haben Wachstumsstrategien auf dem Brisbane Gipfel vorgeschlagen
OECD/IMF Schätzungen: Bei voller Implementierung würden die Vorschläge das G-20 BIP um etwa 2% in 2018 steigern
8
Incremental GDP gains by implementation of policy commitments
Per cent
Growth strategy commitments by area
Investment & Infrastructure
31%
Employment 35%
Competition 19%
Trade 15%
Source: draft G-20 growth strategies, and OECD calculations. 0
5
10
15
20
25
30
0
5
10
15
20
25
30
2009-2013 2014-2018
Increase in GDP relative to baseline if growthstrategies implementedBaseline GDP growth (Cumulative)
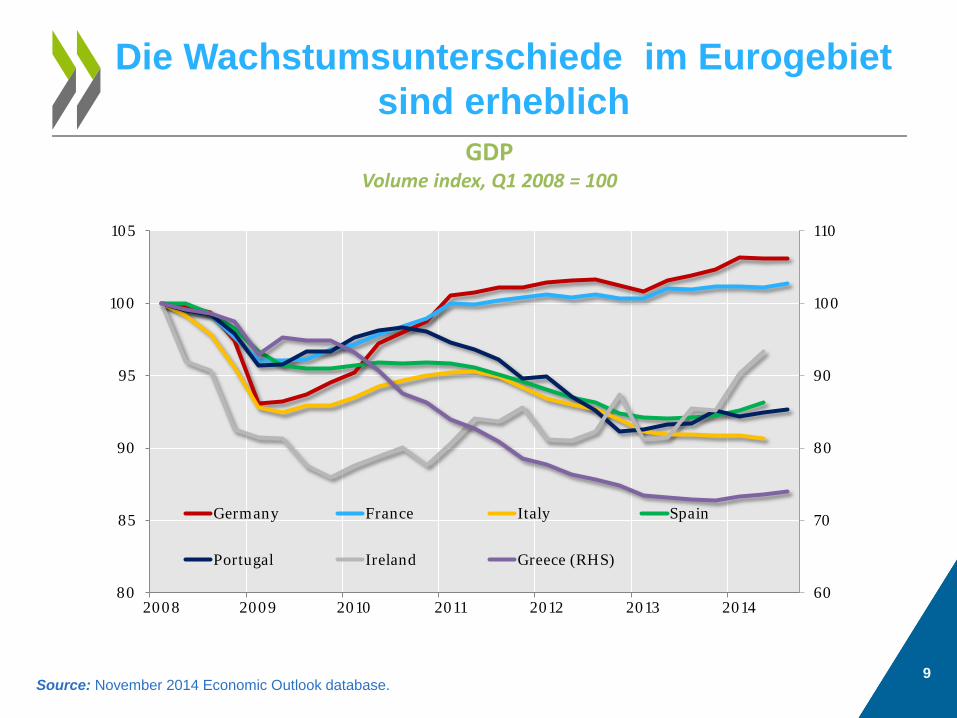
Die Wachstumsunterschiede im Eurogebiet sind erheblich
GDP Volume index, Q1 2008 = 100
Source: November 2014 Economic Outlook database. 9
60
70
80
90
100
110
80
85
90
95
100
105
2008 2009 2010 2011 2012 2013 2014
Germany France Italy Spain
Portugal Ireland Greece (RHS)
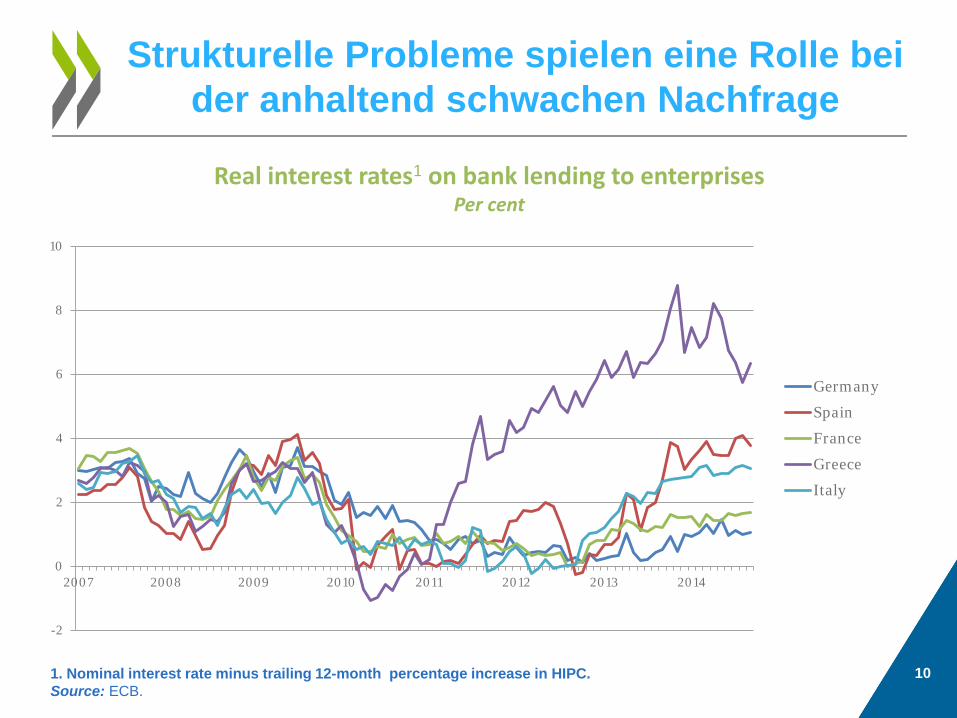
Strukturelle Probleme spielen eine Rolle bei der anhaltend schwachen Nachfrage
1. Nominal interest rate minus trailing 12-month percentage increase in HIPC. Source: ECB.
Real interest rates1 on bank lending to enterprises Per cent
10
-2
0
2
4
6
8
10
2007 2008 2009 2010 2011 2012 2013 2014
Germany
Spain
France
Greece
Italy
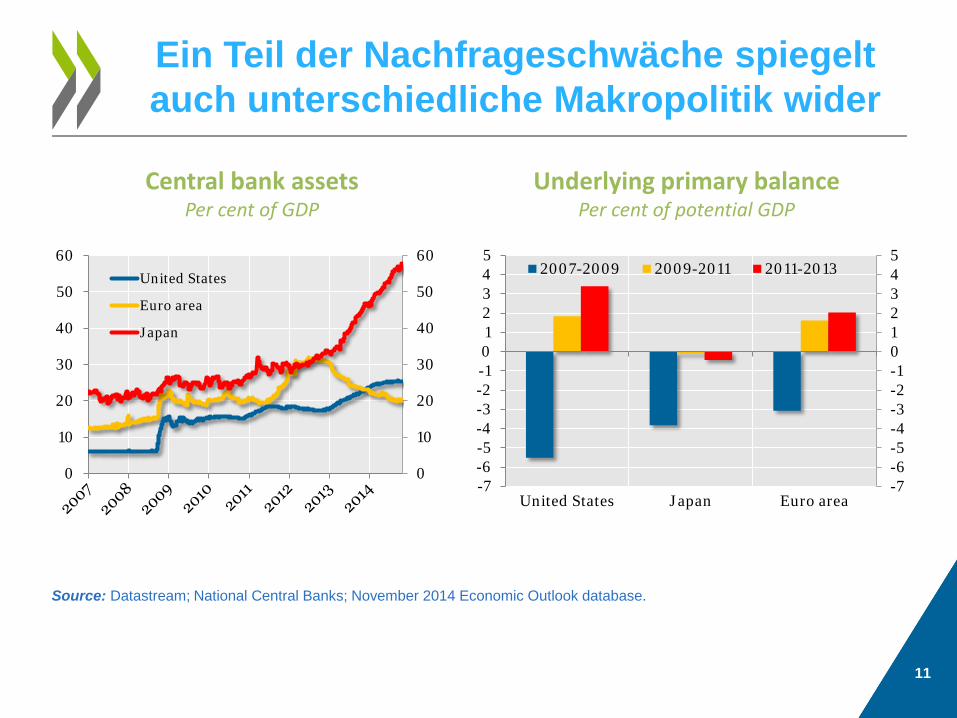
Ein Teil der Nachfrageschwäche spiegelt auch unterschiedliche Makropolitik wider
0
10
20
30
40
50
60
0
10
20
30
40
50
60United States
Euro area
Japan
Central bank assets Per cent of GDP
Source: Datastream; National Central Banks; November 2014 Economic Outlook database.
Underlying primary balance Per cent of potential GDP
11
-7-6-5-4-3-2-1012345
-7-6-5-4-3-2-1012345
United States Japan Euro area
2007-2009 2009-2011 2011-2013
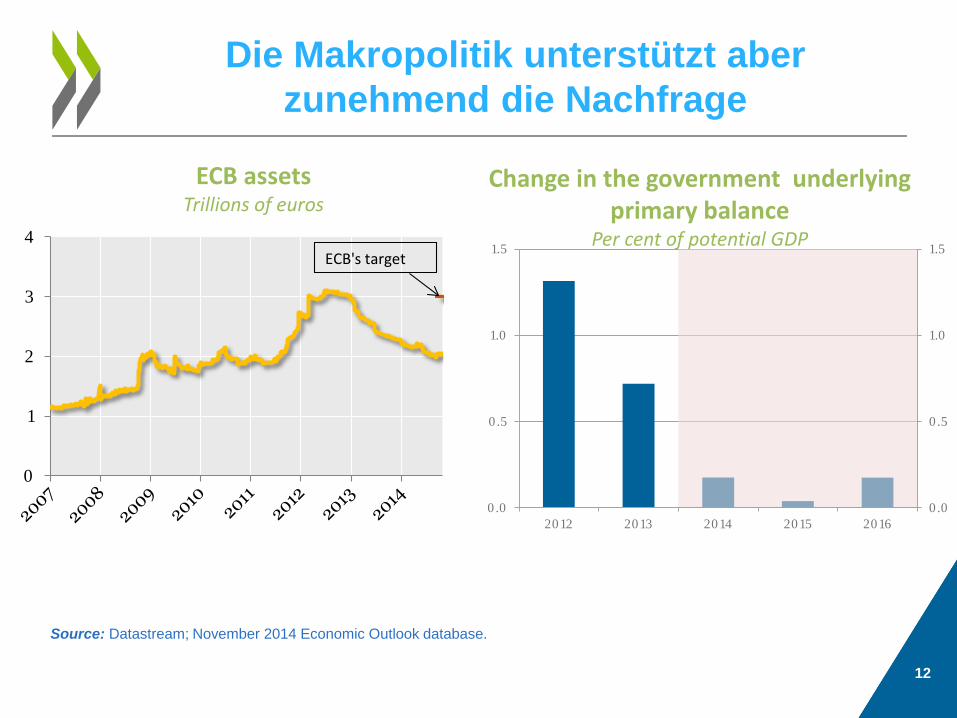
Die Makropolitik unterstützt aber zunehmend die Nachfrage
ECB assets
Trillions of euros
Source: Datastream; November 2014 Economic Outlook database.
12
0
1
2
3
4ECB's target
0.0
0.5
1.0
1.5
0.0
0.5
1.0
1.5
2012 2013 2014 2015 2016
Change in the government underlying primary balance
Per cent of potential GDP
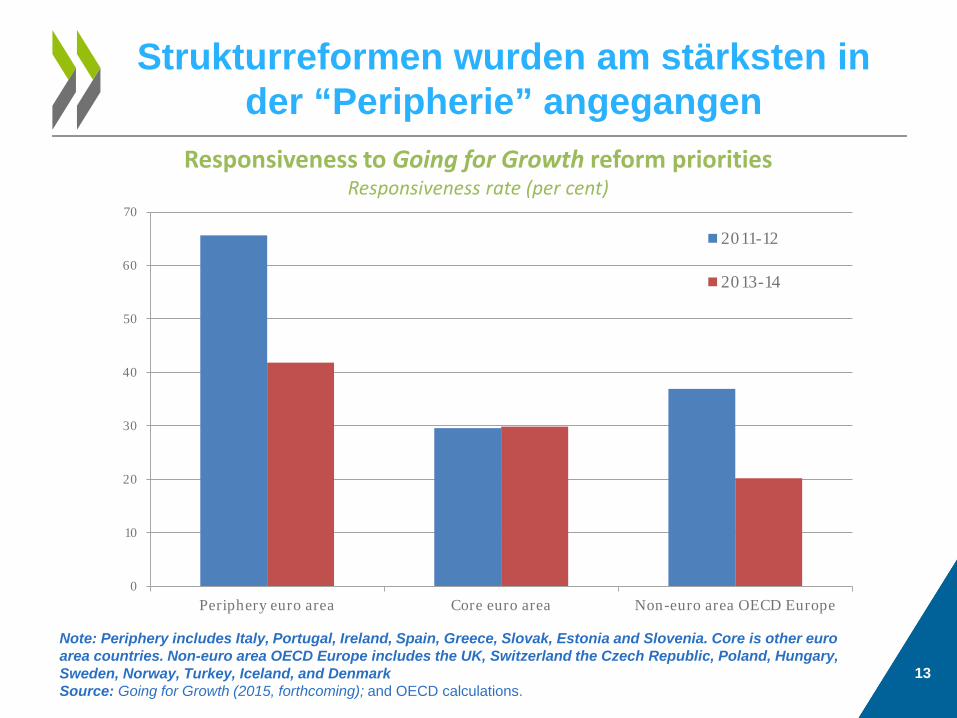
Strukturreformen wurden am stärksten in der “Peripherie” angegangen
0
10
20
30
40
50
60
70
Periphery euro area Core euro area Non-euro area OECD Europe
2011-12
2013-14
Note: Periphery includes Italy, Portugal, Ireland, Spain, Greece, Slovak, Estonia and Slovenia. Core is other euro area countries. Non-euro area OECD Europe includes the UK, Switzerland the Czech Republic, Poland, Hungary, Sweden, Norway, Turkey, Iceland, and Denmark Source: Going for Growth (2015, forthcoming); and OECD calculations.
Responsiveness to Going for Growth reform priorities Responsiveness rate (per cent)
13
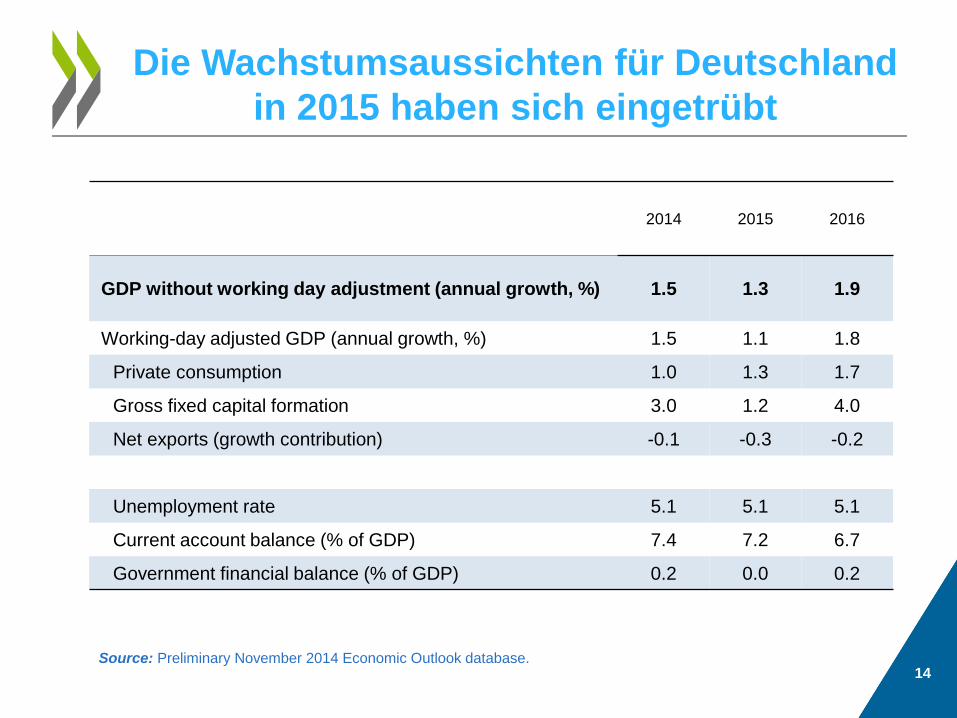
Die Wachstumsaussichten für Deutschland in 2015 haben sich eingetrübt
14 Source: Preliminary November 2014 Economic Outlook database.
2014 2015 2016
GDP without working day adjustment (annual growth, %) 1.5 1.3 1.9
Working-day adjusted GDP (annual growth, %) 1.5 1.1 1.8
Private consumption 1.0 1.3 1.7
Gross fixed capital formation 3.0 1.2 4.0
Net exports (growth contribution) -0.1 -0.3 -0.2
Unemployment rate 5.1 5.1 5.1
Current account balance (% of GDP) 7.4 7.2 6.7
Government financial balance (% of GDP) 0.2 0.0 0.2
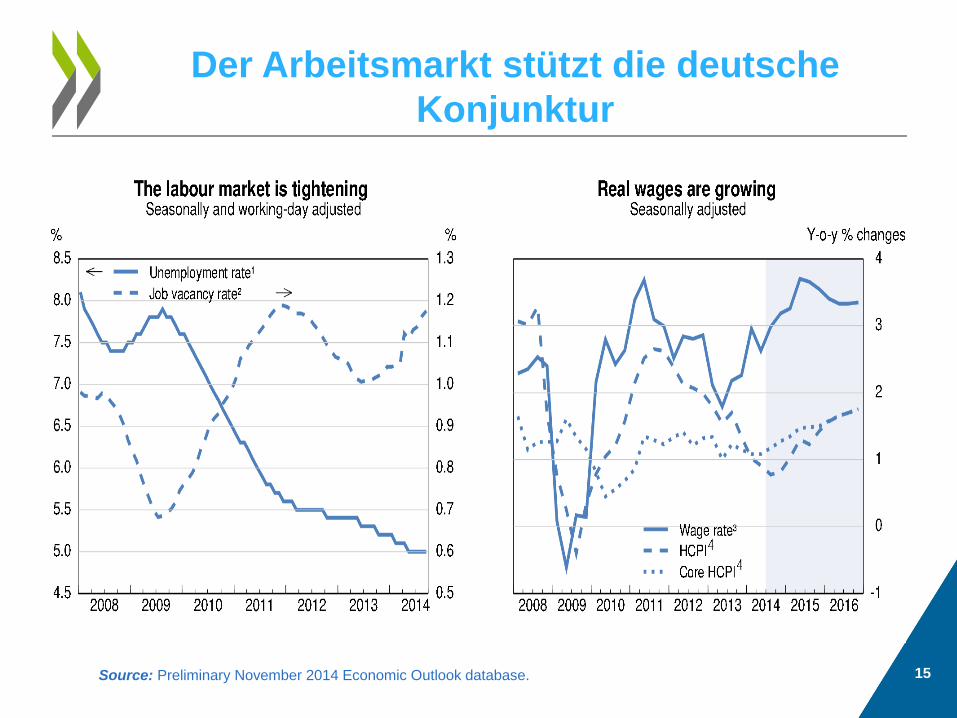
Der Arbeitsmarkt stützt die deutsche Konjunktur
15 Source: Preliminary November 2014 Economic Outlook database.
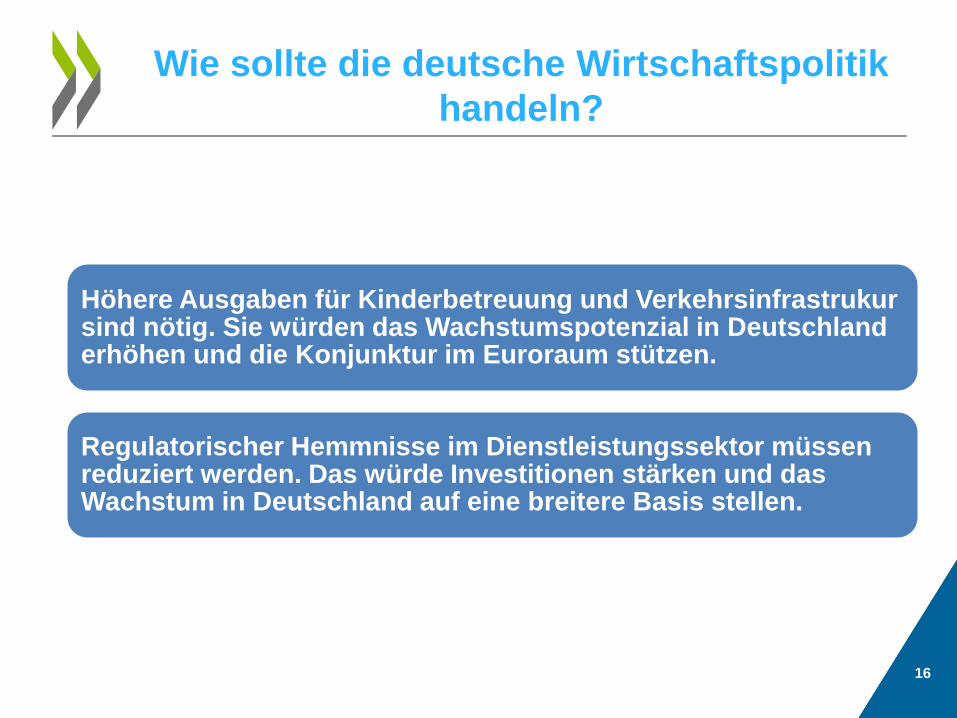
Wie sollte die deutsche Wirtschaftspolitik handeln?
16
Höhere Ausgaben für Kinderbetreuung und Verkehrsinfrastrukur sind nötig. Sie würden das Wachstumspotenzial in Deutschland erhöhen und die Konjunktur im Euroraum stützen.
Regulatorischer Hemmnisse im Dienstleistungssektor müssen reduziert werden. Das würde Investitionen stärken und das Wachstum in Deutschland auf eine breitere Basis stellen.
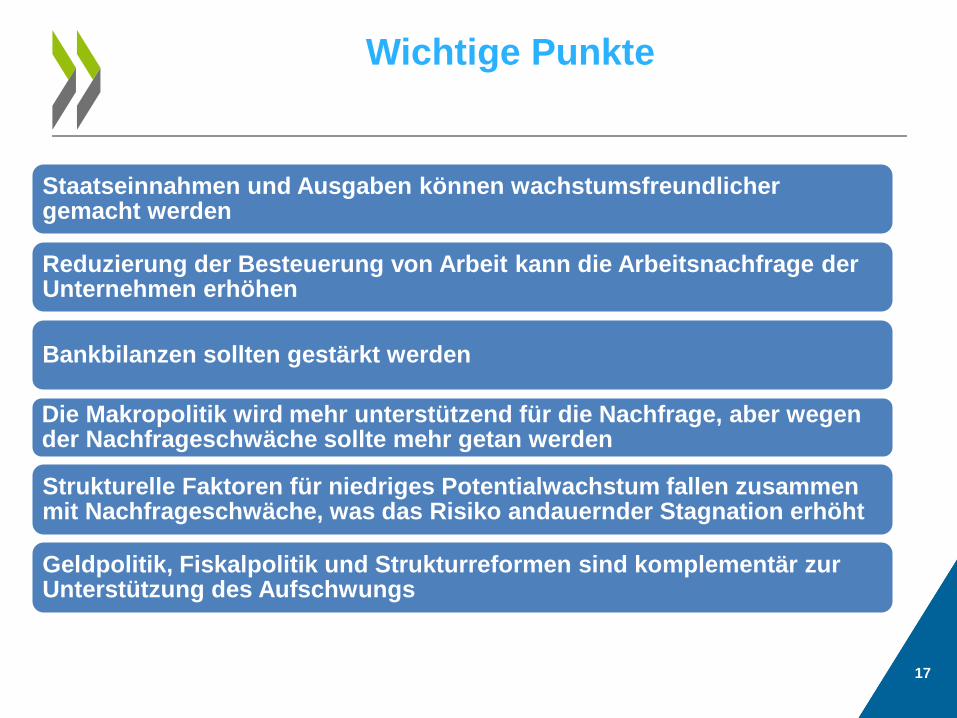
Wichtige Punkte
17
Staatseinnahmen und Ausgaben können wachstumsfreundlicher gemacht werden
Reduzierung der Besteuerung von Arbeit kann die Arbeitsnachfrage der Unternehmen erhöhen
Bankbilanzen sollten gestärkt werden
Die Makropolitik wird mehr unterstützend für die Nachfrage, aber wegen der Nachfrageschwäche sollte mehr getan werden
Strukturelle Faktoren für niedriges Potentialwachstum fallen zusammen mit Nachfrageschwäche, was das Risiko andauernder Stagnation erhöht
Geldpolitik, Fiskalpolitik und Strukturreformen sind komplementär zur Unterstützung des Aufschwungs
18
For further information
data visualization tool
OECD Economic Outlook, November 2014
• Website with additional information
• Read this publication online
• Compare your country with OECD data
www.oecd.org/eco/economicoutlook.htm
OECD OECD Economics
Disclaimers: The statistical data for Israel are supplied by and under the responsibility of the relevant Israeli authorities. The use of such data by the OECD is without prejudice to the status of the Golan Heights, East Jerusalem and Israeli settlements in the West Bank under the terms of international law. This document and any map included herein are without prejudice to the status of or sovereignty over any territory, to the delimitation of international frontiers and boundaries and to the name of any territory, city or area.