Embed Size (px)
Citation preview
BeijingBostonChennaiChicagoLondonLos AngelesMelbourneMilanMumbaiMunichNew Delhi
New YorkParisSan FranciscoSão PauloSeoulShanghaiSingaporeSydneyTokyoWroclaw
Ending the Payer-Provider Cold War:Working together to produce value
Linde Finsrud WilsonL.E.K. ConsultingNew York, New [email protected]
May 7, 2015
2 Footer
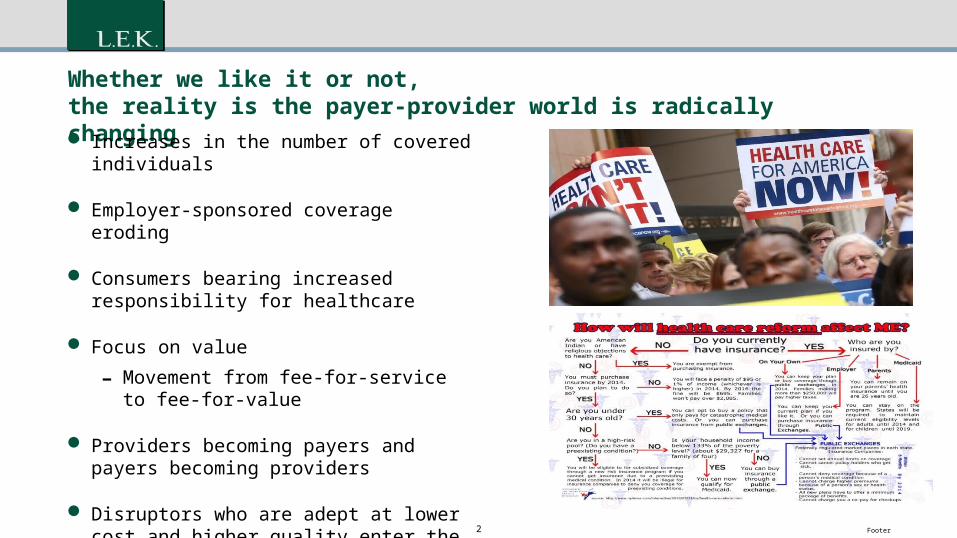
Whether we like it or not, the reality is the payer-provider world is radically changing Increases in the number of covered
individuals
Employer-sponsored coverage eroding
Consumers bearing increased responsibility for healthcare
Focus on value
- Movement from fee-for-service to fee-for-value
Providers becoming payers and payers becoming providers
Disruptors who are adept at lower cost and higher quality enter the market

3 Footer
The wall comes down
No common ground
Variations in language
Lack of trust
Lack of understanding about what is going on on “the other side of the wall”
History of being burned
Line item negotiating fostering animosity and destroying value
Where there are winners there are losers
Periods of “détente” followed by surprise attacks
Two sides of a comingled and interdependent space that cannot operate without each other
4 FooterSource: L.E.K. research and analysis
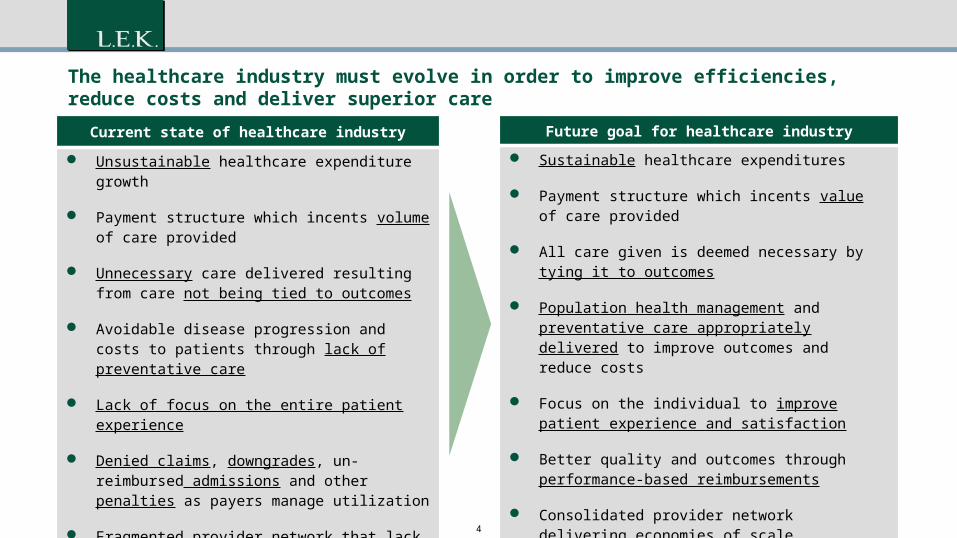
Current state of healthcare industry
Unsustainable healthcare expenditure growth
Payment structure which incents volume of care provided
Unnecessary care delivered resulting from care not being tied to outcomes
Avoidable disease progression and costs to patients through lack of preventative care
Lack of focus on the entire patient experience
Denied claims, downgrades, un-reimbursed admissions and other penalties as payers manage utilization
Fragmented provider network that lack economies of scale
Future goal for healthcare industry Sustainable healthcare expenditures
Payment structure which incents value of care provided
All care given is deemed necessary by tying it to outcomes
Population health management and preventative care appropriately delivered to improve outcomes and reduce costs
Focus on the individual to improve patient experience and satisfaction
Better quality and outcomes through performance-based reimbursements
Consolidated provider network delivering economies of scale
The healthcare industry must evolve in order to improve efficiencies, reduce costs and deliver superior care
5 Footer
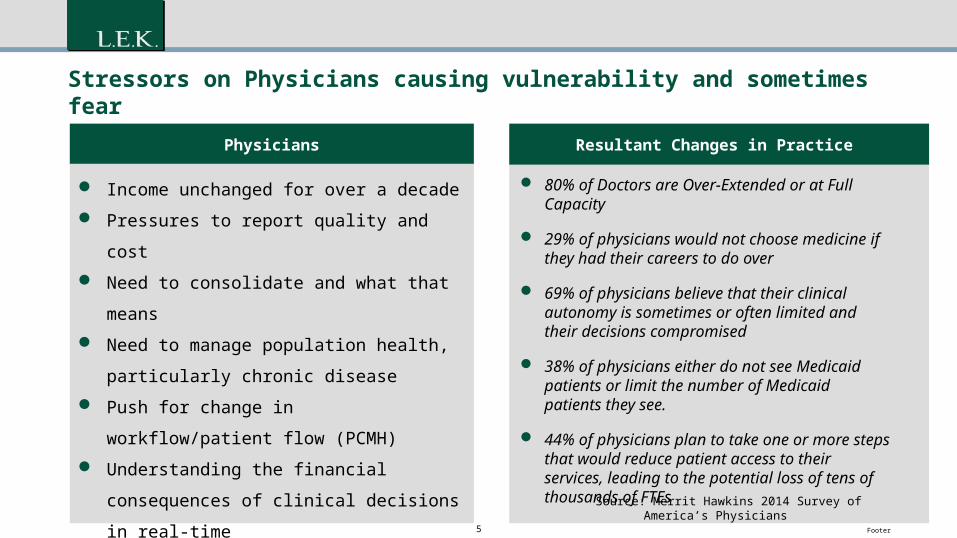
Stressors on Physicians causing vulnerability and sometimes fear
80% of Doctors are Over-Extended or at Full Capacity
29% of physicians would not choose medicine if they had their careers to do over
69% of physicians believe that their clinical autonomy is sometimes or often limited and their decisions compromised
38% of physicians either do not see Medicaid patients or limit the number of Medicaid patients they see.
44% of physicians plan to take one or more steps that would reduce patient access to their services, leading to the potential loss of tens of thousands of FTEs
Source: Merrit Hawkins 2014 Survey of America’s Physicians
Physicians
Income unchanged for over a decade
Pressures to report quality and cost
Need to consolidate and what that means
Need to manage population health, particularly
chronic disease
Push for change in workflow/patient flow
(PCMH)
Understanding the financial consequences of
clinical decisions in real-time
Getting up to speed on multiple IT systems
combined with manual processes
Resultant Changes in Practice
6 Footer
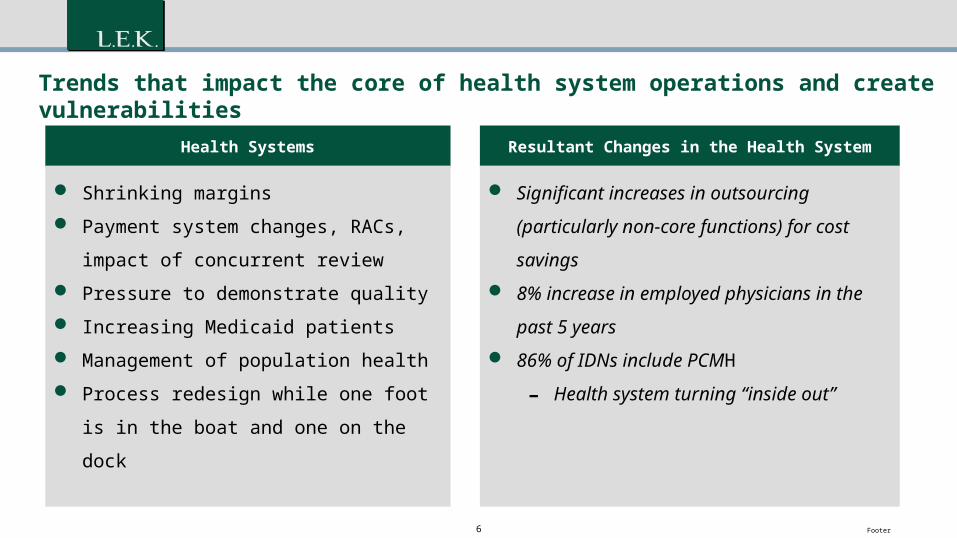
Trends that impact the core of health system operations and create vulnerabilities
Health Systems
Shrinking margins
Payment system changes, RACs, impact of
concurrent review
Pressure to demonstrate quality
Increasing Medicaid patients
Management of population health
Process redesign while one foot is in the
boat and one on the dock
Resultant Changes in the Health System
Significant increases in outsourcing
(particularly non-core functions) for cost
savings 8% increase in employed physicians in the
past 5 years 86% of IDNs include PCMH
- Health system turning “inside out”
7 Footer
403020100 100
4020
0-20
-100
9080706050
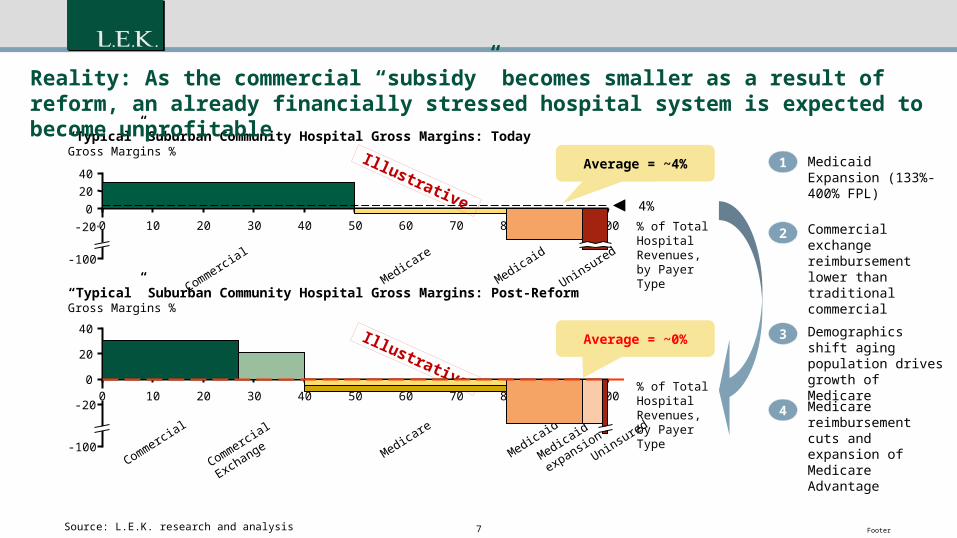
“Typical” Suburban Community Hospital Gross Margins: TodayGross Margins %
4%
Commercial
Medicare
Medicaid
Uninsured
% of Total Hospital Revenues,by Payer Type
Average = ~4%
Average = ~0%
Commercial
Exchange Medicare
Medicaid
Medicaid
expansionUninsured
Commercial
% of Total Hospital Revenues,by Payer Type
Reality: As the commercial “subsidy” becomes smaller as a result of reform, an already financially stressed hospital system is expected to become unprofitable
Source: L.E.K. research and analysis
1
2
3
4
Medicaid Expansion (133%-400% FPL)
Commercial exchange reimbursement lower than traditional commercial
Demographics shift aging population drives growth of Medicare
Medicare reimbursement cuts and expansion of Medicare Advantage
Illustrative
Illustrative
40
20
0
-20
-100
1009080706050403020100
“Typical” Suburban Community Hospital Gross Margins: Post-ReformGross Margins %
8 Footer
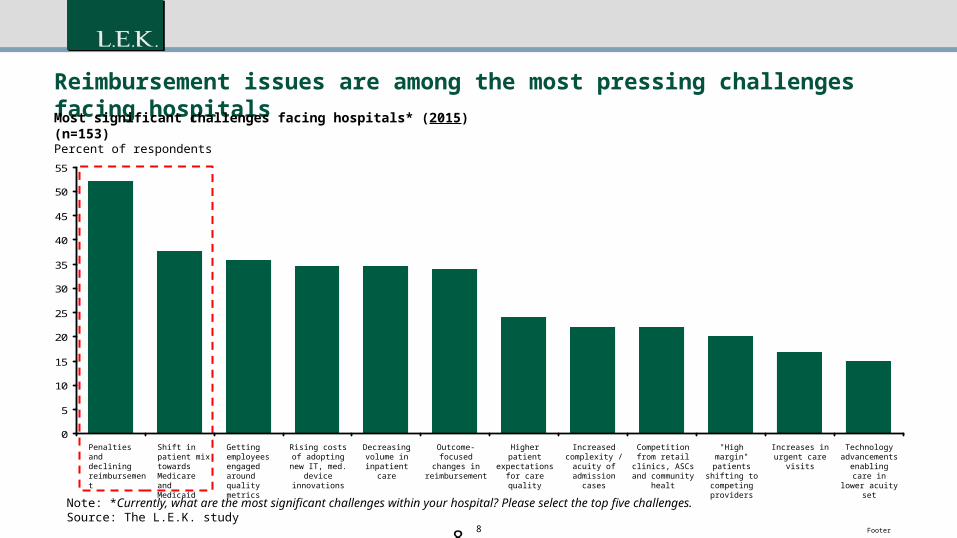
Reimbursement issues are among the most pressing challenges facing hospitals
Note: *Currently, what are the most significant challenges within your hospital? Please select the top five challenges.Source: The L.E.K. study
0
5
10
15
20
25
30
35
40
45
50
55
Rising costs of adopting new IT,
med. device innovations
Decreasing volume in
inpatient care
Outcome-focused changes in
reimbursement
Higher patient expectations for
care quality
Increased complexity /
acuity of admission cases
Competition from retail clinics, ASCs
and community healt
"High margin" patients shifting
to competing providers
Increases in urgent care visits
Technology advancements
enabling care in lower acuity set
Getting employees engaged around quality metrics
Shift in patient mix towards Medicare and Medicaid
Penalties and declining reimbursement
Most significant challenges facing hospitals* (2015) (n=153)Percent of respondents
8
9 Footer
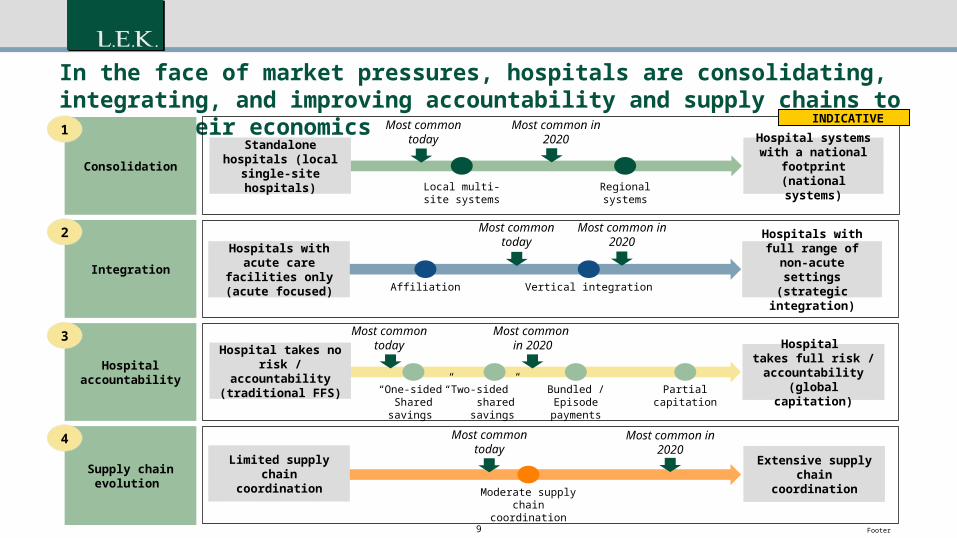
In the face of market pressures, hospitals are consolidating, integrating, and improving accountability and supply chains to improve their economics
Local multi-site systems
Regional systems
Affiliation Vertical integration
Consolidation
Integration
Most common in 2020
Most common today
Most common today
Most common in 2020
Standalone hospitals (local single-site
hospitals)
Hospital systems with a national
footprint (national systems)
Hospitals with acute care facilities only
(acute focused)
Hospitals with full range of non-acute settings (strategic
integration)
“Two-sided” sharedsavings
Bundled /Episode
payments
“One-sided”Sharedsavings
Hospital accountability
Supply chain evolution
Partialcapitation
Most common today
Most common today
Most common in 2020
Moderate supply chain coordination
Most common in 2020
Hospital takes no risk / accountability (traditional FFS)
Hospital takes full risk /
accountability (global capitation)
Limited supply chain coordination
Extensive supply chain coordination
1
2
3
4
INDICATIVE
10 Footer10
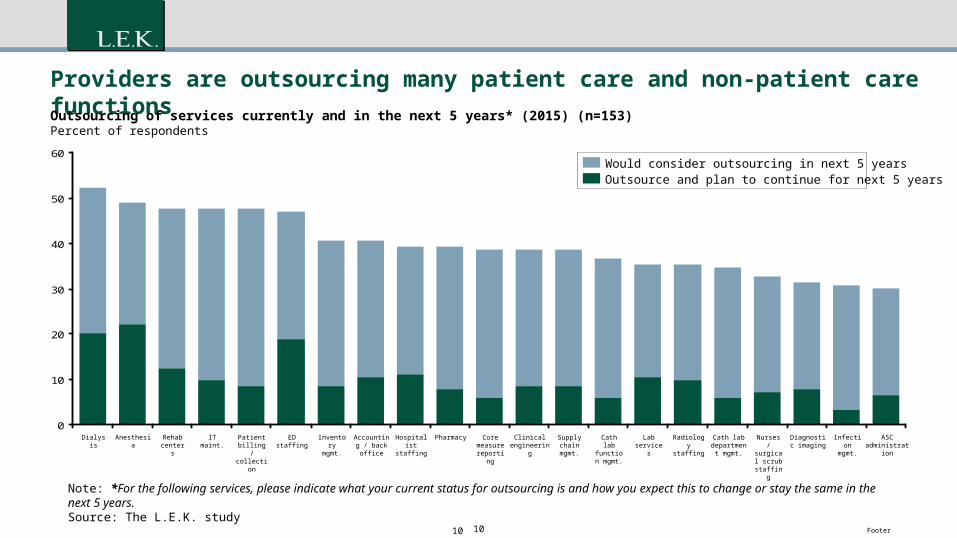
Providers are outsourcing many patient care and non-patient care functions
Note: *For the following services, please indicate what your current status for outsourcing is and how you expect this to change or stay the same in the next 5 years. Source: The L.E.K. study
0
10
20
30
40
50
60
Core measure reporting
Clinical engineering
Supply chain mgmt.
Cath lab function mgmt.
Lab services
Radiology staffing
PharmacyHospitalist staffing
Accounting / back office
Inventory mgmt.
ED staffingPatient billing /
collection
IT maint. Nurses / surgical scrub
staffing
Diagnostic imaging
Infection mgmt.
ASC administration
Cath lab department
mgmt.
Outsourcing of services currently and in the next 5 years* (2015) (n=153)Percent of respondents
Dialysis Anesthesia Rehab centers
Would consider outsourcing in next 5 yearsOutsource and plan to continue for next 5 years
11 Footer
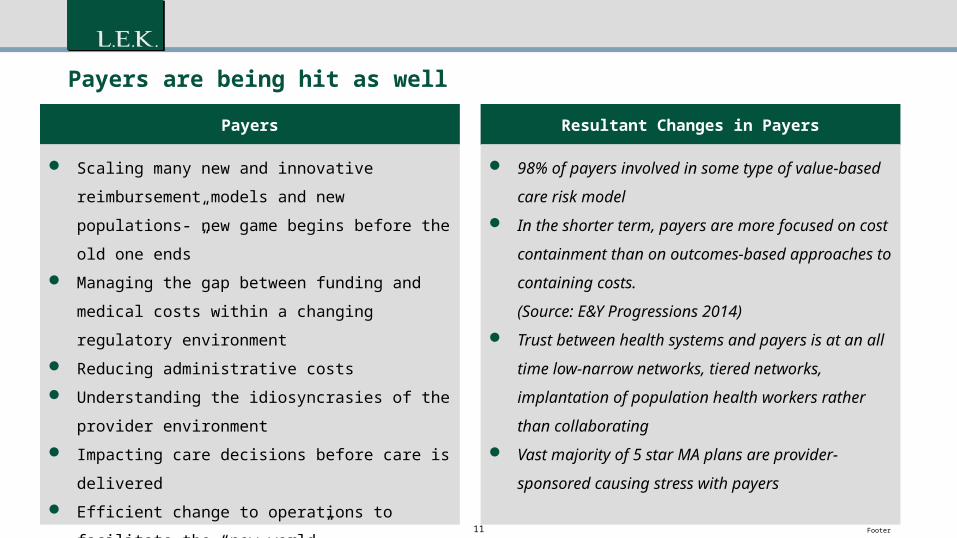
Payers are being hit as well
Payers
Scaling many new and innovative reimbursement
models and new populations-”new game begins
before the old one ends”
Managing the gap between funding and medical
costs within a changing regulatory environment
Reducing administrative costs
Understanding the idiosyncrasies of the provider
environment
Impacting care decisions before care is delivered
Efficient change to operations to facilitate the “new
world”
Inspiring providers to move from traditional model
Provider market consolidation and contract modeling
Resultant Changes in Payers
98% of payers involved in some type of value-based
care risk model In the shorter term, payers are more focused on cost
containment than on outcomes-based approaches to
containing costs.
(Source: E&Y Progressions 2014) Trust between health systems and payers is at an all
time low-narrow networks, tiered networks,
implantation of population health workers rather than
collaborating Vast majority of 5 star MA plans are provider-
sponsored causing stress with payers
12 Footer
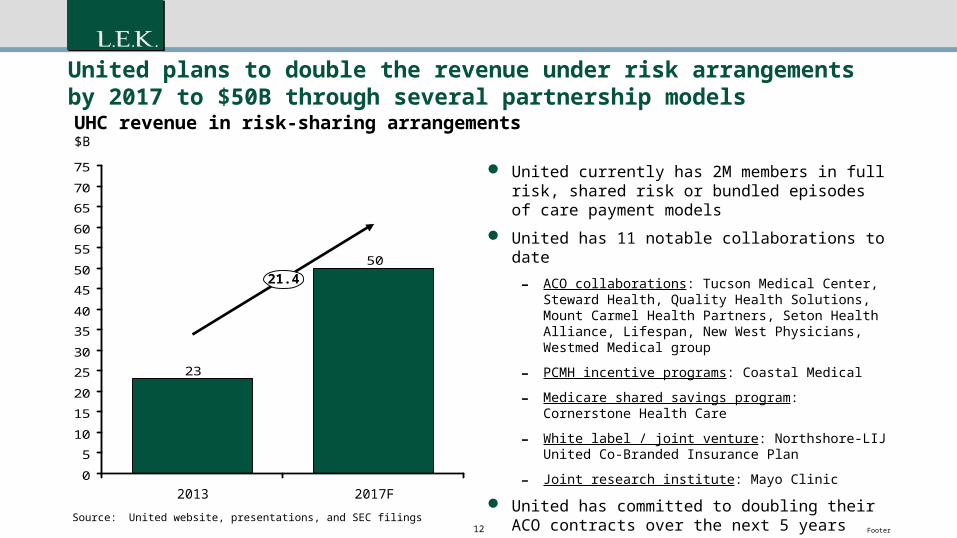
United plans to double the revenue under risk arrangements by 2017 to $50B through several partnership models
United currently has 2M members in full risk, shared risk or bundled episodes of care payment models
United has 11 notable collaborations to date
- ACO collaborations: Tucson Medical Center, Steward Health, Quality Health Solutions, Mount Carmel Health Partners, Seton Health Alliance, Lifespan, New West Physicians, Westmed Medical group
- PCMH incentive programs: Coastal Medical
- Medicare shared savings program: Cornerstone Health Care
- White label / joint venture: Northshore-LIJ United Co-Branded Insurance Plan
- Joint research institute: Mayo Clinic
United has committed to doubling their ACO contracts over the next 5 years
50
23
0
5
10
15
20
25
30
35
40
45
50
55
60
65
70
75
UHC revenue in risk-sharing arrangements$B
21.4
2017F2013
Source: United website, presentations, and SEC filings
13 Footer
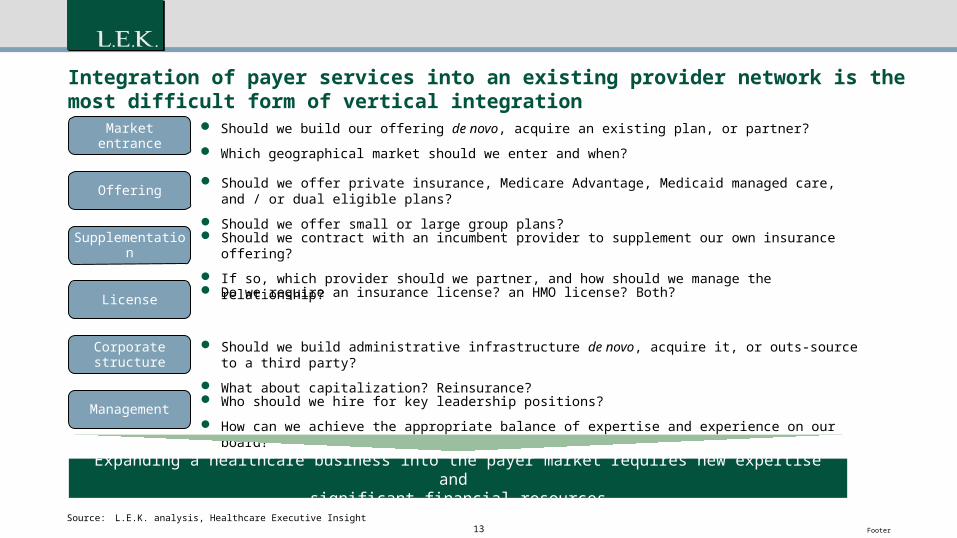
Integration of payer services into an existing provider network is the most difficult form of vertical integration
Source: L.E.K. analysis, Healthcare Executive Insight
Supplementation
Corporate structure
License
Management
Market entrance
Offering Should we offer private insurance, Medicare Advantage, Medicaid managed care, and / or dual eligible
plans?
Should we offer small or large group plans? Should we contract with an incumbent provider to supplement our own insurance offering?
If so, which provider should we partner, and how should we manage the relationship?
Do we require an insurance license? an HMO license? Both?
Should we build administrative infrastructure de novo, acquire it, or outs-source to a third party?
What about capitalization? Reinsurance?
Who should we hire for key leadership positions?
How can we achieve the appropriate balance of expertise and experience on our board?
Should we build our offering de novo, acquire an existing plan, or partner?
Which geographical market should we enter and when?
Expanding a healthcare business into the payer market requires new expertise and significant financial resources
14 Footer
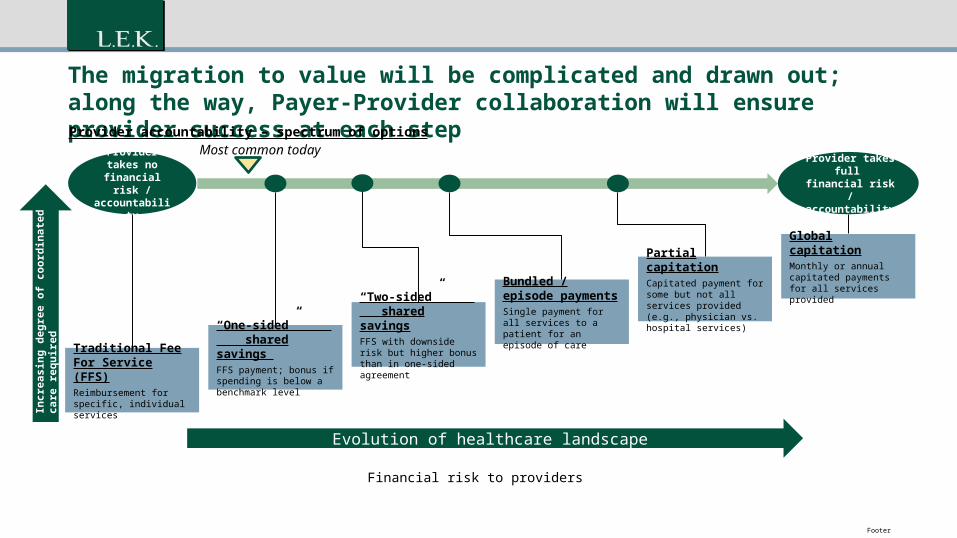
The migration to value will be complicated and drawn out; along the way, Payer-Provider collaboration will ensure provider success at each step
Provider takes full financial risk / accountability
Provider takes no financial risk / accountability
Provider accountability – spectrum of optionsMost common today
Incr
easi
ng d
egre
e of
coo
rdin
ated
car
e re
quire
d
Traditional Fee For Service (FFS)Reimbursement for specific, individual services
“Two-sided” shared savingsFFS with downside risk but higher bonus than in one-sided agreement
“One-sided” shared savings FFS payment; bonus if spending is below a benchmark level
Bundled / episode paymentsSingle payment for all services to a patient for an episode of care
Partial capitationCapitated payment for some but not all services provided (e.g., physician vs. hospital services)
Global capitationMonthly or annual capitated payments for all services provided
14
Financial risk to providers
Evolution of healthcare landscape
15 Footer
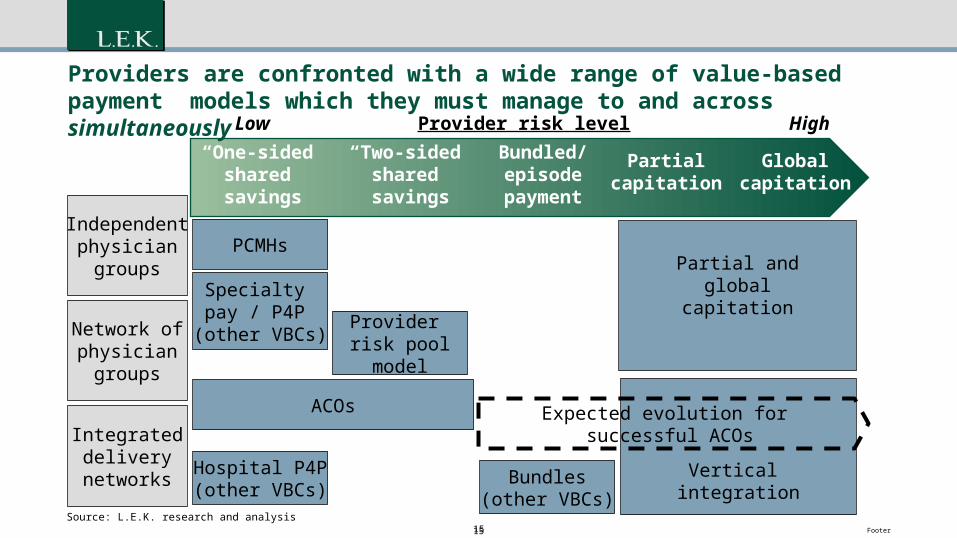
Vertical integration
“One-sided”shared savings
“Two-sided”shared savings
Bundled/episodepayment
Partialcapitation
Globalcapitation
Provider risk level HighLow
Independentphysician
groups
Network ofphysician
groups
Integrateddelivery
networks
PCMHs
Specialty pay / P4P
(other VBCs)Provider risk poolmodel
Hospital P4P(other VBCs)
ACOs
Bundles(other VBCs)
Partial andglobal
capitation
Source: L.E.K. research and analysis
Providers are confronted with a wide range of value-based payment models which they must manage to and across simultaneously
Expected evolution for successful ACOs
15
16 Footer
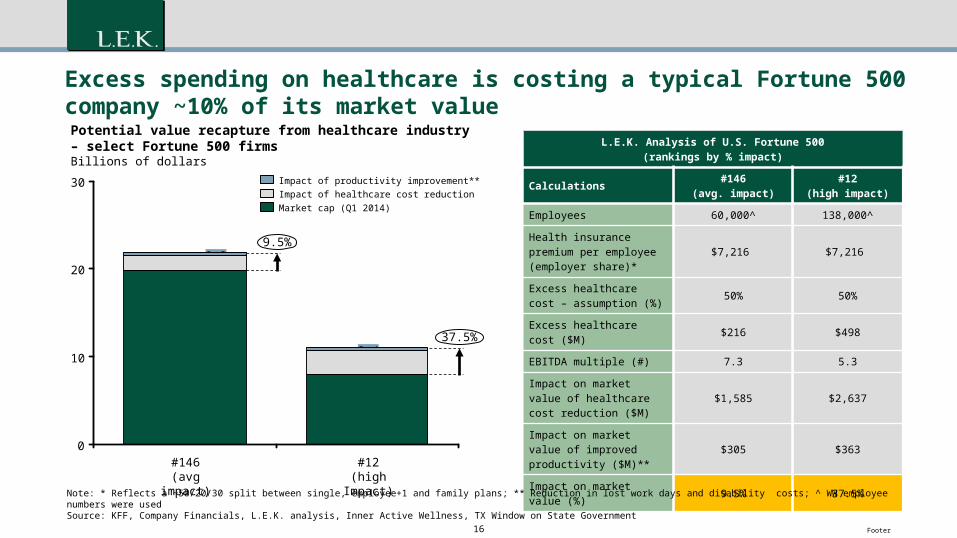
Excess spending on healthcare is costing a typical Fortune 500 company ~10% of its market value
L.E.K. Analysis of U.S. Fortune 500(rankings by % impact)
Calculations #146(avg. impact)
#12(high impact)
Employees 60,000^ 138,000^
Health insurance premium per employee (employer share)*
$7,216 $7,216
Excess healthcare cost – assumption (%) 50% 50%
Excess healthcare cost ($M) $216 $498
EBITDA multiple (#) 7.3 5.3
Impact on market value of healthcare cost reduction ($M)
$1,585 $2,637
Impact on market value of improved productivity ($M)** $305 $363
Impact on market value (%) 9.5% 37.5%
Note: * Reflects a ~50/20/30 split between single, employee+1 and family plans; ** Reduction in lost work days and disability costs; ^ WW employee numbers were usedSource: KFF, Company Financials, L.E.K. analysis, Inner Active Wellness, TX Window on State Government
30
20
10
0
9.5%
Potential value recapture from healthcare industry– select Fortune 500 firmsBillions of dollars
37.5%
#12(high Impact)
8.0
2.60.4
#146(avg impact)
19.9
1.60.3
Market cap (Q1 2014)Impact of healthcare cost reductionImpact of productivity improvement**
17 Footer
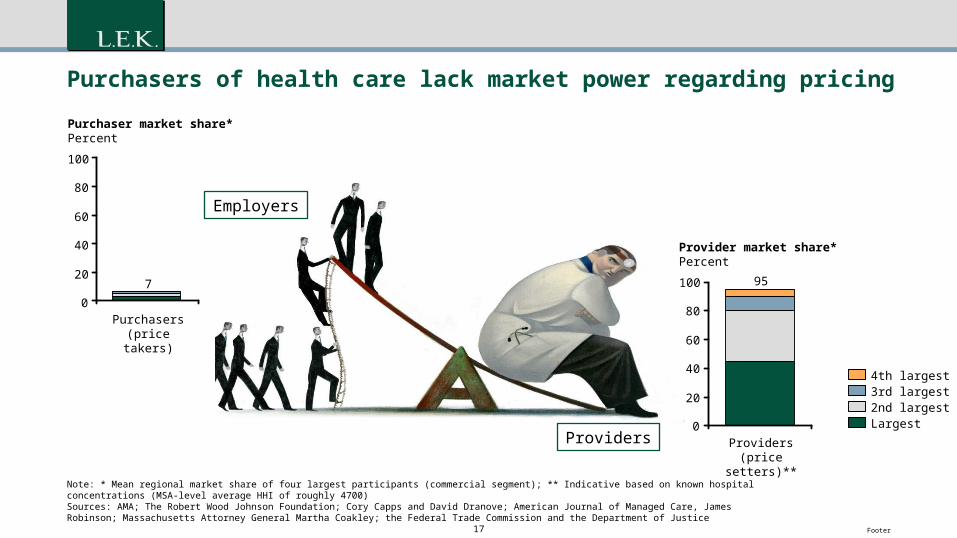
Purchasers of health care lack market power regarding pricing
Note: * Mean regional market share of four largest participants (commercial segment); ** Indicative based on known hospital concentrations (MSA-level average HHI of roughly 4700)Sources: AMA; The Robert Wood Johnson Foundation; Cory Capps and David Dranove; American Journal of Managed Care, James Robinson; Massachusetts Attorney General Martha Coakley; the Federal Trade Commission and the Department of Justice
100
80
60
40
20
0
Purchaser market share*Percent
Purchasers (price takers)
7 100
80
60
40
20
0
Provider market share*Percent
Providers (price setters)**
95
2nd largest
4th largest3rd largest
Largest
Employers
Providers
18 Footer
The demand for value by employers has placed pressure on payers and providers to
collaborate….but years of often double digit price
increases has impacted patience and patients.
The collaborative imperative is now.
19 Footer
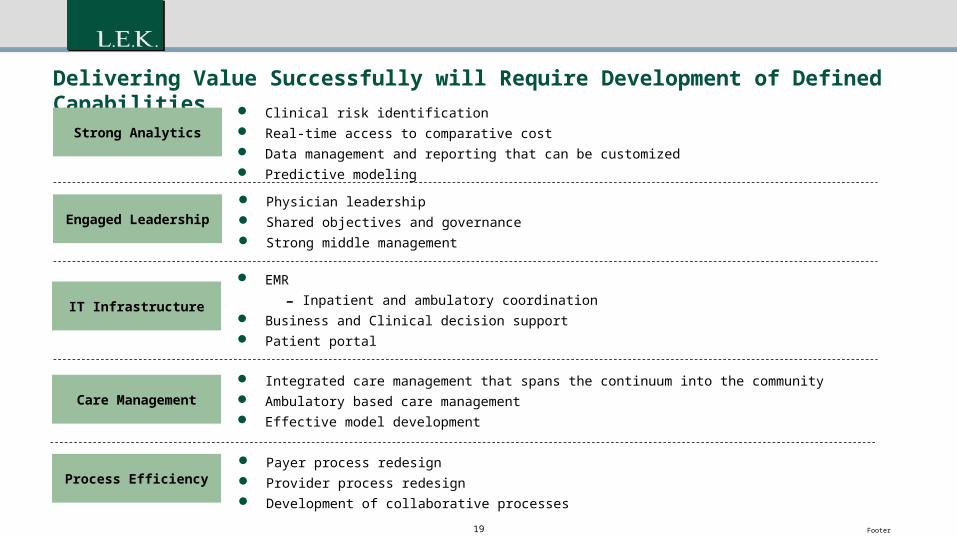
Delivering Value Successfully will Require Development of Defined Capabilities
Strong Analytics
Engaged Leadership
IT Infrastructure
Care Management
Clinical risk identification Real-time access to comparative cost Data management and reporting that can be customized Predictive modeling
Physician leadership Shared objectives and governance Strong middle management
EMR
- Inpatient and ambulatory coordination Business and Clinical decision support Patient portal
Integrated care management that spans the continuum into the community Ambulatory based care management Effective model development
Process Efficiency Payer process redesign Provider process redesign Development of collaborative processes
20 Footer
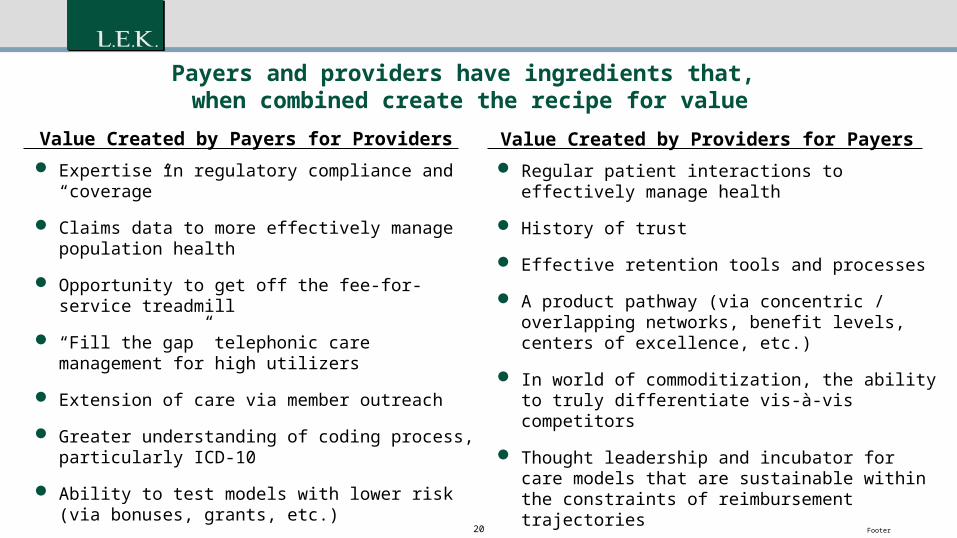
Payers and providers have ingredients that, when combined create the recipe for value
Expertise in regulatory compliance and “coverage”
Claims data to more effectively manage population health
Opportunity to get off the fee-for-service treadmill
“Fill the gap” telephonic care management for high utilizers
Extension of care via member outreach
Greater understanding of coding process, particularly ICD-10
Ability to test models with lower risk (via bonuses, grants, etc.)
Value Created by Payers for Providers Value Created by Providers for Payers Regular patient interactions to effectively manage
health
History of trust
Effective retention tools and processes
A product pathway (via concentric / overlapping networks, benefit levels, centers of excellence, etc.)
In world of commoditization, the ability to truly differentiate vis-à-vis competitors
Thought leadership and incubator for care models that are sustainable within the constraints of reimbursement trajectories
Face-to-face care management through PCMH rather than telephonic
21 Footer
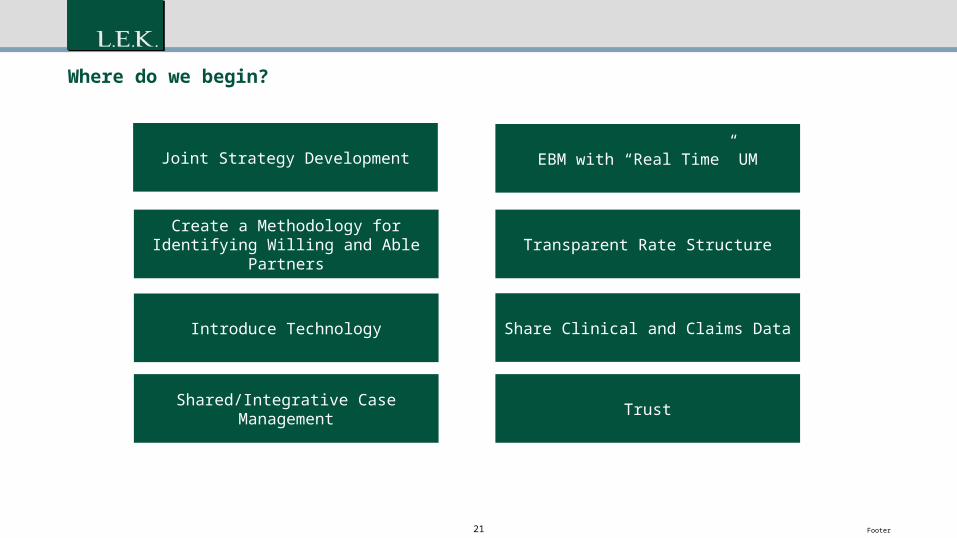
Where do we begin?
EBM with “Real Time” UM
Transparent Rate Structure
Share Clinical and Claims Data
Create a Methodology for Identifying Willing and Able Partners
Joint Strategy Development
Introduce Technology
Shared/Integrative Case Management Trust
22 Footer
Care Coordination
Provider Payer
23 Footer
Disrupter-what happens if payers and providers don’t collaborate?
Optimization of a business model for the needs of a relatively unattractive or small segment
Leverage an enabling technology that allows preservation or enhancement of cost or quality advantages
Design it so Incumbent competitors are unable to respond effectively due to legacy costs and a continuing need to serve their existing customer segments
24 Footer
Background and objectives
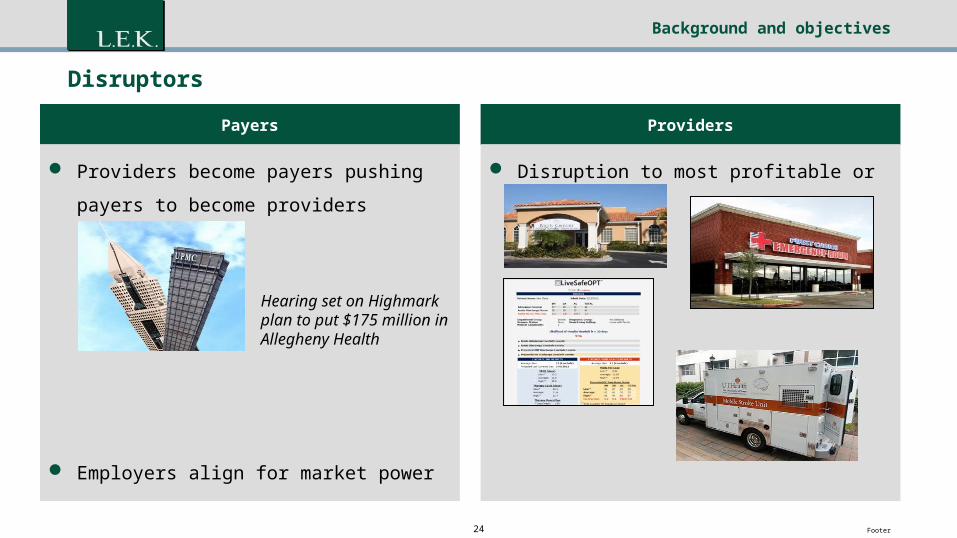
Disruptors
Payers
Providers become payers pushing payers to
become providers
Employers align for market power
Providers
Disruption to most profitable or core services
Hearing set on Highmark plan to put $175 million in Allegheny Health