Embed Size (px)
Citation preview

STILL A MAN’S WORLD: DER WEITE WEG ZUR GESCHLECHTERGERECHTIGKEIT IN DEN
OECD-LÄNDERN
Monika Queisser Abteilungsleiterin für Sozialpolitik Employment, Labour and Social Affairs OECD
Ein Kampf unter widrigen Bedingungen
Was haben OECD Mitgliedsstaaten seit der Verabschiedung der 2013 OECD Gender Recommendation erreicht?
Sehr wenig: Ungleichheiten durchziehen noch immer das soziale, wirtschaftliche und öffentliche Leben.

OECD Gender Recommendations

Wo stehen wir heute?
4
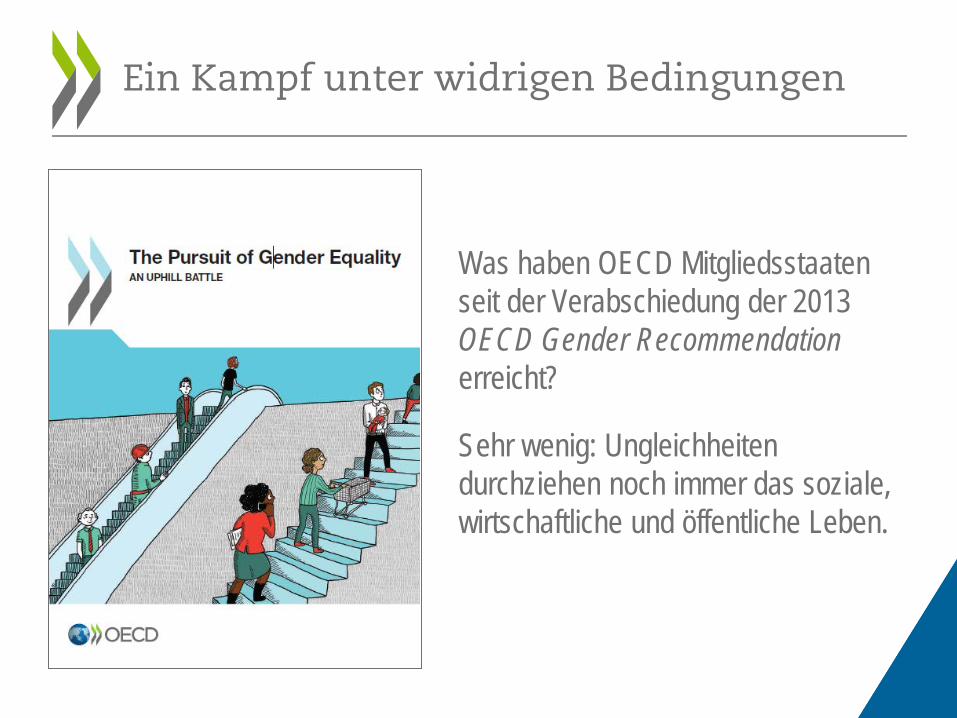
Junge Frauen sind in (fast) allen OECD-Ländern besser ausgebildet
Note: Data for Chile refer to 2013 and for France to 2014. "Tertiary education" includes all types of tertiary-level qualifications – i.e. short-cycle tertiary qualifications (Levels 5 of the International Standard Classification of Education 2011), bachelor or equivalent level qualifications (ISCED 2011 Level 6), master or equivalent level qualifications (ISCED 2011 level 7), and doctoral or equivalent level qualifications (ISCED 2011 level 8). Source: OECD (2017), The Pursuit of Gender Equality: An Uphill Battle, OECD Publishing, Paris. http://dx.doi.org/10.1787/9789264281318-en
Gender gap (male minus female) in the share of the population that has attained tertiary education, 25-34 year olds, 2015 or latest available year
-30
-25
-20
-15
-10
-5
0
5
Gender gap (percentage points)
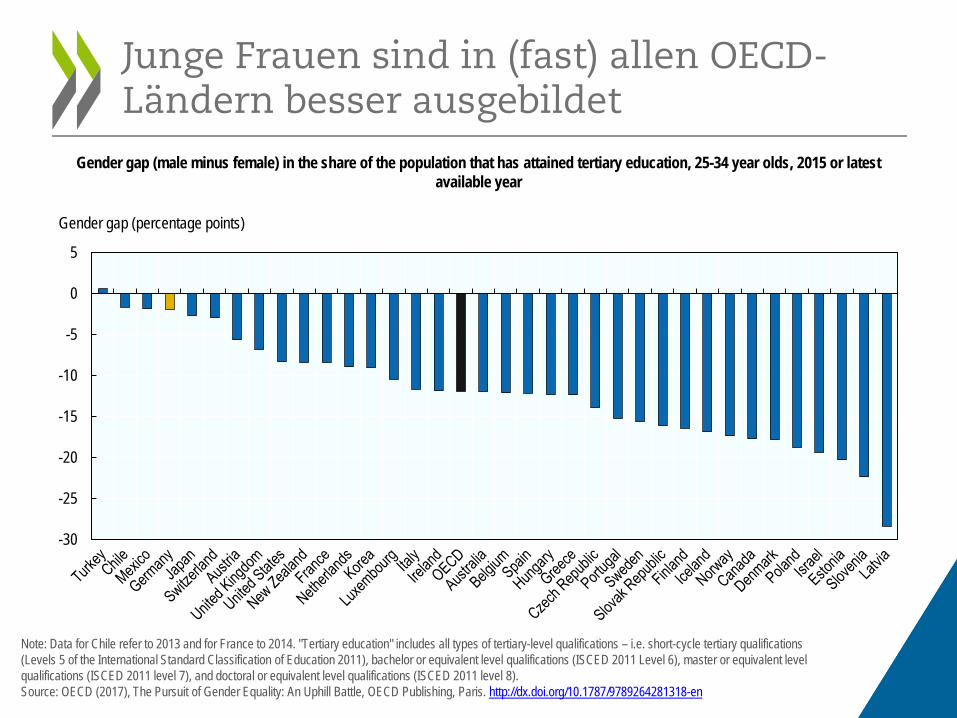
Aber die Wahl der Studienfächer unterscheidet sich nach Geschlecht
Source: OECD (2017), The Pursuit of Gender Equality: An Uphill Battle, OECD Publishing, Paris. http://dx.doi.org/10.1787/9789264281318-en
Female share (%) of new entrants into tertiary education, by field of education, OECD average, 2014
78.2 75.3
63.8 57.3
48.8 48.3
37.3
24.4
0
10
20
30
40
50
60
70
80
90
100
Education Health andwelfare
Humanities andarts
Social sciences,business and law
Services Agriculture Sciences Engineering,manufacturing
and construction
Female share (%) of entrants
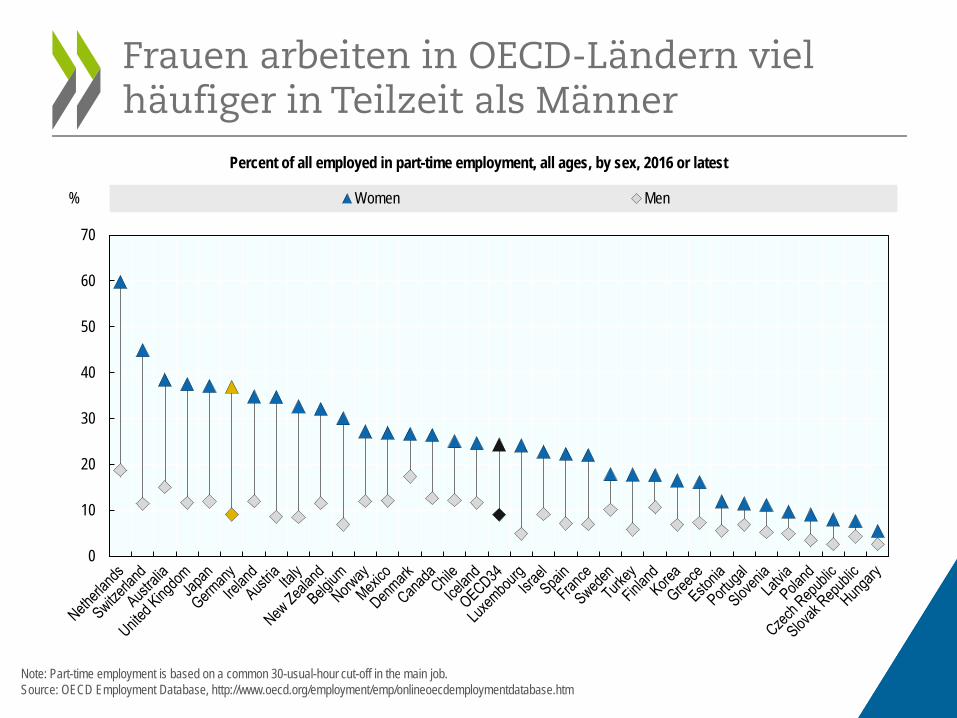
Frauen arbeiten in OECD-Ländern viel häufiger in Teilzeit als Männer
Note: Part-time employment is based on a common 30-usual-hour cut-off in the main job. Source: OECD Employment Database, http://www.oecd.org/employment/emp/onlineoecdemploymentdatabase.htm
Percent of all employed in part-time employment, all ages, by sex, 2016 or latest
0
10
20
30
40
50
60
70
% Women Men
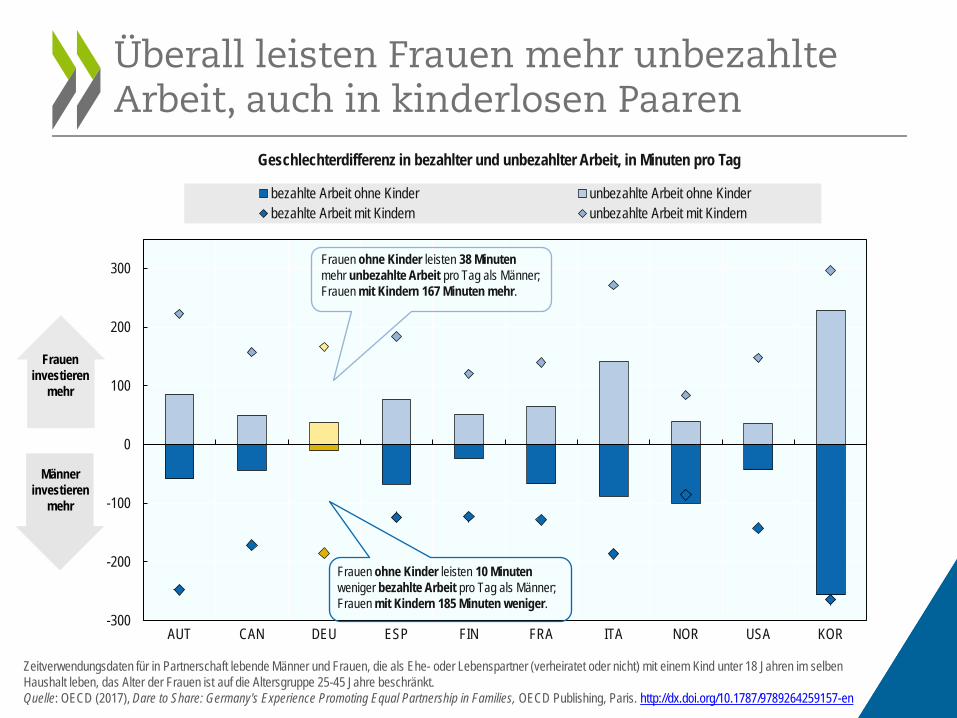
Überall leisten Frauen mehr unbezahlte Arbeit, auch in kinderlosen Paaren
Zeitverwendungsdaten für in Partnerschaft lebende Männer und Frauen, die als Ehe- oder Lebenspartner (verheiratet oder nicht) mit einem Kind unter 18 Jahren im selben Haushalt leben, das Alter der Frauen ist auf die Altersgruppe 25-45 Jahre beschränkt. Quelle: OECD (2017), Dare to Share: Germany's Experience Promoting Equal Partnership in Families, OECD Publishing, Paris. http://dx.doi.org/10.1787/9789264259157-en
Frauen investieren
mehr
Männer investieren
mehr
-300
-200
-100
0
100
200
300
AUT CAN DEU ESP FIN FRA ITA NOR USA KOR
Geschlechterdifferenz in bezahlter und unbezahlter Arbeit, in Minuten pro Tag
bezahlte Arbeit ohne Kinder unbezahlte Arbeit ohne Kinderbezahlte Arbeit mit Kindern unbezahlte Arbeit mit Kindern
Frauen ohne Kinder leisten 38 Minuten mehr unbezahlte Arbeit pro Tag als Männer; Frauen mit Kindern 167 Minuten mehr.
Frauen ohne Kinder leisten 10 Minuten weniger bezahlte Arbeit pro Tag als Männer; Frauen mit Kindern 185 Minuten weniger.
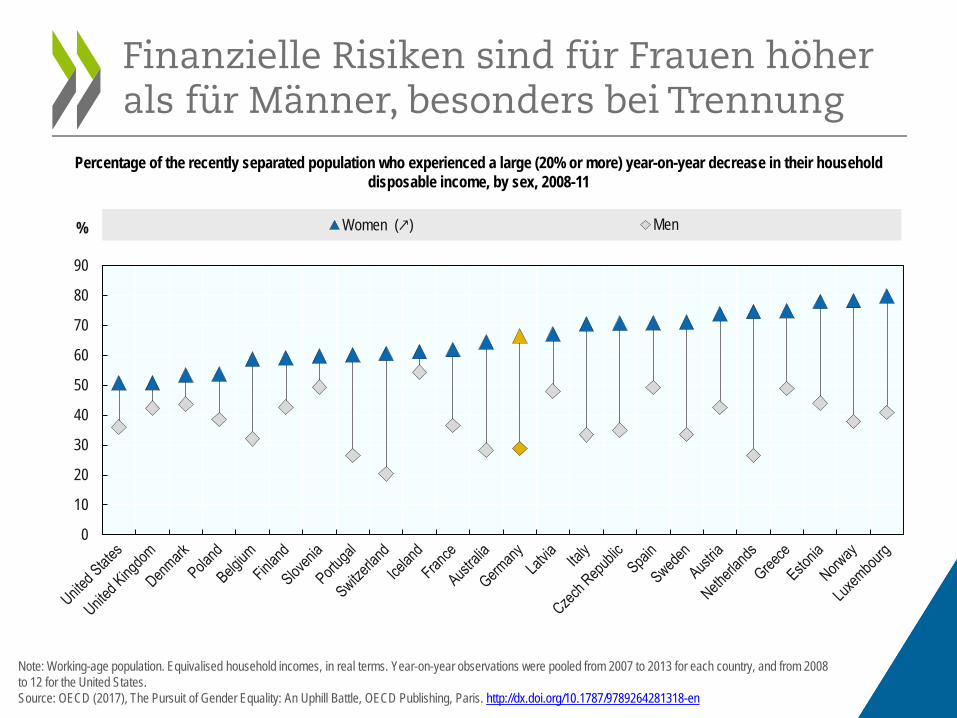
Finanzielle Risiken sind für Frauen höher als für Männer, besonders bei Trennung
Note: Working-age population. Equivalised household incomes, in real terms. Year-on-year observations were pooled from 2007 to 2013 for each country, and from 2008 to 12 for the United States. Source: OECD (2017), The Pursuit of Gender Equality: An Uphill Battle, OECD Publishing, Paris. http://dx.doi.org/10.1787/9789264281318-en
Percentage of the recently separated population who experienced a large (20% or more) year-on-year decrease in their household disposable income, by sex, 2008-11
0
10
20
30
40
50
60
70
80
90
% Women (↗) Men
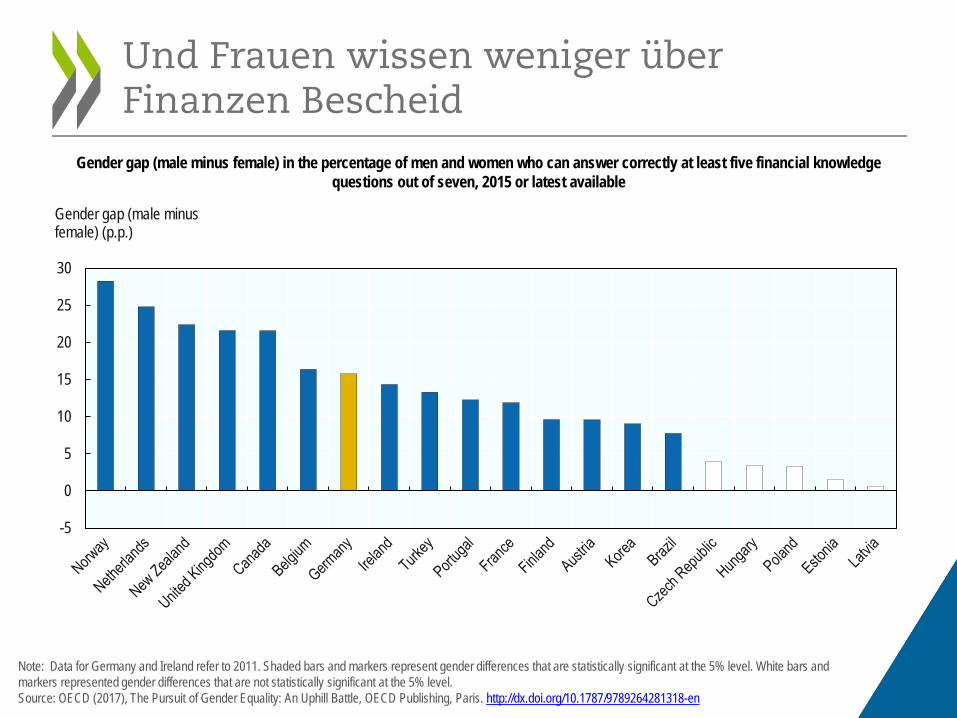
Und Frauen wissen weniger über Finanzen Bescheid
Note: Data for Germany and Ireland refer to 2011. Shaded bars and markers represent gender differences that are statistically significant at the 5% level. White bars and markers represented gender differences that are not statistically significant at the 5% level. Source: OECD (2017), The Pursuit of Gender Equality: An Uphill Battle, OECD Publishing, Paris. http://dx.doi.org/10.1787/9789264281318-en
Gender gap (male minus female) in the percentage of men and women who can answer correctly at least five financial knowledge questions out of seven, 2015 or latest available
-5
0
5
10
15
20
25
30
Gender gap (male minus female) (p.p.)
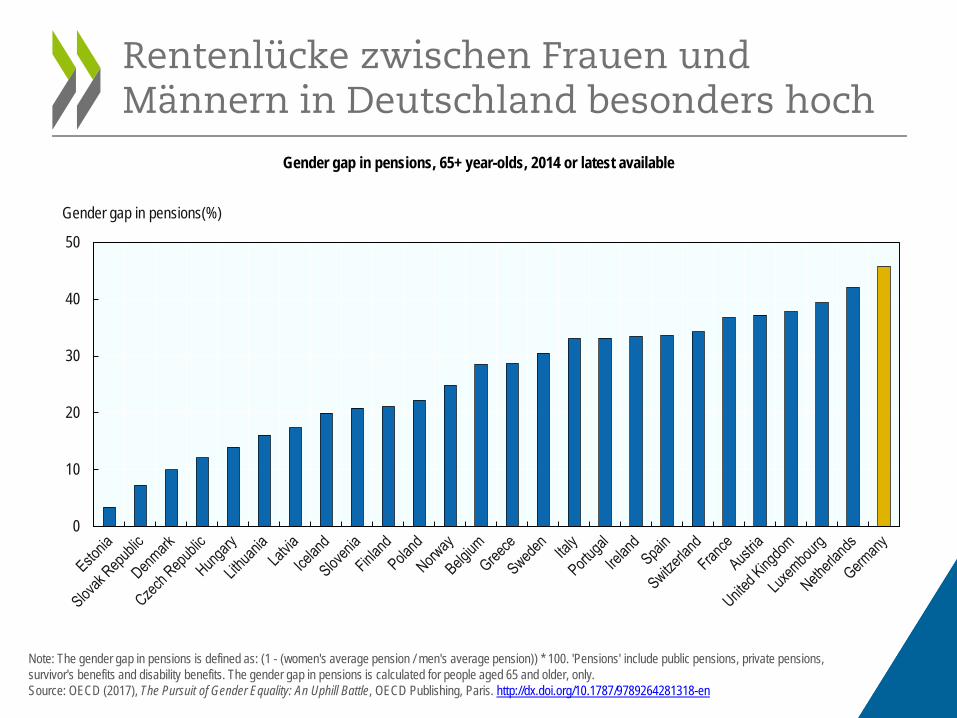
Rentenlücke zwischen Frauen und Männern in Deutschland besonders hoch
Note: The gender gap in pensions is defined as: (1 - (women's average pension / men's average pension)) * 100. 'Pensions' include public pensions, private pensions, survivor's benefits and disability benefits. The gender gap in pensions is calculated for people aged 65 and older, only. Source: OECD (2017), The Pursuit of Gender Equality: An Uphill Battle, OECD Publishing, Paris. http://dx.doi.org/10.1787/9789264281318-en
Gender gap in pensions, 65+ year-olds, 2014 or latest available
0
10
20
30
40
50
Gender gap in pensions(%)
Was unternehmen OECD-Länder dagegen?
12
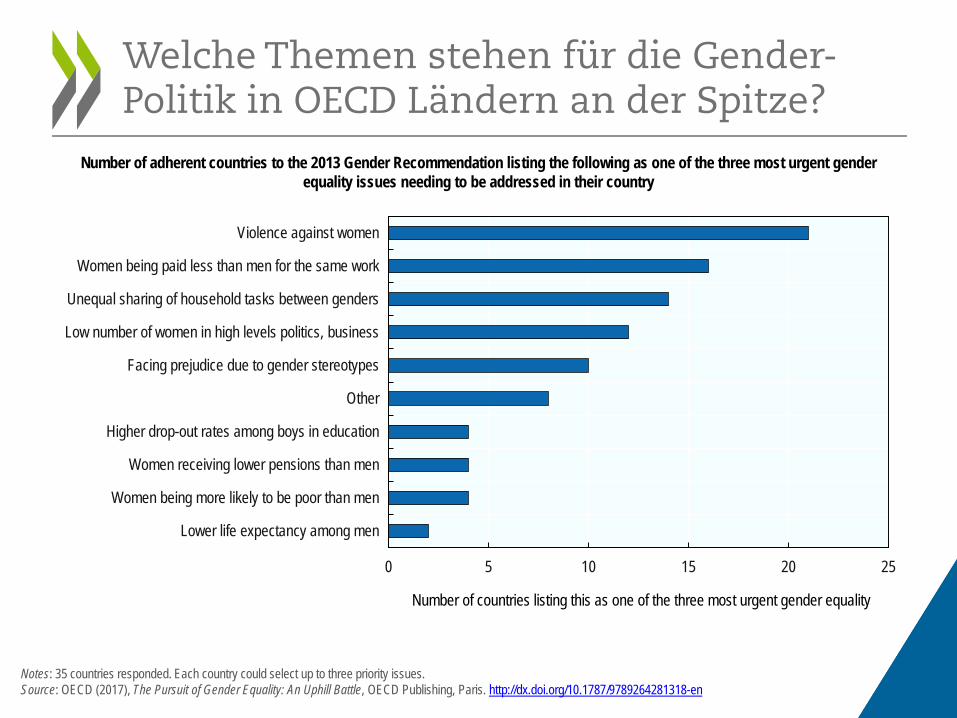
Welche Themen stehen für die Gender- Politik in OECD Ländern an der Spitze?
Notes: 35 countries responded. Each country could select up to three priority issues. Source: OECD (2017), The Pursuit of Gender Equality: An Uphill Battle, OECD Publishing, Paris. http://dx.doi.org/10.1787/9789264281318-en
Number of adherent countries to the 2013 Gender Recommendation listing the following as one of the three most urgent gender equality issues needing to be addressed in their country
0 5 10 15 20 25
Lower life expectancy among men
Women being more likely to be poor than men
Women receiving lower pensions than men
Higher drop-out rates among boys in education
Other
Facing prejudice due to gender stereotypes
Low number of women in high levels politics, business
Unequal sharing of household tasks between genders
Women being paid less than men for the same work
Violence against women
Number of countries listing this as one of the three most urgent gender equality
• In vielen Ländern wurde bezahlter Vaterschaftsurlaub ausgebaut,
damit Väter sich stärker in die Betreuung von Kindern einbringen können, was die Berufstätigkeit von Frauen erleichtert.
• 2/3 aller OECD Länder haben die Transparenz bei Löhnen und Gehältern seit 2013 verbessert.
• Länder ergreifen vermehrt Maßnahmen gegen Gewalt gegen Frauen.
• Positive Diskriminierung hilft, den Anteil von Frauen in Führungspositionen im öffentlichen und privaten Sektor zu erhöhen.
Es gibt Fortschritte in einigen Bereichen
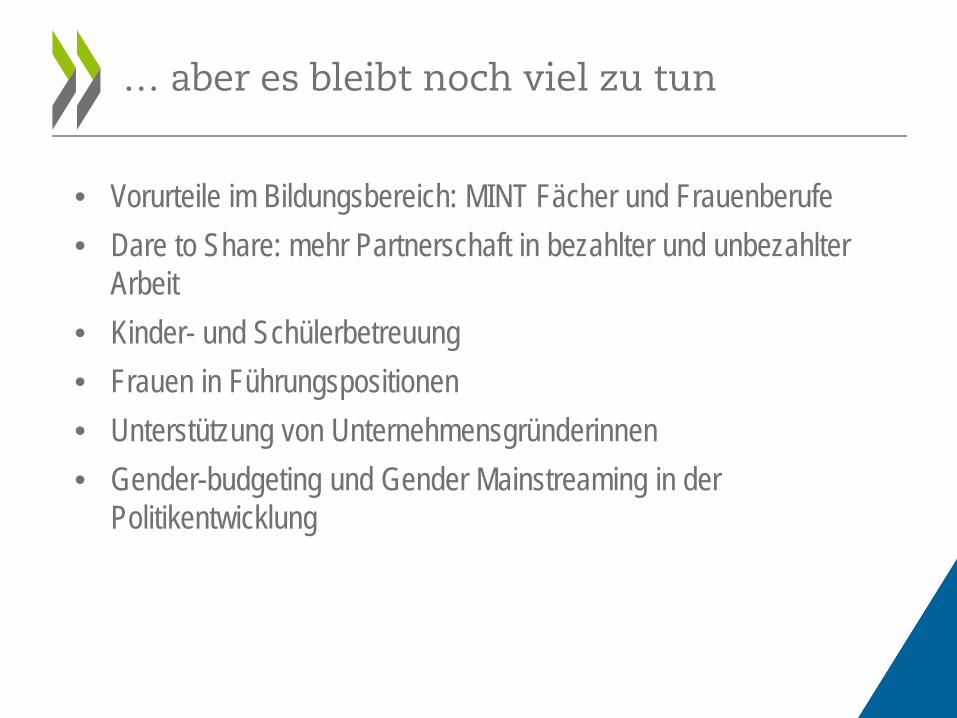
… aber es bleibt noch viel zu tun
• Vorurteile im Bildungsbereich: MINT Fächer und Frauenberufe • Dare to Share: mehr Partnerschaft in bezahlter und unbezahlter
Arbeit • Kinder- und Schülerbetreuung • Frauen in Führungspositionen • Unterstützung von Unternehmensgründerinnen • Gender-budgeting und Gender Mainstreaming in der
Politikentwicklung

Gendergerechte Haushaltsplanung in OECD-Ländern
Source: OECD (2017), The Pursuit of Gender Equality: An Uphill Battle, OECD Publishing, Paris. http://dx.doi.org/10.1787/9789264281318-en
Gender budgeting in OECD countries
AUS CAN CHL
DNK EST
FRA DEU
GRC
HUN
IRL LUX
NZL POL
PRT SVK
SVN CHE GBR USA CZE
TUR ITA
AUT BEL
ISL
FIN
ISR JPN
KOR MEX
NLD NOR
ESP SWE
Introduced
Not planned
Actively considering
Planned
Looking forward – women and the future of work
17

Risiken der Automatisierung in weiblich und männlich dominierten Sektoren
Note: The figure shows the twenty industries with the greatest number of jobs at risk of automation. The width of each bar in the left panel represents the average share of jobs at risk in each industry. The placement of each bar relative to the centre line depicts how that risk is shared between men (light blue) and women (grey). Values in the right panel represent the share of total employment held by each industry. Countries covered in this analysis include the 29 OECD countries that participated in the first and second rounds of the Survey of Adult Skills. Source: OECD (2017), The Pursuit of Gender Equality: An Uphill Battle, OECD Publishing, Paris. http://dx.doi.org/10.1787/9789264281318-en
Share of jobs at risk, by industry and gender, OECD-29 average
0 2.5 5 7.5 10
Employment share (%)
50 40 30 20 10 0 10 20 30 40 50
EducationComputer programming, consultancy and related activities
Public administration and defenceSocial work activities without accommodation
Human health activitiesFinancial serv ice activities
Manufacture of computer, electronic and optical productsLegal and accounting activities
Residential care activitiesInsurance, reinsurance and pension funding
Manufacture of machinery and equipment n.e.c.Manufacture of motor vehicles, trailers and semi-trailers
Wholesale trade, except of motor vehicles and motorcyclesSpecialized construction activ it ies
Manufacture of fabricated metal productsManufacture of food products
Land transport and transport via pipelinesWholesale and retail trade and repair of motor vehiclesRetail trade, except of motor vehicles and motorcycles
Food and beverage service activ it ies
Male share (average risk of automation) Female share (average risk of automation)
Shar
e of
jobs
at r
isk
High
Low
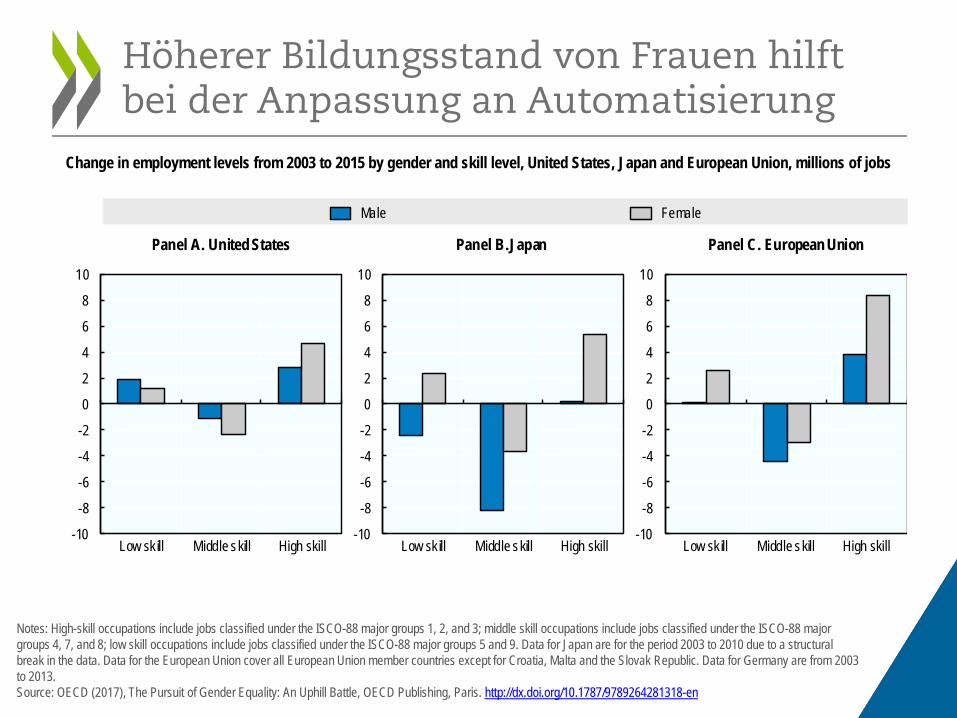
Höherer Bildungsstand von Frauen hilft bei der Anpassung an Automatisierung
Notes: High-skill occupations include jobs classified under the ISCO-88 major groups 1, 2, and 3; middle skill occupations include jobs classified under the ISCO-88 major groups 4, 7, and 8; low skill occupations include jobs classified under the ISCO-88 major groups 5 and 9. Data for Japan are for the period 2003 to 2010 due to a structural break in the data. Data for the European Union cover all European Union member countries except for Croatia, Malta and the Slovak Republic. Data for Germany are from 2003 to 2013. Source: OECD (2017), The Pursuit of Gender Equality: An Uphill Battle, OECD Publishing, Paris. http://dx.doi.org/10.1787/9789264281318-en
Change in employment levels from 2003 to 2015 by gender and skill level, United States, Japan and European Union, millions of jobs
-10
-8
-6
-4
-2
0
2
4
6
8
10
Low sk ill Middle skill High skill
Panel A. United States
-10
-8
-6
-4
-2
0
2
4
6
8
10
Low sk ill Middle skill High skill
Panel B.Japan
-10
-8
-6
-4
-2
0
2
4
6
8
10
Low sk ill Middle skill High skill
Panel C. European Union
Male Female

Weiterführende Informationen
OECD (2017) The Pursuit of Gender Equality: An Uphill Battle: oe.cd/gender2017
OECD (2017) Dare to Share – Deutschlands Weg zur Partnerschaftlichkeit in Familie und Beruf: oe.cd/dts
OECD (2012), Closing the Gender Gap: Act Now, http://www.oecd.org/gender/closingthegap.htm
OECD Gender Data Portal: www.oecd.org/gender
OECD Family Database: www.oecd.org/els/family/database.htm
OECD Social Expenditure Database (SOCX): www.oecd.org/social/expenditure.htm.
@OECD_Social
20

Additional slides
21
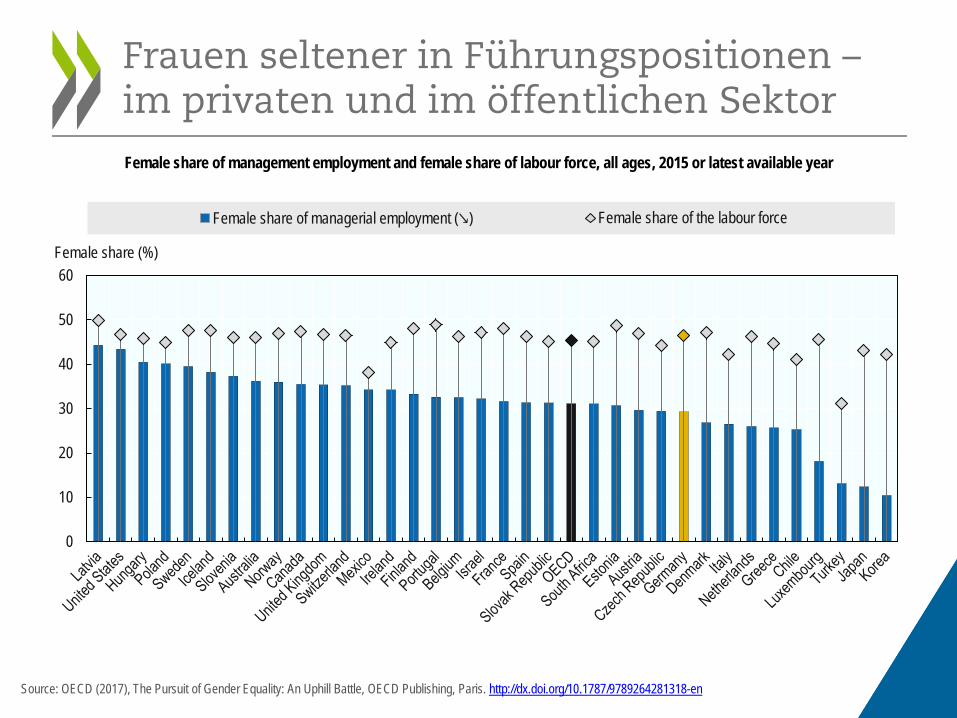
Frauen seltener in Führungspositionen –im privaten und im öffentlichen Sektor
Source: OECD (2017), The Pursuit of Gender Equality: An Uphill Battle, OECD Publishing, Paris. http://dx.doi.org/10.1787/9789264281318-en
Female share of management employment and female share of labour force, all ages, 2015 or latest available year
0
10
20
30
40
50
60Female share (%)
Female share of managerial employment (↘) Female share of the labour force
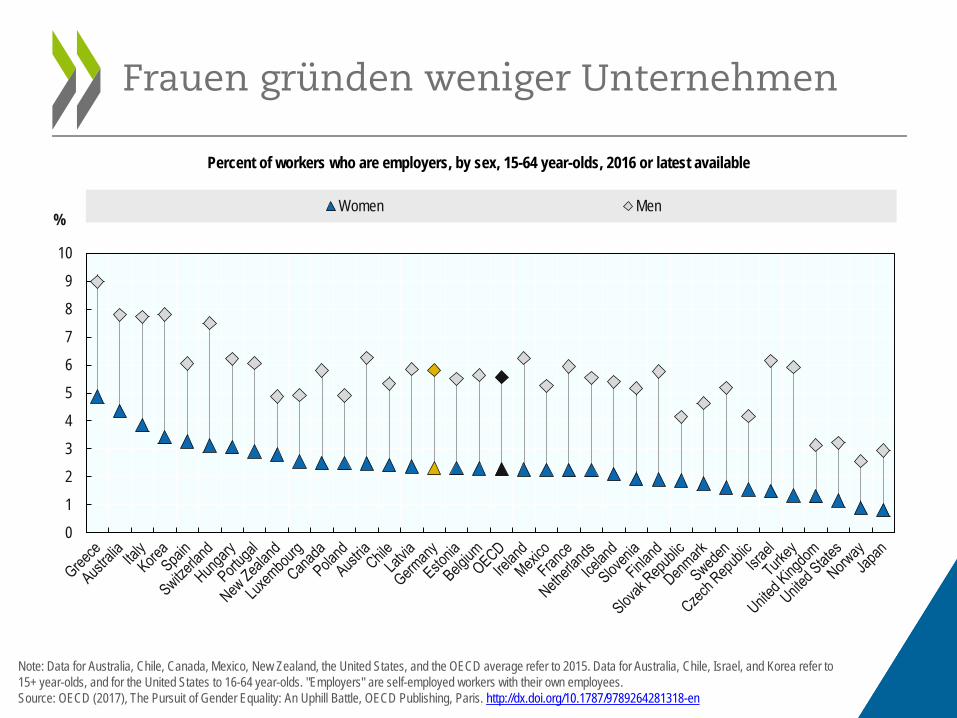
Frauen gründen weniger Unternehmen
Note: Data for Australia, Chile, Canada, Mexico, New Zealand, the United States, and the OECD average refer to 2015. Data for Australia, Chile, Israel, and Korea refer to 15+ year-olds, and for the United States to 16-64 year-olds. "Employers" are self-employed workers with their own employees. Source: OECD (2017), The Pursuit of Gender Equality: An Uphill Battle, OECD Publishing, Paris. http://dx.doi.org/10.1787/9789264281318-en
Percent of workers who are employers, by sex, 15-64 year-olds, 2016 or latest available
0
1
2
3
4
5
6
7
8
9
10
% Women Men