Embed Size (px)
Citation preview

A defined mitochondrial metabolic state in pre-B cells contributes to B cell
homeostasis and is modulated by Swiprosin-2 / EFhd1
Ein definierter Zustand des mitochondrialen Stoffwechsels in Prä-B Zellen trägt zur B Zell
Homöostase bei und wird durch Swiprosin-2 / EFhd1 moduliert
Der Naturwissenschaftlichen Fakultät
der Friedrich-Alexander-Universität Erlangen-Nürnberg
zur
Erlangung des Doktorgrades Dr. rer. nat.
vorgelegt von
Merle Stein
aus Hamburg
2016

II
Als Dissertation genehmigt von der Naturwissenschaftlichen Fakultät der
Friedrich-Alexander-Universität Erlangen-Nürnberg
Tag der mündlichen Prüfung: 29.07.2016
Vorsitzende/r des Promotionsorgans: Prof. Dr. Jörn Wilms Gutachter/in: Prof. Dr. Hans-Martin Jäck
Prof. Dr. Falk Nimmerjahn
III
Table of contents
1.) Summary .......................................................................................................................... 1
2.) Zusammenfassung ............................................................................................................. 2
3.) Introduction ...................................................................................................................... 3
3.1.) The adaptive immune system ..................................................................................................... 3
3.1.1.) B lymphocyte development ................................................................................................. 3
3.1.2.) The Pre-BCR checkpoint ....................................................................................................... 5
3.2.) Metabolism ................................................................................................................................. 8
3.2.1.) Glucose metabolism in cancer ........................................................................................... 13
3.2.2.) The PPAR family of TF and co-regulators ........................................................................... 14
3.3.) Calcium binding EF-hand proteins ............................................................................................ 16
3.3.1) Swiprosin-2/ EFhd1 ............................................................................................................. 16
4.) Aim and scope of this work .............................................................................................. 21
5.) Results ............................................................................................................................ 22
5.1.) Analysis of mitochondrial activity and glucose uptake during early B cell development in WT
murine BM ......................................................................................................................................... 22
5.2.) In vitro analysis of EFhd1 overexpression in HEK 293 cells and its effect on mitochondria ..... 29
5.3.) In vivo analysis of the effect of ectopic EFhd1 expression on mitochondrial metabolism ....... 30
5.3.1.) Analysis of the effect of EFhd1tg expression on mitochondrial and developmental gene
profiles ........................................................................................................................................... 32
5.3.2.) Analysis of mitochondrial activity in EFhd1tg and WT cells during B cell development in
the BM ........................................................................................................................................... 40
5.3.3.) Analysis of mitochondrial activity in EFhd1tg and WT pro-B cell ex vivo cultures ............. 42
5.4.) Analysis of mitochondrial activity in EFhd1 shRNA knock-down cell lines ............................... 51
5.5.) Analysis of the effect of ectopic EFhd1 expression on non-steady state B lymphocyte
homeostasis in a competitive BM transfer ....................................................................................... 53
5.6.) Analysis of mitochondrial activity in EFhd1tg LPS blasts .......................................................... 57
5.7.) Generation of a EFhd1-/- mouse model ..................................................................................... 59
6.) Discussion ....................................................................................................................... 61
6.1) Mitochondrial metabolism changes at the pro- to pre-B cell transition ................................... 61
6.2) EFhd1 expression in the presence of acute stressors can increase mitochondrial mass .......... 63
6.3) Ectopic EFhd1 expression in vivo alters metabolic gene expression profiles of pre-B cells ...... 63
6.4.) Ectopic EFhd1 expression in lymphocytes in vivo does not increase cellular ROS ................... 65
6.5.) Ectopic EFhd1 expression in vivo alters expression of PI(3)K-Akt pathway genes in pre-B cells
........................................................................................................................................................... 66
IV
6.6.) Ectopic EFhd1 expression in lymphocytes in vivo does not increase mitochondrial mass,
membrane potential or ROS.............................................................................................................. 67
6.7.) Proliferation and differentiation of pro-B cells in an ex vivo IL-7 culture is unaltered by ectopic
expression of EFhd1 .......................................................................................................................... 67
6.8.) ShRNA-mediated EFhd1 knock-down in 38B9 cells decreases the Δψµ and ratio of OxPhos to
glycolysis in a dose-dependent manner ............................................................................................ 69
6.9.) EFhd1expression leads to a disadvantage for BM but not splenic B cell repopulation in a
competitive BM transfer ................................................................................................................... 70
6.10.) EFhd1expression in LPS blasts increases mitochondrial activity but does not alter
proliferation....................................................................................................................................... 70
6.11.) Establishment of the EFhd1 knock out mouse ........................................................................ 71
6.12.) Conclusion ............................................................................................................................... 71
6.13.) EFhd1 in cancer ....................................................................................................................... 73
7.) Material and Methods ..................................................................................................... 74
7.1.) Material ..................................................................................................................................... 74
7.1.1.) Manufacturers .................................................................................................................... 74
7.1.2.) Data banks und Software ................................................................................................... 75
7.1.3.) Microorganisms and plasmids............................................................................................ 75
7.1.4.) Oligonucleotides................................................................................................................. 77
7.1.5.) Chemicals ........................................................................................................................... 77
7.1.6.) Bacterial media................................................................................................................... 77
7.1.7.) Solutions ............................................................................................................................. 78
7.1.8.) Antibodies .......................................................................................................................... 79
7.1.9.) Animals ............................................................................................................................... 79
7.1.10.) Cell lines and media ......................................................................................................... 80
7.2.) Methods .................................................................................................................................... 81
7.2.1.) Cell culture ......................................................................................................................... 81
7.2.2.) Transfection of HEK293 cells .............................................................................................. 83
7.2.3.) Isolation of primary cells from mice and erylysis ............................................................... 83
7.2.4.) Enrichment of B cells from spleen and BM ........................................................................ 84
7.2.5.) Pro B cell culture ................................................................................................................ 84
7.2.6.) LPS blast culture ................................................................................................................. 84
7.2.7.) Measurement of extracellular glucose and lactate ........................................................... 84
7.2.8.) Analysis of mitochondrial metabolism by Seahorse extracellular flux analyser ................ 84
7.2.9.) Comet assay ....................................................................................................................... 86
7.2.10.) Homing assay of splenic B cells ........................................................................................ 86
Summary
V
7.2.11.) Competitive BM transfer .................................................................................................. 86
7.2.12.) Flow cytometry ................................................................................................................ 87
7.2.13.) Isolation of DNA ............................................................................................................... 88
7.2.14.) PCR ................................................................................................................................... 89
7.2.15.) Isolation of RNA ................................................................................................................ 89
7.2.16.) cDNA synthesis ................................................................................................................. 89
7.2.17.) Quantitative Real-Time-PCR with SYBR Green ................................................................. 90
7.2.18.) DNA agarose-gel electrophoresis ..................................................................................... 90
7.2.19.) Protein biochemical methods .......................................................................................... 90
8.) Appendix ........................................................................................................................ 93
8.1.) Abbreviations ............................................................................................................................ 93
8.2. Bibliography ................................................................................................................................ 95
8.3.) Acknowledgements ................................................................................................................. 106
8.4.) Affirmation .............................................................................................................................. 107
1
1.) Summary
An important check-point during B cell development is initiated by the expression of the pre-B cell
receptor (pre-BCR) which first results in several rounds of proliferation (large pre-B cells) and then
causes exit of the cell cycle along with genetic rearrangements (small pre-B cells). In this thesis I
tested the hypothesis that mitochondrial metabolism is altered to facilitate these changes and to
support the development of functional and fit B cells. While I could show that mitochondrial
biogenesis is unaltered during early B cell development, large pre-B cells upregulate their
mitochondrial membrane potential (Δψµ), reactive oxygen species (ROS) production and glucose
uptake. Small pre-B cells then downregulate this metabolic program. Rag1-/- B cells with a
heavy-chain knock in and pre-B cells from IL-7 cultures show a higher reliance on aerobic
mitochondrial metabolism (OxPhos) than pro-B cells and exhibit increased mitochondrial coupling of
respiration and ATP production. In accordance, pre-B cells also upregulate genes responsible for
mitochondrial respiration and ROS detoxification, such as sod2 and ppargc1α. The pre-BCR hence
gears mitochondrial activity. Moreover, this work identifies, in the Ca2+ binding protein Swiprosin-2 /
EFhd1, a novel regulator of mitochondrial metabolism at the pro- to pre-B cell transition. EFhd1,
involved in Ca2+ induced mitochondrial flashes, is normally downregulated by surface expression of
the pre-BCR but is ectopically expressed in all lymphocytes in a transgene mouse model (EFhd1tg). A
competitive bone marrow transfer of EFhd1tg and WT cells reveals a significant developmental
disadvantage of EFhd1tg cells in the BM. EFhd1tg pre-B cells were found to upregulate the
mitochondrial metabolic regulator PGC-1α and hence facilitate OxPhos. Vice versa, 38B9 cells with an
EFhd1 knock-down show a dose dependent shift away from the utilization of OxPhos to glycolysis
and a parallel decrease in Δψµ. Paradoxically, in Seahorse Mito Stress Tests EFhd1tg pre-B cells
exhibit reduced mitochondrial ATP production, increased non-mitochondrial respiration and a
decreased mitochondrial coupling efficiency. Thus, ectopic expression of EFhd1 at this developmental
phase, where the protein is usually downregulated leads to mitochondrial dysfunction and distorted
B cell development. Hence, via gene regulation, the pre-BCR establishes a defined mitochondrial
state. In the future an EFhd1 -/- mouse model will show whether expression of EFhd1 in pro-B cells is
required to prime these cells for the more oxidative metabolism observed in pre-B cells.
Zusammenfassung
2
2.) Zusammenfassung
Die Expression des Prä-B Zellrezeptors (Prä-BZR), welcher zunächst einige Zellteilungen (große Prä-B
Zellen) und dann eine mitotische Ruhephase mit genetischen Umlagerungen (kleine Prä-B Zellen)
einleitet, ist ein wichtiger Checkpunkt der B Zellentwicklung. Diese Arbeit testete die Hypothese, dass
sich der mitochondriale Stoffwechsel in diesen Phasen ändert, um die Entwicklung von funktionellen
und fitten B Zellen zu gewährleisten. Es konnte gezeigt werden, dass die mitochondriale Biogenese
während der frühen B Zellentwicklung unverändert ist. Große Prä-B Zellen regulieren jedoch das
mitochondriale Membranpotential (Δψµ), reaktive Sauerstoffspezies (ROS), sowie Glukoseaufnahme
hoch, während kleine Prä-B Zellen diese wieder reduzieren. Rag1-/- B Zellen, welche eine
Immunoglobulin schwere Kette exprimieren, sowie Prä-B Zellen aus einer IL-7 Kultur decken einen
höheren Anteil ihrer Energie durch mitochondriale Atmung (OxPhos) als Pro-B Zellen und zeigten
eine verbesserte mitochondriale Kopplung von Sauerstoffverbrauch und ATP Produktion. Gene des
mitochondrialen Stoffwechsels und ROS Entgiftung wie sod2 und ppargc1a wurden in Prä-B Zellen
ebenfalls hochreguliert. Expression des Prä-BZR ist deshalb ein positiver Regulator der
mitochondrialen Atmung. Mit dem Ca2+-bindenden Protein Swiprosin-2 / EFhd1 identifiziert diese
Arbeit einen neuen Regulator der mitochondrialen Aktivität am Entwicklungsschritt von Pro- zu Prä-B
Zelle. EFhd1 ist involviert in Ca2+ induzierten Mitoflashes und wird normalerweise durch die
Oberflächenexpression des Prä-BZR herunterreguliert; nicht jedoch in einem EFhd1 transgenen
Mausmodel (EFhd1tg), in welchem das Protein ektopisch in allen Lymphozyten exprimiert wird. Ein
kompetitiver Knochenmarkstransfer von EFhd1tg und WT Zellen zeigte einen signifikanten
Entwicklungsnachteil von EFhd1tg B Zellen im Knochenmark. EFhd1tg Prä-B Zellen regulieren den
mitochondrialen Stoffwechselregulator PGC-1α hoch und steigern so OxPhos. In Übereinstimmung
findet sich in 38B9 EFhd1 shRNA knock-down Zellen dosisabhängig weniger OxPhos zu Glykolyse und
ein vermindertes Δψµ. Paradoxerweise zeigen EFhd1tg Prä-B Zellen in Mito Stress Test jedoch
signifikant reduzierte mitochondriale ATP Produktion, erhöhte nicht-mitochondriale Atmung sowie
schlechtere mitochondriale Kopplung. Ektopische Expression von EFhd1 in Prä-B Zellen, in welchen
das Protein normalerweise herunterreguliert wird, führt zur mitochondrialen Dysfunktion und einer
gestörten frühen B Zellentwicklung. Durch Genregulation etabliert der Prä-BZR einen definierten
mitochondrialen Zustand. In Zukunft wird ein EFhd1-/- Mausmodell zeigen, ob die Expression von
EFhd1 in Pro-B Zellen benötigt wird, um einen oxydativeren Prä-B Zellstoffwechsel einzuleiten.
Introduction
3
3.) Introduction
3.1.) The adaptive immune system
For vertebrates the first line of defence against infection by a pathogen is the innate immune system.
An immediate, innate, response consists of three mayor arms: antimicrobial peptides, complement
and phagocytic or certain cytotoxic cells. In contrast, the acquired or adaptive immune response
takes more time to develop, days rather than minutes. It consists of highly specialized T and B
lymphocytes. Due to their T and B cell receptor (TCR and BCR respectively) these cells are specific for
a particular pathogen and able to generate immunological memory, so that upon re-encountering
the same type of pathogen, a faster and in quantity and quality enhanced response is mounted. The
recognition of self from non-self is the key to a functioning immune system. B cells are tested for a
functional receptor-which is also shed as antibody- in several phases during their development.
Mature B cells can further enhance antibody specificity by class-switch recombination (the isotype of
the antibody is altered) or somatic hypermutation (this gives the B cell the possibility of generating a
more affine antibody). Those cells that bind too tightly to body’s own structures undergo apoptosis
or persist but become unresponsive (anergic). Cells that do not bind tightly enough are also
eliminated and die by neglect. Distinguishing foreign from own structures is a tightrope walk. This is
seen in autoimmune diseases, such as systemic lupus erythematosus (SLE) where different
autoantibodies against own structures (e.g. double stranded DNA) are produced or when the
immune system fails to eliminate own cells that have become malignant.
3.1.1.) B lymphocyte development
B lymphocytes develop in the fetal liver and in adult vertebrates from pluripotent stem cells in the
bone marrow (BM). In the BM, hematopoietic stem cells (HSC) require cell contact and specific niches
for their survival and growth. Proliferative HSC and pre-pro B cells, the earliest committed
B lymphocyte progenitors, develop in the vicinity of sinusoids and CXCL12 (SDF-1) producing cells
(fig 1.).1,2 Quiescent HSC in contrast to cycling HSC are found near arterioles close to the bone surface
in the endosteal niche (reviewed in 1,3). Interestingly, after transplantation into irradiated mice, HSC
were found to home preferentially to the endosteum but this may be attributed to the damage done
to sinusoids by radiation.3 HSC likely develop under hypoxic conditions as they are enriched in areas
where little Hoechst 33342 dye is taken up upon perfusion and they stain positive for the chemical
hypoxia marker pimonidazole and express hypoxia-related genes.4,5 Other sources argue against
hypoxic niches but state that hematopoiesis depletes oxygen throughout the marrow.3 The thymus
where T cell precursors develop has also been described as a hypoxic organ with average partial
oxygen pressure below 10 mmHg but without the expression of hypoxia induced genes, indicating an
adaptation to low O2.6 The exact niches for early B lymphocyte development still require some
Introduction
4
elucidation and are at least partially and indirectly dependent on osteoblasts.1,3 B lymphocyte
development follows several defined stages which can be distinguished by the expression of cell
surface markers, genetic rearrangement of Immunoglobulin heavy and light chains, the cell size and
mitotic activity.7 Responsible for the differentiation of B cell precursors are the expression pattern of
specific transcription factors (TF). These in turn activate or inhibit expression of other genes defining
the cellular phenotype. The first developmental step of B lymphocyte development is controlled by
the TFs PU.1 and Ikaros which are expressed in common lymphoid progenitor cells (CLP). Progenitors
then commit to the B cell lineage by expressing the TFs E2A, EBF-1 and Pax-5 (reviewed in 8).
Pre-pro B cells develop into pro-B cells whose proliferation is supported by cell contact (via VLA-4 on
B cells and VCAM-1 on stromal cells) and in particular the cytokine interleukin 7 (IL-7) as well as
SDF-1 and stem cell factor (SCF) produced by reticular stromal (CAR) cells. The majority of IL-7
producing CAR cells is in close contact with the vasculature.9 This pro-B cell niche is distinct from the
niche for HSCs which do not require IL-7. Active migration of cells towards their respective niches is
induced by chemokines such as SDF-1 and progenitor cells are arguably in competition for the best
nurturing spots.9,2 In pro-B cells the immunoglobulin heavy chain (µHC) genes are rearranged. The
responsible enzyme complex of the recombination-activating gene 1 and 2 recombinase (Rag1/2) is
expressed in two waves during the early to late pro-B cell stage and from the small pre-B to the
immature B cell stage. Mice deficient in either of the Rag genes show a developmental B lymphocyte
block and accumulation of pro-B cells in the BM as splicing and rearrangement of the µHC diverse to
joining (D-J) and then variable (V) to the D-J elements cannot take place.10,11 Ectopic expression of the
µHC on a Rag2-/- background in mice leads to the development of phenotypic pre-B cells and the
introduction of a µHC and lambda (λ)-LC leads to the production of peripheral, monoclonal and
immunoglobulin secreting B cells.11 Introduction of a λ-LC alone does not rescue the Rag2-/-
phenotype and highlights the importance of the highly ordered manner of genetic immunoglobulin
rearrangenment.11 Important signals for pro-B cell proliferation come from IL-7 via the IL-7 receptor
(IL-7R) on pro-B cells which for example drives expression of the anti-apoptotic molecules Bcl-2 and
myeloid-cell leukaemia sequence 1 (MCL1) to enhance survival and proliferation.12,2 IL-7 plays an
important role in the commitment, proliferation, maturation and survival of early B cell progenitors
(reviewed in 13). This IL-7 dependency appears to be stronger in mice than in humans, however.14
During B cell development from pro- to immature B cells the responsiveness to IL-7 decreases.13,15 In
vitro IL-7 leads to the proliferation of pro-B cells (Hardy fraction B and C) but not further
differentiated B cells.7 Depletion of IL-7 in pro-B cell cultures causes differentiation of these cells to
pre- and then immature, surface IgM+ (sIgM+) B cells. A much smaller fraction of pre-B- and immature
B cells is also found in the presence of IL-7. The cytokine does not actively supress differentiation,
however; in fact pro-B cells also differentiate into pre-B cells and sIgM+ in the presence of IL-7. But
Introduction
5
these cells are vastly outnumbered by the proliferating pro-B cells.15 Moreover the resulting sIgM+
cells without further stimuli are short lived in culture.15,13
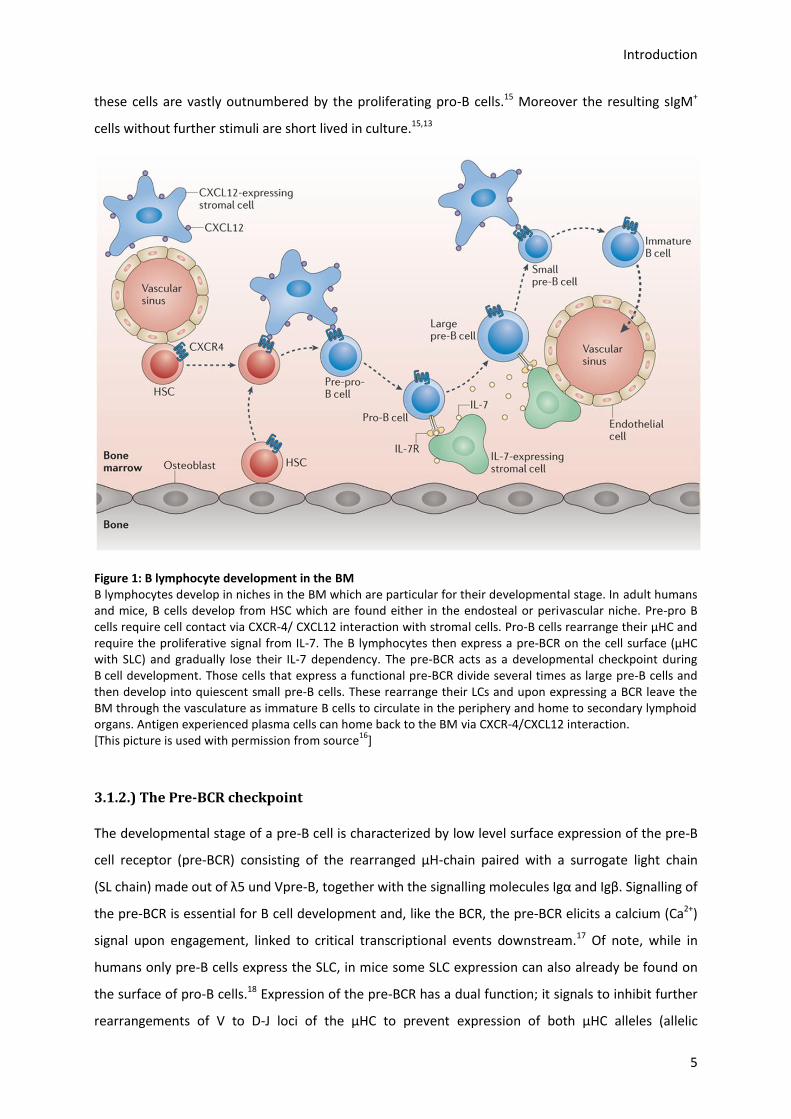
Figure 1: B lymphocyte development in the BM B lymphocytes develop in niches in the BM which are particular for their developmental stage. In adult humans and mice, B cells develop from HSC which are found either in the endosteal or perivascular niche. Pre-pro B cells require cell contact via CXCR-4/ CXCL12 interaction with stromal cells. Pro-B cells rearrange their µHC and require the proliferative signal from IL-7. The B lymphocytes then express a pre-BCR on the cell surface (µHC with SLC) and gradually lose their IL-7 dependency. The pre-BCR acts as a developmental checkpoint during B cell development. Those cells that express a functional pre-BCR divide several times as large pre-B cells and then develop into quiescent small pre-B cells. These rearrange their LCs and upon expressing a BCR leave the BM through the vasculature as immature B cells to circulate in the periphery and home to secondary lymphoid organs. Antigen experienced plasma cells can home back to the BM via CXCR-4/CXCL12 interaction. [This picture is used with permission from source
16]
3.1.2.) The Pre-BCR checkpoint
The developmental stage of a pre-B cell is characterized by low level surface expression of the pre-B
cell receptor (pre-BCR) consisting of the rearranged µH-chain paired with a surrogate light chain
(SL chain) made out of λ5 und Vpre-B, together with the signalling molecules Igα and Igβ. Signalling of
the pre-BCR is essential for B cell development and, like the BCR, the pre-BCR elicits a calcium (Ca2+)
signal upon engagement, linked to critical transcriptional events downstream.17 Of note, while in
humans only pre-B cells express the SLC, in mice some SLC expression can also already be found on
the surface of pro-B cells.18 Expression of the pre-BCR has a dual function; it signals to inhibit further
rearrangements of V to D-J loci of the µHC to prevent expression of both µHC alleles (allelic
Introduction
6
exclusion) and the pre-BCR also acts as a proliferative signal, when µHC rearrangement has
successfully taken place, with an expansion factor of 20-100 fold (i.e. about 4-6 cell divisions).19 These
pre-BCR+, proliferating, pre-B cells are known as large pre-B cells which after several rounds of
division differentiate into quiescent, surface pre-BCR-, small pre-B cells.18 A specific niche for pre-BCR
expressing cells has been described with GAL1 (and VLA-4 and LFA1) expressing stromal cells which
do not produce IL-7. Not the pre-BCR but integrin binding appears to be essential for pre-B cell
homing to these cells.9 GAL1 producing stromal cells are dispersed within the BM with only 3% of the
cells in contact with vessels.9 After expression of a functional pre-BCR and expansion, B lymphocytes
rearrange their kappa (κ) and if necessary lambda (λ) light chains (LC). The TF Forkhead Box class O
orthologue 1 (FoxO1) has been implicated in this LC recombination. Together with Pax5, FoxO1
induces the expression of the Rag1/2 genes as well as Irf4 and p27 which ensure cell cycle arrest
while rearrangement takes place (reviewed in 20,21,22). FoxO1, FoxO3a and FoxO4 are widely
expressed TFs involved in transcriptional programs for cell cycle control, resistance to oxidative
stress and DNA repair.12 FoxO1 is the most prominently expressed TF of this family in B lymphocytes
and enforced expression in B cells results in partial cell cycle arrest in G1 and increased apoptosis.23
This TF is furthermore known to directly up- or downregulate the transcription of important genes
for B cell development. In addition to the Rag1/2 genes, FoxO1 is involved in the upregulation of sell
(CD62L), ccdc135, sema6d as well as efhd1, which will be the focus of this thesis.24,25 This TF also
upregulates expression of the IL-7R and aicda.25 FoxO1 has moreover been suggested to be involved
in B cell tolerance later on via receptor editing by activating recombination-activating genes in
autoreactive B cells.26 While the TFs Ikaros and PU1 are important in CLPs and E2A, Ebf1 and Pax5
establish B lymphocyte identity, the transition of large to small pre-B cells is regulated by interferon
regulatory factors 4 and 8 (Irf4 / Irf8) which in turn induce the expression of Aiolos and Ikaros
involved in pre-BCR downregulation.27 Irf4 and Irf8 cause cell cycle withdrawal; attenuate IL-7
signalling and, in an Aiolos and Ikaros independent manner, promote LC rearrangement by direct
activation of IgL enhancers.
The pre-BCR and IL-7R have synergistic functions.20,21 Receptor unit IL7-Rα recruits Akt subunits p38α
and p38β to cause PI(3)K dependent pre-B cell proliferation.25 Nevertheless, signaling from the IL-7R
but not the pre-BCR promotes FoxO1 protein degradation in pre-B cells in a PI(3)K-Akt pathway
dependent manner.21 FoxO1, phosphatidylinositol-3-OH kinase (PI(3)K) and Akt are regulated by
pre-BCR autonomous signals that require Syk but not Blnk.20 Phosphorylation of FoxO1, depending
on the site, can either stabilize or destabilize the TF. The kinase Akt (also known as PKB)
phosphorylates FoxO1 at the amino acids T24, S256 and S319 which leads to the nuclear export of
FoxO1 with the help of 14-3-3 proteins. This decreases FoxO1 activity and induces cell
proliferation.20,28 Akt activity is dependent on PI(3)K as its activity leads to the production of
Introduction
7
phosphatidylinositol-(3,4,5)-triphosphate (PIP3) which causes localization of Akt to the plasma
membrane where it becomes activated.12 Kinases PDK1 and mTORC2 activate Akt by
phosphorylation.12 Akt is on the other hand inhibited by Blnk and indirectly by Pten.20
Expression of a functional BCR terminates the pre-B cell stage and the B cell is now termed
immature. Not yet having encountered their cognate antigens these immature, naïve, B cells leave
the BM and mature further in the periphery in secondary lymphoid organs (i.e. the spleen, lymph
nodes, Peyer’s patches, MALT, tonsils). At their final developmental stage B cells can home back to
niches in the BM (via CXCL4-CXCR12 interaction) as plasma cells derived from germinal centres (GC).
The BM is also exploited as a growth and survival niche by B cell malignancies. Follicular lymphoma
and chronic lymphocytic leukaemia cause the immigration of follicular DCs and T cells to support
their growth while multiple myeloma cells instruct growth and activation of BM own stromal cells as
a niche.29
Recently a novel pillar of the pre-B cell checkpoint has emerged in the shape of cellular metabolism.
Mice with a ENU-induced null mutation of folliculin-interacting protein 1 (Fnip1) show a block in
B lymphocyte development at the large pre-B cell stage.30 These mice exhibit normal activation of
classical (pre-) BCR signalling molecules (Fyn, Lyn, Blk) and allelic exclusion of the µHC is not affected.
Isolated BM cells also proliferate equally well in IL-7 ex vivo cultures. Deletion of Fnip1, however,
leads to dysregulation of the metabolic regulators AMPK and mTOR. AMP is known to induce
expression of peroxisome proliferator-activated receptor gamma coactivator 1-alpha (PGC-1α) and
peroxisome proliferator-activated receptor gamma (PPARγ) and indeed qPCR reveals an upregulation
of PGC-1α and PPARγ as well as PGC-1β, glucose transporter 1 (GLUT-1), uncoupling protein 3 (ucp3)
and other genes important for mitochondrial activity and metabolism in Fnip1-/- pre-B cells.
Upregulation of these genes may be essential to meet the cells’ energy demands especially at the
highly proliferative large pre-B cell stage. Fnip1 deficient cells also exhibit increased mitochondrial
mass, a higher dependency on glucose and resistance to c-Myc induced tumours by increased
sensitivity to apoptosis. Surprisingly not only catabolism but also mTOR mediated anabolic
metabolism is enhanced in Fnip1-/- cells. The authors conclude that Fnip1 is required for AMPK
induced negative regulation of pre-B cell growth and enhanced sensitivity to apoptosis in response to
metabolic stress. These effects were shown to be B cell intrinsic by BM transfer. The authors
therefore suggest a metabolic checkpoint in pre-B cells to ensure capacity of the cells for
proliferation and to prevent lymphomagenesis.30 In pro-B cells FoxO1 and IL-7 are known to enhance
glycolysis.31,32 Interestingly Fnip1 shows a very similar tissue expression pattern to the protein EFhd1,
which will be addressed in more detail later and on which the work of this thesis is focused. Fnip1 is
Introduction
8
highly abundant in testes, kidney, skeletal muscle, liver, heart and the embryo; as well as in the
thymus, spleen and BM.30
3.2.) Metabolism
Metabolism of a cell involves the breakdown (catabolism) and synthesis (anabolism) of several
classes of macromolecules such as fat, protein and sugar. In the body and also in synthetic media in
vitro, glucose, a monosaccharide sugar, is an important energetic and biosynthetic fuel. This is
particularly true for activated lymphocytes for which quantitatively glucose and glutamine are the
most important fuels despite being able to utilize fatty acids (FA) and ketone bodies.33 Glucose is
transported into eukaryotic cells in a passive process via glucose transporters (GLUT). In lymphocytes
the main glucose transporter is GLUT-1 which is upregulated upon activation.34,35,36 In T cells it was
shown that IL-7 enhances glucose uptake, and GLUT-1 trafficking via STAT5 which activates the
PI(3)K-Akt pathway.32 Engagement of the same signalling cascade likely also occurs in pro-B cells. So
far metabolic research on B cells is still at its beginnings and has mainly focused on later
developmental stages especially metabolically very active plasmablasts and plasma cells.37,34,38,35 To
my knowledge pro-B cell metabolism has not been investigated at all. To close this gap a
characterization of pro-/ pre-B cell metabolism is therefore one aim of this PhD thesis.
In the cytosol glucose can be converted into pyruvate via glycolysis (fig. 2) with a net yield of 2 ATP
per molecule of glucose and 2 H+, 2 H2O as well as 2 NADH as redox equivalents and energy carriers.39
The resulting pyruvate can then either feed the mitochondrial respiratory chain or is further broken
down in the cytoplasm of the cell into lactate (anaerobic glycolysis). Mitochondria are energy
producing organelles in eukaryotic cells. Several mitochondrial proteins are encoded by the nucleus
but mitochondria also carry a part of their own DNA (mtDNA) in nucleoids. These organelles are
highly dynamic structures and vary greatly in number, shape, size and cellular location depending on
the cell type and metabolic status. In addition to providing energy in the form of ATP, they are also
involved in ion, especially Ca2+, homeostasis and the cell’s redox status. Mitochondria also contribute
to the production of cytosolic biosynthetic precursors such as acetyl-CoA and pyrimidines and are
largely responsible for the production of reactive oxygen species (ROS) and cell death decisions by
the intrinsic apoptosis pathway.40 Mitochondria can form intricate networks by fusion and fission
processes and can be transported along microtubules within a mammalian cell to places of high
energy demand, sometimes at velocities of 0.1-2 µms-1. 41 Actin on the other hand is important for
short distance transport, anchoring and division of these organelles.42 Long tubular mitochondrial
networks can function as proton and Ca2+ tunnels within a cell.41 The number, shape and function of
mitochondria are variable between tissues and individual cells (reviewed in 41). Even single
mitochondria within a cell can have different membrane potentials (Δψµ) and ROS production
Introduction
9
levels.41 Also mitochondrial protein expression is adapted to the tissue and differs in mouse brain,
heart, kidney and liver.43 A cell’s Δψµ, the electrochemical gradient across the inner mitochondrial
membrane, is essential for the activity of the ETC (electron transport chain) as it constitutes, together
with the pH gradient, the proton motive force that drives the ATP synthase.44 A decrease in the Δψµ
therefore limits ATP production.45 In accordance, low Δψµ are found in cells under growth factor
depletion and during apoptosis.46 A high Δψµ and very active ETC, however, can lead to increased
ROS production and can hence be detrimental to the cell.47 Δψµs has been described to change
during cellular differentiation due to different energy demands and metabolic status of the cells.48.
The amount of ATP production, however, not only depends on the Δψµ but also on the coupling
tightness of substrate consumption to ATP production which is controlled by the composition of the
mitochondrial membrane as well as allosteric regulations and cell signalling.49 Counterintuitively
hypoxia is known to be able to increase cellular ROS via mitochondrial complex III.50 A recent
discovery shows that individual mitochondria of living and healthy cells also undergo stochastic busts
of superoxide (i.e. ROS) production accompanied by a depolarization of the membrane potential by
transient mitochondrial permeability transition pore (mtPTP) opening. These “mitochondrial flashes”
(mitoflashes) are thought to be a possible result of acceleration in proton pumping, triggered by the
initiation of mitochondrial fusion and / or changes in ion homeostasis. Mitoflashes last for
approximately 10 sec, require an intact ETC and respiratory function and may provide signalling
ROS.51,52 Mitoflashes are not a respiratory by-product but an active process induced by metabolic
stimuli and stressors at the expense of Δψµ collapse and NADH and FADH2 pool depletion.52
Mitoflash frequency can for example be increased by glucose, H2O2 and mitochondrial Ca2+.53 These
events are evolutionary conserved and have been shown to be positively involved in oxidative stress
induced apoptosis and mitoflash frequencies in fact correlate inversely with C. elegans life span.52–54
The role of superoxide versus pH in mitoflashes is still a topic of heated debate and not easily
separated. 51,52,55,56 In a very recent paper EFhd1 has been shown to be a positive regulator of
mitoflashes by overexpression and knock-down in HeLa cells.57
Introduction
10
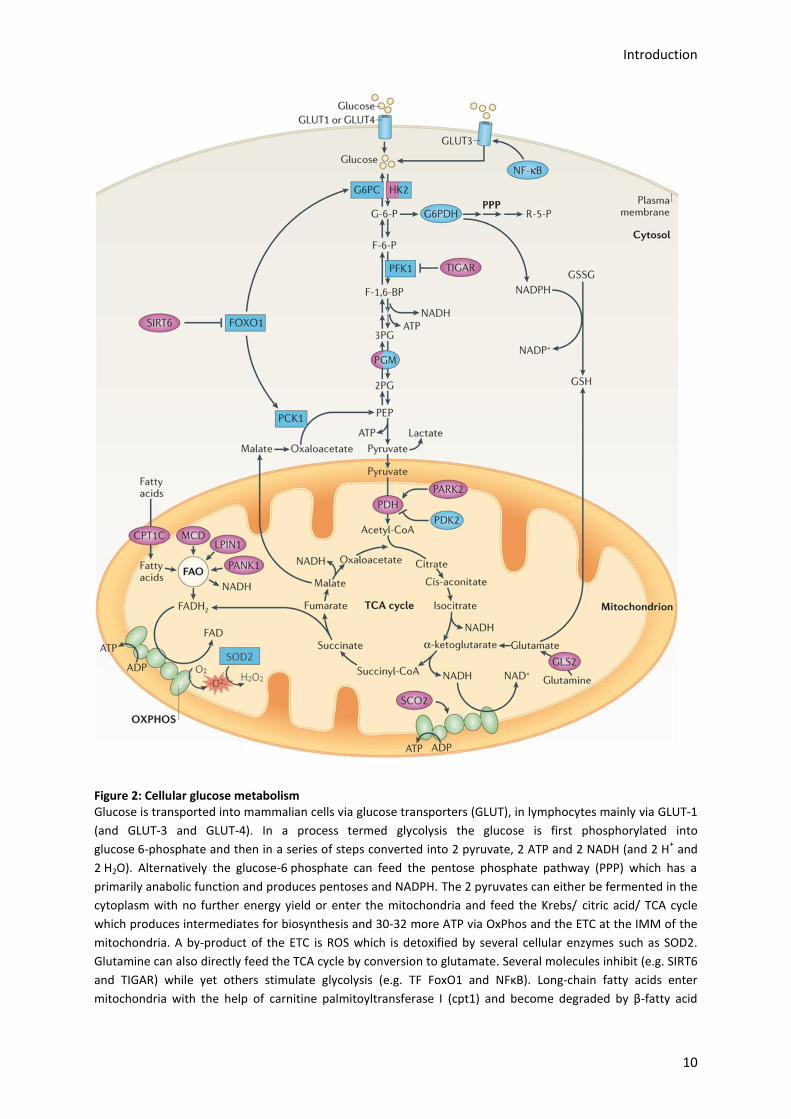
Figure 2: Cellular glucose metabolism Glucose is transported into mammalian cells via glucose transporters (GLUT), in lymphocytes mainly via GLUT-1
(and GLUT-3 and GLUT-4). In a process termed glycolysis the glucose is first phosphorylated into
glucose 6-phosphate and then in a series of steps converted into 2 pyruvate, 2 ATP and 2 NADH (and 2 H+ and
2 H2O). Alternatively the glucose-6 phosphate can feed the pentose phosphate pathway (PPP) which has a
primarily anabolic function and produces pentoses and NADPH. The 2 pyruvates can either be fermented in the
cytoplasm with no further energy yield or enter the mitochondria and feed the Krebs/ citric acid/ TCA cycle
which produces intermediates for biosynthesis and 30-32 more ATP via OxPhos and the ETC at the IMM of the
mitochondria. A by-product of the ETC is ROS which is detoxified by several cellular enzymes such as SOD2.
Glutamine can also directly feed the TCA cycle by conversion to glutamate. Several molecules inhibit (e.g. SIRT6
and TIGAR) while yet others stimulate glycolysis (e.g. TF FoxO1 and NFκB). Long-chain fatty acids enter
mitochondria with the help of carnitine palmitoyltransferase I (cpt1) and become degraded by β-fatty acid
Introduction
11
oxidation (FAO) before products enter the ETC. [picture used with permission from source 58 and modified by
adding the ROS detoxification pathway by SOD2].
The two alternative metabolic fates of pyruvate, cytoplasmic or mitochondrial utilization, have
individual benefits and draw backs. One the one hand mitochondrial OxPhos has a high energy yield
(30- 32 ATP)39 but it requires the presence of oxygen (O2), a mitochondrial membrane potential
(Δψµ) and numerous enzymes which also take energy to uphold and OxPhos furthermore produces
ROS from O2 as a respiratory by-product which in high concentrations can be genotoxic. ROS and
other reactive species can be produced endogenously by the cell or exogenously (e.g. by ionizing
radiation). Mitochondrial complexes I and III of the electron transport chain (ETC) are the major
sources of endogenous ROS generation.59,60,61 Other cellular ROS generators include NADPH oxidases
(NOX) at the plasma membrane (particularly important in activated neutrophils) but also
monooxygenases in the ER and lipooxygenases in peroxisomes and several other enzymes.60,61 The
three cellular ROS species are superoxide anions (·O2-) which are the precursors of hydrogen
peroxide (H2O2) and hydroxyl radicals (·OH). ROS at high levels can cause oxidative stress to cells by
directly inducing single- and double-strand DNA breaks but also by oxidizing fatty acids (FA) or amino
acids (AA) in proteins and by oxidizing co-factors which can deactivate their enzymes.62 Cells have
therefore acquired a potent machinery to counteract oxidative stress and express many enzymes to
detoxify ROS. For example superoxide dismutases (SOD) convert·O2- into O2 and H2O2. SOD2 is the
mitochondrial manganese containing form of this enzyme. Catalases further break down H2O2 into O2
and H2O. Other reducing enzymes are gluthathione peroxidases and mitochondrial peroxiredoxins. It
has emerged that ROS are not only harmful exogenous molecules or by-products of respiration. At
low levels ROS are involved in important cell signaling mechanisms. In stem cells ROS signaling
ensures cycling of the cells.62 The main ROS species involved in intracellular signaling is H2O2 as it has
a long half-life and diffuses easily.62 Signaling can occur by AA oxidation, most prevalently at cysteine
residues.62 Numerous proteins are redox sensors and the oxidation of cysteine in Sirt1 and Pten but
also Akt inactivates them.62
Energy produced via glycolysis and then fermentation of the 2 pyruvates to lactate in the cytoplasm
has a much lower energy yield (2 ATP from glycolysis only) compared to mitochondrial respiration
but this energy is more rapidly available than the ATP produced by OxPhos. Mitochondrial respiration
is also never one hundred percent coupled to ATP production. In fact a substantial amount of energy
in mitochondria is lost as heat under the influence of basal and induced proton leak by uncoupling
proteins (fig. 3) (reviewed in 63). The conversion of pyruvate to lactate does not require O2 but is still
utilized in its presence by robust proliferating cells (Warburg effect).64 During DNA replication this has
the putative benefit of less ROS production and more genetic stability which arguably trumps the
energy economy in situations where substrate is not limiting.65,66 Especially the mtDNA is located
Introduction
12
close to the site where ROS are produced and hence prone to genotoxic insults. Furthermore
glycolysis yields NADH while NADPH and macromolecules needed for DNA replication can then be
produced via the pentose phosphate pathway (PPP).65 Glycolysis may therefore be an actively
induced metabolic program to meet the energy demand of cells in stressful conditions. Th17 and Th1
cells for example undergo a metabolic switch towards aerobic glycolysis when activated. 67,66 Tregs and
naïve T cells in comparison utilize more OxPhos and lipid oxidation.66,67 B and T lymphocytes are
metabolically distinct. In contrast to T cells, B cells undergo broad metabolic reprogramming upon
activation and equally upregulate glycolysis and OxPhos.34 This allows for a more flexible metabolism.
B cells do, however, rely on sustained glycolytic flux to proliferate and produce antibodies.34 It was
also shown that anergic B cells are metabolically suppressed while B cell activating factor of the TNF
family (BAFF, an important B cell survival factor) transgenic B cells are already primed for the
metabolic activation.34 Resting B cells rely more heavily on fatty acid oxidation.34
By weight, fatty acids compared to carbohydrates and proteins carry the highest amount of energy.
Dietary lipids, triacylglycerols, are mobilized in cells by the degradation into fatty acids and glycerol.39
Long-chain fatty acids then become activated and enter mitochondria via conjugation to carnitine.
This step is catalysed by carnitine palmitoyl transferase I (cpt1) in the outer mitochondrial membrane
(OMM).39 The acyl group of the fatty acid is transferred from the sulphur atom of CoA to the hydroxyl
group of carnitine to form acyl-carnitine.39 The acyl-carnitine can enter mitochondria with the help of
a translocase. In the mitochondria, the acyl group transfer is reversed by the carnitine palmitoyl
transferase II (cpt2). Saturated acyl-CoA are then β-oxidized to yield FADH2, NADH, and acetyl CoA
and enter the citric acid cycle.39 The metabolism of unsaturated or saturated fatty acids with an odd
number of carbons requires small alterations.39
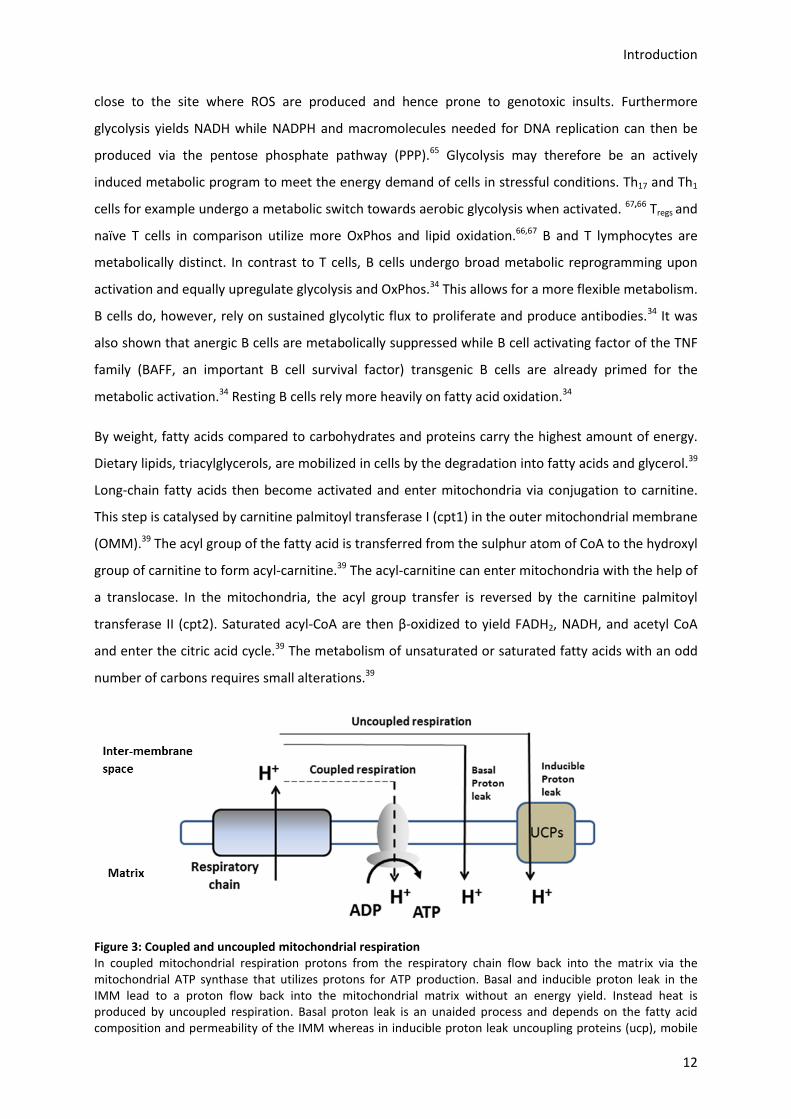
Figure 3: Coupled and uncoupled mitochondrial respiration In coupled mitochondrial respiration protons from the respiratory chain flow back into the matrix via the mitochondrial ATP synthase that utilizes protons for ATP production. Basal and inducible proton leak in the IMM lead to a proton flow back into the mitochondrial matrix without an energy yield. Instead heat is produced by uncoupled respiration. Basal proton leak is an unaided process and depends on the fatty acid composition and permeability of the IMM whereas in inducible proton leak uncoupling proteins (ucp), mobile
Introduction
13
proton carriers, are produced. Their expression depends on the cell type and can be upregulated if ATP demand is low and heat needed (e.g. in animals during hibernation) or if substrate is not limited. [picture adapted from the open-access source
63]
In addition to their function in ATP production, mitochondria in concert with the endoplasmic
reticulum (ER) act as a Ca2+ sink and regulator of cytosolic Ca2+ by buffering and releasing Ca2+. While
the outer mitochondrial membrane (OMM) is freely permeable, the inner mitochondrial membrane
(IMM) acts as a barrier for ions.68 Ca2+ homeostasis and signaling play a crucial role in cellular
metabolism and survival but also programmed cell death decisions.68 Ca2+ concentrations above a
certain threshold lead to activation of the intrinsic apoptosis pathway by mitochondria.
Mitochondrial ROS and Ca2+ signaling are interconnected (reviewed in 68). ROS can increase
mitochondrial permeability to Ca2+.68 Furthermore ROS generating systems in the cell can be sensitive
to Ca2+. Calcium ions can directly increase ROS production as Ca2+ stimulates ATP synthesis by
increasing ROS generating and Krebs cycle enzymes and enhancing OxPhos.68 Increased O2
consumption and metabolic rate also leads to an increase in leakage of electrons of the
mitochondrial respiratory chains and thus increased ROS levels.68 Mitochondrial Ca2+-binding
proteins, of which EFhd1 investigated in this thesis is one, add another interesting regulatory feature
to the equation. Several factors have an antioxidant effect and dampen ROS production. For example
mitochondrial Sirt1, a NAD+-dependent deacetylase which removes acetyl molecules from acetylated
proteins, reduces ROS leakage when activated.69
3.2.1.) Glucose metabolism in cancer
Otto Warburg observed, more than 70 years ago, that many tumors produce excess lactate even in
the presence of O2.64 This became known as the ‘Warburg effect’ (aerobic glycolysis) which he
interpreted as mitochondrial dysfunction.40 This metabolic effect can also be observed in virus
infected cells.70 Recent findings have led to a more detailed yet more confusing picture. Glycolysis is
prevalent in undifferentiated and functionless cells such as the early embryo, stem cells and some
cancer cells.64 Nevertheless the metabolism of cancer cells is very varied and can acquire 0,3- 64% of
its ATP from glycolysis.71 Often glycolysis is also caused by the Pasteur- and not Warburg effect and is
due to the hypoxic milieu of the tumor.71 Mutations in the mtDNA are frequent in cancers but
functional mitochondria are nonetheless important. Removal of mtDNA from cancer cells results in
decreased growth and tumor formation.40 In CLL enhanced mitochondrial biogenesis, OxPhos and
ROS production but also adaptation to oxidative stress via HO1-TFAM has been reported.72 High
levels of OxPhos and healthy mitochondria are also found in some breast cancers where high ROS
levels are also positively correlated with metastasis.73 A subset of cancer cells- which is difficult to
eradicate, shares some features with stem cells and leads to long term relapse-has been termed
cancer stem cells (CSC). To complicate things further, in breast cancer these CSC were shown to rely
Introduction
14
strongly on fermentative glycolysis (i.e. Warburg effect) and have upregulated factors protecting
them from oxidative stress.73 One of the most frequent dysregulations in cancers is the activation of
the PI(3)K-Akt pathway which in turn activates mTOR and increases glycolysis by enhanced
expression of glucose receptors, glycolytic but also lipogenesis genes.40 The PI(3)K-Akt pathway also
stimulates the rate limiting enzymes phosphofructokinase and hexokinase to drive glycolysis.40 Akt
additionally acts as a pro-survival factor by maintaining mitochondrial Δψµ and increasing ATP levels.
P53 is one of the most important tumor suppressor genes and is frequently inactivated in cancer
cells. In addition to being a regulator of apoptosis and cell cycle control, p53 has recently emerged as
a factor involved in the control of respiratory and glycolytic pathways and ROS production.74 Via
activation of TIGAR and SCO2 and inhibition of PGM, p53 is able to increase mitochondrial respiration
and decrease glycolysis.74 In other contexts, however, p53 activation can limit mitochondrial
respiration and even induce cellular senescence. Excessive shortening of chromosomal telomeres
activates p53 which then inhibits the transcription of PGC-1α and PGC-1β which results in diminished
mitochondrial function.40
The environment is of critical importance to cancer cells and a lot of late research has focused on the
metabolic interaction of malignant cells with the surrounding tissue and the recruited immune cells.
T lymphocytes have been shown to be metabolically restricted and their effector functions reduced
by cancer cells with a high glucose consumption.75 Cancer cell ROS production has also been shown
to inactivate caveolin 1 in adjacent stromal fibroblasts. This increases mitophagy, reduces
mitochondrial function and enhances lactate production in these cells. Secreted fibroblast lactate
then fuels cancer cell metabolism, which drives tumour growth and proliferation. This is known as
the ‘reverse Warburg effect’.40
3.2.2.) The PPAR family of TF and co-regulators
Human peroxisome proliferator-activated receptor gamma (PPARγ) was first cloned from the BM.76 It
belongs to a family of PPAR TFs. Three TF subtypes PPARα, β/δ and γ are known with differential
tissue distribution and ligand requirements. Upon ligand binding co-repressors are released and
co-activators recruited to initiate transcription. PPAR TFs are master regulators with a pleiotropic
effect on metabolism. PPARγ is expressed in B and T lymphocytes and BM precursors as well as
macrophages, where it supresses inflammatory reactions.22 PPARγ stabilizes the Δψµ and is
upregulated during T cell activation.77 Low dose PPARγ ligands lead to enhanced survival upon
cytokine deprivation of the pro-B cell line FL5.12 by stimulating ATP production, upregulating ucp2
and supressing ROS production.77 These effects are mitochondria and OxPhos dependent as they can
be abolished by FCCP and oligomycin.77 High expression of PPARγ is found in many lymphomas as
well as carcinomas and breast cancers.77,78 PPARγ has also been implicated in the development of
Introduction
15
cancer but depending on the cancer type has either pro- or anti-neoplastic effects. Increased
proliferation and survival was shown for LPS or IgM stimulated B cells from PPARγ heterozygous
deficient mice (homozygous deletion is embryonically lethal).79 This was attributed to IκBα
phosphorylation and NFκB activation, occurring even in unstimulated heterozygously deleted PPARγ
cells.79 Also the subtype PPARα was found to inhibit NFκB by induction of the inhibitory protein IκBα.
One of the co-regulators of PPARγ and PPARα is the mitochondrial peroxisome proliferation-
activated receptor-γ (PPARγ)-co-activator 1α, PGC-1α (encoded by the gene ppargc1a). PGC-1α
activates mitochondrial biogenesis in adult skeletal and heart muscle as well as in the liver.80 PGC-1α
has therefore been put forwards as a potential target in alcoholic liver disease.81 PGC-1α is, however,
not important in homeostatic mitochondrial maintenance. 80 Expression of PGC-1α induces many
nuclear encoded mitochondrial genes, including those for OxPhos and antioxidant defences e.g.
sod2, sod1, gpx1, ucp1 and ucp2.40,78,82,83 PGC-1α has been shown to directly interact with the
transcriptional partners PPARα, PPARγ, ERα, HNF4α and FoxO1 (reviewed in 80). PGC-1α is also found
in mitochondria where it forms nucleoid associated structures together with Sirt1 and mitochondrial
transcription factor A. Interestingly co-activator PGC-1α has three IRES which are bound by
dephosphorylated FoxO1, increasing ppargc1a transcription.40 PGC-1α also increases angiogenesis
and formation of neuromuscular junctions.84,85
PGC-1α overexpression in HeLa cells increases mitochondrial mass but decreases local mitochondrial
calcium accumulation due to the larger mitochondrial size but also directly by reduced Ca2+ uniporter
activity.86 In accordance PGC-1α overexpression protects against Ca2+ mediated apoptosis by the
intrinsic pathway.86 PGC-1α is required for proper expression of the calcium signal modulator
parvalbumin in several tissues.87 Interestingly in parvalbumin deficient mice several mitochondrial
proteins, among them Efhd1 were found to be upregulated in order to be able to uphold the
electrochemical potential across the mitochondrial membrane.88 In fast-muscle fibres there is an
inverse regulation of mitochondrial mass and parvalbumin by the PGC-1α-Sirt1 axis. The family of
PGC-1 co-activators in addition to PGC-1α consists of PRC and PGC-1β. PGC-1β in contrast to PGC-1α
has a longer half-life and appears not to be as strongly induced by external stimuli but is rather
involved in homeostatic metabolic control. In many cases PGC-1α and PGC-1β show a similar
expression pattern and have redundant binding partners. But PGC-1β participates more in
maintenance of basal mitochondrial function and especially in the liver PGC-1α and PGC-1β are
regulated by different cues.80
Introduction
16
3.3.) Calcium binding EF-hand proteins
A helix-loop-helix motif with Ca2+-binding properties was first described in the protein parvalbumin
by R.H. Kretsinger in the 1970s and termed “EF-hand”.89 It has since been established that proteins
with such calcium-binding EF-hand domains (consensus sequence: X, Y, Z, -Y, -X, -Z) are commonly
found in many cellular compartments of eukaryotic cells and are typically calcium buffers or sensors.
242 such proteins have been detected in the human genome.90 Ca2+-binding EF-hand proteins are
involved in signaling events and become activated by binding to intracellular calcium ions.91 These
proteins have exclusive Ca2+-binding or mixed Ca2+/ Mg2+-binding sites.91 The main cellular calcium
stores are the ER and mitochondria. Upon Ca2+-binding, EF-hand proteins undergo conformational
changes which allow specific interaction with and modulation of their targets.92 Paired EF-hand
motifs with even numbers are a key-feature of most of these proteins.91,92 Of note absence of one of
the EF-hand calcium-binding proteins does not generally lead to the compensatory upregulation of a
related family member.91 In our working group the EF-hand protein Swiprosin-1 / EFhd2 (EFhd2) was
identified in lipid rafts of B lymphocyte WEHI231 cells by sucrose-density gradient centrifugation.93
Characterization of this protein indicated that it is a positive regulator of splenic tyrosine kinase (Syk)
after B-cell receptor (BCR) stimulation.94 In vitro EFhd2 was also found to positively regulate BCR-
induced and spontaneous apoptosis.95 A EFhd2 knock-out mouse finally revealed that lacking the
EFhd2 protein leads to increased humoral immune responses when the mice were challenged with
T cell dependent antigens.96,97 A likely mechanism is the interaction of EFhd2 with the actin
cytoskeleton.98,99 EFhd2 is also highly expressed in the brain and involved in Alzheimer’s disease and
tauopathies.100–102 Homology studies confirmed the existence of a second related protein to EFhd2,
namely Swiprosin-2 / EFhd1 (EFhd1). The two proteins share 64,58% sequence at the protein level
and have almost identical C-termini (fig. 4).103,104 EFhd1 and EFhd2 show difference only in a stretch
of 60 amino acids in front of their EF-hands (AA 20-80 of EFhd2).103 EFhd1, in contrast to EFhd2, is
only present in organisms from the Euteleostomi taxon onwards and therefore likely the result of a
gene duplication of EFhd2 during evolution.103
3.3.1) Swiprosin-2/ EFhd1
The protein EFhd1, also known as Swiprosin-2 or Mitocalcin / Mytocalcin, is a calcium-binding
adaptor protein with a predicted molecular mass of 27 kDa.105,103 EFhd1 was first described in the
neuronal progenitor, 2Y-3t, cell line under the name of mitocalcin.105,106 In this publication the
protein was primarily found in the inner mitochondrial membrane.105 Human efhd1 is located on
chromosome 2 (murine efhd1 on chromosome 1) and five coding EFhd1 splice variants are predicted
with sizes of 81-239 aa.103. In mouse tissue EFhd1 is expressed in the brain (especially in the
cerebellum), as well as in the kidney, muscle (skeletal and heart) and the reproductive system.107,106
Introduction
17
All of these tissues have elevated energy demands and high mitochondrial content. In the brain
EFhd1 expression increases during neuronal development after birth.106 Interestingly in distal
convoluted tubule cells of the kidney efhd1 is upregulated in mice lacking parvalbumin which
normally acts there as a slow-onset Ca2+ buffer.88 Furthermore in addition to efhd1, uncoupling
protein 2 (ucp2), mitochondrial calcium uptake 1 (micu1), mitochondrial calcium uniporter (mcu),
mitochondrial calcium uniporter regulator 1 (mcur1), cytochrome c oxidase subunit 1 (cox1) as well
as ATP synthase subunit β (atp5b) are upregulated in parvalbumin deficient cells. The authors
suggest that mitochondria of parvalbumin deficient cells upregulate these genes as a counterbalance
mechanism to be better suited to uphold the electrochemical potential across the mitochondrial
membrane which is also necessary for mitochondrial Ca2+ uptake. In fact an inverse relationship of
parvalbumin expression and mitochondrial biogenesis is described and ectopic parvalbumin
expression in MDCK cells leads to a decrease in CoxI and mitochondrial mass.88
EFhd1 was also identified as a schizophrenia susceptibility locus.108 It has moreover been published
as an interaction partner of presenilin-1 (PS1) in mitochondria, a protein with an important
regulatory function in Alzheimer disease onset.109 Interestingly presenilins have been shown to be
enriched in endoplasmic reticulum (ER) membranes associated with mitochondria, a compartment
particularly involved in glucose, lipid, cholesterol, and Ca2+ homeostasis.110
Introduction
18
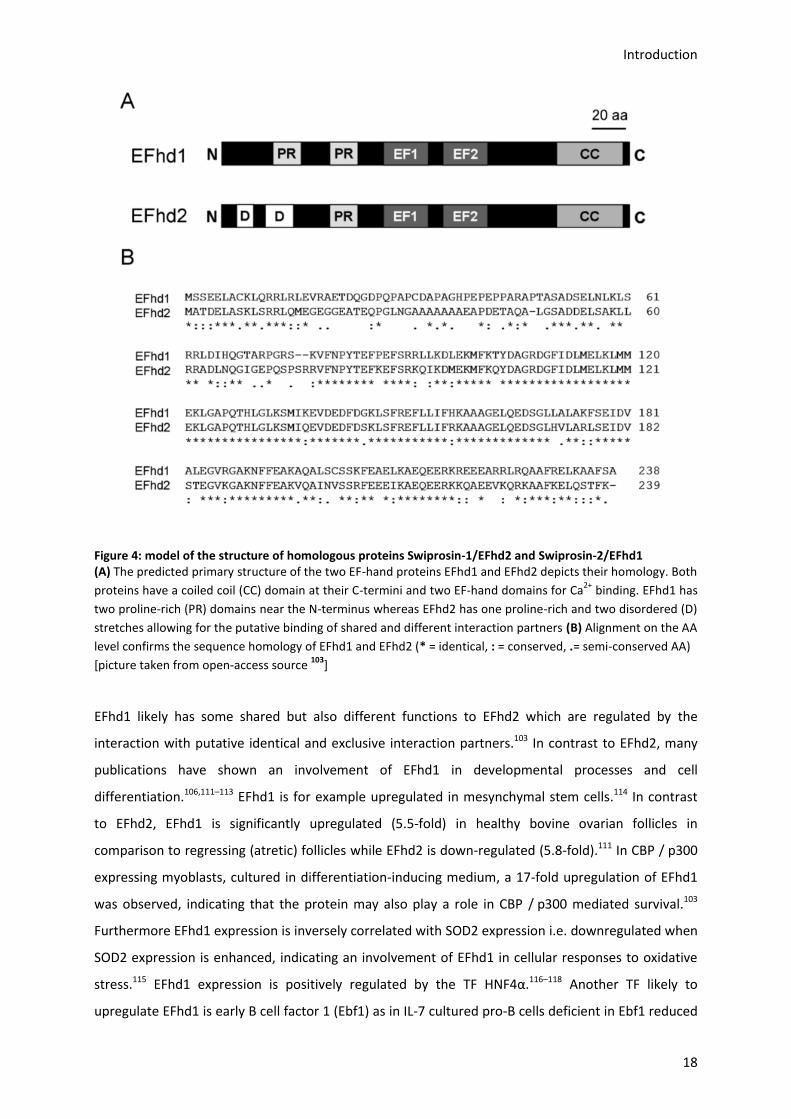
Figure 4: model of the structure of homologous proteins Swiprosin-1/EFhd2 and Swiprosin-2/EFhd1 (A) The predicted primary structure of the two EF-hand proteins EFhd1 and EFhd2 depicts their homology. Both
proteins have a coiled coil (CC) domain at their C-termini and two EF-hand domains for Ca2+
binding. EFhd1 has
two proline-rich (PR) domains near the N-terminus whereas EFhd2 has one proline-rich and two disordered (D)
stretches allowing for the putative binding of shared and different interaction partners (B) Alignment on the AA
level confirms the sequence homology of EFhd1 and EFhd2 (* = identical, : = conserved, .= semi-conserved AA)
[picture taken from open-access source 103
]
EFhd1 likely has some shared but also different functions to EFhd2 which are regulated by the
interaction with putative identical and exclusive interaction partners.103 In contrast to EFhd2, many
publications have shown an involvement of EFhd1 in developmental processes and cell
differentiation.106,111–113 EFhd1 is for example upregulated in mesynchymal stem cells.114 In contrast
to EFhd2, EFhd1 is significantly upregulated (5.5-fold) in healthy bovine ovarian follicles in
comparison to regressing (atretic) follicles while EFhd2 is down-regulated (5.8-fold).111 In CBP / p300
expressing myoblasts, cultured in differentiation-inducing medium, a 17-fold upregulation of EFhd1
was observed, indicating that the protein may also play a role in CBP / p300 mediated survival.103
Furthermore EFhd1 expression is inversely correlated with SOD2 expression i.e. downregulated when
SOD2 expression is enhanced, indicating an involvement of EFhd1 in cellular responses to oxidative
stress.115 EFhd1 expression is positively regulated by the TF HNF4α.116–118 Another TF likely to
upregulate EFhd1 is early B cell factor 1 (Ebf1) as in IL-7 cultured pro-B cells deficient in Ebf1 reduced
Introduction
19
EFhd1 expression was observed.119 EFhd1 mRNA is downregulated, on the other hand by Suz12 as
part of the PRC2 (polycomb repressor complex 2) in murine terato-carcinoma cells.120
EFhd1 is upregulated in human PBMCs isolated from the peritoneum of patients dialysed with
glucose-based dialysis fluids in contrast to icodextrin-based fluids.121 The protein has furthermore
been identified as a gene locus associated with liver enzyme (ALT, ALP, GGT) concentration in
plasma.122 As briefly mentioned before EFhd1 has recently been published to be an activator of
mitoflashes under high glucose, ionomycin or calcium stimulation.57 Interestingly ROS levels were
unaltered in EFhd1 overexpressing or knock-down HeLa cells. Mitochondrial membrane potential
was slightly, but not significantly, enhanced by knock-down or overexpression.57 The enhancement of
mitoflash activity was shown to be dependent on the two EF-hand domains of EFhd1 and sensitized
cells to enhanced mitoflash frequency under Ca2+ elevations without affecting mitochondrial calcium
levels.57 Seahorse measurements of EFhd1 overexpressing and knock-down cells indicated no
statistical difference in their metabolism (ATP coupled OCR, max OCR and proton leak). In the OCR
curves, however, a steeper decrease in EFhd1 overexpressing cell after oligomycin addition is
observed and ATP coupled OCR values correlate with EFhd1 expression levels also in knock-down
cells, albeit not significantly.57 The importance of EFhd1 in cellular metabolism is confirmed by its
aberrant expression in many cancers. In renal cell carcinoma EFhd1 expression is repressed.118,117
EFhd1 is upregulated, however, in a subset of highly malignant melanomas with elevated
mitochondrial metabolism and increased expression of PGC-1α.123 In stage III and IV metastatic
melanoma, increased expression of EFhd1 has moreover been linked to decreased survival rates.124
In contrast, promoter methylation i.e. putative silencing of EFhd1 has been suggested as a marker for
colorectal cancer.125 EFhd1 is upregulated in adenocarcinoma cells from breast in contrast to lung
origin126 and has been patented as a breast cancer marker [Roche Diagnostics GmbH, Patent
WO/2005/040807]. Interestingly EFhd1 has also been co-immunoprecipitated with estrogen receptor
alpha (ERα) from ERα transfected HEK 293T cells.127 This is of potential importance as B cell
homeostasis is altered in pregnancy and β-estradiol (E2)-engagement of ERα actually leads to
decreased BM B cell output. In fact E2 treatment decreases Rag1 mRNA and selectively depletes
large and small pre-B cells.128 This appears to be both a B cell intrinsic response to E2 and caused by
E2-mediated reduction of IL-7 secretion by stromal cells.129,130 Engagement of ERα, however,
increases marginal zone B cells in mouse and human.131 ERα also reduces BCR signals, increases CD22
expression and is a trigger for autoimmunity e.g. SLE and multiple sclerosis.131,132,133 Moreover ERα is
known to be involved in glucose homeostasis and is a transcriptional interaction partner of
PGC-1α.134,80 ERα-/- mice (irrespective of their sex) become obese as they age and develop glucose
intolerance and insulin resistance.135,136
Introduction
20
EFhd1 is also differentially regulated in three basal like (triple-negative) breast cancer cell lines
against three luminal (ER+) cell lines.137 EFhd1 is one of the genes upregulated for a robust oncogenic
signature in gynecological cancers.138 Interestingly many of these signature genes are shared not only
by cancer cells of other cellular origin (breast, lung and prostate) but also by embryonic stem cells.138
In a systematic lung cancer screen efhd1 was found to be downregulated in COPI (responsible for
retrograde protein transport from Golgi to ER and for lysosome acidification) dependent cancer cell
lines together with some other genes mirroring the claudin-low signature, a mesenchymal subtype of
triple negative breast cancer, where efhd1 is also differentially downregulated.139 Interestingly efhd1
is upregulated in BCR-ABL1 transformed cell lines of hematopoietic tumor prone Cdk4 R/R, Cdk6 R/R
mice.140. Knock-in of the two INK4 unresponsive cyclin-dependent kinases leads to a decrease of cells
in the G0 / G1 phase and an increase of cells in G2 / S/ M without increased apoptosis.140 In these
double mutant mice Hardy fraction C is significantly increased while earlier fractions show a
decrease.140
In conclusion a wealth of correlative data indicates an involvement of EFhd1 in cancer and
differentiation processes but so far functional data is sorely missing. Also relatively little is known
about the role of EFhd1 in the immune system and its function in B lymphocytes. In his PhD thesis
Sebastian Dütting in our group showed that EFhd1 is expressed in pro-B cells but downregulated by
µHC expression on the cell surface.107 This downregulation of EFhd1 by the pre-BCR was also
independently confirmed in a transcriptome analysis of primary B lymphoid precursors.141
Furthermore efhd1 mRNA was found to be 12.34-fold decreased in pro-B cells deficient for the
chromatin remodeler Brg1 which controls pro-B cell growth and prevents premature pre-B cell
differentiation highlighting again the pro-B cell stage specificity of the protein.142 Rag1 mRNA was
shown to be upregulated by S. Dütting upon ectopic expression of EFhd1 in pro-B cells and EFhd1
transfected B cells were slower in downregulating the pro-B cell marker c-Kit in culture suggesting
that pre-B differentiation was decelerated.107 Stefanie Krieg a diploma student in our group observed
a co-localization of EFhd1 with FoxO1 in the cytoplasm and nucleus of transfected cells and could
co-immunoprecipitate FoxO1 and endogenous EFhd1 from 293T cells which suggests an interaction
of these two proteins. FoxO1 has in fact been described to be involved in the upregulation of efhd1
at the pro- to pre-B cell transition. When AMuLV-transformed FoxO1f/f / ER-Cre and tamoxifen
treated (i.e. FoxO1-/-) pro-B cells were reconstituted with exogenous FoxO1, efhd1 was found to be
more than 2.5 fold (Log2 -1,370) upregulated. This upregulation was independent of a S215A
mutation in FoxO1 which did abolish rag2 and aicda upregulation.22
Aim and scope of this work
21
4.) Aim and scope of this work
During their early development B lymphocytes face many internal and external cues such as
immunoglobulin rearrangement and pre-BCR signalling but also cytokine, oxygen and nutrient
gradients which they need to integrate in order to proliferate and become quiescent at the right time
to develop into functional and metabolically fit cells but avoid lymphoma formation. The first goal of
this thesis was therefore to provide a characterization of mitochondrial metabolism in pro- and pre-B
cells and analyse differentiation stage specific adaptations. Moreover I also wanted to identify
further players involved in a putative pre-BCR metabolic checkpoint. The protein EFhd1 has first been
described in the IMM of a neuronal cell line.105,106 At the beginning of this thesis it was known, that in
the immune system and B lymphocytes in particular, EFhd1 is expressed during the pro-B cell stage
and then downregulated by cell surface expression of the pre-BCR. EFhd1 has been shown to be a
target gene of the TFs FoxO1 and Ebf1 and also to be upregulated by the chromatin remodeler Brg1,
highlighting the pro-B cell specific expression of this protein. EFhd1 was also found to be upregulated
together with other mitochondrial proteins in parvalbumin deficient renal cells to ensure stability of
their Δψµ.88 EFhd1 is upregulated together with PGC-1α in aggressive melanoma subtypes with
enhanced mitochondrial metabolism 123 The protein has also been implicated in ROS-mediated
cellular stress responses.103 EFhd1 is furthermore a frequently dysregulated gene in different cancers
often with neoplastic but potentially also anti-neoplastic effects depending on the cancer
type.117,118,123¯126,137¯140 While writing this thesis, a publication showed that EFhd1 is involved in
enhancing Ca2+ induced mitoflashes, brief mitochondrial respiration disrupting events. The location
of the protein and correlative data collectively strongly suggest an involvement of the protein in
redox-sensitive proliferation, survival and differentiation processes. The second goal of this PhD
thesis was therefore to determine whether and how EFhd1 is involved in the regulation of
mitochondrial activity and more specifically to find out whether EFhd1 expression in pro-B cells has a
functional role in establishing a defined mitochondrial metabolic program in pre-B cells. Ectopic
expression of EFhd1 in pre-B cells may disturb the metabolic pre-BCR checkpoint. I therefore wanted
to investigate the effect of ectopic EFhd1 expression beyond the pro-B cell stage on mitochondrial
metabolism in an existing EFhd1tg mouse model, were the protein is expressed in all lymphocytes.
I also wanted to generate an EFhd1-/- mouse model to be able to analyse the role of EFhd1 expression
in pro-B cells and assess if the expression of the protein is important for further B lymphocyte
development.
Results
22
5.) Results
A metabolic checkpoint at the pre-B cell stage has previously been identified in mice deficient for
Fnip1.30 Fnip1, however, does not appear to be differentially regulated during the pro-/ pre-B cell
transition and the pre-BCR dynamic nature of its mediated metabolism remains to be elucidated.
Neither mitochondrial activity and metabolism, nor glycolysis have yet been comparatively assessed
in pro- and pre-B cells. Therefore, I first asked whether mitochondrial metabolism and glucose
uptake change during early B lymphocyte development in the murine BM, in particular at the
pre-BCR checkpoint.
5.1.) Analysis of mitochondrial activity and glucose uptake during early
B cell development in WT murine BM
C57BL/6 wild type (WT) mouse BM cells were first incubated with cell permeable markers for either
mitochondrial mass (MitoTracker Green FM), Δψµ (DIOC6; 3, 3′-dihexyloxacarbocyanine iodide),
cellular reactive oxygen species (DCFDA; 2’, 7’–dichlorofluorescin diacetate) or glucose uptake
(6-NBDG; (6-(N-(7-nitrobenz-2-oxa-1, 3-diazol-4-yl) amino)-6-deoxyglucose). MitoTracker Green FM is
utilized to specifically label mitochondrial proteins via mildly thiol-reactive chloromethyl moieties of
the dye. MitoTracker Green FM diffuses through the plasma membrane and is then selectively taken
up by active mitochondria irrespective of their Δψµ.143 Once inside, the dye is not washed out again.
MitoTracker Green FM is therefore used to semi-quantify mitochondrial mass when treating the
same number of cells with the same concentration of the dye for the same time. This also holds true
for the other cell permeable dyes. Increased MitoTracker FM staining can, however, either signify
more or larger mitochondria or more structured mitochondria i.e. increased protein content with
which the dye can react. This parameter is henceforth referred to as the mitochondrial mass of a cell.
In contrast to MitoTracker Green FM, the lipophilic and cationic fluorescent dye DiOC6 at low
concentrations specifically accumulates in mitochondria in relation to their Δψµ.144 The fluorogenic
dye DCFDA detects cellular ROS activity in cells where in lymphocytes the major source of ROS are
the two mitochondrial complexes I and III.59 Inside a cell, DCFDA is first deacetylated but does not
emit fluorescence until oxidized into DCF (2’, 7’-dichlorofluorescein).145 Of note the probe is not
selective for a particular ROS species but elicits a broad specificity particularly in the presence of
cofactors.145 The fluorescent glucose analogue 6-NBDG is used to directly track uptake of the
monosaccharide sugar into cells by incubating them in glucose free medium supplemented with
6-NBDG which is taken up instead of glucose and accumulates in the cells.146 The green fluorescence
emitted after excitation of all four metabolic markers can be measured by flow cytometry (fig. 5).
After incubation with the metabolic trackers, the isolated BM cells were washed and stained with
fluorescently-labeled antibodies against surface markers for pro- and pre-B cells and analyzed by
Results
23
flow cytometry.147 The median fluorescent intensity values (MdFI, more robust against outliers then
MFI) of the metabolic markers were normalized to pro-B cell fluorescence for better comparison
between different markers, cells and experiments. Analysis of WT mouse BM cells with MitoTracker
Green FM revealed that mitochondrial mass does not change significantly during B cell development
in the BM. In contrast, the Δψµ increases significantly from the pro- to the large pre-B cell stage but
drops again in small pre-B and more mature B cells (fig. 5b). This also goes in hand with the highest
amount of ROS in large pre-B cells (fig. 5b). A steep Δψµ can dampen electron transport and hence
increase mitochondrial ROS production.148 Interestingly, cellular glucose uptake similarly increases
from the pro- to the large pre-B cell stage and decreases again at the small pre-B but not mature B
cell stage. To exclude that these effects are caused by different sizes of the cells, the MdFI was
subsequently also normalized to the volume of the cells via the ratio of the cubic forward scatter
time of flight values (FS TOF i.e. pulse width) which is the preferable single parameter to evaluate cell
size rather than the height or area of FSc or SSc.149 After normalization to cell volume, the same
pattern emerged of significantly increased Δψµ, ROS or glucose uptake in large in contrast to small
pre-B and more mature B cells (fig. 5c). The increase from pro- to large pre-B cell stage was
nevertheless only still significant for the parameter of ROS. Strikingly after normalization to the cell
volume, the mitochondrial mass is actually significantly lower in large pre-B than pro-B cells. This
does not hold true for small pre-B cells. The mitochondrial mass is hence not altered proportionally
to the cell size. Large pre-B cells in comparison to pro-B cells have a more active mitochondrial
phenotype which appears to be at least partially fueled by glucose. The mitochondrial mass in these
very active large pre-B cells, however, is not increased but even reduced in relation to the cell
volume. These initial findings show that indeed a change in the mitochondrial metabolic program but
not mitochondrial biogenesis takes place from the pro-B to large pre-B cell stage and then again in
small pre-B cells but not in more mature B lymphocyte developmental stages.
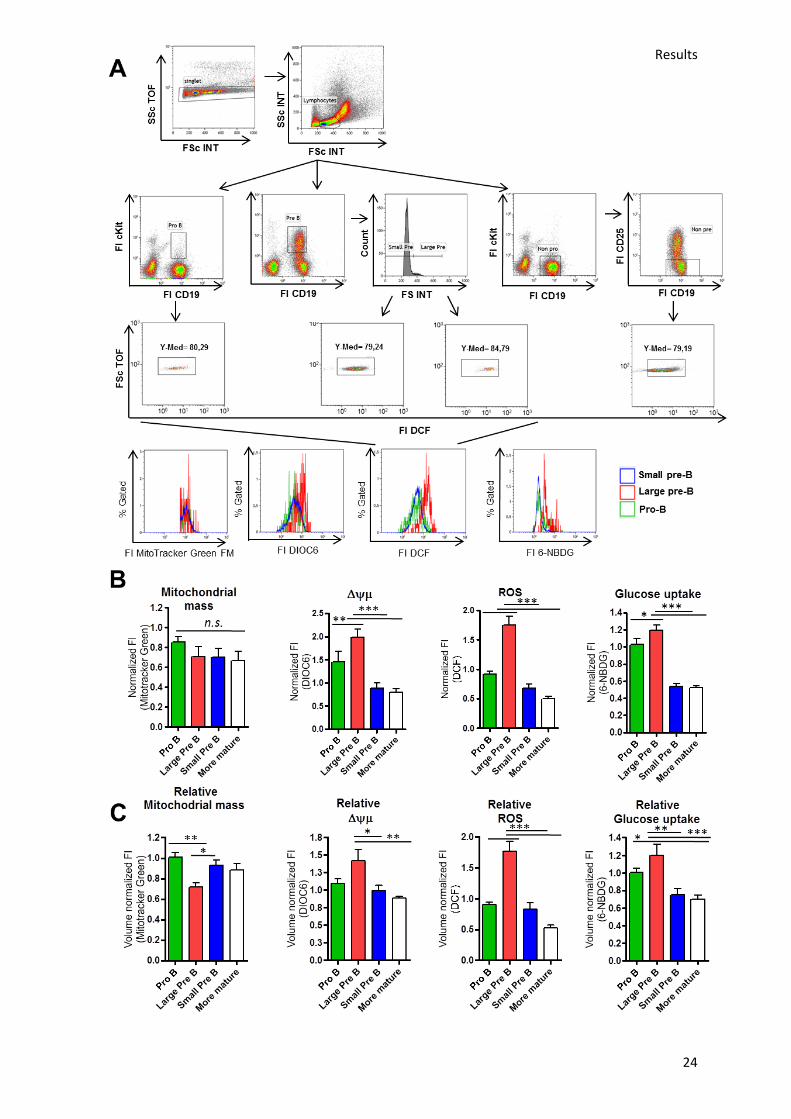
Results
24
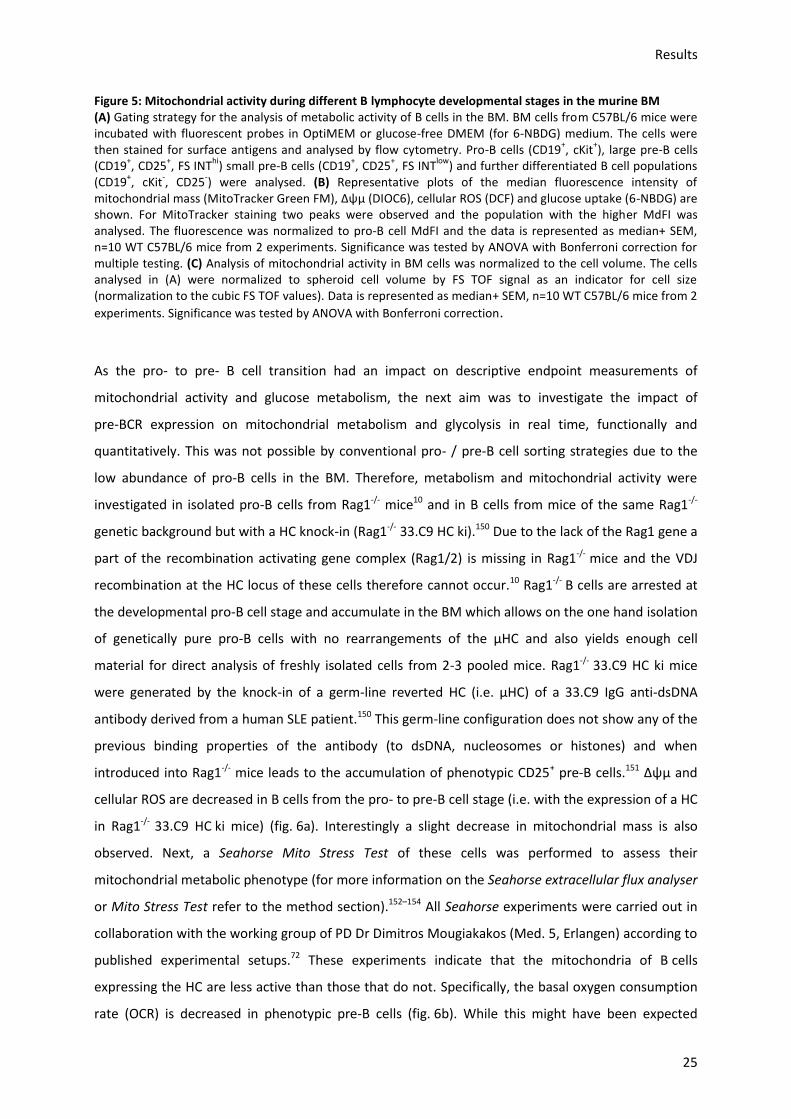
Results
25
Figure 5: Mitochondrial activity during different B lymphocyte developmental stages in the murine BM (A) Gating strategy for the analysis of metabolic activity of B cells in the BM. BM cells from C57BL/6 mice were incubated with fluorescent probes in OptiMEM or glucose-free DMEM (for 6-NBDG) medium. The cells were then stained for surface antigens and analysed by flow cytometry. Pro-B cells (CD19
+, cKit
+), large pre-B cells
(CD19+, CD25
+, FS INT
hi) small pre-B cells (CD19
+, CD25
+, FS INT
low) and further differentiated B cell populations
(CD19+, cKit
-, CD25
-) were analysed. (B) Representative plots of the median fluorescence intensity of
mitochondrial mass (MitoTracker Green FM), Δψµ (DIOC6), cellular ROS (DCF) and glucose uptake (6-NBDG) are shown. For MitoTracker staining two peaks were observed and the population with the higher MdFI was analysed. The fluorescence was normalized to pro-B cell MdFI and the data is represented as median+ SEM, n=10 WT C57BL/6 mice from 2 experiments. Significance was tested by ANOVA with Bonferroni correction for multiple testing. (C) Analysis of mitochondrial activity in BM cells was normalized to the cell volume. The cells analysed in (A) were normalized to spheroid cell volume by FS TOF signal as an indicator for cell size (normalization to the cubic FS TOF values). Data is represented as median+ SEM, n=10 WT C57BL/6 mice from 2
experiments. Significance was tested by ANOVA with Bonferroni correction.
As the pro- to pre- B cell transition had an impact on descriptive endpoint measurements of
mitochondrial activity and glucose metabolism, the next aim was to investigate the impact of
pre-BCR expression on mitochondrial metabolism and glycolysis in real time, functionally and
quantitatively. This was not possible by conventional pro- / pre-B cell sorting strategies due to the
low abundance of pro-B cells in the BM. Therefore, metabolism and mitochondrial activity were
investigated in isolated pro-B cells from Rag1-/- mice10 and in B cells from mice of the same Rag1-/-
genetic background but with a HC knock-in (Rag1-/- 33.C9 HC ki).150 Due to the lack of the Rag1 gene a
part of the recombination activating gene complex (Rag1/2) is missing in Rag1-/- mice and the VDJ
recombination at the HC locus of these cells therefore cannot occur.10 Rag1-/- B cells are arrested at
the developmental pro-B cell stage and accumulate in the BM which allows on the one hand isolation
of genetically pure pro-B cells with no rearrangements of the µHC and also yields enough cell
material for direct analysis of freshly isolated cells from 2-3 pooled mice. Rag1-/- 33.C9 HC ki mice
were generated by the knock-in of a germ-line reverted HC (i.e. µHC) of a 33.C9 IgG anti‐dsDNA
antibody derived from a human SLE patient.150 This germ-line configuration does not show any of the
previous binding properties of the antibody (to dsDNA, nucleosomes or histones) and when
introduced into Rag1-/- mice leads to the accumulation of phenotypic CD25+ pre-B cells.151 Δψµ and
cellular ROS are decreased in B cells from the pro- to pre-B cell stage (i.e. with the expression of a HC
in Rag1-/- 33.C9 HC ki mice) (fig. 6a). Interestingly a slight decrease in mitochondrial mass is also
observed. Next, a Seahorse Mito Stress Test of these cells was performed to assess their
mitochondrial metabolic phenotype (for more information on the Seahorse extracellular flux analyser
or Mito Stress Test refer to the method section).152–154 All Seahorse experiments were carried out in
collaboration with the working group of PD Dr Dimitros Mougiakakos (Med. 5, Erlangen) according to
published experimental setups.72 These experiments indicate that the mitochondria of B cells
expressing the HC are less active than those that do not. Specifically, the basal oxygen consumption
rate (OCR) is decreased in phenotypic pre-B cells (fig. 6b). While this might have been expected
Results
26
because small pre B cells are supposed to not divide anymore 7, it was interesting to note that also
the acidification of the assay medium (extracellular acidification rate, ECAR) was reduced but
proportionally less than the OCR (fig. 6c). These findings indicate that in pro-B cells without a HC,
relatively more glycolysis and less oxidative phosphorylation take place in comparison to pre B cells.
Concomitant with the expression of the HC, both OCR and ECAR are downregulated but shift in favor
of aerobic mitochondrial metabolism (OxPhos). The energy phenotype profile (OCR / ECAR) is
therefore increased in Rag1-/- 33.C9 HC ki cells-towards a more oxidative phenotype (fig. 6d). While
all other parameters from the Seahorse experiment (mitochondrial ATP production, spare capacity
for O2 consumption, non-mitochondrial respiration and proton leak) are decreased in Rag1-/-
33.C9 HC ki cells the mitochondrial coupling of these cells is enhanced, indicating that a higher
proportion of O2 is going into ATP production instead of into other respiratory processes. These less
active mitochondria therefore produce ATP more efficiently. In accordance with the mitochondrial
stains and the Seahorse data, a less active cell cycle profile is observed in Rag1-/- 33.C9 HC ki cells
which show an increased proportion of cells in G1 phase (cells with biosynthetic maintenance but no
division) and a decrease in the S and G2 / M (DNA replication and cell division) phases (fig. 6e). In
addition, when analyzing the size of the cells, it could be observed that the cells with a HC ki have on
average a slightly lower cell size, indicating that these cells are phenotypically more like resting small
pre-B cells (fig. 6f). Hence, whereas the reduction in metabolic activity parallels the reduction in cell
size, the metabolic phenotype does not and is shifted towards a more oxidative profile in
developmentally more advanced pre B cells.
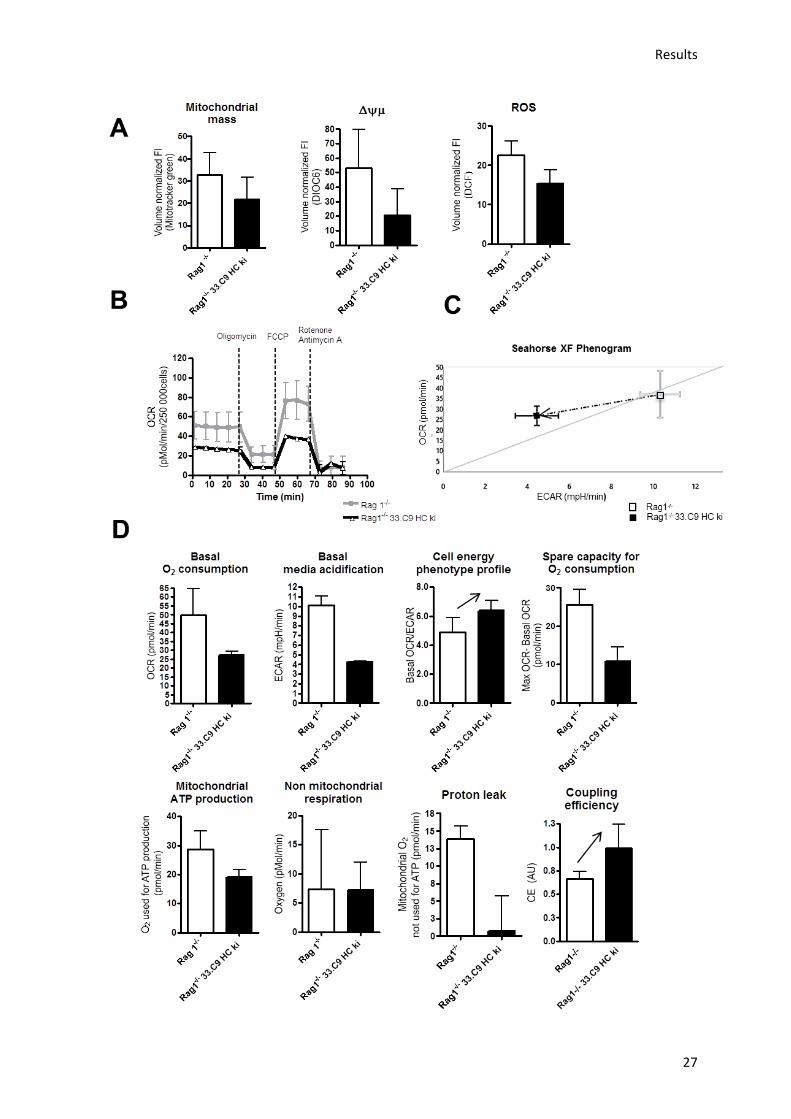
Results
27
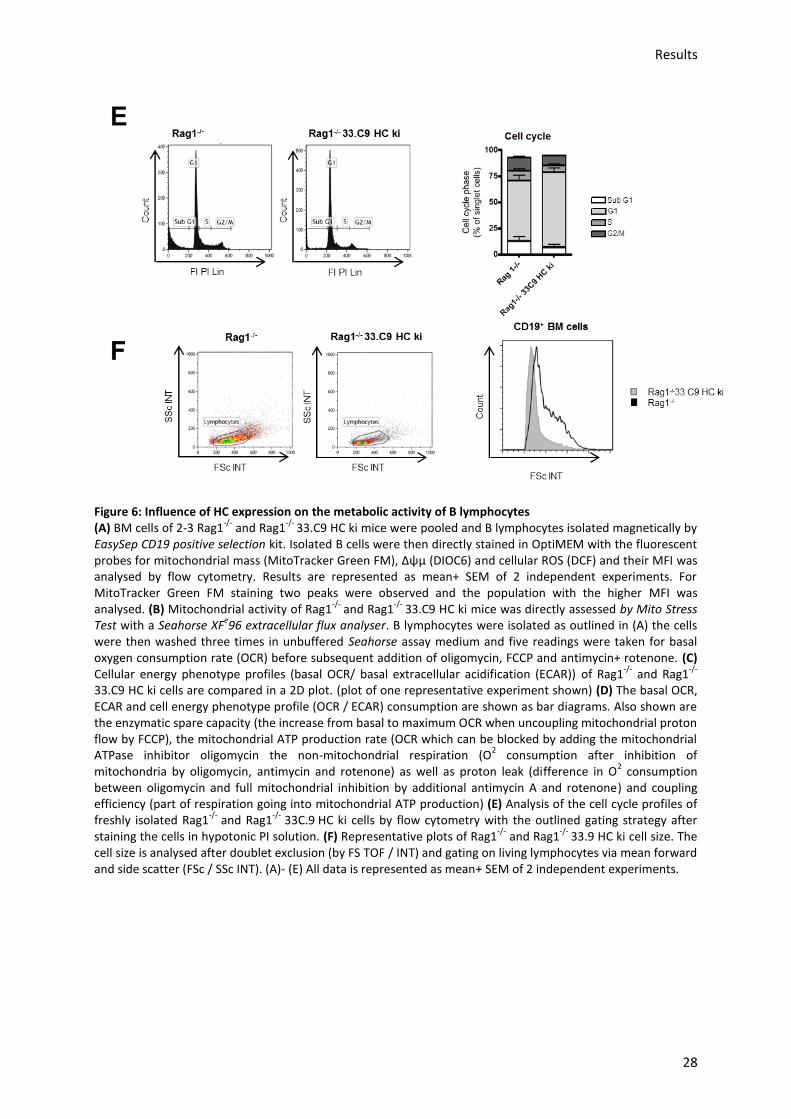
Results
28
Figure 6: Influence of HC expression on the metabolic activity of B lymphocytes (A) BM cells of 2-3 Rag1
-/- and Rag1
-/- 33.C9 HC ki mice were pooled and B lymphocytes isolated magnetically by
EasySep CD19 positive selection kit. Isolated B cells were then directly stained in OptiMEM with the fluorescent probes for mitochondrial mass (MitoTracker Green FM), Δψµ (DIOC6) and cellular ROS (DCF) and their MFI was analysed by flow cytometry. Results are represented as mean+ SEM of 2 independent experiments. For MitoTracker Green FM staining two peaks were observed and the population with the higher MFI was analysed. (B) Mitochondrial activity of Rag1
-/- and Rag1
-/- 33.C9 HC ki mice was directly assessed by Mito Stress
Test with a Seahorse XFe96 extracellular flux analyser. B lymphocytes were isolated as outlined in (A) the cells
were then washed three times in unbuffered Seahorse assay medium and five readings were taken for basal oxygen consumption rate (OCR) before subsequent addition of oligomycin, FCCP and antimycin+ rotenone. (C) Cellular energy phenotype profiles (basal OCR/ basal extracellular acidification (ECAR)) of Rag1
-/- and Rag1
-/-
33.C9 HC ki cells are compared in a 2D plot. (plot of one representative experiment shown) (D) The basal OCR, ECAR and cell energy phenotype profile (OCR / ECAR) consumption are shown as bar diagrams. Also shown are the enzymatic spare capacity (the increase from basal to maximum OCR when uncoupling mitochondrial proton flow by FCCP), the mitochondrial ATP production rate (OCR which can be blocked by adding the mitochondrial ATPase inhibitor oligomycin the non-mitochondrial respiration (O
2 consumption after inhibition of
mitochondria by oligomycin, antimycin and rotenone) as well as proton leak (difference in O2 consumption
between oligomycin and full mitochondrial inhibition by additional antimycin A and rotenone) and coupling efficiency (part of respiration going into mitochondrial ATP production) (E) Analysis of the cell cycle profiles of freshly isolated Rag1
-/- and Rag1
-/- 33C.9 HC ki cells by flow cytometry with the outlined gating strategy after
staining the cells in hypotonic PI solution. (F) Representative plots of Rag1-/-
and Rag1-/-
33.9 HC ki cell size. The cell size is analysed after doublet exclusion (by FS TOF / INT) and gating on living lymphocytes via mean forward and side scatter (FSc / SSc INT). (A)- (E) All data is represented as mean+ SEM of 2 independent experiments.
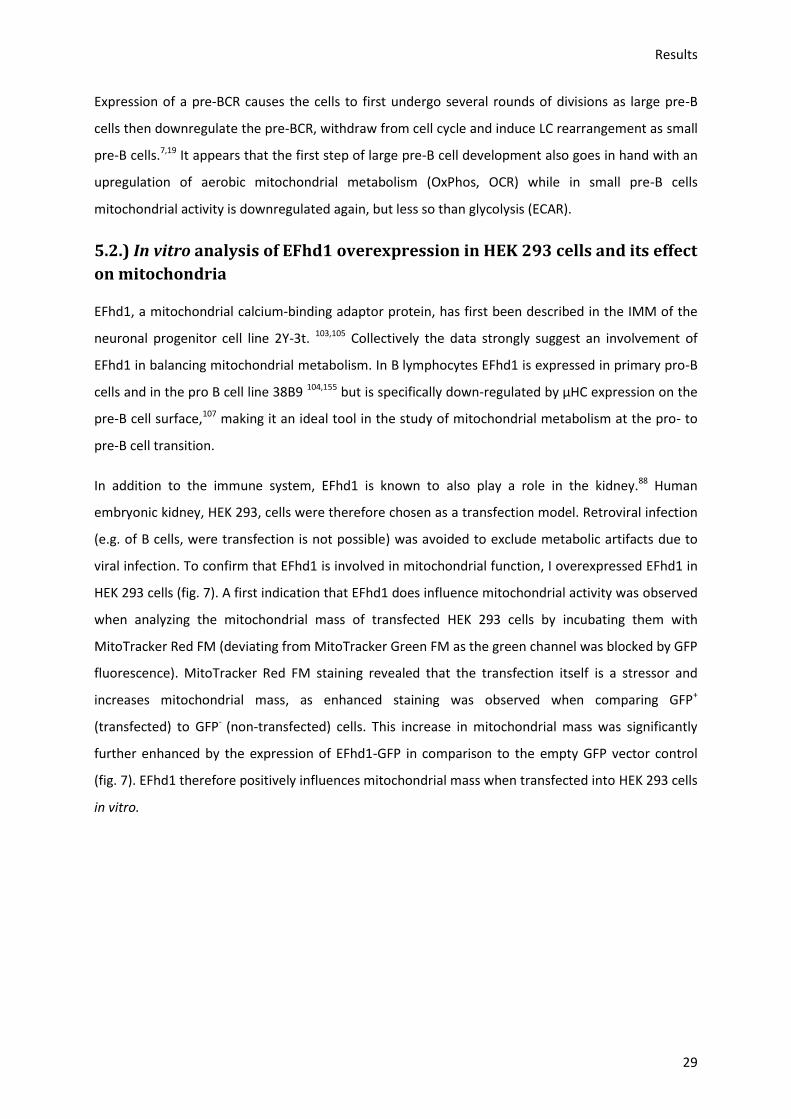
Results
29
Expression of a pre-BCR causes the cells to first undergo several rounds of divisions as large pre-B
cells then downregulate the pre-BCR, withdraw from cell cycle and induce LC rearrangement as small
pre-B cells.7,19 It appears that the first step of large pre-B cell development also goes in hand with an
upregulation of aerobic mitochondrial metabolism (OxPhos, OCR) while in small pre-B cells
mitochondrial activity is downregulated again, but less so than glycolysis (ECAR).
5.2.) In vitro analysis of EFhd1 overexpression in HEK 293 cells and its effect
on mitochondria
EFhd1, a mitochondrial calcium-binding adaptor protein, has first been described in the IMM of the
neuronal progenitor cell line 2Y-3t. 103,105 Collectively the data strongly suggest an involvement of
EFhd1 in balancing mitochondrial metabolism. In B lymphocytes EFhd1 is expressed in primary pro-B
cells and in the pro B cell line 38B9 104,155 but is specifically down-regulated by µHC expression on the
pre-B cell surface,107 making it an ideal tool in the study of mitochondrial metabolism at the pro- to
pre-B cell transition.
In addition to the immune system, EFhd1 is known to also play a role in the kidney.88 Human
embryonic kidney, HEK 293, cells were therefore chosen as a transfection model. Retroviral infection
(e.g. of B cells, were transfection is not possible) was avoided to exclude metabolic artifacts due to
viral infection. To confirm that EFhd1 is involved in mitochondrial function, I overexpressed EFhd1 in
HEK 293 cells (fig. 7). A first indication that EFhd1 does influence mitochondrial activity was observed
when analyzing the mitochondrial mass of transfected HEK 293 cells by incubating them with
MitoTracker Red FM (deviating from MitoTracker Green FM as the green channel was blocked by GFP
fluorescence). MitoTracker Red FM staining revealed that the transfection itself is a stressor and
increases mitochondrial mass, as enhanced staining was observed when comparing GFP+
(transfected) to GFP- (non-transfected) cells. This increase in mitochondrial mass was significantly
further enhanced by the expression of EFhd1-GFP in comparison to the empty GFP vector control
(fig. 7). EFhd1 therefore positively influences mitochondrial mass when transfected into HEK 293 cells
in vitro.
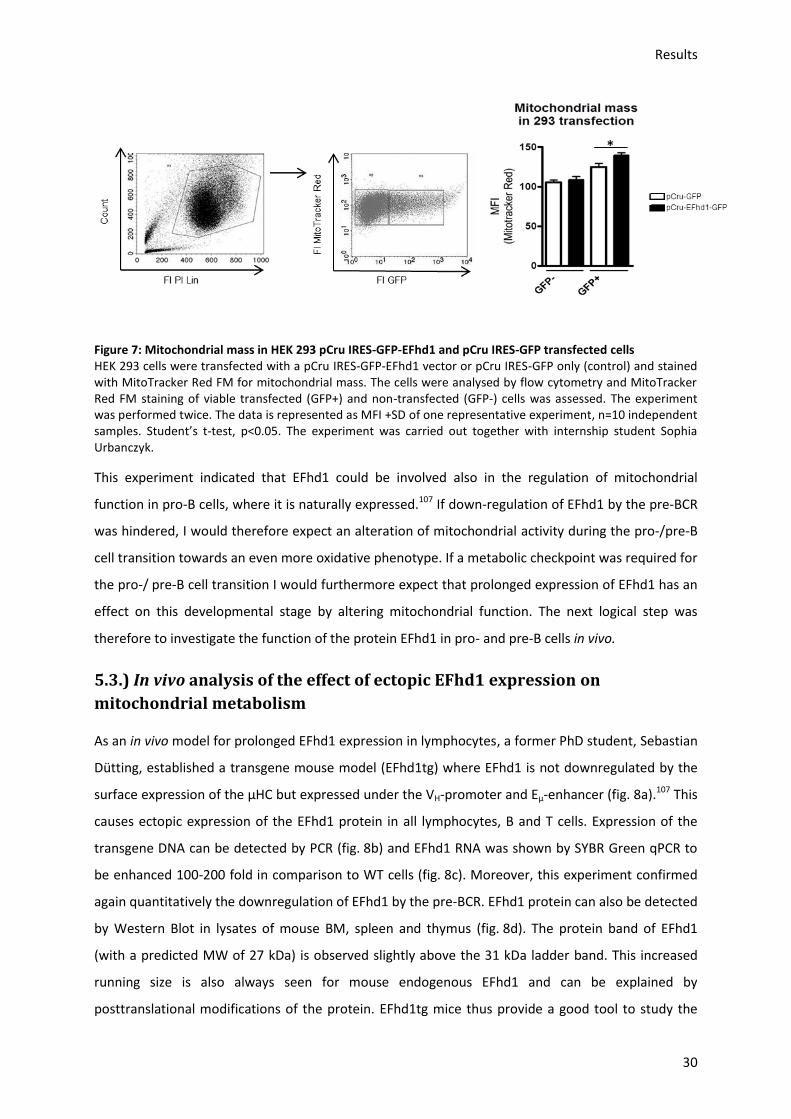
Results
30
Figure 7: Mitochondrial mass in HEK 293 pCru IRES-GFP-EFhd1 and pCru IRES-GFP transfected cells HEK 293 cells were transfected with a pCru IRES-GFP-EFhd1 vector or pCru IRES-GFP only (control) and stained with MitoTracker Red FM for mitochondrial mass. The cells were analysed by flow cytometry and MitoTracker Red FM staining of viable transfected (GFP+) and non-transfected (GFP-) cells was assessed. The experiment was performed twice. The data is represented as MFI +SD of one representative experiment, n=10 independent samples. Student’s t-test, p<0.05. The experiment was carried out together with internship student Sophia Urbanczyk.
This experiment indicated that EFhd1 could be involved also in the regulation of mitochondrial
function in pro-B cells, where it is naturally expressed.107 If down-regulation of EFhd1 by the pre-BCR
was hindered, I would therefore expect an alteration of mitochondrial activity during the pro-/pre-B
cell transition towards an even more oxidative phenotype. If a metabolic checkpoint was required for
the pro-/ pre-B cell transition I would furthermore expect that prolonged expression of EFhd1 has an
effect on this developmental stage by altering mitochondrial function. The next logical step was
therefore to investigate the function of the protein EFhd1 in pro- and pre-B cells in vivo.
5.3.) In vivo analysis of the effect of ectopic EFhd1 expression on
mitochondrial metabolism
As an in vivo model for prolonged EFhd1 expression in lymphocytes, a former PhD student, Sebastian
Dütting, established a transgene mouse model (EFhd1tg) where EFhd1 is not downregulated by the
surface expression of the µHC but expressed under the VH-promoter and Eµ-enhancer (fig. 8a).107 This
causes ectopic expression of the EFhd1 protein in all lymphocytes, B and T cells. Expression of the
transgene DNA can be detected by PCR (fig. 8b) and EFhd1 RNA was shown by SYBR Green qPCR to
be enhanced 100-200 fold in comparison to WT cells (fig. 8c). Moreover, this experiment confirmed
again quantitatively the downregulation of EFhd1 by the pre-BCR. EFhd1 protein can also be detected
by Western Blot in lysates of mouse BM, spleen and thymus (fig. 8d). The protein band of EFhd1
(with a predicted MW of 27 kDa) is observed slightly above the 31 kDa ladder band. This increased
running size is also always seen for mouse endogenous EFhd1 and can be explained by
posttranslational modifications of the protein. EFhd1tg mice thus provide a good tool to study the
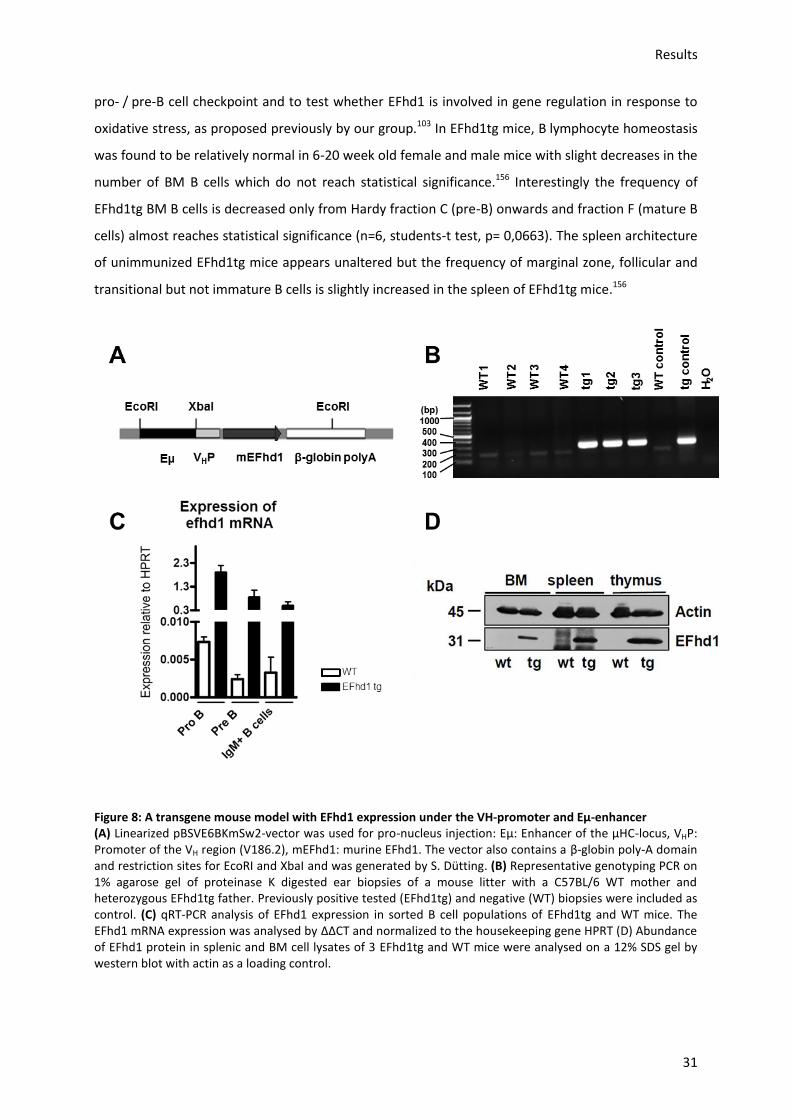
Results
31
pro- / pre-B cell checkpoint and to test whether EFhd1 is involved in gene regulation in response to
oxidative stress, as proposed previously by our group.103 In EFhd1tg mice, B lymphocyte homeostasis
was found to be relatively normal in 6-20 week old female and male mice with slight decreases in the
number of BM B cells which do not reach statistical significance.156 Interestingly the frequency of
EFhd1tg BM B cells is decreased only from Hardy fraction C (pre-B) onwards and fraction F (mature B
cells) almost reaches statistical significance (n=6, students-t test, p= 0,0663). The spleen architecture
of unimmunized EFhd1tg mice appears unaltered but the frequency of marginal zone, follicular and
transitional but not immature B cells is slightly increased in the spleen of EFhd1tg mice.156
Figure 8: A transgene mouse model with EFhd1 expression under the VH-promoter and Eµ-enhancer (A) Linearized pBSVE6BKmSw2-vector was used for pro-nucleus injection: Eµ: Enhancer of the µHC-locus, VHP: Promoter of the VH region (V186.2), mEFhd1: murine EFhd1. The vector also contains a β-globin poly-A domain and restriction sites for EcoRI and XbaI and was generated by S. Dütting. (B) Representative genotyping PCR on 1% agarose gel of proteinase K digested ear biopsies of a mouse litter with a C57BL/6 WT mother and heterozygous EFhd1tg father. Previously positive tested (EFhd1tg) and negative (WT) biopsies were included as control. (C) qRT-PCR analysis of EFhd1 expression in sorted B cell populations of EFhd1tg and WT mice. The EFhd1 mRNA expression was analysed by ΔΔCT and normalized to the housekeeping gene HPRT (D) Abundance of EFhd1 protein in splenic and BM cell lysates of 3 EFhd1tg and WT mice were analysed on a 12% SDS gel by western blot with actin as a loading control.
Results
32
5.3.1.) Analysis of the effect of EFhd1tg expression on mitochondrial and developmental
gene profiles
To first pinpoint changes in the metabolic profiles between pro- and pre-B cells, and second to
identify genes responsible for alterations of mitochondrial activity in EFhd1 overexpressing cells and
then establish a hypothesis for further experiments, an expression analysis of mitochondrial and
metabolic genes was carried out. Freshly sorted pro- (CD19+, cKit+, CD25-, sIgM-), pre- B (CD19+, cKit-,
CD25+, sIgM-), and BCR+ cells (CD19+, sIgM+) from EFhd1tg and WT BM were used, RNA and cDNA was
prepared and analysed by SYBR Green qPCR for several candidate genes (fig. 9). Ebf1 has been
described to regulate EFhd1 expression.119 The mRNA of this TF is similarly abundant in EFhd1tg and
WT cells. An expected upregulation of ebf1 is seen in EFhd1tg and WT pre-B cells and less expression
was observed in BCR+ cells. The PPAR-coactivator family member ppargc1b which in contrast to
ppargc1a is mostly responsible for homeostatic mitochondrial maintenance80 was found to be slightly
downregulated in pre-B cells. PGC-1β is then significantly upregulated in BCR+ B cells. The expression
level of PGC-1β, however, is not altered between EFhd1tg and WT cells at any of the differentiation
stages. In contrast to PGC-1β the co-regulator PGC-1a (ppargc1a) was found to be upregulated in
pre-B in comparison to pro-B cells. This upregulation is even further enhanced in EFhd1tg pre-B cells,
indicating a direct or indirect regulatory function of EFhd1 in PGC-1α expression. Interestingly
PGC-1α is known to be strongly induced by external stimuli signaling an increased energy demand,
which is expected to be the case in proliferating pre-B cells.80,82,85 The expression of PGC-1α promotes
mitochondrial biogenesis and upregulates OxPhos by co-activating the TF PPARα and PPARγ. The
increase in mitochondrial mass in EFhd1 expressing HEK 293 cells supports these data. The enhanced
expression of PGC-1α but not family member PCG-1β and in EFhd1tg pre-B cells highlights the
developmental stage and family member specific nature of the upregulation. Expression of glucose
transporter 1 (GLUT-1) also increases during B cell development and is strongly upregulated in pre-B
and but even more so in BCR+ B cells for both genotypes. This upregulation is moderately but not
significantly higher in WT cells. However, the ratio between PGC-1a and GLUT-1 expression in pre-B
and BCR+ B cells is clearly higher in EFhd1 expressing cells again corroborating a pro-oxidative
function of EFhd1. While uncoupling protein 2 (ucp2) was found to be similarly expressed in pro- and
pre-B cells, uncoupling protein 3 (ucp3) was found to be slightly upregulated. Uncoupling proteins
are described as target genes which are co-activated by PCG-1α. Ucp-3 is found to be expressed at
similar levels in EFhd1tg and WT pro- and BCR+ B cell subsets with slightly decreased expression in
EFhd1tg pre-B cells which does, not meet the criteria of statistical significance. Ucp-2 is expressed at
comparable levels in EFhd1tg B and WT cells and its expression level is stable in pro- and pre-B cells
but decreases in BCR+ cells. Expression of the mitochondrial superoxide dismutase 2 (sod2) is
significantly upregulated in pre-B in comparison to pro-B cells and its expression level stays almost at
Results
33
the same level in BCR+ cells. Interestingly SOD2 has been described to reduce EFhd1 expression and
thus could reflect a potential pathway by which EFhd1 is naturally downregulated in pre-B cells.115 An
up-regulation of sod2 at the pro- to pre-B cell transition was also observed in the immunological
genome project, ImmGen (fig. 9b) by My Gene Set data browser analysis. This upregulation of SOD2
is in agreement with the previous findings that proportionally more OxPhos is taking place in pre-B
cells as the resulting mitochondrial ROS needs to be detoxified. Moreover the upregulation of
PGC-1α and GLUT-1 in pre-B cells confirms an increase in glucose metabolism and mitochondrial
activity at this developmental stage. In this analysis EFhd1tg pre-B cells revealed a partially different
expression of metabolic genes, with a bias towards a more oxidative profile (more PGC-1α and
potentially less GLUT-1 and ucp3). Interestingly ImmGen data reveals a very similar expression
pattern of EFhd1 and PGC-1α during early B lymphocyte developmental stages, solidifying the
hypothesis of functional interaction between these two proteins (fig. 9b). Also in an OptiMEM10
culture with 5 ng / ml IL-7 a strong upregulation of PGC-1α is seen in EFhd1tg pre-B cells (fig. 9c). Due
to variations between individual cultures no statistical significance is obtained. According to ImmGen
expression profiles both EFhd1 and PGC-1α are highly upregulated at the pro-to pre-B cell transition
(Hardy fraction B / C) and down-regulated in fraction C / D pre-B cells. In the ImmGen data base
PGC-1β shows the highest expression in more mature B cells stages, which was also be observed in
my qPCR data.
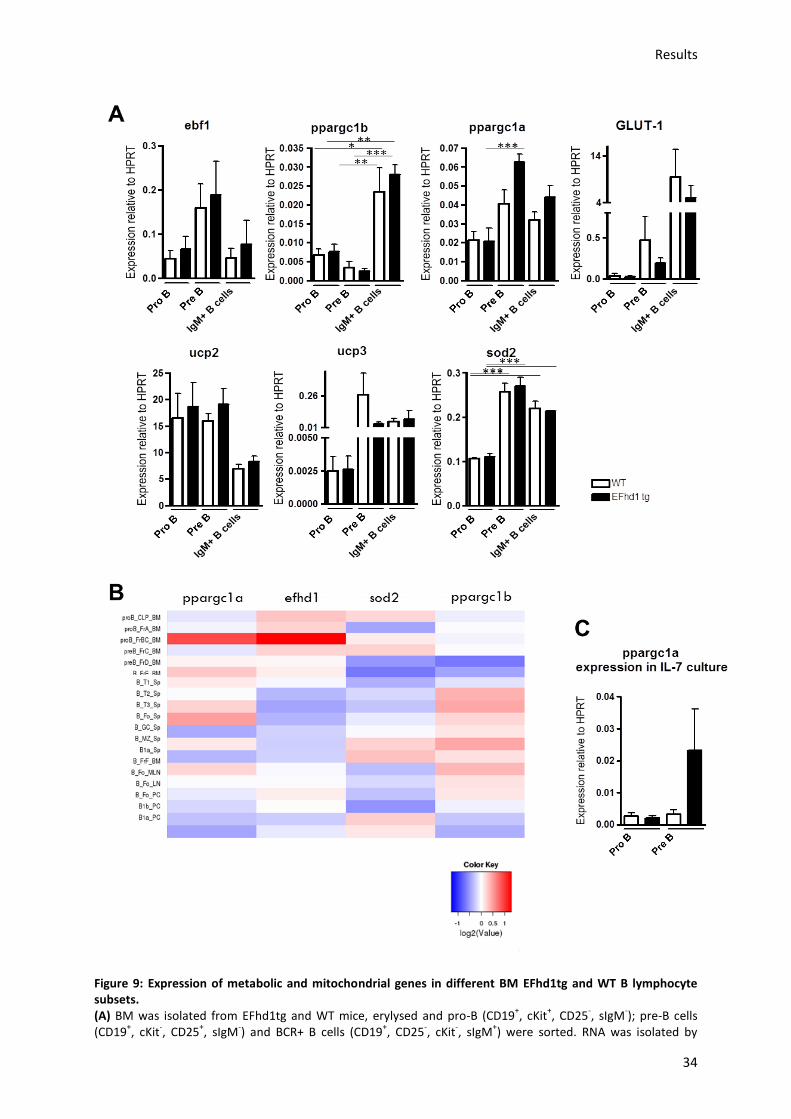
Results
34
Figure 9: Expression of metabolic and mitochondrial genes in different BM EFhd1tg and WT B lymphocyte subsets. (A) BM was isolated from EFhd1tg and WT mice, erylysed and pro-B (CD19
+, cKit
+, CD25
-, sIgM
-); pre-B cells
(CD19+, cKit
-, CD25
+, sIgM
-) and BCR+ B cells (CD19
+, CD25
-, cKit
-, sIgM
+) were sorted. RNA was isolated by
Results
35
RNeasy kit and converted into cDNA. Expression of ebf1 and the PPAR cofactors ppargc1a, ppargc1b as well as glucose transporter GLUT-1 mRNA was evaluated by SYBR Green qPCR, analysed by ΔΔCT and normalized to HPRT. Moreover mRNA expression of mitochondrial uncoupling proteins 2 (ucp2) and 3 (ucp3) and of the mitochondrial manganese superoxide dismutase 2 (sod2) were analysed in the same way. Data is represented as mean+ SEM of 3 independent experiments and was tested for statistical significance by ANOVA with Bonferroni correction for multiple testing (B) „My Gene Set“-tool analysis on the immunological genome project website (www.immgen.org) was used to compare relative expression levels of the genes ppargc1a, ppargc1b and sod2 as well as efhd1 in different B lymphocyte developmental stages and subsets. (C) RNA was isolated by RNeasy kit from sorted pro- (CD19
+, cKit
+, sIgM
-) and pre-B (CD19
+, cKit
-, sIgM
-) cells after 7 days
culture in OptiMEM10 with 5 ng/ ml IL-7 of EFhd1tg and WT pro-B cells. The RNA was converted to cDNA and ppargc1a (PGC-1α) expression was analysed as described in (A). Data is represented as mean+ SEM of 4 independent cultures and sorts per genotype and statistical analysis was carried out by Mann-Whitney-U test.
The differential upregulation of PGC-1α in EFhd1tg pre-B cells suggests that the protein is indeed
involved in increasing mitochondrial activity while ensuring detoxification of the ROS by-products. I
therefore hypothesised that EFhd1 expression in pro-B cells primes the cells for a more oxidative
pre-B cell metabolism. To address this hypothesis two questions needed to be answered. First, does
EFhd1 expression indeed lead to functional metabolic changes in pre-B cells and second, does the
expected increase in mitochondrial metabolism induce more ROS, which could be detrimental?
The qPCR and ImmGen expression data reveal an upregulation of PGC-1α in EFhd1tg pre-B cells.
Therefore a qPCR array of PPAR target genes was carried out to find out about downstream targets
involved in regulating pre-B cell metabolism that were differentially expressed between EFhd1tg and
WT pre-B cells. To address this question the Qiagen “Mouse PPAR Targets RT² Profiler PCR Array”
was used to compare gene expression profiles between isolated pre-B cells from 3 EFhd1tg and WT
mice focusing on PPAR target genes (fig. 10). Interestingly EFhd1tg pre-B cells appear to strongly feed
their increased mitochondrial OxPhos by fatty acids. Most upregulated genes in EFhd1tg pre-B cells
are found among PPARα fatty acid metabolism target genes (acadm, acox3, acsl1, acsl4, cpt1a, cpt1b,
cpt2, fads2, scd1.), as well as genes involved in lipid transport (adipoq, angptl4, apoc3). The carnitine
O-palmitoyltransferase 2 (cpt2) which in contrast to cpt1 sits inside the IMM at the matrix side and
catalyses the oxidation of acyl-carnitine to acyl-CoA and back to carnitine is even significantly more
(3.67-fold) expressed in EFhd1tg than WT pre-B cells. Importantly cpt1 Insulin signalling or
adipogenesis genes appear not to be affected. Upregulated PPARβ/δ targets include etfdh, also
involved in fatty acid metabolism, and iIk which regulates cell proliferation. Fatty acid metabolism
gene fabp4 and insulin signalling gene pdpk1 are down-regulated and pten is even significantly
down-regulated in EFhd1tg in comparison to WT pre-B cells. Upregulation of PPARγ targets include
pck2 and clu involved in cell proliferation while mmp9 is down-regulated. PPAR cofactors src and
ncoa3 are down-regulated as well as slc22a, involved in PPAR ligand transport. As expected also
PGC-1α was found to be upregulated in EFhd1tg in comparison to WT pre-cells (1, 47 fold).
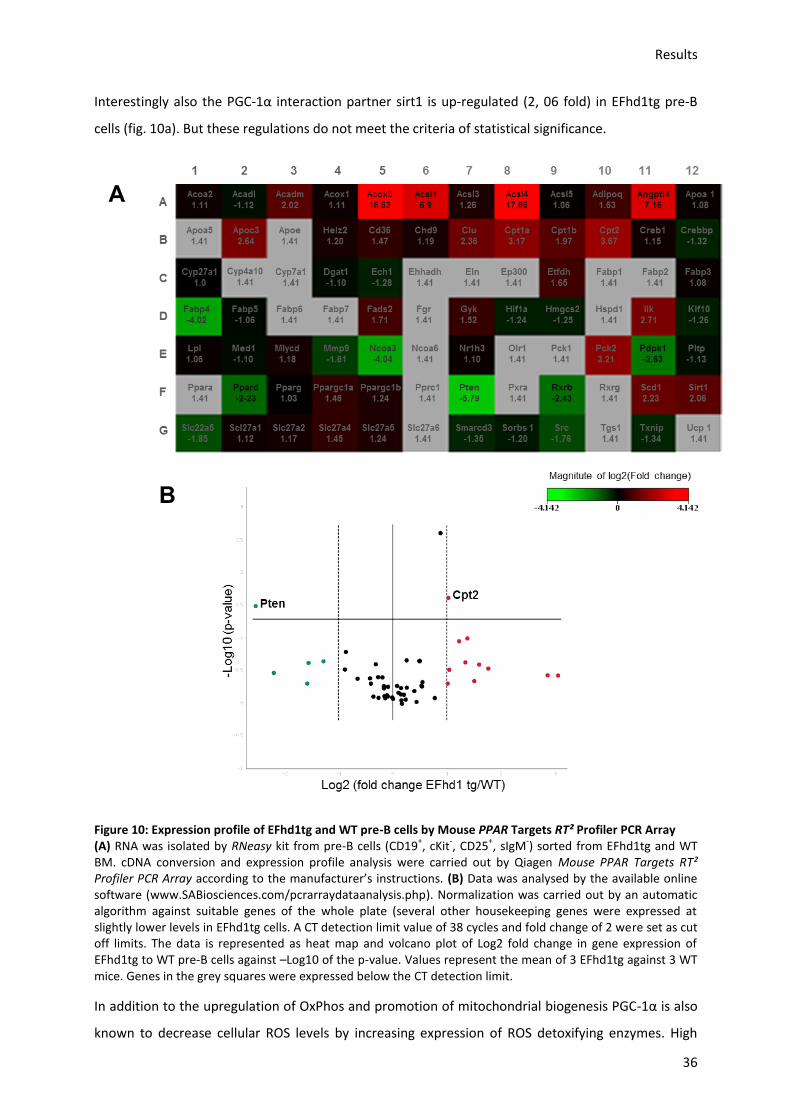
Results
36
Interestingly also the PGC-1α interaction partner sirt1 is up-regulated (2, 06 fold) in EFhd1tg pre-B
cells (fig. 10a). But these regulations do not meet the criteria of statistical significance.
Figure 10: Expression profile of EFhd1tg and WT pre-B cells by Mouse PPAR Targets RT² Profiler PCR Array (A) RNA was isolated by RNeasy kit from pre-B cells (CD19
+, cKit
-, CD25
+, sIgM
-) sorted from EFhd1tg and WT
BM. cDNA conversion and expression profile analysis were carried out by Qiagen Mouse PPAR Targets RT² Profiler PCR Array according to the manufacturer’s instructions. (B) Data was analysed by the available online software (www.SABiosciences.com/pcrarraydataanalysis.php). Normalization was carried out by an automatic algorithm against suitable genes of the whole plate (several other housekeeping genes were expressed at slightly lower levels in EFhd1tg cells. A CT detection limit value of 38 cycles and fold change of 2 were set as cut off limits. The data is represented as heat map and volcano plot of Log2 fold change in gene expression of EFhd1tg to WT pre-B cells against –Log10 of the p-value. Values represent the mean of 3 EFhd1tg against 3 WT mice. Genes in the grey squares were expressed below the CT detection limit.
In addition to the upregulation of OxPhos and promotion of mitochondrial biogenesis PGC-1α is also
known to decrease cellular ROS levels by increasing expression of ROS detoxifying enzymes. High
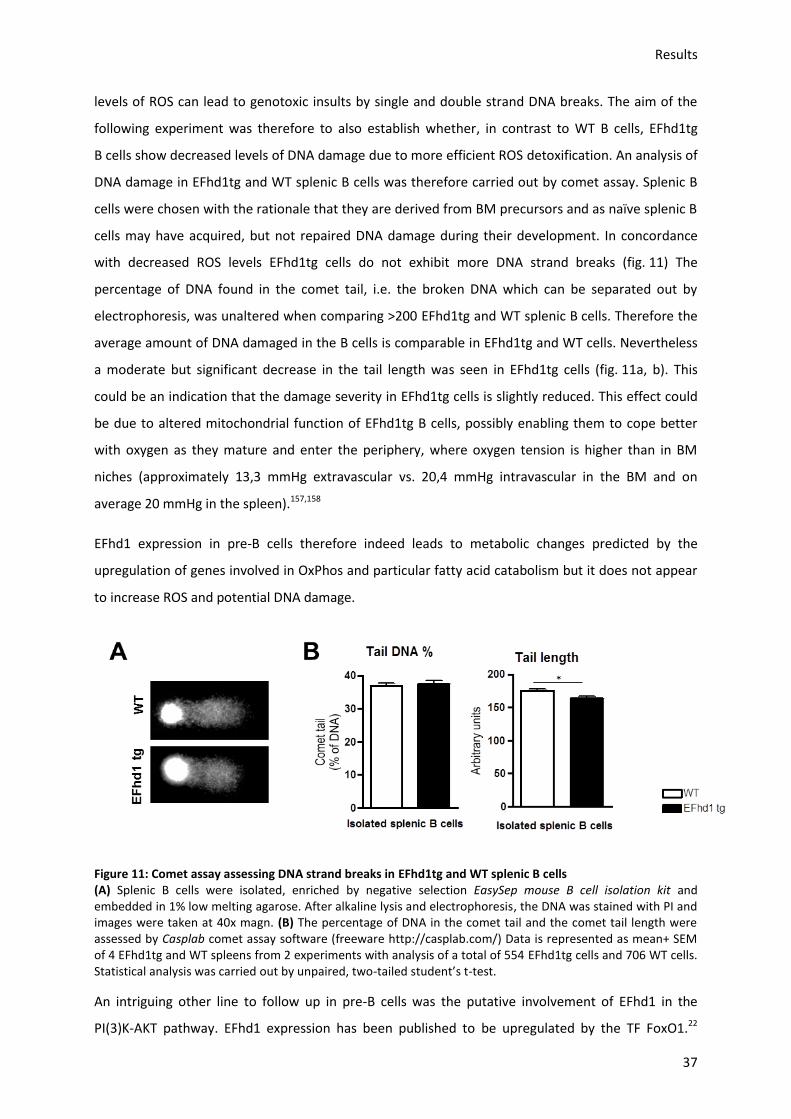
Results
37
levels of ROS can lead to genotoxic insults by single and double strand DNA breaks. The aim of the
following experiment was therefore to also establish whether, in contrast to WT B cells, EFhd1tg
B cells show decreased levels of DNA damage due to more efficient ROS detoxification. An analysis of
DNA damage in EFhd1tg and WT splenic B cells was therefore carried out by comet assay. Splenic B
cells were chosen with the rationale that they are derived from BM precursors and as naïve splenic B
cells may have acquired, but not repaired DNA damage during their development. In concordance
with decreased ROS levels EFhd1tg cells do not exhibit more DNA strand breaks (fig. 11) The
percentage of DNA found in the comet tail, i.e. the broken DNA which can be separated out by
electrophoresis, was unaltered when comparing >200 EFhd1tg and WT splenic B cells. Therefore the
average amount of DNA damaged in the B cells is comparable in EFhd1tg and WT cells. Nevertheless
a moderate but significant decrease in the tail length was seen in EFhd1tg cells (fig. 11a, b). This
could be an indication that the damage severity in EFhd1tg cells is slightly reduced. This effect could
be due to altered mitochondrial function of EFhd1tg B cells, possibly enabling them to cope better
with oxygen as they mature and enter the periphery, where oxygen tension is higher than in BM
niches (approximately 13,3 mmHg extravascular vs. 20,4 mmHg intravascular in the BM and on
average 20 mmHg in the spleen).157,158
EFhd1 expression in pre-B cells therefore indeed leads to metabolic changes predicted by the
upregulation of genes involved in OxPhos and particular fatty acid catabolism but it does not appear
to increase ROS and potential DNA damage.
Figure 11: Comet assay assessing DNA strand breaks in EFhd1tg and WT splenic B cells (A) Splenic B cells were isolated, enriched by negative selection EasySep mouse B cell isolation kit and embedded in 1% low melting agarose. After alkaline lysis and electrophoresis, the DNA was stained with PI and images were taken at 40x magn. (B) The percentage of DNA in the comet tail and the comet tail length were assessed by Casplab comet assay software (freeware http://casplab.com/) Data is represented as mean+ SEM of 4 EFhd1tg and WT spleens from 2 experiments with analysis of a total of 554 EFhd1tg cells and 706 WT cells. Statistical analysis was carried out by unpaired, two-tailed student’s t-test.
An intriguing other line to follow up in pre-B cells was the putative involvement of EFhd1 in the
PI(3)K-AKT pathway. EFhd1 expression has been published to be upregulated by the TF FoxO1.22
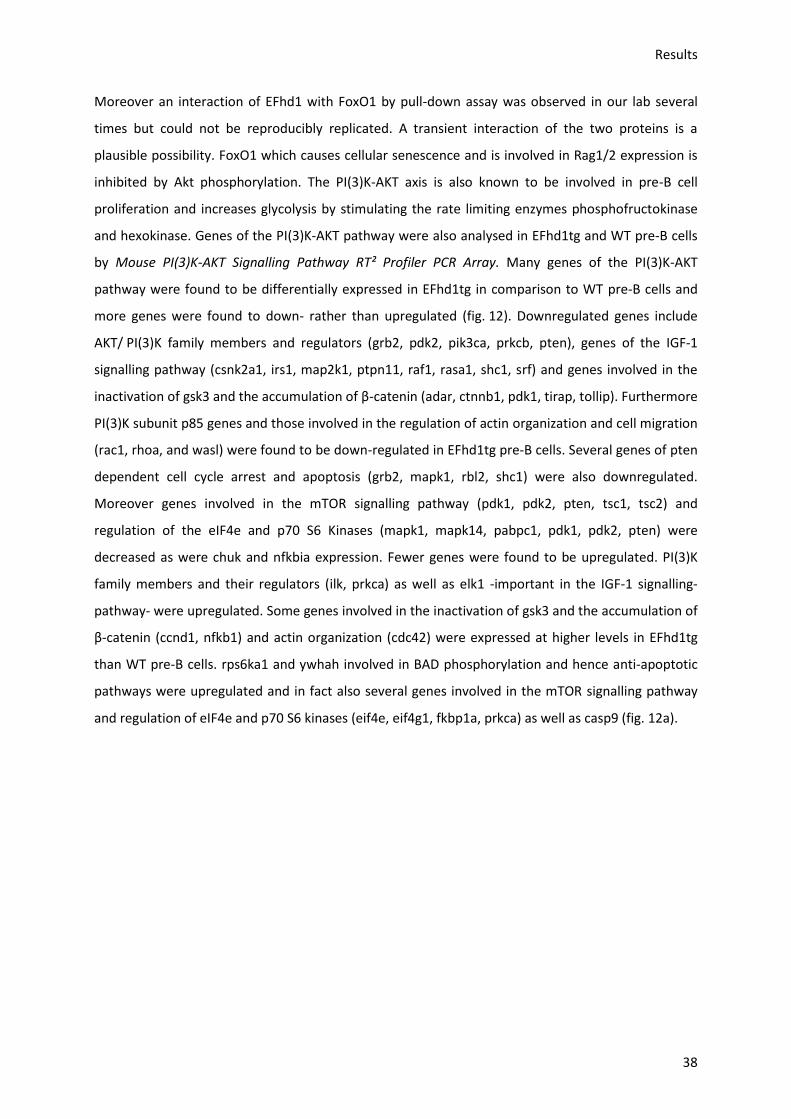
Results
38
Moreover an interaction of EFhd1 with FoxO1 by pull-down assay was observed in our lab several
times but could not be reproducibly replicated. A transient interaction of the two proteins is a
plausible possibility. FoxO1 which causes cellular senescence and is involved in Rag1/2 expression is
inhibited by Akt phosphorylation. The PI(3)K-AKT axis is also known to be involved in pre-B cell
proliferation and increases glycolysis by stimulating the rate limiting enzymes phosphofructokinase
and hexokinase. Genes of the PI(3)K-AKT pathway were also analysed in EFhd1tg and WT pre-B cells
by Mouse PI(3)K-AKT Signalling Pathway RT² Profiler PCR Array. Many genes of the PI(3)K-AKT
pathway were found to be differentially expressed in EFhd1tg in comparison to WT pre-B cells and
more genes were found to down- rather than upregulated (fig. 12). Downregulated genes include
AKT/ PI(3)K family members and regulators (grb2, pdk2, pik3ca, prkcb, pten), genes of the IGF-1
signalling pathway (csnk2a1, irs1, map2k1, ptpn11, raf1, rasa1, shc1, srf) and genes involved in the
inactivation of gsk3 and the accumulation of β-catenin (adar, ctnnb1, pdk1, tirap, tollip). Furthermore
PI(3)K subunit p85 genes and those involved in the regulation of actin organization and cell migration
(rac1, rhoa, and wasl) were found to be down-regulated in EFhd1tg pre-B cells. Several genes of pten
dependent cell cycle arrest and apoptosis (grb2, mapk1, rbl2, shc1) were also downregulated.
Moreover genes involved in the mTOR signalling pathway (pdk1, pdk2, pten, tsc1, tsc2) and
regulation of the eIF4e and p70 S6 Kinases (mapk1, mapk14, pabpc1, pdk1, pdk2, pten) were
decreased as were chuk and nfkbia expression. Fewer genes were found to be upregulated. PI(3)K
family members and their regulators (ilk, prkca) as well as elk1 -important in the IGF-1 signalling-
pathway- were upregulated. Some genes involved in the inactivation of gsk3 and the accumulation of
β-catenin (ccnd1, nfkb1) and actin organization (cdc42) were expressed at higher levels in EFhd1tg
than WT pre-B cells. rps6ka1 and ywhah involved in BAD phosphorylation and hence anti-apoptotic
pathways were upregulated and in fact also several genes involved in the mTOR signalling pathway
and regulation of eIF4e and p70 S6 kinases (eif4e, eif4g1, fkbp1a, prkca) as well as casp9 (fig. 12a).
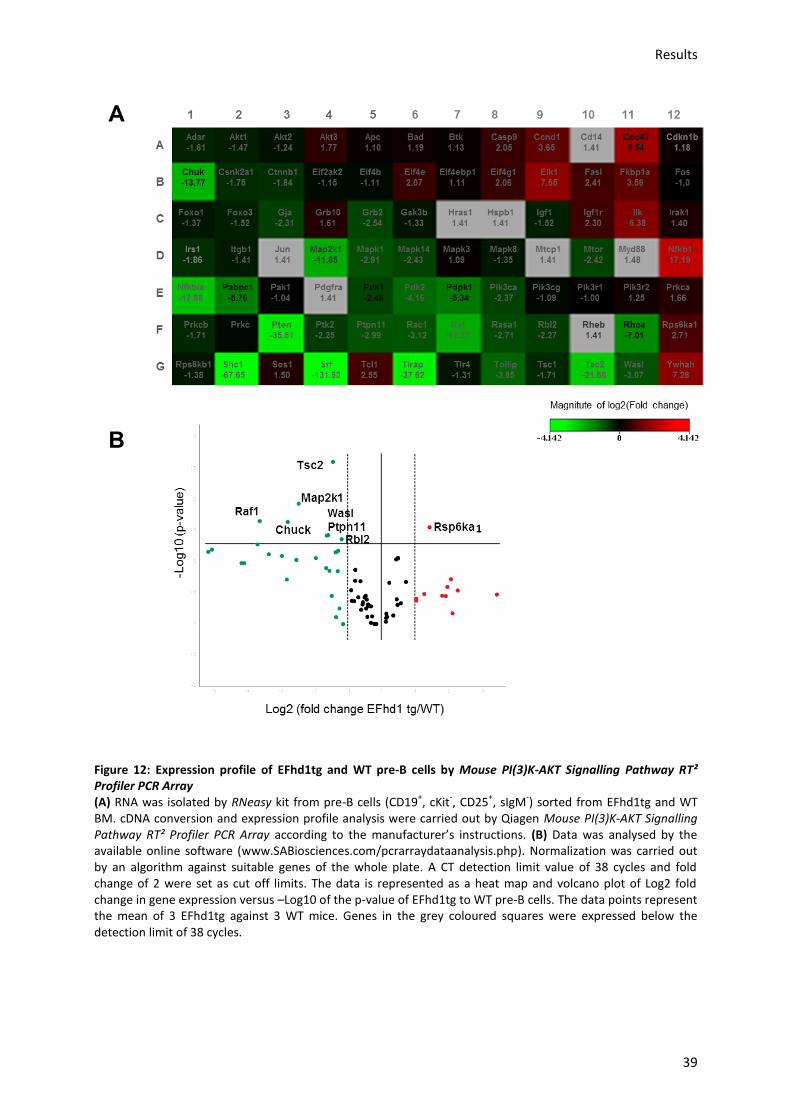
Results
39
Figure 12: Expression profile of EFhd1tg and WT pre-B cells by Mouse PI(3)K-AKT Signalling Pathway RT² Profiler PCR Array (A) RNA was isolated by RNeasy kit from pre-B cells (CD19
+, cKit
-, CD25
+, sIgM
-) sorted from EFhd1tg and WT
BM. cDNA conversion and expression profile analysis were carried out by Qiagen Mouse PI(3)K-AKT Signalling Pathway RT² Profiler PCR Array according to the manufacturer’s instructions. (B) Data was analysed by the available online software (www.SABiosciences.com/pcrarraydataanalysis.php). Normalization was carried out by an algorithm against suitable genes of the whole plate. A CT detection limit value of 38 cycles and fold change of 2 were set as cut off limits. The data is represented as a heat map and volcano plot of Log2 fold change in gene expression versus –Log10 of the p-value of EFhd1tg to WT pre-B cells. The data points represent the mean of 3 EFhd1tg against 3 WT mice. Genes in the grey coloured squares were expressed below the detection limit of 38 cycles.
1
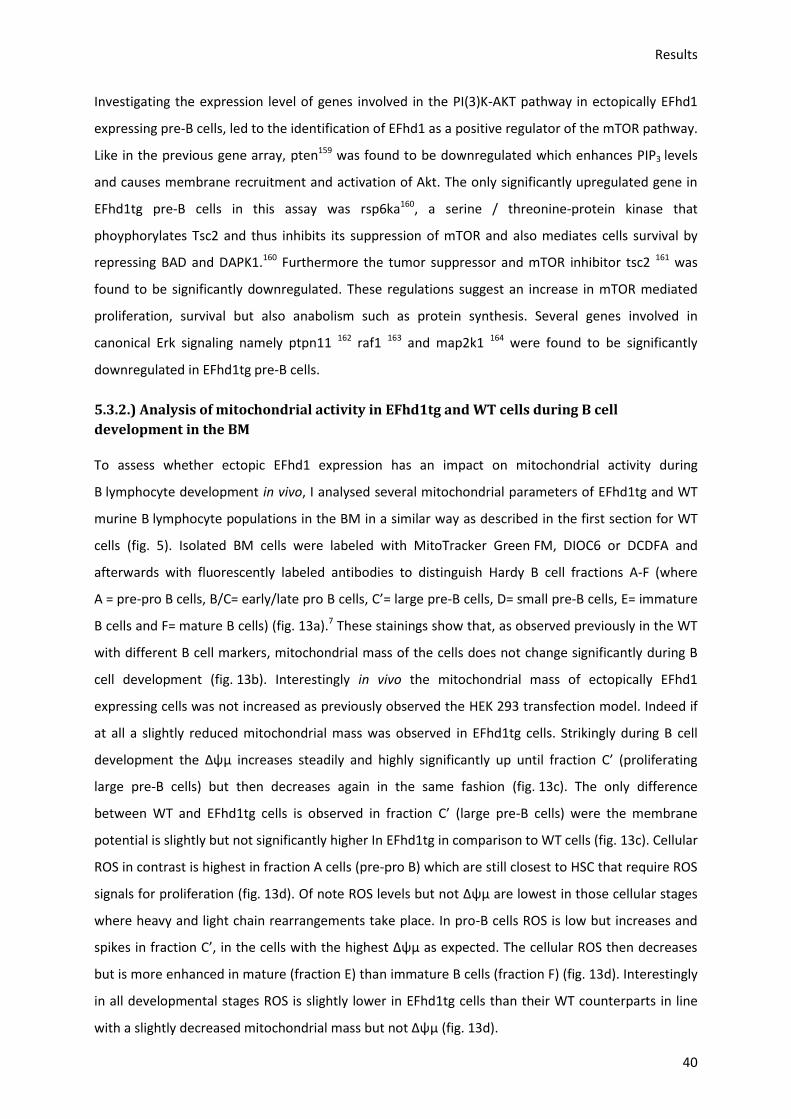
Results
40
Investigating the expression level of genes involved in the PI(3)K-AKT pathway in ectopically EFhd1
expressing pre-B cells, led to the identification of EFhd1 as a positive regulator of the mTOR pathway.
Like in the previous gene array, pten159 was found to be downregulated which enhances PIP3 levels
and causes membrane recruitment and activation of Akt. The only significantly upregulated gene in
EFhd1tg pre-B cells in this assay was rsp6ka160, a serine / threonine-protein kinase that
phoyphorylates Tsc2 and thus inhibits its suppression of mTOR and also mediates cells survival by
repressing BAD and DAPK1.160 Furthermore the tumor suppressor and mTOR inhibitor tsc2 161 was
found to be significantly downregulated. These regulations suggest an increase in mTOR mediated
proliferation, survival but also anabolism such as protein synthesis. Several genes involved in
canonical Erk signaling namely ptpn11 162 raf1 163 and map2k1 164 were found to be significantly
downregulated in EFhd1tg pre-B cells.
5.3.2.) Analysis of mitochondrial activity in EFhd1tg and WT cells during B cell
development in the BM
To assess whether ectopic EFhd1 expression has an impact on mitochondrial activity during
B lymphocyte development in vivo, I analysed several mitochondrial parameters of EFhd1tg and WT
murine B lymphocyte populations in the BM in a similar way as described in the first section for WT
cells (fig. 5). Isolated BM cells were labeled with MitoTracker Green FM, DIOC6 or DCDFA and
afterwards with fluorescently labeled antibodies to distinguish Hardy B cell fractions A-F (where
A = pre-pro B cells, B/C= early/late pro B cells, C’= large pre-B cells, D= small pre-B cells, E= immature
B cells and F= mature B cells) (fig. 13a).7 These stainings show that, as observed previously in the WT
with different B cell markers, mitochondrial mass of the cells does not change significantly during B
cell development (fig. 13b). Interestingly in vivo the mitochondrial mass of ectopically EFhd1
expressing cells was not increased as previously observed the HEK 293 transfection model. Indeed if
at all a slightly reduced mitochondrial mass was observed in EFhd1tg cells. Strikingly during B cell
development the Δψµ increases steadily and highly significantly up until fraction C’ (proliferating
large pre-B cells) but then decreases again in the same fashion (fig. 13c). The only difference
between WT and EFhd1tg cells is observed in fraction C’ (large pre-B cells) were the membrane
potential is slightly but not significantly higher In EFhd1tg in comparison to WT cells (fig. 13c). Cellular
ROS in contrast is highest in fraction A cells (pre-pro B) which are still closest to HSC that require ROS
signals for proliferation (fig. 13d). Of note ROS levels but not Δψµ are lowest in those cellular stages
where heavy and light chain rearrangements take place. In pro-B cells ROS is low but increases and
spikes in fraction C’, in the cells with the highest Δψµ as expected. The cellular ROS then decreases
but is more enhanced in mature (fraction E) than immature B cells (fraction F) (fig. 13d). Interestingly
in all developmental stages ROS is slightly lower in EFhd1tg cells than their WT counterparts in line
with a slightly decreased mitochondrial mass but not Δψµ (fig. 13d).
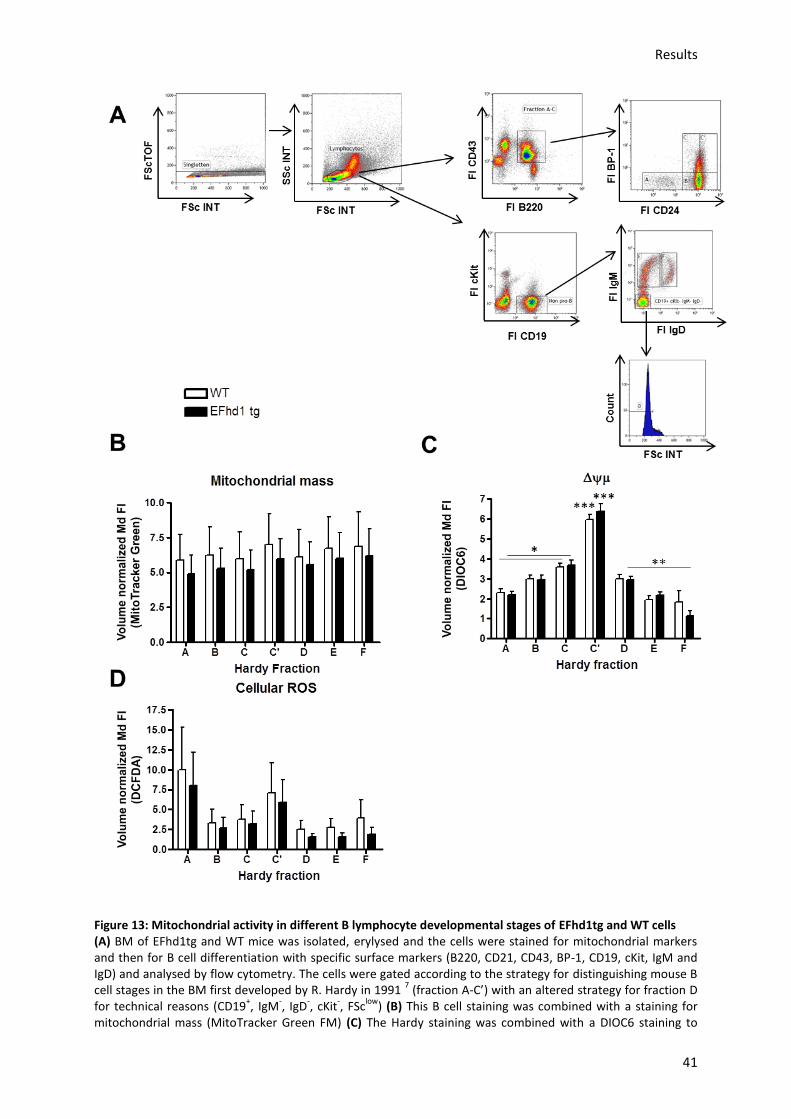
Results
41
Figure 13: Mitochondrial activity in different B lymphocyte developmental stages of EFhd1tg and WT cells (A) BM of EFhd1tg and WT mice was isolated, erylysed and the cells were stained for mitochondrial markers and then for B cell differentiation with specific surface markers (B220, CD21, CD43, BP-1, CD19, cKit, IgM and IgD) and analysed by flow cytometry. The cells were gated according to the strategy for distinguishing mouse B cell stages in the BM first developed by R. Hardy in 1991
7 (fraction A-C’) with an altered strategy for fraction D
for technical reasons (CD19+, IgM
-, IgD
-, cKit
-, FSc
low) (B) This B cell staining was combined with a staining for
mitochondrial mass (MitoTracker Green FM) (C) The Hardy staining was combined with a DIOC6 staining to
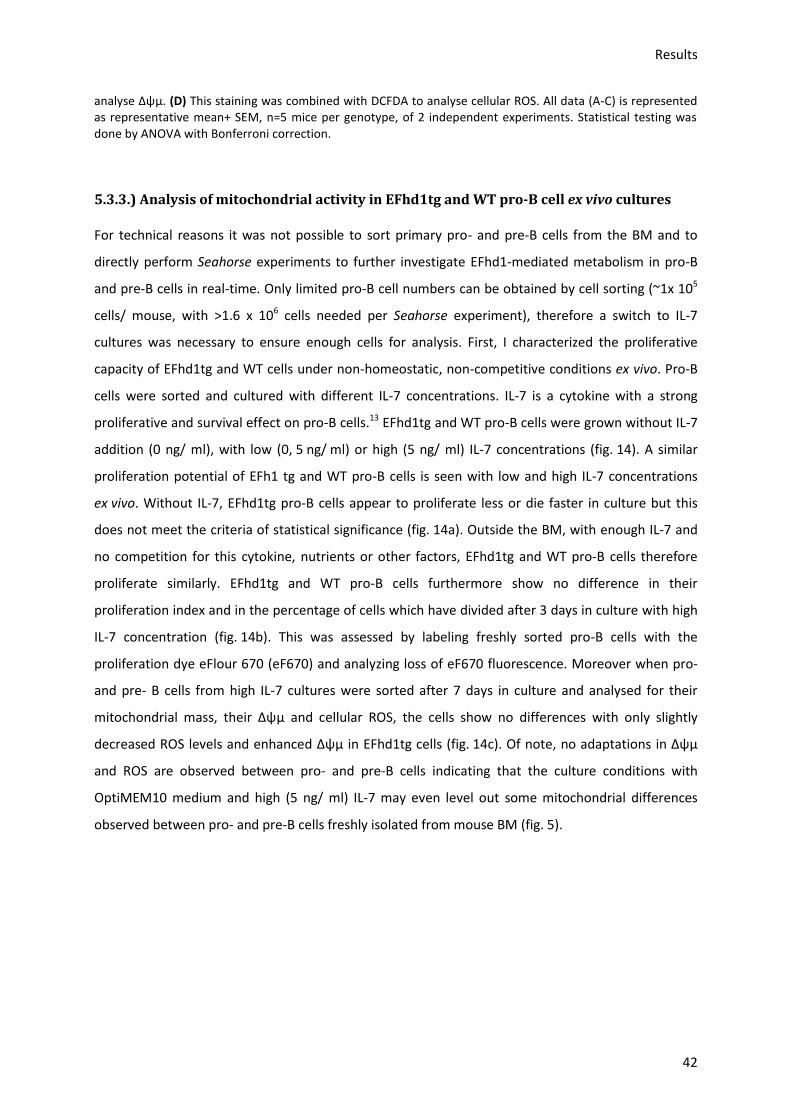
Results
42
analyse Δψµ. (D) This staining was combined with DCFDA to analyse cellular ROS. All data (A-C) is represented as representative mean+ SEM, n=5 mice per genotype, of 2 independent experiments. Statistical testing was done by ANOVA with Bonferroni correction.
5.3.3.) Analysis of mitochondrial activity in EFhd1tg and WT pro-B cell ex vivo cultures
For technical reasons it was not possible to sort primary pro- and pre-B cells from the BM and to
directly perform Seahorse experiments to further investigate EFhd1-mediated metabolism in pro-B
and pre-B cells in real-time. Only limited pro-B cell numbers can be obtained by cell sorting (~1x 10⁵
cells/ mouse, with >1.6 x 10⁶ cells needed per Seahorse experiment), therefore a switch to IL-7
cultures was necessary to ensure enough cells for analysis. First, I characterized the proliferative
capacity of EFhd1tg and WT cells under non-homeostatic, non-competitive conditions ex vivo. Pro-B
cells were sorted and cultured with different IL-7 concentrations. IL-7 is a cytokine with a strong
proliferative and survival effect on pro-B cells.13 EFhd1tg and WT pro-B cells were grown without IL-7
addition (0 ng/ ml), with low (0, 5 ng/ ml) or high (5 ng/ ml) IL-7 concentrations (fig. 14). A similar
proliferation potential of EFh1 tg and WT pro-B cells is seen with low and high IL-7 concentrations
ex vivo. Without IL-7, EFhd1tg pro-B cells appear to proliferate less or die faster in culture but this
does not meet the criteria of statistical significance (fig. 14a). Outside the BM, with enough IL-7 and
no competition for this cytokine, nutrients or other factors, EFhd1tg and WT pro-B cells therefore
proliferate similarly. EFhd1tg and WT pro-B cells furthermore show no difference in their
proliferation index and in the percentage of cells which have divided after 3 days in culture with high
IL-7 concentration (fig. 14b). This was assessed by labeling freshly sorted pro-B cells with the
proliferation dye eFlour 670 (eF670) and analyzing loss of eF670 fluorescence. Moreover when pro-
and pre- B cells from high IL-7 cultures were sorted after 7 days in culture and analysed for their
mitochondrial mass, their Δψµ and cellular ROS, the cells show no differences with only slightly
decreased ROS levels and enhanced Δψµ in EFhd1tg cells (fig. 14c). Of note, no adaptations in Δψµ
and ROS are observed between pro- and pre-B cells indicating that the culture conditions with
OptiMEM10 medium and high (5 ng/ ml) IL-7 may even level out some mitochondrial differences
observed between pro- and pre-B cells freshly isolated from mouse BM (fig. 5).
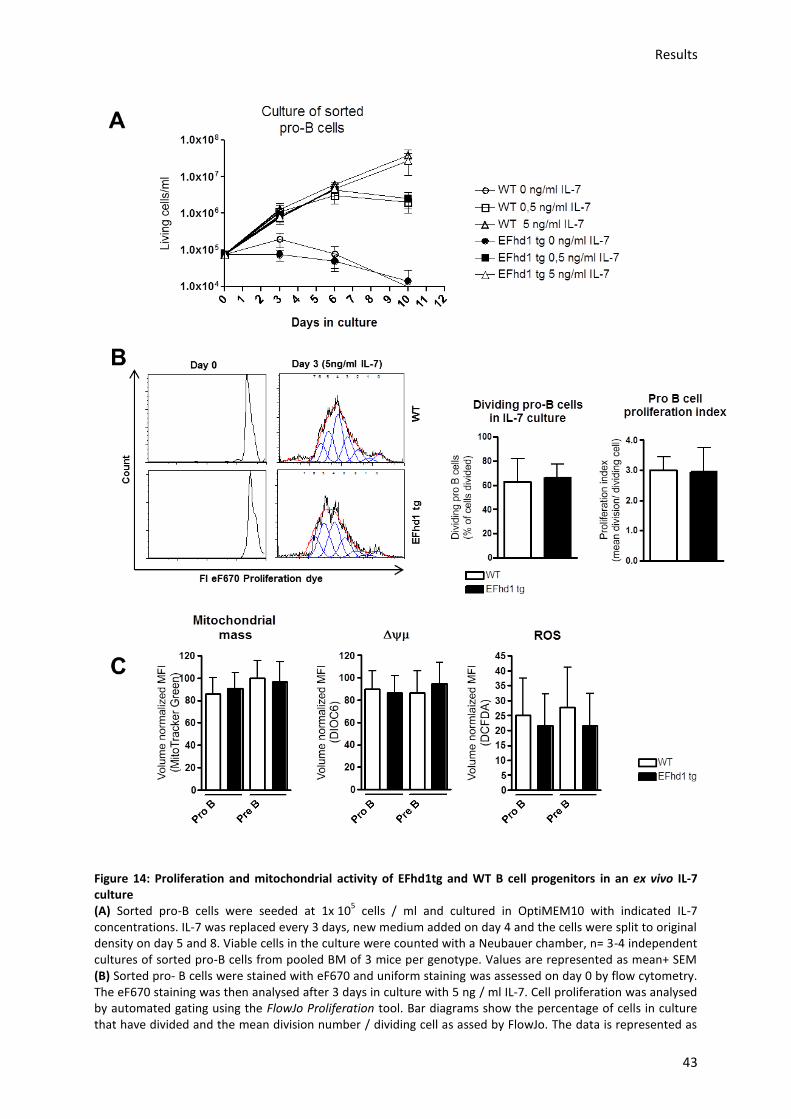
Results
43
Figure 14: Proliferation and mitochondrial activity of EFhd1tg and WT B cell progenitors in an ex vivo IL-7 culture (A) Sorted pro-B cells were seeded at 1x 10
5 cells / ml and cultured in OptiMEM10 with indicated IL-7
concentrations. IL-7 was replaced every 3 days, new medium added on day 4 and the cells were split to original density on day 5 and 8. Viable cells in the culture were counted with a Neubauer chamber, n= 3-4 independent cultures of sorted pro-B cells from pooled BM of 3 mice per genotype. Values are represented as mean+ SEM (B) Sorted pro- B cells were stained with eF670 and uniform staining was assessed on day 0 by flow cytometry. The eF670 staining was then analysed after 3 days in culture with 5 ng / ml IL-7. Cell proliferation was analysed by automated gating using the FlowJo Proliferation tool. Bar diagrams show the percentage of cells in culture that have divided and the mean division number / dividing cell as assed by FlowJo. The data is represented as
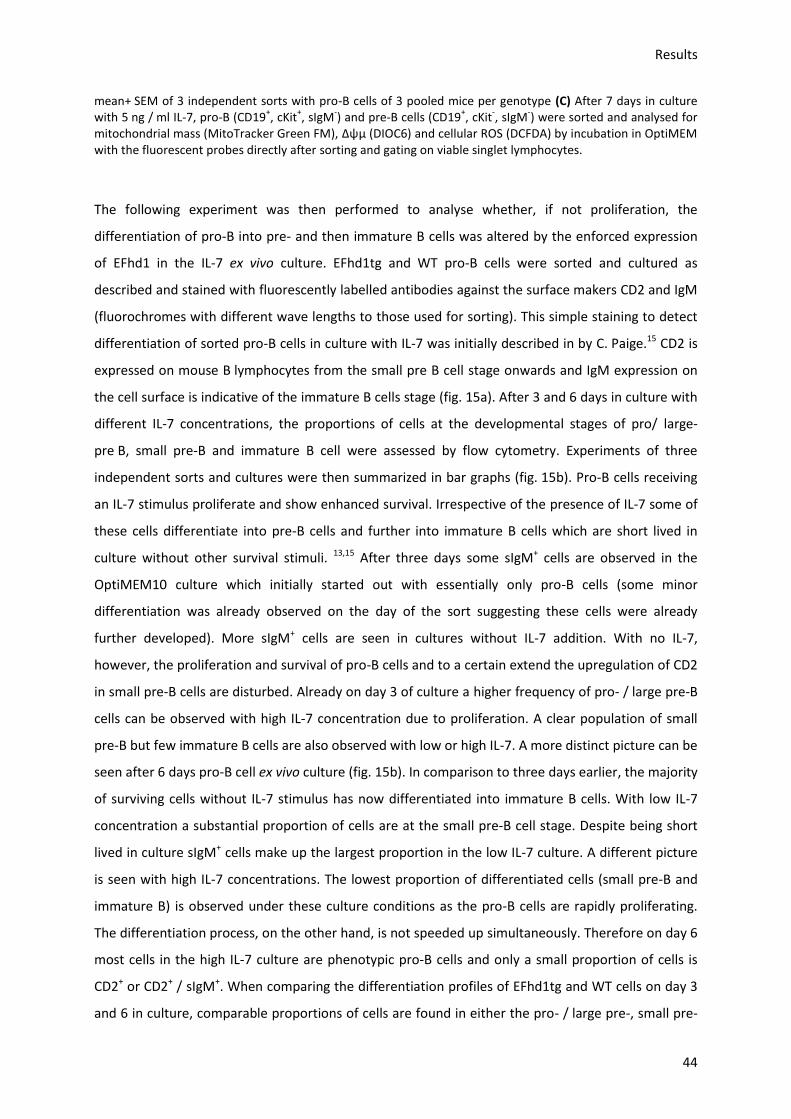
Results
44
mean+ SEM of 3 independent sorts with pro-B cells of 3 pooled mice per genotype (C) After 7 days in culture with 5 ng / ml IL-7, pro-B (CD19
+, cKit
+, sIgM
-) and pre-B cells (CD19
+, cKit
-, sIgM
-) were sorted and analysed for
mitochondrial mass (MitoTracker Green FM), Δψµ (DIOC6) and cellular ROS (DCFDA) by incubation in OptiMEM with the fluorescent probes directly after sorting and gating on viable singlet lymphocytes.
The following experiment was then performed to analyse whether, if not proliferation, the
differentiation of pro-B into pre- and then immature B cells was altered by the enforced expression
of EFhd1 in the IL-7 ex vivo culture. EFhd1tg and WT pro-B cells were sorted and cultured as
described and stained with fluorescently labelled antibodies against the surface makers CD2 and IgM
(fluorochromes with different wave lengths to those used for sorting). This simple staining to detect
differentiation of sorted pro-B cells in culture with IL-7 was initially described in by C. Paige.15 CD2 is
expressed on mouse B lymphocytes from the small pre B cell stage onwards and IgM expression on
the cell surface is indicative of the immature B cells stage (fig. 15a). After 3 and 6 days in culture with
different IL-7 concentrations, the proportions of cells at the developmental stages of pro/ large-
pre B, small pre-B and immature B cell were assessed by flow cytometry. Experiments of three
independent sorts and cultures were then summarized in bar graphs (fig. 15b). Pro-B cells receiving
an IL-7 stimulus proliferate and show enhanced survival. Irrespective of the presence of IL-7 some of
these cells differentiate into pre-B cells and further into immature B cells which are short lived in
culture without other survival stimuli. 13,15 After three days some sIgM+ cells are observed in the
OptiMEM10 culture which initially started out with essentially only pro-B cells (some minor
differentiation was already observed on the day of the sort suggesting these cells were already
further developed). More sIgM+ cells are seen in cultures without IL-7 addition. With no IL-7,
however, the proliferation and survival of pro-B cells and to a certain extend the upregulation of CD2
in small pre-B cells are disturbed. Already on day 3 of culture a higher frequency of pro- / large pre-B
cells can be observed with high IL-7 concentration due to proliferation. A clear population of small
pre-B but few immature B cells are also observed with low or high IL-7. A more distinct picture can be
seen after 6 days pro-B cell ex vivo culture (fig. 15b). In comparison to three days earlier, the majority
of surviving cells without IL-7 stimulus has now differentiated into immature B cells. With low IL-7
concentration a substantial proportion of cells are at the small pre-B cell stage. Despite being short
lived in culture sIgM+ cells make up the largest proportion in the low IL-7 culture. A different picture
is seen with high IL-7 concentrations. The lowest proportion of differentiated cells (small pre-B and
immature B) is observed under these culture conditions as the pro-B cells are rapidly proliferating.
The differentiation process, on the other hand, is not speeded up simultaneously. Therefore on day 6
most cells in the high IL-7 culture are phenotypic pro-B cells and only a small proportion of cells is
CD2+ or CD2+ / sIgM+. When comparing the differentiation profiles of EFhd1tg and WT cells on day 3
and 6 in culture, comparable proportions of cells are found in either the pro- / large pre-, small pre-
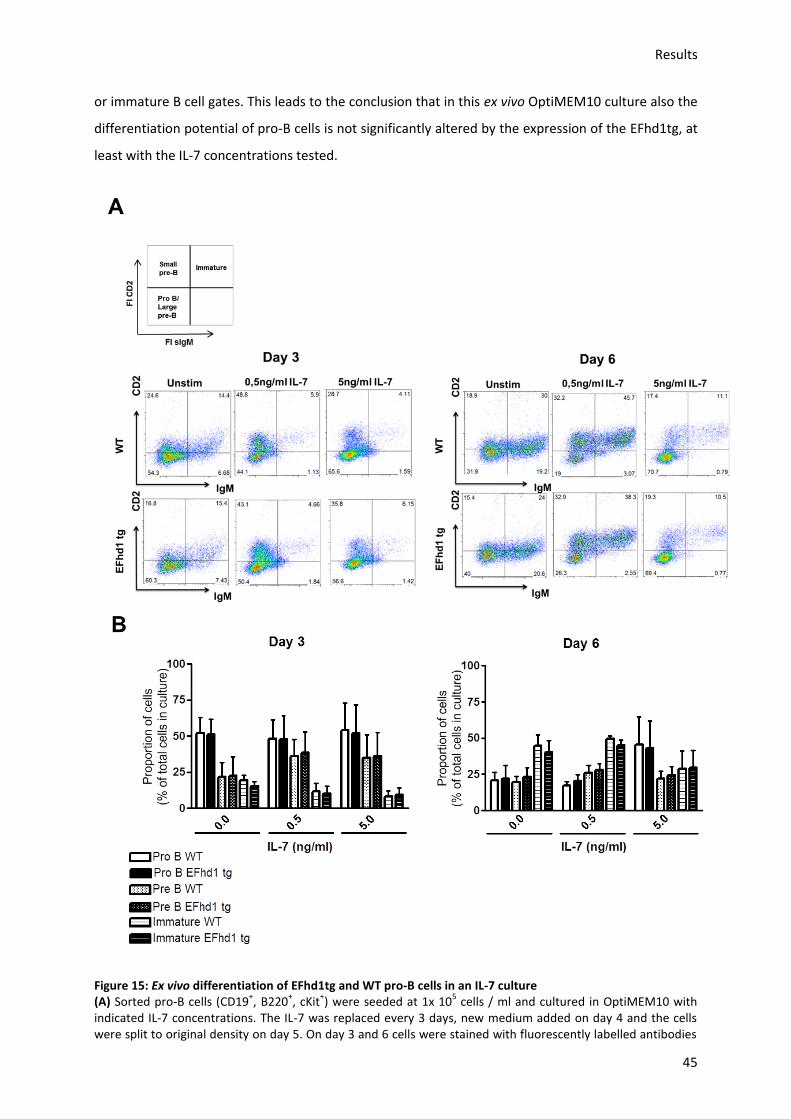
Results
45
or immature B cell gates. This leads to the conclusion that in this ex vivo OptiMEM10 culture also the
differentiation potential of pro-B cells is not significantly altered by the expression of the EFhd1tg, at
least with the IL-7 concentrations tested.
Figure 15: Ex vivo differentiation of EFhd1tg and WT pro-B cells in an IL-7 culture (A) Sorted pro-B cells (CD19
+, B220
+, cKit
+) were seeded at 1x 10
5 cells / ml and cultured in OptiMEM10 with
indicated IL-7 concentrations. The IL-7 was replaced every 3 days, new medium added on day 4 and the cells were split to original density on day 5. On day 3 and 6 cells were stained with fluorescently labelled antibodies
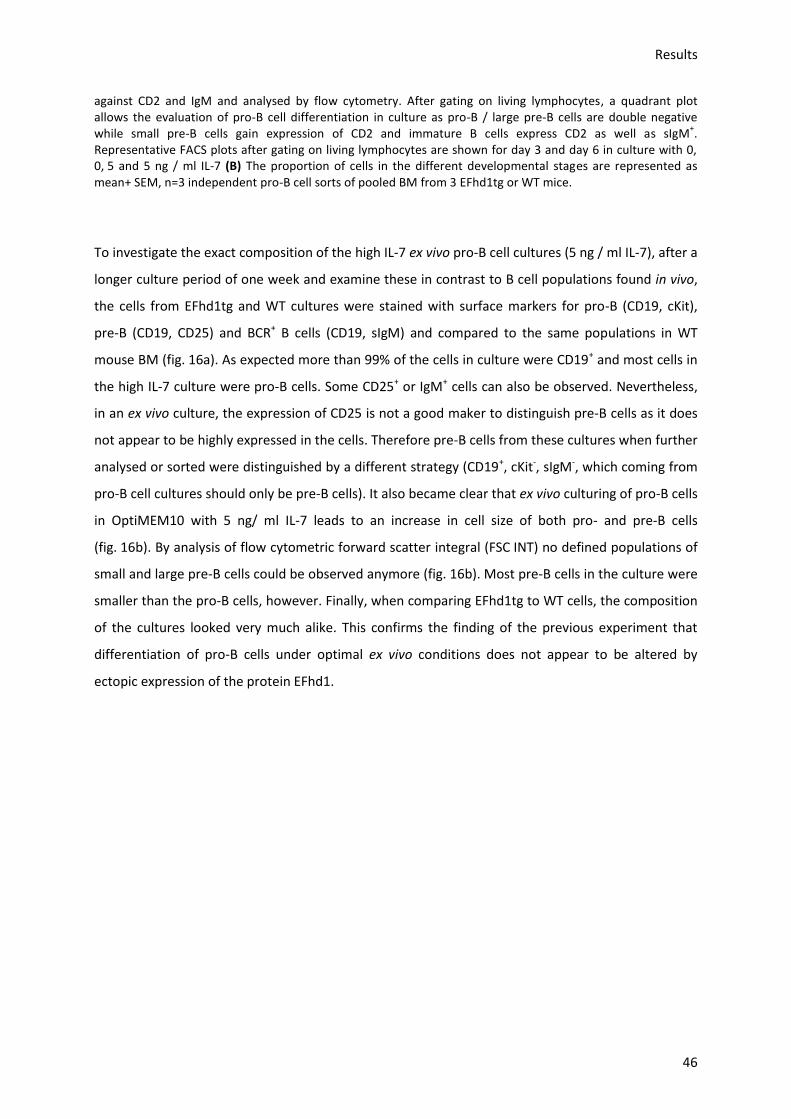
Results
46
against CD2 and IgM and analysed by flow cytometry. After gating on living lymphocytes, a quadrant plot allows the evaluation of pro-B cell differentiation in culture as pro-B / large pre-B cells are double negative while small pre-B cells gain expression of CD2 and immature B cells express CD2 as well as sIgM
+.
Representative FACS plots after gating on living lymphocytes are shown for day 3 and day 6 in culture with 0, 0, 5 and 5 ng / ml IL-7 (B) The proportion of cells in the different developmental stages are represented as mean+ SEM, n=3 independent pro-B cell sorts of pooled BM from 3 EFhd1tg or WT mice.
To investigate the exact composition of the high IL-7 ex vivo pro-B cell cultures (5 ng / ml IL-7), after a
longer culture period of one week and examine these in contrast to B cell populations found in vivo,
the cells from EFhd1tg and WT cultures were stained with surface markers for pro-B (CD19, cKit),
pre-B (CD19, CD25) and BCR+ B cells (CD19, sIgM) and compared to the same populations in WT
mouse BM (fig. 16a). As expected more than 99% of the cells in culture were CD19+ and most cells in
the high IL-7 culture were pro-B cells. Some CD25+ or IgM+ cells can also be observed. Nevertheless,
in an ex vivo culture, the expression of CD25 is not a good maker to distinguish pre-B cells as it does
not appear to be highly expressed in the cells. Therefore pre-B cells from these cultures when further
analysed or sorted were distinguished by a different strategy (CD19+, cKit-, sIgM-, which coming from
pro-B cell cultures should only be pre-B cells). It also became clear that ex vivo culturing of pro-B cells
in OptiMEM10 with 5 ng/ ml IL-7 leads to an increase in cell size of both pro- and pre-B cells
(fig. 16b). By analysis of flow cytometric forward scatter integral (FSC INT) no defined populations of
small and large pre-B cells could be observed anymore (fig. 16b). Most pre-B cells in the culture were
smaller than the pro-B cells, however. Finally, when comparing EFhd1tg to WT cells, the composition
of the cultures looked very much alike. This confirms the finding of the previous experiment that
differentiation of pro-B cells under optimal ex vivo conditions does not appear to be altered by
ectopic expression of the protein EFhd1.
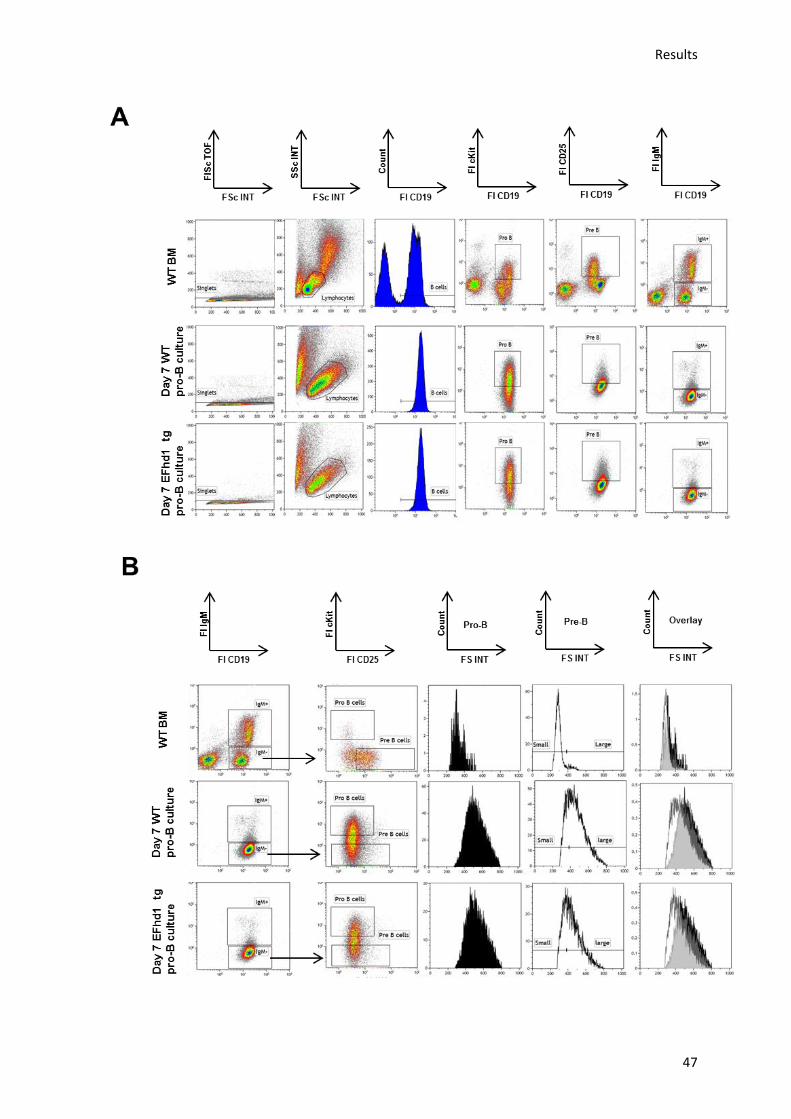
Results
47
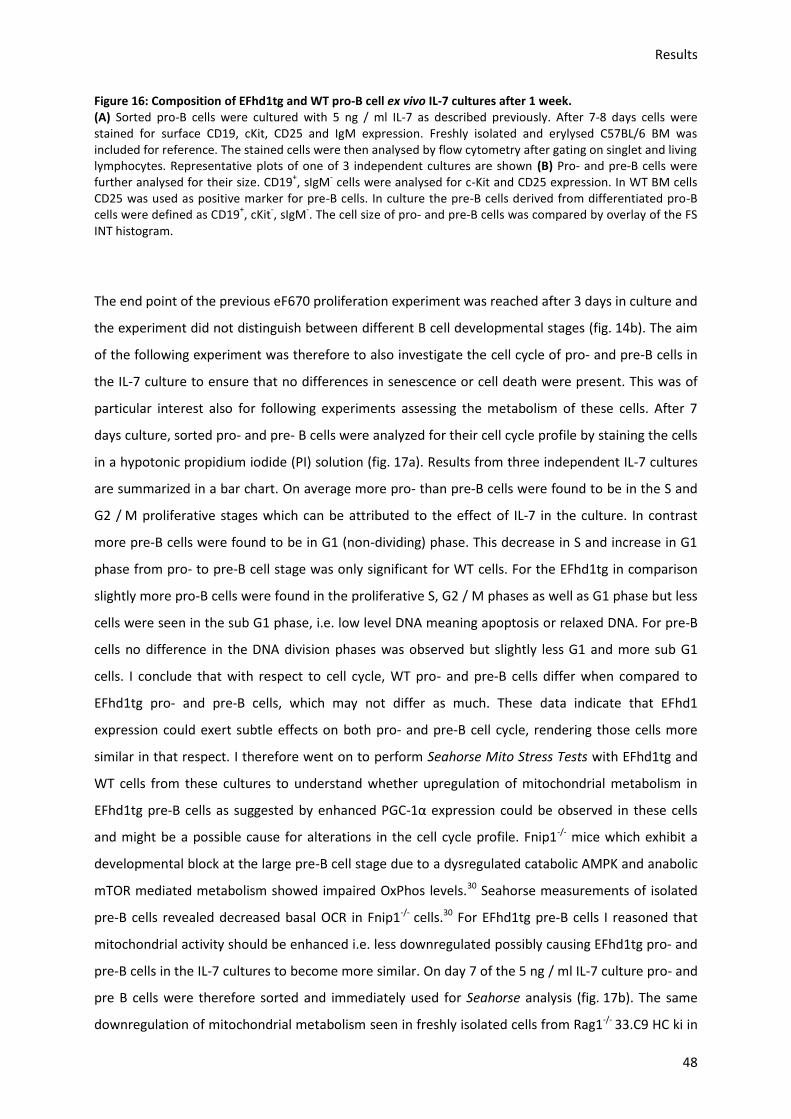
Results
48
Figure 16: Composition of EFhd1tg and WT pro-B cell ex vivo IL-7 cultures after 1 week. (A) Sorted pro-B cells were cultured with 5 ng / ml IL-7 as described previously. After 7-8 days cells were stained for surface CD19, cKit, CD25 and IgM expression. Freshly isolated and erylysed C57BL/6 BM was included for reference. The stained cells were then analysed by flow cytometry after gating on singlet and living lymphocytes. Representative plots of one of 3 independent cultures are shown (B) Pro- and pre-B cells were further analysed for their size. CD19
+, sIgM
- cells were analysed for c-Kit and CD25 expression. In WT BM cells
CD25 was used as positive marker for pre-B cells. In culture the pre-B cells derived from differentiated pro-B cells were defined as CD19
+, cKit
-, sIgM
-. The cell size of pro- and pre-B cells was compared by overlay of the FS
INT histogram.
The end point of the previous eF670 proliferation experiment was reached after 3 days in culture and
the experiment did not distinguish between different B cell developmental stages (fig. 14b). The aim
of the following experiment was therefore to also investigate the cell cycle of pro- and pre-B cells in
the IL-7 culture to ensure that no differences in senescence or cell death were present. This was of
particular interest also for following experiments assessing the metabolism of these cells. After 7
days culture, sorted pro- and pre- B cells were analyzed for their cell cycle profile by staining the cells
in a hypotonic propidium iodide (PI) solution (fig. 17a). Results from three independent IL-7 cultures
are summarized in a bar chart. On average more pro- than pre-B cells were found to be in the S and
G2 / M proliferative stages which can be attributed to the effect of IL-7 in the culture. In contrast
more pre-B cells were found to be in G1 (non-dividing) phase. This decrease in S and increase in G1
phase from pro- to pre-B cell stage was only significant for WT cells. For the EFhd1tg in comparison
slightly more pro-B cells were found in the proliferative S, G2 / M phases as well as G1 phase but less
cells were seen in the sub G1 phase, i.e. low level DNA meaning apoptosis or relaxed DNA. For pre-B
cells no difference in the DNA division phases was observed but slightly less G1 and more sub G1
cells. I conclude that with respect to cell cycle, WT pro- and pre-B cells differ when compared to
EFhd1tg pro- and pre-B cells, which may not differ as much. These data indicate that EFhd1
expression could exert subtle effects on both pro- and pre-B cell cycle, rendering those cells more
similar in that respect. I therefore went on to perform Seahorse Mito Stress Tests with EFhd1tg and
WT cells from these cultures to understand whether upregulation of mitochondrial metabolism in
EFhd1tg pre-B cells as suggested by enhanced PGC-1α expression could be observed in these cells
and might be a possible cause for alterations in the cell cycle profile. Fnip1-/- mice which exhibit a
developmental block at the large pre-B cell stage due to a dysregulated catabolic AMPK and anabolic
mTOR mediated metabolism showed impaired OxPhos levels.30 Seahorse measurements of isolated
pre-B cells revealed decreased basal OCR in Fnip1-/- cells.30 For EFhd1tg pre-B cells I reasoned that
mitochondrial activity should be enhanced i.e. less downregulated possibly causing EFhd1tg pro- and
pre-B cells in the IL-7 cultures to become more similar. On day 7 of the 5 ng / ml IL-7 culture pro- and
pre B cells were therefore sorted and immediately used for Seahorse analysis (fig. 17b). The same
downregulation of mitochondrial metabolism seen in freshly isolated cells from Rag1-/- 33.C9 HC ki in
Results
49
comparison to Rag1-/- mice was now also observed in sorted pre- and pro-B cells from IL-7 ex vivo
cultures, corroborating their corresponding cell sizes. Pre-B cells in these high IL-7 cultures were
shown to be slightly less active than pro-B cells for which IL-7 acts as a strong proliferation stimulus,
the susceptibility to which then gradually gets lost.7 By Seahorse analysis pre-B cells from IL-7
cultures were found consume less oxygen (OCR) but to acidify the medium (ECAR) proportionally
even less in comparison to pro-B cells (fig. 17b). Therefore a higher OCR / ECAR ratio in pre-B cells
was observed despite a decrease in mitochondrial ATP production (fig. 17b). In comparison to pro-B
cells, pre-B cells derive a larger proportion of their energy from OxPhos and their proton leak is
reduced leading to a better coupling. Like the Rag1-/- / Rag1-/- 33.C9 HC ki mice, these IL-7 cultures
confirm a higher reliance of pre-B cells on OxPhos rather than glycolysis for energy production which
is yet higher in EFhd1tg cells as the energy profile if of these cells is increased. In accordance the
enzymatic spare capacity for O2 consumption was also increased in pre-B in comparison to pro-B cells
and the proton leak in these cells was reduced. In WT but not in EFhd1tg pre-B cells also the coupling
efficiency (part of mitochondrial respiration that goes into ATP production) was increased. In EFhd1tg
pre-B cells the coupling efficiency was almost significantly decreased, going in hand with a
significantly decreased mitochondrial ATP production and increased non-mitochondrial respiration.
While mitochondrial respiration in EFhd1tg pre-B cells was not markedly different from WT cells and
the cellular energy phenotype was even slightly enhanced, as expected in cells with a higher
ppargc1a expression, the efficiency of mitochondrial respiration in EFhd1tg pre- but not pro-B cells
was lower. Ectopic expression of EFhd1 in pre-B cells, where the protein is normally downregulated
therefore leads to mitochondrial dysfunction despite higher mitochondrial activity. EFhd1, while
upregulating mitochondrial activity, therefore does not contribute to an increase in functional
mitochondrial metabolism at the pre-B cell stage but appears to be disadvantageous for the cells,
explaining also a necessity of its downregulation.
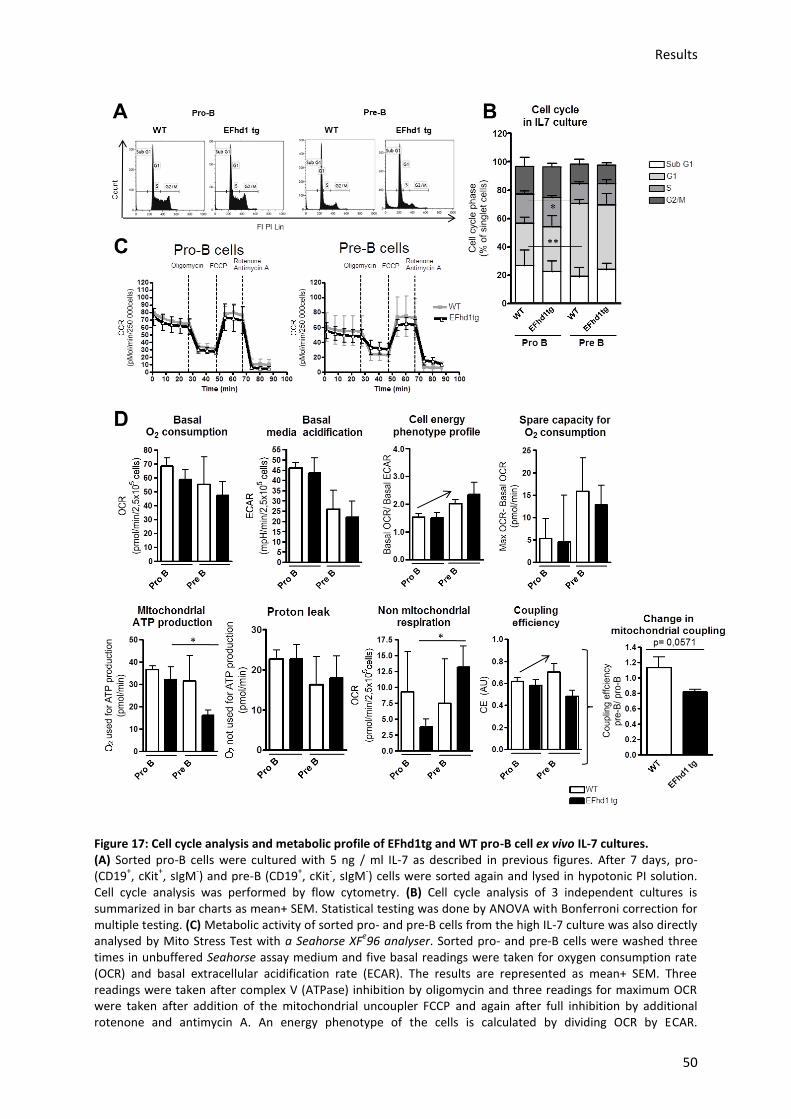
Results
50
Figure 17: Cell cycle analysis and metabolic profile of EFhd1tg and WT pro-B cell ex vivo IL-7 cultures. (A) Sorted pro-B cells were cultured with 5 ng / ml IL-7 as described in previous figures. After 7 days, pro- (CD19
+, cKit
+, sIgM
-) and pre-B (CD19
+, cKit
-, sIgM
-) cells were sorted again and lysed in hypotonic PI solution.
Cell cycle analysis was performed by flow cytometry. (B) Cell cycle analysis of 3 independent cultures is summarized in bar charts as mean+ SEM. Statistical testing was done by ANOVA with Bonferroni correction for multiple testing. (C) Metabolic activity of sorted pro- and pre-B cells from the high IL-7 culture was also directly analysed by Mito Stress Test with a Seahorse XF
e96 analyser. Sorted pro- and pre-B cells were washed three
times in unbuffered Seahorse assay medium and five basal readings were taken for oxygen consumption rate (OCR) and basal extracellular acidification rate (ECAR). The results are represented as mean+ SEM. Three readings were taken after complex V (ATPase) inhibition by oligomycin and three readings for maximum OCR were taken after addition of the mitochondrial uncoupler FCCP and again after full inhibition by additional rotenone and antimycin A. An energy phenotype of the cells is calculated by dividing OCR by ECAR.
Results
51
Furthermore the spare capacity (the increase from basal to maximum OCR) and the mitochondrial ATP production rate (the OCR which can be blocked by adding ATPase inhibitor oligomycin) are shown as bar diagrams. Also the mitochondrial proton leakage (OCR which can be further blocked by antimycin A and rotenone after oligomycin administration) and non-mitochondrial respiration (OCR remaining after fully blocking the mitochondria with oligomycin, antimycin A and rotenone) were calculated. The coupling efficiency represents the part of mitochondrial respiration going into ATP production instead of proton leak. The data is represented as mean+ SEM of 3 independent sorts and Seahorse experiments of 3 pooled EFhd1tg and WT mice. Statistical analysis was done by ANOVA with Bonferroni correction for multiple testing.
5.4.) Analysis of mitochondrial activity in EFhd1 shRNA knock-down cell
lines
To confirm a positive effect of EFhd1 on aerobic mitochondrial respiration, OxPhos, suggested by the
previous experiment and gene expression profile, the reverse experiment was performed with 38B9
cells, a pro-B cell line, with a stable knock-down of EFhd1 by shRNA.155 38B9 cells endogenously
express EFhd1 104 but a stable transfection with shRNA I-III and subcloning by S. Dütting resulted in
four cell lines with various degrees of EFhd1 protein knock-down (fig. 18a).107 The knock-down
efficiency does not correlate with the shRNA expression levels (GFP fluorescence of the vector)
thereby ruling out dose enhanced off target effects (fig. 18b). Seahorse Mito Stress Tests were carried
out with the four knock-down cell lines as well as a cell line where the vector with no shRNA was
introduced (PLMB). In comparison to the control cell line, PLMB, all knock-down cell lines exhibit
reduced basal OCR rates (fig. 18c). All knock-down cell lines (except 38B9 shI) also show increased
ECAR rates leading to decreased OCR / ECAR ratios in comparison to PLMB cells. A knock-down of
EFhd1 in 38B9 pro-B cells therefore has the opposite effect to ectopic overexpression of EFhd1tg in
primary pre-B cells. The degree of EFhd1 knock-down in fact correlates significantly with the
reduction in the OCR / ECAR ratio (fig. 18d). While ectopic expression enhances mitochondrial
activity, knock-down leads to a reduced aerobic mitochondrial metabolism. Spare capacities of the
EFhd1 knock-down cell lines are also considerably decreased but with a high degree of variability.
These measurements as well as the following do not correlate with EFhd1 knock-down efficiency.
While mitochondrial respiration and coupling efficiency is decreased in all EFhd1 knock-down cell
lines, the proton leak and non-mitochondrial-respiration of the cells does not appear to be affected
(fig. 18c). These data indicate that a silencing of EFhd1 protein shifts the cells’ energy production to
the utilization of more glycolysis and less mitochondrial OxPhos in a dose dependent manner.
Furthermore the Δψµ (TMRE fluorescence due to incompatibility of GFP and DIOC6 staining) also
correlated inversely with the EFhd1 knock-down efficiency which could explain the reduced
mitochondrial ATP production. EFhd1 expression under certain conditions therefore appears to be
vital to effectively uphold a membrane potential which has already been suggested previously.87
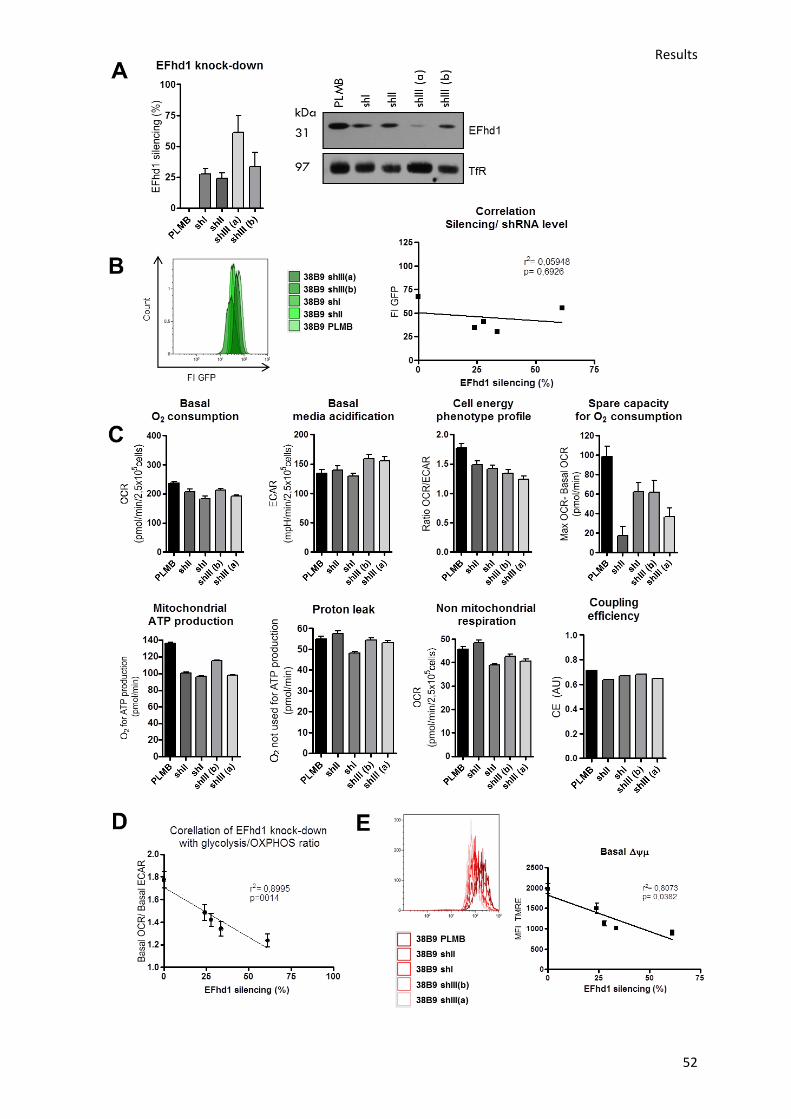
Results
52
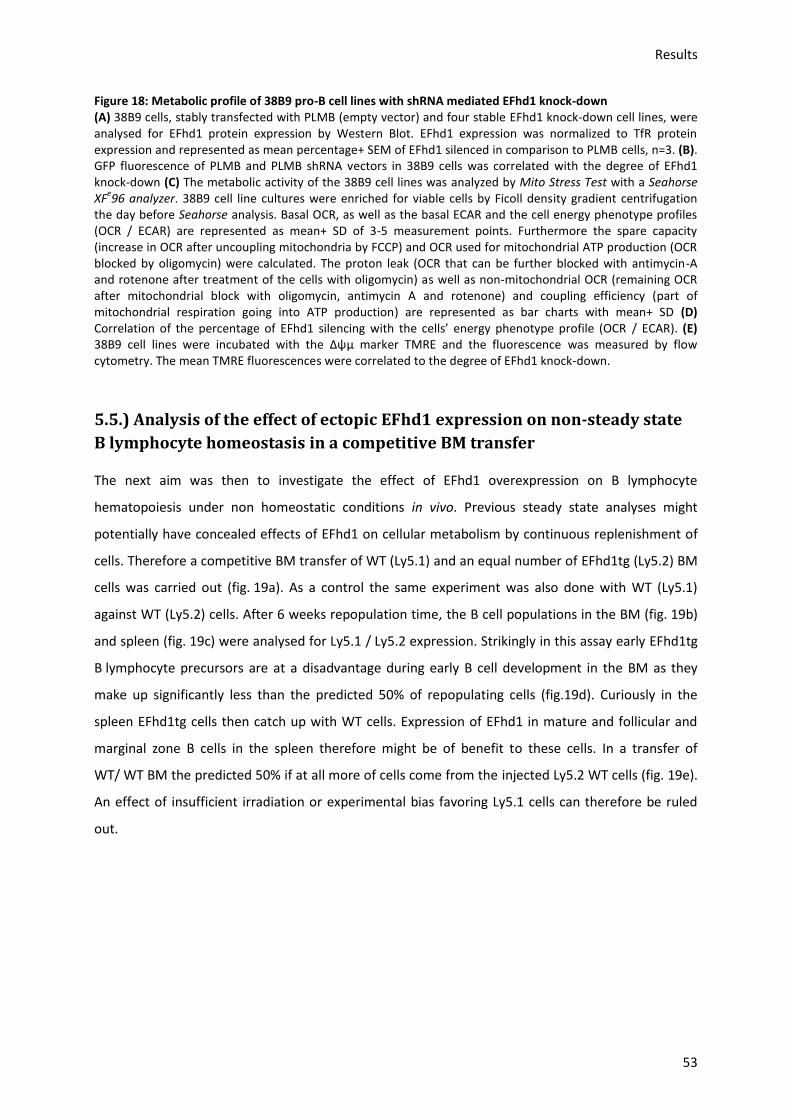
Results
53
Figure 18: Metabolic profile of 38B9 pro-B cell lines with shRNA mediated EFhd1 knock-down (A) 38B9 cells, stably transfected with PLMB (empty vector) and four stable EFhd1 knock-down cell lines, were analysed for EFhd1 protein expression by Western Blot. EFhd1 expression was normalized to TfR protein expression and represented as mean percentage+ SEM of EFhd1 silenced in comparison to PLMB cells, n=3. (B). GFP fluorescence of PLMB and PLMB shRNA vectors in 38B9 cells was correlated with the degree of EFhd1 knock-down (C) The metabolic activity of the 38B9 cell lines was analyzed by Mito Stress Test with a Seahorse XF
e96 analyzer. 38B9 cell line cultures were enriched for viable cells by Ficoll density gradient centrifugation
the day before Seahorse analysis. Basal OCR, as well as the basal ECAR and the cell energy phenotype profiles (OCR / ECAR) are represented as mean+ SD of 3-5 measurement points. Furthermore the spare capacity (increase in OCR after uncoupling mitochondria by FCCP) and OCR used for mitochondrial ATP production (OCR blocked by oligomycin) were calculated. The proton leak (OCR that can be further blocked with antimycin-A and rotenone after treatment of the cells with oligomycin) as well as non-mitochondrial OCR (remaining OCR after mitochondrial block with oligomycin, antimycin A and rotenone) and coupling efficiency (part of mitochondrial respiration going into ATP production) are represented as bar charts with mean+ SD (D) Correlation of the percentage of EFhd1 silencing with the cells’ energy phenotype profile (OCR / ECAR). (E) 38B9 cell lines were incubated with the Δψµ marker TMRE and the fluorescence was measured by flow cytometry. The mean TMRE fluorescences were correlated to the degree of EFhd1 knock-down.
5.5.) Analysis of the effect of ectopic EFhd1 expression on non-steady state
B lymphocyte homeostasis in a competitive BM transfer
The next aim was then to investigate the effect of EFhd1 overexpression on B lymphocyte
hematopoiesis under non homeostatic conditions in vivo. Previous steady state analyses might
potentially have concealed effects of EFhd1 on cellular metabolism by continuous replenishment of
cells. Therefore a competitive BM transfer of WT (Ly5.1) and an equal number of EFhd1tg (Ly5.2) BM
cells was carried out (fig. 19a). As a control the same experiment was also done with WT (Ly5.1)
against WT (Ly5.2) cells. After 6 weeks repopulation time, the B cell populations in the BM (fig. 19b)
and spleen (fig. 19c) were analysed for Ly5.1 / Ly5.2 expression. Strikingly in this assay early EFhd1tg
B lymphocyte precursors are at a disadvantage during early B cell development in the BM as they
make up significantly less than the predicted 50% of repopulating cells (fig.19d). Curiously in the
spleen EFhd1tg cells then catch up with WT cells. Expression of EFhd1 in mature and follicular and
marginal zone B cells in the spleen therefore might be of benefit to these cells. In a transfer of
WT/ WT BM the predicted 50% if at all more of cells come from the injected Ly5.2 WT cells (fig. 19e).
An effect of insufficient irradiation or experimental bias favoring Ly5.1 cells can therefore be ruled
out.
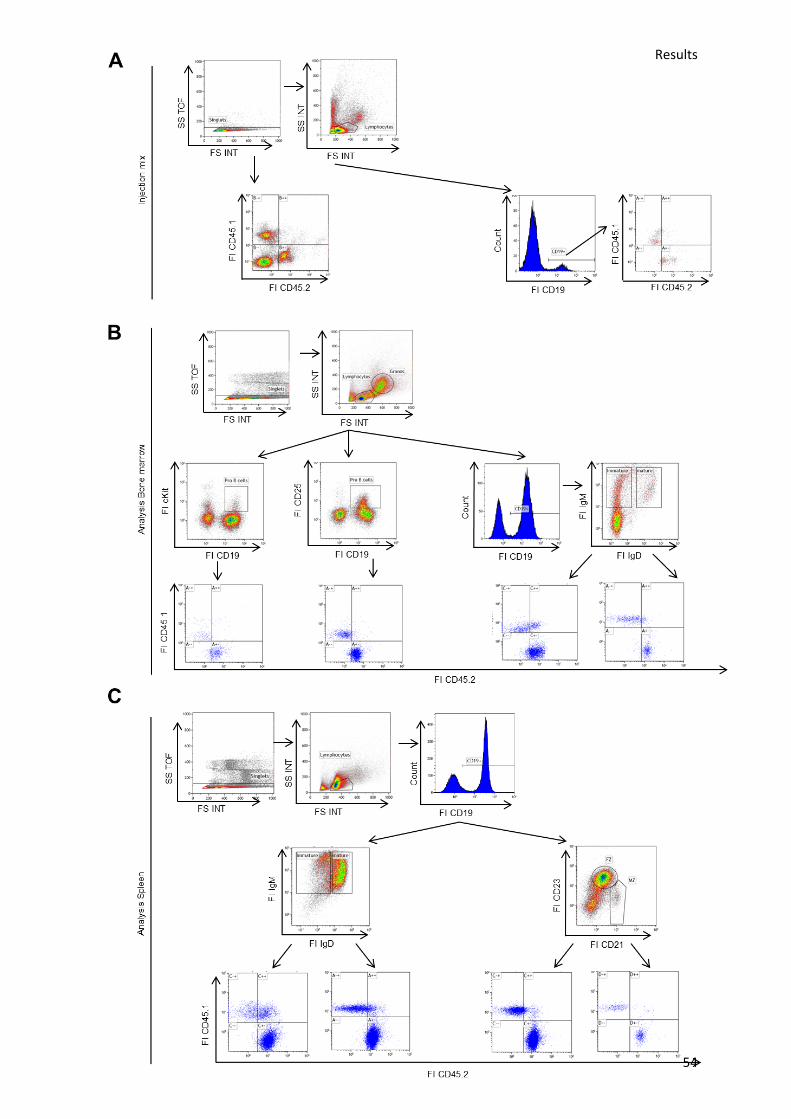
Results
54
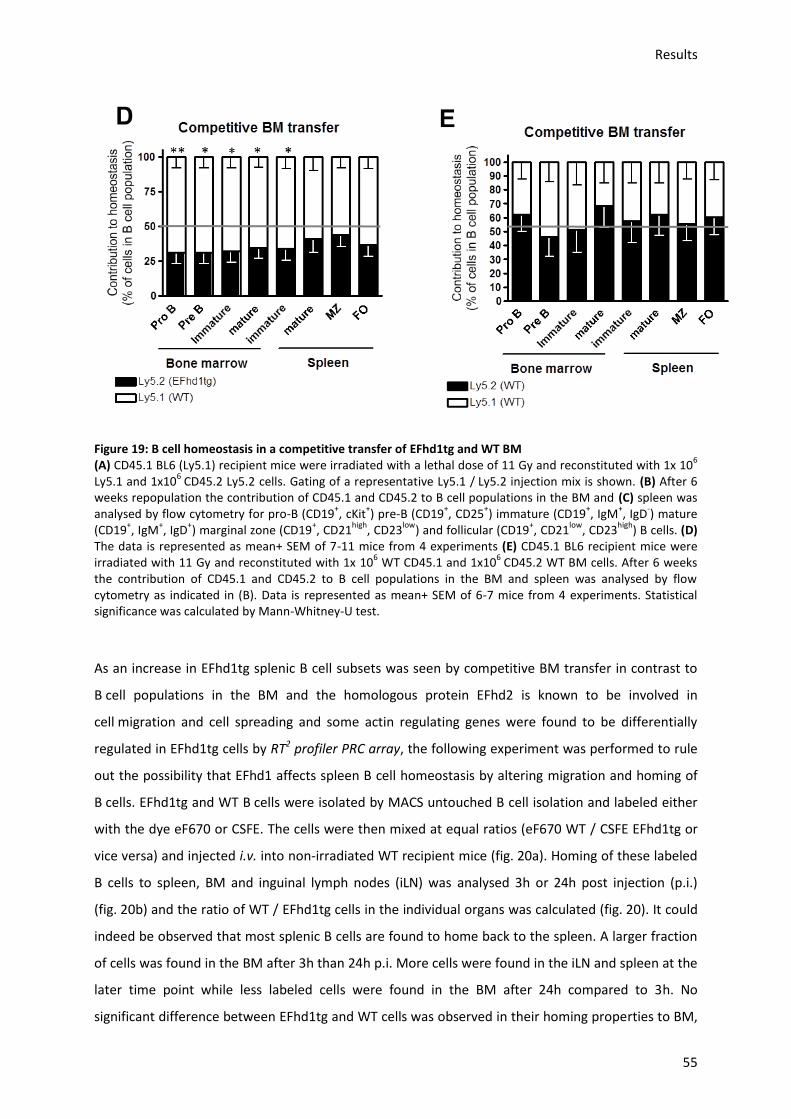
Results
55
Figure 19: B cell homeostasis in a competitive transfer of EFhd1tg and WT BM (A) CD45.1 BL6 (Ly5.1) recipient mice were irradiated with a lethal dose of 11 Gy and reconstituted with 1x 10
6
Ly5.1 and 1x10⁶
CD45.2 Ly5.2 cells. Gating of a representative Ly5.1 / Ly5.2 injection mix is shown. (B) After 6 weeks repopulation the contribution of CD45.1 and CD45.2 to B cell populations in the BM and (C) spleen was analysed by flow cytometry for pro-B (CD19
+, cKit
+) pre-B (CD19
+, CD25
+) immature (CD19
+, IgM
+, IgD
-) mature
(CD19+, IgM
+, IgD
+) marginal zone (CD19
+, CD21
high, CD23
low) and follicular (CD19
+, CD21
low, CD23
high) B cells. (D)
The data is represented as mean+ SEM of 7-11 mice from 4 experiments (E) CD45.1 BL6 recipient mice were irradiated with 11 Gy and reconstituted with 1x 10
6 WT CD45.1 and 1x10
6 CD45.2 WT BM cells. After 6 weeks
the contribution of CD45.1 and CD45.2 to B cell populations in the BM and spleen was analysed by flow cytometry as indicated in (B). Data is represented as mean+ SEM of 6-7 mice from 4 experiments. Statistical significance was calculated by Mann-Whitney-U test.
As an increase in EFhd1tg splenic B cell subsets was seen by competitive BM transfer in contrast to
B cell populations in the BM and the homologous protein EFhd2 is known to be involved in
cell migration and cell spreading and some actin regulating genes were found to be differentially
regulated in EFhd1tg cells by RT2 profiler PRC array, the following experiment was performed to rule
out the possibility that EFhd1 affects spleen B cell homeostasis by altering migration and homing of
B cells. EFhd1tg and WT B cells were isolated by MACS untouched B cell isolation and labeled either
with the dye eF670 or CSFE. The cells were then mixed at equal ratios (eF670 WT / CSFE EFhd1tg or
vice versa) and injected i.v. into non-irradiated WT recipient mice (fig. 20a). Homing of these labeled
B cells to spleen, BM and inguinal lymph nodes (iLN) was analysed 3h or 24h post injection (p.i.)
(fig. 20b) and the ratio of WT / EFhd1tg cells in the individual organs was calculated (fig. 20). It could
indeed be observed that most splenic B cells are found to home back to the spleen. A larger fraction
of cells was found in the BM after 3h than 24h p.i. More cells were found in the iLN and spleen at the
later time point while less labeled cells were found in the BM after 24h compared to 3h. No
significant difference between EFhd1tg and WT cells was observed in their homing properties to BM,
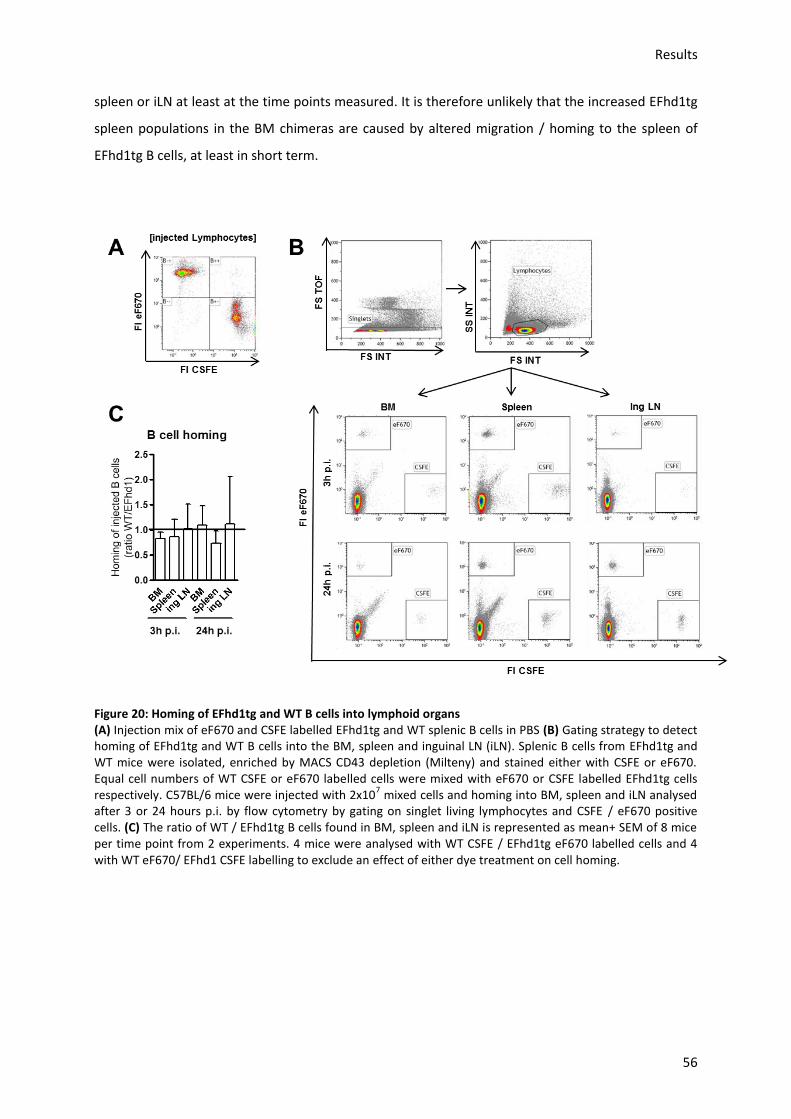
Results
56
spleen or iLN at least at the time points measured. It is therefore unlikely that the increased EFhd1tg
spleen populations in the BM chimeras are caused by altered migration / homing to the spleen of
EFhd1tg B cells, at least in short term.
Figure 20: Homing of EFhd1tg and WT B cells into lymphoid organs (A) Injection mix of eF670 and CSFE labelled EFhd1tg and WT splenic B cells in PBS (B) Gating strategy to detect homing of EFhd1tg and WT B cells into the BM, spleen and inguinal LN (iLN). Splenic B cells from EFhd1tg and WT mice were isolated, enriched by MACS CD43 depletion (Milteny) and stained either with CSFE or eF670. Equal cell numbers of WT CSFE or eF670 labelled cells were mixed with eF670 or CSFE labelled EFhd1tg cells respectively. C57BL/6 mice were injected with 2x10
7 mixed cells and homing into BM, spleen and iLN analysed
after 3 or 24 hours p.i. by flow cytometry by gating on singlet living lymphocytes and CSFE / eF670 positive cells. (C) The ratio of WT / EFhd1tg B cells found in BM, spleen and iLN is represented as mean+ SEM of 8 mice per time point from 2 experiments. 4 mice were analysed with WT CSFE / EFhd1tg eF670 labelled cells and 4 with WT eF670/ EFhd1 CSFE labelling to exclude an effect of either dye treatment on cell homing.
Results
57
5.6.) Analysis of mitochondrial activity in EFhd1tg LPS blasts
Another question to be answered was whether mitochondria could be manipulated by transgenic
EFhd1 expression also at later stages of B cell development in the spleen and not BM. Therefore
splenic B cells were isolated by EasySep untouched B cell isolation kit and activated in an ex vivo in
culture with 10 µg / ml LPS. These cells were analysed for their proliferative potential by eF670
staining directly after the isolation and analysis of the shift in fluorescence after 3 days in culture
(fig. 21a). Comparable percentages of EFhd1tg and WT divided cells were observed in the culture and
the same proliferation index (mean division number / dividing cell) was seen. The LPS blasts were
also analysed for their metabolic profile by Seahorse Mito Stress Test. A slight increase in basal and
maximum OCR as well as basal ECAR was observed in EFhd1tg blasts (fig. 21b). The cell energy
phenotype, however, was unaltered between EFhd1tg and WT cells. The spare capacity,
mitochondrial ATP production and proton leak were slightly enhanced in EFhd1tg LPS blasts
(fig. 21b). The increased proton leak was found to be significant for EFhd1tg cells possibly indicating
more active mitochondria balancing a surplus of energy production. Non-mitochondrial respiration
and coupling efficiency were slightly decreased in EFhd1tg LPS blasts. Therefore under the strong
proliferative and activation stimulus of LPS which has been published to lead to an increase glycolysis
as well as OxPhos in B lymphocytes 34 EFhd1 appears to contribute to some extent to a more active
mitochondrial metabolism. This effect is supposedly smaller than the effect of the LPS itself.
Evidently EFhd1tg does not lead to an altered proliferation potential of these cells. When culturing
EFhd1tg and WT LPS blasts with various alterations in the media, less glucose uptake is seen in
EFhd1tg LPS blast in the presence of the non-metabolisable glucose analogue 2-DG, possibly
indicating a decreased dependency on the sugar and activation of other pathways (fig. 21c). By EM
microscopy also some EFhd1tg LPS blast but not unstimulated cells were found to harbour larger
mitochondria (fig. 21d) in line with the HEK 293 transfection data and the acute metabolic stressor
stimulus by LPS.
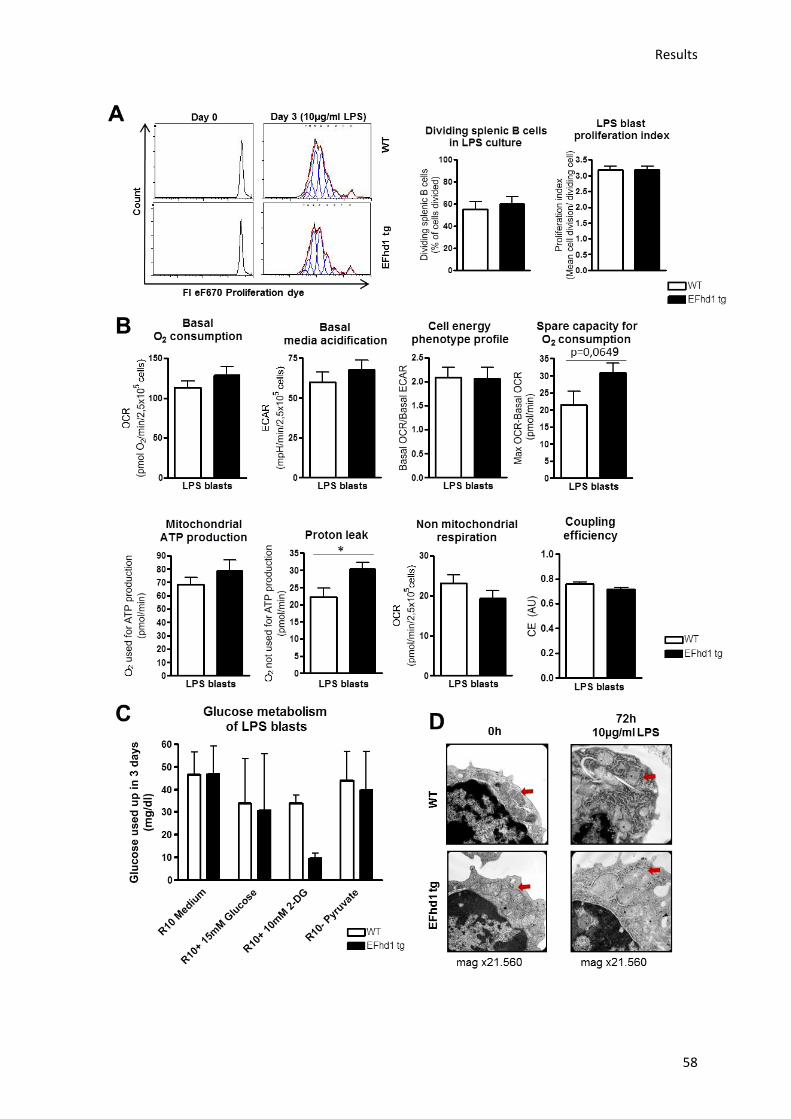
Results
58
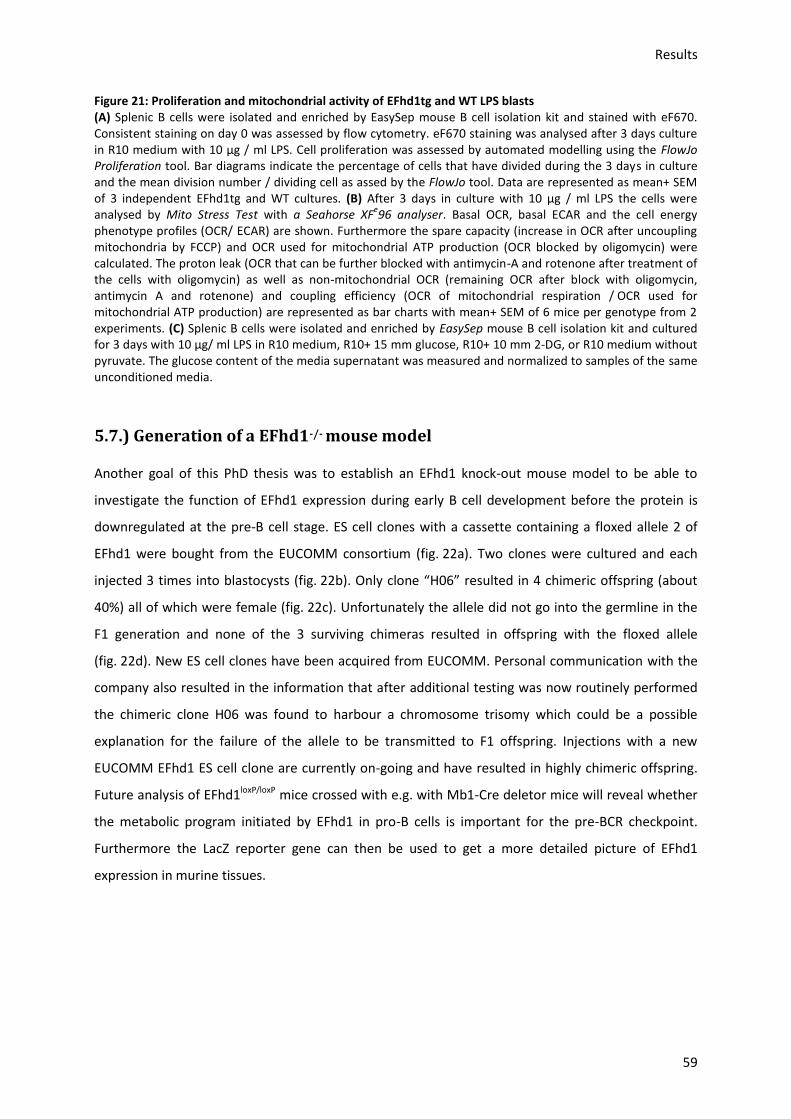
Results
59
Figure 21: Proliferation and mitochondrial activity of EFhd1tg and WT LPS blasts (A) Splenic B cells were isolated and enriched by EasySep mouse B cell isolation kit and stained with eF670. Consistent staining on day 0 was assessed by flow cytometry. eF670 staining was analysed after 3 days culture in R10 medium with 10 µg / ml LPS. Cell proliferation was assessed by automated modelling using the FlowJo Proliferation tool. Bar diagrams indicate the percentage of cells that have divided during the 3 days in culture and the mean division number / dividing cell as assed by the FlowJo tool. Data are represented as mean+ SEM of 3 independent EFhd1tg and WT cultures. (B) After 3 days in culture with 10 µg / ml LPS the cells were analysed by Mito Stress Test with a Seahorse XF
e96 analyser. Basal OCR, basal ECAR and the cell energy
phenotype profiles (OCR/ ECAR) are shown. Furthermore the spare capacity (increase in OCR after uncoupling mitochondria by FCCP) and OCR used for mitochondrial ATP production (OCR blocked by oligomycin) were calculated. The proton leak (OCR that can be further blocked with antimycin-A and rotenone after treatment of the cells with oligomycin) as well as non-mitochondrial OCR (remaining OCR after block with oligomycin, antimycin A and rotenone) and coupling efficiency (OCR of mitochondrial respiration / OCR used for mitochondrial ATP production) are represented as bar charts with mean+ SEM of 6 mice per genotype from 2 experiments. (C) Splenic B cells were isolated and enriched by EasySep mouse B cell isolation kit and cultured for 3 days with 10 µg/ ml LPS in R10 medium, R10+ 15 mm glucose, R10+ 10 mm 2-DG, or R10 medium without pyruvate. The glucose content of the media supernatant was measured and normalized to samples of the same unconditioned media.
5.7.) Generation of a EFhd1-/- mouse model
Another goal of this PhD thesis was to establish an EFhd1 knock-out mouse model to be able to
investigate the function of EFhd1 expression during early B cell development before the protein is
downregulated at the pre-B cell stage. ES cell clones with a cassette containing a floxed allele 2 of
EFhd1 were bought from the EUCOMM consortium (fig. 22a). Two clones were cultured and each
injected 3 times into blastocysts (fig. 22b). Only clone “H06” resulted in 4 chimeric offspring (about
40%) all of which were female (fig. 22c). Unfortunately the allele did not go into the germline in the
F1 generation and none of the 3 surviving chimeras resulted in offspring with the floxed allele
(fig. 22d). New ES cell clones have been acquired from EUCOMM. Personal communication with the
company also resulted in the information that after additional testing was now routinely performed
the chimeric clone H06 was found to harbour a chromosome trisomy which could be a possible
explanation for the failure of the allele to be transmitted to F1 offspring. Injections with a new
EUCOMM EFhd1 ES cell clone are currently on-going and have resulted in highly chimeric offspring.
Future analysis of EFhd1loxP/loxP mice crossed with e.g. with Mb1-Cre deletor mice will reveal whether
the metabolic program initiated by EFhd1 in pro-B cells is important for the pre-BCR checkpoint.
Furthermore the LacZ reporter gene can then be used to get a more detailed picture of EFhd1
expression in murine tissues.
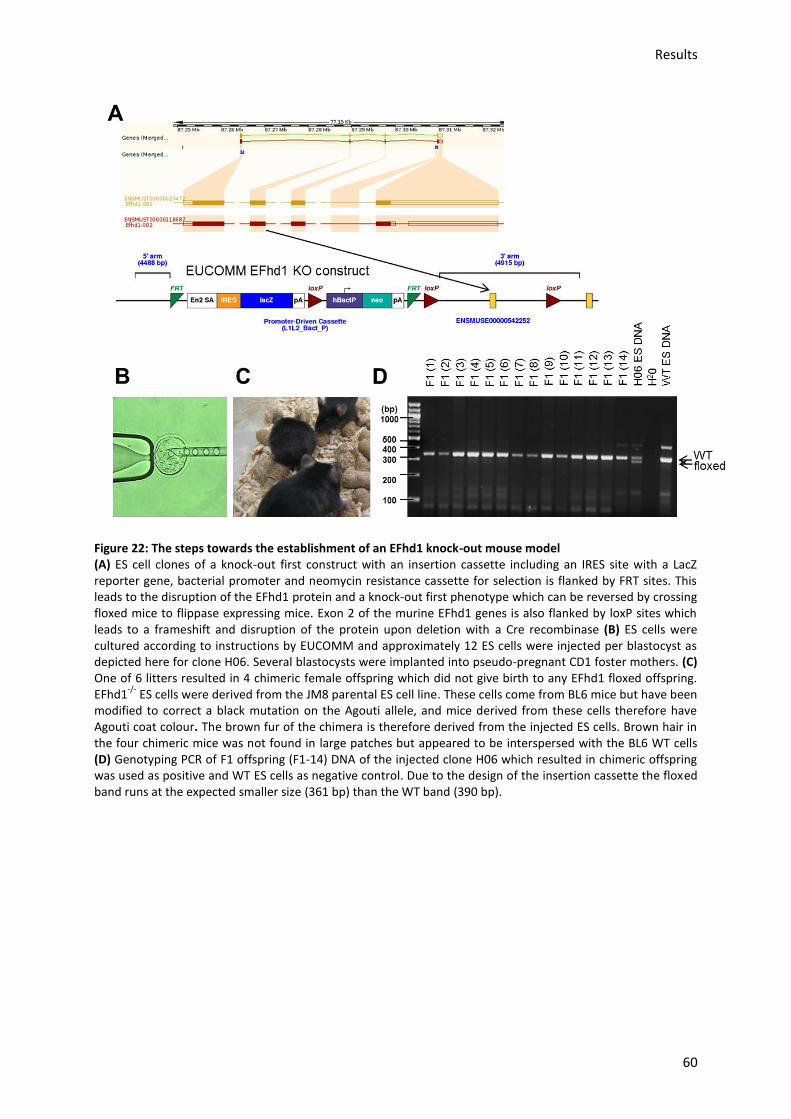
Results
60
Figure 22: The steps towards the establishment of an EFhd1 knock-out mouse model (A) ES cell clones of a knock-out first construct with an insertion cassette including an IRES site with a LacZ reporter gene, bacterial promoter and neomycin resistance cassette for selection is flanked by FRT sites. This leads to the disruption of the EFhd1 protein and a knock-out first phenotype which can be reversed by crossing floxed mice to flippase expressing mice. Exon 2 of the murine EFhd1 genes is also flanked by loxP sites which leads to a frameshift and disruption of the protein upon deletion with a Cre recombinase (B) ES cells were cultured according to instructions by EUCOMM and approximately 12 ES cells were injected per blastocyst as depicted here for clone H06. Several blastocysts were implanted into pseudo-pregnant CD1 foster mothers. (C) One of 6 litters resulted in 4 chimeric female offspring which did not give birth to any EFhd1 floxed offspring. EFhd1
-/- ES cells were derived from the JM8 parental ES cell line. These cells come from BL6 mice but have been
modified to correct a black mutation on the Agouti allele, and mice derived from these cells therefore have Agouti coat colour. The brown fur of the chimera is therefore derived from the injected ES cells. Brown hair in the four chimeric mice was not found in large patches but appeared to be interspersed with the BL6 WT cells (D) Genotyping PCR of F1 offspring (F1-14) DNA of the injected clone H06 which resulted in chimeric offspring was used as positive and WT ES cells as negative control. Due to the design of the insertion cassette the floxed band runs at the expected smaller size (361 bp) than the WT band (390 bp).
Discussion
61
6.) Discussion
6.1) Mitochondrial metabolism changes at the pro- to pre-B cell transition
Comparative data of pro- and pre-B cell mitochondrial metabolism has so far been missing. At these
developmental stages, the cells face numerous challenges in the BM such as changes in
concentrations of oxygen and cytokines, requirements for different niches and mitotically
proliferative and quiescent phases. I therefore anticipated that the metabolism of the cells adapts,
ensuring that pre-B cells have sufficient capacity to differentiate further but also stay within limits to
prevent lymphomagenesis. Staining with specific markers revealed that mitochondrial mass was not
significantly altered between pro-, pre- and later stage mouse BM B lymphocytes. Yet a significant
increase was seen in the Δψµ, cellular ROS (mainly produced by mitochondria) and glucose uptake at
the pro- to large pre-B cell transition. Moreover a significant decrease in these parameters was then
observed from the large to the small pre-B cell stage but no further significant changes occurred in
later stage B cells. This downregulation of mitochondrial parameters in small pre B cells was
furthermore shown to be disproportional to their decrease in size. Large pre-B cells are mitotically
active while small pre-B cells cease surface expression of the pre-BCR, become quiescent and
undergo LC rearrangement. More active mitochondria and a higher glucose uptake in large pre-B
cells but decreased mitochondrial metabolism in small pre-B cells therefore ties in perfectly with the
reported proliferative status of these cell stages. The more surprising finding was that the
mitochondrial metabolism in large pre-B cells does not appear to be upregulated by enhanced
mitochondrial biogenesis but rather at the functional level, as mitochondrial mass in these cells
appeared unaltered and when normalized to the cell volume was even decreased. Mitochondria of
large pre-B cells hence upregulate their Δψµ which then leads to a more active ETC and more ROS
production by complexes I and III. Enhanced mitochondrial activity in large pre-B cells appears to be
at least partially fuelled by higher glucose consumption in large pre-B cells as glucose uptake was
found to be significantly increased, too. A subsequent downregulation of glucose uptake, Δψµ and
hence ROS generation in small pre-B balances energy production and demand of the cells but may
furthermore also prevent unspecific DNA damage at this critical time of LC rearrangement.
A direct effect of pre-BCR (HC) expression on mitochondrial metabolism in B cells was analysed by
comparing Rag1-/- B cells (pro-B cells) to Rag1-/- a 33C9. HC ki (i.e. phenotypic pre-B) cells. Expression
of a HC in Rag1-/- pro-B cells leads to reduced staining with the aforementioned mitochondrial
markers. A potential drawback of this genetic system may be inefficient pairing of the HC with λ5 and
VpreB and hence an unfolded protein response leading to ER and mitochondrial stress.165 The
mitochondrial parameters, however, even show a decreased mitochondrial activity of the cells.
Furthermore preliminary data also indicates similar results for CD19+ isolated BM B cells of
Discussion
62
dTg (Ig-tTA/tet-μ) rag-2−/−mice cultured with (pro-B) or without (pre-B) tetracyclin where pairing is
known to occur (data not shown).166 The arising question is then how this decreased mitochondrial
activity should be reconciled with the fact that surface expression of the pre-BCR is known to give
positive signals for cellular proliferation. This can be explained by the finding that the majority of
Rag1-/- 33.C9 HC ki cells are not proliferating large pre-B cells. Cell cycle and size analysis indicated
that these cells which inevitably fail to rearrange their LCs loci and due to the genetic Rag1-/-
background were phenotypically stuck and accumulated at the small pre-B cell stage. Large, actively
proliferating, pre-B cells may in future be addressed in other systems. For example pre-B cells of
Irf4/ 8 knock-out mice-with a developmental block at the cycling large pre-B cell stage- may be
expected to show an increased mitochondrial activity but not mass in comparison to pro-B cells.167
In accordance with decreased staining for mitochondrial markers and a decreased mitotic activity,
also direct metabolic measurements of glycolysis and OxPhos by Seahorse XFe96 analyser were
reduced in Rag1-/- 33.C9 HC ki cells. Notably when analyzing the energy profiles of Rag1-/- and Rag1-/-
33.C9 HC ki cells, the downregulation of basal mitochondrial metabolism (i.e. OxPhos, OCR) was
relatively less pronounced than the downregulation of glycolysis (ECAR) in the HC expressing cells.
This finding was later corroborated with sorted pro- and pre-B cells from IL-7 cultures. Therefore
pro-B cells rely more on glycolysis for energy production than pre-BCR expressing cells which use
more aerobic mitochondrial respiration to feed their energy demand. In summary a metabolic switch
towards more OxPhos occurs at the pre-BCR checkpoint which is at least in part fuelled by glucose.
Upregulation of ppargc1a, sod2 and glut-1 in pre-B cells support this hypothesis
Pro-B cells have been described to develop close to the vasculature whereas niches for pre-B cell
development are dispersed and in limited contact with blood vessels. This could in fact be beneficial
at the pre-BCR checkpoint to ensure competition of metabolically fit cells and limit ROS damage
when increasing their aerobic mitochondrial metabolism. These metabolic adaptations have
implications for pro- and pre-B cell proliferation. Glycolysis is prevalent in many activated and
robustly proliferating cells but also in stem cells which require hypoxic conditions and low levels of
mitochondrial metabolism to remain in their undifferentiated state.168 In human pluripotent stem
cells mitochondria already have functional respiratory complexes but are suppressed by high ucp2
expression.169 It is also known that OxPhos can be prevalent in cells differentiating away from stem
cells.170,171 The activation of a more mitochondrial metabolism at the pro- to pre-B cell transition is
therefore in line with their differentiation status and a balanced metabolism, preparing the cells for
more oxygenated environments in the periphery, such as the spleen.
Discussion
63
6.2) EFhd1 expression in the presence of acute stressors can increase
mitochondrial mass
The second major aim of this PhD thesis was to elucidate the role of the mitochondrial adaptor
protein EFhd1 in mitochondrial metabolism. Mitochondrial mass was found to be enhanced upon
ectopic EFhd1 expression in HEK293 cells in comparison to cells transfected with the empty GFP-
vector control only. Of note this increase in mitochondrial mass by EFhd1 was only observed in the
situation of stressors such as overexpression by transfection or LPS activation. A difference in cellular
response to chronic EFhd1 expression (EFhd1tg) in comparison to acute overexpression (retroviral
infection) was also observed in the BSc thesis of Linus Rinke. Acute expression of EFhd1 may lead to a
more drastic response and hence upregulation of mitochondrial biogenesis instead of metabolic
pathways. Mitochondrial biogenesis is a rather tightly regulated process as any dysregulation in a
cell’s energy balance can quickly be detrimental. The increase in mitochondrial mass in transfected
HEK 293 cells is therefore an indicator that EFhd1 does indeed play a vital role in mitochondrial
metabolism. This flow cytometric assay nevertheless does not reveal whether EFhd1 overexpression
increases the mitochondrial size, number, protein content, or perhaps even inhibits mitophagy in
HEK 293 cells. A possible explanation may be found in electron microscopy pictures of LPS blasts
which reveal larger mitochondria in some EFhd1tg in comparison to WT LPS blasts. This enhanced
mitochondrial mass was not observed in naïve B cells but only in the presence of the metabolic
stressor LPS.
6.3) Ectopic EFhd1 expression in vivo alters metabolic gene expression
profiles of pre-B cells
To investigate the effect on mitochondrial metabolism if EFhd1 is not down-regulated at the pro- to
pre-B cell transition, a transgene mouse model was used. In this gain of function model EFhd1 is
ectopically expressed by the VH-promoter and Eµ-enhancer in all lymphocytes. Transgene expression
was confirmed on DNA, RNA and protein level. Interestingly the ectopically overexpressed EFhd1
(EFhd1tg) like the endogenous EFhd1 is also found to be decreased on mRNA level in pre-B cells in
comparison to the pro-B cell stage and the expression was even lower in BCR+ B cells. Therefore in
the EFhd1tg either the VH-promoter and Eµ-enhancer are more active in pro-B cells, or some
regulation of EFhd1 takes place at the mRNA level in pre-B and BCR+ B cells suggesting a possible
mechanism of normal EFhd1 downregulation in vivo. Nonetheless EFhd1 transgene mRNA is
expressed 100-200-fold compared to endogenous EFhd1 mRNA in WT cells. Kristin Fritsch, a former
Master student, established by circle PCR that the EFhd1 transgene is integrated into a non-coding
region of the protein MS4A12 (membrane-spanning 4-domains, subfamily A member 12) on mouse
chromosome 19 (position 1334573).156 No further integration sites could be reliably mapped. The
Discussion
64
protein MS4A12 is a colon-selective store-operated calcium channel that promotes malignant cell
processes.172 Integration of the transgene into this non-coding region of the gene is unlikely to have
an effect on lymphocytes due to the tissue specificity of the protein and the transgene may even be
removed by splicing mechanisms. By Southern Blot analysis carried out by K. Fritsch, the transgene
was furthermore calculated to be integrated 7 times when taking into consideration the two
endogenous EFhd1 alleles.156 B cell homeostasis of EFhd1tg mice shows tendencies to reduced cell
numbers and a developmental delay after the pre-BCR checkpoint.156 In the spleen, however,
increased cell numbers of follicular and marginal zone B cells are seen but these changes do not
reveal any tangible differences in B and T lymphocyte populations in 2-20 week old heterozygous
EFhd1tg mice compared to WT litter mates. This could be the case because some counter
mechanisms are set into action in vivo and even out effects of EFhd1 ectopic expression in
lymphocytes to a major extend.
Therefore, to find genes involved in the adaptation of pro- to pre-B cell metabolism and specifically
to investigate differentially expressed genes between EFhd1tg and WT cells, a qPCR analysis of sorted
pro-, pre- and BCR+ B cells was carried out. This experiment revealed that the master regulator of
metabolism PGC-1α, co-activator of PPARα and PPARγ, was significantly upregulated in EFhd1tg
pre-B cells. This was not the case for family member PGC-1β which is known to be more involved in
mitochondrial homeostasis while PGC-1α is strongly upregulated by environmental cues signaling an
increased metabolic demand. Proliferating large pre-B cells most certainly have an increased energy
demand and PGC-1α upregulation in large pre-B cells may even be underestimated as mRNA of total
pre-B cells was analysed, a limitation of this experiment. The up-regulation of PGC-1α (ppargc1a) was
increased to a larger extend in EFhd1tg cells in comparison to WT pre-B cells. A higher PGC-1α
expression was also observed for EFhd1tg pre-B cells differentiated from pro-B cells in an IL-7 culture
and therefore appears to be cell intrinsic. EFhd1 has previously been published to be upregulated
together with PGC-1α in a subset of highly malignant melanomas with increased mitochondrial
metabolism, suggesting a mechanism not limited to B lymphocytes. Furthermore ImmGen expression
data revealed a most similar expression pattern of EFhd1 and PGC-1α during early during B cell
development in the BM, increasing the likelihood of a direct or indirect interaction of these two
proteins. Both have in fact been shown to be localized in mitochondria as well as the nucleus (data
not shown). Direct or indirect upregulation of PGC-1α by EFhd1 at the pro- to pre-B cell transition
suggest a likely mode of action of the protein in gearing pro-B cells to a pre-B cell mitochondrial
metabolism. GLUT-1 and SOD2 upregulation confirm an enhanced aerobic mitochondrial metabolism
in pre-B cells. SOD2 upregulation in pre-B cells furthermore correlates well its published function in
suppressing EFhd1 expression.115 The uncoupling protein 3 (ucp3) but not ucp2 was found to be
slightly but not significantly upregulated in pre-B cells in comparison to pro-B cells. Furthermore ucp1
Discussion
65
was not found to be expressed in pre-B cells in a PCR array. Mitochondrial uncoupling therefore does
not appear to play a major role in pre-B cells and may even be unfavourable in a situation where
proportionally more ATP is acquired by aerobic mitochondrial respiration and the energy demand is
increased. While glut-1 and ucp3 expression were moderately decreased in EFhd1tg pre-B cells,
expression levels of ucp2, sod2 and ppargc1b were comparable in EFhd1 and WT cells, indicating that
these proteins are not involved in the transcriptional network of EFhd1 in pre-B cells. To investigate
target genes downstream of PGC-1α and confirm a functional relevance of enhanced ppargc1α
expression in EFhd1tg pre-B cells, a Mouse PPAR target RT2 Profiler PCR array (pre-pipetted, Qiagen)
was carried out. In line with higher PGC-1α expression, this assay confirmed that in freshly sorted
EFhd1tg pre-B cells many PGC-1α target genes were upregulated albeit most not at statistical
significant levels with 3 EFhd1tg against 3 WT mice. In confirmation of the previous qPRC results,
PGC-1α was also found to be upregulated in EFhd1tg in comparison to WT pre-B cells as well as the
PGC-1α interaction partner Sirt1. EFhd1tg pre-B cells showed increased expression of PGC-1α target
genes commonly involved in the oxidation of fatty acids and lipid transport, several of which are also
involved in redox-sensitive pathways. Carnitine palmitoyltransferase 2 (cpt2) 173 was found to be
significantly upregulated (3, 67-fold, p<0, 05) in EFhd1tg pre-B cells. Cpt2 is responsible for the inner
mitochondrial membrane conversion of acyl-carnitine back into carnitine and acyl-CoA to facilitate
fatty acid oxidation. The tumour suppressor phosphatase and tensin homolog (pten) was significantly
down-regulated (5, 8-fold, p<0, 05) in EFhd1tg in comparison to WT pre-B cells. In fatty acid
metabolism Pten acts as a lipid phosphatase but it is also known as a master regulator of the
mTor-Akt pathway. Pten antagonizes the PI(3)K-AKT pathway, limiting cell survival and cell cycle
progression and via the dephosphorylation of phosphoinositides.159 In summary the upregulation of
PGC-1α and numerous downstream genes involved in fatty acid catabolism confirm that EFhd1tg
pre-B cells gain more energy from fatty acid fuelled OxPhos than WT pre-B cells, suggesting a
functional relevance of lower glut-1 expression in these cells. The differential regulation of several
redox sensitive and hypoxia inducible genes furthermore solidifies the hypothesis of EFhd1
involvement in a redox sensitive network.
6.4.) Ectopic EFhd1 expression in lymphocytes in vivo does not increase
cellular ROS
Several redox-sensitive genes were found to be upregulated in EFhd1tg pre-B cells (e.g. apoc3,
angptl4, adipoq)174,175,176 and PGC-1α is known to up-regulate antioxidant genes and hence reduce
ROS despite increasing OxPhos. Slightly decreased ROS levels were observed in Hardy fraction A-F of
freshly isolated EFhd1tg cells. The amount of DNA damage as a ROS readout was therefore analysed
in EFhd1tg and WT splenic B cells. A comet assay showed that, in accordance with increased PGC-1α
Discussion
66
expression during their development, EFhd1tg B cells in the spleen did not have acquired more DNA
damage. In fact even a slight reduction of damage severity was observed in EFhd1tg cells.
6.5.) Ectopic EFhd1 expression in vivo alters expression of PI(3)K-Akt
pathway genes in pre-B cells
The TF FoxO1 is also known to decrease ROS and has been described to increase EFhd1 expression.22
FoxO1 mediates Rag gene expression and a subsequent down regulation of FoxO1 by PI(3)K-AKT
increases in cell proliferation of pre-B cells 20,28 Before its nuclear export via the PI(3)K-AKT axis,
FoxO1 is also known to increase glycolysis in pro-B cells. The PI(3)K-Akt axis was therefore another
interesting pathway to analyse in detail with respect to pre-B cell development and metabolism,
especially in EFhd1tg pre-B cells. RT2 Profiler PCR arrays for the PI(3)K-Akt pathway of EFhd1tg and
WT pre-B cells revealed significant downregulation of many genes involved in the PI(3)K-Akt pathway
but not of direct Akt targets except for chuck (Inhibitor of nuclear factor kappa-B kinase subunit
alpha)177. Pten 159 was again found to be down-regulated in EFhd1tg pre-B cells. Significantly
downregulated genes in EFhd1tg pre-B cells include map2k1 164 an important kinase of the Map
kinase signal transduction involved in proliferation, survival and differentiation. Also ptpn11 involved
in metabolic control and cell migration 162 and the anti-apoptotic raf1 163 were downregulated. These
genes are involved in canonical erk signalling hence reduce proliferative signals by this pathway. On
the other hand in line with the observed pten downregulation also expression of rbl2 178 involved in
pten dependent cell cycle arrest and apoptosis was decreased. Moreover tumour suppressor tsc2 161
and negative regulator of mTOR was decreased in EFhd1tg pre-B cells. Rps6ka1160 was the only gene
significantly more expressed in EFhd1tg pre-B cells and is involved Tsc2 inactivation and BAD
phosphorylation and hence anti-apoptotic pathways. Pten downregulation leads to an increase in
PIP3 and hence a hyperactivated AKT pathway. With tsc2 downregulation and rps6ka1 upregulation
the mTOR signalling in EFhd1tg cells is most likely increased. mTOR activated anabolism has been a
crucial pathway in the pre-BCR metabolic checkpoint described for Fnip1-/- pre-B cells where its
activation and failure of downregulation by AMPK leads to ATP exhaustion and cell death in vivo but
not under ideal culture conditions in vitro. The same pathway is also regulated in EFhd1tg pre-B cells,
revealing an apparent integral part of metabolic pre-BCR checkpoint, mTOR, which becomes
upregulated in dysfunctional cells. Deletion of pten results in a significant down-regulation of EFhd1
in pre-B ALL cells (communication Markus. Muschen, San Francisco). Decreased Pten then activates
Akt which is known to inactivate Foxo1. This observation of decreased EFhd1 protein in pten-/- cells is
therefore in line with the fact that EFhd1 is a FoxO1 target gene in pro-B cells. While EFhd1
expression stays low after pre-BCR expression, however, FoxO1 becomes upregulated again in small
Discussion
67
pre-B cells to induced Rag1/2 transcription and LC-rearrangements. EFhd1 transcription therefore
likely depends on additional factors in pro-B cells.
6.6.) Ectopic EFhd1 expression in lymphocytes in vivo does not increase
mitochondrial mass, membrane potential or ROS
After having establishing that the gene profile of EFhd1tg pre-B cell shows an increased activation of
OxPhos and fatty acid catabolism (upregulation of ppargc1a, sod2 and cpt2) but also mTOR mediated
anabolism (downregulation of pten, tsc2 but upregulation of rps6ka1a) I addressed the question
whether ectopic EFhd1 expression has a functional impact on mitochondrial activity during B cell
development in the BM. Staining of EFhd1tg and WT BM cells with mitochondrial markers and
fluorescent antibodies against B lymphocyte Hardy fractions revealed a non-significant tendency to
decreased mitochondrial mass and ROS in primary EFhd1tg cells. This observation appears to be in
opposition to the increase in fatty acid catabolism genes in EFhd1tg pre B cells and the increased
mitochondrial mass observed in HEK 293 cells. I suggest that the increased mitochondrial biogenesis
in this setting is due to an additional stressor, the acute nature and amount of EFhd1 protein
expression. Also the Δψµ apart from a slightly higher potential in EFhd1tg Hardy fraction C’ (large-B
cells) and lower potential in fraction F (mature B cells) was very similar in EFhd1tg and WT
B lymphocytes indicating the presence of the same initial driving force for the ETC in EFhd1tg and WT
mitochondria.
6.7.) Proliferation and differentiation of pro-B cells in an ex vivo IL-7 culture
is unaltered by ectopic expression of EFhd1
IL-7 cultures of sorted EFhd1tg and WT pro-B cells show that these cells do not proliferate or
differentiate differently under ideal culture conditions ex vivo where stimulation and nutrients are
abundant. In EFhd1tg and WT cultures with high IL-7 stimulus (5 ng / ml) the same fraction of cells
had divided with the same proliferation index (mean number of divisions / dividing cell) after three
days. Furthermore growth curves with low (0, 5 ng / ml) or high (5 ng / ml) IL-7 did not indicate any
significant differences in EFhd1tg and WT pro-B cell growth. The same observation was also made for
Fnip1-/- pre-B cells when cultured in the presence of IL-7. These cells, nevertheless, show a strong
metabolic phenotype in vivo and are predisposed to apoptosis.30 The similar, non-significant,
tendency was observed in my cultures where without IL-7 EFhd1tg cells appeared to die faster.
Analysis of surface marker expression by flow cytometry revealed that the differentiation efficiency
of the cells in culture was unaltered by EFhd1 expression. Cell cycle analysis of sorted cells after
7 days culture showed generally mitotically more active pro- than pre-B cells which can be attributed
to the stimulatory effect of IL-7 predominantly on pro-B cells. Interestingly the increase of the cells in
Discussion
68
G1 phase was only significant for WT cells. EFhd1tg pro- and pre-B cell in the IL-7 culture may
therefore be mitotically more similar to each other.
In IL-7 ex vivo cultures pro- and pre-B cells do not develop in their specific niches but artificially find
themselves in the same environment. Interestingly this also leads to comparable Δψµ and cellular
ROS (and mitochondrial mass) in pro- and pre-B cells. Pro- and pre- B cells were also found to
increase in size in the culture and no further distinction of small or large pre-B cell was possible by
size. To put these data into context I compared my results to previous findings. During his doctoral
thesis in our department S. Dütting isolated pro-B cells from µHC-inducible mice
(Rag2-/-/tTA+/+/Sp6+/+/λ5+/+). These cells were cultured for 24h with 2% J558 IL-7 supernatant and in
the absence of tetracycline for µHC induction. The cells were then infected with pCru or pCru-EFhd1
vector and living and GFP+ cells were analysed for cKit and CD25 expression after 24, 48 and 72h in
culture with R10 medium in the absence of IL-7 and tetracyclin. In line with my experiments, the size
and proliferation rate was comparable between pCru and pCru-EFhd1 infected cells as was the
induction of CD25. Nevertheless a significantly higher proportion of cKit+ (pro-B cells) was found at
all time points in pCru-EFhd1 infected cells in contrast to the empty vector control. S. Düttings
concluded that downregulation of EFhd1 is required for efficient differentiation of pro- into pre-B
cells as more pro-B cells remained in the culture of EFhd1 overexpressing cells. This nevertheless still
leaves open the question why CD25 upregulation was not observed. This may be because CD25 is not
a reliable pre-B cell marker in vitro and does not appear to be sufficiently expressed. With the culture
conditions I used, however, I did not observe significantly altered differentiation or proliferation of
pro- and pre-B cells expressing EFhd1. Significant alterations in the cell cycle profiles of pro- and
pre-B cells in culture are nevertheless only found for WT cells. Slightly more proliferating EFhd1tg
pro-B cells but similar proportion in pre-B cells were observed, where more sub G1 and less G1 cells
are found in the EFhd1tg culture compared to WT. Seahorse analyses also revealed a decreased
mitochondrial ATP production in EFhd1tg pre-B cells. In contrast to S. Dütting, in my culture
experiments a transgene system was used instead of overexpression by retroviral infection and
instead of R10 medium the cells were cultured in OptiMEM10 medium in presence of purified IL-7
and not IL-7 containing cell supernatants. The observed differences in the experiments with
retrovirally infected (acute EFhd1 overexpression) and EFhd1tg cells (chronic overexpression) can be
due to the different systems or the analysis methods but arrive at the same general conclusion,
namely a developmental benefit of EFhd1 downregulation after the pre-BCR checkpoint
L-7 cultures provide pro-B cells with a strong proliferative stimulus the responsiveness to which gets
lost during B cell development. A Seahorse Mito Stress Test therefore showed that OCR and ECAR of
pre-B cells from these cultures were reduced in comparison to pro-B cells as were mitochondrial ATP
Discussion
69
production and proton leak. Coupling efficiency and spare capacity and also the ratio of oxygen
consumption to media acidification were enhanced in WT pre-B cells (like in Rag 1-/- and Rag 1-/- 33.C9
HC ki B cells), highlighting the importance of mitochondrial metabolism in pre-B cells. This metabolic
switch to proportionally more aerobic mitochondrial respiration is cell intrinsic and not dependent on
BM niches as it can also be observed in pro- and pre-B cells co-cultured in OptiMEM10 with 5 ng / ml
IL-7. Strikingly EFhd1tg pre- but not pro-B cells show significantly decreased mitochondrial ATP
production. At the same time more oxygen is used for non-mitochondrial respiration. Instead of an
increased mitochondrial coupling efficiency, observed in Rag 1-/- 33.C9 HC ki and WT pre-B cells,
EFhd1tg pre-B cells show an almost significantly reduced mitochondrial coupling. Nonetheless the
ratio of OCR / ECAR is still higher in EFhd1tg than WT pre-B cell cells, indicative of a proportionally
enhanced oxidative metabolism and reduced glycolysis. In contrast to the oxygen consumption (OCR)
in EFhd1tg pre-B cells, the media acidifications (ECAR) is even more downregulated in EFhd1tg pre-B
cells. In accordance EFhd1tg pre-B cells have upregulated genes for OxPhos and fatty acid catabolism
like cpt2. IL-7 cultured EFhd1tg expressing pro-B cells, where the protein is also normally present,
behave metabolically relatively similar to their WT counterparts. The addition of morel EFhd1tg
protein might at this stage not have an additive metabolic effect ex vivo or the high IL-7 culture
conditions may equal out differences. IL-7 cultures do not completely represent metabolism of
ex vivo isolated pro- and pre-B cells. IL-7 for example increases mitochondrial spare capacity and
maintains mitochondrial ATP production in cultured WT pre B cells in contrast to Rag1-/- 33.C9 HC ki
cells.
6.8.) ShRNA-mediated EFhd1 knock-down in 38B9 cells decreases the Δψµ
and ratio of OxPhos to glycolysis in a dose-dependent manner
To show a dose-dependent effect of EFhd1 expression on aerobic mitochondrial metabolism, the
reverse experiment to overexpression by transfection or transgene was therefore carried out. Upon
silencing EFhd1 expression in the pro-B cells line 38B9 by shRNA expression, a significant dose
dependent reduction in the rate of oxygen consumption of the cells (OCR) in comparison to extra-
cellular acidification (ECAR) was seen in accordance with the increased OCR / ECAR value in EFhd1tg
pre-B cells. EFhd1 therefore indeed appears to enhance mitochondrial metabolism. The
mitochondrial membrane potential in the silenced cells was also reduced and correlated with the
silencing efficiencies of the shRNAs. The amount of shRNA expression was ruled out as a cause, as
vector GFP fluorescence did not correlate with EFhd1 silencing. Curiously, an enhanced Δψµ was not
observed in EFhd1tg cells apart from a moderate increase in Hardy fraction C’ possibly indicating a
tighter regulation or restrictions by substrate limitation in vivo.
Discussion
70
6.9.) EFhd1expression leads to a disadvantage for BM but not splenic B cell
repopulation in a competitive BM transfer
To investigate an effect of EFhd1 overexpression in vivo under non homeostatic conditions a
competitive transfer of EFhd1tg and WT BM was carried out. In this non homeostatic setting,
EFhd1tg B cells were shown to be at a developmental disadvantage from the pro-B cell stage
onwards in comparison to WT cells. EFhd1tg B cells were fitter in the spleen, however, where their
proportion to WT cells increases. In the hypoxic conditions of the BM, cells with an increased
dependency on aerobic mitochondrial metabolism and / or increased mitoflash activity might be
selected against. EFhd1tg cells which enhance fatty acid oxidation and OxPhos may fare better in a
more oxygenated environment, in particular in combination with reduced ROS levels. In the spleen
and other organs with a high oxygen supply, EFhd1 expression can therefore be of benefit in a
metabolic competition and as assessed is unlikely due to differential homing of EFhd1tg cells to
lymphoid organs. Fatty acid oxidation, which was enhanced in in EFhd1tg cells, is prevalent in resting
splenic B cells.34 According to ImmGen data and previous observations in our group, EFhd1 is only
highly expressed at the pro- to pre-B cell transition in B lymphocytes. There it might serve to kick-
start the large pre-B cell metabolism of increased mitochondrial metabolism necessary for
proliferation. EFhd1 is then normally downregulated in pre-B cells possibly to terminate or avoid
overshooting of the metabolic program and as recently discovered perhaps also to limit mitoflash
activity.
6.10.) EFhd1expression in LPS blasts increases mitochondrial activity but
does not alter proliferation
In resting B cells fatty acid metabolism was found to be a more important energy source than in
activated B cells which upregulate GLUT-1 expression and glycolysis but also OxPhos in a balanced
fashion.34 A sustained glycolytic flux has been shown to be important for B cell proliferation and
antibody production.35,34 Mitochondrial activity, however, was shown to be a crucial factor in the
decision between class-switch recombination and plasma cell differentiation.37 The analysis of
EFhd1tg and WT LPS blasts in vitro revealed that the strong activation with LPS does not lead to
altered proliferation or a different energy profile in EFhd1tg B lymphocytes. The strong LPS stimulus,
upregulating both glycolysis and OxPhos 34,may override the activation of mitochondrial metabolism
by EFhd1. Nonetheless, the spare capacity was almost significantly enhanced in EFhd1tg LPS blasts
while the proton leak was even significantly higher in EFhd1tg LPS blasts indicating a surplus of
mitochondrial energy in EFhd1tg LPS blasts. Interestingly these cells were also shown to consume
less glucose in the presence of 2-DG possibly indicating an increased capability to utilize other
Discussion
71
metabolic pathways. EFhd1tg LPS blasts but not naïve B cells also appeared to have mitochondria of
increased size, which still remains to be properly quantified.
6.11.) Establishment of the EFhd1 knock out mouse
Another aim of this PhD thesis was the generation of an EFhd1 knock-out mouse as a model to
investigate the function of EFhd1 in pro-B cells before its down-regulation by the pre-BCR. Due to
difficulties in germline transmission, the EFhd1 knock-out mouse was not ready to be analysed during
the period this work. New ES cell injections have resulted in highly chemic offspring which are
currently backcrossed. Current breeding will hopefully result in germline Efhd1loxP/loxP mice. As these
EUCOMM ES cells contain a KO-first allele embryonic complications are a possibility but were not
encountered in a total knock-out of the homologous protein EFhd2. I anticipate that a B cell specific
knock-out of EFhd1 will result in cells with proportionally enhanced glycolysis, decreased OxPhos and
in particular decreased FAO which could be favourable for proliferation in an activated state and also
antibody production, but of disadvantage for resting B cells. These mice will therefore help to
determine the importance of fatty acid metabolism and mitochondrial OxPhos during B cell
development, particularly in pro-B cells, but also during later developmental stages and in the GC.
6.12.) Conclusion
EFhd1tg pre-B cells exhibit mitochondrial dysfunction yet higher rates of mitochondrial respiration in
line with an upregulation of PGC-1a and fatty acid metabolism. This mitochondrial dysfunction could
on the one hand indicate that the metabolic program initiated by EFhd1 in pro-B cells is counter
acted by the expression of other gene networks induced by pre-BCR. One such regulation is the
induction of the mTOR pathway along with OxPhos catabolic pathways leading to enhanced ATP
depletion due to increased anabolism. Secondly a very recent publication shows that EFhd1 increases
mitoflash activity in an EF-hand domain dependent manner.57 EFhd1 sensitizes overexpressing HeLa
cells to Ca2+ dependent mitoflash responses. 57 Increased Ca2+ levels caused by pre-BCR signaling
could hence enhance mitoflash activity in EFhd1tg pre-B cells in contrast to WT cells. The uptake of
positively charged Ca2+ ions can also, irrespective of mitoflashes, depolarize the Δψµ to some
extended and so restrict ATP production. Ca2+ signals in general can therefore limit mitochondrial
energy production.179 and could be part of the mechanism to downregulate the active mitochondria
for small pre-B cell differentiation. The function of EFhd1 in this context, however, is unlikely due to
direct Ca2+ binding and sequestering, as calcium levels in mitochondria were found to be unaltered
by the presence of EFhd1.57 High glucose levels were also shown to enhance mitoflashes and GLUT-1
expression and glucose uptake is increased in pre-B cells. Mitoflashes, leading to transient high ROS
levels and collapse of the Δψµ, are known to be involved in ageing and cell death. Furthermore the
Discussion
72
alkalization of the mitochondrial matrix during a mitoflash could cause the ATPase to work in the
opposite direction and convert ATP to ADP. The efficiency of ATP production in cells with a high
mitoflash rate can generally be expected to decrease due to the transient lack of Δψµ. Neither
increased ROS levels nor decreased Δψµ were observed in EFhd1tg cells which are the hallmark of
mitoflash activity. But these stochastical events are too transient and rebound too fast to be
detected by the methods employed in this work. Mitoflashes of single mitochondria are observed
with specific probes by microscopy. Normal levels of Δψµ and other parameters are recovered by the
mitochondrion in a matter of seconds after a mitoflash. Furthermore staining the some of the
fluorescent mitochondrial markers used in this work (TMRE, DCFDA) has been shown follow the
typical mitoflash pattern of a steep drop /rise and fast recovery to initial levels.52 Interestingly in the
publication, identifying EFhd1 as a mitoflash activator, ROS levels were also not found to be
increased in EFhd1 overexpressing and knock-down HeLa cells.57 Furthermore, Seahorse
measurements of EFhd1 overexpressing and knock-down HeLa showed a dose dependent small
increase in oxidative metabolism in overexpressing and decrease in knock-down cells. These data are
in line with my observations. Unfortunately quantification of the mitochondrial mass of silenced and
overexpressing HeLa cells was not carried out in the overexpressing and knock-down HeLa cells
which would have been very interesting to compare to my findings in HEK 293 cells.
In summary, in this work I could show that the activation of mitochondrial metabolism is an integral
part of the complex network of changes elicited by pre-BCR expression which leads to a functional
alteration of the mitochondrial respiratory chain, increasing Δψµ and ROS. Furthermore EFhd1 has
emerged as a new regulator of mitochondrial OxPhos at least partially via the transcriptional
activation of PGC-1α. Downregulation of EFhd1 by the pre-BCR sustains mitochondrial ATP
production; hence, pre BCRs containing µ-HCs that do not support down-regulation of EFhd1, such as
intracellular µHCs, have a competitive disadvantage and cannot be selected and face enhance
mitoflash activity and ATP depletion. A disadvantage of EFhd1 B cell precursors was observed by a
competitive BM transfer in the BM. This competitive situation may not be too far from reality as
pre-B cells are under heavy selection pressure in vivo also for an optimal pre-BCR signalling
strength.21 In that sense, EFhd1tg pre-B cells in the competitive transfer model would represent
pre-B cells where the pre-BCR has induced only insufficient signals to mediate down-regulation of
EFhd1. This would result in decreased mitochondrial ATP production and, thereby, ATP exhaustion. It
is therefore possible that downregulation of EFhd1 represents a mitochondrial-coupled sensor of
optimal pre-BCR signalling strength governing µ-HC selection.
Discussion
73
6.13.) EFhd1 in cancer
EFhd1 expression has also been found to be dysregulated in numerous cancers. EFhd1 is upregulated
in many gynaecological cancers, breast cancers and melanomas but downregulated in renal cell
carcinomas and colon cancers. Importantly these cancers are genetically diverse leading also to
metabolic heterogeneity. The progression of each cancer, the specific mutations and the metabolism
involved are too individually specific to draw general conclusions. Nonetheless in some breast
cancers active OxPhos and mitochondria have been shown to be important.73 EFhd1 may influence
development and progression of particular cancers by enhancing mitochondrial activity and
decreasing ROS, possibly also via PGC-1α upregulation as already observed in one publication for
melanoma cells.123 The increase in fatty acid oxidation by EFhd1 also helps to explain a gene locus
association with liver enzyme (ALT, ALP, GGT) concentration in plasma.122 An interaction of EFhd1
with ERα could be a possible link to breast and gynaecological cancers but requires more elucidation.
ERα is known to be involved in glucose homeostasis and is a transcriptional interaction partner of
PGC-1α.134,80 EFhd1 was interestingly not found to be expressed in any Affimetrix array of almost 800
B cell leukaemia patients (communication Torsten Haferlach, MLL Münchner Leukämielabor GmbH).
It is therefore tempting to speculate that in leukaemia, which originate in the rather hypoxic BM.
EFhd1 is not a favourable factor for cancer development and progression, especially with additionally
enhanced mitoflash frequency and mTOR activation described in this work. In accordance membrane
potential is also known to be higher in many cancers but not lymphomas.48 Along similar lines, EFhd1
was found to be downregulated about 2-fold (p= 0.001157) in BCR-ABL1 transformed pten-/- Pre B-
ALL cells (personal communication, Markus Muschen, San Francisco). Despite this moderate change
in expression, EFhd1 was in fact one of the most highly regulated genes. As ectopic pre-B cell EFhd1
expression in this thesis was shown to significantly downregulated pten this adds the possibility of an
interesting negative feedback loop (possibly involving FoxO1) for future investigations.
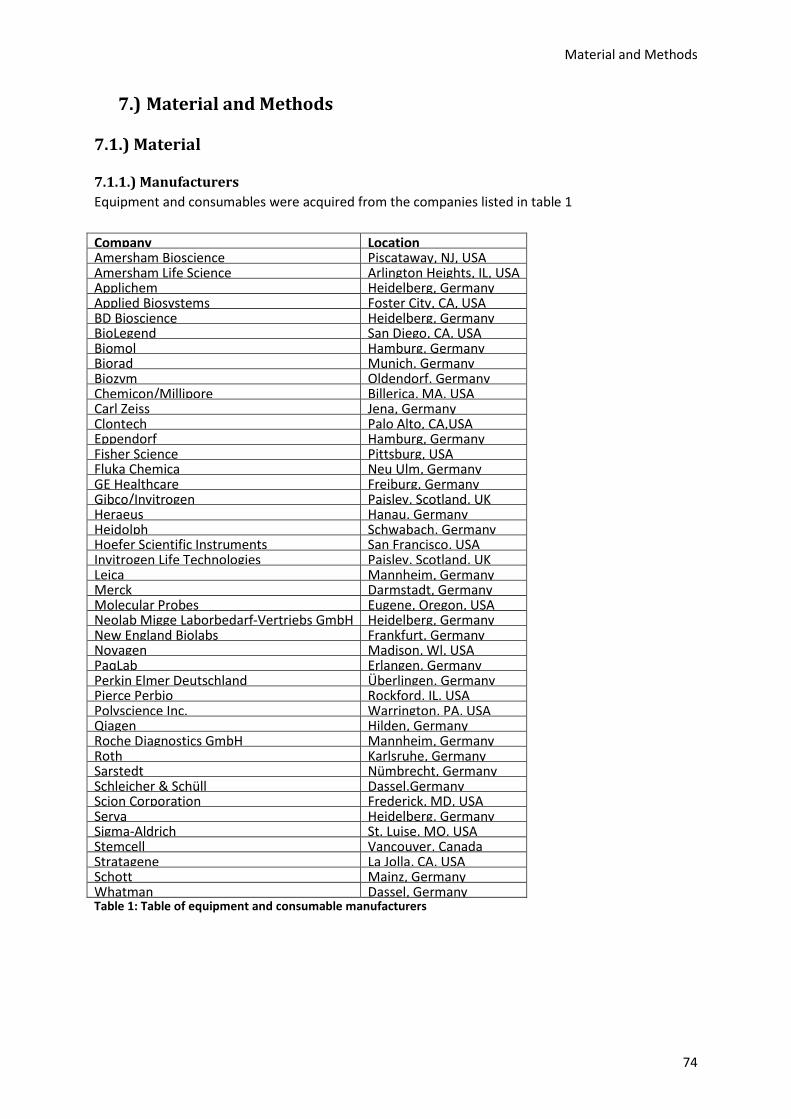
Material and Methods
74
7.) Material and Methods
7.1.) Material
7.1.1.) Manufacturers
Equipment and consumables were acquired from the companies listed in table 1
Company Location Amersham Bioscience Piscataway, NJ, USA Amersham Life Science Arlington Heights, IL, USA Applichem Heidelberg, Germany Applied Biosystems Foster City, CA, USA BD Bioscience Heidelberg, Germany BioLegend San Diego, CA, USA Biomol Hamburg, Germany Biorad Munich, Germany Biozym Oldendorf, Germany Chemicon/Millipore Billerica, MA, USA Carl Zeiss Jena, Germany Clontech Palo Alto, CA,USA Eppendorf Hamburg, Germany Fisher Science Pittsburg, USA Fluka Chemica Neu Ulm, Germany GE Healthcare Freiburg, Germany Gibco/Invitrogen Paisley, Scotland, UK Heraeus Hanau, Germany Heidolph Schwabach, Germany Hoefer Scientific Instruments San Francisco, USA Invitrogen Life Technologies Paisley, Scotland, UK Leica Mannheim, Germany Merck Darmstadt, Germany Molecular Probes Eugene, Oregon, USA Neolab Migge Laborbedarf-Vertriebs GmbH Heidelberg, Germany New England Biolabs Frankfurt, Germany Novagen Madison, Wl, USA PaqLab Erlangen, Germany Perkin Elmer Deutschland Überlingen, Germany Pierce Perbio Rockford, IL, USA Polyscience Inc. Warrington, PA, USA Qiagen Hilden, Germany Roche Diagnostics GmbH Mannheim, Germany Roth Karlsruhe, Germany Sarstedt Nümbrecht, Germany Schleicher & Schüll Dassel.Germany Scion Corporation Frederick, MD, USA Serva Heidelberg, Germany Sigma-Aldrich St. Luise, MO, USA Stemcell Vancouver, Canada Stratagene La Jolla, CA, USA Schott Mainz, Germany Whatman Dassel, Germany Table 1: Table of equipment and consumable manufacturers
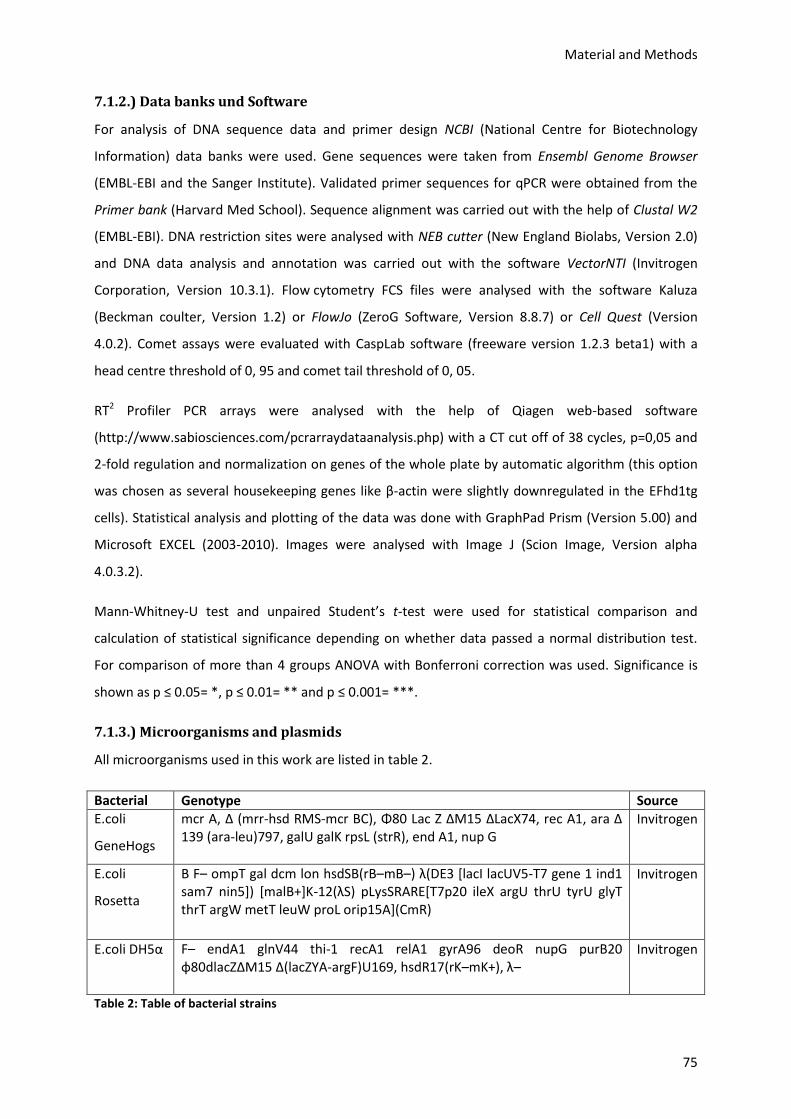
Material and Methods
75
7.1.2.) Data banks und Software
For analysis of DNA sequence data and primer design NCBI (National Centre for Biotechnology
Information) data banks were used. Gene sequences were taken from Ensembl Genome Browser
(EMBL-EBI and the Sanger Institute). Validated primer sequences for qPCR were obtained from the
Primer bank (Harvard Med School). Sequence alignment was carried out with the help of Clustal W2
(EMBL-EBI). DNA restriction sites were analysed with NEB cutter (New England Biolabs, Version 2.0)
and DNA data analysis and annotation was carried out with the software VectorNTI (Invitrogen
Corporation, Version 10.3.1). Flow cytometry FCS files were analysed with the software Kaluza
(Beckman coulter, Version 1.2) or FlowJo (ZeroG Software, Version 8.8.7) or Cell Quest (Version
4.0.2). Comet assays were evaluated with CaspLab software (freeware version 1.2.3 beta1) with a
head centre threshold of 0, 95 and comet tail threshold of 0, 05.
RT2 Profiler PCR arrays were analysed with the help of Qiagen web-based software
(http://www.sabiosciences.com/pcrarraydataanalysis.php) with a CT cut off of 38 cycles, p=0,05 and
2-fold regulation and normalization on genes of the whole plate by automatic algorithm (this option
was chosen as several housekeeping genes like β-actin were slightly downregulated in the EFhd1tg
cells). Statistical analysis and plotting of the data was done with GraphPad Prism (Version 5.00) and
Microsoft EXCEL (2003-2010). Images were analysed with Image J (Scion Image, Version alpha
4.0.3.2).
Mann-Whitney-U test and unpaired Student’s t-test were used for statistical comparison and
calculation of statistical significance depending on whether data passed a normal distribution test.
For comparison of more than 4 groups ANOVA with Bonferroni correction was used. Significance is
shown as p ≤ 0.05= *, p ≤ 0.01= ** and p ≤ 0.001= ***.
7.1.3.) Microorganisms and plasmids
All microorganisms used in this work are listed in table 2.
Bacterial
strain
Genotype Source E.coli
GeneHogs
mcr A, Δ (mrr-hsd RMS-mcr BC), Φ80 Lac Z ΔM15 ΔLacX74, rec A1, ara Δ 139 (ara-leu)797, galU galK rpsL (strR), end A1, nup G
Invitrogen
E.coli
Rosetta
B F– ompT gal dcm lon hsdSB(rB–mB–) λ(DE3 *lacI lacUV5-T7 gene 1 ind1 sam7 nin5]) [malB+]K-12(λS) pLysSRARE*T7p20 ileX argU thrU tyrU glyT thrT argW metT leuW proL orip15A](CmR)
Invitrogen
E.coli DH5α F– endA1 glnV44 thi-1 recA1 relA1 gyrA96 deoR nupG purB20 φ80dlacZΔM15 Δ(lacZYA-argF)U169, hsdR17(rK–mK+), λ–
Invitrogen
Table 2: Table of bacterial strains

Material and Methods
76
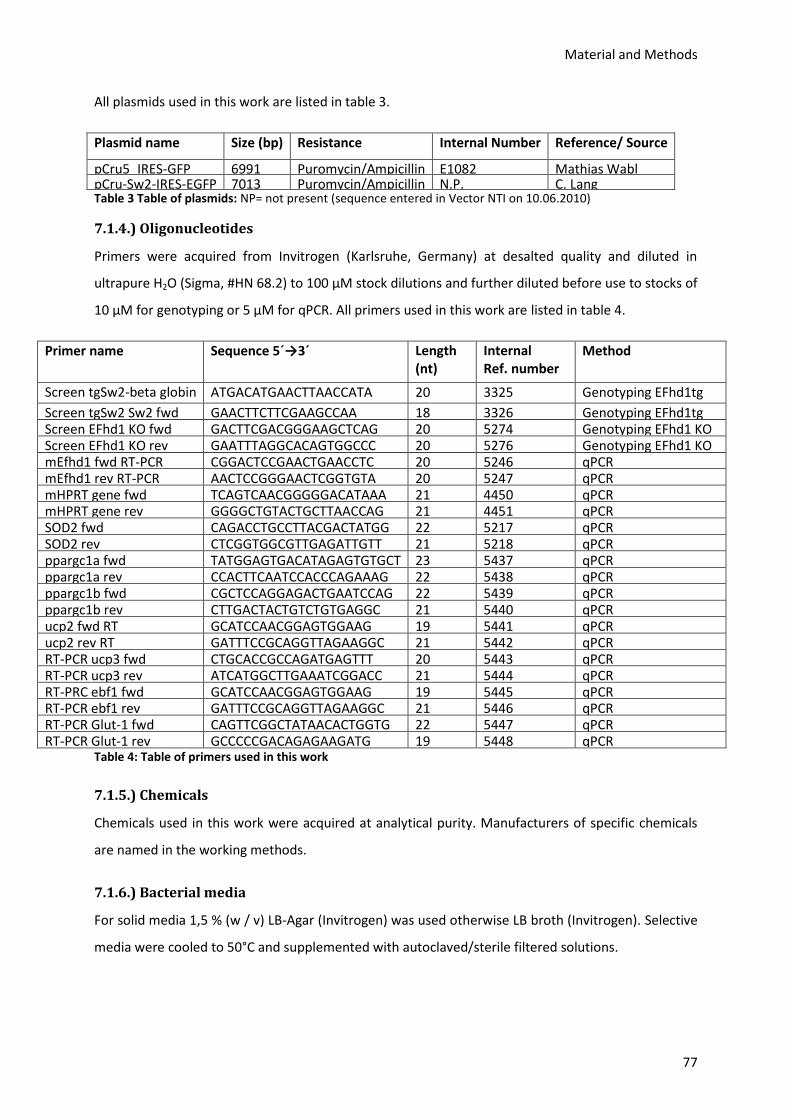
Material and Methods
77
All plasmids used in this work are listed in table 3.
Plasmid name Size (bp) Resistance Internal Number Reference/ Source
pCru5_IRES-GFP 6991 Puromycin/Ampicillin E1082 Mathias Wabl pCru-Sw2-IRES-EGFP 7013 Puromycin/Ampicillin N.P. C. Lang Table 3 Table of plasmids: NP= not present (sequence entered in Vector NTI on 10.06.2010)
7.1.4.) Oligonucleotides
Primers were acquired from Invitrogen (Karlsruhe, Germany) at desalted quality and diluted in
ultrapure H2O (Sigma, #HN 68.2) to 100 µM stock dilutions and further diluted before use to stocks of
10 µM for genotyping or 5 µM for qPCR. All primers used in this work are listed in table 4.
Primer name Sequence 5´→3´ Length (nt)
Internal Ref. number
Method
Screen tgSw2-beta globin rev
ATGACATGAACTTAACCATA 20 3325 Genotyping EFhd1tg
Screen tgSw2 Sw2 fwd GAACTTCTTCGAAGCCAA 18 3326 Genotyping EFhd1tg Screen EFhd1 KO fwd GACTTCGACGGGAAGCTCAG 20 5274 Genotyping EFhd1 KO Screen EFhd1 KO rev GAATTTAGGCACAGTGGCCC 20 5276 Genotyping EFhd1 KO mEfhd1 fwd RT-PCR CGGACTCCGAACTGAACCTC 20 5246 qPCR mEfhd1 rev RT-PCR AACTCCGGGAACTCGGTGTA 20 5247 qPCR mHPRT gene fwd TCAGTCAACGGGGGACATAAA 21 4450 qPCR mHPRT gene rev GGGGCTGTACTGCTTAACCAG 21 4451 qPCR SOD2 fwd CAGACCTGCCTTACGACTATGG 22 5217 qPCR SOD2 rev CTCGGTGGCGTTGAGATTGTT 21 5218 qPCR ppargc1a fwd TATGGAGTGACATAGAGTGTGCT 23 5437 qPCR ppargc1a rev CCACTTCAATCCACCCAGAAAG 22 5438 qPCR ppargc1b fwd CGCTCCAGGAGACTGAATCCAG 22 5439 qPCR ppargc1b rev CTTGACTACTGTCTGTGAGGC 21 5440 qPCR ucp2 fwd RT GCATCCAACGGAGTGGAAG 19 5441 qPCR ucp2 rev RT GATTTCCGCAGGTTAGAAGGC 21 5442 qPCR RT-PCR ucp3 fwd CTGCACCGCCAGATGAGTTT 20 5443 qPCR RT-PCR ucp3 rev ATCATGGCTTGAAATCGGACC 21 5444 qPCR RT-PRC ebf1 fwd GCATCCAACGGAGTGGAAG 19 5445 qPCR RT-PCR ebf1 rev GATTTCCGCAGGTTAGAAGGC 21 5446 qPCR RT-PCR Glut-1 fwd CAGTTCGGCTATAACACTGGTG 22 5447 qPCR RT-PCR Glut-1 rev GCCCCCGACAGAGAAGATG 19 5448 qPCR
Table 4: Table of primers used in this work
7.1.5.) Chemicals
Chemicals used in this work were acquired at analytical purity. Manufacturers of specific chemicals
are named in the working methods.
7.1.6.) Bacterial media
For solid media 1,5 % (w / v) LB-Agar (Invitrogen) was used otherwise LB broth (Invitrogen). Selective
media were cooled to 50°C and supplemented with autoclaved/sterile filtered solutions.
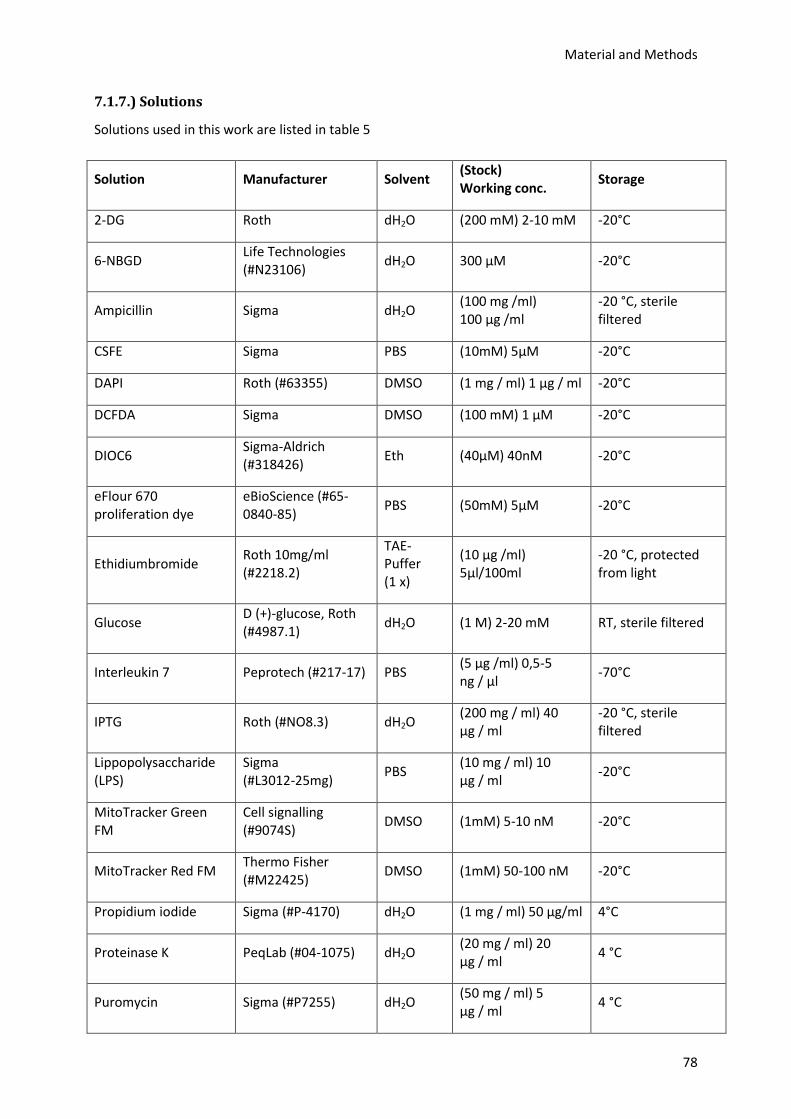
Material and Methods
78
7.1.7.) Solutions
Solutions used in this work are listed in table 5
Solution Manufacturer Solvent (Stock) Working conc.
Storage
2-DG Roth dH2O (200 mM) 2-10 mM -20°C
6-NBGD Life Technologies (#N23106)
dH2O 300 µM -20°C
Ampicillin Sigma dH2O (100 mg /ml) 100 µg /ml
-20 °C, sterile filtered
CSFE Sigma PBS (10mM) 5µM -20°C
DAPI Roth (#63355) DMSO (1 mg / ml) 1 µg / ml -20°C
DCFDA Sigma DMSO (100 mM) 1 µM -20°C
DIOC6 Sigma-Aldrich (#318426)
Eth (40µM) 40nM -20°C
eFlour 670 proliferation dye
eBioScience (#65-0840-85)
PBS (50mM) 5µM -20°C
Ethidiumbromide Roth 10mg/ml (#2218.2)
TAE-Puffer (1 x)
(10 μg /ml) 5µl/100ml
-20 °C, protected from light
Glucose D (+)-glucose, Roth (#4987.1)
dH2O (1 M) 2-20 mM RT, sterile filtered
Interleukin 7 Peprotech (#217-17) PBS (5 µg /ml) 0,5-5 ng / µl
-70°C
IPTG Roth (#NO8.3) dH2O (200 mg / ml) 40 μg / ml
-20 °C, sterile filtered
Lippopolysaccharide (LPS)
Sigma (#L3012-25mg)
PBS (10 mg / ml) 10 µg / ml
-20°C
MitoTracker Green FM
Cell signalling (#9074S)
DMSO (1mM) 5-10 nM -20°C
MitoTracker Red FM Thermo Fisher (#M22425)
DMSO (1mM) 50-100 nM -20°C
Propidium iodide Sigma (#P-4170) dH2O (1 mg / ml) 50 µg/ml 4°C
Proteinase K PeqLab (#04-1075) dH2O (20 mg / ml) 20 μg / ml
4 °C
Puromycin Sigma (#P7255) dH2O (50 mg / ml) 5 μg / ml
4 °C
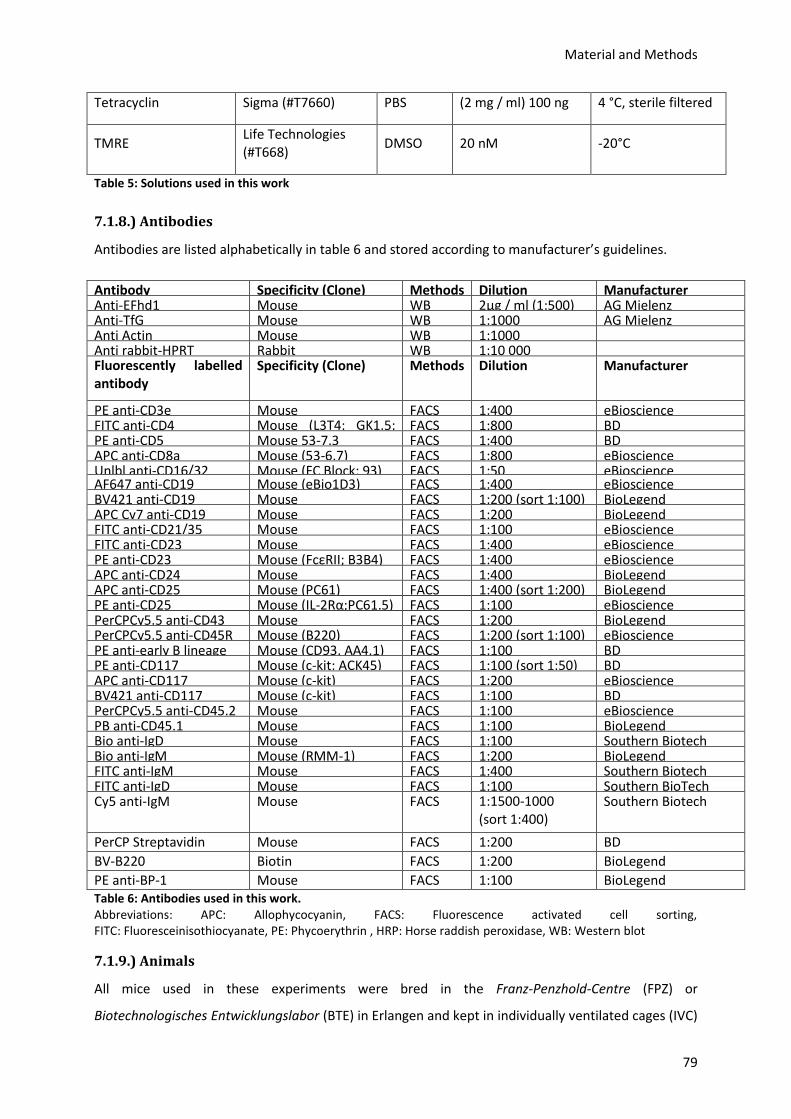
Material and Methods
79
Tetracyclin Sigma (#T7660) PBS (2 mg / ml) 100 ng 4 °C, sterile filtered
TMRE Life Technologies (#T668)
DMSO 20 nM -20°C
Table 5: Solutions used in this work
7.1.8.) Antibodies
Antibodies are listed alphabetically in table 6 and stored according to manufacturer’s guidelines.
Antibody Specificity (Clone) Methods Dilution Manufacturer Anti-EFhd1
Mouse WB 2µg / ml (1:500) AG Mielenz Anti-TfG Mouse WB 1:1000 AG Mielenz Anti Actin Mouse WB 1:1000 Anti rabbit-HPRT Rabbit WB 1:10 000 Fluorescently labelled antibody
Specificity (Clone) Methods Dilution Manufacturer
PE anti-CD3e Mouse FACS 1:400 eBioscience FITC anti-CD4 Mouse (L3T4; GK1.5;
BD), FACS 1:800 BD
PE anti-CD5 Mouse 53-7.3 FACS 1:400 BD APC anti-CD8a Mouse (53-6.7) FACS 1:800 eBioscience Unlbl anti-CD16/32 Mouse (FC Block; 93) FACS 1:50 eBioscience AF647 anti-CD19 Mouse (eBio1D3) FACS 1:400 eBioscience BV421 anti-CD19 Mouse FACS 1:200 (sort 1:100) BioLegend APC Cy7 anti-CD19 Mouse FACS 1:200 BioLegend FITC anti-CD21/35 Mouse
(CR2/CR1;eBio8D9) FACS 1:100 eBioscience
FITC anti-CD23 Mouse FACS 1:400 eBioscience PE anti-CD23 Mouse (FcεRII; B3B4) FACS 1:400 eBioscience APC anti-CD24 Mouse FACS 1:400 BioLegend APC anti-CD25 Mouse (PC61) FACS 1:400 (sort 1:200) BioLegend PE anti-CD25 Mouse (IL-2Rα;PC61.5) FACS 1:100 eBioscience PerCPCy5.5 anti-CD43 Mouse FACS 1:200 BioLegend PerCPCy5.5 anti-CD45R Mouse (B220) FACS 1:200 (sort 1:100) eBioscience PE anti-early B lineage Mouse (CD93, AA4.1) FACS 1:100 BD PE anti-CD117 Mouse (c-kit; ACK45) FACS 1:100 (sort 1:50) BD APC anti-CD117 Mouse (c-kit) FACS 1:200 eBioscience BV421 anti-CD117 Mouse (c-kit) FACS 1:100 BD PerCPCy5.5 anti-CD45.2 Mouse FACS 1:100 eBioscience PB anti-CD45.1 Mouse FACS 1:100 BioLegend Bio anti-IgD Mouse FACS 1:100 Southern Biotech Bio anti-IgM Mouse (RMM-1) FACS 1:200 BioLegend FITC anti-IgM Mouse FACS 1:400 Southern Biotech FITC anti-IgD Mouse FACS 1:100 Southern BioTech Cy5 anti-IgM Mouse FACS 1:1500-1000
(sort 1:400) Southern Biotech
PerCP Streptavidin Mouse FACS 1:200 BD
BV-B220 Biotin FACS 1:200 BioLegend
PE anti-BP-1 Mouse FACS 1:100 BioLegend Table 6: Antibodies used in this work. Abbreviations: APC: Allophycocyanin, FACS: Fluorescence activated cell sorting, FITC: Fluoresceinisothiocyanate, PE: Phycoerythrin , HRP: Horse raddish peroxidase, WB: Western blot
7.1.9.) Animals
All mice used in these experiments were bred in the Franz-Penzhold-Centre (FPZ) or
Biotechnologisches Entwicklungslabor (BTE) in Erlangen and kept in individually ventilated cages (IVC)
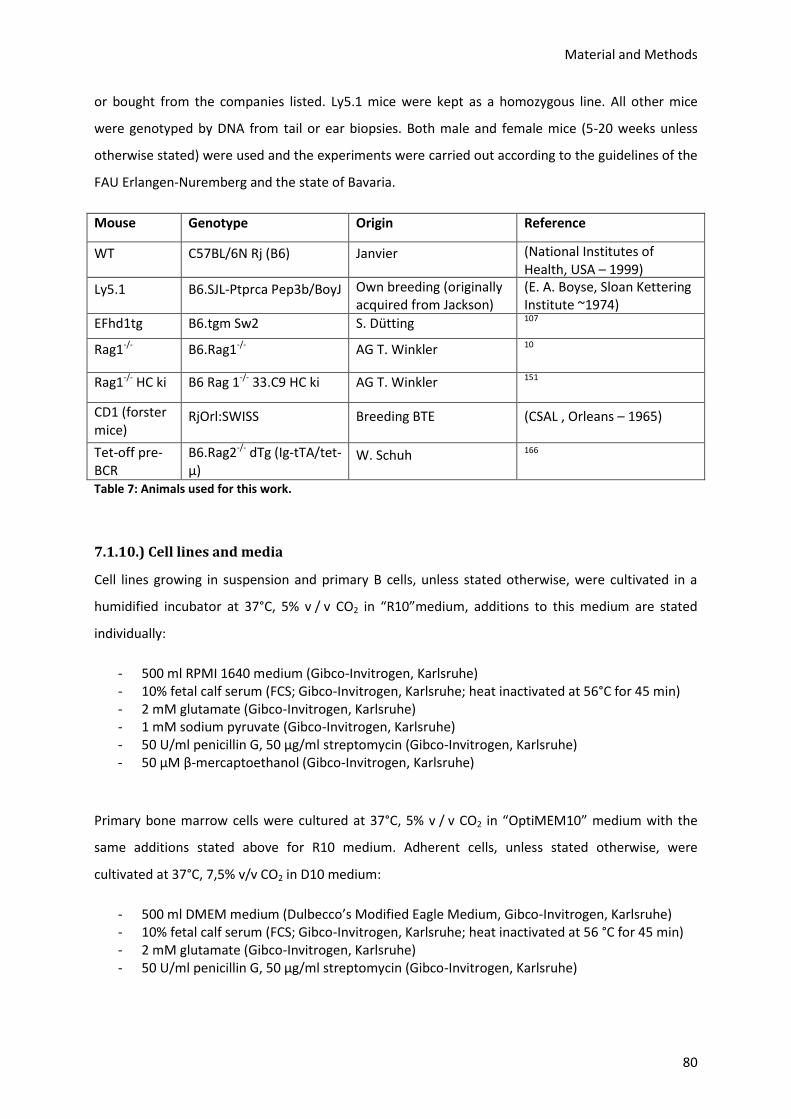
Material and Methods
80
or bought from the companies listed. Ly5.1 mice were kept as a homozygous line. All other mice
were genotyped by DNA from tail or ear biopsies. Both male and female mice (5-20 weeks unless
otherwise stated) were used and the experiments were carried out according to the guidelines of the
FAU Erlangen-Nuremberg and the state of Bavaria.
Mouse
strain
Genotype Origin Reference
WT C57BL/6N Rj (B6) Janvier (National Institutes of Health, USA – 1999)
Ly5.1 B6.SJL-Ptprca Pep3b/BoyJ Own breeding (originally acquired from Jackson)
(E. A. Boyse, Sloan Kettering Institute ~1974)
EFhd1tg B6.tgm Sw2 S. Dütting 107
Rag1-/- B6.Rag1-/- AG T. Winkler 10
Rag1-/- HC ki B6 Rag 1-/- 33.C9 HC ki AG T. Winkler 151
CD1 (forster mice)
RjOrl:SWISS Breeding BTE (CSAL , Orleans – 1965)
Tet-off pre-BCR
B6.Rag2-/- dTg (Ig-tTA/tet-μ)
W. Schuh 166
Table 7: Animals used for this work.
7.1.10.) Cell lines and media
Cell lines growing in suspension and primary B cells, unless stated otherwise, were cultivated in a
humidified incubator at 37°C, 5% v / v CO2 in “R10”medium, additions to this medium are stated
individually:
- 500 ml RPMI 1640 medium (Gibco-Invitrogen, Karlsruhe) - 10% fetal calf serum (FCS; Gibco-Invitrogen, Karlsruhe; heat inactivated at 56°C for 45 min) - 2 mM glutamate (Gibco-Invitrogen, Karlsruhe) - 1 mM sodium pyruvate (Gibco-Invitrogen, Karlsruhe) - 50 U/ml penicillin G, 50 μg/ml streptomycin (Gibco-Invitrogen, Karlsruhe) - 50 μM β-mercaptoethanol (Gibco-Invitrogen, Karlsruhe)
Primary bone marrow cells were cultured at 37°C, 5% v / v CO2 in “OptiMEM10” medium with the
same additions stated above for R10 medium. Adherent cells, unless stated otherwise, were
cultivated at 37°C, 7,5% v/v CO2 in D10 medium:
- 500 ml DMEM medium (Dulbecco’s Modified Eagle Medium, Gibco-Invitrogen, Karlsruhe) - 10% fetal calf serum (FCS; Gibco-Invitrogen, Karlsruhe; heat inactivated at 56 °C for 45 min) - 2 mM glutamate (Gibco-Invitrogen, Karlsruhe) - 50 U/ml penicillin G, 50 μg/ml streptomycin (Gibco-Invitrogen, Karlsruhe)
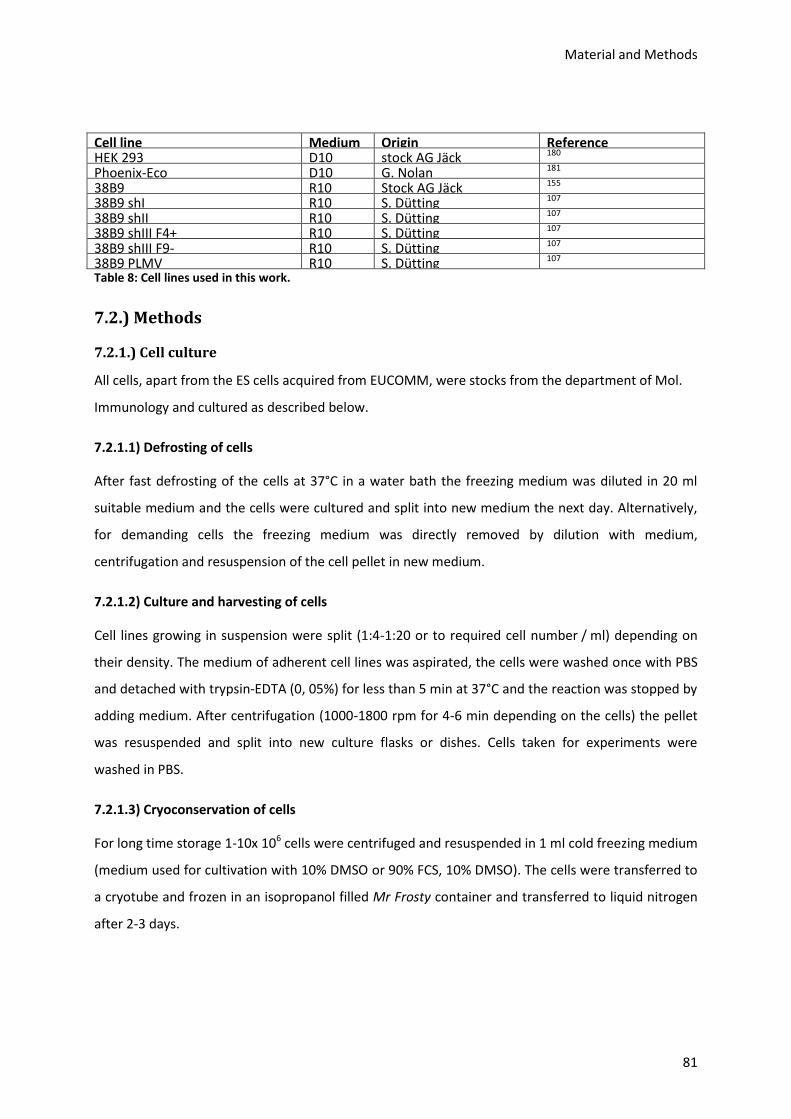
Material and Methods
81
Cell line Medium Origin Reference HEK 293
D10 stock AG Jäck 180 Phoenix-Eco
D10 G. Nolan 181 38B9 R10 Stock AG Jäck 155 38B9 shI R10 S. Dütting 107 38B9 shII R10 S. Dütting 107 38B9 shIII F4+ R10 S. Dütting 107 38B9 shIII F9- R10 S. Dütting 107 38B9 PLMV R10 S. Dütting 107 Table 8: Cell lines used in this work.
7.2.) Methods
7.2.1.) Cell culture
All cells, apart from the ES cells acquired from EUCOMM, were stocks from the department of Mol.
Immunology and cultured as described below.
7.2.1.1) Defrosting of cells
After fast defrosting of the cells at 37°C in a water bath the freezing medium was diluted in 20 ml
suitable medium and the cells were cultured and split into new medium the next day. Alternatively,
for demanding cells the freezing medium was directly removed by dilution with medium,
centrifugation and resuspension of the cell pellet in new medium.
7.2.1.2) Culture and harvesting of cells
Cell lines growing in suspension were split (1:4-1:20 or to required cell number / ml) depending on
their density. The medium of adherent cell lines was aspirated, the cells were washed once with PBS
and detached with trypsin-EDTA (0, 05%) for less than 5 min at 37°C and the reaction was stopped by
adding medium. After centrifugation (1000-1800 rpm for 4-6 min depending on the cells) the pellet
was resuspended and split into new culture flasks or dishes. Cells taken for experiments were
washed in PBS.
7.2.1.3) Cryoconservation of cells
For long time storage 1-10x 106 cells were centrifuged and resuspended in 1 ml cold freezing medium
(medium used for cultivation with 10% DMSO or 90% FCS, 10% DMSO). The cells were transferred to
a cryotube and frozen in an isopropanol filled Mr Frosty container and transferred to liquid nitrogen
after 2-3 days.
Material and Methods
82
7.2.1.4) Evaluation of cell density
Cell suspensions were mixed with 50%- 90% v / v in trypan blue and the living, unstained cells were
counted with a Neubauer chamber. The mean cells / large square were multiplied by the dilution
factor and 104 to calculate the amount of cells / ml.
7.2.1.5) ES cell culture and preparation for blastocysts injection
Cells were cultured according to EUCOMM guidelines. 10 cm tissue culture dishes were coated with
0.1% gelatine and 4x 10⁶ freshly prepared mitotically inactivated (30 Gy irradiated) SNL Feeder cells
(one 80% confluent plate) were pelleted for 3 min at 1000 rpm and seeded onto the aspirated,
coated dish in 5 ml feeder medium and grown at 37°C, 5% CO2. The feeders were then used after 3-7
days. For thawing of JM8 ES cell clones the feeder medium of one well of a 6-well plate (one 10 cm
dish with feeders was used for a 6-well plate) with gelatine and SNL feeder cells was aspirated off
and the feeder cells were overlaid with 2 ml M15G+Lif. The ES cells were defrosted in a 37°C water
bath and diluted into 5ml of pre-warmed M15G+Lif. The cells were pelleted for 3 min at 1200 rpm.
The ES cells were then resuspended in 3 ml of new medium and transferred onto the feeder cells and
grown in a 37°C humidified 5% CO2 incubator. The medium was changed daily until the ES cell clones
had grown but not differentiated (2-4 days). When 80% confluent the cells were split 1:5. For this the
well was washed once with 2 ml PBS and 0, 5 ml Trypsin (PAN Biotech, Trypsin special solution for
ES-cells, #P10-100100) was added for 5 min at 37°C. 4, 5 ml M15G+Lif was added to inactivate the
trypsin. The cell clumps were dispersed by gently mixing 3-4 times up and down and letting the large
clumps settle. The cells were then split into 5 new wells of a 6-well plate. For freezing the cells were
instead pelleted for 3 min at 1200 rpm and resuspended in 800 μl of FM15G + Lif. Per cryovial 200 µl
was aliquoted and the cells were frozen in a styrofoam container or temperature controlled freezing
vessel. The vials were frozen in a -80°C freezer. After 2-3 days the cryovials were transferred to liquid
or vapour phase nitrogen for long term storage. The growth of JM8 ES cells is also possible without
feeder cells on M10G medium which was tested and confirmed.
For microinjection one vial was defrosted, centrifuged and grown on a 10 cm dish with gelatine and
feeder cells for 3-7 days in M15G+Lif.
M15G + Lif (medium for JM8 cells grown on feeders): - 500 ml knockout DMEM medium (GIBCO, #10829)) - + 90 ml FCS (GIBCO, #10439, Lot:#923148) - + 5 ml 100x L-glutamine (GIBCO; #25030) - + 5 ml 100x beta-mercaptoethanol (Sigma, #M7522 (360 μl/500 ml PBS; filtered, stored
at -20°C) - + ESGRO (LIF; Chemicon; #ESG1107) dilute as directed (1000 units/ ml) stored at 4°C
Material and Methods
83
- (for selection: Geneticin (Gibco, #10131) M10G + Lif (medium for JM8 cells grown on gelatin):
- 500 ml Knockout DMEM medium (GIBCO; #10829)) - + 50 ml FCS (GIBCO, #10439, Lot:#923148) - + 5 ml 100x L-glutamine (GIBCO; #25030) - + 5 ml 100x beta-mercaptoethanol (Sigma, #M7522 (360 μl/500 ml PBS; filtered, stored
at -20°C) - + ESGRO (LIF; Chemicon; cat #.: ESG1107) dilute as directed (1000 units/ ml) stored at 4°C
FM15G + Lif (freezing medium for JM8 cells):
- M15G + Lif - + 10% DMSO
Prepared fresh every time before use M-SNL (medium for SNL cells):
- 450 ml medium (DMEM with high glucose) - + L-glutamine (GIBCO, cat #: 41965) - + 50 ml mycoplex FCS (PAA, cat #: A15-105)
FM-SNL (freezing medium for SNL cells):
- medium for SNL cells (see above) - + 10% DMSO (Sigma, cat #: D-5879) (prepare fresh and filter sterilize before use)
Gelatine solution:
- 0.1% gelatine in PBS (2% gelatine, Sigma), stored at 4-8°C
7.2.2.) Transfection of HEK293 cells
HEK 293 cells were cultured until 75% confluent in D10 medium and then transfected by calcium
phosphate method. Directly before transfection the medium was exchanged and per 10 cm dish 1 ml
2X HBS (50 mM hepes pH 7.05, 10 mM KCl, 1,5 mM glucose, 280 mM NaCl, 1,5 mM Na2HPO) was
mixed with 1ml DNA solution (20 µg DNA, 50 µl 25 mM chloroquine, 125 µL 2,5 M KCl in medium).
These 2 ml were slowly added to the culture dish while bubbling air into the solution with a pipette.
After 8-10h cultivation at 37°C, the medium was exchanged again. For transfection in smaller 6- 96
wells plates the reagents were scaled down accordingly.
7.2.3.) Isolation of primary cells from mice and erylysis
The mice were euthanized by CO2 and cervical dislocation. Femora (in some cases also tibia) bone of
the mice were flushed with cold OptiMEM10 medium or FACS buffer. After erylysis the BM was
flushed through a green MACS filter (50 µM). The spleen was taken out after opening of the
peritoneum and meshed in a cell strainer (70 µm, BD Falcon). The lymph nodes were similarly
meshed after isolation. Erythrocytes were lysed after pelleting the cells at 4°C, 1500 rpm, 5 min and
Material and Methods
84
the pellet lysed for 5 min in 5 ml erylysis buffer (8,29 g NH4Cl, 1 g KHCO3, 0,037 g EDTA/ add to 1l
with ddH20) for no more than 5 min The lysis was stopped by adding 7 ml medium or buffer. The cells
were centrifuged and resuspended in 10 ml new medium or buffer.
7.2.4.) Enrichment of B cells from spleen and BM
B cells were enriched from the spleen in MACS buffer (PBS, 2% FCS, 2 mM EDTA) by MACS EasySep
Mouse B cell isolation negative selection kit (EasySep # 19854A) and from the BM by Mouse CD19
positive selection kit (EasySep # 18754) according to the manufacturer’s instructions. The cells were
counted and purification verified by staining with anti-CD19-BV or after CD19 positive selection by
PE- fluorescence which was used as isolation marker in the CD19 kit. Spleen cells were routinely
enriched to > 93% purity whereas CD19+ BM B cells were enriched to > 85% purity.
7.2.5.) Pro B cell culture
Pro B cells were seeded at 105 cells / ml and cultured in OptiMEM10 medium with IL-7 as indicated.
The IL-7 was added fresh at the same concentration every 3 days. Half of the original volume of
medium was freshly added on day 4 of culture to compensate for evaporation and conversion of the
medium into biomass. The cells were split to original density on day 5. To analyse proliferation
freshly sorted pro-B cells were labelled with the proliferation dye eFlour 670 (eBio according the
manufacturer’s instructions. The cells were washed 3x in cold PBS and then cultures in OptiMEM10
with 5 ng / ml IL-7. The eF670 staining of the cells was analysed by flow cytometry. After 3 days
culture the decrease in eF670 was analysed by flow cytometry and the proliferation was analysed by
FlowJo cell cycle tool.
7.2.6.) LPS blast culture
Splenic B cells were isolated and enriched as described and cultures at a starting concentration of
2,5x 10⁵ cells / ml in R10 medium with 10 µg / ml LPS. Activation and proliferation of the cells was
controlled by microscopic observation of clustering of the cells after > 24h in culture.
7.2.7.) Measurement of extracellular glucose and lactate
Cells were cultured in R10 medium with additions as stated and the cells removed by centrifugation.
The glucose and lactate in the supernatant was measured in triplicate with a Hitado GL Compact and
normalized to the same unconditioned medium
7.2.8.) Analysis of mitochondrial metabolism by Seahorse extracellular flux analyser
Seahorse measurements were carried out with a XFe-96 analyser as previously published.72 Cells
were isolated and cultured as indicated and washed three times in seahorse assay medium XF assay
medium (Seahorse bioscience, #102365-100, supplemented with 2 mM pyruvate, 11 mM glucose,

Material and Methods
85
pH 7,4 at 37°C prior to assay). Cells were analysed for cell count and viability with a Merck count and
viability(#MCH10010 ) analysed with MUSE and seeded at 8,9x 10⁴- 2,5x 10⁵ cells per well. The same
number of viable cells used for compared data sets and mitochondrial metabolism was analysed by
Seahorse Mito Stress Test (Seahorse, #103015-100) according to the manufacturer’s instructions or
with individually prepared solutions (1 µM oligomycin A Sigma #75351, 1,5 µM FCCP Sigma # C2920,
3 µM antimycin A Sigma #A8674, 3 µM rotenone Sigma #R8875 all dissolved in DMSO).
Figure 23: Seahorse extracellular flux analyser, Mito Stress Test and cellular energy phenotype profile (A) Set up of a Seahorse extracellular flux analyser. 8- 96 microchambers can be sealed off by a probe(in the down position) after mixing the unbuffered Seahorse assay medium. The pH and oxygen content are measured by sensors. Four injection ports per well allow for automated and time controlled injection of a drug of choice. (B) Measurement of the oxygen consumption rate (OCR) in a Mito Stress Test. After several base-line measurements (basal respiration) oligomycin is injected which specifically inhibits the mitochondrial ATPase and thus decreases the OCR. The drop signifies OCR used for ATP production. After several measurements the
Material and Methods
86
uncoupling agent FCCP is added which is a mobile ion transporter and transports hydrogen ions through the mitochondrial membrane and allows the OCR to occur at its maximum rate. The difference between basal and maximal respiration is termed spare capacity. After another number of measurement points, rotenone and antimycin A are added together which inhibit mitochondrial complexes I and III respectively. This abolishes all mitochondrial respiration. The remaining OCR is then due to non-mitochondrial respiration. Calculation of the difference between OCR after inhibition with oligomycin and the OCR after further inhibition with rotenone and antimycin A then allows determination of the OCR going into proton leak of the cells. The proportion of (mitochondrial) ATP production to total mitochondrial respiration (ATP production+ proton leak) can be used as a measure of assessing the coupling efficiency of the mitochondria. (C) In addition to the OCR also the media acidification (ECAR) is measured by the extracellular flux analyser. A 2D plot of OCR / ECAR allows depiction of the cellular energy phenotype of cells and potential shifts in metabolism. Cells high in OCR and ECAR are very energetic and on the opposite end quiescent. Cells that acidify the medium –by excreting lactate- without using much oxygen are termed glycolytic whereas cells using a lot of oxygen without much extracellular acidification have a very aerobic metabolism. (Illustrations adapted from Seahorse website)
7.2.9.) Comet assay
The alkaline comet assay was essentially carried out as previously described.182 Cover slides were
coated with 1% agarose in dH2O. After drying, 750 µl of a 1x 10⁴ cells / ml suspension in 1% in dH2O
low melting agarose was added per slide and the cells on the slides lysed in fresh alkaline solution A
(1,2 M NaCl, 100 mM Na2EDTA, 0,1% sodium lauryl sarcosinate, 0,26 M NaOH pH >13) over night
after setting of the agarose The slides were then rinsed twice in A2 solution (0,03 M NaOH,
2 mM Na2EDTA pH ~12,3) and gel electrophoresis conducted in A2 buffer at 25 V, 0,04 A, ~1 W for 7
min in a medium electrophoresis chamber). The slides were rinsed 3x 2 min in dH2O and 400 µl of a
10 µg/ ml propidium iodide stock solution pipetted onto each slide. After incubation for 20 min the
slides were again washed 3x 2 min with dH2O and cells analysed at 40x mag. with a fluorescent
microscope (Axioplan 2 imaging and Axiophot 2, Zeiss).
7.2.10.) Homing assay of splenic B cells
Splenic B cells of WT or EFhd1tg donor mice were isolated and enriched by MACS CD43 depletion
(Milteny). EFhd1tg or WT cells were then either labelled with CSFE or eF670 according to the
manufacturer’s instructions After 3 washes in PBS the cells were counted and mixed at equal ratios
with cells of the other genotype and dye (i.e. two injections mixes to control for effects of the dye
treatment). Recipient mice were injected with 2x 10⁷ cells i.v. and BM, spleen and iLN analysed either
after 3 h or 24 h post injection for CSFE / eF670 labelled live lymphocytes by flow cytometry.
7.2.11.) Competitive BM transfer
Ly5.1 C57BL/6 mice were irradiated with 1 dose of 6 Gy and 1 dose of 5 Gy given 4 hours apart,
followed by i.v. reconstitution with a 1:1 mix of 2x 10⁶ BM cells in PBS sterile prepared from the
femur of Ly5.1 C57BL/6 and Ly5.2 EFhd1tg C57BL/6 or Ly5.1 C57BL/6 and Ly5.2 WT C57BL/6,
respectively. Mice were analysed after 6 weeks reconstitution without antibiotics. The contribution
of CD45.1 and CD45.2 to B cell populations in the BM and spleen was analysed by flow cytometry for
pro-B (CD19+, cKit+) pre-B (CD19+, CD25+) immature (CD19+, IgM+, IgD-) mature (CD19+, IgM+, IgD+)
Material and Methods
87
marginal zone (CD19+, CD21high, CD23low) and follicular (CD19+, CD21low, CD23high) B cells. The
frequency of CD45.1/ CD45.2 cells was normalized to slight variations in the injection mix and the
frequency of CD54.1/ CD45.2 fast growing granulocytes.
7.2.12.) Flow cytometry
For the analysis of cell surface and intracellular proteins 5x 10⁵ -2x 10⁶ cells were pelleted in FACS
tubes for 5 min at 1500 rpm and incubated for 20 min at 4°C in the dark with 100 µl fluorescent
antibody mix in FACS buffer (PBS, 2% FCS, 0,05% NaN3). If mentioned the low-affinity FC-receptor
was blocked before addition of antibodies by incubation with 50 µl 1:50 CD16/32 in FACS buffer for
10 min The cells were washed at least once with 500 µl FACS buffer. For intracellular staining the Fix
& Perm Kit (An der Grub, Kaumberg, Austria) was used according to the manufacturer’s instructions.
After washing the cells were analysed in 150- 300 µl FACS buffer by flow cytometry of if applicable
stained with secondary antibodies first. The flow cytometry data was acquired with a GalliosTM
(Beckman Coulter) or CaliburTM (Becton Dickinson).
7.2.12.1.) Flow cytometric analysis of cell numbers
The cells in the FACS tube were resuspended with 250 µl FACS buffer and 10 µl of Coulter CC size
standard L10 (Beckman Coulter, #B01828-AA) in PBS with a known concentration of beads (3-5 x 10⁵
beads / ml). The cells/beads were acquired with a FACS Calibur flow cytometer and the cells
number / FACS tube calculated by normalizing to the fraction of beads acquired.
7.2.12.2) Flow cytometric analysis of mitochondrial activity
Cells were resuspended at 1-3x 10⁶ / ml in 100- 300 µl OptiMEM medium without any additions and
incubated for 30 min at 37°C 5% CO2 with 5-10 nM MitoTracker Green FM or 40 nM DIOC6 or 1 µM
DCFDA. The cells were washed once in the same medium and then stained for surface antigens with
fluorescent antibodies in medium for 20 min at 4°C in the dark. The cells were washed with 500 µl
FACS buffer, resuspended in 250 µl of the same buffer and analysed by flow cytometer. To measure
glucose uptake the cells were instead resuspended in glucose free DMEM with 300 µM 6-NBDG for
30 min at 37°C, 5% CO2. The staining was analysed at the GalliosTM. To adjust the mitochondrial
activity to the volume of the cells the cubic value of FSC TOF was normalized to pro-B cell FSC TOF.
To analyse mitochondrial mass upon ectopic EFhd1 expression HEK293 cells were stained with
50-100 nM MitoTracker Red (Thermo Fisher, #M22425). To analyse mitochondrial membrane
potential in shRNA knock-down cells, cells were stained with 20 nM TMRE. Both were analysed with
the CaliburT.
Material and Methods
88
7.2.12.3) Flow cytometric cell cycle analysis
After pelleting the cells for 5 min at 1500 rpm 4°C the cells were resuspended in hypotonic PI
solution (citrate, 0,1% TritonX-100, 50 µg / ml propidium iodide in dH2O). The cells were resuspended
by rigorous vortexing, kept at 8°C and the linear PI fluorescence was measured by flow cytometry the
next day.
7.2.12.4) Cell sorting by MoFloTM or AstriosTM
For sorting pro-B cells the BM of 2-3 mice from femur (if more cells needed also tibia) were flushed
with 10 ml OptiMEM10. The cells were erylysed and filtered through a green MACS filter in 10 ml
MACS buffer (PBS, 2% FCS, 2 mM EDTA). After centrifugation the cells were stained in approximately
300 µl MACS buffer per mouse (PBS, 2% FCS, 2 mM EDTA) with 1:100 anti-CD19-BV, 1:200 anti-B220
PerCPCy5.5 and 1:50 anti-cKit-PE. The cells were incubated in the dark at 8°C and 9 ml MACS buffer
was added after 20 min. After centrifugation the cells were washed with another 10 ml MACS buffer
and resuspended in 1 ml buffer for sorting. Directly before sorting the cells were again passed
through a green MACS filter and sorted into 2 ml OptiMEM10. To sort pro-, pre- and immature B cells
from the BM the sorting antibody mix contained 1:400 anti-IgM-FITC, 1:100 anti-CD19-BV, 1:200
anti-CD25-APC and 1:50 anti-cKit-PE. For RNA isolation pro-B cells were directly sorted into 350 µl
RLT-buffer (Qiagen) +10 µl/ ml β-ME and pre- and immature B cells into 2 ml sort buffer. They were
centrifuged after the sort, washed once in 1 ml PBS and also lysed in 350 µl RLT-buffer +10 µl/ ml β-
ME. To sort pro- and pre- B cells from an IL-7 culture cells were stained with 1:500 anti-IgM-Cy5,
1:100 anti-CD19-BV and 1:50 anti-cKit-PE. All cells were sorted at a MoFlo sorter (Dako Cytomation,
Hamburg) or Astrios to routinely > 97% purity.
7.2.13.) Isolation of DNA
Plasmid DNA was isolated by Mini-, Medi- or Maxi kits (Qiagen) according to the manufacturer’s
instructions. ES cell DNA was isolated by digestion of the cells in PBND with 1:100 proteinase K at
55°C overnight without mixing. RNA was digested with 20 µl RNAse A (10 mg / ml Qiagen) for 2 h at
37°C. Any non-soluble and undigested cellular debris was pelleted for 10 min at 13000 rpm and RT.
The DNA solution was added to the same volume of phenol and mixed by inverting. The mix was
centrifuged for 5 min at 13000 rpm at RT and the step repeated with the supernatant and the same
volume of phenol:chloroform:isoamylalcohol (25:24:1) (Roti phenol, Roth #A1.156.2). This step was
repeated three times with the supernatant and the same volume of chloroform in 2 ml phase lock gel
heavy reaction tubes (5Prime, Hamburg). The DNA was precipitated overnight at -20°C with
isopropanol. The DNA was carefully removed with a glass pasteur tip and washed in 70% ethanol.
After air drying, the DNA was dissolved in 100 µl TE buffer (100 mM Tris, 10 mM EDTA in dH20) or
dH2O.
Material and Methods
89
Isolation DNA from of mouse tail or ear biopsies was done by digesting the biopsies in
100-150 µl PBND buffer (50 mM KCl, 2,5 mM MgCl2-6x H2O, 0,1 mg / ml gelatine, 0,45 % NP-40
(Amersham Biosciences), 0,45 % Tween20 (Merck), 10 mM Tris-HCl pH 8,3) with 1 µl / ml
proteinase K (20 mg / ml; Peqlab, Erlangen) over night at 56°C, 450 rpm. The proteinase K was heat
inactivated for 5 min at 95°C. The biopsies were centrifuged to pellet any non-digested parts and
kept at 8°C until genotyped. 3 µl biopsy supernatant was used per PCR reaction for genotyping.
7.2.14.) PCR
For genotyping the following components and volumes were used per PCR reaction:
For EFhd1tg or EFhd1-/-:
- Taq-buffer with Mg2Cl (10 x, Genaxxon): 2 μl
- Ultrapure H2O: 12,4 µl
- Primer forward (5 μM stock): 1 μl
- Primer reverse (5 μM stock): 1 μl
- dNTP-mix (10 mM stock): 0,3 μl
- Taq-polymerase (5 U/ μl, Genaxxon): 0,3 μl
- DNA/H2O: 3 μl per reaction
PCR Programs:
- For EFhd1tg -PCR program “Swip tail 2”: 94°C, 5 min; 35 cycles (94°C, 30 s / 60°C, 30 s / 72°C, 1 min) detection on 1% agarose gel.
- For EFhd1 -/-: PCR program “efhd1 KO”: 95°C 2 min, 35 cycles (95°C 30 sec, 58°C 30 sec, 72°C 30 sec) detection on 3% agarose gel.
7.2.15.) Isolation of RNA
RNA was isolated from tissues and cells by RNeasy-Kit (Qiagen, #79654) according to the
manufacturer’s instructions after lysis of the cells by Qia Shredder (Qiagen, #74104). The RNA
concentration in RNAse free H2O was analysed by measuring the absorption at 260 / 280 nm with a
NanoDrop machine (PeqLab, ND-100 Spectrophotometer).
7.2.16.) cDNA synthesis
cDNA synthesis with 50-100 ng RNA was carried out according to the manufacturer’s instructions
with the RevertAid™ cDNA Synthesis Kit (Thermo Scientific, #K1622) with Oligo-dT12-18 primers. Or
with the Quanti Tect Reverse Transcription kit (Qiagen, #205313) and the contained primer mix. To
calculate cDNA concentration for qPCR, a conversion rate of 1:1 was assumed.
Material and Methods
90
7.2.17.) Quantitative Real-Time-PCR with SYBR Green
7.2.17.1.) SYBR- Green RT PCR
SYBR-Green Real-Time-PCR was carried out in triplicates with an SYBR Green PCR Master Mix
(Applied Biosciences, #4309159) with an Applied Biosystems 7300 cycler with the following
components per reaction:
- SYBR Green Mix (2x): 7,5 µl - Forward primer (5 µM): 0,25 µl - Reverse primer (5 µM): 0,25 µl - ultrapure dH20: 6 µl - cDNA/ RNA (1-5 ng / µl): 1 µl per reaction
7.2.17.2.) RT2 Profiler PCR Arrays
RT2 profiler PCR arrays (Qiagen, Mouse PI(3)K-AKT #PAMM-0582F-6 or Mouse PPAR Targets #PAMM-
149ZA-6) were carried out according to the manufacturer’s instructions with RT2 SYBR Green qPCR
Mastermix (Qiagen, #330510) in an Applied Biosystems 7300 cycler after generation of cDNA from
100 ng RNA per 96-well plate prepared by RNeasy kit (Qiagen, #74104) and converted with an RT2
First Strand kit (Qiagen, #330401)
7.2.18.) DNA agarose-gel electrophoresis
For separation and size determination of DNA fragments the DNA was loaded onto 0,7-3% agarose
gels with 5 μl ethidiumbromide (10 mg / ml) per 100 ml 1x TAE (50x: 2 M Tris-HCl pH 8,5 1 M sodium
acetate, 50 mM EDTA). 100 bp or 1 kb size standard ladders (NEB) were included in the first lane.
After electrophoresis at 120 V the ethidiumbromide stained DNA was visualized under UV light
(312 nm) with a Dark hood DH-50 (Biostep) and documented with a Canon camera.
7.2.19.) Protein biochemical methods
7.2.19.1.) Generation of cell lysates
Cells were pelleted by centrifugation, washed in PBS and resuspended in approximately 50 µl lysis
buffer (50 mM Tris-HCl pH 7,5; 150 mM NaCl, 2 mM EDTA, 1% Triton-X-100, 1 mM PMSF, 10 mM
NaF) per 1x 10⁶ cells and lysed for at least 30 min on ice. The cell debris was pelleted for 10 min at
4°C at 13000 rpm (Heraeus Biofuge fresco) the supernatant transferred to a new Eppendorf tube and
stored at -20/-80C°. For demanding lysates proteinase inhibitor cocktail (Sigma, #P8340) was added.
7.2.19.2.) Evaluation of protein concentrations
Protein concentration of lysates was analysed by a BCA kit (Pierce). Solution A was mixed 1:50 with
solution B. 200 µl of this mix was incubated with 2 µl protein solution for 30 min at 37°C. A standard
Material and Methods
91
of 1-20 µg BSA was included for reference. After incubation the absorption was measured at 562 nm
and the mean protein concentration of triplicate measurement was calculated from the standard
curve.
7.2.19.3.) Protein gel-electrophoresis (SDS-PAGE)
Separation of proteins according to their MW was carried out by polyacrylamide gel-electrophoresis
in a Hoefer (San Francisco, USA) 16x 18 cm gel chamber. The separation gel was prepared with
10-12% SDS (according to the expected MW of the protein of interest). The gels were cast with the
following components:
Running gel (10% /12%):
- 1 M Tris/ HCl pH 8,8: 11,7/ 11,7 ml - dH2O: 7,7/ 6,1 ml - 10% SDS: 0,31/0,31 ml - 30% acrylamide/0,8 % Bis: 10,4/ 12,5 ml - 15 mg/ ml APS: 0,65/ 0,65 ml - TEMED: 15,6/ 15,6 µl
Stacking gel (4 %):
- 1 M Tris/HCl pH 6,8: 1,49 ml - dH2O: 8,4 ml - 10% SDS: 0,12 ml - 30% acrylamide/ 0,8 % Bis: 1,68 ml - 15 mg/ml APS: 0,6 ml - TEMED: 12µl
The samples were diluted in 2-5X SDS loading buffer (5 x SLB: 312, 5 mM Tris pH 6, 8; 10% w/v SDS,
25% v/v glycerine, 1 mM EDTA, 500 mM DTT, 0,005 % m/v bromophenol blue, 0, 005% w/v
pyronin Y) accordingly and denatured at 95 °C for 5 min and then kept on ice. The protein samples
plus an SDS page standard broad range (Bio-Rad) or pre-stained protein ladder (Peqgold Protein
marker IV, 10 bands) were loaded to the SDS gel with capillary tips. The SDS gels were run at a
maximum of 70 mA per gel in Laemmli loading buffer (or at 7 mA overnight).
7.2.19.4.) Western Blot-Analysis
For Western blot analysis the separated proteins were blotted onto nitrocellulose membrane
(Whatmann) by semi-dry method (PerfectBlueTM-System, Peqlab, Erlangen). The proteins of an
approximately 13x 13cm gel were transferred for 45 min at 400 mA and the membrane briefly
stained with ponceau-S-staining solution (10 x ponceau-S: 2% w / v ponceau S, 30% w / v trichloric
acid, 30% w / v sulfosalicylic acid) and unspecific staining removed with dH2O. After documentation
of the total transferred proteins the membrane was briefly washed with TBST (10x TBST: 200 mM
Tris pH 7, 4, 1,5 M NaCl, 1% v/v Tween20) to remove any remaining stain. The membrane was then
blocked for 30- 60 min with 5% w/v skimmed milk powder (Spinnrad) in TBST. Detection of specific
proteins was then carried out by incubation of the membrane with the primary antibody (in PBS, 5%
w / v BSA, 0, 1% NaN3) for 1 h at RT or overnight at 4°C. The membrane was washed three times with
TBST for 10 min and then incubated for 1 h with the secondary antibody (in 5% skimmed milk

Material and Methods
92
powder in TBST). After another 3 washes with TBST for 10 min the membrane was briefly washed
with dH2O and luminescence detected by ECL. The membrane was incubated for 1 min in room light
with fresh ECL solution (2 ml 1 M Tris pH 8,5; 200 μl 250 mM luminol (Fluka )/ DMSO, 90 μl of 90 mM
p-cumaric acid (Roth) / DMSO, 18 ml dH2O, 6,1 μl 35% v / v H2O2). The membrane was then
transferred to a transparent autoclave bag and placed in a film cassette. The cassette was opened in
a darkroom and X-ray films placed onto the membrane for 20 sec- 1 h depending on the band
intensity of a first trial film with 1 min exposure. The films were then processed in an Agfa, Curix 60
developer machine and the location marker bands transferred with a pen.
Appendix
93
8.) Appendix
8.1.) Abbreviations
Δψµ (electrochemical) Mitochondrial membrane potential
DCFDA 2’, 7’–dichlorofluorescein diacetate
2-DG 2-Deoxy-D-Glucose
DIOC6 3, 3′-dihexyloxacarbocyanine iodide
6-NBDG 6-(N-(7-nitrobenz-2-oxa-1,3-diazol-4-yl)amino)-6-deoxyglucose)
ATP Adenosine triphosphate,
APC Allophycocyanin
AA Amino acid
BCR B cell receptor
CLL (B-cell) chronic lymphocytic leukemia
BM Bone marrow
BV Brilliant violett 421
CSC Cancer stem cell
CSFE Carboxyfluorescein succinimidyl ester
Cpt Carnitine palmitoyl transferase
Ly5.1 CD45.1
Ly5.2 CD45.2
cDNA Complementary DNA
dsDNA Double stranded DNA
Ebf1 Early B cell factor 1
EFhd1 EF-Hand Domain-Containing Protein 1 (Swiprosin-2)
ETC Electron transport chain
ER Endoplasmic reticulum
ERα Estrogen receptor alpha
ECAR Extracellular acidification rate
FA(O) Fatty acid (Oxidation)
FITC Fluoresceinisothiocyanate
FACS Fluorescence activated cell sorting
Fnip1 Folliculin-interacting protein 1
FSc Forward Scatter
GC Germinal centre
GLUT Glucose transporter
GFP Green fluorescent protein
HSC Hematopoietic stem cells
HRP Horse raddish peroxidase
µHC IgM (BCR) immunoglobulin heavy chain
HC Immunoglobulin heavy chain
LC Immunoglobulin light chain
IgM Immunoglobulin M (membrane form= BCR)
iLN Inguinal lymph node
IMM Inner mitochondrial membrane
IRES Internal ribosome entry site
Irf 4/ 8 Interferon regulatory factor 4/ 8
IL-7 Interleukin-7
Appendix
94
IL-7R Interleukin-7 receptor
LPS Lipopolysaccharide
mtDNA Mitochondrial DNA
OxPhos Mitochondrial Oxidative Phosphorylation
mtPTP Mitochondrial permeability transition pore
PGC-1α/ β Mitochondrial peroxisome proliferation-activated receptor-γ-co-activator 1α/ β
NOX NADPH oxidases
OMM Outer mitochondrial membrane
OCR Oxygen consumption rate
PPP Pentose phosphate pathway
PPAR peroxisome proliferator-activated receptor
Pten Phosphatase and Tensin homolog
PI(3)K Phosphoinositid-3-Kinase
PE Phycoerythrin
p.i. Post injection
pre-BCR Pre-B cell receptor (German: Prä-BZR)
PS1 Presenilin 1
eF670 Proliferation dye eFlour 670
PI Propidium Iodide
Akt Protein kinases B (PKBα/β/γ)
qPCR Quantitative Polymerase Chain reaction
ROS Reactive oxygen species
SSc Sidewards Scatter
ssDNA Single stranded DNA
shRNA Small hairpin RNA
SEM Standard error of the mean
SOD Superoxide dismutase
sIgM Surface IgM
SLE Systemic lupus erythematosus
TMRE Tetramethylrhodamine, Ethyl Ester, Perchlorate
FoxO1 TF Forkhead Box class O orthologue 1
TF Transcription factor
TfR Transferrin receptor
Ucp Uncoupling protein
V / V Volume / Volume
W / V Weight / Volume
WB Western blot
WT Wildtype
Appendix
95
8.2. Bibliography
1. Boulais, P. E. & Frenette, P. S. Making sense of hematopoietic stem cell niches. Blood 125, 2621–2630 (2015).
2. Tokoyoda, K., Egawa, T., Sugiyama, T., Choi, B. Il & Nagasawa, T. Cellular niches controlling B lymphocyte behavior within bone marrow during development. Immunity 20, 707–718 (2004).
3. Morrison, S. J. & Scadden, D. T. The bone marrow niche for haematopoietic stem cells. Nature 505, 327–334 (2014).
4. Parmar, K., Mauch, P., Vergilio, J.-A., Sackstein, R. & Down, J. D. Distribution of hematopoietic stem cells in the bone marrow according to regional hypoxia. Proc. Natl. Acad. Sci. U. S. A. 104, 5431–5436 (2007).
5. Unwin, R. D. et al. Quantitative proteomics reveals posttranslational control as a regulatory factor in primary hematopoietic stem cells. Blood 107, 4687–4694 (2006).
6. Hale, L. P. et al. Hypoxia in the thymus: role of oxygen tension in thymocyte survival. Am. J. Physiol. Heart Circ. Physiol. 282, H1467–H1477 (2002).
7. Hardy, R. R., Carmack, C. E., Shinton, S. a, Kemp, J. D. & Hayakawa, K. Resolution and characterization of pro-B and pre-pro-B cell stages in normal mouse bone marrow. J. Exp. Med. 173, 1213–1225 (1991).
8. Hagman, J. & Lukin, K. Transcription factors drive B cell development. Curr. Opin. Immunol. 18, 127–134 (2006).
9. Breton, C. et al. Galectin-1 – expressing stromal cells constitute a specific niche for pre-BII cell development in mouse bone marrow. Blood 117, 6552–6561 (2011).
10. Mombaerts, P., Johnson, R. S., Herrup, K., Tonegawa, S. & Papaioannouo, V. E. RAG-1-Deficient Mice Have No Mature B and T Lymphocytes. Cell 68, 869–877 (1992).
11. Young, F. et al. Influence of immunoglobulin heavy- and light-chain expression on B-cell differentiation. Genes Dev. 8, 1043–1057 (1994).
12. Hedrick, S. M. The cunning little vixen: Foxo and the cycle of life and death. Nat. Immunol. 10, 1057–1063 (2009).
13. Milne, C. D. & Paige, C. J. IL-7: A key regulator of B lymphopoiesis. Semin. Immunol. 18, 20–30 (2006).
14. Prieyl, J. a & LeBien, T. W. Interleukin 7 independent development of human B cells. Proc.Natl.Acad.Sci.U.S.A 93, 10348–10353 (1996).
15. Milne, C. D., Fleming, H. E. & Paige, C. J. IL-7 does not prevent pro-B/pre-B cell maturation to the immature/sIgM(+) stage. Eur. J. Immunol. 34, 2647–55 (2004).
16. Clark, M. R., Mandal, M., Ochiai, K. & Singh, H. Orchestrating B cell lymphopoiesis. Nat. Rev. Immunol. 14, 69–80 (2013).
17. Guo, B., Kato, R. M., Garcia-Lloret, M., Wahl, M. I. & Rawlings, D. J. Engagement of the Human Pre-B Cell Receptor Generates a Lipid Raft–Dependent Calcium Signaling Complex. Immunity 13, 243–253 (2000).
Appendix
96
18. Wang, Y. H. et al. Differential surrogate light chain expression governs B-cell differentiation. Blood 99, 2459–2467 (2002).
19. Melchers, F. et al. Positive and negative selection events during B lymphopoiesis. Curr. Opin. Immunol. 7, 214–227 (1995).
20. Herzog, S., Reth, M. & Jumaa, H. Regulation of B-cell proliferation and differentiation by pre-B-cell receptor signalling. Nat. Rev. Immunol. 9, 195–205 (2009).
21. Ochiai, K. et al. A self-reinforcing regulatory network triggered by limiting IL-7 activates pre-BCR signaling and differentiation. Nat. Immunol. 13, 300–307 (2012).
22. Chow, K. T., Timblin, G. a., McWhirter, S. M. & Schlissel, M. S. MK5 activates Rag transcription via Foxo1 in developing B cells. J. Exp. Med. 210, 1621–1634 (2013).
23. Yusuf, I., Zhu, X., Kharas, M. G., Chen, J. & Fruman, D. a. Optimal B-cell proliferation requires phosphoinositide 3-kinase-dependent inactivation of FOXO transcription factors. Blood 104, 784–787 (2004).
24. Amin, R. H. & Schlissel, M. S. Foxo1 directly regulates the trancription of recombination activating genes during B cell development. Nat. Immunol. 9, 613–622 (2008).
25. Dengler, H. S. et al. Distinct functions for the transcription factor Foxo1 at various stages of B cell differentiation. Nat. Immunol. 9, 1388–1398 (2008).
26. Rowh, M. a W. & Bassing, C. H. Foxos around make B cells tolerable. Nat. Immunol. 9, 586–8 (2008).
27. Ma, S., Pathak, S., Trinh, L. & Lu, R. Interferon regulatory factors 4 and 8 induce the expression of Ikaros and Aiolos to down-regulate pre-B-cell receptor and promote cell-cycle withdrawal in pre-B-cell development. Blood 111, 1396–1403 (2008).
28. Tzivion, G., Dobson, M. & Ramakrishnan, G. FoxO transcription factors; Regulation by AKT and 14-3-3 proteins. Biochim. Biophys. Acta - Mol. Cell Res. 1813, 1938–1945 (2011).
29. Ghia, P., Granziero, L., Chilosi, M. & Caligaris-Cappio, F. Chronic B cell malignancies and bone marrow microenvironment. Semin. Cancer Biol. 12, 149–155 (2002).
30. Park, H. et al. Disruption of Fnip1 reveals a metabolic checkpoint controlling B lymphocyte development. Immunity 36, 769–781 (2012).
31. Cheng, Z. et al. Foxo1 integrates insulin signaling with mitochondrial function in the liver. Nat Med 15, 1307–1311 (2009).
32. Wofford, J. a et al. IL-7 promotes Glut1 trafficking and glucose uptake via STAT5-mediated activation of Akt to support T cell survival IL-7 promotes Glut1 trafficking and glucose uptake via STAT5-mediated activation of Akt to support T cell survival. Blood 111, 2101–2112 (2007).
33. Wasinski, F. et al. Lymphocyte glucose and glutamine metabolism as targets of the anti-inflammatory and immunomodulatory effects of exercise. Mediators Inflamm. 2014, 326803 (2014).
34. Caro-Maldonado, a. et al. Metabolic Reprogramming Is Required for Antibody Production That Is Suppressed in Anergic but Exaggerated in Chronically BAFF-Exposed B Cells. J. Immunol. 192, 3626–3636 (2014).
35. Dufort, F. J. et al. Cutting edge: IL-4-mediated protection of primary B lymphocytes from
Appendix
97
apoptosis via Stat6-dependent regulation of glycolytic metabolism. J. Immunol. 179, 4953–4957 (2007).
36. Maratou, E. et al. Glucose transporter expression on the plasma membrane of resting and activated white blood cells. Eur. J. Clin. Invest. 37, 282–290 (2007).
37. Jang, K.-J. et al. Mitochondrial function provides instructive signals for activation-induced B-cell fates. Nat. Commun. 6, 6750 (2015).
38. Heise, N. et al. Germinal center B cell maintenance and differentiation are controlled by distinct NF-κB transcription factor subunits. J. Exp. Med. 211, 2103–18 (2014).
39. Berg, J. M., Tymoczko, J. L. & Stryer, L. Biochemistry. WH Freeman and company (2002).
40. Wallace, D. C. Mitochondria and cancer. Nat Rev Cancer 12, 685–698 (2012).
41. Kuznetsov, A. V., Hermann, M., Saks, V., Hengster, P. & Margreiter, R. The cell-type specificity of mitochondrial dynamics. Int. J. Biochem. Cell Biol. 41, 1928–1939 (2009).
42. Jayashankar, V. & Rafelski, S. M. Integrating mitochondrial organization and dynamics with cellular architecture. Curr. Opin. Cell Biol. 26, 34–40 (2014).
43. Mootha, V. K. et al. Integrated analysis of protein composition, tissue diversity, and gene regulation in mouse mitochondria. Cell 115, 629–640 (2003).
44. Mitchell, P. Coupling of phosphorylation to electron and hydrogen transfer by a chemi-osmotic type of mechanism. Nature 191, 144–148 (1961).
45. Leyssens, A., Nowicky, A. V, Patterson, L., Crompton, M. & Duchen, M. R. The relationship between mitochondrial state, ATP hydolysis, [Mg2+]i and [Ca2+]i studied in isolated rat cardiomyocytes. J. Physiol. 496, 111–128 (1996).
46. Gottlieb, E., Armour, S., Harris, M. & Thompson, C. Mitochondrial membrane potential regulates matrix configuration and cytochrome c release during apoptosis. Cell Death Differ. 10, 709–717 (2003).
47. Suski, J. M. et al. Relation between mitochondrial membrane potential and ROS formation. Methods Mol. Biol. 810, 183–205 (2012).
48. Chen, Lan, B. Mitochondrial Membrane Potential in Living Cells. Ann. Rev. Cell BioI. 4, 155–181 (1988).
49. Hüttemann, M., Lee, I., Samavati, L., Yu, H. & Doan, J. W. Regulation of mitochondrial oxidative phosphorylation through cell signaling. Biochim. Biophys. Acta - Mol. Cell Res. 1773, 1701–1720 (2007).
50. Chandel, N. S. et al. Reactive oxygen species generated at mitochondrial Complex III stabilize hypoxia-inducible factor-1?? during hypoxia: A mechanism of O2 sensing. J. Biol. Chem. 275, 25130–25138 (2000).
51. Wang, W. et al. Superoxide Flashes in Single Mitochondria. Cell 134, 279–290 (2008).
52. Hou, T., Wang, X., Ma, Q. & Cheng, H. Mitochondrial flashes: new insights into mitochondrial ROS signaling and beyond. J. Physiol. 17, jphysiol.2014.275735– (2014).
53. Shen, E.-Z. et al. Mitoflash frequency in early adulthood predicts lifespan in Caenorhabditis elegans. Nature 508, 128–32 (2014).
Appendix
98
54. Ma, Q. et al. Superoxide flashes: Early mitochondrial signals for oxidative stress-induced apoptosis. J. Biol. Chem. 286, 27573–27581 (2011).
55. Schwarzländer, M. et al. Mitochondrial ‘flashes’: A radical concept repHined. Trends Cell Biol. 22, 503–508 (2012).
56. Schwarzländer, M. et al. The ‘mitoflash’ probe cpYFP does not respond to superoxide. Nature 514, E12–E14 (2014).
57. Hou, T. et al. Identification of EFHD1 as a novel Ca2+ sensor for mitoflash activation. Cell Calcium 1–9 (2016). doi:10.1016/j.ceca.2016.03.002
58. Kruiswijk, F., Labuschagne, C. F. & Vousden, K. H. P53 in Survival, Death and Metabolic Health: a Lifeguard With a Licence To Kill. Nat. Rev. Mol. Cell Biol. 16, 393–405 (2015).
59. Lenaz, G. The mitochondrial production of reactive oxygen species: mechanisms and implications in human pathology. IUBMB Life 52, 159–64 (2001).
60. Komuro, K., Itakura, K., Boyse, E. A. & John, M. Ly-5: A new T-lymphocyte antigen system. Immunogenetics 1, 452–456 (1974).
61. Circu, M. L. & Aw, T. Y. Reactive oxygen species, cellular redox systems, and apoptosis. Free Radic. Biol. Med. 48, 749–762 (2010).
62. Bigarella, C. L., Liang, R. & Ghaffari, S. Stem cells and the impact of ROS signaling. Development 141, 4206–4218 (2014).
63. Busiello, R. a, Savarese, S. & Lombardi, a. Mitochondrial uncoupling proteins and energy metabolism. Front Physiol 6, 36 (2015).
64. Warburg, O. On the Origin of Cancer Cells. Science (80-. ). 123, 309–14 (1956).
65. Zhang, S. et al. Homeostasis of redox status derived from glucose metabolic pathway could be the key to understanding the Warburg effect. Am. J. Cancer Res. 5, 1265–80 (2015).
66. Brand, K. a & Hermfisse, U. Aerobic glycolysis by proliferating cells: A protective strategy against reactive oxygen species. FASEB J. 11, 388–395 (1997).
67. Palmer, C. S., Ostrowski, M., Balderson, B., Christian, N. & Crowe, S. M. Glucose Metabolism Regulates T Cell Activation, Differentiation, and Functions. Front. Immunol. 6, 1 (2015).
68. Görlach, A., Bertram, K., Hudecova, S. & Krizanova, O. Calcium and ROS: A mutual interplay. Redox Biol. 6, 260–271 (2015).
69. Liu, T. F. & McCall, C. E. Deacetylation by SIRT1 Reprograms Inflammation and Cancer. Genes Cancer 4, 135–47 (2013).
70. Delgado, T. et al. Induction of the Warburg effect by Kaposi’s sarcoma herpesvirus is required for the maintenance of latently infected endothelial cells. Proc. Natl. Acad. Sci. U. S. A. 107, 10696–701 (2010).
71. Zu, X. L. & Guppy, M. Cancer metabolism: facts, fantasy, and fiction. Biochem. Biophys. Res. Commun. 313, 459–465 (2004).
72. Jitschin, R. et al. Mitochondrial metabolism contributes to oxidative stress and reveals therapeutic targets in chronic lymphocytic leukemia. Blood 123, 2663–2672 (2014).
73. Ciavardelli, D. et al. Breast cancer stem cells rely on fermentative glycolysis and are sensitive
Appendix
99
to 2-deoxyglucose treatment. Cell Death Dis. 5, e1336 (2014).
74. Bensaad, K. & Vousden, K. H. P53: New Roles in Metabolism. Trends Cell Biol. 17, 286–291 (2007).
75. Chang, C. et al. Metabolic Competition in the Tumor Microenvironment Is a Driver of Cancer Progression Article Metabolic Competition in the Tumor Microenvironment Is a Driver of Cancer Progression. Cell 162, 1–13 (2015).
76. Greene, M. E. et al. Isolation of the human peroxisome proliferator activated receptor gamma cDNA: expression in hematopoietic cells and chromosomal mapping. Gene Expr. 4, 281–99 (1995).
77. Jo, S.-H. et al. Peroxisome Proliferator-Activated Receptor Promotes Lymphocyte Survival through Its Actions on Cellular Metabolic Activities. J. Immunol. 177, 3737–3745 (2006).
78. Yang, C. et al. Activation of Peroxisome Proliferator-Activated Receptor γ Contributes to the Survival of T Lymphoma Cells by Affecting Cellular Metabolism. Am. J. Pathol. 170, 722–732 (2007).
79. Setoguchi, K. et al. Peroxisome proliferator-activated receptor-gamma haploinsufficiency enhances B cell proliferative responses and exacerbates experimentally induced arthritis. J. Clin. Invest. 108, 1667–1675 (2001).
80. Villena, J. a. New insights into PGC-1 coactivators: redefining their role in the regulation of mitochondrial function and beyond. FEBS J. 282, 647–672 (2015).
81. Nan, Y.-M. Peroxisome proliferator-activated receptor α, a potential therapeutic target for alcoholic liver disease. World J. Gastroenterol. 20, 8055 (2014).
82. Kang, C. & Ji, L. L. Role of PGC-1α in muscle function and aging. J. Sport Heal. Sci. 2, 81–86 (2013).
83. Marmolino, D. et al. PGC-1alpha down-regulation affects the antioxidant response in friedreich’s ataxia. PLoS One 5, 1–11 (2010).
84. Arany, Z. et al. HIF-independent regulation of VEGF and angiogenesis by the transcriptional coactivator PGC-1α. Nature 451, 1008–1012 (2008).
85. Handschin, C. et al. PGC-1a regulates the neuromuscular junction program and ameliorates Duchenne muscular dystrophy. Genes Dev. 21, 770–783 (2007).
86. Bianchi, K. et al. Regulation of Ca2+ signalling and Ca2+-mediated cell death by the transcriptional coactivator PGC-1α. Cell Death Differ. 13, 586–596 (2006).
87. Ducreux, S., Gregory, P. & Schwaller, B. Inverse regulation of the cytosolic Ca2+ buffer parvalbumin and mitochondrial volume in muscle cells via SIRT1/PGC-1α axis. PLoS One 7, e44837 (2012).
88. Henzi, T. & Schwaller, B. Antagonistic Regulation of Parvalbumin Expression and Mitochondrial Calcium Handling Capacity in Renal Epithelial Cells. PLoS One 10, e0142005 (2015).
89. Kretsinger, R. H. & Nockolds, C. E. Carp Muscle Calcium-binding Protein. J. Biol. Chem. (1973).
90. Carafoli, E., Santella, L., Branca, D. & Brini, M. Generation, control, and processing of cellular calcium signals. Crit. Rev. Biochem. Mol. Biol. 36, 107–260 (2001).
Appendix
100
91. Schwaller, B. The continuing disappearance of ‘pure’ Ca2+ buffers. Cell. Mol. Life Sci. 66, 275–300 (2009).
92. Chazin, W. J. Relating Form and Function of EF-hand Calcium Binding Proteins. Acc Chem Res. 44, 171–179 (2011).
93. Mielenz, D. et al. Lipid Rafts Associate with Intracellular B Cell Receptors and Exhibit a B Cell Stage-Specific Protein Composition. J. Immunol. 174, 3508–3517 (2005).
94. Kroczek, C. et al. Swiprosin-1/EFhd2 controls B cell receptor signaling through the assembly of the B cell receptor, Syk, and phospholipase C gamma2 in membrane rafts. J. Immunol. 184, 3665–76 (2010).
95. Avramidou, A. et al. The novel adaptor protein Swiprosin-1 enhances BCR signals and contributes to BCR-induced apoptosis. Cell Death Differ. 14, 1936–47 (2007).
96. Brachs, S. Untersuchungen zur Funktion des murinen Proteins EFhd2 / Swiprosin-1 in der B Zellentwicklung und Immunantwort in vivo. (FAU- Erlangen-Nuremberg, 2012). at <https://opus4.kobv.de/opus4-fau/frontdoor/index/index/docId/2247>
97. Brachs, S. et al. Swiprosin-1/EFhd2 limits germinal center responses and humoral type 2 immunity. Eur. J. Immunol. 44, 3206–19 (2014).
98. Huh, Y. H. et al. Swiprosin-1 modulates actin dynamics by regulating the F-actin accessibility to cofilin. Cell. Mol. Life Sci. 70, 4841–54 (2013).
99. Kwon, M.-S. et al. Swiprosin-1 is a novel actin bundling protein that regulates cell spreading and migration. PLoS One 8, e71626 (2013).
100. Ferrer-Acosta, Y. et al. EFhd2 is a novel amyloid protein associated with pathological tau in Alzheimer’s disease. J. Neurochem. 125, 921–31 (2013).
101. Vega, I. E. et al. A novel calcium-binding protein is associated with tau proteins in tauopathy. J. Neurochem. 106, 96–106 (2008).
102. Purohit, P. et al. The Ca2+ sensor protein swiprosin-1/EFhd2 is present in neurites and involved in kinesin-mediated transport in neurons. PLoS One 9, e103976 (2014).
103. Dütting, S., Brachs, S. & Mielenz, D. Fraternal twins: Swiprosin-1/EFhd2 and Swiprosin-2/EFhd1, two homologous EF-hand containing calcium binding adaptor proteins with distinct functions. Cell Commun. Signal. 9, 2 (2011).
104. Brachs, S. et al. Monoclonal antibodies to discriminate the EF hand containing calcium binding adaptor proteins EFhd1 and EFhd2. Monoclon. Antib. Immunodiagn. Immunother. 32, 237–45 (2013).
105. Tominaga, M. et al. Molecular characterization of mitocalcin, a novel mitochondrial Ca2+-binding protein with EF-hand and coiled-coil domains. J. Neurochem. 96, 292–304 (2006).
106. Tominaga, M. & Tomooka, Y. Novel genes cloned from a neuronal cell line newly established from a cerebellum of an adult p53−/− mouse. Biochem. Biophys. Res. Commun. 297, 473–479 (2002).
107. Dütting, S. Charakterisierung von Swiprosin-2/EFHD1 und dessen Funktion während der frühen B-Zellentwicklung. (2010). at <http://www.opus4.kobv.de/opus4-fau/frontdoor/index/index/year/2010/docId/1383>
Appendix
101
108. Alkelai, A. et al. Identification of new schizophrenia susceptibility loci in an ethnically homogeneous, family-based, Arab-Israeli sample. The FASEB Journal 25, 4011–4023 (2011).
109. Soler-López, M., Zanzoni, A., Lluís, R., Stelzl, U. & Aloy, P. Interactome mapping suggests new mechanistic details underlying Alzheimer’s disease. Genome Res. 21, 364–76 (2011).
110. Area-Gomez, E. et al. Presenilins are enriched in endoplasmic reticulum membranes associated with mitochondria. Am. J. Pathol. 175, 1810–6 (2009).
111. Hatzirodos, N. et al. Transcriptome profiling of granulosa cells from bovine ovarian follicles during atresia. BMC Genomics 15, 40 (2014).
112. Kuninger, D., Wright, A. & Rotwein, P. Muscle cell survival mediated by the transcriptional coactivators p300 and PCAF displays different requirements for acetyltransferase activity. Am. J. Physiol. Cell Physiol. 291, 699–709 (2006).
113. Squazzo, S. L. et al. Suz12 binds to silenced regions of the genome in a cell-type-specific manner. Genome Res. 16, 890–900 (2006).
114. Kim, S.-H. et al. Gene expression profile in mesenchymal stem cells derived from dental tissues and bone marrow. J. Periodontal Implant Sci. 41, 192–200 (2011).
115. Hurt, E. M., Thomas, S. B., Peng, B. & Farrar, W. L. Molecular consequences of SOD2 expression in epigenetically silenced pancreatic carcinoma cell lines. Br. J. Cancer 97, 1116–1123 (2007).
116. Bolotin, E. et al. Integrated approach for the identification of human hepatocyte nuclear factor 4alpha target genes using protein binding microarrays. Hepatology 51, 642–53 (2010).
117. Grigo, K., Wirsing, A., Lucas, B., Klein-Hitpass, L. & Ryffel, G. U. HNF4 alpha orchestrates a set of 14 genes to down-regulate cell proliferation in kidney cells. Biol. Chem. 389, 179–87 (2008).
118. Lucas, B. et al. HNF4alpha reduces proliferation of kidney cells and affects genes deregulated in renal cell carcinoma. Oncogene 24, 6418–31 (2005).
119. Treiber, T. et al. Early B cell factor 1 regulates B cell gene networks by activation, repression, and transcription- independent poising of chromatin. Immunity 32, 714–25 (2010).
120. Squazzo, S. L. et al. Suz12 silences large regions of the genome in a cell type-specific manner. Genome Res. 16, 890–900 (2006).
121. Wilflingseder, J. et al. Biocompatibility of peritoneal dialysis solutions determined by genomics of human leucocytes: a cross-over study. NDT Plus 2, 510–2 (2009).
122. Chambers, J. C. et al. Genome-wide association study identifies loci influencing concentratios of liver enzymes in plasma. Nat. Genet. 43, 1131–1138 (2012).
123. Vazquez, F. et al. PGC1α expression defines a subset of human melanoma tumors with increased mitochondrial capacity and resistance to oxidative stress. Cancer Cell 23, 287–301 (2013).
124. Mandruzzato, S. et al. A gene expression signature associated with survival in metastatic melanoma. J. Transl. Med. 4, 50 (2006).
125. Takane, K. et al. Aberrant promoter methylation of PPP1R3C and EFHD1 in plasma of colorectal cancer patients. Cancer Med. 3, 1235–45 (2014).
Appendix
102
126. Davidson, B. et al. Gene expression signatures differentiate adenocarcinoma of lung and breast origin in effusions. Hum. Pathol. 43, 684–694 (2012).
127. Zhou, Z., Zhou, J. & Du, Y. Estrogen Receptor Alpha Interacts with Mitochondrial Protein HADHB and Affects Beta-Oxidation Activity. Mol. Cell. Proteomics 11, M111.011056–M111.011056 (2012).
128. Silverstone, A. E., Frazier, D. E. J., Fiore, N. C., Soults, J. A. & Gasiewicz, T. A. Dexamethasone, β-Estradiol, and 2,3,7,8,-Tetrachlorodibenzo-p-dioxin Elicit Thymic Atrophy through Different Cellular Targets. Toxocology Appl. Pharmacol. 126, 248–259 (1994).
129. Kincade, P. W. et al. Lymphoid lineage cells in adult murine bone marrow diverge from those of other blood cells at an early hormone-sensitive stage. Semin Immunol 14, 385–394 (2002).
130. Thurmond, T. S. et al. Role of estrogen receptor alpha in hematopoietic stem cell development and B lymphocyte maturation in the male mouse. Endocrinology 141, 2309–2318 (2000).
131. Hill, L., Jeganathan, V., Chinnasamy, P., Grimaldi, C. & Diamond, B. Differential Roles of Estrogen Receptors α and β in Control of B-Cell Maturation and Selection. Mol. Med. 17, 211–220 (2011).
132. Bodhankar, S., Wang, C., Vandenbark, A. A. & Offner, H. Estrogen-induced protection against experimental autoimmune encephalomyelitis is abrogated in the absence of B cells. Eur. J. Immunol. 41, 1165–1175 (2011).
133. Shen, H. et al. Gender-dependent expression of murine Irf5 gene: Implications for sex bias in autoimmunity. J. Mol. Cell Biol. 2, 284–290 (2010).
134. Djouadi, F. et al. Hepatic and Cardiac Metabolism in PPAR ␣ -deficient Mice A Gender-related Defect in Lipid Metabolism and Glucose Homeostasis in Peroxisome Proliferator–activated
Receptor ␣ –deficient Mice. J. Clin. Invest. 102, 1083–1091 (1998).
135. Bryzgalova, G. et al. Evidence that oestrogen receptor-α plays an important role in the regulation of glucose homeostasis in mice: Insulin sensitivity in the liver. Diabetologia 49, 588–597 (2006).
136. Heine, P. a, Taylor, J. a, Iwamoto, G. a, Lubahn, D. B. & Cooke, P. S. Increased adipose tissue in male and female estrogen receptor-alpha knockout mice. Proc. Natl. Acad. Sci. U. S. A. 97, 12729–12734 (2000).
137. Camp, J. T. et al. Interactions with fibroblasts are distinct in Basal-like and luminal breast cancers. Mol Cancer Res 9, 3–13 (2011).
138. Pappa, K. I. et al. Profiling of Discrete Gynecological Cancers Reveals Novel Transcriptional Modules and Common Features Shared by Other Cancer Types and Embryonic Stem Cells. PLoS One 10, e0142229 (2015).
139. Kim, H. S. et al. Systematic Identification of Molecular Subtype-Selective Vulnerabilities in Non-Small-Cell Lung Cancer. Cell 155, 552–566 (2013).
140. Rodríguez-Díez, E. et al. Cdk4 and Cdk6 cooperate in counteracting the INK4 family of inhibitors during murine leukemogenesis. Blood 124, 2380–90 (2014).
141. Schuh, W., Meister, S., Herrmann, K., Bradl, H. & Jäck, H. M. Transcriptome analysis in primary B lymphoid precursors following induction of the pre-B cell receptor. Mol. Immunol. 45, 362–
Appendix
103
375 (2008).
142. Bossen, C. et al. The chromatin remodeler Brg1 activates enhancer repertoires to establish B cell identity and modulate cell growth. Nat. Immunol. 16, 775–784 (2015).
143. Pendergrass, W., Wolf, N. & Pool, M. Efficacy of MitoTracker Green FM and CMXRosamine to measure changes in mitochondrial membrane potentials in living cells and tissues. Cytom. Part A 61, 162–169 (2004).
144. Korchak, H. M., Rich, A. M., Wilkenfeld, C., Rutherford, L. E. & Weissmann, G. A carboxyanine dye, DiOC6(3), acts as a mitochondrial probe in human neutrophils. Biochem. Biophys. Res. Commun. 108, 1495–1501 (1982).
145. Hempel, S. L., Buettner, G. R., O’Malley, Y. Q., Wessels, D. a & Flaherty, D. M. Dihydrofluorescein diacetate is superior for detecting intracellular oxidants: comparison with 2’,7'-dichlorodihydrofluorescein diacetate, 5 (and 6)-caboxy-2',7'-dichlorodihydrofluorescein diacetate, and dihydrorhodamine 123. Free Radic. Biol. Med. 27, 146–159 (1999).
146. Yoshioka, K. et al. Intracellular Fate of 2-NBDG, a Fluorescent Probe for Glucose Uptake Activity, in Escherichia coli Cells. Biosci. Biotech. Biochem 60, 1899–190 (1996).
147. Hardy, R. R. & Hayakawa, K. B cell development pathways. Annu. Rev. Immunolo 19, 595–621 (2001).
148. Hüttemann, M. et al. Regulation of oxidative phosphorylation, the mitochondrial membrane potential, and their role in human disease. J. Bioenerg. Biomembr. 40, 445–456 (2008).
149. Tzur, A., Moore, J. K., Jorgensen, P., Shapiro, H. M. & Kirschner, M. W. Optimizing optical flow cytometry for cell volume-based sorting and analysis. PLoS One 6, 1–9 (2011).
150. Wellmann, U. et al. The evolution of human anti-double-stranded DNA autoantibodies. Proc. Natl. Acad. Sci. U. S. A. 102, 9258–63 (2005).
151. Schroeder, K. Toleranzmechanism für anti-DNA Autoantikörper im Keimzentrum. (Friedrich-Alexander-Universität Erlangen-Nürnberg, 2012). at <https://opus4.kobv.de/opus4-fau/frontdoor/index/index/docId/2914>
152. Lange, M., Zeng, Y., Knight, A., Windebank, A. & Trushina, E. Comprehensive method for culturing embryonic dorsal root ganglion neurons for Seahorse Extracellular Flux XF24 analysis. Front. Neurol. 3 DEC, 1–11 (2012).
153. Wu, M. et al. Multiparameter metabolic analysis reveals a close link between attenuated mitochondrial bioenergetic function and enhanced glycolysis dependency in human tumor cells. Am. J. Physiol. Cell Physiol. 292, C125–36 (2007).
154. Ferrick, D. A., Neilson, A. & Beeson, C. Advances in measuring cellular bioenergetics using extracellular flux. Drug Discov. Today 13, 268–274 (2008).
155. Alt, F., Rosenberg, N., Lewis, S., Thomas, E. & Baltimore, D. Organization and reorganization of immunoglobulin genes in A-MULV- transformed cells: rearrangement of heavy but not light chain genes. Cell 27, 381–90. (1981).
156. Fritsch, K. Bestimmung des Integrationsortes von Swiprosin-2/EFhd1 in transgenen Mäusen und Charakterisierung Swiprosin-2/EFhd1 transgener Mäuse. (Friedrich-Alexander-Universität Erlangen-Nürnberg, 2012).
157. Spencer, J. A. et al. Direct measurement of local oxygen concentration in the bone marrow of
Appendix
104
live animals. Nature 508, 269–73 (2014).
158. Braun, R. D., Lanzen, J. L., Snyder, S. a & Dewhirst, M. W. Comparison of tumor and normal tissue oxygen tension measurements using OxyLite or microelectrodes in rodents. Am. J. Physiol. Heart Circ. Physiol. 280, H2533–H2544 (2001).
159. UniProtKB: O08586. (2016). at <http://www.uniprot.org/uniprot/O08586>
160. UniProtKB: P18653. (2016). at <http://www.uniprot.org/uniprot/P18653>
161. UniProtKB: Q61037. (2016). at <http://www.uniprot.org/uniprot/Q61037>
162. UniProtKB: P35235. (2016). at <http://www.uniprot.org/uniprot/P35235>
163. UniProtKB: Q99N57. (2016). at <http://www.uniprot.org/uniprot/Q99N57>
164. UniProtKB: P31938. (2016). at <http://www.uniprot.org/uniprot/P31938>
165. Santos, C. X. C., Tanaka, L. Y., Wosniak, J. & Laurindo, F. R. M. Mechanisms and implications of reactive oxygen species generation during the unfolded protein response: roles of endoplasmic reticulum oxidoreductases, mitochondrial electron transport, and NADPH oxidase. Antioxid. Redox Signal. 11, 2409–27 (2009).
166. Hess, J. et al. Induction of pre-B cell proliferation after de novo synthesis of the pre-B cell receptor. Proc Natl Acad Sci U S A 98, 1745–1750. (2001).
167. Lu, R., Medina, K. L., Lancki, D. W. & Singh, H. IRF-4 , 8 orchestrate the pre-B-to-B transition in lymphocyte development. Genes Dev. 1703–1708 (2003). doi:10.1101/gad.1104803
168. Keisuke, I. & Toshio, S. Metabolic requirements for the maintenance of self-renewing stem cells. Nat Rev Mol Cell Biol. 15, 243–265 (2014).
169. Zhang, J. et al. UCP2 regulates energy metabolism and differentiation potential of human pluripotent stem cells. EMBO J. 30, 4860–4873 (2011).
170. Hofmann, A. D. et al. Oxphos supercomplexes as a hallmark of the mitochondrial phenotype of adipogenic differentiated human MSCS. PLoS One 7, (2012).
171. Shum, L. C., White, N. S., Mills, B. N., de Mesy Bentley, K. L. & Eliseev, R. A. Energy Metabolism in Mesenchymal Stem Cells During Osteogenic Differentiation. Stem Cells Dev. 25, 114–122 (2016).
172. Koslowski, M. et al. MS4A12 is a colon-selective store-operated calcium channel promoting malignant cell processes. Cancer Res. 68, 3458–3466 (2008).
173. UniProtKB: P52825. (2016). at <http://www.uniprot.org/uniprot/P52825>
174. UniProtKB: Q60994. (2016). at <http://www.uniprot.org/uniprot/Q60994>
175. UniProtKB: P33622. (2016). at <http://www.uniprot.org/uniprot/P33622>
176. UniProtKB: Q9Z1P8. (2016). at <http://www.uniprot.org/uniprot/Q9Z1P8>
177. UniProtKB: Q60680. (2016). at <http://www.uniprot.org/uniprot/Q60680>
178. UniProtKB: Q08999. (2016). at <http://www.uniprot.org/uniprot/Q08999>
179. Chalmers, S. & McCarron, J. G. The mitochondrial membrane potential and Ca2+ oscillations in

Appendix
105
smooth muscle. J. Cell Sci. 121, 75–85 (2008).
180. Hill, M. et al. Characteristics of a Human Cell Line Transformed by D N A from Human Adenovirus Type 5. J. Gen. Virol. 36, 59–74 (1977).
181. Pear, W. S., Nolan, G. P., Scott, M. L. & Baltimore, D. Production of high-titer helper-free retroviruses by transient transfection (retroviral packaing cells/gene therapy). Cell Biol. 90, 8392–8396 (1993).
182. Olive, P. L. & Banáth, J. P. The comet assay: a method to measure DNA damage in individual cells. Nat. Protoc. 1, 23–29 (2006).
Appendix
106
8.3.) Acknowledgements
An erster Stelle möchte ich mich bei meinem Doktorvater PD. Dr. Dirk Mielenz für seine
immerwährende fachliche und moralische Unterstützung bedanken, für die Möglichkeit an diesem
Thema zu arbeiten und in seinem Labor viel zu lernen.
Sehr dankbar bin ich auch Prof. Hans-Martin Jäck und meinem Betreungskommitee Prof. Thomas
Winkler und Prof. Roland Lang für Ihre Zeit und viel wissenschaftlichen Input. Prof. Thomas Winkler
danke ich im Besonderen für seine Bereitschaft die Zweitkorrektur zu übernehmen, mich mit Mäusen
zu versorgen und die Blastozysteninjektion voranzutreiben.
Ein besonderer Dank geht an Dorothea Reimer dafür, dass sie so eine tolle Kollegin und gute
Freundin war und ist. Unsere Kaffee-, Döner-, und Schokoladenpausen sowie unsere fachlichen und
nichtfachlichen Gespräche werde ich sehr vermissen. Ich wünsche dir das allerbeste auf deinem Weg
die eigene Doktorthese zu beenden.
Bessere Mitstreiter als Julia Schmid, Katharina Pracht und Patrick Daum kann man sich kaum
wünschen! Ich danke euch für eure wissenschaftliche und nervliche Unterstützung und die
unterhaltsamen Mittagspausen. Ich wünsche euch das Beste auf euren eigenen Wegen.
Außerdem möchte ich allen Kollegen der Molekularen Immunologie für ihre Hilfe und die tolle
Arbeitsatmosphäre danken. Ihr habt die Messlatte für meine zukünftigen Kollegen verdammt hoch
gelegt! Ich danke auch allen meinen Praktikanten besonders Linus Rinke, Sophia Urbanczyk und
Leonie Zeitler für ihre tatkräftige Unterstützung. Des Weiteren danke ich Uwe Appelt und Markus
Mroz fürs Zellensortieren und fachliche Unterstützung. Mein Dank geht ebenso an Prof. Martin
Herrmann für ein offenes Ohr und fachlichen Rat.
Dr. Anja Glanz danke ich sehr für vielseitige Hilfe und dekadente Burger Essen und mit Dr. Agnes
Giniewski war es eine Freude das Büro zu teilen.
Meinem Freund Christian Reitberger danke ich für seine Unterstützung in der stressigen Endphase.
Ich bin so unglaublich froh und dankbar dich an meiner Seite zu haben!
Ich möchte mich bei allen GK1160 Doktoranden dafür bedanken, dass sie eine so tolle Gruppen
waren, mit mir Zimmer, fachliche und private Gespräche und viele Erlebnisse geteilt haben.
Allen Kollaborateuren danke ich für ihre Unterstützung und die harte Arbeit die sie investiert haben.
Ich danke auch Eric Bode, der mich auf diesem Weg begleitet und mich in arbeitsintensiven Zeiten
gestützt hat.
Am Schluss aber nicht zuletzt möchte ich meiner Familie Anke Lemke-Stein, Hartmut Stein und Wiba
Stein dafür danken, dass sie immer für mich da sind und an mich glauben. Besonders ohne die
Unterstützung meiner Eltern würde ich diese Zeilen heute nicht schreiben.

Appendix
107
8.4.) Affirmation
Ich erkläre: „Ich habe die vorgelegte Dissertation selbständig und ohne unerlaubte fremde Hilfe und
nur mit Hilfen angefertigt, die ich in der Dissertation angegeben habe. Alle Textstellen, die wörtlich
oder sinngemäß aus veröffentlichten oder nicht veröffentlichten Schriften entnommen sind, und alle
Angaben, die auf mündlichen Auskünften beruhen, sind als solche kenntlich gemacht. Bei den von
mir durchgeführten und in der Dissertation erwähnten Untersuchungen habe ich die Grundsätze
guter wissenschaftlicher Praxis eingehalten, wie sie in den „Richtlinien der Friedrich-Alexander-
Universität Erlangen- Nürnberg zur Sicherung guter wissenschaftlicher Praxis„ niedergelegt sind.”
Merle Stein
Erlangen, den 31.03.2016