Embed Size (px)
Citation preview
A Methodology for the Semantic Visualization of Industrial Plant CAD Models
for Virtual Reality Walkthroughs
Vom Fachbereich Informatik
der Technischen Universität Darmstadt genehmigte
Dissertation
zur Erlangung des akademischen Grades eines Doktor-Ingenieurs (Dr.-Ing.) von
Ing.Mec. (honors)
Jorge-León Posada-Velásquez Geboren in Medellín, Kolumbien
Referenten der Arbeit: Prof. Dr. José L. Encarnação
Prof. Dr. Frank L. Krause
Prof. Dr. Julián Flórez
Tag der Einreichung: 25. Oktober 2005
Tag der mündlichen Prüfung: 09. Dezember 2005
Darmstadt - 2006
D17


Erklärung : Hiermit erkläre ich, daß ich die vorliegende Arbeit selbstständig und unter ausschlielicher Verwendung der angegebenen Quellen und Hilfsmittel angefertigt habe.
Darmstadt, den Oktober 25, 2005
ZUSAMMENFASSUNG
Es gibt immer noch viele offene Themen und Fragen in bedeutenden Bereichen der Visualisierung grossen Modelle im Fabrikplanungsbereich (Large Model Visualization –LMV- for Plant Design). Leistungsfähigkeit, um interaktive Raten für sehr grosse Modelle zu erreichen, ist bestimmt eine von diesen, besonders wenn die Ressourcen beschränkt sind, jedoch ist es nicht mehr der kritischste Punkt. Verschieden Techniken und Algorithmen, die heute verfügbar sind betrachten nur ganz wenige –oder gar keine- semantische Aspekte. In der Forschungliteratur sind hauptsächlich Algorithmen und Methoden für Geometrie und Szenegraph-Rendering zu finden. Solche Ansätze nehmen an, dass Darstellungsprobleme in der Visualisierung für Fabrikplanung aus den rein geometrischen Dimension der CAD-Modelle resultieren, wobei die Realität zeigt, dass in diesem bestimmten Bereich auch Domäne, Benutzerprofil und Absicht eine ebenso wichtige Rolle spielen. Diesbezüglich werden folgende Aspekte nicht genügend beachtet: (i) Die Modelle gehören zu einer besonderen, gut begrenzten Domäne im Ingenieurwesen (Fabrikplanung - Plant Design), in der Semantische Aspekte formalisiert sind (mittels bestimmten Standards, z.B. ISO-STEP 10303- AP227); (ii) die Benutzer haben verschiedenen Profile und Absichten in der Visualisierung; und (iii) die Visualisierung des Modelles für eine Walkthrough-Navigation kann spezifisch für jeden Benutzer im Kontext seiner bestimmten Absicht adaptiert werden, um eine optimale Distribution von Techniken und Ressourcen zu schaffen.
Die Hauptmotivation und der Untersuchungsfokus der vorliegenden Arbeit, unter Berücksichtigung der oben aufgeführten Aspekte, ist die explizite Einführung semantischer Aspekte in der Visualisierung grossen Modelle im Fabrikplanungsbereich, um besser geeignete Visualisierungerfahrungen für bestimmten Benutzern, Absichten und verfügbare Ressourcen zu erreichen. Dieser Ansatz wird von einer Ingenieursperspektive gesteuert, und wird ergänzt von Graphischer Datenverarbeitung und Semantischen Technologien.
ABSTRACT
There are still many open questions and needs in important aspects of the scientific area of Large Model Visualization –LMV- for Plant Design. Performance to achieve interactive rates in immersive virtual environments is certainly one of them, especially if resources are limited, but not anymore the most critical one. Surprisingly, the different processes used today to generate the walkthroughs experiences take into account very few explicit semantic considerations. The main approaches presented in the literature in the field of LMV are mainly related to algorithms and compression methods to be applied to the geometric entities that compose the CAD model. However, no sufficient attention is given to the following aspects: (i) These models actually belong to a special engineering domain with related standards; (ii) the different potential users have diverse backgrounds and intentions; and (iii) an adapted visualization walkthrough of the model can be different for a specific user and purpose in that context, in order to use in an optimal way the available resources and techniques.
Therefore, the most common situation is that the generation of visual walkthrough experiences is typically not aware (in proprietary systems with links to PDM the situation is better to some extent) that the 3D CAD model of a plant is actually just a geometric representation of a complex engineering system, and this knowledge is not sufficiently exploited in the generation of the walkthrough experience. The consequence is to have advanced VR environments for the interactive exploration of models of millions of triangles, that have little explicit use of the knowledge –and in many cases none- about the domain, users and visualization purposes involved.
As a result, the main motivation for the present work is focused on one of this research lines not sufficiently covered so far: The explicit introduction of semantic aspects, pushed from an engineering domain perspective –and strongly complemented with computer graphics and semantic technologies-, in the process of generating visual walkthrough experiences for specific users, visualization purposes and resources in the Plant Design domain.


To Maite, Hugo and my parents They are the light, the strength, the reason.


ACKNOWLEDGEMENTS I would like to thank Professor Dr. Encarnação for his decisive support, advice and trust, in this work of course, but also in other important aspects of my life. When I first came from Colombia to Fraunhofer Institute for Computer Graphics, with a short-term DAAD scholarship, I couldn’t imagine that I would have the incredible opportunities and support in many scientific and professional aspects I have had since then. I appreciate especially his full confidence and his help in moments of doubt and difficulty; as well as his genuine joy when things go well. He never gave up, so I didn’t either.
This thesis would not exist if Dr. Andre Stork, my colleague, former boss, office partner and very good friend didn’t help me in decisive times, always giving me excellent advices and orientation. He has always been a lighthouse to follow, and a friend to talk to.
Prof. Dr. Julian Florez has been also very important in this process; he has helped me in critical aspects during the definition of the structure of this work, and his insistence, enthusiasm and experience have been fundamental to reach the final goal.
Thanks to all the people in VICOMTech for sharing a vision and making it happen.
The students and colleagues that worked with me in research projects deserve an extraordinary recognition for their collaboration. I am particularly grateful to Carlos Toro for his enthusiasm and good work during the last two years and to Stefan Wundrak for his dedication and excellent contributions during his stay as a student. It is very satisfactory for me to see that both are working as full-time researchers in different institutes, and I wish them the best in the path towards a successful career. Thanks to Martin Witzel and his help with the functionality of the viewer. I wish him success in Italy. Thanks also to Gorka, Iván and Tim for the good experience of WIDE, it helped indirectly to give me some thoughts. Alberto Larzabal and Miguel Arrieta helped to keep the contact alive.
Special thanks to Dr. Oscar Ruiz, my first advisor in the EAFIT university CAD/CAM/CAE research group. He opened the door to a wonderful world and let me find my own way. Thanks to him I had the first contact with applied research and with Fraunhofer IGD. I would like to thank also Alberto Rodriguez for his support and care.
The collaboration with my colleagues in the Industrial Applications department at Fraunhofer IGD was really a wonderful experience. Thanks to Uwe Jasnoch (who was my first boss), Andre Stork, Joachim Rix, Holger Graf, Gino Brunetti, Alexandra Heidger, Raffaele de Amicis, Brigitte Koch, Martin Maidhof, Marianne Koch, Paul Benölken and Klara Schröder for the good times in the A2. I met there very good friends and partners.
I must dedicate a special mention to Dr. Joachim Rix, who was the closest thing to a father that I had during my years in Germany, and who has always believed in me in the personal and professional aspects. As director of the A2, and now as technical director of the INI-GraphicsNet, he has been at all times a reference and a good friend.
I am also very grateful to Prof. Dr. F.L. Krause for his time and dedication as reviewer of this thesis.
Maite, Hugo, my parents and friends would require another full thesis.

TABLE OF CONTENTS
1 INTRODUCTION 1
1.1 MOTIVATION 1 1.1.1 Short Overview of the Technical Context 2
1.2 PROBLEM STATEMENT AND OBJECTIVES 4 1.3 SUMMARY OF THE MAIN RESULTS 5 1.4 STRUCTURE OF THIS WORK 6
2 BACKGROUND AND RESEARCH THEMES 9
2.1 LARGE MODEL VISUALIZATION FOR WALKTHROUGHS 9 2.1.1 Some Considerations about the Latest Evolution of Graphics
Hardware 12 2.2 3D WALKTHROUGHS FOR DESIGN REVIEW IN PLANT INFORMATION
MANAGEMENT SYSTEMS 14 2.2.1 Plant Information Management (PIM) – Relation with Product
Lifecycle Management (PLM) 14 2.2.2 Need of 3D Walkthrough Systems for Design Review 15
2.2.2.1 Some Comments about existing Commercial Systems 16 2.3 CONCLUSIONS OF THIS CHAPTER 18
2.3.1 Relationship between This Work and the Existing Background 18
3 SEMANTIC ASPECTS IN THE LARGE MODEL VISUALIZATION OF INDUSTRIAL PLANTS 21
3.1 SHORT COMMENT ABOUT THE EVOLUTION OF ONTOLOGY-BASED
APPLICATIONS 21 3.2 SEMANTIC CONSIDERATIONS IN THE FIELDS OF COMPUTER AIDED DESIGN
AND PRODUCT LIFECYCLE MANAGEMENT 24 3.3 SEMANTICS IN THE LARGE MODEL VISUALIZATION AND DESIGN REVIEW 26 3.4 THE SEMANTIC TRIANGLE CONCEPT 27
3.4.1 Model semantics 28 3.4.2 User semantics 29 3.4.3 Resources 30 3.4.4 Explicit Semantics vs. Implicit Semantics 30
3.4.4.1 Explicit semantics 30 3.4.4.2 Implicit semantics 30
3.4.5 Semantic loss 31 3.4.6 Conclusions of this section 32
3.5 THE ISO-STEP 10303 STANDARD AND THE SEMANTIC ADAPTATION OF
PLANT DESIGN MODELS FOR VISUALIZATION WALKTHROUGHS 33 3.5.1 Overview of the ISO 10303 STEP Standard 33 3.5.2 Some comments about the scope of ISO-STEP 10303 AP227 in this
research 35 3.5.3 ISO STEP 10303- Application Protocol 227 - Plant spatial
configuration 36 3.5.4 An ontology based in the ISO-STEP 10303 AP-227 39
3.5.4.1 Ontologies in the AI Community vs. Engineering Community 39
3.5.4.2 Ontology Modeling in Protégé based on ISO-STEP 10303-AP227 39
3.5.4.3 Other Ontologies in the Plant Design Domain 47 3.5.5 Conclusions of this section 47
4 A MATHEMATICAL MODEL FOR THE SEMANTIC ADAPTATION FRAMEWORK 49
4.1 MOTIVATION AND GENERAL CONSIDERATIONS 49 4.2 BASIC DEFINITIONS 50
4.2.1 ISO-STEP 10303-AP227 standard categories 51 4.3 MATHEMATICAL DEFINITION OF THE SYSTEM ARCHITECTURE MODULES 52
4.3.1 The Catalog Reconstruction Module 53 4.3.2 Classes of equivalence for Geometric Similarity Equivalence
Classes 53 4.4 THE ISO-STEP 10303-227 ADAPTATION MODULE 57 4.5 ISO-STEP 10303-227 CLASSIFIABLE SET 60 4.6 THE CELL CONCENTRATION CONCEPT : QI / P 63 4.7 THE FUNCTIONAL SEMANTIC FACTOR FSEM AND THE GEOMETRIC AESTHETIC
FACTOR FGES 65 4.8 THE FUNCTIONAL SEMANTIC FACTOR FSEM 66 4.9 THE GEOMETRIC AESTHETIC FACTOR FGES 69 4.10 THE TESSELLATION AND SIMPLIFICATION TECHNIQUES AND THE VALUE ∆TI 71 4.11 THE SEMANTIC SIMPLIFICATION MODEL AS AN OPTIMIZATION PROBLEM 73 4.12 FOCUS ON OBJECT-BASED TECHNIQUES INSTEAD SPACE-BASED TECHNIQUES 73 4.13 THE SEMANTIC SIMPLIFICATION MATHEMATICAL FORMULATION 75
4.14 A PREDICTIVE VARIANT OF THE OBJECTIVE FUNCTION BASED ON CELL
CONCENTRATIONS QI/P 79 4.15 ELABORATION OF THE CONSTRAINTS OF THE OPTIMIZATION PROBLEM 82 4.16 SUMMARY OF THE MATHEMATICAL FORMULATION 89 4.17 COMMENTS ON THE SOLUTION TO THE OPTIMIZATION PROBLEM 91 4.18 CONCLUSIONS OF THIS CHAPTER 92
5 GENERIC ARCHITECTURE AND SYSTEM IMPLEMENTATION OF SEMANTIC VISUALIZATION WALKTHROUGHS FOR PLANT DESIGN 95
5.1 THE CATALOG RECONSTRUCTION MODULE 98 5.1.1 Searching and classifying instances 98 5.1.2 The Cell Matching Concept 99 5.1.3 Topology based matching 101 5.1.4 Point-clouds based matching 103 5.1.5 The Cell matching algorithm 104
5.2 THE ISO-STEP 10303 ADAPTATION MODULE 108 5.2.1 The ISO STEP 10303-227 Standard 108 5.2.2 Motivation for an Ontology Support 109 5.2.3 Construction of the Ontologies 110 5.2.4 Interaction with the STEP-based Ontology 110 5.2.5 Semantic association of parts with the standard 112
5.3 THE SEMANTIC ADAPTATION MODULE 115 5.3.1 Some Comments about the Ontology Processing Modules 116
5.3.1.1 The Calculation of fges and fsem Factors 117 5.3.2 Some Generic Aspects of the Mirowalk Ontologies 118
5.3.2.1 Ontologies Languages in Mirowalk 118 5.3.2.2 Mirowalk Ontologies Edition 118
5.3.3 The System Ontologies for Mirowalk 119 5.3.3.1 The Domain Ontology 119 5.3.3.2 The Visualization Purpose Ontology 120 5.3.3.3 The Resources Ontology 121 5.3.3.4 The User Ontology 122 5.3.3.5 The Techniques Ontology 123
5.4 THE ADAPTIVE REPRESENTATION MODULE 124 5.4.1 The Brute Force Tessellation Technique 125 5.4.2 The Structured Polygonal Tessellation Technique 127 5.4.3 The NURBS tessellation technique 128 5.4.4 The Geometric LOD tessellation technique 130 5.4.5 Drop Culling LOD (Hiding parts) 132
5.4.6 Piping & HVAC Merging technique 134 5.4.7 Semantic Synonym Symbol LOD 136 5.4.8 Other techniques implemented 141 5.4.9 Custom Complexity for Surfaces 141 5.4.10 Model Compression using Repeated Elements 141
5.5 SEMANTIC VISUALIZATION WALKTHROUGH MODULE 142 5.5.1 Some Implementation Details of the MiroWalk Software System 142 5.5.2 MiroWalk Viewer: An implementation of the Semantic
Visualization Walkthrough Module 146
6 RESULTS 149
6.1 SUMMARY OF THE OVERALL RESULTS OF THIS WORK 149 6.2 COMPARISON AGAINST OTHER PROJECTS AND APPROACHES 151 6.3 SCENARIOS WHERE SEMANTICS CAN IMPROVE THE VISUALIZATION 152
6.3.1 Example with different User Profiles 152 6.3.2 Example with different Models 153 6.3.3 Example with different resources 154
6.4 THE TEST DATASETS: TWO REAL WORLD MODELS OF INDUSTRIAL PLANTS 154 6.4.1 Statistics of the models: Industrial Plant and Process Plant 156
6.4.1.1 Statistics for the Chemical Plant 157 6.4.1.2 Statistics for the Process Plant 158
6.5 RESULTS OF THE TEST ON TWO MODELS IN DIFFERENT RESOURCES 162 6.5.1 Measurements in terms of performance / Techniques 163 6.5.2 Detailed results for semantic steered techniques in the chemical
Plant 166 6.5.3 Conversion Time 169
6.6 ANALYSIS OF THE RESULTS 169 6.7 EXAMPLES FROM ADAPTED VISUALIZATION WALKTHROUGHS 170 6.8 EVALUATION OF THE SEMANTIC VISUALIZATION WALKTHROUGH MODULE 178
6.8.1 Evaluation of interaction and task performance 180 6.8.1.1 General options of the viewer –3D Interactive
Visualization aspects 180 6.8.1.2 Specific task for user profile Designer / Engineer 182 6.8.1.3 Ease of movement through the model – visit key places 183 6.8.1.4 Finding instances of specific components of the Plant 183 6.8.1.5 User interface – influence of WIMP paradigm in specific
OS 184 6.8.2 Summary of the results for Visualization & Interaction 184 6.8.3 Evaluation of Influence of Semantic symbols and Semantic Factors 185
6.8.3.1 Brute force tessellation representation on limited resources 185
6.8.3.2 Adapted model with semantic symbols 186 6.8.3.3 Some feedback regarding semantic symbols 187
7 CONCLUSIONS AND FUTURE WORK 191
7.1 CONCLUSIONS AND MAIN CONTRIBUTIONS 191 7.2 FUTURE WORK 194
8 BIBLIOGRAPHY AND RELATED PUBLICATIONS 197
8.1 PUBLICATIONS RELATED WITH THIS RESEARCH 197 8.1.1 Journals and Book Chapters 197 8.1.2 Conferences 198 8.1.3 Technical Reports 199
8.2 BIBLIOGRAPHY 201
CURRICULUM VITAE (LEBENSLAUF)
LIST OF FIGURES
LIST OF TABLES
ANNEX I – IMPLEMENTED CONCEPTS AND RELATIONSHIPS OF THE
ISO-STEP 10303 AP-227 STANDARD FOR THIS RESEARCH
ANNEX II – QUESTIONNAIRES FOR USER TEST FEEDBACK

1
…you will know what the several images are, and what they represent, because you have seen the beautiful and just and good in their truth.
Plato, The Republic. Book VII – The Myth of the Cave
1 INTRODUCTION
1.1 Motivation
Large Model Visualization (LMV) is a well researched area in Computer Graphics ([FKS96], [ALMA00], [BSG02], [BART03] [YOSM03], [CORR04]), but still with interesting open issues for research. The possibility to have interactive walkthroughs for the very large geometric datasets offers clear benefits, as it reduces design times and allows the engineers and designers to detect early potential construction problems that may appear, especially in the integration of several independent modules of the industrial plant. Indeed, this has been one of the application areas of Virtual Reality with more applicability to industrial needs. The efforts of the research community have been very fruitful in this regard, but still have challenges to solve in the future.
Today, the Design Review (and in less proportion, other tasks related with visualization and interaction) of the CAD models of industrial plants is a process in which the technologies of Computer Graphics have a clear path to maturity. Most large engineering projects of new industrial plants are now discussed and reviewed in different stages of the design using special VR set-ups for collaborative exploration of the model. A typical set-up is for instance a Medium or Large Screen Projection room, where engineers, managers and clients can have an immersive, interactive VR Walkthrough experience to explore in detail the three dimensional model of the plant. They can move at will through the plant, inspect potential conflicts between structural layers of the model, verify accessibility issues, etc. This scenario, which only very few systems and companies were in a position to use just a couple of years ago, is becoming more and more available and affordable. The exponential increase in processing power, and especially in graphics hardware, as well as the lower associated costs of software and hardware, is bridging this gap up to the level of providing interactive walkthrough experiences on workplace PC’s for models which the research community considered almost intractable large models not so long ago. Even commercial companies and products such as Intergraph SmartPlant Review [INTG05], Plant 4D [PL4D05] , Vantage Plant Design Review [AVE05] , NavisWorks [NAV05], Mantra 4D [MNT05], etc. are now providing advanced visualization tools for walkthroughs of large models of industrial plants, either as separate tools or integrated into a Plant Information Management (PIM) system.
Interestingly, the main trend in research in the field of Large Model Visualization for Plant Design has been pushed by the Computer Science area in general, and Computer
2
Graphics in particular (e.g. the Walkthru – GigaWalk group of UNC-Chapel Hill , see [YOSM03][GOVI03][BSM02] and many others), not from the Mechanical or Plant Engineering fields. The advances in several areas of computer graphics such as rendering acceleration techniques, database and scene graph management, interactive collision detection, etc. have helped decisively to achieve the current status.
However, as mentioned before, there is still open room for research in significant issues. Performance to achieve interactive rates in immersive virtual environments is certainly one of them, especially if resources are limited, but not anymore the most critical one. Surprisingly, the different processes used today to generate the walkthroughs experiences take into account (both in research and commercial products) very few explicit semantic considerations. The main approaches presented in the literature in the field of LMV mainly related to algorithms and compression methods to be applied to the geometric entities that compose the CAD model ([ALMA00][BSG02]). However, no sufficient attention is given to the following aspects:
(i) These models actually belong to a special engineering domain with related standards.
(ii) The different potential users have diverse backgrounds and intentions.
(iii) An adapted visualization walkthrough of the model can –and one might even say “should”- be different for a specific user and purpose in that context, in order to use in an optimal way the available resources and techniques.
Therefore, the most common situation is that the generation of visual walkthrough experiences is typically not aware (in proprietary systems with links to PDM the situation is better to some extent) that the 3D CAD model of a plant is actually just a geometric representation of a complex engineering system, and this knowledge is not sufficiently exploited in the generation of the walkthrough experience. The consequence is to have advanced VR environments for the interactive exploration of models of millions of triangles, that have little explicit use of the knowledge –and in many cases none- about the domain, users and visualization purposes involved.
As a result, the main motivation for the present work is focused on one of this research lines not sufficiently covered so far: The explicit introduction of semantic aspects, pushed from an engineering domain perspective –and strongly complemented with computer graphics and semantic technologies-, in the process of generating visual walkthrough experiences for specific users, visualization purposes and resources in the Plant Design domain.
1.1.1 Short Overview of the Technical Context
An important part of the Plant Design process is the generation of the 3D CAD model. The model geometry is usually stored in CAD formats and is later used as a base for advanced visualization and interaction tasks, in particular in interactive walkthroughs for different purposes, such as:
3
(i) Design Review of the model [GBS02], in order to find possible errors in early phases of the design.
(ii) Teamwork discussions about details and alternatives [ACW98], [CBK04], [HKC03].
(iii) Presentation for managers and customers.
(iv) Dissemination to the general public.
Understanding and interpreting very complex CAD models of industrial plants in their native modelling software is still a hard-to-master task for professional engineers and is nearly impossible for non-expert users. Most people who have been working with CAD systems have faced the problem of proper interpretation of CAD models. In many cases, it is not easy to understand what is represented in a CAD model. The more complex a model is, the more difficult it is to achieve a correct visual representation. Sometimes the abstraction level required to understand what is displayed on the computer screen is bigger than the user’s capabilities [PLS02]
Most of the CAD packages do not produce themselves satisfactory interactive 3D walkthroughs for Plant Design, due to the complexity of the models and the limited resources available on common workplace computers. CAD to VR conversion, triangulation, data reduction, etc. has to take place to allow for interactive walkthroughs in complex scenes. This is the basis of most specialised software in the field: the conversion and optimization of the 3D CAD geometry representation of the plant, which almost entirely a tessellation-based process; only in few cases some structural information and relation to non-geometric data is considered.
Several researchers have addressed the visualization of large CAD models in VR; mostly on specialized hardware set-ups but sometimes even on PCs. (see section 2.1 Large Model Visualization for Walkthroughs). A common characteristic in Large Model Visualization of Industrial Plants is to work on the basis of the tessellated model by applying advanced CG techniques, e.g. advanced LOD and culling techniques, such as presented in GigaWalk framework, which is a clear reference in the field [BSG02].
Not so long ago, the main problems in the area were posed by performance issues of the available resources. There was a large of geometric information in the tessellated models, and it was impossible to render them interactively with the available resources without very advanced rendering and simplification techniques. In a reference SIGGRAPH course in the area [ALMA00], Manocha even explicitly says in the introduction that “the complexity of large geometric datasets appears to be growing at a faster rate as compared to the rendering capabilities of the graphics systems.” However, this phrase has to be put in the appropriate context: in my experience the breach between tessellated model size and available resources is actually decreasing in most practical cases (at least in the engineering context of Industrial Plant Design), although there have been always new leading-edge models surpassing the capabilities of modern resources. Just to give a practical example of this fact, the coal-fired power plant (15 million triangles) still shown by his group [YOSM03] just two years ago as a reference large model, could be rendered in 2004 in almost acceptable rates for interactivity (4 fps) just using a consumer-class PC
4
(1 Giga RAM, 2 GHz CPU) new OpenGL extensions for vertex-clustering, and hardware occlusion culling hardware embedded the newest GeForce cards [NUYD02]. Fraunhofer IGD reports also in that year results with a ship model of 10 million triangles at 10 fps with an nVidia 6800. The performance of graphics hardware has just exploded; the newest nVidia GeForce cards (GeForce 7800, June 2005) can render up to 830 million vert/sec. It doesn’t mean however that Manocha estimation is wrong: his example on the Boeing 777 with 2 million parts and 500 millions polygons is still a challenge model even for the best research approaches, not to mention commercial software; although it has been reported in [DIWS04] that a similar model of a Boeing 777 with 350 million triangles could be rendered using a real-time ray tracing approach. Also, as pointed out in [BART03] and [BART01], there are indeed models in the computer-aided engineering (CAE) domain with tessellated, polygonal models of up to 100-500 million polygons. But, for practical purposes, and especially in the Plant Design domain, the breach is clearly decreasing, since most real-world complete plant models have a polygonal tessellation in the order of magnitude of 5-40 million triangles. Other domains (submarines, airplanes, scientific computing, multislice CT data, etc.) are clearly in a different range (terabytes). Thus, the research community can, and should, also tackle interactive visualization problems of a different and complementary nature for that domain. A good example of this evolution is the emerging possibility to explore the synergies between advanced computer graphics techniques and semantic technologies for innovative approaches in the visualization of large Plant Design CAD models.
1.2 Problem Statement and Objectives
This research is focused in the context described in the previous section. There is a need to improve current visualization and walkthrough systems for Plant Design models with semantic aspects, in order to (i) give the user a better visualization which considers the domain, his background, and the visualization purpose; (ii) make a better use of the available resources in restrictive conditions using semantic compression techniques, (iii) provide a common framework to handle heterogeneous 3D CAD models in the domain, and (iv) give the basis for future fields of application in visualization walkthroughs, such as functional analysis of the plant components. Thus, the main objective of this work is the semantic-based generation of visual walkthrough experiences of CAD models in the Plant Design domain.
The following questions are closely related with this objective: Which kind of engineering components are represented by the geometric objects of the CAD model? Why is a user interested in a visualization walkthrough of an industrial plant? What is his background and how this affects the visualization? Is it feasible to increase the explicit semantic content of a 3D CAD model of an industrial plant, for better and more rational computer treatment and adaptation of the visualization walkthrough? Is it possible to take advantage of a more explicit knowledge about these aspects -user, domain, purpose-, in order to provide better interactive walkthroughs of industrial plants in a given context?
5
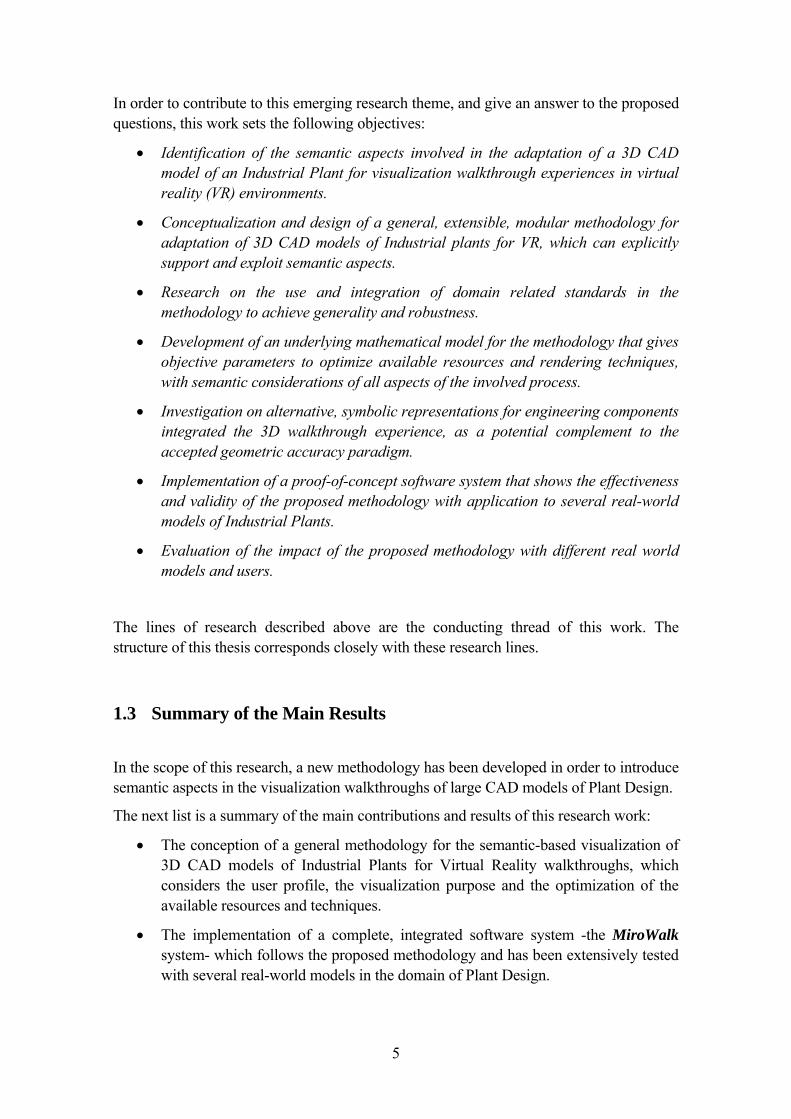
In order to contribute to this emerging research theme, and give an answer to the proposed questions, this work sets the following objectives:
• Identification of the semantic aspects involved in the adaptation of a 3D CAD model of an Industrial Plant for visualization walkthrough experiences in virtual reality (VR) environments.
• Conceptualization and design of a general, extensible, modular methodology for adaptation of 3D CAD models of Industrial plants for VR, which can explicitly support and exploit semantic aspects.
• Research on the use and integration of domain related standards in the methodology to achieve generality and robustness.
• Development of an underlying mathematical model for the methodology that gives objective parameters to optimize available resources and rendering techniques, with semantic considerations of all aspects of the involved process.
• Investigation on alternative, symbolic representations for engineering components integrated the 3D walkthrough experience, as a potential complement to the accepted geometric accuracy paradigm.
• Implementation of a proof-of-concept software system that shows the effectiveness and validity of the proposed methodology with application to several real-world models of Industrial Plants.
• Evaluation of the impact of the proposed methodology with different real world models and users.
The lines of research described above are the conducting thread of this work. The structure of this thesis corresponds closely with these research lines.
1.3 Summary of the Main Results
In the scope of this research, a new methodology has been developed in order to introduce semantic aspects in the visualization walkthroughs of large CAD models of Plant Design.
The next list is a summary of the main contributions and results of this research work:
• The conception of a general methodology for the semantic-based visualization of 3D CAD models of Industrial Plants for Virtual Reality walkthroughs, which considers the user profile, the visualization purpose and the optimization of the available resources and techniques.
• The implementation of a complete, integrated software system -the MiroWalk system- which follows the proposed methodology and has been extensively tested with several real-world models in the domain of Plant Design.
6
• The development of an orthogonal approach for the enhancement (instead of the replacement) of existing visualization walkthrough technologies from the Computer Graphics community to include semantic aspects.
• The application of emerging semantic technologies, especially ontology modelling and querying tools, in the innovative context (for those technologies) of the visualization of industrial plants.
• The inclusion in the methodology of a standard in the domain (the ISO-STEP 10303-AP227 standard) which helps in the disambiguation and classification of the geometric elements in a 3D CAD model of a plant design, independently from the proprietary packages used for the modelling.
• The definition of a mathematical model in the form of an optimization problem that controls the available resources and rendering techniques in a visualization walkthrough scenario considering the semantic aspects involved.
• The evaluation of the system with actual engineers and designers using real models. This last point has also originated new lines of research, as for instance the migration of the proposed methodology to the steel detailing domain using the CIMSteel Integration standard (CIS/2) as basis.
1.4 Structure of this Work
In the present work a semantic based methodology for the adaptation of industrial plant CAD models to virtual reality walkthroughs is presented. The enumeration at the end of this section gives an overview of the content and structure of each individual chapter. Some relevant background aspects are given in Chapter 2. The influence of semantic aspects for the large model visualization of industrial plants is presented mainly in Chapter 3. Chapter 4 explains the underlying mathematical model for the methodology. Chapter 0 is devoted to the description of architecture for the adaptation for semantic visualization walkthroughs of 3D CAD plant design models, including implementation aspects, and Chapter 6 is dedicated to present the results of the software system based on the proposed methodology. The conclusions and future work are presented in Chapter 7, whereas the publications derived from this research, as well as the bibliography of the research community used in this work, are presented in Chapter 8. A more detailed description of each chapter is given below.
• Chapter 2 (BACKGROUND AND RESEARCH THEMES) is dedicated to give the necessary background in the field, and to identify the most relevant research themes involved in this work.
• Chapter 3 (SEMANTIC ASPECTS IN THE LARGE MODEL VISUALIZATION OF INDUSTRIAL PLANTS) explains how different semantic aspects can be useful in the large model visualization of industrial plants in VR walkthroughs, with due consideration to standards in the domain, user background and interest, and available resources and rendering techniques.
7
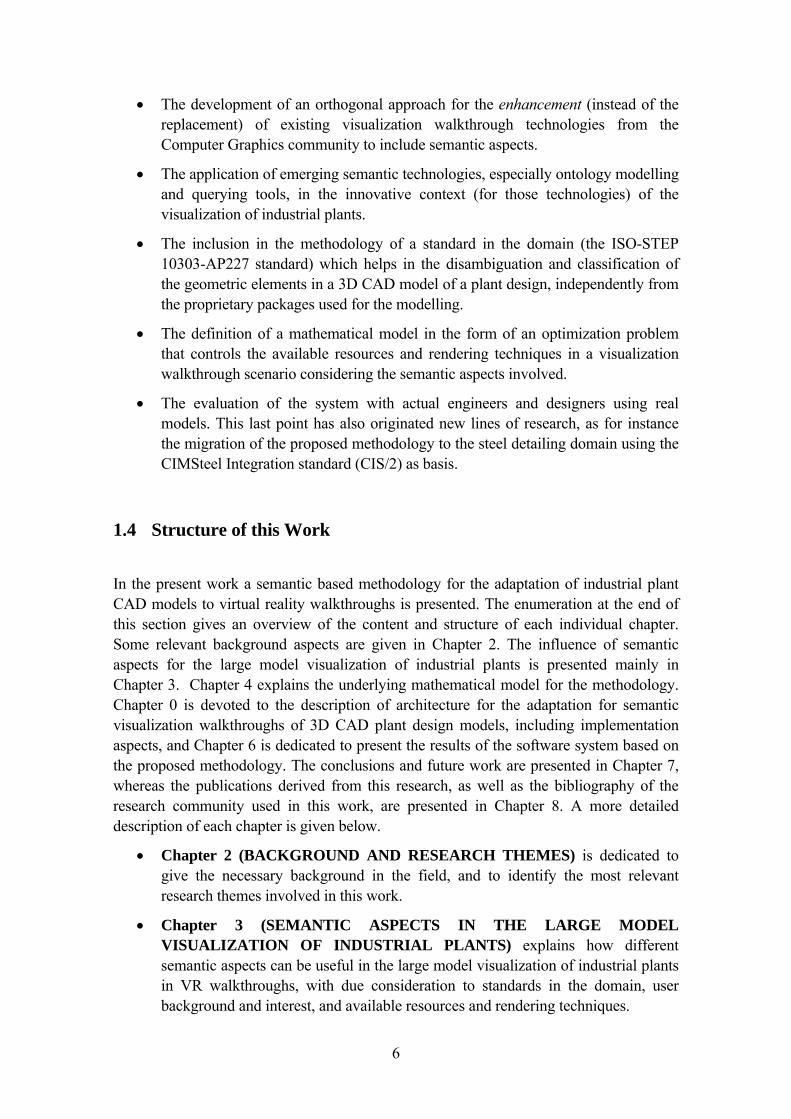
• Chapter 4 (A MATHEMATICAL MODEL FOR THE SEMANTIC ADAPTATION FRAMEWORK) develops a simple but effective mathematical model directly related with the different processes of the methodology and modules of the architecture, in which the available resources and rendering techniques are optimized according with constraints associated with the semantic aspects of the walkthrough visualization.
• Chapter 0 (
• GENERIC ARCHITECTURE AND SYSTEM IMPLEMENTATION OF SEMANTIC VISUALIZATION WALKTHROUGHS FOR PLANT DESIGN) gives a detailed description of a general, semantic-based architecture with different modules involved in the process of adapting a 3D CAD model of an Industrial Plant to a suitable model for a VR walkthrough experience.
• Chapter 6 (RESULTS) is devoted to results and evaluation aspects of the proof-of-concepts software system which was developed following the proposed methodology.
• Chapter 7 (CONCLUSIONS AND FUTURE WORK) gives a synthesis of the main conclusions derived from this work, and points new directions for future work from the applied research perspective.
• Chapter 8 (BIBLIOGRAPHY AND RELATED PUBLICATIONS) provides an overview of the scientific references consulted as well as the scientific publications originated from this work.

8
9
2 BACKGROUND AND RESEARCH THEMES
2.1 Large Model Visualization for Walkthroughs
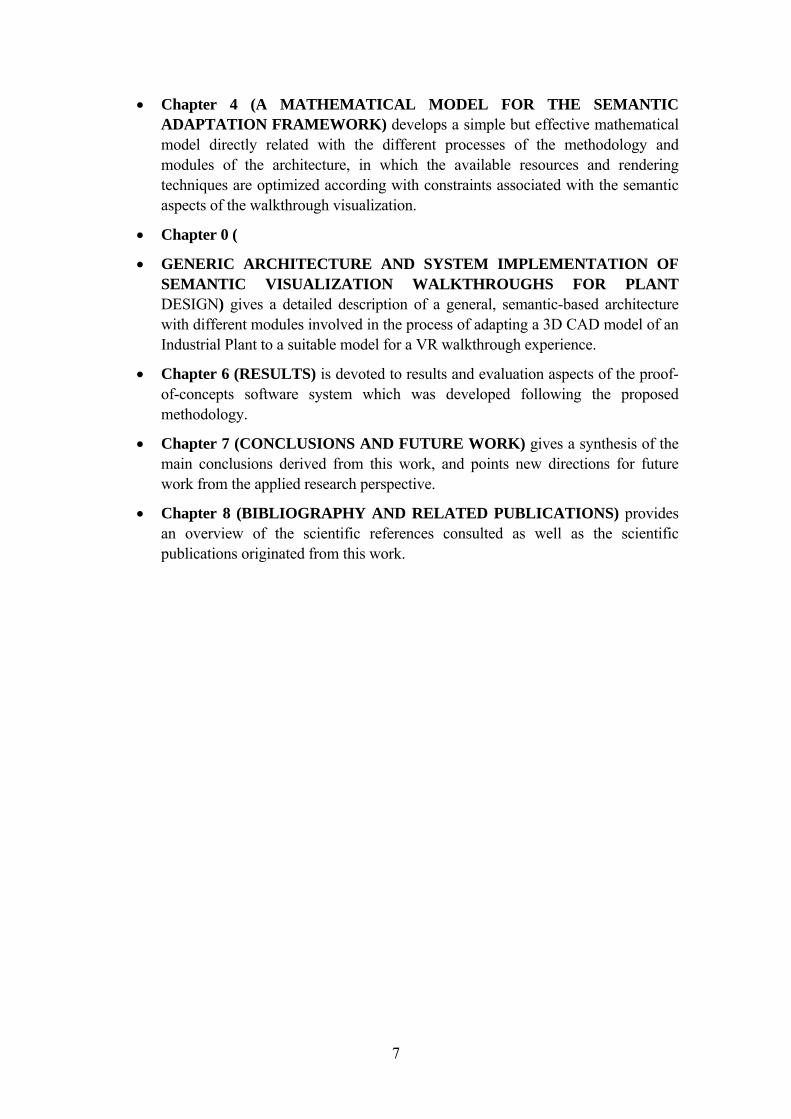
One important area in the Computer Graphics research has been the interactive visualization of large models. In this section I present some of the general aspects related to this field. It is difficult to find an agreement in the research community about what a “large model” is; however, a good definition has bed suggested by the developers of the original Jupiter toolkit library: a large model is a model that can not be rendered directly since it exceeds the graphics capabilities of the available resources [BASS01]. [ALMA00] points out (although this statement is less fortunate since it is indirectly tied to the HW capabilities at a point in time, four years ago) that a large Geometric Dataset is composed by millions of primitives. Whatever definition is chosen, it is clear that in recent times, the area of Large Model Visualization (LMV), also called Large Scale Data Visualization, has acquired an increasing relevance in the scientific community: data coming from several application domains are quickly growing in size and complexity e.g. in the medical area (PET/MRI data), in the Geographical Information Systems field (terrain, satellite images, etc.), in the architectural field, and of course, in the engineering domain (complex designs of products or facilities, design review).
Figure 1. Example of a Large Model of Industrial Plant: the UNC Power Plant model with 15 million
triangles (images taken from [BSG02][CORR04])
Several techniques have been developed to cope with the interactive visualization and interaction on 3D large models. For instance, in the case of medicine, advanced volume rendering techniques for massive medical data have been developed, as in [BART01]. With similar approaches, complex data sets of CFD and similar engineering data can be rendered, suitable for visualization and interaction in VR environments. In the GIS field,
10
also important developments towards 3D interaction on large geographical databases have been developed [ZHCO04].
In the scope of this work, the most relevant topic regarding large model visualization is the research area of interactive walkthroughs of large models. As pointed out by Manocha in a classical SIGGRAPH course [ALMA00], there are basically four families of topics to consider in the interactive walkthroughs of large models :
i) Rendering acceleration techniques
ii) Database management issues
iii) Interactive collision detection
iv) System integration.
There is a quite similar exposition in [BASS01] with a slightly different formulation: according to it, the main rendering techniques focus on database management, architectural aspects of large computing systems, parallel computing, and the most important aspect, rendering techniques for visualization.
Several authors have explored the main rendering acceleration techniques with good results so far. As well explained in [BSG02], and extended in [COCD03] the main acceleration techniques used can be classified in few basic classes. I explain shortly these classes, with references to more comprehensive treatment of each class, as well as some of the challenges still open for them:
i) Culling (occlusion / visibility)
Occlusion culling methods attempt to quickly determine a Potential Visibility Set (PVS) for a viewpoint by excluding geometry that is occluded. I will not go into the details since the present work is not focused on this area. A good recent survey can be consulted in [COCD03]. Some new techniques are also introduced in [YOSM03] and [GOVI03]
While possible for certain environments, performing exact visibility computations on large, general datasets is difficult to achieve in real time on current graphics systems. Furthermore, occlusion culling alone will not sufficiently reduce the load on the graphics pipeline when many primitives are actually visible [BAX00].
ii) Geometric simplification
Simplification algorithms compute a reduced-polygon approximation of a model while attempting to retain the shape of the original. It is also called polygonal simplification.
Geometric simplification techniques e.g. Levels of Detail (LOD) - static / dynamic / view dependant- and Hierarchical Levels of Detail (HLOD) [LURC02] give good results in handling massive data sets. The integration of LOD and good occlusion culling techniques are usually the key factors to achieve interactive rates in walkthrough systems [ASN00] [ERM00]. Other geometric simplification techniques,
11
such as Decimation, Progressive Meshes [SBSL04][HOP96], Vertex Clustering, Simplification Envelopes, Hierarchical Dynamic Simplification (HDS) and geometry compression, are also important in this regard. A very good survey of these techniques can be consulted in [LUEB01]. Spline Models, suitable for static or dynamic tessellation, can also be considered in this category [ALMA00]
The main problem of object based geometric simplification is that it alone has difficulty with high-depth-complexity scenes, as it does not address the problems of overdraw and fill load on the graphics pipeline.
iii) Image-based representations
An alternate simplification method is to replace complex geometry with images using texture mapping (often supported directly by graphics hardware), 3D image warping, etc. Images can be displayed at a rate dependent on screen size and independent of model complexity. There is a good amount of work in the automatic replacement of certain objects (e.g. far away objects) with texture-mapped polygons, referred to as impostors. Also, image based methods do not use polygons but photos or computer generated images for the navigation through a scene. Often new images are computed by interpolating two or more existing 2D images, with the advantage that they are independent of the scene complexity and thus they can visualize scenes of arbitrarily high quality with constant running time. The disadvantages however are the high memory consumption and possible perspective distortions. For more details and comprehensive references, the reader is invited to consult [ZHCH04] and [CUKK02].
There are some promising image-based algorithms, but generating complete samplings of large complex environments automatically and efficiently remains a difficult problem. The use of image-based methods can also lead to popping and aliasing artifacts.
An important issue to consider is how the resources of the system should be scheduled and managed. The budget rendering work of [KLOSI99] and the scheduling policy presented by Faisstnauer [FSP00] are entry points to this field.
A more recent development in Large Model Visualization which is not explicitly addressed in these categories is the Point Based Rendering of complex models, in which the primitives used for rendering are not anymore polygons but points. See [ALGP04] as the most updated and comprehensive information source. It is still to be shown if this development is suitable applied to walkthroughs of large engineering models.
To finalize this section, the reader is invited to study one of the most recent, complete scientific work of relevance in the visualization of large polygonal models, related with (but not only) to walkthroughs: it is the development of out-of-core visualization techniques made in Princeton [CORR04]. He points out that the available memory is nowadays a critical factor since the increase of memory is not growing at the same pace than models size, and develop new techniques able to visualize large polygonal models (even up to some billion triangles) at interactive rates with clusters of 8 PCs.
12
Each one of these main classes has been investigated thoroughly in multiple approaches from research, either independently or in a combined manner. In the evolution of the scene-graph based graphic APIs, many of these techniques have been explicitly integrated. The SGI Open Inventor was probably the first one, and is still a widely used scene graph API which has evolved towards a commercial variant from Mercury Systems, and the open source variant of Coin3D. IRIS Performer, OpenGL Optimizer, Jupiter, Fahrenheit (failed initiative), [BART03], and currently Open SceneGraph, and conspicuously Open SG [REVB02] have followed a natural path towards the integration of many of these technologies in APIs for general use (without specific domain considerations) providing excellent support for large model visualization of polygonal tessellated models.
2.1.1 Some Considerations about the Latest Evolution of Graphics Hardware
During the last years quite a lot of progress has been made in real-time visualization of large engineering models. On the one hand more and more powerful graphics hardware and on the other hand new sophisticated software techniques have propelled visualization capacities into new dimensions. Additionally, a great deal of know-how in geometric description and compression of the models has been accumulated.
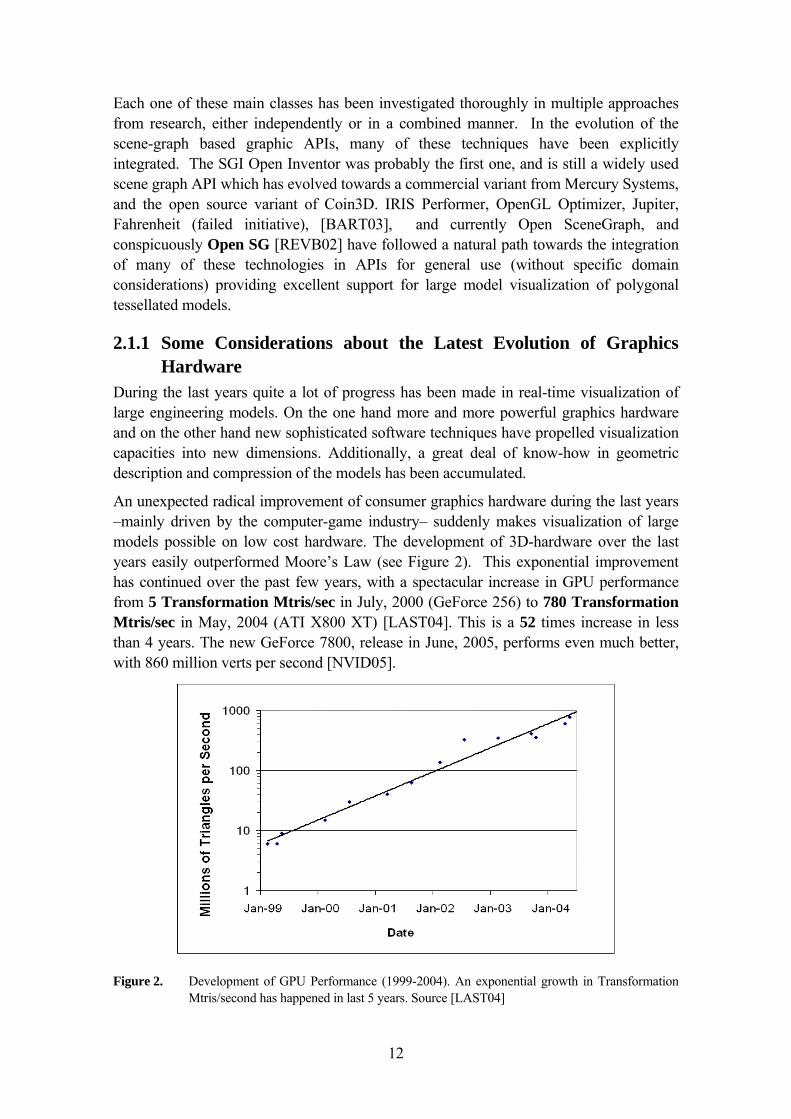
An unexpected radical improvement of consumer graphics hardware during the last years –mainly driven by the computer-game industry– suddenly makes visualization of large models possible on low cost hardware. The development of 3D-hardware over the last years easily outperformed Moore’s Law (see Figure 2). This exponential improvement has continued over the past few years, with a spectacular increase in GPU performance from 5 Transformation Mtris/sec in July, 2000 (GeForce 256) to 780 Transformation Mtris/sec in May, 2004 (ATI X800 XT) [LAST04]. This is a 52 times increase in less than 4 years. The new GeForce 7800, release in June, 2005, performs even much better, with 860 million verts per second [NVID05].
Figure 2. Development of GPU Performance (1999-2004). An exponential growth in Transformation Mtris/second has happened in last 5 years. Source [LAST04]
13
This evolution clearly shows that although some polygonal tessellated models in the M-CAD area are still very large, and increasing [BSG02][BART03], the performance of the graphics cards is increasing at a very fast rate, and suggesting that eventually, for that domain, it will be possible to render directly (with graphics hardware) most models. Of course, such spectacular improvement would not be possible without the HW support of many of the algorithms and techniques developed previously in this research area.
136
860
620
356
0
100
200
300
400
500
600
700
800
900
1000
PixelView GeForce 4 Ti4600(2002)
GeForce FX 5500 (2003) GeForce 6800 (2004) GeForce 7800 (2005)
vert
ices
/sec
(mill
ions
)
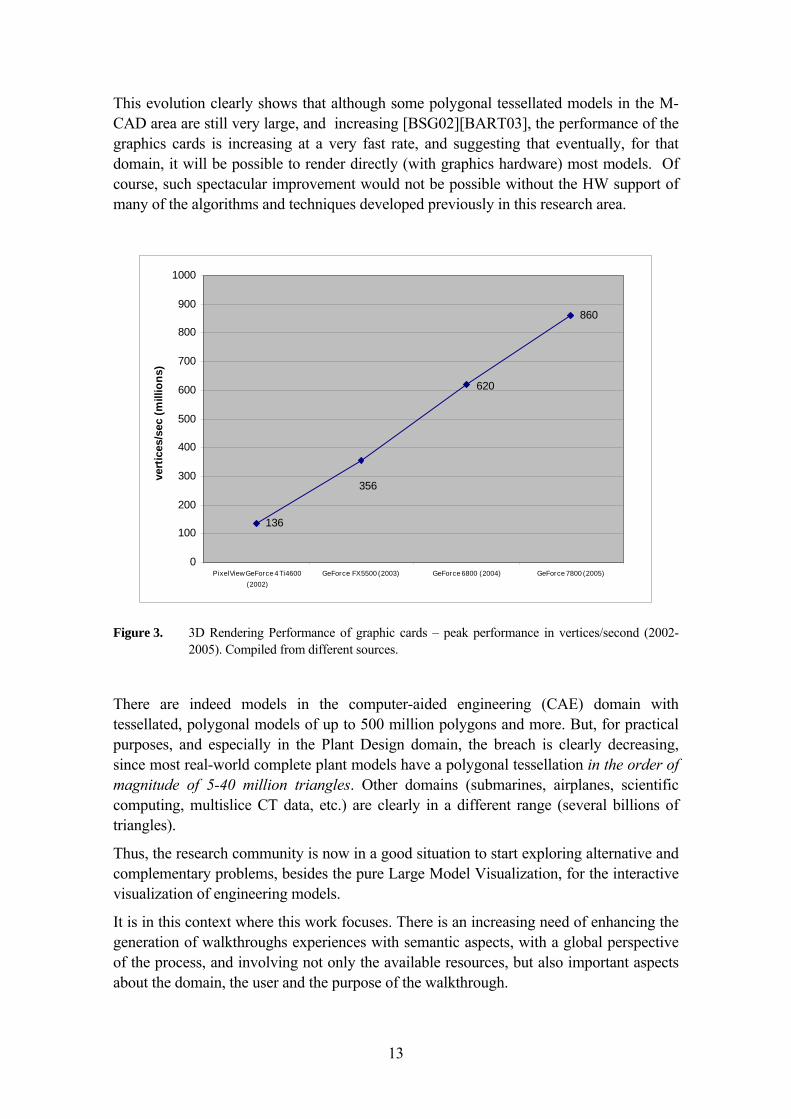
Figure 3. 3D Rendering Performance of graphic cards – peak performance in vertices/second (2002-2005). Compiled from different sources.
There are indeed models in the computer-aided engineering (CAE) domain with tessellated, polygonal models of up to 500 million polygons and more. But, for practical purposes, and especially in the Plant Design domain, the breach is clearly decreasing, since most real-world complete plant models have a polygonal tessellation in the order of magnitude of 5-40 million triangles. Other domains (submarines, airplanes, scientific computing, multislice CT data, etc.) are clearly in a different range (several billions of triangles).
Thus, the research community is now in a good situation to start exploring alternative and complementary problems, besides the pure Large Model Visualization, for the interactive visualization of engineering models.
It is in this context where this work focuses. There is an increasing need of enhancing the generation of walkthroughs experiences with semantic aspects, with a global perspective of the process, and involving not only the available resources, but also important aspects about the domain, the user and the purpose of the walkthrough.
14
2.2 3D Walkthroughs for Design Review in Plant Information Management Systems
Interestingly, the walkthrough of 3D CAD Industrial Plant models has been a reference area for the research on large model visualization. The best reference in this sense is the work of the University of North Carolina at Chapell-Hill [VAM02][BSG02]. However, in order to have a broader perspective, it is necessary to give a short background regarding that application domain, and beyond the computer graphics core algorithms.
2.2.1 Plant Information Management (PIM) – Relation with Product Lifecycle Management (PLM)
The CAD model is usually just one piece of a vast amount of data created during the plant design- and planning-process. This data includes part specifications and parts catalog, CAD drawings and engineering models, engineering analyses, purchase orders and change orders, process plans and routings, project plans, multimedia data, and all the other documentation created by engineering and manufacturing [GOUL03]
The sheer amount of data and the typically large size of workgroups for engineering projects usually create all kinds of problems synchronizing and managing the engineering data between the different members and the different departments involved. PDM (Product Data Management) systems try to address these problems dealing with engineering data and its relations throughout the production lifecycle management (PLM). Important companies such as UGS offer today a variety of products for PLM. It can be said that PDM is for the world of engineering what ERP is for the business world. The high-end CAD systems such as CATIA from Dassault Systems or ProEngineer from Parametric Technology Corp. are already integrated with their own PDM systems. In the world of Plant Design these systems are called PIMS systems (Plant Information Management Systems) [BOW99].
Proprietary plant visualization systems like Bentleys AutoPlant Explorer [BEN05] or Intergraph’s SmartPlant Review have access to this additional engineering data in the PIM system and successfully take advantage of this to provide superior interactive visualizations for design reviews. However, often only the geometric CAD model is accessible, since the link to the engineering data has been lost. Loosing links to engineering data can have many reasons. Some of them are:
• Conversion for data exchange between companies or departments,
• Proprietary closed interfaces,
• Data coming from legacy systems,
• Exported data, etc.
15
2.2.2 Need of 3D Walkthrough Systems for Design Review
Some commercial, professional PIMS have their own module for 3D exploration walkthrough of the plant (e.g. SmartPlant 3D for Intergraph PDS), or agreements with specialised software companies. This need has been identified as critical for Design Review and other purposes related with the design and even operational aspects of the plant.
Although a vast selection of software for visualizing CAD models is available on the market, several of companies let outside providers create visualization of their CAD projects. In the Plant Design sector this is still a common practice, especially when the models involved are very large and complex. These companies are specialized on creating virtual reality scenes or animations out of CAD models. This practice is usually costly and leads to round trip times of several days or weeks. [WUND03].
The correction of planning deficiencies occurring during the construction, reorganization, or retrofit of a factory building is a time- and cost-consuming process. The high costs of correcting such mistakes, which often are not obvious before they can be seen on site, are one reason why design-reviews play an important role in the plant planning phase.
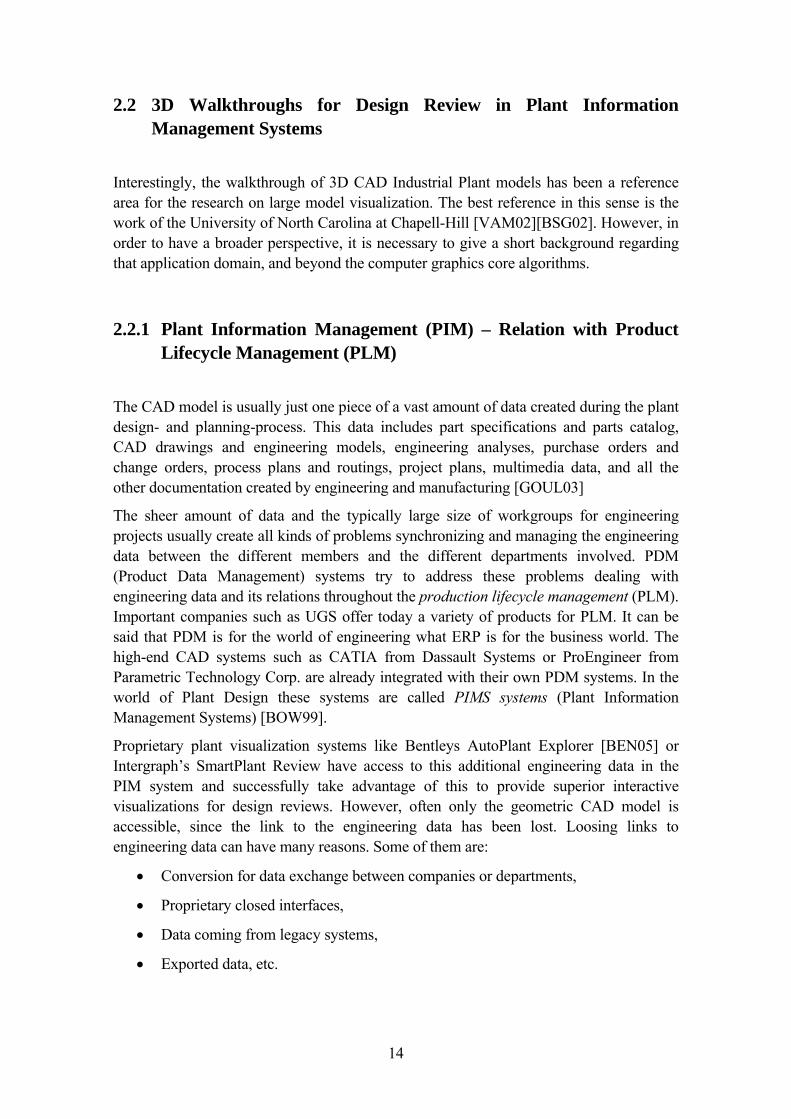
Detecting and analyzing those problems as early as possible is the key to minimizing these costs. For an early verification of the design, a 3D visualization of an Industrial Plant in a virtual environment can provide substantial support in the decision-making process. Appropriate visualization, navigation and interaction techniques have to be available in order to give a complete and realistic impression of the building in the best possible manner. Qualified statements of industrial key managers defending the advantages of 3D Design Review of their plants are enlightening: "On two international projects in particular, we proved that 3D was the way to go. We detected clashes that would not have been noticed until the construction phase if the job had been done in 2D" (Daryn Fitz, CAD Manager at Bovis Lend Lease) [NAV05].
Figure 4. Real-World Example of a design problem detected in 3D design review:
A missing flange between an elbow and a valve.
16
This fact becomes obvious when looking at a design flaw in 3D: while the slight displacement of an elbow-element in a 2D grid drawing may be easily overseen, a VR visualization of the same scene may show an apparent design error (see Figure 4)
An integration of a walkthrough visualization tool into the design process enables the designer to detect and analyze problems as early as possible. The visualization tool should preferably be directly integrated into the CAD environment the design-team is using. Thus, planning deficits can be determined and corrected in the early phase of the design process and mistakes can be avoided in advance, before the building is constructed.
2.2.2.1 Some Comments about existing Commercial Systems
There are several commercial systems now in the market for the evaluation, exploration and design review of industrial plants. There are basically two classes:
• External tools that import 3D CAD models
• Integrated components in PIMS
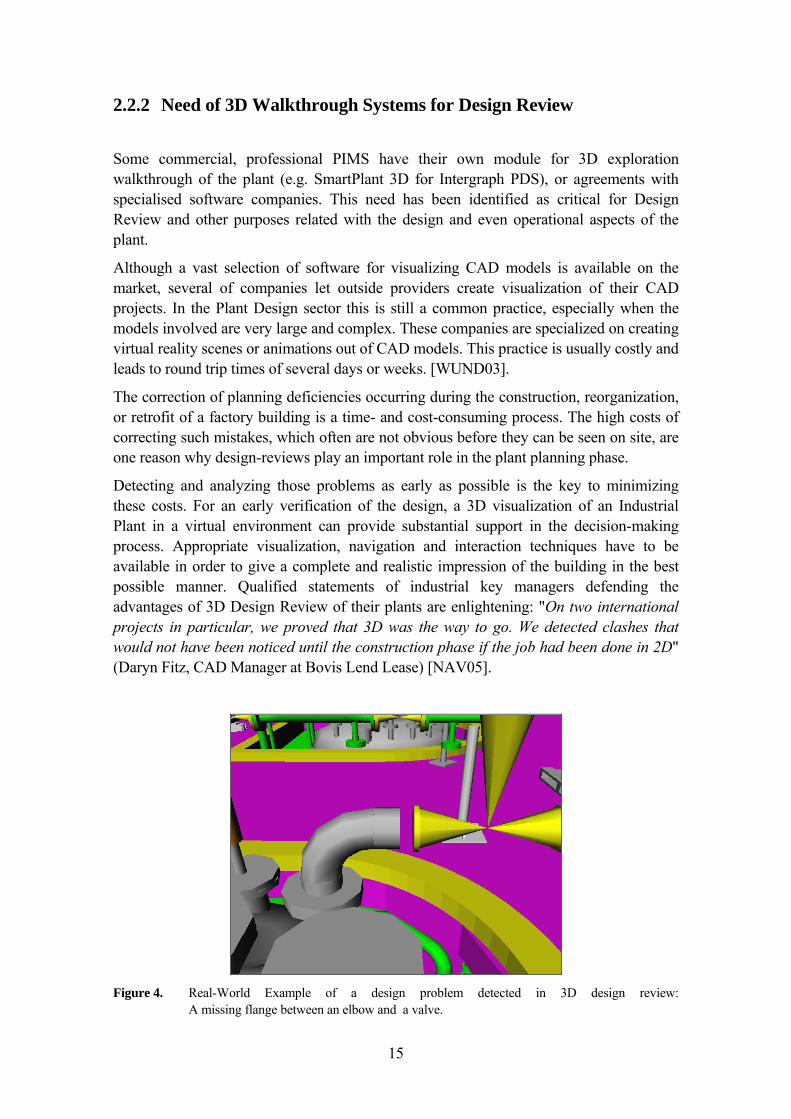
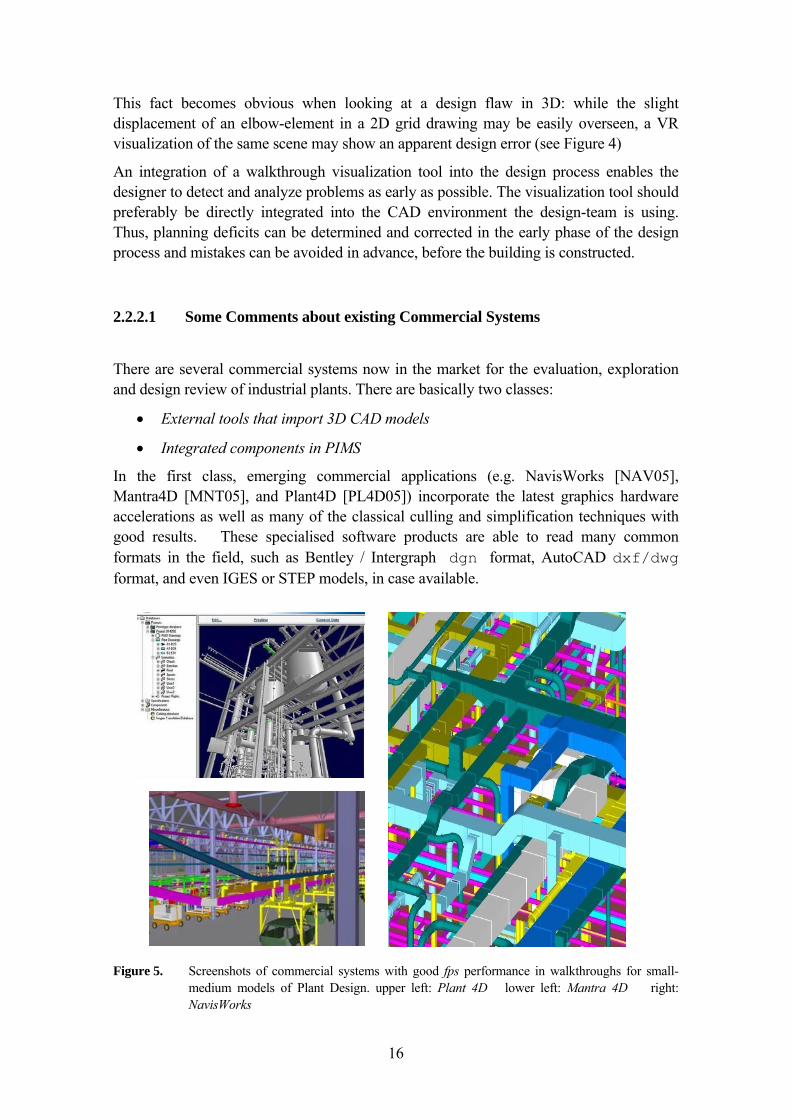
In the first class, emerging commercial applications (e.g. NavisWorks [NAV05], Mantra4D [MNT05], and Plant4D [PL4D05]) incorporate the latest graphics hardware accelerations as well as many of the classical culling and simplification techniques with good results. These specialised software products are able to read many common formats in the field, such as Bentley / Intergraph dgn format, AutoCAD dxf/dwg format, and even IGES or STEP models, in case available.
Figure 5. Screenshots of commercial systems with good fps performance in walkthroughs for small-
medium models of Plant Design. upper left: Plant 4D lower left: Mantra 4D right: NavisWorks
17
These products can handle small and medium-sized models quite efficiently, with high rendering quality and limited support to structural information. Only in the case of pre-existence of a STEP model more domain specific information is provided; if not, merely visual aspects and in some cases collision detection during the walkthrough are possible. Figure 5 shows some screenshots of these representative tools. The walkthroughs do not take into account user profile or purpose, and only in few cases the domain.
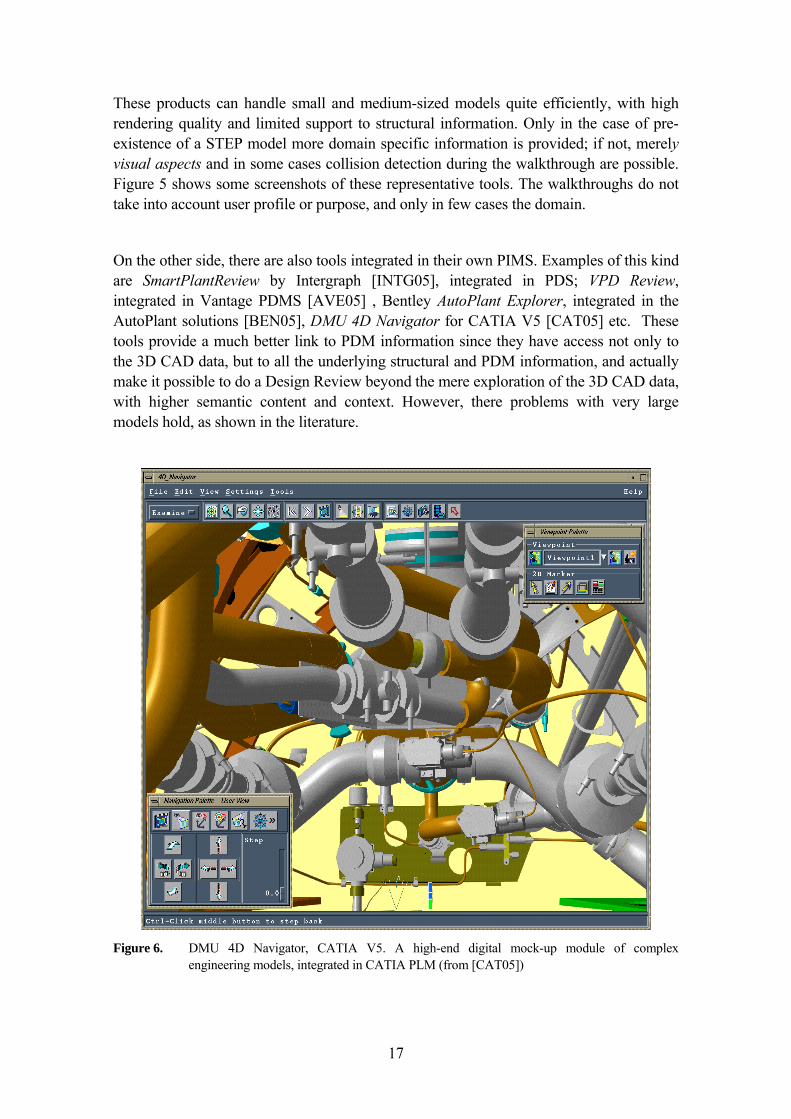
On the other side, there are also tools integrated in their own PIMS. Examples of this kind are SmartPlantReview by Intergraph [INTG05], integrated in PDS; VPD Review, integrated in Vantage PDMS [AVE05] , Bentley AutoPlant Explorer, integrated in the AutoPlant solutions [BEN05], DMU 4D Navigator for CATIA V5 [CAT05] etc. These tools provide a much better link to PDM information since they have access not only to the 3D CAD data, but to all the underlying structural and PDM information, and actually make it possible to do a Design Review beyond the mere exploration of the 3D CAD data, with higher semantic content and context. However, there problems with very large models hold, as shown in the literature.
Figure 6. DMU 4D Navigator, CATIA V5. A high-end digital mock-up module of complex
engineering models, integrated in CATIA PLM (from [CAT05])
18
Besides, the present work can still enhance the current approaches by adding a semantic dimension of users, model domain, and resources to the process of adapting the models for walkthroughs, either for Design Review -main focus- or for other purposes such as presentation to clients, accessibility studies, maintenance planning, etc. Figure 6 shows DMU 4D Navigator as a representative example of such systems.
2.3 Conclusions of this chapter
I have presented the current status of the two main background themes directly related to the present work: the classical Large Model Visualization area on the one side, and the Design Review based on 3D Walkthroughs for Plant Information Management (PIM), as an important part of the Product Lifecycle Management (PLM), on the other side.
2.3.1 Relationship between This Work and the Existing Background
This work is closely related with general research on Large Model Visualization, although with important specific aspects. As it has been shown in this chapter, walkthroughs of large datasets, among which industrial plants (e.g. power plants, pharmaceutical, chemical, and process plants) are important examples, has been a very fruitful research area in the last years, and is still a challenging area of Computer Graphics. Novel culling techniques, geometry simplification and image based representations are the families of rendering techniques more important in the area. Also out-of-core rendering techniques, database management and scene-graph optimization are key subjects for research.
Nevertheless, it has been shown that there are significant, particular issues to be carefully considered in the Plant Design domain. Although current trends in large model visualization research have a more general nature, where the common denominator is to work on achieving interactive rates of 5 to 20 frames-per-second, for the Plant Domain the classical basic problem of rendering complete 3D CAD models at interactive rates is not anymore the main issue (although it is still a very important one). Indeed, advanced research projects and commercial software are able today to handle most real-world models well enough to be of practical use in this field. On the other hand, it seems clear that specific aspects of the domain have not been considered in the main trend of research, especially the aspects related with the role of 3D Walkthroughs for Plant Information Management systems.
My approach explicitly includes semantic aspects regarding the domain of Plant Design, the user profile and background, and the purpose of the visualization walkthrough, in order to generate an optimized representation of the 3D CAD model in a VR

19
walkthrough. In this sense, it complements both the areas of Large Model Visualization and Plant Information Management systems.
Next section will introduce the semantic approach underlying this work, including also detailed background information about related concepts and technologies.

20
21
3 SEMANTIC ASPECTS IN THE LARGE MODEL VISUALIZATION OF INDUSTRIAL PLANTS
The consideration of semantic aspects and technologies in traditional computer applications is a new possibility to increase on the one side accurate and meaningful information management and knowledge sharing, and on the other side reliability and performance (since explicit treatment of the meaning of the data and information can improve algorithmic solutions). The main advantages of this approach are the improved information management, searching and sharing, and the fact that the semantic data empowers the intrinsic knowledge of the elements described.
In the area of Plant Design, several PIM Systems (Plant Information Management) exist on the market, most of them following the conventional approach of providing separate tools to incrementally model the Plant through operations that allow the definition, modification, visualization and interaction with sets of basic parts. These systems typically include also some kind of Design Review and Visualization module for the 3D CAD Models generated as geometric representation of the model, also linked with PDM data and other supporting modules. This module can also be an independent, separate software tool.
In the conventional approach, this Design Review and Visualization module take advantage of traditional simplification and visualization techniques in Computer Graphics. To quote just two examples, algorithms of Level of Detail (LOD) are used to provide alternative representations of complex parts, and culling techniques are applied to avoid the processing of not visible parts, by high-end software packages intended for viewing massive data CAD models. In some cases, the mentioned algorithms are just not powerful enough as they lack of the relationships and intrinsic knowledge that a semantic tool is able to provide.
The methodology I propose in this thesis complements the purely geometric and graphic approach with an additional dimension of semantics, to provide better performance and task-oriented efficiency in the visualization process of the 3D CAD models. The approach is based on a methodology that explicitly takes into account the involved semantics in the process, including the use of the ISO-10303 STEP –AP227 standard, as basis. This chapter explains the way in which semantic tools and models are involved in the process.
3.1 Short comment about the evolution of Ontology-based Applications
In recent years, considerable progress has been made in developing the conceptual bases for building technology that allows the reuse and sharing of knowledge. Ontologies are now used in Knowledge Engineering, Artificial Intelligence and Computer Science, in applications related to knowledge management, natural language processing, e-commerce, sharing of information in engineering [SSSP05a], information retrieval,
22
database design and integration, bioinformatics, education and in new emerging fields like the Semantic Web.
Probably the fields in which computer-based semantic tools and systems are more extended nowadays are Ontology based applications for several heterogeneous domains: medical (LinkBase), chemical (ChEBI. BAO), legal (LODE), cultural (CIDOC-CRM), etc., mainly focused in querying and classification purposes in Information Sharing and Knowledge Management contexts.
Let’s recall shortly what ontologies are and what are they used for. In philosophy, ontology is the most fundamental branch of metaphysics. It studies being or existence as well as the basic categories thereof—trying to find out what entities and what types of entities exist. However, in the Computer Science domain there is a different definition. The following is a widespread accepted definition of what an ontology is in this context, proposed by Tom Gruber: ontology is the explicit specification of a conceptualization; a description of the concepts and relationships in a domain [GRUB95] . It is true, however, that many researchers in the AI community start their publications with their own definitions of ontologies, but in short the definition above is well accepted. Ontologies are commonly used in artificial intelligence and knowledge representation. Computer programs can use an ontology for a variety of purposes including inductive reasoning, classification, a variety of problem solving techniques, as well as to facilitate communication and sharing of information between different systems. Also, emerging Semantic Web systems use ontologies for a better interaction and understanding between different web-based systems using agents.
In this last direction, a recent survey of ontology-based applications, with focus on e-commerce, knowledge management, multimedia, information sharing and educational applications, can be found in [RAGO04].
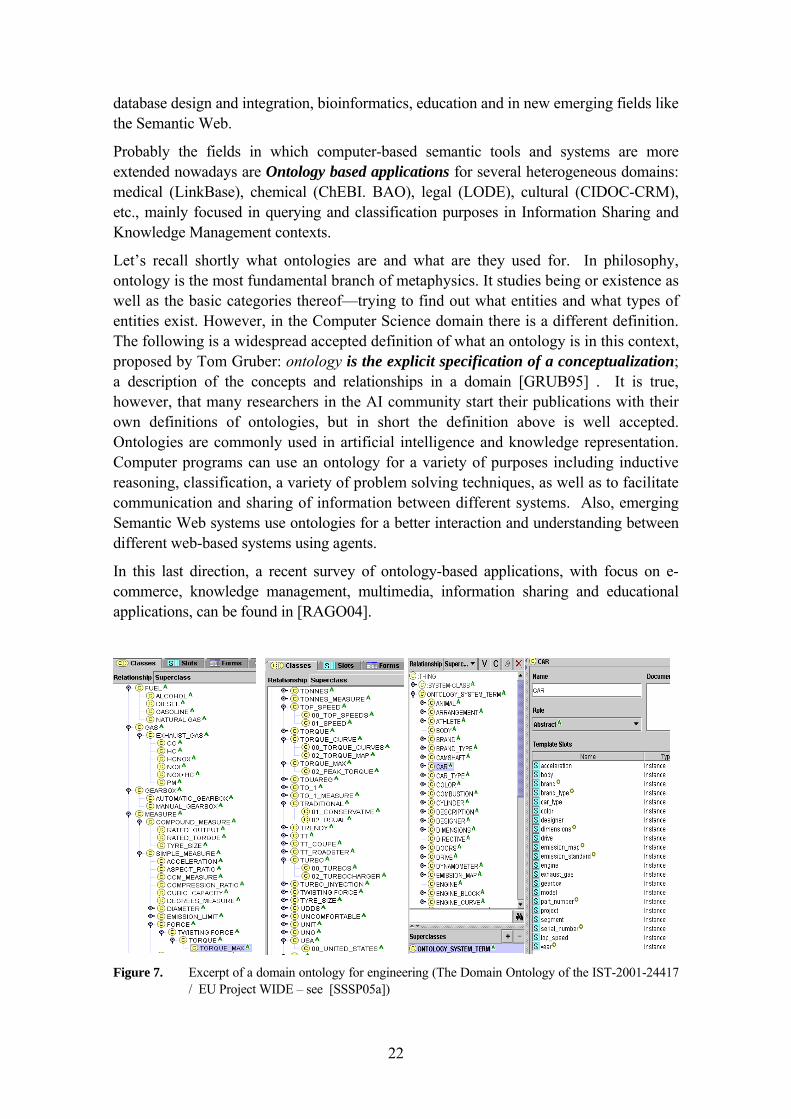
Figure 7. Excerpt of a domain ontology for engineering (The Domain Ontology of the IST-2001-24417
/ EU Project WIDE – see [SSSP05a])
23
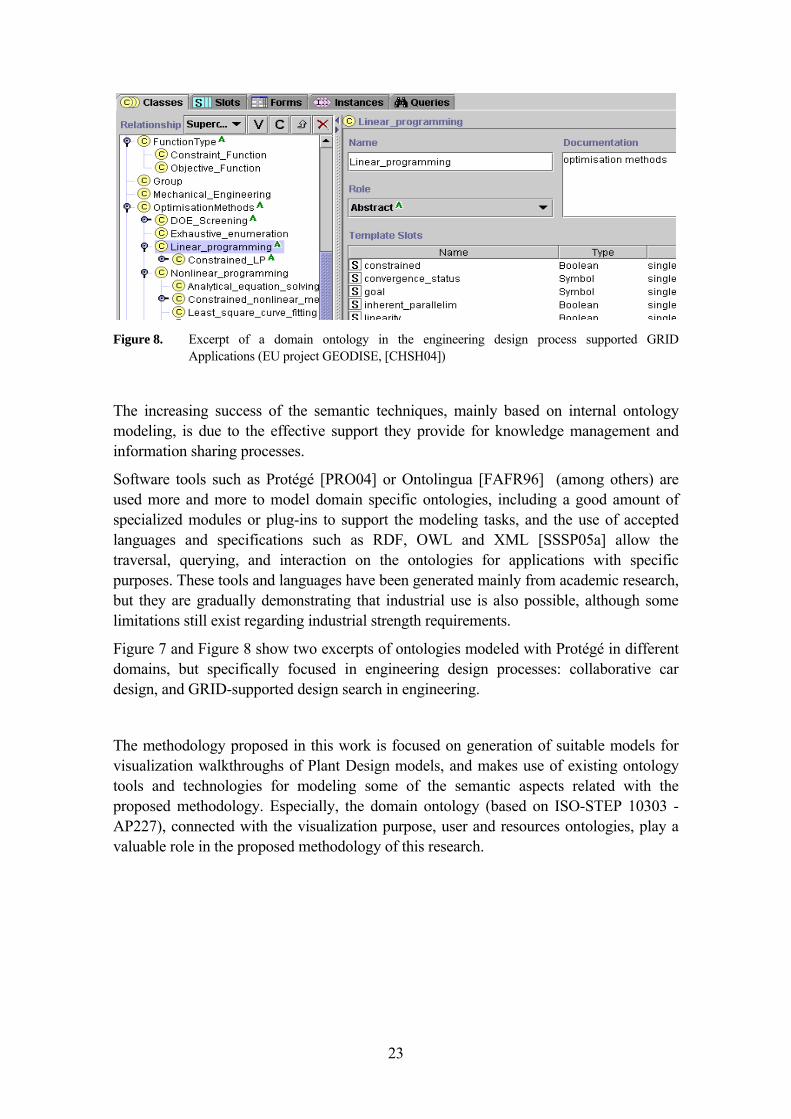
Figure 8. Excerpt of a domain ontology in the engineering design process supported GRID
Applications (EU project GEODISE, [CHSH04])
The increasing success of the semantic techniques, mainly based on internal ontology modeling, is due to the effective support they provide for knowledge management and information sharing processes.
Software tools such as Protégé [PRO04] or Ontolingua [FAFR96] (among others) are used more and more to model domain specific ontologies, including a good amount of specialized modules or plug-ins to support the modeling tasks, and the use of accepted languages and specifications such as RDF, OWL and XML [SSSP05a] allow the traversal, querying, and interaction on the ontologies for applications with specific purposes. These tools and languages have been generated mainly from academic research, but they are gradually demonstrating that industrial use is also possible, although some limitations still exist regarding industrial strength requirements.
Figure 7 and Figure 8 show two excerpts of ontologies modeled with Protégé in different domains, but specifically focused in engineering design processes: collaborative car design, and GRID-supported design search in engineering.
The methodology proposed in this work is focused on generation of suitable models for visualization walkthroughs of Plant Design models, and makes use of existing ontology tools and technologies for modeling some of the semantic aspects related with the proposed methodology. Especially, the domain ontology (based on ISO-STEP 10303 - AP227), connected with the visualization purpose, user and resources ontologies, play a valuable role in the proposed methodology of this research.
24
3.2 Semantic considerations in the fields of Computer Aided Design and Product Lifecycle Management
In the field of Computer Graphics, the elements in a CAD drawing (2D or 3D) were until very recently just geometric representations of the designed object. Their internal structure was primarily based in simple basic geometric primitives such as curves, surfaces and solids.
The objects in some legacy CAD systems (but also in many modern CAD systems) were not aware of internal relationships, and more importantly, didn’t have explicit semantics in the sense that they were not aware of their meaning in the domain, and were not semantically related with other objects and their context. In fact the most common relationships were usually (and this is still valid in some packages) joining or layering relations acting merely as hierarchical groups for organizational purposes. At the most, some relationships to Product Data Management (PDM) systems are available. In some cases information about use, relationships between elements, physical properties, function, etc. is well know by the designer, but it must be attached via an external sheet of specifications or bill of materials.
Some emerging research initiatives are exploring the explicit representation of knowledge in the design and modeling processes. Thus, with a semantic enriched approach, objects should not be anymore a collection of low level data whose meaning is actually only in the mind of the expert designer or engineer. Some good examples of the relevance of this approach can be found in some recent research projects cofinanced by the European Union. The European Project SPACEMANTIX (IST-2001-34159) [MAGA04] in which models in a domain (e.g. furniture) are explicitly related to each other from a functional perspective, with dependencies between them, and the European Project AIM@SHAPE (FP6 IST- NoE 506766) makes advanced research in the direction of semantic-based shape representations and semantic-oriented tools to acquire, build, transmit, and process shapes with their associated knowledge. A similar approach is also followed in the European Project SMARTSKETCHES (IST-2000-28169) [SGFS03] which helps designers and engineers during the shape definition phase with effective semantic support, oriented to the functional aim of the designed part where emotional and technical sketching considerations (from semantics of the domain) help to define sketches of products in 3D VR environments, preserving the restrictions and respecting product requirements. This research work, whose implementation is the Mirowalk system [PWTS04a], is also naturally related with the trend of including semantic aspects in the Product Lifecycle Management.
25
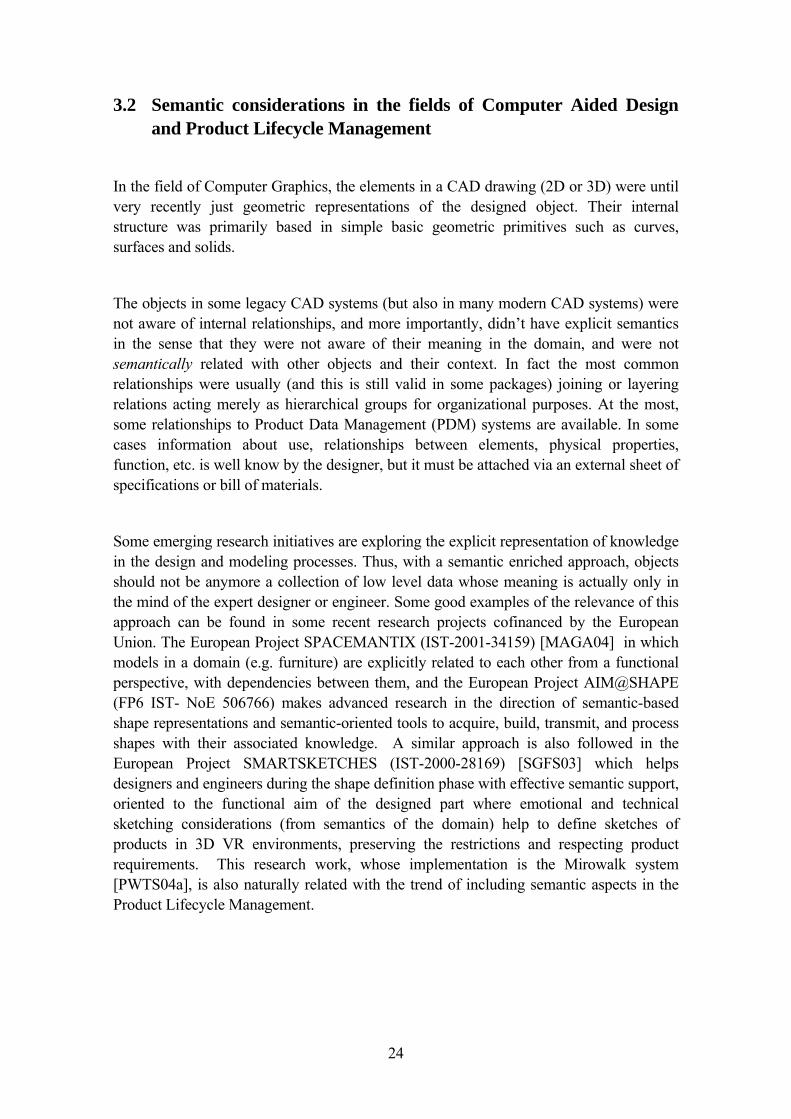
Figure 9. Influence of Semantics and Knowledge Management in some representative research projects in the Product Lifecycle Management for Virtual Engineering
Actually all phases of the design process could benefit from semantic enrichment. In the Figure 9, I show how these projects are focused on special phases of the design process, and how the semantic simplification system (Mirowalk) [PTWS05c] covers a different but complementary phase. I also follow a semantic approach in a special phase of the design process (especially in the Analysis and Production Planning phases), by allowing semantic simplification of large models for Design Review processes.
It’s important to notice that there is a clear tendency in the research community to involve knowledge management and semantic aspects in all phases of the Product Lifecycle Management, initially focusing in the first phases, but with a lot of potential for further phases in the lifecycle [VALU03].
The strong relationship between the STEP standard and the ontology approach in the MiroWalk system is better described in chapter 3.5.
Collaborative Engineering
Mobile Engineering
Knowledge Management
PPrroodduucctt DDeeffiinniittiioonn DDeessiiggnn AAnnaallyyssiiss
PPrroodduucc-- ttiioonn PPllaannnniinngg
MMaannuuffaacc--ttuurriinngg
OOppeerraa--ttiioonn
MMaaiinnttee--nnaannccee
RReeccyy--cclliinngg
VR AR
Digital
Product Data
Physical
Product
SMART SKETCHES
AIM@SHAPE
SPACEMANTIX
MIROWALK
FUTURE PROJECTS
INVOLVING SEMANTICS
AND KNOWLEDGE MANAGEMENT
ASPECTS IN THE
PRODUCT LIFECYCLE MANAGEMENT
WIDE
26
3.3 Semantics in the Large Model Visualization and Design Review
Large datasets in CAD Plant Design are difficult to handle not only for the computer but also for the person who have to understand the information that is stored in the model. Thus, the problem of management of large models has different sides: it is not only necessary that the computer can deal with the model but the visualization has to be easily comprehensible for the user. The model to deal with both sides of the problem is reflected in the following section.
It is true that high-end CAD systems have already excellent visualization tools, but several widespread CAD systems still depend on converting the model to a Virtual Reality format, such as VRML. When the models are not very big, these tools of direct conversion usually work acceptably well. However, this conversion process is not addressed with enough detail for Large Models in normal working environments. As a result, in many cases, the interactive visualization of such a Large Model fails, since it takes to the limit the resources of the computer (memory, processing power, etc.), making it unusable in normal circumstances.
A problem that usually appears is the loss of information during the conversion process to VR model. CAD models store a big amount of information, including (but not only) the geometrical and visual representation. Actually, in some cases, a relevant part of the dataset is invested in complementary information, not directly visible but very useful, such as the organization of the graphic elements in a level-tree or the information associated to the characterization of the different parts. In some CAD systems, after the conversion, a complete model becomes a mere graphical scene in which it is only possible to access the visual geometric information; the access to the rest of the information is only possible in the CAD format, so the VR model is not as useful as it could be.
An automatic (or better, semiautomatic) conversion to VR models is still a valid approach. But to do this conversion process well is still a problem, especially when usual workplace computers are concerned.
This kind of conversion typically considers two factors: the model characteristics (size, structure, complexity...) and the available computational resources (memory, processor, graphics...).
However, an important factor is sometimes neglected: What about the final user? What about the characteristics and capabilities associated to the user who has to interpret and understand the model? The user is a key factor in the conversion process that is usually neglected.
Conversion based on model and resources only, is “blind” to user needs and knowledge. Following the usual approach, optimizations are possible on the converted model, but they are “impersonal”, not oriented to the user of the final VR model. In fact, much knowledge is lost in the conversion process.
27
User knowledge and needs can bring semantics to the process, and allow a faster, better visualization for his purposes. Different users have different abstraction abilities depending on their training and education, among other reasons. The generation of the same VR model for all of them ignores this. It should be more appropriated to show only what the specific user needs to know in a way he can easily understand. For instance, the appropriate VR models of an industrial plant of for a manager, or for an engineer, are different; not only because of the kind of information both users are interested in, but because of the different information they are able to understand.
Thus, if it is not necessary to get a VR model suitable for everybody, it could be possible to define a conversion process in order to customize an adapted model that fit into the system resources and user requirements. Moreover, this can have the additional advantage of an increase in the performance of the visualization.
3.4 The Semantic Triangle Concept
Somehow it is more natural to think that the walkthroughs semantic enhancement should consider that model semantics can help in the conversion of CAD models to VR for a more efficient visualization of large models.
However, semantics are not only linked to the information objectively stored in the model itself, but to the user also. Actually I propose to include user knowledge in the process: to implement conversion and representations considering not only the graphical characteristics of the model, and the way the computer has to display them, but also the meaning and importance of the model for the user.
Thus, the three involved factors (including the resources) for the generation of an interactive 3D experience for Design Review are closely entangled and can be used to improve the walkthrough visualization with semantic considerations. I have introduced in this sense the Semantic Triangle concept, to make explicit the interdependencies between these three factors, in the Figure 10.
The basic concept of Semantic Triangle was already introduced in [PLS02], and it is an important basis for the full methodology for adapting 3D CAD models of Industrial Plant Design to VR Walkthroughs according to the methodology in which this research is based.
The Semantic Triangle can be regarded as a simple but powerful conceptual answer to the problem of involving semantics into the process of converting 3D CAD models of Plant Design to VR environments.
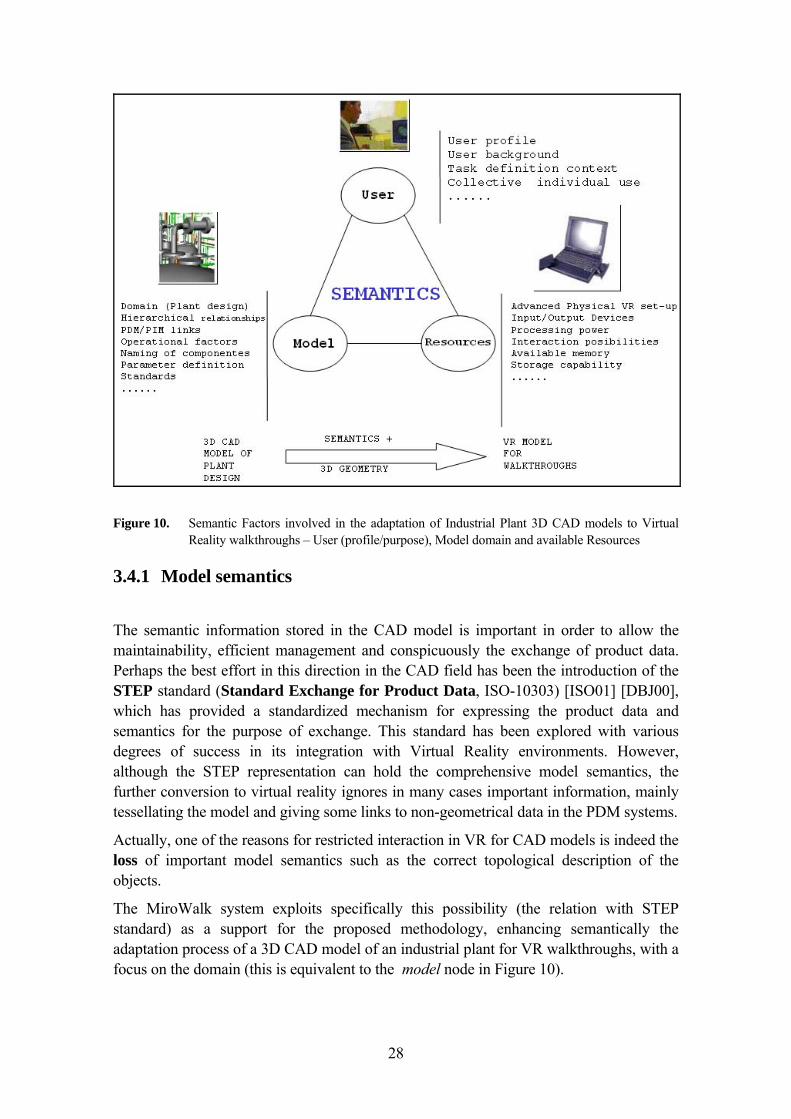
28
Figure 10. Semantic Factors involved in the adaptation of Industrial Plant 3D CAD models to Virtual Reality walkthroughs – User (profile/purpose), Model domain and available Resources
3.4.1 Model semantics
The semantic information stored in the CAD model is important in order to allow the maintainability, efficient management and conspicuously the exchange of product data. Perhaps the best effort in this direction in the CAD field has been the introduction of the STEP standard (Standard Exchange for Product Data, ISO-10303) [ISO01] [DBJ00], which has provided a standardized mechanism for expressing the product data and semantics for the purpose of exchange. This standard has been explored with various degrees of success in its integration with Virtual Reality environments. However, although the STEP representation can hold the comprehensive model semantics, the further conversion to virtual reality ignores in many cases important information, mainly tessellating the model and giving some links to non-geometrical data in the PDM systems.
Actually, one of the reasons for restricted interaction in VR for CAD models is indeed the loss of important model semantics such as the correct topological description of the objects.
The MiroWalk system exploits specifically this possibility (the relation with STEP standard) as a support for the proposed methodology, enhancing semantically the adaptation process of a 3D CAD model of an industrial plant for VR walkthroughs, with a focus on the domain (this is equivalent to the model node in Figure 10).
29
Shortly, it takes into account explicitly that the 3D CAD model belongs indeed to a clear, standardized domain: Industrial Plant Design. Specifically, the ISO-STEP Adaptation module in the architecture allows a mapping between the 3D CAD objects of the industrial plant and categories of the standard. A detailed exposition of the way in which model semantics are modeled in Mirowalk, based on the ISO-STEP 10303 standard, are found in Chapter 5.2. More details about the mathematical foundations for this process are found in Chapter 4.4.
3.4.2 User semantics
Semantics is associated to the user knowledge in all the stages of the model generation process: CAD model design, conversion and visualization. In the model design stage, user knowledge brings semantics at a low level by structuring the information in a layer schema, making well-structured design groups, giving meaningful names to the graphic elements or simply determining the version of the model, among other ways. At a higher level, in PIM systems, it is possible to explicitly define plant components and relationships, which unfortunately are not explicitly stored in the 3D CAD model representation, but in a separate, linked PDM system.
Actually, the user semantics is directly related with the visualization purpose context and user background in a specific walkthrough scenario. This approach is similar to the role user and task contexts are used in the European Project WIDE (IST-2001-34417) [SSSP05b].
This is the sense of the user node in Figure 10.The explicit semantics are the result of work that a user puts into the model during the design stage, for example by structuring the model into levels, naming and coloring parts, annotating parts with product information, etc. In order to make use of implicit semantics hidden in the model the user is needed to discover them. Additionally, the semantic information about the user who is going to view the VR-model is very useful. Different users have different abstraction abilities depending on their training and education, among other reasons. The user has a profession, certain knowledge about the domain and maybe about the model as well. He may be able to understand technical terminology, certain visualizations, symbols, language, etc.
Furthermore, the user may have a focus of interest (structural elements, inner parts, intersections, design layers). The purpose of interest for a user is also a key aspect to consider in the semantic adaptation process. The visualization walkthrough needs are very different, for instance, for an engineer with the purpose of a Design Review, or for a Manager with the purpose of a Presentation to client. Details about how user profile and purpose context are used in this methodology are found in Chapter 5.3.
30
3.4.3 Resources
Besides the already described model and user semantics, a third semantic component comes into play: the resources that are available to create and display the VR-model. These resources are the physical set-up used for the visualization walkthrough: (e.g. a workstation of a CAD Engineer, or the company’s own low-cost CAVE system in the basement, or a cluster of PCs). The proposed methodology involves the available resources in the methodology, as explained later in Chapter 5.3. taking into account different resources (CPU, Memory, Graphics) so that it is possible to predict if the complexity of a model allows its visualization with the available techniques, taking into account the user and domain,
By using the term resources I do not only mean the resources that are available for displaying the model, but also the available hardware for the adaptation process (Figure 10). A quick work progress assessment within 5 minutes on the designer’s computer monitor may need totally different processing power than the customer presentation at the end of the week on a large projection screen with the final client. The preprocessing time of hours and days needed in other projects [BSG02] [ACW98] shows that this is a factor that should not be ignored.
3.4.4 Explicit Semantics vs. Implicit Semantics
3.4.4.1 Explicit semantics
In this approach, I refer to explicit semantics when the knowledge can be extracted from related information already put by users in the CAD or PDM system during the previous modeling stage. Explicit semantics are the semantics that can be accessed directly from the model. Apart from the geometric and topological data that is inherent in CAD models, models often contain further information. This can be a layer-structure applied during the design phase, a hierarchical tree-like-structure that gives important topological information on how parts relate to each other or the still existent grouping information of cells inserted from part-libraries. Furthermore, parts of the CAD models may have been annotated with explicit information about their function, their specifications, bills-of-material data, domain specific data, etc. All this gives valuable information about the model.
3.4.4.2 Implicit semantics
On the other hand, I refer to implicit semantics when a user is necessary to identify and fully reconstruct the knowledge stored in the model: catalogue reconstruction, isolation of parts, removal of aids for model construction, importance of a specific part, etc.
31
Some semantic information of the model may not be stored in an explicit way, but it has to be identified using the knowledge of a user (or sometimes also through sophisticated algorithms). This is what I call implicit semantics. For example, the domain of a model (e.g. process plant or chemical plant) may be either stored explicitly using, e.g., STEP or be reconstructed through the knowledge of an expert user. Further examples are the reconstruction of a parts catalog, isolation of parts, removal of geometrical aids used during design phase, defining the importance of a specific part, etc.
The exploitation of both levels of semantics (implicit and explicit) allows a better Virtual Reality model, oriented to the user, who has introduced semantics and whose knowledge is required in the visualization walkthrough process.
The methodology of this research enhances the explicit semantics of the generation and use of visualization walkthroughs for Industrial plants, as explained in Chapter 0.
3.4.5 Semantic loss
Displaying a model of a plant in a virtual reality environment often involves converting it to a new VR-format. During the conversion process often only geometric information directly needed for the visualization is exported and a lot of the previously described semantic information is lost. Thus additional information like part annotations, links to PDM data, and topological structure is often lost at an early stage of the visualization process. In addition, exported models usually do not hold the parametric representation of primitives. A virtual reality system usually only supports a limited set of primitives. Primitives that are not supported by the virtual reality system must be mapped to substitute structures, loosing topological characteristics of the model. For example, several geometric primitives in the CAD system are not supported in virtual reality environments. This means that in order to view solid structures, they must be converted to NURBS or even tessellated to flat surfaces. This is an example of model semantic loss.
On the other hand, the CAD conversion to Virtual Reality is at a large extent done without any (or very few) participation of the final user in the process. Thus, a high degree of automation is provided, but all semantics related with the user needs and previous knowledge is neglected. Important aspects such as the purpose of the visualization (design review / presentation / interaction with elements / queries / etc.) and the focus of interest (structural elements, inner parts, intersections, design layers) are not considered in the conversion. This kind of information loss is what is called user semantics loss. Some of the typical semantic loss cases are shown in Figure 11: loss of hierarchical structure, parameter loss, part catalog loss, PDM attachment loss, relationship loss, loss of functional operators and loss of naming structure.
As a result of both model and user semantics losses, when advanced computer graphics techniques are used for visualization, they focus solely on the tessellated model obtained by automatic conversion processes.
The outcome is then as good as possible given this starting point, which has already important semantic losses. It is pointed out that taking into consideration the semantics
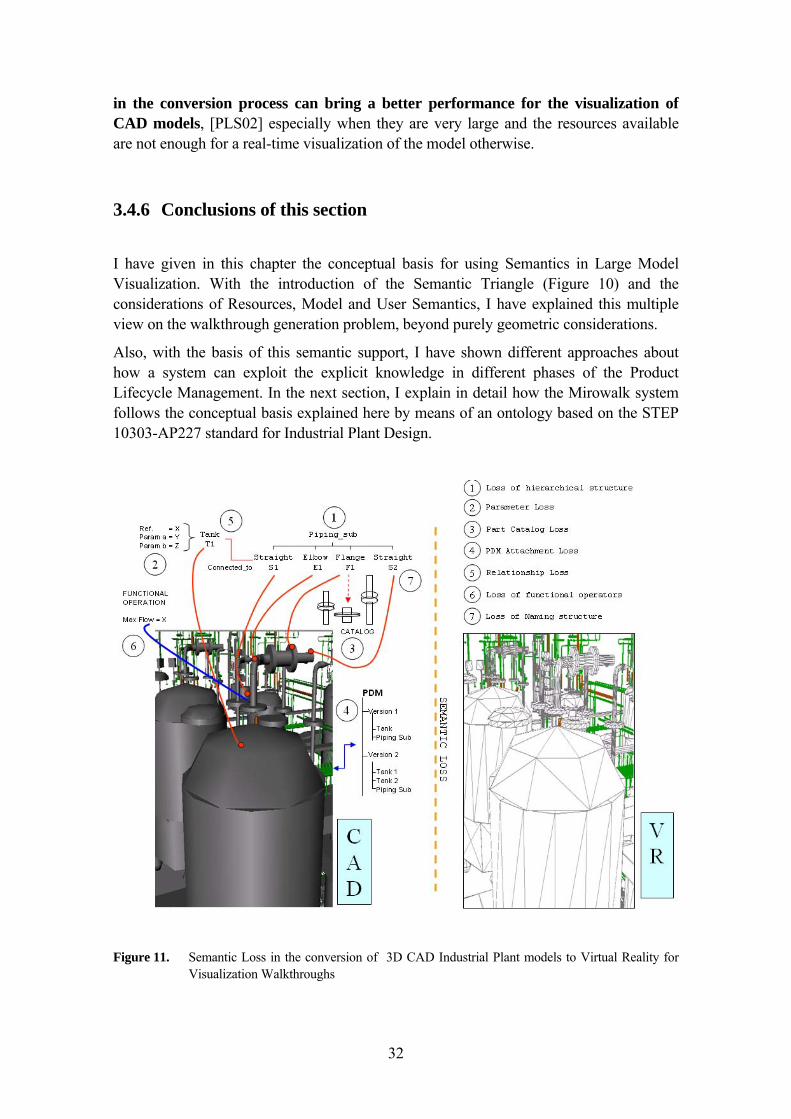
32
in the conversion process can bring a better performance for the visualization of CAD models, [PLS02] especially when they are very large and the resources available are not enough for a real-time visualization of the model otherwise.
3.4.6 Conclusions of this section
I have given in this chapter the conceptual basis for using Semantics in Large Model Visualization. With the introduction of the Semantic Triangle (Figure 10) and the considerations of Resources, Model and User Semantics, I have explained this multiple view on the walkthrough generation problem, beyond purely geometric considerations.
Also, with the basis of this semantic support, I have shown different approaches about how a system can exploit the explicit knowledge in different phases of the Product Lifecycle Management. In the next section, I explain in detail how the Mirowalk system follows the conceptual basis explained here by means of an ontology based on the STEP 10303-AP227 standard for Industrial Plant Design.
Figure 11. Semantic Loss in the conversion of 3D CAD Industrial Plant models to Virtual Reality for
Visualization Walkthroughs
33
3.5 The ISO-STEP 10303 Standard and the Semantic Adaptation of Plant Design Models for Visualization Walkthroughs
In this chapter I will explain how the ISO-STEP 10303 standard is used as the basis to construct the Domain Ontology, which allows the implementation of the semantic steered conversion of 3D CAD Models of Plant design into effective visualization in Virtual Reality walkthrough scenarios.
3.5.1 Overview of the ISO 10303 STEP Standard
The official title of the ISO-10303 standard is Industrial automation systems and integration - Product data representation and exchange [ISO01].
However, ISO-10303 is commonly known as STEP or Standard for the Exchange of Product model data. It is an international standard for the computer-interpretable representation and exchange of industrial product data. The objective is to provide a mechanism that is capable of describing product data throughout the life cycle of a product, independent from any particular system. The nature of this description makes it suitable not only for neutral file exchange, but also as a basis for implementing and sharing product databases and archiving.
The core of STEP consists of a collection of conceptual models, which describe the content, and structure of product data items. ISO 10303 specifies a language by which aspects of product data can be defined. The language is called EXPRESS. ISO 10303-11:2004 [ISO04] also specifies a graphical representation for a subset of the constructs in the EXPRESS language. This graphical representation is called EXPRESS-G. EXPRESS is a data specification language as defined in ISO 10303-1. It consists of language elements that allow an unambiguous data definition and specification of constraints on the data defined.
The development of STEP started in 1984 as a successor of IGES, SET and VDAFS as a CAD exchange format. Whereas IGES was developed primarily for the exchange of pure geometric data between computer aided design (CAD) systems, STEP is intended to handle a much wider range of product-related data covering the entire life-cycle of a product. [PRAT01]
The most useful parts of ISO 10303, i.e., those parts defining models on which translators are based, are known as Application Protocols (APs). Each AP is applicable to one or more lifecycle stages of a particular product class. In 1994/95 ISO publishes the initial release of STEP as international standards (IS) with the parts 1, 11, 21, 31, 41, 42, 43, 44, 46, 101, AP201, AP203. Today, for instance, AP203 (Configuration controlled 3D design) is the most widely supported part of the standard, since it deals mainly with the exchange of product shape models, assembly structure, and configuration control
34
information for Geometry Data Exchange. Thus, many CAD systems use it for import and export, together with AP214 (which is similar but with a broader scope; it belongs to the automotive sector but is widely used in other areas too). With the second major release, which ended in the year 2002, STEP addresses specific needs of various industry areas (AP202, 209, AP210, AP212, AP214, AP224, AP225, AP227, and AP232).
The Application protocol AP227 describes the specifics for plant spatial configuration (Figure 14 shows an excerpt of the Express diagram showing the elbow and flange elements). This is the concrete application protocol of interest for this research.
STEP is developed and maintained by the ISO technical committee TC 184, Technical Industrial automation systems and integration, sub-committee SC4 Industrial data. Like other ISO and IEC standards STEP is copyright by ISO and is not freely available.
Application data according to a given data model can be exchanged either by a STEP-File, STEP-XML or via shared database access using SDAI. The top data models to be used for data exchange are defined in the APs and are based from lower level data models.
STEP is defining two different types of data models, the Application Integrated Models (ARM) and the Application or Module Integrated Models (AIM, MIM). The simplified and incomplete ARM models define application objects from a user’s perspective. The MIM integrated models are based on a common set of generic objects, allowing interpretability between different kinds of industries and life cycle stages.
The numbering of the parts of this International Standard reflects its structure:
• Parts 11 to 14 specify the description methods;
• Parts 21 to 29 specify the implementation methods;
• Parts 31 to 35 specify the conformance testing methodology and framework.
• Parts 41 to 50 specify the integrated generic resources;
• Parts 101 to 107 specify the integrated application resources;
• Parts 201 to 237 specify the application protocols
(The part of interest for my work)
• Parts 301 to 337 specify the abstract test suites;
• Parts 501 to 520 specify the application interpreted constructs.
As explained in this section, the most relevant part of the standard for the proposed methodology is:
Application Protocol AP227 – Plant Spatial Configuration (Editions 1 and 2)
35
It is very important to state clearly at this point that I do not intend to implement a traditional STEP translator in this methodology. See next section for more details about this relevant point.
3.5.2 Some comments about the scope of ISO-STEP 10303 AP227 in this research
At this point, it is important to state clearly that the motivation for the use of the ISO-STEP 10303-AP227 in this research is the following:
To use a standard in the specific domain -Plant Design-, which specifies the components and relationships that can found in a CAD model of an Industrial Plant, with the purpose of having a common, universally accepted, domain-specific reference, in order to associate some relevant geometric entities in a typical 3D CAD model of the domain, with the concepts of that standard. This allows a disambiguation of the geometric representation of the model, as well as the further semantic adaptation of the model for visualization walkthroughs.
I have found that ISO-STEP 10303 AP227 fulfills these requirements very well.
As explained in the standard, there are four levels of implementation:
• Level 1: Passive file transfer
• Level 2: Active file transfer
• Level 3: Shared access database
• Level 4: Integrated knowledge base
But all of them focused on the exchange of product data. Notice that the objective of the present work is not to create a typical STEP translator between CAD models (Levels 1 & 2) or a data sharing framework (Levels 3 & 4).
Thus, I do not produce STEP-compliant physical files or typical STEP frameworks; I use the concepts and relationships described in the standard in EXPRESS-G language, adapted for the purposes of this research, and integrated with other concepts and relationships of resources, user profile, visualization purpose and rendering techniques. For this I have chosen to model ontologies as explained and in Chapter 5.3.
In doing so, I use indeed one of the key benefits of that standard, according to Fowler [FOW95]: “one of the standard’s key benefits is the availability, in the public domain, of world-class information on product data and product data modeling”.
This use of the standard is an integral part of the methodology of this research: to put in context, the role of the standard is to give a sound reference to process the output model of the Catalog Reconstruction Module in order to assign each family of geometric objects with a standard category, which can be used and controlled individually in the adaptation
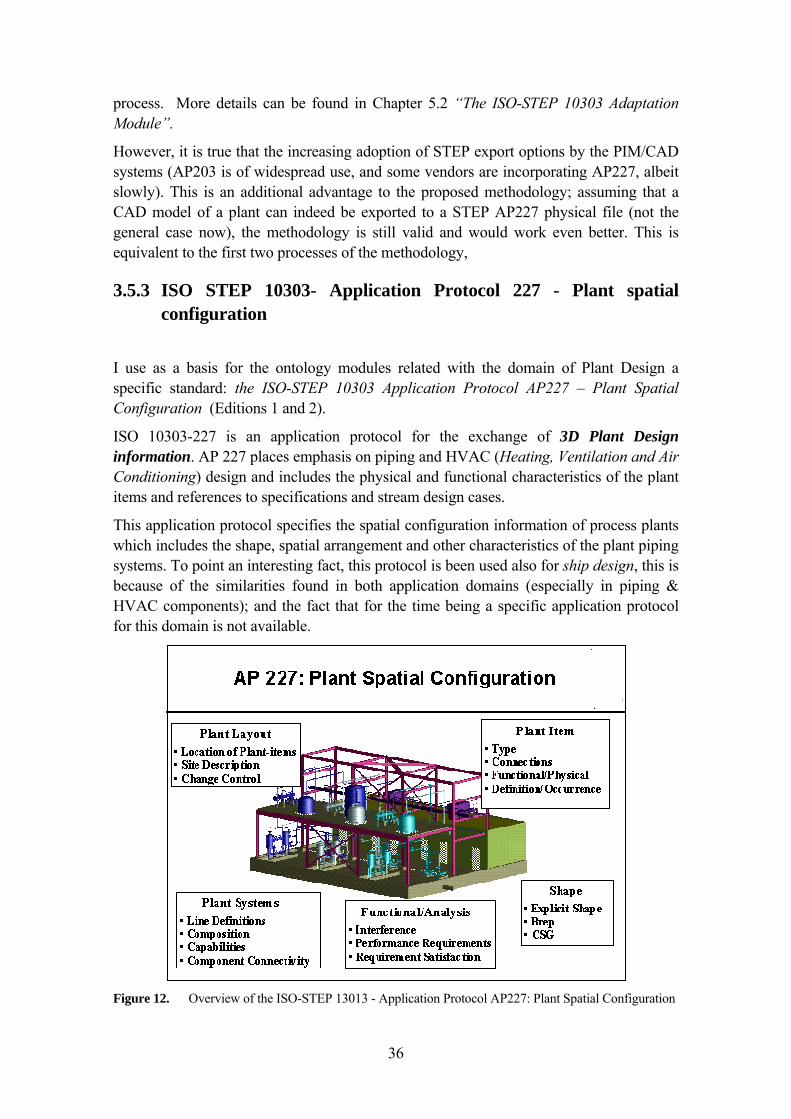
36
process. More details can be found in Chapter 5.2 “The ISO-STEP 10303 Adaptation Module”.
However, it is true that the increasing adoption of STEP export options by the PIM/CAD systems (AP203 is of widespread use, and some vendors are incorporating AP227, albeit slowly). This is an additional advantage to the proposed methodology; assuming that a CAD model of a plant can indeed be exported to a STEP AP227 physical file (not the general case now), the methodology is still valid and would work even better. This is equivalent to the first two processes of the methodology,
3.5.3 ISO STEP 10303- Application Protocol 227 - Plant spatial configuration
I use as a basis for the ontology modules related with the domain of Plant Design a specific standard: the ISO-STEP 10303 Application Protocol AP227 – Plant Spatial Configuration (Editions 1 and 2).
ISO 10303-227 is an application protocol for the exchange of 3D Plant Design information. AP 227 places emphasis on piping and HVAC (Heating, Ventilation and Air Conditioning) design and includes the physical and functional characteristics of the plant items and references to specifications and stream design cases.
This application protocol specifies the spatial configuration information of process plants which includes the shape, spatial arrangement and other characteristics of the plant piping systems. To point an interesting fact, this protocol is been used also for ship design, this is because of the similarities found in both application domains (especially in piping & HVAC components); and the fact that for the time being a specific application protocol for this domain is not available.
Figure 12. Overview of the ISO-STEP 13013 - Application Protocol AP227: Plant Spatial Configuration
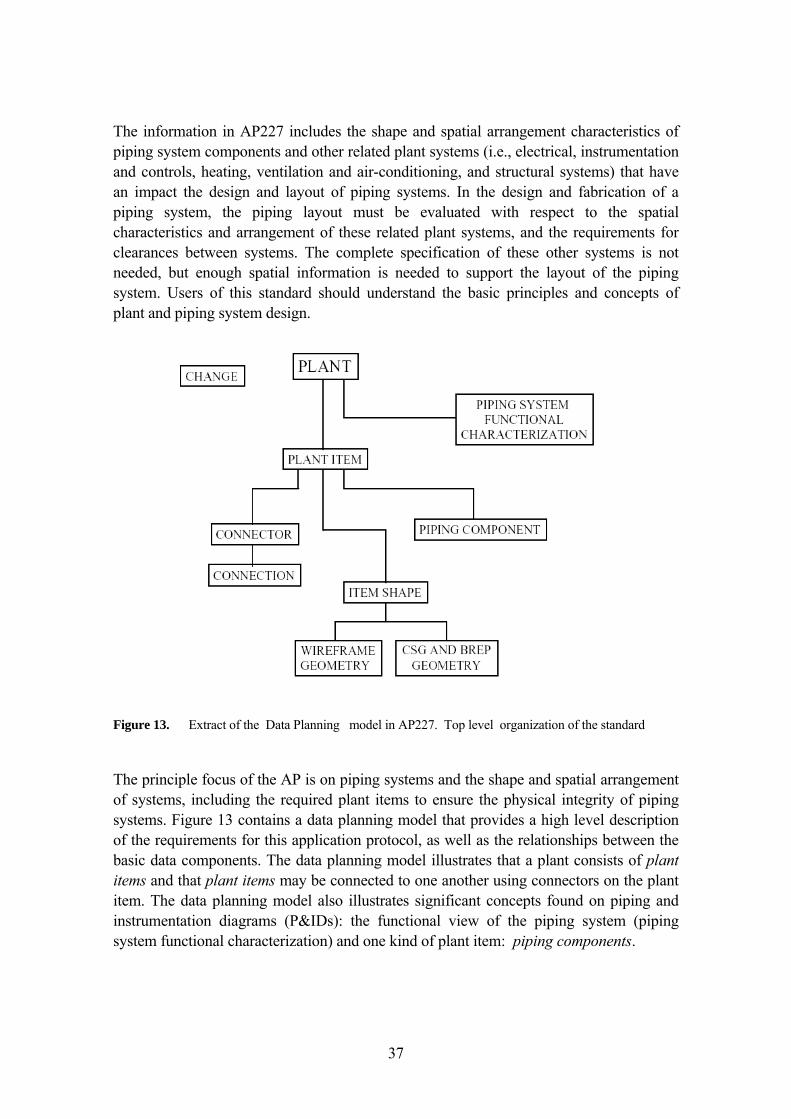
37
The information in AP227 includes the shape and spatial arrangement characteristics of piping system components and other related plant systems (i.e., electrical, instrumentation and controls, heating, ventilation and air-conditioning, and structural systems) that have an impact the design and layout of piping systems. In the design and fabrication of a piping system, the piping layout must be evaluated with respect to the spatial characteristics and arrangement of these related plant systems, and the requirements for clearances between systems. The complete specification of these other systems is not needed, but enough spatial information is needed to support the layout of the piping system. Users of this standard should understand the basic principles and concepts of plant and piping system design.
Figure 13. Extract of the Data Planning model in AP227. Top level organization of the standard
The principle focus of the AP is on piping systems and the shape and spatial arrangement of systems, including the required plant items to ensure the physical integrity of piping systems. Figure 13 contains a data planning model that provides a high level description of the requirements for this application protocol, as well as the relationships between the basic data components. The data planning model illustrates that a plant consists of plant items and that plant items may be connected to one another using connectors on the plant item. The data planning model also illustrates significant concepts found on piping and instrumentation diagrams (P&IDs): the functional view of the piping system (piping system functional characterization) and one kind of plant item: piping components.
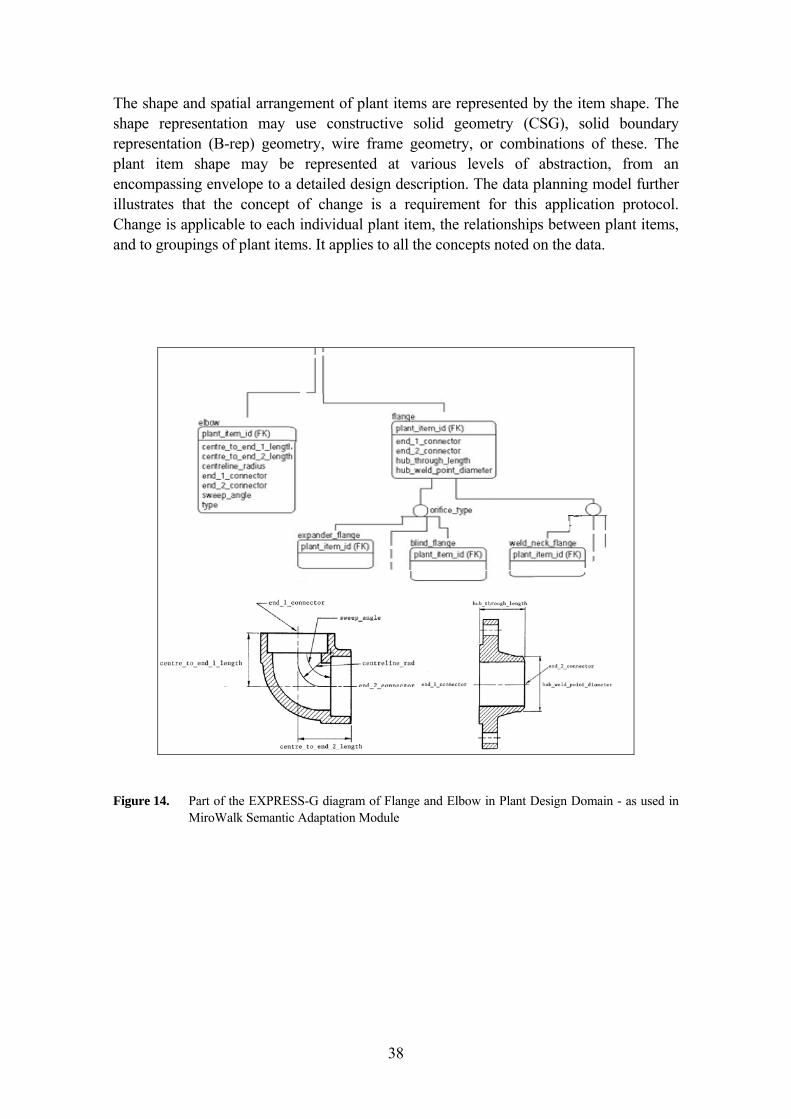
38
The shape and spatial arrangement of plant items are represented by the item shape. The shape representation may use constructive solid geometry (CSG), solid boundary representation (B-rep) geometry, wire frame geometry, or combinations of these. The plant item shape may be represented at various levels of abstraction, from an encompassing envelope to a detailed design description. The data planning model further illustrates that the concept of change is a requirement for this application protocol. Change is applicable to each individual plant item, the relationships between plant items, and to groupings of plant items. It applies to all the concepts noted on the data.
Figure 14. Part of the EXPRESS-G diagram of Flange and Elbow in Plant Design Domain - as used in MiroWalk Semantic Adaptation Module
39
3.5.4 An ontology based in the ISO-STEP 10303 AP-227
3.5.4.1 Ontologies in the AI Community vs. Engineering Community
As pointed out by Uschold and Jasper “A Framework for Understanding and Classifying Ontology Applications” ([USJ99]) in an important reference work for this research, the AI ontology community and the Engineering communities had in the past (and still have) some differences in the approach to the use and understanding of ontologies. Uschold correctly identifies that there is a need to overcome barriers created by disparate vocabularies, representations and tools in a given domain, and that the agreement on an appropriate way to conceptualize the domain and make it explicit in some language is necessary. Ironically, different communities working on ontologies (ontology research groups, software developers, standards organizations) strive to overcome the previous difficulties but in some cases the same underlying barriers apply to a common agreement between these communities.
This research shares some of the ideas of Uschold (Boeing), a world authority in the field of ontologies, regarding his opinion that a detailed engineering specification standard such as STEP is indeed a practical application of ontology, if his classification criteria for ontologies are followed. Thus, I understand in this work the term “ontology” in its broader sense, taking his “lowest common denominator” definition:
“An ontology may take a variety of forms, but necessarily it will include a vocabulary of terms, and some specification of their meaning. This includes definitions and an indication of how concepts are inter-related which collectively impose a structure on the domain and constrain the possible interpretations of terms.” [USJ99]
Quoting him further (boldface is ours):
This broad interpretation helps to show how both the goals and the technologies developed to achieve them are similar across the different communities. For example, common goals include reuse and interoperability. Common technologies include special purpose modeling languages (e.g., Ontolingua, EXPRESS and IDL) and translation tools. Thus, we can easily view a number of standardization efforts (e.g., STEP, OMG) as practical applications of ontologies. [USJ99]
3.5.4.2 Ontology Modeling in Protégé based on ISO-STEP 10303-AP227
I have modeled the ontologies of the MiroWalk system using Protégé 2000, adapting the tags and relationships (to be more suitable for a knowledge representation model) presented in the ISO STEP-10303-227.
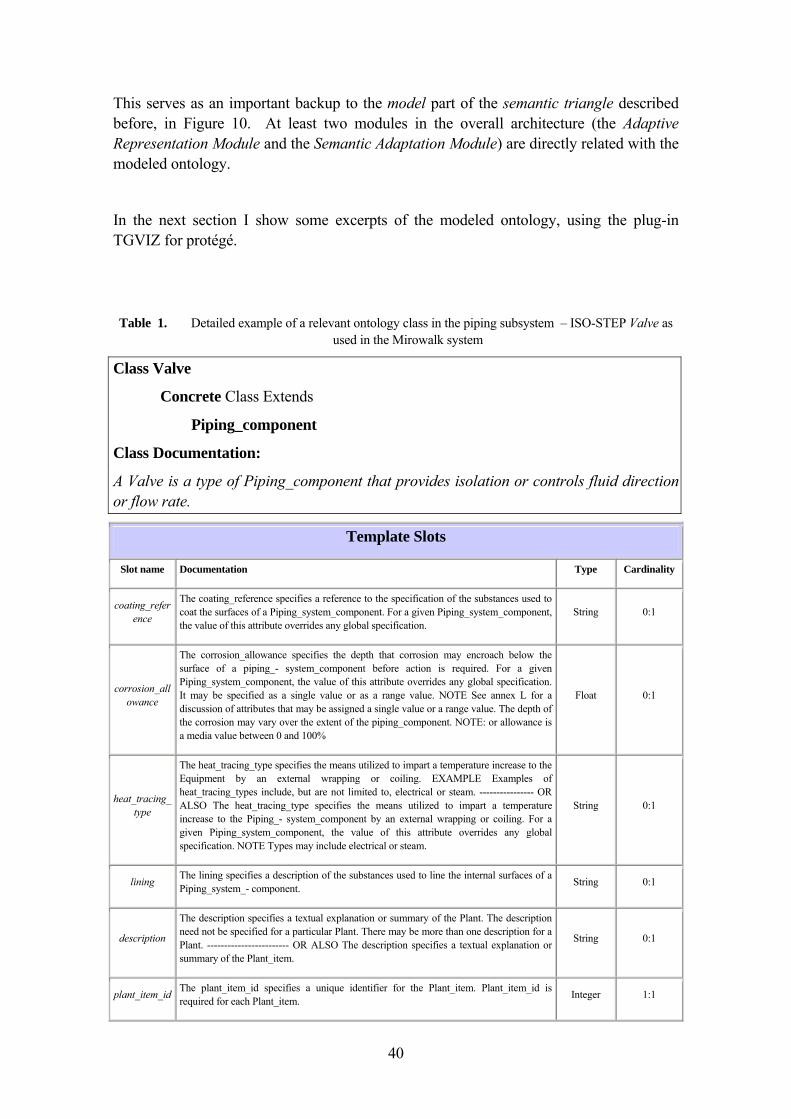
40
This serves as an important backup to the model part of the semantic triangle described before, in Figure 10. At least two modules in the overall architecture (the Adaptive Representation Module and the Semantic Adaptation Module) are directly related with the modeled ontology.
In the next section I show some excerpts of the modeled ontology, using the plug-in TGVIZ for protégé.
Table 1. Detailed example of a relevant ontology class in the piping subsystem – ISO-STEP Valve as
used in the Mirowalk system
Class Valve
Concrete Class Extends
Piping_component
Class Documentation:
A Valve is a type of Piping_component that provides isolation or controls fluid direction or flow rate.
Template Slots
Slot name Documentation Type Cardinality
coating_reference
The coating_reference specifies a reference to the specification of the substances used to coat the surfaces of a Piping_system_component. For a given Piping_system_component, the value of this attribute overrides any global specification.
String 0:1
corrosion_allowance
The corrosion_allowance specifies the depth that corrosion may encroach below the surface of a piping_- system_component before action is required. For a given Piping_system_component, the value of this attribute overrides any global specification. It may be specified as a single value or as a range value. NOTE See annex L for a discussion of attributes that may be assigned a single value or a range value. The depth of the corrosion may vary over the extent of the piping_component. NOTE: or allowance is a media value between 0 and 100%
Float 0:1
heat_tracing_type
The heat_tracing_type specifies the means utilized to impart a temperature increase to the Equipment by an external wrapping or coiling. EXAMPLE Examples of heat_tracing_types include, but are not limited to, electrical or steam. ---------------- OR ALSO The heat_tracing_type specifies the means utilized to impart a temperature increase to the Piping_- system_component by an external wrapping or coiling. For a given Piping_system_component, the value of this attribute overrides any global specification. NOTE Types may include electrical or steam.
String 0:1
lining The lining specifies a description of the substances used to line the internal surfaces of a Piping_system_- component. String 0:1
description
The description specifies a textual explanation or summary of the Plant. The description need not be specified for a particular Plant. There may be more than one description for a Plant. ------------------------ OR ALSO The description specifies a textual explanation or summary of the Plant_item.
String 0:1
plant_item_id The plant_item_id specifies a unique identifier for the Plant_item. Plant_item_id is required for each Plant_item. Integer 1:1
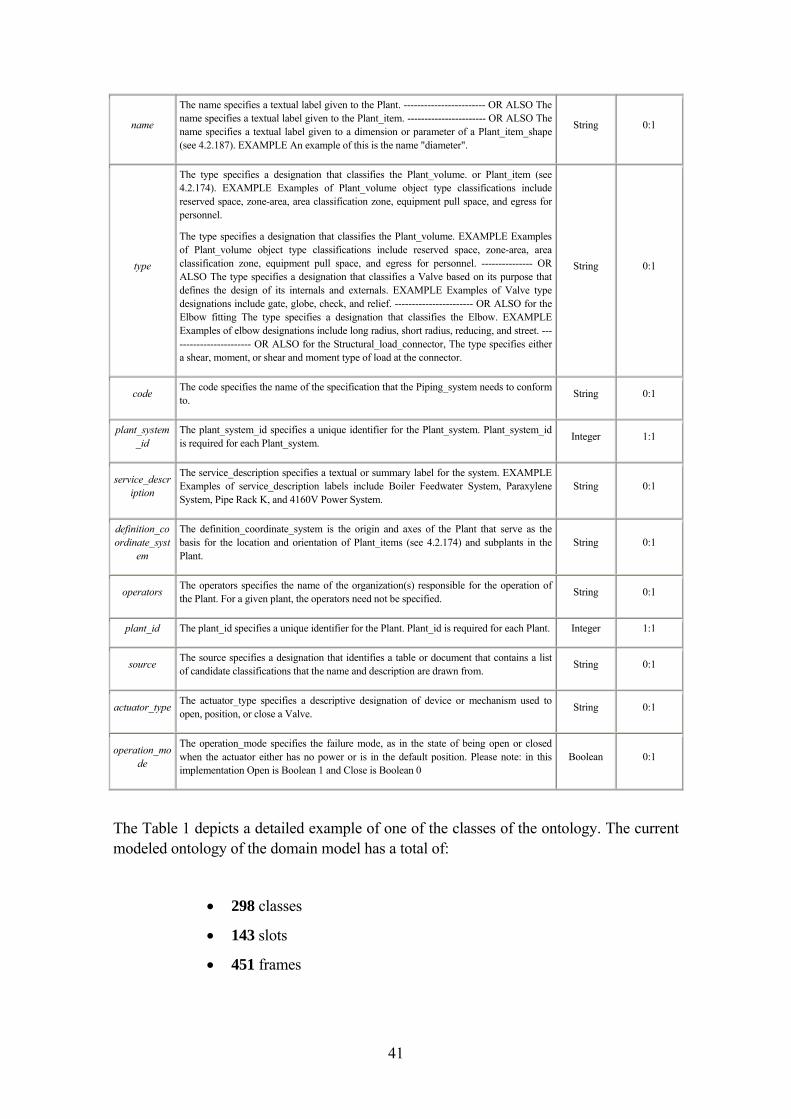
41
name
The name specifies a textual label given to the Plant. ------------------------ OR ALSO The name specifies a textual label given to the Plant_item. ----------------------- OR ALSO The name specifies a textual label given to a dimension or parameter of a Plant_item_shape (see 4.2.187). EXAMPLE An example of this is the name "diameter".
String 0:1
type
The type specifies a designation that classifies the Plant_volume. or Plant_item (see 4.2.174). EXAMPLE Examples of Plant_volume object type classifications include reserved space, zone-area, area classification zone, equipment pull space, and egress for personnel.
The type specifies a designation that classifies the Plant_volume. EXAMPLE Examples of Plant_volume object type classifications include reserved space, zone-area, area classification zone, equipment pull space, and egress for personnel. --------------- OR ALSO The type specifies a designation that classifies a Valve based on its purpose that defines the design of its internals and externals. EXAMPLE Examples of Valve type designations include gate, globe, check, and relief. ----------------------- OR ALSO for the Elbow fitting The type specifies a designation that classifies the Elbow. EXAMPLE Examples of elbow designations include long radius, short radius, reducing, and street. ------------------------ OR ALSO for the Structural_load_connector, The type specifies either a shear, moment, or shear and moment type of load at the connector.
String 0:1
code The code specifies the name of the specification that the Piping_system needs to conform to. String 0:1
plant_system_id
The plant_system_id specifies a unique identifier for the Plant_system. Plant_system_id is required for each Plant_system. Integer 1:1
service_description
The service_description specifies a textual or summary label for the system. EXAMPLE Examples of service_description labels include Boiler Feedwater System, Paraxylene System, Pipe Rack K, and 4160V Power System.
String 0:1
definition_coordinate_syst
em
The definition_coordinate_system is the origin and axes of the Plant that serve as the basis for the location and orientation of Plant_items (see 4.2.174) and subplants in the Plant.
String 0:1
operators The operators specifies the name of the organization(s) responsible for the operation of the Plant. For a given plant, the operators need not be specified. String 0:1
plant_id The plant_id specifies a unique identifier for the Plant. Plant_id is required for each Plant. Integer 1:1
source The source specifies a designation that identifies a table or document that contains a list of candidate classifications that the name and description are drawn from. String 0:1
actuator_type The actuator_type specifies a descriptive designation of device or mechanism used to open, position, or close a Valve. String 0:1
operation_mode
The operation_mode specifies the failure mode, as in the state of being open or closed when the actuator either has no power or is in the default position. Please note: in this implementation Open is Boolean 1 and Close is Boolean 0
Boolean 0:1
The Table 1 depicts a detailed example of one of the classes of the ontology. The current modeled ontology of the domain model has a total of:
• 298 classes
• 143 slots
• 451 frames
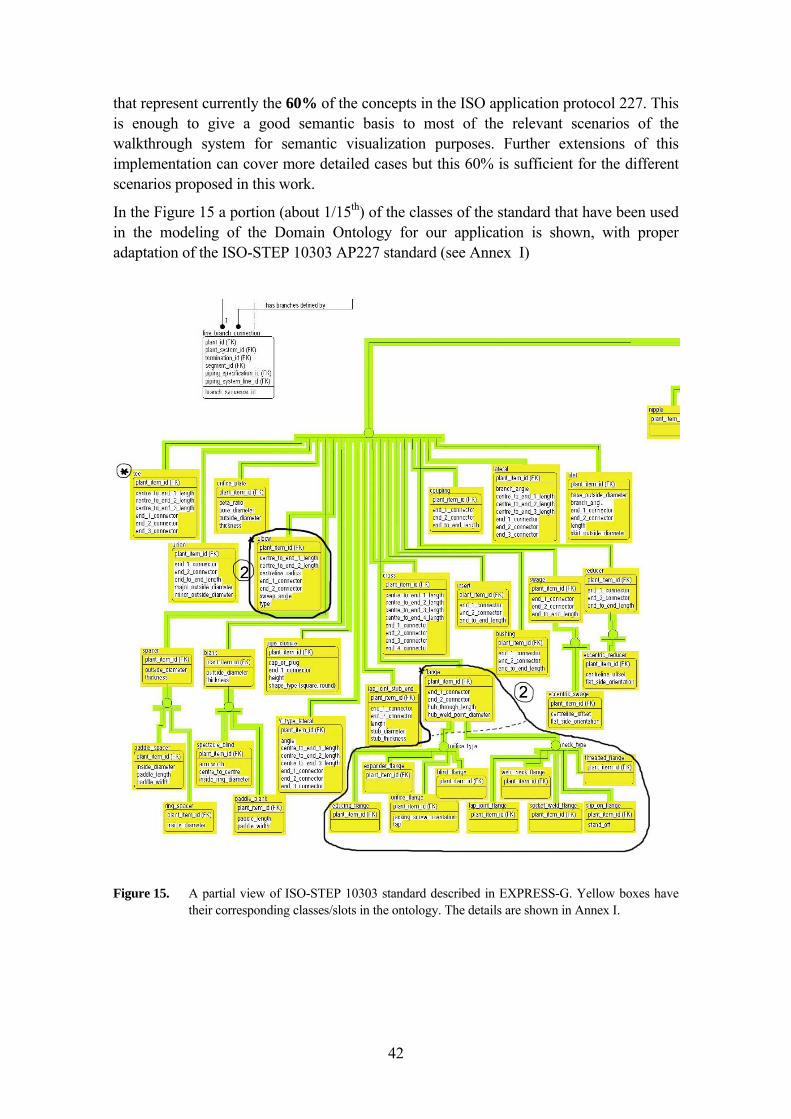
42
that represent currently the 60% of the concepts in the ISO application protocol 227. This is enough to give a good semantic basis to most of the relevant scenarios of the walkthrough system for semantic visualization purposes. Further extensions of this implementation can cover more detailed cases but this 60% is sufficient for the different scenarios proposed in this work.
In the Figure 15 a portion (about 1/15th) of the classes of the standard that have been used in the modeling of the Domain Ontology for our application is shown, with proper adaptation of the ISO-STEP 10303 AP227 standard (see Annex I)
Figure 15. A partial view of ISO-STEP 10303 standard described in EXPRESS-G. Yellow boxes have
their corresponding classes/slots in the ontology. The details are shown in Annex I.
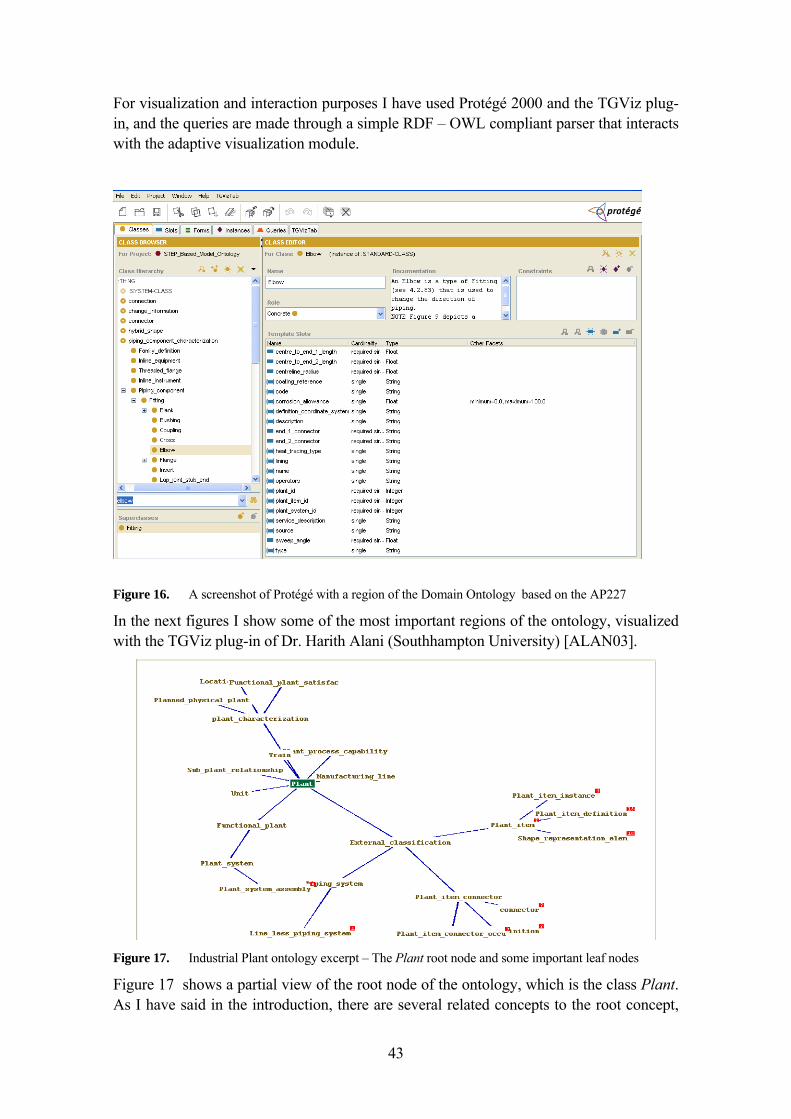
43
For visualization and interaction purposes I have used Protégé 2000 and the TGViz plug-in, and the queries are made through a simple RDF – OWL compliant parser that interacts with the adaptive visualization module.
Figure 16. A screenshot of Protégé with a region of the Domain Ontology based on the AP227
In the next figures I show some of the most important regions of the ontology, visualized with the TGViz plug-in of Dr. Harith Alani (Southhampton University) [ALAN03].
Figure 17. Industrial Plant ontology excerpt – The Plant root node and some important leaf nodes
Figure 17 shows a partial view of the root node of the ontology, which is the class Plant. As I have said in the introduction, there are several related concepts to the root concept,
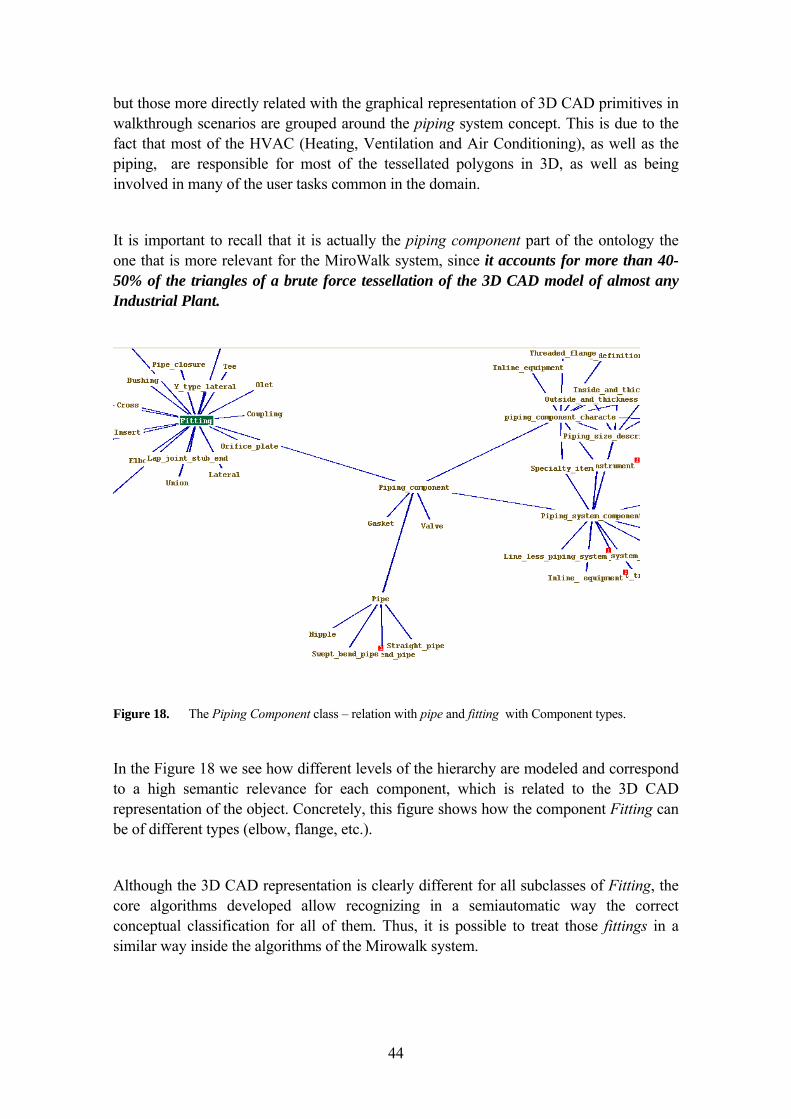
44
but those more directly related with the graphical representation of 3D CAD primitives in walkthrough scenarios are grouped around the piping system concept. This is due to the fact that most of the HVAC (Heating, Ventilation and Air Conditioning), as well as the piping, are responsible for most of the tessellated polygons in 3D, as well as being involved in many of the user tasks common in the domain.
It is important to recall that it is actually the piping component part of the ontology the one that is more relevant for the MiroWalk system, since it accounts for more than 40-50% of the triangles of a brute force tessellation of the 3D CAD model of almost any Industrial Plant.
Figure 18. The Piping Component class – relation with pipe and fitting with Component types.
In the Figure 18 we see how different levels of the hierarchy are modeled and correspond to a high semantic relevance for each component, which is related to the 3D CAD representation of the object. Concretely, this figure shows how the component Fitting can be of different types (elbow, flange, etc.).
Although the 3D CAD representation is clearly different for all subclasses of Fitting, the core algorithms developed allow recognizing in a semiautomatic way the correct conceptual classification for all of them. Thus, it is possible to treat those fittings in a similar way inside the algorithms of the Mirowalk system.
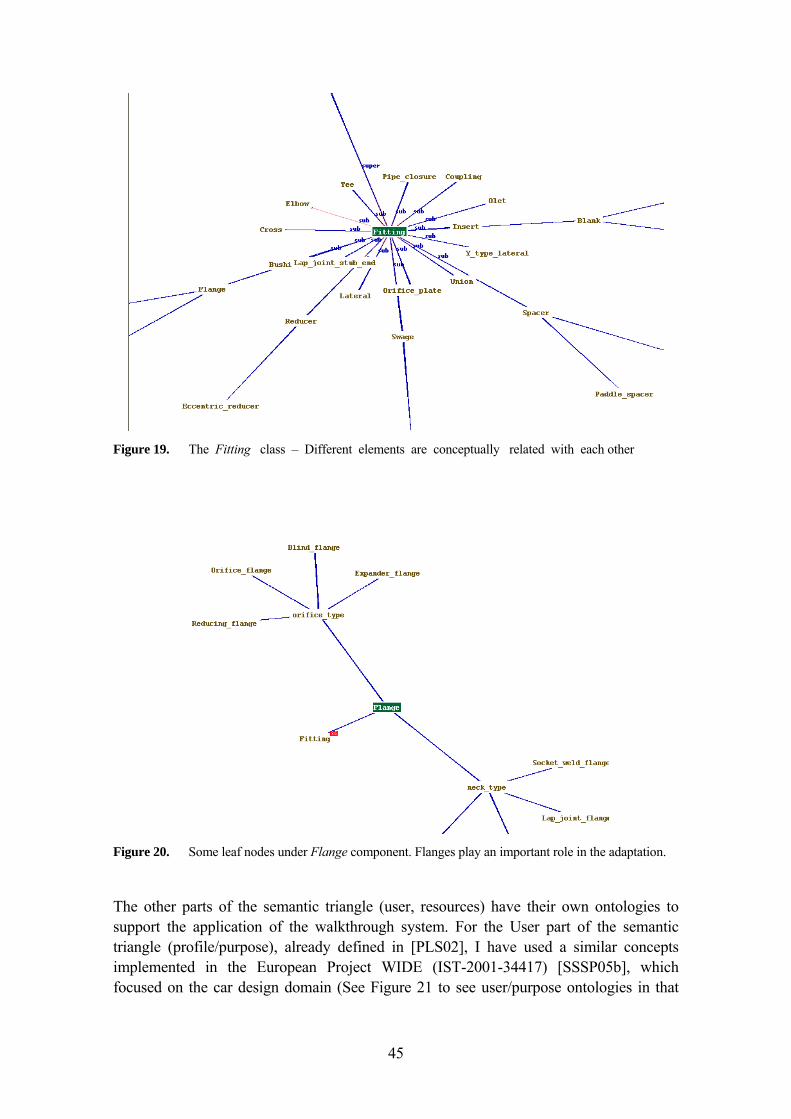
45
Figure 19. The Fitting class – Different elements are conceptually related with each other
Figure 20. Some leaf nodes under Flange component. Flanges play an important role in the adaptation.
The other parts of the semantic triangle (user, resources) have their own ontologies to support the application of the walkthrough system. For the User part of the semantic triangle (profile/purpose), already defined in [PLS02], I have used a similar concepts implemented in the European Project WIDE (IST-2001-34417) [SSSP05b], which focused on the car design domain (See Figure 21 to see user/purpose ontologies in that
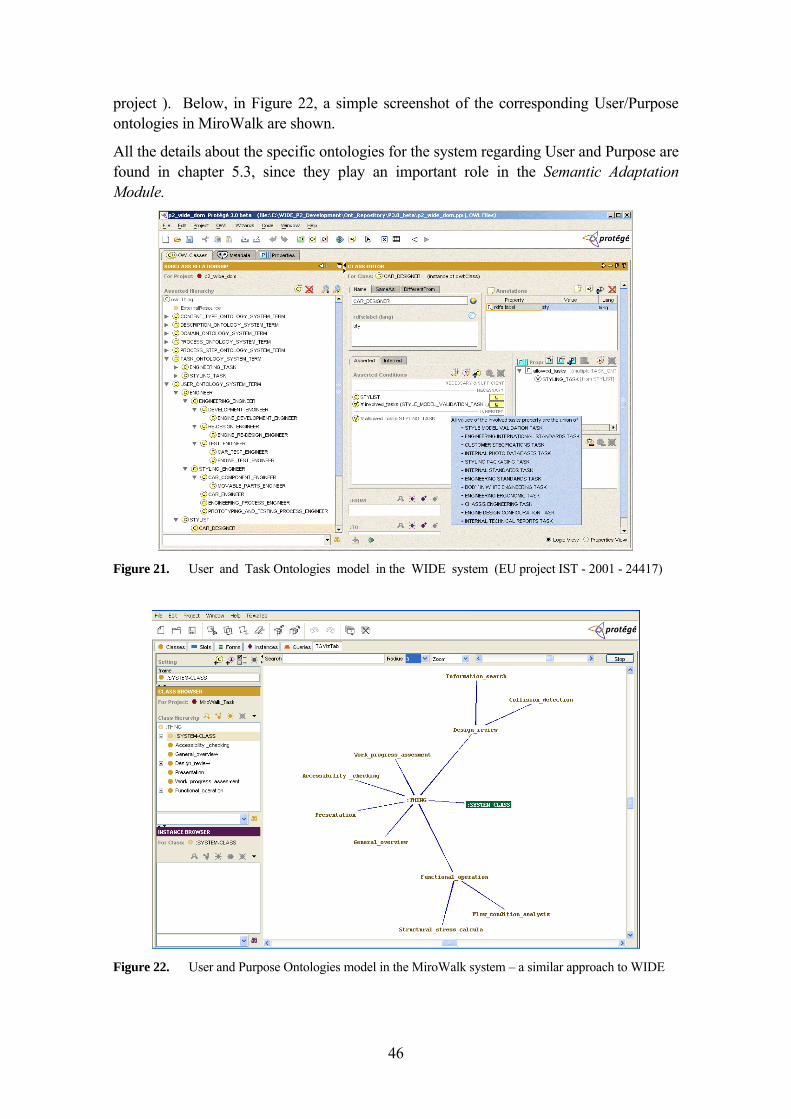
46
project ). Below, in Figure 22, a simple screenshot of the corresponding User/Purpose ontologies in MiroWalk are shown.
All the details about the specific ontologies for the system regarding User and Purpose are found in chapter 5.3, since they play an important role in the Semantic Adaptation Module.
Figure 21. User and Task Ontologies model in the WIDE system (EU project IST - 2001 - 24417)
Figure 22. User and Purpose Ontologies model in the MiroWalk system – a similar approach to WIDE
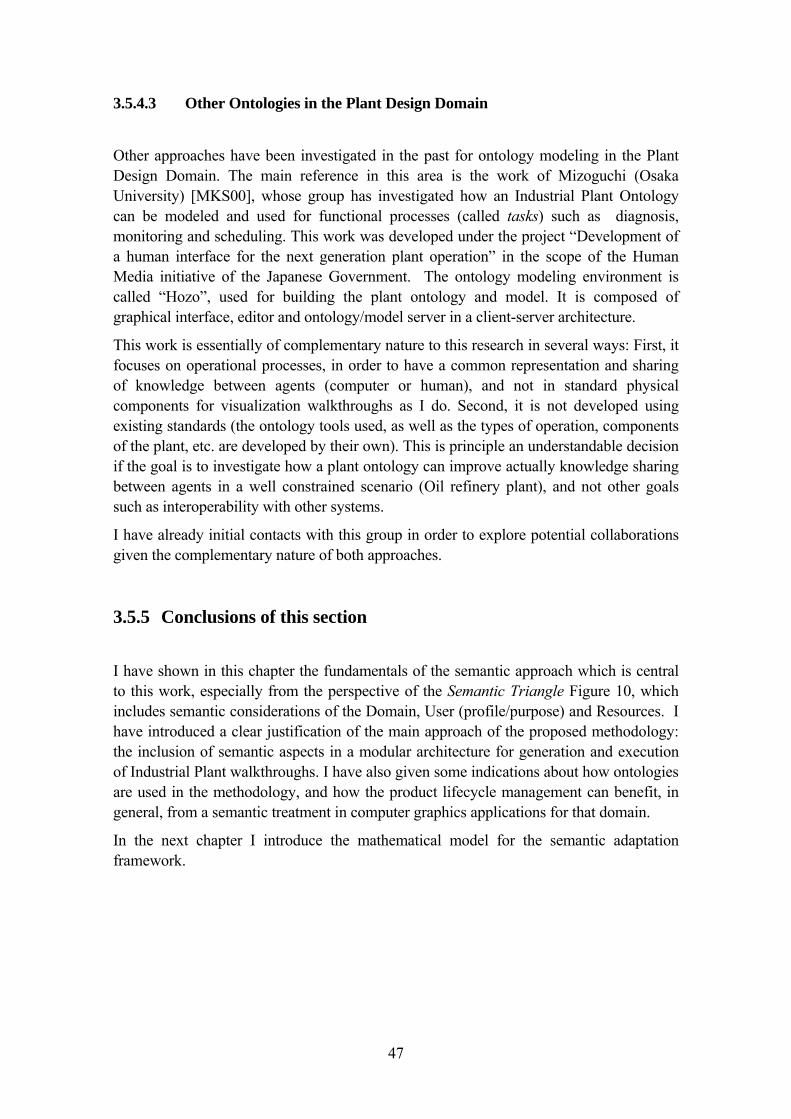
47
3.5.4.3 Other Ontologies in the Plant Design Domain
Other approaches have been investigated in the past for ontology modeling in the Plant Design Domain. The main reference in this area is the work of Mizoguchi (Osaka University) [MKS00], whose group has investigated how an Industrial Plant Ontology can be modeled and used for functional processes (called tasks) such as diagnosis, monitoring and scheduling. This work was developed under the project “Development of a human interface for the next generation plant operation” in the scope of the Human Media initiative of the Japanese Government. The ontology modeling environment is called “Hozo”, used for building the plant ontology and model. It is composed of graphical interface, editor and ontology/model server in a client-server architecture.
This work is essentially of complementary nature to this research in several ways: First, it focuses on operational processes, in order to have a common representation and sharing of knowledge between agents (computer or human), and not in standard physical components for visualization walkthroughs as I do. Second, it is not developed using existing standards (the ontology tools used, as well as the types of operation, components of the plant, etc. are developed by their own). This is principle an understandable decision if the goal is to investigate how a plant ontology can improve actually knowledge sharing between agents in a well constrained scenario (Oil refinery plant), and not other goals such as interoperability with other systems.
I have already initial contacts with this group in order to explore potential collaborations given the complementary nature of both approaches.
3.5.5 Conclusions of this section
I have shown in this chapter the fundamentals of the semantic approach which is central to this work, especially from the perspective of the Semantic Triangle Figure 10, which includes semantic considerations of the Domain, User (profile/purpose) and Resources. I have introduced a clear justification of the main approach of the proposed methodology: the inclusion of semantic aspects in a modular architecture for generation and execution of Industrial Plant walkthroughs. I have also given some indications about how ontologies are used in the methodology, and how the product lifecycle management can benefit, in general, from a semantic treatment in computer graphics applications for that domain.
In the next chapter I introduce the mathematical model for the semantic adaptation framework.

48
49
4 A MATHEMATICAL MODEL FOR THE SEMANTIC ADAPTATION FRAMEWORK
4.1 Motivation and General Considerations
In the previous chapters I have presented different issues related with the possibility to use semantic simplification for the walkthroughs of large Plant Design models. In order to complete the proposed approach, I introduce in this chapter a mathematical model that explicitly takes into account the semantic aspects in a general simplification framework.
This mathematical model gives objective criteria to decide when and how to apply semantic-steered techniques for the simplification. At the same time, it allows the evaluation and quantitative measurement of the effective influence of the semantic approach in the walkthrough generation.
Although the main purpose of the presented model is the inclusion of semantic steered techniques (especially semantic symbols) in a framework for geometry simplification, the model has also the additional advantage that is general enough to be applied for any kind of geometry simplification techniques, whether semantic or not.
The following questions can be solved directly or indirectly with the model:
- What is the optimal combination of traditional techniques and new semantic steered techniques for a specific combination of Resources / User/ Visualization Purpose / Model characteristics?
- How semantic aspects (such as user profile, purpose, and domain knowledge) can be mathematically related with the geometric aspects of the walkthrough model?
- When and how should specific techniques be applied to a model?
- What is the measured impact (in performance, graphical quality, functionality, etc.) of the semantic-steered simplification techniques in a Plant CAD model?
- Is it worth to apply a specific technique (e.g. semantic synonym) for a specific kind of element in a specific CAD model of a plant? When?
I present a basic model structure in a simplified form, and show how this basic model can be extended refining the underlying assumptions and simplifications for specific
50
circumstances. In chapter 6 I present also the results of applying this mathematical model to the different examples of Industrial Plant CAD models.
4.2 Basic Definitions
Let
P be a 3D CAD model of an Industrial Plant, modelled in a specific 3D CAD system.
ci be a cell / Explicit group of 3D CAD geometric elements representing a meaningful unit in Plant Design domain. It can be of 1 or more elements
Examples of cells are:
- One cylinder representing a straight section of a pipe.
- A group of cones, cylinders, polygons, torus, representing a valve.
- A group of NURBS representing a HVAC element.
eij be a geometric element in the 3D CAD system that is part of a cell ci. The kinds of
geometric elements vary between 3D CAD systems (e.g. polygon, NURBS, cylinder, torus, cone, trimmed surface, etc. etc.)
For practical purposes, the relationship between ci and ei can be simplified (ignoring internal relationships and dependencies between elements) as:
ci = {ei1, ei2,…, eij} For a cell i with j elements.
Let also
C = { x | x is a cell ci } be the set of all cells in a 3D CAD model of an Industrial Plant.
expressed differently,
51
C = { c1, c2, … , cn }
For the mathematical model, the simplified definition of the plant P is:
P = C = { x | x is a cell ci }
Note that this is only an adequate simplification for the mathematical model; a 3D CAD model of a plant is much more than just the set of its groups of elements. Hierarchical relationships, parametric dependencies, relation with PDM and non-geometric information, etc. are also integral part of the 3D CAD model of the plant.
4.2.1 ISO-STEP 10303-AP227 standard categories
Let
cti be an ISO-STEP 10303-227 Plant Item category.
For instance, I could assign, according with the standard, j categories in an arbitrary order.
ct0 = FLANGE (STEP COD. 4.2.84)
ct1 = ELBOW (STEP COD. 4.2.66)
ct2 = STRAIGHT PIPE (STEP COD. 4.2.232)
…
ctj = VALVE (STEP COD. 4.2.264)
and
CT = { x | x is an ISO-STEP Plant Item Category} be the set of all ISO-STEP Plant Item Categories. This is the same as:
CT = { ct0, ct1, ct2, …, ctj}
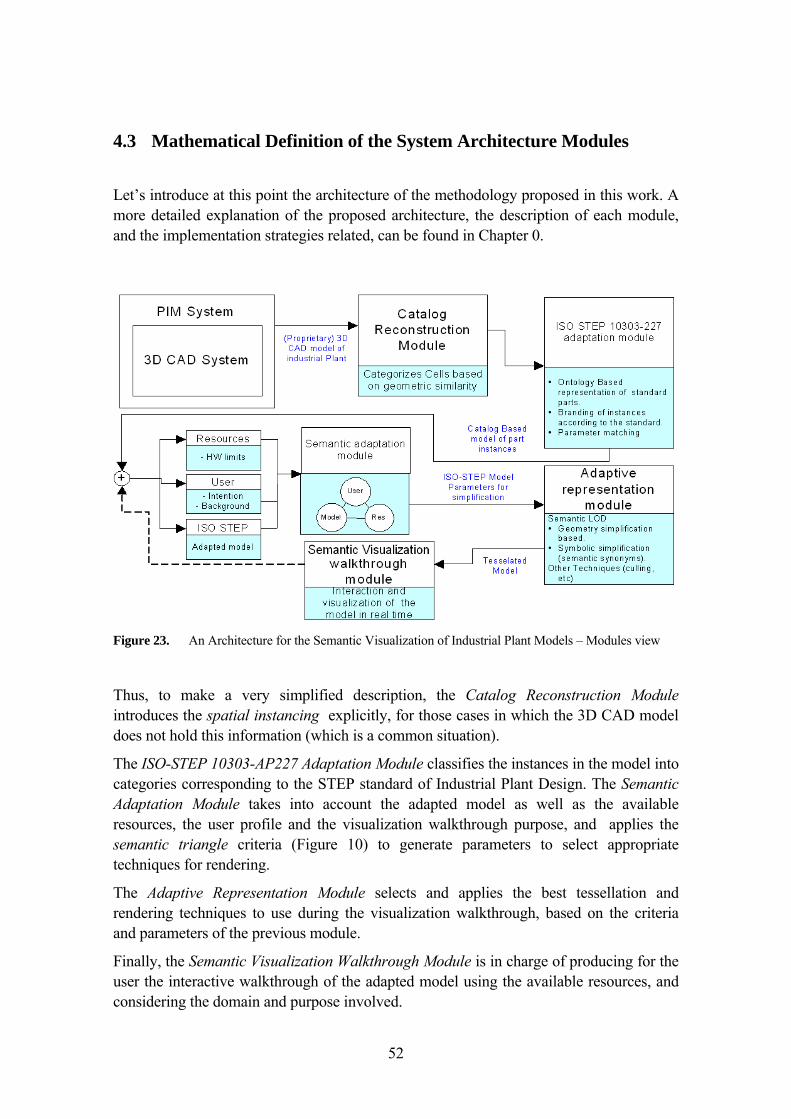
52
4.3 Mathematical Definition of the System Architecture Modules
Let’s introduce at this point the architecture of the methodology proposed in this work. A more detailed explanation of the proposed architecture, the description of each module, and the implementation strategies related, can be found in Chapter 0.
Figure 23. An Architecture for the Semantic Visualization of Industrial Plant Models – Modules view
Thus, to make a very simplified description, the Catalog Reconstruction Module introduces the spatial instancing explicitly, for those cases in which the 3D CAD model does not hold this information (which is a common situation).
The ISO-STEP 10303-AP227 Adaptation Module classifies the instances in the model into categories corresponding to the STEP standard of Industrial Plant Design. The Semantic Adaptation Module takes into account the adapted model as well as the available resources, the user profile and the visualization walkthrough purpose, and applies the semantic triangle criteria (Figure 10) to generate parameters to select appropriate techniques for rendering.
The Adaptive Representation Module selects and applies the best tessellation and rendering techniques to use during the visualization walkthrough, based on the criteria and parameters of the previous module.
Finally, the Semantic Visualization Walkthrough Module is in charge of producing for the user the interactive walkthrough of the adapted model using the available resources, and considering the domain and purpose involved.
53
4.3.1 The Catalog Reconstruction Module
In the system architecture (Chapter 5.1) it is explained that the task of the Catalog Reconstruction Module is to categorizes cells based on geometric similarity. From the definitions given below, a summarized and redefined formulation of this module is given:
The goals of the Catalog Reconstruction module are:
(i) To identify a suitable equivalence relationℜ cm between cells in a plant model according to the cell matching definition (see definition in chapter 5.1.5)
(ii) to find an algorithm to implement computationally ℜ cm in an efficient way
(iii) to execute that algorithm on a specific plant model P
(iv) to find the quotient set of C /ℜ cm for that plant model P
(v) to find the equivalence classes Ga, Gb, … , Gz
given the restrictions of available information and ordering of the inner structure of the implemented cells in a specific 3D CAD model and CAD system.
Notice that this goal is completely independent from the specific domain, and is related only with the geometric representation of the cells. Also, notice that it is independent of
the specific algorithm implemented to realize ℜ cm .Thus, this module is also directly applicable to other domains where 3D CAD models are generated, making the overall approach more general and extensible.
4.3.2 Classes of equivalence for Geometric Similarity Equivalence Classes
We define a partition of a set on C based on Geometric Similarity Equivalence Classes
Gj, which depend only on explicit geometric characteristics of the cells.
54
First, in Chapter 5.1 (Catalog Reconstruction Module) a detailed exposition of the the cell matching problem is introduced, which is one of the key aspects of that module, as well as specific algorithms to solve it. From Chapter 5.1.5 (Catalog Reconstruction Module), the cell matching problem can be stated as follows:
Given two cells Ci and Cj , each composed by an unordered set of geometric primitives, Cj matches or is an instance of Ci if a rigid body transformation matrix T exists that transforms Cj into Ci .
It is well known in Computer Graphics fundamentals that a “rigid body” transformation matrix [VAND04] preserves the lengths and angles of the original geometry. Evidently, rotation and translation matrices are rigid body transformation matrices, as well as matrices resulting from a composition of rotation and translation matrices. The geometric meaning of applying a rigid body transformation matrix to a 3D object is to change its position and/or orientation, preserving its geometry (lengths/angles).
In our approach, we assign the rigid body transformation matrix T to be the
condition for the requested ℜcm :
ci ℜcm ck if ∃ T ik such that T ik ⋅ ci = ck
Notice that also other definitions of ℜcm could be possible, I have assigned this one as the most convenient for the proposed methodology.
It is easy to show that ℜ cm is indeed an equivalence relation in C (as defined in [MAR92]) since:
- ℜ cm is a binary relation defined in C
- ℜ cm is reflexive
o Proof: If we let T ii = I (identity matrix):
∀ ci ∈ C : ci ℜ cm ci
- ℜ cm is symmetric:
o Proof: T ik is a rigid transformation ⇒ T -1ik exists, and
T ki = T -1ik T ki ⋅ ck= ci
Therefore ci ℜ cm ck ⇒ ck ℜ cm ci
- ℜ cm is transitive
55
o Proof: Let [ci ℜ cm ck, ck ℜ cm cm]
If we let T im = T ik T km, T im⋅ ci= cm
T im exists and therefore ci ℜ cm cm
We write as usual that a and b are equivalent on the equivalent relation ℜ cm in this form:
a ≅ b (mod ℜ cm) in a rigorous manner, or just
a ∼b since we know the equivalence is on ℜ cm
Now that we have shown that the cell matching relation is indeed an equivalence relation in C, we can use it to determine partition on C in equivalence classes Gj as follows:
Let a, b, c,…, y, z ∈ C
Ga the equivalence class of all ci ∼ a
Gb with b ∉ Ga the equivalence class of all ci ∼ b
Gc with c ∉ Ga, c ∉ Gb the equivalence class of all ci ∼ c
…
Gz with z∉Ga, c∉Gb,…, c∉Gy the equivalence class of all ci ∼ z
Note that by definition of a set partition,
∀ ci ∃ Gj≠k ⇒ ci ∈ Gj and ci ∉ Gk
Thus,
C = Ga ∪ Gb ∪ Gc …∪ Gy ∪ Gz
And the quotient set of C by R is
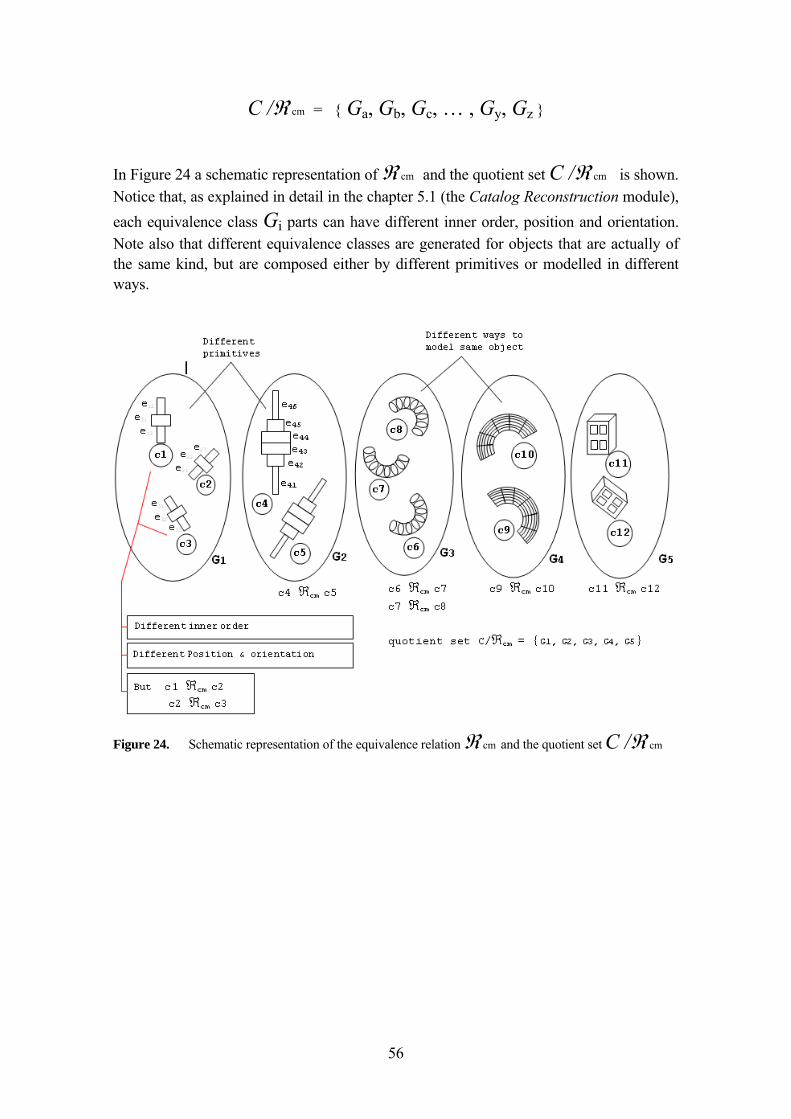
56
C /ℜ cm = { Ga, Gb, Gc, … , Gy, Gz }
In Figure 24 a schematic representation of ℜ cm and the quotient set C /ℜ cm is shown. Notice that, as explained in detail in the chapter 5.1 (the Catalog Reconstruction module), each equivalence class Gi parts can have different inner order, position and orientation. Note also that different equivalence classes are generated for objects that are actually of the same kind, but are composed either by different primitives or modelled in different ways.
Figure 24. Schematic representation of the equivalence relation ℜ cm and the quotient set C /ℜ cm
57
4.4 The ISO-STEP 10303-227 Adaptation Module
This module (ISO-STEP Adaptation module) must find a way to associate the grouping structures (equivalence classes) coming from the Catalog Reconstruction Module to the domain of Plant Design (categories in STEP), in order to increase the explicit semantics associated of the geometric groups, and therefore, to be able to apply semantically steered techniques for model simplification. Below we present this as a mathematical model.
From the previous module (catalog reconstruction) we obtain the equivalence classes
Ga, Gb, … , Gz and the quotient set C /ℜ cm. Shortly, the purpose of the STEP Adaptation Module is to get a relation between the equivalence classes (of pure geometric nature) and the categories of Plant Design elements in the ISO-STEP 10303-227 standard (of semantic value in that domain). In this way, other modules in the system architecture can apply semantically steered techniques for model simplification optimized for that domain. This is not possible in a purely geometric approach.
We can redefine mathematically the purpose of this module as follows:
The main goals of the STEP-13013-227 Adaptation Module are:
(i) to find a binary relation ℜam that associates C/ℜ cm and CT
according with the domain semantics of the equivalence classes Ga, Gb, Gc, … , Gz.
(ii) to classify the equivalence classes Ga, Gb, … , Gz and the
underlying cells ci in a specific plant model P according to ℜam, it is,
to associate each of them to a category in CT (when possible, it is,
when i, j exists such that Gi ℜ ctj). The results of this classification
is the classifiable set S.
(iii) To find the equivalence classes Ga, Gb, … , Gz and the underlying
cells ci that can not be classifiable in CT, this is, that no i, j exists
58
such that Gi ℜ ctj. The result of this classification is the non
classifiable set S .
Now we discuss in more detail how this mathematical definition is applied.
Mathematical meaning of ℜam
Let’s recall that the quotient set C/ℜ cm is formed by all the equivalence classes Ga, Gb, Gc, … , Gz. The meaning of such classes is that each of them contain cells that
share an equivalence relation, which in this case is ℜ cm: if the cells match each other geometrically.
The binary relation ℜam associates each of these equivalence classes of C/ℜ cm to one
category in the ISO-STEP norm, cti. The property to verify in the binary relation is:
ℜam relates one equivalence class Gi of C/ℜ cm to one and only one category ctj
of CT, if the geometric representation of any cell in Gi can be interpreted by a domain expert as a valid representation of an instance of the abstract category ctj.
In Figure 25 a schematic representation of ℜam is presented.
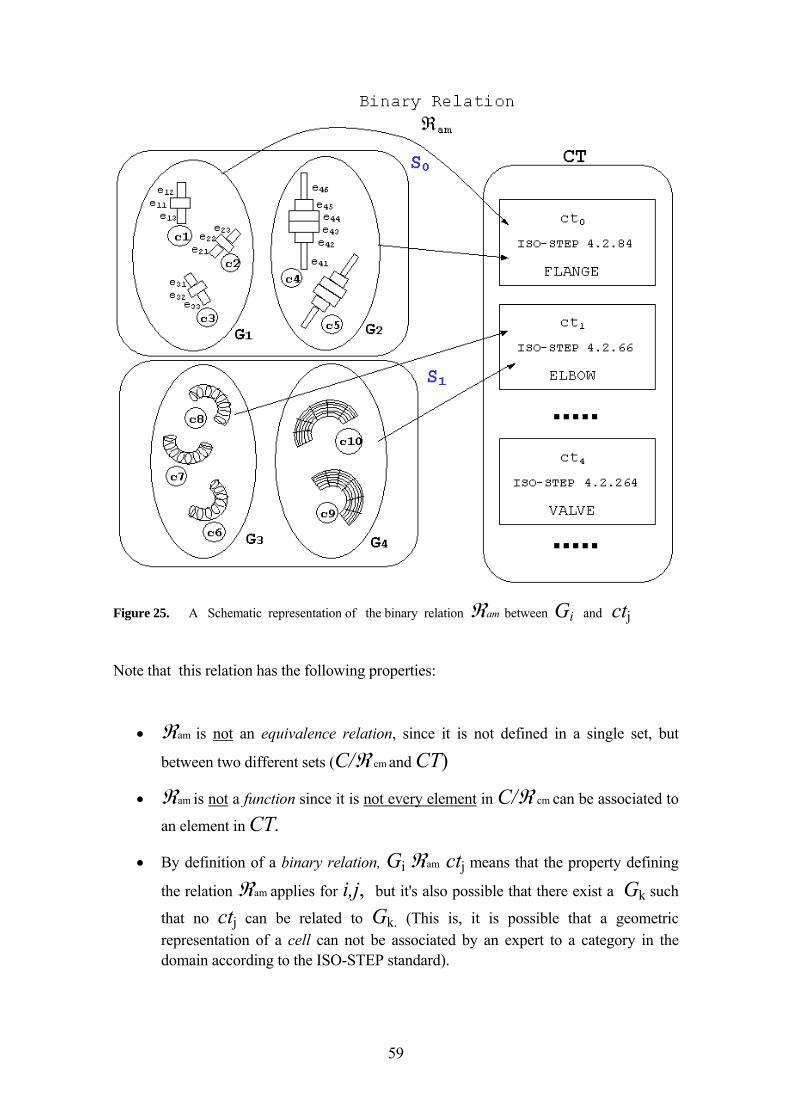
59
Figure 25. A Schematic representation of the binary relation ℜam between Gi and ctj
Note that this relation has the following properties:
• ℜam is not an equivalence relation, since it is not defined in a single set, but
between two different sets (C/ℜ cm and CT)
• ℜam is not a function since it is not every element in C/ℜ cm can be associated to
an element in CT.
• By definition of a binary relation, Gi ℜam ctj means that the property defining
the relation ℜam applies for i,j, but it's also possible that there exist a Gk such
that no ctj can be related to Gk. (This is, it is possible that a geometric representation of a cell can not be associated by an expert to a category in the domain according to the ISO-STEP standard).

60
4.5 ISO-STEP 10303-227 Classifiable Set
For a specific plant P, with a set of cells C, we define a subset S ⊂ C, called classifiable set:
S = {x | x ∈ C and x can be associated to one category in CT } This is, each cell in S corresponds to a category in CT.
We will show that S is actually composed by a set partition according to this mathematical sense in Set Theory. Let us define:
S0 = {x | ∃ Gi : x ∈ Gi ∧ and Gi ℜam ct0 }
S1 = {x | ∃ Gi : x ∈ Gi ∧ and Gi ℜam ct1 }
S2 = {x | ∃ Gi : x ∈ Gi ∧ and Gi ℜam ct2 }
…
Sj = {x | ∃ Gi : x ∈ Gi ∧ and Gi ℜam ctj }
But, since the STEP categories are disjoint:
S = Υ Si ( Sh ∩ Sk = ∅ if h ≠ k )
Therefore it is a valid set partition, and this is the same as:
S0 = { c ∈ S | c can be associated as an element of category ct0 }
S1 = { c ∈ S | c can be associated as an element of category ct1 }
S2 = { c ∈ S | c can be associated as an element of category ct2 }
…
Sj = { c ∈ S | c can be associated as an element of category ctj }
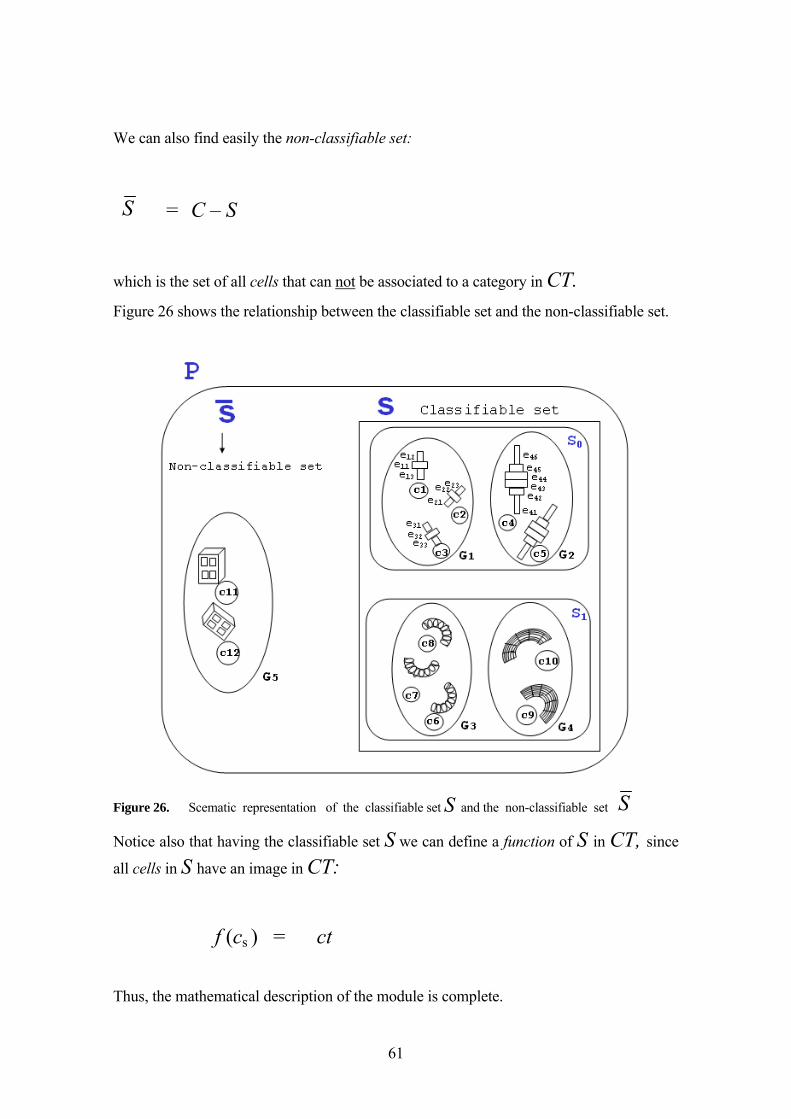
61
We can also find easily the non-classifiable set:
S = C – S
which is the set of all cells that can not be associated to a category in CT. Figure 26 shows the relationship between the classifiable set and the non-classifiable set.
Figure 26. Scematic representation of the classifiable set S and the non-classifiable set S Notice also that having the classifiable set S we can define a function of S in CT, since
all cells in S have an image in CT: f (cs ) = ct
Thus, the mathematical description of the module is complete.

62
Notice that the most important aspect of this module is to find a suitable algorithm that
implements the classification according to the relation ℜam (and indirectly, the
implementation of f (cs ) = ct .
This is not an easy task, and is basically what is now possible in the Mirowalk system with the help of semantic technologies modelling and semiautomatic classification as described in chapter 0 and in [PTWS05c] and [PWTS04a].

63
4.6 The Cell Concentration concept : qi / p
In this section we will introduce the concept of Cell Concentration. Aided by this concept and the definitions above, we will formulate later a semantic optimization problem of general nature for 3D CAD models in a specific domain, independent from the size of the model and the actual subsection rendered after culling.
In chemistry, concentration is the relative proportion of a substance in a solution or mixture. In an analogue manner we define the cell concentration of type i for a plant section as the relative proportion of cells of a specific type with respect to the total number of cells of that section.
Let:
P be the 3D CAD model of an Industrial Plant (see 4.2)
p be the number of cells in P (also P cardinality)
qi be the number of cells belonging to the class partition Si (see Table 4)
PS be a section (subset) of a plant P ( PS ⊂ P )
ps be the number of cells in PS (also PS cardinality)
qsi be the number of cells belonging to both Si and PS.
qi /p is the cell concentration of class i for a Plant P
qsi /ps is the cell concentration of class i for a Plant Section PS
We present some postulates related to the cell concentration qi /p are:
Postulate 1. For the specific domain of Plant Design (and other similar domains with
well constrained basic cells) Σ qi /p ≈ 1.0
In fact, Σ qi /p is an indirect measure of (i) the efficiency of the catalog reconstruction and standard adaptation modules, and (ii) the adjustment of the model to the expected characteristics of the domain. Although in basically all 3D CAD models of Plant Design it
64
is expected to find non classifiable cells according to the domain, a high proportion of the cells should belong to some Si.
Lemma 1.1. If Σ qi /p<< 0.5 either ℜam is not well defined, or f (cs ) = ct is not well implemented, or the reference standard is not complete, or the model is atypical for the domain.
This lemma is highly useful, since it helps to identify in an early stage of the semantic simplification if the necessary conditions from the model semantics perspective exist or not.
Lemma 1.2. Σ qi /p increases proportionally with the number of implemented categories in the ISO-STEP Adaptation module.
This is an interesting fact to consider in ongoing implementations of the module, since it as a direct effect on the semantic simplification: it depends on the covered categories in the standard. However, the focus should be to assign priorities of implementation to those Si that produce the highest number of triangles.
Postulate 2. The values of all qi /p tend to have similar values, within some limits, between different 3D CAD models of the same domain (in this case Plant Design), independently from the modeller used or the size of the model.
This is the consequence of two facts. First, all 3D CAD models in Plant Design share more or less the same kind of cells from a semantic perspective (but not from a geometric perspective!). This is indeed the basic idea behind the creation of a standard such as STEP ISO13013-AP227. Second, between models of complete plants (independently from the size/complexity or modeller used) it is true that the proportion between the different basic components is relatively similar: e.g. the number of valves is somehow proportional to the number of pipes, and so on. Empirical measures between the models studied have corroborated this fact. From this, it can be deduced that qi /p have similar values between different 3D CAD models of Plant Design.
Postulate 3. If PS is a spatial subsection of a complete plant P, then qsi /ps has the
general tendency to be similar to qi /p ( this is: qsi /ps ≅ qi /p )
65
This postulate expresses that a subset of a complete plant has basically a very similar cell concentration than the whole plant. This is however only true if
(i) it is a spatial subsection: this is, if the subsection is composed by all cells constrained between given spatial limits. Note that this is not true for a functional subsection or attribute subsection (e.g. only pipes, only green cells, …).
(ii) if the subsection is big enough to be representative for the whole plant (only a few cells are not representative).
Notice that this is somehow similar to the concept of uniform density in chemistry too: we are saying indirectly that the relative proportion of cells hold for the whole and for the part. However, in any case, it should be clearly stated that this is just a general tendency and that there may be spatial subsections in a model with different values for the cell concentration (as for instance a specialised room with only ventilation equipment).
Postulate 4. qi /p and qsi /ps can be directly calculated very fast, or predicted with relative confidence according to previously calculated cell concentrations in other models.
The calculation of cell concentrations, either for complete plants or for spatial subsections, is very easy since it is just the relation of a couple of counting operations. On the other hand, in some cases it might be useful to just predict the value of the cell concentrations for efficiency reasons, or to have approximate predefined values for some variables in the mathematical model. For the latter case, it is clear from Postulate 2 that precalculated values for some 3D CAD models are a good basis for prediction of new models.
4.7 The Functional Semantic Factor fsem and the Geometric Aesthetic Factor fges
We define two important concepts that will be used in the mathematical formulation:
the Functional Semantic Factor fsem and
the Geometric Aesthetic Factor fges.
These two factors weight the influence of a special technique and/or cell has on the walkthrough experience taking into account semantic and functional factors.
66
4.8 The Functional Semantic Factor fsem
This factor (with values between 0.0 and 1.0) has a numeric value used to quantify the relative influence of graphical representation of a cell with regard to functional and semantic considerations for a cell. Albeit the concrete value of fsem is somehow of subjective nature, it is very helpful to have this factor in numerical form, especially for its further mathematical treatment. Basically, this allows the weighting of the different techniques applied with regard to functional and semantic considerations.
The value of fsem quantifies the subjective effectiveness of the 3D graphical
representation of a cell ci ∈ Si in a walkthrough to convey the functional and semantic role of that representation for a specific user purpose and profile ( 0.0 is lowest, 1.0 is highest).
The functional and semantic role in the definition above relates exclusively with the ability the 3D representation to express the meaningful aspects of a cell with regard to its role for a specific user purpose and profile. As this 3D representation is a direct effect of the selected technique used to generate the tessellation of the cell, it is clear that:
fsem = f (user purpose, user profile, technique used, ci ∈ Si)
The Table 3 illustrates with some examples how the user purpose, user profile and technique used affect the value of fsem. Of course, the highest fsem values are better for the walkthrough purposes, when possible. The comments in the table explain some of the considerations related with fsem.
Notice that fsem has no considerations related to
- Aesthetic aspects
- Tessellation size (number of triangles)
These important aspects are considered in other factors, later on (especially fest).
Now, some comments about the examples in the table. First, the brute force tessellation technique seems to be the best technique for fsem. This corresponds to the intuitive idea that the user (any user) would prefer a very detailed representation since it conveys the most of the semantic / functional aspects. However, it must be noticed that other aspects,

67
especially the cost in number of triangles, not always allow this representation. A schema for optimal management of the resources, user purpose/ profile and model characteristics would probably choose a different technique when suitable, in order to decrease the number of triangles generated. Second, the Geometric LOD representation seems very similar in fsem values to the Semantic Symbol technique. This is indeed true, but with an important difference:
Although the fsem values of Geometric LOD and Semantic Symbols are similar, other factors (number of triangles and resources needed) are much smaller in the Semantic Symbols.
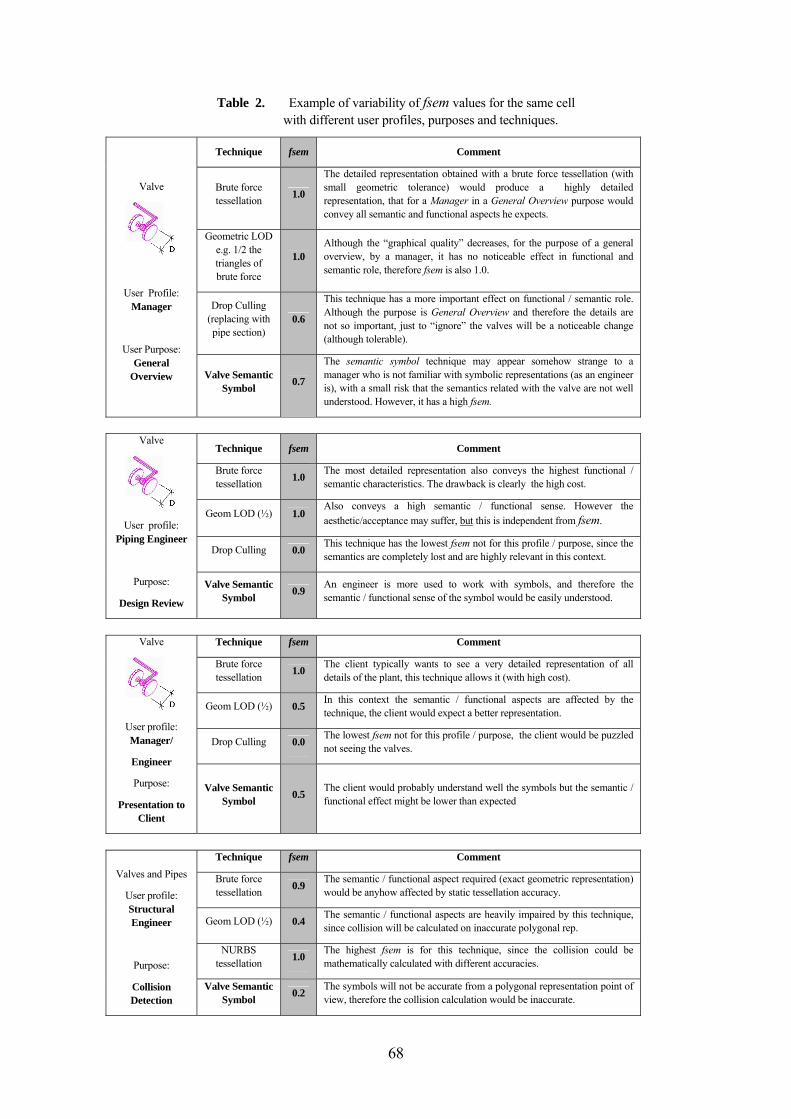
68
Table 2. Example of variability of fsem values for the same cell with different user profiles, purposes and techniques.
Technique fsem Comment
Brute force tessellation 1.0
The detailed representation obtained with a brute force tessellation (with small geometric tolerance) would produce a highly detailed representation, that for a Manager in a General Overview purpose would convey all semantic and functional aspects he expects.
Geometric LOD e.g. 1/2 the triangles of brute force
1.0 Although the “graphical quality” decreases, for the purpose of a general overview, by a manager, it has no noticeable effect in functional and semantic role, therefore fsem is also 1.0.
Drop Culling (replacing with pipe section)
0.6
This technique has a more important effect on functional / semantic role. Although the purpose is General Overview and therefore the details are not so important, just to “ignore” the valves will be a noticeable change (although tolerable).
Valve
User Profile: Manager
User Purpose: General
Overview Valve Semantic Symbol 0.7
The semantic symbol technique may appear somehow strange to a manager who is not familiar with symbolic representations (as an engineer is), with a small risk that the semantics related with the valve are not well understood. However, it has a high fsem.
Technique fsem Comment
Brute force tessellation 1.0 The most detailed representation also conveys the highest functional /
semantic characteristics. The drawback is clearly the high cost.
Geom LOD (½) 1.0 Also conveys a high semantic / functional sense. However the aesthetic/acceptance may suffer, but this is independent from fsem.
Drop Culling 0.0 This technique has the lowest fsem not for this profile / purpose, since the semantics are completely lost and are highly relevant in this context.
Valve
User profile: Piping Engineer
Purpose:
Design Review
Valve Semantic Symbol 0.9 An engineer is more used to work with symbols, and therefore the
semantic / functional sense of the symbol would be easily understood.
Technique fsem Comment
Brute force tessellation 1.0 The client typically wants to see a very detailed representation of all
details of the plant, this technique allows it (with high cost).
Geom LOD (½) 0.5 In this context the semantic / functional aspects are affected by the technique, the client would expect a better representation.
Drop Culling 0.0 The lowest fsem not for this profile / purpose, the client would be puzzled not seeing the valves.
Valve
User profile: Manager/
Engineer
Purpose:
Presentation to Client
Valve Semantic Symbol 0.5 The client would probably understand well the symbols but the semantic /
functional effect might be lower than expected
Technique fsem Comment
Brute force tessellation 0.9 The semantic / functional aspect required (exact geometric representation)
would be anyhow affected by static tessellation accuracy.
Geom LOD (½) 0.4 The semantic / functional aspects are heavily impaired by this technique, since collision will be calculated on inaccurate polygonal rep.
NURBS tessellation 1.0 The highest fsem is for this technique, since the collision could be
mathematically calculated with different accuracies.
Valves and Pipes
User profile: Structural Engineer
Purpose:
Collision Detection
Valve Semantic Symbol 0.2 The symbols will not be accurate from a polygonal representation point of
view, therefore the collision calculation would be inaccurate.
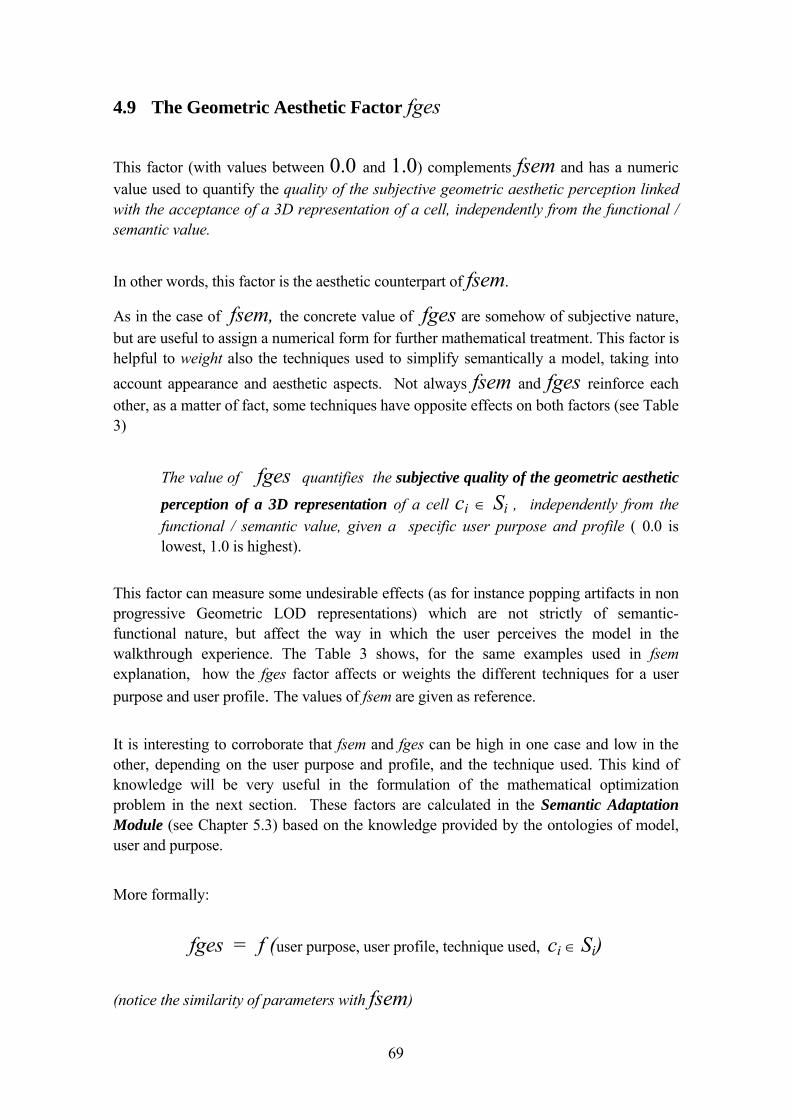
69
4.9 The Geometric Aesthetic Factor fges
This factor (with values between 0.0 and 1.0) complements fsem and has a numeric value used to quantify the quality of the subjective geometric aesthetic perception linked with the acceptance of a 3D representation of a cell, independently from the functional / semantic value.
In other words, this factor is the aesthetic counterpart of fsem.
As in the case of fsem, the concrete value of fges are somehow of subjective nature, but are useful to assign a numerical form for further mathematical treatment. This factor is helpful to weight also the techniques used to simplify semantically a model, taking into account appearance and aesthetic aspects. Not always fsem and fges reinforce each other, as a matter of fact, some techniques have opposite effects on both factors (see Table 3)
The value of fges quantifies the subjective quality of the geometric aesthetic
perception of a 3D representation of a cell ci ∈ Si , independently from the functional / semantic value, given a specific user purpose and profile ( 0.0 is lowest, 1.0 is highest).
This factor can measure some undesirable effects (as for instance popping artifacts in non progressive Geometric LOD representations) which are not strictly of semantic- functional nature, but affect the way in which the user perceives the model in the walkthrough experience. The Table 3 shows, for the same examples used in fsem explanation, how the fges factor affects or weights the different techniques for a user purpose and user profile. The values of fsem are given as reference. It is interesting to corroborate that fsem and fges can be high in one case and low in the other, depending on the user purpose and profile, and the technique used. This kind of knowledge will be very useful in the formulation of the mathematical optimization problem in the next section. These factors are calculated in the Semantic Adaptation Module (see Chapter 5.3) based on the knowledge provided by the ontologies of model, user and purpose. More formally:
fges = f (user purpose, user profile, technique used, ci ∈ Si)
(notice the similarity of parameters with fsem)
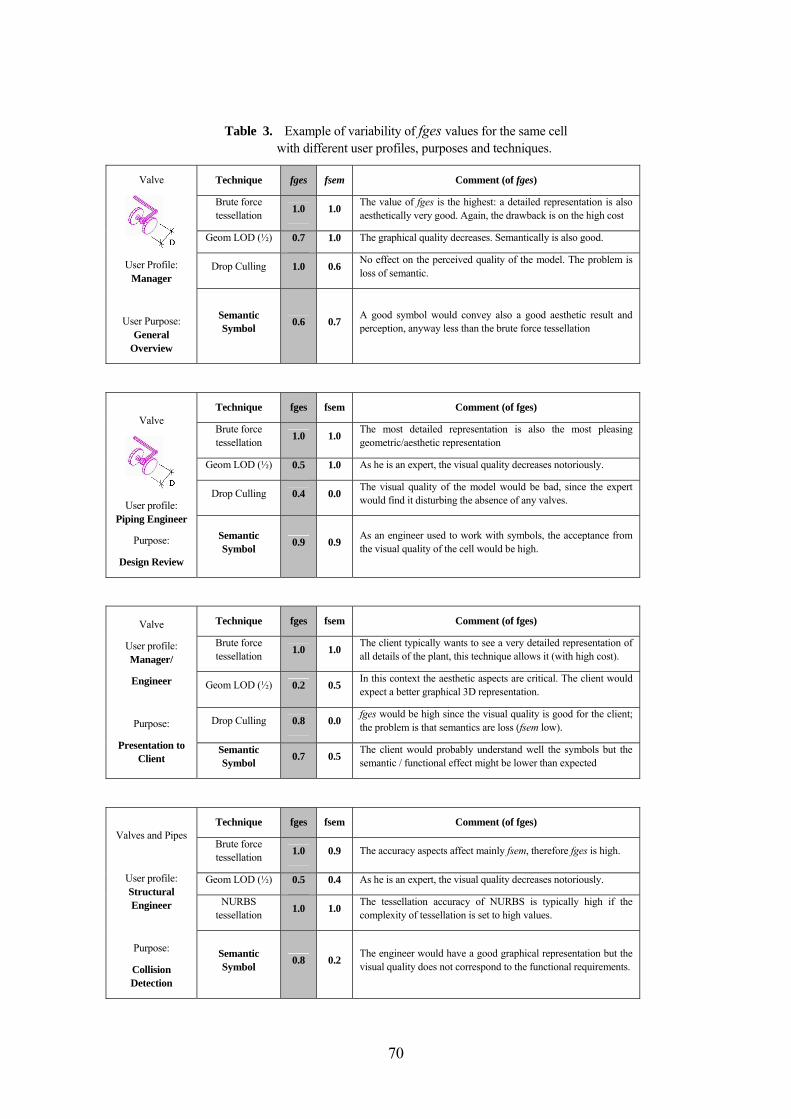
70
Table 3. Example of variability of fges values for the same cell with different user profiles, purposes and techniques.
Technique fges fsem Comment (of fges)
Brute force tessellation 1.0 1.0 The value of fges is the highest: a detailed representation is also
aesthetically very good. Again, the drawback is on the high cost
Geom LOD (½) 0.7 1.0 The graphical quality decreases. Semantically is also good.
Drop Culling 1.0 0.6 No effect on the perceived quality of the model. The problem is loss of semantic.
Valve
User Profile: Manager
User Purpose: General
Overview
Semantic Symbol 0.6 0.7 A good symbol would convey also a good aesthetic result and
perception, anyway less than the brute force tessellation
Technique fges fsem Comment (of fges)
Brute force tessellation 1.0 1.0 The most detailed representation is also the most pleasing
geometric/aesthetic representation
Geom LOD (½) 0.5 1.0 As he is an expert, the visual quality decreases notoriously.
Drop Culling 0.4 0.0 The visual quality of the model would be bad, since the expert would find it disturbing the absence of any valves.
Valve
User profile: Piping Engineer
Purpose:
Design Review
Semantic Symbol 0.9 0.9 As an engineer used to work with symbols, the acceptance from
the visual quality of the cell would be high.
Technique fges fsem Comment (of fges)
Brute force tessellation 1.0 1.0 The client typically wants to see a very detailed representation of
all details of the plant, this technique allows it (with high cost).
Geom LOD (½) 0.2 0.5 In this context the aesthetic aspects are critical. The client would expect a better graphical 3D representation.
Drop Culling 0.8 0.0 fges would be high since the visual quality is good for the client; the problem is that semantics are loss (fsem low).
Valve
User profile: Manager/
Engineer
Purpose:
Presentation to Client
Semantic Symbol 0.7 0.5 The client would probably understand well the symbols but the
semantic / functional effect might be lower than expected
Technique fges fsem Comment (of fges)
Brute force tessellation 1.0 0.9 The accuracy aspects affect mainly fsem, therefore fges is high.
Geom LOD (½) 0.5 0.4 As he is an expert, the visual quality decreases notoriously.
NURBS tessellation 1.0 1.0 The tessellation accuracy of NURBS is typically high if the
complexity of tessellation is set to high values.
Valves and Pipes
User profile: Structural Engineer
Purpose:
Collision Detection
Semantic Symbol 0.8 0.2 The engineer would have a good graphical representation but the
visual quality does not correspond to the functional requirements.
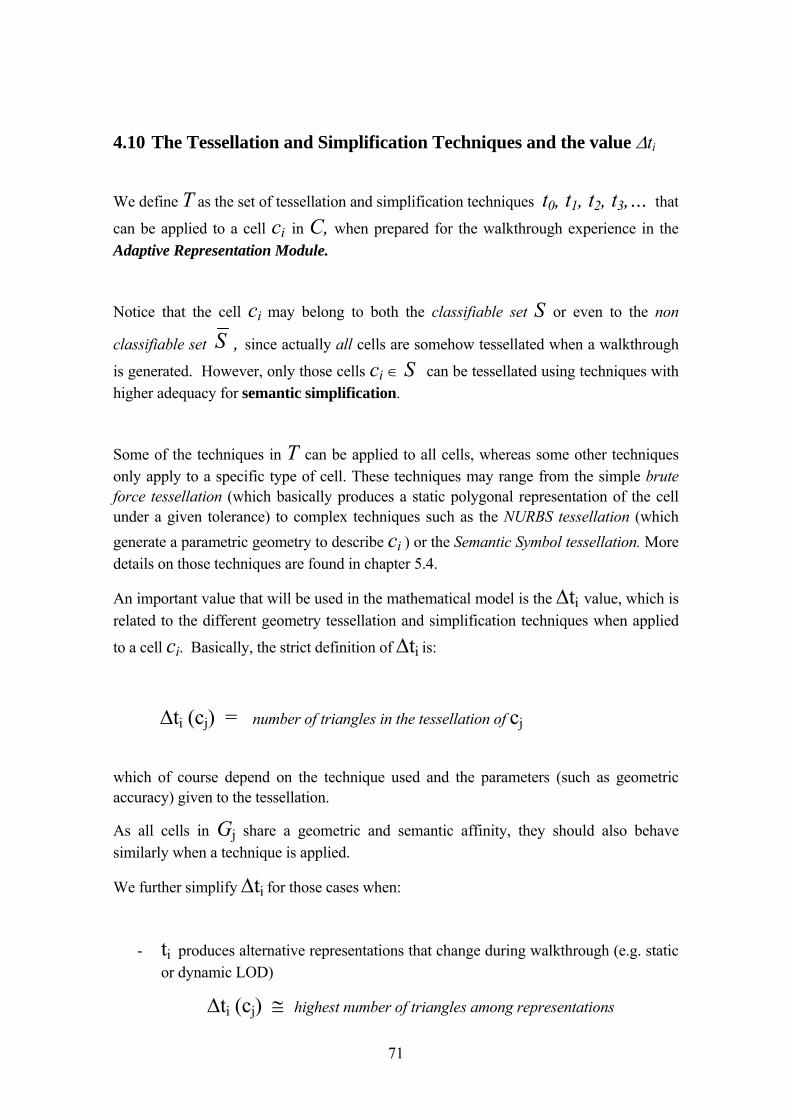
71
4.10 The Tessellation and Simplification Techniques and the value ∆ti
We define T as the set of tessellation and simplification techniques t0, t1, t2, t3,… that
can be applied to a cell ci in C, when prepared for the walkthrough experience in the Adaptive Representation Module.
Notice that the cell ci may belong to both the classifiable set S or even to the non
classifiable set S , since actually all cells are somehow tessellated when a walkthrough
is generated. However, only those cells ci ∈ S can be tessellated using techniques with higher adequacy for semantic simplification.
Some of the techniques in T can be applied to all cells, whereas some other techniques only apply to a specific type of cell. These techniques may range from the simple brute force tessellation (which basically produces a static polygonal representation of the cell under a given tolerance) to complex techniques such as the NURBS tessellation (which generate a parametric geometry to describe ci ) or the Semantic Symbol tessellation. More details on those techniques are found in chapter 5.4.
An important value that will be used in the mathematical model is the ∆ti value, which is related to the different geometry tessellation and simplification techniques when applied
to a cell ci. Basically, the strict definition of ∆ti is:
∆ti (cj) = number of triangles in the tessellation of cj
which of course depend on the technique used and the parameters (such as geometric accuracy) given to the tessellation.
As all cells in Gj share a geometric and semantic affinity, they should also behave similarly when a technique is applied.
We further simplify ∆ti for those cases when:
- ti produces alternative representations that change during walkthrough (e.g. static or dynamic LOD)
∆ti (cj) ≅ highest number of triangles among representations
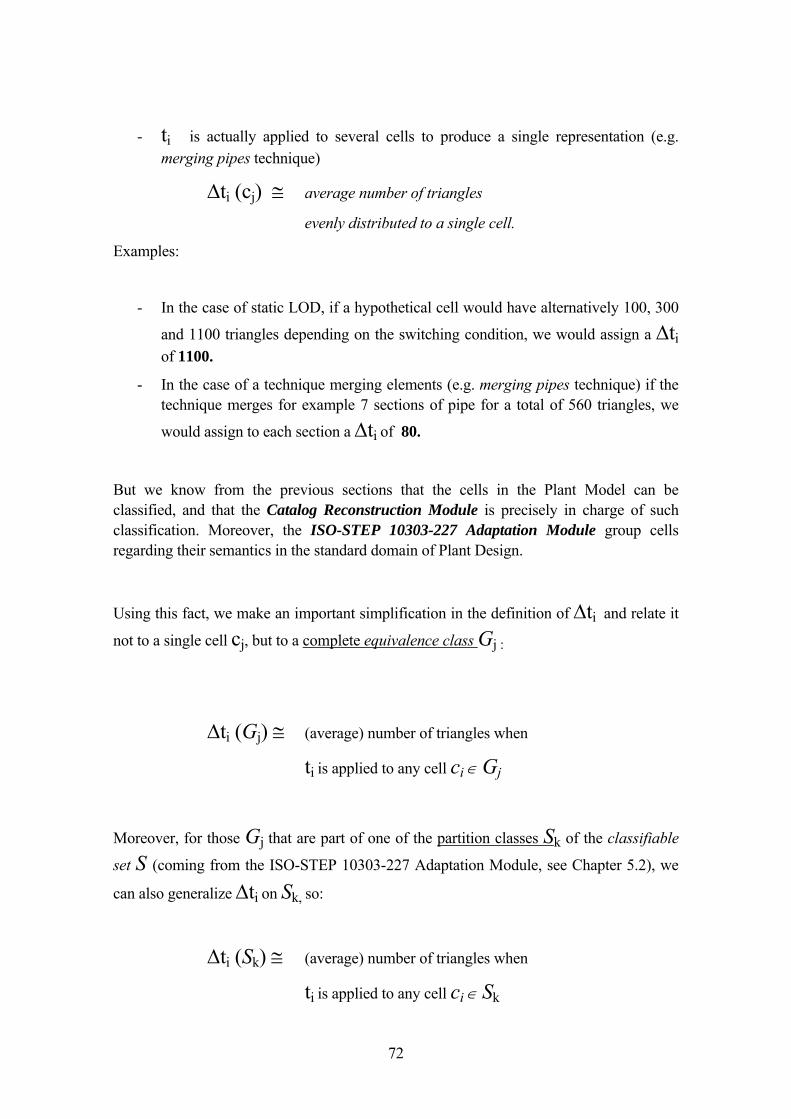
72
- ti is actually applied to several cells to produce a single representation (e.g. merging pipes technique)
∆ti (cj) ≅ average number of triangles
evenly distributed to a single cell.
Examples:
- In the case of static LOD, if a hypothetical cell would have alternatively 100, 300
and 1100 triangles depending on the switching condition, we would assign a ∆ti of 1100.
- In the case of a technique merging elements (e.g. merging pipes technique) if the technique merges for example 7 sections of pipe for a total of 560 triangles, we
would assign to each section a ∆ti of 80.
But we know from the previous sections that the cells in the Plant Model can be classified, and that the Catalog Reconstruction Module is precisely in charge of such classification. Moreover, the ISO-STEP 10303-227 Adaptation Module group cells regarding their semantics in the standard domain of Plant Design.
Using this fact, we make an important simplification in the definition of ∆ti and relate it
not to a single cell cj, but to a complete equivalence class Gj :
∆ti (Gj) ≅ (average) number of triangles when
ti is applied to any cell ci ∈ Gj
Moreover, for those Gj that are part of one of the partition classes S k of the classifiable
set S (coming from the ISO-STEP 10303-227 Adaptation Module, see Chapter 5.2), we
can also generalize ∆ti on Sk, so:
∆ti (Sk) ≅ (average) number of triangles when
ti is applied to any cell ci ∈ Sk

73
4.11 The Semantic Simplification Model as an Optimization Problem
So far we have introduced different mathematical concepts applied to the semantic simplification system. Now, we will use all the concepts described in this section to formulate, in a mathematical form:
A general optimization problem whose solution can answer the basic questions regarding the application of semantic steered techniques to a specific combination of model characteristics, user profile/needs and available resources.
This is, basically, a mathematical formulation of how the simplification techniques have to be applied optimally, considering semantic criteria, in order to solve the questions presented in the introduction of this chapter: optimal combination of techniques, influence of semantic aspects, impact, etc.
4.12 Focus on Object-based techniques instead space-based techniques
Before proceeding with the mathematical model, it is important to emphasize that my approach is focused on object-based tessellation techniques, not on spatial distribution and culling techniques.
It has been shown by several researchers (conspicuously the group of Dinesh Manocha in UNC, [MAN99]) that advanced culling and spatial partitioning techniques are indeed a key factor to achieve interactive rates in Design Review Walkthroughs for large 3D CAD models. Clearly, if a system manages to compute and send efficiently to the rendering pipeline only the visible elements in the current view, the possibility to get 10 fps or more is much more manageable taking into account two facts:
(i) Most of the times the user in a Plant Design walkthrough is looking attentively only to subsection with a small fraction of elements, and
(ii) The increasing processing power of the graphic cards is much closer to handle directly –without much optimizations- typical visible sets after efficient culling.
However it must be emphasized that an efficient use of the resources also depends heavily on the way in which the individual components are tessellated, with object based
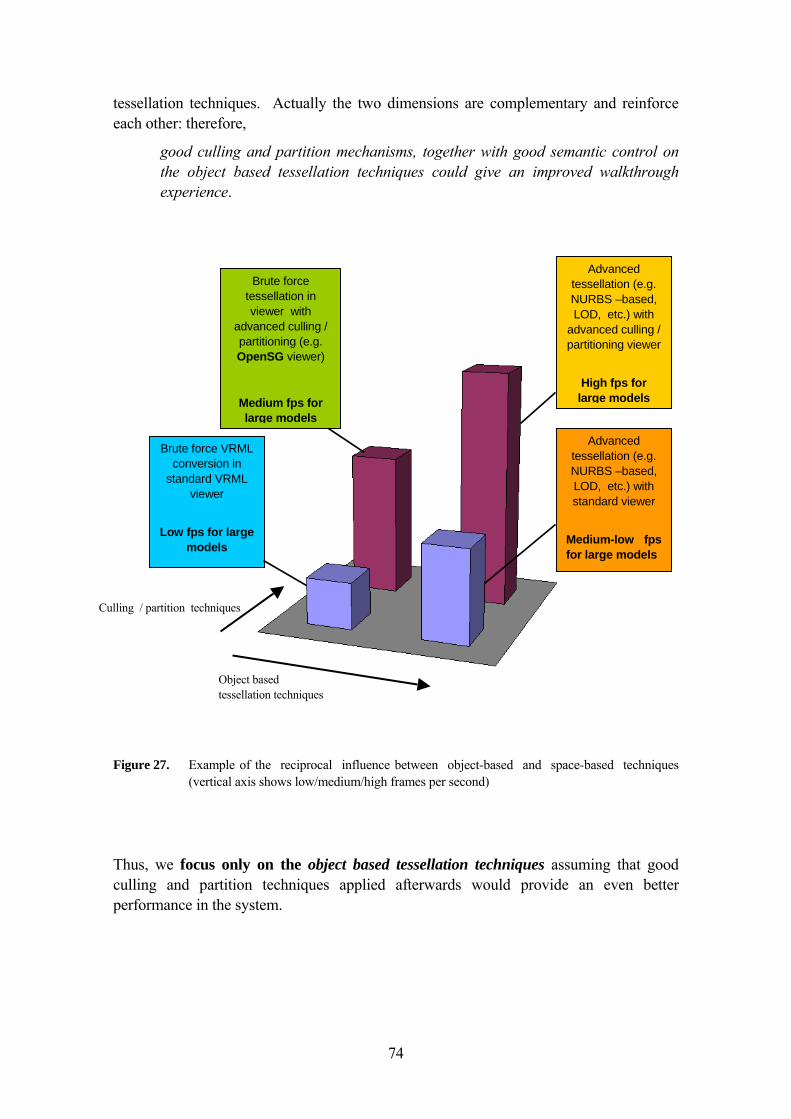
74
tessellation techniques. Actually the two dimensions are complementary and reinforce each other: therefore,
good culling and partition mechanisms, together with good semantic control on the object based tessellation techniques could give an improved walkthrough experience.
Figure 27. Example of the reciprocal influence between object-based and space-based techniques
(vertical axis shows low/medium/high frames per second)
Thus, we focus only on the object based tessellation techniques assuming that good culling and partition techniques applied afterwards would provide an even better performance in the system.
Object based tessellation techniques
Culling / partition techniques
Advanced tessellation (e.g. NURBS –based, LOD, etc.) with standard viewer
Medium-low fpsfor large models
Advanced tessellation (e.g. NURBS –based, LOD, etc.) with
advanced culling / partitioning viewer
High fps for
large models
Brute force tessellation in viewer with
advanced culling / partitioning (e.g. OpenSG viewer)
Medium fps for large models
Brute force VRML conversion in
standard VRML viewer
Low fps for large
models
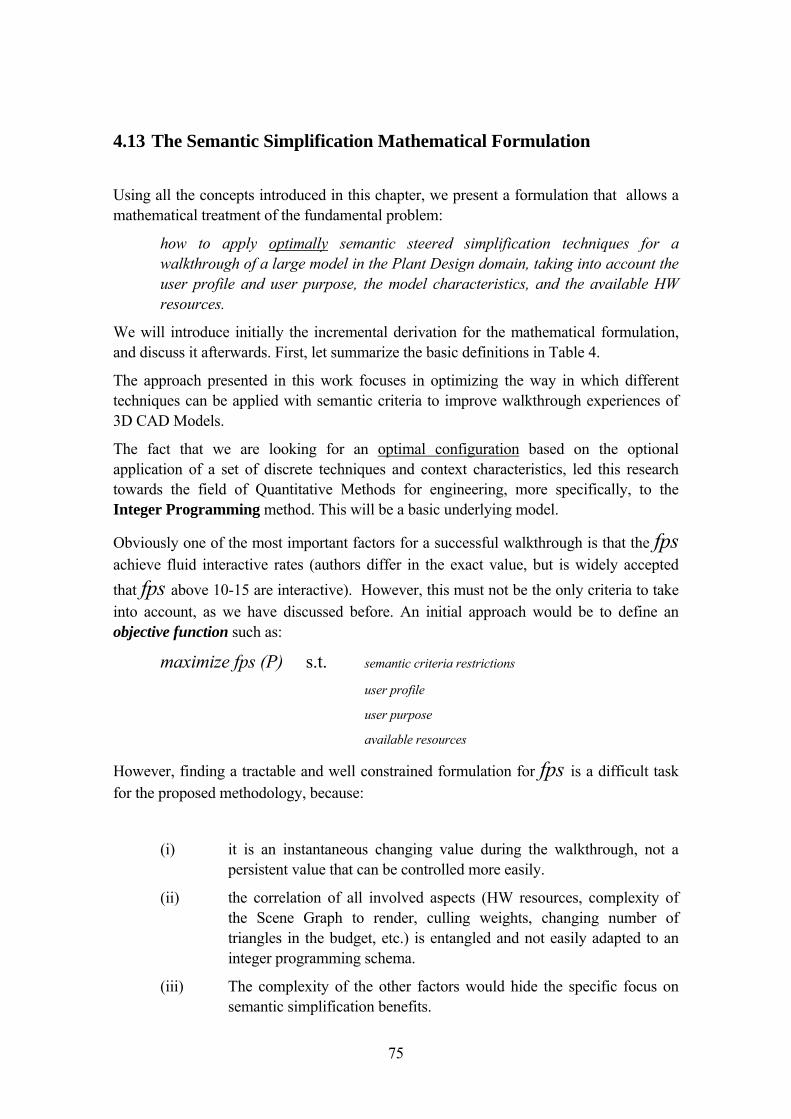
75
4.13 The Semantic Simplification Mathematical Formulation
Using all the concepts introduced in this chapter, we present a formulation that allows a mathematical treatment of the fundamental problem:
how to apply optimally semantic steered simplification techniques for a walkthrough of a large model in the Plant Design domain, taking into account the user profile and user purpose, the model characteristics, and the available HW resources.
We will introduce initially the incremental derivation for the mathematical formulation, and discuss it afterwards. First, let summarize the basic definitions in Table 4.
The approach presented in this work focuses in optimizing the way in which different techniques can be applied with semantic criteria to improve walkthrough experiences of 3D CAD Models.
The fact that we are looking for an optimal configuration based on the optional application of a set of discrete techniques and context characteristics, led this research towards the field of Quantitative Methods for engineering, more specifically, to the Integer Programming method. This will be a basic underlying model.
Obviously one of the most important factors for a successful walkthrough is that the fps achieve fluid interactive rates (authors differ in the exact value, but is widely accepted that fps above 10-15 are interactive). However, this must not be the only criteria to take into account, as we have discussed before. An initial approach would be to define an objective function such as:
maximize fps (P) s.t. semantic criteria restrictions
user profile
user purpose
available resources
However, finding a tractable and well constrained formulation for fps is a difficult task for the proposed methodology, because:
(i) it is an instantaneous changing value during the walkthrough, not a persistent value that can be controlled more easily.
(ii) the correlation of all involved aspects (HW resources, complexity of the Scene Graph to render, culling weights, changing number of triangles in the budget, etc.) is entangled and not easily adapted to an integer programming schema.
(iii) The complexity of the other factors would hide the specific focus on semantic simplification benefits.
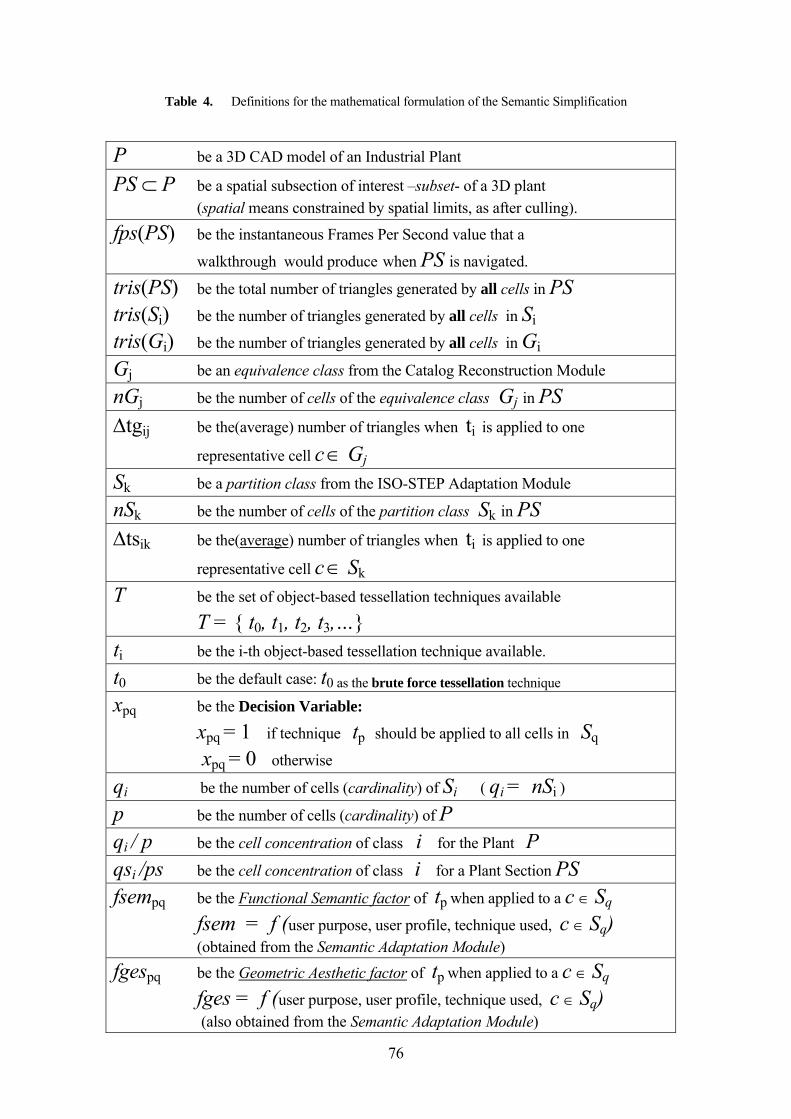
76
Table 4. Definitions for the mathematical formulation of the Semantic Simplification
P be a 3D CAD model of an Industrial Plant PS ⊂ P be a spatial subsection of interest –subset- of a 3D plant (spatial means constrained by spatial limits, as after culling).
fps(PS) be the instantaneous Frames Per Second value that a
walkthrough would produce when PS is navigated. tris(PS) be the total number of triangles generated by all cells in PS tris(Si) be the number of triangles generated by all cells in Si tris(Gi) be the number of triangles generated by all cells in Gi
Gj be an equivalence class from the Catalog Reconstruction Module nGj be the number of cells of the equivalence class Gj in PS ∆tgij be the(average) number of triangles when ti is applied to one
representative cell c ∈ Gj
Sk be a partition class from the ISO-STEP Adaptation Module nSk be the number of cells of the partition class Sk in PS ∆tsik be the(average) number of triangles when ti is applied to one
representative cell c ∈ Sk
T be the set of object-based tessellation techniques available
T = { t0, t1, t2, t3,…} ti be the i-th object-based tessellation technique available. t0 be the default case: t0 as the brute force tessellation technique
xpq be the Decision Variable:
xpq = 1 if technique tp should be applied to all cells in Sq
xpq = 0 otherwise
qi be the number of cells (cardinality) of Si ( qi = nSi )
p be the number of cells (cardinality) of P qi / p be the cell concentration of class i for the Plant P qsi /ps be the cell concentration of class i for a Plant Section PS fsempq be the Functional Semantic factor of tp when applied to a c ∈ Sq fsem = f (user purpose, user profile, technique used, c ∈ Sq) (obtained from the Semantic Adaptation Module) fgespq be the Geometric Aesthetic factor of tp when applied to a c ∈ Sq fges = f (user purpose, user profile, technique used, c ∈ Sq) (also obtained from the Semantic Adaptation Module)
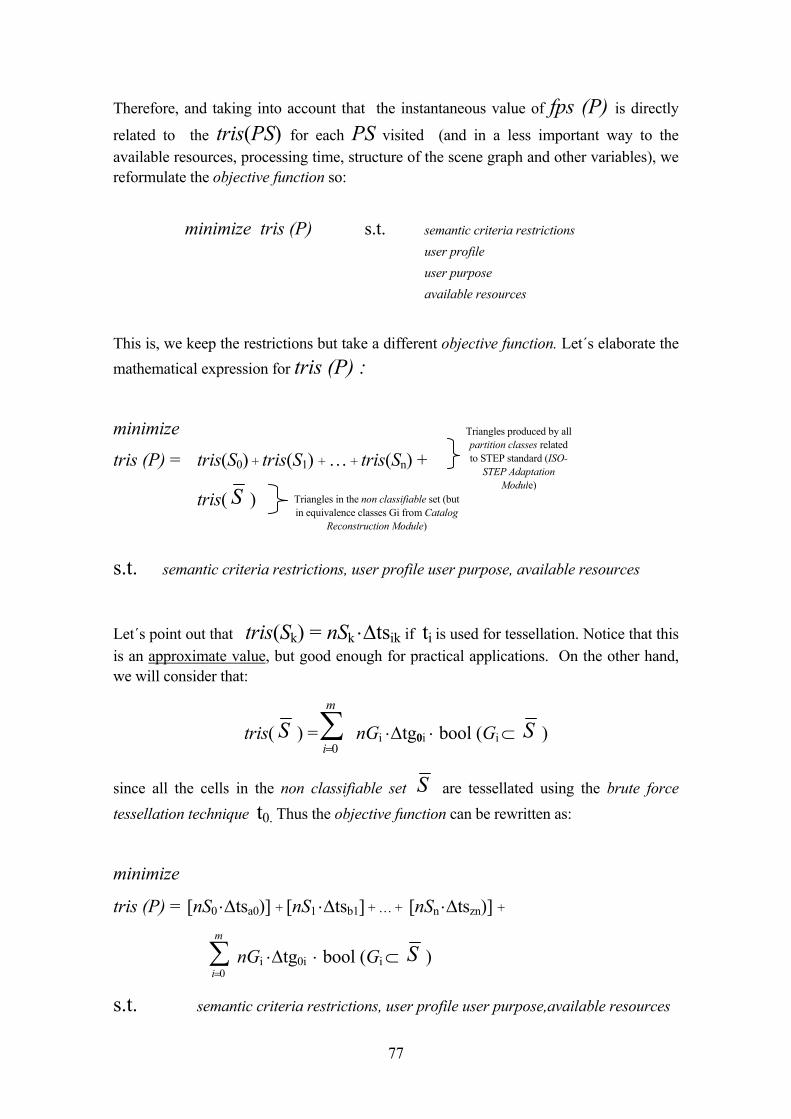
77
Therefore, and taking into account that the instantaneous value of fps (P) is directly
related to the tris(PS) for each PS visited (and in a less important way to the available resources, processing time, structure of the scene graph and other variables), we reformulate the objective function so:
minimize tris (P) s.t. semantic criteria restrictions user profile user purpose available resources
This is, we keep the restrictions but take a different objective function. Let´s elaborate the mathematical expression for tris (P) :
minimize
tris (P) = tris(S0) + tris(S1) + … + tris(Sn) +
tris( S ) s.t. semantic criteria restrictions, user profile user purpose, available resources
Let´s point out that tris(Sk) = nSk ⋅∆tsik if ti is used for tessellation. Notice that this is an approximate value, but good enough for practical applications. On the other hand, we will consider that:
tris( S ) =∑=
m
i 0 nGi ⋅∆tg0i ⋅ bool (Gi ⊂ S )
since all the cells in the non classifiable set S are tessellated using the brute force tessellation technique t0. Thus the objective function can be rewritten as:
minimize
tris (P) = [nS0 ⋅∆tsa0)] + [nS1 ⋅∆tsb1] + … + [nSn ⋅∆tszn)] +
∑=
m
i 0nGi ⋅∆tg0i ⋅ bool (Gi ⊂ S )
s.t. semantic criteria restrictions, user profile user purpose,available resources
Triangles produced by all partition classes related to STEP standard (ISO-
STEP Adaptation Module)
Triangles in the non classifiable set (but in equivalence classes Gi from Catalog
Reconstruction Module)
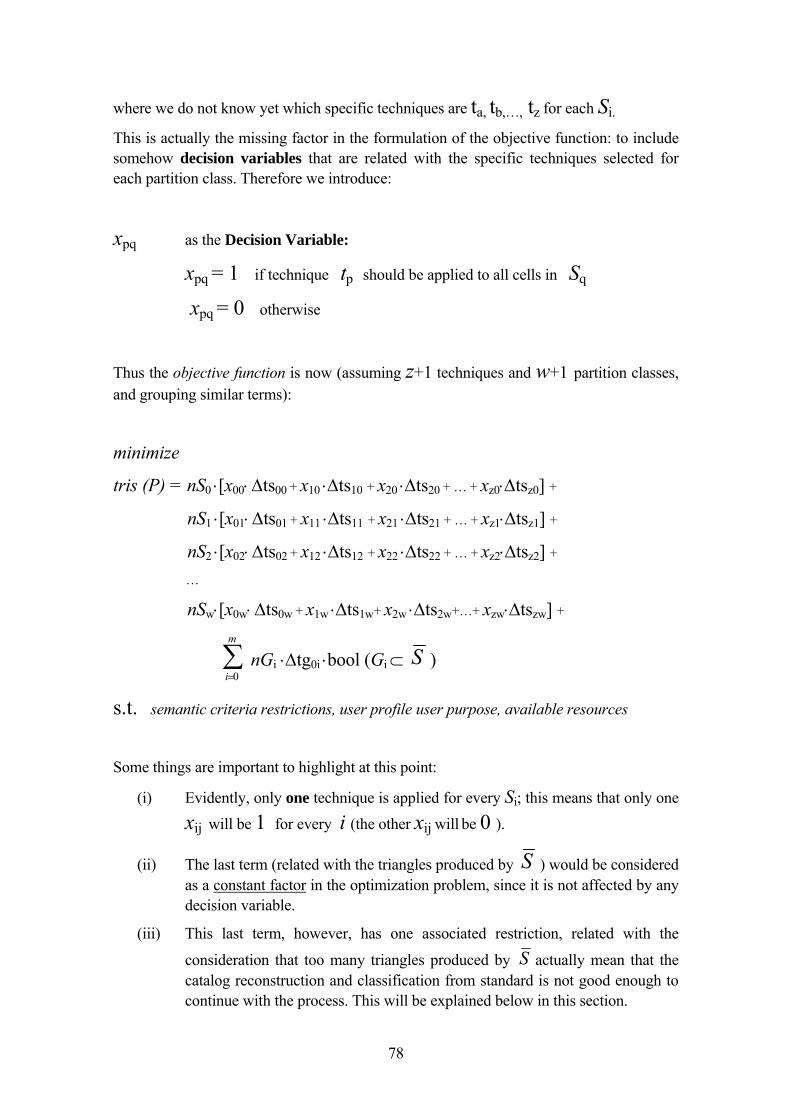
78
where we do not know yet which specific techniques are ta, tb,…, tz for each Si.
This is actually the missing factor in the formulation of the objective function: to include somehow decision variables that are related with the specific techniques selected for each partition class. Therefore we introduce:
xpq as the Decision Variable:
xpq = 1 if technique tp should be applied to all cells in Sq
xpq = 0 otherwise
Thus the objective function is now (assuming z+1 techniques and w+1 partition classes, and grouping similar terms):
minimize
tris (P) = nS0 ⋅[x00⋅ ∆ts00 + x10 ⋅∆ts10 + x20 ⋅∆ts20 + … + xz0⋅∆tsz0] +
nS1 ⋅[x01⋅ ∆ts01 + x11 ⋅∆ts11 + x21 ⋅∆ts21 + … + xz1⋅∆tsz1] +
nS2 ⋅[x02⋅ ∆ts02 + x12 ⋅∆ts12 + x22 ⋅∆ts22 + … + xz2⋅∆tsz2] +
…
nSw⋅[x0w⋅ ∆ts0w + x1w ⋅∆ts1w+ x2w ⋅∆ts2w+…+ xzw⋅∆tszw] +
∑=
m
i 0nGi ⋅∆tg0i ⋅bool (Gi ⊂ S )
s.t. semantic criteria restrictions, user profile user purpose, available resources
Some things are important to highlight at this point:
(i) Evidently, only one technique is applied for every Si; this means that only one xij will be 1 for every i (the other xij will be 0 ).
(ii) The last term (related with the triangles produced by S ) would be considered as a constant factor in the optimization problem, since it is not affected by any decision variable.
(iii) This last term, however, has one associated restriction, related with the
consideration that too many triangles produced by S actually mean that the catalog reconstruction and classification from standard is not good enough to continue with the process. This will be explained below in this section.

79
(iv) From the z techniques available, not all are applicable to every partition class
in S. This will be also explained below as a constraint.
4.14 A predictive variant of the objective function based on cell concentrations qi/p
In the current form, the objective function depends on the number of cells nSi of each partition class for a specific P. This form is useful in case there are enough resources to
actually count the number of elements in a plant P or in a plant section PS as well as in every partition class Si. This of course would give a more accurate value for tris (P). Notice that in the case of plant sections PS, these values should be calculated constantly
in real time for different PS in a walkthrough.
However, in many cases it is useful to have as well a predictive variant of the objective function that doesn’t require a constant calculation of nSi for all PS. Furthermore, it would be useful to have a simplification of the objective function that could be applied to:
• several models of plants P of the same domain, or
• different sections PS of the same plant P
My approach in this direction is based on the Postulate 2 and Postulate 3 presented in the cell concentration section:
- The values of all qi /p tend to have similar values, within some limits, between different 3D CAD models of the same domain (in this case Plant Design), independently from the modeller used or the size of the model.
- If PS is a spatial subsection of a complete plant P, then qsi /ps has the general
tendency to be similar to qi /p (thus: qsi /ps ≅ qi /p )
Thus, we divide the whole objective function by the total number of cells p of the plant, and considering that
qi /p = nSi / p
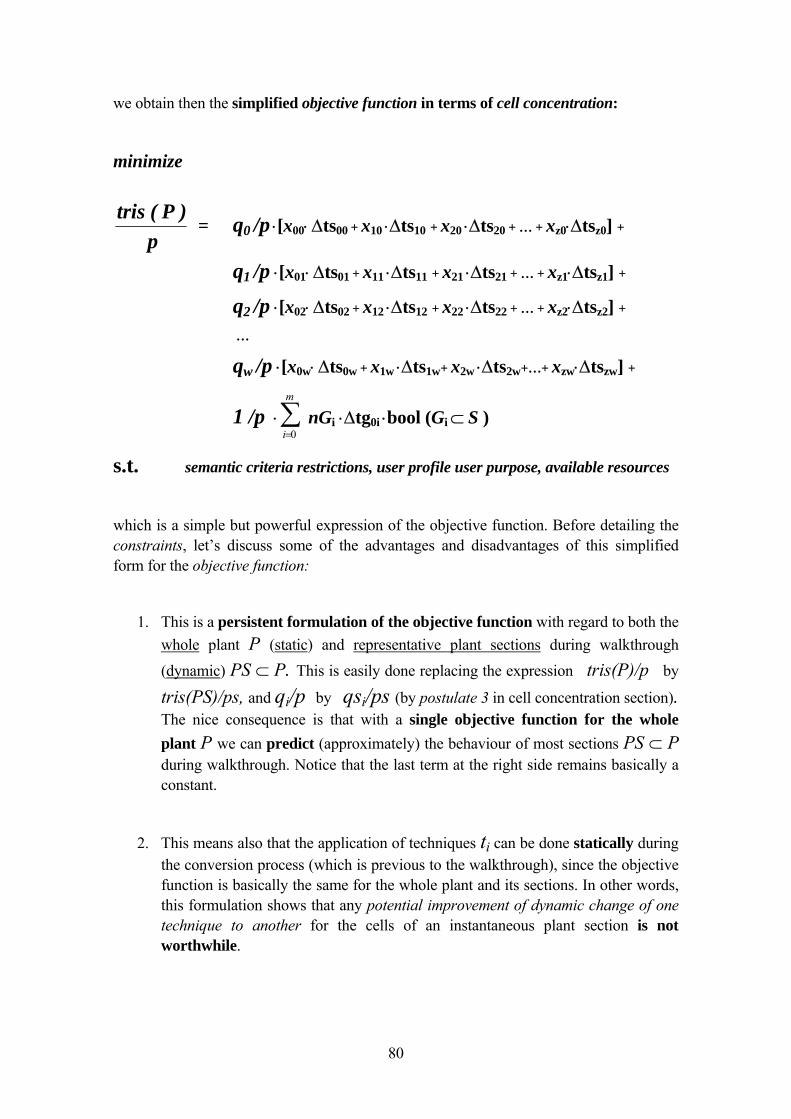
80
we obtain then the simplified objective function in terms of cell concentration:
minimize
p)P(tris
= q0 /p ⋅[x00⋅ ∆ts00 + x10 ⋅∆ts10 + x20 ⋅∆ts20 + … + xz0⋅∆tsz0] +
q1 /p ⋅[x01⋅ ∆ts01 + x11 ⋅∆ts11 + x21 ⋅∆ts21 + … + xz1⋅∆tsz1] +
q2 /p ⋅[x02⋅ ∆ts02 + x12 ⋅∆ts12 + x22 ⋅∆ts22 + … + xz2⋅∆tsz2] +
…
qw /p ⋅[x0w⋅ ∆ts0w + x1w ⋅∆ts1w+ x2w ⋅∆ts2w+…+ xzw⋅∆tszw] +
1 /p ⋅∑=
m
i 0nGi ⋅∆tg0i ⋅bool (Gi ⊂ S )
s.t. semantic criteria restrictions, user profile user purpose, available resources
which is a simple but powerful expression of the objective function. Before detailing the constraints, let’s discuss some of the advantages and disadvantages of this simplified form for the objective function:
1. This is a persistent formulation of the objective function with regard to both the whole plant P (static) and representative plant sections during walkthrough (dynamic) PS ⊂ P. This is easily done replacing the expression tris(P)/p by
tris(PS)/ps, and qi/p by qsi/ps (by postulate 3 in cell concentration section). The nice consequence is that with a single objective function for the whole plant P we can predict (approximately) the behaviour of most sections PS ⊂ P during walkthrough. Notice that the last term at the right side remains basically a constant.
2. This means also that the application of techniques ti can be done statically during the conversion process (which is previous to the walkthrough), since the objective function is basically the same for the whole plant and its sections. In other words, this formulation shows that any potential improvement of dynamic change of one technique to another for the cells of an instantaneous plant section is not worthwhile.

81
3. If there is enough statistical treatment of the cell concentrations (for different but representative 3D CAD models of the Plant Design domain), approximate values of qi /p (e.g. means with some variation) could be pre-calculated. This would provide a way to proceed directly with the optimization function without the need of actually counting the number of cells of a specific plant / section (although this should not be very costly). This is also a consequence of the fact that the 3D CAD models belong to a well structured domain where all models share similar characteristics independently from the modeller used or the size of the model.
4. Expressed in this form, the objective function is actually expressing the inner structure of the distribution of standard components of a plant or plant section, letting the optimization weight basically the optimal cost in number of triangles based on the technique applied to each component (the constraints will balance this including semantic aspects).
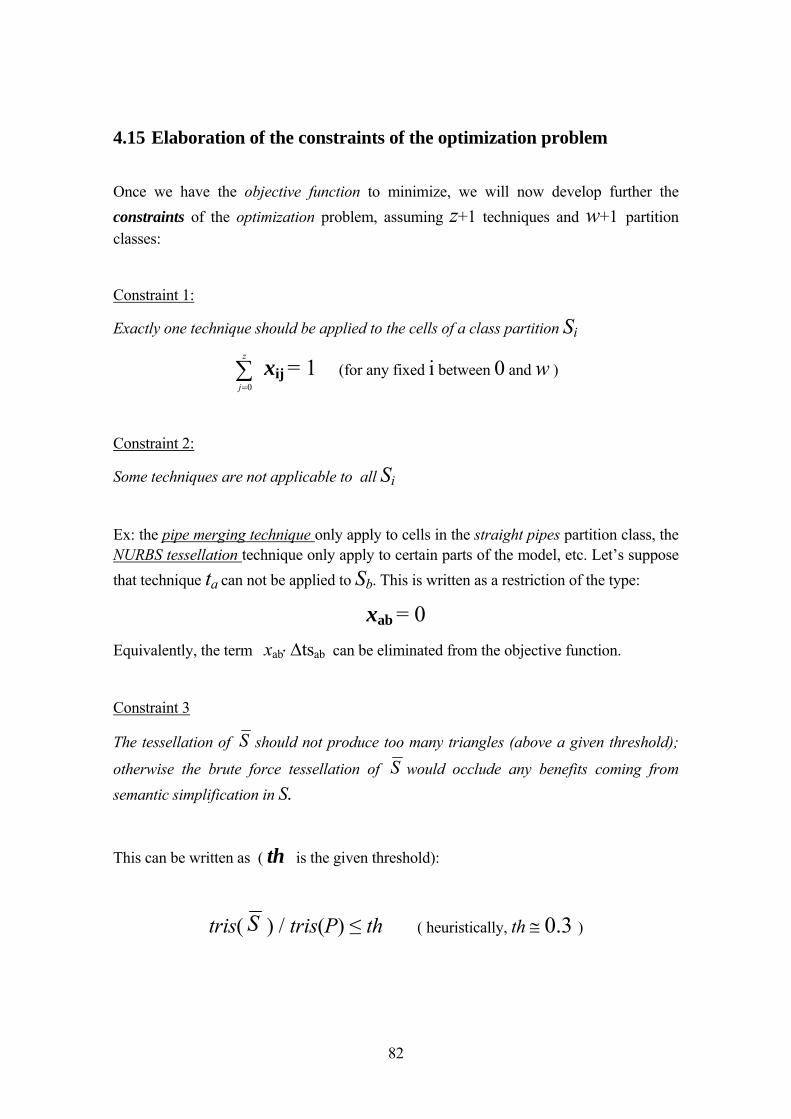
82
4.15 Elaboration of the constraints of the optimization problem
Once we have the objective function to minimize, we will now develop further the constraints of the optimization problem, assuming z+1 techniques and w+1 partition classes:
Constraint 1:
Exactly one technique should be applied to the cells of a class partition Si
∑=
z
j 0xij = 1 (for any fixed i between 0 and w )
Constraint 2:
Some techniques are not applicable to all Si
Ex: the pipe merging technique only apply to cells in the straight pipes partition class, the NURBS tessellation technique only apply to certain parts of the model, etc. Let’s suppose that technique ta can not be applied to Sb. This is written as a restriction of the type:
xab = 0 Equivalently, the term xab⋅ ∆tsab can be eliminated from the objective function.
Constraint 3
The tessellation of S should not produce too many triangles (above a given threshold);
otherwise the brute force tessellation of S would occlude any benefits coming from semantic simplification in S.
This can be written as ( th is the given threshold):
tris( S ) / tris(P) ≤ th ( heuristically, th ≅ 0.3 )
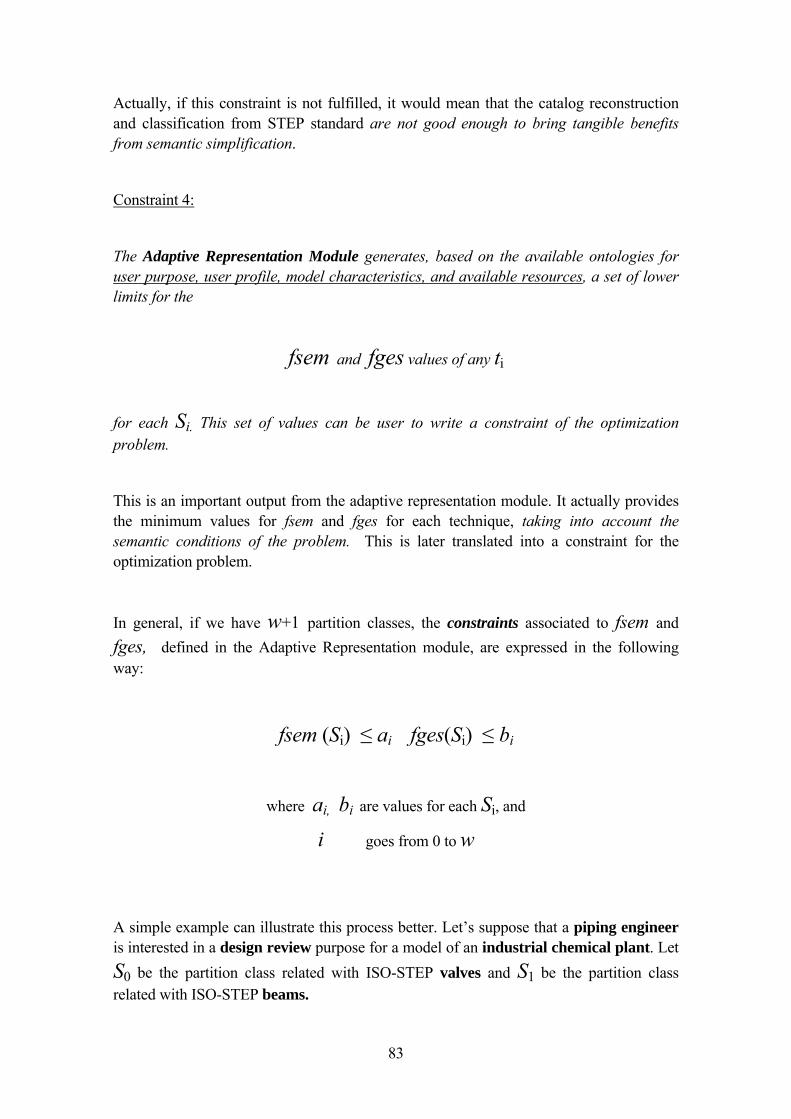
83
Actually, if this constraint is not fulfilled, it would mean that the catalog reconstruction and classification from STEP standard are not good enough to bring tangible benefits from semantic simplification.
Constraint 4:
The Adaptive Representation Module generates, based on the available ontologies for user purpose, user profile, model characteristics, and available resources, a set of lower limits for the
fsem and fges values of any ti
for each Si. This set of values can be user to write a constraint of the optimization problem.
This is an important output from the adaptive representation module. It actually provides the minimum values for fsem and fges for each technique, taking into account the semantic conditions of the problem. This is later translated into a constraint for the optimization problem.
In general, if we have w+1 partition classes, the constraints associated to fsem and fges, defined in the Adaptive Representation module, are expressed in the following way:
fsem (Si) ≤ ai fges(Si) ≤ bi
where ai, bi are values for each Si, and
i goes from 0 to w
A simple example can illustrate this process better. Let’s suppose that a piping engineer is interested in a design review purpose for a model of an industrial chemical plant. Let S0 be the partition class related with ISO-STEP valves and S1 be the partition class related with ISO-STEP beams.
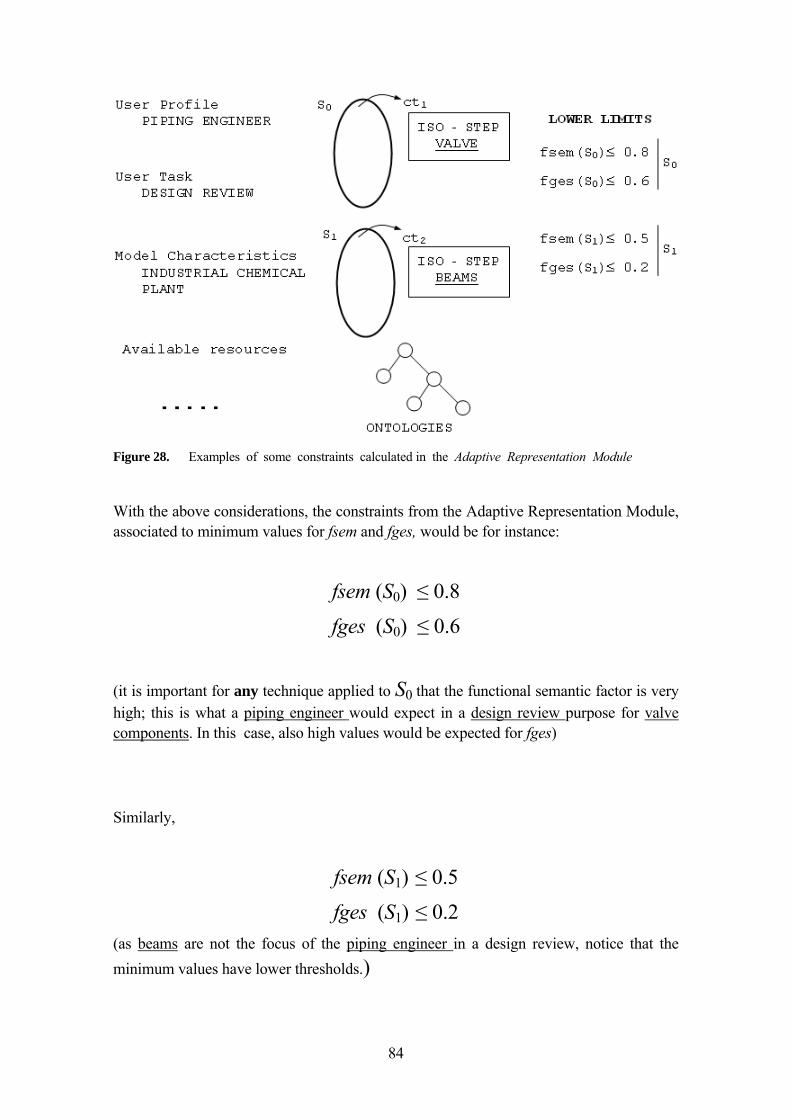
84
Figure 28. Examples of some constraints calculated in the Adaptive Representation Module
With the above considerations, the constraints from the Adaptive Representation Module, associated to minimum values for fsem and fges, would be for instance:
fsem (S0) ≤ 0.8
fges (S0) ≤ 0.6
(it is important for any technique applied to S0 that the functional semantic factor is very high; this is what a piping engineer would expect in a design review purpose for valve components. In this case, also high values would be expected for fges)
Similarly,
fsem (S1) ≤ 0.5
fges (S1) ≤ 0.2 (as beams are not the focus of the piping engineer in a design review, notice that the minimum values have lower thresholds.)
85
This is the way in which the constraints are defined by the adaptive representation module.
The ontologies also help to produce explicitly the different fgespq. In the example, if we
only consider 3 techniques: t0 is brute force tessellation, t1 drop culling, t2 semantic symbols (for a piping engineer in a design review purpose) we would obtain (see Table 3) for example the values:
fsem00 = 1.0 fsem10 = 0.0 fsem20 = 0.9
fges00 = 1.0 fges10 = 0.4 fges 20 = 0.9
and
fsem01 = 1.0 fsem11 = 0.0 fsem21 = 0.8
fges01 = 1.0 fges11 = 0.3 fges 21 = 0.5
The optimization problem would be in charge of selecting the right techniques considering these constraints (in this concrete example t0 and t2 could be candidates for
both S0 and S1, but not t1).
Constraint 5:
So far we have constraints related with the model and with the user background and intention. The following constraints are related to the resources available in the system, especially:
(i) graphic card capability
(ii) available memory (RAM, HD)
(iii) processing power
We will follow a conservative approach to those constraints as explained below. More constraints could also be included; we show a generic methodology to include these aspects in the optimization problem.
86
These two first resources constraints actually depend heavily on the number of triangles generated in the plant P and in each of the different Plant Sections PS. Let’s recall that the objective function to optimize is precisely expressed in terms of this quantity ( tris (P) / p ). Clearly, the objective of the optimization problem is not just to minimize that expression, but to guarantee that the minimal solution fulfils the available resources.
These constraints can be written in the following form:
Graphic Card capability: We call gcmax to the maximum value of tris/second of the graphic card. This is a widely known criterion to measure the performance of a graphic card, which somehow summarizes the effect of several internal characteristics such as card memory, Open GL acceleration, etc. If we assume 10 to 15 fps as an interactive
rate for the walkthrough, with a section PS being rendered, and that the cf is an average
culling factor (let’s take a low value to be conservative; cf ≅ 1.2 ) to the object based
techniques, we could say that each of the Plant Sections PS should be rendered at that rate, thus:
tris (PS) / cf ≤ gcmax / fps , which is approx.
Assigning conservative values,
tris (PS) / 1.2 ≤ gcmax / 15.0 (conservative values)
tris (PS) ≤ 0.08 gcmax
It is interesting to notice that the evolution of gcmax is incredible fast : five years ago was about 5 Mtris/sec (GeForce 256) and today is about 800 Mtris/sec -e.g. NVIDIA GFORCE 7800!) This is of course not considering that the numbers given by the card manufacturer are obtained in very favourable conditions (e.g. all triangles in very few tristrips), therefore the value of gcmax should be also conservative –lower than the “official” number-.
Available Memory capability: This is also a critical factor, and it is difficult to separate it from the processing power and memory speed access when good fetching and out of core strategies (as discussed by [CORR04]) are applied. These fetching strategies are based on the fact that not all the model is loaded in RAM memory, but only necessary
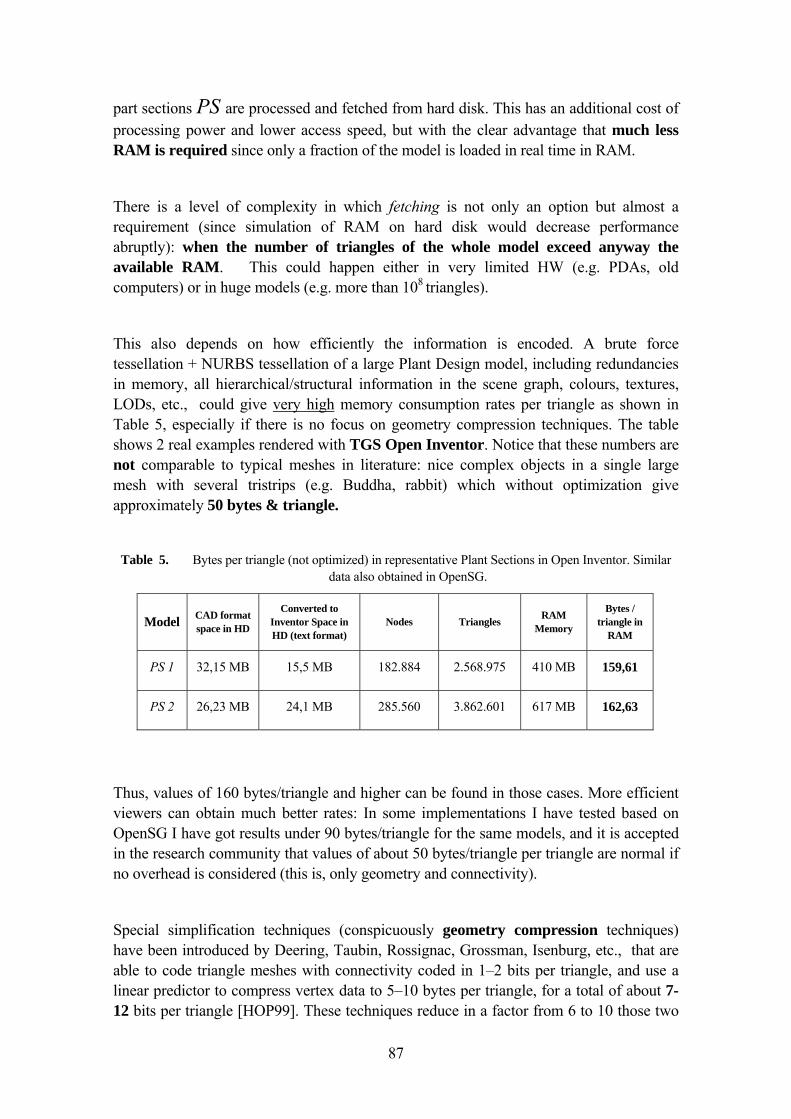
87
part sections PS are processed and fetched from hard disk. This has an additional cost of processing power and lower access speed, but with the clear advantage that much less RAM is required since only a fraction of the model is loaded in real time in RAM.
There is a level of complexity in which fetching is not only an option but almost a requirement (since simulation of RAM on hard disk would decrease performance abruptly): when the number of triangles of the whole model exceed anyway the available RAM. This could happen either in very limited HW (e.g. PDAs, old computers) or in huge models (e.g. more than 108 triangles).
This also depends on how efficiently the information is encoded. A brute force tessellation + NURBS tessellation of a large Plant Design model, including redundancies in memory, all hierarchical/structural information in the scene graph, colours, textures, LODs, etc., could give very high memory consumption rates per triangle as shown in Table 5, especially if there is no focus on geometry compression techniques. The table shows 2 real examples rendered with TGS Open Inventor. Notice that these numbers are not comparable to typical meshes in literature: nice complex objects in a single large mesh with several tristrips (e.g. Buddha, rabbit) which without optimization give approximately 50 bytes & triangle.
Table 5. Bytes per triangle (not optimized) in representative Plant Sections in Open Inventor. Similar
data also obtained in OpenSG.
Model CAD format space in HD
Converted to Inventor Space in HD (text format)
Nodes Triangles RAM Memory
Bytes / triangle in
RAM
PS 1 32,15 MB 15,5 MB 182.884 2.568.975 410 MB 159,61
PS 2 26,23 MB 24,1 MB 285.560 3.862.601 617 MB 162,63
Thus, values of 160 bytes/triangle and higher can be found in those cases. More efficient viewers can obtain much better rates: In some implementations I have tested based on OpenSG I have got results under 90 bytes/triangle for the same models, and it is accepted in the research community that values of about 50 bytes/triangle per triangle are normal if no overhead is considered (this is, only geometry and connectivity).
Special simplification techniques (conspicuously geometry compression techniques) have been introduced by Deering, Taubin, Rossignac, Grossman, Isenburg, etc., that are able to code triangle meshes with connectivity coded in 1–2 bits per triangle, and use a linear predictor to compress vertex data to 5–10 bytes per triangle, for a total of about 7-12 bits per triangle [HOP99]. These techniques reduce in a factor from 6 to 10 those two
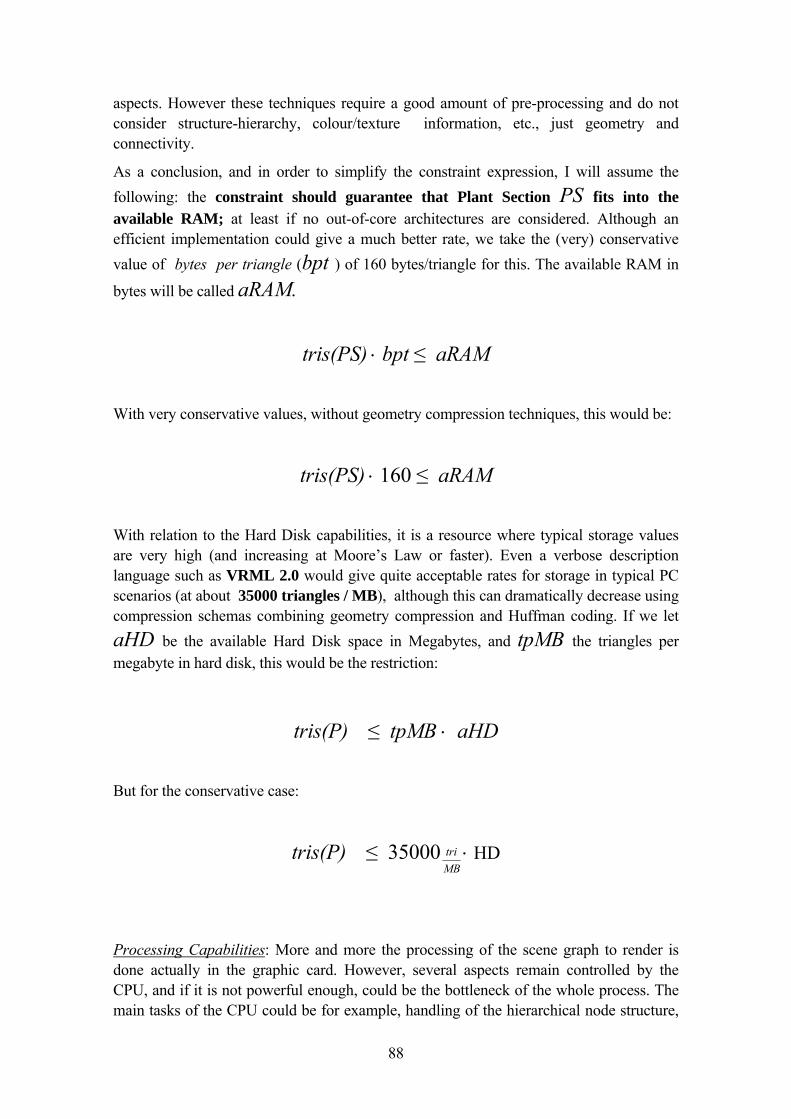
88
aspects. However these techniques require a good amount of pre-processing and do not consider structure-hierarchy, colour/texture information, etc., just geometry and connectivity.
As a conclusion, and in order to simplify the constraint expression, I will assume the following: the constraint should guarantee that Plant Section PS fits into the available RAM; at least if no out-of-core architectures are considered. Although an efficient implementation could give a much better rate, we take the (very) conservative value of bytes per triangle (bpt ) of 160 bytes/triangle for this. The available RAM in
bytes will be called aRAM.
tris(PS) ⋅ bpt ≤ aRAM
With very conservative values, without geometry compression techniques, this would be:
tris(PS) ⋅ 160 ≤ aRAM
With relation to the Hard Disk capabilities, it is a resource where typical storage values are very high (and increasing at Moore’s Law or faster). Even a verbose description language such as VRML 2.0 would give quite acceptable rates for storage in typical PC scenarios (at about 35000 triangles / MB), although this can dramatically decrease using compression schemas combining geometry compression and Huffman coding. If we let aHD be the available Hard Disk space in Megabytes, and tpMB the triangles per megabyte in hard disk, this would be the restriction:
tris(P) ≤ tpMB ⋅ aHD
But for the conservative case:
tris(P) ≤ 35000MBtri ⋅ HD
Processing Capabilities: More and more the processing of the scene graph to render is done actually in the graphic card. However, several aspects remain controlled by the CPU, and if it is not powerful enough, could be the bottleneck of the whole process. The main tasks of the CPU could be for example, handling of the hierarchical node structure,
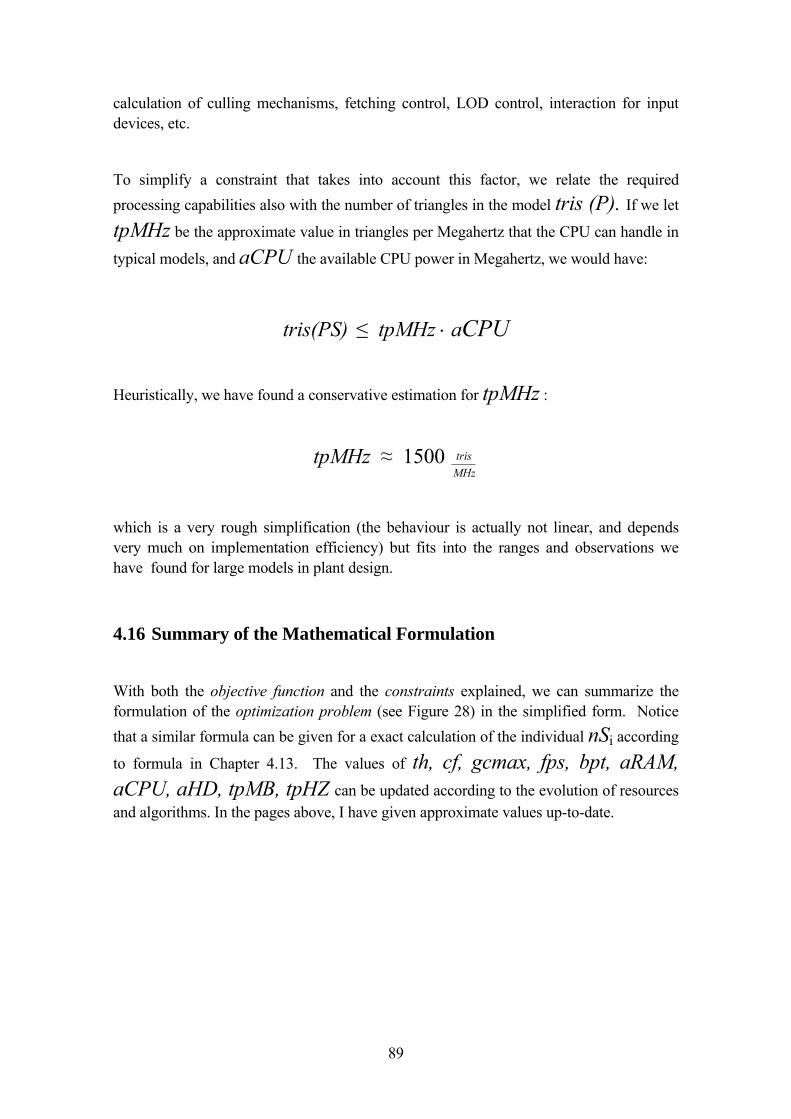
89
calculation of culling mechanisms, fetching control, LOD control, interaction for input devices, etc.
To simplify a constraint that takes into account this factor, we relate the required processing capabilities also with the number of triangles in the model tris (P). If we let
tpMHz be the approximate value in triangles per Megahertz that the CPU can handle in
typical models, and aCPU the available CPU power in Megahertz, we would have:
tris(PS) ≤ tpMHz ⋅ aCPU
Heuristically, we have found a conservative estimation for tpMHz :
tpMHz ≈ 1500 MHztris
which is a very rough simplification (the behaviour is actually not linear, and depends very much on implementation efficiency) but fits into the ranges and observations we have found for large models in plant design.
4.16 Summary of the Mathematical Formulation With both the objective function and the constraints explained, we can summarize the formulation of the optimization problem (see Figure 28) in the simplified form. Notice that a similar formula can be given for a exact calculation of the individual nSi according
to formula in Chapter 4.13. The values of th, cf, gcmax, fps, bpt, aRAM, aCPU, aHD, tpMB, tpHZ can be updated according to the evolution of resources and algorithms. In the pages above, I have given approximate values up-to-date.
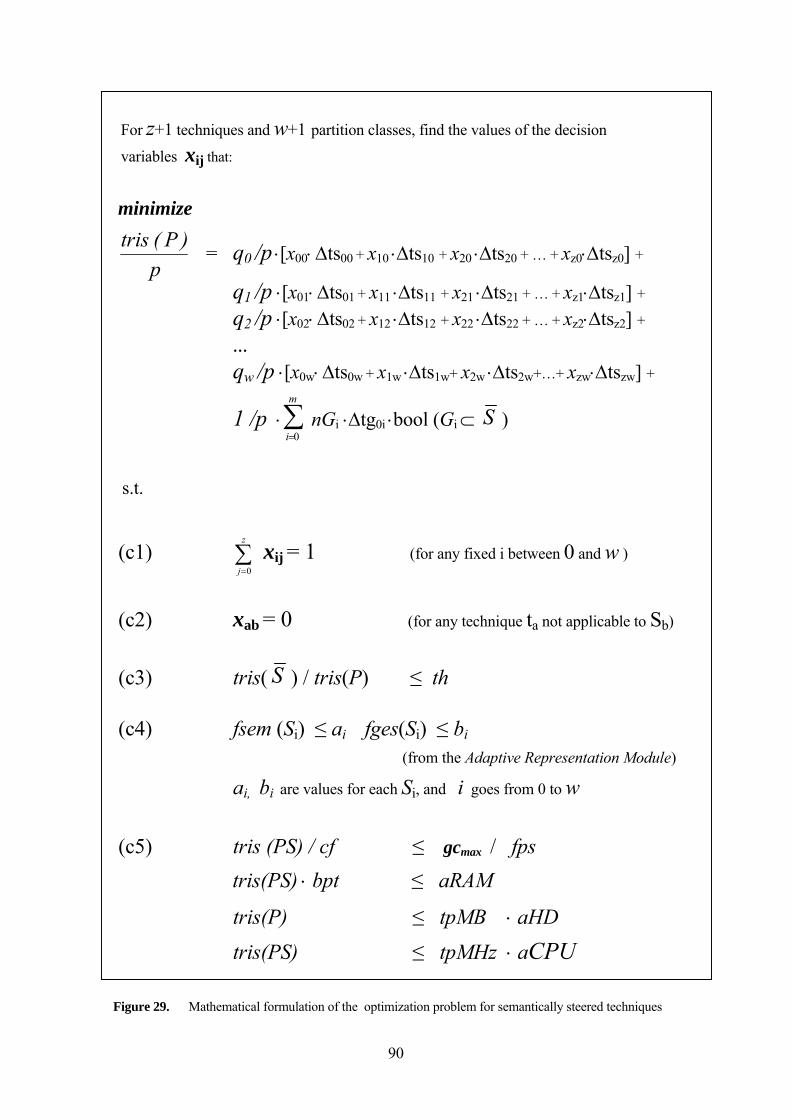
90
For z+1 techniques and w+1 partition classes, find the values of the decision
variables xij that:
minimize
p
)P(tris = q0 /p ⋅[x00⋅ ∆ts00 + x10 ⋅∆ts10 + x20 ⋅∆ts20 + … + xz0⋅∆tsz0] +
q1 /p ⋅[x01⋅ ∆ts01 + x11 ⋅∆ts11 + x21 ⋅∆ts21 + … + xz1⋅∆tsz1] +
q2 /p ⋅[x02⋅ ∆ts02 + x12 ⋅∆ts12 + x22 ⋅∆ts22 + … + xz2⋅∆tsz2] +
…
qw /p ⋅[x0w⋅ ∆ts0w + x1w ⋅∆ts1w+ x2w ⋅∆ts2w+…+ xzw⋅∆tszw] +
1 /p ⋅∑=
m
i 0nGi ⋅∆tg0i ⋅bool (Gi ⊂ S )
s.t.
(c1) ∑=
z
j 0xij = 1 (for any fixed i between 0 and w )
(c2) xab = 0 (for any technique ta not applicable to Sb)
(c3) tris( S ) / tris(P) ≤ th
(c4) fsem (Si) ≤ ai fges(Si) ≤ bi
(from the Adaptive Representation Module)
ai, bi are values for each Si, and i goes from 0 to w
(c5) tris (PS) / cf ≤ gcmax / fps
tris(PS) ⋅ bpt ≤ aRAM
tris(P) ≤ tpMB ⋅ aHD
tris(PS) ≤ tpMHz ⋅ aCPU
Figure 29. Mathematical formulation of the optimization problem for semantically steered techniques
91
4.17 Comments on the Solution to the Optimization Problem For the solution and application of the optimization problem above on the walkthrough of a specific P, I follow this approach:
1. Following the architecture of the system, we find the equivalence classes Gi for
P using the Catalog Reconstruction Module.
2. We find the set partition classes Sj corresponding to the ISO-STEP standard by
means of the ISO-STEP 10303 Adaptation Module, as well as the subset S .
3. In the Semantic Adaptation Module as well as the Adaptive Representation Module actually are in charge of solving the optimization problem and give the appropriate techniques and parameters to apply to the different partition classes. Notice that every single step has a semantic background:
a. From the ontology of ISO-STEP elements, the average number of triangles ∆tsij to represent a part with different techniques is obtained. In case it is unknown, a representative is tessellated and actually measured.
b. In case the simplified form is preferred (based on qi /p) the cell concentrations qi/p are taken from the ontology as typical values for the domain. Otherwise the values qi = nSi are actually calculated (a simple cardinality operation on Si) for the exact form.
c. Constraints 3 and 5 have the special characteristic that they actually depend on tris(P) or tris (PS) which is also part of the left side of the optimization problem. Therefore they should not be included in the initial algorithm for the solution of the problem (cyclic solution), but are considered after the optimization problem is solved with constraints 1,2 and 4.
Then, it can be compared if the correspondent values for tris(P) or tris (PS) are between the limits that constraints 3 and 5 establish. If not, it would mean that a minimum has been found, but it is either:
92
i. Not very efficient due to high proportion of brute force tessellation (constraint 3), or
ii. It is not feasible for the existing resources (constraint 5).
This would require then:
i. In case that just constraint 3 is violated, it is anyway a valid solution; the only problem is that the semantic techniques bring little improvement to that model.
ii. In case constraint 5 is violated, the situation is more serious: a resource constraint has to be relaxed or more resources are required, accordingly.
d. The lower limits for fsem and fges are obtained from the ontologies, as
well as the values for fsemij and fgesij for the specific conditions of user purpose, user profile and model characteristics.
e. The problem is solved with integer programming techniques. If there is
at least one valid minimum solution, the decision variables xij indicate which techniques are applied to the respective cells in the set partitions. Thus, the walkthrough is conditions are prepared.
4.18 Conclusions of this chapter
In this chapter I have introduced a mathematical model that corresponds to the underlying relations of the different modules of the proposed methodology to adapt large CAD models of Industrial Plants for visualization walkthroughs.
This mathematical model gives objective criteria to decide when and how to apply semantic-steered techniques for the simplification.
At the same time, it allows the evaluation and quantitative measurement of the effective influence of the semantic approach in the walkthrough generation

93
We have used set theory and optimization theory in order to give a foundation to the methodology and the architecture of the implementation of the MiroWalk system, which is explained in Chapter 0.
The methodology as well as the mathematical model can be extended to be more comprehensive or efficient, but the basic elements to consider are already included in the formulation.

94
95
5 GENERIC ARCHITECTURE AND SYSTEM
IMPLEMENTATION OF SEMANTIC VISUALIZATION WALKTHROUGHS FOR PLANT DESIGN
In this chapter I present the architecture of the proposed methodology for generation of walkthroughs for Plant Design models, which includes the different semantic and computer graphics aspects described in other sections of this work. I use semantic compression added to simplification techniques of the geometrical data to increase the efficiency and complement the traditional Computer Graphics methods in the field, including semantic aspects.
It is important to recall that the proposed architecture is tightly related with the mathematical model of Chapter 4 , which describes the relationships and processes in the architecture models from a mathematical, generic perspective.
We take as a starting point any proprietary geometric 3D CAD representation of an industrial plant. It is deliberately assumed that no other information is available (e.g. from a modern PIM system) since for many reasons –legacy data, database model exchange between companies, etc.- this is the general case.
We then reconstruct automatically the families of engineering parts in the model, associate those families to the standard, introduce both geometric and semantic object simplification techniques, and present the adapted plant model in an interactive system for design review walkthroughs.
Thus, in this chapter all the different considerations about the underlying mathematical model (Chapter 4), the relationship of the STEP standard and the ontology of Industrial Plant Design (Chapter 3), etc. acquire a concretion in an integrated system architecture.
As a result,
- I have defined this architecture (whose modules are explained in detail in this chapter) with a modular approach in which the relevance of semantic aspects is more evident
- I have implemented a software system, the MiroWalk system, that includes an
advanced implementation of the architecture described, and is fully functional and complete system that applies the methodology described in this thesis to real world CAD models of industrial plants.
96
Each module in the architecture is explained in detail in the following subchapters. The overall architecture of the system can be seen in Figure 30.
The 3D CAD Model is thus processed in such a way that each module adds up a different and complementary semantic dimension to the final model used in the visualization.
Thus, to make a very simplified description, the Catalog Reconstruction Module introduces the spatial instancing explicitly, for those cases in which the 3D CAD model does not hold this information (which is a common situation).
The ISO-STEP 10303-AP227 Adaptation Module classifies the instances in the model into categories corresponding to the STEP standard of Industrial Plant Design. The Semantic Adaptation Module takes into account the adapted model as well as the available resources, the user profile and the visualization walkthrough purpose, and applies the semantic triangle criteria (Figure 10) to generate parameters to select appropriate techniques for rendering.
The Adaptive Representation Module selects and applies the best tessellation and rendering techniques to use during the visualization walkthrough, based on the criteria and parameters of the previous module.
Finally, the Semantic Visualization Walkthrough Module is in charge of producing for the user the interactive walkthrough of the adapted model using the available resources, and considering the domain and purpose involved.
Figure 30 shows the modules of the architecture and the relationships between them. This figure will be the reference to explain in detail each module.
It is necessary to stress that the modules are generic in nature, and extensible to include refinements in different directions. The most important aspect of this architecture is not its current implementation in one system, but the fact that the modular structure presented is the basis of a generic methodology for the semantic adaptations of 3D CAD models in the domain of Plant Design (or even other domains).
Thus, specific algorithmic improvements (e.g. new shape similarity algorithms in the Catalog Reconstruction Module), better semantic reasoning aspects (e.g. automatic prediction of user intention), more comprehensive inclusion of rendering/simplification techniques in the Adaptive Representation Module (e.g. fast progressive meshes, PBR) are always possible, without loss of generality.
I present in this chapter the basic concepts behind each module, as well as the selected implementation approaches used in the MiroWalk system, as integrated, proof of concept system that applies the methodology.
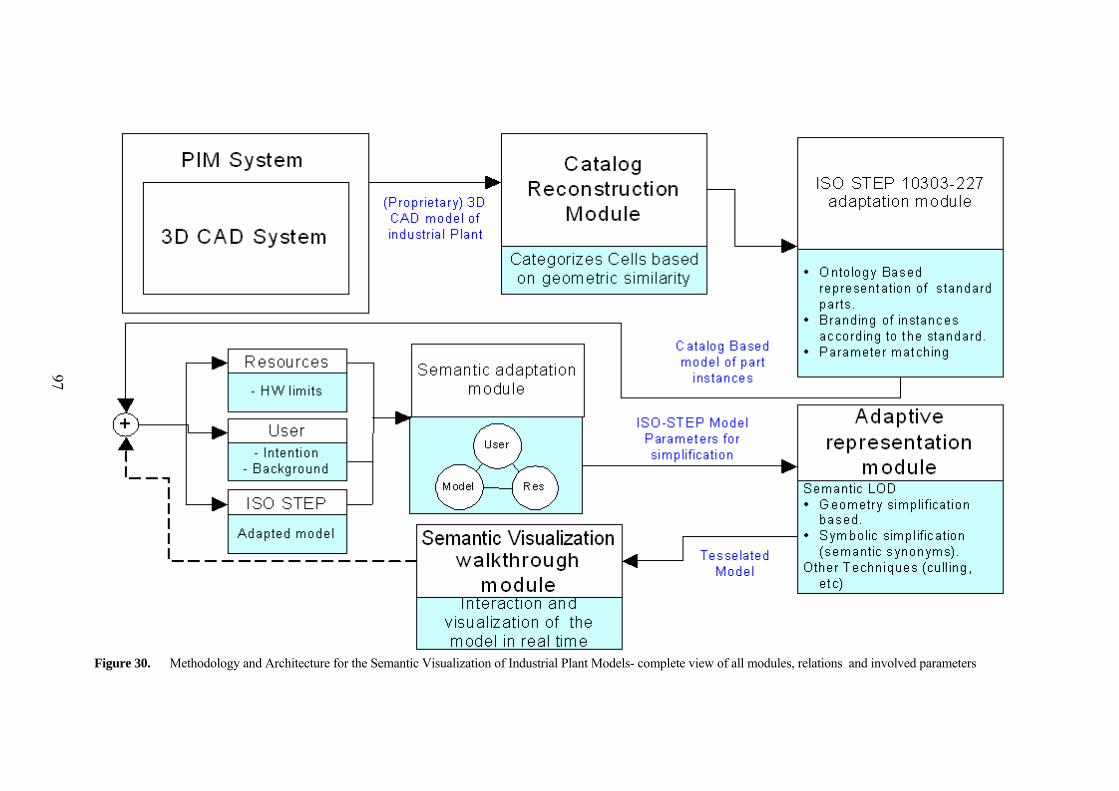
97
Figure 30. Methodology and Architecture for the Semantic Visualization of Industrial Plant Models- complete view of all modules, relations and involved parameters
97
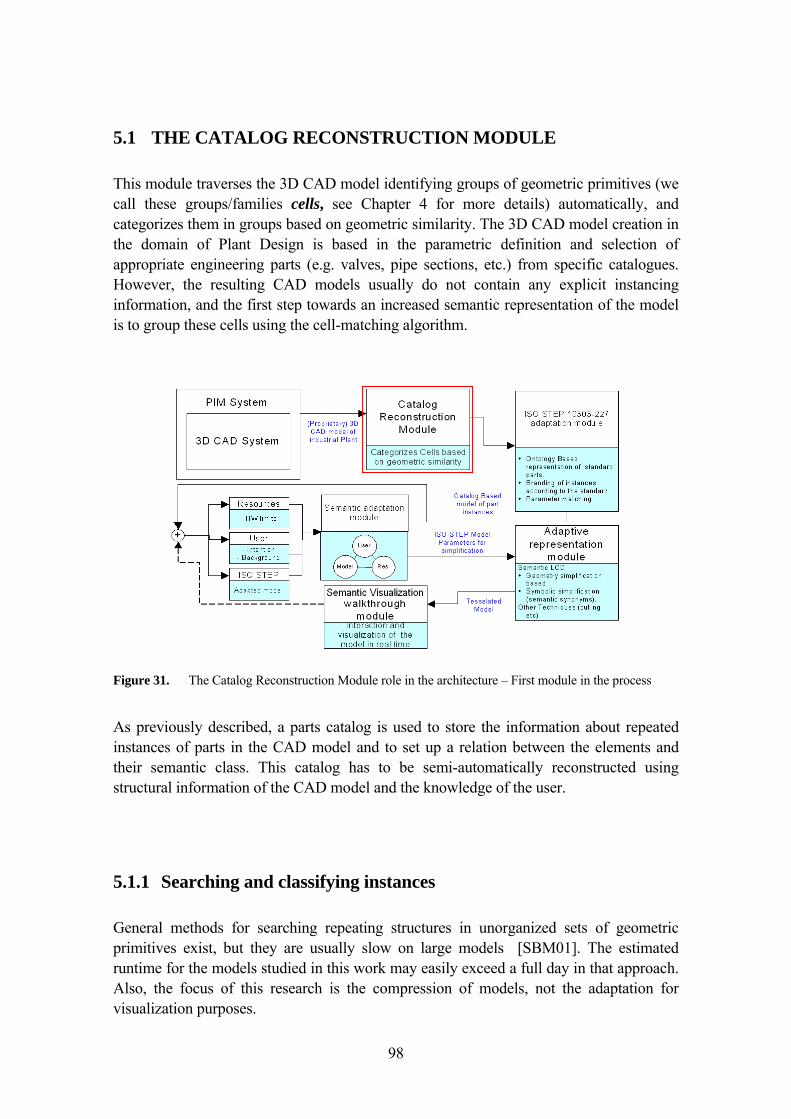
98
5.1 THE CATALOG RECONSTRUCTION MODULE This module traverses the 3D CAD model identifying groups of geometric primitives (we call these groups/families cells, see Chapter 4 for more details) automatically, and categorizes them in groups based on geometric similarity. The 3D CAD model creation in the domain of Plant Design is based in the parametric definition and selection of appropriate engineering parts (e.g. valves, pipe sections, etc.) from specific catalogues. However, the resulting CAD models usually do not contain any explicit instancing information, and the first step towards an increased semantic representation of the model is to group these cells using the cell-matching algorithm.
Figure 31. The Catalog Reconstruction Module role in the architecture – First module in the process
As previously described, a parts catalog is used to store the information about repeated instances of parts in the CAD model and to set up a relation between the elements and their semantic class. This catalog has to be semi-automatically reconstructed using structural information of the CAD model and the knowledge of the user.
5.1.1 Searching and classifying instances General methods for searching repeating structures in unorganized sets of geometric primitives exist, but they are usually slow on large models [SBM01]. The estimated runtime for the models studied in this work may easily exceed a full day in that approach. Also, the focus of this research is the compression of models, not the adaptation for visualization purposes.
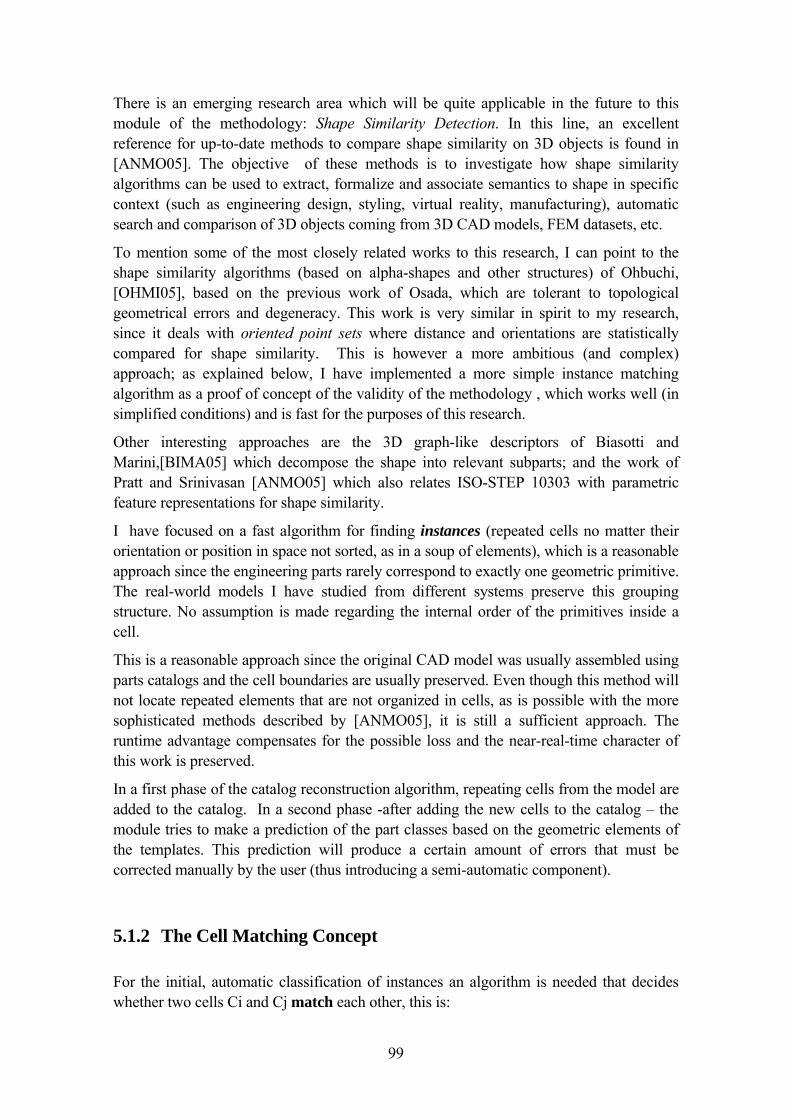
99
There is an emerging research area which will be quite applicable in the future to this module of the methodology: Shape Similarity Detection. In this line, an excellent reference for up-to-date methods to compare shape similarity on 3D objects is found in [ANMO05]. The objective of these methods is to investigate how shape similarity algorithms can be used to extract, formalize and associate semantics to shape in specific context (such as engineering design, styling, virtual reality, manufacturing), automatic search and comparison of 3D objects coming from 3D CAD models, FEM datasets, etc.
To mention some of the most closely related works to this research, I can point to the shape similarity algorithms (based on alpha-shapes and other structures) of Ohbuchi, [OHMI05], based on the previous work of Osada, which are tolerant to topological geometrical errors and degeneracy. This work is very similar in spirit to my research, since it deals with oriented point sets where distance and orientations are statistically compared for shape similarity. This is however a more ambitious (and complex) approach; as explained below, I have implemented a more simple instance matching algorithm as a proof of concept of the validity of the methodology , which works well (in simplified conditions) and is fast for the purposes of this research.
Other interesting approaches are the 3D graph-like descriptors of Biasotti and Marini,[BIMA05] which decompose the shape into relevant subparts; and the work of Pratt and Srinivasan [ANMO05] which also relates ISO-STEP 10303 with parametric feature representations for shape similarity.
I have focused on a fast algorithm for finding instances (repeated cells no matter their orientation or position in space not sorted, as in a soup of elements), which is a reasonable approach since the engineering parts rarely correspond to exactly one geometric primitive. The real-world models I have studied from different systems preserve this grouping structure. No assumption is made regarding the internal order of the primitives inside a cell.
This is a reasonable approach since the original CAD model was usually assembled using parts catalogs and the cell boundaries are usually preserved. Even though this method will not locate repeated elements that are not organized in cells, as is possible with the more sophisticated methods described by [ANMO05], it is still a sufficient approach. The runtime advantage compensates for the possible loss and the near-real-time character of this work is preserved.
In a first phase of the catalog reconstruction algorithm, repeating cells from the model are added to the catalog. In a second phase -after adding the new cells to the catalog – the module tries to make a prediction of the part classes based on the geometric elements of the templates. This prediction will produce a certain amount of errors that must be corrected manually by the user (thus introducing a semi-automatic component).
5.1.2 The Cell Matching Concept For the initial, automatic classification of instances an algorithm is needed that decides whether two cells Ci and Cj match each other, this is:
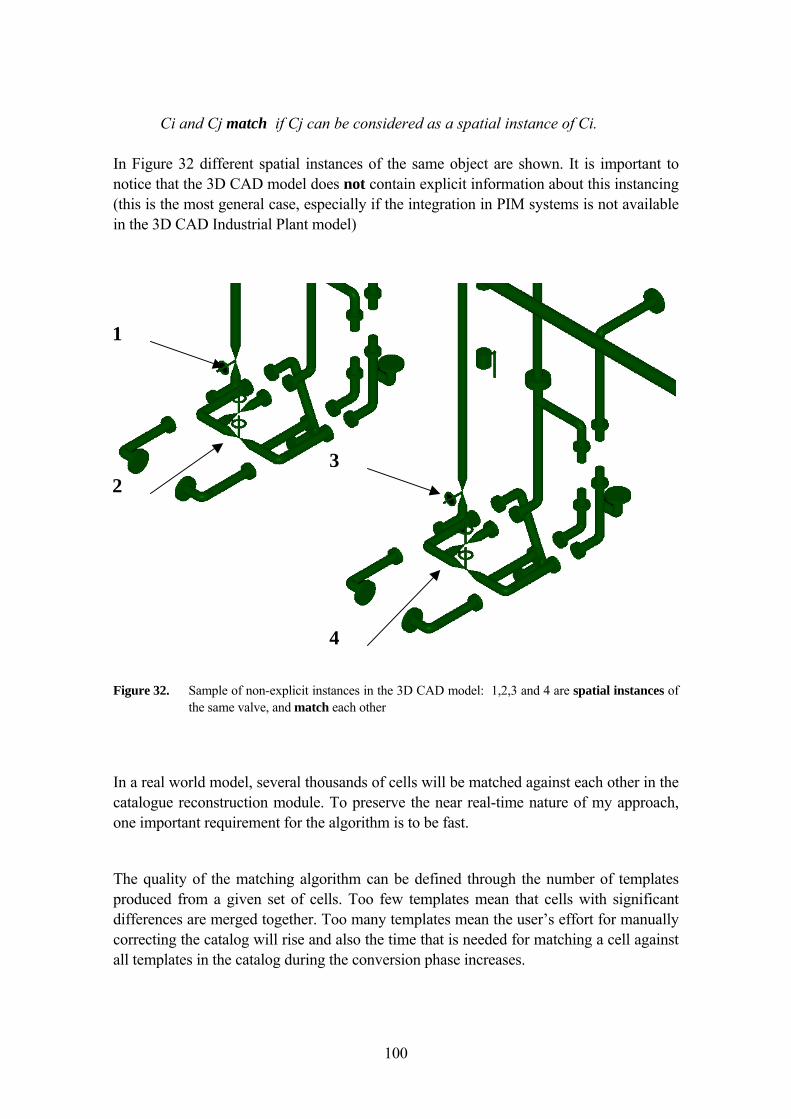
100
Ci and Cj match if Cj can be considered as a spatial instance of Ci.
In Figure 32 different spatial instances of the same object are shown. It is important to notice that the 3D CAD model does not contain explicit information about this instancing (this is the most general case, especially if the integration in PIM systems is not available in the 3D CAD Industrial Plant model)
Figure 32. Sample of non-explicit instances in the 3D CAD model: 1,2,3 and 4 are spatial instances of
the same valve, and match each other
In a real world model, several thousands of cells will be matched against each other in the catalogue reconstruction module. To preserve the near real-time nature of my approach, one important requirement for the algorithm is to be fast.
The quality of the matching algorithm can be defined through the number of templates produced from a given set of cells. Too few templates mean that cells with significant differences are merged together. Too many templates mean the user’s effort for manually correcting the catalog will rise and also the time that is needed for matching a cell against all templates in the catalog during the conversion phase increases.
1
2 3
4
101
The first approach was to match two cells solely based on the cell’s topology. The cell topologies of both cells were traversed recursively and the geometric primitives were compared one-by-one. A difference in their topological structure or geometric primitives was interpreted as a do-not-match result. This approach proved to be very fast, but not feasible, since visually identical elements often had variations in their cell structure – especially if the cells of both example models were considered.
5.1.3 Topology based matching
I considered a first approach matching two cells solely based on the cell’s topology. The cell topologies of both cells were traversed recursively and the geometric primitives were compared one-by-one. A difference in their topological structure or the kind of geometric primitives was interpreted as a do-not-match result. Only if the topology matching was successful, a more detailed geometric matching was performed. This approach proved to be very fast, but not feasible, since visually identical elements often had variations in their cell structure. Furthermore, I had an initial assumption that proved to be wrong: that cells were stored in a normalized orientation – since they originally came from a catalogue – and were then positioned in the model using a transformation matrix. Instead, the cell’s geometry is often relocated by direct redefinition of the parameters of the geometric primitives.
The basic pseudo-algorithm for this approach is illustrated in Figure 33. In case it can be guaranteed that the internal topological structure is preserved between spatial instances, this algorithm could be used, since it is also faster that other algorithms. However, this is not the general case, and the point-clouds based matching algorithm (explained in the next section) has a more generic nature.
To calculate the involved transformation of the pseudo algorithm, I developed a simple algorithm that is in some parts similar to the algorithm described by Shikhare for matching components [SBM01]. However, I do not use the Hostelling Transformation to compute a normalized orientation. Instead we assume – considering that the cells originally came from catalogues – that the structure of the two cells is similar. Thus, we use the first three points from the beginning of the geometric description to calculate a transformation that transforms the elements into each other. Then the two elements are compared using a fuzzy method similar to Shikhare’s method.
During the first stage of the algorithm the cell is converted into two lists: a list P of points
in 3D space and a list S of scalar parameters. We call the tuple (P,S) a cloud and the resulting space a cloud space. Each primitive of the cell contributes to the cloud with a number of points and the exact same number of scalar values, as shown in Table 6. We rely on the assumption that the topology matching holds, thus we look for the 4 first
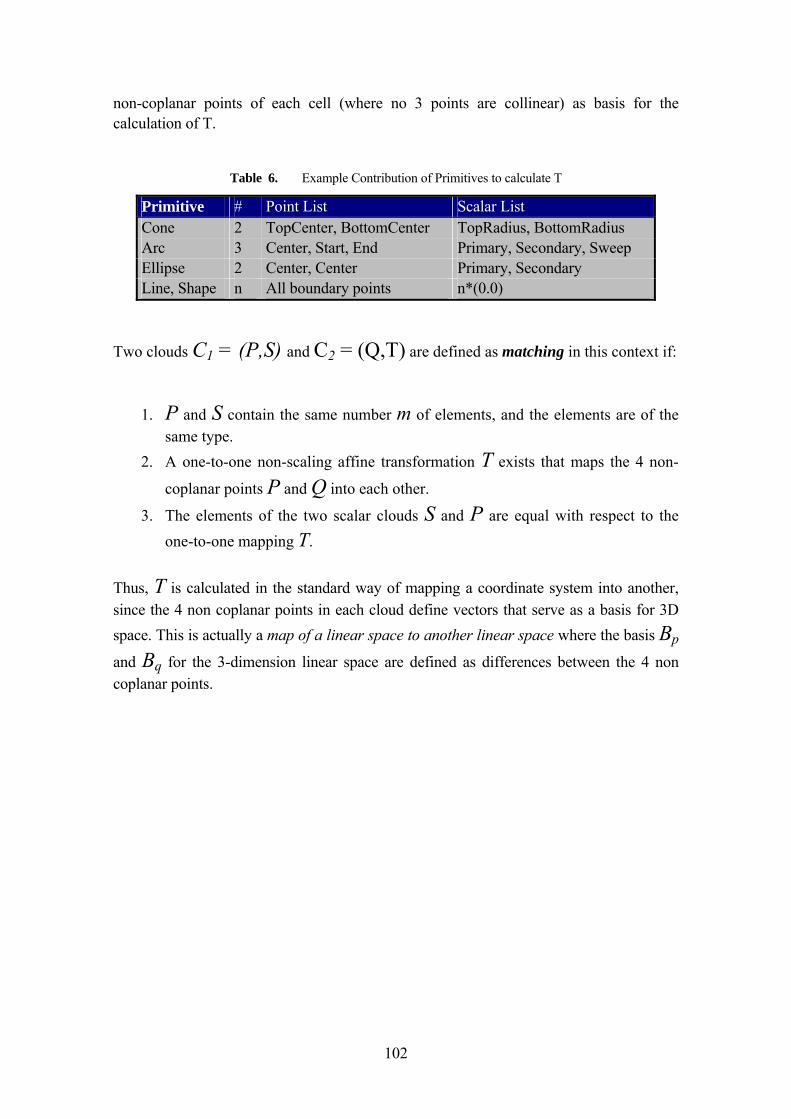
102
non-coplanar points of each cell (where no 3 points are collinear) as basis for the calculation of T.
Table 6. Example Contribution of Primitives to calculate T
Primitive # Point List Scalar List Cone 2 TopCenter, BottomCenter TopRadius, BottomRadius Arc 3 Center, Start, End Primary, Secondary, Sweep Ellipse 2 Center, Center Primary, Secondary Line, Shape n All boundary points n*(0.0)
Two clouds C1 = (P,S) and C2 = (Q,T) are defined as matching in this context if:
1. P and S contain the same number m of elements, and the elements are of the same type.
2. A one-to-one non-scaling affine transformation T exists that maps the 4 non-
coplanar points P and Q into each other.
3. The elements of the two scalar clouds S and P are equal with respect to the one-to-one mapping T.
Thus, T is calculated in the standard way of mapping a coordinate system into another, since the 4 non coplanar points in each cloud define vectors that serve as a basis for 3D space. This is actually a map of a linear space to another linear space where the basis Bp
and Bq for the 3-dimension linear space are defined as differences between the 4 non coplanar points.
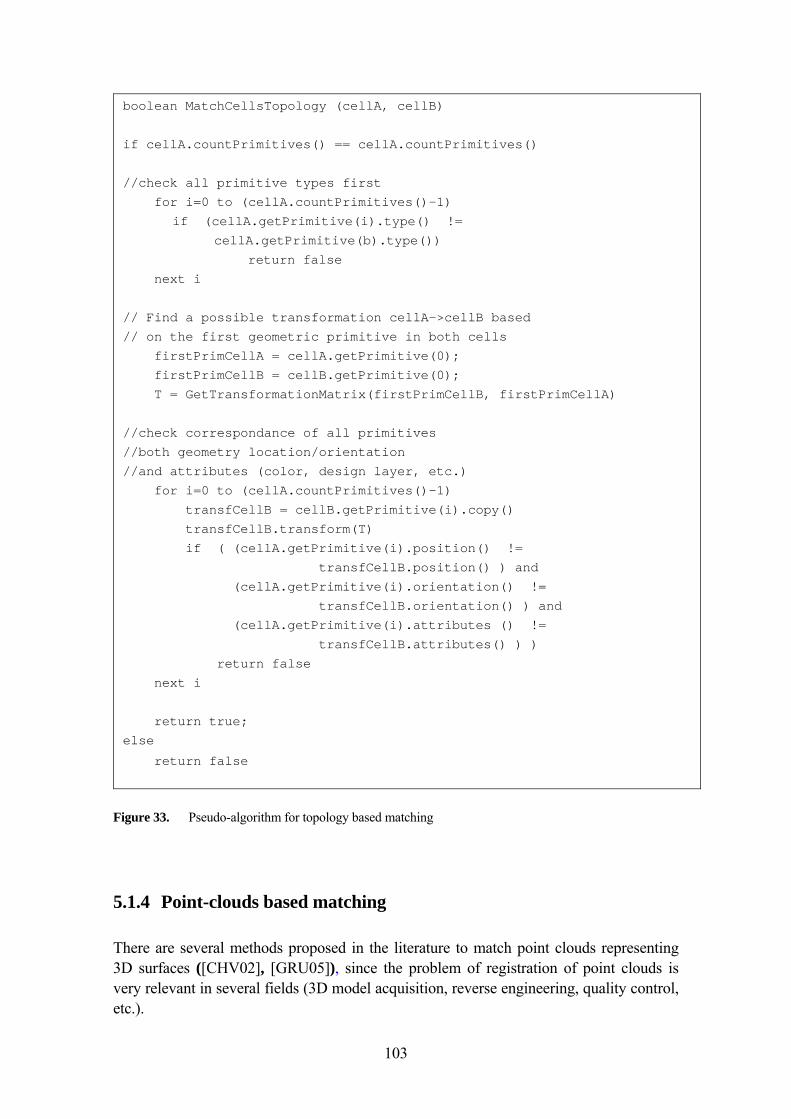
103
Figure 33. Pseudo-algorithm for topology based matching
5.1.4 Point-clouds based matching There are several methods proposed in the literature to match point clouds representing 3D surfaces ([CHV02], [GRU05]), since the problem of registration of point clouds is very relevant in several fields (3D model acquisition, reverse engineering, quality control, etc.).
boolean MatchCellsTopology (cellA, cellB) if cellA.countPrimitives() == cellA.countPrimitives() //check all primitive types first for i=0 to (cellA.countPrimitives()-1) if (cellA.getPrimitive(i).type() != cellA.getPrimitive(b).type()) return false next i // Find a possible transformation cellA->cellB based // on the first geometric primitive in both cells firstPrimCellA = cellA.getPrimitive(0); firstPrimCellB = cellB.getPrimitive(0); T = GetTransformationMatrix(firstPrimCellB, firstPrimCellA) //check correspondance of all primitives //both geometry location/orientation //and attributes (color, design layer, etc.) for i=0 to (cellA.countPrimitives()-1) transfCellB = cellB.getPrimitive(i).copy()
transfCellB.transform(T) if ( (cellA.getPrimitive(i).position() != transfCellB.position() ) and (cellA.getPrimitive(i).orientation() != transfCellB.orientation() ) and (cellA.getPrimitive(i).attributes () != transfCellB.attributes() ) ) return false next i return true; else
return false
104
Some of the most popular algorithms are the Iterative Closest Point (ICP) algorithm [CHV02], with several variations, the Least Square Surface Matching (LS3D) method [GRU05], and the Iterative Closest Points using Invariant Features (ICPIF) [SHA02]. Also the mentioned approaches at the beginning of these section, albeit from a different nature (shape similarity analysis) are very relevant in this sense.
I have considered the possibility to apply some of these algorithms to the cell matching problem, generating point sets from the cells. In the generic registration problem the correspondences between the point sets are unknown a priori [CHV02] and no one-to-one matching between the clouds points can be assumed (since they come usually from scanners).
In my case, however, given the special conditions of the models, this one-to-one correspondence exists, making the task easier. Thus, I developed a simplified algorithm (somehow similar in the approach to ICPIF, although much simpler and restricted) that could be applied successfully for the cell matching and classification. Again, it is important to recall that the problem itself and the need of the Catalog Reconstruction Module are generic; the presented algorithm is indeed one solution but not the only possible one.
5.1.5 The Cell matching algorithm The cell matching algorithm is based in the fact that we don’t know more information than the geometric data (in other words the spatial components of each feature in the model). From a generic point of view, the problem we are solving is to determine if two complex CAD objects are equivalent (if there is a rigid transformation that is able to transform one cloud into the other).
We can reformulate the cell-matching problem as follows:
Given two cells Ci and Cj , each composed by an unordered set of geometric
primitives, Cj matches or is an instance of Ci if a rigid body transformation
matrix T exists that transforms Cj into Ci . The cell-matching algorithm must:
(i) Decide if Cj matches Ci within a given tolerance.
(ii) Obtain the transformation matrix T.
105
We will give some basic definitions for the algorithm below.
A cell Ci is composed by an unordered set of geometric primitives GCij:
Ci = { GCi1, GCi2, … , GCim)
Each G is characterised by: 1) A characteristic point set CPSG : A set of points associated univocally with the spatial position of G. Notice that CPS is not an exhaustive set of surface points (as to differentiate this from ICPIF algorithms) 2) A characteristic scalar set CSSG : A set of scalar values associated univocally with the dimensions of G. 3) A characteristic type CTG This is a code correlative with the geometric primitive type. CPSCi, CSSCi, CTCi are the sets formed with the CPS, CSS and CT of all
primitives GCi. For example:
CPScyl = {Porigin , Pend }
CSScyl = {r}
CTcyl = {CYL}
Where the points are the centres of the covers, r the radius and CYL the type of the
cylinder primitive. Notice that CPS varies between instances of the same cell but
CSS and CT don’t. The point cloud PCCi is the point cloud formed by all the CPS of the primitives
GCi. Each CPS-point keeps a link with its corresponding CSS and CT.
PCCi={CPSG1(P0),…,CPSG1(Pn) , CPSG2(P0),…, CPSGn(Pm)}
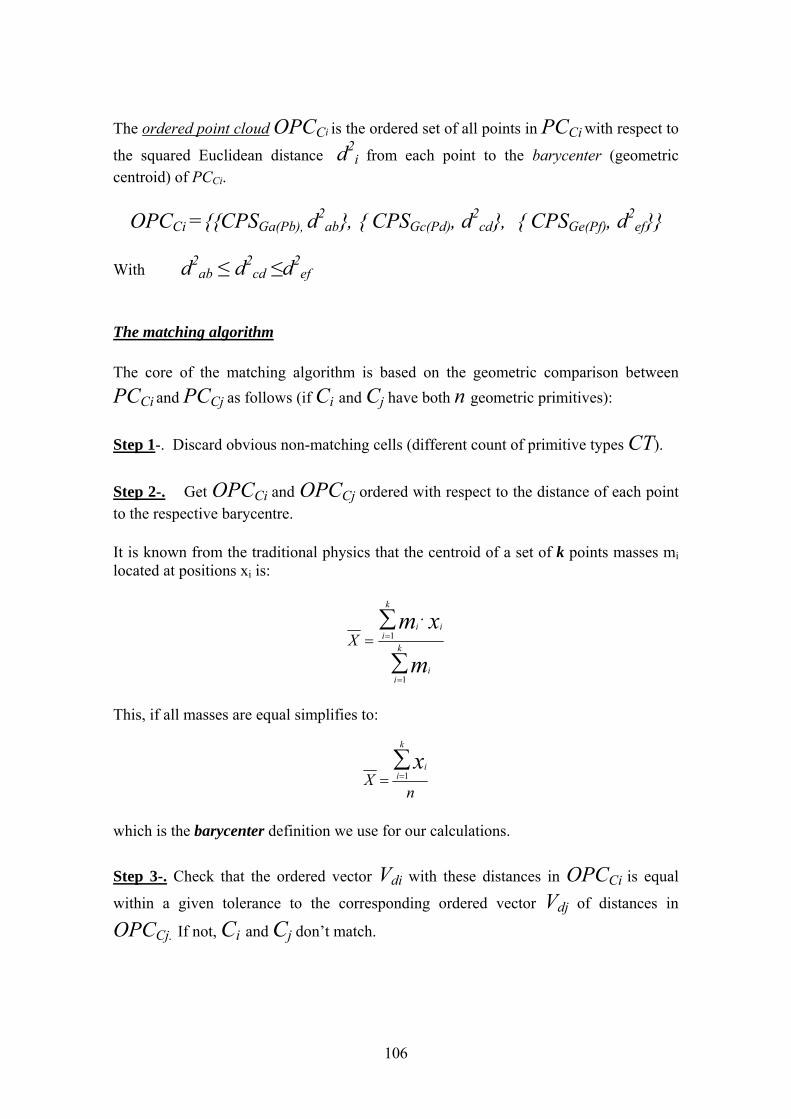
106
The ordered point cloud OPCCi is the ordered set of all points in PCCi with respect to
the squared Euclidean distance d2i from each point to the barycenter (geometric
centroid) of PCCi.
OPCCi ={{CPSGa(Pb), d2ab}, { CPSGc(Pd), d2
cd}, { CPSGe(Pf), d2ef}}
With d2
ab ≤ d2cd ≤d2
ef The matching algorithm
The core of the matching algorithm is based on the geometric comparison between PCCi and PCCj as follows (if Ci and Cj have both n geometric primitives): Step 1-. Discard obvious non-matching cells (different count of primitive types CT). Step 2-. Get OPCCi and OPCCj ordered with respect to the distance of each point to the respective barycentre. It is known from the traditional physics that the centroid of a set of k points masses mi located at positions xi is:
∑
∑
=
=
⋅= k
ii
k
iii
m
xmX
1
1
This, if all masses are equal simplifies to:
nX
k
iix∑
== 1
which is the barycenter definition we use for our calculations. Step 3-. Check that the ordered vector Vdi with these distances in OPCCi is equal
within a given tolerance to the corresponding ordered vector Vdj of distances in
OPCCj. If not, Ci and Cj don’t match.
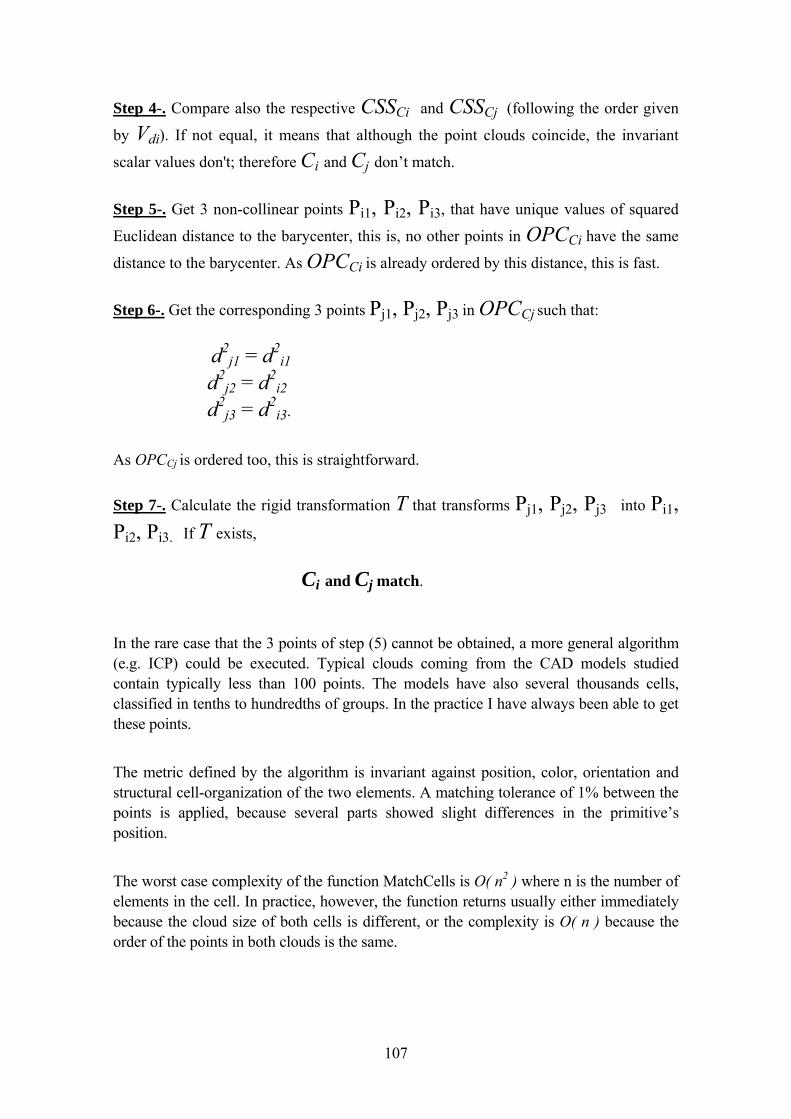
107
Step 4-. Compare also the respective CSSCi and CSSCj (following the order given
by Vdi). If not equal, it means that although the point clouds coincide, the invariant
scalar values don't; therefore Ci and Cj don’t match. Step 5-. Get 3 non-collinear points Pi1, Pi2, Pi3, that have unique values of squared
Euclidean distance to the barycenter, this is, no other points in OPCCi have the same
distance to the barycenter. As OPCCi is already ordered by this distance, this is fast. Step 6-. Get the corresponding 3 points Pj1, Pj2, Pj3 in OPCCj such that:
d2
j1 = d2i1
d2j2 = d2
i2
d2j3 = d2
i3.
As OPCCj is ordered too, this is straightforward. Step 7-. Calculate the rigid transformation T that transforms Pj1, Pj2, Pj3 into Pi1, Pi2, Pi3. If T exists,
Ci and Cj match. In the rare case that the 3 points of step (5) cannot be obtained, a more general algorithm (e.g. ICP) could be executed. Typical clouds coming from the CAD models studied contain typically less than 100 points. The models have also several thousands cells, classified in tenths to hundredths of groups. In the practice I have always been able to get these points.
The metric defined by the algorithm is invariant against position, color, orientation and structural cell-organization of the two elements. A matching tolerance of 1% between the points is applied, because several parts showed slight differences in the primitive’s position.
The worst case complexity of the function MatchCells is O( n2 ) where n is the number of elements in the cell. In practice, however, the function returns usually either immediately because the cloud size of both cells is different, or the complexity is O( n ) because the order of the points in both clouds is the same.
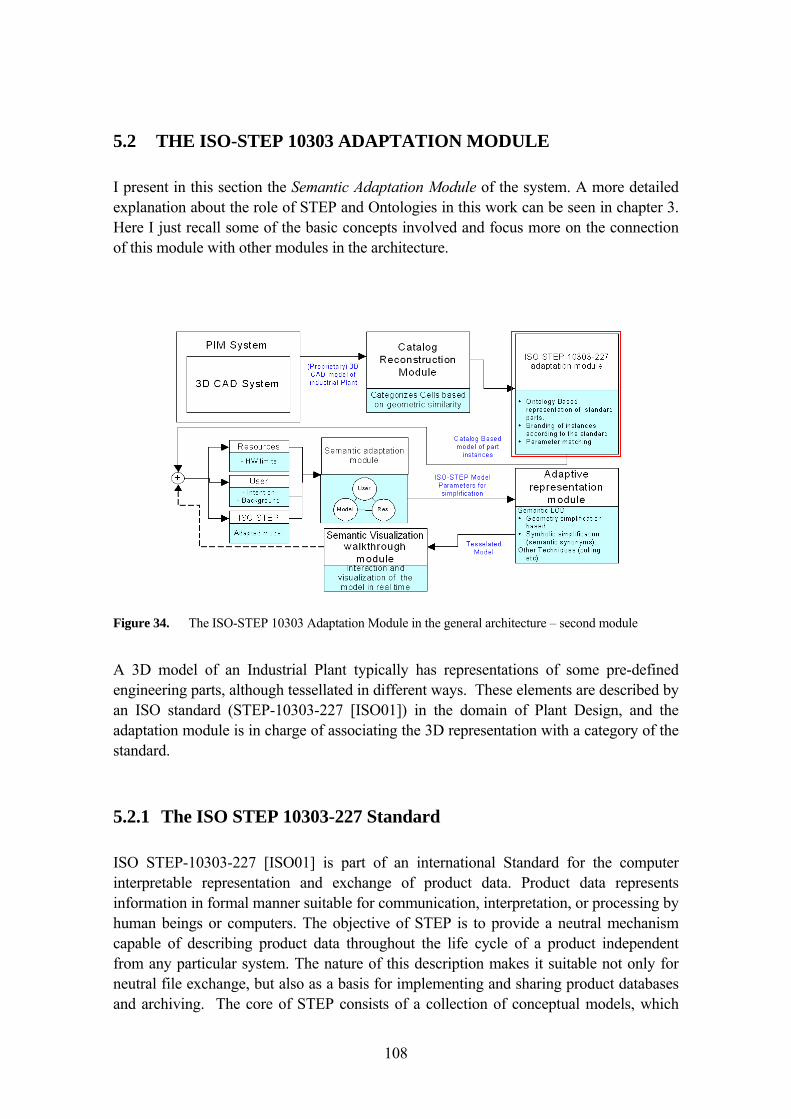
108
5.2 THE ISO-STEP 10303 ADAPTATION MODULE I present in this section the Semantic Adaptation Module of the system. A more detailed explanation about the role of STEP and Ontologies in this work can be seen in chapter 3. Here I just recall some of the basic concepts involved and focus more on the connection of this module with other modules in the architecture.
Figure 34. The ISO-STEP 10303 Adaptation Module in the general architecture – second module
A 3D model of an Industrial Plant typically has representations of some pre-defined engineering parts, although tessellated in different ways. These elements are described by an ISO standard (STEP-10303-227 [ISO01]) in the domain of Plant Design, and the adaptation module is in charge of associating the 3D representation with a category of the standard.
5.2.1 The ISO STEP 10303-227 Standard ISO STEP-10303-227 [ISO01] is part of an international Standard for the computer interpretable representation and exchange of product data. Product data represents information in formal manner suitable for communication, interpretation, or processing by human beings or computers. The objective of STEP is to provide a neutral mechanism capable of describing product data throughout the life cycle of a product independent from any particular system. The nature of this description makes it suitable not only for neutral file exchange, but also as a basis for implementing and sharing product databases and archiving. The core of STEP consists of a collection of conceptual models, which
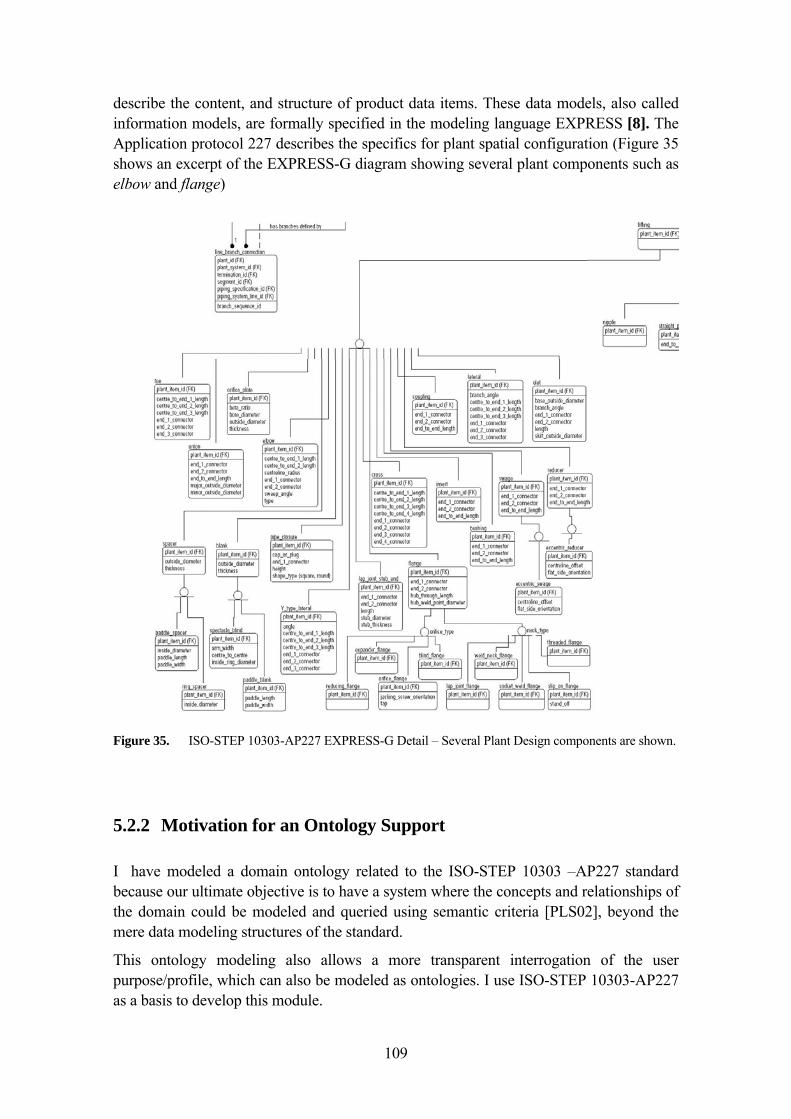
109
describe the content, and structure of product data items. These data models, also called information models, are formally specified in the modeling language EXPRESS [8]. The Application protocol 227 describes the specifics for plant spatial configuration (Figure 35 shows an excerpt of the EXPRESS-G diagram showing several plant components such as elbow and flange)
Figure 35. ISO-STEP 10303-AP227 EXPRESS-G Detail – Several Plant Design components are shown.
5.2.2 Motivation for an Ontology Support I have modeled a domain ontology related to the ISO-STEP 10303 –AP227 standard because our ultimate objective is to have a system where the concepts and relationships of the domain could be modeled and queried using semantic criteria [PLS02], beyond the mere data modeling structures of the standard.
This ontology modeling also allows a more transparent interrogation of the user purpose/profile, which can also be modeled as ontologies. I use ISO-STEP 10303-AP227 as a basis to develop this module.
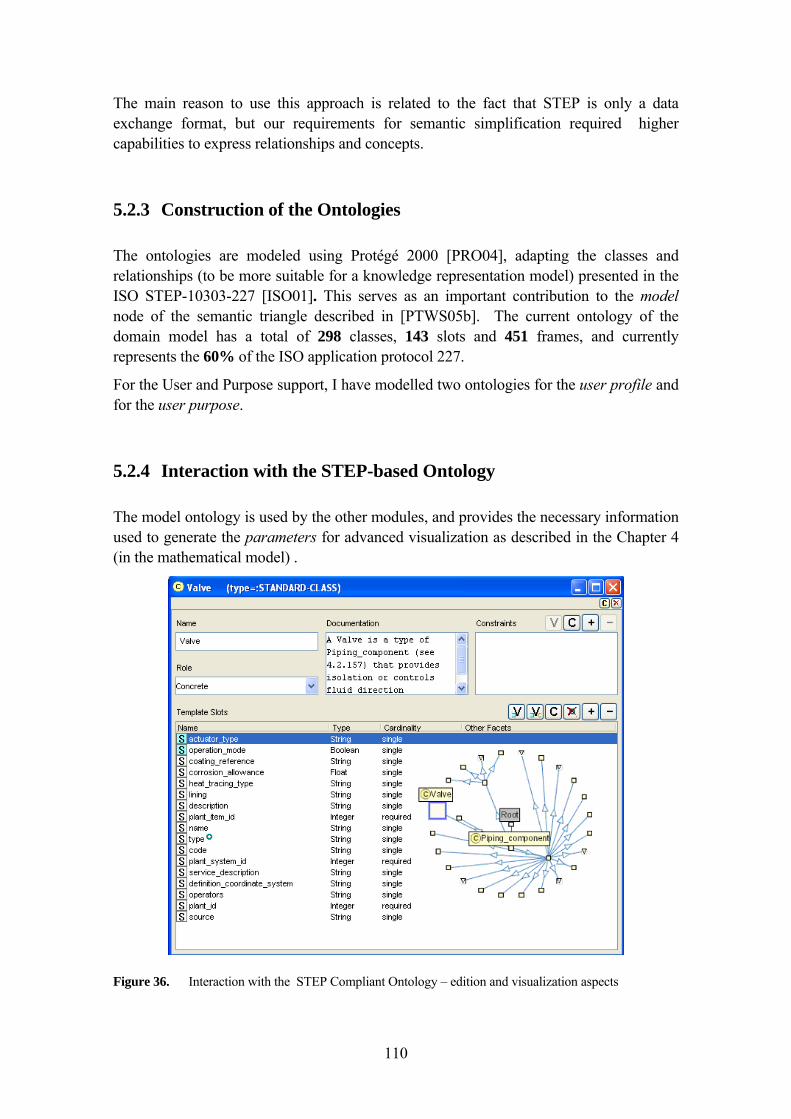
110
The main reason to use this approach is related to the fact that STEP is only a data exchange format, but our requirements for semantic simplification required higher capabilities to express relationships and concepts.
5.2.3 Construction of the Ontologies The ontologies are modeled using Protégé 2000 [PRO04], adapting the classes and relationships (to be more suitable for a knowledge representation model) presented in the ISO STEP-10303-227 [ISO01]. This serves as an important contribution to the model node of the semantic triangle described in [PTWS05b]. The current ontology of the domain model has a total of 298 classes, 143 slots and 451 frames, and currently represents the 60% of the ISO application protocol 227.
For the User and Purpose support, I have modelled two ontologies for the user profile and for the user purpose.
5.2.4 Interaction with the STEP-based Ontology The model ontology is used by the other modules, and provides the necessary information used to generate the parameters for advanced visualization as described in the Chapter 4 (in the mathematical model) .
Figure 36. Interaction with the STEP Compliant Ontology – edition and visualization aspects
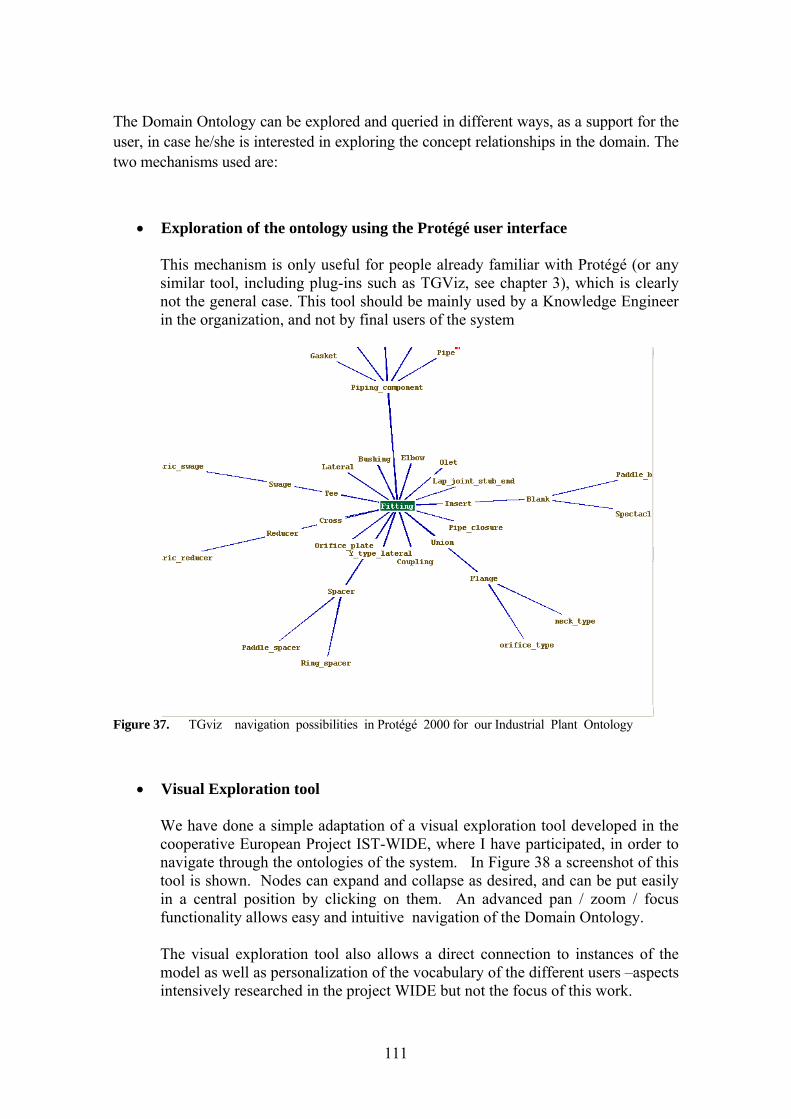
111
The Domain Ontology can be explored and queried in different ways, as a support for the user, in case he/she is interested in exploring the concept relationships in the domain. The two mechanisms used are:
• Exploration of the ontology using the Protégé user interface This mechanism is only useful for people already familiar with Protégé (or any similar tool, including plug-ins such as TGViz, see chapter 3), which is clearly not the general case. This tool should be mainly used by a Knowledge Engineer in the organization, and not by final users of the system
Figure 37. TGviz navigation possibilities in Protégé 2000 for our Industrial Plant Ontology
• Visual Exploration tool
We have done a simple adaptation of a visual exploration tool developed in the cooperative European Project IST-WIDE, where I have participated, in order to navigate through the ontologies of the system. In Figure 38 a screenshot of this tool is shown. Nodes can expand and collapse as desired, and can be put easily in a central position by clicking on them. An advanced pan / zoom / focus functionality allows easy and intuitive navigation of the Domain Ontology. The visual exploration tool also allows a direct connection to instances of the model as well as personalization of the vocabulary of the different users –aspects intensively researched in the project WIDE but not the focus of this work.
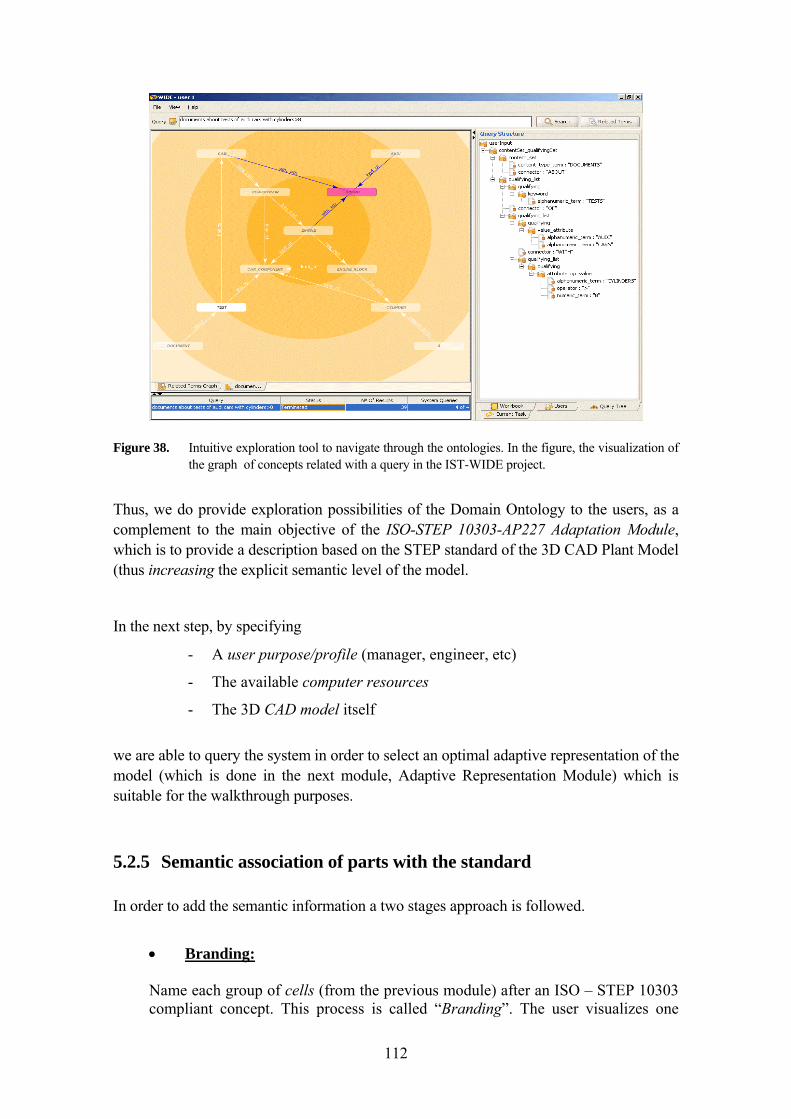
112
Figure 38. Intuitive exploration tool to navigate through the ontologies. In the figure, the visualization of the graph of concepts related with a query in the IST-WIDE project.
Thus, we do provide exploration possibilities of the Domain Ontology to the users, as a complement to the main objective of the ISO-STEP 10303-AP227 Adaptation Module, which is to provide a description based on the STEP standard of the 3D CAD Plant Model (thus increasing the explicit semantic level of the model.
In the next step, by specifying
- A user purpose/profile (manager, engineer, etc)
- The available computer resources
- The 3D CAD model itself
we are able to query the system in order to select an optimal adaptive representation of the model (which is done in the next module, Adaptive Representation Module) which is suitable for the walkthrough purposes.
5.2.5 Semantic association of parts with the standard In order to add the semantic information a two stages approach is followed.
• Branding: Name each group of cells (from the previous module) after an ISO – STEP 10303 compliant concept. This process is called “Branding”. The user visualizes one
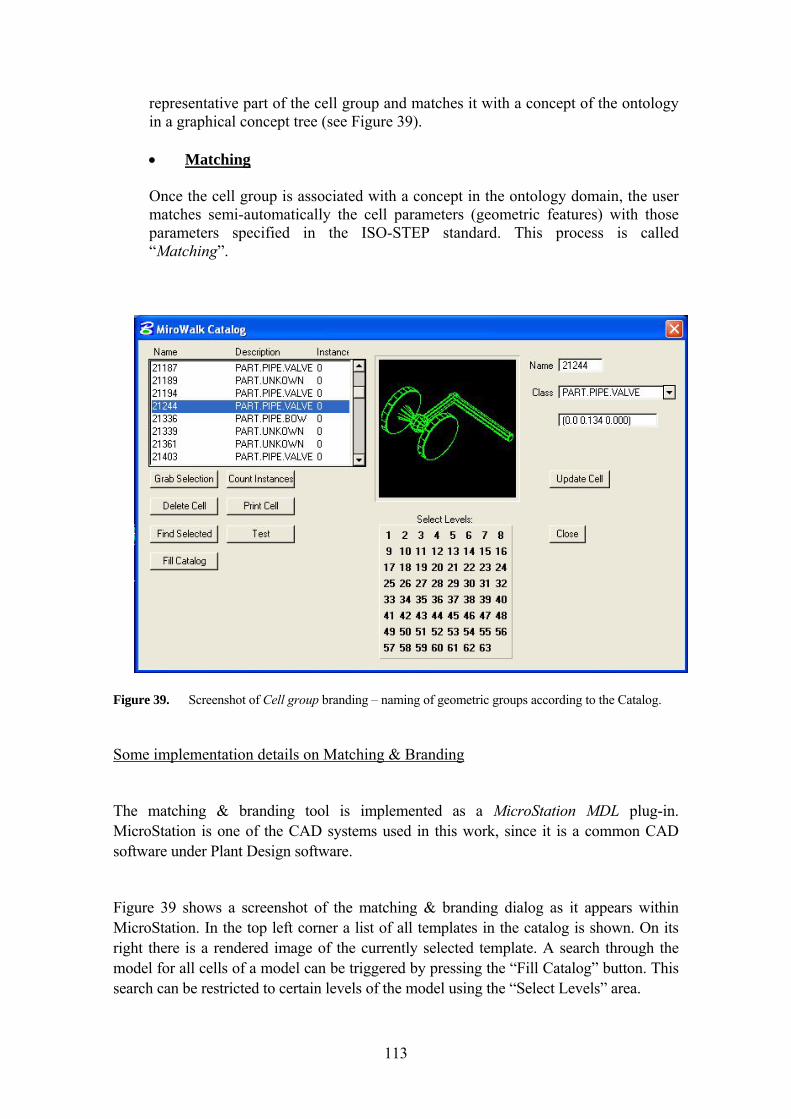
113
representative part of the cell group and matches it with a concept of the ontology in a graphical concept tree (see Figure 39). • Matching Once the cell group is associated with a concept in the ontology domain, the user matches semi-automatically the cell parameters (geometric features) with those parameters specified in the ISO-STEP standard. This process is called “Matching”.
Figure 39. Screenshot of Cell group branding – naming of geometric groups according to the Catalog.
Some implementation details on Matching & Branding
The matching & branding tool is implemented as a MicroStation MDL plug-in. MicroStation is one of the CAD systems used in this work, since it is a common CAD software under Plant Design software.
Figure 39 shows a screenshot of the matching & branding dialog as it appears within MicroStation. In the top left corner a list of all templates in the catalog is shown. On its right there is a rendered image of the currently selected template. A search through the model for all cells of a model can be triggered by pressing the “Fill Catalog” button. This search can be restricted to certain levels of the model using the “Select Levels” area.

114
The “Grab Selection” button will add all cells currently selected in the model to the catalog. The “Name” and the “Class” text-field on the right side of the dialog allow a manual correction of the cell class. Additionally, cells can be deleted, the tool can count the instances of a selected template in the model, and the structure of a template can be printed to the log file for debugging purposes.
MicroStation already has a built-in cell library that contains template cells that can be inserted into the CAD model. This cell library can be accessed using the MDL API. I use this functionality as a base for implementing our catalog. This has two advantages: on the one hand, no extra solution for persistent storage of the catalog has to be implemented. On the other hand, the catalog can still be accessed by the CAD user using MicroStation tools, since it is data-wise a normal Micro Station cell library. Also existent cell libraries can be directly used as a MiroWalk parts branding & matching.
To add cells to the catalog and to match cells from the model to catalog, templates the catalog module described in the next sub-chapter is used. Basically, the catalog tool is the user’s front-end for the branding & matching module.
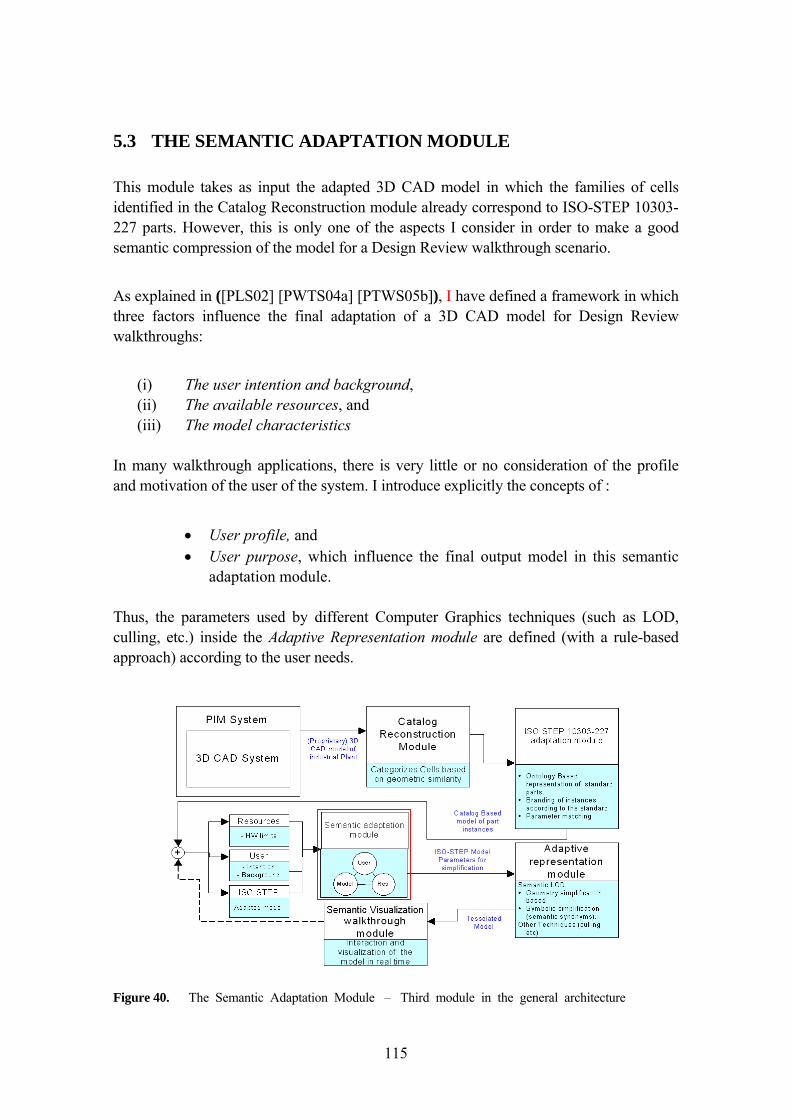
115
5.3 THE SEMANTIC ADAPTATION MODULE This module takes as input the adapted 3D CAD model in which the families of cells identified in the Catalog Reconstruction module already correspond to ISO-STEP 10303-227 parts. However, this is only one of the aspects I consider in order to make a good semantic compression of the model for a Design Review walkthrough scenario.
As explained in ([PLS02] [PWTS04a] [PTWS05b]), I have defined a framework in which three factors influence the final adaptation of a 3D CAD model for Design Review walkthroughs:
(i) The user intention and background, (ii) The available resources, and (iii) The model characteristics
In many walkthrough applications, there is very little or no consideration of the profile and motivation of the user of the system. I introduce explicitly the concepts of :
• User profile, and • User purpose, which influence the final output model in this semantic
adaptation module. Thus, the parameters used by different Computer Graphics techniques (such as LOD, culling, etc.) inside the Adaptive Representation module are defined (with a rule-based approach) according to the user needs.
Figure 40. The Semantic Adaptation Module – Third module in the general architecture
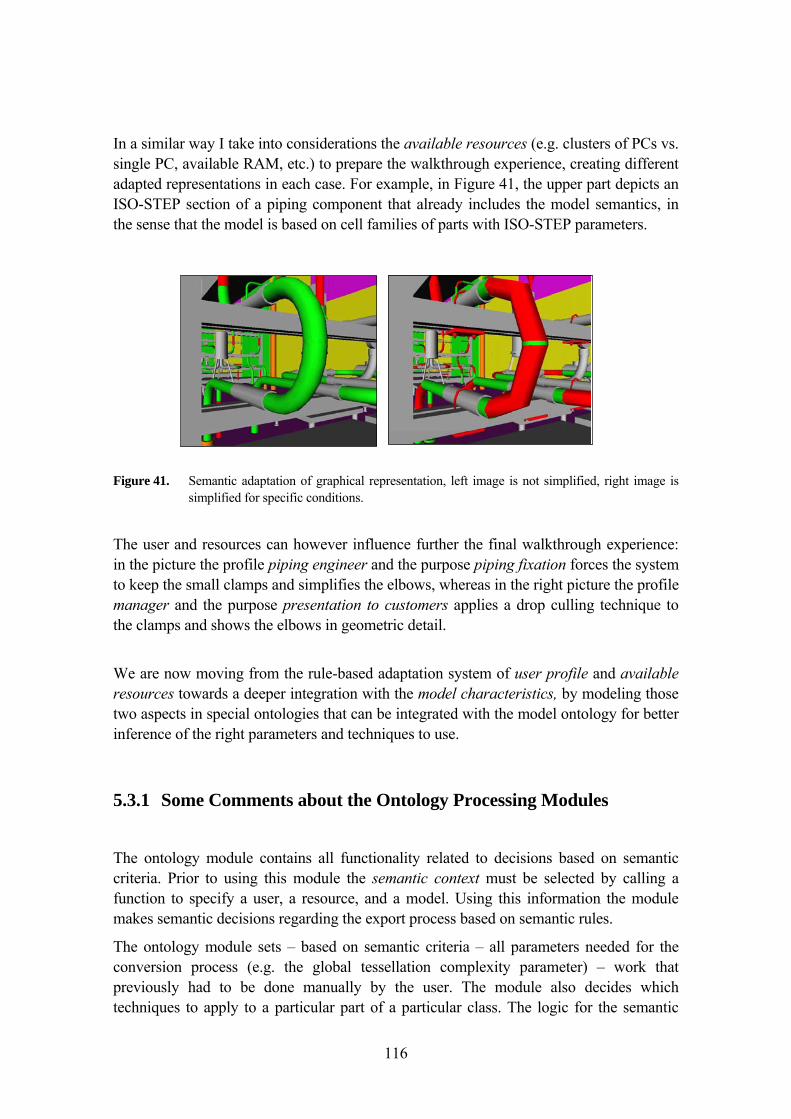
116
In a similar way I take into considerations the available resources (e.g. clusters of PCs vs. single PC, available RAM, etc.) to prepare the walkthrough experience, creating different adapted representations in each case. For example, in Figure 41, the upper part depicts an ISO-STEP section of a piping component that already includes the model semantics, in the sense that the model is based on cell families of parts with ISO-STEP parameters.
Figure 41. Semantic adaptation of graphical representation, left image is not simplified, right image is
simplified for specific conditions.
The user and resources can however influence further the final walkthrough experience: in the picture the profile piping engineer and the purpose piping fixation forces the system to keep the small clamps and simplifies the elbows, whereas in the right picture the profile manager and the purpose presentation to customers applies a drop culling technique to the clamps and shows the elbows in geometric detail.
We are now moving from the rule-based adaptation system of user profile and available resources towards a deeper integration with the model characteristics, by modeling those two aspects in special ontologies that can be integrated with the model ontology for better inference of the right parameters and techniques to use.
5.3.1 Some Comments about the Ontology Processing Modules
The ontology module contains all functionality related to decisions based on semantic criteria. Prior to using this module the semantic context must be selected by calling a function to specify a user, a resource, and a model. Using this information the module makes semantic decisions regarding the export process based on semantic rules.
The ontology module sets – based on semantic criteria – all parameters needed for the conversion process (e.g. the global tessellation complexity parameter) – work that previously had to be done manually by the user. The module also decides which techniques to apply to a particular part of a particular class. The logic for the semantic
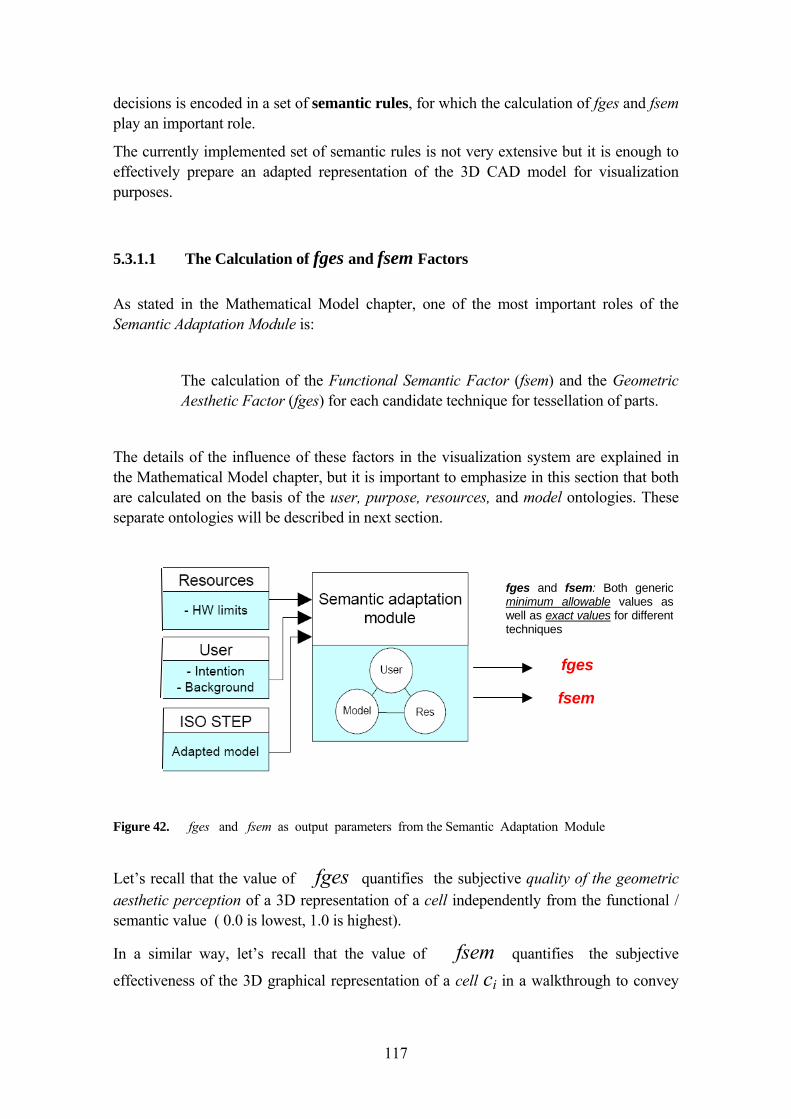
117
decisions is encoded in a set of semantic rules, for which the calculation of fges and fsem play an important role.
The currently implemented set of semantic rules is not very extensive but it is enough to effectively prepare an adapted representation of the 3D CAD model for visualization purposes.
5.3.1.1 The Calculation of fges and fsem Factors As stated in the Mathematical Model chapter, one of the most important roles of the Semantic Adaptation Module is:
The calculation of the Functional Semantic Factor (fsem) and the Geometric Aesthetic Factor (fges) for each candidate technique for tessellation of parts.
The details of the influence of these factors in the visualization system are explained in the Mathematical Model chapter, but it is important to emphasize in this section that both are calculated on the basis of the user, purpose, resources, and model ontologies. These separate ontologies will be described in next section.
Figure 42. fges and fsem as output parameters from the Semantic Adaptation Module
Let’s recall that the value of fges quantifies the subjective quality of the geometric aesthetic perception of a 3D representation of a cell independently from the functional / semantic value ( 0.0 is lowest, 1.0 is highest).
In a similar way, let’s recall that the value of fsem quantifies the subjective
effectiveness of the 3D graphical representation of a cell ci in a walkthrough to convey
fges
fsem
fges and fsem: Both genericminimum allowable values aswell as exact values for differenttechniques
118
the functional and semantic role of that representation for a specific user purpose and profile (0.0 is lowest, 1.0 is highest).
Both values are very useful and needed in the formulation of the mathematical optimization problem (see Chapter 4)
5.3.2 Some Generic Aspects of the Mirowalk Ontologies In the next chapter a detailed description of the domain ontology in our system (the Domain Ontology for Industrial Plant Design) is given. Clearly, in the semantic triangle concept, this ontology plays a central role related with the model node of the triangle.
However, there are other ontologies in the system that serve as support for the semantic aspects related to the user (profile and purpose), the resources, and the techniques used.
Mirowalk has 5 interrelated ontologies (including the Domain ontology already described) that allow the support of the semantic visualization of large plant models. Thus, in this section I will describe some of the different aspects related to the edition, storage and interrogation mechanisms on those ontologies in general, as well as to give a brief description of the each one.
5.3.2.1 Ontologies Languages in Mirowalk In general, the Mirowalk system uses the OWL (Ontology Web Language) [OWL04] to edit the ontologies. This decision was made up recently, once the OWL tools allowed the edition and storage of OWL Ontologies without assuming too many risks.
OWL is a W3C Recommendation since February 2004 and, quoting their promoters, it has been designed for use by applications that need to process the content of information instead of just presenting information to humans. OWL facilitates greater machine interpretability of Web content than that supported by XML, RDF, and RDF Schema (RDF-S) by providing additional vocabulary along with a formal semantics. OWL has three increasingly-expressive sublanguages: OWL Lite, OWL DL, and OWL Full.
5.3.2.2 Mirowalk Ontologies Edition The Edition of the Mirowalk Ontologies has been performed with the Ontology Editor Protegé 2000 [PRO04]. The main characteristics of Protégé is that its community of users is composed of thousands of people, it is open-source, multiplatform (Java) and is able to provide an extensible architecture for the creation of customized knowledge-based applications.
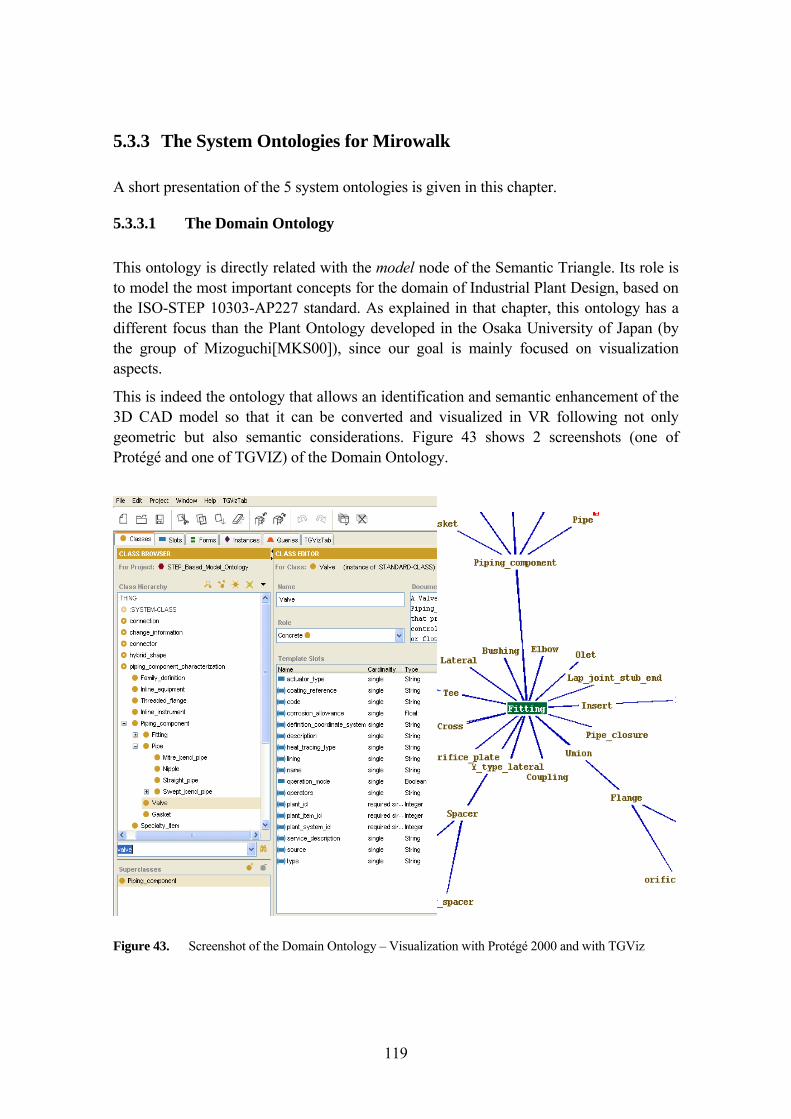
119
5.3.3 The System Ontologies for Mirowalk A short presentation of the 5 system ontologies is given in this chapter.
5.3.3.1 The Domain Ontology This ontology is directly related with the model node of the Semantic Triangle. Its role is to model the most important concepts for the domain of Industrial Plant Design, based on the ISO-STEP 10303-AP227 standard. As explained in that chapter, this ontology has a different focus than the Plant Ontology developed in the Osaka University of Japan (by the group of Mizoguchi[MKS00]), since our goal is mainly focused on visualization aspects.
This is indeed the ontology that allows an identification and semantic enhancement of the 3D CAD model so that it can be converted and visualized in VR following not only geometric but also semantic considerations. Figure 43 shows 2 screenshots (one of Protégé and one of TGVIZ) of the Domain Ontology.
Figure 43. Screenshot of the Domain Ontology – Visualization with Protégé 2000 and with TGViz
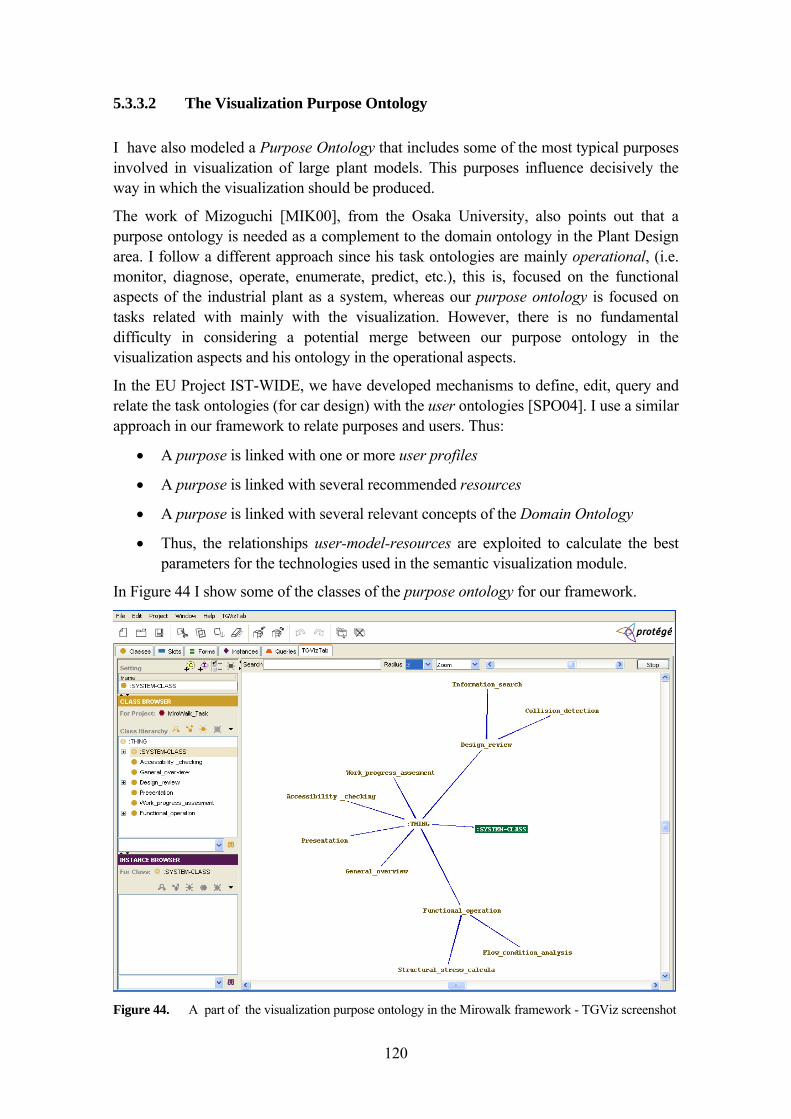
120
5.3.3.2 The Visualization Purpose Ontology I have also modeled a Purpose Ontology that includes some of the most typical purposes involved in visualization of large plant models. This purposes influence decisively the way in which the visualization should be produced.
The work of Mizoguchi [MIK00], from the Osaka University, also points out that a purpose ontology is needed as a complement to the domain ontology in the Plant Design area. I follow a different approach since his task ontologies are mainly operational, (i.e. monitor, diagnose, operate, enumerate, predict, etc.), this is, focused on the functional aspects of the industrial plant as a system, whereas our purpose ontology is focused on tasks related with mainly with the visualization. However, there is no fundamental difficulty in considering a potential merge between our purpose ontology in the visualization aspects and his ontology in the operational aspects.
In the EU Project IST-WIDE, we have developed mechanisms to define, edit, query and relate the task ontologies (for car design) with the user ontologies [SPO04]. I use a similar approach in our framework to relate purposes and users. Thus:
• A purpose is linked with one or more user profiles
• A purpose is linked with several recommended resources
• A purpose is linked with several relevant concepts of the Domain Ontology
• Thus, the relationships user-model-resources are exploited to calculate the best parameters for the technologies used in the semantic visualization module.
In Figure 44 I show some of the classes of the purpose ontology for our framework.
Figure 44. A part of the visualization purpose ontology in the Mirowalk framework - TGViz screenshot
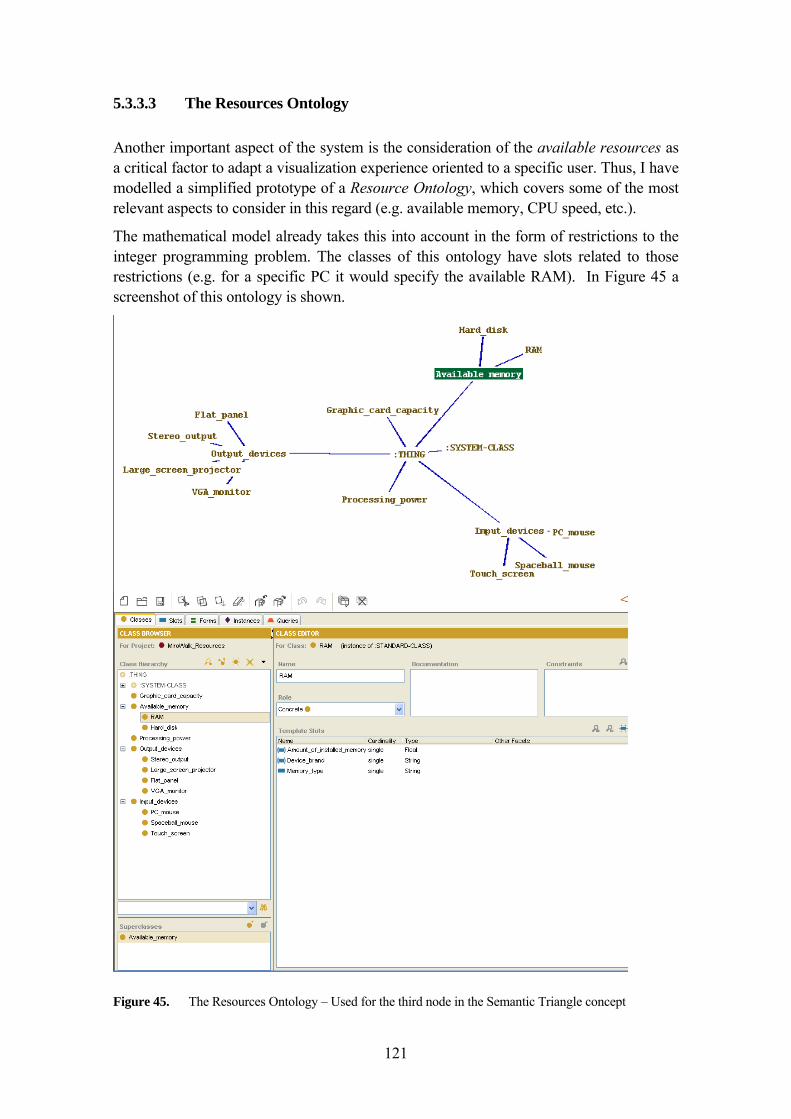
121
5.3.3.3 The Resources Ontology Another important aspect of the system is the consideration of the available resources as a critical factor to adapt a visualization experience oriented to a specific user. Thus, I have modelled a simplified prototype of a Resource Ontology, which covers some of the most relevant aspects to consider in this regard (e.g. available memory, CPU speed, etc.).
The mathematical model already takes this into account in the form of restrictions to the integer programming problem. The classes of this ontology have slots related to those restrictions (e.g. for a specific PC it would specify the available RAM). In Figure 45 a screenshot of this ontology is shown.
Figure 45. The Resources Ontology – Used for the third node in the Semantic Triangle concept
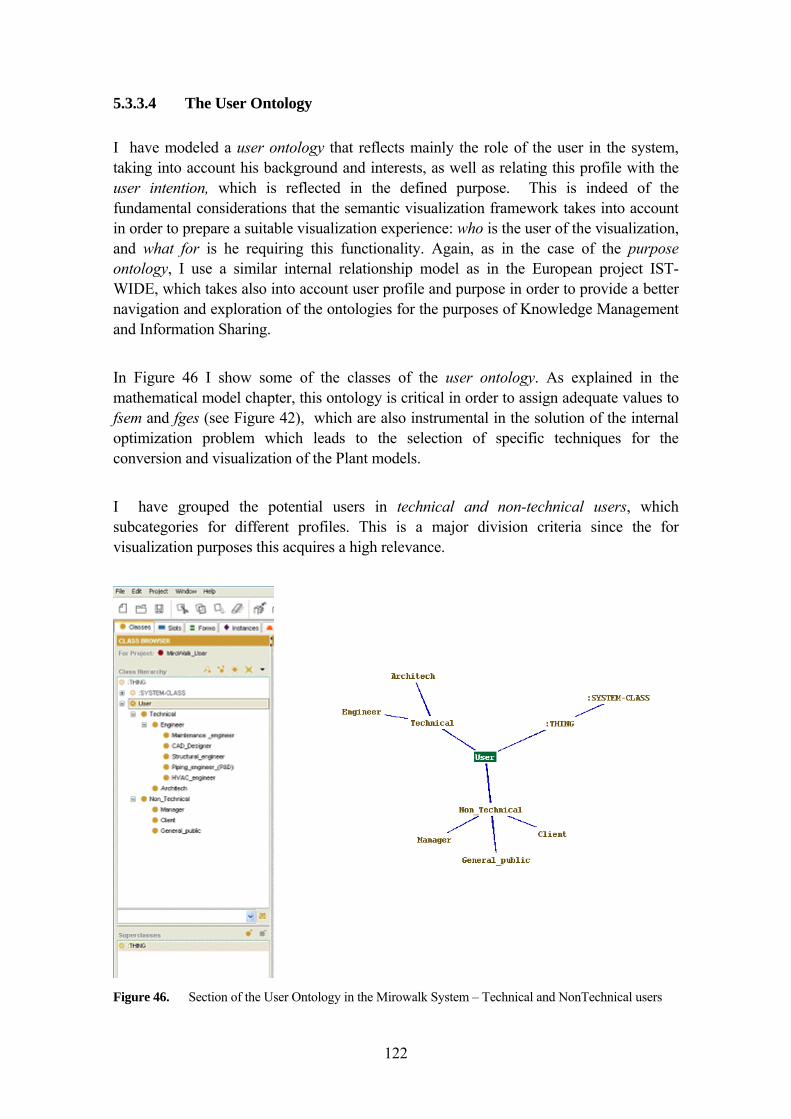
122
5.3.3.4 The User Ontology I have modeled a user ontology that reflects mainly the role of the user in the system, taking into account his background and interests, as well as relating this profile with the user intention, which is reflected in the defined purpose. This is indeed of the fundamental considerations that the semantic visualization framework takes into account in order to prepare a suitable visualization experience: who is the user of the visualization, and what for is he requiring this functionality. Again, as in the case of the purpose ontology, I use a similar internal relationship model as in the European project IST-WIDE, which takes also into account user profile and purpose in order to provide a better navigation and exploration of the ontologies for the purposes of Knowledge Management and Information Sharing.
In Figure 46 I show some of the classes of the user ontology. As explained in the mathematical model chapter, this ontology is critical in order to assign adequate values to fsem and fges (see Figure 42), which are also instrumental in the solution of the internal optimization problem which leads to the selection of specific techniques for the conversion and visualization of the Plant models.
I have grouped the potential users in technical and non-technical users, which subcategories for different profiles. This is a major division criteria since the for visualization purposes this acquires a high relevance.
Figure 46. Section of the User Ontology in the Mirowalk System – Technical and NonTechnical users
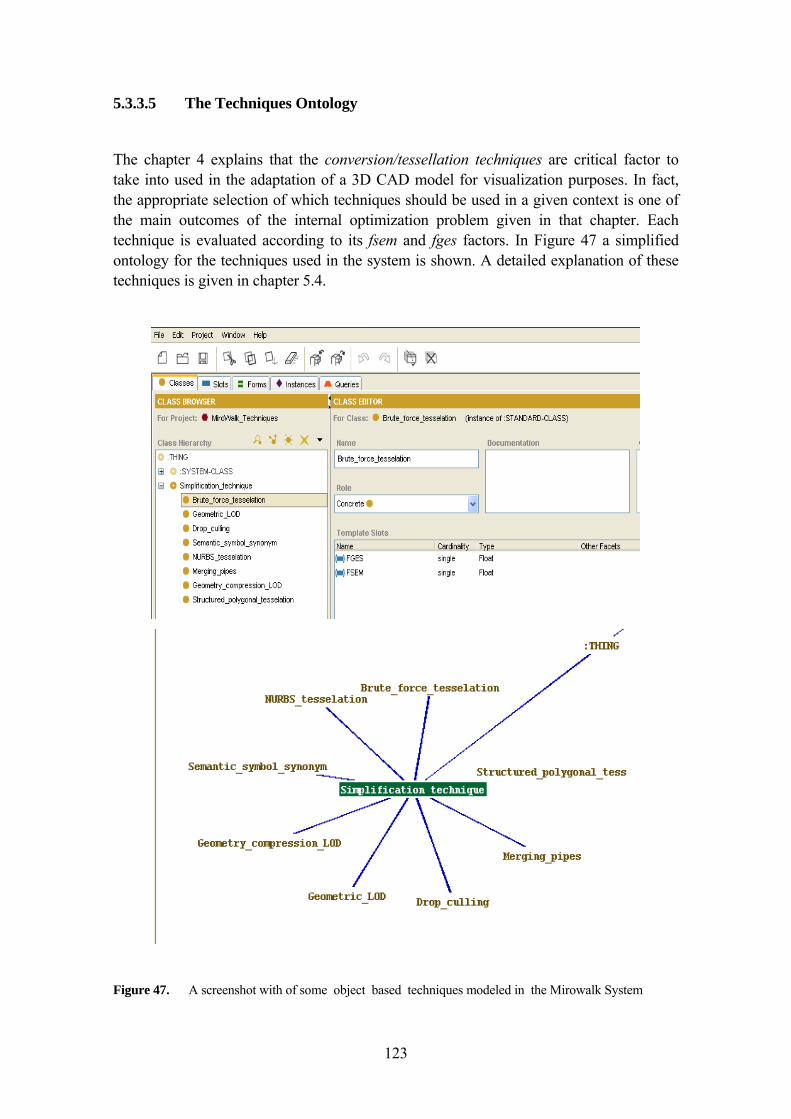
123
5.3.3.5 The Techniques Ontology
The chapter 4 explains that the conversion/tessellation techniques are critical factor to take into used in the adaptation of a 3D CAD model for visualization purposes. In fact, the appropriate selection of which techniques should be used in a given context is one of the main outcomes of the internal optimization problem given in that chapter. Each technique is evaluated according to its fsem and fges factors. In Figure 47 a simplified ontology for the techniques used in the system is shown. A detailed explanation of these techniques is given in chapter 5.4.
Figure 47. A screenshot with of some object based techniques modeled in the Mirowalk System
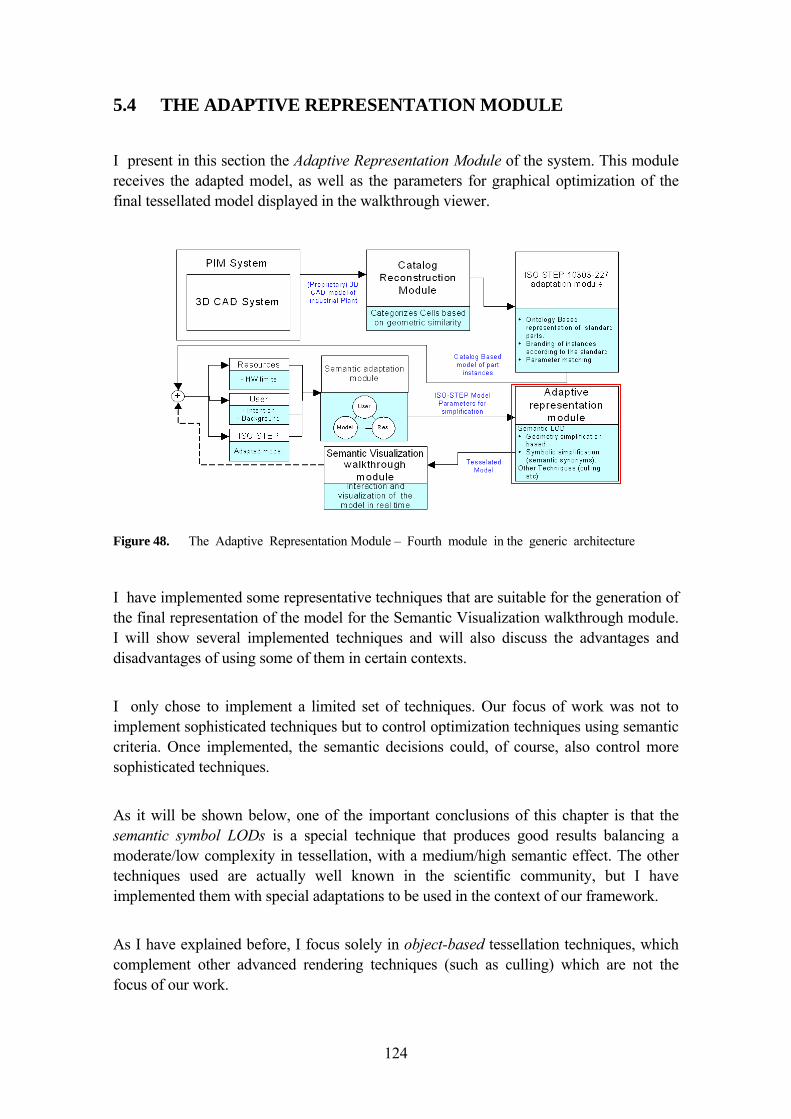
124
5.4 THE ADAPTIVE REPRESENTATION MODULE
I present in this section the Adaptive Representation Module of the system. This module receives the adapted model, as well as the parameters for graphical optimization of the final tessellated model displayed in the walkthrough viewer.
Figure 48. The Adaptive Representation Module – Fourth module in the generic architecture
I have implemented some representative techniques that are suitable for the generation of the final representation of the model for the Semantic Visualization walkthrough module. I will show several implemented techniques and will also discuss the advantages and disadvantages of using some of them in certain contexts.
I only chose to implement a limited set of techniques. Our focus of work was not to implement sophisticated techniques but to control optimization techniques using semantic criteria. Once implemented, the semantic decisions could, of course, also control more sophisticated techniques.
As it will be shown below, one of the important conclusions of this chapter is that the semantic symbol LODs is a special technique that produces good results balancing a moderate/low complexity in tessellation, with a medium/high semantic effect. The other techniques used are actually well known in the scientific community, but I have implemented them with special adaptations to be used in the context of our framework.
As I have explained before, I focus solely in object-based tessellation techniques, which complement other advanced rendering techniques (such as culling) which are not the focus of our work.
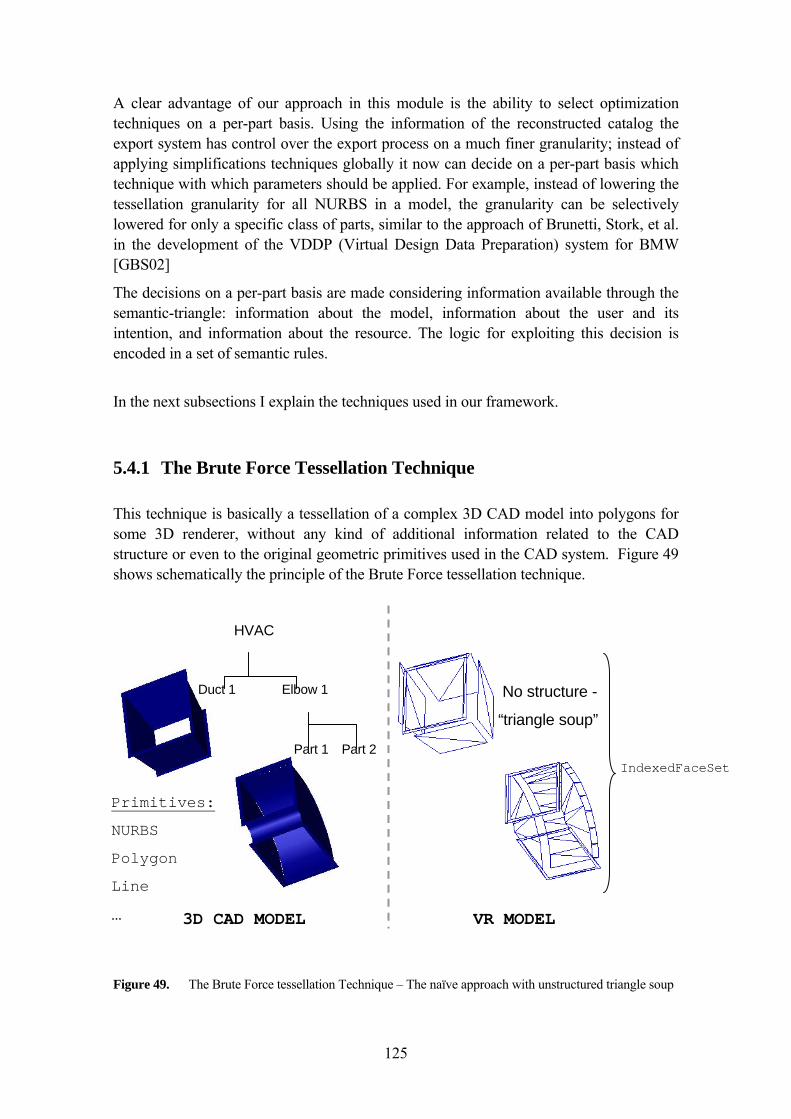
125
A clear advantage of our approach in this module is the ability to select optimization techniques on a per-part basis. Using the information of the reconstructed catalog the export system has control over the export process on a much finer granularity; instead of applying simplifications techniques globally it now can decide on a per-part basis which technique with which parameters should be applied. For example, instead of lowering the tessellation granularity for all NURBS in a model, the granularity can be selectively lowered for only a specific class of parts, similar to the approach of Brunetti, Stork, et al. in the development of the VDDP (Virtual Design Data Preparation) system for BMW [GBS02]
The decisions on a per-part basis are made considering information available through the semantic-triangle: information about the model, information about the user and its intention, and information about the resource. The logic for exploiting this decision is encoded in a set of semantic rules.
In the next subsections I explain the techniques used in our framework.
5.4.1 The Brute Force Tessellation Technique This technique is basically a tessellation of a complex 3D CAD model into polygons for some 3D renderer, without any kind of additional information related to the CAD structure or even to the original geometric primitives used in the CAD system. Figure 49 shows schematically the principle of the Brute Force tessellation technique.
Figure 49. The Brute Force tessellation Technique – The naïve approach with unstructured triangle soup
HVAC
Duct 1 Elbow 1
Part 1 Part 2
No structure -
“triangle soup”
Primitives:
NURBS
Polygon
Line
…
IndexedFaceSet
3D CAD MODEL VR MODEL
126
Some of the characteristics of this technique are:
- The visual quality of the brute force tessellation is usually very good, but small
objects tend to require an excessive number of triangles for rendering, and no simplification is applied.
- The main drawback from the performance perspective is the fact that the model is usually too complex and overloads the visualization system, demanding powerful resources and algorithms to visualize.
- The result is sometimes called “triangle soup” since the connectivity between the (arbitrary) grouping of triangles does not follow any pattern that can be used for semantic understanding, or the model beyond the mere graphical representation.
- The 3D CAD conversion to a VR model is blind, in the sense that no optimization is applied based on knowledge of the structure and nature of the model.
- Considerations about the potential user or the available resources are not considered at all in this technique.
- Basically, the geometric primitives are tessellated directly with some predefined algorithm which converts every primitive into a tessellated representations
- Sometimes the brute force tessellation technique can improve the navigation performance in frames per second of the visualization if compared to structured polygonal tessellation, since the overload for hierarchical structure in the rendering pipeline is reduced.
- Therefore, in some advanced systems for visualization of large models of Industrial Plant design focused only in visual inspection for Design Review, structured polygonal tessellations are considered as intermediate steps and converted into brute force tessellations.
Implementation comments: I have implemented the brute force tessellation technique using internal API functions in the CAD system able to generate polygonal representation of most primitives. When this was not possible, I included our own algorithms to convert the primitives. I have ignored all structural or domain information in this technique.
After the polygonal representation was obtained, I have created a scene graph with the corresponding structures, such as IndexedFaceSet or similar.
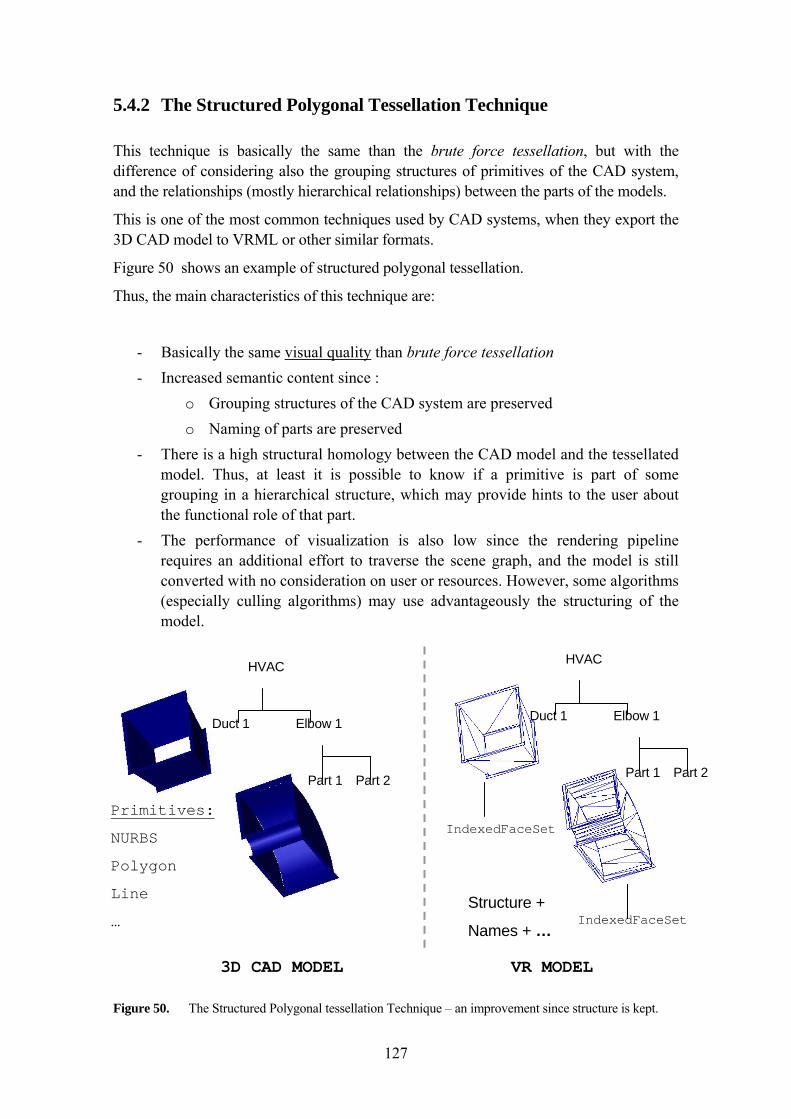
127
5.4.2 The Structured Polygonal Tessellation Technique This technique is basically the same than the brute force tessellation, but with the difference of considering also the grouping structures of primitives of the CAD system, and the relationships (mostly hierarchical relationships) between the parts of the models.
This is one of the most common techniques used by CAD systems, when they export the 3D CAD model to VRML or other similar formats.
Figure 50 shows an example of structured polygonal tessellation.
Thus, the main characteristics of this technique are:
- Basically the same visual quality than brute force tessellation - Increased semantic content since :
o Grouping structures of the CAD system are preserved o Naming of parts are preserved
- There is a high structural homology between the CAD model and the tessellated model. Thus, at least it is possible to know if a primitive is part of some grouping in a hierarchical structure, which may provide hints to the user about the functional role of that part.
- The performance of visualization is also low since the rendering pipeline requires an additional effort to traverse the scene graph, and the model is still converted with no consideration on user or resources. However, some algorithms (especially culling algorithms) may use advantageously the structuring of the model.
Figure 50. The Structured Polygonal tessellation Technique – an improvement since structure is kept.
Structure +
Names + …
HVAC
Duct 1 Elbow 1
Part 1 Part 2
HVAC
Duct 1 Elbow 1
Part 1 Part 2
Primitives:
NURBS
Polygon
Line
…
3D CAD MODEL VR MODEL
IndexedFaceSet
IndexedFaceSet
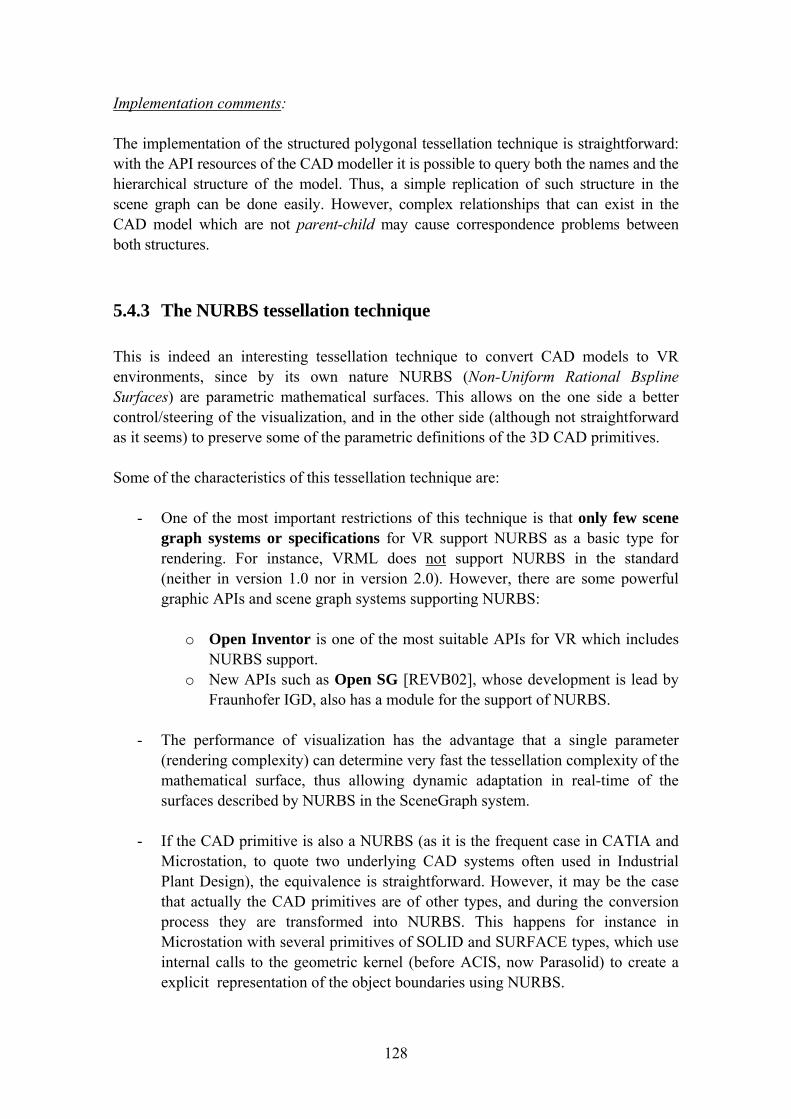
128
Implementation comments: The implementation of the structured polygonal tessellation technique is straightforward: with the API resources of the CAD modeller it is possible to query both the names and the hierarchical structure of the model. Thus, a simple replication of such structure in the scene graph can be done easily. However, complex relationships that can exist in the CAD model which are not parent-child may cause correspondence problems between both structures.
5.4.3 The NURBS tessellation technique This is indeed an interesting tessellation technique to convert CAD models to VR environments, since by its own nature NURBS (Non-Uniform Rational Bspline Surfaces) are parametric mathematical surfaces. This allows on the one side a better control/steering of the visualization, and in the other side (although not straightforward as it seems) to preserve some of the parametric definitions of the 3D CAD primitives. Some of the characteristics of this tessellation technique are:
- One of the most important restrictions of this technique is that only few scene graph systems or specifications for VR support NURBS as a basic type for rendering. For instance, VRML does not support NURBS in the standard (neither in version 1.0 nor in version 2.0). However, there are some powerful graphic APIs and scene graph systems supporting NURBS:
o Open Inventor is one of the most suitable APIs for VR which includes
NURBS support. o New APIs such as Open SG [REVB02], whose development is lead by
Fraunhofer IGD, also has a module for the support of NURBS.
- The performance of visualization has the advantage that a single parameter (rendering complexity) can determine very fast the tessellation complexity of the mathematical surface, thus allowing dynamic adaptation in real-time of the surfaces described by NURBS in the SceneGraph system.
- If the CAD primitive is also a NURBS (as it is the frequent case in CATIA and
Microstation, to quote two underlying CAD systems often used in Industrial Plant Design), the equivalence is straightforward. However, it may be the case that actually the CAD primitives are of other types, and during the conversion process they are transformed into NURBS. This happens for instance in Microstation with several primitives of SOLID and SURFACE types, which use internal calls to the geometric kernel (before ACIS, now Parasolid) to create a explicit representation of the object boundaries using NURBS.
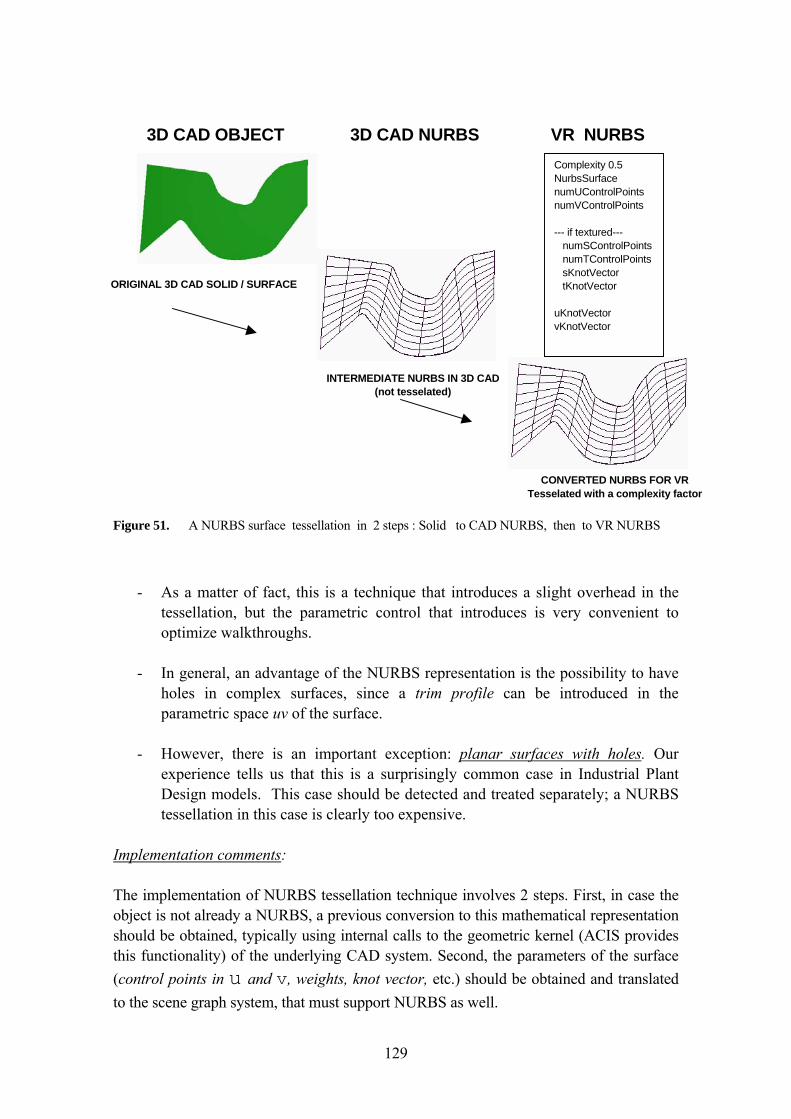
129
Figure 51. A NURBS surface tessellation in 2 steps : Solid to CAD NURBS, then to VR NURBS
- As a matter of fact, this is a technique that introduces a slight overhead in the
tessellation, but the parametric control that introduces is very convenient to optimize walkthroughs.
- In general, an advantage of the NURBS representation is the possibility to have
holes in complex surfaces, since a trim profile can be introduced in the parametric space uv of the surface.
- However, there is an important exception: planar surfaces with holes. Our
experience tells us that this is a surprisingly common case in Industrial Plant Design models. This case should be detected and treated separately; a NURBS tessellation in this case is clearly too expensive.
Implementation comments: The implementation of NURBS tessellation technique involves 2 steps. First, in case the object is not already a NURBS, a previous conversion to this mathematical representation should be obtained, typically using internal calls to the geometric kernel (ACIS provides this functionality) of the underlying CAD system. Second, the parameters of the surface (control points in u and v, weights, knot vector, etc.) should be obtained and translated to the scene graph system, that must support NURBS as well.
Complexity 0.5 NurbsSurface numUControlPoints numVControlPoints --- if textured--- numSControlPoints numTControlPoints sKnotVector tKnotVector uKnotVector vKnotVector
3D CAD NURBS3D CAD OBJECT VR NURBS
ORIGINAL 3D CAD SOLID / SURFACE
INTERMEDIATE NURBS IN 3D CAD (not tesselated)
CONVERTED NURBS FOR VR Tesselated with a complexity factor
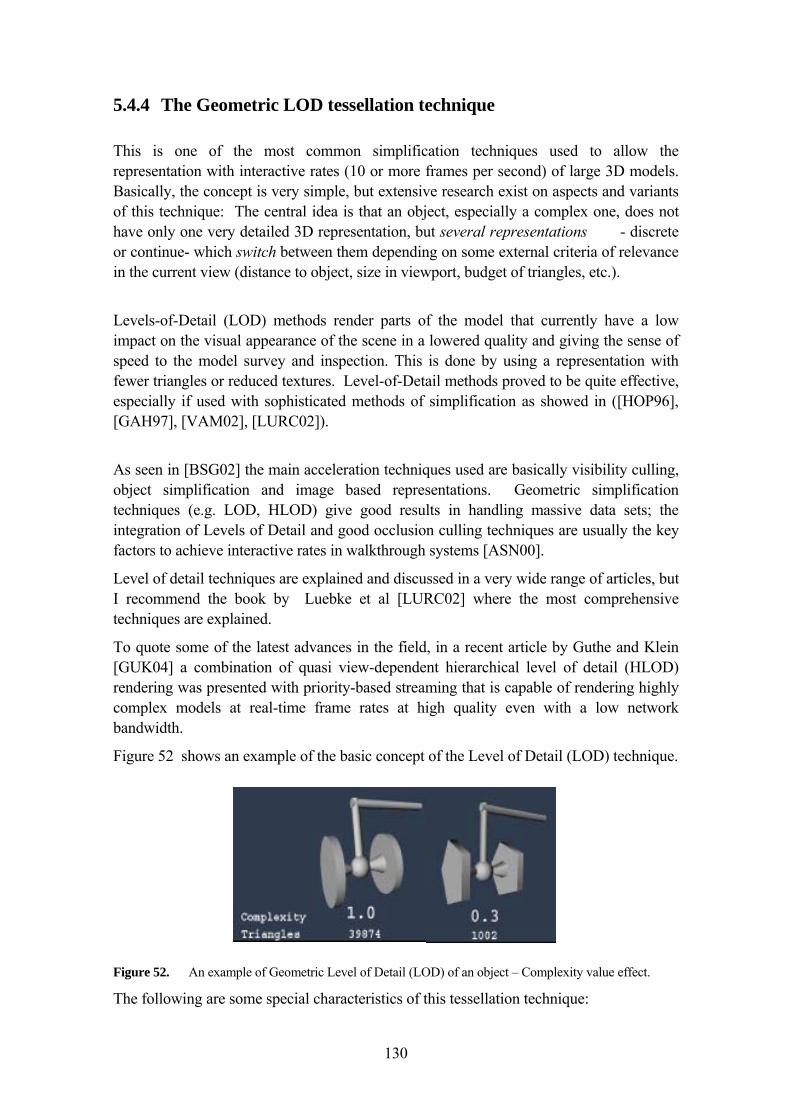
130
5.4.4 The Geometric LOD tessellation technique This is one of the most common simplification techniques used to allow the representation with interactive rates (10 or more frames per second) of large 3D models. Basically, the concept is very simple, but extensive research exist on aspects and variants of this technique: The central idea is that an object, especially a complex one, does not have only one very detailed 3D representation, but several representations - discrete or continue- which switch between them depending on some external criteria of relevance in the current view (distance to object, size in viewport, budget of triangles, etc.).
Levels-of-Detail (LOD) methods render parts of the model that currently have a low impact on the visual appearance of the scene in a lowered quality and giving the sense of speed to the model survey and inspection. This is done by using a representation with fewer triangles or reduced textures. Level-of-Detail methods proved to be quite effective, especially if used with sophisticated methods of simplification as showed in ([HOP96], [GAH97], [VAM02], [LURC02]).
As seen in [BSG02] the main acceleration techniques used are basically visibility culling, object simplification and image based representations. Geometric simplification techniques (e.g. LOD, HLOD) give good results in handling massive data sets; the integration of Levels of Detail and good occlusion culling techniques are usually the key factors to achieve interactive rates in walkthrough systems [ASN00].
Level of detail techniques are explained and discussed in a very wide range of articles, but I recommend the book by Luebke et al [LURC02] where the most comprehensive techniques are explained.
To quote some of the latest advances in the field, in a recent article by Guthe and Klein [GUK04] a combination of quasi view-dependent hierarchical level of detail (HLOD) rendering was presented with priority-based streaming that is capable of rendering highly complex models at real-time frame rates at high quality even with a low network bandwidth.
Figure 52 shows an example of the basic concept of the Level of Detail (LOD) technique.
Figure 52. An example of Geometric Level of Detail (LOD) of an object – Complexity value effect.
The following are some special characteristics of this tessellation technique:
131
- Together with advanced culling techniques, LOD are one of the key techniques
allowing the interactive visualization of 3D Industrial Plant CAD models. - It provides an additional control of the tessellation cost since usually the LOD
instances are static and their cost in number of triangles is fixed. - The static LODs have the problem of important overhead costs in the rendering
pipeline just for evaluation of the switching criterion, especially in the case of large models.
- Static LODs are mostly modelled by designers who take the original object as
reference, and this manual operation evidently impairs the complete automation of the visualization experience (unless a library of representations is built incrementally).
- There are automatic ways of generating an LOD representation of a complex
object (as for instance geometry simplification techniques, which removes vertices and edges), but the visual quality of the final result is not always guaranteed. These techniques are also costly in execution time, making conversion of large models of industrial plant slow. For instance, the worldwide reference project in the Large Model Visualization area of Plant Design (the Walkthru Project of D. Manocha, from UNC), takes a whole day calculating the LODs selected for representation.
- There exist also dynamic LOD techniques, which can be considered as an
extension of geometry simplification techniques with a progressive approach. Thus, vertices and edges are added gradually to the object as more detail is required from the walkthrough. Again, the added cost makes these techniques suitable only if a short conversion time is not a constraint. The evaluation of thousands of parts for their instantaneous level of detail is also an impairment of performance during real time interactive walkthroughs.
- Visual discontinuity artifacts can appear while switching between different
representations while the viewer is moving due to the massive characteristics of the data represented.
Implementation comments: To speed up the rendering, LOD levels can be defined for certain highly distributed or some costly-to-render elements. For parts which are of high importance to the user or for parts that only produce a small number of triangles no LOD levels are needed.
The implementation of LOD in our framework had different forms:
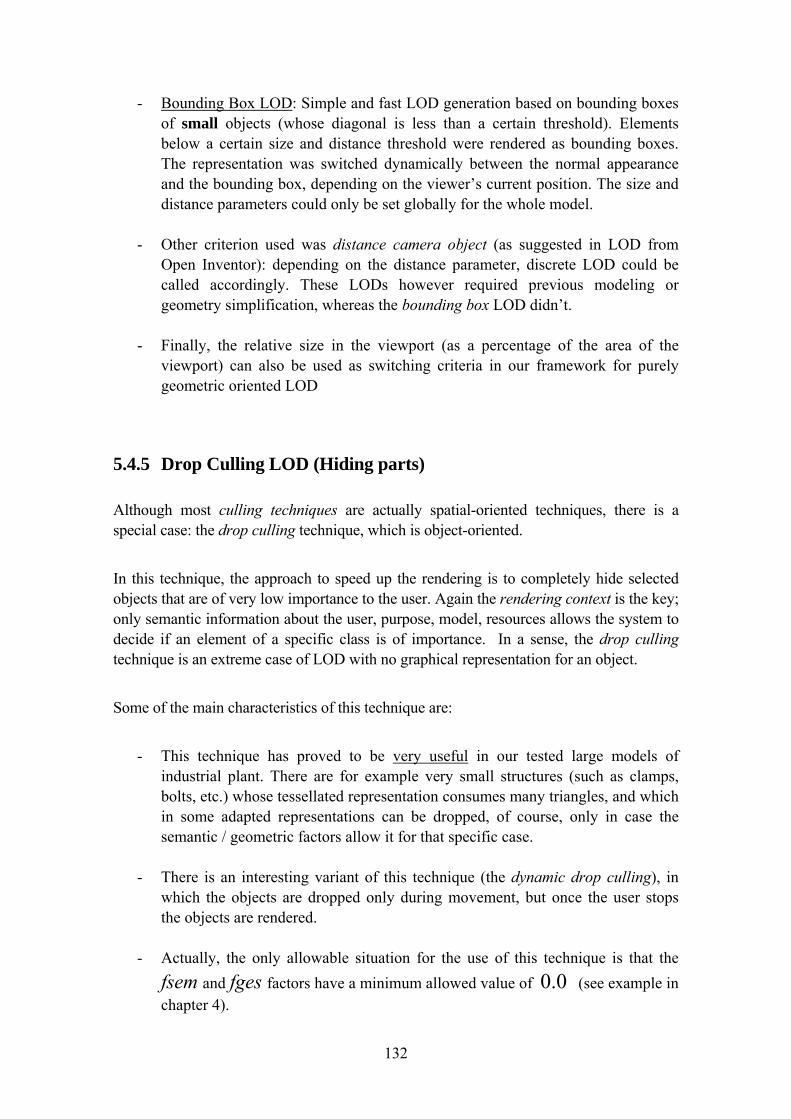
132
- Bounding Box LOD: Simple and fast LOD generation based on bounding boxes of small objects (whose diagonal is less than a certain threshold). Elements below a certain size and distance threshold were rendered as bounding boxes. The representation was switched dynamically between the normal appearance and the bounding box, depending on the viewer’s current position. The size and distance parameters could only be set globally for the whole model.
- Other criterion used was distance camera object (as suggested in LOD from
Open Inventor): depending on the distance parameter, discrete LOD could be called accordingly. These LODs however required previous modeling or geometry simplification, whereas the bounding box LOD didn’t.
- Finally, the relative size in the viewport (as a percentage of the area of the
viewport) can also be used as switching criteria in our framework for purely geometric oriented LOD
5.4.5 Drop Culling LOD (Hiding parts) Although most culling techniques are actually spatial-oriented techniques, there is a special case: the drop culling technique, which is object-oriented.
In this technique, the approach to speed up the rendering is to completely hide selected objects that are of very low importance to the user. Again the rendering context is the key; only semantic information about the user, purpose, model, resources allows the system to decide if an element of a specific class is of importance. In a sense, the drop culling technique is an extreme case of LOD with no graphical representation for an object.
Some of the main characteristics of this technique are:
- This technique has proved to be very useful in our tested large models of
industrial plant. There are for example very small structures (such as clamps, bolts, etc.) whose tessellated representation consumes many triangles, and which in some adapted representations can be dropped, of course, only in case the semantic / geometric factors allow it for that specific case.
- There is an interesting variant of this technique (the dynamic drop culling), in
which the objects are dropped only during movement, but once the user stops the objects are rendered.
- Actually, the only allowable situation for the use of this technique is that the
fsem and fges factors have a minimum allowed value of 0.0 (see example in chapter 4).
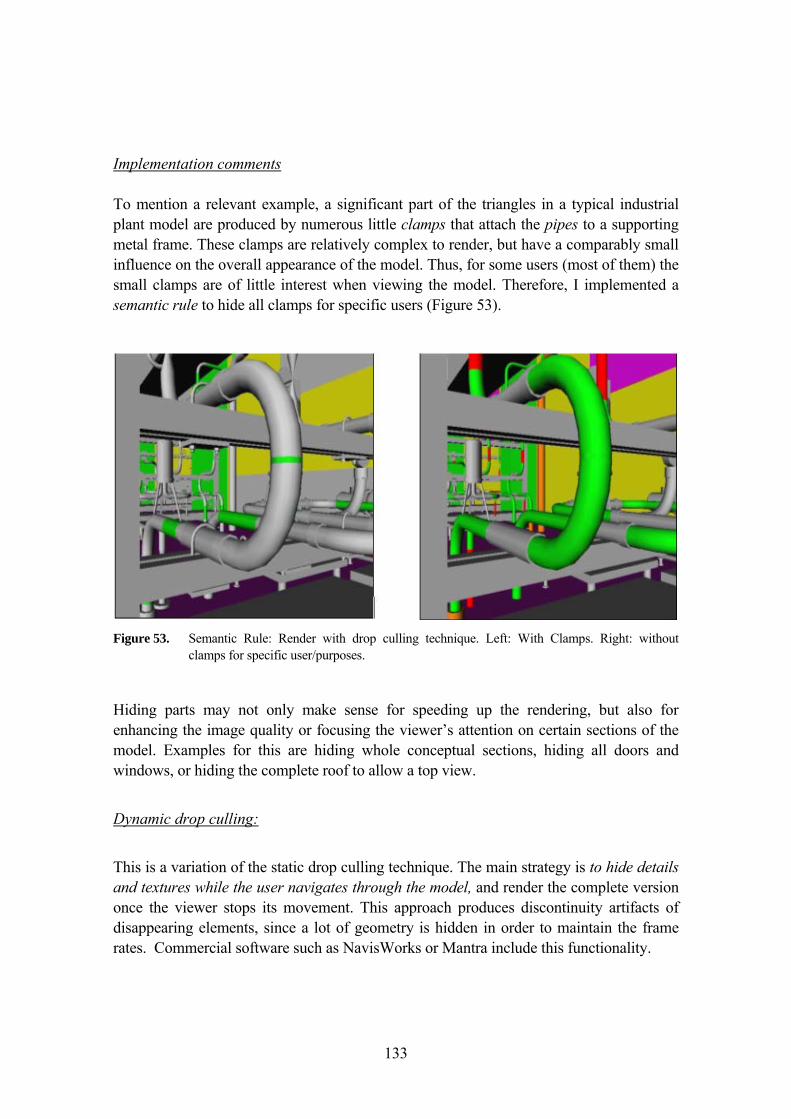
133
Implementation comments To mention a relevant example, a significant part of the triangles in a typical industrial plant model are produced by numerous little clamps that attach the pipes to a supporting metal frame. These clamps are relatively complex to render, but have a comparably small influence on the overall appearance of the model. Thus, for some users (most of them) the small clamps are of little interest when viewing the model. Therefore, I implemented a semantic rule to hide all clamps for specific users (Figure 53).
Figure 53. Semantic Rule: Render with drop culling technique. Left: With Clamps. Right: without
clamps for specific user/purposes.
Hiding parts may not only make sense for speeding up the rendering, but also for enhancing the image quality or focusing the viewer’s attention on certain sections of the model. Examples for this are hiding whole conceptual sections, hiding all doors and windows, or hiding the complete roof to allow a top view.
Dynamic drop culling:
This is a variation of the static drop culling technique. The main strategy is to hide details and textures while the user navigates through the model, and render the complete version once the viewer stops its movement. This approach produces discontinuity artifacts of disappearing elements, since a lot of geometry is hidden in order to maintain the frame rates. Commercial software such as NavisWorks or Mantra include this functionality.
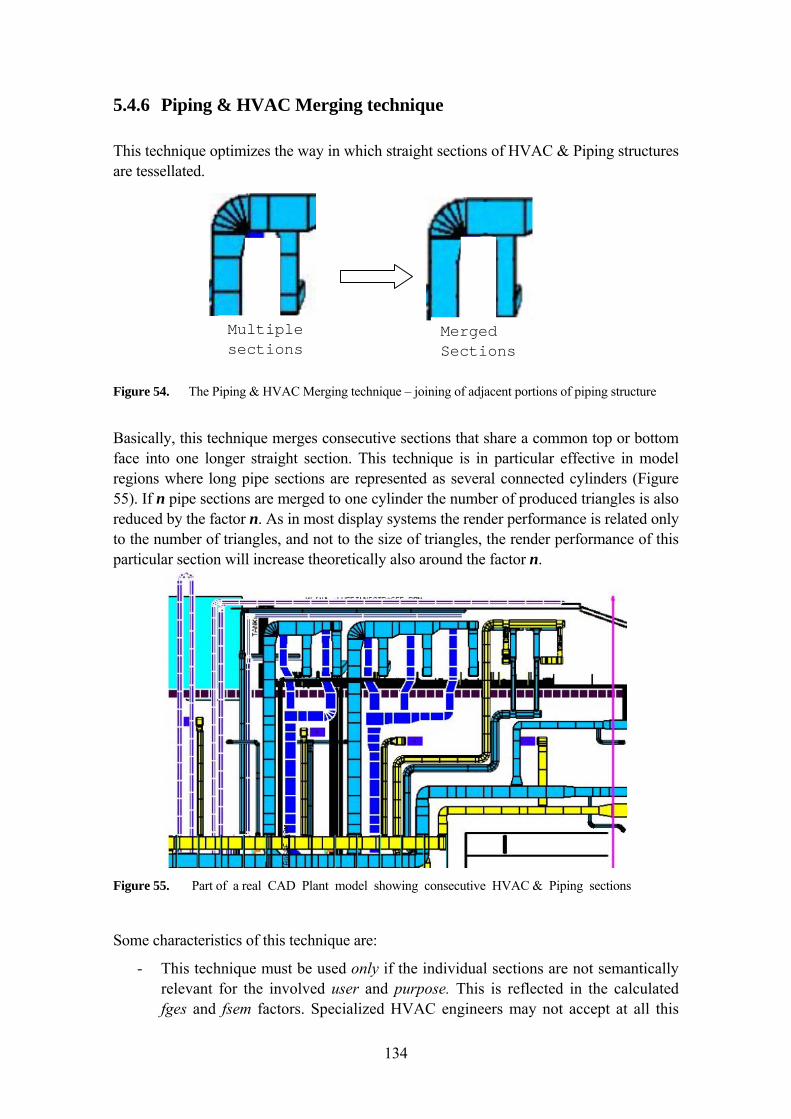
134
5.4.6 Piping & HVAC Merging technique This technique optimizes the way in which straight sections of HVAC & Piping structures are tessellated. Figure 54. The Piping & HVAC Merging technique – joining of adjacent portions of piping structure
Basically, this technique merges consecutive sections that share a common top or bottom face into one longer straight section. This technique is in particular effective in model regions where long pipe sections are represented as several connected cylinders (Figure 55). If n pipe sections are merged to one cylinder the number of produced triangles is also reduced by the factor n. As in most display systems the render performance is related only to the number of triangles, and not to the size of triangles, the render performance of this particular section will increase theoretically also around the factor n.
Figure 55. Part of a real CAD Plant model showing consecutive HVAC & Piping sections
Some characteristics of this technique are:
- This technique must be used only if the individual sections are not semantically relevant for the involved user and purpose. This is reflected in the calculated fges and fsem factors. Specialized HVAC engineers may not accept at all this
Multiple sections
Merged Sections
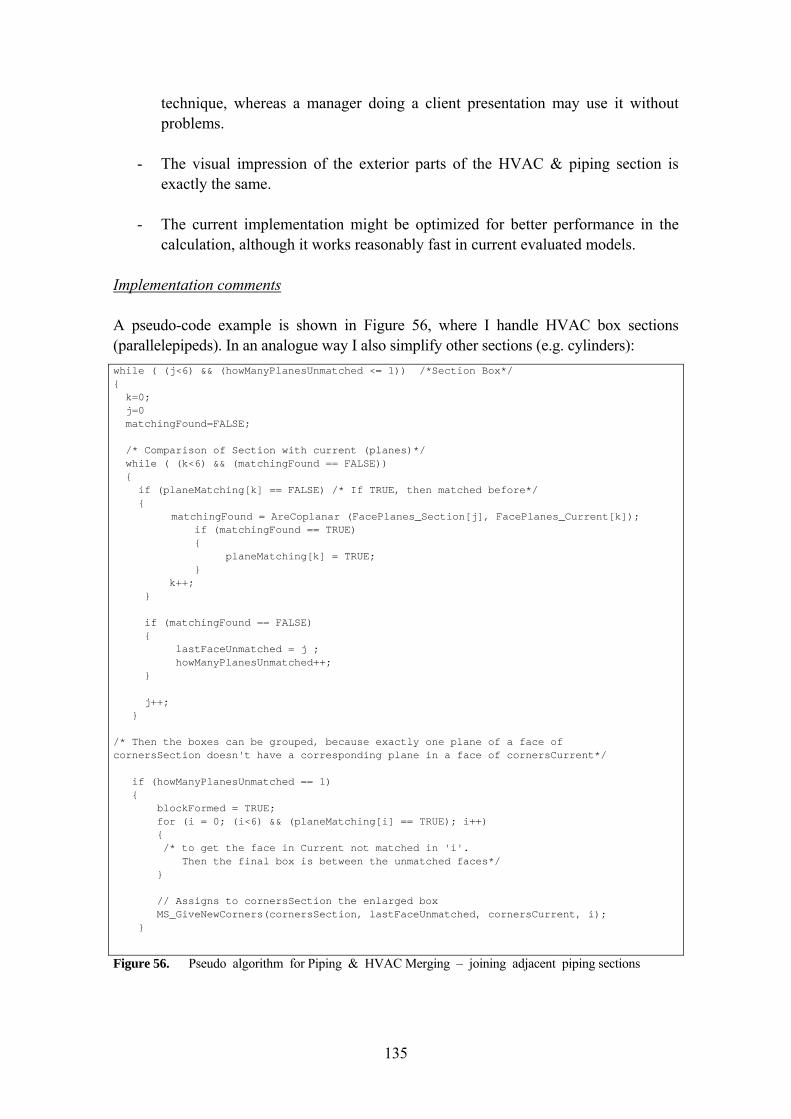
135
technique, whereas a manager doing a client presentation may use it without problems.
- The visual impression of the exterior parts of the HVAC & piping section is
exactly the same.
- The current implementation might be optimized for better performance in the calculation, although it works reasonably fast in current evaluated models.
Implementation comments A pseudo-code example is shown in Figure 56, where I handle HVAC box sections (parallelepipeds). In an analogue way I also simplify other sections (e.g. cylinders): while ( (j<6) && (howManyPlanesUnmatched <= 1)) /*Section Box*/ { k=0; j=0 matchingFound=FALSE; /* Comparison of Section with current (planes)*/ while ( (k<6) && (matchingFound == FALSE)) { if (planeMatching[k] == FALSE) /* If TRUE, then matched before*/ { matchingFound = AreCoplanar (FacePlanes_Section[j], FacePlanes_Current[k]); if (matchingFound == TRUE) { planeMatching[k] = TRUE; } k++; } if (matchingFound == FALSE) { lastFaceUnmatched = j ; howManyPlanesUnmatched++; } j++; } /* Then the boxes can be grouped, because exactly one plane of a face of cornersSection doesn't have a corresponding plane in a face of cornersCurrent*/ if (howManyPlanesUnmatched == 1) { blockFormed = TRUE; for (i = 0; (i<6) && (planeMatching[i] == TRUE); i++) { /* to get the face in Current not matched in 'i'. Then the final box is between the unmatched faces*/ } // Assigns to cornersSection the enlarged box MS_GiveNewCorners(cornersSection, lastFaceUnmatched, cornersCurrent, i); }
Figure 56. Pseudo algorithm for Piping & HVAC Merging – joining adjacent piping sections
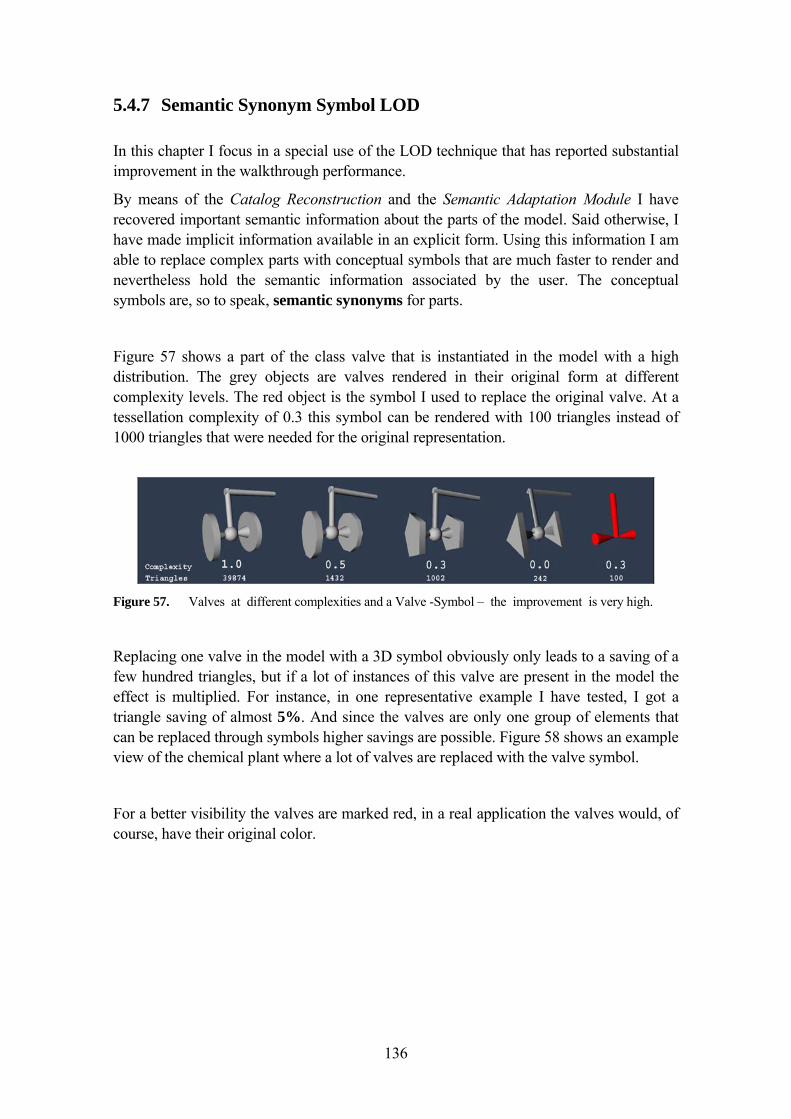
136
5.4.7 Semantic Synonym Symbol LOD In this chapter I focus in a special use of the LOD technique that has reported substantial improvement in the walkthrough performance.
By means of the Catalog Reconstruction and the Semantic Adaptation Module I have recovered important semantic information about the parts of the model. Said otherwise, I have made implicit information available in an explicit form. Using this information I am able to replace complex parts with conceptual symbols that are much faster to render and nevertheless hold the semantic information associated by the user. The conceptual symbols are, so to speak, semantic synonyms for parts.
Figure 57 shows a part of the class valve that is instantiated in the model with a high distribution. The grey objects are valves rendered in their original form at different complexity levels. The red object is the symbol I used to replace the original valve. At a tessellation complexity of 0.3 this symbol can be rendered with 100 triangles instead of 1000 triangles that were needed for the original representation.
Figure 57. Valves at different complexities and a Valve -Symbol – the improvement is very high.
Replacing one valve in the model with a 3D symbol obviously only leads to a saving of a few hundred triangles, but if a lot of instances of this valve are present in the model the effect is multiplied. For instance, in one representative example I have tested, I got a triangle saving of almost 5%. And since the valves are only one group of elements that can be replaced through symbols higher savings are possible. Figure 58 shows an example view of the chemical plant where a lot of valves are replaced with the valve symbol.
For a better visibility the valves are marked red, in a real application the valves would, of course, have their original color.
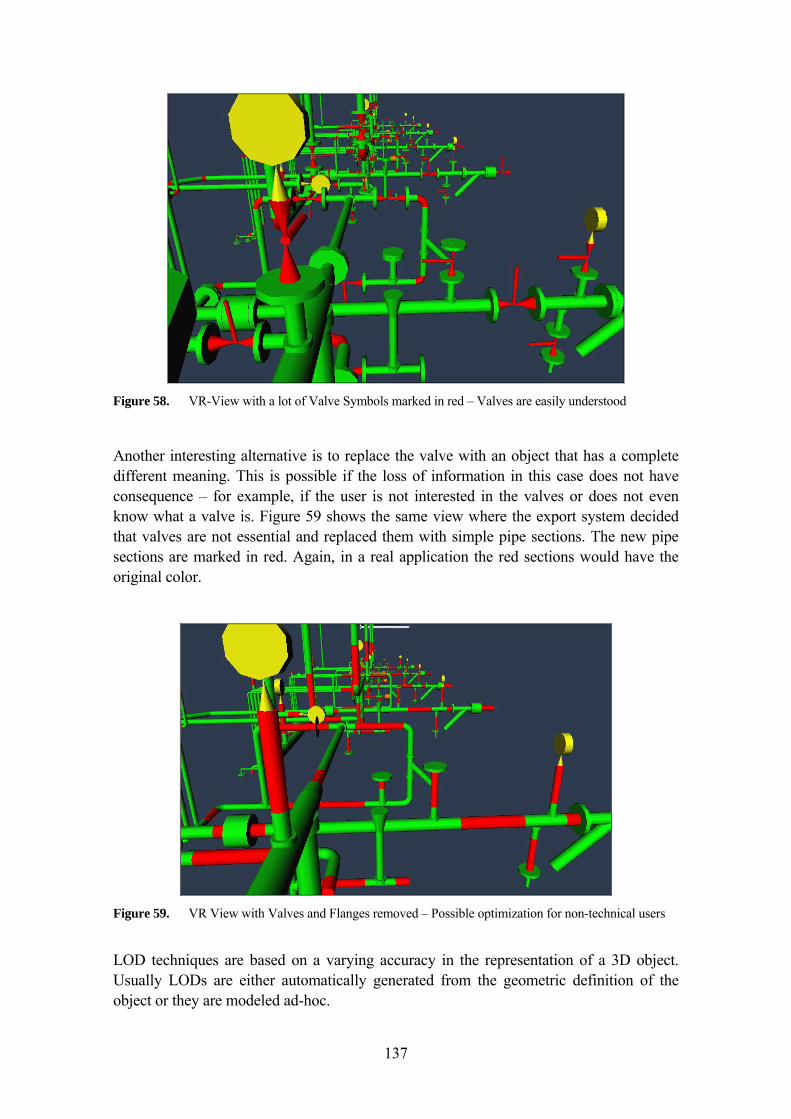
137
Figure 58. VR-View with a lot of Valve Symbols marked in red – Valves are easily understood
Another interesting alternative is to replace the valve with an object that has a complete different meaning. This is possible if the loss of information in this case does not have consequence – for example, if the user is not interested in the valves or does not even know what a valve is. Figure 59 shows the same view where the export system decided that valves are not essential and replaced them with simple pipe sections. The new pipe sections are marked in red. Again, in a real application the red sections would have the original color.
Figure 59. VR View with Valves and Flanges removed – Possible optimization for non-technical users
LOD techniques are based on a varying accuracy in the representation of a 3D object. Usually LODs are either automatically generated from the geometric definition of the object or they are modeled ad-hoc.
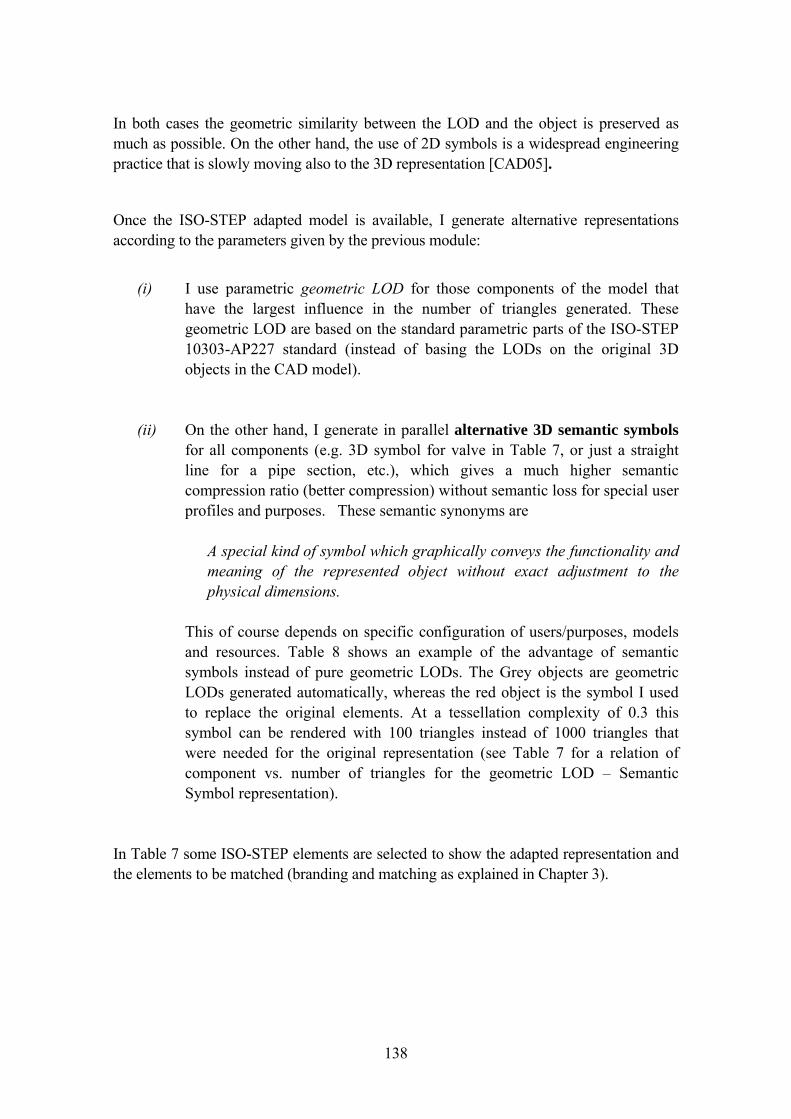
138
In both cases the geometric similarity between the LOD and the object is preserved as much as possible. On the other hand, the use of 2D symbols is a widespread engineering practice that is slowly moving also to the 3D representation [CAD05].
Once the ISO-STEP adapted model is available, I generate alternative representations according to the parameters given by the previous module:
(i) I use parametric geometric LOD for those components of the model that
have the largest influence in the number of triangles generated. These geometric LOD are based on the standard parametric parts of the ISO-STEP 10303-AP227 standard (instead of basing the LODs on the original 3D objects in the CAD model).
(ii) On the other hand, I generate in parallel alternative 3D semantic symbols for all components (e.g. 3D symbol for valve in Table 7, or just a straight line for a pipe section, etc.), which gives a much higher semantic compression ratio (better compression) without semantic loss for special user profiles and purposes. These semantic synonyms are
A special kind of symbol which graphically conveys the functionality and meaning of the represented object without exact adjustment to the physical dimensions.
This of course depends on specific configuration of users/purposes, models and resources. Table 8 shows an example of the advantage of semantic symbols instead of pure geometric LODs. The Grey objects are geometric LODs generated automatically, whereas the red object is the symbol I used to replace the original elements. At a tessellation complexity of 0.3 this symbol can be rendered with 100 triangles instead of 1000 triangles that were needed for the original representation (see Table 7 for a relation of component vs. number of triangles for the geometric LOD – Semantic Symbol representation).
In Table 7 some ISO-STEP elements are selected to show the adapted representation and the elements to be matched (branding and matching as explained in Chapter 3).
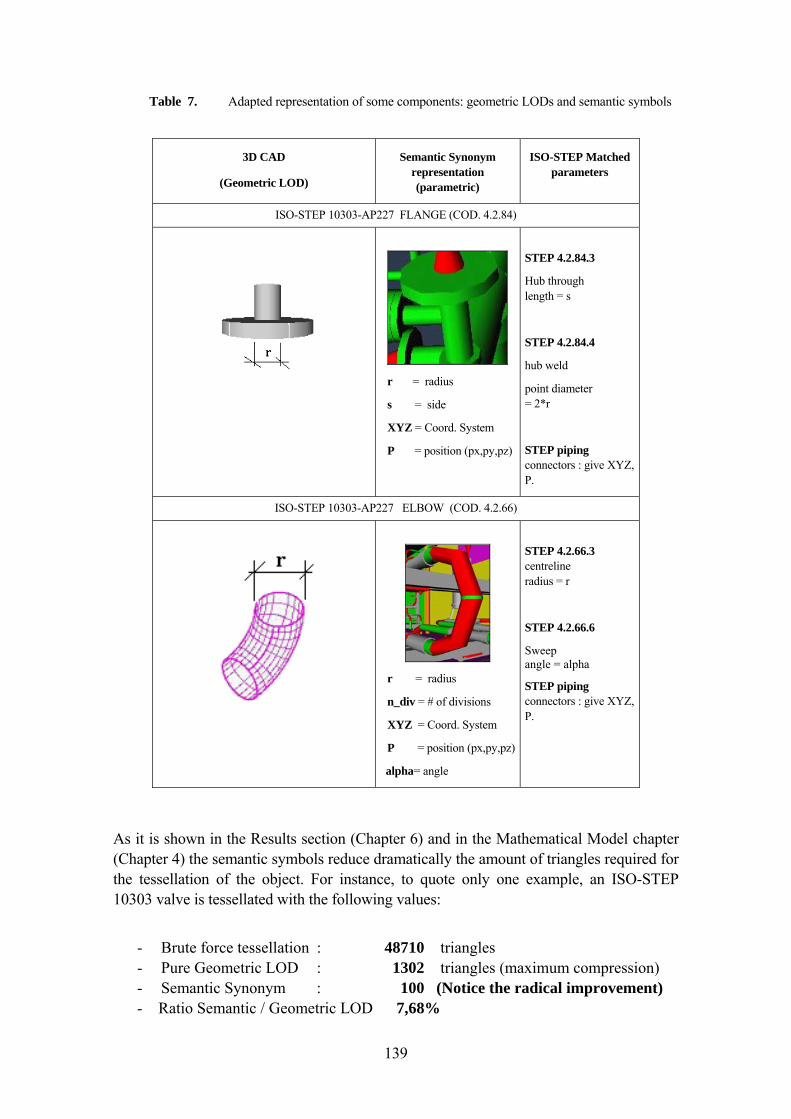
139
Table 7. Adapted representation of some components: geometric LODs and semantic symbols
3D CAD
(Geometric LOD)
Semantic Synonym representation (parametric)
ISO-STEP Matched parameters
ISO-STEP 10303-AP227 FLANGE (COD. 4.2.84)
r = radius
s = side
XYZ = Coord. System
P = position (px,py,pz)
STEP 4.2.84.3
Hub through length = s
STEP 4.2.84.4
hub weld
point diameter = 2*r
STEP piping connectors : give XYZ, P.
ISO-STEP 10303-AP227 ELBOW (COD. 4.2.66)
r = radius
n_div = # of divisions
XYZ = Coord. System
P = position (px,py,pz)
alpha= angle
STEP 4.2.66.3 centreline radius = r
STEP 4.2.66.6
Sweep angle = alpha
STEP piping connectors : give XYZ, P.
As it is shown in the Results section (Chapter 6) and in the Mathematical Model chapter (Chapter 4) the semantic symbols reduce dramatically the amount of triangles required for the tessellation of the object. For instance, to quote only one example, an ISO-STEP 10303 valve is tessellated with the following values:
- Brute force tessellation : 48710 triangles - Pure Geometric LOD : 1302 triangles (maximum compression) - Semantic Synonym : 100 (Notice the radical improvement)
- Ratio Semantic / Geometric LOD 7,68%
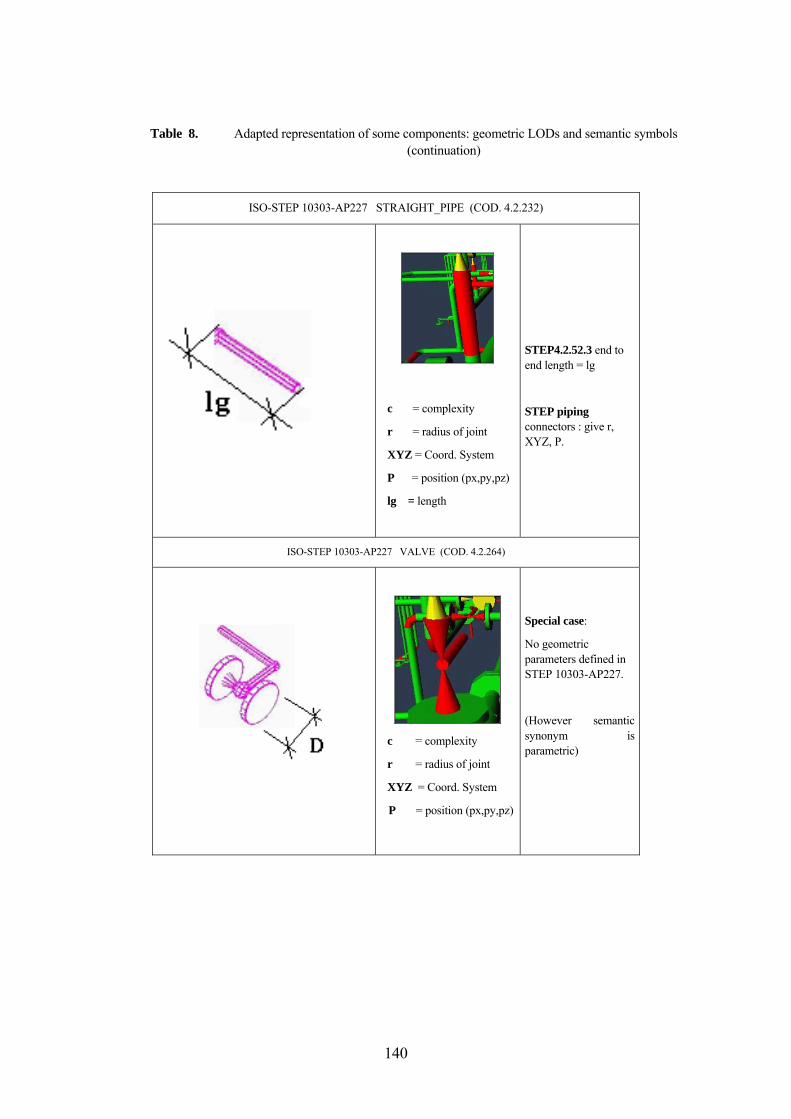
140
Table 8. Adapted representation of some components: geometric LODs and semantic symbols (continuation)
ISO-STEP 10303-AP227 STRAIGHT_PIPE (COD. 4.2.232)
c = complexity
r = radius of joint
XYZ = Coord. System
P = position (px,py,pz)
lg = length
STEP4.2.52.3 end to end length = lg
STEP piping connectors : give r, XYZ, P.
ISO-STEP 10303-AP227 VALVE (COD. 4.2.264)
c = complexity
r = radius of joint
XYZ = Coord. System
P = position (px,py,pz)
Special case:
No geometric parameters defined in STEP 10303-AP227.
(However semantic synonym is parametric)
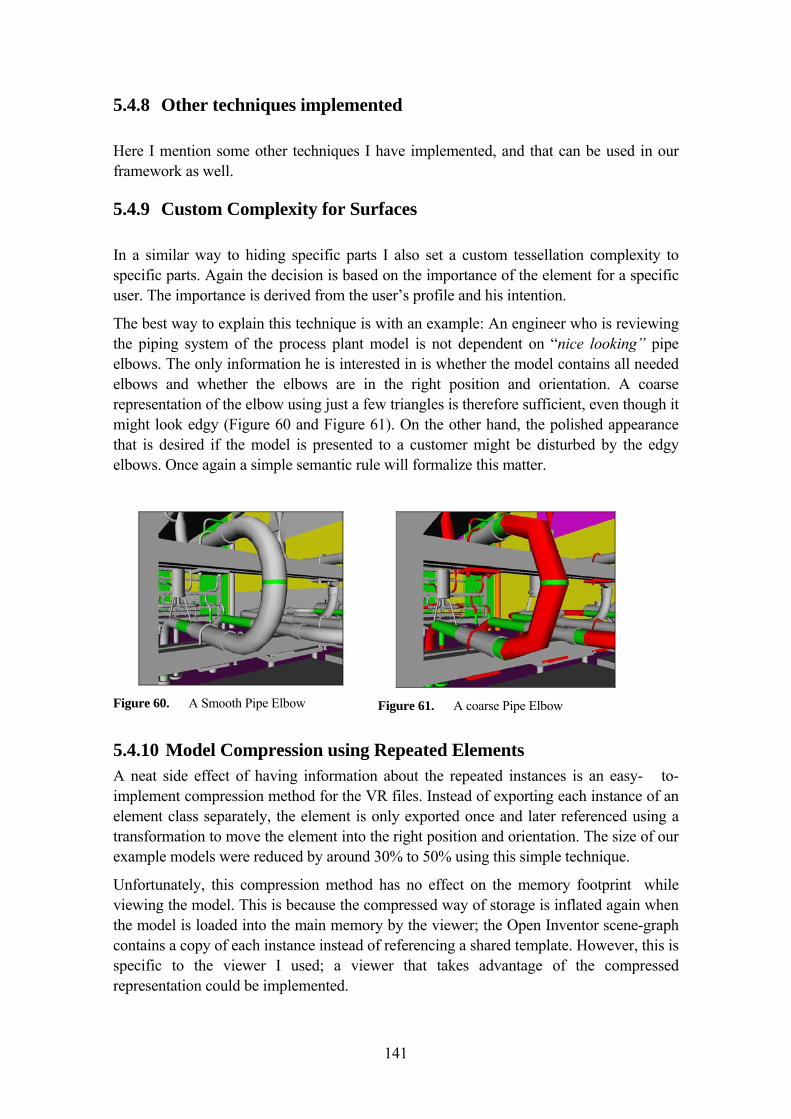
141
5.4.8 Other techniques implemented Here I mention some other techniques I have implemented, and that can be used in our framework as well.
5.4.9 Custom Complexity for Surfaces In a similar way to hiding specific parts I also set a custom tessellation complexity to specific parts. Again the decision is based on the importance of the element for a specific user. The importance is derived from the user’s profile and his intention.
The best way to explain this technique is with an example: An engineer who is reviewing the piping system of the process plant model is not dependent on “nice looking” pipe elbows. The only information he is interested in is whether the model contains all needed elbows and whether the elbows are in the right position and orientation. A coarse representation of the elbow using just a few triangles is therefore sufficient, even though it might look edgy (Figure 60 and Figure 61). On the other hand, the polished appearance that is desired if the model is presented to a customer might be disturbed by the edgy elbows. Once again a simple semantic rule will formalize this matter.
Figure 60. A Smooth Pipe Elbow
Figure 61. A coarse Pipe Elbow
5.4.10 Model Compression using Repeated Elements A neat side effect of having information about the repeated instances is an easy- to-implement compression method for the VR files. Instead of exporting each instance of an element class separately, the element is only exported once and later referenced using a transformation to move the element into the right position and orientation. The size of our example models were reduced by around 30% to 50% using this simple technique.
Unfortunately, this compression method has no effect on the memory footprint while viewing the model. This is because the compressed way of storage is inflated again when the model is loaded into the main memory by the viewer; the Open Inventor scene-graph contains a copy of each instance instead of referencing a shared template. However, this is specific to the viewer I used; a viewer that takes advantage of the compressed representation could be implemented.
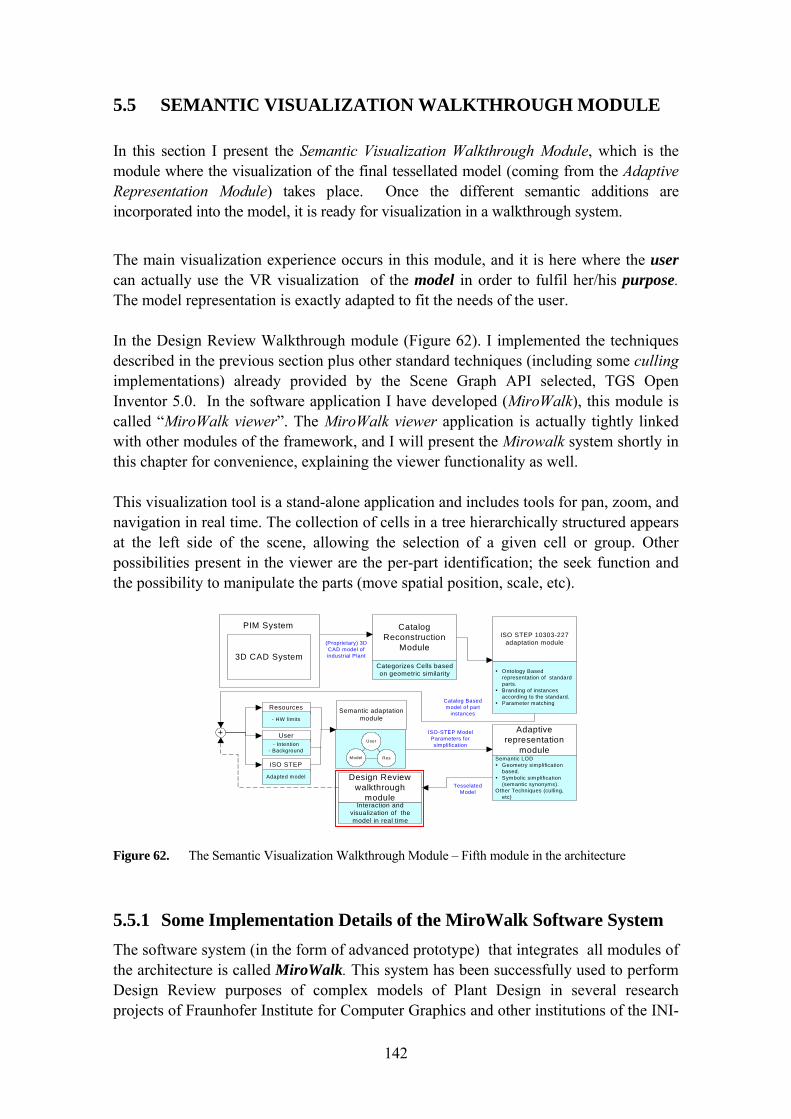
142
5.5 SEMANTIC VISUALIZATION WALKTHROUGH MODULE In this section I present the Semantic Visualization Walkthrough Module, which is the module where the visualization of the final tessellated model (coming from the Adaptive Representation Module) takes place. Once the different semantic additions are incorporated into the model, it is ready for visualization in a walkthrough system.
The main visualization experience occurs in this module, and it is here where the user can actually use the VR visualization of the model in order to fulfil her/his purpose. The model representation is exactly adapted to fit the needs of the user. In the Design Review Walkthrough module (Figure 62). I implemented the techniques described in the previous section plus other standard techniques (including some culling implementations) already provided by the Scene Graph API selected, TGS Open Inventor 5.0. In the software application I have developed (MiroWalk), this module is called “MiroWalk viewer”. The MiroWalk viewer application is actually tightly linked with other modules of the framework, and I will present the Mirowalk system shortly in this chapter for convenience, explaining the viewer functionality as well. This visualization tool is a stand-alone application and includes tools for pan, zoom, and navigation in real time. The collection of cells in a tree hierarchically structured appears at the left side of the scene, allowing the selection of a given cell or group. Other possibilities present in the viewer are the per-part identification; the seek function and the possibility to manipulate the parts (move spatial position, scale, etc).
(Proprietary) 3DCAD model ofindustrial Plant
CatalogReconstruction
Module
Categorizes Cells basedon geometric similarity
Catalog Basedmodel of part
instances
+ ISO-STEP ModelParameters forsimplification
3D CAD System
PIM System
ISO STEP
Adapted model
User- Intention
- Background
Resources
- HW limitsSemantic adaptation
module
Model
User
Res
Adaptiverepresentation
moduleSemantic LOD
Geometry simplificationbased.Symbolic simplification(semantic synonyms).
Other Techniques (culling,etc)
TesselatedModel
ISO STEP 10303-227adaptation module
Ontology Basedrepresentation of standardparts.Branding of instancesaccording to the standard.Parameter matching
Design Reviewwalkthrough
moduleInteraction and
visualization of themodel in real time
Figure 62. The Semantic Visualization Walkthrough Module – Fifth module in the architecture
5.5.1 Some Implementation Details of the MiroWalk Software System The software system (in the form of advanced prototype) that integrates all modules of the architecture is called MiroWalk. This system has been successfully used to perform Design Review purposes of complex models of Plant Design in several research projects of Fraunhofer Institute for Computer Graphics and other institutions of the INI-
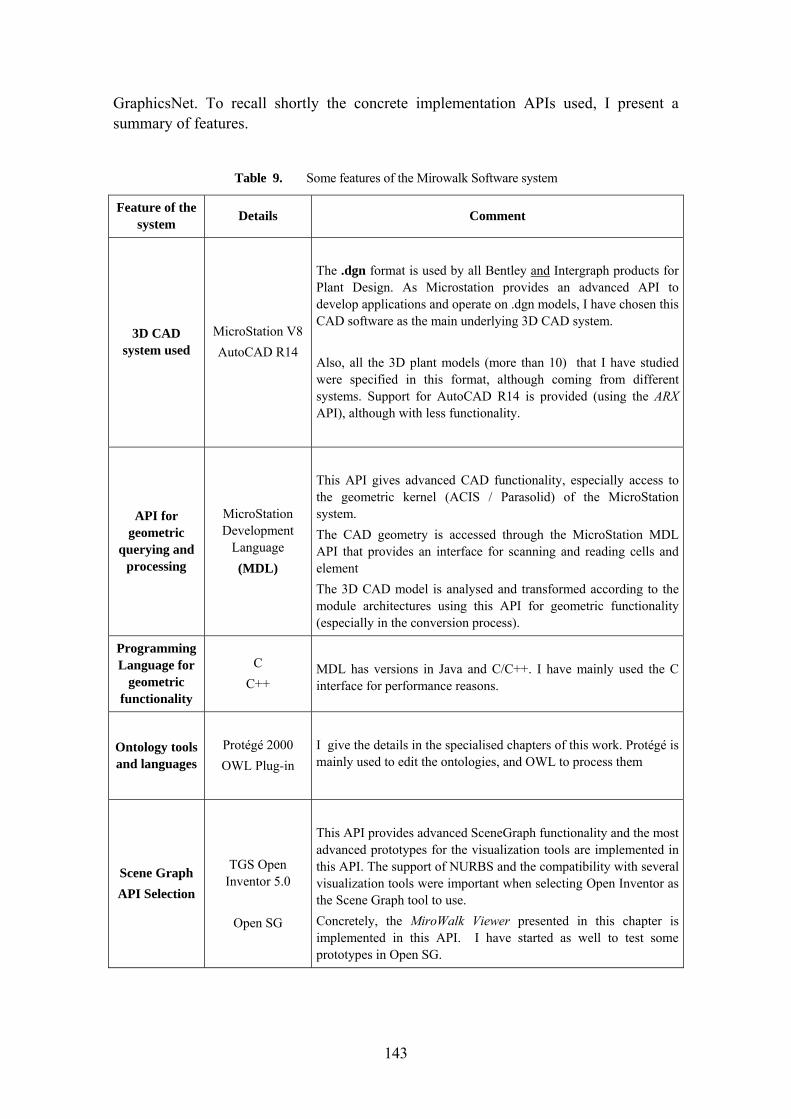
143
GraphicsNet. To recall shortly the concrete implementation APIs used, I present a summary of features.
Table 9. Some features of the Mirowalk Software system
Feature of the system Details Comment
3D CAD system used
MicroStation V8 AutoCAD R14
The .dgn format is used by all Bentley and Intergraph products for Plant Design. As Microstation provides an advanced API to develop applications and operate on .dgn models, I have chosen this CAD software as the main underlying 3D CAD system. Also, all the 3D plant models (more than 10) that I have studied were specified in this format, although coming from different systems. Support for AutoCAD R14 is provided (using the ARX API), although with less functionality.
API for geometric
querying and processing
MicroStation Development
Language (MDL)
This API gives advanced CAD functionality, especially access to the geometric kernel (ACIS / Parasolid) of the MicroStation system. The CAD geometry is accessed through the MicroStation MDL API that provides an interface for scanning and reading cells and element The 3D CAD model is analysed and transformed according to the module architectures using this API for geometric functionality (especially in the conversion process).
Programming Language for
geometric functionality
C C++
MDL has versions in Java and C/C++. I have mainly used the C interface for performance reasons.
Ontology tools and languages
Protégé 2000 OWL Plug-in
I give the details in the specialised chapters of this work. Protégé is mainly used to edit the ontologies, and OWL to process them
Scene Graph API Selection
TGS Open
Inventor 5.0
Open SG
This API provides advanced SceneGraph functionality and the most advanced prototypes for the visualization tools are implemented in this API. The support of NURBS and the compatibility with several visualization tools were important when selecting Open Inventor as the Scene Graph tool to use. Concretely, the MiroWalk Viewer presented in this chapter is implemented in this API. I have started as well to test some prototypes in Open SG.
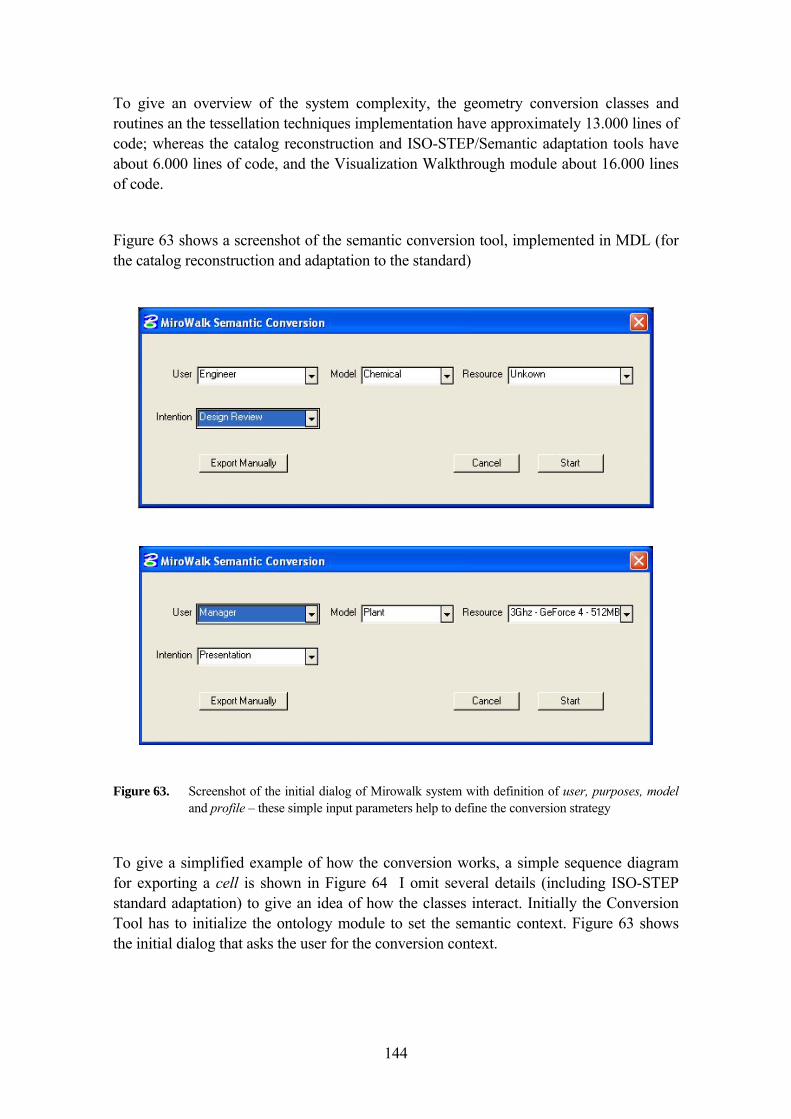
144
To give an overview of the system complexity, the geometry conversion classes and routines an the tessellation techniques implementation have approximately 13.000 lines of code; whereas the catalog reconstruction and ISO-STEP/Semantic adaptation tools have about 6.000 lines of code, and the Visualization Walkthrough module about 16.000 lines of code.
Figure 63 shows a screenshot of the semantic conversion tool, implemented in MDL (for the catalog reconstruction and adaptation to the standard)
Figure 63. Screenshot of the initial dialog of Mirowalk system with definition of user, purposes, model and profile – these simple input parameters help to define the conversion strategy
To give a simplified example of how the conversion works, a simple sequence diagram for exporting a cell is shown in Figure 64 I omit several details (including ISO-STEP standard adaptation) to give an idea of how the classes interact. Initially the Conversion Tool has to initialize the ontology module to set the semantic context. Figure 63 shows the initial dialog that asks the user for the conversion context.
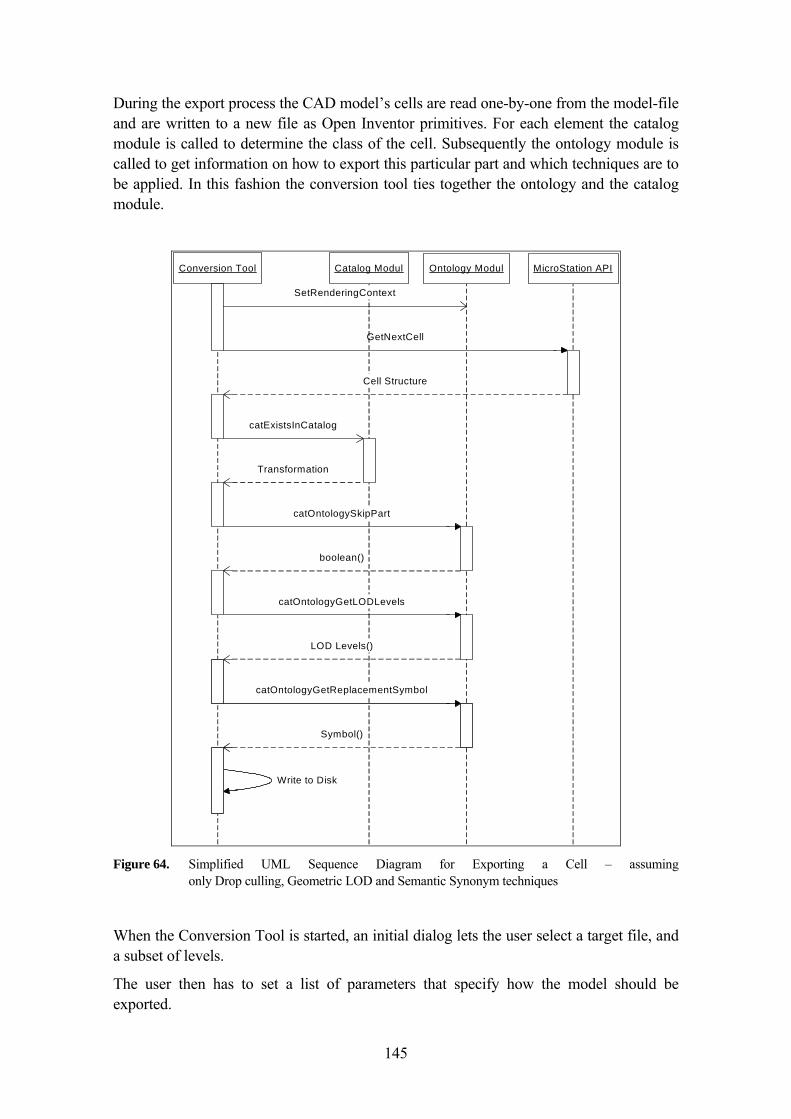
145
During the export process the CAD model’s cells are read one-by-one from the model-file and are written to a new file as Open Inventor primitives. For each element the catalog module is called to determine the class of the cell. Subsequently the ontology module is called to get information on how to export this particular part and which techniques are to be applied. In this fashion the conversion tool ties together the ontology and the catalog module.
Conversion Tool
GetNextCell
Catalog Modul Ontology Modul MicroStation API
Cell Structure
catExistsInCatalog
Transformation
Write to Disk
catOntologySkipPart
boolean()
catOntologyGetLODLevels
LOD Levels()
catOntologyGetReplacementSymbol
Symbol()
SetRenderingContext
Figure 64. Simplified UML Sequence Diagram for Exporting a Cell – assuming
only Drop culling, Geometric LOD and Semantic Synonym techniques
When the Conversion Tool is started, an initial dialog lets the user select a target file, and a subset of levels.
The user then has to set a list of parameters that specify how the model should be exported.
146
5.5.2 MiroWalk Viewer: An implementation of the Semantic Visualization Walkthrough Module
The MiroWalk Viewer is used to visualize and navigate the resulting file in a 3D virtual walkthrough environment. The viewer is a GUI application based on the Microsoft Foundation Class framework and uses the Open Inventor library from TGS for rendering.
The final adapted model which will be used by a specific user, who wants to do a special purpose, is displayed and navigated in this visualization module.
Rendering and navigating the scene is fully handled by the Open Inventor classes. The MiroWalk Viewer extends the Open Inventor classes with functionality needed for engineering visualization, like measuring of distances, hiding selected parts of the model etc.
With the optimisations of the global architecture, the model coming to the viewer can display interactively complex CAD models of Industrial Plants at interactive frame rates of 10 fps or more.
Some of the characteristics of this module are, to name a few:
- Support for different HW set-up: Depending on the available resources (workstation, PC, large screen, input devices, etc.) the viewer adapts the visualization to the existing resources.
- Structural information: The viewer supports the hierarchical tree metaphor to display the internal structure of the 3D CAD model.
- Parts Catalog: It shows the relationship between the geometric elements and the categories coming from the ISO-STEP standard.
- Advanced Navigation Modes: It supports the walk navigation model (always parallel to the ground), fly navigation model (free camera movement in 3D space), examiner (the camera rotates around the object), etc.
- Selection and manipulation possibilities: Each individual object can be selected, interrogated and manipulated.
- Status bar: To inform the user about relevant events and provide him with related data to his purposes.
Figure 65 shows a screenshot of the viewer as well as some available options.
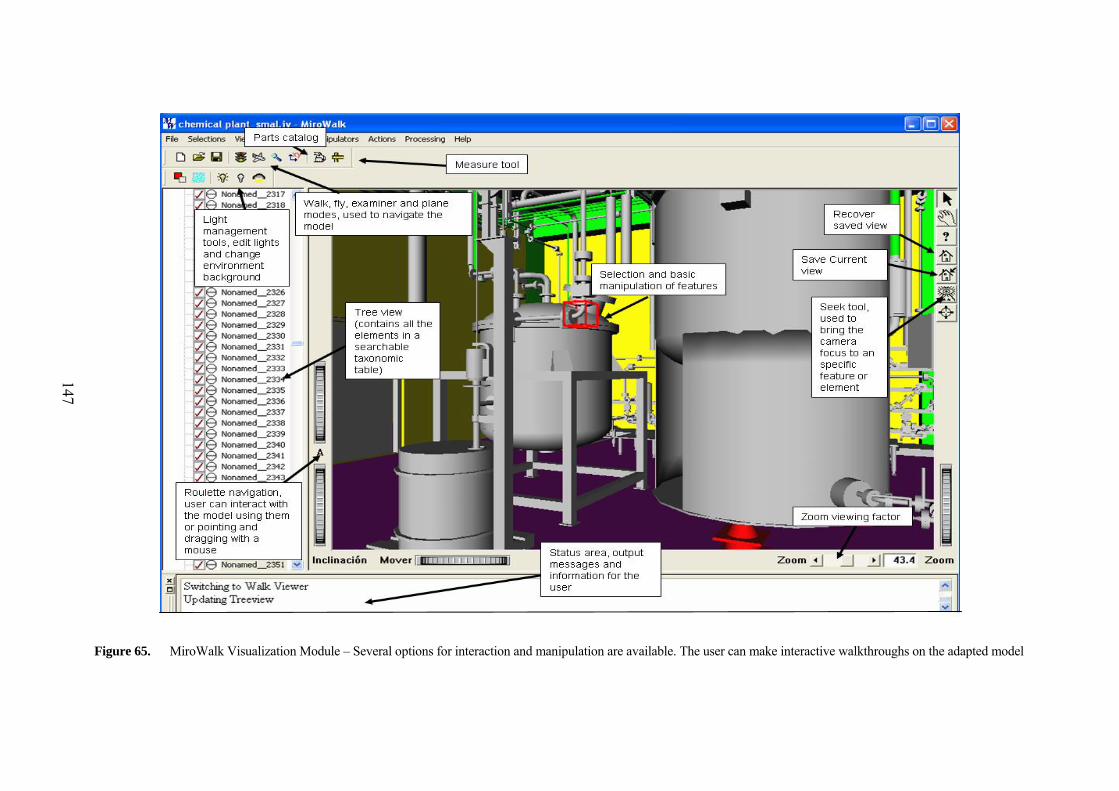
147
Figure 65. MiroWalk Visualization Module – Several options for interaction and manipulation are available. The user can make interactive walkthroughs on the adapted model
147

148