Embed Size (px)
Citation preview
Eutrophication assessment in transitional waters A performance analysis of the
Transitional Water Quality Index (TWQI)
Andrea Bonometto1, Gianmarco Giordani2, Emanuele Ponis1, Chiara Facca3,
Rossella Boscolo Brusà1, Adriano Sfriso3 & Pierluigi Viaroli2
1 Italian National Institute for Environmental Protection and Research (ISPRA) 2 Department of Life Sciences, University of Parma, 43124 Parma, Italy 3 Department of Environmental Sciences, Informatics & Statistics, University Ca’ Foscari, 30123 Venice, Italy
VII EUROLAG - EUROPEAN COASTAL LAGOONS SYMPOSIUM University of Murcia (Spain), 1st to 4th March 2016
VII EUROLAG - EUROPEAN COASTAL LAGOONS SYMPOSIUM University of Murcia (Spain), 1st to 4th March 2016 VII EUROLAG - EUROPEAN COASTAL LAGOONS SYMPOSIUM University of Murcia (Spain), 1st to 4th March 2016
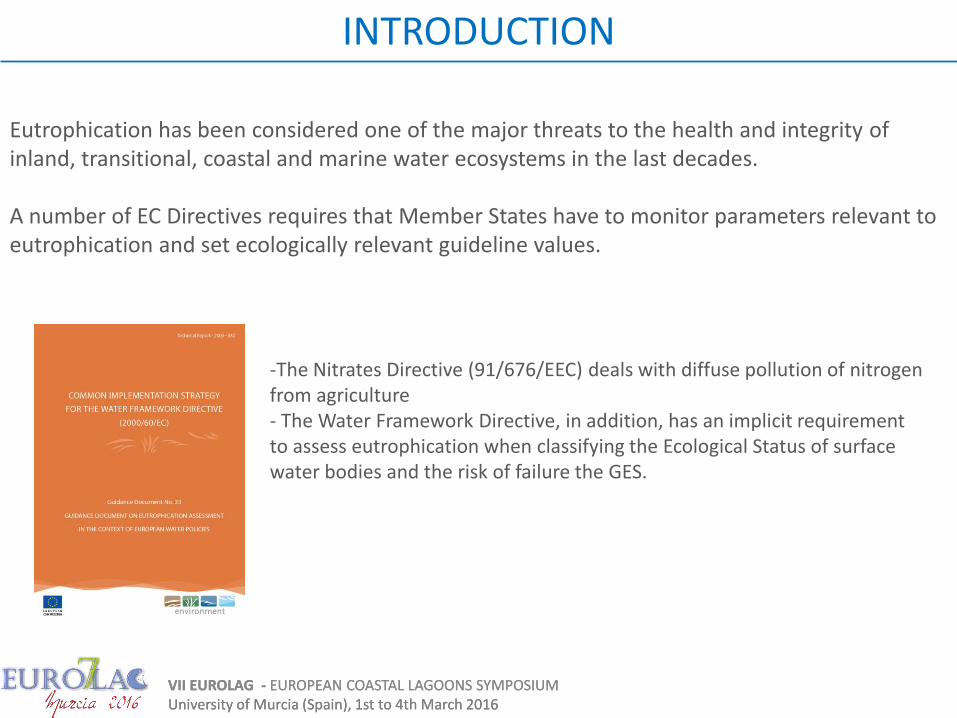
INTRODUCTION
Eutrophication has been considered one of the major threats to the health and integrity of inland, transitional, coastal and marine water ecosystems in the last decades. A number of EC Directives requires that Member States have to monitor parameters relevant to eutrophication and set ecologically relevant guideline values.
-The Nitrates Directive (91/676/EEC) deals with diffuse pollution of nitrogen from agriculture - The Water Framework Directive, in addition, has an implicit requirement to assess eutrophication when classifying the Ecological Status of surface water bodies and the risk of failure the GES.
VII EUROLAG - EUROPEAN COASTAL LAGOONS SYMPOSIUM University of Murcia (Spain), 1st to 4th March 2016 VII EUROLAG - EUROPEAN COASTAL LAGOONS SYMPOSIUM University of Murcia (Spain), 1st to 4th March 2016
INTRODUCTION
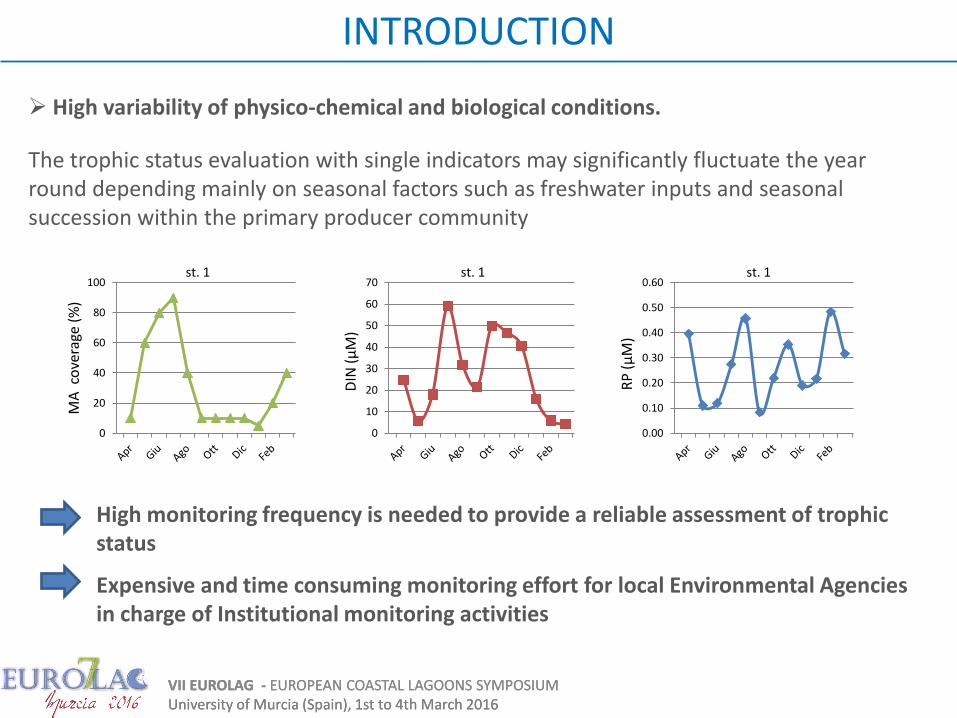
High variability of physico-chemical and biological conditions.
0
20
40
60
80
100
MA
co
vera
ge (
%)
st. 1
0
10
20
30
40
50
60
70
DIN
(µ
M)
st. 1
0.00
0.10
0.20
0.30
0.40
0.50
0.60
RP
(µ
M)
st. 1
High monitoring frequency is needed to provide a reliable assessment of trophic status
The trophic status evaluation with single indicators may significantly fluctuate the year round depending mainly on seasonal factors such as freshwater inputs and seasonal succession within the primary producer community
Expensive and time consuming monitoring effort for local Environmental Agencies in charge of Institutional monitoring activities
VII EUROLAG - EUROPEAN COASTAL LAGOONS SYMPOSIUM University of Murcia (Spain), 1st to 4th March 2016 VII EUROLAG - EUROPEAN COASTAL LAGOONS SYMPOSIUM University of Murcia (Spain), 1st to 4th March 2016
OBJECTIVES
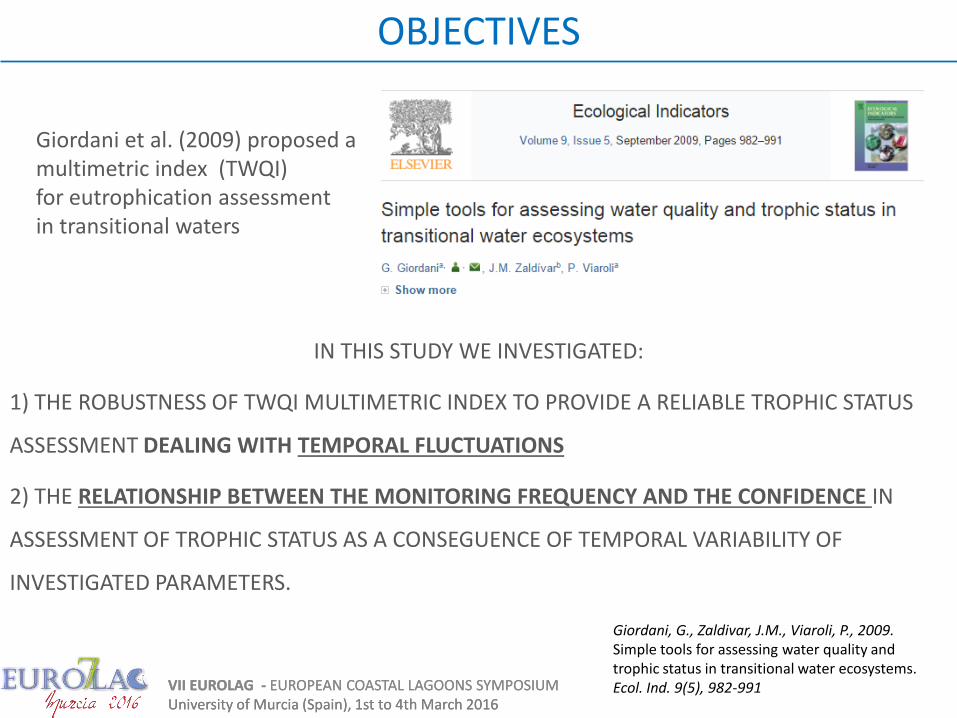
Giordani et al. (2009) proposed a multimetric index (TWQI) for eutrophication assessment in transitional waters
IN THIS STUDY WE INVESTIGATED:
1) THE ROBUSTNESS OF TWQI MULTIMETRIC INDEX TO PROVIDE A RELIABLE TROPHIC STATUS
ASSESSMENT DEALING WITH TEMPORAL FLUCTUATIONS
2) THE RELATIONSHIP BETWEEN THE MONITORING FREQUENCY AND THE CONFIDENCE IN
ASSESSMENT OF TROPHIC STATUS AS A CONSEGUENCE OF TEMPORAL VARIABILITY OF
INVESTIGATED PARAMETERS.
Giordani, G., Zaldivar, J.M., Viaroli, P., 2009. Simple tools for assessing water quality and trophic status in transitional water ecosystems. Ecol. Ind. 9(5), 982-991
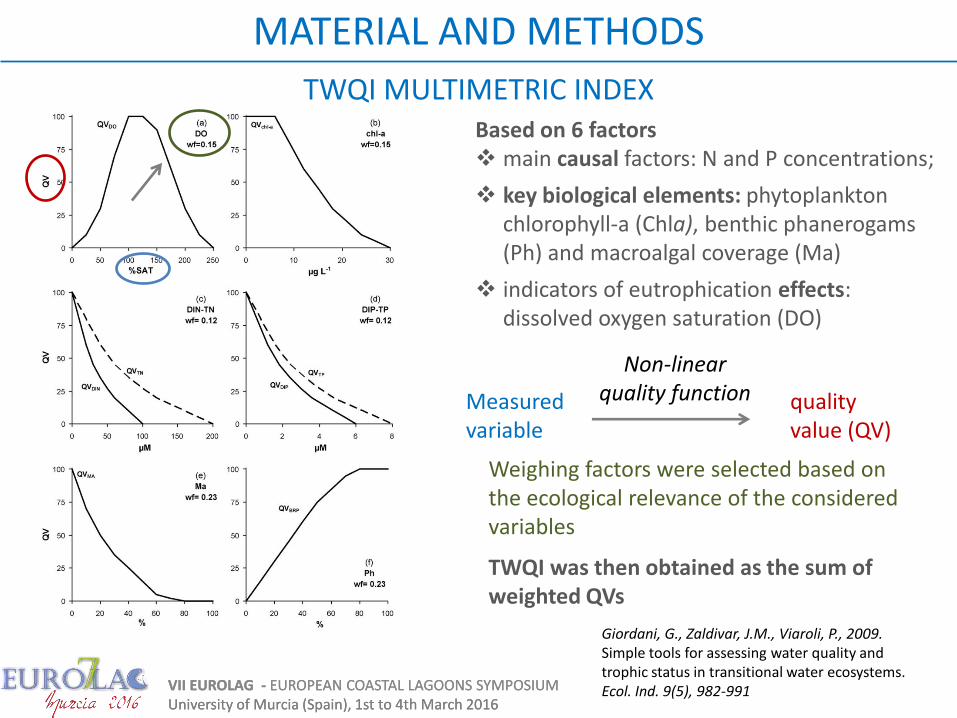
Non-linear quality function
VII EUROLAG - EUROPEAN COASTAL LAGOONS SYMPOSIUM University of Murcia (Spain), 1st to 4th March 2016 VII EUROLAG - EUROPEAN COASTAL LAGOONS SYMPOSIUM University of Murcia (Spain), 1st to 4th March 2016
Measured variable
quality value (QV)
TWQI was then obtained as the sum of weighted QVs
Weighing factors were selected based on the ecological relevance of the considered variables
MATERIAL AND METHODS
TWQI MULTIMETRIC INDEX
Giordani, G., Zaldivar, J.M., Viaroli, P., 2009. Simple tools for assessing water quality and trophic status in transitional water ecosystems. Ecol. Ind. 9(5), 982-991
Based on 6 factors main causal factors: N and P concentrations;
key biological elements: phytoplankton chlorophyll-a (Chla), benthic phanerogams (Ph) and macroalgal coverage (Ma)
indicators of eutrophication effects: dissolved oxygen saturation (DO)
Sile river
Dese river
Brenta Bacchiglione rivers
Adriatic sea
Lido inlet
Malamocco inlet
Chioggia inlet
VenicePorto MargheraIndustrial zone
Airport
Chioggia
Sile river
Dese river
Brenta Bacchiglione rivers
Adriatic sea
Lido inlet
Malamocco inlet
Chioggia inlet
Venice
Porto margheraIndustrial zone
Airport
Chioggia
Sile river
Dese river
Brenta Bacchiglione rivers
Adriatic sea
Lido inlet
Malamocco inlet
Chioggia inlet
Venice
Porto margheraIndustrial zone
Airport
Chioggia
VII EUROLAG - EUROPEAN COASTAL LAGOONS SYMPOSIUM University of Murcia (Spain), 1st to 4th March 2016
MATERIAL AND METHODS
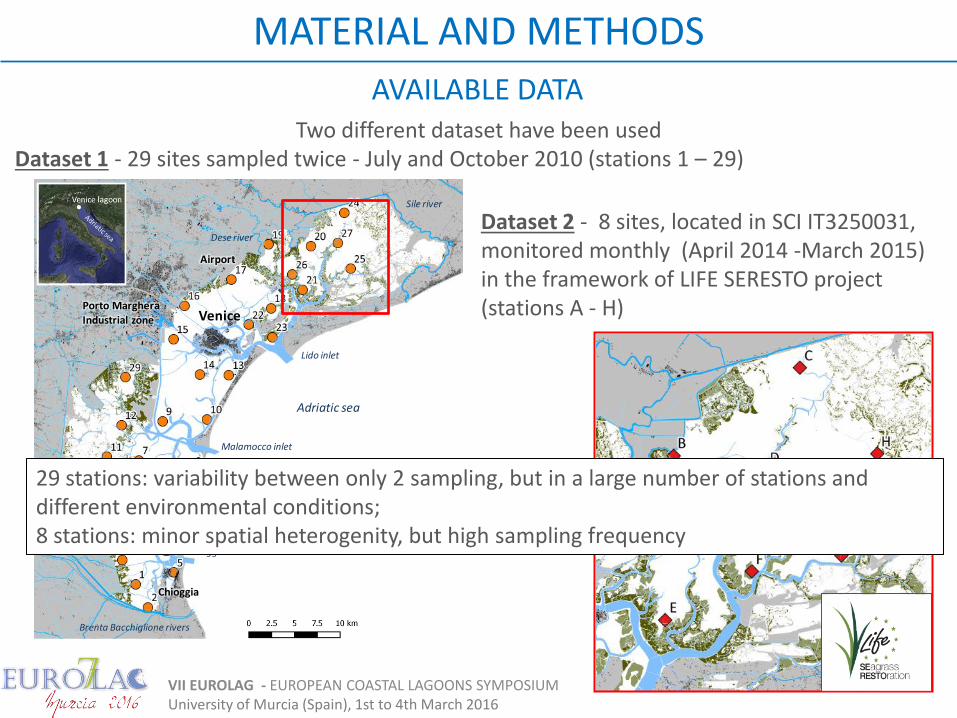
AVAILABLE DATA Two different dataset have been used
Dataset 1 - 29 sites sampled twice - July and October 2010 (stations 1 – 29)
Dataset 2 - 8 sites, located in SCI IT3250031, monitored monthly (April 2014 -March 2015) in the framework of LIFE SERESTO project (stations A - H)
29 stations: variability between only 2 sampling, but in a large number of stations and different environmental conditions; 8 stations: minor spatial heterogenity, but high sampling frequency
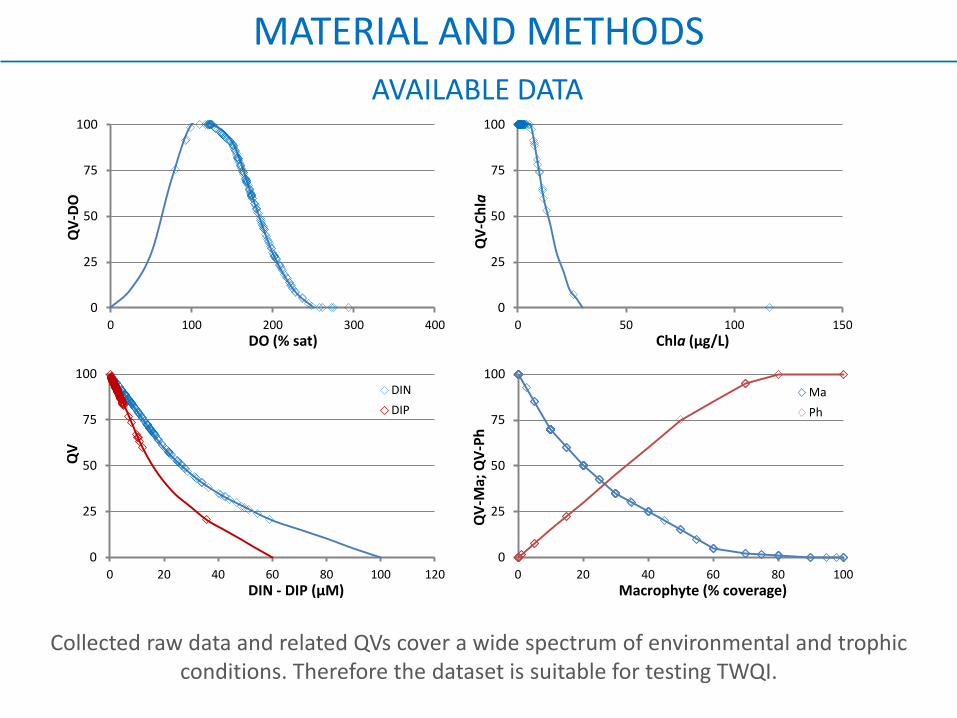
0
25
50
75
100
0 100 200 300 400
QV
-DO
DO (% sat)
0
25
50
75
100
0 50 100 150
QV
-Ch
la
Chla (µg/L)
0
25
50
75
100
0 20 40 60 80 100
QV
-Ma;
QV
-Ph
Macrophyte (% coverage)
Ma
Ph
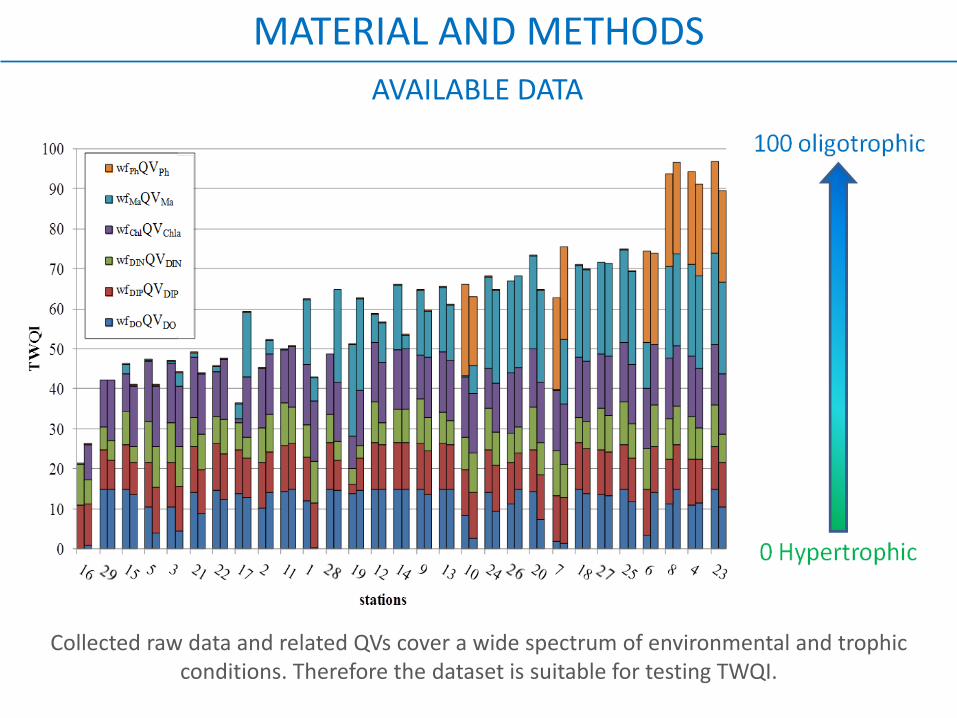
Collected raw data and related QVs cover a wide spectrum of environmental and trophic conditions. Therefore the dataset is suitable for testing TWQI.
AVAILABLE DATA
MATERIAL AND METHODS
0
25
50
75
100
0 20 40 60 80 100 120
QV
DIN - DIP (µM)
DIN
DIP
Collected raw data and related QVs cover a wide spectrum of environmental and trophic conditions. Therefore the dataset is suitable for testing TWQI.
AVAILABLE DATA
MATERIAL AND METHODS
VII EUROLAG - EUROPEAN COASTAL LAGOONS SYMPOSIUM University of Murcia (Spain), 1st to 4th March 2016
MATERIAL AND METHODS
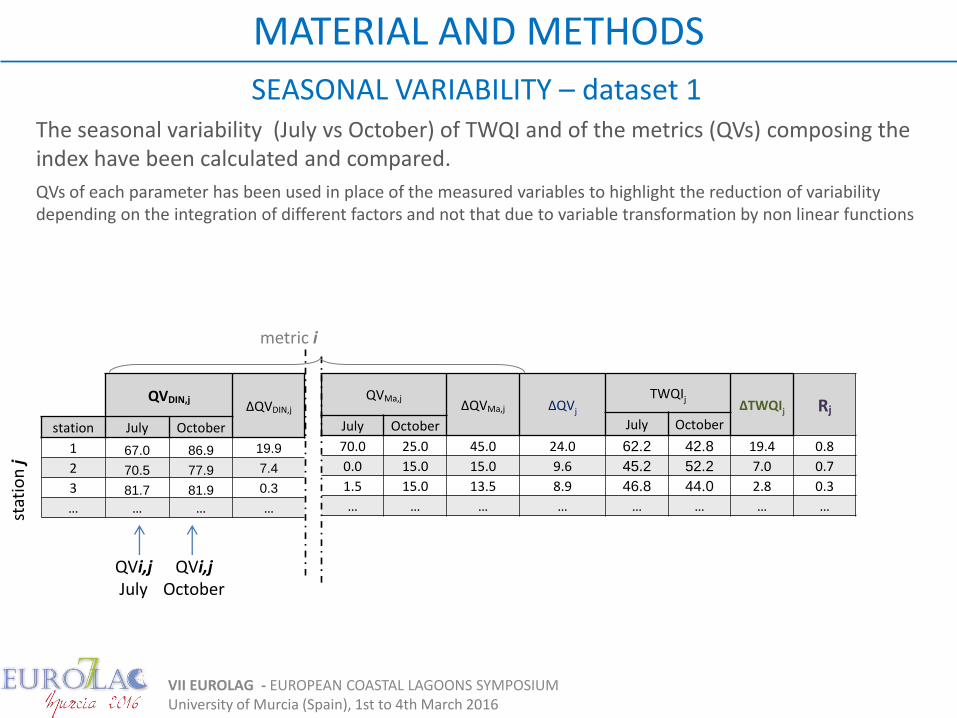
SEASONAL VARIABILITY – dataset 1
R = mean Rj 1
QVDIN,j ΔQVDIN,j
station July October
1 67.0 86.9 19.9
2 70.5 77.9 7.4
3 81.7 81.9 0.3
… … … … stat
ion
j
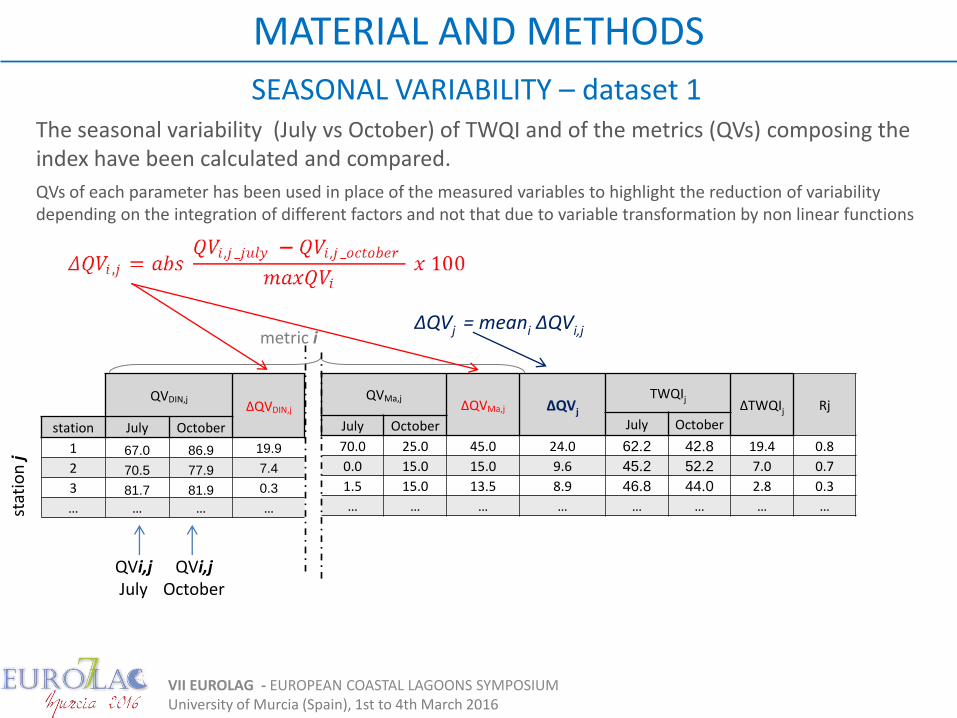
The seasonal variability (July vs October) of TWQI and of the metrics (QVs) composing the index have been calculated and compared.
QVs of each parameter has been used in place of the measured variables to highlight the reduction of variability depending on the integration of different factors and not that due to variable transformation by non linear functions
QVMa,j ΔQVMa,j ΔQVj
TWQIj ΔTWQIj Rj
July October July October
70.0 25.0 45.0 24.0 62.2 42.8 19.4 0.8
0.0 15.0 15.0 9.6 45.2 52.2 7.0 0.7
1.5 15.0 13.5 8.9 46.8 44.0 2.8 0.3
… … … … … … … …
QVi,j July
QVi,j October
metric i
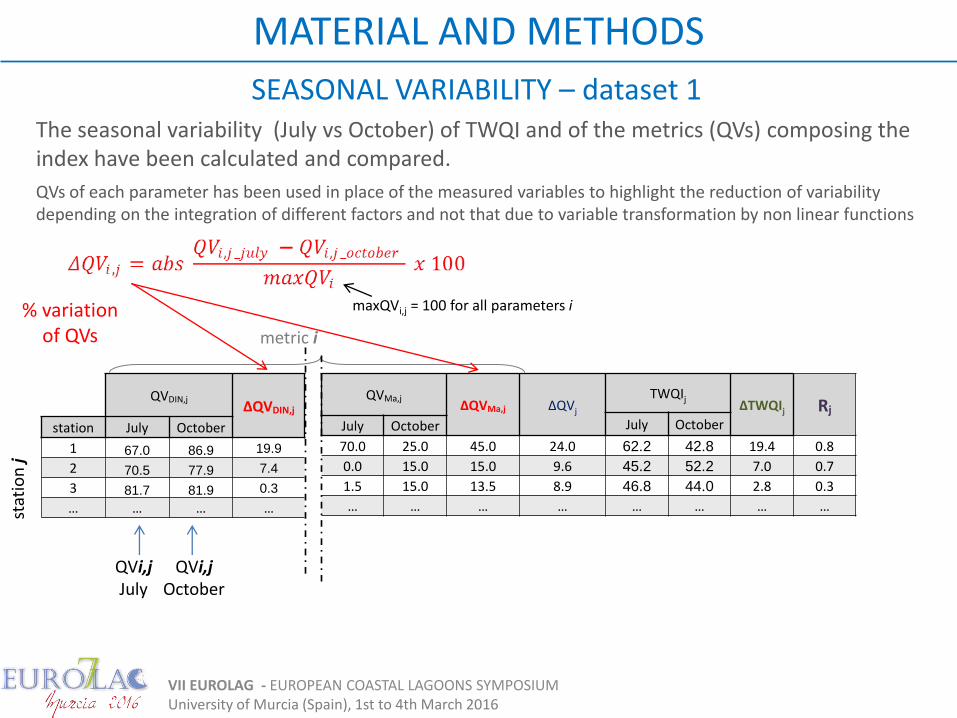
maxQVi,j = 100 for all parameters i
VII EUROLAG - EUROPEAN COASTAL LAGOONS SYMPOSIUM University of Murcia (Spain), 1st to 4th March 2016
MATERIAL AND METHODS
R = mean Rj 1
QVDIN,j ΔQVDIN,j
station July October
1 67.0 86.9 19.9
2 70.5 77.9 7.4
3 81.7 81.9 0.3
… … … … stat
ion
j
QVi,j July
metric i
QVi,j October
QVMa,j ΔQVMa,j ΔQVj
TWQIj ΔTWQIj Rj
July October July October
70.0 25.0 45.0 24.0 62.2 42.8 19.4 0.8
0.0 15.0 15.0 9.6 45.2 52.2 7.0 0.7
1.5 15.0 13.5 8.9 46.8 44.0 2.8 0.3
… … … … … … … …
% variation of QVs
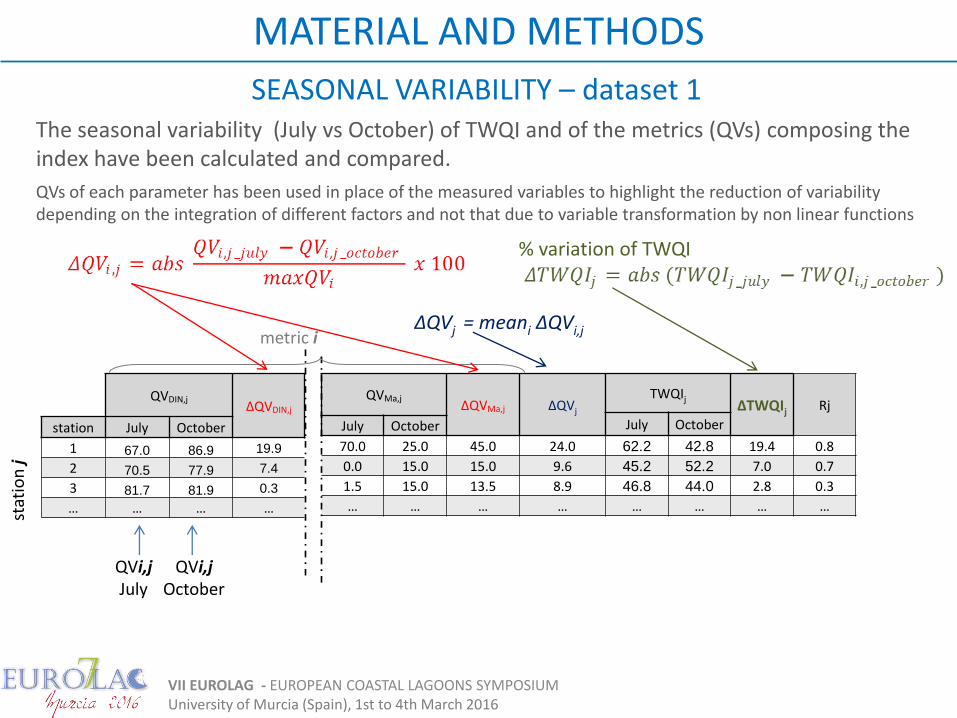
SEASONAL VARIABILITY – dataset 1 The seasonal variability (July vs October) of TWQI and of the metrics (QVs) composing the index have been calculated and compared.
QVs of each parameter has been used in place of the measured variables to highlight the reduction of variability depending on the integration of different factors and not that due to variable transformation by non linear functions
VII EUROLAG - EUROPEAN COASTAL LAGOONS SYMPOSIUM University of Murcia (Spain), 1st to 4th March 2016
MATERIAL AND METHODS
R = mean Rj 1
QVDIN,j ΔQVDIN,j
station July October
1 67.0 86.9 19.9
2 70.5 77.9 7.4
3 81.7 81.9 0.3
… … … …
QVMa,j ΔQVMa,j ΔQVj
TWQIj ΔTWQIj Rj
July October July October
70.0 25.0 45.0 24.0 62.2 42.8 19.4 0.8
0.0 15.0 15.0 9.6 45.2 52.2 7.0 0.7
1.5 15.0 13.5 8.9 46.8 44.0 2.8 0.3
… … … … … … … … stat
ion
j
ΔQVj = meani ΔQVi,j metric i
QVi,j July
QVi,j October
SEASONAL VARIABILITY – dataset 1 The seasonal variability (July vs October) of TWQI and of the metrics (QVs) composing the index have been calculated and compared.
QVs of each parameter has been used in place of the measured variables to highlight the reduction of variability depending on the integration of different factors and not that due to variable transformation by non linear functions
VII EUROLAG - EUROPEAN COASTAL LAGOONS SYMPOSIUM University of Murcia (Spain), 1st to 4th March 2016
MATERIAL AND METHODS
R = mean Rj 1
QVDIN,j ΔQVDIN,j
station July October
1 67.0 86.9 19.9
2 70.5 77.9 7.4
3 81.7 81.9 0.3
… … … …
QVMa,j ΔQVMa,j ΔQVj
TWQIj ΔTWQIj Rj
July October July October
70.0 25.0 45.0 24.0 62.2 42.8 19.4 0.8
0.0 15.0 15.0 9.6 45.2 52.2 7.0 0.7
1.5 15.0 13.5 8.9 46.8 44.0 2.8 0.3
… … … … … … … …
stat
ion
j
% variation of TWQI
QVi,j July
QVi,j October
metric i ΔQVj = meani ΔQVi,j
SEASONAL VARIABILITY – dataset 1 The seasonal variability (July vs October) of TWQI and of the metrics (QVs) composing the index have been calculated and compared.
QVs of each parameter has been used in place of the measured variables to highlight the reduction of variability depending on the integration of different factors and not that due to variable transformation by non linear functions
VII EUROLAG - EUROPEAN COASTAL LAGOONS SYMPOSIUM University of Murcia (Spain), 1st to 4th March 2016
MATERIAL AND METHODS
R = mean Rj 1
QVDIN,j ΔQVDIN,j
station July October
1 67.0 86.9 19.9
2 70.5 77.9 7.4
3 81.7 81.9 0.3
… … … …
QVMa,j ΔQVMa,j ΔQVj
TWQIj ΔTWQIj Rj
July October July October
70.0 25.0 45.0 24.0 62.2 42.8 19.4 0.8
0.0 15.0 15.0 9.6 45.2 52.2 7.0 0.7
1.5 15.0 13.5 8.9 46.8 44.0 2.8 0.3
… … … … … … … …
stat
ion
j
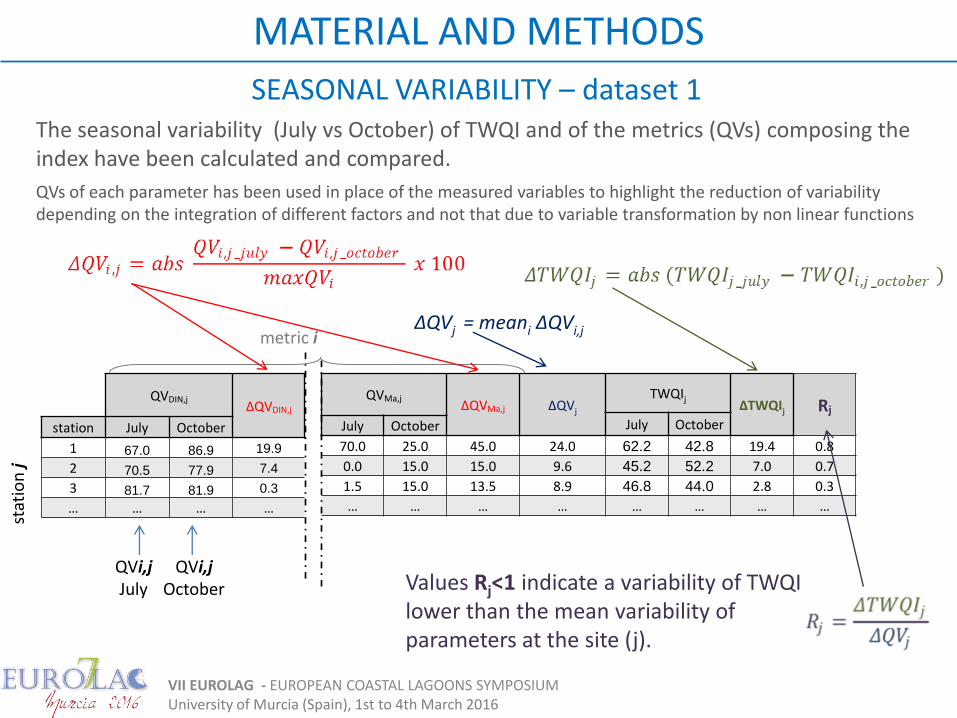
Values Rj<1 indicate a variability of TWQI lower than the mean variability of parameters at the site (j).
QVi,j July
QVi,j October
metric i ΔQVj = meani ΔQVi,j
SEASONAL VARIABILITY – dataset 1 The seasonal variability (July vs October) of TWQI and of the metrics (QVs) composing the index have been calculated and compared.
QVs of each parameter has been used in place of the measured variables to highlight the reduction of variability depending on the integration of different factors and not that due to variable transformation by non linear functions
VII EUROLAG - EUROPEAN COASTAL LAGOONS SYMPOSIUM University of Murcia (Spain), 1st to 4th March 2016
MATERIAL AND METHODS
MONTHLY VARIABILITY – dataset 2
R = mean Rj 1
month QV_DO QV_chla QV_DIN QV_DIP QV_Ma QV_Ph TWQI Apr 93.1 100.0 52.7 86.8 70.0 0.0 61.8
Mag 5.5 100.0 88.9 96.3 5.0 0.0 39.2
Giu 95.0 100.0 63.9 96.0 1.0 0.0 48.7
Lug 91.1 100.0 20.7 90.8 0.0 0.0 42.1
Ago 51.6 100.0 43.3 84.8 25.0 0.0 43.9
Set 1.0 100.0 57.7 97.2 70.0 0.0 49.8
Ott 44.7 100.0 27.2 92.7 70.0 0.0 52.2
Nov 39.1 100.0 29.6 88.2 70.0 0.0 51.1
Dic 68.8 100.0 34.4 93.7 70.0 0.0 56.8
Gen 62.1 100.0 68.5 92.8 85.0 0.0 63.2
Feb 28.7 100.0 88.2 83.9 50.0 0.0 51.5
Mar 0.0 100.0 91.6 89.4 25.0 0.0 42.5
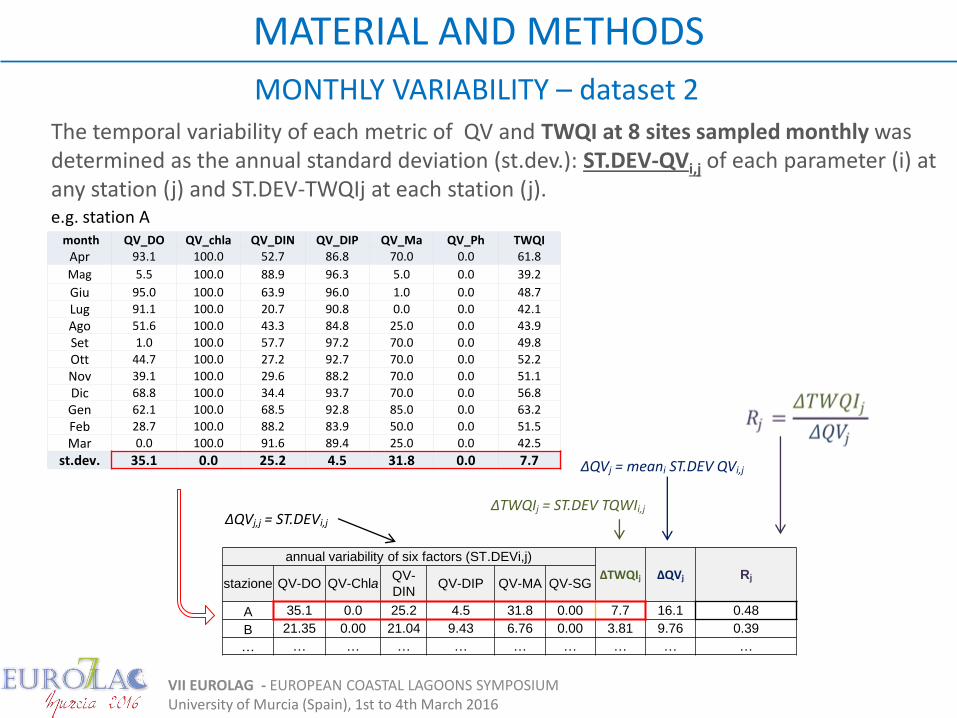
st.dev. 35.1 0.0 25.2 4.5 31.8 0.0 7.7
annual variability of six factors (ST.DEVi,j)
ΔTWQIj ΔQVj Rj stazione QV-DO QV-Chla
QV-
DIN QV-DIP QV-MA QV-SG
A 35.1 0.0 25.2 4.5 31.8 0.00 7.7 16.1 0.48
B 21.35 0.00 21.04 9.43 6.76 0.00 3.81 9.76 0.39
… … … … … … … … … …
ΔQVj = meani ST.DEV QVi,j
ΔTWQIj = ST.DEV TQWIi,j ΔQVj,j = ST.DEVi,j
e.g. station A
The temporal variability of each metric of QV and TWQI at 8 sites sampled monthly was determined as the annual standard deviation (st.dev.): ST.DEV-QVi,j of each parameter (i) at any station (j) and ST.DEV-TWQIj at each station (j).
RESULTS
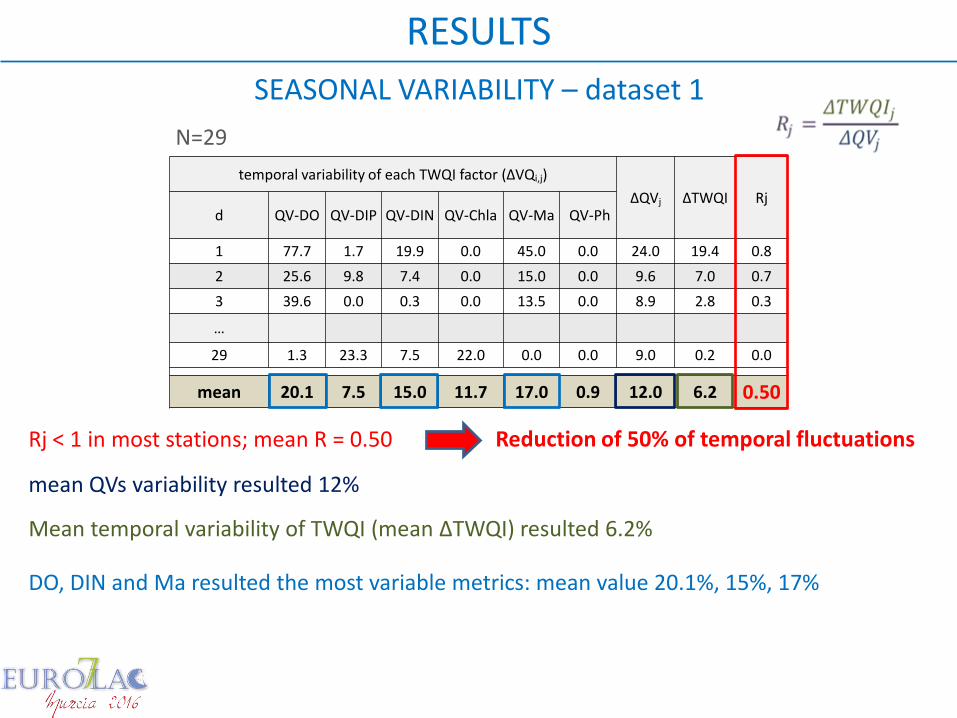
temporal variability of each TWQI factor (ΔVQi,j)
ΔQVj ΔTWQI Rj d QV-DO QV-DIP QV-DIN QV-Chla QV-Ma QV-Ph
1 77.7 1.7 19.9 0.0 45.0 0.0 24.0 19.4 0.8
2 25.6 9.8 7.4 0.0 15.0 0.0 9.6 7.0 0.7
3 39.6 0.0 0.3 0.0 13.5 0.0 8.9 2.8 0.3
…
29 1.3 23.3 7.5 22.0 0.0 0.0 9.0 0.2 0.0
mean 20.1 7.5 15.0 11.7 17.0 0.9 12.0 6.2 0.50
DO, DIN and Ma resulted the most variable metrics: mean value 20.1%, 15%, 17%
mean QVs variability resulted 12%
Mean temporal variability of TWQI (mean ΔTWQI) resulted 6.2%
Rj < 1 in most stations; mean R = 0.50
SEASONAL VARIABILITY – dataset 1
N=29
Reduction of 50% of temporal fluctuations
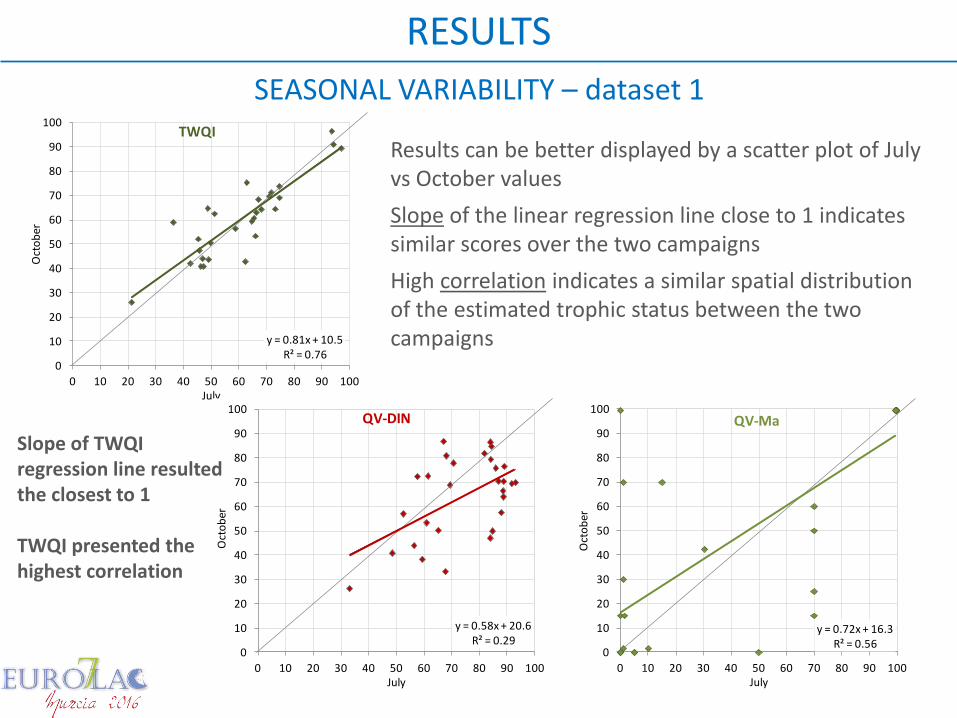
y = 0.81x + 10.5R² = 0.76
0
10
20
30
40
50
60
70
80
90
100
0 10 20 30 40 50 60 70 80 90 100
Oct
ob
er
July
TWQI
y = 0.58x + 20.6R² = 0.29
0
10
20
30
40
50
60
70
80
90
100
0 10 20 30 40 50 60 70 80 90 100
Oct
ob
er
July
QV-DIN
y = 0.72x + 16.3R² = 0.56
0
10
20
30
40
50
60
70
80
90
100
0 10 20 30 40 50 60 70 80 90 100
Oct
ob
er
July
QV-Ma
RESULTS
Results can be better displayed by a scatter plot of July vs October values
Slope of the linear regression line close to 1 indicates similar scores over the two campaigns
High correlation indicates a similar spatial distribution of the estimated trophic status between the two campaigns
Slope of TWQI regression line resulted the closest to 1 TWQI presented the highest correlation
SEASONAL VARIABILITY – dataset 1
VII EUROLAG - EUROPEAN COASTAL LAGOONS SYMPOSIUM University of Murcia (Spain), 1st to 4th March 2016
RESULTS
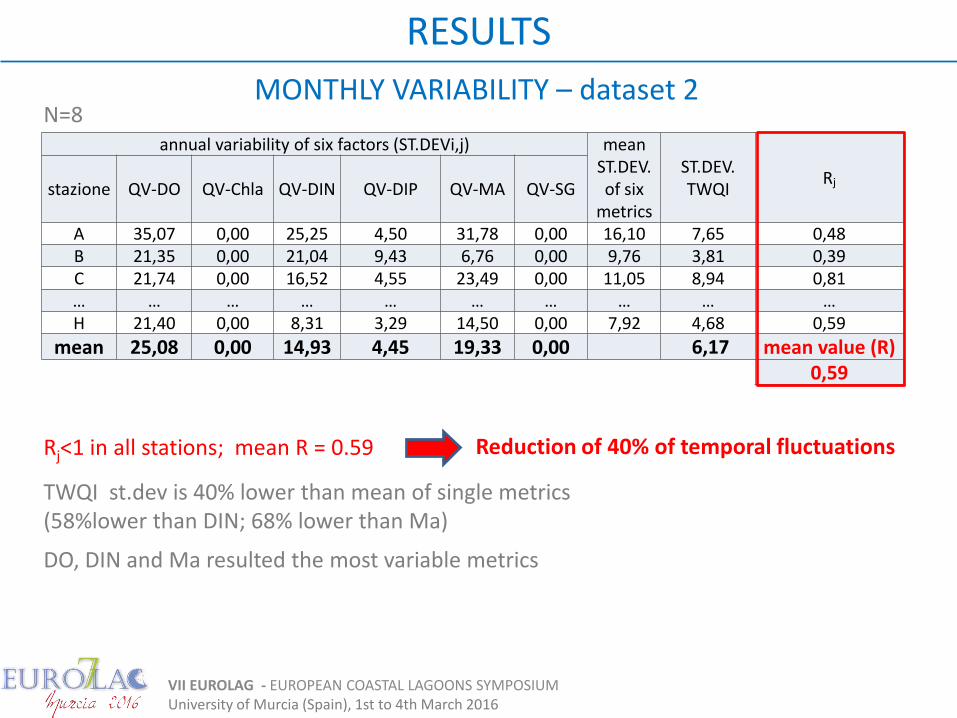
annual variability of six factors (ST.DEVi,j) mean ST.DEV. of six
metrics
ST.DEV. TWQI
Rj stazione QV-DO QV-Chla QV-DIN QV-DIP QV-MA QV-SG
A 35,07 0,00 25,25 4,50 31,78 0,00 16,10 7,65 0,48
B 21,35 0,00 21,04 9,43 6,76 0,00 9,76 3,81 0,39
C 21,74 0,00 16,52 4,55 23,49 0,00 11,05 8,94 0,81
… … … … … … … … … …
H 21,40 0,00 8,31 3,29 14,50 0,00 7,92 4,68 0,59
mean 25,08 0,00 14,93 4,45 19,33 0,00 6,17 mean value (R) 0,59
DO, DIN and Ma resulted the most variable metrics
Rj<1 in all stations; mean R = 0.59
TWQI st.dev is 40% lower than mean of single metrics (58%lower than DIN; 68% lower than Ma)
MONTHLY VARIABILITY – dataset 2 N=8
Reduction of 40% of temporal fluctuations
0
10
20
30
40
50
60
70
0
10
20
30
40
50
60
70
80
90
100
DIN
(µ
M)
TWQ
I; M
A c
ove
rage
(%
)
st. A
VII EUROLAG - EUROPEAN COASTAL LAGOONS SYMPOSIUM University of Murcia (Spain), 1st to 4th March 2016
RESULTS
0
10
20
30
40
50
60
70
80
90
100
Qu
alit
y V
alu
e (Q
V);
TW
QI
St. D
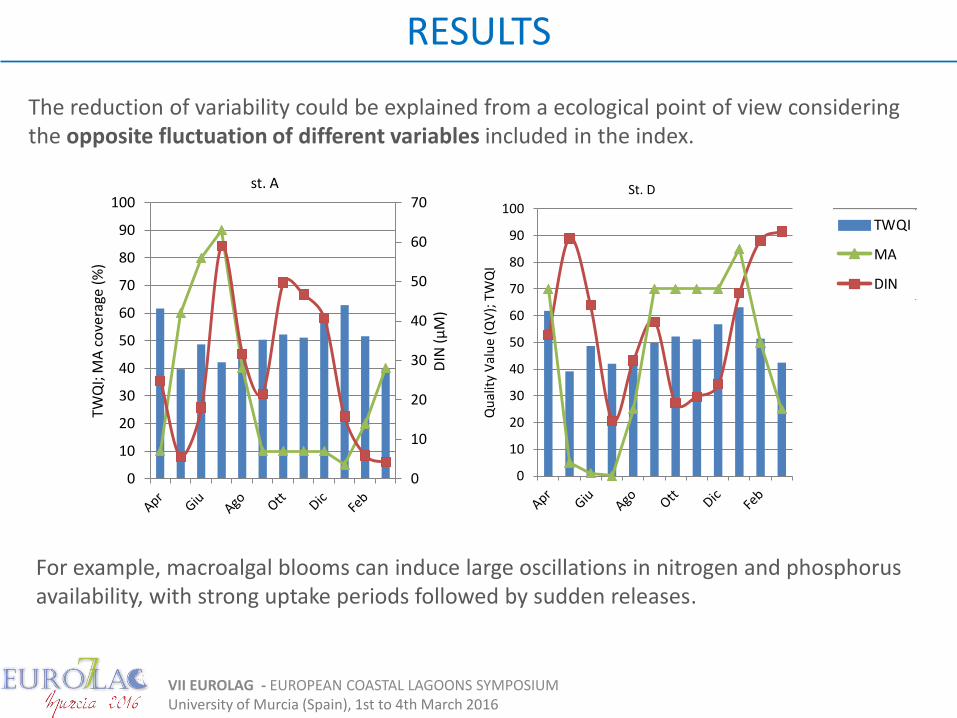
The reduction of variability could be explained from a ecological point of view considering the opposite fluctuation of different variables included in the index.
0
10
20
30
40
50
60
70
0
10
20
30
40
50
60
70
80
90
100
DIN
(µ
M)
TWQ
I; M
A c
ove
rage
(%
)
st. 1
TWQI
MA
DIN
For example, macroalgal blooms can induce large oscillations in nitrogen and phosphorus availability, with strong uptake periods followed by sudden releases.
VII EUROLAG - EUROPEAN COASTAL LAGOONS SYMPOSIUM University of Murcia (Spain), 1st to 4th March 2016
RESULTS
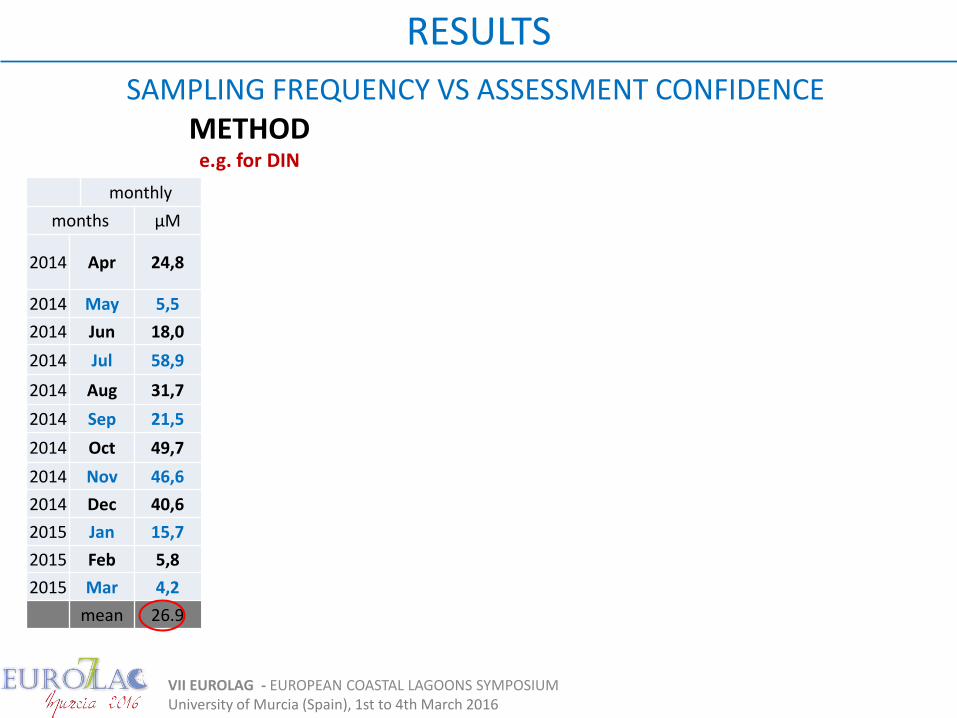
SAMPLING FREQUENCY VS ASSESSMENT CONFIDENCE
monthly
months µM
2014 Apr 24,8
2014 May 5,5
2014 Jun 18,0
2014 Jul 58,9
2014 Aug 31,7
2014 Sep 21,5
2014 Oct 49,7
2014 Nov 46,6
2014 Dec 40,6
2015 Jan 15,7
2015 Feb 5,8
2015 Mar 4,2
mean 26.9
METHOD e.g. for DIN
VII EUROLAG - EUROPEAN COASTAL LAGOONS SYMPOSIUM University of Murcia (Spain), 1st to 4th March 2016
RESULTS
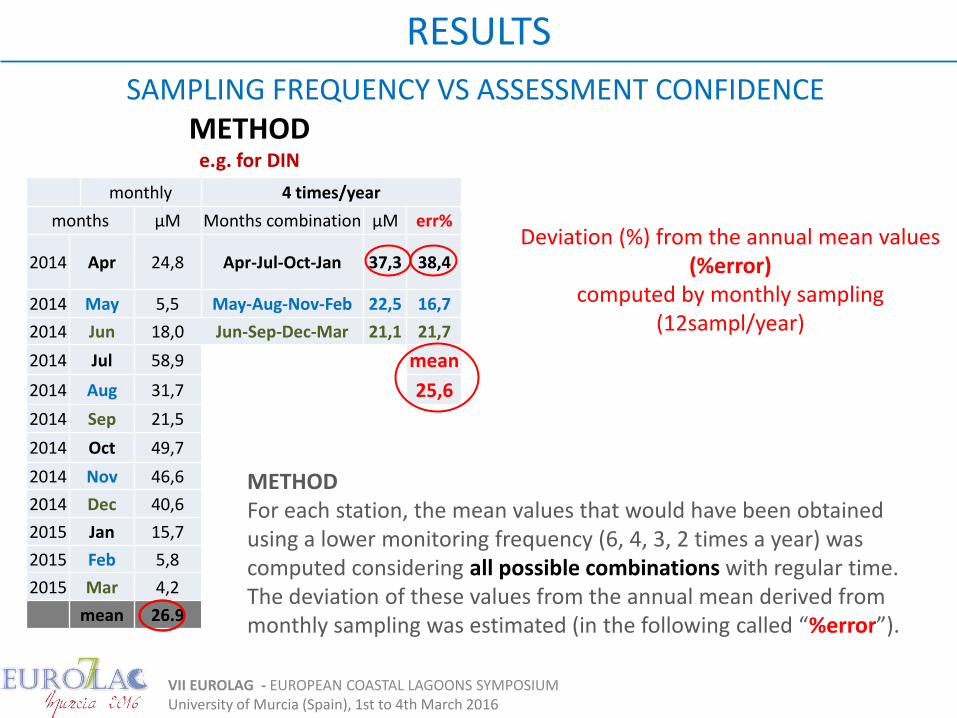
monthly 4 times/year
months µM Months combination µM err%
2014 Apr 24,8 Apr-Jul-Oct-Jan 37,3 38,4
2014 May 5,5 May-Aug-Nov-Feb 22,5 16,7
2014 Jun 18,0 Jun-Sep-Dec-Mar 21,1 21,7
2014 Jul 58,9 mean
2014 Aug 31,7 25,6
2014 Sep 21,5
2014 Oct 49,7
2014 Nov 46,6
2014 Dec 40,6
2015 Jan 15,7
2015 Feb 5,8
2015 Mar 4,2
mean 26.9
SAMPLING FREQUENCY VS ASSESSMENT CONFIDENCE METHOD
e.g. for DIN
METHOD For each station, the mean values that would have been obtained using a lower monitoring frequency (6, 4, 3, 2 times a year) was computed considering all possible combinations with regular time. The deviation of these values from the annual mean derived from monthly sampling was estimated (in the following called “%error”).
Deviation (%) from the annual mean values (%error)
computed by monthly sampling (12sampl/year)
RESULTS
SAMPLING FREQUENCY VS CONFIDENCE
0
20
40
60
80
100
120
2 3 4 5 6
% e
rro
r
n sampling/year
DIN mean % err
DIN max %err
TWQI mean % err
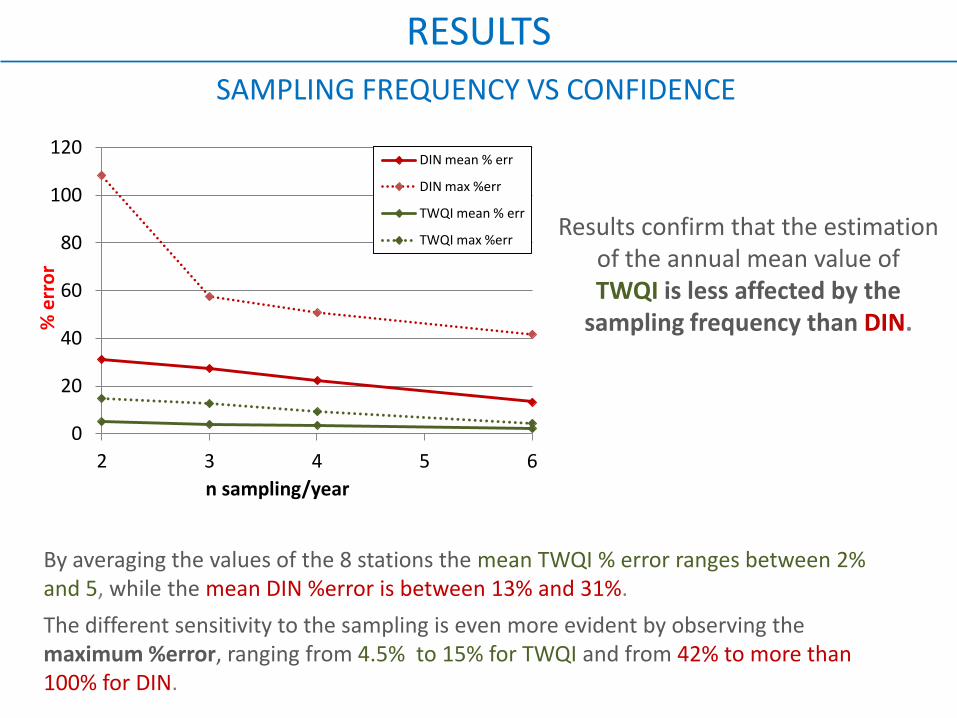
TWQI max %err Results confirm that the estimation
of the annual mean value of TWQI is less affected by the
sampling frequency than DIN.
By averaging the values of the 8 stations the mean TWQI % error ranges between 2% and 5, while the mean DIN %error is between 13% and 31%.
The different sensitivity to the sampling is even more evident by observing the maximum %error, ranging from 4.5% to 15% for TWQI and from 42% to more than 100% for DIN.
VII EUROLAG - EUROPEAN COASTAL LAGOONS SYMPOSIUM University of Murcia (Spain), 1st to 4th March 2016
CONCLUSIONS
TWQI is a simple tool for combining the information from different abiotic and biotic measurements and provide a integrated evaluation of trophic status quantitatively expressed.
Multimetric index TWQI demonstrated to be less affected by temporal variations than the average of the single parameters integrated in the index. The estimation of trophic status by TWQI is less affected by the sampling frequency than single abiotic and biotic metrics (e.g. DIN).
Most of the measurements are generally already considered in the standard monitoring activities of transitional ecosystems
The TWQI could be a smart indicator for eutrophication risk assessment for Institutional monitoring carried out by Environmental Agencies
Thanks for your attention
Most data used in this study have been collected during LIFE SERESTO monitoring activities. The SERESTO project is funded by European Union's LIFE+ financial instrument and contributes to the environmental recovery of a Natura 2000 site (SIC IT3250031 - Northern Venice Lagoon).
www.lifeseresto.eu, [email protected]
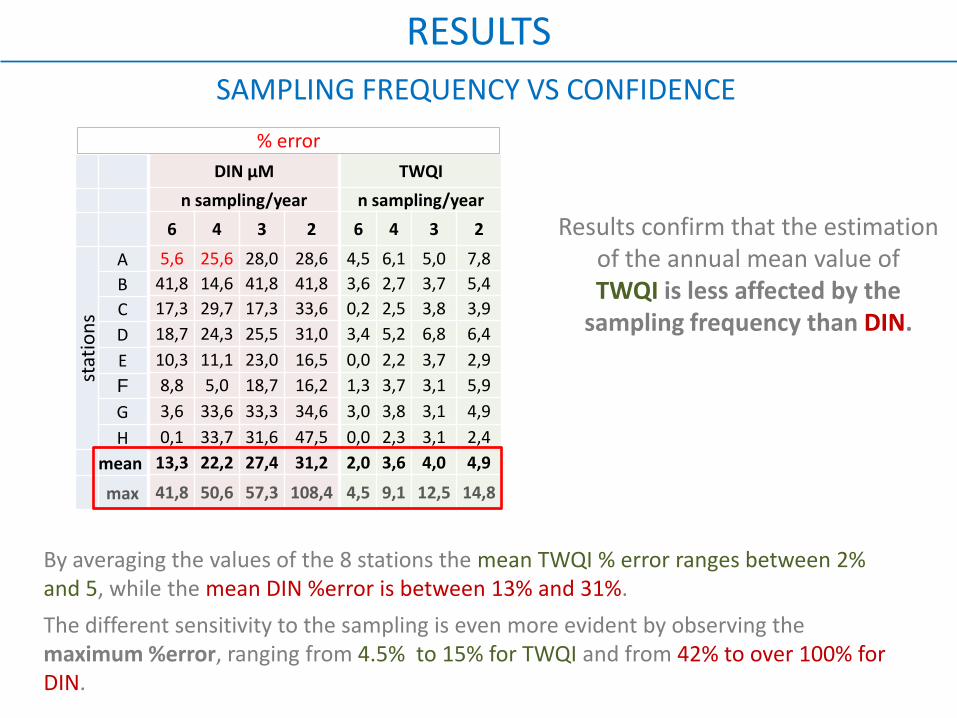
RESULTS
SAMPLING FREQUENCY VS CONFIDENCE
TWQI
n sampling/year
6 4 3 2
4,5 6,1 5,0 7,8
3,6 2,7 3,7 5,4
0,2 2,5 3,8 3,9
3,4 5,2 6,8 6,4
0,0 2,2 3,7 2,9
1,3 3,7 3,1 5,9
3,0 3,8 3,1 4,9
0,0 2,3 3,1 2,4
2,0 3,6 4,0 4,9
4,5 9,1 12,5 14,8
DIN µM
n sampling/year
6 4 3 2
5,6 25,6 28,0 28,6
41,8 14,6 41,8 41,8
17,3 29,7 17,3 33,6
18,7 24,3 25,5 31,0
10,3 11,1 23,0 16,5
8,8 5,0 18,7 16,2
3,6 33,6 33,3 34,6
0,1 33,7 31,6 47,5
13,3 22,2 27,4 31,2
41,8 50,6 57,3 108,4
stat
ion
s
A
B
C
D
E
F
G
H
mean
max
% error
By averaging the values of the 8 stations the mean TWQI % error ranges between 2% and 5, while the mean DIN %error is between 13% and 31%.
The different sensitivity to the sampling is even more evident by observing the maximum %error, ranging from 4.5% to 15% for TWQI and from 42% to over 100% for DIN.
Results confirm that the estimation of the annual mean value of TWQI is less affected by the
sampling frequency than DIN.