Embed Size (px)
Citation preview

Alignment of cell division axes in directed epithelialcell migration
Anna-Kristina Marel1,3, Nils Podewitz2,3, Matthias Zorn1,Joachim Oskar Rädler1 and Jens Elgeti21 Fakultät für Physik and Center for NanoScience, Ludwig-Maximilians-Universität,Geschwister-Scholl-Platz 1, D-80539 München, Germany2 Theoretical Soft Matter and Biophysics, Institute of Complex Systems, ForschungszentrumJülich, D-52425 Jülich, GermanyE-mail: [email protected]
Received 13 May 2014, revised 27 August 2014Accepted for publication 25 September 2014Published 7 November 2014
New Journal of Physics 16 (2014) 115005
doi:10.1088/1367-2630/16/11/115005
AbstractCell division is an essential dynamic event in tissue remodeling during woundhealing, cancer and embryogenesis. In collective migration, tensile stressesaffect cell shape and polarity, hence, the orientation of the cell division axis isexpected to depend on cellular flow patterns. Here, we study the degree oforientation of cell division axes in migrating and resting epithelial cell sheets.We use microstructured channels to create a defined scenario of directed cellinvasion and compare this situation to resting but proliferating cell monolayers.In experiments, we find a strong alignment of the axis due to directed flow whileresting sheets show very weak global order, but local flow gradients still cor-relate strongly with the cell division axis. We compare experimental results witha previously published mesoscopic particle based simulation model. Most of theobserved effects are reproduced by the simulations.
S Online supplementary data available from stacks.iop.org/njp/16/115005/mmedia
Keywords: tissue growth, simulations, MDCK
3 These authors contributed equally to this work.
Content from this work may be used under the terms of the Creative Commons Attribution 3.0 licence.Any further distribution of this work must maintain attribution to the author(s) and the title of the work, journal
citation and DOI.
New Journal of Physics 16 (2014) 1150051367-2630/14/115005+17$33.00 © 2014 IOP Publishing Ltd and Deutsche Physikalische Gesellschaft
1. Introduction
The positioning and orientation of the cell division axis is a key element during thedevelopment of multicellular organisms and to maintain the functionality of the tissue. Manyexamples of pattern formation have been found in the developing embryo depending onemerging anisotropies in cell division, such as the imaginal wing disc of Drosophila [1]. Theseobservations imply that the understanding of cell division orientation is fundamental. Single cellexperiments have shown that the orientation of the cell division plane is determined by manyfactors such as cell shape, cell polarity and the spatial distribution of the extracellular matrix [2–4]. The orientation of cell division within tissues, however, is less well studied. Madin–Darbycanine kidney (MDCK) cells are a widely used model system to study growing motile tissues[5–8]. This epithelial cell line exhibits strong cell–cell junctions and grows as a polarized andcontinuous monolayer in culture [9, 10]. Cell division usually occurs within the plane of theepithelium, producing two daughter cells that remain within the cell sheet [11]. Cells continueto divide at confluent level with decreasing division rates until a maximum density is reached[7]. At the same time, cell motility is reduced with increasing cell density, displaying a glass-like transition in cellular behavior [12]. In general, directed cell migration can be initiated byintroducing a model wound in the cell sheet, creating a new, free surface [8]. Cellsspontaneously start to migrate and proliferate in order to close the gap, displaying strikingfeatures like the formation of fingers [13] and leader-cells [8]. During collective migration ofcell sheets, forces are exerted on the substrate, leading to the development of a global tensilestress within the layer [14]. Individual cells react to generated stresses by changing their shapeto elongated architectures or rearranging within the tissue in order to locally reduce the stresses.The orientation of the mitotic spindle is predicted to self-organize during cell division due tomechanical forces. As early as 1884, Oscar Hertwig proposed a simple concept, known as the‘long axis rule’, implying that the axis of the spindle lies in the direction of the longest axis ofthe cell, cutting this axis transversely [15]. As a consequence, the possible correlation betweenemerging forces during collective migration and cell division orientation is an interesting issue.Poujade et al investigated the orientation of cell divisions in the central region of expanding,stripe shaped MDCK monolayers, finding no preferred direction of the division axis [8]. At therim of the expanding culture, however, finger formation promotes strong correlation of celldivision axis and polarity with the main finger direction as proven by Reffay et al [6]. Amajority of the motility phenomena were explained recently by a simple mechanical model ofgrowth [16] combined with a local orientation mechanism of cellular motility that does notrequire any alignment force from the neighboring cells, or chemical gradients to determine thedirection of cell migration. This simple model was able to reproduce the glassy transition forconfluent monolayers, finger formation at invading fronts, and the tension in expanding cellsheets [17].
In this work, we study the orientation of cell division axes in flowing and resting epithelialmonolayers and compare the experimental results to a computational model. We usemicrostructured channels to create a directional cell flow of migrating and proliferating cells.The distribution and orientation of the cell division events as a function of distance to theleading edge and local flow properties are analyzed. We demonstrate that cell divisions aresignificantly oriented by the emergent cell flow in contrast to the scenario of cells in resting,confluent monolayers within the same channels. Computer simulations based on the algorithmdeveloped by Basan et al [17] are able to reproduce the bulk properties of the experimental
2
New J. Phys. 16 (2014) 115005 A-K Marel et al
results, without further adaptation of the parameters. Near boundaries, however, they displaystrong deviations. Both the experimental data as well as simulations suggest a tight couplingbetween the direction of collective cell migration and the orientation of the cell division axis.
2. Results
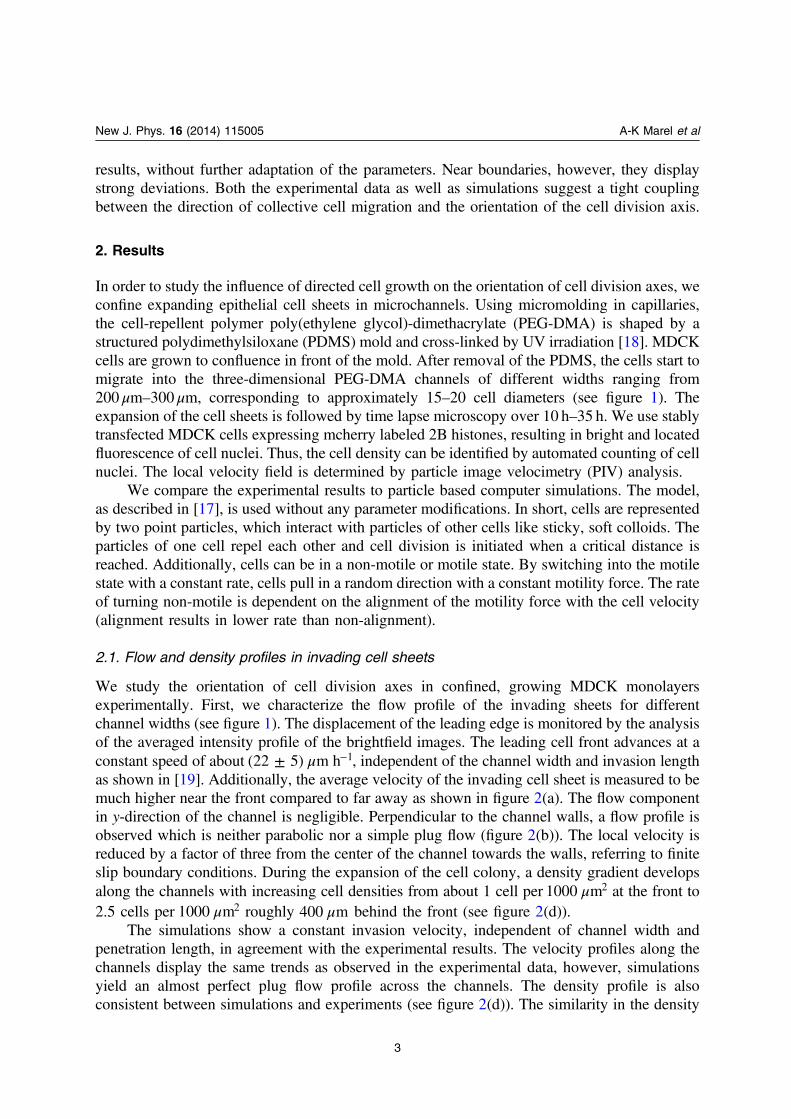
In order to study the influence of directed cell growth on the orientation of cell division axes, weconfine expanding epithelial cell sheets in microchannels. Using micromolding in capillaries,the cell-repellent polymer poly(ethylene glycol)-dimethacrylate (PEG-DMA) is shaped by astructured polydimethylsiloxane (PDMS) mold and cross-linked by UV irradiation [18]. MDCKcells are grown to confluence in front of the mold. After removal of the PDMS, the cells start tomigrate into the three-dimensional PEG-DMA channels of different widths ranging from200 μm–300 μm, corresponding to approximately 15–20 cell diameters (see figure 1). Theexpansion of the cell sheets is followed by time lapse microscopy over 10 h–35 h. We use stablytransfected MDCK cells expressing mcherry labeled 2B histones, resulting in bright and locatedfluorescence of cell nuclei. Thus, the cell density can be identified by automated counting of cellnuclei. The local velocity field is determined by particle image velocimetry (PIV) analysis.
We compare the experimental results to particle based computer simulations. The model,as described in [17], is used without any parameter modifications. In short, cells are representedby two point particles, which interact with particles of other cells like sticky, soft colloids. Theparticles of one cell repel each other and cell division is initiated when a critical distance isreached. Additionally, cells can be in a non-motile or motile state. By switching into the motilestate with a constant rate, cells pull in a random direction with a constant motility force. The rateof turning non-motile is dependent on the alignment of the motility force with the cell velocity(alignment results in lower rate than non-alignment).
2.1. Flow and density profiles in invading cell sheets
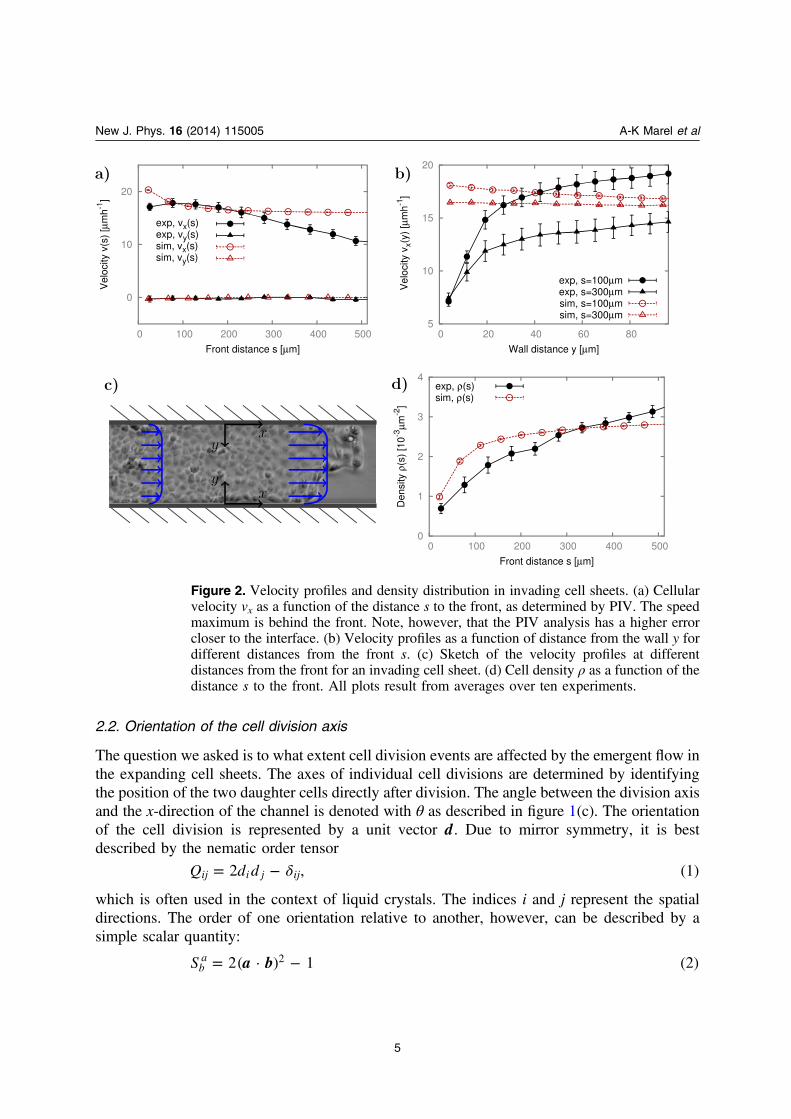
We study the orientation of cell division axes in confined, growing MDCK monolayersexperimentally. First, we characterize the flow profile of the invading sheets for differentchannel widths (see figure 1). The displacement of the leading edge is monitored by the analysisof the averaged intensity profile of the brightfield images. The leading cell front advances at aconstant speed of about μ± −(22 5) m h 1, independent of the channel width and invasion lengthas shown in [19]. Additionally, the average velocity of the invading cell sheet is measured to bemuch higher near the front compared to far away as shown in figure 2(a). The flow componentin y-direction of the channel is negligible. Perpendicular to the channel walls, a flow profile isobserved which is neither parabolic nor a simple plug flow (figure 2(b)). The local velocity isreduced by a factor of three from the center of the channel towards the walls, referring to finiteslip boundary conditions. During the expansion of the cell colony, a density gradient developsalong the channels with increasing cell densities from about 1 cell per μ1000 m2 at the front to2.5 cells per μ1000 m2 roughly μ400 m behind the front (see figure 2(d)).
The simulations show a constant invasion velocity, independent of channel width andpenetration length, in agreement with the experimental results. The velocity profiles along thechannels display the same trends as observed in the experimental data, however, simulationsyield an almost perfect plug flow profile across the channels. The density profile is alsoconsistent between simulations and experiments (see figure 2(d)). The similarity in the density
3
New J. Phys. 16 (2014) 115005 A-K Marel et al
profile shape as well as the constant invasion velocity suggest these quantities as units ofmeasure to rescale the simulation results to physical units (for detailed information seeMaterials and methods).
In order to get good statistics, we averaged over the different experiments of channel sizesbetween μ200 m and μ300 m. We chose a bin size of μ50 m ( μ42 m) along the x- or s-axis forthe experiments (simulations) and averaged over the whole channel width, several individualexperiments and time (60–210 frames per experiment). Cross channel profiles, like the velocityprofile in figure 2(b), are not averaged over the channel width but instead binned in y-directionwith a size of μ8 m ( μ8.4 m).
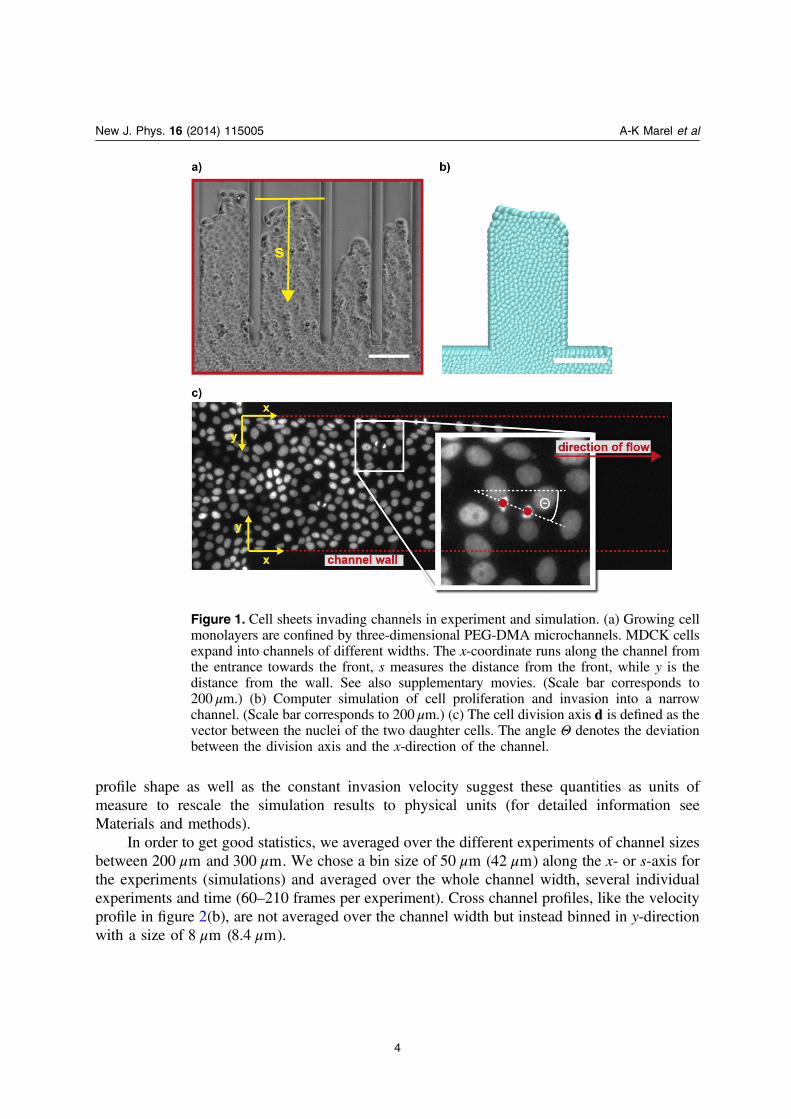
Figure 1. Cell sheets invading channels in experiment and simulation. (a) Growing cellmonolayers are confined by three-dimensional PEG-DMA microchannels. MDCK cellsexpand into channels of different widths. The x-coordinate runs along the channel fromthe entrance towards the front, s measures the distance from the front, while y is thedistance from the wall. See also supplementary movies. (Scale bar corresponds to200 μm.) (b) Computer simulation of cell proliferation and invasion into a narrowchannel. (Scale bar corresponds to 200 μm.) (c) The cell division axis d is defined as thevector between the nuclei of the two daughter cells. The angle Θ denotes the deviationbetween the division axis and the x-direction of the channel.
4
New J. Phys. 16 (2014) 115005 A-K Marel et al
2.2. Orientation of the cell division axis
The question we asked is to what extent cell division events are affected by the emergent flow inthe expanding cell sheets. The axes of individual cell divisions are determined by identifyingthe position of the two daughter cells directly after division. The angle between the division axisand the x-direction of the channel is denoted with θ as described in figure 1(c). The orientationof the cell division is represented by a unit vector d. Due to mirror symmetry, it is bestdescribed by the nematic order tensor
δ= −Q d d2 , (1)ij i j ij
which is often used in the context of liquid crystals. The indices i and j represent the spatialdirections. The order of one orientation relative to another, however, can be described by asimple scalar quantity:
= −a bS 2( · ) 1 (2)ba 2
Figure 2. Velocity profiles and density distribution in invading cell sheets. (a) Cellularvelocity vx as a function of the distance s to the front, as determined by PIV. The speedmaximum is behind the front. Note, however, that the PIV analysis has a higher errorcloser to the interface. (b) Velocity profiles as a function of distance from the wall y fordifferent distances from the front s. (c) Sketch of the velocity profiles at differentdistances from the front for an invading cell sheet. (d) Cell density ρ as a function of thedistance s to the front. All plots result from averages over ten experiments.
5
New J. Phys. 16 (2014) 115005 A-K Marel et al
with the unit vectors a b, for the two directions. Here, we define divisional order relative to thex-axis of the channel
θ= = < > −S e Qe 2 cos 1. (3)xd
x x2
=S 0xd characterizes isotropy, while =S 1x
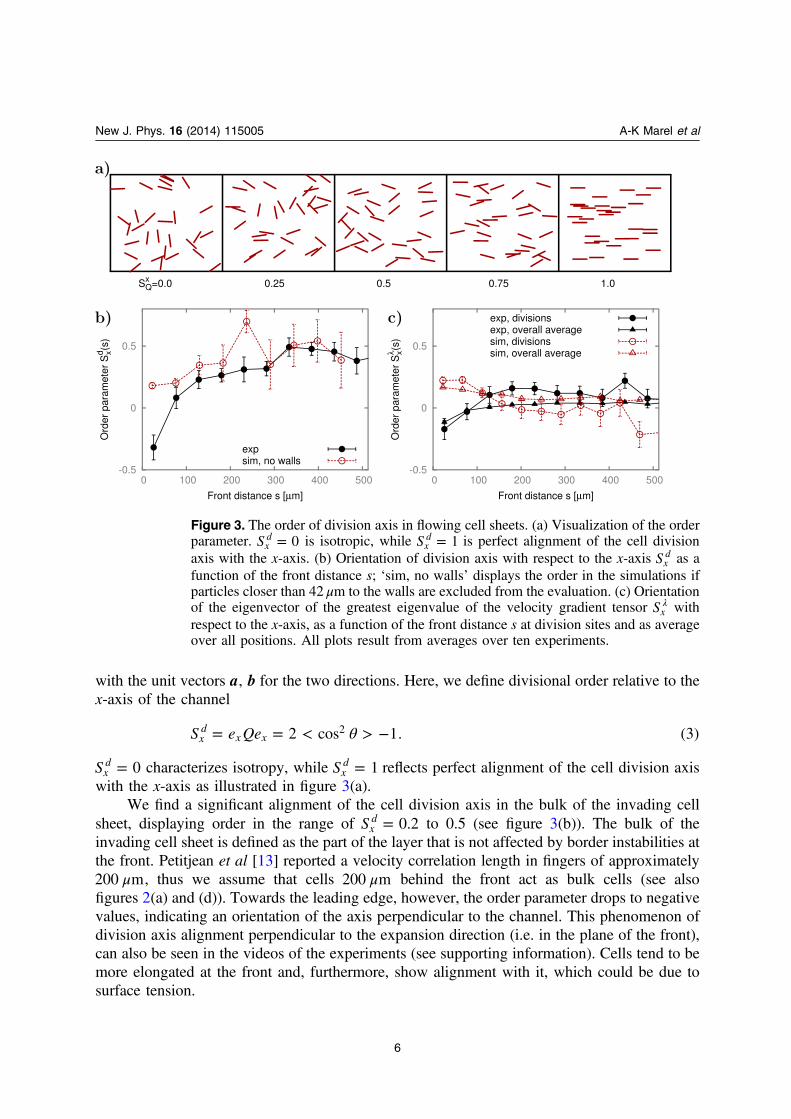
d reflects perfect alignment of the cell division axiswith the x-axis as illustrated in figure 3(a).
We find a significant alignment of the cell division axis in the bulk of the invading cellsheet, displaying order in the range of =S 0.2x
d to 0.5 (see figure 3(b)). The bulk of theinvading cell sheet is defined as the part of the layer that is not affected by border instabilities atthe front. Petitjean et al [13] reported a velocity correlation length in fingers of approximately
μ200 m, thus we assume that cells μ200 m behind the front act as bulk cells (see alsofigures 2(a) and (d)). Towards the leading edge, however, the order parameter drops to negativevalues, indicating an orientation of the axis perpendicular to the channel. This phenomenon ofdivision axis alignment perpendicular to the expansion direction (i.e. in the plane of the front),can also be seen in the videos of the experiments (see supporting information). Cells tend to bemore elongated at the front and, furthermore, show alignment with it, which could be due tosurface tension.
Figure 3. The order of division axis in flowing cell sheets. (a) Visualization of the orderparameter. =S 0x
d is isotropic, while =S 1xd is perfect alignment of the cell division
axis with the x-axis. (b) Orientation of division axis with respect to the x-axis Sxd as a
function of the front distance s; ‘sim, no walls’ displays the order in the simulations ifparticles closer than 42 μm to the walls are excluded from the evaluation. (c) Orientationof the eigenvector of the greatest eigenvalue of the velocity gradient tensor λSx withrespect to the x-axis, as a function of the front distance s at division sites and as averageover all positions. All plots result from averages over ten experiments.
6
New J. Phys. 16 (2014) 115005 A-K Marel et al
Computer simulations are able to quantitatively reproduce the orientation of cell divisionaxes. We find deviations close to the boundaries of the cell sheet (at the leading edge and thechannel walls) between experiment and model, however, if divisions close to boundaries are nottaken into account, agreement is quantitative (see figure 3(b), note that order is dimensionless,and thus without adjustable parameters or units).
It is known from literature [14, 20, 21] that a tensile stress is built up in advancing celllayers. As no direct stress measurements are accessible from the experimental data, we focusinstead on the strain rate tensor
= +⎛⎝⎜⎜
⎞⎠⎟⎟E
v
x
v
x
12
d
d
d
d. (4)ij
i
j
j
i
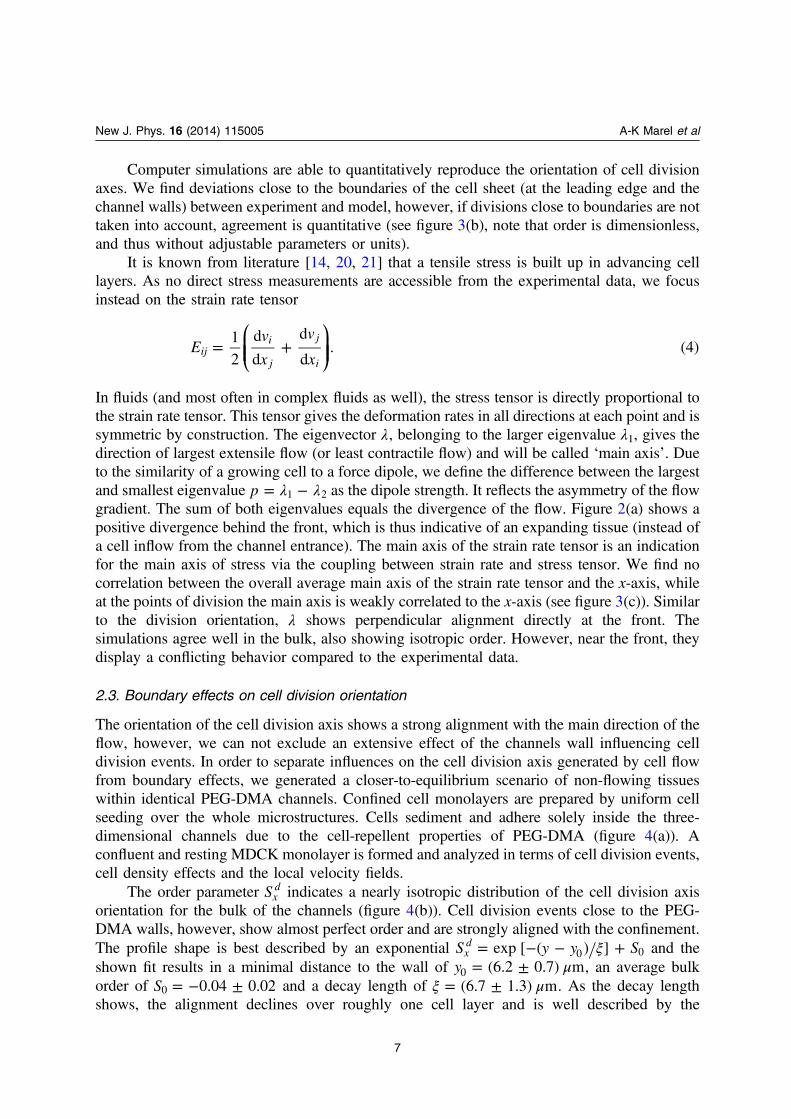
In fluids (and most often in complex fluids as well), the stress tensor is directly proportional tothe strain rate tensor. This tensor gives the deformation rates in all directions at each point and issymmetric by construction. The eigenvector λ, belonging to the larger eigenvalue λ1, gives thedirection of largest extensile flow (or least contractile flow) and will be called ‘main axis’. Dueto the similarity of a growing cell to a force dipole, we define the difference between the largestand smallest eigenvalue λ λ= −p 1 2 as the dipole strength. It reflects the asymmetry of the flowgradient. The sum of both eigenvalues equals the divergence of the flow. Figure 2(a) shows apositive divergence behind the front, which is thus indicative of an expanding tissue (instead ofa cell inflow from the channel entrance). The main axis of the strain rate tensor is an indicationfor the main axis of stress via the coupling between strain rate and stress tensor. We find nocorrelation between the overall average main axis of the strain rate tensor and the x-axis, whileat the points of division the main axis is weakly correlated to the x-axis (see figure 3(c)). Similarto the division orientation, λ shows perpendicular alignment directly at the front. Thesimulations agree well in the bulk, also showing isotropic order. However, near the front, theydisplay a conflicting behavior compared to the experimental data.
2.3. Boundary effects on cell division orientation
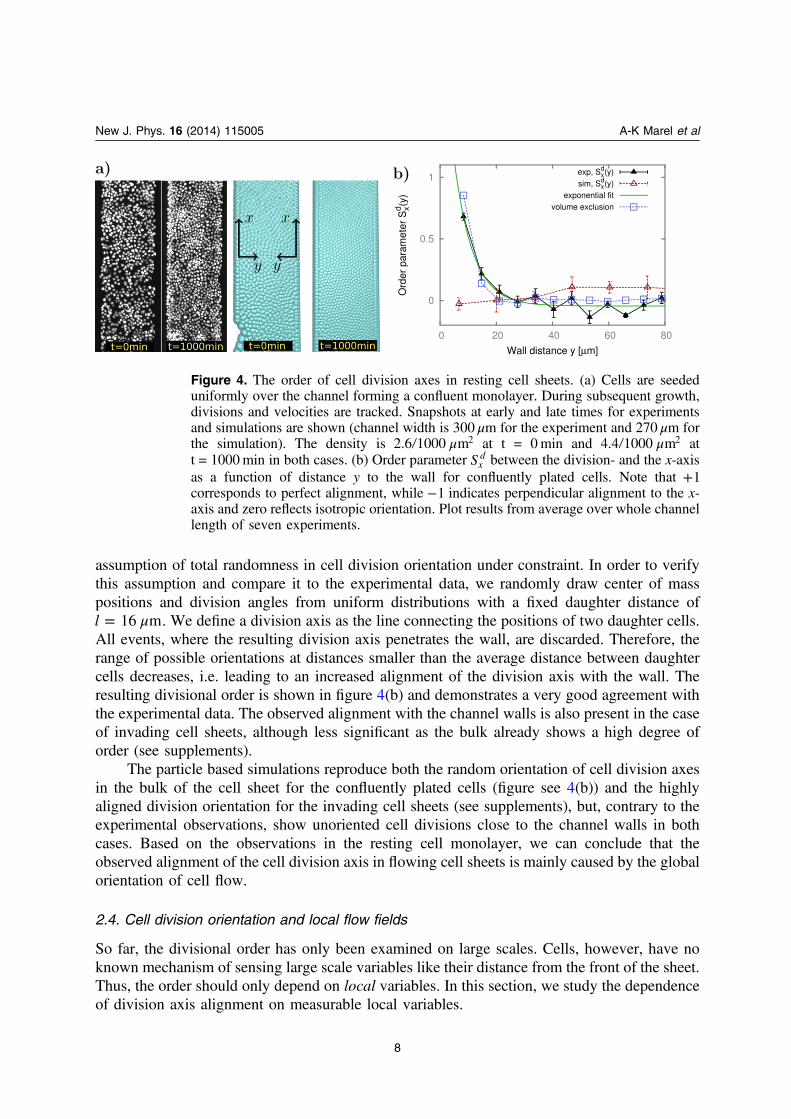
The orientation of the cell division axis shows a strong alignment with the main direction of theflow, however, we can not exclude an extensive effect of the channels wall influencing celldivision events. In order to separate influences on the cell division axis generated by cell flowfrom boundary effects, we generated a closer-to-equilibrium scenario of non-flowing tissueswithin identical PEG-DMA channels. Confined cell monolayers are prepared by uniform cellseeding over the whole microstructures. Cells sediment and adhere solely inside the three-dimensional channels due to the cell-repellent properties of PEG-DMA (figure 4(a)). Aconfluent and resting MDCK monolayer is formed and analyzed in terms of cell division events,cell density effects and the local velocity fields.
The order parameter Sxd indicates a nearly isotropic distribution of the cell division axis
orientation for the bulk of the channels (figure 4(b)). Cell division events close to the PEG-DMA walls, however, show almost perfect order and are strongly aligned with the confinement.The profile shape is best described by an exponential ξ= − − +S y y Sexp [ ( ) ]x
d0 0 and the
shown fit results in a minimal distance to the wall of μ= ±y (6.2 0.7) m0 , an average bulkorder of = − ±S 0.04 0.020 and a decay length of ξ μ= ±(6.7 1.3) m. As the decay lengthshows, the alignment declines over roughly one cell layer and is well described by the
7
New J. Phys. 16 (2014) 115005 A-K Marel et al
assumption of total randomness in cell division orientation under constraint. In order to verifythis assumption and compare it to the experimental data, we randomly draw center of masspositions and division angles from uniform distributions with a fixed daughter distance of
μ=l 16 m. We define a division axis as the line connecting the positions of two daughter cells.All events, where the resulting division axis penetrates the wall, are discarded. Therefore, therange of possible orientations at distances smaller than the average distance between daughtercells decreases, i.e. leading to an increased alignment of the division axis with the wall. Theresulting divisional order is shown in figure 4(b) and demonstrates a very good agreement withthe experimental data. The observed alignment with the channel walls is also present in the caseof invading cell sheets, although less significant as the bulk already shows a high degree oforder (see supplements).
The particle based simulations reproduce both the random orientation of cell division axesin the bulk of the cell sheet for the confluently plated cells (figure see 4(b)) and the highlyaligned division orientation for the invading cell sheets (see supplements), but, contrary to theexperimental observations, show unoriented cell divisions close to the channel walls in bothcases. Based on the observations in the resting cell monolayer, we can conclude that theobserved alignment of the cell division axis in flowing cell sheets is mainly caused by the globalorientation of cell flow.
2.4. Cell division orientation and local flow fields
So far, the divisional order has only been examined on large scales. Cells, however, have noknown mechanism of sensing large scale variables like their distance from the front of the sheet.Thus, the order should only depend on local variables. In this section, we study the dependenceof division axis alignment on measurable local variables.
Figure 4. The order of cell division axes in resting cell sheets. (a) Cells are seededuniformly over the channel forming a confluent monolayer. During subsequent growth,divisions and velocities are tracked. Snapshots at early and late times for experimentsand simulations are shown (channel width is 300 μm for the experiment and 270 μm forthe simulation). The density is μ2.6 1000 m2 at t = 0min and μ4.4 1000 m2 att = 1000min in both cases. (b) Order parameter Sx
d between the division- and the x-axisas a function of distance y to the wall for confluently plated cells. Note that +1corresponds to perfect alignment, while −1 indicates perpendicular alignment to the x-axis and zero reflects isotropic orientation. Plot results from average over whole channellength of seven experiments.
8
New J. Phys. 16 (2014) 115005 A-K Marel et al
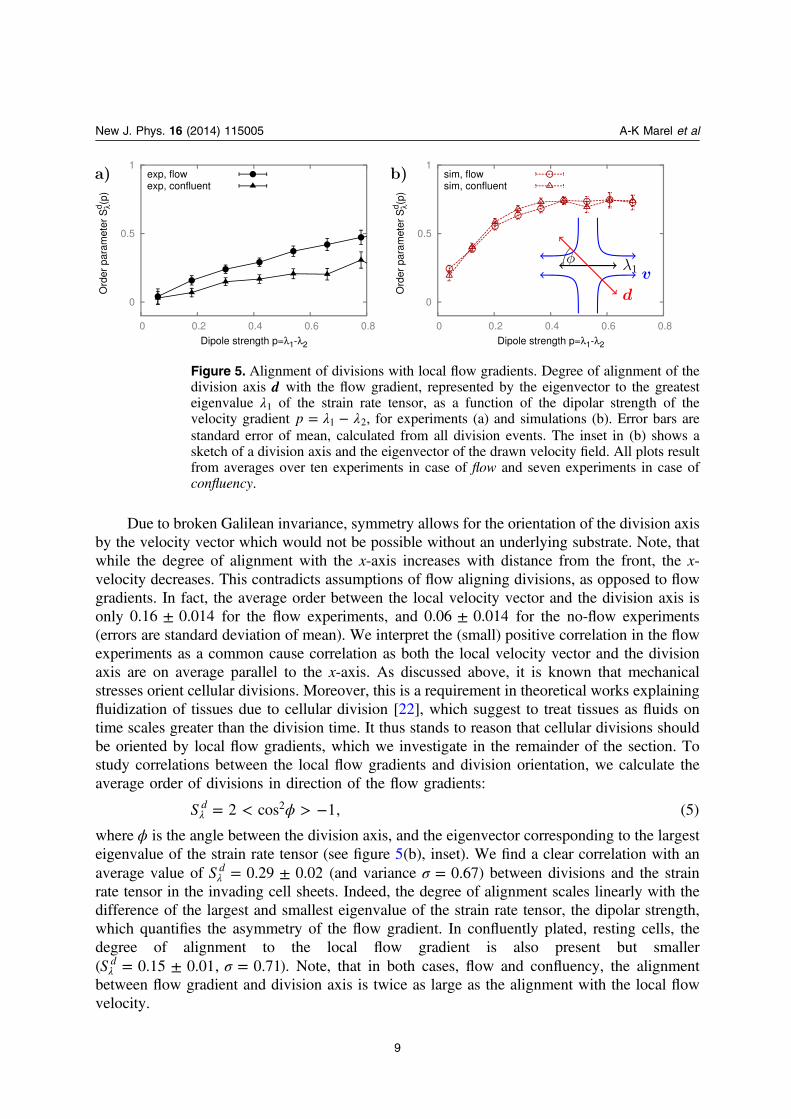
Due to broken Galilean invariance, symmetry allows for the orientation of the division axisby the velocity vector which would not be possible without an underlying substrate. Note, thatwhile the degree of alignment with the x-axis increases with distance from the front, the x-velocity decreases. This contradicts assumptions of flow aligning divisions, as opposed to flowgradients. In fact, the average order between the local velocity vector and the division axis isonly ±0.16 0.014 for the flow experiments, and ±0.06 0.014 for the no-flow experiments(errors are standard deviation of mean). We interpret the (small) positive correlation in the flowexperiments as a common cause correlation as both the local velocity vector and the divisionaxis are on average parallel to the x-axis. As discussed above, it is known that mechanicalstresses orient cellular divisions. Moreover, this is a requirement in theoretical works explainingfluidization of tissues due to cellular division [22], which suggest to treat tissues as fluids ontime scales greater than the division time. It thus stands to reason that cellular divisions shouldbe oriented by local flow gradients, which we investigate in the remainder of the section. Tostudy correlations between the local flow gradients and division orientation, we calculate theaverage order of divisions in direction of the flow gradients:
ϕ= < > −λS 2 cos 1, (5)d 2
where ϕ is the angle between the division axis, and the eigenvector corresponding to the largesteigenvalue of the strain rate tensor (see figure 5(b), inset). We find a clear correlation with anaverage value of = ±λS 0.29 0.02d (and variance σ = 0.67) between divisions and the strainrate tensor in the invading cell sheets. Indeed, the degree of alignment scales linearly with thedifference of the largest and smallest eigenvalue of the strain rate tensor, the dipolar strength,which quantifies the asymmetry of the flow gradient. In confluently plated, resting cells, thedegree of alignment to the local flow gradient is also present but smaller( σ= ± =λS 0.15 0.01, 0.71d ). Note, that in both cases, flow and confluency, the alignmentbetween flow gradient and division axis is twice as large as the alignment with the local flowvelocity.
Figure 5. Alignment of divisions with local flow gradients. Degree of alignment of thedivision axis d with the flow gradient, represented by the eigenvector to the greatesteigenvalue λ1 of the strain rate tensor, as a function of the dipolar strength of thevelocity gradient λ λ= −p 1 2, for experiments (a) and simulations (b). Error bars arestandard error of mean, calculated from all division events. The inset in (b) shows asketch of a division axis and the eigenvector of the drawn velocity field. All plots resultfrom averages over ten experiments in case of flow and seven experiments in case ofconfluency.
9
New J. Phys. 16 (2014) 115005 A-K Marel et al
Closer analysis of the local velocity field reveals that division events seem to be overallcontractile, with < > = − −vdiv ( ) 0.10 h 1 for the flow experiments and < > = − −vdiv ( ) 0.11 h 1
for confluently plated cells. In contrast, the overall flow field in the bulk showed positivedivergence for flow experiments (see figure 2(a)). For the confluently plated cells the overalldivergence is close to zero. Furthermore, fluctuations are large with a standard deviation ofσ = −0.34 h 1 in both experiments. With over 2500 observed divisions, the mean is still clearlystatistically significant, should, however, be taken with care. More intuitively, cell divisionshave an elongational flow field, oriented along their division axis d, which is characterized bythe difference in velocity gradients parallel (∂∥ ∥v ) and perpendicular (∂⊥ ⊥v ) to this axis. Naivelyspeaking this quantity determines the amount of material coming in from the sides and leavingalong d. We find <∂ − ∂ > =∥ ∥ ⊥ ⊥
−v v 0.16 h 1 on average in the flow experiments and
<∂ − ∂ > =∥ ∥ ⊥ ⊥−v v 0.07 h 1 on average in the confluently plated cells, reflecting the asymmetry
of dividing and respreading cells. Fluctuations are large, however, with a standard deviation ofσ = −0.36 h 1 and σ = −0.38 h 1 respectively. Note, that we calculate derivatives (see Materialsand methods for details) as close to the moment of division as possible by choosing the framejust prior the appearance of the daughters. At the moment of division, cells round up andsubsequently respread into the tissue, which might bias the results. By choosing an excludedarea larger than the cell, when calculating the gradients, we avoid the directed motion inside thedividing cell. Studying the same quantities two or three frames earlier shows significantdifferences. In the invasion experiments, for example, < >vdiv ( ) changes from −0.18 h 1 in theframe where the daughters appear to − −0.38 h 1 40min earlier. Investigating the flow gradientsalong the cells trajectory prior to the division event in a more detailed study, will enableexamination of the growth and orientation phase.
The simulations show an even stronger alignment with the local flow gradient,independent of global flow. Here, cell divisions align with the least compressional or mosttensional direction, since the model consists only of physical forces, which orient the cell in away that on average it grows in the direction of least resistance. Furthermore, this underlines theclose correlation between the eigenvalues and eigenvectors of the strain rate tensor and theprincipal stresses. The divergence at division sites is positive for the simulations, although thefluctuations are large (< > = −vdiv ( ) 0.04 h 1, σ = −0.20 h 1 for confluent and< > = −vdiv ( ) 0.06 h 1, σ = −0.27 h 1 for invading cells). As in the experiments, the dipolemoment is similarly positive, independent of the global flow (<∂ − ∂ > =∥ ∥ ⊥ ⊥
−v v 0.16 h 1,
σ = −0.24 h 1 for no flow and <∂ − ∂ > =∥ ∥ ⊥ ⊥−v v 0.15 h 1, σ = −0.33 h 1 for invading sheets).
3. Conclusion
In this article, we have studied the influence of an emerging flow in collective cell migration onthe orientation of cell division axes. Expanding epithelial cell sheets were confined inmicrostructured PEG-DMA channels and flow characteristics were determined by PIV analysis.The tracking of single cell division events was facilitated by stable nuclei staining of the MDCKcells, which additionally provides the basis for automated investigation of the cell density. Wecorrelated flow fields, division events and cell density and managed to extract many quantitativefeatures of tissue migration.
The cell monolayers invaded the channels at a constant front speed with a well definedflow profile. A density gradient, with low densities at the leading edge and higher ones in the
10
New J. Phys. 16 (2014) 115005 A-K Marel et al
bulk, developed. We found a strong alignment of the orientation of the cell division axis withthe direction of the observed flow.
In order to distinguish phenomena caused by the cell flow from boundary effects of thechannel walls, we generated resting cell sheets within the same PEG-DMA microchannels. Inthis scenario, cell division axes were randomly oriented, supporting our suggestion that theemergent flow in migrating monolayers was the main influence on the direction of cell division.
Analyzing local quantities revealed that the orientation of the cell division axis correlatesbest with local flow gradients, as opposed to the channel axis or velocity direction. In fact, wefound the average order between the division axis and the main axis of the strain rate tensor tobe twice as large as the average order between the division axis and the local velocity direction.This is consistent with stresses orienting cell division, and the stress being proportional to theflow gradient.
Experimental results were compared to previously published, particle based computersimulations [16, 17, 22]. The model was originally conceived to study rheology and growthmechanics of three-dimensional tissues. This required an intrinsic and oriented feedbackbetween growth and mechanics, which was achieved by representing single cells by twoparticles that repel each other in order to grow. This simple mechanical feedback was sufficientto describe growth of tissue spheroids [23, 24] and expected viscoelastic properties [22]. Later,the model was extended by a simple motility algorithm, in order to understand particularproperties of growing motile tissues: tension in growing colonies, glass-like arrest with density,swirling motion in bulk and fingering instabilities at the leading edge. These simulations werenever designed to study divisional orientation. Thus, it is striking how many phenomena arecaptured well by the simulations. In particular, they displayed a similar decrease in cell densitytowards the leading edge, comparable emergent flow profiles, a weak correlation of the mainaxis of the strain rate tensor with the x-axis as well as a strong correlation with the division axisand strong correlations between the main axis of the strain rate tensor and the division axis.However, comparing quantities near boundaries (channel walls or leading edge of invasionfront) revealed strong deviations and indicate points, where the model needs to be extended. Asreal cells have a complex inner structure and are highly deformable, we speculate thatrepresenting cells by more than two particles in the simulations is mandatory to resolve thedynamics close to interfaces.
The presented approach of measuring cellular flow and cell division events can be easilyadopted to several adherent cell lines in order to prove the universality of our reported results.Naturally, the orientation mechanism should also work in three dimensions. While thesimulations are inherently three-dimensional, motility experiments are much more challengingin three dimensions.
The orientation of cell division axes in flow fields could be of significant relevance forgrowing tissues in wound healing and development. It seems natural that an expanding tissuewill orient individual cell divisions in the direction of expansion in order to reduce the principalstress. It remains to be seen if in vivo experiments show similar oriented cell divisions incellular flows.
11
New J. Phys. 16 (2014) 115005 A-K Marel et al
4. Materials and methods
4.1. Experimental procedure
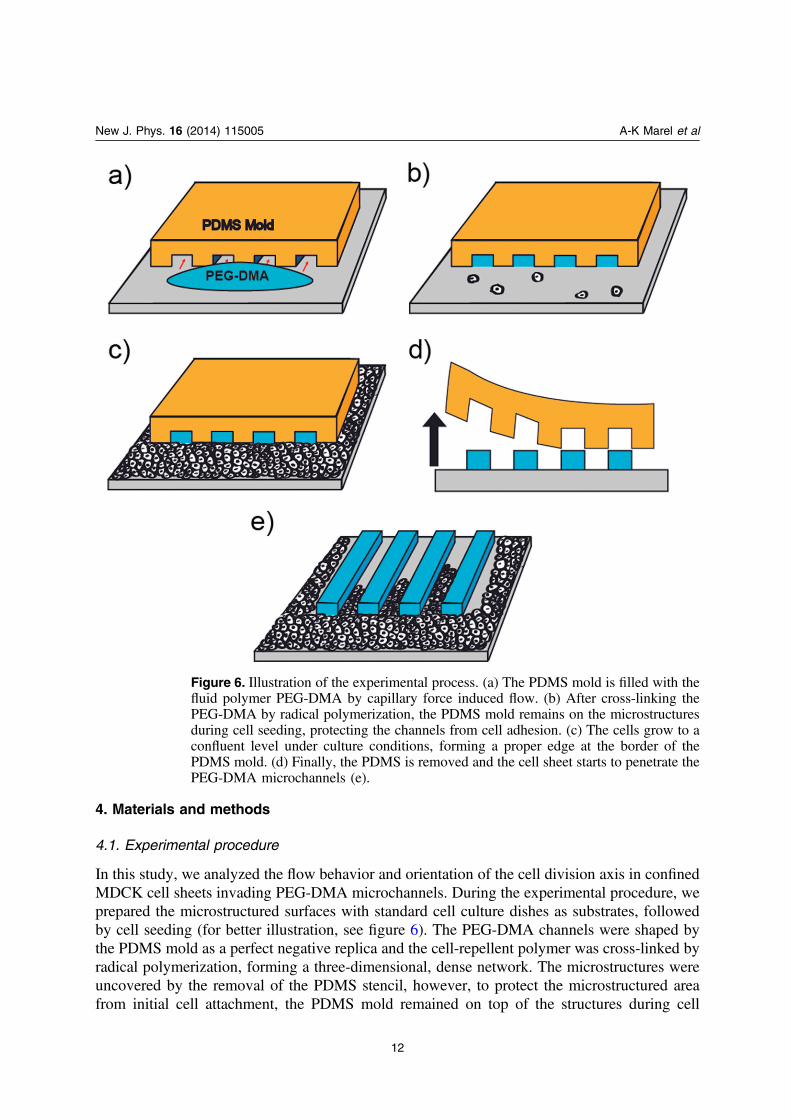
In this study, we analyzed the flow behavior and orientation of the cell division axis in confinedMDCK cell sheets invading PEG-DMA microchannels. During the experimental procedure, weprepared the microstructured surfaces with standard cell culture dishes as substrates, followedby cell seeding (for better illustration, see figure 6). The PEG-DMA channels were shaped bythe PDMS mold as a perfect negative replica and the cell-repellent polymer was cross-linked byradical polymerization, forming a three-dimensional, dense network. The microstructures wereuncovered by the removal of the PDMS stencil, however, to protect the microstructured areafrom initial cell attachment, the PDMS mold remained on top of the structures during cell
Figure 6. Illustration of the experimental process. (a) The PDMS mold is filled with thefluid polymer PEG-DMA by capillary force induced flow. (b) After cross-linking thePEG-DMA by radical polymerization, the PDMS mold remains on the microstructuresduring cell seeding, protecting the channels from cell adhesion. (c) The cells grow to aconfluent level under culture conditions, forming a proper edge at the border of thePDMS mold. (d) Finally, the PDMS is removed and the cell sheet starts to penetrate thePEG-DMA microchannels (e).
12
New J. Phys. 16 (2014) 115005 A-K Marel et al
seeding. The cells were grown to a confluent level around the covered structures forming aproper edge at the border of the PDMS. After removal of the PDMS, the substrate consisted offree-standing PEG-DMA walls that guided the expanding cell sheets as both chemical andphysical barriers. The free surface presented to the cells was the untreated petri-dish. Thechannels exhibited a height of approximately μ15 m and a length of several millimeters,however, we only monitored the cell sheet expansion to a penetration depth of up to μ700 m. Inorder to ensure the correct ascription of the observed effects to the emergent flow in collectivelymigrating MDCK cells as opposed to effects of the PEG-DMA confinement, we created restingcell sheets within the same kind of microchannels. In this case, the PDMS mold was removedbefore cell seeding to bare the channels to sedimenting cells.
4.1.1. Preparation of PEG-DMA microchannels. Three-dimensional PEG-DMA channels wereprepared according to the protocol described previously [18]. Briefly, a PDMS mold thatfeatures channels with 200 μm, 250 μm and 300 μm widths and approximately 15 μm height wascreated by curing the prepolymer against a master prepared by conventional soft lithography.Therefore, the prepolymer solution (Sylgard 184, Dow Corning, USA) was carefully mixedwith the curing agent in a 10 : 1 ratio (w/w) and degassed for 15min. The mixture was depositedon top of the master followed by an additional degassing step for 15min to avoid bubble
formation. Next, the polymer was cured at °70 C for 4 h. The molded stamp was peeled off andcut in a way so that the channels were protected by a small barrier of PDMS on one end of thestructure since the other end of the channels were open. The PDMS was activated by argonplasma (Diener Electronic, Nagold, Germany) for 30 s. Immediately after the treatment, thestamp was placed upside down in close contact with a hydrophilic ibidi μ-dish (ibidi,Martinsried, Germany). A solution of PEG-DMA (Mn = 550) containing 2% (v/v) of thephotoinitiator 2-hydroxy-2-methylpropiophenone (both purchased from Sigma-Aldrich,Germany) was freshly prepared. A small drop was deposited in front of the open ends of thechannels and the structures were filled spontaneously by capillary force induced flow. Theprocess was visually controlled under a microscope to ensure complete filling of the channelsand the formation of proper edges. Once the PEG-DMA filled out the whole channel, it waspolymerized by the use of an UV–ozone cleaning system (UVOH 150 LAB, FHR, Ottendorf,Germany) with a wavelength ranging from 185 nm–546 nm and a power of >50mW −cm 2 for10min. The structures were stored in a drying oven (Binder GmbH, Tuttlingen, Germany)
overnight at °50 C. Immediately before cell seeding, samples were sterilized with 80% ethanolfor 5min, washed three times with PBS and covered with cell medium while the PDMS moldstill remained on top of the structures to protect the channels from cell adhesion.
4.1.2. Experiments with global flow. Cells were trypsinized and centrifuged at 1000 rpm for3min. The cell pellet was resuspended in medium and cells were seeded in front of the PDMSstamp. Then, cells were grown to confluence overnight under culture conditions. The PDMSstamp was removed to bare the protected PEG-DMA channels and the sample was washed withfresh medium to eliminate dead cells. The cell layer started to expand towards themicrochannels. Samples were stored under culture condition until the cell front reached theentrance of the channels (typically after 2 d). For time-lapse measurements, the medium isreplaced with CO2 independent Leibovitzʼs L15 medium, supplemented with 10% fetal bovineserum (FBS).
13
New J. Phys. 16 (2014) 115005 A-K Marel et al
4.1.3. Measurements of non-flowing cell sheets. To prepare confluent cell layers within thePEG-DMA microchannels, cells were seeded all over the uncovered structures. In this case, thePDMS mold was removed after storing the samples overnight in the drying oven. The barechannels were sterilized analogously to the protected ones with 80% ethanol for 5min, followedby three washing steps with PBS. After cell trypsination, centrifugation and resuspension, cellswere seeded all over the whole petri-dish. The non-fouling properties of PEG-DMA preventedcell adhesion on top of the channel walls, and consequentially, cells adhered exclusively insidethe channels. The sample was stored under culture condition until confluence was reached. Fortime-lapse measurements, the medium is replaced with CO2 independent Leibovitzʼs L15medium, supplemented with 10% FBS.
4.2. Cell culture and microscopy
Doubly transfected MDCK cells with lifeact (EGFP) and H2B (mcherry) were kindlyprovided by Dr Wedlich-Söldner of the University of Münster. Cells were routinely culturedin Dulbeccos Modified Eagle Medium, supplemented with 10% FBS, 20mmol L-Glutamine,
high-glucose level (4.5 g l−1 and 110mgl−1 pyruvate). Cells were kept at °37 C in ahumidified atmosphere, 5% CO2 level. Cell migration within the channels was followed bytime-lapse microscopy by using an epifluorescence motorized Nikon Eclipse Ti microscopeequipped with an ibidi heating stage (ibidi GmbH, Martinsried, Germany) and a CCD camera(model Clara E from Andor Technology). Image acquisitions were controlled through μ-Manager open source software. Brightfield and fluorescence images were taken at 10min
intervals using a 10× objective. Cells were maintained at °37 C using a temperature-controlled mounting frame.
4.3. Image analysis
4.3.1. Determination of cell division events. Cell division events were identified from thefluorescence images of labeled cell nuclei. The position of the daughter cells were markedmanually using the open source software ImageJ (National Institutes of Health, Bethesda, MD,USA). The detection was carried out immediately after cell division, meaning in the fist imagewhere the daughter cells appeared. The difference between these two coordinates was defined asthe cell division axis = −d x x1 2. The angle θ between d and the x-axis ex was inferred fromtheir dot product as θ=d e d e· | || | cosx x . The same applies to the angle ϕ between d and theeigenvector of the greatest eigenvalue of the velocity gradient tensor λ. These angles were thenused to calculate the according order parameters Sx
d and λS d .
4.3.2. Calculation of cell density. For cell density determination, positions of all stained cellnuclei (xi) were captured using the ‘find maxima’ function of ImageJ with a manually adjustedthreshold for every movie. The relative error was determined to be below 6% by manual cellcounting. In this two-dimensional system of a cell monolayer, the density ρ was defined asnumber of cells per area. Thus, the density was calculated from the cell nuclei positions xi forany area A as follows: ∫ ∫ρ δ= −x x x x( )d d
A Ai .
4.3.3. Detection of front displacement. In order to identify the leading edge of the growing cellsheet, we used the total intensity as a function of x (i.e. intensities of all pixels with the same y-
14
New J. Phys. 16 (2014) 115005 A-K Marel et al
coordinate are summed up). These spectra showed a sharp drop in intensity, corresponding tothe position of the front. A custom Matlab script (The MathWorks, Natick, MA) was used todetect this sharp drop by calculating a relative ‘coarse-grained’ derivative. It turns out that thefront position is usually well described by this derivative being above a certain threshold. Inorder to calculate this quantity, we first summed the intensity values of ten adjacent pixels andsubtracted it from the sum over the ten adjacent intensity values shifted one pixel to the leftfrom the original interval (meaning from the cell-free surface in the channel towards theadvancing cell front). This difference was divided by the first of the two sums, and the quotientcompared to a chosen threshold value. This process was repeated, shifting the intensity valueintervals for both sums by one pixel to the left each time until the quotient exceeds the thresholdfor the first time, marking the point we defined as the front. The result was compared to theoriginal movie and outliers were identified visually and deleted. The emerging gap was closedby linear interpolation.
4.3.4. PIV analysis. Velocity fields were mapped by PIV analysis using the MatPIV softwarepackage for Matlab (J Kristian Sveen: http://folk.uio.no/jks/matpiv/, GNU general publiclicense), with some slight, custom modifications. The size of the interrogation window was32 × 32 pixels, i.e. 21 × 21 μm, with 62.5% overlap in a single iteration. The resulting velocityvectors were filtered with a signal-to-noise ratio filter, a global histogram operator, a peakheight filter and a local filter (all included in the MatPIV package) to produce smoother vectorfields. Vectors removed by the filtering process were replaced by linear interpolation from thesurrounding vectors, as long as there were at least five neighbors remaining that were notexcluded by the previous step. Requiring this minimal number of neighbors prevented theanalysis from interpolating into the region ahead of the leading edge of the cell sheet.
4.3.5. Calculation of velocity field derivations. Spatial derivatives were obtained by using aplain fitting method. A plane was fitted through all vx that lie within a certain radius rc of a pointxi. The gradient of the resulting plane in x and y direction then corresponds to ∂ ∂v xx and ∂ ∂v yx ,respectively. The same procedure was run for vy to get ∂ ∂v xy and ∂ ∂v yy . For a chosen radius rcthat only includes the four nearest neighbors, the derivatives exactly matched the ones obtainedby a finite differences method. By changing rc, the area over which the derivatives wereaveraged could easily be adjusted. Furthermore, this method allowed the definition of a secondradius <r rs c of excluded points, in order to omit the velocities of the cell itself in the gradientcalculation. The plane fitting was done with a linear least squares algorithm. This transformedthe problem into a linear system of equations, which was solved by applying the LUdecomposition algorithm implemented in the GNU Scientific Library. The choice of rc and rs,within reasonable limits, did not change the qualitative behavior of the results. In this work, weset rs = 11 μm and rc = 23 μm. This choice approximately calculates the derivatives on the scaleof the cells neighbors.
From the derivatives, the strain rate tensor Eij (see equation 4) was calculated. Theeigenvalues and corresponding eigenvectors of this symmetric 2 × 2 matrix were then obtainedthrough the characteristic polynomial. Furthermore, with the unit vectors n parallel to d and ⊥nperpendicular to d, the strain rate tensor Eij was used to calculate ∂ =∥ ∥v En nT and
∂ =⊥ ⊥ ⊥ ⊥v En nT .
15
New J. Phys. 16 (2014) 115005 A-K Marel et al
4.4. Computer simulations
Growth of motile tissues is modeled as presented in [17]. In brief, cells are represented by twopoint-particles, that repel each other with a growth force B. When a critical size is reached, thecells divide with a rate kd. The apoptosis rate was set to zero since experimental data showed aninsignificant number of cell deaths. Mechanical interactions between the cells is achievedthrough a soft volume exclusion and an adhesion force, which basically resembles soft stickyspheres. Energy dissipation and random noise is introduced by a DPD thermostat that actsbetween the particles of one cell as well as between different cells. Cell motility is introduced asa simple two state model, in which each cell can be either in a motile or non-motile state. A non-motile cell changes state with a rate kwake, in which case a uniformly distributed randommotility direction is chosen. The transition rate from the motile into a non-motile state dependson whether the motility direction is aligned with the cell velocity ( +k ) or not ( >− +k k ). Motilecells pull against a background friction with a predefined motility force in the motility direction.
In order to resemble the experimental conditions as close as possible, we confined the cellsin a rectangular box with a channel connected at one side (see figure 1(b)). The rectangular boxacts as a reservoir and is initially covered by a confluent cell layer. We chose the reservoirdimensions as three times the channel width perpendicular to the channel and one times thechannel width parallel to it. To approximate the finite slip boundaries in the experiments,reflective boundary conditions were used. The cells of the confluent simulations were initiallydistributed randomly over the whole channel with a predefined density of 2.3 cells per
μ1000 m .2
In order to obtain the velocity gradient, we directly used the individual velocity of eachparticle as input to the plane fitting algorithm instead of calculating an average velocity on agrid, following the PIV analysis.
4.4.1. Units. A prominent problem of mesoscale simulations is their relation to real units.Computer simulations rely on contracting time and length scales, in order to make them feasible[25]. This naturally leads to discrepancies if one tries to compare all involved time and lengthscales. Thus, taking the model cells as one cell length for example is overinterpreting the model.Instead, one has to carefully choose how to relate simulation with experimental results. In orderto reproduce mesoscopic continuum properties, we choose our rescaling quantities on amesoscopic level. The unit of length is chosen such that the density of cells in the bulk matches.This gives us a length scale to convert simulation lengths to real lengths by μ=l 42 m0 . For theunit of time we use the the fact that both experiments and simulations lead to a robust constantinvasion velocity, independent of channel width and invasion length. With the length scalealready defined, this gives us a timescale of =t 0.11 h0 to convert simulation times into realtime units.
The parameters used in the simulations are the same as in [17].
4.5. Error estimation
Unless otherwise noted, error bars are the standard deviation of mean, where averages over onechannel are considered as one experiment. For example, the density profile in figure 2 iscalculated for different distances from the front for several channels. First, the cell densities aredetermined and related to the actual front position in every frame. We obtain a mean densityprofile for each channel by averaging the densities of corresponding distances from the front
16
New J. Phys. 16 (2014) 115005 A-K Marel et al
over time. Subsequently, each channel’s profile is considered as one measurement from whichwe obtain the mean and standard error of mean. We have no indication of systematic error ofany kind.
Acknowledgments
We would like to thank Dr Christoph Klingner and Professor Wedlich-Söldner for kindlysupplying stably transfected MDCK cell lines. Financial support by the DFG via SFB 1032Project B1, the Excellence Cluster NIM and the Center for NanoScience is gratefullyacknowledged.
References
[1] Bittig T et al 2008 New J. Phys. 10 063001[2] Théry M et al 2006 Proc. Natl Acad. Sci. USA 103 19771[3] Minc N et al 2011 Cell 144 414[4] Théry M et al 2005 Nat. Cell Biol. 7 947[5] Vedula S R K et al 2012 Proc. Natl Acad. Sci. USA 109 12974[6] Reffay M et al 2011 Biophys. J. 100 2566[7] Puliafito A et al 2012 Proc. Natl Acad. Sci. USA 109 739[8] Poujade M et al 2007 Proc. Natl Acad. Sci. USA 104 15988[9] Wegener J 2002 Cell junctions Encyclopedia of Life Sciences (Chichester: Wiley)
[10] Bacallao R et al 1989 J. Cell Biol. 109 2817[11] Reinsch S et al 1994 J. Cell Biol. 126 1509[12] Angelini T E et al 2011 Proc. Natl Acad. Sci. USA 108 4714[13] Petitjean L et al 2010 Biophys. J. 98 1790[14] Trepat X et al 2009 Nat. Phys. 5 426[15] Hertwig O 1884 Das Problem der Befruchtung und der Isotropie des Eies: eine Theorie der Vererbung,
Untersuchungen zur Morphologie und Physiologie der Zelle (Jena: Fischer)[16] Basan M et al 2011 Phys. Biol. 8 026014[17] Basan M et al 2013 Proc. Natl Acad. Sci. USA 110 2452[18] Marel A-K et al 2013 Macromol. Biosci. 13 595[19] Marel A-K et al 2014 Biophys. J. 17 1054[20] Serra-Picamal X et al 2012 Nat. Phys. 8 628[21] Tambe D T et al 2011 Nat. Mater. 10 469[22] Ranft J et al 2010 Proc. Natl Acad. Sci. USA 107 20863[23] Montel F et al 2011 Phys. Rev. Lett. 107 188102[24] Montel F et al 2012 New J. Phys. 14 055008[25] Padding J T et al 2006 Phys. Rev. E 74 031402
17
New J. Phys. 16 (2014) 115005 A-K Marel et al

![Epithelial Polarity, Villin Expression, and Enterocytic ......[CANCER RESEARCH 48, 1936-1942, April 1, 1988] Epithelial Polarity, Villin Expression, and Enterocytic Differentiation](https://img.pdfslide.org/doc/110x75/5f0bffd27e708231d433428e/epithelial-polarity-villin-expression-and-enterocytic-cancer-research.jpg)