Embed Size (px)
Citation preview
Sekretariat der Ständigen Konferenz der Kultusminister der Länder
in der Bundesrepublik Deutschland
Berlin, den 28.02.2019
IV C – DST 1933-4 (20)
Allgemeinbildende Schulen in Ganztagsform
in den Ländern in der Bundesrepublik Deutschland
- Statistik 2013 bis 2017 -
Bearbeitet im Sekretariat der Kultusministerkonferenz
2
Herausgeber:
Sekretariat der Ständigen Konferenz
der Kultusminister der Länder
in der Bundesrepublik Deutschland
Taubenstraße 10
10117 Berlin
Telefon 030/25418-3
Telefax 030-25418-450
e-mail: [email protected]
3
Inhaltsverzeichnis
I Einleitung ................................................................................................................... 4
II Definition von Ganztagsschulen ................................................................................. 4
III Ergebnisse im Überblick ............................................................................................ 7
IV Datensammlung ........................................................................................................15
Tabellenverzeichnis ..............................................................................................................16
4
I Einleitung
Die gesellschaftliche Bedeutung von Ganztagsschulen bzw. -angeboten in
Deutschland ist in den letzten Jahren deutlich angestiegen. Ursächlich hierfür sind
zwei Entwicklungslinien: der hohe Bedarf nach ganztägiger Betreuung zur
Vereinbarkeit von Familie und Beruf sowie die insbesondere durch die Ergebnisse der
OECD-Studie PISA angeregte Diskussion über die besten Rahmenbedingungen für
schulisches Lernen, zu denen viele Wissenschaftler, Lehrer, Eltern und Politiker auch
die Ganztagsschulen zählen. Einen maßgeblichen Einfluss dürfte das
Investitionsprogramm „Zukunft Bildung und Betreuung“ (IZBB) der Bundesregierung
gehabt haben. Mit diesem Programm hat die Bundesregierung die Länder bei dem
bedarfsgerechten Auf- und Ausbau von Ganztagsschulen im Zeitraum von 2003 bis
2009 unterstützt. In dem genannten Zeitraum wurden mit den IZBB-Mitteln über 15.000
Maßnahmen an bundesweit 8.262 Schulen durchgeführt.1 Die Entscheidung, welche
Schulen und Schulformen gefördert werden, sowie die inhaltliche Ausgestaltung und
die Personalausstattung obliegen den Ländern.
Die in vielen Ländern entwickelten Konzepte und Maßnahmen zum Ausbau des
Ganztagsschulbetriebs im Primar- und Sekundarbereich I fanden in der vorliegenden
Analyse der Jahre 2013 bis 20172 ihren Niederschlag.
II Definition von Ganztagsschulen
Die Kultusministerkonferenz berücksichtigt bei ihrer Definition von Ganztagsschulen3
sowohl den Gesichtspunkt der ganztägigen Beschulung als auch den der Betreuung.
Ganztagsschulen sind demnach Schulen, bei denen im Primar- und Sekundar-
bereich I
- an mindestens drei Tagen in der Woche ein ganztägiges Angebot für die
Schülerinnen und Schüler bereitgestellt wird, das täglich mindestens sieben
Zeitstunden umfasst;
- an allen Tagen des Ganztagsschulbetriebs den teilnehmenden Schülerinnen und
Schülern ein Mittagessen bereitgestellt wird;
- die Ganztagsangebote unter der Aufsicht und Verantwortung der Schulleitung
organisiert und in enger Kooperation mit der Schulleitung durchgeführt werden
sowie in einem konzeptionellen Zusammenhang mit dem Unterricht stehen.
1 In dem mit 4 Milliarden Euro ausgestatteten Programm hat die Bundesregierung den bundesweiten Auf- und Ausbau von
Ganztagsschulen gefördert. Dies können entsprechend der Vereinbarung der „Ausbau und Weiterentwicklung“ neuer Ganztagschulen sein, die „Schaffung zusätzlicher Plätze“ an bestehenden Ganztagsschulen oder die „Qualitative Weiterentwicklung“ von Ganztagsangeboten. Die Mittel konnten bis Ende 2009 in Anspruch genommen werden.
2 Entspricht den Schuljahren 2013/14 bis 2017/18.
3 Gezählt werden immer Ganztagsschulen als schulartspezifische Einrichtungen. Die Daten werden nach Schularten
untergliedert, d. h. wenn eine Ganztagsschule über einen Haupt- und einen Realschulzweig verfügt, werden beide gesondert ausgewiesen. Die Summe der Einrichtungen nach Schularten ist daher nicht identisch mit der Zahl der Verwaltungseinheiten. Lediglich die Ganztagsschulen Mecklenburg-Vorpommerns werden bis 2008 als Verwaltungseinheiten ausgewiesen, da andere Zahlen nicht verfügbar waren.
5
Diese Definition trifft auf alle verschiedenen Formen der Ganztagsschulen in den
Ländern zu. Die jeweiligen Bezeichnungen der Ganztagsschulen unterscheiden sich
in den Ländern. Ebenso unterschiedlich stellen sich weitere organisatorische und
inhaltliche Gegebenheiten dar, wie z. B. die Öffnungszeiten (zwischen drei und fünf
Tagen pro Woche und zwischen sieben und neun Stunden pro Tag), die
Differenzierung von für die Kinder verpflichtenden und freiwilligen Elementen des
jeweiligen Angebots oder der Umfang von ergänzenden Ferienangeboten.
Es werden drei Formen unterschieden:
- In der voll gebundenen Form sind alle Schülerinnen und Schüler verpflichtet, an
mindestens drei Wochentagen für jeweils mindestens sieben Zeitstunden an den
ganztägigen Angeboten der Schule teilzunehmen.
- In der teilweise gebundenen Form verpflichtet sich ein Teil der Schülerinnen und
Schüler (z. B. einzelne Klassen oder Klassenstufen), an mindestens drei
Wochentagen für jeweils mindestens sieben Zeitstunden an den ganztägigen
Angeboten der Schule teilzunehmen.
- In der offenen Form können einzelne Schülerinnen und Schüler auf Wunsch an
den ganztägigen Angeboten dieser Schulform teilnehmen. Für die Schülerinnen
und Schüler ist ein Aufenthalt, verbunden mit einem Bildungs- und
Betreuungsangebot in der Schule, an mindestens drei Wochentagen im Umfang
von täglich mindestens sieben Zeitstunden möglich.
Die Teilnahme an den ganztägigen Angeboten ist jeweils durch die Schülerinnen und
Schüler oder deren Erziehungsberechtigten für mindestens ein Schulhalbjahr zu
erklären. Aus Sicht der am Ganztagsschulbetrieb teilnehmenden Schülerinnen und
Schüler besteht kein Unterschied zwischen voll und teilweise gebundenen
Ganztagsschulen.
Gezählt werden neben der Anzahl der Ganztagsschulen die am Ganztagsschulbetrieb
teilnehmenden Schülerinnen und Schüler, nicht aber die an der jeweiligen Schule zur
Verfügung stehenden Plätze.
Sofern eine Ganztagsschule sowohl Angebote in teilgebundener als auch in offener
Form bereitstellt, ist, um Doppelzählungen zu vermeiden, in der Statistik die Schule
nur einmal bei „Schule in teilgebundener Form“ zu zählen.
Weitere Erläuterungen und Definitionen zu den verwendeten Begriffen und Methoden
können beim Sekretariat der Ständigen Konferenz der Kultusminister der Länder in der
Bundesrepublik Deutschland angefordert werden.4
4 Unter https://www.kmk.org/dokumentation-und-statistik/statistik/schulstatistik/definitionenkatalog.html kann der
Definitionenkatalog heruntergeladen werden.
6
Mit Beschluss der Kommission für Statistik vom 04.12.2015 werden zukünftig als
offene Ganztagsangebote auch diejenigen Angebote gezählt, bei denen
- an mindestens drei Tagen in der Woche ein ganztägiges Angebot für
die Schülerinnen und Schüler bereitgestellt wird, das täglich
mindestens sieben Zeitstunden umfasst;
- an allen Tagen des Ganztagsbetriebs den teilnehmenden
Schülerinnen und Schülern ein Mittagessen bereitgestellt wird;
- die Schulleitung auf der Basis eines gemeinsamen pädagogischen
Konzeptes mit einem außerschulischen Träger kooperiert und
- eine Mitverantwortung der Schulleitung für das Angebot besteht.
Die Anpassung dieser ergänzenden Definition greift ab dem Schuljahr 2016/17.
7
III Ergebnisse im Überblick
Grafik- und Tabellenverzeichnis
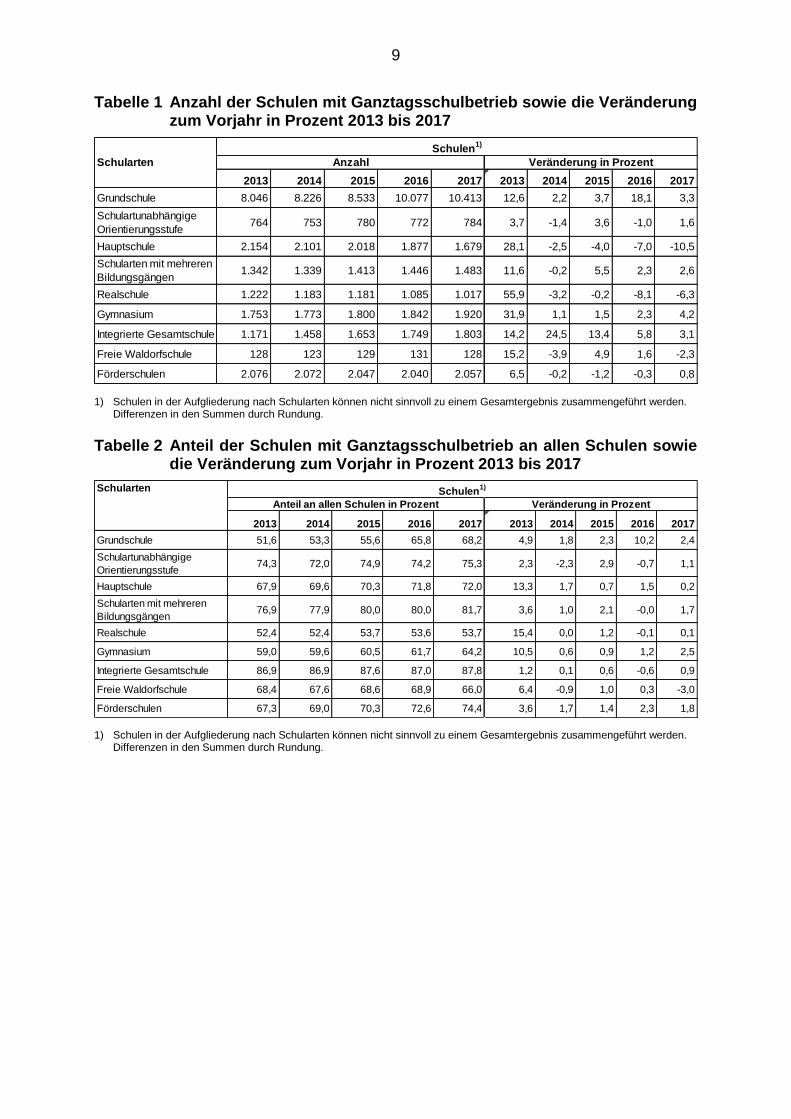
Tabelle 1 Anzahl der Schulen mit Ganztagsschulbetrieb sowie die Veränderung zum Vorjahr in
Prozent 2013 bis 2017 ......................................................................................................... 9
Tabelle 2 Anteil der Schulen mit Ganztagsschulbetrieb an allen Schulen sowie die Veränderung
zum Vorjahr in Prozent 2013 bis 2017 ................................................................................ 9
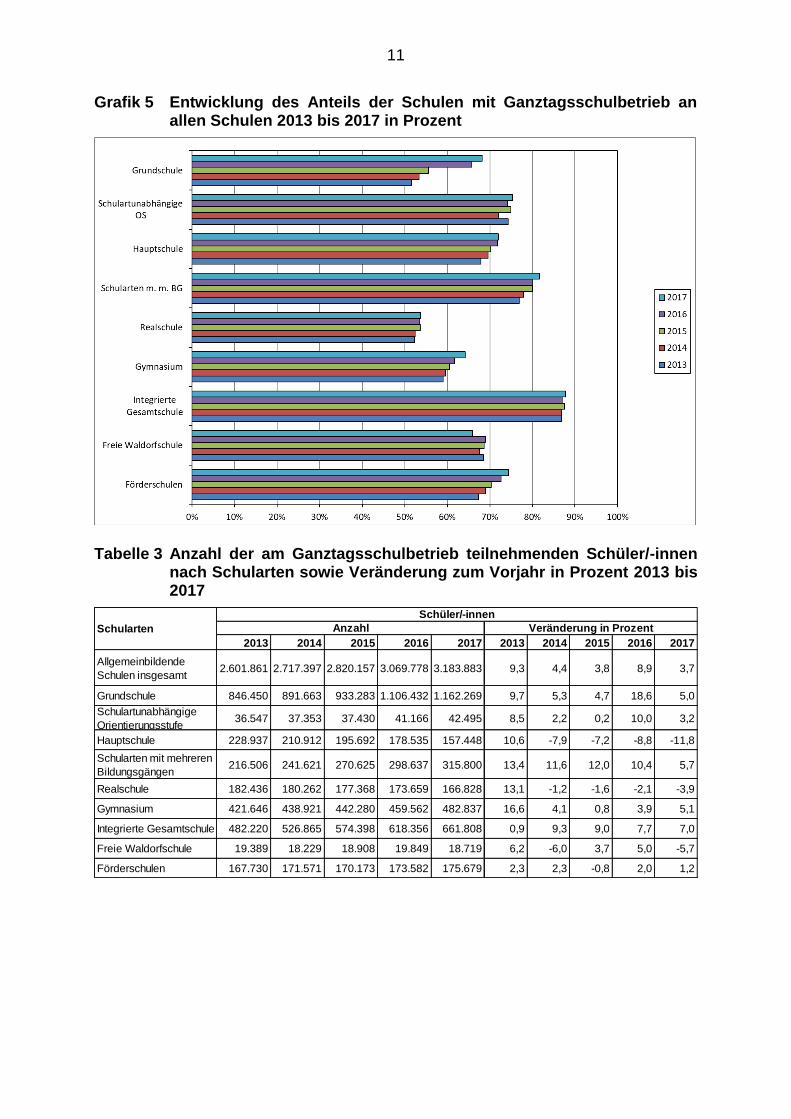
Tabelle 3 Anzahl der am Ganztagsschulbetrieb teilnehmenden Schüler/-innen nach Schularten
sowie Veränderung zum Vorjahr in Prozent 2013 bis 2017 .............................................. 11
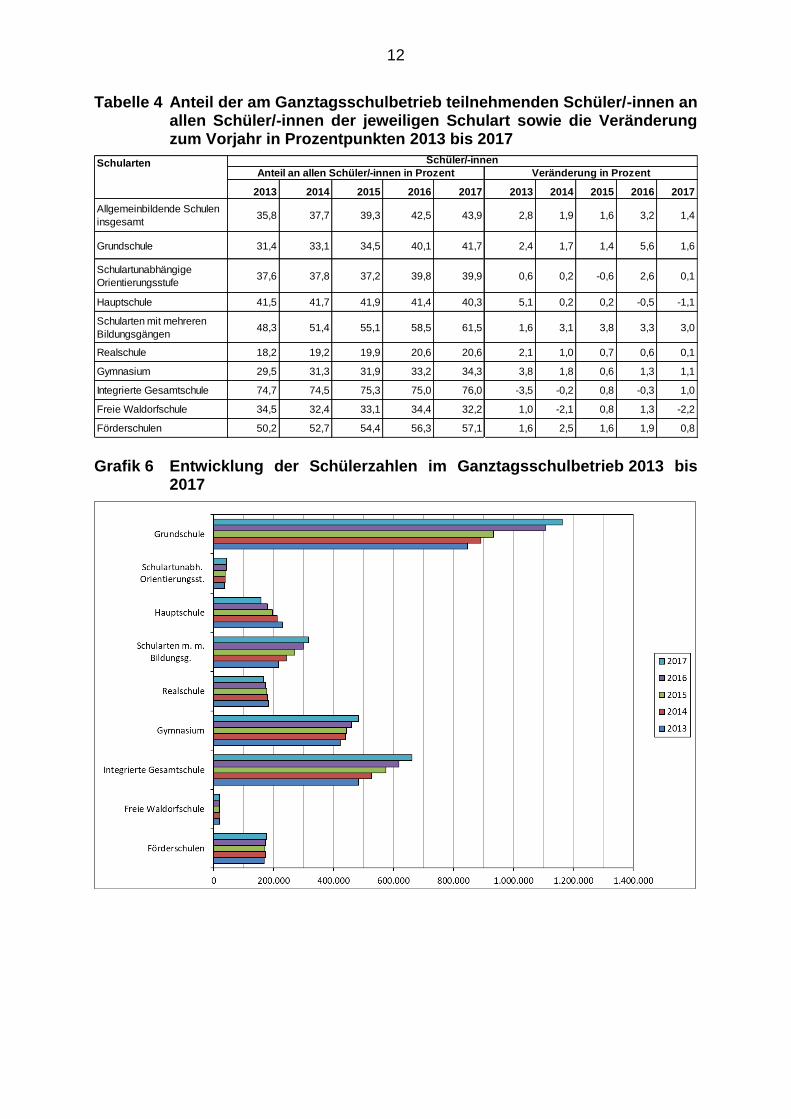
Tabelle 4 Anteil der am Ganztagsschulbetrieb teilnehmenden Schüler/-innen an allen Schüler/-
innen der jeweiligen Schulart sowie die Veränderung zum Vorjahr in Prozentpunkten
2013 bis 2017 .................................................................................................................... 12
Grafik 1 Anzahl der Verwaltungseinheiten mit Ganztagsschulbetrieb in den Ländern
2013 bis 2017 ...................................................................................................................... 8
Grafik 2 Anteil der Verwaltungseinheiten mit Ganztagsschulbetrieb an allen Verwaltungseinheiten
in den Ländern 2013 bis 2017 ............................................................................................. 8
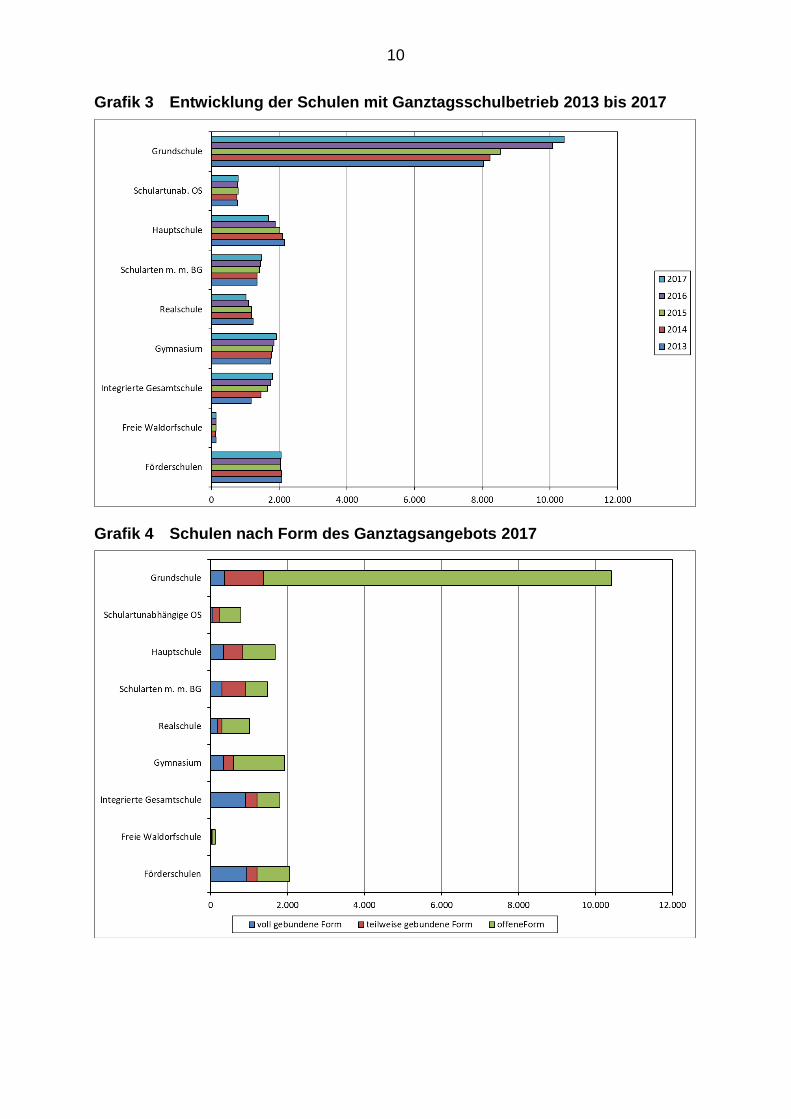
Grafik 3 Entwicklung der Schulen mit Ganztagsschulbetrieb 2013 bis 2017 .................................. 10
Grafik 4 Schulen nach Form des Ganztagsangebots 2017 ............................................................ 10
Grafik 5 Entwicklung des Anteils der Schulen mit Ganztagsschulbetrieb an allen Schulen
2013 bis 2017 in Prozent ................................................................................................... 11
Grafik 6 Entwicklung der Schülerzahlen im Ganztagsschulbetrieb 2013 bis 2017 ......................... 12
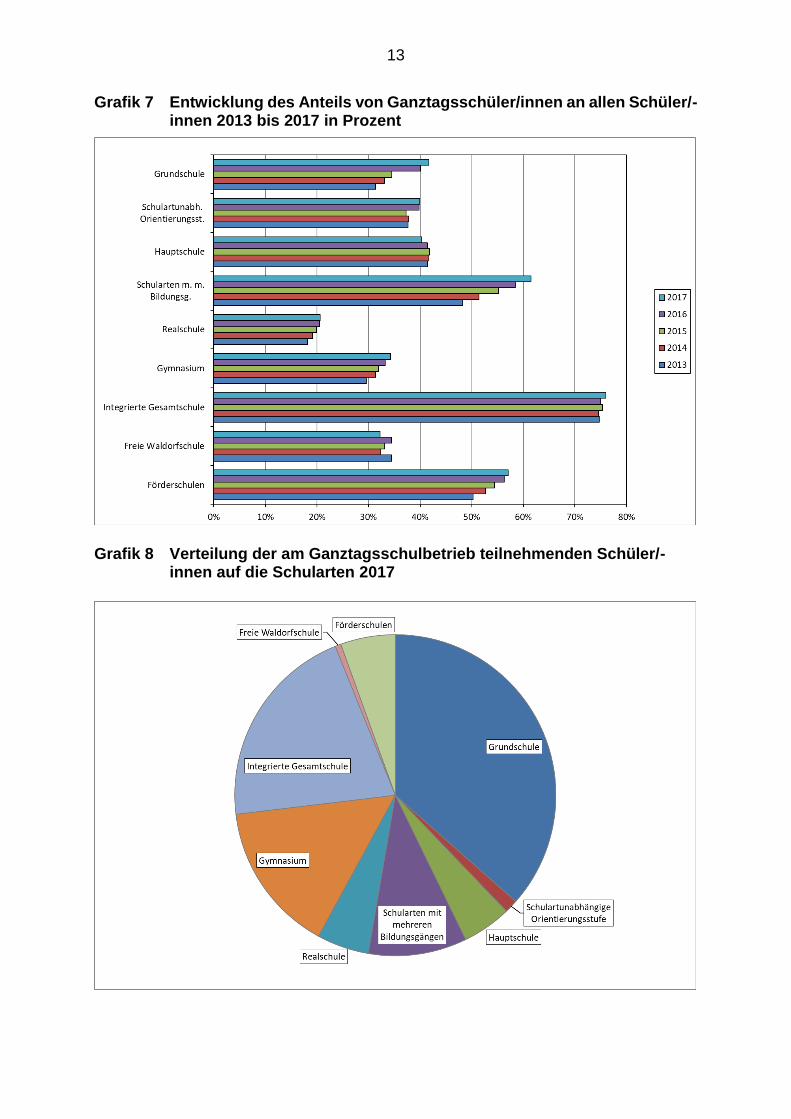
Grafik 7 Entwicklung des Anteils von Ganztagsschüler/innen an allen Schüler/-innen 2013 bis
2017 in Prozent .................................................................................................................. 13
Grafik 8 Verteilung der am Ganztagsschulbetrieb teilnehmenden Schüler/-innen
auf die Schularten 2017 ..................................................................................................... 13
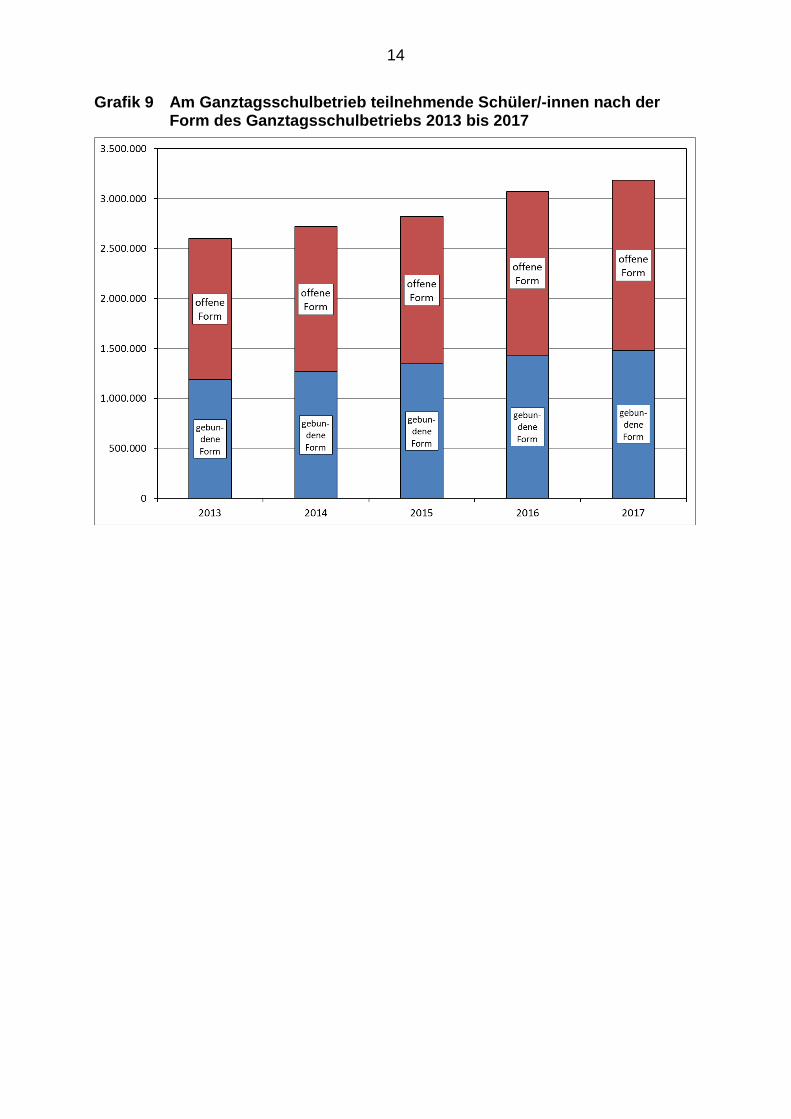
Grafik 9 Am Ganztagsschulbetrieb teilnehmende Schüler/-innen nach der Form des
Ganztagsschulbetriebs 2013 bis 2017 .............................................................................. 14
8
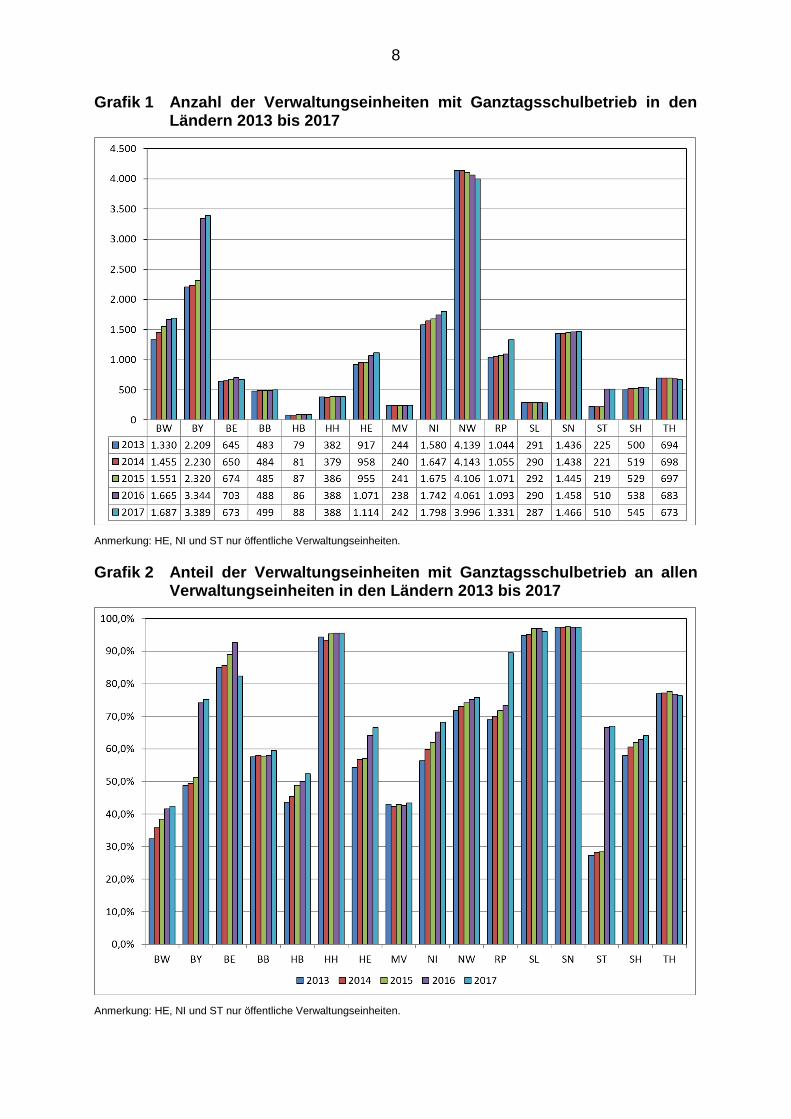
Grafik 1 Anzahl der Verwaltungseinheiten mit Ganztagsschulbetrieb in den Ländern 2013 bis 2017
Anmerkung: HE, NI und ST nur öffentliche Verwaltungseinheiten.
Grafik 2 Anteil der Verwaltungseinheiten mit Ganztagsschulbetrieb an allen Verwaltungseinheiten in den Ländern 2013 bis 2017
Anmerkung: HE, NI und ST nur öffentliche Verwaltungseinheiten.
9
Tabelle 1 Anzahl der Schulen mit Ganztagsschulbetrieb sowie die Veränderung zum Vorjahr in Prozent 2013 bis 2017
1) Schulen in der Aufgliederung nach Schularten können nicht sinnvoll zu einem Gesamtergebnis zusammengeführt werden. Differenzen in den Summen durch Rundung.
Tabelle 2 Anteil der Schulen mit Ganztagsschulbetrieb an allen Schulen sowie die Veränderung zum Vorjahr in Prozent 2013 bis 2017
1) Schulen in der Aufgliederung nach Schularten können nicht sinnvoll zu einem Gesamtergebnis zusammengeführt werden. Differenzen in den Summen durch Rundung.
2013 2014 2015 2016 2017 2013 2014 2015 2016 2017
Grundschule 8.046 8.226 8.533 10.077 10.413 12,6 2,2 3,7 18,1 3,3
Schulartunabhängige
Orientierungsstufe764 753 780 772 784 3,7 -1,4 3,6 -1,0 1,6
Hauptschule 2.154 2.101 2.018 1.877 1.679 28,1 -2,5 -4,0 -7,0 -10,5
Schularten mit mehreren
Bildungsgängen1.342 1.339 1.413 1.446 1.483 11,6 -0,2 5,5 2,3 2,6
Realschule 1.222 1.183 1.181 1.085 1.017 55,9 -3,2 -0,2 -8,1 -6,3
Gymnasium 1.753 1.773 1.800 1.842 1.920 31,9 1,1 1,5 2,3 4,2
Integrierte Gesamtschule 1.171 1.458 1.653 1.749 1.803 14,2 24,5 13,4 5,8 3,1
Freie Waldorfschule 128 123 129 131 128 15,2 -3,9 4,9 1,6 -2,3
Förderschulen 2.076 2.072 2.047 2.040 2.057 6,5 -0,2 -1,2 -0,3 0,8
Veränderung in ProzentSchularten Anzahl
Schulen1)
2013 2014 2015 2016 2017 2013 2014 2015 2016 2017
Grundschule 51,6 53,3 55,6 65,8 68,2 4,9 1,8 2,3 10,2 2,4
Schulartunabhängige
Orientierungsstufe74,3 72,0 74,9 74,2 75,3 2,3 -2,3 2,9 -0,7 1,1
Hauptschule 67,9 69,6 70,3 71,8 72,0 13,3 1,7 0,7 1,5 0,2
Schularten mit mehreren
Bildungsgängen76,9 77,9 80,0 80,0 81,7 3,6 1,0 2,1 -0,0 1,7
Realschule 52,4 52,4 53,7 53,6 53,7 15,4 0,0 1,2 -0,1 0,1
Gymnasium 59,0 59,6 60,5 61,7 64,2 10,5 0,6 0,9 1,2 2,5
Integrierte Gesamtschule 86,9 86,9 87,6 87,0 87,8 1,2 0,1 0,6 -0,6 0,9
Freie Waldorfschule 68,4 67,6 68,6 68,9 66,0 6,4 -0,9 1,0 0,3 -3,0
Förderschulen 67,3 69,0 70,3 72,6 74,4 3,6 1,7 1,4 2,3 1,8
Schularten
Anteil an allen Schulen in Prozent Veränderung in Prozent
Schulen1)
10
Grafik 3 Entwicklung der Schulen mit Ganztagsschulbetrieb 2013 bis 2017
Grafik 4 Schulen nach Form des Ganztagsangebots 2017
11
Grafik 5 Entwicklung des Anteils der Schulen mit Ganztagsschulbetrieb an allen Schulen 2013 bis 2017 in Prozent
Tabelle 3 Anzahl der am Ganztagsschulbetrieb teilnehmenden Schüler/-innen nach Schularten sowie Veränderung zum Vorjahr in Prozent 2013 bis 2017
2013 2014 2015 2016 2017 2013 2014 2015 2016 2017
Allgemeinbildende
Schulen insgesamt2.601.861 2.717.397 2.820.157 3.069.778 3.183.883 9,3 4,4 3,8 8,9 3,7
Grundschule 846.450 891.663 933.283 1.106.432 1.162.269 9,7 5,3 4,7 18,6 5,0
Schulartunabhängige
Orientierungsstufe36.547 37.353 37.430 41.166 42.495 8,5 2,2 0,2 10,0 3,2
Hauptschule 228.937 210.912 195.692 178.535 157.448 10,6 -7,9 -7,2 -8,8 -11,8
Schularten mit mehreren
Bildungsgängen216.506 241.621 270.625 298.637 315.800 13,4 11,6 12,0 10,4 5,7
Realschule 182.436 180.262 177.368 173.659 166.828 13,1 -1,2 -1,6 -2,1 -3,9
Gymnasium 421.646 438.921 442.280 459.562 482.837 16,6 4,1 0,8 3,9 5,1
Integrierte Gesamtschule 482.220 526.865 574.398 618.356 661.808 0,9 9,3 9,0 7,7 7,0
Freie Waldorfschule 19.389 18.229 18.908 19.849 18.719 6,2 -6,0 3,7 5,0 -5,7
Förderschulen 167.730 171.571 170.173 173.582 175.679 2,3 2,3 -0,8 2,0 1,2
Veränderung in Prozent
Schüler/-innen
Schularten Anzahl
12
Tabelle 4 Anteil der am Ganztagsschulbetrieb teilnehmenden Schüler/-innen an allen Schüler/-innen der jeweiligen Schulart sowie die Veränderung zum Vorjahr in Prozentpunkten 2013 bis 2017
Grafik 6 Entwicklung der Schülerzahlen im Ganztagsschulbetrieb 2013 bis 2017
2013 2014 2015 2016 2017 2013 2014 2015 2016 2017
Allgemeinbildende Schulen
insgesamt35,8 37,7 39,3 42,5 43,9 2,8 1,9 1,6 3,2 1,4
Grundschule 31,4 33,1 34,5 40,1 41,7 2,4 1,7 1,4 5,6 1,6
Schulartunabhängige
Orientierungsstufe37,6 37,8 37,2 39,8 39,9 0,6 0,2 -0,6 2,6 0,1
Hauptschule 41,5 41,7 41,9 41,4 40,3 5,1 0,2 0,2 -0,5 -1,1
Schularten mit mehreren
Bildungsgängen48,3 51,4 55,1 58,5 61,5 1,6 3,1 3,8 3,3 3,0
Realschule 18,2 19,2 19,9 20,6 20,6 2,1 1,0 0,7 0,6 0,1
Gymnasium 29,5 31,3 31,9 33,2 34,3 3,8 1,8 0,6 1,3 1,1
Integrierte Gesamtschule 74,7 74,5 75,3 75,0 76,0 -3,5 -0,2 0,8 -0,3 1,0
Freie Waldorfschule 34,5 32,4 33,1 34,4 32,2 1,0 -2,1 0,8 1,3 -2,2
Förderschulen 50,2 52,7 54,4 56,3 57,1 1,6 2,5 1,6 1,9 0,8
SchulartenAnteil an allen Schüler/-innen in Prozent Veränderung in Prozent
Schüler/-innen
13
Grafik 7 Entwicklung des Anteils von Ganztagsschüler/innen an allen Schüler/-innen 2013 bis 2017 in Prozent
Grafik 8 Verteilung der am Ganztagsschulbetrieb teilnehmenden Schüler/-innen auf die Schularten 2017
14
Grafik 9 Am Ganztagsschulbetrieb teilnehmende Schüler/-innen nach der Form des Ganztagsschulbetriebs 2013 bis 2017
15
IV Datensammlung
Abkürzungen
BW Baden-Württemberg BY Bayern BE Berlin BB Brandenburg HB Bremen HH Hamburg HE Hessen MV Mecklenburg-Vorpommern NI Niedersachsen NW Nordrhein-Westfalen RP Rheinland-Pfalz SL Saarland SN Sachsen ST Sachsen-Anhalt SH Schleswig-Holstein TH Thüringen
16
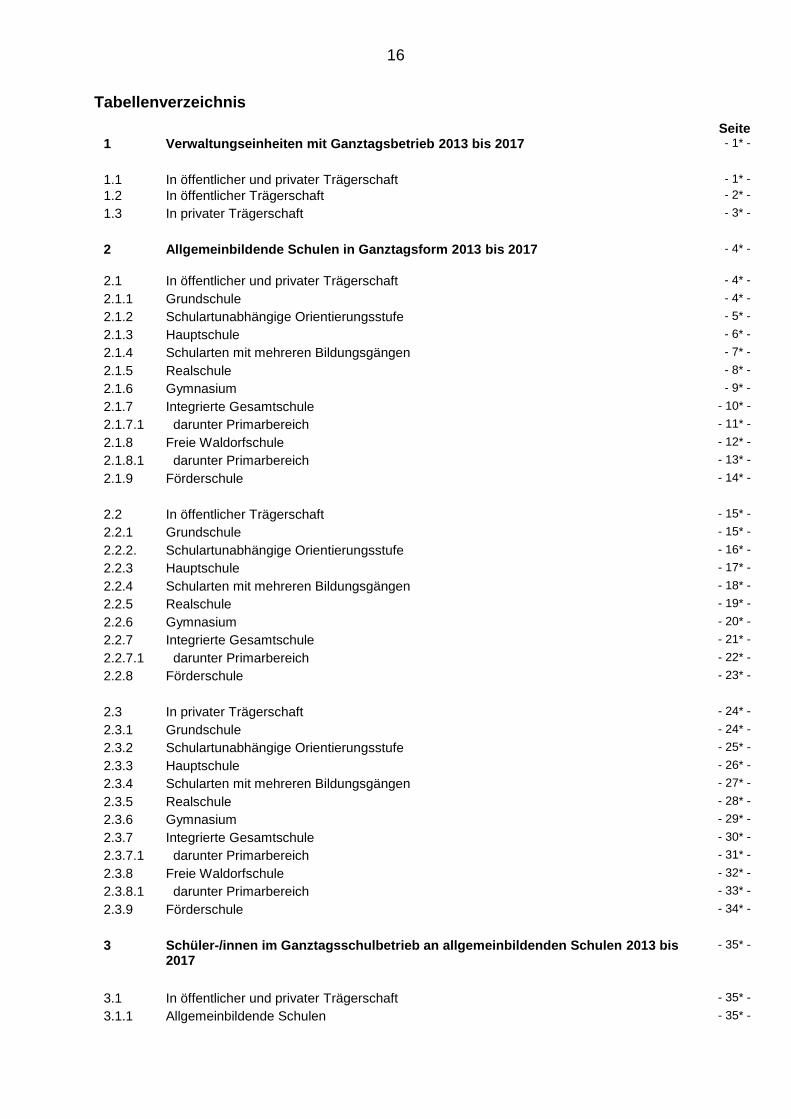
Tabellenverzeichnis
Seite 1 Verwaltungseinheiten mit Ganztagsbetrieb 2013 bis 2017 - 1* -
1.1 In öffentlicher und privater Trägerschaft
- 1* -
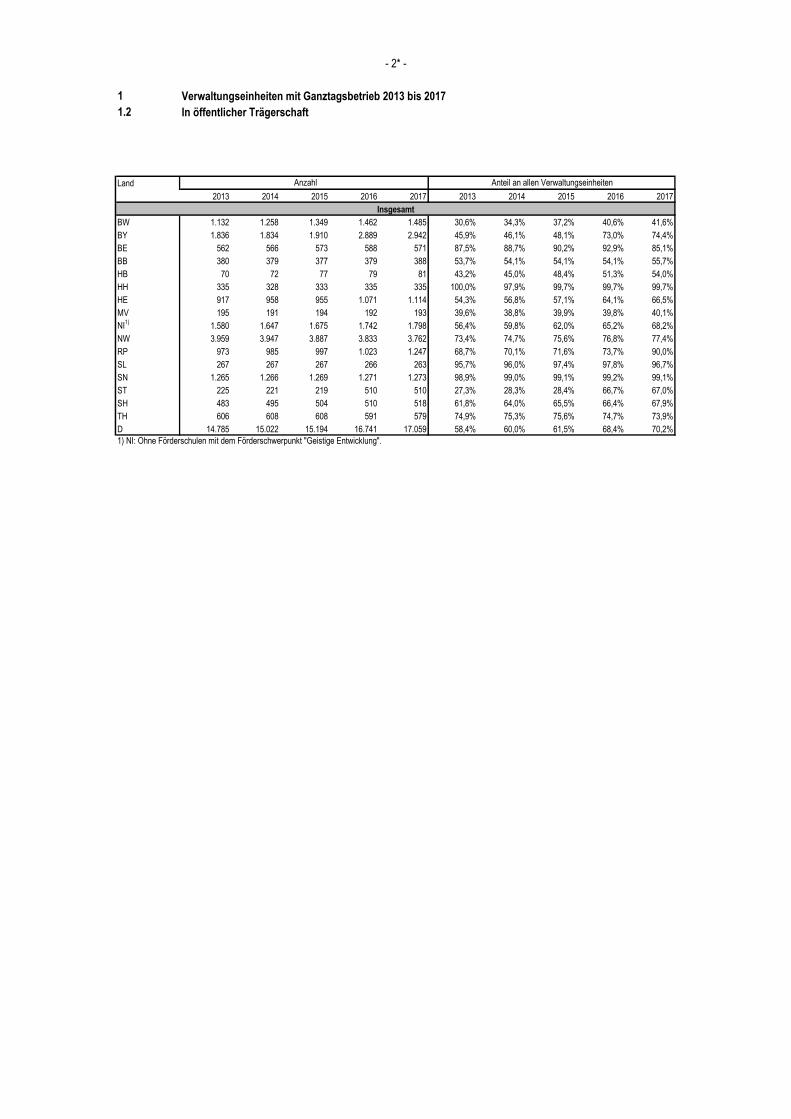
1.2 In öffentlicher Trägerschaft
- 2* -
1.3 In privater Trägerschaft
- 3* -
2 Allgemeinbildende Schulen in Ganztagsform 2013 bis 2017 - 4* -
2.1 In öffentlicher und privater Trägerschaft
- 4* -
2.1.1 Grundschule
- 4* -
2.1.2 Schulartunabhängige Orientierungsstufe
- 5* -
2.1.3 Hauptschule
- 6* -
2.1.4 Schularten mit mehreren Bildungsgängen
- 7* -
2.1.5 Realschule
- 8* -
2.1.6 Gymnasium
- 9* -
2.1.7 Integrierte Gesamtschule
- 10* -
2.1.7.1 darunter Primarbereich - 11* -
2.1.8 Freie Waldorfschule
- 12* -
2.1.8.1 darunter Primarbereich - 13* -
2.1.9 Förderschule
- 14* -
2.2 In öffentlicher Trägerschaft
- 15* -
2.2.1 Grundschule
- 15* -
2.2.2. Schulartunabhängige Orientierungsstufe
- 16* -
2.2.3 Hauptschule
- 17* -
2.2.4 Schularten mit mehreren Bildungsgängen
- 18* -
2.2.5 Realschule
- 19* -
2.2.6 Gymnasium
- 20* -
2.2.7 Integrierte Gesamtschule
- 21* -
2.2.7.1 darunter Primarbereich - 22* -
2.2.8 Förderschule
- 23* -
2.3 In privater Trägerschaft
- 24* -
2.3.1 Grundschule
- 24* -
2.3.2 Schulartunabhängige Orientierungsstufe
- 25* -
2.3.3 Hauptschule
- 26* -
2.3.4 Schularten mit mehreren Bildungsgängen
- 27* -
2.3.5 Realschule
- 28* -
2.3.6 Gymnasium
- 29* -
2.3.7 Integrierte Gesamtschule
- 30* -
2.3.7.1 darunter Primarbereich - 31* -
2.3.8 Freie Waldorfschule
- 32* -
2.3.8.1 darunter Primarbereich - 33* -
2.3.9 Förderschule
- 34* -
3 Schüler-/innen im Ganztagsschulbetrieb an allgemeinbildenden Schulen 2013 bis 2017
- 35* -
3.1 In öffentlicher und privater Trägerschaft
- 35* -
3.1.1 Allgemeinbildende Schulen
- 35* -
17
3.1.2 Grundschule
- 36* -
3.1.3 Schulartunabhängige Orientierungsstufe
- 37* -
3.1.4 Hauptschule
- 38* -
3.1.5 Schularten mit mehreren Bildungsgängen
- 39* -
3.1.6 Realschule
- 40* -
3.1.7 Gymnasium
- 41* -
3.1.8 Integrierte Gesamtschule
- 42* -
3.1.8.1 darunter Primarbereich - 43* -
3.1.9 Freie Waldorfschule
- 44* -
3.1.9.1 darunter Primarbereich - 45* -
3.1.10 Förderschule
- 46* -
3.2 In öffentlicher Trägerschaft
- 47* -
3.2.1 Allgemeinbildende Schulen
- 47* -
3.2.2 Grundschule
- 48* -
3.2.3 Schulartunabhängige Orientierungsstufe
- 49* -
3.2.4 Hauptschule
- 50* -
3.2.5 Schularten mit mehreren Bildungsgängen
- 51* -
3.2.6 Realschule
- 52* -
3.2.7 Gymnasium
- 53* -
3.2.8 Integrierte Gesamtschule
- 54* -
3.2.8.1 darunter Primarbereich - 55* -
3.2.9 Förderschule
- 56* -
3.3 In privater Trägerschaft
- 57* -
3.3.1 Allgemeinbildende Schulen
- 57* -
3.3.2 Grundschule
- 58* -
3.3.3 Schulartunabhängige Orientierungsstufe
- 59* -
3.3.4 Hauptschule
- 60* -
3.3.5 Schularten mit mehreren Bildungsgängen
- 61* -
3.3.6 Realschule
- 62* -
3.3.7 Gymnasium
- 63* -
3.3.8 Integrierte Gesamtschule
- 64* -
3.3.8.1 darunter Primarbereich - 65* -
3.3.9 Freie Waldorfschule
- 66* -
3.3.9.1 darunter Primarbereich - 67* -
3.3.10 Förderschule
- 68* -
18
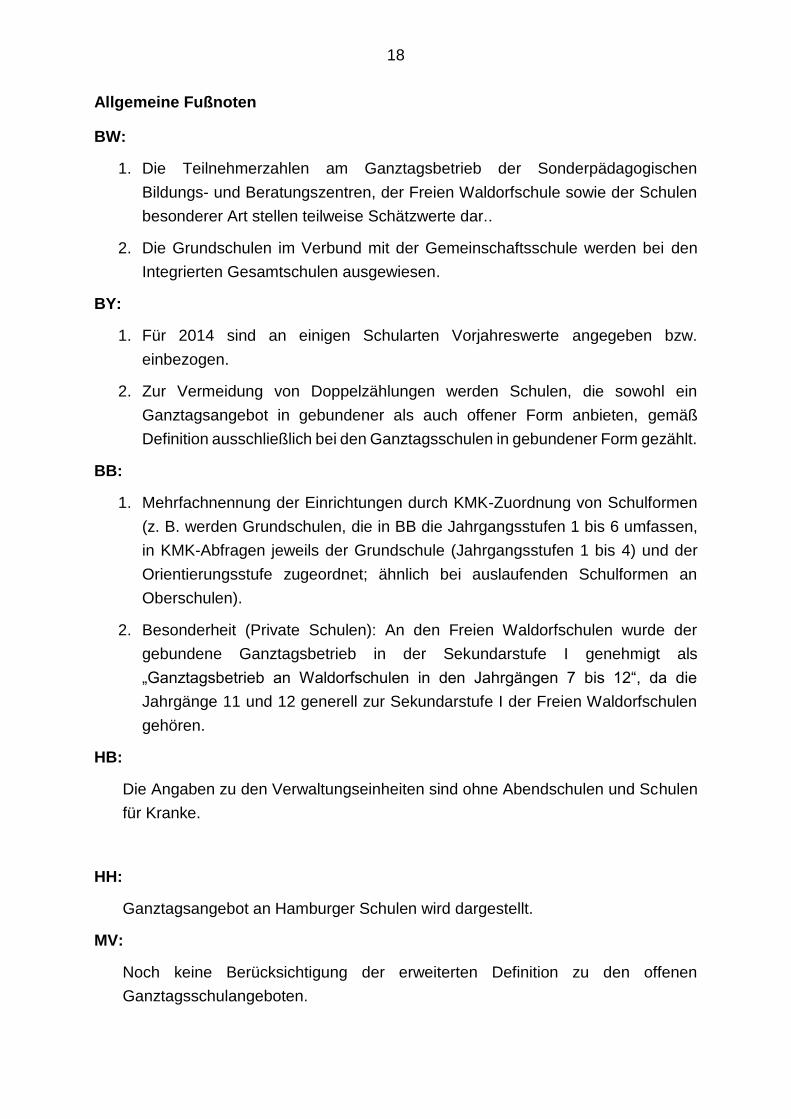
Allgemeine Fußnoten
BW:
1. Die Teilnehmerzahlen am Ganztagsbetrieb der Sonderpädagogischen
Bildungs- und Beratungszentren, der Freien Waldorfschule sowie der Schulen
besonderer Art stellen teilweise Schätzwerte dar..
2. Die Grundschulen im Verbund mit der Gemeinschaftsschule werden bei den
Integrierten Gesamtschulen ausgewiesen.
BY:
1. Für 2014 sind an einigen Schularten Vorjahreswerte angegeben bzw.
einbezogen.
2. Zur Vermeidung von Doppelzählungen werden Schulen, die sowohl ein
Ganztagsangebot in gebundener als auch offener Form anbieten, gemäß
Definition ausschließlich bei den Ganztagsschulen in gebundener Form gezählt.
BB:
1. Mehrfachnennung der Einrichtungen durch KMK-Zuordnung von Schulformen
(z. B. werden Grundschulen, die in BB die Jahrgangsstufen 1 bis 6 umfassen,
in KMK-Abfragen jeweils der Grundschule (Jahrgangsstufen 1 bis 4) und der
Orientierungsstufe zugeordnet; ähnlich bei auslaufenden Schulformen an
Oberschulen).
2. Besonderheit (Private Schulen): An den Freien Waldorfschulen wurde der
gebundene Ganztagsbetrieb in der Sekundarstufe I genehmigt als
„Ganztagsbetrieb an Waldorfschulen in den Jahrgängen 7 bis 12“, da die
Jahrgänge 11 und 12 generell zur Sekundarstufe I der Freien Waldorfschulen
gehören.
HB:
Die Angaben zu den Verwaltungseinheiten sind ohne Abendschulen und Schulen
für Kranke.
HH:
Ganztagsangebot an Hamburger Schulen wird dargestellt.
MV:
Noch keine Berücksichtigung der erweiterten Definition zu den offenen
Ganztagsschulangeboten.
19
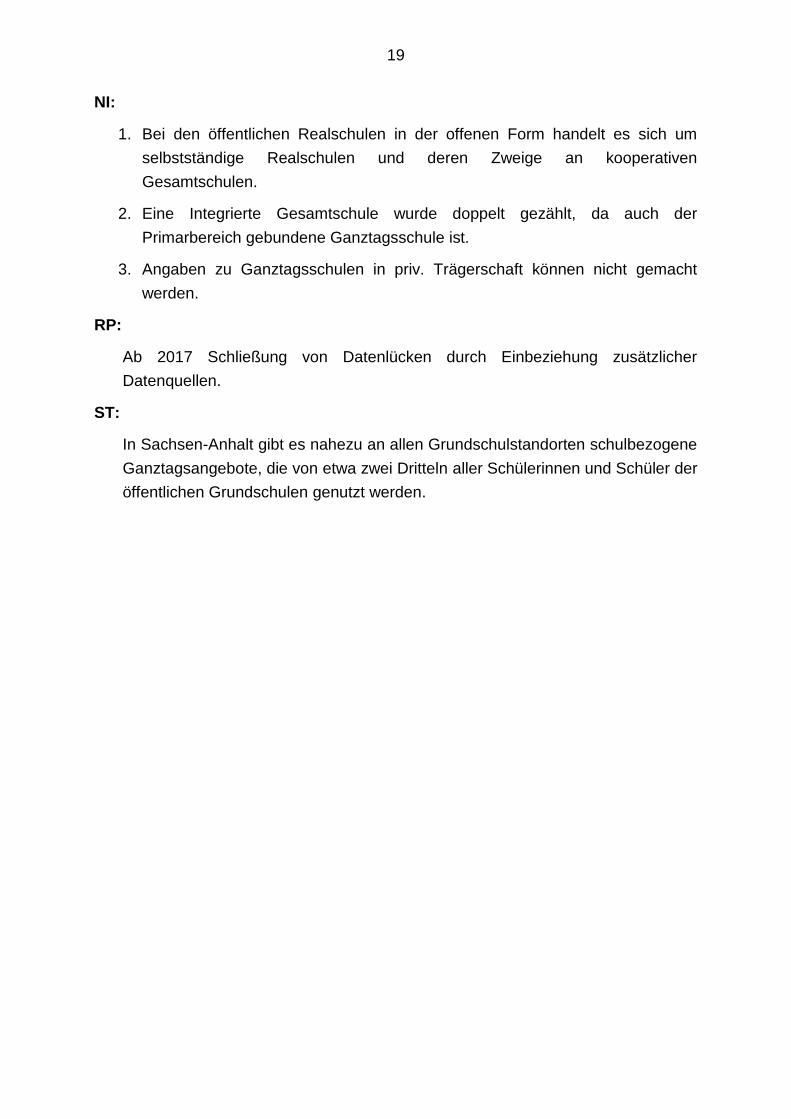
NI:
1. Bei den öffentlichen Realschulen in der offenen Form handelt es sich um
selbstständige Realschulen und deren Zweige an kooperativen
Gesamtschulen.
2. Eine Integrierte Gesamtschule wurde doppelt gezählt, da auch der
Primarbereich gebundene Ganztagsschule ist.
3. Angaben zu Ganztagsschulen in priv. Trägerschaft können nicht gemacht
werden.
RP:
Ab 2017 Schließung von Datenlücken durch Einbeziehung zusätzlicher
Datenquellen.
ST:
In Sachsen-Anhalt gibt es nahezu an allen Grundschulstandorten schulbezogene
Ganztagsangebote, die von etwa zwei Dritteln aller Schülerinnen und Schüler der
öffentlichen Grundschulen genutzt werden.
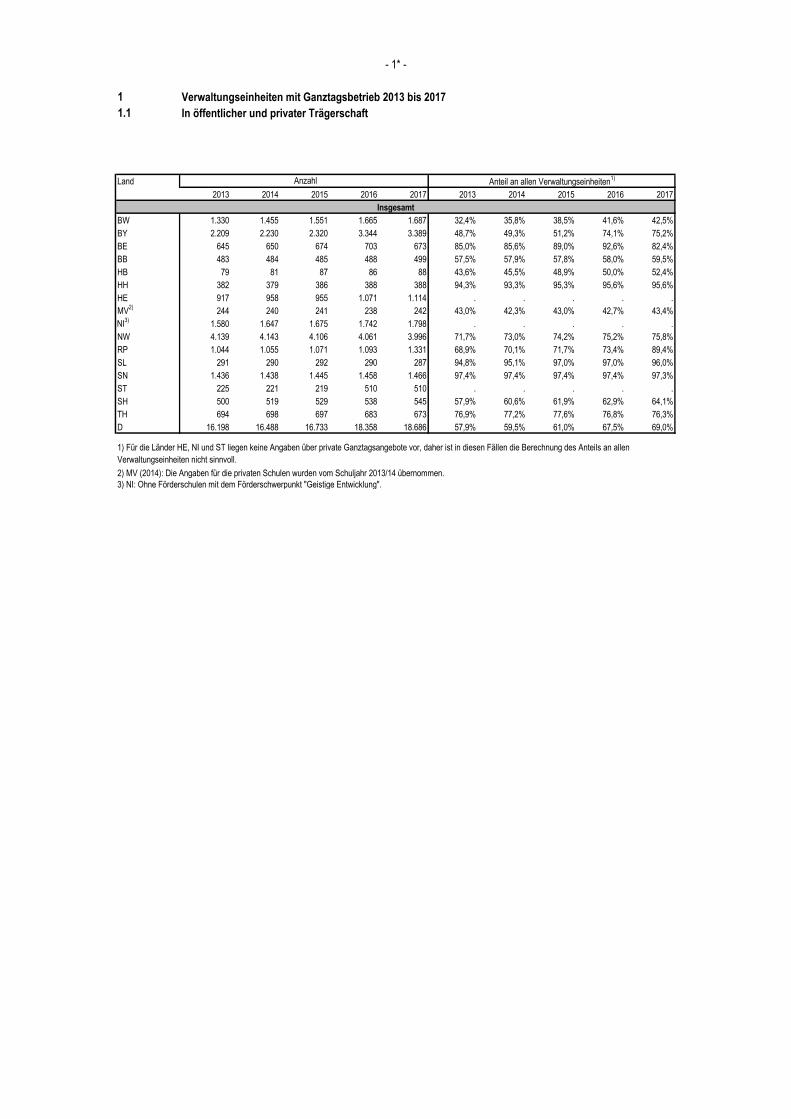
1 Verwaltungseinheiten mit Ganztagsbetrieb 2013 bis 2017
1.1 In öffentlicher und privater Trägerschaft
Land
2013 2014 2015 2016 2017 2013 2014 2015 2016 2017
BW 1.330 1.455 1.551 1.665 1.687 32,4% 35,8% 38,5% 41,6% 42,5%
BY 2.209 2.230 2.320 3.344 3.389 48,7% 49,3% 51,2% 74,1% 75,2%
BE 645 650 674 703 673 85,0% 85,6% 89,0% 92,6% 82,4%
BB 483 484 485 488 499 57,5% 57,9% 57,8% 58,0% 59,5%
HB 79 81 87 86 88 43,6% 45,5% 48,9% 50,0% 52,4%
HH 382 379 386 388 388 94,3% 93,3% 95,3% 95,6% 95,6%
HE 917 958 955 1.071 1.114 . . . . .
MV2)
244 240 241 238 242 43,0% 42,3% 43,0% 42,7% 43,4%
NI3)
1.580 1.647 1.675 1.742 1.798 . . . . .
NW 4.139 4.143 4.106 4.061 3.996 71,7% 73,0% 74,2% 75,2% 75,8%
RP 1.044 1.055 1.071 1.093 1.331 68,9% 70,1% 71,7% 73,4% 89,4%
SL 291 290 292 290 287 94,8% 95,1% 97,0% 97,0% 96,0%
SN 1.436 1.438 1.445 1.458 1.466 97,4% 97,4% 97,4% 97,4% 97,3%
ST 225 221 219 510 510 . . . . .
SH 500 519 529 538 545 57,9% 60,6% 61,9% 62,9% 64,1%
TH 694 698 697 683 673 76,9% 77,2% 77,6% 76,8% 76,3%
D 16.198 16.488 16.733 18.358 18.686 57,9% 59,5% 61,0% 67,5% 69,0%
2) MV (2014): Die Angaben für die privaten Schulen wurden vom Schuljahr 2013/14 übernommen.
3) NI: Ohne Förderschulen mit dem Förderschwerpunkt "Geistige Entwicklung".
Anzahl
Insgesamt
Anteil an allen Verwaltungseinheiten1)
- 1* -
1) Für die Länder HE, NI und ST liegen keine Angaben über private Ganztagsangebote vor, daher ist in diesen Fällen die Berechnung des Anteils an allen
Verwaltungseinheiten nicht sinnvoll.
1 Verwaltungseinheiten mit Ganztagsbetrieb 2013 bis 2017
1.2 In öffentlicher Trägerschaft
Land
2013 2014 2015 2016 2017 2013 2014 2015 2016 2017
BW 1.132 1.258 1.349 1.462 1.485 30,6% 34,3% 37,2% 40,6% 41,6%
BY 1.836 1.834 1.910 2.889 2.942 45,9% 46,1% 48,1% 73,0% 74,4%
BE 562 566 573 588 571 87,5% 88,7% 90,2% 92,9% 85,1%
BB 380 379 377 379 388 53,7% 54,1% 54,1% 54,1% 55,7%
HB 70 72 77 79 81 43,2% 45,0% 48,4% 51,3% 54,0%
HH 335 328 333 335 335 100,0% 97,9% 99,7% 99,7% 99,7%
HE 917 958 955 1.071 1.114 54,3% 56,8% 57,1% 64,1% 66,5%
MV 195 191 194 192 193 39,6% 38,8% 39,9% 39,8% 40,1%
NI1)
1.580 1.647 1.675 1.742 1.798 56,4% 59,8% 62,0% 65,2% 68,2%
NW 3.959 3.947 3.887 3.833 3.762 73,4% 74,7% 75,6% 76,8% 77,4%
RP 973 985 997 1.023 1.247 68,7% 70,1% 71,6% 73,7% 90,0%
SL 267 267 267 266 263 95,7% 96,0% 97,4% 97,8% 96,7%
SN 1.265 1.266 1.269 1.271 1.273 98,9% 99,0% 99,1% 99,2% 99,1%
ST 225 221 219 510 510 27,3% 28,3% 28,4% 66,7% 67,0%
SH 483 495 504 510 518 61,8% 64,0% 65,5% 66,4% 67,9%
TH 606 608 608 591 579 74,9% 75,3% 75,6% 74,7% 73,9%
D 14.785 15.022 15.194 16.741 17.059 58,4% 60,0% 61,5% 68,4% 70,2%
1) NI: Ohne Förderschulen mit dem Förderschwerpunkt "Geistige Entwicklung".
Anzahl
Insgesamt
Anteil an allen Verwaltungseinheiten
- 2* -
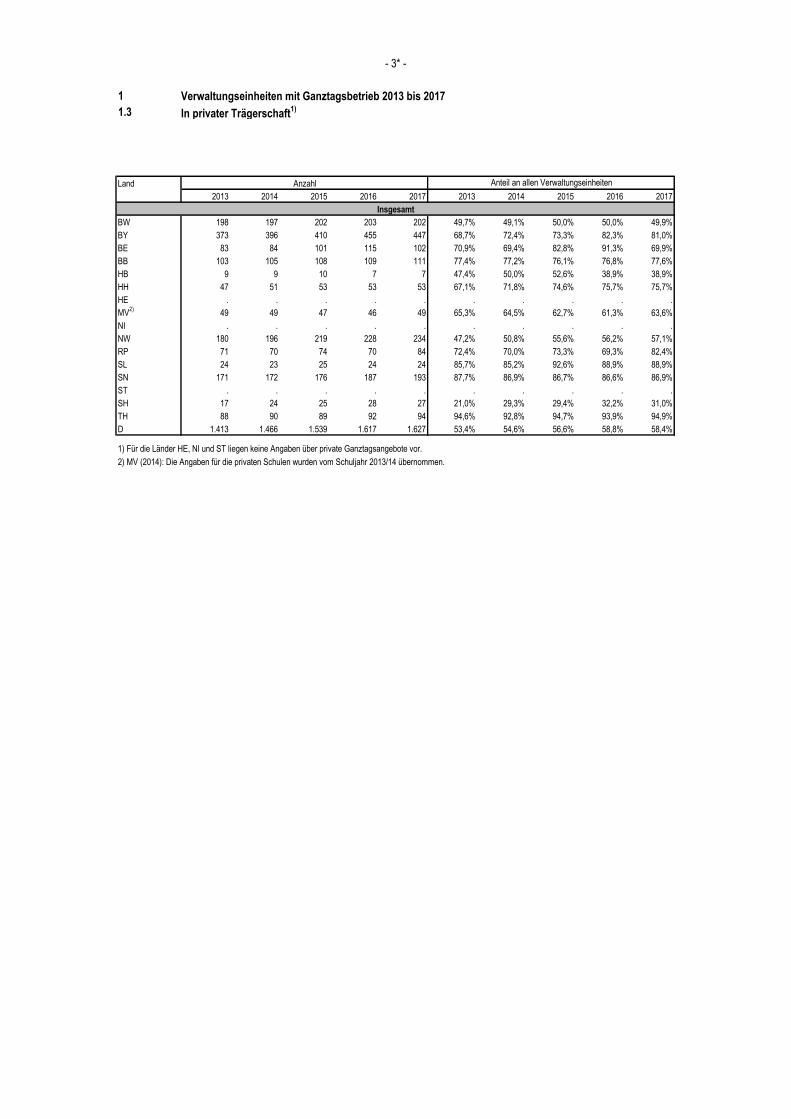
1 Verwaltungseinheiten mit Ganztagsbetrieb 2013 bis 2017
1.3 In privater Trägerschaft1)
Land
2013 2014 2015 2016 2017 2013 2014 2015 2016 2017
BW 198 197 202 203 202 49,7% 49,1% 50,0% 50,0% 49,9%
BY 373 396 410 455 447 68,7% 72,4% 73,3% 82,3% 81,0%
BE 83 84 101 115 102 70,9% 69,4% 82,8% 91,3% 69,9%
BB 103 105 108 109 111 77,4% 77,2% 76,1% 76,8% 77,6%
HB 9 9 10 7 7 47,4% 50,0% 52,6% 38,9% 38,9%
HH 47 51 53 53 53 67,1% 71,8% 74,6% 75,7% 75,7%
HE . . . . . . . . . .
MV2)
49 49 47 46 49 65,3% 64,5% 62,7% 61,3% 63,6%
NI . . . . . . . . . .
NW 180 196 219 228 234 47,2% 50,8% 55,6% 56,2% 57,1%
RP 71 70 74 70 84 72,4% 70,0% 73,3% 69,3% 82,4%
SL 24 23 25 24 24 85,7% 85,2% 92,6% 88,9% 88,9%
SN 171 172 176 187 193 87,7% 86,9% 86,7% 86,6% 86,9%
ST . . . . . . . . . .
SH 17 24 25 28 27 21,0% 29,3% 29,4% 32,2% 31,0%
TH 88 90 89 92 94 94,6% 92,8% 94,7% 93,9% 94,9%
D 1.413 1.466 1.539 1.617 1.627 53,4% 54,6% 56,6% 58,8% 58,4%
2) MV (2014): Die Angaben für die privaten Schulen wurden vom Schuljahr 2013/14 übernommen.
1) Für die Länder HE, NI und ST liegen keine Angaben über private Ganztagsangebote vor.
Anzahl
Insgesamt
Anteil an allen Verwaltungseinheiten
- 3* -
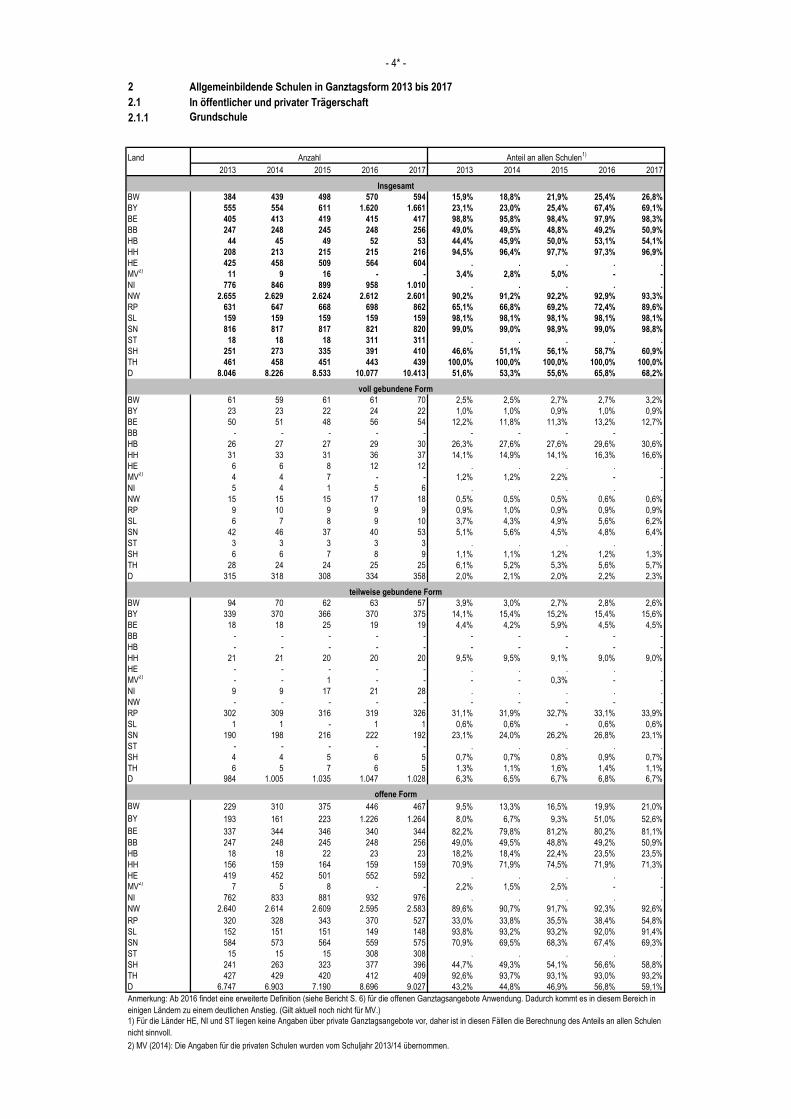
2 Allgemeinbildende Schulen in Ganztagsform 2013 bis 2017
2.1 In öffentlicher und privater Trägerschaft
2.1.1 Grundschule
Land
2013 2014 2015 2016 2017 2013 2014 2015 2016 2017
BW 384 439 498 570 594 15,9% 18,8% 21,9% 25,4% 26,8%
BY 555 554 611 1.620 1.661 23,1% 23,0% 25,4% 67,4% 69,1%
BE 405 413 419 415 417 98,8% 95,8% 98,4% 97,9% 98,3%
BB 247 248 245 248 256 49,0% 49,5% 48,8% 49,2% 50,9%
HB 44 45 49 52 53 44,4% 45,9% 50,0% 53,1% 54,1%
HH 208 213 215 215 216 94,5% 96,4% 97,7% 97,3% 96,9%
HE 425 458 509 564 604 . . . . .
MV2)
11 9 16 - - 3,4% 2,8% 5,0% - -
NI 776 846 899 958 1.010 . . . . .
NW 2.655 2.629 2.624 2.612 2.601 90,2% 91,2% 92,2% 92,9% 93,3%
RP 631 647 668 698 862 65,1% 66,8% 69,2% 72,4% 89,6%
SL 159 159 159 159 159 98,1% 98,1% 98,1% 98,1% 98,1%
SN 816 817 817 821 820 99,0% 99,0% 98,9% 99,0% 98,8%
ST 18 18 18 311 311 . . . . .
SH 251 273 335 391 410 46,6% 51,1% 56,1% 58,7% 60,9%
TH 461 458 451 443 439 100,0% 100,0% 100,0% 100,0% 100,0%
D 8.046 8.226 8.533 10.077 10.413 51,6% 53,3% 55,6% 65,8% 68,2%
BW 61 59 61 61 70 2,5% 2,5% 2,7% 2,7% 3,2%
BY 23 23 22 24 22 1,0% 1,0% 0,9% 1,0% 0,9%
BE 50 51 48 56 54 12,2% 11,8% 11,3% 13,2% 12,7%
BB - - - - - - - - - -
HB 26 27 27 29 30 26,3% 27,6% 27,6% 29,6% 30,6%
HH 31 33 31 36 37 14,1% 14,9% 14,1% 16,3% 16,6%
HE 6 6 8 12 12 . . . . .
MV2)
4 4 7 - - 1,2% 1,2% 2,2% - -
NI 5 4 1 5 6 . . . . .
NW 15 15 15 17 18 0,5% 0,5% 0,5% 0,6% 0,6%
RP 9 10 9 9 9 0,9% 1,0% 0,9% 0,9% 0,9%
SL 6 7 8 9 10 3,7% 4,3% 4,9% 5,6% 6,2%
SN 42 46 37 40 53 5,1% 5,6% 4,5% 4,8% 6,4%
ST 3 3 3 3 3 . . . . .
SH 6 6 7 8 9 1,1% 1,1% 1,2% 1,2% 1,3%
TH 28 24 24 25 25 6,1% 5,2% 5,3% 5,6% 5,7%
D 315 318 308 334 358 2,0% 2,1% 2,0% 2,2% 2,3%
BW 94 70 62 63 57 3,9% 3,0% 2,7% 2,8% 2,6%
BY 339 370 366 370 375 14,1% 15,4% 15,2% 15,4% 15,6%
BE 18 18 25 19 19 4,4% 4,2% 5,9% 4,5% 4,5%
BB - - - - - - - - - -
HB - - - - - - - - - -
HH 21 21 20 20 20 9,5% 9,5% 9,1% 9,0% 9,0%
HE - - - - - . . . . .
MV2)
- - 1 - - - - 0,3% - -
NI 9 9 17 21 28 . . . . .
NW - - - - - - - - - -
RP 302 309 316 319 326 31,1% 31,9% 32,7% 33,1% 33,9%
SL 1 1 - 1 1 0,6% 0,6% - 0,6% 0,6%
SN 190 198 216 222 192 23,1% 24,0% 26,2% 26,8% 23,1%
ST - - - - - . . . . .
SH 4 4 5 6 5 0,7% 0,7% 0,8% 0,9% 0,7%
TH 6 5 7 6 5 1,3% 1,1% 1,6% 1,4% 1,1%
D 984 1.005 1.035 1.047 1.028 6,3% 6,5% 6,7% 6,8% 6,7%
BW 229 310 375 446 467 9,5% 13,3% 16,5% 19,9% 21,0%
BY 193 161 223 1.226 1.264 8,0% 6,7% 9,3% 51,0% 52,6%
BE 337 344 346 340 344 82,2% 79,8% 81,2% 80,2% 81,1%
BB 247 248 245 248 256 49,0% 49,5% 48,8% 49,2% 50,9%
HB 18 18 22 23 23 18,2% 18,4% 22,4% 23,5% 23,5%
HH 156 159 164 159 159 70,9% 71,9% 74,5% 71,9% 71,3%
HE 419 452 501 552 592 . . . . .
MV2)
7 5 8 - - 2,2% 1,5% 2,5% - -
NI 762 833 881 932 976 . . . . .
NW 2.640 2.614 2.609 2.595 2.583 89,6% 90,7% 91,7% 92,3% 92,6%
RP 320 328 343 370 527 33,0% 33,8% 35,5% 38,4% 54,8%
SL 152 151 151 149 148 93,8% 93,2% 93,2% 92,0% 91,4%
SN 584 573 564 559 575 70,9% 69,5% 68,3% 67,4% 69,3%
ST 15 15 15 308 308 . . . . .
SH 241 263 323 377 396 44,7% 49,3% 54,1% 56,6% 58,8%
TH 427 429 420 412 409 92,6% 93,7% 93,1% 93,0% 93,2%
D 6.747 6.903 7.190 8.696 9.027 43,2% 44,8% 46,9% 56,8% 59,1%
2) MV (2014): Die Angaben für die privaten Schulen wurden vom Schuljahr 2013/14 übernommen.
- 4* -
Anteil an allen Schulen1)
Anzahl
offene Form
teilweise gebundene Form
voll gebundene Form
Insgesamt
Anmerkung: Ab 2016 findet eine erweiterte Definition (siehe Bericht S. 6) für die offenen Ganztagsangebote Anwendung. Dadurch kommt es in diesem Bereich in
einigen Ländern zu einem deutlichen Anstieg. (Gilt aktuell noch nicht für MV.)
1) Für die Länder HE, NI und ST liegen keine Angaben über private Ganztagsangebote vor, daher ist in diesen Fällen die Berechnung des Anteils an allen Schulen
nicht sinnvoll.
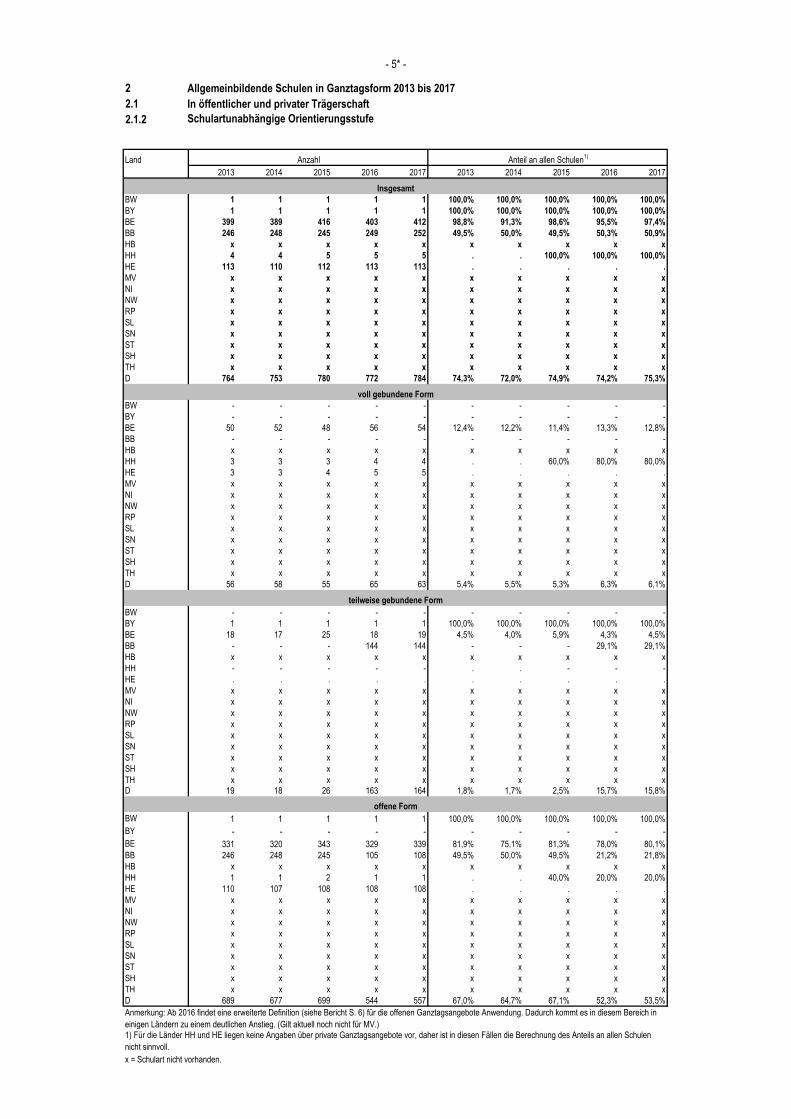
2 Allgemeinbildende Schulen in Ganztagsform 2013 bis 2017
2.1 In öffentlicher und privater Trägerschaft
2.1.2 Schulartunabhängige Orientierungsstufe
Land
2013 2014 2015 2016 2017 2013 2014 2015 2016 2017
BW 1 1 1 1 1 100,0% 100,0% 100,0% 100,0% 100,0%
BY 1 1 1 1 1 100,0% 100,0% 100,0% 100,0% 100,0%
BE 399 389 416 403 412 98,8% 91,3% 98,6% 95,5% 97,4%
BB 246 248 245 249 252 49,5% 50,0% 49,5% 50,3% 50,9%
HB x x x x x x x x x x
HH 4 4 5 5 5 . . 100,0% 100,0% 100,0%
HE 113 110 112 113 113 . . . . .
MV x x x x x x x x x x
NI x x x x x x x x x x
NW x x x x x x x x x x
RP x x x x x x x x x x
SL x x x x x x x x x x
SN x x x x x x x x x x
ST x x x x x x x x x x
SH x x x x x x x x x x
TH x x x x x x x x x x
D 764 753 780 772 784 74,3% 72,0% 74,9% 74,2% 75,3%
BW - - - - - - - - - -
BY - - - - - - - - - -
BE 50 52 48 56 54 12,4% 12,2% 11,4% 13,3% 12,8%
BB - - - - - - - - - -
HB x x x x x x x x x x
HH 3 3 3 4 4 . . 60,0% 80,0% 80,0%
HE 3 3 4 5 5 . . . . .
MV x x x x x x x x x x
NI x x x x x x x x x x
NW x x x x x x x x x x
RP x x x x x x x x x x
SL x x x x x x x x x x
SN x x x x x x x x x x
ST x x x x x x x x x x
SH x x x x x x x x x x
TH x x x x x x x x x x
D 56 58 55 65 63 5,4% 5,5% 5,3% 6,3% 6,1%
BW - - - - - - - - - -
BY 1 1 1 1 1 100,0% 100,0% 100,0% 100,0% 100,0%
BE 18 17 25 18 19 4,5% 4,0% 5,9% 4,3% 4,5%
BB - - - 144 144 - - - 29,1% 29,1%
HB x x x x x x x x x x
HH - - - - - . . - - -
HE . . . . . . . . . .
MV x x x x x x x x x x
NI x x x x x x x x x x
NW x x x x x x x x x x
RP x x x x x x x x x x
SL x x x x x x x x x x
SN x x x x x x x x x x
ST x x x x x x x x x x
SH x x x x x x x x x x
TH x x x x x x x x x x
D 19 18 26 163 164 1,8% 1,7% 2,5% 15,7% 15,8%
BW 1 1 1 1 1 100,0% 100,0% 100,0% 100,0% 100,0%
BY - - - - - - - - - -
BE 331 320 343 329 339 81,9% 75,1% 81,3% 78,0% 80,1%
BB 246 248 245 105 108 49,5% 50,0% 49,5% 21,2% 21,8%
HB x x x x x x x x x x
HH 1 1 2 1 1 . . 40,0% 20,0% 20,0%
HE 110 107 108 108 108 . . . . .
MV x x x x x x x x x x
NI x x x x x x x x x x
NW x x x x x x x x x x
RP x x x x x x x x x x
SL x x x x x x x x x x
SN x x x x x x x x x x
ST x x x x x x x x x x
SH x x x x x x x x x x
TH x x x x x x x x x x
D 689 677 699 544 557 67,0% 64,7% 67,1% 52,3% 53,5%
x = Schulart nicht vorhanden.
Anmerkung: Ab 2016 findet eine erweiterte Definition (siehe Bericht S. 6) für die offenen Ganztagsangebote Anwendung. Dadurch kommt es in diesem Bereich in
einigen Ländern zu einem deutlichen Anstieg. (Gilt aktuell noch nicht für MV.)
1) Für die Länder HH und HE liegen keine Angaben über private Ganztagsangebote vor, daher ist in diesen Fällen die Berechnung des Anteils an allen Schulen
nicht sinnvoll.
- 5* -
Anteil an allen Schulen1)
Anzahl
offene Form
teilweise gebundene Form
voll gebundene Form
Insgesamt
2 Allgemeinbildende Schulen in Ganztagsform 2013 bis 2017
2.1 In öffentlicher und privater Trägerschaft
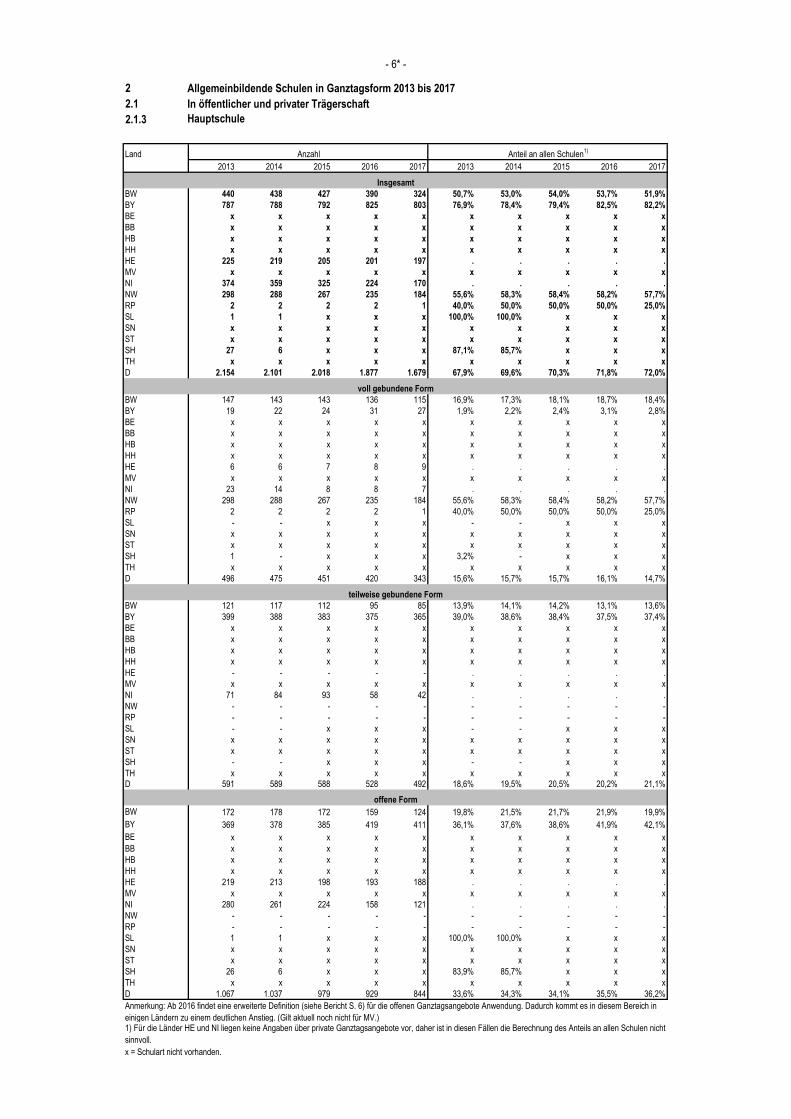
2.1.3 Hauptschule
Land
2013 2014 2015 2016 2017 2013 2014 2015 2016 2017
BW 440 438 427 390 324 50,7% 53,0% 54,0% 53,7% 51,9%
BY 787 788 792 825 803 76,9% 78,4% 79,4% 82,5% 82,2%
BE x x x x x x x x x x
BB x x x x x x x x x x
HB x x x x x x x x x x
HH x x x x x x x x x x
HE 225 219 205 201 197 . . . . .
MV x x x x x x x x x x
NI 374 359 325 224 170 . . . . .
NW 298 288 267 235 184 55,6% 58,3% 58,4% 58,2% 57,7%
RP 2 2 2 2 1 40,0% 50,0% 50,0% 50,0% 25,0%
SL 1 1 x x x 100,0% 100,0% x x x
SN x x x x x x x x x x
ST x x x x x x x x x x
SH 27 6 x x x 87,1% 85,7% x x x
TH x x x x x x x x x x
D 2.154 2.101 2.018 1.877 1.679 67,9% 69,6% 70,3% 71,8% 72,0%
BW 147 143 143 136 115 16,9% 17,3% 18,1% 18,7% 18,4%
BY 19 22 24 31 27 1,9% 2,2% 2,4% 3,1% 2,8%
BE x x x x x x x x x x
BB x x x x x x x x x x
HB x x x x x x x x x x
HH x x x x x x x x x x
HE 6 6 7 8 9 . . . . .
MV x x x x x x x x x x
NI 23 14 8 8 7 . . . . .
NW 298 288 267 235 184 55,6% 58,3% 58,4% 58,2% 57,7%
RP 2 2 2 2 1 40,0% 50,0% 50,0% 50,0% 25,0%
SL - - x x x - - x x x
SN x x x x x x x x x x
ST x x x x x x x x x x
SH 1 - x x x 3,2% - x x x
TH x x x x x x x x x x
D 496 475 451 420 343 15,6% 15,7% 15,7% 16,1% 14,7%
BW 121 117 112 95 85 13,9% 14,1% 14,2% 13,1% 13,6%
BY 399 388 383 375 365 39,0% 38,6% 38,4% 37,5% 37,4%
BE x x x x x x x x x x
BB x x x x x x x x x x
HB x x x x x x x x x x
HH x x x x x x x x x x
HE - - - - - . . . . .
MV x x x x x x x x x x
NI 71 84 93 58 42 . . . . .
NW - - - - - - - - - -
RP - - - - - - - - - -
SL - - x x x - - x x x
SN x x x x x x x x x x
ST x x x x x x x x x x
SH - - x x x - - x x x
TH x x x x x x x x x x
D 591 589 588 528 492 18,6% 19,5% 20,5% 20,2% 21,1%
BW 172 178 172 159 124 19,8% 21,5% 21,7% 21,9% 19,9%
BY 369 378 385 419 411 36,1% 37,6% 38,6% 41,9% 42,1%
BE x x x x x x x x x x
BB x x x x x x x x x x
HB x x x x x x x x x x
HH x x x x x x x x x x
HE 219 213 198 193 188 . . . . .
MV x x x x x x x x x x
NI 280 261 224 158 121 . . . . .
NW - - - - - - - - - -
RP - - - - - - - - - -
SL 1 1 x x x 100,0% 100,0% x x x
SN x x x x x x x x x x
ST x x x x x x x x x x
SH 26 6 x x x 83,9% 85,7% x x x
TH x x x x x x x x x x
D 1.067 1.037 979 929 844 33,6% 34,3% 34,1% 35,5% 36,2%
x = Schulart nicht vorhanden.
Anmerkung: Ab 2016 findet eine erweiterte Definition (siehe Bericht S. 6) für die offenen Ganztagsangebote Anwendung. Dadurch kommt es in diesem Bereich in
einigen Ländern zu einem deutlichen Anstieg. (Gilt aktuell noch nicht für MV.)1) Für die Länder HE und NI liegen keine Angaben über private Ganztagsangebote vor, daher ist in diesen Fällen die Berechnung des Anteils an allen Schulen nicht
sinnvoll.
- 6* -
Anteil an allen Schulen1)
Anzahl
offene Form
teilweise gebundene Form
voll gebundene Form
Insgesamt
2 Allgemeinbildende Schulen in Ganztagsform 2013 bis 2017
2.1 In öffentlicher und privater Trägerschaft
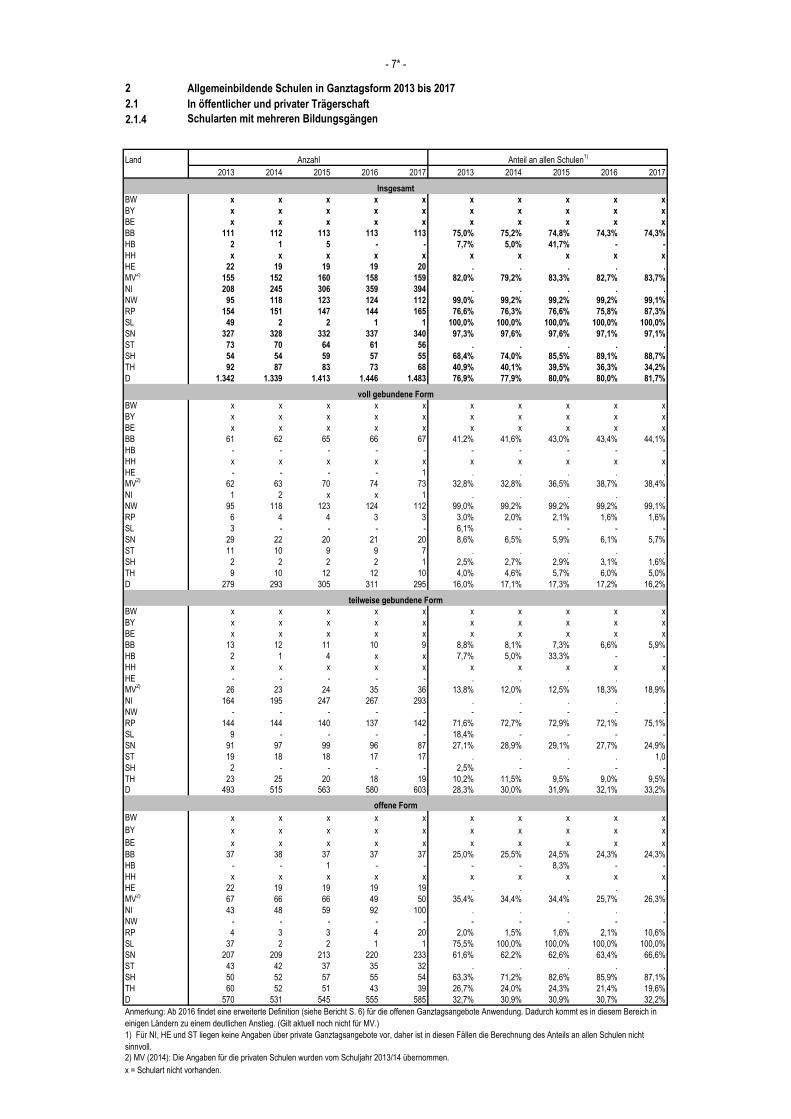
2.1.4 Schularten mit mehreren Bildungsgängen
Land
2013 2014 2015 2016 2017 2013 2014 2015 2016 2017
BW x x x x x x x x x x
BY x x x x x x x x x x
BE x x x x x x x x x x
BB 111 112 113 113 113 75,0% 75,2% 74,8% 74,3% 74,3%
HB 2 1 5 - - 7,7% 5,0% 41,7% - -
HH x x x x x x x x x x
HE 22 19 19 19 20 . . . . .
MV2)
155 152 160 158 159 82,0% 79,2% 83,3% 82,7% 83,7%
NI 208 245 306 359 394 . . . . .
NW 95 118 123 124 112 99,0% 99,2% 99,2% 99,2% 99,1%
RP 154 151 147 144 165 76,6% 76,3% 76,6% 75,8% 87,3%
SL 49 2 2 1 1 100,0% 100,0% 100,0% 100,0% 100,0%
SN 327 328 332 337 340 97,3% 97,6% 97,6% 97,1% 97,1%
ST 73 70 64 61 56 . . . . .
SH 54 54 59 57 55 68,4% 74,0% 85,5% 89,1% 88,7%
TH 92 87 83 73 68 40,9% 40,1% 39,5% 36,3% 34,2%
D 1.342 1.339 1.413 1.446 1.483 76,9% 77,9% 80,0% 80,0% 81,7%
BW x x x x x x x x x x
BY x x x x x x x x x x
BE x x x x x x x x x x
BB 61 62 65 66 67 41,2% 41,6% 43,0% 43,4% 44,1%
HB - - - - - - - - - -
HH x x x x x x x x x x
HE - - - - 1 . . . . .
MV2)
62 63 70 74 73 32,8% 32,8% 36,5% 38,7% 38,4%
NI 1 2 x x 1 . . . . .
NW 95 118 123 124 112 99,0% 99,2% 99,2% 99,2% 99,1%
RP 6 4 4 3 3 3,0% 2,0% 2,1% 1,6% 1,6%
SL 3 - - - - 6,1% - - - -
SN 29 22 20 21 20 8,6% 6,5% 5,9% 6,1% 5,7%
ST 11 10 9 9 7 . . . . .
SH 2 2 2 2 1 2,5% 2,7% 2,9% 3,1% 1,6%
TH 9 10 12 12 10 4,0% 4,6% 5,7% 6,0% 5,0%
D 279 293 305 311 295 16,0% 17,1% 17,3% 17,2% 16,2%
BW x x x x x x x x x x
BY x x x x x x x x x x
BE x x x x x x x x x x
BB 13 12 11 10 9 8,8% 8,1% 7,3% 6,6% 5,9%
HB 2 1 4 x x 7,7% 5,0% 33,3% - -
HH x x x x x x x x x x
HE - - - - - . . . . .
MV2)
26 23 24 35 36 13,8% 12,0% 12,5% 18,3% 18,9%
NI 164 195 247 267 293 . . . . .
NW - - - - - - - - - -
RP 144 144 140 137 142 71,6% 72,7% 72,9% 72,1% 75,1%
SL 9 - - - - 18,4% - - - -
SN 91 97 99 96 87 27,1% 28,9% 29,1% 27,7% 24,9%
ST 19 18 18 17 17 . . . . 1,0
SH 2 - - - - 2,5% - - - -
TH 23 25 20 18 19 10,2% 11,5% 9,5% 9,0% 9,5%
D 493 515 563 580 603 28,3% 30,0% 31,9% 32,1% 33,2%
BW x x x x x x x x x x
BY x x x x x x x x x x
BE x x x x x x x x x x
BB 37 38 37 37 37 25,0% 25,5% 24,5% 24,3% 24,3%
HB - - 1 - - - - 8,3% - -
HH x x x x x x x x x x
HE 22 19 19 19 19 . . . . .
MV2)
67 66 66 49 50 35,4% 34,4% 34,4% 25,7% 26,3%
NI 43 48 59 92 100 . . . . .
NW - - - - - - - - - -
RP 4 3 3 4 20 2,0% 1,5% 1,6% 2,1% 10,6%
SL 37 2 2 1 1 75,5% 100,0% 100,0% 100,0% 100,0%
SN 207 209 213 220 233 61,6% 62,2% 62,6% 63,4% 66,6%
ST 43 42 37 35 32 . . . . .
SH 50 52 57 55 54 63,3% 71,2% 82,6% 85,9% 87,1%
TH 60 52 51 43 39 26,7% 24,0% 24,3% 21,4% 19,6%
D 570 531 545 555 585 32,7% 30,9% 30,9% 30,7% 32,2%
2) MV (2014): Die Angaben für die privaten Schulen wurden vom Schuljahr 2013/14 übernommen.
x = Schulart nicht vorhanden.
Anmerkung: Ab 2016 findet eine erweiterte Definition (siehe Bericht S. 6) für die offenen Ganztagsangebote Anwendung. Dadurch kommt es in diesem Bereich in
einigen Ländern zu einem deutlichen Anstieg. (Gilt aktuell noch nicht für MV.)
1) Für NI, HE und ST liegen keine Angaben über private Ganztagsangebote vor, daher ist in diesen Fällen die Berechnung des Anteils an allen Schulen nicht
sinnvoll.
- 7* -
Anteil an allen Schulen1)
Anzahl
offene Form
teilweise gebundene Form
voll gebundene Form
Insgesamt
2 Allgemeinbildende Schulen in Ganztagsform 2013 bis 2017
2.1 In öffentlicher und privater Trägerschaft
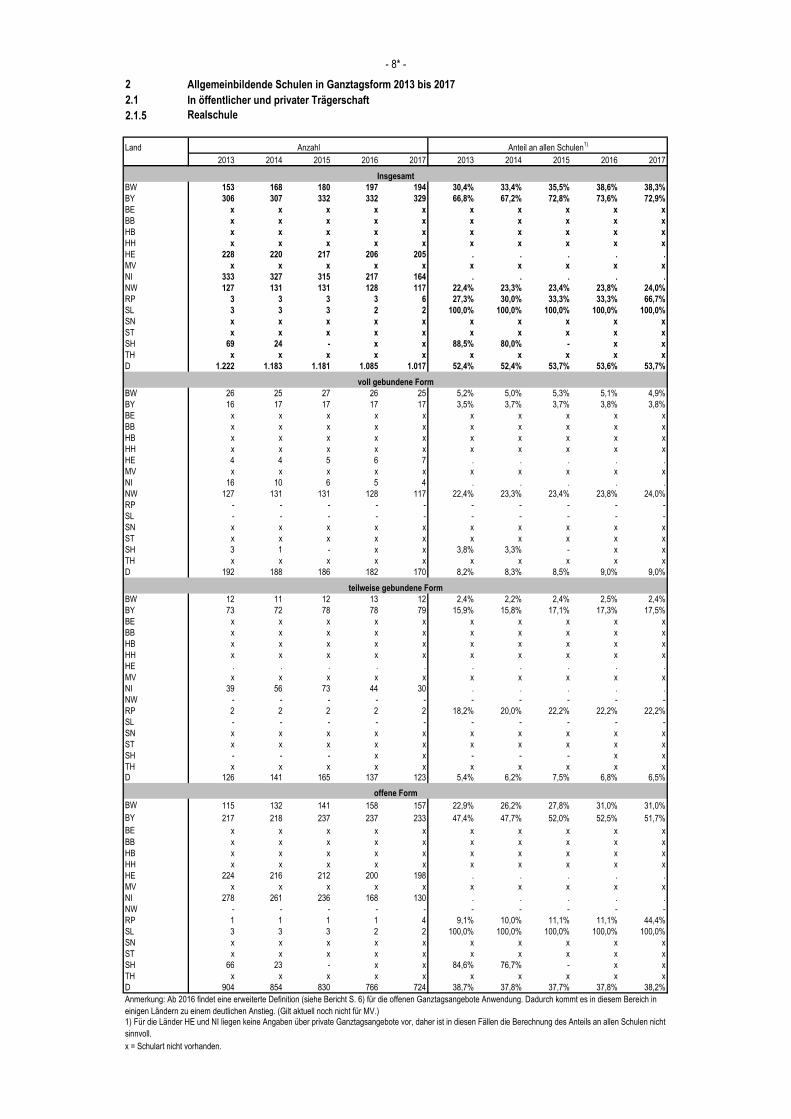
2.1.5 Realschule
Land
2013 2014 2015 2016 2017 2013 2014 2015 2016 2017
BW 153 168 180 197 194 30,4% 33,4% 35,5% 38,6% 38,3%
BY 306 307 332 332 329 66,8% 67,2% 72,8% 73,6% 72,9%
BE x x x x x x x x x x
BB x x x x x x x x x x
HB x x x x x x x x x x
HH x x x x x x x x x x
HE 228 220 217 206 205 . . . . .
MV x x x x x x x x x x
NI 333 327 315 217 164 . . . . .
NW 127 131 131 128 117 22,4% 23,3% 23,4% 23,8% 24,0%
RP 3 3 3 3 6 27,3% 30,0% 33,3% 33,3% 66,7%
SL 3 3 3 2 2 100,0% 100,0% 100,0% 100,0% 100,0%
SN x x x x x x x x x x
ST x x x x x x x x x x
SH 69 24 - x x 88,5% 80,0% - x x
TH x x x x x x x x x x
D 1.222 1.183 1.181 1.085 1.017 52,4% 52,4% 53,7% 53,6% 53,7%
BW 26 25 27 26 25 5,2% 5,0% 5,3% 5,1% 4,9%
BY 16 17 17 17 17 3,5% 3,7% 3,7% 3,8% 3,8%
BE x x x x x x x x x x
BB x x x x x x x x x x
HB x x x x x x x x x x
HH x x x x x x x x x x
HE 4 4 5 6 7 . . . . .
MV x x x x x x x x x x
NI 16 10 6 5 4 . . . . .
NW 127 131 131 128 117 22,4% 23,3% 23,4% 23,8% 24,0%
RP - - - - - - - - - -
SL - - - - - - - - - -
SN x x x x x x x x x x
ST x x x x x x x x x x
SH 3 1 - x x 3,8% 3,3% - x x
TH x x x x x x x x x x
D 192 188 186 182 170 8,2% 8,3% 8,5% 9,0% 9,0%
BW 12 11 12 13 12 2,4% 2,2% 2,4% 2,5% 2,4%
BY 73 72 78 78 79 15,9% 15,8% 17,1% 17,3% 17,5%
BE x x x x x x x x x x
BB x x x x x x x x x x
HB x x x x x x x x x x
HH x x x x x x x x x x
HE . . . . . . . . . .
MV x x x x x x x x x x
NI 39 56 73 44 30 . . . . .
NW - - - - - - - - - -
RP 2 2 2 2 2 18,2% 20,0% 22,2% 22,2% 22,2%
SL - - - - - - - - - -
SN x x x x x x x x x x
ST x x x x x x x x x x
SH - - - x x - - - x x
TH x x x x x x x x x x
D 126 141 165 137 123 5,4% 6,2% 7,5% 6,8% 6,5%
BW 115 132 141 158 157 22,9% 26,2% 27,8% 31,0% 31,0%
BY 217 218 237 237 233 47,4% 47,7% 52,0% 52,5% 51,7%
BE x x x x x x x x x x
BB x x x x x x x x x x
HB x x x x x x x x x x
HH x x x x x x x x x x
HE 224 216 212 200 198 . . . . .
MV x x x x x x x x x x
NI 278 261 236 168 130 . . . . .
NW - - - - - - - - - -
RP 1 1 1 1 4 9,1% 10,0% 11,1% 11,1% 44,4%
SL 3 3 3 2 2 100,0% 100,0% 100,0% 100,0% 100,0%
SN x x x x x x x x x x
ST x x x x x x x x x x
SH 66 23 - x x 84,6% 76,7% - x x
TH x x x x x x x x x x
D 904 854 830 766 724 38,7% 37,8% 37,7% 37,8% 38,2%
x = Schulart nicht vorhanden.
Anmerkung: Ab 2016 findet eine erweiterte Definition (siehe Bericht S. 6) für die offenen Ganztagsangebote Anwendung. Dadurch kommt es in diesem Bereich in
einigen Ländern zu einem deutlichen Anstieg. (Gilt aktuell noch nicht für MV.)
1) Für die Länder HE und NI liegen keine Angaben über private Ganztagsangebote vor, daher ist in diesen Fällen die Berechnung des Anteils an allen Schulen nicht
sinnvoll.
- 8* -
Anteil an allen Schulen1)
Anzahl
offene Form
teilweise gebundene Form
voll gebundene Form
Insgesamt
2 Allgemeinbildende Schulen in Ganztagsform 2013 bis 2017
2.1 In öffentlicher und privater Trägerschaft
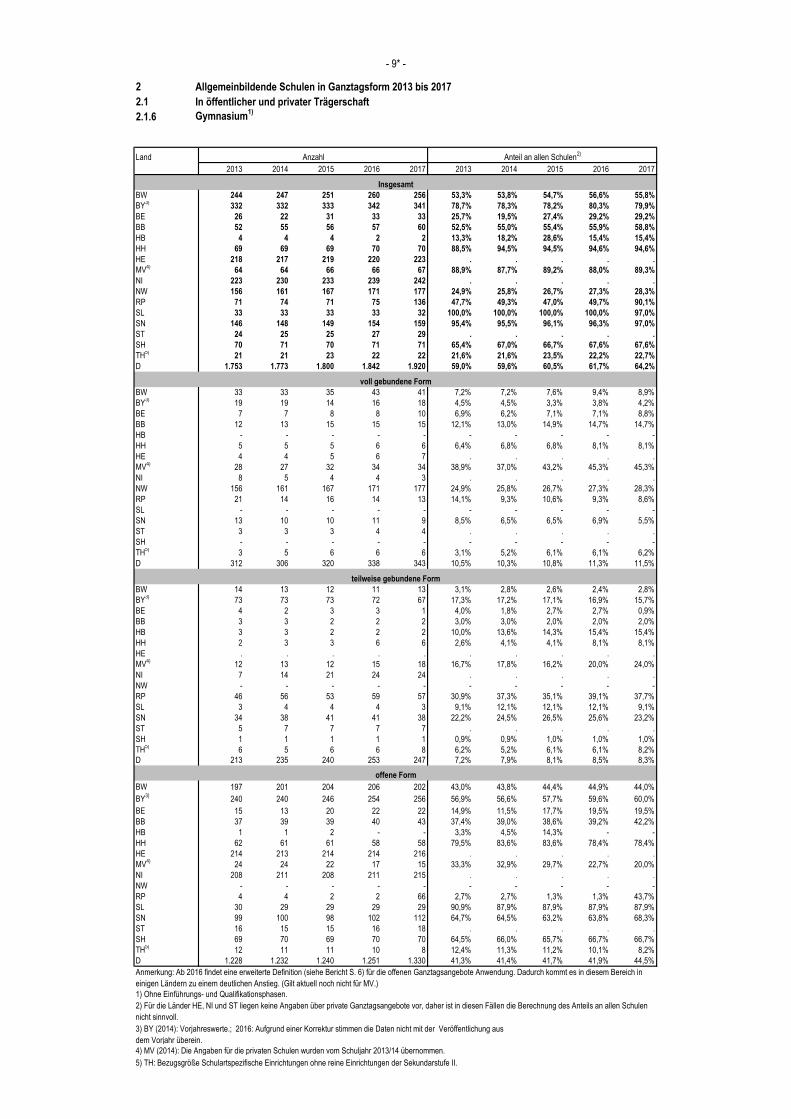
2.1.6 Gymnasium1)
Land
2013 2014 2015 2016 2017 2013 2014 2015 2016 2017
BW 244 247 251 260 256 53,3% 53,8% 54,7% 56,6% 55,8%
BY3)
332 332 333 342 341 78,7% 78,3% 78,2% 80,3% 79,9%
BE 26 22 31 33 33 25,7% 19,5% 27,4% 29,2% 29,2%
BB 52 55 56 57 60 52,5% 55,0% 55,4% 55,9% 58,8%
HB 4 4 4 2 2 13,3% 18,2% 28,6% 15,4% 15,4%
HH 69 69 69 70 70 88,5% 94,5% 94,5% 94,6% 94,6%
HE 218 217 219 220 223 . . . . .
MV4)
64 64 66 66 67 88,9% 87,7% 89,2% 88,0% 89,3%
NI 223 230 233 239 242 . . . . .
NW 156 161 167 171 177 24,9% 25,8% 26,7% 27,3% 28,3%
RP 71 74 71 75 136 47,7% 49,3% 47,0% 49,7% 90,1%
SL 33 33 33 33 32 100,0% 100,0% 100,0% 100,0% 97,0%
SN 146 148 149 154 159 95,4% 95,5% 96,1% 96,3% 97,0%
ST 24 25 25 27 29 . . . . .
SH 70 71 70 71 71 65,4% 67,0% 66,7% 67,6% 67,6%
TH5)
21 21 23 22 22 21,6% 21,6% 23,5% 22,2% 22,7%
D 1.753 1.773 1.800 1.842 1.920 59,0% 59,6% 60,5% 61,7% 64,2%
BW 33 33 35 43 41 7,2% 7,2% 7,6% 9,4% 8,9%
BY3)
19 19 14 16 18 4,5% 4,5% 3,3% 3,8% 4,2%
BE 7 7 8 8 10 6,9% 6,2% 7,1% 7,1% 8,8%
BB 12 13 15 15 15 12,1% 13,0% 14,9% 14,7% 14,7%
HB - - - - - - - - - -
HH 5 5 5 6 6 6,4% 6,8% 6,8% 8,1% 8,1%
HE 4 4 5 6 7 . . . . .
MV4)
28 27 32 34 34 38,9% 37,0% 43,2% 45,3% 45,3%
NI 8 5 4 4 3 . . . . .
NW 156 161 167 171 177 24,9% 25,8% 26,7% 27,3% 28,3%
RP 21 14 16 14 13 14,1% 9,3% 10,6% 9,3% 8,6%
SL - - - - - - - - - -
SN 13 10 10 11 9 8,5% 6,5% 6,5% 6,9% 5,5%
ST 3 3 3 4 4 . . . . .
SH - - - - - - - - - -
TH5)
3 5 6 6 6 3,1% 5,2% 6,1% 6,1% 6,2%
D 312 306 320 338 343 10,5% 10,3% 10,8% 11,3% 11,5%
BW 14 13 12 11 13 3,1% 2,8% 2,6% 2,4% 2,8%
BY3)
73 73 73 72 67 17,3% 17,2% 17,1% 16,9% 15,7%
BE 4 2 3 3 1 4,0% 1,8% 2,7% 2,7% 0,9%
BB 3 3 2 2 2 3,0% 3,0% 2,0% 2,0% 2,0%
HB 3 3 2 2 2 10,0% 13,6% 14,3% 15,4% 15,4%
HH 2 3 3 6 6 2,6% 4,1% 4,1% 8,1% 8,1%
HE . . . . . . . . . .
MV4)
12 13 12 15 18 16,7% 17,8% 16,2% 20,0% 24,0%
NI 7 14 21 24 24 . . . . .
NW - - - - - - - - - -
RP 46 56 53 59 57 30,9% 37,3% 35,1% 39,1% 37,7%
SL 3 4 4 4 3 9,1% 12,1% 12,1% 12,1% 9,1%
SN 34 38 41 41 38 22,2% 24,5% 26,5% 25,6% 23,2%
ST 5 7 7 7 7 . . . . .
SH 1 1 1 1 1 0,9% 0,9% 1,0% 1,0% 1,0%
TH5)
6 5 6 6 8 6,2% 5,2% 6,1% 6,1% 8,2%
D 213 235 240 253 247 7,2% 7,9% 8,1% 8,5% 8,3%
BW 197 201 204 206 202 43,0% 43,8% 44,4% 44,9% 44,0%
BY3)
240 240 246 254 256 56,9% 56,6% 57,7% 59,6% 60,0%
BE 15 13 20 22 22 14,9% 11,5% 17,7% 19,5% 19,5%
BB 37 39 39 40 43 37,4% 39,0% 38,6% 39,2% 42,2%
HB 1 1 2 - - 3,3% 4,5% 14,3% - -
HH 62 61 61 58 58 79,5% 83,6% 83,6% 78,4% 78,4%
HE 214 213 214 214 216 . . . . .
MV4)
24 24 22 17 15 33,3% 32,9% 29,7% 22,7% 20,0%
NI 208 211 208 211 215 . . . . .
NW - - - - - - - - - -
RP 4 4 2 2 66 2,7% 2,7% 1,3% 1,3% 43,7%
SL 30 29 29 29 29 90,9% 87,9% 87,9% 87,9% 87,9%
SN 99 100 98 102 112 64,7% 64,5% 63,2% 63,8% 68,3%
ST 16 15 15 16 18 . . . . .
SH 69 70 69 70 70 64,5% 66,0% 65,7% 66,7% 66,7%
TH5)
12 11 11 10 8 12,4% 11,3% 11,2% 10,1% 8,2%
D 1.228 1.232 1.240 1.251 1.330 41,3% 41,4% 41,7% 41,9% 44,5%
4) MV (2014): Die Angaben für die privaten Schulen wurden vom Schuljahr 2013/14 übernommen.
5) TH: Bezugsgröße Schulartspezifische Einrichtungen ohne reine Einrichtungen der Sekundarstufe II.
- 9* -
3) BY (2014): Vorjahreswerte.; 2016: Aufgrund einer Korrektur stimmen die Daten nicht mit der Veröffentlichung aus
dem Vorjahr überein.
1) Ohne Einführungs- und Qualifikationsphasen.
Anteil an allen Schulen2)
Anzahl
offene Form
teilweise gebundene Form
voll gebundene Form
Insgesamt
Anmerkung: Ab 2016 findet eine erweiterte Definition (siehe Bericht S. 6) für die offenen Ganztagsangebote Anwendung. Dadurch kommt es in diesem Bereich in
einigen Ländern zu einem deutlichen Anstieg. (Gilt aktuell noch nicht für MV.)
2) Für die Länder HE, NI und ST liegen keine Angaben über private Ganztagsangebote vor, daher ist in diesen Fällen die Berechnung des Anteils an allen Schulen
nicht sinnvoll.
2 Allgemeinbildende Schulen in Ganztagsform 2013 bis 2017
2.1 In öffentlicher und privater Trägerschaft
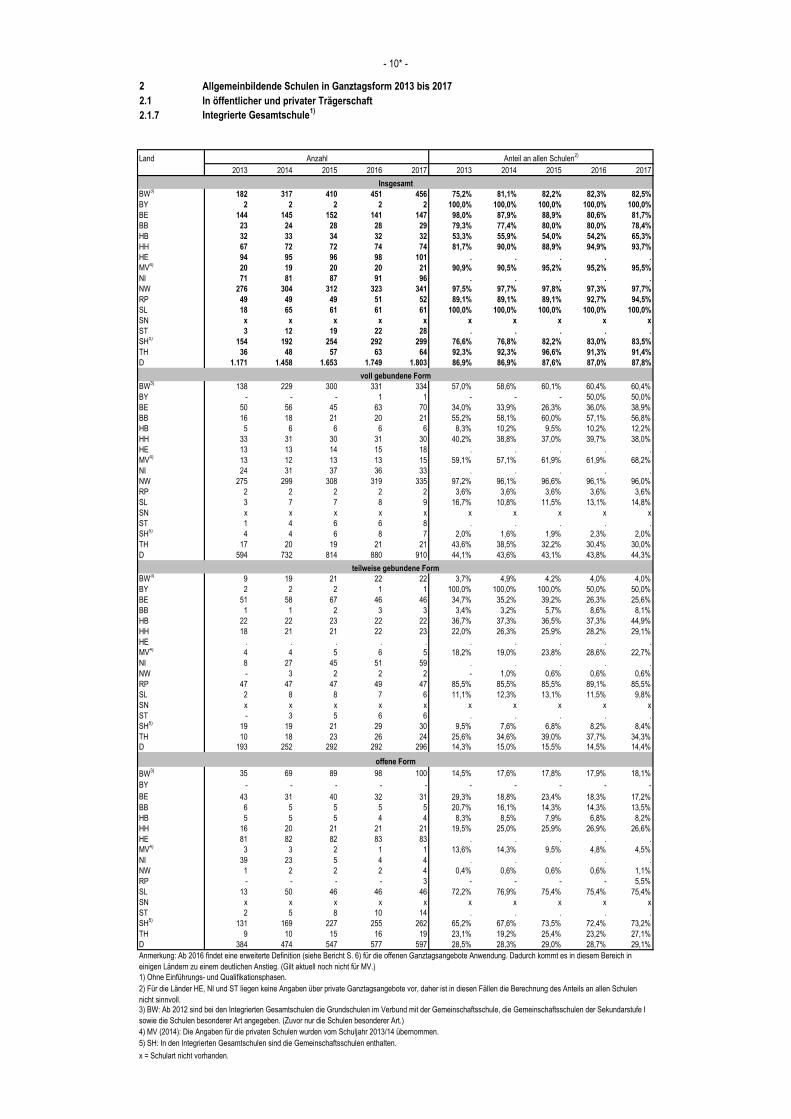
2.1.7 Integrierte Gesamtschule1)
Land
2013 2014 2015 2016 2017 2013 2014 2015 2016 2017
BW3)
182 317 410 451 456 75,2% 81,1% 82,2% 82,3% 82,5%
BY 2 2 2 2 2 100,0% 100,0% 100,0% 100,0% 100,0%
BE 144 145 152 141 147 98,0% 87,9% 88,9% 80,6% 81,7%
BB 23 24 28 28 29 79,3% 77,4% 80,0% 80,0% 78,4%
HB 32 33 34 32 32 53,3% 55,9% 54,0% 54,2% 65,3%
HH 67 72 72 74 74 81,7% 90,0% 88,9% 94,9% 93,7%
HE 94 95 96 98 101 . . . . .
MV4)
20 19 20 20 21 90,9% 90,5% 95,2% 95,2% 95,5%
NI 71 81 87 91 96 . . . . .
NW 276 304 312 323 341 97,5% 97,7% 97,8% 97,3% 97,7%
RP 49 49 49 51 52 89,1% 89,1% 89,1% 92,7% 94,5%
SL 18 65 61 61 61 100,0% 100,0% 100,0% 100,0% 100,0%
SN x x x x x x x x x x
ST 3 12 19 22 28 . . . . .
SH5)
154 192 254 292 299 76,6% 76,8% 82,2% 83,0% 83,5%
TH 36 48 57 63 64 92,3% 92,3% 96,6% 91,3% 91,4%
D 1.171 1.458 1.653 1.749 1.803 86,9% 86,9% 87,6% 87,0% 87,8%
BW3)
138 229 300 331 334 57,0% 58,6% 60,1% 60,4% 60,4%
BY - - - 1 1 - - - 50,0% 50,0%
BE 50 56 45 63 70 34,0% 33,9% 26,3% 36,0% 38,9%
BB 16 18 21 20 21 55,2% 58,1% 60,0% 57,1% 56,8%
HB 5 6 6 6 6 8,3% 10,2% 9,5% 10,2% 12,2%
HH 33 31 30 31 30 40,2% 38,8% 37,0% 39,7% 38,0%
HE 13 13 14 15 18 . . . . .
MV4)
13 12 13 13 15 59,1% 57,1% 61,9% 61,9% 68,2%
NI 24 31 37 36 33 . . . . .
NW 275 299 308 319 335 97,2% 96,1% 96,6% 96,1% 96,0%
RP 2 2 2 2 2 3,6% 3,6% 3,6% 3,6% 3,6%
SL 3 7 7 8 9 16,7% 10,8% 11,5% 13,1% 14,8%
SN x x x x x x x x x x
ST 1 4 6 6 8 . . . . .
SH5)
4 4 6 8 7 2,0% 1,6% 1,9% 2,3% 2,0%
TH 17 20 19 21 21 43,6% 38,5% 32,2% 30,4% 30,0%
D 594 732 814 880 910 44,1% 43,6% 43,1% 43,8% 44,3%
BW3)
9 19 21 22 22 3,7% 4,9% 4,2% 4,0% 4,0%
BY 2 2 2 1 1 100,0% 100,0% 100,0% 50,0% 50,0%
BE 51 58 67 46 46 34,7% 35,2% 39,2% 26,3% 25,6%
BB 1 1 2 3 3 3,4% 3,2% 5,7% 8,6% 8,1%
HB 22 22 23 22 22 36,7% 37,3% 36,5% 37,3% 44,9%
HH 18 21 21 22 23 22,0% 26,3% 25,9% 28,2% 29,1%
HE . . . . . . . . . .
MV4)
4 4 5 6 5 18,2% 19,0% 23,8% 28,6% 22,7%
NI 8 27 45 51 59 . . . . .
NW - 3 2 2 2 - 1,0% 0,6% 0,6% 0,6%
RP 47 47 47 49 47 85,5% 85,5% 85,5% 89,1% 85,5%
SL 2 8 8 7 6 11,1% 12,3% 13,1% 11,5% 9,8%
SN x x x x x x x x x x
ST - 3 5 6 6 . . . . .
SH5)
19 19 21 29 30 9,5% 7,6% 6,8% 8,2% 8,4%
TH 10 18 23 26 24 25,6% 34,6% 39,0% 37,7% 34,3%
D 193 252 292 292 296 14,3% 15,0% 15,5% 14,5% 14,4%
BW3) 35 69 89 98 100 14,5% 17,6% 17,8% 17,9% 18,1%
BY - - - - - - - - - -
BE 43 31 40 32 31 29,3% 18,8% 23,4% 18,3% 17,2%
BB 6 5 5 5 5 20,7% 16,1% 14,3% 14,3% 13,5%
HB 5 5 5 4 4 8,3% 8,5% 7,9% 6,8% 8,2%
HH 16 20 21 21 21 19,5% 25,0% 25,9% 26,9% 26,6%
HE 81 82 82 83 83 . . . . .
MV4)
3 3 2 1 1 13,6% 14,3% 9,5% 4,8% 4,5%
NI 39 23 5 4 4 . . . . .
NW 1 2 2 2 4 0,4% 0,6% 0,6% 0,6% 1,1%
RP - - - - 3 - - - - 5,5%
SL 13 50 46 46 46 72,2% 76,9% 75,4% 75,4% 75,4%
SN x x x x x x x x x x
ST 2 5 8 10 14 . . . . .
SH5)
131 169 227 255 262 65,2% 67,6% 73,5% 72,4% 73,2%
TH 9 10 15 16 19 23,1% 19,2% 25,4% 23,2% 27,1%
D 384 474 547 577 597 28,5% 28,3% 29,0% 28,7% 29,1%
4) MV (2014): Die Angaben für die privaten Schulen wurden vom Schuljahr 2013/14 übernommen.
x = Schulart nicht vorhanden.
Insgesamt
- 10* -
5) SH: In den Integrierten Gesamtschulen sind die Gemeinschaftsschulen enthalten.
1) Ohne Einführungs- und Qualifikationsphasen.
Anteil an allen Schulen2)
Anzahl
offene Form
teilweise gebundene Form
voll gebundene Form
Anmerkung: Ab 2016 findet eine erweiterte Definition (siehe Bericht S. 6) für die offenen Ganztagsangebote Anwendung. Dadurch kommt es in diesem Bereich in
einigen Ländern zu einem deutlichen Anstieg. (Gilt aktuell noch nicht für MV.)
2) Für die Länder HE, NI und ST liegen keine Angaben über private Ganztagsangebote vor, daher ist in diesen Fällen die Berechnung des Anteils an allen Schulen
nicht sinnvoll. 3) BW: Ab 2012 sind bei den Integrierten Gesamtschulen die Grundschulen im Verbund mit der Gemeinschaftsschule, die Gemeinschaftsschulen der Sekundarstufe I
sowie die Schulen besonderer Art angegeben. (Zuvor nur die Schulen besonderer Art.)
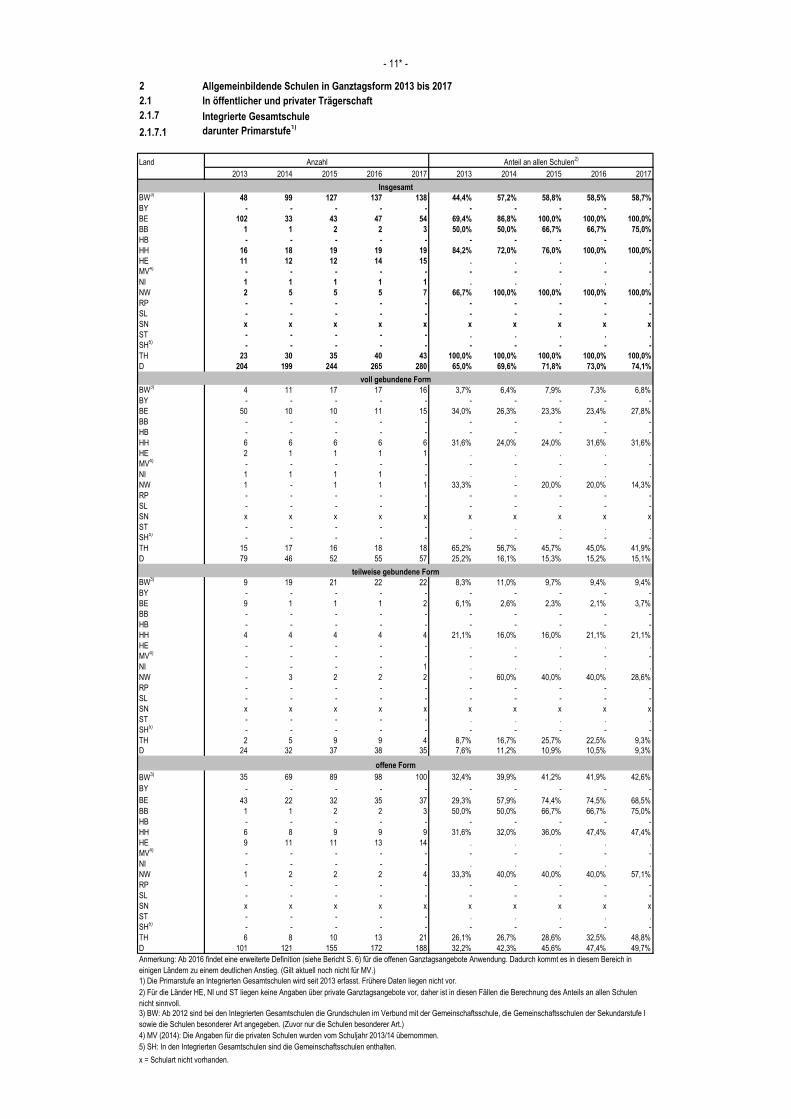
2 Allgemeinbildende Schulen in Ganztagsform 2013 bis 2017
2.1 In öffentlicher und privater Trägerschaft
2.1.7 Integrierte Gesamtschule
2.1.7.1 darunter Primarstufe1)
Land
2013 2014 2015 2016 2017 2013 2014 2015 2016 2017
BW3)
48 99 127 137 138 44,4% 57,2% 58,8% 58,5% 58,7%
BY - - - - - - - - - -
BE 102 33 43 47 54 69,4% 86,8% 100,0% 100,0% 100,0%
BB 1 1 2 2 3 50,0% 50,0% 66,7% 66,7% 75,0%
HB - - - - - - - - - -
HH 16 18 19 19 19 84,2% 72,0% 76,0% 100,0% 100,0%
HE 11 12 12 14 15 . . . . .
MV4)
- - - - - - - - - -
NI 1 1 1 1 1 . . . . .
NW 2 5 5 5 7 66,7% 100,0% 100,0% 100,0% 100,0%
RP - - - - - - - - - -
SL - - - - - - - - - -
SN x x x x x x x x x x
ST - - - - - . . . . .
SH5)
- - - - - - - - - -
TH 23 30 35 40 43 100,0% 100,0% 100,0% 100,0% 100,0%
D 204 199 244 265 280 65,0% 69,6% 71,8% 73,0% 74,1%
BW3)
4 11 17 17 16 3,7% 6,4% 7,9% 7,3% 6,8%
BY - - - - - - - - - -
BE 50 10 10 11 15 34,0% 26,3% 23,3% 23,4% 27,8%
BB - - - - - - - - - -
HB - - - - - - - - - -
HH 6 6 6 6 6 31,6% 24,0% 24,0% 31,6% 31,6%
HE 2 1 1 1 1 . . . . .
MV4)
- - - - - - - - - -
NI 1 1 1 1 - . . . . .
NW 1 - 1 1 1 33,3% - 20,0% 20,0% 14,3%
RP - - - - - - - - - -
SL - - - - - - - - - -
SN x x x x x x x x x x
ST - - - - - . . . . .
SH5)
- - - - - - - - - -
TH 15 17 16 18 18 65,2% 56,7% 45,7% 45,0% 41,9%
D 79 46 52 55 57 25,2% 16,1% 15,3% 15,2% 15,1%
BW3)
9 19 21 22 22 8,3% 11,0% 9,7% 9,4% 9,4%
BY - - - - - - - - - -
BE 9 1 1 1 2 6,1% 2,6% 2,3% 2,1% 3,7%
BB - - - - - - - - - -
HB - - - - - - - - - -
HH 4 4 4 4 4 21,1% 16,0% 16,0% 21,1% 21,1%
HE - - - - - . . . . .
MV4)
- - - - - - - - - -
NI - - - - 1 . . . . .
NW - 3 2 2 2 - 60,0% 40,0% 40,0% 28,6%
RP - - - - - - - - - -
SL - - - - - - - - - -
SN x x x x x x x x x x
ST - - - - - . . . . .
SH5)
- - - - - - - - - -
TH 2 5 9 9 4 8,7% 16,7% 25,7% 22,5% 9,3%
D 24 32 37 38 35 7,6% 11,2% 10,9% 10,5% 9,3%
BW3) 35 69 89 98 100 32,4% 39,9% 41,2% 41,9% 42,6%
BY - - - - - - - - - -
BE 43 22 32 35 37 29,3% 57,9% 74,4% 74,5% 68,5%
BB 1 1 2 2 3 50,0% 50,0% 66,7% 66,7% 75,0%
HB - - - - - - - - - -
HH 6 8 9 9 9 31,6% 32,0% 36,0% 47,4% 47,4%
HE 9 11 11 13 14 . . . . .
MV4)
- - - - - - - - - -
NI - - - - - . . . . .
NW 1 2 2 2 4 33,3% 40,0% 40,0% 40,0% 57,1%
RP - - - - - - - - - -
SL - - - - - - - - - -
SN x x x x x x x x x x
ST - - - - - . . . . .
SH5)
- - - - - - - - - -
TH 6 8 10 13 21 26,1% 26,7% 28,6% 32,5% 48,8%
D 101 121 155 172 188 32,2% 42,3% 45,6% 47,4% 49,7%
4) MV (2014): Die Angaben für die privaten Schulen wurden vom Schuljahr 2013/14 übernommen.
x = Schulart nicht vorhanden.
Insgesamt
- 11* -
5) SH: In den Integrierten Gesamtschulen sind die Gemeinschaftsschulen enthalten.
Anteil an allen Schulen2)
Anzahl
offene Form
teilweise gebundene Form
voll gebundene Form
Anmerkung: Ab 2016 findet eine erweiterte Definition (siehe Bericht S. 6) für die offenen Ganztagsangebote Anwendung. Dadurch kommt es in diesem Bereich in
einigen Ländern zu einem deutlichen Anstieg. (Gilt aktuell noch nicht für MV.)
2) Für die Länder HE, NI und ST liegen keine Angaben über private Ganztagsangebote vor, daher ist in diesen Fällen die Berechnung des Anteils an allen Schulen
nicht sinnvoll. 3) BW: Ab 2012 sind bei den Integrierten Gesamtschulen die Grundschulen im Verbund mit der Gemeinschaftsschule, die Gemeinschaftsschulen der Sekundarstufe I
sowie die Schulen besonderer Art angegeben. (Zuvor nur die Schulen besonderer Art.)
1) Die Primarstufe an Integrierten Gesamtschulen wird seit 2013 erfasst. Frühere Daten liegen nicht vor.
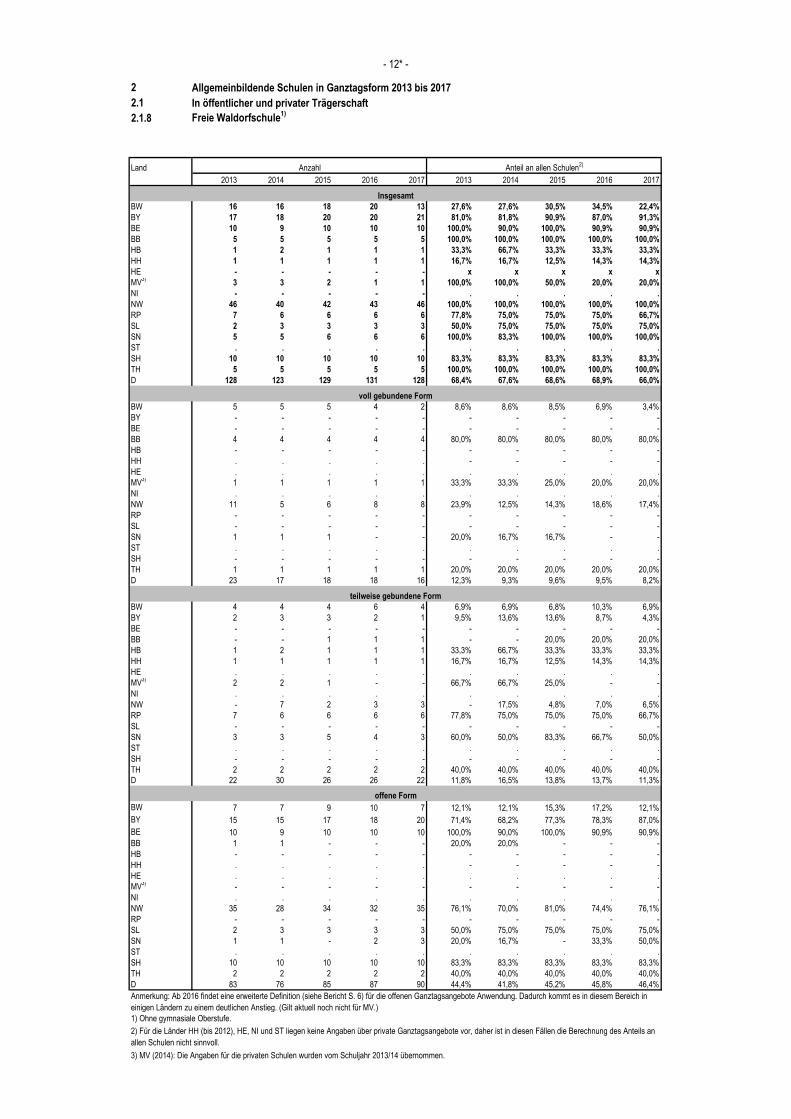
2 Allgemeinbildende Schulen in Ganztagsform 2013 bis 2017
2.1 In öffentlicher und privater Trägerschaft
2.1.8 Freie Waldorfschule1)
Land
2013 2014 2015 2016 2017 2013 2014 2015 2016 2017
BW 16 16 18 20 13 27,6% 27,6% 30,5% 34,5% 22,4%
BY 17 18 20 20 21 81,0% 81,8% 90,9% 87,0% 91,3%
BE 10 9 10 10 10 100,0% 90,0% 100,0% 90,9% 90,9%
BB 5 5 5 5 5 100,0% 100,0% 100,0% 100,0% 100,0%
HB 1 2 1 1 1 33,3% 66,7% 33,3% 33,3% 33,3%
HH 1 1 1 1 1 16,7% 16,7% 12,5% 14,3% 14,3%
HE - - - - - x x x x x
MV3)
3 3 2 1 1 100,0% 100,0% 50,0% 20,0% 20,0%
NI - - - - - . . . . .
NW 46 40 42 43 46 100,0% 100,0% 100,0% 100,0% 100,0%
RP 7 6 6 6 6 77,8% 75,0% 75,0% 75,0% 66,7%
SL 2 3 3 3 3 50,0% 75,0% 75,0% 75,0% 75,0%
SN 5 5 6 6 6 100,0% 83,3% 100,0% 100,0% 100,0%
ST . . . . . . . . . .
SH 10 10 10 10 10 83,3% 83,3% 83,3% 83,3% 83,3%
TH 5 5 5 5 5 100,0% 100,0% 100,0% 100,0% 100,0%
D 128 123 129 131 128 68,4% 67,6% 68,6% 68,9% 66,0%
BW 5 5 5 4 2 8,6% 8,6% 8,5% 6,9% 3,4%
BY - - - - - - - - - -
BE - - - - - - - - - -
BB 4 4 4 4 4 80,0% 80,0% 80,0% 80,0% 80,0%
HB - - - - - - - - - -
HH . . . . . - - - - -
HE . . . . . . . . . .
MV3)
1 1 1 1 1 33,3% 33,3% 25,0% 20,0% 20,0%
NI . . . . . . . . . .
NW 11 5 6 8 8 23,9% 12,5% 14,3% 18,6% 17,4%
RP - - - - - - - - - -
SL - - - - - - - - - -
SN 1 1 1 - - 20,0% 16,7% 16,7% - -
ST . . . . . . . . . .
SH - - - - - - - - - -
TH 1 1 1 1 1 20,0% 20,0% 20,0% 20,0% 20,0%
D 23 17 18 18 16 12,3% 9,3% 9,6% 9,5% 8,2%
BW 4 4 4 6 4 6,9% 6,9% 6,8% 10,3% 6,9%
BY 2 3 3 2 1 9,5% 13,6% 13,6% 8,7% 4,3%
BE - - - - - - - - - -
BB - - 1 1 1 - - 20,0% 20,0% 20,0%
HB 1 2 1 1 1 33,3% 66,7% 33,3% 33,3% 33,3%
HH 1 1 1 1 1 16,7% 16,7% 12,5% 14,3% 14,3%
HE . . . . . . . . . .
MV3)
2 2 1 - - 66,7% 66,7% 25,0% - -
NI . . . . . . . . . .
NW - 7 2 3 3 - 17,5% 4,8% 7,0% 6,5%
RP 7 6 6 6 6 77,8% 75,0% 75,0% 75,0% 66,7%
SL - - - - - - - - - -
SN 3 3 5 4 3 60,0% 50,0% 83,3% 66,7% 50,0%
ST . . . . . . . . . .
SH - - - - - - - - - -
TH 2 2 2 2 2 40,0% 40,0% 40,0% 40,0% 40,0%
D 22 30 26 26 22 11,8% 16,5% 13,8% 13,7% 11,3%
BW 7 7 9 10 7 12,1% 12,1% 15,3% 17,2% 12,1%
BY 15 15 17 18 20 71,4% 68,2% 77,3% 78,3% 87,0%
BE 10 9 10 10 10 100,0% 90,0% 100,0% 90,9% 90,9%
BB 1 1 - - - 20,0% 20,0% - - -
HB - - - - - - - - - -
HH . . . . . - - - - -
HE . . . . . . . . . .
MV3)
- - - - - - - - - -
NI . . . . . . . . . .
NW 35 28 34 32 35 76,1% 70,0% 81,0% 74,4% 76,1%
RP - - - - - - - - - -
SL 2 3 3 3 3 50,0% 75,0% 75,0% 75,0% 75,0%
SN 1 1 - 2 3 20,0% 16,7% - 33,3% 50,0%
ST . . . . . . . . . .
SH 10 10 10 10 10 83,3% 83,3% 83,3% 83,3% 83,3%
TH 2 2 2 2 2 40,0% 40,0% 40,0% 40,0% 40,0%
D 83 76 85 87 90 44,4% 41,8% 45,2% 45,8% 46,4%
3) MV (2014): Die Angaben für die privaten Schulen wurden vom Schuljahr 2013/14 übernommen.
2) Für die Länder HH (bis 2012), HE, NI und ST liegen keine Angaben über private Ganztagsangebote vor, daher ist in diesen Fällen die Berechnung des Anteils an
allen Schulen nicht sinnvoll.
- 12* -
1) Ohne gymnasiale Oberstufe.
Anteil an allen Schulen2)
Anzahl
offene Form
teilweise gebundene Form
voll gebundene Form
Insgesamt
Anmerkung: Ab 2016 findet eine erweiterte Definition (siehe Bericht S. 6) für die offenen Ganztagsangebote Anwendung. Dadurch kommt es in diesem Bereich in
einigen Ländern zu einem deutlichen Anstieg. (Gilt aktuell noch nicht für MV.)
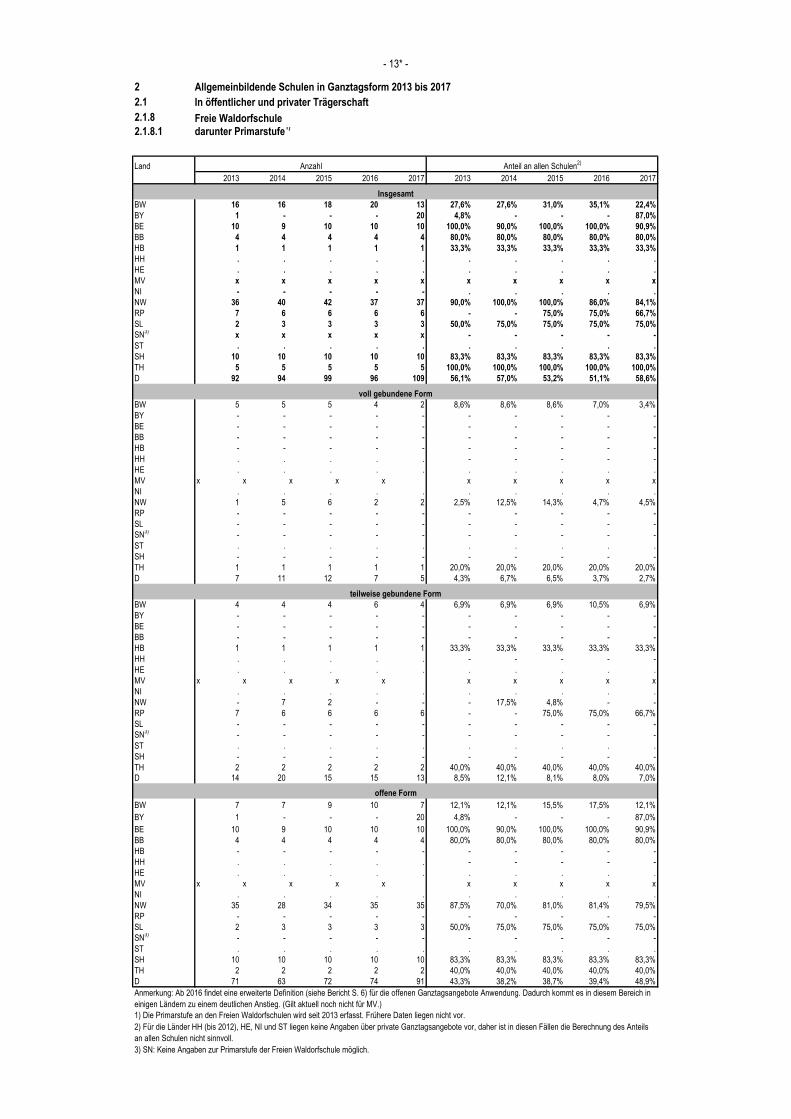
2 Allgemeinbildende Schulen in Ganztagsform 2013 bis 2017
2.1 In öffentlicher und privater Trägerschaft
2.1.8 Freie Waldorfschule2.1.8.1 darunter Primarstufe
1)
Land
2013 2014 2015 2016 2017 2013 2014 2015 2016 2017
BW 16 16 18 20 13 27,6% 27,6% 31,0% 35,1% 22,4%
BY 1 - - - 20 4,8% - - - 87,0%
BE 10 9 10 10 10 100,0% 90,0% 100,0% 100,0% 90,9%
BB 4 4 4 4 4 80,0% 80,0% 80,0% 80,0% 80,0%
HB 1 1 1 1 1 33,3% 33,3% 33,3% 33,3% 33,3%
HH . . . . . . . . . .
HE . . . . . . . . . .
MV x x x x x x x x x x
NI - - - - - . . . . .
NW 36 40 42 37 37 90,0% 100,0% 100,0% 86,0% 84,1%
RP 7 6 6 6 6 - - 75,0% 75,0% 66,7%
SL 2 3 3 3 3 50,0% 75,0% 75,0% 75,0% 75,0%
SN3)
x x x x x - - - - -
ST . . . . . . . . . .
SH 10 10 10 10 10 83,3% 83,3% 83,3% 83,3% 83,3%
TH 5 5 5 5 5 100,0% 100,0% 100,0% 100,0% 100,0%
D 92 94 99 96 109 56,1% 57,0% 53,2% 51,1% 58,6%
BW 5 5 5 4 2 8,6% 8,6% 8,6% 7,0% 3,4%
BY - - - - - - - - - -
BE - - - - - - - - - -
BB - - - - - - - - - -
HB - - - - - - - - - -
HH . . . . . - - - - -
HE . . . . . . . . . .
MV x x x x x x x x x x
NI . . . . . . . . . .
NW 1 5 6 2 2 2,5% 12,5% 14,3% 4,7% 4,5%
RP - - - - - - - - - -
SL - - - - - - - - - -
SN3)
- - - - - - - - - -
ST . . . . . . . . . .
SH - - - - - - - - - -
TH 1 1 1 1 1 20,0% 20,0% 20,0% 20,0% 20,0%
D 7 11 12 7 5 4,3% 6,7% 6,5% 3,7% 2,7%
BW 4 4 4 6 4 6,9% 6,9% 6,9% 10,5% 6,9%
BY - - - - - - - - - -
BE - - - - - - - - - -
BB - - - - - - - - - -
HB 1 1 1 1 1 33,3% 33,3% 33,3% 33,3% 33,3%
HH . . . . . - - - - -
HE . . . . . . . . . .
MV x x x x x x x x x x
NI . . . . . . . . . .
NW - 7 2 - - - 17,5% 4,8% - -
RP 7 6 6 6 6 - - 75,0% 75,0% 66,7%
SL - - - - - - - - - -
SN3)
- - - - - - - - - -
ST . . . . . . . . . .
SH - - - - - - - - - -
TH 2 2 2 2 2 40,0% 40,0% 40,0% 40,0% 40,0%
D 14 20 15 15 13 8,5% 12,1% 8,1% 8,0% 7,0%
BW 7 7 9 10 7 12,1% 12,1% 15,5% 17,5% 12,1%
BY 1 - - - 20 4,8% - - - 87,0%
BE 10 9 10 10 10 100,0% 90,0% 100,0% 100,0% 90,9%
BB 4 4 4 4 4 80,0% 80,0% 80,0% 80,0% 80,0%
HB - - - - - - - - - -
HH . . . . . - - - - -
HE . . . . . . . . . .
MV x x x x x x x x x x
NI . . . . . . . . . .
NW 35 28 34 35 35 87,5% 70,0% 81,0% 81,4% 79,5%
RP - - - - - - - - - -
SL 2 3 3 3 3 50,0% 75,0% 75,0% 75,0% 75,0%
SN3)
- - - - - - - - - -
ST . . . . . . . . . .
SH 10 10 10 10 10 83,3% 83,3% 83,3% 83,3% 83,3%
TH 2 2 2 2 2 40,0% 40,0% 40,0% 40,0% 40,0%
D 71 63 72 74 91 43,3% 38,2% 38,7% 39,4% 48,9%
3) SN: Keine Angaben zur Primarstufe der Freien Waldorfschule möglich.
Anmerkung: Ab 2016 findet eine erweiterte Definition (siehe Bericht S. 6) für die offenen Ganztagsangebote Anwendung. Dadurch kommt es in diesem Bereich in
einigen Ländern zu einem deutlichen Anstieg. (Gilt aktuell noch nicht für MV.)
2) Für die Länder HH (bis 2012), HE, NI und ST liegen keine Angaben über private Ganztagsangebote vor, daher ist in diesen Fällen die Berechnung des Anteils
an allen Schulen nicht sinnvoll.
1) Die Primarstufe an den Freien Waldorfschulen wird seit 2013 erfasst. Frühere Daten liegen nicht vor.
- 13* -
Anteil an allen Schulen2)
Anzahl
offene Form
teilweise gebundene Form
voll gebundene Form
Insgesamt
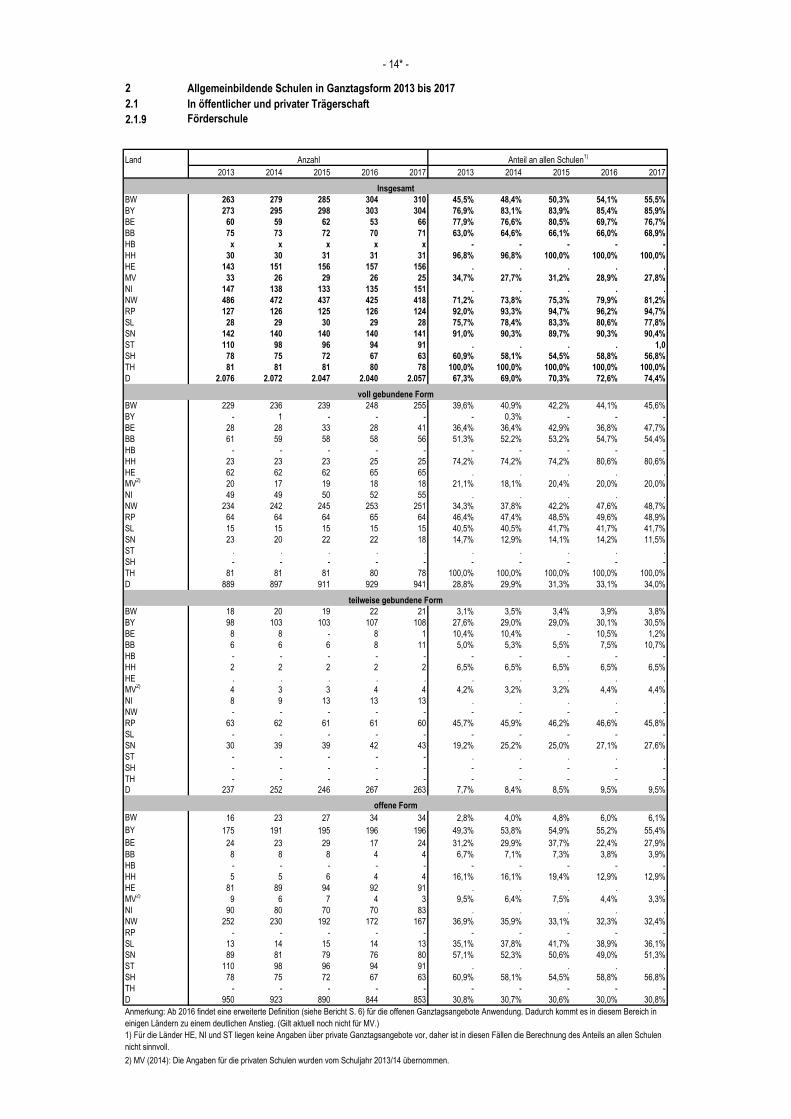
2 Allgemeinbildende Schulen in Ganztagsform 2013 bis 2017
2.1 In öffentlicher und privater Trägerschaft
2.1.9 Förderschule
Land
2013 2014 2015 2016 2017 2013 2014 2015 2016 2017
BW 263 279 285 304 310 45,5% 48,4% 50,3% 54,1% 55,5%
BY 273 295 298 303 304 76,9% 83,1% 83,9% 85,4% 85,9%
BE 60 59 62 53 66 77,9% 76,6% 80,5% 69,7% 76,7%
BB 75 73 72 70 71 63,0% 64,6% 66,1% 66,0% 68,9%
HB x x x x x - - - - -
HH 30 30 31 31 31 96,8% 96,8% 100,0% 100,0% 100,0%
HE 143 151 156 157 156 . . . . .
MV 33 26 29 26 25 34,7% 27,7% 31,2% 28,9% 27,8%
NI 147 138 133 135 151 . . . . .
NW 486 472 437 425 418 71,2% 73,8% 75,3% 79,9% 81,2%
RP 127 126 125 126 124 92,0% 93,3% 94,7% 96,2% 94,7%
SL 28 29 30 29 28 75,7% 78,4% 83,3% 80,6% 77,8%
SN 142 140 140 140 141 91,0% 90,3% 89,7% 90,3% 90,4%
ST 110 98 96 94 91 . . . . 1,0
SH 78 75 72 67 63 60,9% 58,1% 54,5% 58,8% 56,8%
TH 81 81 81 80 78 100,0% 100,0% 100,0% 100,0% 100,0%
D 2.076 2.072 2.047 2.040 2.057 67,3% 69,0% 70,3% 72,6% 74,4%
BW 229 236 239 248 255 39,6% 40,9% 42,2% 44,1% 45,6%
BY - 1 - - - - 0,3% - - -
BE 28 28 33 28 41 36,4% 36,4% 42,9% 36,8% 47,7%
BB 61 59 58 58 56 51,3% 52,2% 53,2% 54,7% 54,4%
HB - - - - - - - - - -
HH 23 23 23 25 25 74,2% 74,2% 74,2% 80,6% 80,6%
HE 62 62 62 65 65 . . . . .
MV2)
20 17 19 18 18 21,1% 18,1% 20,4% 20,0% 20,0%
NI 49 49 50 52 55 . . . . .
NW 234 242 245 253 251 34,3% 37,8% 42,2% 47,6% 48,7%
RP 64 64 64 65 64 46,4% 47,4% 48,5% 49,6% 48,9%
SL 15 15 15 15 15 40,5% 40,5% 41,7% 41,7% 41,7%
SN 23 20 22 22 18 14,7% 12,9% 14,1% 14,2% 11,5%
ST . . . . . . . . . .
SH - - - - - - - - - -
TH 81 81 81 80 78 100,0% 100,0% 100,0% 100,0% 100,0%
D 889 897 911 929 941 28,8% 29,9% 31,3% 33,1% 34,0%
BW 18 20 19 22 21 3,1% 3,5% 3,4% 3,9% 3,8%
BY 98 103 103 107 108 27,6% 29,0% 29,0% 30,1% 30,5%
BE 8 8 - 8 1 10,4% 10,4% - 10,5% 1,2%
BB 6 6 6 8 11 5,0% 5,3% 5,5% 7,5% 10,7%
HB - - - - - - - - - -
HH 2 2 2 2 2 6,5% 6,5% 6,5% 6,5% 6,5%
HE . . . . . . . . . .
MV2)
4 3 3 4 4 4,2% 3,2% 3,2% 4,4% 4,4%
NI 8 9 13 13 13 . . . . .
NW - - - - - - - - - -
RP 63 62 61 61 60 45,7% 45,9% 46,2% 46,6% 45,8%
SL - - - - - - - - - -
SN 30 39 39 42 43 19,2% 25,2% 25,0% 27,1% 27,6%
ST - - - - - . . . . .
SH - - - - - - - - - -
TH - - - - - - - - - -
D 237 252 246 267 263 7,7% 8,4% 8,5% 9,5% 9,5%
BW 16 23 27 34 34 2,8% 4,0% 4,8% 6,0% 6,1%
BY 175 191 195 196 196 49,3% 53,8% 54,9% 55,2% 55,4%
BE 24 23 29 17 24 31,2% 29,9% 37,7% 22,4% 27,9%
BB 8 8 8 4 4 6,7% 7,1% 7,3% 3,8% 3,9%
HB - - - - - - - - - -
HH 5 5 6 4 4 16,1% 16,1% 19,4% 12,9% 12,9%
HE 81 89 94 92 91 . . . . .
MV2)
9 6 7 4 3 9,5% 6,4% 7,5% 4,4% 3,3%
NI 90 80 70 70 83 . . . . .
NW 252 230 192 172 167 36,9% 35,9% 33,1% 32,3% 32,4%
RP - - - - - - - - - -
SL 13 14 15 14 13 35,1% 37,8% 41,7% 38,9% 36,1%
SN 89 81 79 76 80 57,1% 52,3% 50,6% 49,0% 51,3%
ST 110 98 96 94 91 . . . . .
SH 78 75 72 67 63 60,9% 58,1% 54,5% 58,8% 56,8%
TH - - - - - - - - - -
D 950 923 890 844 853 30,8% 30,7% 30,6% 30,0% 30,8%
2) MV (2014): Die Angaben für die privaten Schulen wurden vom Schuljahr 2013/14 übernommen.
Anmerkung: Ab 2016 findet eine erweiterte Definition (siehe Bericht S. 6) für die offenen Ganztagsangebote Anwendung. Dadurch kommt es in diesem Bereich in
einigen Ländern zu einem deutlichen Anstieg. (Gilt aktuell noch nicht für MV.)
1) Für die Länder HE, NI und ST liegen keine Angaben über private Ganztagsangebote vor, daher ist in diesen Fällen die Berechnung des Anteils an allen Schulen
nicht sinnvoll.
- 14* -
Anteil an allen Schulen1)
Anzahl
offene Form
teilweise gebundene Form
voll gebundene Form
Insgesamt
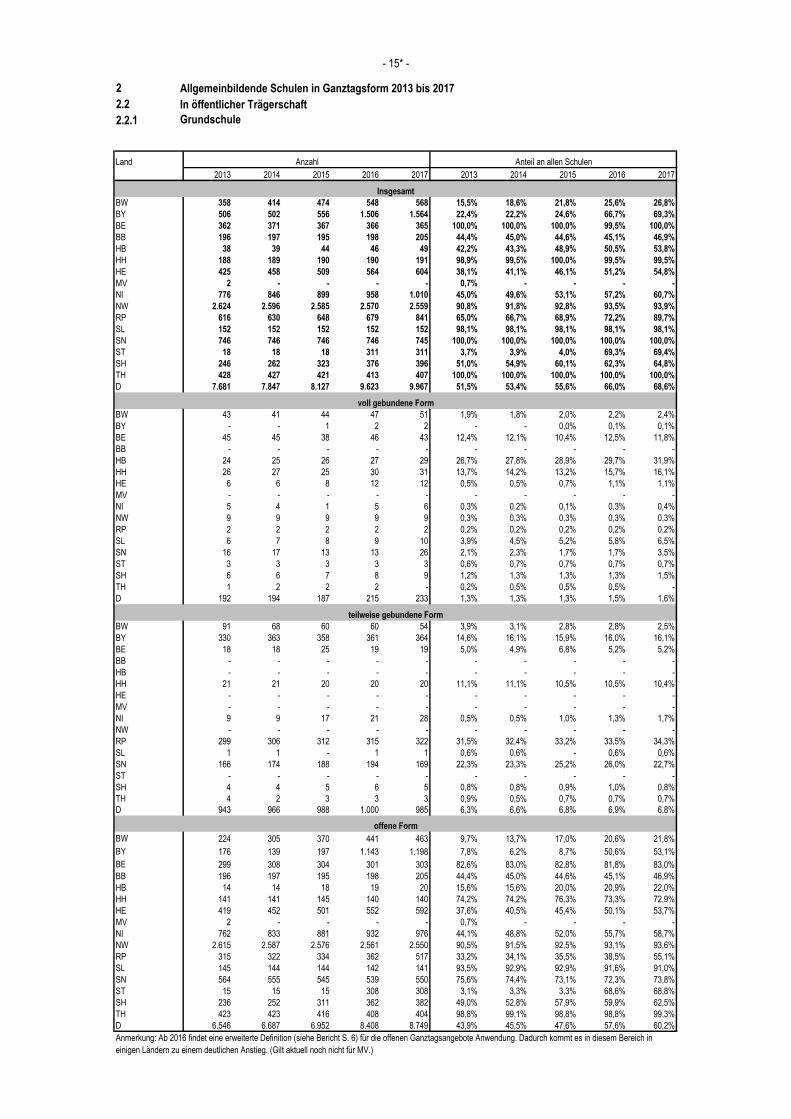
2 Allgemeinbildende Schulen in Ganztagsform 2013 bis 2017
2.2 In öffentlicher Trägerschaft
2.2.1 Grundschule
Land
2013 2014 2015 2016 2017 2013 2014 2015 2016 2017
BW 358 414 474 548 568 15,5% 18,6% 21,8% 25,6% 26,8%
BY 506 502 556 1.506 1.564 22,4% 22,2% 24,6% 66,7% 69,3%
BE 362 371 367 366 365 100,0% 100,0% 100,0% 99,5% 100,0%
BB 196 197 195 198 205 44,4% 45,0% 44,6% 45,1% 46,9%
HB 38 39 44 46 49 42,2% 43,3% 48,9% 50,5% 53,8%
HH 188 189 190 190 191 98,9% 99,5% 100,0% 99,5% 99,5%
HE 425 458 509 564 604 38,1% 41,1% 46,1% 51,2% 54,8%
MV 2 - - - - 0,7% - - - -
NI 776 846 899 958 1.010 45,0% 49,6% 53,1% 57,2% 60,7%
NW 2.624 2.596 2.585 2.570 2.559 90,8% 91,8% 92,8% 93,5% 93,9%
RP 616 630 648 679 841 65,0% 66,7% 68,9% 72,2% 89,7%
SL 152 152 152 152 152 98,1% 98,1% 98,1% 98,1% 98,1%
SN 746 746 746 746 745 100,0% 100,0% 100,0% 100,0% 100,0%
ST 18 18 18 311 311 3,7% 3,9% 4,0% 69,3% 69,4%
SH 246 262 323 376 396 51,0% 54,9% 60,1% 62,3% 64,8%
TH 428 427 421 413 407 100,0% 100,0% 100,0% 100,0% 100,0%
D 7.681 7.847 8.127 9.623 9.967 51,5% 53,4% 55,6% 66,0% 68,6%
BW 43 41 44 47 51 1,9% 1,8% 2,0% 2,2% 2,4%
BY - - 1 2 2 - - 0,0% 0,1% 0,1%
BE 45 45 38 46 43 12,4% 12,1% 10,4% 12,5% 11,8%
BB - - - - - - - - - -
HB 24 25 26 27 29 26,7% 27,8% 28,9% 29,7% 31,9%
HH 26 27 25 30 31 13,7% 14,2% 13,2% 15,7% 16,1%
HE 6 6 8 12 12 0,5% 0,5% 0,7% 1,1% 1,1%
MV - - - - - - - - - -
NI 5 4 1 5 6 0,3% 0,2% 0,1% 0,3% 0,4%
NW 9 9 9 9 9 0,3% 0,3% 0,3% 0,3% 0,3%
RP 2 2 2 2 2 0,2% 0,2% 0,2% 0,2% 0,2%
SL 6 7 8 9 10 3,9% 4,5% 5,2% 5,8% 6,5%
SN 16 17 13 13 26 2,1% 2,3% 1,7% 1,7% 3,5%
ST 3 3 3 3 3 0,6% 0,7% 0,7% 0,7% 0,7%
SH 6 6 7 8 9 1,2% 1,3% 1,3% 1,3% 1,5%
TH 1 2 2 2 - 0,2% 0,5% 0,5% 0,5% -
D 192 194 187 215 233 1,3% 1,3% 1,3% 1,5% 1,6%
BW 91 68 60 60 54 3,9% 3,1% 2,8% 2,8% 2,5%
BY 330 363 358 361 364 14,6% 16,1% 15,9% 16,0% 16,1%
BE 18 18 25 19 19 5,0% 4,9% 6,8% 5,2% 5,2%
BB - - - - - - - - - -
HB - - - - - - - - - -
HH 21 21 20 20 20 11,1% 11,1% 10,5% 10,5% 10,4%
HE - - - - - - - - - -
MV - - - - - - - - - -
NI 9 9 17 21 28 0,5% 0,5% 1,0% 1,3% 1,7%
NW - - - - - - - - - -
RP 299 306 312 315 322 31,5% 32,4% 33,2% 33,5% 34,3%
SL 1 1 - 1 1 0,6% 0,6% - 0,6% 0,6%
SN 166 174 188 194 169 22,3% 23,3% 25,2% 26,0% 22,7%
ST - - - - - - - - - -
SH 4 4 5 6 5 0,8% 0,8% 0,9% 1,0% 0,8%
TH 4 2 3 3 3 0,9% 0,5% 0,7% 0,7% 0,7%
D 943 966 988 1.000 985 6,3% 6,6% 6,8% 6,9% 6,8%
BW 224 305 370 441 463 9,7% 13,7% 17,0% 20,6% 21,8%
BY 176 139 197 1.143 1.198 7,8% 6,2% 8,7% 50,6% 53,1%
BE 299 308 304 301 303 82,6% 83,0% 82,8% 81,8% 83,0%
BB 196 197 195 198 205 44,4% 45,0% 44,6% 45,1% 46,9%
HB 14 14 18 19 20 15,6% 15,6% 20,0% 20,9% 22,0%
HH 141 141 145 140 140 74,2% 74,2% 76,3% 73,3% 72,9%
HE 419 452 501 552 592 37,6% 40,5% 45,4% 50,1% 53,7%
MV 2 - - - - 0,7% - - - -
NI 762 833 881 932 976 44,1% 48,8% 52,0% 55,7% 58,7%
NW 2.615 2.587 2.576 2.561 2.550 90,5% 91,5% 92,5% 93,1% 93,6%
RP 315 322 334 362 517 33,2% 34,1% 35,5% 38,5% 55,1%
SL 145 144 144 142 141 93,5% 92,9% 92,9% 91,6% 91,0%
SN 564 555 545 539 550 75,6% 74,4% 73,1% 72,3% 73,8%
ST 15 15 15 308 308 3,1% 3,3% 3,3% 68,6% 68,8%
SH 236 252 311 362 382 49,0% 52,8% 57,9% 59,9% 62,5%
TH 423 423 416 408 404 98,8% 99,1% 98,8% 98,8% 99,3%
D 6.546 6.687 6.952 8.408 8.749 43,9% 45,5% 47,6% 57,6% 60,2%
teilweise gebundene Form
offene Form
Anmerkung: Ab 2016 findet eine erweiterte Definition (siehe Bericht S. 6) für die offenen Ganztagsangebote Anwendung. Dadurch kommt es in diesem Bereich in
einigen Ländern zu einem deutlichen Anstieg. (Gilt aktuell noch nicht für MV.)
- 15* -
Anteil an allen SchulenAnzahl
Insgesamt
voll gebundene Form
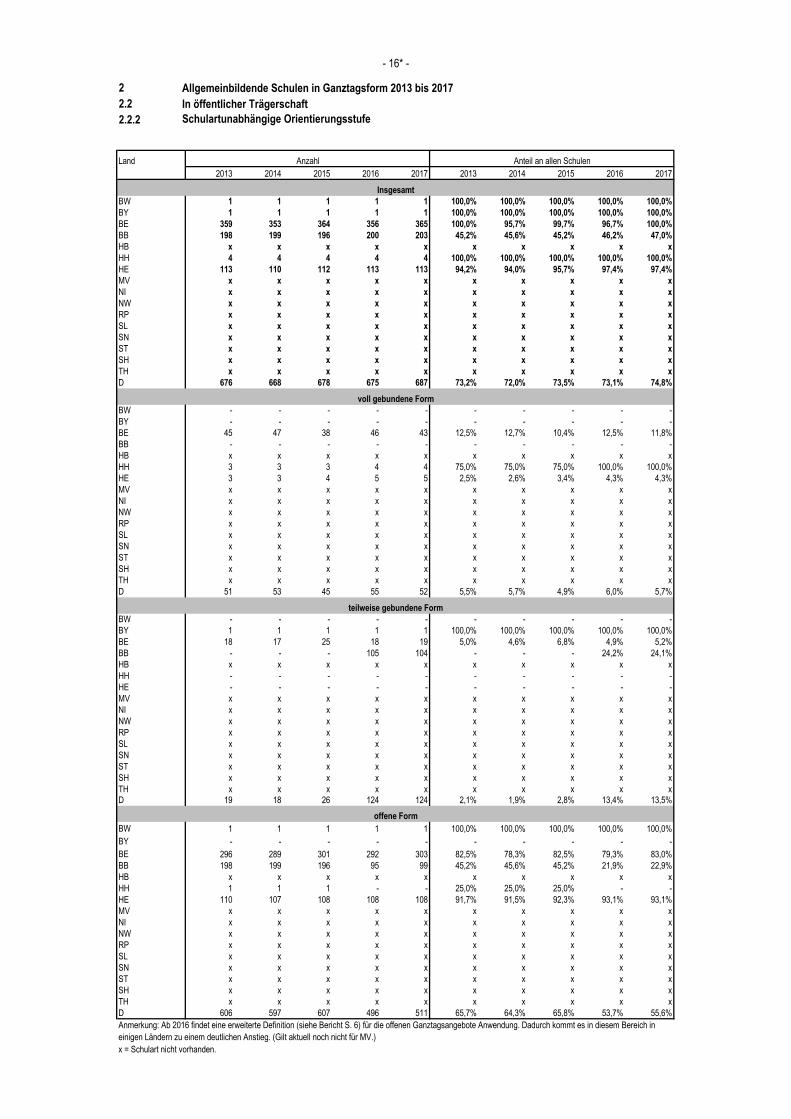
2 Allgemeinbildende Schulen in Ganztagsform 2013 bis 2017
2.2 In öffentlicher Trägerschaft
2.2.2 Schulartunabhängige Orientierungsstufe
Land
2013 2014 2015 2016 2017 2013 2014 2015 2016 2017
BW 1 1 1 1 1 100,0% 100,0% 100,0% 100,0% 100,0%
BY 1 1 1 1 1 100,0% 100,0% 100,0% 100,0% 100,0%
BE 359 353 364 356 365 100,0% 95,7% 99,7% 96,7% 100,0%
BB 198 199 196 200 203 45,2% 45,6% 45,2% 46,2% 47,0%
HB x x x x x x x x x x
HH 4 4 4 4 4 100,0% 100,0% 100,0% 100,0% 100,0%
HE 113 110 112 113 113 94,2% 94,0% 95,7% 97,4% 97,4%
MV x x x x x x x x x x
NI x x x x x x x x x x
NW x x x x x x x x x x
RP x x x x x x x x x x
SL x x x x x x x x x x
SN x x x x x x x x x x
ST x x x x x x x x x x
SH x x x x x x x x x x
TH x x x x x x x x x x
D 676 668 678 675 687 73,2% 72,0% 73,5% 73,1% 74,8%
BW - - - - - - - - - -
BY - - - - - - - - - -
BE 45 47 38 46 43 12,5% 12,7% 10,4% 12,5% 11,8%
BB - - - - - - - - - -
HB x x x x x x x x x x
HH 3 3 3 4 4 75,0% 75,0% 75,0% 100,0% 100,0%
HE 3 3 4 5 5 2,5% 2,6% 3,4% 4,3% 4,3%
MV x x x x x x x x x x
NI x x x x x x x x x x
NW x x x x x x x x x x
RP x x x x x x x x x x
SL x x x x x x x x x x
SN x x x x x x x x x x
ST x x x x x x x x x x
SH x x x x x x x x x x
TH x x x x x x x x x x
D 51 53 45 55 52 5,5% 5,7% 4,9% 6,0% 5,7%
BW - - - - - - - - - -
BY 1 1 1 1 1 100,0% 100,0% 100,0% 100,0% 100,0%
BE 18 17 25 18 19 5,0% 4,6% 6,8% 4,9% 5,2%
BB - - - 105 104 - - - 24,2% 24,1%
HB x x x x x x x x x x
HH - - - - - - - - - -
HE - - - - - - - - - -
MV x x x x x x x x x x
NI x x x x x x x x x x
NW x x x x x x x x x x
RP x x x x x x x x x x
SL x x x x x x x x x x
SN x x x x x x x x x x
ST x x x x x x x x x x
SH x x x x x x x x x x
TH x x x x x x x x x xD 19 18 26 124 124 2,1% 1,9% 2,8% 13,4% 13,5%
BW 1 1 1 1 1 100,0% 100,0% 100,0% 100,0% 100,0%
BY - - - - - - - - - -
BE 296 289 301 292 303 82,5% 78,3% 82,5% 79,3% 83,0%
BB 198 199 196 95 99 45,2% 45,6% 45,2% 21,9% 22,9%
HB x x x x x x x x x x
HH 1 1 1 - - 25,0% 25,0% 25,0% - -
HE 110 107 108 108 108 91,7% 91,5% 92,3% 93,1% 93,1%
MV x x x x x x x x x x
NI x x x x x x x x x x
NW x x x x x x x x x x
RP x x x x x x x x x x
SL x x x x x x x x x x
SN x x x x x x x x x x
ST x x x x x x x x x x
SH x x x x x x x x x x
TH x x x x x x x x x x
D 606 597 607 496 511 65,7% 64,3% 65,8% 53,7% 55,6%
x = Schulart nicht vorhanden.
teilweise gebundene Form
offene Form
Anmerkung: Ab 2016 findet eine erweiterte Definition (siehe Bericht S. 6) für die offenen Ganztagsangebote Anwendung. Dadurch kommt es in diesem Bereich in
einigen Ländern zu einem deutlichen Anstieg. (Gilt aktuell noch nicht für MV.)
- 16* -
Anteil an allen SchulenAnzahl
Insgesamt
voll gebundene Form
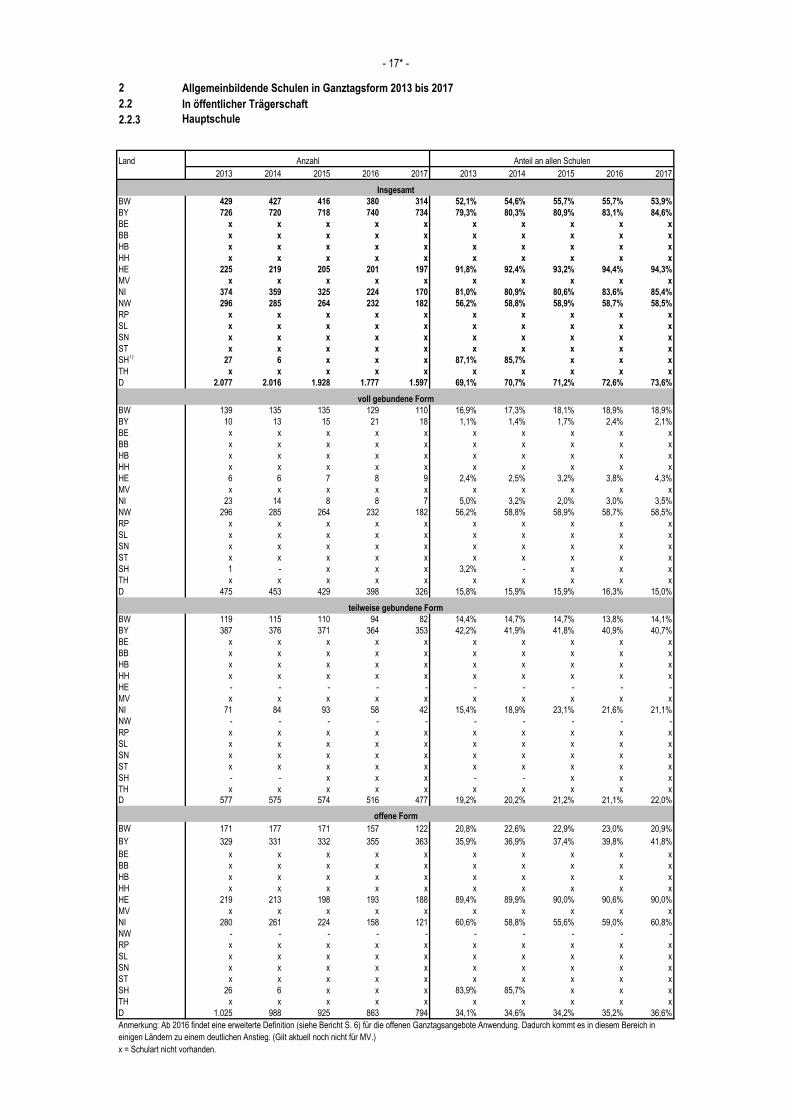
2 Allgemeinbildende Schulen in Ganztagsform 2013 bis 2017
2.2 In öffentlicher Trägerschaft
2.2.3 Hauptschule
Land
2013 2014 2015 2016 2017 2013 2014 2015 2016 2017
BW 429 427 416 380 314 52,1% 54,6% 55,7% 55,7% 53,9%
BY 726 720 718 740 734 79,3% 80,3% 80,9% 83,1% 84,6%
BE x x x x x x x x x x
BB x x x x x x x x x x
HB x x x x x x x x x x
HH x x x x x x x x x x
HE 225 219 205 201 197 91,8% 92,4% 93,2% 94,4% 94,3%
MV x x x x x x x x x x
NI 374 359 325 224 170 81,0% 80,9% 80,6% 83,6% 85,4%
NW 296 285 264 232 182 56,2% 58,8% 58,9% 58,7% 58,5%
RP x x x x x x x x x x
SL x x x x x x x x x x
SN x x x x x x x x x x
ST x x x x x x x x x x
SH1)
27 6 x x x 87,1% 85,7% x x x
TH x x x x x x x x x x
D 2.077 2.016 1.928 1.777 1.597 69,1% 70,7% 71,2% 72,6% 73,6%
BW 139 135 135 129 110 16,9% 17,3% 18,1% 18,9% 18,9%
BY 10 13 15 21 18 1,1% 1,4% 1,7% 2,4% 2,1%
BE x x x x x x x x x x
BB x x x x x x x x x x
HB x x x x x x x x x x
HH x x x x x x x x x x
HE 6 6 7 8 9 2,4% 2,5% 3,2% 3,8% 4,3%
MV x x x x x x x x x x
NI 23 14 8 8 7 5,0% 3,2% 2,0% 3,0% 3,5%
NW 296 285 264 232 182 56,2% 58,8% 58,9% 58,7% 58,5%
RP x x x x x x x x x x
SL x x x x x x x x x x
SN x x x x x x x x x x
ST x x x x x x x x x x
SH 1 - x x x 3,2% - x x x
TH x x x x x x x x x x
D 475 453 429 398 326 15,8% 15,9% 15,9% 16,3% 15,0%
BW 119 115 110 94 82 14,4% 14,7% 14,7% 13,8% 14,1%
BY 387 376 371 364 353 42,2% 41,9% 41,8% 40,9% 40,7%
BE x x x x x x x x x x
BB x x x x x x x x x x
HB x x x x x x x x x x
HH x x x x x x x x x x
HE - - - - - - - - - -
MV x x x x x x x x x x
NI 71 84 93 58 42 15,4% 18,9% 23,1% 21,6% 21,1%
NW - - - - - - - - - -
RP x x x x x x x x x x
SL x x x x x x x x x x
SN x x x x x x x x x x
ST x x x x x x x x x x
SH - - x x x - - x x x
TH x x x x x x x x x xD 577 575 574 516 477 19,2% 20,2% 21,2% 21,1% 22,0%
BW 171 177 171 157 122 20,8% 22,6% 22,9% 23,0% 20,9%
BY 329 331 332 355 363 35,9% 36,9% 37,4% 39,8% 41,8%
BE x x x x x x x x x x
BB x x x x x x x x x x
HB x x x x x x x x x x
HH x x x x x x x x x x
HE 219 213 198 193 188 89,4% 89,9% 90,0% 90,6% 90,0%
MV x x x x x x x x x x
NI 280 261 224 158 121 60,6% 58,8% 55,6% 59,0% 60,8%
NW - - - - - - - - - -
RP x x x x x x x x x x
SL x x x x x x x x x x
SN x x x x x x x x x x
ST x x x x x x x x x x
SH 26 6 x x x 83,9% 85,7% x x x
TH x x x x x x x x x x
D 1.025 988 925 863 794 34,1% 34,6% 34,2% 35,2% 36,6%
x = Schulart nicht vorhanden.
teilweise gebundene Form
offene Form
Anmerkung: Ab 2016 findet eine erweiterte Definition (siehe Bericht S. 6) für die offenen Ganztagsangebote Anwendung. Dadurch kommt es in diesem Bereich in
einigen Ländern zu einem deutlichen Anstieg. (Gilt aktuell noch nicht für MV.)
- 17* -
Anteil an allen SchulenAnzahl
Insgesamt
voll gebundene Form
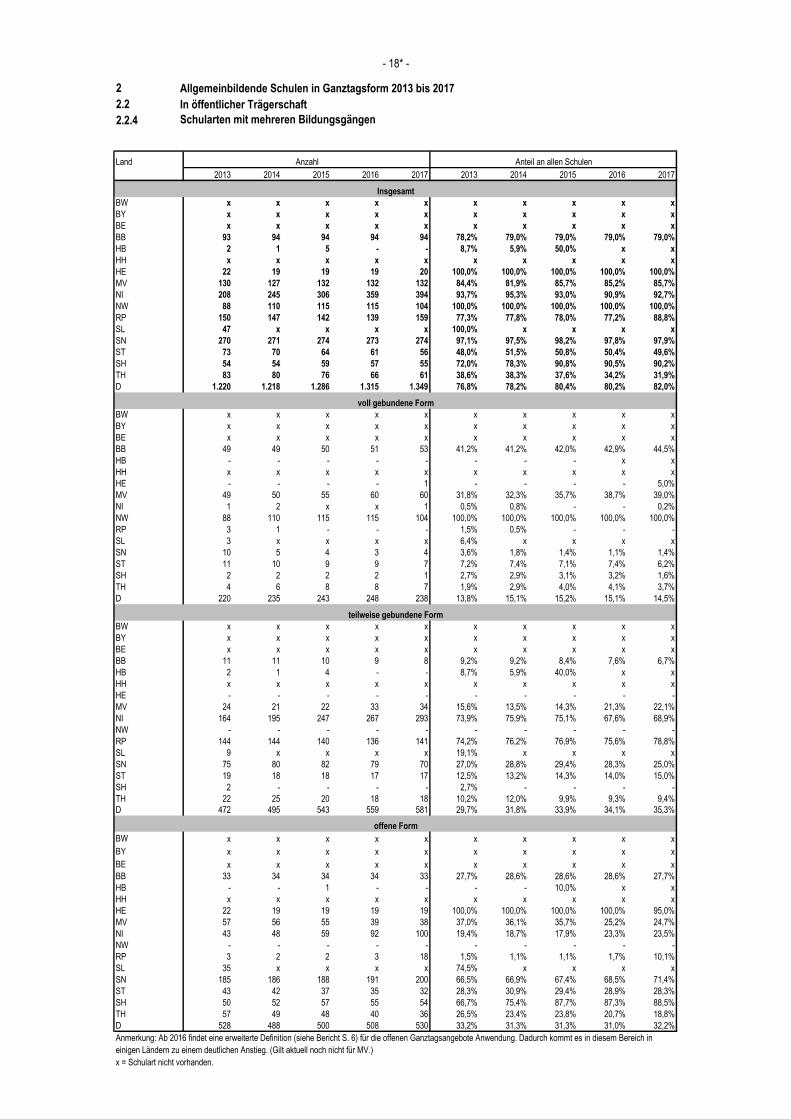
2 Allgemeinbildende Schulen in Ganztagsform 2013 bis 2017
2.2 In öffentlicher Trägerschaft
2.2.4 Schularten mit mehreren Bildungsgängen
Land
2013 2014 2015 2016 2017 2013 2014 2015 2016 2017
BW x x x x x x x x x x
BY x x x x x x x x x x
BE x x x x x x x x x x
BB 93 94 94 94 94 78,2% 79,0% 79,0% 79,0% 79,0%
HB 2 1 5 - - 8,7% 5,9% 50,0% x x
HH x x x x x x x x x x
HE 22 19 19 19 20 100,0% 100,0% 100,0% 100,0% 100,0%
MV 130 127 132 132 132 84,4% 81,9% 85,7% 85,2% 85,7%
NI 208 245 306 359 394 93,7% 95,3% 93,0% 90,9% 92,7%
NW 88 110 115 115 104 100,0% 100,0% 100,0% 100,0% 100,0%
RP 150 147 142 139 159 77,3% 77,8% 78,0% 77,2% 88,8%
SL 47 x x x x 100,0% x x x x
SN 270 271 274 273 274 97,1% 97,5% 98,2% 97,8% 97,9%
ST 73 70 64 61 56 48,0% 51,5% 50,8% 50,4% 49,6%
SH 54 54 59 57 55 72,0% 78,3% 90,8% 90,5% 90,2%
TH 83 80 76 66 61 38,6% 38,3% 37,6% 34,2% 31,9%
D 1.220 1.218 1.286 1.315 1.349 76,8% 78,2% 80,4% 80,2% 82,0%
BW x x x x x x x x x x
BY x x x x x x x x x x
BE x x x x x x x x x x
BB 49 49 50 51 53 41,2% 41,2% 42,0% 42,9% 44,5%
HB - - - - - - - - x x
HH x x x x x x x x x x
HE - - - - 1 - - - - 5,0%
MV 49 50 55 60 60 31,8% 32,3% 35,7% 38,7% 39,0%
NI 1 2 x x 1 0,5% 0,8% - - 0,2%
NW 88 110 115 115 104 100,0% 100,0% 100,0% 100,0% 100,0%
RP 3 1 - - - 1,5% 0,5% - - -
SL 3 x x x x 6,4% x x x x
SN 10 5 4 3 4 3,6% 1,8% 1,4% 1,1% 1,4%
ST 11 10 9 9 7 7,2% 7,4% 7,1% 7,4% 6,2%
SH 2 2 2 2 1 2,7% 2,9% 3,1% 3,2% 1,6%
TH 4 6 8 8 7 1,9% 2,9% 4,0% 4,1% 3,7%
D 220 235 243 248 238 13,8% 15,1% 15,2% 15,1% 14,5%
BW x x x x x x x x x x
BY x x x x x x x x x x
BE x x x x x x x x x x
BB 11 11 10 9 8 9,2% 9,2% 8,4% 7,6% 6,7%
HB 2 1 4 - - 8,7% 5,9% 40,0% x x
HH x x x x x x x x x x
HE - - - - - - - - - -
MV 24 21 22 33 34 15,6% 13,5% 14,3% 21,3% 22,1%
NI 164 195 247 267 293 73,9% 75,9% 75,1% 67,6% 68,9%
NW - - - - - - - - - -
RP 144 144 140 136 141 74,2% 76,2% 76,9% 75,6% 78,8%
SL 9 x x x x 19,1% x x x x
SN 75 80 82 79 70 27,0% 28,8% 29,4% 28,3% 25,0%
ST 19 18 18 17 17 12,5% 13,2% 14,3% 14,0% 15,0%
SH 2 - - - - 2,7% - - - -
TH 22 25 20 18 18 10,2% 12,0% 9,9% 9,3% 9,4%
D 472 495 543 559 581 29,7% 31,8% 33,9% 34,1% 35,3%
BW x x x x x x x x x x
BY x x x x x x x x x x
BE x x x x x x x x x x
BB 33 34 34 34 33 27,7% 28,6% 28,6% 28,6% 27,7%
HB - - 1 - - - - 10,0% x x
HH x x x x x x x x x x
HE 22 19 19 19 19 100,0% 100,0% 100,0% 100,0% 95,0%
MV 57 56 55 39 38 37,0% 36,1% 35,7% 25,2% 24,7%
NI 43 48 59 92 100 19,4% 18,7% 17,9% 23,3% 23,5%
NW - - - - - - - - - -
RP 3 2 2 3 18 1,5% 1,1% 1,1% 1,7% 10,1%
SL 35 x x x x 74,5% x x x x
SN 185 186 188 191 200 66,5% 66,9% 67,4% 68,5% 71,4%
ST 43 42 37 35 32 28,3% 30,9% 29,4% 28,9% 28,3%
SH 50 52 57 55 54 66,7% 75,4% 87,7% 87,3% 88,5%
TH 57 49 48 40 36 26,5% 23,4% 23,8% 20,7% 18,8%
D 528 488 500 508 530 33,2% 31,3% 31,3% 31,0% 32,2%
x = Schulart nicht vorhanden.
teilweise gebundene Form
offene Form
Anmerkung: Ab 2016 findet eine erweiterte Definition (siehe Bericht S. 6) für die offenen Ganztagsangebote Anwendung. Dadurch kommt es in diesem Bereich in
einigen Ländern zu einem deutlichen Anstieg. (Gilt aktuell noch nicht für MV.)
- 18* -
Anteil an allen SchulenAnzahl
Insgesamt
voll gebundene Form
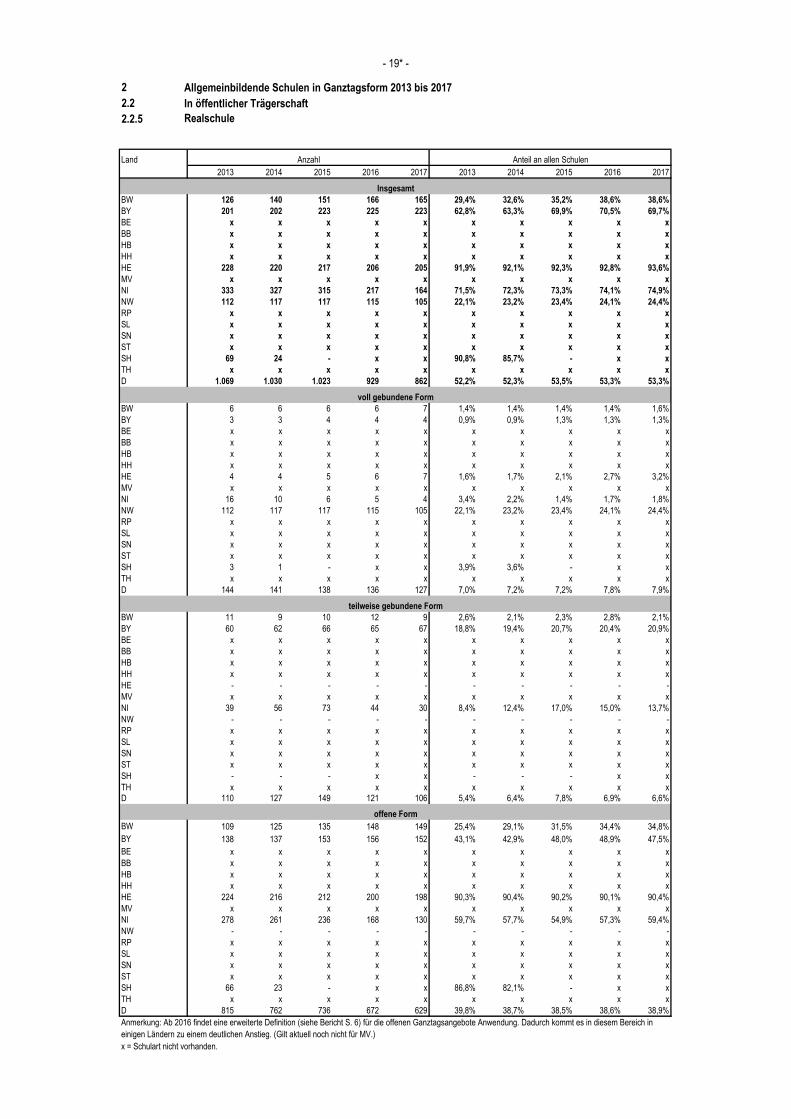
2 Allgemeinbildende Schulen in Ganztagsform 2013 bis 2017
2.2 In öffentlicher Trägerschaft
2.2.5 Realschule
Land
2013 2014 2015 2016 2017 2013 2014 2015 2016 2017
BW 126 140 151 166 165 29,4% 32,6% 35,2% 38,6% 38,6%
BY 201 202 223 225 223 62,8% 63,3% 69,9% 70,5% 69,7%
BE x x x x x x x x x x
BB x x x x x x x x x x
HB x x x x x x x x x x
HH x x x x x x x x x x
HE 228 220 217 206 205 91,9% 92,1% 92,3% 92,8% 93,6%
MV x x x x x x x x x x
NI 333 327 315 217 164 71,5% 72,3% 73,3% 74,1% 74,9%
NW 112 117 117 115 105 22,1% 23,2% 23,4% 24,1% 24,4%
RP x x x x x x x x x x
SL x x x x x x x x x x
SN x x x x x x x x x x
ST x x x x x x x x x x
SH 69 24 - x x 90,8% 85,7% - x x
TH x x x x x x x x x x
D 1.069 1.030 1.023 929 862 52,2% 52,3% 53,5% 53,3% 53,3%
BW 6 6 6 6 7 1,4% 1,4% 1,4% 1,4% 1,6%
BY 3 3 4 4 4 0,9% 0,9% 1,3% 1,3% 1,3%
BE x x x x x x x x x x
BB x x x x x x x x x x
HB x x x x x x x x x x
HH x x x x x x x x x x
HE 4 4 5 6 7 1,6% 1,7% 2,1% 2,7% 3,2%
MV x x x x x x x x x x
NI 16 10 6 5 4 3,4% 2,2% 1,4% 1,7% 1,8%
NW 112 117 117 115 105 22,1% 23,2% 23,4% 24,1% 24,4%
RP x x x x x x x x x x
SL x x x x x x x x x x
SN x x x x x x x x x x
ST x x x x x x x x x x
SH 3 1 - x x 3,9% 3,6% - x x
TH x x x x x x x x x x
D 144 141 138 136 127 7,0% 7,2% 7,2% 7,8% 7,9%
BW 11 9 10 12 9 2,6% 2,1% 2,3% 2,8% 2,1%
BY 60 62 66 65 67 18,8% 19,4% 20,7% 20,4% 20,9%
BE x x x x x x x x x x
BB x x x x x x x x x x
HB x x x x x x x x x x
HH x x x x x x x x x x
HE - - - - - - - - - -
MV x x x x x x x x x x
NI 39 56 73 44 30 8,4% 12,4% 17,0% 15,0% 13,7%
NW - - - - - - - - - -
RP x x x x x x x x x x
SL x x x x x x x x x x
SN x x x x x x x x x x
ST x x x x x x x x x x
SH - - - x x - - - x x
TH x x x x x x x x x x
D 110 127 149 121 106 5,4% 6,4% 7,8% 6,9% 6,6%
BW 109 125 135 148 149 25,4% 29,1% 31,5% 34,4% 34,8%
BY 138 137 153 156 152 43,1% 42,9% 48,0% 48,9% 47,5%
BE x x x x x x x x x x
BB x x x x x x x x x x
HB x x x x x x x x x x
HH x x x x x x x x x x
HE 224 216 212 200 198 90,3% 90,4% 90,2% 90,1% 90,4%
MV x x x x x x x x x x
NI 278 261 236 168 130 59,7% 57,7% 54,9% 57,3% 59,4%
NW - - - - - - - - - -
RP x x x x x x x x x x
SL x x x x x x x x x x
SN x x x x x x x x x x
ST x x x x x x x x x x
SH 66 23 - x x 86,8% 82,1% - x x
TH x x x x x x x x x x
D 815 762 736 672 629 39,8% 38,7% 38,5% 38,6% 38,9%
x = Schulart nicht vorhanden.
teilweise gebundene Form
offene Form
Anmerkung: Ab 2016 findet eine erweiterte Definition (siehe Bericht S. 6) für die offenen Ganztagsangebote Anwendung. Dadurch kommt es in diesem Bereich in
einigen Ländern zu einem deutlichen Anstieg. (Gilt aktuell noch nicht für MV.)
- 19* -
Anteil an allen SchulenAnzahl
Insgesamt
voll gebundene Form
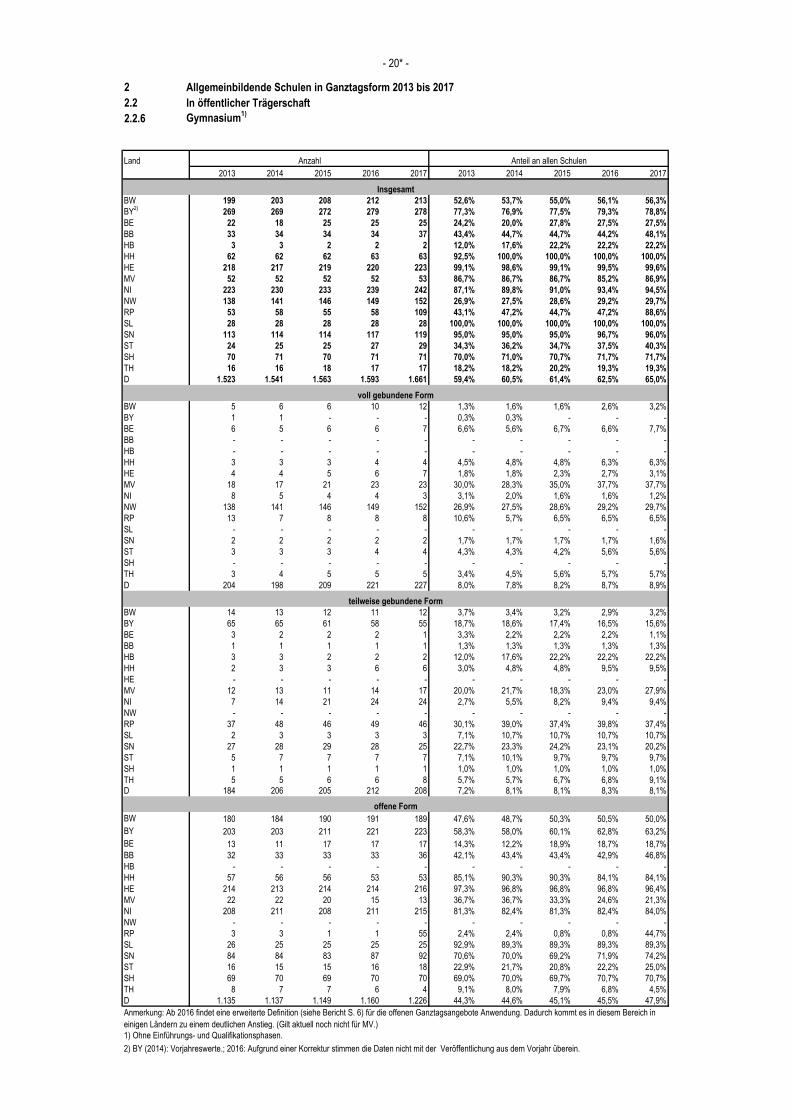
2 Allgemeinbildende Schulen in Ganztagsform 2013 bis 2017
2.2 In öffentlicher Trägerschaft
2.2.6 Gymnasium1)
Land
2013 2014 2015 2016 2017 2013 2014 2015 2016 2017
BW 199 203 208 212 213 52,6% 53,7% 55,0% 56,1% 56,3%
BY2)
269 269 272 279 278 77,3% 76,9% 77,5% 79,3% 78,8%
BE 22 18 25 25 25 24,2% 20,0% 27,8% 27,5% 27,5%
BB 33 34 34 34 37 43,4% 44,7% 44,7% 44,2% 48,1%
HB 3 3 2 2 2 12,0% 17,6% 22,2% 22,2% 22,2%
HH 62 62 62 63 63 92,5% 100,0% 100,0% 100,0% 100,0%
HE 218 217 219 220 223 99,1% 98,6% 99,1% 99,5% 99,6%
MV 52 52 52 52 53 86,7% 86,7% 86,7% 85,2% 86,9%
NI 223 230 233 239 242 87,1% 89,8% 91,0% 93,4% 94,5%
NW 138 141 146 149 152 26,9% 27,5% 28,6% 29,2% 29,7%
RP 53 58 55 58 109 43,1% 47,2% 44,7% 47,2% 88,6%
SL 28 28 28 28 28 100,0% 100,0% 100,0% 100,0% 100,0%
SN 113 114 114 117 119 95,0% 95,0% 95,0% 96,7% 96,0%
ST 24 25 25 27 29 34,3% 36,2% 34,7% 37,5% 40,3%
SH 70 71 70 71 71 70,0% 71,0% 70,7% 71,7% 71,7%
TH 16 16 18 17 17 18,2% 18,2% 20,2% 19,3% 19,3%
D 1.523 1.541 1.563 1.593 1.661 59,4% 60,5% 61,4% 62,5% 65,0%
BW 5 6 6 10 12 1,3% 1,6% 1,6% 2,6% 3,2%
BY 1 1 - - - 0,3% 0,3% - - -
BE 6 5 6 6 7 6,6% 5,6% 6,7% 6,6% 7,7%
BB - - - - - - - - - -
HB - - - - - - - - - -
HH 3 3 3 4 4 4,5% 4,8% 4,8% 6,3% 6,3%
HE 4 4 5 6 7 1,8% 1,8% 2,3% 2,7% 3,1%
MV 18 17 21 23 23 30,0% 28,3% 35,0% 37,7% 37,7%
NI 8 5 4 4 3 3,1% 2,0% 1,6% 1,6% 1,2%
NW 138 141 146 149 152 26,9% 27,5% 28,6% 29,2% 29,7%
RP 13 7 8 8 8 10,6% 5,7% 6,5% 6,5% 6,5%
SL - - - - - - - - - -
SN 2 2 2 2 2 1,7% 1,7% 1,7% 1,7% 1,6%
ST 3 3 3 4 4 4,3% 4,3% 4,2% 5,6% 5,6%
SH - - - - - - - - - -
TH 3 4 5 5 5 3,4% 4,5% 5,6% 5,7% 5,7%
D 204 198 209 221 227 8,0% 7,8% 8,2% 8,7% 8,9%
BW 14 13 12 11 12 3,7% 3,4% 3,2% 2,9% 3,2%
BY 65 65 61 58 55 18,7% 18,6% 17,4% 16,5% 15,6%
BE 3 2 2 2 1 3,3% 2,2% 2,2% 2,2% 1,1%
BB 1 1 1 1 1 1,3% 1,3% 1,3% 1,3% 1,3%
HB 3 3 2 2 2 12,0% 17,6% 22,2% 22,2% 22,2%
HH 2 3 3 6 6 3,0% 4,8% 4,8% 9,5% 9,5%
HE - - - - - - - - - -
MV 12 13 11 14 17 20,0% 21,7% 18,3% 23,0% 27,9%
NI 7 14 21 24 24 2,7% 5,5% 8,2% 9,4% 9,4%
NW - - - - - - - - - -
RP 37 48 46 49 46 30,1% 39,0% 37,4% 39,8% 37,4%
SL 2 3 3 3 3 7,1% 10,7% 10,7% 10,7% 10,7%
SN 27 28 29 28 25 22,7% 23,3% 24,2% 23,1% 20,2%
ST 5 7 7 7 7 7,1% 10,1% 9,7% 9,7% 9,7%
SH 1 1 1 1 1 1,0% 1,0% 1,0% 1,0% 1,0%
TH 5 5 6 6 8 5,7% 5,7% 6,7% 6,8% 9,1%
D 184 206 205 212 208 7,2% 8,1% 8,1% 8,3% 8,1%
BW 180 184 190 191 189 47,6% 48,7% 50,3% 50,5% 50,0%
BY 203 203 211 221 223 58,3% 58,0% 60,1% 62,8% 63,2%
BE 13 11 17 17 17 14,3% 12,2% 18,9% 18,7% 18,7%
BB 32 33 33 33 36 42,1% 43,4% 43,4% 42,9% 46,8%
HB - - - - - - - - - -
HH 57 56 56 53 53 85,1% 90,3% 90,3% 84,1% 84,1%
HE 214 213 214 214 216 97,3% 96,8% 96,8% 96,8% 96,4%
MV 22 22 20 15 13 36,7% 36,7% 33,3% 24,6% 21,3%
NI 208 211 208 211 215 81,3% 82,4% 81,3% 82,4% 84,0%
NW - - - - - - - - - -
RP 3 3 1 1 55 2,4% 2,4% 0,8% 0,8% 44,7%
SL 26 25 25 25 25 92,9% 89,3% 89,3% 89,3% 89,3%
SN 84 84 83 87 92 70,6% 70,0% 69,2% 71,9% 74,2%
ST 16 15 15 16 18 22,9% 21,7% 20,8% 22,2% 25,0%
SH 69 70 69 70 70 69,0% 70,0% 69,7% 70,7% 70,7%
TH 8 7 7 6 4 9,1% 8,0% 7,9% 6,8% 4,5%
D 1.135 1.137 1.149 1.160 1.226 44,3% 44,6% 45,1% 45,5% 47,9%
2) BY (2014): Vorjahreswerte.; 2016: Aufgrund einer Korrektur stimmen die Daten nicht mit der Veröffentlichung aus dem Vorjahr überein.
- 20* -
1) Ohne Einführungs- und Qualifikationsphasen.
Anteil an allen SchulenAnzahl
Insgesamt
voll gebundene Form
teilweise gebundene Form
offene Form
Anmerkung: Ab 2016 findet eine erweiterte Definition (siehe Bericht S. 6) für die offenen Ganztagsangebote Anwendung. Dadurch kommt es in diesem Bereich in
einigen Ländern zu einem deutlichen Anstieg. (Gilt aktuell noch nicht für MV.)
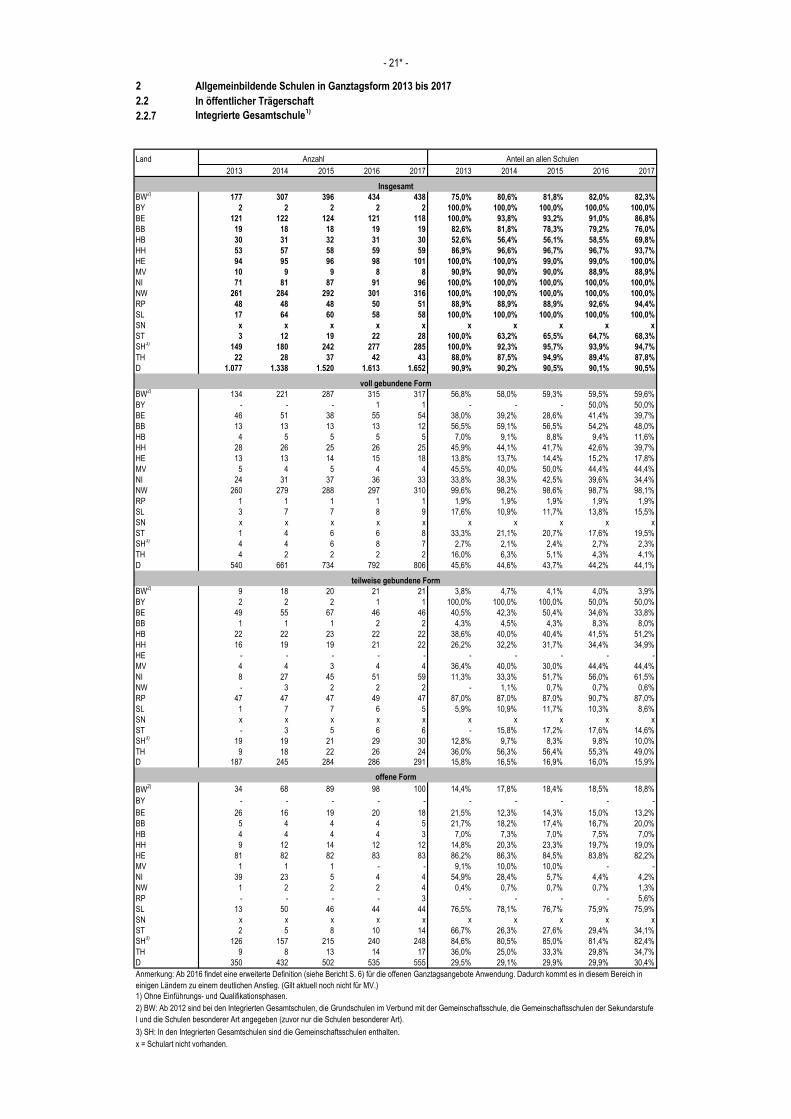
2 Allgemeinbildende Schulen in Ganztagsform 2013 bis 2017
2.2 In öffentlicher Trägerschaft
2.2.7 Integrierte Gesamtschule1)
Land
2013 2014 2015 2016 2017 2013 2014 2015 2016 2017
BW2)
177 307 396 434 438 75,0% 80,6% 81,8% 82,0% 82,3%
BY 2 2 2 2 2 100,0% 100,0% 100,0% 100,0% 100,0%
BE 121 122 124 121 118 100,0% 93,8% 93,2% 91,0% 86,8%
BB 19 18 18 19 19 82,6% 81,8% 78,3% 79,2% 76,0%
HB 30 31 32 31 30 52,6% 56,4% 56,1% 58,5% 69,8%
HH 53 57 58 59 59 86,9% 96,6% 96,7% 96,7% 93,7%
HE 94 95 96 98 101 100,0% 100,0% 99,0% 99,0% 100,0%
MV 10 9 9 8 8 90,9% 90,0% 90,0% 88,9% 88,9%
NI 71 81 87 91 96 100,0% 100,0% 100,0% 100,0% 100,0%
NW 261 284 292 301 316 100,0% 100,0% 100,0% 100,0% 100,0%
RP 48 48 48 50 51 88,9% 88,9% 88,9% 92,6% 94,4%
SL 17 64 60 58 58 100,0% 100,0% 100,0% 100,0% 100,0%
SN x x x x x x x x x x
ST 3 12 19 22 28 100,0% 63,2% 65,5% 64,7% 68,3%
SH3)
149 180 242 277 285 100,0% 92,3% 95,7% 93,9% 94,7%
TH 22 28 37 42 43 88,0% 87,5% 94,9% 89,4% 87,8%
D 1.077 1.338 1.520 1.613 1.652 90,9% 90,2% 90,5% 90,1% 90,5%
BW2)
134 221 287 315 317 56,8% 58,0% 59,3% 59,5% 59,6%
BY - - - 1 1 - - - 50,0% 50,0%
BE 46 51 38 55 54 38,0% 39,2% 28,6% 41,4% 39,7%
BB 13 13 13 13 12 56,5% 59,1% 56,5% 54,2% 48,0%
HB 4 5 5 5 5 7,0% 9,1% 8,8% 9,4% 11,6%
HH 28 26 25 26 25 45,9% 44,1% 41,7% 42,6% 39,7%
HE 13 13 14 15 18 13,8% 13,7% 14,4% 15,2% 17,8%
MV 5 4 5 4 4 45,5% 40,0% 50,0% 44,4% 44,4%
NI 24 31 37 36 33 33,8% 38,3% 42,5% 39,6% 34,4%
NW 260 279 288 297 310 99,6% 98,2% 98,6% 98,7% 98,1%
RP 1 1 1 1 1 1,9% 1,9% 1,9% 1,9% 1,9%
SL 3 7 7 8 9 17,6% 10,9% 11,7% 13,8% 15,5%
SN x x x x x x x x x x
ST 1 4 6 6 8 33,3% 21,1% 20,7% 17,6% 19,5%
SH3)
4 4 6 8 7 2,7% 2,1% 2,4% 2,7% 2,3%
TH 4 2 2 2 2 16,0% 6,3% 5,1% 4,3% 4,1%
D 540 661 734 792 806 45,6% 44,6% 43,7% 44,2% 44,1%
BW2)
9 18 20 21 21 3,8% 4,7% 4,1% 4,0% 3,9%
BY 2 2 2 1 1 100,0% 100,0% 100,0% 50,0% 50,0%
BE 49 55 67 46 46 40,5% 42,3% 50,4% 34,6% 33,8%
BB 1 1 1 2 2 4,3% 4,5% 4,3% 8,3% 8,0%
HB 22 22 23 22 22 38,6% 40,0% 40,4% 41,5% 51,2%
HH 16 19 19 21 22 26,2% 32,2% 31,7% 34,4% 34,9%
HE - - - - - - - - - -
MV 4 4 3 4 4 36,4% 40,0% 30,0% 44,4% 44,4%
NI 8 27 45 51 59 11,3% 33,3% 51,7% 56,0% 61,5%
NW - 3 2 2 2 - 1,1% 0,7% 0,7% 0,6%
RP 47 47 47 49 47 87,0% 87,0% 87,0% 90,7% 87,0%
SL 1 7 7 6 5 5,9% 10,9% 11,7% 10,3% 8,6%
SN x x x x x x x x x x
ST - 3 5 6 6 - 15,8% 17,2% 17,6% 14,6%
SH3)
19 19 21 29 30 12,8% 9,7% 8,3% 9,8% 10,0%
TH 9 18 22 26 24 36,0% 56,3% 56,4% 55,3% 49,0%
D 187 245 284 286 291 15,8% 16,5% 16,9% 16,0% 15,9%
BW2) 34 68 89 98 100 14,4% 17,8% 18,4% 18,5% 18,8%
BY - - - - - - - - - -
BE 26 16 19 20 18 21,5% 12,3% 14,3% 15,0% 13,2%
BB 5 4 4 4 5 21,7% 18,2% 17,4% 16,7% 20,0%
HB 4 4 4 4 3 7,0% 7,3% 7,0% 7,5% 7,0%
HH 9 12 14 12 12 14,8% 20,3% 23,3% 19,7% 19,0%
HE 81 82 82 83 83 86,2% 86,3% 84,5% 83,8% 82,2%
MV 1 1 1 - - 9,1% 10,0% 10,0% - -
NI 39 23 5 4 4 54,9% 28,4% 5,7% 4,4% 4,2%
NW 1 2 2 2 4 0,4% 0,7% 0,7% 0,7% 1,3%
RP - - - - 3 - - - - 5,6%
SL 13 50 46 44 44 76,5% 78,1% 76,7% 75,9% 75,9%
SN x x x x x x x x x x
ST 2 5 8 10 14 66,7% 26,3% 27,6% 29,4% 34,1%
SH3)
126 157 215 240 248 84,6% 80,5% 85,0% 81,4% 82,4%
TH 9 8 13 14 17 36,0% 25,0% 33,3% 29,8% 34,7%
D 350 432 502 535 555 29,5% 29,1% 29,9% 29,9% 30,4%
3) SH: In den Integrierten Gesamtschulen sind die Gemeinschaftsschulen enthalten.
x = Schulart nicht vorhanden.
2) BW: Ab 2012 sind bei den Integrierten Gesamtschulen, die Grundschulen im Verbund mit der Gemeinschaftsschule, die Gemeinschaftsschulen der Sekundarstufe
I und die Schulen besonderer Art angegeben (zuvor nur die Schulen besonderer Art).
- 21* -
1) Ohne Einführungs- und Qualifikationsphasen.
Anteil an allen SchulenAnzahl
Insgesamt
voll gebundene Form
teilweise gebundene Form
offene Form
Anmerkung: Ab 2016 findet eine erweiterte Definition (siehe Bericht S. 6) für die offenen Ganztagsangebote Anwendung. Dadurch kommt es in diesem Bereich in
einigen Ländern zu einem deutlichen Anstieg. (Gilt aktuell noch nicht für MV.)
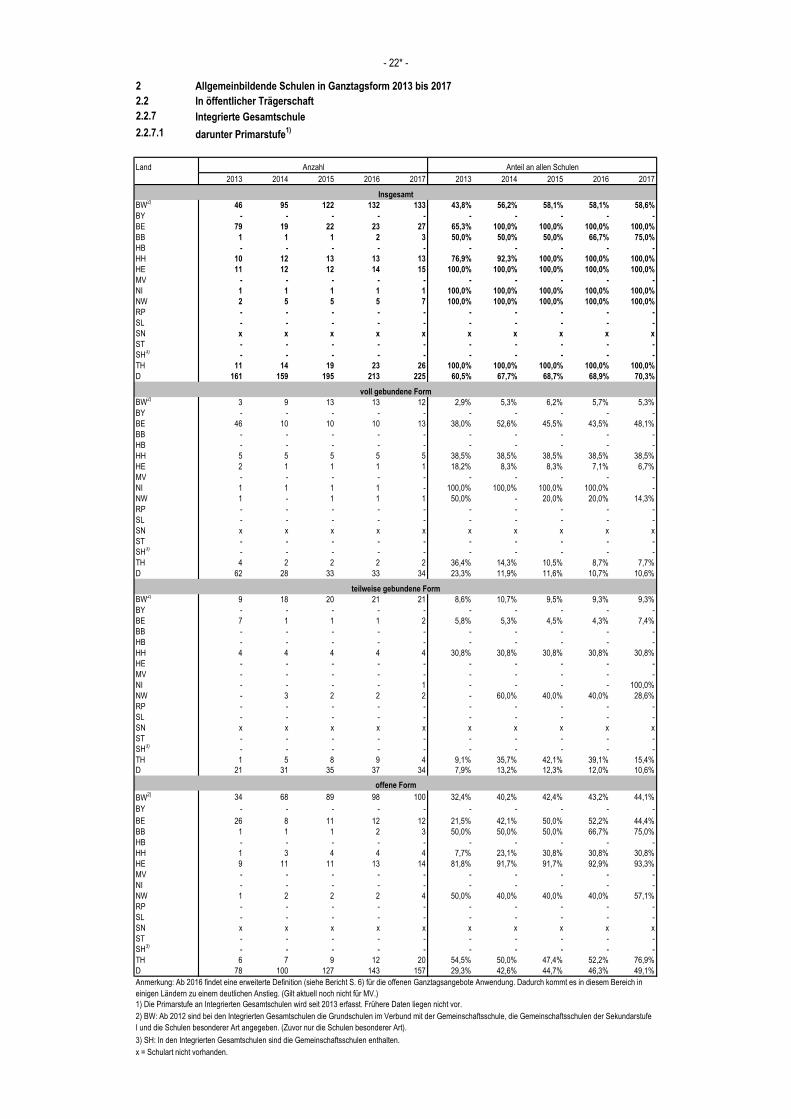
2 Allgemeinbildende Schulen in Ganztagsform 2013 bis 2017
2.2 In öffentlicher Trägerschaft
2.2.7 Integrierte Gesamtschule
2.2.7.1 darunter Primarstufe1)
Land
2013 2014 2015 2016 2017 2013 2014 2015 2016 2017
BW2)
46 95 122 132 133 43,8% 56,2% 58,1% 58,1% 58,6%
BY - - - - - - - - - -
BE 79 19 22 23 27 65,3% 100,0% 100,0% 100,0% 100,0%
BB 1 1 1 2 3 50,0% 50,0% 50,0% 66,7% 75,0%
HB - - - - - - - - - -
HH 10 12 13 13 13 76,9% 92,3% 100,0% 100,0% 100,0%
HE 11 12 12 14 15 100,0% 100,0% 100,0% 100,0% 100,0%
MV - - - - - - - - - -
NI 1 1 1 1 1 100,0% 100,0% 100,0% 100,0% 100,0%
NW 2 5 5 5 7 100,0% 100,0% 100,0% 100,0% 100,0%
RP - - - - - - - - - -
SL - - - - - - - - - -
SN x x x x x x x x x x
ST - - - - - - - - - -
SH3)
- - - - - - - - - -
TH 11 14 19 23 26 100,0% 100,0% 100,0% 100,0% 100,0%
D 161 159 195 213 225 60,5% 67,7% 68,7% 68,9% 70,3%
BW2)
3 9 13 13 12 2,9% 5,3% 6,2% 5,7% 5,3%
BY - - - - - - - - - -
BE 46 10 10 10 13 38,0% 52,6% 45,5% 43,5% 48,1%
BB - - - - - - - - - -
HB - - - - - - - - - -
HH 5 5 5 5 5 38,5% 38,5% 38,5% 38,5% 38,5%
HE 2 1 1 1 1 18,2% 8,3% 8,3% 7,1% 6,7%
MV - - - - - - - - - -
NI 1 1 1 1 - 100,0% 100,0% 100,0% 100,0% -
NW 1 - 1 1 1 50,0% - 20,0% 20,0% 14,3%
RP - - - - - - - - - -
SL - - - - - - - - - -
SN x x x x x x x x x x
ST - - - - - - - - - -
SH3)
- - - - - - - - - -
TH 4 2 2 2 2 36,4% 14,3% 10,5% 8,7% 7,7%
D 62 28 33 33 34 23,3% 11,9% 11,6% 10,7% 10,6%
BW2)
9 18 20 21 21 8,6% 10,7% 9,5% 9,3% 9,3%
BY - - - - - - - - - -
BE 7 1 1 1 2 5,8% 5,3% 4,5% 4,3% 7,4%
BB - - - - - - - - - -
HB - - - - - - - - - -
HH 4 4 4 4 4 30,8% 30,8% 30,8% 30,8% 30,8%
HE - - - - - - - - - -
MV - - - - - - - - - -
NI - - - - 1 - - - - 100,0%
NW - 3 2 2 2 - 60,0% 40,0% 40,0% 28,6%
RP - - - - - - - - - -
SL - - - - - - - - - -
SN x x x x x x x x x x
ST - - - - - - - - - -
SH3)
- - - - - - - - - -
TH 1 5 8 9 4 9,1% 35,7% 42,1% 39,1% 15,4%
D 21 31 35 37 34 7,9% 13,2% 12,3% 12,0% 10,6%
BW2) 34 68 89 98 100 32,4% 40,2% 42,4% 43,2% 44,1%
BY - - - - - - - - - -
BE 26 8 11 12 12 21,5% 42,1% 50,0% 52,2% 44,4%
BB 1 1 1 2 3 50,0% 50,0% 50,0% 66,7% 75,0%
HB - - - - - - - - - -
HH 1 3 4 4 4 7,7% 23,1% 30,8% 30,8% 30,8%
HE 9 11 11 13 14 81,8% 91,7% 91,7% 92,9% 93,3%
MV - - - - - - - - - -
NI - - - - - - - - - -
NW 1 2 2 2 4 50,0% 40,0% 40,0% 40,0% 57,1%
RP - - - - - - - - - -
SL - - - - - - - - - -
SN x x x x x x x x x x
ST - - - - - - - - - -
SH3)
- - - - - - - - - -
TH 6 7 9 12 20 54,5% 50,0% 47,4% 52,2% 76,9%
D 78 100 127 143 157 29,3% 42,6% 44,7% 46,3% 49,1%
3) SH: In den Integrierten Gesamtschulen sind die Gemeinschaftsschulen enthalten.
x = Schulart nicht vorhanden.
2) BW: Ab 2012 sind bei den Integrierten Gesamtschulen die Grundschulen im Verbund mit der Gemeinschaftsschule, die Gemeinschaftsschulen der Sekundarstufe
I und die Schulen besonderer Art angegeben. (Zuvor nur die Schulen besonderer Art).
- 22* -
1) Die Primarstufe an Integrierten Gesamtschulen wird seit 2013 erfasst. Frühere Daten liegen nicht vor.
Anzahl Anteil an allen Schulen
Insgesamt
voll gebundene Form
teilweise gebundene Form
offene Form
Anmerkung: Ab 2016 findet eine erweiterte Definition (siehe Bericht S. 6) für die offenen Ganztagsangebote Anwendung. Dadurch kommt es in diesem Bereich in
einigen Ländern zu einem deutlichen Anstieg. (Gilt aktuell noch nicht für MV.)
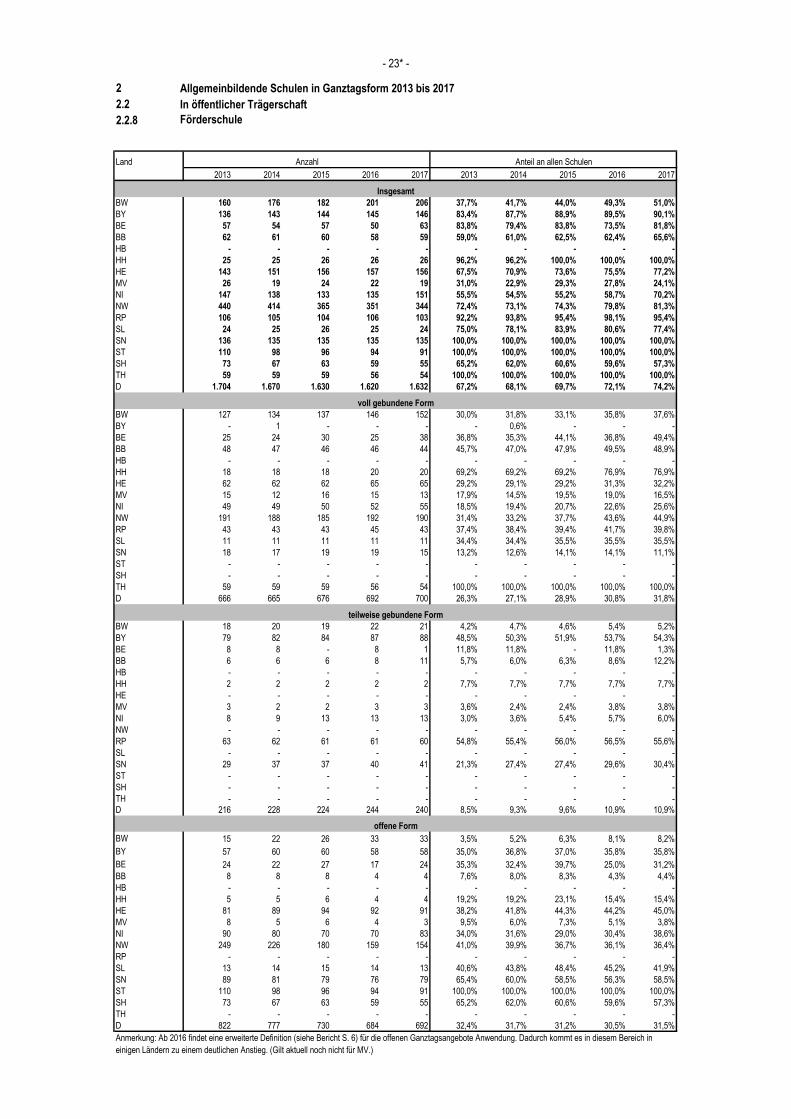
2 Allgemeinbildende Schulen in Ganztagsform 2013 bis 2017
2.2 In öffentlicher Trägerschaft
2.2.8 Förderschule
Land
2013 2014 2015 2016 2017 2013 2014 2015 2016 2017
BW 160 176 182 201 206 37,7% 41,7% 44,0% 49,3% 51,0%
BY 136 143 144 145 146 83,4% 87,7% 88,9% 89,5% 90,1%
BE 57 54 57 50 63 83,8% 79,4% 83,8% 73,5% 81,8%
BB 62 61 60 58 59 59,0% 61,0% 62,5% 62,4% 65,6%
HB - - - - - - - - - -
HH 25 25 26 26 26 96,2% 96,2% 100,0% 100,0% 100,0%
HE 143 151 156 157 156 67,5% 70,9% 73,6% 75,5% 77,2%
MV 26 19 24 22 19 31,0% 22,9% 29,3% 27,8% 24,1%
NI 147 138 133 135 151 55,5% 54,5% 55,2% 58,7% 70,2%
NW 440 414 365 351 344 72,4% 73,1% 74,3% 79,8% 81,3%
RP 106 105 104 106 103 92,2% 93,8% 95,4% 98,1% 95,4%
SL 24 25 26 25 24 75,0% 78,1% 83,9% 80,6% 77,4%
SN 136 135 135 135 135 100,0% 100,0% 100,0% 100,0% 100,0%
ST 110 98 96 94 91 100,0% 100,0% 100,0% 100,0% 100,0%
SH 73 67 63 59 55 65,2% 62,0% 60,6% 59,6% 57,3%
TH 59 59 59 56 54 100,0% 100,0% 100,0% 100,0% 100,0%
D 1.704 1.670 1.630 1.620 1.632 67,2% 68,1% 69,7% 72,1% 74,2%
BW 127 134 137 146 152 30,0% 31,8% 33,1% 35,8% 37,6%
BY - 1 - - - - 0,6% - - -
BE 25 24 30 25 38 36,8% 35,3% 44,1% 36,8% 49,4%
BB 48 47 46 46 44 45,7% 47,0% 47,9% 49,5% 48,9%
HB - - - - - - - - - -
HH 18 18 18 20 20 69,2% 69,2% 69,2% 76,9% 76,9%
HE 62 62 62 65 65 29,2% 29,1% 29,2% 31,3% 32,2%
MV 15 12 16 15 13 17,9% 14,5% 19,5% 19,0% 16,5%
NI 49 49 50 52 55 18,5% 19,4% 20,7% 22,6% 25,6%
NW 191 188 185 192 190 31,4% 33,2% 37,7% 43,6% 44,9%
RP 43 43 43 45 43 37,4% 38,4% 39,4% 41,7% 39,8%
SL 11 11 11 11 11 34,4% 34,4% 35,5% 35,5% 35,5%
SN 18 17 19 19 15 13,2% 12,6% 14,1% 14,1% 11,1%
ST - - - - - - - - - -
SH - - - - - - - - - -
TH 59 59 59 56 54 100,0% 100,0% 100,0% 100,0% 100,0%
D 666 665 676 692 700 26,3% 27,1% 28,9% 30,8% 31,8%
BW 18 20 19 22 21 4,2% 4,7% 4,6% 5,4% 5,2%
BY 79 82 84 87 88 48,5% 50,3% 51,9% 53,7% 54,3%
BE 8 8 - 8 1 11,8% 11,8% - 11,8% 1,3%
BB 6 6 6 8 11 5,7% 6,0% 6,3% 8,6% 12,2%
HB - - - - - - - - - -
HH 2 2 2 2 2 7,7% 7,7% 7,7% 7,7% 7,7%
HE - - - - - - - - - -
MV 3 2 2 3 3 3,6% 2,4% 2,4% 3,8% 3,8%
NI 8 9 13 13 13 3,0% 3,6% 5,4% 5,7% 6,0%
NW - - - - - - - - - -
RP 63 62 61 61 60 54,8% 55,4% 56,0% 56,5% 55,6%
SL - - - - - - - - - -
SN 29 37 37 40 41 21,3% 27,4% 27,4% 29,6% 30,4%
ST - - - - - - - - - -
SH - - - - - - - - - -
TH - - - - - - - - - -
D 216 228 224 244 240 8,5% 9,3% 9,6% 10,9% 10,9%
BW 15 22 26 33 33 3,5% 5,2% 6,3% 8,1% 8,2%
BY 57 60 60 58 58 35,0% 36,8% 37,0% 35,8% 35,8%
BE 24 22 27 17 24 35,3% 32,4% 39,7% 25,0% 31,2%
BB 8 8 8 4 4 7,6% 8,0% 8,3% 4,3% 4,4%
HB - - - - - - - - - -
HH 5 5 6 4 4 19,2% 19,2% 23,1% 15,4% 15,4%
HE 81 89 94 92 91 38,2% 41,8% 44,3% 44,2% 45,0%
MV 8 5 6 4 3 9,5% 6,0% 7,3% 5,1% 3,8%
NI 90 80 70 70 83 34,0% 31,6% 29,0% 30,4% 38,6%
NW 249 226 180 159 154 41,0% 39,9% 36,7% 36,1% 36,4%
RP - - - - - - - - - -
SL 13 14 15 14 13 40,6% 43,8% 48,4% 45,2% 41,9%
SN 89 81 79 76 79 65,4% 60,0% 58,5% 56,3% 58,5%
ST 110 98 96 94 91 100,0% 100,0% 100,0% 100,0% 100,0%
SH 73 67 63 59 55 65,2% 62,0% 60,6% 59,6% 57,3%
TH - - - - - - - - - -
D 822 777 730 684 692 32,4% 31,7% 31,2% 30,5% 31,5%
teilweise gebundene Form
offene Form
Anmerkung: Ab 2016 findet eine erweiterte Definition (siehe Bericht S. 6) für die offenen Ganztagsangebote Anwendung. Dadurch kommt es in diesem Bereich in
einigen Ländern zu einem deutlichen Anstieg. (Gilt aktuell noch nicht für MV.)
- 23* -
Anteil an allen SchulenAnzahl
Insgesamt
voll gebundene Form
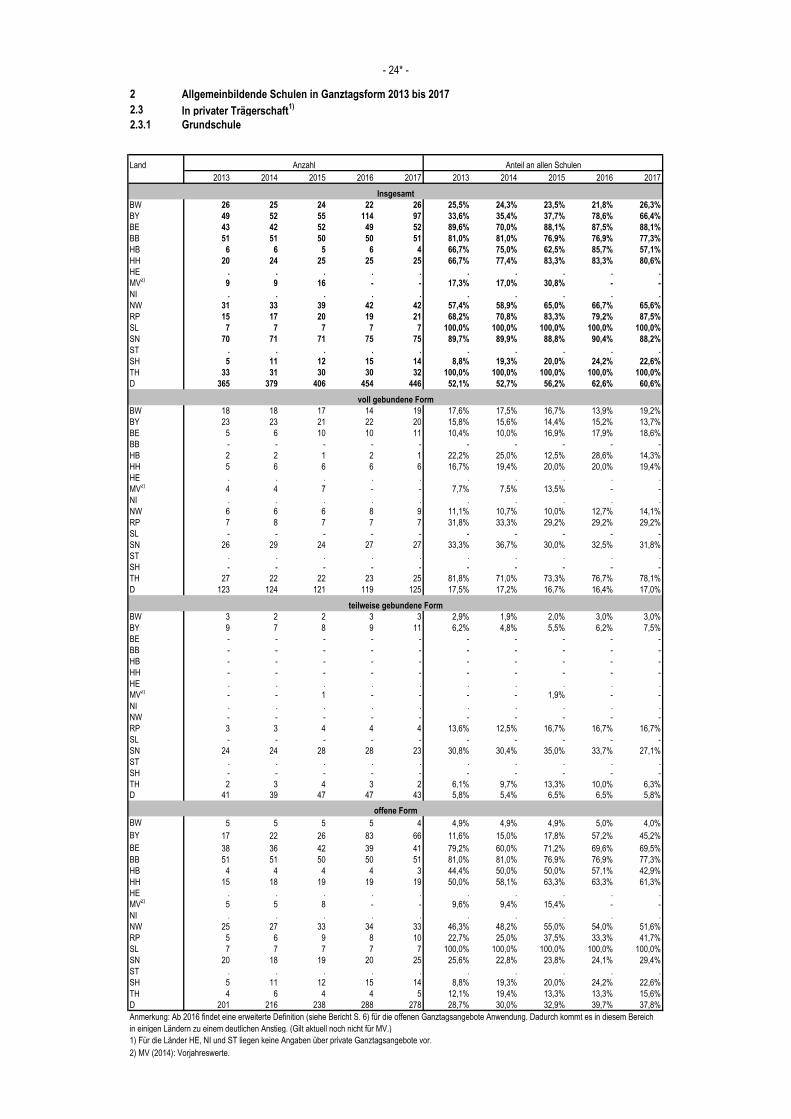
2 Allgemeinbildende Schulen in Ganztagsform 2013 bis 2017
2.3 In privater Trägerschaft1)
2.3.1 Grundschule
Land
2013 2014 2015 2016 2017 2013 2014 2015 2016 2017
BW 26 25 24 22 26 25,5% 24,3% 23,5% 21,8% 26,3%
BY 49 52 55 114 97 33,6% 35,4% 37,7% 78,6% 66,4%
BE 43 42 52 49 52 89,6% 70,0% 88,1% 87,5% 88,1%
BB 51 51 50 50 51 81,0% 81,0% 76,9% 76,9% 77,3%
HB 6 6 5 6 4 66,7% 75,0% 62,5% 85,7% 57,1%
HH 20 24 25 25 25 66,7% 77,4% 83,3% 83,3% 80,6%
HE . . . . . . . . . .
MV2)
9 9 16 - - 17,3% 17,0% 30,8% - -
NI . . . . . . . . . .
NW 31 33 39 42 42 57,4% 58,9% 65,0% 66,7% 65,6%
RP 15 17 20 19 21 68,2% 70,8% 83,3% 79,2% 87,5%
SL 7 7 7 7 7 100,0% 100,0% 100,0% 100,0% 100,0%
SN 70 71 71 75 75 89,7% 89,9% 88,8% 90,4% 88,2%
ST . . . . . . . . . .
SH 5 11 12 15 14 8,8% 19,3% 20,0% 24,2% 22,6%
TH 33 31 30 30 32 100,0% 100,0% 100,0% 100,0% 100,0%
D 365 379 406 454 446 52,1% 52,7% 56,2% 62,6% 60,6%
BW 18 18 17 14 19 17,6% 17,5% 16,7% 13,9% 19,2%
BY 23 23 21 22 20 15,8% 15,6% 14,4% 15,2% 13,7%
BE 5 6 10 10 11 10,4% 10,0% 16,9% 17,9% 18,6%
BB - - - - - - - - - -
HB 2 2 1 2 1 22,2% 25,0% 12,5% 28,6% 14,3%
HH 5 6 6 6 6 16,7% 19,4% 20,0% 20,0% 19,4%
HE . . . . . . . . . .
MV2)
4 4 7 - - 7,7% 7,5% 13,5% - -
NI . . . . . . . . . .
NW 6 6 6 8 9 11,1% 10,7% 10,0% 12,7% 14,1%
RP 7 8 7 7 7 31,8% 33,3% 29,2% 29,2% 29,2%
SL - - - - - - - - - -
SN 26 29 24 27 27 33,3% 36,7% 30,0% 32,5% 31,8%
ST . . . . . . . . . .
SH - - - - - - - - - -
TH 27 22 22 23 25 81,8% 71,0% 73,3% 76,7% 78,1%
D 123 124 121 119 125 17,5% 17,2% 16,7% 16,4% 17,0%
BW 3 2 2 3 3 2,9% 1,9% 2,0% 3,0% 3,0%
BY 9 7 8 9 11 6,2% 4,8% 5,5% 6,2% 7,5%
BE - - - - - - - - - -
BB - - - - - - - - - -
HB - - - - - - - - - -
HH - - - - - - - - - -
HE . . . . . . . . . .
MV2)
- - 1 - - - - 1,9% - -
NI . . . . . . . . . .
NW - - - - - - - - - -
RP 3 3 4 4 4 13,6% 12,5% 16,7% 16,7% 16,7%
SL - - - - - - - - - -
SN 24 24 28 28 23 30,8% 30,4% 35,0% 33,7% 27,1%
ST . . . . . . . . . .
SH - - - - - - - - - -
TH 2 3 4 3 2 6,1% 9,7% 13,3% 10,0% 6,3%
D 41 39 47 47 43 5,8% 5,4% 6,5% 6,5% 5,8%
BW 5 5 5 5 4 4,9% 4,9% 4,9% 5,0% 4,0%
BY 17 22 26 83 66 11,6% 15,0% 17,8% 57,2% 45,2%
BE 38 36 42 39 41 79,2% 60,0% 71,2% 69,6% 69,5%
BB 51 51 50 50 51 81,0% 81,0% 76,9% 76,9% 77,3%
HB 4 4 4 4 3 44,4% 50,0% 50,0% 57,1% 42,9%
HH 15 18 19 19 19 50,0% 58,1% 63,3% 63,3% 61,3%
HE . . . . . . . . . .
MV2)
5 5 8 - - 9,6% 9,4% 15,4% - -
NI . . . . . . . . . .
NW 25 27 33 34 33 46,3% 48,2% 55,0% 54,0% 51,6%
RP 5 6 9 8 10 22,7% 25,0% 37,5% 33,3% 41,7%
SL 7 7 7 7 7 100,0% 100,0% 100,0% 100,0% 100,0%
SN 20 18 19 20 25 25,6% 22,8% 23,8% 24,1% 29,4%
ST . . . . . . . . . .
SH 5 11 12 15 14 8,8% 19,3% 20,0% 24,2% 22,6%
TH 4 6 4 4 5 12,1% 19,4% 13,3% 13,3% 15,6%
D 201 216 238 288 278 28,7% 30,0% 32,9% 39,7% 37,8%
1) Für die Länder HE, NI und ST liegen keine Angaben über private Ganztagsangebote vor.
2) MV (2014): Vorjahreswerte.
teilweise gebundene Form
offene Form
Anmerkung: Ab 2016 findet eine erweiterte Definition (siehe Bericht S. 6) für die offenen Ganztagsangebote Anwendung. Dadurch kommt es in diesem Bereich
in einigen Ländern zu einem deutlichen Anstieg. (Gilt aktuell noch nicht für MV.)
- 24* -
Anzahl Anteil an allen Schulen
Insgesamt
voll gebundene Form
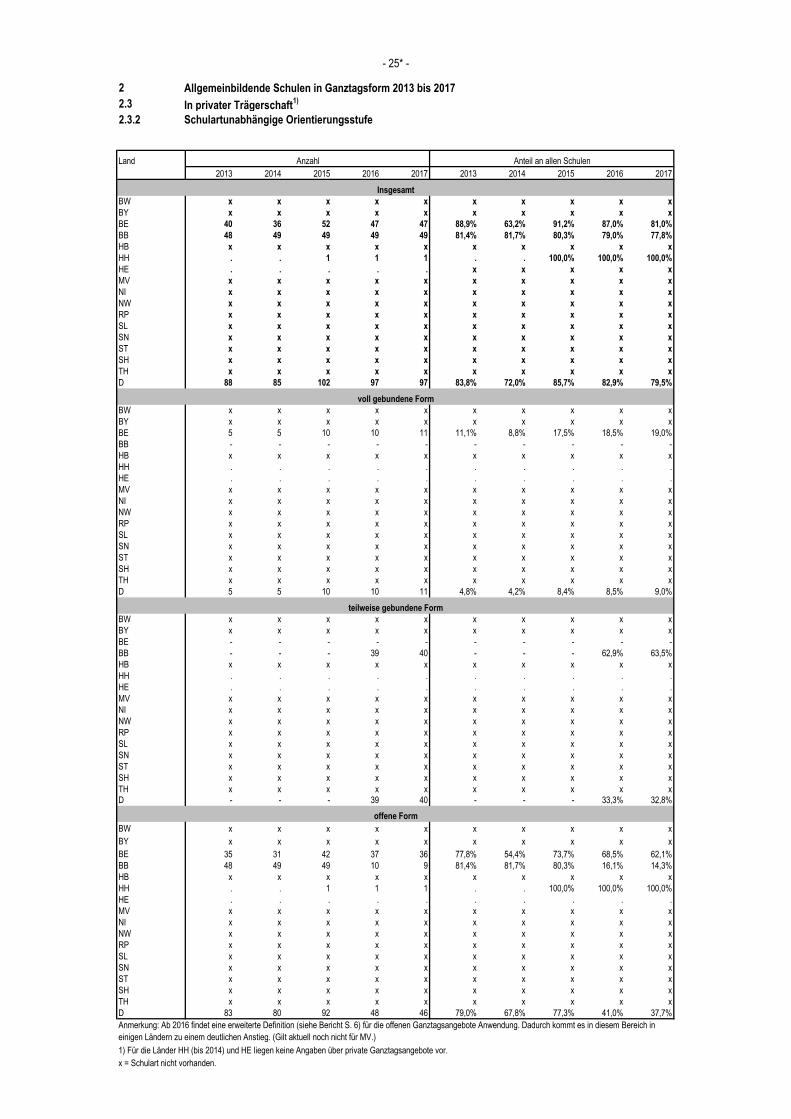
2 Allgemeinbildende Schulen in Ganztagsform 2013 bis 2017
2.3 In privater Trägerschaft1)
2.3.2 Schulartunabhängige Orientierungsstufe
Land
2013 2014 2015 2016 2017 2013 2014 2015 2016 2017
BW x x x x x x x x x x
BY x x x x x x x x x x
BE 40 36 52 47 47 88,9% 63,2% 91,2% 87,0% 81,0%
BB 48 49 49 49 49 81,4% 81,7% 80,3% 79,0% 77,8%
HB x x x x x x x x x x
HH . . 1 1 1 . . 100,0% 100,0% 100,0%
HE . . . . . x x x x x
MV x x x x x x x x x x
NI x x x x x x x x x x
NW x x x x x x x x x x
RP x x x x x x x x x x
SL x x x x x x x x x x
SN x x x x x x x x x x
ST x x x x x x x x x x
SH x x x x x x x x x x
TH x x x x x x x x x x
D 88 85 102 97 97 83,8% 72,0% 85,7% 82,9% 79,5%
BW x x x x x x x x x x
BY x x x x x x x x x x
BE 5 5 10 10 11 11,1% 8,8% 17,5% 18,5% 19,0%
BB - - - - - - - - - -
HB x x x x x x x x x x
HH . . . . . . . . . .
HE . . . . . . . . . .
MV x x x x x x x x x x
NI x x x x x x x x x x
NW x x x x x x x x x x
RP x x x x x x x x x x
SL x x x x x x x x x x
SN x x x x x x x x x x
ST x x x x x x x x x x
SH x x x x x x x x x x
TH x x x x x x x x x x
D 5 5 10 10 11 4,8% 4,2% 8,4% 8,5% 9,0%
BW x x x x x x x x x x
BY x x x x x x x x x x
BE - - - - - - - - - -
BB - - - 39 40 - - - 62,9% 63,5%
HB x x x x x x x x x x
HH . . . . . . . . . .
HE . . . . . . . . . .
MV x x x x x x x x x x
NI x x x x x x x x x x
NW x x x x x x x x x x
RP x x x x x x x x x x
SL x x x x x x x x x x
SN x x x x x x x x x x
ST x x x x x x x x x x
SH x x x x x x x x x x
TH x x x x x x x x x xD - - - 39 40 - - - 33,3% 32,8%
BW x x x x x x x x x x
BY x x x x x x x x x x
BE 35 31 42 37 36 77,8% 54,4% 73,7% 68,5% 62,1%
BB 48 49 49 10 9 81,4% 81,7% 80,3% 16,1% 14,3%
HB x x x x x x x x x x
HH . . 1 1 1 . . 100,0% 100,0% 100,0%
HE . . . . . . . . . .
MV x x x x x x x x x x
NI x x x x x x x x x x
NW x x x x x x x x x x
RP x x x x x x x x x x
SL x x x x x x x x x x
SN x x x x x x x x x x
ST x x x x x x x x x x
SH x x x x x x x x x x
TH x x x x x x x x x x
D 83 80 92 48 46 79,0% 67,8% 77,3% 41,0% 37,7%
1) Für die Länder HH (bis 2014) und HE liegen keine Angaben über private Ganztagsangebote vor.
x = Schulart nicht vorhanden.
teilweise gebundene Form
offene Form
Anmerkung: Ab 2016 findet eine erweiterte Definition (siehe Bericht S. 6) für die offenen Ganztagsangebote Anwendung. Dadurch kommt es in diesem Bereich in
einigen Ländern zu einem deutlichen Anstieg. (Gilt aktuell noch nicht für MV.)
- 25* -
Anzahl Anteil an allen Schulen
Insgesamt
voll gebundene Form
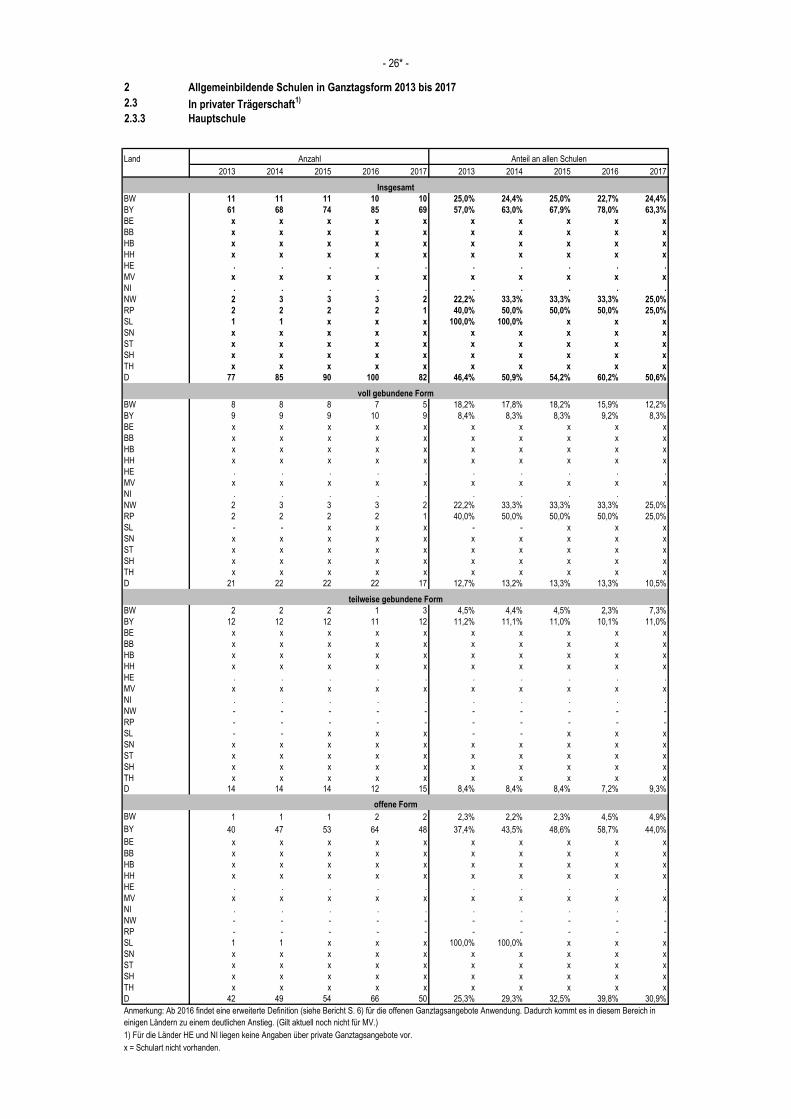
2 Allgemeinbildende Schulen in Ganztagsform 2013 bis 2017
2.3 In privater Trägerschaft1)
2.3.3 Hauptschule
Land
2013 2014 2015 2016 2017 2013 2014 2015 2016 2017
BW 11 11 11 10 10 25,0% 24,4% 25,0% 22,7% 24,4%
BY 61 68 74 85 69 57,0% 63,0% 67,9% 78,0% 63,3%
BE x x x x x x x x x x
BB x x x x x x x x x x
HB x x x x x x x x x x
HH x x x x x x x x x x
HE . . . . . . . . . .
MV x x x x x x x x x x
NI . . . . . . . . . .
NW 2 3 3 3 2 22,2% 33,3% 33,3% 33,3% 25,0%
RP 2 2 2 2 1 40,0% 50,0% 50,0% 50,0% 25,0%
SL 1 1 x x x 100,0% 100,0% x x x
SN x x x x x x x x x x
ST x x x x x x x x x x
SH x x x x x x x x x x
TH x x x x x x x x x x
D 77 85 90 100 82 46,4% 50,9% 54,2% 60,2% 50,6%
BW 8 8 8 7 5 18,2% 17,8% 18,2% 15,9% 12,2%
BY 9 9 9 10 9 8,4% 8,3% 8,3% 9,2% 8,3%
BE x x x x x x x x x x
BB x x x x x x x x x x
HB x x x x x x x x x x
HH x x x x x x x x x x
HE . . . . . . . . . .
MV x x x x x x x x x x
NI . . . . . . . . . .
NW 2 3 3 3 2 22,2% 33,3% 33,3% 33,3% 25,0%
RP 2 2 2 2 1 40,0% 50,0% 50,0% 50,0% 25,0%
SL - - x x x - - x x x
SN x x x x x x x x x x
ST x x x x x x x x x x
SH x x x x x x x x x x
TH x x x x x x x x x x
D 21 22 22 22 17 12,7% 13,2% 13,3% 13,3% 10,5%
BW 2 2 2 1 3 4,5% 4,4% 4,5% 2,3% 7,3%
BY 12 12 12 11 12 11,2% 11,1% 11,0% 10,1% 11,0%
BE x x x x x x x x x x
BB x x x x x x x x x x
HB x x x x x x x x x x
HH x x x x x x x x x x
HE . . . . . . . . . .
MV x x x x x x x x x x
NI . . . . . . . . . .
NW - - - - - - - - - -
RP - - - - - - - - - -
SL - - x x x - - x x x
SN x x x x x x x x x x
ST x x x x x x x x x x
SH x x x x x x x x x x
TH x x x x x x x x x x
D 14 14 14 12 15 8,4% 8,4% 8,4% 7,2% 9,3%
BW 1 1 1 2 2 2,3% 2,2% 2,3% 4,5% 4,9%
BY 40 47 53 64 48 37,4% 43,5% 48,6% 58,7% 44,0%
BE x x x x x x x x x x
BB x x x x x x x x x x
HB x x x x x x x x x x
HH x x x x x x x x x x
HE . . . . . . . . . .
MV x x x x x x x x x x
NI . . . . . . . . . .
NW - - - - - - - - - -
RP - - - - - - - - - -
SL 1 1 x x x 100,0% 100,0% x x x
SN x x x x x x x x x x
ST x x x x x x x x x x
SH x x x x x x x x x x
TH x x x x x x x x x x
D 42 49 54 66 50 25,3% 29,3% 32,5% 39,8% 30,9%
1) Für die Länder HE und NI liegen keine Angaben über private Ganztagsangebote vor.
x = Schulart nicht vorhanden.
teilweise gebundene Form
offene Form
Anmerkung: Ab 2016 findet eine erweiterte Definition (siehe Bericht S. 6) für die offenen Ganztagsangebote Anwendung. Dadurch kommt es in diesem Bereich in
einigen Ländern zu einem deutlichen Anstieg. (Gilt aktuell noch nicht für MV.)
- 26* -
Anzahl Anteil an allen Schulen
Insgesamt
voll gebundene Form
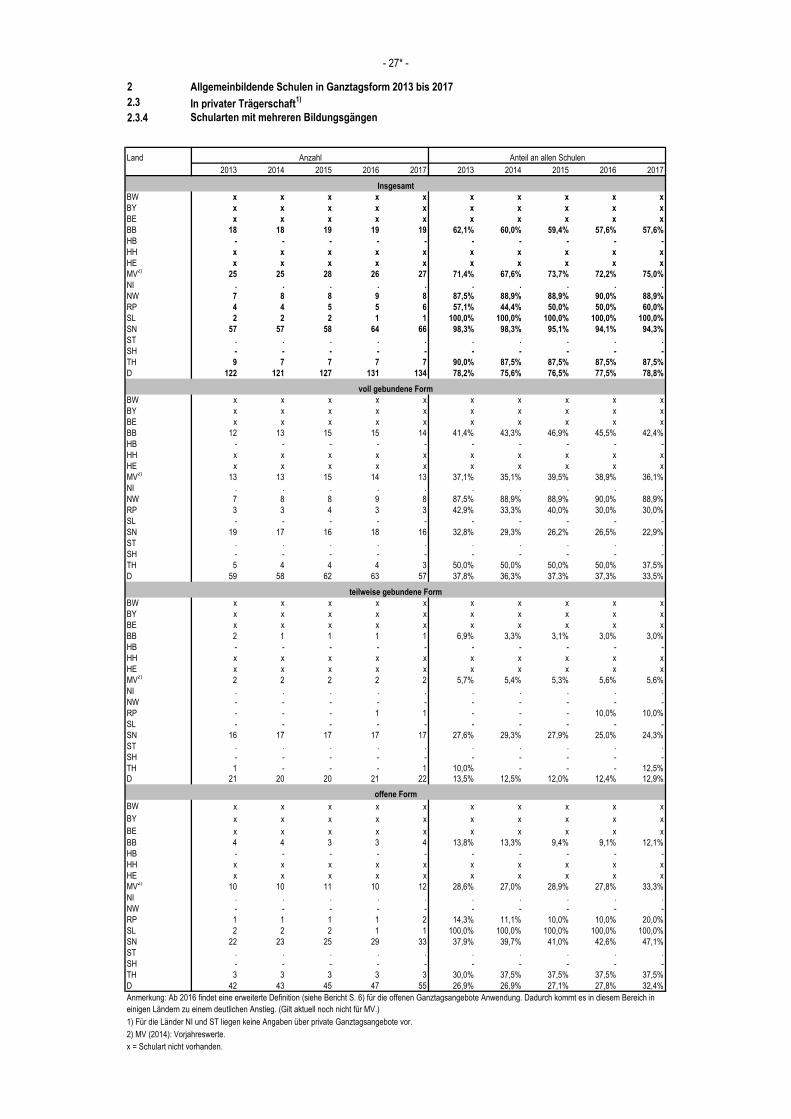
2 Allgemeinbildende Schulen in Ganztagsform 2013 bis 2017
2.3 In privater Trägerschaft1)
2.3.4 Schularten mit mehreren Bildungsgängen
Land
2013 2014 2015 2016 2017 2013 2014 2015 2016 2017
BW x x x x x x x x x x
BY x x x x x x x x x x
BE x x x x x x x x x x
BB 18 18 19 19 19 62,1% 60,0% 59,4% 57,6% 57,6%
HB - - - - - - - - - -
HH x x x x x x x x x x
HE x x x x x x x x x x
MV2)
25 25 28 26 27 71,4% 67,6% 73,7% 72,2% 75,0%
NI . . . . . . . . . .
NW 7 8 8 9 8 87,5% 88,9% 88,9% 90,0% 88,9%
RP 4 4 5 5 6 57,1% 44,4% 50,0% 50,0% 60,0%
SL 2 2 2 1 1 100,0% 100,0% 100,0% 100,0% 100,0%
SN 57 57 58 64 66 98,3% 98,3% 95,1% 94,1% 94,3%
ST . . . . . . . . . .
SH - - - - - - - - - -
TH 9 7 7 7 7 90,0% 87,5% 87,5% 87,5% 87,5%
D 122 121 127 131 134 78,2% 75,6% 76,5% 77,5% 78,8%
BW x x x x x x x x x x
BY x x x x x x x x x x
BE x x x x x x x x x x
BB 12 13 15 15 14 41,4% 43,3% 46,9% 45,5% 42,4%
HB - - - - - - - - - -
HH x x x x x x x x x x
HE x x x x x x x x x x
MV2)
13 13 15 14 13 37,1% 35,1% 39,5% 38,9% 36,1%
NI . . . . . . . . . .
NW 7 8 8 9 8 87,5% 88,9% 88,9% 90,0% 88,9%
RP 3 3 4 3 3 42,9% 33,3% 40,0% 30,0% 30,0%
SL - - - - - - - - - -
SN 19 17 16 18 16 32,8% 29,3% 26,2% 26,5% 22,9%
ST . . . . . . . . . .
SH - - - - - - - - - -
TH 5 4 4 4 3 50,0% 50,0% 50,0% 50,0% 37,5%
D 59 58 62 63 57 37,8% 36,3% 37,3% 37,3% 33,5%
BW x x x x x x x x x x
BY x x x x x x x x x x
BE x x x x x x x x x x
BB 2 1 1 1 1 6,9% 3,3% 3,1% 3,0% 3,0%
HB - - - - - - - - - -
HH x x x x x x x x x x
HE x x x x x x x x x x
MV2)
2 2 2 2 2 5,7% 5,4% 5,3% 5,6% 5,6%
NI . . . . . . . . . .
NW - - - - - - - - - -
RP - - - 1 1 - - - 10,0% 10,0%
SL - - - - - - - - - -
SN 16 17 17 17 17 27,6% 29,3% 27,9% 25,0% 24,3%
ST . . . . . . . . . .
SH - - - - - - - - - -
TH 1 - - - 1 10,0% - - - 12,5%
D 21 20 20 21 22 13,5% 12,5% 12,0% 12,4% 12,9%
BW x x x x x x x x x x
BY x x x x x x x x x x
BE x x x x x x x x x x
BB 4 4 3 3 4 13,8% 13,3% 9,4% 9,1% 12,1%
HB - - - - - - - - - -
HH x x x x x x x x x x
HE x x x x x x x x x x
MV2)
10 10 11 10 12 28,6% 27,0% 28,9% 27,8% 33,3%
NI . . . . . . . . . .
NW - - - - - - - - - -
RP 1 1 1 1 2 14,3% 11,1% 10,0% 10,0% 20,0%
SL 2 2 2 1 1 100,0% 100,0% 100,0% 100,0% 100,0%
SN 22 23 25 29 33 37,9% 39,7% 41,0% 42,6% 47,1%
ST . . . . . . . . . .
SH - - - - - - - - - -
TH 3 3 3 3 3 30,0% 37,5% 37,5% 37,5% 37,5%
D 42 43 45 47 55 26,9% 26,9% 27,1% 27,8% 32,4%
1) Für die Länder NI und ST liegen keine Angaben über private Ganztagsangebote vor.
2) MV (2014): Vorjahreswerte.
x = Schulart nicht vorhanden.
teilweise gebundene Form
offene Form
Anmerkung: Ab 2016 findet eine erweiterte Definition (siehe Bericht S. 6) für die offenen Ganztagsangebote Anwendung. Dadurch kommt es in diesem Bereich in
einigen Ländern zu einem deutlichen Anstieg. (Gilt aktuell noch nicht für MV.)
- 27* -
Anzahl Anteil an allen Schulen
Insgesamt
voll gebundene Form
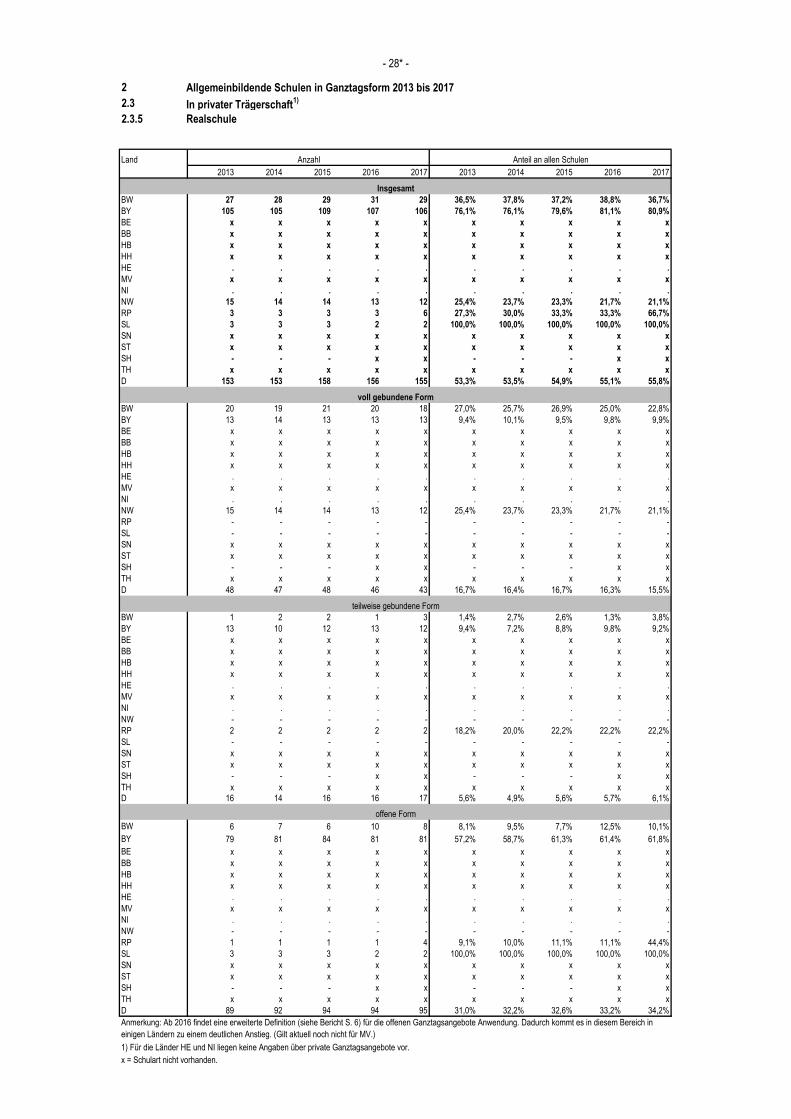
2 Allgemeinbildende Schulen in Ganztagsform 2013 bis 2017
2.3 In privater Trägerschaft1)
2.3.5 Realschule
Land
2013 2014 2015 2016 2017 2013 2014 2015 2016 2017
BW 27 28 29 31 29 36,5% 37,8% 37,2% 38,8% 36,7%
BY 105 105 109 107 106 76,1% 76,1% 79,6% 81,1% 80,9%
BE x x x x x x x x x x
BB x x x x x x x x x x
HB x x x x x x x x x x
HH x x x x x x x x x x
HE . . . . . . . . . .
MV x x x x x x x x x x
NI . . . . . . . . . .
NW 15 14 14 13 12 25,4% 23,7% 23,3% 21,7% 21,1%
RP 3 3 3 3 6 27,3% 30,0% 33,3% 33,3% 66,7%
SL 3 3 3 2 2 100,0% 100,0% 100,0% 100,0% 100,0%
SN x x x x x x x x x x
ST x x x x x x x x x x
SH - - - x x - - - x x
TH x x x x x x x x x x
D 153 153 158 156 155 53,3% 53,5% 54,9% 55,1% 55,8%
BW 20 19 21 20 18 27,0% 25,7% 26,9% 25,0% 22,8%
BY 13 14 13 13 13 9,4% 10,1% 9,5% 9,8% 9,9%
BE x x x x x x x x x x
BB x x x x x x x x x x
HB x x x x x x x x x x
HH x x x x x x x x x x
HE . . . . . . . . . .
MV x x x x x x x x x x
NI . . . . . . . . . .
NW 15 14 14 13 12 25,4% 23,7% 23,3% 21,7% 21,1%
RP - - - - - - - - - -
SL - - - - - - - - - -
SN x x x x x x x x x x
ST x x x x x x x x x x
SH - - - x x - - - x x
TH x x x x x x x x x x
D 48 47 48 46 43 16,7% 16,4% 16,7% 16,3% 15,5%
BW 1 2 2 1 3 1,4% 2,7% 2,6% 1,3% 3,8%
BY 13 10 12 13 12 9,4% 7,2% 8,8% 9,8% 9,2%
BE x x x x x x x x x x
BB x x x x x x x x x x
HB x x x x x x x x x x
HH x x x x x x x x x x
HE . . . . . . . . . .
MV x x x x x x x x x x
NI . . . . . . . . . .
NW - - - - - - - - - -
RP 2 2 2 2 2 18,2% 20,0% 22,2% 22,2% 22,2%
SL - - - - - - - - - -
SN x x x x x x x x x x
ST x x x x x x x x x x
SH - - - x x - - - x x
TH x x x x x x x x x x
D 16 14 16 16 17 5,6% 4,9% 5,6% 5,7% 6,1%
BW 6 7 6 10 8 8,1% 9,5% 7,7% 12,5% 10,1%
BY 79 81 84 81 81 57,2% 58,7% 61,3% 61,4% 61,8%
BE x x x x x x x x x x
BB x x x x x x x x x x
HB x x x x x x x x x x
HH x x x x x x x x x x
HE . . . . . . . . . .
MV x x x x x x x x x x
NI . . . . . . . . . .
NW - - - - - - - - - -
RP 1 1 1 1 4 9,1% 10,0% 11,1% 11,1% 44,4%
SL 3 3 3 2 2 100,0% 100,0% 100,0% 100,0% 100,0%
SN x x x x x x x x x x
ST x x x x x x x x x x
SH - - - x x - - - x x
TH x x x x x x x x x x
D 89 92 94 94 95 31,0% 32,2% 32,6% 33,2% 34,2%
1) Für die Länder HE und NI liegen keine Angaben über private Ganztagsangebote vor.
x = Schulart nicht vorhanden.
teilweise gebundene Form
offene Form
Anmerkung: Ab 2016 findet eine erweiterte Definition (siehe Bericht S. 6) für die offenen Ganztagsangebote Anwendung. Dadurch kommt es in diesem Bereich in
einigen Ländern zu einem deutlichen Anstieg. (Gilt aktuell noch nicht für MV.)
- 28* -
Anzahl Anteil an allen Schulen
Insgesamt
voll gebundene Form
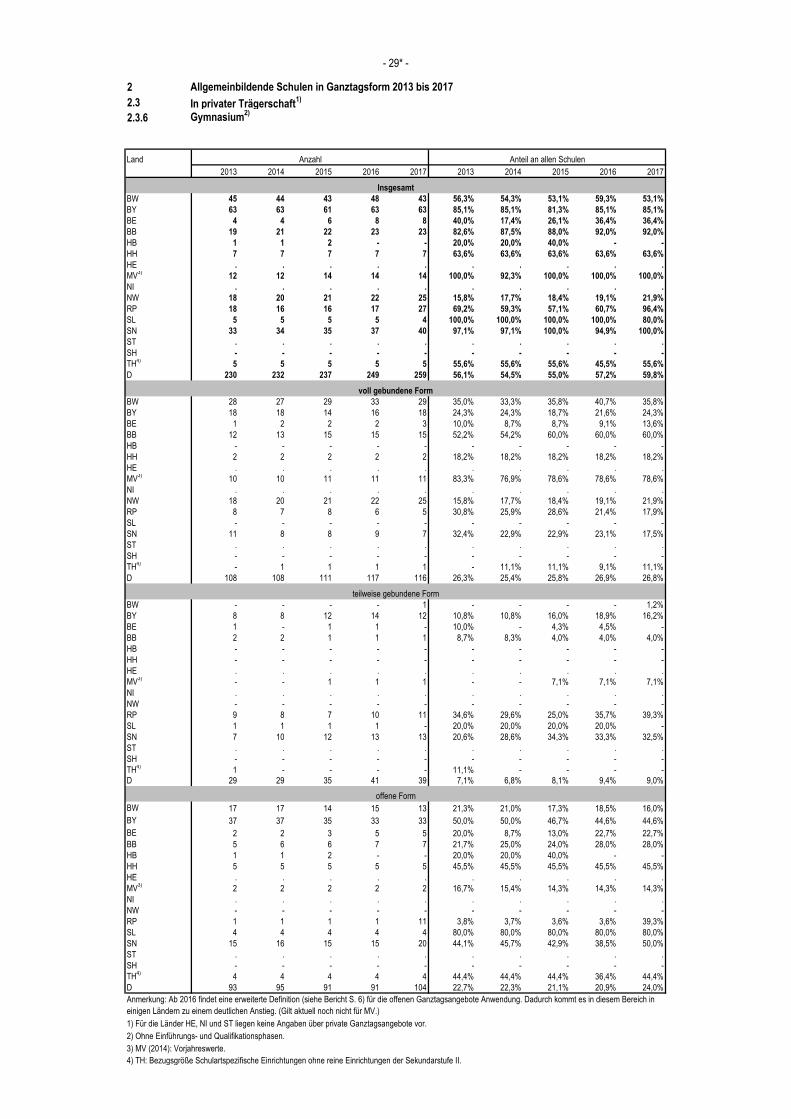
2 Allgemeinbildende Schulen in Ganztagsform 2013 bis 2017
2.3 In privater Trägerschaft1)
2.3.6 Gymnasium2)
Land
2013 2014 2015 2016 2017 2013 2014 2015 2016 2017
BW 45 44 43 48 43 56,3% 54,3% 53,1% 59,3% 53,1%
BY 63 63 61 63 63 85,1% 85,1% 81,3% 85,1% 85,1%
BE 4 4 6 8 8 40,0% 17,4% 26,1% 36,4% 36,4%
BB 19 21 22 23 23 82,6% 87,5% 88,0% 92,0% 92,0%
HB 1 1 2 - - 20,0% 20,0% 40,0% - -
HH 7 7 7 7 7 63,6% 63,6% 63,6% 63,6% 63,6%
HE . . . . . . . . . .
MV3)
12 12 14 14 14 100,0% 92,3% 100,0% 100,0% 100,0%
NI . . . . . . . . . .
NW 18 20 21 22 25 15,8% 17,7% 18,4% 19,1% 21,9%
RP 18 16 16 17 27 69,2% 59,3% 57,1% 60,7% 96,4%
SL 5 5 5 5 4 100,0% 100,0% 100,0% 100,0% 80,0%
SN 33 34 35 37 40 97,1% 97,1% 100,0% 94,9% 100,0%
ST . . . . . . . . . .
SH - - - - - - - - - -
TH4)
5 5 5 5 5 55,6% 55,6% 55,6% 45,5% 55,6%
D 230 232 237 249 259 56,1% 54,5% 55,0% 57,2% 59,8%
BW 28 27 29 33 29 35,0% 33,3% 35,8% 40,7% 35,8%
BY 18 18 14 16 18 24,3% 24,3% 18,7% 21,6% 24,3%
BE 1 2 2 2 3 10,0% 8,7% 8,7% 9,1% 13,6%
BB 12 13 15 15 15 52,2% 54,2% 60,0% 60,0% 60,0%
HB - - - - - - - - - -
HH 2 2 2 2 2 18,2% 18,2% 18,2% 18,2% 18,2%
HE . . . . . . . . . .
MV3)
10 10 11 11 11 83,3% 76,9% 78,6% 78,6% 78,6%
NI . . . . . . . . . .
NW 18 20 21 22 25 15,8% 17,7% 18,4% 19,1% 21,9%
RP 8 7 8 6 5 30,8% 25,9% 28,6% 21,4% 17,9%
SL - - - - - - - - - -
SN 11 8 8 9 7 32,4% 22,9% 22,9% 23,1% 17,5%
ST . . . . . . . . . .
SH - - - - - - - - - -
TH4)
- 1 1 1 1 - 11,1% 11,1% 9,1% 11,1%
D 108 108 111 117 116 26,3% 25,4% 25,8% 26,9% 26,8%
BW - - - - 1 - - - - 1,2%
BY 8 8 12 14 12 10,8% 10,8% 16,0% 18,9% 16,2%
BE 1 - 1 1 - 10,0% - 4,3% 4,5% -
BB 2 2 1 1 1 8,7% 8,3% 4,0% 4,0% 4,0%
HB - - - - - - - - - -
HH - - - - - - - - - -
HE . . . . . . . . . .
MV3)
- - 1 1 1 - - 7,1% 7,1% 7,1%
NI . . . . . . . . . .
NW - - - - - - - - - -
RP 9 8 7 10 11 34,6% 29,6% 25,0% 35,7% 39,3%
SL 1 1 1 1 - 20,0% 20,0% 20,0% 20,0% -
SN 7 10 12 13 13 20,6% 28,6% 34,3% 33,3% 32,5%
ST . . . . . . . . . .
SH - - - - - - - - - -
TH4)
1 - - - - 11,1% - - - -
D 29 29 35 41 39 7,1% 6,8% 8,1% 9,4% 9,0%
BW 17 17 14 15 13 21,3% 21,0% 17,3% 18,5% 16,0%
BY 37 37 35 33 33 50,0% 50,0% 46,7% 44,6% 44,6%
BE 2 2 3 5 5 20,0% 8,7% 13,0% 22,7% 22,7%
BB 5 6 6 7 7 21,7% 25,0% 24,0% 28,0% 28,0%
HB 1 1 2 - - 20,0% 20,0% 40,0% - -
HH 5 5 5 5 5 45,5% 45,5% 45,5% 45,5% 45,5%
HE . . . . . . . . . .
MV3)
2 2 2 2 2 16,7% 15,4% 14,3% 14,3% 14,3%
NI . . . . . . . . . .
NW - - - - - - - - - -
RP 1 1 1 1 11 3,8% 3,7% 3,6% 3,6% 39,3%
SL 4 4 4 4 4 80,0% 80,0% 80,0% 80,0% 80,0%
SN 15 16 15 15 20 44,1% 45,7% 42,9% 38,5% 50,0%
ST . . . . . . . . . .
SH - - - - - - - - - -
TH4)
4 4 4 4 4 44,4% 44,4% 44,4% 36,4% 44,4%
D 93 95 91 91 104 22,7% 22,3% 21,1% 20,9% 24,0%
1) Für die Länder HE, NI und ST liegen keine Angaben über private Ganztagsangebote vor.
2) Ohne Einführungs- und Qualifikationsphasen.
3) MV (2014): Vorjahreswerte.
4) TH: Bezugsgröße Schulartspezifische Einrichtungen ohne reine Einrichtungen der Sekundarstufe II.
teilweise gebundene Form
offene Form
Anmerkung: Ab 2016 findet eine erweiterte Definition (siehe Bericht S. 6) für die offenen Ganztagsangebote Anwendung. Dadurch kommt es in diesem Bereich in
einigen Ländern zu einem deutlichen Anstieg. (Gilt aktuell noch nicht für MV.)
- 29* -
Anzahl Anteil an allen Schulen
Insgesamt
voll gebundene Form
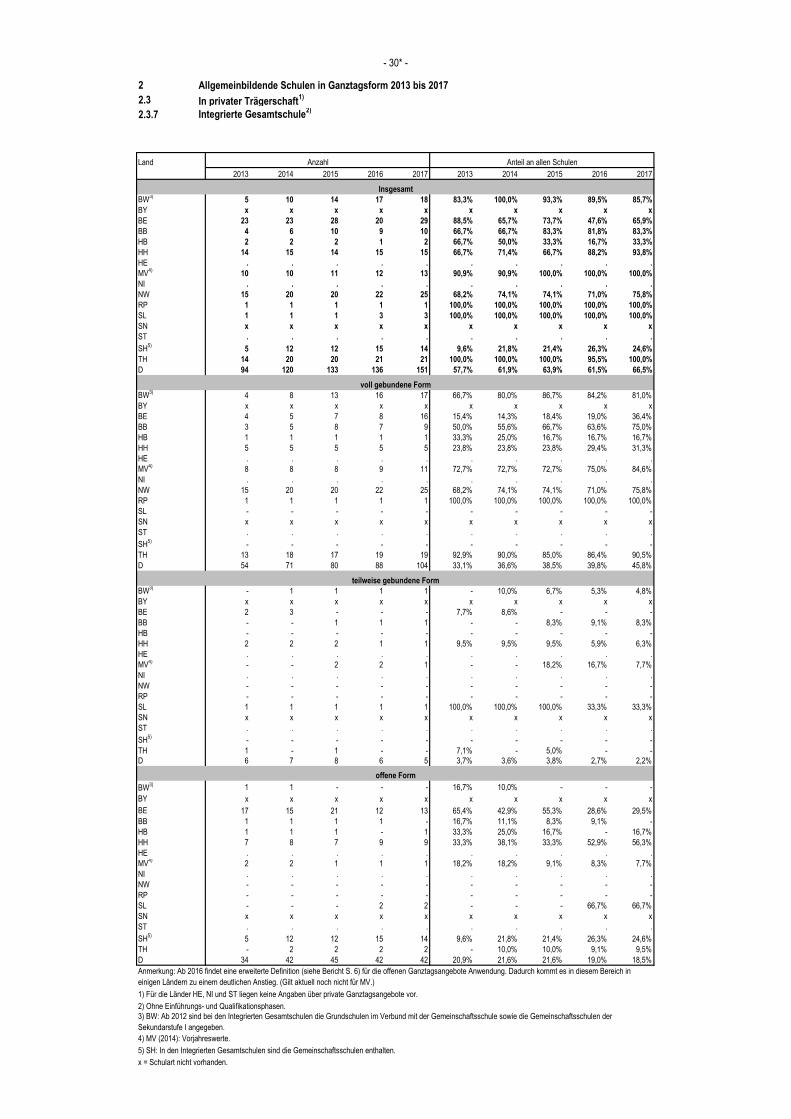
2 Allgemeinbildende Schulen in Ganztagsform 2013 bis 2017
2.3 In privater Trägerschaft1)
2.3.7 Integrierte Gesamtschule2)
Land
2013 2014 2015 2016 2017 2013 2014 2015 2016 2017
BW3)
5 10 14 17 18 83,3% 100,0% 93,3% 89,5% 85,7%
BY x x x x x x x x x x
BE 23 23 28 20 29 88,5% 65,7% 73,7% 47,6% 65,9%
BB 4 6 10 9 10 66,7% 66,7% 83,3% 81,8% 83,3%
HB 2 2 2 1 2 66,7% 50,0% 33,3% 16,7% 33,3%
HH 14 15 14 15 15 66,7% 71,4% 66,7% 88,2% 93,8%
HE . . . . . . . . . .
MV4)
10 10 11 12 13 90,9% 90,9% 100,0% 100,0% 100,0%
NI . . . . . . . . . .
NW 15 20 20 22 25 68,2% 74,1% 74,1% 71,0% 75,8%
RP 1 1 1 1 1 100,0% 100,0% 100,0% 100,0% 100,0%
SL 1 1 1 3 3 100,0% 100,0% 100,0% 100,0% 100,0%
SN x x x x x x x x x x
ST . . . . . . . . . .
SH5)
5 12 12 15 14 9,6% 21,8% 21,4% 26,3% 24,6%
TH 14 20 20 21 21 100,0% 100,0% 100,0% 95,5% 100,0%
D 94 120 133 136 151 57,7% 61,9% 63,9% 61,5% 66,5%
BW3)
4 8 13 16 17 66,7% 80,0% 86,7% 84,2% 81,0%
BY x x x x x x x x x x
BE 4 5 7 8 16 15,4% 14,3% 18,4% 19,0% 36,4%
BB 3 5 8 7 9 50,0% 55,6% 66,7% 63,6% 75,0%
HB 1 1 1 1 1 33,3% 25,0% 16,7% 16,7% 16,7%
HH 5 5 5 5 5 23,8% 23,8% 23,8% 29,4% 31,3%
HE . . . . . . . . . .
MV4)
8 8 8 9 11 72,7% 72,7% 72,7% 75,0% 84,6%
NI . . . . . . . . . .
NW 15 20 20 22 25 68,2% 74,1% 74,1% 71,0% 75,8%
RP 1 1 1 1 1 100,0% 100,0% 100,0% 100,0% 100,0%
SL - - - - - - - - - -
SN x x x x x x x x x x
ST . . . . . . . . . .
SH5)
- - - - - - - - - -
TH 13 18 17 19 19 92,9% 90,0% 85,0% 86,4% 90,5%
D 54 71 80 88 104 33,1% 36,6% 38,5% 39,8% 45,8%
BW3)
- 1 1 1 1 - 10,0% 6,7% 5,3% 4,8%
BY x x x x x x x x x x
BE 2 3 - - - 7,7% 8,6% - - -
BB - - 1 1 1 - - 8,3% 9,1% 8,3%
HB - - - - - - - - - -
HH 2 2 2 1 1 9,5% 9,5% 9,5% 5,9% 6,3%
HE . . . . . . . . . .
MV4)
- - 2 2 1 - - 18,2% 16,7% 7,7%
NI . . . . . . . . . .
NW - - - - - - - - - -
RP - - - - - - - - - -
SL 1 1 1 1 1 100,0% 100,0% 100,0% 33,3% 33,3%
SN x x x x x x x x x x
ST . . . . . . . . . .
SH5)
- - - - - - - - - -
TH 1 - 1 - - 7,1% - 5,0% - -
D 6 7 8 6 5 3,7% 3,6% 3,8% 2,7% 2,2%
BW3) 1 1 - - - 16,7% 10,0% - - -
BY x x x x x x x x x x
BE 17 15 21 12 13 65,4% 42,9% 55,3% 28,6% 29,5%
BB 1 1 1 1 - 16,7% 11,1% 8,3% 9,1% -
HB 1 1 1 - 1 33,3% 25,0% 16,7% - 16,7%
HH 7 8 7 9 9 33,3% 38,1% 33,3% 52,9% 56,3%
HE . . . . . . . . . .
MV4)
2 2 1 1 1 18,2% 18,2% 9,1% 8,3% 7,7%
NI . . . . . . . . . .
NW - - - - - - - - - -
RP - - - - - - - - - -
SL - - - 2 2 - - - 66,7% 66,7%
SN x x x x x x x x x x
ST . . . . . . . . . .
SH5)
5 12 12 15 14 9,6% 21,8% 21,4% 26,3% 24,6%
TH - 2 2 2 2 - 10,0% 10,0% 9,1% 9,5%
D 34 42 45 42 42 20,9% 21,6% 21,6% 19,0% 18,5%
1) Für die Länder HE, NI und ST liegen keine Angaben über private Ganztagsangebote vor.
2) Ohne Einführungs- und Qualifikationsphasen.
4) MV (2014): Vorjahreswerte.
5) SH: In den Integrierten Gesamtschulen sind die Gemeinschaftsschulen enthalten.
x = Schulart nicht vorhanden.
teilweise gebundene Form
offene Form
Anmerkung: Ab 2016 findet eine erweiterte Definition (siehe Bericht S. 6) für die offenen Ganztagsangebote Anwendung. Dadurch kommt es in diesem Bereich in
einigen Ländern zu einem deutlichen Anstieg. (Gilt aktuell noch nicht für MV.)
3) BW: Ab 2012 sind bei den Integrierten Gesamtschulen die Grundschulen im Verbund mit der Gemeinschaftsschule sowie die Gemeinschaftsschulen der
Sekundarstufe I angegeben.
- 30* -
Anzahl Anteil an allen Schulen
Insgesamt
voll gebundene Form
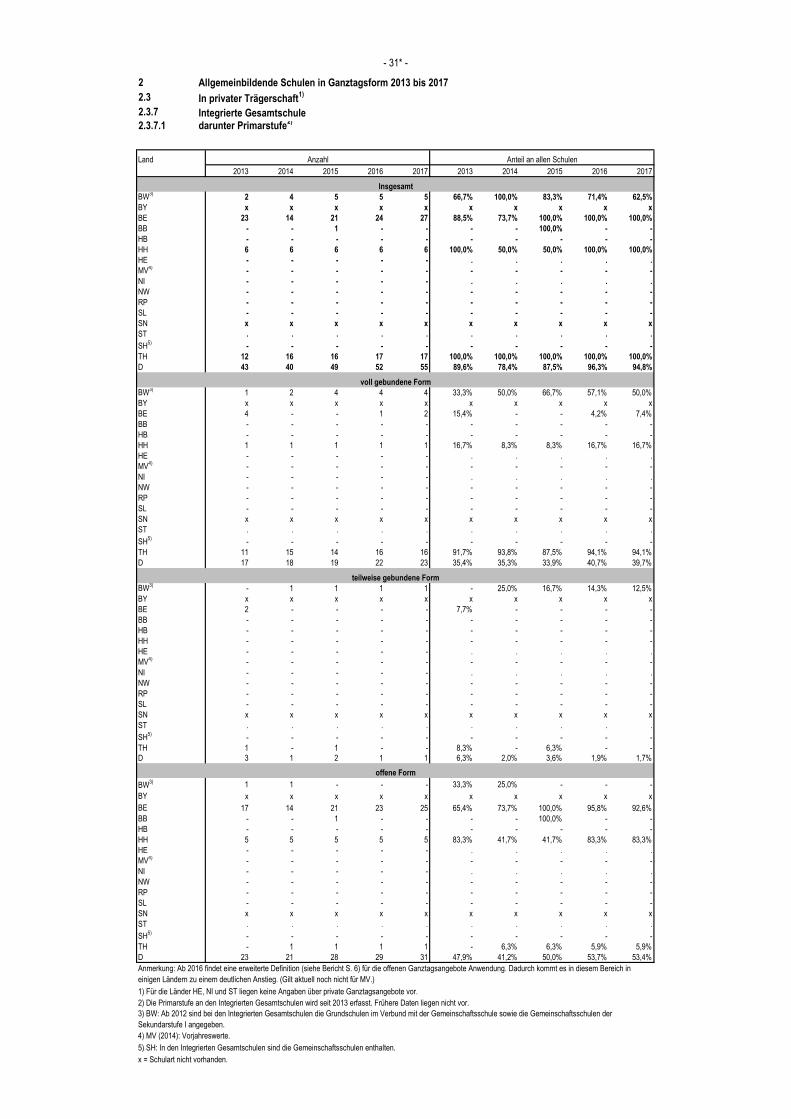
2 Allgemeinbildende Schulen in Ganztagsform 2013 bis 2017
2.3 In privater Trägerschaft1)
2.3.7 Integrierte Gesamtschule2.3.7.1 darunter Primarstufe
2)
Land
2013 2014 2015 2016 2017 2013 2014 2015 2016 2017
BW3)
2 4 5 5 5 66,7% 100,0% 83,3% 71,4% 62,5%
BY x x x x x x x x x x
BE 23 14 21 24 27 88,5% 73,7% 100,0% 100,0% 100,0%
BB - - 1 - - - - 100,0% - -
HB - - - - - - - - - -
HH 6 6 6 6 6 100,0% 50,0% 50,0% 100,0% 100,0%
HE - - - - - . . . . .
MV4)
- - - - - - - - - -
NI - - - - - . . . . .
NW - - - - - - - - - -
RP - - - - - - - - - -
SL - - - - - - - - - -
SN x x x x x x x x x x
ST . . . . . . . . . .
SH5)
- - - - - - - - - -
TH 12 16 16 17 17 100,0% 100,0% 100,0% 100,0% 100,0%
D 43 40 49 52 55 89,6% 78,4% 87,5% 96,3% 94,8%
BW3)
1 2 4 4 4 33,3% 50,0% 66,7% 57,1% 50,0%
BY x x x x x x x x x x
BE 4 - - 1 2 15,4% - - 4,2% 7,4%
BB - - - - - - - - - -
HB - - - - - - - - - -
HH 1 1 1 1 1 16,7% 8,3% 8,3% 16,7% 16,7%
HE - - - - - . . . . .
MV4)
- - - - - - - - - -
NI - - - - - . . . . .
NW - - - - - - - - - -
RP - - - - - - - - - -
SL - - - - - - - - - -
SN x x x x x x x x x x
ST . . . . . . . . . .
SH5)
- - - - - - - - - -
TH 11 15 14 16 16 91,7% 93,8% 87,5% 94,1% 94,1%
D 17 18 19 22 23 35,4% 35,3% 33,9% 40,7% 39,7%
BW3)
- 1 1 1 1 - 25,0% 16,7% 14,3% 12,5%
BY x x x x x x x x x x
BE 2 - - - - 7,7% - - - -
BB - - - - - - - - - -
HB - - - - - - - - - -
HH - - - - - - - - - -
HE - - - - - . . . . .
MV4)
- - - - - - - - - -
NI - - - - - . . . . .
NW - - - - - - - - - -
RP - - - - - - - - - -
SL - - - - - - - - - -
SN x x x x x x x x x x
ST . . . . . . . . . .
SH5)
- - - - - - - - - -
TH 1 - 1 - - 8,3% - 6,3% - -
D 3 1 2 1 1 6,3% 2,0% 3,6% 1,9% 1,7%
BW3) 1 1 - - - 33,3% 25,0% - - -
BY x x x x x x x x x x
BE 17 14 21 23 25 65,4% 73,7% 100,0% 95,8% 92,6%
BB - - 1 - - - - 100,0% - -
HB - - - - - - - - - -
HH 5 5 5 5 5 83,3% 41,7% 41,7% 83,3% 83,3%
HE - - - - - . . . . .
MV4)
- - - - - - - - - -
NI - - - - - . . . . .
NW - - - - - - - - - -
RP - - - - - - - - - -
SL - - - - - - - - - -
SN x x x x x x x x x x
ST . . . . . . . . . .
SH5)
- - - - - - - - - -
TH - 1 1 1 1 - 6,3% 6,3% 5,9% 5,9%
D 23 21 28 29 31 47,9% 41,2% 50,0% 53,7% 53,4%
1) Für die Länder HE, NI und ST liegen keine Angaben über private Ganztagsangebote vor.
4) MV (2014): Vorjahreswerte.
5) SH: In den Integrierten Gesamtschulen sind die Gemeinschaftsschulen enthalten.
x = Schulart nicht vorhanden.
- 31* -
Anzahl Anteil an allen Schulen
Insgesamt
voll gebundene Form
teilweise gebundene Form
offene Form
Anmerkung: Ab 2016 findet eine erweiterte Definition (siehe Bericht S. 6) für die offenen Ganztagsangebote Anwendung. Dadurch kommt es in diesem Bereich in
einigen Ländern zu einem deutlichen Anstieg. (Gilt aktuell noch nicht für MV.)
2) Die Primarstufe an den Integrierten Gesamtschulen wird seit 2013 erfasst. Frühere Daten liegen nicht vor.
3) BW: Ab 2012 sind bei den Integrierten Gesamtschulen die Grundschulen im Verbund mit der Gemeinschaftsschule sowie die Gemeinschaftsschulen der
Sekundarstufe I angegeben.
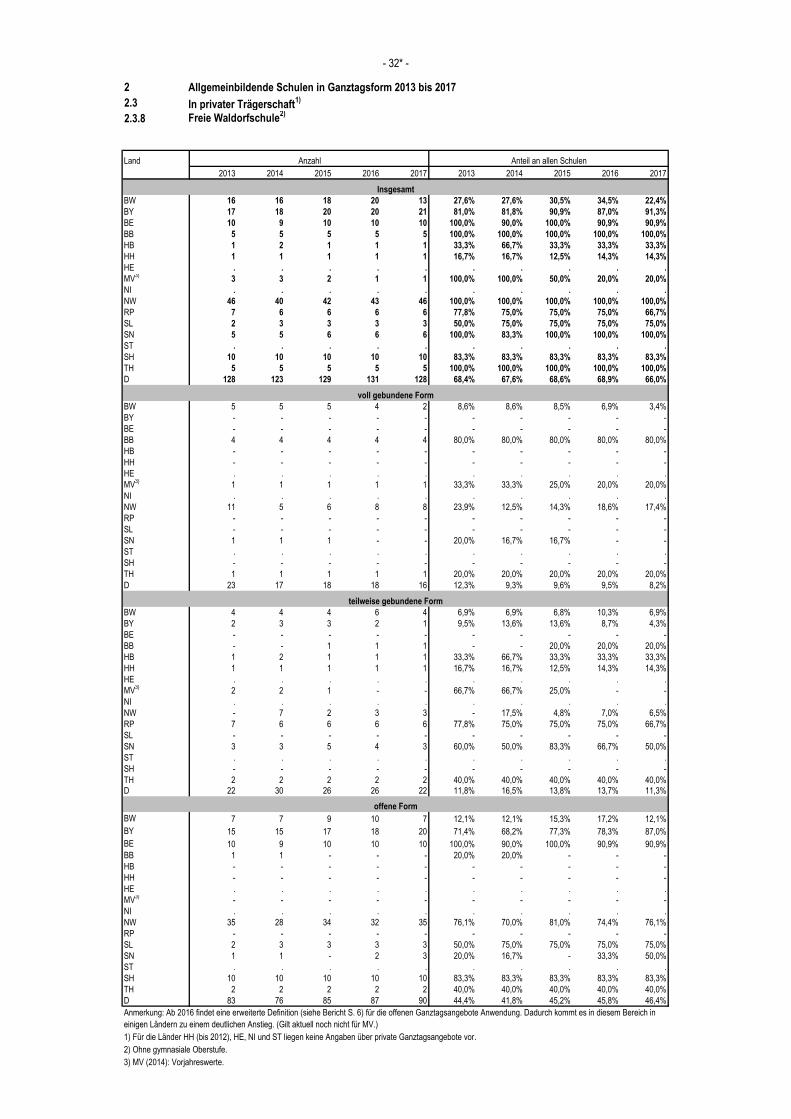
2 Allgemeinbildende Schulen in Ganztagsform 2013 bis 2017
2.3 In privater Trägerschaft1)
2.3.8 Freie Waldorfschule2)
Land
2013 2014 2015 2016 2017 2013 2014 2015 2016 2017
BW 16 16 18 20 13 27,6% 27,6% 30,5% 34,5% 22,4%
BY 17 18 20 20 21 81,0% 81,8% 90,9% 87,0% 91,3%
BE 10 9 10 10 10 100,0% 90,0% 100,0% 90,9% 90,9%
BB 5 5 5 5 5 100,0% 100,0% 100,0% 100,0% 100,0%
HB 1 2 1 1 1 33,3% 66,7% 33,3% 33,3% 33,3%
HH 1 1 1 1 1 16,7% 16,7% 12,5% 14,3% 14,3%
HE . . . . . . . . . .
MV3)
3 3 2 1 1 100,0% 100,0% 50,0% 20,0% 20,0%
NI . . . . . . . . . .
NW 46 40 42 43 46 100,0% 100,0% 100,0% 100,0% 100,0%
RP 7 6 6 6 6 77,8% 75,0% 75,0% 75,0% 66,7%
SL 2 3 3 3 3 50,0% 75,0% 75,0% 75,0% 75,0%
SN 5 5 6 6 6 100,0% 83,3% 100,0% 100,0% 100,0%
ST . . . . . . . . . .
SH 10 10 10 10 10 83,3% 83,3% 83,3% 83,3% 83,3%
TH 5 5 5 5 5 100,0% 100,0% 100,0% 100,0% 100,0%
D 128 123 129 131 128 68,4% 67,6% 68,6% 68,9% 66,0%
BW 5 5 5 4 2 8,6% 8,6% 8,5% 6,9% 3,4%
BY - - - - - - - - - -
BE - - - - - - - - - -
BB 4 4 4 4 4 80,0% 80,0% 80,0% 80,0% 80,0%
HB - - - - - - - - - -
HH - - - - - - - - - -
HE . . . . . . . . . .
MV3)
1 1 1 1 1 33,3% 33,3% 25,0% 20,0% 20,0%
NI . . . . . . . . . .
NW 11 5 6 8 8 23,9% 12,5% 14,3% 18,6% 17,4%
RP - - - - - - - - - -
SL - - - - - - - - - -
SN 1 1 1 - - 20,0% 16,7% 16,7% - -
ST . . . . . . . . . .
SH - - - - - - - - - -
TH 1 1 1 1 1 20,0% 20,0% 20,0% 20,0% 20,0%
D 23 17 18 18 16 12,3% 9,3% 9,6% 9,5% 8,2%
BW 4 4 4 6 4 6,9% 6,9% 6,8% 10,3% 6,9%
BY 2 3 3 2 1 9,5% 13,6% 13,6% 8,7% 4,3%
BE - - - - - - - - - -
BB - - 1 1 1 - - 20,0% 20,0% 20,0%
HB 1 2 1 1 1 33,3% 66,7% 33,3% 33,3% 33,3%
HH 1 1 1 1 1 16,7% 16,7% 12,5% 14,3% 14,3%
HE . . . . . . . . . .
MV3)
2 2 1 - - 66,7% 66,7% 25,0% - -
NI . . . . . . . . . .
NW - 7 2 3 3 - 17,5% 4,8% 7,0% 6,5%
RP 7 6 6 6 6 77,8% 75,0% 75,0% 75,0% 66,7%
SL - - - - - - - - - -
SN 3 3 5 4 3 60,0% 50,0% 83,3% 66,7% 50,0%
ST . . . . . . . . . .
SH - - - - - - - - - -
TH 2 2 2 2 2 40,0% 40,0% 40,0% 40,0% 40,0%
D 22 30 26 26 22 11,8% 16,5% 13,8% 13,7% 11,3%
BW 7 7 9 10 7 12,1% 12,1% 15,3% 17,2% 12,1%
BY 15 15 17 18 20 71,4% 68,2% 77,3% 78,3% 87,0%
BE 10 9 10 10 10 100,0% 90,0% 100,0% 90,9% 90,9%
BB 1 1 - - - 20,0% 20,0% - - -
HB - - - - - - - - - -
HH - - - - - - - - - -
HE . . . . . . . . . .
MV3)
- - - - - - - - - -
NI . . . . . . . . . .
NW 35 28 34 32 35 76,1% 70,0% 81,0% 74,4% 76,1%
RP - - - - - - - - - -
SL 2 3 3 3 3 50,0% 75,0% 75,0% 75,0% 75,0%
SN 1 1 - 2 3 20,0% 16,7% - 33,3% 50,0%
ST . . . . . . . . . .
SH 10 10 10 10 10 83,3% 83,3% 83,3% 83,3% 83,3%
TH 2 2 2 2 2 40,0% 40,0% 40,0% 40,0% 40,0%
D 83 76 85 87 90 44,4% 41,8% 45,2% 45,8% 46,4%
1) Für die Länder HH (bis 2012), HE, NI und ST liegen keine Angaben über private Ganztagsangebote vor.
2) Ohne gymnasiale Oberstufe.
3) MV (2014): Vorjahreswerte.
teilweise gebundene Form
offene Form
Anmerkung: Ab 2016 findet eine erweiterte Definition (siehe Bericht S. 6) für die offenen Ganztagsangebote Anwendung. Dadurch kommt es in diesem Bereich in
einigen Ländern zu einem deutlichen Anstieg. (Gilt aktuell noch nicht für MV.)
- 32* -
Anzahl Anteil an allen Schulen
Insgesamt
voll gebundene Form
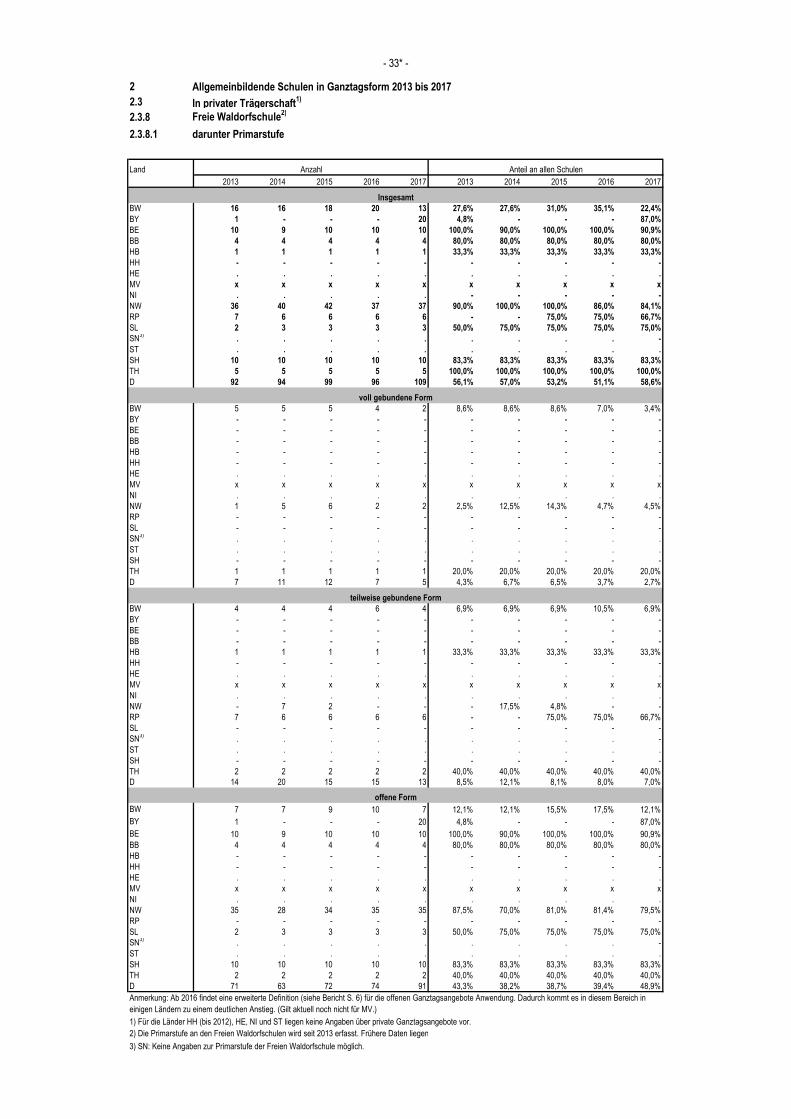
2 Allgemeinbildende Schulen in Ganztagsform 2013 bis 2017
2.3 In privater Trägerschaft1)
2.3.8 Freie Waldorfschule2)
2.3.8.1 darunter Primarstufe
Land
2013 2014 2015 2016 2017 2013 2014 2015 2016 2017
BW 16 16 18 20 13 27,6% 27,6% 31,0% 35,1% 22,4%
BY 1 - - - 20 4,8% - - - 87,0%
BE 10 9 10 10 10 100,0% 90,0% 100,0% 100,0% 90,9%
BB 4 4 4 4 4 80,0% 80,0% 80,0% 80,0% 80,0%
HB 1 1 1 1 1 33,3% 33,3% 33,3% 33,3% 33,3%
HH - - - - - - - - - -
HE . . . . . . . . . .
MV x x x x x x x x x x
NI . . . . . - - - - -
NW 36 40 42 37 37 90,0% 100,0% 100,0% 86,0% 84,1%
RP 7 6 6 6 6 - - 75,0% 75,0% 66,7%
SL 2 3 3 3 3 50,0% 75,0% 75,0% 75,0% 75,0%
SN3)
. . . . . . . . . -
ST . . . . . . . . . .
SH 10 10 10 10 10 83,3% 83,3% 83,3% 83,3% 83,3%
TH 5 5 5 5 5 100,0% 100,0% 100,0% 100,0% 100,0%
D 92 94 99 96 109 56,1% 57,0% 53,2% 51,1% 58,6%
BW 5 5 5 4 2 8,6% 8,6% 8,6% 7,0% 3,4%
BY - - - - - - - - - -
BE - - - - - - - - - -
BB - - - - - - - - - -
HB - - - - - - - - - -
HH - - - - - - - - - -
HE . . . . . . . . . .
MV x x x x x x x x x x
NI . . . . . . . . . .
NW 1 5 6 2 2 2,5% 12,5% 14,3% 4,7% 4,5%
RP - - - - - - - - - -
SL - - - - - - - - - -
SN3)
. . . . . . . . . .
ST . . . . . . . . . .
SH - - - - - - - - - -
TH 1 1 1 1 1 20,0% 20,0% 20,0% 20,0% 20,0%
D 7 11 12 7 5 4,3% 6,7% 6,5% 3,7% 2,7%
BW 4 4 4 6 4 6,9% 6,9% 6,9% 10,5% 6,9%
BY - - - - - - - - - -
BE - - - - - - - - - -
BB - - - - - - - - - -
HB 1 1 1 1 1 33,3% 33,3% 33,3% 33,3% 33,3%
HH - - - - - - - - - -
HE . . . . . . . . . .
MV x x x x x x x x x x
NI . . . . . . . . . .
NW - 7 2 - - - 17,5% 4,8% - -
RP 7 6 6 6 6 - - 75,0% 75,0% 66,7%
SL - - - - - - - - - -
SN3)
. . . . . . . . . -
ST . . . . . . . . . .
SH - - - - - - - - - -
TH 2 2 2 2 2 40,0% 40,0% 40,0% 40,0% 40,0%
D 14 20 15 15 13 8,5% 12,1% 8,1% 8,0% 7,0%
BW 7 7 9 10 7 12,1% 12,1% 15,5% 17,5% 12,1%
BY 1 - - - 20 4,8% - - - 87,0%
BE 10 9 10 10 10 100,0% 90,0% 100,0% 100,0% 90,9%
BB 4 4 4 4 4 80,0% 80,0% 80,0% 80,0% 80,0%
HB - - - - - - - - - -
HH - - - - - - - - - -
HE . . . . . . . . . .
MV x x x x x x x x x x
NI . . . . . . . . . .
NW 35 28 34 35 35 87,5% 70,0% 81,0% 81,4% 79,5%
RP - - - - - - - - - -
SL 2 3 3 3 3 50,0% 75,0% 75,0% 75,0% 75,0%
SN3)
. . . . . . . . . -
ST . . . . . . . . . .
SH 10 10 10 10 10 83,3% 83,3% 83,3% 83,3% 83,3%
TH 2 2 2 2 2 40,0% 40,0% 40,0% 40,0% 40,0%
D 71 63 72 74 91 43,3% 38,2% 38,7% 39,4% 48,9%
1) Für die Länder HH (bis 2012), HE, NI und ST liegen keine Angaben über private Ganztagsangebote vor.
3) SN: Keine Angaben zur Primarstufe der Freien Waldorfschule möglich.
- 33* -
2) Die Primarstufe an den Freien Waldorfschulen wird seit 2013 erfasst. Frühere Daten liegen nicht vor.
Anzahl Anteil an allen Schulen
Insgesamt
voll gebundene Form
teilweise gebundene Form
offene Form
Anmerkung: Ab 2016 findet eine erweiterte Definition (siehe Bericht S. 6) für die offenen Ganztagsangebote Anwendung. Dadurch kommt es in diesem Bereich in
einigen Ländern zu einem deutlichen Anstieg. (Gilt aktuell noch nicht für MV.)
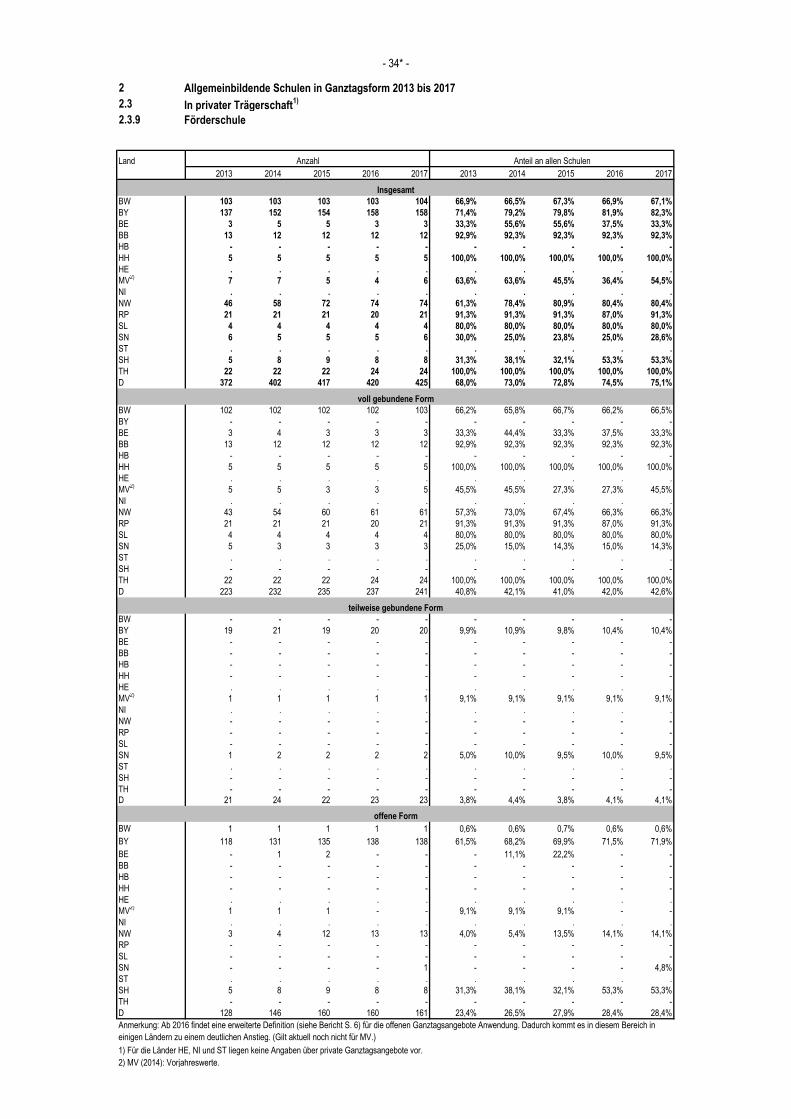
2 Allgemeinbildende Schulen in Ganztagsform 2013 bis 2017
2.3 In privater Trägerschaft1)
2.3.9 Förderschule
Land
2013 2014 2015 2016 2017 2013 2014 2015 2016 2017
BW 103 103 103 103 104 66,9% 66,5% 67,3% 66,9% 67,1%
BY 137 152 154 158 158 71,4% 79,2% 79,8% 81,9% 82,3%
BE 3 5 5 3 3 33,3% 55,6% 55,6% 37,5% 33,3%
BB 13 12 12 12 12 92,9% 92,3% 92,3% 92,3% 92,3%
HB - - - - - - - - - -
HH 5 5 5 5 5 100,0% 100,0% 100,0% 100,0% 100,0%
HE . . . . . . . . . .
MV2)
7 7 5 4 6 63,6% 63,6% 45,5% 36,4% 54,5%
NI . . . . . . . . . .
NW 46 58 72 74 74 61,3% 78,4% 80,9% 80,4% 80,4%
RP 21 21 21 20 21 91,3% 91,3% 91,3% 87,0% 91,3%
SL 4 4 4 4 4 80,0% 80,0% 80,0% 80,0% 80,0%
SN 6 5 5 5 6 30,0% 25,0% 23,8% 25,0% 28,6%
ST . . . . . . . . . .
SH 5 8 9 8 8 31,3% 38,1% 32,1% 53,3% 53,3%
TH 22 22 22 24 24 100,0% 100,0% 100,0% 100,0% 100,0%
D 372 402 417 420 425 68,0% 73,0% 72,8% 74,5% 75,1%
BW 102 102 102 102 103 66,2% 65,8% 66,7% 66,2% 66,5%
BY - - - - - - - - - -
BE 3 4 3 3 3 33,3% 44,4% 33,3% 37,5% 33,3%
BB 13 12 12 12 12 92,9% 92,3% 92,3% 92,3% 92,3%
HB - - - - - - - - - -
HH 5 5 5 5 5 100,0% 100,0% 100,0% 100,0% 100,0%
HE . . . . . . . . . .
MV2)
5 5 3 3 5 45,5% 45,5% 27,3% 27,3% 45,5%
NI . . . . . . . . . .
NW 43 54 60 61 61 57,3% 73,0% 67,4% 66,3% 66,3%
RP 21 21 21 20 21 91,3% 91,3% 91,3% 87,0% 91,3%
SL 4 4 4 4 4 80,0% 80,0% 80,0% 80,0% 80,0%
SN 5 3 3 3 3 25,0% 15,0% 14,3% 15,0% 14,3%
ST . . . . . . . . . .
SH - - - - - - - - - -
TH 22 22 22 24 24 100,0% 100,0% 100,0% 100,0% 100,0%
D 223 232 235 237 241 40,8% 42,1% 41,0% 42,0% 42,6%
BW - - - - - - - - - -
BY 19 21 19 20 20 9,9% 10,9% 9,8% 10,4% 10,4%
BE - - - - - - - - - -
BB - - - - - - - - - -
HB - - - - - - - - - -
HH - - - - - - - - - -
HE . . . . . . . . . .
MV2)
1 1 1 1 1 9,1% 9,1% 9,1% 9,1% 9,1%
NI . . . . . . . . . .
NW - - - - - - - - - -
RP - - - - - - - - - -
SL - - - - - - - - - -
SN 1 2 2 2 2 5,0% 10,0% 9,5% 10,0% 9,5%
ST . . . . . . . . . .
SH - - - - - - - - - -
TH - - - - - - - - - -D 21 24 22 23 23 3,8% 4,4% 3,8% 4,1% 4,1%
BW 1 1 1 1 1 0,6% 0,6% 0,7% 0,6% 0,6%
BY 118 131 135 138 138 61,5% 68,2% 69,9% 71,5% 71,9%
BE - 1 2 - - - 11,1% 22,2% - -
BB - - - - - - - - - -
HB - - - - - - - - - -
HH - - - - - - - - - -
HE . . . . . . . . . .
MV2)
1 1 1 - - 9,1% 9,1% 9,1% - -
NI . . . . . . . . . .
NW 3 4 12 13 13 4,0% 5,4% 13,5% 14,1% 14,1%
RP - - - - - - - - - -
SL - - - - - - - - - -
SN - - - - 1 - - - - 4,8%
ST . . . . . . . . . .
SH 5 8 9 8 8 31,3% 38,1% 32,1% 53,3% 53,3%
TH - - - - - - - - - -
D 128 146 160 160 161 23,4% 26,5% 27,9% 28,4% 28,4%
1) Für die Länder HE, NI und ST liegen keine Angaben über private Ganztagsangebote vor.
2) MV (2014): Vorjahreswerte.
teilweise gebundene Form
offene Form
Anmerkung: Ab 2016 findet eine erweiterte Definition (siehe Bericht S. 6) für die offenen Ganztagsangebote Anwendung. Dadurch kommt es in diesem Bereich in
einigen Ländern zu einem deutlichen Anstieg. (Gilt aktuell noch nicht für MV.)
- 34* -
Anzahl Anteil an allen Schulen
Insgesamt
voll gebundene Form
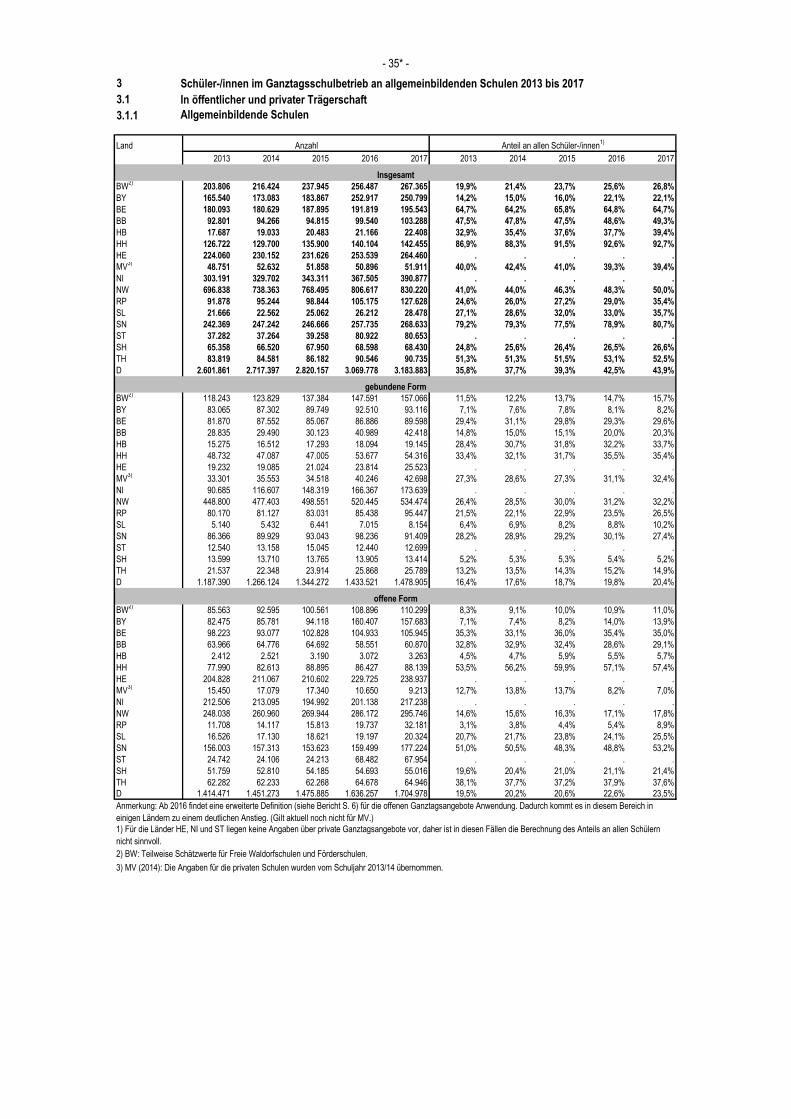
3 Schüler-/innen im Ganztagsschulbetrieb an allgemeinbildenden Schulen 2013 bis 2017
3.1 In öffentlicher und privater Trägerschaft
3.1.1 Allgemeinbildende Schulen
Land
2013 2014 2015 2016 2017 2013 2014 2015 2016 2017
BW2)
203.806 216.424 237.945 256.487 267.365 19,9% 21,4% 23,7% 25,6% 26,8%
BY 165.540 173.083 183.867 252.917 250.799 14,2% 15,0% 16,0% 22,1% 22,1%
BE 180.093 180.629 187.895 191.819 195.543 64,7% 64,2% 65,8% 64,8% 64,7%
BB 92.801 94.266 94.815 99.540 103.288 47,5% 47,8% 47,5% 48,6% 49,3%
HB 17.687 19.033 20.483 21.166 22.408 32,9% 35,4% 37,6% 37,7% 39,4%
HH 126.722 129.700 135.900 140.104 142.455 86,9% 88,3% 91,5% 92,6% 92,7%
HE 224.060 230.152 231.626 253.539 264.460 . . . . .
MV3)
48.751 52.632 51.858 50.896 51.911 40,0% 42,4% 41,0% 39,3% 39,4%
NI 303.191 329.702 343.311 367.505 390.877 . . . . .
NW 696.838 738.363 768.495 806.617 830.220 41,0% 44,0% 46,3% 48,3% 50,0%
RP 91.878 95.244 98.844 105.175 127.628 24,6% 26,0% 27,2% 29,0% 35,4%
SL 21.666 22.562 25.062 26.212 28.478 27,1% 28,6% 32,0% 33,0% 35,7%
SN 242.369 247.242 246.666 257.735 268.633 79,2% 79,3% 77,5% 78,9% 80,7%
ST 37.282 37.264 39.258 80.922 80.653 . . . . .
SH 65.358 66.520 67.950 68.598 68.430 24,8% 25,6% 26,4% 26,5% 26,6%
TH 83.819 84.581 86.182 90.546 90.735 51,3% 51,3% 51,5% 53,1% 52,5%
D 2.601.861 2.717.397 2.820.157 3.069.778 3.183.883 35,8% 37,7% 39,3% 42,5% 43,9%
BW2)
118.243 123.829 137.384 147.591 157.066 11,5% 12,2% 13,7% 14,7% 15,7%
BY 83.065 87.302 89.749 92.510 93.116 7,1% 7,6% 7,8% 8,1% 8,2%
BE 81.870 87.552 85.067 86.886 89.598 29,4% 31,1% 29,8% 29,3% 29,6%
BB 28.835 29.490 30.123 40.989 42.418 14,8% 15,0% 15,1% 20,0% 20,3%
HB 15.275 16.512 17.293 18.094 19.145 28,4% 30,7% 31,8% 32,2% 33,7%
HH 48.732 47.087 47.005 53.677 54.316 33,4% 32,1% 31,7% 35,5% 35,4%
HE 19.232 19.085 21.024 23.814 25.523 . . . . .
MV3)
33.301 35.553 34.518 40.246 42.698 27,3% 28,6% 27,3% 31,1% 32,4%
NI 90.685 116.607 148.319 166.367 173.639 . . . . .
NW 448.800 477.403 498.551 520.445 534.474 26,4% 28,5% 30,0% 31,2% 32,2%
RP 80.170 81.127 83.031 85.438 95.447 21,5% 22,1% 22,9% 23,5% 26,5%
SL 5.140 5.432 6.441 7.015 8.154 6,4% 6,9% 8,2% 8,8% 10,2%
SN 86.366 89.929 93.043 98.236 91.409 28,2% 28,9% 29,2% 30,1% 27,4%
ST 12.540 13.158 15.045 12.440 12.699 . . . . .
SH 13.599 13.710 13.765 13.905 13.414 5,2% 5,3% 5,3% 5,4% 5,2%
TH 21.537 22.348 23.914 25.868 25.789 13,2% 13,5% 14,3% 15,2% 14,9%
D 1.187.390 1.266.124 1.344.272 1.433.521 1.478.905 16,4% 17,6% 18,7% 19,8% 20,4%
BW2)
85.563 92.595 100.561 108.896 110.299 8,3% 9,1% 10,0% 10,9% 11,0%
BY 82.475 85.781 94.118 160.407 157.683 7,1% 7,4% 8,2% 14,0% 13,9%
BE 98.223 93.077 102.828 104.933 105.945 35,3% 33,1% 36,0% 35,4% 35,0%
BB 63.966 64.776 64.692 58.551 60.870 32,8% 32,9% 32,4% 28,6% 29,1%
HB 2.412 2.521 3.190 3.072 3.263 4,5% 4,7% 5,9% 5,5% 5,7%
HH 77.990 82.613 88.895 86.427 88.139 53,5% 56,2% 59,9% 57,1% 57,4%
HE 204.828 211.067 210.602 229.725 238.937 . . . . .
MV3)
15.450 17.079 17.340 10.650 9.213 12,7% 13,8% 13,7% 8,2% 7,0%
NI 212.506 213.095 194.992 201.138 217.238 . . . . .
NW 248.038 260.960 269.944 286.172 295.746 14,6% 15,6% 16,3% 17,1% 17,8%
RP 11.708 14.117 15.813 19.737 32.181 3,1% 3,8% 4,4% 5,4% 8,9%
SL 16.526 17.130 18.621 19.197 20.324 20,7% 21,7% 23,8% 24,1% 25,5%
SN 156.003 157.313 153.623 159.499 177.224 51,0% 50,5% 48,3% 48,8% 53,2%
ST 24.742 24.106 24.213 68.482 67.954 . . . . .
SH 51.759 52.810 54.185 54.693 55.016 19,6% 20,4% 21,0% 21,1% 21,4%
TH 62.282 62.233 62.268 64.678 64.946 38,1% 37,7% 37,2% 37,9% 37,6%
D 1.414.471 1.451.273 1.475.885 1.636.257 1.704.978 19,5% 20,2% 20,6% 22,6% 23,5%
3) MV (2014): Die Angaben für die privaten Schulen wurden vom Schuljahr 2013/14 übernommen.
2) BW: Teilweise Schätzwerte für Freie Waldorfschulen und Förderschulen.
- 35* -
Anteil an allen Schüler-/innen1)
Anzahl
Insgesamt
gebundene Form
offene Form
Anmerkung: Ab 2016 findet eine erweiterte Definition (siehe Bericht S. 6) für die offenen Ganztagsangebote Anwendung. Dadurch kommt es in diesem Bereich in
einigen Ländern zu einem deutlichen Anstieg. (Gilt aktuell noch nicht für MV.)
1) Für die Länder HE, NI und ST liegen keine Angaben über private Ganztagsangebote vor, daher ist in diesen Fällen die Berechnung des Anteils an allen Schülern
nicht sinnvoll.
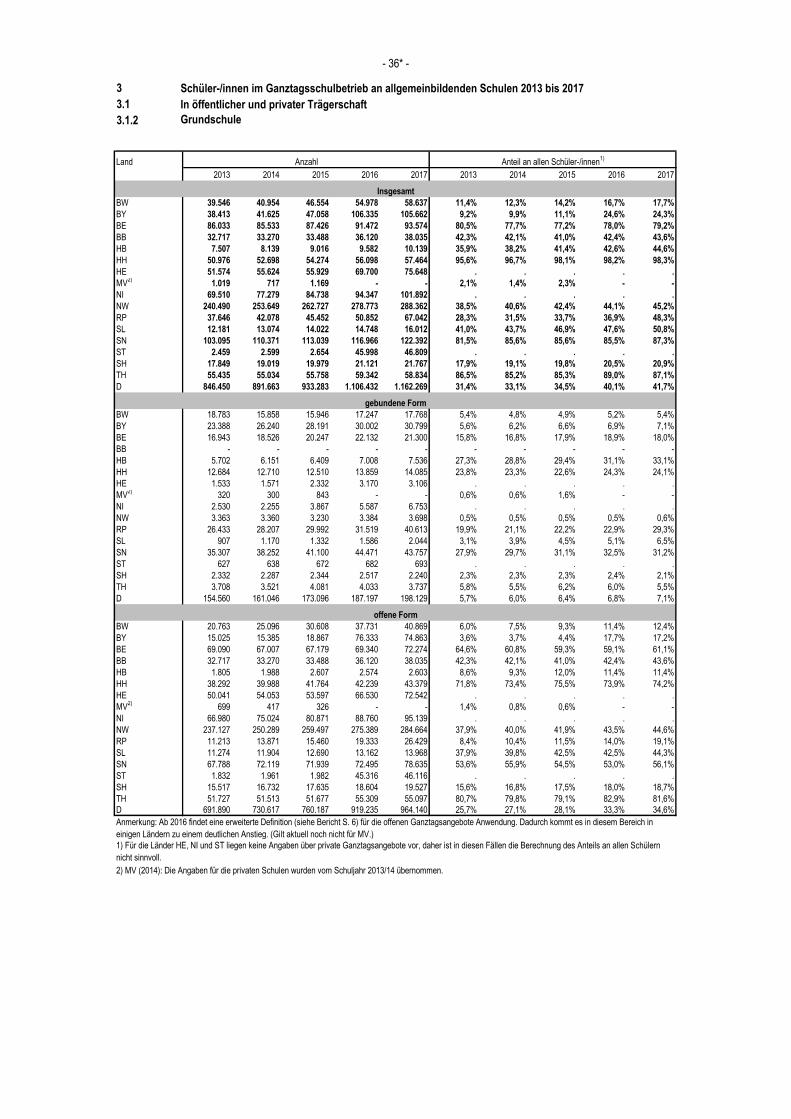
3 Schüler-/innen im Ganztagsschulbetrieb an allgemeinbildenden Schulen 2013 bis 2017
3.1 In öffentlicher und privater Trägerschaft
3.1.2 Grundschule
Land
2013 2014 2015 2016 2017 2013 2014 2015 2016 2017
BW 39.546 40.954 46.554 54.978 58.637 11,4% 12,3% 14,2% 16,7% 17,7%
BY 38.413 41.625 47.058 106.335 105.662 9,2% 9,9% 11,1% 24,6% 24,3%
BE 86.033 85.533 87.426 91.472 93.574 80,5% 77,7% 77,2% 78,0% 79,2%
BB 32.717 33.270 33.488 36.120 38.035 42,3% 42,1% 41,0% 42,4% 43,6%
HB 7.507 8.139 9.016 9.582 10.139 35,9% 38,2% 41,4% 42,6% 44,6%
HH 50.976 52.698 54.274 56.098 57.464 95,6% 96,7% 98,1% 98,2% 98,3%
HE 51.574 55.624 55.929 69.700 75.648 . . . . .
MV2)
1.019 717 1.169 - - 2,1% 1,4% 2,3% - -
NI 69.510 77.279 84.738 94.347 101.892 . . . . .
NW 240.490 253.649 262.727 278.773 288.362 38,5% 40,6% 42,4% 44,1% 45,2%
RP 37.646 42.078 45.452 50.852 67.042 28,3% 31,5% 33,7% 36,9% 48,3%
SL 12.181 13.074 14.022 14.748 16.012 41,0% 43,7% 46,9% 47,6% 50,8%
SN 103.095 110.371 113.039 116.966 122.392 81,5% 85,6% 85,6% 85,5% 87,3%
ST 2.459 2.599 2.654 45.998 46.809 . . . . .
SH 17.849 19.019 19.979 21.121 21.767 17,9% 19,1% 19,8% 20,5% 20,9%
TH 55.435 55.034 55.758 59.342 58.834 86,5% 85,2% 85,3% 89,0% 87,1%
D 846.450 891.663 933.283 1.106.432 1.162.269 31,4% 33,1% 34,5% 40,1% 41,7%
BW 18.783 15.858 15.946 17.247 17.768 5,4% 4,8% 4,9% 5,2% 5,4%
BY 23.388 26.240 28.191 30.002 30.799 5,6% 6,2% 6,6% 6,9% 7,1%
BE 16.943 18.526 20.247 22.132 21.300 15,8% 16,8% 17,9% 18,9% 18,0%
BB - - - - - - - - - -
HB 5.702 6.151 6.409 7.008 7.536 27,3% 28,8% 29,4% 31,1% 33,1%
HH 12.684 12.710 12.510 13.859 14.085 23,8% 23,3% 22,6% 24,3% 24,1%
HE 1.533 1.571 2.332 3.170 3.106 . . . . .
MV2)
320 300 843 - - 0,6% 0,6% 1,6% - -
NI 2.530 2.255 3.867 5.587 6.753 . . . . .
NW 3.363 3.360 3.230 3.384 3.698 0,5% 0,5% 0,5% 0,5% 0,6%
RP 26.433 28.207 29.992 31.519 40.613 19,9% 21,1% 22,2% 22,9% 29,3%
SL 907 1.170 1.332 1.586 2.044 3,1% 3,9% 4,5% 5,1% 6,5%
SN 35.307 38.252 41.100 44.471 43.757 27,9% 29,7% 31,1% 32,5% 31,2%
ST 627 638 672 682 693 . . . . .
SH 2.332 2.287 2.344 2.517 2.240 2,3% 2,3% 2,3% 2,4% 2,1%
TH 3.708 3.521 4.081 4.033 3.737 5,8% 5,5% 6,2% 6,0% 5,5%
D 154.560 161.046 173.096 187.197 198.129 5,7% 6,0% 6,4% 6,8% 7,1%
BW 20.763 25.096 30.608 37.731 40.869 6,0% 7,5% 9,3% 11,4% 12,4%
BY 15.025 15.385 18.867 76.333 74.863 3,6% 3,7% 4,4% 17,7% 17,2%
BE 69.090 67.007 67.179 69.340 72.274 64,6% 60,8% 59,3% 59,1% 61,1%
BB 32.717 33.270 33.488 36.120 38.035 42,3% 42,1% 41,0% 42,4% 43,6%
HB 1.805 1.988 2.607 2.574 2.603 8,6% 9,3% 12,0% 11,4% 11,4%
HH 38.292 39.988 41.764 42.239 43.379 71,8% 73,4% 75,5% 73,9% 74,2%
HE 50.041 54.053 53.597 66.530 72.542 . . . . .
MV2)
699 417 326 - - 1,4% 0,8% 0,6% - -
NI 66.980 75.024 80.871 88.760 95.139 . . . . .
NW 237.127 250.289 259.497 275.389 284.664 37,9% 40,0% 41,9% 43,5% 44,6%
RP 11.213 13.871 15.460 19.333 26.429 8,4% 10,4% 11,5% 14,0% 19,1%
SL 11.274 11.904 12.690 13.162 13.968 37,9% 39,8% 42,5% 42,5% 44,3%
SN 67.788 72.119 71.939 72.495 78.635 53,6% 55,9% 54,5% 53,0% 56,1%
ST 1.832 1.961 1.982 45.316 46.116 . . . . .
SH 15.517 16.732 17.635 18.604 19.527 15,6% 16,8% 17,5% 18,0% 18,7%
TH 51.727 51.513 51.677 55.309 55.097 80,7% 79,8% 79,1% 82,9% 81,6%
D 691.890 730.617 760.187 919.235 964.140 25,7% 27,1% 28,1% 33,3% 34,6%
2) MV (2014): Die Angaben für die privaten Schulen wurden vom Schuljahr 2013/14 übernommen.
offene Form
Anmerkung: Ab 2016 findet eine erweiterte Definition (siehe Bericht S. 6) für die offenen Ganztagsangebote Anwendung. Dadurch kommt es in diesem Bereich in
einigen Ländern zu einem deutlichen Anstieg. (Gilt aktuell noch nicht für MV.)
1) Für die Länder HE, NI und ST liegen keine Angaben über private Ganztagsangebote vor, daher ist in diesen Fällen die Berechnung des Anteils an allen Schülern
nicht sinnvoll.
- 36* -
Anteil an allen Schüler-/innen1)
Anzahl
Insgesamt
gebundene Form
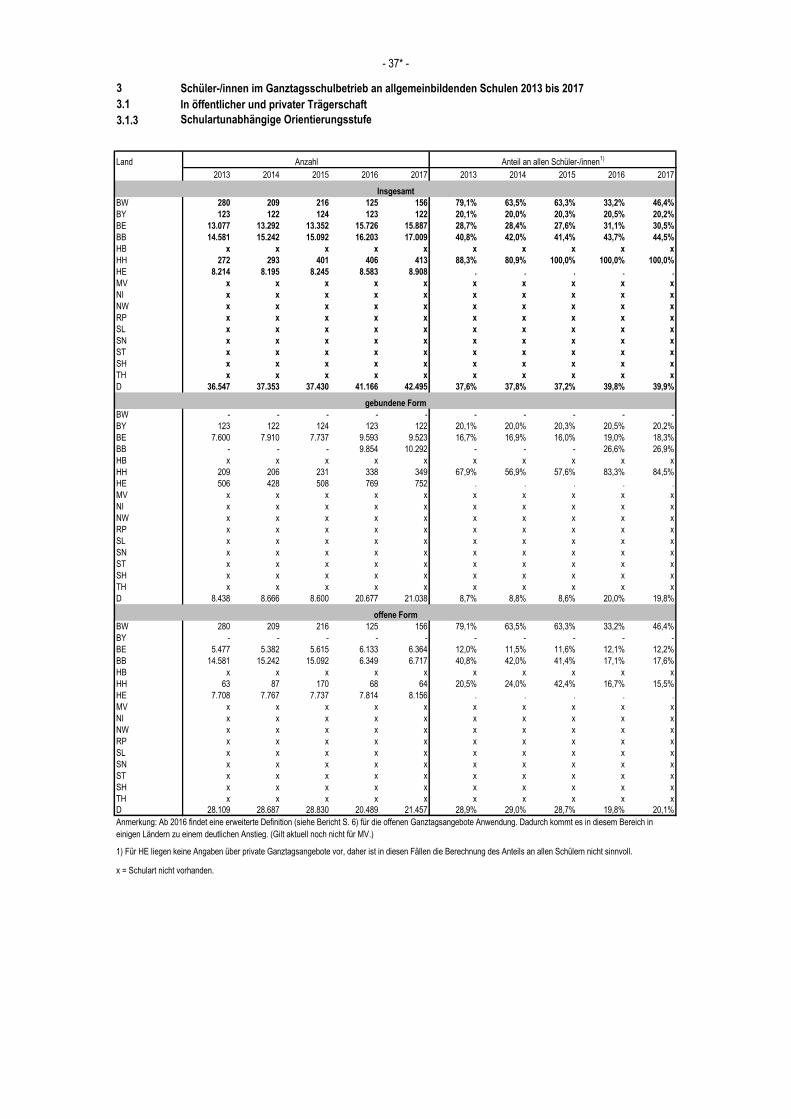
3 Schüler-/innen im Ganztagsschulbetrieb an allgemeinbildenden Schulen 2013 bis 2017
3.1 In öffentlicher und privater Trägerschaft
3.1.3 Schulartunabhängige Orientierungsstufe
Land
2013 2014 2015 2016 2017 2013 2014 2015 2016 2017
BW 280 209 216 125 156 79,1% 63,5% 63,3% 33,2% 46,4%
BY 123 122 124 123 122 20,1% 20,0% 20,3% 20,5% 20,2%
BE 13.077 13.292 13.352 15.726 15.887 28,7% 28,4% 27,6% 31,1% 30,5%
BB 14.581 15.242 15.092 16.203 17.009 40,8% 42,0% 41,4% 43,7% 44,5%
HB x x x x x x x x x x
HH 272 293 401 406 413 88,3% 80,9% 100,0% 100,0% 100,0%
HE 8.214 8.195 8.245 8.583 8.908 . . . . .
MV x x x x x x x x x x
NI x x x x x x x x x x
NW x x x x x x x x x x
RP x x x x x x x x x x
SL x x x x x x x x x x
SN x x x x x x x x x x
ST x x x x x x x x x x
SH x x x x x x x x x x
TH x x x x x x x x x x
D 36.547 37.353 37.430 41.166 42.495 37,6% 37,8% 37,2% 39,8% 39,9%
BW - - - - - - - - - -
BY 123 122 124 123 122 20,1% 20,0% 20,3% 20,5% 20,2%
BE 7.600 7.910 7.737 9.593 9.523 16,7% 16,9% 16,0% 19,0% 18,3%
BB - - - 9.854 10.292 - - - 26,6% 26,9%
HB x x x x x x x x x x
HH 209 206 231 338 349 67,9% 56,9% 57,6% 83,3% 84,5%
HE 506 428 508 769 752 . . . . .
MV x x x x x x x x x x
NI x x x x x x x x x x
NW x x x x x x x x x x
RP x x x x x x x x x x
SL x x x x x x x x x x
SN x x x x x x x x x x
ST x x x x x x x x x x
SH x x x x x x x x x x
TH x x x x x x x x x x
D 8.438 8.666 8.600 20.677 21.038 8,7% 8,8% 8,6% 20,0% 19,8%
BW 280 209 216 125 156 79,1% 63,5% 63,3% 33,2% 46,4%
BY - - - - - - - - - -
BE 5.477 5.382 5.615 6.133 6.364 12,0% 11,5% 11,6% 12,1% 12,2%
BB 14.581 15.242 15.092 6.349 6.717 40,8% 42,0% 41,4% 17,1% 17,6%
HB x x x x x x x x x x
HH 63 87 170 68 64 20,5% 24,0% 42,4% 16,7% 15,5%
HE 7.708 7.767 7.737 7.814 8.156 . . . . .
MV x x x x x x x x x x
NI x x x x x x x x x x
NW x x x x x x x x x x
RP x x x x x x x x x x
SL x x x x x x x x x x
SN x x x x x x x x x x
ST x x x x x x x x x x
SH x x x x x x x x x x
TH x x x x x x x x x x
D 28.109 28.687 28.830 20.489 21.457 28,9% 29,0% 28,7% 19,8% 20,1%
x = Schulart nicht vorhanden.
offene Form
Anmerkung: Ab 2016 findet eine erweiterte Definition (siehe Bericht S. 6) für die offenen Ganztagsangebote Anwendung. Dadurch kommt es in diesem Bereich in
einigen Ländern zu einem deutlichen Anstieg. (Gilt aktuell noch nicht für MV.)
1) Für HE liegen keine Angaben über private Ganztagsangebote vor, daher ist in diesen Fällen die Berechnung des Anteils an allen Schülern nicht sinnvoll.
- 37* -
Anteil an allen Schüler-/innen1)
Anzahl
Insgesamt
gebundene Form

3 Schüler-/innen im Ganztagsschulbetrieb an allgemeinbildenden Schulen 2013 bis 2017
3.1 In öffentlicher und privater Trägerschaft
3.1.4 Hauptschule
Land
2013 2014 2015 2016 2017 2013 2014 2015 2016 2017
BW 53.526 46.945 42.668 34.055 26.946 42,1% 41,2% 42,8% 40,7% 39,7%
BY 54.508 56.092 57.813 60.455 57.714 26,6% 27,7% 28,6% 29,8% 29,0%
BE x x x x x x x x x x
BB x x x x x x x x x x
HB x x x x x x x x x x
HH x x x x x x x x x x
HE 11.809 11.894 12.433 13.659 13.387 . . . . .
MV x x x x x x x x x x
NI 30.555 26.054 21.785 18.031 16.083 . . . . .
NW 78.192 69.769 60.894 52.269 43.270 56,0% 58,5% 58,8% 59,4% 59,9%
RP 101 111 99 66 48 18,0% 23,3% 22,0% 15,0% 12,0%
SL 16 21 x x x 6,1% 7,7% x x x
SN x x x x x x x x x x
ST x x x x x x x x x x
SH 230 26 x x x 25,2% 28,3% x x x
TH x x x x x x x x x x
D 228.937 210.912 195.692 178.535 157.448 41,5% 41,7% 41,9% 41,4% 40,3%
BW 40.884 35.818 33.056 25.897 20.600 32,2% 31,4% 33,1% 30,9% 30,3%
BY 35.400 36.118 36.428 37.314 36.407 17,3% 17,8% 18,0% 18,4% 18,3%
BE x x x x x x x x x x
BB x x x x x x x x x x
HB x x x x x x x x x x
HH x x x x x x x x x x
HE 931 962 1.036 1.302 1.221 . . . . .
MV x x x x x x x x x x
NI 11.930 11.061 9.710 8.431 7.155 . . . . .
NW 78.192 69.769 60.894 52.269 43.270 56,0% 58,5% 58,8% 59,4% 59,9%
RP 101 111 99 66 48 18,0% 23,3% 22,0% 15,0% 12,0%
SL - - x x x - - x x x
SN x x x x x x x x x x
ST x x x x x x x x x x
SH - - x x x - - x x x
TH x x x x x x x x x x
D 167.438 153.839 141.223 125.279 108.701 30,3% 30,4% 30,2% 29,1% 27,9%
BW 12.642 11.127 9.612 8.158 6.346 9,9% 9,8% 9,6% 9,7% 9,3%
BY 19.108 19.974 21.385 23.141 21.307 9,3% 9,8% 10,6% 11,4% 10,7%
BE x x x x x x x x x 1
BB x x x x x x x x x x
HB x x x x x x x x x x
HH x x x x x x x x x x
HE 10.878 10.932 11.397 12.357 12.166 . . . . .
MV x x x x x x x x x x
NI 18.625 14.993 12.075 9.600 8.928 . . . . .
NW - - - - - - - - - -
RP - - - - - - - - - -
SL 16 21 x x x 6,1% 7,7% x x x
SN x x x x x x x x x x
ST x x x x x x x x x x
SH 230 26 x x x 25,2% 28,3% x x x
TH x x x x x x x x x x
D 61.499 57.073 54.469 53.256 48.747 11,1% 11,3% 11,7% 12,3% 12,5%
x = Schulart nicht vorhanden.
offene Form
Anmerkung: Ab 2016 findet eine erweiterte Definition (siehe Bericht S. 6) für die offenen Ganztagsangebote Anwendung. Dadurch kommt es in diesem Bereich in
einigen Ländern zu einem deutlichen Anstieg. (Gilt aktuell noch nicht für MV.)
1) Für die Länder HE und NI liegen keine Angaben über private Ganztagsangebote vor, daher ist in diesen Fällen die Berechnung des Anteils an allen Schülern nicht
sinnvoll.
- 38* -
Anteil an allen Schüler-/innen1)
Anzahl
Insgesamt
gebundene Form
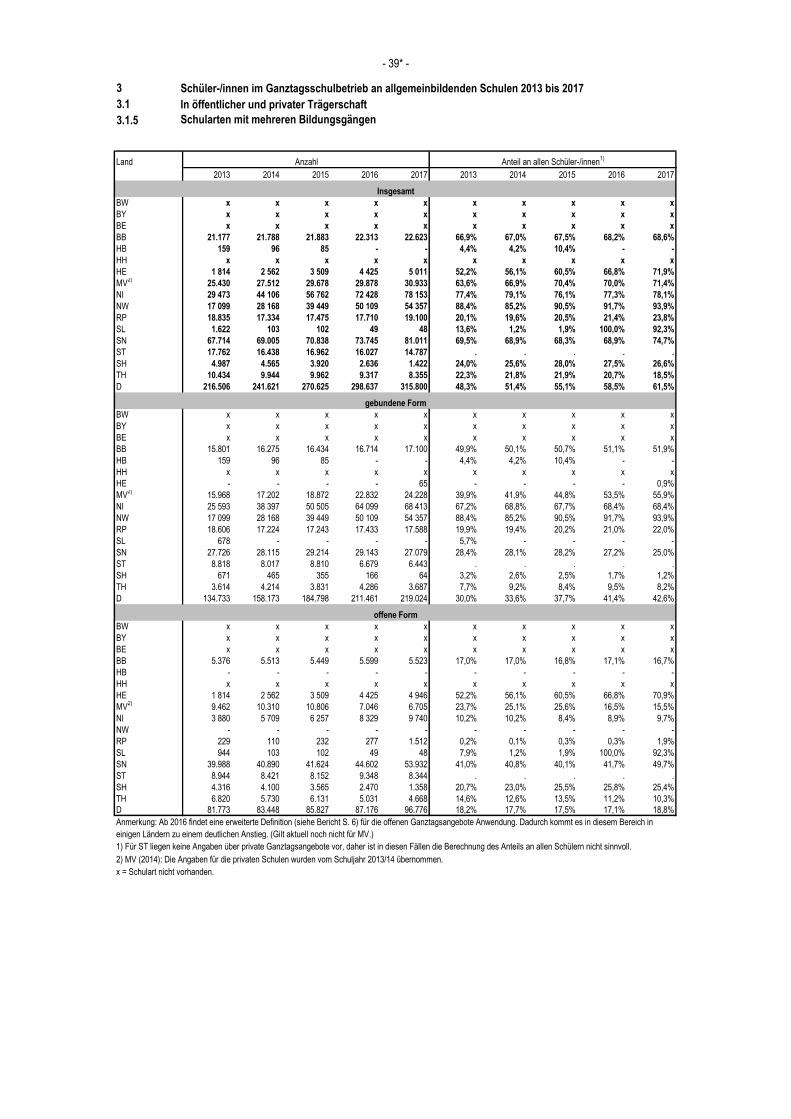
3 Schüler-/innen im Ganztagsschulbetrieb an allgemeinbildenden Schulen 2013 bis 2017
3.1 In öffentlicher und privater Trägerschaft
3.1.5 Schularten mit mehreren Bildungsgängen
Land
2013 2014 2015 2016 2017 2013 2014 2015 2016 2017
BW x x x x x x x x x x
BY x x x x x x x x x x
BE x x x x x x x x x x
BB 21.177 21.788 21.883 22.313 22.623 66,9% 67,0% 67,5% 68,2% 68,6%
HB 159 96 85 - - 4,4% 4,2% 10,4% - -
HH x x x x x x x x x x
HE 1 814 2 562 3 509 4 425 5 011 52,2% 56,1% 60,5% 66,8% 71,9%
MV2)
25.430 27.512 29.678 29.878 30.933 63,6% 66,9% 70,4% 70,0% 71,4%
NI 29 473 44 106 56 762 72 428 78 153 77,4% 79,1% 76,1% 77,3% 78,1%
NW 17 099 28 168 39 449 50 109 54 357 88,4% 85,2% 90,5% 91,7% 93,9%
RP 18.835 17.334 17.475 17.710 19.100 20,1% 19,6% 20,5% 21,4% 23,8%
SL 1.622 103 102 49 48 13,6% 1,2% 1,9% 100,0% 92,3%
SN 67.714 69.005 70.838 73.745 81.011 69,5% 68,9% 68,3% 68,9% 74,7%
ST 17.762 16.438 16.962 16.027 14.787 . . . . .
SH 4.987 4.565 3.920 2.636 1.422 24,0% 25,6% 28,0% 27,5% 26,6%
TH 10.434 9.944 9.962 9.317 8.355 22,3% 21,8% 21,9% 20,7% 18,5%
D 216.506 241.621 270.625 298.637 315.800 48,3% 51,4% 55,1% 58,5% 61,5%
BW x x x x x x x x x x
BY x x x x x x x x x x
BE x x x x x x x x x x
BB 15.801 16.275 16.434 16.714 17.100 49,9% 50,1% 50,7% 51,1% 51,9%
HB 159 96 85 - - 4,4% 4,2% 10,4% - -
HH x x x x x x x x x x
HE - - - - 65 - - - - 0,9%
MV2)
15.968 17.202 18.872 22.832 24.228 39,9% 41,9% 44,8% 53,5% 55,9%
NI 25 593 38 397 50 505 64 099 68 413 67,2% 68,8% 67,7% 68,4% 68,4%
NW 17 099 28 168 39 449 50 109 54 357 88,4% 85,2% 90,5% 91,7% 93,9%
RP 18.606 17.224 17.243 17.433 17.588 19,9% 19,4% 20,2% 21,0% 22,0%
SL 678 - - - - 5,7% - - - -
SN 27.726 28.115 29.214 29.143 27.079 28,4% 28,1% 28,2% 27,2% 25,0%
ST 8.818 8.017 8.810 6.679 6.443 . . . . .
SH 671 465 355 166 64 3,2% 2,6% 2,5% 1,7% 1,2%
TH 3.614 4.214 3.831 4.286 3.687 7,7% 9,2% 8,4% 9,5% 8,2%
D 134.733 158.173 184.798 211.461 219.024 30,0% 33,6% 37,7% 41,4% 42,6%
BW x x x x x x x x x x
BY x x x x x x x x x x
BE x x x x x x x x x x
BB 5.376 5.513 5.449 5.599 5.523 17,0% 17,0% 16,8% 17,1% 16,7%
HB - - - - - - - - - -
HH x x x x x x x x x x
HE 1 814 2 562 3 509 4 425 4 946 52,2% 56,1% 60,5% 66,8% 70,9%
MV2)
9.462 10.310 10.806 7.046 6.705 23,7% 25,1% 25,6% 16,5% 15,5%
NI 3 880 5 709 6 257 8 329 9 740 10,2% 10,2% 8,4% 8,9% 9,7%
NW - - - - - - - - - -
RP 229 110 232 277 1.512 0,2% 0,1% 0,3% 0,3% 1,9%
SL 944 103 102 49 48 7,9% 1,2% 1,9% 100,0% 92,3%
SN 39.988 40.890 41.624 44.602 53.932 41,0% 40,8% 40,1% 41,7% 49,7%
ST 8.944 8.421 8.152 9.348 8.344 . . . . .
SH 4.316 4.100 3.565 2.470 1.358 20,7% 23,0% 25,5% 25,8% 25,4%
TH 6.820 5.730 6.131 5.031 4.668 14,6% 12,6% 13,5% 11,2% 10,3%
D 81.773 83.448 85.827 87.176 96.776 18,2% 17,7% 17,5% 17,1% 18,8%
1) Für ST liegen keine Angaben über private Ganztagsangebote vor, daher ist in diesen Fällen die Berechnung des Anteils an allen Schülern nicht sinnvoll.
2) MV (2014): Die Angaben für die privaten Schulen wurden vom Schuljahr 2013/14 übernommen.
x = Schulart nicht vorhanden.
offene Form
Anmerkung: Ab 2016 findet eine erweiterte Definition (siehe Bericht S. 6) für die offenen Ganztagsangebote Anwendung. Dadurch kommt es in diesem Bereich in
einigen Ländern zu einem deutlichen Anstieg. (Gilt aktuell noch nicht für MV.)
- 39* -
Anteil an allen Schüler-/innen1)
Anzahl
Insgesamt
gebundene Form
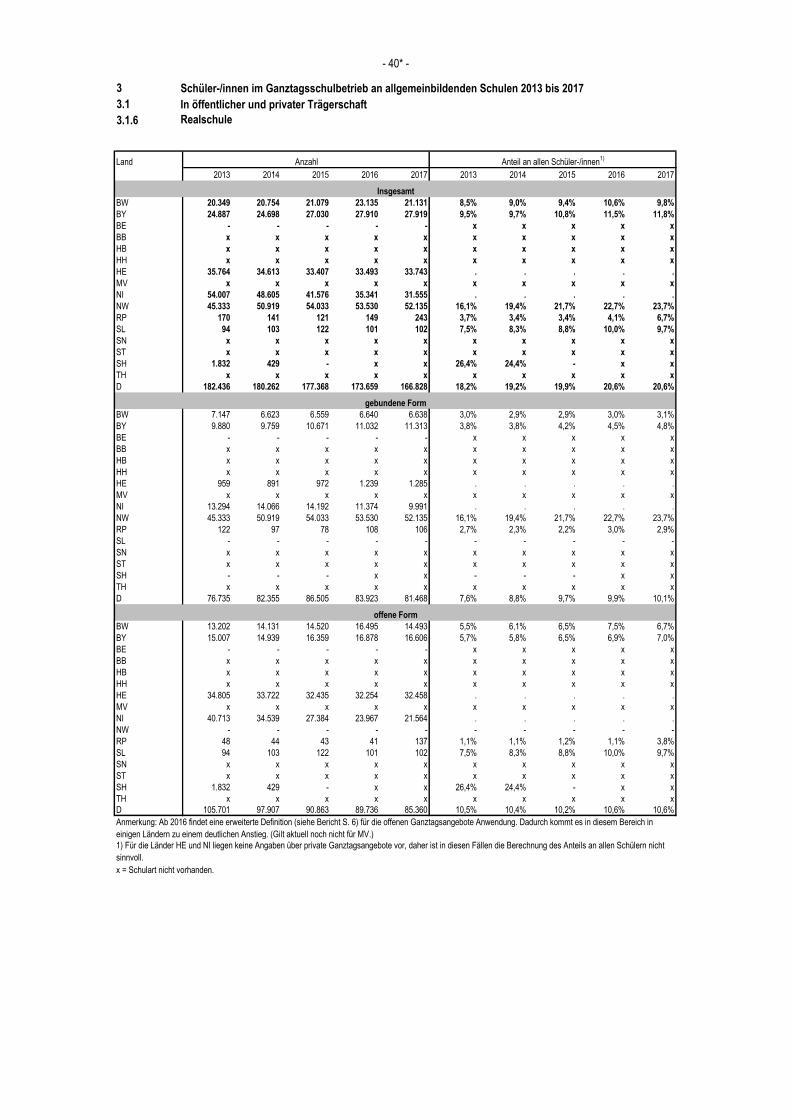
3 Schüler-/innen im Ganztagsschulbetrieb an allgemeinbildenden Schulen 2013 bis 2017
3.1 In öffentlicher und privater Trägerschaft
3.1.6 Realschule
Land
2013 2014 2015 2016 2017 2013 2014 2015 2016 2017
BW 20.349 20.754 21.079 23.135 21.131 8,5% 9,0% 9,4% 10,6% 9,8%
BY 24.887 24.698 27.030 27.910 27.919 9,5% 9,7% 10,8% 11,5% 11,8%
BE - - - - - x x x x x
BB x x x x x x x x x x
HB x x x x x x x x x x
HH x x x x x x x x x x
HE 35.764 34.613 33.407 33.493 33.743 . . . . .
MV x x x x x x x x x x
NI 54.007 48.605 41.576 35.341 31.555 . . . . .
NW 45.333 50.919 54.033 53.530 52.135 16,1% 19,4% 21,7% 22,7% 23,7%
RP 170 141 121 149 243 3,7% 3,4% 3,4% 4,1% 6,7%
SL 94 103 122 101 102 7,5% 8,3% 8,8% 10,0% 9,7%
SN x x x x x x x x x x
ST x x x x x x x x x x
SH 1.832 429 - x x 26,4% 24,4% - x x
TH x x x x x x x x x x
D 182.436 180.262 177.368 173.659 166.828 18,2% 19,2% 19,9% 20,6% 20,6%
BW 7.147 6.623 6.559 6.640 6.638 3,0% 2,9% 2,9% 3,0% 3,1%
BY 9.880 9.759 10.671 11.032 11.313 3,8% 3,8% 4,2% 4,5% 4,8%
BE - - - - - x x x x x
BB x x x x x x x x x x
HB x x x x x x x x x x
HH x x x x x x x x x x
HE 959 891 972 1.239 1.285 . . . . .
MV x x x x x x x x x x
NI 13.294 14.066 14.192 11.374 9.991 . . . . .
NW 45.333 50.919 54.033 53.530 52.135 16,1% 19,4% 21,7% 22,7% 23,7%
RP 122 97 78 108 106 2,7% 2,3% 2,2% 3,0% 2,9%
SL - - - - - - - - - -
SN x x x x x x x x x x
ST x x x x x x x x x x
SH - - - x x - - - x x
TH x x x x x x x x x x
D 76.735 82.355 86.505 83.923 81.468 7,6% 8,8% 9,7% 9,9% 10,1%
BW 13.202 14.131 14.520 16.495 14.493 5,5% 6,1% 6,5% 7,5% 6,7%
BY 15.007 14.939 16.359 16.878 16.606 5,7% 5,8% 6,5% 6,9% 7,0%
BE - - - - - x x x x x
BB x x x x x x x x x x
HB x x x x x x x x x x
HH x x x x x x x x x x
HE 34.805 33.722 32.435 32.254 32.458 . . . . .
MV x x x x x x x x x x
NI 40.713 34.539 27.384 23.967 21.564 . . . . .
NW - - - - - - - - - -
RP 48 44 43 41 137 1,1% 1,1% 1,2% 1,1% 3,8%
SL 94 103 122 101 102 7,5% 8,3% 8,8% 10,0% 9,7%
SN x x x x x x x x x x
ST x x x x x x x x x x
SH 1.832 429 - x x 26,4% 24,4% - x x
TH x x x x x x x x x x
D 105.701 97.907 90.863 89.736 85.360 10,5% 10,4% 10,2% 10,6% 10,6%
x = Schulart nicht vorhanden.
offene Form
Anmerkung: Ab 2016 findet eine erweiterte Definition (siehe Bericht S. 6) für die offenen Ganztagsangebote Anwendung. Dadurch kommt es in diesem Bereich in
einigen Ländern zu einem deutlichen Anstieg. (Gilt aktuell noch nicht für MV.)
1) Für die Länder HE und NI liegen keine Angaben über private Ganztagsangebote vor, daher ist in diesen Fällen die Berechnung des Anteils an allen Schülern nicht
sinnvoll.
- 40* -
Anteil an allen Schüler-/innen1)
Anzahl
Insgesamt
gebundene Form
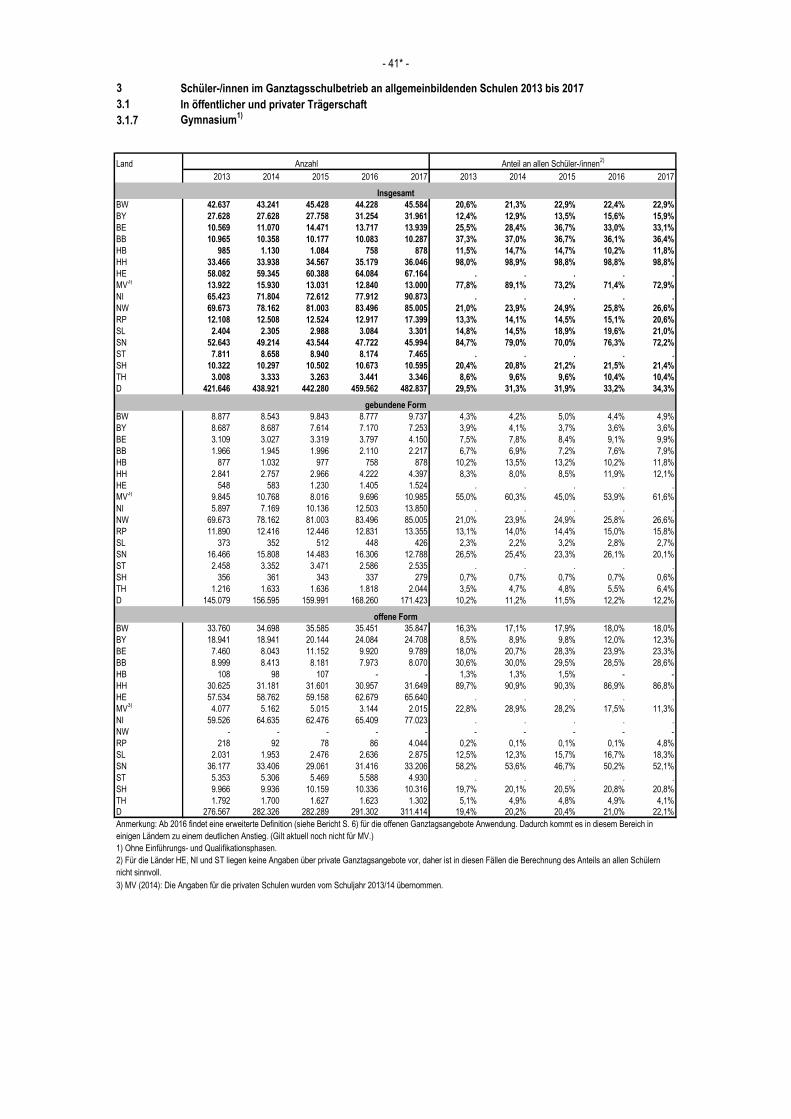
3 Schüler-/innen im Ganztagsschulbetrieb an allgemeinbildenden Schulen 2013 bis 2017
3.1 In öffentlicher und privater Trägerschaft
3.1.7 Gymnasium1)
Land
2013 2014 2015 2016 2017 2013 2014 2015 2016 2017
BW 42.637 43.241 45.428 44.228 45.584 20,6% 21,3% 22,9% 22,4% 22,9%
BY 27.628 27.628 27.758 31.254 31.961 12,4% 12,9% 13,5% 15,6% 15,9%
BE 10.569 11.070 14.471 13.717 13.939 25,5% 28,4% 36,7% 33,0% 33,1%
BB 10.965 10.358 10.177 10.083 10.287 37,3% 37,0% 36,7% 36,1% 36,4%
HB 985 1.130 1.084 758 878 11,5% 14,7% 14,7% 10,2% 11,8%
HH 33.466 33.938 34.567 35.179 36.046 98,0% 98,9% 98,8% 98,8% 98,8%
HE 58.082 59.345 60.388 64.084 67.164 . . . . .
MV3)
13.922 15.930 13.031 12.840 13.000 77,8% 89,1% 73,2% 71,4% 72,9%
NI 65.423 71.804 72.612 77.912 90.873 . . . . .
NW 69.673 78.162 81.003 83.496 85.005 21,0% 23,9% 24,9% 25,8% 26,6%
RP 12.108 12.508 12.524 12.917 17.399 13,3% 14,1% 14,5% 15,1% 20,6%
SL 2.404 2.305 2.988 3.084 3.301 14,8% 14,5% 18,9% 19,6% 21,0%
SN 52.643 49.214 43.544 47.722 45.994 84,7% 79,0% 70,0% 76,3% 72,2%
ST 7.811 8.658 8.940 8.174 7.465 . . . . .
SH 10.322 10.297 10.502 10.673 10.595 20,4% 20,8% 21,2% 21,5% 21,4%
TH 3.008 3.333 3.263 3.441 3.346 8,6% 9,6% 9,6% 10,4% 10,4%
D 421.646 438.921 442.280 459.562 482.837 29,5% 31,3% 31,9% 33,2% 34,3%
BW 8.877 8.543 9.843 8.777 9.737 4,3% 4,2% 5,0% 4,4% 4,9%
BY 8.687 8.687 7.614 7.170 7.253 3,9% 4,1% 3,7% 3,6% 3,6%
BE 3.109 3.027 3.319 3.797 4.150 7,5% 7,8% 8,4% 9,1% 9,9%
BB 1.966 1.945 1.996 2.110 2.217 6,7% 6,9% 7,2% 7,6% 7,9%
HB 877 1.032 977 758 878 10,2% 13,5% 13,2% 10,2% 11,8%
HH 2.841 2.757 2.966 4.222 4.397 8,3% 8,0% 8,5% 11,9% 12,1%
HE 548 583 1.230 1.405 1.524 . . . . .
MV3)
9.845 10.768 8.016 9.696 10.985 55,0% 60,3% 45,0% 53,9% 61,6%
NI 5.897 7.169 10.136 12.503 13.850 . . . . .
NW 69.673 78.162 81.003 83.496 85.005 21,0% 23,9% 24,9% 25,8% 26,6%
RP 11.890 12.416 12.446 12.831 13.355 13,1% 14,0% 14,4% 15,0% 15,8%
SL 373 352 512 448 426 2,3% 2,2% 3,2% 2,8% 2,7%
SN 16.466 15.808 14.483 16.306 12.788 26,5% 25,4% 23,3% 26,1% 20,1%
ST 2.458 3.352 3.471 2.586 2.535 . . . . .
SH 356 361 343 337 279 0,7% 0,7% 0,7% 0,7% 0,6%
TH 1.216 1.633 1.636 1.818 2.044 3,5% 4,7% 4,8% 5,5% 6,4%
D 145.079 156.595 159.991 168.260 171.423 10,2% 11,2% 11,5% 12,2% 12,2%
BW 33.760 34.698 35.585 35.451 35.847 16,3% 17,1% 17,9% 18,0% 18,0%
BY 18.941 18.941 20.144 24.084 24.708 8,5% 8,9% 9,8% 12,0% 12,3%
BE 7.460 8.043 11.152 9.920 9.789 18,0% 20,7% 28,3% 23,9% 23,3%
BB 8.999 8.413 8.181 7.973 8.070 30,6% 30,0% 29,5% 28,5% 28,6%
HB 108 98 107 - - 1,3% 1,3% 1,5% - -
HH 30.625 31.181 31.601 30.957 31.649 89,7% 90,9% 90,3% 86,9% 86,8%
HE 57.534 58.762 59.158 62.679 65.640 . . . . .
MV3)
4.077 5.162 5.015 3.144 2.015 22,8% 28,9% 28,2% 17,5% 11,3%
NI 59.526 64.635 62.476 65.409 77.023 . . . . .
NW - - - - - - - - - -
RP 218 92 78 86 4.044 0,2% 0,1% 0,1% 0,1% 4,8%
SL 2.031 1.953 2.476 2.636 2.875 12,5% 12,3% 15,7% 16,7% 18,3%
SN 36.177 33.406 29.061 31.416 33.206 58,2% 53,6% 46,7% 50,2% 52,1%
ST 5.353 5.306 5.469 5.588 4.930 . . . . .
SH 9.966 9.936 10.159 10.336 10.316 19,7% 20,1% 20,5% 20,8% 20,8%
TH 1.792 1.700 1.627 1.623 1.302 5,1% 4,9% 4,8% 4,9% 4,1%
D 276.567 282.326 282.289 291.302 311.414 19,4% 20,2% 20,4% 21,0% 22,1%
3) MV (2014): Die Angaben für die privaten Schulen wurden vom Schuljahr 2013/14 übernommen.
2) Für die Länder HE, NI und ST liegen keine Angaben über private Ganztagsangebote vor, daher ist in diesen Fällen die Berechnung des Anteils an allen Schülern
nicht sinnvoll.
1) Ohne Einführungs- und Qualifikationsphasen.
- 41* -
Anteil an allen Schüler-/innen2)
Anzahl
Insgesamt
gebundene Form
offene Form
Anmerkung: Ab 2016 findet eine erweiterte Definition (siehe Bericht S. 6) für die offenen Ganztagsangebote Anwendung. Dadurch kommt es in diesem Bereich in
einigen Ländern zu einem deutlichen Anstieg. (Gilt aktuell noch nicht für MV.)
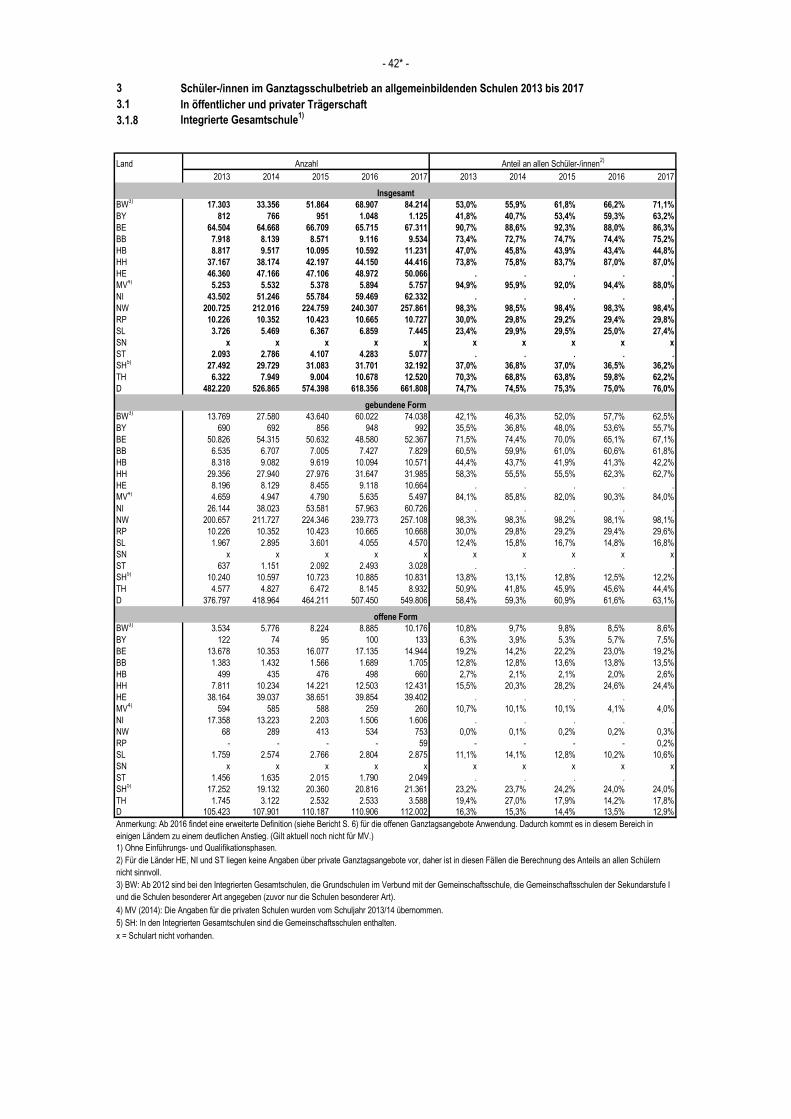
3 Schüler-/innen im Ganztagsschulbetrieb an allgemeinbildenden Schulen 2013 bis 2017
3.1 In öffentlicher und privater Trägerschaft
3.1.8 Integrierte Gesamtschule1)
Land
2013 2014 2015 2016 2017 2013 2014 2015 2016 2017
BW3)
17.303 33.356 51.864 68.907 84.214 53,0% 55,9% 61,8% 66,2% 71,1%
BY 812 766 951 1.048 1.125 41,8% 40,7% 53,4% 59,3% 63,2%
BE 64.504 64.668 66.709 65.715 67.311 90,7% 88,6% 92,3% 88,0% 86,3%
BB 7.918 8.139 8.571 9.116 9.534 73,4% 72,7% 74,7% 74,4% 75,2%
HB 8.817 9.517 10.095 10.592 11.231 47,0% 45,8% 43,9% 43,4% 44,8%
HH 37.167 38.174 42.197 44.150 44.416 73,8% 75,8% 83,7% 87,0% 87,0%
HE 46.360 47.166 47.106 48.972 50.066 . . . . .
MV4)
5.253 5.532 5.378 5.894 5.757 94,9% 95,9% 92,0% 94,4% 88,0%
NI 43.502 51.246 55.784 59.469 62.332 . . . . .
NW 200.725 212.016 224.759 240.307 257.861 98,3% 98,5% 98,4% 98,3% 98,4%
RP 10.226 10.352 10.423 10.665 10.727 30,0% 29,8% 29,2% 29,4% 29,8%
SL 3.726 5.469 6.367 6.859 7.445 23,4% 29,9% 29,5% 25,0% 27,4%
SN x x x x x x x x x x
ST 2.093 2.786 4.107 4.283 5.077 . . . . .
SH5)
27.492 29.729 31.083 31.701 32.192 37,0% 36,8% 37,0% 36,5% 36,2%
TH 6.322 7.949 9.004 10.678 12.520 70,3% 68,8% 63,8% 59,8% 62,2%
D 482.220 526.865 574.398 618.356 661.808 74,7% 74,5% 75,3% 75,0% 76,0%
BW3)
13.769 27.580 43.640 60.022 74.038 42,1% 46,3% 52,0% 57,7% 62,5%
BY 690 692 856 948 992 35,5% 36,8% 48,0% 53,6% 55,7%
BE 50.826 54.315 50.632 48.580 52.367 71,5% 74,4% 70,0% 65,1% 67,1%
BB 6.535 6.707 7.005 7.427 7.829 60,5% 59,9% 61,0% 60,6% 61,8%
HB 8.318 9.082 9.619 10.094 10.571 44,4% 43,7% 41,9% 41,3% 42,2%
HH 29.356 27.940 27.976 31.647 31.985 58,3% 55,5% 55,5% 62,3% 62,7%
HE 8.196 8.129 8.455 9.118 10.664 . . . . .
MV4)
4.659 4.947 4.790 5.635 5.497 84,1% 85,8% 82,0% 90,3% 84,0%
NI 26.144 38.023 53.581 57.963 60.726 . . . . .
NW 200.657 211.727 224.346 239.773 257.108 98,3% 98,3% 98,2% 98,1% 98,1%
RP 10.226 10.352 10.423 10.665 10.668 30,0% 29,8% 29,2% 29,4% 29,6%
SL 1.967 2.895 3.601 4.055 4.570 12,4% 15,8% 16,7% 14,8% 16,8%
SN x x x x x x x x x x
ST 637 1.151 2.092 2.493 3.028 . . . . .
SH5)
10.240 10.597 10.723 10.885 10.831 13,8% 13,1% 12,8% 12,5% 12,2%
TH 4.577 4.827 6.472 8.145 8.932 50,9% 41,8% 45,9% 45,6% 44,4%
D 376.797 418.964 464.211 507.450 549.806 58,4% 59,3% 60,9% 61,6% 63,1%
BW3)
3.534 5.776 8.224 8.885 10.176 10,8% 9,7% 9,8% 8,5% 8,6%
BY 122 74 95 100 133 6,3% 3,9% 5,3% 5,7% 7,5%
BE 13.678 10.353 16.077 17.135 14.944 19,2% 14,2% 22,2% 23,0% 19,2%
BB 1.383 1.432 1.566 1.689 1.705 12,8% 12,8% 13,6% 13,8% 13,5%
HB 499 435 476 498 660 2,7% 2,1% 2,1% 2,0% 2,6%
HH 7.811 10.234 14.221 12.503 12.431 15,5% 20,3% 28,2% 24,6% 24,4%
HE 38.164 39.037 38.651 39.854 39.402 . . . . .
MV4)
594 585 588 259 260 10,7% 10,1% 10,1% 4,1% 4,0%
NI 17.358 13.223 2.203 1.506 1.606 . . . . .
NW 68 289 413 534 753 0,0% 0,1% 0,2% 0,2% 0,3%
RP - - - - 59 - - - - 0,2%
SL 1.759 2.574 2.766 2.804 2.875 11,1% 14,1% 12,8% 10,2% 10,6%
SN x x x x x x x x x x
ST 1.456 1.635 2.015 1.790 2.049 . . . . .
SH5)
17.252 19.132 20.360 20.816 21.361 23,2% 23,7% 24,2% 24,0% 24,0%
TH 1.745 3.122 2.532 2.533 3.588 19,4% 27,0% 17,9% 14,2% 17,8%
D 105.423 107.901 110.187 110.906 112.002 16,3% 15,3% 14,4% 13,5% 12,9%
4) MV (2014): Die Angaben für die privaten Schulen wurden vom Schuljahr 2013/14 übernommen.
5) SH: In den Integrierten Gesamtschulen sind die Gemeinschaftsschulen enthalten.
x = Schulart nicht vorhanden.
2) Für die Länder HE, NI und ST liegen keine Angaben über private Ganztagsangebote vor, daher ist in diesen Fällen die Berechnung des Anteils an allen Schülern
nicht sinnvoll.
3) BW: Ab 2012 sind bei den Integrierten Gesamtschulen, die Grundschulen im Verbund mit der Gemeinschaftsschule, die Gemeinschaftsschulen der Sekundarstufe I
und die Schulen besonderer Art angegeben (zuvor nur die Schulen besonderer Art).
1) Ohne Einführungs- und Qualifikationsphasen.
- 42* -
Anteil an allen Schüler-/innen2)
Anzahl
Insgesamt
gebundene Form
offene Form
Anmerkung: Ab 2016 findet eine erweiterte Definition (siehe Bericht S. 6) für die offenen Ganztagsangebote Anwendung. Dadurch kommt es in diesem Bereich in
einigen Ländern zu einem deutlichen Anstieg. (Gilt aktuell noch nicht für MV.)
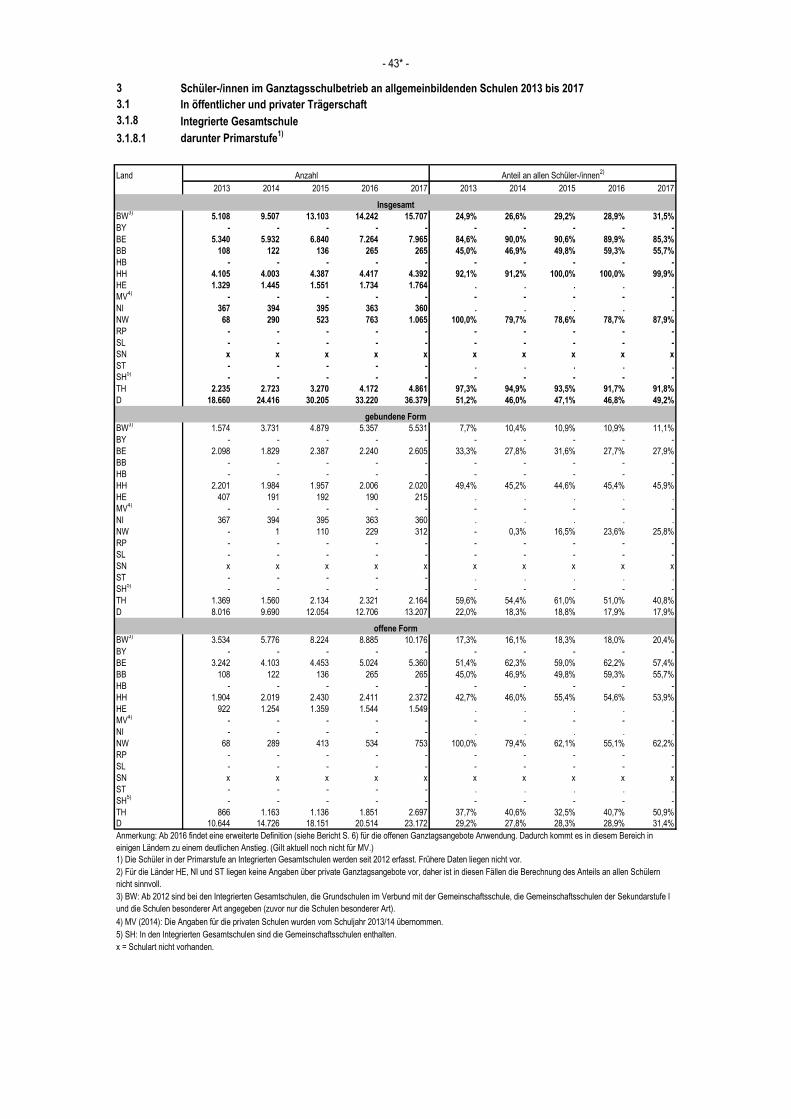
3 Schüler-/innen im Ganztagsschulbetrieb an allgemeinbildenden Schulen 2013 bis 2017
3.1 In öffentlicher und privater Trägerschaft
3.1.8 Integrierte Gesamtschule
3.1.8.1 darunter Primarstufe1)
Land
2013 2014 2015 2016 2017 2013 2014 2015 2016 2017
BW3)
5.108 9.507 13.103 14.242 15.707 24,9% 26,6% 29,2% 28,9% 31,5%
BY - - - - - - - - - -
BE 5.340 5.932 6.840 7.264 7.965 84,6% 90,0% 90,6% 89,9% 85,3%
BB 108 122 136 265 265 45,0% 46,9% 49,8% 59,3% 55,7%
HB - - - - - - - - - -
HH 4.105 4.003 4.387 4.417 4.392 92,1% 91,2% 100,0% 100,0% 99,9%
HE 1.329 1.445 1.551 1.734 1.764 . . . . .
MV4)
- - - - - - - - - -
NI 367 394 395 363 360 . . . . .
NW 68 290 523 763 1.065 100,0% 79,7% 78,6% 78,7% 87,9%
RP - - - - - - - - - -
SL - - - - - - - - - -
SN x x x x x x x x x x
ST - - - - - . . . . .
SH5)
- - - - - - - - - -
TH 2.235 2.723 3.270 4.172 4.861 97,3% 94,9% 93,5% 91,7% 91,8%
D 18.660 24.416 30.205 33.220 36.379 51,2% 46,0% 47,1% 46,8% 49,2%
BW3)
1.574 3.731 4.879 5.357 5.531 7,7% 10,4% 10,9% 10,9% 11,1%
BY - - - - - - - - - -
BE 2.098 1.829 2.387 2.240 2.605 33,3% 27,8% 31,6% 27,7% 27,9%
BB - - - - - - - - - -
HB - - - - - - - - - -
HH 2.201 1.984 1.957 2.006 2.020 49,4% 45,2% 44,6% 45,4% 45,9%
HE 407 191 192 190 215 . . . . .
MV4)
- - - - - - - - - -
NI 367 394 395 363 360 . . . . .
NW - 1 110 229 312 - 0,3% 16,5% 23,6% 25,8%
RP - - - - - - - - - -
SL - - - - - - - - - -
SN x x x x x x x x x x
ST - - - - - . . . . .
SH5)
- - - - - - - - - -
TH 1.369 1.560 2.134 2.321 2.164 59,6% 54,4% 61,0% 51,0% 40,8%
D 8.016 9.690 12.054 12.706 13.207 22,0% 18,3% 18,8% 17,9% 17,9%
BW3)
3.534 5.776 8.224 8.885 10.176 17,3% 16,1% 18,3% 18,0% 20,4%
BY - - - - - - - - - -
BE 3.242 4.103 4.453 5.024 5.360 51,4% 62,3% 59,0% 62,2% 57,4%
BB 108 122 136 265 265 45,0% 46,9% 49,8% 59,3% 55,7%
HB - - - - - - - - - -
HH 1.904 2.019 2.430 2.411 2.372 42,7% 46,0% 55,4% 54,6% 53,9%
HE 922 1.254 1.359 1.544 1.549 . . . . .
MV4)
- - - - - - - - - -
NI - - - - - . . . . .
NW 68 289 413 534 753 100,0% 79,4% 62,1% 55,1% 62,2%
RP - - - - - - - - - -
SL - - - - - - - - - -
SN x x x x x x x x x x
ST - - - - - . . . . .
SH5)
- - - - - - - - - -
TH 866 1.163 1.136 1.851 2.697 37,7% 40,6% 32,5% 40,7% 50,9%
D 10.644 14.726 18.151 20.514 23.172 29,2% 27,8% 28,3% 28,9% 31,4%
4) MV (2014): Die Angaben für die privaten Schulen wurden vom Schuljahr 2013/14 übernommen.
5) SH: In den Integrierten Gesamtschulen sind die Gemeinschaftsschulen enthalten.
x = Schulart nicht vorhanden.
- 43* -
Anteil an allen Schüler-/innen2)
Anzahl
Insgesamt
gebundene Form
offene Form
Anmerkung: Ab 2016 findet eine erweiterte Definition (siehe Bericht S. 6) für die offenen Ganztagsangebote Anwendung. Dadurch kommt es in diesem Bereich in
einigen Ländern zu einem deutlichen Anstieg. (Gilt aktuell noch nicht für MV.)
2) Für die Länder HE, NI und ST liegen keine Angaben über private Ganztagsangebote vor, daher ist in diesen Fällen die Berechnung des Anteils an allen Schülern
nicht sinnvoll.
3) BW: Ab 2012 sind bei den Integrierten Gesamtschulen, die Grundschulen im Verbund mit der Gemeinschaftsschule, die Gemeinschaftsschulen der Sekundarstufe I
und die Schulen besonderer Art angegeben (zuvor nur die Schulen besonderer Art).
1) Die Schüler in der Primarstufe an Integrierten Gesamtschulen werden seit 2012 erfasst. Frühere Daten liegen nicht vor.
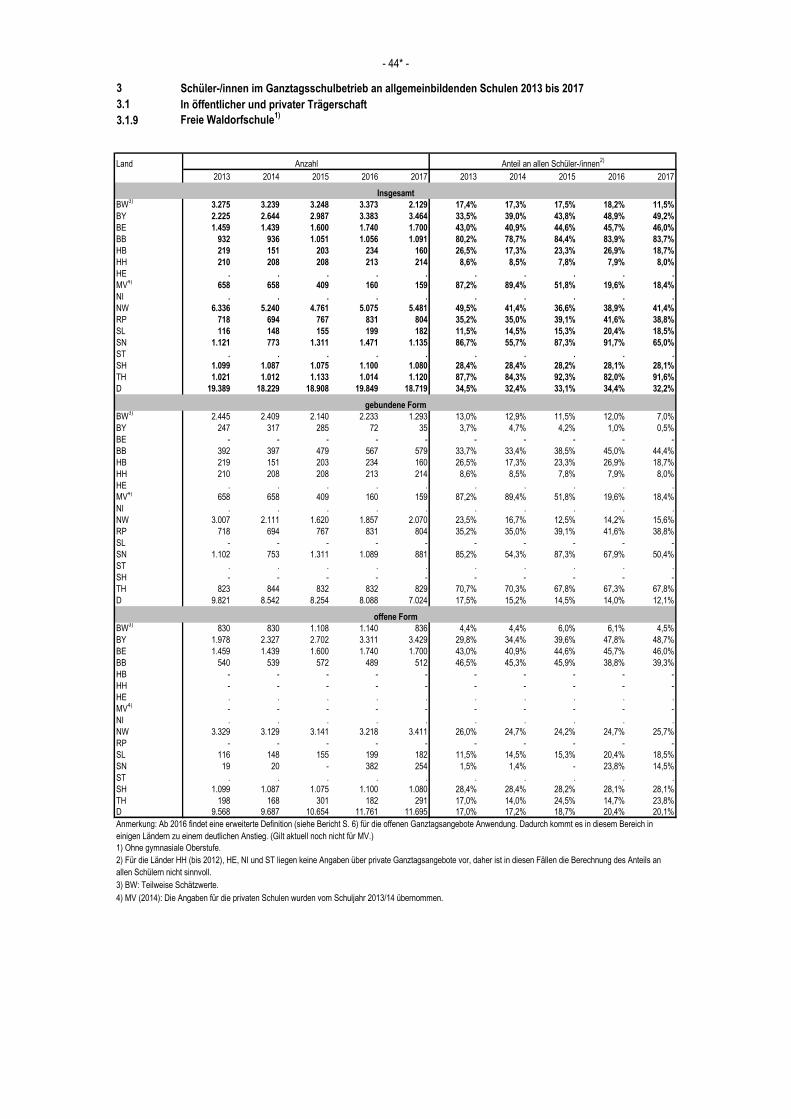
3 Schüler-/innen im Ganztagsschulbetrieb an allgemeinbildenden Schulen 2013 bis 2017
3.1 In öffentlicher und privater Trägerschaft
3.1.9 Freie Waldorfschule1)
Land
2013 2014 2015 2016 2017 2013 2014 2015 2016 2017
BW3)
3.275 3.239 3.248 3.373 2.129 17,4% 17,3% 17,5% 18,2% 11,5%
BY 2.225 2.644 2.987 3.383 3.464 33,5% 39,0% 43,8% 48,9% 49,2%
BE 1.459 1.439 1.600 1.740 1.700 43,0% 40,9% 44,6% 45,7% 46,0%
BB 932 936 1.051 1.056 1.091 80,2% 78,7% 84,4% 83,9% 83,7%
HB 219 151 203 234 160 26,5% 17,3% 23,3% 26,9% 18,7%
HH 210 208 208 213 214 8,6% 8,5% 7,8% 7,9% 8,0%
HE . . . . . . . . . .
MV4)
658 658 409 160 159 87,2% 89,4% 51,8% 19,6% 18,4%
NI . . . . . . . . . .
NW 6.336 5.240 4.761 5.075 5.481 49,5% 41,4% 36,6% 38,9% 41,4%
RP 718 694 767 831 804 35,2% 35,0% 39,1% 41,6% 38,8%
SL 116 148 155 199 182 11,5% 14,5% 15,3% 20,4% 18,5%
SN 1.121 773 1.311 1.471 1.135 86,7% 55,7% 87,3% 91,7% 65,0%
ST . . . . . . . . . .
SH 1.099 1.087 1.075 1.100 1.080 28,4% 28,4% 28,2% 28,1% 28,1%
TH 1.021 1.012 1.133 1.014 1.120 87,7% 84,3% 92,3% 82,0% 91,6%
D 19.389 18.229 18.908 19.849 18.719 34,5% 32,4% 33,1% 34,4% 32,2%
BW3)
2.445 2.409 2.140 2.233 1.293 13,0% 12,9% 11,5% 12,0% 7,0%
BY 247 317 285 72 35 3,7% 4,7% 4,2% 1,0% 0,5%
BE - - - - - - - - - -
BB 392 397 479 567 579 33,7% 33,4% 38,5% 45,0% 44,4%
HB 219 151 203 234 160 26,5% 17,3% 23,3% 26,9% 18,7%
HH 210 208 208 213 214 8,6% 8,5% 7,8% 7,9% 8,0%
HE . . . . . . . . . .
MV4)
658 658 409 160 159 87,2% 89,4% 51,8% 19,6% 18,4%
NI . . . . . . . . . .
NW 3.007 2.111 1.620 1.857 2.070 23,5% 16,7% 12,5% 14,2% 15,6%
RP 718 694 767 831 804 35,2% 35,0% 39,1% 41,6% 38,8%
SL - - - - - - - - - -
SN 1.102 753 1.311 1.089 881 85,2% 54,3% 87,3% 67,9% 50,4%
ST . . . . . . . . . .
SH - - - - - - - - - -
TH 823 844 832 832 829 70,7% 70,3% 67,8% 67,3% 67,8%
D 9.821 8.542 8.254 8.088 7.024 17,5% 15,2% 14,5% 14,0% 12,1%
BW3)
830 830 1.108 1.140 836 4,4% 4,4% 6,0% 6,1% 4,5%
BY 1.978 2.327 2.702 3.311 3.429 29,8% 34,4% 39,6% 47,8% 48,7%
BE 1.459 1.439 1.600 1.740 1.700 43,0% 40,9% 44,6% 45,7% 46,0%
BB 540 539 572 489 512 46,5% 45,3% 45,9% 38,8% 39,3%
HB - - - - - - - - - -
HH - - - - - - - - - -
HE . . . . . . . . . .
MV4)
- - - - - - - - - -
NI . . . . . . . . . .
NW 3.329 3.129 3.141 3.218 3.411 26,0% 24,7% 24,2% 24,7% 25,7%
RP - - - - - - - - - -
SL 116 148 155 199 182 11,5% 14,5% 15,3% 20,4% 18,5%
SN 19 20 - 382 254 1,5% 1,4% - 23,8% 14,5%
ST . . . . . . . . . .
SH 1.099 1.087 1.075 1.100 1.080 28,4% 28,4% 28,2% 28,1% 28,1%
TH 198 168 301 182 291 17,0% 14,0% 24,5% 14,7% 23,8%
D 9.568 9.687 10.654 11.761 11.695 17,0% 17,2% 18,7% 20,4% 20,1%
3) BW: Teilweise Schätzwerte.
4) MV (2014): Die Angaben für die privaten Schulen wurden vom Schuljahr 2013/14 übernommen.
2) Für die Länder HH (bis 2012), HE, NI und ST liegen keine Angaben über private Ganztagsangebote vor, daher ist in diesen Fällen die Berechnung des Anteils an
allen Schülern nicht sinnvoll.
1) Ohne gymnasiale Oberstufe.
- 44* -
Anteil an allen Schüler-/innen2)
Anzahl
Insgesamt
gebundene Form
offene Form
Anmerkung: Ab 2016 findet eine erweiterte Definition (siehe Bericht S. 6) für die offenen Ganztagsangebote Anwendung. Dadurch kommt es in diesem Bereich in
einigen Ländern zu einem deutlichen Anstieg. (Gilt aktuell noch nicht für MV.)
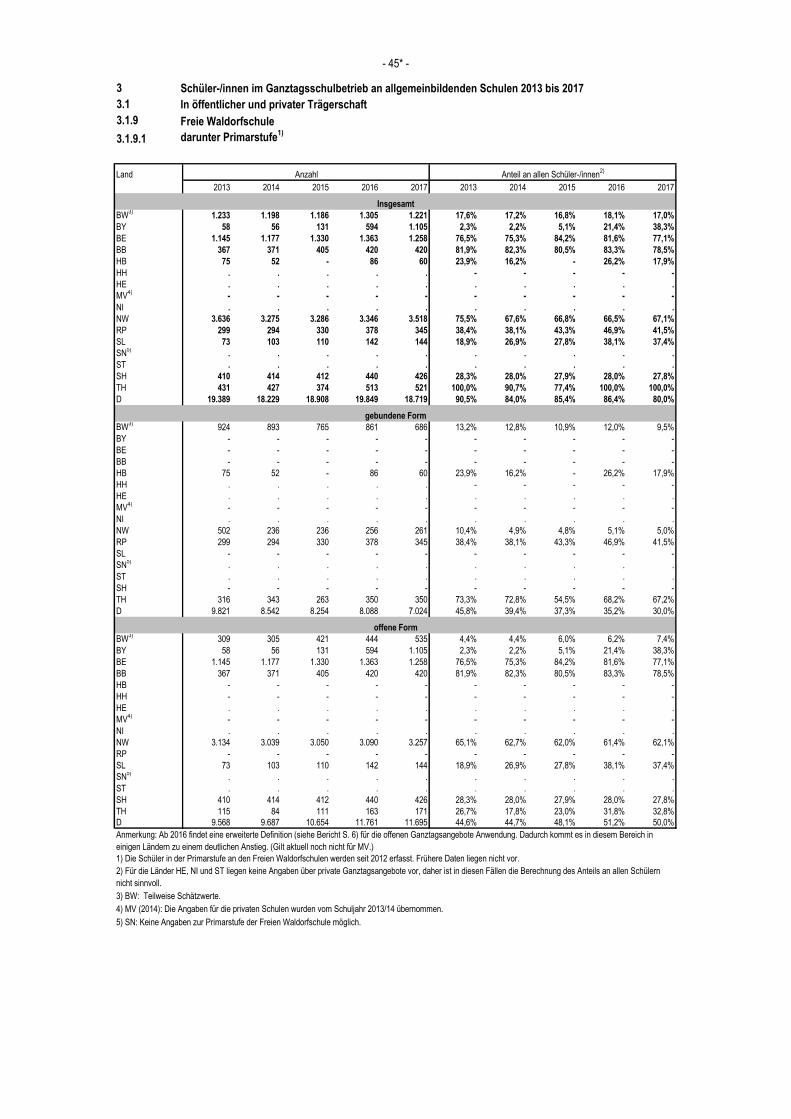
3 Schüler-/innen im Ganztagsschulbetrieb an allgemeinbildenden Schulen 2013 bis 2017
3.1 In öffentlicher und privater Trägerschaft
3.1.9 Freie Waldorfschule
3.1.9.1 darunter Primarstufe1)
Land
2013 2014 2015 2016 2017 2013 2014 2015 2016 2017
BW3)
1.233 1.198 1.186 1.305 1.221 17,6% 17,2% 16,8% 18,1% 17,0%
BY 58 56 131 594 1.105 2,3% 2,2% 5,1% 21,4% 38,3%
BE 1.145 1.177 1.330 1.363 1.258 76,5% 75,3% 84,2% 81,6% 77,1%
BB 367 371 405 420 420 81,9% 82,3% 80,5% 83,3% 78,5%
HB 75 52 - 86 60 23,9% 16,2% - 26,2% 17,9%
HH . . . . . - - - - -
HE . . . . . . . . . .
MV4)
- - - - - - - - - -
NI . . . . . . . . . .
NW 3.636 3.275 3.286 3.346 3.518 75,5% 67,6% 66,8% 66,5% 67,1%
RP 299 294 330 378 345 38,4% 38,1% 43,3% 46,9% 41,5%
SL 73 103 110 142 144 18,9% 26,9% 27,8% 38,1% 37,4%
SN5)
. . . . . . . . . .
ST . . . . . . . . . .
SH 410 414 412 440 426 28,3% 28,0% 27,9% 28,0% 27,8%
TH 431 427 374 513 521 100,0% 90,7% 77,4% 100,0% 100,0%
D 19.389 18.229 18.908 19.849 18.719 90,5% 84,0% 85,4% 86,4% 80,0%
BW3)
924 893 765 861 686 13,2% 12,8% 10,9% 12,0% 9,5%
BY - - - - - - - - - -
BE - - - - - - - - - -
BB - - - - - - - - - -
HB 75 52 - 86 60 23,9% 16,2% - 26,2% 17,9%
HH . . . . . - - - - -
HE . . . . . . . . . .
MV4)
- - - - - - - - - -
NI . . . . . . . . . .
NW 502 236 236 256 261 10,4% 4,9% 4,8% 5,1% 5,0%
RP 299 294 330 378 345 38,4% 38,1% 43,3% 46,9% 41,5%
SL - - - - - - - - - -
SN5)
. . . . . . . . . .
ST . . . . . . . . . .
SH - - - - - - - - - -
TH 316 343 263 350 350 73,3% 72,8% 54,5% 68,2% 67,2%
D 9.821 8.542 8.254 8.088 7.024 45,8% 39,4% 37,3% 35,2% 30,0%
BW3)
309 305 421 444 535 4,4% 4,4% 6,0% 6,2% 7,4%
BY 58 56 131 594 1.105 2,3% 2,2% 5,1% 21,4% 38,3%
BE 1.145 1.177 1.330 1.363 1.258 76,5% 75,3% 84,2% 81,6% 77,1%
BB 367 371 405 420 420 81,9% 82,3% 80,5% 83,3% 78,5%
HB - - - - - - - - - -
HH - - - - - - - - - -
HE . . . . . . . . . .
MV4)
- - - - - - - - - -
NI . . . . . . . . . .
NW 3.134 3.039 3.050 3.090 3.257 65,1% 62,7% 62,0% 61,4% 62,1%
RP - - - - - - - - - -
SL 73 103 110 142 144 18,9% 26,9% 27,8% 38,1% 37,4%
SN5)
. . . . . . . . . .
ST . . . . . . . . . .
SH 410 414 412 440 426 28,3% 28,0% 27,9% 28,0% 27,8%
TH 115 84 111 163 171 26,7% 17,8% 23,0% 31,8% 32,8%
D 9.568 9.687 10.654 11.761 11.695 44,6% 44,7% 48,1% 51,2% 50,0%
3) BW: Teilweise Schätzwerte.
4) MV (2014): Die Angaben für die privaten Schulen wurden vom Schuljahr 2013/14 übernommen.
5) SN: Keine Angaben zur Primarstufe der Freien Waldorfschule möglich.
offene Form
Anmerkung: Ab 2016 findet eine erweiterte Definition (siehe Bericht S. 6) für die offenen Ganztagsangebote Anwendung. Dadurch kommt es in diesem Bereich in
einigen Ländern zu einem deutlichen Anstieg. (Gilt aktuell noch nicht für MV.)
2) Für die Länder HE, NI und ST liegen keine Angaben über private Ganztagsangebote vor, daher ist in diesen Fällen die Berechnung des Anteils an allen Schülern
nicht sinnvoll.
1) Die Schüler in der Primarstufe an den Freien Waldorfschulen werden seit 2012 erfasst. Frühere Daten liegen nicht vor.
- 45* -
Anteil an allen Schüler-/innen2)
Anzahl
Insgesamt
gebundene Form
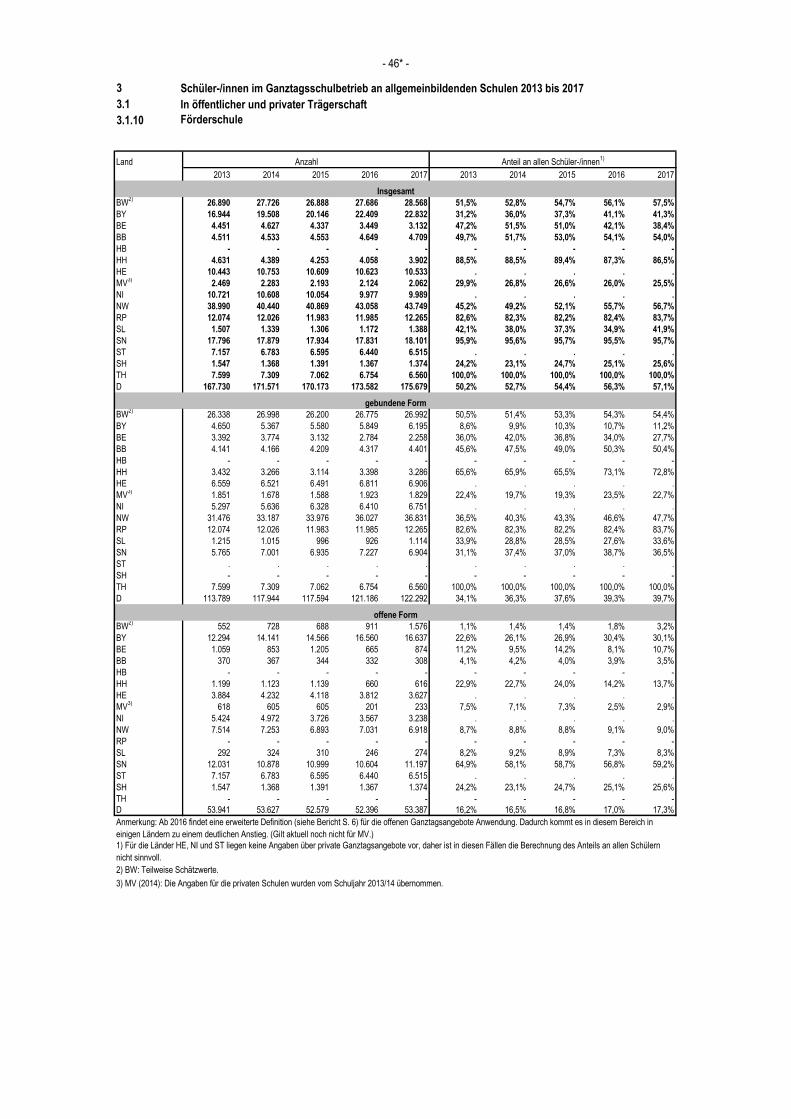
3 Schüler-/innen im Ganztagsschulbetrieb an allgemeinbildenden Schulen 2013 bis 2017
3.1 In öffentlicher und privater Trägerschaft
3.1.10 Förderschule
Land
2013 2014 2015 2016 2017 2013 2014 2015 2016 2017
BW2)
26.890 27.726 26.888 27.686 28.568 51,5% 52,8% 54,7% 56,1% 57,5%
BY 16.944 19.508 20.146 22.409 22.832 31,2% 36,0% 37,3% 41,1% 41,3%
BE 4.451 4.627 4.337 3.449 3.132 47,2% 51,5% 51,0% 42,1% 38,4%
BB 4.511 4.533 4.553 4.649 4.709 49,7% 51,7% 53,0% 54,1% 54,0%
HB - - - - - - - - - -
HH 4.631 4.389 4.253 4.058 3.902 88,5% 88,5% 89,4% 87,3% 86,5%
HE 10.443 10.753 10.609 10.623 10.533 . . . . .
MV3)
2.469 2.283 2.193 2.124 2.062 29,9% 26,8% 26,6% 26,0% 25,5%
NI 10.721 10.608 10.054 9.977 9.989 . . . . .
NW 38.990 40.440 40.869 43.058 43.749 45,2% 49,2% 52,1% 55,7% 56,7%
RP 12.074 12.026 11.983 11.985 12.265 82,6% 82,3% 82,2% 82,4% 83,7%
SL 1.507 1.339 1.306 1.172 1.388 42,1% 38,0% 37,3% 34,9% 41,9%
SN 17.796 17.879 17.934 17.831 18.101 95,9% 95,6% 95,7% 95,5% 95,7%
ST 7.157 6.783 6.595 6.440 6.515 . . . . .
SH 1.547 1.368 1.391 1.367 1.374 24,2% 23,1% 24,7% 25,1% 25,6%
TH 7.599 7.309 7.062 6.754 6.560 100,0% 100,0% 100,0% 100,0% 100,0%
D 167.730 171.571 170.173 173.582 175.679 50,2% 52,7% 54,4% 56,3% 57,1%
BW2)
26.338 26.998 26.200 26.775 26.992 50,5% 51,4% 53,3% 54,3% 54,4%
BY 4.650 5.367 5.580 5.849 6.195 8,6% 9,9% 10,3% 10,7% 11,2%
BE 3.392 3.774 3.132 2.784 2.258 36,0% 42,0% 36,8% 34,0% 27,7%
BB 4.141 4.166 4.209 4.317 4.401 45,6% 47,5% 49,0% 50,3% 50,4%
HB - - - - - - - - - -
HH 3.432 3.266 3.114 3.398 3.286 65,6% 65,9% 65,5% 73,1% 72,8%
HE 6.559 6.521 6.491 6.811 6.906 . . . . .
MV3)
1.851 1.678 1.588 1.923 1.829 22,4% 19,7% 19,3% 23,5% 22,7%
NI 5.297 5.636 6.328 6.410 6.751 . . . . .
NW 31.476 33.187 33.976 36.027 36.831 36,5% 40,3% 43,3% 46,6% 47,7%
RP 12.074 12.026 11.983 11.985 12.265 82,6% 82,3% 82,2% 82,4% 83,7%
SL 1.215 1.015 996 926 1.114 33,9% 28,8% 28,5% 27,6% 33,6%
SN 5.765 7.001 6.935 7.227 6.904 31,1% 37,4% 37,0% 38,7% 36,5%
ST . . . . . . . . . .
SH - - - - - - - - - -
TH 7.599 7.309 7.062 6.754 6.560 100,0% 100,0% 100,0% 100,0% 100,0%
D 113.789 117.944 117.594 121.186 122.292 34,1% 36,3% 37,6% 39,3% 39,7%
BW2)
552 728 688 911 1.576 1,1% 1,4% 1,4% 1,8% 3,2%
BY 12.294 14.141 14.566 16.560 16.637 22,6% 26,1% 26,9% 30,4% 30,1%
BE 1.059 853 1.205 665 874 11,2% 9,5% 14,2% 8,1% 10,7%
BB 370 367 344 332 308 4,1% 4,2% 4,0% 3,9% 3,5%
HB - - - - - - - - - -
HH 1.199 1.123 1.139 660 616 22,9% 22,7% 24,0% 14,2% 13,7%
HE 3.884 4.232 4.118 3.812 3.627 . . . . .
MV3)
618 605 605 201 233 7,5% 7,1% 7,3% 2,5% 2,9%
NI 5.424 4.972 3.726 3.567 3.238 . . . . .
NW 7.514 7.253 6.893 7.031 6.918 8,7% 8,8% 8,8% 9,1% 9,0%
RP - - - - - - - - - -
SL 292 324 310 246 274 8,2% 9,2% 8,9% 7,3% 8,3%
SN 12.031 10.878 10.999 10.604 11.197 64,9% 58,1% 58,7% 56,8% 59,2%
ST 7.157 6.783 6.595 6.440 6.515 . . . . .
SH 1.547 1.368 1.391 1.367 1.374 24,2% 23,1% 24,7% 25,1% 25,6%
TH - - - - - - - - - -
D 53.941 53.627 52.579 52.396 53.387 16,2% 16,5% 16,8% 17,0% 17,3%
3) MV (2014): Die Angaben für die privaten Schulen wurden vom Schuljahr 2013/14 übernommen.
2) BW: Teilweise Schätzwerte.
- 46* -
Anteil an allen Schüler-/innen1)
Anzahl
Insgesamt
gebundene Form
offene Form
Anmerkung: Ab 2016 findet eine erweiterte Definition (siehe Bericht S. 6) für die offenen Ganztagsangebote Anwendung. Dadurch kommt es in diesem Bereich in
einigen Ländern zu einem deutlichen Anstieg. (Gilt aktuell noch nicht für MV.)
1) Für die Länder HE, NI und ST liegen keine Angaben über private Ganztagsangebote vor, daher ist in diesen Fällen die Berechnung des Anteils an allen Schülern
nicht sinnvoll.
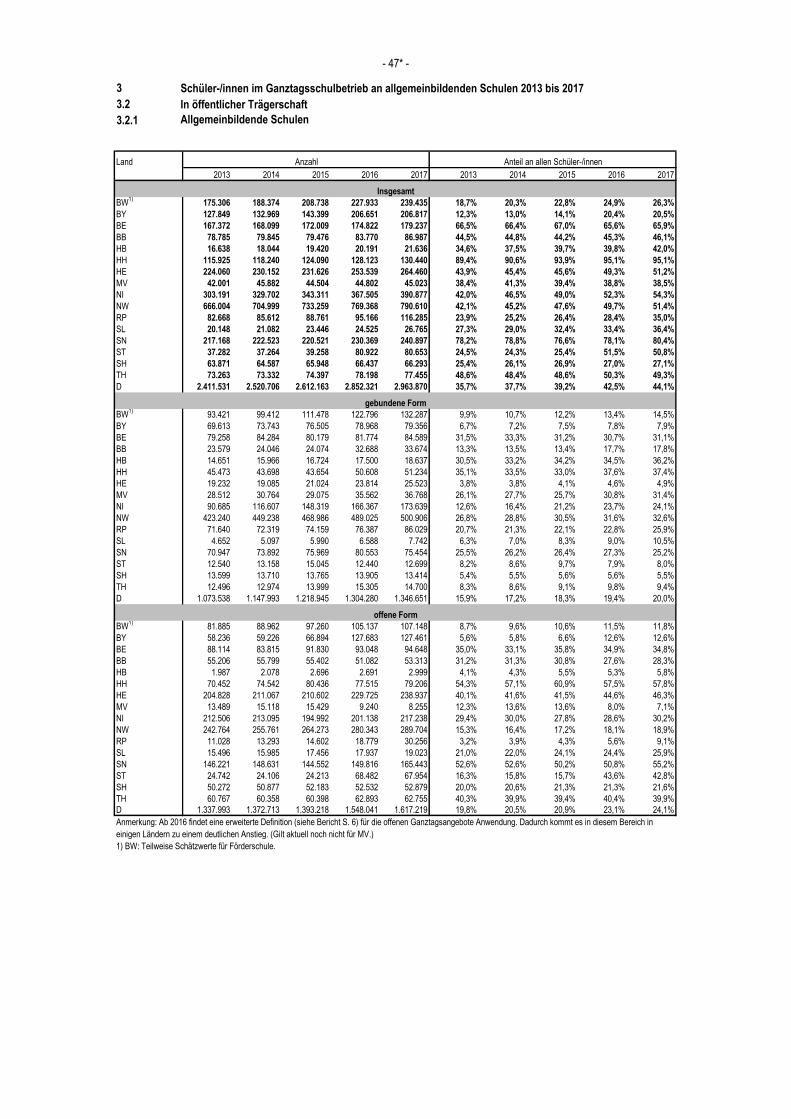
3 Schüler-/innen im Ganztagsschulbetrieb an allgemeinbildenden Schulen 2013 bis 2017
3.2 In öffentlicher Trägerschaft
3.2.1 Allgemeinbildende Schulen
Land
2013 2014 2015 2016 2017 2013 2014 2015 2016 2017
BW1)
175.306 188.374 208.738 227.933 239.435 18,7% 20,3% 22,8% 24,9% 26,3%
BY 127.849 132.969 143.399 206.651 206.817 12,3% 13,0% 14,1% 20,4% 20,5%
BE 167.372 168.099 172.009 174.822 179.237 66,5% 66,4% 67,0% 65,6% 65,9%
BB 78.785 79.845 79.476 83.770 86.987 44,5% 44,8% 44,2% 45,3% 46,1%
HB 16.638 18.044 19.420 20.191 21.636 34,6% 37,5% 39,7% 39,8% 42,0%
HH 115.925 118.240 124.090 128.123 130.440 89,4% 90,6% 93,9% 95,1% 95,1%
HE 224.060 230.152 231.626 253.539 264.460 43,9% 45,4% 45,6% 49,3% 51,2%
MV 42.001 45.882 44.504 44.802 45.023 38,4% 41,3% 39,4% 38,8% 38,5%
NI 303.191 329.702 343.311 367.505 390.877 42,0% 46,5% 49,0% 52,3% 54,3%
NW 666.004 704.999 733.259 769.368 790.610 42,1% 45,2% 47,6% 49,7% 51,4%
RP 82.668 85.612 88.761 95.166 116.285 23,9% 25,2% 26,4% 28,4% 35,0%
SL 20.148 21.082 23.446 24.525 26.765 27,3% 29,0% 32,4% 33,4% 36,4%
SN 217.168 222.523 220.521 230.369 240.897 78,2% 78,8% 76,6% 78,1% 80,4%
ST 37.282 37.264 39.258 80.922 80.653 24,5% 24,3% 25,4% 51,5% 50,8%
SH 63.871 64.587 65.948 66.437 66.293 25,4% 26,1% 26,9% 27,0% 27,1%
TH 73.263 73.332 74.397 78.198 77.455 48,6% 48,4% 48,6% 50,3% 49,3%
D 2.411.531 2.520.706 2.612.163 2.852.321 2.963.870 35,7% 37,7% 39,2% 42,5% 44,1%
BW1)
93.421 99.412 111.478 122.796 132.287 9,9% 10,7% 12,2% 13,4% 14,5%
BY 69.613 73.743 76.505 78.968 79.356 6,7% 7,2% 7,5% 7,8% 7,9%
BE 79.258 84.284 80.179 81.774 84.589 31,5% 33,3% 31,2% 30,7% 31,1%
BB 23.579 24.046 24.074 32.688 33.674 13,3% 13,5% 13,4% 17,7% 17,8%
HB 14.651 15.966 16.724 17.500 18.637 30,5% 33,2% 34,2% 34,5% 36,2%
HH 45.473 43.698 43.654 50.608 51.234 35,1% 33,5% 33,0% 37,6% 37,4%
HE 19.232 19.085 21.024 23.814 25.523 3,8% 3,8% 4,1% 4,6% 4,9%
MV 28.512 30.764 29.075 35.562 36.768 26,1% 27,7% 25,7% 30,8% 31,4%
NI 90.685 116.607 148.319 166.367 173.639 12,6% 16,4% 21,2% 23,7% 24,1%
NW 423.240 449.238 468.986 489.025 500.906 26,8% 28,8% 30,5% 31,6% 32,6%
RP 71.640 72.319 74.159 76.387 86.029 20,7% 21,3% 22,1% 22,8% 25,9%
SL 4.652 5.097 5.990 6.588 7.742 6,3% 7,0% 8,3% 9,0% 10,5%
SN 70.947 73.892 75.969 80.553 75.454 25,5% 26,2% 26,4% 27,3% 25,2%
ST 12.540 13.158 15.045 12.440 12.699 8,2% 8,6% 9,7% 7,9% 8,0%
SH 13.599 13.710 13.765 13.905 13.414 5,4% 5,5% 5,6% 5,6% 5,5%
TH 12.496 12.974 13.999 15.305 14.700 8,3% 8,6% 9,1% 9,8% 9,4%
D 1.073.538 1.147.993 1.218.945 1.304.280 1.346.651 15,9% 17,2% 18,3% 19,4% 20,0%
BW1)
81.885 88.962 97.260 105.137 107.148 8,7% 9,6% 10,6% 11,5% 11,8%
BY 58.236 59.226 66.894 127.683 127.461 5,6% 5,8% 6,6% 12,6% 12,6%
BE 88.114 83.815 91.830 93.048 94.648 35,0% 33,1% 35,8% 34,9% 34,8%
BB 55.206 55.799 55.402 51.082 53.313 31,2% 31,3% 30,8% 27,6% 28,3%
HB 1.987 2.078 2.696 2.691 2.999 4,1% 4,3% 5,5% 5,3% 5,8%
HH 70.452 74.542 80.436 77.515 79.206 54,3% 57,1% 60,9% 57,5% 57,8%
HE 204.828 211.067 210.602 229.725 238.937 40,1% 41,6% 41,5% 44,6% 46,3%
MV 13.489 15.118 15.429 9.240 8.255 12,3% 13,6% 13,6% 8,0% 7,1%
NI 212.506 213.095 194.992 201.138 217.238 29,4% 30,0% 27,8% 28,6% 30,2%
NW 242.764 255.761 264.273 280.343 289.704 15,3% 16,4% 17,2% 18,1% 18,9%
RP 11.028 13.293 14.602 18.779 30.256 3,2% 3,9% 4,3% 5,6% 9,1%
SL 15.496 15.985 17.456 17.937 19.023 21,0% 22,0% 24,1% 24,4% 25,9%
SN 146.221 148.631 144.552 149.816 165.443 52,6% 52,6% 50,2% 50,8% 55,2%
ST 24.742 24.106 24.213 68.482 67.954 16,3% 15,8% 15,7% 43,6% 42,8%
SH 50.272 50.877 52.183 52.532 52.879 20,0% 20,6% 21,3% 21,3% 21,6%
TH 60.767 60.358 60.398 62.893 62.755 40,3% 39,9% 39,4% 40,4% 39,9%
D 1.337.993 1.372.713 1.393.218 1.548.041 1.617.219 19,8% 20,5% 20,9% 23,1% 24,1%
1) BW: Teilweise Schätzwerte für Förderschule.
Anzahl Anteil an allen Schüler-/innen
- 47* -
Insgesamt
gebundene Form
offene Form
Anmerkung: Ab 2016 findet eine erweiterte Definition (siehe Bericht S. 6) für die offenen Ganztagsangebote Anwendung. Dadurch kommt es in diesem Bereich in
einigen Ländern zu einem deutlichen Anstieg. (Gilt aktuell noch nicht für MV.)
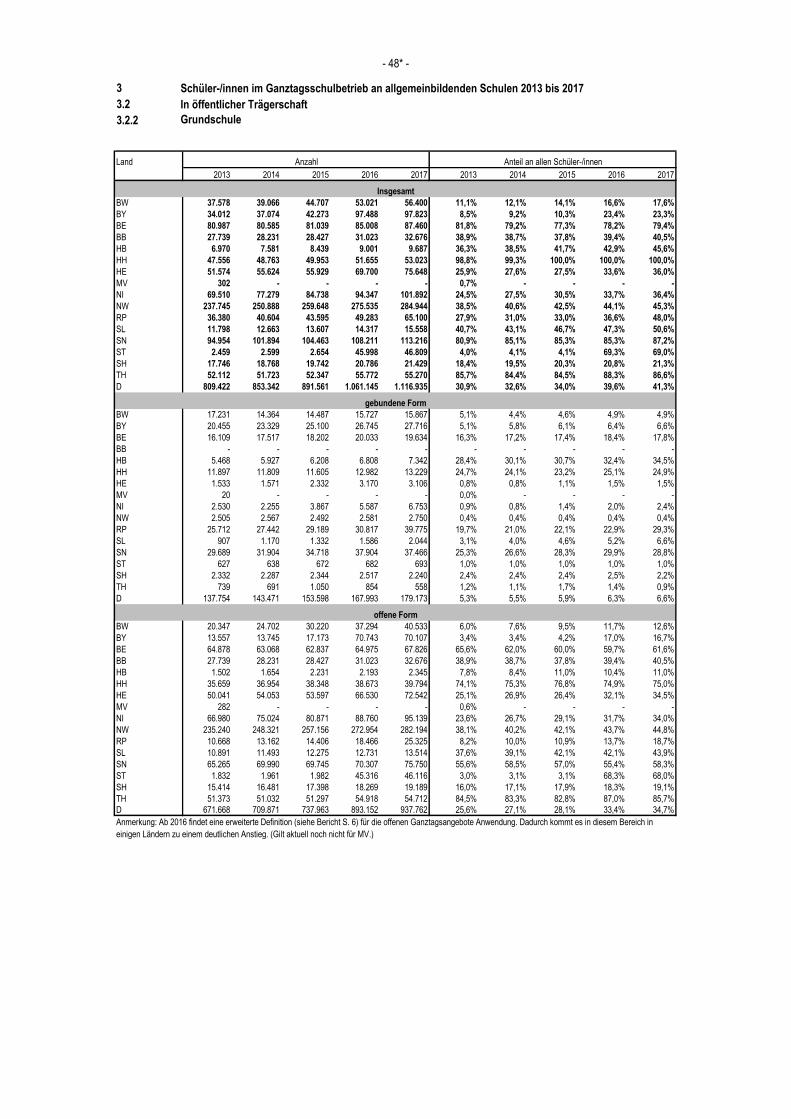
3 Schüler-/innen im Ganztagsschulbetrieb an allgemeinbildenden Schulen 2013 bis 2017
3.2 In öffentlicher Trägerschaft
3.2.2 Grundschule
Land
2013 2014 2015 2016 2017 2013 2014 2015 2016 2017
BW 37.578 39.066 44.707 53.021 56.400 11,1% 12,1% 14,1% 16,6% 17,6%
BY 34.012 37.074 42.273 97.488 97.823 8,5% 9,2% 10,3% 23,4% 23,3%
BE 80.987 80.585 81.039 85.008 87.460 81,8% 79,2% 77,3% 78,2% 79,4%
BB 27.739 28.231 28.427 31.023 32.676 38,9% 38,7% 37,8% 39,4% 40,5%
HB 6.970 7.581 8.439 9.001 9.687 36,3% 38,5% 41,7% 42,9% 45,6%
HH 47.556 48.763 49.953 51.655 53.023 98,8% 99,3% 100,0% 100,0% 100,0%
HE 51.574 55.624 55.929 69.700 75.648 25,9% 27,6% 27,5% 33,6% 36,0%
MV 302 - - - - 0,7% - - - -
NI 69.510 77.279 84.738 94.347 101.892 24,5% 27,5% 30,5% 33,7% 36,4%
NW 237.745 250.888 259.648 275.535 284.944 38,5% 40,6% 42,5% 44,1% 45,3%
RP 36.380 40.604 43.595 49.283 65.100 27,9% 31,0% 33,0% 36,6% 48,0%
SL 11.798 12.663 13.607 14.317 15.558 40,7% 43,1% 46,7% 47,3% 50,6%
SN 94.954 101.894 104.463 108.211 113.216 80,9% 85,1% 85,3% 85,3% 87,2%
ST 2.459 2.599 2.654 45.998 46.809 4,0% 4,1% 4,1% 69,3% 69,0%
SH 17.746 18.768 19.742 20.786 21.429 18,4% 19,5% 20,3% 20,8% 21,3%
TH 52.112 51.723 52.347 55.772 55.270 85,7% 84,4% 84,5% 88,3% 86,6%
D 809.422 853.342 891.561 1.061.145 1.116.935 30,9% 32,6% 34,0% 39,6% 41,3%
BW 17.231 14.364 14.487 15.727 15.867 5,1% 4,4% 4,6% 4,9% 4,9%
BY 20.455 23.329 25.100 26.745 27.716 5,1% 5,8% 6,1% 6,4% 6,6%
BE 16.109 17.517 18.202 20.033 19.634 16,3% 17,2% 17,4% 18,4% 17,8%
BB - - - - - - - - - -
HB 5.468 5.927 6.208 6.808 7.342 28,4% 30,1% 30,7% 32,4% 34,5%
HH 11.897 11.809 11.605 12.982 13.229 24,7% 24,1% 23,2% 25,1% 24,9%
HE 1.533 1.571 2.332 3.170 3.106 0,8% 0,8% 1,1% 1,5% 1,5%
MV 20 - - - - 0,0% - - - -
NI 2.530 2.255 3.867 5.587 6.753 0,9% 0,8% 1,4% 2,0% 2,4%
NW 2.505 2.567 2.492 2.581 2.750 0,4% 0,4% 0,4% 0,4% 0,4%
RP 25.712 27.442 29.189 30.817 39.775 19,7% 21,0% 22,1% 22,9% 29,3%
SL 907 1.170 1.332 1.586 2.044 3,1% 4,0% 4,6% 5,2% 6,6%
SN 29.689 31.904 34.718 37.904 37.466 25,3% 26,6% 28,3% 29,9% 28,8%
ST 627 638 672 682 693 1,0% 1,0% 1,0% 1,0% 1,0%
SH 2.332 2.287 2.344 2.517 2.240 2,4% 2,4% 2,4% 2,5% 2,2%
TH 739 691 1.050 854 558 1,2% 1,1% 1,7% 1,4% 0,9%
D 137.754 143.471 153.598 167.993 179.173 5,3% 5,5% 5,9% 6,3% 6,6%
BW 20.347 24.702 30.220 37.294 40.533 6,0% 7,6% 9,5% 11,7% 12,6%
BY 13.557 13.745 17.173 70.743 70.107 3,4% 3,4% 4,2% 17,0% 16,7%
BE 64.878 63.068 62.837 64.975 67.826 65,6% 62,0% 60,0% 59,7% 61,6%
BB 27.739 28.231 28.427 31.023 32.676 38,9% 38,7% 37,8% 39,4% 40,5%
HB 1.502 1.654 2.231 2.193 2.345 7,8% 8,4% 11,0% 10,4% 11,0%
HH 35.659 36.954 38.348 38.673 39.794 74,1% 75,3% 76,8% 74,9% 75,0%
HE 50.041 54.053 53.597 66.530 72.542 25,1% 26,9% 26,4% 32,1% 34,5%
MV 282 - - - - 0,6% - - - -
NI 66.980 75.024 80.871 88.760 95.139 23,6% 26,7% 29,1% 31,7% 34,0%
NW 235.240 248.321 257.156 272.954 282.194 38,1% 40,2% 42,1% 43,7% 44,8%
RP 10.668 13.162 14.406 18.466 25.325 8,2% 10,0% 10,9% 13,7% 18,7%
SL 10.891 11.493 12.275 12.731 13.514 37,6% 39,1% 42,1% 42,1% 43,9%
SN 65.265 69.990 69.745 70.307 75.750 55,6% 58,5% 57,0% 55,4% 58,3%
ST 1.832 1.961 1.982 45.316 46.116 3,0% 3,1% 3,1% 68,3% 68,0%
SH 15.414 16.481 17.398 18.269 19.189 16,0% 17,1% 17,9% 18,3% 19,1%
TH 51.373 51.032 51.297 54.918 54.712 84,5% 83,3% 82,8% 87,0% 85,7%
D 671.668 709.871 737.963 893.152 937.762 25,6% 27,1% 28,1% 33,4% 34,7%
Anzahl Anteil an allen Schüler-/innen
- 48* -
Insgesamt
gebundene Form
offene Form
Anmerkung: Ab 2016 findet eine erweiterte Definition (siehe Bericht S. 6) für die offenen Ganztagsangebote Anwendung. Dadurch kommt es in diesem Bereich in
einigen Ländern zu einem deutlichen Anstieg. (Gilt aktuell noch nicht für MV.)
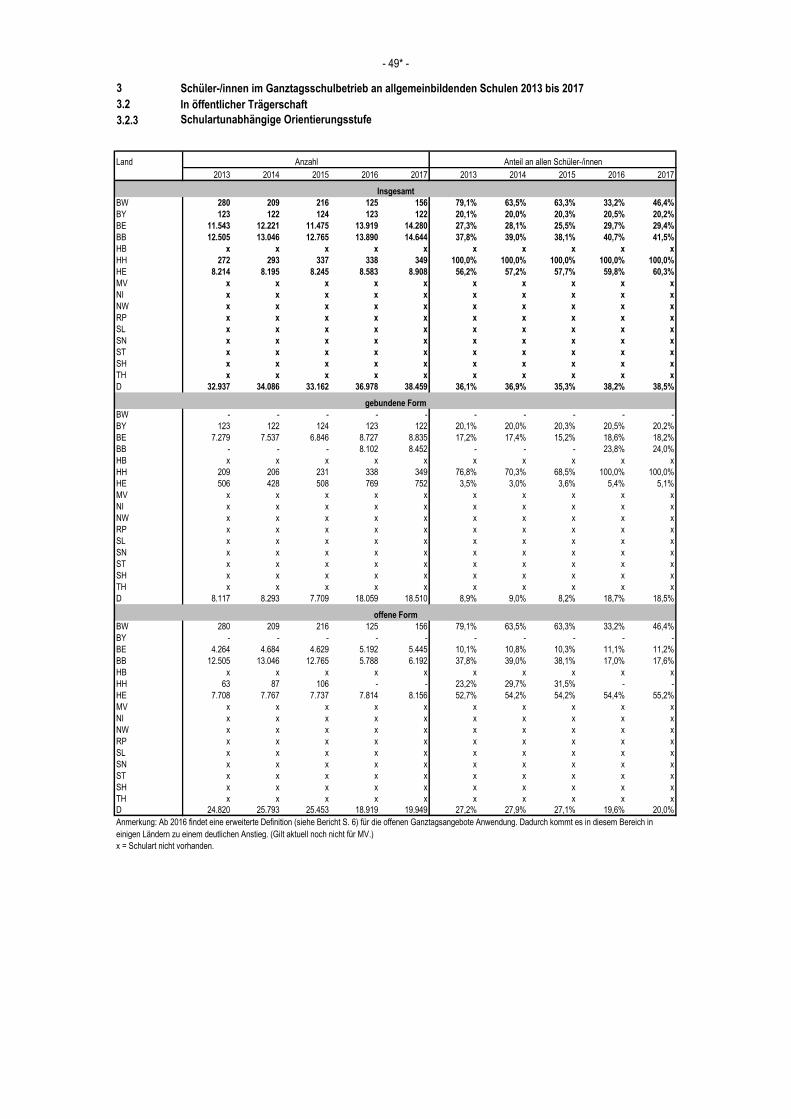
3 Schüler-/innen im Ganztagsschulbetrieb an allgemeinbildenden Schulen 2013 bis 2017
3.2 In öffentlicher Trägerschaft
3.2.3 Schulartunabhängige Orientierungsstufe
Land
2013 2014 2015 2016 2017 2013 2014 2015 2016 2017
BW 280 209 216 125 156 79,1% 63,5% 63,3% 33,2% 46,4%
BY 123 122 124 123 122 20,1% 20,0% 20,3% 20,5% 20,2%
BE 11.543 12.221 11.475 13.919 14.280 27,3% 28,1% 25,5% 29,7% 29,4%
BB 12.505 13.046 12.765 13.890 14.644 37,8% 39,0% 38,1% 40,7% 41,5%
HB x x x x x x x x x x
HH 272 293 337 338 349 100,0% 100,0% 100,0% 100,0% 100,0%
HE 8.214 8.195 8.245 8.583 8.908 56,2% 57,2% 57,7% 59,8% 60,3%
MV x x x x x x x x x x
NI x x x x x x x x x x
NW x x x x x x x x x x
RP x x x x x x x x x x
SL x x x x x x x x x x
SN x x x x x x x x x x
ST x x x x x x x x x x
SH x x x x x x x x x x
TH x x x x x x x x x x
D 32.937 34.086 33.162 36.978 38.459 36,1% 36,9% 35,3% 38,2% 38,5%
BW - - - - - - - - - -
BY 123 122 124 123 122 20,1% 20,0% 20,3% 20,5% 20,2%
BE 7.279 7.537 6.846 8.727 8.835 17,2% 17,4% 15,2% 18,6% 18,2%
BB - - - 8.102 8.452 - - - 23,8% 24,0%
HB x x x x x x x x x x
HH 209 206 231 338 349 76,8% 70,3% 68,5% 100,0% 100,0%
HE 506 428 508 769 752 3,5% 3,0% 3,6% 5,4% 5,1%
MV x x x x x x x x x x
NI x x x x x x x x x x
NW x x x x x x x x x x
RP x x x x x x x x x x
SL x x x x x x x x x x
SN x x x x x x x x x x
ST x x x x x x x x x x
SH x x x x x x x x x x
TH x x x x x x x x x x
D 8.117 8.293 7.709 18.059 18.510 8,9% 9,0% 8,2% 18,7% 18,5%
BW 280 209 216 125 156 79,1% 63,5% 63,3% 33,2% 46,4%
BY - - - - - - - - - -
BE 4.264 4.684 4.629 5.192 5.445 10,1% 10,8% 10,3% 11,1% 11,2%
BB 12.505 13.046 12.765 5.788 6.192 37,8% 39,0% 38,1% 17,0% 17,6%
HB x x x x x x x x x x
HH 63 87 106 - - 23,2% 29,7% 31,5% - -
HE 7.708 7.767 7.737 7.814 8.156 52,7% 54,2% 54,2% 54,4% 55,2%
MV x x x x x x x x x x
NI x x x x x x x x x x
NW x x x x x x x x x x
RP x x x x x x x x x x
SL x x x x x x x x x x
SN x x x x x x x x x x
ST x x x x x x x x x x
SH x x x x x x x x x x
TH x x x x x x x x x x
D 24.820 25.793 25.453 18.919 19.949 27,2% 27,9% 27,1% 19,6% 20,0%
x = Schulart nicht vorhanden.
Anzahl Anteil an allen Schüler-/innen
- 49* -
Insgesamt
gebundene Form
offene Form
Anmerkung: Ab 2016 findet eine erweiterte Definition (siehe Bericht S. 6) für die offenen Ganztagsangebote Anwendung. Dadurch kommt es in diesem Bereich in
einigen Ländern zu einem deutlichen Anstieg. (Gilt aktuell noch nicht für MV.)
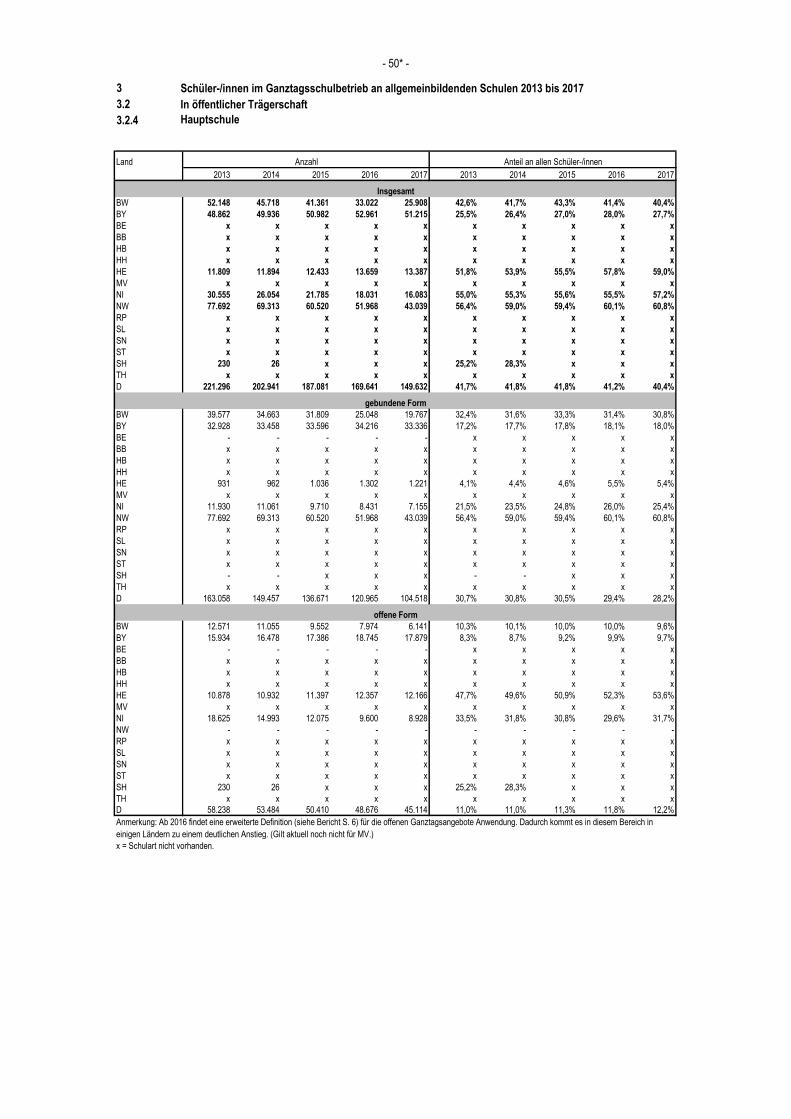
3 Schüler-/innen im Ganztagsschulbetrieb an allgemeinbildenden Schulen 2013 bis 2017
3.2 In öffentlicher Trägerschaft
3.2.4 Hauptschule
Land
2013 2014 2015 2016 2017 2013 2014 2015 2016 2017
BW 52.148 45.718 41.361 33.022 25.908 42,6% 41,7% 43,3% 41,4% 40,4%
BY 48.862 49.936 50.982 52.961 51.215 25,5% 26,4% 27,0% 28,0% 27,7%
BE x x x x x x x x x x
BB x x x x x x x x x x
HB x x x x x x x x x x
HH x x x x x x x x x x
HE 11.809 11.894 12.433 13.659 13.387 51,8% 53,9% 55,5% 57,8% 59,0%
MV x x x x x x x x x x
NI 30.555 26.054 21.785 18.031 16.083 55,0% 55,3% 55,6% 55,5% 57,2%
NW 77.692 69.313 60.520 51.968 43.039 56,4% 59,0% 59,4% 60,1% 60,8%
RP x x x x x x x x x x
SL x x x x x x x x x x
SN x x x x x x x x x x
ST x x x x x x x x x x
SH 230 26 x x x 25,2% 28,3% x x x
TH x x x x x x x x x x
D 221.296 202.941 187.081 169.641 149.632 41,7% 41,8% 41,8% 41,2% 40,4%
BW 39.577 34.663 31.809 25.048 19.767 32,4% 31,6% 33,3% 31,4% 30,8%
BY 32.928 33.458 33.596 34.216 33.336 17,2% 17,7% 17,8% 18,1% 18,0%
BE - - - - - x x x x x
BB x x x x x x x x x x
HB x x x x x x x x x x
HH x x x x x x x x x x
HE 931 962 1.036 1.302 1.221 4,1% 4,4% 4,6% 5,5% 5,4%
MV x x x x x x x x x x
NI 11.930 11.061 9.710 8.431 7.155 21,5% 23,5% 24,8% 26,0% 25,4%
NW 77.692 69.313 60.520 51.968 43.039 56,4% 59,0% 59,4% 60,1% 60,8%
RP x x x x x x x x x x
SL x x x x x x x x x x
SN x x x x x x x x x x
ST x x x x x x x x x x
SH - - x x x - - x x x
TH x x x x x x x x x x
D 163.058 149.457 136.671 120.965 104.518 30,7% 30,8% 30,5% 29,4% 28,2%
BW 12.571 11.055 9.552 7.974 6.141 10,3% 10,1% 10,0% 10,0% 9,6%
BY 15.934 16.478 17.386 18.745 17.879 8,3% 8,7% 9,2% 9,9% 9,7%
BE - - - - - x x x x x
BB x x x x x x x x x x
HB x x x x x x x x x x
HH x x x x x x x x x x
HE 10.878 10.932 11.397 12.357 12.166 47,7% 49,6% 50,9% 52,3% 53,6%
MV x x x x x x x x x x
NI 18.625 14.993 12.075 9.600 8.928 33,5% 31,8% 30,8% 29,6% 31,7%
NW - - - - - - - - - -
RP x x x x x x x x x x
SL x x x x x x x x x x
SN x x x x x x x x x x
ST x x x x x x x x x x
SH 230 26 x x x 25,2% 28,3% x x x
TH x x x x x x x x x x
D 58.238 53.484 50.410 48.676 45.114 11,0% 11,0% 11,3% 11,8% 12,2%
x = Schulart nicht vorhanden.
Anzahl Anteil an allen Schüler-/innen
- 50* -
Insgesamt
gebundene Form
offene Form
Anmerkung: Ab 2016 findet eine erweiterte Definition (siehe Bericht S. 6) für die offenen Ganztagsangebote Anwendung. Dadurch kommt es in diesem Bereich in
einigen Ländern zu einem deutlichen Anstieg. (Gilt aktuell noch nicht für MV.)
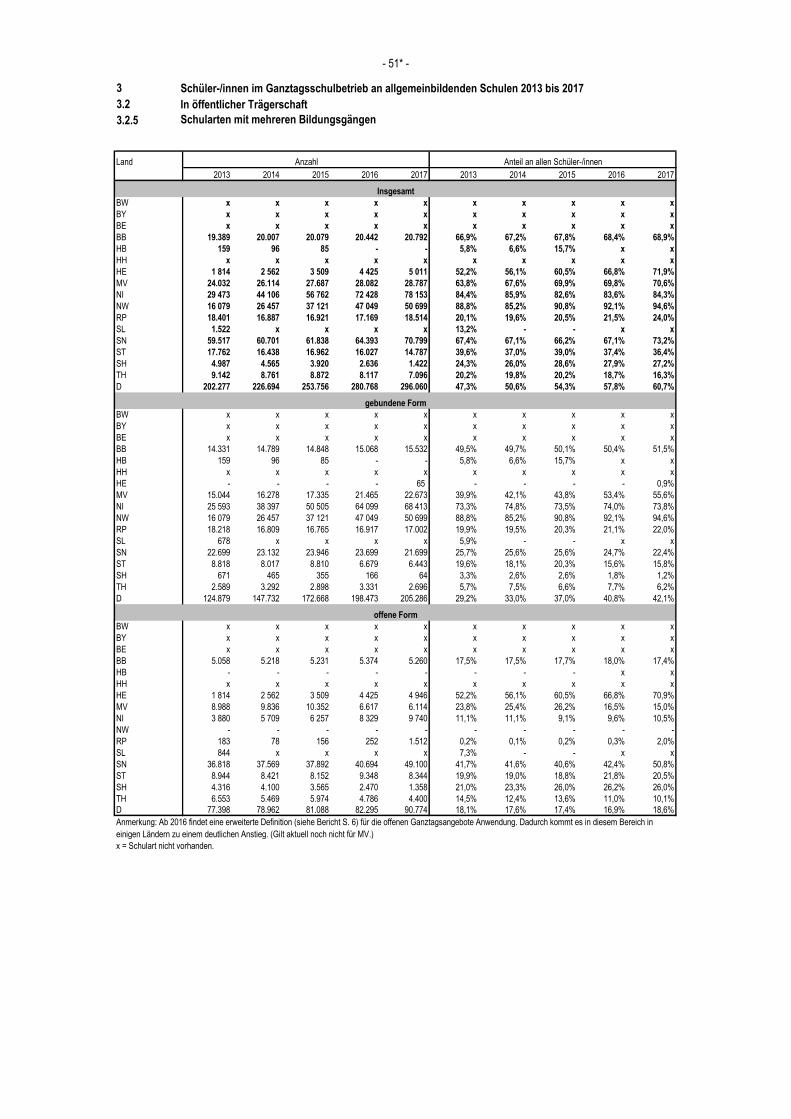
3 Schüler-/innen im Ganztagsschulbetrieb an allgemeinbildenden Schulen 2013 bis 2017
3.2 In öffentlicher Trägerschaft
3.2.5 Schularten mit mehreren Bildungsgängen
Land
2013 2014 2015 2016 2017 2013 2014 2015 2016 2017
BW x x x x x x x x x x
BY x x x x x x x x x x
BE x x x x x x x x x x
BB 19.389 20.007 20.079 20.442 20.792 66,9% 67,2% 67,8% 68,4% 68,9%
HB 159 96 85 - - 5,8% 6,6% 15,7% x x
HH x x x x x x x x x x
HE 1 814 2 562 3 509 4 425 5 011 52,2% 56,1% 60,5% 66,8% 71,9%
MV 24.032 26.114 27.687 28.082 28.787 63,8% 67,6% 69,9% 69,8% 70,6%
NI 29 473 44 106 56 762 72 428 78 153 84,4% 85,9% 82,6% 83,6% 84,3%
NW 16 079 26 457 37 121 47 049 50 699 88,8% 85,2% 90,8% 92,1% 94,6%
RP 18.401 16.887 16.921 17.169 18.514 20,1% 19,6% 20,5% 21,5% 24,0%
SL 1.522 x x x x 13,2% - - x x
SN 59.517 60.701 61.838 64.393 70.799 67,4% 67,1% 66,2% 67,1% 73,2%
ST 17.762 16.438 16.962 16.027 14.787 39,6% 37,0% 39,0% 37,4% 36,4%
SH 4.987 4.565 3.920 2.636 1.422 24,3% 26,0% 28,6% 27,9% 27,2%
TH 9.142 8.761 8.872 8.117 7.096 20,2% 19,8% 20,2% 18,7% 16,3%
D 202.277 226.694 253.756 280.768 296.060 47,3% 50,6% 54,3% 57,8% 60,7%
BW x x x x x x x x x x
BY x x x x x x x x x x
BE x x x x x x x x x x
BB 14.331 14.789 14.848 15.068 15.532 49,5% 49,7% 50,1% 50,4% 51,5%
HB 159 96 85 - - 5,8% 6,6% 15,7% x x
HH x x x x x x x x x x
HE - - - - 65 - - - - 0,9%
MV 15.044 16.278 17.335 21.465 22.673 39,9% 42,1% 43,8% 53,4% 55,6%
NI 25 593 38 397 50 505 64 099 68 413 73,3% 74,8% 73,5% 74,0% 73,8%
NW 16 079 26 457 37 121 47 049 50 699 88,8% 85,2% 90,8% 92,1% 94,6%
RP 18.218 16.809 16.765 16.917 17.002 19,9% 19,5% 20,3% 21,1% 22,0%
SL 678 x x x x 5,9% - - x x
SN 22.699 23.132 23.946 23.699 21.699 25,7% 25,6% 25,6% 24,7% 22,4%
ST 8.818 8.017 8.810 6.679 6.443 19,6% 18,1% 20,3% 15,6% 15,8%
SH 671 465 355 166 64 3,3% 2,6% 2,6% 1,8% 1,2%
TH 2.589 3.292 2.898 3.331 2.696 5,7% 7,5% 6,6% 7,7% 6,2%
D 124.879 147.732 172.668 198.473 205.286 29,2% 33,0% 37,0% 40,8% 42,1%
BW x x x x x x x x x x
BY x x x x x x x x x x
BE x x x x x x x x x x
BB 5.058 5.218 5.231 5.374 5.260 17,5% 17,5% 17,7% 18,0% 17,4%
HB - - - - - - - - x x
HH x x x x x x x x x x
HE 1 814 2 562 3 509 4 425 4 946 52,2% 56,1% 60,5% 66,8% 70,9%
MV 8.988 9.836 10.352 6.617 6.114 23,8% 25,4% 26,2% 16,5% 15,0%
NI 3 880 5 709 6 257 8 329 9 740 11,1% 11,1% 9,1% 9,6% 10,5%
NW - - - - - - - - - -
RP 183 78 156 252 1.512 0,2% 0,1% 0,2% 0,3% 2,0%
SL 844 x x x x 7,3% - - x x
SN 36.818 37.569 37.892 40.694 49.100 41,7% 41,6% 40,6% 42,4% 50,8%
ST 8.944 8.421 8.152 9.348 8.344 19,9% 19,0% 18,8% 21,8% 20,5%
SH 4.316 4.100 3.565 2.470 1.358 21,0% 23,3% 26,0% 26,2% 26,0%
TH 6.553 5.469 5.974 4.786 4.400 14,5% 12,4% 13,6% 11,0% 10,1%
D 77.398 78.962 81.088 82.295 90.774 18,1% 17,6% 17,4% 16,9% 18,6%
Anzahl Anteil an allen Schüler-/innen
- 51* -
Insgesamt
gebundene Form
offene Form
x = Schulart nicht vorhanden.
Anmerkung: Ab 2016 findet eine erweiterte Definition (siehe Bericht S. 6) für die offenen Ganztagsangebote Anwendung. Dadurch kommt es in diesem Bereich in
einigen Ländern zu einem deutlichen Anstieg. (Gilt aktuell noch nicht für MV.)
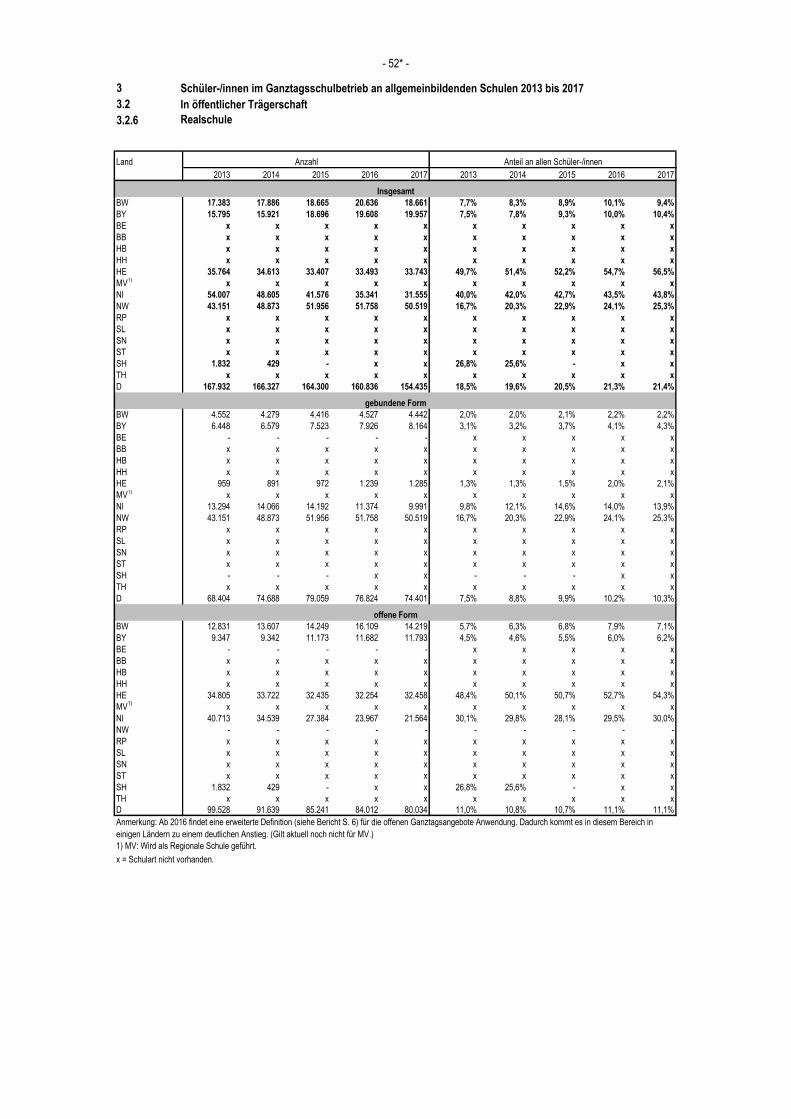
3 Schüler-/innen im Ganztagsschulbetrieb an allgemeinbildenden Schulen 2013 bis 2017
3.2 In öffentlicher Trägerschaft
3.2.6 Realschule
Land
2013 2014 2015 2016 2017 2013 2014 2015 2016 2017
BW 17.383 17.886 18.665 20.636 18.661 7,7% 8,3% 8,9% 10,1% 9,4%
BY 15.795 15.921 18.696 19.608 19.957 7,5% 7,8% 9,3% 10,0% 10,4%
BE x x x x x x x x x x
BB x x x x x x x x x x
HB x x x x x x x x x x
HH x x x x x x x x x x
HE 35.764 34.613 33.407 33.493 33.743 49,7% 51,4% 52,2% 54,7% 56,5%
MV1)
x x x x x x x x x x
NI 54.007 48.605 41.576 35.341 31.555 40,0% 42,0% 42,7% 43,5% 43,8%
NW 43.151 48.873 51.956 51.758 50.519 16,7% 20,3% 22,9% 24,1% 25,3%
RP x x x x x x x x x x
SL x x x x x x x x x x
SN x x x x x x x x x x
ST x x x x x x x x x x
SH 1.832 429 - x x 26,8% 25,6% - x x
TH x x x x x x x x x x
D 167.932 166.327 164.300 160.836 154.435 18,5% 19,6% 20,5% 21,3% 21,4%
BW 4.552 4.279 4.416 4.527 4.442 2,0% 2,0% 2,1% 2,2% 2,2%
BY 6.448 6.579 7.523 7.926 8.164 3,1% 3,2% 3,7% 4,1% 4,3%
BE - - - - - x x x x x
BB x x x x x x x x x x
HB x x x x x x x x x x
HH x x x x x x x x x x
HE 959 891 972 1.239 1.285 1,3% 1,3% 1,5% 2,0% 2,1%
MV1)
x x x x x x x x x x
NI 13.294 14.066 14.192 11.374 9.991 9,8% 12,1% 14,6% 14,0% 13,9%
NW 43.151 48.873 51.956 51.758 50.519 16,7% 20,3% 22,9% 24,1% 25,3%
RP x x x x x x x x x x
SL x x x x x x x x x x
SN x x x x x x x x x x
ST x x x x x x x x x x
SH - - - x x - - - x x
TH x x x x x x x x x x
D 68.404 74.688 79.059 76.824 74.401 7,5% 8,8% 9,9% 10,2% 10,3%
BW 12.831 13.607 14.249 16.109 14.219 5,7% 6,3% 6,8% 7,9% 7,1%
BY 9.347 9.342 11.173 11.682 11.793 4,5% 4,6% 5,5% 6,0% 6,2%
BE - - - - - x x x x x
BB x x x x x x x x x x
HB x x x x x x x x x x
HH x x x x x x x x x x
HE 34.805 33.722 32.435 32.254 32.458 48,4% 50,1% 50,7% 52,7% 54,3%
MV1)
x x x x x x x x x x
NI 40.713 34.539 27.384 23.967 21.564 30,1% 29,8% 28,1% 29,5% 30,0%
NW - - - - - - - - - -
RP x x x x x x x x x x
SL x x x x x x x x x x
SN x x x x x x x x x x
ST x x x x x x x x x x
SH 1.832 429 - x x 26,8% 25,6% - x x
TH x x x x x x x x x x
D 99.528 91.639 85.241 84.012 80.034 11,0% 10,8% 10,7% 11,1% 11,1%
x = Schulart nicht vorhanden.
1) MV: Wird als Regionale Schule geführt.
Anzahl Anteil an allen Schüler-/innen
- 52* -
Insgesamt
gebundene Form
offene Form
Anmerkung: Ab 2016 findet eine erweiterte Definition (siehe Bericht S. 6) für die offenen Ganztagsangebote Anwendung. Dadurch kommt es in diesem Bereich in
einigen Ländern zu einem deutlichen Anstieg. (Gilt aktuell noch nicht für MV.)
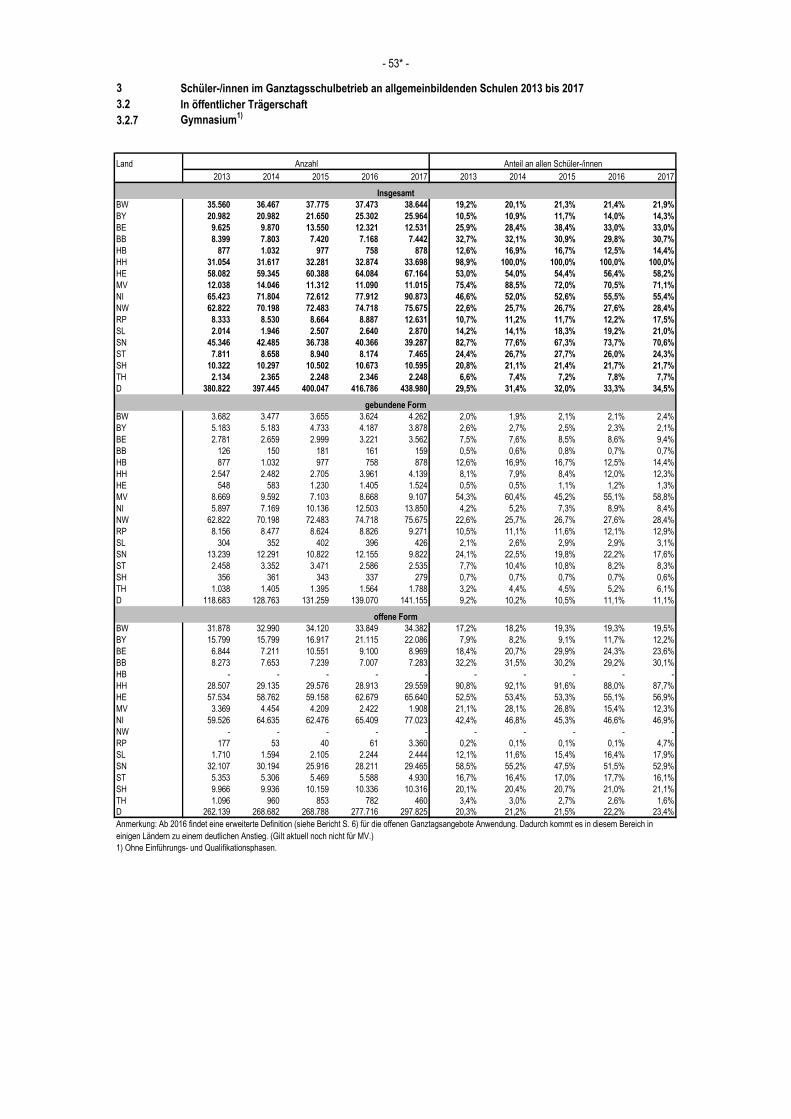
3 Schüler-/innen im Ganztagsschulbetrieb an allgemeinbildenden Schulen 2013 bis 2017
3.2 In öffentlicher Trägerschaft
3.2.7 Gymnasium1)
Land
2013 2014 2015 2016 2017 2013 2014 2015 2016 2017
BW 35.560 36.467 37.775 37.473 38.644 19,2% 20,1% 21,3% 21,4% 21,9%
BY 20.982 20.982 21.650 25.302 25.964 10,5% 10,9% 11,7% 14,0% 14,3%
BE 9.625 9.870 13.550 12.321 12.531 25,9% 28,4% 38,4% 33,0% 33,0%
BB 8.399 7.803 7.420 7.168 7.442 32,7% 32,1% 30,9% 29,8% 30,7%
HB 877 1.032 977 758 878 12,6% 16,9% 16,7% 12,5% 14,4%
HH 31.054 31.617 32.281 32.874 33.698 98,9% 100,0% 100,0% 100,0% 100,0%
HE 58.082 59.345 60.388 64.084 67.164 53,0% 54,0% 54,4% 56,4% 58,2%
MV 12.038 14.046 11.312 11.090 11.015 75,4% 88,5% 72,0% 70,5% 71,1%
NI 65.423 71.804 72.612 77.912 90.873 46,6% 52,0% 52,6% 55,5% 55,4%
NW 62.822 70.198 72.483 74.718 75.675 22,6% 25,7% 26,7% 27,6% 28,4%
RP 8.333 8.530 8.664 8.887 12.631 10,7% 11,2% 11,7% 12,2% 17,5%
SL 2.014 1.946 2.507 2.640 2.870 14,2% 14,1% 18,3% 19,2% 21,0%
SN 45.346 42.485 36.738 40.366 39.287 82,7% 77,6% 67,3% 73,7% 70,6%
ST 7.811 8.658 8.940 8.174 7.465 24,4% 26,7% 27,7% 26,0% 24,3%
SH 10.322 10.297 10.502 10.673 10.595 20,8% 21,1% 21,4% 21,7% 21,7%
TH 2.134 2.365 2.248 2.346 2.248 6,6% 7,4% 7,2% 7,8% 7,7%
D 380.822 397.445 400.047 416.786 438.980 29,5% 31,4% 32,0% 33,3% 34,5%
BW 3.682 3.477 3.655 3.624 4.262 2,0% 1,9% 2,1% 2,1% 2,4%
BY 5.183 5.183 4.733 4.187 3.878 2,6% 2,7% 2,5% 2,3% 2,1%
BE 2.781 2.659 2.999 3.221 3.562 7,5% 7,6% 8,5% 8,6% 9,4%
BB 126 150 181 161 159 0,5% 0,6% 0,8% 0,7% 0,7%
HB 877 1.032 977 758 878 12,6% 16,9% 16,7% 12,5% 14,4%
HH 2.547 2.482 2.705 3.961 4.139 8,1% 7,9% 8,4% 12,0% 12,3%
HE 548 583 1.230 1.405 1.524 0,5% 0,5% 1,1% 1,2% 1,3%
MV 8.669 9.592 7.103 8.668 9.107 54,3% 60,4% 45,2% 55,1% 58,8%
NI 5.897 7.169 10.136 12.503 13.850 4,2% 5,2% 7,3% 8,9% 8,4%
NW 62.822 70.198 72.483 74.718 75.675 22,6% 25,7% 26,7% 27,6% 28,4%
RP 8.156 8.477 8.624 8.826 9.271 10,5% 11,1% 11,6% 12,1% 12,9%
SL 304 352 402 396 426 2,1% 2,6% 2,9% 2,9% 3,1%
SN 13.239 12.291 10.822 12.155 9.822 24,1% 22,5% 19,8% 22,2% 17,6%
ST 2.458 3.352 3.471 2.586 2.535 7,7% 10,4% 10,8% 8,2% 8,3%
SH 356 361 343 337 279 0,7% 0,7% 0,7% 0,7% 0,6%
TH 1.038 1.405 1.395 1.564 1.788 3,2% 4,4% 4,5% 5,2% 6,1%
D 118.683 128.763 131.259 139.070 141.155 9,2% 10,2% 10,5% 11,1% 11,1%
BW 31.878 32.990 34.120 33.849 34.382 17,2% 18,2% 19,3% 19,3% 19,5%
BY 15.799 15.799 16.917 21.115 22.086 7,9% 8,2% 9,1% 11,7% 12,2%
BE 6.844 7.211 10.551 9.100 8.969 18,4% 20,7% 29,9% 24,3% 23,6%
BB 8.273 7.653 7.239 7.007 7.283 32,2% 31,5% 30,2% 29,2% 30,1%
HB - - - - - - - - - -
HH 28.507 29.135 29.576 28.913 29.559 90,8% 92,1% 91,6% 88,0% 87,7%
HE 57.534 58.762 59.158 62.679 65.640 52,5% 53,4% 53,3% 55,1% 56,9%
MV 3.369 4.454 4.209 2.422 1.908 21,1% 28,1% 26,8% 15,4% 12,3%
NI 59.526 64.635 62.476 65.409 77.023 42,4% 46,8% 45,3% 46,6% 46,9%
NW - - - - - - - - - -
RP 177 53 40 61 3.360 0,2% 0,1% 0,1% 0,1% 4,7%
SL 1.710 1.594 2.105 2.244 2.444 12,1% 11,6% 15,4% 16,4% 17,9%
SN 32.107 30.194 25.916 28.211 29.465 58,5% 55,2% 47,5% 51,5% 52,9%
ST 5.353 5.306 5.469 5.588 4.930 16,7% 16,4% 17,0% 17,7% 16,1%
SH 9.966 9.936 10.159 10.336 10.316 20,1% 20,4% 20,7% 21,0% 21,1%
TH 1.096 960 853 782 460 3,4% 3,0% 2,7% 2,6% 1,6%
D 262.139 268.682 268.788 277.716 297.825 20,3% 21,2% 21,5% 22,2% 23,4%
1) Ohne Einführungs- und Qualifikationsphasen.
Anzahl Anteil an allen Schüler-/innen
- 53* -
Insgesamt
gebundene Form
offene Form
Anmerkung: Ab 2016 findet eine erweiterte Definition (siehe Bericht S. 6) für die offenen Ganztagsangebote Anwendung. Dadurch kommt es in diesem Bereich in
einigen Ländern zu einem deutlichen Anstieg. (Gilt aktuell noch nicht für MV.)
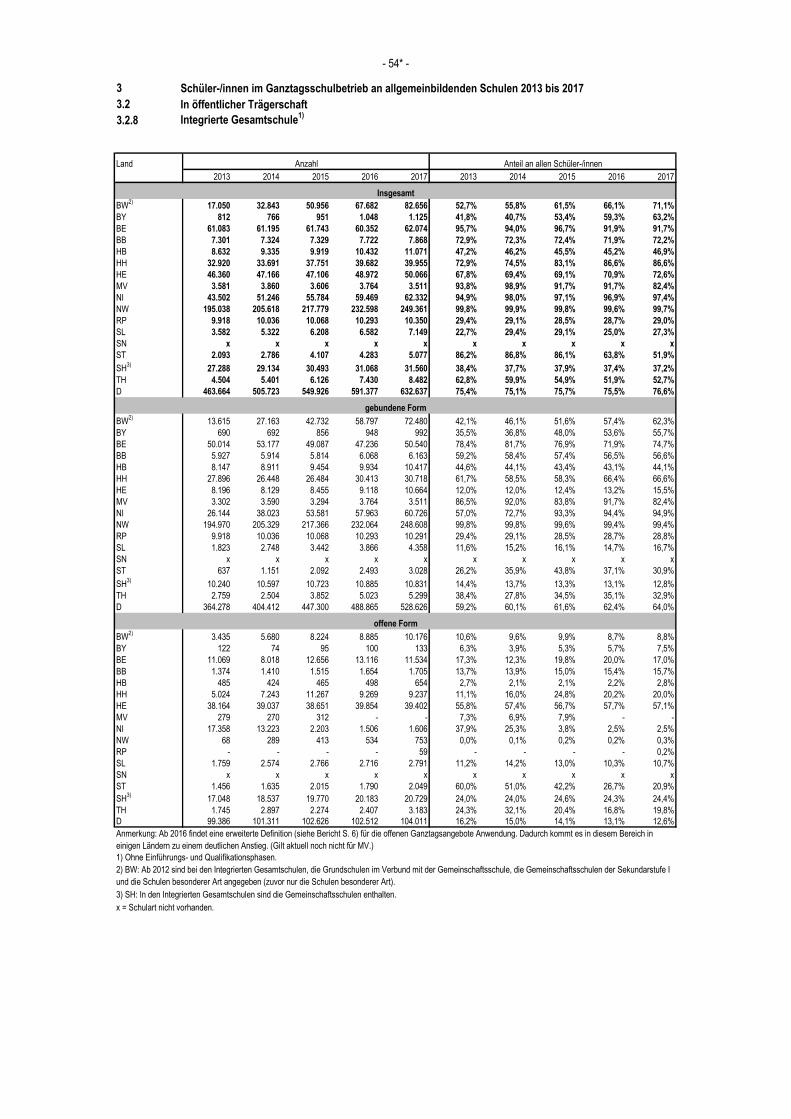
3 Schüler-/innen im Ganztagsschulbetrieb an allgemeinbildenden Schulen 2013 bis 2017
3.2 In öffentlicher Trägerschaft
3.2.8 Integrierte Gesamtschule1)
Land
2013 2014 2015 2016 2017 2013 2014 2015 2016 2017
BW2)
17.050 32.843 50.956 67.682 82.656 52,7% 55,8% 61,5% 66,1% 71,1%
BY 812 766 951 1.048 1.125 41,8% 40,7% 53,4% 59,3% 63,2%
BE 61.083 61.195 61.743 60.352 62.074 95,7% 94,0% 96,7% 91,9% 91,7%
BB 7.301 7.324 7.329 7.722 7.868 72,9% 72,3% 72,4% 71,9% 72,2%
HB 8.632 9.335 9.919 10.432 11.071 47,2% 46,2% 45,5% 45,2% 46,9%
HH 32.920 33.691 37.751 39.682 39.955 72,9% 74,5% 83,1% 86,6% 86,6%
HE 46.360 47.166 47.106 48.972 50.066 67,8% 69,4% 69,1% 70,9% 72,6%
MV 3.581 3.860 3.606 3.764 3.511 93,8% 98,9% 91,7% 91,7% 82,4%
NI 43.502 51.246 55.784 59.469 62.332 94,9% 98,0% 97,1% 96,9% 97,4%
NW 195.038 205.618 217.779 232.598 249.361 99,8% 99,9% 99,8% 99,6% 99,7%
RP 9.918 10.036 10.068 10.293 10.350 29,4% 29,1% 28,5% 28,7% 29,0%
SL 3.582 5.322 6.208 6.582 7.149 22,7% 29,4% 29,1% 25,0% 27,3%
SN x x x x x x x x x x
ST 2.093 2.786 4.107 4.283 5.077 86,2% 86,8% 86,1% 63,8% 51,9%
SH3)
27.288 29.134 30.493 31.068 31.560 38,4% 37,7% 37,9% 37,4% 37,2%
TH 4.504 5.401 6.126 7.430 8.482 62,8% 59,9% 54,9% 51,9% 52,7%
D 463.664 505.723 549.926 591.377 632.637 75,4% 75,1% 75,7% 75,5% 76,6%
BW2)
13.615 27.163 42.732 58.797 72.480 42,1% 46,1% 51,6% 57,4% 62,3%
BY 690 692 856 948 992 35,5% 36,8% 48,0% 53,6% 55,7%
BE 50.014 53.177 49.087 47.236 50.540 78,4% 81,7% 76,9% 71,9% 74,7%
BB 5.927 5.914 5.814 6.068 6.163 59,2% 58,4% 57,4% 56,5% 56,6%
HB 8.147 8.911 9.454 9.934 10.417 44,6% 44,1% 43,4% 43,1% 44,1%
HH 27.896 26.448 26.484 30.413 30.718 61,7% 58,5% 58,3% 66,4% 66,6%
HE 8.196 8.129 8.455 9.118 10.664 12,0% 12,0% 12,4% 13,2% 15,5%
MV 3.302 3.590 3.294 3.764 3.511 86,5% 92,0% 83,8% 91,7% 82,4%
NI 26.144 38.023 53.581 57.963 60.726 57,0% 72,7% 93,3% 94,4% 94,9%
NW 194.970 205.329 217.366 232.064 248.608 99,8% 99,8% 99,6% 99,4% 99,4%
RP 9.918 10.036 10.068 10.293 10.291 29,4% 29,1% 28,5% 28,7% 28,8%
SL 1.823 2.748 3.442 3.866 4.358 11,6% 15,2% 16,1% 14,7% 16,7%
SN x x x x x x x x x x
ST 637 1.151 2.092 2.493 3.028 26,2% 35,9% 43,8% 37,1% 30,9%
SH3)
10.240 10.597 10.723 10.885 10.831 14,4% 13,7% 13,3% 13,1% 12,8%
TH 2.759 2.504 3.852 5.023 5.299 38,4% 27,8% 34,5% 35,1% 32,9%
D 364.278 404.412 447.300 488.865 528.626 59,2% 60,1% 61,6% 62,4% 64,0%
BW2)
3.435 5.680 8.224 8.885 10.176 10,6% 9,6% 9,9% 8,7% 8,8%
BY 122 74 95 100 133 6,3% 3,9% 5,3% 5,7% 7,5%
BE 11.069 8.018 12.656 13.116 11.534 17,3% 12,3% 19,8% 20,0% 17,0%
BB 1.374 1.410 1.515 1.654 1.705 13,7% 13,9% 15,0% 15,4% 15,7%
HB 485 424 465 498 654 2,7% 2,1% 2,1% 2,2% 2,8%
HH 5.024 7.243 11.267 9.269 9.237 11,1% 16,0% 24,8% 20,2% 20,0%
HE 38.164 39.037 38.651 39.854 39.402 55,8% 57,4% 56,7% 57,7% 57,1%
MV 279 270 312 - - 7,3% 6,9% 7,9% - -
NI 17.358 13.223 2.203 1.506 1.606 37,9% 25,3% 3,8% 2,5% 2,5%
NW 68 289 413 534 753 0,0% 0,1% 0,2% 0,2% 0,3%
RP - - - - 59 - - - - 0,2%
SL 1.759 2.574 2.766 2.716 2.791 11,2% 14,2% 13,0% 10,3% 10,7%
SN x x x x x x x x x x
ST 1.456 1.635 2.015 1.790 2.049 60,0% 51,0% 42,2% 26,7% 20,9%
SH3)
17.048 18.537 19.770 20.183 20.729 24,0% 24,0% 24,6% 24,3% 24,4%
TH 1.745 2.897 2.274 2.407 3.183 24,3% 32,1% 20,4% 16,8% 19,8%
D 99.386 101.311 102.626 102.512 104.011 16,2% 15,0% 14,1% 13,1% 12,6%
3) SH: In den Integrierten Gesamtschulen sind die Gemeinschaftsschulen enthalten.
x = Schulart nicht vorhanden.
2) BW: Ab 2012 sind bei den Integrierten Gesamtschulen, die Grundschulen im Verbund mit der Gemeinschaftsschule, die Gemeinschaftsschulen der Sekundarstufe I
und die Schulen besonderer Art angegeben (zuvor nur die Schulen besonderer Art).
- 54* -
Insgesamt
gebundene Form
offene Form
1) Ohne Einführungs- und Qualifikationsphasen.
Anzahl Anteil an allen Schüler-/innen
Anmerkung: Ab 2016 findet eine erweiterte Definition (siehe Bericht S. 6) für die offenen Ganztagsangebote Anwendung. Dadurch kommt es in diesem Bereich in
einigen Ländern zu einem deutlichen Anstieg. (Gilt aktuell noch nicht für MV.)
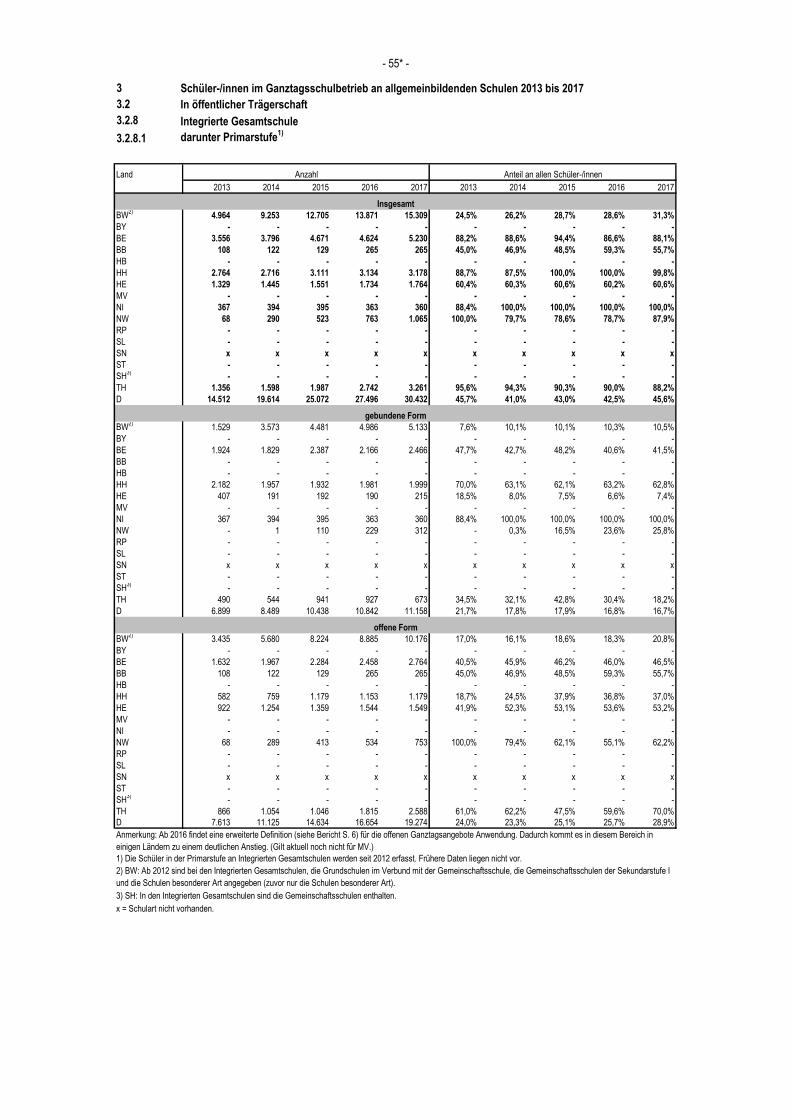
3 Schüler-/innen im Ganztagsschulbetrieb an allgemeinbildenden Schulen 2013 bis 2017
3.2 In öffentlicher Trägerschaft
3.2.8 Integrierte Gesamtschule
3.2.8.1 darunter Primarstufe1)
Land
2013 2014 2015 2016 2017 2013 2014 2015 2016 2017
BW2)
4.964 9.253 12.705 13.871 15.309 24,5% 26,2% 28,7% 28,6% 31,3%
BY - - - - - - - - - -
BE 3.556 3.796 4.671 4.624 5.230 88,2% 88,6% 94,4% 86,6% 88,1%
BB 108 122 129 265 265 45,0% 46,9% 48,5% 59,3% 55,7%
HB - - - - - - - - - -
HH 2.764 2.716 3.111 3.134 3.178 88,7% 87,5% 100,0% 100,0% 99,8%
HE 1.329 1.445 1.551 1.734 1.764 60,4% 60,3% 60,6% 60,2% 60,6%
MV - - - - - - - - - -
NI 367 394 395 363 360 88,4% 100,0% 100,0% 100,0% 100,0%
NW 68 290 523 763 1.065 100,0% 79,7% 78,6% 78,7% 87,9%
RP - - - - - - - - - -
SL - - - - - - - - - -
SN x x x x x x x x x x
ST - - - - - - - - - -
SH3)
- - - - - - - - - -
TH 1.356 1.598 1.987 2.742 3.261 95,6% 94,3% 90,3% 90,0% 88,2%
D 14.512 19.614 25.072 27.496 30.432 45,7% 41,0% 43,0% 42,5% 45,6%
BW2)
1.529 3.573 4.481 4.986 5.133 7,6% 10,1% 10,1% 10,3% 10,5%
BY - - - - - - - - - -
BE 1.924 1.829 2.387 2.166 2.466 47,7% 42,7% 48,2% 40,6% 41,5%
BB - - - - - - - - - -
HB - - - - - - - - - -
HH 2.182 1.957 1.932 1.981 1.999 70,0% 63,1% 62,1% 63,2% 62,8%
HE 407 191 192 190 215 18,5% 8,0% 7,5% 6,6% 7,4%
MV - - - - - - - - - -
NI 367 394 395 363 360 88,4% 100,0% 100,0% 100,0% 100,0%
NW - 1 110 229 312 - 0,3% 16,5% 23,6% 25,8%
RP - - - - - - - - - -
SL - - - - - - - - - -
SN x x x x x x x x x x
ST - - - - - - - - - -
SH3)
- - - - - - - - - -
TH 490 544 941 927 673 34,5% 32,1% 42,8% 30,4% 18,2%
D 6.899 8.489 10.438 10.842 11.158 21,7% 17,8% 17,9% 16,8% 16,7%
BW2)
3.435 5.680 8.224 8.885 10.176 17,0% 16,1% 18,6% 18,3% 20,8%
BY - - - - - - - - - -
BE 1.632 1.967 2.284 2.458 2.764 40,5% 45,9% 46,2% 46,0% 46,5%
BB 108 122 129 265 265 45,0% 46,9% 48,5% 59,3% 55,7%
HB - - - - - - - - - -
HH 582 759 1.179 1.153 1.179 18,7% 24,5% 37,9% 36,8% 37,0%
HE 922 1.254 1.359 1.544 1.549 41,9% 52,3% 53,1% 53,6% 53,2%
MV - - - - - - - - - -
NI - - - - - - - - - -
NW 68 289 413 534 753 100,0% 79,4% 62,1% 55,1% 62,2%
RP - - - - - - - - - -
SL - - - - - - - - - -
SN x x x x x x x x x x
ST - - - - - - - - - -
SH3)
- - - - - - - - - -
TH 866 1.054 1.046 1.815 2.588 61,0% 62,2% 47,5% 59,6% 70,0%
D 7.613 11.125 14.634 16.654 19.274 24,0% 23,3% 25,1% 25,7% 28,9%
3) SH: In den Integrierten Gesamtschulen sind die Gemeinschaftsschulen enthalten.
x = Schulart nicht vorhanden.
Anmerkung: Ab 2016 findet eine erweiterte Definition (siehe Bericht S. 6) für die offenen Ganztagsangebote Anwendung. Dadurch kommt es in diesem Bereich in
einigen Ländern zu einem deutlichen Anstieg. (Gilt aktuell noch nicht für MV.)
2) BW: Ab 2012 sind bei den Integrierten Gesamtschulen, die Grundschulen im Verbund mit der Gemeinschaftsschule, die Gemeinschaftsschulen der Sekundarstufe I
und die Schulen besonderer Art angegeben (zuvor nur die Schulen besonderer Art).
1) Die Schüler in der Primarstufe an Integrierten Gesamtschulen werden seit 2012 erfasst. Frühere Daten liegen nicht vor.
- 55* -
Insgesamt
gebundene Form
offene Form
Anzahl Anteil an allen Schüler-/innen
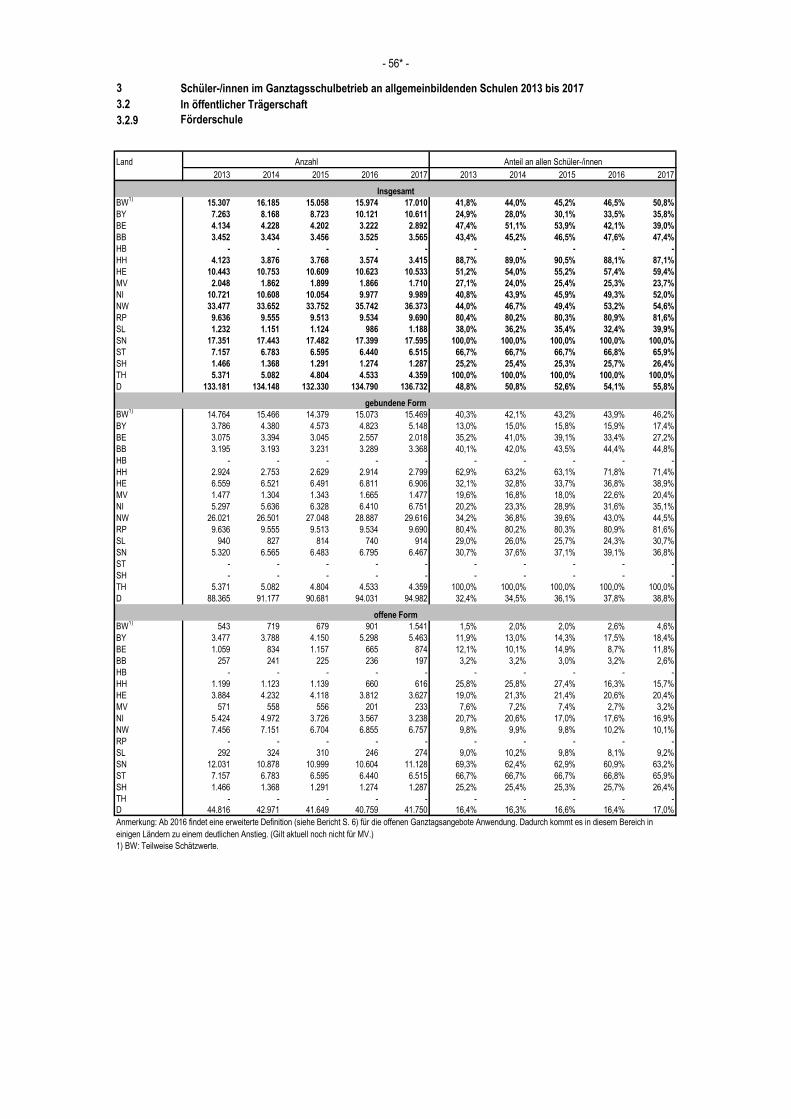
3 Schüler-/innen im Ganztagsschulbetrieb an allgemeinbildenden Schulen 2013 bis 2017
3.2 In öffentlicher Trägerschaft
3.2.9 Förderschule
Land
2013 2014 2015 2016 2017 2013 2014 2015 2016 2017
BW1)
15.307 16.185 15.058 15.974 17.010 41,8% 44,0% 45,2% 46,5% 50,8%
BY 7.263 8.168 8.723 10.121 10.611 24,9% 28,0% 30,1% 33,5% 35,8%
BE 4.134 4.228 4.202 3.222 2.892 47,4% 51,1% 53,9% 42,1% 39,0%
BB 3.452 3.434 3.456 3.525 3.565 43,4% 45,2% 46,5% 47,6% 47,4%
HB - - - - - - - - - -
HH 4.123 3.876 3.768 3.574 3.415 88,7% 89,0% 90,5% 88,1% 87,1%
HE 10.443 10.753 10.609 10.623 10.533 51,2% 54,0% 55,2% 57,4% 59,4%
MV 2.048 1.862 1.899 1.866 1.710 27,1% 24,0% 25,4% 25,3% 23,7%
NI 10.721 10.608 10.054 9.977 9.989 40,8% 43,9% 45,9% 49,3% 52,0%
NW 33.477 33.652 33.752 35.742 36.373 44,0% 46,7% 49,4% 53,2% 54,6%
RP 9.636 9.555 9.513 9.534 9.690 80,4% 80,2% 80,3% 80,9% 81,6%
SL 1.232 1.151 1.124 986 1.188 38,0% 36,2% 35,4% 32,4% 39,9%
SN 17.351 17.443 17.482 17.399 17.595 100,0% 100,0% 100,0% 100,0% 100,0%
ST 7.157 6.783 6.595 6.440 6.515 66,7% 66,7% 66,7% 66,8% 65,9%
SH 1.466 1.368 1.291 1.274 1.287 25,2% 25,4% 25,3% 25,7% 26,4%
TH 5.371 5.082 4.804 4.533 4.359 100,0% 100,0% 100,0% 100,0% 100,0%
D 133.181 134.148 132.330 134.790 136.732 48,8% 50,8% 52,6% 54,1% 55,8%
BW1)
14.764 15.466 14.379 15.073 15.469 40,3% 42,1% 43,2% 43,9% 46,2%
BY 3.786 4.380 4.573 4.823 5.148 13,0% 15,0% 15,8% 15,9% 17,4%
BE 3.075 3.394 3.045 2.557 2.018 35,2% 41,0% 39,1% 33,4% 27,2%
BB 3.195 3.193 3.231 3.289 3.368 40,1% 42,0% 43,5% 44,4% 44,8%
HB - - - - - - - - - -
HH 2.924 2.753 2.629 2.914 2.799 62,9% 63,2% 63,1% 71,8% 71,4%
HE 6.559 6.521 6.491 6.811 6.906 32,1% 32,8% 33,7% 36,8% 38,9%
MV 1.477 1.304 1.343 1.665 1.477 19,6% 16,8% 18,0% 22,6% 20,4%
NI 5.297 5.636 6.328 6.410 6.751 20,2% 23,3% 28,9% 31,6% 35,1%
NW 26.021 26.501 27.048 28.887 29.616 34,2% 36,8% 39,6% 43,0% 44,5%
RP 9.636 9.555 9.513 9.534 9.690 80,4% 80,2% 80,3% 80,9% 81,6%
SL 940 827 814 740 914 29,0% 26,0% 25,7% 24,3% 30,7%
SN 5.320 6.565 6.483 6.795 6.467 30,7% 37,6% 37,1% 39,1% 36,8%
ST - - - - - - - - - -
SH - - - - - - - - - -
TH 5.371 5.082 4.804 4.533 4.359 100,0% 100,0% 100,0% 100,0% 100,0%
D 88.365 91.177 90.681 94.031 94.982 32,4% 34,5% 36,1% 37,8% 38,8%
BW1)
543 719 679 901 1.541 1,5% 2,0% 2,0% 2,6% 4,6%
BY 3.477 3.788 4.150 5.298 5.463 11,9% 13,0% 14,3% 17,5% 18,4%
BE 1.059 834 1.157 665 874 12,1% 10,1% 14,9% 8,7% 11,8%
BB 257 241 225 236 197 3,2% 3,2% 3,0% 3,2% 2,6%
HB - - - - - - - - - -
HH 1.199 1.123 1.139 660 616 25,8% 25,8% 27,4% 16,3% 15,7%
HE 3.884 4.232 4.118 3.812 3.627 19,0% 21,3% 21,4% 20,6% 20,4%
MV 571 558 556 201 233 7,6% 7,2% 7,4% 2,7% 3,2%
NI 5.424 4.972 3.726 3.567 3.238 20,7% 20,6% 17,0% 17,6% 16,9%
NW 7.456 7.151 6.704 6.855 6.757 9,8% 9,9% 9,8% 10,2% 10,1%
RP - - - - - - - - - -
SL 292 324 310 246 274 9,0% 10,2% 9,8% 8,1% 9,2%
SN 12.031 10.878 10.999 10.604 11.128 69,3% 62,4% 62,9% 60,9% 63,2%
ST 7.157 6.783 6.595 6.440 6.515 66,7% 66,7% 66,7% 66,8% 65,9%
SH 1.466 1.368 1.291 1.274 1.287 25,2% 25,4% 25,3% 25,7% 26,4%
TH - - - - - - - - - -
D 44.816 42.971 41.649 40.759 41.750 16,4% 16,3% 16,6% 16,4% 17,0%
Anzahl Anteil an allen Schüler-/innen
- 56* -
Insgesamt
gebundene Form
offene Form
1) BW: Teilweise Schätzwerte.
Anmerkung: Ab 2016 findet eine erweiterte Definition (siehe Bericht S. 6) für die offenen Ganztagsangebote Anwendung. Dadurch kommt es in diesem Bereich in
einigen Ländern zu einem deutlichen Anstieg. (Gilt aktuell noch nicht für MV.)
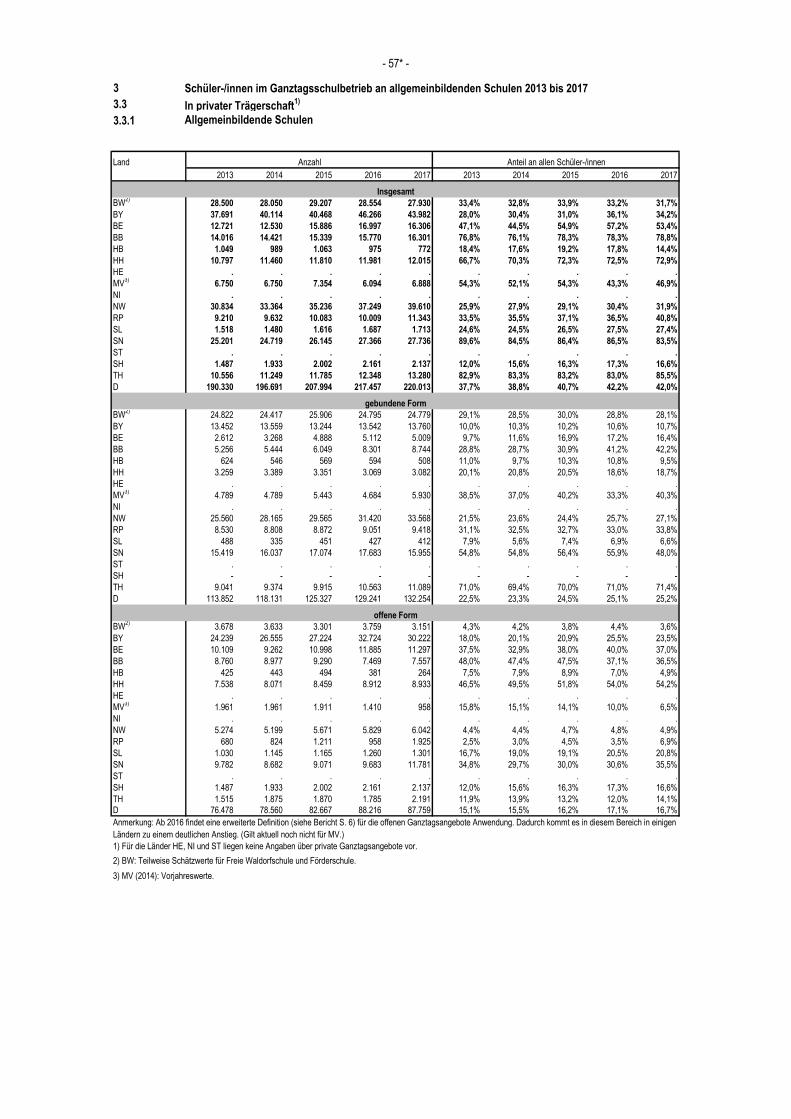
3 Schüler-/innen im Ganztagsschulbetrieb an allgemeinbildenden Schulen 2013 bis 2017
3.3 In privater Trägerschaft1)
3.3.1 Allgemeinbildende Schulen
Land
2013 2014 2015 2016 2017 2013 2014 2015 2016 2017
BW2)
28.500 28.050 29.207 28.554 27.930 33,4% 32,8% 33,9% 33,2% 31,7%
BY 37.691 40.114 40.468 46.266 43.982 28,0% 30,4% 31,0% 36,1% 34,2%
BE 12.721 12.530 15.886 16.997 16.306 47,1% 44,5% 54,9% 57,2% 53,4%
BB 14.016 14.421 15.339 15.770 16.301 76,8% 76,1% 78,3% 78,3% 78,8%
HB 1.049 989 1.063 975 772 18,4% 17,6% 19,2% 17,8% 14,4%
HH 10.797 11.460 11.810 11.981 12.015 66,7% 70,3% 72,3% 72,5% 72,9%
HE . . . . . . . . . .
MV3)
6.750 6.750 7.354 6.094 6.888 54,3% 52,1% 54,3% 43,3% 46,9%
NI . . . . . . . . . .
NW 30.834 33.364 35.236 37.249 39.610 25,9% 27,9% 29,1% 30,4% 31,9%
RP 9.210 9.632 10.083 10.009 11.343 33,5% 35,5% 37,1% 36,5% 40,8%
SL 1.518 1.480 1.616 1.687 1.713 24,6% 24,5% 26,5% 27,5% 27,4%
SN 25.201 24.719 26.145 27.366 27.736 89,6% 84,5% 86,4% 86,5% 83,5%
ST . . . . . . . . . .
SH 1.487 1.933 2.002 2.161 2.137 12,0% 15,6% 16,3% 17,3% 16,6%
TH 10.556 11.249 11.785 12.348 13.280 82,9% 83,3% 83,2% 83,0% 85,5%
D 190.330 196.691 207.994 217.457 220.013 37,7% 38,8% 40,7% 42,2% 42,0%
BW2)
24.822 24.417 25.906 24.795 24.779 29,1% 28,5% 30,0% 28,8% 28,1%
BY 13.452 13.559 13.244 13.542 13.760 10,0% 10,3% 10,2% 10,6% 10,7%
BE 2.612 3.268 4.888 5.112 5.009 9,7% 11,6% 16,9% 17,2% 16,4%
BB 5.256 5.444 6.049 8.301 8.744 28,8% 28,7% 30,9% 41,2% 42,2%
HB 624 546 569 594 508 11,0% 9,7% 10,3% 10,8% 9,5%
HH 3.259 3.389 3.351 3.069 3.082 20,1% 20,8% 20,5% 18,6% 18,7%
HE . . . . . . . . . .
MV3)
4.789 4.789 5.443 4.684 5.930 38,5% 37,0% 40,2% 33,3% 40,3%
NI . . . . . . . . . .
NW 25.560 28.165 29.565 31.420 33.568 21,5% 23,6% 24,4% 25,7% 27,1%
RP 8.530 8.808 8.872 9.051 9.418 31,1% 32,5% 32,7% 33,0% 33,8%
SL 488 335 451 427 412 7,9% 5,6% 7,4% 6,9% 6,6%
SN 15.419 16.037 17.074 17.683 15.955 54,8% 54,8% 56,4% 55,9% 48,0%
ST . . . . . . . . . .
SH - - - - - - - - - -
TH 9.041 9.374 9.915 10.563 11.089 71,0% 69,4% 70,0% 71,0% 71,4%
D 113.852 118.131 125.327 129.241 132.254 22,5% 23,3% 24,5% 25,1% 25,2%
BW2)
3.678 3.633 3.301 3.759 3.151 4,3% 4,2% 3,8% 4,4% 3,6%
BY 24.239 26.555 27.224 32.724 30.222 18,0% 20,1% 20,9% 25,5% 23,5%
BE 10.109 9.262 10.998 11.885 11.297 37,5% 32,9% 38,0% 40,0% 37,0%
BB 8.760 8.977 9.290 7.469 7.557 48,0% 47,4% 47,5% 37,1% 36,5%
HB 425 443 494 381 264 7,5% 7,9% 8,9% 7,0% 4,9%
HH 7.538 8.071 8.459 8.912 8.933 46,5% 49,5% 51,8% 54,0% 54,2%
HE . . . . . . . . . .
MV3)
1.961 1.961 1.911 1.410 958 15,8% 15,1% 14,1% 10,0% 6,5%
NI . . . . . . . . . .
NW 5.274 5.199 5.671 5.829 6.042 4,4% 4,4% 4,7% 4,8% 4,9%
RP 680 824 1.211 958 1.925 2,5% 3,0% 4,5% 3,5% 6,9%
SL 1.030 1.145 1.165 1.260 1.301 16,7% 19,0% 19,1% 20,5% 20,8%
SN 9.782 8.682 9.071 9.683 11.781 34,8% 29,7% 30,0% 30,6% 35,5%
ST . . . . . . . . . .
SH 1.487 1.933 2.002 2.161 2.137 12,0% 15,6% 16,3% 17,3% 16,6%
TH 1.515 1.875 1.870 1.785 2.191 11,9% 13,9% 13,2% 12,0% 14,1%
D 76.478 78.560 82.667 88.216 87.759 15,1% 15,5% 16,2% 17,1% 16,7%
3) MV (2014): Vorjahreswerte.
- 57* -
Insgesamt
gebundene Form
offene Form
2) BW: Teilweise Schätzwerte für Freie Waldorfschule und Förderschule.
1) Für die Länder HE, NI und ST liegen keine Angaben über private Ganztagsangebote vor.
Anzahl Anteil an allen Schüler-/innen
Anmerkung: Ab 2016 findet eine erweiterte Definition (siehe Bericht S. 6) für die offenen Ganztagsangebote Anwendung. Dadurch kommt es in diesem Bereich in einigen
Ländern zu einem deutlichen Anstieg. (Gilt aktuell noch nicht für MV.)
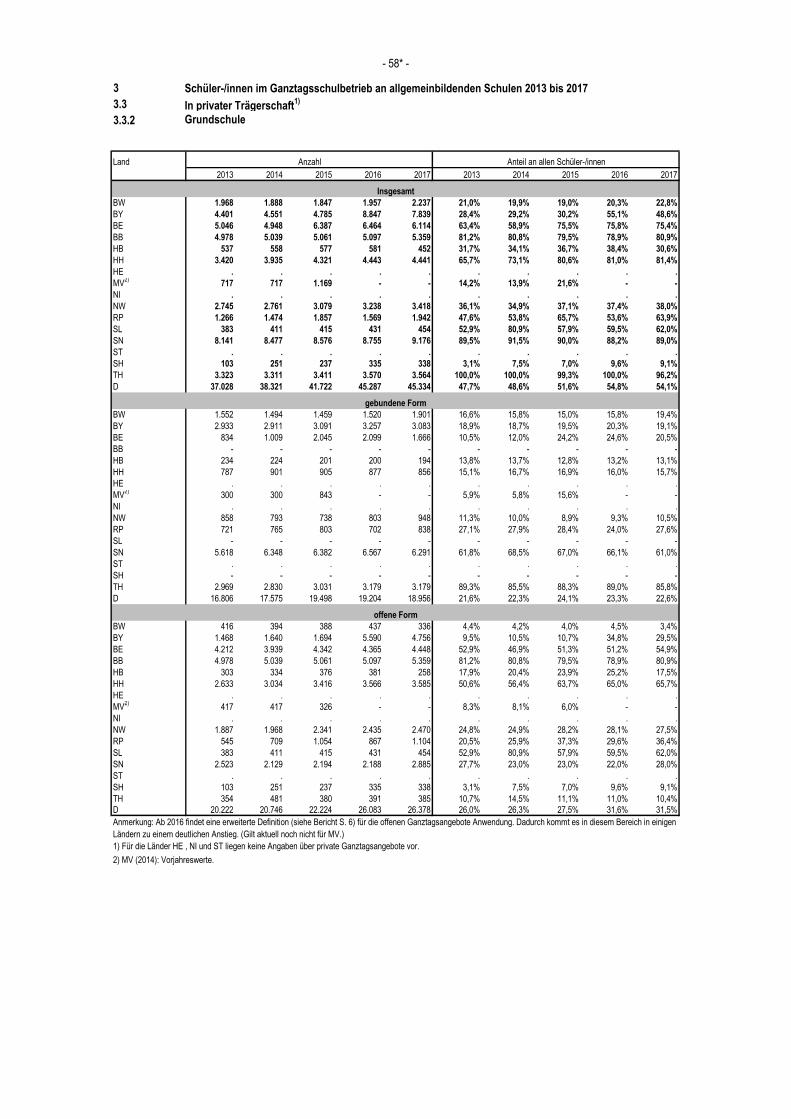
3 Schüler-/innen im Ganztagsschulbetrieb an allgemeinbildenden Schulen 2013 bis 2017
3.3 In privater Trägerschaft1)
3.3.2 Grundschule
Land
2013 2014 2015 2016 2017 2013 2014 2015 2016 2017
BW 1.968 1.888 1.847 1.957 2.237 21,0% 19,9% 19,0% 20,3% 22,8%
BY 4.401 4.551 4.785 8.847 7.839 28,4% 29,2% 30,2% 55,1% 48,6%
BE 5.046 4.948 6.387 6.464 6.114 63,4% 58,9% 75,5% 75,8% 75,4%
BB 4.978 5.039 5.061 5.097 5.359 81,2% 80,8% 79,5% 78,9% 80,9%
HB 537 558 577 581 452 31,7% 34,1% 36,7% 38,4% 30,6%
HH 3.420 3.935 4.321 4.443 4.441 65,7% 73,1% 80,6% 81,0% 81,4%
HE . . . . . . . . . .
MV2)
717 717 1.169 - - 14,2% 13,9% 21,6% - -
NI . . . . . . . . . .
NW 2.745 2.761 3.079 3.238 3.418 36,1% 34,9% 37,1% 37,4% 38,0%
RP 1.266 1.474 1.857 1.569 1.942 47,6% 53,8% 65,7% 53,6% 63,9%
SL 383 411 415 431 454 52,9% 80,9% 57,9% 59,5% 62,0%
SN 8.141 8.477 8.576 8.755 9.176 89,5% 91,5% 90,0% 88,2% 89,0%
ST . . . . . . . . . .
SH 103 251 237 335 338 3,1% 7,5% 7,0% 9,6% 9,1%
TH 3.323 3.311 3.411 3.570 3.564 100,0% 100,0% 99,3% 100,0% 96,2%
D 37.028 38.321 41.722 45.287 45.334 47,7% 48,6% 51,6% 54,8% 54,1%
BW 1.552 1.494 1.459 1.520 1.901 16,6% 15,8% 15,0% 15,8% 19,4%
BY 2.933 2.911 3.091 3.257 3.083 18,9% 18,7% 19,5% 20,3% 19,1%
BE 834 1.009 2.045 2.099 1.666 10,5% 12,0% 24,2% 24,6% 20,5%
BB - - - - - - - - - -
HB 234 224 201 200 194 13,8% 13,7% 12,8% 13,2% 13,1%
HH 787 901 905 877 856 15,1% 16,7% 16,9% 16,0% 15,7%
HE . . . . . . . . . .
MV2)
300 300 843 - - 5,9% 5,8% 15,6% - -
NI . . . . . . . . . .
NW 858 793 738 803 948 11,3% 10,0% 8,9% 9,3% 10,5%
RP 721 765 803 702 838 27,1% 27,9% 28,4% 24,0% 27,6%
SL - - - - - - - - - -
SN 5.618 6.348 6.382 6.567 6.291 61,8% 68,5% 67,0% 66,1% 61,0%
ST . . . . . . . . . .
SH - - - - - - - - - -
TH 2.969 2.830 3.031 3.179 3.179 89,3% 85,5% 88,3% 89,0% 85,8%
D 16.806 17.575 19.498 19.204 18.956 21,6% 22,3% 24,1% 23,3% 22,6%
BW 416 394 388 437 336 4,4% 4,2% 4,0% 4,5% 3,4%
BY 1.468 1.640 1.694 5.590 4.756 9,5% 10,5% 10,7% 34,8% 29,5%
BE 4.212 3.939 4.342 4.365 4.448 52,9% 46,9% 51,3% 51,2% 54,9%
BB 4.978 5.039 5.061 5.097 5.359 81,2% 80,8% 79,5% 78,9% 80,9%
HB 303 334 376 381 258 17,9% 20,4% 23,9% 25,2% 17,5%
HH 2.633 3.034 3.416 3.566 3.585 50,6% 56,4% 63,7% 65,0% 65,7%
HE . . . . . . . . . .
MV2)
417 417 326 - - 8,3% 8,1% 6,0% - -
NI . . . . . . . . . .
NW 1.887 1.968 2.341 2.435 2.470 24,8% 24,9% 28,2% 28,1% 27,5%
RP 545 709 1.054 867 1.104 20,5% 25,9% 37,3% 29,6% 36,4%
SL 383 411 415 431 454 52,9% 80,9% 57,9% 59,5% 62,0%
SN 2.523 2.129 2.194 2.188 2.885 27,7% 23,0% 23,0% 22,0% 28,0%
ST . . . . . . . . . .
SH 103 251 237 335 338 3,1% 7,5% 7,0% 9,6% 9,1%
TH 354 481 380 391 385 10,7% 14,5% 11,1% 11,0% 10,4%
D 20.222 20.746 22.224 26.083 26.378 26,0% 26,3% 27,5% 31,6% 31,5%
2) MV (2014): Vorjahreswerte.
1) Für die Länder HE , NI und ST liegen keine Angaben über private Ganztagsangebote vor.
Anzahl Anteil an allen Schüler-/innen
- 58* -
Insgesamt
gebundene Form
offene Form
Anmerkung: Ab 2016 findet eine erweiterte Definition (siehe Bericht S. 6) für die offenen Ganztagsangebote Anwendung. Dadurch kommt es in diesem Bereich in einigen
Ländern zu einem deutlichen Anstieg. (Gilt aktuell noch nicht für MV.)
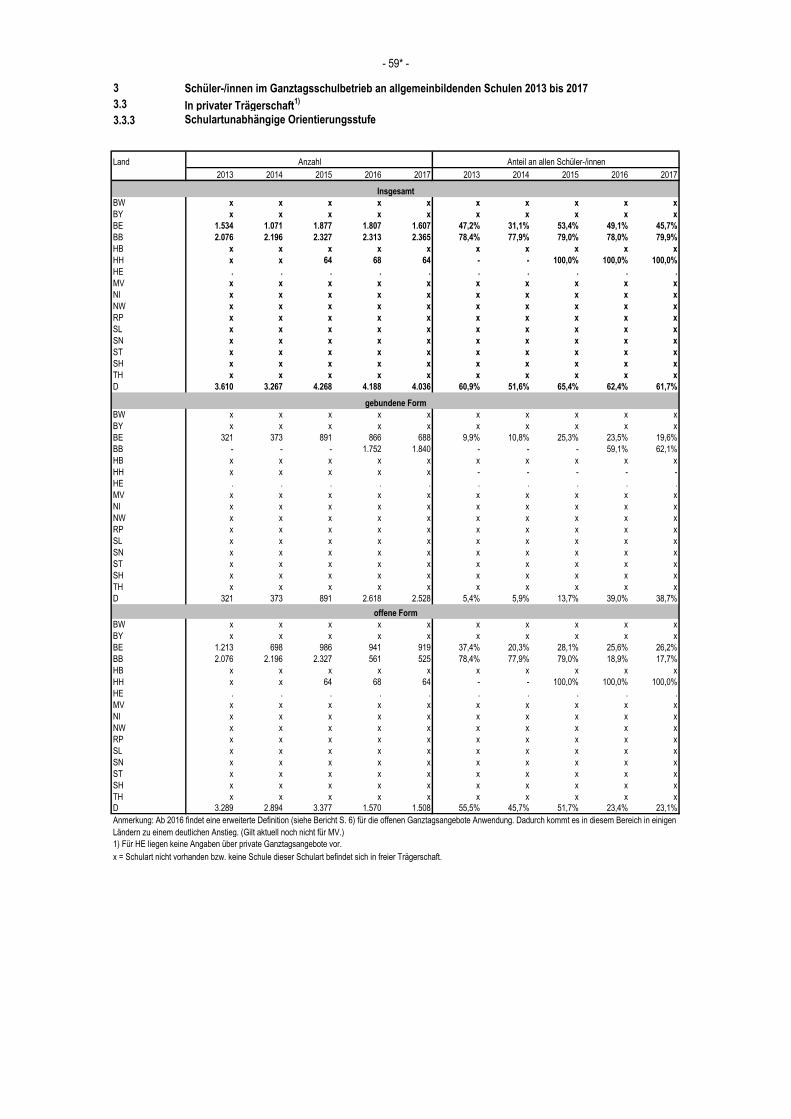
3 Schüler-/innen im Ganztagsschulbetrieb an allgemeinbildenden Schulen 2013 bis 2017
3.3 In privater Trägerschaft1)
3.3.3 Schulartunabhängige Orientierungsstufe
Land
2013 2014 2015 2016 2017 2013 2014 2015 2016 2017
BW x x x x x x x x x x
BY x x x x x x x x x x
BE 1.534 1.071 1.877 1.807 1.607 47,2% 31,1% 53,4% 49,1% 45,7%
BB 2.076 2.196 2.327 2.313 2.365 78,4% 77,9% 79,0% 78,0% 79,9%
HB x x x x x x x x x x
HH x x 64 68 64 - - 100,0% 100,0% 100,0%
HE . . . . . . . . . .
MV x x x x x x x x x x
NI x x x x x x x x x x
NW x x x x x x x x x x
RP x x x x x x x x x x
SL x x x x x x x x x x
SN x x x x x x x x x x
ST x x x x x x x x x x
SH x x x x x x x x x x
TH x x x x x x x x x x
D 3.610 3.267 4.268 4.188 4.036 60,9% 51,6% 65,4% 62,4% 61,7%
BW x x x x x x x x x x
BY x x x x x x x x x x
BE 321 373 891 866 688 9,9% 10,8% 25,3% 23,5% 19,6%
BB - - - 1.752 1.840 - - - 59,1% 62,1%
HB x x x x x x x x x x
HH x x x x x - - - - -
HE . . . . . . . . . .
MV x x x x x x x x x x
NI x x x x x x x x x x
NW x x x x x x x x x x
RP x x x x x x x x x x
SL x x x x x x x x x x
SN x x x x x x x x x x
ST x x x x x x x x x x
SH x x x x x x x x x x
TH x x x x x x x x x x
D 321 373 891 2.618 2.528 5,4% 5,9% 13,7% 39,0% 38,7%
BW x x x x x x x x x x
BY x x x x x x x x x x
BE 1.213 698 986 941 919 37,4% 20,3% 28,1% 25,6% 26,2%
BB 2.076 2.196 2.327 561 525 78,4% 77,9% 79,0% 18,9% 17,7%
HB x x x x x x x x x x
HH x x 64 68 64 - - 100,0% 100,0% 100,0%
HE . . . . . . . . . .
MV x x x x x x x x x x
NI x x x x x x x x x x
NW x x x x x x x x x x
RP x x x x x x x x x x
SL x x x x x x x x x x
SN x x x x x x x x x x
ST x x x x x x x x x x
SH x x x x x x x x x x
TH x x x x x x x x x x
D 3.289 2.894 3.377 1.570 1.508 55,5% 45,7% 51,7% 23,4% 23,1%
x = Schulart nicht vorhanden bzw. keine Schule dieser Schulart befindet sich in freier Trägerschaft.
Anzahl Anteil an allen Schüler-/innen
- 59* -
Insgesamt
gebundene Form
offene Form
1) Für HE liegen keine Angaben über private Ganztagsangebote vor.
Anmerkung: Ab 2016 findet eine erweiterte Definition (siehe Bericht S. 6) für die offenen Ganztagsangebote Anwendung. Dadurch kommt es in diesem Bereich in einigen
Ländern zu einem deutlichen Anstieg. (Gilt aktuell noch nicht für MV.)
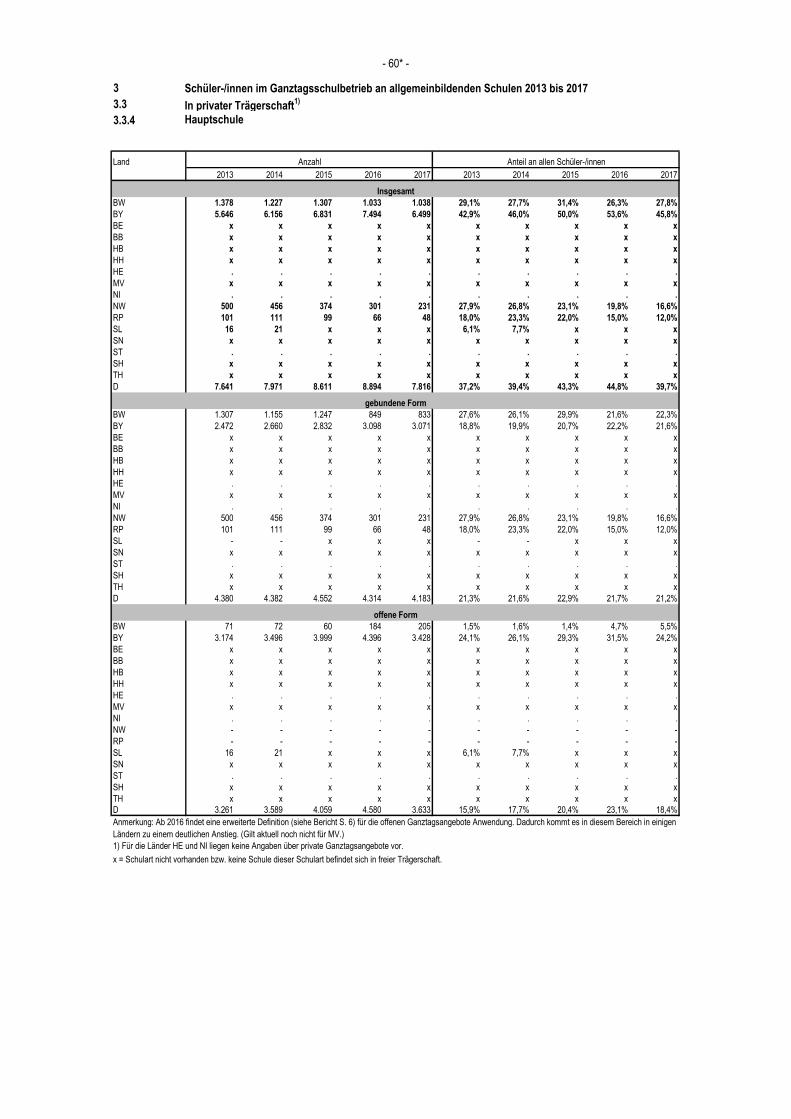
3 Schüler-/innen im Ganztagsschulbetrieb an allgemeinbildenden Schulen 2013 bis 2017
3.3 In privater Trägerschaft1)
3.3.4 Hauptschule
Land
2013 2014 2015 2016 2017 2013 2014 2015 2016 2017
BW 1.378 1.227 1.307 1.033 1.038 29,1% 27,7% 31,4% 26,3% 27,8%
BY 5.646 6.156 6.831 7.494 6.499 42,9% 46,0% 50,0% 53,6% 45,8%
BE x x x x x x x x x x
BB x x x x x x x x x x
HB x x x x x x x x x x
HH x x x x x x x x x x
HE . . . . . . . . . .
MV x x x x x x x x x x
NI . . . . . . . . . .
NW 500 456 374 301 231 27,9% 26,8% 23,1% 19,8% 16,6%
RP 101 111 99 66 48 18,0% 23,3% 22,0% 15,0% 12,0%
SL 16 21 x x x 6,1% 7,7% x x x
SN x x x x x x x x x x
ST . . . . . . . . . .
SH x x x x x x x x x x
TH x x x x x x x x x x
D 7.641 7.971 8.611 8.894 7.816 37,2% 39,4% 43,3% 44,8% 39,7%
BW 1.307 1.155 1.247 849 833 27,6% 26,1% 29,9% 21,6% 22,3%
BY 2.472 2.660 2.832 3.098 3.071 18,8% 19,9% 20,7% 22,2% 21,6%
BE x x x x x x x x x x
BB x x x x x x x x x x
HB x x x x x x x x x x
HH x x x x x x x x x x
HE . . . . . . . . . .
MV x x x x x x x x x x
NI . . . . . . . . . .
NW 500 456 374 301 231 27,9% 26,8% 23,1% 19,8% 16,6%
RP 101 111 99 66 48 18,0% 23,3% 22,0% 15,0% 12,0%
SL - - x x x - - x x x
SN x x x x x x x x x x
ST . . . . . . . . . .
SH x x x x x x x x x x
TH x x x x x x x x x x
D 4.380 4.382 4.552 4.314 4.183 21,3% 21,6% 22,9% 21,7% 21,2%
BW 71 72 60 184 205 1,5% 1,6% 1,4% 4,7% 5,5%
BY 3.174 3.496 3.999 4.396 3.428 24,1% 26,1% 29,3% 31,5% 24,2%
BE x x x x x x x x x x
BB x x x x x x x x x x
HB x x x x x x x x x x
HH x x x x x x x x x x
HE . . . . . . . . . .
MV x x x x x x x x x x
NI . . . . . . . . . .
NW - - - - - - - - - -
RP - - - - - - - - - -
SL 16 21 x x x 6,1% 7,7% x x x
SN x x x x x x x x x x
ST . . . . . . . . . .
SH x x x x x x x x x x
TH x x x x x x x x x x
D 3.261 3.589 4.059 4.580 3.633 15,9% 17,7% 20,4% 23,1% 18,4%
x = Schulart nicht vorhanden bzw. keine Schule dieser Schulart befindet sich in freier Trägerschaft.
1) Für die Länder HE und NI liegen keine Angaben über private Ganztagsangebote vor.
Anzahl Anteil an allen Schüler-/innen
- 60* -
Insgesamt
gebundene Form
offene Form
Anmerkung: Ab 2016 findet eine erweiterte Definition (siehe Bericht S. 6) für die offenen Ganztagsangebote Anwendung. Dadurch kommt es in diesem Bereich in einigen
Ländern zu einem deutlichen Anstieg. (Gilt aktuell noch nicht für MV.)
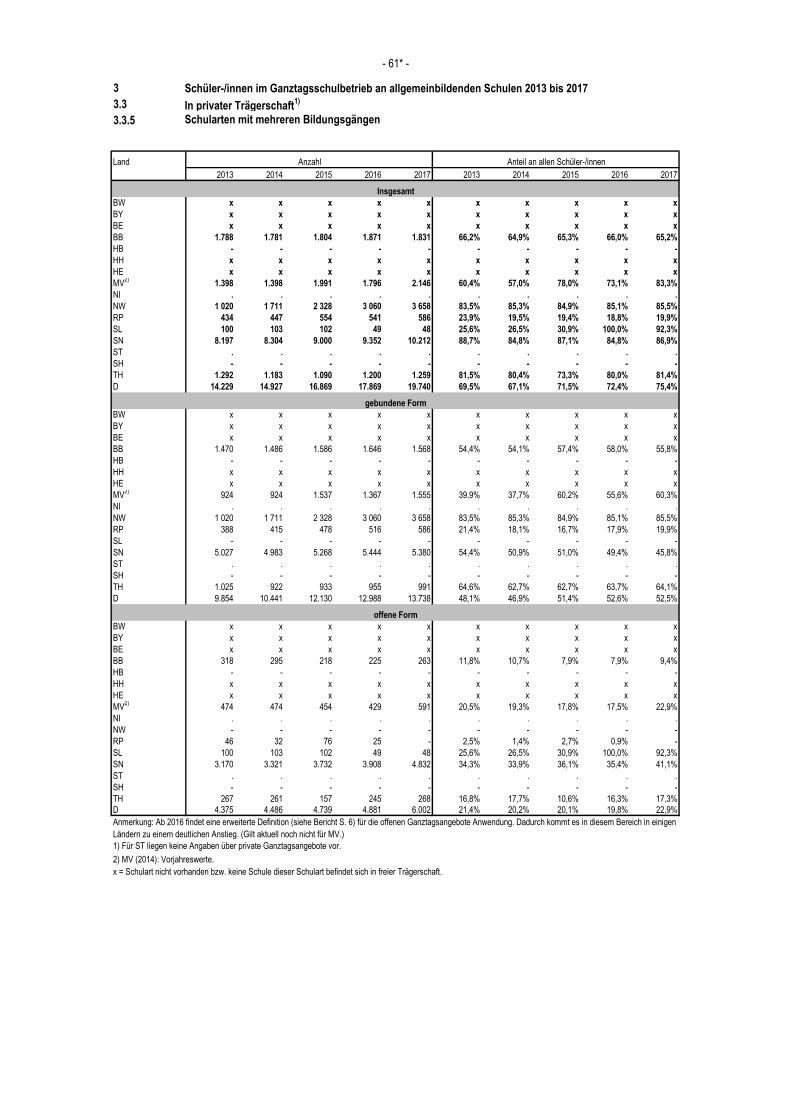
3 Schüler-/innen im Ganztagsschulbetrieb an allgemeinbildenden Schulen 2013 bis 2017
3.3 In privater Trägerschaft1)
3.3.5 Schularten mit mehreren Bildungsgängen
Land
2013 2014 2015 2016 2017 2013 2014 2015 2016 2017
BW x x x x x x x x x x
BY x x x x x x x x x x
BE x x x x x x x x x x
BB 1.788 1.781 1.804 1.871 1.831 66,2% 64,9% 65,3% 66,0% 65,2%
HB - - - - - - - - - -
HH x x x x x x x x x x
HE x x x x x x x x x x
MV2)
1.398 1.398 1.991 1.796 2.146 60,4% 57,0% 78,0% 73,1% 83,3%
NI . . . . . . . . . .
NW 1 020 1 711 2 328 3 060 3 658 83,5% 85,3% 84,9% 85,1% 85,5%
RP 434 447 554 541 586 23,9% 19,5% 19,4% 18,8% 19,9%
SL 100 103 102 49 48 25,6% 26,5% 30,9% 100,0% 92,3%
SN 8.197 8.304 9.000 9.352 10.212 88,7% 84,8% 87,1% 84,8% 86,9%
ST . . . . . . . . . .
SH - - - - - - - - - -
TH 1.292 1.183 1.090 1.200 1.259 81,5% 80,4% 73,3% 80,0% 81,4%
D 14.229 14.927 16.869 17.869 19.740 69,5% 67,1% 71,5% 72,4% 75,4%
BW x x x x x x x x x x
BY x x x x x x x x x x
BE x x x x x x x x x x
BB 1.470 1.486 1.586 1.646 1.568 54,4% 54,1% 57,4% 58,0% 55,8%
HB - - - - - - - - - -
HH x x x x x x x x x x
HE x x x x x x x x x x
MV2)
924 924 1.537 1.367 1.555 39,9% 37,7% 60,2% 55,6% 60,3%
NI . . . . . . . . . .
NW 1 020 1 711 2 328 3 060 3 658 83,5% 85,3% 84,9% 85,1% 85,5%
RP 388 415 478 516 586 21,4% 18,1% 16,7% 17,9% 19,9%
SL - - - - - - - - - -
SN 5.027 4.983 5.268 5.444 5.380 54,4% 50,9% 51,0% 49,4% 45,8%
ST . . . . . . . . . .
SH - - - - - - - - - -
TH 1.025 922 933 955 991 64,6% 62,7% 62,7% 63,7% 64,1%
D 9.854 10.441 12.130 12.988 13.738 48,1% 46,9% 51,4% 52,6% 52,5%
BW x x x x x x x x x x
BY x x x x x x x x x x
BE x x x x x x x x x x
BB 318 295 218 225 263 11,8% 10,7% 7,9% 7,9% 9,4%
HB - - - - - - - - - -
HH x x x x x x x x x x
HE x x x x x x x x x x
MV2)
474 474 454 429 591 20,5% 19,3% 17,8% 17,5% 22,9%
NI . . . . . . . . . .
NW - - - - - - - - - -
RP 46 32 76 25 - 2,5% 1,4% 2,7% 0,9% -
SL 100 103 102 49 48 25,6% 26,5% 30,9% 100,0% 92,3%
SN 3.170 3.321 3.732 3.908 4.832 34,3% 33,9% 36,1% 35,4% 41,1%
ST . . . . . . . . . .
SH - - - - - - - - - -
TH 267 261 157 245 268 16,8% 17,7% 10,6% 16,3% 17,3%
D 4.375 4.486 4.739 4.881 6.002 21,4% 20,2% 20,1% 19,8% 22,9%
2) MV (2014): Vorjahreswerte.
x = Schulart nicht vorhanden bzw. keine Schule dieser Schulart befindet sich in freier Trägerschaft.
Anzahl Anteil an allen Schüler-/innen
- 61* -
Insgesamt
gebundene Form
offene Form
1) Für ST liegen keine Angaben über private Ganztagsangebote vor.
Anmerkung: Ab 2016 findet eine erweiterte Definition (siehe Bericht S. 6) für die offenen Ganztagsangebote Anwendung. Dadurch kommt es in diesem Bereich in einigen
Ländern zu einem deutlichen Anstieg. (Gilt aktuell noch nicht für MV.)
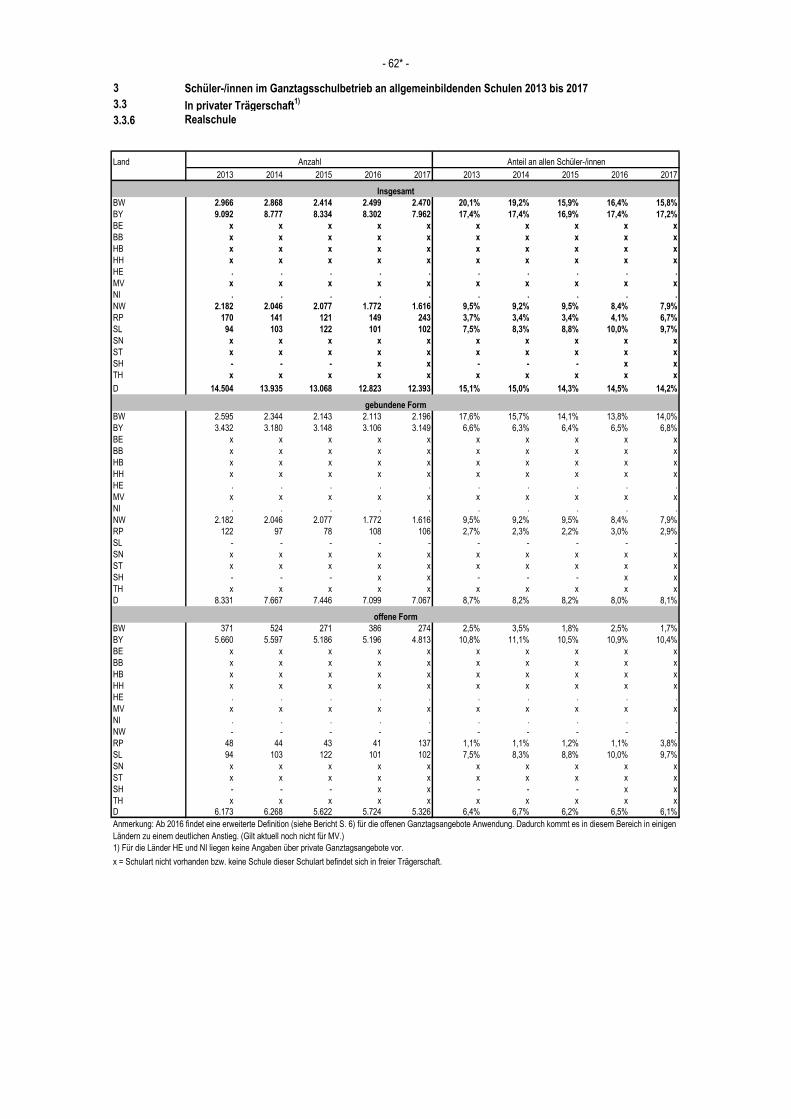
3 Schüler-/innen im Ganztagsschulbetrieb an allgemeinbildenden Schulen 2013 bis 2017
3.3 In privater Trägerschaft1)
3.3.6 Realschule
Land
2013 2014 2015 2016 2017 2013 2014 2015 2016 2017
BW 2.966 2.868 2.414 2.499 2.470 20,1% 19,2% 15,9% 16,4% 15,8%
BY 9.092 8.777 8.334 8.302 7.962 17,4% 17,4% 16,9% 17,4% 17,2%
BE x x x x x x x x x x
BB x x x x x x x x x x
HB x x x x x x x x x x
HH x x x x x x x x x x
HE . . . . . . . . . .
MV x x x x x x x x x x
NI . . . . . . . . . .
NW 2.182 2.046 2.077 1.772 1.616 9,5% 9,2% 9,5% 8,4% 7,9%
RP 170 141 121 149 243 3,7% 3,4% 3,4% 4,1% 6,7%
SL 94 103 122 101 102 7,5% 8,3% 8,8% 10,0% 9,7%
SN x x x x x x x x x x
ST x x x x x x x x x x
SH - - - x x - - - x x
TH x x x x x x x x x x
D 14.504 13.935 13.068 12.823 12.393 15,1% 15,0% 14,3% 14,5% 14,2%
BW 2.595 2.344 2.143 2.113 2.196 17,6% 15,7% 14,1% 13,8% 14,0%
BY 3.432 3.180 3.148 3.106 3.149 6,6% 6,3% 6,4% 6,5% 6,8%
BE x x x x x x x x x x
BB x x x x x x x x x x
HB x x x x x x x x x x
HH x x x x x x x x x x
HE . . . . . . . . . .
MV x x x x x x x x x x
NI . . . . . . . . . .
NW 2.182 2.046 2.077 1.772 1.616 9,5% 9,2% 9,5% 8,4% 7,9%
RP 122 97 78 108 106 2,7% 2,3% 2,2% 3,0% 2,9%
SL - - - - - - - - - -
SN x x x x x x x x x x
ST x x x x x x x x x x
SH - - - x x - - - x x
TH x x x x x x x x x x
D 8.331 7.667 7.446 7.099 7.067 8,7% 8,2% 8,2% 8,0% 8,1%
BW 371 524 271 386 274 2,5% 3,5% 1,8% 2,5% 1,7%
BY 5.660 5.597 5.186 5.196 4.813 10,8% 11,1% 10,5% 10,9% 10,4%
BE x x x x x x x x x x
BB x x x x x x x x x x
HB x x x x x x x x x x
HH x x x x x x x x x x
HE . . . . . . . . . .
MV x x x x x x x x x x
NI . . . . . . . . . .
NW - - - - - - - - - -
RP 48 44 43 41 137 1,1% 1,1% 1,2% 1,1% 3,8%
SL 94 103 122 101 102 7,5% 8,3% 8,8% 10,0% 9,7%
SN x x x x x x x x x x
ST x x x x x x x x x x
SH - - - x x - - - x x
TH x x x x x x x x x x
D 6.173 6.268 5.622 5.724 5.326 6,4% 6,7% 6,2% 6,5% 6,1%
x = Schulart nicht vorhanden bzw. keine Schule dieser Schulart befindet sich in freier Trägerschaft.
1) Für die Länder HE und NI liegen keine Angaben über private Ganztagsangebote vor.
Anzahl Anteil an allen Schüler-/innen
- 62* -
Insgesamt
gebundene Form
offene Form
Anmerkung: Ab 2016 findet eine erweiterte Definition (siehe Bericht S. 6) für die offenen Ganztagsangebote Anwendung. Dadurch kommt es in diesem Bereich in einigen
Ländern zu einem deutlichen Anstieg. (Gilt aktuell noch nicht für MV.)
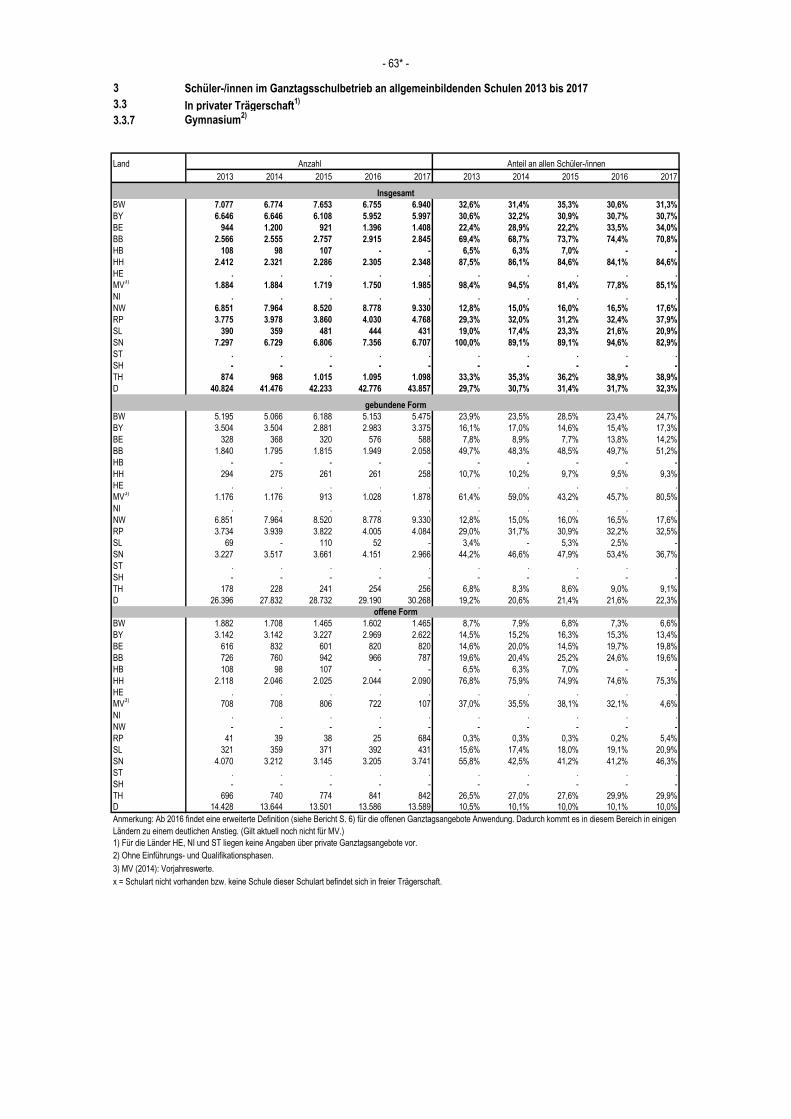
3 Schüler-/innen im Ganztagsschulbetrieb an allgemeinbildenden Schulen 2013 bis 2017
3.3 In privater Trägerschaft1)
3.3.7 Gymnasium2)
Land
2013 2014 2015 2016 2017 2013 2014 2015 2016 2017
BW 7.077 6.774 7.653 6.755 6.940 32,6% 31,4% 35,3% 30,6% 31,3%
BY 6.646 6.646 6.108 5.952 5.997 30,6% 32,2% 30,9% 30,7% 30,7%
BE 944 1.200 921 1.396 1.408 22,4% 28,9% 22,2% 33,5% 34,0%
BB 2.566 2.555 2.757 2.915 2.845 69,4% 68,7% 73,7% 74,4% 70,8%
HB 108 98 107 - - 6,5% 6,3% 7,0% - -
HH 2.412 2.321 2.286 2.305 2.348 87,5% 86,1% 84,6% 84,1% 84,6%
HE . . . . . . . . . .
MV3)
1.884 1.884 1.719 1.750 1.985 98,4% 94,5% 81,4% 77,8% 85,1%
NI . . . . . . . . . .
NW 6.851 7.964 8.520 8.778 9.330 12,8% 15,0% 16,0% 16,5% 17,6%
RP 3.775 3.978 3.860 4.030 4.768 29,3% 32,0% 31,2% 32,4% 37,9%
SL 390 359 481 444 431 19,0% 17,4% 23,3% 21,6% 20,9%
SN 7.297 6.729 6.806 7.356 6.707 100,0% 89,1% 89,1% 94,6% 82,9%
ST . . . . . . . . . .
SH - - - - - - - - - -
TH 874 968 1.015 1.095 1.098 33,3% 35,3% 36,2% 38,9% 38,9%
D 40.824 41.476 42.233 42.776 43.857 29,7% 30,7% 31,4% 31,7% 32,3%
BW 5.195 5.066 6.188 5.153 5.475 23,9% 23,5% 28,5% 23,4% 24,7%
BY 3.504 3.504 2.881 2.983 3.375 16,1% 17,0% 14,6% 15,4% 17,3%
BE 328 368 320 576 588 7,8% 8,9% 7,7% 13,8% 14,2%
BB 1.840 1.795 1.815 1.949 2.058 49,7% 48,3% 48,5% 49,7% 51,2%
HB - - - - - - - - - -
HH 294 275 261 261 258 10,7% 10,2% 9,7% 9,5% 9,3%
HE . . . . . . . . . .
MV3)
1.176 1.176 913 1.028 1.878 61,4% 59,0% 43,2% 45,7% 80,5%
NI . . . . . . . . . .
NW 6.851 7.964 8.520 8.778 9.330 12,8% 15,0% 16,0% 16,5% 17,6%
RP 3.734 3.939 3.822 4.005 4.084 29,0% 31,7% 30,9% 32,2% 32,5%
SL 69 - 110 52 - 3,4% - 5,3% 2,5% -
SN 3.227 3.517 3.661 4.151 2.966 44,2% 46,6% 47,9% 53,4% 36,7%
ST . . . . . . . . . .
SH - - - - - - - - - -
TH 178 228 241 254 256 6,8% 8,3% 8,6% 9,0% 9,1%
D 26.396 27.832 28.732 29.190 30.268 19,2% 20,6% 21,4% 21,6% 22,3%
BW 1.882 1.708 1.465 1.602 1.465 8,7% 7,9% 6,8% 7,3% 6,6%
BY 3.142 3.142 3.227 2.969 2.622 14,5% 15,2% 16,3% 15,3% 13,4%
BE 616 832 601 820 820 14,6% 20,0% 14,5% 19,7% 19,8%
BB 726 760 942 966 787 19,6% 20,4% 25,2% 24,6% 19,6%
HB 108 98 107 - - 6,5% 6,3% 7,0% - -
HH 2.118 2.046 2.025 2.044 2.090 76,8% 75,9% 74,9% 74,6% 75,3%
HE . . . . . . . . . .
MV3)
708 708 806 722 107 37,0% 35,5% 38,1% 32,1% 4,6%
NI . . . . . . . . . .
NW - - - - - - - - - -
RP 41 39 38 25 684 0,3% 0,3% 0,3% 0,2% 5,4%
SL 321 359 371 392 431 15,6% 17,4% 18,0% 19,1% 20,9%
SN 4.070 3.212 3.145 3.205 3.741 55,8% 42,5% 41,2% 41,2% 46,3%
ST . . . . . . . . . .
SH - - - - - - - - - -
TH 696 740 774 841 842 26,5% 27,0% 27,6% 29,9% 29,9%
D 14.428 13.644 13.501 13.586 13.589 10,5% 10,1% 10,0% 10,1% 10,0%
3) MV (2014): Vorjahreswerte.
x = Schulart nicht vorhanden bzw. keine Schule dieser Schulart befindet sich in freier Trägerschaft.
2) Ohne Einführungs- und Qualifikationsphasen.
Anzahl Anteil an allen Schüler-/innen
- 63* -
Insgesamt
gebundene Form
offene Form
1) Für die Länder HE, NI und ST liegen keine Angaben über private Ganztagsangebote vor.
Anmerkung: Ab 2016 findet eine erweiterte Definition (siehe Bericht S. 6) für die offenen Ganztagsangebote Anwendung. Dadurch kommt es in diesem Bereich in einigen
Ländern zu einem deutlichen Anstieg. (Gilt aktuell noch nicht für MV.)
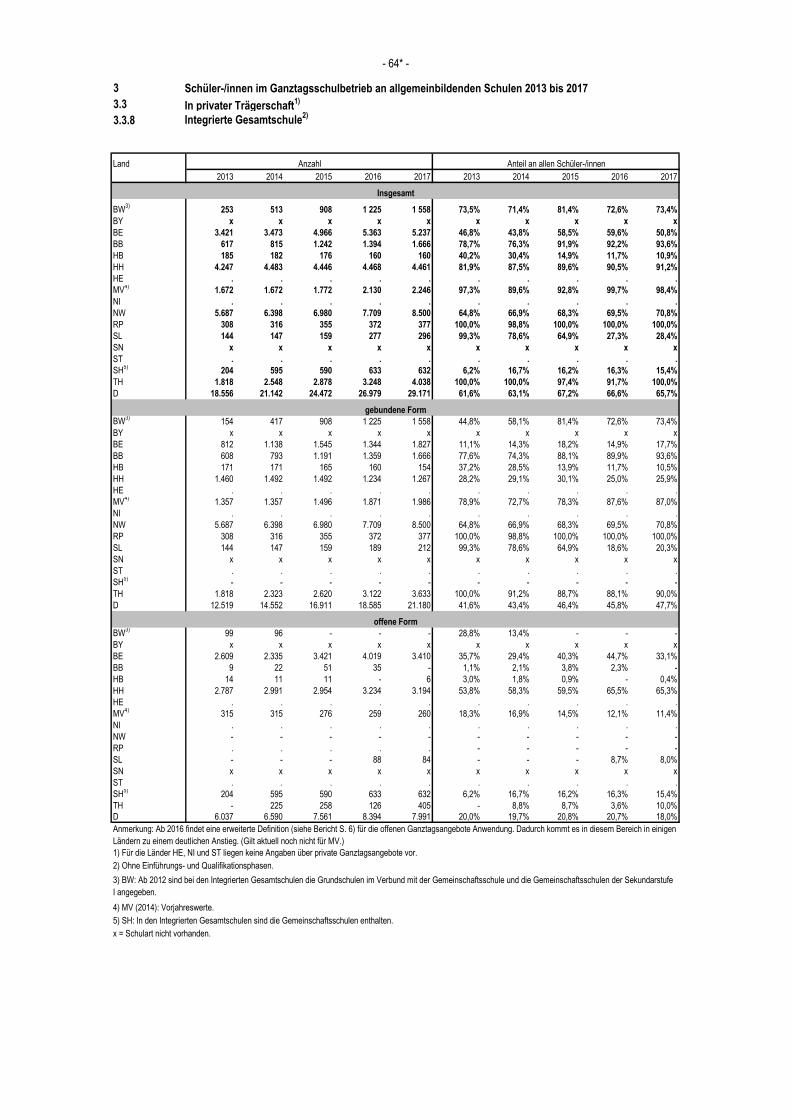
3 Schüler-/innen im Ganztagsschulbetrieb an allgemeinbildenden Schulen 2013 bis 2017
3.3 In privater Trägerschaft1)
3.3.8 Integrierte Gesamtschule2)
Land
2013 2014 2015 2016 2017 2013 2014 2015 2016 2017
BW3)
253 513 908 1 225 1 558 73,5% 71,4% 81,4% 72,6% 73,4%
BY x x x x x x x x x x
BE 3.421 3.473 4.966 5.363 5.237 46,8% 43,8% 58,5% 59,6% 50,8%
BB 617 815 1.242 1.394 1.666 78,7% 76,3% 91,9% 92,2% 93,6%
HB 185 182 176 160 160 40,2% 30,4% 14,9% 11,7% 10,9%
HH 4.247 4.483 4.446 4.468 4.461 81,9% 87,5% 89,6% 90,5% 91,2%
HE . . . . . . . . . .
MV4)
1.672 1.672 1.772 2.130 2.246 97,3% 89,6% 92,8% 99,7% 98,4%
NI . . . . . . . . . .
NW 5.687 6.398 6.980 7.709 8.500 64,8% 66,9% 68,3% 69,5% 70,8%
RP 308 316 355 372 377 100,0% 98,8% 100,0% 100,0% 100,0%
SL 144 147 159 277 296 99,3% 78,6% 64,9% 27,3% 28,4%
SN x x x x x x x x x x
ST . . . . . . . . . .
SH5)
204 595 590 633 632 6,2% 16,7% 16,2% 16,3% 15,4%
TH 1.818 2.548 2.878 3.248 4.038 100,0% 100,0% 97,4% 91,7% 100,0%
D 18.556 21.142 24.472 26.979 29.171 61,6% 63,1% 67,2% 66,6% 65,7%
BW3)
154 417 908 1 225 1 558 44,8% 58,1% 81,4% 72,6% 73,4%
BY x x x x x x x x x x
BE 812 1.138 1.545 1.344 1.827 11,1% 14,3% 18,2% 14,9% 17,7%
BB 608 793 1.191 1.359 1.666 77,6% 74,3% 88,1% 89,9% 93,6%
HB 171 171 165 160 154 37,2% 28,5% 13,9% 11,7% 10,5%
HH 1.460 1.492 1.492 1.234 1.267 28,2% 29,1% 30,1% 25,0% 25,9%
HE . . . . . . . . . .
MV4)
1.357 1.357 1.496 1.871 1.986 78,9% 72,7% 78,3% 87,6% 87,0%
NI . . . . . . . . . .
NW 5.687 6.398 6.980 7.709 8.500 64,8% 66,9% 68,3% 69,5% 70,8%
RP 308 316 355 372 377 100,0% 98,8% 100,0% 100,0% 100,0%
SL 144 147 159 189 212 99,3% 78,6% 64,9% 18,6% 20,3%
SN x x x x x x x x x x
ST . . . . . . . . . .
SH5)
- - - - - - - - - -
TH 1.818 2.323 2.620 3.122 3.633 100,0% 91,2% 88,7% 88,1% 90,0%
D 12.519 14.552 16.911 18.585 21.180 41,6% 43,4% 46,4% 45,8% 47,7%
BW3)
99 96 - - - 28,8% 13,4% - - -
BY x x x x x x x x x x
BE 2.609 2.335 3.421 4.019 3.410 35,7% 29,4% 40,3% 44,7% 33,1%
BB 9 22 51 35 - 1,1% 2,1% 3,8% 2,3% -
HB 14 11 11 - 6 3,0% 1,8% 0,9% - 0,4%
HH 2.787 2.991 2.954 3.234 3.194 53,8% 58,3% 59,5% 65,5% 65,3%
HE . . . . . . . . . .
MV4)
315 315 276 259 260 18,3% 16,9% 14,5% 12,1% 11,4%
NI . . . . . . . . . .
NW - - - - - - - - - -
RP . . . . . - - - - -
SL - - - 88 84 - - - 8,7% 8,0%
SN x x x x x x x x x x
ST . . . . . . . . . .
SH5)
204 595 590 633 632 6,2% 16,7% 16,2% 16,3% 15,4%
TH - 225 258 126 405 - 8,8% 8,7% 3,6% 10,0%
D 6.037 6.590 7.561 8.394 7.991 20,0% 19,7% 20,8% 20,7% 18,0%
4) MV (2014): Vorjahreswerte.
5) SH: In den Integrierten Gesamtschulen sind die Gemeinschaftsschulen enthalten.
x = Schulart nicht vorhanden.
- 64* -
Insgesamt
gebundene Form
offene Form
1) Für die Länder HE, NI und ST liegen keine Angaben über private Ganztagsangebote vor.
2) Ohne Einführungs- und Qualifikationsphasen.
Anzahl Anteil an allen Schüler-/innen
Anmerkung: Ab 2016 findet eine erweiterte Definition (siehe Bericht S. 6) für die offenen Ganztagsangebote Anwendung. Dadurch kommt es in diesem Bereich in einigen
Ländern zu einem deutlichen Anstieg. (Gilt aktuell noch nicht für MV.)
3) BW: Ab 2012 sind bei den Integrierten Gesamtschulen die Grundschulen im Verbund mit der Gemeinschaftsschule und die Gemeinschaftsschulen der Sekundarstufe
I angegeben.
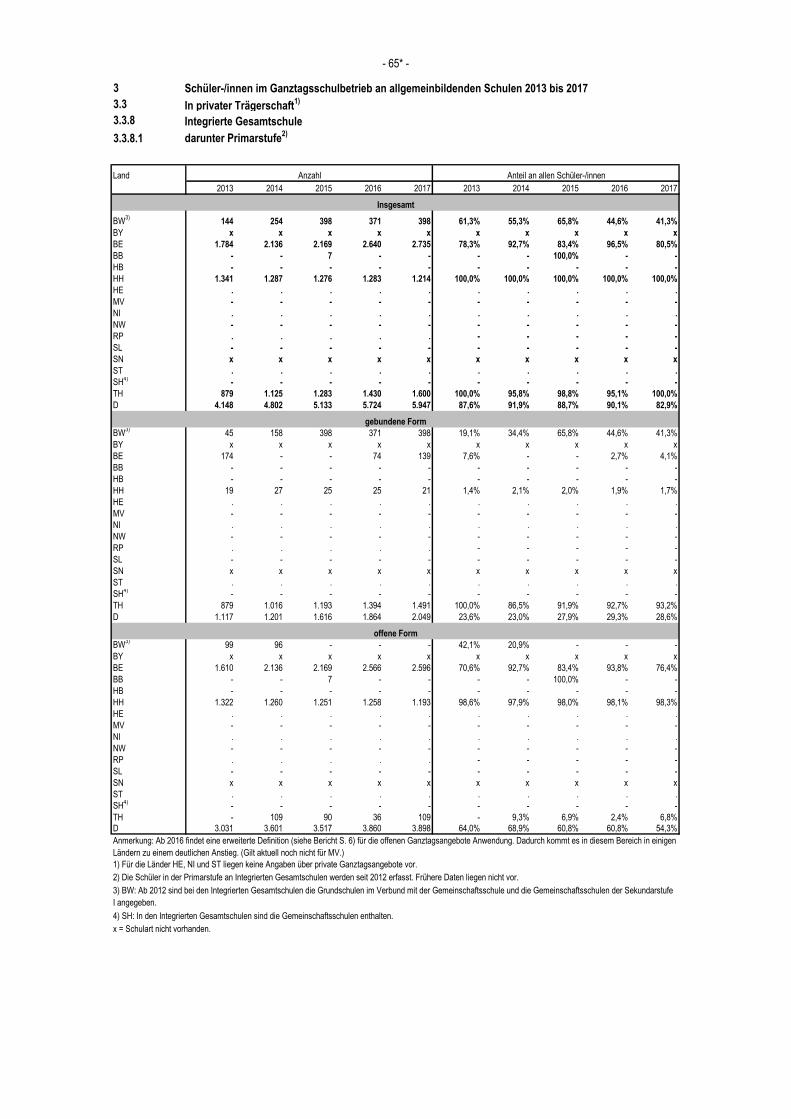
3 Schüler-/innen im Ganztagsschulbetrieb an allgemeinbildenden Schulen 2013 bis 2017
3.3 In privater Trägerschaft1)
3.3.8 Integrierte Gesamtschule
3.3.8.1 darunter Primarstufe2)
Land
2013 2014 2015 2016 2017 2013 2014 2015 2016 2017
BW3)
144 254 398 371 398 61,3% 55,3% 65,8% 44,6% 41,3%
BY x x x x x x x x x x
BE 1.784 2.136 2.169 2.640 2.735 78,3% 92,7% 83,4% 96,5% 80,5%
BB - - 7 - - - - 100,0% - -
HB - - - - - - - - - -
HH 1.341 1.287 1.276 1.283 1.214 100,0% 100,0% 100,0% 100,0% 100,0%
HE . . . . . . . . . .
MV - - - - - - - - - -
NI . . . . . . . . . .
NW - - - - - - - - - -
RP . . . . . - - - - -
SL - - - - - - - - - -
SN x x x x x x x x x x
ST . . . . . . . . . .
SH4)
- - - - - - - - - -
TH 879 1.125 1.283 1.430 1.600 100,0% 95,8% 98,8% 95,1% 100,0%
D 4.148 4.802 5.133 5.724 5.947 87,6% 91,9% 88,7% 90,1% 82,9%
BW3)
45 158 398 371 398 19,1% 34,4% 65,8% 44,6% 41,3%
BY x x x x x x x x x x
BE 174 - - 74 139 7,6% - - 2,7% 4,1%
BB - - - - - - - - - -
HB - - - - - - - - - -
HH 19 27 25 25 21 1,4% 2,1% 2,0% 1,9% 1,7%
HE . . . . . . . . . .
MV - - - - - - - - - -
NI . . . . . . . . . .
NW - - - - - - - - - -
RP . . . . . - - - - -
SL - - - - - - - - - -
SN x x x x x x x x x x
ST . . . . . . . . . .
SH4)
- - - - - - - - - -
TH 879 1.016 1.193 1.394 1.491 100,0% 86,5% 91,9% 92,7% 93,2%
D 1.117 1.201 1.616 1.864 2.049 23,6% 23,0% 27,9% 29,3% 28,6%
BW3)
99 96 - - - 42,1% 20,9% - - -
BY x x x x x x x x x x
BE 1.610 2.136 2.169 2.566 2.596 70,6% 92,7% 83,4% 93,8% 76,4%
BB - - 7 - - - - 100,0% - -
HB - - - - - - - - - -
HH 1.322 1.260 1.251 1.258 1.193 98,6% 97,9% 98,0% 98,1% 98,3%
HE . . . . . . . . . .
MV - - - - - - - - - -
NI . . . . . . . . . .
NW - - - - - - - - - -
RP . . . . . - - - - -
SL - - - - - - - - - -
SN x x x x x x x x x x
ST . . . . . . . . . .
SH4)
- - - - - - - - - -
TH - 109 90 36 109 - 9,3% 6,9% 2,4% 6,8%
D 3.031 3.601 3.517 3.860 3.898 64,0% 68,9% 60,8% 60,8% 54,3%
4) SH: In den Integrierten Gesamtschulen sind die Gemeinschaftsschulen enthalten.
x = Schulart nicht vorhanden.
3) BW: Ab 2012 sind bei den Integrierten Gesamtschulen die Grundschulen im Verbund mit der Gemeinschaftsschule und die Gemeinschaftsschulen der Sekundarstufe
I angegeben.
2) Die Schüler in der Primarstufe an Integrierten Gesamtschulen werden seit 2012 erfasst. Frühere Daten liegen nicht vor.
- 65* -
Insgesamt
gebundene Form
offene Form
1) Für die Länder HE, NI und ST liegen keine Angaben über private Ganztagsangebote vor.
Anzahl Anteil an allen Schüler-/innen
Anmerkung: Ab 2016 findet eine erweiterte Definition (siehe Bericht S. 6) für die offenen Ganztagsangebote Anwendung. Dadurch kommt es in diesem Bereich in einigen
Ländern zu einem deutlichen Anstieg. (Gilt aktuell noch nicht für MV.)
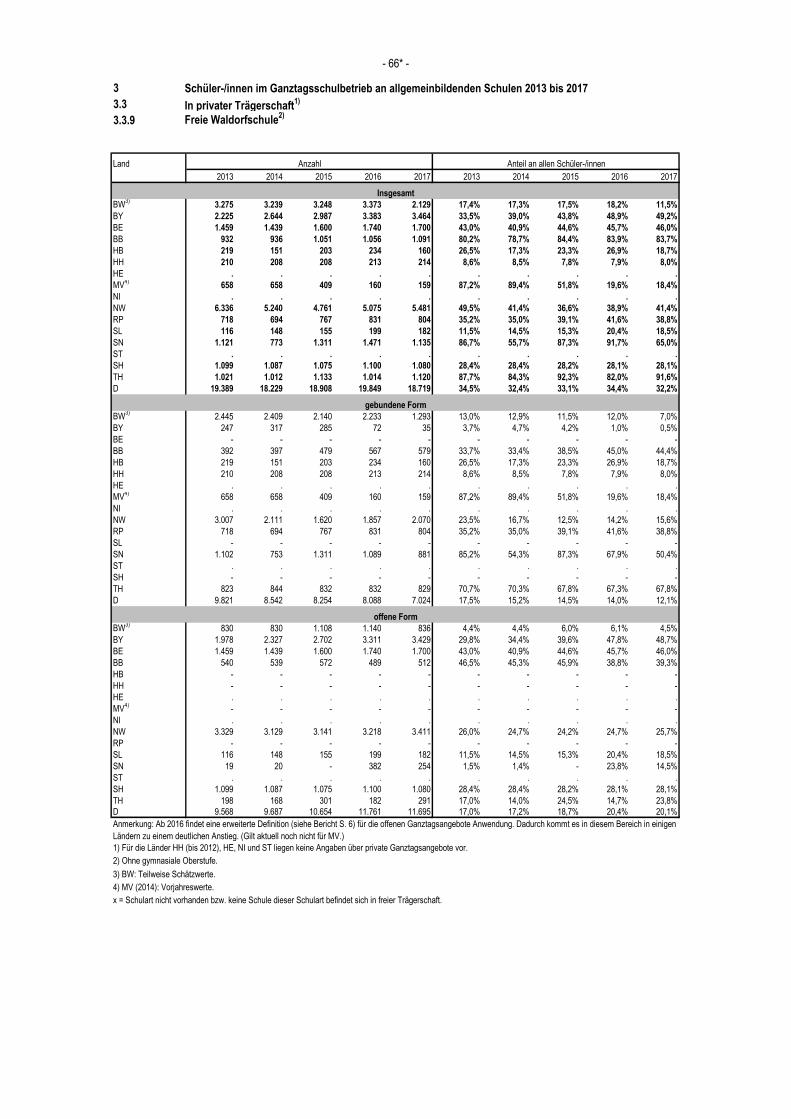
3 Schüler-/innen im Ganztagsschulbetrieb an allgemeinbildenden Schulen 2013 bis 2017
3.3 In privater Trägerschaft1)
3.3.9 Freie Waldorfschule2)
Land
2013 2014 2015 2016 2017 2013 2014 2015 2016 2017
BW3)
3.275 3.239 3.248 3.373 2.129 17,4% 17,3% 17,5% 18,2% 11,5%
BY 2.225 2.644 2.987 3.383 3.464 33,5% 39,0% 43,8% 48,9% 49,2%
BE 1.459 1.439 1.600 1.740 1.700 43,0% 40,9% 44,6% 45,7% 46,0%
BB 932 936 1.051 1.056 1.091 80,2% 78,7% 84,4% 83,9% 83,7%
HB 219 151 203 234 160 26,5% 17,3% 23,3% 26,9% 18,7%
HH 210 208 208 213 214 8,6% 8,5% 7,8% 7,9% 8,0%
HE . . . . . . . . . .
MV4)
658 658 409 160 159 87,2% 89,4% 51,8% 19,6% 18,4%
NI . . . . . . . . . .
NW 6.336 5.240 4.761 5.075 5.481 49,5% 41,4% 36,6% 38,9% 41,4%
RP 718 694 767 831 804 35,2% 35,0% 39,1% 41,6% 38,8%
SL 116 148 155 199 182 11,5% 14,5% 15,3% 20,4% 18,5%
SN 1.121 773 1.311 1.471 1.135 86,7% 55,7% 87,3% 91,7% 65,0%
ST . . . . . . . . . .
SH 1.099 1.087 1.075 1.100 1.080 28,4% 28,4% 28,2% 28,1% 28,1%
TH 1.021 1.012 1.133 1.014 1.120 87,7% 84,3% 92,3% 82,0% 91,6%
D 19.389 18.229 18.908 19.849 18.719 34,5% 32,4% 33,1% 34,4% 32,2%
BW3)
2.445 2.409 2.140 2.233 1.293 13,0% 12,9% 11,5% 12,0% 7,0%
BY 247 317 285 72 35 3,7% 4,7% 4,2% 1,0% 0,5%
BE - - - - - - - - - -
BB 392 397 479 567 579 33,7% 33,4% 38,5% 45,0% 44,4%
HB 219 151 203 234 160 26,5% 17,3% 23,3% 26,9% 18,7%
HH 210 208 208 213 214 8,6% 8,5% 7,8% 7,9% 8,0%
HE . . . . . . . . . .
MV4)
658 658 409 160 159 87,2% 89,4% 51,8% 19,6% 18,4%
NI . . . . . . . . . .
NW 3.007 2.111 1.620 1.857 2.070 23,5% 16,7% 12,5% 14,2% 15,6%
RP 718 694 767 831 804 35,2% 35,0% 39,1% 41,6% 38,8%
SL - - - - - - - - - -
SN 1.102 753 1.311 1.089 881 85,2% 54,3% 87,3% 67,9% 50,4%
ST . . . . . . . . . .
SH - - - - - - - - - -
TH 823 844 832 832 829 70,7% 70,3% 67,8% 67,3% 67,8%
D 9.821 8.542 8.254 8.088 7.024 17,5% 15,2% 14,5% 14,0% 12,1%
BW3)
830 830 1.108 1.140 836 4,4% 4,4% 6,0% 6,1% 4,5%
BY 1.978 2.327 2.702 3.311 3.429 29,8% 34,4% 39,6% 47,8% 48,7%
BE 1.459 1.439 1.600 1.740 1.700 43,0% 40,9% 44,6% 45,7% 46,0%
BB 540 539 572 489 512 46,5% 45,3% 45,9% 38,8% 39,3%
HB - - - - - - - - - -
HH - - - - - - - - - -
HE . . . . . . . . . .
MV4)
- - - - - - - - - -
NI . . . . . . . . . .
NW 3.329 3.129 3.141 3.218 3.411 26,0% 24,7% 24,2% 24,7% 25,7%
RP - - - - - - - - - -
SL 116 148 155 199 182 11,5% 14,5% 15,3% 20,4% 18,5%
SN 19 20 - 382 254 1,5% 1,4% - 23,8% 14,5%
ST . . . . . . . . . .
SH 1.099 1.087 1.075 1.100 1.080 28,4% 28,4% 28,2% 28,1% 28,1%
TH 198 168 301 182 291 17,0% 14,0% 24,5% 14,7% 23,8%
D 9.568 9.687 10.654 11.761 11.695 17,0% 17,2% 18,7% 20,4% 20,1%
3) BW: Teilweise Schätzwerte.
4) MV (2014): Vorjahreswerte.
x = Schulart nicht vorhanden bzw. keine Schule dieser Schulart befindet sich in freier Trägerschaft.
2) Ohne gymnasiale Oberstufe.
Anzahl Anteil an allen Schüler-/innen
- 66* -
Insgesamt
gebundene Form
offene Form
Anmerkung: Ab 2016 findet eine erweiterte Definition (siehe Bericht S. 6) für die offenen Ganztagsangebote Anwendung. Dadurch kommt es in diesem Bereich in einigen
Ländern zu einem deutlichen Anstieg. (Gilt aktuell noch nicht für MV.)
1) Für die Länder HH (bis 2012), HE, NI und ST liegen keine Angaben über private Ganztagsangebote vor.
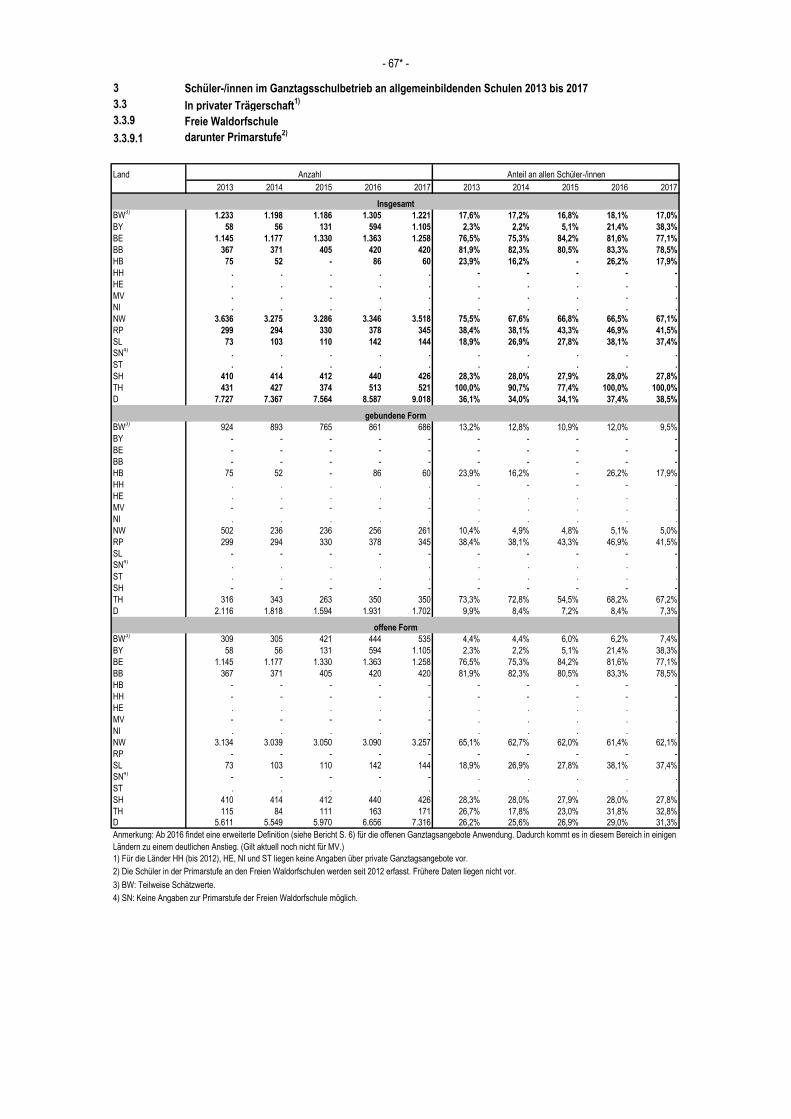
3 Schüler-/innen im Ganztagsschulbetrieb an allgemeinbildenden Schulen 2013 bis 2017
3.3 In privater Trägerschaft1)
3.3.9 Freie Waldorfschule
3.3.9.1 darunter Primarstufe2)
Land
2013 2014 2015 2016 2017 2013 2014 2015 2016 2017
BW3)
1.233 1.198 1.186 1.305 1.221 17,6% 17,2% 16,8% 18,1% 17,0%
BY 58 56 131 594 1.105 2,3% 2,2% 5,1% 21,4% 38,3%
BE 1.145 1.177 1.330 1.363 1.258 76,5% 75,3% 84,2% 81,6% 77,1%
BB 367 371 405 420 420 81,9% 82,3% 80,5% 83,3% 78,5%
HB 75 52 - 86 60 23,9% 16,2% - 26,2% 17,9%
HH . . . . . - - - - -
HE . . . . . . . . . .
MV . . . . . . . . . .
NI . . . . . . . . . .
NW 3.636 3.275 3.286 3.346 3.518 75,5% 67,6% 66,8% 66,5% 67,1%
RP 299 294 330 378 345 38,4% 38,1% 43,3% 46,9% 41,5%
SL 73 103 110 142 144 18,9% 26,9% 27,8% 38,1% 37,4%
SN4)
. . . . . . . . . .
ST . . . . . . . . . .
SH 410 414 412 440 426 28,3% 28,0% 27,9% 28,0% 27,8%
TH 431 427 374 513 521 100,0% 90,7% 77,4% 100,0% 100,0%
D 7.727 7.367 7.564 8.587 9.018 36,1% 34,0% 34,1% 37,4% 38,5%
BW3)
924 893 765 861 686 13,2% 12,8% 10,9% 12,0% 9,5%
BY - - - - - - - - - -
BE - - - - - - - - - -
BB - - - - - - - - - -
HB 75 52 - 86 60 23,9% 16,2% - 26,2% 17,9%
HH . . . . . - - - - -
HE . . . . . . . . . .
MV - - - - - . . . . .
NI . . . . . . . . . .
NW 502 236 236 256 261 10,4% 4,9% 4,8% 5,1% 5,0%
RP 299 294 330 378 345 38,4% 38,1% 43,3% 46,9% 41,5%
SL - - - - - - - - - -
SN4)
. . . . . . . . . .
ST . . . . . . . . . .
SH - - - - - - - - - -
TH 316 343 263 350 350 73,3% 72,8% 54,5% 68,2% 67,2%
D 2.116 1.818 1.594 1.931 1.702 9,9% 8,4% 7,2% 8,4% 7,3%
BW3)
309 305 421 444 535 4,4% 4,4% 6,0% 6,2% 7,4%
BY 58 56 131 594 1.105 2,3% 2,2% 5,1% 21,4% 38,3%
BE 1.145 1.177 1.330 1.363 1.258 76,5% 75,3% 84,2% 81,6% 77,1%
BB 367 371 405 420 420 81,9% 82,3% 80,5% 83,3% 78,5%
HB - - - - - - - - - -
HH - - - - - - - - - -
HE . . . . . . . . . .
MV - - - - - . . . . .
NI . . . . . . . . . .
NW 3.134 3.039 3.050 3.090 3.257 65,1% 62,7% 62,0% 61,4% 62,1%
RP - - - - - - - - - -
SL 73 103 110 142 144 18,9% 26,9% 27,8% 38,1% 37,4%
SN4)
- - - - - . . . . .
ST . . . . . . . . . .
SH 410 414 412 440 426 28,3% 28,0% 27,9% 28,0% 27,8%
TH 115 84 111 163 171 26,7% 17,8% 23,0% 31,8% 32,8%
D 5.611 5.549 5.970 6.656 7.316 26,2% 25,6% 26,9% 29,0% 31,3%
3) BW: Teilweise Schätzwerte.
4) SN: Keine Angaben zur Primarstufe der Freien Waldorfschule möglich.
1) Für die Länder HH (bis 2012), HE, NI und ST liegen keine Angaben über private Ganztagsangebote vor.
2) Die Schüler in der Primarstufe an den Freien Waldorfschulen werden seit 2012 erfasst. Frühere Daten liegen nicht vor.
Anzahl Anteil an allen Schüler-/innen
- 67* -
Insgesamt
gebundene Form
offene Form
Anmerkung: Ab 2016 findet eine erweiterte Definition (siehe Bericht S. 6) für die offenen Ganztagsangebote Anwendung. Dadurch kommt es in diesem Bereich in einigen
Ländern zu einem deutlichen Anstieg. (Gilt aktuell noch nicht für MV.)
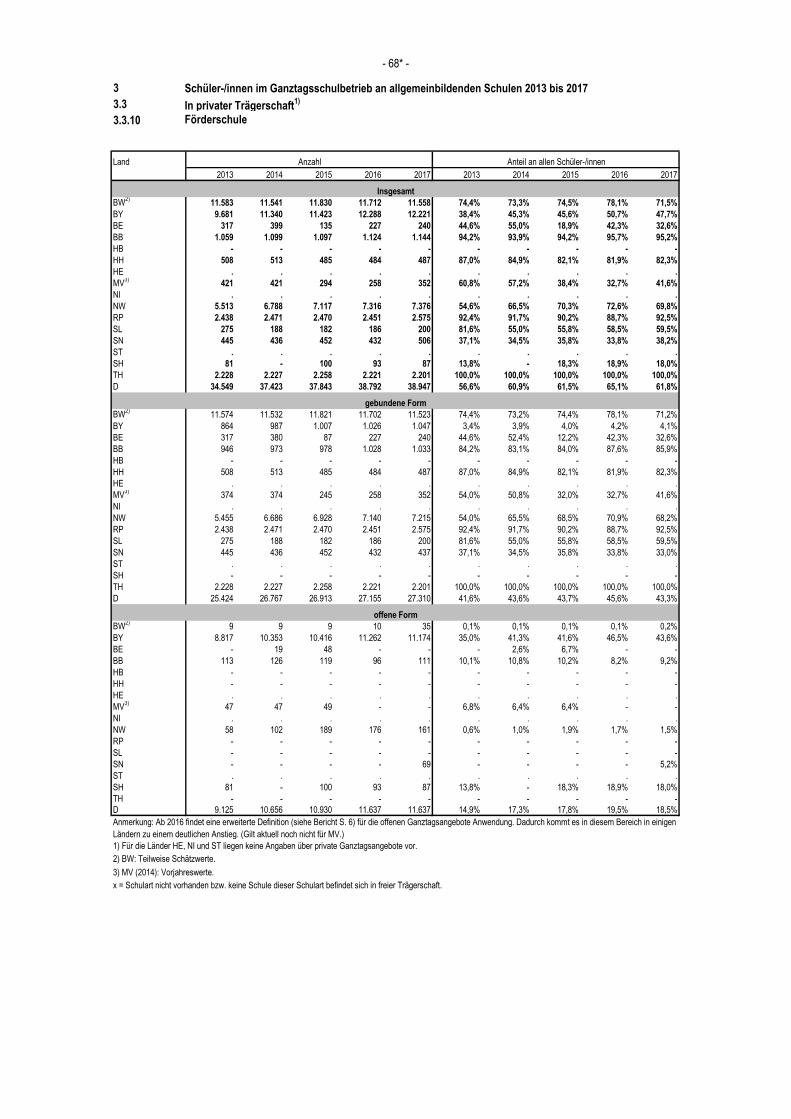
3 Schüler-/innen im Ganztagsschulbetrieb an allgemeinbildenden Schulen 2013 bis 2017
3.3 In privater Trägerschaft1)
3.3.10 Förderschule
Land
2013 2014 2015 2016 2017 2013 2014 2015 2016 2017
BW2)
11.583 11.541 11.830 11.712 11.558 74,4% 73,3% 74,5% 78,1% 71,5%
BY 9.681 11.340 11.423 12.288 12.221 38,4% 45,3% 45,6% 50,7% 47,7%
BE 317 399 135 227 240 44,6% 55,0% 18,9% 42,3% 32,6%
BB 1.059 1.099 1.097 1.124 1.144 94,2% 93,9% 94,2% 95,7% 95,2%
HB - - - - - - - - - -
HH 508 513 485 484 487 87,0% 84,9% 82,1% 81,9% 82,3%
HE . . . . . . . . . .
MV3)
421 421 294 258 352 60,8% 57,2% 38,4% 32,7% 41,6%
NI . . . . . . . . . .
NW 5.513 6.788 7.117 7.316 7.376 54,6% 66,5% 70,3% 72,6% 69,8%
RP 2.438 2.471 2.470 2.451 2.575 92,4% 91,7% 90,2% 88,7% 92,5%
SL 275 188 182 186 200 81,6% 55,0% 55,8% 58,5% 59,5%
SN 445 436 452 432 506 37,1% 34,5% 35,8% 33,8% 38,2%
ST . . . . . . . . . .
SH 81 - 100 93 87 13,8% - 18,3% 18,9% 18,0%
TH 2.228 2.227 2.258 2.221 2.201 100,0% 100,0% 100,0% 100,0% 100,0%
D 34.549 37.423 37.843 38.792 38.947 56,6% 60,9% 61,5% 65,1% 61,8%
BW2)
11.574 11.532 11.821 11.702 11.523 74,4% 73,2% 74,4% 78,1% 71,2%
BY 864 987 1.007 1.026 1.047 3,4% 3,9% 4,0% 4,2% 4,1%
BE 317 380 87 227 240 44,6% 52,4% 12,2% 42,3% 32,6%
BB 946 973 978 1.028 1.033 84,2% 83,1% 84,0% 87,6% 85,9%
HB - - - - - - - - - -
HH 508 513 485 484 487 87,0% 84,9% 82,1% 81,9% 82,3%
HE . . . . . . . . . .
MV3)
374 374 245 258 352 54,0% 50,8% 32,0% 32,7% 41,6%
NI . . . . . . . . . .
NW 5.455 6.686 6.928 7.140 7.215 54,0% 65,5% 68,5% 70,9% 68,2%
RP 2.438 2.471 2.470 2.451 2.575 92,4% 91,7% 90,2% 88,7% 92,5%
SL 275 188 182 186 200 81,6% 55,0% 55,8% 58,5% 59,5%
SN 445 436 452 432 437 37,1% 34,5% 35,8% 33,8% 33,0%
ST . . . . . . . . . .
SH - - - - - - - - - -
TH 2.228 2.227 2.258 2.221 2.201 100,0% 100,0% 100,0% 100,0% 100,0%
D 25.424 26.767 26.913 27.155 27.310 41,6% 43,6% 43,7% 45,6% 43,3%
BW2)
9 9 9 10 35 0,1% 0,1% 0,1% 0,1% 0,2%
BY 8.817 10.353 10.416 11.262 11.174 35,0% 41,3% 41,6% 46,5% 43,6%
BE - 19 48 - - - 2,6% 6,7% - -
BB 113 126 119 96 111 10,1% 10,8% 10,2% 8,2% 9,2%
HB - - - - - - - - - -
HH - - - - - - - - - -
HE . . . . . . . . . .
MV3)
47 47 49 - - 6,8% 6,4% 6,4% - -
NI . . . . . . . . . .
NW 58 102 189 176 161 0,6% 1,0% 1,9% 1,7% 1,5%
RP - - - - - - - - - -
SL - - - - - - - - - -
SN - - - - 69 - - - - 5,2%
ST . . . . . . . . . .
SH 81 - 100 93 87 13,8% - 18,3% 18,9% 18,0%
TH - - - - - - - - - -
D 9.125 10.656 10.930 11.637 11.637 14,9% 17,3% 17,8% 19,5% 18,5%
3) MV (2014): Vorjahreswerte.
x = Schulart nicht vorhanden bzw. keine Schule dieser Schulart befindet sich in freier Trägerschaft.
2) BW: Teilweise Schätzwerte.
Anzahl Anteil an allen Schüler-/innen
- 68* -
Insgesamt
gebundene Form
offene Form
1) Für die Länder HE, NI und ST liegen keine Angaben über private Ganztagsangebote vor.
Anmerkung: Ab 2016 findet eine erweiterte Definition (siehe Bericht S. 6) für die offenen Ganztagsangebote Anwendung. Dadurch kommt es in diesem Bereich in einigen
Ländern zu einem deutlichen Anstieg. (Gilt aktuell noch nicht für MV.)