Embed Size (px)
Citation preview
Fachtagung “Lasermethoden in der Strömungsmesstechnik” 3. – 5. September 2013, München
ANALYSE DER WELLENAUSBREITUNG IN TRANSSONISCHER BUFFET-STRÖMUNG ANALYSIS OF WAVE PROPAGATION IN TRANSONIC BUFFET FLOW
Antje Feldhusen, Axel Hartmann, Michael Klaas, Wolfgang Schröder Aerodynamisches Institut, RWTH Aachen, Wüllnerstraße 5a, 52062 Aachen
Transonic flow, buffet, particle-image velocimetry
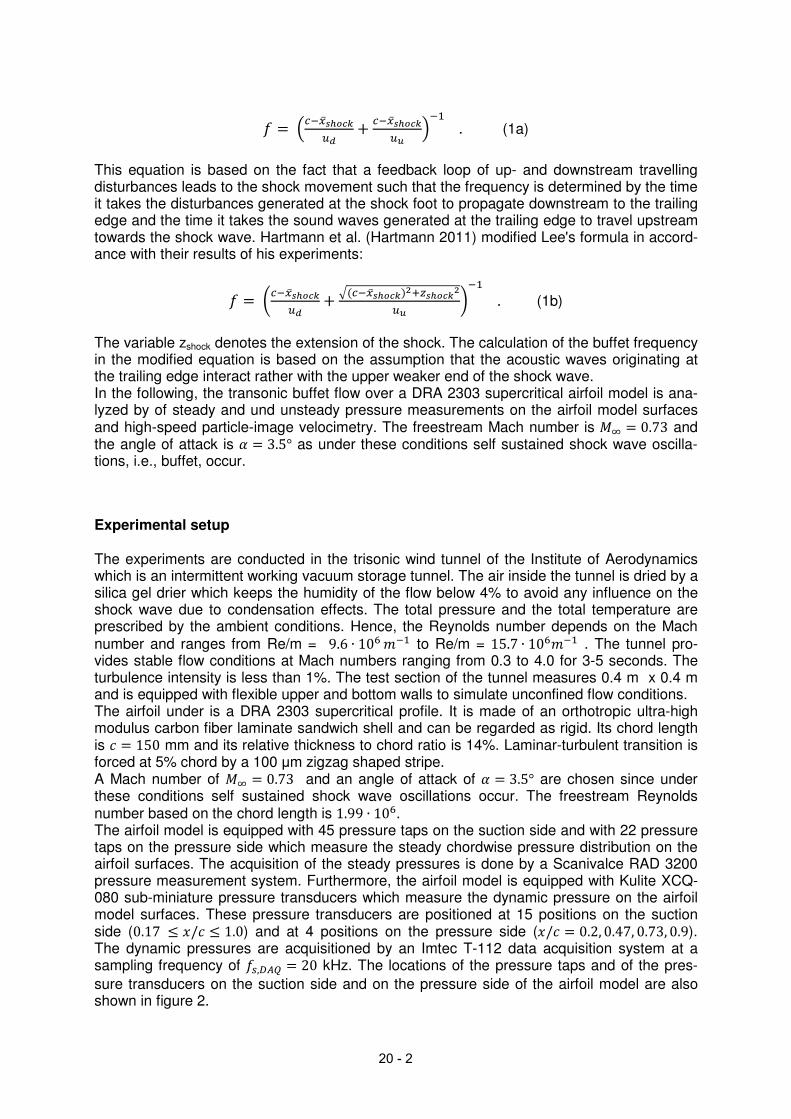
Introduction The transonic buffet flow over a supercritical DRA 2303 airfoil model is analyzed using steady and unsteady pressure measurements in combination with high-speed particle-image velocimetry. Transonic flows over supercritical airfoils are characterized by a local supersonic region and a shock wave on the suction side of the airfoil. Under certain conditions, which depend on the freestream Mach number �� and on the angle of attack α, self-sustained shock wave oscillations can occur and the resulting unsteady loads acting on the wing may lead to a critical state for the wing structure. Studies on this topic can be found, e.g., in Jacquin 2009 or Crouch 2009. However, the mechanisms which lead to this buffet phenome-non are not fully understood, yet. A model for buffet was given by Lee (Lee 2001). According to his model, low frequency disturbances are generated at the shock foot and propagate downstream at the velocity ��. When these disturbances pass the trailing edge, new high frequency disturbances are generated that propagate upstream at the velocity �� and force the shock wave to move into the upstream direction. The buffet suggested by Lee is shown in figure 1.
Fig. 1: Transonic buffet flow over a supercritical airfoil according to ( Lee 2001)
The experiments conducted by Hartmann et al. (Hartmann 2011, Hartmann 2012) revealed that the high frequency disturbances generated at the trailing edge are sound waves and that their varying sound pressure level causes the shock movement. The sound pressure level varies due to the fact that the change of the shock wave position leads to a modification of the separated region downstream of the shock, which results in a modification of the trailing-edge noise. According to Lee the buffet frequency can be calculated by
20 - 1
� = ��̅������� + ��̅������� ��� . (1a)
This equation is based on the fact that a feedback loop of up- and downstream travelling disturbances leads to the shock movement such that the frequency is determined by the time it takes the disturbances generated at the shock foot to propagate downstream to the trailing edge and the time it takes the sound waves generated at the trailing edge to travel upstream towards the shock wave. Hartmann et al. (Hartmann 2011) modified Lee's formula in accord-ance with their results of his experiments:
� = ���̅������� + �(��̅�����)����������� ��� . (1b)
The variable zshock denotes the extension of the shock. The calculation of the buffet frequency in the modified equation is based on the assumption that the acoustic waves originating at the trailing edge interact rather with the upper weaker end of the shock wave. In the following, the transonic buffet flow over a DRA 2303 supercritical airfoil model is ana-lyzed by of steady and und unsteady pressure measurements on the airfoil model surfaces and high-speed particle-image velocimetry. The freestream Mach number is �� = 0.73 and the angle of attack is $ = 3.5° as under these conditions self sustained shock wave oscilla-tions, i.e., buffet, occur.
Experimental setup
The experiments are conducted in the trisonic wind tunnel of the Institute of Aerodynamics which is an intermittent working vacuum storage tunnel. The air inside the tunnel is dried by a silica gel drier which keeps the humidity of the flow below 4% to avoid any influence on the shock wave due to condensation effects. The total pressure and the total temperature are prescribed by the ambient conditions. Hence, the Reynolds number depends on the Mach number and ranges from Re/m = 9.6 ∙ 10+,��to Re/m = 15.7 ∙ 10+,�� . The tunnel pro-vides stable flow conditions at Mach numbers ranging from 0.3 to 4.0 for 3-5 seconds. The turbulence intensity is less than 1%. The test section of the tunnel measures 0.4 m x 0.4 m and is equipped with flexible upper and bottom walls to simulate unconfined flow conditions. The airfoil under is a DRA 2303 supercritical profile. It is made of an orthotropic ultra-high modulus carbon fiber laminate sandwich shell and can be regarded as rigid. Its chord length is - = 150 mm and its relative thickness to chord ratio is 14%. Laminar-turbulent transition is forced at 5% chord by a 100 µm zigzag shaped stripe. A Mach number of �� = 0.73 and an angle of attack of $ = 3.5° are chosen since under these conditions self sustained shock wave oscillations occur. The freestream Reynolds number based on the chord length is 1.99 ∙ 10+. The airfoil model is equipped with 45 pressure taps on the suction side and with 22 pressure taps on the pressure side which measure the steady chordwise pressure distribution on the airfoil surfaces. The acquisition of the steady pressures is done by a Scanivalce RAD 3200 pressure measurement system. Furthermore, the airfoil model is equipped with Kulite XCQ-080 sub-miniature pressure transducers which measure the dynamic pressure on the airfoil model surfaces. These pressure transducers are positioned at 15 positions on the suction side (0.17 ≤ //- ≤ 1.0) and at 4 positions on the pressure side (//- = 0.2, 0.47, 0.73, 0.9). The dynamic pressures are acquisitioned by an Imtec T-112 data acquisition system at a sampling frequency of �4,567 = 20 kHz. The locations of the pressure taps and of the pres-
sure transducers on the suction side and on the pressure side of the airfoil model are also shown in figure 2.
20 - 2
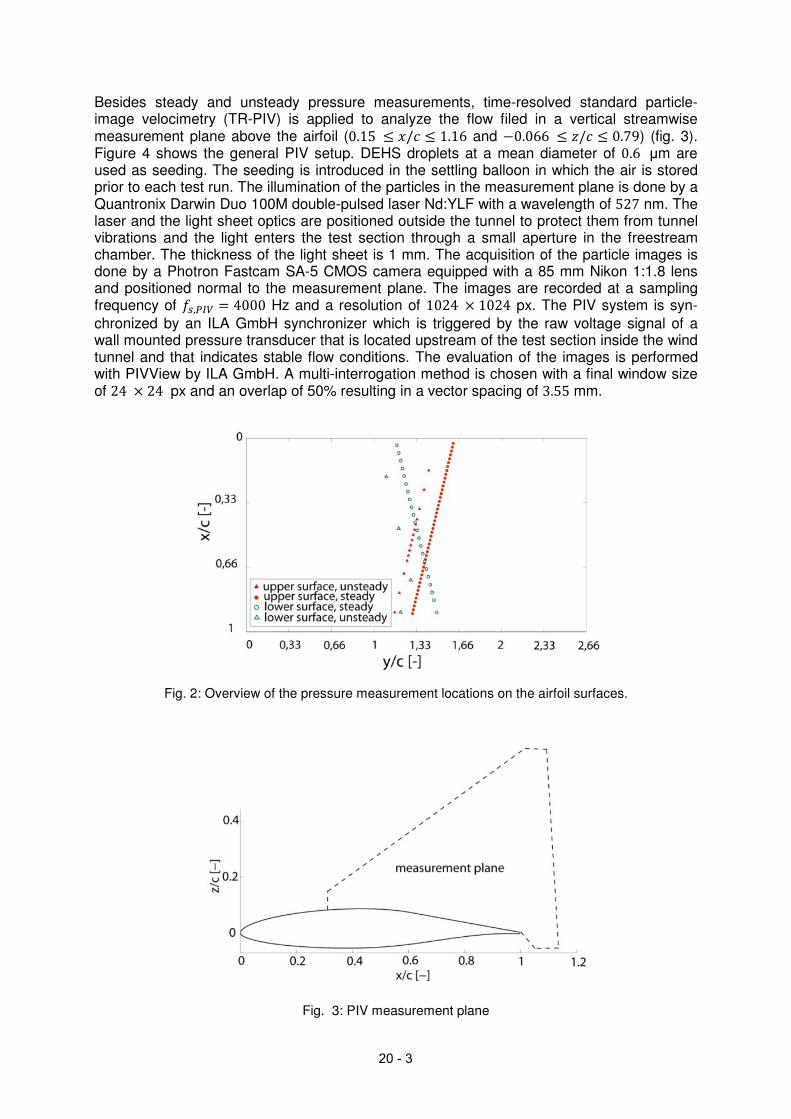
Besides steady and unsteady pressure measurements, time-resolved standard particle-image velocimetry (TR-PIV) is applied to analyze the flow filed in a vertical streamwise measurement plane above the airfoil (0.15 ≤ //- ≤ 1.16 and −0.066 ≤ 9/- ≤ 0.79) (fig. 3). Figure 4 shows the general PIV setup. DEHS droplets at a mean diameter of 0.6 µm are used as seeding. The seeding is introduced in the settling balloon in which the air is stored prior to each test run. The illumination of the particles in the measurement plane is done by a Quantronix Darwin Duo 100M double-pulsed laser Nd:YLF with a wavelength of 527 nm. The laser and the light sheet optics are positioned outside the tunnel to protect them from tunnel vibrations and the light enters the test section through a small aperture in the freestream chamber. The thickness of the light sheet is 1 mm. The acquisition of the particle images is done by a Photron Fastcam SA-5 CMOS camera equipped with a 85 mm Nikon 1:1.8 lens and positioned normal to the measurement plane. The images are recorded at a sampling frequency of �4,:;< = 4000 Hz and a resolution of 1024 × 1024 px. The PIV system is syn-
chronized by an ILA GmbH synchronizer which is triggered by the raw voltage signal of a wall mounted pressure transducer that is located upstream of the test section inside the wind tunnel and that indicates stable flow conditions. The evaluation of the images is performed with PIVView by ILA GmbH. A multi-interrogation method is chosen with a final window size of 24 × 24 px and an overlap of 50% resulting in a vector spacing of 3.55 mm.
Fig. 2: Overview of the pressure measurement locations on the airfoil surfaces.
Fig. 3: PIV measurement plane
20 - 3
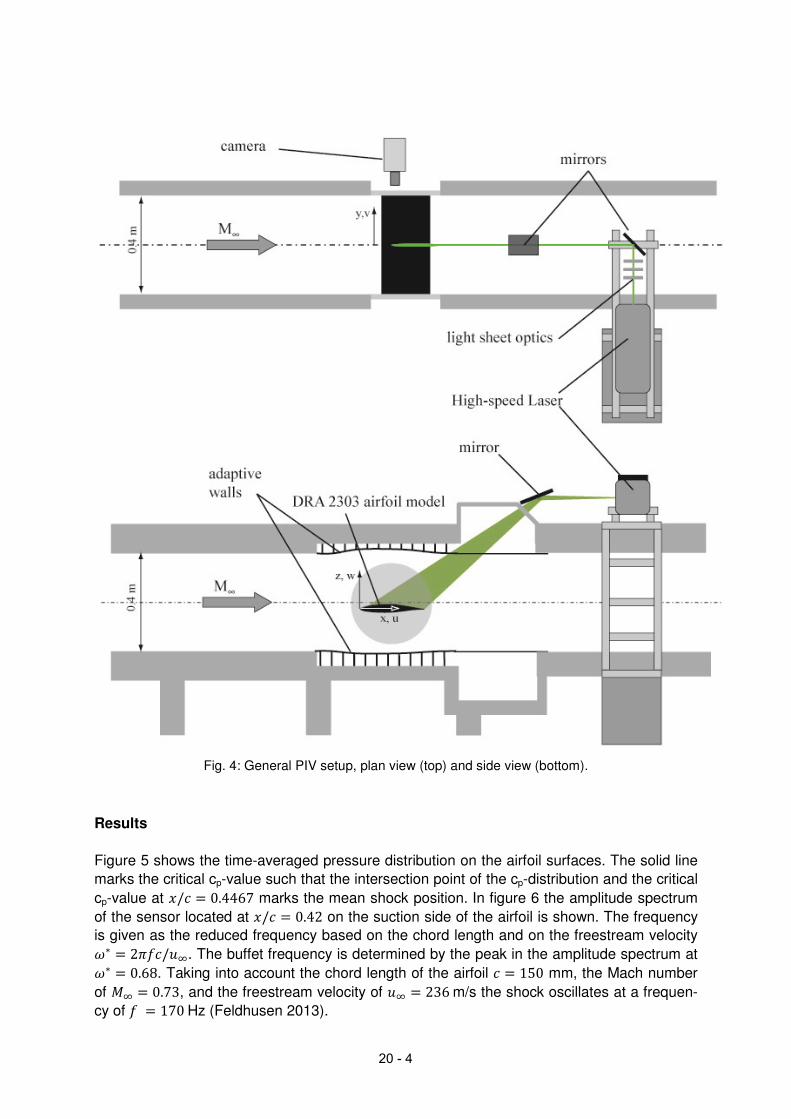
Fig. 4: General PIV setup, plan view (top) and side view (bottom).
Results Figure 5 shows the time-averaged pressure distribution on the airfoil surfaces. The solid line
marks the critical cp-value such that the intersection point of the cp-distribution and the critical
cp-value at //- = 0.4467 marks the mean shock position. In figure 6 the amplitude spectrum
of the sensor located at //- = 0.42 on the suction side of the airfoil is shown. The frequency
is given as the reduced frequency based on the chord length and on the freestream velocity >∗ = 2@�-/��. The buffet frequency is determined by the peak in the amplitude spectrum at >∗ = 0.68. Taking into account the chord length of the airfoil - = 150 mm, the Mach number
of �� = 0.73, and the freestream velocity of �� = 236m/s the shock oscillates at a frequen-
cy of � = 170Hz (Feldhusen 2013).
20 - 4
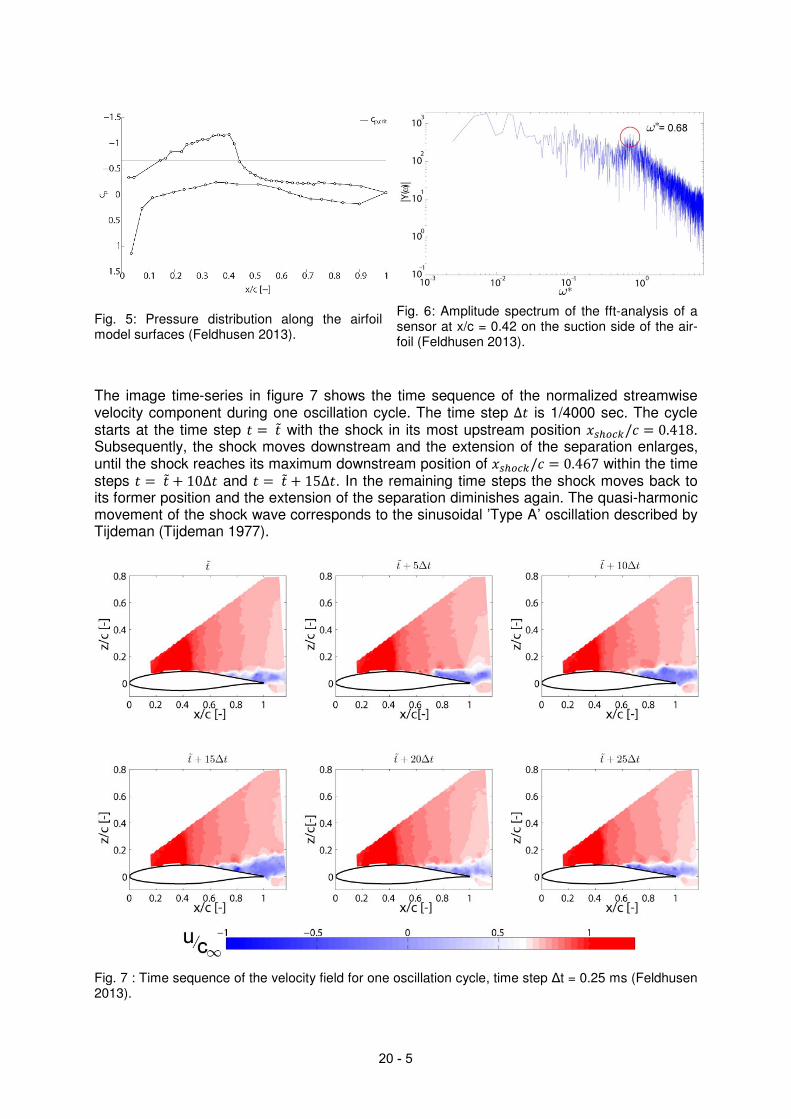
Fig. 5: Pressure distribution along the airfoil model surfaces (Feldhusen 2013).
Fig. 6: Amplitude spectrum of the fft-analysis of a sensor at x/c = 0.42 on the suction side of the air-foil (Feldhusen 2013).
The image time-series in figure 7 shows the time sequence of the normalized streamwise velocity component during one oscillation cycle. The time step ∆C is 1/4000 sec. The cycle starts at the time step C = C̃ with the shock in its most upstream position /4EFG/- = 0.418. Subsequently, the shock moves downstream and the extension of the separation enlarges, until the shock reaches its maximum downstream position of /4EFG/- = 0.467 within the time steps C = C̃ + 10∆C and C = C̃ + 15∆C. In the remaining time steps the shock moves back to its former position and the extension of the separation diminishes again. The quasi-harmonic movement of the shock wave corresponds to the sinusoidal ’Type A’ oscillation described by Tijdeman (Tijdeman 1977).
Fig. 7 : Time sequence of the velocity field for one oscillation cycle, time step ∆t = 0.25 ms (Feldhusen 2013).
20 - 5
To determine the propagation speed of the up- and downstream travelling disturbances with-
in the flow above the suction side of the airfoil the correlation of the time-resolved absolute
velocity fluctuations HIJ (C) and HKJ (C + L) located at two positions /I/- and /K/- along a
time-averaged streamline is performed
MIK(/, L) = NOP(Q)∙NJR(Q�S)TTTTTTTTTTTTTTTTTTTTTTTTUNJP�TTTTT∙NJR�TTTTTT .
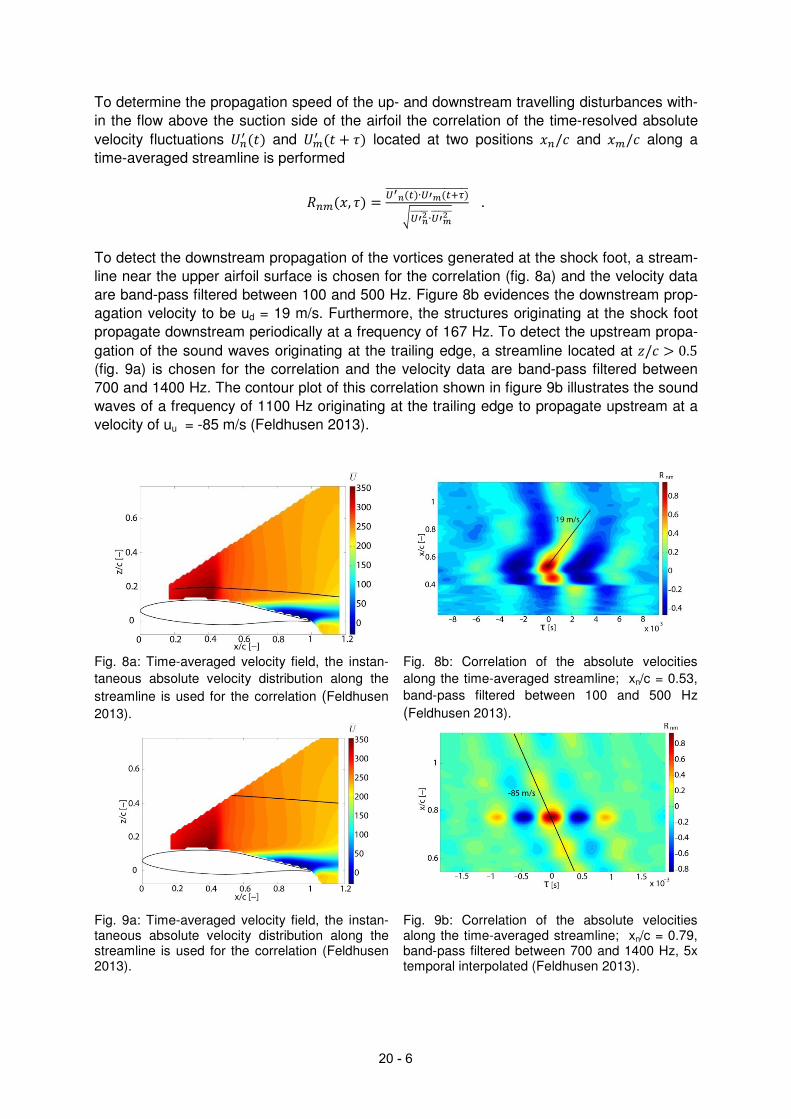
To detect the downstream propagation of the vortices generated at the shock foot, a stream-
line near the upper airfoil surface is chosen for the correlation (fig. 8a) and the velocity data
are band-pass filtered between 100 and 500 Hz. Figure 8b evidences the downstream prop-
agation velocity to be ud = 19 m/s. Furthermore, the structures originating at the shock foot
propagate downstream periodically at a frequency of 167 Hz. To detect the upstream propa-
gation of the sound waves originating at the trailing edge, a streamline located at 9/- > 0.5
(fig. 9a) is chosen for the correlation and the velocity data are band-pass filtered between
700 and 1400 Hz. The contour plot of this correlation shown in figure 9b illustrates the sound
waves of a frequency of 1100 Hz originating at the trailing edge to propagate upstream at a
velocity of uu = -85 m/s (Feldhusen 2013).
Fig. 8a: Time-averaged velocity field, the instan-
taneous absolute velocity distribution along the
streamline is used for the correlation (Feldhusen
2013).
Fig. 8b: Correlation of the absolute velocities
along the time-averaged streamline; xn/c = 0.53,
band-pass filtered between 100 and 500 Hz
(Feldhusen 2013).
Fig. 9a: Time-averaged velocity field, the instan-taneous absolute velocity distribution along the streamline is used for the correlation (Feldhusen 2013).
Fig. 9b: Correlation of the absolute velocities along the time-averaged streamline; xn/c = 0.79, band-pass filtered between 700 and 1400 Hz, 5x temporal interpolated (Feldhusen 2013).
20 - 6
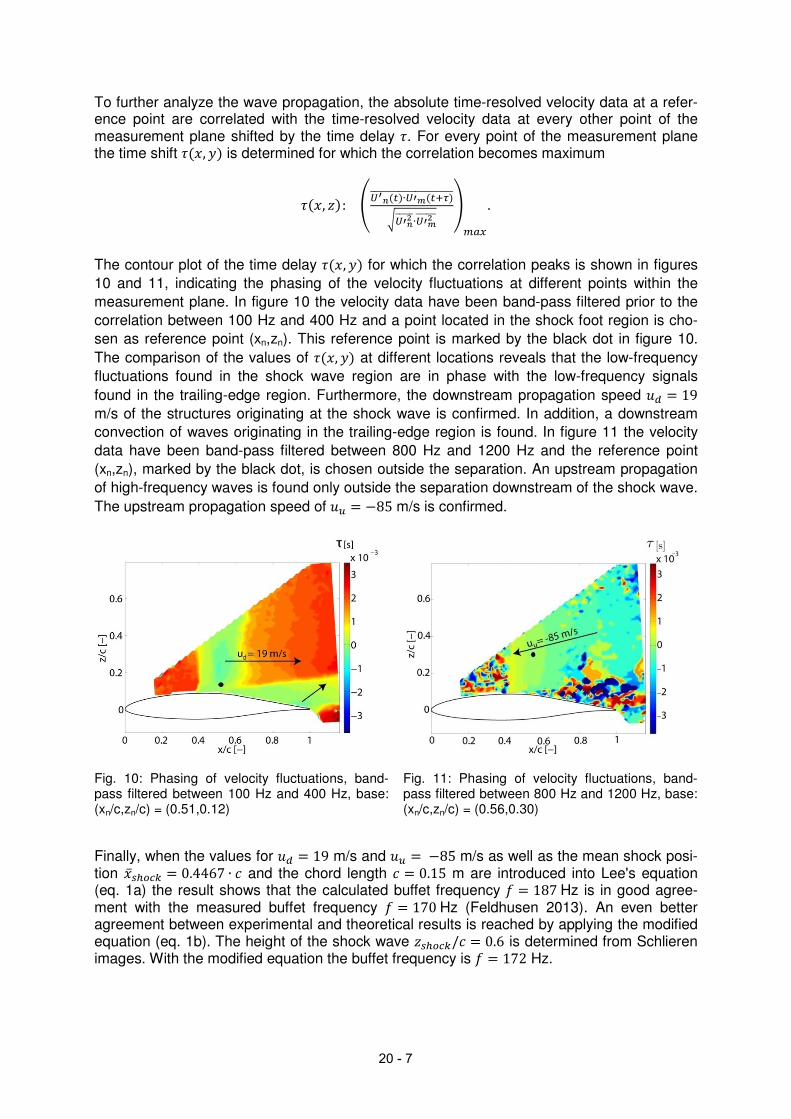
To further analyze the wave propagation, the absolute time-resolved velocity data at a refer-ence point are correlated with the time-resolved velocity data at every other point of the measurement plane shifted by the time delay L. For every point of the measurement plane the time shift L(/, W) is determined for which the correlation becomes maximum
L(/, 9):YNOP(Q)∙NJR(Q�S)TTTTTTTTTTTTTTTTTTTTTTTTUNJP�TTTTT∙NJR�TTTTTT Z
K[�.
The contour plot of the time delay L(/, W) for which the correlation peaks is shown in figures
10 and 11, indicating the phasing of the velocity fluctuations at different points within the
measurement plane. In figure 10 the velocity data have been band-pass filtered prior to the
correlation between 100 Hz and 400 Hz and a point located in the shock foot region is cho-
sen as reference point (xn,zn). This reference point is marked by the black dot in figure 10.
The comparison of the values of L(/, W) at different locations reveals that the low-frequency
fluctuations found in the shock wave region are in phase with the low-frequency signals
found in the trailing-edge region. Furthermore, the downstream propagation speed �� = 19
m/s of the structures originating at the shock wave is confirmed. In addition, a downstream
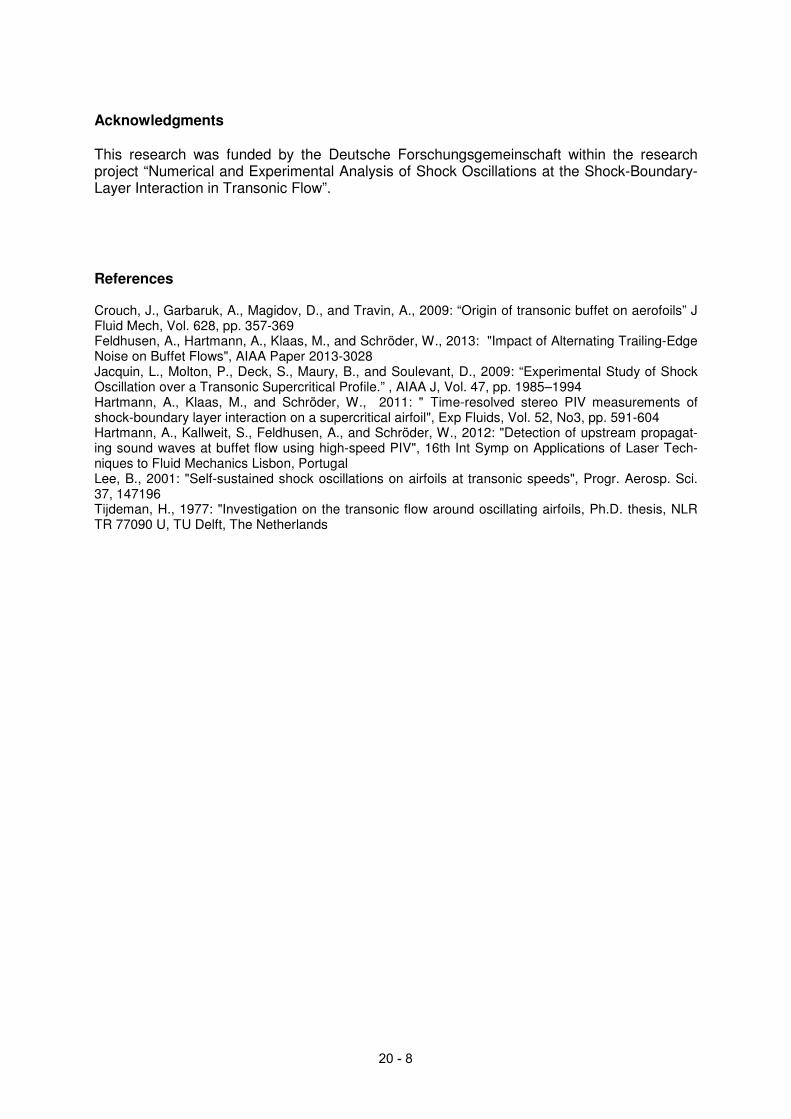
convection of waves originating in the trailing-edge region is found. In figure 11 the velocity
data have been band-pass filtered between 800 Hz and 1200 Hz and the reference point
(xn,zn), marked by the black dot, is chosen outside the separation. An upstream propagation
of high-frequency waves is found only outside the separation downstream of the shock wave.
The upstream propagation speed of �� = −85 m/s is confirmed.
Fig. 10: Phasing of velocity fluctuations, band-pass filtered between 100 Hz and 400 Hz, base: (xn/c,zn/c) = (0.51,0.12)
Fig. 11: Phasing of velocity fluctuations, band-pass filtered between 800 Hz and 1200 Hz, base: (xn/c,zn/c) = (0.56,0.30)
Finally, when the values for �� = 19 m/s and �� =−85 m/s as well as the mean shock posi-tion /̅4EFG = 0.4467 ∙ - and the chord length - = 0.15 m are introduced into Lee's equation (eq. 1a) the result shows that the calculated buffet frequency � = 187Hz is in good agree-ment with the measured buffet frequency � = 170Hz (Feldhusen 2013). An even better agreement between experimental and theoretical results is reached by applying the modified equation (eq. 1b). The height of the shock wave 94EFG/- = 0.6 is determined from Schlieren images. With the modified equation the buffet frequency is � = 172 Hz.
20 - 7
Acknowledgments
This research was funded by the Deutsche Forschungsgemeinschaft within the research project “Numerical and Experimental Analysis of Shock Oscillations at the Shock-Boundary-Layer Interaction in Transonic Flow”.
References
Crouch, J., Garbaruk, A., Magidov, D., and Travin, A., 2009: “Origin of transonic buffet on aerofoils” J Fluid Mech, Vol. 628, pp. 357-369 Feldhusen, A., Hartmann, A., Klaas, M., and Schröder, W., 2013: "Impact of Alternating Trailing-Edge Noise on Buffet Flows", AIAA Paper 2013-3028 Jacquin, L., Molton, P., Deck, S., Maury, B., and Soulevant, D., 2009: “Experimental Study of Shock Oscillation over a Transonic Supercritical Profile.” , AIAA J, Vol. 47, pp. 1985–1994 Hartmann, A., Klaas, M., and Schröder, W., 2011: " Time-resolved stereo PIV measurements of shock-boundary layer interaction on a supercritical airfoil", Exp Fluids, Vol. 52, No3, pp. 591-604 Hartmann, A., Kallweit, S., Feldhusen, A., and Schröder, W., 2012: "Detection of upstream propagat-ing sound waves at buffet flow using high-speed PIV", 16th Int Symp on Applications of Laser Tech-niques to Fluid Mechanics Lisbon, Portugal Lee, B., 2001: "Self-sustained shock oscillations on airfoils at transonic speeds", Progr. Aerosp. Sci. 37, 147196 Tijdeman, H., 1977: "Investigation on the transonic flow around oscillating airfoils, Ph.D. thesis, NLR TR 77090 U, TU Delft, The Netherlands
20 - 8