Embed Size (px)
Citation preview
Acta Polytechnica Hungarica Vol. 14, No. 2, 2017
– 131 –
Analysis of the Efficiency of the Recloser
Function of LV Smart Switchboards
Judith Pálfi, Miklós Tompa, Péter Holcsik
Óbuda University, Kandó Kálmán Faculty of Electrical Engineering, Power
System Department, Research Group of Applied Disciplines and Technologies in
Energetics, Bécsi út 96, H-1034 Budapest, Hungary
[email protected], [email protected],
Abstract: The improvement of the quality of services is the main target of the electricity
suppliers. This can be achieved by minimizing the number and duration in time of the
power outages. The reliability indicators show the quality of the system. The quality of the
services can be increased by proper maintenance, proper renovation activities and the
implementation of advanced tools and functions into the system. Smart switchboard (SSB)
devices are provided with modern and innovative functions which support the activity of the
low voltage (LV) distribution network operators. Remote control and monitoring, fault
location identification support, supply of on-line load-flow input data, and automatic
recloser are only some examples of the newly available technologies. In this paper the
improvement of the LV reliability indicators by using the recloser function of the SBB’s is
presented.
Keywords: LV network; quality of service; smart switchboard; recloser; fault location
1 Introduction
The AD&TE research group recommends the introduction of advanced
switchboards to the power supply companies. This equipment is the smart
switchboard (SSB). By the introduction of the SSB’s, the duration of the power
outages can be significantly reduced. This can be achieved by using the reclose
function of the SSB (more detailed information about the reclose function of the
SSB is provided in Section 1.1). Currently available LV swichboards are not
equipped with the reclose function [1] which has been developed by the authors of
this paper.
In this paper the research team will formulate recommendations to the electricity
companies about the location of these devices. This recommendation is presented
in the form of a function, the so-called efficiency function, which shows the
expected improvement of the quality of services [2] [3].
J. Pálfi et al. Analysis of the Efficiency of the Recloser Function of LV Smart Switchboards
– 132 –
1.1 LV Distribution Network Switchboards Today and
Tomorow
The fuse protecting a section of the LV network melts down when a short circuit
current occurs. The fuse protects the network from the damages caused by the
short circuit currents. (The eventual faults of the measuring stations are not
considered in this paper.)
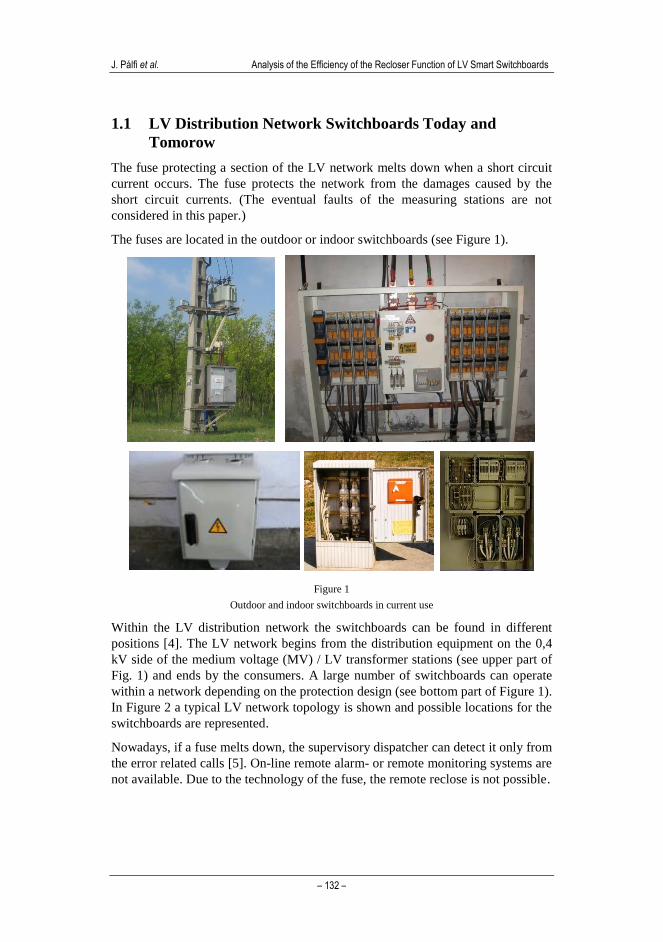
The fuses are located in the outdoor or indoor switchboards (see Figure 1).
Figure 1
Outdoor and indoor switchboards in current use
Within the LV distribution network the switchboards can be found in different
positions [4]. The LV network begins from the distribution equipment on the 0,4
kV side of the medium voltage (MV) / LV transformer stations (see upper part of
Fig. 1) and ends by the consumers. A large number of switchboards can operate
within a network depending on the protection design (see bottom part of Figure 1).
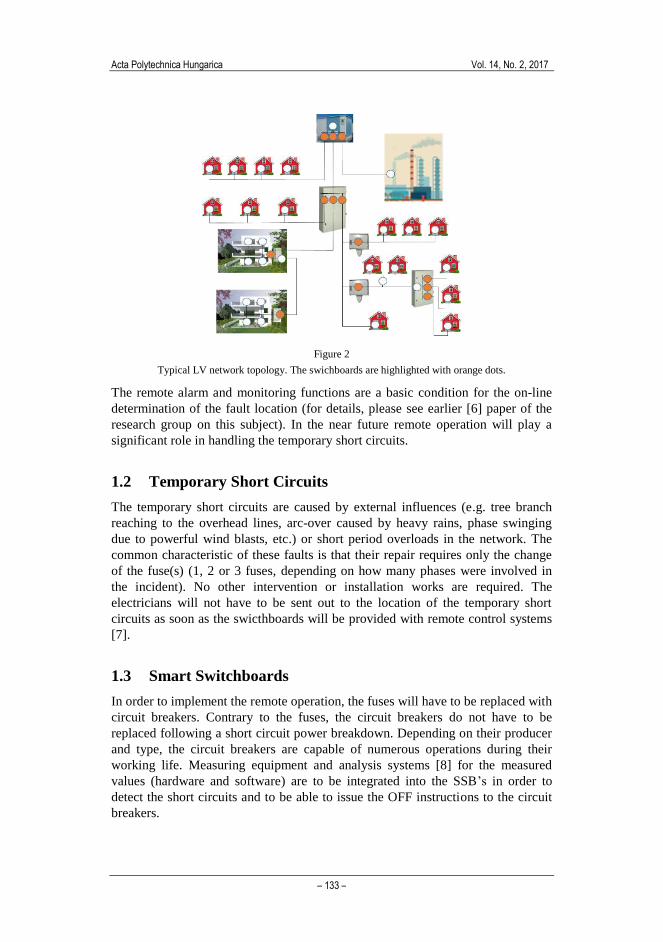
In Figure 2 a typical LV network topology is shown and possible locations for the
switchboards are represented.
Nowadays, if a fuse melts down, the supervisory dispatcher can detect it only from
the error related calls [5]. On-line remote alarm- or remote monitoring systems are
not available. Due to the technology of the fuse, the remote reclose is not possible.
Acta Polytechnica Hungarica Vol. 14, No. 2, 2017
– 133 –
Figure 2
Typical LV network topology. The swichboards are highlighted with orange dots.
The remote alarm and monitoring functions are a basic condition for the on-line
determination of the fault location (for details, please see earlier [6] paper of the
research group on this subject). In the near future remote operation will play a
significant role in handling the temporary short circuits.
1.2 Temporary Short Circuits
The temporary short circuits are caused by external influences (e.g. tree branch
reaching to the overhead lines, arc-over caused by heavy rains, phase swinging
due to powerful wind blasts, etc.) or short period overloads in the network. The
common characteristic of these faults is that their repair requires only the change
of the fuse(s) (1, 2 or 3 fuses, depending on how many phases were involved in
the incident). No other intervention or installation works are required. The
electricians will not have to be sent out to the location of the temporary short
circuits as soon as the swicthboards will be provided with remote control systems
[7].
1.3 Smart Switchboards
In order to implement the remote operation, the fuses will have to be replaced with
circuit breakers. Contrary to the fuses, the circuit breakers do not have to be
replaced following a short circuit power breakdown. Depending on their producer
and type, the circuit breakers are capable of numerous operations during their
working life. Measuring equipment and analysis systems [8] for the measured
values (hardware and software) are to be integrated into the SSB’s in order to
detect the short circuits and to be able to issue the OFF instructions to the circuit
breakers.

J. Pálfi et al. Analysis of the Efficiency of the Recloser Function of LV Smart Switchboards
– 134 –
The SSB concept stands for a remote controlled LV switchboard which uses a
circuit breaker for the dismantling of the short circuit current. The detection of the
short circuit current is done by using a detection equipment together with the
corresponding measurement analysis system. It is suitable for remote switch-on
(circuit breaker activation) which, if necessary, can be turned to clogging mode. It
contains the possibility of visible interruption point and earthing as well.
The visible interruption point and the earthing functions are required for ensuring
the life, health and safety protection during the maintenance, reconstruction, etc.
works.
The remote monitoring functions could actively or passively monitor the current,
the voltage and the performance of the LV system.
The implementation of an automatic recloser, a so-called reclose function into the
SSB is also possible.
1.4 The Reclose Function
When the reclose function is activated, the circuit breaker recloses after a
previously specified time period following the defense action. If the defense
continues to detect the short circuit, the circuit breaker opens again. Following this
and after another pre-set time period, the automatics will close the contacts of the
circuit breaker again. The automatics seeks to switch back two times (two cycles).
The final release is activated if the short circuit persists. Nowadays, the reclose
technology is already in use for MV networks [9]. Its working principle and the
pre-set time periods for MV networks are shown in Figure 3.
Figure 3
Working principle and pre-set time periods of the reclose function in case of MV networks
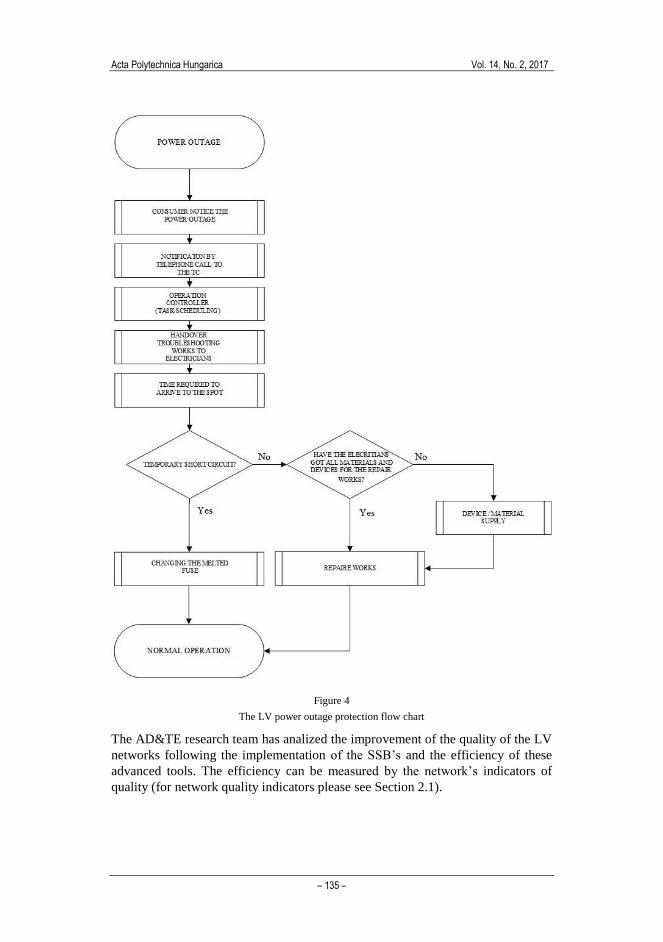
The implementation of the reclose function into the LV network will optimize the
work of the electricians (they do not have to spend any more time going out to
detect the faults in the network) and minimize the length of the LV power outages
caused by short circuits. The earlier time consuming process (see Figure 4) is
reduced to a few minutes (see Figure 3).
Acta Polytechnica Hungarica Vol. 14, No. 2, 2017
– 135 –
Figure 4
The LV power outage protection flow chart
The AD&TE research team has analized the improvement of the quality of the LV
networks following the implementation of the SSB’s and the efficiency of these
advanced tools. The efficiency can be measured by the network’s indicators of
quality (for network quality indicators please see Section 2.1).
J. Pálfi et al. Analysis of the Efficiency of the Recloser Function of LV Smart Switchboards
– 136 –
2 Method Used for Analysing the Efficiency of SSB’s
When switchboards serving a large number of customers are upgraded to SSB’s
the related efficiency of these tools increases, that is a small number of devices
protect a large number of customers [10]. This means that the efficiency of the
reclose function implementation will be higher for those swichboards of which
melting down can impact a larger number of customers. The efficiency will
decrease as the number of customerss served by the upgraded switchboards is
smaller.
The research group recommends to the power supplier companies to begin the
implementation of the SSB’s with the switchboards connected to larger number of
customers.
By carrying out the study of the efficiency the research group determined the
number of customers for which it is worthwhile upgrading the existing equipment.
A cumulative efficiency function has been developed. This function shows the
SAIDI improvement (Section 2.1) which could be achieved when changing some
of the fuses to SSB’s.
The research group examined the data collected from the LV power outages
during years 2014 and 2015. The improvement of the SAIDI indicator has been
determined assuming that during these 2 years SSB’s with reclose function would
have been used instead of the existing equipment (SAIDI indicator in section 2.1).
The input data for the study was provided by ELMŰ Network ltd and ÉMÁSZ
Network ltd.
2.1 The Impact of LV Power Outages on SAIDI and SAIFI
Indicators
The electricity suppliers use several indicators for measuring the quality of
electricity networks. The Hungarian Energy and Public Utility Regulatory
Authority is following two indicators and expects their improvement by the
Hungarian electricity suppliers. These two indicators are the System Average
Interruption Duration Index (SAIDI) and the System Average Interruption
Frequency Index (SAIFI). [2] [11]
Nowadays, a LV power outage duration is taken into account from the time of the
notification of the error until the time of reconnection of the customers. This time
period is the outage time (Ui).
Another factor influencing the SAIDI is the number of customers affected by the
power outage (Ni).

Acta Polytechnica Hungarica Vol. 14, No. 2, 2017
– 137 –
The electricity suppliers keep record of how many customers are affected by the
breakdown of a certain equipment. Consequently, the impact on customers by the
LV outage i can be determined from the IT databases.
The total number of customers (NT) during a particular year for a particular
company, e.g. ELMŰ or ÉMÁSZ is a constant value (pieces).
“The SAIDI network quality indicator is given by [2]:
sec1
T
n
x
ii
N
NU
SAIDI
(1)
where Ni is the number of customers and Ui is the annual outage time for location
i, and NT is the total number of customers served.
In other words [2],
𝑆𝐴𝐼𝐷𝐼 =𝑠𝑢𝑚 𝑜𝑓 𝑎𝑙𝑙 𝑐𝑢𝑠𝑡𝑜𝑚𝑒𝑟 𝑖𝑛𝑡𝑒𝑟𝑟𝑢𝑝𝑡𝑖𝑜𝑛 𝑑𝑢𝑟𝑎𝑡𝑖𝑜𝑛𝑠
𝑡𝑜𝑡𝑎𝑙 𝑛𝑢𝑚𝑏𝑒𝑟 𝑜𝑓 𝑐𝑢𝑠𝑡𝑜𝑚𝑒𝑟𝑠 𝑠𝑒𝑟𝑣𝑒𝑑 (2)
SAIFI stands for the average number of power outages in a year related to the total
number of customers.
The SAIFI network quality indicator is given by [2]:
sec1
T
n
x
ii
N
N
SAIFI
(3)
where λi is the failure rate, Ni is the number of customers for location i and NT is
the total number of customers served. In other words,
SAIFI =total number of customer interruptions
total number of customers served (4)
“.[2]
The SSB device is installed on LV networks. Table 1 shows the ratio of MV and
LV outages in the SAIFI and SAIDI indicators.
Table I
MV/LV ratio in SAIFIs and SAIDIs datas of ELMŰ Hálózati ltd., head of Pest,
01. – 08. 2015
SAIFI SAIDI
LV 0.09 0.72
MV 0.53 0.85
Sum of LV and MV 0.62 1.57
Ratio of the LV / MV 14.51% / 85.49% 45.85% / 54.14%
J. Pálfi et al. Analysis of the Efficiency of the Recloser Function of LV Smart Switchboards
– 138 –
From the data in Table 1, it can be seen that the power outages in the LV networks
have a significantly smaller influence on the SAIFI indicators (14.51%) than on
the SAIDI indicators (45.85%). Therefore, the AD&TE research group considered
the calculation method of SAIDI for setting up the cumulative efficiency function.
The results are given in minutes, similarly to the SAIDI indicator.
The power outage data (outage time, number of affected customers) are gathered
by the electricity suppliers based on the worksheets filled out by the electricians.
These worksheets are checked and validated by the LV operation controllers [12]
[13] [14].
2.2 The Analysis of the Worksheets
The electricity suppliers are recording into their own IT system the customers’
calls related to the power outages [15] [16]. These notices are then converted into
digital worksheets by the LV operators. The worksheets are distributed to the
electricians taking into account their current geographical location, their skills and
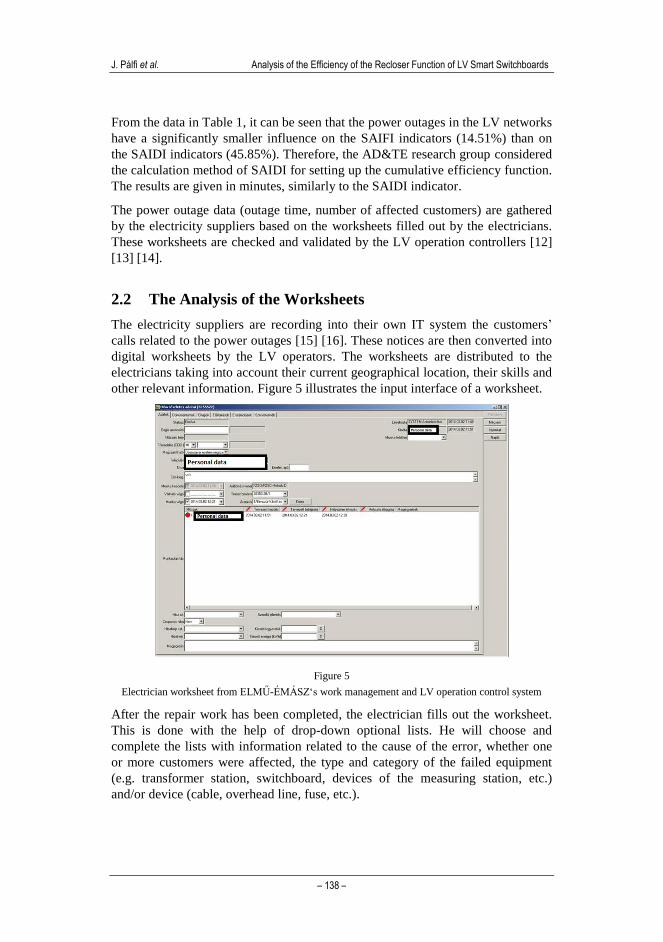
other relevant information. Figure 5 illustrates the input interface of a worksheet.
Figure 5
Electrician worksheet from ELMŰ-ÉMÁSZ‘s work management and LV operation control system
After the repair work has been completed, the electrician fills out the worksheet.
This is done with the help of drop-down optional lists. He will choose and
complete the lists with information related to the cause of the error, whether one
or more customers were affected, the type and category of the failed equipment
(e.g. transformer station, switchboard, devices of the measuring station, etc.)
and/or device (cable, overhead line, fuse, etc.).
Acta Polytechnica Hungarica Vol. 14, No. 2, 2017
– 139 –
In addition to the drop-down lists, free texts can be introduced as well. These
could be notes and/or explanations related to the size of the replaced lining
measured in amper or the type of the repair which has been carried out (e.g.
replacement of a circuit breaker, measuring equipment exchange, reconnection of
a cable, etc.).
The information concerning the type of short circuits which caused the power
outage (temporary or long term) is not recorded in the worksheets. Whether only a
fuse was changed or a more complex repair work was carried out (e.g. cutting the
branches of trees, reconnection of collapsed overhead lines, etc.) is not specified.
Due to this reason, the database in its current form does not allow for a clear and
rapid detection of the power outages caused by short circuits. Concerning that, the
worksheets must be analyzed one by one, taking into account all the information
which has been given in the free text notes and in the drop-down lists as well.
It can happen that the electrician replaced a fuse and the reason of the melt down
of it was not a temporary short circuit but for example, a cable of the network was
cut by a branch of a tree or by an excavator working nearby.
During the two years period of the study a total number of 21351worksheets were
generated (after data cleaning and not including the faults of the public lighting
and of the measuring stations). The examination of the worksheets, one by one,
would have taken more than 550 working hours. Therefore, the research group
decided to apply a sampling method for the analysis of this large amount of
information. [17]
2.3 Selection of the Sample
The analyzed population are the worksheets generated by ELMŰ ÉMÁSZ during
the years 2014 and 2015. The sampling frame consists of as many as 21351
worksheets. Through the sampling process the randomly selected information
from the data gathered in 3-3 weeks of the 2 years period was processed.
The selected weeks are shown in Table 2.
Table 2
Weeks randomly selected in years 2014 and 2015
2014 2015
The calendar number
of the selected weeks
09 05
13 15
37 28
The free text entries of the selected weeks’ worksheets were filtered from the
point of view of whether the reason of the error was clearly due to a temporary
short circuit or not. Manual analysis was not carried out in the cases in which the
power outage was not due to temporary short circuits. Further possibilities for
filtering the free text entries are described in Section 7. After filtering the 3-3
weeks’ worksheets 2060 pieces remained for manual analysis.
J. Pálfi et al. Analysis of the Efficiency of the Recloser Function of LV Smart Switchboards
– 140 –
3 Analysis of the Sample and Results
The sample selected and filtered as described in Section 2.3 consists of 2060
worksheets. The data were analyzed manually, one by one. In the analysis of the
worksheets (see Section 2.2) the information related to the duration of the
intervention of the electricians and the description of the type of the faults was
considered. The faults were categorized in faults which could have been saved by
providing the SSB’s and faults where the provision of the SSB’s would have had
no positive impact. A similar selection has been carried out from the point of view
of the customers.
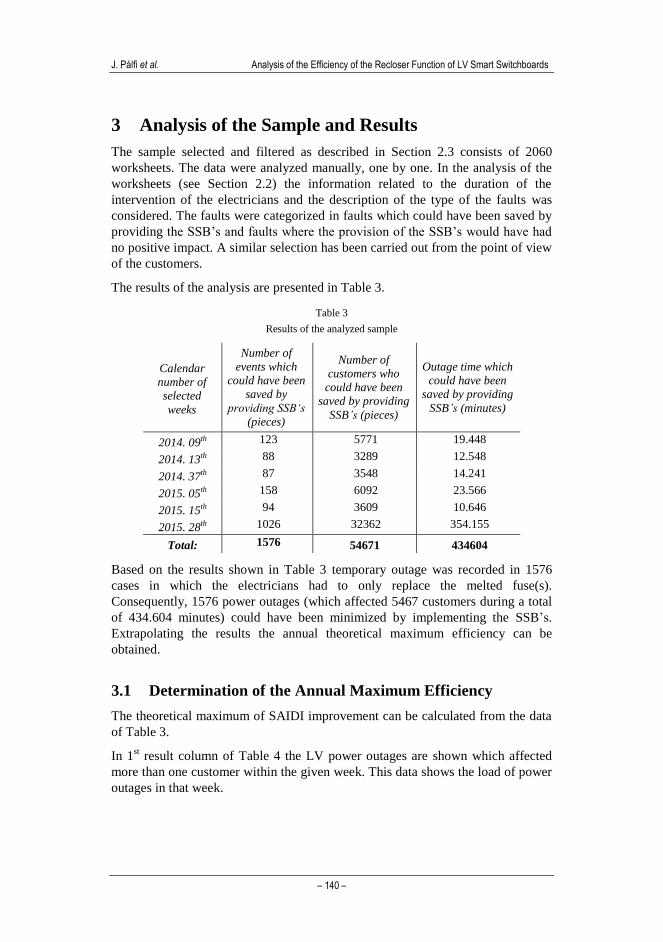
The results of the analysis are presented in Table 3.
Table 3
Results of the analyzed sample
Calendar
number of
selected
weeks
Number of
events which
could have been
saved by
providing SSB‘s
(pieces)
Number of
customers who
could have been
saved by providing
SSB’s (pieces)
Outage time which
could have been
saved by providing
SSB’s (minutes)
2014. 09th 123 5771 19.448
2014. 13th 88 3289 12.548
2014. 37th 87 3548 14.241
2015. 05th 158 6092 23.566
2015. 15th 94 3609 10.646
2015. 28th 1026 32362 354.155
Total: 1576 54671 434604
Based on the results shown in Table 3 temporary outage was recorded in 1576
cases in which the electricians had to only replace the melted fuse(s).
Consequently, 1576 power outages (which affected 5467 customers during a total
of 434.604 minutes) could have been minimized by implementing the SSB’s.
Extrapolating the results the annual theoretical maximum efficiency can be
obtained.
3.1 Determination of the Annual Maximum Efficiency
The theoretical maximum of SAIDI improvement can be calculated from the data
of Table 3.
In 1st result column of Table 4 the LV power outages are shown which affected
more than one customer within the given week. This data shows the load of power
outages in that week.
Acta Polytechnica Hungarica Vol. 14, No. 2, 2017
– 141 –
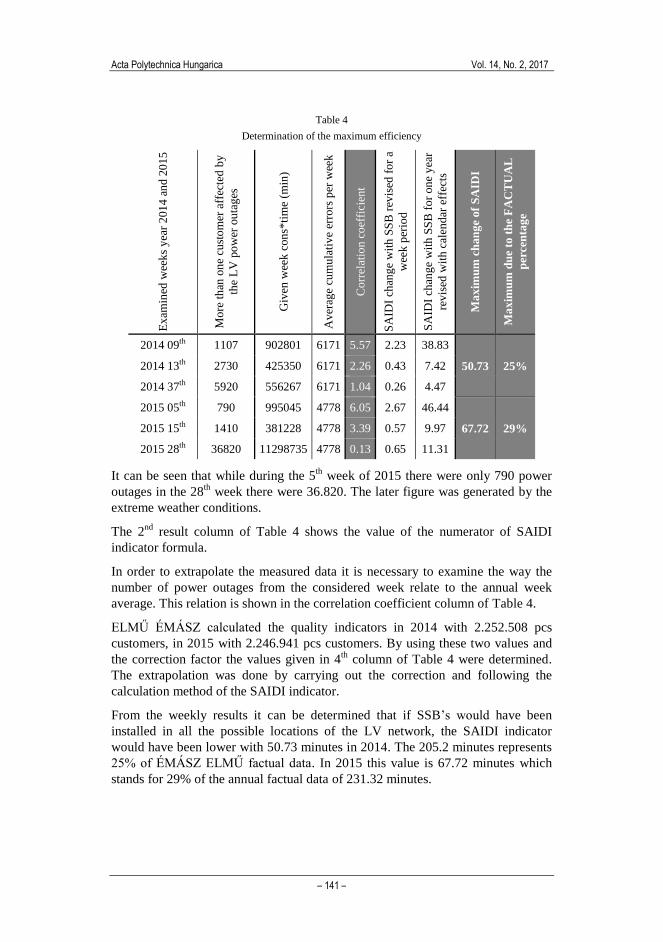
Table 4
Determination of the maximum efficiency
Ex
amin
ed w
eek
s y
ear
201
4 a
nd
20
15
Mo
re t
han
on
e cu
sto
mer
aff
ecte
d b
y
the
LV
po
wer
ou
tag
es
Giv
en w
eek
con
s*ti
me
(min
)
Av
erag
e cu
mu
lati
ve
erro
rs p
er w
eek
Co
rrel
atio
n c
oef
fici
ent
SA
IDI
chan
ge
wit
h S
SB
rev
ised
fo
r a
wee
k p
erio
d
SA
IDI
chan
ge
wit
h S
SB
fo
r on
e y
ear
rev
ised
wit
h c
alen
dar
eff
ects
Ma
xim
um
ch
an
ge
of
SA
IDI
Ma
xim
um
du
e to
th
e F
AC
TU
AL
per
cen
tag
e
2014 09th 1107 902801 6171 5.57 2.23 38.83
50.73 25% 2014 13th 2730 425350 6171 2.26 0.43 7.42
2014 37th 5920 556267 6171 1.04 0.26 4.47
2015 05th 790 995045 4778 6.05 2.67 46.44
67.72 29% 2015 15th 1410 381228 4778 3.39 0.57 9.97
2015 28th 36820 11298735 4778 0.13 0.65 11.31
It can be seen that while during the 5th
week of 2015 there were only 790 power
outages in the 28th
week there were 36.820. The later figure was generated by the
extreme weather conditions.
The 2nd
result column of Table 4 shows the value of the numerator of SAIDI
indicator formula.
In order to extrapolate the measured data it is necessary to examine the way the
number of power outages from the considered week relate to the annual week
average. This relation is shown in the correlation coefficient column of Table 4.
ELMŰ ÉMÁSZ calculated the quality indicators in 2014 with 2.252.508 pcs
customers, in 2015 with 2.246.941 pcs customers. By using these two values and
the correction factor the values given in 4th
column of Table 4 were determined.
The extrapolation was done by carrying out the correction and following the
calculation method of the SAIDI indicator.
From the weekly results it can be determined that if SSB’s would have been
installed in all the possible locations of the LV network, the SAIDI indicator
would have been lower with 50.73 minutes in 2014. The 205.2 minutes represents
25% of ÉMÁSZ ELMŰ factual data. In 2015 this value is 67.72 minutes which
stands for 29% of the annual factual data of 231.32 minutes.
J. Pálfi et al. Analysis of the Efficiency of the Recloser Function of LV Smart Switchboards
– 142 –
3.2 Distributions and the Comparison of Distributions
The research group’s preliminary assumption was that the distribution of the
measured data and the number of customers behind the fuse boxes from the
network correlate with each other. In order to verify this hypothesis, the number of
customers affected by the power outages was examined.
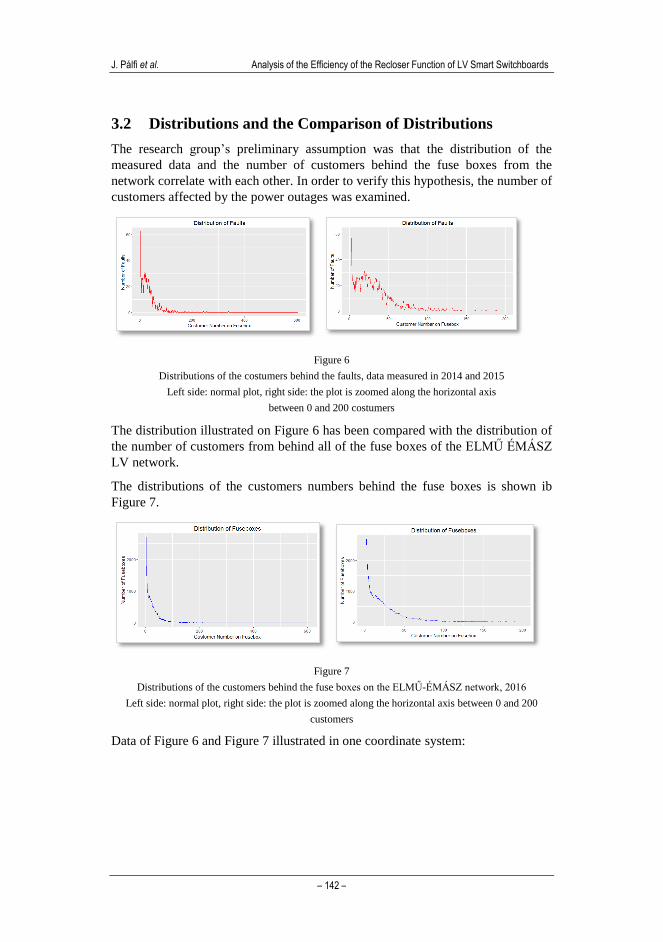
Figure 6
Distributions of the costumers behind the faults, data measured in 2014 and 2015
Left side: normal plot, right side: the plot is zoomed along the horizontal axis
between 0 and 200 costumers
The distribution illustrated on Figure 6 has been compared with the distribution of
the number of customers from behind all of the fuse boxes of the ELMŰ ÉMÁSZ
LV network.
The distributions of the customers numbers behind the fuse boxes is shown ib
Figure 7.
Figure 7
Distributions of the customers behind the fuse boxes on the ELMŰ-ÉMÁSZ network, 2016
Left side: normal plot, right side: the plot is zoomed along the horizontal axis between 0 and 200
customers
Data of Figure 6 and Figure 7 illustrated in one coordinate system:

Acta Polytechnica Hungarica Vol. 14, No. 2, 2017
– 143 –
Figure 8
Distribution of the costumers numbers behind the measured fuse boxes and number of faults in 2014
and 2015
Figure 8 shows that the assumption of the research group was confirmed: both
curves show an exponential decreasing along the horizontal axis. However, beside
the correlation, differences can be observed between the two curves. The reason
for these differences is detailed in Section 6.
4 The Efficiency Function
The recommendation described in Section 2 was to begin the implementation of
the SSB’s into the equipments connected to larger number of customers.
By carrying out the study of the efficiency, the research group determined the
number of customers for which it is worth upgrading the existing equipment. A
cumulative efficiency function has been developed. This function shows the
SAIDI improvement (Section 2.1) which could be achieved when changing some
of the fuses to SSB’s.
For example, in case N=105 customers:
max
105
N
N
ii UNutilityCumulative (5)
where N is the number of customers in the LV network behind the fuse, Nmax is the
maximum number of customers behind a fuse, Ni is the number of customers
affected by the power outage i, Ui is the duration of the power outage i.
J. Pálfi et al. Analysis of the Efficiency of the Recloser Function of LV Smart Switchboards
– 144 –
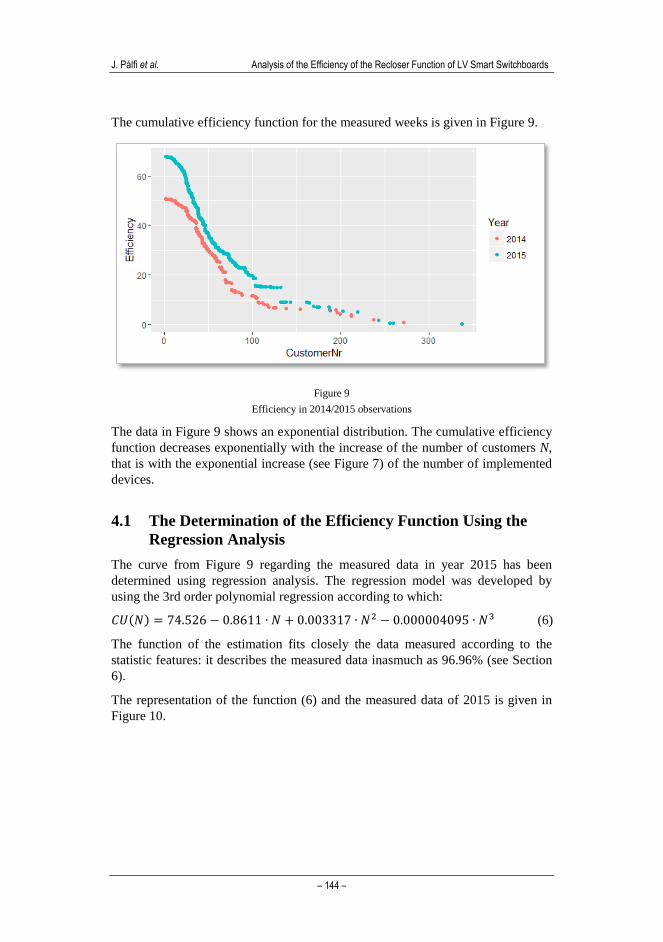
The cumulative efficiency function for the measured weeks is given in Figure 9.
Figure 9
Efficiency in 2014/2015 observations
The data in Figure 9 shows an exponential distribution. The cumulative efficiency
function decreases exponentially with the increase of the number of customers N,
that is with the exponential increase (see Figure 7) of the number of implemented
devices.
4.1 The Determination of the Efficiency Function Using the
Regression Analysis
The curve from Figure 9 regarding the measured data in year 2015 has been
determined using regression analysis. The regression model was developed by
using the 3rd order polynomial regression according to which:
𝐶𝑈(𝑁) = 74.526 − 0.8611 ∙ 𝑁 + 0.003317 ∙ 𝑁2 − 0.000004095 ∙ 𝑁3 (6)
The function of the estimation fits closely the data measured according to the
statistic features: it describes the measured data inasmuch as 96.96% (see Section
6).
The representation of the function (6) and the measured data of 2015 is given in
Figure 10.
Acta Polytechnica Hungarica Vol. 14, No. 2, 2017
– 145 –
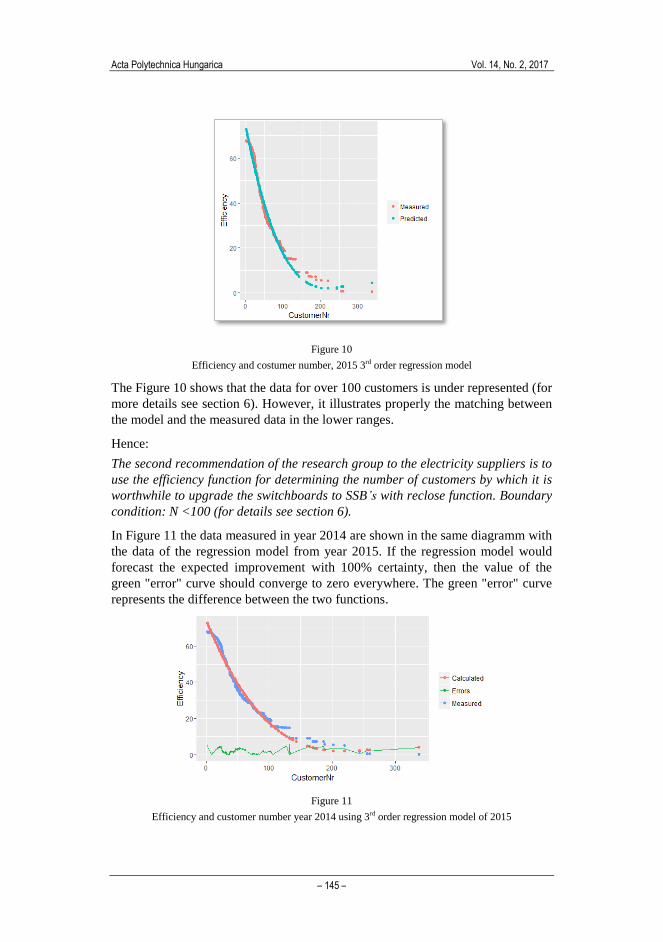
Figure 10
Efficiency and costumer number, 2015 3rd order regression model
The Figure 10 shows that the data for over 100 customers is under represented (for
more details see section 6). However, it illustrates properly the matching between
the model and the measured data in the lower ranges.
Hence:
The second recommendation of the research group to the electricity suppliers is to
use the efficiency function for determining the number of customers by which it is
worthwhile to upgrade the switchboards to SSB’s with reclose function. Boundary
condition: N <100 (for details see section 6).
In Figure 11 the data measured in year 2014 are shown in the same diagramm with
the data of the regression model from year 2015. If the regression model would
forecast the expected improvement with 100% certainty, then the value of the
green "error" curve should converge to zero everywhere. The green "error" curve
represents the difference between the two functions.
Figure 11
Efficiency and customer number year 2014 using 3rd order regression model of 2015
J. Pálfi et al. Analysis of the Efficiency of the Recloser Function of LV Smart Switchboards
– 146 –
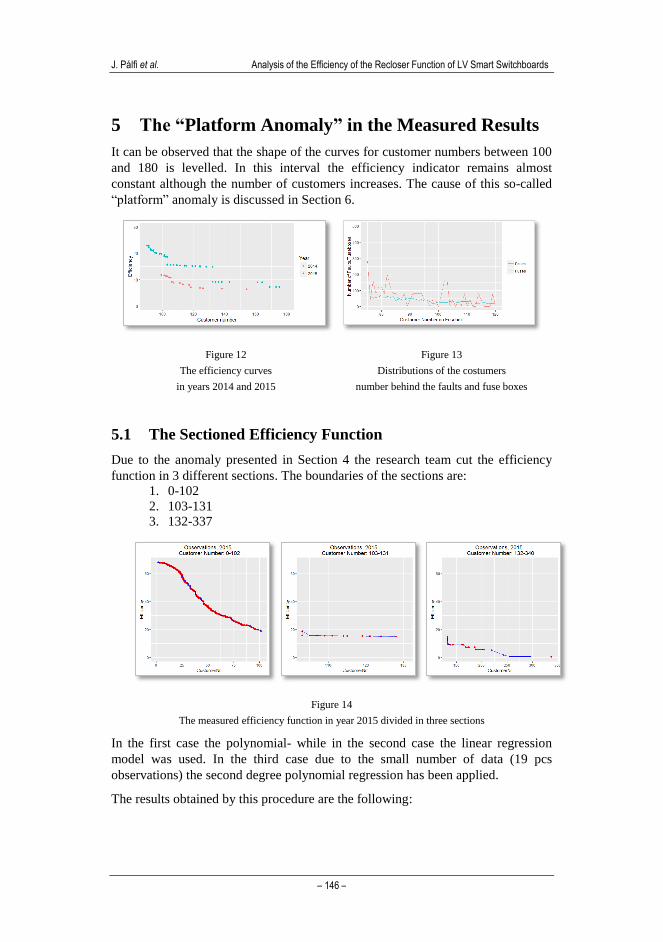
5 The “Platform Anomaly” in the Measured Results
It can be observed that the shape of the curves for customer numbers between 100
and 180 is levelled. In this interval the efficiency indicator remains almost
constant although the number of customers increases. The cause of this so-called
“platform” anomaly is discussed in Section 6.
Figure 12
The efficiency curves
in years 2014 and 2015
Figure 13
Distributions of the costumers
number behind the faults and fuse boxes
5.1 The Sectioned Efficiency Function
Due to the anomaly presented in Section 4 the research team cut the efficiency
function in 3 different sections. The boundaries of the sections are:
1. 0-102
2. 103-131
3. 132-337
Figure 14
The measured efficiency function in year 2015 divided in three sections
In the first case the polynomial- while in the second case the linear regression
model was used. In the third case due to the small number of data (19 pcs
observations) the second degree polynomial regression has been applied.
The results obtained by this procedure are the following:
Acta Polytechnica Hungarica Vol. 14, No. 2, 2017
– 147 –
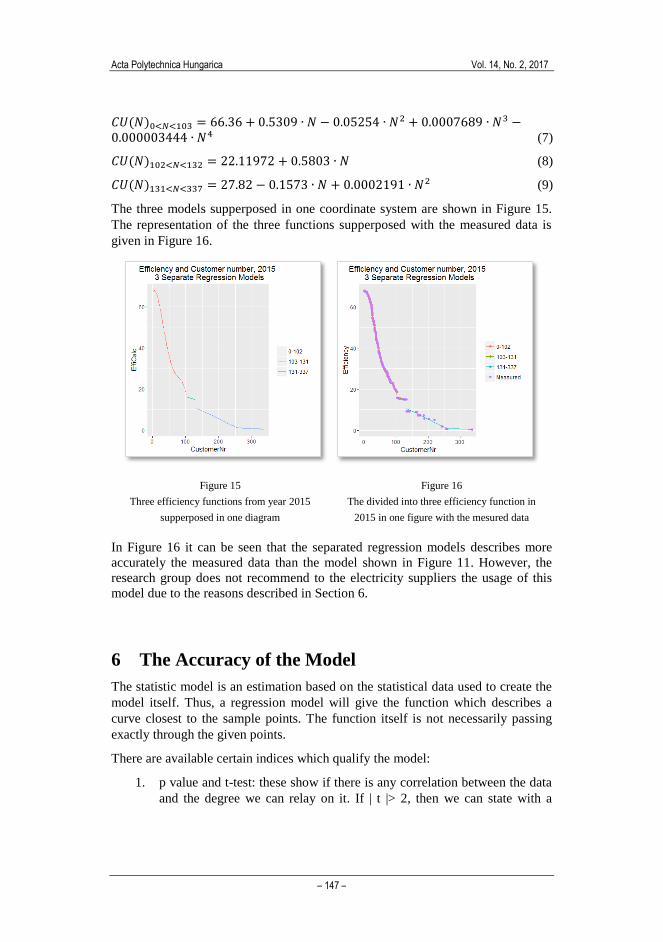
𝐶𝑈(𝑁)0<𝑁<103 = 66.36 + 0.5309 ∙ 𝑁 − 0.05254 ∙ 𝑁2 + 0.0007689 ∙ 𝑁3 −0.000003444 ∙ 𝑁4 (7)
𝐶𝑈(𝑁)102<𝑁<132 = 22.11972 + 0.5803 ∙ 𝑁 (8)
𝐶𝑈(𝑁)131<𝑁<337 = 27.82 − 0.1573 ∙ 𝑁 + 0.0002191 ∙ 𝑁2 (9)
The three models supperposed in one coordinate system are shown in Figure 15.
The representation of the three functions supperposed with the measured data is
given in Figure 16.
Figure 15
Three efficiency functions from year 2015
supperposed in one diagram
Figure 16
The divided into three efficiency function in
2015 in one figure with the mesured data
In Figure 16 it can be seen that the separated regression models describes more
accurately the measured data than the model shown in Figure 11. However, the
research group does not recommend to the electricity suppliers the usage of this
model due to the reasons described in Section 6.
6 The Accuracy of the Model
The statistic model is an estimation based on the statistical data used to create the
model itself. Thus, a regression model will give the function which describes a
curve closest to the sample points. The function itself is not necessarily passing
exactly through the given points.
There are available certain indices which qualify the model:
1. p value and t-test: these show if there is any correlation between the data
and the degree we can relay on it. If | t |> 2, then we can state with a

J. Pálfi et al. Analysis of the Efficiency of the Recloser Function of LV Smart Switchboards
– 148 –
reliability of 95% that there exists a correlation. For| t |> 2.6 we obtain
99% reliability.
2. R2: in the present context its value gives the percentage ratio of the
description of the sample by the model. In case of the non-separated
model its value is 96.96% which confirms a high level superposition
(with the reserves described in section 4.1)
3. Standard Deviation: in the present context it shows how close the actual
values are in relation to the expected values. In case of a non-separated
efficiency function it is 2.6 at the beginning of the series of data.
However, by the end of the series, this number is above 70.
4. Residuals: the difference between the values calculated with the
measured and the model data which stands for the error. See Figure 11.
The above confirms that the models describe properly the measured data.
The compliance of the non-separated regression model is limited by the fact that
for over 100 customers (N) only few measured data is available. This fact could
significantly change the model. One of the reasons for "platform anomaly" is also
due to this fact. Because of this under-representation, further development of the
non-separated model is recommended. The disadvantages of this model can be
elimininated by more frequent sampling.
Conclusion
The manual processing of the entire data is limited. The current aim of the
AD&TE research group is to organize and to transform the entire data in order to
analyze it with machine learning methods. Using the descriptive data (including
the free texts) predict with simpler random forest and more complicated neural
network whether a certain event is an error manageable by SSB or not. By this
method, the entire data could be examined. This would result in the set up of a
more accurate model.
As next step, the research group plans to examine the impact of the weather
conditions on the LV power outages’ data.
Acknowledgment
The research was supported by József Fodor, CEO of the ELMŰ Network ltd. and
the ELMŰ Network ltd., Tibor Fejes from ELMŰ Network ltd, and Dr. András
Köpecsiri, Tímea Kogyela and the leader of the AD&TE research group: Ferenc
Novothny, Ph.D.
References
[1] Dr. F. Novothny, Power System I, Kandó Kálmán Faculty of Electrical
Engineering, Óbuda University, Budapest 2010
Acta Polytechnica Hungarica Vol. 14, No. 2, 2017
– 149 –
[2] “1366-2012 - IEEE Guide for Electric Power Distribution Reliability
Indices” Revision of IEEE Std 1366-2003 (Revision of IEEE Std 1366-
1998), May 31 2012, DOI:10.1109/IEEESTD.2012.6209381
[3] T. Portik, L Pokorádi: The Summarized Weighted Mean of Maxima
Defuzzification and Its Application at the End of the Risk Assessment
Process, in Acta Polytechnica Hungarica, Vol. 11, Issue 3, 2014, pp. 167-
180, DOI: 10.12700/APH.11.03.2014.03.11, ISBN: 1785-8860
[4] B. Barze, A. Sharma, A. L. Barabási: Graph Theory Properties of Cellular
Networks, Handbook of Systems Biology – Concepts and Insights, Chapter
9, Academic Press, Elsevier, 2013, pp. 177-193, ISBN-13: 978-
01023859440
[5] H. Li, R. Yeh, Y. Lin, L. Lin, J. Zhao, C. Lin, I. J. Rudas, Medical Sample
Classifier Design using Fuzzy Cerebellar Model Neural Networks, Acta
Polytechnica Hungarica, Vol. 13, No. 6, pp. 7-24, 2016
[6] J. Pálfi: Localization of Faults in Low Voltage Networks by the Graph
Method, in Proceedings of the 11th
IEEE International Symposium on
Applied Computational Intelligence and Informatics SACI 2016.
Conference: Timisoara, Roumania, 2016.05.12-2016.05.14., 2016, pp. 397-
400, ISBN: 978-1-5090-2379-0
[7] J. Haakana, J. Lassila, T. Kaipia, J. Partanen, Comparison of Reliability
Indices From the Perspective of Network Automation Devices, Power
Delivery IEEE Transactions, Vol. 25, pp. 1547-1555, 2010, ISSN 0885-
8977
[8] A. Varga, E. Rácz and P. Kádár: New Experimental Method for Measuring
Power Characteristics of Photovoltaic Cells at Given Light Irradiation;
IEEE 8th
International Symposium on Applied Computational Intelligence
and Informatics, SACI 2013, Timisoara, Romania, Print ISBN: 978-1-
4673-6397-6, DOI: 10.1109/SACI.2013.6609008, 2013, pp. 405-409, May
2-25, ISBN: 978-146736400-3, Source Type: Conference Proceeding,
Original language: English, DOI: 10.1109/SACI.2013.6609008
[9] Zs. Mitrik: Operation of Third Generation Sulphur-Hexafluoride Circuit
Breakers in Medium Zone of Short Circuit Currents, Kandó Kálmán
Faculty of Electrical Engineering, XXXI. Kandó conference 17. 11 2016,
Óbuda University, Kandó Kálmán Faculty of Electrical Engineering, pp.
53-54, ISBN 978-963-7158-07-0
[10] Pausits P, Szögi G, Nallbani M, Rudas I J, Haidegger T: Identification of
Risks in the Application of Surgical Robotics, 19th
IEEE International
Conference on Intelligent Engineering Systems, Bratislava: INES 2015, pp.
147-151, ISBN:978-1-4673-7938-0
[11] K. Zou, W. W. Keerthipala, S. Perera, "Saidi Minimization of a Remote
Distribution Feeder" in Australasian Universities Power Engineering
J. Pálfi et al. Analysis of the Efficiency of the Recloser Function of LV Smart Switchboards
– 150 –
Conference AUPEC, Perth, Australia, 2007, pp. 342-346, ISBN
9780646494883
[12] J. Kopják, J. Kovács: Timed Cooperative Multitask for Tiny Real-Time
Embedded Systems, Applied Machine Intelligence and Informatics (SAMI)
2012 IEEE 10th
International Symposium on, 2012, pp. 377-382,
DOI: 10.1109/SACI.2011.5873022
[13] R. E. Precup, S. Preitl: Stability and Sensitivity Analysis of Fuzzy Control
Systems. Mechatronics Applications, Acta Polytechnica Hungarica, Vol. 3,
No. 1, pp. 61-76, 2006
[14] R. E. Precup, C. A. Dragos, S. Preitl, M. B. Radac, E. M. Petriu: Novel
Tensor Product Models for Automatic Transmission System Control, IEEE
Systems Journal, Vol. 6, No. 3, pp. 488-498, 2012
[15] I. J. Rudas, J. Gáti, A. Szakál, K. Némethy: From the Smart Hands to Tele-
Operations, Acta Polytechnica Hungarica Vol. 13, No. 1, 2016, pp. 43-60,
DOI: 10,12700 / APH.13.1.2016.1.5
[16] Impact of TCSC on the Transient Stability / Zsolt Čonka, Michal Kolcun -
2013. In: Acta Electrotechnica et Informatica. Roč. 13, č. 2 (2013), s. 50-
54. - ISSN 1335-8243
[17] A. L. Kazakov, A. Lempert: On Mathematical Models for Optimization
Problem of Logistics Infrastructure, International Journal of Artificial
Intelligence, Vol. 13, No. 1, pp. 200-210, 2015