Embed Size (px)
Citation preview
Article
The assessment and the within-plant variation of the morpho-
physiological traits and VOCs profile in endemic and rare Sal-
via ceratophylloides Ard. (Lamiaceae)
Rosa Vescio1, Maria Rosa Abenavoli1, Fabrizio Araniti1, Adriano Sofo2, Valentina Lucia Astrid Laface1, Giovanni
Spampinato1 and Agostino Sorgonà1*
1Department of Agricultural Sciences, “Mediterranea” University of Reggio Calabria, Feo di Vito, 89124 Reggio
Calabria (RC), Italy; 2Department of European and Mediterranean Cultures: Architecture, Environment, Cultural Heritage
(DiCEM), University of Basilicata, Via Lanera, 20 - 75100 Matera (MT), Italy.
[email protected] (R.V.); [email protected] (M.R.A.); [email protected] (F.A);
[email protected] (A.F.); [email protected] (V.L.A.L.); [email protected] (G.S.); [email protected]
(A.S.).
*Correspondence: [email protected] (A.S.)
Abstract: Salvia ceratophylloides (Ard.) is an endemic, rare, threatened plant species recently redis-
covered in very few individuals in two different sites of South Italy. The study of within-plant var-
iation more than among-plant one is fundamental to understand the plant adaptation to the local
conditions, especially in rare species, and consequently to preserve plant biodiversity. Here, we re-
ported the variation of the morpho-ecophysiological and metabolic traits between the sessile and
petiolate leaf of S. ceratophylloides plants in two different sites for understanding the adaptation strat-
egies for surviving in these habitats. The S. ceratophylloides individuals exhibited different net pho-
tosynthetic rate, maximum quantum yield, light intensity for the saturation of the photosynthetic
machinery, stomatal conductance, transpiration rate, leaf area, fractal dimension and some VOCs
between the different leaf types. This within-plant morpho-physiological and metabolic variation
was depended on the site. These results provide empirical evidence of sharply within-plant varia-
tion of the morpho-physiological traits and VOCs profiles in S. ceratophylloides which could be be-
cause of adaptation to the local conditions.
Keywords: Gas exchanges, LMA, rare species, Salvia ceratophylloides Ard., VOC, within-plant plas-
ticity
1. Introduction
Salvia ceratophylloides Ard. is a perennial herbaceous plant, endemic to Southern Ca-
labria, declared as extinct in 1997 [1] and recently rediscovered in a hundred mature indi-
viduals distributed in two sites, 2 Km apart, around the Reggio Calabria hills [2, 3]. Now-
adays, the S. ceratophylloides populations are threatened with extinction because of the
habitat modification and destruction by wild urbanization and agriculture [3]. The spread
of alien species, favored by climate change, establishes an additional threat factor [4, 5].
Despite its vulnerability, no quantitative information on the morphological and ecophys-
iological traits of S. ceratophylloides are actually available, although they are very important
for understanding the habitat requirements for the conservation of the endemic species.
The viability of endangered and rare species, as S. ceratophylloides, depends on their
capability to maintain or even increase its fitness under short- and/or long-term continu-
ous and climate change. Because of its rarity, this endemic species usually pointed out
specific and narrow habitat requirements suggesting that their responses must occur only
Preprints (www.preprints.org) | NOT PEER-REVIEWED | Posted: 17 February 2021 doi:10.20944/preprints202102.0375.v1
© 2021 by the author(s). Distributed under a Creative Commons CC BY license.
in the actual habitat determining local adaptation through phenotypic plasticity and/or
genetic variation [6].
Although the results appeared sometimes contrasting, the plant phenotypic plasticity
assumed a significant role in the viability of rare and endangered species. For example,
Noel et al. [7] observed a high degree of phenotypic plasticity that conferred an increased
fitness in Ranunculus nodiflorus Ten. suggesting the maintenance of the micro-environ-
ment heterogeneity as habitat-based strategy for its conservation. By contrary,
Westerband et al. [8] observed low phenotypic plasticity in response to drought stress in
Schiedea obovate (Sherff) W.L. Wagner & Weller, an endangered, endemic Hawaiian
shrub, showing a high risk of extinction in the future climate change scenarios. Based from
earlier works of the Winn [9, 10] and the De Kroon’s hypothesis [11], which dealt with
plant phenotypic variation at sub-individual level (i.e. organ or module), recently the
‘within-plant’ rather than “among-plant” phenotypic variation could represent the major
source of population-level diversity in several functional traits [12, 13]. Recent works
pointed out the multiple ecological aspects of the ‘within-plant variation’ such as the im-
provement of the exploitation of the heterogeneous-distributed resource [14, 15], the ad-
aptation to biotic and biotic gradients [16], the spreading of the ecological breadth of spe-
cies and individuals [17, 18], the increase of the functional diversity of populations [17],
and the alteration of plant-antagonist interactions [19-22]. In spite, no quantitative char-
acterization of the within-plant variation in endangered and rare plant species has been
tested yet.
In this respect, we started a two years field study for the characterization of the S.
ceratophylloides by leaf-level morpho-ecophysiological and metabolic analysis from its nat-
ural habitat. In particular, this species exhibited a leaf morphology characterized by con-
temporary presence (petiolate leaf) and absence of petiole (sessile leaf), which could sug-
gest a potential within-plant variation. Further, the individuals of this species were in two
different sites, distant < 2 km each other, suggesting no genetic variability between the
two populations [23] and indicating the phenotypic plasticity as the most driver for the
local adaptation. In particular, we focused on the photosynthetic performances as a
marker of tolerance and growth of species to predict the optimal habitat conditions for the
conservation of rare species [24] but also to provide the capacity of plant adaptation to
new conditions associated with climate change and the likely changes in plant communi-
ties [25]. Further, we took in account the leaf mass per area (LMA) as a morphological trait
strictly correlated with the functional syndrome and consequently to plant growth and
development and, ultimately, plant fitness [26]. At the same time, the metabolic profiles
of volatile organic compound (VOC) could provide information on the plant status and
the plant-, microbial- and arthropode-plant communications [27]. The evaluation of all
these functional traits could offer useful information for effectively promoting transloca-
tion and mitigation operations to restore Salvia ceratophylloides rare plant species.
In this framework, the present study has been addressed to assess the morpho-eco-
physiological and metabolic traits of S. ceratophylloides from its natural habitat and to in-
vestigate about the following questions: 1) does the within-plant variation of the photo-
synthetic performance, morphological traits and metabolic profiles occur? 2) Is the within-
plant morpho-physiological and metabolic variation of S. ceratophylloides modified be-
tween the two localities?.
2. Results
2.1. Physiological performances and morphological traits of S. ceratophylloides
The net photosynthetic rate (PN) and the photosynthetic photon flux density (I)
curves of S. ceratophylloides leaves were well-fitted (R2 > 0.95 and p < 0.05) and –described
by Ye mathematical model [28] (Figure 1). The parameters estimated by non-linear regres-
sion have been reported in Table 1. As observed, the leaf type produced a significant and
strong effect on the most photosynthetic parameters. In particular, the sessile leaves had
a higher Isat (1578 μmol(photon) m–2 s–1), Imax (766 μmol(photon) m–2 s–1), PNmax (11.22
μmol(CO2) m–2 s–1) and ϕ(I0 – Icomp) (0.030 µmol(CO2) µmol(photon) –1) level than petiolate
Preprints (www.preprints.org) | NOT PEER-REVIEWED | Posted: 17 February 2021 doi:10.20944/preprints202102.0375.v1
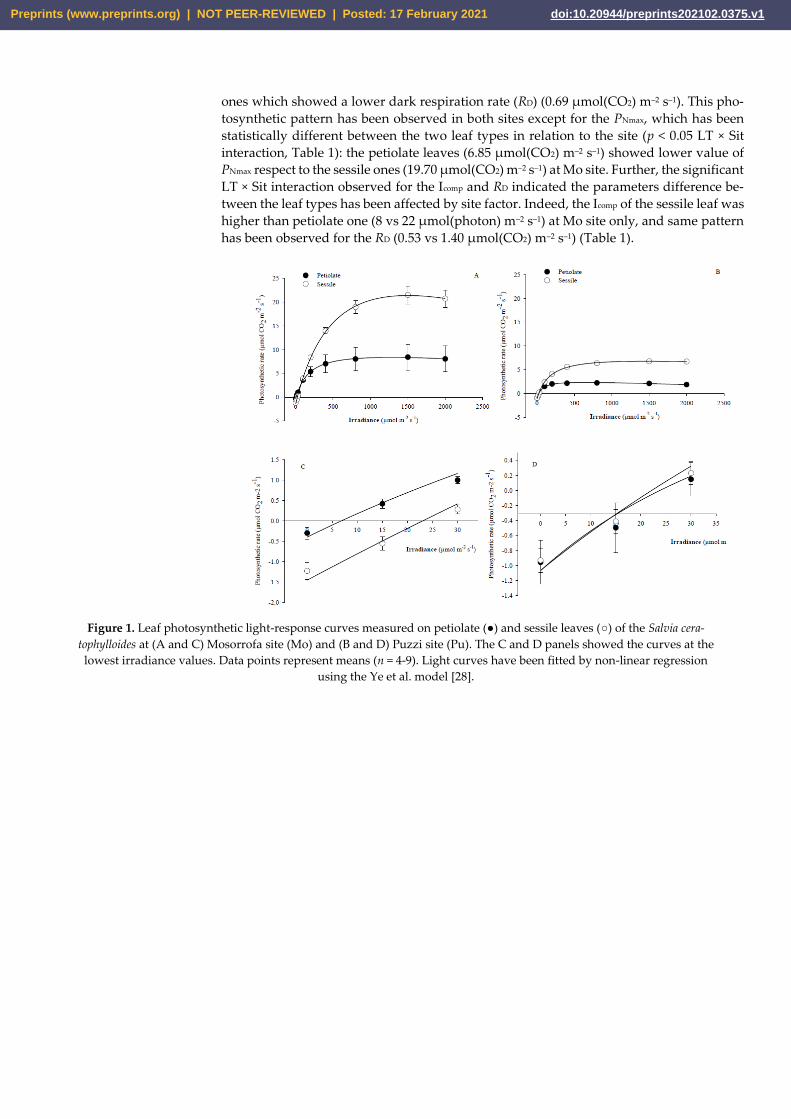
ones which showed a lower dark respiration rate (RD) (0.69 µmol(CO2) m–2 s–1). This pho-
tosynthetic pattern has been observed in both sites except for the PNmax, which has been
statistically different between the two leaf types in relation to the site (p < 0.05 LT × Sit
interaction, Table 1): the petiolate leaves (6.85 µmol(CO2) m–2 s–1) showed lower value of
PNmax respect to the sessile ones (19.70 µmol(CO2) m–2 s–1) at Mo site. Further, the significant
LT × Sit interaction observed for the Icomp and RD indicated the parameters difference be-
tween the leaf types has been affected by site factor. Indeed, the Icomp of the sessile leaf was
higher than petiolate one (8 vs 22 µmol(photon) m–2 s–1) at Mo site only, and same pattern
has been observed for the RD (0.53 vs 1.40 µmol(CO2) m–2 s–1) (Table 1).
Figure 1. Leaf photosynthetic light-response curves measured on petiolate (●) and sessile leaves (○) of the Salvia cera-
tophylloides at (A and C) Mosorrofa site (Mo) and (B and D) Puzzi site (Pu). The C and D panels showed the curves at the
lowest irradiance values. Data points represent means (n = 4-9). Light curves have been fitted by non-linear regression
using the Ye et al. model [28].
Preprints (www.preprints.org) | NOT PEER-REVIEWED | Posted: 17 February 2021 doi:10.20944/preprints202102.0375.v1
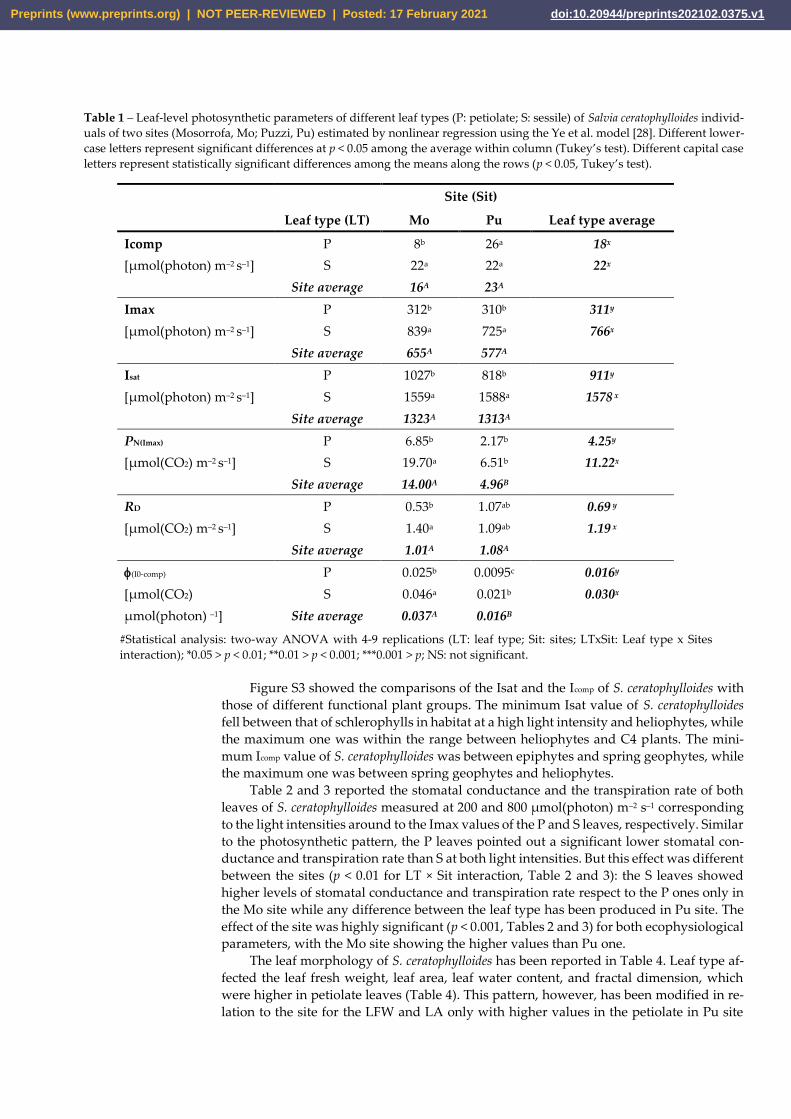
Table 1 – Leaf-level photosynthetic parameters of different leaf types (P: petiolate; S: sessile) of Salvia ceratophylloides individ-
uals of two sites (Mosorrofa, Mo; Puzzi, Pu) estimated by nonlinear regression using the Ye et al. model [28]. Different lower-
case letters represent significant differences at p < 0.05 among the average within column (Tukey’s test). Different capital case
letters represent statistically significant differences among the means along the rows (p < 0.05, Tukey’s test).
#Statistical analysis: two-way ANOVA with 4-9 replications (LT: leaf type; Sit: sites; LTxSit: Leaf type x Sites
interaction); *0.05 > p < 0.01; **0.01 > p < 0.001; ***0.001 > p; NS: not significant.
Figure S3 showed the comparisons of the Isat and the Icomp of S. ceratophylloides with
those of different functional plant groups. The minimum Isat value of S. ceratophylloides
fell between that of schlerophylls in habitat at a high light intensity and heliophytes, while
the maximum one was within the range between heliophytes and C4 plants. The mini-
mum Icomp value of S. ceratophylloides was between epiphytes and spring geophytes, while
the maximum one was between spring geophytes and heliophytes.
Table 2 and 3 reported the stomatal conductance and the transpiration rate of both
leaves of S. ceratophylloides measured at 200 and 800 µmol(photon) m–2 s–1 corresponding
to the light intensities around to the Imax values of the P and S leaves, respectively. Similar
to the photosynthetic pattern, the P leaves pointed out a significant lower stomatal con-
ductance and transpiration rate than S at both light intensities. But this effect was different
between the sites (p < 0.01 for LT × Sit interaction, Table 2 and 3): the S leaves showed
higher levels of stomatal conductance and transpiration rate respect to the P ones only in
the Mo site while any difference between the leaf type has been produced in Pu site. The
effect of the site was highly significant (p < 0.001, Tables 2 and 3) for both ecophysiological
parameters, with the Mo site showing the higher values than Pu one.
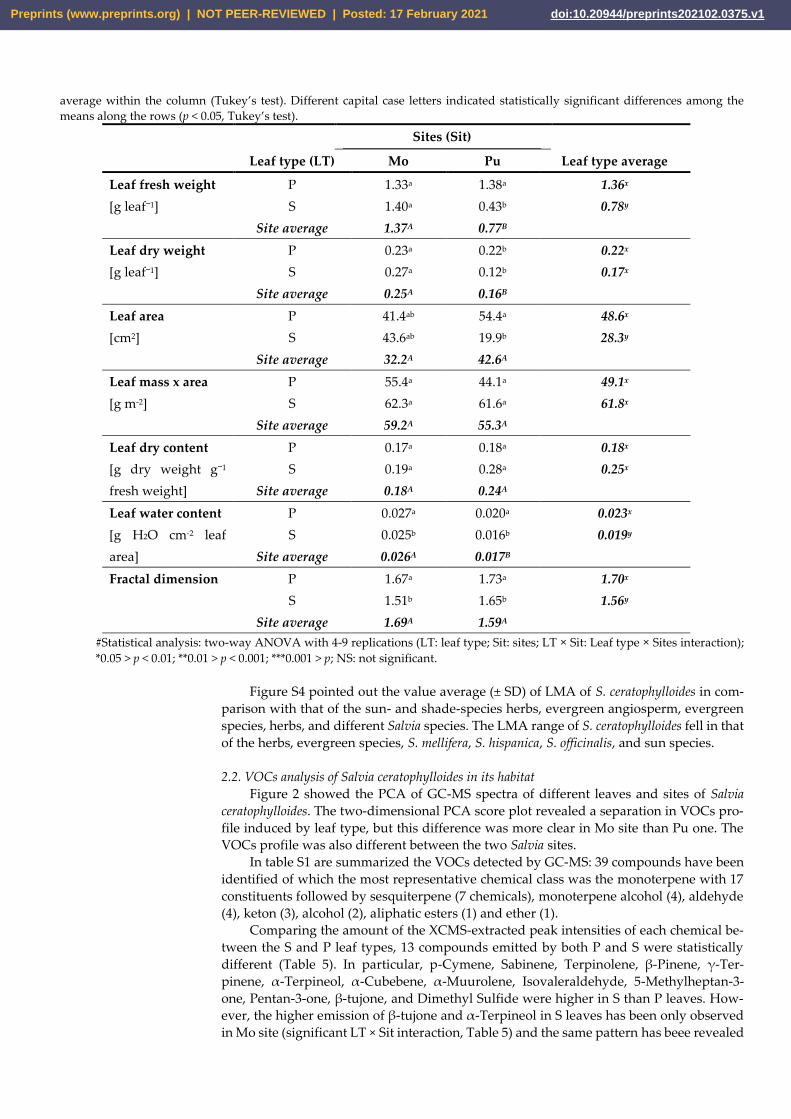
The leaf morphology of S. ceratophylloides has been reported in Table 4. Leaf type af-
fected the leaf fresh weight, leaf area, leaf water content, and fractal dimension, which
were higher in petiolate leaves (Table 4). This pattern, however, has been modified in re-
lation to the site for the LFW and LA only with higher values in the petiolate in Pu site
Site (Sit)
Leaf type (LT) Mo Pu Leaf type average
Icomp
[µmol(photon) m–2 s–1]
P 8b 26a 18x
S 22a 22a 22x
Site average 16A 23A
Imax
[µmol(photon) m–2 s–1]
P 312b 310b 311y
S 839a 725a 766x
Site average 655A 577A
Isat
[µmol(photon) m–2 s–1]
P 1027b 818b 911y
S 1559a 1588a 1578 x
Site average 1323A 1313A
PN(Imax)
[µmol(CO2) m–2 s–1]
P 6.85b 2.17b 4.25y
S 19.70a 6.51b 11.22x
Site average 14.00A 4.96B
RD
[µmol(CO2) m–2 s–1]
P 0.53b 1.07ab 0.69 y
S 1.40a 1.09ab 1.19 x
Site average 1.01A 1.08A
(I0-comp)
[µmol(CO2)
µmol(photon) –1]
P 0.025b 0.0095c 0.016y
S 0.046a 0.021b 0.030x
Site average 0.037A 0.016B
Preprints (www.preprints.org) | NOT PEER-REVIEWED | Posted: 17 February 2021 doi:10.20944/preprints202102.0375.v1
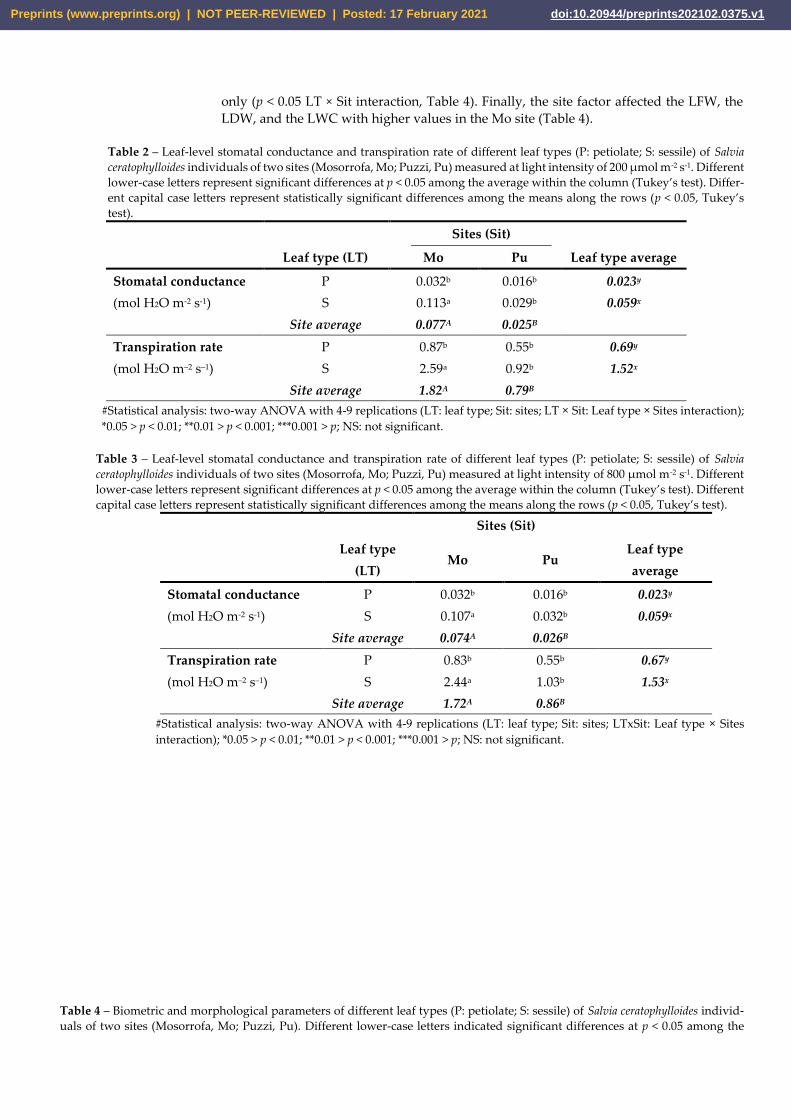
only (p < 0.05 LT × Sit interaction, Table 4). Finally, the site factor affected the LFW, the
LDW, and the LWC with higher values in the Mo site (Table 4).
Table 2 – Leaf-level stomatal conductance and transpiration rate of different leaf types (P: petiolate; S: sessile) of Salvia
ceratophylloides individuals of two sites (Mosorrofa, Mo; Puzzi, Pu) measured at light intensity of 200 µmol m-2 s-1. Different
lower-case letters represent significant differences at p < 0.05 among the average within the column (Tukey’s test). Differ-
ent capital case letters represent statistically significant differences among the means along the rows (p < 0.05, Tukey’s
test).
Sites (Sit)
Leaf type (LT) Mo Pu Leaf type average
Stomatal conductance
(mol H2O m-2 s-1)
P 0.032b 0.016b 0.023y
S 0.113a 0.029b 0.059x
Site average 0.077A 0.025B
Transpiration rate
(mol H2O m–2 s–1)
P 0.87b 0.55b 0.69y
S 2.59a 0.92b 1.52x
Site average 1.82A 0.79B
#Statistical analysis: two-way ANOVA with 4-9 replications (LT: leaf type; Sit: sites; LT × Sit: Leaf type × Sites interaction);
*0.05 > p < 0.01; **0.01 > p < 0.001; ***0.001 > p; NS: not significant.
Table 3 – Leaf-level stomatal conductance and transpiration rate of different leaf types (P: petiolate; S: sessile) of Salvia
ceratophylloides individuals of two sites (Mosorrofa, Mo; Puzzi, Pu) measured at light intensity of 800 µmol m-2 s-1. Different
lower-case letters represent significant differences at p < 0.05 among the average within the column (Tukey’s test). Different
capital case letters represent statistically significant differences among the means along the rows (p < 0.05, Tukey’s test).
Sites (Sit)
Leaf type
(LT) Mo Pu
Leaf type
average
Stomatal conductance
(mol H2O m-2 s-1)
P 0.032b 0.016b 0.023y
S 0.107a 0.032b 0.059x
Site average 0.074A 0.026B
Transpiration rate
(mol H2O m–2 s–1)
P 0.83b 0.55b 0.67y
S 2.44a 1.03b 1.53x
Site average 1.72A 0.86B
#Statistical analysis: two-way ANOVA with 4-9 replications (LT: leaf type; Sit: sites; LTxSit: Leaf type × Sites
interaction); *0.05 > p < 0.01; **0.01 > p < 0.001; ***0.001 > p; NS: not significant.
Table 4 – Biometric and morphological parameters of different leaf types (P: petiolate; S: sessile) of Salvia ceratophylloides individ-
uals of two sites (Mosorrofa, Mo; Puzzi, Pu). Different lower-case letters indicated significant differences at p < 0.05 among the
Preprints (www.preprints.org) | NOT PEER-REVIEWED | Posted: 17 February 2021 doi:10.20944/preprints202102.0375.v1
average within the column (Tukey’s test). Different capital case letters indicated statistically significant differences among the
means along the rows (p < 0.05, Tukey’s test).
Sites (Sit)
Leaf type (LT) Mo Pu Leaf type average
Leaf fresh weight
[g leaf‒1]
P 1.33a 1.38a 1.36x
S 1.40a 0.43b 0.78y
Site average 1.37A 0.77B
Leaf dry weight
[g leaf‒1]
P 0.23a 0.22b 0.22x
S 0.27a 0.12b 0.17x
Site average 0.25A 0.16B
Leaf area
[cm2]
P 41.4ab 54.4a 48.6x
S 43.6ab 19.9b 28.3y
Site average 32.2A 42.6A
Leaf mass x area
[g m-2]
P 55.4a 44.1a 49.1x
S 62.3a 61.6a 61.8x
Site average 59.2A 55.3A
Leaf dry content
[g dry weight g‒1
fresh weight]
P 0.17a 0.18a 0.18x
S 0.19a 0.28a 0.25x
Site average 0.18A 0.24A
Leaf water content
[g H2O cm-2 leaf
area]
P 0.027a 0.020a 0.023x
S 0.025b 0.016b 0.019y
Site average 0.026A 0.017B
Fractal dimension P 1.67a 1.73a 1.70x
S 1.51b 1.65b 1.56y
Site average 1.69A 1.59A
#Statistical analysis: two-way ANOVA with 4-9 replications (LT: leaf type; Sit: sites; LT × Sit: Leaf type × Sites interaction);
*0.05 > p < 0.01; **0.01 > p < 0.001; ***0.001 > p; NS: not significant.
Figure S4 pointed out the value average (± SD) of LMA of S. ceratophylloides in com-
parison with that of the sun- and shade-species herbs, evergreen angiosperm, evergreen
species, herbs, and different Salvia species. The LMA range of S. ceratophylloides fell in that
of the herbs, evergreen species, S. mellifera, S. hispanica, S. officinalis, and sun species.
2.2. VOCs analysis of Salvia ceratophylloides in its habitat
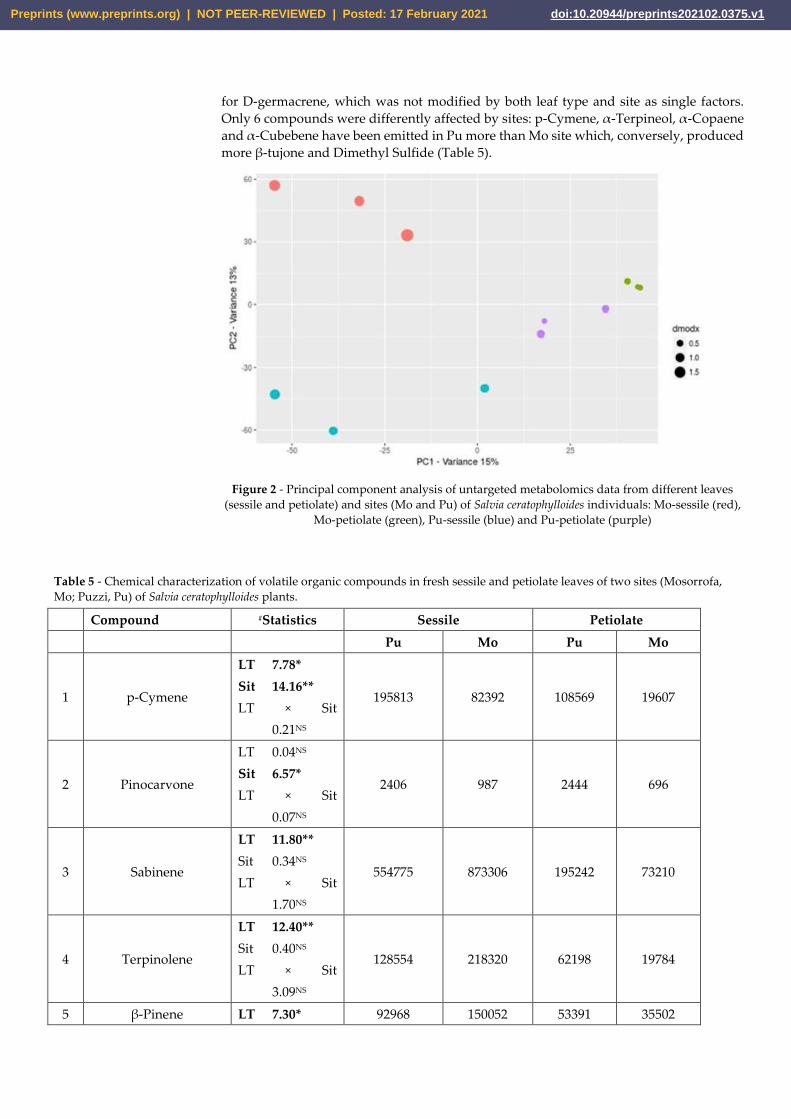
Figure 2 showed the PCA of GC-MS spectra of different leaves and sites of Salvia
ceratophylloides. The two-dimensional PCA score plot revealed a separation in VOCs pro-
file induced by leaf type, but this difference was more clear in Mo site than Pu one. The
VOCs profile was also different between the two Salvia sites.
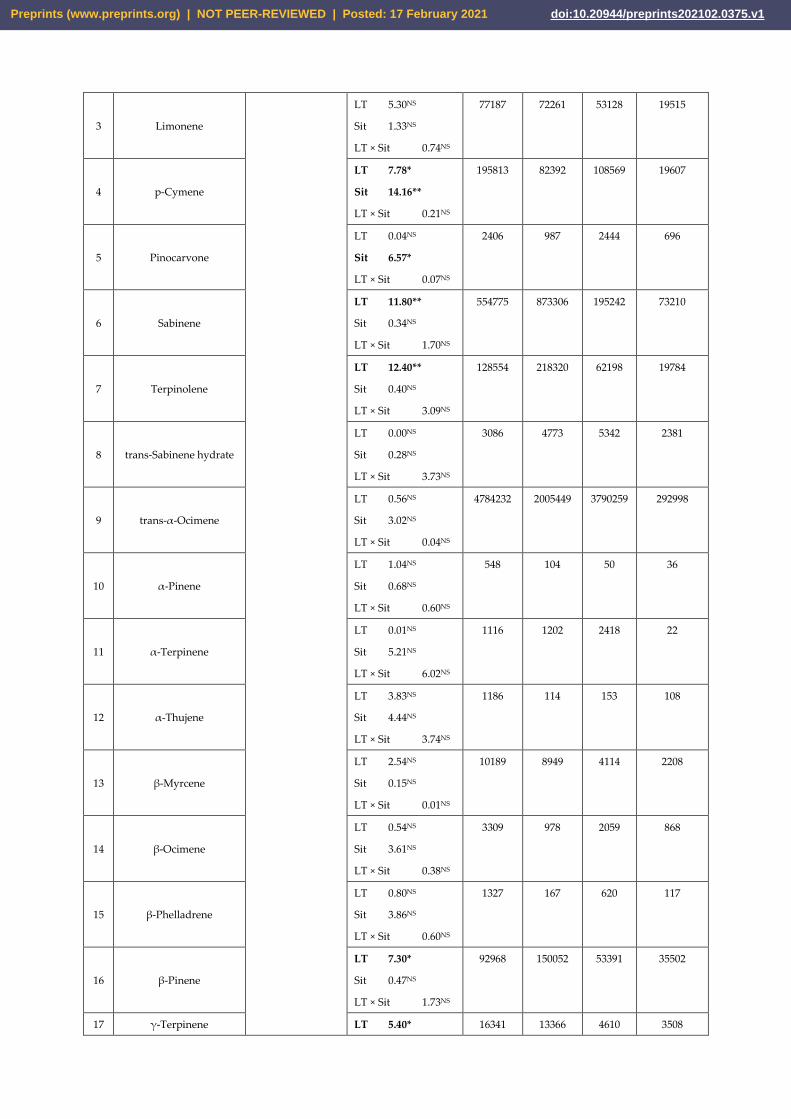
In table S1 are summarized the VOCs detected by GC-MS: 39 compounds have been
identified of which the most representative chemical class was the monoterpene with 17
constituents followed by sesquiterpene (7 chemicals), monoterpene alcohol (4), aldehyde
(4), keton (3), alcohol (2), aliphatic esters (1) and ether (1).
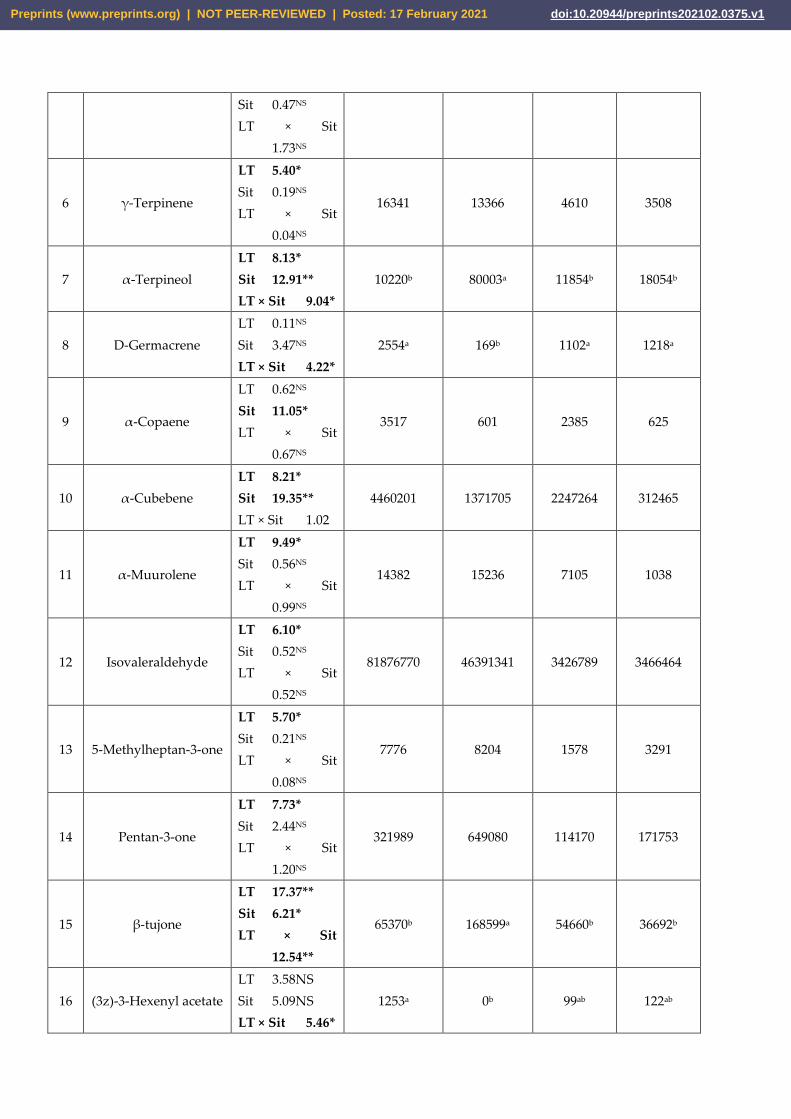
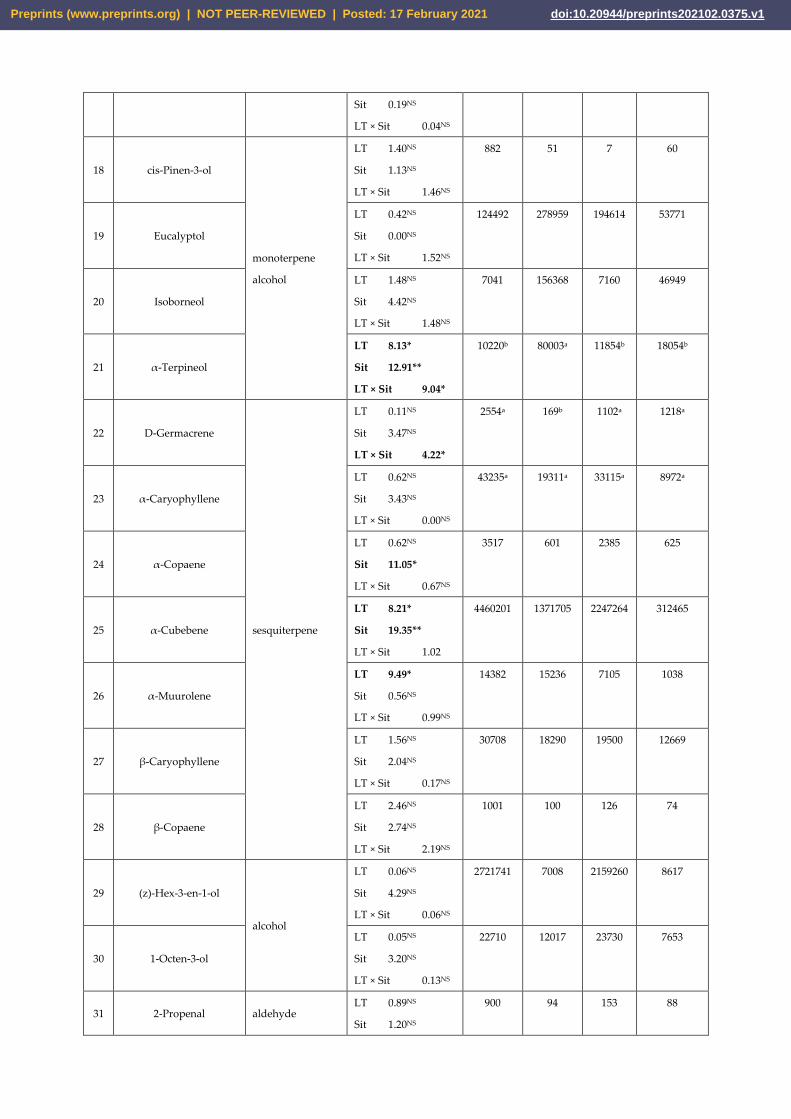
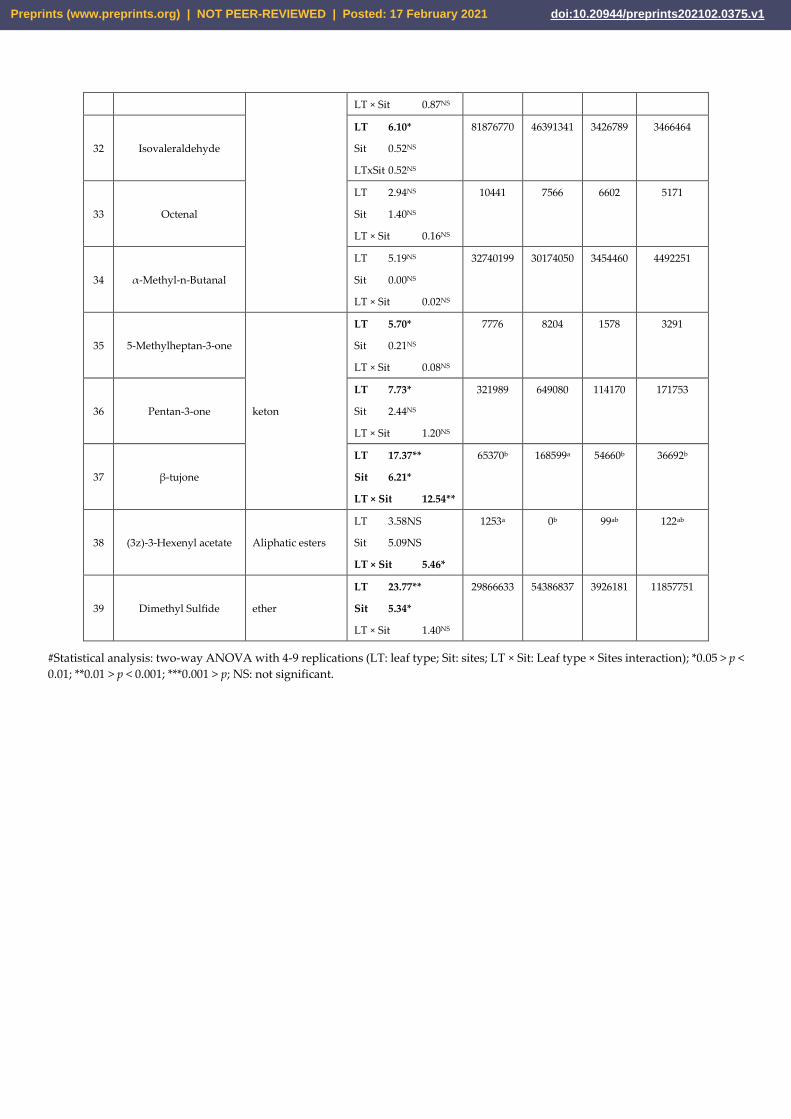
Comparing the amount of the XCMS-extracted peak intensities of each chemical be-
tween the S and P leaf types, 13 compounds emitted by both P and S were statistically
different (Table 5). In particular, p-Cymene, Sabinene, Terpinolene, β-Pinene, γ-Ter-
pinene, α-Terpineol, α-Cubebene, α-Muurolene, Isovaleraldehyde, 5-Methylheptan-3-
one, Pentan-3-one, β-tujone, and Dimethyl Sulfide were higher in S than P leaves. How-
ever, the higher emission of β-tujone and α-Terpineol in S leaves has been only observed
in Mo site (significant LT × Sit interaction, Table 5) and the same pattern has beee revealed
Preprints (www.preprints.org) | NOT PEER-REVIEWED | Posted: 17 February 2021 doi:10.20944/preprints202102.0375.v1
for D-germacrene, which was not modified by both leaf type and site as single factors.
Only 6 compounds were differently affected by sites: p-Cymene, α-Terpineol, α-Copaene
and α-Cubebene have been emitted in Pu more than Mo site which, conversely, produced
more β-tujone and Dimethyl Sulfide (Table 5).
Figure 2 - Principal component analysis of untargeted metabolomics data from different leaves
(sessile and petiolate) and sites (Mo and Pu) of Salvia ceratophylloides individuals: Mo-sessile (red),
Mo-petiolate (green), Pu-sessile (blue) and Pu-petiolate (purple)
Table 5 - Chemical characterization of volatile organic compounds in fresh sessile and petiolate leaves of two sites (Mosorrofa,
Mo; Puzzi, Pu) of Salvia ceratophylloides plants.
Compound #Statistics Sessile Petiolate
Pu Mo Pu Mo
1 p-Cymene
LT 7.78*
Sit 14.16**
LT × Sit
0.21NS
195813 82392 108569 19607
2 Pinocarvone
LT 0.04NS
Sit 6.57*
LT × Sit
0.07NS
2406 987 2444 696
3 Sabinene
LT 11.80**
Sit 0.34NS
LT × Sit
1.70NS
554775 873306 195242 73210
4 Terpinolene
LT 12.40**
Sit 0.40NS
LT × Sit
3.09NS
128554 218320 62198 19784
5 β-Pinene LT 7.30* 92968 150052 53391 35502
Preprints (www.preprints.org) | NOT PEER-REVIEWED | Posted: 17 February 2021 doi:10.20944/preprints202102.0375.v1
Sit 0.47NS
LT × Sit
1.73NS
6 γ-Terpinene
LT 5.40*
Sit 0.19NS
LT × Sit
0.04NS
16341 13366 4610 3508
7 α-Terpineol
LT 8.13*
Sit 12.91**
LT × Sit 9.04*
10220b 80003a 11854b 18054b
8 D-Germacrene
LT 0.11NS
Sit 3.47NS
LT × Sit 4.22*
2554a 169b 1102a 1218a
9 α-Copaene
LT 0.62NS
Sit 11.05*
LT × Sit
0.67NS
3517 601 2385 625
10 α-Cubebene
LT 8.21*
Sit 19.35**
LT × Sit 1.02
4460201 1371705 2247264 312465
11 α-Muurolene
LT 9.49*
Sit 0.56NS
LT × Sit
0.99NS
14382 15236 7105 1038
12 Isovaleraldehyde
LT 6.10*
Sit 0.52NS
LT × Sit
0.52NS
81876770 46391341 3426789 3466464
13 5-Methylheptan-3-one
LT 5.70*
Sit 0.21NS
LT × Sit
0.08NS
7776 8204 1578 3291
14 Pentan-3-one
LT 7.73*
Sit 2.44NS
LT × Sit
1.20NS
321989 649080 114170 171753
15 β-tujone
LT 17.37**
Sit 6.21*
LT × Sit
12.54**
65370b 168599a 54660b 36692b
16 (3z)-3-Hexenyl acetate
LT 3.58NS
Sit 5.09NS
LT × Sit 5.46*
1253a 0b 99ab 122ab
Preprints (www.preprints.org) | NOT PEER-REVIEWED | Posted: 17 February 2021 doi:10.20944/preprints202102.0375.v1
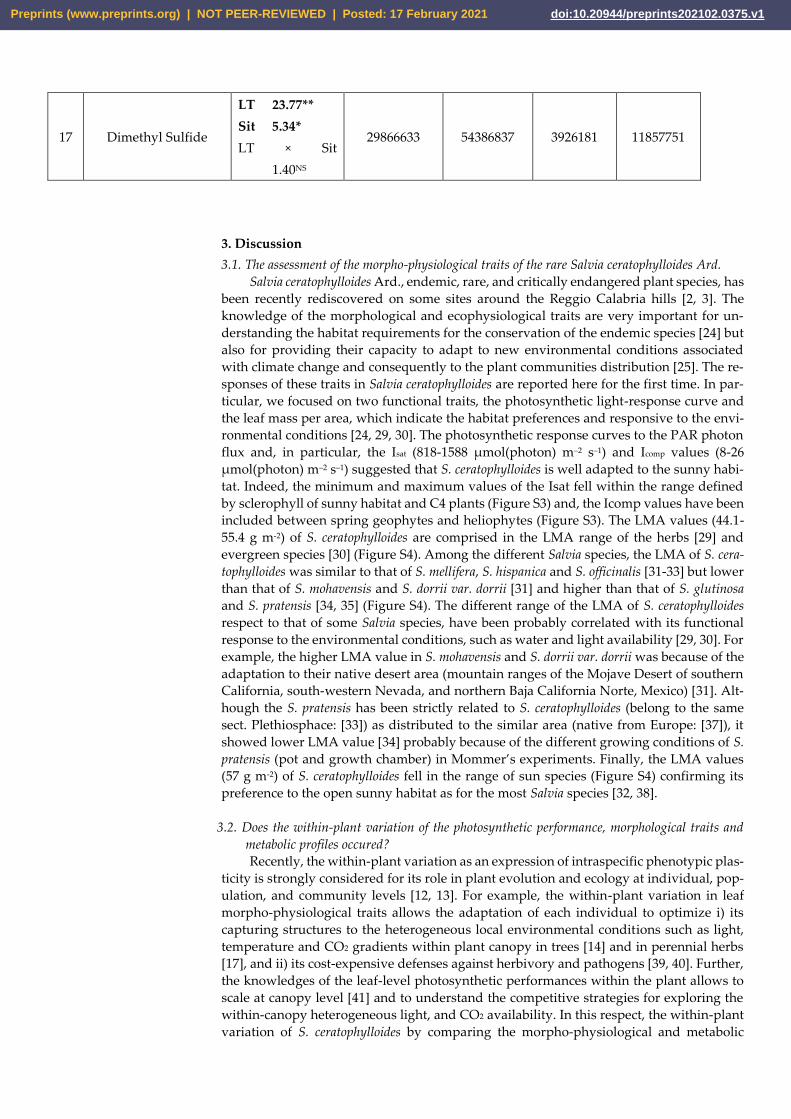
17 Dimethyl Sulfide
LT 23.77**
Sit 5.34*
LT × Sit
1.40NS
29866633 54386837 3926181 11857751
3. Discussion
3.1. The assessment of the morpho-physiological traits of the rare Salvia ceratophylloides Ard.
Salvia ceratophylloides Ard., endemic, rare, and critically endangered plant species, has
been recently rediscovered on some sites around the Reggio Calabria hills [2, 3]. The
knowledge of the morphological and ecophysiological traits are very important for un-
derstanding the habitat requirements for the conservation of the endemic species [24] but
also for providing their capacity to adapt to new environmental conditions associated
with climate change and consequently to the plant communities distribution [25]. The re-
sponses of these traits in Salvia ceratophylloides are reported here for the first time. In par-
ticular, we focused on two functional traits, the photosynthetic light-response curve and
the leaf mass per area, which indicate the habitat preferences and responsive to the envi-
ronmental conditions [24, 29, 30]. The photosynthetic response curves to the PAR photon
flux and, in particular, the Isat (818-1588 µmol(photon) m–2 s–1) and Icomp values (8-26
µmol(photon) m–2 s–1) suggested that S. ceratophylloides is well adapted to the sunny habi-
tat. Indeed, the minimum and maximum values of the Isat fell within the range defined
by sclerophyll of sunny habitat and C4 plants (Figure S3) and, the Icomp values have been
included between spring geophytes and heliophytes (Figure S3). The LMA values (44.1-
55.4 g m-2) of S. ceratophylloides are comprised in the LMA range of the herbs [29] and
evergreen species [30] (Figure S4). Among the different Salvia species, the LMA of S. cera-
tophylloides was similar to that of S. mellifera, S. hispanica and S. officinalis [31-33] but lower
than that of S. mohavensis and S. dorrii var. dorrii [31] and higher than that of S. glutinosa
and S. pratensis [34, 35] (Figure S4). The different range of the LMA of S. ceratophylloides
respect to that of some Salvia species, have been probably correlated with its functional
response to the environmental conditions, such as water and light availability [29, 30]. For
example, the higher LMA value in S. mohavensis and S. dorrii var. dorrii was because of the
adaptation to their native desert area (mountain ranges of the Mojave Desert of southern
California, south-western Nevada, and northern Baja California Norte, Mexico) [31]. Alt-
hough the S. pratensis has been strictly related to S. ceratophylloides (belong to the same
sect. Plethiosphace: [33]) as distributed to the similar area (native from Europe: [37]), it
showed lower LMA value [34] probably because of the different growing conditions of S.
pratensis (pot and growth chamber) in Mommer’s experiments. Finally, the LMA values
(57 g m-2) of S. ceratophylloides fell in the range of sun species (Figure S4) confirming its
preference to the open sunny habitat as for the most Salvia species [32, 38].
3.2. Does the within-plant variation of the photosynthetic performance, morphological traits and
metabolic profiles occured?
Recently, the within-plant variation as an expression of intraspecific phenotypic plas-
ticity is strongly considered for its role in plant evolution and ecology at individual, pop-
ulation, and community levels [12, 13]. For example, the within-plant variation in leaf
morpho-physiological traits allows the adaptation of each individual to optimize i) its
capturing structures to the heterogeneous local environmental conditions such as light,
temperature and CO2 gradients within plant canopy in trees [14] and in perennial herbs
[17], and ii) its cost-expensive defenses against herbivory and pathogens [39, 40]. Further,
the knowledges of the leaf-level photosynthetic performances within the plant allows to
scale at canopy level [41] and to understand the competitive strategies for exploring the
within-canopy heterogeneous light, and CO2 availability. In this respect, the within-plant
variation of S. ceratophylloides by comparing the morpho-physiological and metabolic
Preprints (www.preprints.org) | NOT PEER-REVIEWED | Posted: 17 February 2021 doi:10.20944/preprints202102.0375.v1
traits of petiole and sessile leaves have been here tested, for the first time at our
knowledge.
The S. ceratophylloides individuals exhibited a clear within-plant variation determined
by the differences in most functional traits considered between the two leaf types (Table
1, 2 and 3 and Fig. 3). Indeed, comparing the leaf types, the S pointed out a better photo-
synthetic performance by higher net photosynthetic rate and maximum quantum yield,
and higher Isat (1578 vs 911 µmol(photon) m–2 s–1) but, conversely, they exhibited a lower
leaf area and capacity to fill the space as evidenced by FD, respect than the P ones. Hence,
a within-plant efficient subdivision of the functional traits for the resource acquisition and
use (light, CO2) has been observed in S. ceratophylloides with the short-term low-expensive
physiological traits in S leaves (uppermost) and the long-term high-expensive morpho-
logical traits in P leaves (lowest). Hence, the leaves placed at the top of the shoot of S.
ceratophylloides facing high light intensity, temperature, and vapor pressure deficit, could
use higher photon and CO2 fluxes for increased their carbon gains by high Isat and stomatal
conductance. The spatial distribution of more efficient structures or functions within
plants to fit the micro-environmental heterogeneous conditions and to maximize the pho-
tosynthesis and carbon gain is already known in different plant species [42]. Besides the
functional traits linked to the resource acquisition, the two leaf types of S. ceratophylloides
pointed out difference in the stomatal conductance and transpiration with the S leaf show-
ing higher values (Table 2 and 3). The higher stomatal conductance and transpiration rate
limited the leaf overheating, as reported by Lin et al. [43] in dry areas species. The lower
aerodynamic resistance caused by the smaller size and shape of the sessile leaves (lower
leaf area and fractal dimension) was further beneficial allied for avoiding leaf overheating
[43, 44] but also for reducing the water loss by smaller total leaf area. Overall, the leaf
position in the S. ceratophylloides canopy showed different strategies to cope with the fine-
scaled environmental gradients: from higher to lower light intensity and from dry to wet
conditions along the uppermost sessile and lowest petiolate leaf gradient.
The within-plant variation of S. ceratophylloides has been also observed in the VOCs
composition and emission. Indeed, the S and P leaves have been sharply separated by
VOC-based metabolic profiles (Figure 3) suggesting different intensity and composition
between two leaves. Further, the emission of 14 out of 39 identified VOCs has statisti-
cally increased in S leaves respect than P ones (Table 5 and Table S1). The VOCs with
higher emission in sessile leaves included monoterpenes (p-Cymene, Sabinene, Terpino-
lene, β-Pinene, γ-Terpinene, and α-Terpineol), sesquiterpenes (D-Germacrene, α-Cu-
bebene, α-Muurolene) and green leaf volatiles ((3z)-3-Hexenyl acetate) mostly involved
in defenses against herbivory and pathogens [45] and in responses to abiotic stress [46].
The within-plant variation of VOCs emission in response to herbivory has been already
observed in wild and crop species [47, 48] but no evidence at field level has been reported
yet. Why do S. ceratophylloides plants defend the S more than P leaves by higher VOCs
emission? Probably, the upper, younger, sessile leaves are more protected in views of its
high performing photosynthetic machinery and nutritive value (the high leaf dry content,
although not statistical support) as suggested by optimal defense hypothesis [39, 40].
Overall, these results pointed out the within-plant functional subdivision at morpho-
physiological and metabolic levels of S. ceratophylloides mimicking what has been already
observed in the wide crown of trees for heat tolerance [49], light acquisition and differen-
tial expression of genetic polymorphisms in sun and shade leaves of trees [50] and defense
responses to herbivory [51].
The within-plant variation of both morpho-physiological and metabolic traits has
been affected by site suggesting that Salvia plants have been adapted to local conditions.
Indeed, the morpho-physiological patterns of the S and P leaves changed between the two
sites for most traits (on 12 that showed the leaf type factor as statistically significant, nine
traits pointed out LT × Sit interaction). The S leaves pointed out a higher photosynthetic
rate, stomatal conductance, and transpiration rate associated with higher dark respiration
and Icomp than P ones in the Mo site only. These results could be because of phenotypic
plasticity response to the local conditions [52, 53] because preliminary results showed a
Preprints (www.preprints.org) | NOT PEER-REVIEWED | Posted: 17 February 2021 doi:10.20944/preprints202102.0375.v1
low genetic variability of S. ceratophylloides populations [23]. It has been observed that the
within-plant phenotypic variation responded to the microhabitat environmental hetero-
geneity or fine-grained (small-scale) environmental variations [9, 11, 14, 15] rather than
macro-geographical or coarse-grained environmental variations [17, 54, 55]. In this re-
spect, we can hypothesize that the S. ceratophylloides individuals in the Mo site, showing a
statistically significant within-plant variation of the leaf morpho-physiological traits,
could face with a higher microhabitat environmental heterogeneity, especially for light
intensity and/or temperature gradients (the most important abiotic stresses affecting the
leaf growth), than Pu site. Opedal et al. [56] observed that the microhabitat environmental
heterogeneity increased with the topographically complex sites changing the intraspecific
traits of 16 plant species. The Pu site is characterized by flatter, more open terrains and
higher altitude than Mo one, which conversely is placed at a lower altitude at the base of
the valley, closed and with rough terrains (Figure 1) likely determining a short duration
of light and steeply thermal and light gradients in the latter location.
Unlike the morpho-physiological traits, the within-plant variation of metabolic pro-
files was lesser affected by the different sites. Indeed, the PCA pointed out that the meta-
bolic profiles of S and P leaves were separate at both sites, and only 4 single VOCs out 13
exhibited a statistically significant Lt × Sit interaction. Considering that the VOCs emission
is more involved to the biotic stress (plant-plant, plant-herbivory, and plant-pathogen in-
teractions) [27], probably the Salvia plants in both sites are faced to similar biotic environ-
ment heterogeneity or variability (predation, competition, etc.) differently to the abiotic
ones (light, temperature, etc.), determining thus the maintaining of the same within-plant
VOCs emission in S. ceratophylloides at both sites.
Finally, we observed that the metabolite profiling and physiological traits (10 out of
10 parameters, considering the LT × Sit interaction also; Table 1, 2 and 3, Figure 3) varied
more than morphological features (4 out 7 parameters; Table 4). Why do S. ceratophylloides
plants choose to invest in the physiological and metabolic capacity more than morpholog-
ical-related traits between S and P leaves? The physiological plasticity is a low cost and
more rapid response with respect to the cost-expensive changes of morphological traits,
allowing the expression of the most adequate plant phenotype in response to the more
variable climatic conditions. For example, the plant physiological plasticity is more related
to an enhanced ability to colonize gaps and open areas and, hence, exploiting the transient
environmental resources at low cost by short-term adjustments, briefly the plant acclima-
tization [47-60]. Conversely, the plant expensive morphological plasticity is more func-
tional for the plant adaptation at the long-term and probably useful for growing in forest
understories [57, 61]. The choice to invest in higher plasticity of the physiological traits
than morphological ones has been also reported by Herrera et al. [17], which observed
that the within-ramet variation in Helleborus foetidus L. was more due to the stomatal fea-
tures than leaf size- and area-related traits causing an increase of seed number produced
by each individual [13].
4. Materials and Methods
4.1. Species and sites
Salvia ceratophylloides Ard. has been studied by Crisafulli et al. [2] and Spampinato et
al. [3]. Briefly, it is a perennial herb, scapose hemicryptophyte, with woody and upright
stems with a dense pubescence of glandular and simple patent hairs (Figure S1C). The
leaves are opposite pinnate-partite with toothed lobes and morphologically distinct in peti-
olate (basal, 12x4 cm long and less discrete pinnate lobes and presence of the petiole) and
sessile (cauline, 3-4 × 1-2 cm long and more incise pinnate lobes, clasp the stem) (Figure S1C).
Inflorescences are 20-30 cm in length and made up of 5–6 verticillaster each with 4–6 flowers.
S. ceratophylloides plants have been studied in two different and closer sites (< 2 Km)
located around the Reggio Calabria hills, Mosorrofa (Mo) (38° 5’ 42.66” N latitude, 15°43’
18.66”E longitude) and Puzzi (Pu) (38° 4’ 52.34” N latitude, 15° 42’ 29.23”E longitude)
(Southern Italy) (Fig. S2). Each site consisted in around 60 and 240 individuals for Mosorrofa
and Puzzi, respectively. Further, Mosorrofa site is topographically complex and in a little
Preprints (www.preprints.org) | NOT PEER-REVIEWED | Posted: 17 February 2021 doi:10.20944/preprints202102.0375.v1
valley while Puzzi pointed out open and flatter terrains (Fig. S1A and B). Both sites are char-
acterized by layers of loose sand alternating with benches of soft calcarenites of Pliocene
origin. The soils have a sandy texture with a basic pH and fall into the group Calcaric Cam-
bisols [62].
Species identification is in agreement with Pignatti [63] and specimens are deposited
in the Herbarium of Mediterranean University of Reggio Calabria (acronym REGGIO).
The S. ceratophylloides location pointed out a Mediterranean climate with average an-
nual temperatures of 18°C and average annual rainfall of 600 mm mostly in autumn-winter,
and a dry period in summer. According to Rivas-Martínez [64], the macro-bioclimate is
“Mediterranean pluviseasonal oceanic” (upper thermos-Mediterranean thermotype and a
lower subhumid ombrotype).
4.2. Measurements and samplings
Measurements and samplings have been conducted during the early summer (May-
June) of 2016 and 2017 on two leaf types: 1) upper sessile leaves (S) (two to three nodes from
the apex) and 2) lower petiolate leaves (P) (from fifth to sixth nodes from the apex) (Figure
1C). For the morphological and physiological analysis, 4-9 and 5-9 samples for petiolate and
sessile leaves, respectively, have been collected from each site; while the metabolic analysis
has been carried out on 3 leaves of each type and site.
4.3. Physiological analysis
The net photosynthetic light response curves have been determined by the LI-6400XT
portable photosynthesis system (Li-Cor, Inc. Lincoln, Nebraska, USA) at the following irra-
diance levels: 2000, 1500, 800, 400, 200, 100, 30, 15, and 0 µmol m-2 s-1. The net photosynthesis
has been measured at 500 cm3 min−1 flow rate, 26 °C leaf temperature, CO2 concentration
400 μmol(CO2) mol(air)–1 (controlled by CO2 cylinder). Each measurement was made with a
minimum and maximum wait time of 120 and 200 s, respectively, and matching the infrared
gas analyzers for 50 μmol(CO2) mol(air)–1 difference in the CO2 concentration between the
sample and the reference before every change in irradiance levels. The leaf to-air vapor pres-
sure difference (VPD) has been setted to 1.5 kPa, and continuously monitored around the
leaf during measurements and maintained at a constant level by manipulating the humidity
of incoming air as needed. The measurements were made on sunny days during 8:30–11:30
am. Finally, stomatal conductance (gs, mol H2O m-2 s-1) and transpiration rate measurements
(T, mmol H2O m-2 s-1) at each light intensity have been evaluated.
4.4. Morphological analysis
After the physiological measurements, the same leaves have been used for the mor-
phological analysis. In particular, leaf fresh weight (LFW, g) and dry weight (LDW, g), de-
termined after oven-drying at 70 °C for 2 days, and leaf area (LA, cm2) that has been meas-
ured by WinRhizo Pro v. 4.0 software package (Instruments Régent Inc., Chemin Sainte-
Foy, Québec, Canada) after scanned at a resolution of 300 dpi by WinRhizo STD 1600 (In-
struments Régent Inc., Canada). Further, the fractal dimension of the leaf (FD) has been ob-
tained by the “fractal analysis module” through the WinRhizo software, based on the box-
counting method with the following settings: maximal pixel size (2.0mm), box sizes ranging
from 2 to 32 and filters, and a length/width ratio smaller than 2.00. The FD provides infor-
mation on the space occupation of the object: the fractal dimension approaches the value of
2 as the leaves become dense to the point of “filling in” a shape. For this reason, the FD has
been used to correlate the root architecture to the soil resource acquisition [65], but also as
the correction parameter in the LAI-Light interception models [66].
By these parameters, we also calculated the leaf mass per area (LMA, g LDW cm-2 LA),
strongly related to photosynthetic rate [67], growth rate [68] and decomposition rate [69];
the leaf dry content (LDC, g dry weight/g fresh weight), strongly related with relative
growth rate [70], flammability [71], and post-fire regeneration strategy [72]; and leaf water
content or leaf succulence (LWC, g H2O/cm2 leaf area], which indicates the leaf water content
in relation to its leaf area, directly correlated with the plant responses to abiotic stresses [73].
Preprints (www.preprints.org) | NOT PEER-REVIEWED | Posted: 17 February 2021 doi:10.20944/preprints202102.0375.v1
4.5. VOC analysis: HeadSpace/Solid-Phase Micro-Extraction (HS/SPME) GC-MS analysis
The volatiles (VOCs) produced by petiolate and sessile leaves of Salvia ceratophylloides
have been chemically characterized using the HS/SPME method. One gram of plant mate-
rial, per sample and replicate (N=3), has been sealed in a 20 ml vial and allowed to equili-
brate for 20 minutes at room temperature. Successively, the SPME gray fiber (StableFlex,
divinylbenzene/Carboxen on polydimethylsiloxane coating; 50/30 μm coating; Supleco) has
been exposed to plant VOCs for 20 minutes to allow the VOCs adsorption on the fiber.
VOCs have been identified using a Thermo Fisher gas chromatograph apparatus (Trace
1310) coupled with a single quadrupole mass spectrometer (ISQ LT). The capillary column
was a TG-5MS 30 m × 0.25 mm × 0.25µm. Helium has been used as carrier gas with a flow
of 1 ml/min. Samples have been injected in a split mode with a split ratio of 60. Injector and
source have been settled at the temperature of 200 °C and 260 °C, respectively. The temper-
ature ramp has been settled as follow: 7 min at 45 °C, from 45 °C to 80 °C with a rate of
10°C×min, from 80 °C to 200 °C with a rate of 20 °C × min then isocratic for 3 minutes 200
°C. Mass spectra have been recorded in electronic impact (EI) mode at 70 eV, scanning the
45–500 m/z range.
Native raw chromatograms (RAW), previously converted in mzXML using the tool
MSconvert of proteowizard [74], have been normalized for TIC intensity, aligned, deconvo-
luted and peak intensities extracted using the open source software XCMS [75]. For peak
analysis the GC/Single Quad (matchedFilter) pre-settled method has been used.
After chromatograms processing and peak picking, features and normalized peak ar-
eas have been imported to Excel for further statistical analysis. Compounds identification
has been carried out comparing the relative retention time and mass spectra of molecules
with those of commercial libraries (NIST Mass Spectral Reference Library) and open source
EI spectral libraries (Mass Bank of North America, Golm Metabolome Database) [76, 77].
4.6. Statistical analysis
Light curves have been fitted by nonlinear regression using the Ye [28] model equation:
𝑃𝑁 = ∅(𝐼0−𝐼𝑐𝑜𝑚𝑝) × 1−𝛽×𝐼
1+𝛾×𝐼× (𝐼 − 𝐼𝑐𝑜𝑚𝑝) (1)
where: PN – the net photosynthetic rate [μmol(CO2) m–2 s–1]; I – the photosynthetic pho-
ton flux density [μmol(photon) m–2 s–1]; Icomp – the light compensation point [μmol(photon)
m–2 s–1]; β – the adjusting factor (dimensionless); γ – the adjusting factor (dimensionless); ϕ
(I0 – Icomp) – the quantum yield obtained at the range between I0 and Icomp [μmol(CO2)
μmol(photon)–1]. The following leaf-level photosynthetic parameters have been calculated
by these equations [28]:
𝑃𝑔𝑚𝑎𝑥 = ∅(𝐼0−𝐼𝑐𝑜𝑚𝑝) × 1−𝛽×𝐼
1+𝛾×𝐼× (𝐼 − 𝐼𝑐𝑜𝑚𝑝) + 𝑅𝐷 (2)
𝑅𝐷 = ∅(𝐼0−𝐼𝑐𝑜𝑚𝑝) × 𝐼𝑐𝑜𝑚𝑝 (3)
𝐼𝑠𝑎𝑡 =√
(𝛽+𝛾)×(1+𝛾×𝐼𝑐𝑜𝑚𝑝)
𝛽−1
𝛾 (4)
Isat – the light saturation point [μmol(photon) m–2 s–1]; Pgmax – the asymptotic estimate of
the maximum gross photosynthetic rate [μmol(CO2) m–2 s–1]; RD – the dark respiration rate
[μmol(CO2) m–2 s–1]. Finally, the ϕ (Icomp – I200) has been calculated as the slope of the linear
regression of PN for values of I between Icomp and 200 μmol (photon) m–2 s–1 representing
the “maximum quantum yield”.
Finally, according to Lobo et al. [78], we reported the Imax (μmol(photon) m–2 s–1) (light
saturation point beyond which there is no significant change in PN) and the PN (Imax)
(μmol(CO2) m–2 s–1) (maximum value of PN obtained at I = Imax) instead of Isat and Pgmax as
more realistically adequate. We used a simple routine to minimize the error sum of squares
Preprints (www.preprints.org) | NOT PEER-REVIEWED | Posted: 17 February 2021 doi:10.20944/preprints202102.0375.v1
(SSE) for fitting the models, allowing the determination of equation parameters using the
Microsoft Excel spreadsheet and Solver function (Microsoft Excel 2010). Non-linear regres-
sions were repeated several times in order to minimize the sum of square of deviation be-
tween predicted and experimental values to less than 0.01% between two consecutive fits
[79].
In order to evaluate the effect of the Years (Y) (2016 and 2017), we used the one-way
ANOVA on the gas exchange parameters, which quickly respond to the environmental con-
ditions. Since the Years factor was not significant (p > 0.05) for almost all the gas exchange
traits (Table S1), all the morpho-physiological parameters have been analyzed by two-way
analysis of variance with the Leaf Type (LT) (sessile and petiolate) and Site (Sit) (Mosorrofa
and Puzzi) as main factors and their interaction Lt × Sit. Then, Tukey’s test has been used to
compare the means of all the parameters of each LT and Sit. All data have been tested for
normality (Kolmogorov–Smirnoff test) and homogeneity of variance (Levene median test)
and, where required, the data have been transformed.
For the comparison of the LMA and PN of S. ceratophylloides with that of different plant
functional groups and Salvia spp., we used the Isat and Icomp data obtained from [80, 81]
for evergreen angiosperm, [29] for evergreen shrub, [30] for evergreen species, [82] for S.
officinalis, [34] for S. pratensis, [35] for S. glutinosa, [33] for S. hispanica, [31] for S. mohavensis,
S. leucophylla, S. dorrii var. dorrii and S. mellifera.
The TIC intensity normalized dataset obtained from metabolomic data analysis have
been classified through unsupervised Principal Component Analysis (PCA) where the out-
put consisted of score plots to visualize the contrast among different samples. PCA analysis
has been carried out on all the features detected by the analysis. Successively, identified and
annotated compounds have been statistically analyzed through univariate two-way analy-
sis of variance with the LT (sessile and petiolate) and Sit (Mosorrofa and Puzzi) as major
factors. Then, the Tukey’s test has been used to compare the compound means of each leaf
type and site (p<0.05).
5. Conclusions
The eco-physiological adaptation of S. ceratphylloides, a rare and endangered plant
species, to its habitat by functional traits has been studied. The higher light saturation and
compensation point and leaf mass per area indicated a sunny habitat preference of S. cer-
atophylloides. These results suggested that for its in situ conservation, lower competition
(low density and diversity) especially with woody species (trees and shrubs), should be
favored. However, the S. ceratophylloides habitat has been destroyed and continuously
fragmented because of anthropogenic disturbance and environmental deterioration and,
consequently, further and deepening study needs to identify the main stressful factors
that threaten its growth, development, and fitness. For the artificial propagation, ex situ
conservation, we recommend growing the seedlings at least half sunlight (1200 µmol
(photons) m-2 s-1).
Further, for the first time, the “continuous within-plant variation” of the morpho-
physiological traits and metabolic profiles of endangered and rare plant species has been
assessed in the field. The results indicated that the physiologic and metabolic traits ex-
plained most of this within-plant plasticity, which has been also affected by the location.
Indeed, the sessile and petiolate leaves of S. ceratophylloides showed different photosyn-
thetic performances and metabolic profiles, but the sub-individual variation of the photo-
synthetic-related parameters, differently to the volatilome, has been exhibited in one site
only. These within-plant patterns, probably related to the micro-environmental heteroge-
neity, could optimize the growth and defenses machinery for the fitness’s improvement
to specific habitats. Overall, the magnitude of the within-plant variation should be taken
into consideration when designing sampling schemes for the ecological studies of S. cera-
tophylloides.
Preprints (www.preprints.org) | NOT PEER-REVIEWED | Posted: 17 February 2021 doi:10.20944/preprints202102.0375.v1
Supplementary Materials: The following are available online at www.mdpi.com/xxx/s1, Figure S1:
title, Table S1: title, Video S1: title.
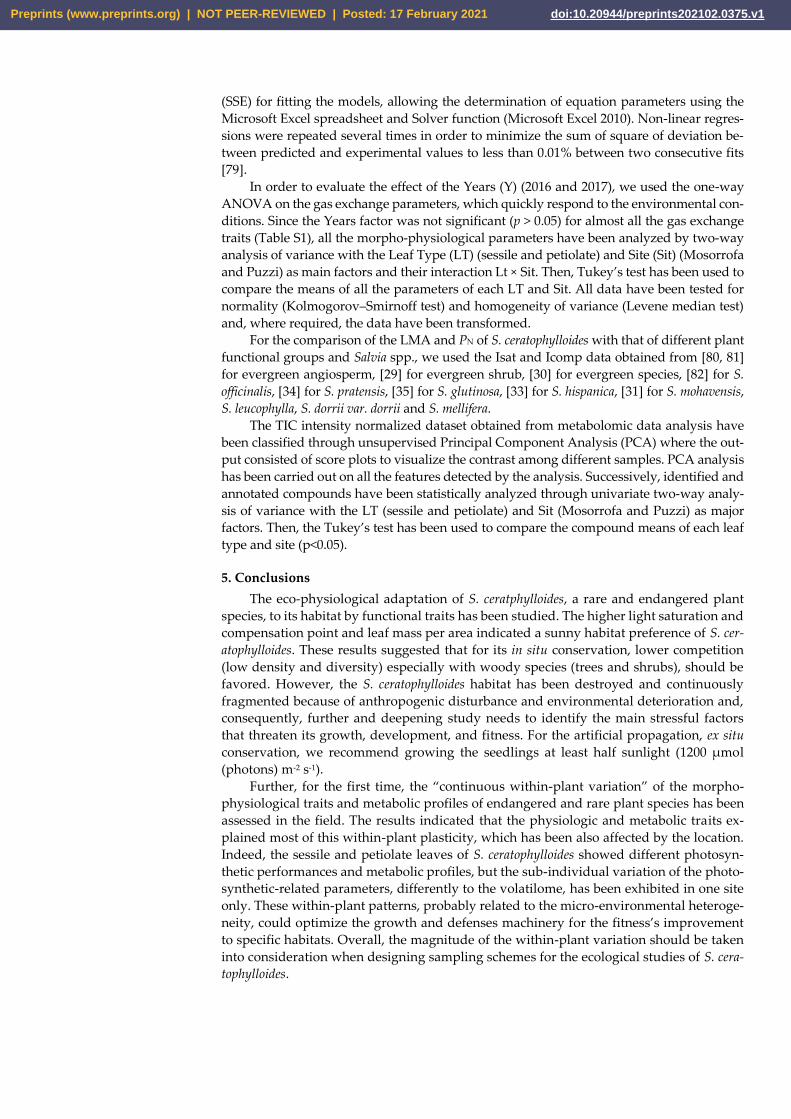
Figure S1. - Plants of Salvia ceratophylloides in the two sites, Mosorrofa (A) [Mo] and Puzzi (B) [Pu]. The red circles indicate the places
where the Salvia ceratophylloides plants have been discovered. (C) Individual plant of Salvia ceratophylloides and different leaves: peti-
olate (P) and sessile leaf (S)
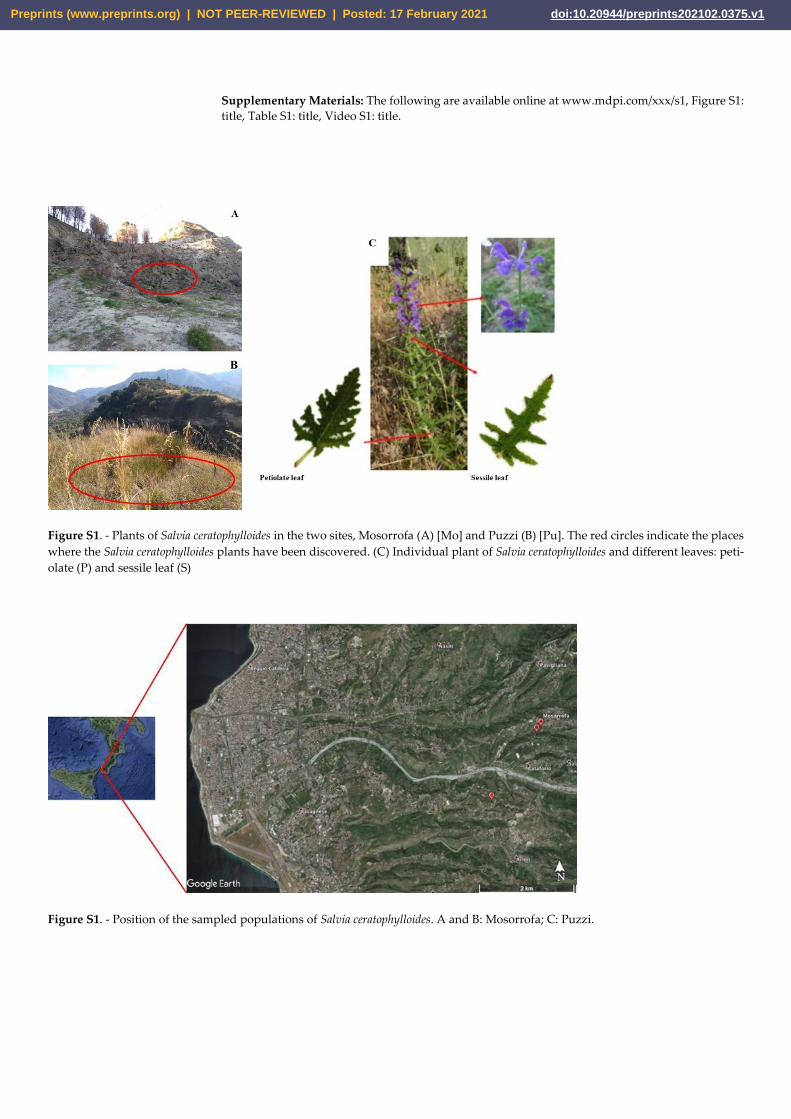
Figure S1. - Position of the sampled populations of Salvia ceratophylloides. A and B: Mosorrofa; C: Puzzi.
Preprints (www.preprints.org) | NOT PEER-REVIEWED | Posted: 17 February 2021 doi:10.20944/preprints202102.0375.v1
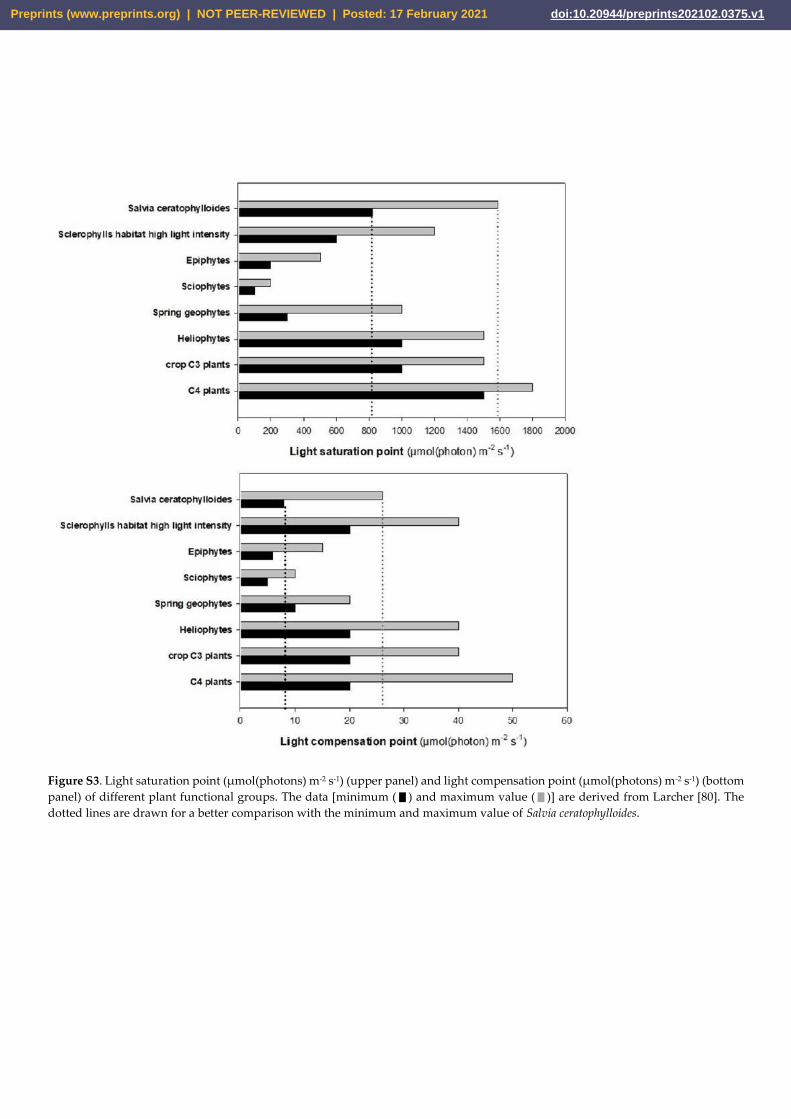
Figure S3. Light saturation point (µmol(photons) m-2 s-1) (upper panel) and light compensation point (µmol(photons) m-2 s-1) (bottom
panel) of different plant functional groups. The data [minimum (▮) and maximum value (▮)] are derived from Larcher [80]. The
dotted lines are drawn for a better comparison with the minimum and maximum value of Salvia ceratophylloides.
Preprints (www.preprints.org) | NOT PEER-REVIEWED | Posted: 17 February 2021 doi:10.20944/preprints202102.0375.v1
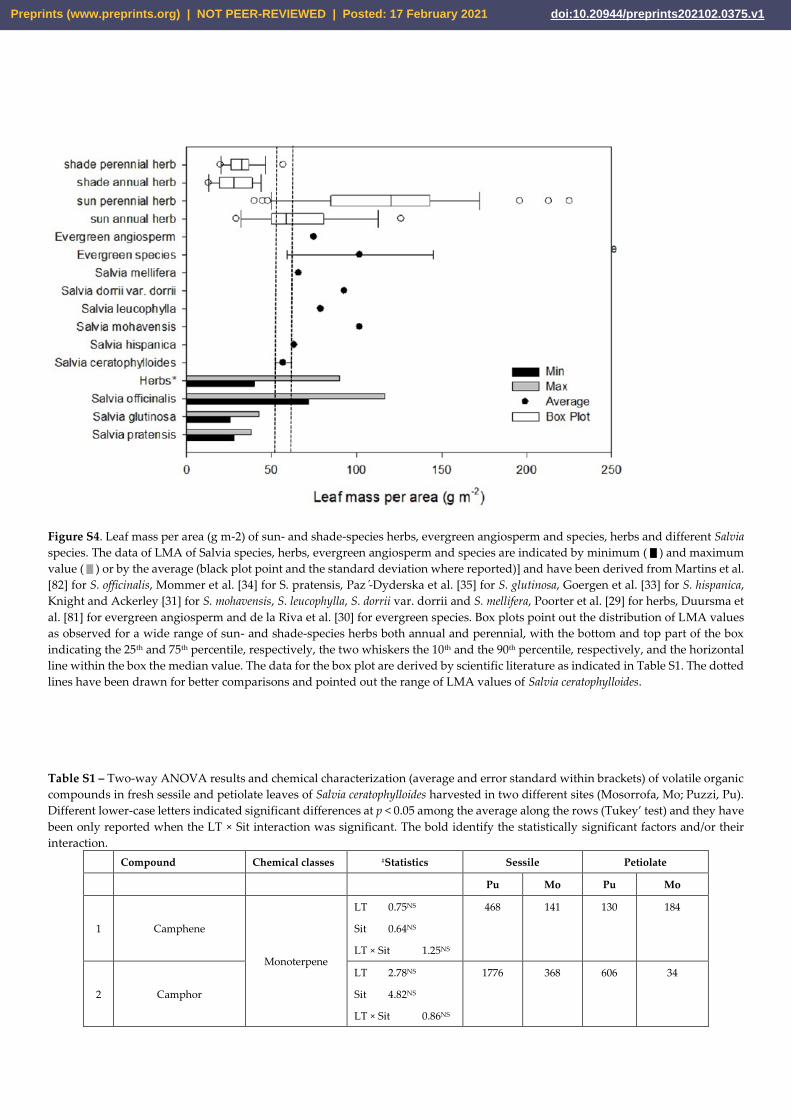
Figure S4. Leaf mass per area (g m-2) of sun- and shade-species herbs, evergreen angiosperm and species, herbs and different Salvia
species. The data of LMA of Salvia species, herbs, evergreen angiosperm and species are indicated by minimum (▮) and maximum
value (▮) or by the average (black plot point and the standard deviation where reported)] and have been derived from Martins et al.
[82] for S. officinalis, Mommer et al. [34] for S. pratensis, Paz -́Dyderska et al. [35] for S. glutinosa, Goergen et al. [33] for S. hispanica,
Knight and Ackerley [31] for S. mohavensis, S. leucophylla, S. dorrii var. dorrii and S. mellifera, Poorter et al. [29] for herbs, Duursma et
al. [81] for evergreen angiosperm and de la Riva et al. [30] for evergreen species. Box plots point out the distribution of LMA values
as observed for a wide range of sun- and shade-species herbs both annual and perennial, with the bottom and top part of the box
indicating the 25th and 75th percentile, respectively, the two whiskers the 10th and the 90th percentile, respectively, and the horizontal
line within the box the median value. The data for the box plot are derived by scientific literature as indicated in Table S1. The dotted
lines have been drawn for better comparisons and pointed out the range of LMA values of Salvia ceratophylloides.
Table S1 – Two-way ANOVA results and chemical characterization (average and error standard within brackets) of volatile organic
compounds in fresh sessile and petiolate leaves of Salvia ceratophylloides harvested in two different sites (Mosorrofa, Mo; Puzzi, Pu).
Different lower-case letters indicated significant differences at p < 0.05 among the average along the rows (Tukey’ test) and they have
been only reported when the LT × Sit interaction was significant. The bold identify the statistically significant factors and/or their
interaction.
Compound Chemical classes #Statistics Sessile Petiolate
Pu Mo Pu Mo
1 Camphene
Monoterpene
LT 0.75NS
Sit 0.64NS
LT × Sit 1.25NS
468 141 130 184
2 Camphor
LT 2.78NS
Sit 4.82NS
LT × Sit 0.86NS
1776 368 606 34
Preprints (www.preprints.org) | NOT PEER-REVIEWED | Posted: 17 February 2021 doi:10.20944/preprints202102.0375.v1
3 Limonene
LT 5.30NS
Sit 1.33NS
LT × Sit 0.74NS
77187 72261 53128 19515
4 p-Cymene
LT 7.78*
Sit 14.16**
LT × Sit 0.21NS
195813 82392 108569 19607
5 Pinocarvone
LT 0.04NS
Sit 6.57*
LT × Sit 0.07NS
2406 987 2444 696
6 Sabinene
LT 11.80**
Sit 0.34NS
LT × Sit 1.70NS
554775 873306 195242 73210
7 Terpinolene
LT 12.40**
Sit 0.40NS
LT × Sit 3.09NS
128554 218320 62198 19784
8 trans-Sabinene hydrate
LT 0.00NS
Sit 0.28NS
LT × Sit 3.73NS
3086 4773 5342 2381
9 trans-α-Ocimene
LT 0.56NS
Sit 3.02NS
LT × Sit 0.04NS
4784232 2005449 3790259 292998
10 α-Pinene
LT 1.04NS
Sit 0.68NS
LT × Sit 0.60NS
548 104 50 36
11 α-Terpinene
LT 0.01NS
Sit 5.21NS
LT × Sit 6.02NS
1116 1202 2418 22
12 α-Thujene
LT 3.83NS
Sit 4.44NS
LT × Sit 3.74NS
1186 114 153 108
13 β-Myrcene
LT 2.54NS
Sit 0.15NS
LT × Sit 0.01NS
10189 8949 4114 2208
14 β-Ocimene
LT 0.54NS
Sit 3.61NS
LT × Sit 0.38NS
3309 978 2059 868
15 β-Phelladrene
LT 0.80NS
Sit 3.86NS
LT × Sit 0.60NS
1327 167 620 117
16 β-Pinene
LT 7.30*
Sit 0.47NS
LT × Sit 1.73NS
92968 150052 53391 35502
17 γ-Terpinene LT 5.40* 16341 13366 4610 3508
Preprints (www.preprints.org) | NOT PEER-REVIEWED | Posted: 17 February 2021 doi:10.20944/preprints202102.0375.v1
Sit 0.19NS
LT × Sit 0.04NS
18 cis-Pinen-3-ol
monoterpene
alcohol
LT 1.40NS
Sit 1.13NS
LT × Sit 1.46NS
882 51 7 60
19 Eucalyptol
LT 0.42NS
Sit 0.00NS
LT × Sit 1.52NS
124492 278959 194614 53771
20 Isoborneol
LT 1.48NS
Sit 4.42NS
LT × Sit 1.48NS
7041 156368 7160 46949
21 α-Terpineol
LT 8.13*
Sit 12.91**
LT × Sit 9.04*
10220b 80003a 11854b 18054b
22 D-Germacrene
sesquiterpene
LT 0.11NS
Sit 3.47NS
LT × Sit 4.22*
2554a 169b 1102a 1218a
23 α-Caryophyllene
LT 0.62NS
Sit 3.43NS
LT × Sit 0.00NS
43235a 19311a 33115a 8972a
24 α-Copaene
LT 0.62NS
Sit 11.05*
LT × Sit 0.67NS
3517 601 2385 625
25 α-Cubebene
LT 8.21*
Sit 19.35**
LT × Sit 1.02
4460201 1371705 2247264 312465
26 α-Muurolene
LT 9.49*
Sit 0.56NS
LT × Sit 0.99NS
14382 15236 7105 1038
27 β-Caryophyllene
LT 1.56NS
Sit 2.04NS
LT × Sit 0.17NS
30708 18290 19500 12669
28 β-Copaene
LT 2.46NS
Sit 2.74NS
LT × Sit 2.19NS
1001 100 126 74
29 (z)-Hex-3-en-1-ol
alcohol
LT 0.06NS
Sit 4.29NS
LT × Sit 0.06NS
2721741 7008 2159260 8617
30 1-Octen-3-ol
LT 0.05NS
Sit 3.20NS
LT × Sit 0.13NS
22710 12017 23730 7653
31 2-Propenal aldehyde LT 0.89NS
Sit 1.20NS
900 94 153 88
Preprints (www.preprints.org) | NOT PEER-REVIEWED | Posted: 17 February 2021 doi:10.20944/preprints202102.0375.v1
LT × Sit 0.87NS
32 Isovaleraldehyde
LT 6.10*
Sit 0.52NS
LTxSit 0.52NS
81876770 46391341 3426789 3466464
33 Octenal
LT 2.94NS
Sit 1.40NS
LT × Sit 0.16NS
10441 7566 6602 5171
34 α-Methyl-n-Butanal
LT 5.19NS
Sit 0.00NS
LT × Sit 0.02NS
32740199 30174050 3454460 4492251
35 5-Methylheptan-3-one
keton
LT 5.70*
Sit 0.21NS
LT × Sit 0.08NS
7776 8204 1578 3291
36 Pentan-3-one
LT 7.73*
Sit 2.44NS
LT × Sit 1.20NS
321989 649080 114170 171753
37 β-tujone
LT 17.37**
Sit 6.21*
LT × Sit 12.54**
65370b 168599a 54660b 36692b
38 (3z)-3-Hexenyl acetate Aliphatic esters
LT 3.58NS
Sit 5.09NS
LT × Sit 5.46*
1253a 0b 99ab 122ab
39 Dimethyl Sulfide ether
LT 23.77**
Sit 5.34*
LT × Sit 1.40NS
29866633 54386837 3926181 11857751
#Statistical analysis: two-way ANOVA with 4-9 replications (LT: leaf type; Sit: sites; LT × Sit: Leaf type × Sites interaction); *0.05 > p <
0.01; **0.01 > p < 0.001; ***0.001 > p; NS: not significant.
Preprints (www.preprints.org) | NOT PEER-REVIEWED | Posted: 17 February 2021 doi:10.20944/preprints202102.0375.v1
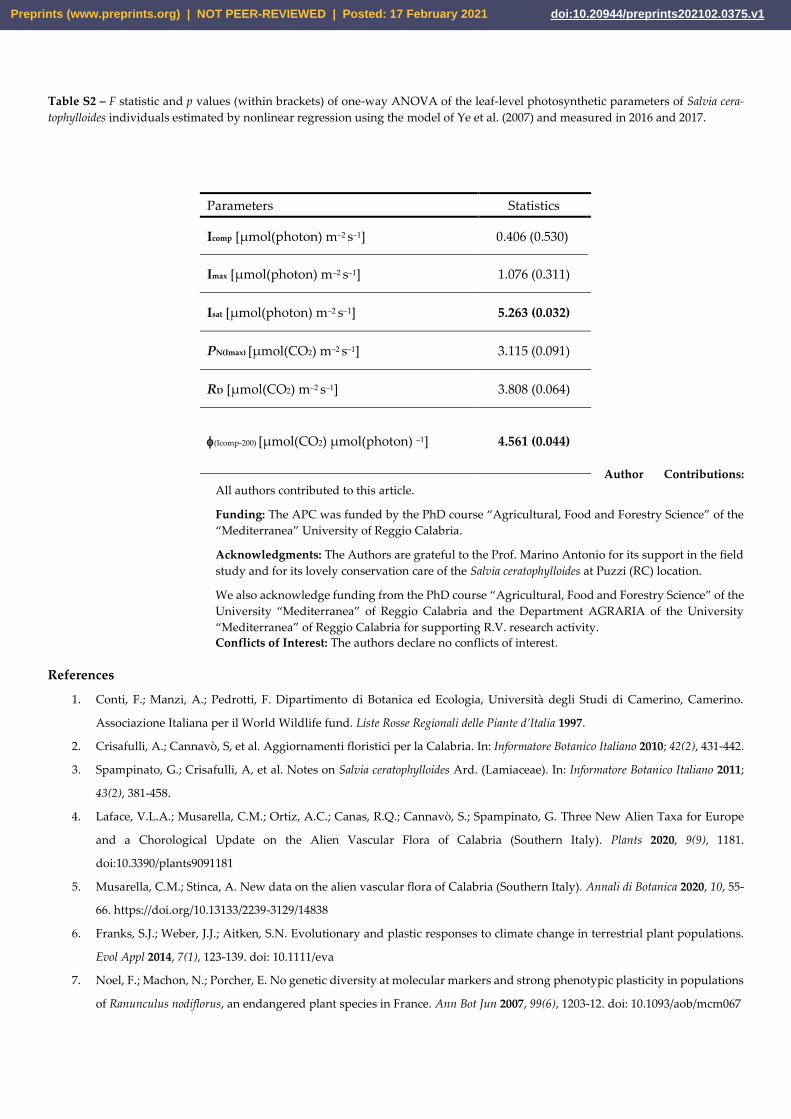
Table S2 – F statistic and p values (within brackets) of one-way ANOVA of the leaf-level photosynthetic parameters of Salvia cera-
tophylloides individuals estimated by nonlinear regression using the model of Ye et al. (2007) and measured in 2016 and 2017.
Author Contributions:
All authors contributed to this article.
Funding: The APC was funded by the PhD course “Agricultural, Food and Forestry Science” of the
“Mediterranea” University of Reggio Calabria.
Acknowledgments: The Authors are grateful to the Prof. Marino Antonio for its support in the field
study and for its lovely conservation care of the Salvia ceratophylloides at Puzzi (RC) location.
We also acknowledge funding from the PhD course “Agricultural, Food and Forestry Science” of the
University “Mediterranea” of Reggio Calabria and the Department AGRARIA of the University
“Mediterranea” of Reggio Calabria for supporting R.V. research activity.
Conflicts of Interest: The authors declare no conflicts of interest.
References
1. Conti, F.; Manzi, A.; Pedrotti, F. Dipartimento di Botanica ed Ecologia, Università degli Studi di Camerino, Camerino.
Associazione Italiana per il World Wildlife fund. Liste Rosse Regionali delle Piante d’Italia 1997.
2. Crisafulli, A.; Cannavò, S, et al. Aggiornamenti floristici per la Calabria. In: Informatore Botanico Italiano 2010; 42(2), 431-442.
3. Spampinato, G.; Crisafulli, A, et al. Notes on Salvia ceratophylloides Ard. (Lamiaceae). In: Informatore Botanico Italiano 2011;
43(2), 381-458.
4. Laface, V.L.A.; Musarella, C.M.; Ortiz, A.C.; Canas, R.Q.; Cannavò, S.; Spampinato, G. Three New Alien Taxa for Europe
and a Chorological Update on the Alien Vascular Flora of Calabria (Southern Italy). Plants 2020, 9(9), 1181.
doi:10.3390/plants9091181
5. Musarella, C.M.; Stinca, A. New data on the alien vascular flora of Calabria (Southern Italy). Annali di Botanica 2020, 10, 55-
66. https://doi.org/10.13133/2239-3129/14838
6. Franks, S.J.; Weber, J.J.; Aitken, S.N. Evolutionary and plastic responses to climate change in terrestrial plant populations.
Evol Appl 2014, 7(1), 123-139. doi: 10.1111/eva
7. Noel, F.; Machon, N.; Porcher, E. No genetic diversity at molecular markers and strong phenotypic plasticity in populations
of Ranunculus nodiflorus, an endangered plant species in France. Ann Bot Jun 2007, 99(6), 1203-12. doi: 10.1093/aob/mcm067
Parameters Statistics
Icomp [µmol(photon) m–2 s–1] 0.406 (0.530)
Imax [µmol(photon) m–2 s–1] 1.076 (0.311)
Isat [µmol(photon) m–2 s–1] 5.263 (0.032)
PN(Imax) [µmol(CO2) m–2 s–1] 3.115 (0.091)
RD [µmol(CO2) m–2 s–1] 3.808 (0.064)
(Icomp-200) [µmol(CO2) µmol(photon) –1] 4.561 (0.044)
Preprints (www.preprints.org) | NOT PEER-REVIEWED | Posted: 17 February 2021 doi:10.20944/preprints202102.0375.v1
8. Westerband, A.C.; Bialic-Murphy, L. Intraspecific variation in seedling drought tolerance and associated traits in a critically
endangered, endemic Hawaiian shrub. Plant Ecol Divers 2020. doi: 10.1080/17550874.2020.1730459
9. Winn, A.A. Adaptation to fine-grained environmental variation: an analysis of within-individual leaf variation in an annual
plant. Evolution 1996a, 50(3), 1111-1118. doi: 10.1111/j.1558-5646.1996.tb02351.x.
10. Winn, A.A. The contributions of programmed developmental change and phenotypic plasticity to within-individual varia-
tion in leaf traits in Dicerandra linearifolia. J Evol Biol 1996b, 9, 737-752. doi: 10.1046/j.1420-9101.1996.9060737.x
11. de Kroon, H.; Huber, H.; Stuefer, J.F. A modular concept of phenotypic plasticity in plants. New Phytol 2005, 166, 73– 82. doi:
10.1111/j.1469-8137.2004.01310.x
12. Herrera, C.M. Multiplicity in Unity: Plant Subindividual Variation and Interactions with Animals. University of Chicago
Press, Chicago, USA, 2009.
13. Herrera, C.M. The ecology of subindividual variability in plants: patterns, processes, and prospects. Web Ecol 2017, 17(2),
51–64. doi: 10.5194/we-17-51-2017
14. Osada, N.; Yasumura, Y.; Ishida, A. Leaf nitrogen distribution in relation to crown architecture in the tall canopy species,
Fagus crenata. Oecologia 2014, 175, 1093–1106. doi: 10.1007/s00442-014-2966-y
15. Ponce-Bautista, A.; Valverde, P.L. Photosynthetically active radiation and carbon gain drives the southern orientation of
Myrtillocactus geometrizans fruits. Plant Biol 2017, 19, 279–285. doi: 10.1111/plb.12530
16. Hidalgo, J.; Rubio de Casas, R.; Muñoz, M.A. Environmental unpredictability and inbreeding depression select for mixed
dispersal syndromes. BMC Evol Biol 2016, 16, 71. doi: 10.1186/s12862-016-0638-8
17. Herrera, C.M.; Medrano, M.; Bazaga, P. Continuous within plant variation as a source of intraspecific functional diversity:
patterns, magnitude, and genetic correlates of leaf variability in Helleborus foetidus (Ranunculaceae). Am J Bot 2015, 102(2),
225–232. doi: 10.3732/ajb.1400437
18. Dai, C.; Liang, X.J. The mean and variability of a floral trait have opposing effects on fitness traits. Ann Bot 2016, 117(3), 421–
429. doi: 10.1093/aob/mcv189
19. Sobral, M.; Guitián, J. Seed predators exert selection on the subindividual variation of seed size. Plant Biol 2014, 16, 836–842.
doi: 10.1111/plb.12118.
20. Shimada, T.; Takahashi, A. Effects of within plant variability in seed weight and tannin content on foraging behavior of seed
consumers. Funct Ecol 2015, 29, 1513–1521. doi: 10.1111/1365-2435.12464
21. Wetzel, W.C.; Kharouba, H.M. Variability in plant nutrients reduces insect herbivore performance. Nature 2016, 539, 425–
427. doi: 10.1038/nature20140
22. Wetzel, W.C.; Meek, M.H. Physical defenses and herbivory vary more within plants than among plants in the tropical un-
derstory shrub Piper polytrichum. Botany 2019, 97, 113–121. doi.: 10.1139/cjb-2018-0160
23. Di Iorio, A.; Vescio, R. The rediscovery of an endemic sage species in Calabria (Italy): an assessment of genetic diversity and
structure in Salvia ceratophylloides Ard. (Lamiaceae). In: Book of Abstract, p 61. 113° Congresso della Società Botanica Italiana.
V International Plant Science Conference (IPSC). Fisciano (SA), Italy, 12-15 September 2018. ISBN: 978-88-85915-22-0
24. Aleric, K.M.; Kirkman, L.K. Growth and photosynthetic responses of the federally endangered shrub, Lindera melissifolia
(Lauraceae), to varied light environments. Am J Bot 2005, 92, 682–689. doi: 10.3732/ajb.92.4.682
25. Tkemaladze, G.Sh.; Makhashvili, K.A. Climate changes and photosynthesis. Annals of Agrarian Science 2016, 14(2), 119-126.
doi: 10.1016/j.aasci.2016.05.012
26. Díaz, S.; Kattge, J. The global spectrum of plant form and function. Nature 2016, 529(7585), 167-171. doi: 10.1038/nature16489
27. Holopainen, J.K.; Gershenzon, J. Trends Plant Sci 2010, 15(3), 176-184. doi: 10.1016/j.tplants.2010.01.006
Preprints (www.preprints.org) | NOT PEER-REVIEWED | Posted: 17 February 2021 doi:10.20944/preprints202102.0375.v1
28. Ye, Z.P. A new model for relationship between irradiance and the rate of photosynthesis in Oryza sativa. Photosynthetica
2007, 45(5), 637-640. doi:10.1007/s11099-007-0110-5
29. Poorter, H.; Niinemets, U. Causes and consequences of variation in leaf mass per area (LMA): a meta-analysis. New Phytol
2009, 182(3), 565-88. doi: 10.1111/j.1469-8137.2009.02830.x
30. de la Riva, E.G.; Olmo, M. Leaf Mass per Area (LMA) and Its Relationship with Leaf Structure and Anatomy in 34 Mediter-
ranean Woody Species along a Water Availability Gradient. PLoS One 2016, 11(2): e0148788. doi: 10.1371/jour-
nal.pone.0148788
31. Knight, C.A.; Ackerly, D.D. An ecological and evolutionary analysis of photosynthetic thermotolerance using the tempera-
ture dependent increase in fluorescence. Oecologia 2002, 130, 505–514. doi: 10.1007/s00442-001-0841-0
32. Castrillo, M.; Vizcaino, D.; Moreno, E. Specific leaf mass, fresh: dry weight ratio, sugar and protein contents in species of
Lamiaceae from different light environments. Rev Biol Trop 2005, 53(1-2), 23-8. doi: 10.15517/rbt.v53i1-2.14296
33. Goergen, P.C.H.; Lago, I. Performance of Chia on Different Sowing Dates: Characteristics of Growth Rate, Leaf Area Index,
Shoot Dry Matter Partitioning and Grain Yield. J Agric Sci 2019, 11(9), 252-263. doi: 10.5539/jas.v11n9p252
34. Mommer, L.; Wolters-Arts, M. Submergence-induced leaf acclimation in terrestrial species varying in flooding tolerance.
New Phytol 2007, 176(2), 337-345. doi: 10.1111/j.1469-8137.2007.02166.x
35. Paź-Dyderska, S.; Dyderski, M.K. Leaf Traits and Aboveground Biomass Variability of Forest Understory Herbaceous Plant
Species. Ecosystems 2020, 23, 555–569. doi: 10.1007/s10021-019-00421-6
36. Hedge, I.C. Notes on Salvia. Flora Europaea. In: Tutin, TG et al (eds), Salvia L. Vol. 3. Cambridge Univ Press, 1972, pp 188-
192.
37. Govaerts, R. World Checklist of Selected Plant Families Database in Access: 1-216203. The Board of Trustees of the Royal
Botanic Gardens, Kew, 2003.
38. Nikolova, M.; Aneva, I. European Species of Genus Salvia: Distribution, Chemodiversity and Biological Activity. In:
Georgiev V, Pavlov A (eds) Salvia Biotechnology. Springer Cham, 2017, 1-30.
39. McKey, D. Adaptive patterns in alkaloid physiology. Am Nat 1974, 108, 305–320. doi: 10.1086/282909
40. Meldau, S.; Erb, M.; Baldwin, I.T. Defence on demand: mechanisms behind optimal defence patterns. Ann Bot 2012, 110(8),
1503–1514. doi: 10.1093/aob/mcs212
41. Medrano, H.; Tomás, M. From leaf to whole-plant water use efficiency (WUE) in complex canopies: Limitations of leaf WUE
as a selection target. The Crop Journal 2015, 3(3), 220-228. doi: 10.1016/j.cj.2015.04.002
42. Schurr, U.; Walter, A.; Rascher, U. Functional dynamics of plant growth and photosynthesis–from steady-state to dynamics–
from homogeneity to heterogeneity. Plant Cell Environ 2006, 29(3), 340-352. doi: 10.1111/j.1365-3040.2005.01490.x
43. Lin, H.; Chen, Y. Stronger cooling effects of transpiration and leaf physical traits of plants from a hot dry habitat than from
a hot wet habitat. Funct Ecol 2017, 31, 2202–2211. doi: 10.1111/1365-2435.12923
44. Leuzinger, S.; Korner, C. Tree species diversity affects canopy leaf temperatures in a mature temperate forest. Agr Forest
Meteorol 2007, 146, 29–37. doi: 10.1016/j.agrformet.2007.05.007
45. Pichersky, E.; Raguso, R.A. Why do plants produce so many terpenoid compounds? New Phytol 2018, 220, 692–702. doi:
10.1111/nph.14178
46. Loreto, F.; Schnitzler, J.P. Abiotic stresses and induced BVOCs. Trends Plant Sci 2010, 15(3), 154-166. doi:
10.1016/j.tplants.2009.12.006
47. Frost, C.J.; Appel, H.M. Within-plant signalling via volatiles overcomes vascular constraints on systemic signalling and
primes responses against herbivores. Ecol Lett 2007, 10, 490–498. doi: 10.1111/j.1461-0248.2007.01043.x
Preprints (www.preprints.org) | NOT PEER-REVIEWED | Posted: 17 February 2021 doi:10.20944/preprints202102.0375.v1
48. Rodriguez-Saona, C.R.; Rodriguez-Saona, L.E.; Frost, C. Herbivore-Induced Volatiles in the Perennial Shrub, Vaccinium co-
rymbosum, and Their Role in Inter-branch Signaling. J Chem Ecol 2009, 35, 163–175. https://doi.org/10.1007/s10886-008-9579-
z
49. Slot, M.; Krause, G.H. Photosynthetic heat tolerance of shade and sun leaves of three tropical tree species. Photosynth Res
2019, 141, 119–130. doi: 10.1007/s11120-018-0563-3
50. de Casas, R.R.; Vargas, P. Sun and shade leaves of Olea europaea respond differently to plant size, light availability and
genetic variation. Funct Ecol 2011, 25, 802-812. doi: 10.1111/j.1365-2435.2011.01851.x
51. Girón-Calva, P.S.; Li, T. A Role for Volatiles in Intra- and Inter-Plant Interactions in Birch. J Chem Ecol 2014, 40(11-12), 1203–
1211. doi: 10.1007/s10886-014-0514-1
52. Alberto, F.J.; Aitken, S.N. Potential for evolutionary responses to climate change–evidence from tree populations. Global
Change Biol 2013, 19, 1645–1661. doi: 10.1111/gcb.12181
53. Aitken, S.N.; Whitlock, M.C. Assisted gene flow to facilitate local adaptation to climate change. Annu Rev Ecol Evol Syst 2013,
44, 367–388. doi: 10.1146/annurev-ecolsys-110512-135747
54. Sobral, M.; Guitiàn, J.; Guitiàn, P. Selective larchure along a Latitudinal Gradient Affects Subindividual Variation in Plants.
Plos One 2013, 8(9), 74356. doi: 10.1371/journal.pone.0074356
55. Bruschi, P.; Grossoni, P.; Bussotti, F. Within- and among-tree variation in leaf morphology of Quercus petraea (Matt.) Liebl.
natural populations. Trees 2003, 17, 164–172. doi: 10.1007/s00468-002-0218-y
56. Opedal, Ø.H.; Armbruster, W.S.; Graae, B.J. Linking small-scale topography with microclimate, plant species diversity and
intra-specific trait variation in an alpine landscape. Plant Ecol Divers 2015, 8(3), 305-315. doi: 10.1080/17550874.2014.987330
57. Niinemets, U.; Valladares, F. Photosynthetic acclimation to simultaneous and interacting environmental stresses along
natural light gradients: optimality and constraints. Plant Biol 2004, 6(3), 254–268. doi: 10.1055/s-2004-817881
58. Meier, I.C.; Leuschner, C. Genotypic variation and phenotypic plasticity in the drought response of fine roots of European
beech. Tree Physiol 2008, 28, 297–309. doi: 10.1093/treephys/28.2.297
59. Marchiori, P.E.R.; Machado, E.C. Physiological Plasticity Is Important for Maintaining Sugarcane Growth under Water
Deficit. Front Plant Sci 2017, 8, 2148. doi: 10.3389/fpls.2017.02148
60. Puglielli, G.; Catoni, R. L. Short-term physiological plasticity: Trade-off between drought and recovery responses in three
Mediterranean Cistus species. Ecol Evol 2017, 7(24), 10880–10889. doi: 10.1002/ece3.3484
61. Valladares, F.; Martinez-Ferri, E. Low leaf-level response to light and nutrients in Mediterranean evergreen oaks: a con-
servative resource-use strategy? New Phytol 2000, 148(1), 79–91. doi: 10.1046/j.1469-8137.2000.00737.x
62. ARSSA. I suoli della Calabria – Carta dei suoli in scala 1:250.000 della regione Calabria. Rubettino Editore: Soveria Mannelli,
2003, pp. 387.
63. Pignatti, S. Flora d’Italia: In 4 Volumi. Volume 3: Flora d’Italia & Flora Digitale, 2nd ed.; Edagricole-Edizioni Agricole di
New Business Media srl: Milano, Italy, 2018; ISBN 978-88-506-5244-0.
64. Rivas-Martínez, S. Global Bioclimatics (Clasificación Bioclimática de la Tierra).
http://www.globalbioclimatics.org/book/publications.htm. Accessed on-line 26 Sep 2019
65. Doussan, C.; Pagès, L.; Pierret, A. Soil exploration and resource acquisition by plant roots: an architectural and modelling
point of view. Agronomie EDP Sciences 2003, 23(5-6), 419-431. doi: 10.1007/978-90-481-2666-8_36
66. Jonckheere, I.; Nackaerts, K. A fractal dimension-based modelling approach for studying the effect of leaf distribution on
LAI retrieval in forest canopies. Ecol Model 2006, 97(1–2), 179-195. doi: 10.1016/j.ecolmodel.2006.02.036
Preprints (www.preprints.org) | NOT PEER-REVIEWED | Posted: 17 February 2021 doi:10.20944/preprints202102.0375.v1
67. Quero, J.L.; Villar, R.; Marañon, T.; Zamora, R. Interactions of drought and shade effects on seedlings of four Quercus species:
physiological and structural leaf responses. New Phytol 2006, 170, 819–834. doi: 10.1111/j.1469-8137.2006.01713.x
68. Ruíz-Robleto, J.; Villar, R. Relative growth rate and biomass allocation in ten woody species with different leaf longevity
using phylogenetic independent contrasts (PICs). Plant Biol 2005, 7, 484–494. doi: 10.1055/s-2005-865905
69. Cornelissen, J.H.C.; Pérez-Hargundeguy, N. Leaf structure and defence control litter decomposition rate across species and
life forms in regional floras on two continents. New Phytol 1999, 143, 191–200. doi: 10.1046/j.1469-8137.1999.00430.x
70. Ryser, P.; Aeschlimann, U. Proportional dry-mass content as an underlying trait for the variation in relative growth rate
among 22 Eurasian populations of Dactylis glomerata s.l. Funct Ecol 1999, 13, 473–482. doi: 10.1046/j.1365-2435.1999.00349.x
71. Pérez-Harguindeguy, N.; Diaz, S. New handbook for standardized measurement of plant functional traits worldwide. Aust
J Bot 2013, 61,–234. doi: 10.1071/BT12225
72. Saura-Mas, S.; Shipley, B.; Lloret, F. Relationship between post-fire regeneration and leaf economics spectrum in Mediter-
ranean woody species. Funct Ecol 2009, 23, 103–110. doi: 10.1111/j.1365-2435.2008.01474.x
73. Cruz, A.F.S.; Adiel, F. Stress index, water potentials and leaf succulence in cauliflower cultivated hydroponically with brack-
ish water. Rev Bras Eng Agr Amb 2018, 22(9), 622-627. doi: 10.1590/1807-1929/agriambi.v22n9p622-627
74. Chambers, M.C.; Maclean, B. A cross-platform toolkit for mass spectrometry and proteomics. Nat Biotechnol 2012, 30(10),
918–920. doi: 10.1038/nbt.2377
75. Tautenhahn, R.; Patti, G.J. XCMS Online: a web-based platform to process untargeted metabolomic data. Anal Chem 2012,
84(11),. 5035-5039. doi: 10.1021/ac300698c.
76. Kopka, J.; Schauer, N. GMD@ CSB. DB: the Golm metabolome database. Bioinformatics 2005, 21(8), 1635-1638. doi: 10.1093/bi-
oinformatics/bti236
77. Horai, H.; Arita, M. MassBank: a public repository for sharing mass spectral data for life sciences. J Mass Spectrom 2010,
45(7), 703-714. doi: 10.1002/jms.1777
78. Lobo, F.; de Barros, M.P. Fitting net photosynthetic light-response curves with Microsoft Excel — a critical look at the mod-
els. Photosynthetica 2013, 51(3), 445–456 doi: 10.1007/s11099-013-0045-y
79. Press, W.H.; Teukosky, S.A. Numerical recipes in C. The art of scientific computing, 2nd ed. Cambridge University Press,
Cambridge, 1992.
80. Larcher, W. Physiological Plant Ecology. Ecophysiology and Stress Physiology of Functional Groups. 4th ed. Springer. Hei-
delberg, Germany, 2003.
81. Duursma, R.A.; Falster, D.S. Leaf mass per area, not total leaf area, drives differences in above-ground biomass distri-
bution among woody plant functional types. New Phytol 2016, 212(2), 368-376. doi: 10.1111/nph.14033.
82. Martins, F.; Oliveira, İ. Leaf morpho-physiological dynamics in Salvia officinalis L. var. purpurascens. Turk J Biol 2017,
41, 134-144. doi: 10.3906/bot-1607-24
Preprints (www.preprints.org) | NOT PEER-REVIEWED | Posted: 17 February 2021 doi:10.20944/preprints202102.0375.v1