Embed Size (px)
Citation preview
Johann Wolfgang Goethe Universitat Frankfurt am Main
Institut fur Kernphysik
Bachelorarbeit
im Studiengang Physik
Thema: Femtosecond VUV-IR pump-probe studies on the carbon dioxide dissociation
eingereicht von: Philip Maurice Trapp 〈[email protected]〉
eingereicht am: 21.03.2016
Erstgutachter: Herr Prof. Dr. Reinhard Dorner
Zweitgutachter: PD Dr. Till Jahnke

Abstract
In this thesis femtosecond laser pulses from the ”Kansas Light Source” (KLS) laserfacility, located at the James R. Macdonald Laboratory in Manhattan, Kansas, wereused to explore ultrafast molecular dynamics of the carbon dioxide molecule with differ-ent pump-probe experiments. High Harmonics in the Vacuum Ultraviolet (VUV) bandwere generated and separated by a grating pair. Two pump-probe experiments on CO2
were implemented, one with an 11th harmonic pump pulse of ∼ 17.05eV photon energyand one with a 13th harmonic pump pulse of ∼ 20.15eV photon energy. Each time adelayed 1.55eV IR pulse was used to ”probe” the excited CO+
2 ion. Resulting ions werecollected via an ion momentum spectrometer, by means of which the temporal and spa-tial information of each particle was measured. The main goals of these measurementswere to confirm the data of D. Trabert in [1] with an 11th harmonic pump- IR- probeexperiment on CO2 and to check whether the CO+ yield curve for an experiment witha 13th harmonic pump pulse turns out to be consistent with the interpretation of theion rotating out of its initial alignment, as first discussed by Timmers et al. in [2]. Forboth experiments the CO+ yield vs. delay curves for two different IR polarizationsshow that the ions rotation is very likely the reason for the noticeable differences ofboth. Furthermore, it was observed that a 13th harmonic pump pulse alone alreadyleads to most of the measured O+ fragments while the CO+ fragments increase signif-icantly only after the IR probe pulse comes in. This suggests that some ion states arepreferred by the excitation of the 13th harmonic pump pulse.
i

Contents
List of Figures iv
1 Introduction 1
2 Theoretical background 32.1 Light as an electromagnetic wave . . . . . . . . . . . . . . . . . . . . . . 32.2 Gaussian beam . . . . . . . . . . . . . . . . . . . . . . . . . . . . . . . . 42.3 Light as a particle . . . . . . . . . . . . . . . . . . . . . . . . . . . . . . 62.4 High Harmonic Generation . . . . . . . . . . . . . . . . . . . . . . . . . 6
2.4.1 Multi-photon process . . . . . . . . . . . . . . . . . . . . . . . . . 62.4.2 Above-threshold ionization (ATI) . . . . . . . . . . . . . . . . . . 62.4.3 Strong-Field-Approximation (SFA) . . . . . . . . . . . . . . . . . 72.4.4 Eγ in MPI picture and Keldysh Parameter . . . . . . . . . . . . 10
2.5 Functional principle of a laser . . . . . . . . . . . . . . . . . . . . . . . . 112.6 Generating ultrafast laser pulses . . . . . . . . . . . . . . . . . . . . . . 12
3 Experimental setup 133.1 Interferometer . . . . . . . . . . . . . . . . . . . . . . . . . . . . . . . . . 133.2 High Harmonic generation unit . . . . . . . . . . . . . . . . . . . . . . . 143.3 Grating pair . . . . . . . . . . . . . . . . . . . . . . . . . . . . . . . . . . 153.4 COLTRIMS . . . . . . . . . . . . . . . . . . . . . . . . . . . . . . . . . . 163.5 Microchannel plate detectors . . . . . . . . . . . . . . . . . . . . . . . . 163.6 Delay line anode . . . . . . . . . . . . . . . . . . . . . . . . . . . . . . . 173.7 Data acquisition . . . . . . . . . . . . . . . . . . . . . . . . . . . . . . . 18
3.7.1 Constant Fraction Discriminator (CFD) . . . . . . . . . . . . . . 193.7.2 Time to Digital Converter (TDC) . . . . . . . . . . . . . . . . . 19
3.8 Alignment tools inside the chamber . . . . . . . . . . . . . . . . . . . . . 20
4 Experiment 214.1 Selecting a harmonic . . . . . . . . . . . . . . . . . . . . . . . . . . . . . 214.2 Spatial overlap . . . . . . . . . . . . . . . . . . . . . . . . . . . . . . . . 214.3 Temporal overlap . . . . . . . . . . . . . . . . . . . . . . . . . . . . . . . 224.4 Time of flight . . . . . . . . . . . . . . . . . . . . . . . . . . . . . . . . . 234.5 Molecular structure of CO2 . . . . . . . . . . . . . . . . . . . . . . . . . 244.6 VUV-IR delay scans of neon and molecular oxygen . . . . . . . . . . . . 274.7 VUV-IR delay scan of carbon dioxide . . . . . . . . . . . . . . . . . . . . 294.8 Discussion of possible error sources . . . . . . . . . . . . . . . . . . . . . 36
5 Conclusion 37
6 Appendix 38
References 39
iii

List of Figures
2.1.1 Electromagnetic waves (from [3]) . . . . . . . . . . . . . . . . . . . . . . 42.2.1 Gaussian wave packet (from [4]) . . . . . . . . . . . . . . . . . . . . . . . 52.4.1 Different ionization processes (from [5]) . . . . . . . . . . . . . . . . . . 72.4.2 SFA-Ionization processes (from [6]) . . . . . . . . . . . . . . . . . . . . . 72.4.3 Electron trajectories in a laser field (from [7]) . . . . . . . . . . . . . . . 92.4.4 three-step model of HHG (from [8]) . . . . . . . . . . . . . . . . . . . . . 92.5.1 Functional principle of a laser (from [9]) . . . . . . . . . . . . . . . . . . 113.1 Interferometer . . . . . . . . . . . . . . . . . . . . . . . . . . . . . . . . . 133.3.1 Grating pair (from [6]) . . . . . . . . . . . . . . . . . . . . . . . . . . . . 153.4.1 COLTRIMS scheme (from [6]) . . . . . . . . . . . . . . . . . . . . . . . . 173.5.1 Model of a MCP (from [10]) . . . . . . . . . . . . . . . . . . . . . . . . . 173.6.1 MCP with following delay line anode (from [6]) . . . . . . . . . . . . . . 183.7.1 Sketch of the data acquisition electronics (from [6]) . . . . . . . . . . . . 193.8.1 Harmonics on phosphorus screen . . . . . . . . . . . . . . . . . . . . . . 204.3.1 Ionization and dissociation scheme of neon and O2 . . . . . . . . . . . . 234.5.1 CO2 Potential curves including the molecules ground state and orbital
symmetries (from [11] and [12]) . . . . . . . . . . . . . . . . . . . . . . . 244.5.2 Electronspectrum (from [1]) . . . . . . . . . . . . . . . . . . . . . . . . . 264.5.3 CO+
2 Potential curves (modified from [13]) . . . . . . . . . . . . . . . . . 264.6.1 O2 delay scan . . . . . . . . . . . . . . . . . . . . . . . . . . . . . . . . . 274.6.2 Neon delay scan (2D) . . . . . . . . . . . . . . . . . . . . . . . . . . . . 284.6.3 Neon delay scan (1D) . . . . . . . . . . . . . . . . . . . . . . . . . . . . 284.7.1 TOF spectra harmonics only . . . . . . . . . . . . . . . . . . . . . . . . 304.7.2 TOF spectrum IR only . . . . . . . . . . . . . . . . . . . . . . . . . . . . 304.7.3 TOF spectrum 11th harmonic pump-probe (integrated) . . . . . . . . . 314.7.4 TOF spectrum 13th harmonic pump-probe (integrated) . . . . . . . . . 314.7.5 11th harmonic pump-probe delay scan; IR parallel . . . . . . . . . . . . 324.7.6 11th harmonic pump-probe delay scan; IR perpendicular . . . . . . . . . 324.7.7 13th harmonic pump-probe delay scan; IR parallel . . . . . . . . . . . . 334.7.8 13th harmonic pump-probe delay scan; IR perpendicular . . . . . . . . . 334.8.1 Y vs. TOF detector image . . . . . . . . . . . . . . . . . . . . . . . . . . 36
iv
1 INTRODUCTION
1 Introduction
Starting in ancient Greece, it has been an argument for thousands of years what thefundamental parts of nature are and whether there are such things as atoms. Alsothe question about the nature of light and the interaction of light and matter hasinterested inquisitive people from the past until today. In the beginning, this discussionwas mainly held by philosophers. However, during the Enlightenment natural sciencesevolved, and they proved to be the most critical and rational method to explain nature.In the late 17th and early 18th century, the fundamental nature of matter and lightbecame a field of physical interest. Scientists started to aim for mathematical proofsand experimental confirmation of their theoretical concepts of nature. For a long timethere seemed to be supporting evidence for the theory that light is a wave, especiallyafter James Clerk Maxwell and the equations which are named after him. Nonetheless,with the beginning of the 20th century, the discovery of quantum mechanics opened acompletely new field of physics. The founders of quantum mechanics, including Bohr,de Broglie and numerous others, found out that there is no such thing as a wave or aparticle for a microscopic object. Rather a microscopic object is both wave and particle,and only the way of measuring it determines which aspect of this object is observed.Nowadays, modern physics and technologies are founded on such sophisticated quantumtheories which seem to break with almost everything people thought to know withtheir classical theories. One huge step for experimentalists of atomic, molecular andoptical physics was the discovery of the laser by Maiman in 1960 and the followingimprovements of it, leading to coherent light sources in the femtosecond regime. Thisinnovation, together with different experimental techniques, made it possible to analyzethe dynamics of atoms and molecules which mainly take place in the femto- or evenattosecond regime.This thesis deals with a modern, so-called ”pump-probe” experiment that uses theinteraction of light and matter to measure ultrafast molecular behavior. The pump-probe experiment in this thesis was performed at the James R. Macdonald Laboratoryat the Kansas State University in Manhattan, Kansas. Using the femtosecond laser”Kansas Light Source” (KLS), very high laser intensities could be accomplished. Thismade the highly nonlinear effect of High Harmonic generation possible. Those HighHarmonic pulses were used as a so-called ”pump pulse”, meaning that they excite aspecific target gas. A special feature of the setup I was working on is the gratingpair on the harmonic beam path. Due to this feature it is possible to separate thedifferent harmonics energetically and to perform the experiment with a single harmonicpump pulse. The interferometer in this experiment was constructed to give anotherfemtosecond IR pulse a variable delay. This delayed IR pulse was supposed to work asa ”probe pulse” which ionizes or dissociates the previously excited atom or molecule atdifferent delay times. The time-of-flight (TOF) and detector positions of the ions werethen measured using a COLTRIMS spectrometer with a microchannel plate detector(MCP) for signal amplification and a delay line anode (DLA) for position readout.During my scientific internship at the JRM lab various target gases were used, namelyargon, molecular oxygen, neon and carbon dioxide. Being one of the nature’s mostabundant molecules attracting a lot of public interest due to its central role in manynatural processes, CO2 is a very interesting candidate for research focusing on thismolecule’s dynamics. Therefore, the main experiment was performed on carbon dioxide.Daniel Trabert, a former intern at KSU who was working on the same setup and alsomade experiments on CO2, discussed some very interesting delay and polarizationdependent effects he found for an 11th harmonic-IR pump-probe experiment in hisbachelor thesis [1]. The goal of my thesis is to verify those observations by anothermeasurement and to perform a similar pump-probe experiment on carbon dioxide witha 13th harmonic pump pulse. Because the KLS provides 25fs pulses with a centerwavelength of 790nm [14], the 11th and 13th harmonic pump pulses have energies of
1
1 INTRODUCTION
≈ 17.05eV and ≈ 20.15eV , respectively. The energy regime where those harmonicsare in is called Vacuum Ultraviolet (VUV) band. A classification of the pulse energyinto a CO+
2 potential curve shows that the 11th harmonic pump pulse has sufficientenergy to populate the A2Πu excited ionic state of CO+
2 . D. Trabert proved this bya photo-electron spectrum. From this state two additional IR photons (≈ 1.55eVeach) are needed to reach the first dissociative levels to O+ (∼ 19.07eV [13]) or CO+
(∼ 19.47eV [13]). The 13th harmonic has already sufficient energy to populate thepredissociative C2Σ+
g state in the CO+2 ion, but there will also be ions in the lower
lying B2Σ+u state. This state is of particular interest for the pump-probe experiment
because one additional IR photon enables the transition to the predissociative C2Σ+g
state. The C2Σ+g state dissociates via the a4Σ−g and the b4Πu states in ∼ 1ps [13] to
O+(4Su)+CO(X1Σ+) respectively CO+(X2Σ+)+O(3P ). In the experiment, differentIR probe pulse polarization directions (parallel and perpendicular to the VUV pumppulse) were used to check whether there are differences in the CO+ and O+ yield vs.delay curves. Such curves can help us understand the molecular dynamics of the CO+
2
ion’s excited states.The experimental results, following a short discussion of the experimental procedureand an analysis of the molecular structure of CO2, are presented in chapter 4 of thisthesis. Chapter 2 covers the theoretical background of the discussed phenomenons andchapter 3 deals with the experimental setup in detail. Finally, chapter 5 completes mythesis with a short conclusion.
2
2 THEORETICAL BACKGROUND
2 Theoretical background
2.1 Light as an electromagnetic wave
In 1873, James Clerk Maxwell brought his Maxwell‘s Equations to their final form [3]:
~∇ ~E =1
ε0ρ (Gauss‘s law) (2.1)
~∇ ~B = 0 (2.2)
~∇× ~E = −∂~B
∂t(Faraday‘s law) (2.3)
~∇× ~B = µ0 ~J + µ0ε0∂ ~E
∂t(Ampere‘s law with Maxwell‘s correction) (2.4)
His equations for the vacuum- (formulas (2.1)-(2.4)) and matter case, together with theforce law
~F = q( ~E + ~v × ~B) (2.5)
allowed physicists to describe almost every phenomena of electrodynamics. Also, thelight could then be understood as an electromagnetic wave and properties like theinterference patterns of light, scattering and reflection, and refraction of light could beexplained. In regions where there is no charge or current, equation (2.1) gets zero and
equation (2.4) facilitates to ~∇ × ~B = µ0ε0∂ ~E∂t . Now the four equations (2.1-2.4) are
coupled partial differential equations of first order. It is possible to decouple them byapplying the curl to (2.3) and (2.4) [3]:
~∇× (~∇× ~E) = ~∇(~∇ ~E)− ~∇2 ~E = ~∇× (−∂~B
∂t) = − ∂
∂t(~∇× ~B) = −µ0ε0
∂2 ~E
∂t2(2.6)
And analogous:
~∇× (~∇× ~B) = ~∇(~∇ ~B)− ~∇2 ~B = ~∇× (µ0ε0∂ ~E
∂t) = µ0ε0
∂
∂t(~∇× ~E) = −µ0ε0
∂2 ~B
∂t2(2.7)
It follows that:
~∇2 ~E = µ0ε0∂2 ~E
∂t2(2.8)
~∇2 ~B = µ0ε0∂2 ~B
∂t2(2.9)
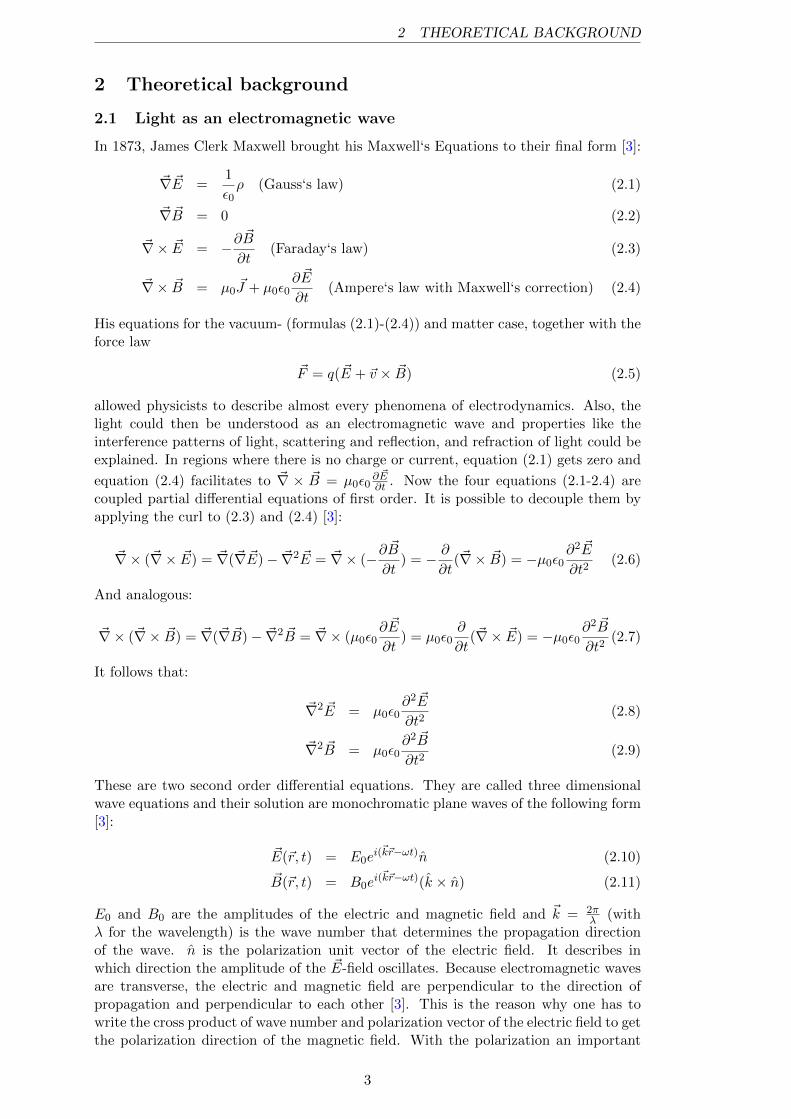
These are two second order differential equations. They are called three dimensionalwave equations and their solution are monochromatic plane waves of the following form[3]:
~E(~r, t) = E0ei(~k~r−ωt)n (2.10)
~B(~r, t) = B0ei(~k~r−ωt)(k × n) (2.11)
E0 and B0 are the amplitudes of the electric and magnetic field and ~k = 2πλ (with
λ for the wavelength) is the wave number that determines the propagation directionof the wave. n is the polarization unit vector of the electric field. It describes inwhich direction the amplitude of the ~E-field oscillates. Because electromagnetic wavesare transverse, the electric and magnetic field are perpendicular to the direction ofpropagation and perpendicular to each other [3]. This is the reason why one has towrite the cross product of wave number and polarization vector of the electric field to getthe polarization direction of the magnetic field. With the polarization an important
3
2.2 Gaussian beam 2 THEORETICAL BACKGROUND
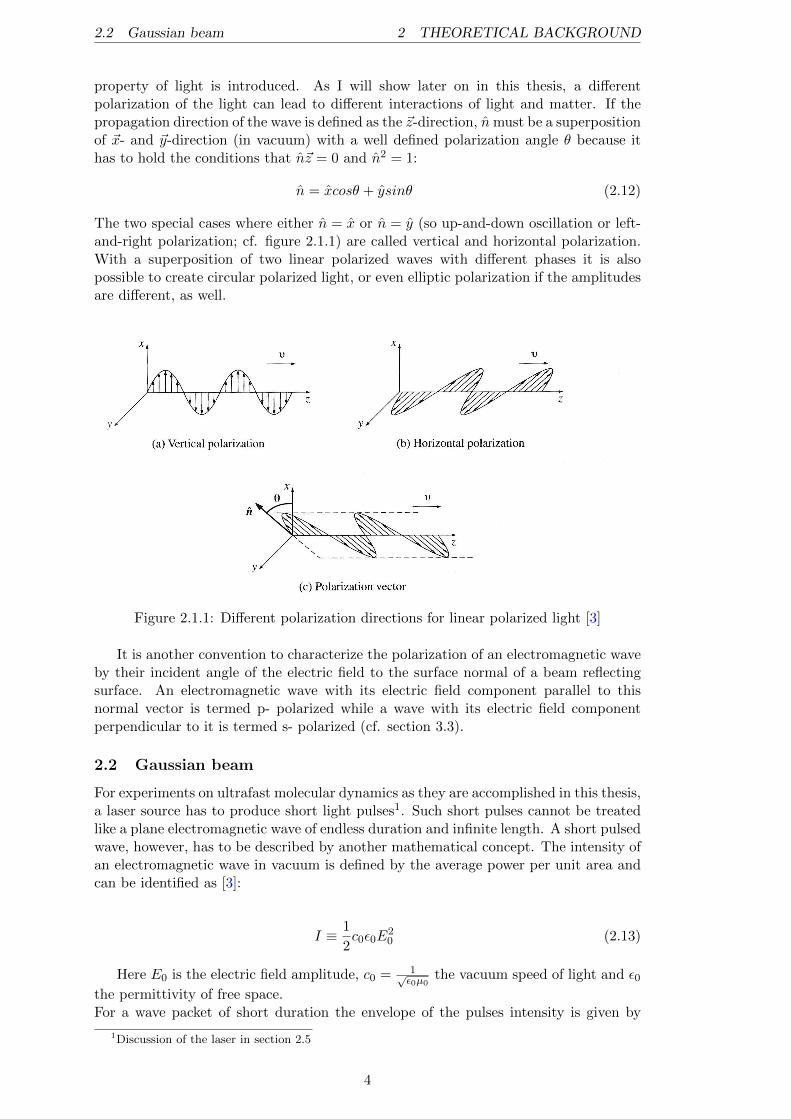
property of light is introduced. As I will show later on in this thesis, a differentpolarization of the light can lead to different interactions of light and matter. If thepropagation direction of the wave is defined as the ~z-direction, nmust be a superpositionof ~x- and ~y-direction (in vacuum) with a well defined polarization angle θ because ithas to hold the conditions that n~z = 0 and n2 = 1:
n = xcosθ + ysinθ (2.12)
The two special cases where either n = x or n = y (so up-and-down oscillation or left-and-right polarization; cf. figure 2.1.1) are called vertical and horizontal polarization.With a superposition of two linear polarized waves with different phases it is alsopossible to create circular polarized light, or even elliptic polarization if the amplitudesare different, as well.9.2. ELECTROMAGNETIC WAVES IN VACUUM
(a) Vertical polarization (b) Horizontal polarization
(c) Polarization vector
Figure 9.8
Electromagnetic Waves in Vacuum
9,2.1 The Wave Equation for E and B
ln regions of space where there is no charge or current, Maxwell,s equations read
315
(e.40)
(i) v.E:0. (iii) V x E: -#. I
(ii) V.B :0, (iv) V x B: ,r.,ff J
'l'hcy constitute a set of coupled, first-order, partial differential equations for E and B. They
cnn be decoupled by applying the curl to (iii) and (iv):
V x (V xE) :V(V.E)-V2E:V x (-#)
= -*,o x B) = -t oro#,
V x (V xB) -V(V,B)-v2B=V x (rr-#)
Figure 2.1.1: Different polarization directions for linear polarized light [3]
It is another convention to characterize the polarization of an electromagnetic waveby their incident angle of the electric field to the surface normal of a beam reflectingsurface. An electromagnetic wave with its electric field component parallel to thisnormal vector is termed p- polarized while a wave with its electric field componentperpendicular to it is termed s- polarized (cf. section 3.3).
2.2 Gaussian beam
For experiments on ultrafast molecular dynamics as they are accomplished in this thesis,a laser source has to produce short light pulses1. Such short pulses cannot be treatedlike a plane electromagnetic wave of endless duration and infinite length. A short pulsedwave, however, has to be described by another mathematical concept. The intensity ofan electromagnetic wave in vacuum is defined by the average power per unit area andcan be identified as [3]:
I ≡ 1
2c0ε0E
20 (2.13)
Here E0 is the electric field amplitude, c0 = 1√ε0µ0
the vacuum speed of light and ε0the permittivity of free space.For a wave packet of short duration the envelope of the pulses intensity is given by
1Discussion of the laser in section 2.5
4
2.2 Gaussian beam 2 THEORETICAL BACKGROUND
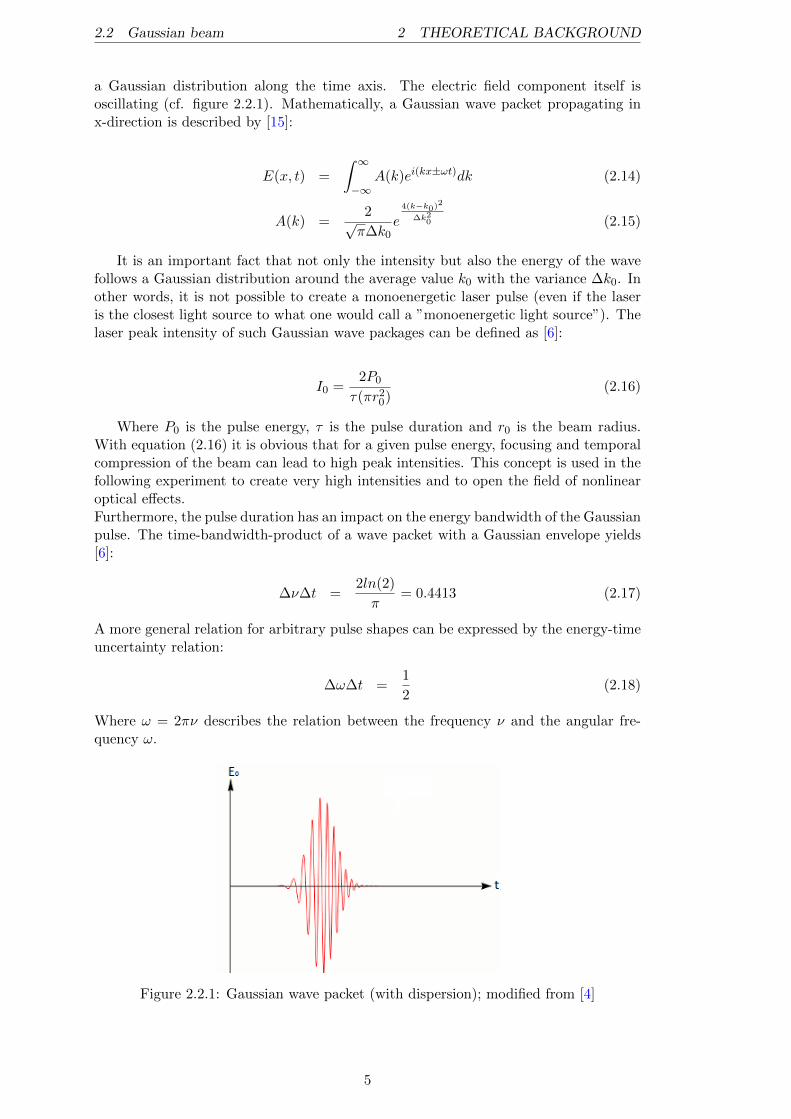
a Gaussian distribution along the time axis. The electric field component itself isoscillating (cf. figure 2.2.1). Mathematically, a Gaussian wave packet propagating inx-direction is described by [15]:
E(x, t) =
∫ ∞−∞
A(k)ei(kx±ωt)dk (2.14)
A(k) =2√π∆k0
e4(k−k0)2
∆k20 (2.15)
It is an important fact that not only the intensity but also the energy of the wavefollows a Gaussian distribution around the average value k0 with the variance ∆k0. Inother words, it is not possible to create a monoenergetic laser pulse (even if the laseris the closest light source to what one would call a ”monoenergetic light source”). Thelaser peak intensity of such Gaussian wave packages can be defined as [6]:
I0 =2P0
τ(πr20)(2.16)
Where P0 is the pulse energy, τ is the pulse duration and r0 is the beam radius.With equation (2.16) it is obvious that for a given pulse energy, focusing and temporalcompression of the beam can lead to high peak intensities. This concept is used in thefollowing experiment to create very high intensities and to open the field of nonlinearoptical effects.Furthermore, the pulse duration has an impact on the energy bandwidth of the Gaussianpulse. The time-bandwidth-product of a wave packet with a Gaussian envelope yields[6]:
∆ν∆t =2ln(2)
π= 0.4413 (2.17)
A more general relation for arbitrary pulse shapes can be expressed by the energy-timeuncertainty relation:
∆ω∆t =1
2(2.18)
Where ω = 2πν describes the relation between the frequency ν and the angular fre-quency ω.
Figure 2.2.1: Gaussian wave packet (with dispersion); modified from [4]
5
2.3 Light as a particle 2 THEORETICAL BACKGROUND
2.3 Light as a particle
It was already a controversial discussion in the times of Newton and Huygens, whetherlight is a wave or a particle. After Maxwell introduced his works everything seemed topoint towards Huygens and the statement that light has a wave nature. Almost half acentury later, Albert Einstein published his theoretical explanation of the photoelectriceffect (in 1905)2 and experiments and observations showing a particle-like behavior oflight could be explained. Together with Planck‘s discovery of the Planck constant h,this discovery introduced a new era for physics because quantum mechanics was born.Light-matter interaction became a field of focused researches. It is stated that a lightquantum, the so-called photon, with a certain amount of energy can liberate an electronout of its atomic orbit.
Ekin,e− = hν − Ebind (2.19)
hν is the photon energy with the Planck constant h and the frequency of the lightν. Ebind is the binding energy of the bound electron and Ekine,e− is the kinetic energyof the free electron after the photon is absorbed by the atom.Nowadays, the single photon process is well understood. But with the development ofhigh-energy and high intensity light sources another big field of research opened for thescientists working on light-matter interaction.
2.4 High Harmonic Generation
High Harmonics are besides Free Electron Lasers (FEL) one of the best tools to generateshort pulsed coherent light below the wavelength of 100nm. The medium to generatethose harmonics is typically a noble gas with a low gas pressure. For the generationof such High Harmonics very high field intensities are needed. The processes whichdescribe the effect of High Harmonic generation are discussed in this section.
2.4.1 Multi-photon process
In the regime of high intensities there are two different processes that cause the ioniza-tion of an atom or a molecule. One of them is the Multi-photon ionization (MPI). Inthis process the electron absorbs many photons of one specific energy. The energy ofone single photon is not enough to ionize the atom but it is possible for the electron togo in a metastable state. From there it absorbs another photon. This process repeatsuntil the electron is free and the atom is ionized. The kinetic energy of the free electronis then given by [7]:
Ekin,e− = nhν − (Ebind + UP ) (2.20)
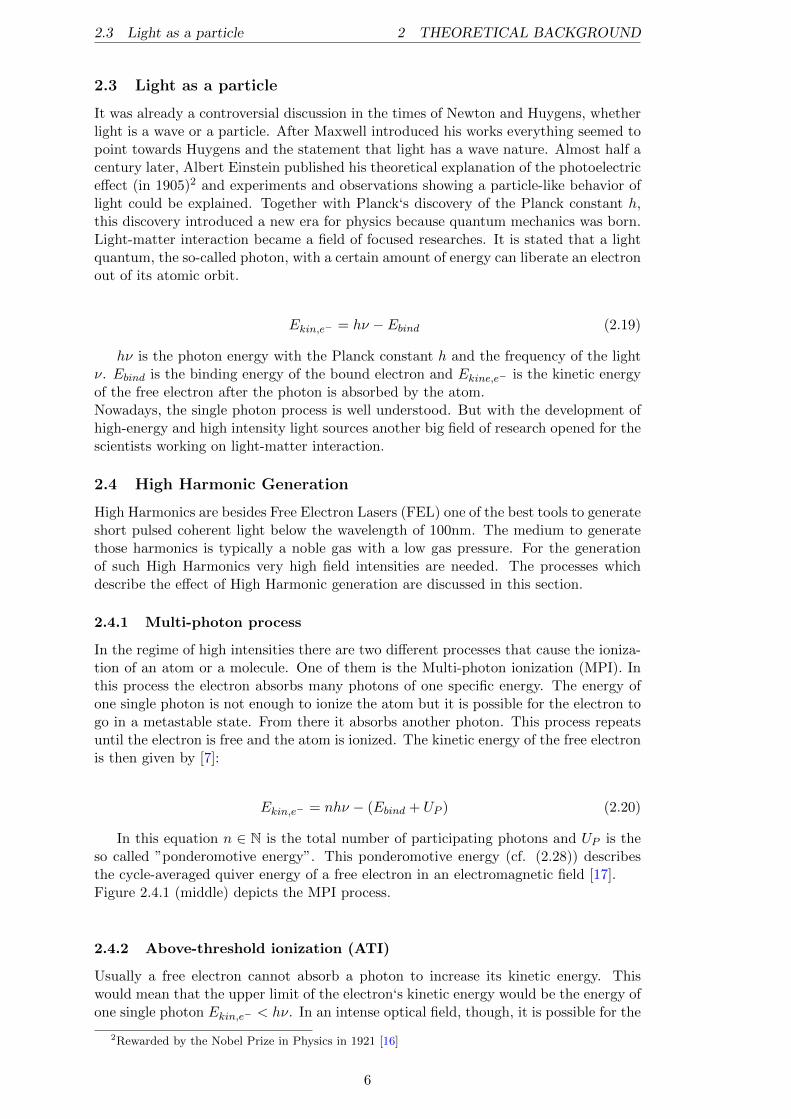
In this equation n ∈ N is the total number of participating photons and UP is theso called ”ponderomotive energy”. This ponderomotive energy (cf. (2.28)) describesthe cycle-averaged quiver energy of a free electron in an electromagnetic field [17].Figure 2.4.1 (middle) depicts the MPI process.
2.4.2 Above-threshold ionization (ATI)
Usually a free electron cannot absorb a photon to increase its kinetic energy. Thiswould mean that the upper limit of the electron‘s kinetic energy would be the energy ofone single photon Ekin,e− < hν. In an intense optical field, though, it is possible for the
2Rewarded by the Nobel Prize in Physics in 1921 [16]
6
2.4 High Harmonic Generation 2 THEORETICAL BACKGROUND
atom to absorb more photons than actually required for the ionization process. Thisprocess was first described by Agostini et al. [18] in 1979 and is called above-thresholdionization (ATI).
2.4.3 Strong-Field-Approximation (SFA)
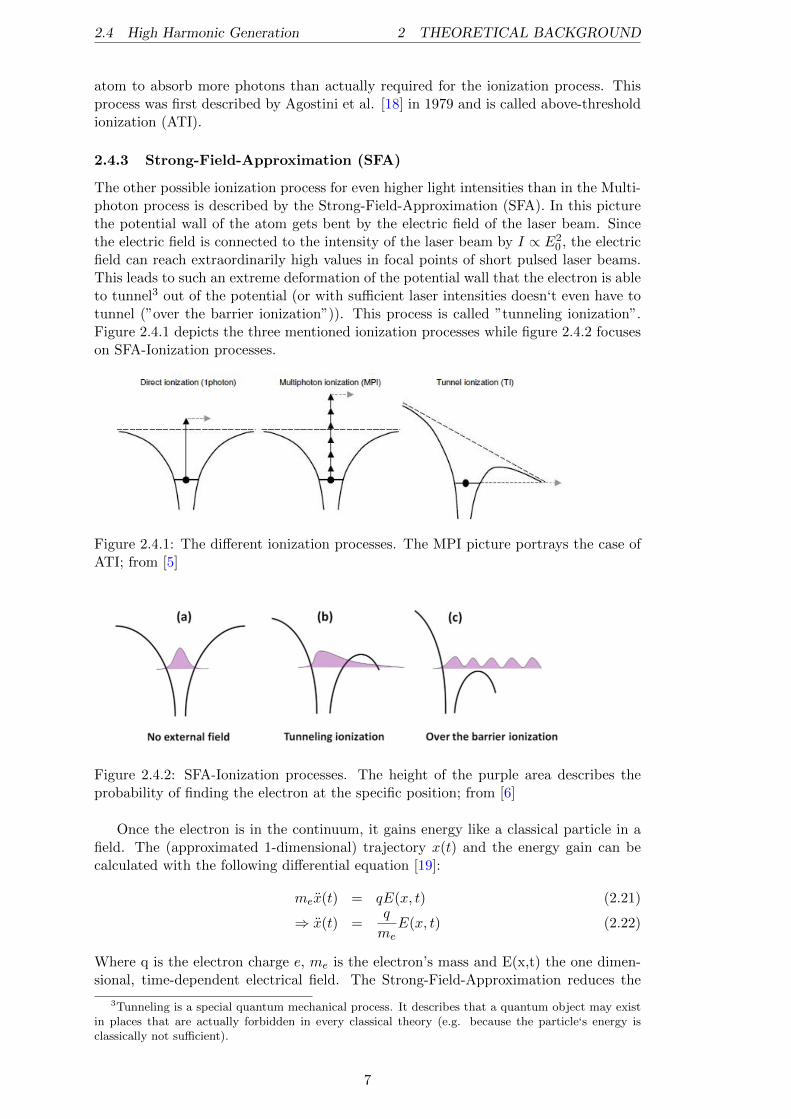
The other possible ionization process for even higher light intensities than in the Multi-photon process is described by the Strong-Field-Approximation (SFA). In this picturethe potential wall of the atom gets bent by the electric field of the laser beam. Sincethe electric field is connected to the intensity of the laser beam by I ∝ E2
0 , the electricfield can reach extraordinarily high values in focal points of short pulsed laser beams.This leads to such an extreme deformation of the potential wall that the electron is ableto tunnel3 out of the potential (or with sufficient laser intensities doesn‘t even have totunnel (”over the barrier ionization”)). This process is called ”tunneling ionization”.Figure 2.4.1 depicts the three mentioned ionization processes while figure 2.4.2 focuseson SFA-Ionization processes.
Figure 2.4.1: The different ionization processes. The MPI picture portrays the case ofATI; from [5]
Figure 2.4.2: SFA-Ionization processes. The height of the purple area describes theprobability of finding the electron at the specific position; from [6]
Once the electron is in the continuum, it gains energy like a classical particle in afield. The (approximated 1-dimensional) trajectory x(t) and the energy gain can becalculated with the following differential equation [19]:
mex(t) = qE(x, t) (2.21)
⇒ x(t) =q
meE(x, t) (2.22)
Where q is the electron charge e, me is the electron’s mass and E(x,t) the one dimen-sional, time-dependent electrical field. The Strong-Field-Approximation reduces the
3Tunneling is a special quantum mechanical process. It describes that a quantum object may existin places that are actually forbidden in every classical theory (e.g. because the particle‘s energy isclassically not sufficient).
7
2.4 High Harmonic Generation 2 THEORETICAL BACKGROUND
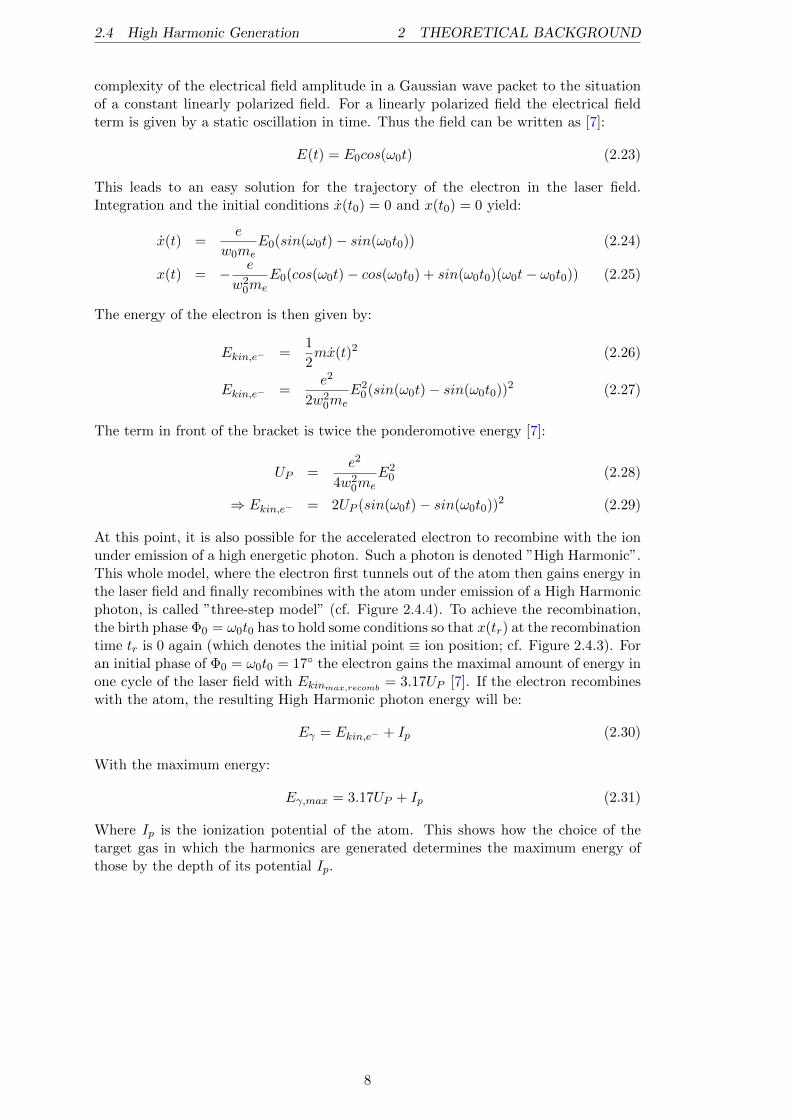
complexity of the electrical field amplitude in a Gaussian wave packet to the situationof a constant linearly polarized field. For a linearly polarized field the electrical fieldterm is given by a static oscillation in time. Thus the field can be written as [7]:
E(t) = E0cos(ω0t) (2.23)
This leads to an easy solution for the trajectory of the electron in the laser field.Integration and the initial conditions x(t0) = 0 and x(t0) = 0 yield:
x(t) =e
w0meE0(sin(ω0t)− sin(ω0t0)) (2.24)
x(t) = − e
w20me
E0(cos(ω0t)− cos(ω0t0) + sin(ω0t0)(ω0t− ω0t0)) (2.25)
The energy of the electron is then given by:
Ekin,e− =1
2mx(t)2 (2.26)
Ekin,e− =e2
2w20me
E20(sin(ω0t)− sin(ω0t0))
2 (2.27)
The term in front of the bracket is twice the ponderomotive energy [7]:
UP =e2
4w20me
E20 (2.28)
⇒ Ekin,e− = 2UP (sin(ω0t)− sin(ω0t0))2 (2.29)
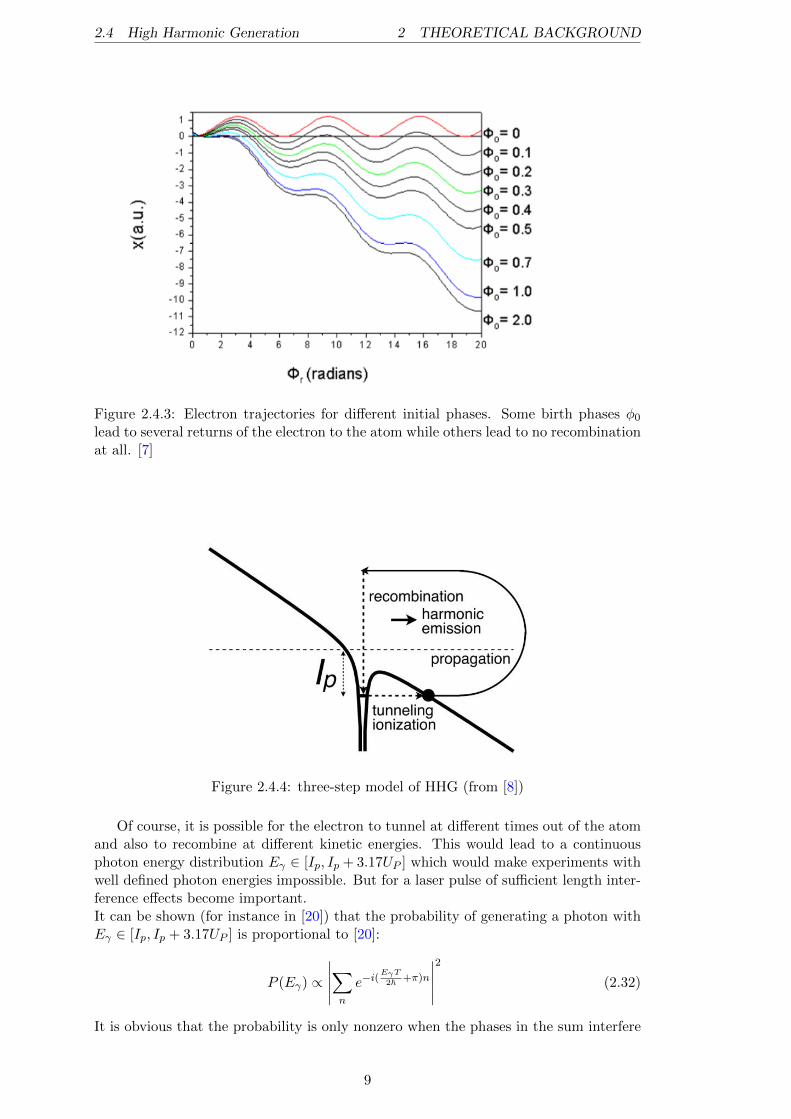
At this point, it is also possible for the accelerated electron to recombine with the ionunder emission of a high energetic photon. Such a photon is denoted ”High Harmonic”.This whole model, where the electron first tunnels out of the atom then gains energy inthe laser field and finally recombines with the atom under emission of a High Harmonicphoton, is called ”three-step model” (cf. Figure 2.4.4). To achieve the recombination,the birth phase Φ0 = ω0t0 has to hold some conditions so that x(tr) at the recombinationtime tr is 0 again (which denotes the initial point ≡ ion position; cf. Figure 2.4.3). Foran initial phase of Φ0 = ω0t0 = 17 the electron gains the maximal amount of energy inone cycle of the laser field with Ekinmax,recomb = 3.17UP [7]. If the electron recombineswith the atom, the resulting High Harmonic photon energy will be:
Eγ = Ekin,e− + Ip (2.30)
With the maximum energy:
Eγ,max = 3.17UP + Ip (2.31)
Where Ip is the ionization potential of the atom. This shows how the choice of thetarget gas in which the harmonics are generated determines the maximum energy ofthose by the depth of its potential Ip.
8
2.4 High Harmonic Generation 2 THEORETICAL BACKGROUND
Figure 2.4.3: Electron trajectories for different initial phases. Some birth phases φ0lead to several returns of the electron to the atom while others lead to no recombinationat all. [7]
Figure 2.4.4: three-step model of HHG (from [8])
Of course, it is possible for the electron to tunnel at different times out of the atomand also to recombine at different kinetic energies. This would lead to a continuousphoton energy distribution Eγ ∈ [Ip, Ip + 3.17UP ] which would make experiments withwell defined photon energies impossible. But for a laser pulse of sufficient length inter-ference effects become important.It can be shown (for instance in [20]) that the probability of generating a photon withEγ ∈ [Ip, Ip + 3.17UP ] is proportional to [20]:
P (Eγ) ∝
∣∣∣∣∣∑n
e−i(EγT
2~ +π)n
∣∣∣∣∣2
(2.32)
It is obvious that the probability is only nonzero when the phases in the sum interfere
9
2.4 High Harmonic Generation 2 THEORETICAL BACKGROUND
constructively. This leads to the equation:
EγT
2~+ π = 2πZ (2.33)
Where Z is an integer. With the identity ω = 2π/T it follows that there are only oddmultiples of the initial photon energy that interfere constructively.
Eγ2ω~
+1
2= Z (2.34)
Eγ = ~ω(2Z − 1) (2.35)
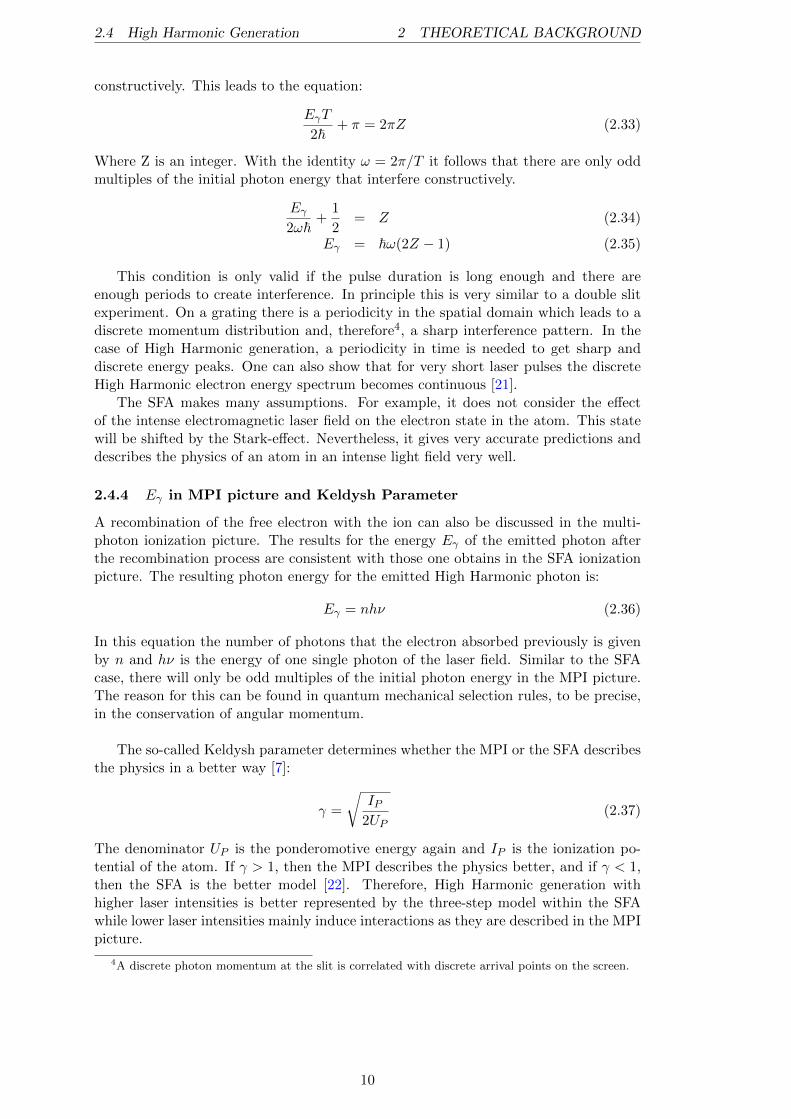
This condition is only valid if the pulse duration is long enough and there areenough periods to create interference. In principle this is very similar to a double slitexperiment. On a grating there is a periodicity in the spatial domain which leads to adiscrete momentum distribution and, therefore4, a sharp interference pattern. In thecase of High Harmonic generation, a periodicity in time is needed to get sharp anddiscrete energy peaks. One can also show that for very short laser pulses the discreteHigh Harmonic electron energy spectrum becomes continuous [21].
The SFA makes many assumptions. For example, it does not consider the effectof the intense electromagnetic laser field on the electron state in the atom. This statewill be shifted by the Stark-effect. Nevertheless, it gives very accurate predictions anddescribes the physics of an atom in an intense light field very well.
2.4.4 Eγ in MPI picture and Keldysh Parameter
A recombination of the free electron with the ion can also be discussed in the multi-photon ionization picture. The results for the energy Eγ of the emitted photon afterthe recombination process are consistent with those one obtains in the SFA ionizationpicture. The resulting photon energy for the emitted High Harmonic photon is:
Eγ = nhν (2.36)
In this equation the number of photons that the electron absorbed previously is givenby n and hν is the energy of one single photon of the laser field. Similar to the SFAcase, there will only be odd multiples of the initial photon energy in the MPI picture.The reason for this can be found in quantum mechanical selection rules, to be precise,in the conservation of angular momentum.
The so-called Keldysh parameter determines whether the MPI or the SFA describesthe physics in a better way [7]:
γ =
√IP
2UP(2.37)
The denominator UP is the ponderomotive energy again and IP is the ionization po-tential of the atom. If γ > 1, then the MPI describes the physics better, and if γ < 1,then the SFA is the better model [22]. Therefore, High Harmonic generation withhigher laser intensities is better represented by the three-step model within the SFAwhile lower laser intensities mainly induce interactions as they are described in the MPIpicture.
4A discrete photon momentum at the slit is correlated with discrete arrival points on the screen.
10
2.5 Functional principle of a laser 2 THEORETICAL BACKGROUND
2.5 Functional principle of a laser
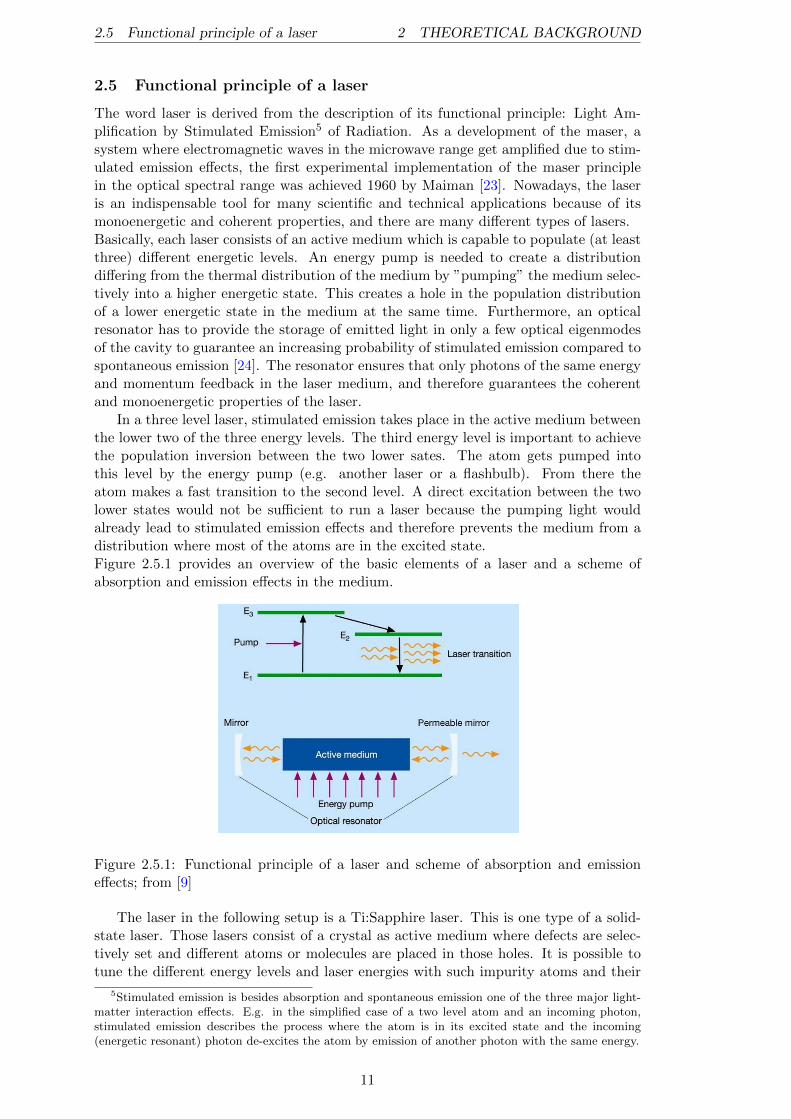
The word laser is derived from the description of its functional principle: Light Am-plification by Stimulated Emission5 of Radiation. As a development of the maser, asystem where electromagnetic waves in the microwave range get amplified due to stim-ulated emission effects, the first experimental implementation of the maser principlein the optical spectral range was achieved 1960 by Maiman [23]. Nowadays, the laseris an indispensable tool for many scientific and technical applications because of itsmonoenergetic and coherent properties, and there are many different types of lasers.Basically, each laser consists of an active medium which is capable to populate (at leastthree) different energetic levels. An energy pump is needed to create a distributiondiffering from the thermal distribution of the medium by ”pumping” the medium selec-tively into a higher energetic state. This creates a hole in the population distributionof a lower energetic state in the medium at the same time. Furthermore, an opticalresonator has to provide the storage of emitted light in only a few optical eigenmodesof the cavity to guarantee an increasing probability of stimulated emission compared tospontaneous emission [24]. The resonator ensures that only photons of the same energyand momentum feedback in the laser medium, and therefore guarantees the coherentand monoenergetic properties of the laser.
In a three level laser, stimulated emission takes place in the active medium betweenthe lower two of the three energy levels. The third energy level is important to achievethe population inversion between the two lower sates. The atom gets pumped intothis level by the energy pump (e.g. another laser or a flashbulb). From there theatom makes a fast transition to the second level. A direct excitation between the twolower states would not be sufficient to run a laser because the pumping light wouldalready lead to stimulated emission effects and therefore prevents the medium from adistribution where most of the atoms are in the excited state.Figure 2.5.1 provides an overview of the basic elements of a laser and a scheme ofabsorption and emission effects in the medium.
Figure 2.5.1: Functional principle of a laser and scheme of absorption and emissioneffects; from [9]
The laser in the following setup is a Ti:Sapphire laser. This is one type of a solid-state laser. Those lasers consist of a crystal as active medium where defects are selec-tively set and different atoms or molecules are placed in those holes. It is possible totune the different energy levels and laser energies with such impurity atoms and their
5Stimulated emission is besides absorption and spontaneous emission one of the three major light-matter interaction effects. E.g. in the simplified case of a two level atom and an incoming photon,stimulated emission describes the process where the atom is in its excited state and the incoming(energetic resonant) photon de-excites the atom by emission of another photon with the same energy.
11
2.6 Generating ultrafast laser pulses 2 THEORETICAL BACKGROUND
positions in the lattice. This provides a wide bandwidth and makes solid-state lasersconvenient because of their wide area of application [24].
2.6 Generating ultrafast laser pulses
As one can see in the previous sections, laser pulses of high intensities and short durationare needed to generate High Harmonics and to perform pump-probe experiments witha good temporal resolution. The laser beam used for this experiment comes from theKansas Light Source (KLS) laser. The KLS is a very strong laser source which producesultrafast femtosecond laser pulses with high intensities. The high intensities arise froma temporal compression of the laser pulse. Because of the identity Power ∝ Energy
time , apulse of the same energy becomes more intense when it is compressed in time.The pulse duration range of the KLS goes from 8fs to 30ps [14]. The repetition rateis 2kHz and the center wavelength is 790nm [14]. The pulse energies vary with thepulse duration of the laser beam from 0.5mJ @ 5fs to 5mJ @ 30ps [14]. It is possibleto reach intensities up to 1016 Watts/cm2 with a focused laser beam of the KLS. Withthe principle of chirped pulse amplification it is possible to generate a 25fs pulse withan energy of 2.5mJ. To achieve this, the pulse first gets stretched (from 10fs to 100ps)by a pair of gratings to protect the laser amplification medium from damage. Then thepulse is amplified by sending it several times through a Ti:Sapphire crystal. After theamplification, the pulse is 30ps long with an energy of 5mJ. To compress the pulse to25fs, the pulse passes two gratings with a different phase modulation.
12
3 EXPERIMENTAL SETUP
3 Experimental setup
FL/Delay:Stage
FLp
RM
TM
HF
GP
Gas cell
PhotodiodeKLS beam4ufs @ 8uunm
I/
Ip
I3
I4 I5
BS
M3M4
M5
M6
M7 M8
A
M9M/u
toCOLTRIMS
M/:M/u: Plane mirrorI/:I5: IrisesFL/CFLp: Focussing lensA: AttenuatorBS: 8u+pu Beam splitterGP: Grating pairHF: Harmonic filterTM: Toroidal mirrorRM: Recombination mirror
M/
Mp
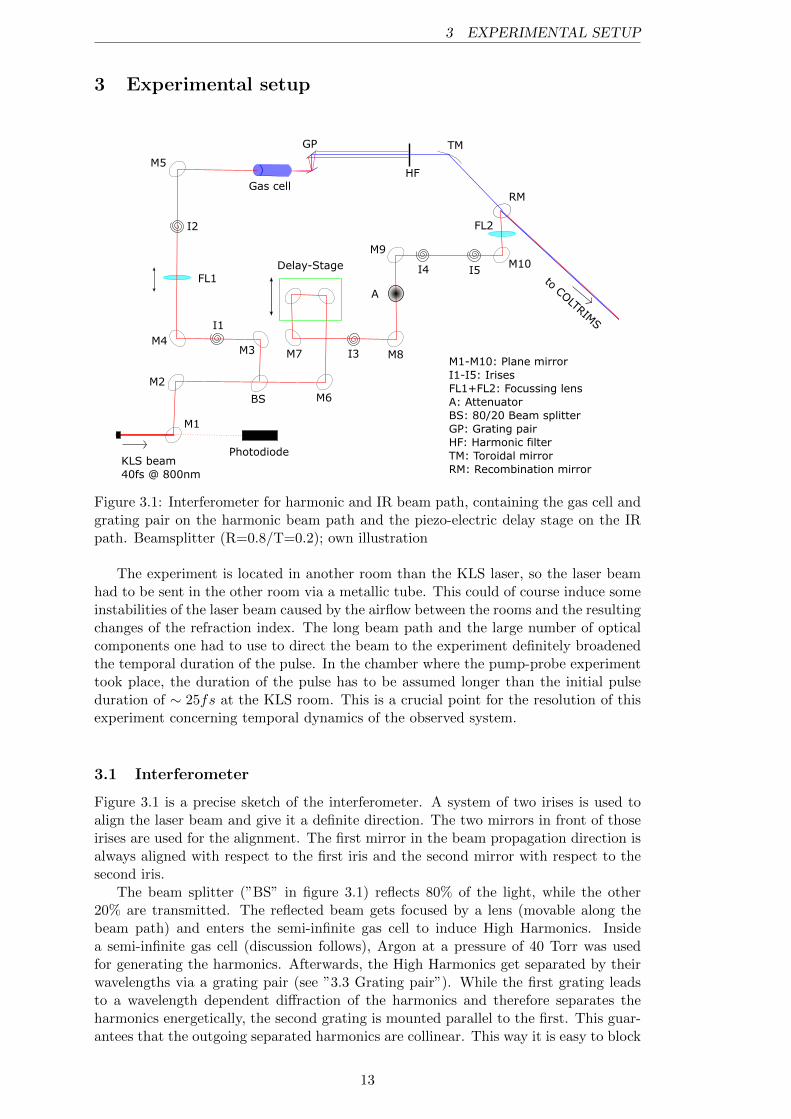
Figure 3.1: Interferometer for harmonic and IR beam path, containing the gas cell andgrating pair on the harmonic beam path and the piezo-electric delay stage on the IRpath. Beamsplitter (R=0.8/T=0.2); own illustration
The experiment is located in another room than the KLS laser, so the laser beamhad to be sent in the other room via a metallic tube. This could of course induce someinstabilities of the laser beam caused by the airflow between the rooms and the resultingchanges of the refraction index. The long beam path and the large number of opticalcomponents one had to use to direct the beam to the experiment definitely broadenedthe temporal duration of the pulse. In the chamber where the pump-probe experimenttook place, the duration of the pulse has to be assumed longer than the initial pulseduration of ∼ 25fs at the KLS room. This is a crucial point for the resolution of thisexperiment concerning temporal dynamics of the observed system.
3.1 Interferometer
Figure 3.1 is a precise sketch of the interferometer. A system of two irises is used toalign the laser beam and give it a definite direction. The two mirrors in front of thoseirises are used for the alignment. The first mirror in the beam propagation direction isalways aligned with respect to the first iris and the second mirror with respect to thesecond iris.
The beam splitter (”BS” in figure 3.1) reflects 80% of the light, while the other20% are transmitted. The reflected beam gets focused by a lens (movable along thebeam path) and enters the semi-infinite gas cell to induce High Harmonics. Insidea semi-infinite gas cell (discussion follows), Argon at a pressure of 40 Torr was usedfor generating the harmonics. Afterwards, the High Harmonics get separated by theirwavelengths via a grating pair (see ”3.3 Grating pair”). While the first grating leadsto a wavelength dependent diffraction of the harmonics and therefore separates theharmonics energetically, the second grating is mounted parallel to the first. This guar-antees that the outgoing separated harmonics are collinear. This way it is easy to block
13
3.2 High Harmonic generation unit 3 EXPERIMENTAL SETUP
unwanted harmonics with an adjustable beam block (c.f. harmonic filter in figure 3.1)and select single harmonics for the experiment. A metallic sheet with a tiny hole6 isused to separate the semi-infinite gas cell from the ultra-high vacuum chamber. Theultra-high vacuum is essential for experiments with VUV light as harmonics are ab-sorbed in air. Behind the harmonic filter, the harmonic beam gets reflected and focusedby a toroidal mirror into the interaction region. At the end of the interferometer, theHigh Harmonic beam crosses the recombination mirror. This mirror is a silver mirrororientated at 45 degrees with a 2mm hole in the center through which the High Har-monic beam crosses. At this position the High Harmonic beam recombines with thedelayed IR beam from the other path.
The transmitted fundamental beam (≡ 20% of the laser intensity) passes a mov-able delay-stage. This delay-stage can be moved within 90µm electronically through apiezoelectric device and 2cm manually. This covers a time delay of 300fs and 66.7ps,respectively. Because the light has to travel twice this way it is possible to scan withina range of 600fs electronically via the LABVIEW software. This delay stage is the keyelement of the following pump-probe measurement. With the piezoelectric elements itis possible to accurately move the delay stage by a certain distance and hence to adjustthe temporal delay. To measure the molecular dynamics in real time one first finds thetime overlap of the two pulses and then scans the delay relative to this time zero.The end of the IR beamline contains irises for alignment as well as an attenuator toadjust the beam intensity7. Finally the IR beam passes a lens for focusing the beamin the interaction region and is then reflected by the recombination mirror. Here theIR beam loses a lot of its intensity because the central part of the gaussian beamhits the hole in the recombination mirror and is therefore not reflected. Nevertheless,the intensity of the IR beam is sufficient for its purpose of probing the excited molecules.
3.2 High Harmonic generation unit
For the generation of the harmonics a semi-infinite gas cell is used in this experiment.A lens focuses the laser beam into this semi-infinite gas cell, in order to create highfield intensities. The gas cell is called ”semi-infinite” because the length of the cell islarge compared to the Rayleigh length8 of the focused laser field and thus the wholefocusing volume is the interaction region [26]. This kind of generation unit has severaladvantages. Compared to other methods the conversion energy is high due to the largeinteraction length. Furthermore, the beam alignment is easy and there are no technicaldifficulties.A disadvantage for this kind of generation unit is the intensity variation across the biginteraction region. This leads to problems with the phases of the High Harmonics [6].Experimentally it is possible to tune the intensity inside the semi-infinite gas cell viaan iris in front of the generation unit (c.f. I2 in figure 3.1). Together with varying thelens position (FL1 in figure 3.1), which implies varying the focal point position, the irisis a useful tool to optimize the phase matching condition of the High Harmonics.
6This hole was formerly burned in the metallic sheet with the laser. Hence, its diameter is limitedby the beam diameter at the end of the semi-infinite gas cell. Every time something in the beampath changed, like opening of the iris or changing the focusing lens position (for optimizing the phasematching condition; see ”3.2 High Harmonic generation unit”) in front of the gas cell, the hole gotwider, and therefore the sheet had to be changed frequently.
7This attenuator is needed when one would like to check the IR beam position at the phosphorusscreen (cf. ”3.8 Alignment tools inside the chamber”).
8The Rayleigh length describes the length measured from the beam waist of the laser beam to apoint where the radius of the beam is increased by a factor of
√2 [25].
14
3.3 Grating pair 3 EXPERIMENTAL SETUP
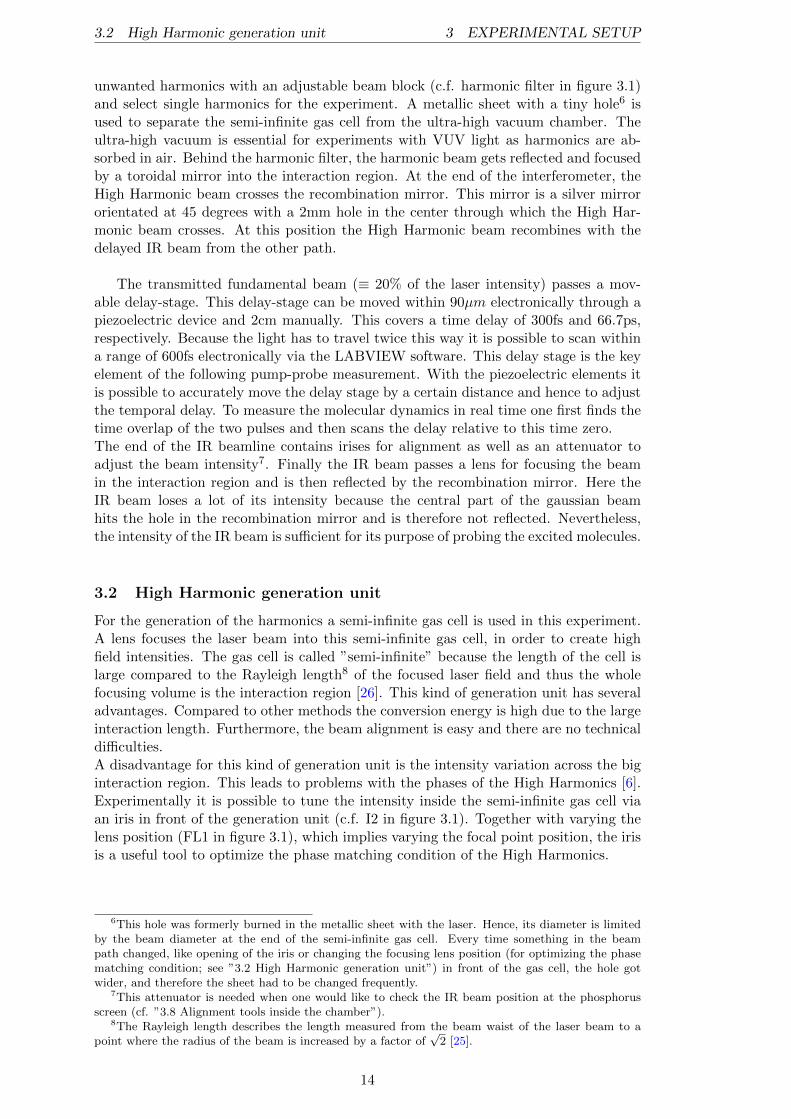
3.3 Grating pair
Figure 3.3.1: a) Grating pair scheme with properties; from [6]and b) Switching harmonics via movement of grating 2; from [6]
As it was mentioned earlier, a grating pair is used in this setup to separate theharmonics and direct them on a collinear path towards the harmonic filter and toroidalmirror (c.f. figure 3.1 ”GP”).In principle the physics behind the grating pair is given by diffraction effects on thegrating. For an arbitrary grating, the condition for constructive interference for a pathdifference (dn) is:
dn = nλ = g sin(φn) (3.1)
With n ∈ Z the order of the maximum, λ the wavelength of the light, g the gratingconstant and φn the angle of the n-th diffraction maximum.In this setup reflective gratings are used. Each grating consists of many periodicallyarranged edges (so called ”blazed grating”; sawtooth structure). Equation (3.1) changesfor this special case because the incoming and outgoing beams have different angles αand β in general. The new condition for positive interference is then [6]:
g(sin(α) + sin(β)) = nλ (3.2)
In Wei Cao‘s setup9 the gratings have a groove density of 3600mm . This corresponds
to g = 2.8 · 10−7mm. In order to maximize the efficiency of the diffracted light, thegroove lines are parallel to the laser polarization (s-polarized) [6]. With formula (3.2)it is obvious that different wavelengths will have different diffraction angles. A smallerwavelength leads to a smaller angle and vice versa. This leads to a separation of thedifferent harmonics. Theoretically, one could start single harmonic experiments alreadyat this point. But there are several reasons to introduce a second grating:
If a second identical grating is placed parallel to the first one, the outgoing beamwill be parallel to the incoming beam before the grating pair. This makes the beams foreach harmonic order collinear after the second grating (c.f. figure 3.3.1 a)), hence it isvery easy to switch between harmonics and to block the unwanted harmonics. One canswitch between the harmonics by just changing the distance of the gratings (c.f. figure3.3.1 b)). Another reason why the second grating is important is that the temporalchirp introduced by the first grating can be eliminated to some extend. The estimatedVUV pulse duration after the grating pair is 90fs [6].This method is an important step for the experiments with single harmonics and itmakes the handling of switching and blocking the harmonics trivial.
9Wei Cao was a former Ph.D. student at the JRM lab. The setup I used for my experiments wasbuilt by him. That is why I refer to it as ”Wei Cao‘s setup”.
15
3.4 COLTRIMS 3 EXPERIMENTAL SETUP
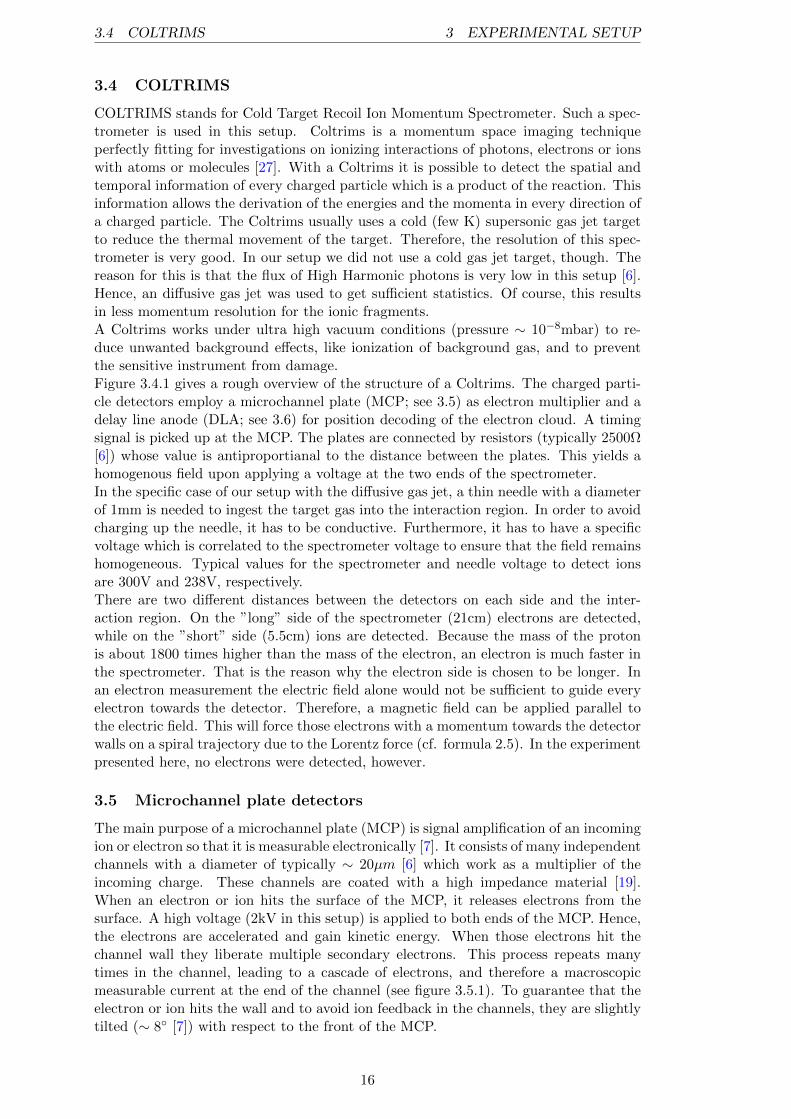
3.4 COLTRIMS
COLTRIMS stands for Cold Target Recoil Ion Momentum Spectrometer. Such a spec-trometer is used in this setup. Coltrims is a momentum space imaging techniqueperfectly fitting for investigations on ionizing interactions of photons, electrons or ionswith atoms or molecules [27]. With a Coltrims it is possible to detect the spatial andtemporal information of every charged particle which is a product of the reaction. Thisinformation allows the derivation of the energies and the momenta in every direction ofa charged particle. The Coltrims usually uses a cold (few K) supersonic gas jet targetto reduce the thermal movement of the target. Therefore, the resolution of this spec-trometer is very good. In our setup we did not use a cold gas jet target, though. Thereason for this is that the flux of High Harmonic photons is very low in this setup [6].Hence, an diffusive gas jet was used to get sufficient statistics. Of course, this resultsin less momentum resolution for the ionic fragments.A Coltrims works under ultra high vacuum conditions (pressure ∼ 10−8mbar) to re-duce unwanted background effects, like ionization of background gas, and to preventthe sensitive instrument from damage.Figure 3.4.1 gives a rough overview of the structure of a Coltrims. The charged parti-cle detectors employ a microchannel plate (MCP; see 3.5) as electron multiplier and adelay line anode (DLA; see 3.6) for position decoding of the electron cloud. A timingsignal is picked up at the MCP. The plates are connected by resistors (typically 2500Ω[6]) whose value is antiproportianal to the distance between the plates. This yields ahomogenous field upon applying a voltage at the two ends of the spectrometer.In the specific case of our setup with the diffusive gas jet, a thin needle with a diameterof 1mm is needed to ingest the target gas into the interaction region. In order to avoidcharging up the needle, it has to be conductive. Furthermore, it has to have a specificvoltage which is correlated to the spectrometer voltage to ensure that the field remainshomogeneous. Typical values for the spectrometer and needle voltage to detect ionsare 300V and 238V, respectively.There are two different distances between the detectors on each side and the inter-action region. On the ”long” side of the spectrometer (21cm) electrons are detected,while on the ”short” side (5.5cm) ions are detected. Because the mass of the protonis about 1800 times higher than the mass of the electron, an electron is much faster inthe spectrometer. That is the reason why the electron side is chosen to be longer. Inan electron measurement the electric field alone would not be sufficient to guide everyelectron towards the detector. Therefore, a magnetic field can be applied parallel tothe electric field. This will force those electrons with a momentum towards the detectorwalls on a spiral trajectory due to the Lorentz force (cf. formula 2.5). In the experimentpresented here, no electrons were detected, however.
3.5 Microchannel plate detectors
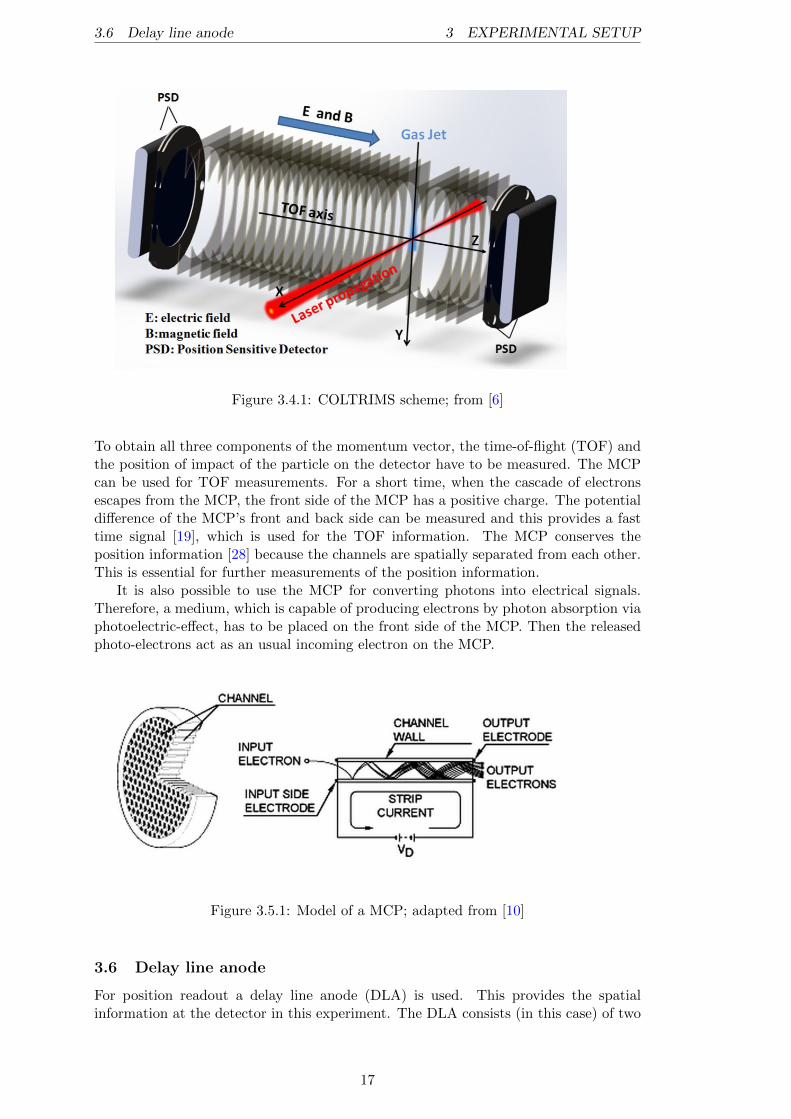
The main purpose of a microchannel plate (MCP) is signal amplification of an incomingion or electron so that it is measurable electronically [7]. It consists of many independentchannels with a diameter of typically ∼ 20µm [6] which work as a multiplier of theincoming charge. These channels are coated with a high impedance material [19].When an electron or ion hits the surface of the MCP, it releases electrons from thesurface. A high voltage (2kV in this setup) is applied to both ends of the MCP. Hence,the electrons are accelerated and gain kinetic energy. When those electrons hit thechannel wall they liberate multiple secondary electrons. This process repeats manytimes in the channel, leading to a cascade of electrons, and therefore a macroscopicmeasurable current at the end of the channel (see figure 3.5.1). To guarantee that theelectron or ion hits the wall and to avoid ion feedback in the channels, they are slightlytilted (∼ 8 [7]) with respect to the front of the MCP.
16
3.6 Delay line anode 3 EXPERIMENTAL SETUP
Figure 3.4.1: COLTRIMS scheme; from [6]
To obtain all three components of the momentum vector, the time-of-flight (TOF) andthe position of impact of the particle on the detector have to be measured. The MCPcan be used for TOF measurements. For a short time, when the cascade of electronsescapes from the MCP, the front side of the MCP has a positive charge. The potentialdifference of the MCP’s front and back side can be measured and this provides a fasttime signal [19], which is used for the TOF information. The MCP conserves theposition information [28] because the channels are spatially separated from each other.This is essential for further measurements of the position information.
It is also possible to use the MCP for converting photons into electrical signals.Therefore, a medium, which is capable of producing electrons by photon absorption viaphotoelectric-effect, has to be placed on the front side of the MCP. Then the releasedphoto-electrons act as an usual incoming electron on the MCP.
Figure 3.5.1: Model of a MCP; adapted from [10]
3.6 Delay line anode
For position readout a delay line anode (DLA) is used. This provides the spatialinformation at the detector in this experiment. The DLA consists (in this case) of two
17

3.7 Data acquisition 3 EXPERIMENTAL SETUP
spirals10 of wire pairs wound around a base plate. These two wire layers are orderedperpendicular to each other. Spatially, the DLA is placed right behind the MCP.For the distinction between real and false events, each spiral consists of a signal anda reference wire with a potential difference of 50V. For a real event the electrons willalways hit the signal wire with the lower voltage. The noise shows no preference of onespecific wire. By subtracting the signals of the reference wire from those of the signalwire, the noise can be eliminated [6].The functional principle of the DLA is shown in figure 3.6.1. Electrons hit the DLAat a certain spatial position. The wires receive a signal at one specific crossing andtransmit it to their ends. Depending on the position of impact, the signal will arriveat different times at both ends of the x- and y-wire. The exact detector position of thesignal can then be derived with the following formulas:
x = gx(tx1 − tx2) (3.3)
y = gy(ty1 − ty2) (3.4)
gx/y is a factor for the conversion of a time (typically ns in such apparatuses) into alength (typically in mm). It is more or less the velocity of the electronic signal in thewire. Hence, the resulting dimension is mm
ns [6].
Figure 3.6.1: MCP with following delay line anode [6]
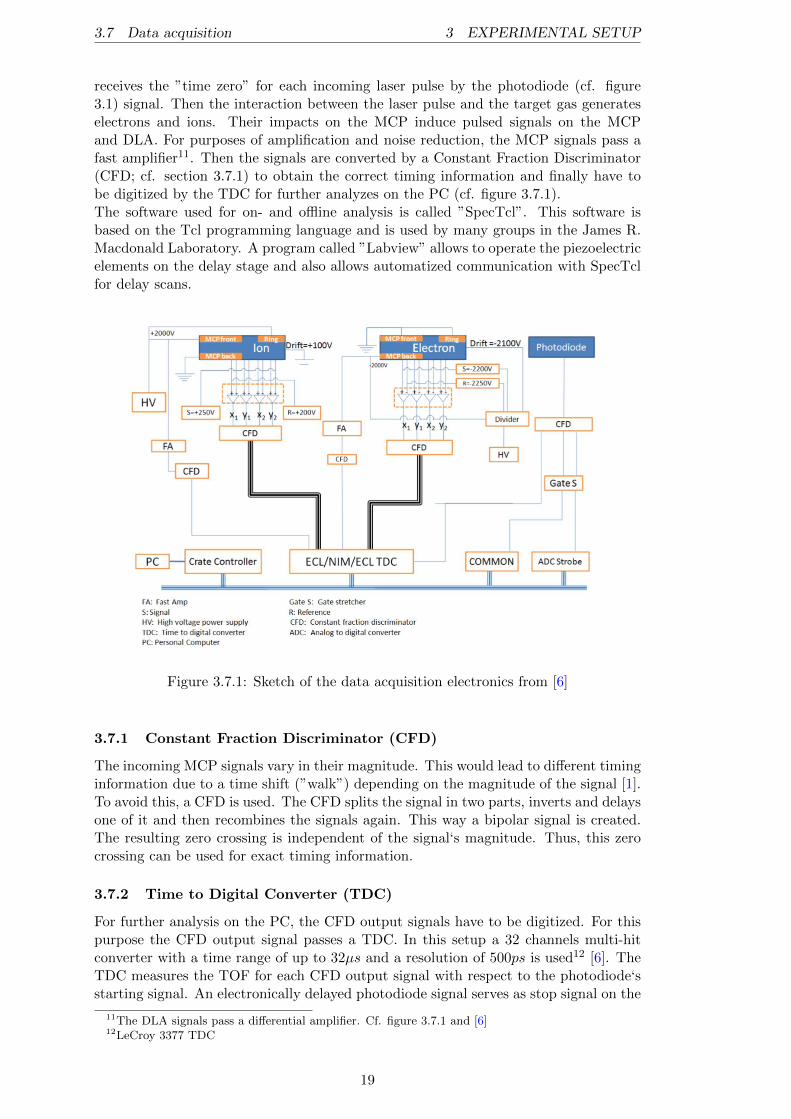
3.7 Data acquisition
There are several electronic components needed for the data collection, as well as asoftware for taking the data and further offline analyses.The output signals of MCP and DLA are processed in several steps. The first stepof collecting the data is that the Time to Digital Converter (TDC; cf. section 3.7.2)
10There are also DLA‘s with three spirals of wire pairs, where two elements always enclose an angleof 60.
18
3.7 Data acquisition 3 EXPERIMENTAL SETUP
receives the ”time zero” for each incoming laser pulse by the photodiode (cf. figure3.1) signal. Then the interaction between the laser pulse and the target gas generateselectrons and ions. Their impacts on the MCP induce pulsed signals on the MCPand DLA. For purposes of amplification and noise reduction, the MCP signals pass afast amplifier11. Then the signals are converted by a Constant Fraction Discriminator(CFD; cf. section 3.7.1) to obtain the correct timing information and finally have tobe digitized by the TDC for further analyzes on the PC (cf. figure 3.7.1).The software used for on- and offline analysis is called ”SpecTcl”. This software isbased on the Tcl programming language and is used by many groups in the James R.Macdonald Laboratory. A program called ”Labview” allows to operate the piezoelectricelements on the delay stage and also allows automatized communication with SpecTclfor delay scans.
Figure 3.7.1: Sketch of the data acquisition electronics from [6]
3.7.1 Constant Fraction Discriminator (CFD)
The incoming MCP signals vary in their magnitude. This would lead to different timinginformation due to a time shift (”walk”) depending on the magnitude of the signal [1].To avoid this, a CFD is used. The CFD splits the signal in two parts, inverts and delaysone of it and then recombines the signals again. This way a bipolar signal is created.The resulting zero crossing is independent of the signal‘s magnitude. Thus, this zerocrossing can be used for exact timing information.
3.7.2 Time to Digital Converter (TDC)
For further analysis on the PC, the CFD output signals have to be digitized. For thispurpose the CFD output signal passes a TDC. In this setup a 32 channels multi-hitconverter with a time range of up to 32µs and a resolution of 500ps is used12 [6]. TheTDC measures the TOF for each CFD output signal with respect to the photodiode‘sstarting signal. An electronically delayed photodiode signal serves as stop signal on the
11The DLA signals pass a differential amplifier. Cf. figure 3.7.1 and [6]12LeCroy 3377 TDC
19
3.8 Alignment tools inside the chamber 3 EXPERIMENTAL SETUP
TDC. This way the photodiode sets a measuring interval for each incoming laser pulsein order to filter out statistical signals which are not correlated in time to the incominglaser beam.
3.8 Alignment tools inside the chamber
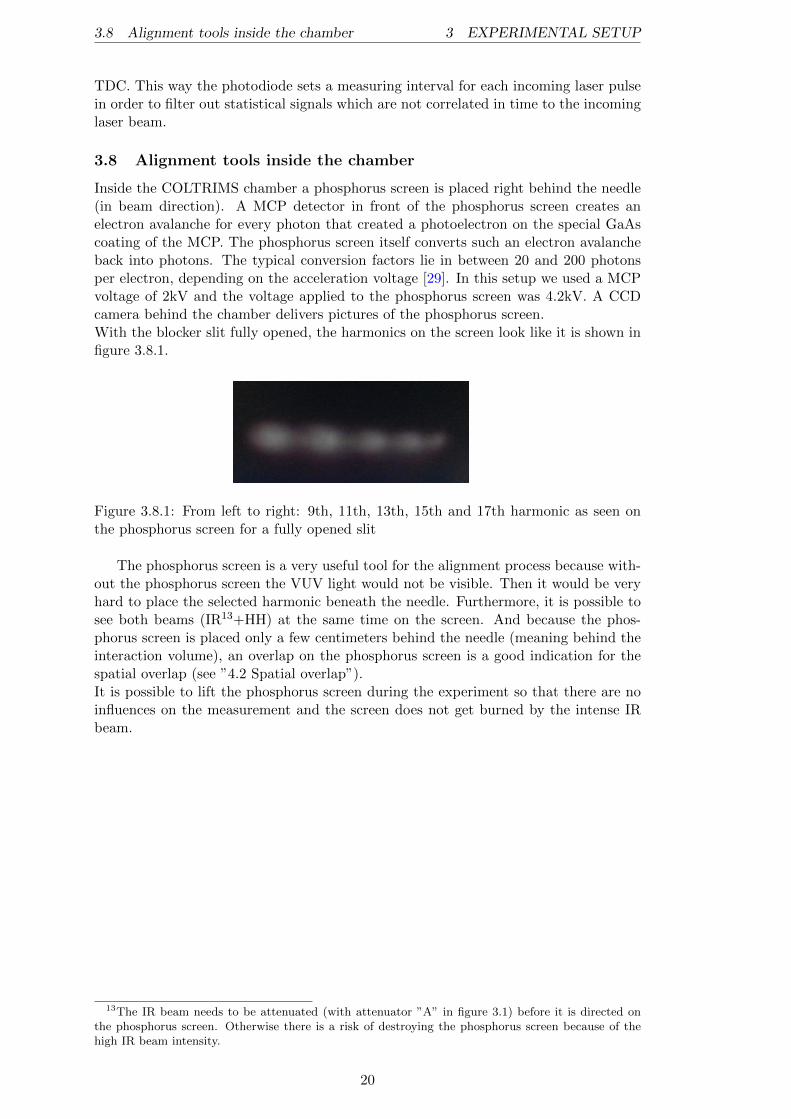
Inside the COLTRIMS chamber a phosphorus screen is placed right behind the needle(in beam direction). A MCP detector in front of the phosphorus screen creates anelectron avalanche for every photon that created a photoelectron on the special GaAscoating of the MCP. The phosphorus screen itself converts such an electron avalancheback into photons. The typical conversion factors lie in between 20 and 200 photonsper electron, depending on the acceleration voltage [29]. In this setup we used a MCPvoltage of 2kV and the voltage applied to the phosphorus screen was 4.2kV. A CCDcamera behind the chamber delivers pictures of the phosphorus screen.With the blocker slit fully opened, the harmonics on the screen look like it is shown infigure 3.8.1.
Figure 3.8.1: From left to right: 9th, 11th, 13th, 15th and 17th harmonic as seen onthe phosphorus screen for a fully opened slit
The phosphorus screen is a very useful tool for the alignment process because with-out the phosphorus screen the VUV light would not be visible. Then it would be veryhard to place the selected harmonic beneath the needle. Furthermore, it is possible tosee both beams (IR13+HH) at the same time on the screen. And because the phos-phorus screen is placed only a few centimeters behind the needle (meaning behind theinteraction volume), an overlap on the phosphorus screen is a good indication for thespatial overlap (see ”4.2 Spatial overlap”).It is possible to lift the phosphorus screen during the experiment so that there are noinfluences on the measurement and the screen does not get burned by the intense IRbeam.
13The IR beam needs to be attenuated (with attenuator ”A” in figure 3.1) before it is directed onthe phosphorus screen. Otherwise there is a risk of destroying the phosphorus screen because of thehigh IR beam intensity.
20
4 EXPERIMENT
4 Experiment
At the beginning of each laser beam time, the metallic seal of the semi-infinite gas cellhad to be changed to ensure a small hole diameter and, therefore, a stable gas pressureinside the cell.For the laser alignment process the irises were used.
4.1 Selecting a harmonic
The alignment for the high harmonic beam path was quite simple. With the IR pathclosed, the harmonic beam block had to be fully open to see as many harmonics aspossible on the phosphorus screen. Usually, if the beam was well aligned in front ofthe semi-infinite gas cell, the harmonics were already visible on the phosphorus screenbecause the toroidal mirror should never be touched. Then the needle was loweredto see its position compared to the position of the harmonics. This was quite simplebecause the needle blocks one harmonic at least in part when it is lowered. Then onearbitrary harmonic had to be centered beneath the needle. The changing of the gratingpair distance leads to a movement of the harmonics to the left or right respectively.When this position was found, the needle was lifted by about 1.5mm14 and the slit wasclosed from both sides to block the unwanted harmonics. At the end, only one harmonicshould be visible on the screen with a position right in the interaction volume beneaththe needle.If a gas with a lower ionization energy than the energy of the selected harmonic is cho-sen as target gas, ionization can occur and one will see counts on the detector. However,for a case where the ionization energy is higher than the energy of the harmonic, therewill be no counts15. For the selection of a harmonic, Argon gas is a good candidate.Argon has an ionization energy of ∼ 15.76eV [30]. This energy lies in between theenergies of the 9th (∼ 13.95eV ) and the 11th (∼ 17.05eV ) harmonic. By switching theharmonics until there is a sudden increase of the count rate between two, one can besure to have found the transition between 9th and 11th harmonic. After the harmonicof interest is chosen and the position beneath the needle as well as the phase matchingcondition is optimized, the next step to do pump-probe experiments is getting a spatialoverlap between the harmonic pulse and the IR pulse.
4.2 Spatial overlap
There are not many degrees of freedom to change the harmonic path besides moving ithorizontally via changing the grating pair distance. For this reason, the spatial overlapof the two pulses was found by walking the IR beam. At first, the harmonic beampath has to be closed to adjust the IR beam. With the mirrors ”M9” and ”M10” (seefigure 3.1) the beam has to be directed in a way that there is always a ring structurevisible at the camera position behind the chamber16 and that the count rate is veryhigh. This indicates that the interaction volume beneath the needle is hit by the IRbeam. Once such a position is found, one is already pretty close to a spatial overlap.Then the remaining steps are to alternately open the harmonic and the IR path and
14The interaction region lies about 1.5mm beneath the needle because the quick expansion of the gasprovides the thickest local gas density there [6].
15Usually the counts are a little higher than the background count rate. This is due to the fact thateach first order diffracted harmonic is overlapping with the second order diffraction of the harmonicwith twice the energy (see formula (3.1)). Hence the first order diffracted 11th harmonic is for exampleoverlapping with the second order diffraction of the 21st and 23rd harmonic.
16This is an indication that the beam is hitting the hole mirror (”RM” in figure 3.1) at the centerand there is no scattering at the edges.
21
4.3 Temporal overlap 4 EXPERIMENT
to optimize the overlap according to the detector- and TOF positions. Furthermore,the overlap of both pulses on the phosphorus screen has to be checked. When the twobeams are overlapping in those two positions inside the chamber (interaction region andphosphorus screen), they obviously follow the same line. Because the screen is behindthe needle with respect to the beam propagation direction, the detector position is thecorresponding iris for the mirror ”M9” and the phosphorus screen is the iris for mirror”M10”.The most crucial point for a good spatial overlap is, of course, the overlap in theinteraction region. It is important that this overlap is determined precisely with the X-, Y- and TOF detector coordinates. The X-direction on the detector is equivalent to thebeam propagation direction. If there is need to optimize the overlap in this direction,one has to move the focusing lens in front of the chamber (”FL2”) to change thefocal point position of the IR beam along the propagation direction. The Y- directioncorresponds to the vertical direction, and the TOF is correlated to the distance ofinteraction point and the MCP and is thus corresponding to the direction horizontallyalong the electric field in the chamber. Optimization of the Y- and TOF detectorpositions can be achieved by slight corrections on the mirror ”M9” in the vertical (forY- corrections) or horizontal (for TOF corrections) direction.
4.3 Temporal overlap
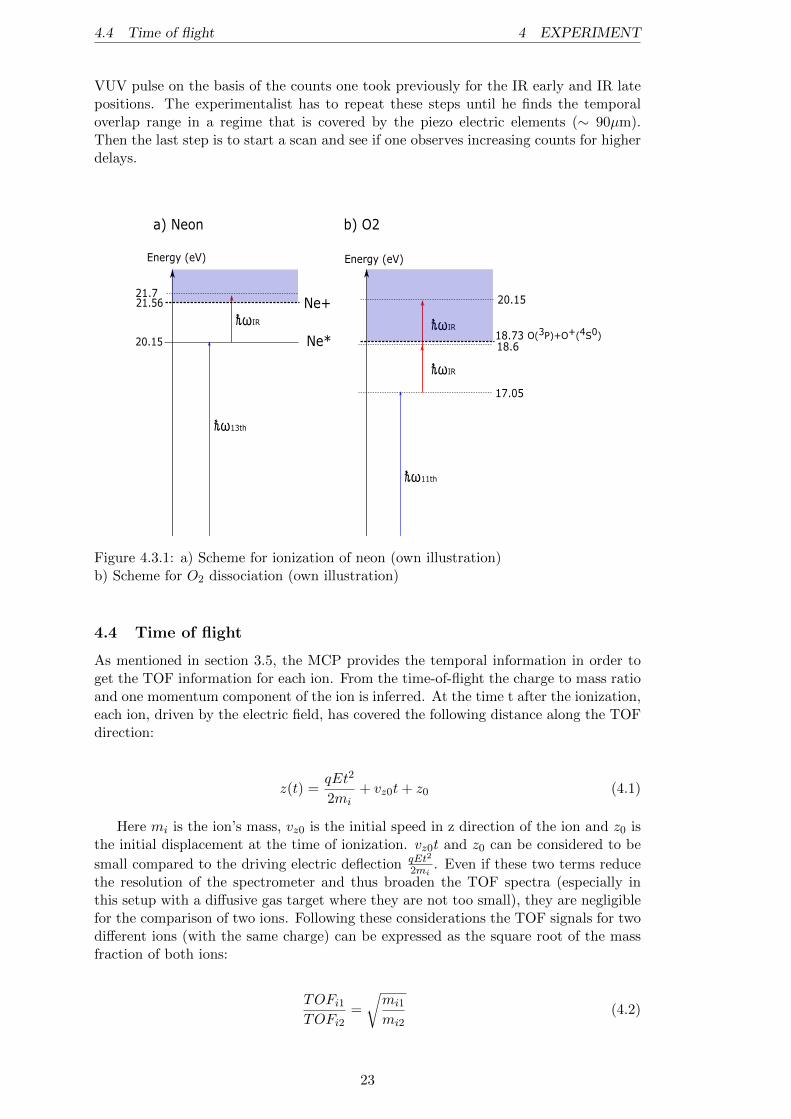
Once the spatial overlap is found, the next step for a pump-probe experiment is findingthe temporal overlap.The principle of finding the temporal overlap between the harmonic and the IR pulse isquite simple. Similar to the spatial overlap case, one needs to find a fitting target gas.While for the spatial overlap a gas is needed which can be ionized/dissociated by each ofthe two beams alone, for the temporal overlap the gas may only be ionized/dissociatedby one harmonic photon and an additional IR photon. As a result, there will be noion counts if the IR beam comes earlier than the harmonic beam, and as soon as theIR beam comes later than the harmonic beam, counts will be observed. In the caseof the experiments discussed in this thesis, the gases are the oxygen molecule for the11th harmonic and neon for the 13th harmonic. From the arrangement of the gratingpair (section 3.3), it is obvious why there is need to find the temporal overlap for eachharmonic in particular. Switching a harmonic via changing the grating pair distancealways introduces an optical path length difference of the harmonic beam. Thus, it isnecessary to realign the delay stage whenever the harmonic is changed for the experi-ment.The oxygen molecule is a good candidate for the 11th harmonic because the disso-ciation energy to O+ and O is ∼ 18.73eV [19] and is consequently reached by onephoton of the 11th harmonic plus one or two additional IR photons ~ω11th + 1.55eV =17.05eV + 1.55eV = 18.6eV (20.15eV for two additional IR photons)17.For the 13th harmonic, neon is the gas of choice because with an ionization energy of∼ 21.56eV [30] the ionization limit is exceeded by one harmonic and one IR photon:~ω13th + 1.55eV = 20.15eV + 1.55eV = 21.7eV (see fig. 4.3.1).
It has been found that the bisection method is the fastest and most promisingmethod to find the temporal overlap. With this method, the experimentalist recordsthe counts for the ion of interest for different specific delay stage positions which covera big delay range. One should then obtain significantly higher counts for the IR lateposition. After this, the delay stage is manually moved to the middle of those positions.At this position, one can check again if the IR pulse comes earlier or later than the
17This is only a rough energy estimation. The photon energies of the IR and the harmonic as wellare Gauss distributed around the energies of 1.55eV and 17.05eV. Therefore, the actual dissociationlimit of 18.73eV can be reached by a 2 photon process (one harmonic and one IR photon), as well.
22
4.4 Time of flight 4 EXPERIMENT
VUV pulse on the basis of the counts one took previously for the IR early and IR latepositions. The experimentalist has to repeat these steps until he finds the temporaloverlap range in a regime that is covered by the piezo electric elements (∼ 90µm).Then the last step is to start a scan and see if one observes increasing counts for higherdelays.
Energy (eV)
ℏω13th
20.15 Ne*ℏωIR
21.56 Ne+21.7
Energy (eV)
ℏω11th
a) Neon b) O2
ℏωIR
ℏωIR
17.05
18.73
20.15
18.6O(3P)+O+(4S0)
Figure 4.3.1: a) Scheme for ionization of neon (own illustration)b) Scheme for O2 dissociation (own illustration)
4.4 Time of flight
As mentioned in section 3.5, the MCP provides the temporal information in order toget the TOF information for each ion. From the time-of-flight the charge to mass ratioand one momentum component of the ion is inferred. At the time t after the ionization,each ion, driven by the electric field, has covered the following distance along the TOFdirection:
z(t) =qEt2
2mi+ vz0t+ z0 (4.1)
Here mi is the ion’s mass, vz0 is the initial speed in z direction of the ion and z0 isthe initial displacement at the time of ionization. vz0t and z0 can be considered to be
small compared to the driving electric deflection qEt2
2mi. Even if these two terms reduce
the resolution of the spectrometer and thus broaden the TOF spectra (especially inthis setup with a diffusive gas target where they are not too small), they are negligiblefor the comparison of two ions. Following these considerations the TOF signals for twodifferent ions (with the same charge) can be expressed as the square root of the massfraction of both ions:
TOFi1TOFi2
=
√mi1
mi2(4.2)
23
4.5 Molecular structure of CO2 4 EXPERIMENT
With this equation it is quite simple to estimate the TOF position for the observedtarget gas with only its mass and the TOF position and mass of a reference ion. Usu-ally it is obvious which peak is corresponding to the target gas. But for instance in anexperiment with neon, which is quite hard to ionize (cf. figure 4.3.1 a)), there can besituations where the background counts are higher than the actual target gas counts.For situations like this, a rough position estimation can be very helpful to correctlyidentify the peaks in a spectrum. Water is a good candidate as a reference ion becauseit is always in the spectra (as residual gas), and it is very easy to recognize due to theresulting eye-catching and close lying triple peak of H2O+, OH+ and O+ (cf. figures4.7.3 and 4.7.4).
4.5 Molecular structure of CO2
a) b)
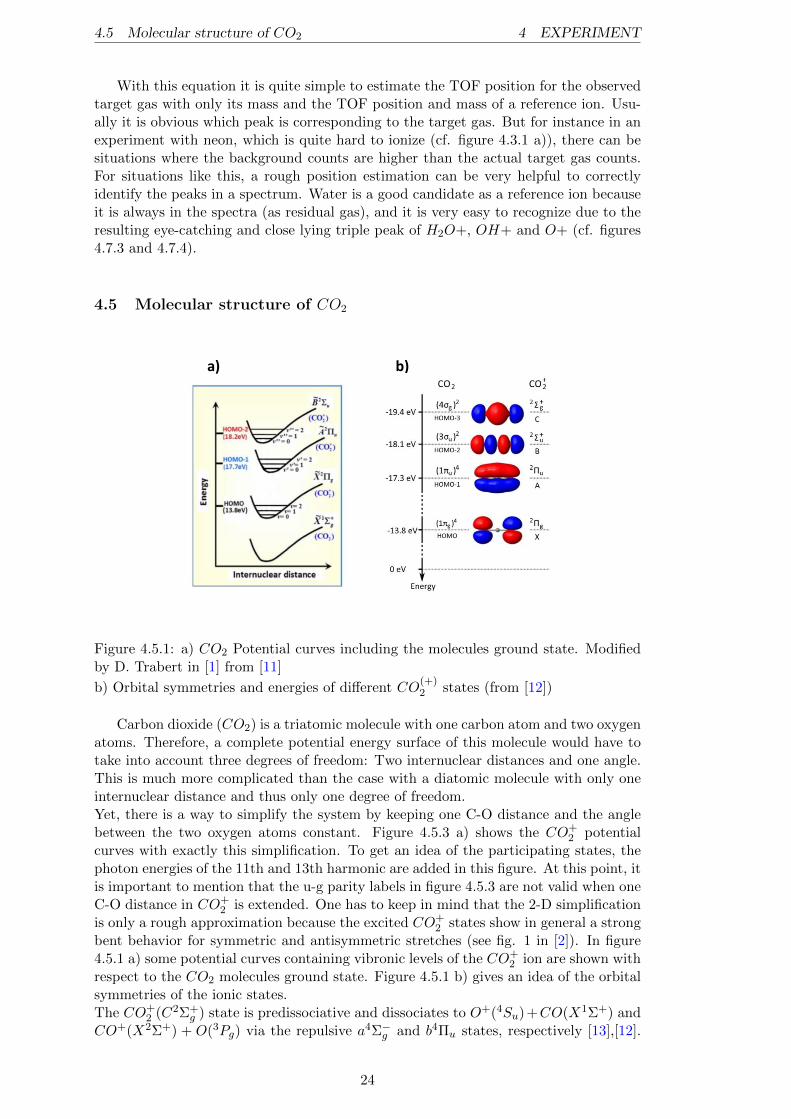
Figure 4.5.1: a) CO2 Potential curves including the molecules ground state. Modifiedby D. Trabert in [1] from [11]
b) Orbital symmetries and energies of different CO(+)2 states (from [12])
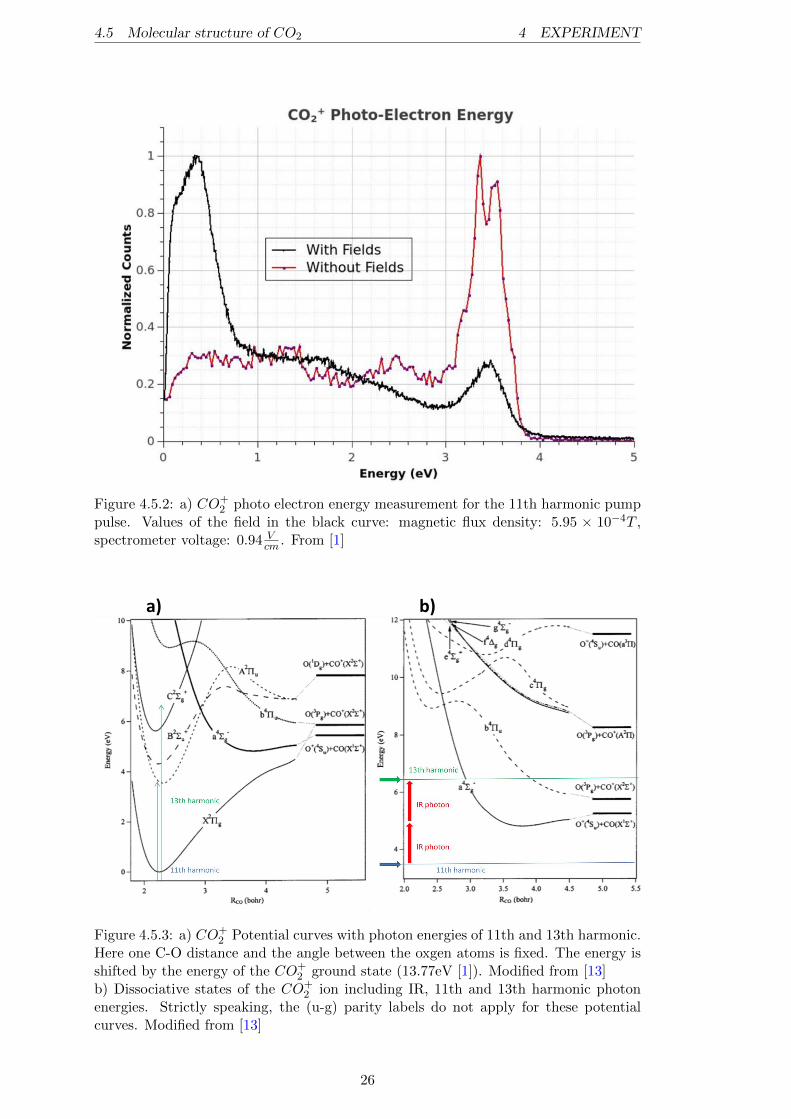
Carbon dioxide (CO2) is a triatomic molecule with one carbon atom and two oxygenatoms. Therefore, a complete potential energy surface of this molecule would have totake into account three degrees of freedom: Two internuclear distances and one angle.This is much more complicated than the case with a diatomic molecule with only oneinternuclear distance and thus only one degree of freedom.Yet, there is a way to simplify the system by keeping one C-O distance and the anglebetween the two oxygen atoms constant. Figure 4.5.3 a) shows the CO+
2 potentialcurves with exactly this simplification. To get an idea of the participating states, thephoton energies of the 11th and 13th harmonic are added in this figure. At this point, itis important to mention that the u-g parity labels in figure 4.5.3 are not valid when oneC-O distance in CO+
2 is extended. One has to keep in mind that the 2-D simplificationis only a rough approximation because the excited CO+
2 states show in general a strongbent behavior for symmetric and antisymmetric stretches (see fig. 1 in [2]). In figure4.5.1 a) some potential curves containing vibronic levels of the CO+
2 ion are shown withrespect to the CO2 molecules ground state. Figure 4.5.1 b) gives an idea of the orbitalsymmetries of the ionic states.The CO+
2 (C2Σ+g ) state is predissociative and dissociates to O+(4Su)+CO(X1Σ+) and
CO+(X2Σ+) + O(3Pg) via the repulsive a4Σ−g and b4Πu states, respectively [13],[12].
24
4.5 Molecular structure of CO2 4 EXPERIMENT
While the spin-orbit coupling of the C2Σ+g state and the b4Πu state is highly efficient
(≈ 40cm−1, [13]), the coupling integral between the C2Σ+g state and the a4Σ−g state
gives no contribution. Therefore, Liu et al. [13] have suggested that the predissociationof the C2Σ+
g state leading to O+ fragments may involve the A2Πu state followed by therepulsive a4Σ−g state via vibronic and spin-orbit couplings, respectively. Furthermore,they stated that for C-O distances of 3 bohr and more, the spin-orbit coupling integralbetween the b4Πu and a4Σ−g states becomes sufficiently big to allow efficient couplings
from CO+2 (b4Πu) to CO+
2 (a4Σ−g ), opening another dissociation pathway leading to O+
fragments. For a CO+2 (C2Σ+
g ) ion prepared in its vibrational ground state, it is knownthat the only available dissociation limit leads to O+ production [12]. However, forhigher vibrational levels, the dissociation via the b4Πu state leading to CO+ fragmentsopens.
In experiments with the 13th harmonic, the CO+2 ion can be excited up to the C2Σ+
g
state. There is also a certain probability of occupying vibronic states of the lower-lyingA2Πu and B2Σ+
g states. These states are of particular interest. While Timmers et al. [2]found a certain delay and polarization dependence18 for the CO+ dissociation channel,claiming to have mainly populated the CO+
2 (B2Σ+g ) state with a train of harmonics;
Daniel Trabert, who used Wei Cao‘s setup as well, found similar delay and polarizationdependencies for an ion in the CO+
2 (A2Πu) state for both dissociation channels (CO+
and O+) [1]. These experimental results gave rise to do further observations on thistopic with single harmonic pump-probe studies. Especially interesting is the questionhow the dissociation behaves for a 13th harmonic pump pulse, where ions in every stateup to the energy of ∼ 20.15eV are generated.
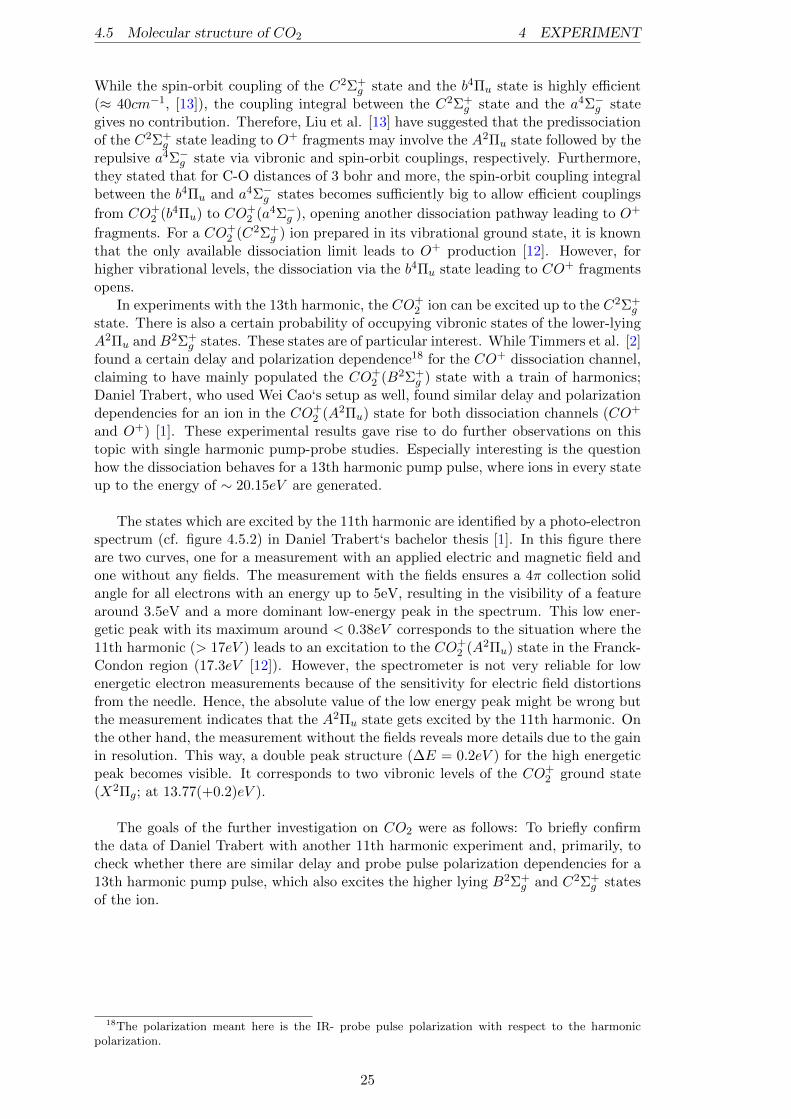
The states which are excited by the 11th harmonic are identified by a photo-electronspectrum (cf. figure 4.5.2) in Daniel Trabert‘s bachelor thesis [1]. In this figure thereare two curves, one for a measurement with an applied electric and magnetic field andone without any fields. The measurement with the fields ensures a 4π collection solidangle for all electrons with an energy up to 5eV, resulting in the visibility of a featurearound 3.5eV and a more dominant low-energy peak in the spectrum. This low ener-getic peak with its maximum around < 0.38eV corresponds to the situation where the11th harmonic (> 17eV ) leads to an excitation to the CO+
2 (A2Πu) state in the Franck-Condon region (17.3eV [12]). However, the spectrometer is not very reliable for lowenergetic electron measurements because of the sensitivity for electric field distortionsfrom the needle. Hence, the absolute value of the low energy peak might be wrong butthe measurement indicates that the A2Πu state gets excited by the 11th harmonic. Onthe other hand, the measurement without the fields reveals more details due to the gainin resolution. This way, a double peak structure (∆E = 0.2eV ) for the high energeticpeak becomes visible. It corresponds to two vibronic levels of the CO+
2 ground state(X2Πg; at 13.77(+0.2)eV ).
The goals of the further investigation on CO2 were as follows: To briefly confirmthe data of Daniel Trabert with another 11th harmonic experiment and, primarily, tocheck whether there are similar delay and probe pulse polarization dependencies for a13th harmonic pump pulse, which also excites the higher lying B2Σ+
g and C2Σ+g states
of the ion.
18The polarization meant here is the IR- probe pulse polarization with respect to the harmonicpolarization.
25
4.5 Molecular structure of CO2 4 EXPERIMENT
Figure 4.5.2: a) CO+2 photo electron energy measurement for the 11th harmonic pump
pulse. Values of the field in the black curve: magnetic flux density: 5.95 × 10⁻⁴T ,spectrometer voltage: 0.94 V
cm . From [1]
a) b)
Figure 4.5.3: a) CO+2 Potential curves with photon energies of 11th and 13th harmonic.
Here one C-O distance and the angle between the oxgen atoms is fixed. The energy isshifted by the energy of the CO+
2 ground state (13.77eV [1]). Modified from [13]b) Dissociative states of the CO+
2 ion including IR, 11th and 13th harmonic photonenergies. Strictly speaking, the (u-g) parity labels do not apply for these potentialcurves. Modified from [13]
26
4.6 VUV-IR delay scans of neon and molecular oxygen 4 EXPERIMENT
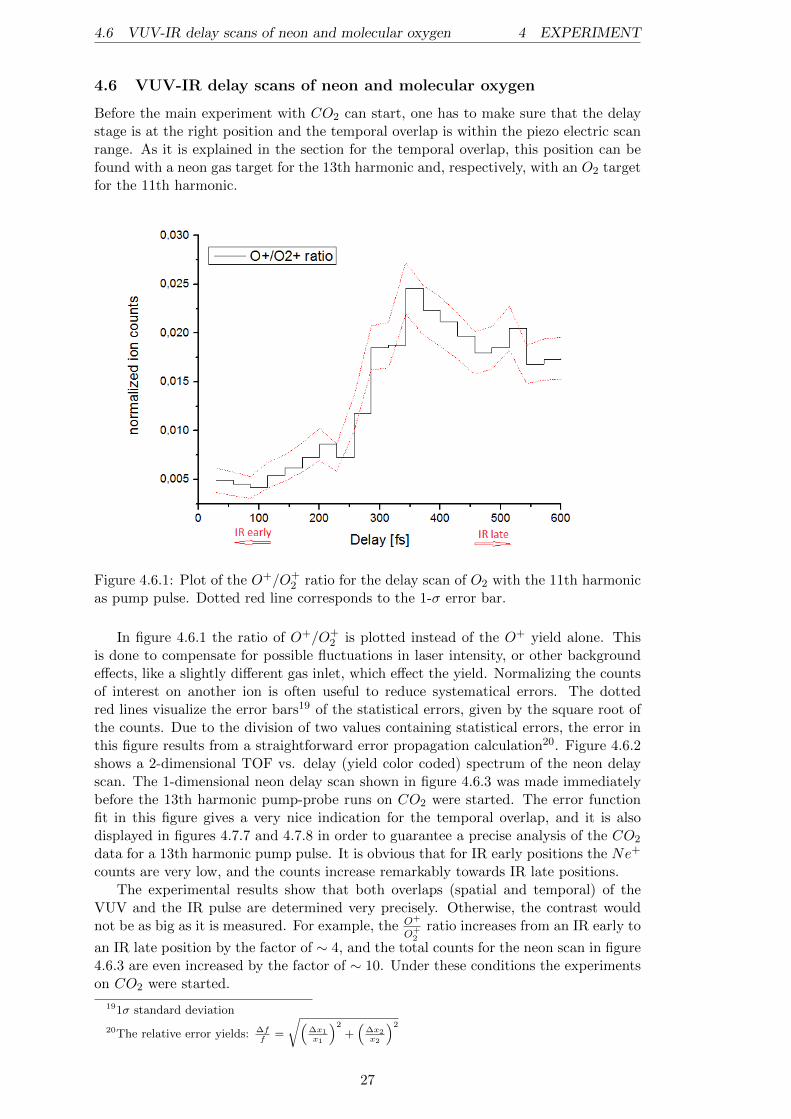
4.6 VUV-IR delay scans of neon and molecular oxygen
Before the main experiment with CO2 can start, one has to make sure that the delaystage is at the right position and the temporal overlap is within the piezo electric scanrange. As it is explained in the section for the temporal overlap, this position can befound with a neon gas target for the 13th harmonic and, respectively, with an O2 targetfor the 11th harmonic.
Figure 4.6.1: Plot of the O+/O+2 ratio for the delay scan of O2 with the 11th harmonic
as pump pulse. Dotted red line corresponds to the 1-σ error bar.
In figure 4.6.1 the ratio of O+/O+2 is plotted instead of the O+ yield alone. This
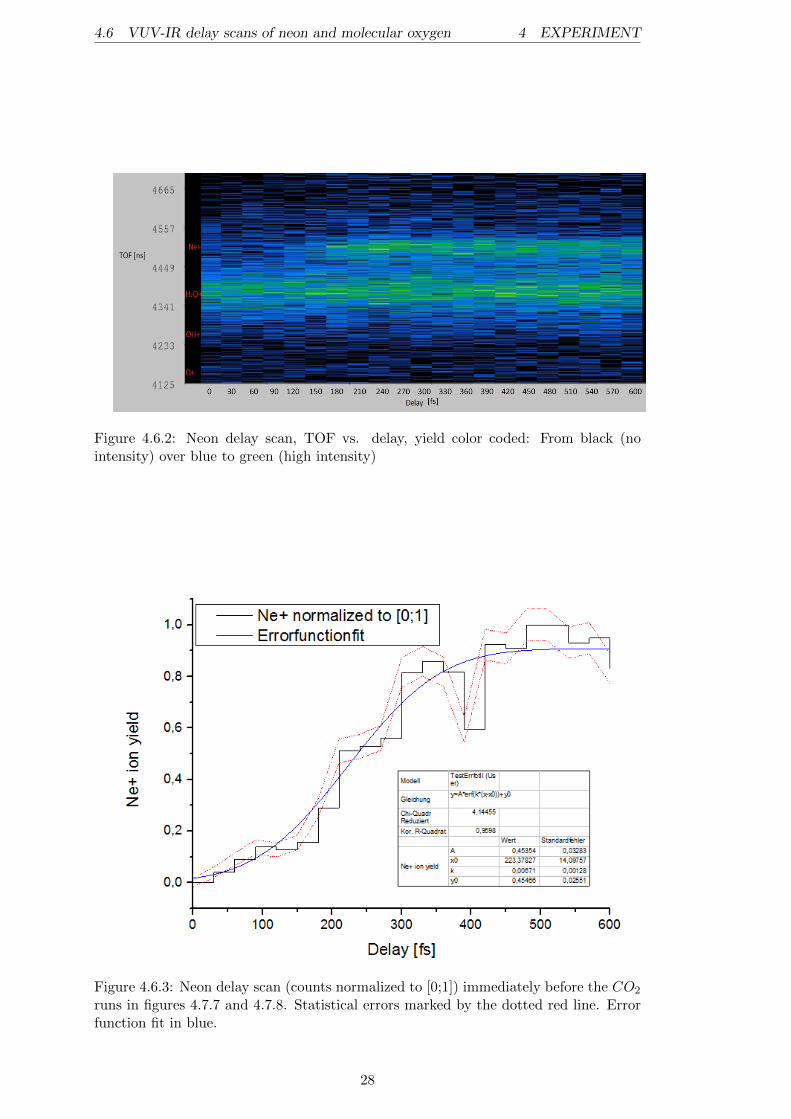
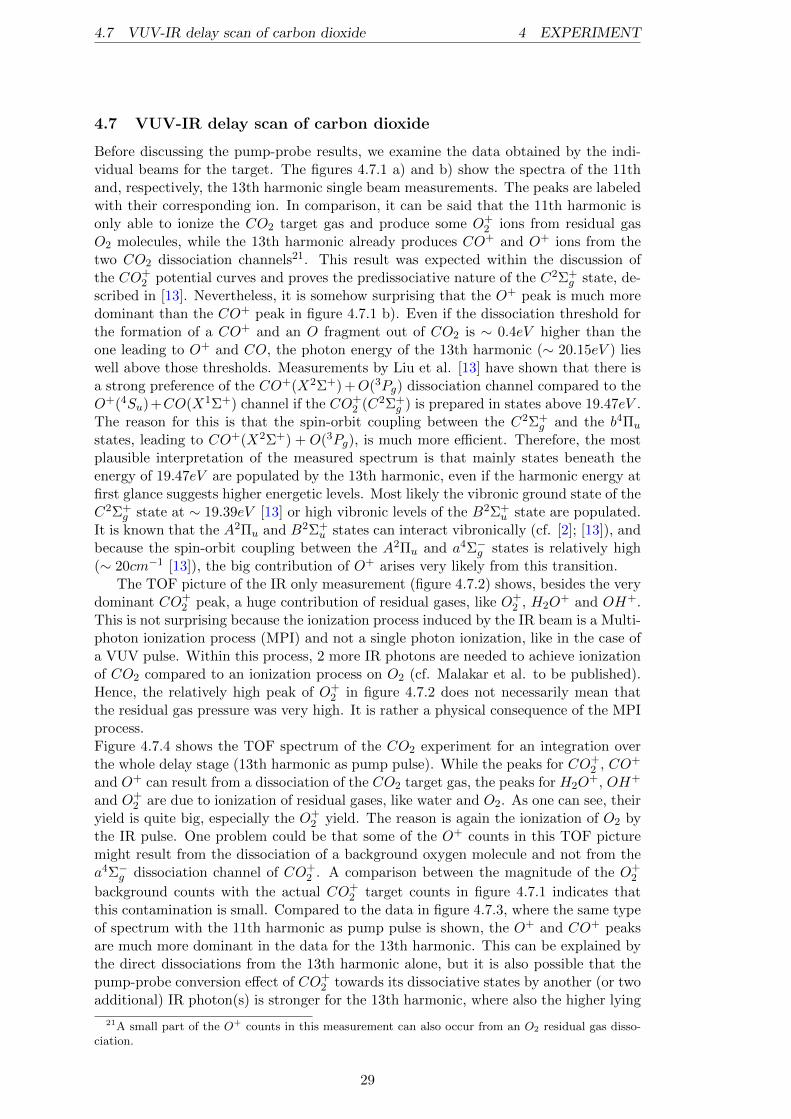
is done to compensate for possible fluctuations in laser intensity, or other backgroundeffects, like a slightly different gas inlet, which effect the yield. Normalizing the countsof interest on another ion is often useful to reduce systematical errors. The dottedred lines visualize the error bars19 of the statistical errors, given by the square root ofthe counts. Due to the division of two values containing statistical errors, the error inthis figure results from a straightforward error propagation calculation20. Figure 4.6.2shows a 2-dimensional TOF vs. delay (yield color coded) spectrum of the neon delayscan. The 1-dimensional neon delay scan shown in figure 4.6.3 was made immediatelybefore the 13th harmonic pump-probe runs on CO2 were started. The error functionfit in this figure gives a very nice indication for the temporal overlap, and it is alsodisplayed in figures 4.7.7 and 4.7.8 in order to guarantee a precise analysis of the CO2
data for a 13th harmonic pump pulse. It is obvious that for IR early positions the Ne+
counts are very low, and the counts increase remarkably towards IR late positions.The experimental results show that both overlaps (spatial and temporal) of the
VUV and the IR pulse are determined very precisely. Otherwise, the contrast wouldnot be as big as it is measured. For example, the O+
O+2
ratio increases from an IR early to
an IR late position by the factor of ∼ 4, and the total counts for the neon scan in figure4.6.3 are even increased by the factor of ∼ 10. Under these conditions the experimentson CO2 were started.
191σ standard deviation
20The relative error yields: ∆ff
=
√(∆x1x1
)2
+(
∆x2x2
)2
27
4.6 VUV-IR delay scans of neon and molecular oxygen 4 EXPERIMENT
Figure 4.6.2: Neon delay scan, TOF vs. delay, yield color coded: From black (nointensity) over blue to green (high intensity)
Figure 4.6.3: Neon delay scan (counts normalized to [0;1]) immediately before the CO2
runs in figures 4.7.7 and 4.7.8. Statistical errors marked by the dotted red line. Errorfunction fit in blue.
28
4.7 VUV-IR delay scan of carbon dioxide 4 EXPERIMENT
4.7 VUV-IR delay scan of carbon dioxide
Before discussing the pump-probe results, we examine the data obtained by the indi-vidual beams for the target. The figures 4.7.1 a) and b) show the spectra of the 11thand, respectively, the 13th harmonic single beam measurements. The peaks are labeledwith their corresponding ion. In comparison, it can be said that the 11th harmonic isonly able to ionize the CO2 target gas and produce some O+
2 ions from residual gasO2 molecules, while the 13th harmonic already produces CO+ and O+ ions from thetwo CO2 dissociation channels21. This result was expected within the discussion ofthe CO+
2 potential curves and proves the predissociative nature of the C2Σ+g state, de-
scribed in [13]. Nevertheless, it is somehow surprising that the O+ peak is much moredominant than the CO+ peak in figure 4.7.1 b). Even if the dissociation threshold forthe formation of a CO+ and an O fragment out of CO2 is ∼ 0.4eV higher than theone leading to O+ and CO, the photon energy of the 13th harmonic (∼ 20.15eV ) lieswell above those thresholds. Measurements by Liu et al. [13] have shown that there isa strong preference of the CO+(X2Σ+) +O(3Pg) dissociation channel compared to theO+(4Su)+CO(X1Σ+) channel if the CO+
2 (C2Σ+g ) is prepared in states above 19.47eV .
The reason for this is that the spin-orbit coupling between the C2Σ+g and the b4Πu
states, leading to CO+(X2Σ+) + O(3Pg), is much more efficient. Therefore, the mostplausible interpretation of the measured spectrum is that mainly states beneath theenergy of 19.47eV are populated by the 13th harmonic, even if the harmonic energy atfirst glance suggests higher energetic levels. Most likely the vibronic ground state of theC2Σ+
g state at ∼ 19.39eV [13] or high vibronic levels of the B2Σ+u state are populated.
It is known that the A2Πu and B2Σ+u states can interact vibronically (cf. [2]; [13]), and
because the spin-orbit coupling between the A2Πu and a4Σ−g states is relatively high(∼ 20cm−1 [13]), the big contribution of O+ arises very likely from this transition.
The TOF picture of the IR only measurement (figure 4.7.2) shows, besides the verydominant CO+
2 peak, a huge contribution of residual gases, like O+2 , H2O
+ and OH+.This is not surprising because the ionization process induced by the IR beam is a Multi-photon ionization process (MPI) and not a single photon ionization, like in the case ofa VUV pulse. Within this process, 2 more IR photons are needed to achieve ionizationof CO2 compared to an ionization process on O2 (cf. Malakar et al. to be published).Hence, the relatively high peak of O+
2 in figure 4.7.2 does not necessarily mean thatthe residual gas pressure was very high. It is rather a physical consequence of the MPIprocess.Figure 4.7.4 shows the TOF spectrum of the CO2 experiment for an integration overthe whole delay stage (13th harmonic as pump pulse). While the peaks for CO+
2 , CO+
and O+ can result from a dissociation of the CO2 target gas, the peaks for H2O+, OH+
and O+2 are due to ionization of residual gases, like water and O2. As one can see, their
yield is quite big, especially the O+2 yield. The reason is again the ionization of O2 by
the IR pulse. One problem could be that some of the O+ counts in this TOF picturemight result from the dissociation of a background oxygen molecule and not from thea4Σ−g dissociation channel of CO+
2 . A comparison between the magnitude of the O+2
background counts with the actual CO+2 target counts in figure 4.7.1 indicates that
this contamination is small. Compared to the data in figure 4.7.3, where the same typeof spectrum with the 11th harmonic as pump pulse is shown, the O+ and CO+ peaksare much more dominant in the data for the 13th harmonic. This can be explained bythe direct dissociations from the 13th harmonic alone, but it is also possible that thepump-probe conversion effect of CO+
2 towards its dissociative states by another (or twoadditional) IR photon(s) is stronger for the 13th harmonic, where also the higher lying
21A small part of the O+ counts in this measurement can also occur from an O2 residual gas disso-ciation.
29
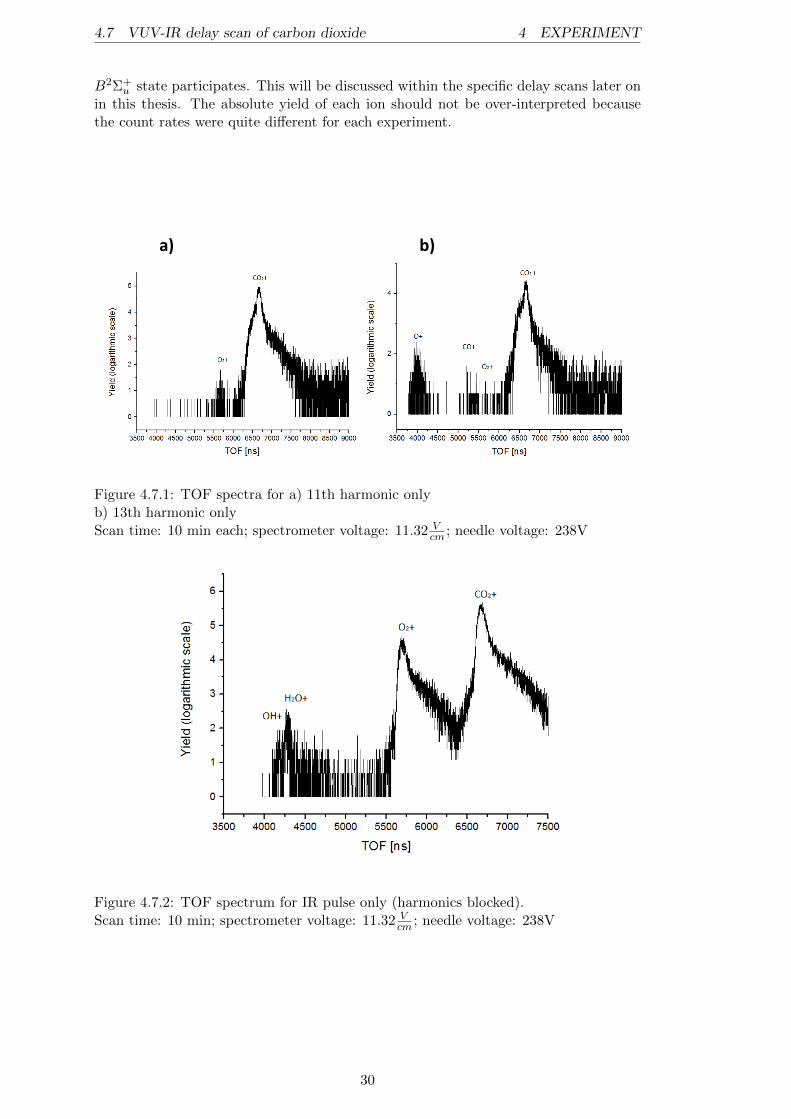
4.7 VUV-IR delay scan of carbon dioxide 4 EXPERIMENT
B2Σ+u state participates. This will be discussed within the specific delay scans later on
in this thesis. The absolute yield of each ion should not be over-interpreted becausethe count rates were quite different for each experiment.
a) b)
Figure 4.7.1: TOF spectra for a) 11th harmonic onlyb) 13th harmonic onlyScan time: 10 min each; spectrometer voltage: 11.32 V
cm ; needle voltage: 238V
Figure 4.7.2: TOF spectrum for IR pulse only (harmonics blocked).Scan time: 10 min; spectrometer voltage: 11.32 V
cm ; needle voltage: 238V
30
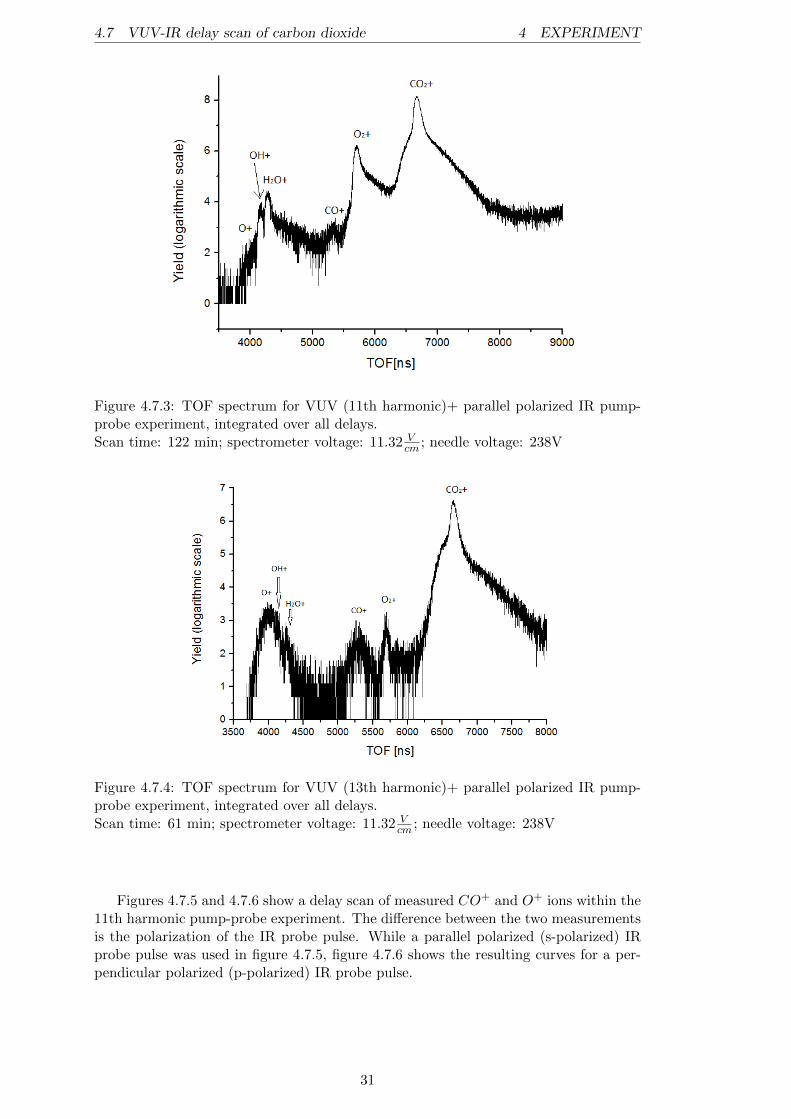
4.7 VUV-IR delay scan of carbon dioxide 4 EXPERIMENT
Figure 4.7.3: TOF spectrum for VUV (11th harmonic)+ parallel polarized IR pump-probe experiment, integrated over all delays.Scan time: 122 min; spectrometer voltage: 11.32 V
cm ; needle voltage: 238V
Figure 4.7.4: TOF spectrum for VUV (13th harmonic)+ parallel polarized IR pump-probe experiment, integrated over all delays.Scan time: 61 min; spectrometer voltage: 11.32 V
cm ; needle voltage: 238V
Figures 4.7.5 and 4.7.6 show a delay scan of measured CO+ and O+ ions within the11th harmonic pump-probe experiment. The difference between the two measurementsis the polarization of the IR probe pulse. While a parallel polarized (s-polarized) IRprobe pulse was used in figure 4.7.5, figure 4.7.6 shows the resulting curves for a per-pendicular polarized (p-polarized) IR probe pulse.
31
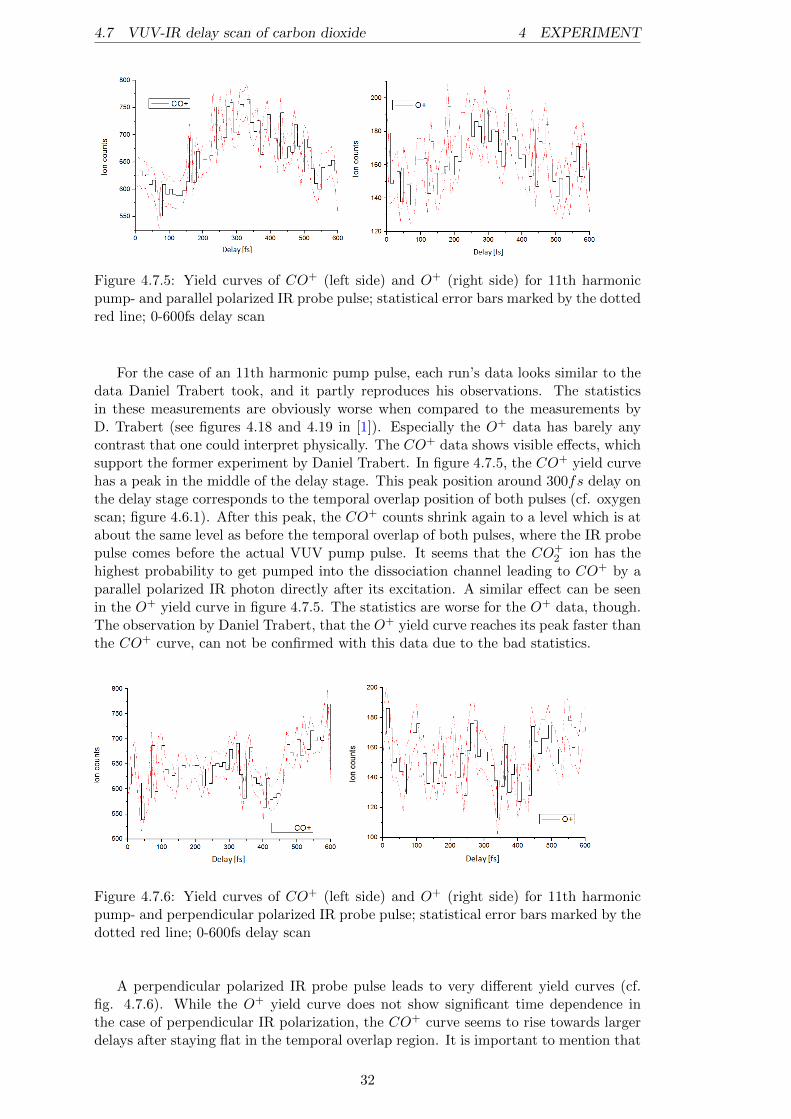
4.7 VUV-IR delay scan of carbon dioxide 4 EXPERIMENT
Figure 4.7.5: Yield curves of CO+ (left side) and O+ (right side) for 11th harmonicpump- and parallel polarized IR probe pulse; statistical error bars marked by the dottedred line; 0-600fs delay scan
For the case of an 11th harmonic pump pulse, each run’s data looks similar to thedata Daniel Trabert took, and it partly reproduces his observations. The statisticsin these measurements are obviously worse when compared to the measurements byD. Trabert (see figures 4.18 and 4.19 in [1]). Especially the O+ data has barely anycontrast that one could interpret physically. The CO+ data shows visible effects, whichsupport the former experiment by Daniel Trabert. In figure 4.7.5, the CO+ yield curvehas a peak in the middle of the delay stage. This peak position around 300fs delay onthe delay stage corresponds to the temporal overlap position of both pulses (cf. oxygenscan; figure 4.6.1). After this peak, the CO+ counts shrink again to a level which is atabout the same level as before the temporal overlap of both pulses, where the IR probepulse comes before the actual VUV pump pulse. It seems that the CO+
2 ion has thehighest probability to get pumped into the dissociation channel leading to CO+ by aparallel polarized IR photon directly after its excitation. A similar effect can be seenin the O+ yield curve in figure 4.7.5. The statistics are worse for the O+ data, though.The observation by Daniel Trabert, that the O+ yield curve reaches its peak faster thanthe CO+ curve, can not be confirmed with this data due to the bad statistics.
Figure 4.7.6: Yield curves of CO+ (left side) and O+ (right side) for 11th harmonicpump- and perpendicular polarized IR probe pulse; statistical error bars marked by thedotted red line; 0-600fs delay scan
A perpendicular polarized IR probe pulse leads to very different yield curves (cf.fig. 4.7.6). While the O+ yield curve does not show significant time dependence inthe case of perpendicular IR polarization, the CO+ curve seems to rise towards largerdelays after staying flat in the temporal overlap region. It is important to mention that
32
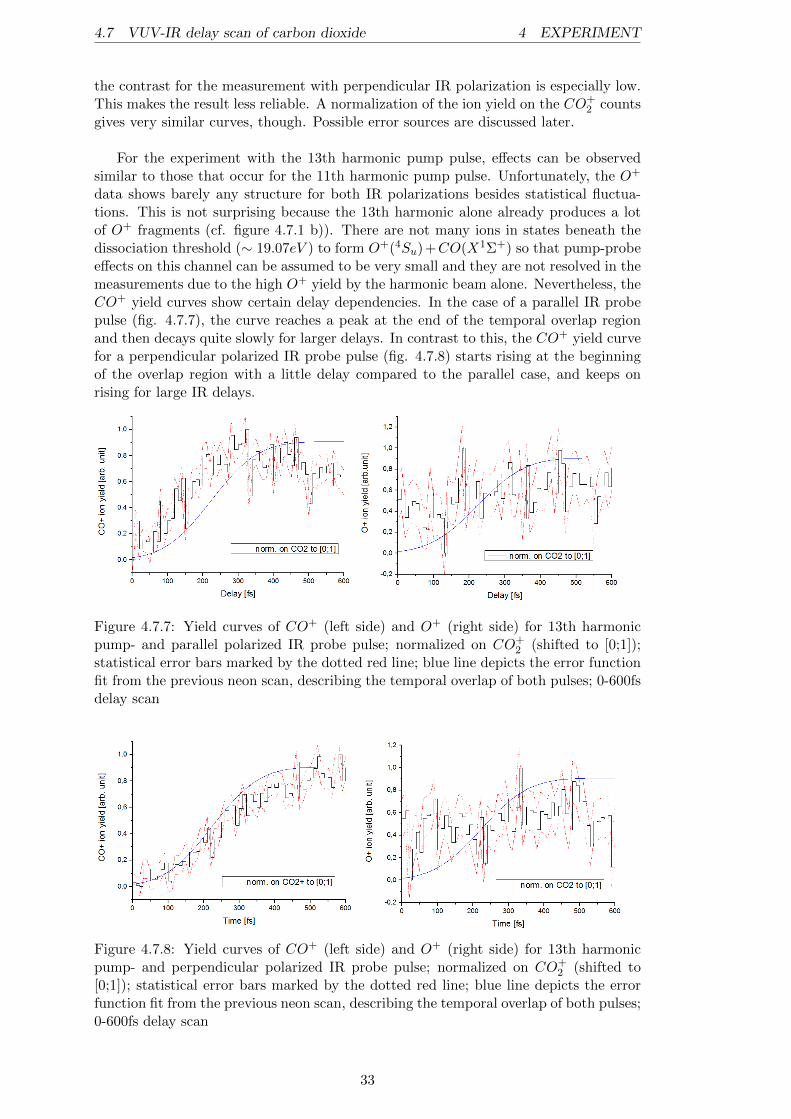
4.7 VUV-IR delay scan of carbon dioxide 4 EXPERIMENT
the contrast for the measurement with perpendicular IR polarization is especially low.This makes the result less reliable. A normalization of the ion yield on the CO+
2 countsgives very similar curves, though. Possible error sources are discussed later.
For the experiment with the 13th harmonic pump pulse, effects can be observedsimilar to those that occur for the 11th harmonic pump pulse. Unfortunately, the O+
data shows barely any structure for both IR polarizations besides statistical fluctua-tions. This is not surprising because the 13th harmonic alone already produces a lotof O+ fragments (cf. figure 4.7.1 b)). There are not many ions in states beneath thedissociation threshold (∼ 19.07eV ) to form O+(4Su)+CO(X1Σ+) so that pump-probeeffects on this channel can be assumed to be very small and they are not resolved in themeasurements due to the high O+ yield by the harmonic beam alone. Nevertheless, theCO+ yield curves show certain delay dependencies. In the case of a parallel IR probepulse (fig. 4.7.7), the curve reaches a peak at the end of the temporal overlap regionand then decays quite slowly for larger delays. In contrast to this, the CO+ yield curvefor a perpendicular polarized IR probe pulse (fig. 4.7.8) starts rising at the beginningof the overlap region with a little delay compared to the parallel case, and keeps onrising for large IR delays.
Figure 4.7.7: Yield curves of CO+ (left side) and O+ (right side) for 13th harmonicpump- and parallel polarized IR probe pulse; normalized on CO+
2 (shifted to [0;1]);statistical error bars marked by the dotted red line; blue line depicts the error functionfit from the previous neon scan, describing the temporal overlap of both pulses; 0-600fsdelay scan
Figure 4.7.8: Yield curves of CO+ (left side) and O+ (right side) for 13th harmonicpump- and perpendicular polarized IR probe pulse; normalized on CO+
2 (shifted to[0;1]); statistical error bars marked by the dotted red line; blue line depicts the errorfunction fit from the previous neon scan, describing the temporal overlap of both pulses;0-600fs delay scan
33
4.7 VUV-IR delay scan of carbon dioxide 4 EXPERIMENT
Most probable, the structure in the CO+ yield curve for a 13th harmonic pump pulsearises from an excitation of the CO2 molecule to the B2Σ+
u state by the VUV pumppulse and an additional absorption of one IR probe photon, leading to a transition tothe predissociative C2Σ+
g state. For the case of parallel IR polarization, this transitionis possible directly after the excitation of the molecule. The decay for large delayscan be explained by a rotation of the CO+
2 ion (respectively the C-O molecule axis)after the excitation. This rotation leads to a situation, where the symmetry of thetwo participating states forbids the B2Σ+
u → C2Σ+g transition. On the other hand,
contrary effects are observed for a perpendicular polarized IR probe pulse. In this case,the rotation enables such a Σ → Σ transition. These measurements seem to confirmthe interpretation by Timmers et al. [2], who argue that the delay-dependent yieldstructure for the two different IR polarizations comes from the rotation of the exitedCO+
2 (B2Σ+u ) ion out of the initial alignment as the IR delay-time goes by.
It has to be said that the curves definitely differ from the observations by Timmers etal. [2] to some extent. But if one considers that the pulse length for these measurementswere distinctly higher, differences like the relatively low contrast of the count-decay inthe parallel case can easily be explained. Even if the data goes reasonably well with theinterpretation of a B2Σ+
u → C2Σ+g transition, other pathways leading to CO+ could not
be suppressed in our measurements and have to be discussed. Such a different pathwaycould include a one-photon transition from a high vibronic A2Πu state (formerly excitedby the VUV pulse) to the C2Σ+
g state. Considering the symmetry (Π ↔ Σ) of bothstates, this interpretation could explain the observation that the yield is quite bigeven for large delays in the case of parallel IR polarization and that the yield is alsoremarkable in the temporal overlap region in the perpendicular case. Such a transition isonly allowed, if the exited axis of the ion is perpendicular to the polarization directionof the photon. If one applies now the interpretation of the ion rotating out of itsalignment, it is obvious why this effect counteracts the B2Σ+
u → C2Σ+g transition effect
mentioned before. For a perpendicular polarized probe pulse, the CO+2 ion is aligned
perpendicular to the incoming photon immediately after its excitation. This leads toan increase of counts right after the temporal overlap has passed by, whereas in the caseof a parallel polarized IR photon, the ion needs some time to rotate into the positionwhere the C-O axis is perpendicular to the IR photon. Here a rise of the CO+ countsoccurs for larger IR delays.The curve will, of course, mainly be determined by B2Σ+
u → C2Σ+g transition effects
because the occupation density of such a high vibronic level of CO+2 (A2Πu) at ∼ 18eV
can assumed to be low. Nonetheless, the transition discussed above can also contributeto the yield curve, explaining, besides the long pulse duration, the ”smoothness” ofboth curves which is seen in figures 4.7.7 and 4.7.8.Another CO+ dissociation pathway could include ions in the vibrational ground stateof the CO+
2 (C2Σ+g ) state. The single harmonic experiment suggests that there are
many ions in this state with sufficient energy to induce dissociation to O+ but not toCO+. It is possible to lift the ion to a higher vibronic level, for instance by effectslike two-photon stimulated Raman scattering22. Because the CO+
2 (C2Σ+g ) potential is
quite deep, it also appears plausible that the transition to a higher vibronic level ofthis state happens via a photon excitation.Such effects won‘t show any IR polarization dependencies, though. In a delay scanthey will just follow the error function fit because this pathway opens as soon as theIR pulse comes later.
One has to point out that a direct excitation to one of the dissociative states (b4Πu
22Raman scattering describes a phenomenon where the molecule absorbs an IR photon and emitsa photon of different wavelength so that the molecule ends up in another vibronic level. For a 40fsIR pulse duration, formula 2.17 yields an energetic bandwidth of ∼ 0.05eV . This makes vibronictransitions via stimulated Raman scattering not easy because the energy difference of different vibronicstates is rather ∼ 0.1eV (cf. [13]).
34
4.7 VUV-IR delay scan of carbon dioxide 4 EXPERIMENT
and a4Σ−g ) by a photon is not allowed due to the different spin multiplicity betweenthese dissociative states and the bound ionic states.
While the data for the 13th harmonic can be explained by a single photon transitionafter the ion’s excitation by the VUV pulse, the 11th harmonic measurement needsother explanations. First of all, it is important to mention that there are at least twoIR photons required to induce a dissociation of the ion for an 11th harmonic pumppulse. The 11th harmonic photon leads to an occupation of the CO+
2 (A2Πu) state(∼ 17.3eV ). Energetically at least two additional IR photons (each ∼ 1.55eV ) areneeded to reach the O+(4Su) + CO(X1Σ+) dissociation threshold at ∼ 19.07eV [13],or else the O(3Pg) +CO+(X2Σ+) dissociation threshold at ∼ 19.47eV [13]. A probingprocess involving two IR photons leads to an u-u transition. In a diatomic molecule,a two-photon transition from the A2Πu state to the C2Σ+
g state would therefore beexcluded, or only possible for a much more unlikely situation of a three-photon probingprocess. But because CO2 is a triatomic molecule, the selection rules are not limitingin the same way. Strictly spoken, the u-g parity labels do not apply when one C-Odistance in CO+
2 is extended. Therefore, a two-photon transition to CO+2 (C2Σ+
g ) ispossible.Different to the case of an one-photon transition, a two-photon process leads in thecase of a parallel aligned molecular axis to a perpendicular transition (Π→ Σ) becauseof the additional photon‘s angular momentum. It turns out that the measured dataare consistent with the interpretation of a two-photon transition from the A2Πu stateto the C2Σ+
g state. Furthermore, this explanation is compatible with the theory thatthe decay of the CO+ and O+ yield curves for a parallel IR polarization and the risefor a perpendicular IR polarization, like they occur in figures 4.7.5 and 4.7.6 (and infigures 4.18 and 4.19 in [1]), emerges from the CO+
2 ion‘s coupling to its rotationaldegrees of freedom. Because the included states have a perpendicular symmetry and atwo-photon process is present, the yield curve rises in the temporal overlap region fora parallel polarized probe pulse (Π→ Σ transitions are allowed) and decays after sometime, when the ion has rotated by 90 degrees and Π→ Σ transitions are forbidden fora two-photon process. For a perpendicular polarized probe pulse, these transitions areonly allowed when the molecule has already rotated by 90 degrees. Therefore, the yieldcurve rises for larger delays.
35
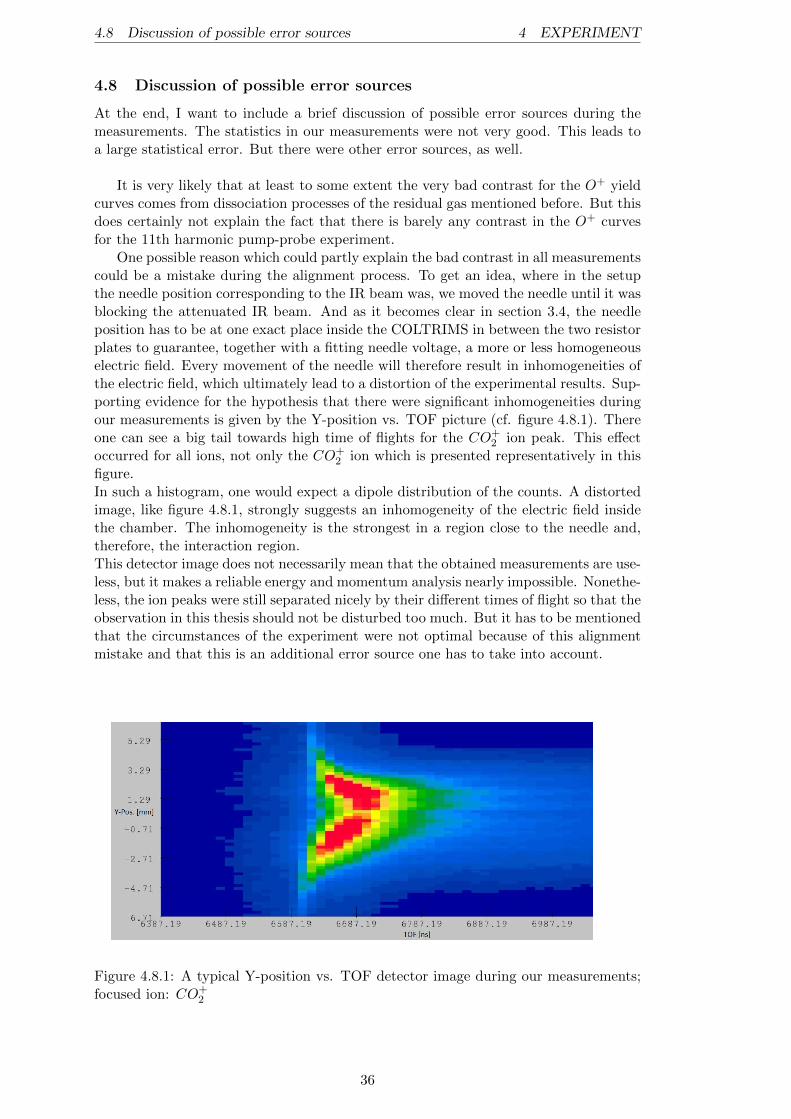
4.8 Discussion of possible error sources 4 EXPERIMENT
4.8 Discussion of possible error sources
At the end, I want to include a brief discussion of possible error sources during themeasurements. The statistics in our measurements were not very good. This leads toa large statistical error. But there were other error sources, as well.
It is very likely that at least to some extent the very bad contrast for the O+ yieldcurves comes from dissociation processes of the residual gas mentioned before. But thisdoes certainly not explain the fact that there is barely any contrast in the O+ curvesfor the 11th harmonic pump-probe experiment.
One possible reason which could partly explain the bad contrast in all measurementscould be a mistake during the alignment process. To get an idea, where in the setupthe needle position corresponding to the IR beam was, we moved the needle until it wasblocking the attenuated IR beam. And as it becomes clear in section 3.4, the needleposition has to be at one exact place inside the COLTRIMS in between the two resistorplates to guarantee, together with a fitting needle voltage, a more or less homogeneouselectric field. Every movement of the needle will therefore result in inhomogeneities ofthe electric field, which ultimately lead to a distortion of the experimental results. Sup-porting evidence for the hypothesis that there were significant inhomogeneities duringour measurements is given by the Y-position vs. TOF picture (cf. figure 4.8.1). Thereone can see a big tail towards high time of flights for the CO+
2 ion peak. This effectoccurred for all ions, not only the CO+
2 ion which is presented representatively in thisfigure.In such a histogram, one would expect a dipole distribution of the counts. A distortedimage, like figure 4.8.1, strongly suggests an inhomogeneity of the electric field insidethe chamber. The inhomogeneity is the strongest in a region close to the needle and,therefore, the interaction region.This detector image does not necessarily mean that the obtained measurements are use-less, but it makes a reliable energy and momentum analysis nearly impossible. Nonethe-less, the ion peaks were still separated nicely by their different times of flight so that theobservation in this thesis should not be disturbed too much. But it has to be mentionedthat the circumstances of the experiment were not optimal because of this alignmentmistake and that this is an additional error source one has to take into account.
Figure 4.8.1: A typical Y-position vs. TOF detector image during our measurements;focused ion: CO+
2
36
5 CONCLUSION
5 Conclusion
The goal of this thesis was to reproduce the results of D. Trabert [1] with an 11th har-monic pump- IR probe experiment on the CO2 target. Furthermore, it was of interestto check whether there are visible delay effects for different IR probe pulse polarizationsfor the 13th harmonic as pump pulse, as well.The experiments with an 11th harmonic pump pulse confirm D. Trabert‘s observations,and interesting effects also occur for a 13th harmonic pump pulse. For the 11th har-monic, due to experimental problems, only rather limited statistics could be achieved,while for the 13th harmonic much more data could be collected.
In the 13th harmonic measurement, the observed decay of the CO+ ion yield forlarge delays in the case of parallel IR probe polarization and the rise for large delays inthe case of perpendicular polarization can respectively be explained by the excitationof the B2Σ+
u state by the pump pulse and a transition to the predissociative C2Σ+g
state by the probe pulse. This transition is only possible for a parallel orientation ofthe photon‘s polarization and the excited C-O-axis of the ion. The rotation of the ioncauses a decay of the CO+ counts in the case of a parallel polarized probe pulse andan increase of those counts in the case of a perpendicular polarized probe pulse as thedelay time goes by.Other transitions leading to CO+ fragments could not be excluded. They could includethe lower lying A2Πu state which gets probed perpendicularly to the predissociativeC2Σ+
g state, or (resp. and) ions which are pumped to the vibronic ground level of theC2Σ+
g state couple to IR probe photons, leading to a transition to a higher vibroniclevel of this state from where a dissociation to CO+ is possible.We have also shown that most of the O+ fragmentation is already induced by the 13thharmonic pump pulse alone, and that this dissociation channel was more dominantfor the single harmonic measurement than the CO+ dissociation channel. From thisobservation one can learn about the excited states of the CO+
2 ion, populated by theVUV photons.
The experiment with an 11th harmonic pump pulse revealed similar effects. Butthis experiment needs another interpretation because the ion gets excited to the Franck-Condon region of the A2Πu state by the pump pulse and, starting there, a two-photontransition to the C2Σ+
g state occurs. This two-photon transition between Σ and Πstates corresponds to an one-photon transition and the same state symmetry: Themolecule can only absorb the photons as long as its excited axis is parallel to the po-larization of the incoming photons. This theoretical consideration seems to fit with theexperimental data. For a parallel polarization of the IR pump pulse, the yield curvesin both fragmentation channels (CO+ and O+) show a peak feature in the temporaloverlap region while a perpendicular polarized IR probe pulse yields to an increase ofmeasured ions for larger delays. Again, the rotation of the ion is most likely responsiblefor those effects.At the end, both experiments suggest the interpretation that the ion’s coupling to itsrotational degrees of freedom leads to the dominant polarization specific, delay depen-dent behavior, first mentioned by Timmers et al. in [2].
This thesis demonstrates the potential of VUV-IR pump-probe measurements withsingle harmonic pump pulses. Such narrow bandwidth pump pulses allowed the popu-lation of different molecular states selectively. Although the pulse duration was com-paratively long, molecular dynamics of the carbon dioxide molecule could be resolved.Ongoing experiments at the JRM Laboratory focus on the topic of this thesis, and cur-rent efforts include an optimization of the beam alignment in order to achieve betterstatistics. An interesting next step would be to measure an electron spectrum for a13th harmonic pump pulse. This would allow a more founded interpretation of the iondelay vs. yield curves.
37
6 APPENDIX
6 Appendix
Acknowledgements
First of all, I want to thank Prof. Artem Rudenko from the Kansas State Univer-sity for giving me the opportunity to work with his team at the James R. MacdonaldLaboratory. He was the supervisor of my work and helped me with good counsel. Fur-thermore, many thanks to Prof. Reinhard Dorner, my assessor at the Goethe Universityin Frankfurt. He suggested to me to make my measurements at the KSU and set upthe contact with Prof. Artem Rudenko. I also want to thank PD Dr. Till Jahnke forbeing my second assessor.A lot of thanks to Xiang Lee, who worked with me on the experiment and helped mea lot to solve any issue an experimentalist could face.Thanks to Lee Pearson, Yubaraj Malakar, Balram Kaderiya and Kanakaraju Pandirifor giving me a hand at the setup or helping me with the data analysis.Special thanks to the German Academic Exchange Service (DAAD) for their financialsupport during my time abroad.Last, but not least, I want to thank my family, who has always supported me duringmy years of school and study, and through that has made this thesis possible.
Selbststandigkeitserklarung
Nach § 30 (12) der Ordnung fur den Bachelor- und den Masterstudiengang desFachbereichs Physik an der Johann Wolfgang Goethe-Universitat:Hiermit erklare ich, Philip Trapp, dass ich die Arbeit selbststandig und ohne Benutzunganderer als der angegebenen Quellen und Hilfsmittel verfasst habe. Alle Stellen derArbeit, die wortlich oder sinngemaß aus Veroffentlichungen oder aus anderen fremdenTexten entnommen wurden, sind von mir als solche kenntlich gemacht worden. Fernererklare ich, dass die Arbeit nicht - auch nicht auszugsweise - fur eine andere Prufungverwendet wurde.
Frankfurt, den 21.03.2015
Philip Maurice Trapp
38
REFERENCES REFERENCES
References
[1] Daniel Trabert. Imaging ultrafast molecular dynamics triggered by extreme ultra-violet photoabsorption. Bachelorthesis, Goethe University Frankfurt, 2015.
[2] Henry Timmers, Zheng Li, Niranjan Shivaram, Robin Santra, Oriol Vendrell, andArvinder Sandhu. Coherent electron hole dynamics near a conical intersection.Phys. Rev. Lett., 113:113003, Sep 2014.
[3] David J. Griffiths. Introduction to Electrodynamics.
[4] Janet Tate and Elizabeth Gire. Time evolution of a gaussian wave packet.http://physics.oregonstate.edu/portfolioswiki/_media/activities:
content:photos:wvgausswavepacket.gif?w=&h=&cache=cache. Online; ac-cessed 22-December-2015.
[5] Molecular photonics group of Queen‘s University. Strong fields. http://faculty.chem.queensu.ca/people/faculty/stolow/Images/Research/SF_fig1.jpg.
[6] Wei Cao. PUMP-PROBE STUDY OF ATOMS AND SMALL MOLECULESWITH LASER DRIVEN HIGH ORDER HARMONICS. PhD thesis, Kansas StateUniversity, 2014.
[7] Chakra Man Maharajan. MOMENTUM IMAGING STUDIES OF ELECTRONAND ION DYNAMICS IN A STRONG LASER FIELD. PhD thesis, Kansas StateUniversity, 2007.
[8] Kenichi L. Ishikawa. Three step model of high-harmonic generation. http://www.intechopen.com/source/html/8418/media/image3.jpeg, February 2010. On-line; accessed 17-August-2015.
[9] HASYLAB. Free-electron lasers and conventional lasers. http:
//photon-science.desy.de/sites/site_photonscience/content/e58/
e186104/e186305/e186344/e186350/e196982/e186352/Chapter2_p10_2_
eng.jpg, 2016. Online; accessed 05-January-2016.
[10] Del Mar Photonics. Microchannel plates. http://www.dmphotonics.com/MCP_
MCPImageIntensifiers/Image27.gif. Online; accessed 12-November-2015.
[11] Jinping Yao, Guihua Li, Xinyan Jia, Xiaolei Hao, Bin Zeng, Chenrui Jing, WeiChu, Jielei Ni, Haisu Zhang, Hongqiang Xie, Chaojin Zhang, Zengxiu Zhao, JingChen, Xiaojun Liu, Ya Cheng, and Zhizhan Xu. Alignment-dependent fluorescenceemission induced by tunnel ionization of carbon dioxide from lower-lying orbitals.Phys. Rev. Lett., 111:133001, Sep 2013.
[12] M Oppermann, S J Weber, F Morales, M Richter, S Patchkovskii, A Csehi, A Vi-bok, M Ivanov, O Smirnova, and J P Marangos. Control and identification of strongfield dissociative channels in co via molecular alignment. Journal of Physics B:Atomic, Molecular and Optical Physics, 47(12):124025, 2014.
[13] Jianbo Liu, Wenwu Chen, M. Hochlaf, Ximei Qian, Chao Chang, and C.Y. Ng.Unimolecular decay pathways of state-selected co2+ in the internal energy rangeof 5.2 to 6.2 ev: An experimental and theoretical study. The Journal of ChemicalPhysics, 118:149–163, 2003.
[14] JRMLab. Kansas light source. https://jrm.phys.ksu.edu/lasers.html, Jan-uary 2015. Online; accessed 18-August-2015.
39
REFERENCES REFERENCES
[15] Wolfgang Nolting. Grundkurs Theoretische Physik 3:. Grundkurs TheoretischePhysik.
[16] Reinhard Doerner. Experimentalphysik 3b: Atome und Quanten; Skript zur Vor-lesung; Stunde 3. 2013.
[17] J. P. Connerade. Highly Excited Atoms. Cambridge Univerity Press, 1998.
[18] P. Agostini, F. Fabre, G. Mainfray, G. Petite, and N. Rahman. Free-free transitionsfollowing six-photon ionization of xenon atoms. Phys. Rev. Lett 42, 1127, 1979.
[19] Florian Wilhelm. Xuv-ir femtosecond pump-probe experiments on o2 fragmenta-tion. Bachelorthesis, Goethe University Frankfurt, 2014.
[20] J. Marcus Dahlstroem. Strong field approximation for high order harmonic gener-ation with w/2w laser fields. Lund Reports on Atomic Physics, LRAP-381, 2007.
[21] Ferenc Krausz and Misha Ivanov. Attosecond physics. Rev. Mod. Phys., 81:163–234, Feb 2009.
[22] Reinhard Doerner. Atomphysik 1; Stunde 12. 2014.
[23] T. H. Maiman. Stimulated optical radiation in ruby. Nature 187, 493, 1960.
[24] Wolfgang Demtroeder. Experimentalphysik 3- Atome, Molekle und Festkrper.Springer, 2005.
[25] Rdiger Paschotta. Rayleigh length. https://www.rp-photonics.com/rayleigh_length.html. Online; accessed 20-November-2015.
[26] Daniel S. Steingrube, Tobias Vockerodt, Emilia Schulz, Uwe Morgner, and MilutinKovacev. Phase matching of high-order harmonics in a semi-infinite gas cell. Phys.Rev. A, 80:043819, Oct 2009.
[27] R. Doerner, V. Mergel, L. Jagutzki, O.and Spielberger, J. Ullrich, R. Mosham-mer, and H. Schmidt-Boecking. Cold target recoil ion momentum spectroscopy:a momentum microscope to view atomic collision dynamics. Physics Reports 330(2000) 95 192, 2000.
[28] L. P. H. Schmidt, S. Schler, A. Czasch, O. Jagutzki, and R. Doerner. Mi-crochannel plate detectors. https://www.atom.uni-frankfurt.de/research/
coltrims/mcp/. Online; accessed 12-November-2015.
[29] Stanford Computer Optics. Image intensifier: Phosphor screen. http:
//www.stanfordcomputeroptics.com/technology/image-intensifier/
phosphor-screen.html, 2013. Online; accessed 27-November-2015.
[30] UNI TERRA Kindler und Gliech GbR. Erste ionisierungsenergie. http://www.
uniterra.de/rutherford/tab_iong.htm, 1996. Online; accessed 30-November-2015.
40