Embed Size (px)
Citation preview
Bernhard Mlecnik
Database for cancer immunology
Master Thesis
1Institute for Biomedical Engineering, Graz University of
Technology, Graz, Austria
2Institut National de la Sante et de la Recherche Medical
Unite 255, Centre de Recherches Biomedicales des
Cordeliers, Paris, France
Supervisors: Dipl.-Ing. Robert Molidor1, Dr. Jerome Galon2, Ao.Univ.-Prof.
Dipl.-Ing. Dr.techn. Zlatko Trajanoski1
Evaluator: Ao.Univ.-Prof. Dipl.-Ing. Dr.techn. Zlatko Trajanoski1
Head of Institute: Univ.-Prof. Dipl.-Ing. Dr.techn. Gert Pfurtscheller1
Graz, February 2003

For my parents
Fur meine Eltern
Abstract
Abstract
Cancer is a worldwide public health problem. Each year, 6 million people die from cancer and 8,1
million new cases are diagnosed. In twenty years from now, the cancer burden will exceed 50% due to
the ageing of the population and their increasing exposure to risk factors. It is proven that the immune
system plays a major role in recognising and destroying tumour cells, and it is possible that it may induce
immunological responses, which may have therapeutical benefits against certain tumours.
The broad, long-term objective of the functional genomic studies in this thesis is to identify molecular
signatures and pathways in T-cells surrounding cancer. The specific aim of this thesis was to develop a
tumoral microenvironment (TME) database for storing and maintaining all the data which are arising
from different immunological experiments.
The data were obtained from cancer patients as well as from healthy donors. The used software tech-
nology was based on the newest Java-Client-Server technologies and applied Java Database Connectivity
(JDBC), Java Server Pages (JSP) and Enterprise Java Beans (EJB). The collected FACS (fluorescence ac-
tivated cell sorter) data was clustered using hierarchical clustering algorithm. The results demonstrated
that immunophenotypic and functional data can be used to group patients and controls into distinct
groups.
In future work, immunophenotypic and functional data will be integrated with microarray data in
order to explore new relations between expression patterns and cell surface markers.
Keywords: Cancer, Tumoral Microenvironment, T-Cells, Databases, Bioinformatics
i
Abstract
Kurzfassung
Krebs hat sich langst zu einem weltweiten Gesundheitsproblem entwickelt. Jahrlich sterben 6 Mil-
lionen Menschen an den Folgen einer Krebserkrankung und 8,1 Millionen neue Falle werden diagnos-
tiziert. In den kommenden zwanzig Jahren soll die Krebsrate um 50% steigen. Es ist bewiesen, dass
das Immunsystem eine wichtige Rolle im Erkennen und Zerstoren von Krebszellen einnimmt, wobei es
immunologische Reaktionen hervorrufen konnte, die therapeutisch gegen gewisse Krebsarten einsetzbar
waren.
Das Ziel langfristiger funktioneller genomischer Studien in dieser Diplomarbeit soll neue moleku-
lare Signaturen in T-Zellen aufdecken, die sich in unmittelbarer Umgebung eines Tumors befinden. Das
Ziel dieser Arbeit war es eine Datenbank zu entwickeln, die phenotypische wie funktionelle immunolo-
gische Daten speichern und verwalten soll, die wahrend verschiedner Experimente aufkamen, bzw. noch
aufkommen werden.
Die Softwaretechnologie zur Realisierung dieser Diplomarbeit basiert auf der neuesten Java-Client-
Server Technologie, unter Verwendung von Java Server Pages (JSP), Java Database Connectivity (JDBC)
und Enterprise Java Bean (EJB). Die gespeicherten FACS (fluorescence activated cell sorter) Daten wur-
den vereint und mit hierarchischen Cluster-Algorithmen geclustert. Es konnte gezeigt werden, dass
immunophenotypische und funktionelle Daten von Patienten und Kontrollpersonen verwendet werden
konnen, um sie in verschiedene Gruppen zu unterteilen.
In Zukunft sollen auch Microarray-Experimente mit den immunologischen Daten zusammengefuhrt
werden, um neue Zusammenhange zwischen intrazellularen Expressionsmustern und Oberflachenmark-
ern zu erforschen.
Schlusselworter: Krebs, Tumoral Micro Environment T-Zellen, Datenbanken, Bioinformatik
ii
Contents
Glossary viii
1 Introduction 1
1.1 Cancer . . . . . . . . . . . . . . . . . . . . . . . . . . . . . . . . . . . . . . .1
1.2 Tumoral microenvironment . . . . . . . . . . . . . . . . . . . . . . . . . . . .2
1.3 Immunity . . . . . . . . . . . . . . . . . . . . . . . . . . . . . . . . . . . . . 2
1.3.1 Innate and adaptive immunity . . . . . . . . . . . . . . . . . . . . . .4
1.3.2 B cells . . . . . . . . . . . . . . . . . . . . . . . . . . . . . . . . . . 4
1.3.3 T cells . . . . . . . . . . . . . . . . . . . . . . . . . . . . . . . . . . . 5
1.3.4 Cluster Designation (CD) . . . . . . . . . . . . . . . . . . . . . . . .5
1.3.5 Cytokines . . . . . . . . . . . . . . . . . . . . . . . . . . . . . . . . . 6
1.4 Tumour immunology . . . . . . . . . . . . . . . . . . . . . . . . . . . . . . . 7
1.4.1 Immune surveillance . . . . . . . . . . . . . . . . . . . . . . . . . . .7
1.4.2 Tumour antigens . . . . . . . . . . . . . . . . . . . . . . . . . . . . .8
1.4.3 Immunotherapy . . . . . . . . . . . . . . . . . . . . . . . . . . . . . .8
2 Objectives 10
2.1 Database development . . . . . . . . . . . . . . . . . . . . . . . . . . . . . .11
2.2 Application server deployment . . . . . . . . . . . . . . . . . . . . . . . . . .11
2.3 Web application development . . . . . . . . . . . . . . . . . . . . . . . . . . .11
3 Methods 12
iii
CONTENTS CONTENTS
3.1 Fluorescent-activated cell sorter (FACS) . . . . . . . . . . . . . . . . . . . . .12
3.1.1 FACS analyses . . . . . . . . . . . . . . . . . . . . . . . . . . . . . .13
3.1.2 Sample treatments . . . . . . . . . . . . . . . . . . . . . . . . . . . .14
3.1.3 Phenotype analysis . . . . . . . . . . . . . . . . . . . . . . . . . . . .15
3.1.4 Proliferation analysis . . . . . . . . . . . . . . . . . . . . . . . . . . .17
3.1.5 Cytokine secretion analysis . . . . . . . . . . . . . . . . . . . . . . . .18
3.2 Database development (Enterprise Information System (EIS)-Tier) . . . . . . .19
3.2.1 Relational databases . . . . . . . . . . . . . . . . . . . . . . . . . . .19
3.2.1.1 Normalisation . . . . . . . . . . . . . . . . . . . . . . . . .20
3.2.1.2 Integrity rules . . . . . . . . . . . . . . . . . . . . . . . . .20
3.2.2 Structured Query Language (SQL) . . . . . . . . . . . . . . . . . . . .21
3.2.2.1 Data Definition Language (DDL) . . . . . . . . . . . . . . .21
3.2.2.2 Data Manipulation Language (DML) . . . . . . . . . . . . .22
3.2.3 Java Database Connectivity (JDBC) . . . . . . . . . . . . . . . . . . .22
3.2.3.1 Two-tier and Three-tier Models . . . . . . . . . . . . . . . .23
3.3 Application server deployment (Middle-Tier) . . . . . . . . . . . . . . . . . .24
3.3.1 Enterprise Java Beans 2 (EJB2) . . . . . . . . . . . . . . . . . . . . .24
3.3.2 The Java 2 Enterprise Edition (J2EE) server . . . . . . . . . . . . . . .26
3.3.3 Java Cryptography Extension (JCE) . . . . . . . . . . . . . . . . . . .27
3.3.4 Extensible Markup Language (XML) . . . . . . . . . . . . . . . . . .27
3.3.5 JDOM (Java Document Object Model) . . . . . . . . . . . . . . . . .28
3.4 Web application development (WEB-Tier) . . . . . . . . . . . . . . . . . . . .28
3.4.1 Java Server Page (JSP) . . . . . . . . . . . . . . . . . . . . . . . . . .28
3.4.2 JSP Tag libraries . . . . . . . . . . . . . . . . . . . . . . . . . . . . .29
3.4.3 The Jakarta Struts Framework . . . . . . . . . . . . . . . . . . . . . .31
3.4.4 Struts Application Flow . . . . . . . . . . . . . . . . . . . . . . . . .31
4 Results 34
4.1 The Database Model . . . . . . . . . . . . . . . . . . . . . . . . . . . . . . .34
iv
CONTENTS CONTENTS
4.1.1 Patient and Experiment Table . . . . . . . . . . . . . . . . . . . . . .35
4.1.2 User Management Tables . . . . . . . . . . . . . . . . . . . . . . . . .35
4.1.3 Experiment Related Tables . . . . . . . . . . . . . . . . . . . . . . . .35
4.1.4 Application server connection . . . . . . . . . . . . . . . . . . . . . .38
4.2 The Web Application . . . . . . . . . . . . . . . . . . . . . . . . . . . . . . .38
4.2.1 The TME.db Web Page . . . . . . . . . . . . . . . . . . . . . . . . . .39
4.2.2 User Management . . . . . . . . . . . . . . . . . . . . . . . . . . . .40
4.2.3 The Patient Overview . . . . . . . . . . . . . . . . . . . . . . . . . . .41
4.2.3.1 Cancer Information . . . . . . . . . . . . . . . . . . . . . .42
4.2.3.2 Biological Markers . . . . . . . . . . . . . . . . . . . . . .43
4.2.3.3 Treatments . . . . . . . . . . . . . . . . . . . . . . . . . . .43
4.2.3.4 FACS Phenotype Assays . . . . . . . . . . . . . . . . . . .44
4.2.3.5 FACS Proliferation Assays . . . . . . . . . . . . . . . . . .45
4.2.3.6 FACS Cytokine Secretion Assays . . . . . . . . . . . . . . .49
4.2.4 Basic Queries . . . . . . . . . . . . . . . . . . . . . . . . . . . . . . .49
4.2.5 Custom Queries . . . . . . . . . . . . . . . . . . . . . . . . . . . . . .50
4.2.5.1 Building A Custom Query . . . . . . . . . . . . . . . . . . .52
4.2.5.2 Clustering the FACS data . . . . . . . . . . . . . . . . . . .55
5 Discussion 59
Bibliography 62
A Database Model 65
B Cluster Designation List 67
v
List of Figures
1.1 Tumour micro ecology [14] . . . . . . . . . . . . . . . . . . . . . . . . . . . . 2
1.2 The principal components of the immune system [27] . . . . . . . . . . . . . .3
1.3 T cell encounters an APC [27] . . . . . . . . . . . . . . . . . . . . . . . . . .5
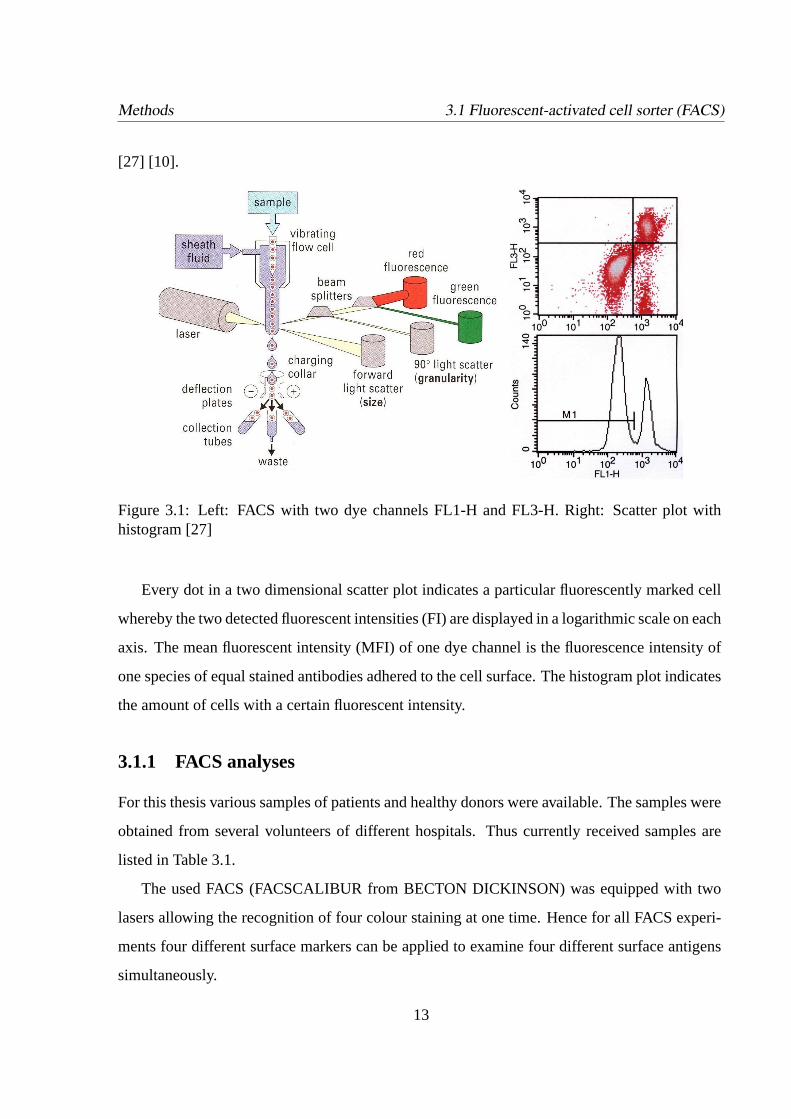
3.1 Left: FACS with two dye channels FL1-H and FL3-H. Right: Scatter plot with
histogram [27] . . . . . . . . . . . . . . . . . . . . . . . . . . . . . . . . . . .13
3.2 Phenotype scatter plots. Day 0, cells withoutCD25+ markers. Right: Day 5
after stimulation, cells with an increased amount ofCD25+ markers . . . . . . 16
3.3 Proliferation scatter plots. Left: Day 0, cells stained with CFSE. Right: Day 5
after stimulation with Il-10 and IL-15. . . . . . . . . . . . . . . . . . . . . . .17
3.4 Cytokine secreting cell [20] . . . . . . . . . . . . . . . . . . . . . . . . . . . .18
3.5 Multi Tier Model [11] . . . . . . . . . . . . . . . . . . . . . . . . . . . . . . . 23
3.6 EJB Model [1] . . . . . . . . . . . . . . . . . . . . . . . . . . . . . . . . . . .26
3.7 JSP MVC model [23] . . . . . . . . . . . . . . . . . . . . . . . . . . . . . . .29
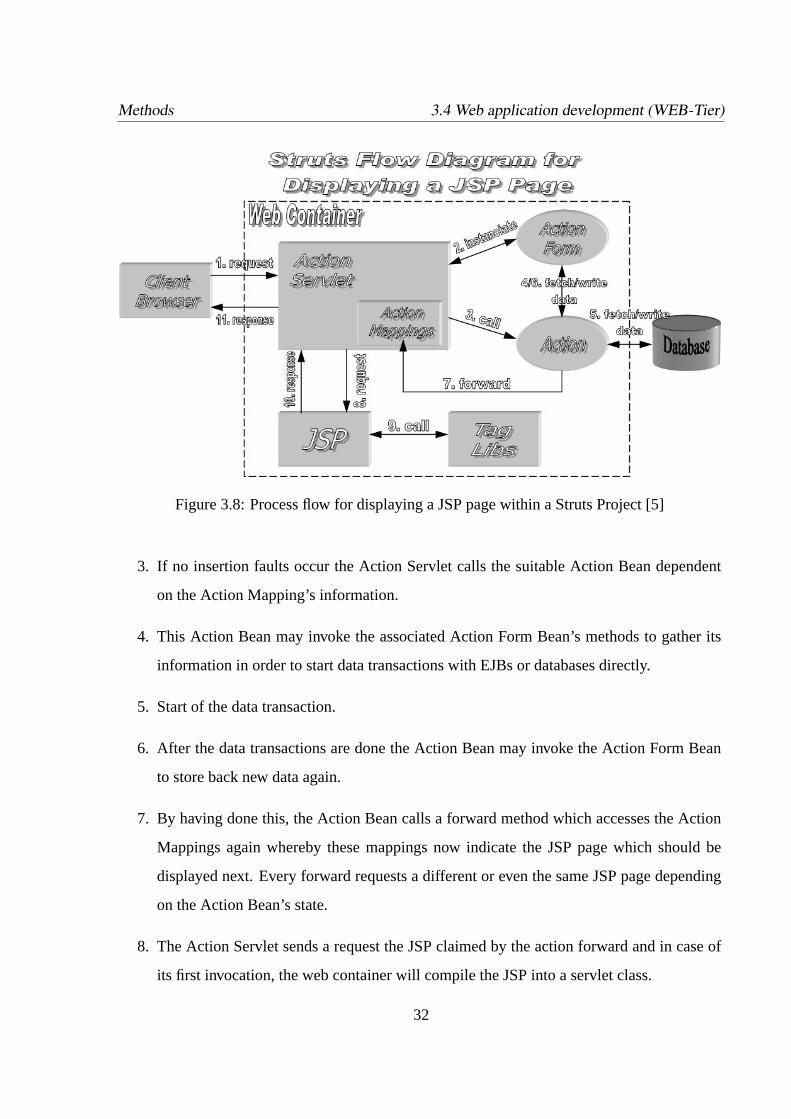
3.8 Process flow for displaying a JSP page within a Struts Project [5] . . . . . . . .32
4.1 TME Web Page Overview . . . . . . . . . . . . . . . . . . . . . . . . . . . .39
4.2 Add User Panel . . . . . . . . . . . . . . . . . . . . . . . . . . . . . . . . . .40
4.3 Patient Overview . . . . . . . . . . . . . . . . . . . . . . . . . . . . . . . . .41
4.4 Phenotype Assay Overview with scatter plot. . . . . . . . . . . . . . . . . . .44
4.5 Proliferation Assay Overview with: FSC-SSC-plot, scatter plot and histogram
plot. . . . . . . . . . . . . . . . . . . . . . . . . . . . . . . . . . . . . . . . .46
vi
LIST OF FIGURES LIST OF FIGURES
4.6 Basic Query Page with certain selected Gates and Antigens . . . . . . . . . . .49
4.7 Custom List Section with selected experiment tab . . . . . . . . . . . . . . . .50
4.8 Custom Query Section with selected cancer tab . . . . . . . . . . . . . . . . .51
4.9 Custom Savings Section with saved query . . . . . . . . . . . . . . . . . . . .52
4.10 Custom Query Listings page with specified selections . . . . . . . . . . . . . .53
4.11 Patient FACS experiment list . . . . . . . . . . . . . . . . . . . . . . . . . . .54
4.12 Custom Query pages with specified selections . . . . . . . . . . . . . . . . . .54
4.13 File download . . . . . . . . . . . . . . . . . . . . . . . . . . . . . . . . . . .54
4.14 Hierarchical Cluster result of the FACS data . . . . . . . . . . . . . . . . . . .55
4.15 3D plot of the clusters within the 3 most influential Principle Components . . .57
vii
Glossary
APCs Antigen presenting cells, have the ability to present antigen particles bound to specific
receptors on their surface.
CDxx Cluster of Designation, terms lymphoid surface antigens.
CFSE Carboxy-fluorescein diacetate, succinimidyl ester, used for intracellular staining of
cells.
CSFs Colony-stimulating factors, have influence in controlling and directing the division and
differentiation of bone-marrow stem cells.
DDL Data Definition Language, is a sub section of SQL allowing the creation and deletion of
tables in the database.
DML Data Manipulation Language, is a sub section of SQL include the syntax for complex
queries as well as for updates, insertions and deletions of data records.
EJB Enterprise Java Bean, a business data object specification developed in java technology.
ELISA special kit for detecting particular cytokines secreted by APCs or other cytokine se-
creting cells.
viii
Glossary
FACS Fluorescent-activated cell sorter, designed for an automatic separation and analysis of
fluorescently stained cells.
Ficoll is used to separate immune cells from the blood.
FK Foreign Key, is a PK of a foreign data table.
HCL Hierarchical Clustering, cluster algorithm for creating a relational data tree (dendro-
gram).
IFNs Interferons, are mainly involved into the cell’s prevention of certain viral infections.
IgG Immune globulin G, soluble antibody secreted by B cells.
ILs Interleukins, cytokines mainly produced by T cells.
JCE Java Cryptography Extension, is a non-commercial cryptography extension for Java con-
taining a package which provides implementations for encryption.
JDBC Java Database Connectivity, Java software tool for accessing databases.
JSPs Java Server Pages, have been developed to provide an easy and intuitive way in creating
dynamical generated HTML pages.
MFI Mean fluorescent intensity, is measured within FACS experiments on stained antigens
bound to cell surfaces.
MHC Major Histocompatibility Complex, antigen presenting receptor.
NK Natural Killer cells, are a group of lymphocytes which have intrinsic ability to recognise
and destroy some virally infected cells.
ix
Glossary
PCA Principle Component Analysis, determines basis functions of a similarity matirx.
PHA Phytohemagglutin, mitogen for activating T cell receptors.
PK Primary Key, defines the uniqueness of each data record.
SQL Structured Query Language, non procedural language for accessing relational databases.
TCR T cell receptor, connects with the antigen presenting MHC receptor.
TGFs Transforming growth factors, have a partial effect in mediating inflammation reactions.
TME Tumoral microenvironment, comprises all the biomolecules and cells which surround a
tumour.
TNFs Tumour necrosis factors, have a partial effect in cytotoxic reactions against tumour
cells.
x

Chapter 1
Introduction
Cancer is a public health problem worldwide. Each year, 6 million people die from cancer
and 8.1 million new cases are diagnosed. The growth rate of cancer is now 2.1% per year,
a rate that exceeds the growth rate of the world’s population at 1.7 % per year. The leading
causes of worldwide cancer deaths are lung cancer, which accounts for over 900,000 deaths,
gastric cancer (600,000 deaths) and colorectal cancer (400,000 deaths) [3]. The occurring cases
of different types of cancer differ between developed and developing countries, whereby more
than 55% of the detected deaths occur in developing countries. The most common cancers in
developed countries are lung, stomach, breast, and colorectal cancer, whereas in developing
countries lung, stomach, breast, cervical, and oesophageal cancer accounts for the main part of
the occurring cases. The average 5-year survival is as low as 8 % in Europe and 14% in the
United States [3].
1.1 Cancer
The main indicator of cancer is the uncontrolled growth and dispersion of cells as a result of
abnormal changes to the genetic material contained in those cells. A single cell or group of cells
can undergo genetic events such as mutations, influenced by inherited or environmental factors
as well as a result of certain levels of hormones or growth factors, which may change the cells’
behaviours. These events, which may take years to arise, cause the cells to proceed down the
1
Introduction 1.2 Tumoral microenvironment
pathway to the development of cancer [2].
If cells divide abnormal in an early stage of development, they may evolve into a cell pop-
ulation that could be immortalized and which may lose the control mechanisms of normal cell
division, activity and interactions with neighbouring cells. Such immortalized cell populations
may evolve into malignant tumour cell populations, whose behaviour may violate the tissue
environment.
Once certain cell populations became malignant they may form solid tumours which invade
and destroy sane tissues as well as they may metastasize (spread) all over the body by releasing
tumour cells into the blood and lymph system, where they may continue to grow and develop
by forming new cancers [2].
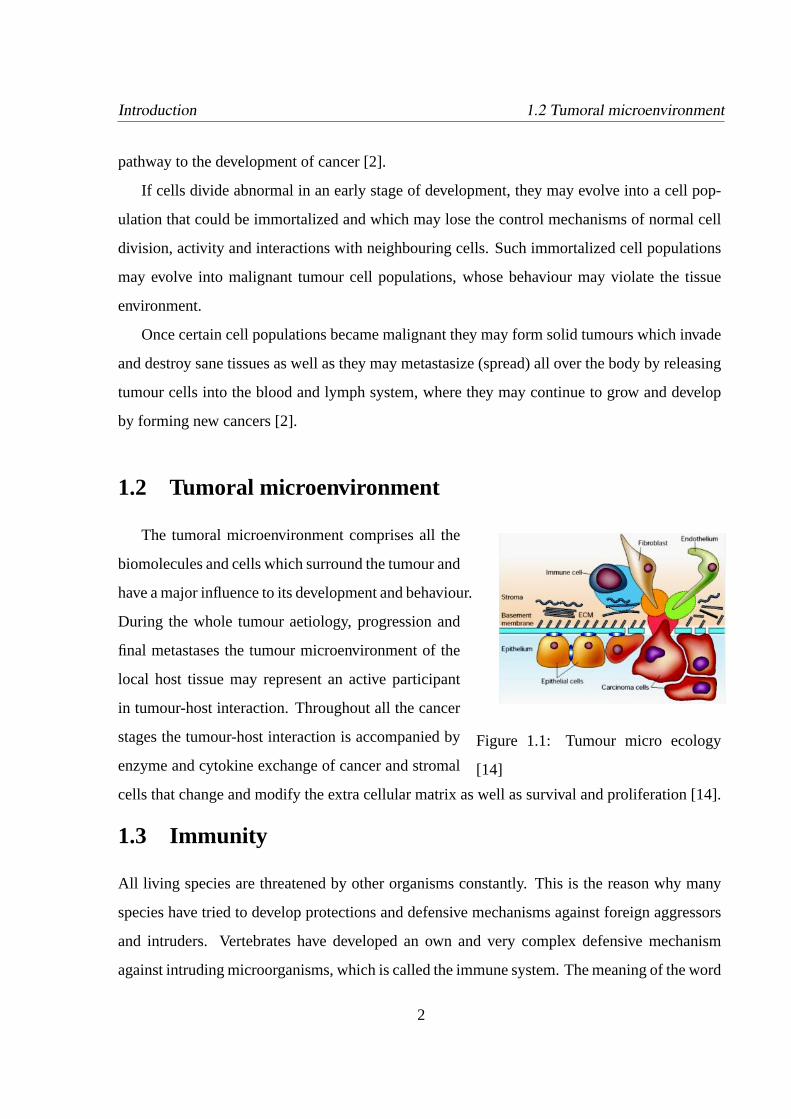
1.2 Tumoral microenvironment
The tumoral microenvironment comprises all the
Figure 1.1: Tumour micro ecology
[14]
biomolecules and cells which surround the tumour and
have a major influence to its development and behaviour.
During the whole tumour aetiology, progression and
final metastases the tumour microenvironment of the
local host tissue may represent an active participant
in tumour-host interaction. Throughout all the cancer
stages the tumour-host interaction is accompanied by
enzyme and cytokine exchange of cancer and stromal
cells that change and modify the extra cellular matrix as well as survival and proliferation [14].
1.3 Immunity
All living species are threatened by other organisms constantly. This is the reason why many
species have tried to develop protections and defensive mechanisms against foreign aggressors
and intruders. Vertebrates have developed an own and very complex defensive mechanism
against intruding microorganisms, which is called the immune system. The meaning of the word
2
Introduction 1.3 Immunity
immunity derives from the Latin word immunis (unhurt, protected) and describes the protection
and immunity against particular infectious agents. During the encounter with foreign micro
organisms the immune system runs through a learn process whereby the recognition of the
infectious agents is a crucial step in immune defence. The most important task of the immune
system is to distinguish between own and foreign bio molecules to make sure that only foreign
intruders are attacked and destroyed [15].
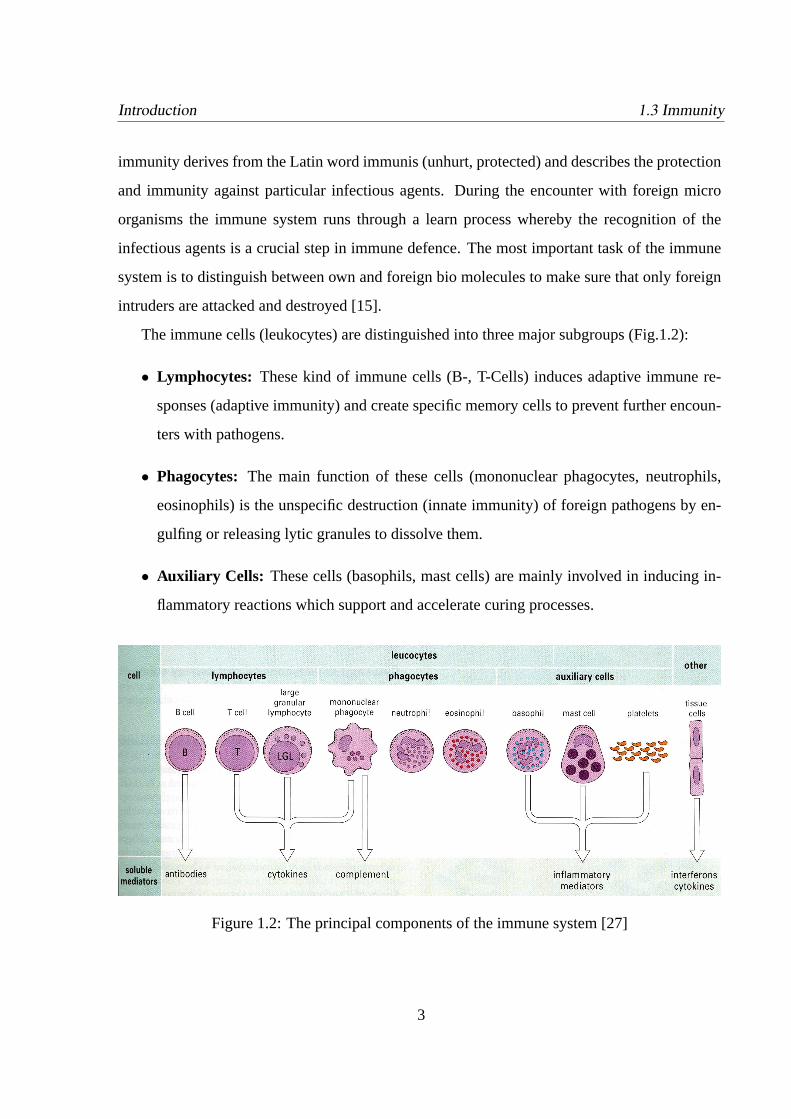
The immune cells (leukocytes) are distinguished into three major subgroups (Fig.1.2):
• Lymphocytes: These kind of immune cells (B-, T-Cells) induces adaptive immune re-
sponses (adaptive immunity) and create specific memory cells to prevent further encoun-
ters with pathogens.
• Phagocytes: The main function of these cells (mononuclear phagocytes, neutrophils,
eosinophils) is the unspecific destruction (innate immunity) of foreign pathogens by en-
gulfing or releasing lytic granules to dissolve them.
• Auxiliary Cells: These cells (basophils, mast cells) are mainly involved in inducing in-
flammatory reactions which support and accelerate curing processes.
Figure 1.2: The principal components of the immune system [27]
3
Introduction 1.3 Immunity
1.3.1 Innate and adaptive immunity
Any immune response firstly recognises the pathogen or foreign material and eliminates it af-
terwards. There are different immune responses which fall into two categories: innate (or non-
adaptive) immune responses and adaptive immune responses. The main difference between
these two is that an adaptive immune response is highly specific against a particular pathogen.
The innate immune response does not alter during repeated encounters with infectious agents,
whereby the adaptive immune response improves with each successive encounter with the same
pathogen: in effect the adaptive immune response ’remembers’ the infectious agent and may
prevent it from causing a disease later [27]. The main tasks of the innate immune system are
non-specific recognition and digestion of foreign intruders and therefore it is also called the
first line of defence against infection. The major participants in this kind of immunity are the
phagocytic cells (Fig.1.2), the monocytes as well as the macrophages [27].
The strength of the adaptive immunity is the specific recognition of particular pathogens in
the host’s tissues and body fluids. Lymphocytes, which are distinguished into two major sub
groups, the B and the T lymphocytes (Fig.1.2), support the cells’ acting within the adaptive
immunity [27].
1.3.2 B cells
Every B cell bears a unique genetic information in its genome to encode its own very specific
surface marker which may only bind to one particular antigen. Once a B cell encounters a
specific antigen, fitting to its receptors, internal pathways are activated and the cell starts to
proliferate and differentiates itself into a plasma cell. Differentiated plasma cells raise a large
amount of soluble antibodies which are secreted afterwards. These antibodies are large glyco-
proteins situated in the blood which bind to the same type of antigen which initially encounters
the B cell’s receptors. So the antigen which has evoked an immunological response is covered
with antibodies all over, which may bind to the surface of a phagocyte that may engulf the
antigen and destroy it later [27].
4
Introduction 1.3 Immunity
1.3.3 T cells
Both B and T cells have the same precursors, the bone-marrow stem cells that are situated in
the cavities of the large bones. It is crucial that all specific immune cells are tested against auto-
immunity to prevent the body’s own proteins from being attacked. Mature lymphocytes which
show auto-immunity are detected and destroyed before they can enter the lymphatic system. T
cells migrate to the thymus where they mature and on passing the auto-immunity check (nega-
tive selection) they are released to the lymph system. Otherwise the cells are destroyed.
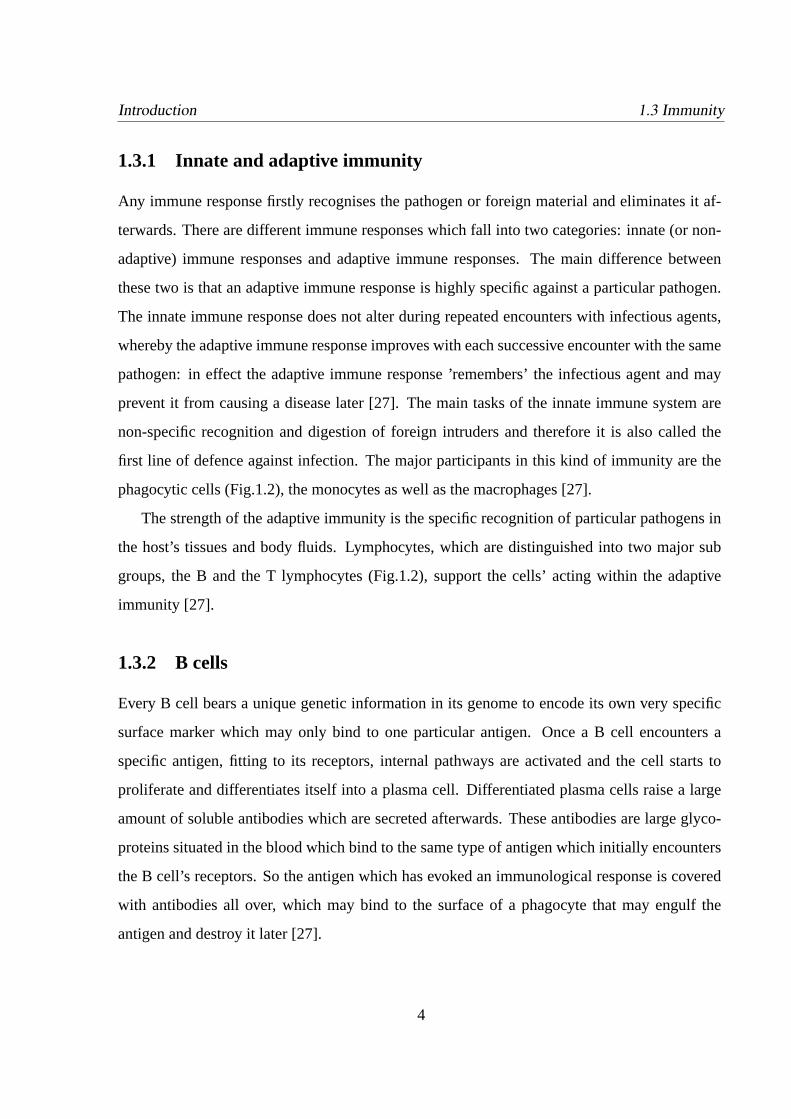
T cells are characteristic for detecting and bind-
Figure 1.3: T cell encounters an APC
[27]
ing unexceptionally to antigen presenting cells (APCs)
which have the ability to present antigen particles bound
to specific receptors on their surface. Because of their
far reaching genetic invariance these kinds of antigen
representing receptors are termed the major histocom-
patibity complex (MHC). The T cells in turn possess the T cell receptor (TCR) which may
connect with the antigen presenting MHC receptor (Fig.1.3). The T cells are distinguished into
two categories, the cytotoxic T cells (TC), which kill the APCs in case of an encounter, and
the T helper cells (TH) which initiate a secretion of soluble proteins called cytokines to induce
several different cell events. The cytotoxic cells use in addition to the TCR theCD8 (Cluster
Designation) receptor to detect the MHC of type I, whereas the T helper cells use theCD4 re-
ceptor to detect the MHC of type II. These complex recognition qualities are important security
mechanisms to make sure that there may not be any confusion in these complicated interactions
of cells [27].
1.3.4 Cluster Designation (CD)
Researchers in many scattered laboratories identified many of new lymphoid surface antigens
and termed them with self defined names. It became apparent that there were a vast amount
5
Introduction 1.3 Immunity
of various called antigens which seemed to be identically. Due to these confusions the cluster
designation (CD) system has been developed over the last few years. Now new investigated
antigens at first have to be termed ’CDw’ whereby ’w’ indicates the not yet being confirmed
label and within some years the label is changed to a true CD designation confirmed by an
international committee [6] [21]. A list of CD labels used in this thesis is given in appendix B.
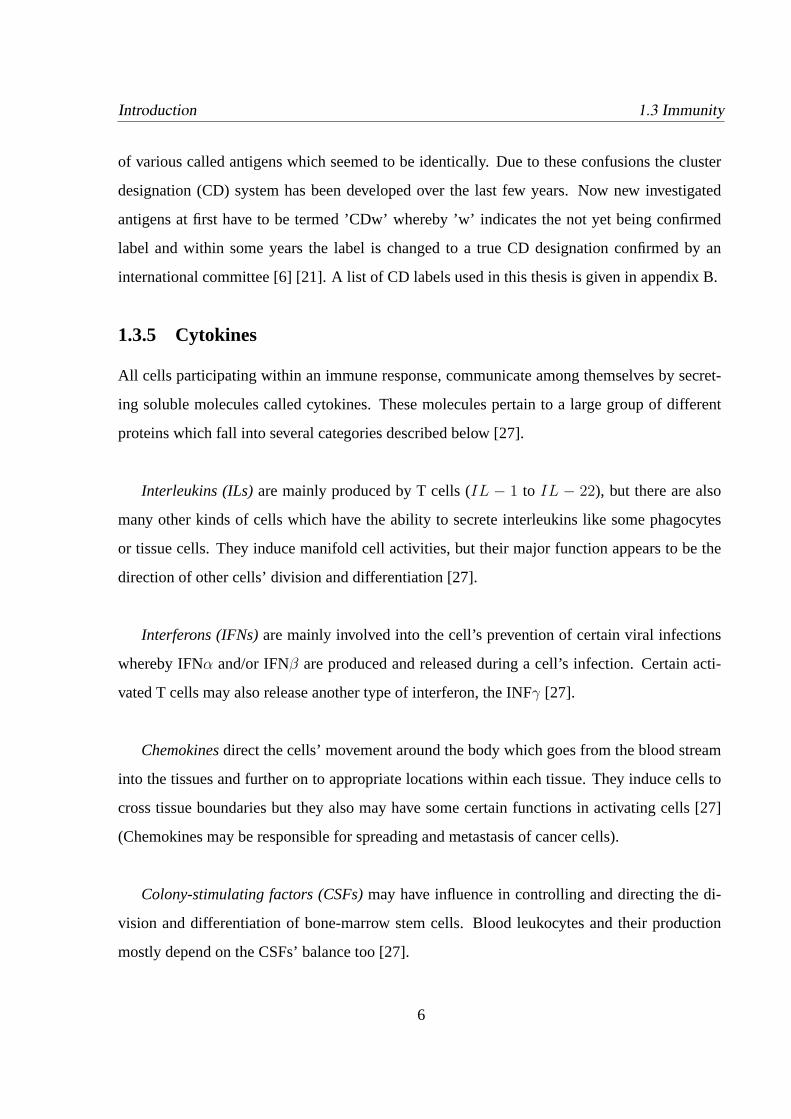
1.3.5 Cytokines
All cells participating within an immune response, communicate among themselves by secret-
ing soluble molecules called cytokines. These molecules pertain to a large group of different
proteins which fall into several categories described below [27].
Interleukins (ILs)are mainly produced by T cells (IL − 1 to IL − 22), but there are also
many other kinds of cells which have the ability to secrete interleukins like some phagocytes
or tissue cells. They induce manifold cell activities, but their major function appears to be the
direction of other cells’ division and differentiation [27].
Interferons (IFNs)are mainly involved into the cell’s prevention of certain viral infections
whereby IFNα and/or IFNβ are produced and released during a cell’s infection. Certain acti-
vated T cells may also release another type of interferon, the INFγ [27].
Chemokinesdirect the cells’ movement around the body which goes from the blood stream
into the tissues and further on to appropriate locations within each tissue. They induce cells to
cross tissue boundaries but they also may have some certain functions in activating cells [27]
(Chemokines may be responsible for spreading and metastasis of cancer cells).
Colony-stimulating factors (CSFs)may have influence in controlling and directing the di-
vision and differentiation of bone-marrow stem cells. Blood leukocytes and their production
mostly depend on the CSFs’ balance too [27].
6
Introduction 1.4 Tumour immunology
Other cytokineslike the tumour necrosis factors (TNFs) and transforming growth factors
(TGFs) have a partial effect in mediating inflammation and cytotoxic reactions [27].
All these protein molecules are secreted by the white blood cells and act like hormones by
having a major influence in cells’ interactions and behaviour. Although a lot of cytokines are
already known there remains a vast of unidentified functions they may induce.
1.4 Tumour immunology
It is well known that tumours may induce immunological responses. In the early19th century
Paul Ehrlich was one of the first who suggested that tumours might be regarded as similar to
grafted tissue which may be rejected by the host, if causing an immunological response. A first
approach revealed a regression of grafted tumour tissue in the host, but it came in discredit as
it was apparent that the regression was caused by the foreignness of the MHC receptors (every
individuum bears its own kind of MHC receptors). Hence it was established that tumours might
be rejected in presence of antigenic disparity between tumour and host. Later, when inbred
rodents became available, studies on animals bearing a tumour expressing identical MHC anti-
gens were accomplished and the term immune surveillance became more and more important
[27].
1.4.1 Immune surveillance
At first it was suggested that the immune system surveys and recognises abnormal cells in a
very early stage in order to destroy them. There were proposals that the immune system plays
a major part in delaying growth and causing regression of already established tumours. Some
evidences which arose are outlined below:
• Spontaneous regression of tumours occurred.
7
Introduction 1.4 Tumour immunology
• Postmortem data suggested that there may be more tumours than became clinically ap-
parent.
• Tumours arose frequently in immunosuppressed or immunodeficient individuals.
• Many tumours contained lymphoid infiltrates which may have been a favourable sign.
Despite these impressive evidences there was no proved correlation between immunosup-
pression and an increased tumour incidence. It rather seemed that the immune surveillance
acted against viruses which also might have caused tumoral spreading [27].
1.4.2 Tumour antigens
Abundant evidences have shown that almost all tumours indicate genetic alterations which lead
to the expression of mutated and sometimes overexpressed molecules. Tumour antigens were
first demonstrated by transplantation tests. When a tumour was grafted to an animal previously
immunized with inactivated cells of the same tumour, resistance to the graft was seen. There
are two known groups of tumour antigens:
• Tumour-specific antigenscaused by genetic mutations in tumour genes.
• Shared tumour antigensfound on several tumours induced by viruses.
It is important to explore a variety of new means which take the fact into account that the
immune system possesses the ability of recognising specific antigens on cells surfaces. This
specificity is of greatest importance in applying immunotherapies with T cells [27].
1.4.3 Immunotherapy
There is a long history behind immunotherapy but only during the last recent years it gained
more and more importance and is now established as a new reliable form of therapy for some
kinds of tumours. There are several forms of interventions like active or passive, specific or
non-specific treatments, but all of these remain currently in an experimental stage. Some of the
latest established therapies are listed below:
8
Introduction 1.4 Tumour immunology
• Immunization with tumour antigens
• Immunotherapy with cytokine can cause tumour regression
• Immunization against oncogenic viruses
• Therapy with lymphokine-activated killer cells
• Immunotherapy with T cells
• Therapy with antibodies
As already mentioned all these therapies may only act against some particular forms of can-
cer and are therefore very restricted in their appliance. But nonetheless there are a lot of studies
engaged with the development of new means pertaining to this kind of therapeutic treatments
[27].
9
Chapter 2
Objectives
The aim of this thesis is to develop a database for different immunological data and make it
accessible via a web interface. The database should be maintainable by an administrator or
different users with particular access admissions. A basic demand was an encryption of data
pertaining to patient and user specific information. Different upload routines and input masks,
which should be accessible via a web browser, have to be written in order to fill the database
with the required data.
Several query algorithms have to be established with which the requested information should
be aligned in an appropriate way for the clustering software.
Finally the database’s re-obtained immunological data should be brought into a clusterable
form in order to apply the different cluster algorithms to observe different expression patterns
in the same way, as it is already used for microarray data [29]. The received data should contain
all the different experiment and patient information for each patient, all aligned in a matrix
which can be clustered with particular algorithms. Some cluster results should be shown to
demonstrate the functionality and necessity of this project.
The major goals of this project will be separated into three main parts:
10
Objectives 2.1 Database development
2.1 Database development
The first part is to develop and design a database for immunological data which will arise
within several different FACS analyses of different kinds of sample material (lung cancer tissue,
pleural liquid, etc.) from patients and healthy donors. The database should be flexible and easily
extendable to ensure the possibility of adding new tables and relations.
2.2 Application server deployment
For the second part the business logic should be programmed and deployed to an application
server to map the entity relations of the database in an appropriate and easy accessible way for
other client programs. The application server should bear the business logic and separate and
hide the data management layer from the accessing client layer. The data management should
contain the up- and download routines as well as the data maintaining methods.
2.3 Web application development
To make the data accessible for clients the third part should be the development of a web applica-
tion that communicates with the application server which processes the data from the database.
By using a browser the web server can be accessed by an appropriate web address. The server
creates and returns html pages which contain the requested information for the user.
11
Chapter 3
Methods
This chapter will give a brief survey of the FACS technology in respect to phenotypic and
functional analyses of immune cells. Further it will give a survey of current Java technologies
with regard to establishing server side applications with database connections. First it shows
the data storing layer, next it leads through the business logic up to the web server application
layer and finally faces the user’s web interface.
3.1 Fluorescent-activated cell sorter (FACS)
Flow cytometry is a powerful means in modern biology and has already gained a key position
in immunology and cell biology. It can be used to separate various kinds of cells using different
stainings of their diverse surface markers. It also allows examining the number of cell cycles
with intracellular immunofluorescence. The FACS was designed for an automatic separation
and analysis of fluorescently stained cells. The diluted cells pass through a thin vibrating nozzle
forming very small droplets which contain just one cell at a time. These cells are detected one by
one passing a laser beam which measures the wavelength and the intensity of their fluorescence
at a time. Dependent on this information the type and the size of one single cell can be examined
and displayed in an appropriate scatter plot (Fig.3.1). Newer FACS equipments may recognize
more than two different fluorescence colours at one time, thus it is possible to mark the cells’
surface antigens with several fluorescently stained antibodies to isolate different cell populations
12
Methods 3.1 Fluorescent-activated cell sorter (FACS)
[27] [10].
Figure 3.1: Left: FACS with two dye channels FL1-H and FL3-H. Right: Scatter plot withhistogram [27]
Every dot in a two dimensional scatter plot indicates a particular fluorescently marked cell
whereby the two detected fluorescent intensities (FI) are displayed in a logarithmic scale on each
axis. The mean fluorescent intensity (MFI) of one dye channel is the fluorescence intensity of
one species of equal stained antibodies adhered to the cell surface. The histogram plot indicates
the amount of cells with a certain fluorescent intensity.
3.1.1 FACS analyses
For this thesis various samples of patients and healthy donors were available. The samples were
obtained from several volunteers of different hospitals. Thus currently received samples are
listed in Table 3.1.
The used FACS (FACSCALIBUR from BECTON DICKINSON) was equipped with two
lasers allowing the recognition of four colour staining at one time. Hence for all FACS experi-
ments four different surface markers can be applied to examine four different surface antigens
simultaneously.
13
Methods 3.1 Fluorescent-activated cell sorter (FACS)
Donor Sample material Primitive cancer Cancer type Cancer subtype
Healthy blood, pleural liq-uid, purified Tcells
- - -
Patient tumour, lymphn-ode, pleural liq-uid, blood, not tu-moral biopsy
lung, breast,colon
KBP, MesM, K2 ADK, Kepi, K1P,NOS, Infl., Sark.
Table 3.1: Sample material list
3.1.2 Sample treatments
To prepare the different samples for the FACS analyses, several material treatments have to be
done, in order to extract the cells of interest.
Dilacerations are done to break up solid sample materials to bring them into an utilisable
form for further processing.
Ficoll is used on all sample materials to separate the immunologic cells of interest (leuko-
cytes) from the remaining blood compartment (red blood cells, dead cells, necrotic cells etc.).
The achieved leukocytes are purified, diluted and mixed with different fluorescent stained anti-
bodies later on to prepare it for the different FACS analyses.
Proliferation experiments are performed before and/or after T cell purification. The cells are
activatedandstimulated with different stimulus (cytokines, antibodies, mitogens etc.) and the
following proliferation was analysed by the FACS.
Purification of cell mixture with the monoclonal antibodies has to be done in order to isolate
T cells for proliferation assays and RNA extraction. There are several purification kits available
dependent on ensuing analyses and starting material. If there is a sufficient amount of cells
RNA extractions may be done for subsequent microarray experiments.
14
Methods 3.1 Fluorescent-activated cell sorter (FACS)
3.1.3 Phenotype analysis
A phenotypeis a physical manifestation of internally coded, inheritable information of ageno-
typewhich encodes and maintains the cells entire behaviours and structures [4]. Hence a phe-
notype analysis tries to examine different cell populations within a multicomponent mixture of
cells. The only way in doing this is to use different signs which are common within a partic-
ular cell subpopulation. In immunology the easiest way to distinguish between different cell
populations is to use monoclonal antibodies against the multiplicity of a cell’s surface markers
which are specific for a certain population.
The phenotype analysis starts with the proportioning of the prepared cell dilution into sev-
eral tubes. Each tube’s cell mixture is stained by using four different species of antibodies
marked with different fluorescent dyes. The fluorescent antibodies bind to their specific antigen
receptors and in subsequent FACS analyses they reveal the cells’ characteristics.
Tube FL1H FL2H FL3H FL4H
1 IgG1 IgG1 IgG1 IgG12 CD19 CD56 CD3 CD143 CD4 CD103 CD3 CD694 CD1a CD83 CD45 CD14
Table 3.2: FACS tube list
FL1H to FL4H mark the different fluorescent dyes. The IgG1 inTube 1 is an immuno glob-
ulin which binds with itsFC region end toFC receptors. Thus it is used for a calibrating process
to reveal the amount ofFC receptors on the cell’s surface because specific antigens may also
bind to theFC receptors and falsify the FACS result. The calibration process starts by inserting
the first tube (with the four different stained IgGs) into the FACS whereby each of the acquired
scatter plots indicates a cloud of points lying close together. This cloud is used to calibrate the
axes of the scatter plot by moving it into the left lower quadrant. All of the following analyses
use this adjustment, which defines if a cell has a positive (points above the axis) or negative
(point below the axis) expression of a certain surface marker.
15
Methods 3.1 Fluorescent-activated cell sorter (FACS)
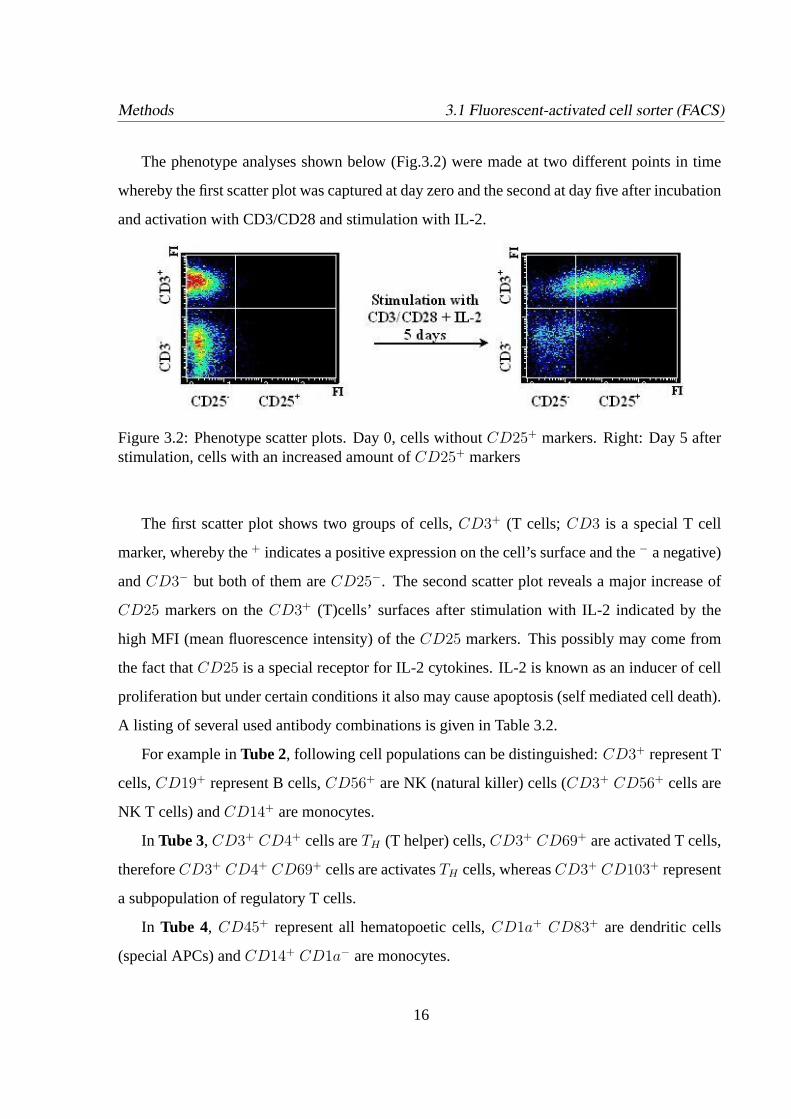
The phenotype analyses shown below (Fig.3.2) were made at two different points in time
whereby the first scatter plot was captured at day zero and the second at day five after incubation
and activation with CD3/CD28 and stimulation with IL-2.
Figure 3.2: Phenotype scatter plots. Day 0, cells withoutCD25+ markers. Right: Day 5 afterstimulation, cells with an increased amount ofCD25+ markers
The first scatter plot shows two groups of cells,CD3+ (T cells; CD3 is a special T cell
marker, whereby the+ indicates a positive expression on the cell’s surface and the− a negative)
andCD3− but both of them areCD25−. The second scatter plot reveals a major increase of
CD25 markers on theCD3+ (T)cells’ surfaces after stimulation with IL-2 indicated by the
high MFI (mean fluorescence intensity) of theCD25 markers. This possibly may come from
the fact thatCD25 is a special receptor for IL-2 cytokines. IL-2 is known as an inducer of cell
proliferation but under certain conditions it also may cause apoptosis (self mediated cell death).
A listing of several used antibody combinations is given in Table 3.2.
For example inTube 2, following cell populations can be distinguished:CD3+ represent T
cells,CD19+ represent B cells,CD56+ are NK (natural killer) cells (CD3+ CD56+ cells are
NK T cells) andCD14+ are monocytes.
In Tube 3, CD3+ CD4+ cells areTH (T helper) cells,CD3+ CD69+ are activated T cells,
thereforeCD3+ CD4+ CD69+ cells are activatesTH cells, whereasCD3+ CD103+ represent
a subpopulation of regulatory T cells.
In Tube 4, CD45+ represent all hematopoetic cells,CD1a+ CD83+ are dendritic cells
(special APCs) andCD14+ CD1a− are monocytes.
16
Methods 3.1 Fluorescent-activated cell sorter (FACS)
3.1.4 Proliferation analysis
The proliferation analysis tries to examine the cells’ behaviour of cell division and augmentation
under certain activation and stimulation conditions. To observe cell proliferation Carboxy-
fluorescein diacetate, succinimidyl ester (CFSE) a red fluorescent dye is used for an intracellular
staining of all cells. Within each cell division the CFSE amount and therefore the MFI bisects
and diminishes.
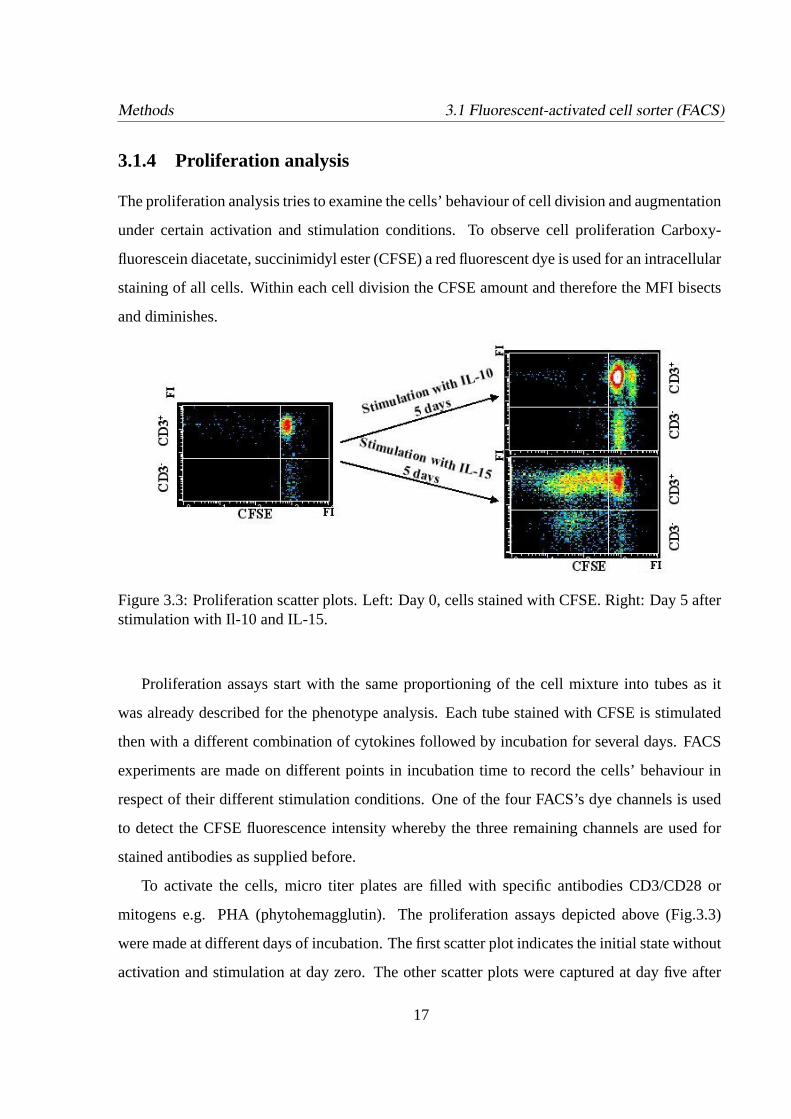
Figure 3.3: Proliferation scatter plots. Left: Day 0, cells stained with CFSE. Right: Day 5 afterstimulation with Il-10 and IL-15.
Proliferation assays start with the same proportioning of the cell mixture into tubes as it
was already described for the phenotype analysis. Each tube stained with CFSE is stimulated
then with a different combination of cytokines followed by incubation for several days. FACS
experiments are made on different points in incubation time to record the cells’ behaviour in
respect of their different stimulation conditions. One of the four FACS’s dye channels is used
to detect the CFSE fluorescence intensity whereby the three remaining channels are used for
stained antibodies as supplied before.
To activate the cells, micro titer plates are filled with specific antibodies CD3/CD28 or
mitogens e.g. PHA (phytohemagglutin). The proliferation assays depicted above (Fig.3.3)
were made at different days of incubation. The first scatter plot indicates the initial state without
activation and stimulation at day zero. The other scatter plots were captured at day five after
17
Methods 3.1 Fluorescent-activated cell sorter (FACS)
stimulation with IL-10 or IL-15. The IL-15 stimulation reveals a considerably amount of cell
divisions ofCD3+ cells whereas IL-10 seems to inhibit cell proliferation.
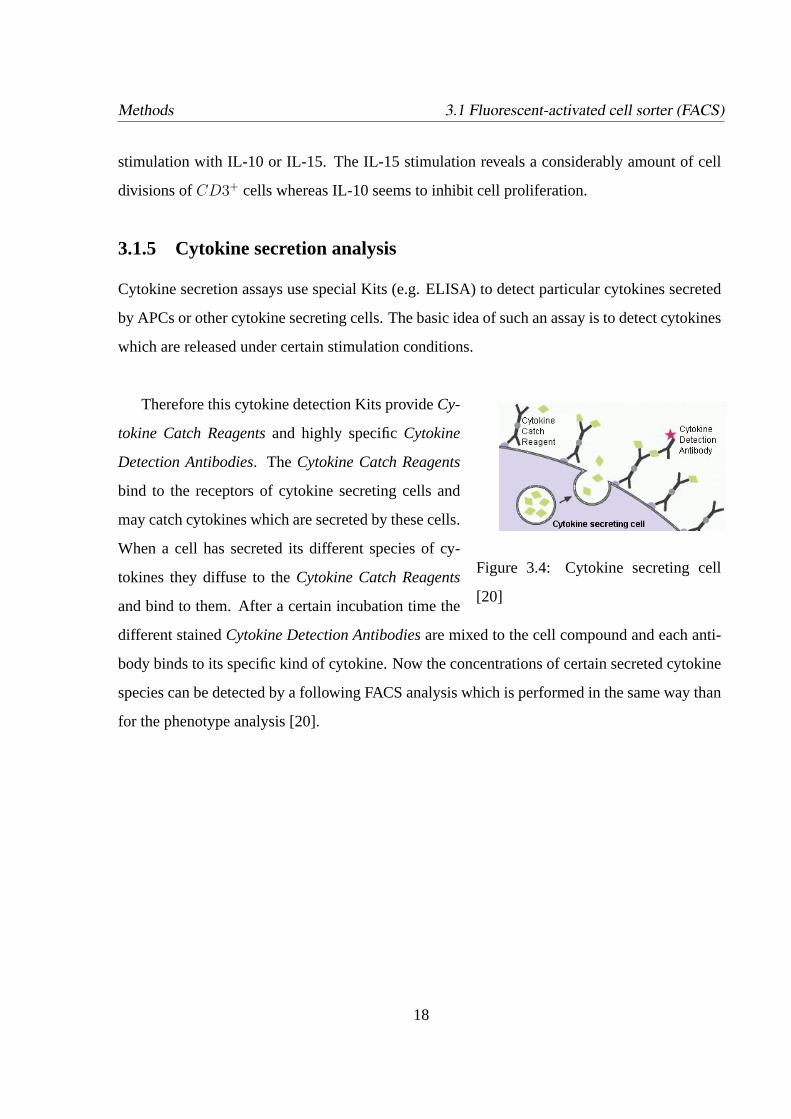
3.1.5 Cytokine secretion analysis
Cytokine secretion assays use special Kits (e.g. ELISA) to detect particular cytokines secreted
by APCs or other cytokine secreting cells. The basic idea of such an assay is to detect cytokines
which are released under certain stimulation conditions.
Therefore this cytokine detection Kits provideCy-
Figure 3.4: Cytokine secreting cell
[20]
tokine Catch Reagentsand highly specificCytokine
Detection Antibodies. The Cytokine Catch Reagents
bind to the receptors of cytokine secreting cells and
may catch cytokines which are secreted by these cells.
When a cell has secreted its different species of cy-
tokines they diffuse to theCytokine Catch Reagents
and bind to them. After a certain incubation time the
different stainedCytokine Detection Antibodiesare mixed to the cell compound and each anti-
body binds to its specific kind of cytokine. Now the concentrations of certain secreted cytokine
species can be detected by a following FACS analysis which is performed in the same way than
for the phenotype analysis [20].
18
Methods 3.2 Database development (Enterprise Information System (EIS)-Tier)
3.2 Database development (Enterprise Information System
(EIS)-Tier)
3.2.1 Relational databases
Relational databases are rested upon the theory of relational mathematics based on the set the-
ory. The basic idea behind relational database models is a collection of two-dimensional tables,
linked among themselves by different keys. Real world objects are mapped by abstract entities
which are represented by their according tables [11]. Tables are storing information about in-
stances of entities, their attributes and their relations among each others. Every entity instance
consisting of a unique record (tuple) of data represents a row in the table . The uniqueness
of each data record is based on one well-defined primary key (PK) whose occurrence must be
unique within each table. To realise one to many (1:N) or many to one (N:1) interrelations, data
records must contain primary keys of foreign tables, called foreign keys (FK). An implementa-
tion of many to many (N:N) relations requires an additional table storing explicit allocations of
different foreign keys. The fact of defined relations allows the stored data to be broken down
into smaller logical and easier maintainable units. Some good reasons why relational databases
should be used are outlined below:
• Reducing of duplicate data:Leads to improved data integrity
• Data independence:Data can be thought of as being stored in tables regardless of how
physically stored
• Application independence:The database is independent of accessing systems and pro-
grams
• Data sharing with a multiplicity of users
• Single queries may retrieve data from more than just one table
19
Methods 3.2 Database development (Enterprise Information System (EIS)-Tier)
3.2.1.1 Normalisation
Normalisation is used to break up araw database into logical and easy maintainable units called
tables. The idea is to create a level of minimized redundancy that allows two or more tables
to be joined within a single query. To realise such an implementation certain theoretical rules,
callednormal forms, have to be performed. There are six nested normal forms but in generally
the first three are used to meet the requirements of a well-formed business database.
First normal form (1NF): All attributes must be atomic and there must not be any repeating
values whereby each row/column intersection may have just one value [11].
Second normal form (2NF): The table must be in 1NF and there must not be any partial
dependencies in a table. Hence every non prime attribute must be fully functionally dependent
on a primary key.
Third normal form (3NF): table must be in 2NF and there must be no transitive dependencies
hence the value of a non-key attribute must not depend on another non-key’s value.
3.2.1.2 Integrity rules
There are three integrity rules which have to be performed in a well-designed database.
• Key constraint:Candidate keys are defined for each relation and must be unique for every
tuple in any relation instance of that schema.
• Entity integrity:All values pertaining to the primary (PK) must be no ’null’ values. Each
tuple must be uniquely identifiable.
• Referential integrity:There must not exist any foreign key (FK) in the database which is
not another table’s primary key [11] [25].
To prevent violations of integrity rules some safety precautions, like the interdiction of PK
alterations or a cascading alteration of all entries associated to the PK in case of an inevitable
change of the PK can be taken into account.
20
Methods 3.2 Database development (Enterprise Information System (EIS)-Tier)
3.2.2 Structured Query Language (SQL)
The father of relational databases, and thus SQL, is Dr. E.F. ’Ted’ Codd who worked for IBM.
After Codd described a relational model for databases in 1970, IBM spent a lot of time and
money researching how to implement his ideas [9]. Now SQL has already evolved into a stan-
dard, open language without cooperative ownership and almost all nowadays available database
implementations are designed to meet the SQL standards. SQL pertains to the category of non
procedural languages called declarative languages. In opposition to procedural languages which
result in many lines of code, SQL results in just one statement of the desired demand. A single
database query consists of a SQL statement which includes all desired requests. This statement
is sent then to the database management system (DBMS) which executes a hidden internal code
and returns a somehow defined dataset [9]. There are two possibilities in accomplishing data
manipulations with SQL: commands which return demanded datasets are defined in the data
manipulation language (DML) and manipulating commands which alter the database’s internal
structures use the data definition language (DDL).
3.2.2.1 Data Definition Language (DDL)
The DDL is a sub section of SQL allowing the creation and deletion of tables in the database
as well as the definition of indexes (keys) and links between tables. It is also possible to enable
constraints among different tables, defined by foreign keys[7]. Some of the most important
DDL commands are listed below:
• CREATE TABLE -creates a new database table
• ALTER TABLE -alters (changes) a database table
• DROP TABLE -deletes a database table
• CREATE INDEX -creates an index (search key)
• DROP INDEX -deletes an index
21
Methods 3.2 Database development (Enterprise Information System (EIS)-Tier)
3.2.2.2 Data Manipulation Language (DML)
The DML defines the second part of SQL commands. It includes the syntax for complex queries
as well as for updates, insertions and deletions of data records [7]. The four basic manipulation
commands are outlined below:
• SELECT -extracts data from a database table
• UPDATE -updates data in a database table
• DELETE -deletes data from a database table
• INSERT INTO -inserts new data into a database table
The basic body of almost all query statements is given in the following example:
• TheSELECT statement creates a recordset from existing tables according to the param-
eters that follow the statement.
• TheFROM command apprises the database engine to return all the fields in the selected
tables. The fields specified in the SQL statement become the columns in the new record-
set.
• TheWHERE condition restricts the rows returned to only rows containing the data spec-
ified in the SQL statement.
• TheORDER BY command notifies the database engine to sort the records before return-
ing them.
Example: SELECT address FROM patients WHERE ( name = ’...’)
3.2.3 Java Database Connectivity (JDBC)
JDBC is a low-level API (application programming interface) performed in Java programming
language [11] which allows an external access to any SQL database to manipulate and update
22
Methods 3.2 Database development (Enterprise Information System (EIS)-Tier)
stored data. It provides library routines which supports the integration of direct SQL calls into
the Java programming environment. These routines support an interface which makes it very
easy to access the database by opening a connection and send SQL code to the database engine
which executes the demanded commands. Having accomplished the request the Java program
closes the connection and continues with its execution [31]. Java is already a well-established
web programming language and in combination with JDBC it becomes an extremely useful
tool in generating web based database applications. Due to Java’s platform independence it is
an extremely useful tool no matter which operating system is used [30]. Compendious JDBC
makes it possible to do three things:
• Establishes a connection to a database
• Sends SQL queries
• Processes and returns the results
3.2.3.1 Two-tier and Three-tier Models
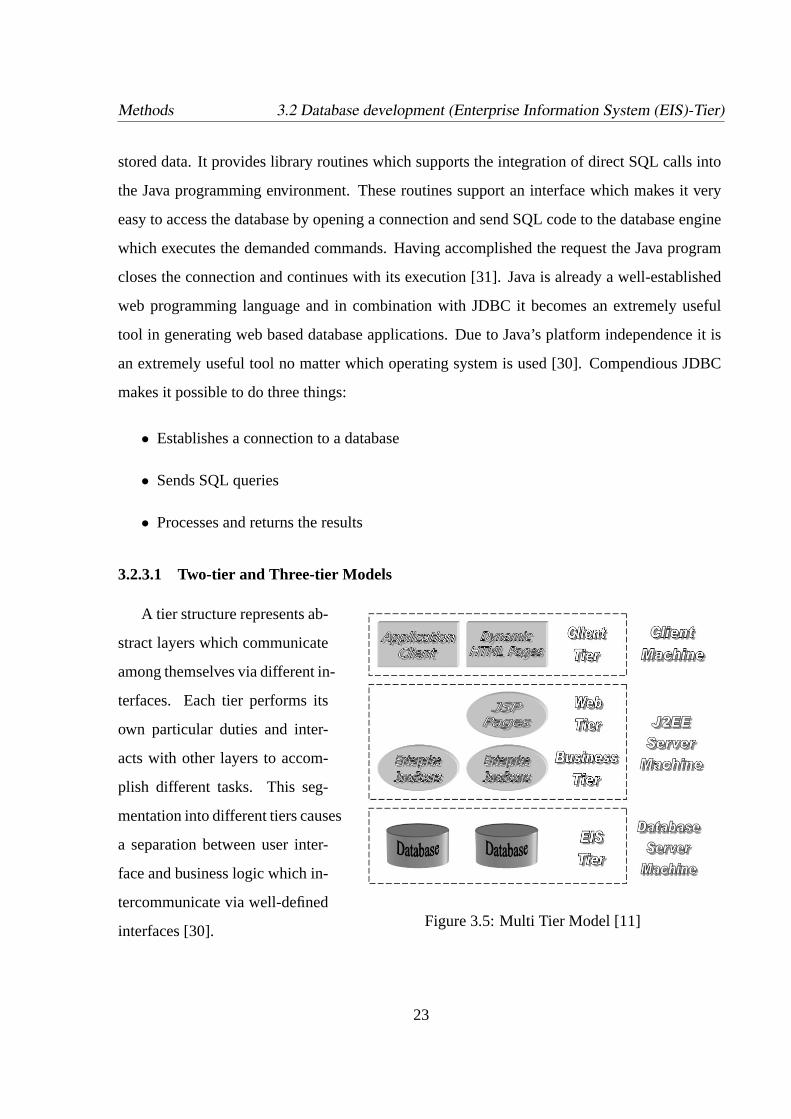
A tier structure represents ab-
Figure 3.5: Multi Tier Model [11]
stract layers which communicate
among themselves via different in-
terfaces. Each tier performs its
own particular duties and inter-
acts with other layers to accom-
plish different tasks. This seg-
mentation into different tiers causes
a separation between user inter-
face and business logic which in-
tercommunicate via well-defined
interfaces [30].
23
Methods 3.3 Application server deployment (Middle-Tier)
Two-tier models may be java applications or applets which directly access the database.
Therefore a JDBC driver is needed which can communicate with the particular DBMS to send
SQL statements to the database. If the database is located on another machine it is called a
client/server configuration, whereby the accessing application acts as client. The connection
may be established via intranet or internet standard TCP/IP protocols [30].
Three-tier models (see Fig.3.5) use a middle layer the ’middle-tier’ which receives com-
mands from two different sides. The middle-tier conduces as service layer which executes
commands obtained from the user layer and sends them to the database. The database (EIS-
Tier) in turn processes the received SQL commands and returns the appropriate results to the
middle tier which then sends them to the Client-Tier. The major advance of a middle-tier is an
encapsulating of low-level calls hidden for the user who may access them by a high-level appli-
cation interface (Client-Tier). This architecture may also provide performance and maintaining
advantages [30].
3.3 Application server deployment (Middle-Tier)
3.3.1 Enterprise Java Beans 2 (EJB2)
EJBs are business data objects developed in java technology running in an EJB container sup-
ported by Java 2 Enterprise Edition (J2EE) application servers. The encapsulation mechanism
of EJBs allows the developer to concentrate on assignments belonging to his own business,
without caring about the beans’ interactions with the container. EJBs may be accessed by an
abundance of different users with appropriate admissions. The major advantage of EJBs is its
portability among a variety of application servers supporting the J2EE container specification
[13] [1]. The major improvement of EJB2 is the advanced EJB QL (Query Language) allowing
complex queries with optimised SQL statements mixed with Java code. EJBs fall into three sub
groups enumerated below:
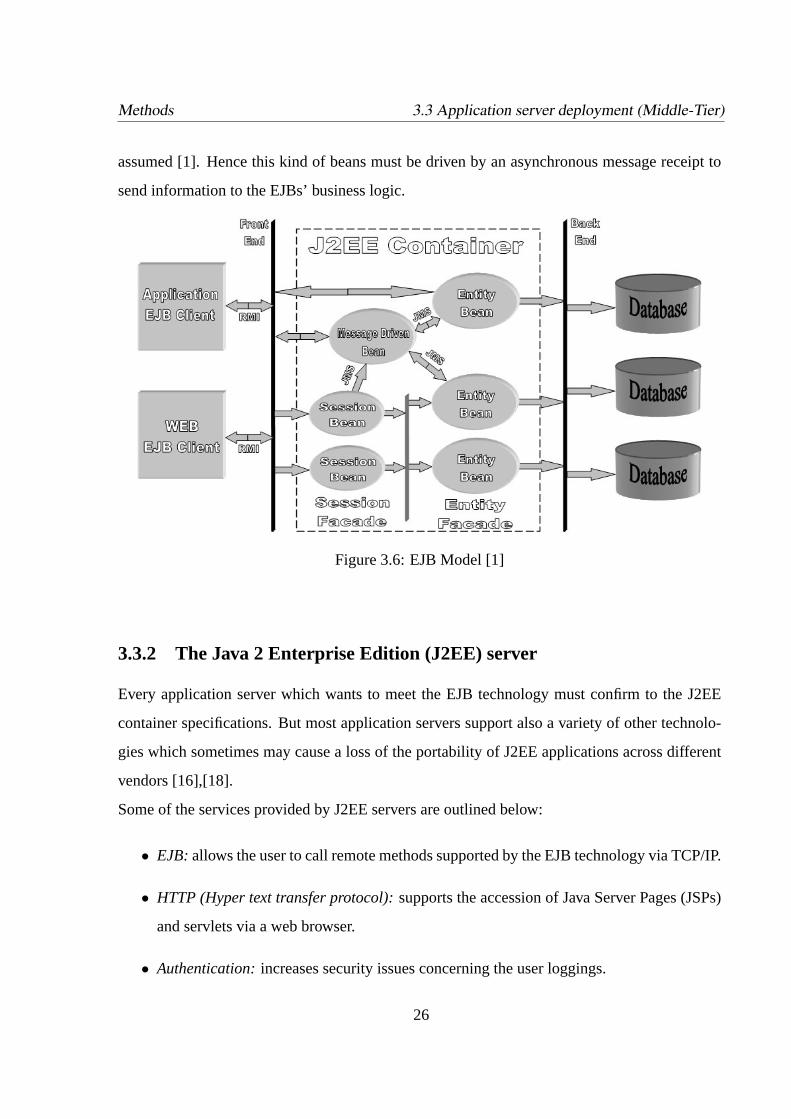
Session beans:This kind of beans account for the first layer of an EJB structure model (see
Fig.3.6) seen by the client and mainly support getter and setter methods for the client. Thus
24
Methods 3.3 Application server deployment (Middle-Tier)
Session Beans comprise the main part of the client’s business logic for accessing the data layer.
As implied by their name, session beans only exist during on single session by executing one
specific remote method invocation. To speed up client connections session beans, once if they
were used, are sent to a pool where they wait for other invocations [1]. Session beans may be
subdivided into two groups:
• Stateless session beansdo not maintain their state among different method invocations.
• Stateful session beanshold the client state across method invocations.
Entity beans: These are beans persisted within the EJB container (see Fig.3.6) for a di-
rectly mapping of database entries. One entity bean corresponds exactly to one table within the
database, whereby each table’s entry accords with setter and getter methods defined in the en-
tity bean. These entity accessing methods may be invoked by session beans in case of a client’s
request. The entity layer therefore is a mediator between databases and session beans by hiding
the database’s specific accessing language from the developer [1]. Entity beans fall into two
groups:
• Container-managed persistence (CMP)- In case of a CMP the container must supply the
full synchronisation between the database and the entity layer. The container ensures the
consistency and integrity during the beans’ entire lifetime. The developer does not care
about how the beans access the database, but it is important that the underlying database
is relational in nature.
• Bean-managed persistence (BMP)- In case of a BMP the programmer is entirely respon-
sible for all the synchronising steps to connect the entity beans with the database. All the
necessary SQL statements and JDBC calls must be coded by the programmer. The ad-
vantage of this kind of persisting entity beans is the full control over all actions pertaining
the database, allowing an access optimisation [1].
Message driven beans:Message deliveries in contrast to method invocations are asyn-
chronous. Therefore an availability of the bean at the time of an occurring message can not be
25
Methods 3.3 Application server deployment (Middle-Tier)
assumed [1]. Hence this kind of beans must be driven by an asynchronous message receipt to
send information to the EJBs’ business logic.
Figure 3.6: EJB Model [1]
3.3.2 The Java 2 Enterprise Edition (J2EE) server
Every application server which wants to meet the EJB technology must confirm to the J2EE
container specifications. But most application servers support also a variety of other technolo-
gies which sometimes may cause a loss of the portability of J2EE applications across different
vendors [16],[18].
Some of the services provided by J2EE servers are outlined below:
• EJB:allows the user to call remote methods supported by the EJB technology via TCP/IP.
• HTTP (Hyper text transfer protocol):supports the accession of Java Server Pages (JSPs)
and servlets via a web browser.
• Authentication:increases security issues concerning the user loggings.
26
Methods 3.3 Application server deployment (Middle-Tier)
• JNDI (Java Naming and Directory Interface):enables the location of programs and ser-
vices within the J2EE platform.
3.3.3 Java Cryptography Extension (JCE)
JCE is a non-commercial cryptography extension for Java containing a package which provides
implementations for encryption, key generation and key agreement, and Message Authentica-
tion Code (MAC) algorithms [19]. It is an extremely valuable encipher tool for information of
a high security level. Restrictions to applets or application may be specified in certain ’jurisdic-
tion policy files’ dependent on their different jurisdiction context (location). Some features of
interest are listed below [19]:
• JCE is a pure java implementation
• Implementations and interfaces of ciphers, key agreements, MACs, etc.
• Support for the following algorithms by the SunJCE provider:
– DES
– DESede
– Blowfish
– PBEWithMD5AndDES
– Diffie-Hellman key agreement among multiple parties
– HmacMD5
– HmacSHA1
3.3.4 Extensible Markup Language (XML)
XML was developed by the W3C between 1996 and 1998 to provide a universal format for
describing structured documents and data; in other words, it allows data to be self-describing
[12]. XML tries to bring information into a clearly arranged text form storable in flat files.
27
Methods 3.4 Web application development (WEB-Tier)
Analogical to HTML (Hyper Text Markup Language) XML uses tags which may be defined
in DTDs (Document Type Definition) by the programmer arbitrarily [28]. DTDs describe in
a formal way which names are to be used for the different types of tag elements, where they
may occur, and how they all fit together. A well-defined tree structure makes it easy to parse
XML files to extract information. Different from HTML which is used to define the display of
web pages, XML’s is applied to store and transmit information whereby it is often used to save
configurations.
The most important reason of using XML files is their quality of storing information outside
of an program application. Hard coded (binary) constants may be separated into XML files
which are easily modified without changing the applications source code.
3.3.5 JDOM (Java Document Object Model)
JDOM is an open source library for Java-optimised XML data manipulation similar to DOM
(Document Object Model) but not build on it. The DOM model tries to represent documents
as a hierarchy of Node objects which may have child Nodes of various types. JDOM supplies
methods for an easy and efficient reading of XML files and is not an XML parser, but rather a
document object model that uses XML parsers to build documents whereby nearly any parser
may be used [8].
3.4 Web application development (WEB-Tier)
3.4.1 Java Server Page (JSP)
Java Server Page technology has been developed to provide an easy and intuitive way in creating
dynamical generated HTML pages. JSPs are like HTML pages but in addition to the static
HTML tags JSPs may contain Java code and specific tags, which account for the dynamic
generated part. By carrying the extension *.jsp the web engine of a JSP supporting web server
compiles the JSPs to servlets which are launched then in the web container to perform their
demanded tasks. Servlets running on the web server are similar to applets which are running
28
Methods 3.4 Web application development (WEB-Tier)
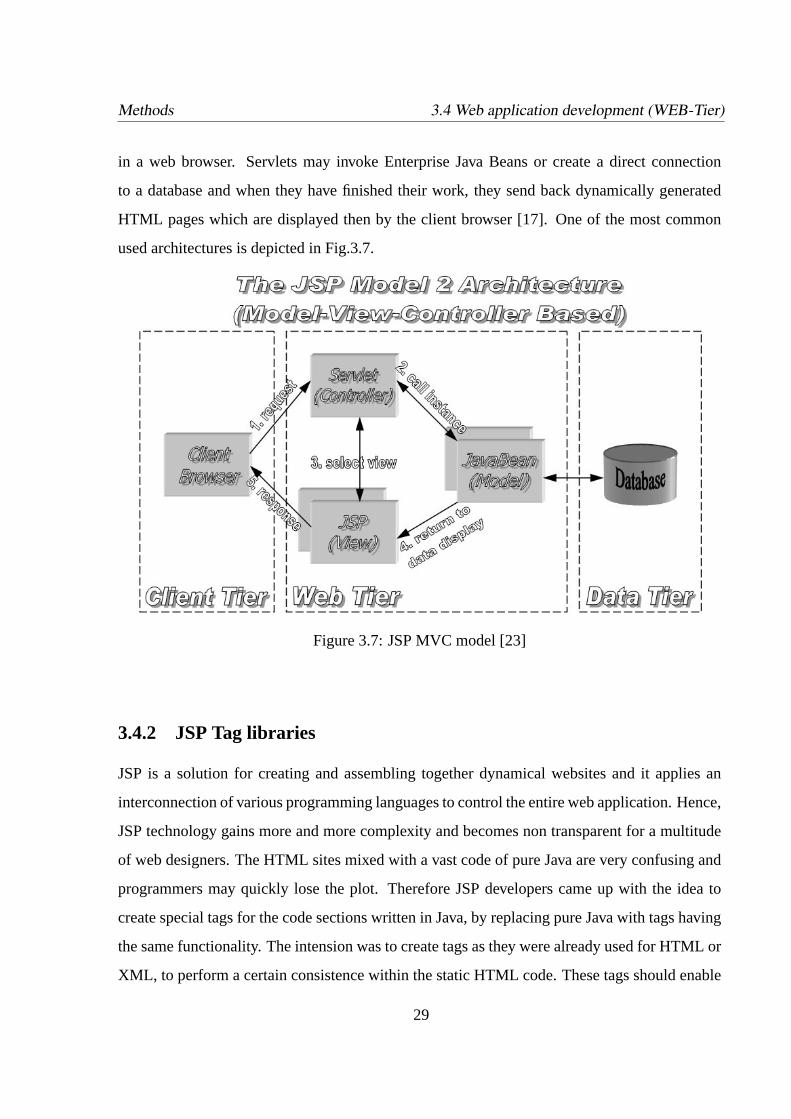
in a web browser. Servlets may invoke Enterprise Java Beans or create a direct connection
to a database and when they have finished their work, they send back dynamically generated
HTML pages which are displayed then by the client browser [17]. One of the most common
used architectures is depicted in Fig.3.7.
Figure 3.7: JSP MVC model [23]
3.4.2 JSP Tag libraries
JSP is a solution for creating and assembling together dynamical websites and it applies an
interconnection of various programming languages to control the entire web application. Hence,
JSP technology gains more and more complexity and becomes non transparent for a multitude
of web designers. The HTML sites mixed with a vast code of pure Java are very confusing and
programmers may quickly lose the plot. Therefore JSP developers came up with the idea to
create special tags for the code sections written in Java, by replacing pure Java with tags having
the same functionality. The intension was to create tags as they were already used for HTML or
XML, to perform a certain consistence within the static HTML code. These tags should enable
29
Methods 3.4 Web application development (WEB-Tier)
an easy accession and usage of Java extensions for non Java programmers and web designers
[5].
A Tag is represented by a well-defined syntax which exactly constitutes where it starts and
where it ends. Tags are enclosed by angled brackets which may bear attributes defining the
tag’s behaviours and it may embed information or further hierarchically arranged tags (in case
of XML files) in its body. An example is given below:
< tag1attribute1=’value1’ attribute2=’value2’ >
The tag‘s body ...
< / tag1>
Tags are used to store information in text oriented flat files and due to their well-structured
form they are easily parsed in turn. It depends on the application how to handle and translate
the parsed file’s information. So if the application is a web browser, the information file will
be interpreted in a graphical way displayed on a screen. In case of a JSP the engine of the
web server processes the *.jsp file and generates a servlet by using the JSP tags. Every JSP
tag possesses its own special Java tag class which defines the tag’s behaviours and contains the
pertaining Java code which was previously defined in the JSP. The attributes the tags possibly
have, are associated with the tags’ class initialising setter and getter methods. These tag classes
are used by the web engine to compile the servlet class which processes the associated tasks
and returns the result to the client’s web browser. A tag library now stores packages of different
tag classes in a clearly arranged way hidden for the JSP developer who merely sees the JSP tags
he is using [5]. Some of the major advantages of JSP tags:
• The average web designer can now maintain JSP sites
• Tags are portable within different web applications
• Tags speed up web developments by reusing Java code
• Tags are easily extendible by additional functionality
30
Methods 3.4 Web application development (WEB-Tier)
3.4.3 The Jakarta Struts Framework
Struts is the first open source framework supporting web design practises along with the thought
of the JSP Custom Tag technology. It was developed by Craig R. McClanahan who freely
offered the source to the Apache Software Foundation [5].
Struts implements the previous mentioned Model 2 JSP web application architecture (Fig.3.7)
that uses a servlet asController for dispatching the incoming requests, a Java Bean representing
theModelpart which stores the data for the request, and a JSP visualising the data to the user
accounts for theView part. Hence Struts represents the perfect decoupling of business logic,
application control and presentation [5] [24]. Other benefits to Struts are:
Extensive JSP Custom Tag libraries:which reduce the major part of Java scriptlet code
from the Java Server Pages and enable its reusability.
A generally reduce of code for web applications:by supplying a well tested base of
software technology.
A support of internationalisation for web applications: the web sites are dynamically
updated with the appropriate language of the operating system.
3.4.4 Struts Application Flow
The following characterisation of how Struts is handling a user request refers to Fig.3.8 depicted
below:
1. The first step to invoke a Struts web application is to open an appropriate web site which
sends a request to the Action Servlet controller by triggering a submit action (e.g. a button
or invoking a site).
2. Receiving the request the Action Servlet checks the Action Mappings and instantiates
an Action Form Bean which pertain to the invoking HTML form, to store then the form
fields’ information. The Action Form Bean bears a validation method which cancels the
user’s request if wrong parameters have been entered. In this case the Action Servlet
sends back the previous invoked JSP and indicates the occurred error messages.
31
Methods 3.4 Web application development (WEB-Tier)
Figure 3.8: Process flow for displaying a JSP page within a Struts Project [5]
3. If no insertion faults occur the Action Servlet calls the suitable Action Bean dependent
on the Action Mapping’s information.
4. This Action Bean may invoke the associated Action Form Bean’s methods to gather its
information in order to start data transactions with EJBs or databases directly.
5. Start of the data transaction.
6. After the data transactions are done the Action Bean may invoke the Action Form Bean
to store back new data again.
7. By having done this, the Action Bean calls a forward method which accesses the Action
Mappings again whereby these mappings now indicate the JSP page which should be
displayed next. Every forward requests a different or even the same JSP page depending
on the Action Bean’s state.
8. The Action Servlet sends a request the JSP claimed by the action forward and in case of
its first invocation, the web container will compile the JSP into a servlet class.
32
Methods 3.4 Web application development (WEB-Tier)
9. The JSP servlet calls and includes demanded tag libraries in its method, processing and
generating dynamically the HTML code by including the Action Form Bean’s data and
the JSP’s own HTML code.
10. The following response called by the JSP servlet returns the generated HTML code to the
Action Servlet.
11. The Action Servlet in turn induces its own response and delivers the HTML code back to
the browser. The browser parses the HTML code and visualises the web site for the user.
33
Chapter 4
Results
This chapter will present the developed data model for the Tumoral Micro Environment database
(TME.db) for storing the immunological data, which was obtained from different cancer pa-
tients and controls. Further the functionality of the developed web application will be shown by
giving some maintaining and querying examples. Finally some cluster experiments, performed
with re-obtained and particular aligned FACS and patient data, will be shown.
4.1 The Database Model
The first part for storing all the arising immunological data as well as the donor specific infor-
mation was to develop an appropriate, flexible and easily maintainable data model. The data
tables should be broken up into smallest possible units to ensure best flexibility among different
data tables. To realise an adequate model a relational database management system (Oracle)
was chosen for gathering the data. Oracle was the best choice because it has already been used
by the bioinformatics work group for several database projects like GOLD.db or MARS.db. All
considerations due to the table design were accomplished in regard to real world’s facts in order
to create an intuitive data model.
34
Results 4.1 The Database Model
4.1.1 Patient and Experiment Table
The core of the data model is embodied by thePatientsand theExperiments table represented
by the red tables (see appendix A). The patient table contains specific personal information
about the donors of the sample materials whereby all the data is encrypted with a special algo-
rithm supported by JCE. The patient table is linked to theHospitals table within a many to one
relation as well as one patient may have links to many experiments stored in the experiment
table.
TheExperiments table comprises all the information related to the experiment , and by hav-
ing an one to many relation to all the possible experiment tables, it links the database’s entire
available information (Therapies→ orange section, Cancers→ blue section, Biolmarkers→
yellow section, Proliferations→ pink section, Sampletreatments→ blue section, FACSLympho-
cytes(Phenotypes)→ light green section, Testmaterial→ grey section, Cytokineexperiments→
green section).
4.1.2 User Management Tables
The light orangetables depicted in appendix A store the user related information. The centre
of this section is represented by thePatientDBUserstable which stores the encrypted (by JCE)
user related information. Each user may save some specific query options which are stored in
the SavedQueryOptionstable. A many to many relation between thePatientDBUserstable
and thePatientDBUserRolestable, established by theUsersUserRolestable, enables multiple
user roles for one single user. The same relation construction is created with theUsersHospitals
to add to one user a variety of hospitals, which in turn are again linked with the patients table.
4.1.3 Experiment Related Tables
All the following explanations refer to appendix A whereby the description starts with the ther-
apies table and swift through the model counter clockwise.
35
Results 4.1 The Database Model
The orange sectionstores possible therapeutic patient treatments like chemo therapies, x-
ray treatments etc. TheTherapies table contains all necessary ids and links (many to one) to
theTreatments table which stores the actual therapy name.
Theblue sectioncontains a collection of different cancer related tables like primitive cancer,
cancer type, cancer subtype, tumoral liquid, as well as different cancer stages. The Cancer table
stores solely the FKs (foreign keys) which link to the associated tables likePrimitiveCancers,
CancerType, CancerSubType, CancerTumoralLiquid andCancerStages. The cancer stage
table in turn contains again a tuple of FK which link to four different cancer stages;PStage,
TStage, NStageandMStage(particulars to these will be given in a later part of this chapter).
The yellow sectionrefers to certain patient stimulations with different biological markers
which may induce ascertained health effects. TheBiolFactors table contains the different stim-
ulation values and links with two FKs to theBiolMarkers table storing the different markers,
and to theTestType table which stores the test types of used stimulations. TheTestTypeBiol-
markers table enables a many to many relation between the latter two tables which defines the
affiliation of the test types to the biological markers.
The pink sectionpertains to the proliferation assays whereby each experiment may have
many proliferation experiments. To store and access the proliferation experiments’ information
more flexible, the data is split into a table containing particular experiment information about
the experiment’s handling and a FACS data specific table containing all the data processed by
the FACS analyses. As explained theProliferations table stores FACS experiment specific data
and links to theFACSCellProliferations table that stores the percentage of cell expressions and
pertaining MFI values. This table as well contains two FKs linked to theActivations and the
Stimulations table which save possible activations and stimulations for the proliferating cells.
The ActivationsStimulations table establishes again a many to many relation of these latter
tables and defines the stimulations which may account to appointed activations. At last the
stimulation table relates to theStimulationRangestable which contains particular stimulation
36
Results 4.1 The Database Model
ranges comprising a min and max value for each stimulation. This is an important feature for
later queries to map the values to defined ranges, claimed by theGenesis softwarefor analysing
the data.
Theblue sectionis a special one which stores all the possible pre-treatments of one particu-
lar test material (e.g. blood or pleural liquid) for one single experiment. There are a lot of many
to many relations between these tables because a multiple performance of all different treatment
should be enabled. All these different treatment tables relate to the oneSampleTreatmentsta-
ble containing particular material treatments, which have no multiple occurrences. The other
tables store e.g. information about RNA extractions which may be performed with different
RNA-kits on even one sample material gathering RNA for microarray assays, or information
about different stimulations of the material before ficoll etc.
The light green sectionrelates to the phenotype analyses and uses a similar data model
as for the proliferation experiments. In this case theFACSLymphocytes table again stores
experiment specific information and links to theFACSLymphocyteGatescontaining all the
possible gates and theFACSLymphocyteTypescontaining all possibly occurring phenotypes.
TheFACSLymphocyteGatesTypestable characterises again a many to many interconnection
of the phenotypes pertaining to one single gate and theAntigenRangestable define particular
ranges of the expression of certain surface antigens and their MFI values. This form table model
was chosen to ensure the possibility of a dynamically update of gates and antigens at every time
to enlarge the storable data set (the same was applied for the proliferation and cytokine experi-
ments).
The grey section(table) defines all possible sample materials and was separated from the
experiment table to enable a later update of additional arising materials.
Thegreen sectiondescribes the cytokine experiment table relations with exact the same data
model as used for the phenotypes. These similarities in the data models allow a faster develop-
37
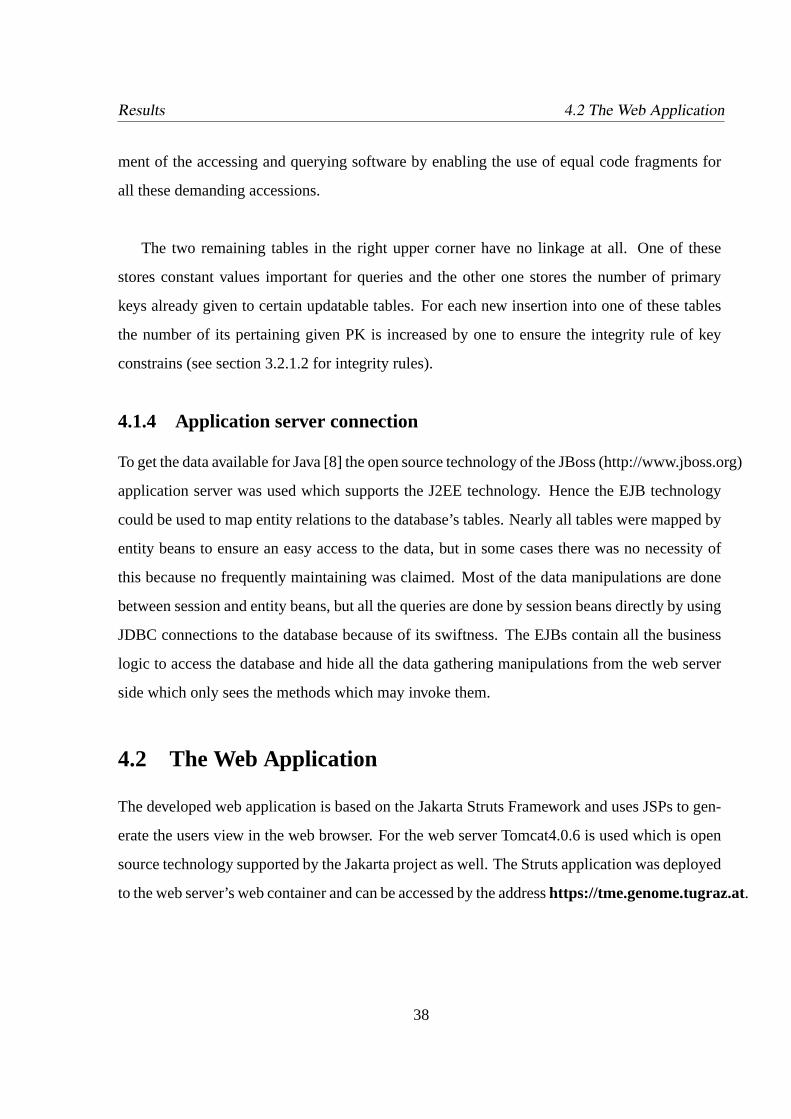
Results 4.2 The Web Application
ment of the accessing and querying software by enabling the use of equal code fragments for
all these demanding accessions.
The two remaining tables in the right upper corner have no linkage at all. One of these
stores constant values important for queries and the other one stores the number of primary
keys already given to certain updatable tables. For each new insertion into one of these tables
the number of its pertaining given PK is increased by one to ensure the integrity rule of key
constrains (see section 3.2.1.2 for integrity rules).
4.1.4 Application server connection
To get the data available for Java [8] the open source technology of the JBoss (http://www.jboss.org)
application server was used which supports the J2EE technology. Hence the EJB technology
could be used to map entity relations to the database’s tables. Nearly all tables were mapped by
entity beans to ensure an easy access to the data, but in some cases there was no necessity of
this because no frequently maintaining was claimed. Most of the data manipulations are done
between session and entity beans, but all the queries are done by session beans directly by using
JDBC connections to the database because of its swiftness. The EJBs contain all the business
logic to access the database and hide all the data gathering manipulations from the web server
side which only sees the methods which may invoke them.
4.2 The Web Application
The developed web application is based on the Jakarta Struts Framework and uses JSPs to gen-
erate the users view in the web browser. For the web server Tomcat4.0.6 is used which is open
source technology supported by the Jakarta project as well. The Struts application was deployed
to the web server’s web container and can be accessed by the addresshttps://tme.genome.tugraz.at.
38
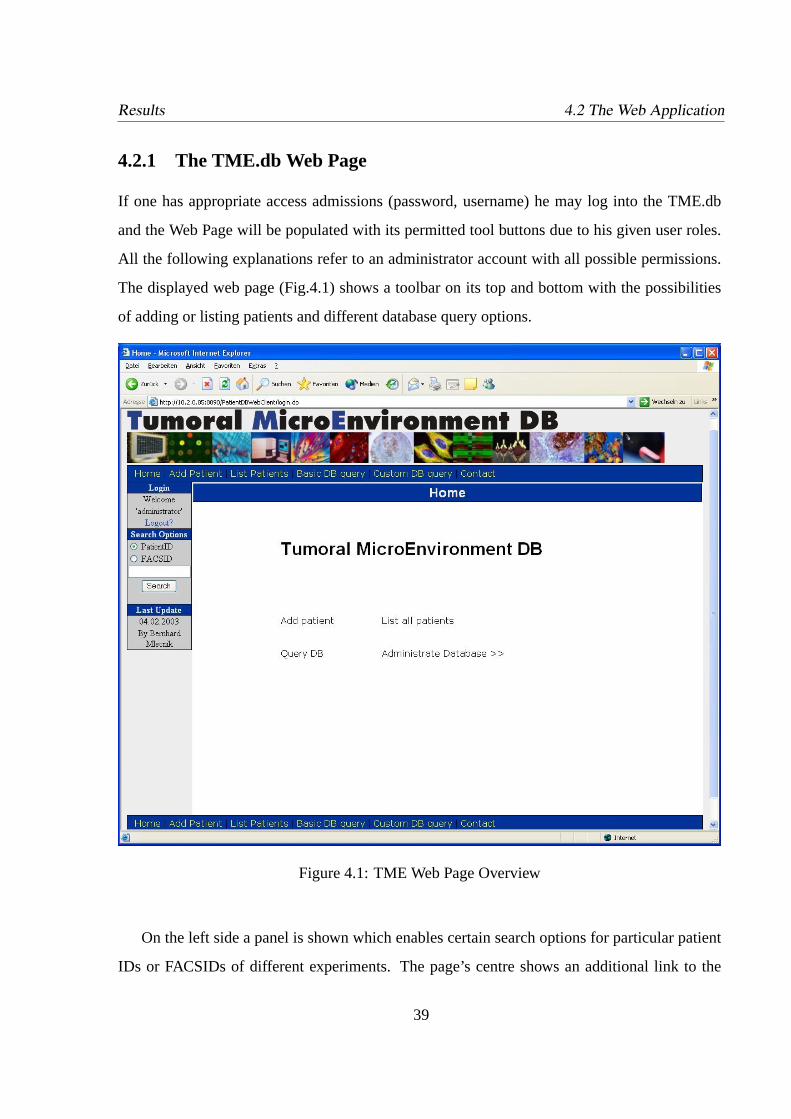
Results 4.2 The Web Application
4.2.1 The TME.db Web Page
If one has appropriate access admissions (password, username) he may log into the TME.db
and the Web Page will be populated with its permitted tool buttons due to his given user roles.
All the following explanations refer to an administrator account with all possible permissions.
The displayed web page (Fig.4.1) shows a toolbar on its top and bottom with the possibilities
of adding or listing patients and different database query options.
Figure 4.1: TME Web Page Overview
On the left side a panel is shown which enables certain search options for particular patient
IDs or FACSIDs of different experiments. The page’s centre shows an additional link to the
39
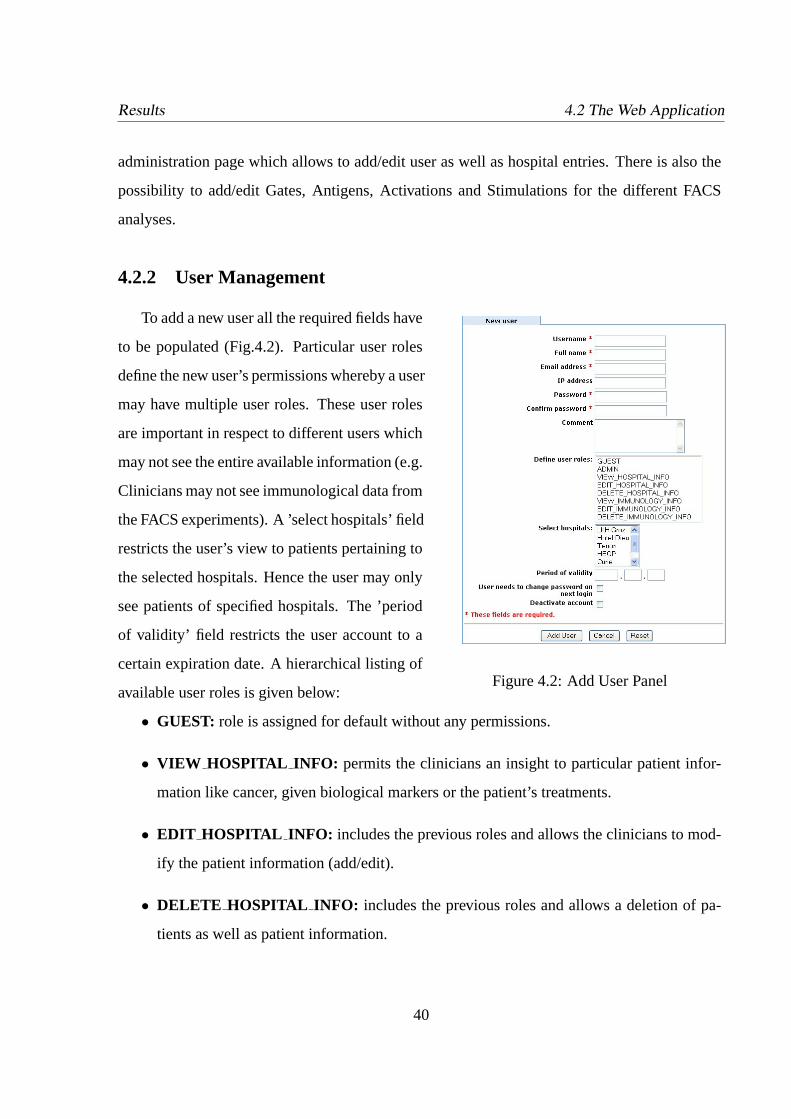
Results 4.2 The Web Application
administration page which allows to add/edit user as well as hospital entries. There is also the
possibility to add/edit Gates, Antigens, Activations and Stimulations for the different FACS
analyses.
4.2.2 User Management
To add a new user all the required fields have
Figure 4.2: Add User Panel
to be populated (Fig.4.2). Particular user roles
define the new user’s permissions whereby a user
may have multiple user roles. These user roles
are important in respect to different users which
may not see the entire available information (e.g.
Clinicians may not see immunological data from
the FACS experiments). A ’select hospitals’ field
restricts the user’s view to patients pertaining to
the selected hospitals. Hence the user may only
see patients of specified hospitals. The ’period
of validity’ field restricts the user account to a
certain expiration date. A hierarchical listing of
available user roles is given below:
• GUEST: role is assigned for default without any permissions.
• VIEW HOSPITAL INFO: permits the clinicians an insight to particular patient infor-
mation like cancer, given biological markers or the patient’s treatments.
• EDIT HOSPITAL INFO: includes the previous roles and allows the clinicians to mod-
ify the patient information (add/edit).
• DELETE HOSPITAL INFO: includes the previous roles and allows a deletion of pa-
tients as well as patient information.
40
Results 4.2 The Web Application
• VIEW IMMUNOLOGICAL INFO: includes previous VIEW roles and allows the im-
munologists to view the immunological experiments (phenotype, cytokine and prolifera-
tion analyses).
• EDIT IMMUNOLOGICAL INFO: includes previous VIEW and EDIT roles permis-
sions with additional modifying rights of immunological data.
• DELETE IMMUNOLOGICAL INFO: includes all previous permissions and the dele-
tion rights of immunological information.
• ADMIN: includes all roles and the right of maintaining users, hospitals and specific per-
missions already mentioned in section 4.2.1.
4.2.3 The Patient Overview
Figure 4.3: Patient Overview
41
Results 4.2 The Web Application
The Patient Overview joins together the entire given patient information (Fig.4.3). The top
of the page contains the patient’s particulars and if appropriate permissions are given (section
4.2.2) the patient information may be changed or deleted. Every patient may have many exper-
iments whereby each of them is displayed in a separately tabbed panel.
The header of the experiment panels shows the experiment’s specific information as well as
options to alter and delete it. There is also a link to the sample treatments page which contains
information about certain performed treatments of the experiment’s sample material (Fig.4.4).
Below the description header the experiment specific performed assays are shown, each pictured
with a particular icon (Cancer Information, Biological Markers, Treatments, FACS Phenotype
assays, FACS Cytokine Secretion assays, FACS Proliferation assays).
4.2.3.1 Cancer Information
This panel provides specific cancer information about the experiment’s sample material.
• Primitive Cancer:describes an umbrella term of a certain kind of cancer like lung, colon,
breast etc.
• Cancer Type:characterises a specific occurrence of certain forms of cancer.
• Cancer Sub Type:represents a particular sub specification of a cancer type.
• Tumoral Liquid: bears important information dependent on having tumoral cells in it or
not.
• P-Stage:constitutes if the detected tumour is malignant or not [26].
• T-Stage:distinguishes the tumoral stage into different states [26]
– A Tx tumour has a proven existence but cannot be assessed.
– A T1 cancer is less than 3cm in size and completely surrounded by lung tissue.
– A T2cancer is larger then 3cm without invading structures in the middle of the chest.
– A T3 cancer is of any size invading chest structures and it is still savely resectable.
42
Results 4.2 The Web Application
– A T4 is a tumour of any size invading vital structures and is unresectable.
• N-Stage:refers to the involvement of cancer into lymph nodes and is distinguished into
different stages [26]:
– N0 refers to the absence of any lymph node involvement.
– N1 refers to the presence of cancer in the hilar lymph nodes.
– N2 refers to an involvement of the mediastinal lymph nodes on the cancer side.
– N3 cancers involve the lymph nodes on the other side of the chest, or in the supra-
clavicular area.
• M-Stage:is used to define the presence of metastasis [26]:
– M0 implies the absence of any evidence of cancer spread to other organs.
– M1 implies cancer spread to any organ.
The M-Stages may be subdivided into more precise stages.
To all these cancer information values were given to score their occurrence in queries later on.
4.2.3.2 Biological Markers
Biological markers are given to organisms to reveal physiological and biochemical responses
provoked by them. To identify potential markers several factors like the correlation between
response and effect, the feasibility of determining them or the specificity of the response need
to be investigated. In this project the availability of biological marker types likeIHC or ELISA ,
used on patients, should be taken into consideration by scoring them with specific values. These
kinds of markers may reveal certain kinds of cancers or their occurrence. But for the moment
there are no markers available at all and still remain in prospective.
4.2.3.3 Treatments
The treatments refer to certain therapies which were applied to the patient like chemo therapies
or radiological treatments. These patient treatments serve as additional information which may
43
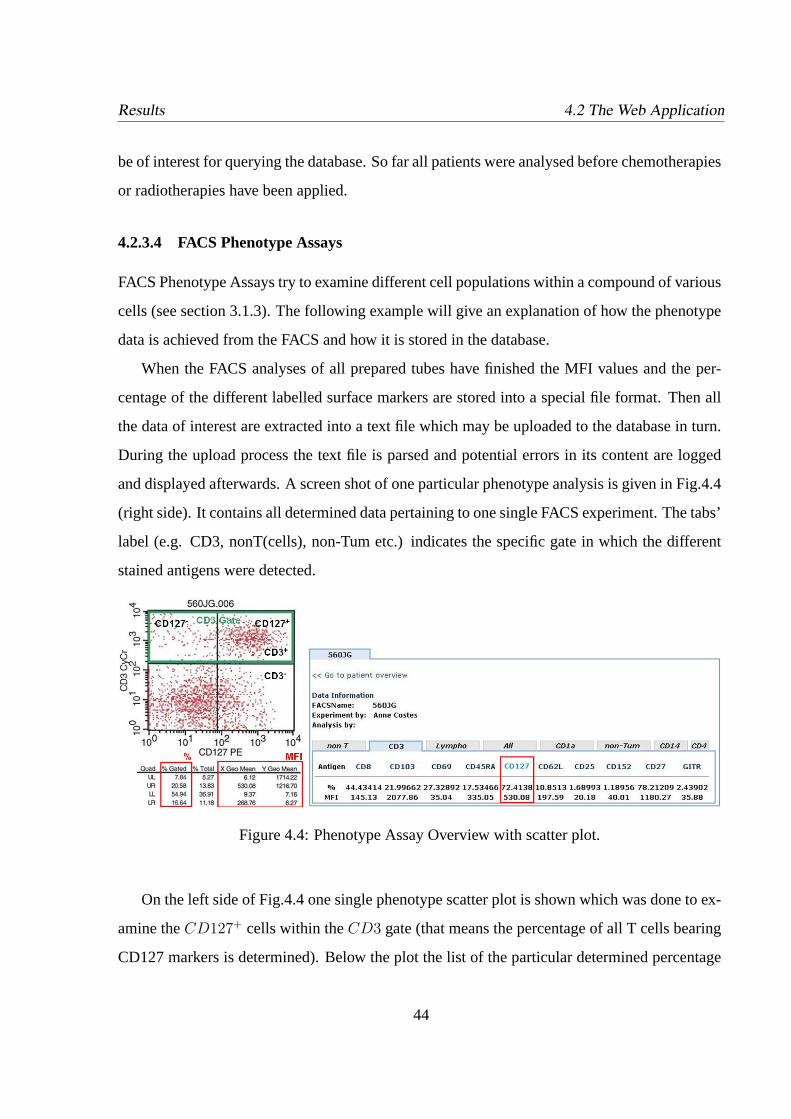
Results 4.2 The Web Application
be of interest for querying the database. So far all patients were analysed before chemotherapies
or radiotherapies have been applied.
4.2.3.4 FACS Phenotype Assays
FACS Phenotype Assays try to examine different cell populations within a compound of various
cells (see section 3.1.3). The following example will give an explanation of how the phenotype
data is achieved from the FACS and how it is stored in the database.
When the FACS analyses of all prepared tubes have finished the MFI values and the per-
centage of the different labelled surface markers are stored into a special file format. Then all
the data of interest are extracted into a text file which may be uploaded to the database in turn.
During the upload process the text file is parsed and potential errors in its content are logged
and displayed afterwards. A screen shot of one particular phenotype analysis is given in Fig.4.4
(right side). It contains all determined data pertaining to one single FACS experiment. The tabs’
label (e.g. CD3, nonT(cells), non-Tum etc.) indicates the specific gate in which the different
stained antigens were detected.
Figure 4.4: Phenotype Assay Overview with scatter plot.
On the left side of Fig.4.4 one single phenotype scatter plot is shown which was done to ex-
amine theCD127+ cells within theCD3 gate (that means the percentage of all T cells bearing
CD127 markers is determined). Below the plot the list of the particular determined percentage
44
Results 4.2 The Web Application
and MFI values is given which directly result form the FACS analysis. The first column defines
the four quadrants of the scatter plot, the second refers to the percentage of gated cells (in this
case the ’% Gated’ refers to all cells which are alive), the third (% Total) displays the percentage
of cells in a quadrant as regard to all detected cells (dead cells included) and the X, Y Geo Mean
columns indicate the logarithmic scaled MFI of the stainedCD markers in each quadrant (in
this caseCD127 refers to the X Mean andCD3 to the Y Mean).
As depicted in Fig.4.4 theCD3 gate surrounds the both upper quadrants, hence the percent-
age of all T cells which areCD127+ is calculated as following:
CD3 CD127 % =UR of % Gated · 100
UR of % gated + UL of % Gated=
20, 58 · 100
20, 58 + 7, 84= 72, 41%
The MFI value of the T cells which areCD127+ is the X Geo Mean of the upper right
quadrant (Fig.4.4).
CD3 CD127 MFI = 530, 08
This tuple of phenotype parameters is determined for each antigen within each of the given
gates whereby each gate represents a particular phenotype.
4.2.3.5 FACS Proliferation Assays
FACS Proliferation Assays are performed in order to observe cell proliferation under certain
stimulation conditions (see section 3.1.4). The following example will give an explanation of
how the proliferation data is determined from a FACS analysis.
The proliferation FACS analysis follows the same data flow as already mentioned for the
phenotype analysis the only difference is that there may be more than just one analysis for one
experiment (e.g analyses on day 6, 7, etc. Fig.4.3). The FACS data is stored into an spread
sheet and after performing some modifications the data is uploaded into the database. The
following example will give explanation of how the data is modified before the upload process
45
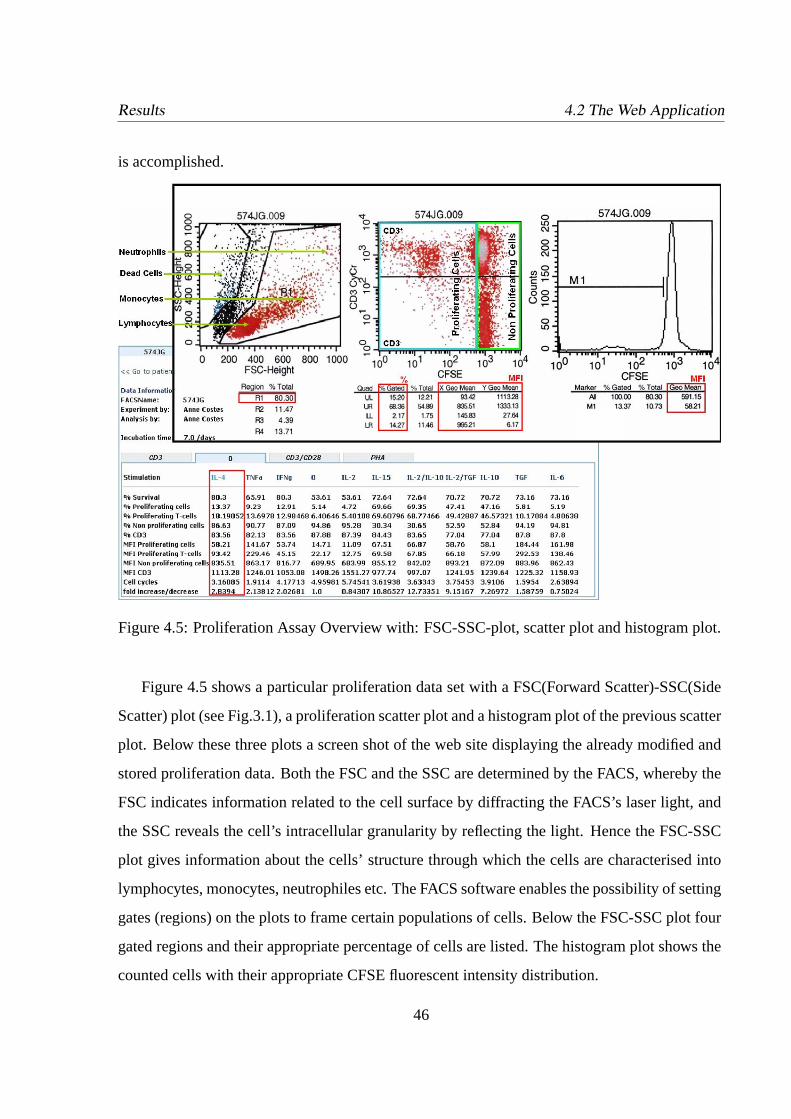
Results 4.2 The Web Application
is accomplished.
Figure 4.5: Proliferation Assay Overview with: FSC-SSC-plot, scatter plot and histogram plot.
Figure 4.5 shows a particular proliferation data set with a FSC(Forward Scatter)-SSC(Side
Scatter) plot (see Fig.3.1), a proliferation scatter plot and a histogram plot of the previous scatter
plot. Below these three plots a screen shot of the web site displaying the already modified and
stored proliferation data. Both the FSC and the SSC are determined by the FACS, whereby the
FSC indicates information related to the cell surface by diffracting the FACS’s laser light, and
the SSC reveals the cell’s intracellular granularity by reflecting the light. Hence the FSC-SSC
plot gives information about the cells’ structure through which the cells are characterised into
lymphocytes, monocytes, neutrophiles etc. The FACS software enables the possibility of setting
gates (regions) on the plots to frame certain populations of cells. Below the FSC-SSC plot four
gated regions and their appropriate percentage of cells are listed. The histogram plot shows the
counted cells with their appropriate CFSE fluorescent intensity distribution.
46
Results 4.2 The Web Application
All used values for the following calculations are listed in the FACS plot (Fig.4.5) whereby
% Gated refers to the cells gated with R1 and % Total refers to all cells, dead cells included.
The region R1 is set to include all living cells for the following analsyses. Dead cells are
displayed in a different part of the FSC-SSC plot because of their changed cell characteristics.
Thus R1 is the first parameter of interest because all following experiments refer solely to
these R1 gated cells. For the given FACS example the cells have been activated with ’0’ (no
activation) and stimulated with ’IL-4’.
Thepercentage of living cellscorrespond to the R1 gated cells:
0 IL− 4 % Survival = 80, 3%
The next value of interest is thepercentage of proliferating cellswhich are displayed in
the FACS plot next to the FCS-SSC plot. The proliferating cells are situated in the Upper-Left
(UL) and Lower-Left (LL) quadrant, thus the their percentage is:
0 IL− 4 % ProliferatingCells = % of UL + % of LL = 15, 20 + 2, 17 = 17, 37%
The percentage of proliferating T cells refers to the percentage of proliferatingCD3+
cells and is calculated as followed:
0 IL− 4 % ProlifTCells =% of UL · 100
% of UL + % of UR=
15, 2, 58 · 100
15, 2 + 68, 36= 18, 19%
The next value is thepercentage of non proliferating cellswhich is the percentage of all
cells in the right quadrants:
0 IL− 4 % NonProliferatingCells = % of UR + % of LR = 68, 36 + 14, 27 = 82, 63%
Thepercentage of CD3 cellsis the percentage of all T cells (CD3+), thus the sum of the
percentage of both upper quadrants:
47
Results 4.2 The Web Application
0 IL− 4 % CD3 = % of UR + % of UL = 68, 36 + 15, 2 = 83, 56%
TheMFI of the proliferating cells is the Geo Mean determined by the M1 range depicted
in the histogram plot (Fig.4.5):
0 IL− 4 MFI ProliferatingCells = 58, 21
TheMFI of the proliferating T cells is the X Geo Mean of the UL quadrant:
0 IL− 4 MFI ProlifTCells = 93, 42
TheMFI of the non proliferating cells is the X Geo Mean of the UR quadrant:
0 IL− 4 MFI NonProliferatingCells = 835, 51
TheMFI of the CD3 cells is the Y Geo Mean of the UL quadrant:
0 IL− 4 MFI CD3 = 1113, 28
The undergonecell cyclesare calculated as followed:
0 IL− 4 cellcycles =ln(MFI NonProliferatingCells
MFI ProlifTCells)
ln(2)=
ln(835,5193,42
)
ln(2)= 3, 16Cycles
Thefold increase/decreasedetermines the relative increase/decrease of the proliferation of
the stimulated(in this case with IL-4) T cells in respect to the unstimulated(0) T cells:
0 IL− 4 foldincrease/decrease =% ProlifTCells(IL− 4)
% ProlifTCells(0)=
18, 19
6, 406= 2, 83%
48
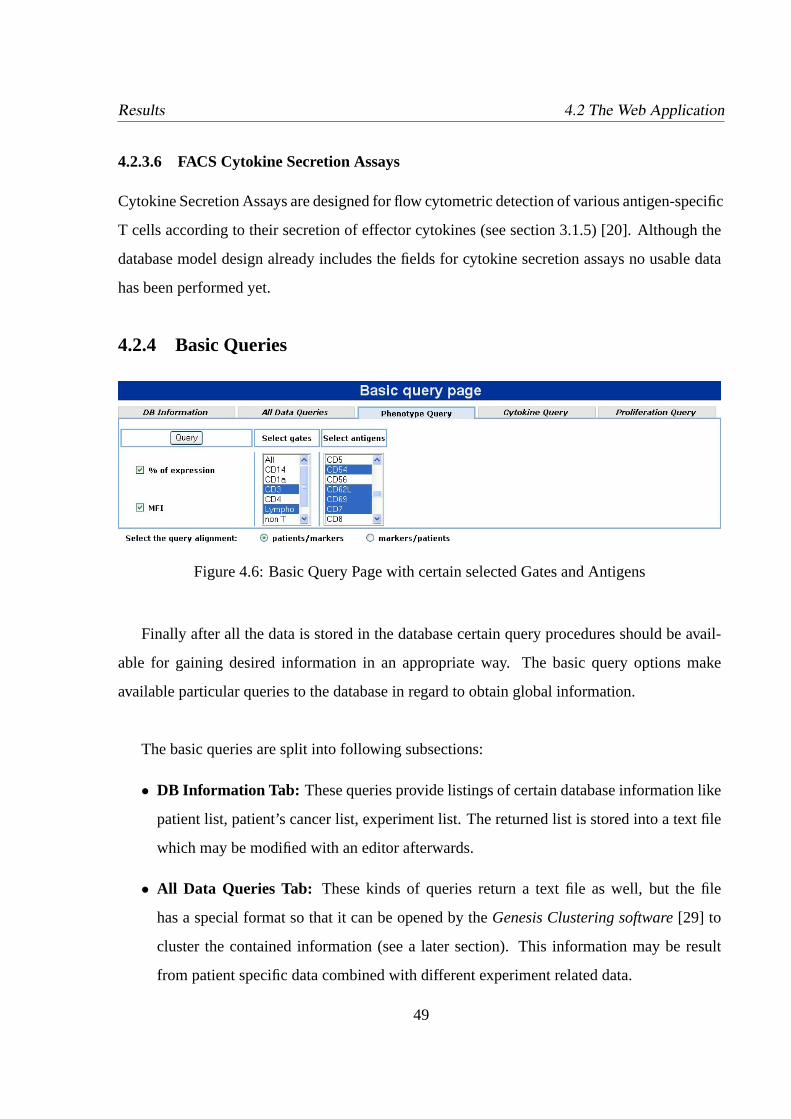
Results 4.2 The Web Application
4.2.3.6 FACS Cytokine Secretion Assays
Cytokine Secretion Assays are designed for flow cytometric detection of various antigen-specific
T cells according to their secretion of effector cytokines (see section 3.1.5) [20]. Although the
database model design already includes the fields for cytokine secretion assays no usable data
has been performed yet.
4.2.4 Basic Queries
Figure 4.6: Basic Query Page with certain selected Gates and Antigens
Finally after all the data is stored in the database certain query procedures should be avail-
able for gaining desired information in an appropriate way. The basic query options make
available particular queries to the database in regard to obtain global information.
The basic queries are split into following subsections:
• DB Information Tab: These queries provide listings of certain database information like
patient list, patient’s cancer list, experiment list. The returned list is stored into a text file
which may be modified with an editor afterwards.
• All Data Queries Tab: These kinds of queries return a text file as well, but the file
has a special format so that it can be opened by theGenesis Clustering software[29] to
cluster the contained information (see a later section). This information may be result
from patient specific data combined with different experiment related data.
49
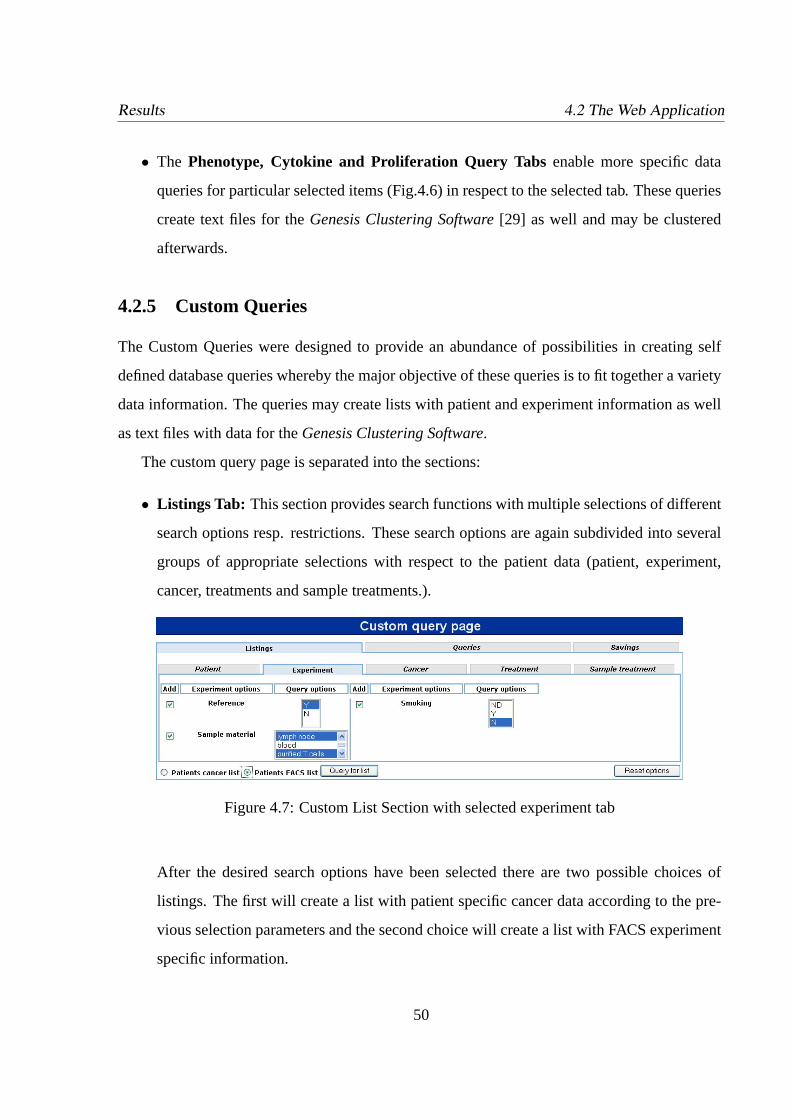
Results 4.2 The Web Application
• The Phenotype, Cytokine and Proliferation Query Tabsenable more specific data
queries for particular selected items (Fig.4.6) in respect to the selected tab. These queries
create text files for theGenesis Clustering Software[29] as well and may be clustered
afterwards.
4.2.5 Custom Queries
The Custom Queries were designed to provide an abundance of possibilities in creating self
defined database queries whereby the major objective of these queries is to fit together a variety
data information. The queries may create lists with patient and experiment information as well
as text files with data for theGenesis Clustering Software.
The custom query page is separated into the sections:
• Listings Tab: This section provides search functions with multiple selections of different
search options resp. restrictions. These search options are again subdivided into several
groups of appropriate selections with respect to the patient data (patient, experiment,
cancer, treatments and sample treatments.).
Figure 4.7: Custom List Section with selected experiment tab
After the desired search options have been selected there are two possible choices of
listings. The first will create a list with patient specific cancer data according to the pre-
vious selection parameters and the second choice will create a list with FACS experiment
specific information.
50
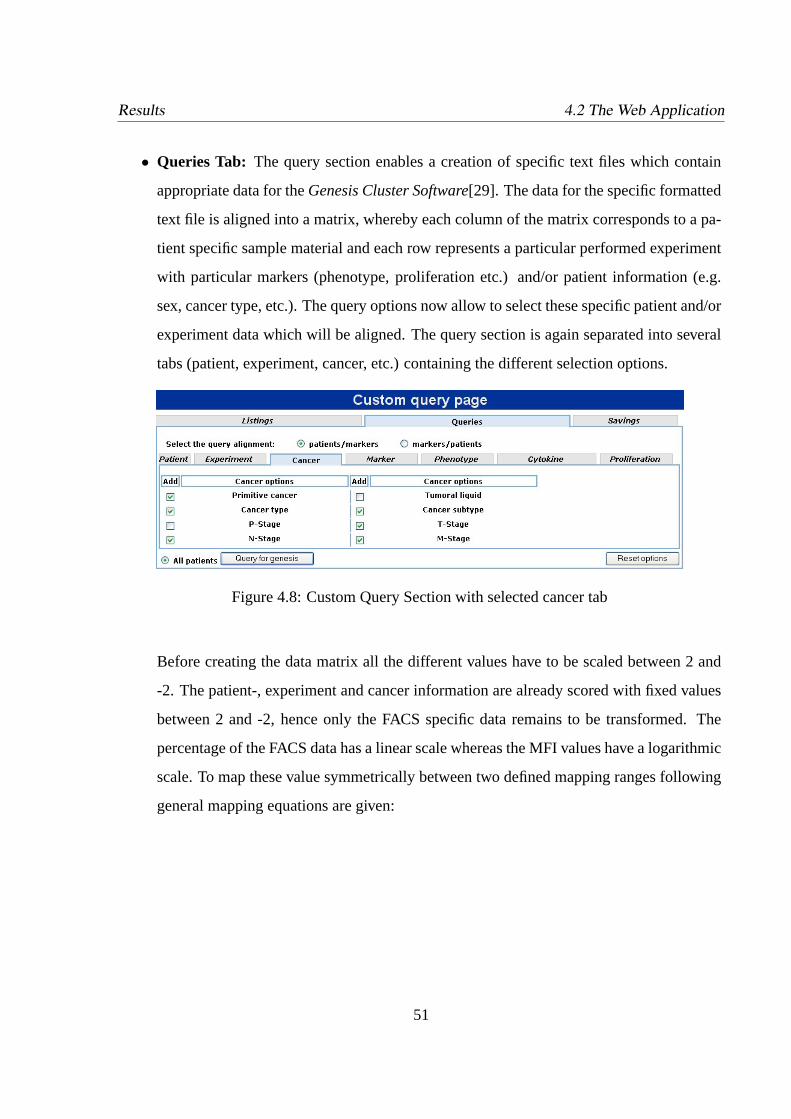
Results 4.2 The Web Application
• Queries Tab: The query section enables a creation of specific text files which contain
appropriate data for theGenesis Cluster Software[29]. The data for the specific formatted
text file is aligned into a matrix, whereby each column of the matrix corresponds to a pa-
tient specific sample material and each row represents a particular performed experiment
with particular markers (phenotype, proliferation etc.) and/or patient information (e.g.
sex, cancer type, etc.). The query options now allow to select these specific patient and/or
experiment data which will be aligned. The query section is again separated into several
tabs (patient, experiment, cancer, etc.) containing the different selection options.
Figure 4.8: Custom Query Section with selected cancer tab
Before creating the data matrix all the different values have to be scaled between 2 and
-2. The patient-, experiment and cancer information are already scored with fixed values
between 2 and -2, hence only the FACS specific data remains to be transformed. The
percentage of the FACS data has a linear scale whereas the MFI values have a logarithmic
scale. To map these value symmetrically between two defined mapping ranges following
general mapping equations are given:
51
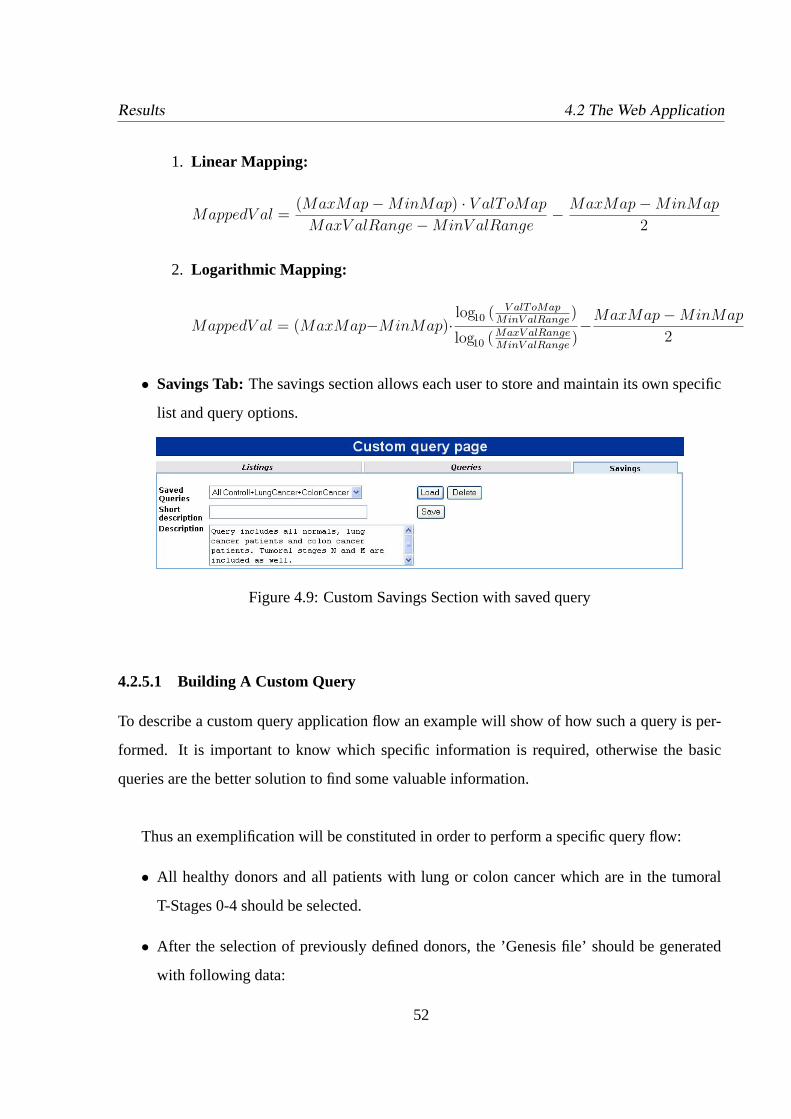
Results 4.2 The Web Application
1. Linear Mapping:
MappedV al =(MaxMap−MinMap) · V alToMap
MaxV alRange−MinV alRange− MaxMap−MinMap
2
2. Logarithmic Mapping:
MappedV al = (MaxMap−MinMap)·log10 ( V alToMap
MinV alRange)
log10 (MaxV alRangeMinV alRange
)−MaxMap−MinMap
2
• Savings Tab:The savings section allows each user to store and maintain its own specific
list and query options.
Figure 4.9: Custom Savings Section with saved query
4.2.5.1 Building A Custom Query
To describe a custom query application flow an example will show of how such a query is per-
formed. It is important to know which specific information is required, otherwise the basic
queries are the better solution to find some valuable information.
Thus an exemplification will be constituted in order to perform a specific query flow:
• All healthy donors and all patients with lung or colon cancer which are in the tumoral
T-Stages 0-4 should be selected.
• After the selection of previously defined donors, the ’Genesis file’ should be generated
with following data:
52
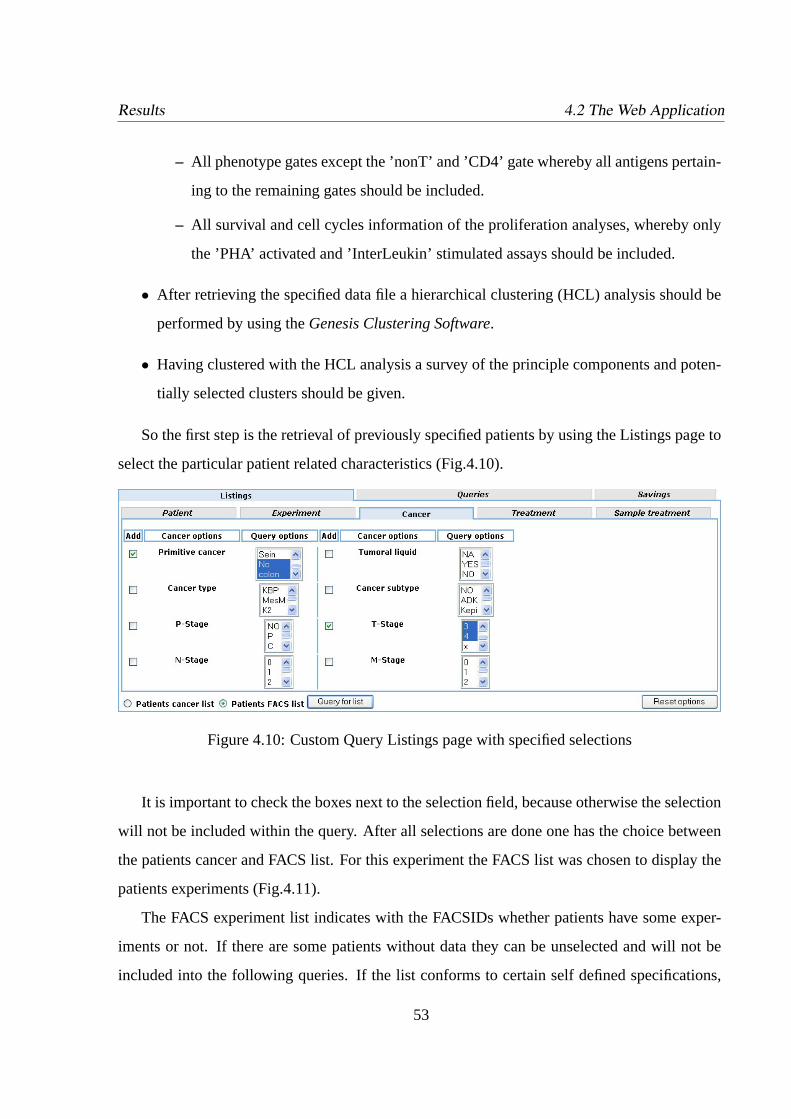
Results 4.2 The Web Application
– All phenotype gates except the ’nonT’ and ’CD4’ gate whereby all antigens pertain-
ing to the remaining gates should be included.
– All survival and cell cycles information of the proliferation analyses, whereby only
the ’PHA’ activated and ’InterLeukin’ stimulated assays should be included.
• After retrieving the specified data file a hierarchical clustering (HCL) analysis should be
performed by using theGenesis Clustering Software.
• Having clustered with the HCL analysis a survey of the principle components and poten-
tially selected clusters should be given.
So the first step is the retrieval of previously specified patients by using the Listings page to
select the particular patient related characteristics (Fig.4.10).
Figure 4.10: Custom Query Listings page with specified selections
It is important to check the boxes next to the selection field, because otherwise the selection
will not be included within the query. After all selections are done one has the choice between
the patients cancer and FACS list. For this experiment the FACS list was chosen to display the
patients experiments (Fig.4.11).
The FACS experiment list indicates with the FACSIDs whether patients have some exper-
iments or not. If there are some patients without data they can be unselected and will not be
included into the following queries. If the list conforms to certain self defined specifications,
53
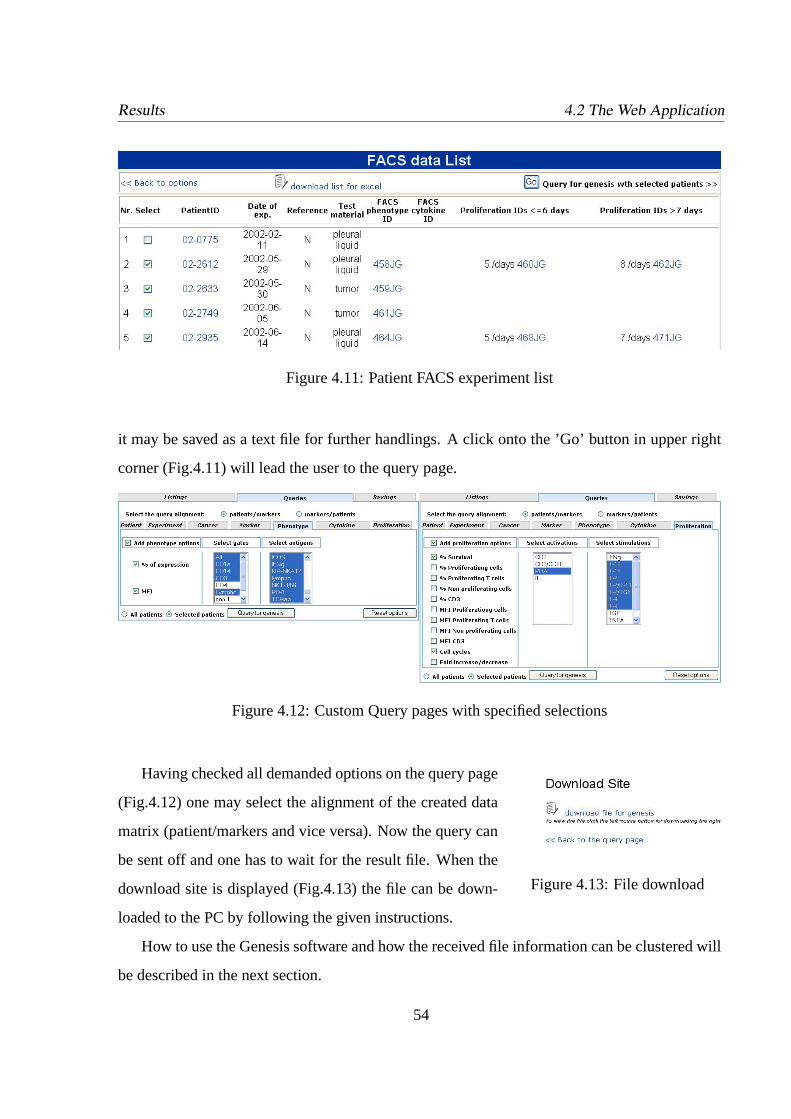
Results 4.2 The Web Application
Figure 4.11: Patient FACS experiment list
it may be saved as a text file for further handlings. A click onto the ’Go’ button in upper right
corner (Fig.4.11) will lead the user to the query page.
Figure 4.12: Custom Query pages with specified selections
Having checked all demanded options on the query page
Figure 4.13: File download
(Fig.4.12) one may select the alignment of the created data
matrix (patient/markers and vice versa). Now the query can
be sent off and one has to wait for the result file. When the
download site is displayed (Fig.4.13) the file can be down-
loaded to the PC by following the given instructions.
How to use the Genesis software and how the received file information can be clustered will
be described in the next section.
54
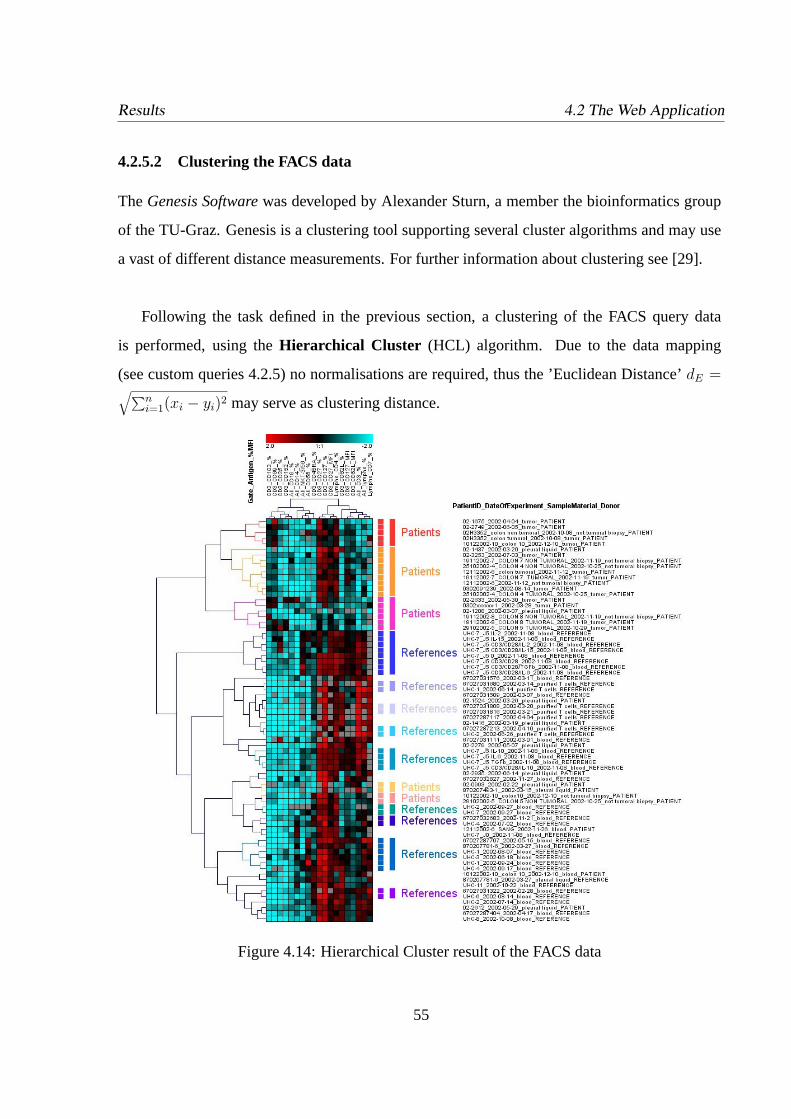
Results 4.2 The Web Application
4.2.5.2 Clustering the FACS data
TheGenesis Softwarewas developed by Alexander Sturn, a member the bioinformatics group
of the TU-Graz. Genesis is a clustering tool supporting several cluster algorithms and may use
a vast of different distance measurements. For further information about clustering see [29].
Following the task defined in the previous section, a clustering of the FACS query data
is performed, using theHierarchical Cluster (HCL) algorithm. Due to the data mapping
(see custom queries 4.2.5) no normalisations are required, thus the ’Euclidean Distance’dE =√∑ni=1(xi − yi)2 may serve as clustering distance.
Figure 4.14: Hierarchical Cluster result of the FACS data
55
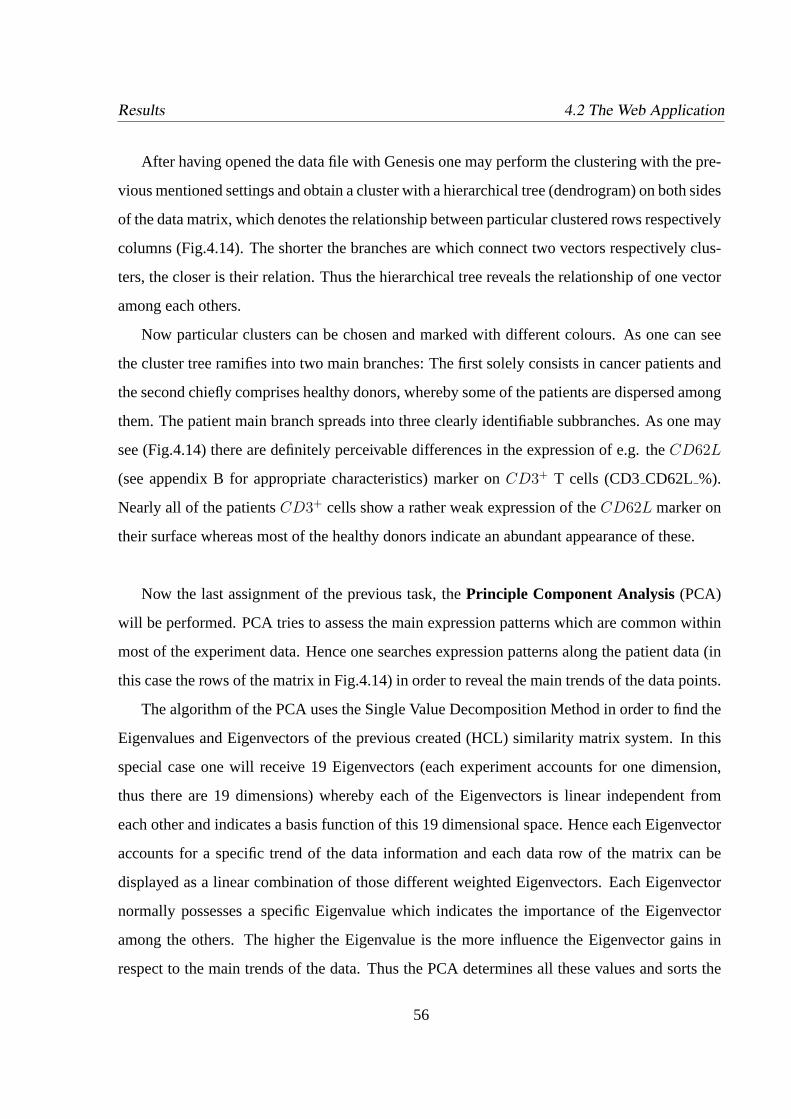
Results 4.2 The Web Application
After having opened the data file with Genesis one may perform the clustering with the pre-
vious mentioned settings and obtain a cluster with a hierarchical tree (dendrogram) on both sides
of the data matrix, which denotes the relationship between particular clustered rows respectively
columns (Fig.4.14). The shorter the branches are which connect two vectors respectively clus-
ters, the closer is their relation. Thus the hierarchical tree reveals the relationship of one vector
among each others.
Now particular clusters can be chosen and marked with different colours. As one can see
the cluster tree ramifies into two main branches: The first solely consists in cancer patients and
the second chiefly comprises healthy donors, whereby some of the patients are dispersed among
them. The patient main branch spreads into three clearly identifiable subbranches. As one may
see (Fig.4.14) there are definitely perceivable differences in the expression of e.g. theCD62L
(see appendix B for appropriate characteristics) marker onCD3+ T cells (CD3CD62L %).
Nearly all of the patientsCD3+ cells show a rather weak expression of theCD62L marker on
their surface whereas most of the healthy donors indicate an abundant appearance of these.
Now the last assignment of the previous task, thePrinciple Component Analysis(PCA)
will be performed. PCA tries to assess the main expression patterns which are common within
most of the experiment data. Hence one searches expression patterns along the patient data (in
this case the rows of the matrix in Fig.4.14) in order to reveal the main trends of the data points.
The algorithm of the PCA uses the Single Value Decomposition Method in order to find the
Eigenvalues and Eigenvectors of the previous created (HCL) similarity matrix system. In this
special case one will receive 19 Eigenvectors (each experiment accounts for one dimension,
thus there are 19 dimensions) whereby each of the Eigenvectors is linear independent from
each other and indicates a basis function of this 19 dimensional space. Hence each Eigenvector
accounts for a specific trend of the data information and each data row of the matrix can be
displayed as a linear combination of those different weighted Eigenvectors. Each Eigenvector
normally possesses a specific Eigenvalue which indicates the importance of the Eigenvector
among the others. The higher the Eigenvalue is the more influence the Eigenvector gains in
respect to the main trends of the data. Thus the PCA determines all these values and sorts the
56
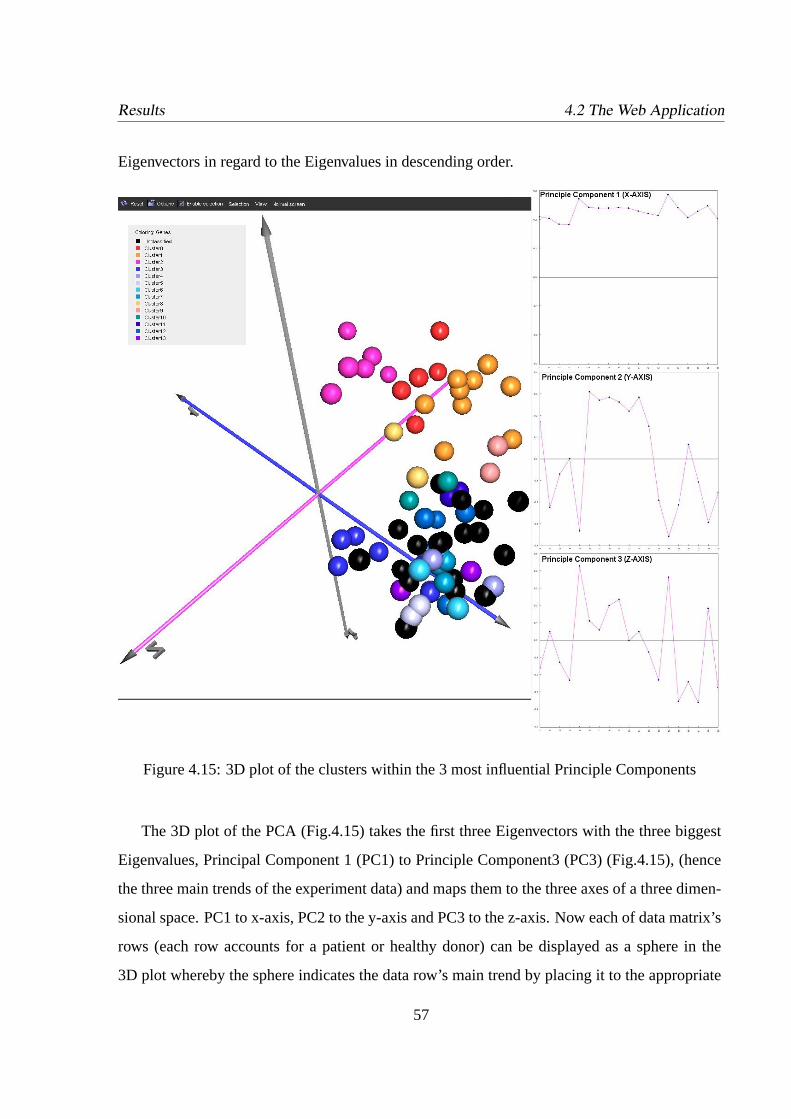
Results 4.2 The Web Application
Eigenvectors in regard to the Eigenvalues in descending order.
Figure 4.15: 3D plot of the clusters within the 3 most influential Principle Components
The 3D plot of the PCA (Fig.4.15) takes the first three Eigenvectors with the three biggest
Eigenvalues, Principal Component 1 (PC1) to Principle Component3 (PC3) (Fig.4.15), (hence
the three main trends of the experiment data) and maps them to the three axes of a three dimen-
sional space. PC1 to x-axis, PC2 to the y-axis and PC3 to the z-axis. Now each of data matrix’s
rows (each row accounts for a patient or healthy donor) can be displayed as a sphere in the
3D plot whereby the sphere indicates the data row’s main trend by placing it to the appropriate
57
Results 4.2 The Web Application
location in the 3D space. Thus spheres which are close together in this space have nearly the
same trend respectively expression of the data points.
The different selected clusters of the HCL tree are dyed in the PCA plot as well and one can
easily assess whether the clusters in the 3D space are close together or not. So the PCA can be
used for a better visualisation and verification of cluster algorithms.
As one can see in Fig.4.15 the classified patients (dyed with warm colours) are lying close
together whereas the healthy donors (dyed with cool colours) are displayed in another location
of the space. The black coloured spheres indicate not classified donors.
58
Chapter 5
Discussion
The specific aim of this thesis was to develop a tumoral microenvironment (TME) database
for storing and maintaining all the data which are arising from different immunological ex-
periments. This information comprises pathological information, patient related information,
experiment related information, and data from clinical treatments. This database was especially
developed for tumour microenvironment related data, but the flexible design suggests that it can
be used for other cancer related information as well.
As the whole system depends on the data layer, the development of it was the crucial point.
It is obvious that the design of databases for clinical as well as immunological data has to be
very flexible, to be able to adapt or even upgrade the whole system to new scientific insights
without major changes. The usage of relational databases together with latest Java technologies
(EJB, JDBC, etc. ) on the server side enables a fulfillment of all these demands.
As this database is designed for clinicians and immunologists which are working in dif-
ferent locations, it is important to provide an easy way to give the clients access to the stored
information. Thus a web application is the best solution to provide an easy data accession. The
flexible user management and the secure web connection allow an accession and insight to the
data to only those people having appropriate admissions. For users who need an evaluation and
analysis of their data, appropriate query methods are given, which bring the information into
59
Discussion
desired formats. The best option for a quick data exploring are the basic queries. To get deeper
insights into the data and create queries on parameters to which one is interested in, the custom
queries represent the best solution. The custom queries further provide save options for each
user in order to store specific query parameters in the database.
Security issues need to be treated in a highly specific manner in regard to the interest of
patients. Therefore an encryption of identifiable or indirectly identifiable personal patient infor-
mation was applied. Secured web protocols for data encryption are established and the database
management systems are hidden behind firewalls ensuring best opacity against non authorised
accessors. In terms of storing tumour and immunological related information, a consent proce-
dure proposes [22] that identifiable patient information would require a written informed con-
sent from the patient for further usage, and coded respectively anonymous information could be
collected on an opt-out basis.
Cluster algorithms applied to query data sets have shown that it is possible to distinguish
differences in certain pattern expressions. This demonstrated that the data visualisation with
clustering tools (e.g. HCL) and projection methods (e.g. PCA) are powerful means for further
evaluations of stored data information.
In future work, immunophenotypic and functional data will be integrated with microarray
data in order to explore new relations between expression patterns and cell surface markers.
In conclusion this tool brings together a vast of different data information in order to inves-
tigate new patterns to distinguish between patients and healthy donors. Hence, this database
should become a valuable mean in immunological and cancer related studies.
60
Acknowledgements
At first I want to thank my supervisor Robert Molidor who supported me with all his knowl-
edge and friendship through out my studies. As well I would like to thank my supervisors
Zlatko Trajanoski and Jerome Galon who gave me the great opportunity to perform the studies
for my thesis at the INSERM255 Unit.
Further I want thank Jerome Galon and the members of my work group at INSERM255,
Anne Costes, Mathieu Camus and Arnaud van Cortenbosh, who supported me with their broad
immunological knowledge. It was a great experience and pleasure to work with them.
Special thanks to the members of the bioinformatics group, Alexander Sturn for supporting
me with knowledge about clustering tools, and Michael Maurer for assisting with his experience
in Struts technology.
Finally I want to thank my family for supporting me with all their love and faith through out
my entire studies. I want to express my sincere gratitude.
61
Bibliography
[1] Rahim Adatia.Professional EJB. Wrox Press Ltd, 2001.
[2] Vogelstein B. The multistep nature of cancer. WWW, 1993.
http://www.cancervax.com/info/cancerdev.htm.
[3] Robert C. Bast.Cancer Medicine. An Official Publication of the American Cancer Society,
5th edition, 2000.
[4] John Blamire. Genotype and Phenotype Relationship. WWW, 2000.
http://www.brooklyn.cuny.edu/bc/ahp/BioInfo/GP/Relationship.html.
[5] Simon Brown.Professional JSP. Wrox Press Ltd, 2001.
[6] Keratin Com. Cluster designation marker system. WWW, 2002.
http://www.keratin.com/am/am025.shtml.
[7] Refsnes Data. Introduction to SQL: W3C schools. WWW, 2002.
http://www.w3schools.com/sql/sqlintro.asp.
[8] JDOM FAQ. Java Document Model. WWW, 2002. http://www.jdom.org/docs/faq.html.
[9] Oleg Gdalevich. Introduction to SQL: vbip books. WWW, 2002.
http://www.vbip.com/books/1861001800/chapter180002.asp.
[10] Richard A. Goldsby.Kuby Immunology. W. H. Freeman and Company, 2000.
[11] Jurgen Hartler. Database development for mental illnesses. Master’s thesis, TU-Graz,
2002.
62
BIBLIOGRAPHY BIBLIOGRAPHY
[12] JGuru. XML quick reference. WWW, 2002.
http://www.devguru.com/Technologies/xmldom/quickref/xmldomintro.html.
[13] Michael Kmiec. Introduction to EJB. WWW, 2002.
http://www.zdnet.com.au/builder/program/java/story/0,2000034779,20266100,00.htm.
[14] Lance A. Liotta. The microenviroment of the tumour-host interface.Nature, 411:375–379,
May 2001.
[15] Harvey Lodish.Molecular Cell Biology. W. H. Freeman and Company, 1995.
[16] Sun Microsystems. Enterprise Java Technology Specification. WWW, 2002.
http://java.sun.com/products/ejb/docs.html.
[17] Sun Microsystems. Introduction into JSP. WWW, 2002.
http://java.sun.com/products/jsp/faq.html.
[18] Sun Microsystems. Java Beans. WWW, 2002. http://java.sun.com/products/javabeans.
[19] Sun Microsystems. Java Cryptography Extension. WWW, 2002.
http://java.sun.com/products/jce/.
[20] Milteny Biotec . Cytokine Secretion Assays - the principle. WWW, 2002.
http://www.miltenyibiotec.com/macs/products/cytokine/princ.htm.
[21] University of medicine and dentistry of NewJersy. Immunophenotyping. WWW, 2002.
http://pleiad.umdnj.edu/hemepath/immuno/immuno.html.
[22] Jan Willhelm Coebergh Oosterhuis J. Wolter and Evert-Ben van Veen. Tumour banks:
well-guarded treasures in the interest of patients.Perspectives, 3:73–77, January 2003.
[23] Orbeon. JSP Model 2 and MVC. WWW, 2002. http://www.orbeon.com/oxf/doc/intro-
mvc.
[24] Jakarta Apache Org. The Jakarta Struts Framework Project. WWW, 2002.
http://jakarta.apache.org/struts/userGuide/struts-html.html.
63
BIBLIOGRAPHY BIBLIOGRAPHY
[25] Krishnasamy P.N. Integrity Rules. WWW, 2002. http://www.cis.ohio-
state.edu/ samy/Cis670/670CourseNotes/RelationalIntegrity.pdf.
[26] PRR Inc. NY. Lung Cancer Staging - Its Definition and Significance. WWW, 2002.
http://http://www.intouchlive.com/myths/lung/Lung06.htm.
[27] Ivan Roitt. Immunology. Gower Medical Publishing Ltd, 2001.
[28] W3C Schools. Introduction into XML. WWW, 2002. http://www.w3.org/XML/.
[29] Alexander Sturn. Cluster Analysis For Large Scale Gene Expression Studies. Master’s
thesis, TU-Graz, 2001. http://www.genome.tugraz.at.
[30] JAVA SUN. Introduction to JDBC. WWW, 2002.
http://java.sun.com/docs/books/jdbc/intro.html.
[31] Stanford University. Introduction to JDBC. WWW, 2002. http://www-db.stanford.edu/ ul
lman/fcdb/oracle/or-jdbc.html.
64
Appendix A
Database Model
See next page . . .
65
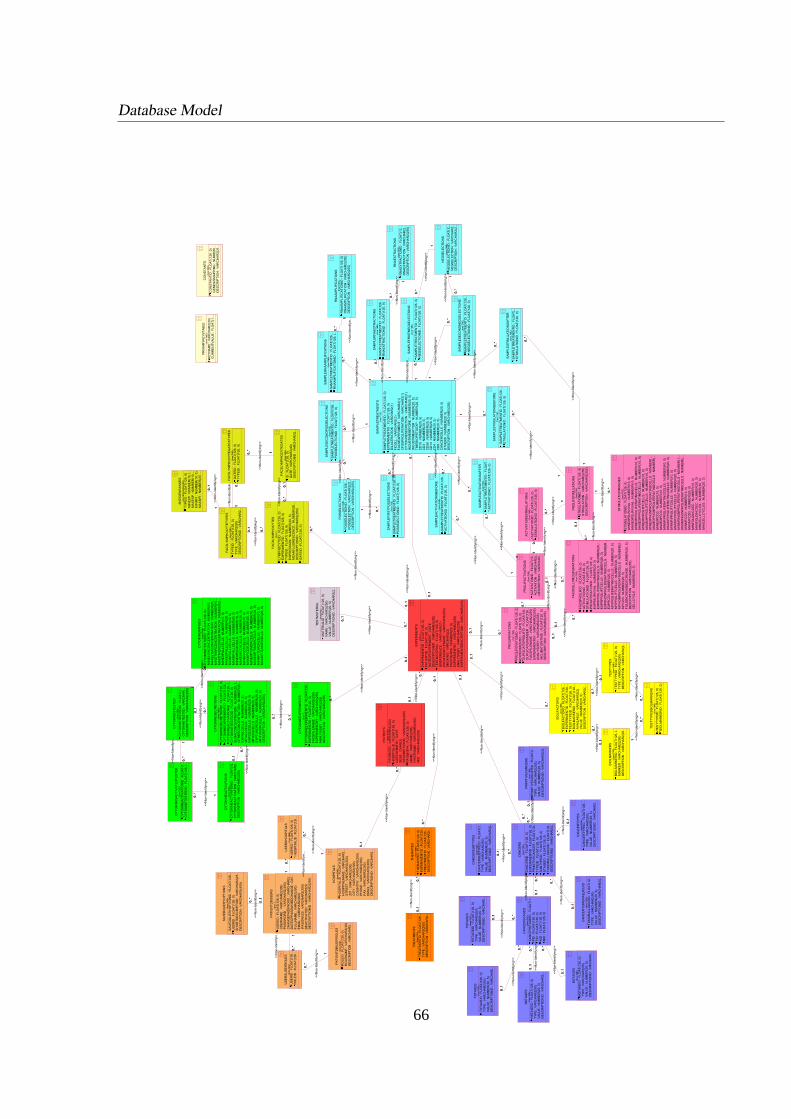
Database Model
CO
NST
AN
TS
CO
NS
TAN
TID
: FL
OA
T(12
6, 0
)G
EN
ES
ISM
AP
PIN
G :
NU
MB
ER
(...
DE
SC
RIP
TIO
N :
VA
RC
HA
R2(
25...
(from
TM
E)
CYT
OK
INE
RAN
GE
S
CYT
OK
INE
TES
TED
ID :
FLO
AT(1
26, 0
)M
INE
LIS
AC
ON
CE
NTR
ATI
ON
: N
UM
BE
R(1
0, ..
.M
AX
ELI
SA
CO
NC
EN
TRA
TIO
N :
NU
MB
ER
(20,
...M
INO
THE
RC
ON
CE
NTR
ATI
ON
: N
UM
BE
R(1
0...
MA
XO
THE
RC
ON
CE
NTR
ATI
ON
: N
UM
BE
R(2
0...M
INE
XPA
LLC
ELL
S :
NU
MB
ER
(10,
0)
MAX
EX
PAL
LCE
LLS
: N
UM
BER
(20,
0)
MIN
MFI
ALL
CE
LLS
: N
UM
BE
R(1
0, 0
)M
AXM
FIAL
LCEL
LS :
NU
MBE
R(2
0, 0
)M
INE
XPC
D3C
ELL
S :
NU
MB
ER
(10,
0)
MAX
EX
PC
D3C
ELL
S :
NU
MBE
R(2
0, 0
)M
INM
FIC
D3C
ELLS
: N
UM
BE
R(1
0, 0
)M
AXM
FIC
D3C
ELLS
: N
UM
BER
(20,
0)
MIN
EXP
TUM
OR
CE
LLS
: N
UM
BE
R(1
0, 0
)M
AXEX
PTU
MO
RC
ELL
S : N
UM
BER
(20,
0)
MIN
MFI
TUM
OR
CEL
LS :
NU
MBE
R(1
0, 0
)M
AXM
FITU
MO
RC
ELL
S :
NU
MBE
R(2
0, 0
)
(from
TM
E)
CYT
OK
INE
SAC
TIV
ATE
DTE
STE
D
CY
TOK
INE
AC
TIV
ATI
ON
ID :
FLO
AT(
1...
CY
TOK
INE
TES
TED
ID :
FLO
AT(
126,
0...
(from
TM
E)
CYT
OK
INE
AC
TIVA
TIO
NS
CY
TOK
INE
AC
TIV
ATI
ON
ID :
FLO
AT(
12...
CY
TOK
INE
AC
TIV
ATI
ON
: V
AR
CH
AR
2...
DES
CR
IPTI
ON
: V
AR
CH
AR
2(25
5)
(from
TM
E)
10..* 10..*
<<N
on-Id
entif
ying
>>
CYT
OK
INE
STE
STE
D
CY
TOK
INE
TES
TED
ID :
FLO
AT(
1...
CY
TOK
INE
TES
TED
: V
AR
CH
AR
2...
DES
CR
IPTI
ON
: V
ARC
HA
R2(
255)
(from
TM
E)
1
0..*
1
0..*
<<N
on-Id
entif
ying
>>
10.
.*1
0..*
<<N
on-Id
entif
yin.
..
PR
IMAR
YK
EYS
TAB
LE
KEY
NA
ME
: VA
RC
HA
R2(
30)
CU
RR
EN
TVA
LUE
: FL
OA
T(1.
..
(from
TM
E)
RN
AEX
TRAC
TIO
NS
RN
AE
XTR
AC
TIO
NID
: FL
OA
T(12
...R
NA
EX
TRA
CTI
ON
: V
AR
CH
AR
2(...
DES
CR
IPTI
ON
: V
AR
CH
AR
2(25
5)
(from
TM
E)
NEG
SELE
CTI
ON
S
NE
GS
ELE
CTI
ON
ID :
FLO
AT(
12...
NE
GS
ELE
CTI
ON
: V
AR
CH
AR
2...
DE
SC
RIP
TIO
N :
VA
RC
HA
R2(
2...
(from
TM
E)
POSS
ELE
CTI
ON
S
PO
SS
ELE
CTI
ON
ID :
FLO
AT(
126,
...P
OS
SE
LEC
TIO
N :
VA
RC
HA
R2(
25...
DES
CR
IPTI
ON
: VA
RC
HAR
2(25
5)
(from
TM
E)
RN
AAM
PLIF
ICAT
ION
S
RN
AA
MPL
IFIC
ATI
ON
ID :
FLO
AT(1
26, 0
)R
NAA
MPL
IFIC
ATI
ON
: V
ARC
HA
R2(
255)
DES
CR
IPTI
ON
: VA
RC
HAR
2(25
5)
(from
TM
E)
PR
OLI
FAC
TIV
ATI
ON
S
AC
TIV
ATI
ON
ID :
FLO
AT(
12...
AC
TIV
ATI
ON
: V
AR
CH
AR
2(...
DE
SC
RIP
TIO
N :
VA
RC
HA
R...
(from
TM
E)AC
TIVA
TIO
NS
STIM
ULA
TIO
NS
AC
TIVA
TIO
NID
: FL
OAT
(126
, 0)
STI
MU
LATI
ON
ID :
FLO
AT(1
26, 0
)
(from
TM
E)
10.
.*1
0..*
<<N
on-Id
entif
ying
>>
PR
OLI
FSTI
MU
LATI
ON
S
STI
MU
LATI
ON
ID :
FLO
AT(1
26, 0
)ST
IMU
LATI
ON
: VA
RC
HA
R2(
255)
DES
CR
IPTI
ON
: VA
RC
HA
R2(
255)
(from
TM
E)
1
0..*
1
0..*
<<N
on-Id
entif
ying
>>
STI
MU
LATI
ON
RAN
GE
S
STIM
ULA
TIO
NID
: FL
OAT
(126
, 0)
MIN
EXPS
UR
VIV
AL :
NU
MBE
R(1
0, 0
)M
AXEX
PSU
RVI
VAL
: NU
MBE
R(1
0, 0
)M
INEX
PPR
OLI
FER
ATIN
GC
ELLS
: N
UM
BER
(10,
0)
MAX
EXPP
RO
LIFE
RAT
ING
CEL
LS :
NU
MBE
R(1
0, 0
)M
INEX
PPR
OLI
FTC
ELLS
: N
UM
BER
(10,
0)
MAX
EXPP
RO
LIFT
CEL
LS :
NU
MBE
R(1
0, 0
)M
INE
XP
NO
NP
RO
LIFE
RA
TIN
GC
ELL
S :
NU
MB
ER
(1...
MA
XE
XP
NO
NP
RO
LIFE
RA
TIN
GC
ELL
S :
NU
MB
ER
(...
MIN
EXPC
D3
: NU
MBE
R(1
0, 0
)M
AXEX
PCD
3 : N
UM
BER
(10,
0)
MIN
MFI
PRO
LIFE
RAT
ING
CE
LLS
: N
UM
BER
(10,
0)
MAX
MFI
PRO
LIFE
RAT
ING
CE
LLS
: N
UM
BER
(20,
0)
MIN
MFI
PRO
LIFT
CEL
LS :
NU
MBE
R(1
0, 0
)M
AXM
FIPR
OLI
FTC
ELLS
: N
UM
BER
(20,
0)
MIN
MFI
NO
NP
RO
LIFE
RA
TIN
GC
ELL
S :
NU
MB
ER
(1...
MA
XM
FIN
ON
PR
OLI
FER
ATI
NG
CE
LLS
: N
UM
BE
R(2.
..M
INM
FIC
D3
: NU
MBE
R(1
0, 0
)M
AXM
FIC
D3
: NU
MBE
R(2
0, 0
)M
INFO
LDIN
CD
EC :
NU
MBE
R(1
0, 3
)M
AX
FOLD
INC
DE
C :
NU
MBE
R(2
0, 3
)M
INC
ELL
CY
CLE
S :
NU
MBE
R(1
0, 3
)M
AXC
ELLC
YCLE
S : N
UM
BER
(20,
3)
(from
TM
E)1 0..*
1 0..*
<<N
on-Id
entif
ying
>>
CYT
OK
INE
SEC
RE
TIO
NS
CYT
OK
INE
SEC
RE
TIO
NID
: FL
OAT
(126
, 0)
CY
TOK
INE
EX
PE
RIM
EN
TID
: FL
OA
T(12
6,...
CY
TOK
INE
AC
TIV
ATI
ON
ID :
FLO
AT(
126,
0...
CYT
OK
INE
TES
TED
ID :
FLO
AT(1
26, 0
)E
LIS
AC
ON
CE
NTR
ATI
ON
: N
UM
BE
R(2
0, 5.
..O
THE
RC
ON
CE
NTR
ATI
ON
: N
UM
BE
R(2
0...
EXP
ALLC
ELL
S :
NU
MBE
R(2
0, 5
)M
FIAL
LCEL
LS :
NU
MBE
R(2
0, 5
)E
XPC
D3C
ELL
S :
NU
MBE
R(2
0, 5
)M
FIC
D3C
ELL
S :
NU
MB
ER
(20,
5)
EXP
TUM
OR
CE
LLS
: N
UM
BER
(20,
5)
MFI
TUM
OR
CE
LLS
: N
UM
BER
(20,
5)
DES
CR
IPTI
ON
: VA
RC
HA
R2(
255)
(from
TM
E)
0..1
0..*
0..1
0..*
<<N
on-Id
entif
ying
>>
0..1
0..*
0..1
0..*
<<N
on-Id
entif
ying
>>
FAC
SCEL
LPR
OLI
FER
ATIO
NS
FAC
SPR
OLI
FID
: FL
OAT
(126
, 0)
ACTI
VATI
ON
ID :
FLO
AT(1
26, 0
)ST
IMU
LATI
ON
ID :
FLO
AT(1
26, 0
)PR
OLI
FER
ATIO
NID
: FL
OAT
(126
, 0)
EX
PR
SU
RV
IVA
L : N
UM
BE
R(2
0, 5
)E
XP
RP
RO
LIFE
RA
TIN
GC
ELL
S :
NU
MB
ER
(20,
5...
EX
PR
PR
OLI
FTC
ELL
S :
NU
MBE
R(2
0, 5
)E
XP
RN
ON
PR
OLI
FER
ATI
NG
CE
LLS
: N
UM
BE
R...
EX
PR
CD
3 : N
UM
BER
(20,
5)
MFI
PRO
LIFE
RAT
ING
CEL
LS :
NU
MBE
R(2
0, 5
)M
FIPR
OLI
FTC
ELLS
: N
UM
BER
(20,
5)
MFI
NO
NP
RO
LIFE
RA
TIN
GC
ELL
S :
NU
MB
ER
(2...
MFI
CD
3 : N
UM
BER
(20,
5)
FOLD
INC
RE
AS
EDE
CR
EA
SE
: N
UM
BER
(20,
5)
DES
CR
IPTI
ON
: V
ARC
HA
R2(
255)
CEL
LCYC
LE :
NU
MBE
R(2
0, 5
)
(from
TM
E)
0..1
0..*
0..1
0..*
<<N
on-Id
entif
ying
>>
0..1
0..*
0..1
0..*
<<N
on-Id
entif
ying
>>
SAM
PLE
ACTI
VA
TIO
NS
BEFO
RE
SA
MP
LETR
EA
TME
NTI
D :
FLO
AT(
126,
...A
CTI
VATI
ON
ID :
FLO
AT(1
26, 0
)
(from
TM
E)
1
0..*
1
0..*
<<N
on-Id
entif
ying
>>
SAM
PLE
SEC
ON
DP
OS
SELE
CTI
ON
S
SA
MP
LETR
EA
TME
NTI
D :
FLO
AT(
126,
...
PO
SSE
LEC
TIO
NID
: FL
OA
T(12
6, 0
)
(from
TM
E)
10.
.*1
0..*
<<N
on-Id
entif
yin.
..
SAM
PLE
FIR
STN
EGSE
LEC
TIO
NS
SAM
PLE
TREA
TME
NTI
D :
FLO
AT(1
26, 0
)N
EGSE
LEC
TIO
NID
: FL
OAT
(126
, 0)
(from
TM
E)
1
0..*
1
0..*
<<N
on-Id
entif
ying
>>
SAM
PLE
STIM
ULA
TIO
NSA
FTE
R
SA
MP
LETR
EA
TME
NTI
D :
FLO
AT(
...S
TIM
ULA
TIO
NID
: FL
OAT
(126
, 0)
(from
TM
E)
1
0..*
1
0..*
<<N
on-Id
entif
ying
>>
SAM
PLER
NAE
XTR
ACTI
ON
S
SA
MP
LETR
EA
TME
NTI
D :
FLO
AT(
126.
..R
NA
EX
TRA
CTI
ON
ID :
FLO
AT(
126,
0)
(from
TM
E)
1
0..*
1
0..*
<<N
on-Id
entif
ying
>>
SAM
PLES
ECO
ND
NEG
SELE
CTI
ON
S
SA
MP
LETR
EA
TME
NTI
D :
FLO
AT(
126.
..N
EGSE
LEC
TIO
NID
: FL
OAT
(126
, 0)
(from
TM
E)
1
0..*
1
0..*
<<N
on-Id
entif
ying
>>
SAM
PLEF
IRST
POSS
ELEC
TIO
NS
SAM
PLET
REA
TMEN
TID
: FL
OA
T(12
6, 0
)P
OS
SE
LEC
TIO
NID
: FL
OAT
(126
, 0)
(from
TM
E)
1 0..*1 0..*
<<N
on-Id
entif
ying
>>
SAM
PLE
RN
AAM
PLI
FIC
ATIO
NS
SA
MP
LETR
EA
TME
NTI
D :
FLO
AT(
126,
...R
NA
AM
PLI
FIC
ATI
ON
ID :
FLO
AT(
126,
0...
(from
TM
E)
1
0..*
1
0..*
<<N
on-Id
entif
yin.
..
SAM
PLEA
CTI
VATI
ON
SAFT
ER
SA
MP
LETR
EA
TME
NTI
D :
FLO
AT.
..AC
TIVA
TIO
NID
: FL
OAT
(126
, 0)
(from
TM
E)
1
0..*
1
0..*
<<N
on-Id
entif
ying
>>
SAM
PLES
TIM
ULA
TIO
NSB
EFO
RE
SA
MP
LETR
EA
TME
NTI
D :
FLO
AT(
126,
...S
TIM
ULA
TIO
NID
: FL
OAT
(126
, 0)
(from
TM
E)
1
0..*
1
0..*
<<N
on-Id
entif
ying
>>
TRE
ATM
ENTS
TRE
ATM
EN
TID
: FL
OA
T(12
6,...
TYP
E : V
AR
CH
AR
2(25
5)D
ES
CR
IPTI
ON
: V
AR
CH
AR
2(...
(from
TM
E)
CAN
CER
SUBT
YPE
S
CA
NC
ER
SU
BTY
PE
ID :
FLO
AT(
1...
TYP
E : V
AR
CH
AR
2(50
)V
ALU
E :
NU
MBE
R(2
0, 5
)D
ES
CR
IPTI
ON
ID :
VA
RC
HA
R2(
2...
(from
TM
E)
CAN
CE
RTU
MO
RA
LLIQ
UID
TUM
OR
ALL
IQU
IDID
: FL
OA
T(12
6...TY
PE
: VA
RC
HA
R2(
50)
VA
LUE
: N
UM
BER
(20,
5)
DE
SC
RIP
TIO
NID
: V
AR
CH
AR
2(2..
.
(from
TM
E)
CAN
CE
RTY
PES
CA
NC
ER
TYP
EID
: FL
OA
T(12
6,...
TYP
E : V
AR
CH
AR
2(50
)V
ALU
E :
NU
MBE
R(2
0, 5
)D
ES
CR
IPTI
ON
ID :
VA
RC
HA
R2.
..
(from
TM
E)
PR
IMIT
IVE
CA
NC
ER
S
PR
IMIT
IVE
CA
NC
ER
ID :
FLO
AT(
1...
TYPE
: V
ARC
HA
R2(
255)
VAL
UE
: NU
MBE
R(2
0, 5
)D
ES
CR
IPTI
ON
ID :
VA
RC
HA
R2(
25...
(from
TM
E)
MST
AGES
MST
AGE
ID :
FLO
AT(1
26, 0
)TY
PE :
VAR
CH
AR
2(50
)V
ALU
E : N
UM
BER
(20,
5)
DE
SC
RIP
TIO
NID
: V
AR
CH
AR
2...
(from
TM
E)
NS
TAG
ES
NST
AGE
ID :
FLO
AT(1
26, 0
)TY
PE
: V
ARC
HA
R2(
50)
VALU
E : N
UM
BER
(20,
5)
DE
SC
RIP
TIO
NID
: V
AR
CH
AR
2...
(from
TM
E)
PST
AG
ES
PST
AGE
ID :
FLO
AT(
126,
0)
TYP
E : V
AR
CH
AR
2(50
)VA
LUE
: N
UM
BER
(20,
5)
DE
SC
RIP
TIO
NID
: V
AR
CH
AR
2...
(from
TM
E)
TSTA
GES
TSTA
GE
ID :
FLO
AT(1
26, 0
)TY
PE
: VAR
CH
AR
2(50
)V
ALU
E :
NU
MB
ER
(20,
5)
DE
SC
RIP
TIO
NID
: V
AR
CH
AR
2...
(from
TM
E)
CAN
CER
STAG
ES
CA
NC
ER
STA
GE
ID :
FLO
AT(
1...
PID
: FL
OAT
(126
, 0)
TID
: FL
OAT
(126
, 0)
NID
: FL
OA
T(12
6, 0
)M
ID :
FLO
AT(1
26, 0
)
(from
TM
E)
0..1
0..*
0..1
0..*
<<N
on-Id
entif
ying
>>
0..1
0..*
0..1
0..*
<<N
on-Id
entif
ying
>>
0..1
0..*
0..1
0..*
<<N
on-Id
entif
ying
>>0.
.1
0..*
0..1
0..*
<<N
on-Id
entif
ying
>>
HO
SP
ITAL
S
HO
SPI
TALI
D :
FLO
AT(1
26, 0
)H
OS
PIT
ALN
AM
E :
VA
RC
HA
R2.
..S
TREE
T : V
ARC
HA
R2(
300)
ZIP
: V
AR
CH
AR
2(30
0)C
ITY
: V
ARC
HA
R2(
300)
CO
UN
TRY
: V
AR
CH
AR
2(30
0)P
HO
NE
: VA
RC
HA
R2(
300)
FAX
: VA
RC
HA
R2(
300)
EM
AIL
: V
AR
CH
AR
2(30
0)D
ES
CR
IPTI
ON
ID :
VA
RC
HA
R2.
..
(from
TM
E)
SAV
EDQ
UE
RY
OPT
ION
S
SA
VE
DQ
UE
RY
OP
TIO
NID
: FL
OA
T(12
6...
USE
RID
: FL
OAT
(126
, 0)
SH
OR
TDE
SC
RIP
TIO
N :
VA
RC
HA
R2(
25...
DES
CR
IPTI
ON
: V
ARC
HA
R2(
400)
(from
TM
E)
US
ER
SH
OS
PITA
LS
USE
RID
: FL
OAT
(126
, 0)
HO
SP
ITA
LID
: FL
OA
T(12
6...
(from
TM
E)
1
0..*
1
0..*
<<N
on-Id
entif
ying
>>
PAT
IEN
TDB
US
ER
S
US
ER
ID :
FLO
AT(1
26, 0
)U
SER
NA
ME
: VAR
CH
AR2(
300)
PA
SS
WO
RD
_ : V
ARC
HA
R2(
300)
CH
AN
GE
PA
SS
WO
RD
: V
AR
CH
AR
2(5..
.D
ATE
OFP
AS
SW
OR
DC
HA
NG
E :
DA
T...
FULL
NAM
E : V
ARC
HAR
2(30
0)EM
AIL
: VAR
CH
AR
2(30
0)IP
AD
DR
ES
S :
VA
RC
HA
R2(
300)
DE
AC
TIV
ATE
D :
VA
RC
HA
R2(
5)D
ESC
RIP
TIO
NID
: V
ARC
HA
R2(
255)
(from
T...0.
.1
0..*
0..1
0..*
<<N
on-Id
entif
ying
>>
10.
.*1
0..*
<<N
on-Id
entif
yin.
..
PAT
IEN
TDB
US
ERR
OLE
S
RO
LEID
: FL
OAT
(126
, 0)
RO
LEN
AM
E : V
ARC
HAR
2(30
)D
ES
CR
IPTI
ON
: V
AR
CH
AR
2...
(from
TM
E)
USE
RS
USE
RR
OLE
S
US
ER
ID :
FLO
AT(
126.
..R
OLE
ID :
FLO
AT(
126,.
..
(from
TM
E)
10.
.*1
0..*
<<N
on-Id
entif
yin.
..
1
0..*
1
0..*
<<N
on-Id
entif
ying
>>
CYT
OK
INE
EXP
ER
IME
NTS
CY
TOK
INE
EX
PE
RIM
EN
TID
: FL
OA
T(12
6...
EXP
ERIM
ENTI
D :
FLO
AT(1
26, 0
)FA
CSF
ILEN
AME
: VAR
CH
AR
2(25
5)E
XPER
IME
NTB
Y : V
ARC
HA
R2(
255)
AN
ALY
SIS
BY
: VAR
CH
AR2(
255)
DES
CR
IPTI
ON
: VA
RC
HAR
2(25
5)
(from
T...
0..10..*
0..10..*
<<N
on-Id
entif
ying
>>
CA
NC
ER
S
CAN
CER
ID :
FLO
AT(1
26, 0
)E
XP
ERIM
ENTI
D :
FLO
AT(1
26, 0
)P
RIM
ITIV
EC
AN
CE
R :
FLO
AT(
126...
TYPE
ID :
FLO
AT(1
26, 0
)SU
BTY
PEID
: FL
OAT
(126
, 0)
STAG
EID
: FL
OAT
(126
, 0)
TUM
OR
ALL
IQU
IDID
: FL
OA
T(12
6...D
ES
CR
IPTI
ON
ID :
VA
RC
HA
R2(
2...
(from
TM
E)
0..1 0..*
0..1 0..*
<<N
on-Id
entif
ying
>>
0..1
0..*
0..1
0..*
<<N
on-Id
entif
ying
>>
0..1
0..*
0..1
0..* <<N
on-Id
entif
ying
>>
0..1
0..*
0..1
0..*
<<N
on-Id
entif
ying
>>0.
.10.
.*0.
.10.
.*
<<N
on-Id
entif
ying
>>
PATI
ENTS
PATI
ENTI
D :
VAR
CH
AR
2(30
0)H
OSP
ITAL
ID :
FLO
AT(1
26, 0
)D
ATEO
FBIR
TH :
DAT
ES
EXE
: CH
AR
(2)
DES
CR
IPTI
ON
ID :
VA
RC
HA
R2(
250)
PATI
ENTP
K : F
LOAT
(126
, 0)
NAM
E : V
AR
CH
AR
2(30
0)FI
RST
NAM
E : V
ARC
HAR
2(30
0)M
ID :
VAR
CH
AR
2(30
0)
(from
TM
E)
0..1
0..*
0..1
0..*
<<N
on-Id
entif
ying
>>
PR
OLI
FER
ATI
ON
S
PR
OLI
FER
ATI
ON
ID :
FLO
AT(
126,
0)
EXP
ERIM
ENTI
D :
FLO
AT(1
26, 0
)D
UP
LIC
ATE
PR
OLI
FID
: FL
OA
T(12
6...
DU
PLI
CA
TEN
UM
BE
R :
FLO
AT(
126.
..FA
CSF
ILEN
AME
: VAR
CH
AR
2(25
5)E
XPER
IMEN
TBY
: VAR
CH
AR
2(25
5)A
NA
LYS
ISB
Y : V
ARC
HA
R2(
255)
INC
UBA
TIO
NTI
ME
: FL
OAT
(126
, 0)
DES
CR
IPTI
ON
: V
AR
CH
AR
2(25
5)
(from
TM
E)
0..*
0..1
0..*
<<N
on-Id
entif
ying
>>0.
.10.
.1
0..*
0..1
0..*
<<N
on-Id
entif
ying
>>
SAM
PLET
REA
TMEN
TS
SAM
PLET
REA
TMEN
TID
: FL
OA
T(12
6, 0
)E
XP
ER
IME
NTI
D :
FLO
AT(
126,
0)
DIL
ACER
ATIO
N :
VAR
CH
AR2(
1)FI
CO
LL :
VAR
CH
AR2(
1)FA
CS
EX
PE
RIM
EN
T : V
AR
CH
AR
2(1)
CFS
EP
RO
LIFE
RA
TIO
N :
VA
RC
HA
R2(
1)C
YTO
KIN
ESEC
RET
ION
: VA
RC
HA
R2(
1)IN
CU
BTI
ME
BE
FOR
E :
NU
MBE
R(2
0, 5
)IN
CU
BTIM
EAFT
ER :
NU
MBE
R(2
0, 5
)TI
MEB
IOPS
TOEX
P : N
UM
BER
(20,
5)
CD
19 :
NU
MB
ER
(20,
5)
CD
3 : N
UM
BER
(20,
5)
CD
56 :
NU
MB
ER
(20,
5)
CD
14 :
NU
MB
ER
(20,
5)
CD
4 : N
UM
BER
(20,
5)
CD
8 : N
UM
BER
(20,
5)
CAN
CER
CEL
LS :
NU
MBE
R(2
0, 5
)O
THE
RS
: N
UM
BE
R(2
0, 5
)D
ESC
RIP
TIO
N :
VAR
CH
AR2(
255)
(from
TM
E)
1
0..*
1
0..*
<<N
on-Id
entif
ying
>>
1
0..*
1
0..*
<<N
on-Id
entif
ying
>>
10.
.*1
0..*
<<N
on-Id
entif
yin.
..
1
0..*
1
0..*
<<N
on-Id
entif
ying
>>
1
0..*
1
0..*
<<N
on-Id
entif
yin.
..
1
0..*
1
0..*
<<N
on-Id
entif
ying
>>
1
0..*
1
0..*
<<N
on-Id
entif
ying
>>
1
0..*
1
0..*
<<N
on-Id
entif
ying
>>
1
0..*
1
0..*
<<N
on-Id
entif
ying
>>1 0.
.*1 0..*
<<N
on-Id
entif
ying
>>
TES
TMA
TER
IAL
MAT
ERIA
LID
: FL
OAT
(126
, 0)
NAM
E : V
AR
CH
AR
2(25
0)V
ALU
E :
NU
MB
ER
(20,
5)
DE
SC
RIP
TIO
NID
: V
AR
CH
AR
2(2..
.
(from
TM
E)
THE
RA
PIE
S
THE
RA
PIE
ID :
FLO
AT(
126,
0)
EX
PE
RIM
EN
TID
: FL
OA
T(12
6...
TRE
ATM
EN
TID
: FL
OA
T(12
6, ...
DE
SC
RIP
TIO
N :
VA
RC
HA
R2(
...
(from
TM
E)0.
.10.
.*0.
.10.
.*
<<N
on-Id
entif
ying
>>
AN
TIG
EN
RA
NG
ES
TYP
EID
: FL
OAT
(126
, 0)
MIN
EX
P :
NU
MB
ER
(10,
0...
MA
XE
XP
: N
UM
BE
R(1
0, ...
MIN
MFI
: N
UM
BER
(10,
0)
MA
XM
FI :
NU
MB
ER
(20,
...
(from
BIO
LMAR
KER
S)
FAC
SLY
MP
HO
CY
TES
LYM
PHO
CYT
EID
: FL
OAT
(126
, 0)
EXP
ERIM
ENTI
D :
FLO
AT(1
26, 0
)TY
PE
ID :
FLO
AT(1
26, 0
)E
XPR
ES
SIO
N :
NU
MBE
R(2
0, 5
)M
EA
NFL
UO
RE
SC
EN
CE
: N
UM
BE
R(2
0...
DES
CR
IPTI
ON
ID :
VAR
CH
AR
2(25
0)G
ATEI
D :
FLO
AT(1
26, 0
)
(from
T...
FAC
SLYM
PHO
CYT
EGAT
ES
ID :
FLO
AT(1
26, 0
)G
ATE
: V
AR
CH
AR
2(40
)D
ES
CR
IPTI
ON
ID :
VA
RC
HA
R2(
2...
(from
TM
E)0.
.10.
.*0.
.10.
.*
<<N
on-Id
entif
ying
>>
FAC
SLY
MP
HO
CY
TETY
PES
TYPE
ID :
FLO
AT(1
26, 0
)TY
PE :
VAR
CH
AR
2(60
)D
ES
CR
IPTI
ON
ID :
VA
RC
HA
R2.
..
(from
TM
E)
1
0..1
1
0..1
<<N
on-Id
entif
ying
>>
0..1
0..*
0..1
0..*
<<N
on-Id
entif
ying
>>
FAC
SLY
MPH
OC
YTEG
ATE
STY
PES
GAT
EID
: FL
OA
T(12
6, 0
)TY
PEI
D :
FLO
AT(
126,
0)
(from
TM
E) 10..* 10..*
<<N
on-Id
entif
ying
>>
10.
.*1
0..*
<<N
on-Id
entif
yin.
..
TEST
TYPE
SBI
OLM
ARKE
RS
TES
TTYP
EID
: FL
OAT
(126
, 0)
BIO
LMA
RK
ER
ID :
FLO
AT(1
26, 0
)
(from
TM
E)
BIO
LMA
RK
ER
S
BIO
LMA
RK
ER
ID :
FLO
AT(
126,
0...
MAR
KER
: V
ARC
HA
R2(
255)
DE
SC
RIP
TIO
N :
VA
RC
HA
R2(
25...
(from
TM
E)
1
0..*
1
0..*
<<N
on-Id
entif
ying
>>
TEST
TYPE
S
TES
TTYP
EID
: FL
OAT
(126
, 0)
TYP
E : V
ARC
HA
R2(
255)
DE
SC
RIP
TIO
N :
VA
RC
HA
R2(
2...
(from
TM
E)
1
0..*
1
0..*
<<N
on-Id
entif
ying
>>
EX
PER
IME
NTS
EX
PER
IME
NTI
D :
FLO
AT(1
26, 0
)P
ATI
ENTI
D :
FLO
AT(1
26, 0
)D
ATE
OFE
XPE
RIM
EN
T : D
ATE
DE
SC
RIP
TIO
NID
: V
AR
CH
AR
2(25
0)TE
STM
ATE
RIA
L : F
LOAT
(126
, 0)
ISR
EFER
EN
CE
: VAR
CH
AR2(
1)O
RIG
FAC
SFI
LEN
AM
E :
VAR
CH
AR
2(25
5)S
MO
KIN
G :
VA
RC
HA
R2(
2)P
AC
KYE
AR
S : N
UM
BE
R(2
0, 5
)E
XP
ERIM
EN
TBY
: VA
RC
HA
R2(
255)
AN
ALY
SIS
BY
: VA
RC
HA
R2(
255)
EX
PER
IME
NTD
ESC
RIP
TIO
N :
VAR
CH
AR
2(50
)
(from
T...
0..1
0..*
0..1
0..*
<<N
on-Id
entif
ying
>>
0..1
0..*
0..1
0..*
<<N
on-Id
entif
ying
>>
0..1
0..*
0..1
0..*
<<N
on-Id
entif
ying
>>
0..1
0..*0..1
0..*
<<N
on-Id
entif
ying
>>
0..1
0..*
0..1
0..*
<<N
on-Id
entif
ying
>>
0..1
0..*
0..1
0..*
<<N
on-Id
entif
ying
>>
0..1
0..*
0..1
0..*
<<N
on-Id
entif
ying
>>
0..1
0..*
0..1
0..*
<<N
on-Id
entif
ying
>>
BIO
LFA
CTO
RS
BIO
LFA
CTO
RID
: FL
OA
T(12
6,...
EX
PE
RIM
EN
TID
: FL
OA
T(12
6...
TES
TTY
PE
ID :
FLO
AT(
126,
0)
BIO
LMA
RK
ER
ID :
FLO
AT(
126.
..A
VA
ILA
BLE
: V
AR
CH
AR
2(2)
VALU
E : N
UM
BER
(20,
5)
DE
SC
RIP
TIO
N :
VA
RC
HA
R2(
2...
(from
TM
E)
0..1
0..*
0..1
0..*
<<N
on-Id
entif
ying
>>0.
.1
0..*
0..1
0..*
<<N
on-Id
entif
ying
>>
0..1
0..*
0..1
0..*
<<N
on-Id
entif
ying
>>
66
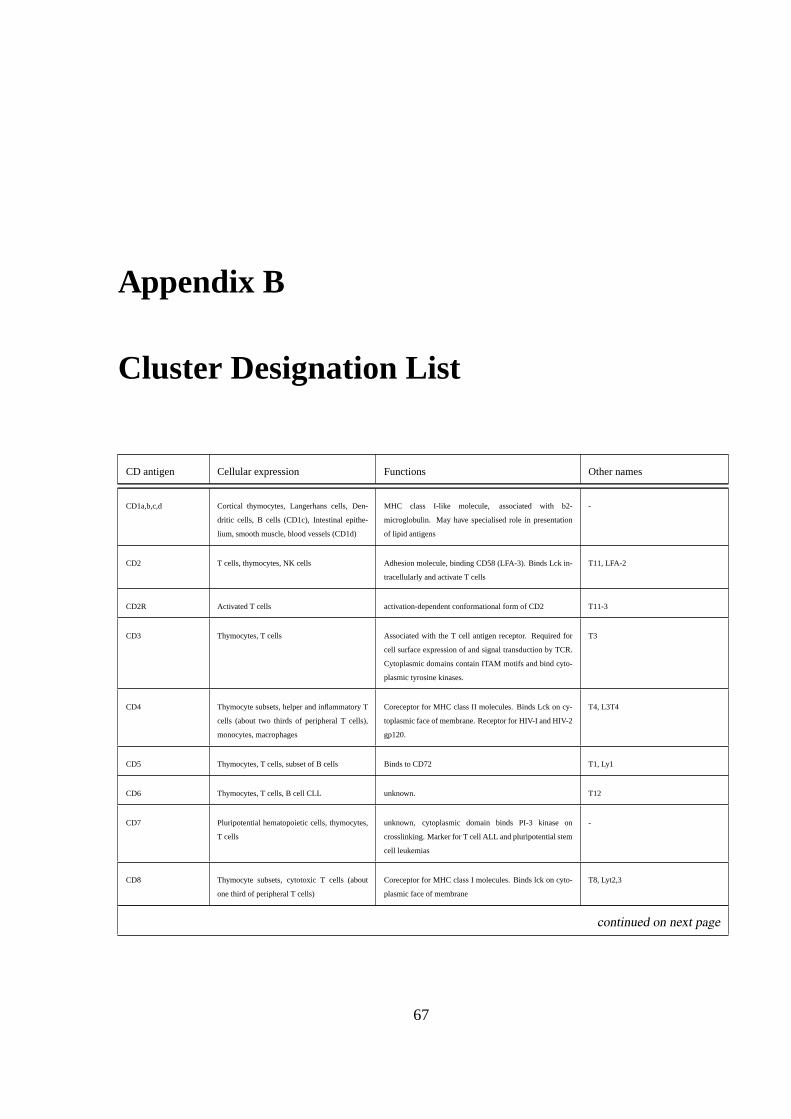
Appendix B
Cluster Designation List
CD antigen Cellular expression Functions Other names
CD1a,b,c,d Cortical thymocytes, Langerhans cells, Den-
dritic cells, B cells (CD1c), Intestinal epithe-
lium, smooth muscle, blood vessels (CD1d)
MHC class I-like molecule, associated with b2-
microglobulin. May have specialised role in presentation
of lipid antigens
-
CD2 T cells, thymocytes, NK cells Adhesion molecule, binding CD58 (LFA-3). Binds Lck in-
tracellularly and activate T cells
T11, LFA-2
CD2R Activated T cells activation-dependent conformational form of CD2 T11-3
CD3 Thymocytes, T cells Associated with the T cell antigen receptor. Required for
cell surface expression of and signal transduction by TCR.
Cytoplasmic domains contain ITAM motifs and bind cyto-
plasmic tyrosine kinases.
T3
CD4 Thymocyte subsets, helper and inflammatory T
cells (about two thirds of peripheral T cells),
monocytes, macrophages
Coreceptor for MHC class II molecules. Binds Lck on cy-
toplasmic face of membrane. Receptor for HIV-I and HIV-2
gp120.
T4, L3T4
CD5 Thymocytes, T cells, subset of B cells Binds to CD72 T1, Ly1
CD6 Thymocytes, T cells, B cell CLL unknown. T12
CD7 Pluripotential hematopoietic cells, thymocytes,
T cells
unknown, cytoplasmic domain binds PI-3 kinase on
crosslinking. Marker for T cell ALL and pluripotential stem
cell leukemias
-
CD8 Thymocyte subsets, cytotoxic T cells (about
one third of peripheral T cells)
Coreceptor for MHC class I molecules. Binds lck on cyto-
plasmic face of membrane
T8, Lyt2,3
continued on next page
67
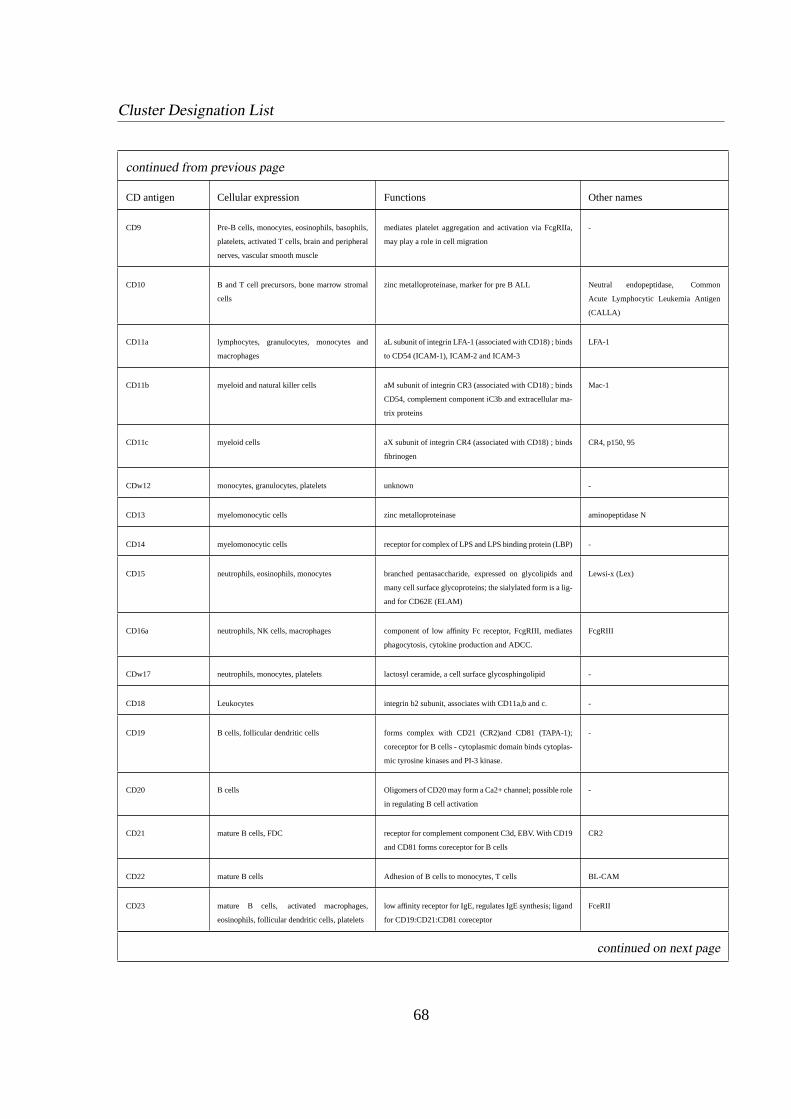
Cluster Designation List
continued from previous page
CD antigen Cellular expression Functions Other names
CD9 Pre-B cells, monocytes, eosinophils, basophils,
platelets, activated T cells, brain and peripheral
nerves, vascular smooth muscle
mediates platelet aggregation and activation via FcgRIIa,
may play a role in cell migration
-
CD10 B and T cell precursors, bone marrow stromal
cells
zinc metalloproteinase, marker for pre B ALL Neutral endopeptidase, Common
Acute Lymphocytic Leukemia Antigen
(CALLA)
CD11a lymphocytes, granulocytes, monocytes and
macrophages
aL subunit of integrin LFA-1 (associated with CD18) ; binds
to CD54 (ICAM-1), ICAM-2 and ICAM-3
LFA-1
CD11b myeloid and natural killer cells aM subunit of integrin CR3 (associated with CD18) ; binds
CD54, complement component iC3b and extracellular ma-
trix proteins
Mac-1
CD11c myeloid cells aX subunit of integrin CR4 (associated with CD18) ; binds
fibrinogen
CR4, p150, 95
CDw12 monocytes, granulocytes, platelets unknown -
CD13 myelomonocytic cells zinc metalloproteinase aminopeptidase N
CD14 myelomonocytic cells receptor for complex of LPS and LPS binding protein (LBP) -
CD15 neutrophils, eosinophils, monocytes branched pentasaccharide, expressed on glycolipids and
many cell surface glycoproteins; the sialylated form is a lig-
and for CD62E (ELAM)
Lewsi-x (Lex)
CD16a neutrophils, NK cells, macrophages component of low affinity Fc receptor, FcgRIII, mediates
phagocytosis, cytokine production and ADCC.
FcgRIII
CDw17 neutrophils, monocytes, platelets lactosyl ceramide, a cell surface glycosphingolipid -
CD18 Leukocytes integrin b2 subunit, associates with CD11a,b and c. -
CD19 B cells, follicular dendritic cells forms complex with CD21 (CR2)and CD81 (TAPA-1);
coreceptor for B cells - cytoplasmic domain binds cytoplas-
mic tyrosine kinases and PI-3 kinase.
-
CD20 B cells Oligomers of CD20 may form a Ca2+ channel; possible role
in regulating B cell activation
-
CD21 mature B cells, FDC receptor for complement component C3d, EBV. With CD19
and CD81 forms coreceptor for B cells
CR2
CD22 mature B cells Adhesion of B cells to monocytes, T cells BL-CAM
CD23 mature B cells, activated macrophages,
eosinophils, follicular dendritic cells, platelets
low affinity receptor for IgE, regulates IgE synthesis; ligand
for CD19:CD21:CD81 coreceptor
FceRII
continued on next page
68
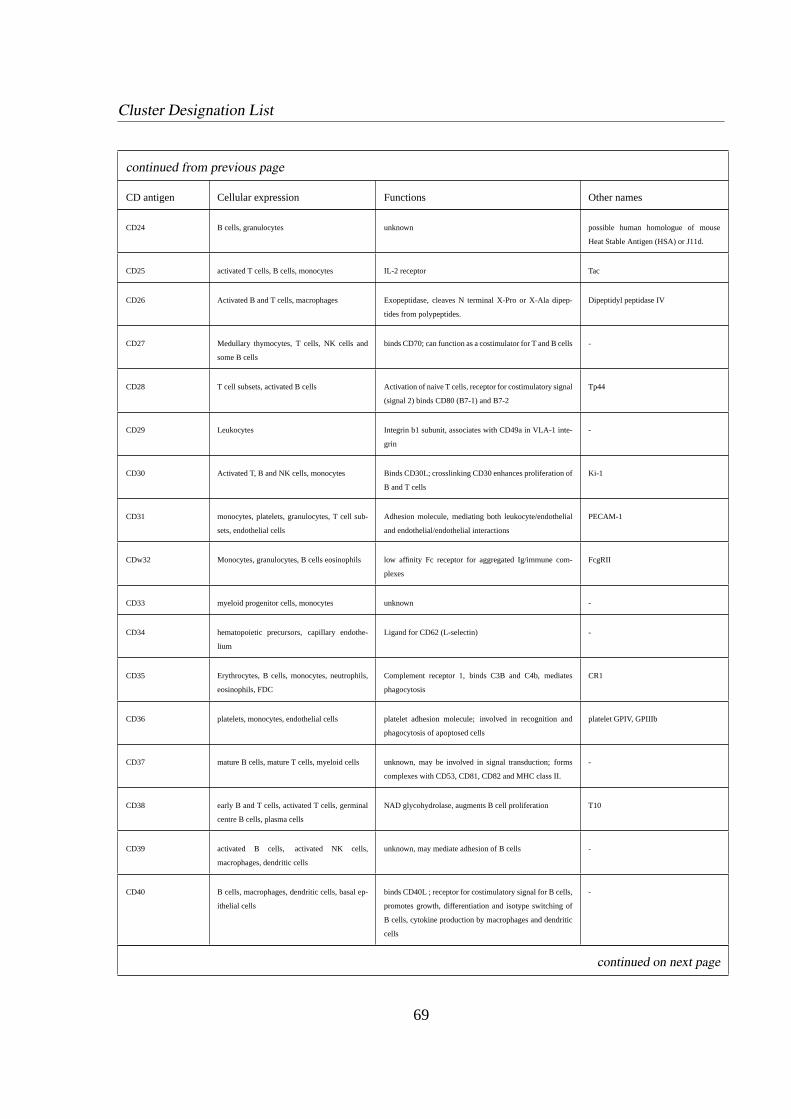
Cluster Designation List
continued from previous page
CD antigen Cellular expression Functions Other names
CD24 B cells, granulocytes unknown possible human homologue of mouse
Heat Stable Antigen (HSA) or J11d.
CD25 activated T cells, B cells, monocytes IL-2 receptor Tac
CD26 Activated B and T cells, macrophages Exopeptidase, cleaves N terminal X-Pro or X-Ala dipep-
tides from polypeptides.
Dipeptidyl peptidase IV
CD27 Medullary thymocytes, T cells, NK cells and
some B cells
binds CD70; can function as a costimulator for T and B cells-
CD28 T cell subsets, activated B cells Activation of naive T cells, receptor for costimulatory signal
(signal 2) binds CD80 (B7-1) and B7-2
Tp44
CD29 Leukocytes Integrin b1 subunit, associates with CD49a in VLA-1 inte-
grin
-
CD30 Activated T, B and NK cells, monocytes Binds CD30L; crosslinking CD30 enhances proliferation of
B and T cells
Ki-1
CD31 monocytes, platelets, granulocytes, T cell sub-
sets, endothelial cells
Adhesion molecule, mediating both leukocyte/endothelial
and endothelial/endothelial interactions
PECAM-1
CDw32 Monocytes, granulocytes, B cells eosinophils low affinity Fc receptor for aggregated Ig/immune com-
plexes
FcgRII
CD33 myeloid progenitor cells, monocytes unknown -
CD34 hematopoietic precursors, capillary endothe-
lium
Ligand for CD62 (L-selectin) -
CD35 Erythrocytes, B cells, monocytes, neutrophils,
eosinophils, FDC
Complement receptor 1, binds C3B and C4b, mediates
phagocytosis
CR1
CD36 platelets, monocytes, endothelial cells platelet adhesion molecule; involved in recognition and
phagocytosis of apoptosed cells
platelet GPIV, GPIIIb
CD37 mature B cells, mature T cells, myeloid cells unknown, may be involved in signal transduction; forms
complexes with CD53, CD81, CD82 and MHC class II.
-
CD38 early B and T cells, activated T cells, germinal
centre B cells, plasma cells
NAD glycohydrolase, augments B cell proliferation T10
CD39 activated B cells, activated NK cells,
macrophages, dendritic cells
unknown, may mediate adhesion of B cells -
CD40 B cells, macrophages, dendritic cells, basal ep-
ithelial cells
binds CD40L ; receptor for costimulatory signal for B cells,
promotes growth, differentiation and isotype switching of
B cells, cytokine production by macrophages and dendritic
cells
-
continued on next page
69
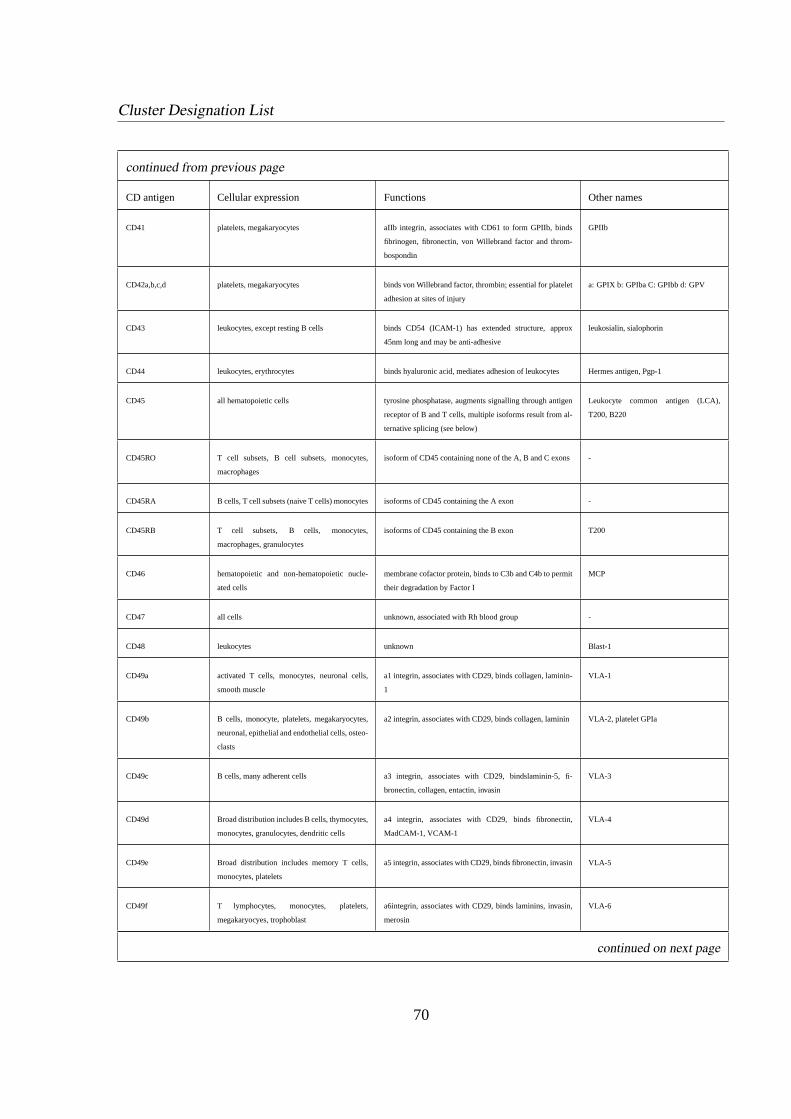
Cluster Designation List
continued from previous page
CD antigen Cellular expression Functions Other names
CD41 platelets, megakaryocytes aIIb integrin, associates with CD61 to form GPIIb, binds
fibrinogen, fibronectin, von Willebrand factor and throm-
bospondin
GPIIb
CD42a,b,c,d platelets, megakaryocytes binds von Willebrand factor, thrombin; essential for platelet
adhesion at sites of injury
a: GPIX b: GPIba C: GPIbb d: GPV
CD43 leukocytes, except resting B cells binds CD54 (ICAM-1) has extended structure, approx
45nm long and may be anti-adhesive
leukosialin, sialophorin
CD44 leukocytes, erythrocytes binds hyaluronic acid, mediates adhesion of leukocytes Hermes antigen, Pgp-1
CD45 all hematopoietic cells tyrosine phosphatase, augments signalling through antigen
receptor of B and T cells, multiple isoforms result from al-
ternative splicing (see below)
Leukocyte common antigen (LCA),
T200, B220
CD45RO T cell subsets, B cell subsets, monocytes,
macrophages
isoform of CD45 containing none of the A, B and C exons -
CD45RA B cells, T cell subsets (naive T cells) monocytes isoforms of CD45 containing the A exon -
CD45RB T cell subsets, B cells, monocytes,
macrophages, granulocytes
isoforms of CD45 containing the B exon T200
CD46 hematopoietic and non-hematopoietic nucle-
ated cells
membrane cofactor protein, binds to C3b and C4b to permit
their degradation by Factor I
MCP
CD47 all cells unknown, associated with Rh blood group -
CD48 leukocytes unknown Blast-1
CD49a activated T cells, monocytes, neuronal cells,
smooth muscle
a1 integrin, associates with CD29, binds collagen, laminin-
1
VLA-1
CD49b B cells, monocyte, platelets, megakaryocytes,
neuronal, epithelial and endothelial cells, osteo-
clasts
a2 integrin, associates with CD29, binds collagen, laminin VLA-2, platelet GPIa
CD49c B cells, many adherent cells a3 integrin, associates with CD29, bindslaminin-5, fi-
bronectin, collagen, entactin, invasin
VLA-3
CD49d Broad distribution includes B cells, thymocytes,
monocytes, granulocytes, dendritic cells
a4 integrin, associates with CD29, binds fibronectin,
MadCAM-1, VCAM-1
VLA-4
CD49e Broad distribution includes memory T cells,
monocytes, platelets
a5 integrin, associates with CD29, binds fibronectin, invasinVLA-5
CD49f T lymphocytes, monocytes, platelets,
megakaryocyes, trophoblast
a6integrin, associates with CD29, binds laminins, invasin,
merosin
VLA-6
continued on next page
70
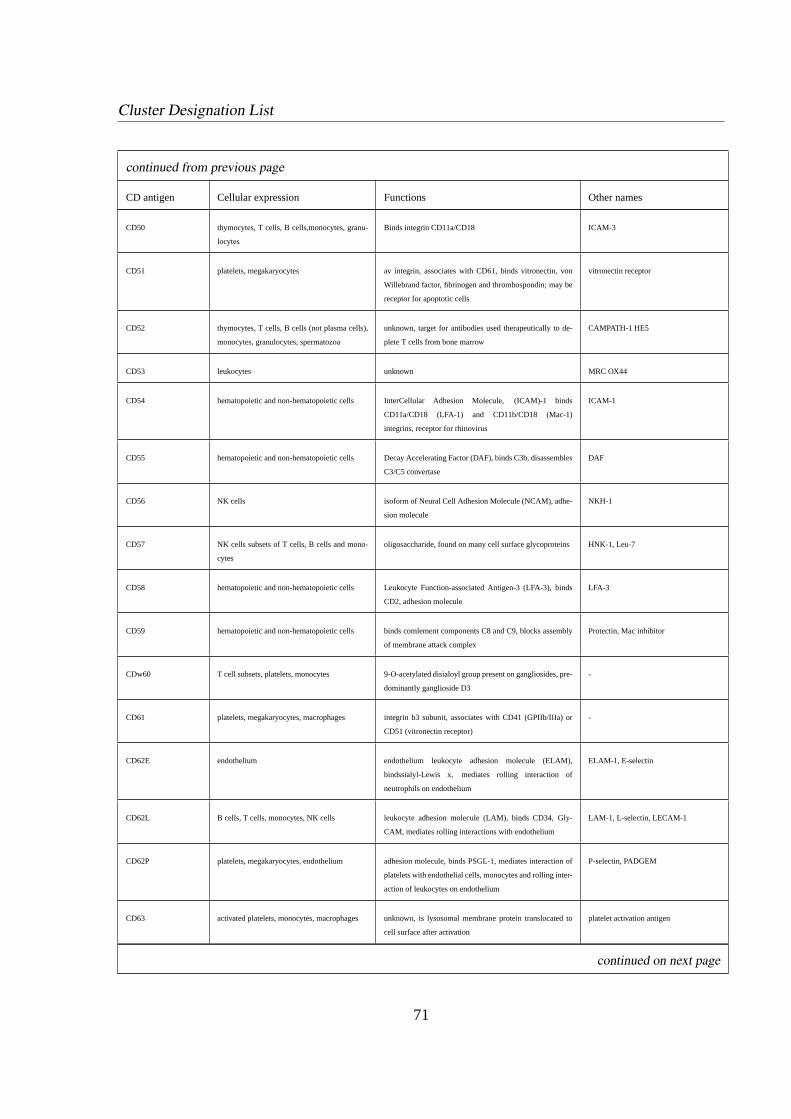
Cluster Designation List
continued from previous page
CD antigen Cellular expression Functions Other names
CD50 thymocytes, T cells, B cells,monocytes, granu-
locytes
Binds integrin CD11a/CD18 ICAM-3
CD51 platelets, megakaryocytes av integrin, associates with CD61, binds vitronectin, von
Willebrand factor, fibrinogen and thrombospondin; may be
receptor for apoptotic cells
vitronectin receptor
CD52 thymocytes, T cells, B cells (not plasma cells),
monocytes, granulocytes, spermatozoa
unknown, target for antibodies used therapeutically to de-
plete T cells from bone marrow
CAMPATH-1 HE5
CD53 leukocytes unknown MRC OX44
CD54 hematopoietic and non-hematopoietic cells InterCellular Adhesion Molecule, (ICAM)-1 binds
CD11a/CD18 (LFA-1) and CD11b/CD18 (Mac-1)
integrins, receptor for rhinovirus
ICAM-1
CD55 hematopoietic and non-hematopoietic cells Decay Accelerating Factor (DAF), binds C3b, disassembles
C3/C5 convertase
DAF
CD56 NK cells isoform of Neural Cell Adhesion Molecule (NCAM), adhe-
sion molecule
NKH-1
CD57 NK cells subsets of T cells, B cells and mono-
cytes
oligosaccharide, found on many cell surface glycoproteins HNK-1, Leu-7
CD58 hematopoietic and non-hematopoietic cells Leukocyte Function-associated Antigen-3 (LFA-3), binds
CD2, adhesion molecule
LFA-3
CD59 hematopoietic and non-hematopoietic cells binds comlement components C8 and C9, blocks assembly
of membrane attack complex
Protectin, Mac inhibitor
CDw60 T cell subsets, platelets, monocytes 9-O-acetylated disialoyl group present on gangliosides, pre-
dominantly ganglioside D3
-
CD61 platelets, megakaryocytes, macrophages integrin b3 subunit, associates with CD41 (GPIIb/IIIa) or
CD51 (vitronectin receptor)
-
CD62E endothelium endothelium leukocyte adhesion molecule (ELAM),
bindssialyl-Lewis x, mediates rolling interaction of
neutrophils on endothelium
ELAM-1, E-selectin
CD62L B cells, T cells, monocytes, NK cells leukocyte adhesion molecule (LAM), binds CD34, Gly-
CAM, mediates rolling interactions with endothelium
LAM-1, L-selectin, LECAM-1
CD62P platelets, megakaryocytes, endothelium adhesion molecule, binds PSGL-1, mediates interaction of
platelets with endothelial cells, monocytes and rolling inter-
action of leukocytes on endothelium
P-selectin, PADGEM
CD63 activated platelets, monocytes, macrophages unknown, is lysosomal membrane protein translocated to
cell surface after activation
platelet activation antigen
continued on next page
71
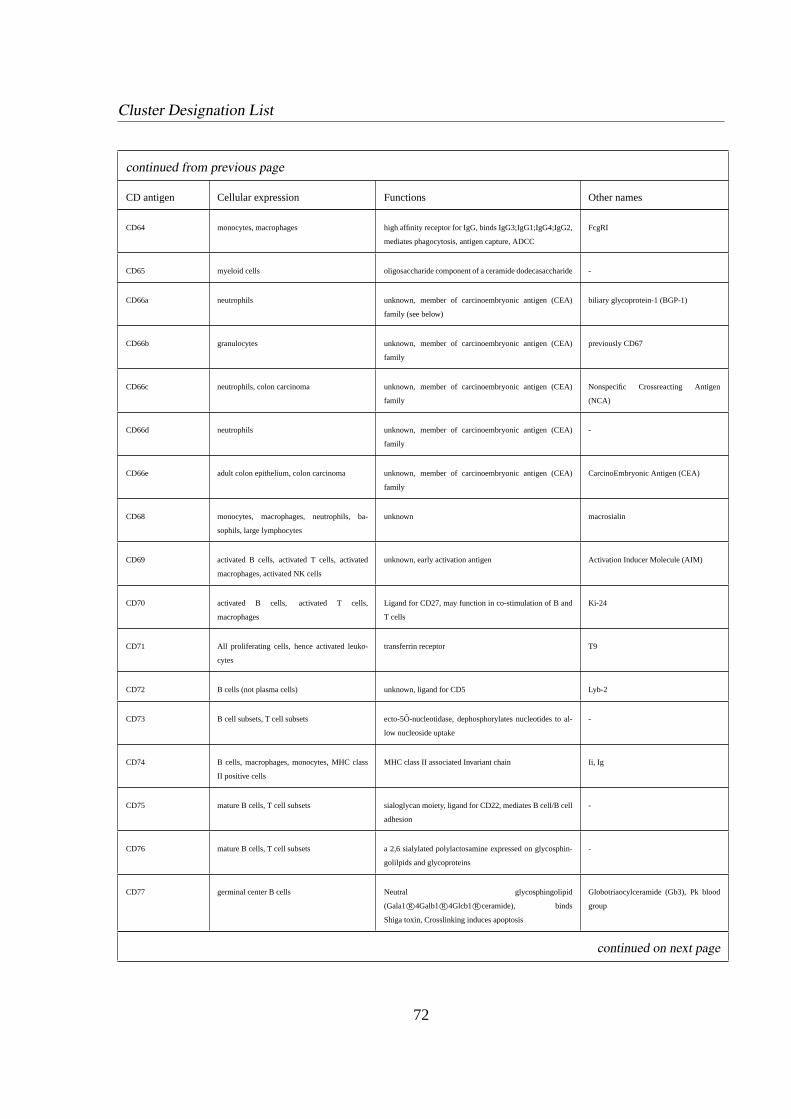
Cluster Designation List
continued from previous page
CD antigen Cellular expression Functions Other names
CD64 monocytes, macrophages high affinity receptor for IgG, binds IgG3;IgG1;IgG4;IgG2,
mediates phagocytosis, antigen capture, ADCC
FcgRI
CD65 myeloid cells oligosaccharide component of a ceramide dodecasaccharide-
CD66a neutrophils unknown, member of carcinoembryonic antigen (CEA)
family (see below)
biliary glycoprotein-1 (BGP-1)
CD66b granulocytes unknown, member of carcinoembryonic antigen (CEA)
family
previously CD67
CD66c neutrophils, colon carcinoma unknown, member of carcinoembryonic antigen (CEA)
family
Nonspecific Crossreacting Antigen
(NCA)
CD66d neutrophils unknown, member of carcinoembryonic antigen (CEA)
family
-
CD66e adult colon epithelium, colon carcinoma unknown, member of carcinoembryonic antigen (CEA)
family
CarcinoEmbryonic Antigen (CEA)
CD68 monocytes, macrophages, neutrophils, ba-
sophils, large lymphocytes
unknown macrosialin
CD69 activated B cells, activated T cells, activated
macrophages, activated NK cells
unknown, early activation antigen Activation Inducer Molecule (AIM)
CD70 activated B cells, activated T cells,
macrophages
Ligand for CD27, may function in co-stimulation of B and
T cells
Ki-24
CD71 All proliferating cells, hence activated leuko-
cytes
transferrin receptor T9
CD72 B cells (not plasma cells) unknown, ligand for CD5 Lyb-2
CD73 B cell subsets, T cell subsets ecto-5O-nucleotidase, dephosphorylates nucleotides to al-
low nucleoside uptake
-
CD74 B cells, macrophages, monocytes, MHC class
II positive cells
MHC class II associated Invariant chain Ii, Ig
CD75 mature B cells, T cell subsets sialoglycan moiety, ligand for CD22, mediates B cell/B cell
adhesion
-
CD76 mature B cells, T cell subsets a 2,6 sialylated polylactosamine expressed on glycosphin-
golilpids and glycoproteins
-
CD77 germinal center B cells Neutral glycosphingolipid
(Gala1R©4Galb1R©4Glcb1R©ceramide), binds
Shiga toxin, Crosslinking induces apoptosis
Globotriaocylceramide (Gb3), Pk blood
group
continued on next page
72
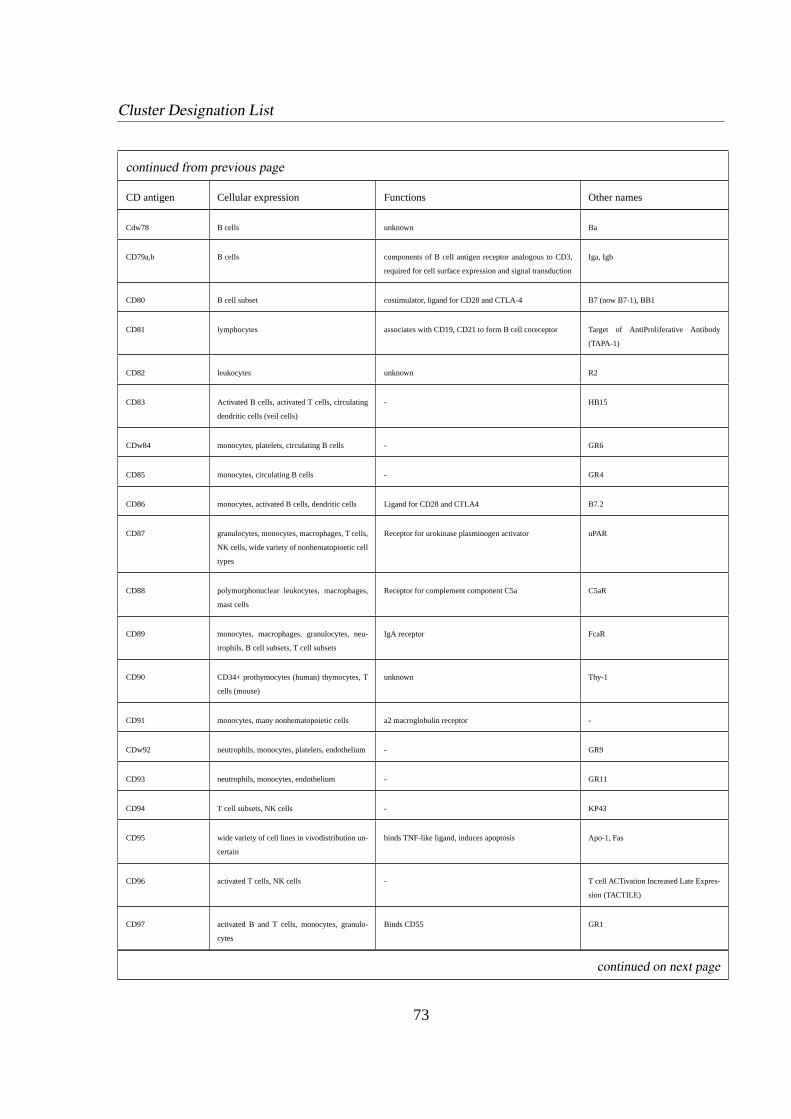
Cluster Designation List
continued from previous page
CD antigen Cellular expression Functions Other names
Cdw78 B cells unknown Ba
CD79a,b B cells components of B cell antigen receptor analogous to CD3,
required for cell surface expression and signal transduction
Iga, Igb
CD80 B cell subset costimulator, ligand for CD28 and CTLA-4 B7 (now B7-1), BB1
CD81 lymphocytes associates with CD19, CD21 to form B cell coreceptor Target of AntiProliferative Antibody
(TAPA-1)
CD82 leukocytes unknown R2
CD83 Activated B cells, activated T cells, circulating
dendritic cells (veil cells)
- HB15
CDw84 monocytes, platelets, circulating B cells - GR6
CD85 monocytes, circulating B cells - GR4
CD86 monocytes, activated B cells, dendritic cells Ligand for CD28 and CTLA4 B7.2
CD87 granulocytes, monocytes, macrophages, T cells,
NK cells, wide variety of nonhematopioetic cell
types
Receptor for urokinase plasminogen activator uPAR
CD88 polymorphonuclear leukocytes, macrophages,
mast cells
Receptor for complement component C5a C5aR
CD89 monocytes, macrophages, granulocytes, neu-
trophils, B cell subsets, T cell subsets
IgA receptor FcaR
CD90 CD34+ prothymocytes (human) thymocytes, T
cells (mouse)
unknown Thy-1
CD91 monocytes, many nonhematopoietic cells a2 macroglobulin receptor -
CDw92 neutrophils, monocytes, platelets, endothelium - GR9
CD93 neutrophils, monocytes, endothelium - GR11
CD94 T cell subsets, NK cells - KP43
CD95 wide variety of cell lines in vivodistribution un-
certain
binds TNF-like ligand, induces apoptosis Apo-1, Fas
CD96 activated T cells, NK cells - T cell ACTivation Increased Late Expres-
sion (TACTILE)
CD97 activated B and T cells, monocytes, granulo-
cytes
Binds CD55 GR1
continued on next page
73
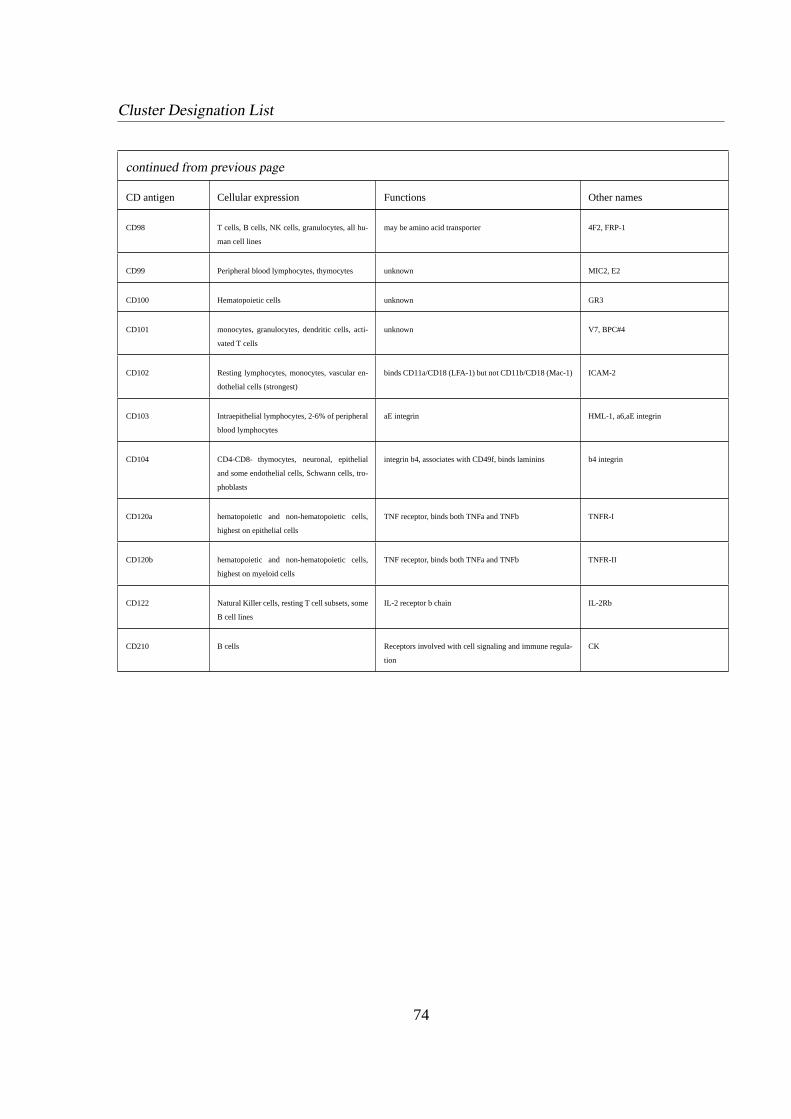
Cluster Designation List
continued from previous page
CD antigen Cellular expression Functions Other names
CD98 T cells, B cells, NK cells, granulocytes, all hu-
man cell lines
may be amino acid transporter 4F2, FRP-1
CD99 Peripheral blood lymphocytes, thymocytes unknown MIC2, E2
CD100 Hematopoietic cells unknown GR3
CD101 monocytes, granulocytes, dendritic cells, acti-
vated T cells
unknown V7, BPC#4
CD102 Resting lymphocytes, monocytes, vascular en-
dothelial cells (strongest)
binds CD11a/CD18 (LFA-1) but not CD11b/CD18 (Mac-1) ICAM-2
CD103 Intraepithelial lymphocytes, 2-6% of peripheral
blood lymphocytes
aE integrin HML-1, a6,aE integrin
CD104 CD4-CD8- thymocytes, neuronal, epithelial
and some endothelial cells, Schwann cells, tro-
phoblasts
integrin b4, associates with CD49f, binds laminins b4 integrin
CD120a hematopoietic and non-hematopoietic cells,
highest on epithelial cells
TNF receptor, binds both TNFa and TNFb TNFR-I
CD120b hematopoietic and non-hematopoietic cells,
highest on myeloid cells
TNF receptor, binds both TNFa and TNFb TNFR-II
CD122 Natural Killer cells, resting T cell subsets, some
B cell lines
IL-2 receptor b chain IL-2Rb
CD210 B cells Receptors involved with cell signaling and immune regula-
tion
CK
74


![[2T ä] 2} = [i]. - uni-magdeburg.de · vektor u = (u1‚ 112) eines Körpers, der ein Gebiet QC R2 einnimmt, und der im Körperherrschende hy-drostatische Druckp beigegebenerBelastung](https://img.pdfslide.org/doc/110x75/5d49eb4488c9937e198b770e/2t-ae-2-i-uni-vektor-u-u1-112-eines-koerpers-der-ein-gebiet.jpg)