Embed Size (px)
Citation preview
Biomass-based Fuel Cells for Manned Space Exploration
Final Report Authors: Xiachang Zhang, Tomi Ylikorpi, Giuseppe PepeAffiliation: Helsinki University of Technology ESA Research Fellow/Technical Officer: Tiziana Pipoli Contacts: Aarne Halme Tel: +358-9-451 3308 Fax: +358-9-451 3301 e-mail: [email protected]
Tiziana Pipoli Tel: +31 (0)71 56 55174 Fax: +31(0)715658018 e-mail: [email protected]
Available on the ACT ebsite whttp://www.esa.int/act
Ariadna ID: 04/2301 Study Duration: 4 months
Contract Number: 4532/18877/05/NL/MV
Biomass-based Fuel Cells for Manned Space Exploration
REF : ARIADNA ISSUE : 1.2 DATE : 31.10.2005 PAGE : - i -
DOCUMENT TYPE: Final Report
TITLE: ARIADNA AO/1-4532/03/NL/MV
Biomass-based Fuel Cells for Manned Space Exploration
HELSINKI UNIVERSITY OF TECHNOLOGY
Automation technology laboratory
FUNCTION NAME ADDRESS or PHONE
PREPARED BY Project Team: ARIADNA
Helsinki University of Technology FINLAND
Xiachang Zhang Tomi Ylikorpi Giuseppe Pepe
[email protected] [email protected] [email protected]
CHECKED BY Key reasearcher Xiachang Zhang [email protected]
APPROVED BY Professor, Chief of the Automation technology
Aarne Halme [email protected]
The project was organized by ESTEC administrator Ms. Tiziana Pipoli ([email protected])
Biomass-based Fuel Cells for Manned Space Exploration
REF : ARIADNA ISSUE : 1.2 DATE : 31.10.2005 PAGE : - ii -
Table of Contents 1 Abstract................................................................................................................... 1 2 Introduction............................................................................................................ 2 3 Mars Environment ................................................................................................. 6
3.1 General Characteristics of Mars ........................................................................ 6
3.2 Surface of Mars................................................................................................... 6
3.3 Atmosphere, Temperature and Winds................................................................. 6
3.4 Solar Flux............................................................................................................ 9
3.5 References ......................................................................................................... 10 4 Analysis and Characterization of Biomass during the Space Exploration. ...... 11
4.1 Amount of Biomass Available during the Mars Exploration Mission; Extended Base, All Plants Menu....................................................................................... 11
4.2 Analysis and Characterization of Vegetable and Fruit Biomass and Other Waste Material.................................................................................................. 12
4.3 Crop Metabolism .............................................................................................. 14
4.4 Sulphur Content of Waste Material .................................................................. 14
4.5 Elemental Consolidation................................................................................... 16
4.6 Amount of Biomass Available during the Mars Exploration Mission; Transit to Mars .................................................................................................................. 17
4.7 Conclusion ........................................................................................................ 17
4.8 References ......................................................................................................... 21 5 Anaerobic Digestion............................................................................................. 23
5.1 Digestion Process ............................................................................................. 24 5.1.1 Hydrolysis and Acidogenesis of Biomass [3]........................................... 25 5.1.2. Acidification ............................................................................................. 26
5.2 Digester Designs............................................................................................... 29 5.2.1 Using the Effluent ..................................................................................... 30
5.3 References ......................................................................................................... 31 6 Anaerobic Digestion for Space Mission.............................................................. 32
6.1 System Analysis of the HSLAD Process for Space Missions ............................ 33 6.1.1 The HSLAD System for the Space Mission ............................................. 34 6.1.2 Applied Waste Stream Used in the System Analysis ............................... 35 6.1.3 Sizing of HSLAD...................................................................................... 35 6.1.4 Integration Potential Analysis................................................................... 38
Biomass-based Fuel Cells for Manned Space Exploration
REF : ARIADNA ISSUE : 1.2 DATE : 31.10.2005 PAGE : - iii -
6.1.5 Equivalent System Mass (ESM) Calculation of HSLAD......................... 39
6.2 Conclusions....................................................................................................... 40
6.3 References ......................................................................................................... 42 7 Fuel cell technology............................................................................................. 43
7.1 Introduction....................................................................................................... 43
7.2 Objective ........................................................................................................... 43
7.3 Fuel Cell Overview ........................................................................................... 44
7.4 PEM Candidate................................................................................................. 44
7.5 SOFC Candidate............................................................................................... 45 7.5.1 Direct Oxidation of Hydrocarbons in a Solid Oxide Fuel Cells ............... 46
7.6 Fuel Cell System ............................................................................................... 46 7.6.1 Air Supply Subsystem............................................................................... 49 7.6.2 Electrical Power Conditioning System ..................................................... 51 7.6.3 Fuel Processing ......................................................................................... 52 7.6.4 Plant Support Equipment .......................................................................... 56
7.7 Comparison of Methane Fuelled PEMFC System and SOFC System.............. 59
7.8 Energy Balance................................................................................................. 60 7.8.1 Energy of Reactants .................................................................................. 60
7.9 System Efficiency .............................................................................................. 61
7.10 Heat Management............................................................................................. 62 7.10.1 Exhaust Gas Treatment ............................................................................. 62
7.11 Conclusions....................................................................................................... 63
7.12 Reference Fuel Cell Systems............................................................................. 64
7.13 References ......................................................................................................... 64 8 Biological Fuel Cell ............................................................................................. 66
8.1 Geobactor Microbes and its Fuel Cell Perspective.......................................... 67 8.1.1 Review by Dr. Bruce Rittmann, Northwestern University [3] ................. 67 8.1.2 Test of Geobactor Fuel Cell by Bruce Logan, Penn State University ...... 68 8.1.3 Hydrogen Produced Bacterium Fuel Cell [4] ........................................... 69 8.1.4 Genetic Engineering of Clostridium acetobutylicum for Enhanced
Production of Hydrogen Gas [5]............................................................... 70 8.1.5 Microbial Fuel Cell: High Yield Hydrogen Source and Wastewater
Cleaner ...................................................................................................... 70
8.2 Design of a Biofuel Cell Device........................................................................ 72 8.2.1 Structure and Materials of Single Tubular Fuel Cell ................................ 72 8.2.2 Fuel Cell Stack.......................................................................................... 72
Biomass-based Fuel Cells for Manned Space Exploration
REF : ARIADNA ISSUE : 1.2 DATE : 31.10.2005 PAGE : - iv -
8.2.3 The Fuel Cell System Design ................................................................... 73 8.2.4 Estimate Power and Energy Conversion Rate .......................................... 74 8.2.5 in the Stacks .............................................................................................. 74
8.3 References ......................................................................................................... 74 9 Fuel Cell Study at TKK and VTT ........................................................................ 75
9.1 Fuel Cell Pilot Plant Experiences at TKK and VTT......................................... 75 9.1.1 Description of 5kW SOFC Demonstration Unit....................................... 75 9.1.2 Description of 1 kW PEMFC Demonstration Unit................................... 78
9.2 Biological Fuel Cell Study at TKK ................................................................... 81 9.2.1 Microorganism Fuel Cell at TKK............................................................. 83 9.2.2 Enzymatic Fuel Cell Study at TKK .......................................................... 89
9.3 References ......................................................................................................... 95 10 Summary and Conclusions.................................................................................. 97
10.1 SOFC and PEM Fuel Cell Systems................................................................... 98
10.2 Biological Fuel Cell System.............................................................................. 99
10.3 Conclusions..................................................................................................... 100
Biomass-based Fuel Cells for Manned Space Exploration
REF : ARIADNA ISSUE : 1.2 DATE : 31.10.2005 PAGE : Page 1 of 104
1 Abstract Human feces represent a potential source of methane and hence hydrogen, which can be used as fuel in fuel cells, or in propellant gas mixtures, which would be very significant for the space exploration. Such a process would provide fuel from available resources, reducing fuel transportation from Earth, and contribute to waste disposal in the mission of Mars exploration. During the twentieth century energy consumption of human population has increased dramatically. While there is no sign that the increase of energy consumption will abate (particularly amongst the developing nations), there is now an awareness of the transience of non-renewable resources and the irreversible damage caused to the environment. These applications of energy demanding require small, lightweight power sources that are able to sustain operation over long periods of time, particularly in remote off-the-grid locations and in space exploration. Fuel cells and/or biofuel cells offer a potential solution to this problem by taking nature’s solutions of energy generation and dimensioning them to our own needs. They convert readily available substrates from renewable sources such as cereal materials, vegetable, fruits, fish meat and even human waste to electricity and benign by-products such as water. Since the biofuel cells use concentrated sources of chemical energy, they can be small and lightweight, a crucial matter in the space application. The development of fuel cell technology has already made efficient compact fuel cell possible. In this report, the feasibility of fuel cell and/or biofuel cell application to space exploration is researched in detail. Also a suitable anaerobic digestion process for the fuel production from biodegradable waste such as vegetable residues and human excreta will be introduced. The research indicates that both conventional fuel cell and biological fuel cell systems are feasible for the waste treatment and energy recycling in the manned space exploration. Both systems produce a net energy (electricity) near to zero. Further study in both fields could make the systems a more positive energy producer. Keywords: Fuel cells, proton exchange membrane fuel cell, solid oxide fuel cell, biological fuel cell, biomass energy, microorganism, and Mars exploration.
Biomass-based Fuel Cells for Manned Space Exploration
REF : ARIADNA ISSUE : 1.2 DATE : 31.10.2005 PAGE : Page 2 of 104
2 Introduction The planetary objects to be explored in future have very different environment from Earth. Some planets are covered with fluid; some moons or asteroids are covered with ice or snow; some of them have little or no water and oxygen like our targeting planet – Mars. It means that most of energy, food and water sources should be transported from Earth or carried with the spacecraft although some part of energy could be received from solar and wind energy, and some part of vegetable could be grown in the spacecraft and on Mars. In order to reduce the burden to spacecraft, it will be very significant to have a micro ecological life support system especially in the mission period on surface of Mars. The detail information is available in the MELISSA project of ESA [1]. On the other hand, on a two and half-year trip for Mars exploration, according to one estimate, a crew of six humans will generate more than six tons of solid organic waste -- much of it feces. So what do we do with all that? Right now, astronaut waste is returned back to Earth. But in the long-term exploration, it would be important to recycle it because it holds resources that astronauts will need: it will provide drinking water, fertilizer, and with the help of a recently discovered microbe, it will also provide electricity directly by a biological fuel cell system. Alternatively the biomass may be fermented in an anaerobic digester to produce biogas, which is fuel for fuel cell to produce electricity. Human feces represent a potential source of methane and hence hydrogen, which can be used as fuel in a fuel cell, or in propellant gas mixtures. At the same time such a process would provide fuel from available resources reducing fuel transportation from Earth, and contributing to waste disposal. The process converting human excrement and vegetable residues into methane, carbon dioxide and other gases is anaerobic digestion, an well-established process. It occurs naturally wherever high concentrations of wet organic matter accumulate in the absence of dissolved oxygen. The process takes place over a wide range of temperatures and with moisture content from 60 % to 90 % [2]. Fuel cell technology is becoming more and more important especially due to high petroleum price nowadays. Full cells provide a range of critical benefits that no other single power technology can match [3]. A fuel cell converts the chemical energy of hydrogen and oxygen directly to produce water, electricity, and heat. They are therefore inherently clean and efficient and are uniquely able to address the issues of environmental degradation and energy security. They are also safe, quiet and very reliable. Fuelled with pure hydrogen, they produce zero emissions of carbon dioxide, oxides of nitrogen or any other pollutant. Even if fuelled with fossil fuels as a source of hydrogen, noxious emissions are orders of magnitude below those of conventional equipment. They offer significant improvements in energy efficiency as they remove the intermediate step of combustion and mechanical devices such as turbines and pistons. Unlike conventional systems, they operate at high efficiency at partial load. Also, unlike conventional plants, their high efficiency is not
Biomass-based Fuel Cells for Manned Space Exploration
REF : ARIADNA ISSUE : 1.2 DATE : 31.10.2005 PAGE : Page 3 of 104
compromised by small sizes. High efficiency saves fuel and reduces carbon dioxide emissions. Fuel cell power plants have demonstrated unprecedented reliability and durability. This is significantly better than that of conventional equipment. Fuel cells can use hydrogen derived from a variety of sources, including natural gas and coal, and renewable sources such as biomass or, through electrolysis, wind and solar energy. Fuel cells offer the opportunity to customers with a value-added energy service at overall lower cost that is not subject to the same competitive or regulatory pressures as for conventional electric supply. Biofuel cells use biocatalysts for the conversion of chemical energy to electrical energy. Biocatalysts could be microorganism(s) or enzyme(s). There are two types of biofuel cells. In an indirect biofuel cell the biocatalysts generate the fuel substrates for the fuel cell by biocatalytic transformations or metabolic processes. Anaerobic digestion together with a conventional fuel cell is one of such processes. In a direct biofuel cell the biocatalysts participate in the electron transfer chain between the fuel substrates and the electrode surfaces. Both fuel producing reaction and electrode reaction take place in the same container. Both systems utilize most organic substrates as fuel to generate energy. The biocatalyzed oxidation of organic substances by oxygen or other oxidizers at two-electrode interfaces provides means for the conversion of chemical energy to electricity. Abundant organic materials such as methanol, organic acids or glucose and even organic waste, like vegetable residues and human excrements, can be used as substrates for the oxidation process from which hydrogen or methane is formed. Both methane and hydrogen are potential fuels for the fuel cell system. Methane produced biologically could be as well chemically reformed with a miniature reformer to produce hydrogen for the fuel cell. Atmospheric oxygen or peroxide, H2O2, can act as the oxidant being reduced in the electricity producing process within the fuel cell. In space exploration the fuel transportation from Earth should be minimized. A good solution for the electricity production is through a biofuel cell using organic waste, food residues and human excrements as fuel. Since the composition of the substrate is quite complicated, enzymatic fuel cell may not be best suited. One type of enzyme can only use one type of substrate and each enzyme usually has a specific optimum condition. Thus, the best solution would be a microbial fuel cell system, which is a more robust system according to our previous experience [4]. Recently new approaches have been developed for the functionalization of electrode surfaces with monolayers and multilayers consisting of redox enzymes, electrocatalysts and bioelectrocatalysts that stimulate electrochemical transformations at the electrode interfaces. The assembly of electrically contacted bioactive monolayer electrodes could be advantageous for applications of biofuel cell as the biocatalyst and electrode support are integrated [5]. Biofuel cells for the generation of electrical energy from abundant organic substrates can be organized by different approaches. In one approach includes the use of microorganisms as biological reactors, or “biological reformers”, for the fermentation of organic materials to fuel, e.g. hydrogen that is delivered into a conventional fuel cell.
Biomass-based Fuel Cells for Manned Space Exploration
REF : ARIADNA ISSUE : 1.2 DATE : 31.10.2005 PAGE : Page 4 of 104
The other approach is to utilize microorganisms in the assembly of biofuel cells including the in situ electrical coupling of metabolites generated in the microbial cells with the electrode support. A further methodology to develop biofuel cells involves the application of redox enzymes for the targeted oxidation and reduction of a specific fuel and oxidizer substrates at the electrode supports and the generation of the electrical power output. To reach this goal, it is essential to tailor integrated enzyme-electrodes that exhibit electrical contact and communication with the conductive supports. The detailed characterization of the interfacial electron transfer rates, biocatalytic rate-constants and cell resistances is essential upon the construction of the biofuel cells. The identification of the rate-limiting steps allows then the development of strategies to improve and enhance the cell’s performance. The chemical modification of redox enzymes with synthetic units that improve the electrical contact with the electrodes provides a general means to enhance the electrical output of biofuel cells. The site-specific modification of redox enzymes and the surface-reconstitution of enzymes represent novel and attractive means to align and orient biocatalysts on electrode surfaces. The effective electrical contacting of aligned proteins with electrodes suggests that future efforts may be directed towards the development of structural mutants of redox-proteins to enhance their electrical communication with electrodes. The stepwise nanoengineering of the electrode surfaces with relay-cofactor-biocatalyst units by organic synthesis principles allows us to control the electron transfer cascades in the assemblies. By tuning the redox-potentials of the synthetic relays or biocatalytic mutants, enhanced power outputs from the biofuel cells may be envisaged. State-of-the-art in biofuel cells allows miniaturization of biocatalytic electrodes [6]. The object of this study is the investigation of different routes for the production of fuels for a fuel cell from organic waste, and in particular from human excrements, during manned exploration of the Moon and Mars. A trade-off between the processes will be performed and discussed. Substrates available in Mars space exploration will be determined and considered as fuel for fuel cells after they are processed, for instance anaerobic digestion. The substrates are mainly organic waste for instance vegetable residues and human excrements. Based on the investigation, several fuel cell systems will be discussed in order to compare their different features and decide which fuel cell system will be more suitable for the purpose. Our laboratory has studied biological fuel cells and conventional fuel cell such as PEMFC and SOFC for many years. We have used microorganisms collected from the sediments of Baltic Sea as catalyst in our fuel cell and tested various substrates such as plankton, fish meat, fruits etc. A couple of enzymatic fuel cell processes have been also studied in the laboratory. The experience gathered in the previous studies helps us to find suitable processes for this purpose. In this final report, Mars environment and mission requirements will be introduced at first. One chapter analyzes and characterizes the biomass available during the space
Biomass-based Fuel Cells for Manned Space Exploration
REF : ARIADNA ISSUE : 1.2 DATE : 31.10.2005 PAGE : Page 5 of 104
exploration. Then in another chapter anaerobic digestion process is discussed. The following chapter discusses the special application of the anaerobic digestion process in space mission. In the next chapter, the fuel cell technology and fuel cell system are introduced and analyzed. Biological fuel cell and its application with a brief design of the process are described in the Chapter 8. Chapter 9 will briefly introduce the studies of (bio)fuel cells in the Helsinki University of Technology. Finally conclusions and summarization for different processes and their mass and energy balance will be presented in the chapter 10. References: [1] http://www.estec.esa.nl/ecls/?p=melissa. [2] Pipoli T., Feasibility of biomass-based fuels cells for manned space exploration’
Proc.’Seventh European Space Power Conference, Stresa, Italy, May 2005. [3] http://fuelcellworld.org/article_flat.fcm?articleid=13&subsite=1172 [4] Zhang XC et.al., Enzymatic Fuel Cells, Internal report of Automation
Technology Laboratory, Helsinki University of Technology, 2004. [5] Willner I. and Katz E., Angew. Chem. Int. Ed., 39, 1180 (2000). [6] http://chem.ch.huji.ac.il/~eugeniik/biofuel/biofuel_cells4.html.
Biomass-based Fuel Cells for Manned Space Exploration
REF : ARIADNA ISSUE : 1.2 DATE : 31.10.2005 PAGE : Page 6 of 104
3 Mars Environment
3.1 General Characteristics of Mars Mars, of all the planets in our Solar System, is the most similar to Earth. It is smaller than Earth; its diameter is 6787 km, only 53% that of Earth. Its weight is 6.4*1023 kg and its volume is 1.6*1011 km3. Its mean density is 3940 kg/m3. Gravitational acceleration on Mars surface is 0.38 times of that of Earth i.e., 3.727 m/sec2 according to NASA National Space Science Data Center (NSSDC) Mars Fact Sheet [1].
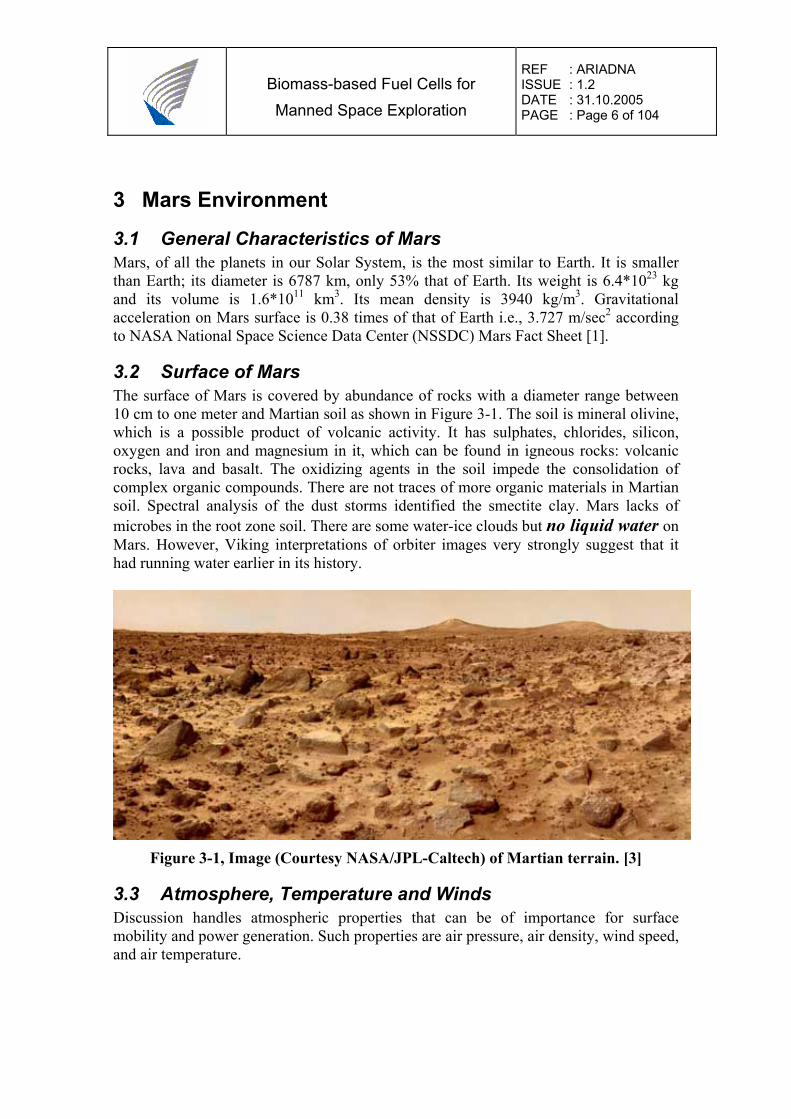
3.2 Surface of Mars The surface of Mars is covered by abundance of rocks with a diameter range between 10 cm to one meter and Martian soil as shown in Figure 3-1. The soil is mineral olivine, which is a possible product of volcanic activity. It has sulphates, chlorides, silicon, oxygen and iron and magnesium in it, which can be found in igneous rocks: volcanic rocks, lava and basalt. The oxidizing agents in the soil impede the consolidation of complex organic compounds. There are not traces of more organic materials in Martian soil. Spectral analysis of the dust storms identified the smectite clay. Mars lacks of microbes in the root zone soil. There are some water-ice clouds but no liquid water on Mars. However, Viking interpretations of orbiter images very strongly suggest that it had running water earlier in its history.
Figure 3-1, Image (Courtesy NASA/JPL-Caltech) of Martian terrain. [3]
3.3 Atmosphere, Temperature and Winds Discussion handles atmospheric properties that can be of importance for surface mobility and power generation. Such properties are air pressure, air density, wind speed, and air temperature.
Biomass-based Fuel Cells for Manned Space Exploration
REF : ARIADNA ISSUE : 1.2 DATE : 31.10.2005 PAGE : Page 7 of 104
NASA National Space Science Data Center (NSSDC) Mars Fact Sheet [1], The DLR HRSC-Experiment web page [4] and [5] present the following data on Martian atmosphere:
The atmosphere in Mars is very thin, only about 1% as dense as on Earth. Atmospheric pressure is 7 mbar with quite high variation (25-30%). There is no liquid water on Mars. Ultraviolet light impedes life because Mars has not an ozone layer. The absence of an ozone layer on Mars allows the dangerous Ultraviolet radiations to reach the surface of Mars.
Mean molecular weight of Martian air is 43.34 g/mole. The Mars atmosphere constitutes of the following gases: CO2 (95.32%), N2 (2.7%), Ar (1.6%), O2 (0.13%), CO (0.07%), H2O (0.03%) [4] .
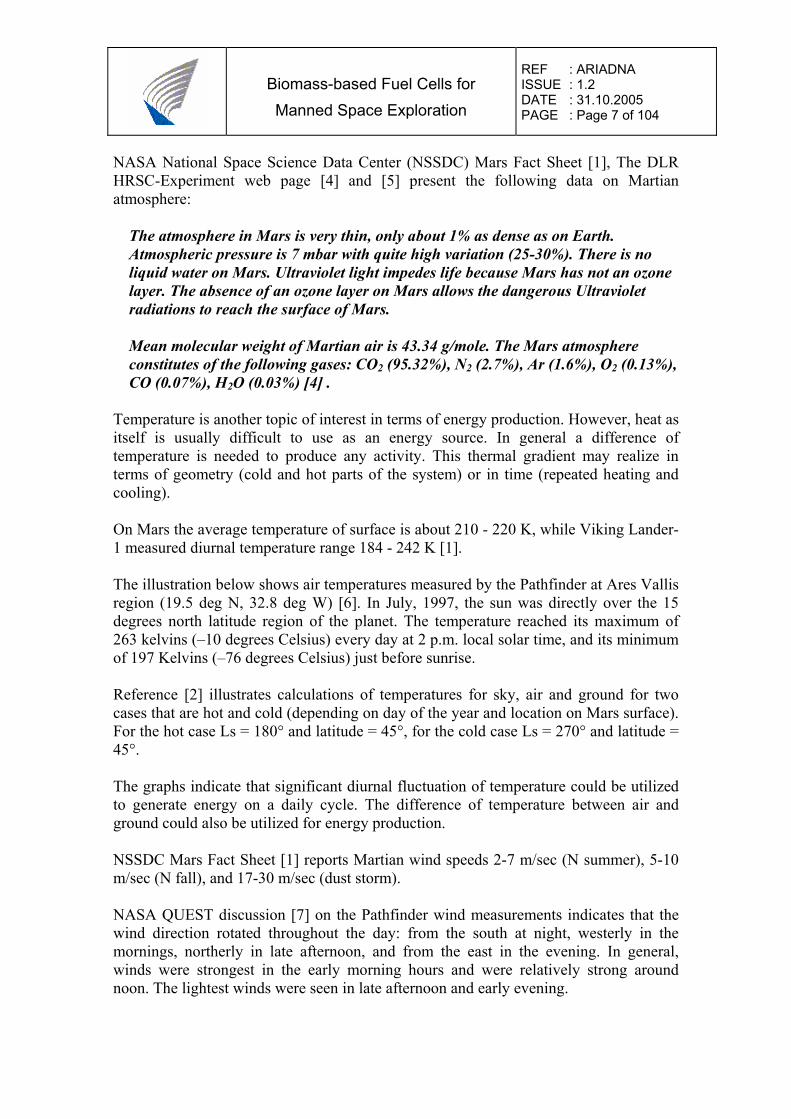
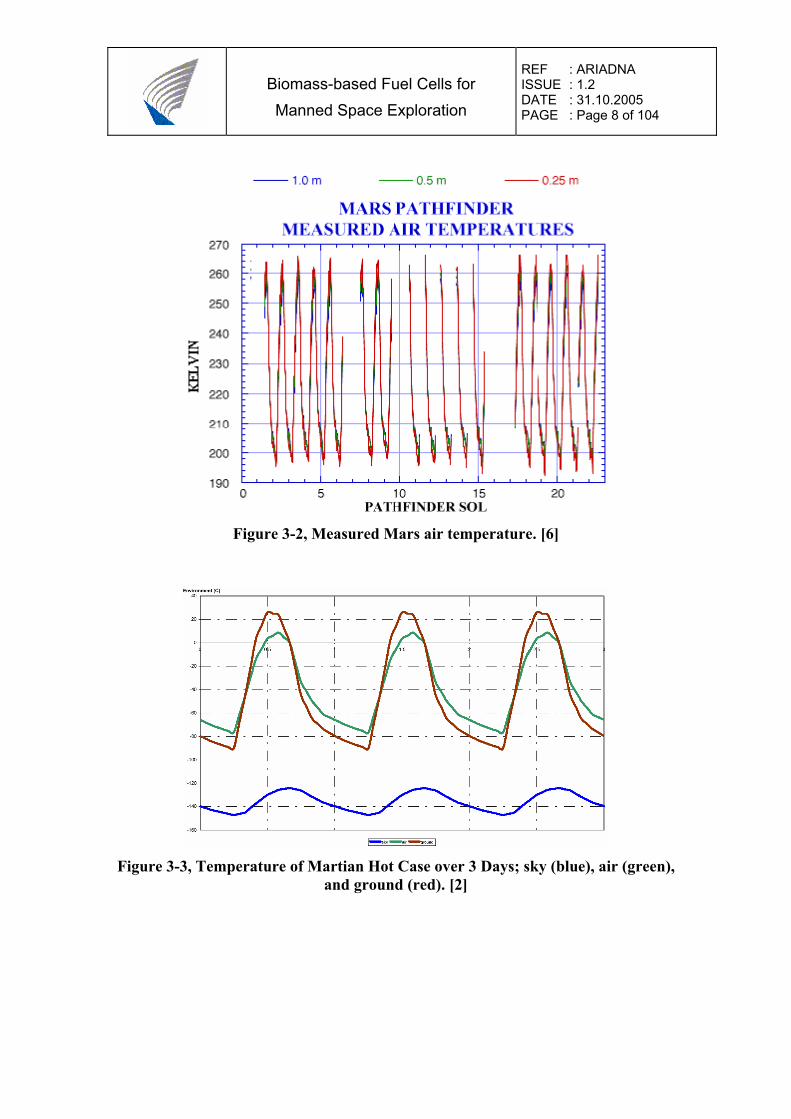
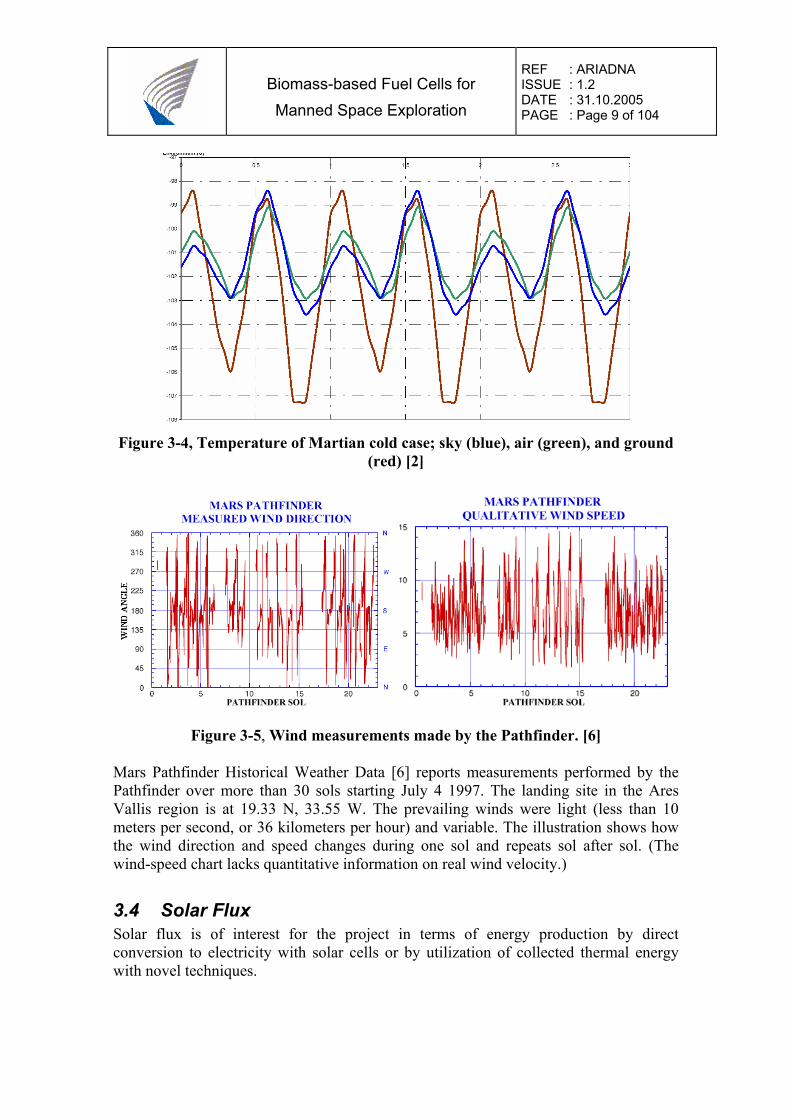
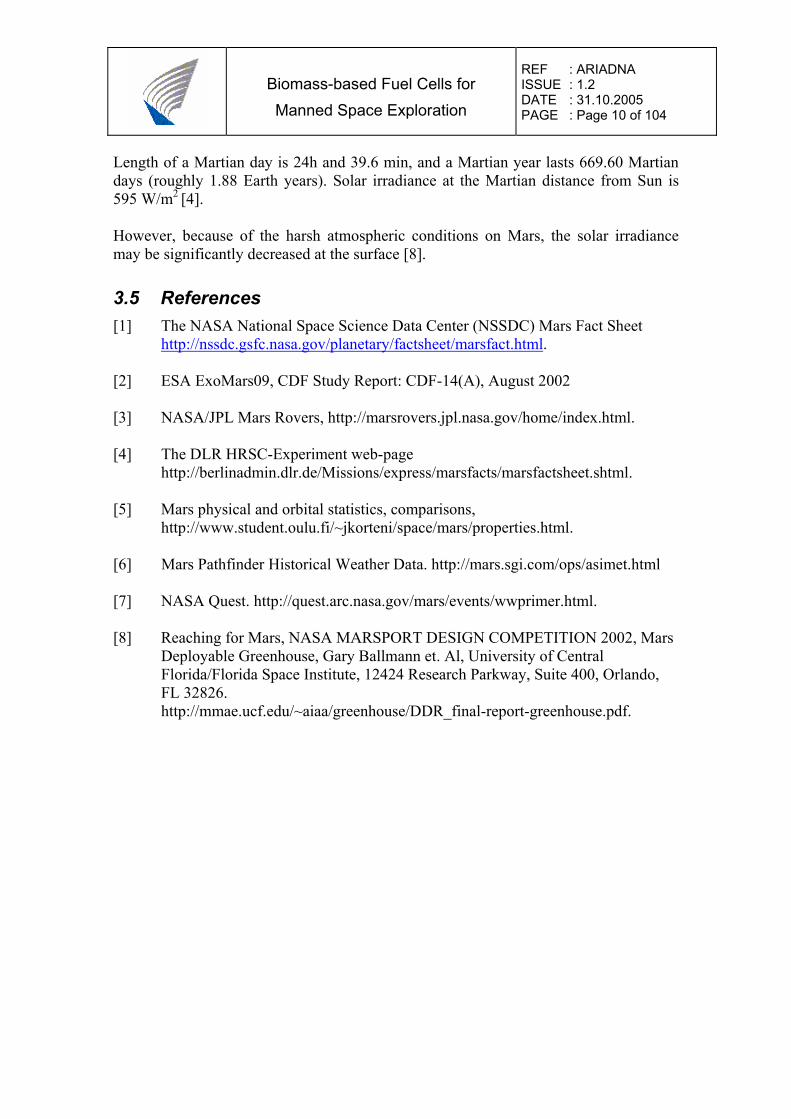
Temperature is another topic of interest in terms of energy production. However, heat as itself is usually difficult to use as an energy source. In general a difference of temperature is needed to produce any activity. This thermal gradient may realize in terms of geometry (cold and hot parts of the system) or in time (repeated heating and cooling). On Mars the average temperature of surface is about 210 - 220 K, while Viking Lander-1 measured diurnal temperature range 184 - 242 K [1]. The illustration below shows air temperatures measured by the Pathfinder at Ares Vallis region (19.5 deg N, 32.8 deg W) [6]. In July, 1997, the sun was directly over the 15 degrees north latitude region of the planet. The temperature reached its maximum of 263 kelvins (–10 degrees Celsius) every day at 2 p.m. local solar time, and its minimum of 197 Kelvins (–76 degrees Celsius) just before sunrise. Reference [2] illustrates calculations of temperatures for sky, air and ground for two cases that are hot and cold (depending on day of the year and location on Mars surface). For the hot case Ls = 180° and latitude = 45°, for the cold case Ls = 270° and latitude = 45°. The graphs indicate that significant diurnal fluctuation of temperature could be utilized to generate energy on a daily cycle. The difference of temperature between air and ground could also be utilized for energy production. NSSDC Mars Fact Sheet [1] reports Martian wind speeds 2-7 m/sec (N summer), 5-10 m/sec (N fall), and 17-30 m/sec (dust storm). NASA QUEST discussion [7] on the Pathfinder wind measurements indicates that the wind direction rotated throughout the day: from the south at night, westerly in the mornings, northerly in late afternoon, and from the east in the evening. In general, winds were strongest in the early morning hours and were relatively strong around noon. The lightest winds were seen in late afternoon and early evening.
Biomass-based Fuel Cells for Manned Space Exploration
REF : ARIADNA ISSUE : 1.2 DATE : 31.10.2005 PAGE : Page 8 of 104
Figure 3-2, Measured Mars air temperature. [6]
Figure 3-3, Temperature of Martian Hot Case over 3 Days; sky (blue), air (green),
and ground (red). [2]
Biomass-based Fuel Cells for Manned Space Exploration
REF : ARIADNA ISSUE : 1.2 DATE : 31.10.2005 PAGE : Page 9 of 104
Figure 3-4, Temperature of Martian cold case; sky (blue), air (green), and ground
(red) [2]
Figure 3-5, Wind measurements made by the Pathfinder. [6] Mars Pathfinder Historical Weather Data [6] reports measurements performed by the Pathfinder over more than 30 sols starting July 4 1997. The landing site in the Ares Vallis region is at 19.33 N, 33.55 W. The prevailing winds were light (less than 10 meters per second, or 36 kilometers per hour) and variable. The illustration shows how the wind direction and speed changes during one sol and repeats sol after sol. (The wind-speed chart lacks quantitative information on real wind velocity.)
3.4 Solar Flux Solar flux is of interest for the project in terms of energy production by direct conversion to electricity with solar cells or by utilization of collected thermal energy with novel techniques.
Biomass-based Fuel Cells for Manned Space Exploration
REF : ARIADNA ISSUE : 1.2 DATE : 31.10.2005 PAGE : Page 10 of 104
Length of a Martian day is 24h and 39.6 min, and a Martian year lasts 669.60 Martian days (roughly 1.88 Earth years). Solar irradiance at the Martian distance from Sun is 595 W/m2 [4]. However, because of the harsh atmospheric conditions on Mars, the solar irradiance may be significantly decreased at the surface [8].
3.5 References [1] The NASA National Space Science Data Center (NSSDC) Mars Fact Sheet
http://nssdc.gsfc.nasa.gov/planetary/factsheet/marsfact.html. [2] ESA ExoMars09, CDF Study Report: CDF-14(A), August 2002 [3] NASA/JPL Mars Rovers, http://marsrovers.jpl.nasa.gov/home/index.html. [4] The DLR HRSC-Experiment web-page
http://berlinadmin.dlr.de/Missions/express/marsfacts/marsfactsheet.shtml. [5] Mars physical and orbital statistics, comparisons,
http://www.student.oulu.fi/~jkorteni/space/mars/properties.html. [6] Mars Pathfinder Historical Weather Data. http://mars.sgi.com/ops/asimet.html [7] NASA Quest. http://quest.arc.nasa.gov/mars/events/wwprimer.html. [8] Reaching for Mars, NASA MARSPORT DESIGN COMPETITION 2002, Mars
Deployable Greenhouse, Gary Ballmann et. Al, University of Central Florida/Florida Space Institute, 12424 Research Parkway, Suite 400, Orlando, FL 32826. http://mmae.ucf.edu/~aiaa/greenhouse/DDR_final-report-greenhouse.pdf.
Biomass-based Fuel Cells for Manned Space Exploration
REF : ARIADNA ISSUE : 1.2 DATE : 31.10.2005 PAGE : Page 11 of 104
4 Analysis and Characterization of Biomass during the Space Exploration.
Objective of this section is to clarify amounts of resources (oxygen, carbon dioxide, food, waste, energy, etc.) that would be included in a closed system of a manned space mission. Special interest lies on waste material that could be used for energy production through gasification and fuel cells. Here only food and waste management system is considered although additional scientific and maintenance systems require their own share of resources. Also the external energy sources are omitted at this time. Later it can be calculated if any additional energy would be needed, or if some would be available for other resources.
This data is mostly based on information derived from home page of NASA Advanced Life Support Program (http://advlifesupport.jsc.nasa.gov/index.html) and especially on documents [1]-[3]. Some additional information on e.g. sulphur and ash content was found in research documents for terrestrial applications in [4]-[9]. The data presented here might not be absolutely unquestionable. Available information on the references was often inaccurate (e.g. it is not clear, if the stated composition refers to wet basis or dry basis, sources and applicability of all waste material are not clear). Some light adjustment has been performed in this presentation in order to reach convergent results falling within 10-15% range. Adjustment has been performed in some elemental composition that varied in different sources, and also in produced amount of waste material, that also varied. In future experience of a professional biologist could be used to revise elemental contents of biomass.
4.1 Amount of Biomass Available during the Mars Exploration Mission; Extended Base, All Plants Menu
Nature of resources circulation depends a lot on mission type, especially on the type of astronaut’s diet. Especially amount of grown food is important, as inedible plant biomass plays a significant role in waste material circulation. During transit to Mars possibilities to grow food on space ship are very much different from those on Mars base. And also on Mars base there are several different ways to build the astronaut’s diet, which in turn has a great effect on amount and nature of circulating matter. The references [1] and [3] present 6 different diets of which one is selected to be a starting point for this study. The selected scenario is the ‘Extended Base, All Plants Menu’. When moving on to ‘Transit to Mars’-menu the ratio of grown food decreases and amount of packaged food increases. This increases the amount of packaging waste and decreases amount of plant biomass waste. Two material flow models are to be explored: input and output of a crew member, and input and output of plant growing facility. The third model: input and output of the gasification/fuel cell is to be explored later based on the information of this section. The
Biomass-based Fuel Cells for Manned Space Exploration
REF : ARIADNA ISSUE : 1.2 DATE : 31.10.2005 PAGE : Page 12 of 104
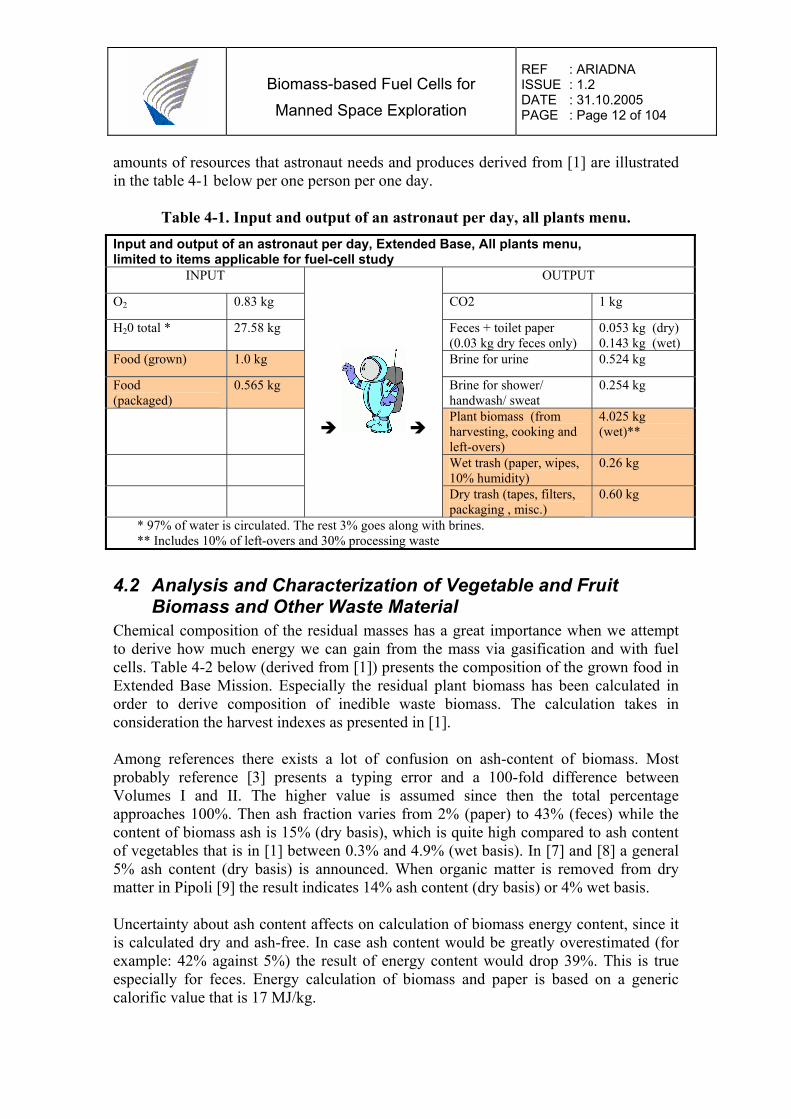
amounts of resources that astronaut needs and produces derived from [1] are illustrated in the table 4-1 below per one person per one day.
Table 4-1. Input and output of an astronaut per day, all plants menu. Input and output of an astronaut per day, Extended Base, All plants menu, limited to items applicable for fuel-cell study
INPUT OUTPUT
O2 0.83 kg CO2 1 kg
H20 total * 27.58 kg Feces + toilet paper (0.03 kg dry feces only)
0.053 kg (dry) 0.143 kg (wet)
Food (grown) 1.0 kg Brine for urine 0.524 kg
Food (packaged)
0.565 kg Brine for shower/ handwash/ sweat
0.254 kg
Plant biomass (from harvesting, cooking and left-overs)
4.025 kg (wet)**
Wet trash (paper, wipes, 10% humidity)
0.26 kg
Dry trash (tapes, filters, packaging , misc.)
0.60 kg
* 97% of water is circulated. The rest 3% goes along with brines. ** Includes 10% of left-overs and 30% processing waste
4.2 Analysis and Characterization of Vegetable and Fruit Biomass and Other Waste Material
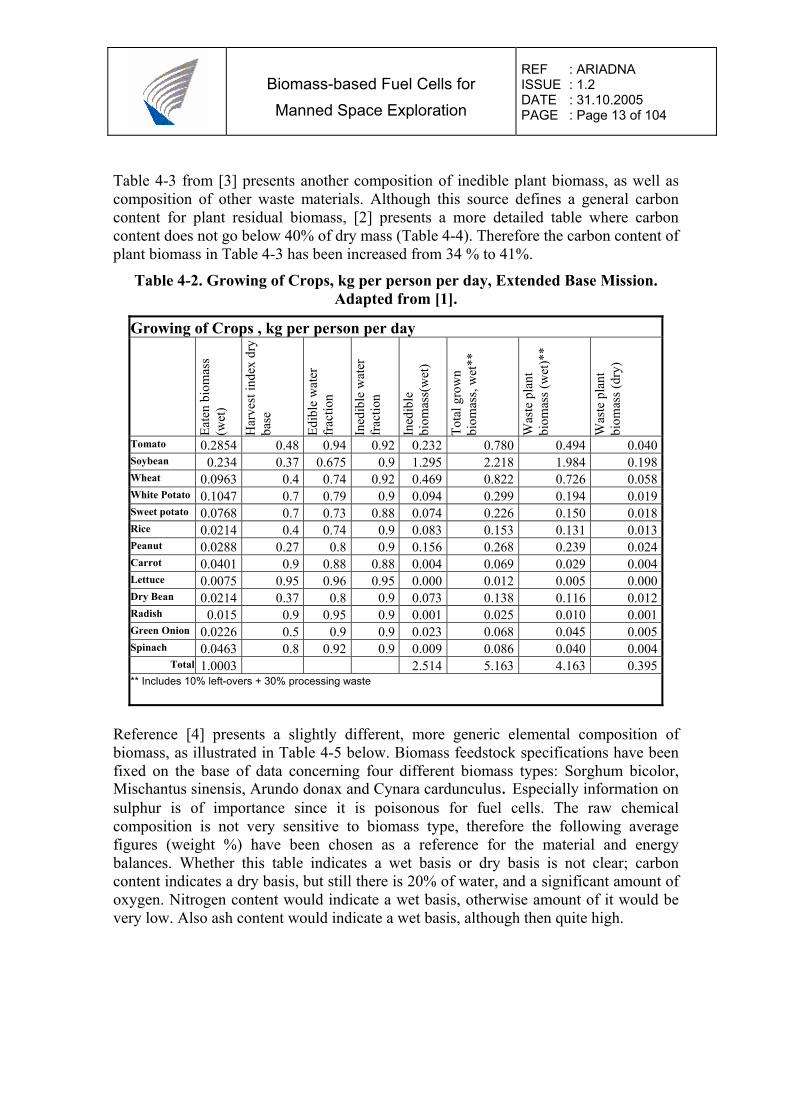
Chemical composition of the residual masses has a great importance when we attempt to derive how much energy we can gain from the mass via gasification and with fuel cells. Table 4-2 below (derived from [1]) presents the composition of the grown food in Extended Base Mission. Especially the residual plant biomass has been calculated in order to derive composition of inedible waste biomass. The calculation takes in consideration the harvest indexes as presented in [1]. Among references there exists a lot of confusion on ash-content of biomass. Most probably reference [3] presents a typing error and a 100-fold difference between Volumes I and II. The higher value is assumed since then the total percentage approaches 100%. Then ash fraction varies from 2% (paper) to 43% (feces) while the content of biomass ash is 15% (dry basis), which is quite high compared to ash content of vegetables that is in [1] between 0.3% and 4.9% (wet basis). In [7] and [8] a general 5% ash content (dry basis) is announced. When organic matter is removed from dry matter in Pipoli [9] the result indicates 14% ash content (dry basis) or 4% wet basis. Uncertainty about ash content affects on calculation of biomass energy content, since it is calculated dry and ash-free. In case ash content would be greatly overestimated (for example: 42% against 5%) the result of energy content would drop 39%. This is true especially for feces. Energy calculation of biomass and paper is based on a generic calorific value that is 17 MJ/kg.
Biomass-based Fuel Cells for Manned Space Exploration
REF : ARIADNA ISSUE : 1.2 DATE : 31.10.2005 PAGE : Page 13 of 104
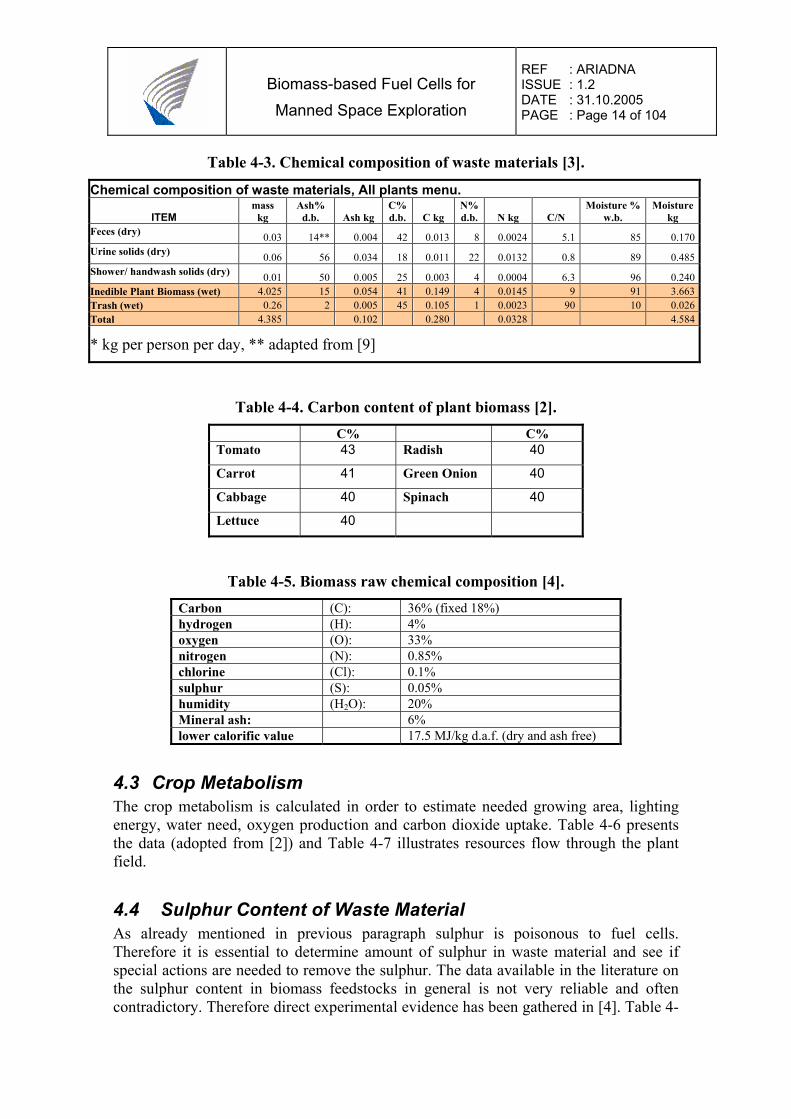
Table 4-3 from [3] presents another composition of inedible plant biomass, as well as composition of other waste materials. Although this source defines a general carbon content for plant residual biomass, [2] presents a more detailed table where carbon content does not go below 40% of dry mass (Table 4-4). Therefore the carbon content of plant biomass in Table 4-3 has been increased from 34 % to 41%.
Table 4-2. Growing of Crops, kg per person per day, Extended Base Mission. Adapted from [1].
Growing of Crops , kg per person per day
Eate
n bi
omas
s (w
et)
Har
vest
inde
x dr
y ba
se
Edib
le w
ater
fr
actio
n
Ined
ible
wat
er
frac
tion
Ined
ible
bi
omas
s(w
et)
Tota
l gro
wn
biom
ass,
wet
**
Was
te p
lant
bi
omas
s (w
et)*
*
Was
te p
lant
bi
omas
s (dr
y)
Tomato 0.2854 0.48 0.94 0.92 0.232 0.780 0.494 0.040Soybean 0.234 0.37 0.675 0.9 1.295 2.218 1.984 0.198Wheat 0.0963 0.4 0.74 0.92 0.469 0.822 0.726 0.058White Potato 0.1047 0.7 0.79 0.9 0.094 0.299 0.194 0.019Sweet potato 0.0768 0.7 0.73 0.88 0.074 0.226 0.150 0.018Rice 0.0214 0.4 0.74 0.9 0.083 0.153 0.131 0.013Peanut 0.0288 0.27 0.8 0.9 0.156 0.268 0.239 0.024Carrot 0.0401 0.9 0.88 0.88 0.004 0.069 0.029 0.004Lettuce 0.0075 0.95 0.96 0.95 0.000 0.012 0.005 0.000Dry Bean 0.0214 0.37 0.8 0.9 0.073 0.138 0.116 0.012Radish 0.015 0.9 0.95 0.9 0.001 0.025 0.010 0.001Green Onion 0.0226 0.5 0.9 0.9 0.023 0.068 0.045 0.005Spinach 0.0463 0.8 0.92 0.9 0.009 0.086 0.040 0.004
Total 1.0003 2.514 5.163 4.163 0.395** Includes 10% left-overs + 30% processing waste
Reference [4] presents a slightly different, more generic elemental composition of biomass, as illustrated in Table 4-5 below. Biomass feedstock specifications have been fixed on the base of data concerning four different biomass types: Sorghum bicolor, Mischantus sinensis, Arundo donax and Cynara cardunculus. Especially information on sulphur is of importance since it is poisonous for fuel cells. The raw chemical composition is not very sensitive to biomass type, therefore the following average figures (weight %) have been chosen as a reference for the material and energy balances. Whether this table indicates a wet basis or dry basis is not clear; carbon content indicates a dry basis, but still there is 20% of water, and a significant amount of oxygen. Nitrogen content would indicate a wet basis, otherwise amount of it would be very low. Also ash content would indicate a wet basis, although then quite high.
Biomass-based Fuel Cells for Manned Space Exploration
REF : ARIADNA ISSUE : 1.2 DATE : 31.10.2005 PAGE : Page 14 of 104
Table 4-3. Chemical composition of waste materials [3].
Chemical composition of waste materials, All plants menu.
ITEM mass
kg Ash%
d.b. Ash kg C% d.b. C kg
N% d.b. N kg C/N
Moisture % w.b.
Moisture kg
Feces (dry) 0.03 14** 0.004 42 0.013 8 0.0024 5.1 85 0.170Urine solids (dry) 0.06 56 0.034 18 0.011 22 0.0132 0.8 89 0.485Shower/ handwash solids (dry) 0.01 50 0.005 25 0.003 4 0.0004 6.3 96 0.240Inedible Plant Biomass (wet) 4.025 15 0.054 41 0.149 4 0.0145 9 91 3.663Trash (wet) 0.26 2 0.005 45 0.105 1 0.0023 90 10 0.026Total 4.385 0.102 0.280 0.0328 4.584
* kg per person per day, ** adapted from [9]
Table 4-4. Carbon content of plant biomass [2]. C% C%
Tomato 43 Radish 40
Carrot 41 Green Onion 40
Cabbage 40 Spinach 40
Lettuce 40
Table 4-5. Biomass raw chemical composition [4]. Carbon (C): 36% (fixed 18%) hydrogen (H): 4% oxygen (O): 33% nitrogen (N): 0.85% chlorine (Cl): 0.1% sulphur (S): 0.05% humidity (H2O): 20% Mineral ash: 6% lower calorific value 17.5 MJ/kg d.a.f. (dry and ash free)
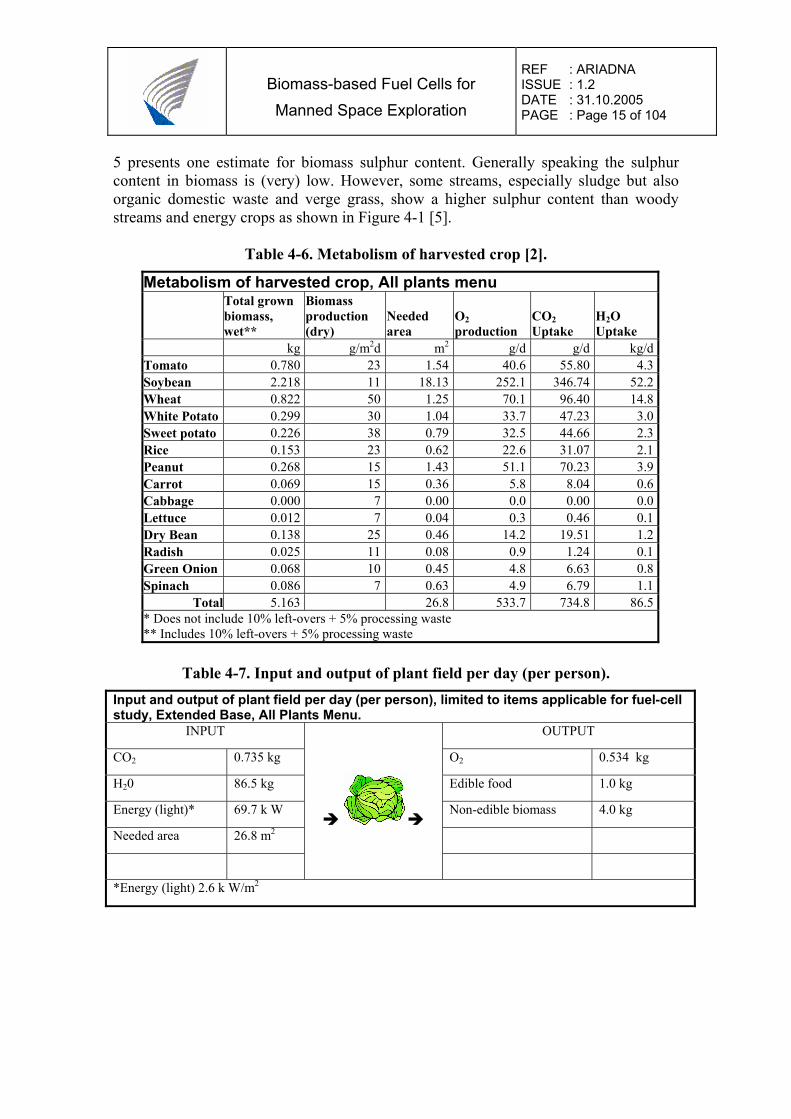
4.3 Crop Metabolism The crop metabolism is calculated in order to estimate needed growing area, lighting energy, water need, oxygen production and carbon dioxide uptake. Table 4-6 presents the data (adopted from [2]) and Table 4-7 illustrates resources flow through the plant field.
4.4 Sulphur Content of Waste Material As already mentioned in previous paragraph sulphur is poisonous to fuel cells. Therefore it is essential to determine amount of sulphur in waste material and see if special actions are needed to remove the sulphur. The data available in the literature on the sulphur content in biomass feedstocks in general is not very reliable and often contradictory. Therefore direct experimental evidence has been gathered in [4]. Table 4-
Biomass-based Fuel Cells for Manned Space Exploration
REF : ARIADNA ISSUE : 1.2 DATE : 31.10.2005 PAGE : Page 15 of 104
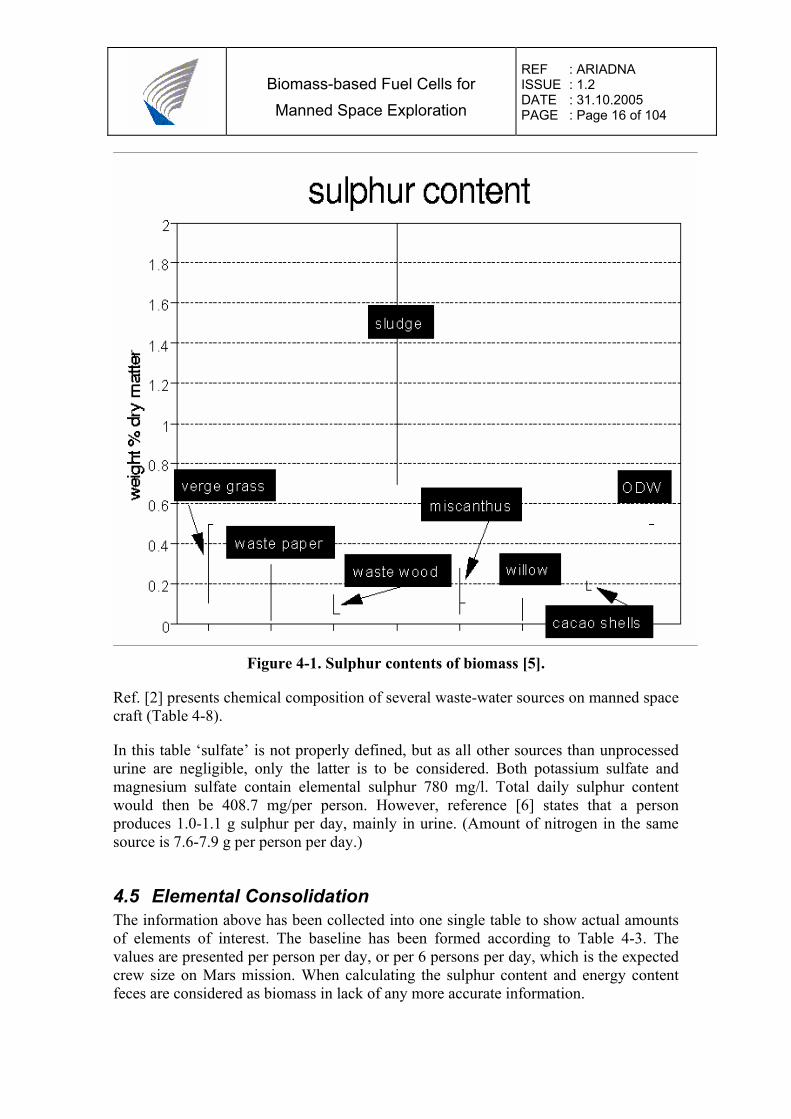
5 presents one estimate for biomass sulphur content. Generally speaking the sulphur content in biomass is (very) low. However, some streams, especially sludge but also organic domestic waste and verge grass, show a higher sulphur content than woody streams and energy crops as shown in Figure 4-1 [5].
Table 4-6. Metabolism of harvested crop [2].
Metabolism of harvested crop, All plants menu Total grown
biomass, wet**
Biomass production (dry)
Needed area
O2 production
CO2 Uptake
H2O Uptake
kg g/m2d m2 g/d g/d kg/d Tomato 0.780 23 1.54 40.6 55.80 4.3 Soybean 2.218 11 18.13 252.1 346.74 52.2 Wheat 0.822 50 1.25 70.1 96.40 14.8 White Potato 0.299 30 1.04 33.7 47.23 3.0 Sweet potato 0.226 38 0.79 32.5 44.66 2.3 Rice 0.153 23 0.62 22.6 31.07 2.1 Peanut 0.268 15 1.43 51.1 70.23 3.9 Carrot 0.069 15 0.36 5.8 8.04 0.6 Cabbage 0.000 7 0.00 0.0 0.00 0.0 Lettuce 0.012 7 0.04 0.3 0.46 0.1 Dry Bean 0.138 25 0.46 14.2 19.51 1.2 Radish 0.025 11 0.08 0.9 1.24 0.1 Green Onion 0.068 10 0.45 4.8 6.63 0.8 Spinach 0.086 7 0.63 4.9 6.79 1.1
Total 5.163 26.8 533.7 734.8 86.5 * Does not include 10% left-overs + 5% processing waste ** Includes 10% left-overs + 5% processing waste
Table 4-7. Input and output of plant field per day (per person). Input and output of plant field per day (per person), limited to items applicable for fuel-cell study, Extended Base, All Plants Menu.
INPUT OUTPUT
CO2 0.735 kg O2 0.534 kg
H20 86.5 kg Edible food 1.0 kg
Energy (light)* 69.7 k W Non-edible biomass 4.0 kg
Needed area 26.8 m2
*Energy (light) 2.6 k W/m2
Biomass-based Fuel Cells for Manned Space Exploration
REF : ARIADNA ISSUE : 1.2 DATE : 31.10.2005 PAGE : Page 16 of 104
Figure 4-1. Sulphur contents of biomass [5].
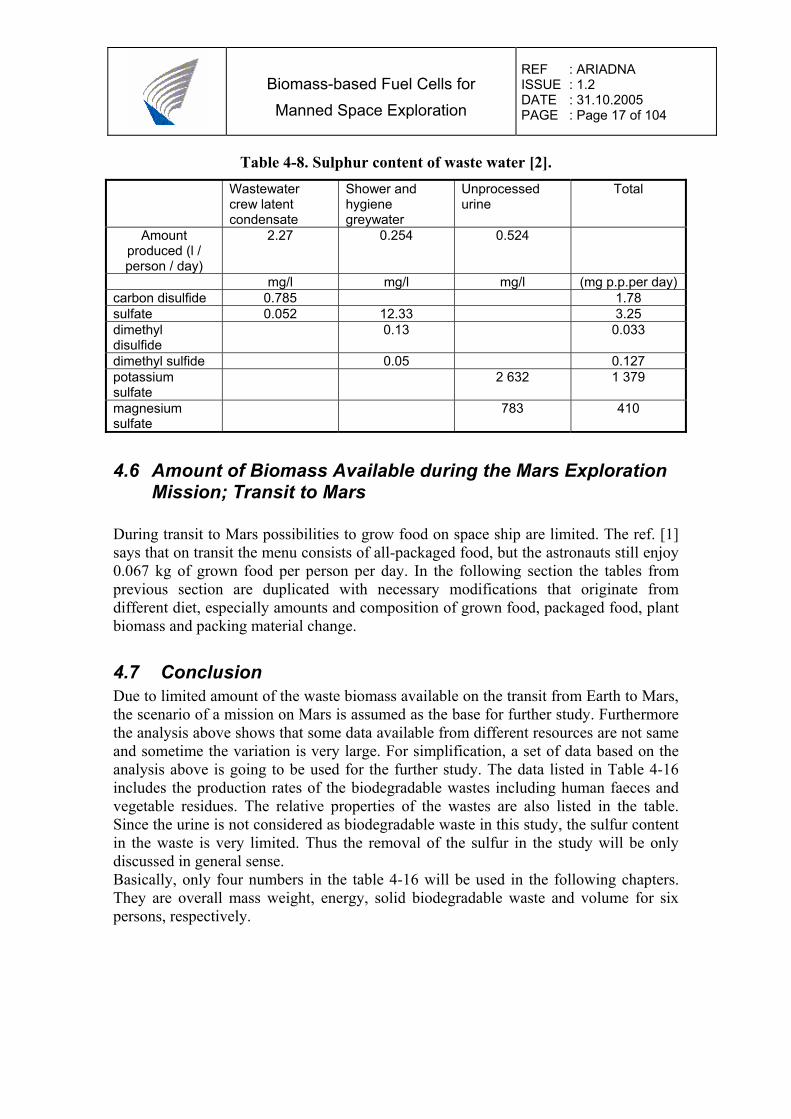
Ref. [2] presents chemical composition of several waste-water sources on manned space craft (Table 4-8).
In this table ‘sulfate’ is not properly defined, but as all other sources than unprocessed urine are negligible, only the latter is to be considered. Both potassium sulfate and magnesium sulfate contain elemental sulphur 780 mg/l. Total daily sulphur content would then be 408.7 mg/per person. However, reference [6] states that a person produces 1.0-1.1 g sulphur per day, mainly in urine. (Amount of nitrogen in the same source is 7.6-7.9 g per person per day.)
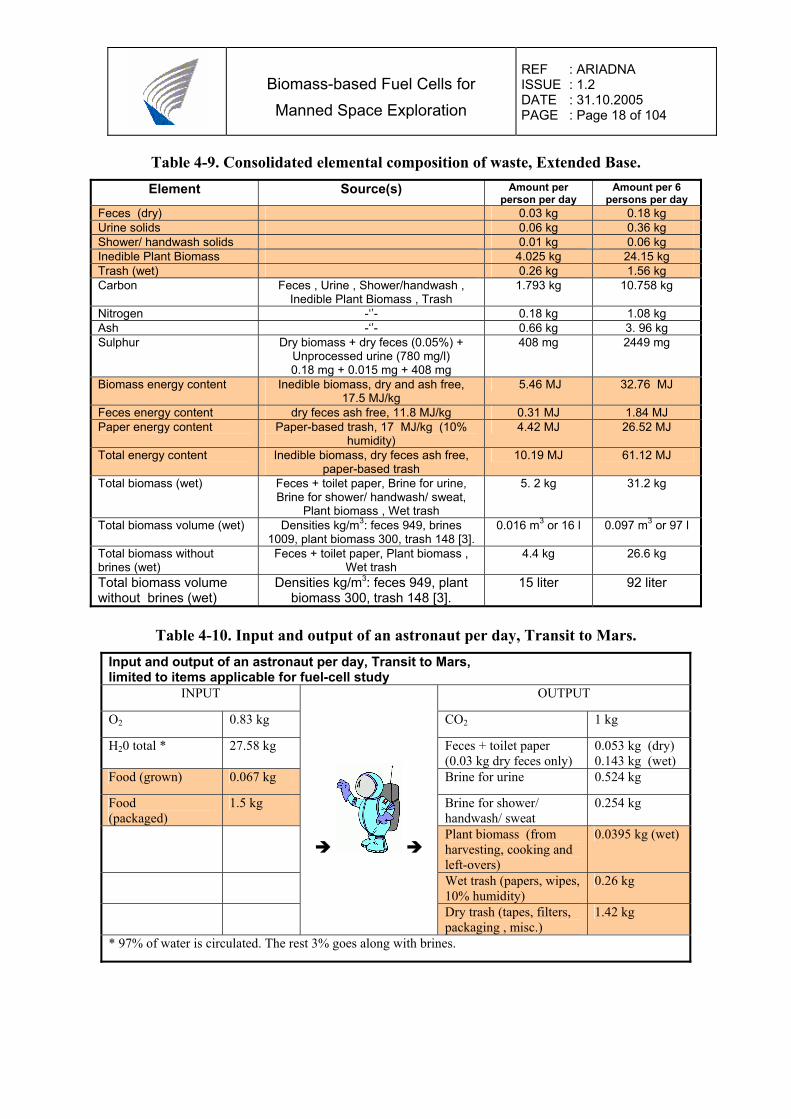
4.5 Elemental Consolidation The information above has been collected into one single table to show actual amounts of elements of interest. The baseline has been formed according to Table 4-3. The values are presented per person per day, or per 6 persons per day, which is the expected crew size on Mars mission. When calculating the sulphur content and energy content feces are considered as biomass in lack of any more accurate information.
Biomass-based Fuel Cells for Manned Space Exploration
REF : ARIADNA ISSUE : 1.2 DATE : 31.10.2005 PAGE : Page 17 of 104
Table 4-8. Sulphur content of waste water [2]. Wastewater
crew latent condensate
Shower and hygiene greywater
Unprocessed urine
Total
Amount produced (l / person / day)
2.27 0.254 0.524
mg/l mg/l mg/l (mg p.p.per day) carbon disulfide 0.785 1.78 sulfate 0.052 12.33 3.25 dimethyl disulfide
0.13 0.033
dimethyl sulfide 0.05 0.127 potassium sulfate
2 632 1 379
magnesium sulfate
783 410
4.6 Amount of Biomass Available during the Mars Exploration Mission; Transit to Mars
During transit to Mars possibilities to grow food on space ship are limited. The ref. [1] says that on transit the menu consists of all-packaged food, but the astronauts still enjoy 0.067 kg of grown food per person per day. In the following section the tables from previous section are duplicated with necessary modifications that originate from different diet, especially amounts and composition of grown food, packaged food, plant biomass and packing material change.
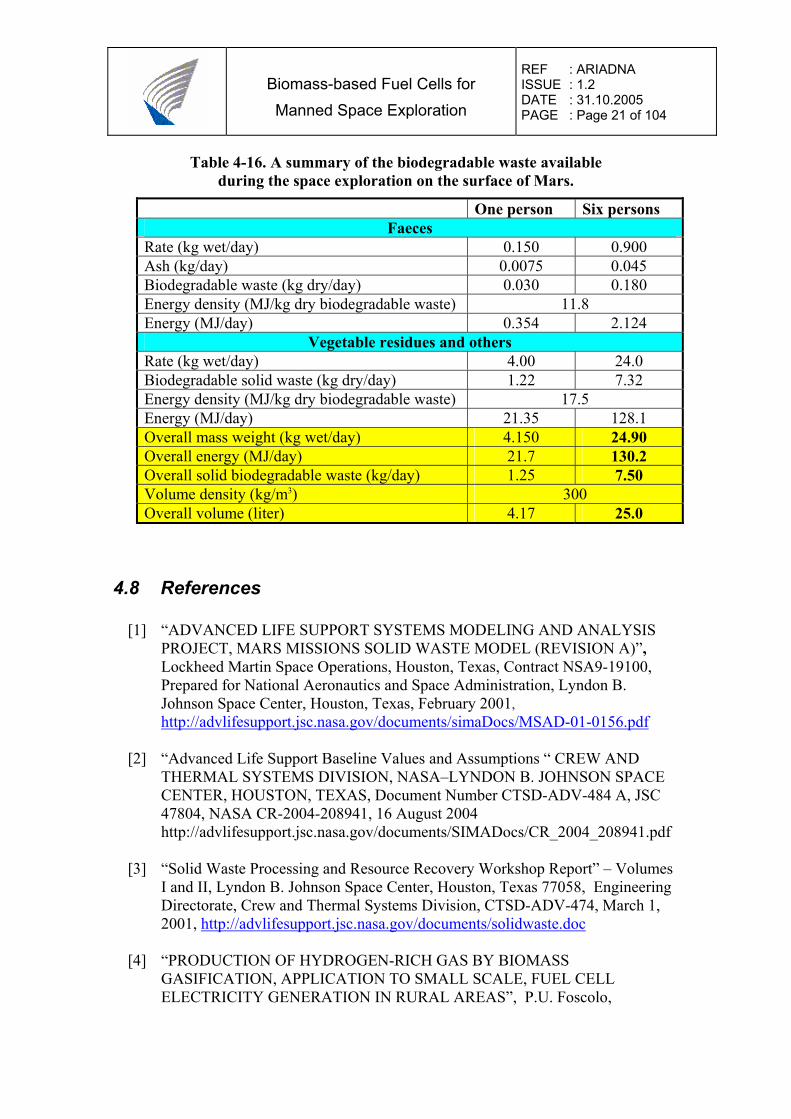
4.7 Conclusion Due to limited amount of the waste biomass available on the transit from Earth to Mars, the scenario of a mission on Mars is assumed as the base for further study. Furthermore the analysis above shows that some data available from different resources are not same and sometime the variation is very large. For simplification, a set of data based on the analysis above is going to be used for the further study. The data listed in Table 4-16 includes the production rates of the biodegradable wastes including human faeces and vegetable residues. The relative properties of the wastes are also listed in the table. Since the urine is not considered as biodegradable waste in this study, the sulfur content in the waste is very limited. Thus the removal of the sulfur in the study will be only discussed in general sense. Basically, only four numbers in the table 4-16 will be used in the following chapters. They are overall mass weight, energy, solid biodegradable waste and volume for six persons, respectively.
Biomass-based Fuel Cells for Manned Space Exploration
REF : ARIADNA ISSUE : 1.2 DATE : 31.10.2005 PAGE : Page 18 of 104
Table 4-9. Consolidated elemental composition of waste, Extended Base. Element Source(s) Amount per
person per day Amount per 6
persons per day Feces (dry) 0.03 kg 0.18 kg Urine solids 0.06 kg 0.36 kg Shower/ handwash solids 0.01 kg 0.06 kg Inedible Plant Biomass 4.025 kg 24.15 kg Trash (wet) 0.26 kg 1.56 kg Carbon Feces , Urine , Shower/handwash ,
Inedible Plant Biomass , Trash 1.793 kg 10.758 kg
Nitrogen -‘’- 0.18 kg 1.08 kg Ash -‘’- 0.66 kg 3. 96 kg Sulphur Dry biomass + dry feces (0.05%) +
Unprocessed urine (780 mg/l) 0.18 mg + 0.015 mg + 408 mg
408 mg 2449 mg
Biomass energy content Inedible biomass, dry and ash free, 17.5 MJ/kg
5.46 MJ 32.76 MJ
Feces energy content dry feces ash free, 11.8 MJ/kg 0.31 MJ 1.84 MJ Paper energy content
Paper-based trash, 17 MJ/kg (10% humidity)
4.42 MJ 26.52 MJ
Total energy content Inedible biomass, dry feces ash free, paper-based trash
10.19 MJ 61.12 MJ
Total biomass (wet) Feces + toilet paper, Brine for urine, Brine for shower/ handwash/ sweat,
Plant biomass , Wet trash
5. 2 kg 31.2 kg
Total biomass volume (wet) Densities kg/m3: feces 949, brines 1009, plant biomass 300, trash 148 [3].
0.016 m3 or 16 l 0.097 m3 or 97 l
Total biomass without brines (wet)
Feces + toilet paper, Plant biomass , Wet trash
4.4 kg 26.6 kg
Total biomass volume without brines (wet)
Densities kg/m3: feces 949, plant biomass 300, trash 148 [3].
15 liter 92 liter
Table 4-10. Input and output of an astronaut per day, Transit to Mars.
Input and output of an astronaut per day, Transit to Mars, limited to items applicable for fuel-cell study
INPUT OUTPUT
O2 0.83 kg CO2 1 kg
H20 total * 27.58 kg Feces + toilet paper (0.03 kg dry feces only)
0.053 kg (dry) 0.143 kg (wet)
Food (grown) 0.067 kg Brine for urine 0.524 kg
Food (packaged)
1.5 kg Brine for shower/ handwash/ sweat
0.254 kg
Plant biomass (from harvesting, cooking and left-overs)
0.0395 kg (wet)
Wet trash (papers, wipes, 10% humidity)
0.26 kg
Dry trash (tapes, filters, packaging , misc.)
1.42 kg
* 97% of water is circulated. The rest 3% goes along with brines.
Biomass-based Fuel Cells for Manned Space Exploration
REF : ARIADNA ISSUE : 1.2 DATE : 31.10.2005 PAGE : Page 19 of 104
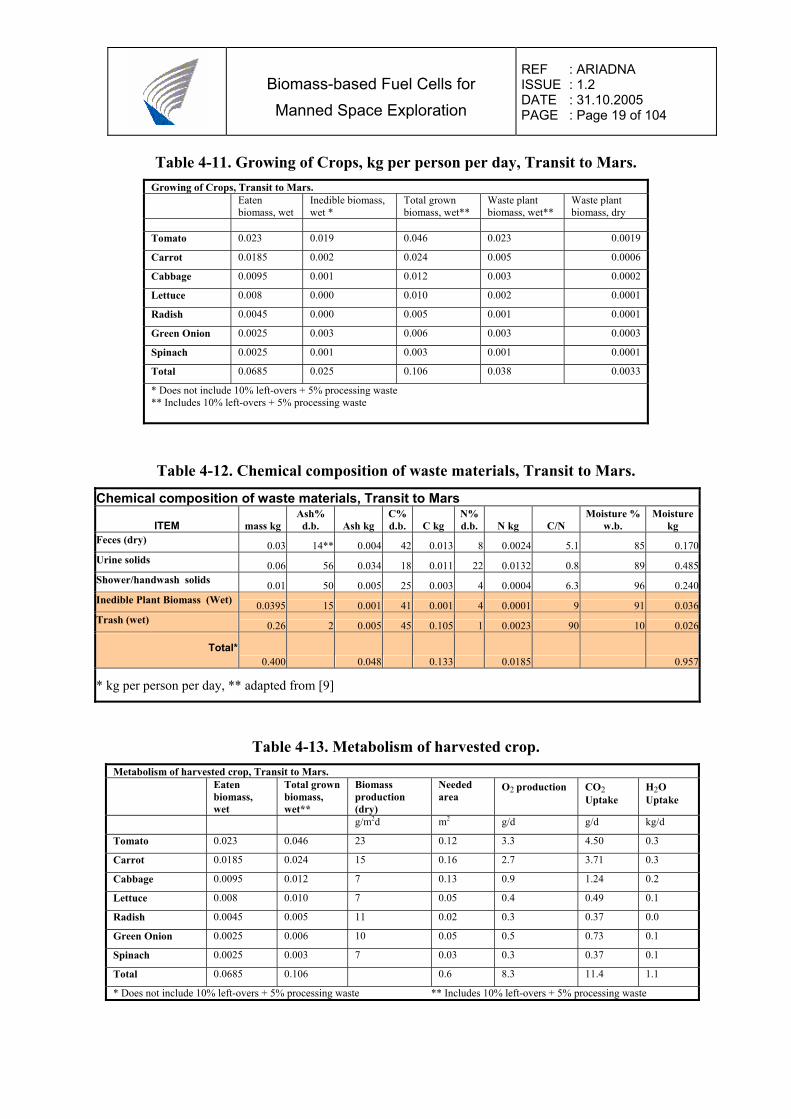
Table 4-11. Growing of Crops, kg per person per day, Transit to Mars. Growing of Crops, Transit to Mars. Eaten
biomass, wet Inedible biomass, wet *
Total grown biomass, wet**
Waste plant biomass, wet**
Waste plant biomass, dry
Tomato 0.023 0.019 0.046 0.023 0.0019
Carrot 0.0185 0.002 0.024 0.005 0.0006
Cabbage 0.0095 0.001 0.012 0.003 0.0002
Lettuce 0.008 0.000 0.010 0.002 0.0001
Radish 0.0045 0.000 0.005 0.001 0.0001
Green Onion 0.0025 0.003 0.006 0.003 0.0003
Spinach 0.0025 0.001 0.003 0.001 0.0001
Total 0.0685 0.025 0.106 0.038 0.0033
* Does not include 10% left-overs + 5% processing waste ** Includes 10% left-overs + 5% processing waste
Table 4-12. Chemical composition of waste materials, Transit to Mars.
Chemical composition of waste materials, Transit to Mars
ITEM mass kg Ash%
d.b. Ash kg C% d.b. C kg
N% d.b. N kg C/N
Moisture % w.b.
Moisture kg
Feces (dry) 0.03 14** 0.004 42 0.013 8 0.0024 5.1 85 0.170Urine solids 0.06 56 0.034 18 0.011 22 0.0132 0.8 89 0.485Shower/handwash solids 0.01 50 0.005 25 0.003 4 0.0004 6.3 96 0.240Inedible Plant Biomass (Wet) 0.0395 15 0.001 41 0.001 4 0.0001 9 91 0.036Trash (wet) 0.26 2 0.005 45 0.105 1 0.0023 90 10 0.026
Total*0.400 0.048 0.133 0.0185 0.957
* kg per person per day, ** adapted from [9]
Table 4-13. Metabolism of harvested crop. Metabolism of harvested crop, Transit to Mars. Eaten
biomass, wet
Total grown biomass, wet**
Biomass production (dry)
Needed area
O2 production CO2 Uptake
H2O Uptake
g/m2d m2 g/d g/d kg/d
Tomato 0.023 0.046 23 0.12 3.3 4.50 0.3
Carrot 0.0185 0.024 15 0.16 2.7 3.71 0.3
Cabbage 0.0095 0.012 7 0.13 0.9 1.24 0.2
Lettuce 0.008 0.010 7 0.05 0.4 0.49 0.1
Radish 0.0045 0.005 11 0.02 0.3 0.37 0.0
Green Onion 0.0025 0.006 10 0.05 0.5 0.73 0.1
Spinach 0.0025 0.003 7 0.03 0.3 0.37 0.1
Total 0.0685 0.106 0.6 8.3 11.4 1.1
* Does not include 10% left-overs + 5% processing waste ** Includes 10% left-overs + 5% processing waste
Biomass-based Fuel Cells for Manned Space Exploration
REF : ARIADNA ISSUE : 1.2 DATE : 31.10.2005 PAGE : Page 20 of 104
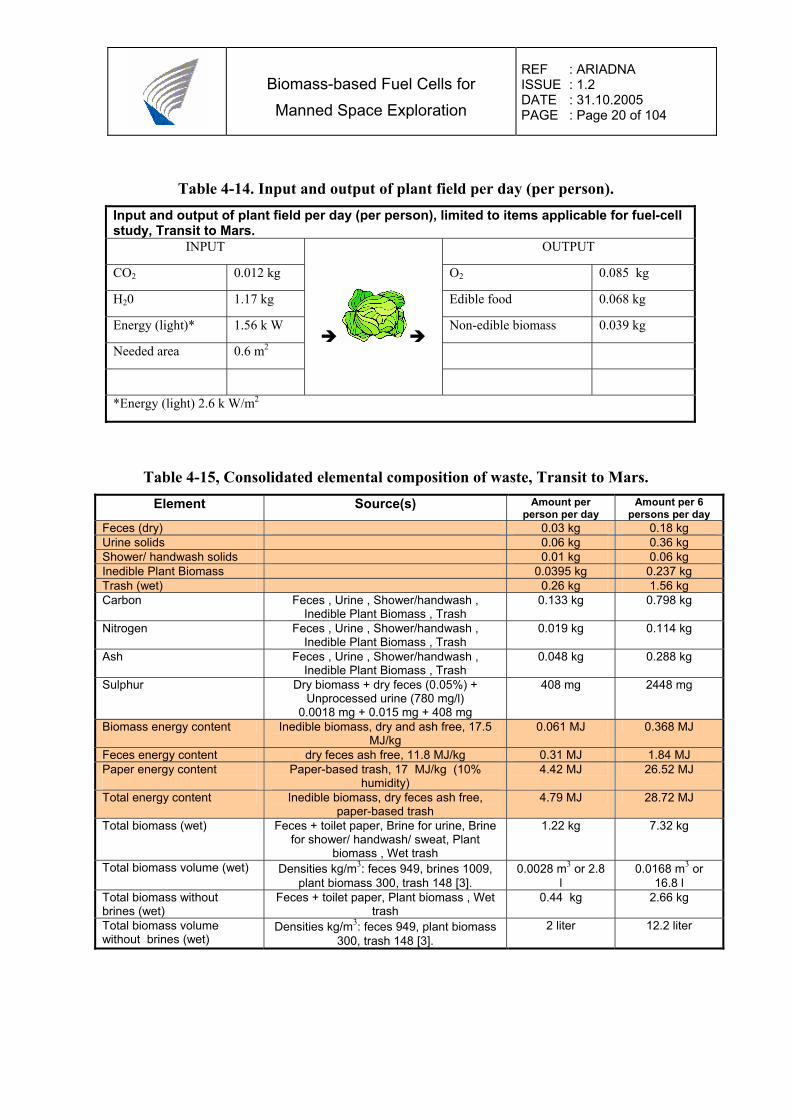
Table 4-14. Input and output of plant field per day (per person). Input and output of plant field per day (per person), limited to items applicable for fuel-cell study, Transit to Mars.
INPUT OUTPUT
CO2 0.012 kg O2 0.085 kg
H20 1.17 kg Edible food 0.068 kg
Energy (light)* 1.56 k W Non-edible biomass 0.039 kg
Needed area 0.6 m2
*Energy (light) 2.6 k W/m2
Table 4-15, Consolidated elemental composition of waste, Transit to Mars. Element Source(s) Amount per
person per day Amount per 6
persons per day Feces (dry) 0.03 kg 0.18 kg Urine solids 0.06 kg 0.36 kg Shower/ handwash solids 0.01 kg 0.06 kg Inedible Plant Biomass 0.0395 kg 0.237 kg Trash (wet) 0.26 kg 1.56 kg Carbon Feces , Urine , Shower/handwash ,
Inedible Plant Biomass , Trash 0.133 kg 0.798 kg
Nitrogen Feces , Urine , Shower/handwash , Inedible Plant Biomass , Trash
0.019 kg 0.114 kg
Ash Feces , Urine , Shower/handwash , Inedible Plant Biomass , Trash
0.048 kg 0.288 kg
Sulphur Dry biomass + dry feces (0.05%) + Unprocessed urine (780 mg/l)
0.0018 mg + 0.015 mg + 408 mg
408 mg 2448 mg
Biomass energy content Inedible biomass, dry and ash free, 17.5 MJ/kg
0.061 MJ 0.368 MJ
Feces energy content dry feces ash free, 11.8 MJ/kg 0.31 MJ 1.84 MJ Paper energy content
Paper-based trash, 17 MJ/kg (10% humidity)
4.42 MJ 26.52 MJ
Total energy content Inedible biomass, dry feces ash free, paper-based trash
4.79 MJ 28.72 MJ
Total biomass (wet) Feces + toilet paper, Brine for urine, Brine for shower/ handwash/ sweat, Plant
biomass , Wet trash
1.22 kg 7.32 kg
Total biomass volume (wet) Densities kg/m3: feces 949, brines 1009, plant biomass 300, trash 148 [3].
0.0028 m3 or 2.8 l
0.0168 m3 or 16.8 l
Total biomass without brines (wet)
Feces + toilet paper, Plant biomass , Wet trash
0.44 kg 2.66 kg
Total biomass volume without brines (wet)
Densities kg/m3: feces 949, plant biomass 300, trash 148 [3].
2 liter 12.2 liter
Biomass-based Fuel Cells for Manned Space Exploration
REF : ARIADNA ISSUE : 1.2 DATE : 31.10.2005 PAGE : Page 21 of 104
Table 4-16. A summary of the biodegradable waste available
during the space exploration on the surface of Mars.
4.8 References
[1] “ADVANCED LIFE SUPPORT SYSTEMS MODELING AND ANALYSIS PROJECT, MARS MISSIONS SOLID WASTE MODEL (REVISION A)”, Lockheed Martin Space Operations, Houston, Texas, Contract NSA9-19100, Prepared for National Aeronautics and Space Administration, Lyndon B. Johnson Space Center, Houston, Texas, February 2001, http://advlifesupport.jsc.nasa.gov/documents/simaDocs/MSAD-01-0156.pdf
[2] “Advanced Life Support Baseline Values and Assumptions “ CREW AND THERMAL SYSTEMS DIVISION, NASA–LYNDON B. JOHNSON SPACE CENTER, HOUSTON, TEXAS, Document Number CTSD-ADV-484 A, JSC 47804, NASA CR-2004-208941, 16 August 2004 http://advlifesupport.jsc.nasa.gov/documents/SIMADocs/CR_2004_208941.pdf
[3] “Solid Waste Processing and Resource Recovery Workshop Report” – Volumes
I and II, Lyndon B. Johnson Space Center, Houston, Texas 77058, Engineering Directorate, Crew and Thermal Systems Division, CTSD-ADV-474, March 1, 2001, http://advlifesupport.jsc.nasa.gov/documents/solidwaste.doc
[4] “PRODUCTION OF HYDROGEN-RICH GAS BY BIOMASS
GASIFICATION, APPLICATION TO SMALL SCALE, FUEL CELL ELECTRICITY GENERATION IN RURAL AREAS”, P.U. Foscolo,
One person Six persons Faeces
Rate (kg wet/day) 0.150 0.900 Ash (kg/day) 0.0075 0.045 Biodegradable waste (kg dry/day) 0.030 0.180 Energy density (MJ/kg dry biodegradable waste) 11.8 Energy (MJ/day) 0.354 2.124
Vegetable residues and others Rate (kg wet/day) 4.00 24.0 Biodegradable solid waste (kg dry/day) 1.22 7.32 Energy density (MJ/kg dry biodegradable waste) 17.5 Energy (MJ/day) 21.35 128.1 Overall mass weight (kg wet/day) 4.150 24.90 Overall energy (MJ/day) 21.7 130.2 Overall solid biodegradable waste (kg/day) 1.25 7.50 Volume density (kg/m3) 300 Overall volume (liter) 4.17 25.0
Biomass-based Fuel Cells for Manned Space Exploration
REF : ARIADNA ISSUE : 1.2 DATE : 31.10.2005 PAGE : Page 22 of 104
UNIVERSITY OF L’AQUILA, Contract JOR3-CT95-0037, PUBLISHABLE FINAL REPORT, January 1, 1996 to December 31, 1997, http://dsiaq.ing.univaq.it/~bio_en/eu1995.html
[5] “Characteristics and availability of biomass waste and residues in the
Netherlands for gasification”, Joep van Doorn, Toine Curvers, Lars Waldheim, Eva Olsson, Ad van Wijk, Cees Daey-Ouwens, Published in 'Biomass and Bioenergy' Vol.12, No. 4, pp.225-240, 1997, http://www.chem.uu.nl/nws/www/publica/97046c2.htm
[6] “Composition of human excreta--a case study from Southern Thailand”, Schouw
NL, Danteravanich S, Mosbaek H, Tjell JC., Sci Total Environ. 2002 Mar 8;286(1-3):155-66., Environment and Resources, DTU, Technical University of Denmark, Lyngby, [email protected], http://www.ncbi.nlm.nih.gov/entrez/query.fcgi?cmd=Retrieve&db=PubMed&list_uids=11886091&dopt=Abstract
[7] “Anaerobic Digestion for Reduction and Stabilization of Organic Solid Waste
During Space Missions: Systems Analysis”, Qiyong Xu and Tim Townsend, Environmental Engineering &. Science University of Florida; David Chynoweth, Patrick Haley, John Owens, and Elana Rich, Agricultural and Biological. Engineering University of Florida; Sabrina Maxwell, Boeing; Hong-Lim Choi, Animal Science and Technology Seoul National University.
[8] “Anaerobic Digestion for Reduction and Stabilization of Organic Solid Wastes
During Space Missions: Laboratory Studies”, David Chynoweth, Patrick Haley, John Owens, Art Teixeira, Bruce Welt, and Elana Rich, Ag. and Biol. Eng., University of Florida; Tim Townsend, Envir. Eng. Sci., University of Florida, Hong-Lim Choi, Animal Sci. and Tech., Seoul National University, Copyright © 2001 Society of Automotive Engineers, Inc. 2002-01-2351
[9] “FEASIBILITY OF BIOMASS-BASED FUEL CELLS FOR MANNED
SPACE EXPLORATION”, Tiziana Pipoli, ESA-ESTEC Advanced Concepts Team, Keplerlaan 1-P.O. Box 299, 2200 AG Noordwijk ZH – The Netherlands,
Biomass-based Fuel Cells for Manned Space Exploration
REF : ARIADNA ISSUE : 1.2 DATE : 31.10.2005 PAGE : Page 23 of 104
5 Anaerobic Digestion Human excrement represents a potential source of methane and hence hydrogen, which can be used as fuel in a fuel cell, or in propellant gas mixtures. At the same time such a process would provide fuel from available resources, reducing fuel transportation from Earth, and contribute to waste disposal. Anaerobic digestion is a biological process that produces a gas principally composed of methane (CH4) and carbon dioxide (CO2) otherwise known as biogas. These gases are produced from organic wastes such as livestock manure, food processing waste, human excrement, vegetable residues etc. Anaerobic processes could either occur naturally or in a controlled environment such as a biogas plant or an anaerobic digester. Organic waste such as human excrement, vegetable residues and various types of bacteria are put in an airtight container called digester so the process could occur. Depending on the waste feedstock and the system design, biogas is typically 55 to 75 percent pure methane. State-of-the-art systems report producing biogas that is more than 95 percent pure methane [1]. Methane is a gas that consists of one atom of carbon and four atoms of hydrogen. It is the major component of the "natural" gas used in many homes for cooking and heating. It is odorless, colorless, and yields about 37.67 kJ of heat energy per liter when burned. For example, biogas composed of 65% methane yields 24.49 kJ/liter. Methane can be reformed into hydrogen, which is the main fuel source for many types of fuel cells to produce electricity. Anaerobic bacteria shown in the right are some of the oldest forms of life on Earth. They evolved before the photosynthesis of green plants released large quantities of oxygen into the atmosphere. Anaerobic bacteria break down or "digest" organic material in the absence of oxygen and produce "biogas" as a waste product. Anaerobic decomposition occurs naturally in swamps, water-logged soils and rice fields, deep bodies of water, and in the digestive systems of termites and large animals. Anaerobic processes can be managed in a "digester" or a covered lagoon (a pond used to store manure) for waste treatment. The primary benefits of anaerobic digestion are nutrient recycling, waste treatment, and odor control [2]. Biogas produced in anaerobic digesters consists mainly of methane and carbon dioxide, and trace levels of other gases such as hydrogen, carbon monoxide, nitrogen, oxygen,
Biomass-based Fuel Cells for Manned Space Exploration
REF : ARIADNA ISSUE : 1.2 DATE : 31.10.2005 PAGE : Page 24 of 104
and hydrogen sulfide. The relative percentage of these gases in biogas depends on the feed material and management of the process.
5.1 Digestion Process Anaerobic decomposition is a complex process. It occurs in three basic stages as the result of the activity of a variety of microorganisms. Initially, a group of microorganisms converts organic material to a form that a second group of organisms utilizes to form organic acids. Methane-producing (methanogenic) anaerobic bacteria utilize these acids and complete the decomposition process. A variety of factors affects the rate of digestion and biogas production. The most important of these factors is temperature. Anaerobic bacteria communities can endure temperatures ranging from below freezing to above 57.2° Centigrade, but they thrive best at temperatures of about 36.7°C (mesophilic) and 54.4°C (thermophilic). Bacteria activity, and thus biogas production, falls off significantly between about 39.4° and 51.7°C and gradually from 35° to 0°C [2]. In the thermophilic range, decomposition and biogas production occur more rapidly than in the mesophilic range. However, the process is highly sensitive to disturbances such as changes in feed materials or temperature. While all anaerobic digesters reduce the viability of weed seeds and disease-producing (pathogenic) organisms, the higher temperatures of thermophilic digestion result in more complete destruction. Although digesters operated in the mesophilic range must be larger (to accommodate a longer period of decomposition within the tank [residence time]), the process is less sensitive to upset or change in operating regimen. To optimize the digestion process, the digester must be kept at a consistent temperature, as rapid changes will upset bacterial activity. The trade-offs in maintaining optimum digester temperatures to maximize gas production while minimizing expenses are somewhat complex. The suitable temperature could be decided by the experimental result, which might be different from one place to another. Other factors affect the rate and amount of biogas output. These include pH, water/solids ratio, carbon/nitrogen ratio, mixing of the digesting material, the particle size of the material being digested, and retention time. Pre-sizing and mixing of the feed material for a uniform consistency allows the bacteria to work more quickly. The pH is self-regulating in most of the cases. Bicarbonate of soda can be added to maintain a consistent pH, for example when too much "green" or material high in nitrogen content is added. It may be necessary to add water to the feed material if it is too dry, or if the nitrogen content is very high. A carbon/nitrogen ratio of 20/1 to 30/1 is best. Occasional mixing or agitation of the digesting material can aid the digestion process. Complete digestion and retention time depend on all of the above factors.
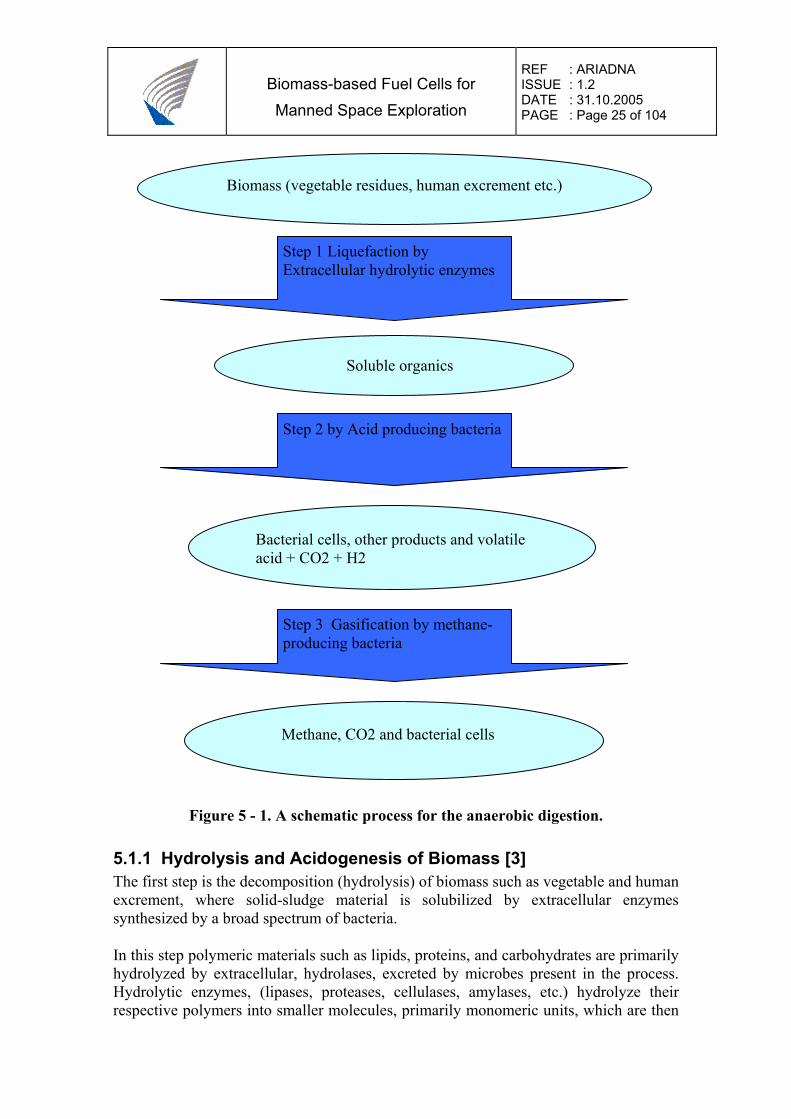
The process of anaerobic digestion consists of three steps; a simplified schematic of the overall mechanism of anaerobic digestion is described in Figure 5-1:
Biomass-based Fuel Cells for Manned Space Exploration
REF : ARIADNA ISSUE : 1.2 DATE : 31.10.2005 PAGE : Page 25 of 104
Figure 5 - 1. A schematic process for the anaerobic digestion.
5.1.1 Hydrolysis and Acidogenesis of Biomass [3] The first step is the decomposition (hydrolysis) of biomass such as vegetable and human excrement, where solid-sludge material is solubilized by extracellular enzymes synthesized by a broad spectrum of bacteria.
In this step polymeric materials such as lipids, proteins, and carbohydrates are primarily hydrolyzed by extracellular, hydrolases, excreted by microbes present in the process. Hydrolytic enzymes, (lipases, proteases, cellulases, amylases, etc.) hydrolyze their respective polymers into smaller molecules, primarily monomeric units, which are then
Biomass (vegetable residues, human excrement etc.)
Step 1 Liquefaction by Extracellular hydrolytic enzymes
Soluble organics
Bacterial cells, other products and volatile acid + CO2 + H2
Methane, CO2 and bacterial cells
Step 3 Gasification by methane-producing bacteria
Step 2 by Acid producing bacteria
Biomass-based Fuel Cells for Manned Space Exploration
REF : ARIADNA ISSUE : 1.2 DATE : 31.10.2005 PAGE : Page 26 of 104
consumed by microbes. In methane fermentation of waste waters containing high concentrations of organic polymers, the hydrolytic activity relevant to each polymer is of paramount significance, in that polymer hydrolysis may become a rate-limiting step for the production of simpler bacterial substrates to be used in subsequent degradation steps.
Lipases convert lipids to long-chain fatty acids. A population density of 104 - 105
lipolytic bacteria per ml of digester fluid has been reported. Clostridia and the micrococci appear to be responsible for most of the extracellular lipase producers. The long-chain fatty acids produced are further degraded by p-oxidation to produce acetyl CoA. Proteins are generally hydrolyzed to amino acids by proteases, secreted by Bacteroides, Butyrivibrio, Clostridium, Fusobacterium, Selenomonas, and Streptococcus. The amino acids produced are then degraded to fatty acids such as acetate, propionate, and butyrate, and to ammonia as found in Clostridium, Peptococcus, Selenomonas, Campylobacter, and Bacteroides. Polysaccharides such as cellulose, starch, and pectin are hydrolyzed by cellulases, amylases, and pectinases. The majority of microbial cellulases are composed of three species: (a) endo-3-l,4-glucanases; (b) exo-p-l,4-glucanases; (c) cellobiase or p-glucosidase. These three enzymes act synergistically on cellulose effectively hydrolyzing its crystal structure, to produce glucose. Microbial hydrolysis of raw starch to glucose requires amylolytic activity, which consist of 5 amylase species: (a) α-amylases that endocleave α±1-4 bonds; (b) p-amylases that exocleave α±1-4 bonds; (c) amyloglucosidases that exocleave α±l-4 and α±l-6 bonds; (d) debranching enzymes that act on α±l-6 bonds; (e) maltase that acts on maltose liberating glucose. Pectins are degraded by pectinases, including pectinesterases and depolymerases. Xylans are degraded with α²-endo-xylanase and α²-xylosidase to produce xylose. Hexoses and pentoses are generally converted to C2 and C3 intermediates and to reduced electron carriers (e.g., NADH) via common pathways. Most of the anaerobic bacteria undergo hexose metabolism via the Emden-Meyerhof-Parnas pathway (EMP) which produces pyruvate as an intermediate along with NADH. The pyruvate and NADH thus generated are transformed into fermentation endo-products such as lactate, propionate, acetate, and ethanol by other enzymatic activities which vary tremendously with microbial species. Thus, in hydrolysis and acidogenesis, sugars, amino acids, and fatty acids produced by microbial degradation of biopolymers are successively metabolised by groups of bacteria and are primarily fermented to acetate, propionate, butyrate, lactate, ethanol, carbon dioxide, and hydrogen. The step usually proceeds fast enough to prevent from limiting the rate of the overall reaction sequence.
5.1.2. Acidification The second step is the conversion of decomposed matter to organic acids and hydrogen by hydrogen producing acetogenic bacteria. The step is also quite fast. The
Biomass-based Fuel Cells for Manned Space Exploration
REF : ARIADNA ISSUE : 1.2 DATE : 31.10.2005 PAGE : Page 27 of 104
microorganisms in the step are usually facultative heterotrophs which function best in a range of pH from 4.0 to 6.5. The major product of this step is acetic acid. Propionic, butyric acid, hydrogen and carbon dioxide are also produced.
Obligate H2-producing acetogenic bacteria are capable of producing acetate and H2 from higher fatty acids. Only Syntrophobacter wolinii, a propionate decomposer and Sytrophomonos wolfei, a butyrate decomposer have thus far been isolated due to technical difficulties involved in the isolation of pure strains, since H2 produced, severely inhibits the growth of these strains. The use of co-culture techniques incorporating H2 consumers such as methanogens and sulfate-reducing bacteria may therefore facilitate elucidation of the biochemical breakdown of fatty acids.
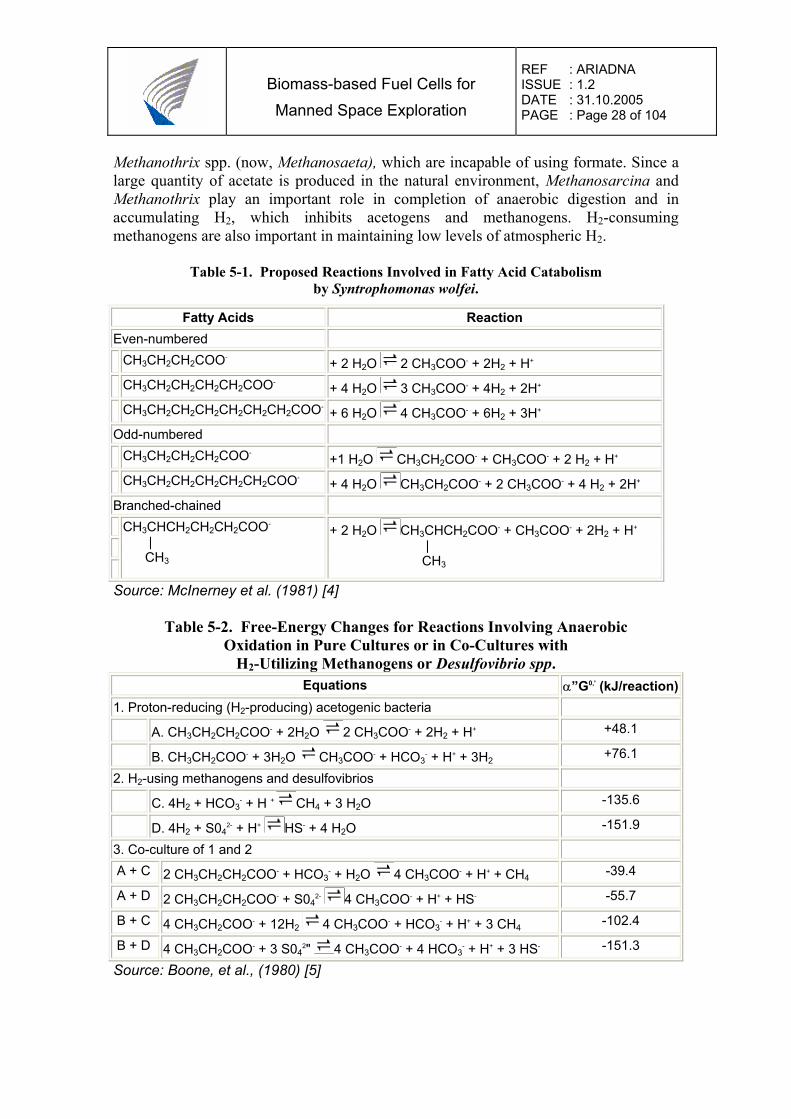
Overall breakdown reactions for long-chain fatty acids are presented in Tables 5-1 and 5-2. H2 production by acetogens is generally energetically unfavorable due to high free energy requirements (α”Go > 0; Table 5-1 and 5-2). However, with a combination of H2-consuming bacteria (Table 5-2, 5-3), co-culture systems provide favorable conditions for the decomposition of fatty acids to acetate and CH4 or H2S (α”Go < 0). In addition to the decomposition of long-chain fatty acids, ethanol and lactate are also converted to acetate and H2 by an acetogen and Clostridium formicoaceticum, respectively.
The effect of the partial pressure of H2 on the free energy associated with the conversion of ethanol, propionate, acetate, and H2/CO2 during methane fermentation is shown in Fig. 5-2. An extremely low partial pressure of H2 (10-5 atm) appears to be a significant factor in propionate degradation to CH4. Such a low partial pressure can be achieved in a co-culture with H2-consuming bacteria as previously described (Table 5-2, 5-3).
Acetic acid is the most important substrate for the final reaction of the sequence, since about 70 % of the methane produced has been shown to derive from that component. The last step (gasification) of the process involves methane bacteria, strict anaerobes. A narrower range of pH, from 7.0 to 7.8, is optimal for these organisms. The acids together with hydrogen etc are converted to methane gas by methanogenic bacteria. Usually the last step is the rate-limiting step in the series of reactions.
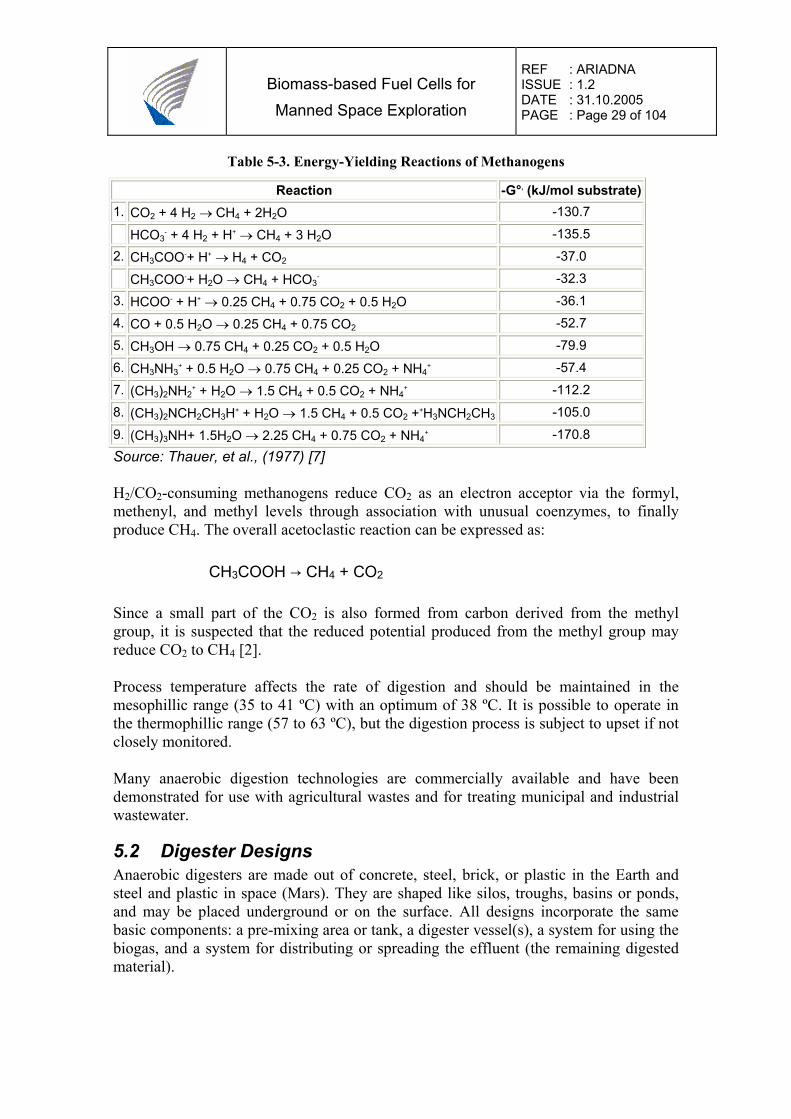
Methanogens are physiologically united as methane producers in anaerobic digestion. Although acetate and H2/CO2 are the main substrates available in the natural environment, formate, methanol, methylamines, and CO are also converted to CH4 (Table 5 - 3).
Since methanogens, as obligate anaerobes, require a redox potential of less than -300 mV for growth, their isolation and cultivation was somewhat elusive due to technical difficulties encountered in handling them under completely O2-free conditions. However, as a result of a greatly improved methanogen isolation techniques developed by Hungate [6], more than 40 strains of pure methanogens have now been isolated. Methanogens can be divided into two groups: H2/CO2- and acetate-consumers. Although some of the H2/CO2-consumers are capable of utilizing formate, acetate is consumed by a limited number of strains, such as Methanosarcina spp. and
Biomass-based Fuel Cells for Manned Space Exploration
REF : ARIADNA ISSUE : 1.2 DATE : 31.10.2005 PAGE : Page 28 of 104
Methanothrix spp. (now, Methanosaeta), which are incapable of using formate. Since a large quantity of acetate is produced in the natural environment, Methanosarcina and Methanothrix play an important role in completion of anaerobic digestion and in accumulating H2, which inhibits acetogens and methanogens. H2-consuming methanogens are also important in maintaining low levels of atmospheric H2.
Table 5-1. Proposed Reactions Involved in Fatty Acid Catabolism by Syntrophomonas wolfei.
Fatty Acids Reaction Even-numbered CH3CH2CH2COO- + 2 H2O 2 CH3COO- + 2H2 + H+ CH3CH2CH2CH2CH2COO- + 4 H2O 3 CH3COO- + 4H2 + 2H+ CH3CH2CH2CH2CH2CH2CH2COO- + 6 H2O 4 CH3COO- + 6H2 + 3H+ Odd-numbered CH3CH2CH2CH2COO- +1 H2O CH3CH2COO- + CH3COO- + 2 H2 + H+ CH3CH2CH2CH2CH2CH2COO- + 4 H2O CH3CH2COO- + 2 CH3COO- + 4 H2 + 2H+ Branched-chained
CH3CHCH2CH2CH2COO-
| CH3
+ 2 H2O CH3CHCH2COO- + CH3COO- + 2H2 + H+
| CH3
Source: McInerney et al. (1981) [4]
Table 5-2. Free-Energy Changes for Reactions Involving Anaerobic Oxidation in Pure Cultures or in Co-Cultures with
H2-Utilizing Methanogens or Desulfovibrio spp. Equations α”G0,' (kJ/reaction)
1. Proton-reducing (H2-producing) acetogenic bacteria A. CH3CH2CH2COO- + 2H2O 2 CH3COO- + 2H2 + H+ +48.1
B. CH3CH2COO- + 3H2O CH3COO- + HCO3- + H+ + 3H2 +76.1
2. H2-using methanogens and desulfovibrios C. 4H2 + HCO3
- + H + CH4 + 3 H2O -135.6
D. 4H2 + S042- + H+ HS- + 4 H2O -151.9
3. Co-culture of 1 and 2 A + C 2 CH3CH2CH2COO- + HCO3
- + H2O 4 CH3COO- + H+ + CH4 -39.4
A + D 2 CH3CH2CH2COO- + S042- 4 CH3COO- + H+ + HS- -55.7
B + C 4 CH3CH2COO- + 12H2 4 CH3COO- + HCO3- + H+ + 3 CH4 -102.4
B + D 4 CH3CH2COO- + 3 S042" 4 CH3COO- + 4 HCO3
- + H+ + 3 HS- -151.3
Source: Boone, et al., (1980) [5]
Biomass-based Fuel Cells for Manned Space Exploration
REF : ARIADNA ISSUE : 1.2 DATE : 31.10.2005 PAGE : Page 29 of 104
Table 5-3. Energy-Yielding Reactions of Methanogens
Reaction -G°, (kJ/mol substrate) 1. CO2 + 4 H2 → CH4 + 2H2O -130.7
HCO3- + 4 H2 + H+ → CH4 + 3 H2O -135.5
2. CH3COO-+ H+ → H4 + CO2 -37.0
CH3COO-+ H2O → CH4 + HCO3- -32.3
3. HCOO- + H+ → 0.25 CH4 + 0.75 CO2 + 0.5 H2O -36.1
4. CO + 0.5 H2O → 0.25 CH4 + 0.75 CO2 -52.7
5. CH3OH → 0.75 CH4 + 0.25 CO2 + 0.5 H2O -79.9
6. CH3NH3+ + 0.5 H2O → 0.75 CH4 + 0.25 CO2 + NH4
+ -57.4
7. (CH3)2NH2+ + H2O → 1.5 CH4 + 0.5 CO2 + NH4
+ -112.2
8. (CH3)2NCH2CH3H+ + H2O → 1.5 CH4 + 0.5 CO2 ++H3NCH2CH3 -105.0
9. (CH3)3NH+ 1.5H2O → 2.25 CH4 + 0.75 CO2 + NH4+ -170.8
Source: Thauer, et al., (1977) [7]
H2/CO2-consuming methanogens reduce CO2 as an electron acceptor via the formyl, methenyl, and methyl levels through association with unusual coenzymes, to finally produce CH4. The overall acetoclastic reaction can be expressed as:
CH3COOH → CH4 + CO2
Since a small part of the CO2 is also formed from carbon derived from the methyl group, it is suspected that the reduced potential produced from the methyl group may reduce CO2 to CH4 [2].
Process temperature affects the rate of digestion and should be maintained in the mesophillic range (35 to 41 ºC) with an optimum of 38 ºC. It is possible to operate in the thermophillic range (57 to 63 ºC), but the digestion process is subject to upset if not closely monitored. Many anaerobic digestion technologies are commercially available and have been demonstrated for use with agricultural wastes and for treating municipal and industrial wastewater.
5.2 Digester Designs Anaerobic digesters are made out of concrete, steel, brick, or plastic in the Earth and steel and plastic in space (Mars). They are shaped like silos, troughs, basins or ponds, and may be placed underground or on the surface. All designs incorporate the same basic components: a pre-mixing area or tank, a digester vessel(s), a system for using the biogas, and a system for distributing or spreading the effluent (the remaining digested material).
Biomass-based Fuel Cells for Manned Space Exploration
REF : ARIADNA ISSUE : 1.2 DATE : 31.10.2005 PAGE : Page 30 of 104
There are two basic types of digesters: batch and continuous. Batch-type digesters are the simplest to build. Their operation consists of loading the digester with organic materials and allowing it to digest. The retention time depends on temperature and other factors. Once the digestion is complete, the effluent is removed and the process is repeated. In a continuous digester, organic material is constantly or regularly fed into the digester. The material moves through the digester either mechanically or by the force of the new feed pushing out digested material. Unlike batch-type digesters, continuous digesters produce biogas without the interruption of loading material and unloading effluent. They may be better suited for large-scale operations. There are three types of continuous digesters: vertical tank systems, horizontal tank or plug-flow systems, and multiple tank systems. Proper design, operation, and maintenance of continuous digesters produce a steady and predictable supply of usable biogas. Many livestock operations store the manure they produce in waste lagoons, or ponds. A growing number of these operations are placing floating covers on their lagoons to capture the biogas. They use it to run an engine/generator to produce electricity.
5.2.1 Using the Effluent The material drawn from the digester is called sludge, or effluent. It is rich in nutrients (ammonia, phosphorus, potassium, and more than a dozen trace elements) and is an excellent soil conditioner. It can also be used as a livestock feed additive when dried. Any toxic compounds (pesticides, etc.) that are in the digester feedstock material may become concentrated in the effluent. Therefore, it is important to test the effluent before using it on a large scale. The effluent can be used as nutrients for the production of plant or vegetables in the ecological system in the Melissa project [8]. Today, it is commonly burned in an internal combustion engine to generate electricity. Practical experience with small-scale internal combustion engines with a rated capacity of less than 200-kW indicate an electrical conversion efficiency of less than 25% [9]. Larger engines can have greater conversion efficiency. One engine supplier claims to have an engine with an electrical conversion efficiency that averages 38% for engines in the 600-1000 kW range [10]. When biogas is used to produce electricity, there is the added potential for harvesting hot water and steam from the engine’s exhaust and cooling systems. Combining hot water and steam recovery with electricity generation may provide an overall conversion efficiency of 80% or more. Biogas is also burned in boilers to produce hot water and steam used for heating and sanitary washing.
Biomass-based Fuel Cells for Manned Space Exploration
REF : ARIADNA ISSUE : 1.2 DATE : 31.10.2005 PAGE : Page 31 of 104
5.3 References [1] http://www.energy.ca.gov/development/biomass/anaerobic.html [2] Methane (Biogas) from Anaerobic Digesters
http://www.eere.energy.gov/consumerinfo/factsheets/ab5.html [3] Chapter 4 - Methane production Chapter 4 - Methane production http://www.fao.org/docrep/w7241e/w7241e0f.htm#TopOfPage [4] McInerney, M.J. et al., Appl. Environ. Microbiol., 41, 1029-1039 (1981). [5] Boone, D.R. et al., Appl. Environ. Microbiol., 40, 626-632 (1980). [6] Hungate, R.E., Methods in Microbiol., 3B, 117-132 (1969). [7] Thauer, R.K. et al., Bact. Rev., 41, 100-180 (1977). [8] http://www.estec.esa.nl/ecls/?p=melissa. [9] Moser, M. (15 April 1997). Personal communication. RCM Digesters, Inc.,
Berkeley, CA. [10] Jenbacher Energiesysteme (1998). Information available at
http://mirror.us.netwing.at/jenbacher/60hz.htm.
Biomass-based Fuel Cells for Manned Space Exploration
REF : ARIADNA ISSUE : 1.2 DATE : 31.10.2005 PAGE : Page 32 of 104
6 Anaerobic Digestion for Space Mission The technical feasibility of applying anaerobic digestion for reduction and stabilization of the organic fraction of solid wastes generated during space missions was investigated in [1]. The process has the advantages of not requiring oxygen or high temperature and pressure while producing methane, carbon dioxide, nutrients and compost as valuable products. The process involves solid phase fermentation with leachate recycle between new and old reactors for inoculation, wetting, and removal of volatile organic acids during startup. When anaerobic conversion is complete, the compost bed may be used for plant growth medium. The process is called as high solids leached anaerobic digestion (HSLAD). HSLAD also offers a potential option for treatment of biodegradable waste on long duration space mission and for permanent planetary bases and would produce 1.5 kg of methane, 4.1 kg of carbon dioxide and 1.9 kg of compost from 7.5 kg of biodegradable solid wastes generated daily from a crew of six. A detailed analysis of the process was conducted to design the system size required for a space mission with a 6- person crew. The balance of mass, energy and water of the process and the analysis of equivalent system mass (ESM) are discussed in [2]. The function of the process is to convert biodegradable waste produced during space mission into biogas, which is to be used as fuel in the fuel cell to produce electricity. It was supposed to have 7.5 kg organic biomass produced per day during the mission on the surface of Mars. The biomass includes dry human wastes, inedible plant residues, trash, packaging materials, paper tape, filters and so on [3]. The focus of the work is to evaluate a new version of the patented high-solids process Sequential Batch Anaerobic Composting (SEBAC) developed by the same group for hypo- and micro-gravity environments of space missions. The process uses a combination of solid-phase fermentation and leachate recycle to provide a simple, reliable process that inoculates new batches, removes volatile organic acid, and concentrates nutrients and buffer. The organic matter in the process is decomposed primarily to methane, carbon dioxide, and compost over a residence time of up to 30 days. The process is very stable at low ambient or normal pressure and does not required mixing and oxygen. It is resilient after months of being idle without feedstock addition. For space applications, it is a five-reactor system including one for feed collection and compaction, three for anaerobic composting, and one for post-treatment processing as shown in the Figure 6-1. Feed would be collected, coarsely shredded, mixed with station wastewater to give the desired < 35 % solids, and compacted to a density of 300 kgdw/m3. The pretreatment step would require 5 days and be conducted in the same reactor used for the entire treatment process. The anaerobic digestion would proceed for 15 days.
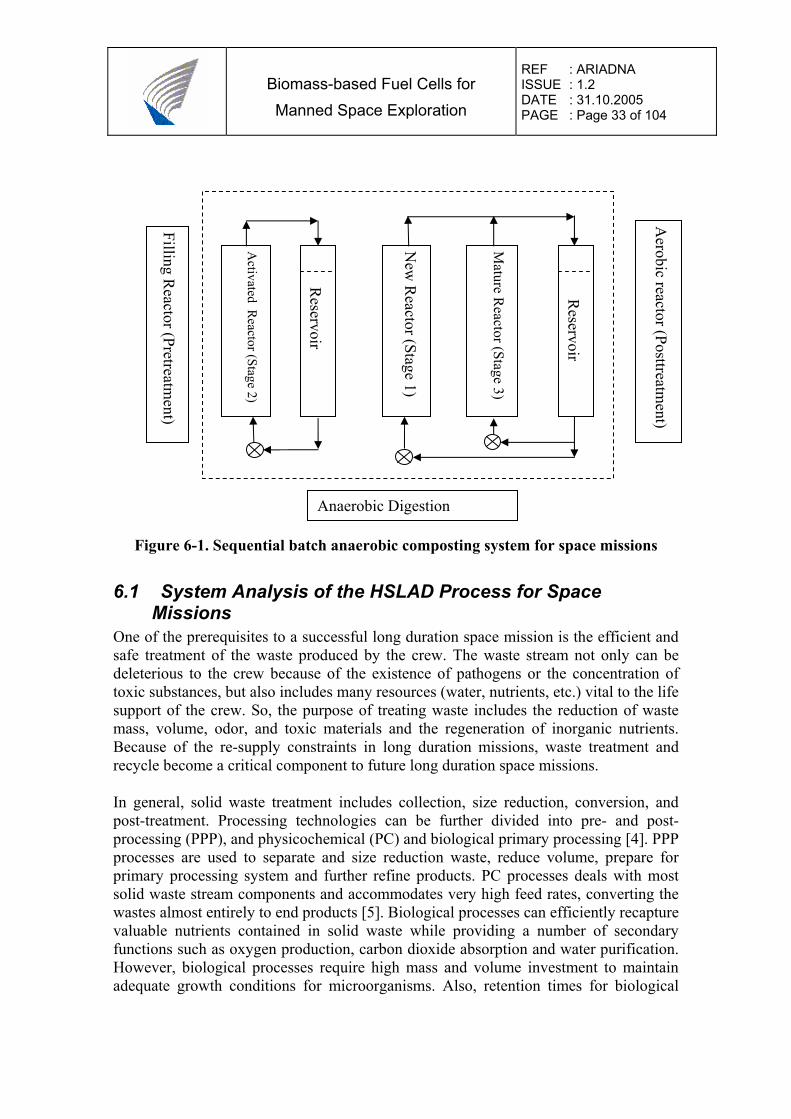
Biomass-based Fuel Cells for Manned Space Exploration
REF : ARIADNA ISSUE : 1.2 DATE : 31.10.2005 PAGE : Page 33 of 104
Figure 6-1. Sequential batch anaerobic composting system for space missions
6.1 System Analysis of the HSLAD Process for Space Missions
One of the prerequisites to a successful long duration space mission is the efficient and safe treatment of the waste produced by the crew. The waste stream not only can be deleterious to the crew because of the existence of pathogens or the concentration of toxic substances, but also includes many resources (water, nutrients, etc.) vital to the life support of the crew. So, the purpose of treating waste includes the reduction of waste mass, volume, odor, and toxic materials and the regeneration of inorganic nutrients. Because of the re-supply constraints in long duration missions, waste treatment and recycle become a critical component to future long duration space missions.
In general, solid waste treatment includes collection, size reduction, conversion, and post-treatment. Processing technologies can be further divided into pre- and post-processing (PPP), and physicochemical (PC) and biological primary processing [4]. PPP processes are used to separate and size reduction waste, reduce volume, prepare for primary processing system and further refine products. PC processes deals with most solid waste stream components and accommodates very high feed rates, converting the wastes almost entirely to end products [5]. Biological processes can efficiently recapture valuable nutrients contained in solid waste while providing a number of secondary functions such as oxygen production, carbon dioxide absorption and water purification. However, biological processes require high mass and volume investment to maintain adequate growth conditions for microorganisms. Also, retention times for biological
Activated R
eactor (Stage 2)
New
Reactor (Stage 1)
Mature R
eactor (Stage 3)
Reservoir
Reservoir
Filling Reactor (Pretreatm
ent)
Anaerobic Digestion
Aerobic reactor (Posttreatm
ent)
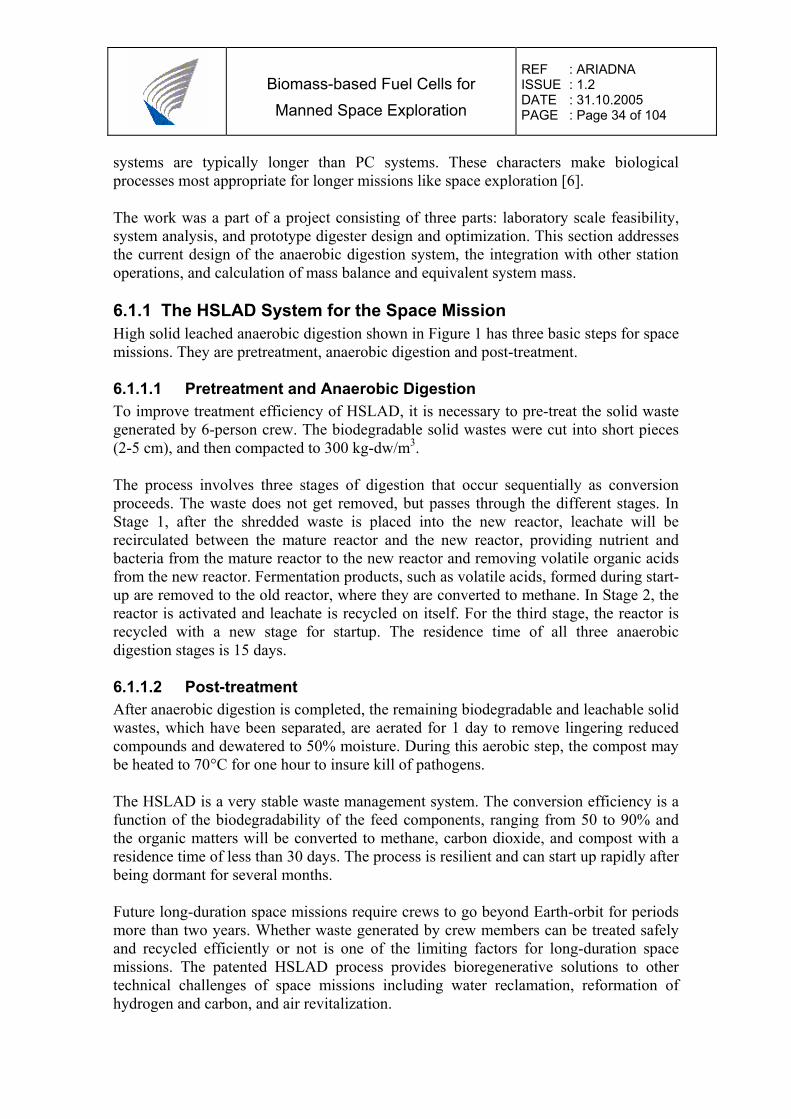
Biomass-based Fuel Cells for Manned Space Exploration
REF : ARIADNA ISSUE : 1.2 DATE : 31.10.2005 PAGE : Page 34 of 104
systems are typically longer than PC systems. These characters make biological processes most appropriate for longer missions like space exploration [6].
The work was a part of a project consisting of three parts: laboratory scale feasibility, system analysis, and prototype digester design and optimization. This section addresses the current design of the anaerobic digestion system, the integration with other station operations, and calculation of mass balance and equivalent system mass.
6.1.1 The HSLAD System for the Space Mission High solid leached anaerobic digestion shown in Figure 1 has three basic steps for space missions. They are pretreatment, anaerobic digestion and post-treatment.
6.1.1.1 Pretreatment and Anaerobic Digestion To improve treatment efficiency of HSLAD, it is necessary to pre-treat the solid waste generated by 6-person crew. The biodegradable solid wastes were cut into short pieces (2-5 cm), and then compacted to 300 kg-dw/m3.
The process involves three stages of digestion that occur sequentially as conversion proceeds. The waste does not get removed, but passes through the different stages. In Stage 1, after the shredded waste is placed into the new reactor, leachate will be recirculated between the mature reactor and the new reactor, providing nutrient and bacteria from the mature reactor to the new reactor and removing volatile organic acids from the new reactor. Fermentation products, such as volatile acids, formed during start-up are removed to the old reactor, where they are converted to methane. In Stage 2, the reactor is activated and leachate is recycled on itself. For the third stage, the reactor is recycled with a new stage for startup. The residence time of all three anaerobic digestion stages is 15 days.
6.1.1.2 Post-treatment After anaerobic digestion is completed, the remaining biodegradable and leachable solid wastes, which have been separated, are aerated for 1 day to remove lingering reduced compounds and dewatered to 50% moisture. During this aerobic step, the compost may be heated to 70°C for one hour to insure kill of pathogens.
The HSLAD is a very stable waste management system. The conversion efficiency is a function of the biodegradability of the feed components, ranging from 50 to 90% and the organic matters will be converted to methane, carbon dioxide, and compost with a residence time of less than 30 days. The process is resilient and can start up rapidly after being dormant for several months.
Future long-duration space missions require crews to go beyond Earth-orbit for periods more than two years. Whether waste generated by crew members can be treated safely and recycled efficiently or not is one of the limiting factors for long-duration space missions. The patented HSLAD process provides bioregenerative solutions to other technical challenges of space missions including water reclamation, reformation of hydrogen and carbon, and air revitalization.
Biomass-based Fuel Cells for Manned Space Exploration
REF : ARIADNA ISSUE : 1.2 DATE : 31.10.2005 PAGE : Page 35 of 104
6.1.2 Applied Waste Stream Used in the System Analysis Waste produced during space missions can be classified into crew waste, life support system waste, and payload waste [4]. Crew waste includes metabolic wastes and related materials such as packaging, food containers, and wipes for housekeeping and personal hygiene, and trash. Life support system wastes are wastes generated by the Environmental Control and Life Support System, and payload wastes are any wastes generated specific to a payload, such as animal metabolic wastes and plant remains. Table 4-16 estimated the amount of the waste generated daily from a 6-person crew in Mars exploration mission. The most significant components of waste are inedible plant wastes, vegetable residues, faeces, packing materials, paper and so on.
6.1.3 Sizing of HSLAD As well known, the room space in space mission is very limited. A compact and efficient design of the anaerobic digester is very important. For a typical 15-day anaerobic digestion cycle (5 days for one anaerobic stage), every reactor contains 5-day solid waste generated by crew. Thus, the waste amount in each reactor is:
7.5 kg waste/day x 5 days = 37.5 kg waste, (6-1)
After compaction, the density of the biodegradable wastes is about 0.3 kg (dw)/L. Then, reactor volume (V) needed for waste:
V = 37.5 kg/0.3 kg/liter = 125 liters (6-2) If the reactor is cubical-shaped, with a height to side ratio of 2 and it is necessary to add an additional 25% to the height for leachate distribution and collection, the practical dimension of the reactor can be calculated as followed:
V=L2xH (6-3)
H =H' /1.25 (6-4)
H' / L = 2 (6-5)
If the side of the reactors is L= 0.43 m; the height of the reactors is H' = 0.86 m; the waste height is H = 0.69 m, then the practical reactor volume Vp= 160 liters.
As shown in Figure 6-1, two water reservoirs are used in the HSLAD system, which mainly provide the necessary leachate to amount of optimal moisture content, 70%. In addition, the reservoirs can serve as gas separators and replace water lost due to evaporation loss.
After the dry waste is compacted to 0.3 kg/L, some water must be added for the anaerobic digestion, which leads to a wet density of approximately 1 kg/L. For one reactor, the amount of water needed is:
Biomass-based Fuel Cells for Manned Space Exploration
REF : ARIADNA ISSUE : 1.2 DATE : 31.10.2005 PAGE : Page 36 of 104
125 liter x (1000 - 300) kg/m3 = 87.5 kg = 87.5 liter water (6-6)
Because there are three anaerobic reactors in the HSLAD system, the total amount of water needed:
87.5 (L) x 3 =262 liters (6-7)
Assuming two reservoirs are the same size, each reservoir will be 131 liters with the same height as the reactor, 0.86 m, and the side length of reservoir is 0.39 m.
Two pumps are used to recirculate the leachate from reservoir to reactor in the system. As calculated above, for one reactor, the required leachate volume is 87.5 liters. Based on the operation experience, it is assumed that the total leachate recirculation volume per day is 10 times the required leachate volume, 87.5 m3 and the pumps work 20 minutes per 2 hours. So, the leachate recirculation flow rate is:
Q = 10 x 87.5 (liter/day) / (24/2 x 20) (min/day) = 3.6 liter/min (6-8)
According to Darcy’s Law, the hydraulic head of leachate (h) can be calculated by:
q = K x i = K x (h + H)/H (6-9)
q = Q/A = Q/L2 (6-10)
h = 28.2 m
this is the hydraulic head of water and can be converted to pressure:
p= 28.2m x l000 (kg/m3) x g = 276 kPa (6-11)
So, 276 kPa pressure should be provided by pump A. For pump B, because it should provide two reactors energy, the pressure is double. PB = 553 kPa.
According to Energy Conservation Law, the energy required can be calculated as follows:
ET = 0.5mv2 + mgH (6-12)
v=Q/D2 (6-13)
where: m is the total mass of leachate recirculation; v is the flow rate in leachate pipe; H is the reactor height; and D is the inner diameter of leachate pipe.
To simplify the calculation, it is assumed that the head loss is ignored. The results of pump design are listed in Table 6-1.
Biomass-based Fuel Cells for Manned Space Exploration
REF : ARIADNA ISSUE : 1.2 DATE : 31.10.2005 PAGE : Page 37 of 104
Table 6-1. Design Parameters of HSLAD for Space Mission (6 crew) Height
(cm) Side length (cm)
Volume (liter)
Leachate Recirculation Volume (liter)
Pressure (kPa)
Reactor 86 43 160 87.5 Water Reservoir
86 39 130 87.5
Pump A 276 Pump B 553
Water balance analysis is discussed below. For a 6-person crew, it would generate about 10.6 kg-dw/d (7.5 kg organic matter) solid waste, including dry human wastes, inedible plant waste, trash, packing material, paper, tape, filters, and miscellaneous items. The organic matter can be biodegradated by bacteria into methane, carbon dioxide, compost and other trace biogases. Biochemical reactions occurring in anaerobic composting include:
C6H12O6 → 3CH4 +3CO2 (6-14)
Protein → CH4 +CO2 +H2S+NH3 (6-15)
Fats → CH4 +CO2 (6-16)
The conversion of organic matter in the HSLAD systems is a function of feedstock, ranging from 50 to 90%. Based on the composition of solid waste generated by 6-person crew, it is assumed that about 75% solid waste can be biodegraded. According to the mass balance law, the solid waste balanced reaction can be written as follows:
7.5 kg biodegradable solids
→ 1.5 kg CH4 (1.3 m3) + 4.l kg CO2 (1.3 m3)+1.9 kg compost (6-17)
Moisture content plays an important role in HSLAD operation and optimal moisture content is about 70%. After pretreatment, the moisture content of solid waste is lower than 70%. So, it is necessary to add extra water for SLAD operation. The water mass (Mw) needed:
Mw = 7.5 (kg/day)/(1-70 %) – 7.5 kg/day = 17.5 kg/day (6-18)
Energy balance analysis is a very important issue for the long-term space missions. In the HSLAD process, electrical energy is required to operate the bulk materials conveying system, the ventilation system, the odor control system, and the pumping system. However, the HSLAD process has the potential for being a net energy producer since biogas produced from the HSLAD process is quite similar to "natural" gas and contains lots of energy. The biogas has a lower calorific value than natural gas,
Biomass-based Fuel Cells for Manned Space Exploration
REF : ARIADNA ISSUE : 1.2 DATE : 31.10.2005 PAGE : Page 38 of 104
approximately 22,248 kJ/m3 for biogas versus 40,789 kJ/m3 of natural gas. The energy contents of the biogas can be calculated as follow:
(1.3 + 1.3) m3 x 22248 kJ/m3 = 58000 kJ (6-19)
Energy consumption in the entire process is mainly for pumping operation and water heating operation from room temperature to 35 °C (operation temperature for digester process) if enough oxygen is provided. According to operation experience, the energy consumption is about 31.8 MJ/day for six crew member. It makes the net energy produced by HSLAD is 45% of the biogas energy.
As shown in Table 6-2, the HSLAD process would produce 1.5 kg of methane, 4.1 kg of carbon dioxide, and 1.9 kg of compost daily from 7.5 kg of biodegradable solid waste generated daily from a crew of six. Thus, the HSLAD is a net energy producer.
Table 6-2. Mass and Energy Balance of HSLAD System. Balance Input Output Net energy Mass (kg) 7.5 kg biodegradable
waste 1.5 kg methane, 4.1 kg carbon
dioxide and 1.9 kg compost
Energy (kJ) 31 800/day 58 000/day 26 200/day
6.1.4 Integration Potential Analysis
6.1.4.1 Wastewater Reclamation One of the potential advantages of HSLAD is that it can pre-treat wastewater through reducing Biochemical Oxygen Demand (BOD), volatile organics, dissolved and suspended solids in wastewater. For any biological system, moisture plays a vital role in growth, metabolism, solute transport, and other functions. Moisture content can range from 55 to 70% for a solid-phase system, such as composting, and approximately 98% for an aqueous system. The optimal moisture content for the HSLAD operation is 70%, however, after shredding and compaction process in pretreatment, the moisture content of solid waste is less than 70%. The wastewater from clothes wash and dish wash would be used for the makeup water needed for the HSLAD conversion of solid waste. As calculated above, 17.5 kg waste water are needed to be added per day for HSLAD operation. The biodegradable components of the wastewater will be partially biodegraded during the anaerobic composting process making the process a coarse treatment operation for water recycling.
6.1.4.2 Reformation of Carbon Dioxide and Hydrogen A closed Advanced Life Support (ALS) system must include a CO2 reduction subsystem to reduce carbon dioxide produced from crew respiration and combustion. Since the oxygen supply from plants is relative limited, especially in the space mission with low food closure, water could be electrolyzed to provide oxygen, but hydrogen will be produced as a byproduct. So it is desirable to develop a subsystem so that it can pre-treat wastewater to reduce both CO2 and H2.
Biomass-based Fuel Cells for Manned Space Exploration
REF : ARIADNA ISSUE : 1.2 DATE : 31.10.2005 PAGE : Page 39 of 104
HSLAD can provide a bioregenerative alternative for hydrogen oxidation using carbon dioxide as the electron acceptor.
CO2 +4H2 → CH4 +2H2O (6-20)
The reaction is a well-known biomethanogenesis reaction and can be accomplished in the same reactor used for the proposed anaerobic stages of solid waste conversion.
However, the reformation of carbon dioxide and hydrogen is not necessary in this study since the hydrogen is the best fuel for fuel cell to produce electricity.
6.1.4.3 Biofiltration of Ambient Air or Pure Oxygen In the post-treatment of the HSLAD system, the remaining solids are treated with ambient air or pure oxygen (which is available in space mission) to oxidize reduced residues and damage pathogens in the compost. A possible use of compost is to absorb air contaminants, such as VOCs and NH3, because compost contains organic material and has a large surface area where microorganisms are able to attach and grow. When the ambient air passes through the compost, the compost can absorb particles and chemicals in ambient air and the microbial population in compost can degrade a wide array of VOCs. Additionally, NH3 can be captured and converted to nitrate through nitrification for return to a plant growth system [7]. The compost biofilter can handle a wide range of loading rates with low mass, water, power and maintenance requirements and simultaneously remove many trace air contaminants.
6.1.4.4 Plant Growth Substrate Another potential use of HSLAD compost is as a nutrient-rich plant growth medium. Compost contains substantial amounts of inorganic nutrients vital for plant growth. Plants are able to effectively extract nutrients that remain in the compost. Additionally, it is possible that any nutrients, poorly extracted during short-term aqueous extraction methods, will be recovered over the long term through direct extraction by the plant root system [7].
6.1.5 Equivalent System Mass (ESM) Calculation of HSLAD
Equivalent System Mass (ESM) is a technique through which several physical quantities describing a system or subsystem may be reduced to a single physical parameter, mass. In 1999, ESM was selected as the basis of the NASA Advanced Life Support (ALS) Project Research and Technology Development Metric. The advantage of ESM analysis is that it allows the comparison of two life support systems with different parameters using a single scale.
ESM may be used to objectively evaluate different systems based on their mass, volume, power, cooling, and crew time requirement. The technology with the lowest ESM value is the most cost effective option for the mission being considered if the options have the same function reliability.
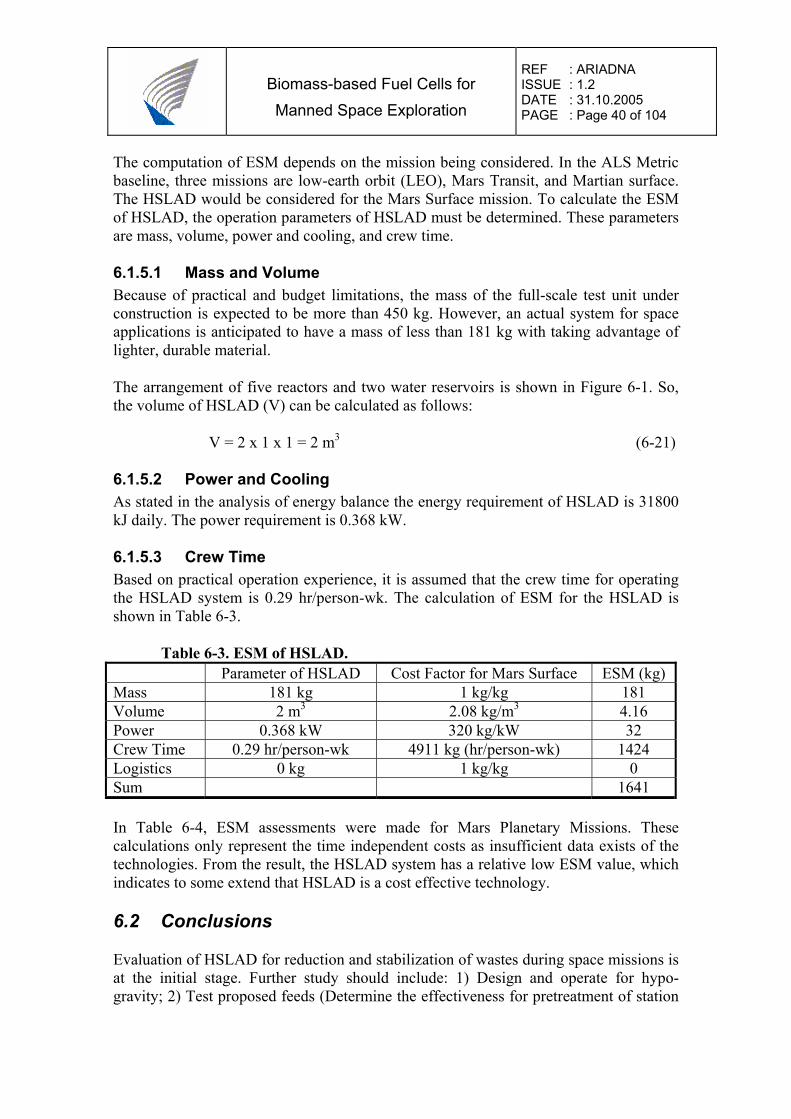
Biomass-based Fuel Cells for Manned Space Exploration
REF : ARIADNA ISSUE : 1.2 DATE : 31.10.2005 PAGE : Page 40 of 104
The computation of ESM depends on the mission being considered. In the ALS Metric baseline, three missions are low-earth orbit (LEO), Mars Transit, and Martian surface. The HSLAD would be considered for the Mars Surface mission. To calculate the ESM of HSLAD, the operation parameters of HSLAD must be determined. These parameters are mass, volume, power and cooling, and crew time.
6.1.5.1 Mass and Volume Because of practical and budget limitations, the mass of the full-scale test unit under construction is expected to be more than 450 kg. However, an actual system for space applications is anticipated to have a mass of less than 181 kg with taking advantage of lighter, durable material.
The arrangement of five reactors and two water reservoirs is shown in Figure 6-1. So, the volume of HSLAD (V) can be calculated as follows:
V = 2 x 1 x 1 = 2 m3 (6-21)
6.1.5.2 Power and Cooling As stated in the analysis of energy balance the energy requirement of HSLAD is 31800 kJ daily. The power requirement is 0.368 kW.
6.1.5.3 Crew Time Based on practical operation experience, it is assumed that the crew time for operating the HSLAD system is 0.29 hr/person-wk. The calculation of ESM for the HSLAD is shown in Table 6-3.
Table 6-3. ESM of HSLAD. Parameter of HSLAD Cost Factor for Mars Surface ESM (kg) Mass 181 kg 1 kg/kg 181 Volume 2 m3 2.08 kg/m3 4.16 Power 0.368 kW 320 kg/kW 32 Crew Time 0.29 hr/person-wk 4911 kg (hr/person-wk) 1424 Logistics 0 kg 1 kg/kg 0 Sum 1641
In Table 6-4, ESM assessments were made for Mars Planetary Missions. These calculations only represent the time independent costs as insufficient data exists of the technologies. From the result, the HSLAD system has a relative low ESM value, which indicates to some extend that HSLAD is a cost effective technology.
6.2 Conclusions
Evaluation of HSLAD for reduction and stabilization of wastes during space missions is at the initial stage. Further study should include: 1) Design and operate for hypo-gravity; 2) Test proposed feeds (Determine the effectiveness for pretreatment of station
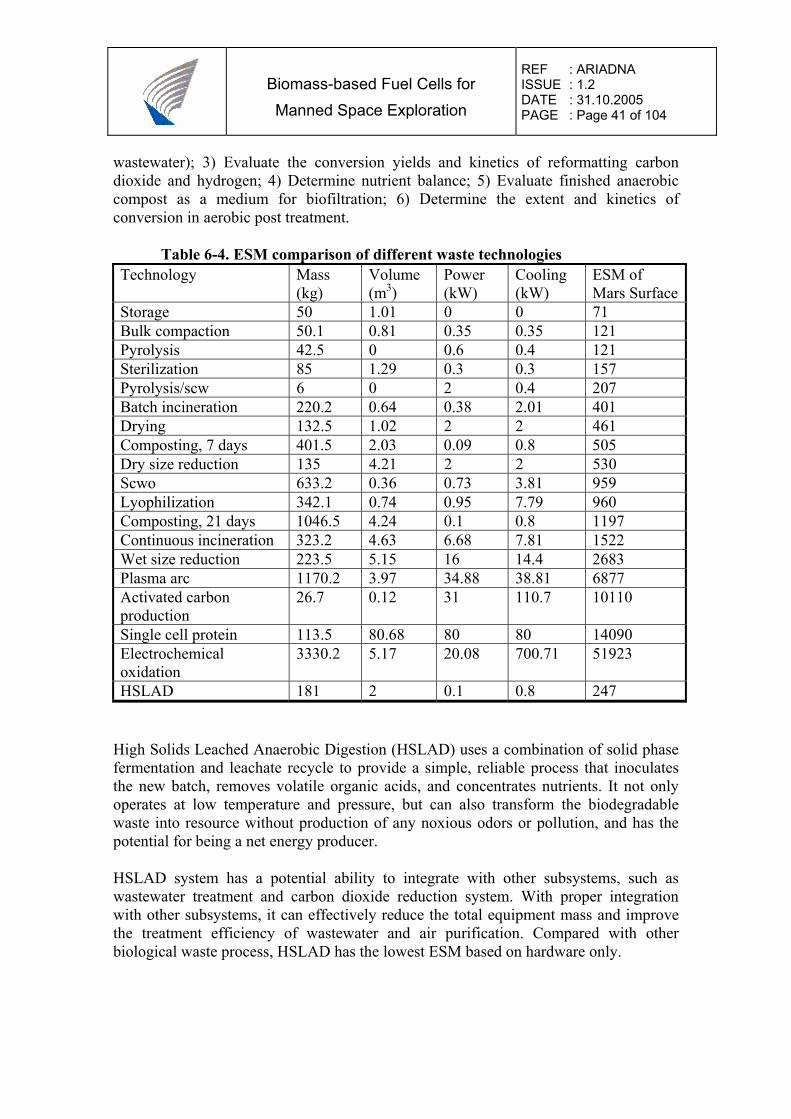
Biomass-based Fuel Cells for Manned Space Exploration
REF : ARIADNA ISSUE : 1.2 DATE : 31.10.2005 PAGE : Page 41 of 104
wastewater); 3) Evaluate the conversion yields and kinetics of reformatting carbon dioxide and hydrogen; 4) Determine nutrient balance; 5) Evaluate finished anaerobic compost as a medium for biofiltration; 6) Determine the extent and kinetics of conversion in aerobic post treatment.
Table 6-4. ESM comparison of different waste technologies Technology Mass
(kg) Volume (m3)
Power (kW)
Cooling (kW)
ESM of Mars Surface
Storage 50 1.01 0 0 71 Bulk compaction 50.1 0.81 0.35 0.35 121 Pyrolysis 42.5 0 0.6 0.4 121 Sterilization 85 1.29 0.3 0.3 157 Pyrolysis/scw 6 0 2 0.4 207 Batch incineration 220.2 0.64 0.38 2.01 401 Drying 132.5 1.02 2 2 461 Composting, 7 days 401.5 2.03 0.09 0.8 505 Dry size reduction 135 4.21 2 2 530 Scwo 633.2 0.36 0.73 3.81 959 Lyophilization 342.1 0.74 0.95 7.79 960 Composting, 21 days 1046.5 4.24 0.1 0.8 1197 Continuous incineration 323.2 4.63 6.68 7.81 1522 Wet size reduction 223.5 5.15 16 14.4 2683 Plasma arc 1170.2 3.97 34.88 38.81 6877 Activated carbon production
26.7 0.12 31 110.7 10110
Single cell protein 113.5 80.68 80 80 14090 Electrochemical oxidation
3330.2 5.17 20.08 700.71 51923
HSLAD 181 2 0.1 0.8 247
High Solids Leached Anaerobic Digestion (HSLAD) uses a combination of solid phase fermentation and leachate recycle to provide a simple, reliable process that inoculates the new batch, removes volatile organic acids, and concentrates nutrients. It not only operates at low temperature and pressure, but can also transform the biodegradable waste into resource without production of any noxious odors or pollution, and has the potential for being a net energy producer.
HSLAD system has a potential ability to integrate with other subsystems, such as wastewater treatment and carbon dioxide reduction system. With proper integration with other subsystems, it can effectively reduce the total equipment mass and improve the treatment efficiency of wastewater and air purification. Compared with other biological waste process, HSLAD has the lowest ESM based on hardware only.
Biomass-based Fuel Cells for Manned Space Exploration
REF : ARIADNA ISSUE : 1.2 DATE : 31.10.2005 PAGE : Page 42 of 104
6.3 References [1] Anaerobic Digestion for Reduction and Stabilization of Organic Solid Waste
During Space Missions: Laboratory Studies David Chynoweth, Patrick Haley, John Owens, Art Teixeira, Bruce Welt and Elana Rich from Agricultural and Biological, Engineering University of Florida, Tim Townsend from Environment Engineering & Science University of Florida and Hong-Lim Choi from Animal Science and Technology Seoul National University
[2] Anaerobic Digestion for Reduction and Stabilization of Organic Solid Waste During Space Missions: System Analysis Qiyong Xu and Tim Townsend from Environment Engineering & Science University of Florida, David Chynoweth, Patrick Haley, John Owens and Elana Rich from Agricultural and Biological, Engineering University of Florida, Sabrina Maxwell from Boeing and Hong-Lim Choi from Animal Science and Technology Seoul National University
[3] Solids Waste Processing and Resource Recovery for Long-Duration Missions – A workshop. ICES Conference, Orlando, FL, Paper 01-2351. by C. Verostko, M. Alazaki, J. Joshi and J. Fiisher in the year 2001
[4] Optimization of Feedstock Composition and Pre-Processing for Composting in
Advanced Life Support Systems.2001-01-2297 by Kang, S, Hogan, J.A.,(2001) [5] Preliminary Design Considerations on Biological Treatment Alternatives for a
Simulated Mars Base Wastewater Treatment System. 2000-01-2467. by Blersch, D.M., Biermann, E., and Kangas, P. (2000)
[6] Systems Analysis of Life Support tor Long-Duration Missions. 2000-01-2394.
by Drysdale, A.E., Maxwell, S., Ewert, M.K., and Hanford, A.J., (2000) [7] Integration of Composting, Plant Growth and Biofiltration for Advanced Life
Support System. 2001-01-2211. by Hogan J. A., Perez L. C. and Lertsiriyothin W., et al., (2001)
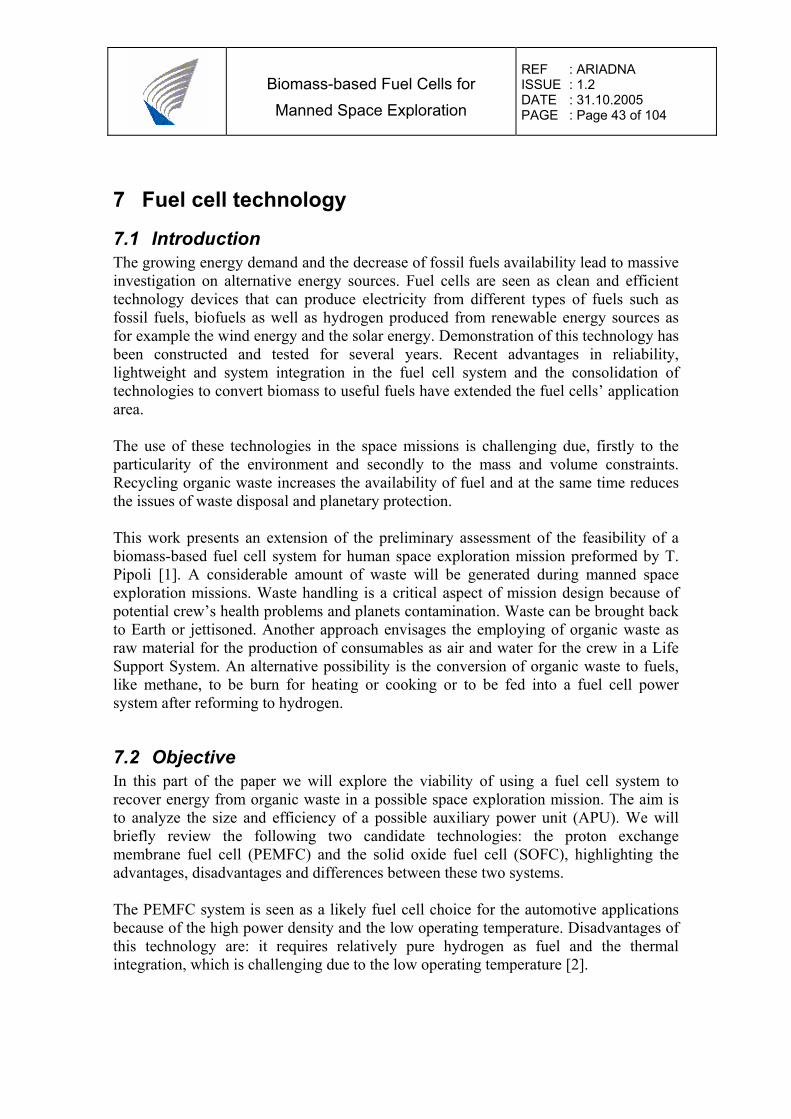
Biomass-based Fuel Cells for Manned Space Exploration
REF : ARIADNA ISSUE : 1.2 DATE : 31.10.2005 PAGE : Page 43 of 104
7 Fuel cell technology
7.1 Introduction The growing energy demand and the decrease of fossil fuels availability lead to massive investigation on alternative energy sources. Fuel cells are seen as clean and efficient technology devices that can produce electricity from different types of fuels such as fossil fuels, biofuels as well as hydrogen produced from renewable energy sources as for example the wind energy and the solar energy. Demonstration of this technology has been constructed and tested for several years. Recent advantages in reliability, lightweight and system integration in the fuel cell system and the consolidation of technologies to convert biomass to useful fuels have extended the fuel cells’ application area. The use of these technologies in the space missions is challenging due, firstly to the particularity of the environment and secondly to the mass and volume constraints. Recycling organic waste increases the availability of fuel and at the same time reduces the issues of waste disposal and planetary protection. This work presents an extension of the preliminary assessment of the feasibility of a biomass-based fuel cell system for human space exploration mission preformed by T. Pipoli [1]. A considerable amount of waste will be generated during manned space exploration missions. Waste handling is a critical aspect of mission design because of potential crew’s health problems and planets contamination. Waste can be brought back to Earth or jettisoned. Another approach envisages the employing of organic waste as raw material for the production of consumables as air and water for the crew in a Life Support System. An alternative possibility is the conversion of organic waste to fuels, like methane, to be burn for heating or cooking or to be fed into a fuel cell power system after reforming to hydrogen.
7.2 Objective In this part of the paper we will explore the viability of using a fuel cell system to recover energy from organic waste in a possible space exploration mission. The aim is to analyze the size and efficiency of a possible auxiliary power unit (APU). We will briefly review the following two candidate technologies: the proton exchange membrane fuel cell (PEMFC) and the solid oxide fuel cell (SOFC), highlighting the advantages, disadvantages and differences between these two systems. The PEMFC system is seen as a likely fuel cell choice for the automotive applications because of the high power density and the low operating temperature. Disadvantages of this technology are: it requires relatively pure hydrogen as fuel and the thermal integration, which is challenging due to the low operating temperature [2].
Biomass-based Fuel Cells for Manned Space Exploration
REF : ARIADNA ISSUE : 1.2 DATE : 31.10.2005 PAGE : Page 44 of 104
The SOFC is compatible with the anaerobic digestion gas (ADG). SOFC has less stringent requirements for fuel purity and even carbon monoxide can be considered as a fuel. It operates at high temperatures that are difficult to reach when the power of the application is a fraction of kilowatts.
7.3 Fuel Cell Overview There are various types of fuel cell system available nowadays. According to the different features of the fuel cells, fuel cells are classified into: polymer electrolyte membrane fuel cells, alkaline fuel cells, phosphoric acid fuel cells, molten carbonate fuel cells, solid oxide fuel cells, direct methanol fuel cell and biological fuel cells. Figure 7-1 shows some types of fuel cells and the differences in characteristics of the ion flows are highlighted.
Figure 7-1. Ion flow in different type of fuel cells.
Fuel cells are usually classified according to the nature of the electrolyte exception for the biological fuel cells. The reactions at the electrodes are different even if the overall reaction does not change.
7.4 PEM Candidate The electrolyte in the PEMFC is a solid polymeric membrane fitted between two platinum-catalyzed porous electrodes. PEMFCs typically operate at temperature about 60-85°C, that is determined by both the thermal stability and the ionic conductivity characteristics of the polymeric membrane. To get sufficient ionic conductivity, the proton-conducting polymer electrolyte requires proper humidification. Thus, temperatures are limited to less than 100 °C at ordinary pressures (1 atm). The low-
Biomass-based Fuel Cells for Manned Space Exploration
REF : ARIADNA ISSUE : 1.2 DATE : 31.10.2005 PAGE : Page 45 of 104
operating temperature allows the PEMFCs to be brought up to steady-state operation rapidly. As with many lower temperature fuel cells, PEMFCs require a pure hydrogen source for operation. Since ADG contains gases such as carbon monoxide and H2S that are detrimental to fuel cell operation, it requires additional fuel processing. The main technical issues that PEMFCs developers face include:
• Electro catalyst poisoning by low-level carbon monoxide concentrations in the fuel.
• Water management and membrane operating temperature limits. • System complexity due the integration of the stack with the reformer and
fuel cleaning system • Cell life.
In the PEM fuel cell the hydrogen flows into the anode and it is split in hydrogen ions and electrons. The hydrogen ions permeate across the electrolyte to the cathode, the electrons flow through the external circuit. At the cathode oxygen combines with the electron and the hydrogen ions to form water. The chemical reactions taking place in a PEM are:
At the anode: −+ +→ eHH 442 2 (7-1)
At the cathode: OHeHO 22 244 →++ −+ (7-2)
The overall reaction: OHOH 222 22 →+ (7-3)
7.5 SOFC Candidate SOFCs employ a solid-state electrolyte and operate at the highest temperature for all fuel cell types. The operating temperature of SOFCs is sufficiently high to provide the necessary heat for the endothermic reforming reaction in the typology called “internal reforming SOFCs”. Or with particularly types of membrane it is possible to operate the SOFCs directly whit methane. SOFCs, therefore, are more tolerant to fuel impurities and they can operate using hydrogen and carbon monoxide fuels directly at the anode. SOFCs do not require external costly reformers or expensive catalysts to produce hydrogen. The relative insensitivity of SOFCs to gas contaminants normally considered as “poisons” to low temperature fuel cells makes them especially attractive for unconventional fuels, such as biomass or coal gasification. The disadvantage of the SOFCs is the stringent materials requirement for the critical cell components due to high operating temperature. The development issues for SOFCs include:
Biomass-based Fuel Cells for Manned Space Exploration
REF : ARIADNA ISSUE : 1.2 DATE : 31.10.2005 PAGE : Page 46 of 104
• Refining the thermal management of stack heat flows (air cooling, internal reforming, etc.).
• Increasing the power density • Slow start up • Stability to thermal cycles
The chemical reactions in a SOFC are:
At the anode (if methane, hydrogen and carbon monoxide are available):
COHOHCH +→+ 224 3 (7-4) −− +→+ eOHOH 22
22 (7-5)
−− +→+ eCOOCO 222 (7-6)
At the cathode: −− →+ 2
2 24 OeO (7-7) The overall reaction (only hydrogen case):
OHOH 222 22 →+ (7-8)
At the high temperatures within the cell, it is feasible for the water gas shift reaction: 222 HCOOHCO +=+ and the steam reforming reaction: (in the case of natural gas) to take place to produce H2 that is easily oxidized at the anode. The direct oxidation of CO in fuel cells is well established while the direct oxidation of CH4 has not been completely studied.
7.5.1 Direct Oxidation of Hydrocarbons in a Solid Oxide Fuel Cells It is the latest technology. At the moment we know only few studies [6, 7] that confirm that the direct oxidation of dry methane is possible with reasonable performances. The direct oxidation of hydrocarbons tries to overcome some of the problems typical of the internal reforming SOFCs. Mainly operating in dry condition at the anode the management of water is absent and also the control of the temperature is simplified. The disadvantage is that at the moment it has not been found yet the electrolyte and the catalyst that guarantee the same performances of the yttria-stabilized zirconia (YSZ) with nickel Ni catalyst. The Table 7-1 presents a comparison between PEMFC and SOFC.
7.6 Fuel Cell System The basic physical structure of a fuel cell consists of an electrolyte layer and a porous anode and cathode. Fuel cells have no moving parts, which is one of their advantages, since no moving parts means no losses due to friction and silent operation. Figure 7-2 highlights the most important components of a fuel cell.
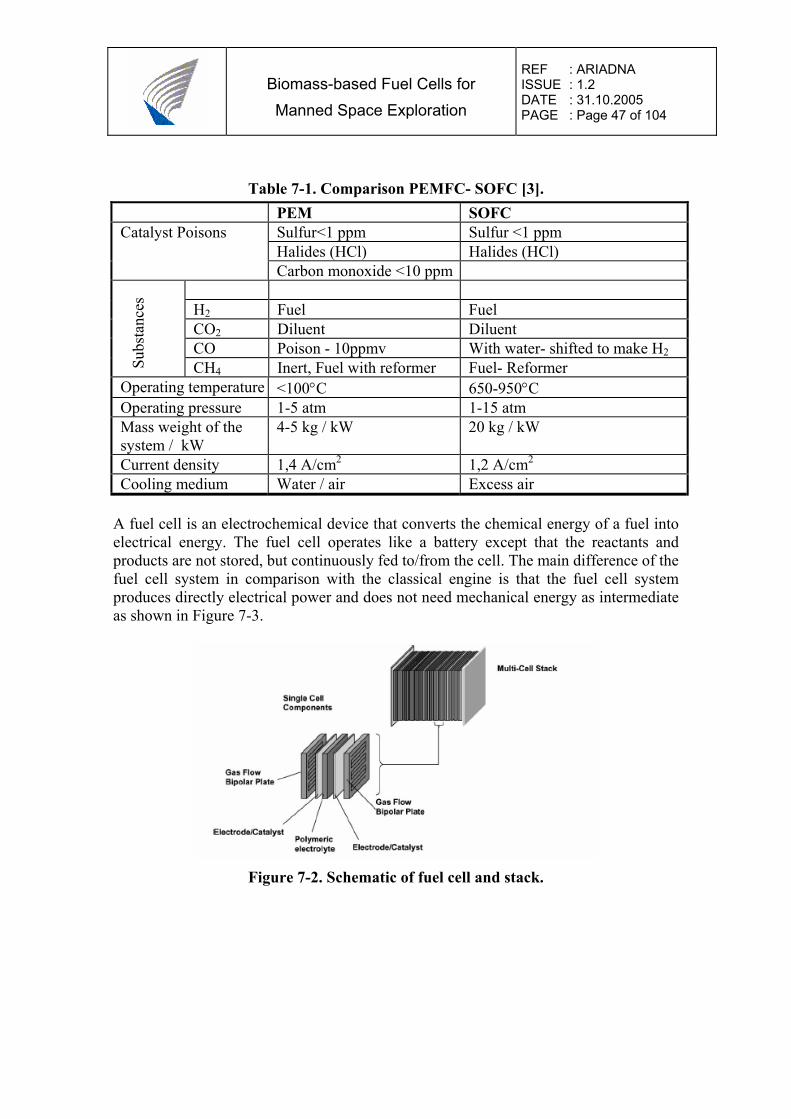
Biomass-based Fuel Cells for Manned Space Exploration
REF : ARIADNA ISSUE : 1.2 DATE : 31.10.2005 PAGE : Page 47 of 104
Table 7-1. Comparison PEMFC- SOFC [3]. PEM SOFC
Sulfur<1 ppm Sulfur <1 ppm Halides (HCl) Halides (HCl)
Catalyst Poisons
Carbon monoxide <10 ppm H2 Fuel Fuel CO2 Diluent Diluent CO Poison - 10ppmv With water- shifted to make H2
Subs
tanc
es
CH4 Inert, Fuel with reformer Fuel- Reformer Operating temperature <100°C 650-950°C Operating pressure 1-5 atm 1-15 atm Mass weight of the system / kW
4-5 kg / kW 20 kg / kW
Current density 1,4 A/cm2 1,2 A/cm2
Cooling medium Water / air Excess air A fuel cell is an electrochemical device that converts the chemical energy of a fuel into electrical energy. The fuel cell operates like a battery except that the reactants and products are not stored, but continuously fed to/from the cell. The main difference of the fuel cell system in comparison with the classical engine is that the fuel cell system produces directly electrical power and does not need mechanical energy as intermediate as shown in Figure 7-3.
Figure 7-2. Schematic of fuel cell and stack.
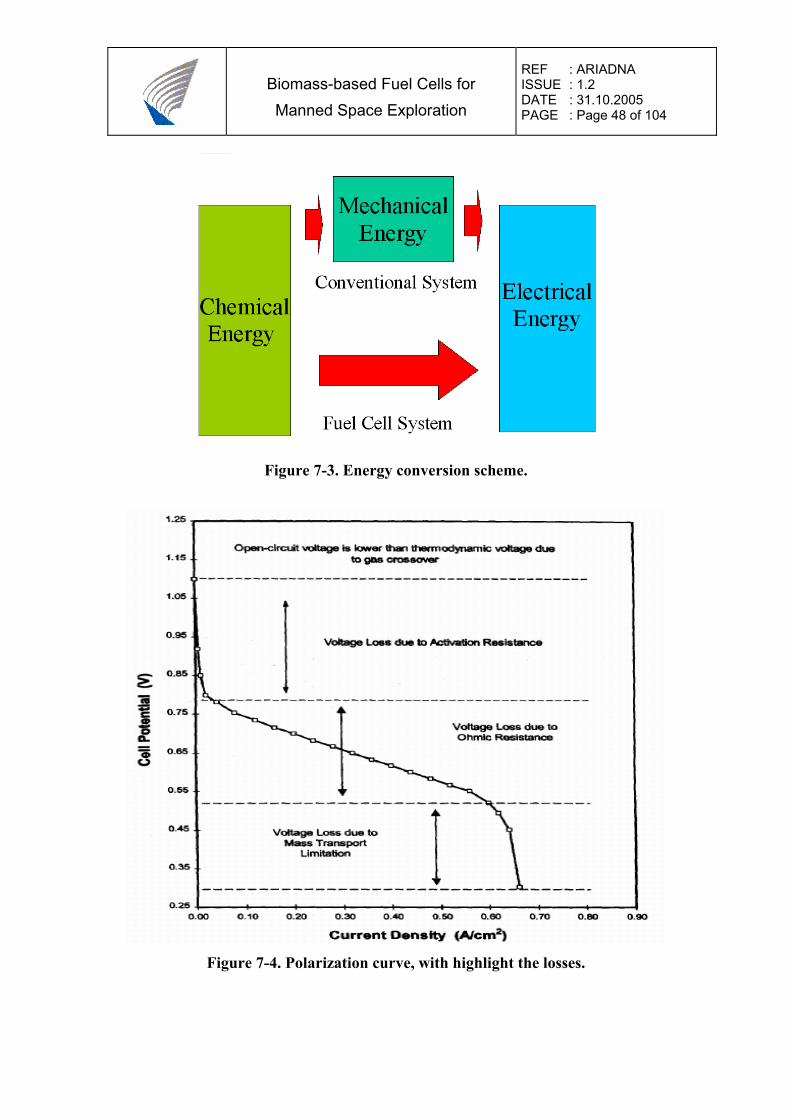
Biomass-based Fuel Cells for Manned Space Exploration
REF : ARIADNA ISSUE : 1.2 DATE : 31.10.2005 PAGE : Page 48 of 104
Figure 7-3. Energy conversion scheme.
Figure 7-4. Polarization curve, with highlight the losses.
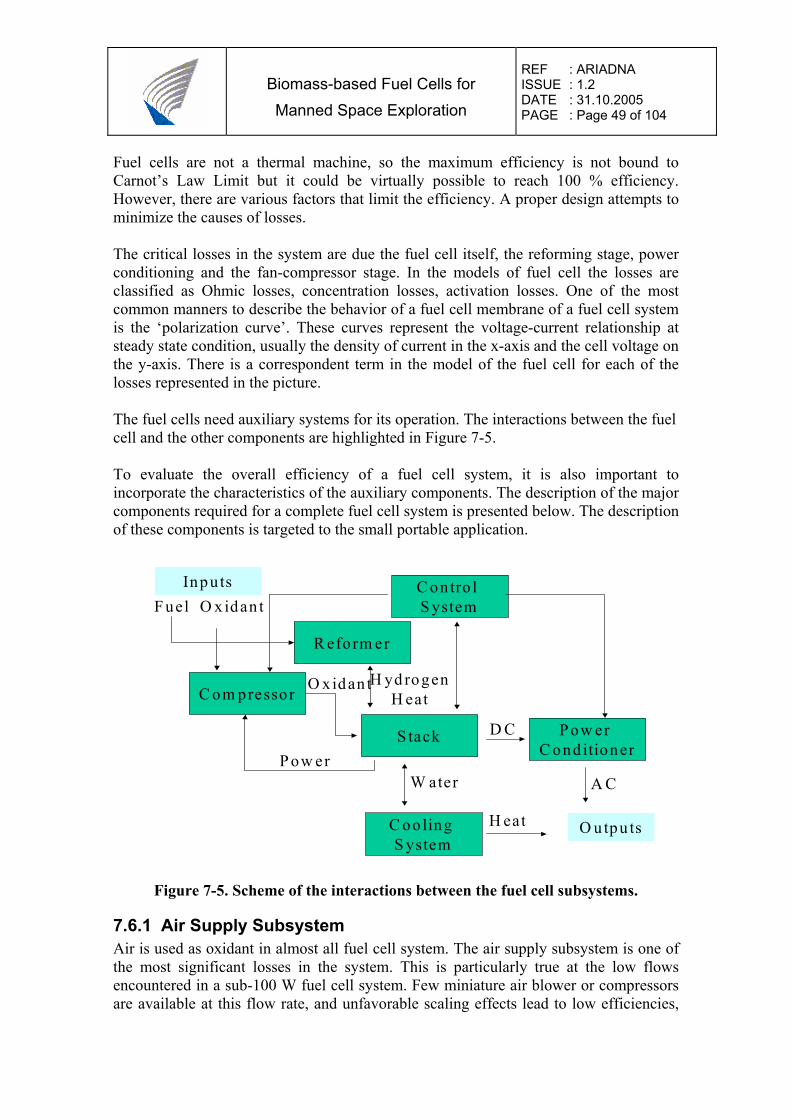
Biomass-based Fuel Cells for Manned Space Exploration
REF : ARIADNA ISSUE : 1.2 DATE : 31.10.2005 PAGE : Page 49 of 104
Fuel cells are not a thermal machine, so the maximum efficiency is not bound to Carnot’s Law Limit but it could be virtually possible to reach 100 % efficiency. However, there are various factors that limit the efficiency. A proper design attempts to minimize the causes of losses. The critical losses in the system are due the fuel cell itself, the reforming stage, power conditioning and the fan-compressor stage. In the models of fuel cell the losses are classified as Ohmic losses, concentration losses, activation losses. One of the most common manners to describe the behavior of a fuel cell membrane of a fuel cell system is the ‘polarization curve’. These curves represent the voltage-current relationship at steady state condition, usually the density of current in the x-axis and the cell voltage on the y-axis. There is a correspondent term in the model of the fuel cell for each of the losses represented in the picture. The fuel cells need auxiliary systems for its operation. The interactions between the fuel cell and the other components are highlighted in Figure 7-5. To evaluate the overall efficiency of a fuel cell system, it is also important to incorporate the characteristics of the auxiliary components. The description of the major components required for a complete fuel cell system is presented below. The description of these components is targeted to the small portable application.
C om pressor
C ontro l S ystem
S tack P ow er C ond itioner
O xidan t
H eat
P ow erA C
D C
O xidan t
W ater
C oo ling S ystem
O utpu ts
Inpu tsF uel
R eform er
H yd rogenH eat
Figure 7-5. Scheme of the interactions between the fuel cell subsystems.
7.6.1 Air Supply Subsystem Air is used as oxidant in almost all fuel cell system. The air supply subsystem is one of the most significant losses in the system. This is particularly true at the low flows encountered in a sub-100 W fuel cell system. Few miniature air blower or compressors are available at this flow rate, and unfavorable scaling effects lead to low efficiencies,
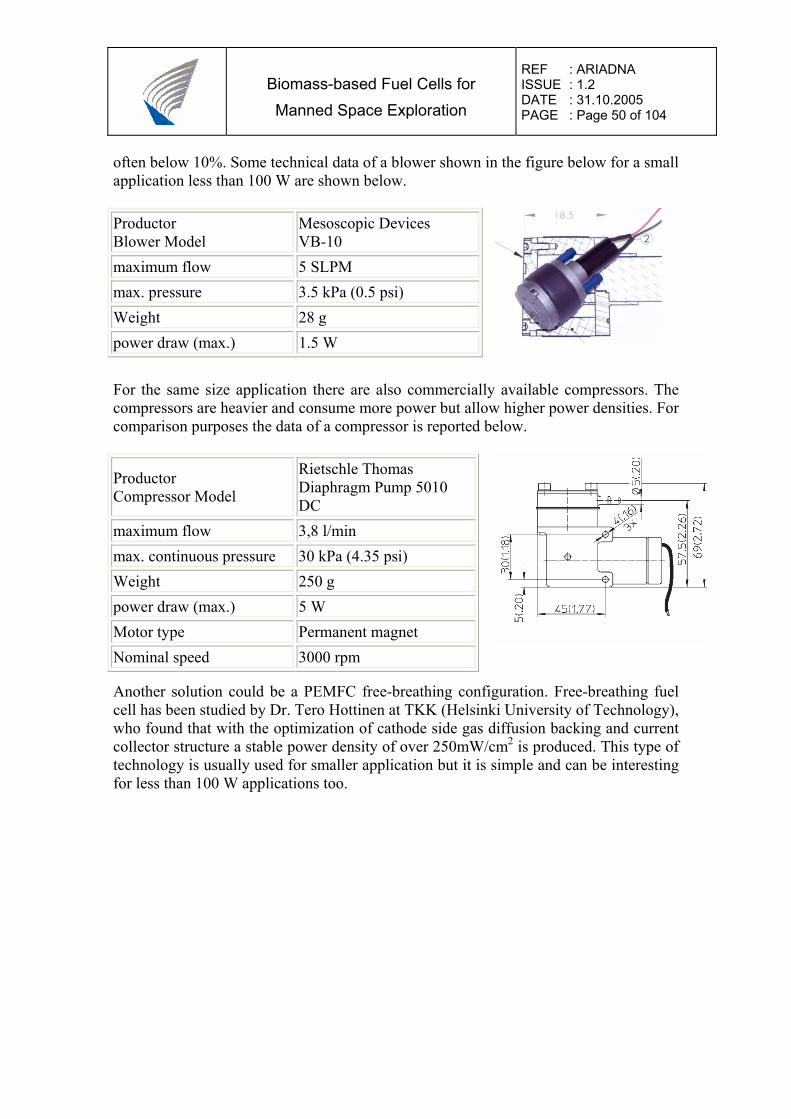
Biomass-based Fuel Cells for Manned Space Exploration
REF : ARIADNA ISSUE : 1.2 DATE : 31.10.2005 PAGE : Page 50 of 104
often below 10%. Some technical data of a blower shown in the figure below for a small application less than 100 W are shown below.
For the same size application there are also commercially available compressors. The compressors are heavier and consume more power but allow higher power densities. For comparison purposes the data of a compressor is reported below.
Another solution could be a PEMFC free-breathing configuration. Free-breathing fuel cell has been studied by Dr. Tero Hottinen at TKK (Helsinki University of Technology), who found that with the optimization of cathode side gas diffusion backing and current collector structure a stable power density of over 250mW/cm2 is produced. This type of technology is usually used for smaller application but it is simple and can be interesting for less than 100 W applications too.
Productor Blower Model
Mesoscopic Devices VB-10
maximum flow 5 SLPM max. pressure 3.5 kPa (0.5 psi) Weight 28 g power draw (max.) 1.5 W
Productor Compressor Model
Rietschle Thomas Diaphragm Pump 5010 DC
maximum flow 3,8 l/min max. continuous pressure 30 kPa (4.35 psi) Weight 250 g power draw (max.) 5 W Motor type Permanent magnet Nominal speed 3000 rpm
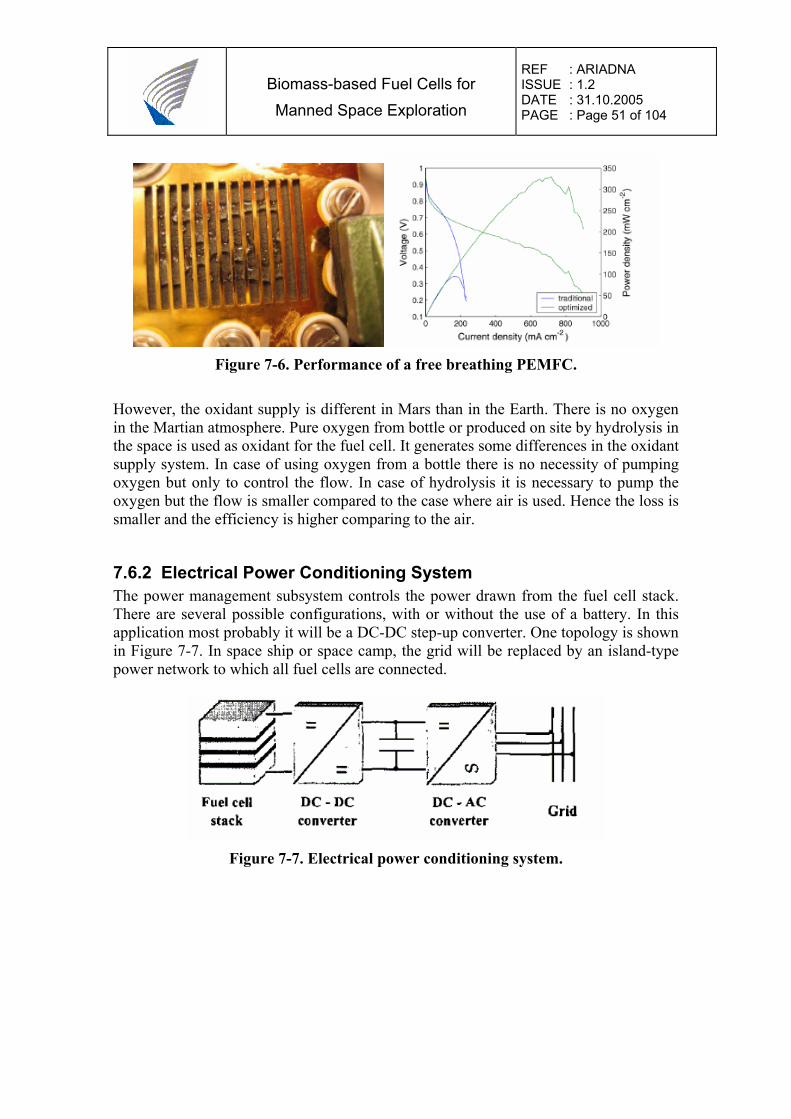
Biomass-based Fuel Cells for Manned Space Exploration
REF : ARIADNA ISSUE : 1.2 DATE : 31.10.2005 PAGE : Page 51 of 104
Figure 7-6. Performance of a free breathing PEMFC.
However, the oxidant supply is different in Mars than in the Earth. There is no oxygen in the Martian atmosphere. Pure oxygen from bottle or produced on site by hydrolysis in the space is used as oxidant for the fuel cell. It generates some differences in the oxidant supply system. In case of using oxygen from a bottle there is no necessity of pumping oxygen but only to control the flow. In case of hydrolysis it is necessary to pump the oxygen but the flow is smaller compared to the case where air is used. Hence the loss is smaller and the efficiency is higher comparing to the air.
7.6.2 Electrical Power Conditioning System The power management subsystem controls the power drawn from the fuel cell stack. There are several possible configurations, with or without the use of a battery. In this application most probably it will be a DC-DC step-up converter. One topology is shown in Figure 7-7. In space ship or space camp, the grid will be replaced by an island-type power network to which all fuel cells are connected.
Figure 7-7. Electrical power conditioning system.
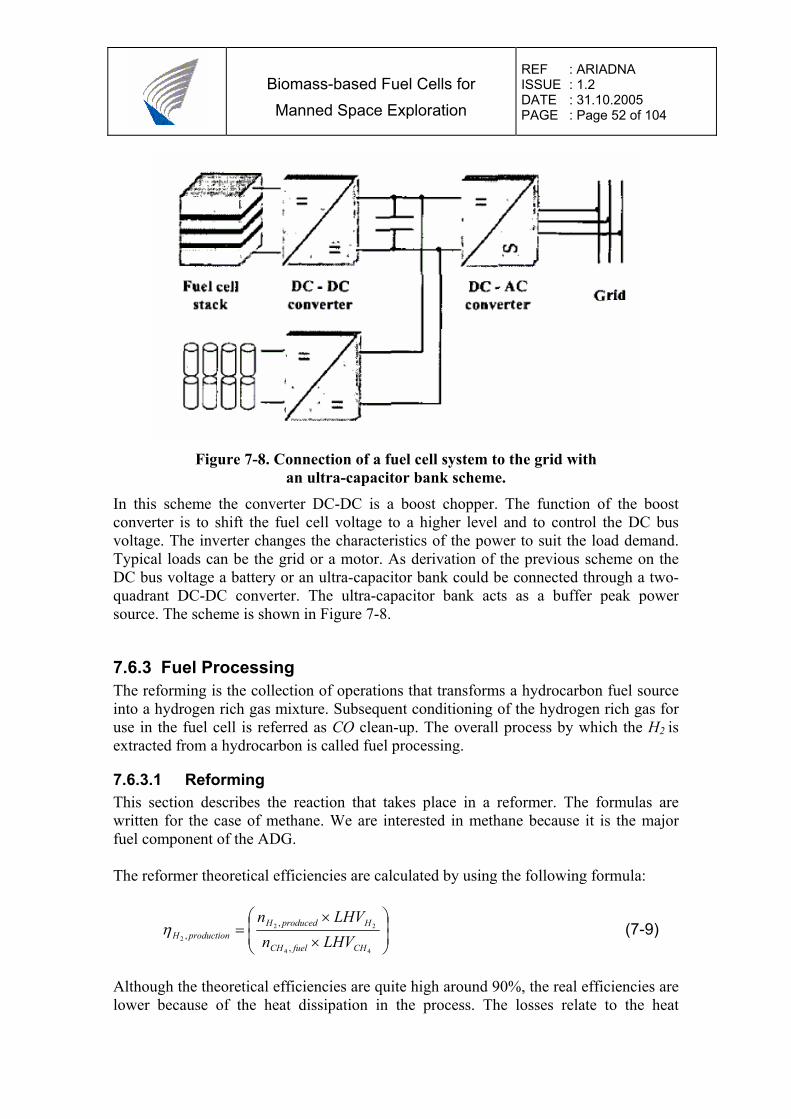
Biomass-based Fuel Cells for Manned Space Exploration
REF : ARIADNA ISSUE : 1.2 DATE : 31.10.2005 PAGE : Page 52 of 104
Figure 7-8. Connection of a fuel cell system to the grid with
an ultra-capacitor bank scheme. In this scheme the converter DC-DC is a boost chopper. The function of the boost converter is to shift the fuel cell voltage to a higher level and to control the DC bus voltage. The inverter changes the characteristics of the power to suit the load demand. Typical loads can be the grid or a motor. As derivation of the previous scheme on the DC bus voltage a battery or an ultra-capacitor bank could be connected through a two-quadrant DC-DC converter. The ultra-capacitor bank acts as a buffer peak power source. The scheme is shown in Figure 7-8.
7.6.3 Fuel Processing The reforming is the collection of operations that transforms a hydrocarbon fuel source into a hydrogen rich gas mixture. Subsequent conditioning of the hydrogen rich gas for use in the fuel cell is referred as CO clean-up. The overall process by which the H2 is extracted from a hydrocarbon is called fuel processing.
7.6.3.1 Reforming This section describes the reaction that takes place in a reformer. The formulas are written for the case of methane. We are interested in methane because it is the major fuel component of the ADG. The reformer theoretical efficiencies are calculated by using the following formula:
⎟⎟⎠
⎞⎜⎜⎝
⎛
×
×=
44
22
2,
,,
CHfuelCH
HproducedHproductionH LHVn
LHVnη (7-9)
Although the theoretical efficiencies are quite high around 90%, the real efficiencies are lower because of the heat dissipation in the process. The losses relate to the heat
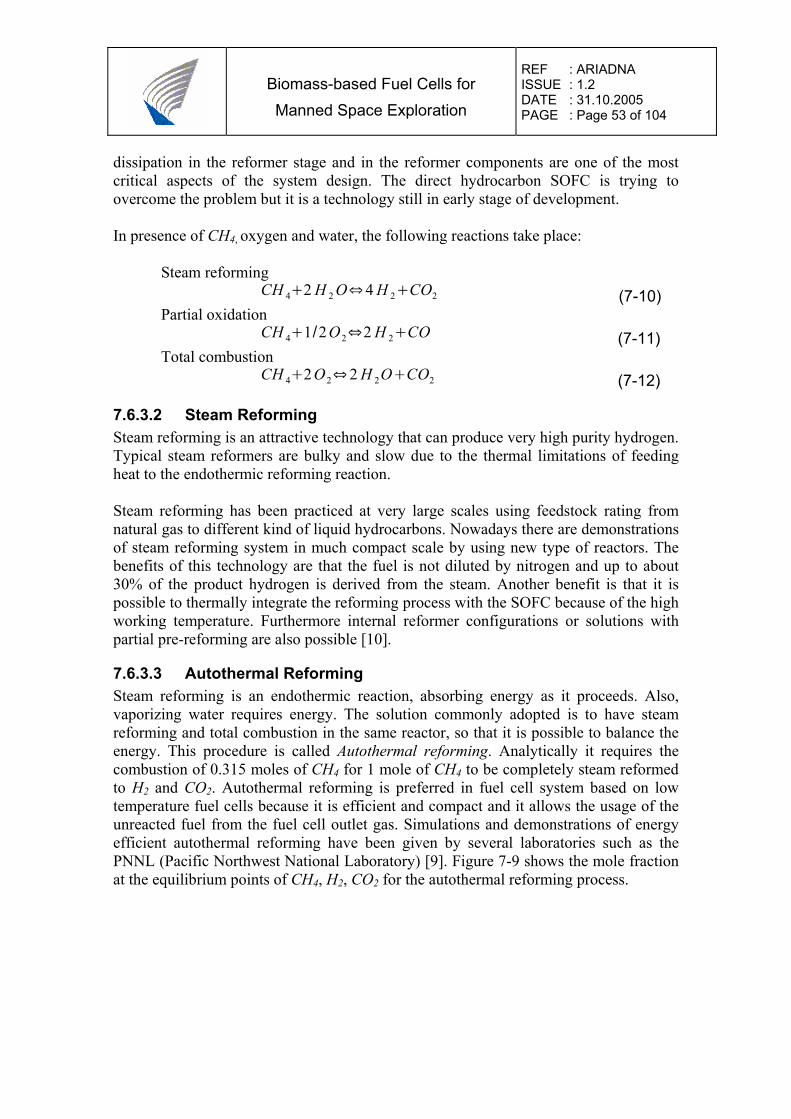
Biomass-based Fuel Cells for Manned Space Exploration
REF : ARIADNA ISSUE : 1.2 DATE : 31.10.2005 PAGE : Page 53 of 104
dissipation in the reformer stage and in the reformer components are one of the most critical aspects of the system design. The direct hydrocarbon SOFC is trying to overcome the problem but it is a technology still in early stage of development. In presence of CH4, oxygen and water, the following reactions take place:
Steam reforming CH 4 2 H 2 O 4 H 2 CO2 (7-10)
Partial oxidation CH 4 1 2O2 2 H 2 CO (7-11)
Total combustion CH 4 2O2 2 H 2O CO2 (7-12)
7.6.3.2 Steam Reforming Steam reforming is an attractive technology that can produce very high purity hydrogen. Typical steam reformers are bulky and slow due to the thermal limitations of feeding heat to the endothermic reforming reaction. Steam reforming has been practiced at very large scales using feedstock rating from natural gas to different kind of liquid hydrocarbons. Nowadays there are demonstrations of steam reforming system in much compact scale by using new type of reactors. The benefits of this technology are that the fuel is not diluted by nitrogen and up to about 30% of the product hydrogen is derived from the steam. Another benefit is that it is possible to thermally integrate the reforming process with the SOFC because of the high working temperature. Furthermore internal reformer configurations or solutions with partial pre-reforming are also possible [10].
7.6.3.3 Autothermal Reforming Steam reforming is an endothermic reaction, absorbing energy as it proceeds. Also, vaporizing water requires energy. The solution commonly adopted is to have steam reforming and total combustion in the same reactor, so that it is possible to balance the energy. This procedure is called Autothermal reforming. Analytically it requires the combustion of 0.315 moles of CH4 for 1 mole of CH4 to be completely steam reformed to H2 and CO2. Autothermal reforming is preferred in fuel cell system based on low temperature fuel cells because it is efficient and compact and it allows the usage of the unreacted fuel from the fuel cell outlet gas. Simulations and demonstrations of energy efficient autothermal reforming have been given by several laboratories such as the PNNL (Pacific Northwest National Laboratory) [9]. Figure 7-9 shows the mole fraction at the equilibrium points of CH4, H2, CO2 for the autothermal reforming process.
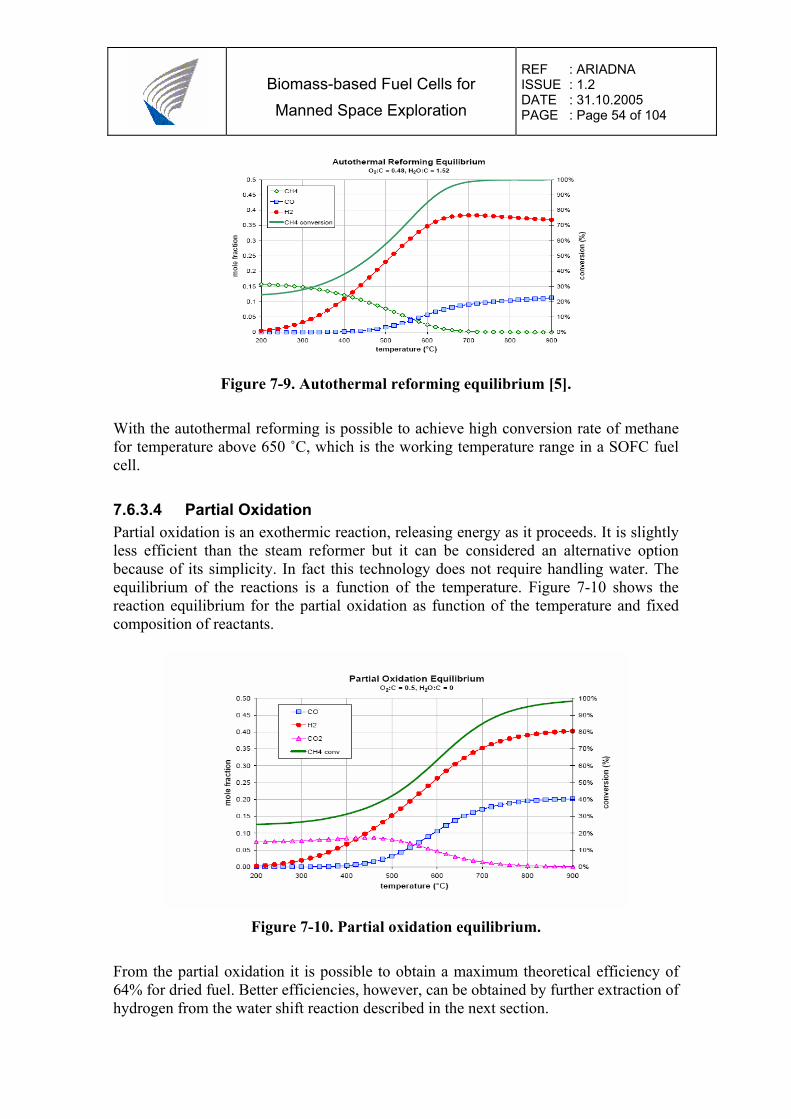
Biomass-based Fuel Cells for Manned Space Exploration
REF : ARIADNA ISSUE : 1.2 DATE : 31.10.2005 PAGE : Page 54 of 104
Figure 7-9. Autothermal reforming equilibrium [5].
With the autothermal reforming is possible to achieve high conversion rate of methane for temperature above 650 ˚C, which is the working temperature range in a SOFC fuel cell.
7.6.3.4 Partial Oxidation Partial oxidation is an exothermic reaction, releasing energy as it proceeds. It is slightly less efficient than the steam reformer but it can be considered an alternative option because of its simplicity. In fact this technology does not require handling water. The equilibrium of the reactions is a function of the temperature. Figure 7-10 shows the reaction equilibrium for the partial oxidation as function of the temperature and fixed composition of reactants.
Figure 7-10. Partial oxidation equilibrium.
From the partial oxidation it is possible to obtain a maximum theoretical efficiency of 64% for dried fuel. Better efficiencies, however, can be obtained by further extraction of hydrogen from the water shift reaction described in the next section.
Biomass-based Fuel Cells for Manned Space Exploration
REF : ARIADNA ISSUE : 1.2 DATE : 31.10.2005 PAGE : Page 55 of 104
Assuming that the entire CO reacts with water, the theoretical efficiency of the whole process would be about 90 %.
7.6.3.5 Water Gas Shift Reactor This is the first stage of the CO cleaning process that is necessary for the PEM system operation. The inlet of the water gas shift reactor is the effluent of the reforming unit. The water gas shift (WGS) reaction catalytically converts carbon monoxide in the presence of steam to produce carbon dioxide and hydrogen. This reaction is exothermic and thermodynamically in favor of lower temperatures (200-500 ºC). The equation of the WGS is given below.
222 HCOOHCO +=+ molkJSTPH r /1.41)( ⋅−=∆ (7-13)
Heat removal is needed to maintain isothermal operation here. The typical industrial operating temperature for the WGS reaction in a fixed-bed reactor ranges from 330 ºC to 530 ºC over a chrome and zinc promoted iron and copper oxide catalyst. The superficial contact time calculated on a wet-gas basis varies from 3 s to 9 s [11]. Conventional gas water shift processing technology based on fixed-bed reactors do not scale well with the small fuel cell application in which we are interested. In order to reduce the size of conventional WGS reactors, microchannel reactors have been developed. Microchannel reactors reduce heat and mass transport limitations for reactions. The reactors are made of small parallel flowpaths and the typical parameters are reported in the table 7-2 below.
Table 7-2. Specifications of partial oxidation reactor. Channel width 100-1000 µm Channel height to width ratio Between 1:1 to 100:1
The combination of high surface area per unit volume and high heat transfer coefficients allows microchannel reactors to achieve high reaction rates in tiny volumes. The reactors with thermal power densities in the 100 kW/liter can be used in the case.
7.6.3.6 Preferential Oxidation Usually preferential oxidation is the last stage of the fuel processing. It consists of feeding oxygen in the hydrogen rich gas, coming from the reformer, in a catalytic chamber. The CO in the hydrogen rich gas is oxidized to form CO2. This process must be selective because some H2 reacts also with the added oxygen. Therefore the partial oxidation is done at fixed temperature in presence of certain catalyst that helps to discriminate the reactivity of O2 in favor of CO over that H2.
Biomass-based Fuel Cells for Manned Space Exploration
REF : ARIADNA ISSUE : 1.2 DATE : 31.10.2005 PAGE : Page 56 of 104
7.6.3.7 Methanation Methanation is the inverse of the reforming reaction. In the preferential oxidation process it is used to remove CO from fuel by reacting CO and H2 to form CH4. The methanation can occur with either CO or CO2.
OHCHHCO 2423 +⇔+ (7-14) OHCHHCO 2422 24 +⇔+ (7-15)
In this case, H2 reacts with both CO (to be removed) and CO2 to reform methane. The reaction 7-15 is not welcomed here. Thus, a highly selective catalyst is necessary to achieve good efficiency.
7.6.3.8 Desulphurization Hydrogen sulphide (H2S) is commonly found in the biogases in concentration that can be poisonous for the fuel cells. The tolerance of PEMFC and SOFC to H2S is as low as only 1 ppm. Hydrogen sulphide is produced by sulphate reducing bacteria present in the bacteria consortium. It can cause corrosion of reactor’s parts and pipelines and it acts as a strong poison for fuel cells and reformers catalysts. In standard anaerobic digestion plants most of the hydrogen sulphide can be removed with iron and heavy metal salts to form insoluble sulphides, or with activated carbon filters. However, traces of hydrogen sulphide remain in the biogas [1]. An alternative technique used to remove H2S from the reformed gases is to let it react with ZnO to form ZnS: H2S+ZnO<->ZnS+H2O. This reaction has the equilibrium concentration of H2S less than 1 ppm. However, the situation in this project is much simpler than mentioned above. According to the early study (Chapter 5), human urine is the main source for the sulphide. Except for the urine, the sulphide concentration in the biodegradable waste is very low. The maximum amount of hydrogen sulphide in the biogas is 3 ppm if all the sulfur related substance is converted into hydrogen sulphide in the anaerobic digestion process. It makes the removal of the sulphide less important.
7.6.4 Plant Support Equipment Plant support equipment includes all the equipment needed for a proper operation of the fuel cell system. Usually it is assumed that the support equipment drains a fixed amount of power. For a system bigger than some kW the losses from support equipment is usually neglected even though support equipment is always one of the key design factors. One of the tasks of the support equipment is to ensure system operation at the design temperature. The thermal management system uses pumps, water tanks and other components tin order to maintain the correct temperature. Supporting components are: sensors, controllers, pumps, atomizer, vaporizer, afterburners and safety equipments. A short description of those components is given below.
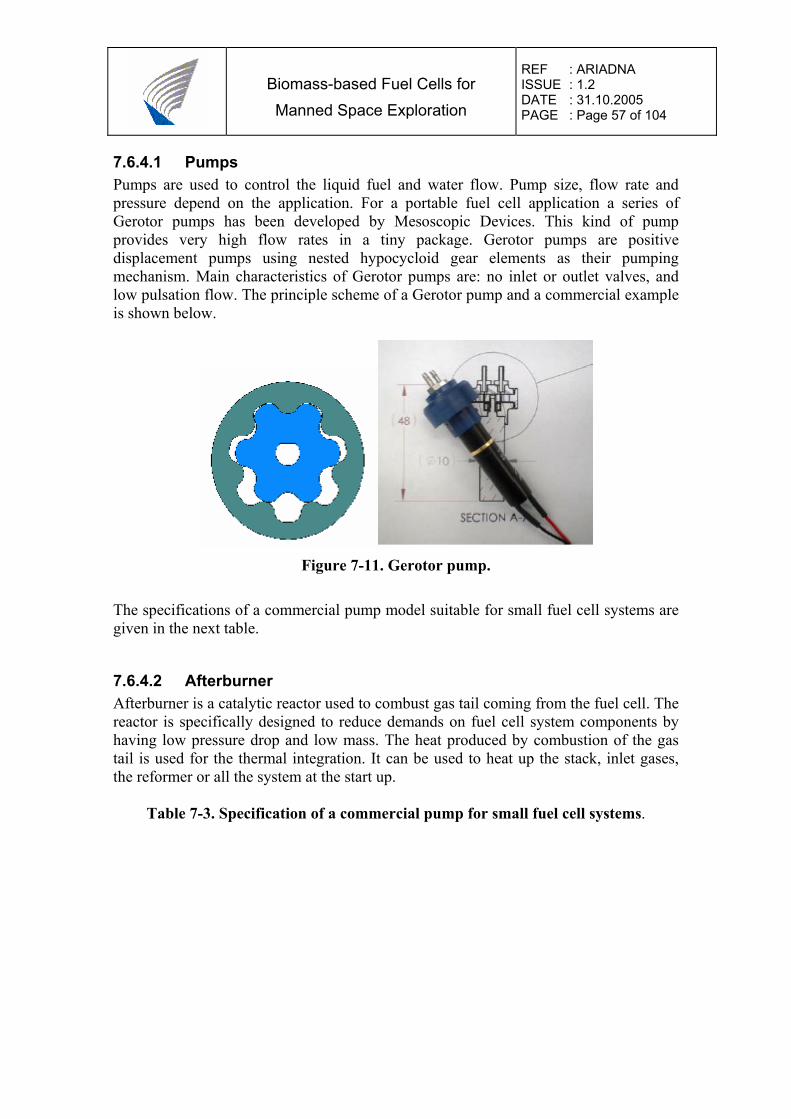
Biomass-based Fuel Cells for Manned Space Exploration
REF : ARIADNA ISSUE : 1.2 DATE : 31.10.2005 PAGE : Page 57 of 104
7.6.4.1 Pumps Pumps are used to control the liquid fuel and water flow. Pump size, flow rate and pressure depend on the application. For a portable fuel cell application a series of Gerotor pumps has been developed by Mesoscopic Devices. This kind of pump provides very high flow rates in a tiny package. Gerotor pumps are positive displacement pumps using nested hypocycloid gear elements as their pumping mechanism. Main characteristics of Gerotor pumps are: no inlet or outlet valves, and low pulsation flow. The principle scheme of a Gerotor pump and a commercial example is shown below.
Figure 7-11. Gerotor pump.
The specifications of a commercial pump model suitable for small fuel cell systems are given in the next table.
7.6.4.2 Afterburner Afterburner is a catalytic reactor used to combust gas tail coming from the fuel cell. The reactor is specifically designed to reduce demands on fuel cell system components by having low pressure drop and low mass. The heat produced by combustion of the gas tail is used for the thermal integration. It can be used to heat up the stack, inlet gases, the reformer or all the system at the start up.
Table 7-3. Specification of a commercial pump for small fuel cell systems.
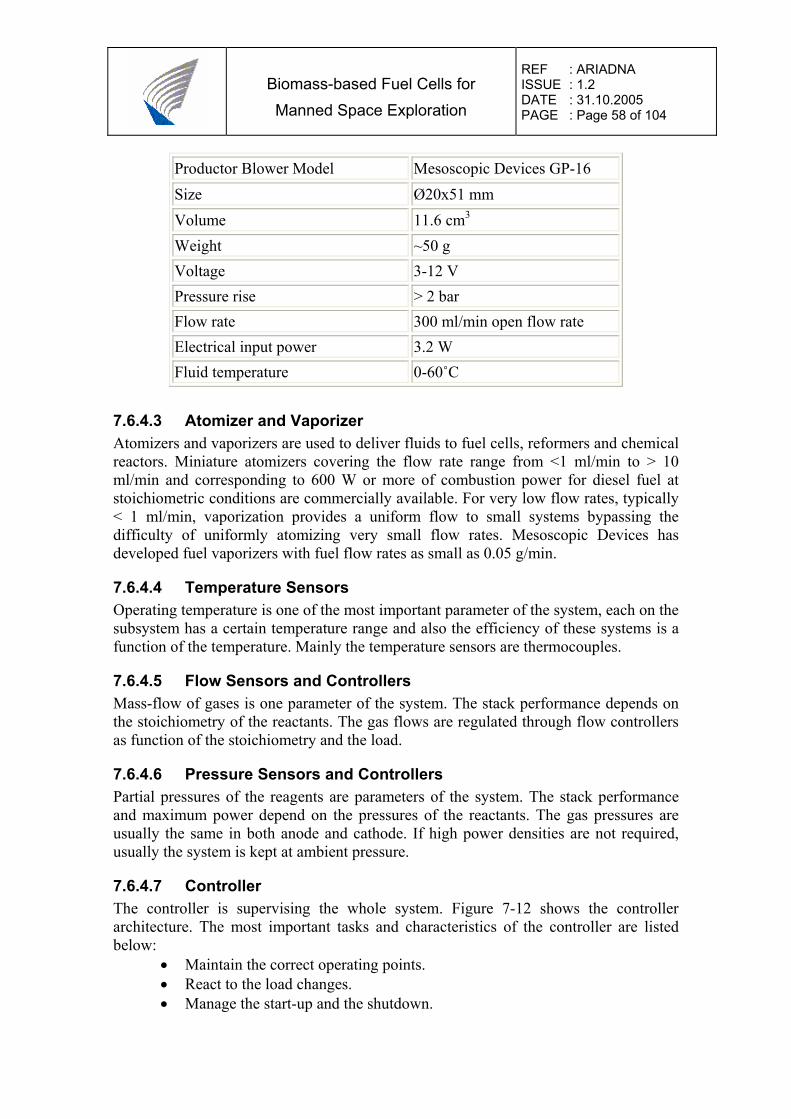
Biomass-based Fuel Cells for Manned Space Exploration
REF : ARIADNA ISSUE : 1.2 DATE : 31.10.2005 PAGE : Page 58 of 104
7.6.4.3 Atomizer and Vaporizer Atomizers and vaporizers are used to deliver fluids to fuel cells, reformers and chemical reactors. Miniature atomizers covering the flow rate range from <1 ml/min to > 10 ml/min and corresponding to 600 W or more of combustion power for diesel fuel at stoichiometric conditions are commercially available. For very low flow rates, typically < 1 ml/min, vaporization provides a uniform flow to small systems bypassing the difficulty of uniformly atomizing very small flow rates. Mesoscopic Devices has developed fuel vaporizers with fuel flow rates as small as 0.05 g/min.
7.6.4.4 Temperature Sensors Operating temperature is one of the most important parameter of the system, each on the subsystem has a certain temperature range and also the efficiency of these systems is a function of the temperature. Mainly the temperature sensors are thermocouples.
7.6.4.5 Flow Sensors and Controllers Mass-flow of gases is one parameter of the system. The stack performance depends on the stoichiometry of the reactants. The gas flows are regulated through flow controllers as function of the stoichiometry and the load.
7.6.4.6 Pressure Sensors and Controllers Partial pressures of the reagents are parameters of the system. The stack performance and maximum power depend on the pressures of the reactants. The gas pressures are usually the same in both anode and cathode. If high power densities are not required, usually the system is kept at ambient pressure.
7.6.4.7 Controller The controller is supervising the whole system. Figure 7-12 shows the controller architecture. The most important tasks and characteristics of the controller are listed below:
• Maintain the correct operating points. • React to the load changes. • Manage the start-up and the shutdown.
Productor Blower Model Mesoscopic Devices GP-16 Size Ø20x51 mm Volume 11.6 cm3
Weight ~50 g Voltage 3-12 V Pressure rise > 2 bar Flow rate 300 ml/min open flow rate Electrical input power 3.2 W Fluid temperature 0-60˚C
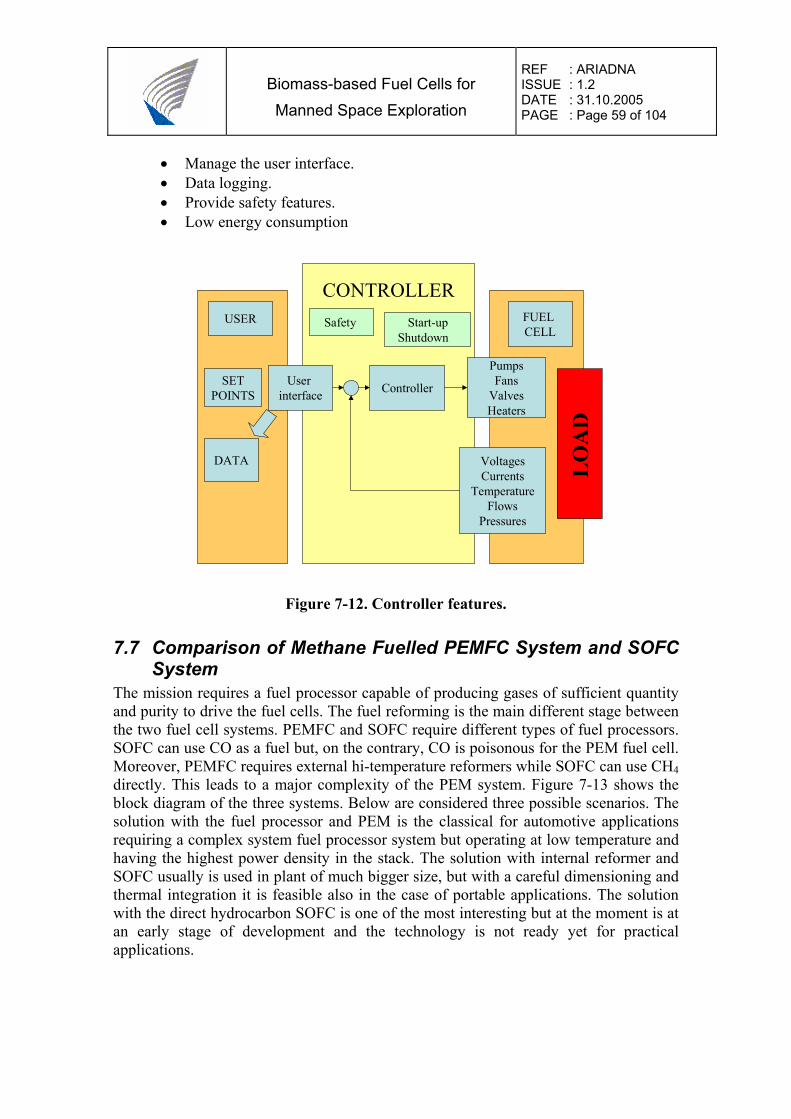
Biomass-based Fuel Cells for Manned Space Exploration
REF : ARIADNA ISSUE : 1.2 DATE : 31.10.2005 PAGE : Page 59 of 104
• Manage the user interface. • Data logging. • Provide safety features. • Low energy consumption
CONTROLLER
Controller
USER
SETPOINTS
FUEL CELL
PumpsFans
ValvesHeaters
VoltagesCurrents
TemperatureFlows
Pressures
User interface
DATA
Safety Start-upShutdown
LO
AD
Figure 7-12. Controller features.
7.7 Comparison of Methane Fuelled PEMFC System and SOFC System
The mission requires a fuel processor capable of producing gases of sufficient quantity and purity to drive the fuel cells. The fuel reforming is the main different stage between the two fuel cell systems. PEMFC and SOFC require different types of fuel processors. SOFC can use CO as a fuel but, on the contrary, CO is poisonous for the PEM fuel cell. Moreover, PEMFC requires external hi-temperature reformers while SOFC can use CH4 directly. This leads to a major complexity of the PEM system. Figure 7-13 shows the block diagram of the three systems. Below are considered three possible scenarios. The solution with the fuel processor and PEM is the classical for automotive applications requiring a complex system fuel processor system but operating at low temperature and having the highest power density in the stack. The solution with internal reformer and SOFC usually is used in plant of much bigger size, but with a careful dimensioning and thermal integration it is feasible also in the case of portable applications. The solution with the direct hydrocarbon SOFC is one of the most interesting but at the moment is at an early stage of development and the technology is not ready yet for practical applications.
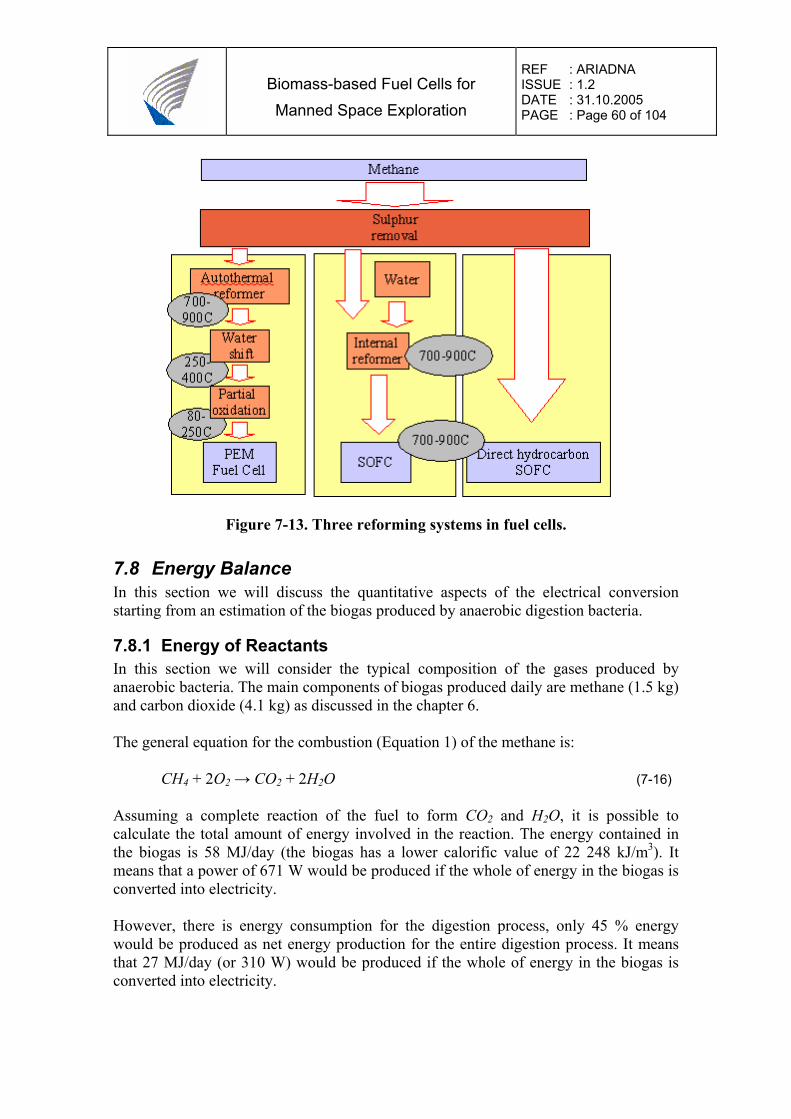
Biomass-based Fuel Cells for Manned Space Exploration
REF : ARIADNA ISSUE : 1.2 DATE : 31.10.2005 PAGE : Page 60 of 104
Figure 7-13. Three reforming systems in fuel cells.
7.8 Energy Balance In this section we will discuss the quantitative aspects of the electrical conversion starting from an estimation of the biogas produced by anaerobic digestion bacteria.
7.8.1 Energy of Reactants In this section we will consider the typical composition of the gases produced by anaerobic bacteria. The main components of biogas produced daily are methane (1.5 kg) and carbon dioxide (4.1 kg) as discussed in the chapter 6. The general equation for the combustion (Equation 1) of the methane is:
CH4 + 2O2 → CO2 + 2H2O (7-16) Assuming a complete reaction of the fuel to form CO2 and H2O, it is possible to calculate the total amount of energy involved in the reaction. The energy contained in the biogas is 58 MJ/day (the biogas has a lower calorific value of 22 248 kJ/m3). It means that a power of 671 W would be produced if the whole of energy in the biogas is converted into electricity. However, there is energy consumption for the digestion process, only 45 % energy would be produced as net energy production for the entire digestion process. It means that 27 MJ/day (or 310 W) would be produced if the whole of energy in the biogas is converted into electricity.
Biomass-based Fuel Cells for Manned Space Exploration
REF : ARIADNA ISSUE : 1.2 DATE : 31.10.2005 PAGE : Page 61 of 104
7.9 System Efficiency The fuel cell system can be seen as a chain, where at each step there is a transformation and consequently there is efficiency connected with the transformation. Especially the production and transportation of hydrogen can cause considerable loss of energy before the hydrogen is converted in the fuel cell system. To determine the total system efficiency it is possible to use the following formula:
⎟⎟⎠
⎞⎜⎜⎝
⎛⎟⎟⎠
⎞⎜⎜⎝
⎛−×××=
systemFC
BOPHFCproductionHsysel Power
PowerUtil
,,, 1
22ηηη
(7-17) The efficiency of the system depends on:
• The efficiency of the stack (ηFC). For a fixed operating condition the stack efficiency is the ratio of the individual cell with the Nernst potential.
• The efficiency of the reformer-cleaning system (ηH2,production). The efficiency of the
reformer is defined by the following formula:
⎟⎟⎠
⎞⎜⎜⎝
⎛
×
×=
44
22
2,
,,
CHfuelCH
HproducedHproductionH LHVn
LHVnη [5] (7-18)
Where in
is the moles of species i, and LHVi is the lower heating value of species i [12]. • The fuel utilization (UtilH2). Typical fuel utilization ratio is 0.8 [1 and 4]. • Power consumed by the plant support equipment. In this application the plant
support equipment include the fuel cell reactant supply, the control system and the sensors. For a similar application [4] the total power loss was found to be less than 15 W with an efficiency of:
%831,
=⎟⎟⎠
⎞⎜⎜⎝
⎛⎟⎟⎠
⎞⎜⎜⎝
⎛−=
systemFC
BOPBOP Power
Powerη
(7-19) As notable examples we report the efficiencies of 28% for a 75W portable SOFC generator, with 80% fuel utilization ratio [4] and 38.2% electrical efficiency for a 3.4 kW SOFC system operating by anaerobic digestion gas [1]. Electrical systems efficiencies are evaluated for the three different scenarios.
1. PEM electrical efficiency. For PEM systems the autothermal reforming has been demonstrated by the PNNL [8].
28.083.054.064.0, =××=syselη
(7-20)
Biomass-based Fuel Cells for Manned Space Exploration
REF : ARIADNA ISSUE : 1.2 DATE : 31.10.2005 PAGE : Page 62 of 104
Efficiency is calculated assuming that hydrogen and methane in the fuel cell waste anode are combusted to provide heat for the system. For PEM system this is the only possible thermal integration.
2. SOFC electrical efficiency.
⎟⎟⎠
⎞⎜⎜⎝
⎛⎟⎟⎠
⎞⎜⎜⎝
⎛−×××=
systemFC
BOPHFCproductionHsysel Power
PowerUtil
,,, 1
22ηηη
(7-21)
In SOFC systems it is also possible to recover the heat produced by the stack losses to heat the reformer, allowing higher reforming performances.
38.083.055.085.0, =××=syselη
(7-22)
3. Direct hydrocarbon SOFC electrical efficiency. In direct hydrocarbon SOFC systems there is no reformer
25.083.030.0, =×=syselη
(7-23)
7.10 Heat Management The heat management is reviewed with consideration to the current application. For a small SOFC operating at high fuel utilization very tight thermal integration is critical to obtain thermally self-sustaining operation. With 75% fuel utilization in the stack only a small amount of heat is available to maintain stack temperature. Heat is produced in the stack due the losses in the membrane. Combustion of unutilized fuel, treatment of exhaust gases and use of exothermic reactions are necessary to compensate the heat losses from the system which take place through the insulation and through ineffective recuperation. Ineffective recuperation losses are due to finite effectiveness in the recuperators that preheat gases for the stack
7.10.1 Exhaust Gas Treatment Exhaust gas treatment is necessary for both PEM and SOFC systems to improve the overall efficiency. In the picture below is shown a heat exchanger used to recuperate heat from the cathode exhaust stream sized for a 20 W application in Mesoscopic Devices Ltd. The heat exchanger is designed to operate at a 750 ºC hot end inlet temperature, exchange 29W at 74% effectiveness and show a pressure drop of 0.7 kPa. The heat exchanger is made from oxidation resistant alloys and weighs less than 9 g. In order to obtain this high power density extremely uniform channels with a height of 450 µm are used.
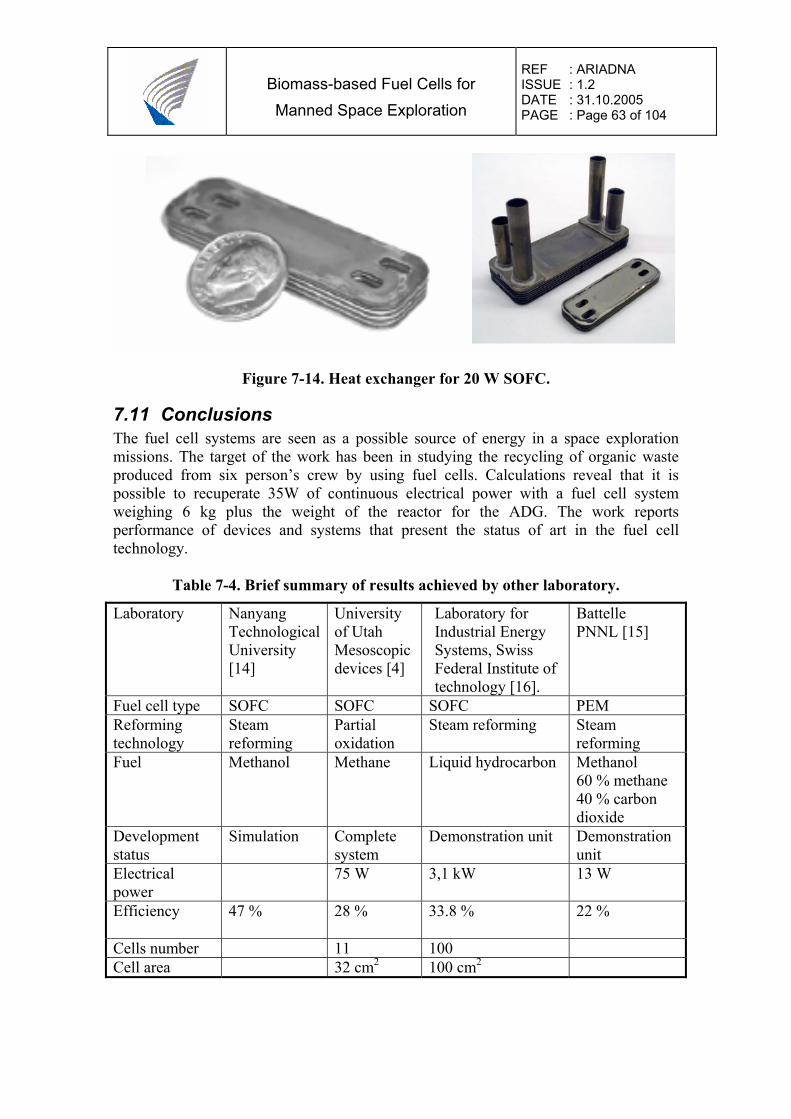
Biomass-based Fuel Cells for Manned Space Exploration
REF : ARIADNA ISSUE : 1.2 DATE : 31.10.2005 PAGE : Page 63 of 104
Figure 7-14. Heat exchanger for 20 W SOFC.
7.11 Conclusions The fuel cell systems are seen as a possible source of energy in a space exploration missions. The target of the work has been in studying the recycling of organic waste produced from six person’s crew by using fuel cells. Calculations reveal that it is possible to recuperate 35W of continuous electrical power with a fuel cell system weighing 6 kg plus the weight of the reactor for the ADG. The work reports performance of devices and systems that present the status of art in the fuel cell technology.
Table 7-4. Brief summary of results achieved by other laboratory.
Laboratory
Nanyang Technological University [14]
University of Utah Mesoscopic devices [4]
Laboratory for Industrial Energy Systems, Swiss Federal Institute of technology [16].
Battelle PNNL [15]
Fuel cell type SOFC SOFC SOFC PEM Reforming technology
Steam reforming
Partial oxidation
Steam reforming Steam reforming
Fuel Methanol Methane Liquid hydrocarbon Methanol 60 % methane 40 % carbon dioxide
Development status
Simulation Complete system
Demonstration unit Demonstration unit
Electrical power
75 W 3,1 kW 13 W
Efficiency
47 % 28 % 33.8 % 22 %
Cells number 11 100 Cell area 32 cm2 100 cm2
Biomass-based Fuel Cells for Manned Space Exploration
REF : ARIADNA ISSUE : 1.2 DATE : 31.10.2005 PAGE : Page 64 of 104
7.12 Reference Fuel Cell Systems Several stack modules and complete systems with power ranging from few watts to some mega-watt are currently being built and tested. As a reference we report the data achieved in existing systems or models that have a strict affinity with the system that could fulfill the requirements of the mission. In particular different technologies and sizes of those systems lead to a difficult comparison task.
7.13 References [1][Tiziana Pipoli,’ Feasibility of biomass-based fuels cells for manned space exploration’ Proc.’Seventh European Space Power Conference’, Stresa, Italy, May 2005] [2][James Zizelman, Steven Shaffer and Subhasish Mukerjee,”Solid Oxide Fuel Cell Auxiliary Power Unit- A Development Update”, SAE 2002]. [3][D.C. Dayton,June 2001, “Fuel cell integration- A Study of the impacts of gas quality and impurities”, Milestone completion report]. [4][J.L.Martin, A. Virkar, T. Armstrong,’ 75 W portable SOFC generator’] [5][James Sun, Johnson Matthey,’Hydrogen generation for PEM Fuel Cells’, September 2001, FUEL CELL TADAY] [6][Seungdoo Park, Radu Craciun, John M. Vohs, and Raymond J. Gorte,'Direct oxidation of hydrocarbons in a solid oxide fuel cell I. Methane oxidation', Journal of the electrochemical society 146 (10) 3603-3605 (1999)] [7][Steven Mc Intosh and Raymond J. Gorte, 'Direct Hydrocarbon Solid oxide fuel cells] [8] [ G.A.Whyatt, W.E.TeGrotenhuis, J.G.H.Geeting, J.M.Davis, R.S.Wegeng and L.R.Pederson, ‘Demonstration of energy efficient stream reforming in microchannels for automotivr fuel processing’, Pacific Northwest National Laboratory, USA,] [9][G.A.Whyatt, W.E.TeGrotenhuis, J.G.H.Geeting, J.M.Davis,R.S.Wegeng, L.R.Pederson, ‘Demonstration of energy efficient stream reforming in microchannels for automotive fuel processing’, Pacific Northwest National Laboratory, USA] [10] [J.Meusinger, E. Riensche, U. Stimming, ‘ Reforming of natural gas in solid oxide fuel cell systems, Journal of power sources 71, (1988) 315-320] [11] [A.Y. Tonkovich, J.L.Zilka, M.J:LaMont, Y.Wang and R.S.Wegeng, ‘ Microchannel reactors for fuel processing application. I. Water gas shift reactor’, Chemical engineering science 54 (1999) 2947-2951]
Biomass-based Fuel Cells for Manned Space Exploration
REF : ARIADNA ISSUE : 1.2 DATE : 31.10.2005 PAGE : Page 65 of 104
[12][Frank de Bruijn, 'The current status of fuel cell technology for mobile and stationary applications', Green chemistry, 2005,7,132-150] [13] [Matias Halinen, ‘Development and Control of a 5 kW Solid Oxide Fuel Cell Demonstration Unit’, Master’s thesis, 10.1.2005] [14] [S.h: Chang, O.L.Ding,’ Simulation of a solid oxide fuel cell power system fed by methane, Journal of hydrogen energy 30 (2005) 167-179] [15] [D.R.Palo, J.D.Holladay, R.T.Rozmiarek, C.E.Guzman-Leong, Y. Wang, J.Hu, Y.-H. Ching, R.A. Dagle, E. G. Baker, ‘Fuel processor development for a soldier portables fuel cell system’ ] [16] [Jan Van herle, F. Maréchal, S. Leuenberger, D. Favrat, ‘Energy balance model of a SOFC cogenerator operated with biogas’, Journal of power sources 118(2003) 375-383]
Biomass-based Fuel Cells for Manned Space Exploration
REF : ARIADNA ISSUE : 1.2 DATE : 31.10.2005 PAGE : Page 66 of 104
8 Biological Fuel Cell
Biological fuel cell is using microorganism(s) or enzyme(s) as catalyst(s) rather than expensive metal in the conventional chemical fuel cell. Microbial fuel cell (MFCs) is a type of the biological fuel cell, which represents a completely new method of renewable energy recovery: the direct conversion of organic matter to electricity using bacteria or other microorganisms. It is not science fiction. It has been known for many years that bacteria could be used to generate electricity. The enzymatic fuel cell is another type of the biological fuel cell, which is using enzyme(s) as catalyst. Due to the specific feature of enzyme, an enzyme can be catalyst only for a certain substrate, for instance, alcohol dehydrogenase only catalyzes the converting reaction from alcohol into aldehyde and further to acid. The enzyme is not able to catalyze any other substrate but alcohol. Hence, only microorganism fuel cell will be discussed in detail.
As well known, the current density in the biological fuel cells is usually quite lower comparing to one in the conventional fuel cells. It is because the electron transfer from bacteria to anode electrode is a slow process and also the reaction is carried out in the lower temperature. In order to accelerate the electron transfer or increase the current density from the fuel cell, a mediator is usually needed to promote the electron transfer between bacteria and electrode as an electron shuttle. There are many studies published concerning about the mediator-aid biological fuel cell. In our laboratory, we have studied bacterial fuel cell and enzyme fuel cell with the help of mediators, which will be discussed late in the report. However, the mediator is usually a toxic and expensive chemical, which limit its application of microbial fuel cell in the waste water treatment for electricity.
Fortunately, many bacteria were found to have strong ability to deliver electron from bacteria to anode electrode. These bacteria are able to produce enough electricity using any biodegradable material including waste water without help of any special chemicals as mediator. These bacteria include some metal-reducing bacteria, such as Rhodoferax species (for instance Shewanella putrefacians) and Geobacter (for instance Geobacter metallireducens). They reduce Fe(III) to Fe(II)], which can be oxidized at the surface of anode to make electricity. There are many other bacteria already present in wastewater that can do this [1, 2].
There is another type of bacteria that convert bio-substrate into hydrogen gas, which is a common fuel for any conventional fuel cells. The bacterium is Clostridium acetobutylicum. Combined the bioprocess to certain fuel cell process, an indirect biological fuel cell system is set up.
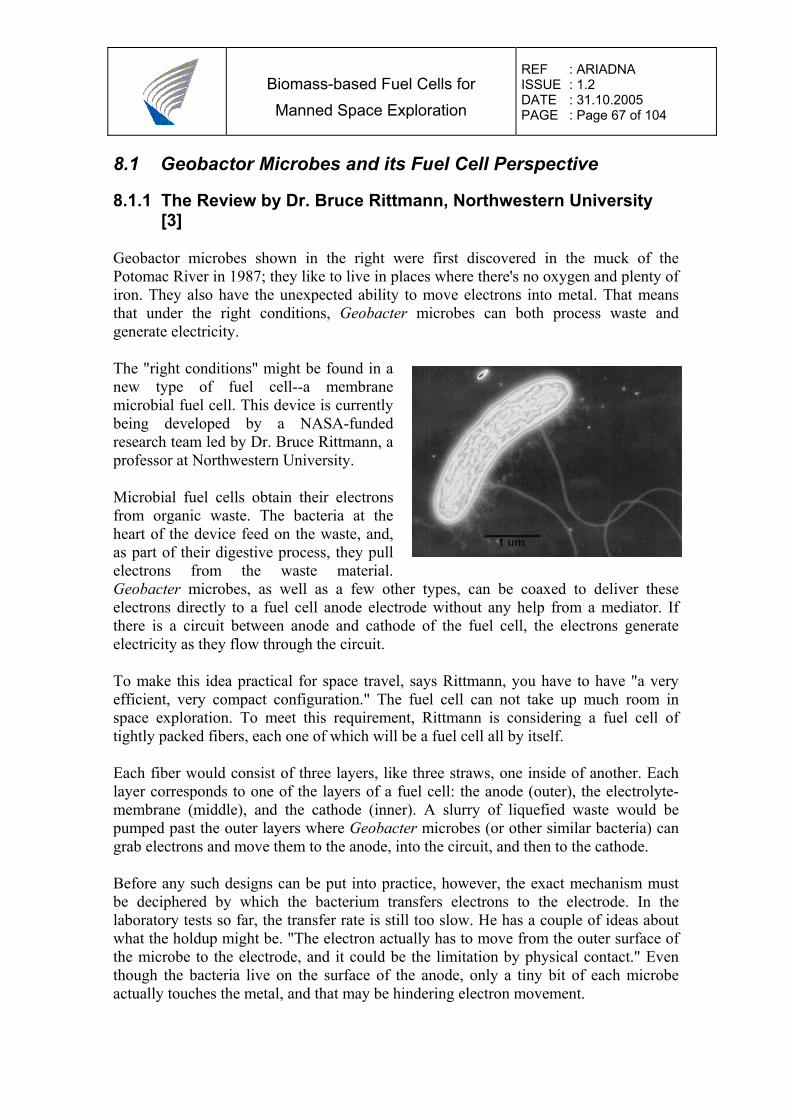
Biomass-based Fuel Cells for Manned Space Exploration
REF : ARIADNA ISSUE : 1.2 DATE : 31.10.2005 PAGE : Page 67 of 104
8.1 Geobactor Microbes and its Fuel Cell Perspective
8.1.1 The Review by Dr. Bruce Rittmann, Northwestern University [3]
Geobactor microbes shown in the right were first discovered in the muck of the Potomac River in 1987; they like to live in places where there's no oxygen and plenty of iron. They also have the unexpected ability to move electrons into metal. That means that under the right conditions, Geobacter microbes can both process waste and generate electricity.
The "right conditions" might be found in a new type of fuel cell--a membrane microbial fuel cell. This device is currently being developed by a NASA-funded research team led by Dr. Bruce Rittmann, a professor at Northwestern University.
Microbial fuel cells obtain their electrons from organic waste. The bacteria at the heart of the device feed on the waste, and, as part of their digestive process, they pull electrons from the waste material. Geobacter microbes, as well as a few other types, can be coaxed to deliver these electrons directly to a fuel cell anode electrode without any help from a mediator. If there is a circuit between anode and cathode of the fuel cell, the electrons generate electricity as they flow through the circuit.
To make this idea practical for space travel, says Rittmann, you have to have "a very efficient, very compact configuration." The fuel cell can not take up much room in space exploration. To meet this requirement, Rittmann is considering a fuel cell of tightly packed fibers, each one of which will be a fuel cell all by itself.
Each fiber would consist of three layers, like three straws, one inside of another. Each layer corresponds to one of the layers of a fuel cell: the anode (outer), the electrolyte-membrane (middle), and the cathode (inner). A slurry of liquefied waste would be pumped past the outer layers where Geobacter microbes (or other similar bacteria) can grab electrons and move them to the anode, into the circuit, and then to the cathode.
Before any such designs can be put into practice, however, the exact mechanism must be deciphered by which the bacterium transfers electrons to the electrode. In the laboratory tests so far, the transfer rate is still too slow. He has a couple of ideas about what the holdup might be. "The electron actually has to move from the outer surface of the microbe to the electrode, and it could be the limitation by physical contact." Even though the bacteria live on the surface of the anode, only a tiny bit of each microbe actually touches the metal, and that may be hindering electron movement.
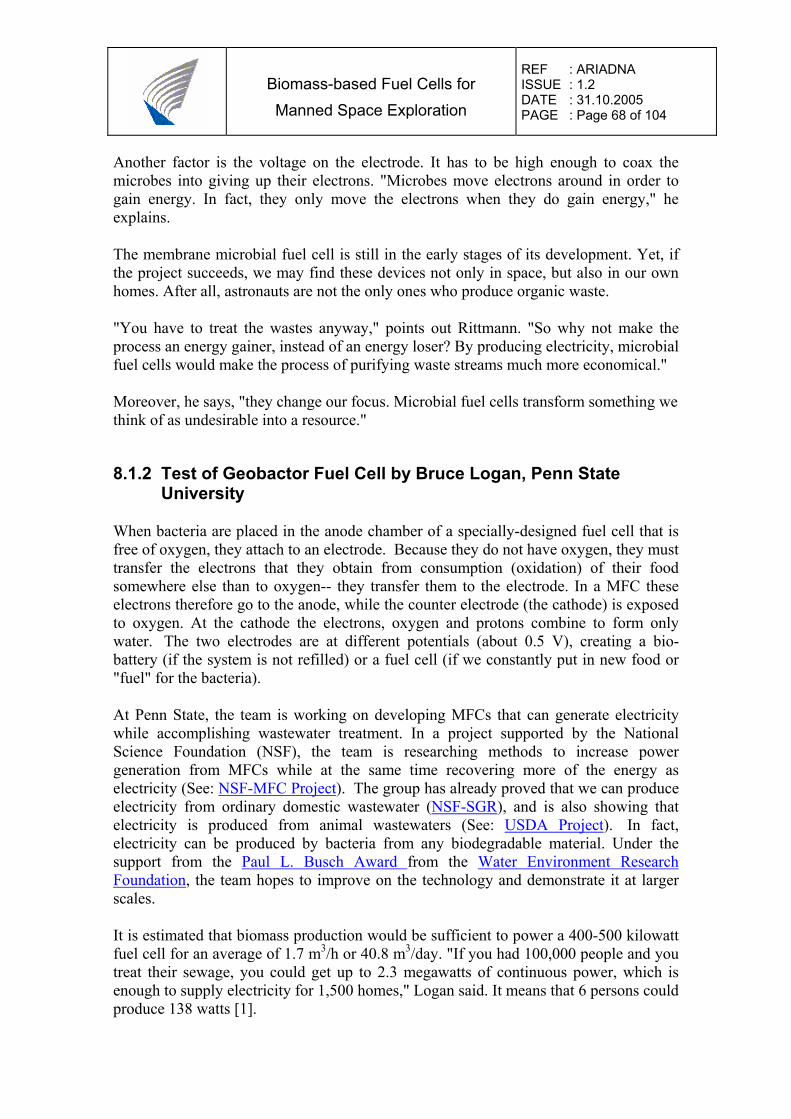
Biomass-based Fuel Cells for Manned Space Exploration
REF : ARIADNA ISSUE : 1.2 DATE : 31.10.2005 PAGE : Page 68 of 104
Another factor is the voltage on the electrode. It has to be high enough to coax the microbes into giving up their electrons. "Microbes move electrons around in order to gain energy. In fact, they only move the electrons when they do gain energy," he explains.
The membrane microbial fuel cell is still in the early stages of its development. Yet, if the project succeeds, we may find these devices not only in space, but also in our own homes. After all, astronauts are not the only ones who produce organic waste.
"You have to treat the wastes anyway," points out Rittmann. "So why not make the process an energy gainer, instead of an energy loser? By producing electricity, microbial fuel cells would make the process of purifying waste streams much more economical."
Moreover, he says, "they change our focus. Microbial fuel cells transform something we think of as undesirable into a resource."
8.1.2 Test of Geobactor Fuel Cell by Bruce Logan, Penn State University
When bacteria are placed in the anode chamber of a specially-designed fuel cell that is free of oxygen, they attach to an electrode. Because they do not have oxygen, they must transfer the electrons that they obtain from consumption (oxidation) of their food somewhere else than to oxygen-- they transfer them to the electrode. In a MFC these electrons therefore go to the anode, while the counter electrode (the cathode) is exposed to oxygen. At the cathode the electrons, oxygen and protons combine to form only water. The two electrodes are at different potentials (about 0.5 V), creating a bio-battery (if the system is not refilled) or a fuel cell (if we constantly put in new food or "fuel" for the bacteria).
At Penn State, the team is working on developing MFCs that can generate electricity while accomplishing wastewater treatment. In a project supported by the National Science Foundation (NSF), the team is researching methods to increase power generation from MFCs while at the same time recovering more of the energy as electricity (See: NSF-MFC Project). The group has already proved that we can produce electricity from ordinary domestic wastewater (NSF-SGR), and is also showing that electricity is produced from animal wastewaters (See: USDA Project). In fact, electricity can be produced by bacteria from any biodegradable material. Under the support from the Paul L. Busch Award from the Water Environment Research Foundation, the team hopes to improve on the technology and demonstrate it at larger scales.
It is estimated that biomass production would be sufficient to power a 400-500 kilowatt fuel cell for an average of 1.7 m3/h or 40.8 m3/day. "If you had 100,000 people and you treat their sewage, you could get up to 2.3 megawatts of continuous power, which is enough to supply electricity for 1,500 homes," Logan said. It means that 6 persons could produce 138 watts [1].
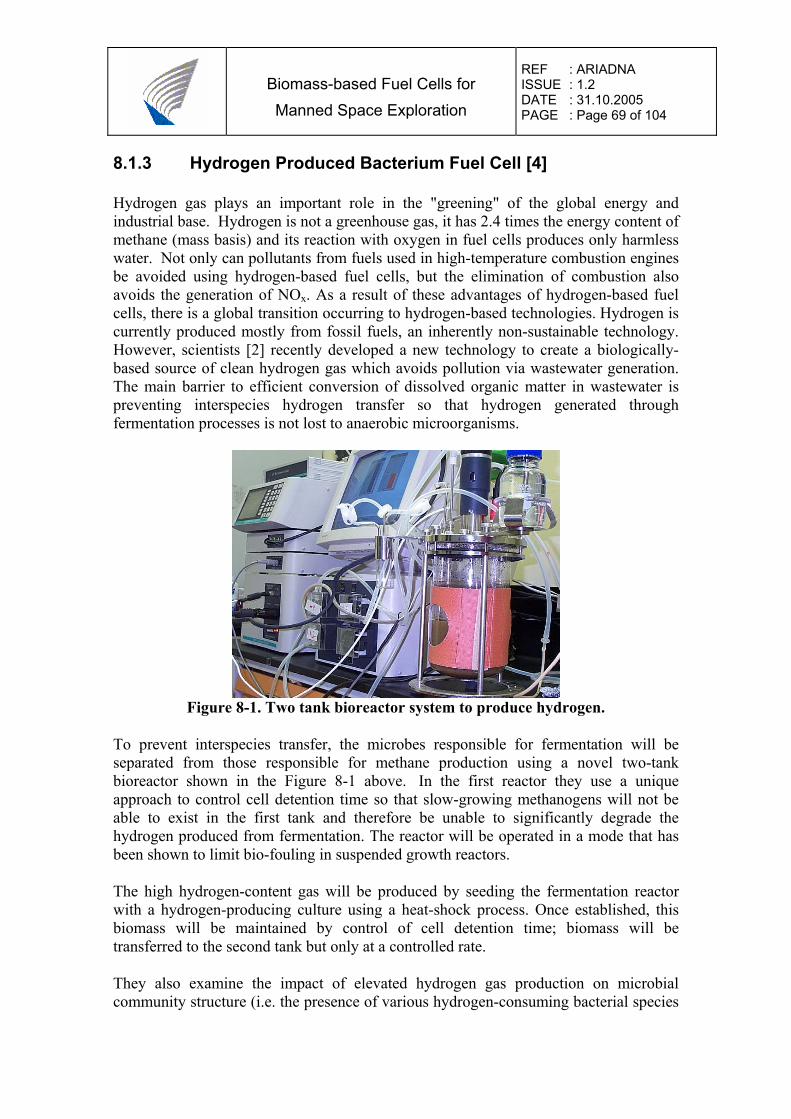
Biomass-based Fuel Cells for Manned Space Exploration
REF : ARIADNA ISSUE : 1.2 DATE : 31.10.2005 PAGE : Page 69 of 104
8.1.3 Hydrogen Produced Bacterium Fuel Cell [4] Hydrogen gas plays an important role in the "greening" of the global energy and industrial base. Hydrogen is not a greenhouse gas, it has 2.4 times the energy content of methane (mass basis) and its reaction with oxygen in fuel cells produces only harmless water. Not only can pollutants from fuels used in high-temperature combustion engines be avoided using hydrogen-based fuel cells, but the elimination of combustion also avoids the generation of NOx. As a result of these advantages of hydrogen-based fuel cells, there is a global transition occurring to hydrogen-based technologies. Hydrogen is currently produced mostly from fossil fuels, an inherently non-sustainable technology. However, scientists [2] recently developed a new technology to create a biologically-based source of clean hydrogen gas which avoids pollution via wastewater generation. The main barrier to efficient conversion of dissolved organic matter in wastewater is preventing interspecies hydrogen transfer so that hydrogen generated through fermentation processes is not lost to anaerobic microorganisms.
Figure 8-1. Two tank bioreactor system to produce hydrogen.
To prevent interspecies transfer, the microbes responsible for fermentation will be separated from those responsible for methane production using a novel two-tank bioreactor shown in the Figure 8-1 above. In the first reactor they use a unique approach to control cell detention time so that slow-growing methanogens will not be able to exist in the first tank and therefore be unable to significantly degrade the hydrogen produced from fermentation. The reactor will be operated in a mode that has been shown to limit bio-fouling in suspended growth reactors.
The high hydrogen-content gas will be produced by seeding the fermentation reactor with a hydrogen-producing culture using a heat-shock process. Once established, this biomass will be maintained by control of cell detention time; biomass will be transferred to the second tank but only at a controlled rate.
They also examine the impact of elevated hydrogen gas production on microbial community structure (i.e. the presence of various hydrogen-consuming bacterial species
Biomass-based Fuel Cells for Manned Space Exploration
REF : ARIADNA ISSUE : 1.2 DATE : 31.10.2005 PAGE : Page 70 of 104
in the reactor). To examine these ecological responses, they will examine shifts in microbial community structure using 16S rDNA analysis.
The three specific tasks that will be accomplished in this project are therefore:
• Examination of maximum hydrogen production versus thermodynamic predictions, using batch and continuous flow reactors;
• Construction and testing of a novel bioreactor for hydrogen production (fermentation step only);
• Community profiling of the microorganisms in the hydrogen-producing bioreactor.
8.1.4 Genetic Engineering of Clostridium acetobutylicum for Enhanced Production of Hydrogen Gas [5].
Hydrogen is currently produced primarily from fossil fuels via non-sustainable technologies such as steam reforming processes. Biological hydrogen production is possible by two routes: photosynthetic (using algae and photosynthetic bacteria) and fermentative. Fermentative hydrogen production can be accomplished by hydrogen-producing bacteria, such as various Clostridium spp. Fermentative H2 production bacteria has advantages compared to photosynthetic routes that include: continuous (versus only during daylight) hydrogen production; capability to convert a variety of carbon sources; and the ability to recover energy from waste materials produced from agriculture and industry. Large-scale hydrogen production from photo/solar-based technologies will not be feasible due to land and water requirements for growing algae. In contrast, the infrastructure already exists for a fermentative-based industry with biomass-based substrates.
It has been shown that it is possible to produce a high hydrogen-content gas (50 to 75%) from the fermentation of simple sugars, but the efficiency (overall conversion rate) of biomass materials is only ~50% and needs to be increased. In the project Clostridium acetobutylicum will be modified genetically in order to increase the efficiency of biohydrogen production.
8.1.5 Microbial Fuel Cell: High Yield Hydrogen Source and Wastewater Cleaner
Using a new electrically-assisted microbial fuel cell (MFC) that does not require oxygen, Penn State environmental engineers and a scientist at Ion Power Inc. have developed the first process that enables bacteria to coax four times as much hydrogen directly out of biomass than can be generated typically by fermentation alone.
Dr. Bruce Logan, the Kappe professor of environmental engineering and an inventor of the MFC, says, "This MFC process is not limited to using only carbohydrate-based biomass for hydrogen production like conventional fermentation processes. It is theoretically said that the MFC can obtain high yields of hydrogen from any
Biomass-based Fuel Cells for Manned Space Exploration
REF : ARIADNA ISSUE : 1.2 DATE : 31.10.2005 PAGE : Page 71 of 104
biodegradable, dissolved, organic matter -- human, agricultural or industrial wastewater, for example -- and simultaneously clean the wastewater.
"While there is likely insufficient waste biomass to sustain a global hydrogen economy, this form of renewable energy production may help offset the substantial costs of wastewater treatment as well as provide a contribution to nations able to harness hydrogen as an energy source," Logan notes.
The new approach is described in a paper, "Electrochemically Assisted Microbial Production of Hydrogen from Acetate," released online currently and scheduled for a future issue of Environmental Science and Technology. The authors are Dr. Hong Liu, postdoctoral researcher in environmental engineering; Dr. Stephen Grot, president and founder of Ion Power, Inc.; and Logan. Grot, a former Penn State student, suggested the idea of modifying an MFC to generate hydrogen.
In the paper, the researchers explain that hydrogen production by bacterial fermentation is currently limited by the "fermentation barrier" -- the fact that bacteria, without a power boost, can only convert carbohydrates to a limited amount of hydrogen and a mixture of "dead end" fermentation end products such as acetic and butyric acids.
However, giving the bacteria a small assist with a tiny amount of electricity -- about 0.25 volts or a small fraction of the voltage needed to run a typical 6 volt cell phone -- they can leap over the fermentation barrier and convert a "dead end" fermentation product, acetic acid, into carbon dioxide and hydrogen.
Logan notes, "Basically, we use the same microbial fuel cell we developed to clean wastewater and produce electricity. However, to produce hydrogen, we keep oxygen out of the MFC and add a small amount of power into the system."
In the new MFC, when the bacteria eat biomass, they transfer electrons to an anode. The bacteria also release protons, hydrogen atoms stripped of their electrons, which go into solution. The electrons on the anode migrate via a wire to the cathode, the other electrode in the fuel cell, where they are electrochemically assisted to combine with the protons and produce hydrogen gas.
The researchers call their hydrogen-producing MFC a BioElectrochemically-Assisted Microbial Reactor or BEAMR. The BEAMR not only produces hydrogen but simultaneously cleans the wastewater used as its feedstock. It uses about one-tenth of the voltage needed for electrolysis, the process that uses electricity to break water down into hydrogen and oxygen. This new process demonstrated, for the first time, that there is real potential to capture hydrogen for fuel from renewable sources for clean transportation.
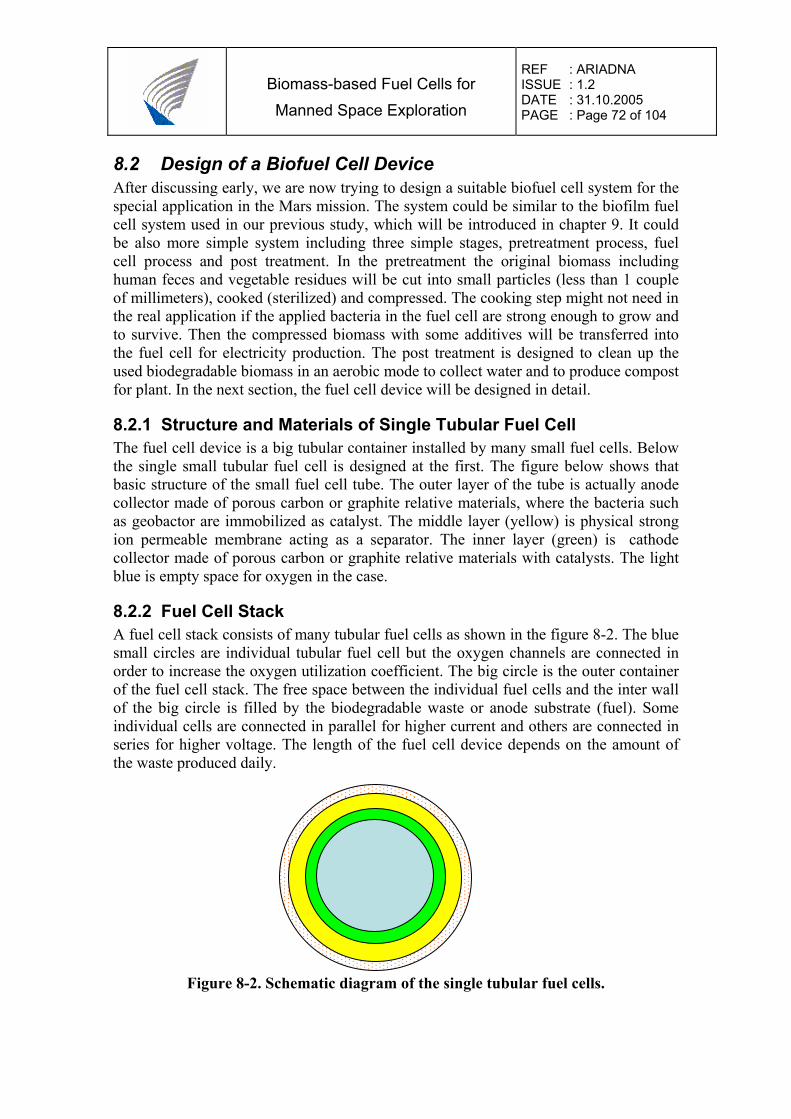
Biomass-based Fuel Cells for Manned Space Exploration
REF : ARIADNA ISSUE : 1.2 DATE : 31.10.2005 PAGE : Page 72 of 104
8.2 Design of a Biofuel Cell Device After discussing early, we are now trying to design a suitable biofuel cell system for the special application in the Mars mission. The system could be similar to the biofilm fuel cell system used in our previous study, which will be introduced in chapter 9. It could be also more simple system including three simple stages, pretreatment process, fuel cell process and post treatment. In the pretreatment the original biomass including human feces and vegetable residues will be cut into small particles (less than 1 couple of millimeters), cooked (sterilized) and compressed. The cooking step might not need in the real application if the applied bacteria in the fuel cell are strong enough to grow and to survive. Then the compressed biomass with some additives will be transferred into the fuel cell for electricity production. The post treatment is designed to clean up the used biodegradable biomass in an aerobic mode to collect water and to produce compost for plant. In the next section, the fuel cell device will be designed in detail.
8.2.1 Structure and Materials of Single Tubular Fuel Cell The fuel cell device is a big tubular container installed by many small fuel cells. Below the single small tubular fuel cell is designed at the first. The figure below shows that basic structure of the small fuel cell tube. The outer layer of the tube is actually anode collector made of porous carbon or graphite relative materials, where the bacteria such as geobactor are immobilized as catalyst. The middle layer (yellow) is physical strong ion permeable membrane acting as a separator. The inner layer (green) is cathode collector made of porous carbon or graphite relative materials with catalysts. The light blue is empty space for oxygen in the case.
8.2.2 Fuel Cell Stack A fuel cell stack consists of many tubular fuel cells as shown in the figure 8-2. The blue small circles are individual tubular fuel cell but the oxygen channels are connected in order to increase the oxygen utilization coefficient. The big circle is the outer container of the fuel cell stack. The free space between the individual fuel cells and the inter wall of the big circle is filled by the biodegradable waste or anode substrate (fuel). Some individual cells are connected in parallel for higher current and others are connected in series for higher voltage. The length of the fuel cell device depends on the amount of the waste produced daily.
Figure 8-2. Schematic diagram of the single tubular fuel cells.
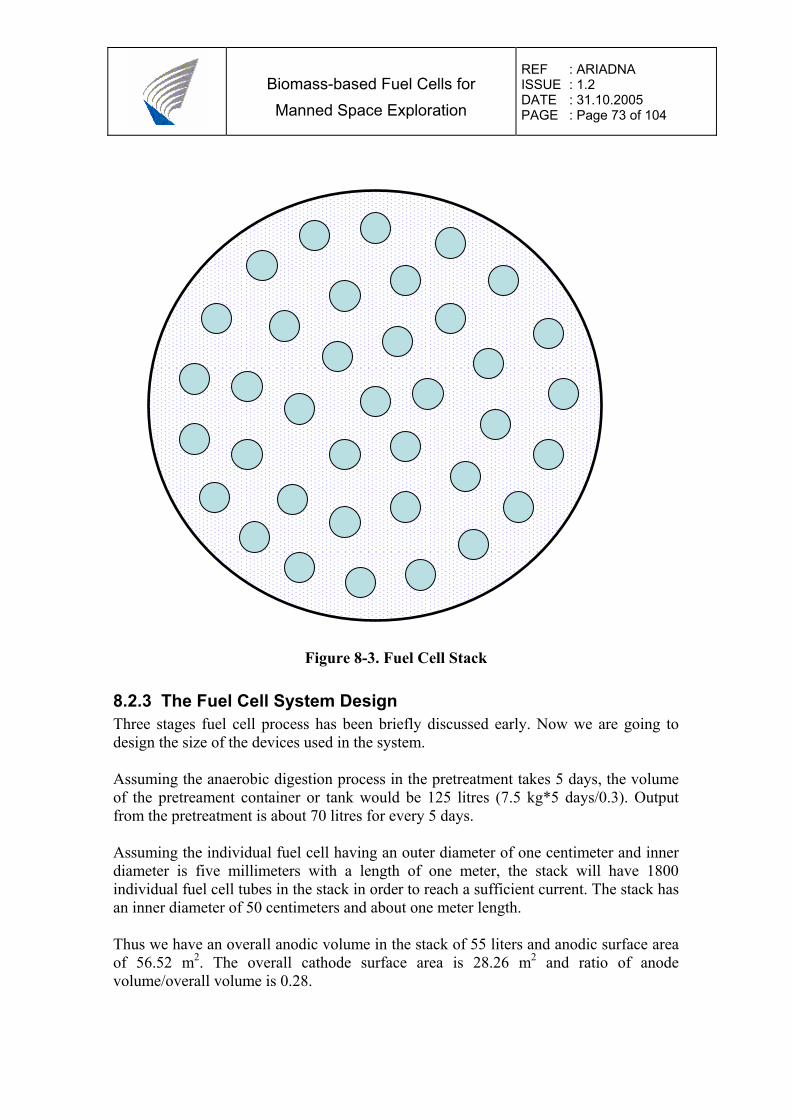
Biomass-based Fuel Cells for Manned Space Exploration
REF : ARIADNA ISSUE : 1.2 DATE : 31.10.2005 PAGE : Page 73 of 104
Figure 8-3. Fuel Cell Stack
8.2.3 The Fuel Cell System Design Three stages fuel cell process has been briefly discussed early. Now we are going to design the size of the devices used in the system. Assuming the anaerobic digestion process in the pretreatment takes 5 days, the volume of the pretreament container or tank would be 125 litres (7.5 kg*5 days/0.3). Output from the pretreatment is about 70 litres for every 5 days. Assuming the individual fuel cell having an outer diameter of one centimeter and inner diameter is five millimeters with a length of one meter, the stack will have 1800 individual fuel cell tubes in the stack in order to reach a sufficient current. The stack has an inner diameter of 50 centimeters and about one meter length. Thus we have an overall anodic volume in the stack of 55 liters and anodic surface area of 56.52 m2. The overall cathode surface area is 28.26 m2 and ratio of anode volume/overall volume is 0.28.
Biomass-based Fuel Cells for Manned Space Exploration
REF : ARIADNA ISSUE : 1.2 DATE : 31.10.2005 PAGE : Page 74 of 104
8.2.4 Estimate Power and Energy Conversion Rate in the Stacks In our previous study, the power density reached for long period was in the range between 0.14 – 0.72 mW/cm2 for biological fuel cell. If a power density of 0.4 mW/cm2 is obtained in this case, a power of 226 W or 19.5 MJ/day will be produced from the fuel cell stack. Overall energy conversion rate is about 15 %. If a power density of 0.8 mW/cm2 would be reached, the net power produced from the biological fuel cell system would be 452 W or 39 MJ/day. The energy conversion rate would be 30 %.
8.3 References [1] http://www.engr.psu.edu/ce/enve/NSF-H2.html [2] http://www.geobacter.org/research/microbial/ [3] http://science.nasa.gov/headlines/y2004/18may_wastenot.htm [4] http://www.engr.psu.edu/ce/enve/NSF-H2.html [5] http://www.engr.psu.edu/ce/enve/mfc-Logan_files/mfc-Logan.htm
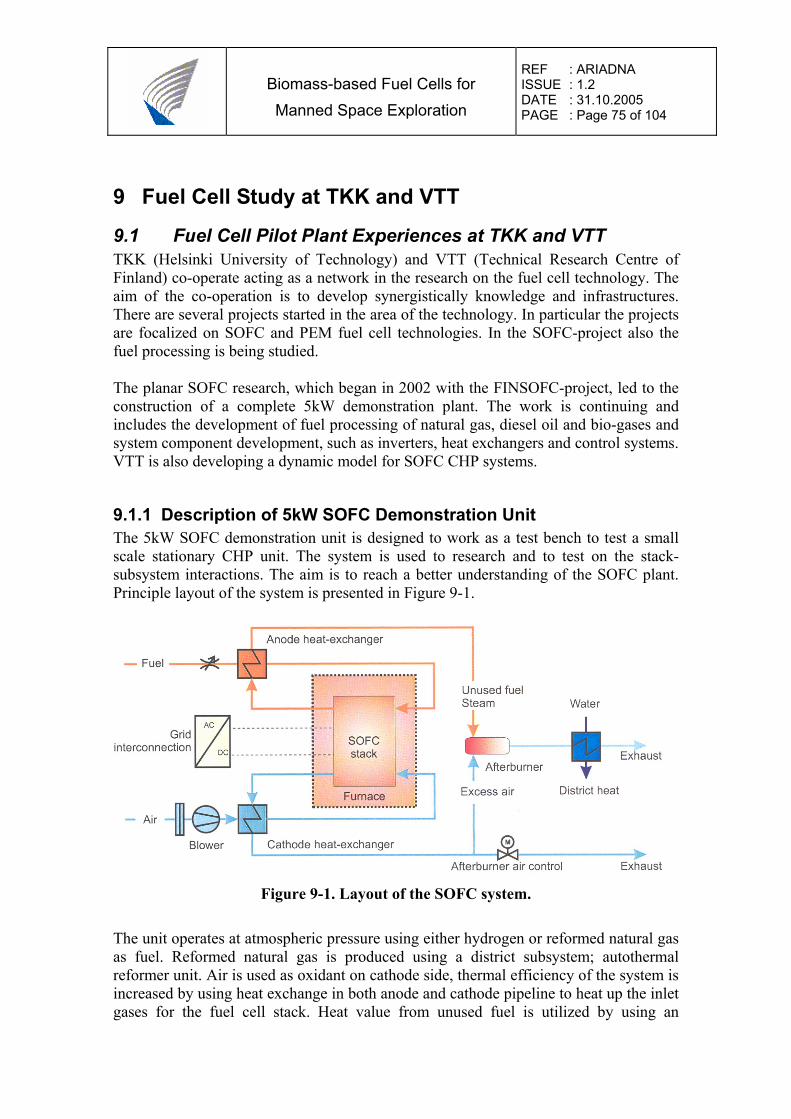
Biomass-based Fuel Cells for Manned Space Exploration
REF : ARIADNA ISSUE : 1.2 DATE : 31.10.2005 PAGE : Page 75 of 104
9 Fuel Cell Study at TKK and VTT
9.1 Fuel Cell Pilot Plant Experiences at TKK and VTT TKK (Helsinki University of Technology) and VTT (Technical Research Centre of Finland) co-operate acting as a network in the research on the fuel cell technology. The aim of the co-operation is to develop synergistically knowledge and infrastructures. There are several projects started in the area of the technology. In particular the projects are focalized on SOFC and PEM fuel cell technologies. In the SOFC-project also the fuel processing is being studied. The planar SOFC research, which began in 2002 with the FINSOFC-project, led to the construction of a complete 5kW demonstration plant. The work is continuing and includes the development of fuel processing of natural gas, diesel oil and bio-gases and system component development, such as inverters, heat exchangers and control systems. VTT is also developing a dynamic model for SOFC CHP systems.
9.1.1 Description of 5kW SOFC Demonstration Unit The 5kW SOFC demonstration unit is designed to work as a test bench to test a small scale stationary CHP unit. The system is used to research and to test on the stack-subsystem interactions. The aim is to reach a better understanding of the SOFC plant. Principle layout of the system is presented in Figure 9-1.
Figure 9-1. Layout of the SOFC system.
The unit operates at atmospheric pressure using either hydrogen or reformed natural gas as fuel. Reformed natural gas is produced using a district subsystem; autothermal reformer unit. Air is used as oxidant on cathode side, thermal efficiency of the system is increased by using heat exchange in both anode and cathode pipeline to heat up the inlet gases for the fuel cell stack. Heat value from unused fuel is utilized by using an
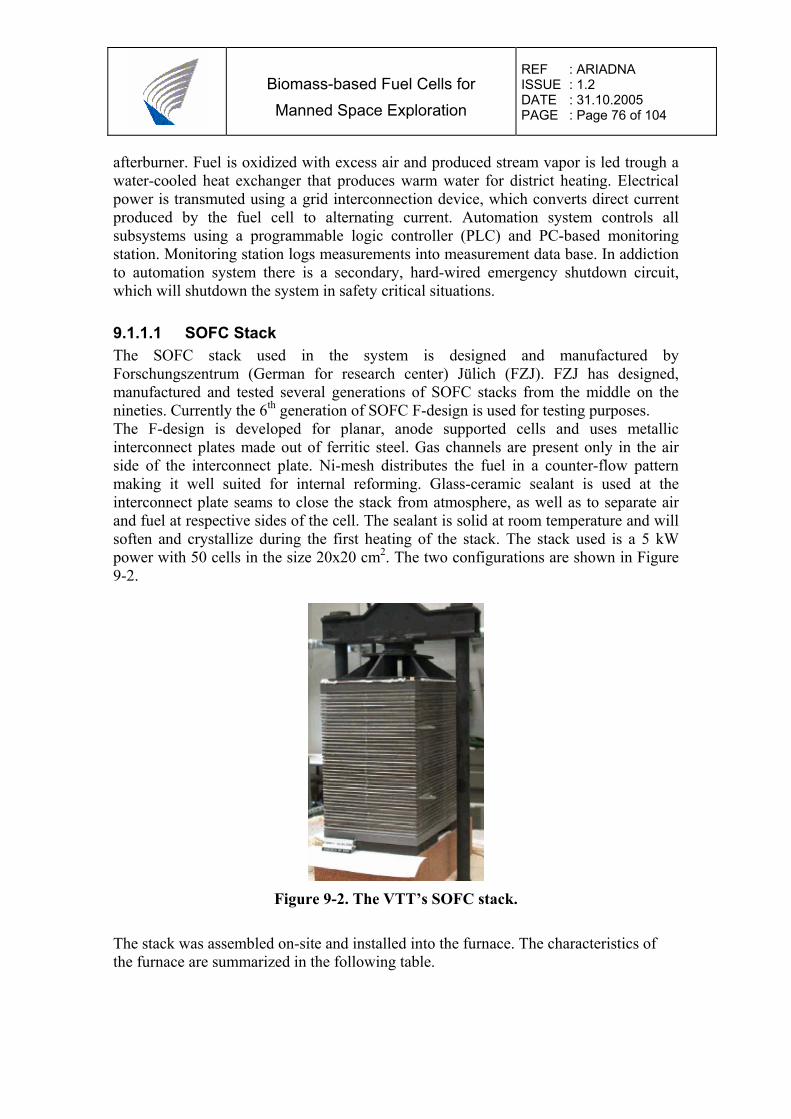
Biomass-based Fuel Cells for Manned Space Exploration
REF : ARIADNA ISSUE : 1.2 DATE : 31.10.2005 PAGE : Page 76 of 104
afterburner. Fuel is oxidized with excess air and produced stream vapor is led trough a water-cooled heat exchanger that produces warm water for district heating. Electrical power is transmuted using a grid interconnection device, which converts direct current produced by the fuel cell to alternating current. Automation system controls all subsystems using a programmable logic controller (PLC) and PC-based monitoring station. Monitoring station logs measurements into measurement data base. In addiction to automation system there is a secondary, hard-wired emergency shutdown circuit, which will shutdown the system in safety critical situations.
9.1.1.1 SOFC Stack The SOFC stack used in the system is designed and manufactured by Forschungszentrum (German for research center) Jülich (FZJ). FZJ has designed, manufactured and tested several generations of SOFC stacks from the middle on the nineties. Currently the 6th generation of SOFC F-design is used for testing purposes. The F-design is developed for planar, anode supported cells and uses metallic interconnect plates made out of ferritic steel. Gas channels are present only in the air side of the interconnect plate. Ni-mesh distributes the fuel in a counter-flow pattern making it well suited for internal reforming. Glass-ceramic sealant is used at the interconnect plate seams to close the stack from atmosphere, as well as to separate air and fuel at respective sides of the cell. The sealant is solid at room temperature and will soften and crystallize during the first heating of the stack. The stack used is a 5 kW power with 50 cells in the size 20x20 cm2. The two configurations are shown in Figure 9-2.
Figure 9-2. The VTT’s SOFC stack.
The stack was assembled on-site and installed into the furnace. The characteristics of the furnace are summarized in the following table.
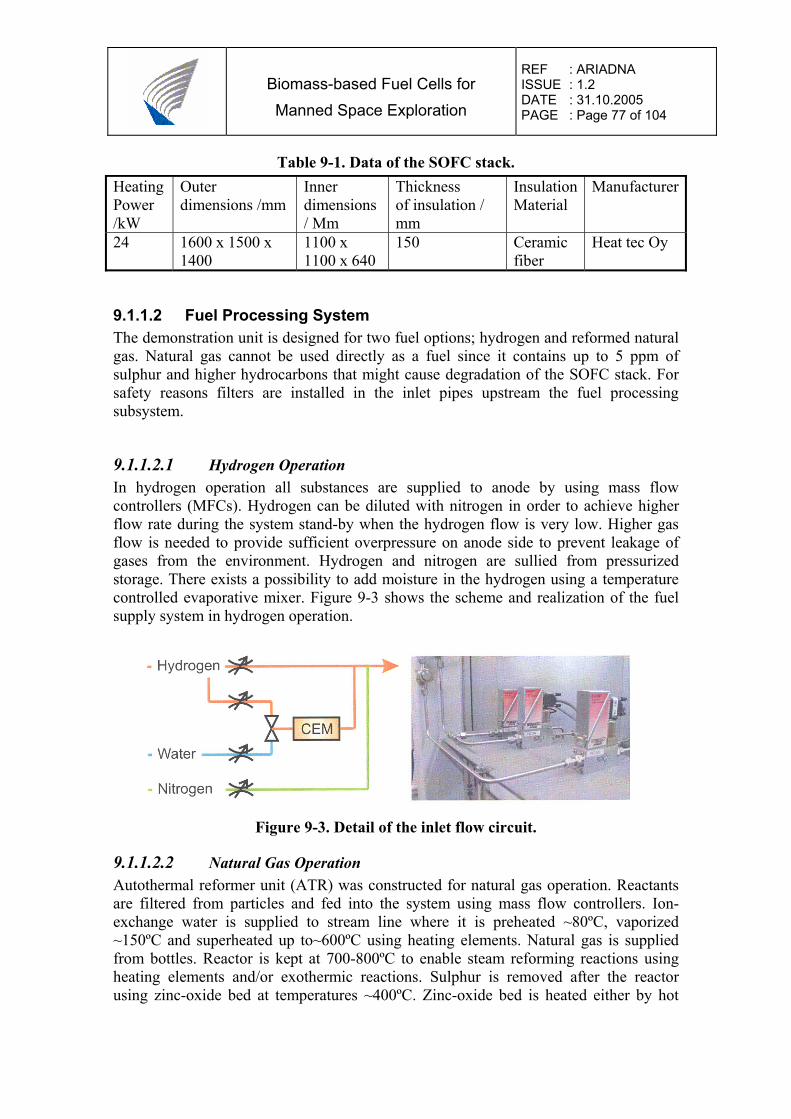
Biomass-based Fuel Cells for Manned Space Exploration
REF : ARIADNA ISSUE : 1.2 DATE : 31.10.2005 PAGE : Page 77 of 104
Table 9-1. Data of the SOFC stack. Heating Power /kW
Outer dimensions /mm
Inner dimensions / Mm
Thickness of insulation / mm
Insulation Material
Manufacturer
24 1600 x 1500 x 1400
1100 x 1100 x 640
150 Ceramic fiber
Heat tec Oy
9.1.1.2 Fuel Processing System The demonstration unit is designed for two fuel options; hydrogen and reformed natural gas. Natural gas cannot be used directly as a fuel since it contains up to 5 ppm of sulphur and higher hydrocarbons that might cause degradation of the SOFC stack. For safety reasons filters are installed in the inlet pipes upstream the fuel processing subsystem.
9.1.1.2.1 Hydrogen Operation In hydrogen operation all substances are supplied to anode by using mass flow controllers (MFCs). Hydrogen can be diluted with nitrogen in order to achieve higher flow rate during the system stand-by when the hydrogen flow is very low. Higher gas flow is needed to provide sufficient overpressure on anode side to prevent leakage of gases from the environment. Hydrogen and nitrogen are sullied from pressurized storage. There exists a possibility to add moisture in the hydrogen using a temperature controlled evaporative mixer. Figure 9-3 shows the scheme and realization of the fuel supply system in hydrogen operation.
Figure 9-3. Detail of the inlet flow circuit.
9.1.1.2.2 Natural Gas Operation Autothermal reformer unit (ATR) was constructed for natural gas operation. Reactants are filtered from particles and fed into the system using mass flow controllers. Ion-exchange water is supplied to stream line where it is preheated ~80ºC, vaporized ~150ºC and superheated up to~600ºC using heating elements. Natural gas is supplied from bottles. Reactor is kept at 700-800ºC to enable steam reforming reactions using heating elements and/or exothermic reactions. Sulphur is removed after the reactor using zinc-oxide bed at temperatures ~400ºC. Zinc-oxide bed is heated either by hot
Biomass-based Fuel Cells for Manned Space Exploration
REF : ARIADNA ISSUE : 1.2 DATE : 31.10.2005 PAGE : Page 78 of 104
reformed gas or heating elements. Experimentations reveal that the fuel conversion efficiency was 73%. 9.1.1.3 Cathode Air Supply Cathode air supply is taken from ambient and supplied into the system with a blower. The blower is actually formed of two separate blowers that are connected mechanically into series to provide sufficient flow for air circulation. Ambient air is purified from dust and other particles by using a filter that is coupled into the blower inlet. 9.1.1.4 Exhaust Gas Treatment Anode product gases and a part or all of the cathode air are fed to a catalytic afterburner that oxidises unused fuel and produces water vapour and heat. The catalyst in the afterburner is of woven wire mesh type. Air is fed into the afterburner by choking cathode exhaust with an automatically controlled electrical poppet valve. 9.1.1.5 Heat Exchangers Anode fuel and cathode air are circulated through anode and cathode heat exchangers before the furnace and SOFC stack. It is necessary to heat up the gas flows to prevent the stack cooling below operating temperature. Heat exchangers also improve the system overall efficiency by employing the heat from the cell reactions into the gas heating. Waste heat from afterburner is utilized using a water cooled heat exchanger.
9.1.1.6 Grid Interconnection and System Power Supply Grid connection device consists of DC-DC converters, DC-AC inverter, filter and transformer. DC-DC converters raise stack voltage from 30-50 VDC to 400 VDC. The controller embedded in the inverter shifts automatically the phase to connect the cell system to the grid.
9.1.2 Description of 1 kW PEMFC Demonstration Unit In the PEM project a 1kW PEM stack has been constructed and a complete system is under construction at present.
9.1.2.1 Stack Components
9.1.2.1.1 Membrane The membrane is a crucial component of the fuel cell. The different companies producing polymer electrolyte membranes have their own technology and own products. However, the base of these products is a sulphorated fluoropolymer, usually fluoroethylene. The most well known is Nafion (Dupont). This particular product is widely discussed and described in the literature and it is often considered as the standard membrane. In Table 9-2 and Table 9-3, the main characteristic on the different types of membranes available on the market are summarized.
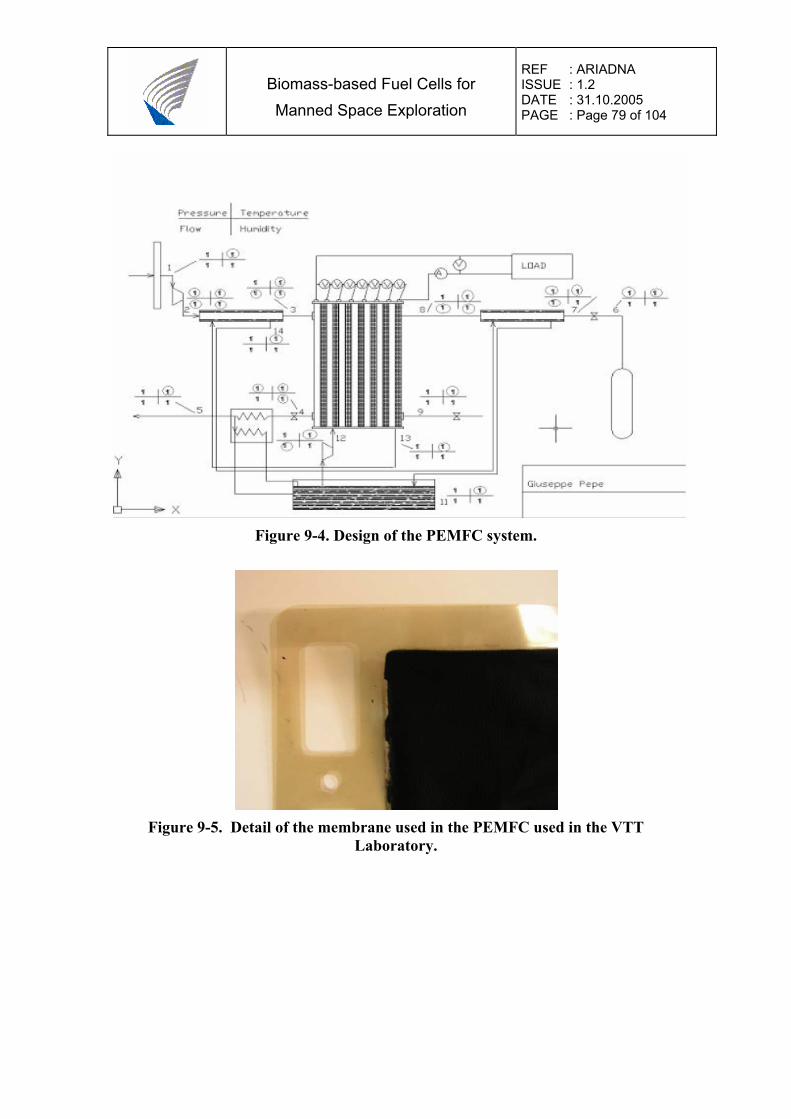
Biomass-based Fuel Cells for Manned Space Exploration
REF : ARIADNA ISSUE : 1.2 DATE : 31.10.2005 PAGE : Page 79 of 104
Figure 9-4. Design of the PEMFC system.
Figure 9-5. Detail of the membrane used in the PEMFC used in the VTT
Laboratory.
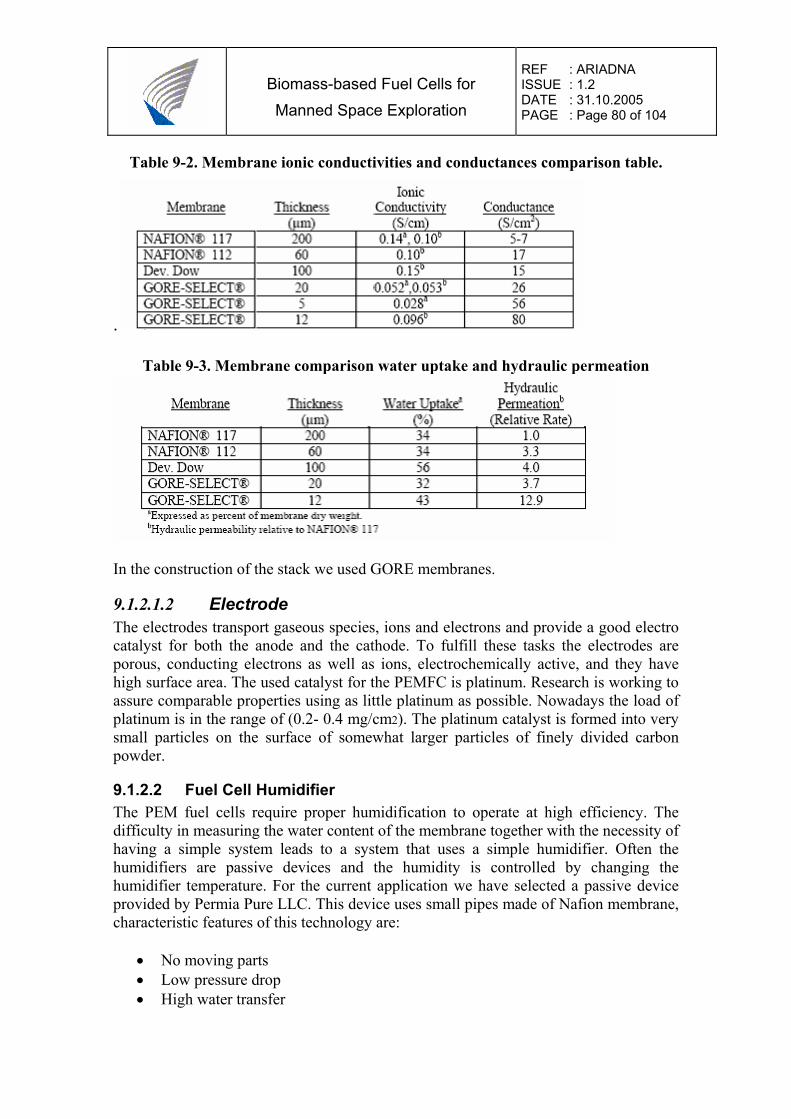
Biomass-based Fuel Cells for Manned Space Exploration
REF : ARIADNA ISSUE : 1.2 DATE : 31.10.2005 PAGE : Page 80 of 104
Table 9-2. Membrane ionic conductivities and conductances comparison table.
.
Table 9-3. Membrane comparison water uptake and hydraulic permeation
In the construction of the stack we used GORE membranes.
9.1.2.1.2 Electrode The electrodes transport gaseous species, ions and electrons and provide a good electro catalyst for both the anode and the cathode. To fulfill these tasks the electrodes are porous, conducting electrons as well as ions, electrochemically active, and they have high surface area. The used catalyst for the PEMFC is platinum. Research is working to assure comparable properties using as little platinum as possible. Nowadays the load of platinum is in the range of (0.2- 0.4 mg/cm2). The platinum catalyst is formed into very small particles on the surface of somewhat larger particles of finely divided carbon powder.
9.1.2.2 Fuel Cell Humidifier The PEM fuel cells require proper humidification to operate at high efficiency. The difficulty in measuring the water content of the membrane together with the necessity of having a simple system leads to a system that uses a simple humidifier. Often the humidifiers are passive devices and the humidity is controlled by changing the humidifier temperature. For the current application we have selected a passive device provided by Permia Pure LLC. This device uses small pipes made of Nafion membrane, characteristic features of this technology are:
• No moving parts • Low pressure drop • High water transfer
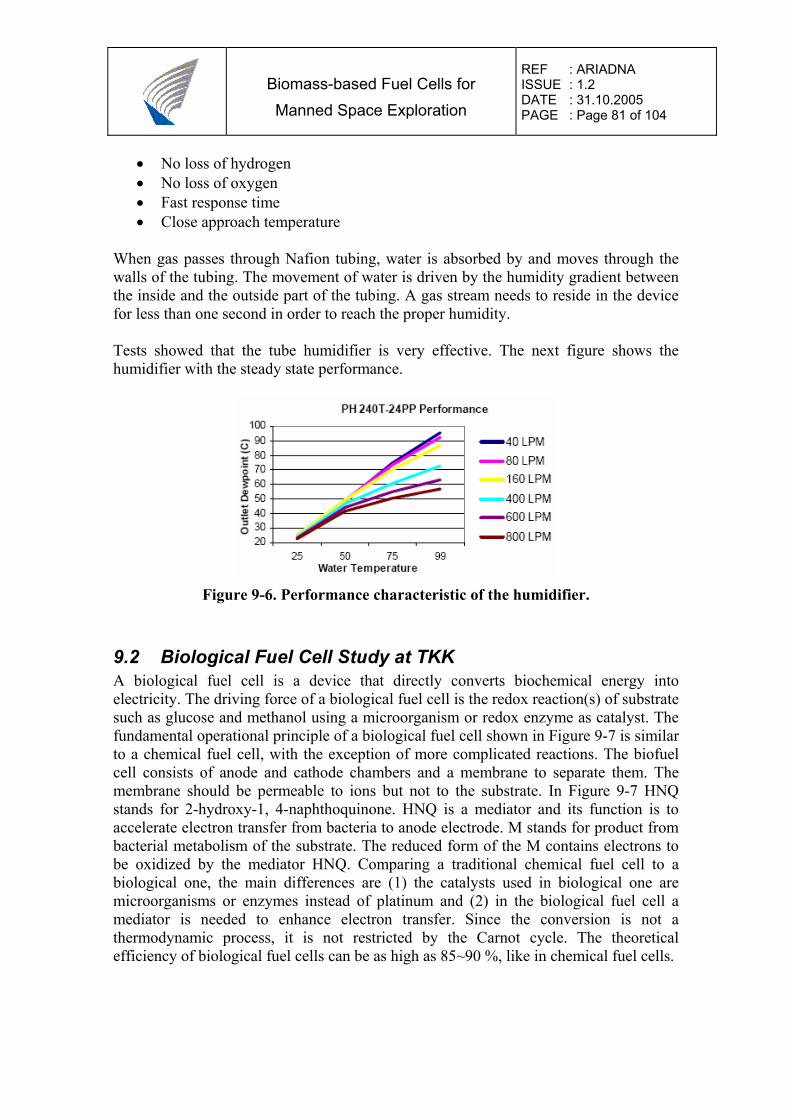
Biomass-based Fuel Cells for Manned Space Exploration
REF : ARIADNA ISSUE : 1.2 DATE : 31.10.2005 PAGE : Page 81 of 104
• No loss of hydrogen • No loss of oxygen • Fast response time • Close approach temperature
When gas passes through Nafion tubing, water is absorbed by and moves through the walls of the tubing. The movement of water is driven by the humidity gradient between the inside and the outside part of the tubing. A gas stream needs to reside in the device for less than one second in order to reach the proper humidity. Tests showed that the tube humidifier is very effective. The next figure shows the humidifier with the steady state performance.
Figure 9-6. Performance characteristic of the humidifier.
9.2 Biological Fuel Cell Study at TKK A biological fuel cell is a device that directly converts biochemical energy into electricity. The driving force of a biological fuel cell is the redox reaction(s) of substrate such as glucose and methanol using a microorganism or redox enzyme as catalyst. The fundamental operational principle of a biological fuel cell shown in Figure 9-7 is similar to a chemical fuel cell, with the exception of more complicated reactions. The biofuel cell consists of anode and cathode chambers and a membrane to separate them. The membrane should be permeable to ions but not to the substrate. In Figure 9-7 HNQ stands for 2-hydroxy-1, 4-naphthoquinone. HNQ is a mediator and its function is to accelerate electron transfer from bacteria to anode electrode. M stands for product from bacterial metabolism of the substrate. The reduced form of the M contains electrons to be oxidized by the mediator HNQ. Comparing a traditional chemical fuel cell to a biological one, the main differences are (1) the catalysts used in biological one are microorganisms or enzymes instead of platinum and (2) in the biological fuel cell a mediator is needed to enhance electron transfer. Since the conversion is not a thermodynamic process, it is not restricted by the Carnot cycle. The theoretical efficiency of biological fuel cells can be as high as 85~90 %, like in chemical fuel cells.
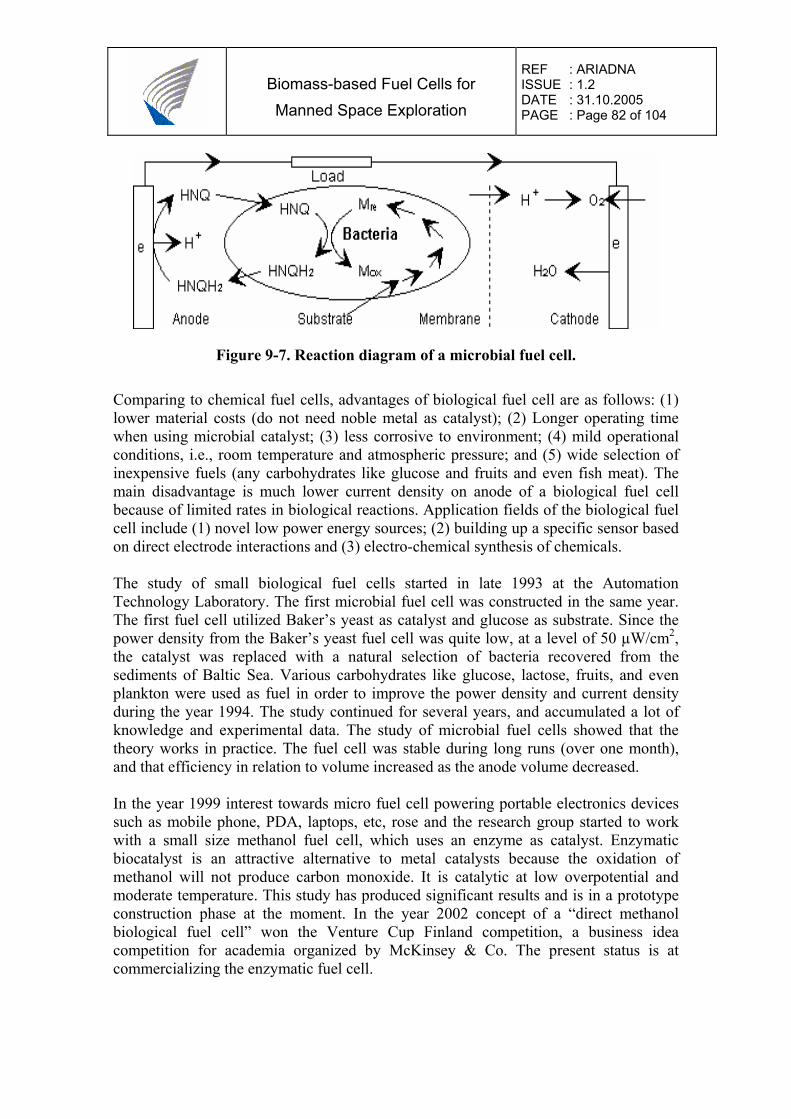
Biomass-based Fuel Cells for Manned Space Exploration
REF : ARIADNA ISSUE : 1.2 DATE : 31.10.2005 PAGE : Page 82 of 104
Figure 9-7. Reaction diagram of a microbial fuel cell. Comparing to chemical fuel cells, advantages of biological fuel cell are as follows: (1) lower material costs (do not need noble metal as catalyst); (2) Longer operating time when using microbial catalyst; (3) less corrosive to environment; (4) mild operational conditions, i.e., room temperature and atmospheric pressure; and (5) wide selection of inexpensive fuels (any carbohydrates like glucose and fruits and even fish meat). The main disadvantage is much lower current density on anode of a biological fuel cell because of limited rates in biological reactions. Application fields of the biological fuel cell include (1) novel low power energy sources; (2) building up a specific sensor based on direct electrode interactions and (3) electro-chemical synthesis of chemicals. The study of small biological fuel cells started in late 1993 at the Automation Technology Laboratory. The first microbial fuel cell was constructed in the same year. The first fuel cell utilized Baker’s yeast as catalyst and glucose as substrate. Since the power density from the Baker’s yeast fuel cell was quite low, at a level of 50 µW/cm2, the catalyst was replaced with a natural selection of bacteria recovered from the sediments of Baltic Sea. Various carbohydrates like glucose, lactose, fruits, and even plankton were used as fuel in order to improve the power density and current density during the year 1994. The study continued for several years, and accumulated a lot of knowledge and experimental data. The study of microbial fuel cells showed that the theory works in practice. The fuel cell was stable during long runs (over one month), and that efficiency in relation to volume increased as the anode volume decreased. In the year 1999 interest towards micro fuel cell powering portable electronics devices such as mobile phone, PDA, laptops, etc, rose and the research group started to work with a small size methanol fuel cell, which uses an enzyme as catalyst. Enzymatic biocatalyst is an attractive alternative to metal catalysts because the oxidation of methanol will not produce carbon monoxide. It is catalytic at low overpotential and moderate temperature. This study has produced significant results and is in a prototype construction phase at the moment. In the year 2002 concept of a “direct methanol biological fuel cell” won the Venture Cup Finland competition, a business idea competition for academia organized by McKinsey & Co. The present status is at commercializing the enzymatic fuel cell.
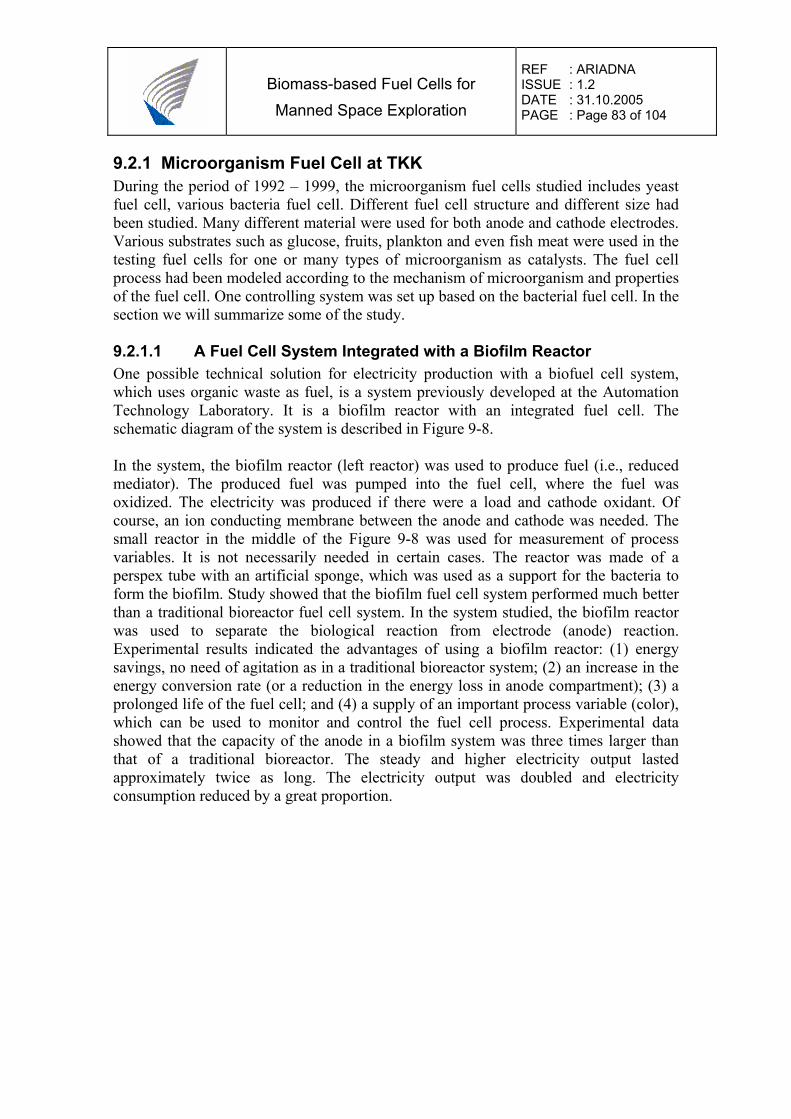
Biomass-based Fuel Cells for Manned Space Exploration
REF : ARIADNA ISSUE : 1.2 DATE : 31.10.2005 PAGE : Page 83 of 104
9.2.1 Microorganism Fuel Cell at TKK During the period of 1992 – 1999, the microorganism fuel cells studied includes yeast fuel cell, various bacteria fuel cell. Different fuel cell structure and different size had been studied. Many different material were used for both anode and cathode electrodes. Various substrates such as glucose, fruits, plankton and even fish meat were used in the testing fuel cells for one or many types of microorganism as catalysts. The fuel cell process had been modeled according to the mechanism of microorganism and properties of the fuel cell. One controlling system was set up based on the bacterial fuel cell. In the section we will summarize some of the study. 9.2.1.1 A Fuel Cell System Integrated with a Biofilm Reactor One possible technical solution for electricity production with a biofuel cell system, which uses organic waste as fuel, is a system previously developed at the Automation Technology Laboratory. It is a biofilm reactor with an integrated fuel cell. The schematic diagram of the system is described in Figure 9-8. In the system, the biofilm reactor (left reactor) was used to produce fuel (i.e., reduced mediator). The produced fuel was pumped into the fuel cell, where the fuel was oxidized. The electricity was produced if there were a load and cathode oxidant. Of course, an ion conducting membrane between the anode and cathode was needed. The small reactor in the middle of the Figure 9-8 was used for measurement of process variables. It is not necessarily needed in certain cases. The reactor was made of a perspex tube with an artificial sponge, which was used as a support for the bacteria to form the biofilm. Study showed that the biofilm fuel cell system performed much better than a traditional bioreactor fuel cell system. In the system studied, the biofilm reactor was used to separate the biological reaction from electrode (anode) reaction. Experimental results indicated the advantages of using a biofilm reactor: (1) energy savings, no need of agitation as in a traditional bioreactor system; (2) an increase in the energy conversion rate (or a reduction in the energy loss in anode compartment); (3) a prolonged life of the fuel cell; and (4) a supply of an important process variable (color), which can be used to monitor and control the fuel cell process. Experimental data showed that the capacity of the anode in a biofilm system was three times larger than that of a traditional bioreactor. The steady and higher electricity output lasted approximately twice as long. The electricity output was doubled and electricity consumption reduced by a great proportion.
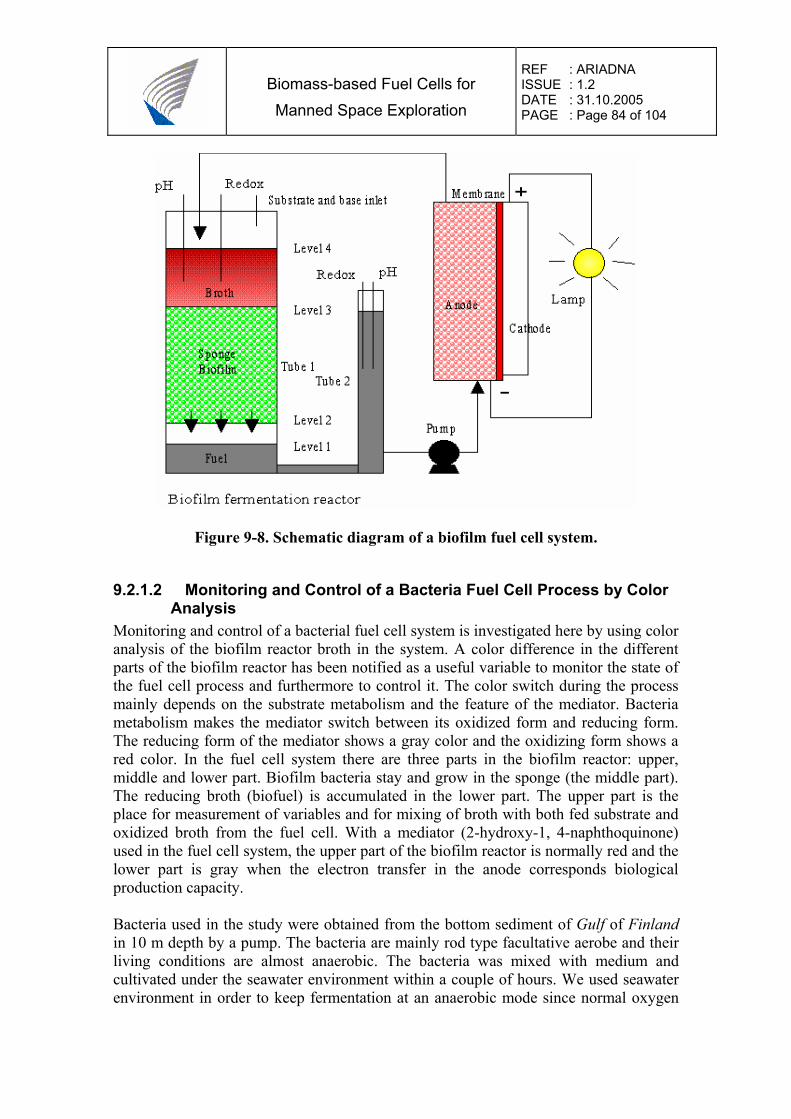
Biomass-based Fuel Cells for Manned Space Exploration
REF : ARIADNA ISSUE : 1.2 DATE : 31.10.2005 PAGE : Page 84 of 104
Figure 9-8. Schematic diagram of a biofilm fuel cell system.
9.2.1.2 Monitoring and Control of a Bacteria Fuel Cell Process by Color Analysis
Monitoring and control of a bacterial fuel cell system is investigated here by using color analysis of the biofilm reactor broth in the system. A color difference in the different parts of the biofilm reactor has been notified as a useful variable to monitor the state of the fuel cell process and furthermore to control it. The color switch during the process mainly depends on the substrate metabolism and the feature of the mediator. Bacteria metabolism makes the mediator switch between its oxidized form and reducing form. The reducing form of the mediator shows a gray color and the oxidizing form shows a red color. In the fuel cell system there are three parts in the biofilm reactor: upper, middle and lower part. Biofilm bacteria stay and grow in the sponge (the middle part). The reducing broth (biofuel) is accumulated in the lower part. The upper part is the place for measurement of variables and for mixing of broth with both fed substrate and oxidized broth from the fuel cell. With a mediator (2-hydroxy-1, 4-naphthoquinone) used in the fuel cell system, the upper part of the biofilm reactor is normally red and the lower part is gray when the electron transfer in the anode corresponds biological production capacity. Bacteria used in the study were obtained from the bottom sediment of Gulf of Finland in 10 m depth by a pump. The bacteria are mainly rod type facultative aerobe and their living conditions are almost anaerobic. The bacteria was mixed with medium and cultivated under the seawater environment within a couple of hours. We used seawater environment in order to keep fermentation at an anaerobic mode since normal oxygen
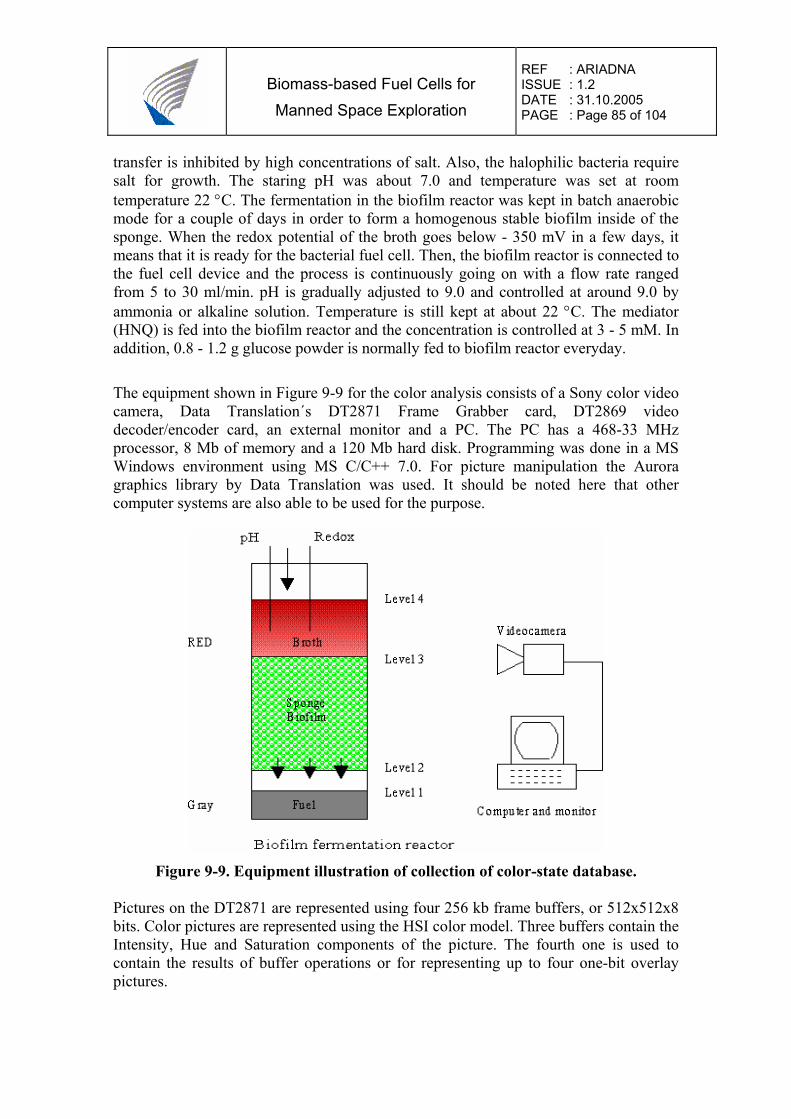
Biomass-based Fuel Cells for Manned Space Exploration
REF : ARIADNA ISSUE : 1.2 DATE : 31.10.2005 PAGE : Page 85 of 104
transfer is inhibited by high concentrations of salt. Also, the halophilic bacteria require salt for growth. The staring pH was about 7.0 and temperature was set at room temperature 22 °C. The fermentation in the biofilm reactor was kept in batch anaerobic mode for a couple of days in order to form a homogenous stable biofilm inside of the sponge. When the redox potential of the broth goes below - 350 mV in a few days, it means that it is ready for the bacterial fuel cell. Then, the biofilm reactor is connected to the fuel cell device and the process is continuously going on with a flow rate ranged from 5 to 30 ml/min. pH is gradually adjusted to 9.0 and controlled at around 9.0 by ammonia or alkaline solution. Temperature is still kept at about 22 °C. The mediator (HNQ) is fed into the biofilm reactor and the concentration is controlled at 3 - 5 mM. In addition, 0.8 - 1.2 g glucose powder is normally fed to biofilm reactor everyday.
The equipment shown in Figure 9-9 for the color analysis consists of a Sony color video camera, Data Translation´s DT2871 Frame Grabber card, DT2869 video decoder/encoder card, an external monitor and a PC. The PC has a 468-33 MHz processor, 8 Mb of memory and a 120 Mb hard disk. Programming was done in a MS Windows environment using MS C/C++ 7.0. For picture manipulation the Aurora graphics library by Data Translation was used. It should be noted here that other computer systems are also able to be used for the purpose.
Figure 9-9. Equipment illustration of collection of color-state database.
Pictures on the DT2871 are represented using four 256 kb frame buffers, or 512x512x8 bits. Color pictures are represented using the HSI color model. Three buffers contain the Intensity, Hue and Saturation components of the picture. The fourth one is used to contain the results of buffer operations or for representing up to four one-bit overlay pictures.
Biomass-based Fuel Cells for Manned Space Exploration
REF : ARIADNA ISSUE : 1.2 DATE : 31.10.2005 PAGE : Page 86 of 104
The HSI color model represents more closely the way humans perceive color when compared with the often used RGB model. Hue is a measure of pure color present. Saturation also affects the color. It represents the amount by which the pure color is mixed with white. Saturated colors contain little white. Intensity is a color independent measure of relative brightness.
9.2.1.3 Basic Features of the Microbial Fuel Cell For the single microbial fuel cell, an open voltage of about 800 mV and a short circuit current over 300 mA are normally reached in our experiments. As same as in electrochemical fuel cell, there are three polarizations in the microbial fuel cell. Those are resistance, activity and concentration polarization. The existing polarization in a fuel cell results in that the loading voltage of the fuel cell varies under various loading resistances. Figure 9-10 illustrates the change of voltage and current output with various resistances in a run. When loading resistance goes up, voltage of the fuel cell goes up and current output goes down.
500
550
600
650
700
750
800
850
900
0 200 400 600 800 1000
Resistance (ohm)
Volta
ge (m
V)
0
5
10
15
20
25
30
Cur
rent
(mA
)
Figure 9-10. The basic behavior of the microbial fuel cell. Figure 9-11 is a long term loading behavior of the microbial fuel cell, where the loading resistance is 20 ohm and the area of the anode is 100 cm2. The open voltage before loading was 840 mV. The same level of output lasted over 70 days although the figure only captures 15 days performance. During the 70 days, pH was controlled at between 8.9 and 9.2 and everyday about 0.9 g glucose was fed to the biofilm reactor by one time which resulted in the oscillation in the performance of current and power outputs. The circulation rate in the case was 12 ml/min. Normally the cathode electrolyte was renewed every second day, which also resulted in the fluctuation in the performance of current and power outputs. The average outputs of the current and the power for 70 days were respectively 24.8 mA and 12.3 mW. If considering the relationship between the outputs (current and power) and the color of broth in a day, we got a result that the red color of the biofilm reactor was deeper and extended to more area, some time it was red even in the lower part of the reactor before feeding substrate to the reactor in the morning. At the same time, the outputs (current and power) were lower. However, the red color in the upper part of the reactor was diluted in about 20 minus after feeding substrate to the reactor and also the outputs increased.
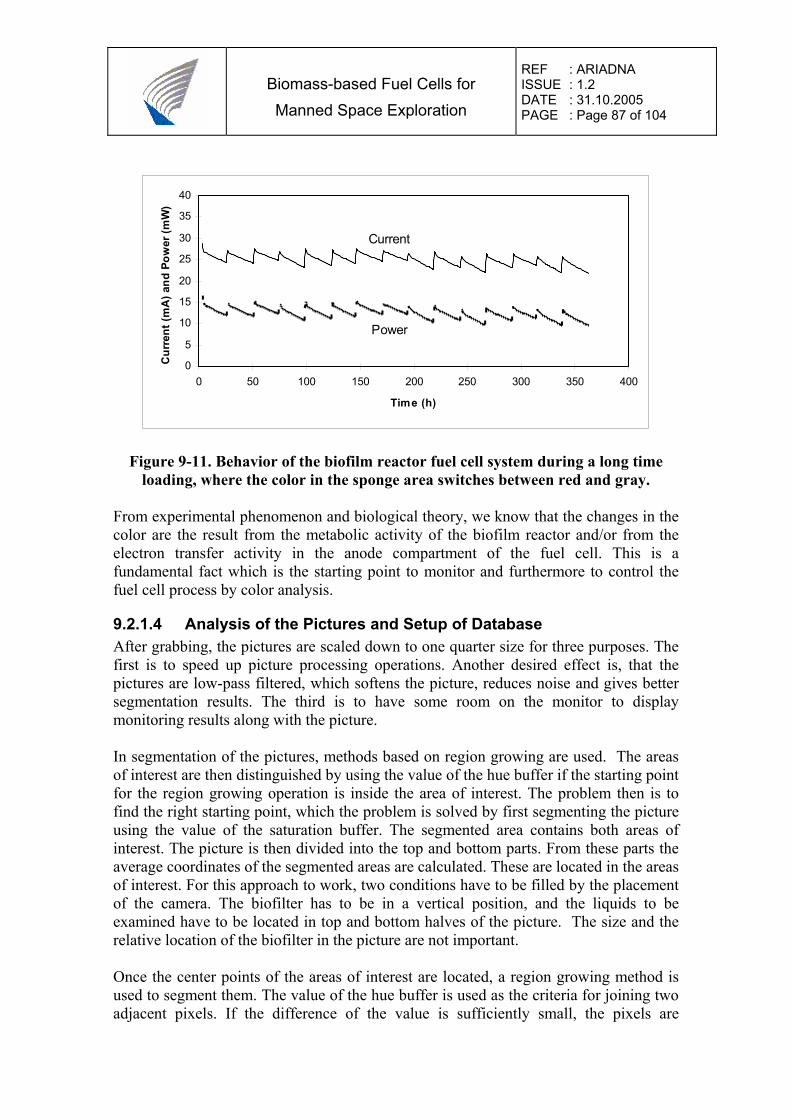
Biomass-based Fuel Cells for Manned Space Exploration
REF : ARIADNA ISSUE : 1.2 DATE : 31.10.2005 PAGE : Page 87 of 104
0
5
10
15
20
25
30
35
40
0 50 100 150 200 250 300 350 400
Time (h)
Cur
rent
(mA
) and
Pow
er (m
W)
Power
Current
Figure 9-11. Behavior of the biofilm reactor fuel cell system during a long time loading, where the color in the sponge area switches between red and gray.
From experimental phenomenon and biological theory, we know that the changes in the color are the result from the metabolic activity of the biofilm reactor and/or from the electron transfer activity in the anode compartment of the fuel cell. This is a fundamental fact which is the starting point to monitor and furthermore to control the fuel cell process by color analysis.
9.2.1.4 Analysis of the Pictures and Setup of Database After grabbing, the pictures are scaled down to one quarter size for three purposes. The first is to speed up picture processing operations. Another desired effect is, that the pictures are low-pass filtered, which softens the picture, reduces noise and gives better segmentation results. The third is to have some room on the monitor to display monitoring results along with the picture. In segmentation of the pictures, methods based on region growing are used. The areas of interest are then distinguished by using the value of the hue buffer if the starting point for the region growing operation is inside the area of interest. The problem then is to find the right starting point, which the problem is solved by first segmenting the picture using the value of the saturation buffer. The segmented area contains both areas of interest. The picture is then divided into the top and bottom parts. From these parts the average coordinates of the segmented areas are calculated. These are located in the areas of interest. For this approach to work, two conditions have to be filled by the placement of the camera. The biofilter has to be in a vertical position, and the liquids to be examined have to be located in top and bottom halves of the picture. The size and the relative location of the biofilter in the picture are not important. Once the center points of the areas of interest are located, a region growing method is used to segment them. The value of the hue buffer is used as the criteria for joining two adjacent pixels. If the difference of the value is sufficiently small, the pixels are
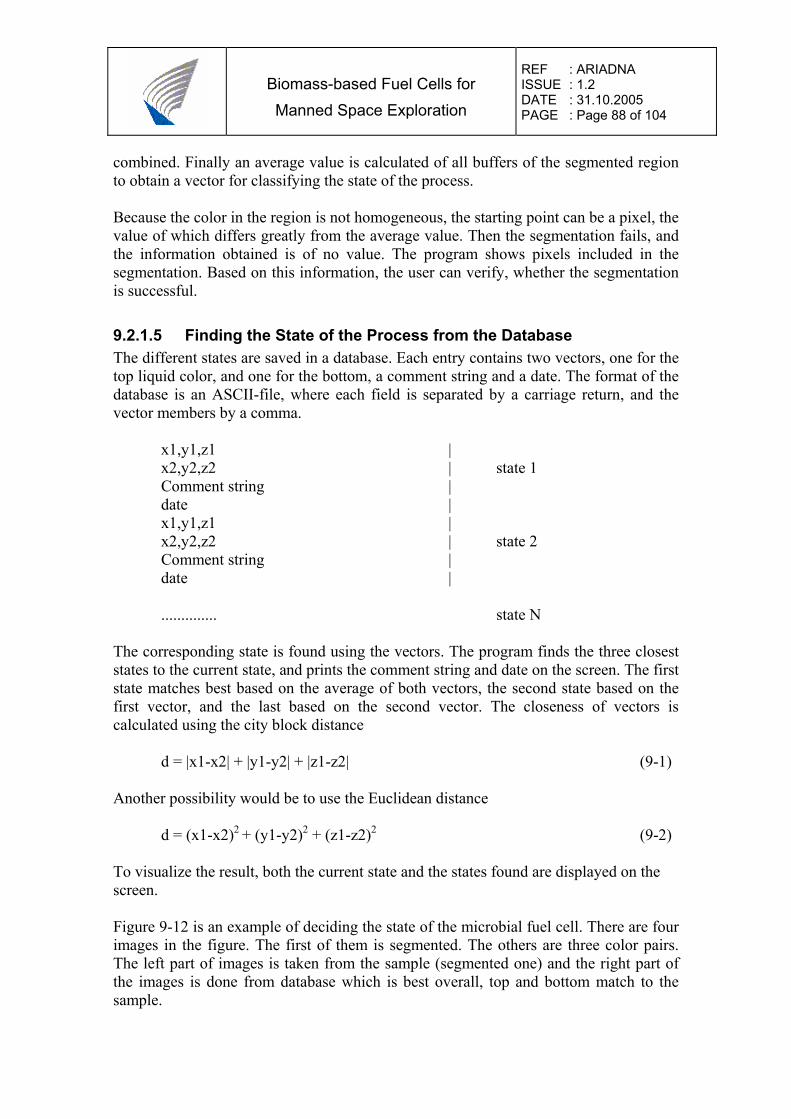
Biomass-based Fuel Cells for Manned Space Exploration
REF : ARIADNA ISSUE : 1.2 DATE : 31.10.2005 PAGE : Page 88 of 104
combined. Finally an average value is calculated of all buffers of the segmented region to obtain a vector for classifying the state of the process. Because the color in the region is not homogeneous, the starting point can be a pixel, the value of which differs greatly from the average value. Then the segmentation fails, and the information obtained is of no value. The program shows pixels included in the segmentation. Based on this information, the user can verify, whether the segmentation is successful.
9.2.1.5 Finding the State of the Process from the Database The different states are saved in a database. Each entry contains two vectors, one for the top liquid color, and one for the bottom, a comment string and a date. The format of the database is an ASCII-file, where each field is separated by a carriage return, and the vector members by a comma. x1,y1,z1 | x2,y2,z2 | state 1 Comment string | date | x1,y1,z1 | x2,y2,z2 | state 2 Comment string | date | .............. state N The corresponding state is found using the vectors. The program finds the three closest states to the current state, and prints the comment string and date on the screen. The first state matches best based on the average of both vectors, the second state based on the first vector, and the last based on the second vector. The closeness of vectors is calculated using the city block distance d = |x1-x2| + |y1-y2| + |z1-z2| (9-1) Another possibility would be to use the Euclidean distance d = (x1-x2)2 + (y1-y2)2 + (z1-z2)2 (9-2) To visualize the result, both the current state and the states found are displayed on the screen. Figure 9-12 is an example of deciding the state of the microbial fuel cell. There are four images in the figure. The first of them is segmented. The others are three color pairs. The left part of images is taken from the sample (segmented one) and the right part of the images is done from database which is best overall, top and bottom match to the sample.
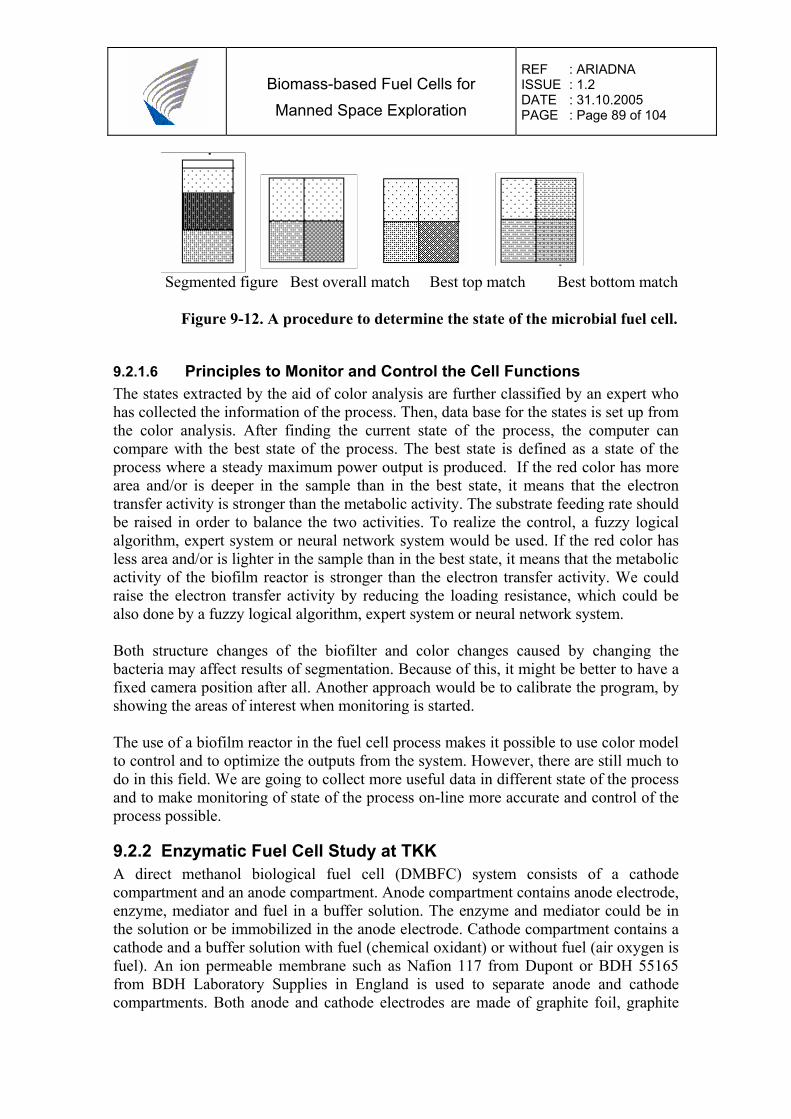
Biomass-based Fuel Cells for Manned Space Exploration
REF : ARIADNA ISSUE : 1.2 DATE : 31.10.2005 PAGE : Page 89 of 104
Segmented figure Best overall match Best top match Best bottom match Figure 9-12. A procedure to determine the state of the microbial fuel cell.
9.2.1.6 Principles to Monitor and Control the Cell Functions The states extracted by the aid of color analysis are further classified by an expert who has collected the information of the process. Then, data base for the states is set up from the color analysis. After finding the current state of the process, the computer can compare with the best state of the process. The best state is defined as a state of the process where a steady maximum power output is produced. If the red color has more area and/or is deeper in the sample than in the best state, it means that the electron transfer activity is stronger than the metabolic activity. The substrate feeding rate should be raised in order to balance the two activities. To realize the control, a fuzzy logical algorithm, expert system or neural network system would be used. If the red color has less area and/or is lighter in the sample than in the best state, it means that the metabolic activity of the biofilm reactor is stronger than the electron transfer activity. We could raise the electron transfer activity by reducing the loading resistance, which could be also done by a fuzzy logical algorithm, expert system or neural network system. Both structure changes of the biofilter and color changes caused by changing the bacteria may affect results of segmentation. Because of this, it might be better to have a fixed camera position after all. Another approach would be to calibrate the program, by showing the areas of interest when monitoring is started. The use of a biofilm reactor in the fuel cell process makes it possible to use color model to control and to optimize the outputs from the system. However, there are still much to do in this field. We are going to collect more useful data in different state of the process and to make monitoring of state of the process on-line more accurate and control of the process possible.
9.2.2 Enzymatic Fuel Cell Study at TKK A direct methanol biological fuel cell (DMBFC) system consists of a cathode compartment and an anode compartment. Anode compartment contains anode electrode, enzyme, mediator and fuel in a buffer solution. The enzyme and mediator could be in the solution or be immobilized in the anode electrode. Cathode compartment contains a cathode and a buffer solution with fuel (chemical oxidant) or without fuel (air oxygen is fuel). An ion permeable membrane such as Nafion 117 from Dupont or BDH 55165 from BDH Laboratory Supplies in England is used to separate anode and cathode compartments. Both anode and cathode electrodes are made of graphite foil, graphite
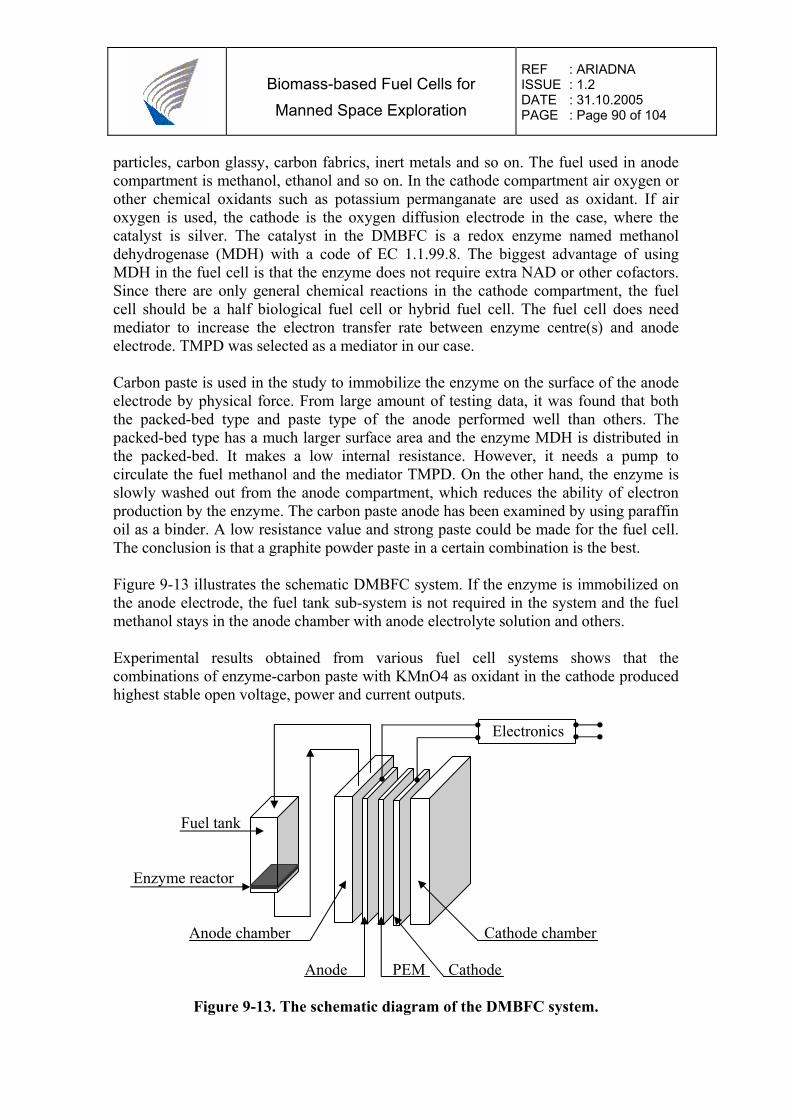
Biomass-based Fuel Cells for Manned Space Exploration
REF : ARIADNA ISSUE : 1.2 DATE : 31.10.2005 PAGE : Page 90 of 104
particles, carbon glassy, carbon fabrics, inert metals and so on. The fuel used in anode compartment is methanol, ethanol and so on. In the cathode compartment air oxygen or other chemical oxidants such as potassium permanganate are used as oxidant. If air oxygen is used, the cathode is the oxygen diffusion electrode in the case, where the catalyst is silver. The catalyst in the DMBFC is a redox enzyme named methanol dehydrogenase (MDH) with a code of EC 1.1.99.8. The biggest advantage of using MDH in the fuel cell is that the enzyme does not require extra NAD or other cofactors. Since there are only general chemical reactions in the cathode compartment, the fuel cell should be a half biological fuel cell or hybrid fuel cell. The fuel cell does need mediator to increase the electron transfer rate between enzyme centre(s) and anode electrode. TMPD was selected as a mediator in our case. Carbon paste is used in the study to immobilize the enzyme on the surface of the anode electrode by physical force. From large amount of testing data, it was found that both the packed-bed type and paste type of the anode performed well than others. The packed-bed type has a much larger surface area and the enzyme MDH is distributed in the packed-bed. It makes a low internal resistance. However, it needs a pump to circulate the fuel methanol and the mediator TMPD. On the other hand, the enzyme is slowly washed out from the anode compartment, which reduces the ability of electron production by the enzyme. The carbon paste anode has been examined by using paraffin oil as a binder. A low resistance value and strong paste could be made for the fuel cell. The conclusion is that a graphite powder paste in a certain combination is the best. Figure 9-13 illustrates the schematic DMBFC system. If the enzyme is immobilized on the anode electrode, the fuel tank sub-system is not required in the system and the fuel methanol stays in the anode chamber with anode electrolyte solution and others. Experimental results obtained from various fuel cell systems shows that the combinations of enzyme-carbon paste with KMnO4 as oxidant in the cathode produced highest stable open voltage, power and current outputs. Electronics Fuel tank Enzyme reactor Anode chamber Cathode chamber Anode PEM Cathode
Figure 9-13. The schematic diagram of the DMBFC system.
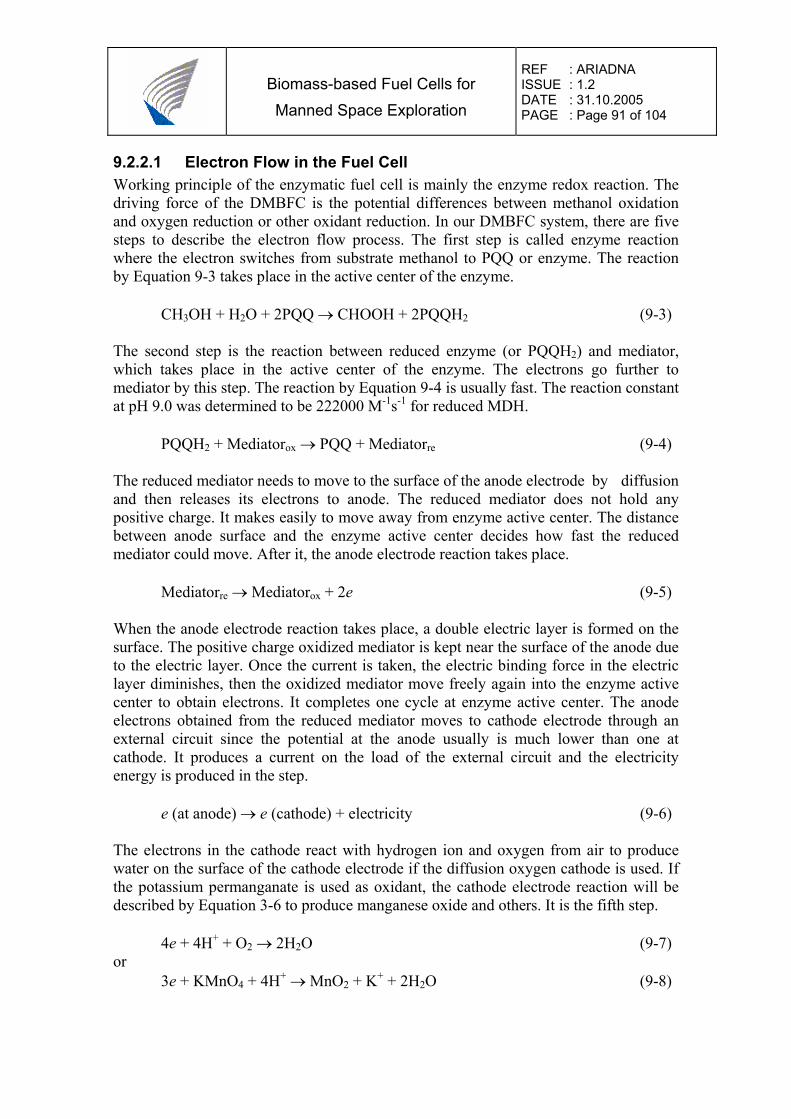
Biomass-based Fuel Cells for Manned Space Exploration
REF : ARIADNA ISSUE : 1.2 DATE : 31.10.2005 PAGE : Page 91 of 104
9.2.2.1 Electron Flow in the Fuel Cell Working principle of the enzymatic fuel cell is mainly the enzyme redox reaction. The driving force of the DMBFC is the potential differences between methanol oxidation and oxygen reduction or other oxidant reduction. In our DMBFC system, there are five steps to describe the electron flow process. The first step is called enzyme reaction where the electron switches from substrate methanol to PQQ or enzyme. The reaction by Equation 9-3 takes place in the active center of the enzyme. CH3OH + H2O + 2PQQ → CHOOH + 2PQQH2 (9-3)
The second step is the reaction between reduced enzyme (or PQQH2) and mediator, which takes place in the active center of the enzyme. The electrons go further to mediator by this step. The reaction by Equation 9-4 is usually fast. The reaction constant at pH 9.0 was determined to be 222000 M-1s-1 for reduced MDH. PQQH2 + Mediatorox → PQQ + Mediatorre (9-4) The reduced mediator needs to move to the surface of the anode electrode by diffusion and then releases its electrons to anode. The reduced mediator does not hold any positive charge. It makes easily to move away from enzyme active center. The distance between anode surface and the enzyme active center decides how fast the reduced mediator could move. After it, the anode electrode reaction takes place.
Mediatorre → Mediatorox + 2e (9-5) When the anode electrode reaction takes place, a double electric layer is formed on the surface. The positive charge oxidized mediator is kept near the surface of the anode due to the electric layer. Once the current is taken, the electric binding force in the electric layer diminishes, then the oxidized mediator move freely again into the enzyme active center to obtain electrons. It completes one cycle at enzyme active center. The anode electrons obtained from the reduced mediator moves to cathode electrode through an external circuit since the potential at the anode usually is much lower than one at cathode. It produces a current on the load of the external circuit and the electricity energy is produced in the step. e (at anode) → e (cathode) + electricity (9-6) The electrons in the cathode react with hydrogen ion and oxygen from air to produce water on the surface of the cathode electrode if the diffusion oxygen cathode is used. If the potassium permanganate is used as oxidant, the cathode electrode reaction will be described by Equation 3-6 to produce manganese oxide and others. It is the fifth step. 4e + 4H+ + O2 → 2H2O (9-7) or 3e + KMnO4 + 4H+ → MnO2 + K+ + 2H2O (9-8)
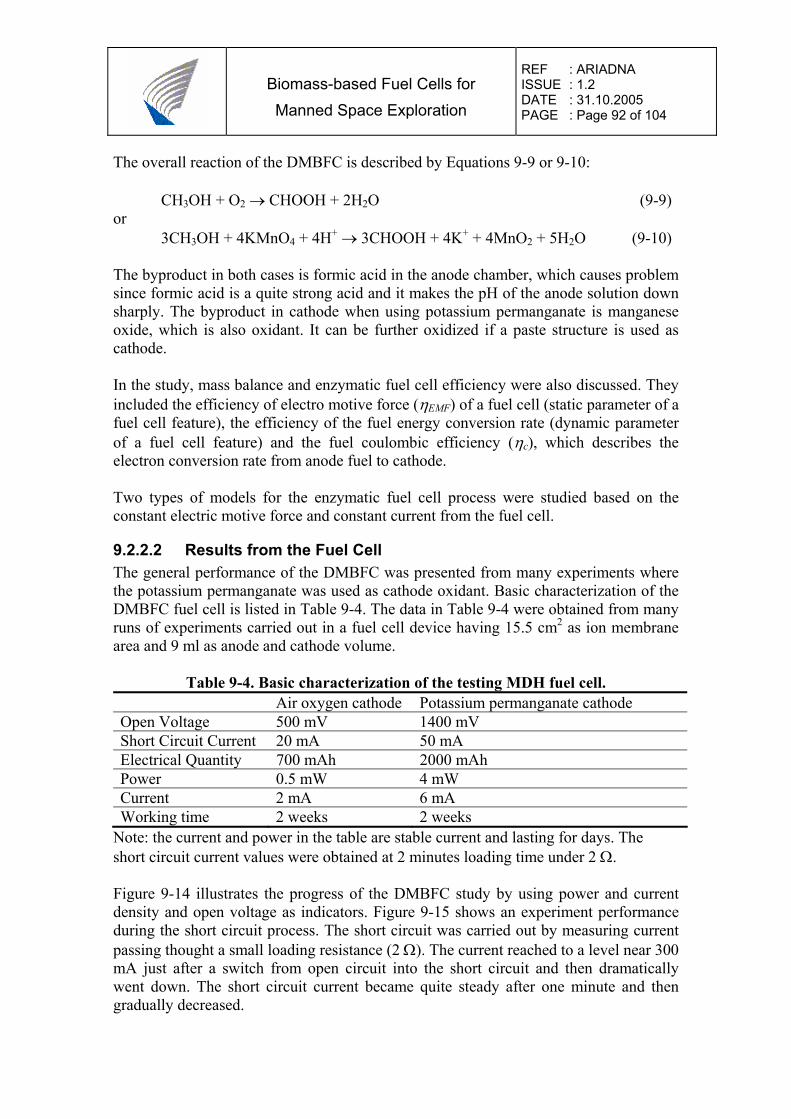
Biomass-based Fuel Cells for Manned Space Exploration
REF : ARIADNA ISSUE : 1.2 DATE : 31.10.2005 PAGE : Page 92 of 104
The overall reaction of the DMBFC is described by Equations 9-9 or 9-10:
CH3OH + O2 → CHOOH + 2H2O (9-9) or 3CH3OH + 4KMnO4 + 4H+ → 3CHOOH + 4K+ + 4MnO2 + 5H2O (9-10) The byproduct in both cases is formic acid in the anode chamber, which causes problem since formic acid is a quite strong acid and it makes the pH of the anode solution down sharply. The byproduct in cathode when using potassium permanganate is manganese oxide, which is also oxidant. It can be further oxidized if a paste structure is used as cathode. In the study, mass balance and enzymatic fuel cell efficiency were also discussed. They included the efficiency of electro motive force (ηEMF) of a fuel cell (static parameter of a fuel cell feature), the efficiency of the fuel energy conversion rate (dynamic parameter of a fuel cell feature) and the fuel coulombic efficiency (ηc), which describes the electron conversion rate from anode fuel to cathode. Two types of models for the enzymatic fuel cell process were studied based on the constant electric motive force and constant current from the fuel cell.
9.2.2.2 Results from the Fuel Cell The general performance of the DMBFC was presented from many experiments where the potassium permanganate was used as cathode oxidant. Basic characterization of the DMBFC fuel cell is listed in Table 9-4. The data in Table 9-4 were obtained from many runs of experiments carried out in a fuel cell device having 15.5 cm2 as ion membrane area and 9 ml as anode and cathode volume.
Table 9-4. Basic characterization of the testing MDH fuel cell. Air oxygen cathode Potassium permanganate cathode Open Voltage 500 mV 1400 mV Short Circuit Current 20 mA 50 mA Electrical Quantity 700 mAh 2000 mAh Power 0.5 mW 4 mW Current 2 mA 6 mA Working time 2 weeks 2 weeks
Note: the current and power in the table are stable current and lasting for days. The short circuit current values were obtained at 2 minutes loading time under 2 Ω. Figure 9-14 illustrates the progress of the DMBFC study by using power and current density and open voltage as indicators. Figure 9-15 shows an experiment performance during the short circuit process. The short circuit was carried out by measuring current passing thought a small loading resistance (2 Ω). The current reached to a level near 300 mA just after a switch from open circuit into the short circuit and then dramatically went down. The short circuit current became quite steady after one minute and then gradually decreased.
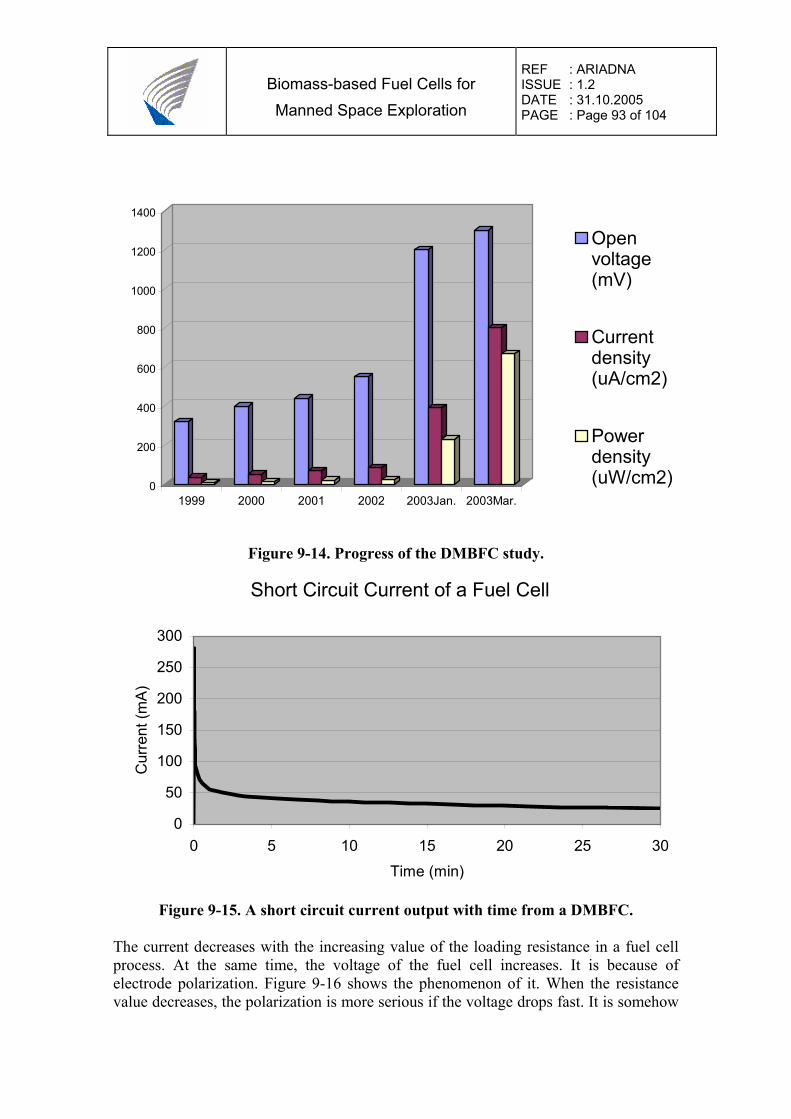
Biomass-based Fuel Cells for Manned Space Exploration
REF : ARIADNA ISSUE : 1.2 DATE : 31.10.2005 PAGE : Page 93 of 104
0
200
400
600
800
1000
1200
1400
1999 2000 2001 2002 2003Jan. 2003Mar.
Openvoltage(mV)
Currentdensity(uA/cm2)
Powerdensity(uW/cm2)
Figure 9-14. Progress of the DMBFC study.
Short Circuit Current of a Fuel Cell
0
50
100
150
200
250
300
0 5 10 15 20 25 30
Time (min)
Cur
rent
(mA
)
Figure 9-15. A short circuit current output with time from a DMBFC. The current decreases with the increasing value of the loading resistance in a fuel cell process. At the same time, the voltage of the fuel cell increases. It is because of electrode polarization. Figure 9-16 shows the phenomenon of it. When the resistance value decreases, the polarization is more serious if the voltage drops fast. It is somehow
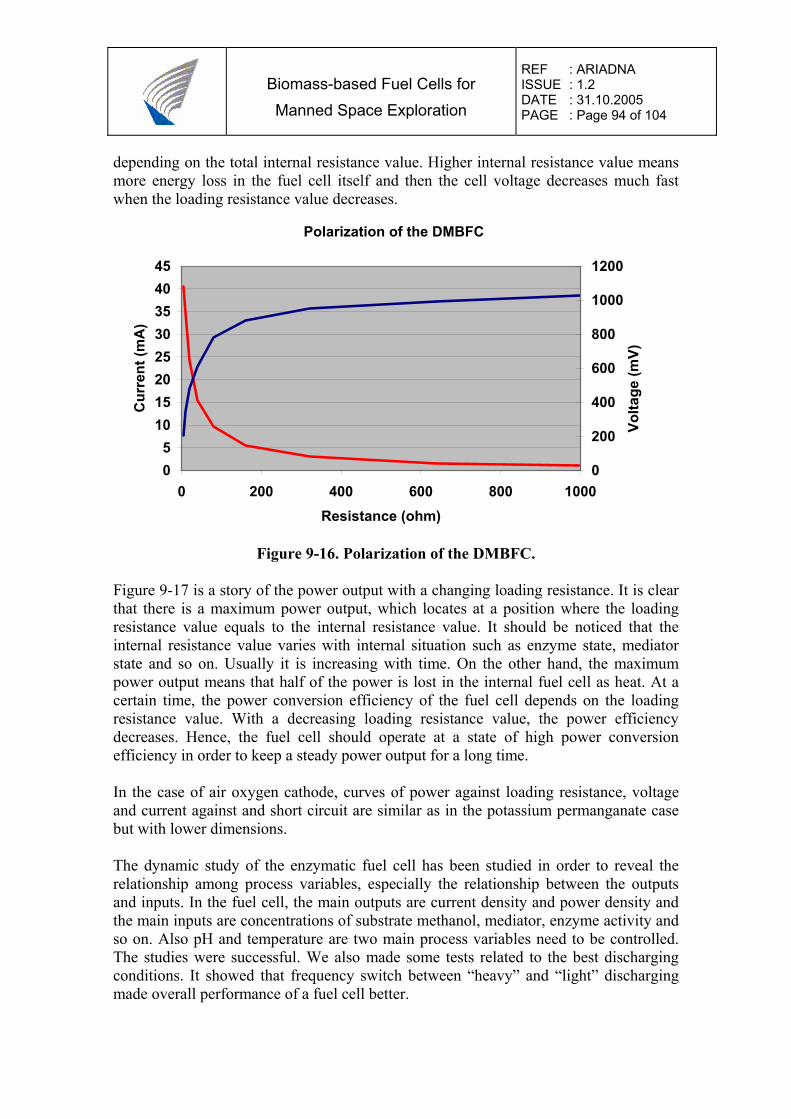
Biomass-based Fuel Cells for Manned Space Exploration
REF : ARIADNA ISSUE : 1.2 DATE : 31.10.2005 PAGE : Page 94 of 104
depending on the total internal resistance value. Higher internal resistance value means more energy loss in the fuel cell itself and then the cell voltage decreases much fast when the loading resistance value decreases.
Polarization of the DMBFC
05
1015202530354045
0 200 400 600 800 1000Resistance (ohm)
Cur
rent
(mA
)
0
200
400
600
800
1000
1200
Volta
ge (m
V)
Figure 9-16. Polarization of the DMBFC.
Figure 9-17 is a story of the power output with a changing loading resistance. It is clear that there is a maximum power output, which locates at a position where the loading resistance value equals to the internal resistance value. It should be noticed that the internal resistance value varies with internal situation such as enzyme state, mediator state and so on. Usually it is increasing with time. On the other hand, the maximum power output means that half of the power is lost in the internal fuel cell as heat. At a certain time, the power conversion efficiency of the fuel cell depends on the loading resistance value. With a decreasing loading resistance value, the power efficiency decreases. Hence, the fuel cell should operate at a state of high power conversion efficiency in order to keep a steady power output for a long time. In the case of air oxygen cathode, curves of power against loading resistance, voltage and current against and short circuit are similar as in the potassium permanganate case but with lower dimensions. The dynamic study of the enzymatic fuel cell has been studied in order to reveal the relationship among process variables, especially the relationship between the outputs and inputs. In the fuel cell, the main outputs are current density and power density and the main inputs are concentrations of substrate methanol, mediator, enzyme activity and so on. Also pH and temperature are two main process variables need to be controlled. The studies were successful. We also made some tests related to the best discharging conditions. It showed that frequency switch between “heavy” and “light” discharging made overall performance of a fuel cell better.
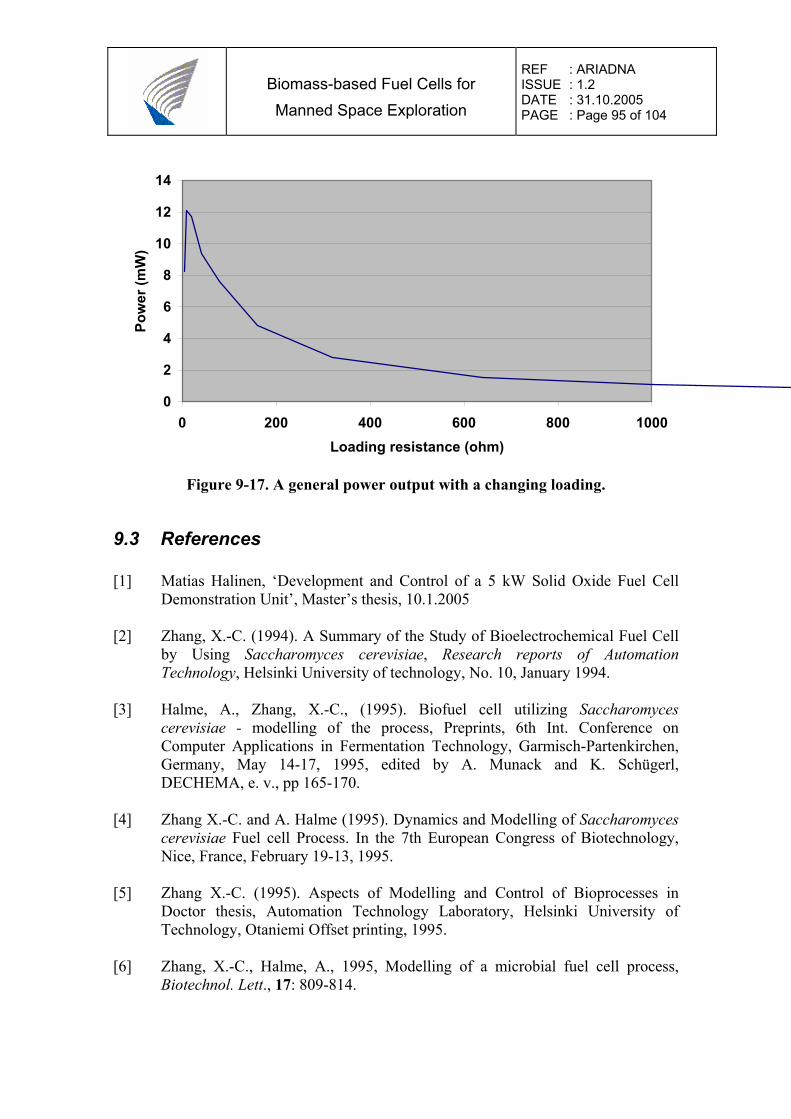
Biomass-based Fuel Cells for Manned Space Exploration
REF : ARIADNA ISSUE : 1.2 DATE : 31.10.2005 PAGE : Page 95 of 104
0
2
4
6
8
10
12
14
0 200 400 600 800 1000Loading resistance (ohm)
Pow
er (m
W)
Figure 9-17. A general power output with a changing loading.
9.3 References [1] Matias Halinen, ‘Development and Control of a 5 kW Solid Oxide Fuel Cell
Demonstration Unit’, Master’s thesis, 10.1.2005 [2] Zhang, X.-C. (1994). A Summary of the Study of Bioelectrochemical Fuel Cell
by Using Saccharomyces cerevisiae, Research reports of Automation Technology, Helsinki University of technology, No. 10, January 1994.
[3] Halme, A., Zhang, X.-C., (1995). Biofuel cell utilizing Saccharomyces
cerevisiae - modelling of the process, Preprints, 6th Int. Conference on Computer Applications in Fermentation Technology, Garmisch-Partenkirchen, Germany, May 14-17, 1995, edited by A. Munack and K. Schügerl, DECHEMA, e. v., pp 165-170.
[4] Zhang X.-C. and A. Halme (1995). Dynamics and Modelling of Saccharomyces
cerevisiae Fuel cell Process. In the 7th European Congress of Biotechnology, Nice, France, February 19-13, 1995.
[5] Zhang X.-C. (1995). Aspects of Modelling and Control of Bioprocesses in
Doctor thesis, Automation Technology Laboratory, Helsinki University of Technology, Otaniemi Offset printing, 1995.
[6] Zhang, X.-C., Halme, A., 1995, Modelling of a microbial fuel cell process,
Biotechnol. Lett., 17: 809-814.
Biomass-based Fuel Cells for Manned Space Exploration
REF : ARIADNA ISSUE : 1.2 DATE : 31.10.2005 PAGE : Page 96 of 104
[7] Halme, A., Zhang, X.-C., 1995, Experimental study of bioelectrochemical fuel cell using bacteria from Baltic sea, Research Reports of Automation Technology, Helsinki University of Technology, No.12; February 1995.
[8] Zhang X.-C. and A. Halme (1996). Studies of Microbial Fuel Cell processes and
its Reactors, 10th International Biotechnology Symposium, Sydney, 25-30 August 1996.
[9] Zhang X.-C. and A. Halme (1997). Effect of Size and Structure of a Bacterial
Fuel Cell on the Electricity Production and Energy Conversion Rate. Research reports of Automation Laboratory of HUT, No. 17, March 1997.
[10] Halme A., X.-C. Zhang and N. Rintala (1998). Monitoring and Control of a
Bacteria Fuel Cell Process by Colour Analysis, in the 7th international Conference on Computer Applications on Biotechnology, May 31 - June 4, 1998, OSAKA, Japan, pp 467-472.
[11] Zhang X.-C. and A. Halme (1999). A Biofilm Reactor for a Bacterial Fuel Cell
System. Research reports of Automation Laboratory of HUT, No. 20, August 1999.
[12] A.Ranta, X.-C. Zhang, and A. Halme, Enzymatic Fuel Cell, Biochemical Energy Conversion, Power Sources for the New Millenium, Proceedings of the International Symposium of ECS October 22-27, 2000 Phoenix USA, Proceedings Volume 2000-22, Editors Ryan, M.A., Surampudi, S., and Jain, M., The Electrochemical Society Inc., Pennington, USA, 2001, p.108-117.
[13] Zhang X.-C., Halme A., and Ranta A., Enzymatic Fuel Cell. Internal 100 pages
report, 2004.
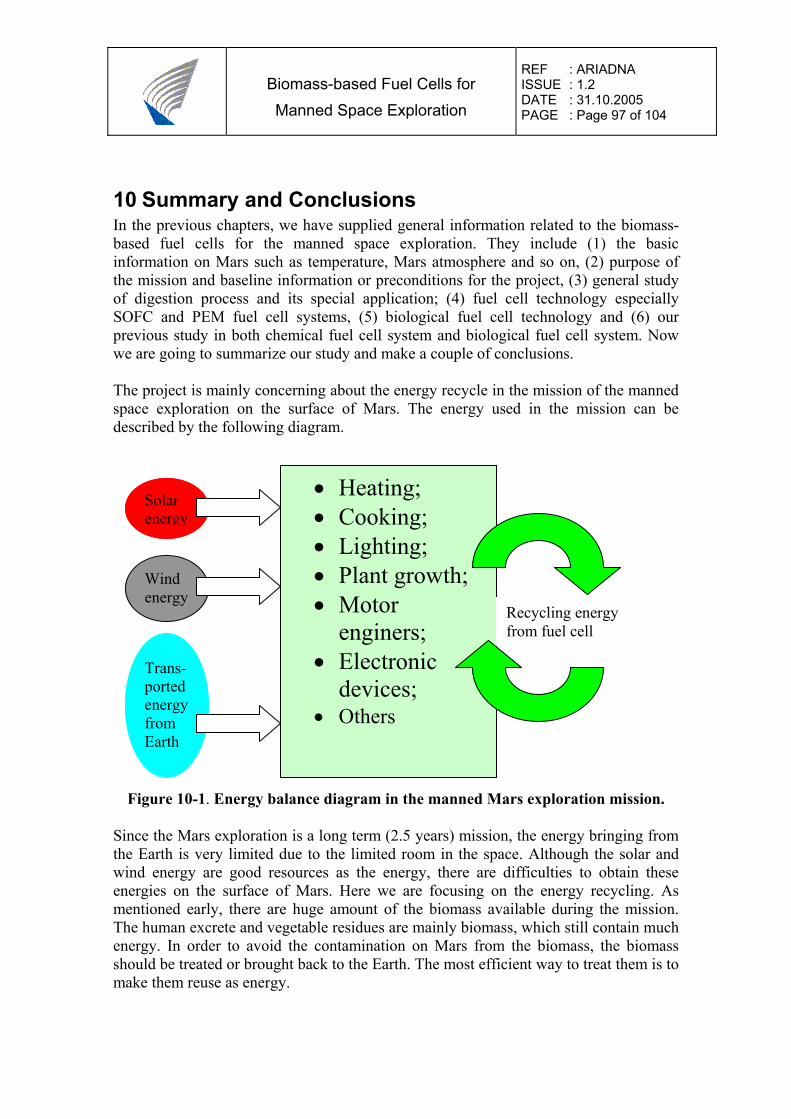
Biomass-based Fuel Cells for Manned Space Exploration
REF : ARIADNA ISSUE : 1.2 DATE : 31.10.2005 PAGE : Page 97 of 104
10 Summary and Conclusions In the previous chapters, we have supplied general information related to the biomass-based fuel cells for the manned space exploration. They include (1) the basic information on Mars such as temperature, Mars atmosphere and so on, (2) purpose of the mission and baseline information or preconditions for the project, (3) general study of digestion process and its special application; (4) fuel cell technology especially SOFC and PEM fuel cell systems, (5) biological fuel cell technology and (6) our previous study in both chemical fuel cell system and biological fuel cell system. Now we are going to summarize our study and make a couple of conclusions. The project is mainly concerning about the energy recycle in the mission of the manned space exploration on the surface of Mars. The energy used in the mission can be described by the following diagram.
Figure 10-1. Energy balance diagram in the manned Mars exploration mission.
Since the Mars exploration is a long term (2.5 years) mission, the energy bringing from the Earth is very limited due to the limited room in the space. Although the solar and wind energy are good resources as the energy, there are difficulties to obtain these energies on the surface of Mars. Here we are focusing on the energy recycling. As mentioned early, there are huge amount of the biomass available during the mission. The human excrete and vegetable residues are mainly biomass, which still contain much energy. In order to avoid the contamination on Mars from the biomass, the biomass should be treated or brought back to the Earth. The most efficient way to treat them is to make them reuse as energy.
Solar energy
Wind energy
Trans-ported energy from Earth
• Heating; • Cooking; • Lighting; • Plant growth; • Motor
enginers; • Electronic
devices; • Others
Recycling energy from fuel cell
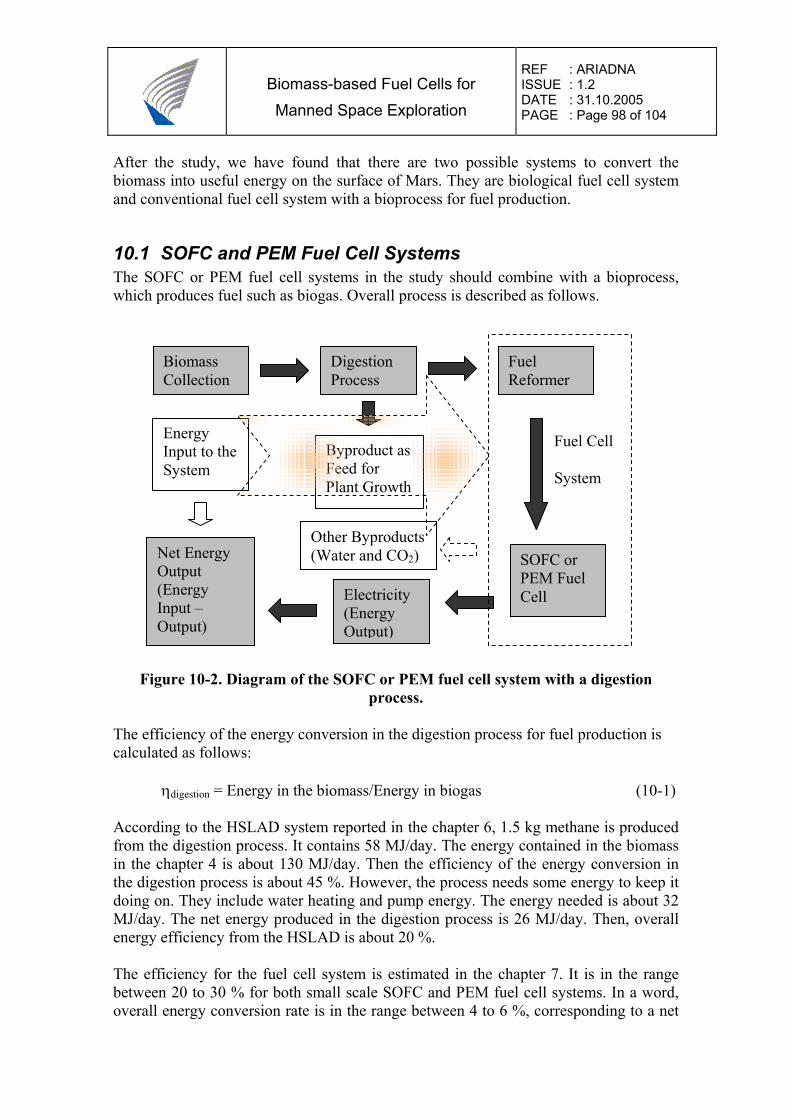
Biomass-based Fuel Cells for Manned Space Exploration
REF : ARIADNA ISSUE : 1.2 DATE : 31.10.2005 PAGE : Page 98 of 104
After the study, we have found that there are two possible systems to convert the biomass into useful energy on the surface of Mars. They are biological fuel cell system and conventional fuel cell system with a bioprocess for fuel production.
10.1 SOFC and PEM Fuel Cell Systems The SOFC or PEM fuel cell systems in the study should combine with a bioprocess, which produces fuel such as biogas. Overall process is described as follows.
Figure 10-2. Diagram of the SOFC or PEM fuel cell system with a digestion
process. The efficiency of the energy conversion in the digestion process for fuel production is calculated as follows: ηdigestion = Energy in the biomass/Energy in biogas (10-1) According to the HSLAD system reported in the chapter 6, 1.5 kg methane is produced from the digestion process. It contains 58 MJ/day. The energy contained in the biomass in the chapter 4 is about 130 MJ/day. Then the efficiency of the energy conversion in the digestion process is about 45 %. However, the process needs some energy to keep it doing on. They include water heating and pump energy. The energy needed is about 32 MJ/day. The net energy produced in the digestion process is 26 MJ/day. Then, overall energy efficiency from the HSLAD is about 20 %. The efficiency for the fuel cell system is estimated in the chapter 7. It is in the range between 20 to 30 % for both small scale SOFC and PEM fuel cell systems. In a word, overall energy conversion rate is in the range between 4 to 6 %, corresponding to a net
Digestion Process
Fuel Reformer
Biomass Collection
SOFC or PEM Fuel Cell Electricity
(Energy Output)
Byproduct as Feed for Plant Growth
Net Energy Output (Energy Input – Output)
Energy Input to the System
Fuel Cell System
Other Byproducts (Water and CO2)
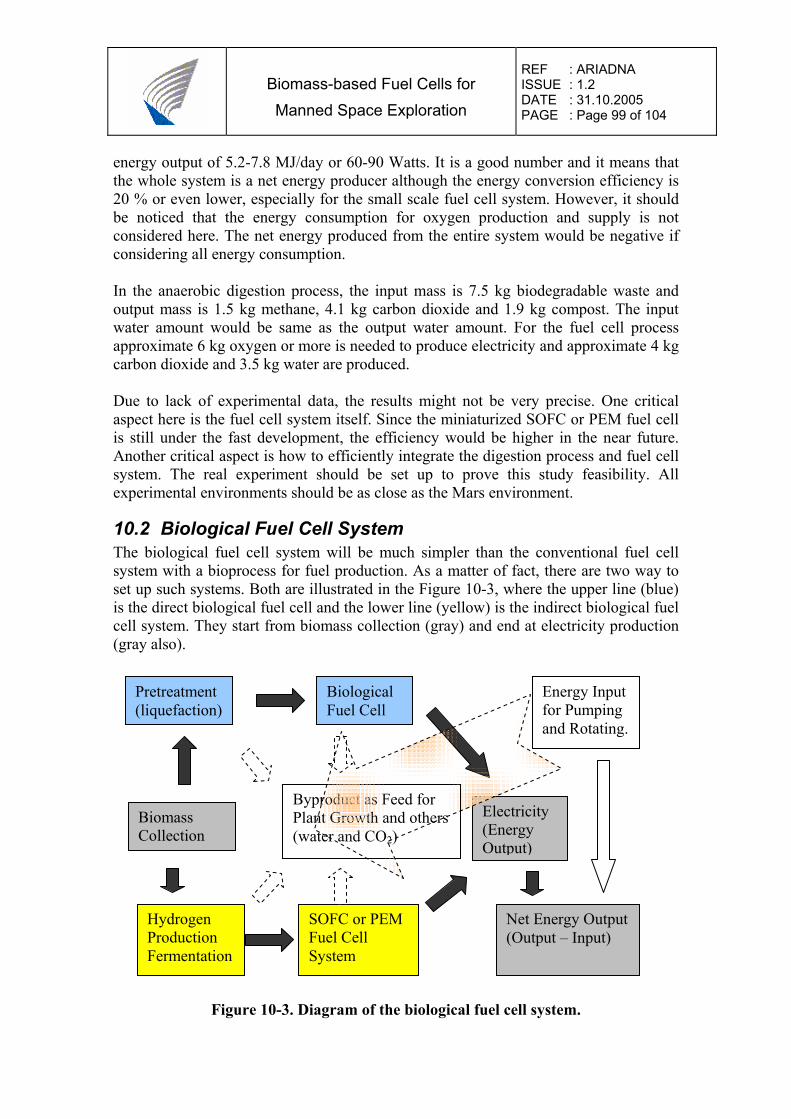
Biomass-based Fuel Cells for Manned Space Exploration
REF : ARIADNA ISSUE : 1.2 DATE : 31.10.2005 PAGE : Page 99 of 104
energy output of 5.2-7.8 MJ/day or 60-90 Watts. It is a good number and it means that the whole system is a net energy producer although the energy conversion efficiency is 20 % or even lower, especially for the small scale fuel cell system. However, it should be noticed that the energy consumption for oxygen production and supply is not considered here. The net energy produced from the entire system would be negative if considering all energy consumption. In the anaerobic digestion process, the input mass is 7.5 kg biodegradable waste and output mass is 1.5 kg methane, 4.1 kg carbon dioxide and 1.9 kg compost. The input water amount would be same as the output water amount. For the fuel cell process approximate 6 kg oxygen or more is needed to produce electricity and approximate 4 kg carbon dioxide and 3.5 kg water are produced. Due to lack of experimental data, the results might not be very precise. One critical aspect here is the fuel cell system itself. Since the miniaturized SOFC or PEM fuel cell is still under the fast development, the efficiency would be higher in the near future. Another critical aspect is how to efficiently integrate the digestion process and fuel cell system. The real experiment should be set up to prove this study feasibility. All experimental environments should be as close as the Mars environment.
10.2 Biological Fuel Cell System The biological fuel cell system will be much simpler than the conventional fuel cell system with a bioprocess for fuel production. As a matter of fact, there are two way to set up such systems. Both are illustrated in the Figure 10-3, where the upper line (blue) is the direct biological fuel cell and the lower line (yellow) is the indirect biological fuel cell system. They start from biomass collection (gray) and end at electricity production (gray also).
Figure 10-3. Diagram of the biological fuel cell system.
Pretreatment (liquefaction)
Biomass Collection
Biological Fuel Cell
Electricity (Energy Output)
Byproduct as Feed for Plant Growth and others (water and CO2)
Hydrogen Production Fermentation
Energy Input for Pumping and Rotating.
SOFC or PEM Fuel Cell System
Net Energy Output (Output – Input)
Biomass-based Fuel Cells for Manned Space Exploration
REF : ARIADNA ISSUE : 1.2 DATE : 31.10.2005 PAGE : Page 100 of 104
For the case of direct biological fuel cell, the energy contained in the biodegradable waste is about 130 MJ/day. The energy consumption for the entire process is unknown. Our estimated value is 30 MJ/day. The energy consumed is mainly for substrate pumping, mixing, oxygen supply and so on. It will be proved from the real experiments. The electricity produced (energy output) is 19.5 MJ/day or 226 W if the power density produced is 0.4 mW/cm2. The electricity is 39 MJ/day or 452 W for a power density of 0.8 mW/cm2. It means that the net energy change for the entire process is almost zero and energy conversion rate of the process is about 15 to 30 %. The mass balance is that the inputs are about 7.5 kg biodegradable waste and 3.5 – 6 kg oxygen. The amount of oxygen consumed in the process depends on the current density and the efficiency of oxygen utilization. The outputs contain 2-3 kg compost, 5-5.5 kg carbon dioxide, 3 – 3.5 kg water and others according to our estimation. The critical issues here are (1) how to improve the power density from the direct biological fuel cell system in order to make the direct biological fuel cell process a net energy producer and (2) how to stabilize the bacteria used as catalyst in the process in order to make the life time of the system longer and efficient.
10.3 Conclusions Based on the previous study, we have a couple of preliminary conclusions and suggestions. Both biological fuel cell and conventional fuel cell with digestion process are valuable for the mission of Mars space exploration although the net energy production from them is low or near to zero. It is because at least the problem of waste treatment is solved in the aid of the system. On the other hand, the net energy production will be more positive when pure oxygen is used as oxidant on the surface of the Mars and after more research will be made in the field. We have assumed though out the study that there are enough oxygen available in site on the surface of Mars. However, the real fact is the oxygen will be produced by water electrolysis or other method in site on the surface of Mars. If the energy needed to produce oxygen is considered in the process, it might make both systems a net energy production negative. It might be helpful if other solid or liquid form oxidant would be used as cathode oxidant in the direct biological fuel cell system. If a strong chemical oxidant such as potassium permanganese is used, the cell voltage will be higher than using air oxygen as cathode oxidant. It also makes the power density higher in the direct biological fuel cell. Finally, we would like to express our great appreciation to Ms. Tiziana Pipoli and others for giving us this opportunity to involve that interesting project and for their strong support during the project period.


![Design Space Exploration of Hardware Spiking …FPGA-Spartan6 LX150 no RTL FC LIF Frame-based Classification ConfConvNode[23]-2018 Digital FPGA-Xilinx Spartan6 no RTL Conv/Pool LIF](https://img.pdfslide.org/doc/110x75/5f4c53e8a433d341a632c49c/design-space-exploration-of-hardware-spiking-fpga-spartan6-lx150-no-rtl-fc-lif-frame-based.jpg)


![POTENTIALS IN AYURVED & THEIR EXPLORATION · POTENTIALS IN AYURVED & THEIR EXPLORATION AAAayauvao Aayauvaoayauvao----d maoM samBaavanaaeM evaM ]naka AnvaoYaNad maoM samBaavanaaeM](https://img.pdfslide.org/doc/110x75/5e6166c6481b101f37237db5/potentials-in-ayurved-their-potentials-in-ayurved-their-exploration.jpg)