Embed Size (px)
Citation preview

The bankfor a changing
world
MAPPING THE UK’S POST-BREXIT GROWTH
BNP PARIBAS MARKET LEADERS REPORT

Foreword5
Executive Summary6
Key Findings7
Fastest growing sectors in the UK � GVA
� Employment
� Locations of high growth sectors
� Deep dive sectors
8
Drivers of growth: survey analysis of ‘Market Leaders’ � External growth drivers
� Technological drivers
� Employee drivers
� Business strategy drivers
14
Conclusion18
Appendix19

03
BNP PARIBAS MARKET LEADERS REPORT
© Centre for Economics and Business Research

In times of unprecedented change, commentators, analysts and business leaders can be forgiven for focusing on the here and now. However, what we must guard against is falling into the trap of short-termism. Instead, we need to demonstrate discipline and vision to look beyond the latest tweet, headline, or cycle of quarterly reporting, which can so often generate more heat than light. More than ever, as well as managing the ‘now’, it’s vital for businesses to look up, to look forward, and make time to analyse the long term.
BNP Paribas has been serving UK businesses for more than 150 years. Today, we help finance businesses; manage risks for businesses; lease equipment for businesses; administer car fleets for businesses; provide real estate solutions for businesses. We lend, move, invest and keep money safe. We have, in short, a long-term stake in serving UK PLC.
To this end, we wanted to know where the UK economy is going and what are the drivers shaping it. That’s why we commissioned the Centre for Economics and Business Research (Cebr) to look not just at the next year, or even five years, but the next two decades.
Forecasting can be a tricky business, but the BNP Paribas Market Leaders Report indicates that the long-term economic future of the UK looks promising. Growth and job creation are likely to come through innovation in the sustainable businesses of the future – from clean energy, to disruptive technology, to health and social care – that help make our lives better.
We hope that the findings help shed light on the long term, generate debate and ideas, and provide an additional perspective on our changing world.
ANNE MARIE VERSTRAETEN UK COUNTRY HEAD, BNP PARIBAS
BNP PARIBAS MARKET LEADERS REPORT
05
EXECUTIVE SUMMARY
While there is plenty of research that looks at the near-term Brexit fall out, less well considered is the UK’s ultimate return to prosperity after leaving the European Union: the long-term economic picture. This report, undertaken by Cebr, seeks to identify and examine the industries that will ultimately prosper in a post-Brexit business landscape.
06
BNP PARIBAS MARKET LEADERS REPORT
© Centre for Economics and Business Research
Following the EU referendum, uncertainty has been prevalent in the UK economy, along with the need for businesses to prepare for Brexit.
For some, this has led to a short-term boost. For example, the Office of National Statistics reports that the manufacturing sector grew at its fastest rate in 2019 since 1988, driven by the well-publicised stock piling effect. The news in the latest quarterly GDP figures however was less encouraging. Additionally, ratings agency Moody’s has warned that a recession is now likely in the event of a ‘no deal’ EU exit.
However, while there is plenty of research that looks at the near-term Brexit fall out, less well considered is the UK’s ultimate return to prosperity after leaving the European Union: the long-term economic picture. This report, undertaken by Cebr, seeks to identify and examine the industries that will ultimately prosper in a post-Brexit business landscape. To make these predictions it uses both Cebr’s forecasting model, based on economic output and employment figures, and a survey of more than 1,500 UK enterprises.
The report tells us that despite Brexit headwinds, there are a number of opportunities that will be open to many industries in the long term, particularly in the UK science and technology sectors. There is no doubt that Brexit will provide a catalyst for businesses in these fields to scale further, particularly across markets outside the EU, not least in the fields of computer programming, cyber security and consulting.
In addition, the UK’s 2050 net zero emissions target has put a spotlight on environmental sustainability as a driver of growth for the economy. For example, the automotive industry, seen by some as a sector embedded firmly in a high-carbon economy, is overwhelmingly positive about the impact of green initiatives on growth. In fact, it is the factor that most leaders in the sector believe will positively affect growth.
One of the great achievements of the twentieth century is a dramatic rise in life expectancy. And while an older population presents many challenges to labour markets, government tax, government spending and the wider economy, it presents a real opportunity for many sectors to grow in response to the demands of this growing demographic. Over the next 20 years, we are going to see leaps forward in scientific research and development, pharmaceutical advances and many more jobs created in health and social care.
Indeed, improving services for older people requires us to consider each component of care, since many older people use multiple services, and the quality, capacity and responsiveness of any one component will affect others. This means that multiple companies, in multiple sectors, may prosper in a bid to ensure holistic and enduring care.

KEY FINDINGSThe key findings in this report are:
l The Scientific, Admin & Support sector is set to be the fastest growing sector in terms of output growth over the next two decades. It is set to see a 43% increase in the value of output per year over the ten years to 2028, and double in size by 2038. Scientific research and development will rise in importance over the coming years as growing demand for healthcare from an ageing population intensifies the need for advanced medical and pharmaceutical solutions.
l The second fastest economic growth over the next two decades will be in the Transport, Storage and Communications sector, with a 40% rise in output between 2018 and 2028, and a 92% increase in the 20 years to 2038. This will be driven by computer programming, consulting and related activities, as technological advancements including AI, automation and robotics proliferate.
l The sector that is expected to see the fastest employment growth over the two decades to 2038 is Transport, Storage and Communication. We forecast a 37% increase in the number of workers over this time period. The IT and computer programming subsector of this broad industry is likely to see a significant rise in the number of people in employment, fuelled in part by widespread digital disruption across all industries.
l The Construction sector is also expected to see a notable increase in the level of employment in the coming years, with a 35% rise in employment over the next two decades.
l Environmental sustainability issues are key growth drivers for Automotive (68%) and Construction industry (60%) leaders, the top and third most positive respectively.
A key external factor affecting growth at different enterprises is Brexit. Businesses that have experienced above average revenue and employment growth for the past three years are much more likely to say that they have benefited from Brexit, with 10% saying they have been very positively affected and 24% saying they have been fairly positively affected.
© Centre for Economics and Business Research 07
BNP PARIBAS MARKET LEADERS REPORT
08
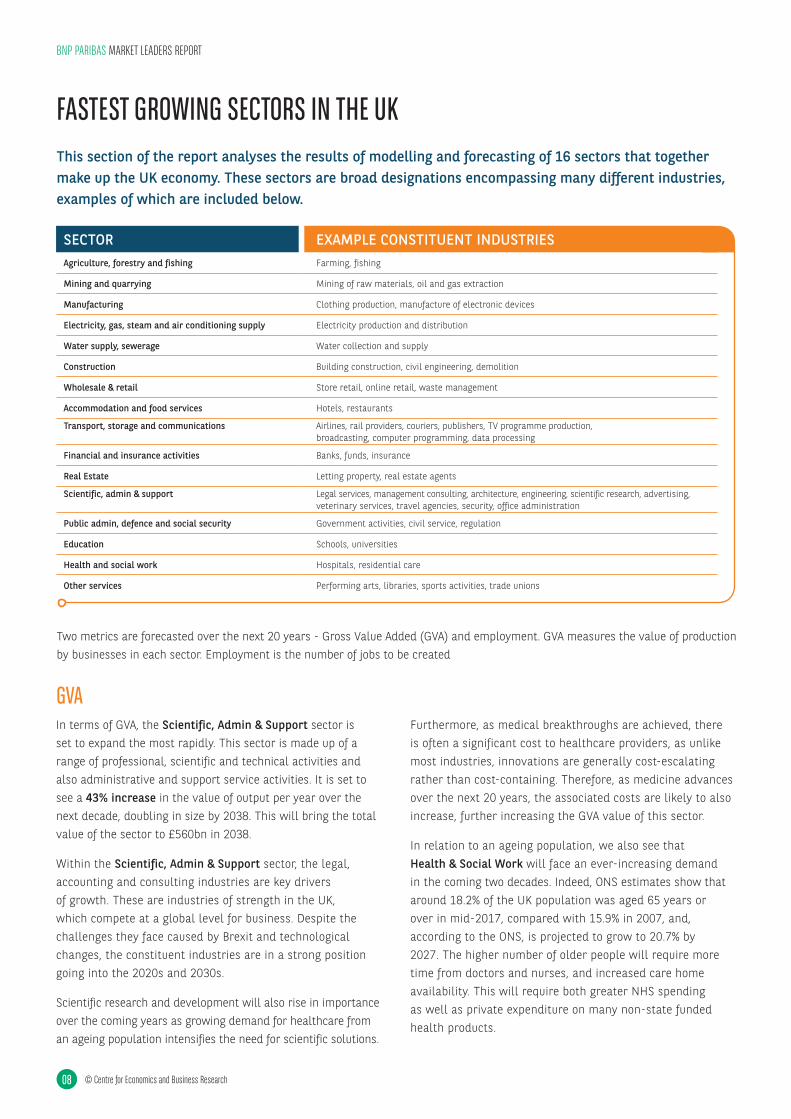
This section of the report analyses the results of modelling and forecasting of 16 sectors that together make up the UK economy. These sectors are broad designations encompassing many different industries, examples of which are included below.
Two metrics are forecasted over the next 20 years - Gross Value Added (GVA) and employment. GVA measures the value of production by businesses in each sector. Employment is the number of jobs to be created
In terms of GVA, the Scientific, Admin & Support sector is set to expand the most rapidly. This sector is made up of a range of professional, scientific and technical activities and also administrative and support service activities. It is set to see a 43% increase in the value of output per year over the next decade, doubling in size by 2038. This will bring the total value of the sector to £560bn in 2038.
Within the Scientific, Admin & Support sector, the legal, accounting and consulting industries are key drivers of growth. These are industries of strength in the UK, which compete at a global level for business. Despite the challenges they face caused by Brexit and technological changes, the constituent industries are in a strong position going into the 2020s and 2030s.
Scientific research and development will also rise in importance over the coming years as growing demand for healthcare from an ageing population intensifies the need for scientific solutions.
Furthermore, as medical breakthroughs are achieved, there is often a significant cost to healthcare providers, as unlike most industries, innovations are generally cost-escalating rather than cost-containing. Therefore, as medicine advances over the next 20 years, the associated costs are likely to also increase, further increasing the GVA value of this sector.
In relation to an ageing population, we also see that Health & Social Work will face an ever-increasing demand in the coming two decades. Indeed, ONS estimates show that around 18.2% of the UK population was aged 65 years or over in mid-2017, compared with 15.9% in 2007, and, according to the ONS, is projected to grow to 20.7% by 2027. The higher number of older people will require more time from doctors and nurses, and increased care home availability. This will require both greater NHS spending as well as private expenditure on many non-state funded health products.
FASTEST GROWING SECTORS IN THE UK
GVA
SECTOR EXAMPLE CONSTITUENT INDUSTRIES Agriculture, forestry and fishing Farming, fishing
Mining and quarrying Mining of raw materials, oil and gas extraction
Manufacturing Clothing production, manufacture of electronic devices
Electricity, gas, steam and air conditioning supply Electricity production and distribution
Water supply, sewerage Water collection and supply
Construction Building construction, civil engineering, demolition
Wholesale & retail Store retail, online retail, waste management
Accommodation and food services Hotels, restaurants
Transport, storage and communications Airlines, rail providers, couriers, publishers, TV programme production, broadcasting, computer programming, data processing
Financial and insurance activities Banks, funds, insurance
Real Estate Letting property, real estate agents
Scientific, admin & support Legal services, management consulting, architecture, engineering, scientific research, advertising, veterinary services, travel agencies, security, office administration
Public admin, defence and social security Government activities, civil service, regulation
Education Schools, universities
Health and social work Hospitals, residential care
Other services Performing arts, libraries, sports activities, trade unions
BNP PARIBAS MARKET LEADERS REPORT
© Centre for Economics and Business Research
09
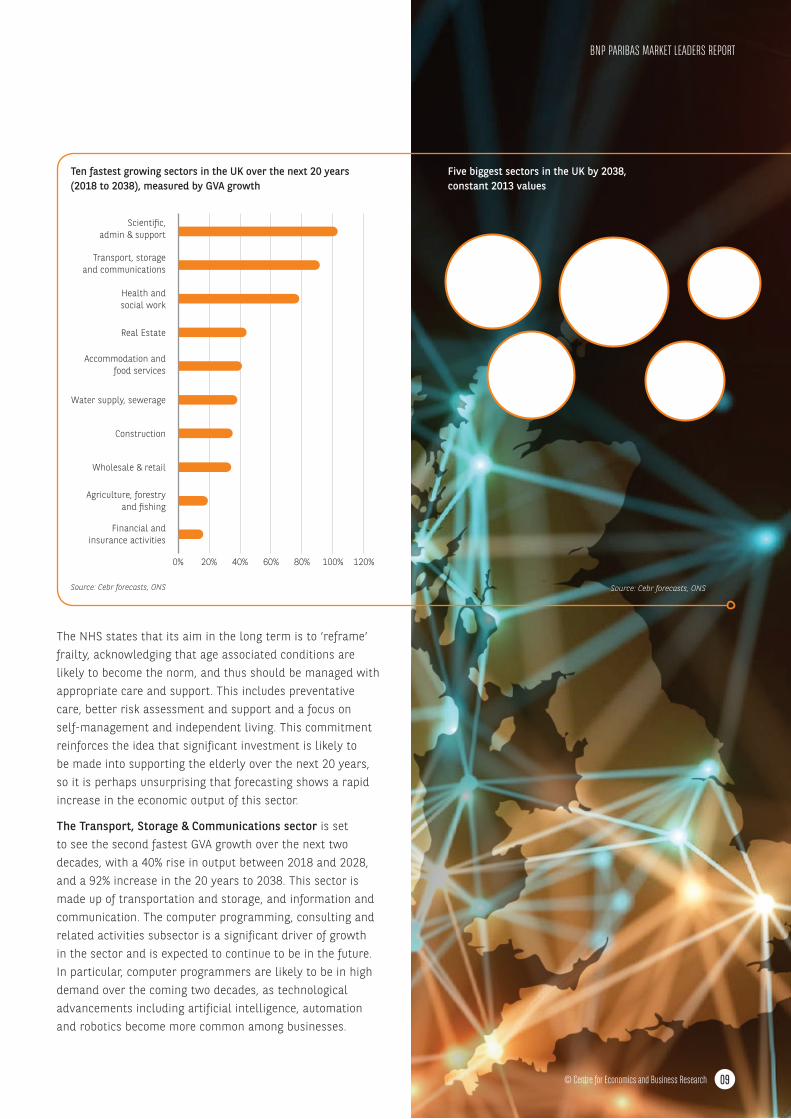
The NHS states that its aim in the long term is to ‘reframe’ frailty, acknowledging that age associated conditions are likely to become the norm, and thus should be managed with appropriate care and support. This includes preventative care, better risk assessment and support and a focus on self-management and independent living. This commitment reinforces the idea that significant investment is likely to be made into supporting the elderly over the next 20 years, so it is perhaps unsurprising that forecasting shows a rapid increase in the economic output of this sector.
The Transport, Storage & Communications sector is set to see the second fastest GVA growth over the next two decades, with a 40% rise in output between 2018 and 2028, and a 92% increase in the 20 years to 2038. This sector is made up of transportation and storage, and information and communication. The computer programming, consulting and related activities subsector is a significant driver of growth in the sector and is expected to continue to be in the future. In particular, computer programmers are likely to be in high demand over the coming two decades, as technological advancements including artificial intelligence, automation and robotics become more common among businesses.
0% 20% 40% 60% 80% 100% 120%
Financial and insurance activities
Agriculture, forestry and �shing
Wholesale & retail
Construction
Water supply, sewerage
Accommodation andfood services
Real Estate
Health and social work
Transport, storage and communications
Scienti�c, admin & support
Transport, storage and
communications
£451bn
Scienti c, admin & support
£560bn
Health and social work
£258bn
Real Estate
£354bnWholesale
& retail
£317bn
Five biggest sectors in the UK by 2038, constant 2013 values
Source: Cebr forecasts, ONSSource: Cebr forecasts, ONS
Ten fastest growing sectors in the UK over the next 20 years (2018 to 2038), measured by GVA growth
BNP PARIBAS MARKET LEADERS REPORT
© Centre for Economics and Business Research
10
In addition to a forecast of economic growth, we have modelled the labour markets of the 16 ONS economic sectors to understand how they are set to change in the coming 20 years.
Across the economy, major themes disrupting the labour market include:
l The automation of repetitive tasks
l The rise of the gig economy
l Technological changes requiring labour to have new skills and qualifications
l Brexit impacting the availability of migrant workers
l Demands from employees for flexible working.
These themes affect different industries in different ways, with some seeing a reduction in the number of people employed. This is the case for the Wholesale & Retail & Manufacturing sector, which is expected to see a contraction in the number of workers over the next decade.
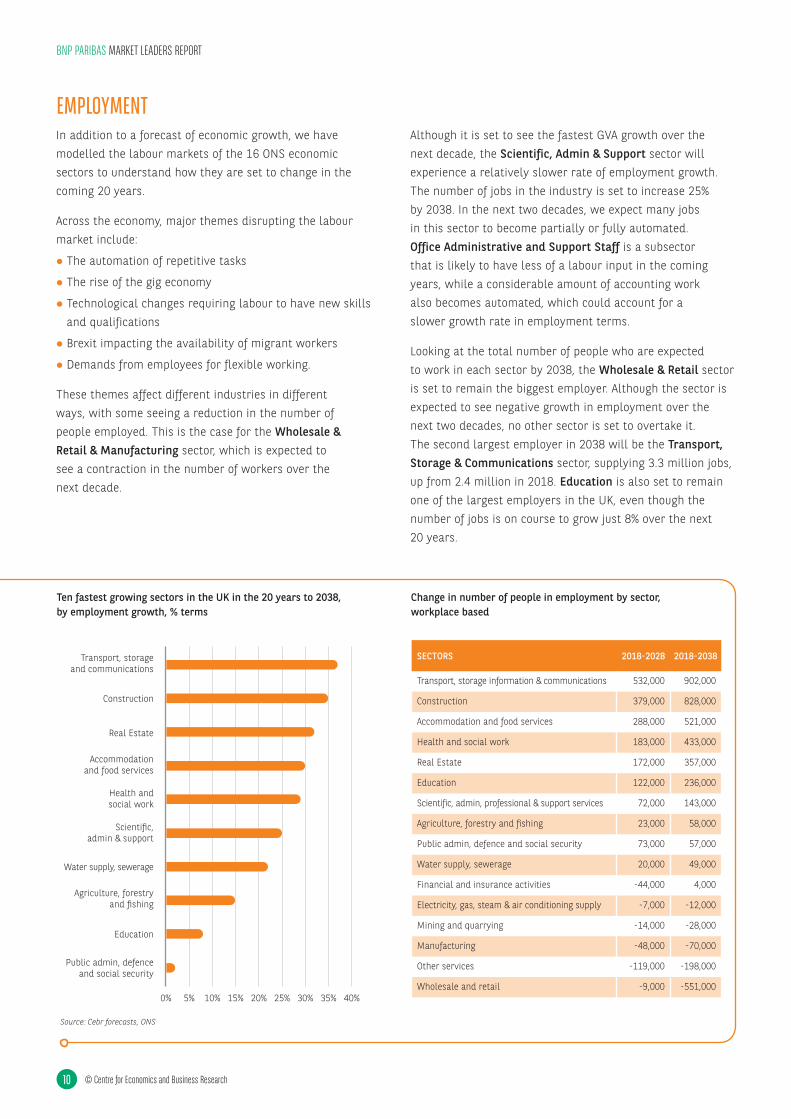
Although it is set to see the fastest GVA growth over the next decade, the Scientific, Admin & Support sector will experience a relatively slower rate of employment growth. The number of jobs in the industry is set to increase 25% by 2038. In the next two decades, we expect many jobs in this sector to become partially or fully automated. Office Administrative and Support Staff is a subsector that is likely to have less of a labour input in the coming years, while a considerable amount of accounting work also becomes automated, which could account for a slower growth rate in employment terms.
Looking at the total number of people who are expected to work in each sector by 2038, the Wholesale & Retail sector is set to remain the biggest employer. Although the sector is expected to see negative growth in employment over the next two decades, no other sector is set to overtake it. The second largest employer in 2038 will be the Transport, Storage & Communications sector, supplying 3.3 million jobs, up from 2.4 million in 2018. Education is also set to remain one of the largest employers in the UK, even though the number of jobs is on course to grow just 8% over the next 20 years.
EMPLOYMENT
BNP PARIBAS MARKET LEADERS REPORT
© Centre for Economics and Business Research
0% 5% 10% 15% 20% 25% 30% 35% 40%
Public admin, defenceand social security
Education
Agriculture, forestryand �shing
Water supply, sewerage
Scienti�c, admin & support
Health andsocial work
Accommodationand food services
Real Estate
Construction
Transport, storageand communications
Ten fastest growing sectors in the UK in the 20 years to 2038, by employment growth, % terms
Source: Cebr forecasts, ONS
Change in number of people in employment by sector, workplace based
SECTORS 2018-2028 2018-2038
Transport, storage information & communications 532,000 902,000
Construction 379,000 828,000
Accommodation and food services 288,000 521,000
Health and social work 183,000 433,000
Real Estate 172,000 357,000
Education 122,000 236,000
Scientific, admin, professional & support services 72,000 143,000
Agriculture, forestry and fishing 23,000 58,000
Public admin, defence and social security 73,000 57,000
Water supply, sewerage 20,000 49,000
Financial and insurance activities -44,000 4,000
Electricity, gas, steam & air conditioning supply -7,000 -12,000
Mining and quarrying -14,000 -28,000
Manufacturing -48,000 -70,000
Other services -119,000 -198,000
Wholesale and retail -9,000 -551,000
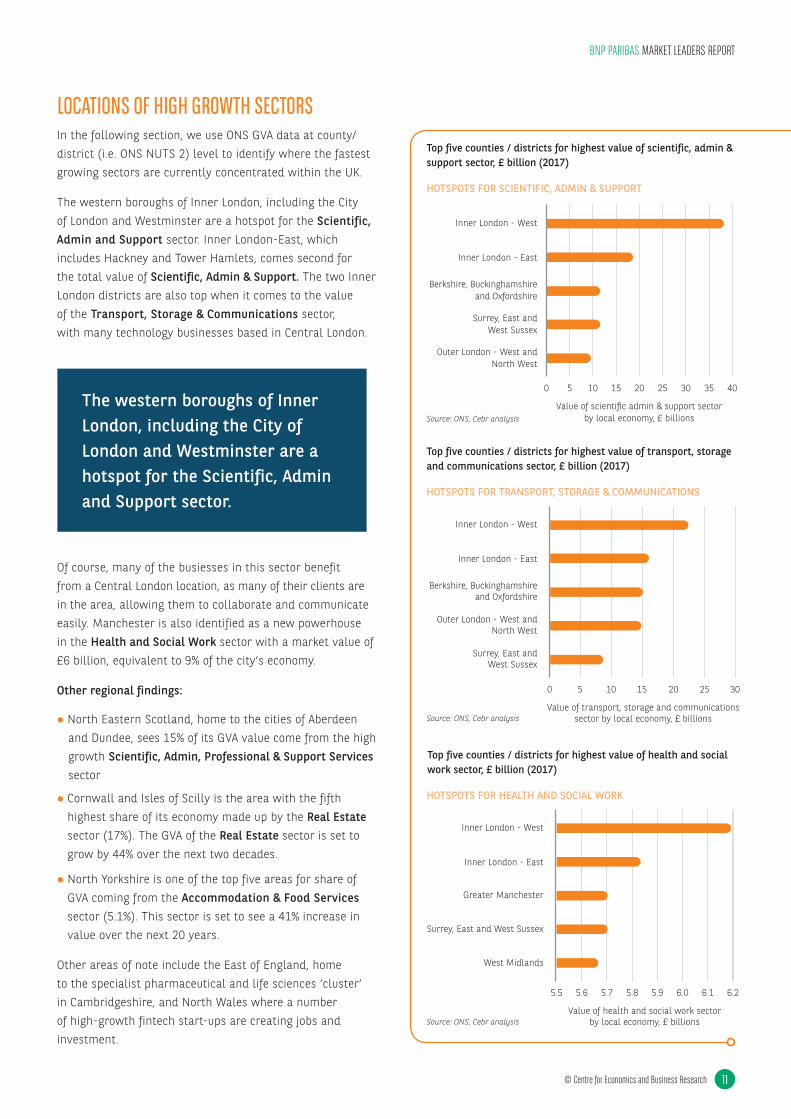
In the following section, we use ONS GVA data at county/district (i.e. ONS NUTS 2) level to identify where the fastest growing sectors are currently concentrated within the UK.
The western boroughs of Inner London, including the City of London and Westminster are a hotspot for the Scientific, Admin and Support sector. Inner London-East, which includes Hackney and Tower Hamlets, comes second for the total value of Scientific, Admin & Support. The two Inner London districts are also top when it comes to the value of the Transport, Storage & Communications sector, with many technology businesses based in Central London.
Of course, many of the busiesses in this sector benefit from a Central London location, as many of their clients are in the area, allowing them to collaborate and communicate easily. Manchester is also identified as a new powerhouse in the Health and Social Work sector with a market value of £6 billion, equivalent to 9% of the city‘s economy.
Other regional findings:
l North Eastern Scotland, home to the cities of Aberdeen and Dundee, sees 15% of its GVA value come from the high growth Scientific, Admin, Professional & Support Services sector
l Cornwall and Isles of Scilly is the area with the fifth highest share of its economy made up by the Real Estate sector (17%). The GVA of the Real Estate sector is set to grow by 44% over the next two decades.
l North Yorkshire is one of the top five areas for share of GVA coming from the Accommodation & Food Services sector (5.1%). This sector is set to see a 41% increase in value over the next 20 years.
Other areas of note include the East of England, home to the specialist pharmaceutical and life sciences ‘cluster’ in Cambridgeshire, and North Wales where a number of high-growth fintech start-ups are creating jobs and investment.
LOCATIONS OF HIGH GROWTH SECTORS
© Centre for Economics and Business Research
BNP PARIBAS MARKET LEADERS REPORT
11
The western boroughs of Inner London, including the City of London and Westminster are a hotspot for the Scientific, Admin and Support sector.
0 5 10 15 20 25 30 35 40
Outer London - West andNorth West
Surrey, East andWest Sussex
Berkshire, Buckinghamshireand Oxfordshire
Inner London - East
Inner London - West
Value of scienti c admin & support sectorby local economy, £ billions
Top five counties / districts for highest value of scientific, admin & support sector, £ billion (2017)
HOTSPOTS FOR SCIENTIFIC, ADMIN & SUPPORT
Source: ONS, Cebr analysis
0 5 10 15 20 25 30
Surrey, East andWest Sussex
Outer London - West andNorth West
Berkshire, Buckinghamshireand Oxfordshire
Inner London - East
Inner London - West
Value of transport, storage and communicationssector by local economy, £ billions
Top five counties / districts for highest value of transport, storage and communications sector, £ billion (2017)
HOTSPOTS FOR TRANSPORT, STORAGE & COMMUNICATIONS
Source: ONS, Cebr analysis
5.5 5.6 5.7 5.8 5.9 6.0 6.1 6.2
West Midlands
Surrey, East and West Sussex
Greater Manchester
Inner London - East
Inner London - West
Value of health and social work sectorby local economy, £ billions
Top five counties / districts for highest value of health and social work sector, £ billion (2017)
Source: ONS, Cebr analysis
HOTSPOTS FOR HEALTH AND SOCIAL WORK
12
In addition to the 16 sectors analysed, we conducted a more in depth analysis of growth in four sectors. These are:
l Automotive, made up of three subsectors:
l Manufacture of motor vehicles, trailers and semi-trailers
l Retail and repair of motor vehicles and motorcycles
l Renting and leasing of motor vehicles
l Computer programming, consultancy and related activities
l Construction
l Real Estate.
The Construction and Real Estate sectors are two of the 16 broad sectors already analysed in this report, but the three automotive subsectors and computer programming, consultancy and related activities required additional forecasts, are presented below.
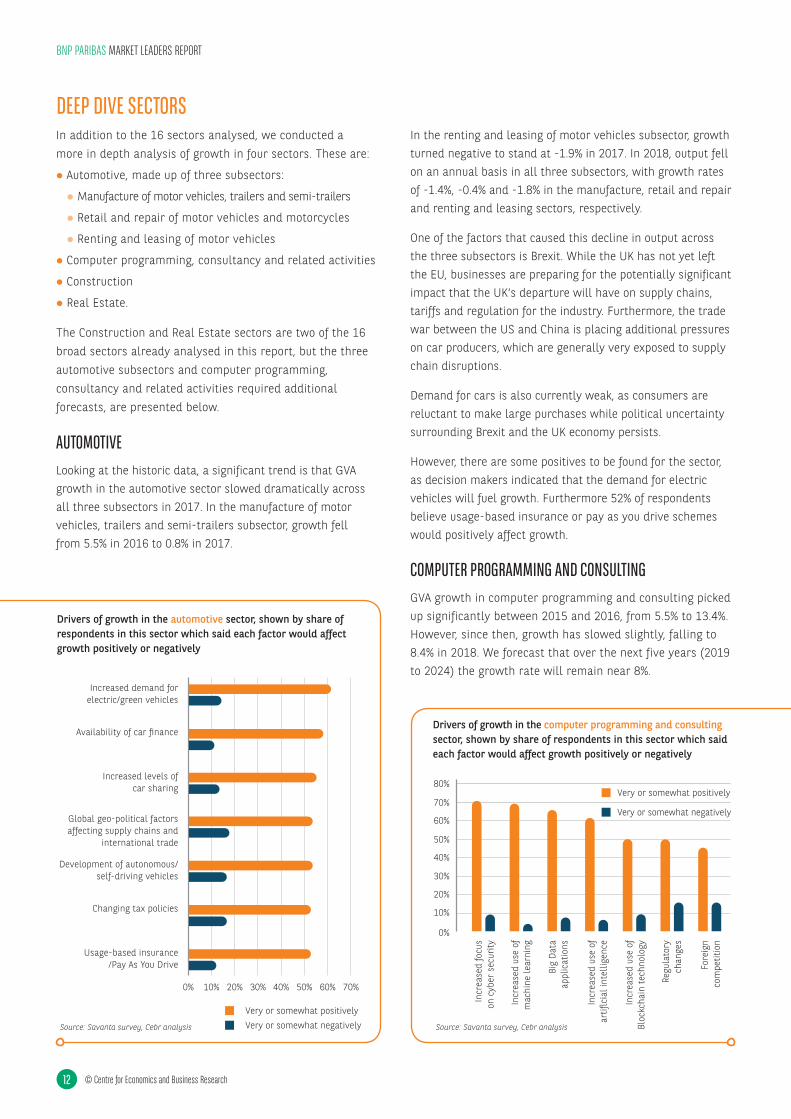
AUTOMOTIVE Looking at the historic data, a significant trend is that GVA growth in the automotive sector slowed dramatically across all three subsectors in 2017. In the manufacture of motor vehicles, trailers and semi-trailers subsector, growth fell from 5.5% in 2016 to 0.8% in 2017.
In the renting and leasing of motor vehicles subsector, growth turned negative to stand at -1.9% in 2017. In 2018, output fell on an annual basis in all three subsectors, with growth rates of -1.4%, -0.4% and -1.8% in the manufacture, retail and repair and renting and leasing sectors, respectively.
One of the factors that caused this decline in output across the three subsectors is Brexit. While the UK has not yet left the EU, businesses are preparing for the potentially significant impact that the UK’s departure will have on supply chains, tariffs and regulation for the industry. Furthermore, the trade war between the US and China is placing additional pressures on car producers, which are generally very exposed to supply chain disruptions.
Demand for cars is also currently weak, as consumers are reluctant to make large purchases while political uncertainty surrounding Brexit and the UK economy persists.
However, there are some positives to be found for the sector, as decision makers indicated that the demand for electric vehicles will fuel growth. Furthermore 52% of respondents believe usage-based insurance or pay as you drive schemes would positively affect growth.
COMPUTER PROGRAMMING AND CONSULTING GVA growth in computer programming and consulting picked up significantly between 2015 and 2016, from 5.5% to 13.4%. However, since then, growth has slowed slightly, falling to 8.4% in 2018. We forecast that over the next five years (2019 to 2024) the growth rate will remain near 8%.
DEEP DIVE SECTORS
BNP PARIBAS MARKET LEADERS REPORT
© Centre for Economics and Business Research
Drivers of growth in the computer programming and consulting sector, shown by share of respondents in this sector which said each factor would affect growth positively or negatively
80%
70%
60%
50%
40%
30%
20%
10%
0%
Incr
ease
d fo
cus
on c
yber
sec
urity
Incr
ease
d us
e of
mac
hine
lear
ning
Big
Data
appl
icat
ions
Incr
ease
d us
e of
arti�
cial
inte
llige
nce
Incr
ease
d us
e of
Bloc
kcha
in te
chno
logy
Regu
lato
rych
ange
s
Fore
ign
com
petit
ion
Very or somewhat positively
Very or somewhat negatively
Very or somewhat positivelyVery or somewhat negatively
0% 10% 20% 30% 40% 50% 60% 70%
Usage-based insurance/Pay As You Drive
Changing tax policies
Development of autonomous/self-driving vehicles
Global geo-political factorsaffecting supply chains and
international trade
Increased levels ofcar sharing
Availability of car �nance
Increased demand forelectric/green vehicles
Drivers of growth in the automotive sector, shown by share of respondents in this sector which said each factor would affect growth positively or negatively
Source: Savanta survey, Cebr analysisSource: Savanta survey, Cebr analysis
© Centre for Economics and Business Research
A key growth diver in this industry over the next 20 years will be the increased focus on cyber security, on behalf of consumers and businesses. This focus creates demand for products such as antivirus software, as well as specialised consulting services. 71% of the computer programming and consulting businesses that responded to the survey said they think this factor would positively affect growth in the industry.
Another growth driver comes in the form of increased usage of machine learning among businesses. This technology, as well as similar technological advancements, requires significant input from computer programmers and computing consultants, meaning it will be a significant cause of growth in the sector.
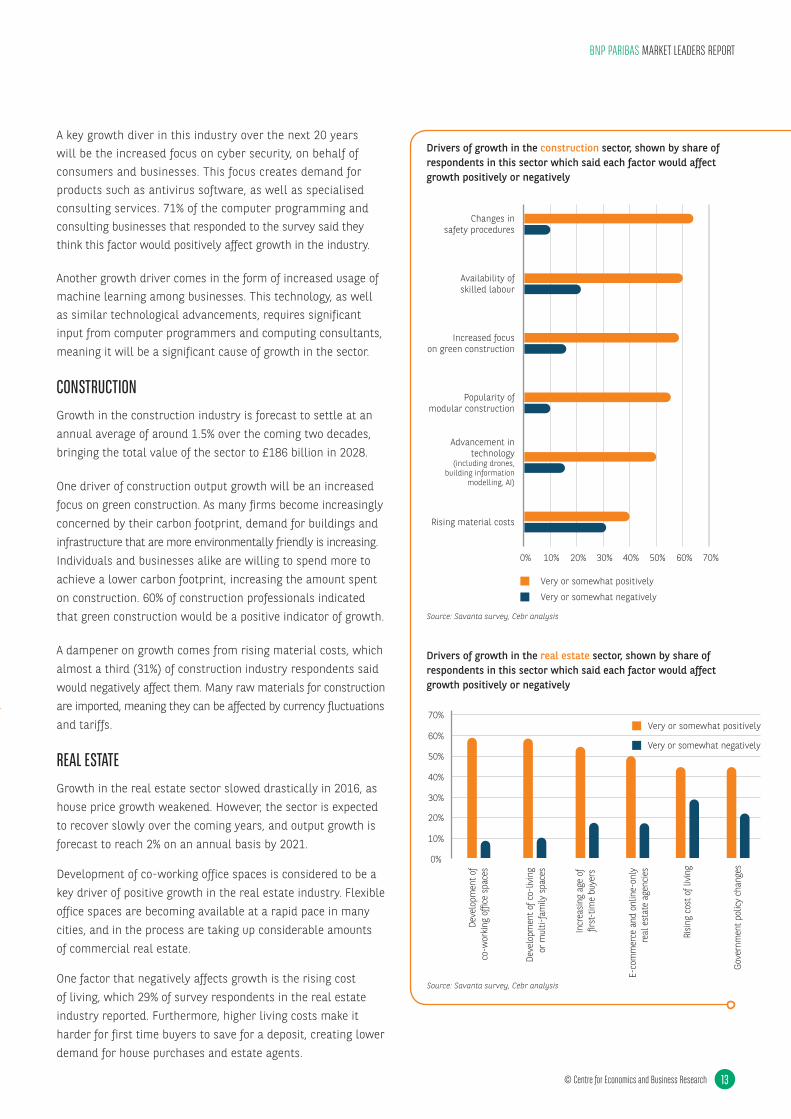
CONSTRUCTIONGrowth in the construction industry is forecast to settle at an annual average of around 1.5% over the coming two decades, bringing the total value of the sector to £186 billion in 2028.
One driver of construction output growth will be an increased focus on green construction. As many firms become increasingly concerned by their carbon footprint, demand for buildings and infrastructure that are more environmentally friendly is increasing. Individuals and businesses alike are willing to spend more to achieve a lower carbon footprint, increasing the amount spent on construction. 60% of construction professionals indicated that green construction would be a positive indicator of growth.
A dampener on growth comes from rising material costs, which almost a third (31%) of construction industry respondents said would negatively affect them. Many raw materials for construction are imported, meaning they can be affected by currency fluctuations and tariffs.
REAL ESTATEGrowth in the real estate sector slowed drastically in 2016, as house price growth weakened. However, the sector is expected to recover slowly over the coming years, and output growth is forecast to reach 2% on an annual basis by 2021.
Development of co-working office spaces is considered to be a key driver of positive growth in the real estate industry. Flexible office spaces are becoming available at a rapid pace in many cities, and in the process are taking up considerable amounts of commercial real estate.
One factor that negatively affects growth is the rising cost of living, which 29% of survey respondents in the real estate industry reported. Furthermore, higher living costs make it harder for first time buyers to save for a deposit, creating lower demand for house purchases and estate agents.
BNP PARIBAS MARKET LEADERS REPORT
13
0% 10% 20% 30% 40% 50% 60% 70%
Rising material costs
Advancement intechnology
(including drones,building information
modelling, AI)
Popularity ofmodular construction
Changes insafety procedures
Availability ofskilled labour
Increased focuson green construction
Very or somewhat positively
Very or somewhat negatively
60%
50%
70%
40%
30%
20%
10%
0%
Deve
lopm
ent o
fco
-wor
king
of�
ce s
pace
s
Deve
lopm
ent o
f co-
livin
gor
mul
ti-fa
mily
spa
ces
Incr
easin
g ag
e of
�rst
-tim
e bu
yers
E-co
mm
erce
and
onl
ine-
only
real
est
ate
agen
cies
Risin
g co
st o
f liv
ing
Gove
rnm
ent p
olic
y ch
ange
sVery or somewhat positively
Very or somewhat negatively
Drivers of growth in the construction sector, shown by share of respondents in this sector which said each factor would affect growth positively or negatively
Drivers of growth in the real estate sector, shown by share of respondents in this sector which said each factor would affect growth positively or negatively
Source: Savanta survey, Cebr analysis
Source: Savanta survey, Cebr analysis
60%
50%
40%
30%
20%
10%
0%
Sign
i�ca
ntly
affe
cted
Mod
erat
ely
affe
cted
Slig
htly
affe
cted
Not
affe
cted
Leaders
Followers
60%
50%
70%
40%
30%
20%
10%
0%
My
busi
ness
has
bee
n ve
ry p
ositi
vely
affe
cted
by
Brex
it
My
busi
ness
has
bee
n fa
irly
posi
tivel
yaf
fect
ed b
y Br
exit
My
busi
ness
as
been
nei
ther
pos
itive
lyor
neg
ativ
ely
affe
cted
by
Brex
it
My
busi
ness
has
bee
n fa
irly
nega
tivel
yaf
fect
ed b
y Br
exit
My
busi
ness
has
bee
n ve
ry n
egat
ivel
yaf
fect
ed b
y Br
exit
Don'
t kno
w
Leaders Followers
14
To understand more about what is driving growth at market-leading businesses, we used a survey of more than 1,500 UK enterprises. Questions focused on characteristics that could be affecting growth across companies in different sectors, to understand what makes high growth businesses successful.
To establish which businesses are market leaders, we used the following methodology:
l If a business has achieved above average growth for bothturnover and employment growth for the last three years,they are considered to be a ‘market leader’
l If the business did not achieve above average growth forturnover and employment growth, they are considered tobe a ‘follower’
l In total, there are 498 market leaders and 1,012 followers.
DRIVERS OF GROWTH: SURVEY ANALYSIS OF ‘MARKET LEADERS’
BNP PARIBAS MARKET LEADERS REPORT
© Centre for Economics and Business Research
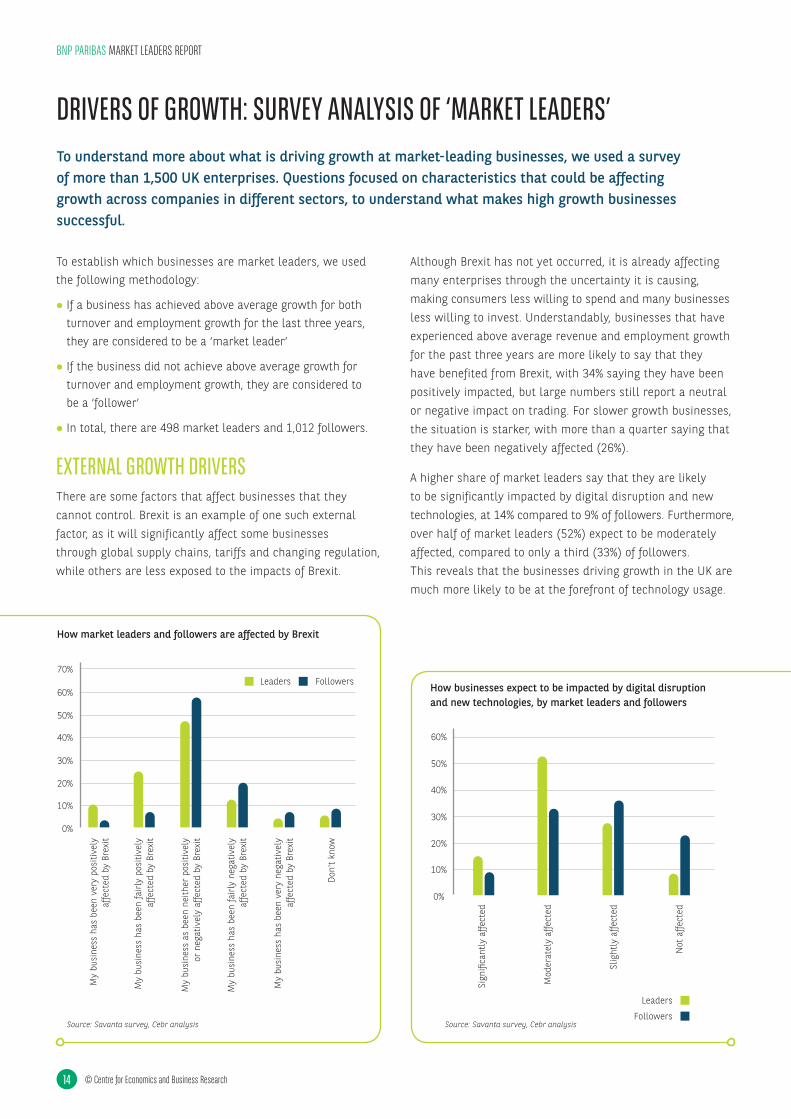
EXTERNAL GROWTH DRIVERSThere are some factors that affect businesses that they cannot control. Brexit is an example of one such external factor, as it will significantly affect some businesses through global supply chains, tariffs and changing regulation, while others are less exposed to the impacts of Brexit.
Although Brexit has not yet occurred, it is already affecting many enterprises through the uncertainty it is causing, making consumers less willing to spend and many businesses less willing to invest. Understandably, businesses that have experienced above average revenue and employment growth for the past three years are more likely to say that they have benefited from Brexit, with 34% saying they have been positively impacted, but large numbers still report a neutral or negative impact on trading. For slower growth businesses, the situation is starker, with more than a quarter saying that they have been negatively affected (26%).
A higher share of market leaders say that they are likely to be significantly impacted by digital disruption and new technologies, at 14% compared to 9% of followers. Furthermore, over half of market leaders (52%) expect to be moderately affected, compared to only a third (33%) of followers. This reveals that the businesses driving growth in the UK are much more likely to be at the forefront of technology usage.
How market leaders and followers are affected by Brexit
How businesses expect to be impacted by digital disruption and new technologies, by market leaders and followers
Source: Savanta survey, Cebr analysis Source: Savanta survey, Cebr analysis
TECHNOLOGICAL DRIVERSAs demonstrated in the previous section by the relatively high share of fast-growing businesses expecting to be affected by digital disruption, technology is an important driver of growth.
Purchasing technology such as artificial intelligence, robotics or automated processes can be a significant upfront cost; over time however, this investment usually pays off, as workers become more productive, output increases and products improve. This means that firms seeking the benefits of technological progress need to be able to invest considerable sums into new machinery, software or other types of technology.
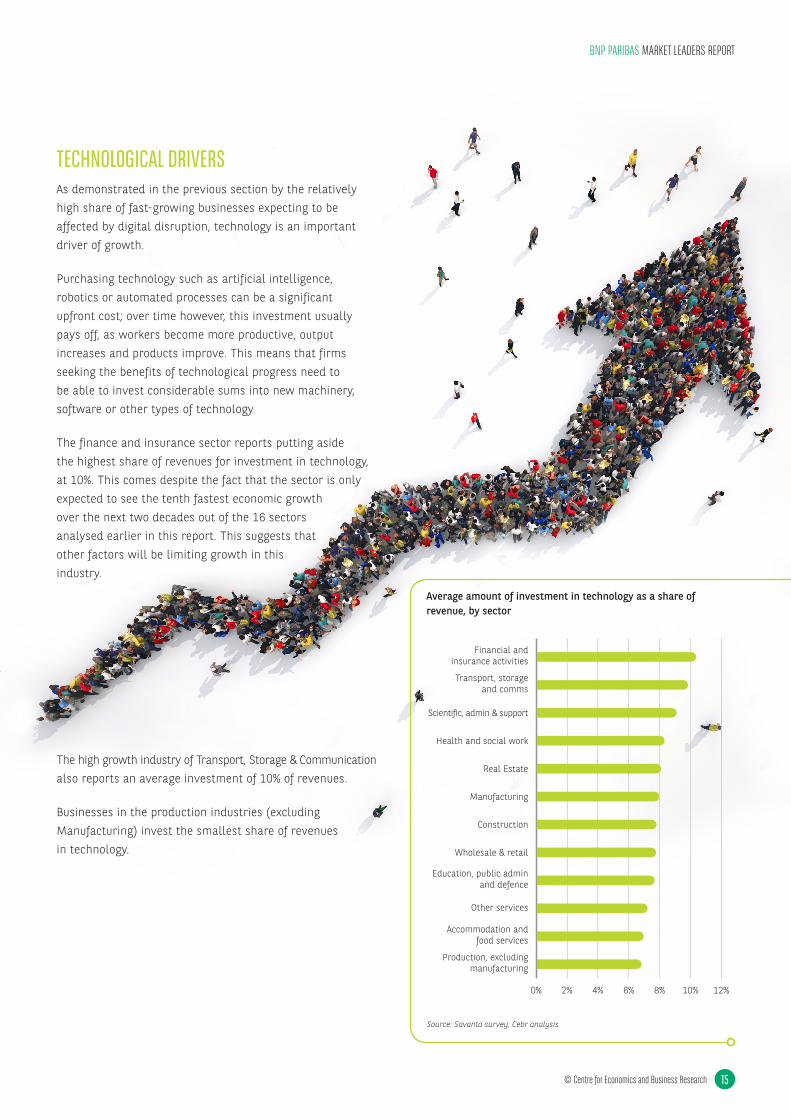
The finance and insurance sector reports putting aside the highest share of revenues for investment in technology, at 10%. This comes despite the fact that the sector is only expected to see the tenth fastest economic growth over the next two decades out of the 16 sectors analysed earlier in this report. This suggests that other factors will be limiting growth in this industry.
The high growth industry of Transport, Storage & Communication also reports an average investment of 10% of revenues.
Businesses in the production industries (excluding Manufacturing) invest the smallest share of revenues in technology.
BNP PARIBAS MARKET LEADERS REPORT
© Centre for Economics and Business Research 15
Source: Savanta survey, Cebr analysis
0% 2% 4% 6% 8% 10% 12%
Financial andinsurance activities
Transport, storageand comms
Scienti�c, admin & support
Health and social work
Real Estate
Manufacturing
Construction
Wholesale & retail
Education, public adminand defence
Other services
Accommodation andfood services
Production, excludingmanufacturing
Average amount of investment in technology as a share of revenue, by sector
0% 10%
Leaders Followers
20% 30% 40% 50% 60%
Break area in business buildingwhich employees are encouraged
to use at regular intervals
Offer of paid days of leaveabove legal minimum
Financial performance incentivesfor employees (i.e. commissions,
bonuses or shares in business)
Employees regularly receivepromotion opportunities within
the business
Employees and their managers setgoals and assess if they have been
achieved at least once per year
Education and trainingcourses for employees
Offer of pension contributionsabove legal minimum
Sponsorship ofprofessional quali�cations
Non-�nancial performanceincentives for employees
(e.g. meal at a restaurant or carfor good performance)
16
BNP PARIBAS MARKET LEADERS REPORT
© Centre for Economics and Business Research
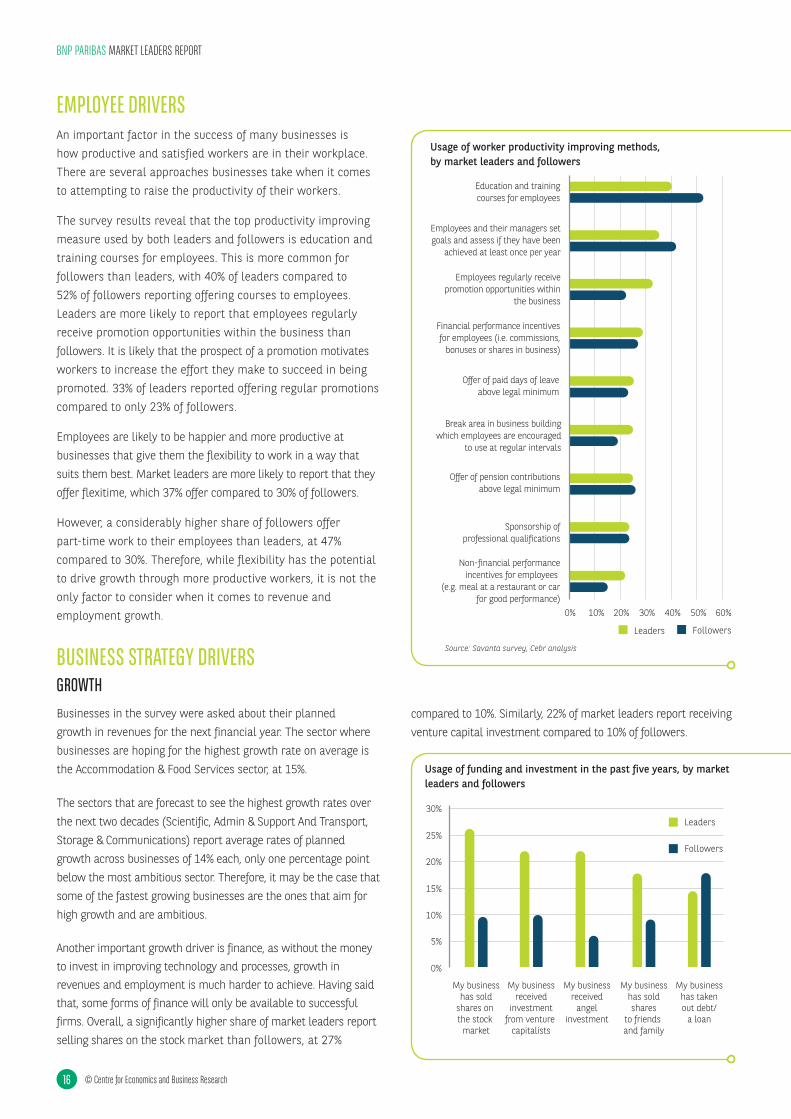
EMPLOYEE DRIVERSAn important factor in the success of many businesses is how productive and satisfied workers are in their workplace. There are several approaches businesses take when it comes to attempting to raise the productivity of their workers.
The survey results reveal that the top productivity improving measure used by both leaders and followers is education and training courses for employees. This is more common for followers than leaders, with 40% of leaders compared to 52% of followers reporting offering courses to employees. Leaders are more likely to report that employees regularly receive promotion opportunities within the business than followers. It is likely that the prospect of a promotion motivates workers to increase the effort they make to succeed in being promoted. 33% of leaders reported offering regular promotions compared to only 23% of followers.
Employees are likely to be happier and more productive at businesses that give them the flexibility to work in a way that suits them best. Market leaders are more likely to report that they offer flexitime, which 37% offer compared to 30% of followers.
However, a considerably higher share of followers offer part-time work to their employees than leaders, at 47% compared to 30%. Therefore, while flexibility has the potential to drive growth through more productive workers, it is not the only factor to consider when it comes to revenue and employment growth.
BUSINESS STRATEGY DRIVERSGROWTH
Businesses in the survey were asked about their planned growth in revenues for the next financial year. The sector where businesses are hoping for the highest growth rate on average is the Accommodation & Food Services sector, at 15%.
The sectors that are forecast to see the highest growth rates over the next two decades (Scientific, Admin & Support And Transport, Storage & Communications) report average rates of planned growth across businesses of 14% each, only one percentage point below the most ambitious sector. Therefore, it may be the case that some of the fastest growing businesses are the ones that aim for high growth and are ambitious.
Another important growth driver is finance, as without the money to invest in improving technology and processes, growth in revenues and employment is much harder to achieve. Having said that, some forms of finance will only be available to successful firms. Overall, a significantly higher share of market leaders report selling shares on the stock market than followers, at 27%
Usage of funding and investment in the past five years, by market leaders and followers
compared to 10%. Similarly, 22% of market leaders report receiving venture capital investment compared to 10% of followers.
30%
25%
20%
15%
10%
5%
0%
My businesshas sold
shares on the stock market
My businessreceived
investmentfrom venture
capitalists
My businessreceived
angelinvestment
My businesshas soldshares
to friends and family
My businesshas takenout debt/
a loan
Leaders
Followers
Usage of worker productivity improving methods, by market leaders and followers
Source: Savanta survey, Cebr analysis
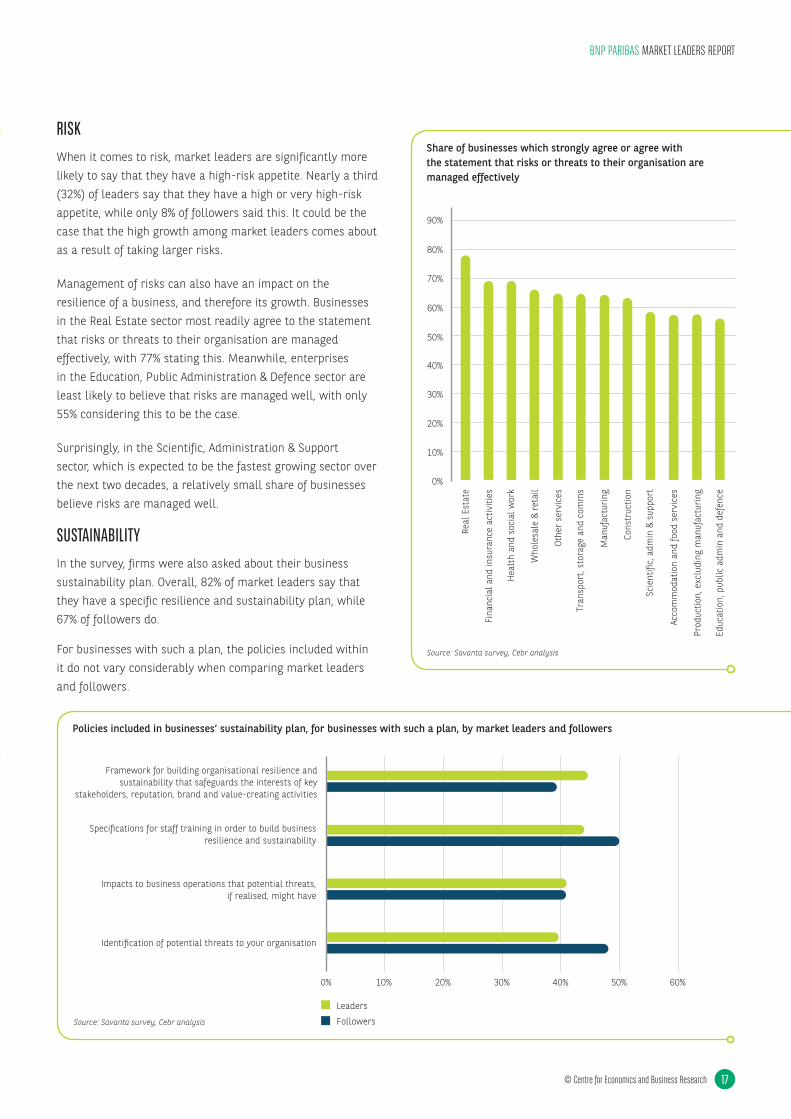
RISKWhen it comes to risk, market leaders are significantly more likely to say that they have a high-risk appetite. Nearly a third (32%) of leaders say that they have a high or very high-risk appetite, while only 8% of followers said this. It could be the case that the high growth among market leaders comes about as a result of taking larger risks.
Management of risks can also have an impact on the resilience of a business, and therefore its growth. Businesses in the Real Estate sector most readily agree to the statement that risks or threats to their organisation are managed effectively, with 77% stating this. Meanwhile, enterprises in the Education, Public Administration & Defence sector are least likely to believe that risks are managed well, with only 55% considering this to be the case.
Surprisingly, in the Scientific, Administration & Support sector, which is expected to be the fastest growing sector over the next two decades, a relatively small share of businesses believe risks are managed well.
SUSTAINABILITYIn the survey, firms were also asked about their business sustainability plan. Overall, 82% of market leaders say that they have a specific resilience and sustainability plan, while 67% of followers do.
For businesses with such a plan, the policies included within it do not vary considerably when comparing market leaders and followers.
© Centre for Economics and Business Research
BNP PARIBAS MARKET LEADERS REPORT
17
90%
80%
70%
60%
50%
40%
30%
20%
10%
0%
Real
Est
ate
Fina
ncia
l and
insu
ranc
e ac
tiviti
es
Hea
lth
and
soci
al w
ork
Who
lesa
le &
ret
ail
Othe
r se
rvic
es
Tran
spor
t, st
orag
e an
d co
mm
s
Man
ufac
turin
g
Cons
truc
tion
Scie
nti�
c, a
dmin
& s
uppo
rt
Acco
mm
odat
ion
and
food
ser
vice
s
Prod
uctio
n, e
xclu
ding
man
ufac
turin
g
Educ
atio
n, p
ublic
adm
in a
nd d
efen
cePolicies included in businesses’ sustainability plan, for businesses with such a plan, by market leaders and followers
0% 10%
Leaders
Followers
20% 30% 40% 50% 60%
Framework for building organisational resilience andsustainability that safeguards the interests of key
stakeholders, reputation, brand and value-creating activities
Speci�cations for staff training in order to build businessresilience and sustainability
Impacts to business operations that potential threats,if realised, might have
Identi�cation of potential threats to your organisation
Source: Savanta survey, Cebr analysis
Share of businesses which strongly agree or agree with the statement that risks or threats to their organisation are managed effectively
Source: Savanta survey, Cebr analysis

BNP PARIBAS MARKET LEADERS REPORT
Scientific
Elec
tricit
y
SecurityAirlines
SchoolsHotels
Wat
er s
uppl
y
Def
ence
Storage
Electricity
Property
Wholesale
Fishin
g
Universities
Architecture AgricultureVeterinary
Transport
Bank
s Oil
HealthPublishersDefence
Retail
Airlines
Arts
Cour
iers
Arts
Soci
al se
curit
y
Quarrying Transport
Libraries
Steam
StorageClothing
Process
ing
Elec
tric
ity
CouriersBuilding
Lib
rari
es
RetailLegal services
HospitalsAirlin
es
Schoo
ls
Resid
entia
l care
Farm
ingBa
nks
Secu
rity Retail
Min
ing
Restaurants
Schools
Universities
Engi
neer
ing
Veterinary
Educ
atio
n
Data processingRestaurants
Sewerage
Real Estate
InsuranceTrade unions
Wholes
ale
Regulation
Advertising
RestaurantsAirli
nes
Broa
dcas
ting
Acco
mm
odat
ion
Hote
ls
Ban
k
Fore
stry
Onl
ine
reta
il
Cou
rier
s
Quarrying
Civil service
TradeunionsClothing
Gas
Engi
neer
ing
Security
Couriers
Mining
Trad
e un
ions
Rai
l pro
vide
rs
Insurance
Regulation
Retail
Gas
Cour
iers
Arts
Gas
Oil
Banks
Regulation
Sewerage
Scien
tific
rese
arch
Minin
g
ForestryFunds
Insurance
Funds
Social w
ork
Adver
tising
MiningHealth
Acco
mmod
ation
Defence
Stor
age
Reta
il
Real estate
TV Programm
e
InsuranceHotels
Restaurants
Defence
Trad
eSe
curi
ty
Trade unions
Fishing
Cons
ulting Social work
Trade
Wholesale
BroadcastingStorage
AirlinesSch
ools
Scientific
Storage
Construction
Building
Man
agem
ent
Soci
al w
ork
Libraries
Couriers
Funds
Retail
FoodGas Ai
rline
s
Sports
Wholesale
Dem
oliti
on
Publishers
Oil
Couriers
Insura
nce
Research
Defence
Rail
Gas
Oil
Insurance
Fishing
Agriculture Broadcasting
Insura
nce
Airlines
Security
Broadc
asting
RetailInsura
nce
Insurance Health
ServicesSch
ools
Food
Regu
lation
ArtsInsuranceSportsPublishers
Publishers
Banks
Sports
Sport
s
Agriculture
Lib
rari
esH
ospi
talsLibraries
Forestry
Mining
Regulation
CONCLUSIONIt is clear that Brexit is likely to have a short-term effect on economic growth in the UK, but over the long term we are seeing the impact of bigger societal and technological trends. Indeed, over the course of the 20-year forecast it is likely that growth rates will return to Cebr’s central forecast’s predictions, once businesses have had time to acclimatise to the new trading conditions.
Driving much of the growth is a commitment to sustainability and tackling environmental concerns. Indeed, the Government’s binding contract to legislate for net zero emissions by 2050 will drive demand for innovation and creation of new products from the growing number of businesses and consumers seeking to become carbon neutral. Additionally, a net zero economy requires low carbon infrastructure and construction – for example, an increase in the use of electric vehicles requires further development of a smart grid and widespread construction of charging terminals.
It’s also unsurprising to see a big uplift in the IT sector, fuelled in part by widespread digital disruption together with cyber security fears powering a need for more consultants. Indeed, while growth in employment rates in this sector is offset somewhat by labour efficiencies coming from automation, we will continue to see specialist technology sectors booming over the next twenty years.
When it comes to how businesses can best prepare for growth, organisations can learn from the ‘market leaders’ identified in this report. These high growth companies are characterised by being less risk averse, but make significant investment in strategic planning for growth. They are also able to capitalise on game changing technology advancements and are committed to providing options for workforce development and training, such as flexibility of employment, to attract and retain staff.
18 © Centre for Economics and Business Research

© Centre for Economics and Business Research
BNP PARIBAS MARKET LEADERS REPORT
09
ScientificElec
tricity
SecurityAirlines
Schools
Hotels
Wat
er su
pply
Defence
Storage
Electricity
Property
WholesaleFis
hing
Universities
Architecture
AgricultureVeterinary
Transport
Banks
Oil
HealthPublishers
Defence
Retail
Airlines
Arts
Cour
iers
Arts
Socia
l sec
urity
Quarrying TransportLibraries
Steam
StorageClothing
Processing
Elec
tricit
y
Couriers
Building
Libr
arie
sRetail
Legal services
Hospitals
Airlines
School
s
Reside
ntial ca
re
Farming
Bank
sSe
curit
y
Retail
Mining
RestaurantsSchools
Universities
Engineering
Veterinary Educ
ation
Data processing
Restaurants
Sewerage
Real Estate
InsuranceTrade unionsWholesale
Regulation
Advertising
Restaurants
Airlines
Broad
casti
ng
Acco
mm
odat
ion
Hote
ls
Bank
Fore
stry
Onl
ine r
etai
lCo
urie
rs
Quarrying
Civil service
Tradeunions
Clothing
Gas
Engin
eerin
g
Security
Couriers
Mining
Trad
e uni
ons
Rail
prov
ider
s
Insurance
Regulation Retail
GasCo
urier
s
Arts
GasOil
BanksRegulation
Sewerage
Scien
tific r
esearc
h
Mining
ForestryFunds
Insurance
Funds
Social workAdve
rtising
Mining
HealthAc
comm
odati
on
Defence
Stor
age
Reta
ilReal estate
TV Programm
e
Insurance
Hotels
Restaurants
DefenceTr
ade
Secu
rity
Trade unionsFishing
Consu
lting
Social work
Trade
Wholesale
Broadcasting
Storage
Airlines
Schools
Scientific
StorageConstructionBuilding
Manage
ment
Socia
l wor
k
Libraries
CouriersFunds
Retail
FoodGas Ai
rline
s
Sports
Wholesale
Demoli
tionPublishers
Oil
Couriers
Insurance
ResearchDefence
Rail
Gas
Oil
Insurance
FishingAgriculture Broadcasting
Insura
nceAirlines
Security
Broadcasting
RetailInsurance
Insurance Health
Services
School
s Food
Regu
lation
ArtsInsurance
Sports Publishers
Publishers
BanksSports
Sports
Agriculture
Libr
arie
sH
ospi
tals
LibrariesForestryMining
Regulation
© Centre for Economics and Business Research 19
BNP PARIBAS MARKET LEADERS REPORT
FORECAST METHODOLOGY AND ASSUMPTIONS
Cebr used its internal models to produce the forecasts contained in this report. On the basis of statistical calculations and additional sector knowledge, forecasts of what Cebr considers to be the most likely growth trend for the UK economy by sector were produced.
SURVEY METHODOLOGY
Cebr partnered with Savanta to survey decision makers at 1,510 UK businesses that have operated for at least five years. The survey was in the field in June-July 2019. Out of the businesses surveyed, 35% of businesses are small in size (10-49 employees), 56% are medium (50-249 employees) and 8% are large (250+ employees) after rounding. No micro-sized businesses were surveyed.
To study the differences between market leaders and followers, Cebr defined a market leader as a business with revenue and employment growth over the past three years both above the average for all businesses in the survey. If the business failed to meet that criteria, they are defined as a follower. In total, there were 498 leaders, and 1,012 followers.
APPENDIX
Scientific
Elec
tricit
y
SecurityAirlines
SchoolsHotels
Wat
ersu
pply
Def
ence
Storage
Electricity
Property
Wholesale
Fishin
g
Universities
Architecture AgricultureVeterinary
Transport
Bank
s Oil
HealthPublishersDefence
Retail
Airlines
Arts
Cour
iers
Arts
Soci
alse
curit
y
Quarrying Transport
Libraries
Steam
StorageClothing
Process
ing
Elec
tric
ity
CouriersBuilding
Lib
rari
es
RetailLegal services
HospitalsAirlin
es
Schoo
ls
Resid
entia
l care
Farm
ingBa
nks
Secu
rity Retail
Min
ing
Restaurants
Schools
Universities
Engi
neer
ing
Veterinary
Educ
atio
n
Data processingRestaurants
Sewerage
Real Estate
InsuranceTrade unions
Wholes
ale
Regulation
Advertising
RestaurantsAirli
nes
Broa
dcas
ting
Acco
mm
odat
ion
Hote
ls
Ban
k
Fore
stry
Onl
ine
reta
il
Cou
rier
s
Quarrying
Civil service
TradeunionsClothing
Gas
Engi
neer
ing
Security
Couriers
Mining
Trad
eun
ions
Rai
l pro
vide
rs
Insurance
Regulation
Retail
Gas
Cour
iers
Arts
Gas
Oil
Banks
Regulation
Sewerage
Scien
tific
resea
rch
Minin
g
ForestryFunds
Insurance
Funds
Social w
ork
Adver
tising
MiningHealth
Acco
mmod
ation
Defence
Stor
age
Reta
il
Real estate
TV Programm
e
InsuranceHotels
Restaurants
Defence
Trad
eSe
curi
ty
Trade unions
Fishing
Cons
ulting Social work
Trade
Wholesale
BroadcastingStorage
AirlinesSch
ools
Scientific
Storage
Construction
Building
Man
agem
ent
Soci
alwo
rk
Libraries
Couriers
Funds
Retail
FoodGas Ai
rline
s
Sports
Wholesale
Dem
oliti
on
Publishers
Oil
Couriers
Insura
nce
Research
Defence
Rail
Gas
Oil
Insurance
Fishing
Agriculture Broadcasting
Insura
nce
Airlines
Security
Broadc
asting
RetailInsura
nce
Insurance Health
Services
Schoo
ls
Food
Regu
lation
ArtsInsuranceSportsPublishers
Publishers
Banks
Sports
Sport
s
Agriculture
Lib
rari
esH
ospi
talsLibraries
Forestry
Mining
Regulation

The bankfor a changing
world