Embed Size (px)
Citation preview

Das Fräulein stand am MeereUnd seufzte lang und bang,Es rührte sie so sehreDer Sonnenuntergang.
„Mein Fräulein! Sein Sie munter,Das ist ein altes Stück;Hier vorne geht sie unterUnd kehrt von hinten zurück.”
Heinrich Heine
Für meine Eltern

List of Papers
This thesis is based on the following five papers, which are referred to in thetext by their Roman numerals.
I Ute B. Cappel, Elizabeth A. Gibson, Anders Hagfeldt, Gerrit BoschlooDye regeneration by spiro-MeOTAD in solid state dye-sensitizedsolar cells studied by photoinduced absorption spectroscopy andspectroelectrochemistryJ. Phys. Chem. C 113, 6275-6281 (2009)
II Ute B. Cappel, Sandra M. Feldt, Jan Schöneboom, Anders Hagfeldt,Gerrit BoschlooThe effect of local electric fields on photoinduced absorption in dye-sensitized solar cellsJ. Am. Chem. Soc. 132, 9096-9101 (2010)
III Ute B. Cappel, Martin H. Karlsson, Neil G. Pschirer, Felix Eickemeyer,Jan Schöneboom, Peter Erk, Gerrit Boschloo, Anders HagfeldtA broadly absorbing perylene dye for solid-state dye-sensitizedsolar cellsJ. Phys. Chem. C 113, 14595-14597 (2009)
IV Ute B. Cappel, Amanda L. Smeigh, Stefan Plogmaker, Erik M. J. Jo-hansson, Håkan Rensmo, Leif Hammarström, Anders Hagfeldt, GerritBoschlooCharacterization of the interface properties and processes in solidstate dye-sensitized solar cells employing a perylene sensitizerJ. Phys. Chem. C 115, 4345-4358 (2011)
V Ute B. Cappel, Stefan Plogmaker, Erik M. J. Johansson, AndersHagfeldt, Gerrit Boschloo, Håkan RensmoEnergy alignment and surface dipoles of rylene dyes adsorbed toTiO2 nanoparticlesSubmitted to Phys. Chem. Chem. Phys. (2011)
Reprints were made with permission from the publishers.
Comments on my own ContributionI was the main responsible person for the project for all papers. I prepared
samples, carried out most experiments and data analysis and wrote most partsof the manuscripts. I did not perform any quantum chemical calculations,organic synthesis or optimisation of solar cell efficiencies. I took part in photo-electron spectroscopy measurements and data analysis but was not the mainresponsible person. The SEM pictures presented in Paper I were taken byDr. Elizabeth Gibson. Dr. Amanda Smeigh carried out the femtosecond tran-sient absorption measurements presented in Paper IV, while I carried out mostof the data analysis of them.
I am a co-author of the following papers which are not included in this thesis.
• Rebecca S. Sage, Ute B. Cappel, Michael N. R. Ashfold, Nicholas R.WalkerQuadrupole mass spectrometry and time-of-flight analysis of ionsresulting from 532 nm pulsed laser ablation of Ni, Al, and ZnO targetsJ. Appl. Phys. 103, 093301/1-093301/8 (2008)
• Ute B. Cappel, Ian M. Bell, Laura K. PickardRemoving cosmic ray features from Raman map data by a refinednearest neighbour comparison method as a precursor for chemometricanalysisAppl. Spectrosc. 64, 195-200 (2010)
• Sandra M. Feldt, Ute B. Cappel, Erik Johansson, Gerrit Boschloo, AndersHagfeldtCharacterization of surface passivation by poly(methylsiloxane) fordye-sensitized solar cells employing the ferrocene redox coupleJ. Phys. Chem. C 114, 10551-10558 (2010)
Abbreviations and symbols
A electron acceptor in organic dye moleculesA absorbance∆A change or difference in absorbanceAPCE absorbed photon to current conversion efficiencyc the speed of lightC concentrationCB conduction bandCE counter electrodeCE(λ ) colouration efficiencyCV cyclic voltammetryD electron donor in organic dye moleculesDCM dichloromethaneDPV differential pulse voltammetryDSC dye-sensitized solar celle elementary chargeE energyE0−0 transition energy between the relaxed ground-state and excited stateEF,redox redox Fermi level (energy)EF,TiO2 Fermi level (energy) of the TiO2
EA electroabsorption spectroscopyf frequencyF Faraday’s constant−→F electric fieldFc ferroceneff fill factorFTO fluorine doped tin oxideh Planck’s constantHOMO highest occupied molecular orbitalI currentI0 photon fluxICT internal charge transferIPCE incident photon to current conversion efficiencyJ current density (current per area)JPh photocurrent (density)JSC short-circuit current (density)
k rate constantl path length or thicknessLHE light harvesting efficiencyLiTFSI Li(CF3SO2)2NLUMO lowest unoccupied molecular orbitalMeCN acetonitrileMPN 3-methoxyproprionitrileNA Avogadro’s constantnCB density of conduction band electronsNCB density of states in the conduction bandNHE normal hydrogen electrodeP power, usually given as a power densityPin power density of a light sourcePES photoelectron spectroscopyPIA photo-induced absorption (spectroscopy)PMMA poly(methyl methacrylate)Q charge (per unit area)RE reference electrode[s] the number of moles of species s per unit areasDSC solid state dye-sensitized solar cellspiro-MeOTAD 2,2’7,7’-tetrakis-(N,N-di-p-methoxyphenyl-amine)-9,9’-spirobifluoreneT transmissionTAS transient absorption spectroscopyTBA tetrabutylammoniumtBP 4-tertbutylpyridineU potentialU0′
F,redox formal redox potentialV voltageVOC open-circuit voltageVB valence bandWE working electrodeα a constant between 0 and 1β a constant describing the recombination orderε extinction coefficientη efficiency of a solar cellηcc charge collection efficiencyλ wavelength or reorganisation energy−→µ dipole momentπ conjugated linker in organic dye moleculesτ time constantΦinj quantum efficiency of photo-induced electron injectionΦreg quantum efficiency of oxidised dye regenerationω angular frequency
Contents
1 Introduction . . . . . . . . . . . . . . . . . . . . . . . . . . . . . . . . . . . . . . . . . . 111.1 Energy from the sun . . . . . . . . . . . . . . . . . . . . . . . . . . . . . . . . 111.2 The dye-sensitized solar cell . . . . . . . . . . . . . . . . . . . . . . . . . . 111.3 The aim and content of this thesis . . . . . . . . . . . . . . . . . . . . . . 14
2 Solid state dye-sensitized solar cells . . . . . . . . . . . . . . . . . . . . . . . . 152.1 Interface reactions in solid state DSC . . . . . . . . . . . . . . . . . . . . 162.2 Differences between spiro-MeOTAD and a redox electrolyte . . 182.3 Performance limitations of solid state DSCs . . . . . . . . . . . . . . . 18
3 Organic dyes for solid state dye-sensitized solar cells . . . . . . . . . . . 213.1 Donor-linker-acceptor dyes . . . . . . . . . . . . . . . . . . . . . . . . . . . 213.2 Dipole moments in ground and excited states . . . . . . . . . . . . . . 233.3 Rylene dyes . . . . . . . . . . . . . . . . . . . . . . . . . . . . . . . . . . . . . . . 24
4 Electric fields in DSCs and the Stark effect . . . . . . . . . . . . . . . . . . . 254.1 Energetics and electric fields at the TiO2 surface . . . . . . . . . . . 254.2 The Stark effect . . . . . . . . . . . . . . . . . . . . . . . . . . . . . . . . . . . . 27
5 Characterisation techniques . . . . . . . . . . . . . . . . . . . . . . . . . . . . . . 335.1 Characterisation of components . . . . . . . . . . . . . . . . . . . . . . . . 33
5.1.1 UV-visible spectroscopy . . . . . . . . . . . . . . . . . . . . . . . . . 335.1.2 Spectroelectrochemistry . . . . . . . . . . . . . . . . . . . . . . . . . . 355.1.3 Photo-induced absorption spectroscopy . . . . . . . . . . . . . . 425.1.4 Electroabsorption spectroscopy . . . . . . . . . . . . . . . . . . . . 475.1.5 Fluorescence spectroscopy . . . . . . . . . . . . . . . . . . . . . . . . 485.1.6 Photoelectron spectroscopy . . . . . . . . . . . . . . . . . . . . . . . 49
5.2 Characterisation of complete devices . . . . . . . . . . . . . . . . . . . . 495.2.1 Current-voltage measurements . . . . . . . . . . . . . . . . . . . . . 495.2.2 Incident photon to current conversion efficiency . . . . . . . . 515.2.3 “Toolbox” techniques . . . . . . . . . . . . . . . . . . . . . . . . . . . . 53
6 Energy alignment and interface processes in solid state DSCs . . . . . 616.1 DSC results with ID176 . . . . . . . . . . . . . . . . . . . . . . . . . . . . . . 616.2 Energy alignment . . . . . . . . . . . . . . . . . . . . . . . . . . . . . . . . . . 62
6.2.1 Redox potential of spiro-MeOTAD . . . . . . . . . . . . . . . . . . 626.2.2 Density of states in the titanium dioxide . . . . . . . . . . . . . . 636.2.3 Energetics of dye molecules adsorbed to TiO2 surfaces . . 64
6.3 Electron injection . . . . . . . . . . . . . . . . . . . . . . . . . . . . . . . . . . 666.4 Regeneration . . . . . . . . . . . . . . . . . . . . . . . . . . . . . . . . . . . . . . 676.5 Recombination . . . . . . . . . . . . . . . . . . . . . . . . . . . . . . . . . . . . 69

7 Conclusions and outlook . . . . . . . . . . . . . . . . . . . . . . . . . . . . . . . . 71Summary in Swedish . . . . . . . . . . . . . . . . . . . . . . . . . . . . . . . . . . . . . . 73Summary in German . . . . . . . . . . . . . . . . . . . . . . . . . . . . . . . . . . . . . . 77Acknowledgments . . . . . . . . . . . . . . . . . . . . . . . . . . . . . . . . . . . . . . . . 81References . . . . . . . . . . . . . . . . . . . . . . . . . . . . . . . . . . . . . . . . . . . . . . 83
1. Introduction
1.1 Energy from the sunThe effects of CO2 emissions on the climate and the limited amount of fossilfuel resources are the two main driving forces for the research into renewableenergies. Renewable energy sources include sunlight, wind, rain, tides, andgeothermal heat. Energy from the sun is the largest one of these sources.1
1.7 ·105 TW of solar power strike the earth’s atmosphere and the practicalterrestrial global solar potential is estimated to be about 600 TW. The currentglobal power consumption is approximately 15 TW and is expected to rise inthe coming decades.
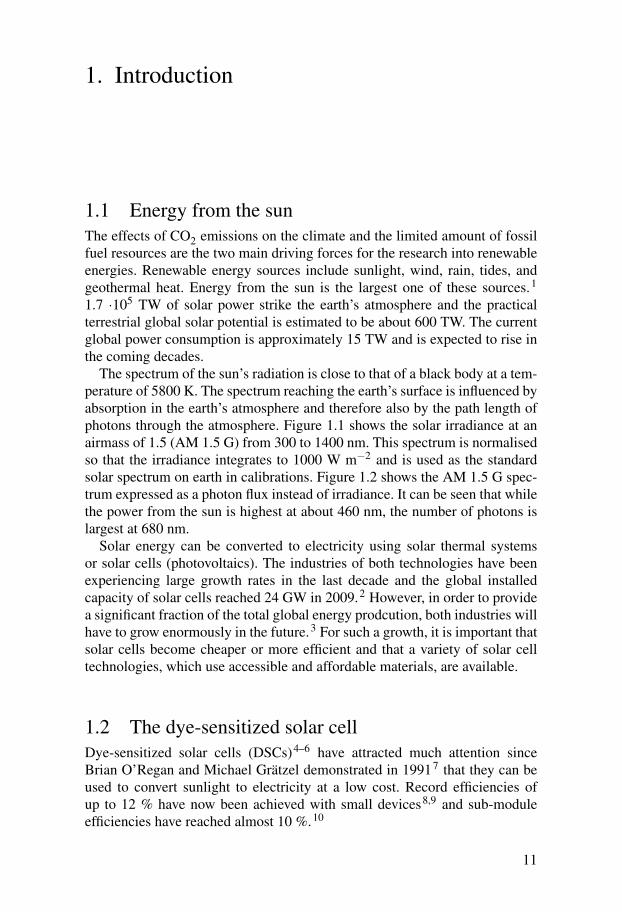
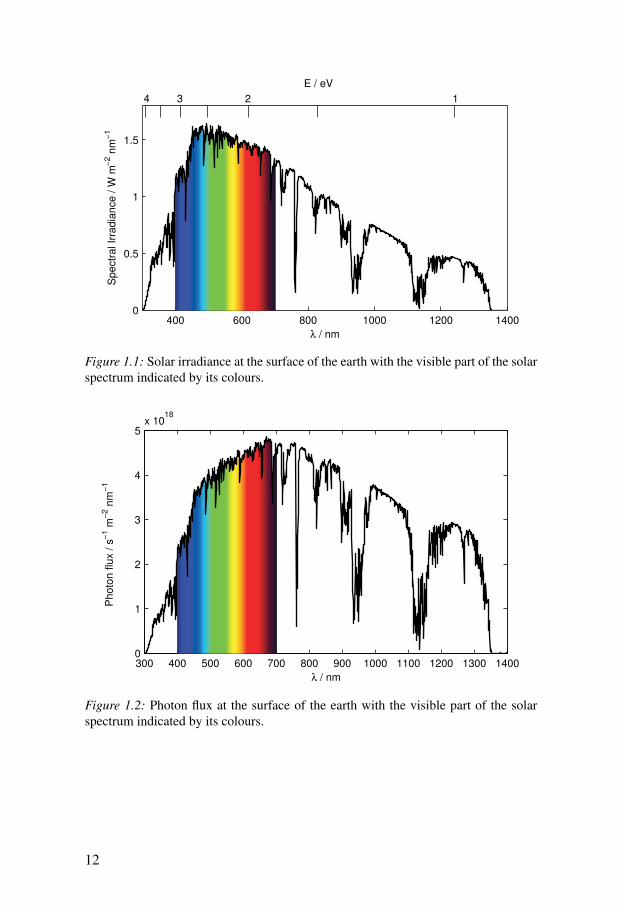
The spectrum of the sun’s radiation is close to that of a black body at a tem-perature of 5800 K. The spectrum reaching the earth’s surface is influenced byabsorption in the earth’s atmosphere and therefore also by the path length ofphotons through the atmosphere. Figure 1.1 shows the solar irradiance at anairmass of 1.5 (AM 1.5 G) from 300 to 1400 nm. This spectrum is normalisedso that the irradiance integrates to 1000 W m−2 and is used as the standardsolar spectrum on earth in calibrations. Figure 1.2 shows the AM 1.5 G spec-trum expressed as a photon flux instead of irradiance. It can be seen that whilethe power from the sun is highest at about 460 nm, the number of photons islargest at 680 nm.
Solar energy can be converted to electricity using solar thermal systemsor solar cells (photovoltaics). The industries of both technologies have beenexperiencing large growth rates in the last decade and the global installedcapacity of solar cells reached 24 GW in 2009.2 However, in order to providea significant fraction of the total global energy prodcution, both industries willhave to grow enormously in the future.3 For such a growth, it is important thatsolar cells become cheaper or more efficient and that a variety of solar celltechnologies, which use accessible and affordable materials, are available.
1.2 The dye-sensitized solar cellDye-sensitized solar cells (DSCs)4–6 have attracted much attention sinceBrian O’Regan and Michael Grätzel demonstrated in 19917 that they can beused to convert sunlight to electricity at a low cost. Record efficiencies ofup to 12 % have now been achieved with small devices8,9 and sub-moduleefficiencies have reached almost 10 %.10
11
400 600 800 1000 1200 14000
0.5
1
1.5
λ / nm
Spectr
al Ir
radia
nce / W
m−
2 n
m−
1
E / eV
4 3 2 1
Figure 1.1: Solar irradiance at the surface of the earth with the visible part of the solarspectrum indicated by its colours.
300 400 500 600 700 800 900 1000 1100 1200 1300 14000
1
2
3
4
5x 10
18
λ / nm
Photo
n flu
x / s
−1 m
−2 n
m−
1
Figure 1.2: Photon flux at the surface of the earth with the visible part of the solarspectrum indicated by its colours.
12
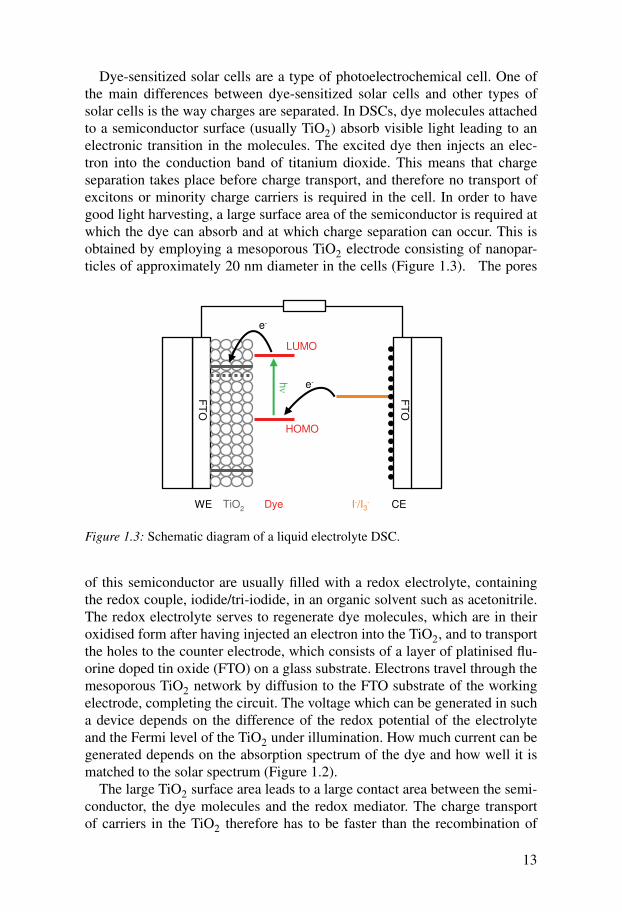
Dye-sensitized solar cells are a type of photoelectrochemical cell. One ofthe main differences between dye-sensitized solar cells and other types ofsolar cells is the way charges are separated. In DSCs, dye molecules attachedto a semiconductor surface (usually TiO2) absorb visible light leading to anelectronic transition in the molecules. The excited dye then injects an elec-tron into the conduction band of titanium dioxide. This means that chargeseparation takes place before charge transport, and therefore no transport ofexcitons or minority charge carriers is required in the cell. In order to havegood light harvesting, a large surface area of the semiconductor is required atwhich the dye can absorb and at which charge separation can occur. This isobtained by employing a mesoporous TiO2 electrode consisting of nanopar-ticles of approximately 20 nm diameter in the cells (Figure 1.3). The pores
TiO2 Dye I-/I3-
he-
e-
HOMO
LUMO
FT
O
FT
O
CEWE
Figure 1.3: Schematic diagram of a liquid electrolyte DSC.
of this semiconductor are usually filled with a redox electrolyte, containingthe redox couple, iodide/tri-iodide, in an organic solvent such as acetonitrile.The redox electrolyte serves to regenerate dye molecules, which are in theiroxidised form after having injected an electron into the TiO2, and to transportthe holes to the counter electrode, which consists of a layer of platinised flu-orine doped tin oxide (FTO) on a glass substrate. Electrons travel through themesoporous TiO2 network by diffusion to the FTO substrate of the workingelectrode, completing the circuit. The voltage which can be generated in sucha device depends on the difference of the redox potential of the electrolyteand the Fermi level of the TiO2 under illumination. How much current can begenerated depends on the absorption spectrum of the dye and how well it ismatched to the solar spectrum (Figure 1.2).
The large TiO2 surface area leads to a large contact area between the semi-conductor, the dye molecules and the redox mediator. The charge transportof carriers in the TiO2 therefore has to be faster than the recombination of
13
charge carriers across this interface in order to avoid recombination losses.The recombination of electrons in TiO2 with tri-iodide is very slow undersolar cell working conditions (tens to hundreds of milliseconds) allowing theDSC to function.6,11
The two main areas for academic research on dye-sensitized solar cellshave been the development and testing of new or different components andthe study of the complicated working mechanism underlying the operationof the cell. In this thesis, a solid state version of the conventional DSC wasstudied. In this solid state DSC, the liquid electrolyte has been replaced by theorganic hole conductor 2,2’7,7’-tetrakis-(N,N-di-p-methoxyphenyl-amine)-9,9’-spirobifluorene (spiro-MeOTAD).12,13 This potentially offers advantagesover standard DSCs in terms of stability and large-scale processing, andefficiencies of up to 6 % have been achieved in solid state DSCs.14,15
1.3 The aim and content of this thesisThe aim of this thesis work was to study the working mechanism of organicdyes in solid state DSCs. Of particular interest was a perylene dye, termedID176, which showed much better performances in solid state than liquidelectrolyte DSCs. However, before I was able to study and understand thisproblem, I spent time adapting characterisation techniques for use in solidstate DSCs (Paper I). This work lead to the observation of a Stark effect inphoto-induced absorption spectroscopy of sensitised TiO2 films (Paper II).Paper III and IV contain the studies of the sensitiser ID176: Paper III sum-marises its solar cell performance while in Paper IV, the energy alignmentand interface processes of the dye were studied. Finally, Paper V comparesdifferent methods to study the energy alignment and surface dipoles of dyesadsorbed to mesoporous TiO2 films.
The following chapters will provide background reading to the papers, asummary of the results and an outlook for future work:• The properties and problems of solid state DSCs, and in particular the
interface processes which were studied will be introduced in Chapter 2.• I will summarise the requirements for properties of organic dyes used in
DSCs and I will introduce the dyes studied here in Chapter 3.• Chapter 4 will describe the treatment of electric fields in DSCs, introduce
the Stark effect and ways to measure it.• In Chapter 5, I will describe the methods used in this work and the theory
required for applying them.• Chapter 6 will summarise some of the results from my papers regarding the
study of energy alignment and interface processes in solid state DSCs.• Finally, I will summarise the implications of my results for the measure-
ment and development of solid state DSCs and provide an outlook forfuture work (Chapter 7).
14
2. Solid state dye-sensitized solar cells
The development of solid state alternatives to the liquid electrolyte in DSCsbegan in order to avoid solvent evaporation or leakage which might occurin liquid electrolyte DSCs. One approach to this problem was to replaceorganic solvents in the liquid electrolyte by ionic liquids16 or polymers.17
The other approach was to completely replace the iodide/tri-iodide redoxcouple by solid state hole conductors. Both inorganic18,19 and organic12,20,21
hole conductors have been tested for this purpose. In a recent publication, animpressive 6 % efficiency were achieved with in situ polymerised poly(3,4-ethylenedioxythiophene) (PEDOT) as a hole conducting material.22 The mostwidely used hole conductor is the organic hole conductor spiro-MeOTAD(2,2’7,7’-tetrakis-(N,N-di-p-methoxyphenyl-amine)-9,9’-spirobifluorene)12
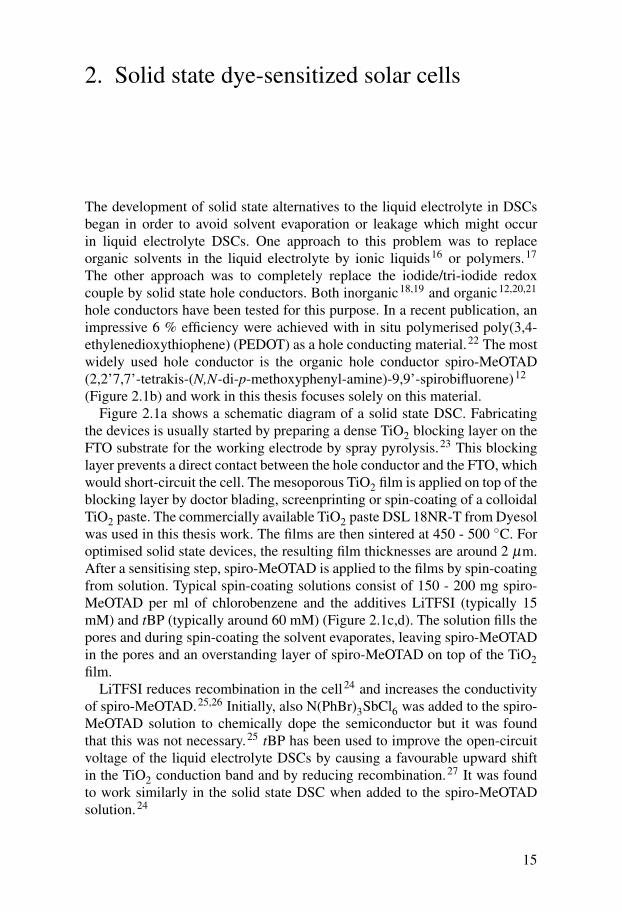
(Figure 2.1b) and work in this thesis focuses solely on this material.Figure 2.1a shows a schematic diagram of a solid state DSC. Fabricating
the devices is usually started by preparing a dense TiO2 blocking layer on theFTO substrate for the working electrode by spray pyrolysis.23 This blockinglayer prevents a direct contact between the hole conductor and the FTO, whichwould short-circuit the cell. The mesoporous TiO2 film is applied on top of theblocking layer by doctor blading, screenprinting or spin-coating of a colloidalTiO2 paste. The commercially available TiO2 paste DSL 18NR-T from Dyesolwas used in this thesis work. The films are then sintered at 450 - 500 ◦C. Foroptimised solid state devices, the resulting film thicknesses are around 2 µm.After a sensitising step, spiro-MeOTAD is applied to the films by spin-coatingfrom solution. Typical spin-coating solutions consist of 150 - 200 mg spiro-MeOTAD per ml of chlorobenzene and the additives LiTFSI (typically 15mM) and tBP (typically around 60 mM) (Figure 2.1c,d). The solution fills thepores and during spin-coating the solvent evaporates, leaving spiro-MeOTADin the pores and an overstanding layer of spiro-MeOTAD on top of the TiO2film.
LiTFSI reduces recombination in the cell24 and increases the conductivityof spiro-MeOTAD.25,26 Initially, also N(PhBr)3SbCl6 was added to the spiro-MeOTAD solution to chemically dope the semiconductor but it was foundthat this was not necessary.25 tBP has been used to improve the open-circuitvoltage of the liquid electrolyte DSCs by causing a favourable upward shiftin the TiO2 conduction band and by reducing recombination.27 It was foundto work similarly in the solid state DSC when added to the spiro-MeOTADsolution.24
15
Ag / Au contact
hole conductor
mesoporousTiO2
compact TiO2
dye
FT
O s
ub
stra
te
a) b)
c) d)
Figure 2.1: a) Schematic diagram of a solid state DSC. Molecular structure of b)spiro-MeOTAD, c) LiTFSI, and d) 4-tertbutylpyridine (tBP).
Solid state DSCs are completed by evaporation of a metal back contact.Both gold and silver have been shown to work well. Silver offers the addi-tional advantage of being more reflectant than gold and can help to enhancephotocurrents.28
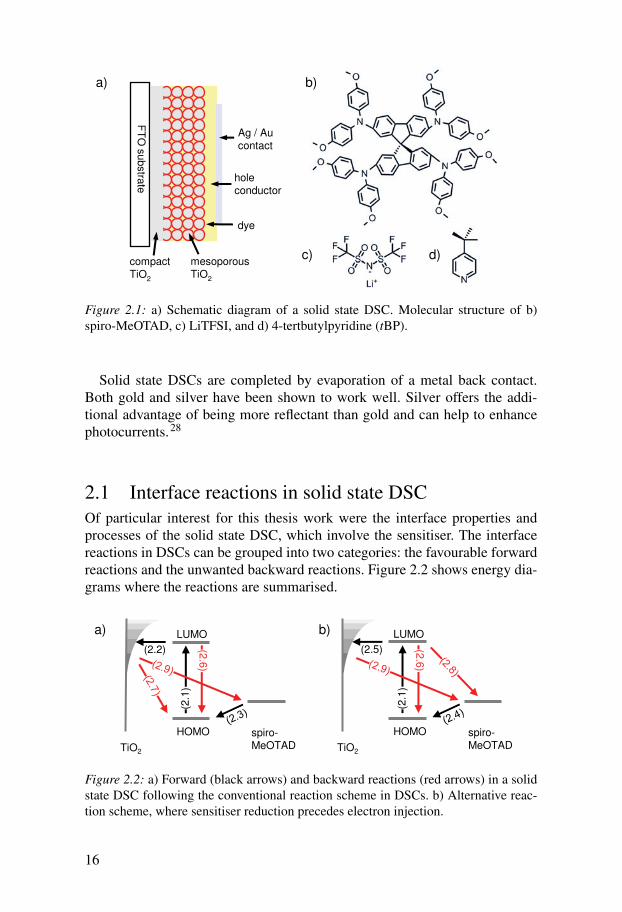
2.1 Interface reactions in solid state DSCOf particular interest for this thesis work were the interface properties andprocesses of the solid state DSC, which involve the sensitiser. The interfacereactions in DSCs can be grouped into two categories: the favourable forwardreactions and the unwanted backward reactions. Figure 2.2 shows energy dia-grams where the reactions are summarised.
HOMO
LUMO
(2.2) (2.6
)
(2.1
)
TiO2
spiro-MeOTAD
a) b)
HOMO
LUMO
(2.5) (2.6
)
(2.1
)
TiO2
spiro-MeOTAD
Figure 2.2: a) Forward (black arrows) and backward reactions (red arrows) in a solidstate DSC following the conventional reaction scheme in DSCs. b) Alternative reac-tion scheme, where sensitiser reduction precedes electron injection.
16
The first reaction always has to be the excitation of the sensitiser by absorp-tion of a photon:
D+hν −→ D∗ (2.1)
The excited dye molecule will then inject an electron into the TiO2 so that thesensitiser is oxidised (Equation 2.2). The oxidised sensitiser can then receivean electron from the hole conductor so that the sensitiser is regenerated and ahole is created in the hole conductor (Equation 2.3).
D∗ −→ D+ + e− (2.2)
D+ −→ D+h+ (2.3)
This reaction scheme is equivalent to the one observed in liquid electrolyteDSCs. For solid state DSCs, one can also consider that the excited sensitisermight be reductively quenched by the hole conductor creating the reducedsensitiser and a hole in spiro-MeOTAD (Equation 2.4).29 This option will bediscussed in more detail in Chapter 6.4 and in Paper IV. The reduced sensi-tiser might then inject its electron into the TiO2 completing charge separation(Equation 2.5).
D∗ −→ D−+h+ (2.4)
D− −→ D+ e− (2.5)
Recombination reactions are possible after each step of charge generation:
D∗ −→ D(+hν) (2.6)
D+ + e− −→ D (2.7)
D−+h+ −→ D (2.8)
e−+h+ −→ (2.9)
If one of the forward reactions is not efficient, charge carriers will recom-bine. A forward reaction should therefore be faster than the backward reac-tion of the previous step. For example, regeneration of oxidised dye molecules(Reaction 2.3) should be faster than recombination of oxidised dye moleculesand electrons (Reaction 2.7). Finally, the recombination of electrons in theTiO2 and holes in spiro-MeOTAD (Equation 2.9) competes with the chargetransport to the contacts.
17
2.2 Differences between spiro-MeOTAD and a redoxelectrolyteComparing the properties of spiro-MeOTAD to the properties of a redox elec-trolyte, it is immediately obvious that the charge transport mechanism ofpositive charge carriers is different in solid state and liquid electrolyte DSCs.In the liquid electrolyte case, the redox mediator diffuses in a liquid mediumwhile in the solid state case, the holes move in a solid medium. The ratio oftri-iodide and iodide in the liquid electrolyte cells is about 1 to 10 and bothare present in large quantities. In the solid state DSCs considered here, spiro-MeOTAD is not actively doped and the concentration of holes might be verylow. There is some evidence that spiro-MeOTAD can become oxidised in thepresence of oxygen and LiTFSI and that this improves device performances.30
Considering the interface reactions discussed in the previous section, it isclear that all reactions involving spiro-MeOTAD will be different to the equiv-alent reactions in the liquid electrolyte DSC. In the latter, iodide has to diffuseto the oxidised dye molecule, while in the solid state DSC, a spiro-MeOTADmolecule is either present close to the dye molecule or not. If it is, then the re-generation reaction might be expected to occur much faster than in the liquidelectrolyte DSC. Regeneration in the picosecond time scale has indeed beenobserved with spiro-MeOTAD.31
The recombination between tri-iodide and electrons in the liquid electrolyteDSC (the equivalent of Reaction 2.9) is slow, as iodide/tri-iodide is a twoelectron redox couple.32 Faster recombination has been observed in solid stateDSCs.33,34
Finally, the energy level / redox potential of spiro-MeOTAD is differentfrom the redox potential of iodide/tri-iodide. Iodide/tri-iodide has a redox po-tential of approximately -0.32 V vs. Fc/Fc+,27 while the redox potential ofspiro-MeOTAD has been determined to be 0.12 V vs. Fc/Fc+ in solution35
and 0.15 V vs. Fc/Fc+ in a solid film (Paper I). Therefore solid state DSCscan give higher voltages and have a potential for higher efficiencies than liquidelectrolyte DSCs.
2.3 Performance limitations of solid state DSCsAs mentioned above, the highest efficiencies in solid state DSCs have beenachieved using approximately 2 µm thick TiO2 films. This is much lowerthan optimised film thicknesses of liquid electrolyte DSCs. Light harvesting,especially in the red part of the solar spectrum, is often not complete whenusing such thin films. In order to improve the efficiencies of solid state DSCsfurther, it is important to understand the cause of the low optimal film thick-ness. One needs to determine which processes work well in the cell and whichprocesses are limiting.
18
Another way to improve the light harvesting in thin films is to use organicdyes with high extinction coefficients.36–38 This was also the motivation forusing organic dyes in this thesis work and design principles and properties ofsuch dyes are discussed in the next chapter.
Difficulties in filling the pores of mesoporous TiO2 have been viewed asone of the reasons for the limitations in the TiO2 film thickness.20,31 Oneshould distinguish here between the contacting of the dye molecules by thehole conductor and the actual filling of all pores of the titanium dioxide. On theone hand, if some dye molecules are not contacted by the hole conductor, theymight not be regenerated. On the other hand, incomplete filling of the porescould lead to difficulties in transporting holes out of the spiro-MeOTAD film.Recent studies have shown that filling fractions can be very high for thin TiO2films and might be as high as 60 % for 7 µm thick TiO2 films.39,40 In PaperI, I tried to study the pore filling by studying the regeneration of oxidised dyemolecules at different spiro-MeOTAD concentrations. This method examinesthe contact behaviour rather than the actual pore filling.
Another reason for the lower efficiencies of solid state DSCs seems to bethat the electron diffusion length close to open-circuit conditions is close tothe optimum film thickness.33,34,39 Other studies have suggested that the elec-tron diffusion length is sufficiently long for complete charge collection undershort circuit conditions.39,41 The diffusion length can be either improved bydecreasing the transport times or by decreasing recombination. It has beensuggested that the electron transport in the TiO2 is limiting rather than thehole transport in spiro-MeOTAD.28 Therefore, one might be able to improvethe devices by employing more ordered TiO2 structures with better transportproperties.
Recombination in solid state DSCs has been inhibited by adding tBP to thespiro-MeOTAD solution.24 Another approach has been to protect the TiO2surface by using small organic molecules as co-adsorbers42 or by coatingthe TiO2 surface with an insulating oxide layer prior to dye adsorption.43,44
While this latter approach is very efficient in reducing recombination, it canalso block electron injection and therefore does not always improve efficien-cies. The largest improvements in efficiency have come from employing dyeswith long alkyl chains, which can reduce recombination at the TiO2/spiro-MeOTAD interface.14,28,36 This indicates the central role the dye and theTiO2/dye/spiro-MeOTAD interface play in understanding and optimising theproperties of solid state DSCs.
19

3. Organic dyes for solid statedye-sensitized solar cells
One of the components of the dye-sensitized solar cell, which is easiest tovary, is the sensitising dye and many different dyes have been synthesisedfor DSCs and tested in functional devices.6,45 The most successful devicesstill use ruthenium sensitisers4,8,9,46 but efficiencies of up to 10 % have beenobtained using organic sensitisers in liquid electrolyte DSCs.47 Organic dyeshave some advantages over ruthenium dyes. They exhibit higher extinctioncoefficients and therefore do not need as thick mesoporous TiO2 films asruthenium sensitisers for complete light harvesting. They can be relativelyeasily modified to tune their properties.
In general, dyes for DSCs should fulfil the following properties to besuccessfully used in devices:6,48
1. The dye should have at least one anchoring group to bind to the TiO2surface.
2. The excited state of the dye must be high enough in energy and long-livedenough to allow for electron injection into the TiO2.
3. The highest occupied molecular orbital (HOMO) of the dye should be lowenough to allow for regeneration.
4. The dye should have a high extinction coefficient over a large region of thesolar spectrum.
5. The dye should be photo-, thermally and electrochemically stable.6. The dye should form a densely packed monolayer on the TiO2 surface.
3.1 Donor-linker-acceptor dyesA common line of development for organic dyes in DSCs is to synthesiseso called D-π-A dyes, consisting of an electron donor (D), a conjugatedlinker (π) and an electron acceptor (A).45,48 The idea behind this concept isthat in such molecules most electron density of the HOMO will be locatedon the donor, while most density of the lowest unoccupied molecularorbital (LUMO) will be located on the acceptor. The dyes therefore showintramolecular charge transfer (ICT) from the donor to the acceptor uponexcitation.
For typical n-type dyes used in standard DSCs, the anchoring group islocated close to or is even part of the acceptor. This ensures that the excited
21
state of the dye is located closer to the TiO2 surface than the hole remainingon the dye after electron injection. This should help supressing recombinationbetween electrons and oxidised dye molecules and make the hole easily acces-sible for the redox mediator, which is beneficial for regeneration. A variationof this theme is employed in p-type DSCs, which use a p-type semiconductor(NiO) as a photocathode.49,50 In these DSCs, a hole is injected into the semi-conductor and therefore the anchoring group will now be on the donor of thesensitiser, facilitating hole injection.
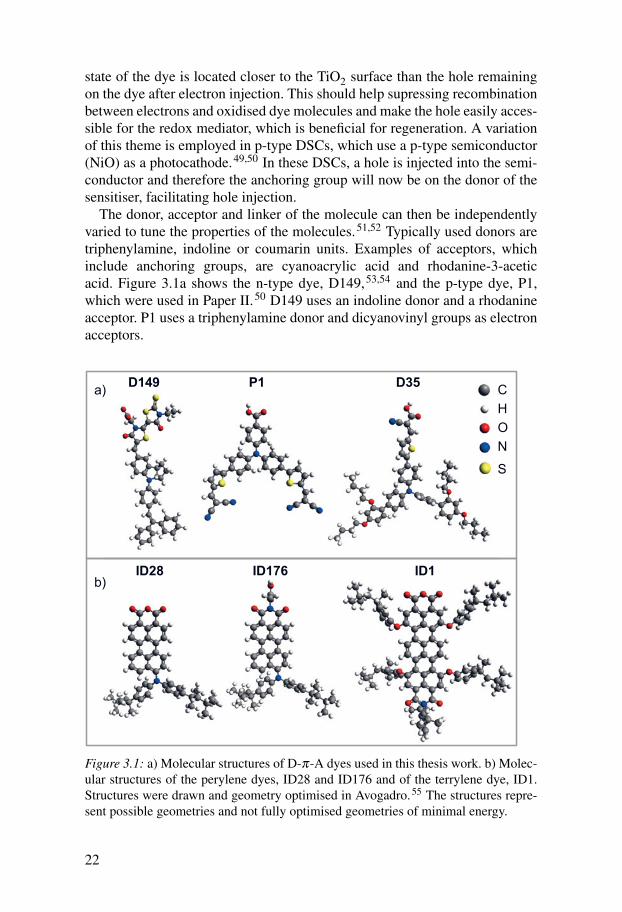
The donor, acceptor and linker of the molecule can then be independentlyvaried to tune the properties of the molecules.51,52 Typically used donors aretriphenylamine, indoline or coumarin units. Examples of acceptors, whichinclude anchoring groups, are cyanoacrylic acid and rhodanine-3-aceticacid. Figure 3.1a shows the n-type dye, D149,53,54 and the p-type dye, P1,which were used in Paper II.50 D149 uses an indoline donor and a rhodanineacceptor. P1 uses a triphenylamine donor and dicyanovinyl groups as electronacceptors.
P1 D35C
H
O
N
S
D149
ID28 ID176 ID1
a)
b)
Figure 3.1: a) Molecular structures of D-π-A dyes used in this thesis work. b) Molec-ular structures of the perylene dyes, ID28 and ID176 and of the terrylene dye, ID1.Structures were drawn and geometry optimised in Avogadro.55 The structures repre-sent possible geometries and not fully optimised geometries of minimal energy.
22
Another modification often made to organic dyes is to introduce alkylchains to the linker or donor part of the molecule. These can preventformation of dye aggregates and/or inhibit electron and hole recombinationby protecting the TiO2 surface. An example of such a dye based on atriphenylamine donor is D3556,57 (Figure 3.1a), which has been successfullyemployed in liquid electrolyte as well as solid state DSCs. This dye was usedfor the comparison of measurements on complete solid state devices to liquidelectrolyte devices here (Chapter 5.2).
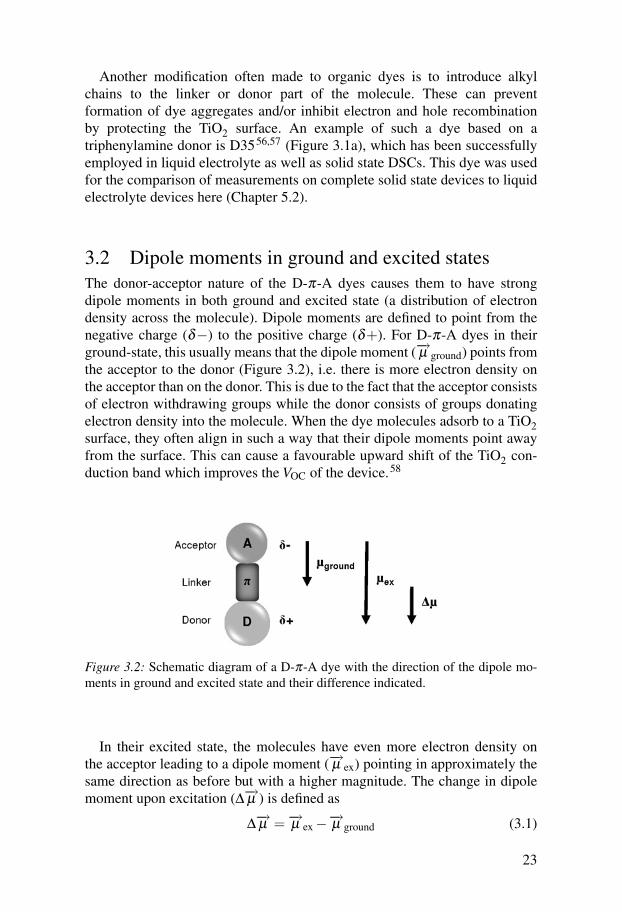
3.2 Dipole moments in ground and excited statesThe donor-acceptor nature of the D-π-A dyes causes them to have strongdipole moments in both ground and excited state (a distribution of electrondensity across the molecule). Dipole moments are defined to point from thenegative charge (δ−) to the positive charge (δ+). For D-π-A dyes in theirground-state, this usually means that the dipole moment (−→µ ground) points fromthe acceptor to the donor (Figure 3.2), i.e. there is more electron density onthe acceptor than on the donor. This is due to the fact that the acceptor consistsof electron withdrawing groups while the donor consists of groups donatingelectron density into the molecule. When the dye molecules adsorb to a TiO2surface, they often align in such a way that their dipole moments point awayfrom the surface. This can cause a favourable upward shift of the TiO2 con-duction band which improves the VOC of the device.58
Figure 3.2: Schematic diagram of a D-π-A dye with the direction of the dipole mo-ments in ground and excited state and their difference indicated.
In their excited state, the molecules have even more electron density onthe acceptor leading to a dipole moment (−→µ ex) pointing in approximately thesame direction as before but with a higher magnitude. The change in dipolemoment upon excitation (∆−→µ ) is defined as
∆−→µ =−→µ ex−−→µ ground (3.1)
23
This quantity gives information about the magnitude of the intramolecularcharge transfer upon excitation and is therefore an important parameter in thecharacterisation of D-π-A dyes.
For p-type dyes like P1, the dipole moments typically point in the oppositedirection relative to the binding group and the semiconductor surface than forn-type dyes.
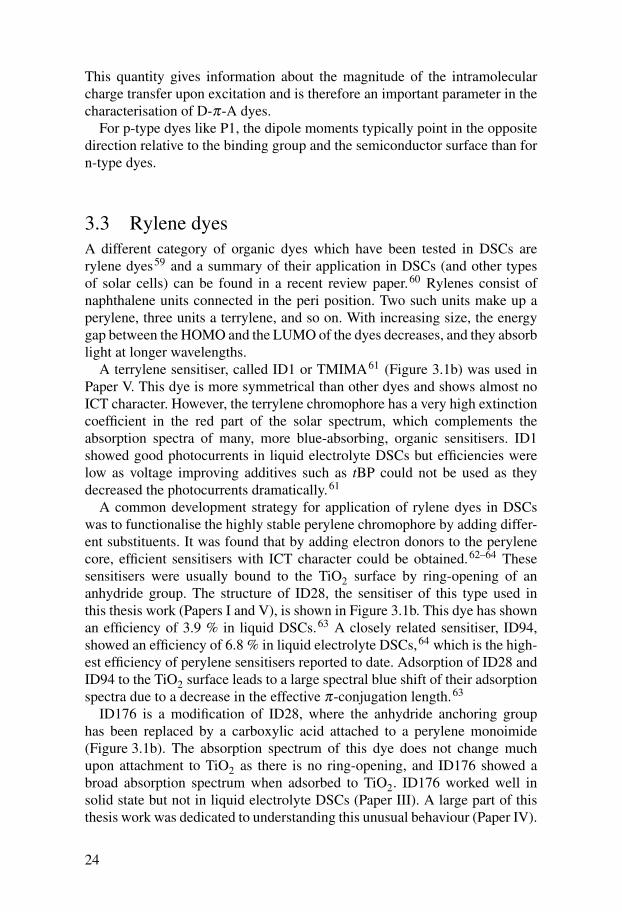
3.3 Rylene dyesA different category of organic dyes which have been tested in DSCs arerylene dyes59 and a summary of their application in DSCs (and other typesof solar cells) can be found in a recent review paper.60 Rylenes consist ofnaphthalene units connected in the peri position. Two such units make up aperylene, three units a terrylene, and so on. With increasing size, the energygap between the HOMO and the LUMO of the dyes decreases, and they absorblight at longer wavelengths.
A terrylene sensitiser, called ID1 or TMIMA61 (Figure 3.1b) was used inPaper V. This dye is more symmetrical than other dyes and shows almost noICT character. However, the terrylene chromophore has a very high extinctioncoefficient in the red part of the solar spectrum, which complements theabsorption spectra of many, more blue-absorbing, organic sensitisers. ID1showed good photocurrents in liquid electrolyte DSCs but efficiencies werelow as voltage improving additives such as tBP could not be used as theydecreased the photocurrents dramatically.61
A common development strategy for application of rylene dyes in DSCswas to functionalise the highly stable perylene chromophore by adding differ-ent substituents. It was found that by adding electron donors to the perylenecore, efficient sensitisers with ICT character could be obtained.62–64 Thesesensitisers were usually bound to the TiO2 surface by ring-opening of ananhydride group. The structure of ID28, the sensitiser of this type used inthis thesis work (Papers I and V), is shown in Figure 3.1b. This dye has shownan efficiency of 3.9 % in liquid DSCs.63 A closely related sensitiser, ID94,showed an efficiency of 6.8 % in liquid electrolyte DSCs,64 which is the high-est efficiency of perylene sensitisers reported to date. Adsorption of ID28 andID94 to the TiO2 surface leads to a large spectral blue shift of their adsorptionspectra due to a decrease in the effective π-conjugation length.63
ID176 is a modification of ID28, where the anhydride anchoring grouphas been replaced by a carboxylic acid attached to a perylene monoimide(Figure 3.1b). The absorption spectrum of this dye does not change muchupon attachment to TiO2 as there is no ring-opening, and ID176 showed abroad absorption spectrum when adsorbed to TiO2. ID176 worked well insolid state but not in liquid electrolyte DSCs (Paper III). A large part of thisthesis work was dedicated to understanding this unusual behaviour (Paper IV).
24
4. Electric fields in DSCs and theStark effect
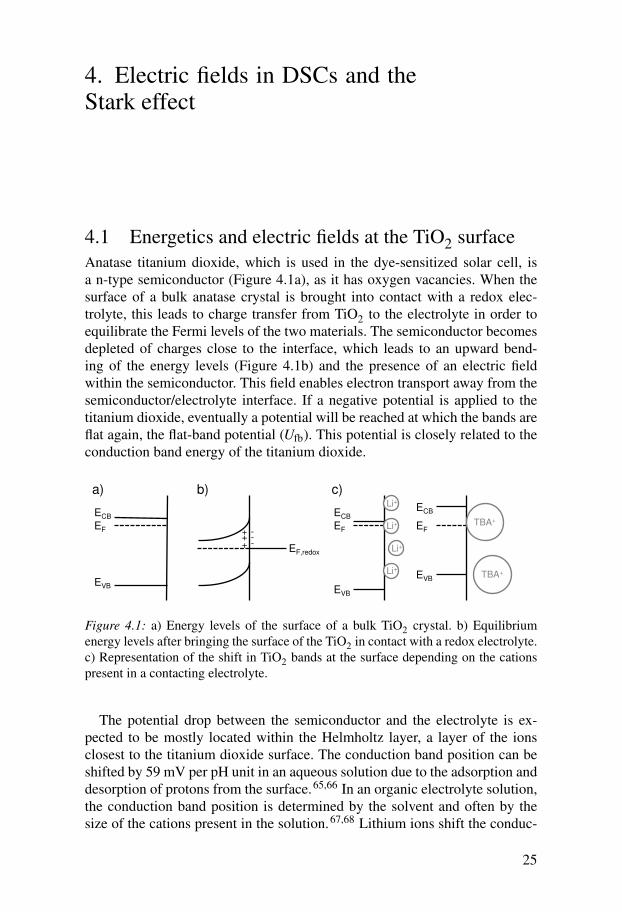
4.1 Energetics and electric fields at the TiO2 surfaceAnatase titanium dioxide, which is used in the dye-sensitized solar cell, isa n-type semiconductor (Figure 4.1a), as it has oxygen vacancies. When thesurface of a bulk anatase crystal is brought into contact with a redox elec-trolyte, this leads to charge transfer from TiO2 to the electrolyte in order toequilibrate the Fermi levels of the two materials. The semiconductor becomesdepleted of charges close to the interface, which leads to an upward bend-ing of the energy levels (Figure 4.1b) and the presence of an electric fieldwithin the semiconductor. This field enables electron transport away from thesemiconductor/electrolyte interface. If a negative potential is applied to thetitanium dioxide, eventually a potential will be reached at which the bands areflat again, the flat-band potential (Ufb). This potential is closely related to theconduction band energy of the titanium dioxide.
ECB
EVB
EF
a)
EF,redox
++
+
---
b) c)
ECB
EVB
EF Li+
Li+
Li+
ECB
EVB
EFTBA+
TBA+
Li+
Figure 4.1: a) Energy levels of the surface of a bulk TiO2 crystal. b) Equilibriumenergy levels after bringing the surface of the TiO2 in contact with a redox electrolyte.c) Representation of the shift in TiO2 bands at the surface depending on the cationspresent in a contacting electrolyte.
The potential drop between the semiconductor and the electrolyte is ex-pected to be mostly located within the Helmholtz layer, a layer of the ionsclosest to the titanium dioxide surface. The conduction band position can beshifted by 59 mV per pH unit in an aqueous solution due to the adsorption anddesorption of protons from the surface.65,66 In an organic electrolyte solution,the conduction band position is determined by the solvent and often by thesize of the cations present in the solution.67,68 Lithium ions shift the conduc-
25
tion band downwards in energy compared to the bulky TBA ions, as they canadsorb directly to the TiO2 surface (Figure 4.1c). When the cations are ad-sorbed closer to the surface it becomes easier to inject an electron into theTiO2 and harder to remove one, as the counter charge is closer to the electron.In a similar way, also the dipole moments of a molecules adsorbed to the TiO2surface can change the conduction band position. Dipole moments pointingtowards the TiO2 surface shift it to more positive potentials while dipole mo-ments pointing away from the TiO2 surface shift it to more negative potentials.An example of this is the use of tBP as an additive to liquid electrolytes or tospiro-MeOTAD to shift the conduction band to more negative potentials andto improve the open-circuit voltage of DSCs.
In mesoporous TiO2 films, band bending of the TiO2 bands is not consid-ered to play a role. The particles become essentially depleted of conductionband electrons upon contact with the redox mediator. As the particles are small(20 nm in diameter), the potential drop within the particles is only estimatedto be about a few meV.66,69 Charges therefore travel within and between theparticles by diffusion rather than by the drive of an electric field. Furthermore,in the consideration of the DSC energetics, it is not just the conduction bandposition, which is important but also the density of trap states in the bandgap.70 The density of states is expected to decrease exponentially below theconduction band edge. The density of states in the TiO2 has been probed byelectrochemistry in this thesis work and the density of surface trap states hasbeen measured by photoelectron spectroscopy (Chapter 6.2 and Paper IV).
In DSCs, dye molecules are present at the TiO2 surface. These dyemolecules might be closer adsorbed to the TiO2 surface than any of the ionsin the electrolyte and therefore be located within the Helmholtz layer. In sucha case, their potentials have been observed to follow the potential of theTiO2 surface.71,72 Alternatively, if the dye molecules are located outside theHelmholtz layer, the potentials of the dye molecules will not follow those ofthe TiO2.71 This might be the case for large dye molecules, or if the ions inthe electrolyte are small and can adsorb closer to the TiO2 surface than thedye molecules, shielding the dye molecules from the potential at the TiO2surface.
In this thesis work, a shift to longer wavelengths of the absorption spectrawas observed for dye molecules adsorbed to TiO2 in presence of lithium ions(Figures 4.6a and 5.1b). It was found that the oxidation potentials of dyes wereessentially unchanged in presence of different cations, while their excited statepotential and their reduction potential followed the potential of the titaniumdioxide (Chapter 6.2 and Paper IV).
Photo-induced electron injection into the TiO2 leads to an increasedamount of charge present in the semiconductor. These charges are thoughtto be screened by the shell of adsorbed ions around the TiO2. This is alsoconsidered to be the case in solid state DSCs, where LiTFSI has been addedto the spiro-MeOTAD matrix. However, if dye molecules are located within
26
the Helmholtz layer, they may be exposed to an increased potential drop uponelectron injection. This effect was observed in this thesis work (Paper II) andsimultaneously by Meyer and co-workers.73 Photo-induced electron injectionwas found to cause a Stark shift in the ground-state absorption spectra of dyemolecules adsorbed to the TiO2 surface.
4.2 The Stark effectElectric fields can induce a change in the transition energies of molecules(∆E).74–76 This effect is called Stark effect, electroabsorption orelectrochromism.i In very general terms the change in transition energy dueto an external electric field (
−→F ) is given by:ii
∆E =−∆−→µ ·−→F − 1
2−→F ·∆α ·−→F (4.1)
where ∆α is the change in polarisability due to the transition. This equationis valid for electronic transitions as well as for other transitions. One distin-guishes the first order Stark effect, which is linear in the electric field, and thesecond order Stark effect, which is quadratic in the electric field.
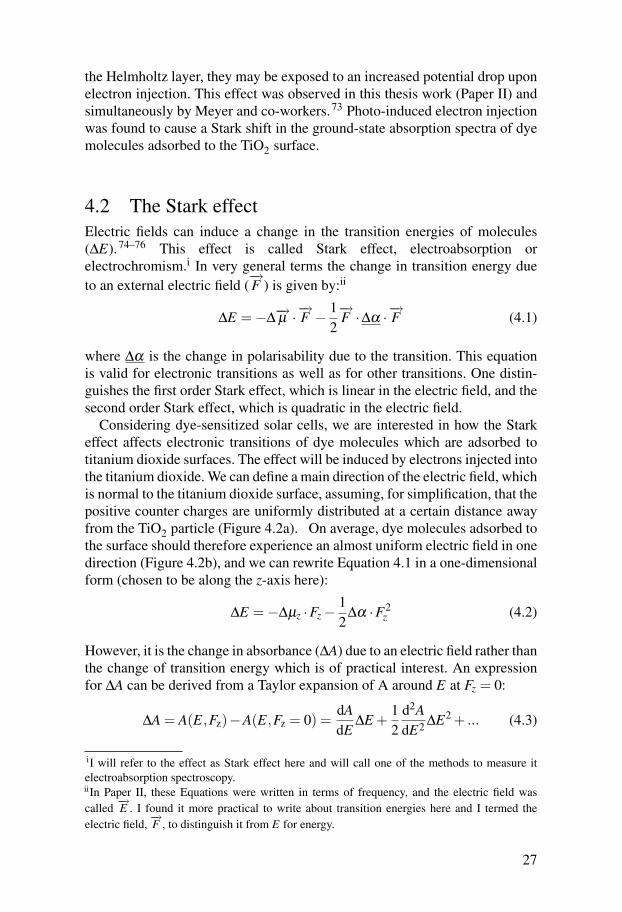
Considering dye-sensitized solar cells, we are interested in how the Starkeffect affects electronic transitions of dye molecules which are adsorbed totitanium dioxide surfaces. The effect will be induced by electrons injected intothe titanium dioxide. We can define a main direction of the electric field, whichis normal to the titanium dioxide surface, assuming, for simplification, that thepositive counter charges are uniformly distributed at a certain distance awayfrom the TiO2 particle (Figure 4.2a). On average, dye molecules adsorbed tothe surface should therefore experience an almost uniform electric field in onedirection (Figure 4.2b), and we can rewrite Equation 4.1 in a one-dimensionalform (chosen to be along the z-axis here):
∆E =−∆µz ·Fz−12
∆α ·F2z (4.2)
However, it is the change in absorbance (∆A) due to an electric field rather thanthe change of transition energy which is of practical interest. An expressionfor ∆A can be derived from a Taylor expansion of A around E at Fz = 0:
∆A = A(E,Fz)−A(E,Fz = 0) =dAdE
∆E +12
d2AdE2 ∆E2 + ... (4.3)
iI will refer to the effect as Stark effect here and will call one of the methods to measure itelectroabsorption spectroscopy.iiIn Paper II, these Equations were written in terms of frequency, and the electric field wascalled
−→E . I found it more practical to write about transition energies here and I termed the
electric field,−→F , to distinguish it from E for energy.
27
E
A
A
e-
e-
e-
e- x 10
Fz
E
a) b) c)
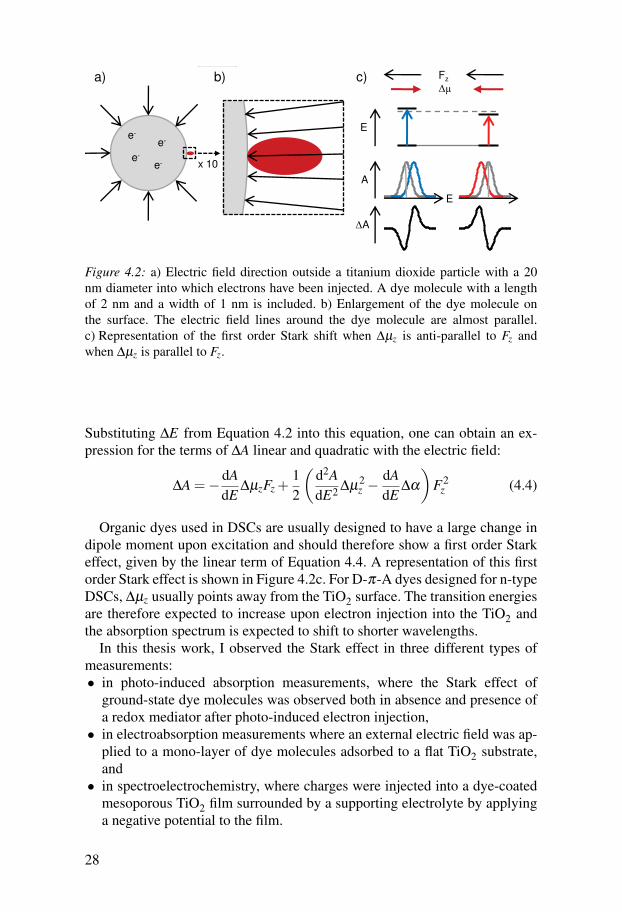
Figure 4.2: a) Electric field direction outside a titanium dioxide particle with a 20nm diameter into which electrons have been injected. A dye molecule with a lengthof 2 nm and a width of 1 nm is included. b) Enlargement of the dye molecule onthe surface. The electric field lines around the dye molecule are almost parallel.c) Representation of the first order Stark shift when ∆µz is anti-parallel to Fz andwhen ∆µz is parallel to Fz.
Substituting ∆E from Equation 4.2 into this equation, one can obtain an ex-pression for the terms of ∆A linear and quadratic with the electric field:
∆A =−dAdE
∆µzFz +12
(d2AdE2 ∆µ
2z −
dAdE
∆α
)F2
z (4.4)
Organic dyes used in DSCs are usually designed to have a large change indipole moment upon excitation and should therefore show a first order Starkeffect, given by the linear term of Equation 4.4. A representation of this firstorder Stark effect is shown in Figure 4.2c. For D-π-A dyes designed for n-typeDSCs, ∆µz usually points away from the TiO2 surface. The transition energiesare therefore expected to increase upon electron injection into the TiO2 andthe absorption spectrum is expected to shift to shorter wavelengths.
In this thesis work, I observed the Stark effect in three different types ofmeasurements:• in photo-induced absorption measurements, where the Stark effect of
ground-state dye molecules was observed both in absence and presence ofa redox mediator after photo-induced electron injection,
• in electroabsorption measurements where an external electric field was ap-plied to a mono-layer of dye molecules adsorbed to a flat TiO2 substrate,and
• in spectroelectrochemistry, where charges were injected into a dye-coatedmesoporous TiO2 film surrounded by a supporting electrolyte by applyinga negative potential to the film.
28
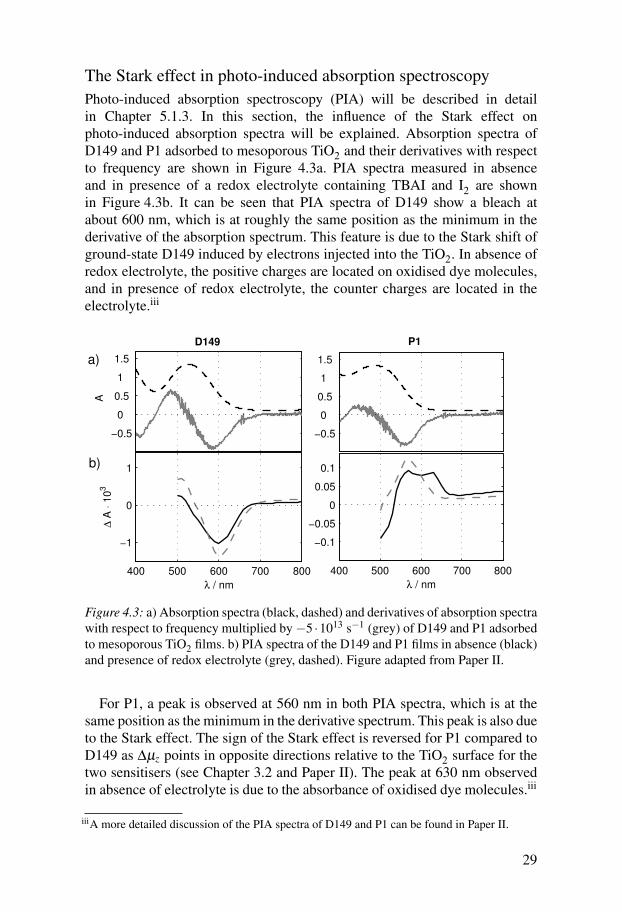
The Stark effect in photo-induced absorption spectroscopyPhoto-induced absorption spectroscopy (PIA) will be described in detailin Chapter 5.1.3. In this section, the influence of the Stark effect onphoto-induced absorption spectra will be explained. Absorption spectra ofD149 and P1 adsorbed to mesoporous TiO2 and their derivatives with respectto frequency are shown in Figure 4.3a. PIA spectra measured in absenceand in presence of a redox electrolyte containing TBAI and I2 are shownin Figure 4.3b. It can be seen that PIA spectra of D149 show a bleach atabout 600 nm, which is at roughly the same position as the minimum in thederivative of the absorption spectrum. This feature is due to the Stark shift ofground-state D149 induced by electrons injected into the TiO2. In absence ofredox electrolyte, the positive charges are located on oxidised dye molecules,and in presence of redox electrolyte, the counter charges are located in theelectrolyte.iii
−0.5
0
0.5
1
1.5
−0.5
0
0.5
1
1.5
A
400 500 600 700 800
−1
0
1
λ / nm
∆ A
⋅ 1
03
400 500 600 700 800
−0.1
−0.05
0
0.05
0.1
λ / nm
D149 P1
a)
b)
Figure 4.3: a) Absorption spectra (black, dashed) and derivatives of absorption spectrawith respect to frequency multiplied by−5 ·1013 s−1 (grey) of D149 and P1 adsorbedto mesoporous TiO2 films. b) PIA spectra of the D149 and P1 films in absence (black)and presence of redox electrolyte (grey, dashed). Figure adapted from Paper II.
For P1, a peak is observed at 560 nm in both PIA spectra, which is at thesame position as the minimum in the derivative spectrum. This peak is also dueto the Stark effect. The sign of the Stark effect is reversed for P1 compared toD149 as ∆µz points in opposite directions relative to the TiO2 surface for thetwo sensitisers (see Chapter 3.2 and Paper II). The peak at 630 nm observedin absence of electrolyte is due to the absorbance of oxidised dye molecules.iii
iiiA more detailed discussion of the PIA spectra of D149 and P1 can be found in Paper II.
29
Stark shifts were also observed in PIA spectra of all other dyes used inthis thesis work and in femtosecond transient absorption measurements(Paper IV).
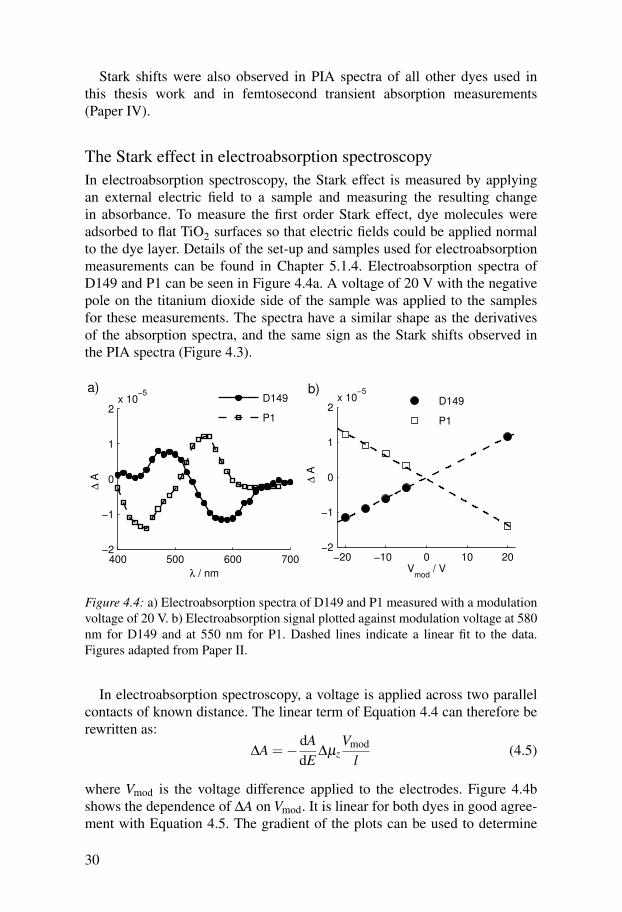
The Stark effect in electroabsorption spectroscopyIn electroabsorption spectroscopy, the Stark effect is measured by applyingan external electric field to a sample and measuring the resulting changein absorbance. To measure the first order Stark effect, dye molecules wereadsorbed to flat TiO2 surfaces so that electric fields could be applied normalto the dye layer. Details of the set-up and samples used for electroabsorptionmeasurements can be found in Chapter 5.1.4. Electroabsorption spectra ofD149 and P1 can be seen in Figure 4.4a. A voltage of 20 V with the negativepole on the titanium dioxide side of the sample was applied to the samplesfor these measurements. The spectra have a similar shape as the derivativesof the absorption spectra, and the same sign as the Stark shifts observed inthe PIA spectra (Figure 4.3).
400 500 600 700−2
−1
0
1
2x 10
−5
λ / nm
∆ A
D149
P1
a)
−20 −10 0 10 20−2
−1
0
1
2x 10
−5
Vmod
/ V
∆ A
D149
P1
b)
Figure 4.4: a) Electroabsorption spectra of D149 and P1 measured with a modulationvoltage of 20 V. b) Electroabsorption signal plotted against modulation voltage at 580nm for D149 and at 550 nm for P1. Dashed lines indicate a linear fit to the data.Figures adapted from Paper II.
In electroabsorption spectroscopy, a voltage is applied across two parallelcontacts of known distance. The linear term of Equation 4.4 can therefore berewritten as:
∆A =−dAdE
∆µzVmod
l(4.5)
where Vmod is the voltage difference applied to the electrodes. Figure 4.4bshows the dependence of ∆A on Vmod. It is linear for both dyes in good agree-ment with Equation 4.5. The gradient of the plots can be used to determine
30
∆µz if the magnitude of dAdE is known. For D149, ∆µz was estimated to be
approximately 1 Debye (Paper II).
The Stark effect in spectroelectrochemistryThe Stark effect can also be observed in spectroelectrochemistry. This was al-ready shown in Paper I, even though the effect was not identified as the Starkeffect there. Details of the experimental set-up for spectroelectrochemistryof dyes adsorbed to mesoporous TiO2 can be found in Chapter 5.1.2. Whenapplying a negative potential to a TiO2 film, charges are injected into bandgap states in the TiO2 and at sufficiently negative potentials also into the con-duction band. The counter ions of these charges are cations in the supportingelectrolyte. The electrons injected into the TiO2 can cause a Stark shift ofthe adsorbed dye molecules in a similar manner to photo-injected electrons inphoto-induced absorption spectroscopy.
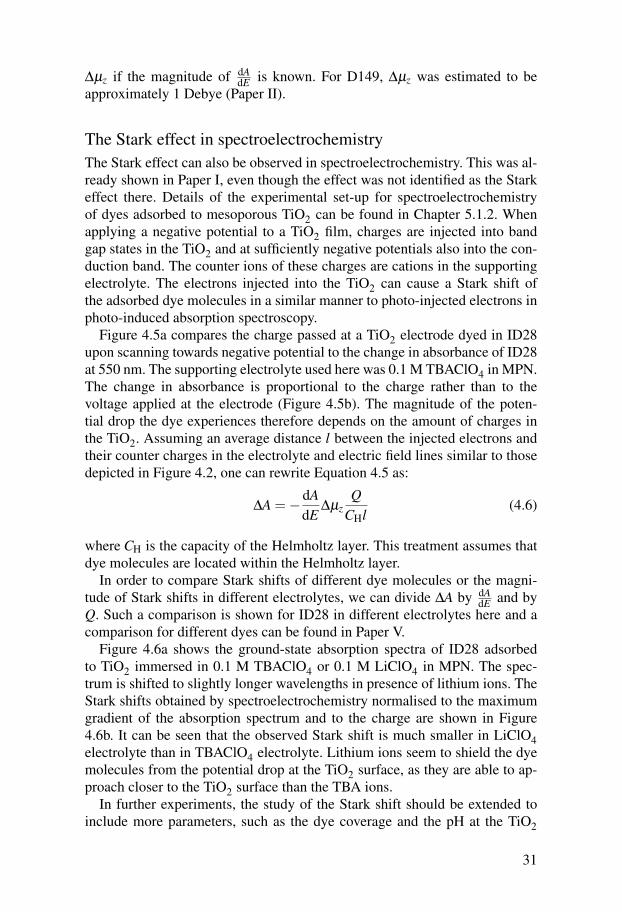
Figure 4.5a compares the charge passed at a TiO2 electrode dyed in ID28upon scanning towards negative potential to the change in absorbance of ID28at 550 nm. The supporting electrolyte used here was 0.1 M TBAClO4 in MPN.The change in absorbance is proportional to the charge rather than to thevoltage applied at the electrode (Figure 4.5b). The magnitude of the poten-tial drop the dye experiences therefore depends on the amount of charges inthe TiO2. Assuming an average distance l between the injected electrons andtheir counter charges in the electrolyte and electric field lines similar to thosedepicted in Figure 4.2, one can rewrite Equation 4.5 as:
∆A =−dAdE
∆µzQ
CHl(4.6)
where CH is the capacity of the Helmholtz layer. This treatment assumes thatdye molecules are located within the Helmholtz layer.
In order to compare Stark shifts of different dye molecules or the magni-tude of Stark shifts in different electrolytes, we can divide ∆A by dA
dE and byQ. Such a comparison is shown for ID28 in different electrolytes here and acomparison for different dyes can be found in Paper V.
Figure 4.6a shows the ground-state absorption spectra of ID28 adsorbedto TiO2 immersed in 0.1 M TBAClO4 or 0.1 M LiClO4 in MPN. The spec-trum is shifted to slightly longer wavelengths in presence of lithium ions. TheStark shifts obtained by spectroelectrochemistry normalised to the maximumgradient of the absorption spectrum and to the charge are shown in Figure4.6b. It can be seen that the observed Stark shift is much smaller in LiClO4electrolyte than in TBAClO4 electrolyte. Lithium ions seem to shield the dyemolecules from the potential drop at the TiO2 surface, as they are able to ap-proach closer to the TiO2 surface than the TBA ions.
In further experiments, the study of the Stark shift should be extended toinclude more parameters, such as the dye coverage and the pH at the TiO2
31
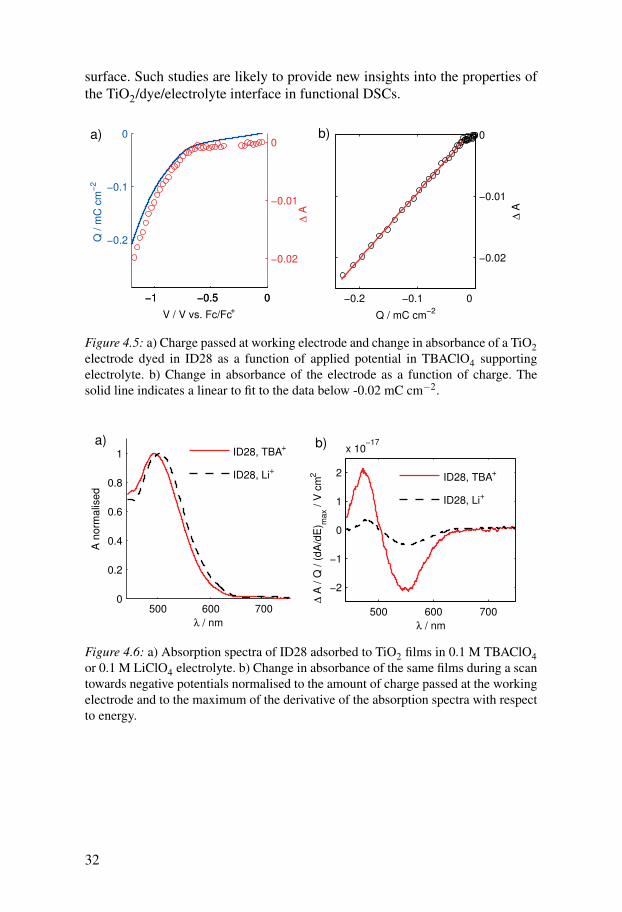
surface. Such studies are likely to provide new insights into the properties ofthe TiO2/dye/electrolyte interface in functional DSCs.
−1 −0.5 0
−0.2
−0.1
0
Q / m
C c
m−
2
V / V vs. Fc/Fc+
−1 −0.5 0
−0.02
−0.01
0
∆ A
a)
−0.2 −0.1 0
−0.02
−0.01
0
Q / mC cm−2
∆ A
b)
Figure 4.5: a) Charge passed at working electrode and change in absorbance of a TiO2electrode dyed in ID28 as a function of applied potential in TBAClO4 supportingelectrolyte. b) Change in absorbance of the electrode as a function of charge. Thesolid line indicates a linear to fit to the data below -0.02 mC cm−2.
500 600 7000
0.2
0.4
0.6
0.8
1
λ / nm
A n
orm
alis
ed
ID28, TBA
+
ID28, Li+
a)
500 600 700
−2
−1
0
1
2
x 10−17
λ / nm
∆ A
/ Q
/ (
dA
/dE
) max / V
cm
2
ID28, TBA+
ID28, Li+
b)
Figure 4.6: a) Absorption spectra of ID28 adsorbed to TiO2 films in 0.1 M TBAClO4or 0.1 M LiClO4 electrolyte. b) Change in absorbance of the same films during a scantowards negative potentials normalised to the amount of charge passed at the workingelectrode and to the maximum of the derivative of the absorption spectra with respectto energy.
32
5. Characterisation techniques
This chapter describes the different techniques used for characterisation ofdye-sensitized solar cells throughout my PhD studies. The techniques can bedivided into two sub-categories, where one focuses on mainly spectroscopictechniques which are applied to components of the solar cell and the secondon electrical measurements of complete devices.
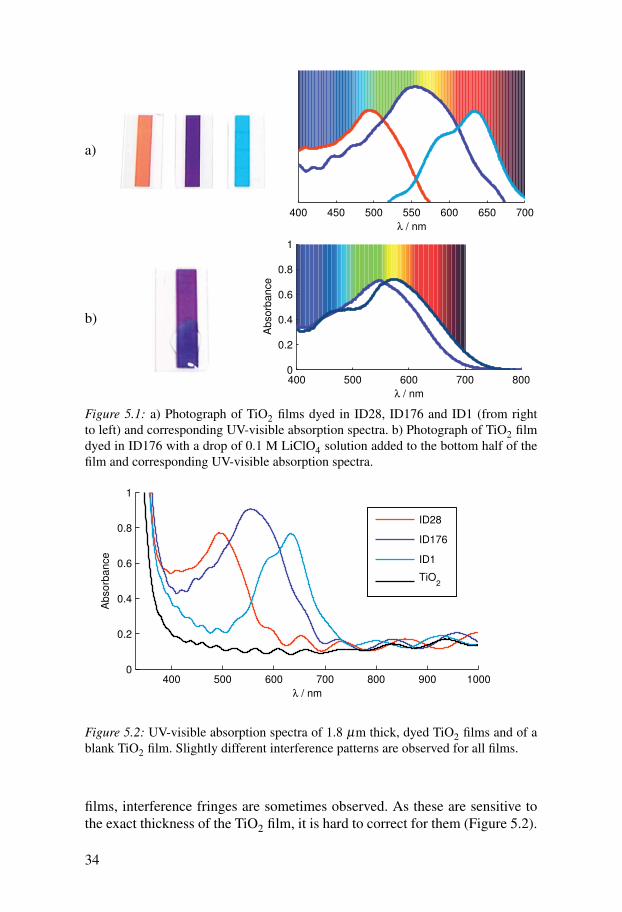
5.1 Characterisation of components5.1.1 UV-visible spectroscopyOne of the nice aspects of working with dyes is the use of colourful sam-ples (Figure 5.1). Visual inspection of samples can often give a first indicationof samples changing. Figure 5.1 shows two examples of colours and colourchanges of dyes adsorbed to TiO2. Photographs and UV-visible spectra ofTiO2 films dyed in ID28, ID176, and ID1 can be seen in Figure 5.1a. ID28absorbs mainly in the blue and green part of the solar spectrum resulting inits reddish colour. ID176 absorbs at most visible wavelengths with a maxi-mum absorption at green wavelengths leading to its purple colour. ID1 absorbsstrongly in the red region of the solar spectrum resulting in its blue colour.
The second example shows the colour change of ID176 upon addition of adrop of LiClO4 solution on the dyed TiO2 surface. Lithium ions red-shift theabsorption spectrum of ID176 leading to a more bluish colour (Figure 5.1b).
UV-visible spectra presented in this thesis were recorded on a HR-2000Ocean Optics fiber optics spectrophotometer in transmission mode. The spec-trometer was usually calibrated against air and background correction wascarried out separately. The absorbance, A, of a sample was automatically cal-culated by the Ocean Optics software according to:
A =− log10 T (5.1)
This calculation ignores any losses of transmission due to reflectance. Whereused for further calculations, A was background corrected by subtracting abaseline at the relevant wavelength or by subtracting the absorbance of ablank sample (e.g. the absorbance of the solvent or of a blank TiO2 film,A = Asample−Abaseline). When measuring absorbances on relatively thin TiO2
33
a)
400 450 500 550 600 650 700
λ / nm
b)
400 500 600 700 8000
0.2
0.4
0.6
0.8
1
λ / nm
Absorb
ance
Figure 5.1: a) Photograph of TiO2 films dyed in ID28, ID176 and ID1 (from rightto left) and corresponding UV-visible absorption spectra. b) Photograph of TiO2 filmdyed in ID176 with a drop of 0.1 M LiClO4 solution added to the bottom half of thefilm and corresponding UV-visible absorption spectra.
400 500 600 700 800 900 10000
0.2
0.4
0.6
0.8
1
λ / nm
Absorb
ance
ID28
ID176
ID1
TiO2
Figure 5.2: UV-visible absorption spectra of 1.8 µm thick, dyed TiO2 films and of ablank TiO2 film. Slightly different interference patterns are observed for all films.
films, interference fringes are sometimes observed. As these are sensitive tothe exact thickness of the TiO2 film, it is hard to correct for them (Figure 5.2).
34
A is related to the extinction coefficient (ε) of the examined species by:
A = ε ·C · l (5.2)
where C is the concentration of the species in solution and l is the path length.Using this equation, extinction coefficients of dye molecules in solution canbe determined.
For quantification of other experiments (e.g. fluorescence spectroscopy,IPCE), the percentage of light absorbed at each wavelength is needed, i.e. thelight harvesting efficiency (LHE), which can be calculated from A by:
LHE(λ ) = 1−10−A(λ ) (5.3)
5.1.2 SpectroelectrochemistryElectrochemistry of molecules in solution is one of the standardcharacterisation techniques used for dye molecules and will be found inmost papers publishing new dyes for DSCs.37,47,77,78 Here, I will focuson describing electrochemistry of mesoporous semiconductor films and ofdyes adsorbed to these films carried out in combination with UV-visiblespectroscopy (spectroelectrochemistry).
Electrochemistry of mesoporous semiconductor films is one method tostudy the density of states in these films68,79–81 (Paper IV). Electrochemistryof dyes adsorbed to semiconductor films can be used to determine redoxpotentials of dyes in surroundings similar to solar cell conditions (allPapers). Only a small amount of material is required for these studies anddye molecules do not need to be soluble in the supporting electrolyte. Theabsorption spectra measured during the electrochemical experiment canhelp to identify the oxidation or reduction processes occurring and cangive information about the reversibility of the electrochemical reaction.Absorption spectra of oxidised or reduced dye molecules can be used toidentify species observed in photo-induced absorption spectroscopy (PapersI, II and IV). In an optimal case, even the extinction coefficients of theelectrochemically created species can be obtained.
Experimental set-upElectrochemical measurements presented in this thesis were mostlyperformed on a CH Instruments 660 potentiostat with a 3-electrode set-up,i.e. with a working electrode (WE), a reference electrode (RE) and a counterelectrode (CE). Between 6 and 15 mm wide FTO (TEC 8) working electrodeswere used, where approximately the bottom centimeter was coated with themesoporous semiconductor film to be measured. The films were covered withsupporting electrolyte (Figure 5.3). The most common supporting electrolytesused were 0.1 M lithium perchlorate or 0.1 M tetrabutylammoniumperchlorate in acetonitrile (MeCN) or methoxyproprionitrile (MPN). For
35
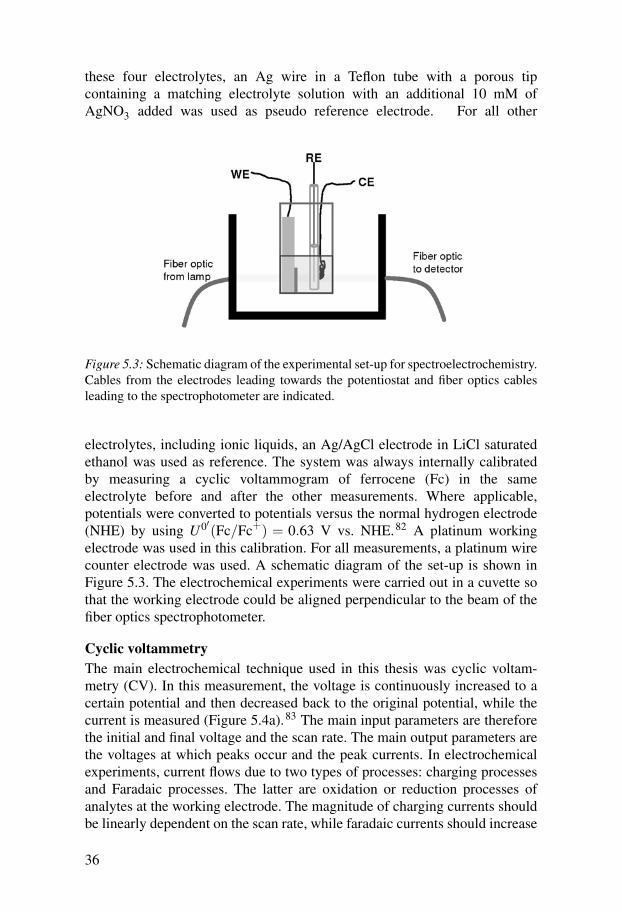
these four electrolytes, an Ag wire in a Teflon tube with a porous tipcontaining a matching electrolyte solution with an additional 10 mM ofAgNO3 added was used as pseudo reference electrode. For all other
Figure 5.3: Schematic diagram of the experimental set-up for spectroelectrochemistry.Cables from the electrodes leading towards the potentiostat and fiber optics cablesleading to the spectrophotometer are indicated.
electrolytes, including ionic liquids, an Ag/AgCl electrode in LiCl saturatedethanol was used as reference. The system was always internally calibratedby measuring a cyclic voltammogram of ferrocene (Fc) in the sameelectrolyte before and after the other measurements. Where applicable,potentials were converted to potentials versus the normal hydrogen electrode(NHE) by using U0′(Fc/Fc+) = 0.63 V vs. NHE.82 A platinum workingelectrode was used in this calibration. For all measurements, a platinum wirecounter electrode was used. A schematic diagram of the set-up is shown inFigure 5.3. The electrochemical experiments were carried out in a cuvette sothat the working electrode could be aligned perpendicular to the beam of thefiber optics spectrophotometer.
Cyclic voltammetryThe main electrochemical technique used in this thesis was cyclic voltam-metry (CV). In this measurement, the voltage is continuously increased to acertain potential and then decreased back to the original potential, while thecurrent is measured (Figure 5.4a).83 The main input parameters are thereforethe initial and final voltage and the scan rate. The main output parameters arethe voltages at which peaks occur and the peak currents. In electrochemicalexperiments, current flows due to two types of processes: charging processesand Faradaic processes. The latter are oxidation or reduction processes ofanalytes at the working electrode. The magnitude of charging currents shouldbe linearly dependent on the scan rate, while faradaic currents should increase
36
with the square root of the scan rate, if the analytes travel to and from theworking electrode by diffusion.
0 50 100 150 200
0
0.1
0.2
0.3
0.4
0.5
0.6
0.7
V / V
vs F
c/F
c+
time / s
0 0.2 0.4 0.6−0.4
−0.2
0
0.2
0.4
V / V vs Fc/Fc+
J / m
A c
m−
2
a) b)
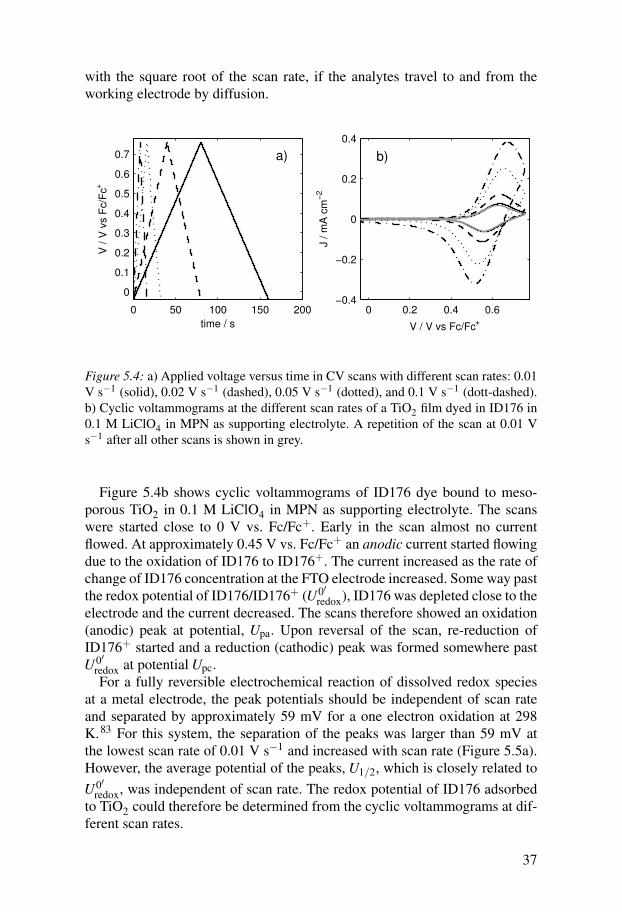
Figure 5.4: a) Applied voltage versus time in CV scans with different scan rates: 0.01V s−1 (solid), 0.02 V s−1 (dashed), 0.05 V s−1 (dotted), and 0.1 V s−1 (dott-dashed).b) Cyclic voltammograms at the different scan rates of a TiO2 film dyed in ID176 in0.1 M LiClO4 in MPN as supporting electrolyte. A repetition of the scan at 0.01 Vs−1 after all other scans is shown in grey.
Figure 5.4b shows cyclic voltammograms of ID176 dye bound to meso-porous TiO2 in 0.1 M LiClO4 in MPN as supporting electrolyte. The scanswere started close to 0 V vs. Fc/Fc+. Early in the scan almost no currentflowed. At approximately 0.45 V vs. Fc/Fc+ an anodic current started flowingdue to the oxidation of ID176 to ID176+. The current increased as the rate ofchange of ID176 concentration at the FTO electrode increased. Some way pastthe redox potential of ID176/ID176+ (U0′
redox), ID176 was depleted close to theelectrode and the current decreased. The scans therefore showed an oxidation(anodic) peak at potential, Upa. Upon reversal of the scan, re-reduction ofID176+ started and a reduction (cathodic) peak was formed somewhere pastU0′
redox at potential Upc.For a fully reversible electrochemical reaction of dissolved redox species
at a metal electrode, the peak potentials should be independent of scan rateand separated by approximately 59 mV for a one electron oxidation at 298K.83 For this system, the separation of the peaks was larger than 59 mV atthe lowest scan rate of 0.01 V s−1 and increased with scan rate (Figure 5.5a).However, the average potential of the peaks, U1/2, which is closely related toU0′
redox, was independent of scan rate. The redox potential of ID176 adsorbedto TiO2 could therefore be determined from the cyclic voltammograms at dif-ferent scan rates.
37
0.01 0.02 0.05 0.10.5
0.55
0.6
0.65
0.7
Scan rate / V s−1
V / V
vs F
c/F
c+
0.01 0.02 0.05 0.10
0.1
0.2
0.3
0.4
Scan rate / V s−1
J / m
A c
m−
2
a) b)
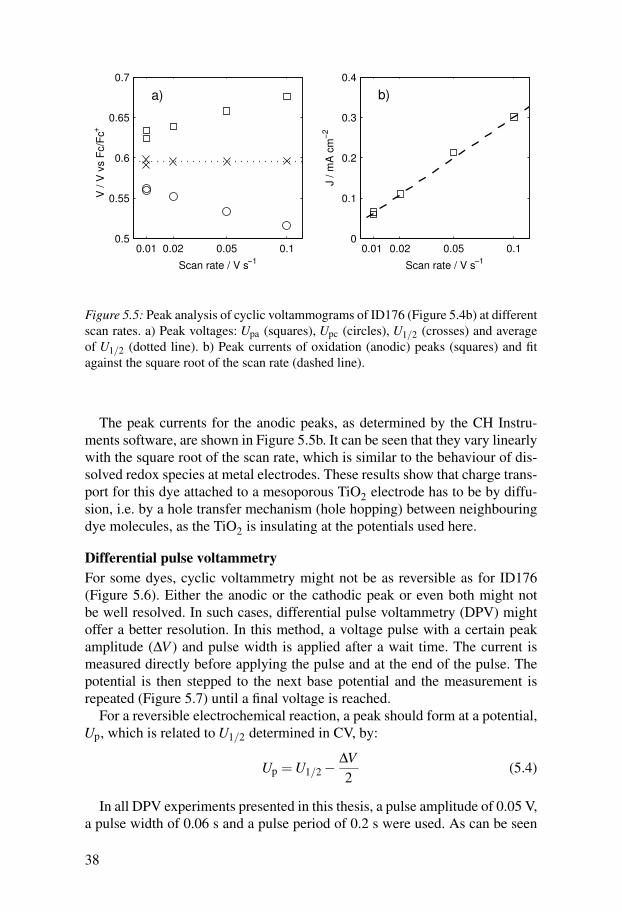
Figure 5.5: Peak analysis of cyclic voltammograms of ID176 (Figure 5.4b) at differentscan rates. a) Peak voltages: Upa (squares), Upc (circles), U1/2 (crosses) and averageof U1/2 (dotted line). b) Peak currents of oxidation (anodic) peaks (squares) and fitagainst the square root of the scan rate (dashed line).
The peak currents for the anodic peaks, as determined by the CH Instru-ments software, are shown in Figure 5.5b. It can be seen that they vary linearlywith the square root of the scan rate, which is similar to the behaviour of dis-solved redox species at metal electrodes. These results show that charge trans-port for this dye attached to a mesoporous TiO2 electrode has to be by diffu-sion, i.e. by a hole transfer mechanism (hole hopping) between neighbouringdye molecules, as the TiO2 is insulating at the potentials used here.
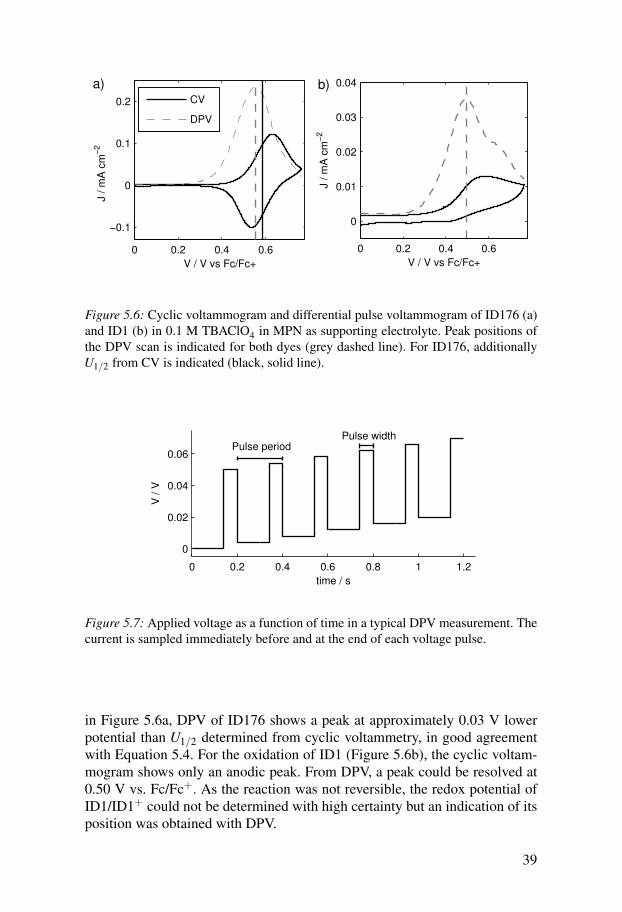
Differential pulse voltammetryFor some dyes, cyclic voltammetry might not be as reversible as for ID176(Figure 5.6). Either the anodic or the cathodic peak or even both might notbe well resolved. In such cases, differential pulse voltammetry (DPV) mightoffer a better resolution. In this method, a voltage pulse with a certain peakamplitude (∆V ) and pulse width is applied after a wait time. The current ismeasured directly before applying the pulse and at the end of the pulse. Thepotential is then stepped to the next base potential and the measurement isrepeated (Figure 5.7) until a final voltage is reached.
For a reversible electrochemical reaction, a peak should form at a potential,Up, which is related to U1/2 determined in CV, by:
Up = U1/2−∆V2
(5.4)
In all DPV experiments presented in this thesis, a pulse amplitude of 0.05 V,a pulse width of 0.06 s and a pulse period of 0.2 s were used. As can be seen
38
0 0.2 0.4 0.6
−0.1
0
0.1
0.2
V / V vs Fc/Fc+
J / m
A c
m−
2
0 0.2 0.4 0.6
0
0.01
0.02
0.03
0.04
V / V vs Fc/Fc+
J / m
A c
m−
2
CV
DPV
b)a)
Figure 5.6: Cyclic voltammogram and differential pulse voltammogram of ID176 (a)and ID1 (b) in 0.1 M TBAClO4 in MPN as supporting electrolyte. Peak positions ofthe DPV scan is indicated for both dyes (grey dashed line). For ID176, additionallyU1/2 from CV is indicated (black, solid line).
0 0.2 0.4 0.6 0.8 1 1.2
0
0.02
0.04
0.06
time / s
V / V
Pulse periodPulse width
Figure 5.7: Applied voltage as a function of time in a typical DPV measurement. Thecurrent is sampled immediately before and at the end of each voltage pulse.
in Figure 5.6a, DPV of ID176 shows a peak at approximately 0.03 V lowerpotential than U1/2 determined from cyclic voltammetry, in good agreementwith Equation 5.4. For the oxidation of ID1 (Figure 5.6b), the cyclic voltam-mogram shows only an anodic peak. From DPV, a peak could be resolved at0.50 V vs. Fc/Fc+. As the reaction was not reversible, the redox potential ofID1/ID1+ could not be determined with high certainty but an indication of itsposition was obtained with DPV.
39
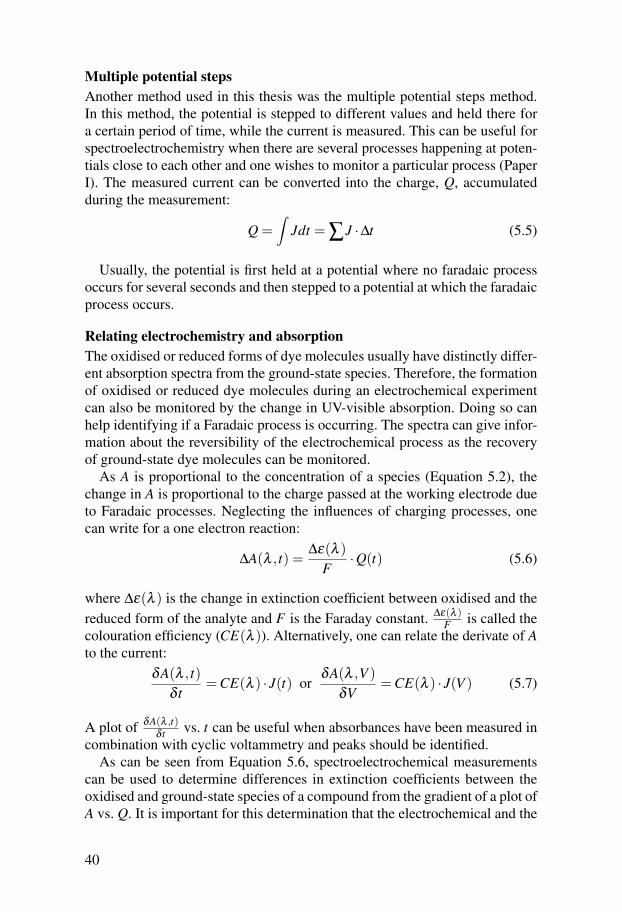
Multiple potential stepsAnother method used in this thesis was the multiple potential steps method.In this method, the potential is stepped to different values and held there fora certain period of time, while the current is measured. This can be useful forspectroelectrochemistry when there are several processes happening at poten-tials close to each other and one wishes to monitor a particular process (PaperI). The measured current can be converted into the charge, Q, accumulatedduring the measurement:
Q =∫
Jdt = ∑J ·∆t (5.5)
Usually, the potential is first held at a potential where no faradaic processoccurs for several seconds and then stepped to a potential at which the faradaicprocess occurs.
Relating electrochemistry and absorptionThe oxidised or reduced forms of dye molecules usually have distinctly differ-ent absorption spectra from the ground-state species. Therefore, the formationof oxidised or reduced dye molecules during an electrochemical experimentcan also be monitored by the change in UV-visible absorption. Doing so canhelp identifying if a Faradaic process is occurring. The spectra can give infor-mation about the reversibility of the electrochemical process as the recoveryof ground-state dye molecules can be monitored.
As A is proportional to the concentration of a species (Equation 5.2), thechange in A is proportional to the charge passed at the working electrode dueto Faradaic processes. Neglecting the influences of charging processes, onecan write for a one electron reaction:
∆A(λ , t) =∆ε(λ )
F·Q(t) (5.6)
where ∆ε(λ ) is the change in extinction coefficient between oxidised and thereduced form of the analyte and F is the Faraday constant. ∆ε(λ )
F is called thecolouration efficiency (CE(λ )). Alternatively, one can relate the derivate of Ato the current:
δA(λ , t)δ t
= CE(λ ) · J(t) orδA(λ ,V )
δV= CE(λ ) · J(V ) (5.7)
A plot of δA(λ ,t)δ t vs. t can be useful when absorbances have been measured in
combination with cyclic voltammetry and peaks should be identified.As can be seen from Equation 5.6, spectroelectrochemical measurements
can be used to determine differences in extinction coefficients between theoxidised and ground-state species of a compound from the gradient of a plot ofA vs. Q. It is important for this determination that the electrochemical and the
40
spectral measurements have a common time zero. Ideally, both experimentsshould be started simultaneously automatically. This was not possible withthe equipment used in this thesis work and time axes were aligned manually.
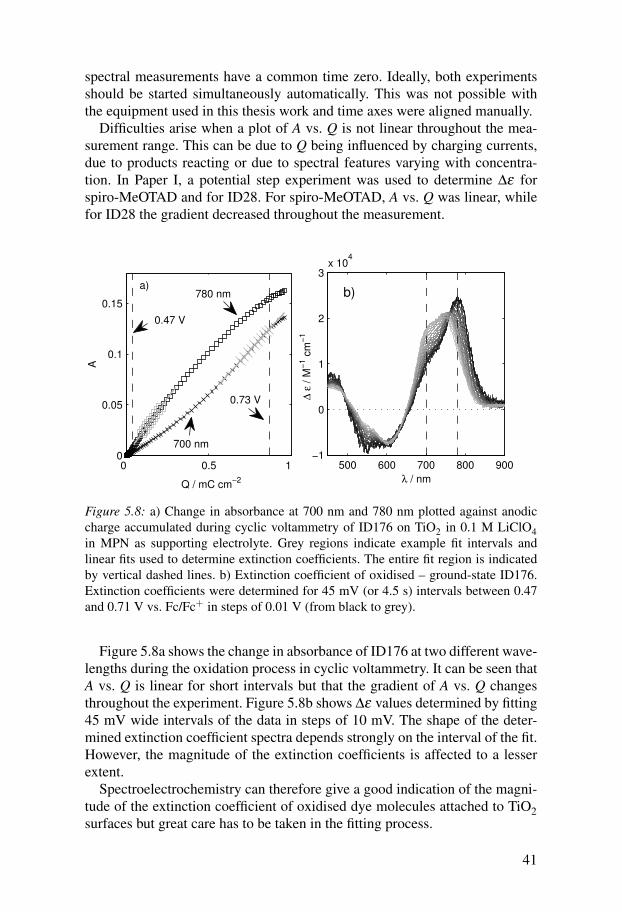
Difficulties arise when a plot of A vs. Q is not linear throughout the mea-surement range. This can be due to Q being influenced by charging currents,due to products reacting or due to spectral features varying with concentra-tion. In Paper I, a potential step experiment was used to determine ∆ε forspiro-MeOTAD and for ID28. For spiro-MeOTAD, A vs. Q was linear, whilefor ID28 the gradient decreased throughout the measurement.
0 0.5 1 0
0.05
0.1
0.15
Q / mC cm−2
A
a)
0.47 V
780 nm
0.73 V
700 nm
500 600 700 800 900−1
0
1
2
3x 10
4
λ / nm
∆ ε
/ M
−1 c
m−
1b)
Figure 5.8: a) Change in absorbance at 700 nm and 780 nm plotted against anodiccharge accumulated during cyclic voltammetry of ID176 on TiO2 in 0.1 M LiClO4in MPN as supporting electrolyte. Grey regions indicate example fit intervals andlinear fits used to determine extinction coefficients. The entire fit region is indicatedby vertical dashed lines. b) Extinction coefficient of oxidised – ground-state ID176.Extinction coefficients were determined for 45 mV (or 4.5 s) intervals between 0.47and 0.71 V vs. Fc/Fc+ in steps of 0.01 V (from black to grey).
Figure 5.8a shows the change in absorbance of ID176 at two different wave-lengths during the oxidation process in cyclic voltammetry. It can be seen thatA vs. Q is linear for short intervals but that the gradient of A vs. Q changesthroughout the experiment. Figure 5.8b shows ∆ε values determined by fitting45 mV wide intervals of the data in steps of 10 mV. The shape of the deter-mined extinction coefficient spectra depends strongly on the interval of the fit.However, the magnitude of the extinction coefficients is affected to a lesserextent.
Spectroelectrochemistry can therefore give a good indication of the magni-tude of the extinction coefficient of oxidised dye molecules attached to TiO2surfaces but great care has to be taken in the fitting process.
41
5.1.3 Photo-induced absorption spectroscopyTransient absorption spectroscopy (TAS) is a common tool for the study ofthe kinetics of dye-sensitized solar cells.31,84–89 Usually, the change in ab-sorption of a visible probe light by a dyed TiO2 film is measured as a functionof time following excitation of the dye by a short laser pulse (the pump). Thistechnique is also referred to as laser flash photolysis and kinetics can be mea-sured on different time scales depending on the equipment and the laser pulselength. In femtosecond TAS, a femtosecond laser pulse is split into a pumpand probe pulse of which one can be delayed to reach the sample at a differ-ent time. Kinetics in the femto- and picosecond time scales can be resolved(electron injection and regeneration in the solid state DSCs). Results of suchmeasurements are presented in Paper IV.i When lasers with nanosecond longpulses are used, the probe light is often supplied by a separate lamp and kinet-ics on the nano- and microsecond time scales can be resolved (regenerationin liquid electrolyte DSCs and recombination). In order to create a detectableconcentration of transient species, TAS often requires the use of high lightintensities in the pump.
In this thesis work (in Papers I, II, IV, and V), photo-induced absorptionspectroscopy (PIA)90,91 was mostly used instead of laser flash photolysis. InPIA, the difference in absorption between a pump light being on and off ismeasured as a function of modulation frequency and probe wavelength. Asthe on-time of the pump is relatively long in these experiments (55 ms at a 9Hz modulation), light intensities similar to the light intensities under operatingconditions of the solar cell can be used.
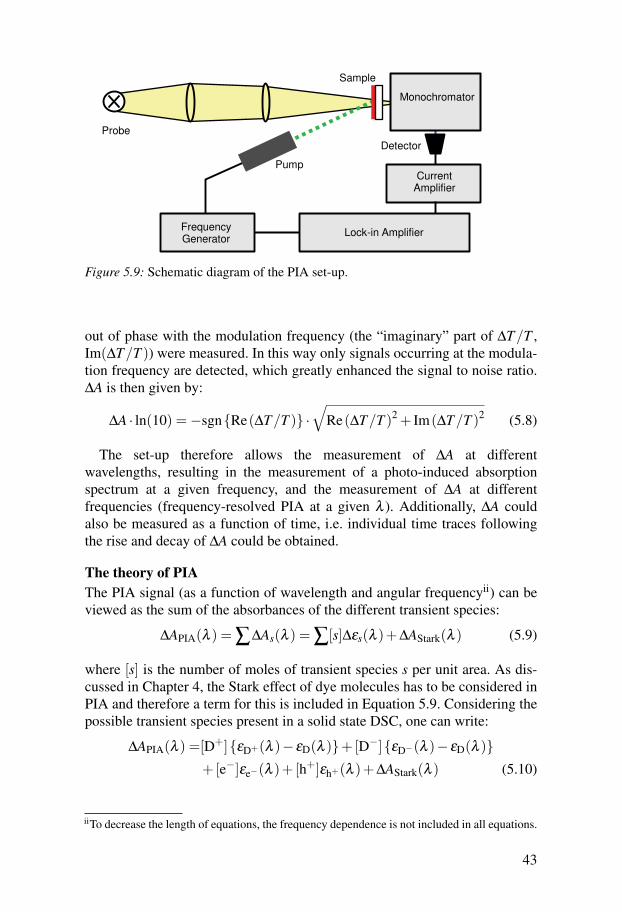
The PIA set-upA schematic diagram of the PIA set-up is shown in Figure 5.9. A white probelight, provided by a 20 W tungsten-halogen lamp, was focused onto the sampleby a series of optics. Superimposed at the sample was the pump light used forexcitation. Typical excitation intensities at the sample were between 8 and 25mW cm−2, and typical probe intensities were between 10 % of 1 sun and 40 %of 1 sun. The pump light could be chosen between a blue LED (Luxeon Star, 1W, Royal Blue, 460 nm), a green LED-pumped laser at 530 nm, or a red-diodelaser at 640 nm. The pump light was square-wave modulated (on/off) with afunction generator (HP 33120A) at a frequency, f
(= ω
2π
). After transmis-
sion through the sample the probe light was focused onto a monochromator(Acton Research Corporation SP-150) and detected by a UV enhanced siliconphotodiode, allowing for measurements between 400 and 1100 nm. The de-tector was connected to a current amplifier and a lock-in amplifier (StanfordResearch Systems models SR570 and SR830, respectively). The lock-in am-plifier was locked to the modulation frequency, such that ∆T/T in phase withthe modulation frequency (the “real” part of ∆T/T , Re(∆T/T )) and ∆T/T
iFemtosecond TAS measurements were carried out by Amanda Smeigh.
42
Monochromator
Lock-in AmplifierFrequency Generator
Current Amplifier
Probe
Pump
Sample
Detector
Figure 5.9: Schematic diagram of the PIA set-up.
out of phase with the modulation frequency (the “imaginary” part of ∆T/T ,Im(∆T/T )) were measured. In this way only signals occurring at the modula-tion frequency are detected, which greatly enhanced the signal to noise ratio.∆A is then given by:
∆A · ln(10) =−sgn{Re(∆T/T )} ·√
Re(∆T/T )2 + Im(∆T/T )2 (5.8)
The set-up therefore allows the measurement of ∆A at differentwavelengths, resulting in the measurement of a photo-induced absorptionspectrum at a given frequency, and the measurement of ∆A at differentfrequencies (frequency-resolved PIA at a given λ ). Additionally, ∆A couldalso be measured as a function of time, i.e. individual time traces followingthe rise and decay of ∆A could be obtained.
The theory of PIAThe PIA signal (as a function of wavelength and angular frequencyii) can beviewed as the sum of the absorbances of the different transient species:
∆APIA(λ ) = ∑∆As(λ ) = ∑[s]∆εs(λ )+∆AStark(λ ) (5.9)
where [s] is the number of moles of transient species s per unit area. As dis-cussed in Chapter 4, the Stark effect of dye molecules has to be considered inPIA and therefore a term for this is included in Equation 5.9. Considering thepossible transient species present in a solid state DSC, one can write:
∆APIA(λ ) =[D+]{εD+(λ )− εD(λ )}+[D−]{εD−(λ )− εD(λ )}+[e−]εe−(λ )+ [h+]εh+(λ )+∆AStark(λ ) (5.10)
iiTo decrease the length of equations, the frequency dependence is not included in all equations.
43
This equation allows for the calculation of the PIA signal from spectra ofthe individual components, which can, for example, be obtained by spectro-electrochemistry (an example of such a calculation can be found in Paper I).Considering now the case of dye molecules attached to a TiO2 surface in ab-sence of spiro-MeOTAD or redox electrolyte, this equation reduces to:
∆APIA(λ ) = [D+,e−]∆ε(λ )+∆AStark(λ ) (5.11)
where ∆ε(λ ) = {εD+(λ )+ εe−(λ )− εD(λ )}. An equation for [D+,e−] can befound considering the generation and recombination rates (G and R) of thetransient species:91
G = Φinj ·I0
NA·LHE (5.12)
where Φinj is the quantum efficiency of photo-induced electron injection, I0is the incident photon flux, NA is Avogadro’s constant and LHE is the lightharvesting efficiency of the sample at the pump wavelength, and
R = krec · [D+,e−]β (5.13)
where krec is the rate constant of recombination and β is a constant, relatedto the recombination order. β is included as the kinetics of recombinationobserved in PIA are seldom simply first order.
Under steady-state illumination (or when frequencies used are significantlylower than krec), equilibrium is reached so that R = G, and the steady-stateconcentration, [D+,e−]SS, can be found:
[D+,e−]SS =(
1krec·Φinj ·
I0
NA·LHE
)1/β
(5.14)
Substituting this expression into Equation 5.11, one obtains an expression for∆ASS:
∆ASS(λ ) = ∆ε(λ ) ·(
1krec·Φinj ·
I0
NA·LHE
)1/β
+∆AStark(λ ) (5.15)
This equation makes it in principle possible to determine Φinj from PIA mea-surements: The recombination order can be determined from the gradient ofa plot of log∆ASS vs. logI0, and ∆ASS and krec can be obtained from either afrequency-resolved PIA measurement or a time-resolved PIA measurement. Iwill only provide a description of frequency-resolved PIA here as this is alsorelevant for spectral PIA measurements. A description of time-resolved PIAcan be found elsewhere.91
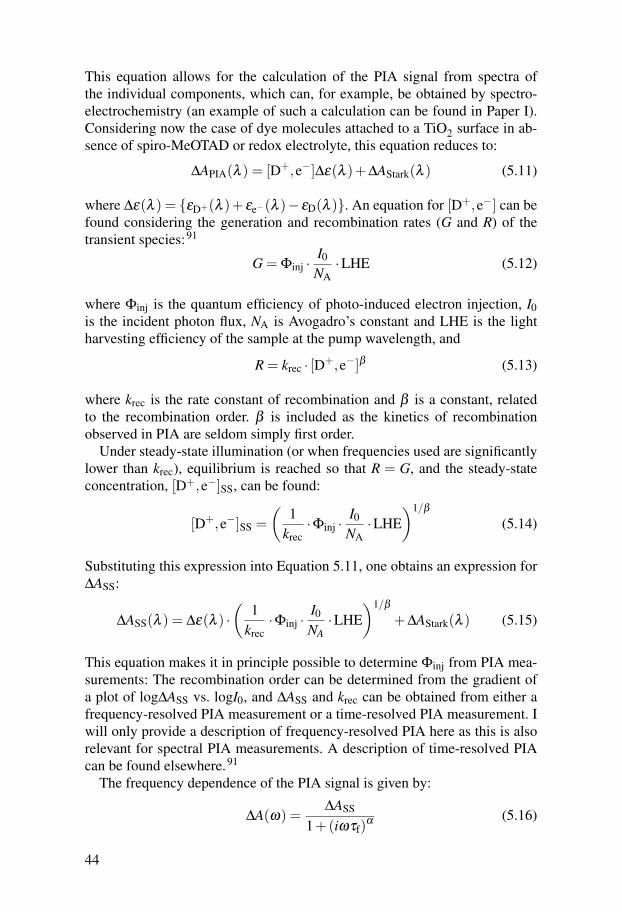
The frequency dependence of the PIA signal is given by:
∆A(ω) =∆ASS
1+(iωτf)α (5.16)
44
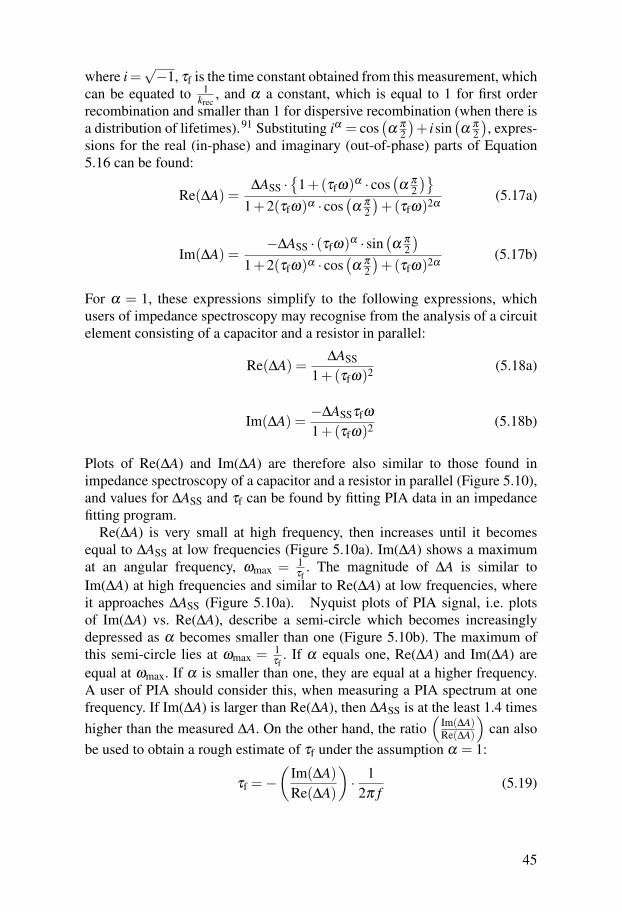
where i =√−1, τf is the time constant obtained from this measurement, which
can be equated to 1krec
, and α a constant, which is equal to 1 for first orderrecombination and smaller than 1 for dispersive recombination (when there isa distribution of lifetimes).91 Substituting iα = cos
(α
π
2
)+ isin
(α
π
2
), expres-
sions for the real (in-phase) and imaginary (out-of-phase) parts of Equation5.16 can be found:
Re(∆A) =∆ASS ·
{1+(τfω)α · cos
(α
π
2
)}1+2(τfω)α · cos
(α
π
2
)+(τfω)2α
(5.17a)
Im(∆A) =−∆ASS · (τfω)α · sin
(α
π
2
)1+2(τfω)α · cos
(α
π
2
)+(τfω)2α
(5.17b)
For α = 1, these expressions simplify to the following expressions, whichusers of impedance spectroscopy may recognise from the analysis of a circuitelement consisting of a capacitor and a resistor in parallel:
Re(∆A) =∆ASS
1+(τfω)2 (5.18a)
Im(∆A) =−∆ASSτfω
1+(τfω)2 (5.18b)
Plots of Re(∆A) and Im(∆A) are therefore also similar to those found inimpedance spectroscopy of a capacitor and a resistor in parallel (Figure 5.10),and values for ∆ASS and τf can be found by fitting PIA data in an impedancefitting program.
Re(∆A) is very small at high frequency, then increases until it becomesequal to ∆ASS at low frequencies (Figure 5.10a). Im(∆A) shows a maximumat an angular frequency, ωmax = 1
τf. The magnitude of ∆A is similar to
Im(∆A) at high frequencies and similar to Re(∆A) at low frequencies, whereit approaches ∆ASS (Figure 5.10a). Nyquist plots of PIA signal, i.e. plotsof Im(∆A) vs. Re(∆A), describe a semi-circle which becomes increasinglydepressed as α becomes smaller than one (Figure 5.10b). The maximum ofthis semi-circle lies at ωmax = 1
τf. If α equals one, Re(∆A) and Im(∆A) are
equal at ωmax. If α is smaller than one, they are equal at a higher frequency.A user of PIA should consider this, when measuring a PIA spectrum at onefrequency. If Im(∆A) is larger than Re(∆A), then ∆ASS is at the least 1.4 timeshigher than the measured ∆A. On the other hand, the ratio
(Im(∆A)Re(∆A)
)can also
be used to obtain a rough estimate of τf under the assumption α = 1:
τf =−(
Im(∆A)Re(∆A)
)· 1
2π f(5.19)
45
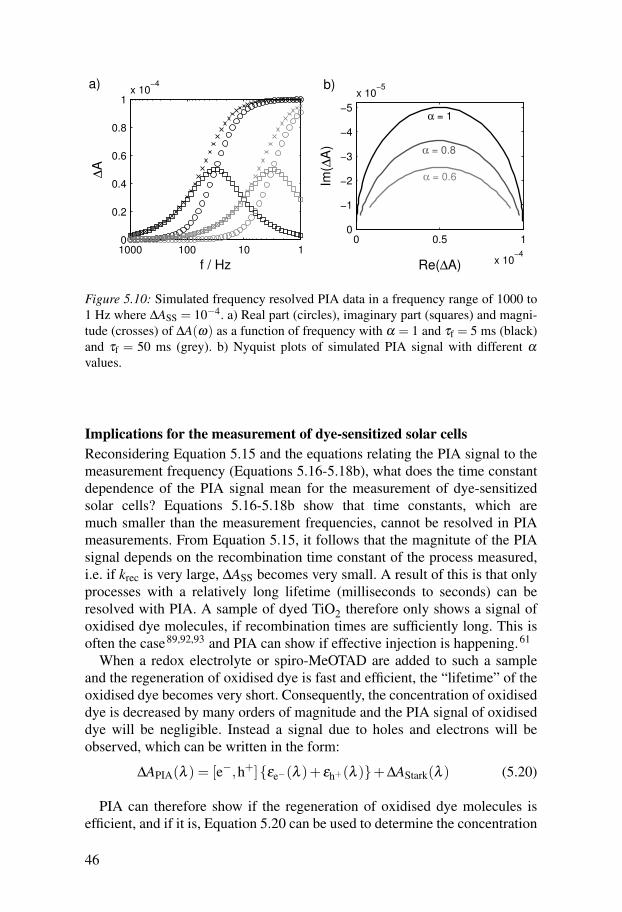
11010010000
0.2
0.4
0.6
0.8
1x 10
−4
f / Hz
∆A
0 0.5 1
x 10−4
−5
−4
−3
−2
−1
0
x 10−5
Re(∆A)
Im(∆
A)
a) b)
α = 0.8
α = 0.6
α = 1
Figure 5.10: Simulated frequency resolved PIA data in a frequency range of 1000 to1 Hz where ∆ASS = 10−4. a) Real part (circles), imaginary part (squares) and magni-tude (crosses) of ∆A(ω) as a function of frequency with α = 1 and τf = 5 ms (black)and τf = 50 ms (grey). b) Nyquist plots of simulated PIA signal with different α
values.
Implications for the measurement of dye-sensitized solar cellsReconsidering Equation 5.15 and the equations relating the PIA signal to themeasurement frequency (Equations 5.16-5.18b), what does the time constantdependence of the PIA signal mean for the measurement of dye-sensitizedsolar cells? Equations 5.16-5.18b show that time constants, which aremuch smaller than the measurement frequencies, cannot be resolved in PIAmeasurements. From Equation 5.15, it follows that the magnitute of the PIAsignal depends on the recombination time constant of the process measured,i.e. if krec is very large, ∆ASS becomes very small. A result of this is that onlyprocesses with a relatively long lifetime (milliseconds to seconds) can beresolved with PIA. A sample of dyed TiO2 therefore only shows a signal ofoxidised dye molecules, if recombination times are sufficiently long. This isoften the case89,92,93 and PIA can show if effective injection is happening.61
When a redox electrolyte or spiro-MeOTAD are added to such a sampleand the regeneration of oxidised dye is fast and efficient, the “lifetime” of theoxidised dye becomes very short. Consequently, the concentration of oxidiseddye is decreased by many orders of magnitude and the PIA signal of oxidiseddye will be negligible. Instead a signal due to holes and electrons will beobserved, which can be written in the form:
∆APIA(λ ) = [e−,h+]{εe−(λ )+ εh+(λ )}+∆AStark(λ ) (5.20)
PIA can therefore show if the regeneration of oxidised dye molecules isefficient, and if it is, Equation 5.20 can be used to determine the concentration
46
of photo-generated holes and electrons and therefore the amount of charge inthe TiO2.
A conclusion one might draw from the above equations is that using PIAfor quantification of the injection and regeneration efficiencies (Φinj and Φreg)is very difficult. First, one needs to choose a wavelength, at which the Starkeffect of the dye is not observed. Then, one needs to determine the rate con-stant of recombination and the order of recombination by measuring and fit-ting frequency-resolved PIA at different light intensities. Finally, any valuesof Φinj and Φreg will include any recombination, which occurs on faster timescales than the PIA measurement.
In this thesis, PIA was therefore mainly used for qualitative studies of theeffectiveness of injection and regeneration processes and to determine timescales of recombination processes. I would like to conclude this section bysummarising the advantages of PIA: PIA can be measured over a large wave-length range, which can even be extended by using a different detector. PIAmeasurements can be carried out under illumination intensities similar to solarconditions. Finally, PIA measurements are relatively fast (acquisition of aspectrum often takes only 10 minutes) and very easy to set-up and use.
5.1.4 Electroabsorption spectroscopyElectroabsorption spectroscopy (EA) was one of the methods used to deter-mine the Stark effect of dye molecules adsorbed to TiO2 (Papers II and IV).This technique is closely related to photo-induced absorption spectroscopybut instead of modulating a light source, an electric field is modulated acrossthe sample. The same equipment was used for these measurements as for PIAmeasurements. The only difference was that the frequency generator was con-nected directly to the sample instead of to a light source, thereby modulating avoltage directly across the sample. In the lock-in detection, only the in-phasepart of the signal was used as change in absorbance in electroabsorption mea-surements is instantaneous and therefore not frequency dependent:
∆AEA · ln(10) =−Re(∆T/T ) (5.21)
Equations relating to the ∆A to the electric field can be found in Chapter 4.An important consideration for this technique was what type of samples touse in order to be able to measure the first order Stark effect, which is rel-evant for DSCs. Electroabsorption spectroscopy has mostly been measuredon disordered samples where only the second order effect is observed,76,94
but there are also a few examples where electroabsorption was measured onordered Langmuir-Blodgett films, where both the first and second order effectcould be observed.95,96
For our experiments, we chose to use samples where the dye molecules areattached to a flat TiO2 film, which was prepared on an FTO substrate by spray
47
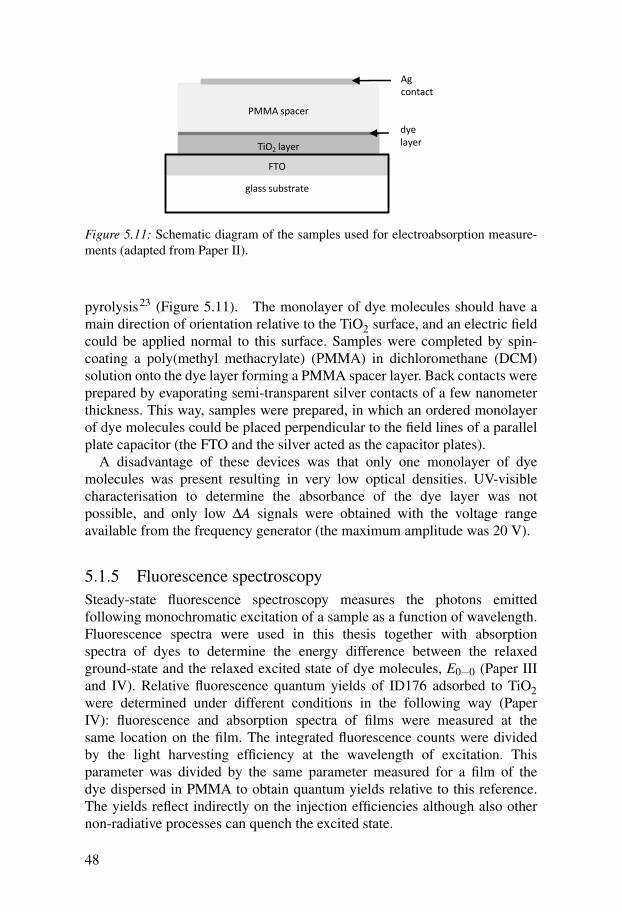
glass substrate
FTO
TiO2 layer
Ag contact
dye layer
PMMA spacer
Figure 5.11: Schematic diagram of the samples used for electroabsorption measure-ments (adapted from Paper II).
pyrolysis23 (Figure 5.11). The monolayer of dye molecules should have amain direction of orientation relative to the TiO2 surface, and an electric fieldcould be applied normal to this surface. Samples were completed by spin-coating a poly(methyl methacrylate) (PMMA) in dichloromethane (DCM)solution onto the dye layer forming a PMMA spacer layer. Back contacts wereprepared by evaporating semi-transparent silver contacts of a few nanometerthickness. This way, samples were prepared, in which an ordered monolayerof dye molecules could be placed perpendicular to the field lines of a parallelplate capacitor (the FTO and the silver acted as the capacitor plates).
A disadvantage of these devices was that only one monolayer of dyemolecules was present resulting in very low optical densities. UV-visiblecharacterisation to determine the absorbance of the dye layer was notpossible, and only low ∆A signals were obtained with the voltage rangeavailable from the frequency generator (the maximum amplitude was 20 V).
5.1.5 Fluorescence spectroscopySteady-state fluorescence spectroscopy measures the photons emittedfollowing monochromatic excitation of a sample as a function of wavelength.Fluorescence spectra were used in this thesis together with absorptionspectra of dyes to determine the energy difference between the relaxedground-state and the relaxed excited state of dye molecules, E0−0 (Paper IIIand IV). Relative fluorescence quantum yields of ID176 adsorbed to TiO2were determined under different conditions in the following way (PaperIV): fluorescence and absorption spectra of films were measured at thesame location on the film. The integrated fluorescence counts were dividedby the light harvesting efficiency at the wavelength of excitation. Thisparameter was divided by the same parameter measured for a film of thedye dispersed in PMMA to obtain quantum yields relative to this reference.The yields reflect indirectly on the injection efficiencies although also othernon-radiative processes can quench the excited state.
48
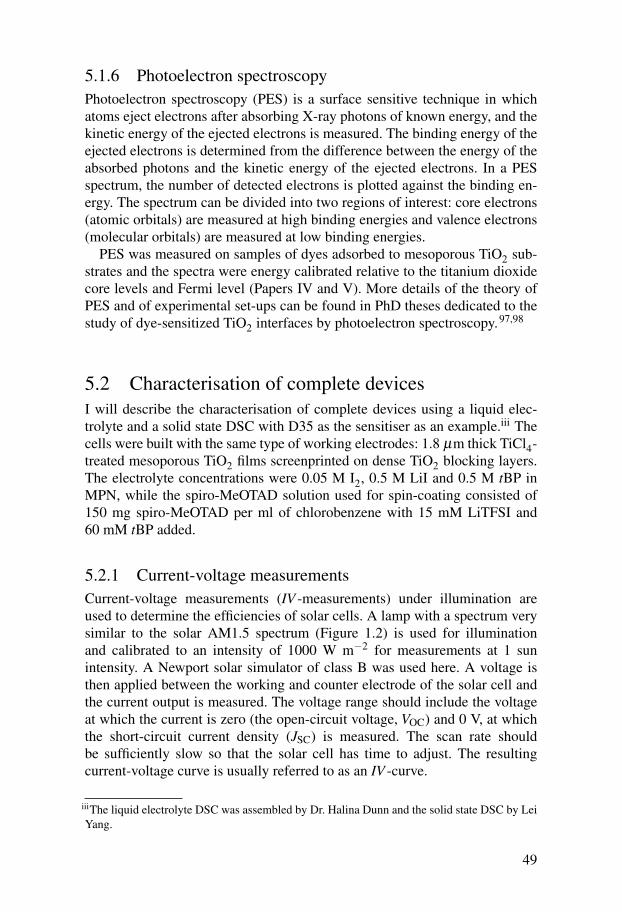
5.1.6 Photoelectron spectroscopyPhotoelectron spectroscopy (PES) is a surface sensitive technique in whichatoms eject electrons after absorbing X-ray photons of known energy, and thekinetic energy of the ejected electrons is measured. The binding energy of theejected electrons is determined from the difference between the energy of theabsorbed photons and the kinetic energy of the ejected electrons. In a PESspectrum, the number of detected electrons is plotted against the binding en-ergy. The spectrum can be divided into two regions of interest: core electrons(atomic orbitals) are measured at high binding energies and valence electrons(molecular orbitals) are measured at low binding energies.
PES was measured on samples of dyes adsorbed to mesoporous TiO2 sub-strates and the spectra were energy calibrated relative to the titanium dioxidecore levels and Fermi level (Papers IV and V). More details of the theory ofPES and of experimental set-ups can be found in PhD theses dedicated to thestudy of dye-sensitized TiO2 interfaces by photoelectron spectroscopy.97,98
5.2 Characterisation of complete devicesI will describe the characterisation of complete devices using a liquid elec-trolyte and a solid state DSC with D35 as the sensitiser as an example.iii Thecells were built with the same type of working electrodes: 1.8 µm thick TiCl4-treated mesoporous TiO2 films screenprinted on dense TiO2 blocking layers.The electrolyte concentrations were 0.05 M I2, 0.5 M LiI and 0.5 M tBP inMPN, while the spiro-MeOTAD solution used for spin-coating consisted of150 mg spiro-MeOTAD per ml of chlorobenzene with 15 mM LiTFSI and60 mM tBP added.
5.2.1 Current-voltage measurementsCurrent-voltage measurements (IV -measurements) under illumination areused to determine the efficiencies of solar cells. A lamp with a spectrum verysimilar to the solar AM1.5 spectrum (Figure 1.2) is used for illuminationand calibrated to an intensity of 1000 W m−2 for measurements at 1 sunintensity. A Newport solar simulator of class B was used here. A voltage isthen applied between the working and counter electrode of the solar cell andthe current output is measured. The voltage range should include the voltageat which the current is zero (the open-circuit voltage, VOC) and 0 V, at whichthe short-circuit current density (JSC) is measured. The scan rate shouldbe sufficiently slow so that the solar cell has time to adjust. The resultingcurrent-voltage curve is usually referred to as an IV -curve.
iiiThe liquid electrolyte DSC was assembled by Dr. Halina Dunn and the solid state DSC by LeiYang.
49
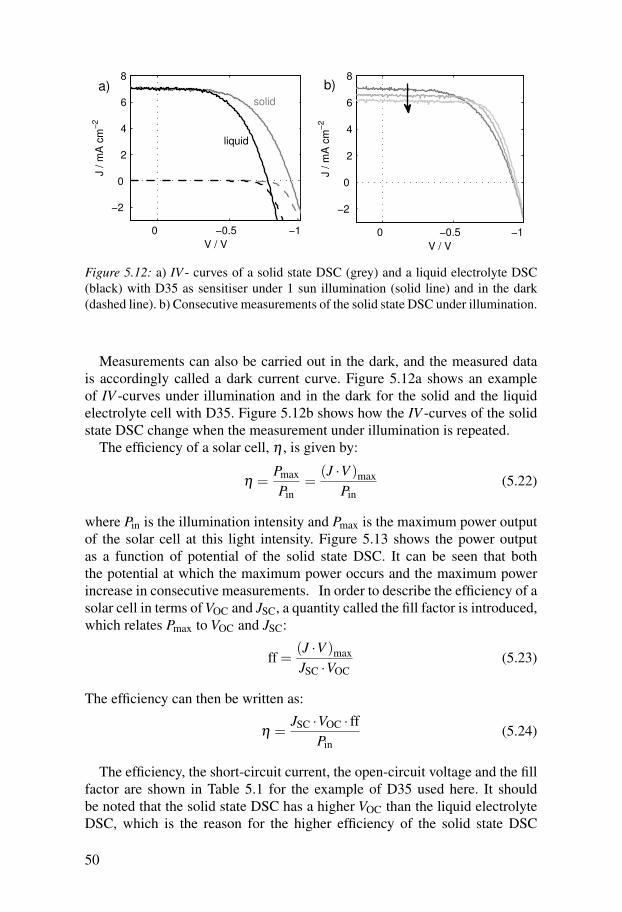
0 −0.5 −1
8
6
4
2
0
−2
V / V
J / m
A c
m−
2
0 −0.5 −1
8
6
4
2
0
−2
V / V
J / m
A c
m−
2
a) b)solid
liquid
Figure 5.12: a) IV - curves of a solid state DSC (grey) and a liquid electrolyte DSC(black) with D35 as sensitiser under 1 sun illumination (solid line) and in the dark(dashed line). b) Consecutive measurements of the solid state DSC under illumination.
Measurements can also be carried out in the dark, and the measured datais accordingly called a dark current curve. Figure 5.12a shows an exampleof IV -curves under illumination and in the dark for the solid and the liquidelectrolyte cell with D35. Figure 5.12b shows how the IV -curves of the solidstate DSC change when the measurement under illumination is repeated.
The efficiency of a solar cell, η , is given by:
η =Pmax
Pin=
(J ·V )maxPin
(5.22)
where Pin is the illumination intensity and Pmax is the maximum power outputof the solar cell at this light intensity. Figure 5.13 shows the power outputas a function of potential of the solid state DSC. It can be seen that boththe potential at which the maximum power occurs and the maximum powerincrease in consecutive measurements. In order to describe the efficiency of asolar cell in terms of VOC and JSC, a quantity called the fill factor is introduced,which relates Pmax to VOC and JSC:
ff =(J ·V )maxJSC ·VOC
(5.23)
The efficiency can then be written as:
η =JSC ·VOC · ff
Pin(5.24)
The efficiency, the short-circuit current, the open-circuit voltage and the fillfactor are shown in Table 5.1 for the example of D35 used here. It shouldbe noted that the solid state DSC has a higher VOC than the liquid electrolyteDSC, which is the reason for the higher efficiency of the solid state DSC
50
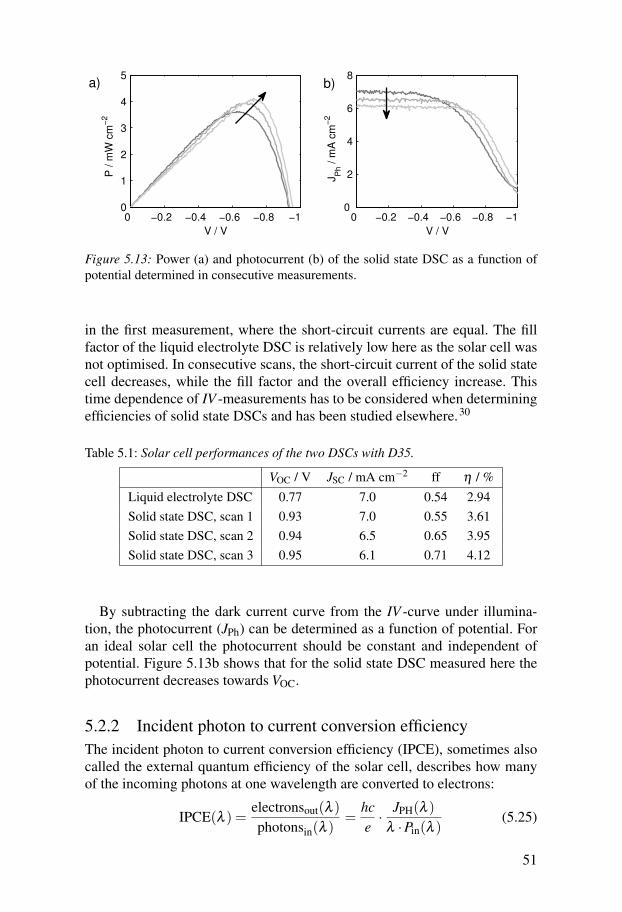
0 −0.2 −0.4 −0.6 −0.8 −1 0
1
2
3
4
5
V / V
P / m
W c
m−
2
0 −0.2 −0.4 −0.6 −0.8 −1
8
6
4
2
0
V / V
JP
h / m
A c
m−
2
a) b)
Figure 5.13: Power (a) and photocurrent (b) of the solid state DSC as a function ofpotential determined in consecutive measurements.
in the first measurement, where the short-circuit currents are equal. The fillfactor of the liquid electrolyte DSC is relatively low here as the solar cell wasnot optimised. In consecutive scans, the short-circuit current of the solid statecell decreases, while the fill factor and the overall efficiency increase. Thistime dependence of IV -measurements has to be considered when determiningefficiencies of solid state DSCs and has been studied elsewhere.30
Table 5.1: Solar cell performances of the two DSCs with D35.
VOC / V JSC / mA cm−2 ff η / %Liquid electrolyte DSC 0.77 7.0 0.54 2.94Solid state DSC, scan 1 0.93 7.0 0.55 3.61Solid state DSC, scan 2 0.94 6.5 0.65 3.95Solid state DSC, scan 3 0.95 6.1 0.71 4.12
By subtracting the dark current curve from the IV -curve under illumina-tion, the photocurrent (JPh) can be determined as a function of potential. Foran ideal solar cell the photocurrent should be constant and independent ofpotential. Figure 5.13b shows that for the solid state DSC measured here thephotocurrent decreases towards VOC.
5.2.2 Incident photon to current conversion efficiencyThe incident photon to current conversion efficiency (IPCE), sometimes alsocalled the external quantum efficiency of the solar cell, describes how manyof the incoming photons at one wavelength are converted to electrons:
IPCE(λ ) =electronsout(λ )photonsin(λ )
=hce· JPH(λ )
λ ·Pin(λ )(5.25)
51
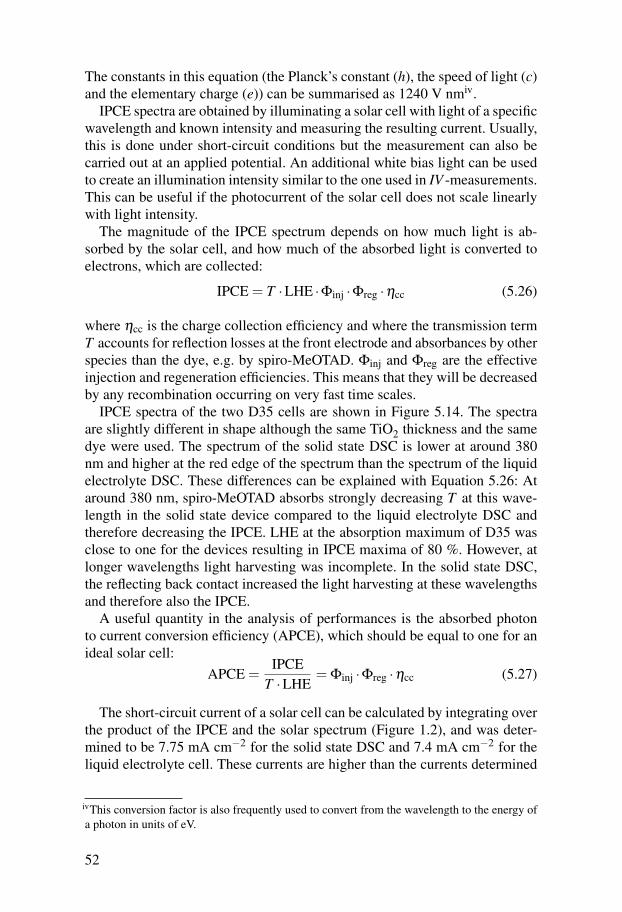
The constants in this equation (the Planck’s constant (h), the speed of light (c)and the elementary charge (e)) can be summarised as 1240 V nmiv.
IPCE spectra are obtained by illuminating a solar cell with light of a specificwavelength and known intensity and measuring the resulting current. Usually,this is done under short-circuit conditions but the measurement can also becarried out at an applied potential. An additional white bias light can be usedto create an illumination intensity similar to the one used in IV -measurements.This can be useful if the photocurrent of the solar cell does not scale linearlywith light intensity.
The magnitude of the IPCE spectrum depends on how much light is ab-sorbed by the solar cell, and how much of the absorbed light is converted toelectrons, which are collected:
IPCE = T ·LHE ·Φinj ·Φreg ·ηcc (5.26)
where ηcc is the charge collection efficiency and where the transmission termT accounts for reflection losses at the front electrode and absorbances by otherspecies than the dye, e.g. by spiro-MeOTAD. Φinj and Φreg are the effectiveinjection and regeneration efficiencies. This means that they will be decreasedby any recombination occurring on very fast time scales.
IPCE spectra of the two D35 cells are shown in Figure 5.14. The spectraare slightly different in shape although the same TiO2 thickness and the samedye were used. The spectrum of the solid state DSC is lower at around 380nm and higher at the red edge of the spectrum than the spectrum of the liquidelectrolyte DSC. These differences can be explained with Equation 5.26: Ataround 380 nm, spiro-MeOTAD absorbs strongly decreasing T at this wave-length in the solid state device compared to the liquid electrolyte DSC andtherefore decreasing the IPCE. LHE at the absorption maximum of D35 wasclose to one for the devices resulting in IPCE maxima of 80 %. However, atlonger wavelengths light harvesting was incomplete. In the solid state DSC,the reflecting back contact increased the light harvesting at these wavelengthsand therefore also the IPCE.
A useful quantity in the analysis of performances is the absorbed photonto current conversion efficiency (APCE), which should be equal to one for anideal solar cell:
APCE =IPCE
T ·LHE= Φinj ·Φreg ·ηcc (5.27)
The short-circuit current of a solar cell can be calculated by integrating overthe product of the IPCE and the solar spectrum (Figure 1.2), and was deter-mined to be 7.75 mA cm−2 for the solid state DSC and 7.4 mA cm−2 for theliquid electrolyte cell. These currents are higher than the currents determined
ivThis conversion factor is also frequently used to convert from the wavelength to the energy ofa photon in units of eV.
52
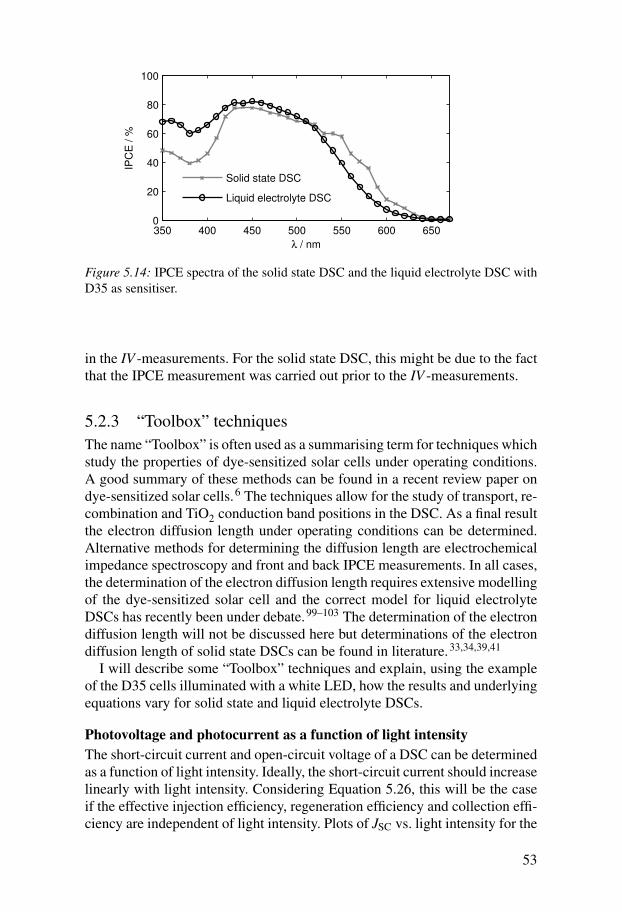
350 400 450 500 550 600 6500
20
40
60
80
100
λ / nm
IPC
E / %
Solid state DSC
Liquid electrolyte DSC
Figure 5.14: IPCE spectra of the solid state DSC and the liquid electrolyte DSC withD35 as sensitiser.
in the IV -measurements. For the solid state DSC, this might be due to the factthat the IPCE measurement was carried out prior to the IV -measurements.
5.2.3 “Toolbox” techniquesThe name “Toolbox” is often used as a summarising term for techniques whichstudy the properties of dye-sensitized solar cells under operating conditions.A good summary of these methods can be found in a recent review paper ondye-sensitized solar cells.6 The techniques allow for the study of transport, re-combination and TiO2 conduction band positions in the DSC. As a final resultthe electron diffusion length under operating conditions can be determined.Alternative methods for determining the diffusion length are electrochemicalimpedance spectroscopy and front and back IPCE measurements. In all cases,the determination of the electron diffusion length requires extensive modellingof the dye-sensitized solar cell and the correct model for liquid electrolyteDSCs has recently been under debate.99–103 The determination of the electrondiffusion length will not be discussed here but determinations of the electrondiffusion length of solid state DSCs can be found in literature.33,34,39,41
I will describe some “Toolbox” techniques and explain, using the exampleof the D35 cells illuminated with a white LED, how the results and underlyingequations vary for solid state and liquid electrolyte DSCs.
Photovoltage and photocurrent as a function of light intensityThe short-circuit current and open-circuit voltage of a DSC can be determinedas a function of light intensity. Ideally, the short-circuit current should increaselinearly with light intensity. Considering Equation 5.26, this will be the caseif the effective injection efficiency, regeneration efficiency and collection effi-ciency are independent of light intensity. Plots of JSC vs. light intensity for the
53
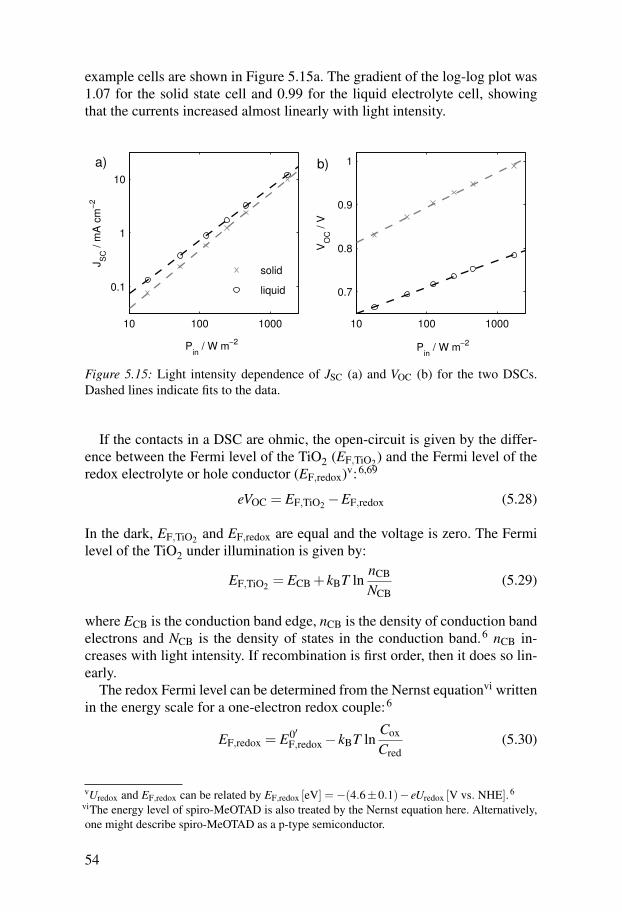
example cells are shown in Figure 5.15a. The gradient of the log-log plot was1.07 for the solid state cell and 0.99 for the liquid electrolyte cell, showingthat the currents increased almost linearly with light intensity.
10 100 1000
0.1
1
10
Pin
/ W m−2
JS
C / m
A c
m−
2
10 100 1000
0.7
0.8
0.9
1
Pin
/ W m−2
VO
C / V
solid
liquid
a) b)
Figure 5.15: Light intensity dependence of JSC (a) and VOC (b) for the two DSCs.Dashed lines indicate fits to the data.
If the contacts in a DSC are ohmic, the open-circuit is given by the differ-ence between the Fermi level of the TiO2 (EF,TiO2) and the Fermi level of theredox electrolyte or hole conductor (EF,redox)v:6,69
eVOC = EF,TiO2−EF,redox (5.28)
In the dark, EF,TiO2 and EF,redox are equal and the voltage is zero. The Fermilevel of the TiO2 under illumination is given by:
EF,TiO2 = ECB + kBT lnnCB
NCB(5.29)
where ECB is the conduction band edge, nCB is the density of conduction bandelectrons and NCB is the density of states in the conduction band.6 nCB in-creases with light intensity. If recombination is first order, then it does so lin-early.
The redox Fermi level can be determined from the Nernst equationvi writtenin the energy scale for a one-electron redox couple:6
EF,redox = E0′F,redox− kBT ln
Cox
Cred(5.30)
vUredox and EF,redox can be related by EF,redox [eV] =−(4.6±0.1)− eUredox [V vs. NHE]. 6
viThe energy level of spiro-MeOTAD is also treated by the Nernst equation here. Alternatively,one might describe spiro-MeOTAD as a p-type semiconductor.
54
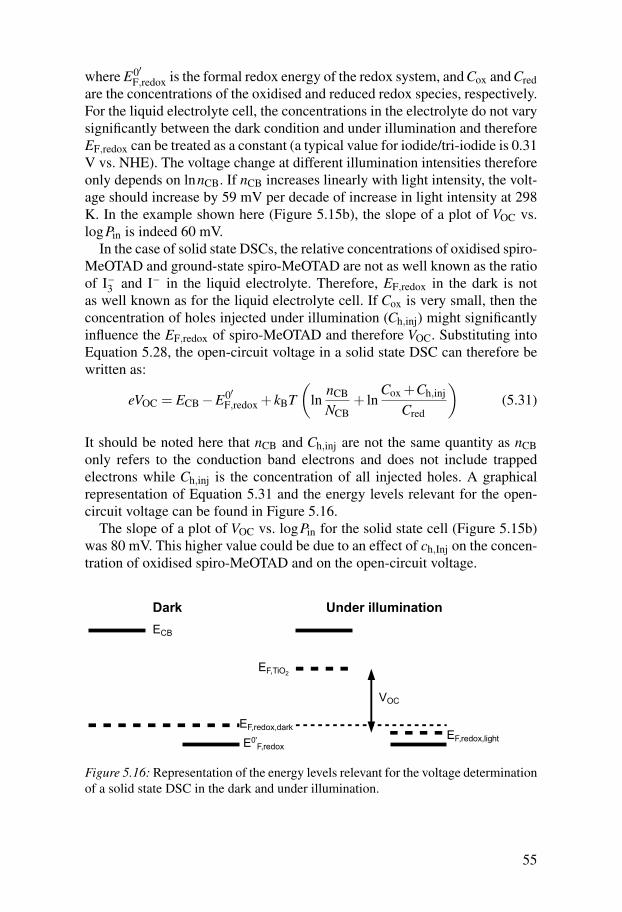
where E0′F,redox is the formal redox energy of the redox system, and Cox and Cred
are the concentrations of the oxidised and reduced redox species, respectively.For the liquid electrolyte cell, the concentrations in the electrolyte do not varysignificantly between the dark condition and under illumination and thereforeEF,redox can be treated as a constant (a typical value for iodide/tri-iodide is 0.31V vs. NHE). The voltage change at different illumination intensities thereforeonly depends on lnnCB. If nCB increases linearly with light intensity, the volt-age should increase by 59 mV per decade of increase in light intensity at 298K. In the example shown here (Figure 5.15b), the slope of a plot of VOC vs.logPin is indeed 60 mV.
In the case of solid state DSCs, the relative concentrations of oxidised spiro-MeOTAD and ground-state spiro-MeOTAD are not as well known as the ratioof I–
3 and I– in the liquid electrolyte. Therefore, EF,redox in the dark is notas well known as for the liquid electrolyte cell. If Cox is very small, then theconcentration of holes injected under illumination (Ch,inj) might significantlyinfluence the EF,redox of spiro-MeOTAD and therefore VOC. Substituting intoEquation 5.28, the open-circuit voltage in a solid state DSC can therefore bewritten as:
eVOC = ECB−E0′F,redox + kBT
(ln
nCB
NCB+ ln
Cox +Ch,inj
Cred
)(5.31)
It should be noted here that nCB and Ch,inj are not the same quantity as nCBonly refers to the conduction band electrons and does not include trappedelectrons while Ch,inj is the concentration of all injected holes. A graphicalrepresentation of Equation 5.31 and the energy levels relevant for the open-circuit voltage can be found in Figure 5.16.
The slope of a plot of VOC vs. logPin for the solid state cell (Figure 5.15b)was 80 mV. This higher value could be due to an effect of ch,Inj on the concen-tration of oxidised spiro-MeOTAD and on the open-circuit voltage.
ECB
E0'F,redox
EF,redox,darkEF,redox,light
EF,TiO2
Dark Under illumination
VOC
Figure 5.16: Representation of the energy levels relevant for the voltage determinationof a solid state DSC in the dark and under illumination.
55
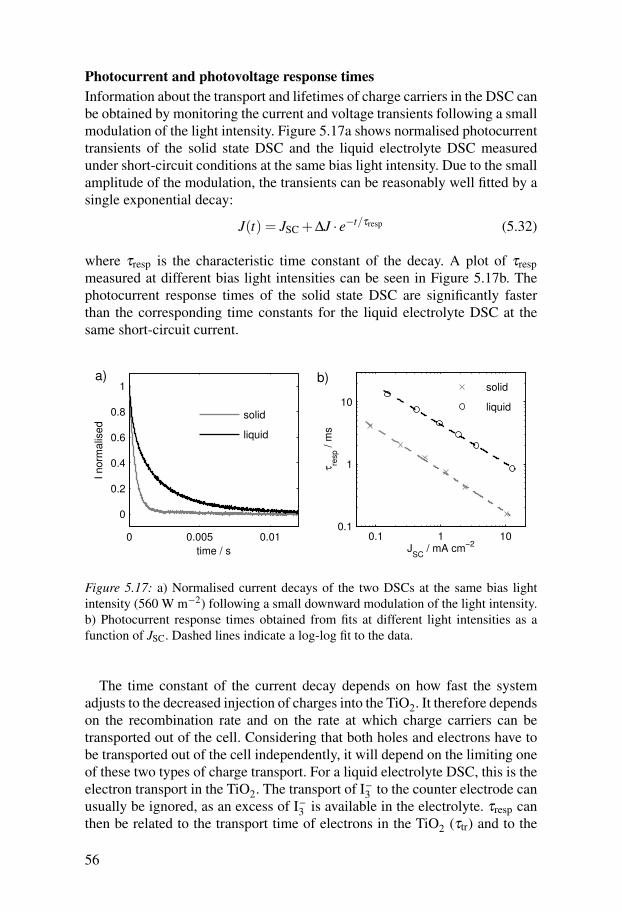
Photocurrent and photovoltage response timesInformation about the transport and lifetimes of charge carriers in the DSC canbe obtained by monitoring the current and voltage transients following a smallmodulation of the light intensity. Figure 5.17a shows normalised photocurrenttransients of the solid state DSC and the liquid electrolyte DSC measuredunder short-circuit conditions at the same bias light intensity. Due to the smallamplitude of the modulation, the transients can be reasonably well fitted by asingle exponential decay:
J(t) = JSC +∆J · e−t/τresp (5.32)
where τresp is the characteristic time constant of the decay. A plot of τrespmeasured at different bias light intensities can be seen in Figure 5.17b. Thephotocurrent response times of the solid state DSC are significantly fasterthan the corresponding time constants for the liquid electrolyte DSC at thesame short-circuit current.
0 0.005 0.01
0
0.2
0.4
0.6
0.8
1
time / s
I norm
alis
ed
0.1 1 100.1
1
10
JSC
/ mA cm−2
τre
sp / m
s
solid
liquid
solid
liquid
a) b)
Figure 5.17: a) Normalised current decays of the two DSCs at the same bias lightintensity (560 W m−2) following a small downward modulation of the light intensity.b) Photocurrent response times obtained from fits at different light intensities as afunction of JSC. Dashed lines indicate a log-log fit to the data.
The time constant of the current decay depends on how fast the systemadjusts to the decreased injection of charges into the TiO2. It therefore dependson the recombination rate and on the rate at which charge carriers can betransported out of the cell. Considering that both holes and electrons have tobe transported out of the cell independently, it will depend on the limiting oneof these two types of charge transport. For a liquid electrolyte DSC, this is theelectron transport in the TiO2. The transport of I–
3 to the counter electrode canusually be ignored, as an excess of I–
3 is available in the electrolyte. τresp canthen be related to the transport time of electrons in the TiO2 (τtr) and to the
56
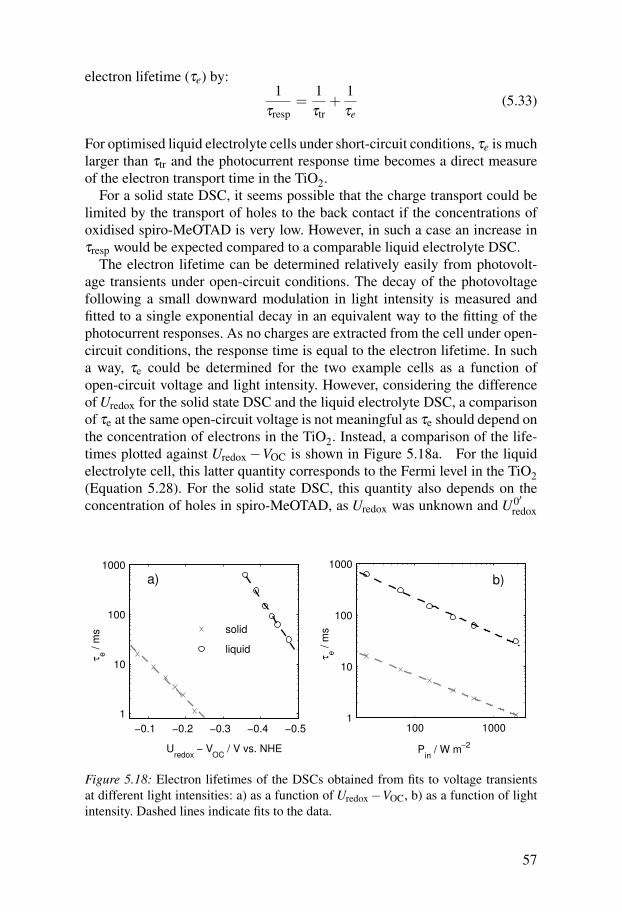
electron lifetime (τe) by:1
τresp=
1τtr
+1τe
(5.33)
For optimised liquid electrolyte cells under short-circuit conditions, τe is muchlarger than τtr and the photocurrent response time becomes a direct measureof the electron transport time in the TiO2.
For a solid state DSC, it seems possible that the charge transport could belimited by the transport of holes to the back contact if the concentrations ofoxidised spiro-MeOTAD is very low. However, in such a case an increase inτresp would be expected compared to a comparable liquid electrolyte DSC.
The electron lifetime can be determined relatively easily from photovolt-age transients under open-circuit conditions. The decay of the photovoltagefollowing a small downward modulation in light intensity is measured andfitted to a single exponential decay in an equivalent way to the fitting of thephotocurrent responses. As no charges are extracted from the cell under open-circuit conditions, the response time is equal to the electron lifetime. In sucha way, τe could be determined for the two example cells as a function ofopen-circuit voltage and light intensity. However, considering the differenceof Uredox for the solid state DSC and the liquid electrolyte DSC, a comparisonof τe at the same open-circuit voltage is not meaningful as τe should depend onthe concentration of electrons in the TiO2. Instead, a comparison of the life-times plotted against Uredox−VOC is shown in Figure 5.18a. For the liquidelectrolyte cell, this latter quantity corresponds to the Fermi level in the TiO2(Equation 5.28). For the solid state DSC, this quantity also depends on theconcentration of holes in spiro-MeOTAD, as Uredox was unknown and U0′
redox
−0.5−0.4−0.3−0.2−0.1
1
10
100
1000
Uredox
− VOC
/ V vs. NHE
τe / m
s
100 10001
10
100
1000
Pin
/ W m−2
τe / m
ssolid
liquid
a) b)
Figure 5.18: Electron lifetimes of the DSCs obtained from fits to voltage transientsat different light intensities: a) as a function of Uredox−VOC, b) as a function of lightintensity. Dashed lines indicate fits to the data.
57
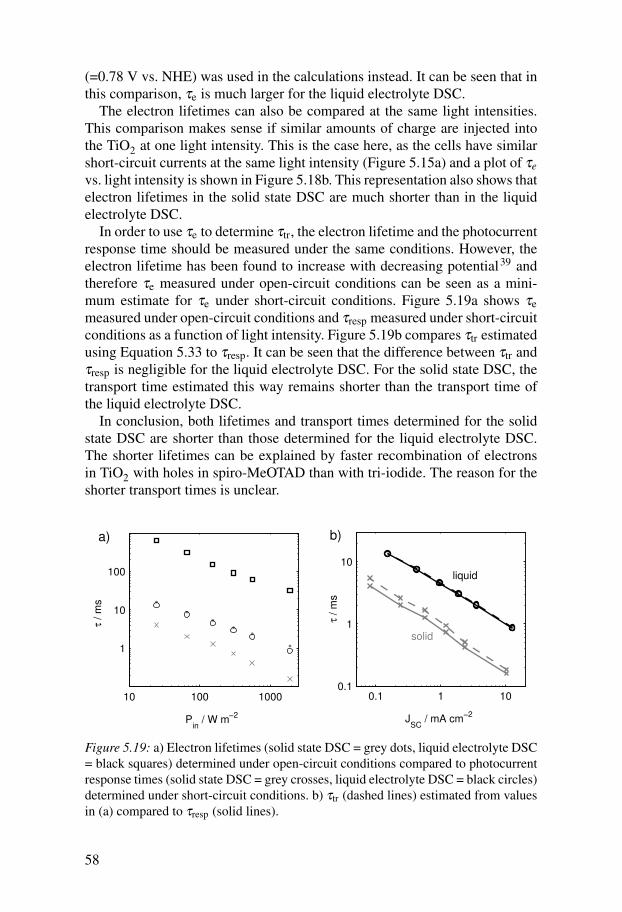
(=0.78 V vs. NHE) was used in the calculations instead. It can be seen that inthis comparison, τe is much larger for the liquid electrolyte DSC.
The electron lifetimes can also be compared at the same light intensities.This comparison makes sense if similar amounts of charge are injected intothe TiO2 at one light intensity. This is the case here, as the cells have similarshort-circuit currents at the same light intensity (Figure 5.15a) and a plot of τevs. light intensity is shown in Figure 5.18b. This representation also shows thatelectron lifetimes in the solid state DSC are much shorter than in the liquidelectrolyte DSC.
In order to use τe to determine τtr, the electron lifetime and the photocurrentresponse time should be measured under the same conditions. However, theelectron lifetime has been found to increase with decreasing potential39 andtherefore τe measured under open-circuit conditions can be seen as a mini-mum estimate for τe under short-circuit conditions. Figure 5.19a shows τemeasured under open-circuit conditions and τresp measured under short-circuitconditions as a function of light intensity. Figure 5.19b compares τtr estimatedusing Equation 5.33 to τresp. It can be seen that the difference between τtr andτresp is negligible for the liquid electrolyte DSC. For the solid state DSC, thetransport time estimated this way remains shorter than the transport time ofthe liquid electrolyte DSC.
In conclusion, both lifetimes and transport times determined for the solidstate DSC are shorter than those determined for the liquid electrolyte DSC.The shorter lifetimes can be explained by faster recombination of electronsin TiO2 with holes in spiro-MeOTAD than with tri-iodide. The reason for theshorter transport times is unclear.
10 100 1000
1
10
100
Pin
/ W m−2
τ / m
s
0.1 1 100.1
1
10
JSC
/ mA cm−2
τ / m
s
a)
solid
liquid
b)
Figure 5.19: a) Electron lifetimes (solid state DSC = grey dots, liquid electrolyte DSC= black squares) determined under open-circuit conditions compared to photocurrentresponse times (solid state DSC = grey crosses, liquid electrolyte DSC = black circles)determined under short-circuit conditions. b) τtr (dashed lines) estimated from valuesin (a) compared to τresp (solid lines).
58
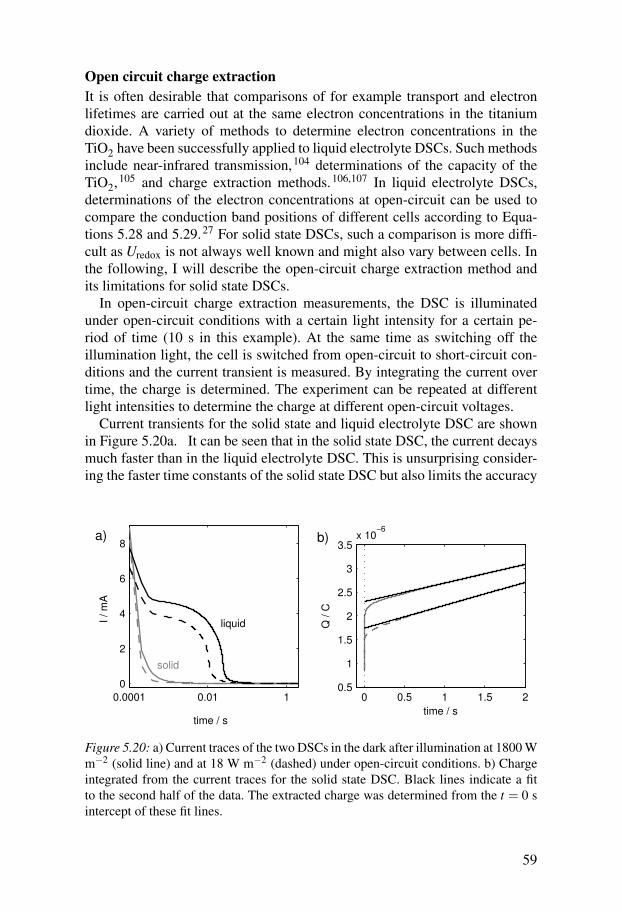
Open circuit charge extractionIt is often desirable that comparisons of for example transport and electronlifetimes are carried out at the same electron concentrations in the titaniumdioxide. A variety of methods to determine electron concentrations in theTiO2 have been successfully applied to liquid electrolyte DSCs. Such methodsinclude near-infrared transmission,104 determinations of the capacity of theTiO2,105 and charge extraction methods.106,107 In liquid electrolyte DSCs,determinations of the electron concentrations at open-circuit can be used tocompare the conduction band positions of different cells according to Equa-tions 5.28 and 5.29.27 For solid state DSCs, such a comparison is more diffi-cult as Uredox is not always well known and might also vary between cells. Inthe following, I will describe the open-circuit charge extraction method andits limitations for solid state DSCs.
In open-circuit charge extraction measurements, the DSC is illuminatedunder open-circuit conditions with a certain light intensity for a certain pe-riod of time (10 s in this example). At the same time as switching off theillumination light, the cell is switched from open-circuit to short-circuit con-ditions and the current transient is measured. By integrating the current overtime, the charge is determined. The experiment can be repeated at differentlight intensities to determine the charge at different open-circuit voltages.
Current transients for the solid state and liquid electrolyte DSC are shownin Figure 5.20a. It can be seen that in the solid state DSC, the current decaysmuch faster than in the liquid electrolyte DSC. This is unsurprising consider-ing the faster time constants of the solid state DSC but also limits the accuracy
0.0001 0.01 1
0
2
4
6
8
time / s
I / m
A
0 0.5 1 1.5 20.5
1
1.5
2
2.5
3
3.5x 10
−6
time / s
Q / C
a) b)
solid
liquid
Figure 5.20: a) Current traces of the two DSCs in the dark after illumination at 1800 Wm−2 (solid line) and at 18 W m−2 (dashed) under open-circuit conditions. b) Chargeintegrated from the current traces for the solid state DSC. Black lines indicate a fitto the second half of the data. The extracted charge was determined from the t = 0 sintercept of these fit lines.
59
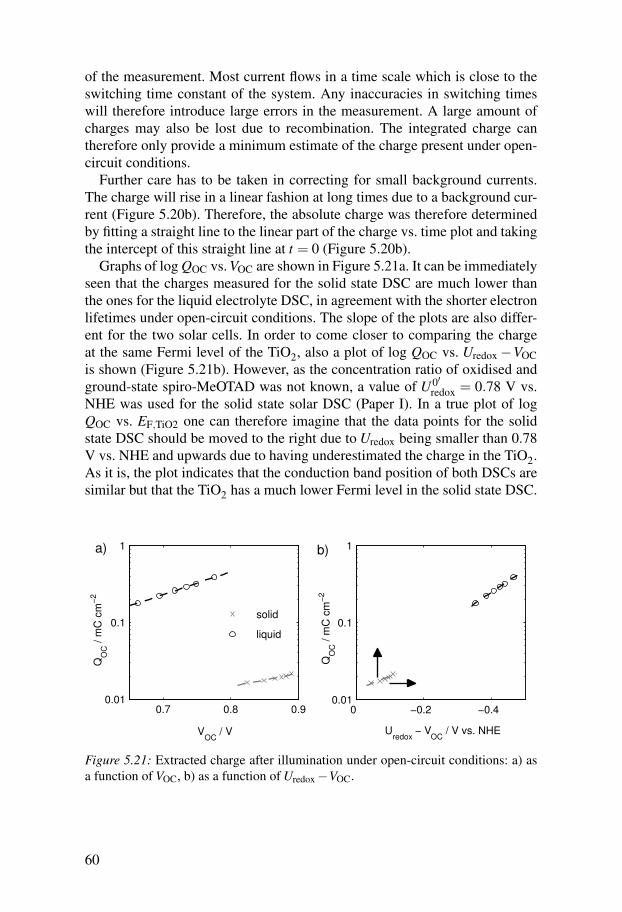
of the measurement. Most current flows in a time scale which is close to theswitching time constant of the system. Any inaccuracies in switching timeswill therefore introduce large errors in the measurement. A large amount ofcharges may also be lost due to recombination. The integrated charge cantherefore only provide a minimum estimate of the charge present under open-circuit conditions.
Further care has to be taken in correcting for small background currents.The charge will rise in a linear fashion at long times due to a background cur-rent (Figure 5.20b). Therefore, the absolute charge was therefore determinedby fitting a straight line to the linear part of the charge vs. time plot and takingthe intercept of this straight line at t = 0 (Figure 5.20b).
Graphs of log QOC vs. VOC are shown in Figure 5.21a. It can be immediatelyseen that the charges measured for the solid state DSC are much lower thanthe ones for the liquid electrolyte DSC, in agreement with the shorter electronlifetimes under open-circuit conditions. The slope of the plots are also differ-ent for the two solar cells. In order to come closer to comparing the chargeat the same Fermi level of the TiO2, also a plot of log QOC vs. Uredox−VOCis shown (Figure 5.21b). However, as the concentration ratio of oxidised andground-state spiro-MeOTAD was not known, a value of U0′
redox = 0.78 V vs.NHE was used for the solid state solar DSC (Paper I). In a true plot of logQOC vs. EF,TiO2 one can therefore imagine that the data points for the solidstate DSC should be moved to the right due to Uredox being smaller than 0.78V vs. NHE and upwards due to having underestimated the charge in the TiO2.As it is, the plot indicates that the conduction band position of both DSCs aresimilar but that the TiO2 has a much lower Fermi level in the solid state DSC.
0.7 0.8 0.90.01
0.1
1
VOC
/ V
QO
C / m
C c
m−
2
0 −0.2 −0.40.01
0.1
1
Uredox
− VOC
/ V vs. NHE
QO
C / m
C c
m−
2
solid
liquid
a) b)
Figure 5.21: Extracted charge after illumination under open-circuit conditions: a) asa function of VOC, b) as a function of Uredox−VOC.
60
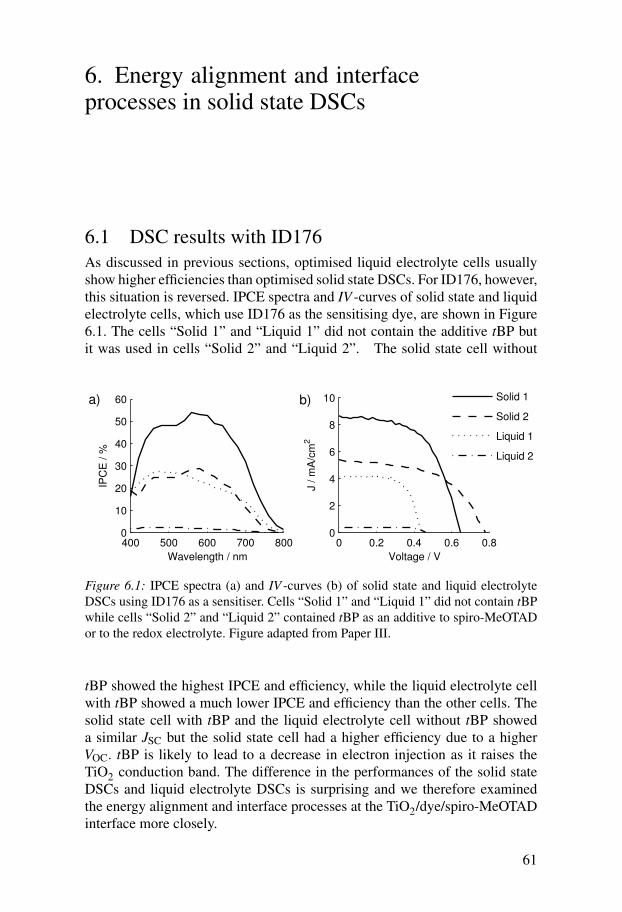
6. Energy alignment and interfaceprocesses in solid state DSCs
6.1 DSC results with ID176As discussed in previous sections, optimised liquid electrolyte cells usuallyshow higher efficiencies than optimised solid state DSCs. For ID176, however,this situation is reversed. IPCE spectra and IV -curves of solid state and liquidelectrolyte cells, which use ID176 as the sensitising dye, are shown in Figure6.1. The cells “Solid 1” and “Liquid 1” did not contain the additive tBP butit was used in cells “Solid 2” and “Liquid 2”. The solid state cell without
400 500 600 700 8000
10
20
30
40
50
60
Wavelength / nm
IPC
E / %
0 0.2 0.4 0.6 0.80
2
4
6
8
10
Voltage / V
J / m
A/c
m2
Solid 1
Solid 2
Liquid 1
Liquid 2
a) b)
Figure 6.1: IPCE spectra (a) and IV -curves (b) of solid state and liquid electrolyteDSCs using ID176 as a sensitiser. Cells “Solid 1” and “Liquid 1” did not contain tBPwhile cells “Solid 2” and “Liquid 2” contained tBP as an additive to spiro-MeOTADor to the redox electrolyte. Figure adapted from Paper III.
tBP showed the highest IPCE and efficiency, while the liquid electrolyte cellwith tBP showed a much lower IPCE and efficiency than the other cells. Thesolid state cell with tBP and the liquid electrolyte cell without tBP showeda similar JSC but the solid state cell had a higher efficiency due to a higherVOC. tBP is likely to lead to a decrease in electron injection as it raises theTiO2 conduction band. The difference in the performances of the solid stateDSCs and liquid electrolyte DSCs is surprising and we therefore examinedthe energy alignment and interface processes at the TiO2/dye/spiro-MeOTADinterface more closely.
61
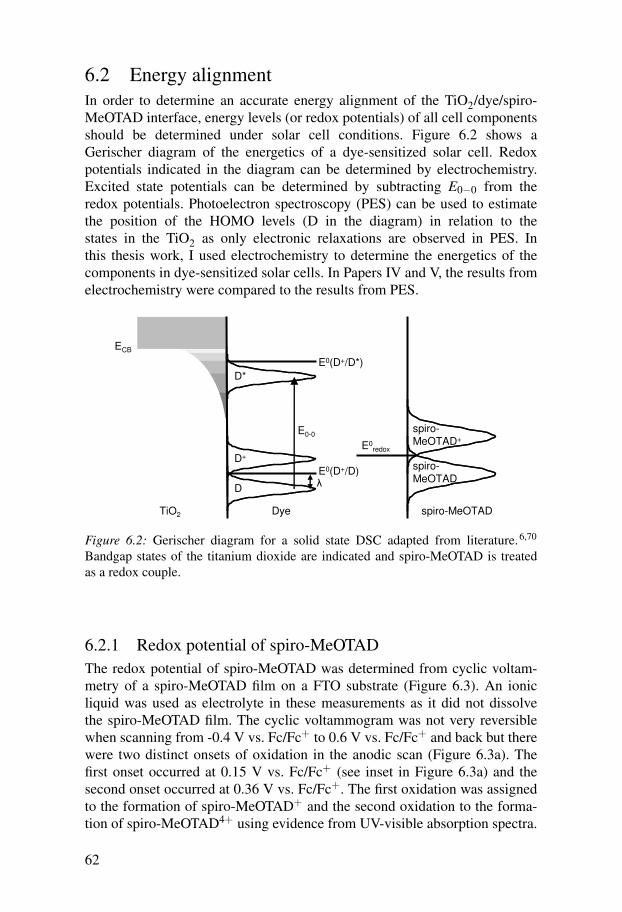
6.2 Energy alignmentIn order to determine an accurate energy alignment of the TiO2/dye/spiro-MeOTAD interface, energy levels (or redox potentials) of all cell componentsshould be determined under solar cell conditions. Figure 6.2 shows aGerischer diagram of the energetics of a dye-sensitized solar cell. Redoxpotentials indicated in the diagram can be determined by electrochemistry.Excited state potentials can be determined by subtracting E0−0 from theredox potentials. Photoelectron spectroscopy (PES) can be used to estimatethe position of the HOMO levels (D in the diagram) in relation to thestates in the TiO2 as only electronic relaxations are observed in PES. Inthis thesis work, I used electrochemistry to determine the energetics of thecomponents in dye-sensitized solar cells. In Papers IV and V, the results fromelectrochemistry were compared to the results from PES.
D
D+
D*
ECB
E0(D+/D)
E0(D+/D*)
E0-0
E0redox
spiro-MeOTAD
spiro-MeOTAD+
TiO2 Dye spiro-MeOTAD
Figure 6.2: Gerischer diagram for a solid state DSC adapted from literature.6,70
Bandgap states of the titanium dioxide are indicated and spiro-MeOTAD is treatedas a redox couple.
6.2.1 Redox potential of spiro-MeOTADThe redox potential of spiro-MeOTAD was determined from cyclic voltam-metry of a spiro-MeOTAD film on a FTO substrate (Figure 6.3). An ionicliquid was used as electrolyte in these measurements as it did not dissolvethe spiro-MeOTAD film. The cyclic voltammogram was not very reversiblewhen scanning from -0.4 V vs. Fc/Fc+ to 0.6 V vs. Fc/Fc+ and back but therewere two distinct onsets of oxidation in the anodic scan (Figure 6.3a). Thefirst onset occurred at 0.15 V vs. Fc/Fc+ (see inset in Figure 6.3a) and thesecond onset occurred at 0.36 V vs. Fc/Fc+. The first oxidation was assignedto the formation of spiro-MeOTAD+ and the second oxidation to the forma-tion of spiro-MeOTAD4+ using evidence from UV-visible absorption spectra.
62
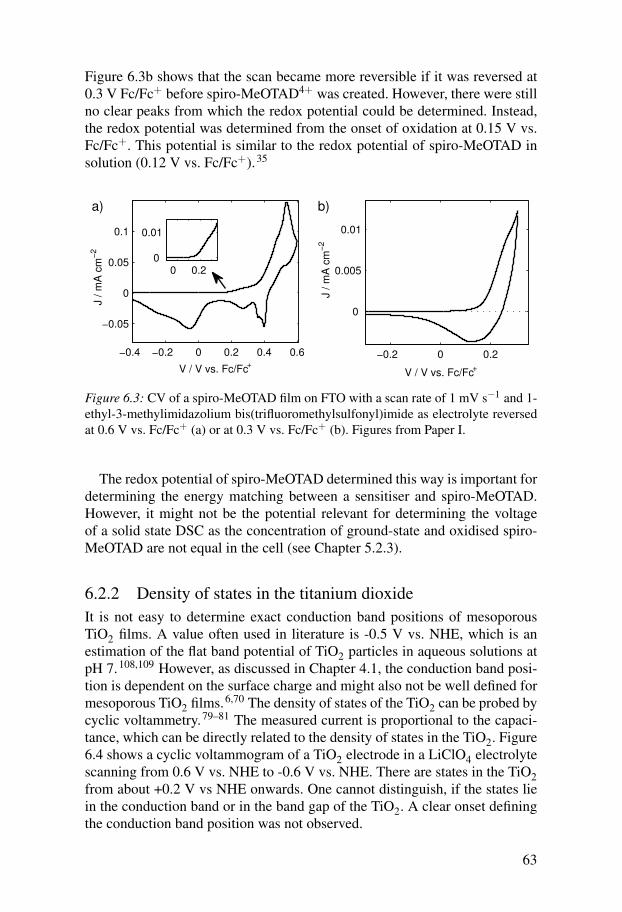
Figure 6.3b shows that the scan became more reversible if it was reversed at0.3 V Fc/Fc+ before spiro-MeOTAD4+ was created. However, there were stillno clear peaks from which the redox potential could be determined. Instead,the redox potential was determined from the onset of oxidation at 0.15 V vs.Fc/Fc+. This potential is similar to the redox potential of spiro-MeOTAD insolution (0.12 V vs. Fc/Fc+).35
−0.4 −0.2 0 0.2 0.4 0.6
−0.05
0
0.05
0.1
V / V vs. Fc/Fc+
J / m
A c
m−
2
0 0.2
0
0.01
a)
−0.2 0 0.2
0
0.005
0.01
V / V vs. Fc/Fc+
J / m
A c
m−
2
b)
Figure 6.3: CV of a spiro-MeOTAD film on FTO with a scan rate of 1 mV s−1 and 1-ethyl-3-methylimidazolium bis(trifluoromethylsulfonyl)imide as electrolyte reversedat 0.6 V vs. Fc/Fc+ (a) or at 0.3 V vs. Fc/Fc+ (b). Figures from Paper I.
The redox potential of spiro-MeOTAD determined this way is important fordetermining the energy matching between a sensitiser and spiro-MeOTAD.However, it might not be the potential relevant for determining the voltageof a solid state DSC as the concentration of ground-state and oxidised spiro-MeOTAD are not equal in the cell (see Chapter 5.2.3).
6.2.2 Density of states in the titanium dioxideIt is not easy to determine exact conduction band positions of mesoporousTiO2 films. A value often used in literature is -0.5 V vs. NHE, which is anestimation of the flat band potential of TiO2 particles in aqueous solutions atpH 7.108,109 However, as discussed in Chapter 4.1, the conduction band posi-tion is dependent on the surface charge and might also not be well defined formesoporous TiO2 films.6,70 The density of states of the TiO2 can be probed bycyclic voltammetry.79–81 The measured current is proportional to the capaci-tance, which can be directly related to the density of states in the TiO2. Figure6.4 shows a cyclic voltammogram of a TiO2 electrode in a LiClO4 electrolytescanning from 0.6 V vs. NHE to -0.6 V vs. NHE. There are states in the TiO2from about +0.2 V vs NHE onwards. One cannot distinguish, if the states liein the conduction band or in the band gap of the TiO2. A clear onset definingthe conduction band position was not observed.
63
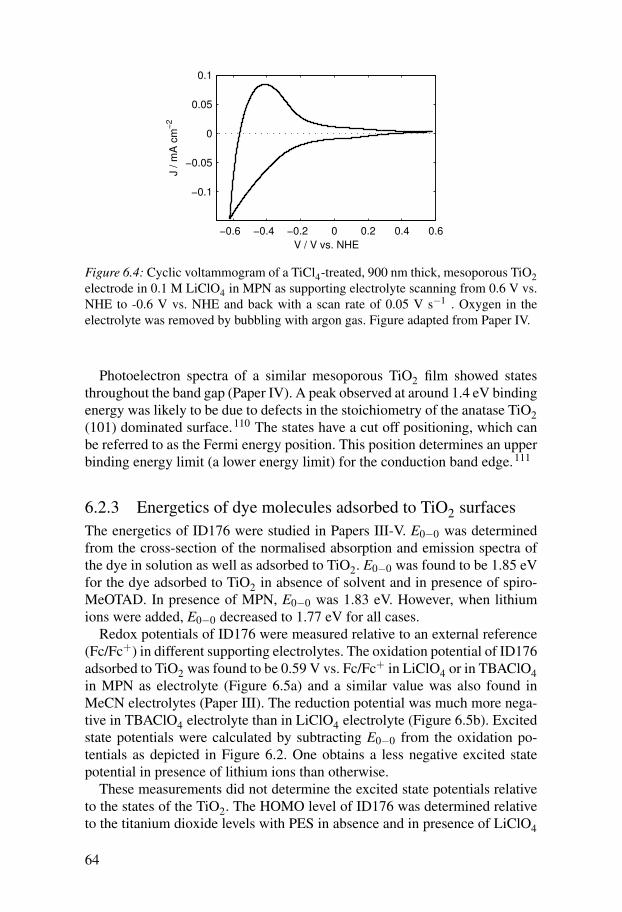
−0.6 −0.4 −0.2 0 0.2 0.4 0.6
−0.1
−0.05
0
0.05
0.1
V / V vs. NHE
J / m
A c
m−
2
Figure 6.4: Cyclic voltammogram of a TiCl4-treated, 900 nm thick, mesoporous TiO2electrode in 0.1 M LiClO4 in MPN as supporting electrolyte scanning from 0.6 V vs.NHE to -0.6 V vs. NHE and back with a scan rate of 0.05 V s−1 . Oxygen in theelectrolyte was removed by bubbling with argon gas. Figure adapted from Paper IV.
Photoelectron spectra of a similar mesoporous TiO2 film showed statesthroughout the band gap (Paper IV). A peak observed at around 1.4 eV bindingenergy was likely to be due to defects in the stoichiometry of the anatase TiO2(101) dominated surface.110 The states have a cut off positioning, which canbe referred to as the Fermi energy position. This position determines an upperbinding energy limit (a lower energy limit) for the conduction band edge.111
6.2.3 Energetics of dye molecules adsorbed to TiO2 surfacesThe energetics of ID176 were studied in Papers III-V. E0−0 was determinedfrom the cross-section of the normalised absorption and emission spectra ofthe dye in solution as well as adsorbed to TiO2. E0−0 was found to be 1.85 eVfor the dye adsorbed to TiO2 in absence of solvent and in presence of spiro-MeOTAD. In presence of MPN, E0−0 was 1.83 eV. However, when lithiumions were added, E0−0 decreased to 1.77 eV for all cases.
Redox potentials of ID176 were measured relative to an external reference(Fc/Fc+) in different supporting electrolytes. The oxidation potential of ID176adsorbed to TiO2 was found to be 0.59 V vs. Fc/Fc+ in LiClO4 or in TBAClO4in MPN as electrolyte (Figure 6.5a) and a similar value was also found inMeCN electrolytes (Paper III). The reduction potential was much more nega-tive in TBAClO4 electrolyte than in LiClO4 electrolyte (Figure 6.5b). Excitedstate potentials were calculated by subtracting E0−0 from the oxidation po-tentials as depicted in Figure 6.2. One obtains a less negative excited statepotential in presence of lithium ions than otherwise.
These measurements did not determine the excited state potentials relativeto the states of the TiO2. The HOMO level of ID176 was determined relativeto the titanium dioxide levels with PES in absence and in presence of LiClO4
64
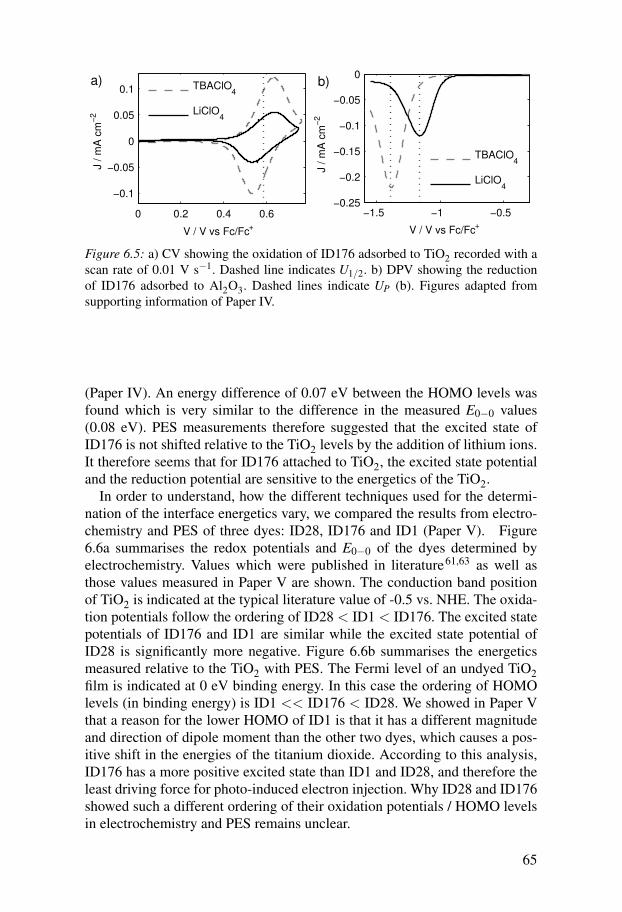
0 0.2 0.4 0.6
−0.1
−0.05
0
0.05
0.1
V / V vs Fc/Fc+
J / m
A c
m−
2
TBAClO
4
LiClO4
a)
−1.5 −1 −0.5−0.25
−0.2
−0.15
−0.1
−0.05
0
V / V vs Fc/Fc+
J / m
A c
m−
2
TBAClO4
LiClO4
b)
Figure 6.5: a) CV showing the oxidation of ID176 adsorbed to TiO2 recorded with ascan rate of 0.01 V s−1. Dashed line indicates U1/2. b) DPV showing the reductionof ID176 adsorbed to Al2O3. Dashed lines indicate UP (b). Figures adapted fromsupporting information of Paper IV.
(Paper IV). An energy difference of 0.07 eV between the HOMO levels wasfound which is very similar to the difference in the measured E0−0 values(0.08 eV). PES measurements therefore suggested that the excited state ofID176 is not shifted relative to the TiO2 levels by the addition of lithium ions.It therefore seems that for ID176 attached to TiO2, the excited state potentialand the reduction potential are sensitive to the energetics of the TiO2.
In order to understand, how the different techniques used for the determi-nation of the interface energetics vary, we compared the results from electro-chemistry and PES of three dyes: ID28, ID176 and ID1 (Paper V). Figure6.6a summarises the redox potentials and E0−0 of the dyes determined byelectrochemistry. Values which were published in literature61,63 as well asthose values measured in Paper V are shown. The conduction band positionof TiO2 is indicated at the typical literature value of -0.5 vs. NHE. The oxida-tion potentials follow the ordering of ID28 < ID1 < ID176. The excited statepotentials of ID176 and ID1 are similar while the excited state potential ofID28 is significantly more negative. Figure 6.6b summarises the energeticsmeasured relative to the TiO2 with PES. The Fermi level of an undyed TiO2film is indicated at 0 eV binding energy. In this case the ordering of HOMOlevels (in binding energy) is ID1 << ID176 < ID28. We showed in Paper Vthat a reason for the lower HOMO of ID1 is that it has a different magnitudeand direction of dipole moment than the other two dyes, which causes a pos-itive shift in the energies of the titanium dioxide. According to this analysis,ID176 has a more positive excited state than ID1 and ID28, and therefore theleast driving force for photo-induced electron injection. Why ID28 and ID176showed such a different ordering of their oxidation potentials / HOMO levelsin electrochemistry and PES remains unclear.
65
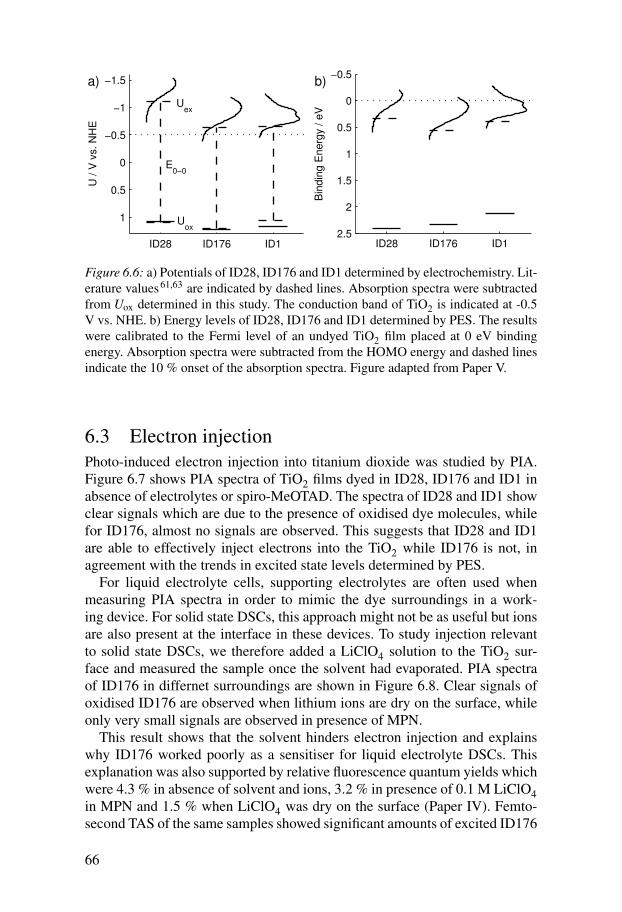
ID28 ID176 ID1
−1.5
−1
−0.5
0
0.5
1
U / V
vs. N
HE
a)
Uex
E0−0
Uox
ID28 ID176 ID1
−0.5
0
0.5
1
1.5
2
2.5
Bin
din
g E
nerg
y / e
V
b)
Figure 6.6: a) Potentials of ID28, ID176 and ID1 determined by electrochemistry. Lit-erature values61,63 are indicated by dashed lines. Absorption spectra were subtractedfrom Uox determined in this study. The conduction band of TiO2 is indicated at -0.5V vs. NHE. b) Energy levels of ID28, ID176 and ID1 determined by PES. The resultswere calibrated to the Fermi level of an undyed TiO2 film placed at 0 eV bindingenergy. Absorption spectra were subtracted from the HOMO energy and dashed linesindicate the 10 % onset of the absorption spectra. Figure adapted from Paper V.
6.3 Electron injectionPhoto-induced electron injection into titanium dioxide was studied by PIA.Figure 6.7 shows PIA spectra of TiO2 films dyed in ID28, ID176 and ID1 inabsence of electrolytes or spiro-MeOTAD. The spectra of ID28 and ID1 showclear signals which are due to the presence of oxidised dye molecules, whilefor ID176, almost no signals are observed. This suggests that ID28 and ID1are able to effectively inject electrons into the TiO2 while ID176 is not, inagreement with the trends in excited state levels determined by PES.
For liquid electrolyte cells, supporting electrolytes are often used whenmeasuring PIA spectra in order to mimic the dye surroundings in a work-ing device. For solid state DSCs, this approach might not be as useful but ionsare also present at the interface in these devices. To study injection relevantto solid state DSCs, we therefore added a LiClO4 solution to the TiO2 sur-face and measured the sample once the solvent had evaporated. PIA spectraof ID176 in differnet surroundings are shown in Figure 6.8. Clear signals ofoxidised ID176 are observed when lithium ions are dry on the surface, whileonly very small signals are observed in presence of MPN.
This result shows that the solvent hinders electron injection and explainswhy ID176 worked poorly as a sensitiser for liquid electrolyte DSCs. Thisexplanation was also supported by relative fluorescence quantum yields whichwere 4.3 % in absence of solvent and ions, 3.2 % in presence of 0.1 M LiClO4in MPN and 1.5 % when LiClO4 was dry on the surface (Paper IV). Femto-second TAS of the same samples showed significant amounts of excited ID176
66
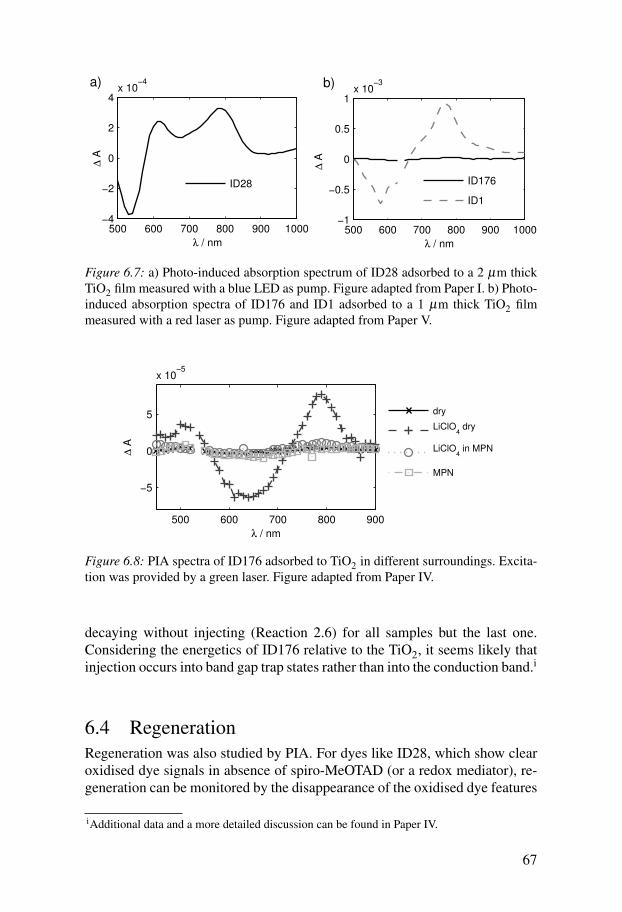
500 600 700 800 900 1000−4
−2
0
2
4x 10
−4
∆ A
λ / nm
ID28
a)
500 600 700 800 900 1000−1
−0.5
0
0.5
1x 10
−3
λ / nm
∆ A
ID176
ID1
b)
Figure 6.7: a) Photo-induced absorption spectrum of ID28 adsorbed to a 2 µm thickTiO2 film measured with a blue LED as pump. Figure adapted from Paper I. b) Photo-induced absorption spectra of ID176 and ID1 adsorbed to a 1 µm thick TiO2 filmmeasured with a red laser as pump. Figure adapted from Paper V.
500 600 700 800 900
−5
0
5
x 10−5
λ / nm
∆ A
dry
LiClO4 dry
LiClO4 in MPN
MPN
Figure 6.8: PIA spectra of ID176 adsorbed to TiO2 in different surroundings. Excita-tion was provided by a green laser. Figure adapted from Paper IV.
decaying without injecting (Reaction 2.6) for all samples but the last one.Considering the energetics of ID176 relative to the TiO2, it seems likely thatinjection occurs into band gap trap states rather than into the conduction band.i
6.4 RegenerationRegeneration was also studied by PIA. For dyes like ID28, which show clearoxidised dye signals in absence of spiro-MeOTAD (or a redox mediator), re-generation can be monitored by the disappearance of the oxidised dye features
iAdditional data and a more detailed discussion can be found in Paper IV.
67
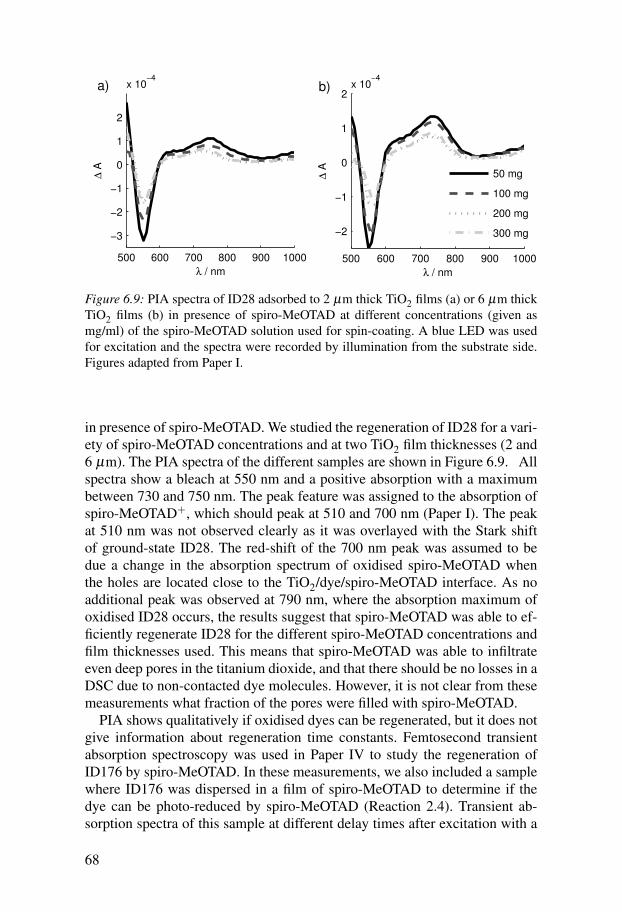
500 600 700 800 900 1000
−3
−2
−1
0
1
2
x 10−4
∆ A
λ / nm
500 600 700 800 900 1000
−2
−1
0
1
2x 10
−4
λ / nm
∆ A
50 mg
100 mg
200 mg
300 mg
a) b)
Figure 6.9: PIA spectra of ID28 adsorbed to 2 µm thick TiO2 films (a) or 6 µm thickTiO2 films (b) in presence of spiro-MeOTAD at different concentrations (given asmg/ml) of the spiro-MeOTAD solution used for spin-coating. A blue LED was usedfor excitation and the spectra were recorded by illumination from the substrate side.Figures adapted from Paper I.
in presence of spiro-MeOTAD. We studied the regeneration of ID28 for a vari-ety of spiro-MeOTAD concentrations and at two TiO2 film thicknesses (2 and6 µm). The PIA spectra of the different samples are shown in Figure 6.9. Allspectra show a bleach at 550 nm and a positive absorption with a maximumbetween 730 and 750 nm. The peak feature was assigned to the absorption ofspiro-MeOTAD+, which should peak at 510 and 700 nm (Paper I). The peakat 510 nm was not observed clearly as it was overlayed with the Stark shiftof ground-state ID28. The red-shift of the 700 nm peak was assumed to bedue a change in the absorption spectrum of oxidised spiro-MeOTAD whenthe holes are located close to the TiO2/dye/spiro-MeOTAD interface. As noadditional peak was observed at 790 nm, where the absorption maximum ofoxidised ID28 occurs, the results suggest that spiro-MeOTAD was able to ef-ficiently regenerate ID28 for the different spiro-MeOTAD concentrations andfilm thicknesses used. This means that spiro-MeOTAD was able to infiltrateeven deep pores in the titanium dioxide, and that there should be no losses in aDSC due to non-contacted dye molecules. However, it is not clear from thesemeasurements what fraction of the pores were filled with spiro-MeOTAD.
PIA shows qualitatively if oxidised dyes can be regenerated, but it does notgive information about regeneration time constants. Femtosecond transientabsorption spectroscopy was used in Paper IV to study the regeneration ofID176 by spiro-MeOTAD. In these measurements, we also included a samplewhere ID176 was dispersed in a film of spiro-MeOTAD to determine if thedye can be photo-reduced by spiro-MeOTAD (Reaction 2.4). Transient ab-sorption spectra of this sample at different delay times after excitation with a
68
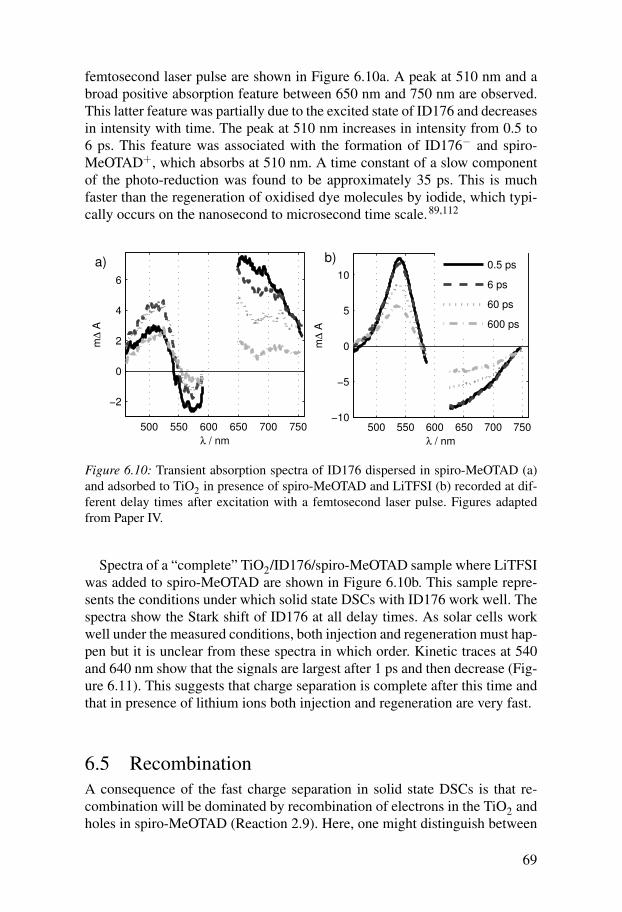
femtosecond laser pulse are shown in Figure 6.10a. A peak at 510 nm and abroad positive absorption feature between 650 nm and 750 nm are observed.This latter feature was partially due to the excited state of ID176 and decreasesin intensity with time. The peak at 510 nm increases in intensity from 0.5 to6 ps. This feature was associated with the formation of ID176− and spiro-MeOTAD+, which absorbs at 510 nm. A time constant of a slow componentof the photo-reduction was found to be approximately 35 ps. This is muchfaster than the regeneration of oxidised dye molecules by iodide, which typi-cally occurs on the nanosecond to microsecond time scale.89,112
500 550 600 650 700 750
−2
0
2
4
6
m∆
A
λ / nm
500 550 600 650 700 750−10
−5
0
5
10
λ / nm
m∆
A
0.5 ps
6 ps
60 ps
600 ps
a) b)
Figure 6.10: Transient absorption spectra of ID176 dispersed in spiro-MeOTAD (a)and adsorbed to TiO2 in presence of spiro-MeOTAD and LiTFSI (b) recorded at dif-ferent delay times after excitation with a femtosecond laser pulse. Figures adaptedfrom Paper IV.
Spectra of a “complete” TiO2/ID176/spiro-MeOTAD sample where LiTFSIwas added to spiro-MeOTAD are shown in Figure 6.10b. This sample repre-sents the conditions under which solid state DSCs with ID176 work well. Thespectra show the Stark shift of ID176 at all delay times. As solar cells workwell under the measured conditions, both injection and regeneration must hap-pen but it is unclear from these spectra in which order. Kinetic traces at 540and 640 nm show that the signals are largest after 1 ps and then decrease (Fig-ure 6.11). This suggests that charge separation is complete after this time andthat in presence of lithium ions both injection and regeneration are very fast.
6.5 RecombinationA consequence of the fast charge separation in solid state DSCs is that re-combination will be dominated by recombination of electrons in the TiO2 andholes in spiro-MeOTAD (Reaction 2.9). Here, one might distinguish between
69
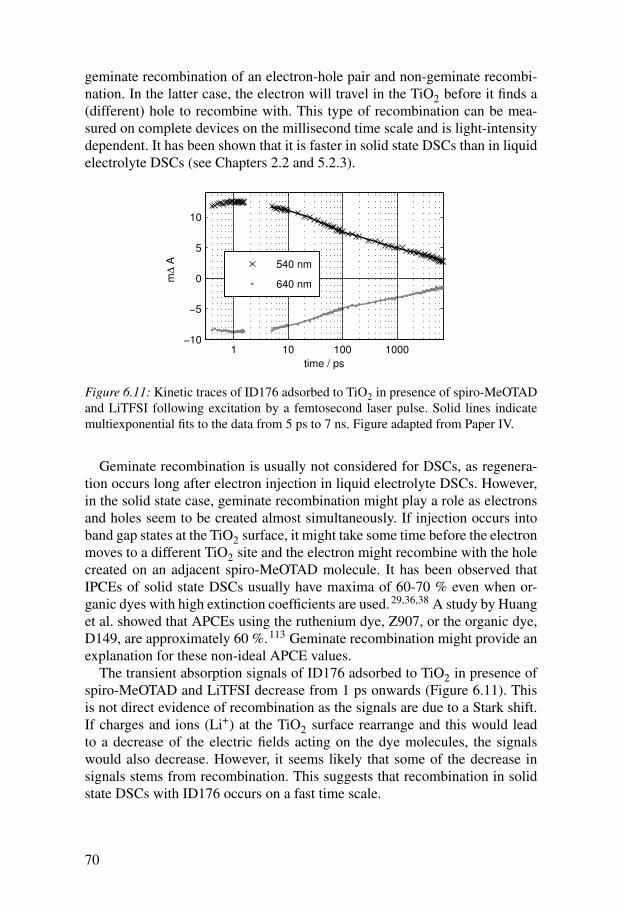
geminate recombination of an electron-hole pair and non-geminate recombi-nation. In the latter case, the electron will travel in the TiO2 before it finds a(different) hole to recombine with. This type of recombination can be mea-sured on complete devices on the millisecond time scale and is light-intensitydependent. It has been shown that it is faster in solid state DSCs than in liquidelectrolyte DSCs (see Chapters 2.2 and 5.2.3).
1 10 100 1000−10
−5
0
5
10
time / ps
m∆
A
540 nm
640 nm
Figure 6.11: Kinetic traces of ID176 adsorbed to TiO2 in presence of spiro-MeOTADand LiTFSI following excitation by a femtosecond laser pulse. Solid lines indicatemultiexponential fits to the data from 5 ps to 7 ns. Figure adapted from Paper IV.
Geminate recombination is usually not considered for DSCs, as regenera-tion occurs long after electron injection in liquid electrolyte DSCs. However,in the solid state case, geminate recombination might play a role as electronsand holes seem to be created almost simultaneously. If injection occurs intoband gap states at the TiO2 surface, it might take some time before the electronmoves to a different TiO2 site and the electron might recombine with the holecreated on an adjacent spiro-MeOTAD molecule. It has been observed thatIPCEs of solid state DSCs usually have maxima of 60-70 % even when or-ganic dyes with high extinction coefficients are used.29,36,38 A study by Huanget al. showed that APCEs using the ruthenium dye, Z907, or the organic dye,D149, are approximately 60 %.113 Geminate recombination might provide anexplanation for these non-ideal APCE values.
The transient absorption signals of ID176 adsorbed to TiO2 in presence ofspiro-MeOTAD and LiTFSI decrease from 1 ps onwards (Figure 6.11). Thisis not direct evidence of recombination as the signals are due to a Stark shift.If charges and ions (Li+) at the TiO2 surface rearrange and this would leadto a decrease of the electric fields acting on the dye molecules, the signalswould also decrease. However, it seems likely that some of the decrease insignals stems from recombination. This suggests that recombination in solidstate DSCs with ID176 occurs on a fast time scale.
70
7. Conclusions and outlook
In this thesis work, I used and developed measurement techniques tostudy the properties and processes of solid state DSCs under conditionsclose the operating conditions of the solar cell. Electrochemistry andphotoelectron spectroscopy were used to study the energy alignment at theTiO2/dye/spiro-MeOTAD interface. Photo-induced absorption spectroscopyand femtosecond transient absorption spectroscopy were used to study theinjection, regeneration and recombination processes across this interface. Itwas found that the results of the latter two techniques are strongly influencedby a Stark shift of the ground-state absorption spectra of dye moleculescaused by electrons in the TiO2. The Stark shift has the shape of thederivative of the absorption spectrum and depends on the size and magnitudeof the change in dipole moment of the molecule normal to the TiO2 surface.
The results of the measurements revealed some fundamental differencesbetween solid state DSCs employing the hole conductor spiro-MeOTAD andconventional liquid electrolyte DSCs, which employ the iodide/tri-iodideredox couple. An organic dye (ID176) studied here was able to efficientlyinject electrons into the TiO2 in absence but not in presence of an organicsolvent. As a consequence, liquid electrolyte DSCs using this dye showedpoor performances, while the dye worked well in solid state DSCs.Regeneration by spiro-MeOTAD is very fast and can even preceed electroninjection into the titanium dioxide. The dominating recombination reactionoccurring in solid state DSCs is recombination between electrons in the TiO2and holes in spiro-MeOTAD, which is faster than recombination of electronswith tri-iodide. In addition to non-geminate recombination, also geminaterecombination might cause losses in solid state DSCs.
Redox potentials and energy levels of dye molecules adsorbed to TiO2surfaces determined by electrochemistry and photoelectron spectroscopy canshow different trends, as the redox potentials in electrochemistry are measuredrelative to an external reference and the energy levels in PES are measuredrelative to the levels of the TiO2. Furthermore, dyes are in a solvent and ionenvironment in electrochemistry, which they are (usually) not in PES. PESmight be better suited for predicting driving forces for electron injection,especially for solid state DSCs. For ID176, some evidence was found that it isnot the conduction band of the TiO2, which is important for electron injection,but rather the density of available states in the band gap of the TiO2.
71
The results of this thesis work show that it is important to consider the inter-play and matching of all components of a DSC both when applying measure-ment techniques to the system and when replacing one of the components.This is in line with some of the recent successes in DSC research: alternativeredox couples capable of replacing iodide/tri-iodide were successfully usedin DSCs together with organic dyes,114,115 which were much better suited tothese systems than the standard ruthenium complexes, such as N719, whichhad been used previously.
In the future, it will be interesting to apply new time-resolved techniques,such as time resolved vibrational spectroscopies, to the solid state DSC andto modify some existing techniques to come even closer to measuring theoperating system. An example of the latter is to include ions, solvents and holeconductors in the interface measurements with photoelectron spectroscopy.
Studies of how negative the oxidation potential of dye molecules areallowed to be for efficient regeneration by spiro-MeOTAD might helpimprove solid state DSCs. In this way, the energy losses in the system couldbe minimised. Dyes which absorb in the near-infrared could be used toincrease the light-harvesting in solid state DSCs – either on their own or asco-sensitisers together with organic dyes which absorb strongly in the visiblepart of the solar spectrum.
Recombination between electrons in the TiO2 and holes in spiro-MeOTADmight be reduced by an optimised engineering of the interface: dyes whichprotect the surface such as D35 and also co-adsorbers could be used. Alterna-tively, an additional potential step could be included in the injection or regen-eration process in order to separate the charges more effectively.44
New hole conductors with more positive potentials or higher hole mobili-ties could replace spiro-MeOTAD. A new hole conductor should be doped bya known amount in order to obtain stable and predictable cell performances,and have minimal competitive absorption of its oxidised state with the absorp-tion spectrum of the sensitiser. An alternative approach might be to use holeconductors, which absorb visible light in their ground-state and can contributeto the photocurrent by injecting electrons into the TiO2.116,117
72
Sammanfattning
InledningUtveckling av energiproduktion från förnybara energikällor är viktigt avolika anledningar. Just nu behöver världens befolkning 15 TW effekt ochman förväntar sig att det ska öka. Den största delen av energin är produceradfrån fossila bränslen, men reserverna av fossila bränslen är begränsad ochtillgängligheten blir allt svårare. Samtidigt är det väldigt troligt att CO2 somproduceras i förbränningen av fossila bränslen påverkar jordens klimat på ettnegativt sätt.
Därför är det väldigt viktigt att man försöker att ersätta ström som ärproducerad från fossila bränslen med ström som är tillverkad från förnybaraenergikällor såsom vind, vatten, våg och solljus. Kärnkraft tillhör inte deförnybara energikällorna eftersom det används ett bränsle under produktionen(uran).
Av de förnybara energikällor som finns är solljuset det med den största po-tentialen: 10000 gånger mer än vad som skulle behövas, men att omvandlaljuset till ström är inte helt enkelt. Just nu är det bara 24 GW elektrisk effektsom kan produceras från solljuset och nästan allt är producerad med kiselsol-celler eller med solvärmeanläggningar som omvandlar värme från solljuset tillström.
För att verkligen utnyttja den stora potentialen hos solljuset är det viktigtatt utveckla många olika tekniker för att omvandla solljuset till ström ellerbränsle. Solceller måste bli billiga att producera och vanligt förekommandematerial måste användas för att tekniken ska kunna ersätta andra energikällor.
Färgämnessensiterade solcellerEn av de typer av solceller som utvecklas är färgämnessensiterade solceller(figur 1, också kallad för Grätzelsolceller efter Michael Grätzel som visadeden första cellen med bra verkningsgrad).
Så hur tillverkar man färgämnessensiterade solceller och hur fungerar de?Solcellerna byggs på glas som är belagt med ett transparent ledande skikt avett material som kallas FTO (fluordopad tennoxid). På glaset sätts en film avsmå partiklar av titandioxid (en typisk film är 10 µm tjock och partiklarna ärungefär 20 nm stora). Titandioxiden är en n-typ halvledare vilket betyder att
73
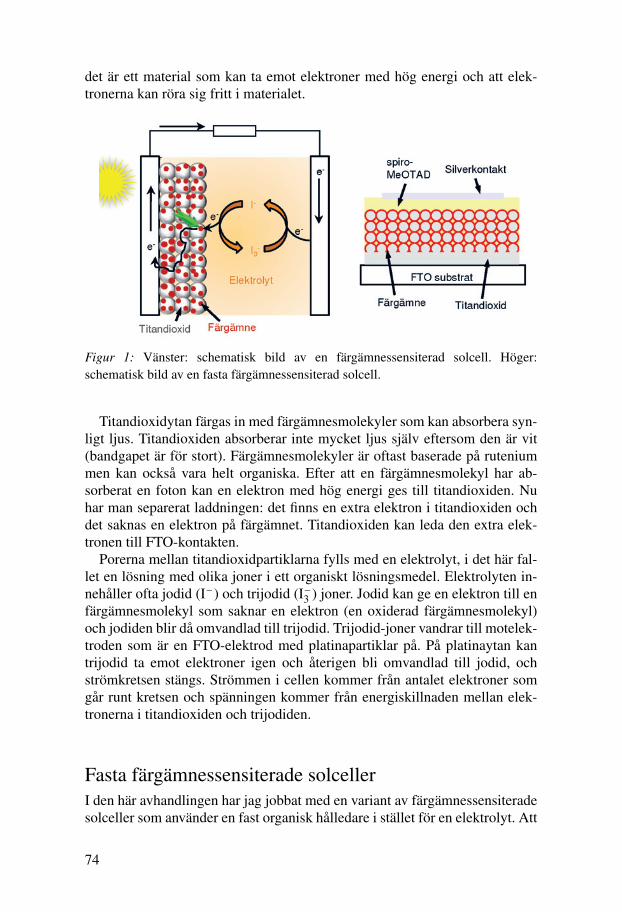
det är ett material som kan ta emot elektroner med hög energi och att elek-tronerna kan röra sig fritt i materialet.
Figur 1: Vänster: schematisk bild av en färgämnessensiterad solcell. Höger:schematisk bild av en fasta färgämnessensiterad solcell.
Titandioxidytan färgas in med färgämnesmolekyler som kan absorbera syn-ligt ljus. Titandioxiden absorberar inte mycket ljus själv eftersom den är vit(bandgapet är för stort). Färgämnesmolekyler är oftast baserade på ruteniummen kan också vara helt organiska. Efter att en färgämnesmolekyl har ab-sorberat en foton kan en elektron med hög energi ges till titandioxiden. Nuhar man separerat laddningen: det finns en extra elektron i titandioxiden ochdet saknas en elektron på färgämnet. Titandioxiden kan leda den extra elek-tronen till FTO-kontakten.
Porerna mellan titandioxidpartiklarna fylls med en elektrolyt, i det här fal-let en lösning med olika joner i ett organiskt lösningsmedel. Elektrolyten in-nehåller ofta jodid (I– ) och trijodid (I–
3 ) joner. Jodid kan ge en elektron till enfärgämnesmolekyl som saknar en elektron (en oxiderad färgämnesmolekyl)och jodiden blir då omvandlad till trijodid. Trijodid-joner vandrar till motelek-troden som är en FTO-elektrod med platinapartiklar på. På platinaytan kantrijodid ta emot elektroner igen och återigen bli omvandlad till jodid, ochströmkretsen stängs. Strömmen i cellen kommer från antalet elektroner somgår runt kretsen och spänningen kommer från energiskillnaden mellan elek-tronerna i titandioxiden och trijodiden.
Fasta färgämnessensiterade solcellerI den här avhandlingen har jag jobbat med en variant av färgämnessensiteradesolceller som använder en fast organisk hålledare i stället för en elektrolyt. Att
74
använda ett fast material i stället för en vätska kan vara bra i syfte att producerastabila solceller. Materialet som användes här heter 2,2’7,7’-tetrakis-(N,N-di-p-methoxyphenyl-amine)-9,9’-spirobifluorene (eller kortare spiro-MeOTAD)och sätts in i titandioxidens porer från ett lösningsmedel som sedan evaporerasbort och det fasta materialet stannar kvar i porerna. Ovanpå spiro-MeOTADevaporeras en silver- eller guldkontakt (figur 1).
Spiro-MeOTAD kan ge elektroner till de oxiderade färgämnesmolekylernaoch på så sätt generas positiva laddningar (hål) i spiro-MeOTAD som sedankan transporteras till silverkontakten. Fasta färgämnessensiterade solceller harvisat verkningsgrader upp till 6 % vilket är ungefär hälften av verkningsgradenhos liknande solceller med jodidelektrolyt.
Syftet med det här arbetet var att undersöka olika organiska färgämnen ochhur de fungerar i den fasta färgämnessensiterade solcellen. Ett av färgämnenavisade dålig verkningsgrad i vanliga färgämnessensiterade solceller men braverkningsgrad (runt 3 %) i solceller med spiro-MeOTAD (Paper III). Medhjälp av olika karaktäriseringsmetoder visade det sig att färgämnet fungerade ifasta solceller och inte i vanliga solceller därför att det är lättare för färgämnetatt ge elektroner till titandioxiden när det inte är i kontakt med en vätska.Samtidigt kan också spiro-MeOTAD ge elektroner mycket snabbare till detoxiderade färgämnet än vad jodid kan (Paper IV).
Photo-induced absorption spectroscopy ochStarkeffekten
En av de metoder jag använde mest för karaktärisering var photo-induced ab-sorption spectroscopy (PIA). PIA används för att undersöka om färgämnenkan ge elektroner till titandioxiden och om oxiderade färgämnesmolekyler kanfå elektroner tillbaka från jodid eller spiro-MeOTAD. I PIA mäts skillnadeni absorbtionsspektrum när färgämnesmolekyler på titandioxid har exciteratsrespektive inte. Om exciterade färgämnesmolekyler ger en elektron till titan-dioxid så blir molekylerna oxiderade och har ett annat absorbtionsspektrumän molekyler som är i grundtillstånd (figur 2a). När det även finns jodid ellerspiro-MeOTAD på provet så kan de oxiderade molekylerna få en elektron till-baka. Om det händer, så är molekyler inte längre i oxiderat tillstånd och sig-nalen av oxiderade färgämnen försvinner (figur 2a).
I det här arbetet visade det sig att man mäter en signal till i PIA som kom-mer från en Starkeffekt av färgämnesmolekyler (Paper II). Elektroner i titan-dioxid kan orsaka ett elektriskt fält som påverkar färgämnesmolekyler somär i grundtillståndet. Det här fältet orsakar ett skift i färgämnens absorptions-spektrum, ett Starkskift. Skiftet finns kvar i spektrumet även när jodid ellerspiro-MeOTAD finns i provet eftersom fältet på färgämnet är kvar (figur 2b).
75
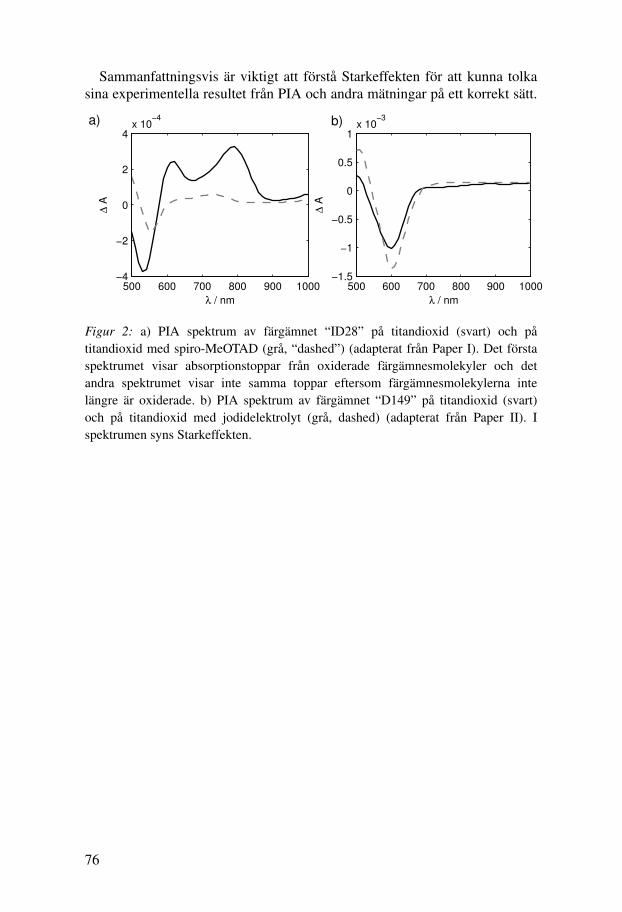
Sammanfattningsvis är viktigt att förstå Starkeffekten för att kunna tolkasina experimentella resultet från PIA och andra mätningar på ett korrekt sätt.
500 600 700 800 900 1000−4
−2
0
2
4x 10
−4
λ / nm
∆ A
500 600 700 800 900 1000−1.5
−1
−0.5
0
0.5
1x 10
−3
λ / nm
∆ A
a) b)
Figur 2: a) PIA spektrum av färgämnet “ID28” på titandioxid (svart) och påtitandioxid med spiro-MeOTAD (grå, “dashed”) (adapterat från Paper I). Det förstaspektrumet visar absorptionstoppar från oxiderade färgämnesmolekyler och detandra spektrumet visar inte samma toppar eftersom färgämnesmolekylerna intelängre är oxiderade. b) PIA spektrum av färgämnet “D149” på titandioxid (svart)och på titandioxid med jodidelektrolyt (grå, dashed) (adapterat från Paper II). Ispektrumen syns Starkeffekten.
76
Meine Doktorarbeit – ein klassisches Drama infünf Akten
Liebe Leser,ich möchte euch mit dieser Zusammenfassung zum einen mein Forschungs-gebiet etwas näher bringen und zum anderen die Entstehungsgeschichte derArtikel in dieser Arbeit beleuchten.
Die AkteureDie Farbstoffsolarzelle: Eine „fotoelektrochemische” Solarzelle, in derFarbstoffmoleküle auf der Oberfläche von einem Netzwerk aus Titandioxid-partikeln gebunden sind. Der Farbstoff absorbiert Sonnenlicht und gibt die sogewonnene Energie in Form von Elektronen an das Titandioxid weiter. DieserProzess wird Injektion genannt. Die Elektronen können durch das Netzwerkaus Titandioxid zu einem elektrischen Kontakt transportiert werden. Da daszuvor elektrische neutrale Farbstoffmoleül nun ein Elektron zu wenig besitzt,bekommt es ein neues Elektron von einem Ion, das in einem Elektrolytschwimmt, die sogenannte Regeneration. Die dadurch im Elektrolyt entste-henden, positiven Ladungsträger, sogenannte Löcher, werden im Elektrolytzu der Gegenelektrode auf der anderen Seite der Zelle transportiert. In einemexternen Stromkreis können sich Löcher und Elektronen wieder vereinigen,wodurch Strom aus der Zelle fließt. Eine Spannung entsteht, da die Elek-tronen im Titandioxid eine andere Energie als die Löcher im Elektrolyt haben.
Die feste Farbstoffsolarzelle: Eine Variante der Farbstoffsolar-zelle, in welcher das flüssige Elektrolyt durch einen Feststoff ersetzt wurde,einem sogenannten organischen Lochleiter. Dieser besteht, wie sein Nameandeutet, aus einem organischen Molekül und wird spiro-MeOTAD genannt.Der organische Lochleiter kann, wie sonst die Ionen im Elektrolyt, einElektron an einen Farbstoff abgeben. Das entstehende Loch kann dann vonMolekül zu Molekül „hüpfen” bis es den Gegenkontakt erreicht - in diesemFall eine Silberelektrode. Allerdings besteht auch die Möglichkeit, dass dieLöcher zurück zu der Oberfläche eines Titandioxidpartikels transportiertwerden und dort ein Elektron finden mit dem sie dann rekombinieren.Dieser Prozess ist natürlich in der Solarzelle nicht erwünscht. Ein anderesProblem der Feststoffzelle ist, dass die spiro-MeOTAD Moleküle unter
77
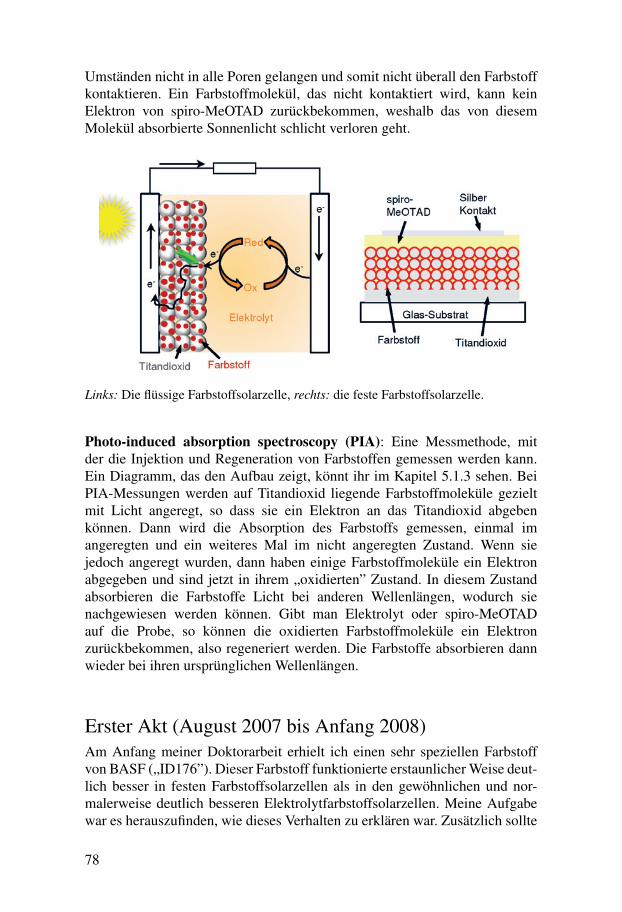
Umständen nicht in alle Poren gelangen und somit nicht überall den Farbstoffkontaktieren. Ein Farbstoffmolekül, das nicht kontaktiert wird, kann keinElektron von spiro-MeOTAD zurückbekommen, weshalb das von diesemMolekül absorbierte Sonnenlicht schlicht verloren geht.
Links: Die flüssige Farbstoffsolarzelle, rechts: die feste Farbstoffsolarzelle.
Photo-induced absorption spectroscopy (PIA): Eine Messmethode, mitder die Injektion und Regeneration von Farbstoffen gemessen werden kann.Ein Diagramm, das den Aufbau zeigt, könnt ihr im Kapitel 5.1.3 sehen. BeiPIA-Messungen werden auf Titandioxid liegende Farbstoffmoleküle gezieltmit Licht angeregt, so dass sie ein Elektron an das Titandioxid abgebenkönnen. Dann wird die Absorption des Farbstoffs gemessen, einmal imangeregten und ein weiteres Mal im nicht angeregten Zustand. Wenn siejedoch angeregt wurden, dann haben einige Farbstoffmoleküle ein Elektronabgegeben und sind jetzt in ihrem „oxidierten” Zustand. In diesem Zustandabsorbieren die Farbstoffe Licht bei anderen Wellenlängen, wodurch sienachgewiesen werden können. Gibt man Elektrolyt oder spiro-MeOTADauf die Probe, so können die oxidierten Farbstoffmoleküle ein Elektronzurückbekommen, also regeneriert werden. Die Farbstoffe absorbieren dannwieder bei ihren ursprünglichen Wellenlängen.
Erster Akt (August 2007 bis Anfang 2008)Am Anfang meiner Doktorarbeit erhielt ich einen sehr speziellen Farbstoffvon BASF („ID176”). Dieser Farbstoff funktionierte erstaunlicher Weise deut-lich besser in festen Farbstoffsolarzellen als in den gewöhnlichen und nor-malerweise deutlich besseren Elektrolytfarbstoffsolarzellen. Meine Aufgabewar es herauszufinden, wie dieses Verhalten zu erklären war. Zusätzlich sollte
78
ich auch studieren, ob spiro-MeOTAD die Poren des Titandioxides füllenkonnte. Ich begann mit PIA-Messungen, die zeigten, dass für den Farbstoffauf der Titandioxidoberfläche das Signal sehr klein war. Ich schlussfolgertedaraus, dass der Farbstoff kein Elektron an das Titandioxid abgeben konnte.Doch mit spiro-MeOTAD zusammen konnte ich ein grosses Signal messen,welches auf irgendeine Weise mit dem Farbstoff zusammenhängen musste.Dieses Ergebnis war ich für mich als neue Doktorandin nicht zu erklären undso ließ ich dieses Projekt zunächst ruhen und studierte stattdessen das Poren-füllen von spiro-MeOTAD.
Zweiter Akt (Anfang 2008 bis Anfang 2009)Mein nächstes Projekt war, PIA-Messungen mit einen „normalen” Farbstoffdurchzuführen, um zu testen, ob man mit dieser Methode das Füllen der Porenim Titandioxidnetzwerk studieren kann. Hierzu verwendete ich einen anderenFarbstoff von BASF, genannt ID28. Doch auch in diesem Projekt gab es, wiein der Forschung üblich, unvorhergesehene Schwierigkeiten. Wenn ich spiro-MeOTAD oder Elektrolyt zu meinen Proben gab, verschwand zwar das nundeutliche Signal des oxidierten Farbstoffs, doch auch in diesen Messungen sahich ein merkwürdiges, vom Farbstoff stammendes Signal. Schließlich kam ichauf eine Erklärung meiner Beobachtungen: Elektronen im Titandioxid beein-flussen den Farbstoff, so dass sich der Wellenlängenbereich verschiebt, in demder Farbstoff Licht absorbiert. Mit dieser Erklärung konnte ich nun das Poren-füllen studieren und fand heraus, dass zumindest das Kontaktieren von ID28eigentlich kein Problem ist. Dieses Resultat veröffentlichte ich in Paper I.
Dritter Akt (Anfang 2009 bis August 2009)Nachdem ich das vorherige Projekt abgeschlossen hatte, begann ich michwieder dem Farbstoff ID176 zu widmen. Zum einen entschieden wir unsnun dazu, die Solarzellenergebnisse von ID176 schon einmal vorab zupublizieren (Paper III). Zum anderen beschlossen wir auch, dass wir nochzusätzliche, zeitaufgelöste Messungen brauchen würden, um „ID176 zuverstehen”, welche Dr. Amanda Smeigh für mich durchführte. Und dannsaß ich im August 2009 wieder vor einem jetzt noch größeren Berg Daten,die ich nicht verstand. Die Ergebnisse von Amanda zeigten dasselbe Signal,das ich auch zwei Jahre zuvor schon nicht erklären konnte. Die Theorie mitden Elektronen im Titandioxid passte nicht wirklich und es erschien mir fastso, als ob es keine logische Erklärung für meine Daten gäbe.
79
Vierter Akt (September 2009 bis Frühling 2010)Mitte September fuhr ich zu einer Konferenz in England. Kurz vormeiner Abreise hatte ich ein Gespräch mit meinem wissenschaftlichenBetreuer, Dr. Gerrit Boschloo, der mir sagte: „Vielleicht könnten deineDaten auch mit dem Stark-Effekt zusammenhängen.” Nach der Konferenzbesuchte ich Dr. Henry Snaith in Oxford, um mit ihm meine Ergebnissezu diskutieren. Er hatte folgenden Rat für mich: „Vielleicht hängen deine(und meine) Ergebnisse wirklich mit Elektroabsorption zusammen. Dassolltest du wirklich versuchen zu beweisen!” Der Stark-Effekt wird auchElektroabsorption genannt und bedeutet, dass sich die Absorption von einemFarbstoff verändert, wenn sich dieser in einem elektrischen Feld befindet.Elektronen im Titandioxid könnten ein elektrisches Feld verursachen,welches diesen Effekt in Farbstoffen hervorruft. Somit könnte dieser Effekttatsächlich meine Ergebnisse erklären. Also machte ich mich, nachdem ichaus England zurück war, an die Arbeit, eine Methode zu finden, um denStark-Effekt zu messen. Zunächst bastelte ich Proben nach Gerrits Konzept,später nach meinem eigenen. Nach einer Woche, Freitag Abend um siebenUhr hatte ich das erste Messergebnis: Ich konnte den Stark-Effekt messen!Die Probe fiel dann zwar nach der Messung auseinander, aber das störte michin diesem Moment nicht sehr. In den nächsten Wochen verbesserte ich meineProbenbauweise und weitete die Messung auf verschiedene Farbstoffe aus.Und auf einmal passte alles zusammen: Die PIA-Messungen passten zu denStark-Effekt Messungen, die Ergebnisse passten zur Theorie. Anfang 2010schrieb ich dann den Artikel zu diesen Ergebnissen (Paper II).
Fünfter Akt (Frühling 2010 bis Ende 2010)Eines war aber nun doch noch offen: „ID176 zu verstehen”. Dies war nunmöglich, denn wenn wir den Stark-Effekt in Betracht zogen, konnten wirunsere vorherigen Messergebnisse erklären. Ich wiederholte einen Teilmeiner alten Messungen und ergänzte diese noch mit neuen Messungen.Danach verbrachte ich Zeit damit, Daten zu analysieren, Ergebnisse zudiskutieren und einen Artikel zu den Ergebnissen zu schreiben (Paper IV).Es hatte sich herausgestellt, dass die Erklärung dieses Systems komplizierterwar, als drei Jahre zuvor erwartet, und einige Fragen bleiben auch weiterhinoffen. Doch zumindest wissen wir nun soviel über ID176: Wenn der Farbstoffvon Flüssigkeit umgeben ist, kann er fast keine Elektronen an das Titandioxidabgeben. Außerdem ist die Regeneration des Farbstoffes mit spiro-MeOTADdeutlich schneller als mit dem flüssigen Elektrolyt, wodurch die festeFarbstoffsolarzelle besser funktioniert als die Farbstoffsolarzelle mit demflüssigen Elektrolyt.
80

Acknowledgments
I would like to thank Anders Hagfeldt, “the Boss”, for accepting me as aPhD student, for providing everyone in your group with great working con-ditions and for (when you’re around) being positive and excited about every-thing. Thanks to Gerrit Boschloo for answering my millions of questions, fordiscussing my results with me and for building and maintaining the measure-ment set-ups which I used.
I would also like to thank the following people: Erik Johansson for goodcollaborations and scientific discussions. Martin Karlsson for sharing anoffice and the “fate” of being a BASF-sponsored PhD student with me.Stefan Plogmaker for good collaborations and a very good friendshipthroughout the last years. The “XPS people” for introducing me to the worldof photoelectron spectroscopy. Amanda Smeigh for measuring my sampleswith a femtosecond laser. Henry Snaith for taking a day to discuss myID176 results with me and for suggesting to measure the Stark effect. TanniaMarinado, Eva Unger and Leif Häggman for teaching me about DSC-makingand “life in the Anders Hagfeldt group” at the beginning of my PhD studies.The other past and present members of our research group and of the CMD.Special thanks to Libby Gibson, “my post-doc”, for all your advice and thefun at conferences.
I would like to thank Erik, Susanna Kaufmann, Tomas Edvinsson and theCappel-Porters for proof-reading parts of this thesis.
My thesis work was funded by BASF as part of a BMBF (Bundes-ministerium für Bildung und Forschung) project on organic photovoltaics. Iwould like to thank BASF and BMBF for funding but also thank the peopleI worked with at BASF: Felix Eickemeyer, Neil Pschirer, Peter Erk, JanSchöneboom, Ingmar Bruder, Anke Handreck and Alfred Kuhn.
I’d like to thank my friends of the “Friday beer club” for the perfect wayto spend a Friday evening after a working week: with food, beer and fundiscussions at the Uppsala student nations. Thanks to Martin Amft for beingthe voice of logic. Thanks to Else, Julia, Martin, and Halina for supplyingme with food, tea and coffee. Thanks to my fellow kayakers from UppsalaPaddlarklubb for good times on and off the water and for teaching meSwedish.
Finally, I would like to thank my parents, Bernd and Elisabeth, for all yoursupport and advice, even when I had the crazy idea to move to a “cold anddark country” – without you this would not have been possible!
81

References
[1] Schiermeier, Q.; Tollefson, J.; Scully, T.; Witze, A.; Morton, O. Nature2008, 454, 816–823.
[2] REN21, Renewables 2010 Global Status Report.,http://www.ren21.net/, 2010.
[3] Nozik, A. J.; Miller, J. Chem. Rev. 2010, 110, 6443–6445.
[4] Grätzel, M. J. Photochem. Photobiol., A 2004, 164, 3–14.
[5] Peter, L. M. J. Phys. Chem. C 2007, 111, 6601–6612.
[6] Hagfeldt, A.; Boschloo, G.; Sun, L.; Kloo, L.; Pettersson, H. Chem.Rev. 2010, 110, 6595–6663.
[7] O’Regan, B.; Grätzel, M. Nature 1991, 353, 737–740.
[8] Chiba, Y.; Islam, A.; Watanabe, Y.; Komiya, R.; Koide, N.; Han, L. Jpn.J. Appl. Phys., Part 2 2006, 45, L638–L640.
[9] Yu, Q.; Wang, Y.; Yi, Z.; Zu, N.; Zhang, J.; Zhang, M.; Wang, P. ACSNano 2010, 4, 6032–6038.
[10] Green, M. A.; Emery, K.; Hishikawa, Y.; Warta, W. Prog. Photovolt:Res. Appl. 2011, 19, 84–92.
[11] Fisher, A. C.; Peter, L. M.; Ponomarev, E. A.; Walker, A. B.; Wijayan-tha, K. G. U. J. Phys. Chem. B 2000, 104, 949–958.
[12] Bach, U.; Lupo, D.; Comte, P.; Moser, J. E.; Weissörtel, F.; Salbeck, J.;Spreitzer, H.; Grätzel, M. Nature 1998, 395, 583–585.
[13] Yum, J. H.; Chen, P.; Grätzel, M.; Nazeeruddin, M. K. Chemsuschem2008, 1, 699–707.
[14] Wang, M.; Liu, J.; Cevey-Ha, N.-L.; Moon, S.-J.; Liska, P.; Humphry-Baker, R.; Moser, J.-E.; Grätzel, C.; Wang, P.; Zakeeruddin, S. M.;Grätzel, M. Nano Today 2010, 5, 169–174.
[15] Cai, N.; Moon, S.-J.; Cevey-Ha, L.; Moehl, T.; Humphry-Baker, R.;Wang, P.; Zakeeruddin, S. M.; Grätzel, M. Nano Lett. 2011, Doi:10.1021/nl104034e.
[16] Zakeeruddin, S. M.; Grätzel, M. Adv. Funct. Mater. 2009, 19, 2187–2202.
83
[17] Nogueira, A. F.; Durrant, J. R.; De Paoli, M. A. Adv.Mater. 2001, 13,826–830.
[18] Tennakone, K.; Kumara, G.; Kumarasinghe, A.; Wijayantha, K.; Siri-manne, P. Semicond. Sci. Technol. 1995, 10, 1689–1693.
[19] Meng, Q.-B.; Takahashi, K.; Zhang, X.-T.; Sutanto, I.; Rao, T. N.;Sato, O.; Fujishima, A.; Watanabe, H.; Nakamori, T.; Uragami, M.Langmuir 2003, 19, 3572–3574.
[20] Schmidt-Mende, L.; Grätzel, M. Thin Solid Films 2006, 500, 296–301.
[21] Kroeze, J. E.; Hirata, N.; Schmidt-Mende, L.; Orizu, C.; Ogier, S. D.;Carr, K.; Grätzel, M.; Durrant, J. R. Adv. Funct. Mater. 2006, 16, 1832–1838.
[22] Liu, X.; Zhang, W.; Uchida, S.; Cai, L.; Liu, B.; Ramakrishna, S. Adv.Mater. 2010, 22, E150–E155.
[23] Peng, B.; Jungmann, G.; Jäger, C.; Haarer, D.; Schmidt, H.-W.; The-lakkat, M. Coord. Chem. Rev. 2004, 248, 1479–1489.
[24] Krüger, J.; Plass, R.; Cevey, L.; Piccirelli, M.; Grätzel, M.; Bach, U.Appl. Phys. Lett. 2001, 79, 2085–2087.
[25] Snaith, H. J.; Grätzel, M. Appl. Phys. Lett. 2006, 89, 262114.
[26] Snaith, H. J.; Grätzel, M. Adv. Mater. 2007, 19, 3643–3647.
[27] Boschloo, G.; Häggman, L.; Hagfeldt, A. J. Phys. Chem. B 2006, 110,13144–13150.
[28] Snaith, H. J.; Moule, A. J.; Klein, C.; Meerholz, K.; Friend, R. H.;Grätzel, M. Nano Lett. 2007, 7, 3372–3376.
[29] Snaith, H. J.; Petrozza, A.; Ito, S.; Miura, H.; Grätzel, M. Adv. Funct.Mater. 2009, 19, 1810–1818.
[30] Karlsson, M.; Rensmo, H.; Boschloo, G.; Hagfeldt, A. Effects of oxygenin solid-state dye sensitized solar cells, submitted, 2011.
[31] Bach, U.; Tachibana, Y.; Moser, J.-E.; Haque, S. A.; Durrant, J. R.;Grätzel, M.; Klug, D. R. J. Am. Chem. Soc. 1999, 121, 7445–7446.
[32] Boschloo, G.; Hagfeldt, A. Acc. Chem. Res. 2009, 42, 1819–1826.
[33] Krüger, J.; Plass, R.; Grätzel, M.; Cameron, P. J.; Peter, L. M. J. Phys.Chem. B 2003, 107, 7536–7539.
[34] Fabregat-Santiago, F.; Bisquert, J.; Cevey, L.; Chen, P.; Wang, M. K.;Zakeeruddin, S. M.; Grätzel, M. J. Am. Chem. Soc. 2009, 131, 558–562.
[35] Bach, U. Ph.D. thesis, EPFL, 2000.
84
[36] Schmidt-Mende, L.; Bach, U.; Humphry-Baker, R.; Horiuchi, T.;Miura, H.; Ito, S.; Uchida, S.; Grätzel, M. Adv. Mater. 2005, 17, 813–815.
[37] Wang, M.; Xu, M.; Shi, D.; Li, R.; Gao, F.; Zhang, G.; Yi, Z.; Humphry-Baker, R.; Wang, P.; Zakeeruddin, S. M.; Grätzel, M. Adv. Mater. 2008,20, 4460–4463.
[38] Yum, J. H.; Hagberg, D. P.; Moon, S. J.; Karlsson, K. M.; Marinado, T.;Sun, L. C.; Hagfeldt, A.; Nazeeruddin, M. K.; Grätzel, M. Angew.Chem., Int. Ed. 2009, 48, 1576–1580.
[39] Snaith, H. J.; Humphry-Baker, R.; Chen, P.; Cesar, I.; Zakeerud-din, S. M.; Grätzel, M. Nanotechnology 2008, 19, 424003.
[40] Ding, I. K.; Tetreault, N.; Brillet, J.; Hardin, B. E.; Smith, E. H.; Rosen-thal, S. J.; Sauvage, F.; Grätzel, M.; McGehee, M. D. Adv. Funct. Mater.2009, 19, 2431–2436.
[41] Jennings, J. R.; Peter, L. M. J. Phys. Chem. C 2007, 111, 16100–16104.
[42] Wang, M.; Grätzel, C.; Moon, S.-J.; Humphry-Baker, R.; Rossier-Iten, N.; Zakeeruddin, S. M.; Grätzel, M. Adv. Funct. Mater. 2009, 19,2163–2172.
[43] Li, T. C.; Goes, M. S.; Fabregat-Santiago, F.; Bisquert, J.; Bueno, P. R.;Prasittichai, C.; Hupp, J. T.; Marks, T. J. J. Phys. Chem. C 2009, 113,18385–18390.
[44] Snaith, H. J.; Ducati, C. Nano Lett. 2010, 10, 1259–1265.
[45] Mishra, A.; Fischer, M. K. R.; Bäuerle, P. Angew. Chem., Int. Ed. 2009,48, 2474–2499.
[46] Nazeeruddin, M. K.; Kay, A.; Rodicio, I.; Humphry-Baker, R.;Müller, E.; Liska, P.; Vlachopoulos, N.; Grätzel, M. J. Am. Chem. Soc.1993, 115, 6382–6390.
[47] Zeng, W.; Cao, Y.; Bai, Y.; Wang, Y.; Shi, Y.; Zhang, M.; Wang, F.;Pan, C.; Wang, P. Chem. Mater. 2010, 22, 1915–1925.
[48] Ooyama, Y.; Harima, Y. Eur. J. Org. Chem. 2009, 2009, 2903–2934.
[49] He, J. J.; Lindstrom, H.; Hagfeldt, A.; Lindquist, S. E. J. Phys. Chem.B 1999, 103, 8940–8943.
[50] Qin, P.; Zhu, H. J.; Edvinsson, T.; Boschloo, G.; Hagfeldt, A.;Sun, L. C. J. Am. Chem. Soc. 2008, 130, 8570–8571.
[51] Hagberg, D. Ph.D. thesis, KTH, 2009.
[52] Marinado, T. Ph.D. thesis, KTH, 2009.
85
[53] Horiuchi, T.; Miura, H.; Sumioka, K.; Uchida, S. J. Am. Chem. Soc.2004, 126, 12218–12219.
[54] Ito, S.; Zakeeruddin, S. M.; Humphry-Baker, R.; Liska, P.; Charvet, R.;Comte, P.; Nazeeruddin, M. K.; Pechy, P.; Takata, M.; Miura, H.;Uchida, S.; Grätzel, M. Adv. Mater. 2006, 18, 1202–1205.
[55] http://avogadro.openmolecules.net/wiki/Main_Page.
[56] Hagberg, D. P.; Jiang, X.; Gabrielsson, E.; Linder, M.; Marinado, T.;Brinck, T.; Hagfeldt, A.; Sun, L. C. J. Mater. Chem. 2009, 19, 7232–7238.
[57] Jiang, X.; Marinado, T.; Gabrielsson, E.; Hagberg, D. P.; Sun, L. C.;Hagfeldt, A. J. Phys. Chem. C 2010, 114, 2799–2805.
[58] Chen, P.; Yum, J. H.; Angelis, F. D.; Mosconi, E.; Fantacci, S.;Moon, S.-J.; Baker, R. H.; Ko, J.; Nazeeruddin, M. K.; Grätzel, M.Nano Lett. 2009, 9, 2487–2492.
[59] Herrmann, A.; Müllen, K. Chem. Lett. 2006, 35, 978–985.
[60] Li, C.; Liu, M.; Pschirer, N. G.; Baumgarten, M.; Müllen, K. Chem.Rev. 2010, 110, 6817–6855.
[61] Edvinsson, T.; Pschirer, N.; Schöneboom, J.; Eickemeyer, F.;Boschloo, G.; Hagfeldt, A. Chem. Phys. 2009, 357, 124–131.
[62] Ferrere, S.; Gregg, B. A. New J. Chem. 2002, 26, 1155–1160.
[63] Edvinsson, T.; Li, C.; Pschirer, N.; Schöneboom, J.; Eickemeyer, F.;Sens, R.; Boschloo, G.; Herrmann, A.; Müllen, K.; Hagfeldt, A. J. Phys.Chem. C 2007, 111, 15137–15140.
[64] Li, C.; Yum, J.-H.; Moon, S.-J.; Herrmann, A.; Eickemeyer, F.;Pschirer, N. G.; Erk, P.; Schöneboom, J.; Müllen, K.; Grätzel, M.;Nazeeruddin, M. K. ChemSusChem 2008, 1, 615–618.
[65] Memming, R. Semiconductor Electrochemistry; Wiley-v C H VerlagGmbh, 2001.
[66] Watson, D. F.; Meyer, G. J. Coord. Chem. Rev. 2004, 248, 1391–1406.
[67] Redmond, G.; Fitzmaurice, D. J. Phys. Chem. 1993, 97, 1426–1430.
[68] Boschloo, G.; Fitzmaurice, D. J. Phys. Chem. B 1999, 103, 7860–7868.
[69] Peter, L. M. Phys. Chem. Chem. Phys. 2007, 9, 2630–2642.
[70] Ardo, S.; Meyer, G. J. Chem. Soc. Rev. 2009, 38, 115–164.
[71] Zaban, A.; Ferrere, S.; Sprague, J.; Gregg, B. A. J. Phys. Chem. B 1997,101, 55–57.
86

[72] Zaban, A.; Ferrere, S.; Gregg, B. A. J. Phys. Chem. B 1998, 102, 452–460.
[73] Ardo, S.; Sun, Y.; Staniszewski, A.; Castellano, F. N.; Meyer, G. J. J.Am. Chem. Soc. 2010, 132, 6696–6709.
[74] Stark, J. Nature 1914, 92, 401–401.
[75] Leone, M.; Paoletti, A.; Robotti, N. Phys. Perspect. 2004, 6, 271–294.
[76] Bublitz, G. U.; Boxer, S. G. Annu. Rev. Phys. Chem. 1997, 48, 213–242.
[77] Hagberg, D. P.; Yum, J. H.; Lee, H.; De Angelis, F.; Marinado, T.;Karlsson, K. M.; Humphry-Baker, R.; Sun, L. C.; Hagfeldt, A.;Grätzel, M.; Nazeeruddin, M. K. J. Am. Chem. Soc. 2008, 130, 6259–6266.
[78] Geiger, T.; Kuster, S.; Yum, J.-H.; Moon, S.-J.; Nazeeruddin, M. K.;Grätzel, M.; Nuesch, F. Adv. Funct. Mater. 2009, 19, 2720–2727.
[79] Kay, A.; Humphry-Baker, R.; Grätzel, M. J. Phys. Chem. 1994, 98,952–959.
[80] Fabregat-Santiago, F.; Mora-Sero, I.; Garcia-Belmonte, G.; Bisquert, J.J. Phys. Chem. B 2003, 107, 758–768.
[81] Bisquert, J.; Fabregat-Santiago, F.; Mora-Sero, I.; Garcia-Belmonte, G.; Barea, E. M.; Palomares, E. Inorg. Chim. Acta2008, 361, 684–698.
[82] Pavlishchuk, V. V.; Addison, A. W. Inorg. Chim. Acta 2000, 298, 97–102.
[83] Bard, A. J.; Faulkner, L. R. Electrochemical Methods: Fundamentalsand Applications; John Wiley & Sons, Inc., 2001.
[84] O’Regan, B.; Moser, J.; Anderson, M.; Grätzel, M. J. Phys. Chem.1990, 94, 8720–8726.
[85] Eichberger, R.; Willig, F. Chem. Phys. 1990, 141, 159–173.
[86] Tachibana, Y.; Moser, J. E.; Grätzel, M.; Klug, D. R.; Durrant, J. R. J.Phys. Chem. 1996, 100, 20056–20062.
[87] Kallioinen, J.; Benkö, G.; Sundström, V.; Korppi-Tommola, J. E. I.;Yartsev, A. P. J. Phys. Chem. B 2002, 106, 4396–4404.
[88] Wenger, B.; Grätzel, M.; Moser, J.-E. J. Am. Chem. Soc. 2005, 127,12150–12151.
[89] Koops, S. E.; Barnes, P. R. F.; O’Regan, B. C.; Durrant, J. R. J. Phys.Chem. C 2010, 114, 8054–8061.
[90] Boschloo, G.; Hagfeldt, A. Chem. Phys. Lett. 2003, 370, 381–386.
87
[91] Boschloo, G.; Hagfeldt, A. Inorg. Chim. Acta 2008, 361, 729–734.
[92] Haque, S. A.; Tachibana, Y.; Klug, D. R.; Durrant, J. R. J. Phys. Chem.B 1998, 102, 1745–1749.
[93] Kelly, C. A.; Farzad, F.; Thompson, D. W.; Stipkala, J. M.; Meyer, G. J.Langmuir 1999, 15, 7047–7054.
[94] Boxer, S. G. J. Phys. Chem. B 2009, 113, 2972–2983.
[95] Bücher, H.; Wiegand, J.; Snavely, B. B.; Beck, K. H.; Kuhn, H. Chem.Phys. Lett. 1969, 3, 508–511.
[96] Ohta, N.; Okazaki, S.; Yamazaki, I. Chem. Phys. Lett. 1994, 229, 394–400.
[97] Johansson, E. Ph.D. thesis, Uppsala Universitet, 2006.
[98] Hahlin, M. Ph.D. thesis, Uppsala Universitet, 2010.
[99] Barnes, P. R. F.; Anderson, A. Y.; Koops, S. E.; Durrant, J. R.;O’Regan, B. C. J. Phys. Chem. C 2009, 113, 1126–1136.
[100] Barnes, P. R. F.; Liu, L.; Li, X.; Anderson, A. Y.; Kisserwan, H.; Ghad-dar, T. H.; Durrant, J. R.; O’Regan, B. C. Nano Lett. 2009, 9, 3532–3538.
[101] O’Regan, B. C.; Durrant, J. R. Acc. Chem. Res. 2009, 42, 1799–1808.
[102] Villanueva-Cab, J.; Wang, H.; Oskam, G.; Peter, L. M. J. Phys. Chem.Lett. 2010, 1, 748–751.
[103] Jennings, J. R.; Li, F.; Wang, Q. J. Phys. Chem. C 2010, 114, 14665–14674.
[104] Nguyen, T. T. O.; Peter, L. M.; Wang, H. J. Phys. Chem. C 2009, 113,8532–8536.
[105] O’Regan, B. C.; Scully, S.; Mayer, A. C.; Palomares, E.; Durrant, J. J.Phys. Chem. B 2005, 109, 4616–4623.
[106] Duffy, N. W.; Peter, L. M.; Rajapakse, R. M. G.; Wijayantha, K. G. U.Electrochem. Commun. 2000, 2, 658–662.
[107] Boschloo, G.; Hagfeldt, A. J. Phys. Chem. B 2005, 109, 12093–12098.
[108] Dung, D.; Ramsden, J.; Grätzel, M. J. Am. Chem. Soc. 1982, 104, 2977–2985.
[109] Rothenberger, G.; Fitzmaurice, D.; Grätzel, M. J. Phys. Chem. 1992,96, 5983–5986.
[110] Sandell, A.; Sanyal, B.; Walle, L. E.; Richter, J. H.; Plogmaker, S.;Karlsson, P. G.; Borg, A.; Uvdal, P. Phys. Rev. B 2008, 78, 075113.
88
[111] Westermark, K.; Henningsson, A.; Rensmo, H.; Södergren, S.; Sieg-bahn, H.; Hagfeldt, A. Chem. Phys. 2002, 285, 157–165.
[112] Pelet, S.; Moser, J.-E.; Grätzel, M. J. Phys. Chem. B 2000, 104, 1791–1795.
[113] Huang, D. M.; Snaith, H. J.; Grätzel, M.; Meerholz, K.; Moule, A. J. J.Appl. Phys. 2009, 106, 073112.
[114] Feldt, S. M.; Gibson, E. A.; Gabrielsson, E.; Sun, L.; Boschloo, G.;Hagfeldt, A. J. Am. Chem. Soc. 2010, 132, 16714–16724.
[115] Daeneke, T.; Kwon, T.-H.; Holmes, A. B.; Duffy, N. W.; Bach, U.; Spic-cia, L. Nature Chem. 2011, 3, 213–217.
[116] Mor, G. K.; Kim, S.; Paulose, M.; Varghese, O. K.; Shankar, K.;Basham, J.; Grimes, C. A. Nano Lett. 2009, 9, 4250–4257.
[117] Unger, E. L.; Ripaud, E.; Leriche, P.; Cravino, A.; Roncali, J.; Johans-son, E. M. J.; Hagfeldt, A.; Boschloo, G. J. Phys. Chem. C 2010, 114,11659–11664.
89