Embed Size (px)
Citation preview
Thermochemical characterisation of the gas circulation
in the relevant cement industry processes
Doctoral Thesis
To be awarded the degree
Doctor rerum naturalium (Dr. rer. nat.)
submitted by
Kamila Anna Armatys
from Wrocław, Poland
approved by the Faculty of Natural and Material Science
Clausthal University of Technology
Date of oral examination
7 October
Gedruckt mit Unterstützung des Deutschen Akademischen Austauschdienst
The work was written in the Institute for Nonmetallic Materials, Clausthal University of Technology.
Chairperson of the board of examiners: Prof. Dr.-Ing. habil. Joachim Deubener
Chief reviewer: Prof. Dr. rer. nat. Albrecht Wolter
Reviewer: Prof. Dr.-Ing. habil. Mirosław Miller

Acknowledgements
In completing this piece of research I would like to acknowledge the kind assistance of the following
people:
Prof. Dr. A. Wolter, TU Clausthal, Institute for Non- metallic Materials for suggesting the subject,
supervising this work and valuable suggestions,
Prof. Dr. M. Miller, TU Wrocław, EIT+ Research Center for supervising the work, many years of
patience, suggestions, invaluable discussions, infinite encouragement, guidance, and support,
Dipl. Chem. D. Kobertz, FZ Juelich, for introducing me into the complicated KEMS world, many
discussions, helpful suggestions and a lot of patience,
Dr. L. Bencze for the help by the thermodynamic calculations and a lot of discussions and
suggestions,
Dr. A. Matraszek for many suggestions, patience and supporting me at that time,
Dipl. Ing. Seelbach for technical support,
All colleagues in the Institute for Non Metallic Materials, especially Mr. Zellmann for XRF/XRD
analyses, Mrs. Luer and Mr. Rust for chemical analyses, A. Blasig for years of support by KEMS,
J.P. Fouda, Ch. Ott, Ch. Mehling, T. Bohne, Mrs. Behfeld, Mr. Putzig and Mr. Holly, Mrs. Bringe-
Schubert, and Mr. Schaaf,
DAAD (Scholarschip No. A0878364) and Klaus-Dyckerhoff Stiftung for the financial support,
further support came from Forschungsinstitute der Zementindustrie in Düsseldorf (i.e. materials for
Knudsen cells)
My family and friends for a lot of support and patience.
Table of content
Table of content
INTRODUCTION
1. Fundamentals 6
1.1 Manufacture of cement clinker 7
1.2 Material cycle 9
2. Knudsen effusion mass spectrometry 13
2.1 Principle of the method 14
2.2 Hardware aspects 16
2.3 Partial pressures 18
2.3.1. Calibration procedure 20
2.4 Thermodynamic properties of the condensed phase 21
2.5 Congruent effusion 24
3. The aims of the work 26
EXPERIMENTAL SECTION
4. Investigation methods, apparatus 27
4.1. KEMS 27
4.1.1Calibration of the mass spectrometer 29
4.2 Additional methods 31
4.2.1. XRD 31
4.2.2. XRF 31
5. Alkali sulphates 32
5. 1.Fundamentals 32
5.2. Vaporisation of Na2SO4 35
5.3. Vaporisation of K2SO4 40
5.4. Vaporisation of CaSO4 47
Table of content
5.5. System Na2SO4 – CaSO4 50
5.5.1. Thermodynamic activities for the system Na2SO4 – CaSO4 52
5.6. System K2SO4-CaSO4 55
5.6.1. Thermodynamic activities for the system K2SO4-CaSO4 57
5.7. System Na2SO4-K2SO4 61
5.8. Discussion 66
6. Industrial samples 70
6.1. The fundamentals of the experiment 70
6.2 Characterization of the industrial materials 73
6.2.1 Humidity and volatile matter 73
6.2.2. XRF Results 74
6.2.2.1 The degree of sulphatisation 76
6.2.3. XRD Results 78
6.3 Analysis of the vaporisation of industrial samples by KEMS 80
6.3.1. The investigation procedure 80
6.3.2 The assignment of the ions to the neutral precursors 82
6.3.3. The comparison of the materials vaporisation 84
6.3.3.1. Materials from different part of the kiln 85
6.3.3.2. Materials from different cement plants 98
6.3.4. Lead vaporisation 106
6.3.5. Mixed and polymeric species 109
6.4. Discussion 111
7. Outlook 117
8. Conclusions 120
9. References 122
1. Fundamentals
6
INTRODUCTION
1. Fundamentals
The present investigations were undertaken due to the serious industry problems with obtaining
cement clinker. Raw materials and fuels used for clinker production contain significant amounts of
sulphates, chlorides, alkali, alkali earth compounds as well as heavy metal compounds. These
substances can react under technological conditions, giving volatile species that vaporize completely
and subsequently condense in colder reactor parts. Simultaneously, raw materials flow continuously
introduced into reactor causes secondary steering of volatile species to the high temperature reactor
area. During that process, the evaporation/condensation cycle of volatile species produced in the
technological regime takes place, leading to unsteady kiln operation, increased refractory
consumption and clinker quality, clogging and finally the necessity of production breaks aimed in
reactor cleaning from substances deposed at its walls. In investigating the mechanism of such
processes of particular importance are the vapour pressure investigation and determination of the
thermodynamic properties. The typical methods used in cement chemistry for the investigation of the
alkali circulation and clogging phenomenon are x-ray diffraction, x-ray fluorescence, SEM, and other
analytical methods describing mostly the condensed phase, along with the modelling of chemical
reactions of the alkalis in the cement kiln. The mechanism of vaporisation of the gaseous species in
the cement kiln has not been investigated directly so far. A very versatile method of analysis of high-
temperature vapours and such complex processes should be therefore the Knudsen effusion mass
spectrometry (KEMS) that enables the identification of the gaseous species and determination of their
partial pressures as well as thermochemical characteristics of chemical processes going on in the
cement kiln. The present study widely implemented KEMS for studying the cement – clinker
processes following investigations completed in the research group of Prof. Albrecht Wolter (Institut
fur Nichtmetallische Werkstoffe TU Clausthal) by Graciela Eguia [1].
1. Fundamentals
7
1.1 Manufacture of cement clinker
The clinker used for cement production is produced by using the most readily available and cheapest
raw materials. It is composed of different oxides that are typically 67% CaO, 22% SiO2, 5% Al2O3,
and 3% Fe2O3. The remaining 3% are other oxides and nonoxide components. It is common in
cement chemistry to use an abbreviation for the formulae of the commoner oxides as single letters,
according to table 1.1.The chemical formula can be written further as a sum of particular oxides,
which indicates that the constituent oxides have no separate existence within the structure.
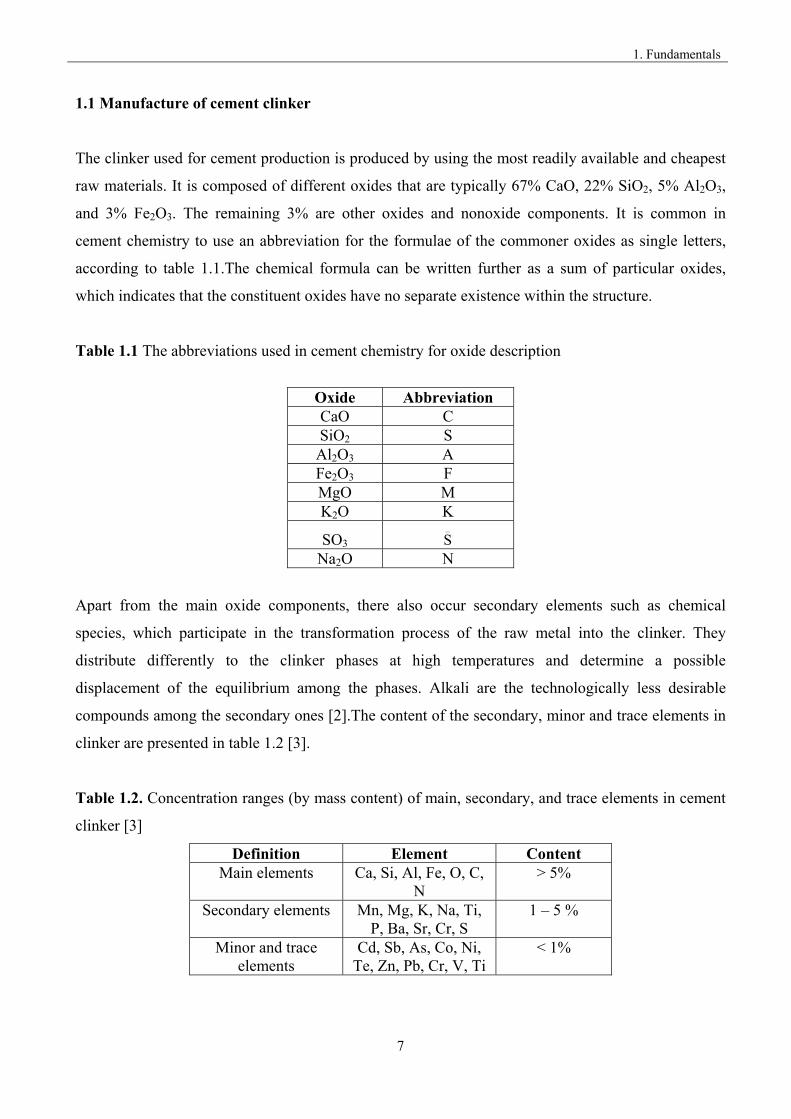
Table 1.1 The abbreviations used in cement chemistry for oxide description
Oxide Abbreviation CaO C SiO2 S Al2O3 A Fe2O3 F MgO M K2O K
SO3
_
S Na2O N
Apart from the main oxide components, there also occur secondary elements such as chemical
species, which participate in the transformation process of the raw metal into the clinker. They
distribute differently to the clinker phases at high temperatures and determine a possible
displacement of the equilibrium among the phases. Alkali are the technologically less desirable
compounds among the secondary ones [2].The content of the secondary, minor and trace elements in
clinker are presented in table 1.2 [3].
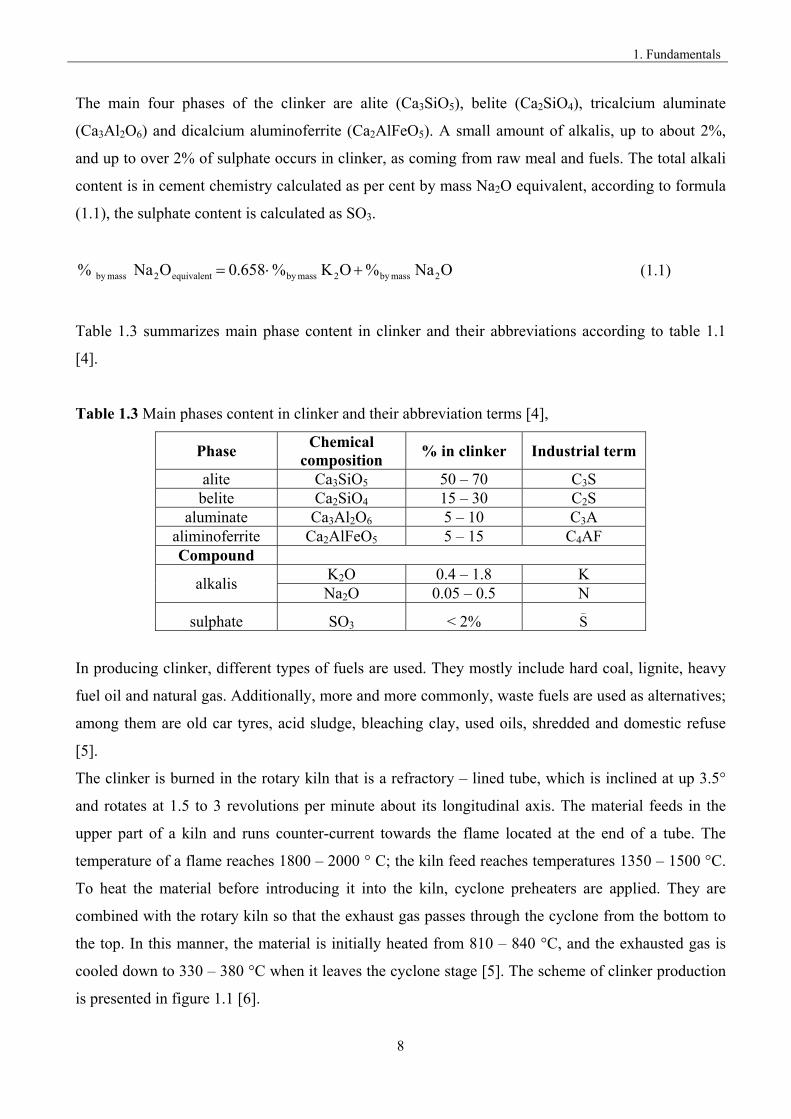
Table 1.2. Concentration ranges (by mass content) of main, secondary, and trace elements in cement
clinker [3]
Definition Element Content Main elements Ca, Si, Al, Fe, O, C,
N > 5%
Secondary elements Mn, Mg, K, Na, Ti, P, Ba, Sr, Cr, S
1 – 5 %
Minor and trace elements
Cd, Sb, As, Co, Ni, Te, Zn, Pb, Cr, V, Ti
< 1%
1. Fundamentals
8
The main four phases of the clinker are alite (Ca3SiO5), belite (Ca2SiO4), tricalcium aluminate
(Ca3Al2O6) and dicalcium aluminoferrite (Ca2AlFeO5). A small amount of alkalis, up to about 2%,
and up to over 2% of sulphate occurs in clinker, as coming from raw meal and fuels. The total alkali
content is in cement chemistry calculated as per cent by mass Na2O equivalent, according to formula
(1.1), the sulphate content is calculated as SO3.
ONa%OK%658.0ONa % 2 massby 2 massby equivalent2 massby (1.1)
Table 1.3 summarizes main phase content in clinker and their abbreviations according to table 1.1
[4].
Table 1.3 Main phases content in clinker and their abbreviation terms [4],
Phase Chemical
composition % in clinker Industrial term
alite Ca3SiO5 50 – 70 C3S belite Ca2SiO4 15 – 30 C2S
aluminate Ca3Al2O6 5 – 10 C3A aliminoferrite Ca2AlFeO5 5 – 15 C4AF Compound
alkalis K2O 0.4 – 1.8 K Na2O 0.05 – 0.5 N
sulphate SO3 < 2% _
S
In producing clinker, different types of fuels are used. They mostly include hard coal, lignite, heavy
fuel oil and natural gas. Additionally, more and more commonly, waste fuels are used as alternatives;
among them are old car tyres, acid sludge, bleaching clay, used oils, shredded and domestic refuse
[5].
The clinker is burned in the rotary kiln that is a refractory – lined tube, which is inclined at up 3.5°
and rotates at 1.5 to 3 revolutions per minute about its longitudinal axis. The material feeds in the
upper part of a kiln and runs counter-current towards the flame located at the end of a tube. The
temperature of a flame reaches 1800 – 2000 ° C; the kiln feed reaches temperatures 1350 – 1500 °C.
To heat the material before introducing it into the kiln, cyclone preheaters are applied. They are
combined with the rotary kiln so that the exhaust gas passes through the cyclone from the bottom to
the top. In this manner, the material is initially heated from 810 – 840 °C, and the exhausted gas is
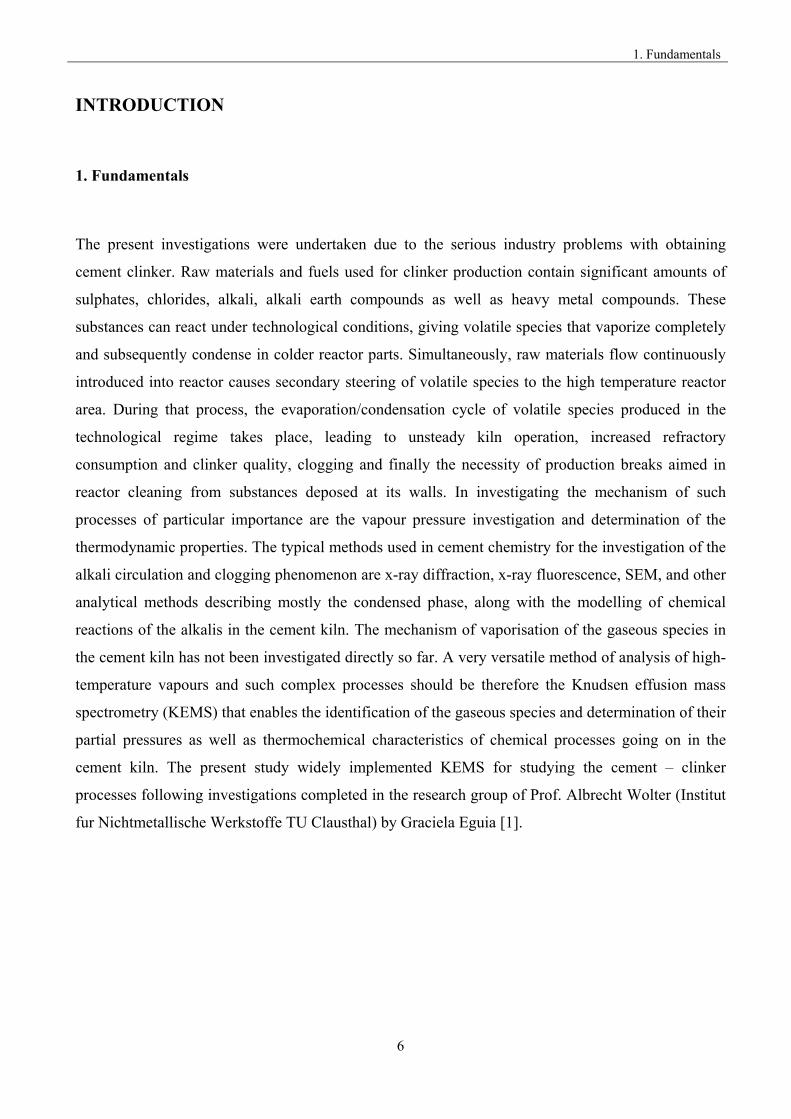
cooled down to 330 – 380 °C when it leaves the cyclone stage [5]. The scheme of clinker production
is presented in figure 1.1 [6].
1. Fundamentals
9
Figure 1.1. A schematic draft of the cement production installation; therotary kiln is combined with
cyclone preheater.
1.2 Material cycle
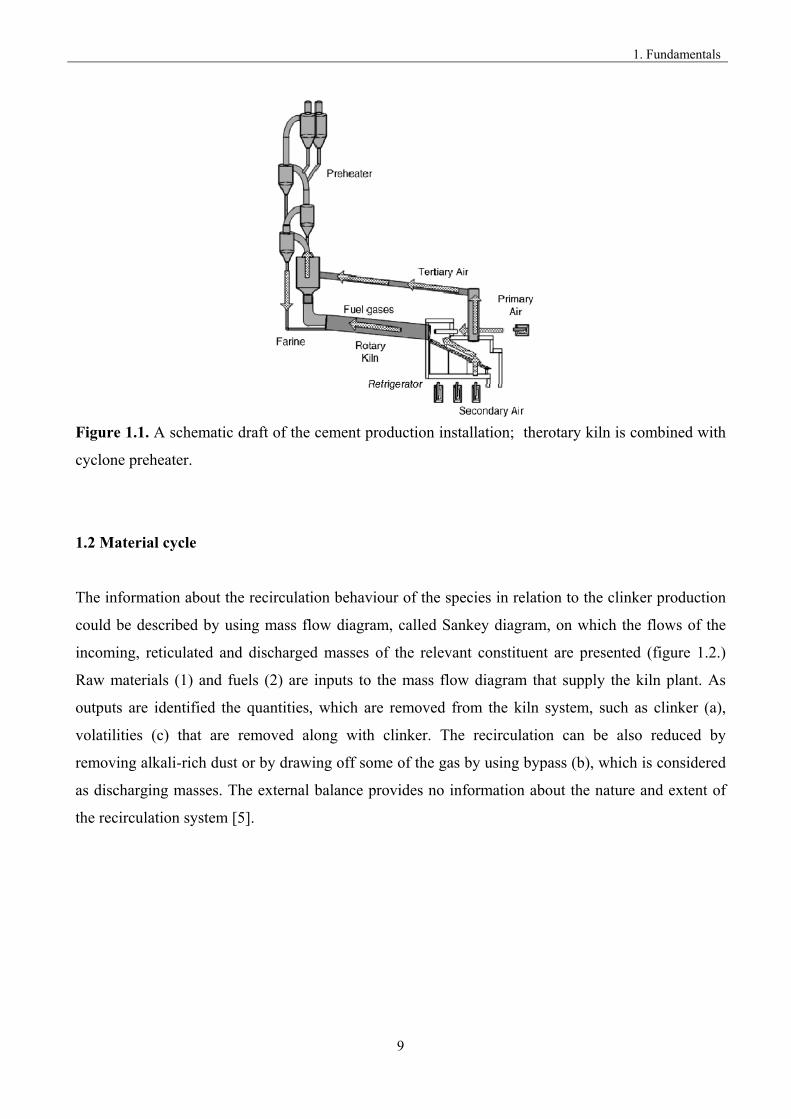
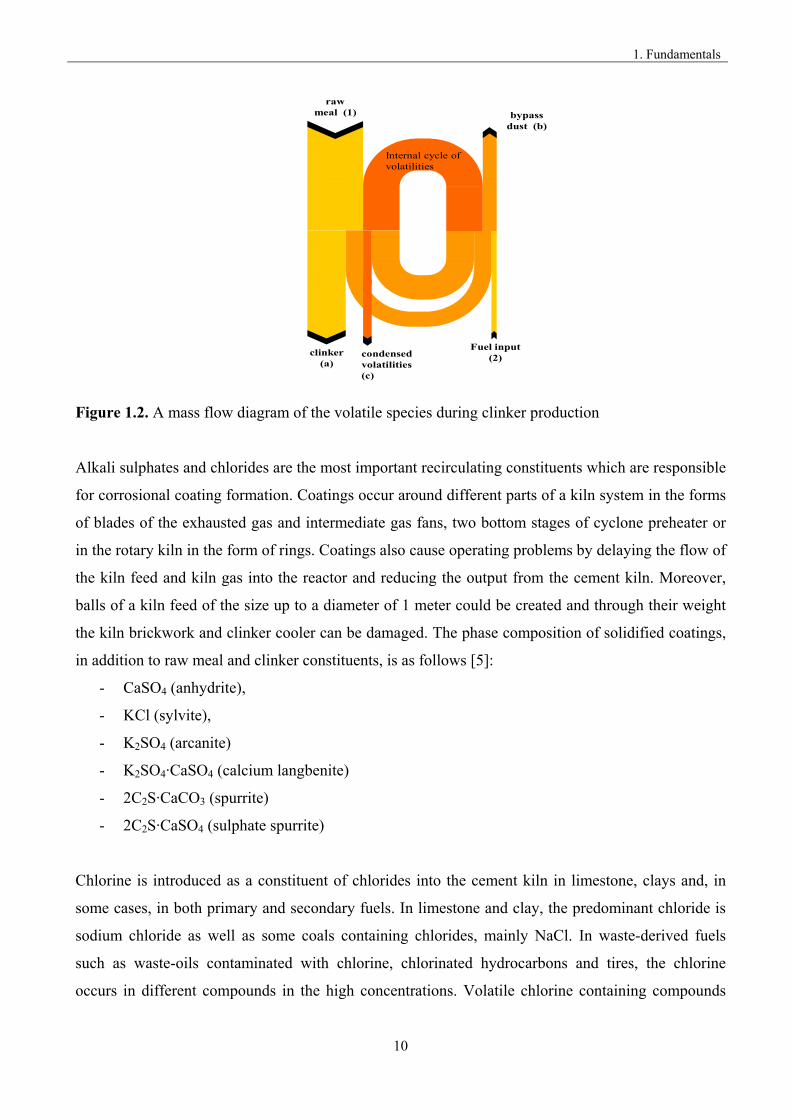
The information about the recirculation behaviour of the species in relation to the clinker production
could be described by using mass flow diagram, called Sankey diagram, on which the flows of the
incoming, reticulated and discharged masses of the relevant constituent are presented (figure 1.2.)
Raw materials (1) and fuels (2) are inputs to the mass flow diagram that supply the kiln plant. As
outputs are identified the quantities, which are removed from the kiln system, such as clinker (a),
volatilities (c) that are removed along with clinker. The recirculation can be also reduced by
removing alkali-rich dust or by drawing off some of the gas by using bypass (b), which is considered
as discharging masses. The external balance provides no information about the nature and extent of
the recirculation system [5].
1. Fundamentals
10
rawmeal (1)
clinker(a)
Fuel input(2)
bypassdust (b)
condensed volatilities (c)
Internal cycle of volatilities
Figure 1.2. A mass flow diagram of the volatile species during clinker production
Alkali sulphates and chlorides are the most important recirculating constituents which are responsible
for corrosional coating formation. Coatings occur around different parts of a kiln system in the forms
of blades of the exhausted gas and intermediate gas fans, two bottom stages of cyclone preheater or
in the rotary kiln in the form of rings. Coatings also cause operating problems by delaying the flow of
the kiln feed and kiln gas into the reactor and reducing the output from the cement kiln. Moreover,
balls of a kiln feed of the size up to a diameter of 1 meter could be created and through their weight
the kiln brickwork and clinker cooler can be damaged. The phase composition of solidified coatings,
in addition to raw meal and clinker constituents, is as follows [5]:
- CaSO4 (anhydrite),
- KCl (sylvite),
- K2SO4 (arcanite)
- K2SO4·CaSO4 (calcium langbenite)
- 2C2S·CaCO3 (spurrite)
- 2C2S·CaSO4 (sulphate spurrite)
Chlorine is introduced as a constituent of chlorides into the cement kiln in limestone, clays and, in
some cases, in both primary and secondary fuels. In limestone and clay, the predominant chloride is
sodium chloride as well as some coals containing chlorides, mainly NaCl. In waste-derived fuels
such as waste-oils contaminated with chlorine, chlorinated hydrocarbons and tires, the chlorine
occurs in different compounds in the high concentrations. Volatile chlorine containing compounds
1. Fundamentals
11
react readily with alkalis, causing serious operational problems even in kilns equipped with bypass
[3].
Sulphur is frequently present in coals, some fuel oils, and in limestones. Clayey sediments, the so-
called marls, sometimes contain also sulphur as sulphides and sulphates. Sulphur forms volatile
compounds and its behaviour in a kiln is complex. There is some fundamental knowledge of the
sulphate behaviour, stated that the sulphur, coming from raw materials and fuels under oxidizing
burning conditions, forms to SO2, which further in the presence of oxygen tends to react with alkalis
present in different oxide phases according to reactions [5]:
SO2(g) + ½ O2(g) + Na2O(g) = Na2SO4(g) (1.2)
SO2(g) + ½ O2(g) + K2O(g) = K2SO4(g) (1.3)
Sulphates combine preferably with alkalis, giving alkali sulphates. When there is an excess of
sulphates it tends to react with CaO and form calcium potassium sulphate 2CaSO4·K2SO4
(langbeinite) or CaSO4 (anhydrite). Major alkali sulphates formed with SO2 and their melting
temperatures on base of Bhatty report [3] are presented in table 1.4.
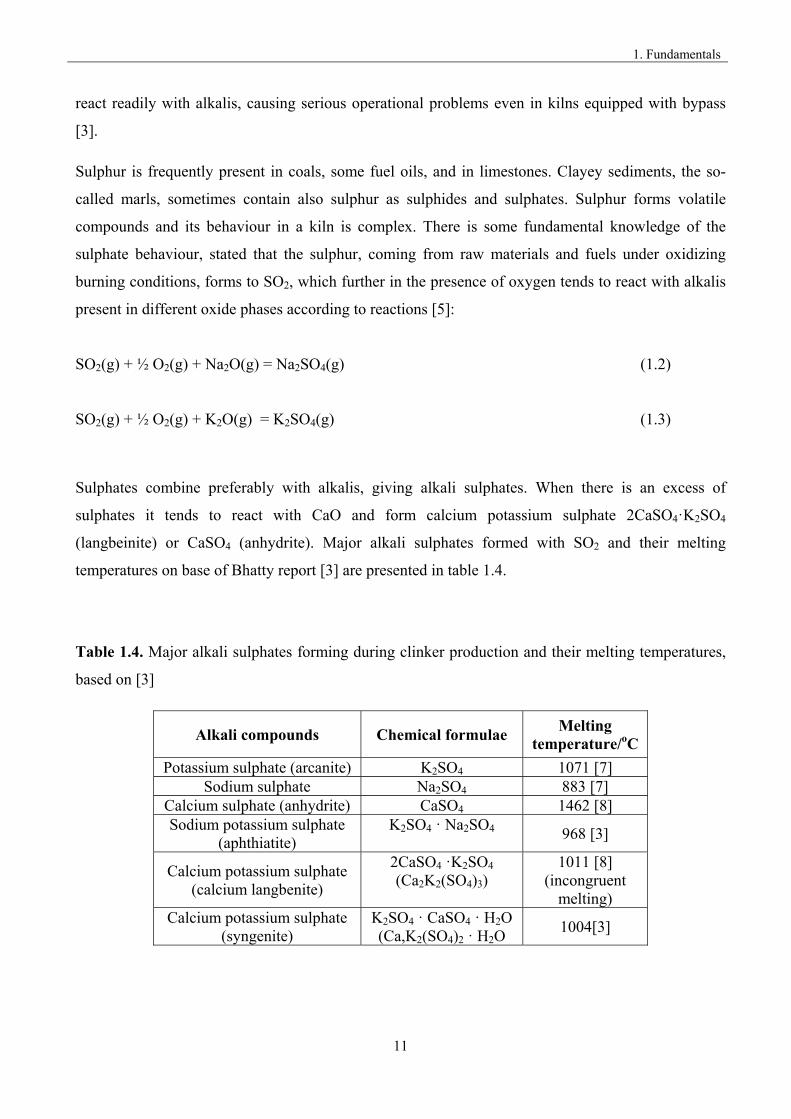
Table 1.4. Major alkali sulphates forming during clinker production and their melting temperatures,
based on [3]
Alkali compounds Chemical formulae Melting
temperature/oC
Potassium sulphate (arcanite) K2SO4 1071 [7] Sodium sulphate Na2SO4 883 [7]
Calcium sulphate (anhydrite) CaSO4 1462 [8] Sodium potassium sulphate
(aphthiatite) K2SO4 · Na2SO4 968 [3]
Calcium potassium sulphate (calcium langbenite)
2CaSO4 ·K2SO4 (Ca2K2(SO4)3)
1011 [8] (incongruent
melting) Calcium potassium sulphate
(syngenite) K2SO4 · CaSO4 · H2O (Ca,K2(SO4)2 · H2O
1004[3]
1. Fundamentals
12
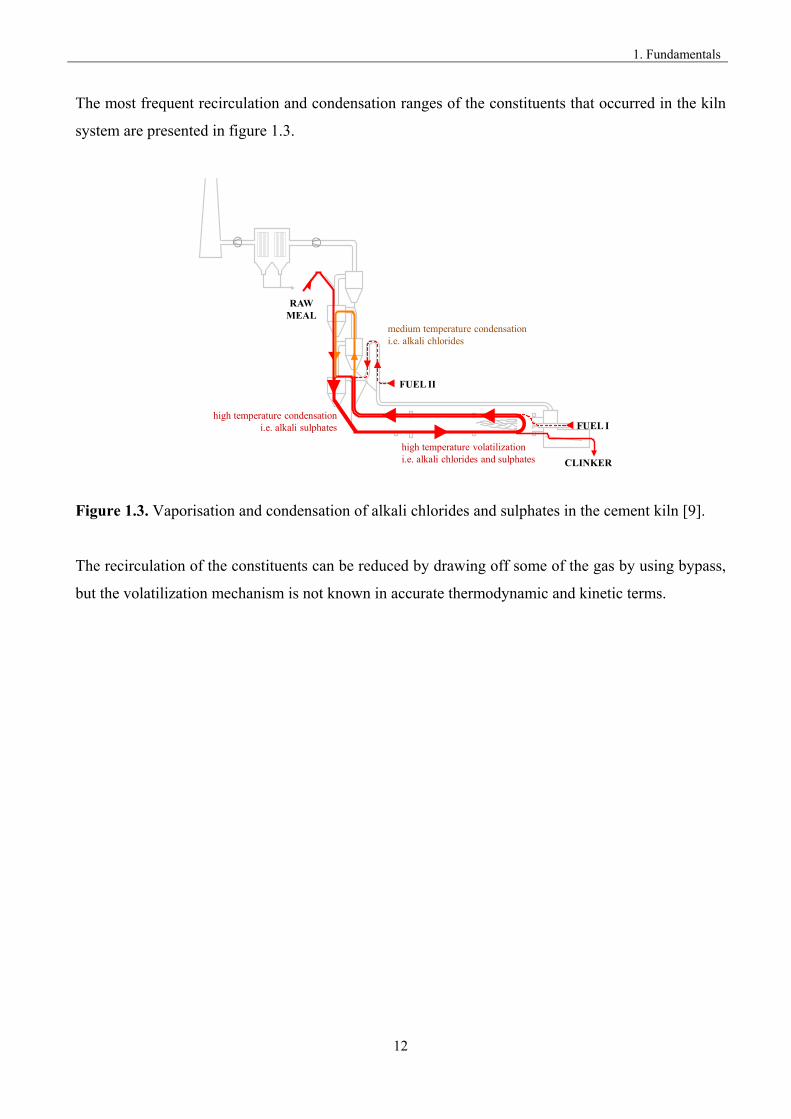
The most frequent recirculation and condensation ranges of the constituents that occurred in the kiln
system are presented in figure 1.3.
high temperature volatilizationi.e. alkali chlorides and sulphates
RAW MEAL
FUEL I
CLINKER
FUEL II
medium temperature condensationi.e. alkali chlorides
high temperature condensationi.e. alkali sulphates
(EMISSION)
Figure 1.3. Vaporisation and condensation of alkali chlorides and sulphates in the cement kiln [9].
The recirculation of the constituents can be reduced by drawing off some of the gas by using bypass,
but the volatilization mechanism is not known in accurate thermodynamic and kinetic terms.
2. Knudsen effusion mass spectrometry
13
2. Knudsen Effusion Mass Spectrometry
High temperature processes have nowadays become more common since the advent of new
technologies. They have created a possibility of producing new materials, new efficient and
ecological energy sources or to receive pure compounds in metallurgical processes based on chemical
transport. Unfortunately, all high temperature processes also pose new problems and difficulties. For
example, in the high temperature sections of the reactor only very small materials can be applied for
its building since the utility of various materials decreases with the increasing temperature. Chemical
and physical processes such as corrosion, diffusion and vaporisation, which do not occur at low
temperatures, rise to an enormous challenge at high temperatures [10].
High temperature mass spectrometry, also known as Knudsen effusion mass spectrometry (KEMS),
is the most powerful method to analyse vapour species in equilibrium with the condensed phases in
spite of its rather rare applications for this purpose. It enables the identification of the major, minor
and even traces of gaseous species and the determination of their partial pressures. This method
offers the highest potential for equilibrium vaporisation studies. From the partial pressure one can
obtain the thermodynamic data like activity, enthalpy ΔH or entropy ΔS. This method offers the
highest potential for equilibrium vaporization studies.
Mass spectrometry combined with Knudsen effusion method was applied for the first time in 1948 by
Ionov [11] for studying a vaporisation of alkali metal halides; later, the investigation of the free
evaporation of carbon by Chupka and Inghram [12] and Honig [13] were carried out by applying
KEMS method. Since that time, Knudsen effusion mass spectrometry, with its attractive features of
high sensitivity and resolution under high vacuum conditions, has become a useful tool for the
quantitative detection of gaseous species effusing from the Knudsen cell. Nowadays, the method is
still a powerful tool for thermodynamic investigations of inorganic materials by the determination of
the composition of the equilibrium gaseous phase. At present, around twenty six research groups
work with this unique technique, showing still a large activity in this area [14].
2. Knudsen effusion mass spectrometry
14
2.1. Principle of the method
In past studies, in high temperature chemistry by studying the gas phase over the condensation phase,
it was often assumed that the molecules in the gas phase should be simple and small, related to the
chemical stoichiometry of the studied compound. In 1948, Ionov [11] showed in his first work, by
means of the Knudsen effusion mass spectrometry, that the equilibrium vapour over the alkali halides
MX(c) consists of the monomer and dimmer molecules MX(g) and (MX)2(g), Chupka and Inghram
[12] as well as Honig [13] showed that the main gas molecule over the carbon sample is C3(g).The
identification of such molecules brought about some entirely new aspects to the usual concepts of
chemical bonding and valence because in many cases complex molecules are the predominant
species. Therefore, the subject of gas chemistry at high temperatures has grown to become a branch
as distinct and varied as solution chemistry [15]. The molecular effusion method combined with mass
spectrometry has become a standard thermodynamic tool applied to the characterization of vapour
pressures of a variety of high-temperature materials and systems.
The Knudsen effusion mass spectrometry is the combination of two different experimental
techniques. One technique is based on Knudsen effusion which was described by Martin Knudsen in
the 1900 [16] and is based on the kinetic theory of dilute gases by which the molecular flux at a
boundary can be calculated for a gas at equilibrium [17]; the other part is the mass spectrometry as a
powerful complementary technique that enables a sensitive analysis of a gas phase.
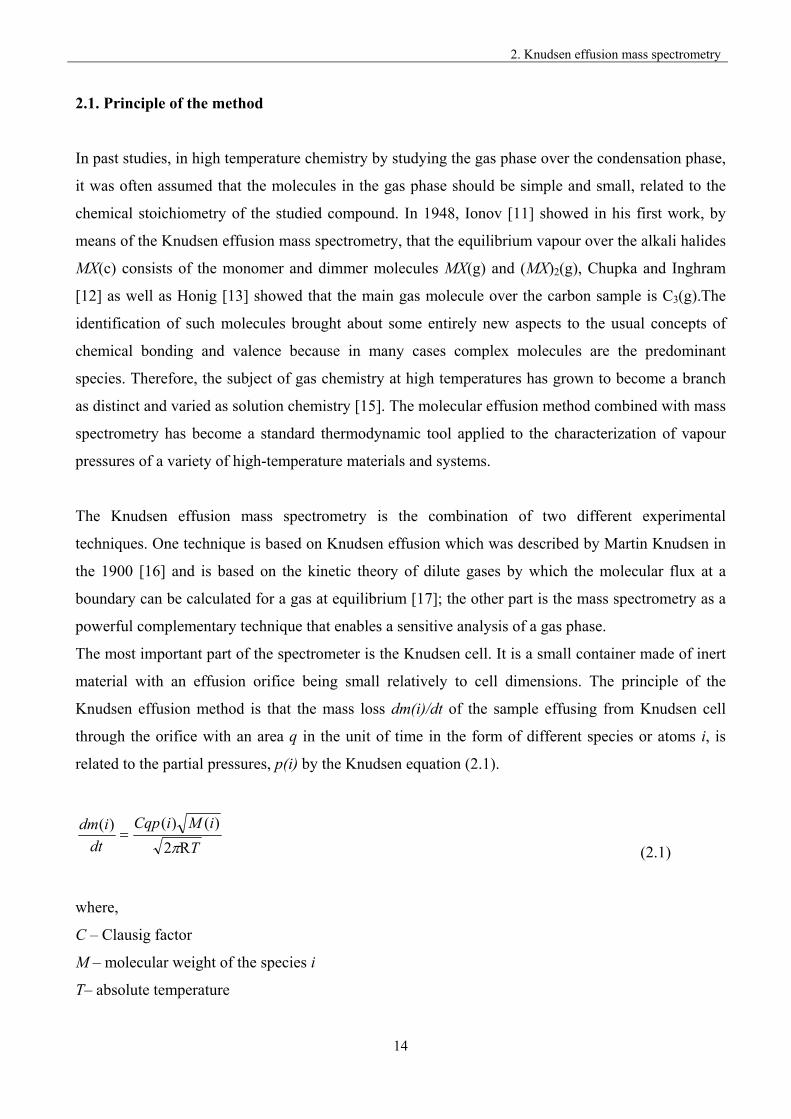
The most important part of the spectrometer is the Knudsen cell. It is a small container made of inert
material with an effusion orifice being small relatively to cell dimensions. The principle of the
Knudsen effusion method is that the mass loss dm(i)/dt of the sample effusing from Knudsen cell
through the orifice with an area q in the unit of time in the form of different species or atoms i, is
related to the partial pressures, p(i) by the Knudsen equation (2.1).
T
iMiCqp
dt
idm
R2
)()()(
(2.1)
where,
C – Clausig factor
M – molecular weight of the species i
T– absolute temperature
2. Knudsen effusion mass spectrometry
15
The loss of vapour which effuses from the cell does not disturb the equilibrium inside, therefore it
can be considered quantitatively and qualitatively as a representative of the equilibrium gaseous
phase being in equilibrium with condensed species present in the Knudsen cell. The Clausing factor
C describes the probability of leaving the Knudsen cell by the gaseous species which reached the
effusion orifice. It depends on the geometry and the size of the orifice [18].
The Knudsen effusion method is spoken, when the molecular flow takes place, that is the molecules
of the gas passing through an orifice move nearly independently of one another and thereby have no
appreciable effect on the equilibrium; these conditions are filled primarily in the medium and lower –
pressure regions. The condition for the molecular flow was established by the equation [17]
10D
(2.2)
where
λ – mean free path for the gas
D – orifice diameter
Therefore, the disadvantage of the method is its limitation to comparatively low pressures up to about
10 Pa, which is a typical limit for the molecular flow. When the molecular flow is preserved, there
are no gas collisions and molecules arriving at the orifice come directly from the area of the
vaporizing material or from the walls of the enclosure. [17] The mathematical description of the
probability of the molecule leaving the Knudsen cell according to limitation of the method was
described by Motzfeldt [19], Whitman [20], et al. [21-25].
2. Knudsen effusion mass spectrometry
16
2.2. Hardware aspects
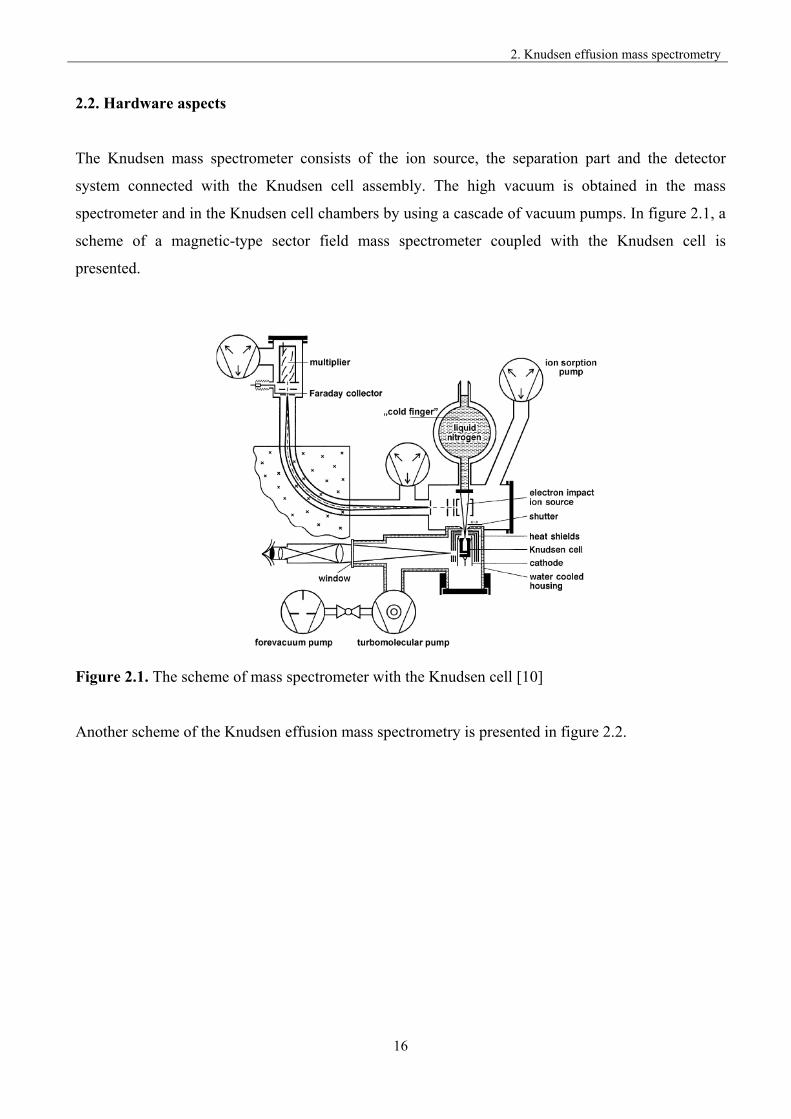
The Knudsen mass spectrometer consists of the ion source, the separation part and the detector
system connected with the Knudsen cell assembly. The high vacuum is obtained in the mass
spectrometer and in the Knudsen cell chambers by using a cascade of vacuum pumps. In figure 2.1, a
scheme of a magnetic-type sector field mass spectrometer coupled with the Knudsen cell is
presented.
Figure 2.1. The scheme of mass spectrometer with the Knudsen cell [10]
Another scheme of the Knudsen effusion mass spectrometry is presented in figure 2.2.
2. Knudsen effusion mass spectrometry
17
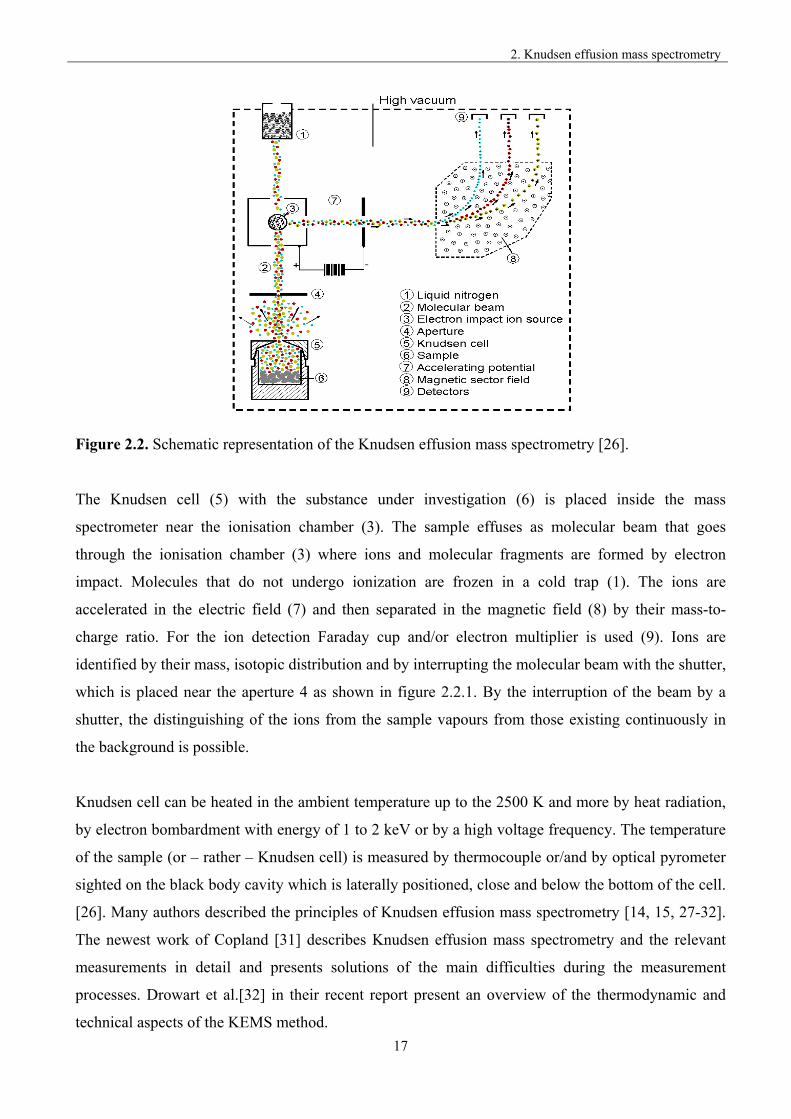
Figure 2.2. Schematic representation of the Knudsen effusion mass spectrometry [26].
The Knudsen cell (5) with the substance under investigation (6) is placed inside the mass
spectrometer near the ionisation chamber (3). The sample effuses as molecular beam that goes
through the ionisation chamber (3) where ions and molecular fragments are formed by electron
impact. Molecules that do not undergo ionization are frozen in a cold trap (1). The ions are
accelerated in the electric field (7) and then separated in the magnetic field (8) by their mass-to-
charge ratio. For the ion detection Faraday cup and/or electron multiplier is used (9). Ions are
identified by their mass, isotopic distribution and by interrupting the molecular beam with the shutter,
which is placed near the aperture 4 as shown in figure 2.2.1. By the interruption of the beam by a
shutter, the distinguishing of the ions from the sample vapours from those existing continuously in
the background is possible.
Knudsen cell can be heated in the ambient temperature up to the 2500 K and more by heat radiation,
by electron bombardment with energy of 1 to 2 keV or by a high voltage frequency. The temperature
of the sample (or – rather – Knudsen cell) is measured by thermocouple or/and by optical pyrometer
sighted on the black body cavity which is laterally positioned, close and below the bottom of the cell.
[26]. Many authors described the principles of Knudsen effusion mass spectrometry [14, 15, 27-32].
The newest work of Copland [31] describes Knudsen effusion mass spectrometry and the relevant
measurements in detail and presents solutions of the main difficulties during the measurement
processes. Drowart et al.[32] in their recent report present an overview of the thermodynamic and
technical aspects of the KEMS method.
2. Knudsen effusion mass spectrometry
18
Knudsen effusion mass spectrometry is a unique, and yet universal, method of gas analysis in the
vapour over the condensed phase in equilibrium. Almost all groups of inorganic materials were
investigated so far, which include: borides, carbides, fullerens, nitrates, sulphates, halides, metals,
alloys, oxides, glasses, and ceramics. An overview of these studies is summarized in the recent issue
of The Open Journal of Thermodynamics [14].
2.3. Partial pressures
An understanding of the vaporisation process requires knowledge of both the condensed and the
gaseous phases. The first step is the characterization of the vapour phase and the identification of the
vapour species. There are several ways of measuring the vapour pressures of substances. The most
common are: the static, boiling point, transpiration, Knudsen effusion and Langmuir free-evaporation
methods. The Knudsen and the Langmuir methods are the most suitable because the experiment is
carried out in the vacuum and the material transported away from the investigated sample [17].
The identification of the species allows then for the determination of other related aspects such as the
thermodynamics of the various equilibria, mechanism of vaporisation, or even the molecular
structures of the gaseous species could be further explored with great facility since the various
gaseous species existing are known.
The first step in the gas phase analysis is the identification of the gas species. Mass spectrometry is
the most versatile method for this purpose, since it enables very a sensitive identification of the
various species in the vapour. High temperature mass spectrometry technique could be connected
with Knudsen effusion method as a source of vapour species. In this manner, the various species
occurring in the vapour could be detected and their partial pressures determined. Mass spectrometry
is most universal for gas analysis used for the wide spectrum of analytical inorganic and organic
samples [10, 33, 34].
The relationship between ion intensity measured by the detection system of the Knudsen effusion
mass spectrometer and the partial pressure of a neutral species i inside a cell at the temperature T is
defined by equation (2.3).
2. Knudsen effusion mass spectrometry
19
)(
),()(
i
ijITkip
(2.3)
where:
p(i) - partial pressure of a molecule i
I(j,i) - measured ion current j originating from the molecule i,
σ (i) - the total ionization cross-section of the molecule i
k - sensitivity constant of the KEMS system
When an ion j has more isotopes, only the most intense ion is usually measured, while and others are
re-calculated taking into consideration their well-established isotopic distributions. The most difficult
part in these calculations is the assignment of the ions to their neutral precursors, because the
fragmentation of gas molecules makes it complicated. If an ion has more than one precursor, the
contribution of each neutral precursor to the intensity of a particular ion must be determined.
The total ionization cross-section of the complex gaseous species could be either calculated or
determined. The ionisation cross sections of the atoms were calculated theoretically by Mann [35],
and measured by Freund et al. [36, 37]. The results for most chemical elements have shown
complicity between the theoretical and measured values. The experimental studies of the ionisation
cross section of the molecules have only been undertaken by few authors [36, 38]. For that reason,
the additivity rule:
σ(MxNyKv) = ∑σ(x σ(M)+y σ(N)+v σ(K)) (2.4)
was suggested by Otvos and Stevenson [39] to obtain ionisation cross sections of complex molecules.
However, the recent studies do suggest some modifications of the additivity rule [32]. The extensive
calculation description of ionisation cross section was summarized in the IUPAC Report, by Drowart
et al. [32].
2. Knudsen effusion mass spectrometry
20
2.3.1. The calibration procedure
The calibration procedure used in the present work was developed by Miller [10]. The temperature is
measured by means of a thermocouple or by pyrometer calibrated in situ at the melting point of pure
metal (Me), for example gold, nickel, silver placed in the effusion cell. Calibration constant k is
calculated according to equation 2.5:
meltTMeI
MeMepk
)(
)()(
(2.5)
where Me is a pure metal and Tmelt the temperature of the melting point of this metal.
For cooling the sample from T1 to Tmelt or heating from Tmelt to T1, the temperature dependence of the
vapour pressure of Me is described by an equation:
RR/)/,(ln ,/,/
omsubvap
omsubvap S
T
HPasolliqMep
= A/T + B (2.6)
The vaporisation/ sublimation enthalpy and vaporisation/sublimation entropy near the melting point
are well known from the literature, for example [40]. The above reaction can be rearranged for the
partial pressure of Me at T1 and Tmelt to the following equation:
melto
meltmelto
melto
melto
TT
TITI
TT
TMepTMep
/1/1
)ln()ln(
/1/1
),(ln),(lnA
1
11
1
1
(2.7)
where A is a calculated constant, from known values of vaporisation/sublimation enthalpy and
vaporisation/sublimation entropy near the melting point and T1o is the corrected temperature. The
only unknown value in equation (2.7) is T1o, which can be easily calculated by iteration. If
temperature (T1 of the pyrometer/thermocouple is measured, the temperature correction ΔTcorr can be
obtained as a difference T1o – T1, the schematic representation of the calibration procedure is shown
in figure (2.3).
2. Knudsen effusion mass spectrometry
21
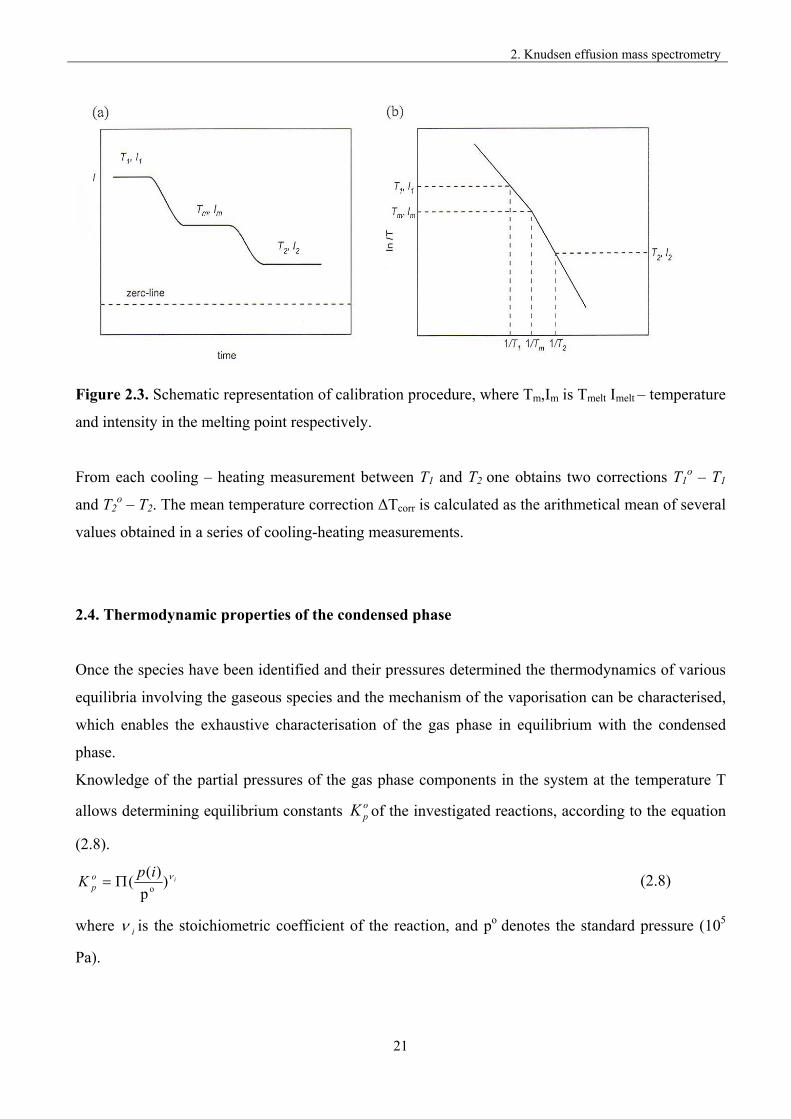
Figure 2.3. Schematic representation of calibration procedure, where Tm,Im is Tmelt Imelt – temperature
and intensity in the melting point respectively.
From each cooling – heating measurement between T1 and T2 one obtains two corrections T1o – T1
and T2o – T2. The mean temperature correction ΔTcorr is calculated as the arithmetical mean of several
values obtained in a series of cooling-heating measurements.
2.4. Thermodynamic properties of the condensed phase
Once the species have been identified and their pressures determined the thermodynamics of various
equilibria involving the gaseous species and the mechanism of the vaporisation can be characterised,
which enables the exhaustive characterisation of the gas phase in equilibrium with the condensed
phase.
Knowledge of the partial pressures of the gas phase components in the system at the temperature T
allows determining equilibrium constants opK of the investigated reactions, according to the equation
(2.8).
iip
K op
)p
)((
o (2.8)
where i is the stoichiometric coefficient of the reaction, and po denotes the standard pressure (105
Pa).
2. Knudsen effusion mass spectrometry
22
Temperature dependencies of the equilibrium constant are expressed by equation (2.9):
BT
AT )(Kln o
p (2.9)
from which the value of enthalpy (2.10) and entropy (2.11) of the reaction are determined as follows
R
)( mo
r THA
(2.10)
R
)( mo
r TSB
(2.11)
The next step could be the determination of the Gibbs energy of the equilibrium process, as expressed
by equation (2.12).
(T)RTlnK(T)STΔ(T)HΔ(T)GΔ op
or
or
or (2.12)
Other thermodynamic values which can be determined by Knudsen effusion mass spectrometry are
the thermodynamic activities of the component. The thermodynamic activity a(i), of component i, at
temperature T, in the condensed phase of the investigated system can be obtained from the partial
pressure of the pure component, po(i), and its partial pressures over the mixture, p(i), determined at
this temperature:
)()('
)()(
)(
)()(
iiIk
iiIk
ip
ipia
oo
(2.13)
Providing thermodynamic activity of one component of binary system is known in the whole
composition range, while the activities of the second component can be calculated by the Gibbs-
Duhem method. At constant temperatures and pressure, the Gibbs-Duhem equation could be written
as follows:
0ln i
ii adx (2.14)
where:
xi mole fraction of component i
ai the activity of the component i.
The summation extends over all components. Adding d ln aj to each side of the equation (2.14) and
rearranging, one could obtain [41]:
2. Knudsen effusion mass spectrometry
23
i j
iij a
adxad lnln (2.15)
The rearranging of the eq. 2.15 lead to the equation 2.16 for activities calculation
ij
ij ad
x
xad lnln (2.16)
Thermodynamic activities or activity coefficient and excess quantities can be obtained by the ion
intensity ratio integration method developed by Belton and Fruehan [41]. The activity of a
component is directly proportional to the partial pressure (assuming ideal gas behaviour) of the
corresponding monomer gas species and in turn, is directly proportional to the measured ion current
of an isotope of that species:
j
ii
ij I
Idxad lnln (2.17)
For a binary system and with the pure component as standard state
1
1 11
221 lnln
xx
x I
Idxa (2.18)
is obtained upon integration. For pure j component a1 equals to zero; therefore, to avoid the
neglecting of a certain integration area, instead of calculating activities directly, more suitable
graphical integration of equation 2.18, that is
11
1 11
2
1
221 lnlnln
xx
x x
x
I
Idx (2.19)
can be evaluated, where 1 – is the activity coefficient, defined as
1
11 x
a (2.20)
The activity coefficients are firstly calculated since 1 is not zero in pure j component but a finite
value.
2. Knudsen effusion mass spectrometry
24
2.5. Congruent effusion
The applications of the molecular – effusion method require that the vaporisation process can be
considered as a congruent one and the rate of vaporisation of the sample under investigation must be
much greater than the rate of effusion. These conditions ensure that the vapour pressure is time
invariant and the effusion rate is independent of the detailed mechanism of the vaporisation process
[17]. The system must also be maintained at a constant temperature and there should be no reaction
of the sample with the crucible material.
The distinction between the congruent and incongruent processes is that, as congruent vaporisation is
concerned, when a gas has the same overall chemical composition as the condensed phase from
which it arises, the same amount of the molecules turns up in the vapours and in the condensed
phase. For example, alkali sulphate vaporisation, M2SO4(c) = 2M2(g) + O2(g) + SO2(g) is a congruent
process. In the incongruent vaporisation process, the gas has a different composition from the
condensed phase, for example vaporisation of water from the potassium chloride solution, H2O(KCl
solution) = H2O(g) [17].
For a pressure measurement at a constant temperature in a two-component system to be meaningful,
one of the following conditions must be applied:
a) three phases must be present
b) there must be two phases of the same composition
c) there must be two phases that compositions are specified and fixed [17]
It is also possible to investigate a sample by means of the effusion method even though it vaporizes
incongruently, but one of the cases (a) – (c) is fulfilled, for example reaction CaSO4(c) = CaO(c) +
SO2(g) + ½ O2(g). There are three phases present and the vapour has a different composition from the
condensed phase, but the composition of the phases is strictly specified. From one mole of CaSO4
arise 1 mole CaO, 1 mole SO2(g) and 0.5 mole of oxygen, therefore the conditions a) and c) are
fulfilled for pressure investigations. In the case of the water vaporisation from the potassium
chloride/water system, the state of the water in the condensed phase is inadequately specified, the
conditions a) – c) are not fulfilled, thus the congruent effusion method for this vaporisation cannot be
applied.
2. Knudsen effusion mass spectrometry
25
According to the Knudsen effusion equation
RT
iMiCqp
dt
idm
2
)()()(
(2.21)
Dividing both sides by molecular weight M(i) of species (i) one obtain further
)(2
)()(
iMRT
iCqp
dt
idn
(2.22)
The vaporisation from the time when t = 0 to a particular time t will describe the total mass loss
))(2
)()((
0 iMRT
iCqp
dt
idnt
(2.23)
therefore, for the constant temperature, the total mole number of species M(i) effusing from the
Knudsen cell can be expressed as a result of the previous integration and give the following equation
(2.24) .
)(
)(B)(
iM
ipin
(2.24)
where B is a constant.
3. The aims of the work
26
3. The aims of the work
The present investigations were undertaken due to the serious problems of industry in obtaining
clinker used for cement production. The aim of this work is a better understanding of the volatile
cycles in cement production technology by studying the thermodynamics of gas-gas and gas-solid
reactions between chemicals occurring in the cement kiln.
In order to study such chemically complex processes, investigations of pure compounds volatile at
the cement production conditions: sulphates of sodium, potassium and calcium, are of particular
importance. In the present work, mass spectra of the gaseous species over the samples of Na2SO4,
K2SO4, CaSO4 and their thermodynamic characteristics (vaporisation, thermal stability) were
determined by the method of the Knudsen effusion mass spectrometry.
This work was focused on two aspects:
- the investigation of the quasi-binary systems Na2SO4 – CaSO4 and K2SO4 – CaSO4 and the
determination of the chemical activities of components in both binaries
- the determination of the volatiles over the samples taken directly from the cement kiln to
characterise the species that vaporise from such samples and the interaction of alkali chlorides
and sulphates occurring during clinker burning.
By an innovative combination of the investigation of pure substances, the binary systems, and
thermodynamic data determined for the industrial samples, the characterisation of vaporisation and
processes occurring in the cement kiln could be performed in the current study. Such an innovative
approach to the combination of the different data (model and real samples) also reinforces the
applications of the Knudsen effusion mass spectrometry for the industrial purposes.
EXPERI
4. Invest
4.1 KEMS
The mass
spectromet
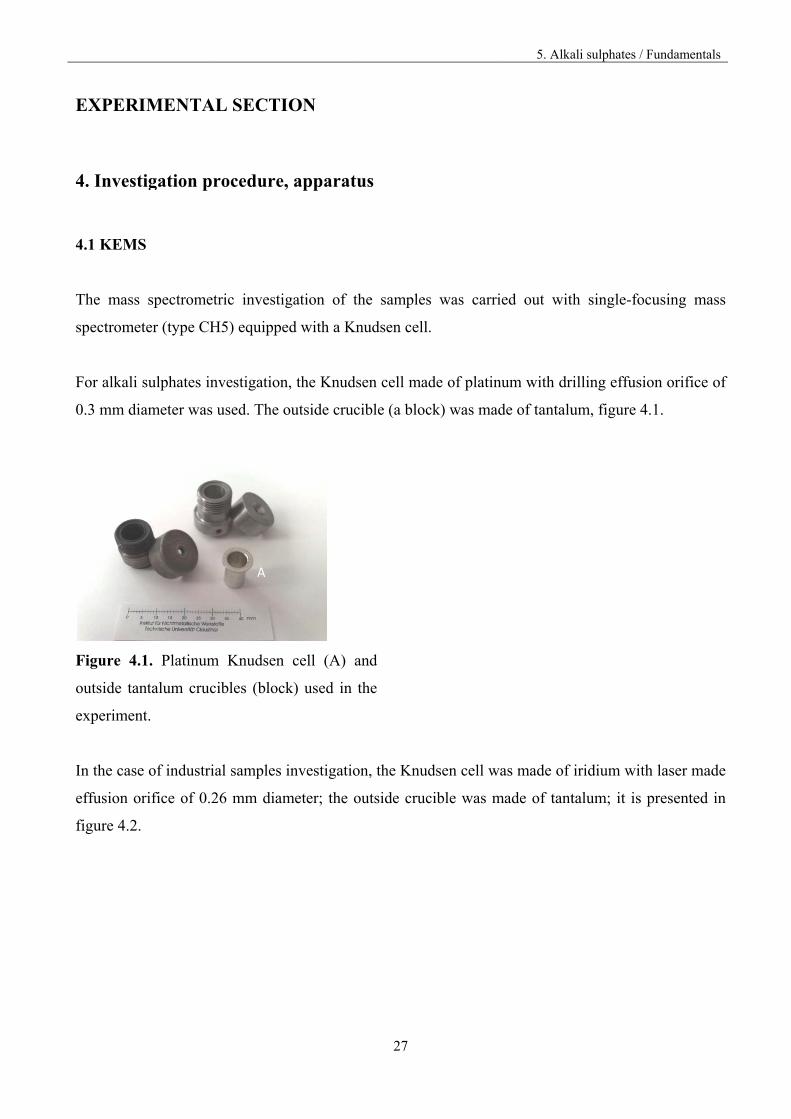
For alkali s
0.3 mm dia
Figure 4.1
outside tan
experiment
In the case
effusion or
figure 4.2.
IMENTA
igation pr
S
spectromet
ter (type CH
sulphates in
ameter was
1. Platinum
ntalum cruc
t.
e of industri
rifice of 0.2
AL SECTI
rocedure,
tric investig
H5) equippe
nvestigation
used. The o
m Knudsen
cibles (block
al samples
26 mm diam
A
ION
, apparatu
gation of t
ed with a Kn
n, the Knuds
outside cruc
cell (A) a
k) used in
investigatio
meter; the o
27
us
the samples
nudsen cell
sen cell mad
cible (a bloc
and
the
on, the Knud
outside cruc
s was carri
.
de of platin
ck) was mad
dsen cell wa
cible was m
5. Alka
ied out wit
num with dr
de of tantalu
as made of
made of tant
ali sulphates /
th single-fo
rilling effusi
um, figure 4
iridium wit
talum; it is
Fundamental
ocusing mas
ion orifice o
4.1.
th laser mad
presented i
ls
ss
of
de
in
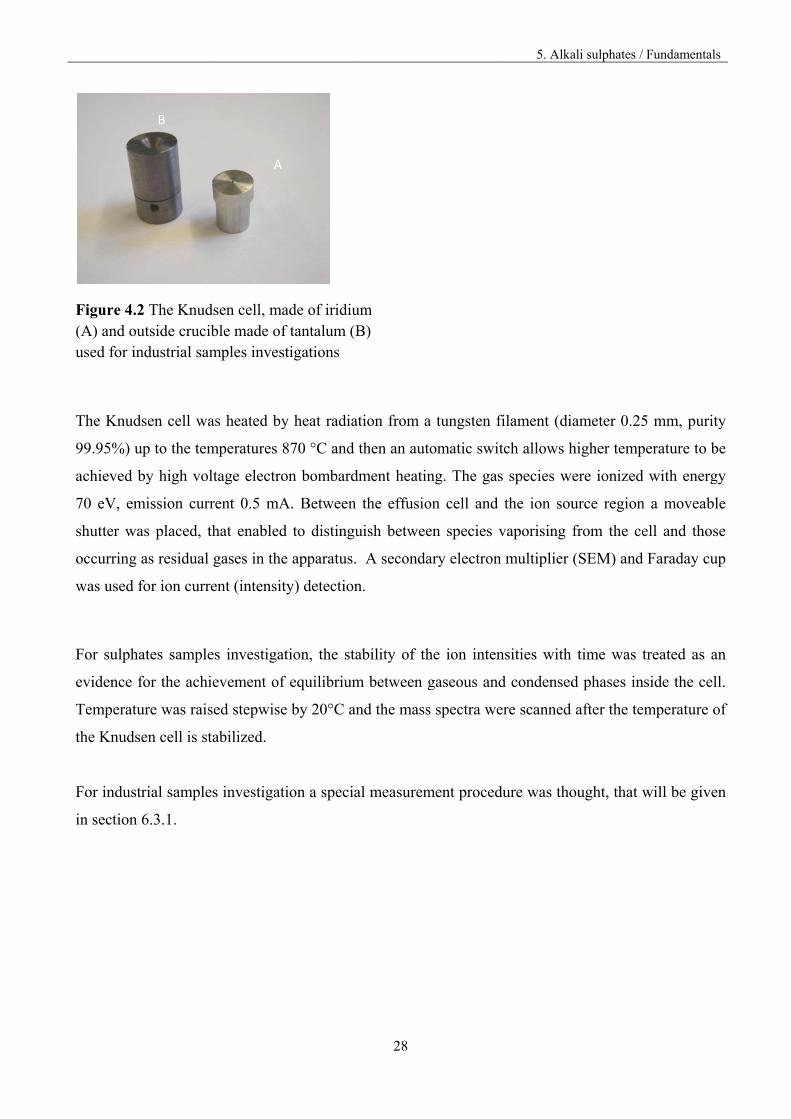
Figure 4.2(A) and ouused for in
The Knuds
99.95%) up
achieved b
70 eV, em
shutter wa
occurring a
was used f
For sulpha
evidence f
Temperatu
the Knudse
For industr
in section 6
2 The Knudsutside crucibndustrial sam
sen cell wa
p to the tem
by high volt
mission curr
as placed, th
as residual g
for ion curre
ates sample
for the achie
ure was raise
en cell is sta
rial samples
6.3.1.
B
sen cell, mable made of mples invest
s heated by
mperatures 8
tage electro
rent 0.5 mA
hat enabled
gases in the
ent (intensit
s investigat
evement of
ed stepwise
abilized.
s investigati
A
ade of iridiuf tantalum (Btigations
y heat radia
870 °C and
on bombard
A. Between
d to distingu
e apparatus.
ty) detection
tion, the sta
f equilibrium
e by 20°C an
ion a specia
28
um B)
ation from a
then an aut
dment heatin
the effusio
uish betwee
A seconda
n.
ability of th
m between g
nd the mass
al measurem
a tungsten f
tomatic swit
ng. The gas
on cell and
en species v
ary electron
he ion inten
gaseous and
s spectra we
ment proced
5. Alka
filament (di
tch allows h
s species w
the ion sou
vaporising
n multiplier
nsities with
d condensed
ere scanned
dure was tho
ali sulphates /
ameter 0.25
higher temp
ere ionized
urce region
from the ce
(SEM) and
time was t
d phases in
after the te
ought, that w
Fundamental
5 mm, purit
perature to b
with energ
n a moveabl
ell and thos
Faraday cu
treated as a
side the cel
mperature o
will be give
ls
ty
be
gy
le
se
up
an
ll.
of
en
5. Alkali sulphates / Fundamentals
29
4.1.1 Calibration of the mass spectrometer
The calibration of the Knudsen effusion mass spectrometer was carried out over the period of two
years and therefore is discussed separately. The temperature was measured with Pt-Pt10Rh
thermocouple (type S) and pyrometer (ISQ 5, Impac Infratherm GmbH, Germany), calibrated in situ
at the melting point of silver, purity 99,99%. The calibration constant k and the corrected temperature
was calculated according to the calibration procedure from Miller [10], see Section 2.3.1 with the
cross section σi value of 5.35 adopted from [37].
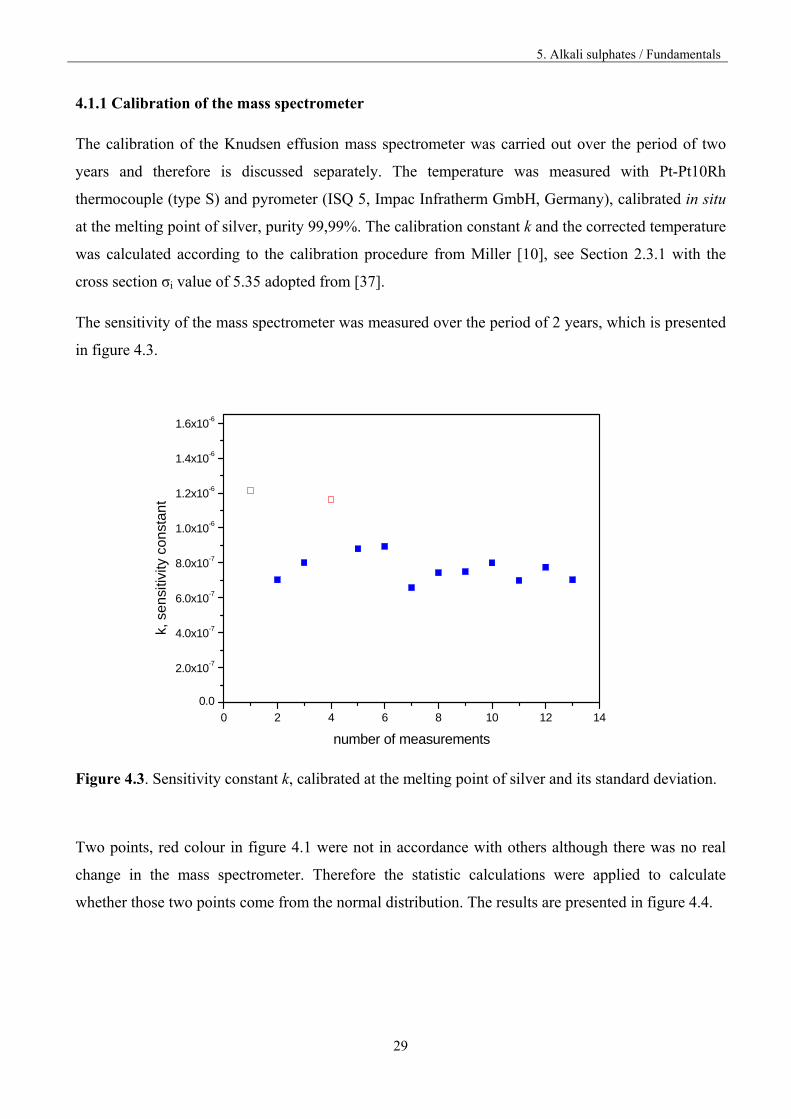
The sensitivity of the mass spectrometer was measured over the period of 2 years, which is presented
in figure 4.3.
0 2 4 6 8 10 12 14
0.0
2.0x10⁻⁷
4.0x10⁻⁷
6.0x10⁻⁷
8.0x10⁻⁷
1.0x10⁻⁶
1.2x10⁻⁶
1.4x10⁻⁶
1.6x10⁻⁶
k, s
ensi
tivity
con
stan
t
number of measurements
Figure 4.3. Sensitivity constant k, calibrated at the melting point of silver and its standard deviation.
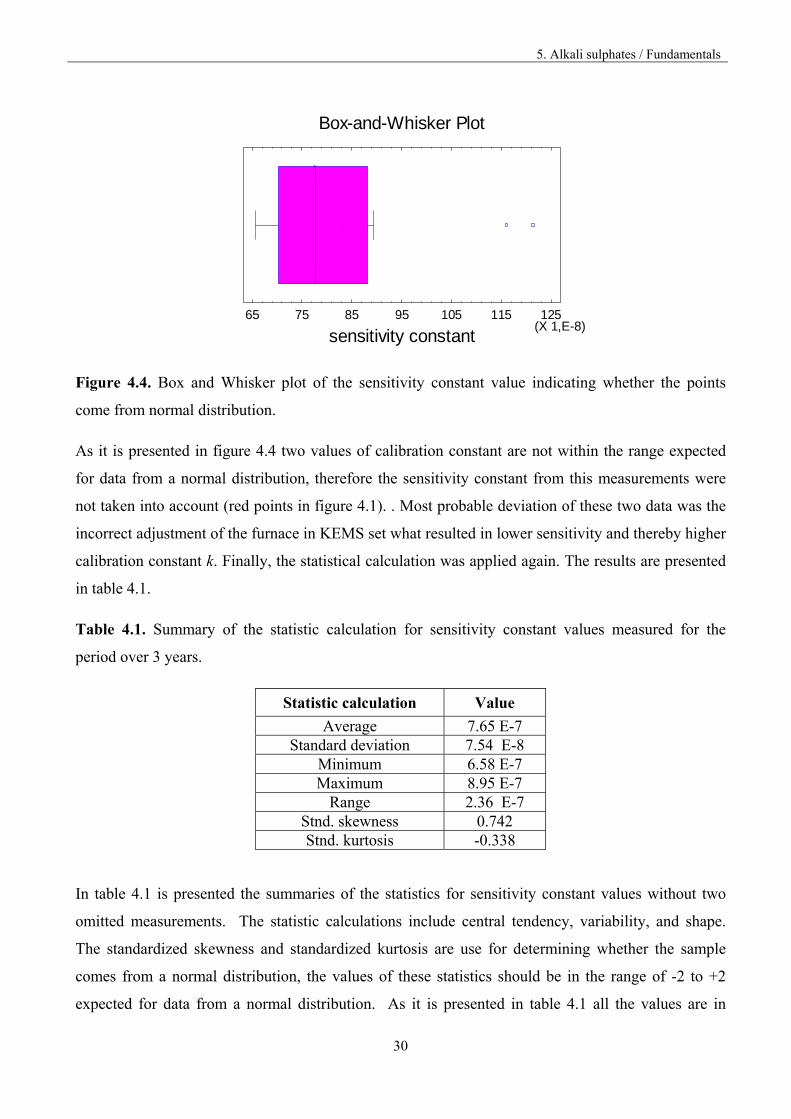
Two points, red colour in figure 4.1 were not in accordance with others although there was no real
change in the mass spectrometer. Therefore the statistic calculations were applied to calculate
whether those two points come from the normal distribution. The results are presented in figure 4.4.
5. Alkali sulphates / Fundamentals
30
Figure 4.4. Box and Whisker plot of the sensitivity constant value indicating whether the points
come from normal distribution.
As it is presented in figure 4.4 two values of calibration constant are not within the range expected
for data from a normal distribution, therefore the sensitivity constant from this measurements were
not taken into account (red points in figure 4.1). . Most probable deviation of these two data was the
incorrect adjustment of the furnace in KEMS set what resulted in lower sensitivity and thereby higher
calibration constant k. Finally, the statistical calculation was applied again. The results are presented
in table 4.1.
Table 4.1. Summary of the statistic calculation for sensitivity constant values measured for the
period over 3 years.
Statistic calculation Value
Average 7.65 E-7 Standard deviation 7.54 E-8
Minimum 6.58 E-7 Maximum 8.95 E-7
Range 2.36 E-7 Stnd. skewness 0.742 Stnd. kurtosis -0.338
In table 4.1 is presented the summaries of the statistics for sensitivity constant values without two
omitted measurements. The statistic calculations include central tendency, variability, and shape.
The standardized skewness and standardized kurtosis are use for determining whether the sample
comes from a normal distribution, the values of these statistics should be in the range of -2 to +2
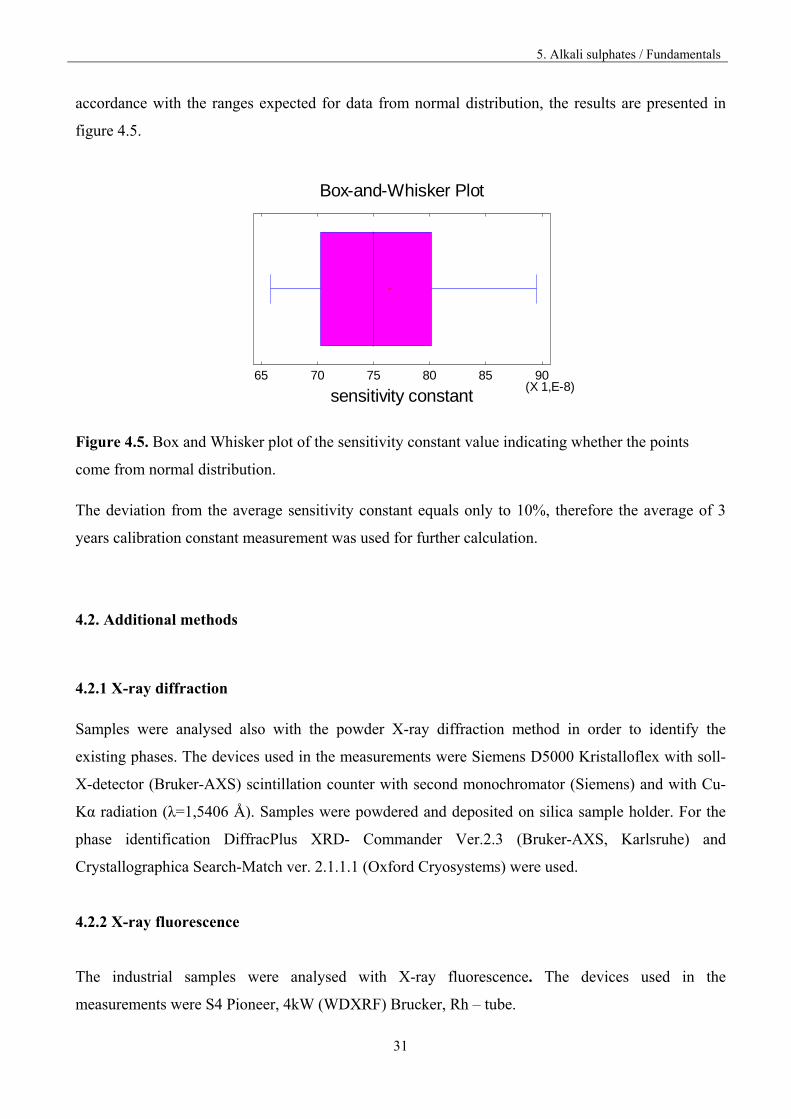
expected for data from a normal distribution. As it is presented in table 4.1 all the values are in
Box-and-Whisker Plot
65 75 85 95 105 115 125(X 1,E-8)
sensitivity constant
5. Alkali sulphates / Fundamentals
31
accordance with the ranges expected for data from normal distribution, the results are presented in
figure 4.5.
Figure 4.5. Box and Whisker plot of the sensitivity constant value indicating whether the points
come from normal distribution.
The deviation from the average sensitivity constant equals only to 10%, therefore the average of 3
years calibration constant measurement was used for further calculation.
4.2. Additional methods
4.2.1 X-ray diffraction
Samples were analysed also with the powder X-ray diffraction method in order to identify the
existing phases. The devices used in the measurements were Siemens D5000 Kristalloflex with soll-
X-detector (Bruker-AXS) scintillation counter with second monochromator (Siemens) and with Cu-
Kα radiation (λ=1,5406 Å). Samples were powdered and deposited on silica sample holder. For the
phase identification DiffracPlus XRD- Commander Ver.2.3 (Bruker-AXS, Karlsruhe) and
Crystallographica Search-Match ver. 2.1.1.1 (Oxford Cryosystems) were used.
4.2.2 X-ray fluorescence
The industrial samples were analysed with X-ray fluorescence. The devices used in the
measurements were S4 Pioneer, 4kW (WDXRF) Brucker, Rh – tube.
Box-and-Whisker Plot
sensitivity constant65 70 75 80 85 90
(X 1,E-8)
5. Alkali sulphates / Fundamentals
32
5. Alkali sulphates
5.1 Fundamentals
One of the more important elements influencing chemical transport via the gas phase in the rotary
kiln is sulphur, which can be introduced into the kiln by the raw meal and fuel. Alkali containing
compounds are also present in the kiln gas atmosphere and these have a high affinity for sulphur.
Reactions between SO2 and the alkali oxides (for instance solved in silicate and/or aluminasilicate
phases) to form alkali sulphates take place during oxidation. Alkali sulphates evaporate and then
condense in the colder parts of the reactor thereby contributing to a clogging formation [42]. Calcium
sulphate is also being formed in the cement kiln as a reaction product between CaO and SO2.
Calcium sulphate (CaSO4) can, in turn, build liquid and solid phases with alkali sulphates and so it
can moderate their chemical activity and vaporisation behaviour. The explanation of the chemical
transport of the sulphur and alkalis in the kiln on the thermodynamic base is therefore needed.
The first step was to determine the vaporisation of different systems containing alkali sulphates. First,
pure salts K2SO4, Na2SO4, CaSO4 were determined as a pattern for binary systems, which are
a) Na2SO4 – CaSO4
b) K2SO4 – CaSO4
At the sintering temperature of clinker about 1450 °C, the resulting sulphate systems are present as a
melt, the alkali sulphates K2SO4, Na2SO4, (Na, K)2SO4, a mixed crystal phase with variable
Na2O/K2O molar ratio are formed by crystallization of the sulphate melt, also a compound with
formula K2Ca2(SO4)3 or K2SO4·2CaSO4 is found [5]. Therefore the systems of sodium or potassium
sulphate together with CaSO4 were chosen to characterize the influence of the existence of CaO and
CaSO4, on the alkali sulphate vaporisation. Moreover another aim of choosing this system was the
investigation of interaction of SO2 liberating from CaSO4 decomposition at higher temperature range
on the alkali sulphates vaporisation. Such influences can be important for the description of the
overall mechanism of the alkalis vaporisation in the clinker kiln.
In this work, the system Na2SO4-K2SO4 previous determined by the Author [43] will be summarised
briefly, as these results have great importance in further understanding of the technical samples
vaporisation.
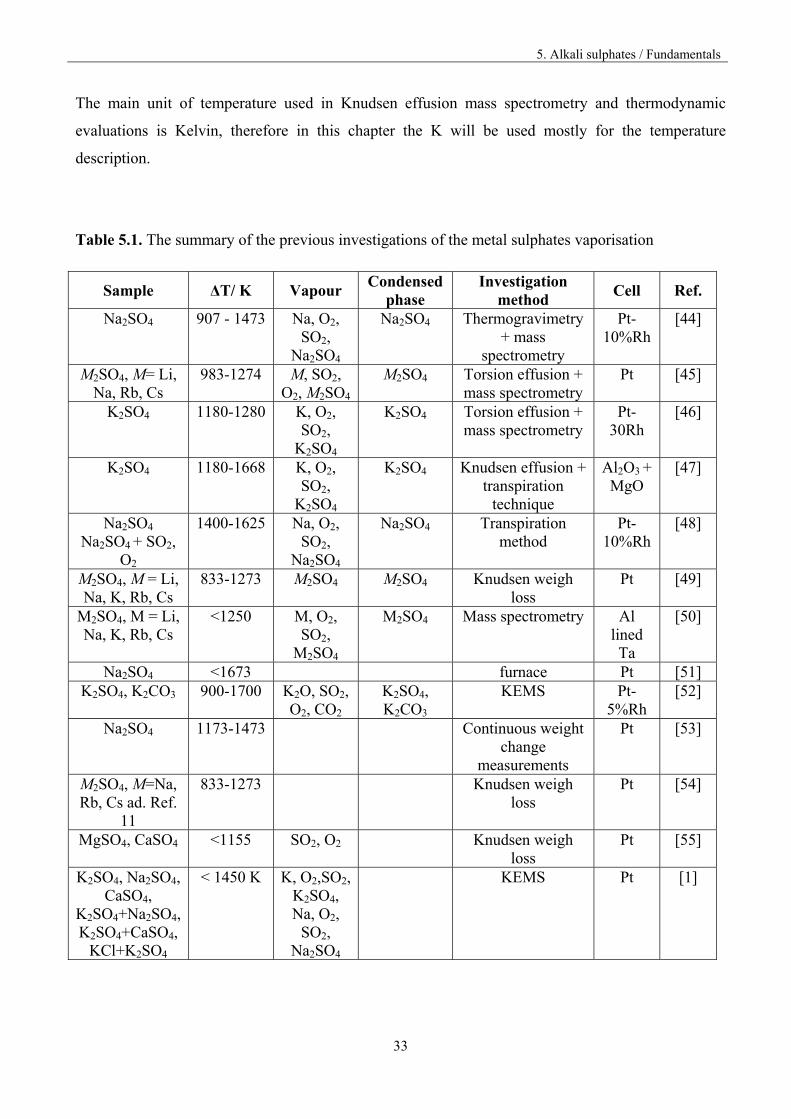
The vaporisation of metal sulphates was subject of the many previous determinations; table 5.1
summarizes most of the original works about vaporisation of pure metal sulphates and the metal
sulphate systems, performed by effusion methods, incl. KEMS.
5. Alkali sulphates / Fundamentals
33
The main unit of temperature used in Knudsen effusion mass spectrometry and thermodynamic
evaluations is Kelvin, therefore in this chapter the K will be used mostly for the temperature
description.
Table 5.1. The summary of the previous investigations of the metal sulphates vaporisation
Sample ΔT/ K Vapour Condensed
phase Investigation
method Cell Ref.
Na2SO4 907 - 1473 Na, O2, SO2,
Na2SO4
Na2SO4 Thermogravimetry + mass
spectrometry
Pt-10%Rh
[44]
M2SO4, M= Li, Na, Rb, Cs
983-1274 M, SO2, O2, M2SO4
M2SO4 Torsion effusion + mass spectrometry
Pt [45]
K2SO4 1180-1280 K, O2, SO2,
K2SO4
K2SO4 Torsion effusion + mass spectrometry
Pt-30Rh
[46]
K2SO4 1180-1668 K, O2, SO2,
K2SO4
K2SO4 Knudsen effusion + transpiration
technique
Al2O3 + MgO
[47]
Na2SO4 Na2SO4 + SO2,
O2
1400-1625 Na, O2, SO2,
Na2SO4
Na2SO4 Transpiration method
Pt-10%Rh
[48]
M2SO4, M = Li, Na, K, Rb, Cs
833-1273 M2SO4 M2SO4 Knudsen weigh loss
Pt [49]
M2SO4, M = Li, Na, K, Rb, Cs
<1250 M, O2, SO2,
M2SO4
M2SO4 Mass spectrometry Al lined Ta
[50]
Na2SO4 <1673 furnace Pt [51] K2SO4, K2CO3 900-1700 K2O, SO2,
O2, CO2 K2SO4, K2CO3
KEMS Pt-5%Rh
[52]
Na2SO4 1173-1473 Continuous weight change
measurements
Pt [53]
M2SO4, M=Na, Rb, Cs ad. Ref.
11
833-1273 Knudsen weigh loss
Pt [54]
MgSO4, CaSO4 <1155 SO2, O2 Knudsen weigh loss
Pt [55]
K2SO4, Na2SO4, CaSO4,
K2SO4+Na2SO4, K2SO4+CaSO4,
KCl+K2SO4
< 1450 K K, O2,SO2, K2SO4, Na, O2,
SO2, Na2SO4
KEMS Pt [1]
5. Alkali sulphates / Fundamentals
34
According to literature the vaporisation of the M2SO4 can be described by two reactions:
a) with dissociation
M2SO4(c) = 2M(g) + SO2(g) + O2(g) and (5.1)
b) without dissociation
M2SO4(c) = M2SO4(g) (5.2)
where M = K, Na.
The vaporisation processes in both cases are congruently ones, what means that both vapour and
condensed phases present still M2SO4 stoichiometry. In contrary, CaSO4 vaporises (decomposes)
incongruently according to reaction
CaSO4(c) = CaO (s) + ½ O2(g) + SO2(g) (5.3)
As the vaporisation of pure sulphates was deeply investigated, this work was mostly concentrated on
binary systems K2SO4-CaSO4 and Na2SO4-CaSO4, not investigated before. The aim of renewed pure
alkali sulphate vaporisation study was the division of the M+ ion among M2SO4(g) and M(g) gas
species, which was not solved in the previous work [1, 43]. The vaporisation of the pure sulphates
will be therefore only briefly presented.
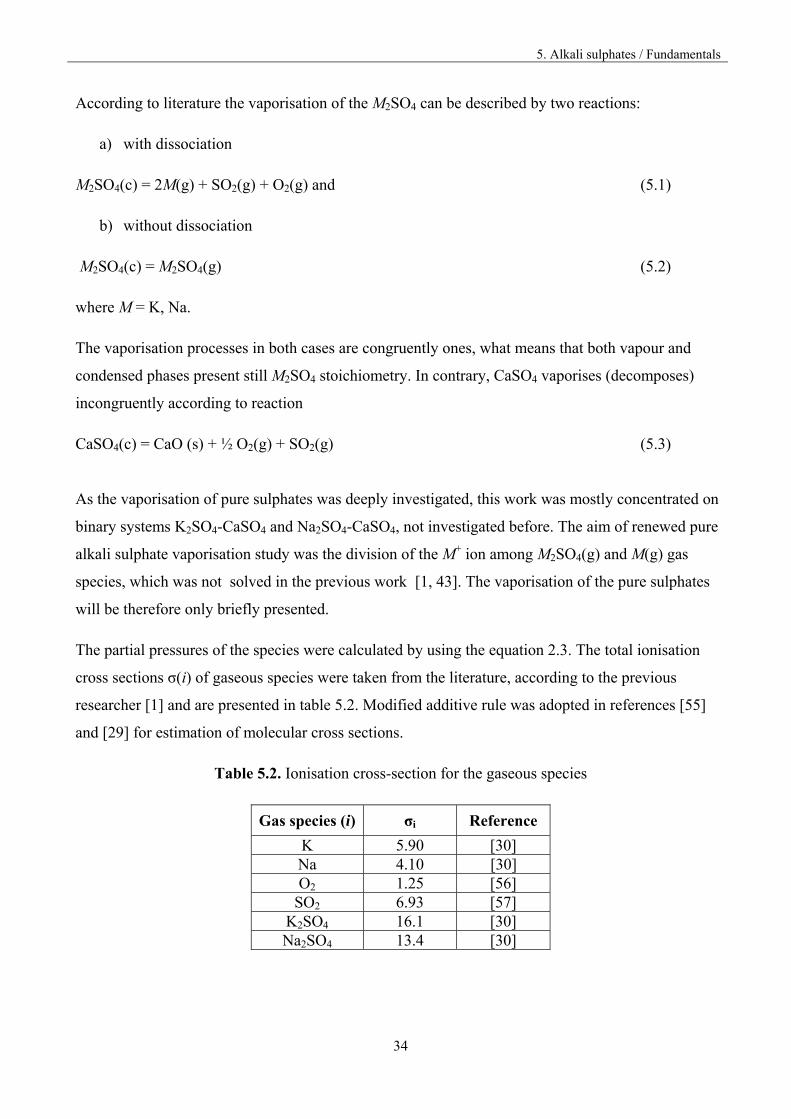
The partial pressures of the species were calculated by using the equation 2.3. The total ionisation
cross sections σ(i) of gaseous species were taken from the literature, according to the previous
researcher [1] and are presented in table 5.2. Modified additive rule was adopted in references [55]
and [29] for estimation of molecular cross sections.
Table 5.2. Ionisation cross-section for the gaseous species
Gas species (i) σi Reference
K 5.90 [30] Na 4.10 [30] O2 1.25 [56]
SO2 6.93 [57] K2SO4 16.1 [30] Na2SO4 13.4 [30]
5. Alkali sulphates / Vaporisation of Na2SO4
35
5.2. Vaporisation of Na2SO4
For the measurement, sodium sulphate (Fluka, for analysis 99%) was used. The sample was firstly
heated in the Knudsen cell in the mass spectrometer at the temp 873 K over the night before the
measurement started. Mass spectrometric study of the vaporisation of pure Na2SO4 was carried out
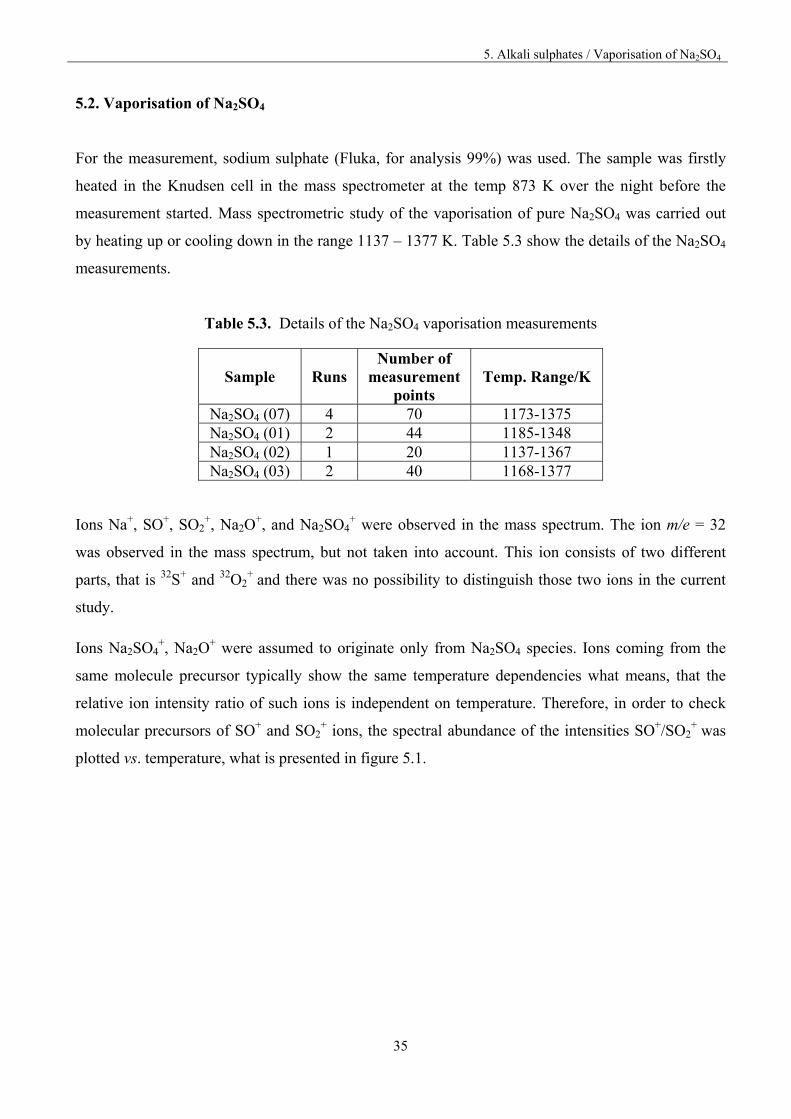
by heating up or cooling down in the range 1137 – 1377 K. Table 5.3 show the details of the Na2SO4
measurements.
Table 5.3. Details of the Na2SO4 vaporisation measurements
Sample
Runs
Number of measurement
points
Temp. Range/K
Na2SO4 (07) 4 70 1173-1375 Na2SO4 (01) 2 44 1185-1348 Na2SO4 (02) 1 20 1137-1367 Na2SO4 (03) 2 40 1168-1377
Ions Na+, SO+, SO2+, Na2O
+, and Na2SO4+ were observed in the mass spectrum. The ion m/e = 32
was observed in the mass spectrum, but not taken into account. This ion consists of two different
parts, that is 32S+ and 32O2+ and there was no possibility to distinguish those two ions in the current
study.
Ions Na2SO4+, Na2O
+ were assumed to originate only from Na2SO4 species. Ions coming from the
same molecule precursor typically show the same temperature dependencies what means, that the
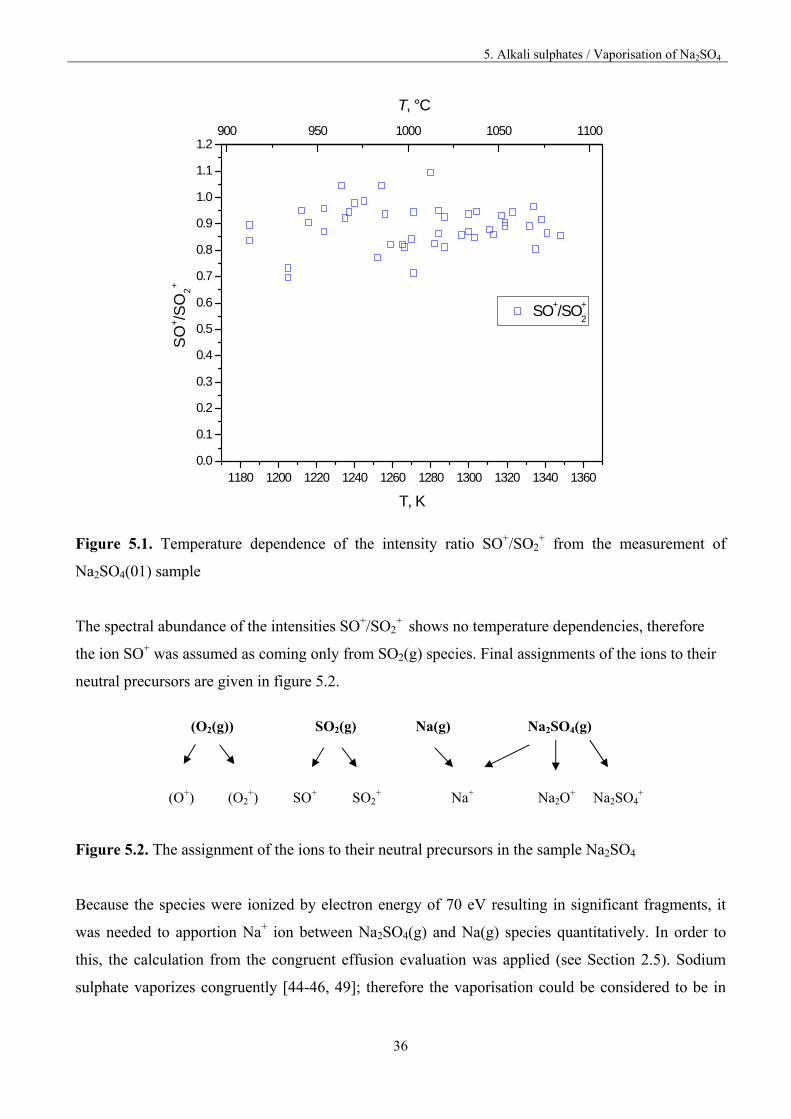
relative ion intensity ratio of such ions is independent on temperature. Therefore, in order to check
molecular precursors of SO+ and SO2+ ions, the spectral abundance of the intensities SO+/SO2
+ was
plotted vs. temperature, what is presented in figure 5.1.
5. Alkali sulphates / Vaporisation of Na2SO4
36
1180 1200 1220 1240 1260 1280 1300 1320 1340 13600.0
0.1
0.2
0.3
0.4
0.5
0.6
0.7
0.8
0.9
1.0
1.1
1.2
SO+/SO+
2
SO
+/S
O2
+
T, K
900 950 1000 1050 1100
T, °C
Figure 5.1. Temperature dependence of the intensity ratio SO+/SO2
+ from the measurement of
Na2SO4(01) sample
The spectral abundance of the intensities SO+/SO2+
shows no temperature dependencies, therefore
the ion SO+ was assumed as coming only from SO2(g) species. Final assignments of the ions to their
neutral precursors are given in figure 5.2.
(O2(g)) SO2(g) Na(g) Na2SO4(g)
(O+) (O2+)
SO+
SO2+
Na+
Na2O+
Na2SO4+
Figure 5.2. The assignment of the ions to their neutral precursors in the sample Na2SO4
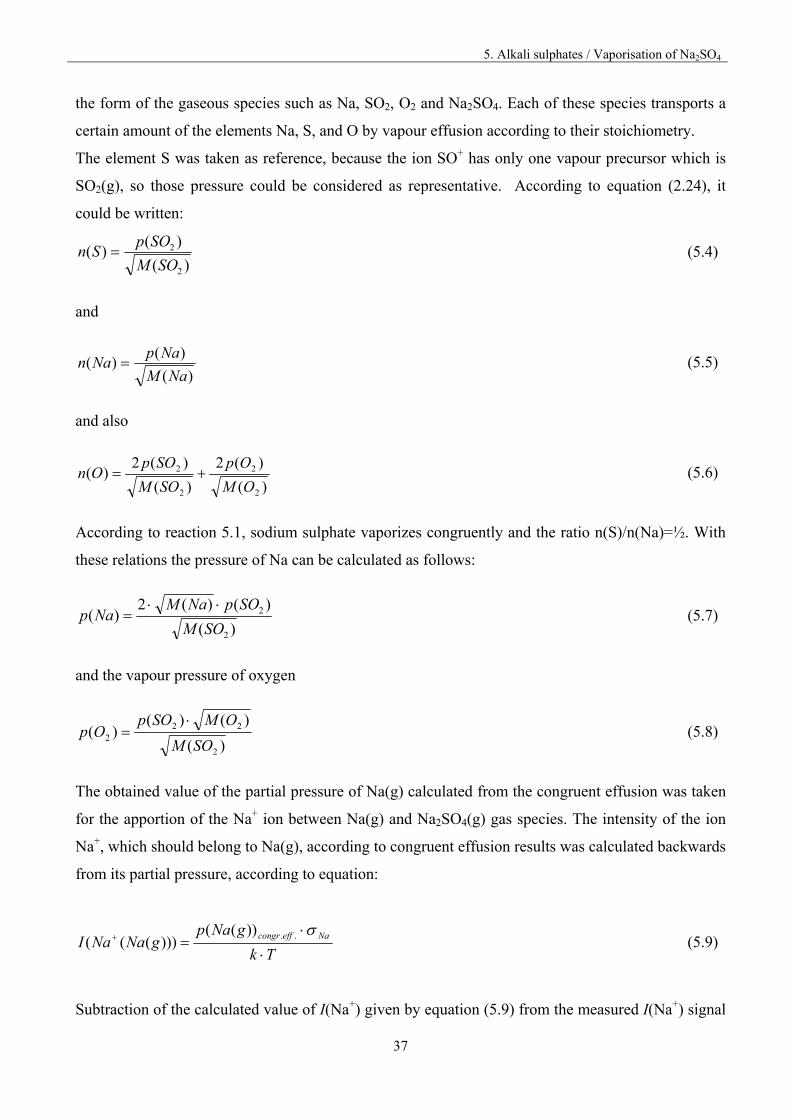
Because the species were ionized by electron energy of 70 eV resulting in significant fragments, it
was needed to apportion Na+ ion between Na2SO4(g) and Na(g) species quantitatively. In order to
this, the calculation from the congruent effusion evaluation was applied (see Section 2.5). Sodium
sulphate vaporizes congruently [44-46, 49]; therefore the vaporisation could be considered to be in
5. Alkali sulphates / Vaporisation of Na2SO4
37
the form of the gaseous species such as Na, SO2, O2 and Na2SO4. Each of these species transports a
certain amount of the elements Na, S, and O by vapour effusion according to their stoichiometry.
The element S was taken as reference, because the ion SO+ has only one vapour precursor which is
SO2(g), so those pressure could be considered as representative. According to equation (2.24), it
could be written:
)(
)()(
2
2
SOM
SOpSn (5.4)
and
)(
)()(
NaM
NapNan (5.5)
and also
)(
)(2
)(
)(2)(
2
2
2
2
OM
Op
SOM
SOpOn (5.6)
According to reaction 5.1, sodium sulphate vaporizes congruently and the ratio n(S)/n(Na)=½. With
these relations the pressure of Na can be calculated as follows:
)(
)()(2)(
2
2
SOM
SOpNaMNap
(5.7)
and the vapour pressure of oxygen
)(
)()()(
2
222
SOM
OMSOpOp
(5.8)
The obtained value of the partial pressure of Na(g) calculated from the congruent effusion was taken
for the apportion of the Na+ ion between Na(g) and Na2SO4(g) gas species. The intensity of the ion
Na+, which should belong to Na(g), according to congruent effusion results was calculated backwards
from its partial pressure, according to equation:
Tk
gNapgNaNaI Naeffcongr
..))((
)))((( (5.9)
Subtraction of the calculated value of I(Na+) given by equation (5.9) from the measured I(Na+) signal
5. Alkali sulphates / Vaporisation of Na2SO4
38
over condensed Na2SO4 remains in the part of I(Na+) fragment belonging to Na2SO4(g). Such
calculation could be applied, because the ionization cross section of the atom Na is well known from
the literature [30].
The apportion of the Na+ ion intensity between Na(g) and Na2SO4(g) allows the determination of the
equilibrium constant Kop (I) for reaction (5.1) and Ko
p (II) for reaction (5.2) using the precursor
assignment given in figure 5.1. The temperature dependence of the equilibrium constants was
evaluated for each run by the last squares method, and compared with literature data [40] at the
temperature of 1320 K. The results are presented in tables 5.4 – 5.5.
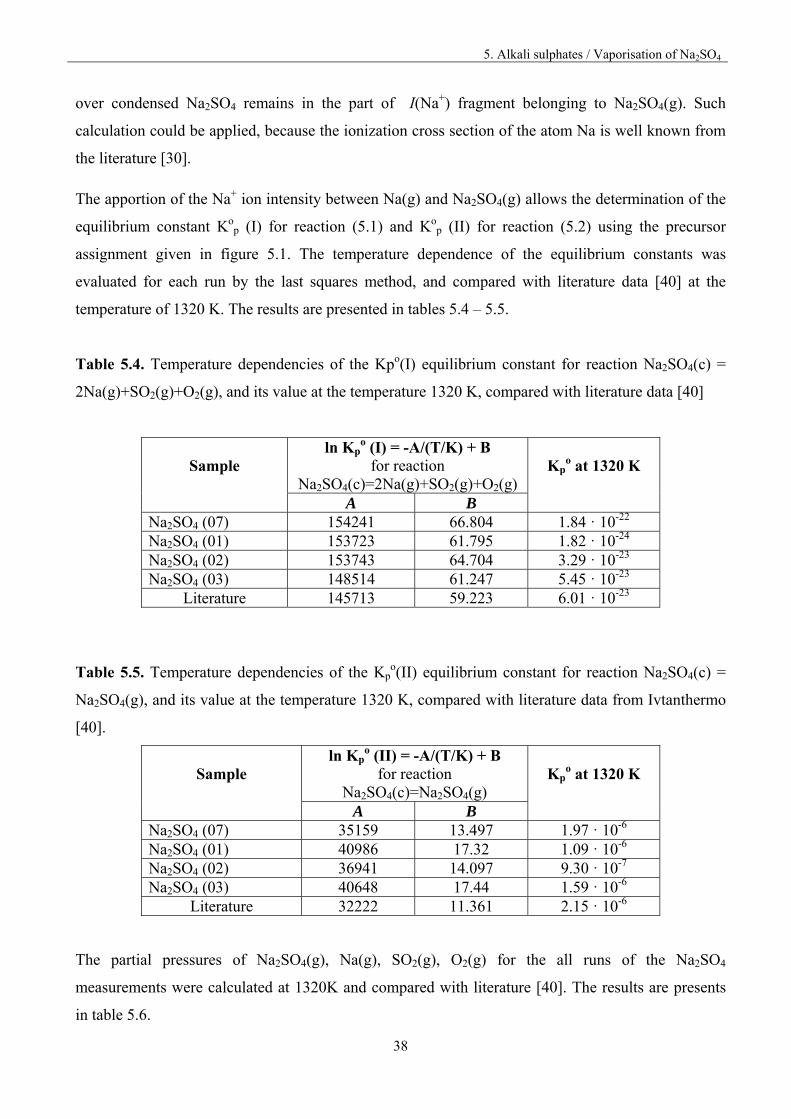
Table 5.4. Temperature dependencies of the Kpo(I) equilibrium constant for reaction Na2SO4(c) =
2Na(g)+SO2(g)+O2(g), and its value at the temperature 1320 K, compared with literature data [40]
Sample
ln Kpo (I) = -A/(T/K) + B
for reaction Na2SO4(c)=2Na(g)+SO2(g)+O2(g)
Kp
o at 1320 K
A B Na2SO4 (07) 154241 66.804 1.84 · 10-22
Na2SO4 (01) 153723 61.795 1.82 · 10-24
Na2SO4 (02) 153743 64.704 3.29 · 10-23
Na2SO4 (03) 148514 61.247 5.45 · 10-23
Literature 145713 59.223 6.01 · 10-23
Table 5.5. Temperature dependencies of the Kpo(II) equilibrium constant for reaction Na2SO4(c) =
Na2SO4(g), and its value at the temperature 1320 K, compared with literature data from Ivtanthermo
[40].
Sample
ln Kpo (II) = -A/(T/K) + B
for reaction Na2SO4(c)=Na2SO4(g)
Kp
o at 1320 K
A B Na2SO4 (07) 35159 13.497 1.97 · 10-6
Na2SO4 (01) 40986 17.32 1.09 · 10-6
Na2SO4 (02) 36941 14.097 9.30 · 10-7
Na2SO4 (03) 40648 17.44 1.59 · 10-6
Literature 32222 11.361 2.15 · 10-6
The partial pressures of Na2SO4(g), Na(g), SO2(g), O2(g) for the all runs of the Na2SO4
measurements were calculated at 1320K and compared with literature [40]. The results are presents
in table 5.6.
5. Alkali sulphates / Vaporisation of Na2SO4
39
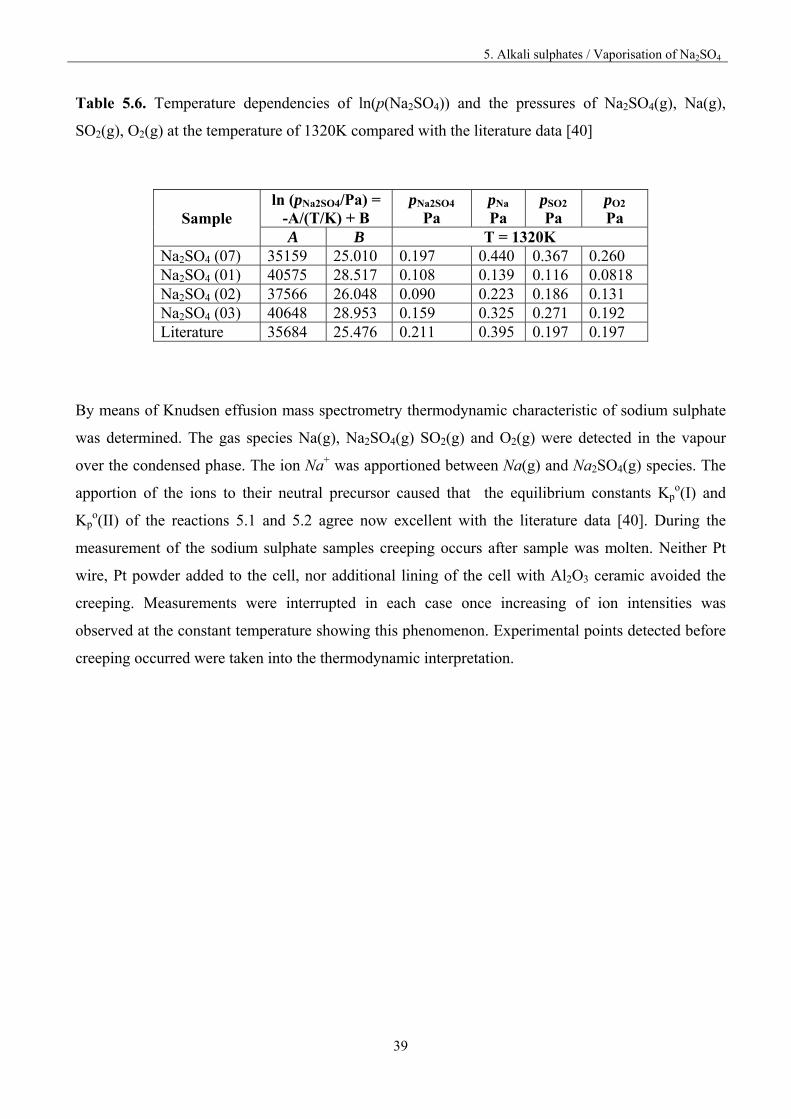
Table 5.6. Temperature dependencies of ln(p(Na2SO4)) and the pressures of Na2SO4(g), Na(g),
SO2(g), O2(g) at the temperature of 1320K compared with the literature data [40]
Sample ln (pNa2SO4/Pa) =
-A/(T/K) + B pNa2SO4
Pa pNa
PapSO2
Pa pO2
Pa A B T = 1320K
Na2SO4 (07) 35159 25.010 0.197 0.440 0.367 0.260 Na2SO4 (01) 40575 28.517 0.108 0.139 0.116 0.0818 Na2SO4 (02) 37566 26.048 0.090 0.223 0.186 0.131 Na2SO4 (03) 40648 28.953 0.159 0.325 0.271 0.192 Literature 35684 25.476 0.211 0.395 0.197 0.197
By means of Knudsen effusion mass spectrometry thermodynamic characteristic of sodium sulphate
was determined. The gas species Na(g), Na2SO4(g) SO2(g) and O2(g) were detected in the vapour
over the condensed phase. The ion Na+ was apportioned between Na(g) and Na2SO4(g) species. The
apportion of the ions to their neutral precursor caused that the equilibrium constants Kpo(I) and
Kpo(II) of the reactions 5.1 and 5.2 agree now excellent with the literature data [40]. During the
measurement of the sodium sulphate samples creeping occurs after sample was molten. Neither Pt
wire, Pt powder added to the cell, nor additional lining of the cell with Al2O3 ceramic avoided the
creeping. Measurements were interrupted in each case once increasing of ion intensities was
observed at the constant temperature showing this phenomenon. Experimental points detected before
creeping occurred were taken into the thermodynamic interpretation.
5. Alkali sulphates / Vaporisation of K2SO4
40
5.3. Vaporisation of K2SO4
For the measurement, potassium sulphate (Riedel-de Haen, anhydrous for analysis >99%) was used.
The sample was initially heated in the Knudsen cell in the mass spectrometer at the temp 873 K over
the night before the measurement started. Mass spectrometric study of the vaporisation of pure
K2SO4 was carried out by heating up or cooling down in the range 1172 – 1361 K. Over the period of
two days 39 measurement points were registered.
Ions K+, SO+, SO2+, K2O
+, and K2SO4+ were observed in the mass spectrum. The ion m/e = 32 was
observed in the mass spectrum, but not taken into account, for the same reason as describe in chapter
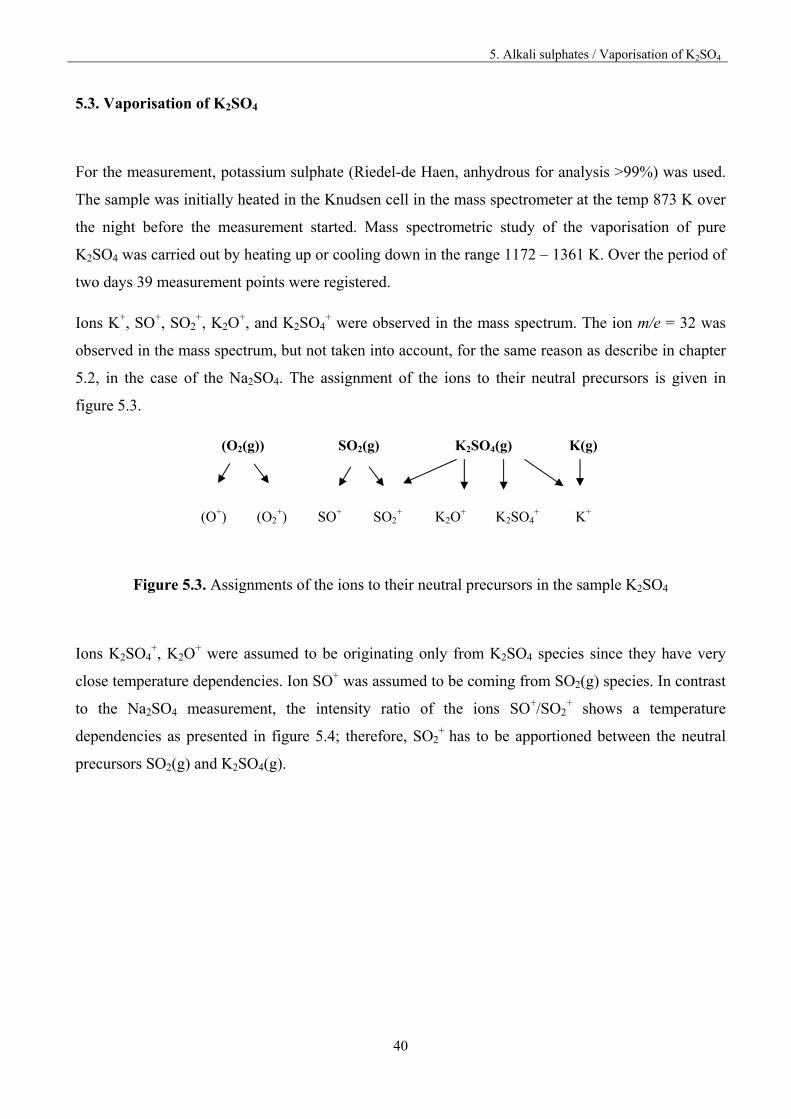
5.2, in the case of the Na2SO4. The assignment of the ions to their neutral precursors is given in
figure 5.3.
(O2(g)) SO2(g) K2SO4(g) K(g)
(O+) (O2+)
SO+
SO2+
K2O+
K2SO4+ K+
Figure 5.3. Assignments of the ions to their neutral precursors in the sample K2SO4
Ions K2SO4+, K2O
+ were assumed to be originating only from K2SO4 species since they have very
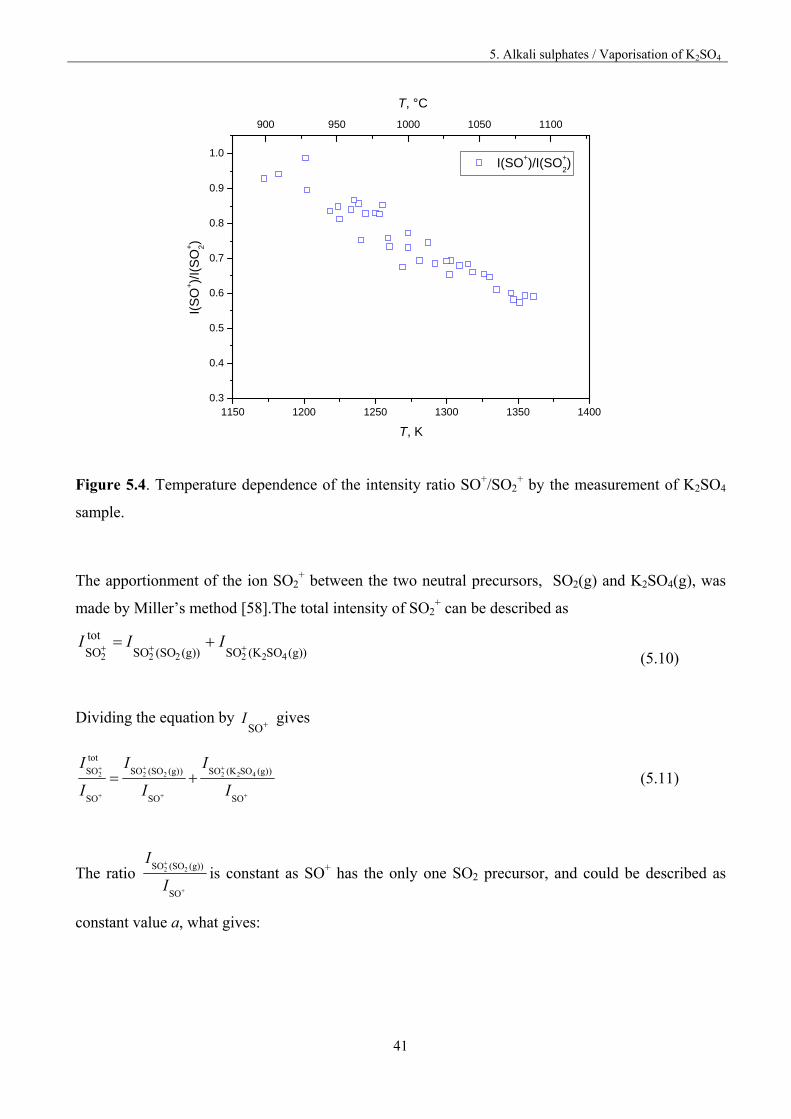
close temperature dependencies. Ion SO+ was assumed to be coming from SO2(g) species. In contrast
to the Na2SO4 measurement, the intensity ratio of the ions SO+/SO2+ shows a temperature
dependencies as presented in figure 5.4; therefore, SO2+ has to be apportioned between the neutral
precursors SO2(g) and K2SO4(g).
5. Alkali sulphates / Vaporisation of K2SO4
41
1150 1200 1250 1300 1350 14000.3
0.4
0.5
0.6
0.7
0.8
0.9
1.0
I(SO+)/I(SO+
2)
I(S
O+)/
I(S
O+ 2)
T, K
900 950 1000 1050 1100
T, °C
Figure 5.4. Temperature dependence of the intensity ratio SO+/SO2+ by the measurement of K2SO4
sample.
The apportionment of the ion SO2+ between the two neutral precursors, SO2(g) and K2SO4(g), was
made by Miller’s method [58].The total intensity of SO2+ can be described as
)(g)SO(KSO)(g)(SOSO
tot
SO 422222 III
(5.10)
Dividing the equation by SOI gives
SO
)(g)SO(KSO
SO
)(g)(SOSO
SO
tot
SO 422222
I
I
I
I
I
I (5.11)
The ratio
SO
)(g)(SOSO 22
I
Iis constant as SO+ has the only one SO2 precursor, and could be described as
constant value a, what gives:
5. Alkali sulphates / Vaporisation of K2SO4
42
SO
)(g)SO(KSO
SO
)(g)SO(KSO
SO
)(g)(SOSO
SO
tot
SO 422422222
I
Ia
I
I
I
I
I
I
(5.12)
The fraction
SO
)(g)SO(KSO 422
I
I is extended by
42
42
SOK
SOK
I
I and then split into two fractions
SO
SOK
SOK
)(g)SO(KSO
SO
tot
SO 42
42
4222
I
I
I
Ia
I
I
(5.13)
The ratio
42
422
SOK
)(g)SO(KSO
I
I is constant as ions come from the same neutral precursor, so it could be further
called constant value b and one obtain the final equation (5.14).
SO
SOK
SO
tot
SO 422
I
Iba
I
I (5.14)
where a and b are spectral ion intensity ratios in the specific mass spectrum of SO2(g) and K2SO4(g),
respectively and, therefore, do not depend on either the composition or the temperature [59]. The
values of a and b constant ratio were determined by linear regression using the ion intensities vs.
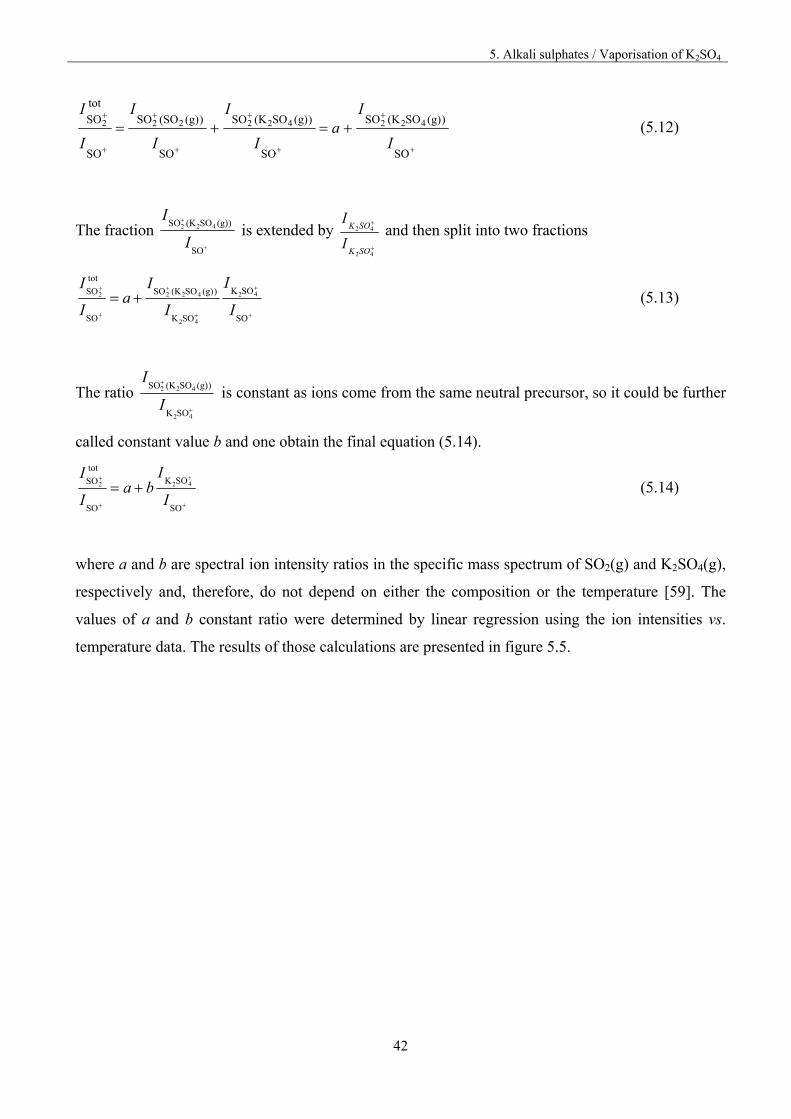
temperature data. The results of those calculations are presented in figure 5.5.
5. Alkali sulphates / Vaporisation of K2SO4
43
0.40 0.45 0.50 0.55 0.60 0.65 0.70 0.75
0.6
0.8
1.0
1.2
1.4
1.6
1.8
2.0
2.2
2.4
SO+
2/SO+
SO
+ 2/S
O+
K2SO+
4/SO+
y = 1.397x + 0.6159
Figure 5.5. The apportionment of the SO2
+ ion between K2SO4(g) and SO2(g) species, where
a=0.616, b= 1.40.
Following equations (5.15), (5.16) will distribute the ion intensity of tot
SO2I between the precursor
molecules SO2(g) and K2SO4(g).
SOgSOSO
II 62.0))(( 22
(5.15)
42422
40.1))(( SOKgSOKSO
II (5.16)
For apportion of the ion K+ between K2SO4(g) and K(g) species, similarly as by the Na2SO4 sample,
the calculation from the congruent effusion was applied. Potassium sulphate vaporises congruently
[46, 47, 49, 52], therefore the vaporisation of K2SO4 could be considered in the form of the gaseous
species such as K, SO2, O2. Each of these species transports by vapour effusion certain amount of
specific atoms (K, S, O) according to their stoichiometry. Atom of S was taken as reference, because
the ion SO+ and apportioned ion SO2+ has the only one source which is SO2(g), thus those pressure
could be considered as reference, according to the equation 5.4. Potassium sulphate vaporizes
congruently, and according to the reaction 5.1, therefore, similarly as in the case of Na2SO4 sample,
the calculation of the congruent effusion from the appropriate equations 5.5 – 5.8 could be applied.
5. Alkali sulphates / Vaporisation of K2SO4
44
The obtained value of the partial pressure of K(g) was taken for the apportion of the K+ ion
distribution between K(g) and K2SO4(g), as it was done by the Na2SO4 sample. The intensity of the
ion K+, belonging to K(g), was calculated backwards from the partial pressure K(g) value, according
to equation (5.17).
Tk
gKpKI Keffcongr
..))((
)( (5.17)
The obtained value of I(K+) calculated from equation (5.17) was subtracted from the whole measured
intensity of K+, which yielded the intensities of K+ belonging to K2SO4(g). The ionization cross
section of the atom K is well know, and reported before [30, 60], hence this calculation could be
applied. The apportioning of the ion to their neutral precursor in per cent is presented in table 5.7.
Table 5.7. The fragmentation scheme of SO2(g), K2SO4(g) and K(g).
Fragmentation of the species
SO2(g) K2SO4(g) K(g) SO+ SO2
+ K+ SO2+ K2O
+ K2SO4+ K+
63% 37% 85% 6.0% 3.5% 5.5% 100% After the apportioning of the ion SO2
+ between SO2(g) and K2SO4(g) and the ion K+ between K(g)
and K2SO4(g) species, the temperature dependence of the equilibrium constant Kpo(I) for reaction
(5.1) and Kpo(II) for reaction (5.2) was evaluated for each run by the last squares method. The results
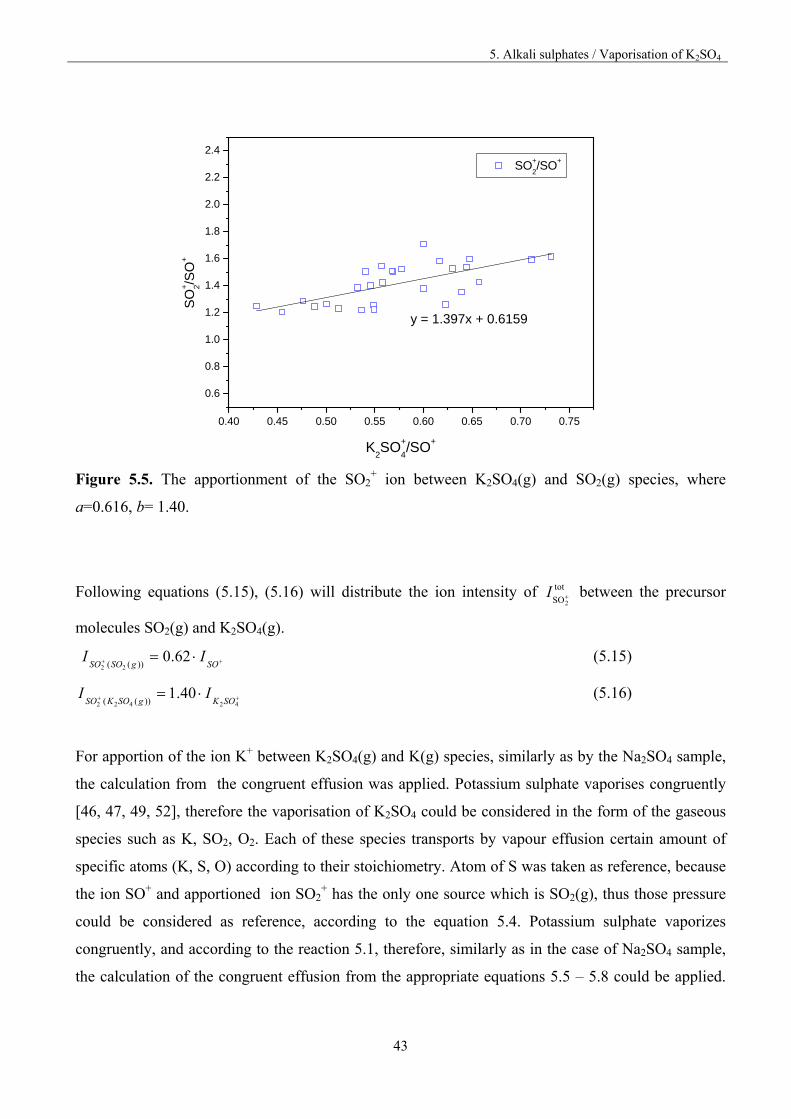
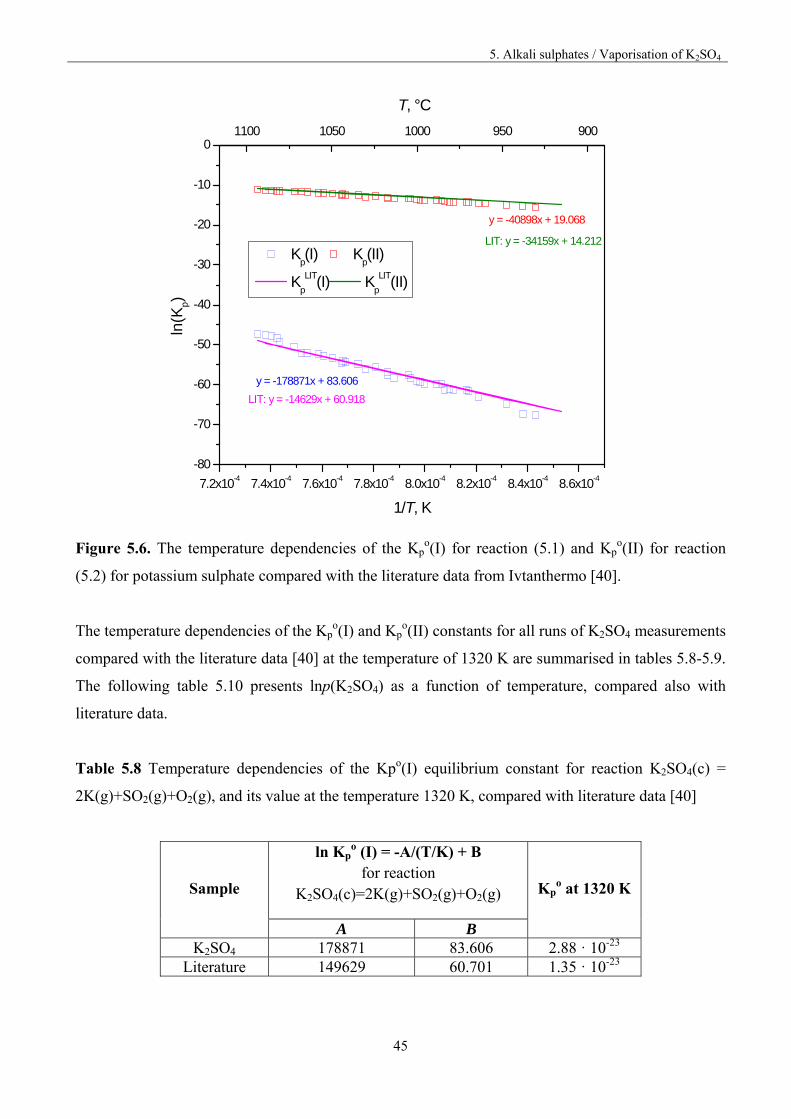
are presented graphically in figure 5.6.
5. Alkali sulphates / Vaporisation of K2SO4
45
7.2x10⁻⁴ 7.4x10⁻⁴ 7.6x10⁻⁴ 7.8x10⁻⁴ 8.0x10⁻⁴ 8.2x10⁻⁴ 8.4x10⁻⁴ 8.6x10⁻⁴
-80
-70
-60
-50
-40
-30
-20
-10
0
ln(K
p)
1/T, K
LIT: y = -34159x + 14.212
y = -40898x + 19.068
LIT: y = -14629x + 60.918
y = -178871x + 83.606
Kp(I) K
p(II)
Kp
LIT(I) Kp
LIT(II)
1100 1050 1000 950 900
T, °C
Figure 5.6. The temperature dependencies of the Kp
o(I) for reaction (5.1) and Kpo(II) for reaction
(5.2) for potassium sulphate compared with the literature data from Ivtanthermo [40].
The temperature dependencies of the Kpo(I) and Kp
o(II) constants for all runs of K2SO4 measurements
compared with the literature data [40] at the temperature of 1320 K are summarised in tables 5.8-5.9.
The following table 5.10 presents lnp(K2SO4) as a function of temperature, compared also with
literature data.
Table 5.8 Temperature dependencies of the Kpo(I) equilibrium constant for reaction K2SO4(c) =
2K(g)+SO2(g)+O2(g), and its value at the temperature 1320 K, compared with literature data [40]
Sample
ln Kpo (I) = -A/(T/K) + B
for reaction K2SO4(c)=2K(g)+SO2(g)+O2(g)
Kpo at 1320 K
A B K2SO4 178871 83.606 2.88 · 10-23
Literature 149629 60.701 1.35 · 10-23
5. Alkali sulphates / Vaporisation of K2SO4
46
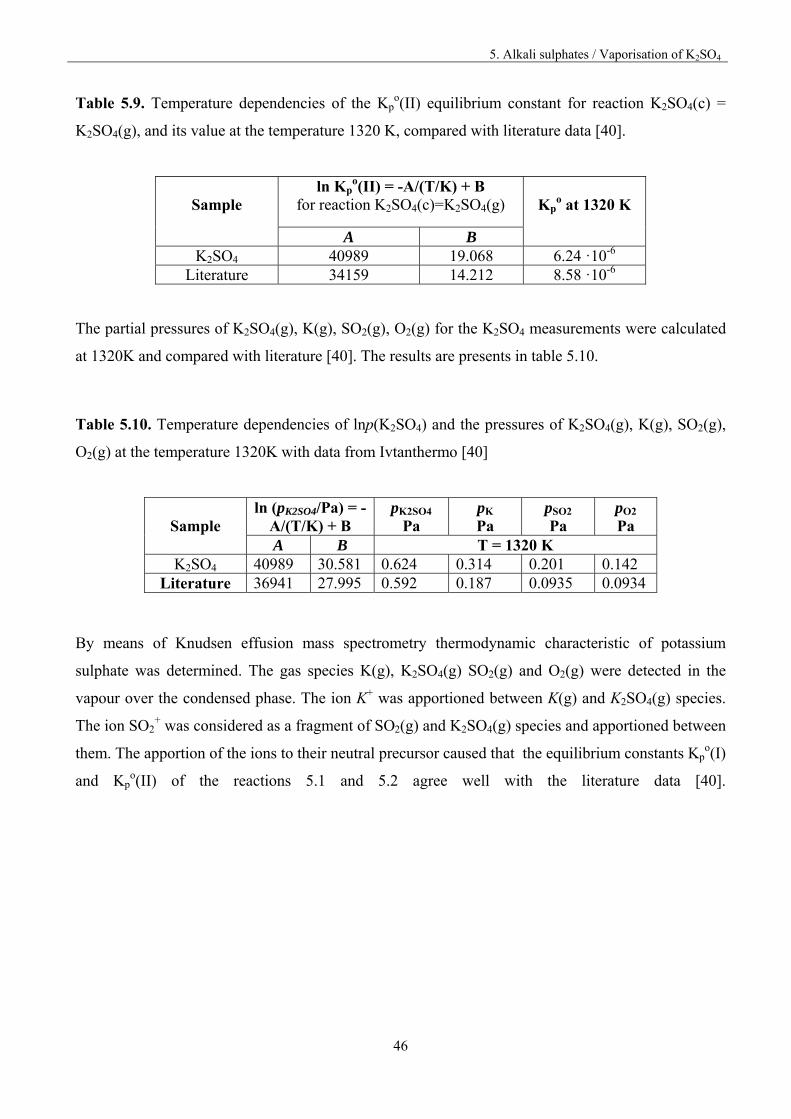
Table 5.9. Temperature dependencies of the Kpo(II) equilibrium constant for reaction K2SO4(c) =
K2SO4(g), and its value at the temperature 1320 K, compared with literature data [40].
Sample
ln Kpo(II) = -A/(T/K) + B
for reaction K2SO4(c)=K2SO4(g)
Kpo at 1320 K
A B K2SO4 40989 19.068 6.24 ·10-6
Literature 34159 14.212 8.58 ·10-6
The partial pressures of K2SO4(g), K(g), SO2(g), O2(g) for the K2SO4 measurements were calculated
at 1320K and compared with literature [40]. The results are presents in table 5.10.
Table 5.10. Temperature dependencies of lnp(K2SO4) and the pressures of K2SO4(g), K(g), SO2(g),
O2(g) at the temperature 1320K with data from Ivtanthermo [40]
Sample
ln (pK2SO4/Pa) = -A/(T/K) + B
pK2SO4
Pa pK
Pa pSO2
Pa pO2
Pa A B T = 1320 K
K2SO4 40989 30.581 0.624 0.314 0.201 0.142 Literature 36941 27.995 0.592 0.187 0.0935 0.0934
By means of Knudsen effusion mass spectrometry thermodynamic characteristic of potassium
sulphate was determined. The gas species K(g), K2SO4(g) SO2(g) and O2(g) were detected in the
vapour over the condensed phase. The ion K+ was apportioned between K(g) and K2SO4(g) species.
The ion SO2+ was considered as a fragment of SO2(g) and K2SO4(g) species and apportioned between
them. The apportion of the ions to their neutral precursor caused that the equilibrium constants Kpo(I)
and Kpo(II) of the reactions 5.1 and 5.2 agree well with the literature data [40].
5. Alkali sulphates / Vaporisation of CaSO4
47
5.4. Vaporisation of CaSO4
For the measurement, calcium sulphate (Riedel-de Haen, dehydrate, for analysis >99%) was used.
The sample was first heated in the Knudsen cell in the mass spectrometer at the temperature 873 K
over the night before the measurement started in order to remove the moisture. Mass spectrometric
study of the vaporisation of pure CaSO4 was carried out by heating up or cooling down in the range
1143 – 1324 K. The details of the CaSO4 measurements are presented in table 5.11.
Table 5.11. Details of the CaSO4 vaporisation measurements
Sample Runs Number of
measurements points
Temp. range, K
CaSO4(01) 3 37 1153 - 1312 CaSO4(02) 3 38 1143 - 1324
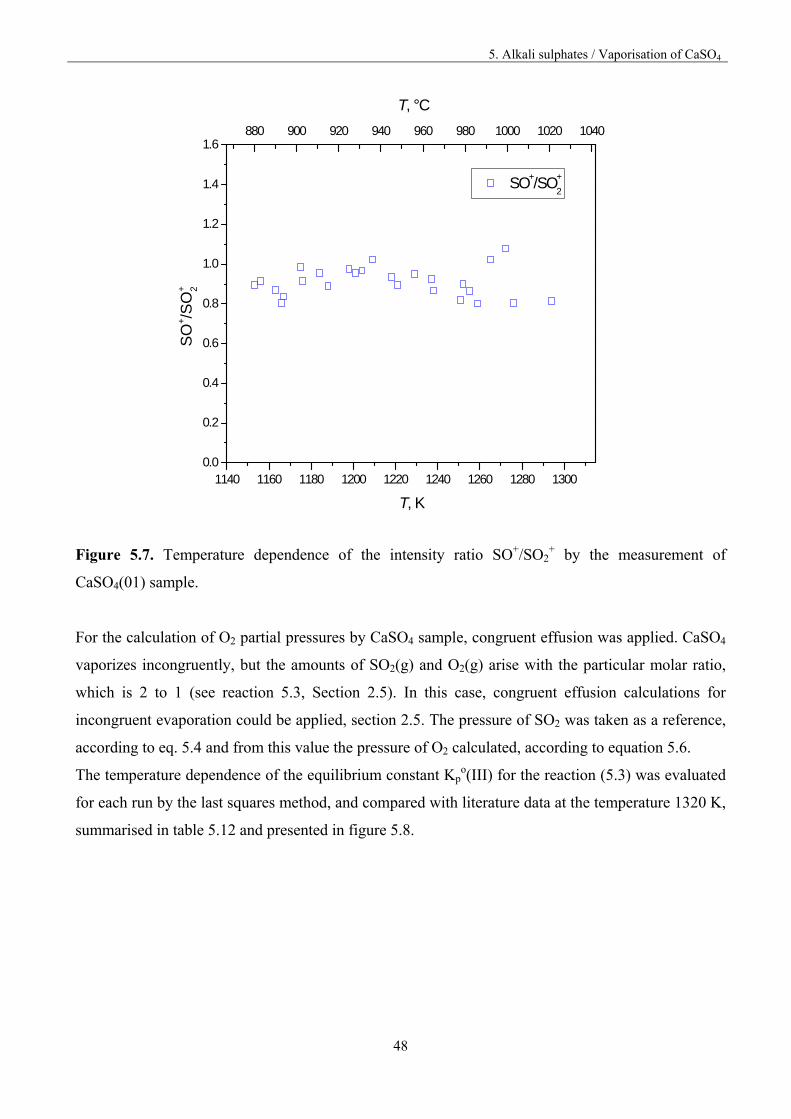
Only ions SO+, and SO2
+ were observed in the mass spectrum. The ion 32 was observed but not taken
into account for the same reason as in the case of Na2SO4 and K2SO4.
In the case of the CaSO4 sample, the ions SO+ and SO2+ have only one precursor, that is SO2(g),
because CaSO4 vaporizes incongruently according to reaction 5.3. Therefore, relative ion intensity
ratio of SO+/SO2+ ions must be independent of temperature, which was confirmed by plotting
SO+/SO2+ intensities ratio versus temperature, presented in figure 5.7.
5. Alkali sulphates / Vaporisation of CaSO4
48
1140 1160 1180 1200 1220 1240 1260 1280 13000.0
0.2
0.4
0.6
0.8
1.0
1.2
1.4
1.6
SO+/SO+
2S
O+/S
O+ 2
T, K
880 900 920 940 960 980 1000 1020 1040
T, °C
Figure 5.7. Temperature dependence of the intensity ratio SO+/SO2+ by the measurement of
CaSO4(01) sample.
For the calculation of O2 partial pressures by CaSO4 sample, congruent effusion was applied. CaSO4
vaporizes incongruently, but the amounts of SO2(g) and O2(g) arise with the particular molar ratio,
which is 2 to 1 (see reaction 5.3, Section 2.5). In this case, congruent effusion calculations for
incongruent evaporation could be applied, section 2.5. The pressure of SO2 was taken as a reference,
according to eq. 5.4 and from this value the pressure of O2 calculated, according to equation 5.6.
The temperature dependence of the equilibrium constant Kpo(III) for the reaction (5.3) was evaluated
for each run by the last squares method, and compared with literature data at the temperature 1320 K,
summarised in table 5.12 and presented in figure 5.8.
5. Alkali sulphates / Vaporisation of CaSO4
49
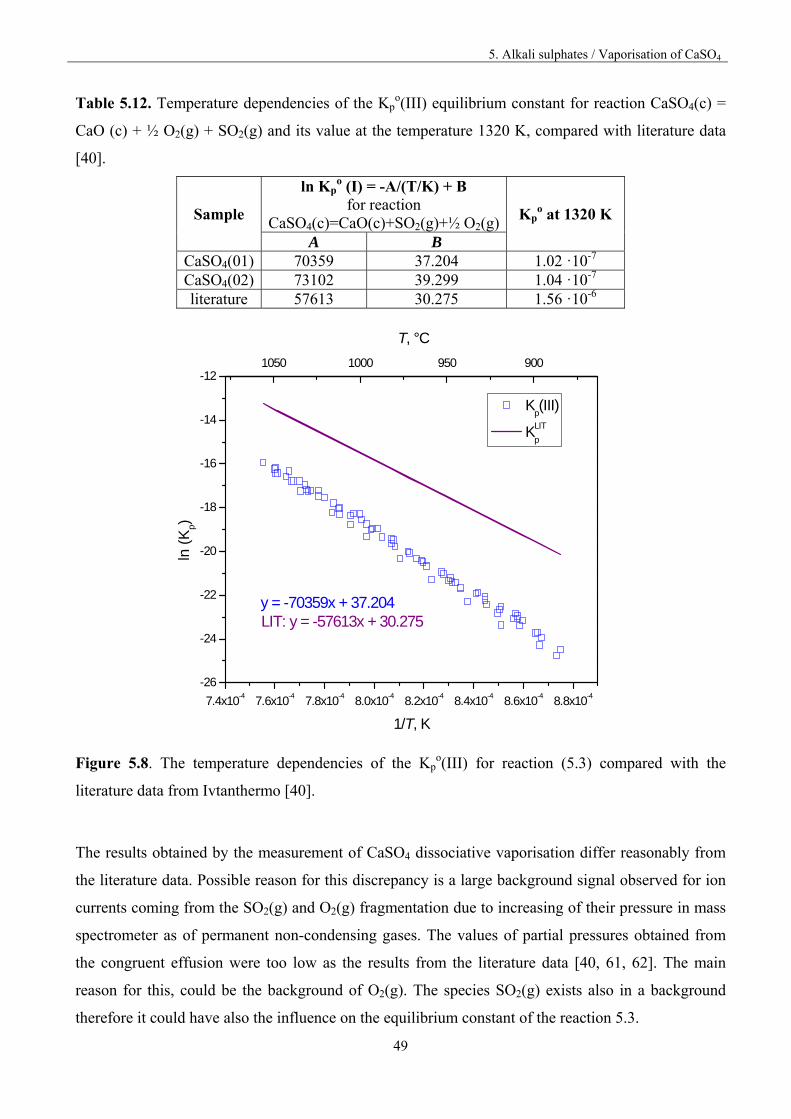
Table 5.12. Temperature dependencies of the Kpo(III) equilibrium constant for reaction CaSO4(c) =
CaO (c) + ½ O2(g) + SO2(g) and its value at the temperature 1320 K, compared with literature data
[40].
Sample
ln Kpo (I) = -A/(T/K) + B
for reaction CaSO4(c)=CaO(c)+SO2(g)+½ O2(g) Kp
o at 1320 K
A B CaSO4(01) 70359 37.204 1.02 ·10-7 CaSO4(02) 73102 39.299 1.04 ·10-7
literature 57613 30.275 1.56 ·10-6
7.4x10⁻⁴ 7.6x10⁻⁴ 7.8x10⁻⁴ 8.0x10⁻⁴ 8.2x10⁻⁴ 8.4x10⁻⁴ 8.6x10⁻⁴ 8.8x10⁻⁴
-26
-24
-22
-20
-18
-16
-14
-12
Kp(III)
KLIT
p
ln (
Kp)
1/T, K
LIT: y = -57613x + 30.275y = -70359x + 37.204
1050 1000 950 900
T, °C
Figure 5.8. The temperature dependencies of the Kp
o(III) for reaction (5.3) compared with the
literature data from Ivtanthermo [40].
The results obtained by the measurement of CaSO4 dissociative vaporisation differ reasonably from
the literature data. Possible reason for this discrepancy is a large background signal observed for ion
currents coming from the SO2(g) and O2(g) fragmentation due to increasing of their pressure in mass
spectrometer as of permanent non-condensing gases. The values of partial pressures obtained from
the congruent effusion were too low as the results from the literature data [40, 61, 62]. The main
reason for this, could be the background of O2(g). The species SO2(g) exists also in a background
therefore it could have also the influence on the equilibrium constant of the reaction 5.3.
5. Alkali sulphates / System Na2SO4 - CaSO4
50
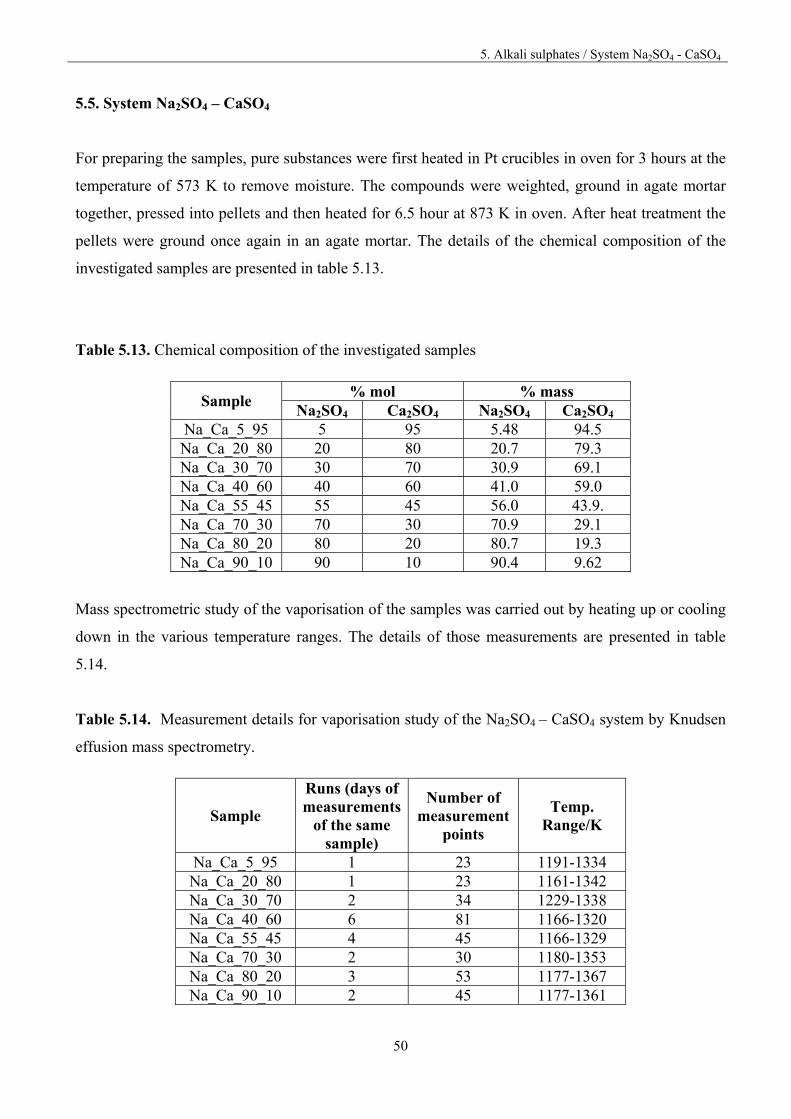
5.5. System Na2SO4 – CaSO4
For preparing the samples, pure substances were first heated in Pt crucibles in oven for 3 hours at the
temperature of 573 K to remove moisture. The compounds were weighted, ground in agate mortar
together, pressed into pellets and then heated for 6.5 hour at 873 K in oven. After heat treatment the
pellets were ground once again in an agate mortar. The details of the chemical composition of the
investigated samples are presented in table 5.13.
Table 5.13. Chemical composition of the investigated samples
Sample % mol % mass
Na2SO4 Ca2SO4 Na2SO4 Ca2SO4 Na_Ca_5_95 5 95 5.48 94.5 Na_Ca_20_80 20 80 20.7 79.3 Na_Ca_30_70 30 70 30.9 69.1 Na_Ca_40_60 40 60 41.0 59.0 Na_Ca_55_45 55 45 56.0 43.9. Na_Ca_70_30 70 30 70.9 29.1 Na_Ca_80_20 80 20 80.7 19.3 Na_Ca_90_10 90 10 90.4 9.62
Mass spectrometric study of the vaporisation of the samples was carried out by heating up or cooling
down in the various temperature ranges. The details of those measurements are presented in table
5.14.
Table 5.14. Measurement details for vaporisation study of the Na2SO4 – CaSO4 system by Knudsen
effusion mass spectrometry.
Sample
Runs (days of measurements
of the same sample)
Number of measurement
points
Temp. Range/K
Na_Ca_5_95 1 23 1191-1334 Na_Ca_20_80 1 23 1161-1342 Na_Ca_30_70 2 34 1229-1338 Na_Ca_40_60 6 81 1166-1320 Na_Ca_55_45 4 45 1166-1329 Na_Ca_70_30 2 30 1180-1353 Na_Ca_80_20 3 53 1177-1367 Na_Ca_90_10 2 45 1177-1361
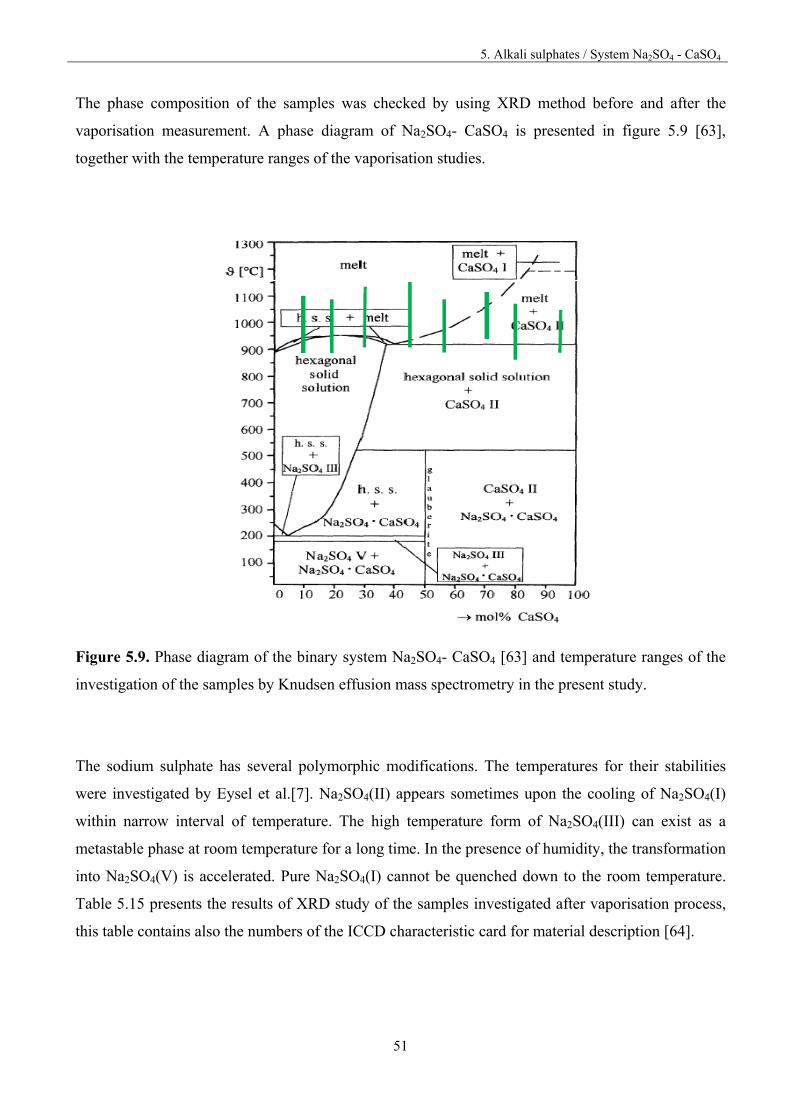
5. Alkali sulphates / System Na2SO4 - CaSO4
51
The phase composition of the samples was checked by using XRD method before and after the
vaporisation measurement. A phase diagram of Na2SO4- CaSO4 is presented in figure 5.9 [63],
together with the temperature ranges of the vaporisation studies.
Figure 5.9. Phase diagram of the binary system Na2SO4- CaSO4 [63] and temperature ranges of the
investigation of the samples by Knudsen effusion mass spectrometry in the present study.
The sodium sulphate has several polymorphic modifications. The temperatures for their stabilities
were investigated by Eysel et al.[7]. Na2SO4(II) appears sometimes upon the cooling of Na2SO4(I)
within narrow interval of temperature. The high temperature form of Na2SO4(III) can exist as a
metastable phase at room temperature for a long time. In the presence of humidity, the transformation
into Na2SO4(V) is accelerated. Pure Na2SO4(I) cannot be quenched down to the room temperature.
Table 5.15 presents the results of XRD study of the samples investigated after vaporisation process,
this table contains also the numbers of the ICCD characteristic card for material description [64].
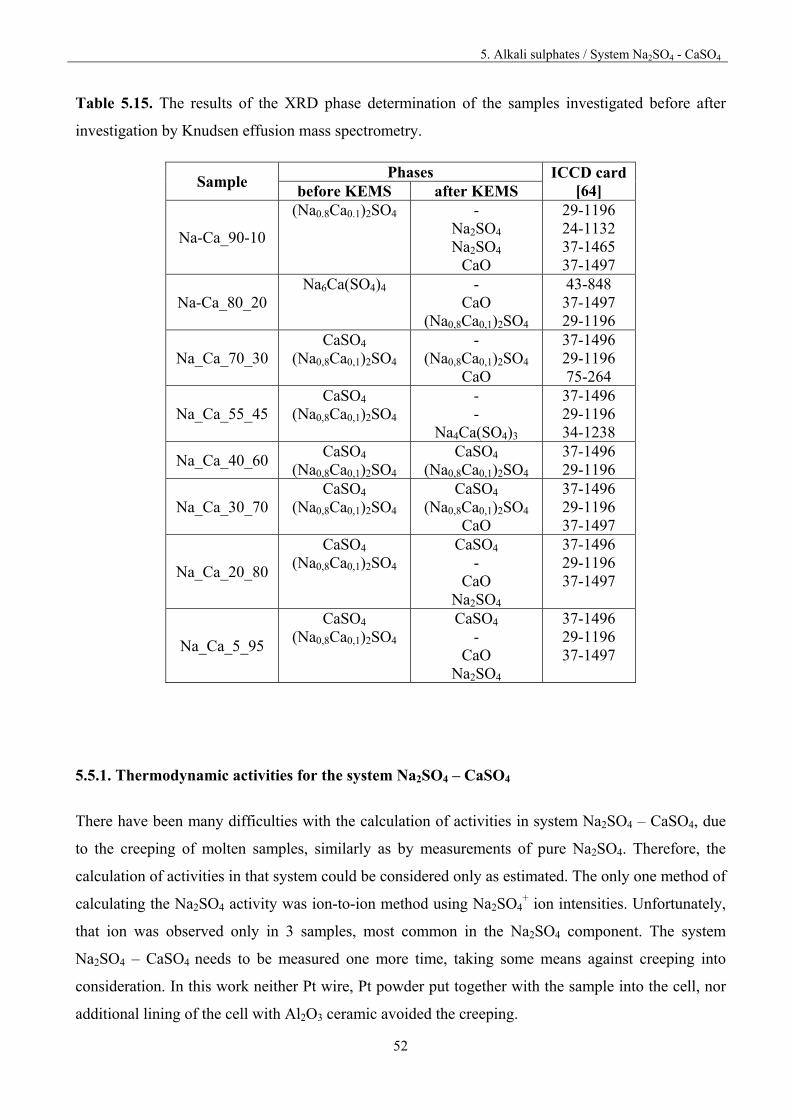
5. Alkali sulphates / System Na2SO4 - CaSO4
52
Table 5.15. The results of the XRD phase determination of the samples investigated before after
investigation by Knudsen effusion mass spectrometry.
Sample Phases ICCD card
[64] before KEMS after KEMS
Na-Ca_90-10
(Na0.8Ca0.1)2SO4
- Na2SO4 Na2SO4
CaO
29-1196 24-1132 37-1465 37-1497
Na-Ca_80_20 Na6Ca(SO4)4
-
CaO (Na0,8Ca0,1)2SO4
43-848 37-1497 29-1196
Na_Ca_70_30 CaSO4
(Na0,8Ca0,1)2SO4 -
(Na0,8Ca0,1)2SO4
CaO
37-1496 29-1196 75-264
Na_Ca_55_45 CaSO4
(Na0,8Ca0,1)2SO4 - -
Na4Ca(SO4)3
37-1496 29-1196 34-1238
Na_Ca_40_60 CaSO4
(Na0,8Ca0,1)2SO4 CaSO4
(Na0,8Ca0,1)2SO4 37-1496 29-1196
Na_Ca_30_70 CaSO4
(Na0,8Ca0,1)2SO4
CaSO4 (Na0,8Ca0,1)2SO4
CaO
37-1496 29-1196 37-1497
Na_Ca_20_80
CaSO4 (Na0,8Ca0,1)2SO4
CaSO4 -
CaO Na2SO4
37-1496 29-1196 37-1497
Na_Ca_5_95
CaSO4 (Na0,8Ca0,1)2SO4
CaSO4 -
CaO Na2SO4
37-1496 29-1196 37-1497
5.5.1. Thermodynamic activities for the system Na2SO4 – CaSO4
There have been many difficulties with the calculation of activities in system Na2SO4 – CaSO4, due
to the creeping of molten samples, similarly as by measurements of pure Na2SO4. Therefore, the
calculation of activities in that system could be considered only as estimated. The only one method of
calculating the Na2SO4 activity was ion-to-ion method using Na2SO4+ ion intensities. Unfortunately,
that ion was observed only in 3 samples, most common in the Na2SO4 component. The system
Na2SO4 – CaSO4 needs to be measured one more time, taking some means against creeping into
consideration. In this work neither Pt wire, Pt powder put together with the sample into the cell, nor
additional lining of the cell with Al2O3 ceramic avoided the creeping.
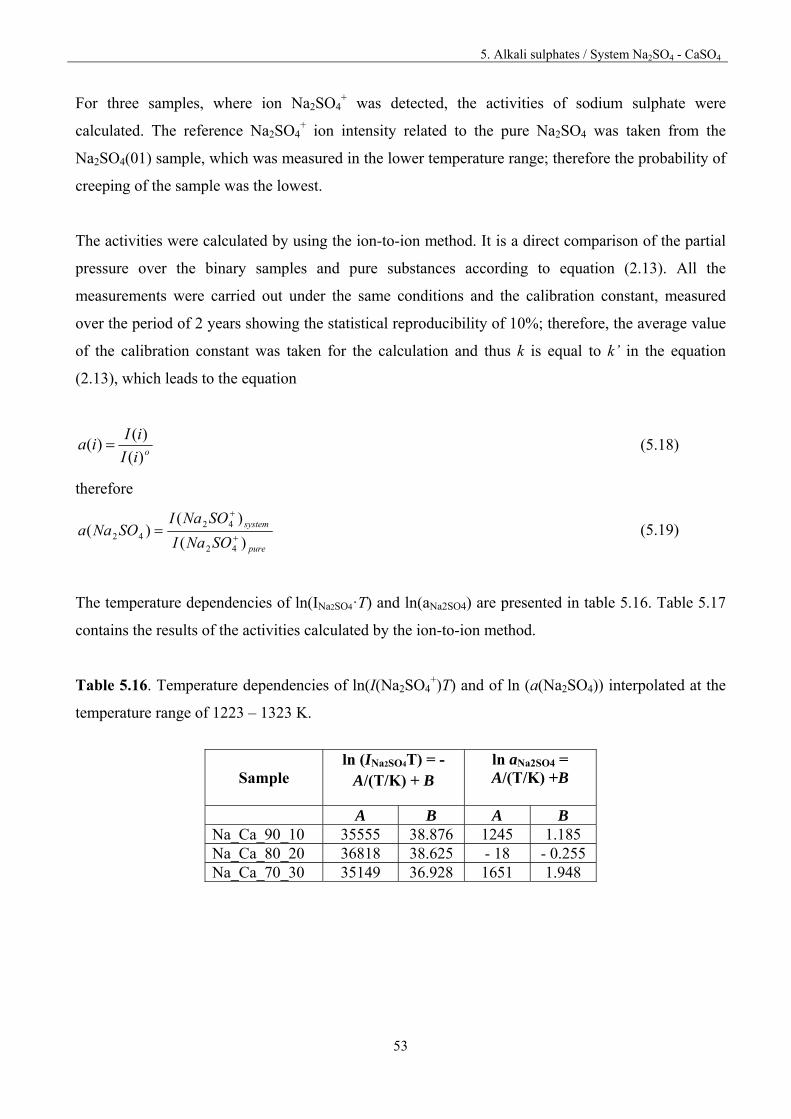
5. Alkali sulphates / System Na2SO4 - CaSO4
53
For three samples, where ion Na2SO4+ was detected, the activities of sodium sulphate were
calculated. The reference Na2SO4+ ion intensity related to the pure Na2SO4 was taken from the
Na2SO4(01) sample, which was measured in the lower temperature range; therefore the probability of
creeping of the sample was the lowest.
The activities were calculated by using the ion-to-ion method. It is a direct comparison of the partial
pressure over the binary samples and pure substances according to equation (2.13). All the
measurements were carried out under the same conditions and the calibration constant, measured
over the period of 2 years showing the statistical reproducibility of 10%; therefore, the average value
of the calibration constant was taken for the calculation and thus k is equal to k’ in the equation
(2.13), which leads to the equation
oiI
iIia
)(
)()( (5.18)
therefore
pure
system
SONaI
SONaISONaa
)(
)()(
42
4242
(5.19)
The temperature dependencies of ln(INa2SO4·T) and ln(aNa2SO4) are presented in table 5.16. Table 5.17
contains the results of the activities calculated by the ion-to-ion method.
Table 5.16. Temperature dependencies of ln(I(Na2SO4+)T) and of ln (a(Na2SO4)) interpolated at the
temperature range of 1223 – 1323 K.
Sample ln (INa2SO4T) = -
A/(T/K) + B ln aNa2SO4 = A/(T/K) +B
A B A B Na_Ca_90_10 35555 38.876 1245 1.185 Na_Ca_80_20 36818 38.625 - 18 - 0.255 Na_Ca_70_30 35149 36.928 1651 1.948
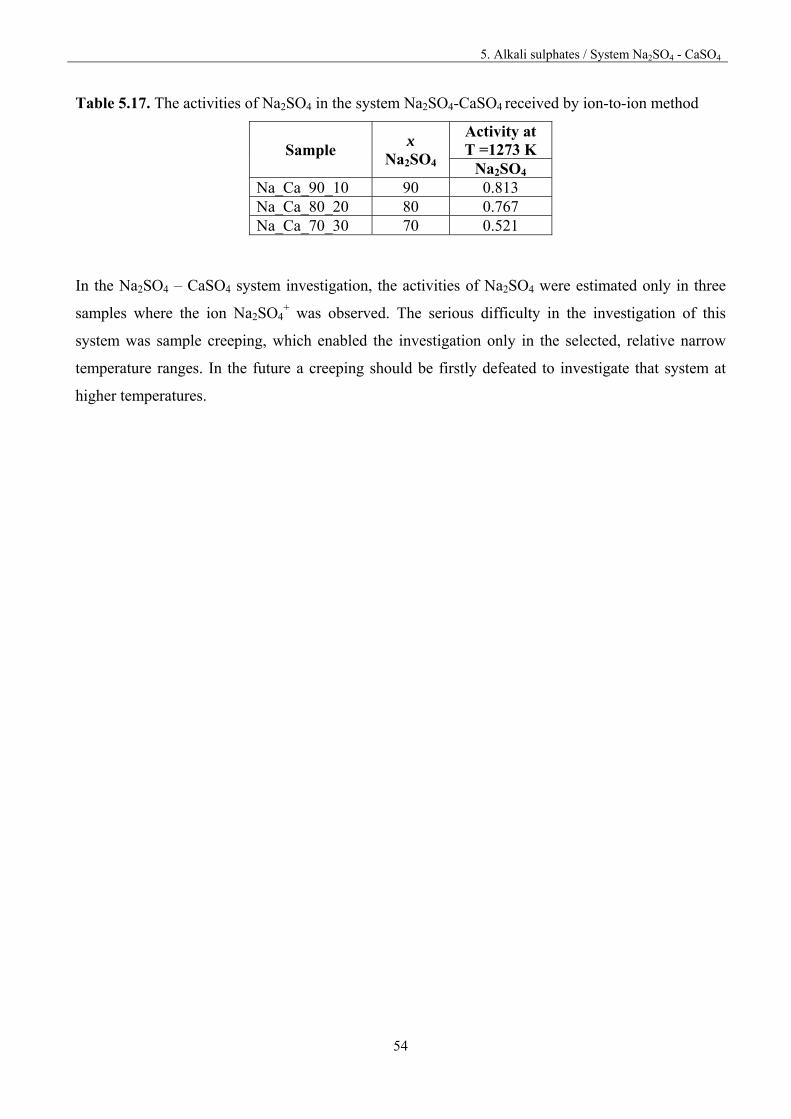
5. Alkali sulphates / System Na2SO4 - CaSO4
54
Table 5.17. The activities of Na2SO4 in the system Na2SO4-CaSO4 received by ion-to-ion method
Sample x
Na2SO4
Activity at T =1273 K
Na2SO4 Na_Ca_90_10 90 0.813 Na_Ca_80_20 80 0.767 Na_Ca_70_30 70 0.521
In the Na2SO4 – CaSO4 system investigation, the activities of Na2SO4 were estimated only in three
samples where the ion Na2SO4+ was observed. The serious difficulty in the investigation of this
system was sample creeping, which enabled the investigation only in the selected, relative narrow
temperature ranges. In the future a creeping should be firstly defeated to investigate that system at
higher temperatures.
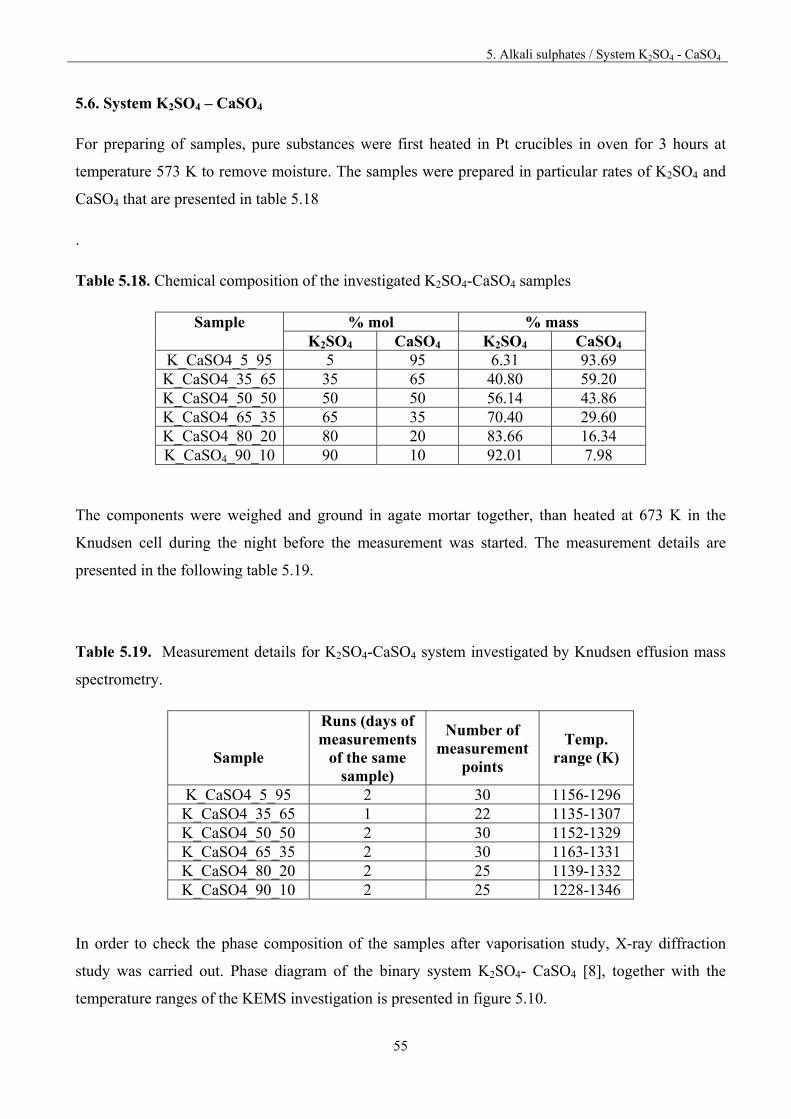
5. Alkali sulphates / System K2SO4 - CaSO4
55
5.6. System K2SO4 – CaSO4
For preparing of samples, pure substances were first heated in Pt crucibles in oven for 3 hours at
temperature 573 K to remove moisture. The samples were prepared in particular rates of K2SO4 and
CaSO4 that are presented in table 5.18
.
Table 5.18. Chemical composition of the investigated K2SO4-CaSO4 samples
Sample % mol % mass K2SO4 CaSO4 K2SO4 CaSO4
K_CaSO4_5_95 5 95 6.31 93.69 K_CaSO4_35_65 35 65 40.80 59.20 K_CaSO4_50_50 50 50 56.14 43.86 K_CaSO4_65_35 65 35 70.40 29.60 K_CaSO4_80_20 80 20 83.66 16.34 K_CaSO4_90_10 90 10 92.01 7.98
The components were weighed and ground in agate mortar together, than heated at 673 K in the
Knudsen cell during the night before the measurement was started. The measurement details are
presented in the following table 5.19.
Table 5.19. Measurement details for K2SO4-CaSO4 system investigated by Knudsen effusion mass
spectrometry.
Sample
Runs (days of measurements
of the same sample)
Number of measurement
points
Temp. range (K)
K_CaSO4_5_95 2 30 1156-1296 K_CaSO4_35_65 1 22 1135-1307 K_CaSO4_50_50 2 30 1152-1329 K_CaSO4_65_35 2 30 1163-1331 K_CaSO4_80_20 2 25 1139-1332 K_CaSO4_90_10 2 25 1228-1346
In order to check the phase composition of the samples after vaporisation study, X-ray diffraction
study was carried out. Phase diagram of the binary system K2SO4- CaSO4 [8], together with the
temperature ranges of the KEMS investigation is presented in figure 5.10.
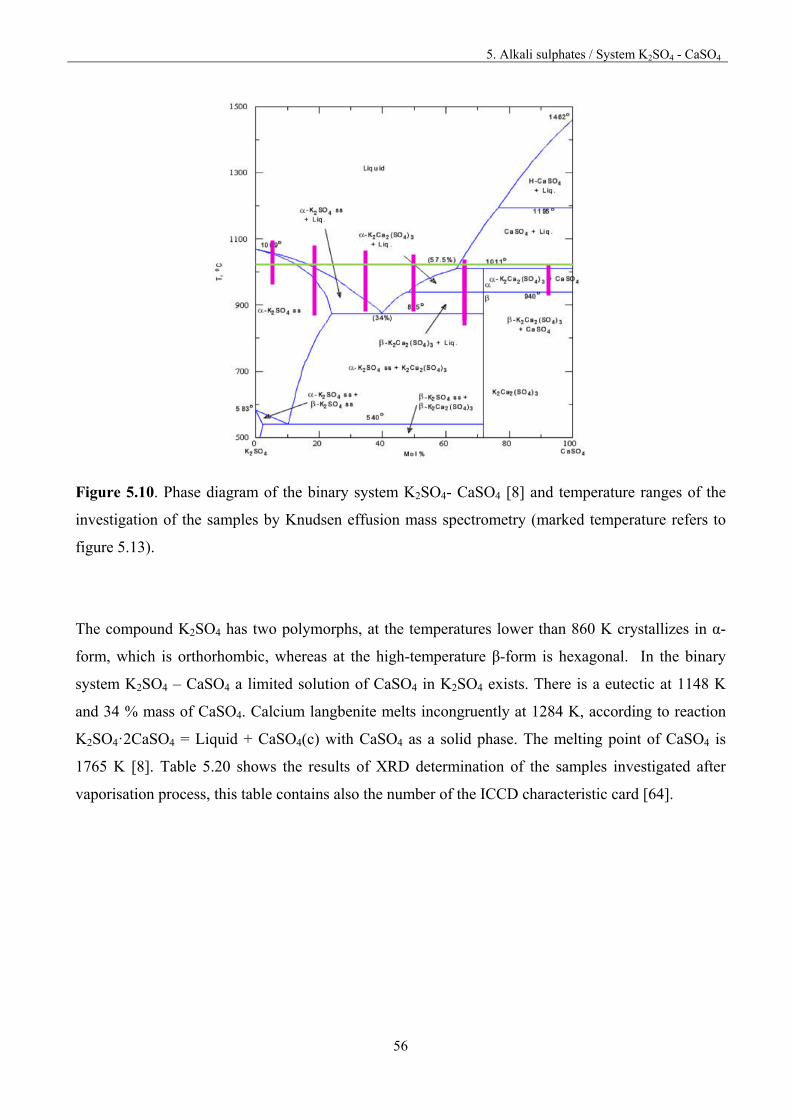
5. Alkali sulphates / System K2SO4 - CaSO4
56
Figure 5.10. Phase diagram of the binary system K2SO4- CaSO4 [8] and temperature ranges of the
investigation of the samples by Knudsen effusion mass spectrometry (marked temperature refers to
figure 5.13).
The compound K2SO4 has two polymorphs, at the temperatures lower than 860 K crystallizes in α-
form, which is orthorhombic, whereas at the high-temperature β-form is hexagonal. In the binary
system K2SO4 – CaSO4 a limited solution of CaSO4 in K2SO4 exists. There is a eutectic at 1148 K
and 34 % mass of CaSO4. Calcium langbenite melts incongruently at 1284 K, according to reaction
K2SO4·2CaSO4 = Liquid + CaSO4(c) with CaSO4 as a solid phase. The melting point of CaSO4 is
1765 K [8]. Table 5.20 shows the results of XRD determination of the samples investigated after
vaporisation process, this table contains also the number of the ICCD characteristic card [64].
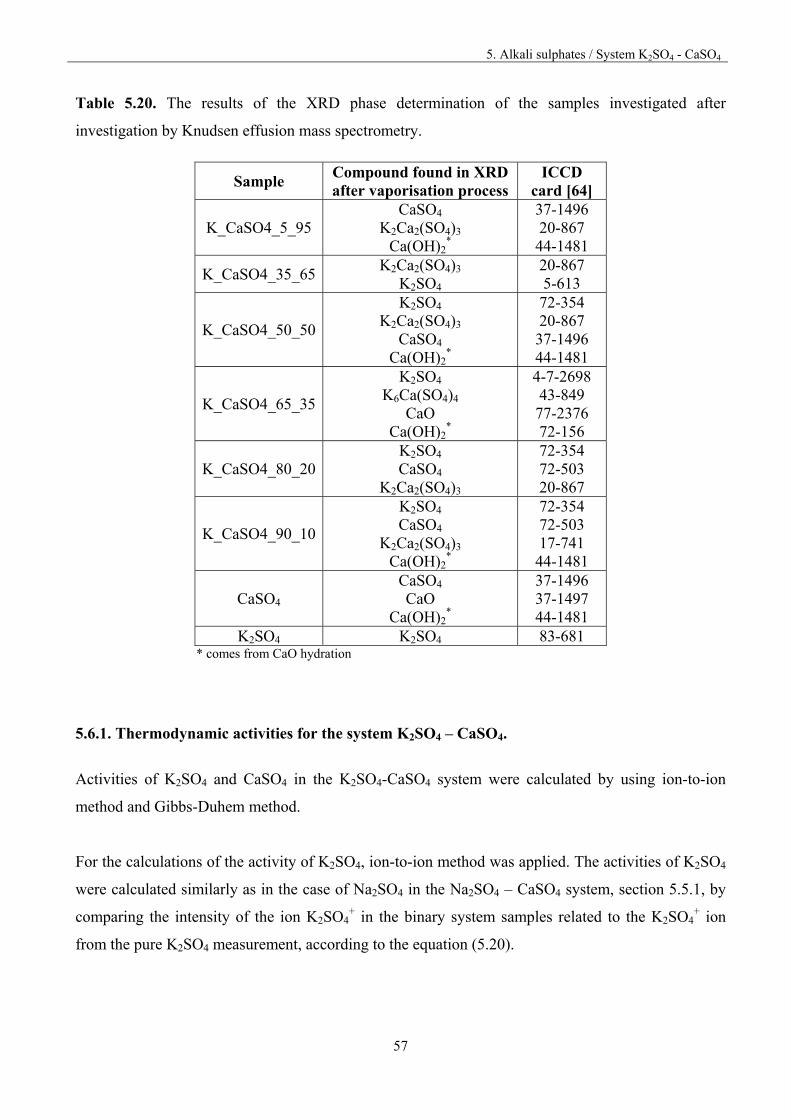
5. Alkali sulphates / System K2SO4 - CaSO4
57
Table 5.20. The results of the XRD phase determination of the samples investigated after
investigation by Knudsen effusion mass spectrometry.
Sample Compound found in XRD after vaporisation process
ICCD card [64]
K_CaSO4_5_95 CaSO4
K2Ca2(SO4)3 Ca(OH)2
*
37-1496 20-867 44-1481
K_CaSO4_35_65 K2Ca2(SO4)3
K2SO4 20-867 5-613
K_CaSO4_50_50
K2SO4 K2Ca2(SO4)3
CaSO4 Ca(OH)2
*
72-354 20-867 37-1496 44-1481
K_CaSO4_65_35
K2SO4 K6Ca(SO4)4
CaO Ca(OH)2
*
4-7-2698 43-849 77-2376 72-156
K_CaSO4_80_20 K2SO4 CaSO4
K2Ca2(SO4)3
72-354 72-503 20-867
K_CaSO4_90_10
K2SO4 CaSO4
K2Ca2(SO4)3 Ca(OH)2
*
72-354 72-503 17-741 44-1481
CaSO4 CaSO4 CaO
Ca(OH)2*
37-1496 37-1497 44-1481
K2SO4 K2SO4 83-681 * comes from CaO hydration
5.6.1. Thermodynamic activities for the system K2SO4 – CaSO4.
Activities of K2SO4 and CaSO4 in the K2SO4-CaSO4 system were calculated by using ion-to-ion
method and Gibbs-Duhem method.
For the calculations of the activity of K2SO4, ion-to-ion method was applied. The activities of K2SO4
were calculated similarly as in the case of Na2SO4 in the Na2SO4 – CaSO4 system, section 5.5.1, by
comparing the intensity of the ion K2SO4+ in the binary system samples related to the K2SO4
+ ion
from the pure K2SO4 measurement, according to the equation (5.20).
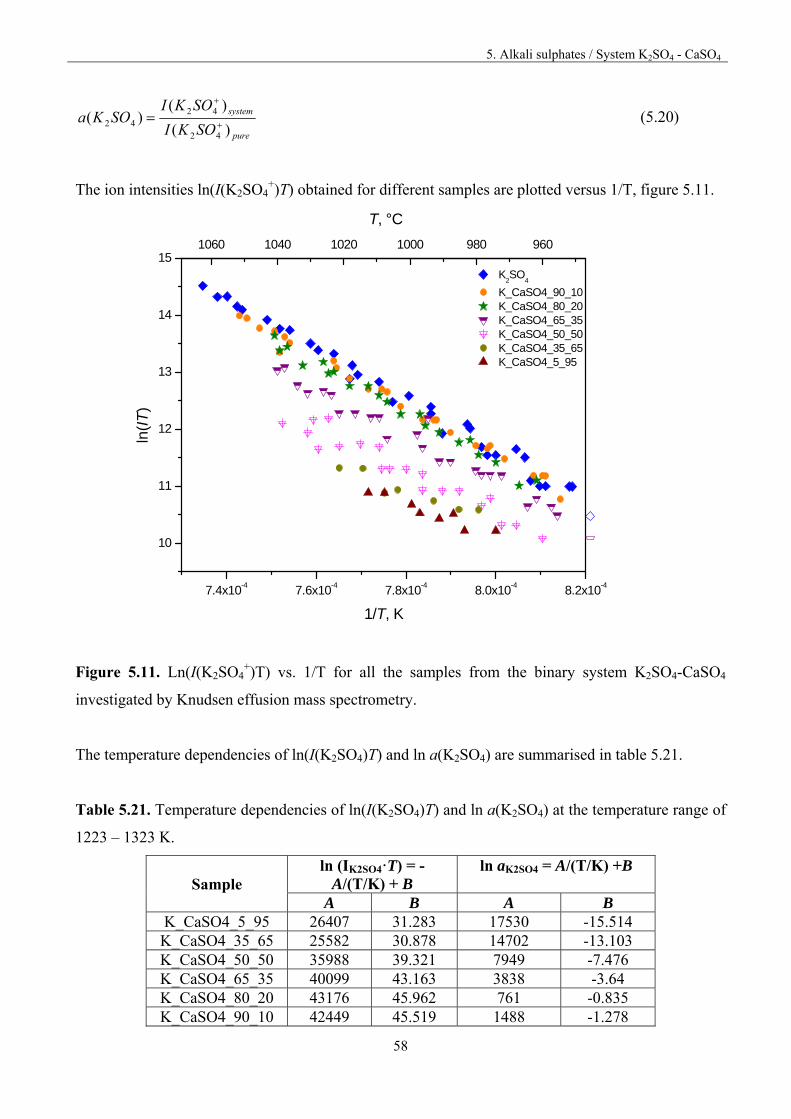
5. Alkali sulphates / System K2SO4 - CaSO4
58
pure
system
SOKI
SOKISOKa
)(
)()(
42
4242
(5.20)
The ion intensities ln(I(K2SO4+)T) obtained for different samples are plotted versus 1/T, figure 5.11.
7.4x10⁻⁴ 7.6x10⁻⁴ 7.8x10⁻⁴ 8.0x10⁻⁴ 8.2x10⁻⁴
10
11
12
13
14
15
K2SO
4
K_CaSO4_90_10 K_CaSO4_80_20 K_CaSO4_65_35 K_CaSO4_50_50 K_CaSO4_35_65 K_CaSO4_5_95
ln(I
T)
1/T, K
1060 1040 1020 1000 980 960
T, °C
Figure 5.11. Ln(I(K2SO4
+)T) vs. 1/T for all the samples from the binary system K2SO4-CaSO4
investigated by Knudsen effusion mass spectrometry.
The temperature dependencies of ln(I(K2SO4)T) and ln a(K2SO4) are summarised in table 5.21.
Table 5.21. Temperature dependencies of ln(I(K2SO4)T) and ln a(K2SO4) at the temperature range of
1223 – 1323 K.
Sample ln (IK2SO4·T) = -
A/(T/K) + Bln aK2SO4 = A/(T/K) +B
A B A B K_CaSO4_5_95 26407 31.283 17530 -15.514 K_CaSO4_35_65 25582 30.878 14702 -13.103 K_CaSO4_50_50 35988 39.321 7949 -7.476 K_CaSO4_65_35 40099 43.163 3838 -3.64 K_CaSO4_80_20 43176 45.962 761 -0.835 K_CaSO4_90_10 42449 45.519 1488 -1.278
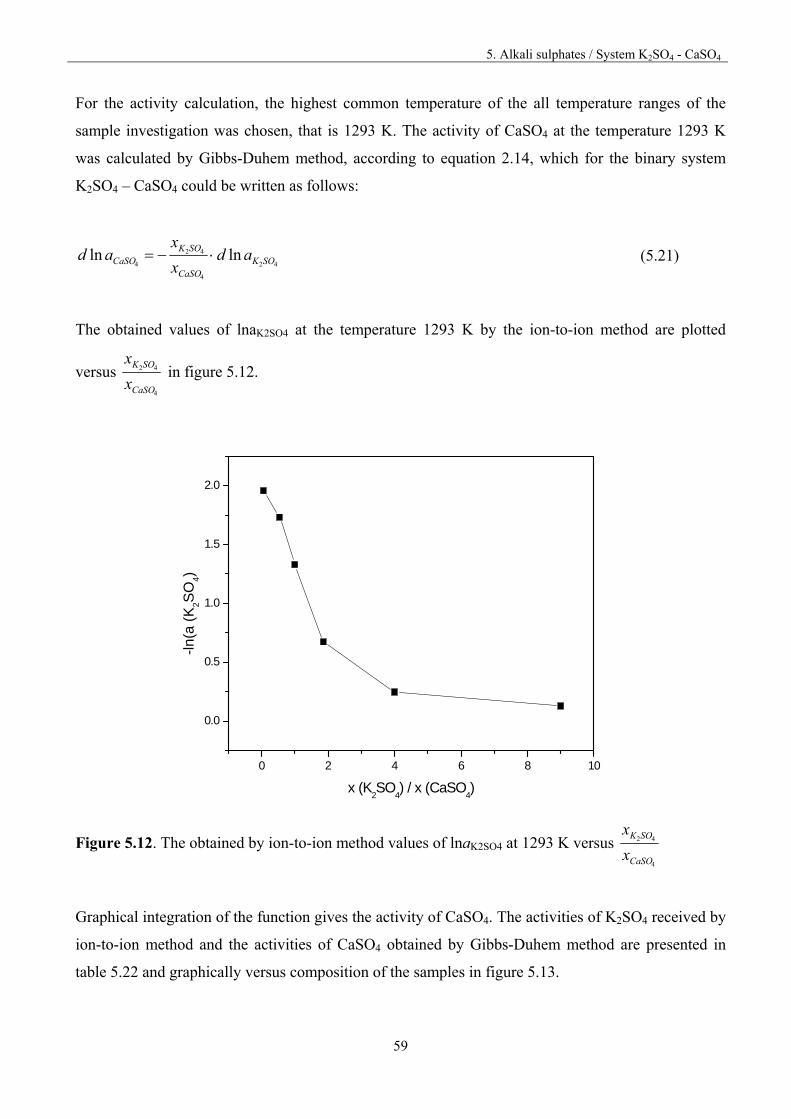
5. Alkali sulphates / System K2SO4 - CaSO4
59
For the activity calculation, the highest common temperature of the all temperature ranges of the
sample investigation was chosen, that is 1293 K. The activity of CaSO4 at the temperature 1293 K
was calculated by Gibbs-Duhem method, according to equation 2.14, which for the binary system
K2SO4 – CaSO4 could be written as follows:
42
4
42
4lnln SOK
CaSO
SOKCaSO ad
x
xad (5.21)
The obtained values of lnaK2SO4 at the temperature 1293 K by the ion-to-ion method are plotted
versus 4
42
CaSO
SOK
x
x in figure 5.12.
0 2 4 6 8 10
0.0
0.5
1.0
1.5
2.0
-ln(a
(K
2SO
4)
x (K2SO
4) / x (CaSO
4)
Figure 5.12. The obtained by ion-to-ion method values of lnaK2SO4 at 1293 K versus 4
42
CaSO
SOK
x
x
Graphical integration of the function gives the activity of CaSO4. The activities of K2SO4 received by
ion-to-ion method and the activities of CaSO4 obtained by Gibbs-Duhem method are presented in
table 5.22 and graphically versus composition of the samples in figure 5.13.
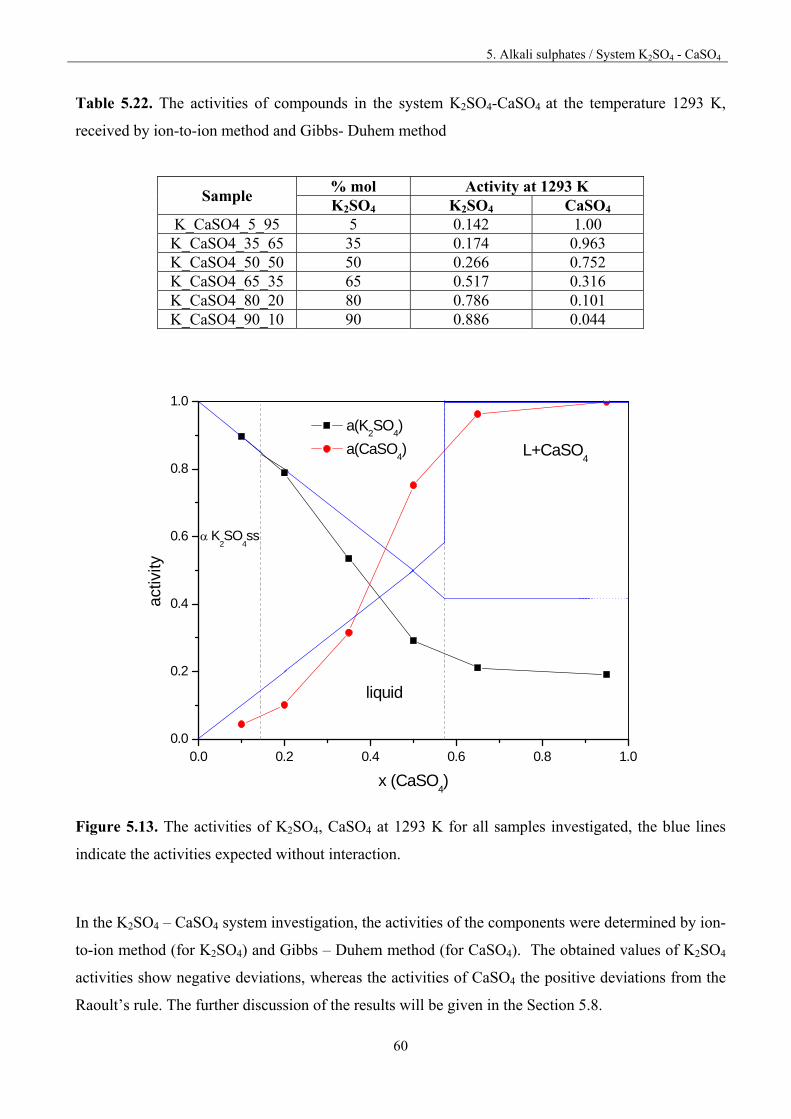
5. Alkali sulphates / System K2SO4 - CaSO4
60
Table 5.22. The activities of compounds in the system K2SO4-CaSO4 at the temperature 1293 K,
received by ion-to-ion method and Gibbs- Duhem method
Sample % mol Activity at 1293 K K2SO4 K2SO4 CaSO4
K_CaSO4_5_95 5 0.142 1.00 K_CaSO4_35_65 35 0.174 0.963 K_CaSO4_50_50 50 0.266 0.752 K_CaSO4_65_35 65 0.517 0.316 K_CaSO4_80_20 80 0.786 0.101 K_CaSO4_90_10 90 0.886 0.044
0.0 0.2 0.4 0.6 0.8 1.00.0
0.2
0.4
0.6
0.8
1.0
activ
ity
x (CaSO4)
a(K2SO
4)
a(CaSO4) L+CaSO
4
K2SO
4ss
liquid
Figure 5.13. The activities of K2SO4, CaSO4 at 1293 K for all samples investigated, the blue lines
indicate the activities expected without interaction.
In the K2SO4 – CaSO4 system investigation, the activities of the components were determined by ion-
to-ion method (for K2SO4) and Gibbs – Duhem method (for CaSO4). The obtained values of K2SO4
activities show negative deviations, whereas the activities of CaSO4 the positive deviations from the
Raoult’s rule. The further discussion of the results will be given in the Section 5.8.
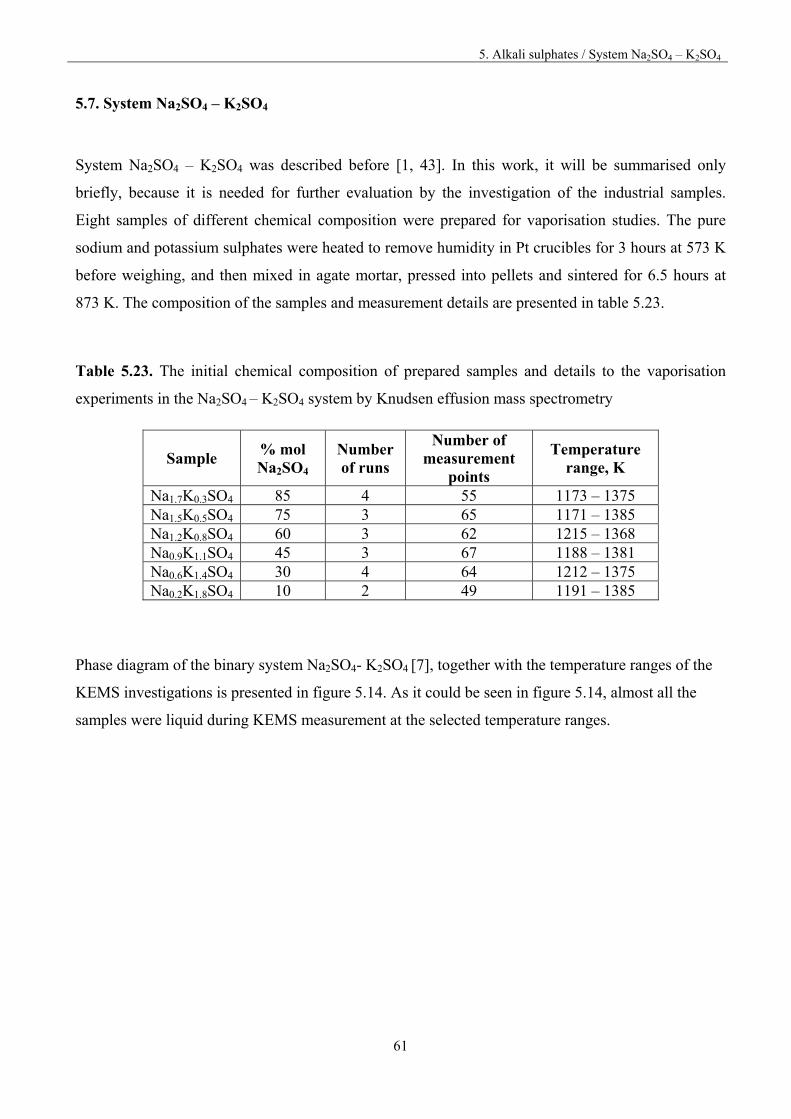
5. Alkali sulphates / System Na2SO4 – K2SO4
61
5.7. System Na2SO4 – K2SO4
System Na2SO4 – K2SO4 was described before [1, 43]. In this work, it will be summarised only
briefly, because it is needed for further evaluation by the investigation of the industrial samples.
Eight samples of different chemical composition were prepared for vaporisation studies. The pure
sodium and potassium sulphates were heated to remove humidity in Pt crucibles for 3 hours at 573 K
before weighing, and then mixed in agate mortar, pressed into pellets and sintered for 6.5 hours at
873 K. The composition of the samples and measurement details are presented in table 5.23.
Table 5.23. The initial chemical composition of prepared samples and details to the vaporisation
experiments in the Na2SO4 – K2SO4 system by Knudsen effusion mass spectrometry
Sample % mol Na2SO4
Number of runs
Number of measurement
points
Temperature range, K
Na1.7K0.3SO4 85 4 55 1173 – 1375 Na1.5K0.5SO4 75 3 65 1171 – 1385 Na1.2K0.8SO4 60 3 62 1215 – 1368 Na0.9K1.1SO4 45 3 67 1188 – 1381 Na0.6K1.4SO4 30 4 64 1212 – 1375 Na0.2K1.8SO4 10 2 49 1191 – 1385
Phase diagram of the binary system Na2SO4- K2SO4 [7], together with the temperature ranges of the
KEMS investigations is presented in figure 5.14. As it could be seen in figure 5.14, almost all the
samples were liquid during KEMS measurement at the selected temperature ranges.
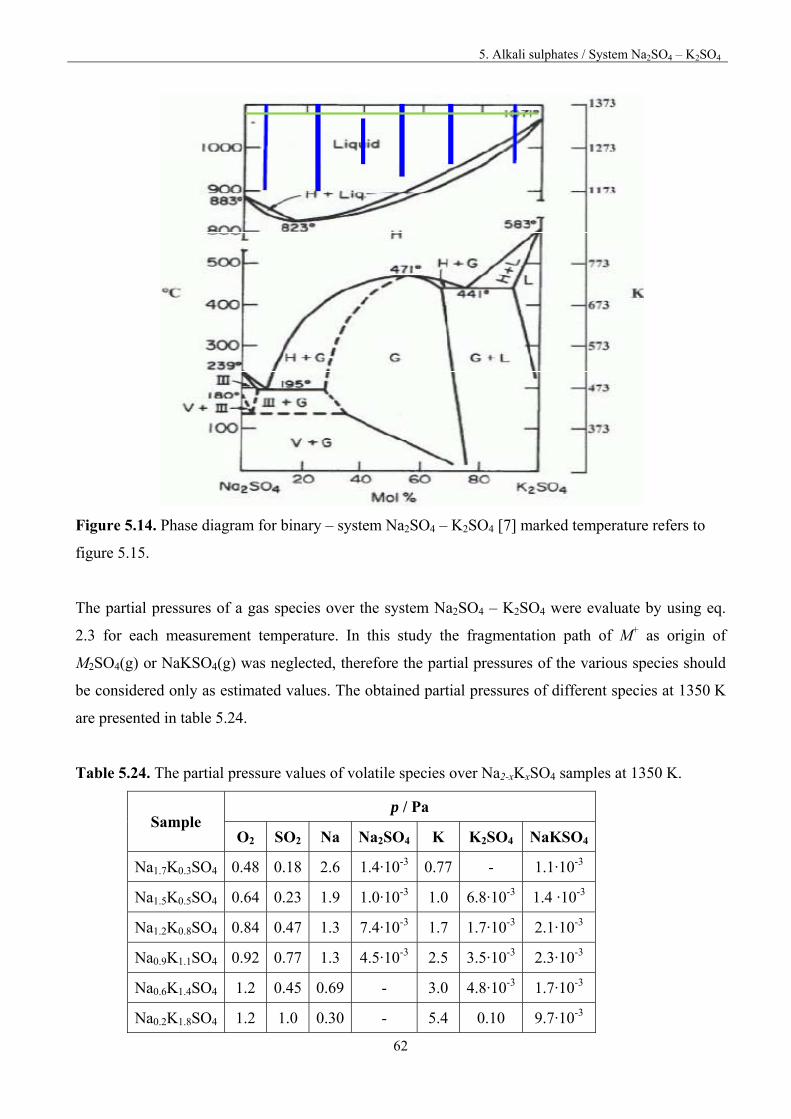
5. Alkali sulphates / System Na2SO4 – K2SO4
62
Figure 5.14. Phase diagram for binary – system Na2SO4 – K2SO4 [7] marked temperature refers to
figure 5.15.
The partial pressures of a gas species over the system Na2SO4 – K2SO4 were evaluate by using eq.
2.3 for each measurement temperature. In this study the fragmentation path of M+ as origin of
M2SO4(g) or NaKSO4(g) was neglected, therefore the partial pressures of the various species should
be considered only as estimated values. The obtained partial pressures of different species at 1350 K
are presented in table 5.24.
Table 5.24. The partial pressure values of volatile species over Na2-xKxSO4 samples at 1350 K.
Sample p / Pa
O2 SO2 Na Na2SO4 K K2SO4 NaKSO4
Na1.7K0.3SO4 0.48 0.18 2.6 1.4·10-3 0.77 - 1.1·10-3
Na1.5K0.5SO4 0.64 0.23 1.9 1.0·10-3 1.0 6.8·10-3 1.4 ·10-3
Na1.2K0.8SO4 0.84 0.47 1.3 7.4·10-3 1.7 1.7·10-3 2.1·10-3
Na0.9K1.1SO4 0.92 0.77 1.3 4.5·10-3 2.5 3.5·10-3 2.3·10-3
Na0.6K1.4SO4 1.2 0.45 0.69 - 3.0 4.8·10-3 1.7·10-3
Na0.2K1.8SO4 1.2 1.0 0.30 - 5.4 0.10 9.7·10-3
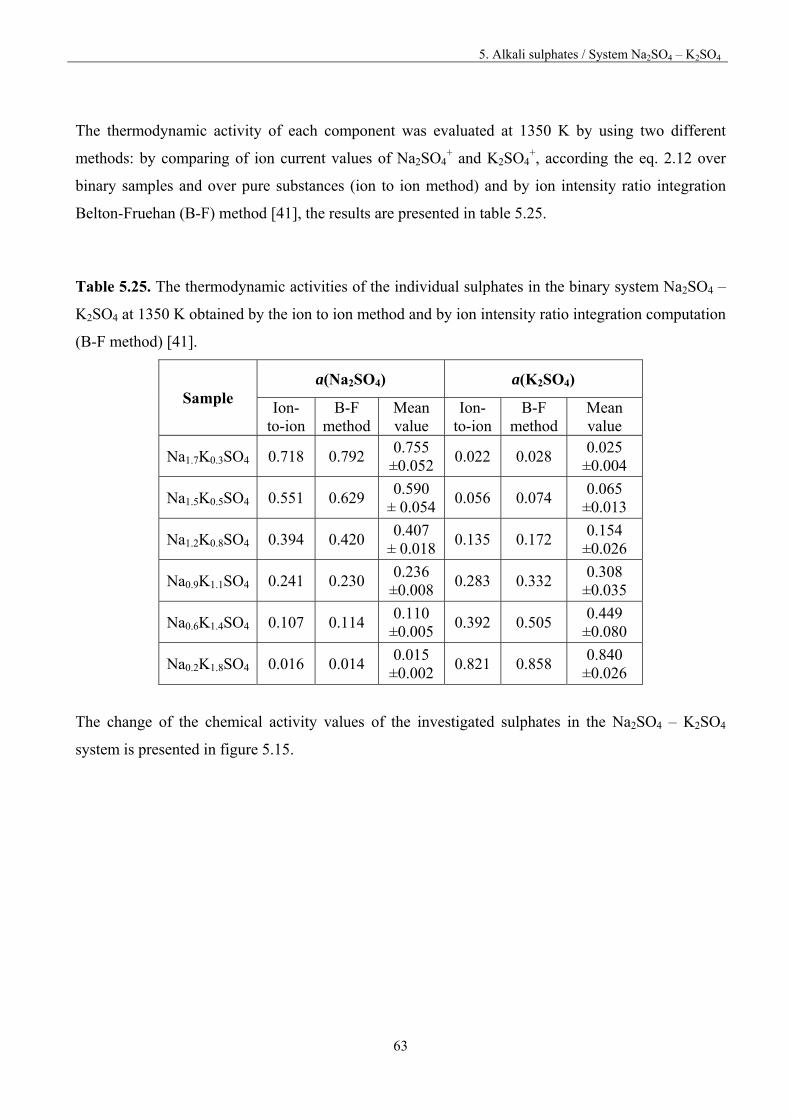
5. Alkali sulphates / System Na2SO4 – K2SO4
63
The thermodynamic activity of each component was evaluated at 1350 K by using two different
methods: by comparing of ion current values of Na2SO4+ and K2SO4
+, according the eq. 2.12 over
binary samples and over pure substances (ion to ion method) and by ion intensity ratio integration
Belton-Fruehan (B-F) method [41], the results are presented in table 5.25.
Table 5.25. The thermodynamic activities of the individual sulphates in the binary system Na2SO4 –
K2SO4 at 1350 K obtained by the ion to ion method and by ion intensity ratio integration computation
(B-F method) [41].
Sample a(Na2SO4) a(K2SO4)
Ion-to-ion
B-F method
Mean value
Ion-to-ion
B-F method
Mean value
Na1.7K0.3SO4 0.718 0.792 0.755
±0.052 0.022 0.028
0.025 ±0.004
Na1.5K0.5SO4 0.551 0.629 0.590
± 0.054 0.056 0.074
0.065 ±0.013
Na1.2K0.8SO4 0.394 0.420 0.407
± 0.018 0.135 0.172
0.154 ±0.026
Na0.9K1.1SO4 0.241 0.230 0.236
±0.008 0.283 0.332
0.308 ±0.035
Na0.6K1.4SO4 0.107 0.114 0.110
±0.005 0.392 0.505
0.449 ±0.080
Na0.2K1.8SO4 0.016 0.014 0.015
±0.002 0.821 0.858
0.840 ±0.026
The change of the chemical activity values of the investigated sulphates in the Na2SO4 – K2SO4
system is presented in figure 5.15.
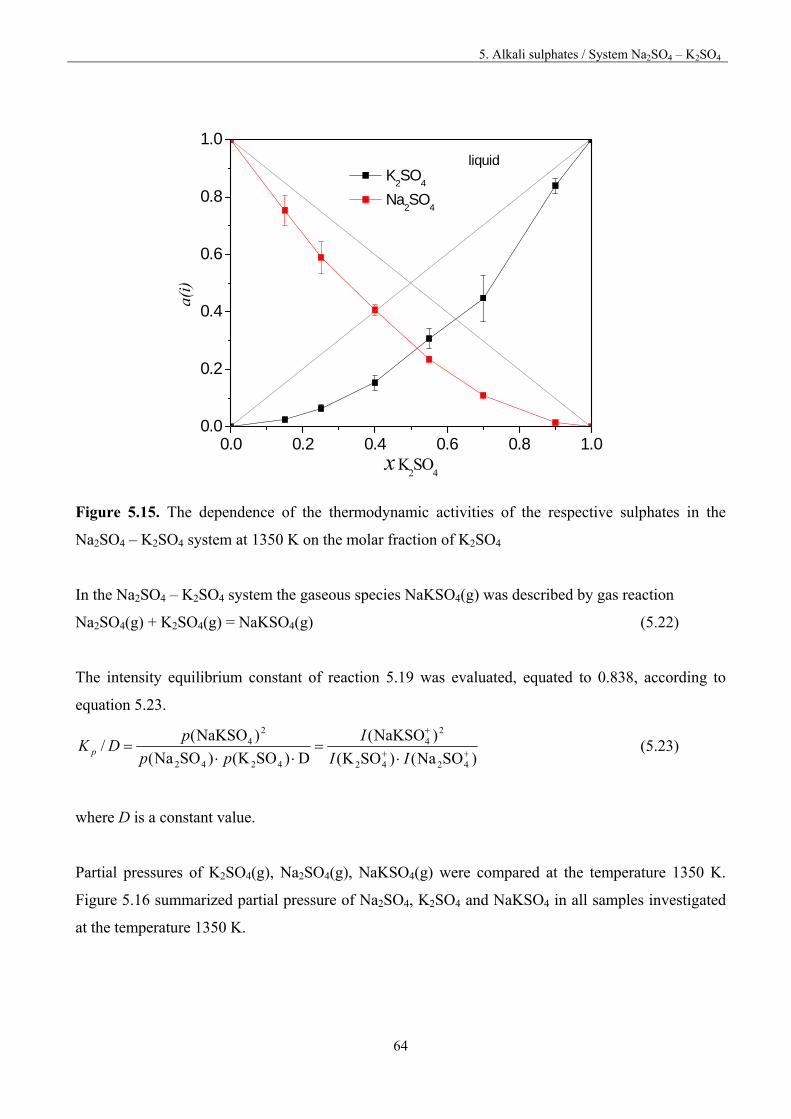
5. Alkali sulphates / System Na2SO4 – K2SO4
64
0.0 0.2 0.4 0.6 0.8 1.00.0
0.2
0.4
0.6
0.8
1.0
a(i)
x K2SO
4
K2SO
4
Na2SO
4
liquid
Figure 5.15. The dependence of the thermodynamic activities of the respective sulphates in the
Na2SO4 – K2SO4 system at 1350 K on the molar fraction of K2SO4
In the Na2SO4 – K2SO4 system the gaseous species NaKSO4(g) was described by gas reaction
Na2SO4(g) + K2SO4(g) = NaKSO4(g) (5.22)
The intensity equilibrium constant of reaction 5.19 was evaluated, equated to 0.838, according to
equation 5.23.
)SONa()SOK(
)NaKSO(
D)SOK()SONa(
)NaKSO(/
4242
24
4242
24
II
I
pp
pDK p (5.23)
where D is a constant value.
Partial pressures of K2SO4(g), Na2SO4(g), NaKSO4(g) were compared at the temperature 1350 K.
Figure 5.16 summarized partial pressure of Na2SO4, K2SO4 and NaKSO4 in all samples investigated
at the temperature 1350 K.
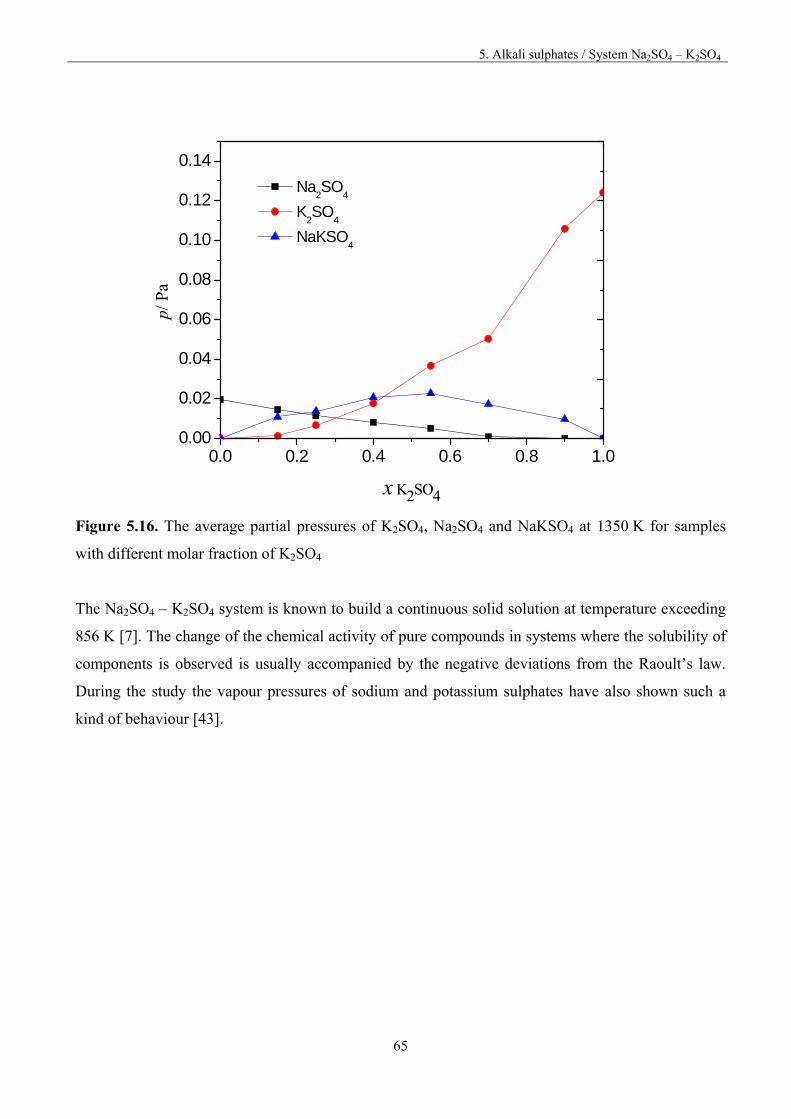
5. Alkali sulphates / System Na2SO4 – K2SO4
65
0.0 0.2 0.4 0.6 0.8 1.00.00
0.02
0.04
0.06
0.08
0.10
0.12
0.14p/
Pa
x K2SO4
Na2SO
4
K2SO
4
NaKSO4
Figure 5.16. The average partial pressures of K2SO4, Na2SO4 and NaKSO4 at 1350 K for samples
with different molar fraction of K2SO4
The Na2SO4 – K2SO4 system is known to build a continuous solid solution at temperature exceeding
856 K [7]. The change of the chemical activity of pure compounds in systems where the solubility of
components is observed is usually accompanied by the negative deviations from the Raoult’s law.
During the study the vapour pressures of sodium and potassium sulphates have also shown such a
kind of behaviour [43].
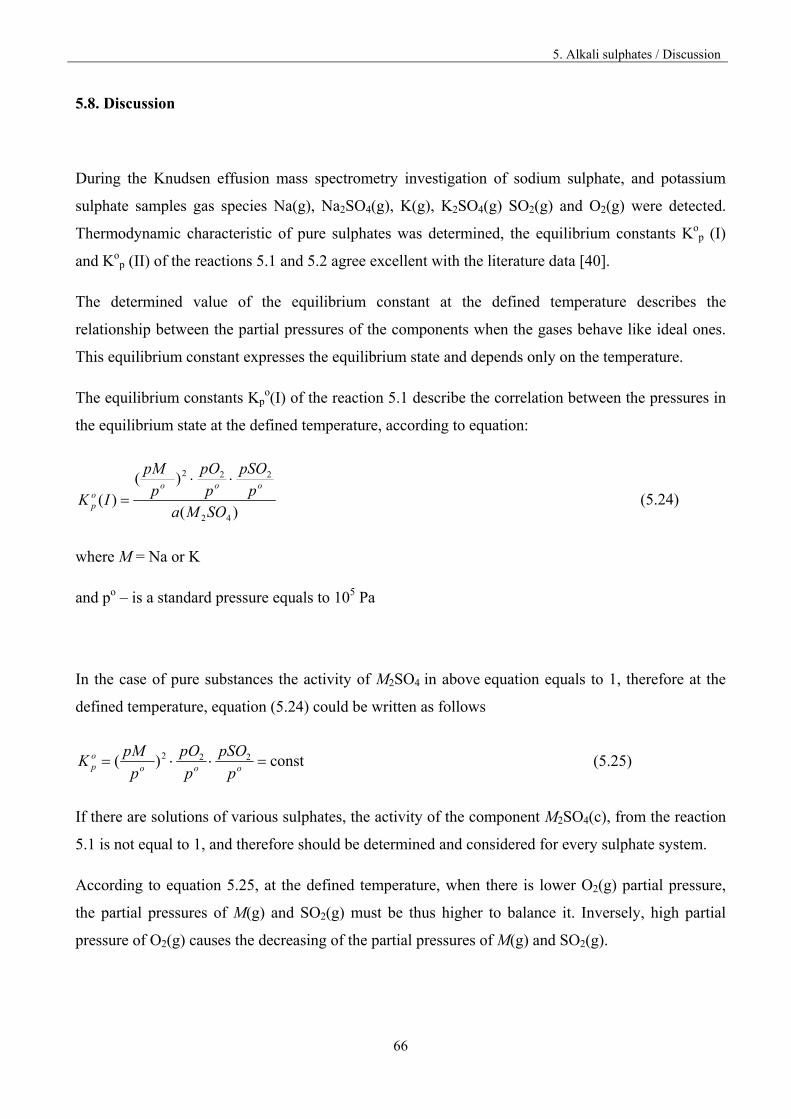
5. Alkali sulphates / Discussion
66
5.8. Discussion
During the Knudsen effusion mass spectrometry investigation of sodium sulphate, and potassium
sulphate samples gas species Na(g), Na2SO4(g), K(g), K2SO4(g) SO2(g) and O2(g) were detected.
Thermodynamic characteristic of pure sulphates was determined, the equilibrium constants Kop (I)
and Kop (II) of the reactions 5.1 and 5.2 agree excellent with the literature data [40].
The determined value of the equilibrium constant at the defined temperature describes the
relationship between the partial pressures of the components when the gases behave like ideal ones.
This equilibrium constant expresses the equilibrium state and depends only on the temperature.
The equilibrium constants Kpo(I) of the reaction 5.1 describe the correlation between the pressures in
the equilibrium state at the defined temperature, according to equation:
)(
)()(
42
222
SOMap
pSO
p
pO
p
pM
IKooo
op
(5.24)
where M = Na or K
and po – is a standard pressure equals to 105 Pa
In the case of pure substances the activity of M2SO4 in above equation equals to 1, therefore at the
defined temperature, equation (5.24) could be written as follows
const )( 222 ooo
op p
pSO
p
pO
p
pMK (5.25)
If there are solutions of various sulphates, the activity of the component M2SO4(c), from the reaction
5.1 is not equal to 1, and therefore should be determined and considered for every sulphate system.
According to equation 5.25, at the defined temperature, when there is lower O2(g) partial pressure,
the partial pressures of M(g) and SO2(g) must be thus higher to balance it. Inversely, high partial
pressure of O2(g) causes the decreasing of the partial pressures of M(g) and SO2(g).
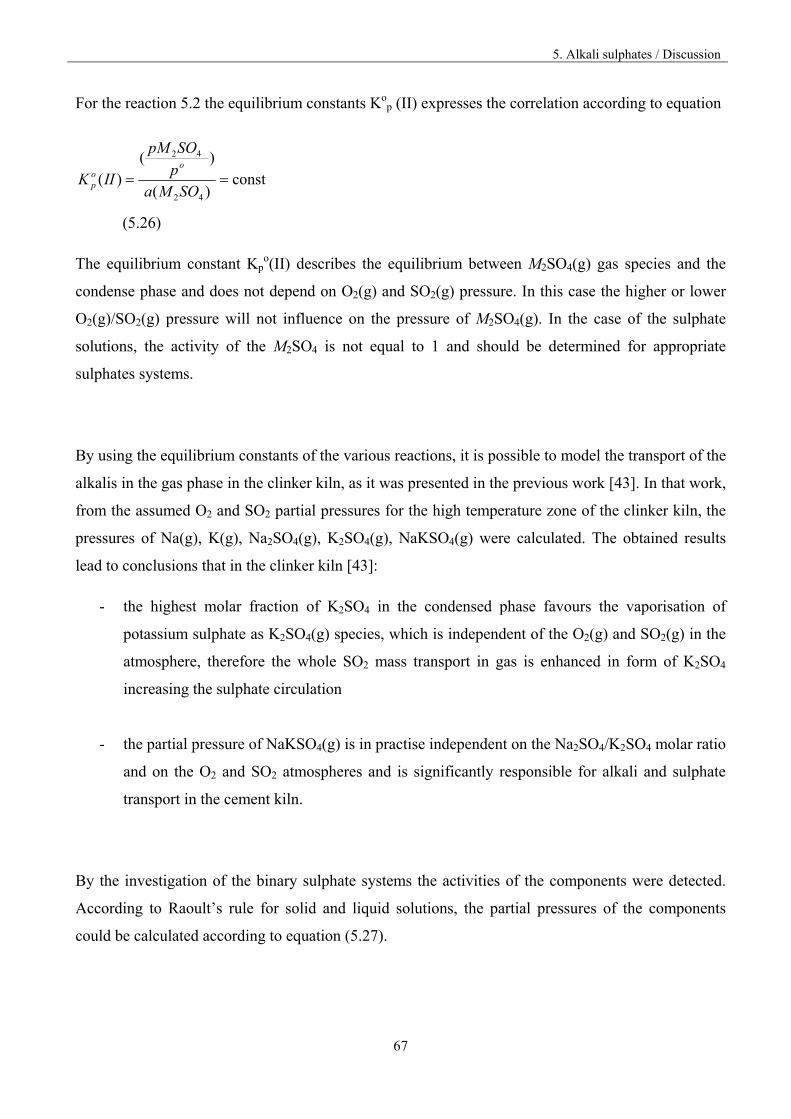
5. Alkali sulphates / Discussion
67
For the reaction 5.2 the equilibrium constants Kop (II) expresses the correlation according to equation
const)(
)()(
42
42
SOMa
p
SOpM
IIKo
op
(5.26)
The equilibrium constant Kpo(II) describes the equilibrium between M2SO4(g) gas species and the
condense phase and does not depend on O2(g) and SO2(g) pressure. In this case the higher or lower
O2(g)/SO2(g) pressure will not influence on the pressure of M2SO4(g). In the case of the sulphate
solutions, the activity of the M2SO4 is not equal to 1 and should be determined for appropriate
sulphates systems.
By using the equilibrium constants of the various reactions, it is possible to model the transport of the
alkalis in the gas phase in the clinker kiln, as it was presented in the previous work [43]. In that work,
from the assumed O2 and SO2 partial pressures for the high temperature zone of the clinker kiln, the
pressures of Na(g), K(g), Na2SO4(g), K2SO4(g), NaKSO4(g) were calculated. The obtained results
lead to conclusions that in the clinker kiln [43]:
- the highest molar fraction of K2SO4 in the condensed phase favours the vaporisation of
potassium sulphate as K2SO4(g) species, which is independent of the O2(g) and SO2(g) in the
atmosphere, therefore the whole SO2 mass transport in gas is enhanced in form of K2SO4
increasing the sulphate circulation
- the partial pressure of NaKSO4(g) is in practise independent on the Na2SO4/K2SO4 molar ratio
and on the O2 and SO2 atmospheres and is significantly responsible for alkali and sulphate
transport in the cement kiln.
By the investigation of the binary sulphate systems the activities of the components were detected.
According to Raoult’s rule for solid and liquid solutions, the partial pressures of the components
could be calculated according to equation (5.27).
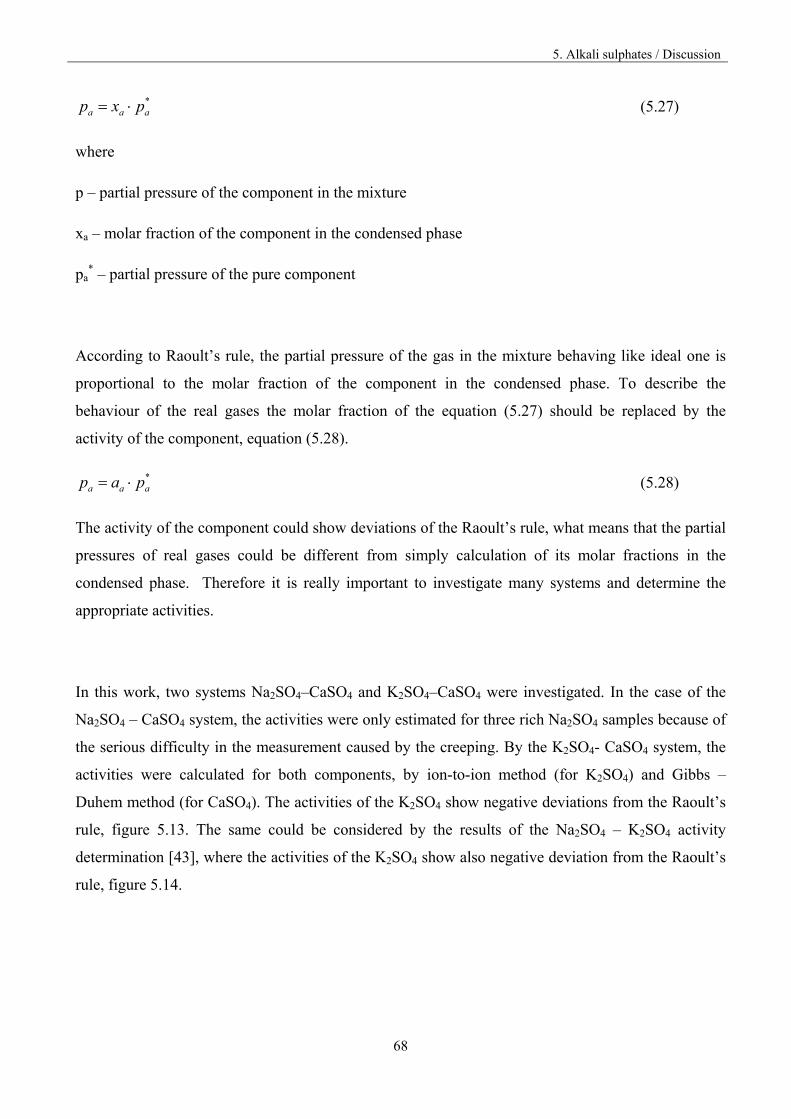
5. Alkali sulphates / Discussion
68
*aaa pxp (5.27)
where
p – partial pressure of the component in the mixture
xa – molar fraction of the component in the condensed phase
pa* – partial pressure of the pure component
According to Raoult’s rule, the partial pressure of the gas in the mixture behaving like ideal one is
proportional to the molar fraction of the component in the condensed phase. To describe the
behaviour of the real gases the molar fraction of the equation (5.27) should be replaced by the
activity of the component, equation (5.28).
*aaa pap (5.28)
The activity of the component could show deviations of the Raoult’s rule, what means that the partial
pressures of real gases could be different from simply calculation of its molar fractions in the
condensed phase. Therefore it is really important to investigate many systems and determine the
appropriate activities.
In this work, two systems Na2SO4–CaSO4 and K2SO4–CaSO4 were investigated. In the case of the
Na2SO4 – CaSO4 system, the activities were only estimated for three rich Na2SO4 samples because of
the serious difficulty in the measurement caused by the creeping. By the K2SO4- CaSO4 system, the
activities were calculated for both components, by ion-to-ion method (for K2SO4) and Gibbs –
Duhem method (for CaSO4). The activities of the K2SO4 show negative deviations from the Raoult’s
rule, figure 5.13. The same could be considered by the results of the Na2SO4 – K2SO4 activity
determination [43], where the activities of the K2SO4 show also negative deviation from the Raoult’s
rule, figure 5.14.
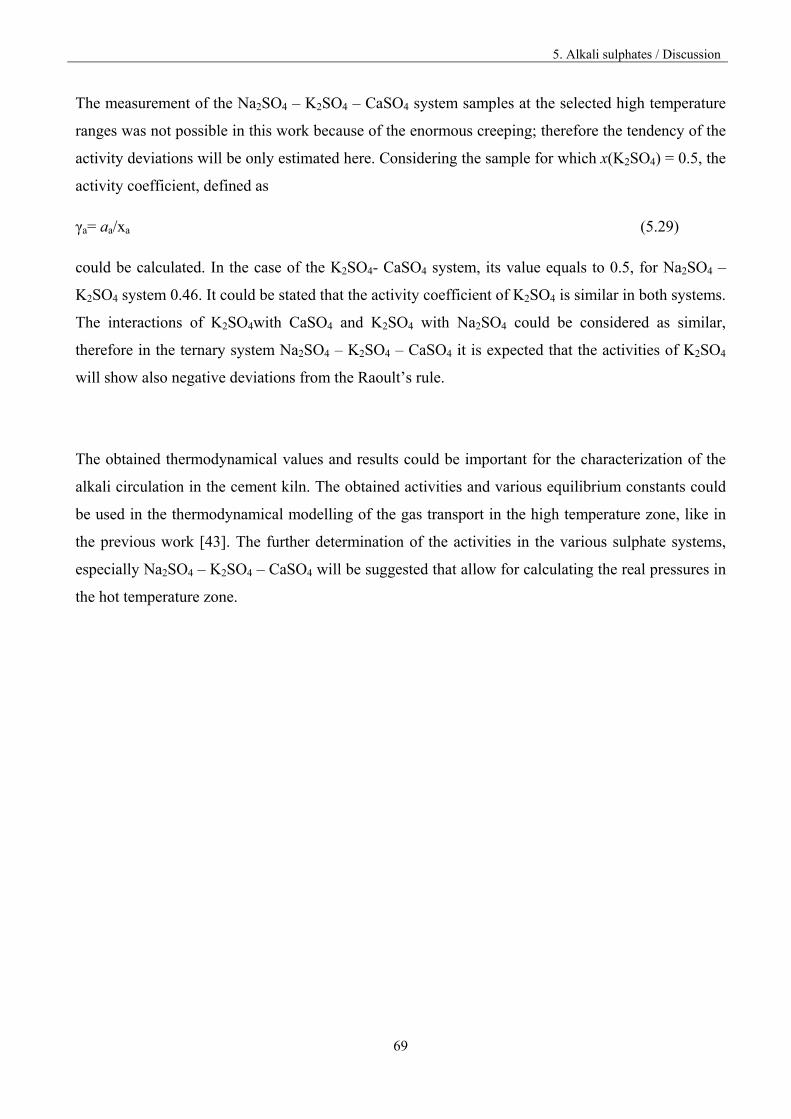
5. Alkali sulphates / Discussion
69
The measurement of the Na2SO4 – K2SO4 – CaSO4 system samples at the selected high temperature
ranges was not possible in this work because of the enormous creeping; therefore the tendency of the
activity deviations will be only estimated here. Considering the sample for which x(K2SO4) = 0.5, the
activity coefficient, defined as
γa= aa/xa (5.29)
could be calculated. In the case of the K2SO4- CaSO4 system, its value equals to 0.5, for Na2SO4 –
K2SO4 system 0.46. It could be stated that the activity coefficient of K2SO4 is similar in both systems.
The interactions of K2SO4with CaSO4 and K2SO4 with Na2SO4 could be considered as similar,
therefore in the ternary system Na2SO4 – K2SO4 – CaSO4 it is expected that the activities of K2SO4
will show also negative deviations from the Raoult’s rule.
The obtained thermodynamical values and results could be important for the characterization of the
alkali circulation in the cement kiln. The obtained activities and various equilibrium constants could
be used in the thermodynamical modelling of the gas transport in the high temperature zone, like in
the previous work [43]. The further determination of the activities in the various sulphate systems,
especially Na2SO4 – K2SO4 – CaSO4 will be suggested that allow for calculating the real pressures in
the hot temperature zone.
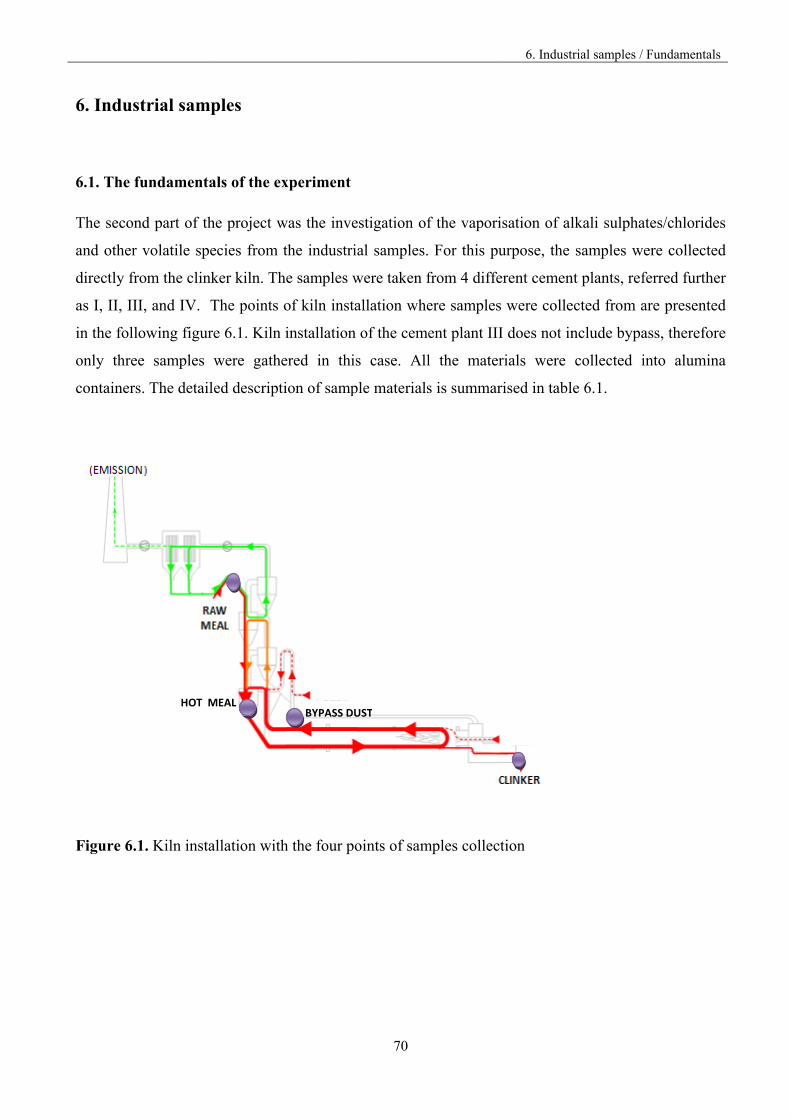
6. Indust
6.1. The fu
The second
and other v
directly fro
as I, II, III
in the follo
only three
containers.
Figure 6.1
trial samp
undamenta
d part of th
volatile spe
om the clink
, and IV. T
owing figure
e samples w
. The detaile
1. Kiln insta
HOT M
ples
als of the ex
he project w
ecies from t
ker kiln. Th
The points o
e 6.1. Kiln i
were gathe
ed descripti
allation with
MEAL
xperiment
was the inve
the industria
e samples w
of kiln insta
installation
ered in this
ion of samp
h the four po
BYPASS DU
70
estigation of
al samples.
were taken f
allation whe
of the ceme
s case. All
ple materials
oints of sam
UST
f the vapori
For this pu
from 4 diffe
ere samples
ent plant III
l the mater
s is summar
mples collect
6. Indust
isation of al
urpose, the
erent cemen
s were colle
I does not in
rials were
rised in tabl
tion
trial samples /
lkali sulpha
samples w
nt plants, ref
ected from a
nclude bypa
collected i
le 6.1.
Fundamental
ates/chloride
ere collecte
ferred furthe
are presente
ass, therefor
into alumin
ls
es
ed
er
ed
re
na
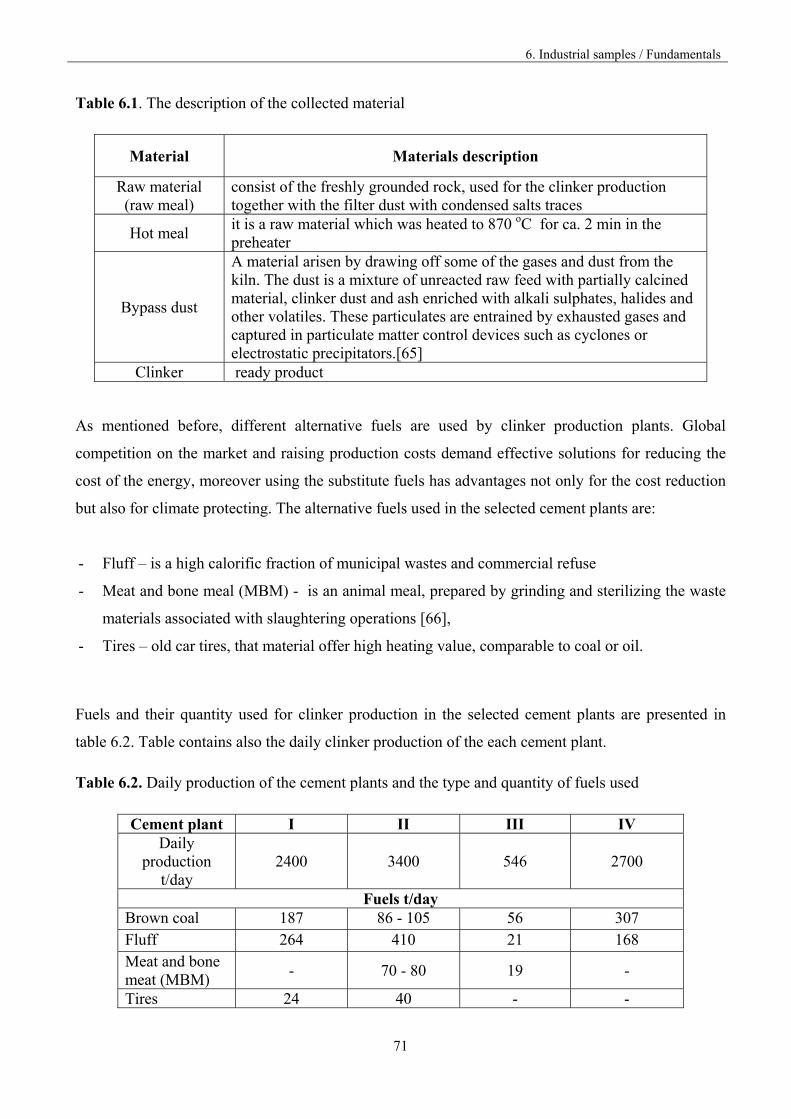
6. Industrial samples / Fundamentals
71
Table 6.1. The description of the collected material
Material Materials description
Raw material (raw meal)
consist of the freshly grounded rock, used for the clinker production together with the filter dust with condensed salts traces
Hot meal it is a raw material which was heated to 870 oC for ca. 2 min in the preheater
Bypass dust
A material arisen by drawing off some of the gases and dust from the kiln. The dust is a mixture of unreacted raw feed with partially calcined material, clinker dust and ash enriched with alkali sulphates, halides and other volatiles. These particulates are entrained by exhausted gases and captured in particulate matter control devices such as cyclones or electrostatic precipitators.[65]
Clinker ready product
As mentioned before, different alternative fuels are used by clinker production plants. Global
competition on the market and raising production costs demand effective solutions for reducing the
cost of the energy, moreover using the substitute fuels has advantages not only for the cost reduction
but also for climate protecting. The alternative fuels used in the selected cement plants are:
- Fluff – is a high calorific fraction of municipal wastes and commercial refuse
- Meat and bone meal (MBM) - is an animal meal, prepared by grinding and sterilizing the waste
materials associated with slaughtering operations [66],
- Tires – old car tires, that material offer high heating value, comparable to coal or oil.
Fuels and their quantity used for clinker production in the selected cement plants are presented in
table 6.2. Table contains also the daily clinker production of the each cement plant.
Table 6.2. Daily production of the cement plants and the type and quantity of fuels used
Cement plant I II III IV Daily
production t/day
2400 3400 546 2700
Fuels t/day Brown coal 187 86 - 105 56 307 Fluff 264 410 21 168 Meat and bone meat (MBM)
- 70 - 80 19 -
Tires 24 40 - -
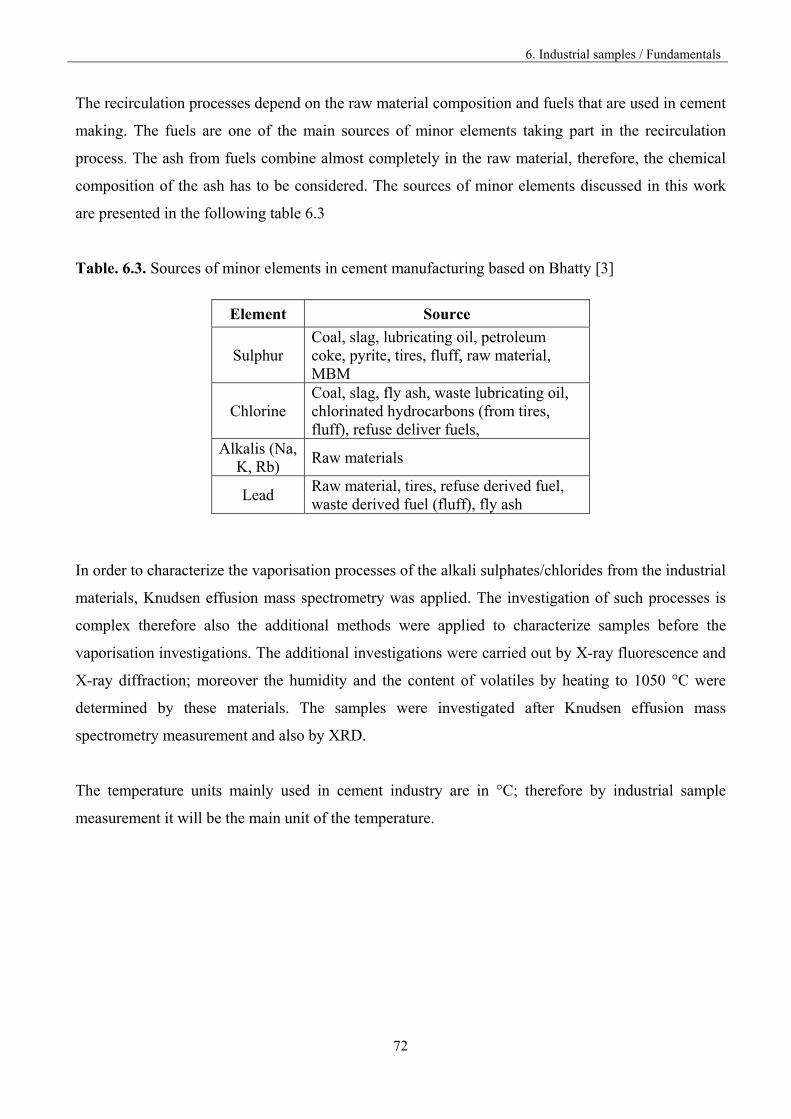
6. Industrial samples / Fundamentals
72
The recirculation processes depend on the raw material composition and fuels that are used in cement
making. The fuels are one of the main sources of minor elements taking part in the recirculation
process. The ash from fuels combine almost completely in the raw material, therefore, the chemical
composition of the ash has to be considered. The sources of minor elements discussed in this work
are presented in the following table 6.3
Table. 6.3. Sources of minor elements in cement manufacturing based on Bhatty [3]
Element Source
Sulphur Coal, slag, lubricating oil, petroleum coke, pyrite, tires, fluff, raw material, MBM
Chlorine Coal, slag, fly ash, waste lubricating oil, chlorinated hydrocarbons (from tires, fluff), refuse deliver fuels,
Alkalis (Na, K, Rb)
Raw materials
Lead Raw material, tires, refuse derived fuel, waste derived fuel (fluff), fly ash
In order to characterize the vaporisation processes of the alkali sulphates/chlorides from the industrial
materials, Knudsen effusion mass spectrometry was applied. The investigation of such processes is
complex therefore also the additional methods were applied to characterize samples before the
vaporisation investigations. The additional investigations were carried out by X-ray fluorescence and
X-ray diffraction; moreover the humidity and the content of volatiles by heating to 1050 °C were
determined by these materials. The samples were investigated after Knudsen effusion mass
spectrometry measurement and also by XRD.
The temperature units mainly used in cement industry are in °C; therefore by industrial sample
measurement it will be the main unit of the temperature.
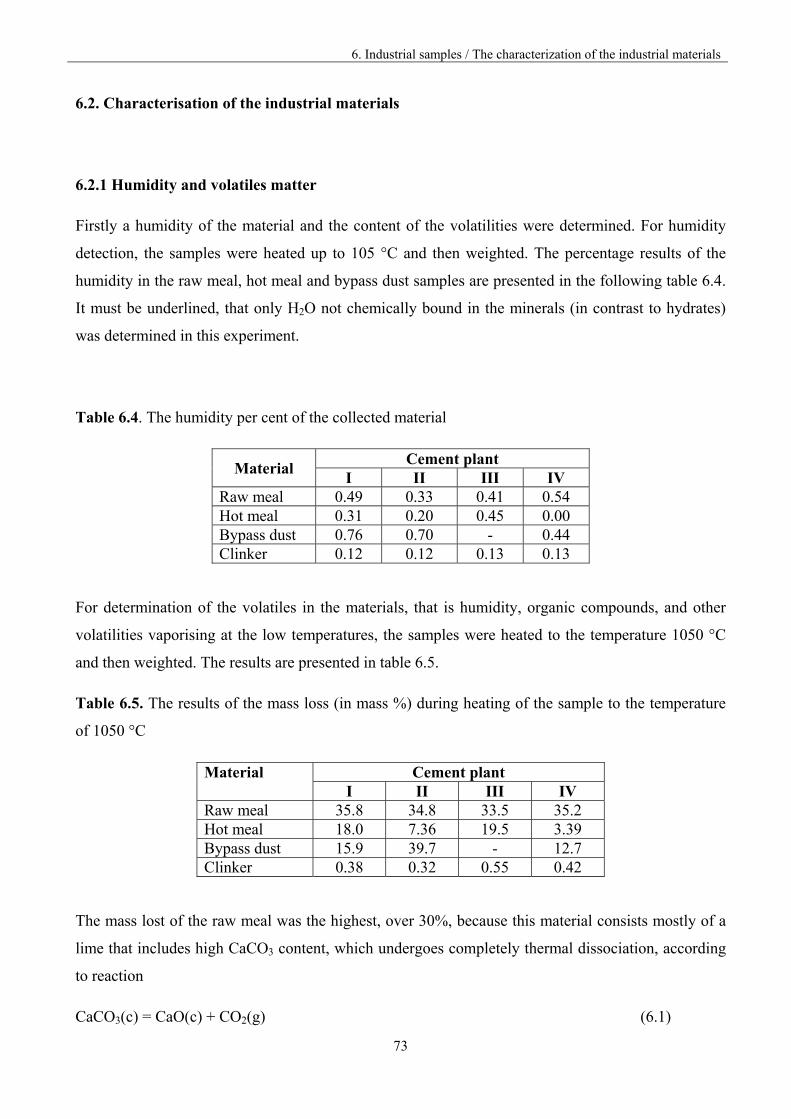
6. Industrial samples / The characterization of the industrial materials
73
6.2. Characterisation of the industrial materials
6.2.1 Humidity and volatiles matter
Firstly a humidity of the material and the content of the volatilities were determined. For humidity
detection, the samples were heated up to 105 °C and then weighted. The percentage results of the
humidity in the raw meal, hot meal and bypass dust samples are presented in the following table 6.4.
It must be underlined, that only H2O not chemically bound in the minerals (in contrast to hydrates)
was determined in this experiment.
Table 6.4. The humidity per cent of the collected material
Material Cement plant
I II III IV Raw meal 0.49 0.33 0.41 0.54 Hot meal 0.31 0.20 0.45 0.00 Bypass dust 0.76 0.70 - 0.44 Clinker 0.12 0.12 0.13 0.13
For determination of the volatiles in the materials, that is humidity, organic compounds, and other
volatilities vaporising at the low temperatures, the samples were heated to the temperature 1050 °C
and then weighted. The results are presented in table 6.5.
Table 6.5. The results of the mass loss (in mass %) during heating of the sample to the temperature
of 1050 °C
Material Cement plant I II III IV
Raw meal 35.8 34.8 33.5 35.2 Hot meal 18.0 7.36 19.5 3.39 Bypass dust 15.9 39.7 - 12.7 Clinker 0.38 0.32 0.55 0.42
The mass lost of the raw meal was the highest, over 30%, because this material consists mostly of a
lime that includes high CaCO3 content, which undergoes completely thermal dissociation, according
to reaction
CaCO3(c) = CaO(c) + CO2(g) (6.1)
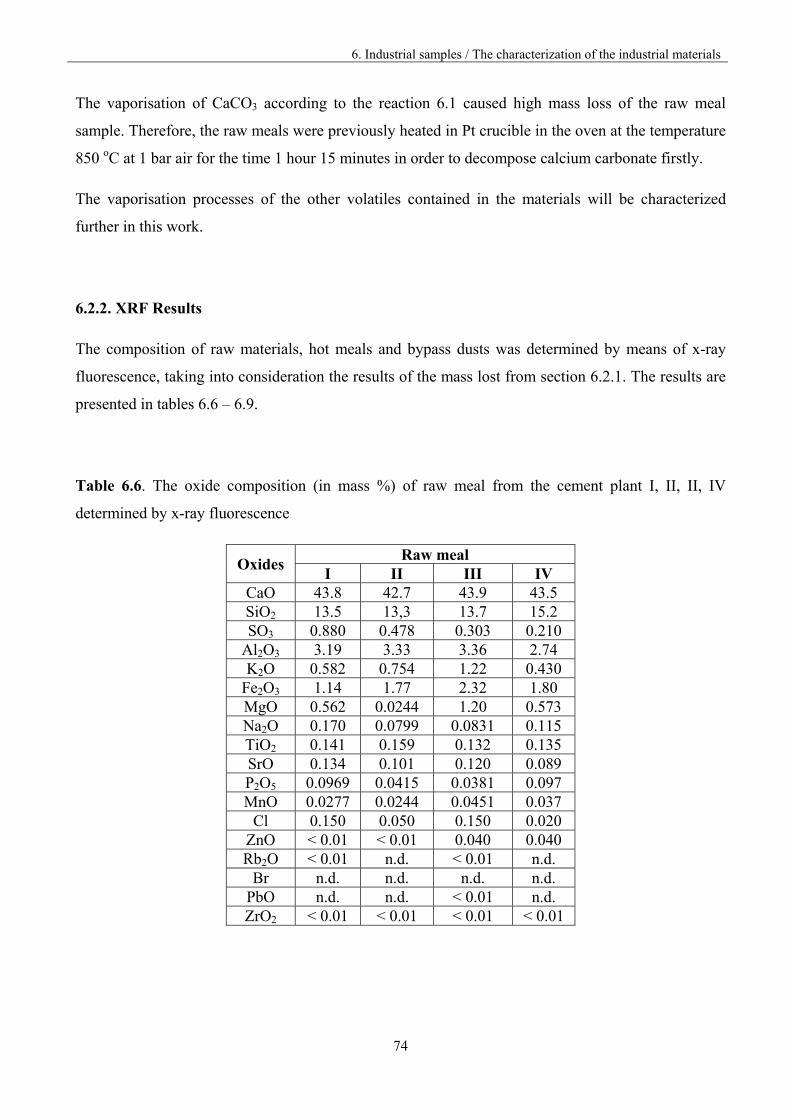
6. Industrial samples / The characterization of the industrial materials
74
The vaporisation of CaCO3 according to the reaction 6.1 caused high mass loss of the raw meal
sample. Therefore, the raw meals were previously heated in Pt crucible in the oven at the temperature
850 oC at 1 bar air for the time 1 hour 15 minutes in order to decompose calcium carbonate firstly.
The vaporisation processes of the other volatiles contained in the materials will be characterized
further in this work.
6.2.2. XRF Results
The composition of raw materials, hot meals and bypass dusts was determined by means of x-ray
fluorescence, taking into consideration the results of the mass lost from section 6.2.1. The results are
presented in tables 6.6 – 6.9.
Table 6.6. The oxide composition (in mass %) of raw meal from the cement plant I, II, II, IV
determined by x-ray fluorescence
Oxides Raw meal
I II III IV CaO 43.8 42.7 43.9 43.5 SiO2 13.5 13,3 13.7 15.2 SO3 0.880 0.478 0.303 0.210
Al2O3 3.19 3.33 3.36 2.74 K2O 0.582 0.754 1.22 0.430
Fe2O3 1.14 1.77 2.32 1.80 MgO 0.562 0.0244 1.20 0.573 Na2O 0.170 0.0799 0.0831 0.115 TiO2 0.141 0.159 0.132 0.135 SrO 0.134 0.101 0.120 0.089 P2O5 0.0969 0.0415 0.0381 0.097 MnO 0.0277 0.0244 0.0451 0.037
Cl 0.150 0.050 0.150 0.020 ZnO < 0.01 < 0.01 0.040 0.040 Rb2O < 0.01 n.d. < 0.01 n.d.
Br n.d. n.d. n.d. n.d. PbO n.d. n.d. < 0.01 n.d. ZrO2 < 0.01 < 0.01 < 0.01 < 0.01
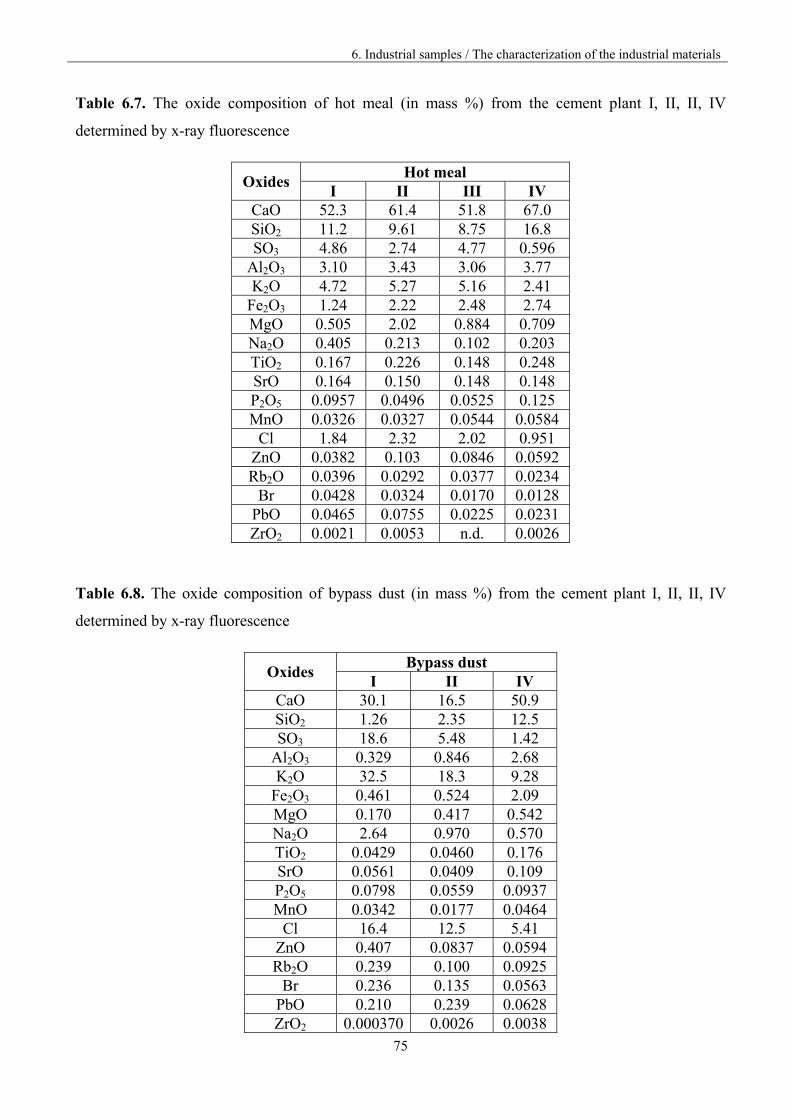
6. Industrial samples / The characterization of the industrial materials
75
Table 6.7. The oxide composition of hot meal (in mass %) from the cement plant I, II, II, IV
determined by x-ray fluorescence
Oxides Hot meal
I II III IV CaO 52.3 61.4 51.8 67.0 SiO2 11.2 9.61 8.75 16.8 SO3 4.86 2.74 4.77 0.596
Al2O3 3.10 3.43 3.06 3.77 K2O 4.72 5.27 5.16 2.41
Fe2O3 1.24 2.22 2.48 2.74 MgO 0.505 2.02 0.884 0.709 Na2O 0.405 0.213 0.102 0.203 TiO2 0.167 0.226 0.148 0.248 SrO 0.164 0.150 0.148 0.148 P2O5 0.0957 0.0496 0.0525 0.125 MnO 0.0326 0.0327 0.0544 0.0584
Cl 1.84 2.32 2.02 0.951 ZnO 0.0382 0.103 0.0846 0.0592 Rb2O 0.0396 0.0292 0.0377 0.0234
Br 0.0428 0.0324 0.0170 0.0128 PbO 0.0465 0.0755 0.0225 0.0231 ZrO2 0.0021 0.0053 n.d. 0.0026
Table 6.8. The oxide composition of bypass dust (in mass %) from the cement plant I, II, II, IV
determined by x-ray fluorescence
Oxides Bypass dust
I II IV CaO 30.1 16.5 50.9 SiO2 1.26 2.35 12.5 SO3 18.6 5.48 1.42
Al2O3 0.329 0.846 2.68 K2O 32.5 18.3 9.28
Fe2O3 0.461 0.524 2.09 MgO 0.170 0.417 0.542 Na2O 2.64 0.970 0.570 TiO2 0.0429 0.0460 0.176 SrO 0.0561 0.0409 0.109 P2O5 0.0798 0.0559 0.0937 MnO 0.0342 0.0177 0.0464
Cl 16.4 12.5 5.41 ZnO 0.407 0.0837 0.0594 Rb2O 0.239 0.100 0.0925
Br 0.236 0.135 0.0563 PbO 0.210 0.239 0.0628 ZrO2 0.000370 0.0026 0.0038
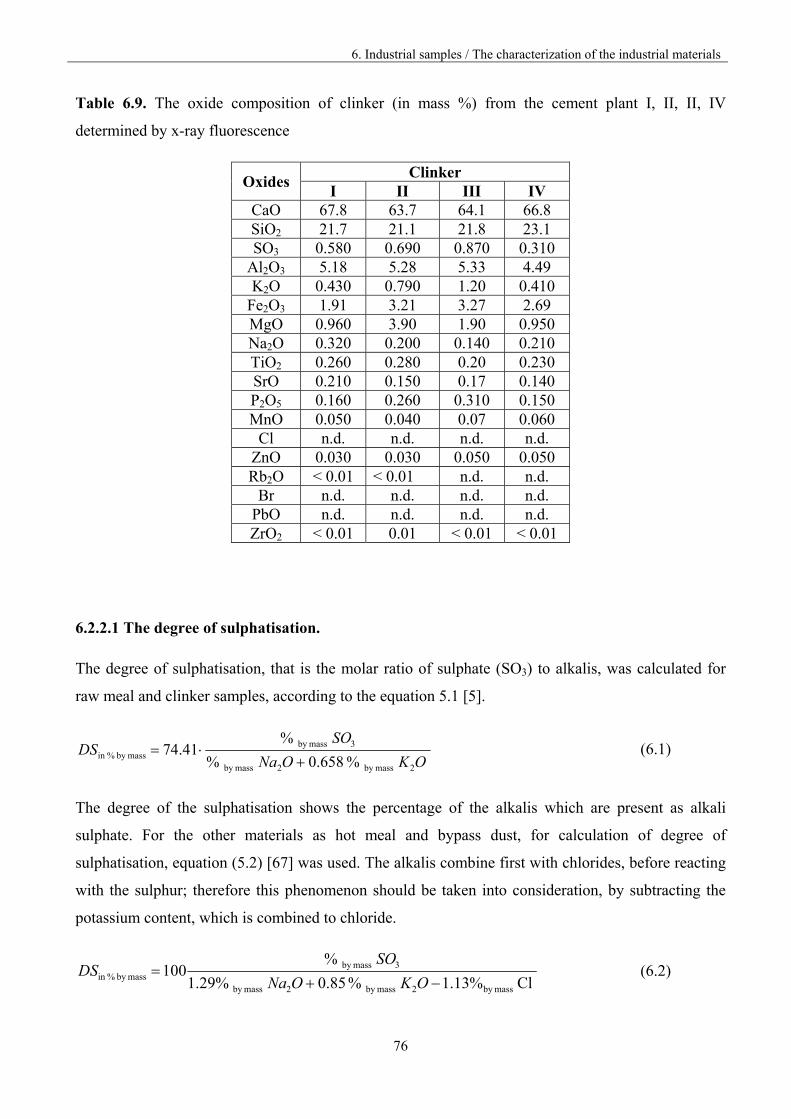
6. Industrial samples / The characterization of the industrial materials
76
Table 6.9. The oxide composition of clinker (in mass %) from the cement plant I, II, II, IV
determined by x-ray fluorescence
Oxides Clinker
I II III IV CaO 67.8 63.7 64.1 66.8 SiO2 21.7 21.1 21.8 23.1 SO3 0.580 0.690 0.870 0.310
Al2O3 5.18 5.28 5.33 4.49 K2O 0.430 0.790 1.20 0.410
Fe2O3 1.91 3.21 3.27 2.69 MgO 0.960 3.90 1.90 0.950 Na2O 0.320 0.200 0.140 0.210 TiO2 0.260 0.280 0.20 0.230 SrO 0.210 0.150 0.17 0.140 P2O5 0.160 0.260 0.310 0.150 MnO 0.050 0.040 0.07 0.060
Cl n.d. n.d. n.d. n.d. ZnO 0.030 0.030 0.050 0.050 Rb2O < 0.01 < 0.01 n.d. n.d.
Br n.d. n.d. n.d. n.d. PbO n.d. n.d. n.d. n.d. ZrO2 < 0.01 0.01 < 0.01 < 0.01
6.2.2.1 The degree of sulphatisation.
The degree of sulphatisation, that is the molar ratio of sulphate (SO3) to alkalis, was calculated for
raw meal and clinker samples, according to the equation 5.1 [5].
% 0.658 %
%41.74
2massby 2massby
3massby massby %in OKONa
SODS
(6.1)
The degree of the sulphatisation shows the percentage of the alkalis which are present as alkali
sulphate. For the other materials as hot meal and bypass dust, for calculation of degree of
sulphatisation, equation (5.2) [67] was used. The alkalis combine first with chlorides, before reacting
with the sulphur; therefore this phenomenon should be taken into consideration, by subtracting the
potassium content, which is combined to chloride.
Cl %13.1 % 0.85 1.29%
%100
massby 2massby 2massby
3massby massby %in
OKONa
SODS (6.2)
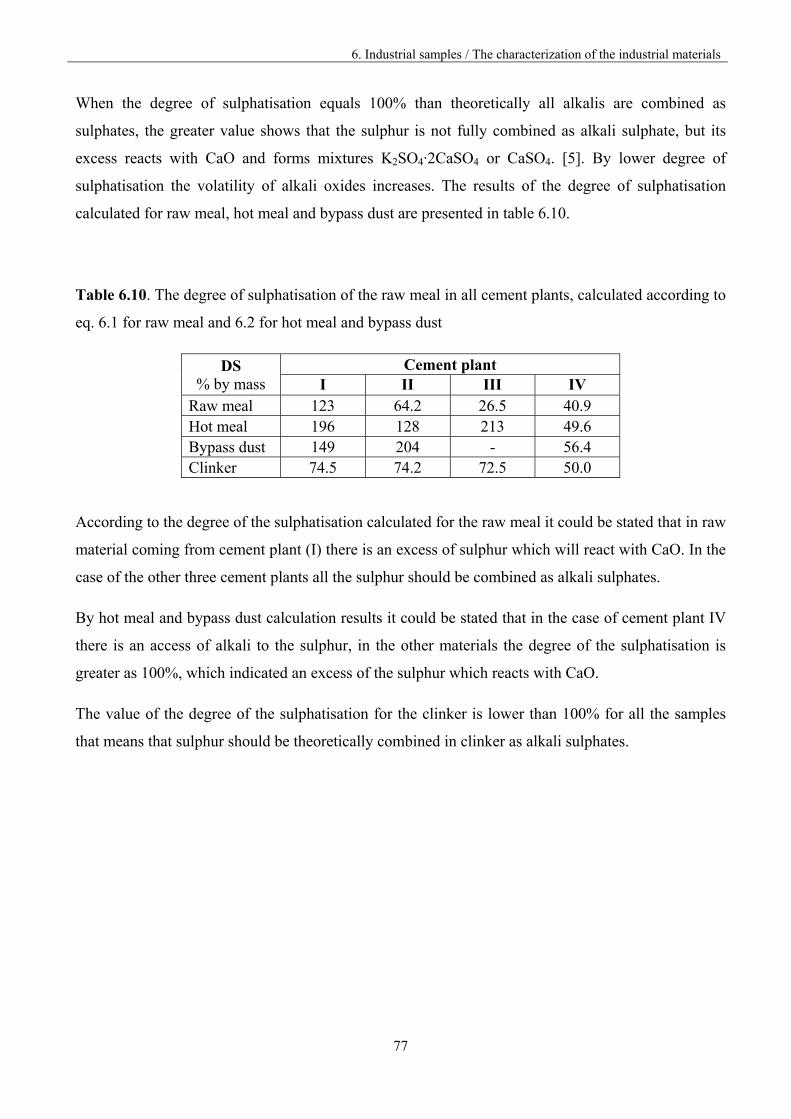
6. Industrial samples / The characterization of the industrial materials
77
When the degree of sulphatisation equals 100% than theoretically all alkalis are combined as
sulphates, the greater value shows that the sulphur is not fully combined as alkali sulphate, but its
excess reacts with CaO and forms mixtures K2SO4·2CaSO4 or CaSO4. [5]. By lower degree of
sulphatisation the volatility of alkali oxides increases. The results of the degree of sulphatisation
calculated for raw meal, hot meal and bypass dust are presented in table 6.10.
Table 6.10. The degree of sulphatisation of the raw meal in all cement plants, calculated according to
eq. 6.1 for raw meal and 6.2 for hot meal and bypass dust
DS % by mass
Cement plant I II III IV
Raw meal 123 64.2 26.5 40.9 Hot meal 196 128 213 49.6 Bypass dust 149 204 - 56.4 Clinker 74.5 74.2 72.5 50.0
According to the degree of the sulphatisation calculated for the raw meal it could be stated that in raw
material coming from cement plant (I) there is an excess of sulphur which will react with CaO. In the
case of the other three cement plants all the sulphur should be combined as alkali sulphates.
By hot meal and bypass dust calculation results it could be stated that in the case of cement plant IV
there is an access of alkali to the sulphur, in the other materials the degree of the sulphatisation is
greater as 100%, which indicated an excess of the sulphur which reacts with CaO.
The value of the degree of the sulphatisation for the clinker is lower than 100% for all the samples
that means that sulphur should be theoretically combined in clinker as alkali sulphates.
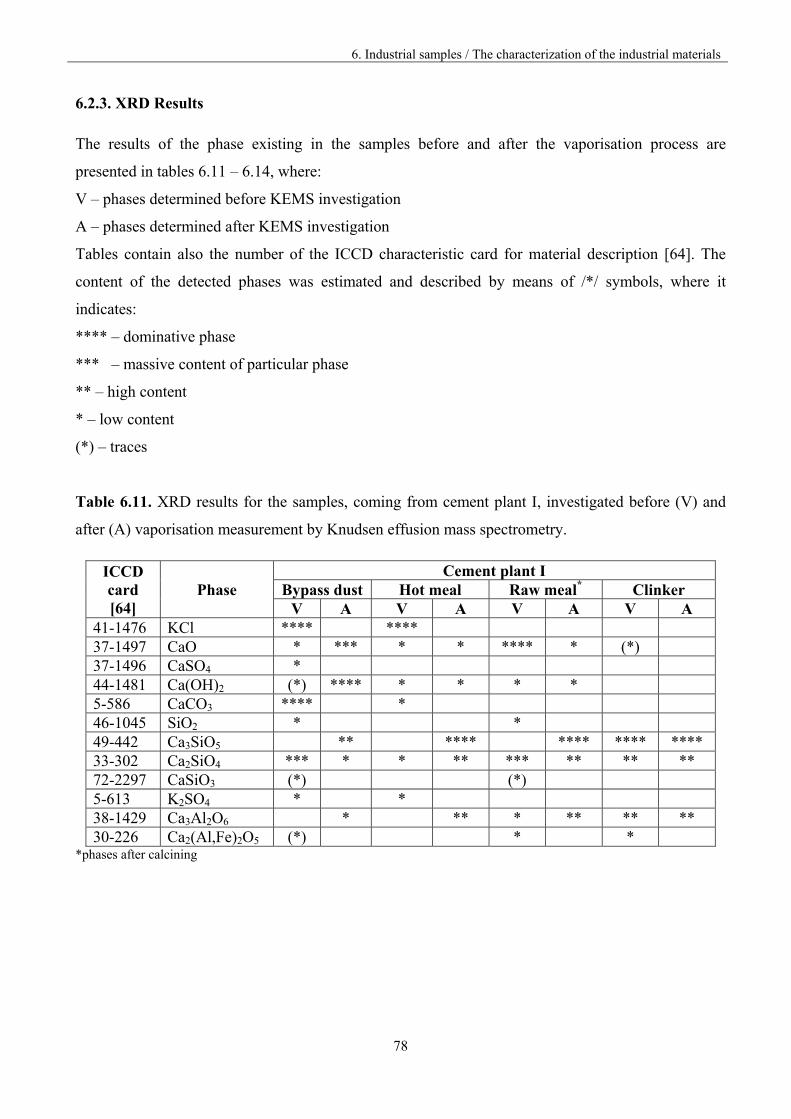
6. Industrial samples / The characterization of the industrial materials
78
6.2.3. XRD Results
The results of the phase existing in the samples before and after the vaporisation process are
presented in tables 6.11 – 6.14, where:
V – phases determined before KEMS investigation
A – phases determined after KEMS investigation
Tables contain also the number of the ICCD characteristic card for material description [64]. The
content of the detected phases was estimated and described by means of /*/ symbols, where it
indicates:
**** – dominative phase
*** – massive content of particular phase
** – high content
* – low content
(*) – traces
Table 6.11. XRD results for the samples, coming from cement plant I, investigated before (V) and
after (A) vaporisation measurement by Knudsen effusion mass spectrometry.
ICCD card [64]
Phase Cement plant I
Bypass dust Hot meal Raw meal* Clinker V A V A V A V A
41-1476 KCl **** **** 37-1497 CaO * *** * * **** * (*) 37-1496 CaSO4 * 44-1481 Ca(OH)2 (*) **** * * * * 5-586 CaCO3 **** * 46-1045 SiO2 * * 49-442 Ca3SiO5 ** **** **** **** **** 33-302 Ca2SiO4 *** * * ** *** ** ** ** 72-2297 CaSiO3 (*) (*) 5-613 K2SO4 * * 38-1429 Ca3Al2O6 * ** * ** ** ** 30-226 Ca2(Al,Fe)2O5 (*) * *
*phases after calcining
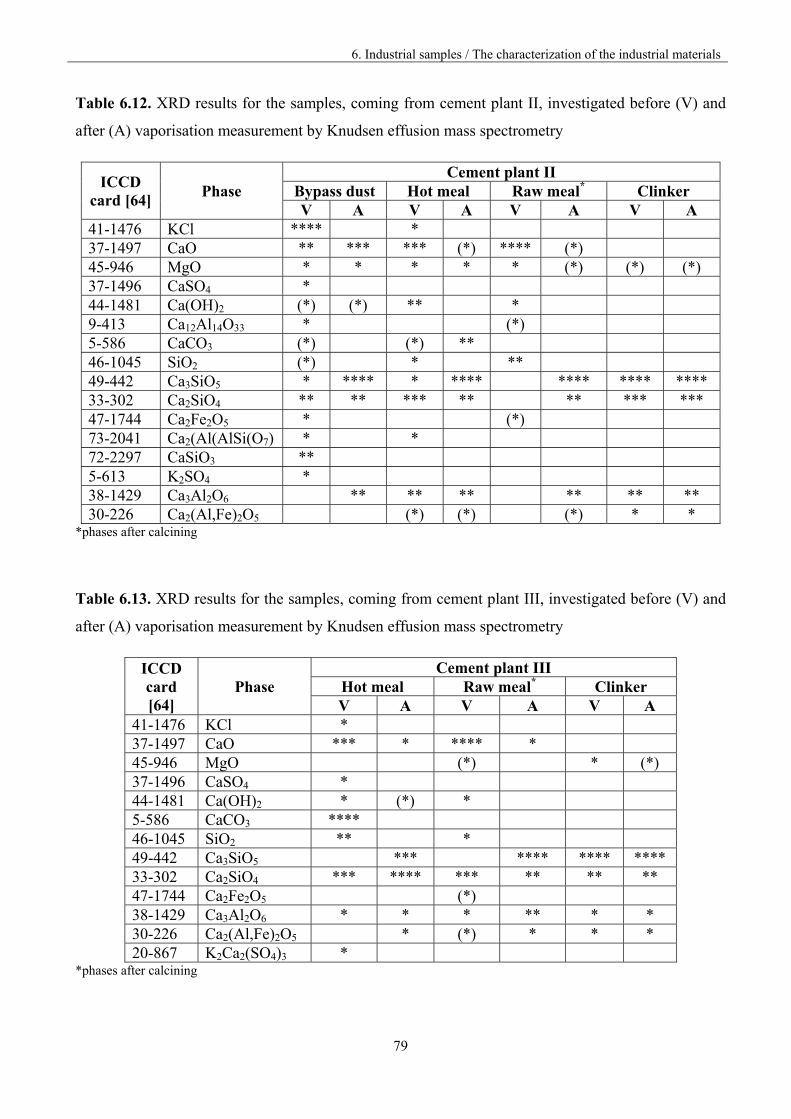
6. Industrial samples / The characterization of the industrial materials
79
Table 6.12. XRD results for the samples, coming from cement plant II, investigated before (V) and
after (A) vaporisation measurement by Knudsen effusion mass spectrometry
ICCD card [64]
Phase Cement plant II
Bypass dust Hot meal Raw meal* Clinker V A V A V A V A
41-1476 KCl **** * 37-1497 CaO ** *** *** (*) **** (*) 45-946 MgO * * * * * (*) (*) (*) 37-1496 CaSO4 * 44-1481 Ca(OH)2 (*) (*) ** * 9-413 Ca12Al14O33 * (*) 5-586 CaCO3 (*) (*) ** 46-1045 SiO2 (*) * ** 49-442 Ca3SiO5 * **** * **** **** **** **** 33-302 Ca2SiO4 ** ** *** ** ** *** *** 47-1744 Ca2Fe2O5 * (*) 73-2041 Ca2(Al(AlSi(O7) * * 72-2297 CaSiO3 ** 5-613 K2SO4 * 38-1429 Ca3Al2O6 ** ** ** ** ** ** 30-226 Ca2(Al,Fe)2O5 (*) (*) (*) * *
*phases after calcining
Table 6.13. XRD results for the samples, coming from cement plant III, investigated before (V) and
after (A) vaporisation measurement by Knudsen effusion mass spectrometry
ICCD card [64]
Phase Cement plant III
Hot meal Raw meal* Clinker V A V A V A
41-1476 KCl * 37-1497 CaO *** * **** * 45-946 MgO (*) * (*) 37-1496 CaSO4 * 44-1481 Ca(OH)2 * (*) * 5-586 CaCO3 **** 46-1045 SiO2 ** * 49-442 Ca3SiO5 *** **** **** **** 33-302 Ca2SiO4 *** **** *** ** ** ** 47-1744 Ca2Fe2O5 (*) 38-1429 Ca3Al2O6 * * * ** * * 30-226 Ca2(Al,Fe)2O5 * (*) * * * 20-867 K2Ca2(SO4)3 *
*phases after calcining
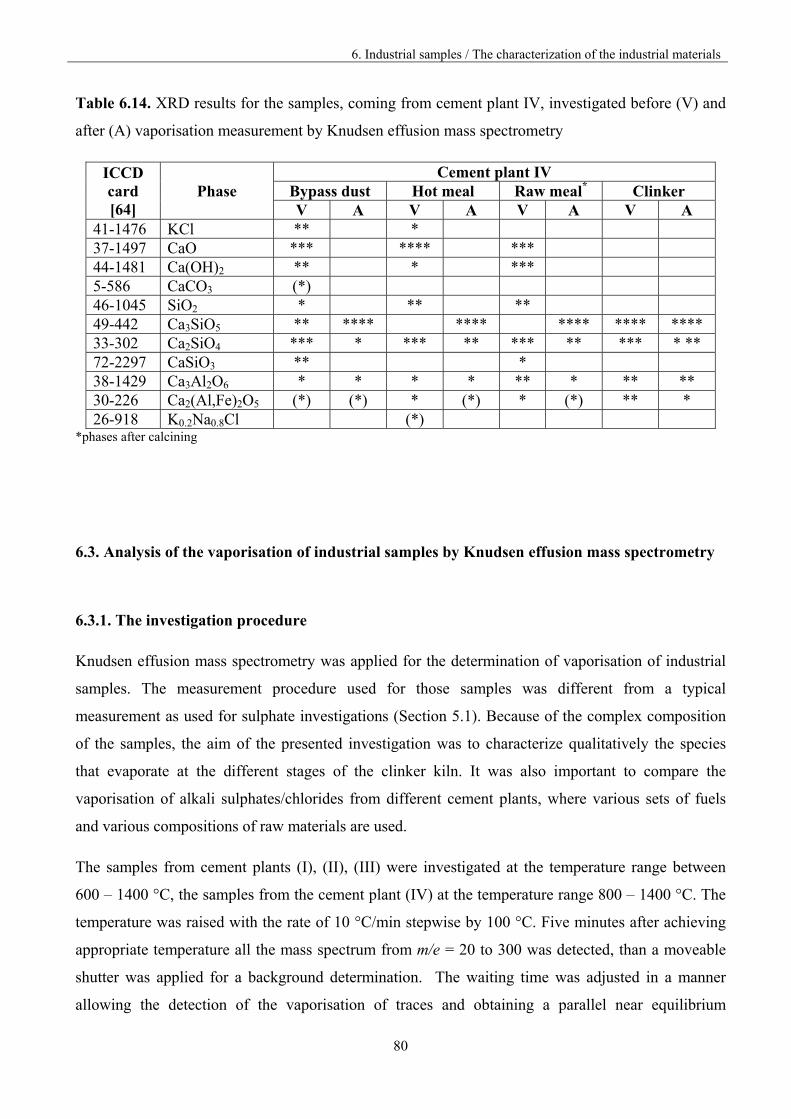
6. Industrial samples / The characterization of the industrial materials
80
Table 6.14. XRD results for the samples, coming from cement plant IV, investigated before (V) and
after (A) vaporisation measurement by Knudsen effusion mass spectrometry
ICCD card [64]
Phase Cement plant IV
Bypass dust Hot meal Raw meal* Clinker V A V A V A V A
41-1476 KCl ** * 37-1497 CaO *** **** *** 44-1481 Ca(OH)2 ** * *** 5-586 CaCO3 (*) 46-1045 SiO2 * ** ** 49-442 Ca3SiO5 ** **** **** **** **** **** 33-302 Ca2SiO4 *** * *** ** *** ** *** * ** 72-2297 CaSiO3 ** * 38-1429 Ca3Al2O6 * * * * ** * ** ** 30-226 Ca2(Al,Fe)2O5 (*) (*) * (*) * (*) ** * 26-918 K0.2Na0.8Cl (*)
*phases after calcining
6.3. Analysis of the vaporisation of industrial samples by Knudsen effusion mass spectrometry
6.3.1. The investigation procedure
Knudsen effusion mass spectrometry was applied for the determination of vaporisation of industrial
samples. The measurement procedure used for those samples was different from a typical
measurement as used for sulphate investigations (Section 5.1). Because of the complex composition
of the samples, the aim of the presented investigation was to characterize qualitatively the species
that evaporate at the different stages of the clinker kiln. It was also important to compare the
vaporisation of alkali sulphates/chlorides from different cement plants, where various sets of fuels
and various compositions of raw materials are used.
The samples from cement plants (I), (II), (III) were investigated at the temperature range between
600 – 1400 °C, the samples from the cement plant (IV) at the temperature range 800 – 1400 °C. The
temperature was raised with the rate of 10 °C/min stepwise by 100 °C. Five minutes after achieving
appropriate temperature all the mass spectrum from m/e = 20 to 300 was detected, than a moveable
shutter was applied for a background determination. The waiting time was adjusted in a manner
allowing the detection of the vaporisation of traces and obtaining a parallel near equilibrium
6. Industrial samples / KEMS
81
condition. This procedure was applied for all the samples under investigation to achieve an overview
of the vaporisation at all kiln zones, corresponding to the low, medium and high temperatures.
Because the “raw meal” material includes high CaCO3 content, it was unfeasible to investigate that
material directly by means of the Knudsen effusion mass spectrometry. The liberation of the high
CO2 contents disturbed proper high vacuum maintenance. Therefore, the materials “raw meal” was
previously heated in Pt crucible in the oven at the temperature 850 oC at 1 bar air for the time 1 hour
15 minutes in order to decompose the calcium carbonate firstly.
A thermodynamic interpretation of the mass spectrometric results requires qualitative and
quantitative assignment of the observed ions to their neutral precursors. The quantitative assignment
of the ions to their neutral precursors was not possible here, due to the complex vapour composition,
complexity of the samples under investigation and a difficult fragmentation. However, a qualitative
and quasi-quantitative assignment of the ion currents to the specific vaporisation processes could be
performed on the basis of the vaporisation studies of pure substances and of model melts studies in
this work.
Therefore, in the case of the industrial samples investigation, the determination of the vaporisation
quantitatively and partial pressure determination were omitted. For those samples, only qualitative
and semi-quantitative analyses are presented and on that basis the vaporisation process of volatilities
estimated. Resting upon the constancy of the sensitivity of mass spectrometer throughout this study, a
comparison between these processes going on in four different kiln installations I-IV was possible.
The ions presented in the mass spectrum originating from the vapour species were identified by the
mass-to-charge ratio and the isotopic distribution by applying isotope calculator [68].
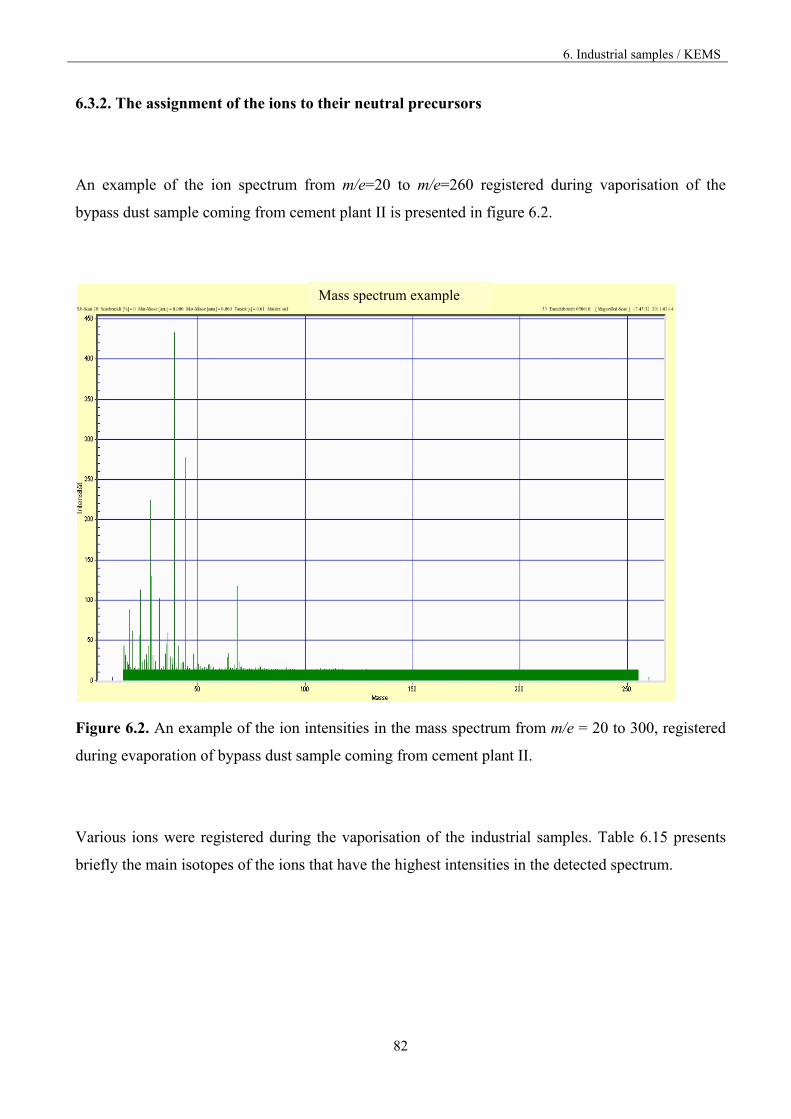
6. Industrial samples / KEMS
82
6.3.2. The assignment of the ions to their neutral precursors
An example of the ion spectrum from m/e=20 to m/e=260 registered during vaporisation of the
bypass dust sample coming from cement plant II is presented in figure 6.2.
Figure 6.2. An example of the ion intensities in the mass spectrum from m/e = 20 to 300, registered
during evaporation of bypass dust sample coming from cement plant II.
Various ions were registered during the vaporisation of the industrial samples. Table 6.15 presents
briefly the main isotopes of the ions that have the highest intensities in the detected spectrum.
Mass spectrum example
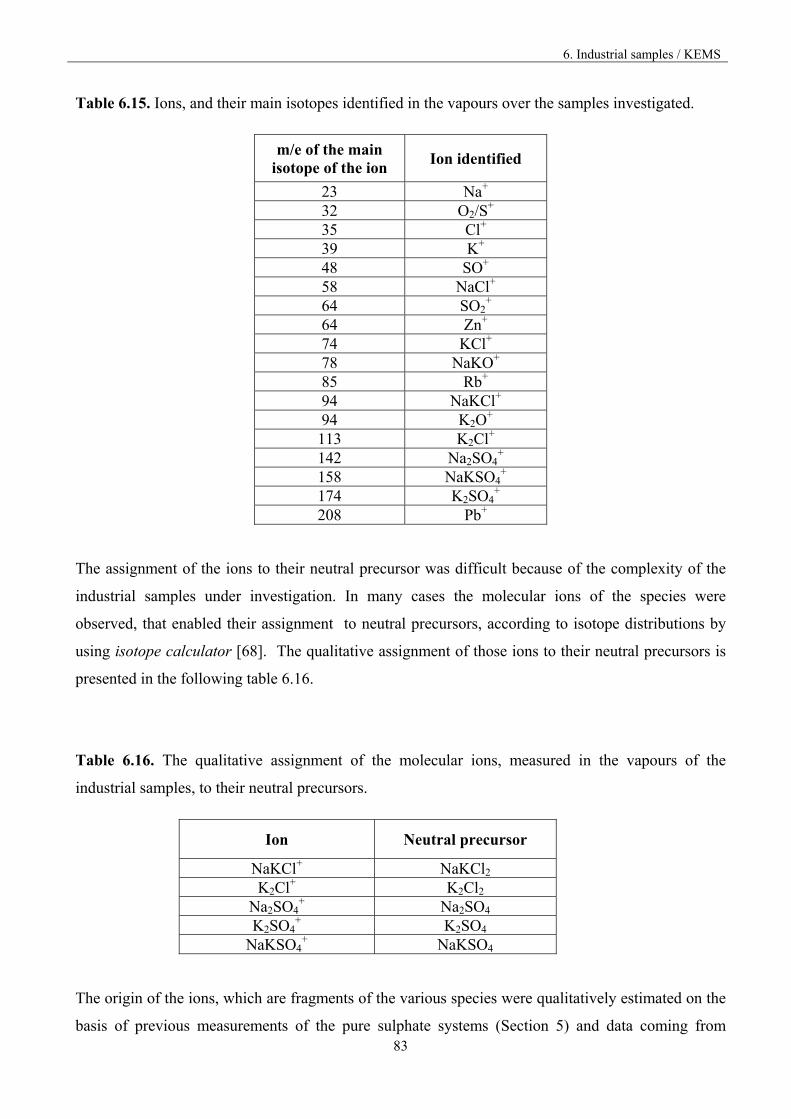
6. Industrial samples / KEMS
83
Table 6.15. Ions, and their main isotopes identified in the vapours over the samples investigated.
m/e of the main isotope of the ion
Ion identified
23 Na+
32 O2/S+
35 Cl+
39 K+
48 SO+
58 NaCl+
64 SO2+
64 Zn+
74 KCl+
78 NaKO+
85 Rb+
94 NaKCl+
94 K2O+
113 K2Cl+
142 Na2SO4+
158 NaKSO4+
174 K2SO4+
208 Pb+
The assignment of the ions to their neutral precursor was difficult because of the complexity of the
industrial samples under investigation. In many cases the molecular ions of the species were
observed, that enabled their assignment to neutral precursors, according to isotope distributions by
using isotope calculator [68]. The qualitative assignment of those ions to their neutral precursors is
presented in the following table 6.16.
Table 6.16. The qualitative assignment of the molecular ions, measured in the vapours of the
industrial samples, to their neutral precursors.
Ion Neutral precursor
NaKCl+ NaKCl2 K2Cl+ K2Cl2
Na2SO4+ Na2SO4
K2SO4+ K2SO4
NaKSO4+ NaKSO4
The origin of the ions, which are fragments of the various species were qualitatively estimated on the
basis of previous measurements of the pure sulphate systems (Section 5) and data coming from
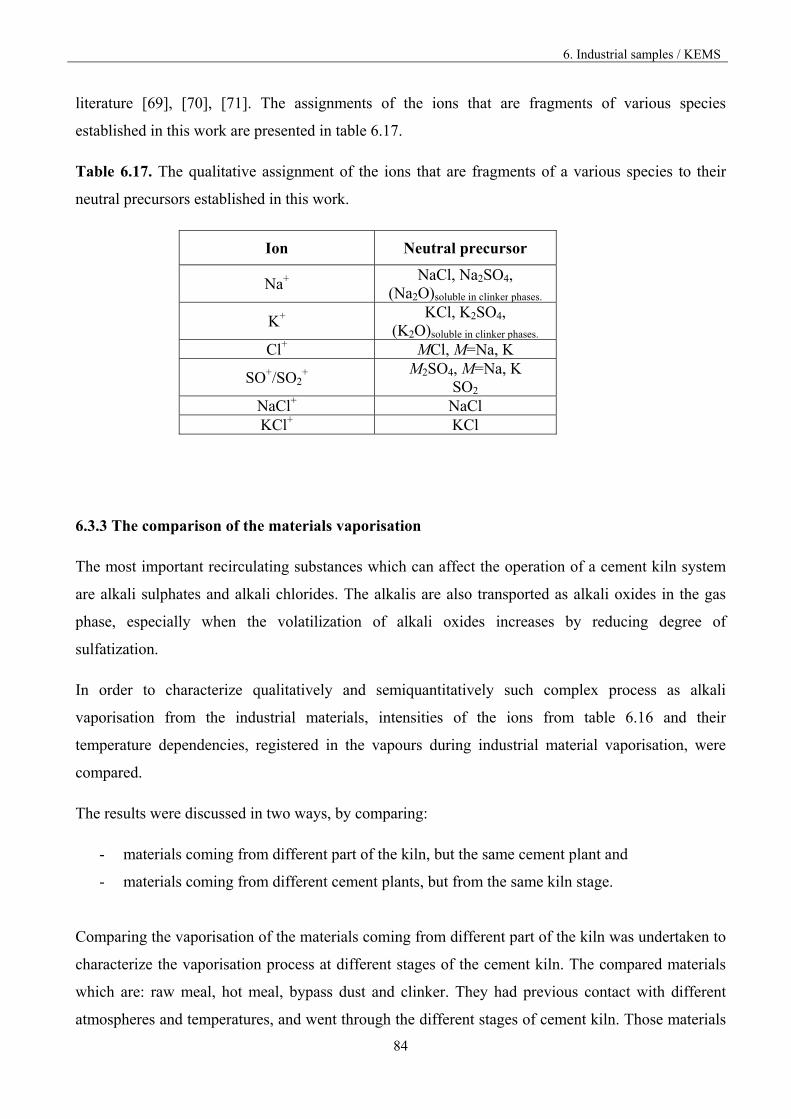
6. Industrial samples / KEMS
84
literature [69], [70], [71]. The assignments of the ions that are fragments of various species
established in this work are presented in table 6.17.
Table 6.17. The qualitative assignment of the ions that are fragments of a various species to their
neutral precursors established in this work.
Ion Neutral precursor
Na+ NaCl, Na2SO4,
(Na2O)soluble in clinker phases.
K+ KCl, K2SO4,
(K2O)soluble in clinker phases. Cl+ MCl, M=Na, K
SO+/SO2+
M2SO4, M=Na, K SO2
NaCl+ NaCl KCl+ KCl
6.3.3 The comparison of the materials vaporisation
The most important recirculating substances which can affect the operation of a cement kiln system
are alkali sulphates and alkali chlorides. The alkalis are also transported as alkali oxides in the gas
phase, especially when the volatilization of alkali oxides increases by reducing degree of
sulfatization.
In order to characterize qualitatively and semiquantitatively such complex process as alkali
vaporisation from the industrial materials, intensities of the ions from table 6.16 and their
temperature dependencies, registered in the vapours during industrial material vaporisation, were
compared.
The results were discussed in two ways, by comparing:
- materials coming from different part of the kiln, but the same cement plant and
- materials coming from different cement plants, but from the same kiln stage.
Comparing the vaporisation of the materials coming from different part of the kiln was undertaken to
characterize the vaporisation process at different stages of the cement kiln. The compared materials
which are: raw meal, hot meal, bypass dust and clinker. They had previous contact with different
atmospheres and temperatures, and went through the different stages of cement kiln. Those materials
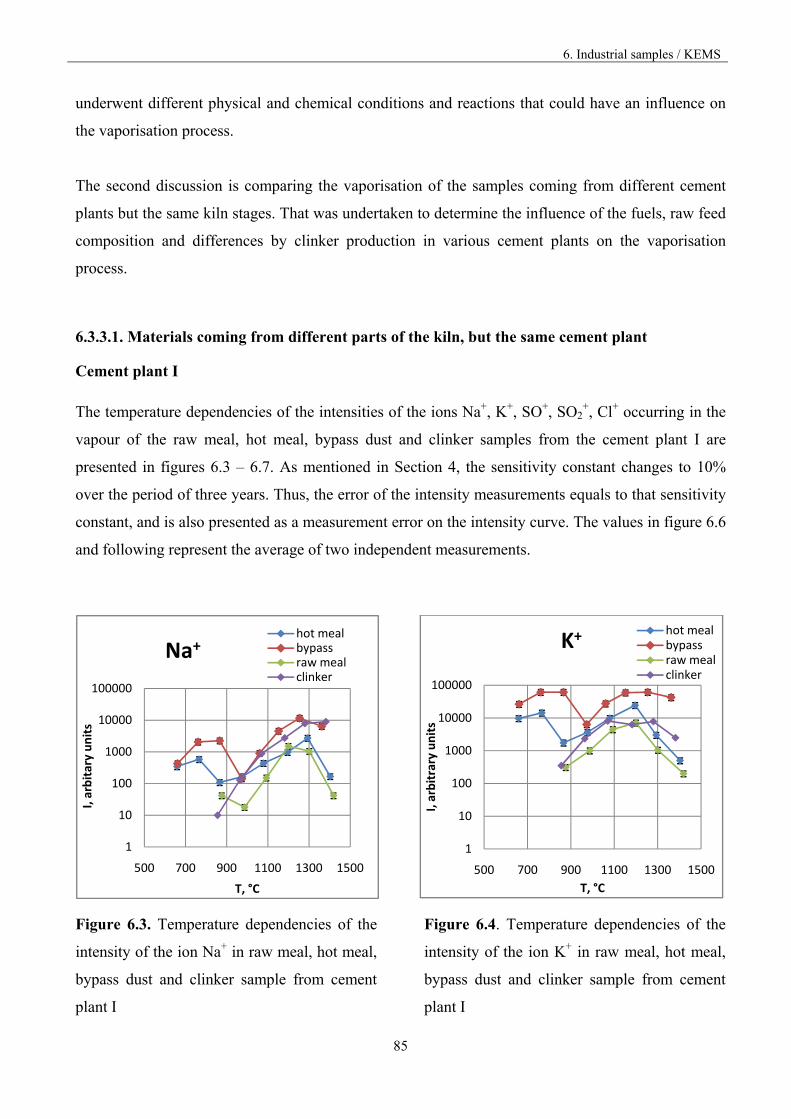
6. Industrial samples / KEMS
85
underwent different physical and chemical conditions and reactions that could have an influence on
the vaporisation process.
The second discussion is comparing the vaporisation of the samples coming from different cement
plants but the same kiln stages. That was undertaken to determine the influence of the fuels, raw feed
composition and differences by clinker production in various cement plants on the vaporisation
process.
6.3.3.1. Materials coming from different parts of the kiln, but the same cement plant
Cement plant I
The temperature dependencies of the intensities of the ions Na+, K+, SO+, SO2+, Cl+ occurring in the
vapour of the raw meal, hot meal, bypass dust and clinker samples from the cement plant I are
presented in figures 6.3 – 6.7. As mentioned in Section 4, the sensitivity constant changes to 10%
over the period of three years. Thus, the error of the intensity measurements equals to that sensitivity
constant, and is also presented as a measurement error on the intensity curve. The values in figure 6.6
and following represent the average of two independent measurements.
Figure 6.3. Temperature dependencies of the
intensity of the ion Na+ in raw meal, hot meal,
bypass dust and clinker sample from cement
plant I
Figure 6.4. Temperature dependencies of the
intensity of the ion K+ in raw meal, hot meal,
bypass dust and clinker sample from cement
plant I
1
10
100
1000
10000
100000
500 700 900 1100 1300 1500
I, arbitary units
T, °C
Na+hot mealbypassraw mealclinker
1
10
100
1000
10000
100000
500 700 900 1100 1300 1500
I, arbitrary units
T, °C
K+hot mealbypassraw mealclinker
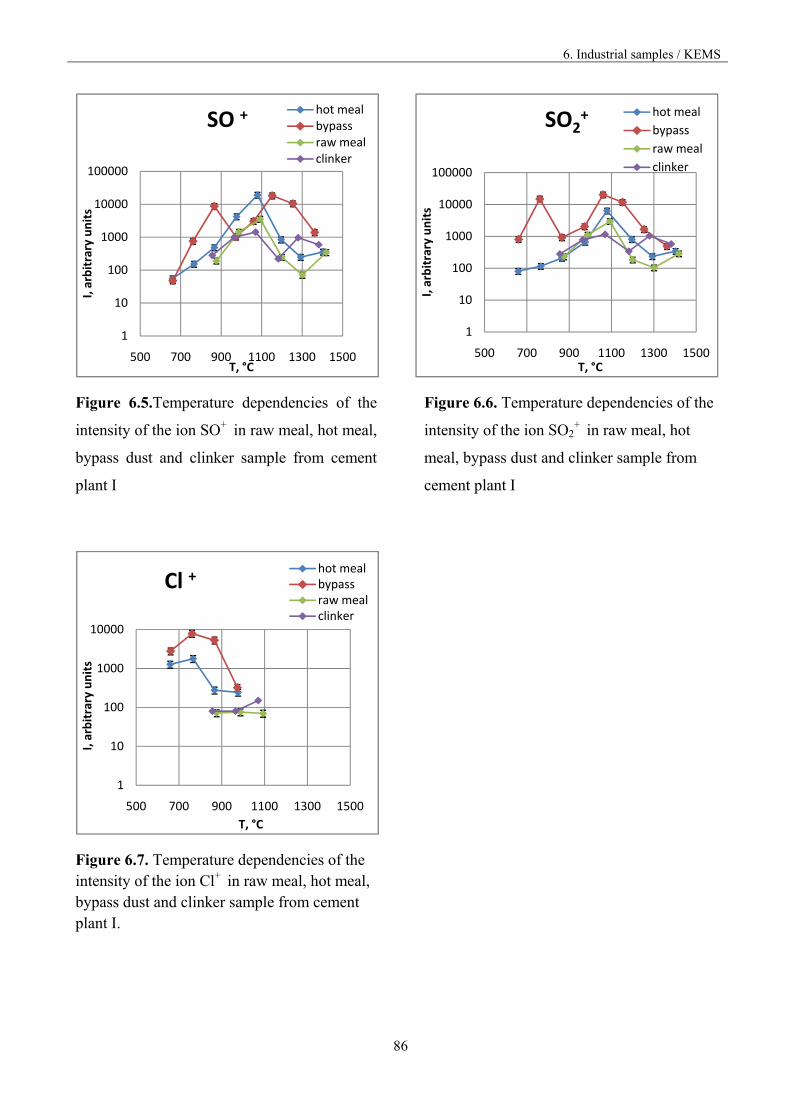
6. Industrial samples / KEMS
86
Figure 6.5.Temperature dependencies of the
intensity of the ion SO+ in raw meal, hot meal,
bypass dust and clinker sample from cement
plant I
Figure 6.6. Temperature dependencies of the
intensity of the ion SO2+ in raw meal, hot
meal, bypass dust and clinker sample from
cement plant I
Figure 6.7. Temperature dependencies of the intensity of the ion Cl+ in raw meal, hot meal, bypass dust and clinker sample from cement plant I.
1
10
100
1000
10000
100000
500 700 900 1100 1300 1500
I, arbitrary units
T, °C
SO +hot mealbypassraw mealclinker
1
10
100
1000
10000
100000
500 700 900 1100 1300 1500
I, arbitrary units
T, °C
SO2+ hot meal
bypass
raw meal
clinker
1
10
100
1000
10000
500 700 900 1100 1300 1500
I, arbitrary units
T, °C
Cl +hot mealbypassraw mealclinker
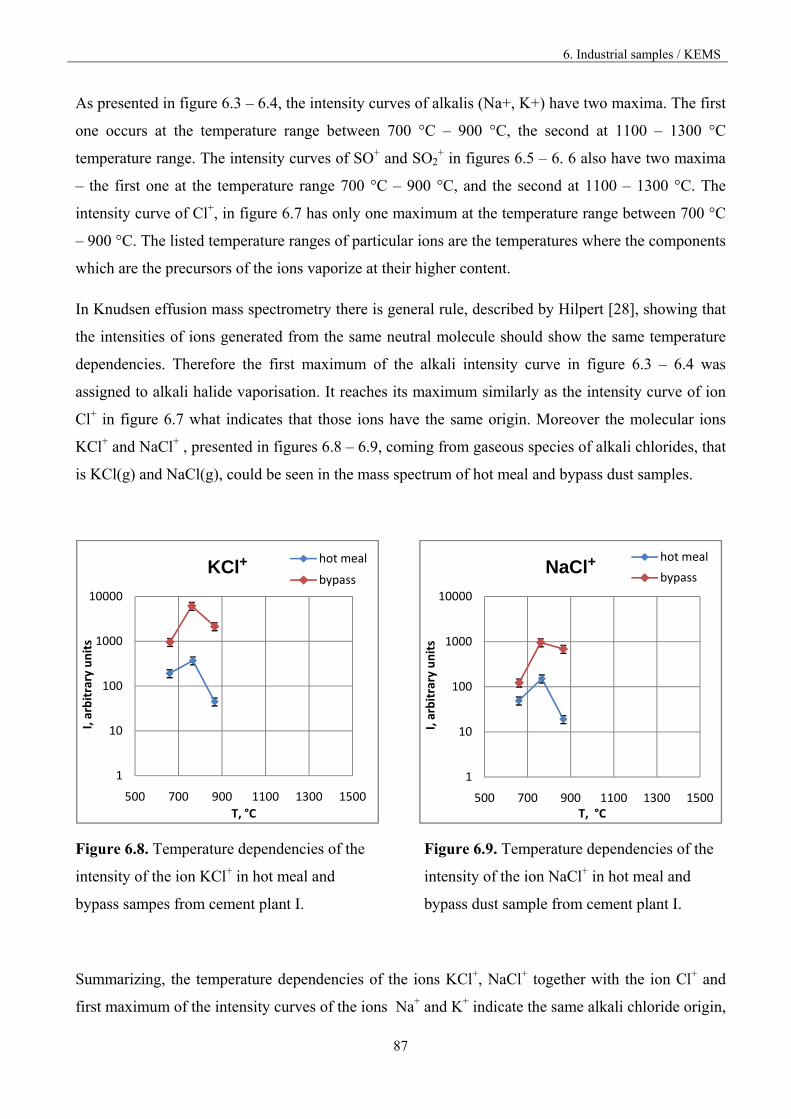
6. Industrial samples / KEMS
87
As presented in figure 6.3 – 6.4, the intensity curves of alkalis (Na+, K+) have two maxima. The first
one occurs at the temperature range between 700 °C – 900 °C, the second at 1100 – 1300 °C
temperature range. The intensity curves of SO+ and SO2+ in figures 6.5 – 6. 6 also have two maxima
– the first one at the temperature range 700 °C – 900 °C, and the second at 1100 – 1300 °C. The
intensity curve of Cl+, in figure 6.7 has only one maximum at the temperature range between 700 °C
– 900 °C. The listed temperature ranges of particular ions are the temperatures where the components
which are the precursors of the ions vaporize at their higher content.
In Knudsen effusion mass spectrometry there is general rule, described by Hilpert [28], showing that
the intensities of ions generated from the same neutral molecule should show the same temperature
dependencies. Therefore the first maximum of the alkali intensity curve in figure 6.3 – 6.4 was
assigned to alkali halide vaporisation. It reaches its maximum similarly as the intensity curve of ion
Cl+ in figure 6.7 what indicates that those ions have the same origin. Moreover the molecular ions
KCl+ and NaCl+ , presented in figures 6.8 – 6.9, coming from gaseous species of alkali chlorides, that
is KCl(g) and NaCl(g), could be seen in the mass spectrum of hot meal and bypass dust samples.
Figure 6.8. Temperature dependencies of the
intensity of the ion KCl+ in hot meal and
bypass sampes from cement plant I.
Figure 6.9. Temperature dependencies of the
intensity of the ion NaCl+ in hot meal and
bypass dust sample from cement plant I.
Summarizing, the temperature dependencies of the ions KCl+, NaCl+ together with the ion Cl+ and
first maximum of the intensity curves of the ions Na+ and K+ indicate the same alkali chloride origin,
1
10
100
1000
10000
500 700 900 1100 1300 1500
I, arbitrary units
T, °C
KCl+hot meal
bypass
1
10
100
1000
10000
500 700 900 1100 1300 1500
I, arbitrary units
T, °C
NaCl+hot meal
bypass
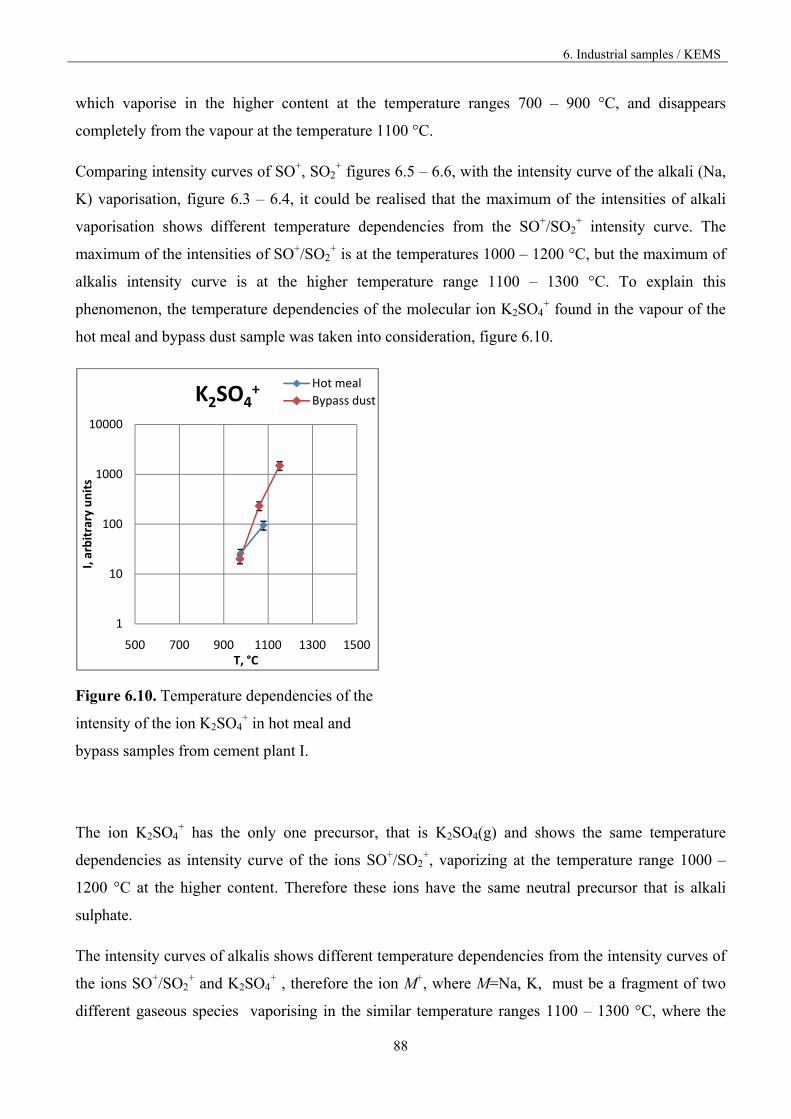
6. Industrial samples / KEMS
88
which vaporise in the higher content at the temperature ranges 700 – 900 °C, and disappears
completely from the vapour at the temperature 1100 °C.
Comparing intensity curves of SO+, SO2+ figures 6.5 – 6.6, with the intensity curve of the alkali (Na,
K) vaporisation, figure 6.3 – 6.4, it could be realised that the maximum of the intensities of alkali
vaporisation shows different temperature dependencies from the SO+/SO2+ intensity curve. The
maximum of the intensities of SO+/SO2+ is at the temperatures 1000 – 1200 °C, but the maximum of
alkalis intensity curve is at the higher temperature range 1100 – 1300 °C. To explain this
phenomenon, the temperature dependencies of the molecular ion K2SO4+ found in the vapour of the
hot meal and bypass dust sample was taken into consideration, figure 6.10.
Figure 6.10. Temperature dependencies of the
intensity of the ion K2SO4+ in hot meal and
bypass samples from cement plant I.
The ion K2SO4+ has the only one precursor, that is K2SO4(g) and shows the same temperature
dependencies as intensity curve of the ions SO+/SO2+, vaporizing at the temperature range 1000 –
1200 °C at the higher content. Therefore these ions have the same neutral precursor that is alkali
sulphate.
The intensity curves of alkalis shows different temperature dependencies from the intensity curves of
the ions SO+/SO2+ and K2SO4
+ , therefore the ion M+, where M=Na, K, must be a fragment of two
different gaseous species vaporising in the similar temperature ranges 1100 – 1300 °C, where the
1
10
100
1000
10000
500 700 900 1100 1300 1500
I, arbitrary units
T, °C
K2SO4+ Hot meal
Bypass dust
6. Industrial samples / KEMS
89
second intensity maximum occurs, in figures 6.3 – 6.4. First part of this intensity maximum is alkali
sulphate vaporisation at the temperature range 900 – 1200 °C, what is with agreement with
temperature dependencies of the molecular ion K2SO4+ in figure 6.10. Second part of the intensity
maximum is the vaporisation of alkali oxide from the clinker melt that occurs at higher temperature
ranges as sulphates, that is at 1200 – 1300 °C.
Summarizing, the maximum on the alkali intensity curve, consists of the vaporisation of two neutral
precursors, alkali sulphate and alkali oxide from the clinker melt. Because the vaporisation of alkali
sulphates and alkali oxides from clinker melt occurs in the similar temperature range it could be seen
as the only one maximum on the alkali intensity curve, but in fact there are two different vaporisation
processes, by which the alkali are transported in the gas phase.
Moreover, in figures 6.5 – 6.6, in the case of bypass dust sample, there is an additional maximum of
the intensity curve of SO+, SO2+ at the temperatures between 700 – 900 °C. This maximum comes
from the incongruent vaporisation of CaSO4 according to reaction 5.3. The reason for that is, that
calcium sulphate vaporise incongruently at the lower temperature range as alkali sulphate, section 5.
The low content of calcium sulphate phase was also detected by XRD analysis in a bypass dust
sample, table 6.10.
If there is a CaSO4 content in the sample under investigation, even not observable in XRD, its
vaporisation causes a shift of the maxima of SO+ and SO2+ intensity curves towards the lower
temperatures. Calcium sulphate vaporises with decomposition according to the reaction 5.3 at the
lower temperature ranges compared to alkali sulphates (see Section 5).
Cement plant II
The same analysing procedure was applied in the case of cement plant II. The temperature
dependencies of the intensities of ions Na+, K+, SO+, SO2+, Cl+ together with an error, occurring in
the vapour of raw meal, hot meal, bypass dust, clinker samples coming from the cement plant II are
presented in figures 6.11- 6.15.
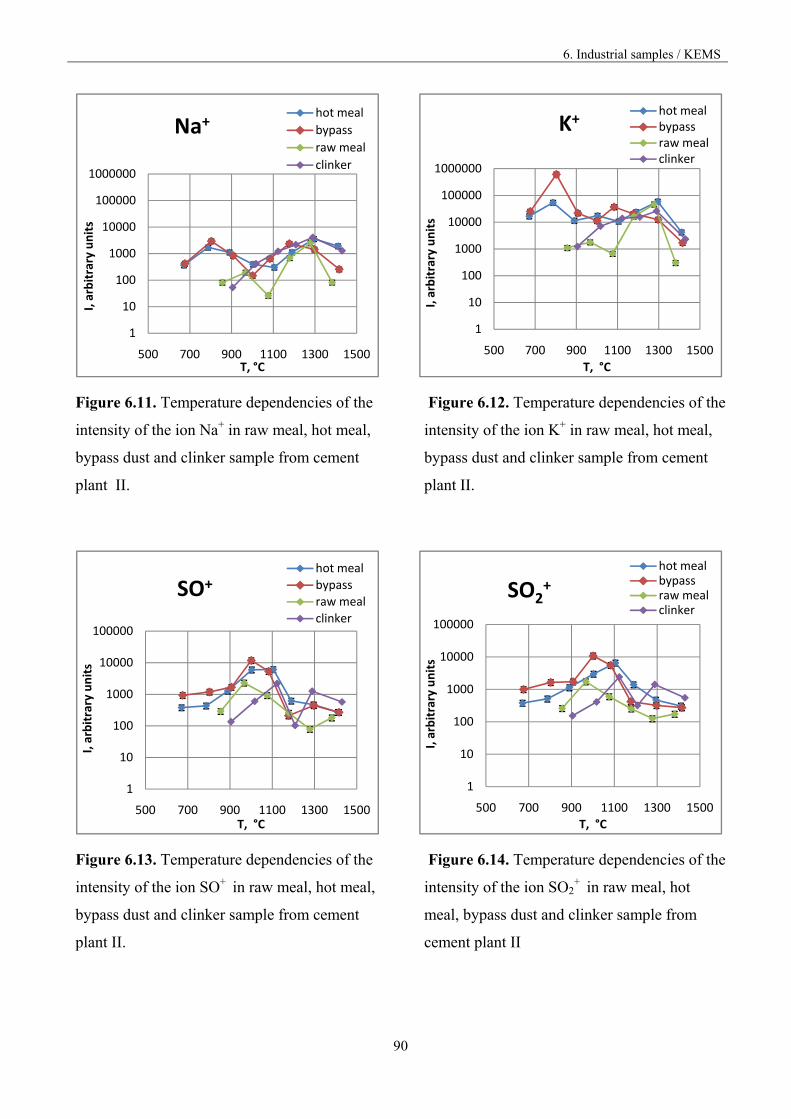
6. Industrial samples / KEMS
90
Figure 6.11. Temperature dependencies of the
intensity of the ion Na+ in raw meal, hot meal,
bypass dust and clinker sample from cement
plant II.
Figure 6.12. Temperature dependencies of the
intensity of the ion K+ in raw meal, hot meal,
bypass dust and clinker sample from cement
plant II.
Figure 6.13. Temperature dependencies of the
intensity of the ion SO+ in raw meal, hot meal,
bypass dust and clinker sample from cement
plant II.
Figure 6.14. Temperature dependencies of the
intensity of the ion SO2+ in raw meal, hot
meal, bypass dust and clinker sample from
cement plant II
1
10
100
1000
10000
100000
1000000
500 700 900 1100 1300 1500
I, arbitrary units
T, °C
Na+hot meal
bypass
raw meal
clinker
1
10
100
1000
10000
100000
1000000
500 700 900 1100 1300 1500
I, arbitrary units
T, °C
K+hot mealbypassraw mealclinker
1
10
100
1000
10000
100000
500 700 900 1100 1300 1500
I, arbitrary units
T, °C
SO+hot meal
bypass
raw meal
clinker
1
10
100
1000
10000
100000
500 700 900 1100 1300 1500
I, arbitrary units
T, °C
SO2+
hot mealbypassraw mealclinker
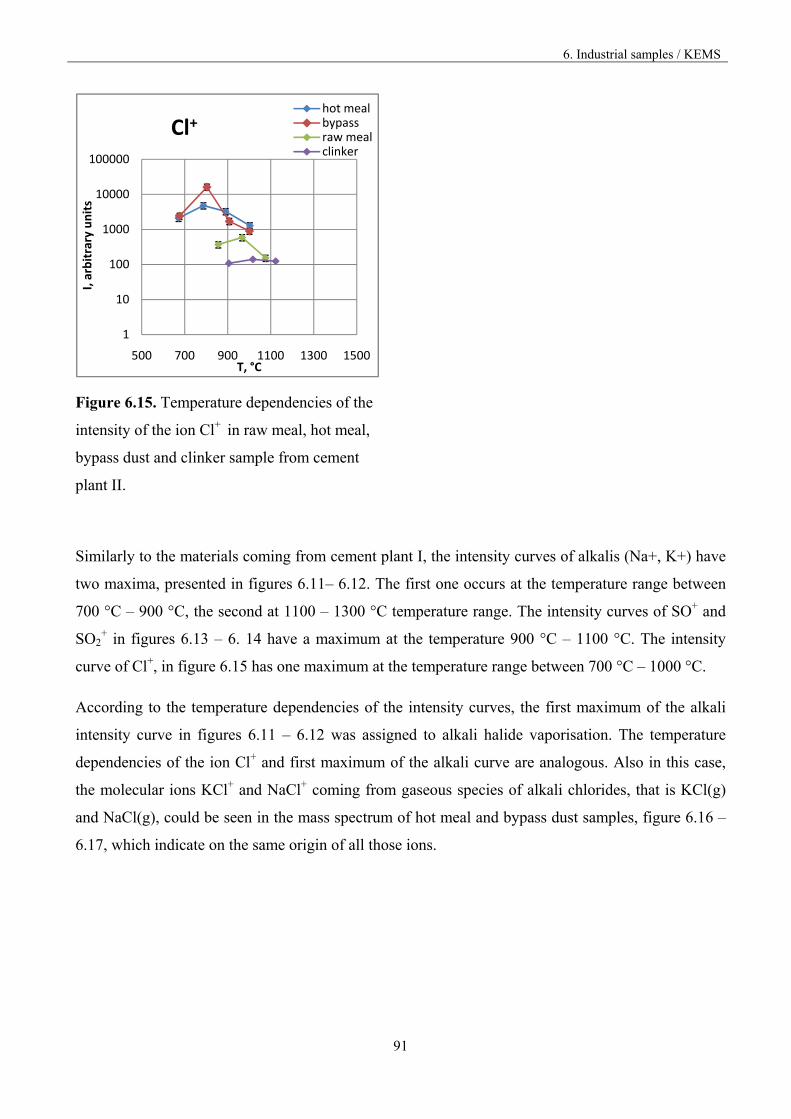
6. Industrial samples / KEMS
91
Figure 6.15. Temperature dependencies of the
intensity of the ion Cl+ in raw meal, hot meal,
bypass dust and clinker sample from cement
plant II.
Similarly to the materials coming from cement plant I, the intensity curves of alkalis (Na+, K+) have
two maxima, presented in figures 6.11– 6.12. The first one occurs at the temperature range between
700 °C – 900 °C, the second at 1100 – 1300 °C temperature range. The intensity curves of SO+ and
SO2+ in figures 6.13 – 6. 14 have a maximum at the temperature 900 °C – 1100 °C. The intensity
curve of Cl+, in figure 6.15 has one maximum at the temperature range between 700 °C – 1000 °C.
According to the temperature dependencies of the intensity curves, the first maximum of the alkali
intensity curve in figures 6.11 – 6.12 was assigned to alkali halide vaporisation. The temperature
dependencies of the ion Cl+ and first maximum of the alkali curve are analogous. Also in this case,
the molecular ions KCl+ and NaCl+ coming from gaseous species of alkali chlorides, that is KCl(g)
and NaCl(g), could be seen in the mass spectrum of hot meal and bypass dust samples, figure 6.16 –
6.17, which indicate on the same origin of all those ions.
1
10
100
1000
10000
100000
500 700 900 1100 1300 1500
I, arbitrary units
T, °C
Cl+hot mealbypassraw mealclinker
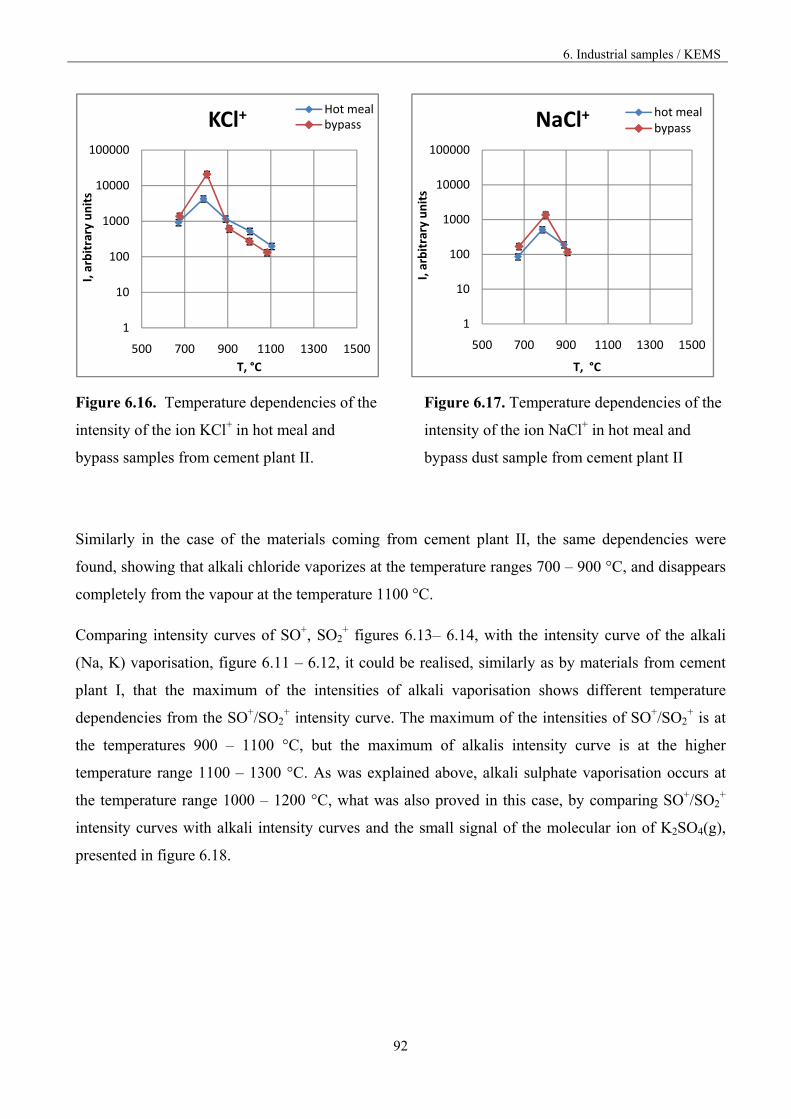
6. Industrial samples / KEMS
92
Figure 6.16. Temperature dependencies of the
intensity of the ion KCl+ in hot meal and
bypass samples from cement plant II.
Figure 6.17. Temperature dependencies of the
intensity of the ion NaCl+ in hot meal and
bypass dust sample from cement plant II
Similarly in the case of the materials coming from cement plant II, the same dependencies were
found, showing that alkali chloride vaporizes at the temperature ranges 700 – 900 °C, and disappears
completely from the vapour at the temperature 1100 °C.
Comparing intensity curves of SO+, SO2+ figures 6.13– 6.14, with the intensity curve of the alkali
(Na, K) vaporisation, figure 6.11 – 6.12, it could be realised, similarly as by materials from cement
plant I, that the maximum of the intensities of alkali vaporisation shows different temperature
dependencies from the SO+/SO2+ intensity curve. The maximum of the intensities of SO+/SO2
+ is at
the temperatures 900 – 1100 °C, but the maximum of alkalis intensity curve is at the higher
temperature range 1100 – 1300 °C. As was explained above, alkali sulphate vaporisation occurs at
the temperature range 1000 – 1200 °C, what was also proved in this case, by comparing SO+/SO2+
intensity curves with alkali intensity curves and the small signal of the molecular ion of K2SO4(g),
presented in figure 6.18.
1
10
100
1000
10000
100000
500 700 900 1100 1300 1500
I, arbitrary units
T, °C
KCl+Hot mealbypass
1
10
100
1000
10000
100000
500 700 900 1100 1300 1500
I, arbitrary units
T, °C
NaCl+ hot mealbypass
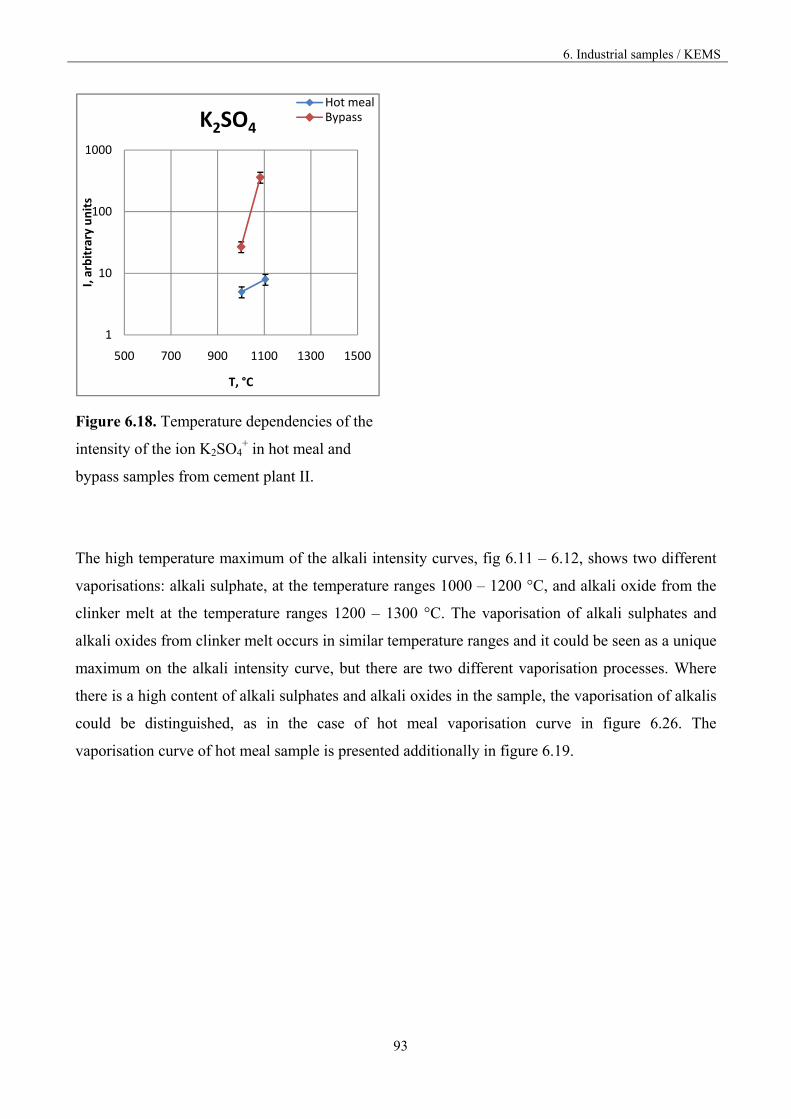
6. Industrial samples / KEMS
93
Figure 6.18. Temperature dependencies of the
intensity of the ion K2SO4+ in hot meal and
bypass samples from cement plant II.
The high temperature maximum of the alkali intensity curves, fig 6.11 – 6.12, shows two different
vaporisations: alkali sulphate, at the temperature ranges 1000 – 1200 °C, and alkali oxide from the
clinker melt at the temperature ranges 1200 – 1300 °C. The vaporisation of alkali sulphates and
alkali oxides from clinker melt occurs in similar temperature ranges and it could be seen as a unique
maximum on the alkali intensity curve, but there are two different vaporisation processes. Where
there is a high content of alkali sulphates and alkali oxides in the sample, the vaporisation of alkalis
could be distinguished, as in the case of hot meal vaporisation curve in figure 6.26. The
vaporisation curve of hot meal sample is presented additionally in figure 6.19.
1
10
100
1000
500 700 900 1100 1300 1500
I, arbitrary units
T, °C
K2SO4
Hot mealBypass
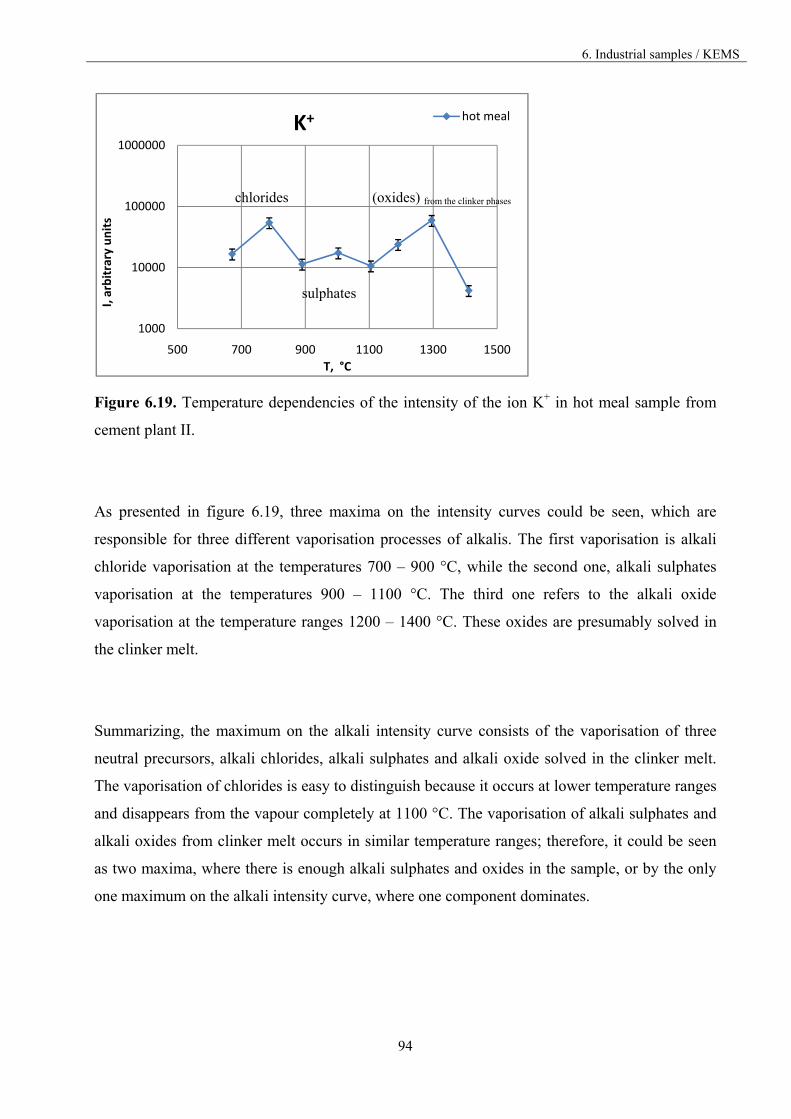
6. Industrial samples / KEMS
94
Figure 6.19. Temperature dependencies of the intensity of the ion K+ in hot meal sample from
cement plant II.
As presented in figure 6.19, three maxima on the intensity curves could be seen, which are
responsible for three different vaporisation processes of alkalis. The first vaporisation is alkali
chloride vaporisation at the temperatures 700 – 900 °C, while the second one, alkali sulphates
vaporisation at the temperatures 900 – 1100 °C. The third one refers to the alkali oxide
vaporisation at the temperature ranges 1200 – 1400 °C. These oxides are presumably solved in
the clinker melt.
Summarizing, the maximum on the alkali intensity curve consists of the vaporisation of three
neutral precursors, alkali chlorides, alkali sulphates and alkali oxide solved in the clinker melt.
The vaporisation of chlorides is easy to distinguish because it occurs at lower temperature ranges
and disappears from the vapour completely at 1100 °C. The vaporisation of alkali sulphates and
alkali oxides from clinker melt occurs in similar temperature ranges; therefore, it could be seen
as two maxima, where there is enough alkali sulphates and oxides in the sample, or by the only
one maximum on the alkali intensity curve, where one component dominates.
1000
10000
100000
1000000
500 700 900 1100 1300 1500
I, arbitrary units
T, °C
K+ hot meal
chlorides
sulphates
(oxides) from the clinker phases
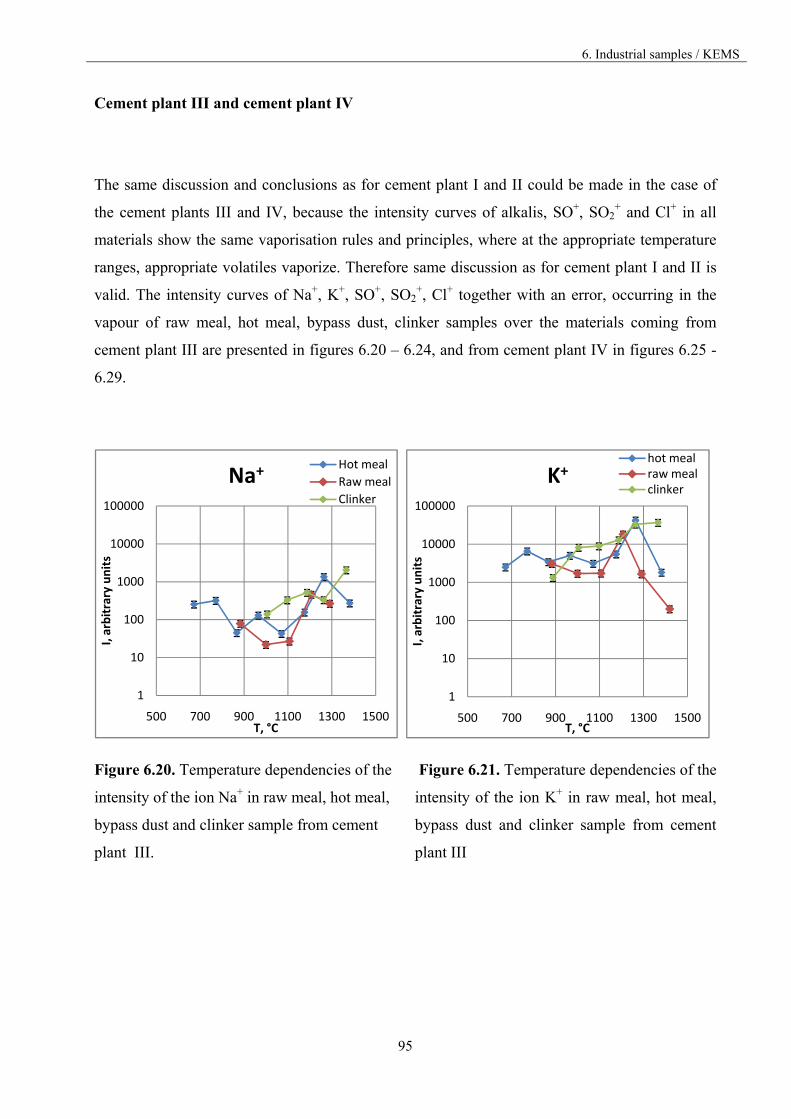
6. Industrial samples / KEMS
95
Cement plant III and cement plant IV
The same discussion and conclusions as for cement plant I and II could be made in the case of
the cement plants III and IV, because the intensity curves of alkalis, SO+, SO2+ and Cl+ in all
materials show the same vaporisation rules and principles, where at the appropriate temperature
ranges, appropriate volatiles vaporize. Therefore same discussion as for cement plant I and II is
valid. The intensity curves of Na+, K+, SO+, SO2+, Cl+ together with an error, occurring in the
vapour of raw meal, hot meal, bypass dust, clinker samples over the materials coming from
cement plant III are presented in figures 6.20 – 6.24, and from cement plant IV in figures 6.25 -
6.29.
Figure 6.20. Temperature dependencies of the
intensity of the ion Na+ in raw meal, hot meal,
bypass dust and clinker sample from cement
plant III.
Figure 6.21. Temperature dependencies of the
intensity of the ion K+ in raw meal, hot meal,
bypass dust and clinker sample from cement
plant III
1
10
100
1000
10000
100000
500 700 900 1100 1300 1500
I, arbitrary units
T, °C
Na+Hot meal
Raw meal
Clinker
1
10
100
1000
10000
100000
500 700 900 1100 1300 1500
I, arbitrary units
T, °C
K+hot mealraw mealclinker
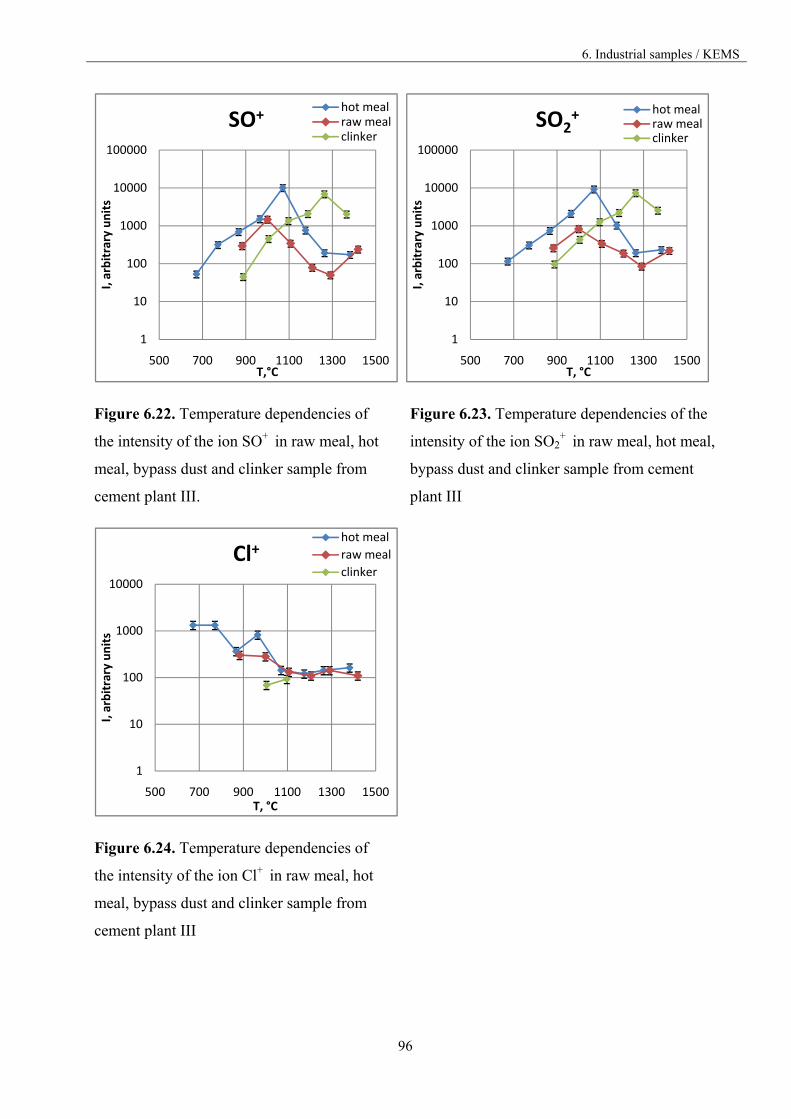
6. Industrial samples / KEMS
96
Figure 6.22. Temperature dependencies of
the intensity of the ion SO+ in raw meal, hot
meal, bypass dust and clinker sample from
cement plant III.
Figure 6.23. Temperature dependencies of the
intensity of the ion SO2+ in raw meal, hot meal,
bypass dust and clinker sample from cement
plant III
Figure 6.24. Temperature dependencies of
the intensity of the ion Cl+ in raw meal, hot
meal, bypass dust and clinker sample from
cement plant III
1
10
100
1000
10000
100000
500 700 900 1100 1300 1500
I, arbitrary units
T,°C
SO+hot mealraw mealclinker
1
10
100
1000
10000
100000
500 700 900 1100 1300 1500
I, arbitrary units
T, °C
SO2+ hot meal
raw mealclinker
1
10
100
1000
10000
500 700 900 1100 1300 1500
I, arbitrary units
T, °C
Cl+hot meal
raw meal
clinker
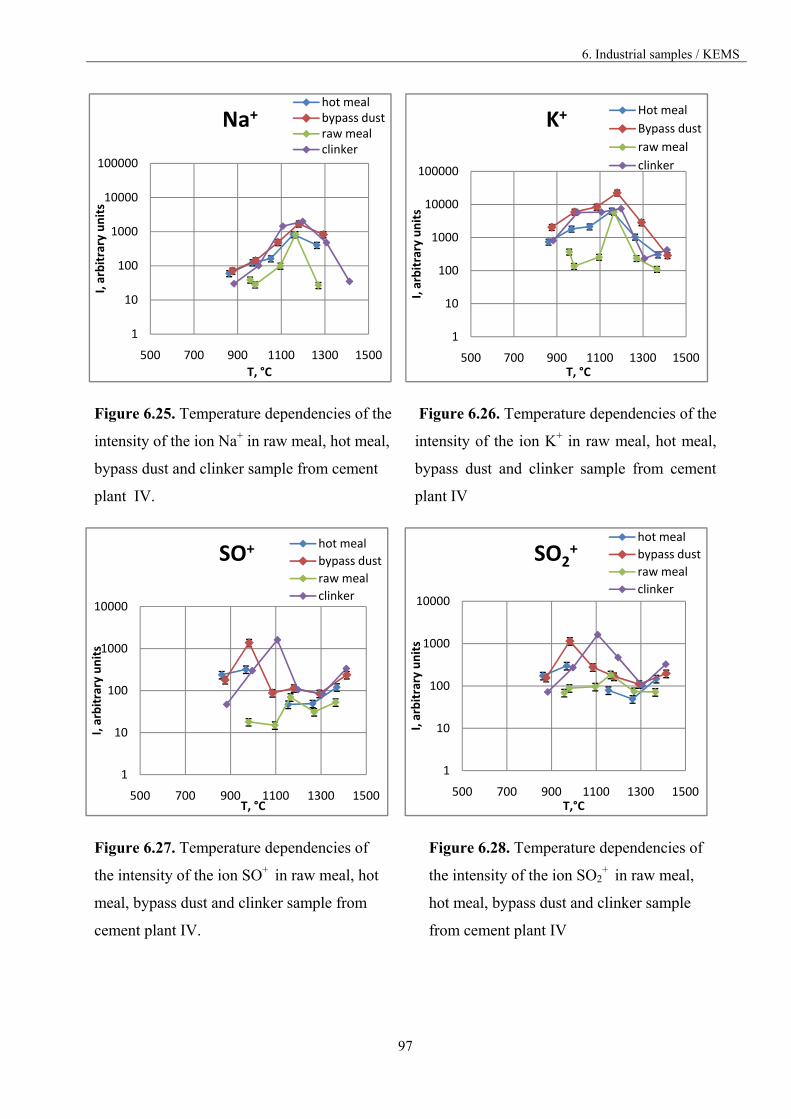
6. Industrial samples / KEMS
97
Figure 6.25. Temperature dependencies of the
intensity of the ion Na+ in raw meal, hot meal,
bypass dust and clinker sample from cement
plant IV.
Figure 6.26. Temperature dependencies of the
intensity of the ion K+ in raw meal, hot meal,
bypass dust and clinker sample from cement
plant IV
Figure 6.27. Temperature dependencies of
the intensity of the ion SO+ in raw meal, hot
meal, bypass dust and clinker sample from
cement plant IV.
Figure 6.28. Temperature dependencies of
the intensity of the ion SO2+ in raw meal,
hot meal, bypass dust and clinker sample
from cement plant IV
1
10
100
1000
10000
100000
500 700 900 1100 1300 1500
I, arbitrary units
T, °C
Na+hot mealbypass dustraw mealclinker
1
10
100
1000
10000
100000
500 700 900 1100 1300 1500
I, arbitrary units
T, °C
K+Hot meal
Bypass dust
raw meal
clinker
1
10
100
1000
10000
500 700 900 1100 1300 1500
I, arbitrary units
T, °C
SO+ hot meal
bypass dust
raw meal
clinker
1
10
100
1000
10000
500 700 900 1100 1300 1500
I, arbitrary units
T,°C
SO2+
hot meal
bypass dust
raw meal
clinker
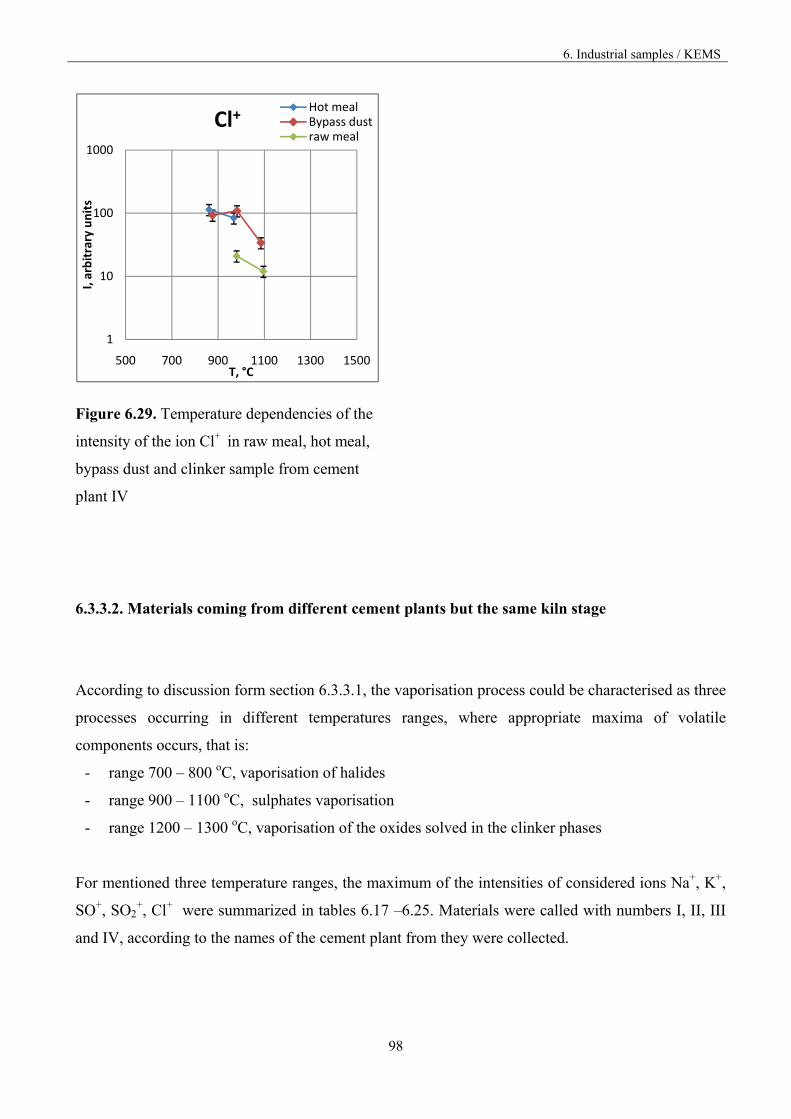
6. Industrial samples / KEMS
98
Figure 6.29. Temperature dependencies of the
intensity of the ion Cl+ in raw meal, hot meal,
bypass dust and clinker sample from cement
plant IV
6.3.3.2. Materials coming from different cement plants but the same kiln stage
According to discussion form section 6.3.3.1, the vaporisation process could be characterised as three
processes occurring in different temperatures ranges, where appropriate maxima of volatile
components occurs, that is:
- range 700 – 800 oC, vaporisation of halides
- range 900 – 1100 oC, sulphates vaporisation
- range 1200 – 1300 oC, vaporisation of the oxides solved in the clinker phases
For mentioned three temperature ranges, the maximum of the intensities of considered ions Na+, K+,
SO+, SO2+, Cl+ were summarized in tables 6.17 –6.25. Materials were called with numbers I, II, III
and IV, according to the names of the cement plant from they were collected.
1
10
100
1000
500 700 900 1100 1300 1500
I, arbitrary units
T, °C
Cl+Hot mealBypass dustraw meal
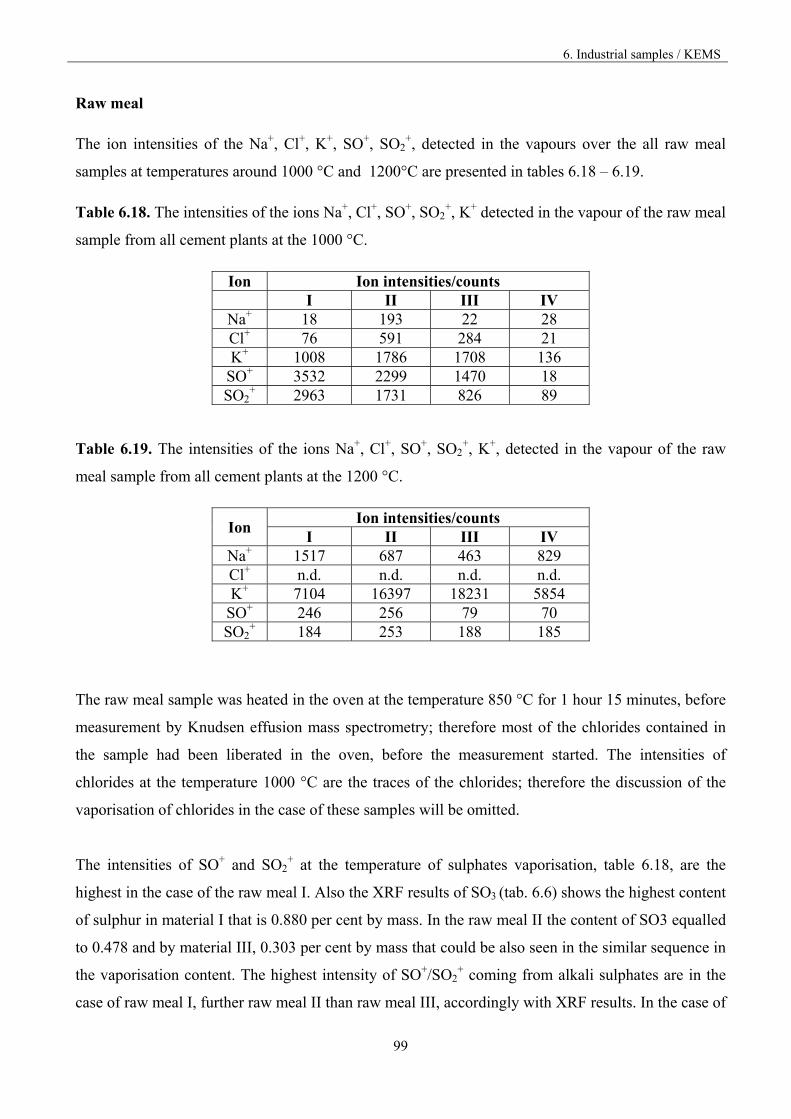
6. Industrial samples / KEMS
99
Raw meal
The ion intensities of the Na+, Cl+, K+, SO+, SO2+, detected in the vapours over the all raw meal
samples at temperatures around 1000 °C and 1200°C are presented in tables 6.18 – 6.19.
Table 6.18. The intensities of the ions Na+, Cl+, SO+, SO2+, K+ detected in the vapour of the raw meal
sample from all cement plants at the 1000 °C.
Ion Ion intensities/counts I II III IV
Na+ 18 193 22 28 Cl+ 76 591 284 21 K+ 1008 1786 1708 136
SO+ 3532 2299 1470 18 SO2
+ 2963 1731 826 89
Table 6.19. The intensities of the ions Na+, Cl+, SO+, SO2+, K+, detected in the vapour of the raw
meal sample from all cement plants at the 1200 °C.
Ion Ion intensities/counts
I II III IV Na+ 1517 687 463 829 Cl+ n.d. n.d. n.d. n.d. K+ 7104 16397 18231 5854
SO+ 246 256 79 70 SO2
+ 184 253 188 185
The raw meal sample was heated in the oven at the temperature 850 °C for 1 hour 15 minutes, before
measurement by Knudsen effusion mass spectrometry; therefore most of the chlorides contained in
the sample had been liberated in the oven, before the measurement started. The intensities of
chlorides at the temperature 1000 °C are the traces of the chlorides; therefore the discussion of the
vaporisation of chlorides in the case of these samples will be omitted.
The intensities of SO+ and SO2+ at the temperature of sulphates vaporisation, table 6.18, are the
highest in the case of the raw meal I. Also the XRF results of SO3 (tab. 6.6) shows the highest content
of sulphur in material I that is 0.880 per cent by mass. In the raw meal II the content of SO3 equalled
to 0.478 and by material III, 0.303 per cent by mass that could be also seen in the similar sequence in
the vaporisation content. The highest intensity of SO+/SO2+ coming from alkali sulphates are in the
case of raw meal I, further raw meal II than raw meal III, accordingly with XRF results. In the case of
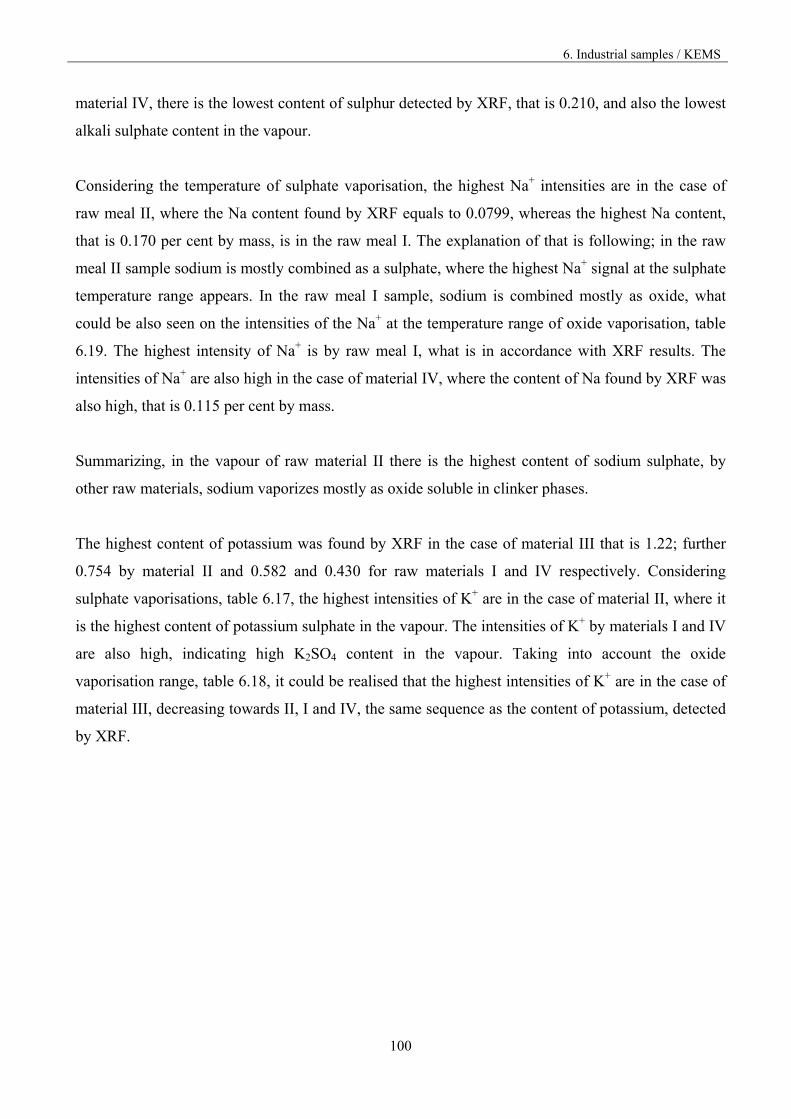
6. Industrial samples / KEMS
100
material IV, there is the lowest content of sulphur detected by XRF, that is 0.210, and also the lowest
alkali sulphate content in the vapour.
Considering the temperature of sulphate vaporisation, the highest Na+ intensities are in the case of
raw meal II, where the Na content found by XRF equals to 0.0799, whereas the highest Na content,
that is 0.170 per cent by mass, is in the raw meal I. The explanation of that is following; in the raw
meal II sample sodium is mostly combined as a sulphate, where the highest Na+ signal at the sulphate
temperature range appears. In the raw meal I sample, sodium is combined mostly as oxide, what
could be also seen on the intensities of the Na+ at the temperature range of oxide vaporisation, table
6.19. The highest intensity of Na+ is by raw meal I, what is in accordance with XRF results. The
intensities of Na+ are also high in the case of material IV, where the content of Na found by XRF was
also high, that is 0.115 per cent by mass.
Summarizing, in the vapour of raw material II there is the highest content of sodium sulphate, by
other raw materials, sodium vaporizes mostly as oxide soluble in clinker phases.
The highest content of potassium was found by XRF in the case of material III that is 1.22; further
0.754 by material II and 0.582 and 0.430 for raw materials I and IV respectively. Considering
sulphate vaporisations, table 6.17, the highest intensities of K+ are in the case of material II, where it
is the highest content of potassium sulphate in the vapour. The intensities of K+ by materials I and IV
are also high, indicating high K2SO4 content in the vapour. Taking into account the oxide
vaporisation range, table 6.18, it could be realised that the highest intensities of K+ are in the case of
material III, decreasing towards II, I and IV, the same sequence as the content of potassium, detected
by XRF.
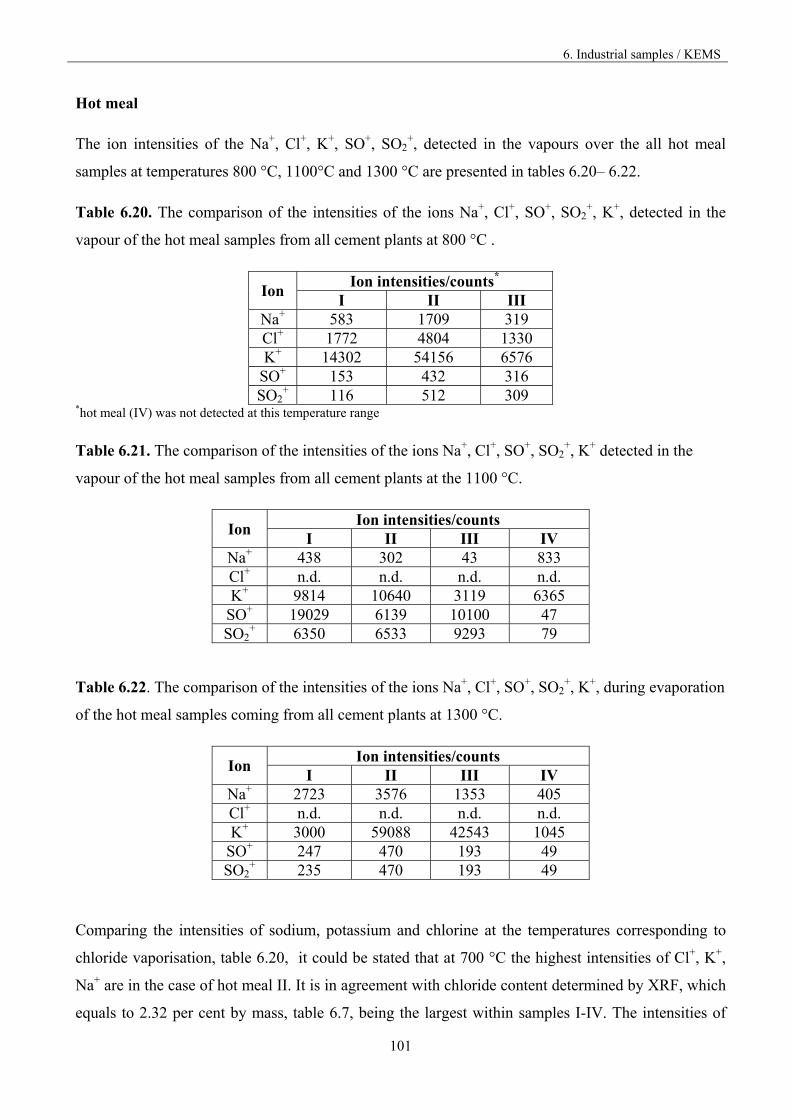
6. Industrial samples / KEMS
101
Hot meal
The ion intensities of the Na+, Cl+, K+, SO+, SO2+, detected in the vapours over the all hot meal
samples at temperatures 800 °C, 1100°C and 1300 °C are presented in tables 6.20– 6.22.
Table 6.20. The comparison of the intensities of the ions Na+, Cl+, SO+, SO2+, K+, detected in the
vapour of the hot meal samples from all cement plants at 800 °C .
Ion Ion intensities/counts*
I II III Na+ 583 1709 319 Cl+ 1772 4804 1330 K+ 14302 54156 6576
SO+ 153 432 316 SO2
+ 116 512 309 *hot meal (IV) was not detected at this temperature range
Table 6.21. The comparison of the intensities of the ions Na+, Cl+, SO+, SO2+, K+ detected in the
vapour of the hot meal samples from all cement plants at the 1100 °C.
Ion Ion intensities/counts
I II III IV Na+ 438 302 43 833 Cl+ n.d. n.d. n.d. n.d. K+ 9814 10640 3119 6365
SO+ 19029 6139 10100 47 SO2
+ 6350 6533 9293 79
Table 6.22. The comparison of the intensities of the ions Na+, Cl+, SO+, SO2+, K+, during evaporation
of the hot meal samples coming from all cement plants at 1300 °C.
Ion Ion intensities/counts
I II III IV Na+ 2723 3576 1353 405 Cl+ n.d. n.d. n.d. n.d. K+ 3000 59088 42543 1045
SO+ 247 470 193 49 SO2
+ 235 470 193 49
Comparing the intensities of sodium, potassium and chlorine at the temperatures corresponding to
chloride vaporisation, table 6.20, it could be stated that at 700 °C the highest intensities of Cl+, K+,
Na+ are in the case of hot meal II. It is in agreement with chloride content determined by XRF, which
equals to 2.32 per cent by mass, table 6.7, being the largest within samples I-IV. The intensities of
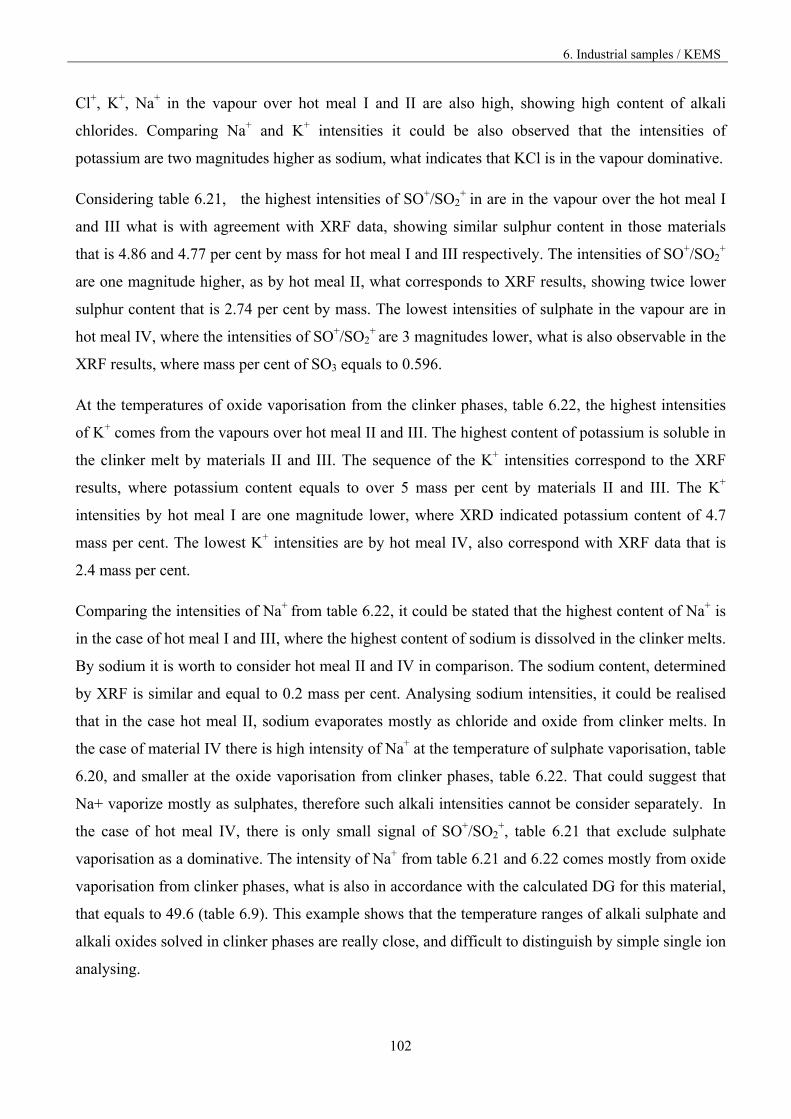
6. Industrial samples / KEMS
102
Cl+, K+, Na+ in the vapour over hot meal I and II are also high, showing high content of alkali
chlorides. Comparing Na+ and K+ intensities it could be also observed that the intensities of
potassium are two magnitudes higher as sodium, what indicates that KCl is in the vapour dominative.
Considering table 6.21, the highest intensities of SO+/SO2+ in are in the vapour over the hot meal I
and III what is with agreement with XRF data, showing similar sulphur content in those materials
that is 4.86 and 4.77 per cent by mass for hot meal I and III respectively. The intensities of SO+/SO2+
are one magnitude higher, as by hot meal II, what corresponds to XRF results, showing twice lower
sulphur content that is 2.74 per cent by mass. The lowest intensities of sulphate in the vapour are in
hot meal IV, where the intensities of SO+/SO2+ are 3 magnitudes lower, what is also observable in the
XRF results, where mass per cent of SO3 equals to 0.596.
At the temperatures of oxide vaporisation from the clinker phases, table 6.22, the highest intensities
of K+ comes from the vapours over hot meal II and III. The highest content of potassium is soluble in
the clinker melt by materials II and III. The sequence of the K+ intensities correspond to the XRF
results, where potassium content equals to over 5 mass per cent by materials II and III. The K+
intensities by hot meal I are one magnitude lower, where XRD indicated potassium content of 4.7
mass per cent. The lowest K+ intensities are by hot meal IV, also correspond with XRF data that is
2.4 mass per cent.
Comparing the intensities of Na+ from table 6.22, it could be stated that the highest content of Na+ is
in the case of hot meal I and III, where the highest content of sodium is dissolved in the clinker melts.
By sodium it is worth to consider hot meal II and IV in comparison. The sodium content, determined
by XRF is similar and equal to 0.2 mass per cent. Analysing sodium intensities, it could be realised
that in the case hot meal II, sodium evaporates mostly as chloride and oxide from clinker melts. In
the case of material IV there is high intensity of Na+ at the temperature of sulphate vaporisation, table
6.20, and smaller at the oxide vaporisation from clinker phases, table 6.22. That could suggest that
Na+ vaporize mostly as sulphates, therefore such alkali intensities cannot be consider separately. In
the case of hot meal IV, there is only small signal of SO+/SO2+, table 6.21 that exclude sulphate
vaporisation as a dominative. The intensity of Na+ from table 6.21 and 6.22 comes mostly from oxide
vaporisation from clinker phases, what is also in accordance with the calculated DG for this material,
that equals to 49.6 (table 6.9). This example shows that the temperature ranges of alkali sulphate and
alkali oxides solved in clinker phases are really close, and difficult to distinguish by simple single ion
analysing.
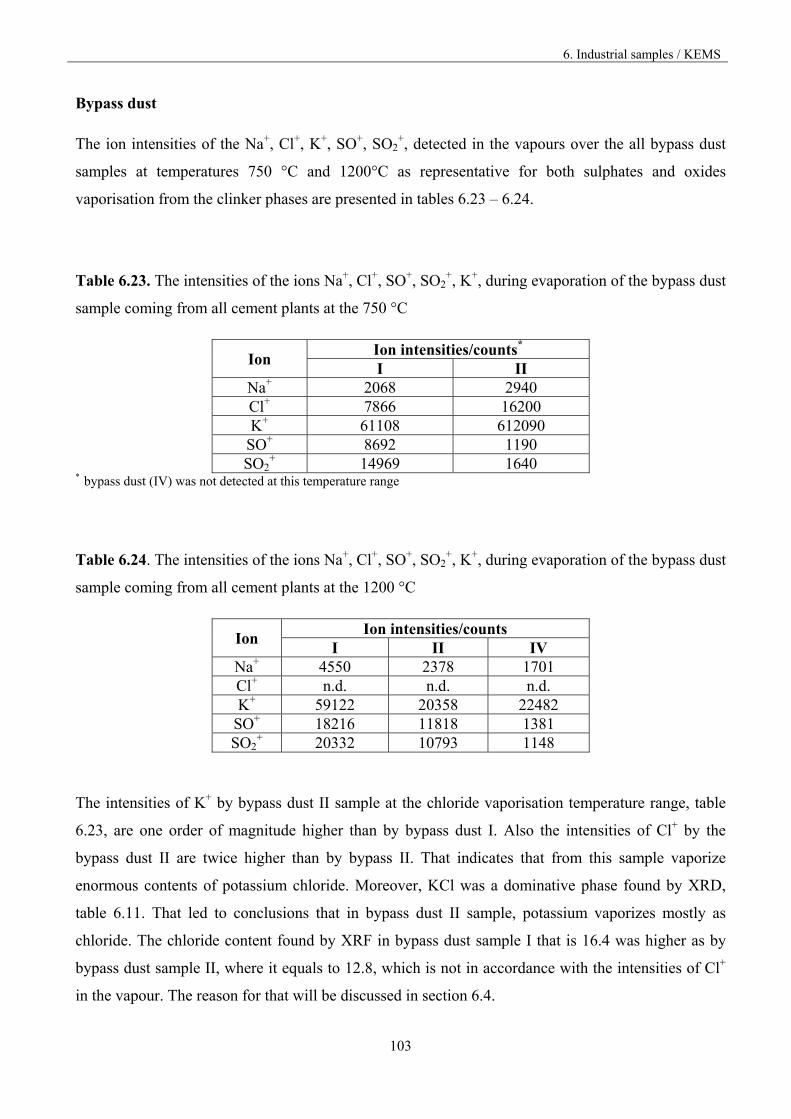
6. Industrial samples / KEMS
103
Bypass dust
The ion intensities of the Na+, Cl+, K+, SO+, SO2+, detected in the vapours over the all bypass dust
samples at temperatures 750 °C and 1200°C as representative for both sulphates and oxides
vaporisation from the clinker phases are presented in tables 6.23 – 6.24.
Table 6.23. The intensities of the ions Na+, Cl+, SO+, SO2+, K+, during evaporation of the bypass dust
sample coming from all cement plants at the 750 °C
Ion Ion intensities/counts*
I II Na+ 2068 2940 Cl+ 7866 16200 K+ 61108 612090
SO+ 8692 1190 SO2
+ 14969 1640 * bypass dust (IV) was not detected at this temperature range
Table 6.24. The intensities of the ions Na+, Cl+, SO+, SO2+, K+, during evaporation of the bypass dust
sample coming from all cement plants at the 1200 °C
Ion Ion intensities/counts
I II IV Na+ 4550 2378 1701 Cl+ n.d. n.d. n.d. K+ 59122 20358 22482
SO+ 18216 11818 1381 SO2
+ 20332 10793 1148
The intensities of K+ by bypass dust II sample at the chloride vaporisation temperature range, table
6.23, are one order of magnitude higher than by bypass dust I. Also the intensities of Cl+ by the
bypass dust II are twice higher than by bypass II. That indicates that from this sample vaporize
enormous contents of potassium chloride. Moreover, KCl was a dominative phase found by XRD,
table 6.11. That led to conclusions that in bypass dust II sample, potassium vaporizes mostly as
chloride. The chloride content found by XRF in bypass dust sample I that is 16.4 was higher as by
bypass dust sample II, where it equals to 12.8, which is not in accordance with the intensities of Cl+
in the vapour. The reason for that will be discussed in section 6.4.
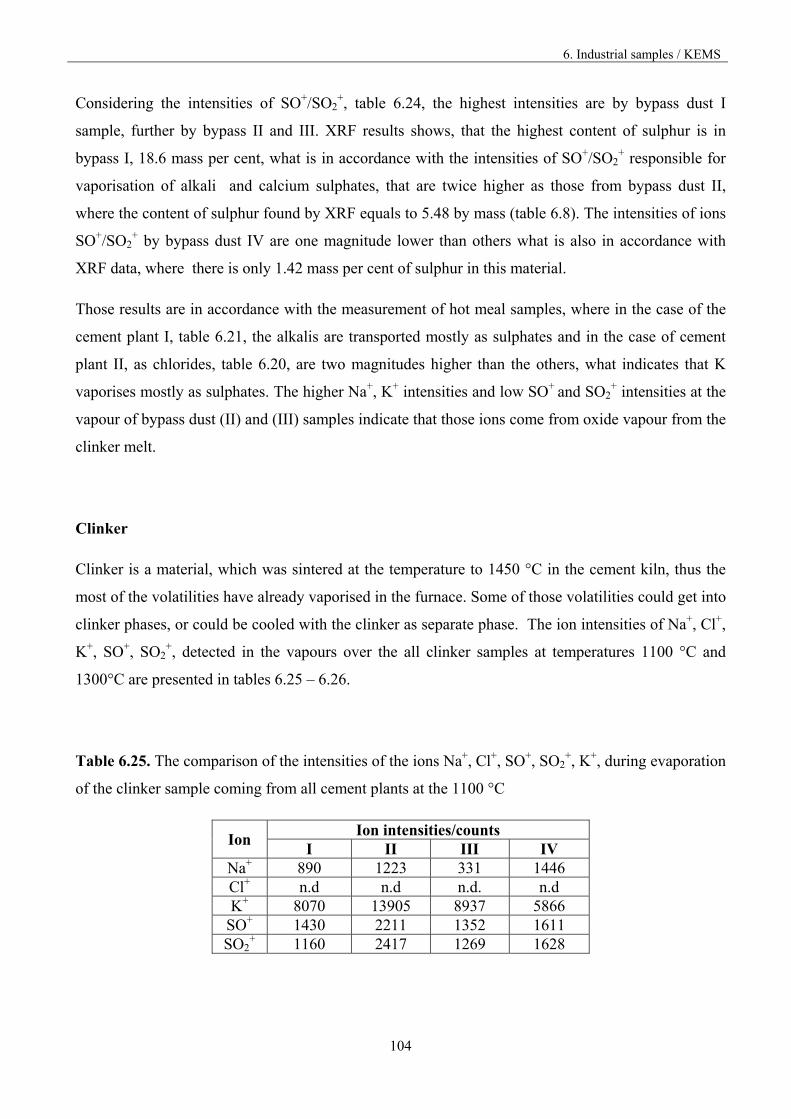
6. Industrial samples / KEMS
104
Considering the intensities of SO+/SO2+, table 6.24, the highest intensities are by bypass dust I
sample, further by bypass II and III. XRF results shows, that the highest content of sulphur is in
bypass I, 18.6 mass per cent, what is in accordance with the intensities of SO+/SO2+ responsible for
vaporisation of alkali and calcium sulphates, that are twice higher as those from bypass dust II,
where the content of sulphur found by XRF equals to 5.48 by mass (table 6.8). The intensities of ions
SO+/SO2+ by bypass dust IV are one magnitude lower than others what is also in accordance with
XRF data, where there is only 1.42 mass per cent of sulphur in this material.
Those results are in accordance with the measurement of hot meal samples, where in the case of the
cement plant I, table 6.21, the alkalis are transported mostly as sulphates and in the case of cement
plant II, as chlorides, table 6.20, are two magnitudes higher than the others, what indicates that K
vaporises mostly as sulphates. The higher Na+, K+ intensities and low SO+ and SO2+ intensities at the
vapour of bypass dust (II) and (III) samples indicate that those ions come from oxide vapour from the
clinker melt.
Clinker
Clinker is a material, which was sintered at the temperature to 1450 °C in the cement kiln, thus the
most of the volatilities have already vaporised in the furnace. Some of those volatilities could get into
clinker phases, or could be cooled with the clinker as separate phase. The ion intensities of Na+, Cl+,
K+, SO+, SO2+, detected in the vapours over the all clinker samples at temperatures 1100 °C and
1300°C are presented in tables 6.25 – 6.26.
Table 6.25. The comparison of the intensities of the ions Na+, Cl+, SO+, SO2+, K+, during evaporation
of the clinker sample coming from all cement plants at the 1100 °C
Ion Ion intensities/counts
I II III IV Na+ 890 1223 331 1446 Cl+ n.d n.d n.d. n.d K+ 8070 13905 8937 5866
SO+ 1430 2211 1352 1611 SO2
+ 1160 2417 1269 1628
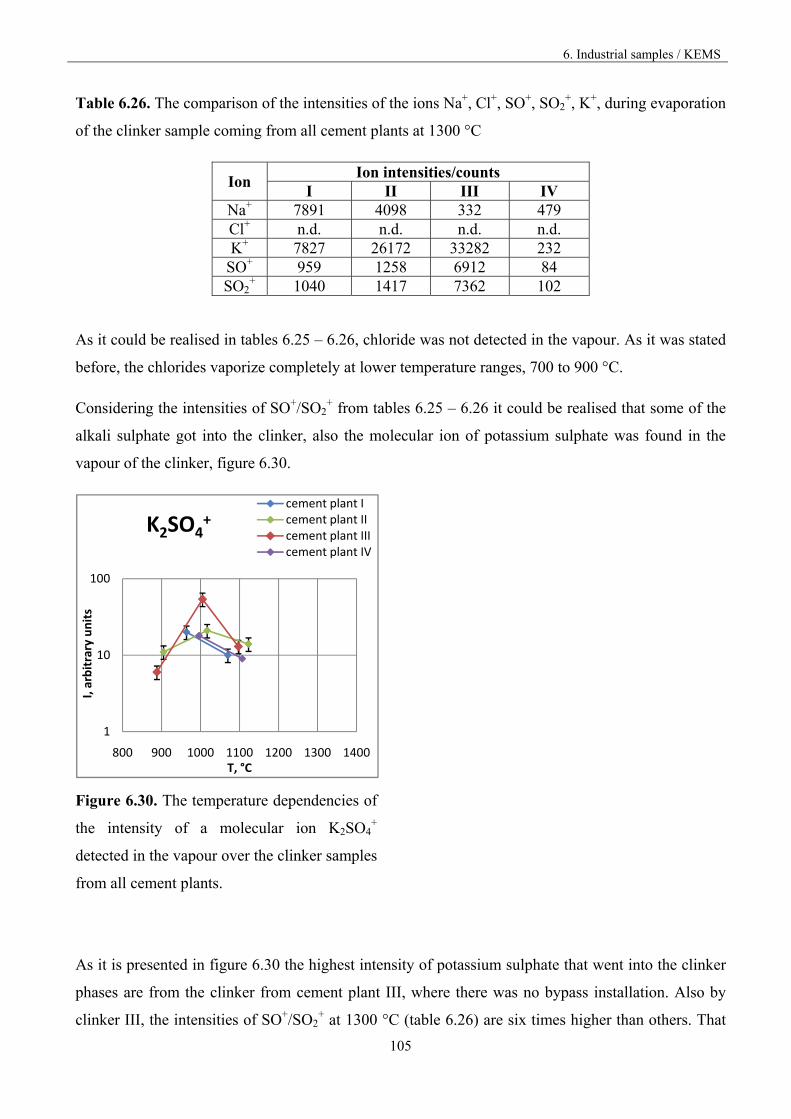
6. Industrial samples / KEMS
105
Table 6.26. The comparison of the intensities of the ions Na+, Cl+, SO+, SO2+, K+, during evaporation
of the clinker sample coming from all cement plants at 1300 °C
Ion Ion intensities/counts
I II III IV Na+ 7891 4098 332 479 Cl+ n.d. n.d. n.d. n.d. K+ 7827 26172 33282 232
SO+ 959 1258 6912 84 SO2
+ 1040 1417 7362 102
As it could be realised in tables 6.25 – 6.26, chloride was not detected in the vapour. As it was stated
before, the chlorides vaporize completely at lower temperature ranges, 700 to 900 °C.
Considering the intensities of SO+/SO2+ from tables 6.25 – 6.26 it could be realised that some of the
alkali sulphate got into the clinker, also the molecular ion of potassium sulphate was found in the
vapour of the clinker, figure 6.30.
Figure 6.30. The temperature dependencies of
the intensity of a molecular ion K2SO4+
detected in the vapour over the clinker samples
from all cement plants.
As it is presented in figure 6.30 the highest intensity of potassium sulphate that went into the clinker
phases are from the clinker from cement plant III, where there was no bypass installation. Also by
clinker III, the intensities of SO+/SO2+ at 1300 °C (table 6.26) are six times higher than others. That
1
10
100
800 900 1000 1100 1200 1300 1400
I, arbitrary units
T, °C
K2SO4+
cement plant Icement plant IIcement plant IIIcement plant IV
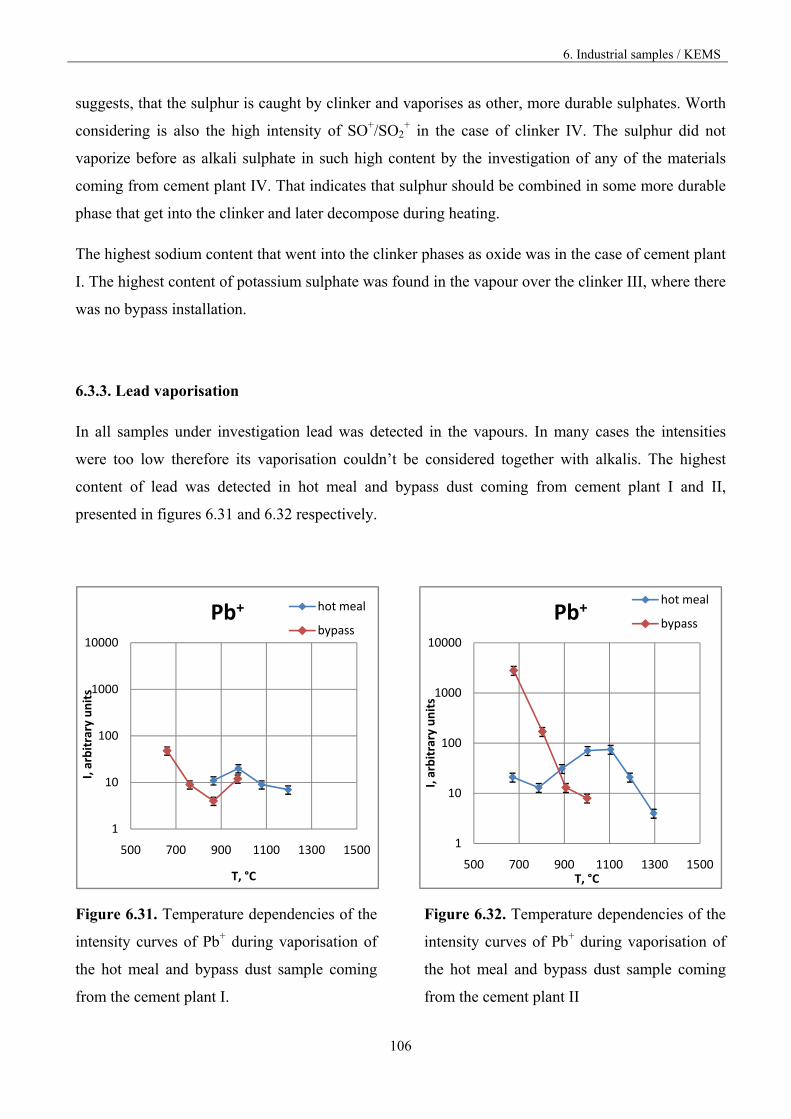
6. Industrial samples / KEMS
106
suggests, that the sulphur is caught by clinker and vaporises as other, more durable sulphates. Worth
considering is also the high intensity of SO+/SO2+ in the case of clinker IV. The sulphur did not
vaporize before as alkali sulphate in such high content by the investigation of any of the materials
coming from cement plant IV. That indicates that sulphur should be combined in some more durable
phase that get into the clinker and later decompose during heating.
The highest sodium content that went into the clinker phases as oxide was in the case of cement plant
I. The highest content of potassium sulphate was found in the vapour over the clinker III, where there
was no bypass installation.
6.3.3. Lead vaporisation
In all samples under investigation lead was detected in the vapours. In many cases the intensities
were too low therefore its vaporisation couldn’t be considered together with alkalis. The highest
content of lead was detected in hot meal and bypass dust coming from cement plant I and II,
presented in figures 6.31 and 6.32 respectively.
Figure 6.31. Temperature dependencies of the
intensity curves of Pb+ during vaporisation of
the hot meal and bypass dust sample coming
from the cement plant I.
Figure 6.32. Temperature dependencies of the
intensity curves of Pb+ during vaporisation of
the hot meal and bypass dust sample coming
from the cement plant II
1
10
100
1000
10000
500 700 900 1100 1300 1500
I, arbitrary units
T, °C
Pb+ hot meal
bypass
1
10
100
1000
10000
500 700 900 1100 1300 1500
I, arbitrary units
T, °C
Pb+hot meal
bypass
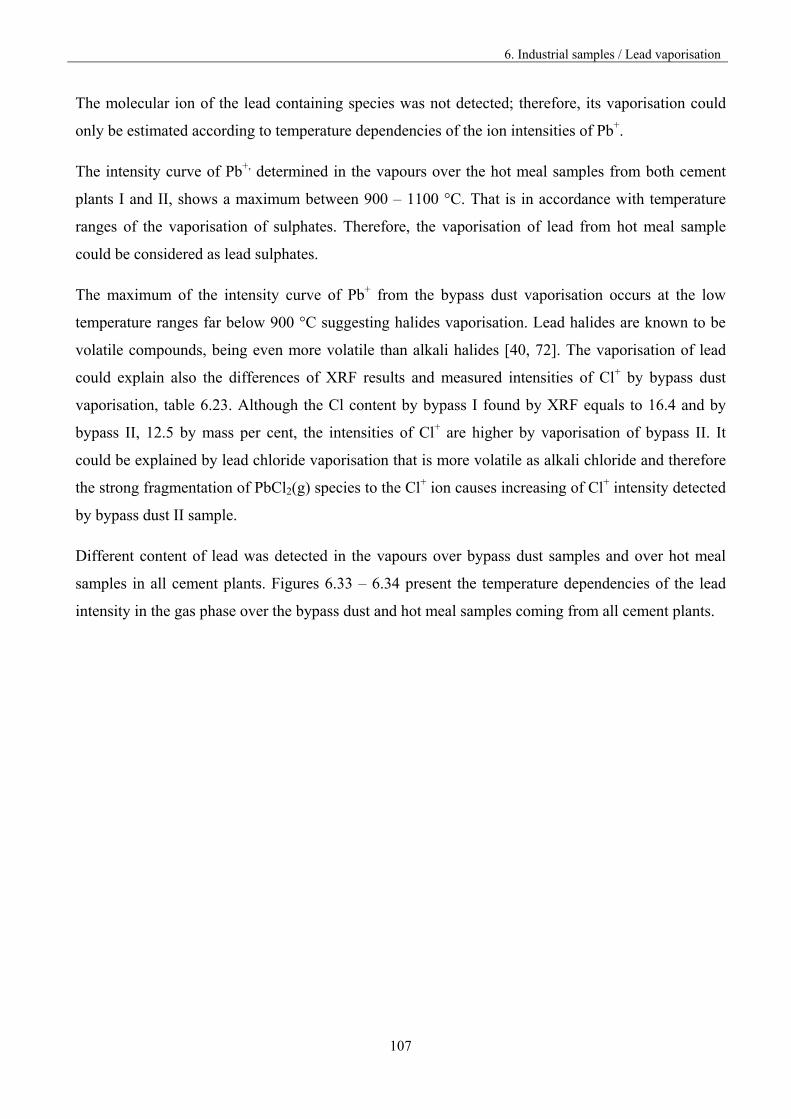
6. Industrial samples / Lead vaporisation
107
The molecular ion of the lead containing species was not detected; therefore, its vaporisation could
only be estimated according to temperature dependencies of the ion intensities of Pb+.
The intensity curve of Pb+, determined in the vapours over the hot meal samples from both cement
plants I and II, shows a maximum between 900 – 1100 °C. That is in accordance with temperature
ranges of the vaporisation of sulphates. Therefore, the vaporisation of lead from hot meal sample
could be considered as lead sulphates.
The maximum of the intensity curve of Pb+ from the bypass dust vaporisation occurs at the low
temperature ranges far below 900 °C suggesting halides vaporisation. Lead halides are known to be
volatile compounds, being even more volatile than alkali halides [40, 72]. The vaporisation of lead
could explain also the differences of XRF results and measured intensities of Cl+ by bypass dust
vaporisation, table 6.23. Although the Cl content by bypass I found by XRF equals to 16.4 and by
bypass II, 12.5 by mass per cent, the intensities of Cl+ are higher by vaporisation of bypass II. It
could be explained by lead chloride vaporisation that is more volatile as alkali chloride and therefore
the strong fragmentation of PbCl2(g) species to the Cl+ ion causes increasing of Cl+ intensity detected
by bypass dust II sample.
Different content of lead was detected in the vapours over bypass dust samples and over hot meal
samples in all cement plants. Figures 6.33 – 6.34 present the temperature dependencies of the lead
intensity in the gas phase over the bypass dust and hot meal samples coming from all cement plants.
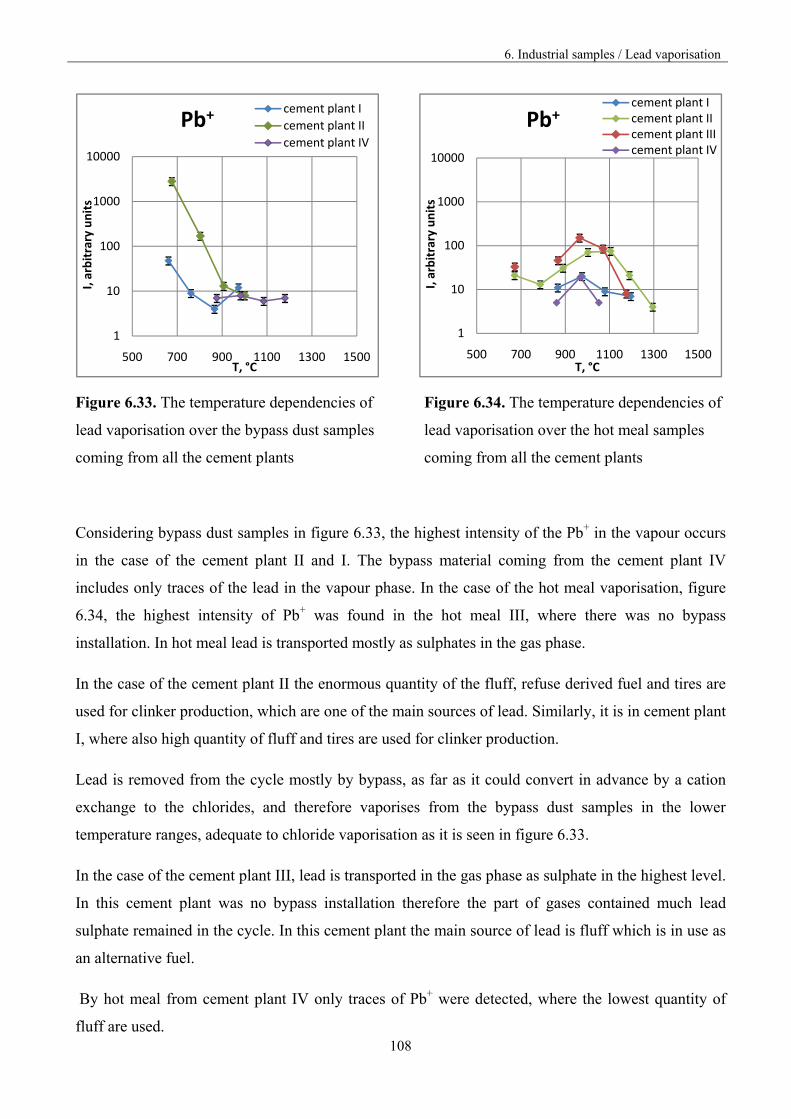
6. Industrial samples / Lead vaporisation
108
Figure 6.33. The temperature dependencies of
lead vaporisation over the bypass dust samples
coming from all the cement plants
Figure 6.34. The temperature dependencies of
lead vaporisation over the hot meal samples
coming from all the cement plants
Considering bypass dust samples in figure 6.33, the highest intensity of the Pb+ in the vapour occurs
in the case of the cement plant II and I. The bypass material coming from the cement plant IV
includes only traces of the lead in the vapour phase. In the case of the hot meal vaporisation, figure
6.34, the highest intensity of Pb+ was found in the hot meal III, where there was no bypass
installation. In hot meal lead is transported mostly as sulphates in the gas phase.
In the case of the cement plant II the enormous quantity of the fluff, refuse derived fuel and tires are
used for clinker production, which are one of the main sources of lead. Similarly, it is in cement plant
I, where also high quantity of fluff and tires are used for clinker production.
Lead is removed from the cycle mostly by bypass, as far as it could convert in advance by a cation
exchange to the chlorides, and therefore vaporises from the bypass dust samples in the lower
temperature ranges, adequate to chloride vaporisation as it is seen in figure 6.33.
In the case of the cement plant III, lead is transported in the gas phase as sulphate in the highest level.
In this cement plant was no bypass installation therefore the part of gases contained much lead
sulphate remained in the cycle. In this cement plant the main source of lead is fluff which is in use as
an alternative fuel.
By hot meal from cement plant IV only traces of Pb+ were detected, where the lowest quantity of
fluff are used.
1
10
100
1000
10000
500 700 900 1100 1300 1500
I, arbitrary units
T, °C
Pb+cement plant I
cement plant II
cement plant IV
1
10
100
1000
10000
500 700 900 1100 1300 1500
I, arbitrary units
T, °C
Pb+cement plant Icement plant IIcement plant IIIcement plant IV
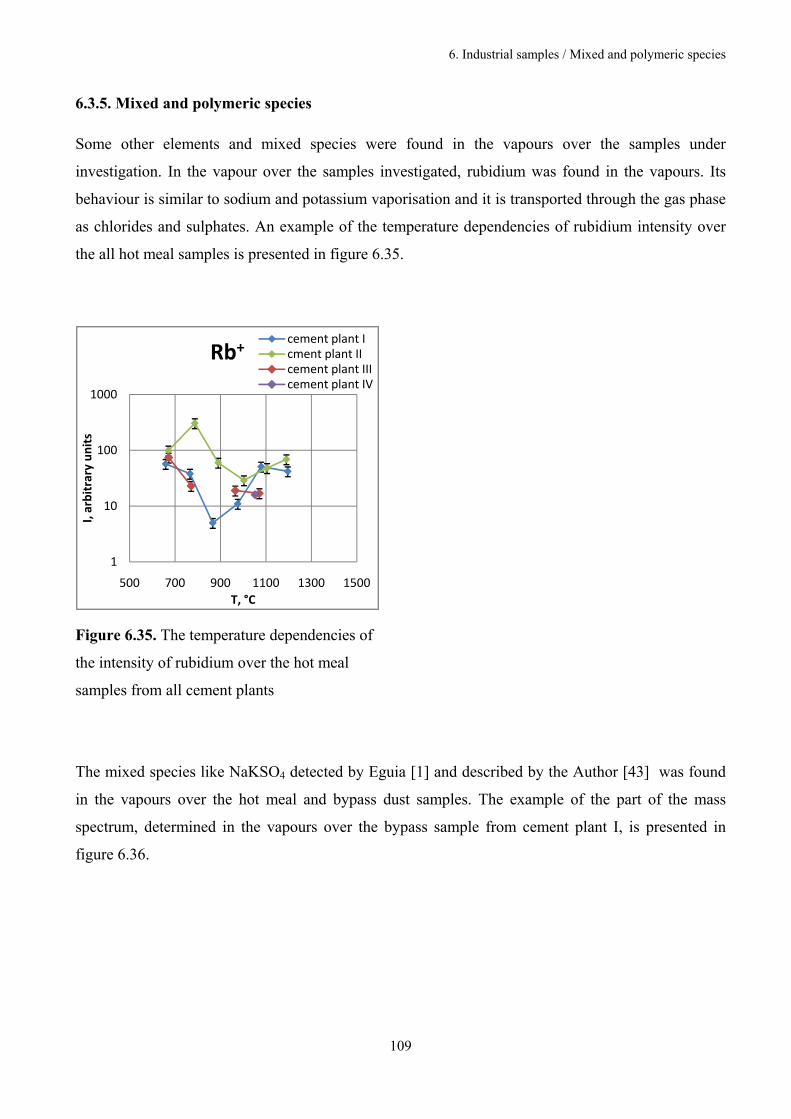
6. Industrial samples / Mixed and polymeric species
109
6.3.5. Mixed and polymeric species
Some other elements and mixed species were found in the vapours over the samples under
investigation. In the vapour over the samples investigated, rubidium was found in the vapours. Its
behaviour is similar to sodium and potassium vaporisation and it is transported through the gas phase
as chlorides and sulphates. An example of the temperature dependencies of rubidium intensity over
the all hot meal samples is presented in figure 6.35.
Figure 6.35. The temperature dependencies of
the intensity of rubidium over the hot meal
samples from all cement plants
The mixed species like NaKSO4 detected by Eguia [1] and described by the Author [43] was found
in the vapours over the hot meal and bypass dust samples. The example of the part of the mass
spectrum, determined in the vapours over the bypass sample from cement plant I, is presented in
figure 6.36.
1
10
100
1000
500 700 900 1100 1300 1500
I, arbitrary units
T, °C
Rb+cement plant Icment plant IIcement plant IIIcement plant IV
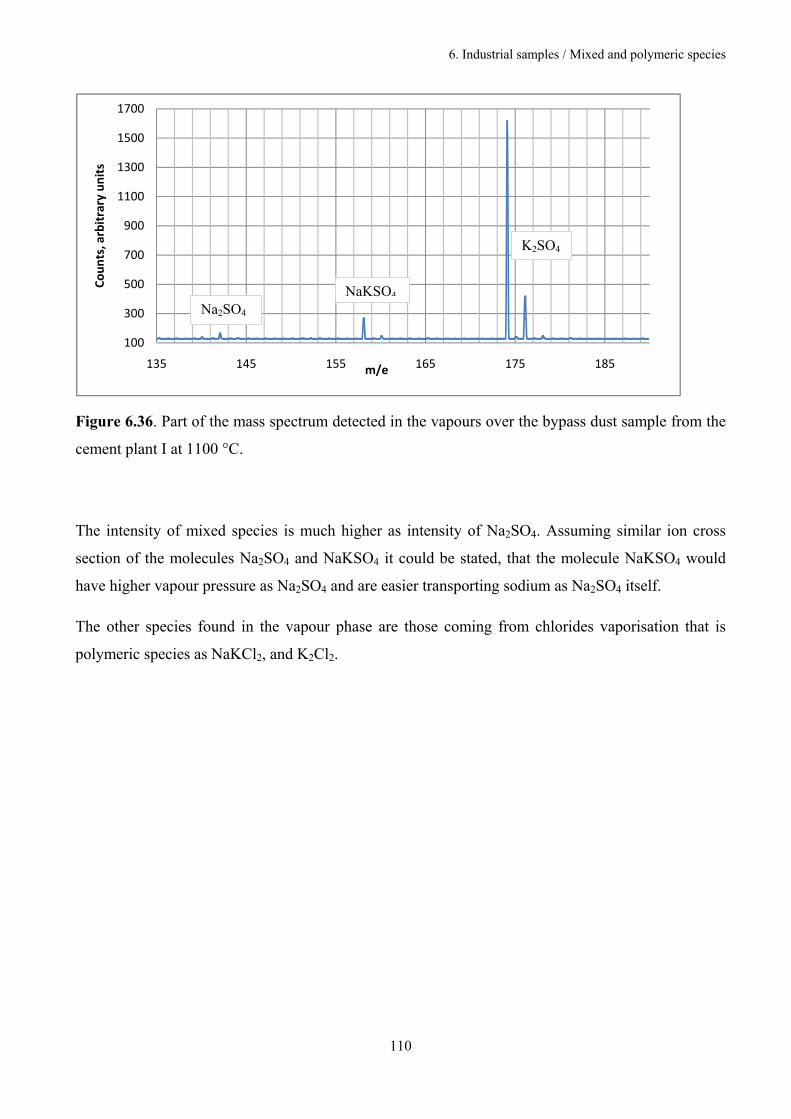
6. Industrial samples / Mixed and polymeric species
110
Figure 6.36. Part of the mass spectrum detected in the vapours over the bypass dust sample from the
cement plant I at 1100 °C.
The intensity of mixed species is much higher as intensity of Na2SO4. Assuming similar ion cross
section of the molecules Na2SO4 and NaKSO4 it could be stated, that the molecule NaKSO4 would
have higher vapour pressure as Na2SO4 and are easier transporting sodium as Na2SO4 itself.
The other species found in the vapour phase are those coming from chlorides vaporisation that is
polymeric species as NaKCl2, and K2Cl2.
100
300
500
700
900
1100
1300
1500
1700
135 145 155 165 175 185
Counts, arbitrary units
m/e
K2SO4
NaKSO4
Na2SO4
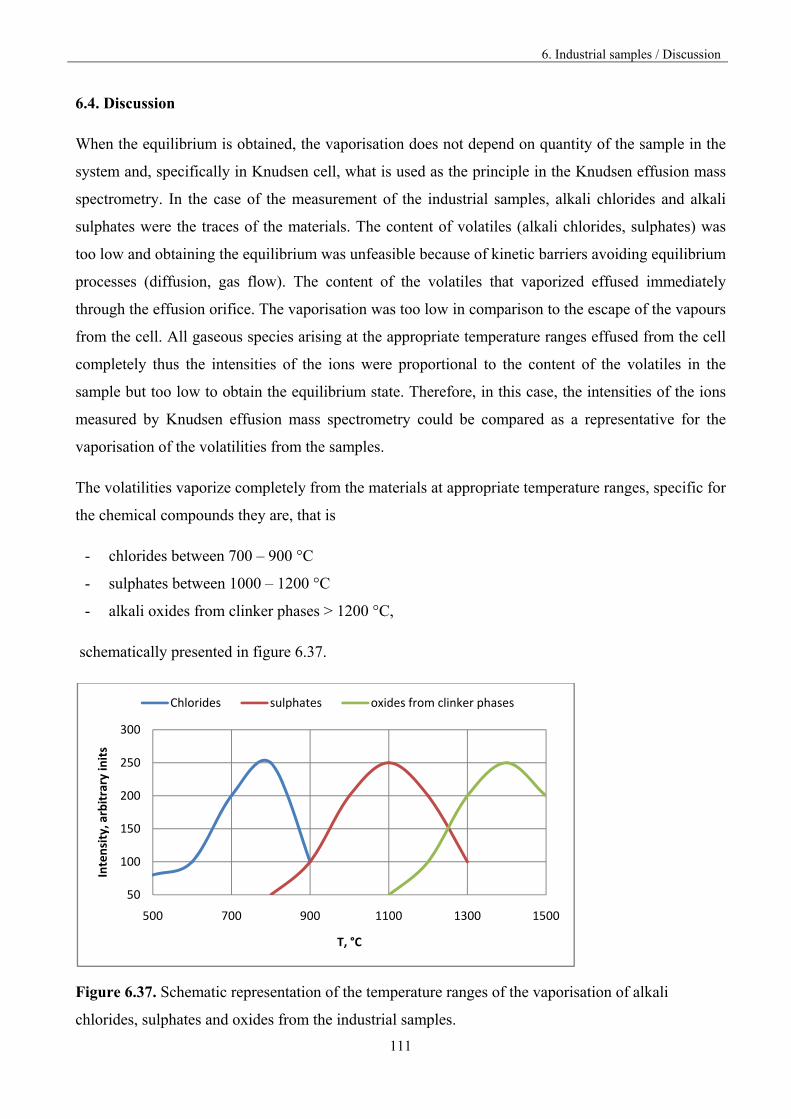
6. Industrial samples / Discussion
111
6.4. Discussion
When the equilibrium is obtained, the vaporisation does not depend on quantity of the sample in the
system and, specifically in Knudsen cell, what is used as the principle in the Knudsen effusion mass
spectrometry. In the case of the measurement of the industrial samples, alkali chlorides and alkali
sulphates were the traces of the materials. The content of volatiles (alkali chlorides, sulphates) was
too low and obtaining the equilibrium was unfeasible because of kinetic barriers avoiding equilibrium
processes (diffusion, gas flow). The content of the volatiles that vaporized effused immediately
through the effusion orifice. The vaporisation was too low in comparison to the escape of the vapours
from the cell. All gaseous species arising at the appropriate temperature ranges effused from the cell
completely thus the intensities of the ions were proportional to the content of the volatiles in the
sample but too low to obtain the equilibrium state. Therefore, in this case, the intensities of the ions
measured by Knudsen effusion mass spectrometry could be compared as a representative for the
vaporisation of the volatilities from the samples.
The volatilities vaporize completely from the materials at appropriate temperature ranges, specific for
the chemical compounds they are, that is
- chlorides between 700 – 900 °C
- sulphates between 1000 – 1200 °C
- alkali oxides from clinker phases > 1200 °C,
schematically presented in figure 6.37.
Figure 6.37. Schematic representation of the temperature ranges of the vaporisation of alkali
chlorides, sulphates and oxides from the industrial samples.
50
100
150
200
250
300
500 700 900 1100 1300 1500
Intensity, arbitrary inits
T, °C
Chlorides sulphates oxides from clinker phases
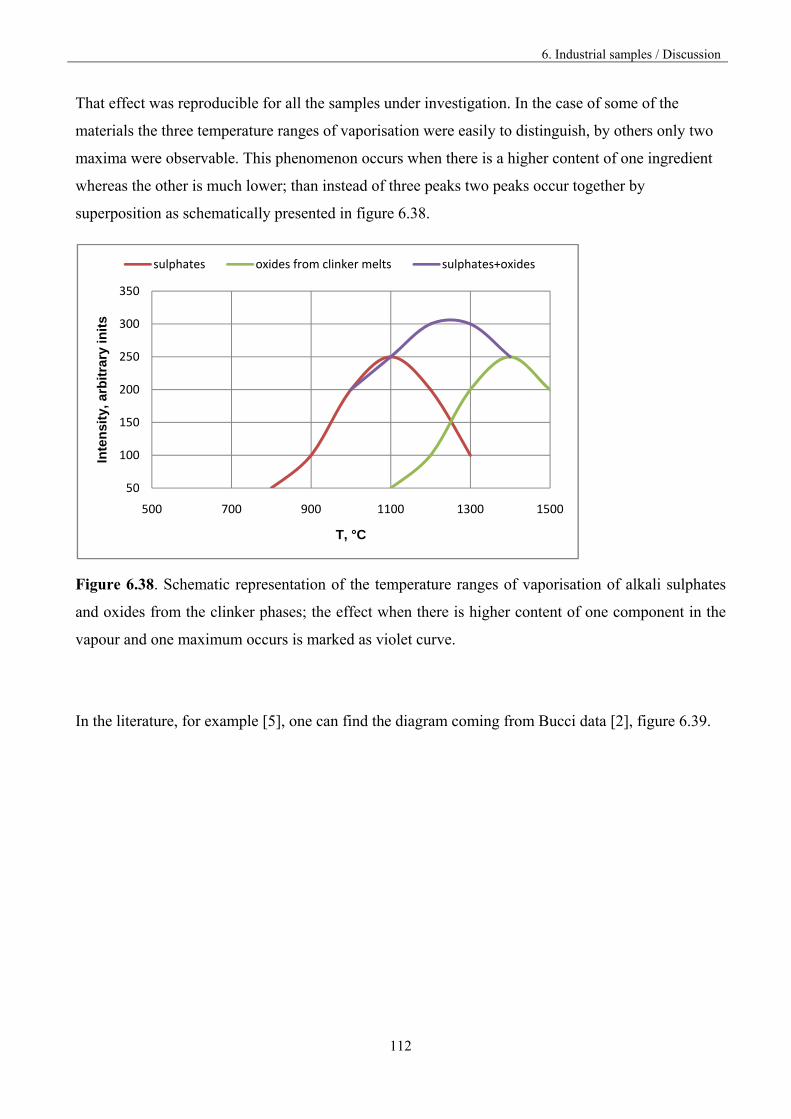
6. Industrial samples / Discussion
112
That effect was reproducible for all the samples under investigation. In the case of some of the
materials the three temperature ranges of vaporisation were easily to distinguish, by others only two
maxima were observable. This phenomenon occurs when there is a higher content of one ingredient
whereas the other is much lower; than instead of three peaks two peaks occur together by
superposition as schematically presented in figure 6.38.
Figure 6.38. Schematic representation of the temperature ranges of vaporisation of alkali sulphates
and oxides from the clinker phases; the effect when there is higher content of one component in the
vapour and one maximum occurs is marked as violet curve.
In the literature, for example [5], one can find the diagram coming from Bucci data [2], figure 6.39.
50
100
150
200
250
300
350
500 700 900 1100 1300 1500
Inte
nsi
ty, a
rbit
rary
in
its
T, °C
sulphates oxides from clinker melts sulphates+oxides
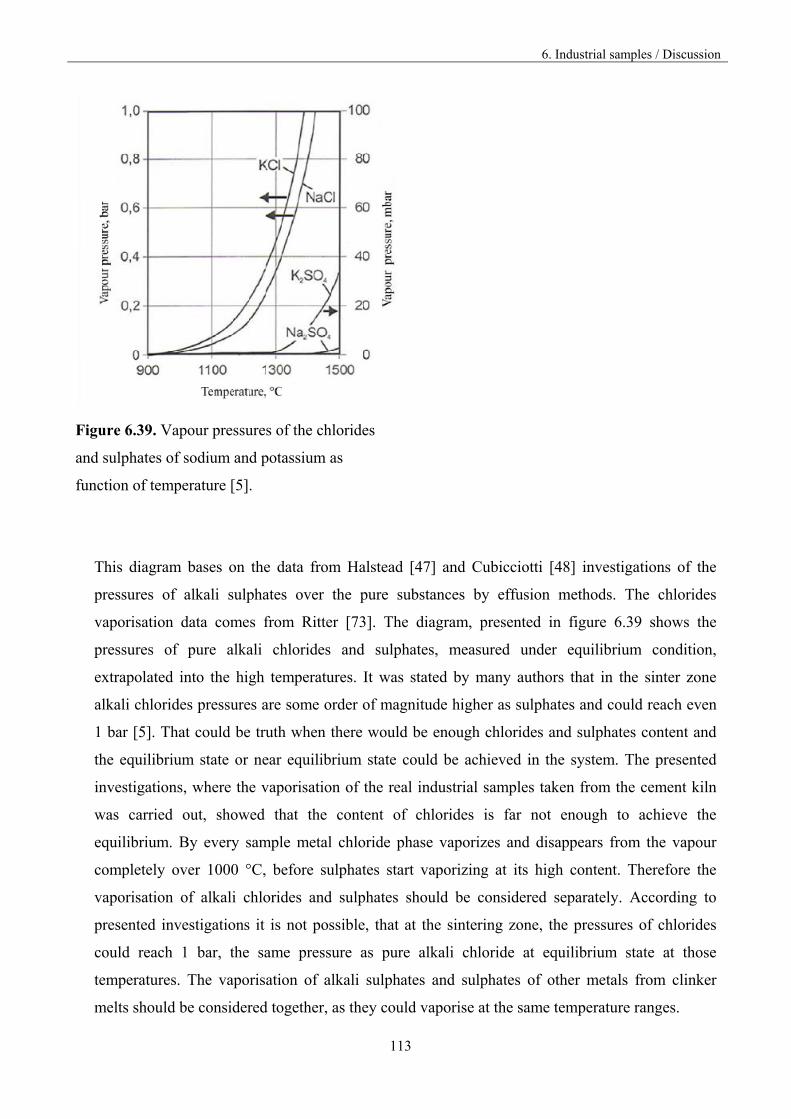
6. Industrial samples / Discussion
113
Figure 6.39. Vapour pressures of the chlorides
and sulphates of sodium and potassium as
function of temperature [5].
This diagram bases on the data from Halstead [47] and Cubicciotti [48] investigations of the
pressures of alkali sulphates over the pure substances by effusion methods. The chlorides
vaporisation data comes from Ritter [73]. The diagram, presented in figure 6.39 shows the
pressures of pure alkali chlorides and sulphates, measured under equilibrium condition,
extrapolated into the high temperatures. It was stated by many authors that in the sinter zone
alkali chlorides pressures are some order of magnitude higher as sulphates and could reach even
1 bar [5]. That could be truth when there would be enough chlorides and sulphates content and
the equilibrium state or near equilibrium state could be achieved in the system. The presented
investigations, where the vaporisation of the real industrial samples taken from the cement kiln
was carried out, showed that the content of chlorides is far not enough to achieve the
equilibrium. By every sample metal chloride phase vaporizes and disappears from the vapour
completely over 1000 °C, before sulphates start vaporizing at its high content. Therefore the
vaporisation of alkali chlorides and sulphates should be considered separately. According to
presented investigations it is not possible, that at the sintering zone, the pressures of chlorides
could reach 1 bar, the same pressure as pure alkali chloride at equilibrium state at those
temperatures. The vaporisation of alkali sulphates and sulphates of other metals from clinker
melts should be considered together, as they could vaporise at the same temperature ranges.
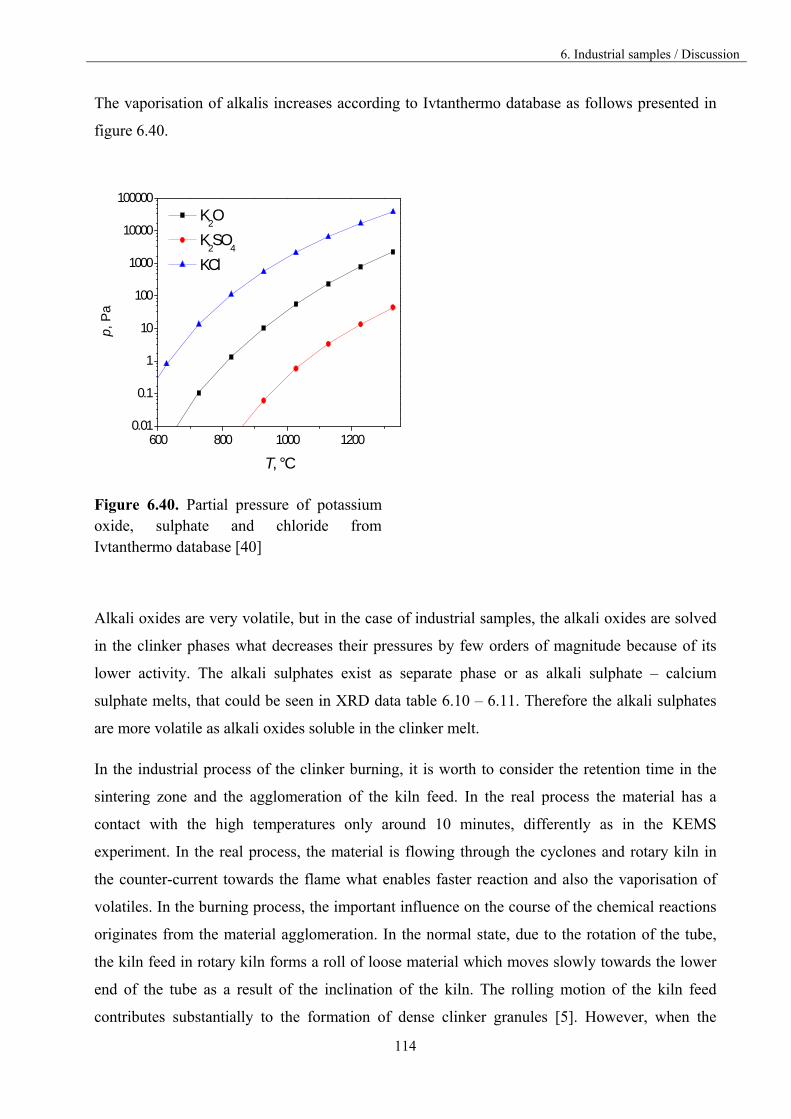
6. Industrial samples / Discussion
114
The vaporisation of alkalis increases according to Ivtanthermo database as follows presented in
figure 6.40.
600 800 1000 12000.01
0.1
1
10
100
1000
10000
100000
p, P
a
T, °C
K2O
K2SO
4
KCl
Figure 6.40. Partial pressure of potassium oxide, sulphate and chloride from Ivtanthermo database [40]
Alkali oxides are very volatile, but in the case of industrial samples, the alkali oxides are solved
in the clinker phases what decreases their pressures by few orders of magnitude because of its
lower activity. The alkali sulphates exist as separate phase or as alkali sulphate – calcium
sulphate melts, that could be seen in XRD data table 6.10 – 6.11. Therefore the alkali sulphates
are more volatile as alkali oxides soluble in the clinker melt.
In the industrial process of the clinker burning, it is worth to consider the retention time in the
sintering zone and the agglomeration of the kiln feed. In the real process the material has a
contact with the high temperatures only around 10 minutes, differently as in the KEMS
experiment. In the real process, the material is flowing through the cyclones and rotary kiln in
the counter-current towards the flame what enables faster reaction and also the vaporisation of
volatiles. In the burning process, the important influence on the course of the chemical reactions
originates from the material agglomeration. In the normal state, due to the rotation of the tube,
the kiln feed in rotary kiln forms a roll of loose material which moves slowly towards the lower
end of the tube as a result of the inclination of the kiln. The rolling motion of the kiln feed
contributes substantially to the formation of dense clinker granules [5]. However, when the
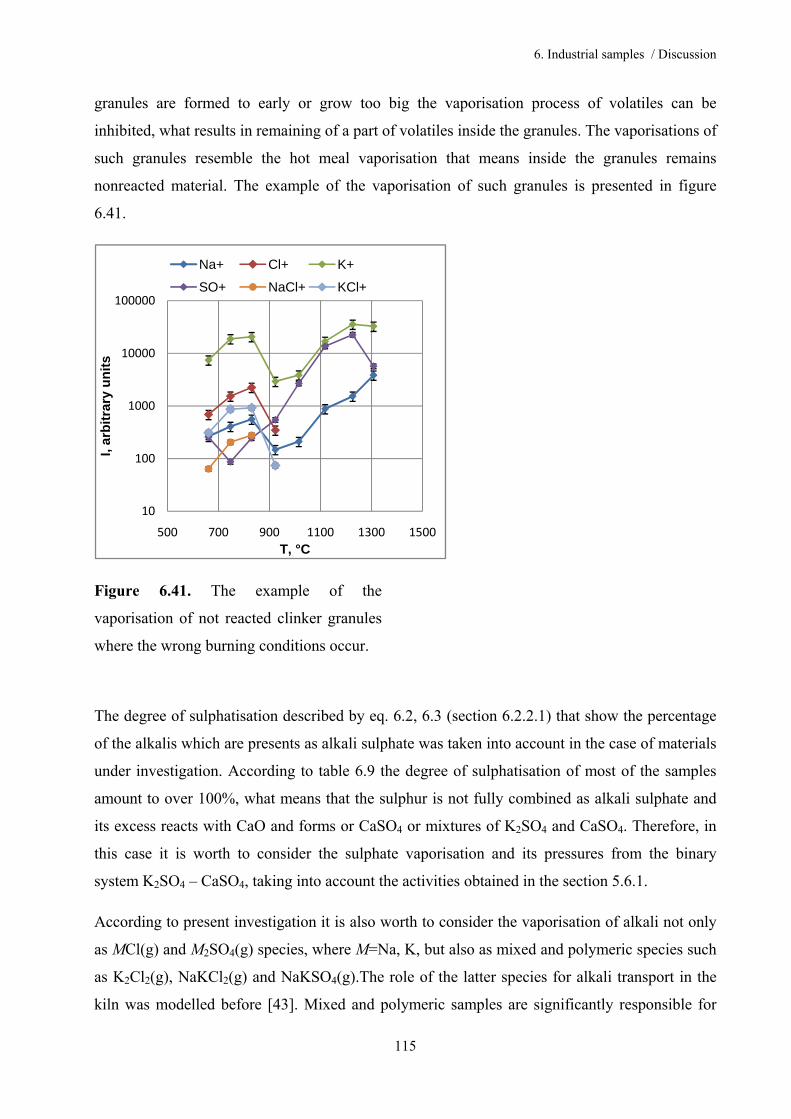
6. Industrial samples / Discussion
115
granules are formed to early or grow too big the vaporisation process of volatiles can be
inhibited, what results in remaining of a part of volatiles inside the granules. The vaporisations of
such granules resemble the hot meal vaporisation that means inside the granules remains
nonreacted material. The example of the vaporisation of such granules is presented in figure
6.41.
Figure 6.41. The example of the
vaporisation of not reacted clinker granules
where the wrong burning conditions occur.
The degree of sulphatisation described by eq. 6.2, 6.3 (section 6.2.2.1) that show the percentage
of the alkalis which are presents as alkali sulphate was taken into account in the case of materials
under investigation. According to table 6.9 the degree of sulphatisation of most of the samples
amount to over 100%, what means that the sulphur is not fully combined as alkali sulphate and
its excess reacts with CaO and forms or CaSO4 or mixtures of K2SO4 and CaSO4. Therefore, in
this case it is worth to consider the sulphate vaporisation and its pressures from the binary
system K2SO4 – CaSO4, taking into account the activities obtained in the section 5.6.1.
According to present investigation it is also worth to consider the vaporisation of alkali not only
as MCl(g) and M2SO4(g) species, where M=Na, K, but also as mixed and polymeric species such
as K2Cl2(g), NaKCl2(g) and NaKSO4(g).The role of the latter species for alkali transport in the
kiln was modelled before [43]. Mixed and polymeric samples are significantly responsible for
10
100
1000
10000
100000
500 700 900 1100 1300 1500
I, ar
bit
rary
un
its
T, °C
Na+ Cl+ K+
SO+ NaCl+ KCl+
6. Industrial samples / Discussion
116
alkali transport. According to previous researches [43], the atom K is the major alkali metal
transported in the kiln, mostly by K2SO4(g) molecule, whereas presence of NaKSO4 molecule
has significant influence for transport of atom Na, figure 5.16. That was also confirmed in the
presented results of the industrial samples vaporisation studies.
It is also worth to discuss the influence of the alternative fuels on the vaporisation rate. In the
case of materials coming from cement plants II and I, where enormous amounts of alternative
fuels are used, the vaporisation of the volatilities is the highest from all the materials under
investigation. The intensities of sulphur and alkalis were the highest in the case of those two
cement plants. Also high vaporisation of sulphur and alkalis was detected in the case of materials
coming from cement plant III. The lowest quantity of alkali sulphate/chloride vaporisation was
detected in the case of cement plant IV, where mostly brown coal and brow coal dust and the low
fluff content as alternative fuel are used. The chlorides vaporisation are the highest in the case of
cement plant II, where the highest amount of fluff is used that is one of the main sources of
chloride.
The special attention was drawn to the lead vaporisation. The highest vaporisation of lead from
hot meal sample was detected in the case of the cement plant III and from hot meal coming from
cement plant II vaporising as sulphates.
The enormous content of lead is caught by bypass installation in the cement plant II, and cement
plant I, where the most alternative fuels as the lead sources are used. The most alternative fuels is
used in cement plant II, therefore the intensities of Pb+ vaporising as chloride from bypass dust
sample are the highest.
Summarising, the vaporisation of volatiles could be combined with the quantity of the alternative
fuels used. The vaporisation of alkalis should be considered as three different processes, from
which the chloride vaporisation does not influence on alkali sulphate and alkali oxide
vaporisation from clinker melt. Also the mixed species and polymeric species should be
considered by modelling of the alkali transport in the gas phase.
7. Outlook
117
7. Outlook
Some of the industrial samples, that are bypass dust and hot meal sample coming from the
cement plant II, were investigated by the new developed experimental method, the commercial
skimmer coupled mass spectrometer with simultaneous thermal analysis (DTA/TG).
The investigation of the materials by this method was originally not a part of the project,
therefore the principle of the method and the experiment will be presented only briefly. The
measurements were carried out for a trial to determine the possibility of the further application of
the method into the characterization of the vaporisation of the industrial materials. The
investigations of the industrial samples were carried out in the FZ Jülich [74].
7.1. The principle of the method
By skimmer coupled mass spectrometer (MS) with simultaneous thermal analysis (DTA/TG)
method, the amounts of gases generated by the volatilization of the materials can be detected as
the function of temperature when the temperature of the sample is increased at the predetermined
heating rate. The gaseous products are flushed out of the furnace chamber operated at 1 atm
thereby simulating the technology regime used in the industrial installation. Gas products are
flushing out with help of pure gas for example air, N2 etc. The involved gas is introduced in MS
detector through a coupling system which acts both as MS inlet and pressure reduction system
[75]. The coupling takes place directly in the furnace and is arranged right above the sample
container. Since the entire system has sample temperature, no condensation during the gas
emanation changes the condition of the vapour phase of the sample [76]. The schematic diagram
of a skimmer coupled mass spectrometer with simultaneous thermal analysis (DTA/TG) is
presented in figure 7.1 [77].
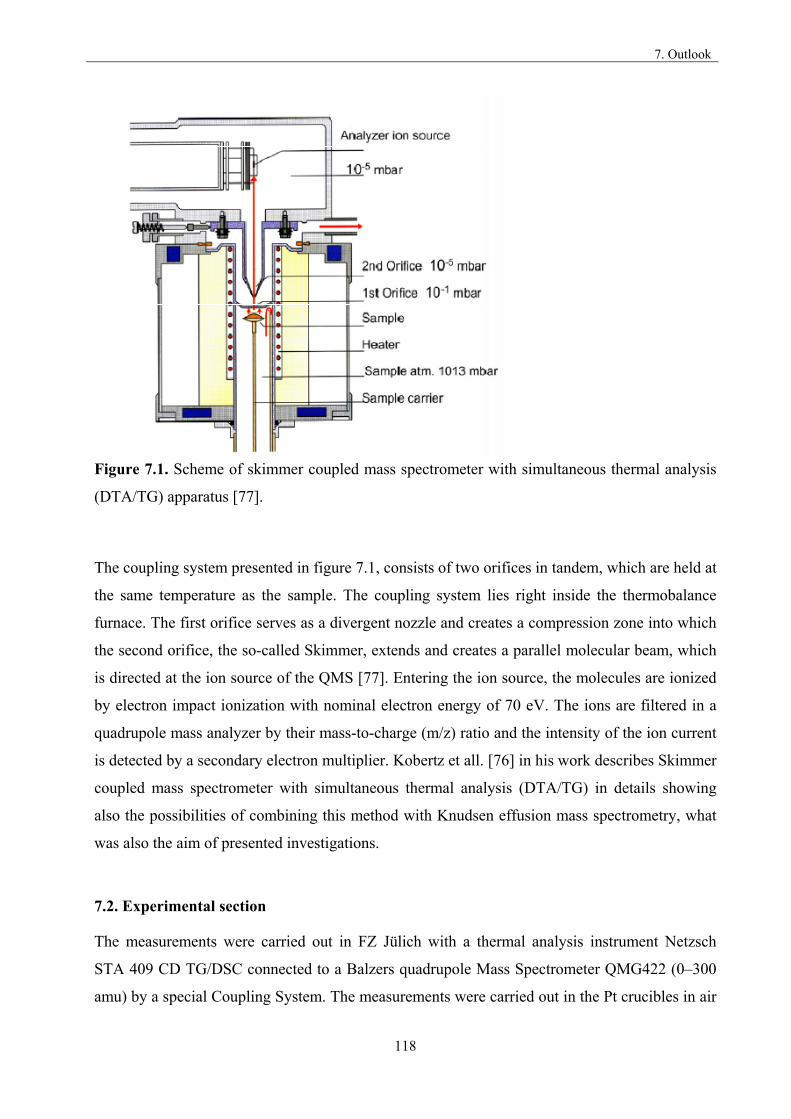
7. Outlook
118
Figure 7.1. Scheme of skimmer coupled mass spectrometer with simultaneous thermal analysis
(DTA/TG) apparatus [77].
The coupling system presented in figure 7.1, consists of two orifices in tandem, which are held at
the same temperature as the sample. The coupling system lies right inside the thermobalance
furnace. The first orifice serves as a divergent nozzle and creates a compression zone into which
the second orifice, the so-called Skimmer, extends and creates a parallel molecular beam, which
is directed at the ion source of the QMS [77]. Entering the ion source, the molecules are ionized
by electron impact ionization with nominal electron energy of 70 eV. The ions are filtered in a
quadrupole mass analyzer by their mass-to-charge (m/z) ratio and the intensity of the ion current
is detected by a secondary electron multiplier. Kobertz et all. [76] in his work describes Skimmer
coupled mass spectrometer with simultaneous thermal analysis (DTA/TG) in details showing
also the possibilities of combining this method with Knudsen effusion mass spectrometry, what
was also the aim of presented investigations.
7.2. Experimental section
The measurements were carried out in FZ Jülich with a thermal analysis instrument Netzsch
STA 409 CD TG/DSC connected to a Balzers quadrupole Mass Spectrometer QMG422 (0–300
amu) by a special Coupling System. The measurements were carried out in the Pt crucibles in air
7. Outlook
119
atmosphere. The temperature was increased from the temperature of 100 °C to 1400 °C with
heating grate of 10 °C /min.
The obtained results of the investigation show the potential of the method for its application for
the investigation of the vaporisation of industrial materials, but are not reliable enough for
publishing at this stage.
The Skimmer coupled mass spectrometer with simultaneous thermal analysis (DTA/TG) could
be a compliment for Knudsen effusion mass spectrometry because it enables the kinetically
oriented identification of vaporisation by various atmospheres. The connection of Knudsen
effusion mass spectrometry and Skimmer coupled with mass spectrometer and a simultaneous
thermal analysis (DTA/TG) could in the future potentially fulfil the characterization of the
vaporisation processes in the cement kiln through the determination of the partial species and
their thermodynamic data together with the determination of kinetically oriented vaporisation by
simulating the temperatures and atmospheres in the kiln oven.
8. Conclusions
120
8. Conclusions
This work focused on the thermochemical characterization of the gas circulation in the cement
kiln and was undertaken due to the real industry problems during clinker production. Nowadays
engineers can deal with some of the gas recirculation problems, but mechanism of such
processes is not known. For this purpose the studies by the Knudsen effusion mass spectrometry
was applied for gas vaporisation investigations. These studies widely implement KEMS as a tool
for studying the vaporisation of volatilities occurring during clinker production and are in
accordance with the previous investigation made in this field [1] completed before the
aforementioned results were obtained.
The aim of the presented investigation was a better understanding of the volatile cycles in
cement production technology by studying the thermodynamics of gas-gas and gas-solid
reactions between chemicals occurring in the cement kiln, focused mostly on alkali sulphates
vaporisation.
The first part of the project was the investigation of pure sulphate compounds, Na2SO4, K2SO4
and CaSO4 and the quasi binary system Na2SO4 – CaSO4, K2SO4 – CaSO4. By renewed pure
alkali sulphates vaporisation, the thermodynamic characteristic of pure sulphates was determined
and the fragmentation path of the gaseous species explained. The results are in accordance with
the literature data. In the renewed investigation of K2SO4 – CaSO4 system, the activities of the
compounds were obtained with a higher accuracy. By the measurement of Na2SO4 – CaSO4
system, the activities of Na2SO4 were obtained by Na2SO4 – rich samples, but the experiments
did not compile the system exhaustively. In the measurement many difficulties were encountered
due to creeping and therefore those experiments need to be repeated for better accuracy of the
data.
The second part of the project was the determination of volatiles over the samples taken directly
from the kiln from four different cement plants. The industrial materials were collected from four
different cement plants, at four different kiln stages to characterize the dependence of volatilities
vaporisation on various parameters such as atmospheres and temperature.
8. Conclusions
121
The obtained results showed the three vaporisation stages of volatilities alkali chlorides from all
the industry materials; at the low temperature ranges 700 – 900 °C as alkali chlorides
vaporisation, alkali sulphates vaporisation at 1000 – 1200 °C and vaporisation of alkali oxides
from clinker phases at the temperature above 1200 °C. The present investigation showed that the
vaporisation of alkali chlorides and alkali sulphates do not influence each other and the alkali
chloride disappears from the vapour completely over 1000 °C, before sulphates start vaporizing
at a high content; therefore, it is not possible that the chlorides could reach 1 bar in the sintering
zone in the cement kiln, as it was considered before. Present investigation showed the similar
temperature ranges of vaporisation of alkali sulphates and alkali oxides from clinker phases.
These vaporisation processes were difficult to distinguish. The further investigation of
vaporisation of alkali sulphates together with alkali oxides solved in the clinker melt will be
needed to complete the characterization of alkali circulation in the clinker kiln.
The presented investigation described also the importance of the polymeric and mixed species
such as NaKSO4 in the gas transport processes and should be therefore considered by every
modelling of the alkali transport, chemical reactions and equilibrium constants equations.
In this work, the first investigations of the industrial materials by skimmer coupled mass
spectrometer with simultaneous thermal analysis (DTA/TG) were undertaken, indicating a great
potential of this method combined with Knudsen effusion mass spectrometry for the
investigation of the gaseous processes during clinker production.
9. References
122
9. References
1. Eguia, G.E., Chemische und thermodynamische Untersuchung von kreislaufrelevanten Verbindungen bei der Zementherstellung durch Knudsen-Effusionmassenspektrometie, in Institut für Nichtmetallische Werkstoffe. 2006, Technische Universität Clausthal: Clausthal-Zellerfeld.
2. Bucchi, R., Influence of the nature and preparationof raw materials on the reactivity of raw mix, in 7. Intern. Congr. Chem. Cem. 1980: Paris. p. I-3-43.
3. Bhatty, J.I., Role of Minor Elements in Cement Manufacture and use. PCA Research and Development Bulletin, 1995. RD 109.03T: p. 1-39.
4. Taylor, H.F.W., Cement Chemistry, ed. T. Telford. 1997, London. 5. Locher, F.W., ed. Cement - Principles of production and use. 2006: Düsseldorf. 6. Fidaros, D.K., et al., Numerical modelling of flow and transport processes in a calciner
for cement production. Powder Technology, 2007. 171: p. 81-95. 7. Eysel, W., Crystal chemistry of the system Na2SO4-K2SO4-K2CrO4-Na2CrO4 and the
glaserite Phase. American Mineralogist, 1973. 58: p. 736-747. 8. Rowe, J.J., G.W. Morey, and I.D. Hansen, The binary system K2SO4 -CaSO4. Journal of
Inorganic and Nuclear Chemistry, 1965. 27: p. 53-58. 9. Wolter, A., Minor constituent recirculation in kiln system, in European Cement
Conference. 2001: Dresden. 10. Miller, M., Thermodynamics investigations of the metal halide systems by Knudsen
effusion mass spectrometry. Scientific Papers of the Institute of Inorganic Chemistry and Metallurgy of Rare Elements of the Technical University of Wroclaw. Vol. 66. 1997, Wroclaw: Oficyna Wydawnicza Politechniki Wroclawskiej.
11. Ionov, N.I., Doklady Akademii Nauk SSSR, 1948. 59(467-469): p. 467. 12. Chupka, W.A. and M.G. Inghram, Journal of Phisical Chemistry, 1955. 59: p. 100-1004. 13. Honig, R.E., Journal of Chemical Physics, 1954. 22: p. 126-131. 14. Miller, M. and K. Armatys, Twenty Years of Knudsen Effusion Mass Spectrometry:
Studies Performed in the Period 1990 - 2010. accepted for publication, 2011. 15. Inghram, M.G. and J. Drowart, Mass Spectrometry Applied to High Temperature
Chemistry, in High Temperature Technology. 1960, McGraw-Hill Book Company: New York.
16. Knudsen, M., Annalen Der Physik, 1909. 29: p. 75-130. 17. Margrave, J.L., The Characterisation of High-Temperature Vapours. 1967, New York
London Sydney: John Wiley&Sons INC. 18. Clausing, P., Uber die Stromung sehr verdunnter Gase durch Rohren von beliebiger
Lange. Annalen Der Physik, 1932. 404(8): p. 961-989. 19. Motzfeldt K., The thermal decompiosition of sodium carbonate by the effusion method.
1955. 59: p. 139-147. 20. Whitman, C.I., On the measurement of the pressures by effusion. The Journal of
Chemical Physics, 1952. 20(1): p. 161-164. 21. Ramsey, N.F., Z. Phys. D. - Atoms, Molecules, Clusters, 1988. 10: p. 121-125. 22. Carlson, K.D., P.W. Gilles, and R.J.J. Thorn, Journal of Chemical Physics, 1963. 38(11):
p. 2725-2735.
9. References
123
23. Rosenblatt, G.M., Journal of The Electrochemical Society, 1963. 110(6): p. 563-569. 24. Vande, J.E. and C.I. Whitman, Journal of Chemical Physics, 1951. 19(6): p. 744-748. 25. Stern, J.H. and N.W. Gregory, The Condensation Coefficient of Iodine. Journal of
Phisical Chemistry, 1957. 61(9): p. 1226-1232. 26. Hilpert K., Potential of mass spectrometry for the analysis of inorganic high-temperature
vapors. Fresenius J Anal Chem, 2001. 370: p. 471-478. 27. Hilpert K., High-temperature mass spectrometry in materials research. Rapid
Communications in Mass Spectrometry, 1991. 5: p. 175-187. 28. Hilpert K., Chemistry of Inorganic Vapors, in Structure and Bonding. 1990: Berlin. p.
97-198. 29. Sidorov, L.N., Inorganic Chemistry, Applications of Mass Spectrometry, in Encyclopedia
of Spectroscopy and Spectrometry. 2000, Elsevier Science. p. 915-923. 30. Drowart, J. and P. Goldfinger, Die massenspektrometrie anorganisher systeme bei hohen
Temperaturen. Angewandte Chemie, 1967. 79(13): p. 589-604. 31. Copland, E.H. and N.S. Jacobson, Measuring Thermodynamic Properties of Metals and
Alloys With Knudsen Effusion Mass Spectrometry. NASA/TP—2010-216795, 2010. 32. Drowart, J., et al., High-temperature mass spectrometry: instrumental techniques,
ionization cross-sections, pressure measurements, and thermodynamic data. Pure and Applied Chemistry, 2005. 77(4): p. 683-737.
33. Stolyarova , V.L. and G.A. Semenov, Mass Spectrometric Study of the vaporization of Oxide Systems, ed. J.H. Beynon FRS. 1994, Chichester: John Wiley & Sons.
34. Skudlarski, K., Speltrometria mas i parowanie nadrenianow litowcow. Vol. 20. 1973, Wroclaw: Prace naukowe Inst. Chem. Nieorg. i Met. Pierw. Rzadkich Politechniki Wroclawskiej.
35. Mann, J.B., Ionization Cross Sections of the Elements Calculated from Mean-Square Radii of Atomic Orbitals. The Journal of Chemical Physics, 1967. 46(5): p. 1646-1651.
36. Freund, R.S., R.C. Wetzel, and R.J. Shul, Measurements of electron-impact-ionization cross sections of N2, CO, CO2, CS, S2, CS2 and metastable. Physical Review A, 1990. 41(11): p. 5861-5868.
37. Freund, R.S., et al., Cross-section measurements for electron-impact ionization of atoms. Physical Review A, 1990. 41(7): p. 3575-3595.
38. Shul, R.J., R.S. Freund, and R.C. Wetzel, Electron-impact-ionization cross sections of GaCl, GeCl, and SnCl. Physical Review A, 1990. 41(11): p. 5856-5860.
39. Otvos, J.W. and D.P. Stevenson, Journal of the American Ceramic Society, 1956. 78: p. 546-551.
40. IVTANTHERMO, ed. A Thermodynamic database and Software System for the Personal Computer, . ed. M.V.A. Yungman V.S., Veits I.V. and Bergman G.A. 1993, CRS Press and Begell House, Boca Raton, FL,.
41. Belton, G.R. and R.J. Fruehan, The determination of activitics by mass spectrometry. I. The liquid metallic system iron-nickel and iron-cobalt. The Journal of Physical Chemistry, 1967. 71(5): p. 1403-1409.
42. Goldmann, W., W. Kreft, and R. Schutte, Cyclic phenomena of sulphur in cement kilns. World Cement Technology, 1981. 11: p. 424-430.
9. References
124
43. Armatys, K., et al., Vaporization study of sodium sulphate - potassium sulphate binary system by Knudsen effusion mass spectrometry. accepted for publication, 2011.
44. Halle, J.C. and K.H. Stern, Vaporization and decomposition of Na2SO4. Thermodynamics and kinetics. Journal of Physical Chemistry, 1980. 84: p. 1699-1704.
45. Lau, K.H., et al., Studies of the vaporization/decomosition of alkali sulfates. Journal of the Electrochemical Society: Solid States science and Technology, 1985. 132(12): p. 3041-3048.
46. Lau, K.H., D. Cubicciotti, and D.L. Hildenbrand, Effusion Studies of the vaporization/decomposition of potassium sulfate. Journal of the Electrochemical Society: Solid States science and Technology, 1979. 126(3): p. 490-495.
47. Halstead, W.D., Saturated Vapour Pressure of Potassium Sulphate. Transactions of the Faraday Society, 1970. 66: p. 1966-1973.
48. Cubicciotti, D. and F.J. Keneshea, Thermodynamics of Vaporization of Sodium Sulfate. High Temperature Science, 1972. 4: p. 32-40.
49. Powell, D.G. and P.A.H. Wyatt, Vapour Pressures of Anhydrous Sulphates. Part 1. Knudsen Effusion Results between 560 and 1000 °C for Alkali-metal Sulphates. Journal of the Chemical Society A, 1971: p. 3614-3617.
50. Ficalora, P.J., et al., Mass spectrometric studies at high temperatures: XXIX, thermal decomposition and sublimation of alkali metal sulfates. Journal of the American Ceramic Society, 1968. 51(10): p. 574-577.
51. Fotiev, A.A. and B.V. Slobodin, Russian Journal of Inorganic Chemistry, 1965. 10(3): p. 309-311.
52. Kosugi, T., Measurements of the vapor and dissociation presures of potassium sulfate and carbonate at high temperatures. Bulletin of the Chemical Society of Japan, 1972. 45: p. 15-19.
53. Uhlig, G.F., H.H. Davis, and H.C. Graham, Vaporization Kinetic of Na2SO4 from 900° to 1200 °C
Journal of the American Ceramic Society, 1975. 58(5-6): p. 201-203. 54. Jagannathan, G.V. and P.A.H. Wyatt, Journal of Chemical Research S, 1978: p. 203. 55. Jagannathan, G.V., D.G. Powell, and P.A.H. Wyatt, Journal of Chemical Research S,
1978: p. 372-373. 56. Märk, T.D., Cross section for single and double ionization of N2 and O2 molecules by
electron impact from threshold up to 170 eV. Journal of Chemical Physics, 1975. 63(9): p. 3731-3736.
57. Orient, O.J. and S.K. Srivastava, Mass spectrometric determination of partial and total electron impact ionization cross sections of 502 from threshold up to 200 eV. Journal of Chemical Physics, 1984. 80(1): p. 140-143.
58. Miller, M. and J. Kapała, Niektóre aspekty fragmentacji jonowych cząsteczek gazowych w badaniach termodynamiki halogenków metali metoda spektrometrii mas. Annales Universitatis Marie Curie-Skłodowska Lublin - Polonia, 1992. XLVI/XLVII 28(AAA): p. 283-296.
59. Bencze, L., e-mail correspondence.
9. References
125
60. Drowart J., et al., High-temperature mass spectrometry: instrumental techniques, ionization cross-sections, pressure measurements, and thermodynamic data. Pure and Applied Chemistry, 2005. 77: p. 683-737.
61. Lau, K.H., D. Cubicciotti, and D.L. Hildenbrand, Effusion studies of the thermal decomposition of magnesium and calcium sulfates. The Journal of Chemical Physics, 1977. 66(10): p. 4532 - 4539.
62. Zawadzki, J., Zur Kenntnis des Systems Calcium-Schwefel-Sauerstoff. Zeitschrift fur Anorganische und Allgemeine Chemie, 1932. 205: p. 180-192.
63. Freyer, D., W. Voigt, and K. Kohnke, The phase diagram of the system Na2SO4 - CaSO4. European Journal of Solid State and Inorganic Chemistry, 1998. 35: p. 595-606.
64. JCPDS - International Centre for Diffraction Data, ICDD cards. 65. Adaska, W.S. and D.H. Taubert, Beneficial uses of cement kiln dust, in IEEE/PCA 50th
Cement Industry Technical Conf. 2008: Miami. 66. Ariyaratne, W.K.H., et al., Meat and Bone Meal as a Renewable Energy Source in
Cement Kilns: Investigation of Optimum Feeding Rate, in International Conference on Renewable Energies and Power Quality (ICREPQ’11). 2010: Spain.
67. Wolter, A. Phase composition of calcined raw meal. in 8th International Congress of Chemistry of Cement. 1986. Rio de Janerio.
68. Isotope Calculator. Available from: http://www.sisweb.com/mstools/isotope.htm. 69. Milne, T.A., H.M. Klein, and C. D., Mass Spectroometer Analysis of the Vapor in
Equilibium with the Alkali- Metal Chlorides. Journal of Chemical Physics, 1958. 28: p. 718-719.
70. Van der Kemp W. J. M., et al., The vapour composition and pressure over solid potassium chloride: new mass-spectrometric results and effusion masses. J. Chem. Thermodynamics, 1991. 23: p. 593-604.
71. Gesenhues U., Reuhl K., and W. H., Vapour pressure and composition above mixed melts of alkali chlorides and aluminium chloride. International Journal of Mass Spectrometry and Ion Physics, 1983. 47: p. 251-252.
72. McPhail, D.S., M.G. Hocking, and J.H.E. Jeffes, Metal halide vapour complexes: mass spectrometry. International Journal of Mass Spectrometry and Ion Processes, 1984. 59: p. 261-276.
73. Ritter, F., Uber den Flugstaub deutscher Portland - Zementwerke. 1930: Jena. 74. FZ Julich, IEK - 2. 75. Arii, T., Envolved Gas Analysis-Mass Spectrometry (EGA-MS) Using Skimmer Interface
System Equipped with Pressure Control Function. J. Mass Spectrom. Soc. Jpn., 2005. 53(4): p. 211 - 216.
76. Kobertz, D., C. Guguschev, and M. Müller, Investigations at High Temperature in Both Equilibrium and Kinetic State with Knudsen Effusion Mass Spectrometry (KEMS) and a Skimmer Integrated Coupling System of Mass Spectrometer and Thermal Analysis (STAMS). Open Journal, in press, 2011.
77. Sennecea, O., F. Scherillo, and A. Nunziata, Thermal degradation of pesticides under oxidative conditions. J. Anal. Appl. Pyrolysis, 2007. 80: p. 61 - 76.
Eidesstattliche Erklärung
126
Eidesstattliche Erklärung
Hiermit erkläre ich an Eides Statt, dass ich die bei der Fakultät für Natur- und
Materialwissenschaften der Technischen Universität Clausthal eingereichte Dissertation
selbständig und ohne unerlaubte Hilfe verfasst und die benutzten Hilfsmittel vollständig
angegeben habe.
Clausthal – Zellerfeld, September 2011
……………………………………….
Kamila Anna Armatys
Lebenslauf
127
Lebenslauf
Name: Kamila Armatys
Nationality: Polish
Date of birth: 07.12.1984
Place of birth: Wrocław, Poland
Education
2008 – 2011 PhD Student, Institute for Non- Metallic Materials, Clausthal University of
Technology, Germany, DAAD Scholarship
2003 – 2008 Master of Science (engineer) at Wrocław University of Technology,
Poland, Faculty Chemistry
1999 – 2003 Secondary School, Wrocław, Poland,
Profile: biology and chemistry