Embed Size (px)
Citation preview

Characterization of
Pressure Sensitive Adhesive Systems
for Transdermal Patches
Dissertation
zur Erlangung des Doktorgrades
der Naturwissenschaften (Dr. rer. nat.)
an der Fakultät für
Mathematik, Informatik und Naturwissenschaften
Fachbereich Chemie
der Universität Hamburg
vorgelegt von
Marc Michaelis aus Hannover
Hamburg 2015
Reviewer of the dissertation: Professor Dr. Claudia S. Leopold
Professor Dr. Patrick Théato
Reviewer of the disputation: Professor Dr. Claudia S. Leopold
Professor Dr. Hans-Ulrich Moritz
Dr. Birgit Fischer
Date of the disputation: 20.03.2015
“Die Grenzen meiner Sprache bedeuten die Grenzen meiner Welt.”
Ludwig Wittgenstein

Danksagung I
Danksagung
Diese Dissertation wurde an der Universität Hamburg am Fachbereich Chemie in der Abteilung
Pharmazeutische Technologie auf Anregung und unter der Leitung von Frau Prof. Dr. Claudia S.
Leopold verfasst.
Ich möchte mich an dieser Stelle bei vielen Personen bedanken, die mich bei der Erstellung dieser
Arbeit sehr unterstützt haben.
An erster Stelle möchte ich Frau Prof. Dr. Claudia S. Leopold für die freundliche Überlassung des
hochinteressanten Themas und die Bereitstellung des Arbeitsplatzes danken. Ich verdanke ihr
darüber hinaus hilfreiche Unterstützung und viele anregende Diskussionen. Jede Phase dieser Arbeit
wurde von ihr intensiv und warmherzig begleitet. Besonders bedanken will ich mich auch für die
Freiheit, die sie mir während des gesamten Forschungsprojektes gewährte.
Herrn Dr. Albrecht Sakmann sei herzlich gedankt für die hilfreichen Tipps bei der Einführung in das
Praktikum sowie die freundliche Aufnahme in den Arbeitskreis.
Herrn Prof. Dr. Patrick Théato gilt mein besonderer Dank für die freundliche Übernahme des
Gutachtens der vorliegenden Dissertation. Herrn Prof. Dr. Hans-Ulrich Moritz und Frau Dr. Birgit
Fischer danke ich für ihre Bereitschaft, als Begutachtende in der Prüfungskommission mitzuwirken.
Für die professionelle Einführung in die Rheologie der Haftklebstoffe danke ich Herrn Rüdiger
Brummer der Firma Beiersdorf. Ebenfalls Herrn Frank Hetzel und Herrn Martin Griebenow der Firma
Beiersdorf möchte ich für die stets hilfsbereite und sachkundige Unterstützung bei den
rheometrischen Messungen im Hause Beiersdorf danken.
Großer Dank gebührt meinen Kollegen der Pharmazeutischen Technologie und der Pharmazeutischen
Chemie. Vielen Dank für eure Unterstützung, die vielen konstruktiven Gespräche und schönen sowie
in jeder Lebenslage humorvollen Momente. Besonders möchte ich dabei Frau Dr. Ines Saniocki und
Herrn Dr. Sebastian Kruggel für das gewissenhafte Korrekturlesen danken.
Frau Petra Borbe danke ich für die ausgezeichnete und tatkräftige Unterstützung während meiner
Arbeit am Lehrstuhl.
Danksagung II
Den Mitarbeitern der TMC-Werkstatt möchte ich für ihre Geduld und ihre professionelle Umsetzung
meiner zahlreichen Spezialanfertigungen danken.
Der Firma Henkel, sowie im Besonderen Dr. Paul B. Foreman und Mr. Nigel Brown möchte ich für die
sofortige und immerwährende Unterstützung meiner Arbeit, zum einen durch Materialien zum
anderen durch konstruktive Gespräche, meinen Dank aussprechen.
Bedanken möchte ich mich auch bei Herrn Prof. Dr. Ullrich. Schäfer, Herrn Dr. Harald Heßberger
sowie Herrn Leslie Chao, die mir in entscheidenden Momenten meiner Arbeit die richtige Richtung
gewiesen haben.
Weiterhin danke ich den Firmen Dow Corning, Epurex Films und 3M für die kostenlose Bereitstellung
von Materialien für die Pflasterherstellung, sowie der Firma Stat-Ease für das Recht, Ergebnisse der
Demo-Version von Design-Expert® 8.0.6 zu veröffentlichen.
Darüber hinaus möchte ich mich bei den Firmen Acino und Chemsultans für die Bereitstellung von
Bildmaterial und das Recht für deren Veröffentlichung bedanken.
Meinen Eltern, meiner Schwester Nora, meiner Oma und meinen Freunden danke ich für ihr
Verständnis, ihre Rücksichtnahme und ihren Beistand in jeder Phase der Promotion.
Zu guter Letzt möchte ich meiner Frau Heidi und meinen Kindern Finley, Emil und Bruno aus ganzem
Herzen für Ihre Unterstützung danken, die nicht in Worte zu fassen ist und maßgeblich zum Gelingen
dieser Arbeit beigetragen hat.
Summary III
Summary
In general, transdermal patch development is a very straight forward, however non-systematic and
not goal-oriented approach. Lack of methods for screening and collecting systematically data, even at
the early stage of development, lead to the situation that most studies are performed via trial and
error based on the personal experience of the developer.
The scope of the present work was to evaluate statistically designed methods for formulation
development and to systematically investigate analytical methods as claimed in the international
guidances.
Although many studies have been performed to investigate either the adhesion properties or the
viscoelastic properties of plain pressure sensitive adhesives (PSAs), still little is known on the
interaction of these properties if a low molecular weight substance is added. Most of the adhesion
performance tests are influenced by the viscoelastic properties of the sample and should be
described already in the development phase. Therefore, DMA/DMTA was used to investigate possible
API-PSA interactions and to compare these measurements with standard adhesion performance tests.
For this purpose patch-like samples as well as samples with sufficient thickness for rheometrical
measurements were prepared. A method was developed to prepare patches of varying thicknesses
and sizes comprising of a release liner, the adhesive matrix, the API and a backing membrane.
Subsequently, the method was further modified to achieve samples of about 1200 µm thickness for
rheometrical measurements. Special emphasis was laid on reproducibility and high quality of the
samples (absence of air bubbles or coating defects). Therefore, the process was standardized and
automatized as much as possible.
The crosslinked acrylic PSA DuroTak® 87-4287 was mixed with increasing amounts of ibuprofen as a
model drug, and the adhesion performance was measured as rolling ball tack, probe tack and shear
adhesion in dependence of the ibuprofen concentration. These results were compared with data
from frequency sweeps and temperature sweeps from DMA/DMTA measurements. It could be shown
that DMA/DMTA was a suitable method to detect the influence of ibuprofen on DuroTak® 87-4287 in
dependence of its concentration. Furthermore, DMA/DMTA was able to significantly reveal the
phenomenon of antiplasticization for the investigated drug-loaded matrices, and based on the data
the term “antiplasticization space” was introduced.
Summary IV
The probe tack test proved itself as a fast method, applicable to the final pharmaceutical product and
may be used as a process control sensor e.g. process analytical technology (PAT). In a second study it
was decided to evaluate a systematic approach for a measurement system analysis (MSA) of the
probe tack test. The strength of the introduced approach is on the one hand the possibility to identify
significant parameters and their interactions with influence on the analytical test result. On the other
hand the transferability of this methodology to other analytical methods is given. With the method of
design of experiments (DoE), the effect of detachment speed, dwell time, contact force, adhesive
matrix thickness and API content on the tack measurement of a pressure sensitive adhesive was
investigated. The results implied that all investigated factors have a significant influence on the test
parameters. Furthermore, interactions between dwell time, contact force, adhesive matrix thickness
and API content could be identified. Remarkably, it was observed that with decreasing adhesive
matrix thickness the PSA showed unexpectedly high tack values. This phenomenon could be
explained by increased mechanical strength of thin PSA films caused by orientation of hydrophilic
polymer chains of the PSA.
In a final study, the method “Mixture Design” was evaluated as a Quality by Design (QbD) approach to
develop a multiple polymer drug-in-adhesive system. Only few studies have been performed to
investigate multiple polymer adhesive systems to be applied in transdermal patches, and information
on the influence of the components on the performance of these systems is rare. This may be a result
of the complexity of these systems rather than the various possible interactions of the components.
As a model drug ibuprofen was chosen and blended with varying amounts of silicone adhesive, acrylic
adhesive and oleyl alcohol. Drug-in-adhesive samples were prepared at different levels of the
components according to the mixture design. Response surfaces of tack, shear adhesion, extent of
creaming, crystallization, droplet size and droplet distribution range were obtained as contour plots.
The results implied that the levels of the components had a significant effect on the performance of
the patch. In all cases adhesion properties were decreased when compared to the plain adhesives.
Remarkably, it could be observed that crystallization was decreased at all component levels and
correlated well with the droplet size of the mixtures, whereas lowest crystallization was observed at
smallest droplet sizes. No beneficial effect of oleyl alcohol on the performance of the patch was
observed at any level and interestingly, its addition had a negative effect on all responses. Based on
these results an optimized mixture of a multiple polymer adhesive system as transdermal patch was
calculated with a numeric optimization and experimentally verified.
Zusammenfassung V
Zusammenfassung
Die Entwicklung von transdermalen Pflastern basiert im Allgemeinen auf wenig systematischen,
zielorientierten Methoden. Der Mangel an systematischen Methoden, die dem Screening und
Sammeln von wissenschaftlichen Daten dienen könnten, führt dazu, dass die meisten Ergebnisse
durch einfaches Ausprobieren erzielt werden. Demnach richten sich der Aufwand sowie letztendlich
auch der Erfolg nach der Erfahrung des Entwicklers. Das Ziel der vorliegenden Arbeit war die
Erprobung von statistischen Methoden für die Formulierungsentwicklung und die systematische
Untersuchung analytischer Methoden, so wie es in den internationalen Richtlinien gefordert wird.
Obwohl bisher viele Untersuchungen durchgeführt wurden, um entweder die Klebeigenschaften oder
die viskoelastischen Eigenschaften von reinen Haftklebstoffen zu bestimmen, ist wenig über die
Änderung dieser Eigenschaften bekannt, wenn eine niedermolekulare Substanz hinzugefügt wird. Die
meisten Tests zur Messung der Klebeigenschaften werden durch die viskoelastischen Eigenschaften
der Probe beeinflusst und sollten bereits in der Entwicklungsphase bekannt sein. Daher wurde
DMA/DMTA verwendet, um mögliche Arzneistoff/Haftklebstoff-Interaktionen zu untersuchen und die
erhaltenen Ergebnisse mit denen von klassischen Klebkraft-Tests zu vergleichen.
Für diesen Zweck mussten zum einen pflasterähnliche Proben hergestellt werden, um die Klebkraft zu
messen; zum anderen wurden jedoch auch Proben mit ausreichender Dicke für rheometrische
Messungen benötigt. Es konnte eine Methode entwickelt werden, die es erlaubte, Pflaster bestehend
aus Schutzfolie, Haftklebstoffmatrix, Arzneistoff und einer Abziehfolie in unterschiedlicher Dicke und
Größe herzustellen. Diese wurde dann weiter entwickelt, so dass Proben mit einer Dicke von
ca. 1200 µm für rheometrische Messungen erhalten werden konnten. Besondere Aufmerksamkeit
wurde dabei auf eine gute Reproduzierbarkeit und hohe Qualität (Abwesenheit von Luftblasen und
Beschichtungsdefekten) gelegt. Aus diesem Grunde wurde der Prozess weitestgehend standardisiert
und automatisiert.
Der quervernetzte Acrylat-Haftklebstoff DuroTak® 87-4287 wurde mit steigendem Anteil an Ibuprofen
als Modellarzneistoff gemischt und die Klebeigenschaften als Rolling Ball Tack, Probe Tack und
Scherfestigkeit in Abhängigkeit von der Ibuprofen-Konzentration gemessen. Die Ergebnisse wurden
mit Daten von Frequenz- und Temperaturversuchen aus DMA/DMTA-Messungen verglichen. Es
konnte gezeigt werden, dass DMA/DMTA geeignet ist, um den Einfluss von Ibuprofen auf
Zusammenfassung VI
DuroTak® 87-4287 in Abhängigkeit von seiner Konzentration zu bestimmen. Weiterhin konnte die
Methode das Phänomen der Antiweichmachung für das untersuchte System signifikant nachweisen
und der Begriff „antiplasticization space“ eingeführt werden.
Im Rahmen dieser Untersuchungen erwies sich der Probe Tack-Test als eine schnelle Methode, mit
dem Potenzial als Sensor für die Inprozesskontrolle eingesetzt zu werden, wie z.B. als Process
Analytical Technology (PAT). Im zweiten Teil der Arbeit wurde ein systematischer Ansatz zur
Untersuchung dieser analytischen Methode im Sinne einer Messsystemanalyse (MSA) entwickelt. Die
Bedeutung der vorgeschlagenen Methode besteht zum einen in der Möglichkeit, signifikante
Testparameter sowie deren Interaktionen mit Einfluss auf das Messergebnis zu bestimmen, zum
anderen in der Übertragbarkeit auf weitere analytische Methoden. Unter Verwendung von
statistischer Versuchsplanung konnte der Einfluss von Abzugsgeschwindigkeit, Druckhaltezeit,
Anpresskraft, Klebschichtdicke und Arzneistoffgehalt auf das Messergebnis der Probe Tack-Messung
eines Haftklebstoffes untersucht werden. Die Ergebnisse zeigten, dass alle untersuchten Faktoren
einen signifikanten Einfluss auf das Messergebnis haben. Weiterhin konnten eindeutige Interaktionen
zwischen Druckhaltezeit, Anpresskraft, Klebschichtdicke und Arzneistoffgehalt identifiziert werden.
Bemerkenswerterweise konnten mit abnehmender Schichtdicke unerwartet hohe Messergebnisse
des Probe Tack-Tests erhalten werden. Dieses Phänomen konnte durch Zunahme der mechanischen
Festigkeit bei dünnen Haftklebstoffschichten mittels Orientierung von hydrophilen Polymerketten des
Haftklebstoffes erklärt werden.
Schließlich wurde im letzten Teil der Arbeit die Versuchsplanungsmethode „Mixture Design“ als ein
Quality by Design (QbD) Ansatz zur Entwicklung von transdermalen Pflastern des Typs „drug-in-
adhesive“ (DIA) mit einem multiplen Haftklebstoffsystem angewandt.
Bisher haben sich nur wenige Studien mit der Verwendung von multiplen Haftklebstoffsystemen für
transdermale Pflaster befasst, und nur wenige Informationen über den Einfluss der Komponenten auf
die Klebleistung dieser Systeme liegen vor. Dies mag zum einen der Komplexität dieser Systeme, zum
anderen den vielfältigen Interaktionsmöglichkeiten der Komponenten geschuldet sein.
Ibuprofen wurde als Modellarzneistoff gewählt und Pflaster mit variierenden Mengen von Silikon-
Haftklebstoff, Acrylat-Haftklebstoff und Oleylalkohol gemäß dem zuvor erstellten Mischungsplan
hergestellt. Die erhaltenen „response surfaces“ von Tack, Scherfestigkeit, Phasentrennung,
Zusammenfassung VII
Kristallisierung des Arzneistoffes, Größe und Spannweite der Tröpfchen wurden als Kontur-
Diagramme dargestellt. Die Ergebnisse zeigten, dass die Mischungsverhältnisse der Komponenten
einen signifikanten Einfluss auf die Klebleistung des Pflasters hatten. Bei allen Mischungen war die
Klebleistung im Vergleich zu Proben mit reinen Klebstoffen schwächer. Bemerkenswerterweise
konnte eine Reduktion der Kristallisation des Arzneistoffes bei allen hergestellten Pflastern
beobachtet werden. Diese war mit der Größe der Tröpfchen in den Haftklebstoffmischungen insofern
korreliert, dass die geringste Arzneistoffkristallisation bei den Mischungen mit den kleinsten
Tröpfchen beobachtet wurde. In Bezug auf die gemessenen Eigenschaften konnte hingegen durch die
Zugabe von Oleylalkohol kein positiver Effekt beobachtet werden. Basierend auf diesen Resultaten
konnte eine optimierte Mischung eines multiplen Haftklebstoffsystems für die Anwendung als
transdermales Pflaster über eine numerische Optimierung berechnet und anschließend experimentell
bestätigt werden.
Contents VIII
Contents
Danksagung ............................................................................................................................................... I
Summary ................................................................................................................................................. III
Zusammenfassung.................................................................................................................................... V
Contents ................................................................................................................................................ VIII
1. Introduction.......................................................................................................................................... 1
1.1. Transdermal patches ..................................................................................................................... 2
1.1.1. Overview of transdermal patches .......................................................................................... 2
1.1.2. Components of a transdermal DIA patch ............................................................................... 4
1.1.2.1. Pressure sensitive adhesives (PSAs) ................................................................................ 4
1.1.2.1.1. Acrylate adhesives .................................................................................................... 5
1.1.2.1.2. Silicone adhesives .................................................................................................... 9
1.1.2.1.3. Polyisobutylene adhesives ..................................................................................... 12
1.1.2.2. Backing membranes and release liners ......................................................................... 13
1.1.2.3. Active pharmaceutical ingredients ................................................................................ 14
1.1.2.4. Additives ........................................................................................................................ 14
1.1.3. Manufacturing of DIA patches ............................................................................................. 15
1.2. Adhesion in transdermal drug delivery ....................................................................................... 17
1.2.1. Measurement of adhesion performance ............................................................................. 18
1.2.1.1. Tack ............................................................................................................................... 18
1.2.1.2. Peel resistance .............................................................................................................. 19
1.2.1.3. Shear adhesion .............................................................................................................. 20
1.2.2. Rheology of pressure sensitive adhesives ............................................................................ 21
1.2.3. Factors influencing adhesion................................................................................................ 26
1.3. Design of Experiments (DoE) ....................................................................................................... 30
Contents IX
1.4. Objectives of this work ................................................................................................................ 36
2. Materials and methods ...................................................................................................................... 38
2.1. Materials ..................................................................................................................................... 39
2.2. Methods of “Evaluation of DMA/DMTA for transdermal patch development” ......................... 40
2.2.1. Determination of the NVC .................................................................................................... 40
2.2.2. Preparation of the wet mixes ............................................................................................... 40
2.2.3. Preparation of the dry adhesive matrices ............................................................................ 40
2.2.3.1. Laminates for rheological characterization ................................................................... 41
2.2.3.2. Test specimens for probe tack experiments ................................................................. 41
2.2.3.3. Test specimens for rolling ball tack and shear adhesion experiments ......................... 41
2.2.4. Monitoring of ibuprofen crystal formation .......................................................................... 42
2.2.5. Dynamic Mechanical Analysis (DMA) / Dynamic Mechanical Thermal Analysis (DMTA) .... 42
2.2.5.1. Strain sweeps ................................................................................................................ 43
2.2.5.2. Frequency sweeps ......................................................................................................... 43
2.2.5.3. Temperature sweeps..................................................................................................... 44
2.2.6. Adhesion performance ......................................................................................................... 44
2.2.6.1. Probe tack test .............................................................................................................. 44
2.2.6.2. Rolling ball tack test (PSTC-6) ........................................................................................ 45
2.2.6.3. Shear adhesion test (PSTC-107 A) ................................................................................. 46
2.2.7. Differential Scanning Calorimetry (DSC) .............................................................................. 46
2.3. Methods of “Systematic investigation of the probe tack test” ................................................... 47
2.3.1. Design of Experiments: IV-optimal design ........................................................................... 47
2.3.2. Preparation of the wet mixes ............................................................................................... 49
2.3.3. Preparation of the dry adhesive matrices ............................................................................ 49
2.3.4. DMA Measurements ............................................................................................................ 49
Contents X
2.3.5. Probe tack test ..................................................................................................................... 49
2.3.6. Statistical data analysis ........................................................................................................ 51
2.4. Methods of “Formulation development of a multiple polymer adhesive patch” ...................... 53
2.4.1. Mixture design ..................................................................................................................... 53
2.4.2. Preparation of the wet mixes ............................................................................................... 56
2.4.3. Preparation of the dry adhesive matrices ............................................................................ 57
2.4.4. Responses ............................................................................................................................. 57
2.4.4.1. Tack ............................................................................................................................... 57
2.4.4.2. Shear adhesion .............................................................................................................. 57
2.4.4.3. Crystal growth ............................................................................................................... 57
2.3.4.4. Extent of creaming (phase separation) ......................................................................... 58
2.4.4.5. Droplet size.................................................................................................................... 58
2.4.4.6. Droplet distribution range ............................................................................................. 58
2.4.5. Statistical data analysis ........................................................................................................ 58
3. Results and discussion ........................................................................................................................ 59
3.1. Results and discussion of “Evaluation of DMA/DMTA for transdermal patch development” ... 60
3.1.1. Monitoring ibuprofen crystal formation .............................................................................. 60
3.1.2. Dynamic Mechanical Analysis (DMA)/Dynamic Mechanical Thermal Analysis (DMTA) ...... 60
3.1.2.1. Strain sweeps ................................................................................................................ 62
3.1.2.2. Frequency sweeps ......................................................................................................... 62
3.1.2.3. Temperature sweeps..................................................................................................... 70
3.1.3. Differential Scanning Calorimetry (DSC) .............................................................................. 72
3.1.4. Adhesion performance ......................................................................................................... 73
3.1.4.1. Probe tack ..................................................................................................................... 75
3.1.4.2. Rolling ball tack ............................................................................................................. 76
Contents XI
3.1.4.3. Shear adhesion .............................................................................................................. 77
3.1.5. Suggested model of plasticization and antiplasticization .................................................... 79
3.1.6. Conclusion ............................................................................................................................ 80
3.2. Results and discussions of “Systematic investigation of the probe tack test”............................ 82
3.2.1. DMA Measurements ............................................................................................................ 82
3.2.2. ANOVA of the results of the probe tack test........................................................................ 83
3.2.3. Evaluation of the main effect plots ...................................................................................... 86
3.2.3.1. Factor A: Detachment Speed ........................................................................................ 86
3.2.3.2. Factor B: Dwell time ...................................................................................................... 87
3.2.3.3. Factor C: Contact force .................................................................................................. 88
3.2.3.4. Factor D: Adhesive matrix thickness ............................................................................. 89
3.2.3.5. Factor E: API Content .................................................................................................... 92
3.2.4. Interaction plots ................................................................................................................... 92
3.2.4.1. Interaction between Factors B and D............................................................................ 93
3.2.4.2. Interaction between Factors C and D ............................................................................ 93
3.2.4.3. Interaction between Factors D and E ............................................................................ 94
3.2.5. Interpretation of the data .................................................................................................... 95
3.2.6. Conclusion ............................................................................................................................ 97
3.3. Results and discussions of “Formulation development of a multiple polymer adhesive patch” 99
3.3.1. Tack .................................................................................................................................... 102
3.3.2. Shear adhesion ................................................................................................................... 107
3.3.3. Crystal growth .................................................................................................................... 109
3.3.4. Extent of creaming ............................................................................................................. 111
3.3.5. Droplet size ......................................................................................................................... 111
3.3.6. Droplet distribution range .................................................................................................. 112
Contents XII
3.3.7. Multi response optimization and validation ...................................................................... 113
3.3.8. Interpretation of the data .................................................................................................. 113
3.3.9. Conclusion .......................................................................................................................... 114
3.4. Final discussion .......................................................................................................................... 115
4. References ........................................................................................................................................ 118
5. Appendix .......................................................................................................................................... 138
5.1 Appendix – Curriculum Vitae ..................................................................................................... 139
5.2 Appendix – Publication List ........................................................................................................ 140
5.3 Appendix – Hazardous Materials ............................................................................................... 144
6. Eidesstattliche Versicherung ............................................................................................................ 146
1. Introduction 1
1. Introduction
1. Introduction 2
1. Introduction
1.1. Transdermal patches
1.1.1. Overview of transdermal patches
In 1979 Alza corporation obtained the approval for the first transdermal patch in the United States for
delivery of scopolamine to treat motion sickness (1, 2). A decade later, nicotine patches became the
first transdermal blockbuster. Today, patches of 17 different active pharmaceutical ingredients (APIs)
such as fentanyl, estradiol and rivastigmin along with numerous generic products are on the market
(3, 4). It is estimated that more than one billion transdermal patches are currently manufactured each
year (2). In 2014 around 81 ongoing clinical trials were reported, ranging from applications in
vaccines, drug delivery, to biofeedback loops. Transdermal delivery is estimated to generate a
turnover of up to $6 billion within the next 10 years (5).
Transdermal drug delivery has a variety of advantages compared to the oral or the parenteral drug
delivery. The avoidance of the first-pass metabolism leads to a better bioavailability and may result in
fewer side effects. Transdermal patches are non-invasive and can be administered by the patients
themselves. Furthermore, transdermal patches can provide drug release for periods of up to one
week and improve patient compliance (2, 6, 7, 8, 14).
The European Pharmacopeia defines transdermal patches as flexible pharmaceutical preparations of
varying sizes, containing one or more APIs. Transdermal patches are intended to be applied to the
intact skin in order to deliver the API to the systemic circulation after passing through the skin barrier
(10, 11).
For successful transdermal administration the API should have a molecular mass of less than about
350 Daltons (2, 12, 13). Furthermore, to achieve a therapeutic effect at low blood concentrations
1. Introduction 3
doses of only a few milligrams per day or less are necessary. The substances must exhibit octanol-
water partition coefficients that show lipophilic properties to be able to penetrate the skin but at the
same time hydrophilic properties to permeate subsequently into the bloodstream (2, 14, 15).
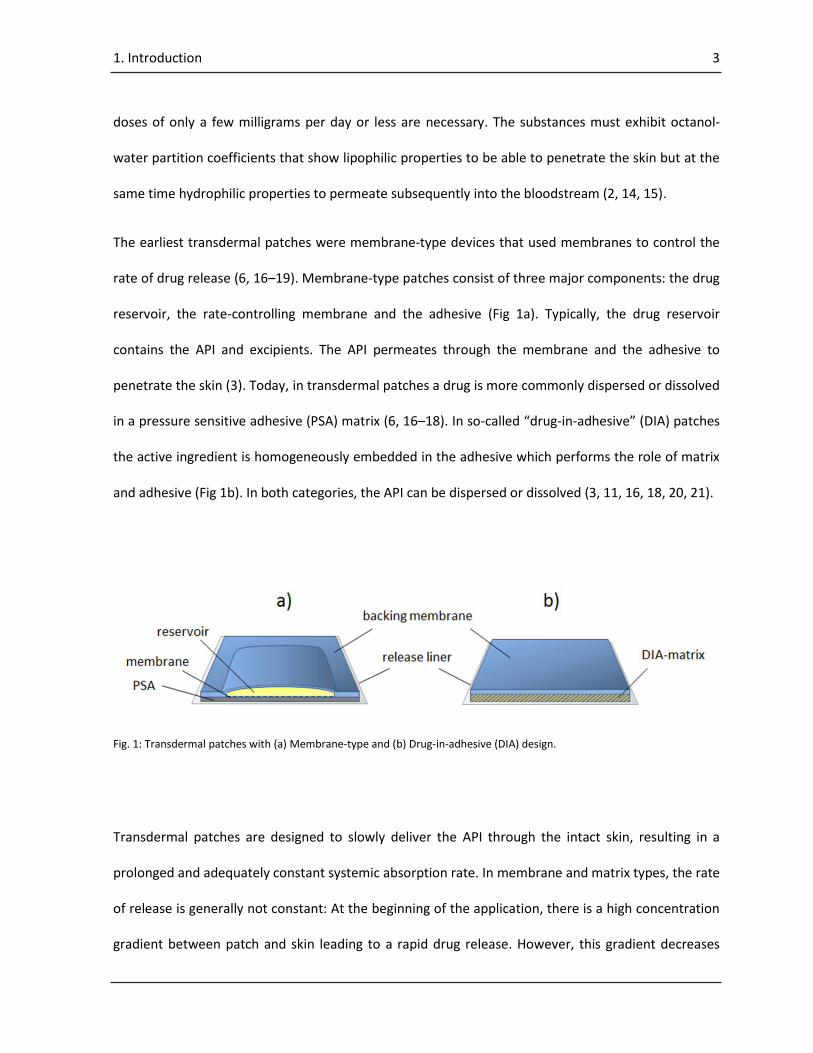
The earliest transdermal patches were membrane-type devices that used membranes to control the
rate of drug release (6, 16–19). Membrane-type patches consist of three major components: the drug
reservoir, the rate-controlling membrane and the adhesive (Fig 1a). Typically, the drug reservoir
contains the API and excipients. The API permeates through the membrane and the adhesive to
penetrate the skin (3). Today, in transdermal patches a drug is more commonly dispersed or dissolved
in a pressure sensitive adhesive (PSA) matrix (6, 16–18). In so-called “drug-in-adhesive” (DIA) patches
the active ingredient is homogeneously embedded in the adhesive which performs the role of matrix
and adhesive (Fig 1b). In both categories, the API can be dispersed or dissolved (3, 11, 16, 18, 20, 21).
Fig. 1: Transdermal patches with (a) Membrane-type and (b) Drug-in-adhesive (DIA) design.
Transdermal patches are designed to slowly deliver the API through the intact skin, resulting in a
prolonged and adequately constant systemic absorption rate. In membrane and matrix types, the rate
of release is generally not constant: At the beginning of the application, there is a high concentration
gradient between patch and skin leading to a rapid drug release. However, this gradient decreases
1. Introduction 4
with time and the drug release is reduced. Therefore, transdermal patches often have to be replaced
before the full amount of API is released. Despite the different dissolution profiles of the membrane
and the matrix system, the rate limiting step for systemic absorption of the drug substance is usually
the absorption through the skin (11, 22, 23).
Transdermal patches are composed of the API, the pressure sensitive adhesive (PSA) that assures the
adhesion of the patch to the skin, the backing membrane which protects the patch from the outer
environment and the release liner which protects the patch during storage (Fig. 1). To adjust adhesion
performance, flexibility or stability of the patch, or to increase solubility or permeability of the API,
additives such as penetration enhancers, tackifiers, plasticizers, fillers or solubilizers may be added to
the formulation (24, 25).
1.1.2. Components of a transdermal DIA patch
1.1.2.1. Pressure sensitive adhesives (PSAs)
Pressure sensitive adhesives for the application in transdermal patches must allow as much contact as
possible with the surface of the skin. To obtain this extent of contact, the material must be able to
deform under slight pressure overcoming the roughness of the skin. Adhesion involves a liquid-like
flow of the PSA resulting in wetting of the skin surface upon the bonding phase and the ability to
resist shear and debonding forces when the patch is worn for an extended period of time (26). The
interfacial adhesion and resistance to progressive debonding dominate the applicability of
transdermal patches (27).
An ideal PSA for a transdermal patch is non-sensitizing to the skin, has good initial and long-term
adhesion properties to individual skin phenotypes, is easily removable without skin damage, leaves
1. Introduction 5
no residue on the skin upon removal, is compatible with the API and the excipients, and is
comfortable to wear (3, 6, 18, 28).
In the context of these requirements, the following types of polymers represent the majority of PSAs
used since the beginning of transdermal patch development.
1.1.2.1.1. Acrylate adhesives
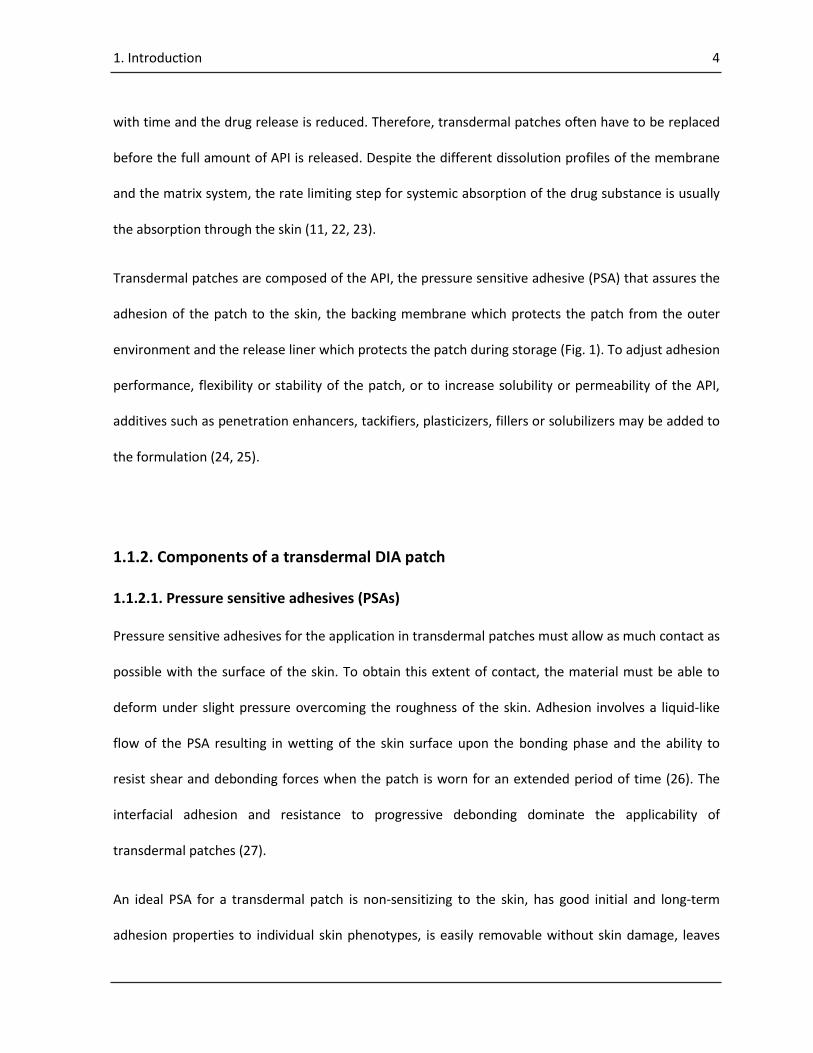
Acrylic polymers are prepared by emulsion or organic solution polymerization of alkyl esters of acrylic
acid (17, 29). Their general structure is displayed in Fig. 2. In the case of an acrylic ester, R1 represents
an H-atom in the case of a methacrylic ester, R1 represents –CH3, and R is an alkyl group usually in the
range of C4 – C8.
Fig. 2: General chemical structure of alkyl esters of acrylic acid with R1 = H for acrylic acid esters or –CH3 for methacrylic
acid esters and R = alkyl group.
Acrylic homopolymers are inherently poor adhesives, as they provide either good tack and low shear
adhesion or good shear adhesion and low tack. Thus, it is absolutely necessary to design copolymers
by mixtures of soft segments with a low homopolymer glass transition temperature Tg responsible for
bonding (primary monomer) and hard segments with a higher homopolymer Tg for resistance to
1. Introduction 6
debonding (secondary monomer). Such copolymers could be prepared either by a mixture of
different acrylic esters or by the addition of vinyl monomers (6, 18, 29–31).
Primary monomers are responsible for good tack and sufficient peel resistance. As primary
monomers, the patent literature recommends either n-butyl acrylate (BA) with a homopolymer Tg of
-43 °C (32) or 2-ethyl hexyl acrylate (EHA) with a homopolymer Tg of -58 °C (32) with about 50 % to
about 98 % by weight of the PSA (29, 33).
As already discussed, a good PSA also requires secondary monomers, also called modifying
monomers. Commonly used monomers are methyl methacrylate (MMA) and vinyl acetate (VAc)
which both provide sufficient cohesive strength usually in the range between 10 and
35 % by weight of the PSA. Their presence ensures clean removal and resistance to shear forces to
prevent cold flow or oozing and dark rings (29).
In some cases, monomers with polar functional groups have to be added to adjust the amount of
dipole-dipole interactions due to adjustment of adhesion or to change the pH of the polymer (33).
This may be necessary if the API or excipients act as plasticizers or if a special environment for pH-
sensitive drugs is needed. Also, the solubility of the API in the polymer can be adjusted by
introduction of functional groups in the PSA. For this purpose, usually carboxylic acids such as acrylic
acid or methacrylic acid are used. If acid base reactions between the API and the polymer are
expected, 2-hydroxyethyl acrylate is a preferred alternative monomer (34). Normally, it is used up to
a fraction of 5 %. However, proportions of up to 30 % have been reported to increase API
solubility (16).
The molecular weight MW of acrylic PSAs is directly proportional to the storage modulus G’ (35). A
high molecular weight is responsible for good shear adhesion and good debonding properties; a low
1. Introduction 7
molecular weight is beneficial for good bonding properties and flexibility. Therefore, the molecular
weight has to be adjusted to the intended use.
Additionally, the molecular weight between entanglements Me plays an important role with respect
to the mechanical behavior of acrylic PSAs. The storage modulus G’ is inversely proportional to Me,
whereas the mechanical strength improves if Me decreases and the number of entanglements
increases (36, 37). Entanglements can be increased either by physical or chemical crosslinking (29,
35). Physical crosslinks can be formed by microphase separation due to hydrogen, electrostatic or
ionic bonding between functional groups among themselves or between functional groups and
additives. Chemical crosslinking can be achieved by chain transfer or by internal crosslinking of
functional groups of monomers such as 2,3-epoxypropyl methacrylate and 2-hydroxyethyl acrylate.
An alternative approach is external crosslinking, where organometallics are used to crosslink these
groups.
Compounding of acrylic PSAs with tackifiers is not as common because acrylic PSAs can be
manufactured with tailored adhesion properties (29).
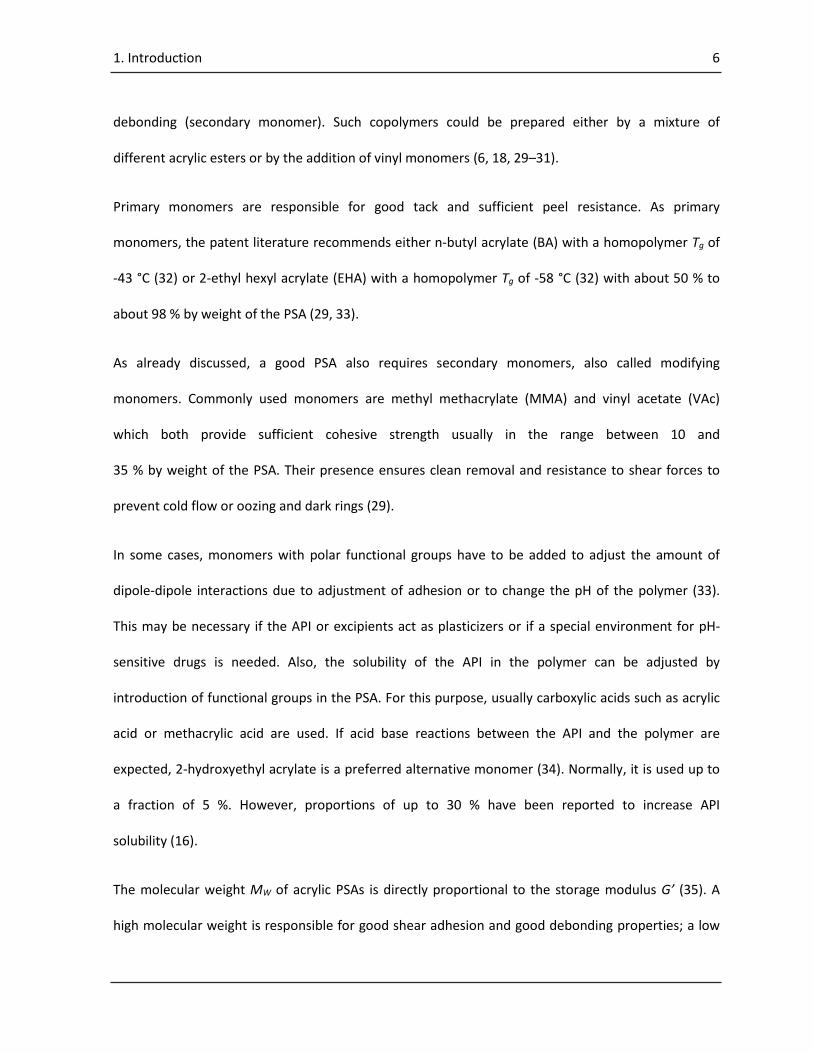
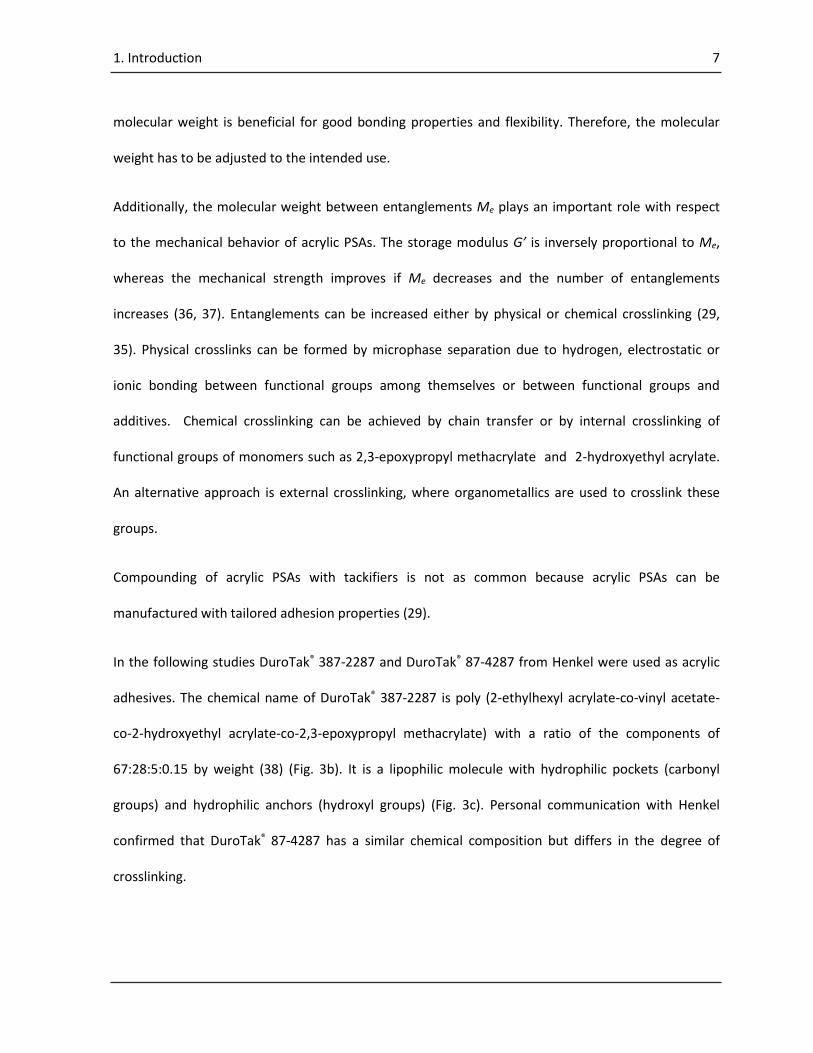
In the following studies DuroTak® 387-2287 and DuroTak® 87-4287 from Henkel were used as acrylic
adhesives. The chemical name of DuroTak® 387-2287 is poly (2-ethylhexyl acrylate-co-vinyl acetate-
co-2-hydroxyethyl acrylate-co-2,3-epoxypropyl methacrylate) with a ratio of the components of
67:28:5:0.15 by weight (38) (Fig. 3b). It is a lipophilic molecule with hydrophilic pockets (carbonyl
groups) and hydrophilic anchors (hydroxyl groups) (Fig. 3c). Personal communication with Henkel
confirmed that DuroTak® 87-4287 has a similar chemical composition but differs in the degree of
crosslinking.
1. Introduction 8
Fig. 3: (a) Monomers of DuroTak® 387-2287, (b) Ratio of monomers, (c) 3D-structure of DuroTak® 387-2287
(n = 20 monomers), generated with ACD/ChemSketch 12.01 software. Grey spheres represent carbon, red spheres
oxygen and white spheres hydrogen atoms.

1. Introduction 9
1.1.2.1.2. Silicone adhesives
Silicone adhesives are composed of linear silicone polymers and siloxane resins (6, 18, 39, 40).
Linear silicone polymers are high molecular weight poly dimethyl siloxane (PDMS) polymers with the
general structure of MOHDnMOH as illustrated in Fig. 4a, b. Siloxane resins are composed of M units and
Q units (Fig. 4b, c). It is believed that MQ siloxane resins build a highly branched three dimensional
network where a core of Q-units is surrounded by a shell of M-units (39) (Fig. 4c, d).
Fig. 4: (a) Chemical structure of linear silicone with MOH- and D-Units, (b) Table of silicone units, (c) Scheme of MQ siloxane
resin with core of Q-units and shell of M-units, (d) Computer model of a MQ siloxane resin, modified from: (39).
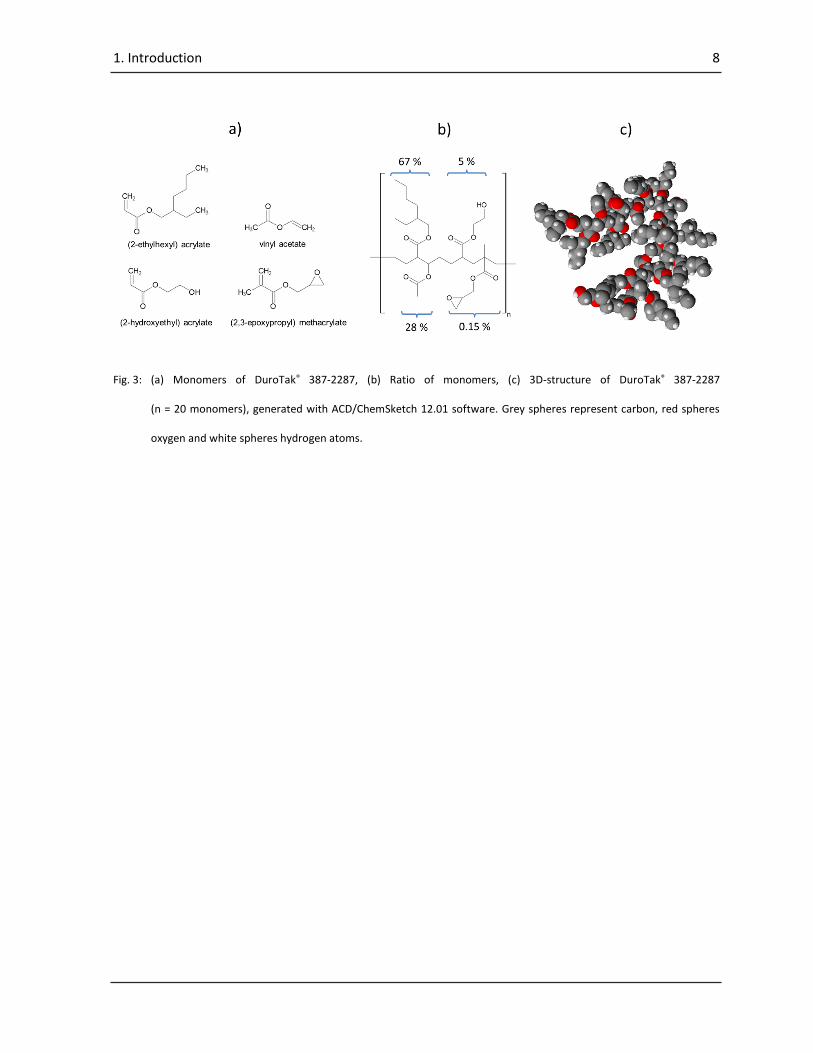
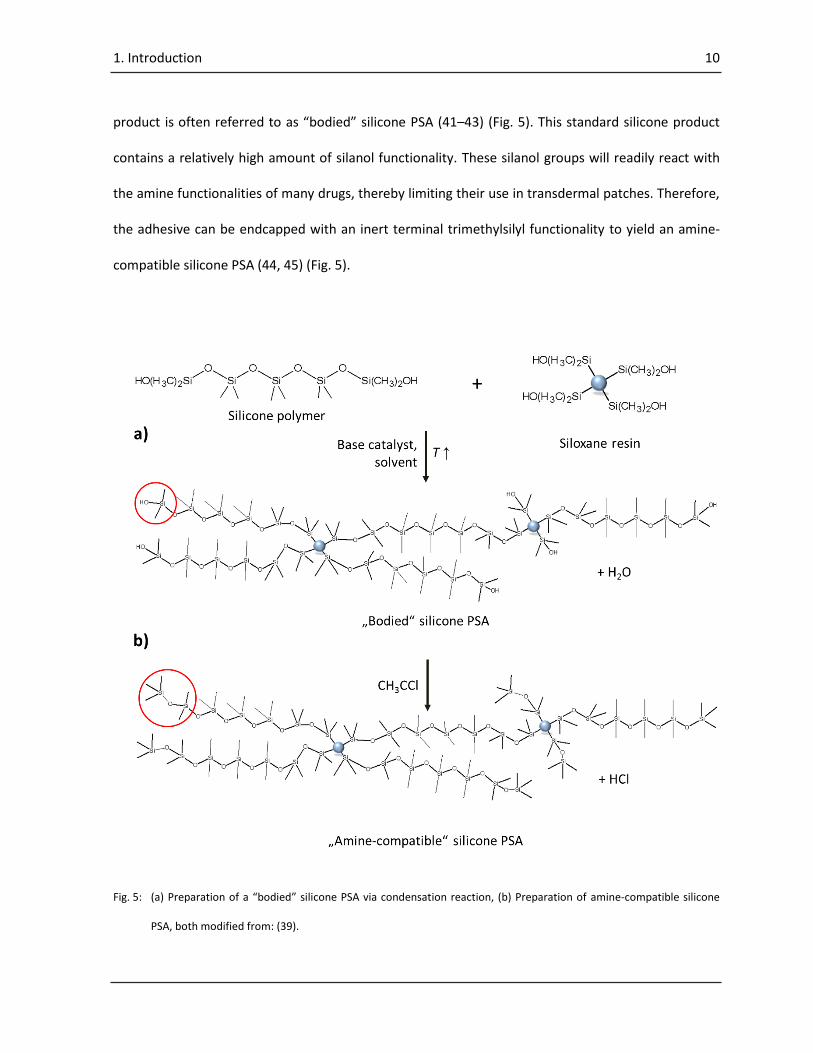
To achieve improved cohesive strength of the PSA, both components (i.e. PDMS and MQ siloxane
resin) are crosslinked by a condensation reaction through the silanol functionalities. The reaction
1. Introduction 10
product is often referred to as “bodied” silicone PSA (41–43) (Fig. 5). This standard silicone product
contains a relatively high amount of silanol functionality. These silanol groups will readily react with
the amine functionalities of many drugs, thereby limiting their use in transdermal patches. Therefore,
the adhesive can be endcapped with an inert terminal trimethylsilyl functionality to yield an amine-
compatible silicone PSA (44, 45) (Fig. 5).
Fig. 5: (a) Preparation of a “bodied” silicone PSA via condensation reaction, (b) Preparation of amine-compatible silicone
PSA, both modified from: (39).

1. Introduction 11
Silicone PSAs show medium adhesive properties, which so far limits their application to short time
wearing periods. The solubility and permeability for lipophilic APIs in silicone PSAs is very good, but is
limited with hydrophilic APIs due to the lack of hydrophilic functionalities. Silicone adhesives have a
good air and water permeability, which is an advantage, as no skin maceration takes place. However,
their biggest drawbacks are currently the missing functionalization option and their high price (40,
46–50).
1. Introduction 12
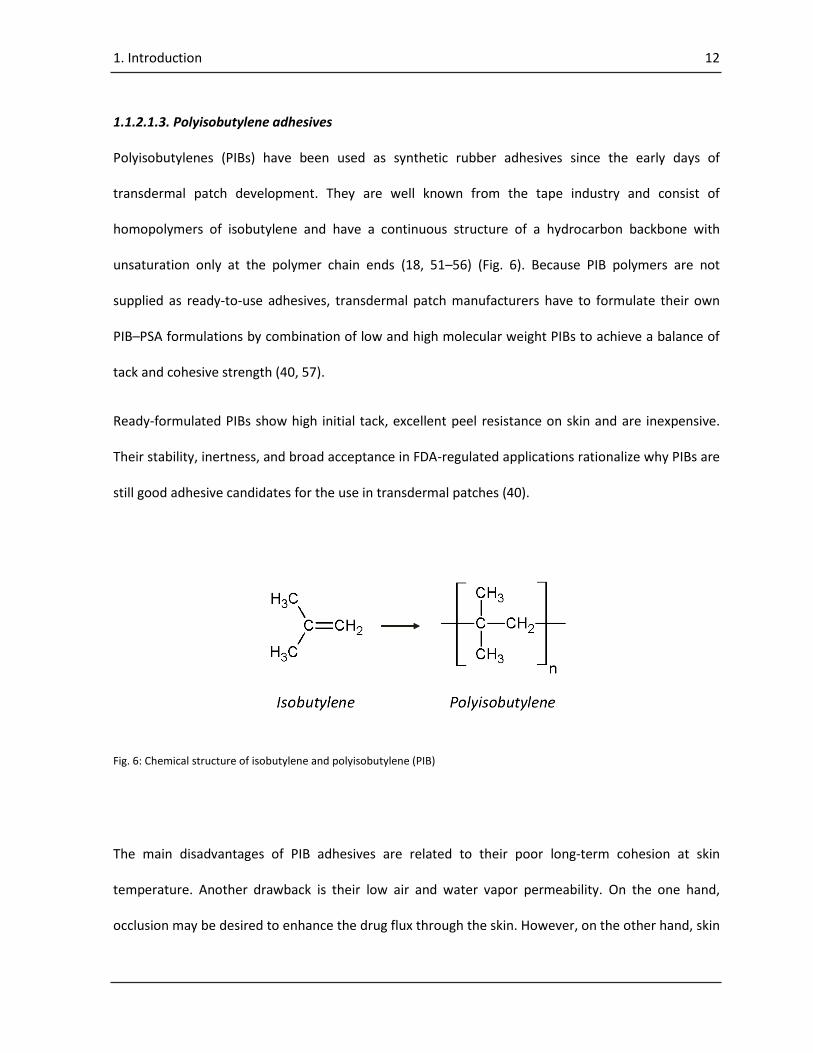
1.1.2.1.3. Polyisobutylene adhesives
Polyisobutylenes (PIBs) have been used as synthetic rubber adhesives since the early days of
transdermal patch development. They are well known from the tape industry and consist of
homopolymers of isobutylene and have a continuous structure of a hydrocarbon backbone with
unsaturation only at the polymer chain ends (18, 51–56) (Fig. 6). Because PIB polymers are not
supplied as ready-to-use adhesives, transdermal patch manufacturers have to formulate their own
PIB–PSA formulations by combination of low and high molecular weight PIBs to achieve a balance of
tack and cohesive strength (40, 57).
Ready-formulated PIBs show high initial tack, excellent peel resistance on skin and are inexpensive.
Their stability, inertness, and broad acceptance in FDA-regulated applications rationalize why PIBs are
still good adhesive candidates for the use in transdermal patches (40).
Fig. 6: Chemical structure of isobutylene and polyisobutylene (PIB)
The main disadvantages of PIB adhesives are related to their poor long-term cohesion at skin
temperature. Another drawback is their low air and water vapor permeability. On the one hand,
occlusion may be desired to enhance the drug flux through the skin. However, on the other hand, skin
1. Introduction 13
maceration and irritation may occur, especially if the patch remains in the same position for a
prolonged period of time.
1.1.2.2. Backing membranes and release liners
The backing membrane protects the matrix from the outer environment and is selected with regards
to appearance, flexibility and need for occlusion (58). The material used for the backing membrane
should be inert and incapable of absorbing drugs or other components of the formulation. Examples
of polymers useful for the backing are polyesters, polyethylene, polypropylene and polyurethane (59–
64). The thickness of the backing membrane is preferably in the range between 15 µm and 250 µm
and may be pigmented or aluminum vapor coated. Metal layers often lead to stiffness and high
occlusiveness with retention of moisture vapor and air, which cause the transdermal patch to peel-off
and possibly irritate the skin during long-term wear (3, 65). The backings are tan or translucent and
have in most cases a matte finish which may be printable (66). Corona treatment is avoided in
backing membranes for pharmaceutical applications because of the possible reactive byproducts
which may be formed during treatment (66).
During storage the patch is covered by a protective liner that is removed and discarded before
application of the patch to the skin. As the release liner is in intimate contact with the transdermal
patch, the liner should be chemically inert and impermeable to the drug. Release liners are typically
made of polyesters or polypropylene treated with silicone or fluorocarbons (65, 67–69). The thickness
of the liner has to be accurate to allow die cutting and is usually in the range between 50 and 150 µm
(66).
1. Introduction 14
1.1.2.3. Active pharmaceutical ingredients
Generally, a transdermal patch contains a sufficient amount of API to achieve therapeutic blood levels
for up to 7 days. To provide a high API flux through the skin, the API should be dissolved close to its
solubility limit in the matrix, but not significantly exceed this critical limit. With supersaturated
systems there is a high risk of recrystallization of the API during storage (70). Several attempts have
been undertaken to determine the solubility of an API in a PSA or in a polymer in general, but so far
none of them could provide an accurate forecast of solubility making it difficult to determine the
stability of transdermal patches over the minimum time scale of two years (71, 72).
1.1.2.4. Additives
Penetration enhancers can increase skin permeability, but their potential of irritation and toxicity to
living cells in the deeper skin layers has constrained their application (2). Today’s patches contain
propylene glycol, ethyl oleate, lauric acid, oleic acid, N-methyl-pyrrolidone, Azone®, isopropyl
myristate, or ethanol as penetration enhancer (73–79). Williams and Barry described the modes of
action of penetration enhancers and proposed three main mechanisms (80): (1) disruption of the
highly ordered structure of stratum corneum lipids, fluidization of the lipid layers and increase in the
diffusion coefficient of the drug within the stratum corneum; (2) interaction with intracellular protein
and provision of short polar transport pathways for the drug; and (3) improvement in partitioning of
the drug, coenhancer, or cosolvent into the stratum corneum.
Pressure sensitive adhesives such as acrylics are designed to inherently have good tack properties and
should be tailored for their end use without need for further modification. Silicone and
polyisobutylene adhesives may be tackified with their own low molecular weight fractions (40, 57,
1. Introduction 15
81). For styrene-butadiene adhesives, rosin ester resins, hydrocarbon resins and polyterpenes were
found to efficiently increase the tack (40, 82–85). Generally, the addition of tackifiers should be
avoided, as they may cause stability problems by syneresis or migration into the packaging material.
Also, their potential for skin irritation and possible interactions with the API may constrain their use in
transdermal patch development.
Plasticizers improve flexibility and removability from skin by reduction of polymer-polymer chain
secondary bonds thus increasing the polymer free volume (86, 87). Small molecules such as paraffin
oil (88–90), triacetin (91, 92), oleic acid (93), or triethyl citrate (TEC) (94) may be added to the PSA.
The main reason for application of fillers in transdermal patches is an increase of cohesiveness.
Preferably substances such as fumed silica, silica gels or microcrystalline wax are used due to their
transparent appearance in the matrix (25, 40, 95). Nevertheless, traditional fillers such as clay and
microcrystalline cellulose are still found in some systems (40).
To achieve higher concentrations of the API in the matrix an association colloid can be added. The
incorporation of a substance into or onto the micelles of an association colloid is called micellar
solubilization or briefly solubilization (96, 97). Known solubilizers in transdermal patches are Tween
80® (98), Span80® (98), oleic acid dimer (65), neodecanonic acid (65), Kollidon 25® (99), Labrasol® (100)
or a mixture of PVP and DMSO (101).
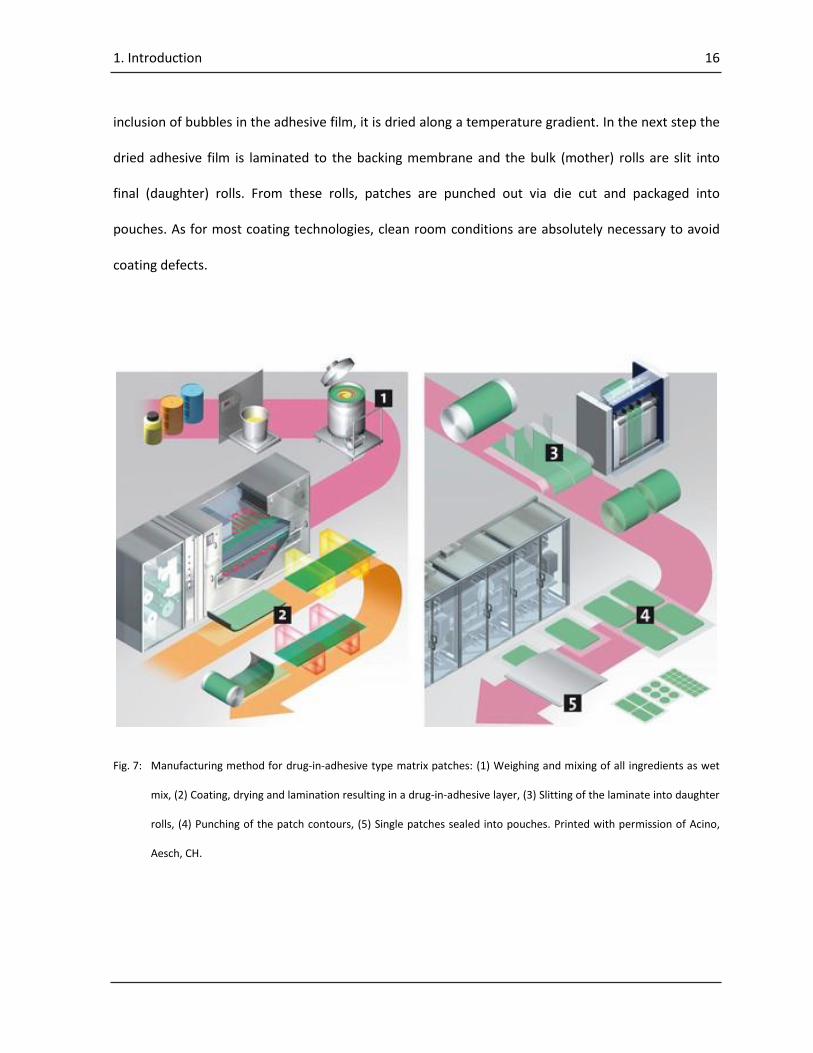
1.1.3. Manufacturing of DIA patches
Generally, the production of a DIA patch is carried out by coating, drying, laminating, cutting and
packaging (20, 102, 103) (Fig. 7, 1-5). First, the process starts with mixing of the adhesive, the
additives and the API. The so-called wet mix is applied to the release liner. To avoid skin building and
1. Introduction 16
inclusion of bubbles in the adhesive film, it is dried along a temperature gradient. In the next step the
dried adhesive film is laminated to the backing membrane and the bulk (mother) rolls are slit into
final (daughter) rolls. From these rolls, patches are punched out via die cut and packaged into
pouches. As for most coating technologies, clean room conditions are absolutely necessary to avoid
coating defects.
Fig. 7: Manufacturing method for drug-in-adhesive type matrix patches: (1) Weighing and mixing of all ingredients as wet
mix, (2) Coating, drying and lamination resulting in a drug-in-adhesive layer, (3) Slitting of the laminate into daughter
rolls, (4) Punching of the patch contours, (5) Single patches sealed into pouches. Printed with permission of Acino,
Aesch, CH.
1. Introduction 17
1.2. Adhesion in transdermal drug delivery
The therapeutic performance of a transdermal patch can be affected by the quality of the contact
between patch and skin. Lack of adhesion and dark rings around the patch caused by cold flow of the
adhesive alter the contact surface and result in improper dosing (3, 18, 104, 105). Therefore, good
adhesion is required for transdermal patches. However, it is desired that the patch is removable
without leaving residuals and with moderate force to prevent skin damage (18, 28).
Adhesion is a complex process. Given the variety of all factors, no single model or theory may meet
the requirements of a universal description of the underlying mechanism. The thermodynamic model
of adhesion which is believed to explain most of the reported effects is based on the assumption that
the adhesive adheres to the substrate because of interatomic and intermolecular forces established
at the interface. The most common interfacial forces result from van der Waals and Lewis acid–base
interactions. Generally, for formation of a bond, close contact is achieved by spreading of the
adhesive on the substrate. Therefore, the criteria for good adhesion essentially correspond to those
for good wetting (26, 106). To ensure good wetting, the ideal adhesive should possess a slightly lower
surface energy than that of the substrate and should be able to deform under low pressure.
However, the wetting ability is a necessary but not sufficient condition. According to this condition
water would be a good adhesive. In addition, a PSA needs to be able to build a network structure that
is able to resist debonding forces by high cohesion and energy dissipation (3, 37, 105, 106).
As indicated earlier, PSAs originate from a film-forming elastomer which has an ability to quickly wet
the substrate and overcome the surface roughness to provide instant bonding at low pressure as a
result of its flow characteristics. In addition, PSAs possess sufficient cohesiveness and elasticity, to
resist debonding and to be removed from surfaces without leaving residues. Essentially, PSAs require
1. Introduction 18
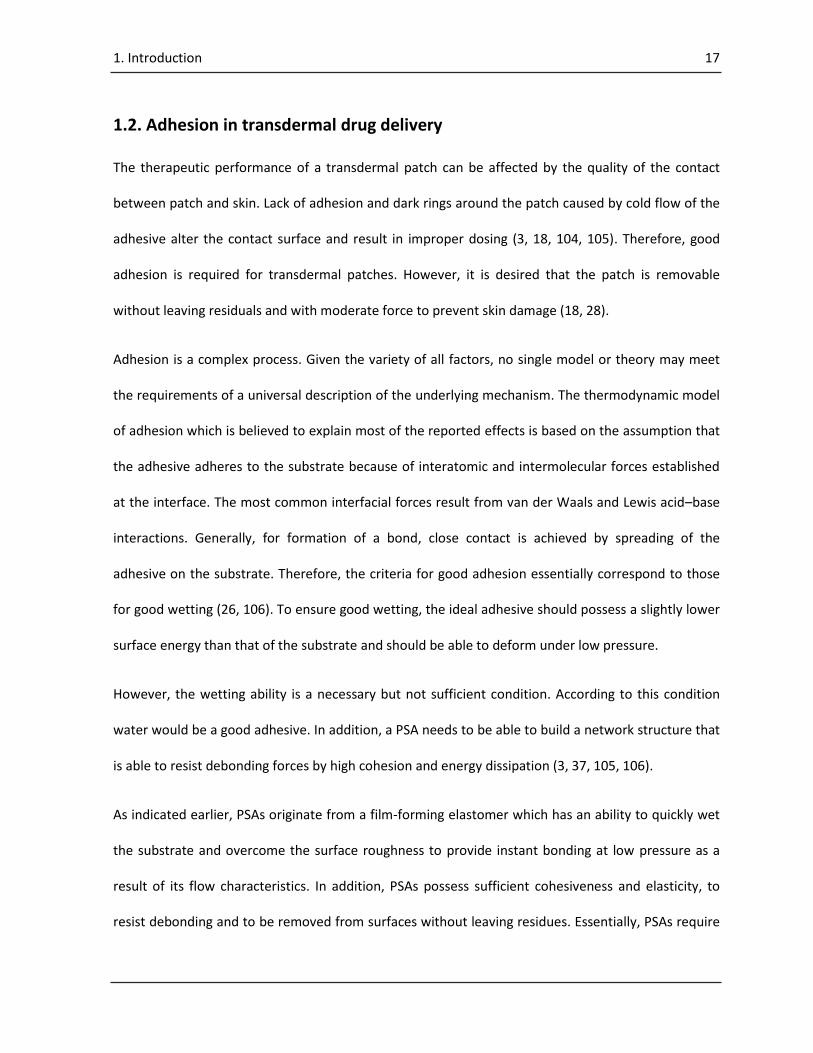
a balance between their viscous and elastic properties. It should be noted that PSAs have to satisfy
these contradictory requirements under different strain rate conditions. Which means that at low
strain rates they must flow (bonding) and at high strain rates (i.e. peeling) they have to respond
elastically (debonding) (6, 37) (Fig. 8).
Fig. 8: Adhesion performance considering tack, peel resistance, shear adhesion and their relation to liquid- and solid-like
behavior of bonding and debonding of a PSA.
1.2.1. Measurement of adhesion performance
The adhesive properties of a transdermal patch can only be fully and correctly characterized by
measurement of the essential adhesion performance such as tack, peel resistance and shear
adhesion. Generally, the first two properties, i.e. tack and peel resistance, are directly related to each
other while both are inversely related to shear adhesion (6, 28, 37, 104).
1.2.1.1. Tack
Tack is the ability to form a bond of measurable strength by short contact with a surface. It is not a
fundamental material property with mathematically exact correlations to other factors, however it is
1. Introduction 19
strongly influenced by the viscoelastic and interfacial properties of the materials and by the type of
measurement (82, 107–109).
The majority of methods for tack measurement of transdermal patches such as rolling ball, loop and
probe tack are adapted from the tape industry (110). All measurements try to imitate the regular
“thumb tack test” and include a bonding and a debonding step. During the bonding step, contact is
made with the surface of the adhesive, and the contact area increases by wetting out and elastic
deformation. For typical tack tests, the bonding time is between a few milliseconds and a few seconds
(26, 111). During the debonding step the adhesive has to resist debonding forces by elastic
deformation and energy dissipation (37).
The different tests mainly vary in the time frame of the bonding as well of the debonding step (83).
The quickest and most simple test is the rolling ball tack test (112, 113) (Fig. 9a). However, it has a
poor reproducibility and is therefore mostly used for in-process control during production. The loop
tack test (Fig. 9b) is predominately used to test different types of substrates and the influence of the
backing membrane on the test result. The probe tack test (Fig. 9c) has the advantage of applying a
uniform stress and strain rate to the adhesive allowing the complete bonding and debonding process
to be investigated (36, 114).
1.2.1.2. Peel resistance
Peel resistance is the force required to remove a pressure sensitive tape from a test surface at a
controlled angle and at a specified peel rate (110). Two standard setups are used for peel resistance
tests: peel resistance at 180˚ angle and at 90° angle. With both methods a sample is applied to the
surface with controlled pressure. Then the tape is peeled off at the respective angle and a specified
1. Introduction 20
peel rate and the peel force is measured throughout the test (26, 84, 115–120) (Fig. 9d). Peel
resistance correlates with tack and is strongly influenced by the type of backing membrane and the
mechanical behavior of the surface.
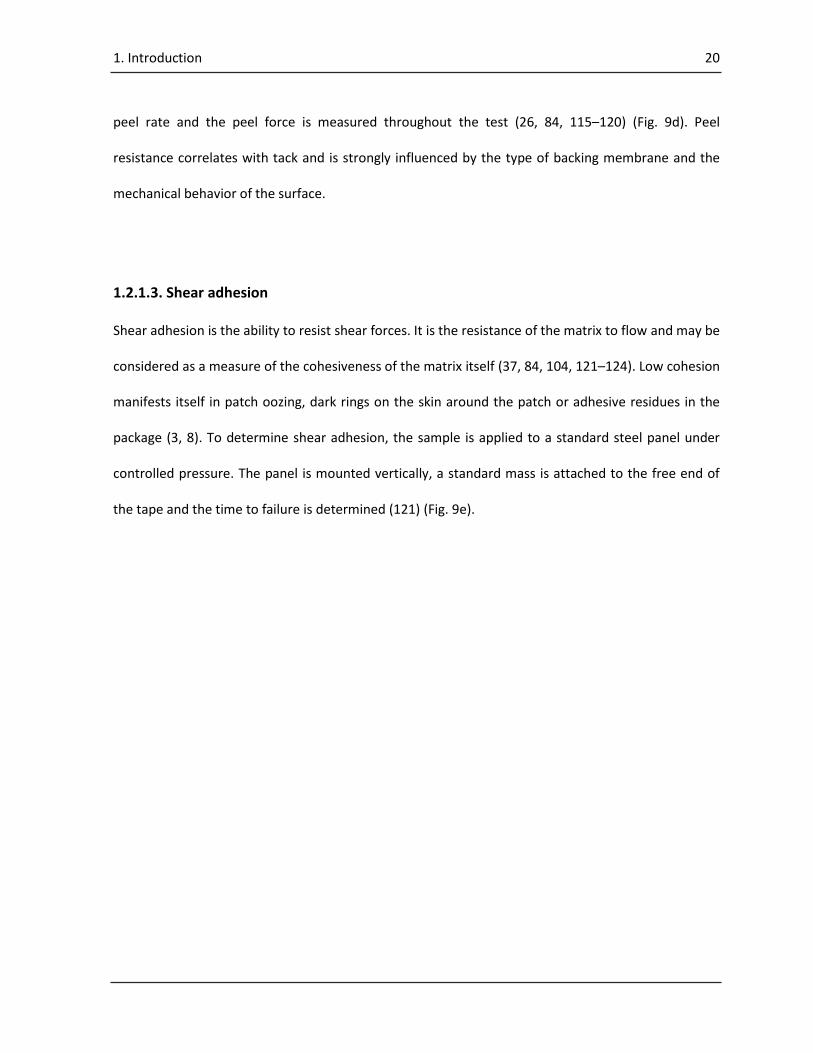
1.2.1.3. Shear adhesion
Shear adhesion is the ability to resist shear forces. It is the resistance of the matrix to flow and may be
considered as a measure of the cohesiveness of the matrix itself (37, 84, 104, 121–124). Low cohesion
manifests itself in patch oozing, dark rings on the skin around the patch or adhesive residues in the
package (3, 8). To determine shear adhesion, the sample is applied to a standard steel panel under
controlled pressure. The panel is mounted vertically, a standard mass is attached to the free end of
the tape and the time to failure is determined (121) (Fig. 9e).
1. Introduction 21
Fig. 9: Adhesion performance tests with (a) Rolling ball tack, (b) Loop tack, (c) Probe tack, (d) Peel resistance at 90° and
180°, (e) Shear adhesion. Printed with permission of Chemsultants International, Mentor/OH, USA.
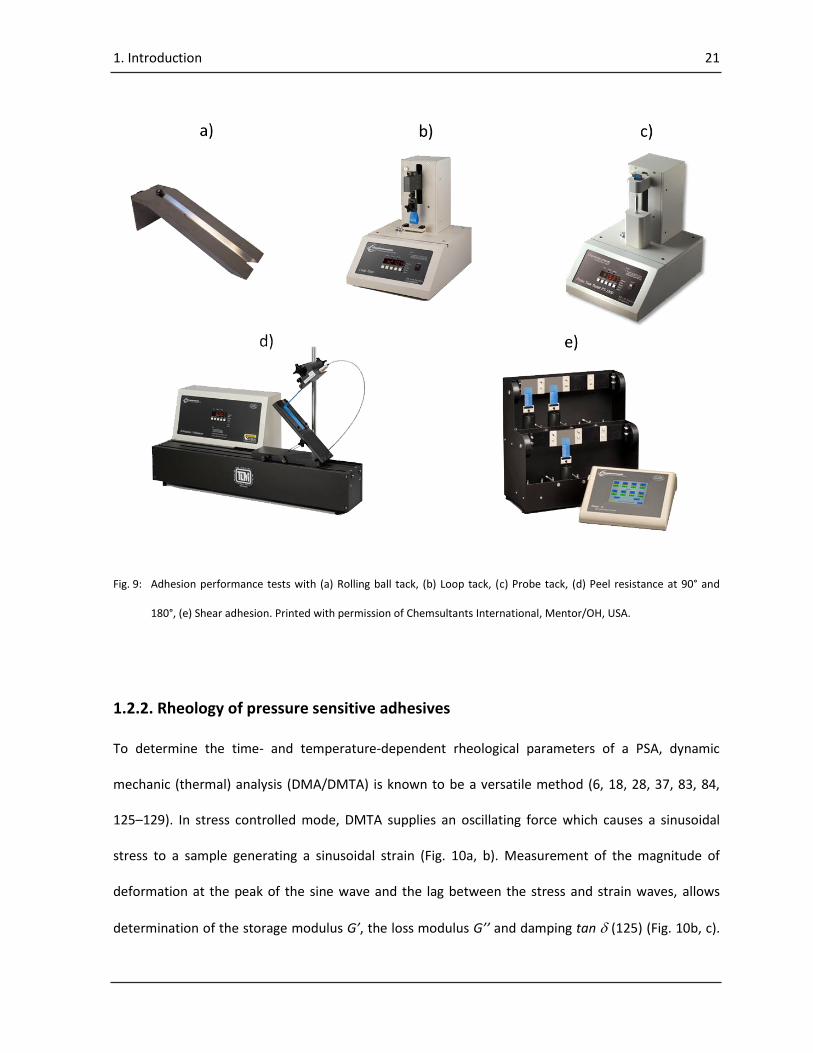
1.2.2. Rheology of pressure sensitive adhesives
To determine the time- and temperature-dependent rheological parameters of a PSA, dynamic
mechanic (thermal) analysis (DMA/DMTA) is known to be a versatile method (6, 18, 28, 37, 83, 84,
125–129). In stress controlled mode, DMTA supplies an oscillating force which causes a sinusoidal
stress to a sample generating a sinusoidal strain (Fig. 10a, b). Measurement of the magnitude of
deformation at the peak of the sine wave and the lag between the stress and strain waves, allows
determination of the storage modulus G’, the loss modulus G’’ and damping tan (125) (Fig. 10b, c).
1. Introduction 22
DMTA can also be performed in strain controlled mode, where an oscillating deformation is applied,
generating a sinusoidal stress.
Fig. 10: (a) Oscillatory deformation, (b) Sine waves of stress and strain , and their phase angle , (c) Vectorial illustration
of the complex modulus G*, the storage G’ and the loss modulus G’’.
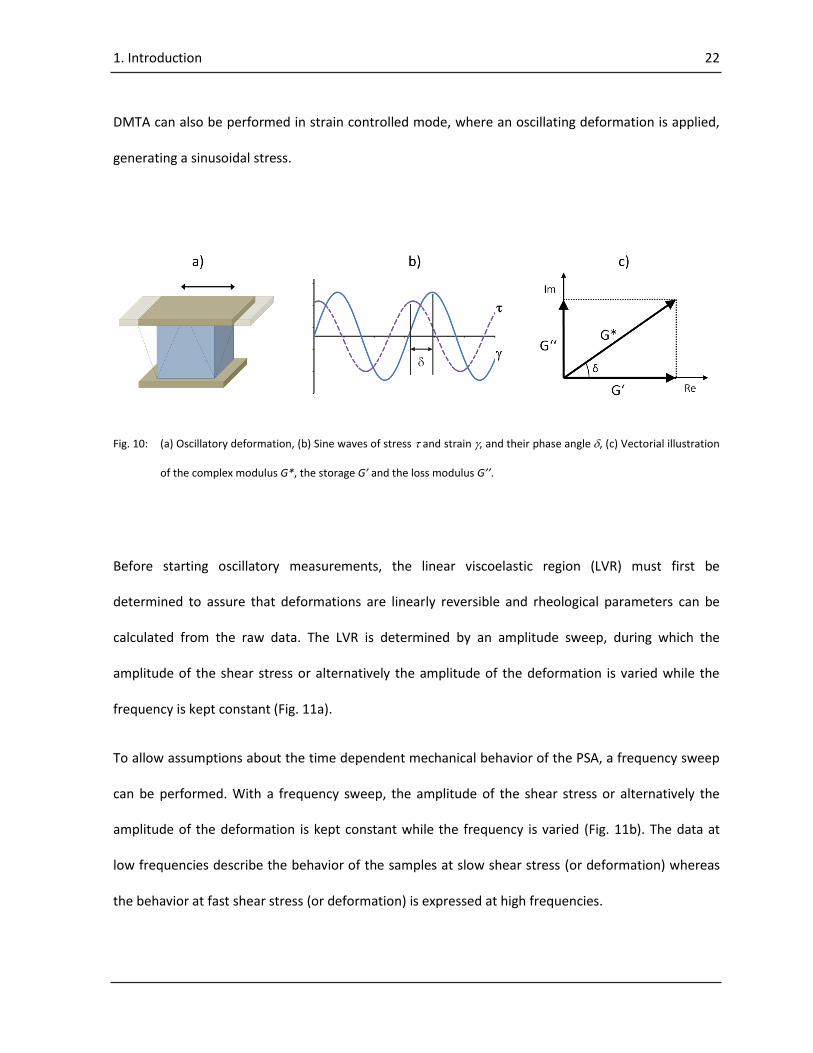
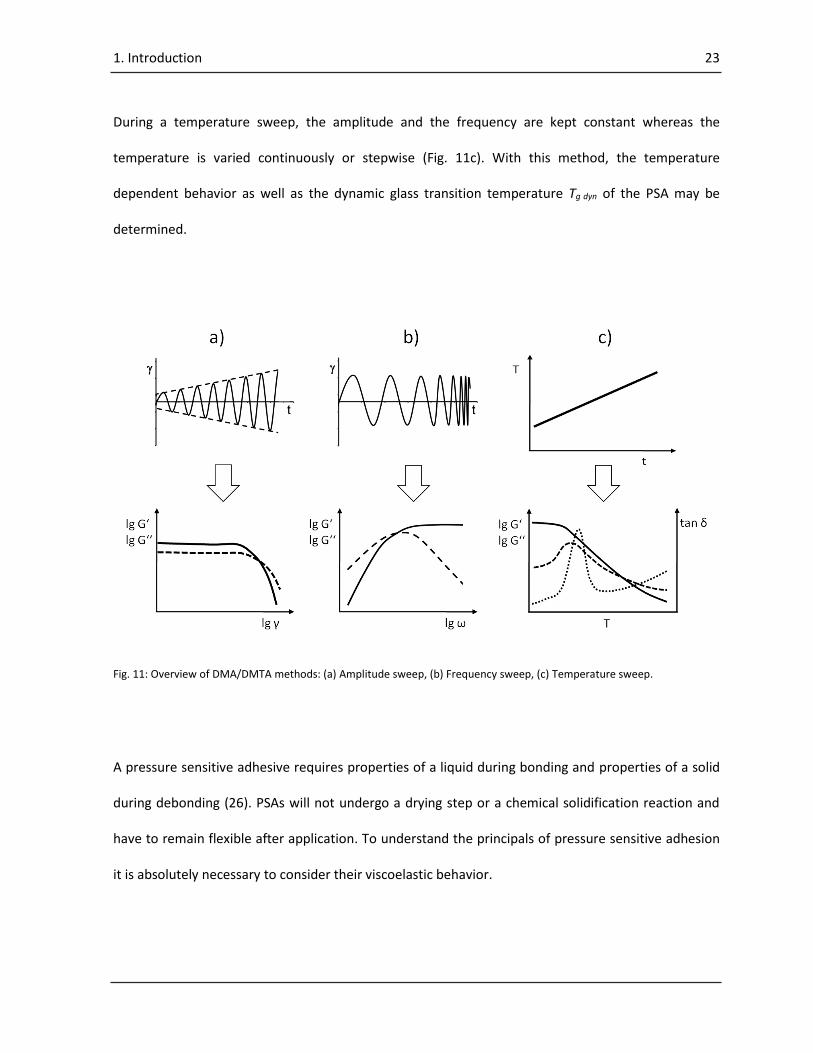
Before starting oscillatory measurements, the linear viscoelastic region (LVR) must first be
determined to assure that deformations are linearly reversible and rheological parameters can be
calculated from the raw data. The LVR is determined by an amplitude sweep, during which the
amplitude of the shear stress or alternatively the amplitude of the deformation is varied while the
frequency is kept constant (Fig. 11a).
To allow assumptions about the time dependent mechanical behavior of the PSA, a frequency sweep
can be performed. With a frequency sweep, the amplitude of the shear stress or alternatively the
amplitude of the deformation is kept constant while the frequency is varied (Fig. 11b). The data at
low frequencies describe the behavior of the samples at slow shear stress (or deformation) whereas
the behavior at fast shear stress (or deformation) is expressed at high frequencies.
1. Introduction 23
During a temperature sweep, the amplitude and the frequency are kept constant whereas the
temperature is varied continuously or stepwise (Fig. 11c). With this method, the temperature
dependent behavior as well as the dynamic glass transition temperature Tg dyn of the PSA may be
determined.
Fig. 11: Overview of DMA/DMTA methods: (a) Amplitude sweep, (b) Frequency sweep, (c) Temperature sweep.
A pressure sensitive adhesive requires properties of a liquid during bonding and properties of a solid
during debonding (26). PSAs will not undergo a drying step or a chemical solidification reaction and
have to remain flexible after application. To understand the principals of pressure sensitive adhesion
it is absolutely necessary to consider their viscoelastic behavior.
1. Introduction 24
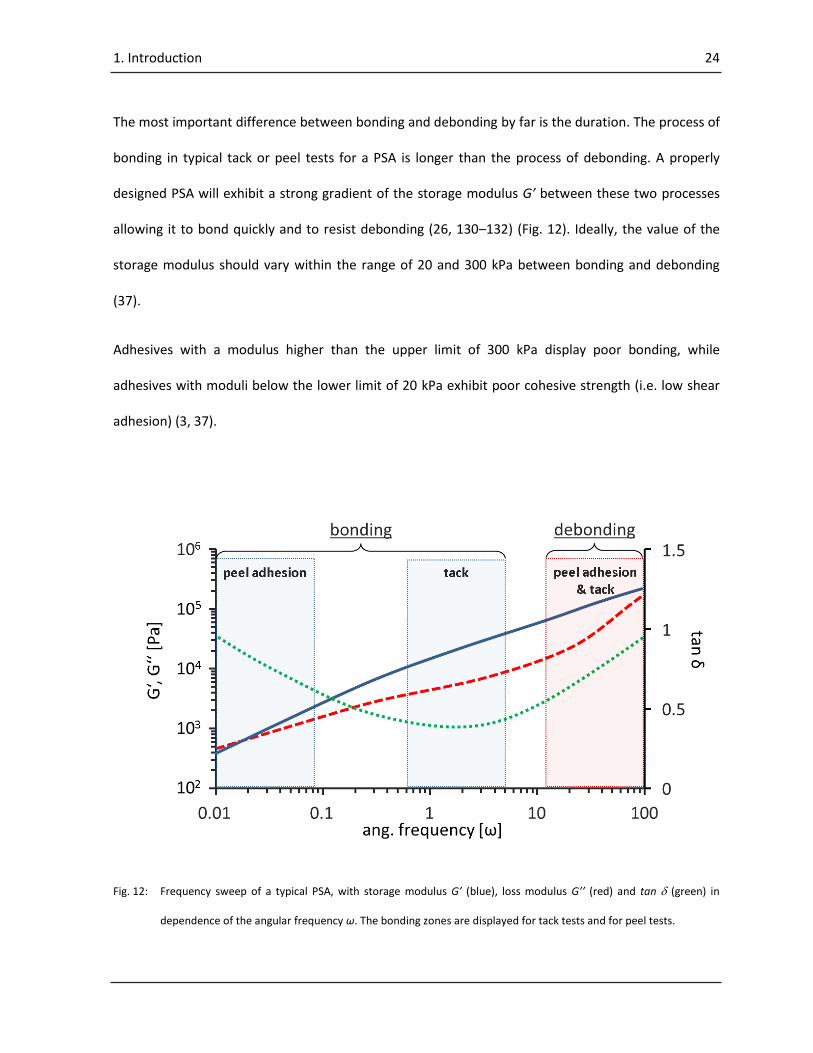
The most important difference between bonding and debonding by far is the duration. The process of
bonding in typical tack or peel tests for a PSA is longer than the process of debonding. A properly
designed PSA will exhibit a strong gradient of the storage modulus G’ between these two processes
allowing it to bond quickly and to resist debonding (26, 130–132) (Fig. 12). Ideally, the value of the
storage modulus should vary within the range of 20 and 300 kPa between bonding and debonding
(37).
Adhesives with a modulus higher than the upper limit of 300 kPa display poor bonding, while
adhesives with moduli below the lower limit of 20 kPa exhibit poor cohesive strength (i.e. low shear
adhesion) (3, 37).
Fig. 12: Frequency sweep of a typical PSA, with storage modulus G’ (blue), loss modulus G’’ (red) and tan (green) in
dependence of the angular frequency ω. The bonding zones are displayed for tack tests and for peel tests.
1. Introduction 25
In addition to the required behavior of the storage modulus, high energy dissipation at debonding
promotes good adhesion. Dissipation can be expressed by the loss modulus G’’. It is proposed that
the loss modulus peak temperature of PSAs for transdermal patches should be between -20 °C and -
30 °C, i.e. 50 °C below the operating temperature (37). Furthermore, G’’ should already be located in
the so-called transition zone to dissipate the energy caused by deformation (Fig. 12) (105). The
transition zone represents the onset of the glass transition. If the strain rate exceeds the movability of
the polymer chains, they are no longer able to follow the applied strain and become brittle. It
therefore can be stated that a typical pressure sensitive adhesive is in a rubbery-liquid like state at
bonding and in a rubbery-glassy like state at debonding.
There have also been attempts to determine the adhesion properties using the damping factor tan
(37, 83). As the tan peak correlates with the glass transition temperature Tg, it obviously should be
located at sufficiently low temperatures to allow the PSA to wet the substrate during bonding (132).
Also, shear adhesion and peel resistance properties may be correlated with tan at low frequencies
(37, 129). Although, it has been found that a change of tan may lead to a change of adhesion
behavior, the adhesion behavior can be modified without recognizing a change of tan (37).
Unfortunately, the damping factor tan which is equivalent to the ratio between G’’ and G’ does not
cover all necessary factors for determination of the adhesion performance. However, it can be helpful
in conjunction with the other rheological parameters to determine small changes in adhesion
performance, especially in the low shear region (129).
Finally, it has to be mentioned that in common tack, peel and shear adhesion tests, strains of up to
1000 % may occur (26). In addition, strain rates usually are non-constant during testing (37).
Therefore, correlations of rheological and adhesion data sometimes are not easy to interpret.
1. Introduction 26
1.2.3. Factors influencing adhesion
It can be assumed that the measured adhesive performance of a PSA may be expressed as a function
of two main factors, namely interfacial molecular interactions and viscoelastic properties of the
adhesive (26, 84). Factors influencing one of these main factors will consequently have an impact on
the adhesion behavior. Apparently, adhesion is a good example for a multivariate and non-linear
phenomenon. Factors can have similar or contrary effects on both main factors with varying impact.
For example, elevated temperatures may soften the adhesive and therefore increase the bonding
behavior, but at the same time decreases the cohesiveness and has a negative effect on the
resistance to debonding (84, 124, 133). Prolonged time for bonding (dwell time) as well as high
pressure may increase the adhesion up to a certain level due to more pronounced wetting whereas
an excessive increase of both parameters will not necessarily further amplify the effect (3, 84, 85,
107, 109, 134). Also, an increase of surface roughness increases adhesion, initially up to a maximum
and then decreases due to a reduced contact area (135–137).
Surface related factors such as surface energy are dependent on the surface chemistry of the
polymer and the substrate. Surface energy cannot be considered as being an intrinsic property of a
polymer as it can drastically change depending on the nature of the medium in contact and the
polarity and mobility of the polymer chains. This phenomenon results from an orientation and
organization of the macromolecules to minimize the interfacial energy between the polymer and the
orienting substrate. These oriented structures exhibit a glassy-like behavior with increased moduli
(e.g. G’, E’) and thus, an increased mechanical strength (138–145). Interestingly, this phenomenon
has not been studied well with PSAs. However, tack, peel resistance and shear adhesion may directly
be correlated to G’ and E’ (6, 18, 26, 37, 84, 134, 146) and therefore, it is assumed that they are
1. Introduction 27
affected by the mechanical strengthening. For example, higher values of shear adhesion were
observed on stainless steel panels than on high density polyethylene (HDPE) panels (147).
As already mentioned, the temperature range in which the polymer changes from a rubber-like state
into a glassy state, known as the glass transition temperature Tg, has a particular relevance in the
characterization of PSAs (17, 33, 37, 84, 125, 134). Differences in the Tg can be directly related to the
steric size of the side chains and the mobility of the polymer (37, 148–150). Because the Tg is not a
thermodynamic phase transition but a dynamic phenomenon, it cannot be determined as an absolute
value and depends on the mechanical history and the method of determination. Two major
measuring principles are exploited in the determination of the Tg of a PSA. The first is based on a
change of heat capacity at the Tg and can be determined by differential scanning calorimetry (DSC).
The second principle directly measures a change in deformation behavior and can be determined by
DMTA. A close and predictable relationship exists between the Tg measured by DSC and the dynamic
Tg dyn measured by DMTA (35, 37, 151). With regard to the tack of PSAs, a Tg in the range between 40
°C and 75 °C below the operating temperature was found to be optimal (33, 84, 134). Thus, factors
influencing the Tg affect the adhesion behavior.
A plasticizer in the sense of external plasticization is defined as a low molecular weight compound
that is added to polymers to reduce the Tg, improve polymer flexibility, decrease tensile strength,
stiffness, and toughness, and to increase elongation and ductility (35, 89, 152–156). It is known that
the addition of a plasticizer reduces the entanglements of a polymer and decreases the storage
modulus G’ (26, 87, 89). The efficiency of a plasticizer depends on its molecular size and its ability to
interact with the polymer (157). For plasticization of PSAs, small molecular weight compounds as
mentioned in chapter 1.1.2.4 are used. However, in most cases the addition of plasticizers to
polymers in pharmaceutical applications is unintentional and may even occur with the incorporated
1. Introduction 28
APIs as observed for ketoprofen and guaifenisin in polyethylene oxide (152), nitroglycerin and
nicotine in PSAs (21), lidocaine and diphenhydramine in Eudragit® E100 (94), ibuprofen and
metoprolol tartrate in Eudragit RS (157), chlorpheniramine maleate in Eudragit® RL PM and Eudragit®
RS PM (158) and ibuprofen, chlorpheniramine maleate and theophylline in Eudragit® RS 30 D (155).
Antiplasticization can be observed, if only small amounts of plasticizer are added to a polymer.
Except for the decrease in Tg, opposite effects such as an increase of the storage modulus as well as
the mechanical strength and a decreased elongation were reported (35, 86, 153, 156, 159).
Antiplasticization has been observed with traditional plasticizers (159, 160) as well as with non-
traditional plasticizers such as APIs (161, 162). According to Anderson (160), the plasticizer molecules
accumulate in the existing free volume voids of the polymer and interact with the polymer to build a
network structure by physical crosslinking.
Generally, if a substance is added to a PSA, an unpredictable alteration of the adhesive properties can
occur due to its plasticizing or antiplasticizing effect (6). The effect of non-traditional plasticization
and antiplasticization is one of the major topics of the performed studies and will be discussed in
more depth later on.
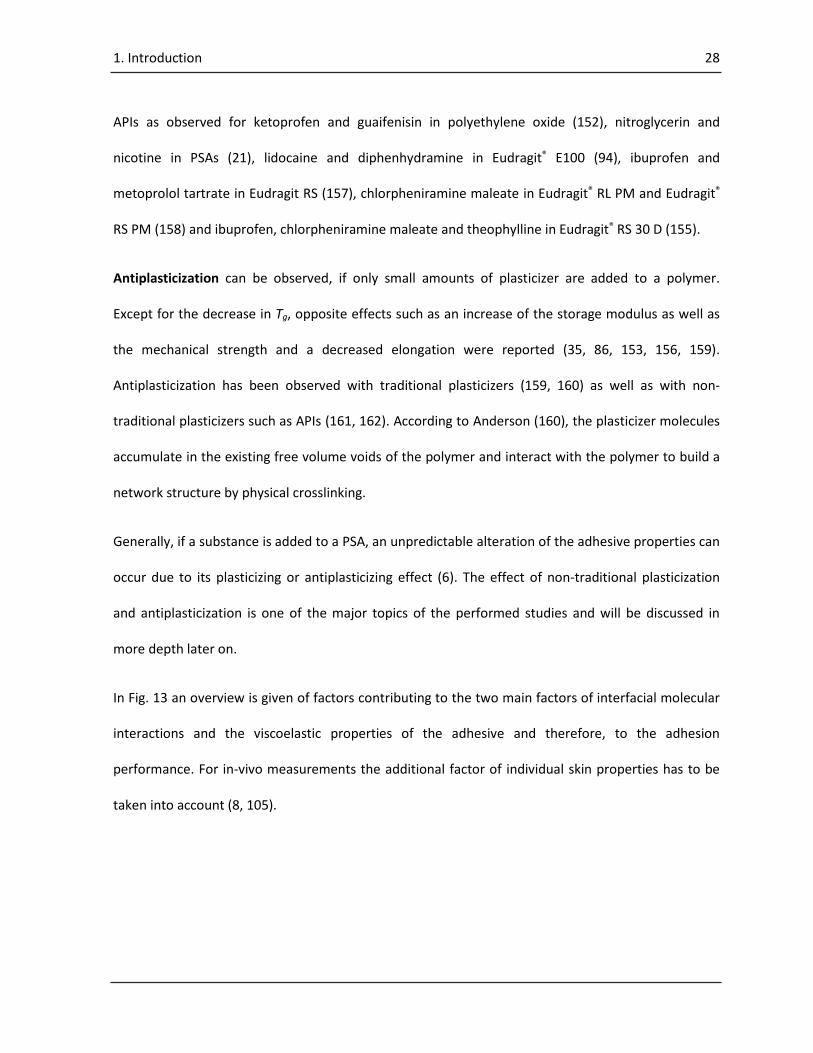
In Fig. 13 an overview is given of factors contributing to the two main factors of interfacial molecular
interactions and the viscoelastic properties of the adhesive and therefore, to the adhesion
performance. For in-vivo measurements the additional factor of individual skin properties has to be
taken into account (8, 105).
1. Introduction 29
Fig. 13: Overview of factors contributing to the adhesion performance, measured as tack, peel resistance and shear
adhesion.
1. Introduction 30
1.3. Design of Experiments (DoE)
In general, with the implementation of the methodology of DoE detailed information on effects of
factors significantly influencing the output of a process can be assessed by controlled experiments
(163–169).
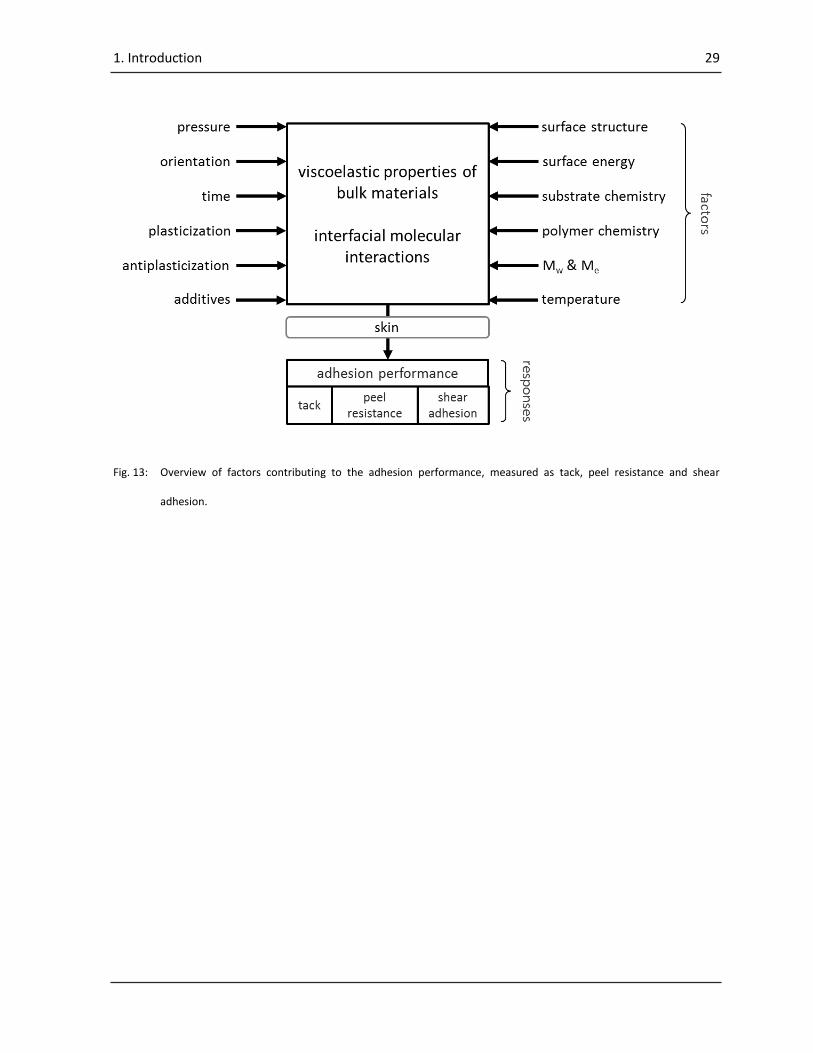
Every process can be described with controllable and uncontrollable factors as input variables and
responses as output variables (170) (Fig. 14). To investigate the influence of a factor, its level is set
between a minimum and a maximum value. Subsequently, the difference in the response is
measured. All other factors must be kept constant or at least be monitored to be able to clearly
differentiate between the effects of the respective factors. The controlled setting of each factor has
to be performed in all possible combinations and will represent the design space.
Fig. 14: Process with controllable and uncontrollable factors as input variables and responses as output variables.
1. Introduction 31
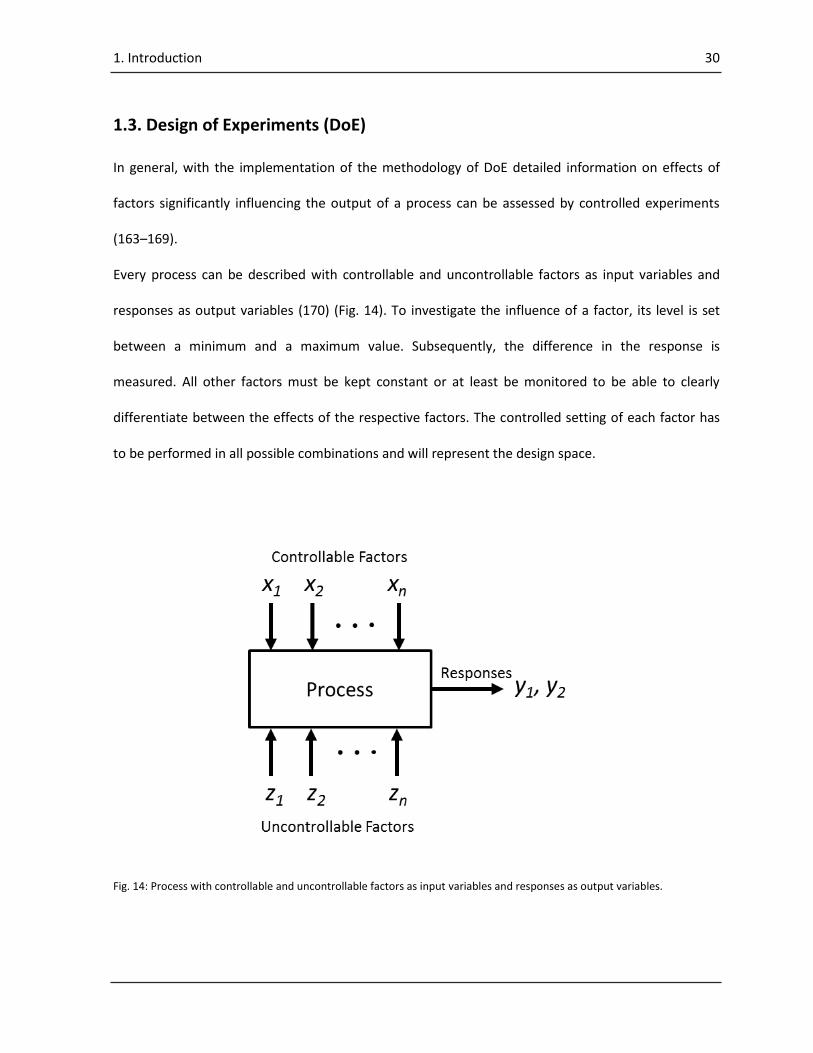
In Fig. 15a, a one factorial design with two levels and three levels is displayed, respectively. If the
experiment is augmented to two factors, the number of experiments increases with two levels to four
experiments and with three levels to nine experiments (Fig. 15b). For three factors the number of
experiments increases with two levels to eight and with three levels to 27 (Fig. 15c).
Fig. 15: (a) One factorial design, (b) Two factorial design, (c) Three factorial design. Blue spheres represent a two level
design, blue and green spheres together represent a three level design. With f = number of factors,
l = number of levels and n = number of experiments.
The number of factors f, the number of levels l and the number of experiments n are related as
follows:
𝑛 = 𝑓𝑙 Eq. 1
With DoE a response surface which describes the influence of a factor on a response can be
developed for every measured response in the design space. The advantage of developing a response
surface is the possibility to detect interactions of factors or to reveal trends, minima, maxima or even
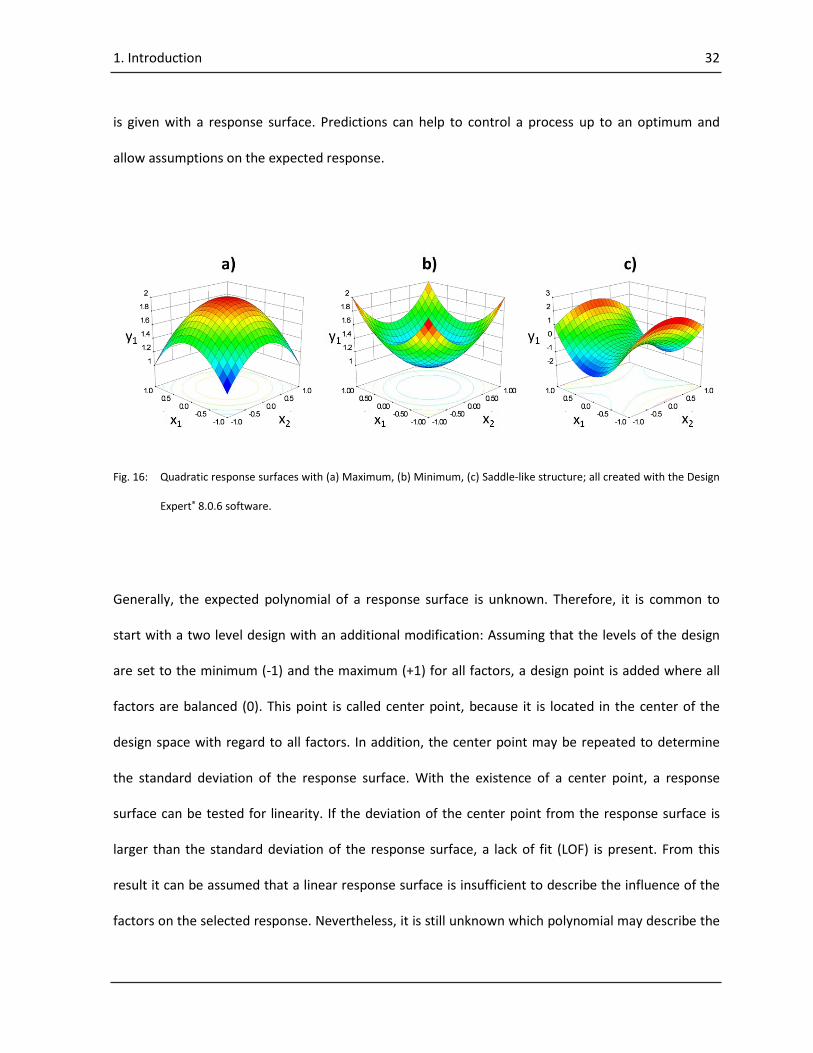
more complex shapes of the response in the design space (Fig. 16). Also, the possibility of predictions
1. Introduction 32
is given with a response surface. Predictions can help to control a process up to an optimum and
allow assumptions on the expected response.
Fig. 16: Quadratic response surfaces with (a) Maximum, (b) Minimum, (c) Saddle-like structure; all created with the Design
Expert® 8.0.6 software.
Generally, the expected polynomial of a response surface is unknown. Therefore, it is common to
start with a two level design with an additional modification: Assuming that the levels of the design
are set to the minimum (-1) and the maximum (+1) for all factors, a design point is added where all
factors are balanced (0). This point is called center point, because it is located in the center of the
design space with regard to all factors. In addition, the center point may be repeated to determine
the standard deviation of the response surface. With the existence of a center point, a response
surface can be tested for linearity. If the deviation of the center point from the response surface is
larger than the standard deviation of the response surface, a lack of fit (LOF) is present. From this
result it can be assumed that a linear response surface is insufficient to describe the influence of the
factors on the selected response. Nevertheless, it is still unknown which polynomial may describe the
1. Introduction 33
relationship exactly. In order to be able to further use the results of the performed experiments the
design may be augmented, which means that additional design points are added to be able to
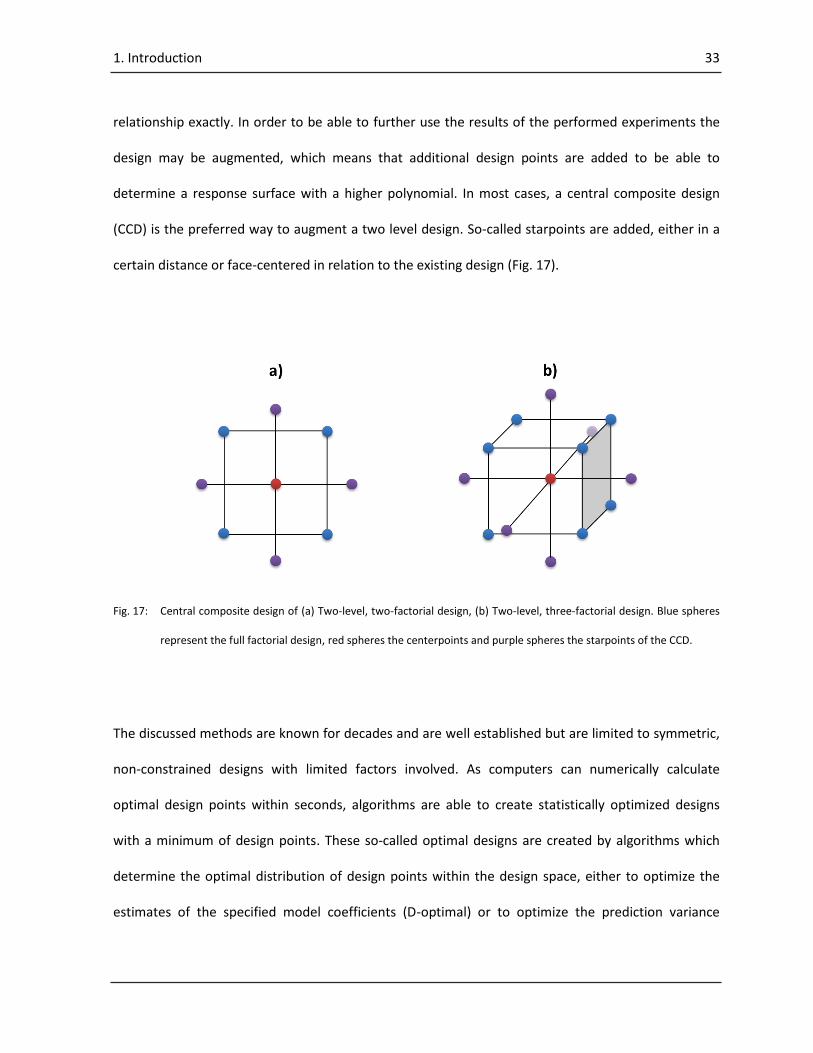
determine a response surface with a higher polynomial. In most cases, a central composite design
(CCD) is the preferred way to augment a two level design. So-called starpoints are added, either in a
certain distance or face-centered in relation to the existing design (Fig. 17).
Fig. 17: Central composite design of (a) Two-level, two-factorial design, (b) Two-level, three-factorial design. Blue spheres
represent the full factorial design, red spheres the centerpoints and purple spheres the starpoints of the CCD.
The discussed methods are known for decades and are well established but are limited to symmetric,
non-constrained designs with limited factors involved. As computers can numerically calculate
optimal design points within seconds, algorithms are able to create statistically optimized designs
with a minimum of design points. These so-called optimal designs are created by algorithms which
determine the optimal distribution of design points within the design space, either to optimize the
estimates of the specified model coefficients (D-optimal) or to optimize the prediction variance
1. Introduction 34
around the model (IV-optimal). One advantage is that augmentation of optimal designs can be
performed stepwise to any polynomial and with any constraints of the factors.
A modification of DoE is the methodology of mixture designs (164, 165, 171, 172). Instead of factors,
components are used and instead of levels, fractions. Mixture experiments differ from standard
experiments, as a mixture experiment is an experiment in which the response is assumed to depend
only on the relative proportions of the components but not on the amount of the components (171).
The fractions of the components always have to sum up to 100 %. It is not possible to change one
component without changing at least another. This fact has a profound effect on every aspect of
experimentation with mixtures: the design space, the design properties, and the interpretation of the
results (171).
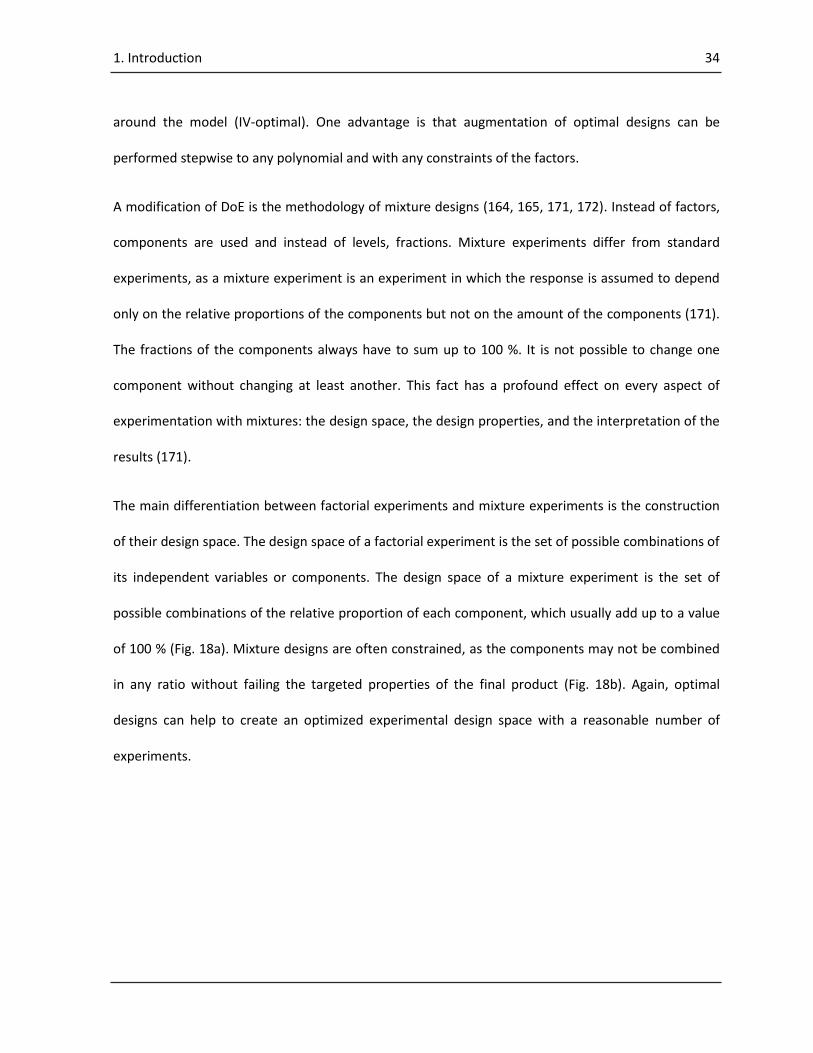
The main differentiation between factorial experiments and mixture experiments is the construction
of their design space. The design space of a factorial experiment is the set of possible combinations of
its independent variables or components. The design space of a mixture experiment is the set of
possible combinations of the relative proportion of each component, which usually add up to a value
of 100 % (Fig. 18a). Mixture designs are often constrained, as the components may not be combined
in any ratio without failing the targeted properties of the final product (Fig. 18b). Again, optimal
designs can help to create an optimized experimental design space with a reasonable number of
experiments.
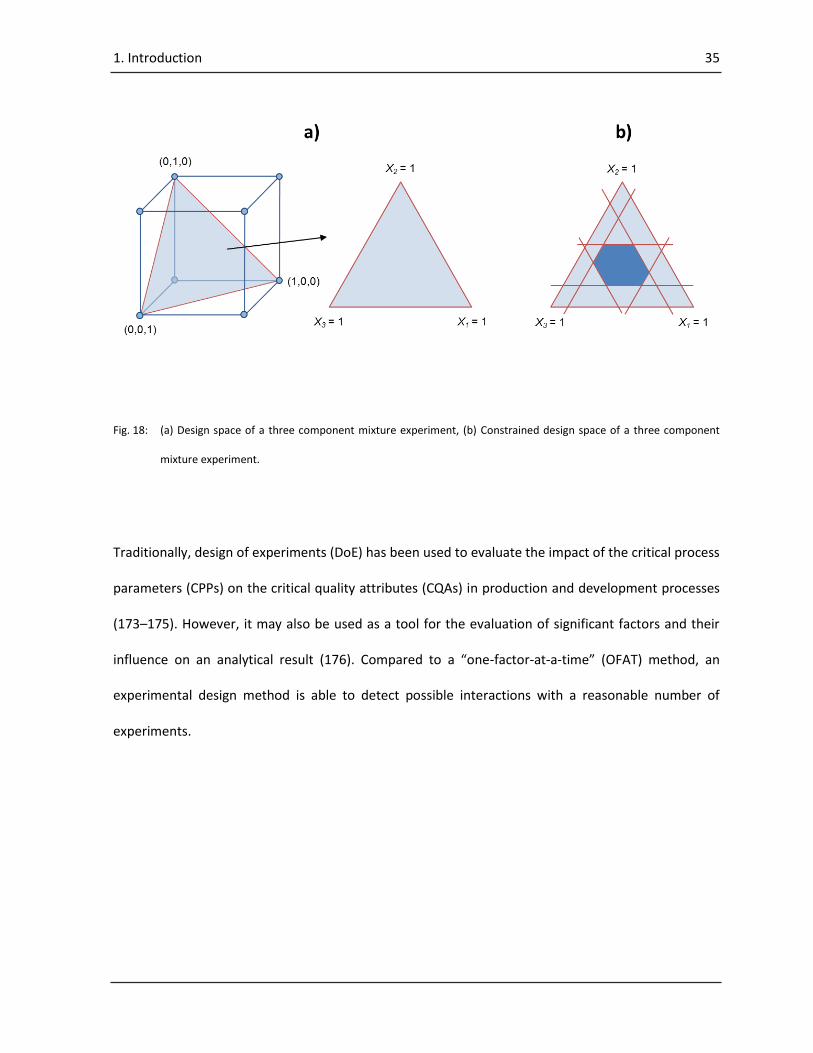
1. Introduction 35
Fig. 18: (a) Design space of a three component mixture experiment, (b) Constrained design space of a three component
mixture experiment.
Traditionally, design of experiments (DoE) has been used to evaluate the impact of the critical process
parameters (CPPs) on the critical quality attributes (CQAs) in production and development processes
(173–175). However, it may also be used as a tool for the evaluation of significant factors and their
influence on an analytical result (176). Compared to a “one-factor-at-a-time” (OFAT) method, an
experimental design method is able to detect possible interactions with a reasonable number of
experiments.
1. Introduction 36
1.4. Objectives of this work
Transdermal patches are known in the pharmaceutical community for decades but until now only few
well established methods are available in the development and analysis of new patch formulations.
Currently, in many of the clinical trials placebo patches are used to determine the adhesion
performance of new transdermal patch formulations (3). The use of placebo patches cannot be
justified because the compatibility of the API with the patch components, especially the PSA, may
have an effect on the adhesive properties of the final drug product. The addition of an API may alter
the viscoelastic behavior and therefore also the adhesion performance of a transdermal patch (6).
The United States Food and Drug Administration (US-FDA) has received numerous reports of
‘‘adhesion lacking’’ for transdermal drug delivery systems (3, 177). In addition to the adhesive
problems, there is the phenomenon of the so-called dark ring around the patch caused by cold flow
resulting from low cohesive strength of the PSA (11, 105). Lack of adhesion and cold flow may result
in improper dosing as the extent of contact between patch and skin directly affects drug delivery (3).
Furthermore, problems during storage may occur because of oozing of the PSA into the pouch (8).
The main objective of this thesis is the attempt to introduce systematical methods in the
development and analysis of transdermal patches as claimed by the draft “Guideline on quality of
transdermal patches” (11) and the “ICH guidance Q8 Pharmaceutical Development” (167).
To gain a deeper insight into the adhesion performance of a transdermal patch, a reliable method to
manufacture patches with different PSAs, varying API content and matrix thicknesses with emphasis
on a reproducible quality is supposed to be established.
Currently, standard test methods from the tape industry are used to evaluate the adhesion
performance of a patch (21, 28). Unfortunately, these methods were developed as quality control
1. Introduction 37
tools for pressure sensitive products in general and show poor reproducibility and are not adjusted to
pharmaceutical end points. Usually, single point measurements with a low degree of information are
performed. Furthermore, these methods gather viscoelastic as well as interfacial properties of the
patch. Because with DMA/DMTA the complete bonding and debonding behavior of a PSA can be
examined, this method is investigated in the first part of the thesis with regard to its suitability to
detect alterations in viscoelasticity and adhesion performance caused by an API.
In the second part of the thesis, the probe tack test which recently was demonstrated to be able to
predict in-vivo adhesion performance of placebo patches (105) is investigated in depth. By
introduction the method of design of experiments (DoE) in a measurement system analysis (MSA),
the variation of the test result caused by interactions of the test parameters and the sample
properties, can be discussed on a more consolidated background.
Finally, a novel method of formulation development for transdermal patches is established for a
multiple polymer adhesive patch following the draft “Guideline on quality of transdermal patches”
(11) and the “ICH guidance Q8 Pharmaceutical Development” (167).
2. Materials and methods 38
2. Materials and methods
2. Materials and methods 39
2. Materials and methods
2.1. Materials
Solvent based polyacrylic pressure sensitive adhesives DuroTak® 387-2287 and DuroTak® 87-4287
were kindly donated by Henkel, Bridgewater, USA. Solvent based silicone pressure sensitive adhesive
BIO-PSA® 7-4302 was donated by Dow Corning, Seneffe, Belgium. Oleylalcohol was purchased by
Caesar & Loretz, Hilden, Germany. Ibuprofen was supplied by BASF, Ludwigshafen, Germany. Platilon®
U073 100 Natural PE Backing Membrane was kindly donated by Epurex Films, Bomlitz, Germany.
Fluoropolymer coated Scotchpak® 1020 Release Liner was purchased by 3M, Neuss, Germany. All
other reagents used were of analytical grade.

2. Materials and methods 40
2.2. Methods of “Evaluation of DMA/DMTA for transdermal patch
development”1
2.2.1. Determination of the NVC
The non-volatile content (NVC) of the adhesive was determined gravimetrically by drying accurately
weighed amounts (2-3 g) of adhesive at 80.0 °C for 24 h. From five samples the average NVC was
calculated.
2.2.2. Preparation of the wet mixes
Wet mixes were then prepared by addition of ibuprofen to the DuroTak® 87-4287 at concentrations of
1, 2, 4, 8 and 16 % (w/w) referring to the NVC. The samples were shaken in an overhead shaker (in-
house development) at 30 rpm and room temperature (RT) for 24 h and then stored for additional 24
h to remove air bubbles. For plain, drug-free films the adhesive was used as supplied.
2.2.3. Preparation of the dry adhesive matrices
The wet mixes were cast on the release liner. To achieve the final thickness of dry films of 200 ± 10
µm for rheological and probe tack tests and of 55 ± 10 µm for rolling ball tack and shear adhesion
tests, a CX 4 semiautomatic lab coater equipped with a bar film applicator (MTV Messtechnik,
Cologne, Germany) was used.
Solvent evaporation was done by storage of the freshly prepared adhesive matrices for 15 min at RT
and subsequently for 30 min at 80.0 °C in a drying oven (Heraeus T6060, Thermo Fisher Scientific,
1 This chapter has been published as shown in Table 10, p. 141.

2. Materials and methods 41
Waltham, USA). The thickness of the adhesive matrices was measured with a digimatic indicator
(Mitutoyo Deutschland, Neuss, Germany).
All films were stored in an air-conditioned room at 21.0 °C and 50 % R.H. for 24 h.
2.2.3.1. Laminates for rheological characterization
Adhesive matrices for rheological analysis were prepared by lamination of multiple layers of the dry
adhesive matrix with a lamination device (in-house development) to achieve a final matrix thickness
of 1145 ± 82 μm (Fig. 19a). The samples were stored in an air-conditioned room at 21.0 °C and 50 %
R.H. for 1 week. For further investigation the samples were cut into discs of 25.0 mm diameter each
with a cutter (Richard Hess MBV, Sonsbeck, Germany).
2.2.3.2. Test specimens for probe tack experiments
For probe tack experiments the dry adhesive matrices were cut into 12.0 mm x 150.0 mm specimens
with a strip cutter (Emmeram Karg Industrietechnik, Krailling, Germany) (Fig. 19b). The samples were
stored as described in chapter 2.2.3.1.
2.2.3.3. Test specimens for rolling ball tack and shear adhesion experiments
For rolling ball tack and shear adhesion experiments laminates consisting of backing membrane,
release liner and adhesive matrix were prepared by lamination of the dry adhesive matrix with the
polyester backing membrane (Fig. 19b). The laminates were further treated as mentioned in chapter
2.2.3.2.
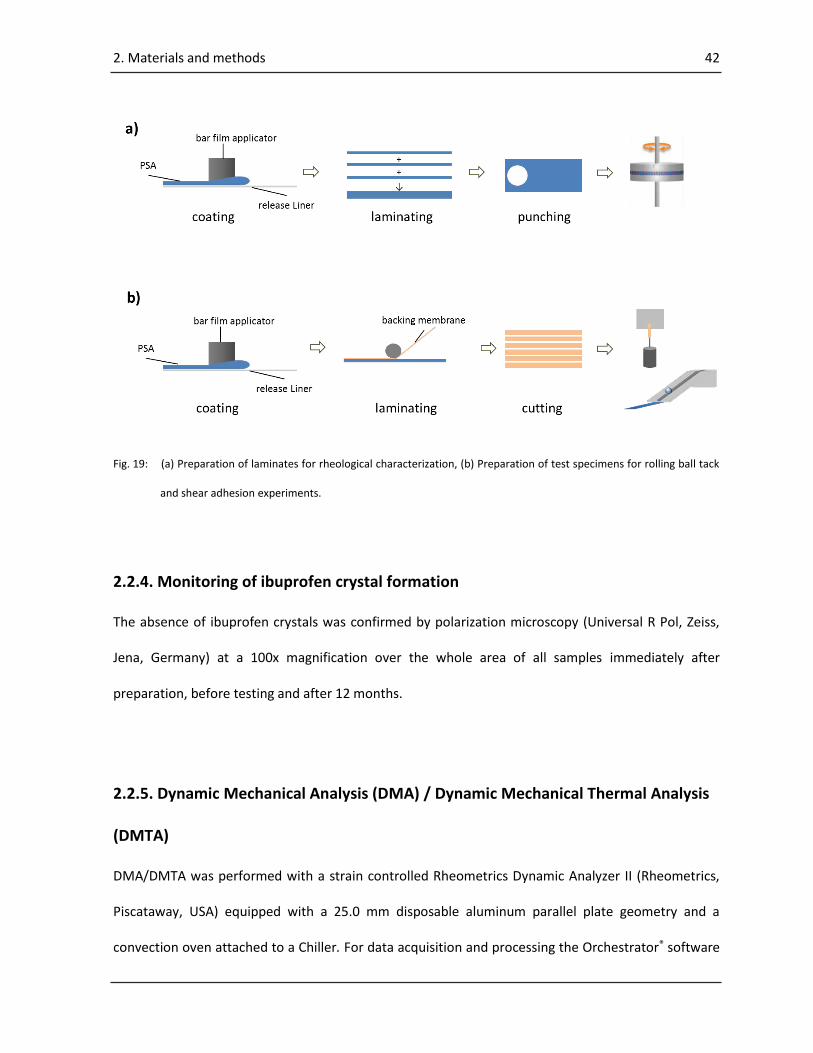
2. Materials and methods 42
Fig. 19: (a) Preparation of laminates for rheological characterization, (b) Preparation of test specimens for rolling ball tack
and shear adhesion experiments.
2.2.4. Monitoring of ibuprofen crystal formation
The absence of ibuprofen crystals was confirmed by polarization microscopy (Universal R Pol, Zeiss,
Jena, Germany) at a 100x magnification over the whole area of all samples immediately after
preparation, before testing and after 12 months.
2.2.5. Dynamic Mechanical Analysis (DMA) / Dynamic Mechanical Thermal Analysis
(DMTA)
DMA/DMTA was performed with a strain controlled Rheometrics Dynamic Analyzer II (Rheometrics,
Piscataway, USA) equipped with a 25.0 mm disposable aluminum parallel plate geometry and a
convection oven attached to a Chiller. For data acquisition and processing the Orchestrator® software
2. Materials and methods 43
(TA Instruments, Eschborn, Germany) was used. The upper release liner of the samples was peeled off
and each sample was pressed onto the parallel plate geometry. Thereafter, the lower release liner
was removed. To bring the specimen in contact with the lower plate the gap between the plates was
adjusted by instrument normal force control to 8.0 N for 10 s. For the conditioning steps the normal
force control was set to 0.0 N. Frequency sweep and temperature sweep experiments were
conducted after determination of the linear viscoelastic region (LVR) by strain sweeps. All tests were
performed in triplicate. Strain sweeps and frequency sweeps were run at 21 and 32 °C, respectively.
2.2.5.1. Strain sweeps
All samples were conditioned at the respective test temperature for 30 min. The LVR was determined
by strain tests from 0.1 % to 20 % strain at ω =0.01 rad/s and 100 rad/s, respectively. These
experiments were performed with plain adhesive matrix as well as with an ibuprofen content of
8.0 %.
2.2.5.2. Frequency sweeps
All samples were conditioned as described above. Frequency sweeps were performed from ω = 0.01
up to 500 rad/s and at a controlled strain of 5.0 %. G*, G’, G’’ and tan were determined in
dependence of the angular frequency ω.
2. Materials and methods 44
2.2.5.3. Temperature sweeps
All samples were conditioned at -55.0 °C for 60 min. The gap between the plates was adjusted by
instrument normal force control to 0.0 N with an autotension sensitivity of 0.2 N. Temperature
sweeps were run from -55.0 °C to +100.0 °C in steps of 1.0 K at ω = 1.0 rad/s and a controlled strain of
1.0 %. Conditioning time period at each temperature step was 5.0 min prior data acquisition. G*, G’,
G’’ and tan were determined in dependence of the temperature T.
2.2.6. Adhesion performance
Test specimens were analyzed by a probe tack test at 21.0 °C and by standard test methods of the
Pressure sensitive Tape Council (PSTC) such as rolling ball tack (PSTC-6) and shear adhesion
(PSTC-107 A) at 21.0 °C and 32.0 °C, respectively. Experiments at 21.0 °C were performed in an air-
conditioned room. For rolling ball tack and shear adhesion experiments at 32.0 °C the equipment was
transferred into a Heraeus B5050E drying oven (Heraeus, Hanau, Germany). 24 h prior to the
experiments the equipment as well as the specimens were conditioned at the respective test
temperature.
2.2.6.1. Probe tack test
With the probe tack test the complete debonding process can be observed. Stress strain curves,
generated from force and displacement data were used to determine the tack as stress maximum
(σmax).

2. Materials and methods 45
For probe tack experiments test specimens consisting of release liner and dry adhesive matrix were
transferred to a slideable aluminum mounting (in-house development). Prior the probe tack
experiments the release liner was peeled off. The probe tack test was performed with an universal
testing machine (Inspect Mini, Hegewald & Peschke, Nossen, Germany) equipped with a 3 mm
stainless steel probe and test parameters shown in Table 1. All measurements were repeated 5 times.
Table 1: Test parameters for probe tack test.
Parameter Setting
Approaching speed 0.1 mm/s
Contact time 1.0 s
Contact force 0.4 N
Detachment speed 5.0 mm/s
2.2.6.2. Rolling ball tack test (PSTC-6)
The rolling ball tack test is one method of attempting to quantify the ability of an adhesive to adhere
quickly to another surface (121). For the tack measurements the size of the test specimens was 12.0
mm x 150.0 mm instead of 24.0 mm x 300.0 mm. The specimen were positioned adhesive side up on
the working surface and the raceway of the rolling ball tack test apparatus (RBT-100,
Cheminstruments, Fairfield, USA) was aligned with the specimen. A 13.5 mm stainless steel ball was
released and rolled until it was stopped by the adhesive. The distance was measured from the point
where the ball initially was in contact with the adhesive to the position where the ball was stopped.
All measurements were repeated 5 times, each with a fresh specimen.
2. Materials and methods 46
2.2.6.3. Shear adhesion test (PSTC-107 A)
Shear adhesion is the ability of a tape to resist static forces applied in the same plane as the backing
(121). According to PSTC-107 A the ability of a pressure sensitive tape to adhere to a standard steel
panel under constant stress is measured. A 12.0 mm x 150.0 mm specimen was applied to a standard
steel panel under controlled pressure with a rubber covered steel hand roller (Cheminstruments,
Fairfield, USA) such that the effective contact area between specimen and steel panel was 12.0 x 12.0
mm. The panel was mounted vertically in an 8 bank shear tester (S-HT-8, Cheminstruments, Fairfield,
USA). A standard mass of 500.0 g was attached to the free end of the tape with a clamp and the time
to cohesive failure was determined. All samples were measured in triplicate.
2.2.7. Differential Scanning Calorimetry (DSC)
Tg values of the dry adhesive matrices were measured by DSC (PerkinElmer, Waltham, USA) from -130
°C to 100 °C at a heating rate of 10 K/min with nitrogen purge of 20 ml/min. Accurately weighed
samples of about 10 mg were placed in pin-holed and sealed 30 µl aluminum pans. The first heating
run data were discarded and only the second heating runs were evaluated. The Tg values were
determined as the midpoint of the inflection in the DSC thermograms. Before measurement the DSC
was calibrated with 1-pentanol analytical standard (Fluka) and water LiChrosolv® (Merck Millipore). All
samples were measured in triplicate.
2. Materials and methods 47
2.3. Methods of “Systematic investigation of the probe tack test”
2.3.1. Design of Experiments: IV-optimal design
To examine the significance of potential influencing factors and the linearity of the probe tack test,
five factors were chosen to be investigated: detachment speed (A), dwell time (B), contact force (C),
adhesive matrix thickness (D) and API content (E).
To evaluate the main effects of these five factors, their interactions and quadratic effects a
randomized response surface design with 38 runs was built (Table 2) with the Design-Expert® 8.0.6
software (Stat-Ease, Minneapolis, MN, USA). An “IV-optimal” algorithm with point exchange was used
because the thickness of the adhesive matrices and the API content were adjusted to predefined
levels.
The maximum of the stress strain curve of the probe tack test (σmax, Fig. 20d) was selected as
response.

2. Materials and methods 48
Table 2: Experimental design of the probe tack test with the five investigated factors detachment speed (A),
dwell time (B), contact force (C), adhesive matrix thickness (D) and API content (E).
factor A factor B factor C factor D factor E
Standard Run detachment speed
dwell time contact force
adhesive matrix
thickness
API content
mm/s s N µm % (w/w)
8 1 2.9 10.0 2.6 200 0
3 2 1.0 8.7 4.0 50 0
5 3 5.0 7.8 0.5 100 0
26 4 2.7 7.1 0.5 50 12
6 5 1.0 4.0 0.5 200 3
24 6 1.0 1.4 4.0 50 10
12 7 4.0 7.0 4.0 200 5
18 8 3.0 5.5 2.3 150 6
17 9 3.0 5.5 2.3 150 6
23 10 2.0 1.0 0.5 50 8
30 11 5.0 8.0 2.0 150 12
14 12 3.0 5.5 1.2 150 9
34 13 4.0 1.0 4.0 200 12
31 14 1.0 1.0 0.5 150 12
19 15 3.5 1.0 0.5 200 6
15 16 3.0 5.5 2.3 150 3
7 17 5.0 1.0 2.0 200 0
33 18 2.0 7.9 2.8 200 11
16 19 3.0 5.5 2.3 150 6
11 20 2.5 10.0 3.7 150 5
28 21 3.2 10.0 4.0 100 11
13 22 1.0 10.0 0.5 100 6
9 23 2.9 10.0 2.6 200 0
25 24 2.7 7.1 0.5 50 12
20 25 1.4 4.7 4.0 200 6
4 26 5.0 7.8 0.5 100 0
1 27 3.8 1.0 1.3 50 2
29 28 3.2 10 4.0 100 12
22 29 5.0 10 2.4 50 6
10 30 2.0 2.5 4.0 150 1
27 31 5.0 2.3 2.7 100 9
32 32 5.0 10 0.5 200 9
2 33 4.5 4.0 4.0 50 0
21 34 5.0 10 2.4 50 6
36 35 5.0 7.8 0.5 100 0
35 36 2.0 2.5 4.0 150 7
37 37 3.0 5.5 2.3 150 7
38 38 3.0 5.5 2.3 150 7
2. Materials and methods 49
2.3.2. Preparation of the wet mixes
The NVC of DuroTak® 387-2287 was determined as described in chapter 2.2.1. The wet mixes were
prepared as described in chapter 2.2.2. For drug-loaded matrices, ibuprofen was mixed with the
adhesive at concentrations shown in Table 2 referring to the NVC.
2.3.3. Preparation of the dry adhesive matrices
For probe tack test experiments, adhesive matrices of DuroTak® 387-2287 with thicknesses shown in
Table 2 were prepared as described in chapter 2.2.3. For DMA measurements, samples with 0 %, 6 %
and 12 % (w/w) ibuprofen content were used.
2.3.4. DMA Measurements
DMA measurements were performed as described in chapters 2.2.5. and 2.2.5.2. at
21 °C. Strain sweeps were conducted for samples with 8 % ibuprofen content at 100 rad/s. Frequency
sweeps were performed from 0.1 to 100 rad/s.
2.3.5. Probe tack test
The probe tack test was performed as described in chapter 2.2.6.1. however, equipped with an in-
house developed 3 mm stainless steel probe (Fig. 20b). The probe was developed to apply constant
stress to the test specimen during contact. Therefore, it was built in two parts: One part is a cylinder
that is connected to the force transducer and holds the moveable probe. The probe was designed as a
hollow piston that is able to move up and down inside the cylinder. The contact force was adjusted by
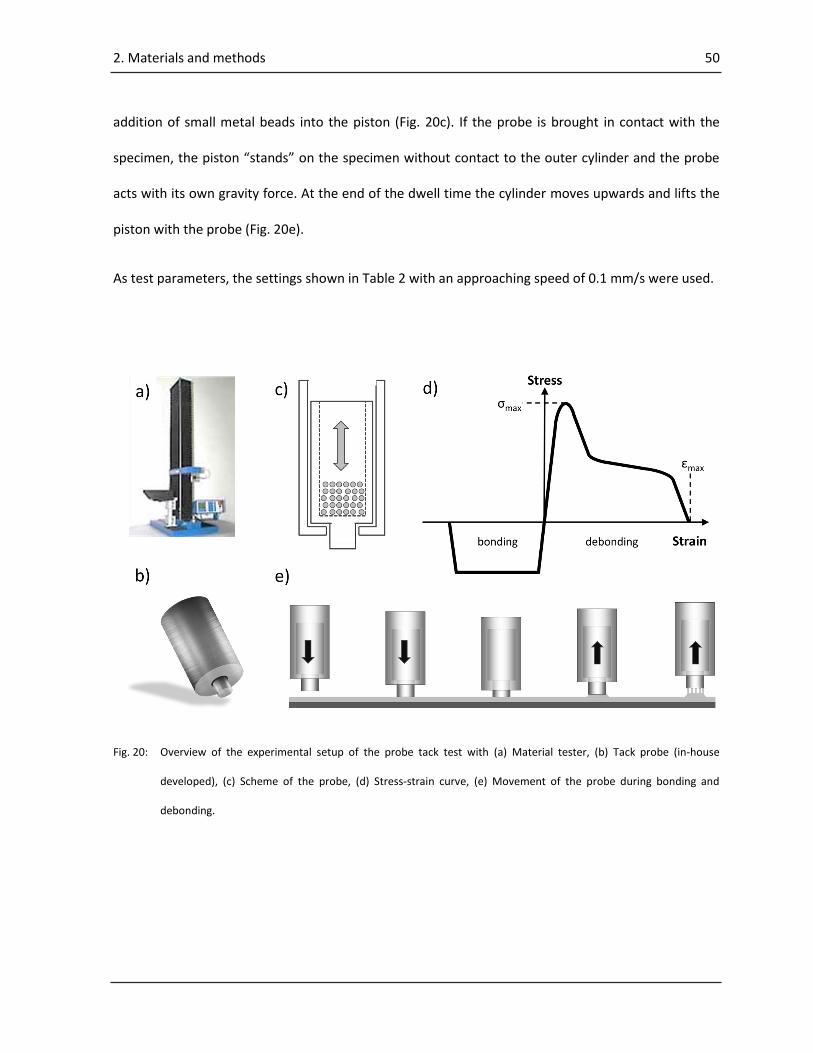
2. Materials and methods 50
addition of small metal beads into the piston (Fig. 20c). If the probe is brought in contact with the
specimen, the piston “stands” on the specimen without contact to the outer cylinder and the probe
acts with its own gravity force. At the end of the dwell time the cylinder moves upwards and lifts the
piston with the probe (Fig. 20e).
As test parameters, the settings shown in Table 2 with an approaching speed of 0.1 mm/s were used.
Fig. 20: Overview of the experimental setup of the probe tack test with (a) Material tester, (b) Tack probe (in-house
developed), (c) Scheme of the probe, (d) Stress-strain curve, (e) Movement of the probe during bonding and
debonding.
2. Materials and methods 51
2.3.6. Statistical data analysis
Data analysis was performed by the scheme displayed in Fig. 21. At first, the “Fit Summary” of the
design was checked. Then the model with the highest polynomial degree that was not aliased was
chosen.
In the next step an ANOVA was evaluated for significance of the model, “Lack of Fit” (LOF) and
adjusted R² as well as predicted R². In case the predicted R² was too low a backward reduction of the
model was performed.
For diagnostics the “Box-Cox” plot for power transformations was checked. If the “Box-Cox” plot
recommended a data transformation, it was carried out and the scheme was repeated.
In the next step the “Normal Probability Plot of the Studentized Residuals” was investigated for
normality of residuals. Then the “Internally Studentized Residuals vs. Predicted” plot was reviewed
for constant error. Finally the “Externally Studentized Residuals” plot was investigated for outliers, i.e.
influential values. Provided that the model statistics and diagnostic plots showed acceptable results,
the procedure was finished up with the model graphs.

2. Materials and methods 52
Fig. 21: Scheme of data analysis carried out with Design-Expert 8.0.6 software.
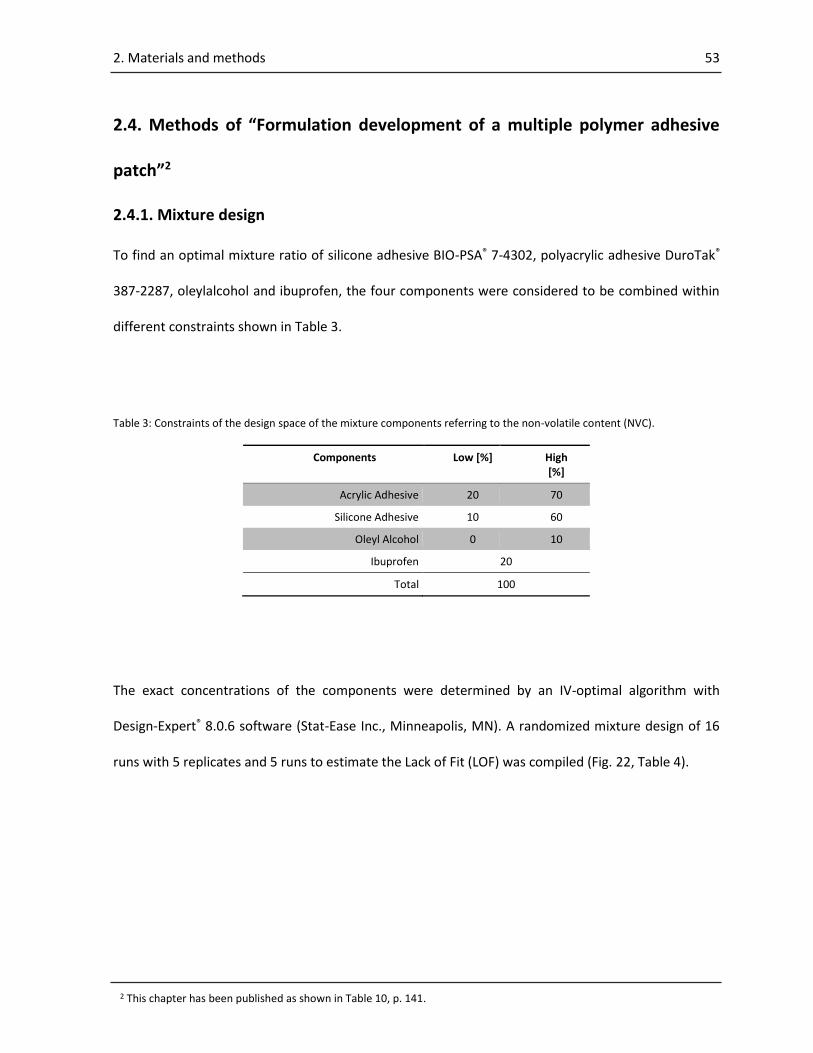
2. Materials and methods 53
2.4. Methods of “Formulation development of a multiple polymer adhesive
patch”2
2.4.1. Mixture design
To find an optimal mixture ratio of silicone adhesive BIO-PSA® 7-4302, polyacrylic adhesive DuroTak®
387-2287, oleylalcohol and ibuprofen, the four components were considered to be combined within
different constraints shown in Table 3.
Table 3: Constraints of the design space of the mixture components referring to the non-volatile content (NVC).
Components
Low [%] High [%]
Acrylic Adhesive 20 70
Silicone Adhesive 10 60
Oleyl Alcohol 0 10
Ibuprofen 20
Total 100
The exact concentrations of the components were determined by an IV-optimal algorithm with
Design-Expert® 8.0.6 software (Stat-Ease Inc., Minneapolis, MN). A randomized mixture design of 16
runs with 5 replicates and 5 runs to estimate the Lack of Fit (LOF) was compiled (Fig. 22, Table 4).
2 This chapter has been published as shown in Table 10, p. 141.
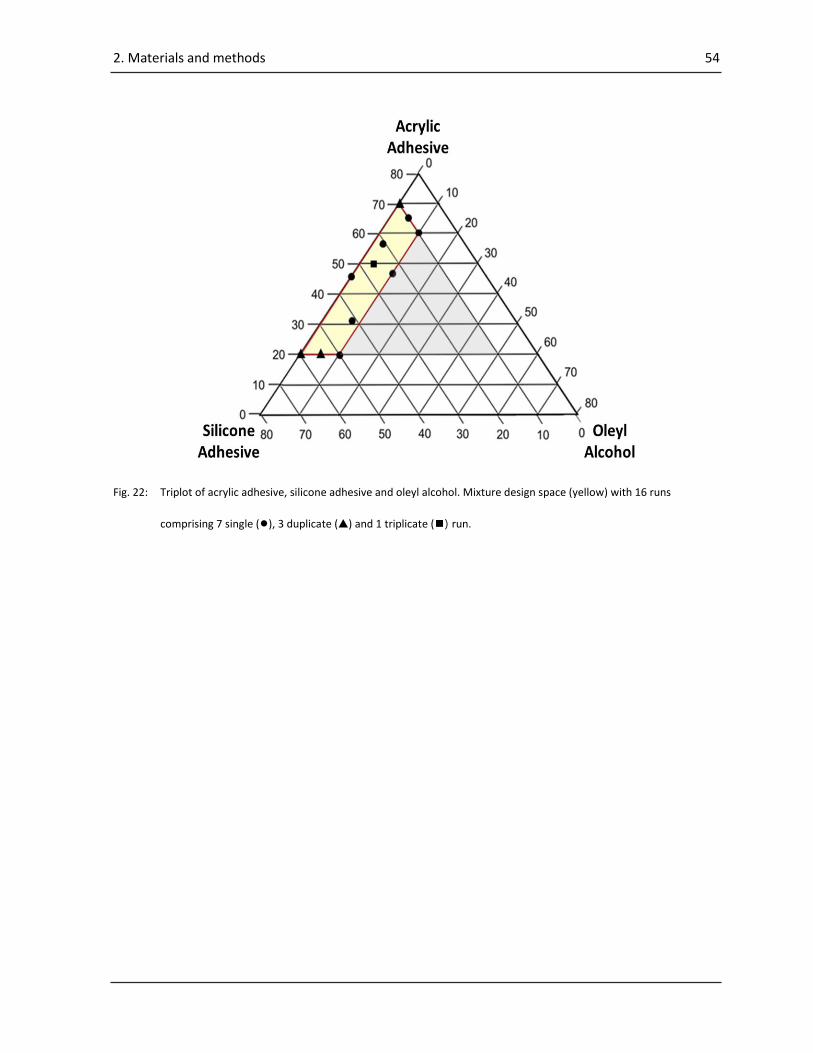
2. Materials and methods 54
Fig. 22: Triplot of acrylic adhesive, silicone adhesive and oleyl alcohol. Mixture design space (yellow) with 16 runs
comprising 7 single (●), 3 duplicate (▲) and 1 triplicate (◼) run.
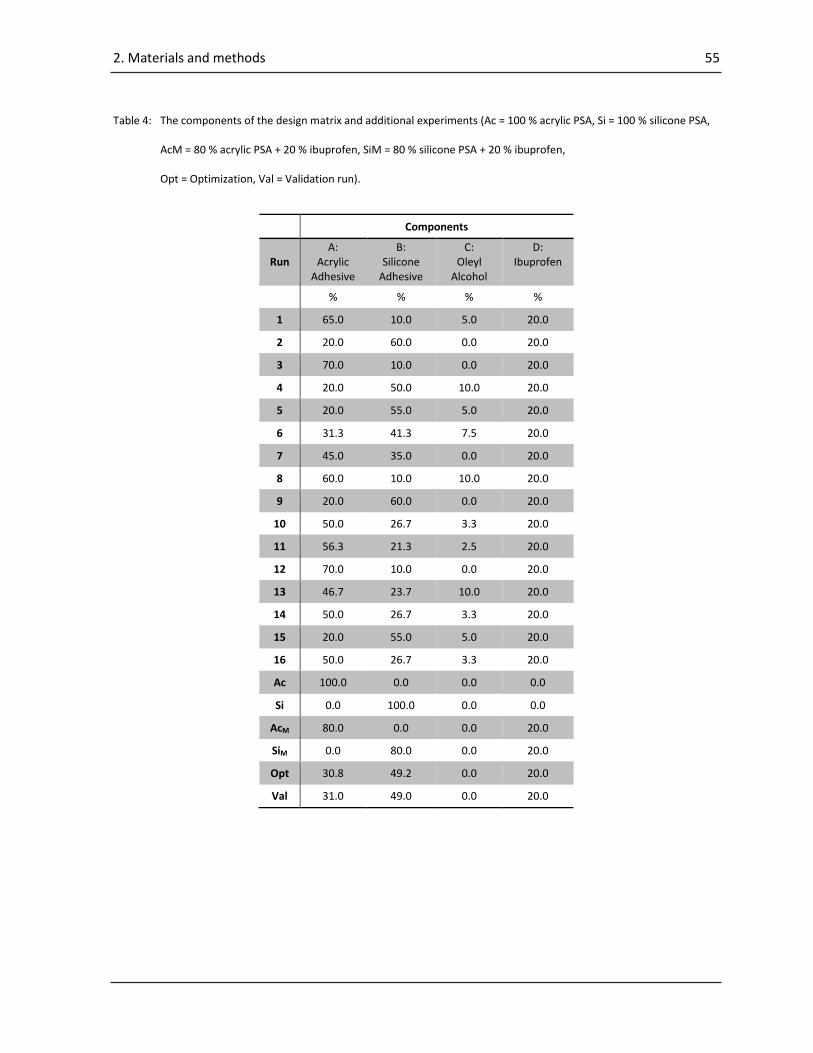
2. Materials and methods 55
Table 4: The components of the design matrix and additional experiments (Ac = 100 % acrylic PSA, Si = 100 % silicone PSA,
AcM = 80 % acrylic PSA + 20 % ibuprofen, SiM = 80 % silicone PSA + 20 % ibuprofen,
Opt = Optimization, Val = Validation run).
Components
Run A:
Acrylic Adhesive
B: Silicone
Adhesive
C: Oleyl
Alcohol
D: Ibuprofen
% % % %
1 65.0 10.0 5.0 20.0
2 20.0 60.0 0.0 20.0
3 70.0 10.0 0.0 20.0
4 20.0 50.0 10.0 20.0
5 20.0 55.0 5.0 20.0
6 31.3 41.3 7.5 20.0
7 45.0 35.0 0.0 20.0
8 60.0 10.0 10.0 20.0
9 20.0 60.0 0.0 20.0
10 50.0 26.7 3.3 20.0
11 56.3 21.3 2.5 20.0
12 70.0 10.0 0.0 20.0
13 46.7 23.7 10.0 20.0
14 50.0 26.7 3.3 20.0
15 20.0 55.0 5.0 20.0
16 50.0 26.7 3.3 20.0
Ac 100.0 0.0 0.0 0.0
Si 0.0 100.0 0.0 0.0
AcM 80.0 0.0 0.0 20.0
SiM 0.0 80.0 0.0 20.0
Opt 30.8 49.2 0.0 20.0
Val 31.0 49.0 0.0 20.0

2. Materials and methods 56
As responses tack, shear adhesion, crystal growth, extent of creaming, droplet size and droplet
distribution range were selected (Fig. 23).
Additionally, four reference samples with and without addition of ibuprofen were prepared for each
adhesive.
Fig. 23: Responses: a) Probe tack test, b) Shear adhesion, c) Crystallization of ibuprofen, d) Scheme of creaming,
e) Examples for different droplet sizes and droplet distribution ranges.
2.4.2. Preparation of the wet mixes
The NVC of DuroTak® 387-2287 was determined as described in chapter 2.2.1. To eliminate effects
caused by varying amounts of ethyl acetate all components were adjusted to a NVC of 40 %. Wet
mixes of 20 g each were prepared in glass vials by addition of the components at concentrations
shown in Table 4 referring to the NVC. After 15 min of shaking at 90 rpm in a MM 200 mixer mill
(Retsch, Haan, Germany) the samples were stored for 24 h in a conditioned environment to
determine the extent of creaming. For preparation of the adhesive matrix the samples required an

2. Materials and methods 57
additional treatment at 90 rpm for 15 min and further intermediate storage for 60 s to remove air
bubbles.
2.4.3. Preparation of the dry adhesive matrices
Dry adhesive matrices with a thickness of about 100 µm were prepared as described in chapter 2.2.3.
2.4.4. Responses
2.4.4.1. Tack
Probe tack experiments were performed as described in chapter 2.2.6.1 (Fig. 23 a).
2.4.4.2. Shear adhesion
For determination of the shear adhesion the test method from chapter 2.2.6.3 was applied with a
standard mass of 250 g (Fig. 23b).
2.4.4.3. Crystal growth
An area of 100 cm2 of the dry adhesive matrix was inspected with regard to crystallization of the API
(Fig. 23c). As observed with all investigated samples crystallization proceeded homogeneously from
the periphery of the adhesive matrix to the center of the adhesive matrix. Due to this fact, the area
covered by crystals in % of the whole area was determined by cutting and weighing of the crystallized
area after 24 h.
2. Materials and methods 58
2.3.4.4. Extent of creaming (phase separation)
For determination of the extent of creaming, the height of the separated phase of the wet mixes
compared to the total height in the vials after 24 h was measured using a digital caliper (Fig. 23d).
From this measurement the percentage of separated phase to mixed phase was calculated.
2.4.4.5. Droplet size
As all blends of the mixture design exhibited two-phase dispersions the matrices were transferred to
a glass slide and investigated by polarization microscopy (Universal R Pol, Zeiss, Jena, Germany) at a
100x magnification 24 h after preparation (Fig. 23e). The mean droplet diameter of 30 droplets was
determined.
2.4.4.6. Droplet distribution range
Samples from the determination of the droplet size were also used for the evaluation of the droplet
distribution range (Fig. 23e). The droplet distribution range was calculated from the size of the largest
and the smallest droplet.
2.4.5. Statistical data analysis
The statistical analysis of the results was performed as described in chapter 2.3.6.

3. Results and discussion 59
3. Results and discussion
3. Results and discussion 60
3. Results and discussion
3.1. Results and discussion of “Evaluation of DMA/DMTA for transdermal
patch development”3
The aim of the first study was to investigate the suitability of DMA/DMTA to detect changes of the
PSA properties by adding ibuprofen as a model drug to provide a better understanding of API/PSA
interactions.
3.1.1. Monitoring ibuprofen crystal formation
Immediately after preparation of the adhesive matrices, no ibuprofen crystal formation could be
observed at all investigated concentrations. After storage of the matrices for 1 week crystal formation
was observed for samples with 16 % ibuprofen content. Because of these results, only samples with
1 %, 2 %, 4 %, and 8 % ibuprofen content were used for further experiments. Re-examinations after
12 months showed similar results.
3.1.2. Dynamic Mechanical Analysis (DMA)/Dynamic Mechanical Thermal Analysis
(DMTA)
The viscoelastic behavior of a PSA can provide information on the mechanical properties and
therefore the quality of a PSA product such as a transdermal patch. The balance of these properties
affects the time- and temperature-dependent responses as well as the adhesion performance of a
transdermal patch.
3 This chapter has been published as shown in Table 10, p. 141.
3. Results and discussion 61
For frequency sweeps, a good correlation of the storage modulus G′ and the damping factor tan
with the tack of a PSA was found. The frequency at which G′ and tan are determined depends on
the type of tack test. Bonding of a PSA is found at lower frequencies, whereas debonding is related to
higher frequencies. At the bonding step, the adhesive has to be more liquid-like, and at the
debonding step, it has to be more solid-like and should exhibit a high damping behavior at both. Thus,
G′ has to be low at low frequencies and high at higher frequencies with a sufficiently high slope.
Furthermore, tan should be high at lower frequencies because of a reduction of G′, indicating
flowability. At higher frequencies, it should also be high because of the increase in the loss modulus
G″, indicating the onset of the Tg which is associated with strain-hardening. This results in an
increased energy dissipation which prevents breaking of the adhesive bonds (18, 84, 105, 146).
Dahlquist suggested that adhesives with G′ higher than a limit of 105 Pa at the bonding frequency of
the tack test have poor adhesive strength (37). Adhesives with G′ below an acceptable limit at the
debonding frequency exhibit poor cohesive strength and large amounts of adhesive remain on the
skin during patch removal (33). A good shear adhesion performance is associated with a high plateau
modulus of G′ and thus with low tan values at lower frequencies. This is in contrast to the formerly
discussed requirement of a low G′ and a high tan for a good tack. Consequently, adhesives with a
low tan value at low frequencies show high shear adhesion but low tack and vice versa. With
placebo patches, low shear adhesion was correlated with good in-vivo adhesion performance (105).
In addition to the aspects discussed above, PSAs should have a Tg at least about 40 °C below
application temperature (33, 84).
3. Results and discussion 62
3.1.2.1. Strain sweeps
Evaluation of the recorded data showed no deviation from the linear viscoelastic behavior. Hence, the
LVR could be confirmed for the whole investigated range of strain, frequency, temperature, and API
concentration.
3.1.2.2. Frequency sweeps
The moduli G*, G′, G″, and the damping factor tan are plotted in dependence of the angular
frequency ω for 21 °C (Fig. 24a–d) and 32 °C (Fig. 25a–d). All moduli show frequency dependence in a
way that they increase with rising frequency at all ibuprofen concentrations and at both investigated
temperatures. Depending on the API concentration, the shape of the tan curves is characterized by
a shift of the minimum from ω = 1 to 5 rad/s at 21 °C and from ω = 8 to 20 rad/s at 32 °C.
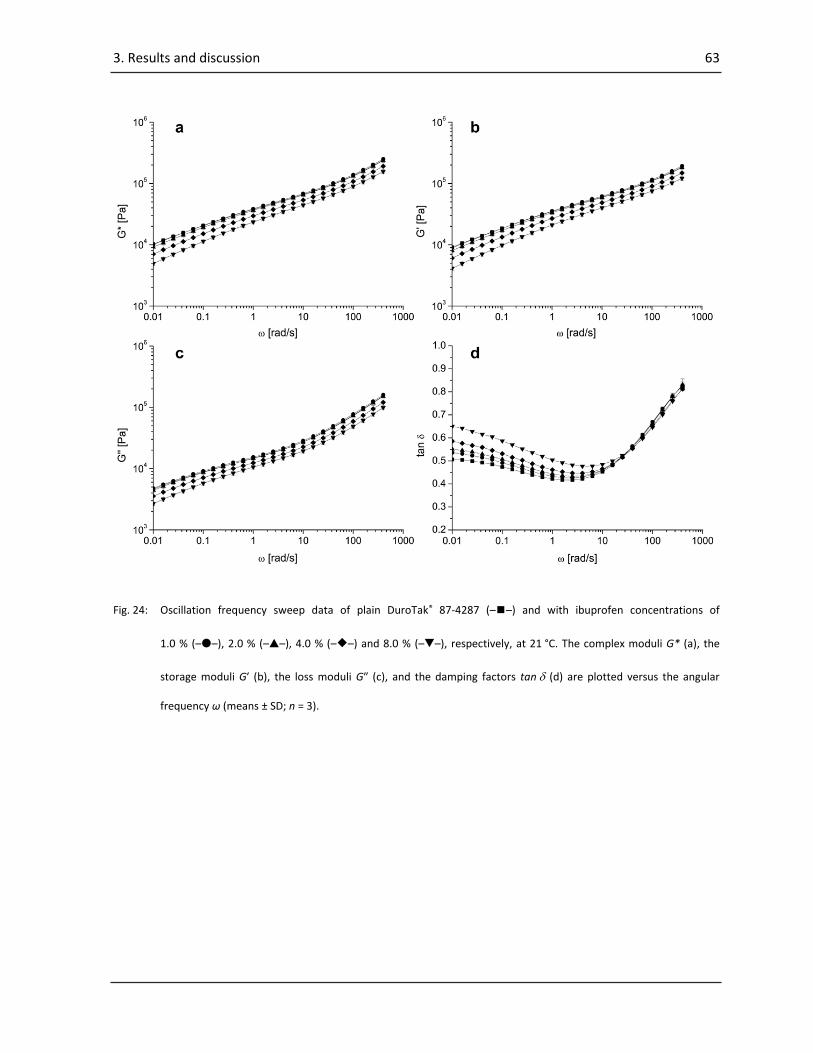
3. Results and discussion 63
Fig. 24: Oscillation frequency sweep data of plain DuroTak® 87-4287 (–◼–) and with ibuprofen concentrations of
1.0 % (–●–), 2.0 % (–▲–), 4.0 % (–◆–) and 8.0 % (–▼–), respectively, at 21 °C. The complex moduli G* (a), the
storage moduli G′ (b), the loss moduli G″ (c), and the damping factors tan (d) are plotted versus the angular
frequency ω (means ± SD; n = 3).
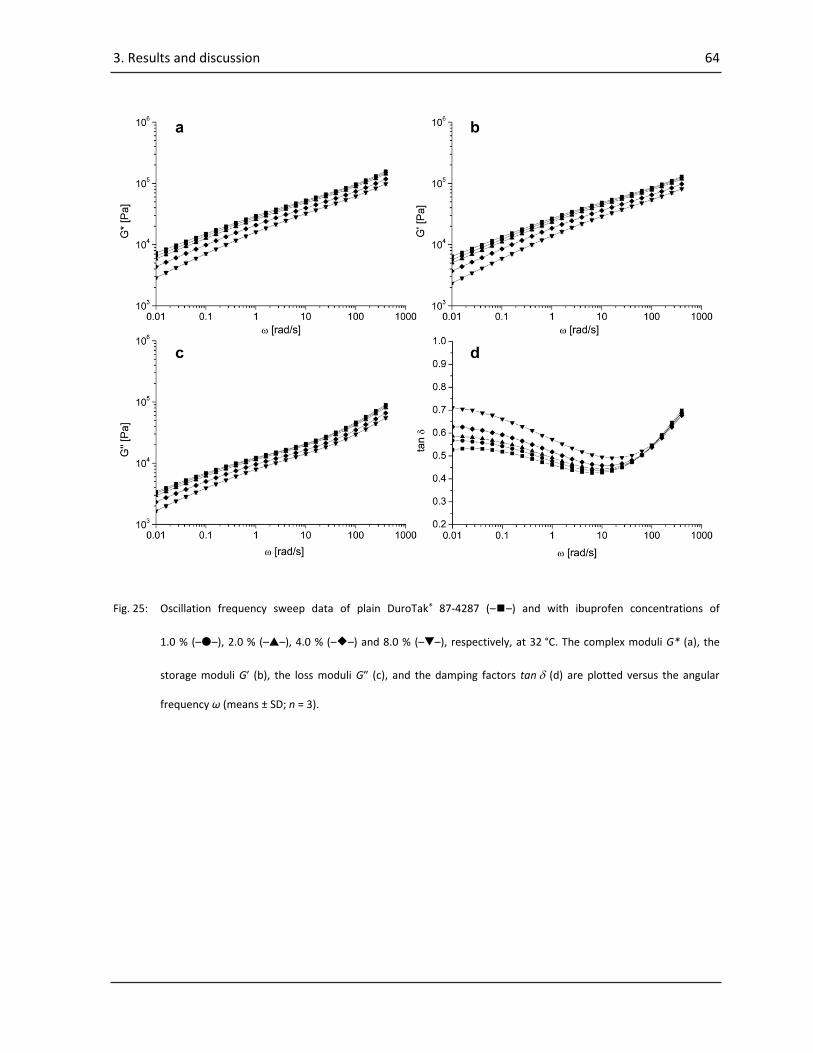
3. Results and discussion 64
Fig. 25: Oscillation frequency sweep data of plain DuroTak® 87-4287 (–◼–) and with ibuprofen concentrations of
1.0 % (–●–), 2.0 % (–▲–), 4.0 % (–◆–) and 8.0 % (–▼–), respectively, at 32 °C. The complex moduli G* (a), the
storage moduli G′ (b), the loss moduli G″ (c), and the damping factors tan (d) are plotted versus the angular
frequency ω (means ± SD; n = 3).
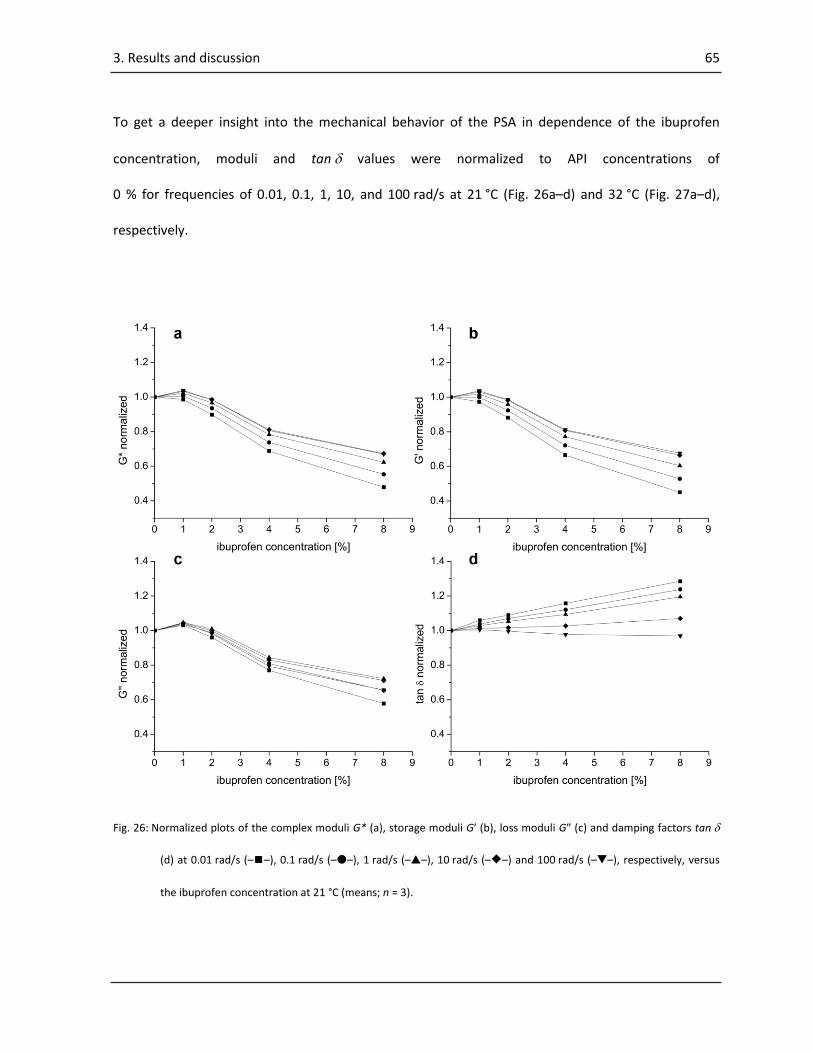
3. Results and discussion 65
To get a deeper insight into the mechanical behavior of the PSA in dependence of the ibuprofen
concentration, moduli and tan values were normalized to API concentrations of
0 % for frequencies of 0.01, 0.1, 1, 10, and 100 rad/s at 21 °C (Fig. 26a–d) and 32 °C (Fig. 27a–d),
respectively.
Fig. 26: Normalized plots of the complex moduli G* (a), storage moduli G′ (b), loss moduli G″ (c) and damping factors tan
(d) at 0.01 rad/s (–◼–), 0.1 rad/s (–●–), 1 rad/s (–▲–), 10 rad/s (–◆–) and 100 rad/s (–▼–), respectively, versus
the ibuprofen concentration at 21 °C (means; n = 3).

3. Results and discussion 66
Fig. 27: Normalized plots of the complex moduli G* (a), storage moduli G′ (b), loss moduli G″ (c), and damping factors tan
(d) at 0.01 rad/s (–◼–), 0.1 rad/s (–●–), 1 rad/s (–▲–), 10 rad/s (–◆–) and 100 rad/s (–▼–), respectively, versus
the ibuprofen concentration at 32 °C (means; n = 3).
At 21 °C, an ibuprofen- and frequency-dependent tendency of decreasing G*, G′ and G″ values was
observed (Fig. 26a–c). Obviously, the viscoelastic behavior of the PSA changes in dependence of the
ibuprofen concentration. At the lowest frequency, the decrease of G*, G,′ and G″ is most pronounced.
At high frequencies, this decrease is less pronounced with highest values of G* and G′ at an ibuprofen
concentration of 1 %. This is also true for G″, but at all investigated frequencies.
3. Results and discussion 67
To better understand the behavior of the moduli, the damping factor tan should be taken into
account. The tan gives insight into the proportion of dissipated to stored energy, i.e. the proportion
of viscous to elastic behavior. At lower frequencies, tan values increased with increasing
concentration of ibuprofen (Fig. 26d). The highest slope is apparent at ω = 0.01 rad/s with a decrease
at higher frequencies. At ω = 100 rad/s, no change in tan in dependence of the API concentration is
detected.
From these results, it may be summarized that ibuprofen concentrations of up to 1 % cause an
increase and higher ibuprofen concentrations a decrease in the mechanical strength of the PSA. An
increased damping behavior can be observed at low frequencies.
At 32 °C, a similar ibuprofen- and frequency-dependent tendency of a more pronounced decrease of
G*, G′, and G″ values at lower frequencies and a less pronounced decrease at higher frequencies was
observed (Fig. 27a–c). Interestingly, in contrast to the data derived at 21 °C, no maximum for the
moduli is observed. The damping behavior showed the same tendency of an increase of tan with
increased drug concentration for lower frequencies and no change in tan for higher frequencies
(Fig. 27d). These results show that ibuprofen causes a decrease in the mechanical strength of the PSA
at every investigated concentration. At lower frequencies, plastic deformation becomes more
apparent indicated by an increased tan .
The softening of a PSA by a small molecule can be described as the effect of plasticizing. In the
literature a plasticizer is defined as a low molecular weight compound that is added to polymers to
improve their flexibility, to lower their Tg, to decrease their tensile strength, stiffness, and toughness,
and to increase their elongation and ductility (35, 152–155, 178). The addition of low molecular
weight compounds reduces the entanglements of the PSA and decreases the storage modulus G′ (26,
3. Results and discussion 68
178). Furthermore, the modulus is decreased with increasing amount of plasticizer at all frequencies
(84). Plasticization can not only be caused by traditional plasticizers such as liquid paraffin (90, 178),
triacetin (91, 92) and triethyl citrate (TEC) (94) but also by APIs such as ibuprofen (72), ketoprofen
(152), nitroglycerin (21), nicotine (21), or chlorpheniramine maleate (155, 158). Based on the results
obtained at 21 °C, it is concluded that concentrations of above 2 % ibuprofen have a plasticizing effect
on DuroTak® 87-4287. In contrast, at 32 °C, ibuprofen has a plasticizing effect at every investigated
concentration.
The effect of increased moduli at 1 % ibuprofen concentration at 21 °C could be explained by the
phenomenon of antiplasticization. By incorporation of certain types of additives in polymers, the
storage modulus and tensile strength of the films are increased, and the elongation is decreased. This
effect is called antiplasticization, because except for the change in Tg, the opposite results are
obtained with plasticization such as decreased storage modulus and tensile strength and increased
elongation (35, 153). The anomaly of an increase in moduli and simultaneously reduction of the Tg is
associated with an increase in -relaxation temperature (179).
Antiplasticization depends on physical and physicochemical interactions between the API and the
polymer. On the one hand, time, temperature, stress, strain, and mechanical history affect the
antiplasticization effect (180, 181). On the other hand, molecular weight, polarity, and concentration
of the additive also have a significant influence (35, 160).
However, Anderson et al. (160) found that antiplasticization is based on the interaction of the
polymer chain ends with the additive. It is not clear whether this mechanism can also be postulated
for ibuprofen and DuroTak® 87-4287. Also, an interaction via hydrogen bonds with the alcohol side
chains of the polymer is possible.
3. Results and discussion 69
Known antiplasticizer polymer interactions were first observed by Jackson and Caldwell (153) and
further studied by Anderson et al. (160) with traditional plasticizer polymer combinations. These
interactions could also be observed for APIs as non-traditional plasticizers. Lee et al. (161)
investigated phenacetin acetanilide and polyethylene terephthalate (PET), and Lin et al. (162) studied
the influence of piroxicam on Eudragit® E. Based on the obtained results at 21 °C, it is concluded that a
concentration of 1 % ibuprofen has an antiplasticizing effect on DuroTak® 87-4287. At 32 °C, no
antiplasticizing effect by ibuprofen is apparent.
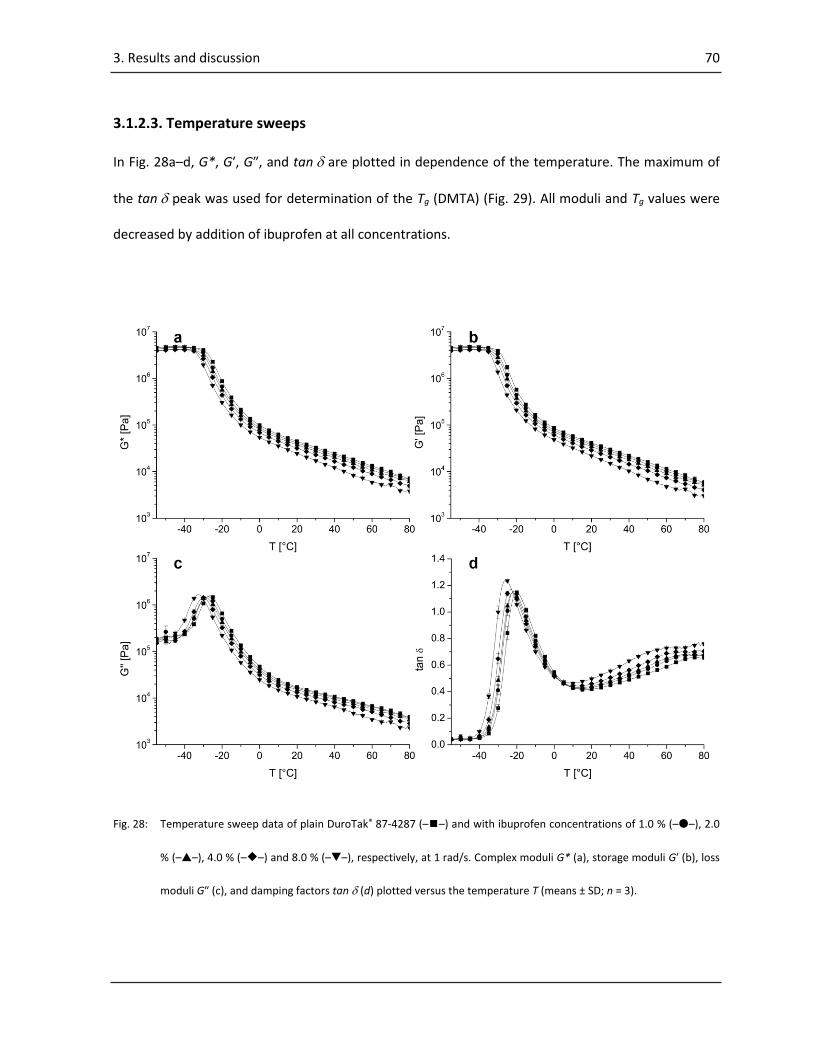
3. Results and discussion 70
3.1.2.3. Temperature sweeps
In Fig. 28a–d, G*, G′, G″, and tan are plotted in dependence of the temperature. The maximum of
the tan peak was used for determination of the Tg (DMTA) (Fig. 29). All moduli and Tg values were
decreased by addition of ibuprofen at all concentrations.
Fig. 28: Temperature sweep data of plain DuroTak® 87-4287 (–◼–) and with ibuprofen concentrations of 1.0 % (–●–), 2.0
% (–▲–), 4.0 % (–◆–) and 8.0 % (–▼–), respectively, at 1 rad/s. Complex moduli G* (a), storage moduli G′ (b), loss
moduli G″ (c), and damping factors tan (d) plotted versus the temperature T (means ± SD; n = 3).
3. Results and discussion 71
The addition of low molecular weight compounds such as plasticizers reduces the entanglements of
the polymer and lowers the plateau modulus of G′ and the glass transition temperature of the
systems (26, 178, 182).
At 21 °C, an increase of G*, G′, and G″ at 1 % drug concentration by antiplasticization as observed
with frequency sweeps at 21 °C could not be confirmed.
This may be explained by the fact that a strain of only 1 % was applied in the temperature sweep
experiments in contrast to a 5 % strain used in the frequency sweep experiments. Furthermore, the
PSA provides a mechanical deformation history due to the permanent deformation during
measurement. This supports the hypothesis of Mascia and Margetts (183) and Soong et al. (181) that
the antiplasticizing effect is a reversible physical crosslinking effect that depends on strain and
mechanical history.
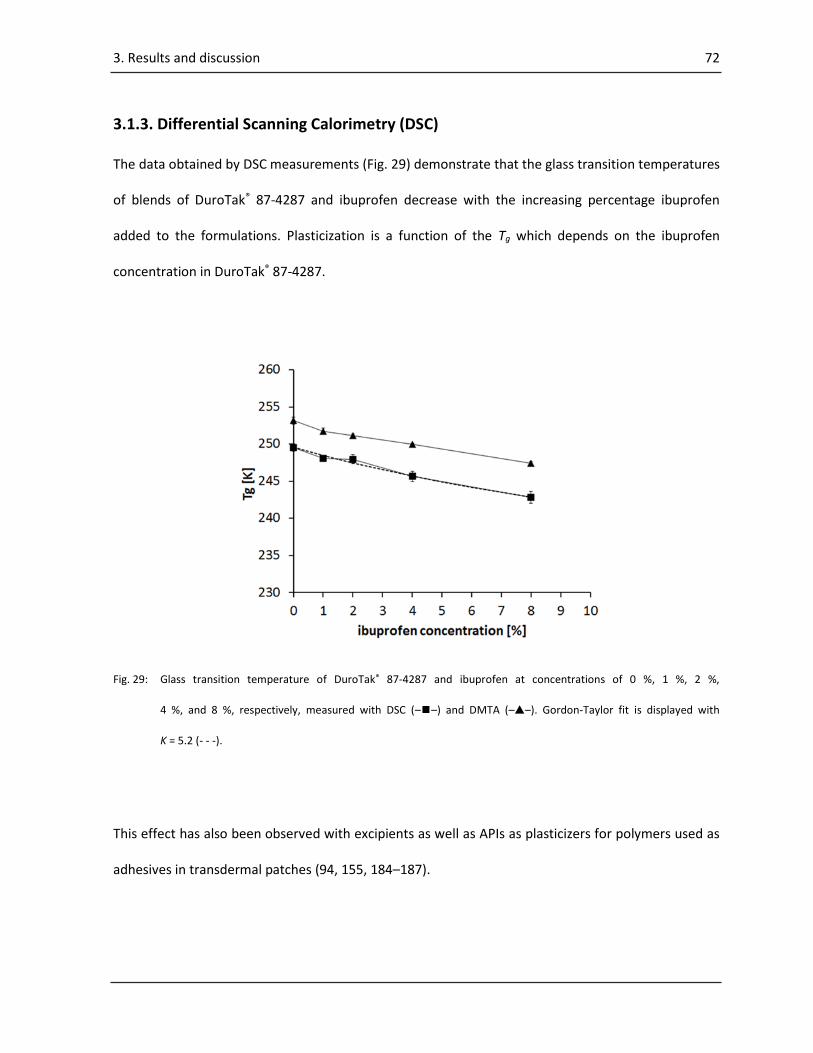
3. Results and discussion 72
3.1.3. Differential Scanning Calorimetry (DSC)
The data obtained by DSC measurements (Fig. 29) demonstrate that the glass transition temperatures
of blends of DuroTak® 87-4287 and ibuprofen decrease with the increasing percentage ibuprofen
added to the formulations. Plasticization is a function of the Tg which depends on the ibuprofen
concentration in DuroTak® 87-4287.
Fig. 29: Glass transition temperature of DuroTak® 87-4287 and ibuprofen at concentrations of 0 %, 1 %, 2 %,
4 %, and 8 %, respectively, measured with DSC (–◼–) and DMTA (–▲–). Gordon-Taylor fit is displayed with
K = 5.2 (- - -).
This effect has also been observed with excipients as well as APIs as plasticizers for polymers used as
adhesives in transdermal patches (94, 155, 184–187).
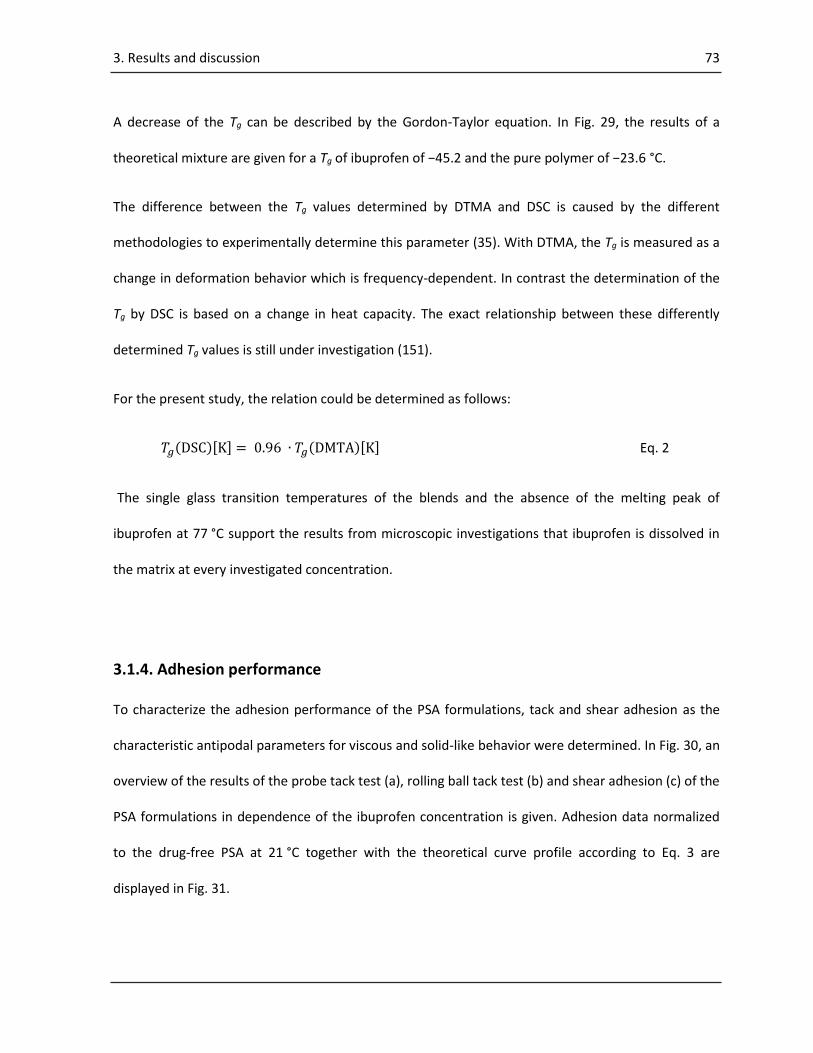
3. Results and discussion 73
A decrease of the Tg can be described by the Gordon-Taylor equation. In Fig. 29, the results of a
theoretical mixture are given for a Tg of ibuprofen of −45.2 and the pure polymer of −23.6 °C.
The difference between the Tg values determined by DTMA and DSC is caused by the different
methodologies to experimentally determine this parameter (35). With DTMA, the Tg is measured as a
change in deformation behavior which is frequency-dependent. In contrast the determination of the
Tg by DSC is based on a change in heat capacity. The exact relationship between these differently
determined Tg values is still under investigation (151).
For the present study, the relation could be determined as follows:
𝑇𝑔(DSC)[K] = 0.96 ∙ 𝑇𝑔(DMTA)[K] Eq. 2
The single glass transition temperatures of the blends and the absence of the melting peak of
ibuprofen at 77 °C support the results from microscopic investigations that ibuprofen is dissolved in
the matrix at every investigated concentration.
3.1.4. Adhesion performance
To characterize the adhesion performance of the PSA formulations, tack and shear adhesion as the
characteristic antipodal parameters for viscous and solid-like behavior were determined. In Fig. 30, an
overview of the results of the probe tack test (a), rolling ball tack test (b) and shear adhesion (c) of the
PSA formulations in dependence of the ibuprofen concentration is given. Adhesion data normalized
to the drug-free PSA at 21 °C together with the theoretical curve profile according to Eq. 3 are
displayed in Fig. 31.

3. Results and discussion 74
Fig. 30: Probe tack test (a), rolling ball tack test (b), shear adhesion (c) of DuroTak® 87-4287 at 21 °C and 32 °C (means ± SD;
n = 5 for probe tack test and rolling ball tack test, n = 3 for shear adhesion).
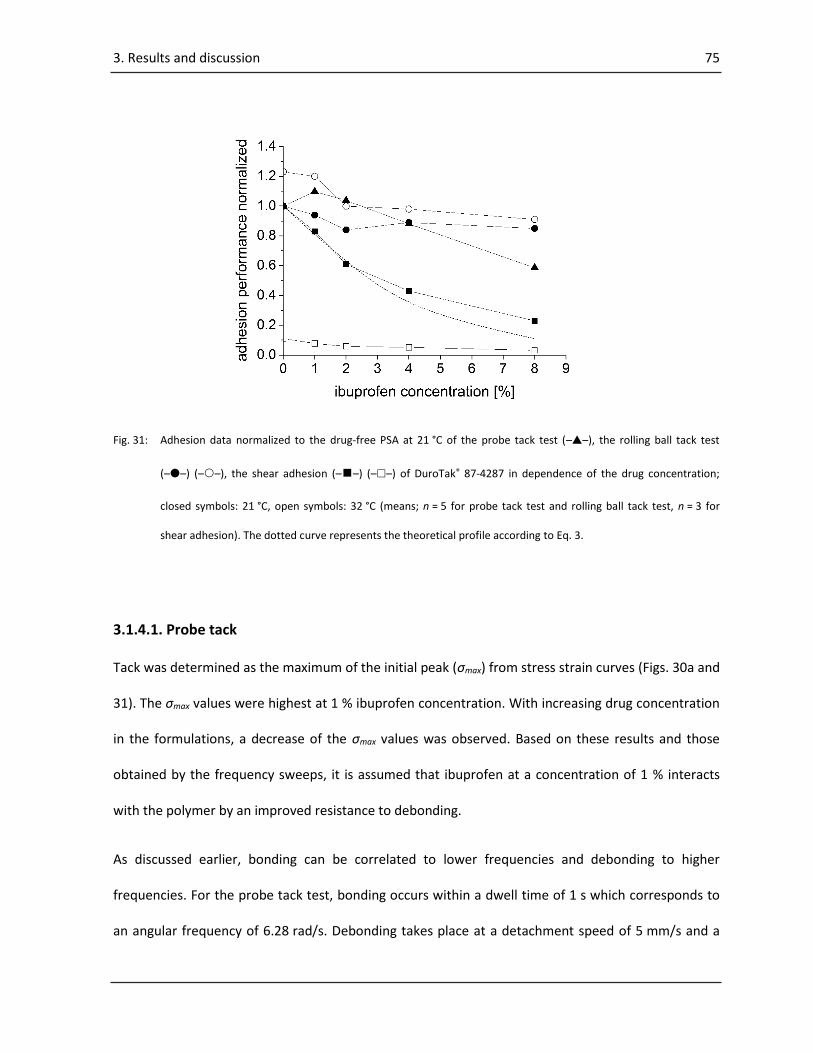
3. Results and discussion 75
Fig. 31: Adhesion data normalized to the drug-free PSA at 21 °C of the probe tack test (–▲–), the rolling ball tack test
(–●–) (––), the shear adhesion (–◼–) (––) of DuroTak® 87-4287 in dependence of the drug concentration;
closed symbols: 21 °C, open symbols: 32 °C (means; n = 5 for probe tack test and rolling ball tack test, n = 3 for
shear adhesion). The dotted curve represents the theoretical profile according to Eq. 3.
3.1.4.1. Probe tack
Tack was determined as the maximum of the initial peak (σmax) from stress strain curves (Figs. 30a and
31). The σmax values were highest at 1 % ibuprofen concentration. With increasing drug concentration
in the formulations, a decrease of the σmax values was observed. Based on these results and those
obtained by the frequency sweeps, it is assumed that ibuprofen at a concentration of 1 % interacts
with the polymer by an improved resistance to debonding.
As discussed earlier, bonding can be correlated to lower frequencies and debonding to higher
frequencies. For the probe tack test, bonding occurs within a dwell time of 1 s which corresponds to
an angular frequency of 6.28 rad/s. Debonding takes place at a detachment speed of 5 mm/s and a

3. Results and discussion 76
matrix thickness of 55 μm which correlates with an angular frequency higher than 100 rad/s. At the
debonding step, tack is mainly dependent on cohesion and therefore on the elastic modulus.
As determined by frequency sweeps, G′ is unaffected by antiplasticization at bonding frequencies,
while it is increased at debonding frequencies (Fig. 26b). As a result, bonding is unaffected by
ibuprofen, whereas debonding is increased. This indicates that tack is increased at a concentration of
1 % ibuprofen because of an increased resistance to debonding by antiplasticization.
At higher concentrations, ibuprofen has a plasticizing effect on the polymer, and all moduli are
decreased. Thus, both bonding and debonding are affected. Bonding is increased by an improved
wetting behavior, while debonding is decreased because G′ is below a critical value at the debonding
frequency, so that the PSA does not provide sufficient cohesion. Tack appears to be more influenced
by a reduced cohesion than by an improved wetting behavior. Thus, a decrease in tack was observed
at higher ibuprofen concentrations.
The phenomenon of an initial increase compared to the plain PSA and a final decrease in the tack by
increasing concentrations of an API or excipient in PSAs has already been described before (91, 152,
186, 188). However, this observation has not yet been explained by the viscoelastic mechanism of
plasticizing and antiplasticizing.
3.1.4.2. Rolling ball tack
The distance traveled by the ball is inversely proportional to the tackiness of the adhesive. A higher
ball distance means lower tackiness. In Fig. 30b, it is shown that the distance traveled by the rolling
ball increases with increasing ibuprofen concentration at 21 °C and 32 °C, respectively. Apparently,
tack is increased at elevated temperature and decreased at higher ibuprofen concentrations (Fig. 31).
3. Results and discussion 77
In contrast to the probe tack experiment, the anomaly of an increased tack at low drug
concentrations could not be observed. On the one hand, the strain rate dependency for
antiplasticization may be responsible for this observation. The strain rate i.e. the frequency of the
rolling ball tack test is believed to be higher than that of the probe tack test. On the other hand, it
should be noted that the data showed unsatisfactory reproducibility. To reduce the high standard
deviation, larger steel balls were used to maximize the traveling distance. However, even with these
steel balls, the standard deviation could not be noticeably reduced. It becomes clear that there is a
trade-off between the simplicity of the experimental setup and the challenge in interpreting the data.
3.1.4.3. Shear adhesion
It was found that the shear adhesion significantly decreased with increasing concentrations of
ibuprofen (Fig. 30c). At 21 °C, the time to failure is decreased from 140 s (drug-free PSA) to 30 s at a
concentration of 8 % ibuprofen. A temperature increase in the drug-free PSA to skin temperature of
32 °C results in a decrease in the time to failure from 140 s to 15 s. If under these conditions, the drug
concentration is increased up to 8 %, a final decrease in the time failure to 5 s is registered. These
results are consistent with the data published by Minghetti et al., which revealed that the addition of
miconazole nitrate to a methacrylic-based PSA significantly decreased shear adhesion values (189).
Cilurzo et al. observed that potassium diclofenac and nicotine cause a reduction in the shear adhesion
of a polyacrylate matrix to 9 % of the shear adhesion of the drug-free matrix (91).
The shear adhesion is controlled by zero shear viscosity η0 which is related to molecular weight Mw,
molecular weight between entanglements Me, temperature T, glass transition temperature Tg, and
the fitting parameters A and B by the following equation (37):
3. Results and discussion 78
log 𝜂0 = 3.4 log 𝑀𝑤 − 2.4 log 𝑀𝑒 +𝐴
(𝑇−𝑇𝑔+70)+ 𝐵 Eq. 3
From Fig. 31, it is obvious that a good approximation results if a constant Mw and Me changes in the
order of 1/G′ at ω = 1 rad/s and Tg values from DTMA measurements are chosen.
The approach to choose 1/G′ for Me is based on the reciprocal relationship between the storage
modulus and the Me of a polymer (37). The frequency of 1 rad/s was chosen because it is in the same
order of magnitude as the corresponding angular frequency ω derived by the deformation s/d and
time to failure t via:
�̇� = 𝑠
𝑑 ∙ 𝑡 =̂ 𝜔 Eq. 4
Applied to our experimental conditions, the following angular frequency of 1.7 rad/s was calculated.
γ ̇ = 12 mm
0.05 mm ∙ 140 s = 1.7 s-1 =̂ 1.7 rad/s Eq. 5
At higher drug concentrations, the theoretical curve deviates from the measured data, because the
frequency of 1.7 rad/s corresponds to the time to failure of the drug-free PSA. At higher drug
concentrations, the time to failure decreases, and thus, the shear rate and corresponding frequency
increases. At higher frequencies, a higher G′ was observed and η0, or more precisely, the shear
adhesion is expected to be higher than calculated.
From these results, it may be concluded that the shear adhesion of DuroTak® 87-4287 is decreased by
addition of ibuprofen. Shear adhesion is mostly influenced by the temperature, while
antiplasticization has only a marginal effect.
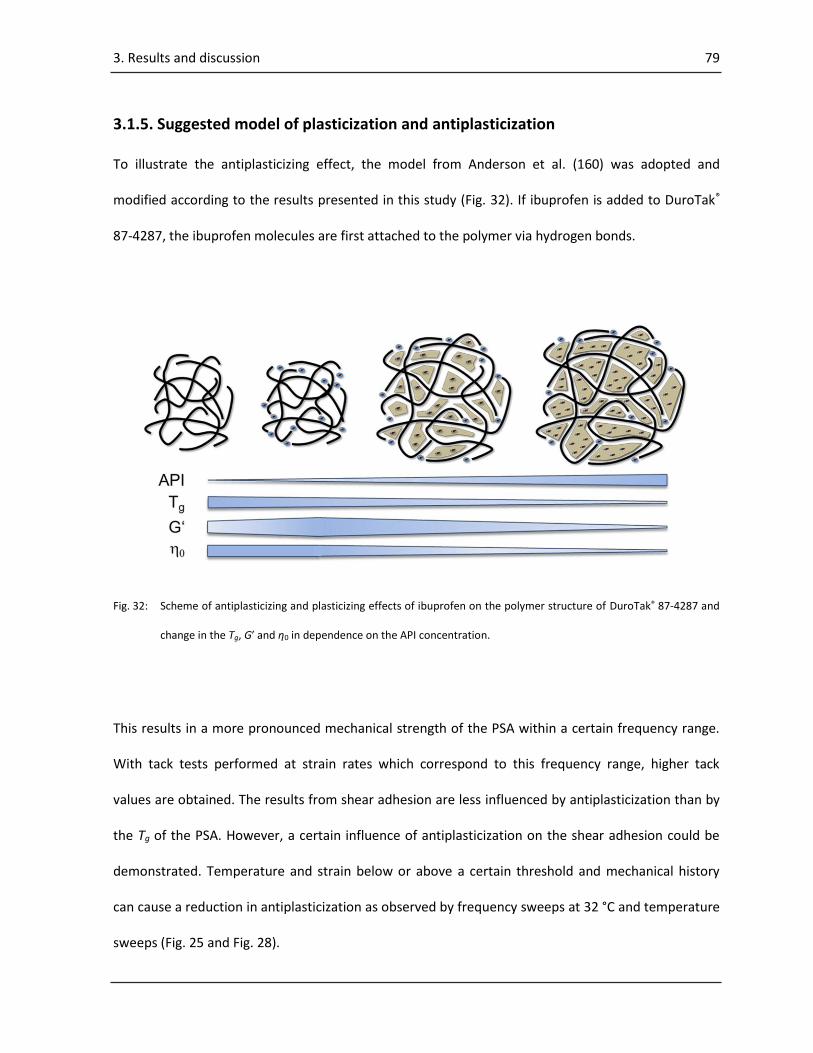
3. Results and discussion 79
3.1.5. Suggested model of plasticization and antiplasticization
To illustrate the antiplasticizing effect, the model from Anderson et al. (160) was adopted and
modified according to the results presented in this study (Fig. 32). If ibuprofen is added to DuroTak®
87-4287, the ibuprofen molecules are first attached to the polymer via hydrogen bonds.
Fig. 32: Scheme of antiplasticizing and plasticizing effects of ibuprofen on the polymer structure of DuroTak® 87-4287 and
change in the Tg, G′ and η0 in dependence on the API concentration.
This results in a more pronounced mechanical strength of the PSA within a certain frequency range.
With tack tests performed at strain rates which correspond to this frequency range, higher tack
values are obtained. The results from shear adhesion are less influenced by antiplasticization than by
the Tg of the PSA. However, a certain influence of antiplasticization on the shear adhesion could be
demonstrated. Temperature and strain below or above a certain threshold and mechanical history
can cause a reduction in antiplasticization as observed by frequency sweeps at 32 °C and temperature
sweeps (Fig. 25 and Fig. 28).
3. Results and discussion 80
If larger quantities of ibuprofen are added, ibuprofen will accumulate in the free volume domains,
and the average domain size increases. Moduli and therefore mechanical strength are reduced by the
effect of plasticizing. In terms of adhesion properties, tack adhesion and shear adhesion decrease.
It is suggested that API/polymer blends may possess an antiplasticizing space which is characterized
by time, temperature, stress, strain, molecular weight, and polarity of both compounds and additive
concentration.
3.1.6. Conclusion
If a substance is added to a PSA, an unpredictable alteration of the mechanical properties can occur.
Rheometry is a powerful tool to make predictions concerning the adhesion performance and the
influence of the API or other additives on the viscoelastic behavior of the PSA. It was demonstrated
that ibuprofen may act as plasticizer or antiplasticizer on DuroTak® 87-4287 (see Fig. 32). The
plasticizing/antiplasticizing effect depends on the API concentration, temperature, strain, strain rate,
and mechanical history. Thus, it is necessary to adjust the factors of the tests such that the condition
for the intended application is simulated. It could be shown that the elastic modulus G′ correlates
well with the results obtained by probe tack measurements. Tack and G′ were affected by
plasticization and antiplasticization in dependence of ibuprofen concentration. Shear adhesion is
mainly influenced by the Tg and the temperature. Antiplasticization contributes only marginally to the
results of shear adhesion because of the low strain rate of the test.
In consequence, an alteration of the concentration of an API in a polymer by diffusion out of the
polymer or migration into the polymer can lead to a change in the mechanical behavior due to
plasticizing or antiplasticizing. Because the antiplasticizing space of an API/polymer blend can

3. Results and discussion 81
certainly influence processing, stability and in vivo behavior a formulation containing the blend and
therefore needs to be further investigated with regards to known API/polymer combinations.
3. Results and discussion 82
3.2. Results and discussions of “Systematic investigation of the probe tack
test”
In the second study, DuroTak® 387-2287, a solvent-based crosslinked acrylic PSA is investigated with
the probe tack test by a DoE approach to evaluate all significant factors and possible interactions that
may influence the test result.
3.2.1. DMA Measurements
The results of the frequency sweeps are displayed in Fig. 33. With increasing ibuprofen content, the
modulus G* decreases at all investigated frequencies whereas tan values increase at lower
frequencies. The onset of glass transition is shifted to higher frequencies with increasing ibuprofen
content accompanied by a decrease of the tan values at higher frequencies.
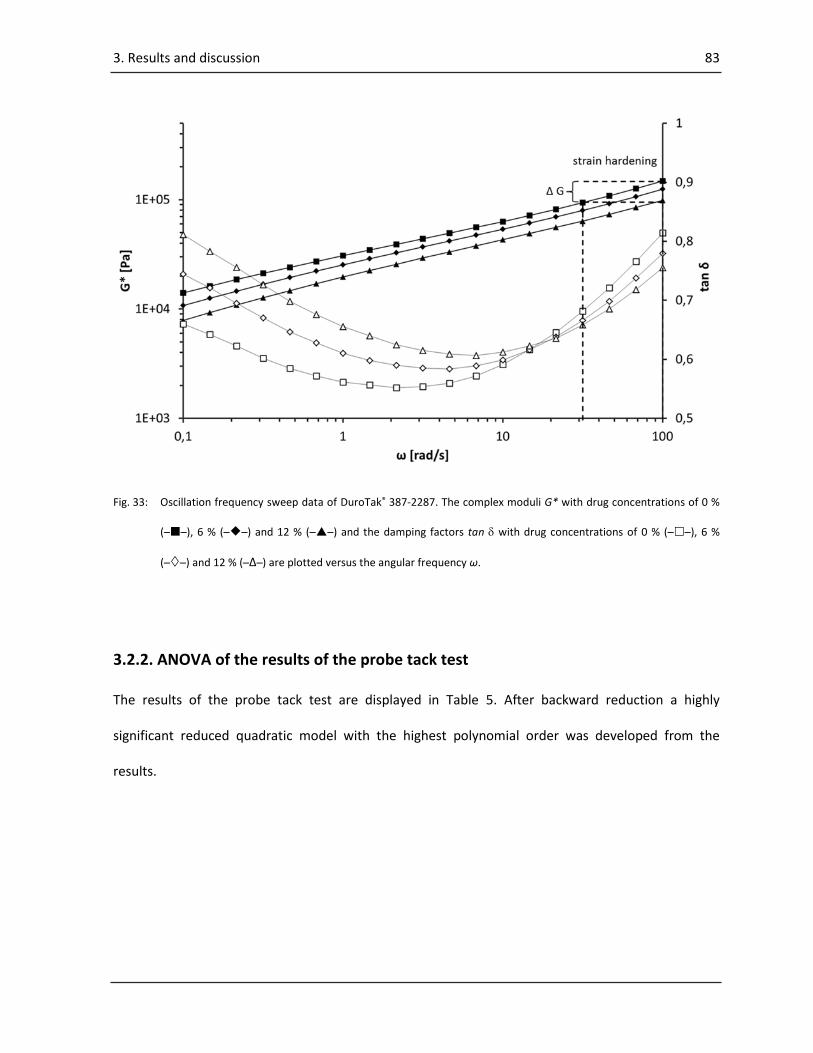
3. Results and discussion 83
Fig. 33: Oscillation frequency sweep data of DuroTak® 387-2287. The complex moduli G* with drug concentrations of 0 %
(──), 6 % (──) and 12 % (──) and the damping factors tan with drug concentrations of 0 % (──), 6 %
(──) and 12 % (─Δ─) are plotted versus the angular frequency ω.
3.2.2. ANOVA of the results of the probe tack test
The results of the probe tack test are displayed in Table 5. After backward reduction a highly
significant reduced quadratic model with the highest polynomial order was developed from the
results.
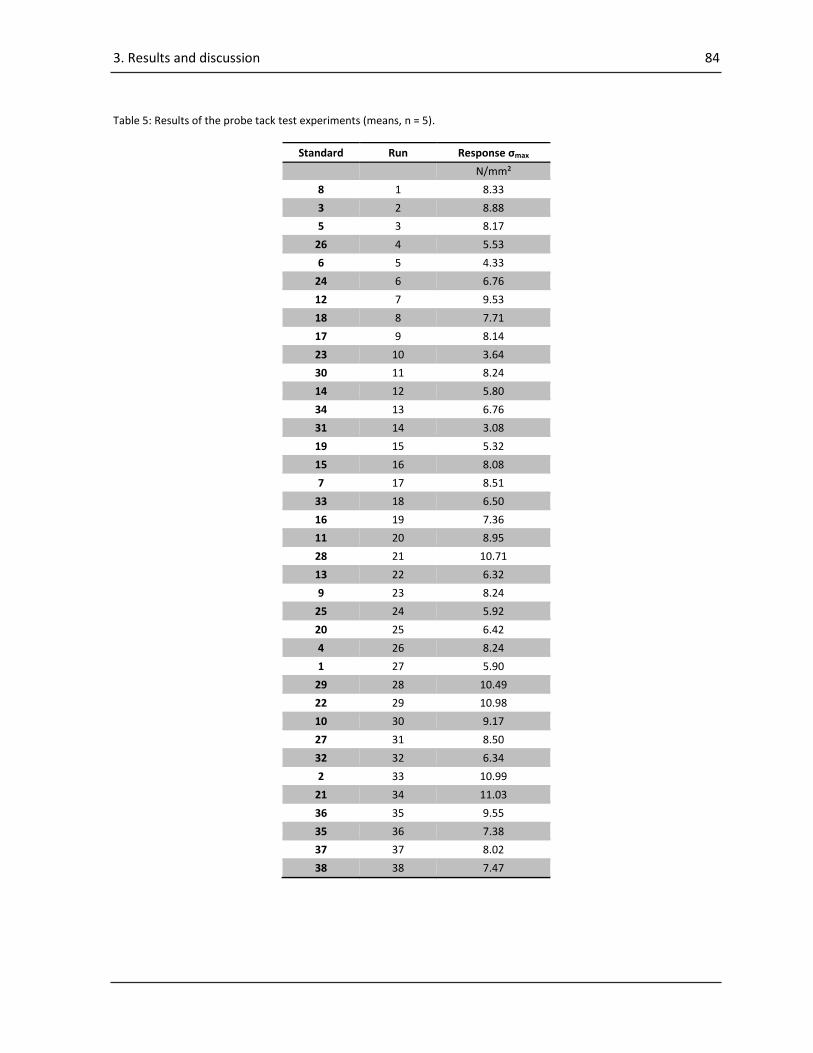
3. Results and discussion 84
Table 5: Results of the probe tack test experiments (means, n = 5).
Standard Run Response σmax
N/mm²
8 1 8.33
3 2 8.88
5 3 8.17
26 4 5.53
6 5 4.33
24 6 6.76
12 7 9.53
18 8 7.71
17 9 8.14
23 10 3.64
30 11 8.24
14 12 5.80
34 13 6.76
31 14 3.08
19 15 5.32
15 16 8.08
7 17 8.51
33 18 6.50
16 19 7.36
11 20 8.95
28 21 10.71
13 22 6.32
9 23 8.24
25 24 5.92
20 25 6.42
4 26 8.24
1 27 5.90
29 28 10.49
22 29 10.98
10 30 9.17
27 31 8.50
32 32 6.34
2 33 10.99
21 34 11.03
36 35 9.55
35 36 7.38
37 37 8.02
38 38 7.47
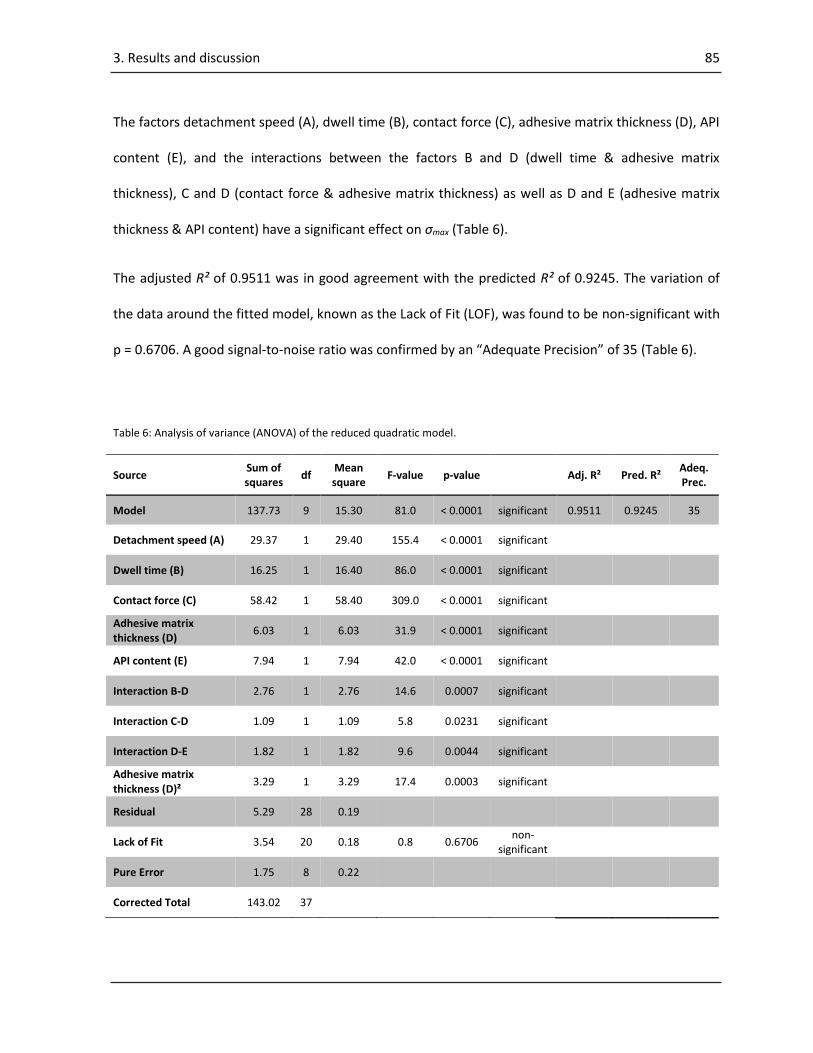
3. Results and discussion 85
The factors detachment speed (A), dwell time (B), contact force (C), adhesive matrix thickness (D), API
content (E), and the interactions between the factors B and D (dwell time & adhesive matrix
thickness), C and D (contact force & adhesive matrix thickness) as well as D and E (adhesive matrix
thickness & API content) have a significant effect on σmax (Table 6).
The adjusted R² of 0.9511 was in good agreement with the predicted R² of 0.9245. The variation of
the data around the fitted model, known as the Lack of Fit (LOF), was found to be non-significant with
p = 0.6706. A good signal-to-noise ratio was confirmed by an “Adequate Precision” of 35 (Table 6).
Table 6: Analysis of variance (ANOVA) of the reduced quadratic model.
Source Sum of squares
df Mean square
F-value p-value
Adj. R² Pred. R² Adeq. Prec.
Model 137.73 9 15.30 81.0 < 0.0001 significant 0.9511 0.9245 35
Detachment speed (A) 29.37 1 29.40 155.4 < 0.0001 significant
Dwell time (B) 16.25 1 16.40 86.0 < 0.0001 significant
Contact force (C) 58.42 1 58.40 309.0 < 0.0001 significant
Adhesive matrix thickness (D)
6.03 1 6.03 31.9 < 0.0001 significant
API content (E) 7.94 1 7.94 42.0 < 0.0001 significant
Interaction B-D 2.76 1 2.76 14.6 0.0007 significant
Interaction C-D 1.09 1 1.09 5.8 0.0231 significant
Interaction D-E 1.82 1 1.82 9.6 0.0044 significant
Adhesive matrix thickness (D)²
3.29 1 3.29 17.4 0.0003 significant
Residual 5.29 28 0.19
Lack of Fit 3.54 20 0.18 0.8 0.6706 non-
significant
Pure Error 1.75 8 0.22
Corrected Total 143.02 37
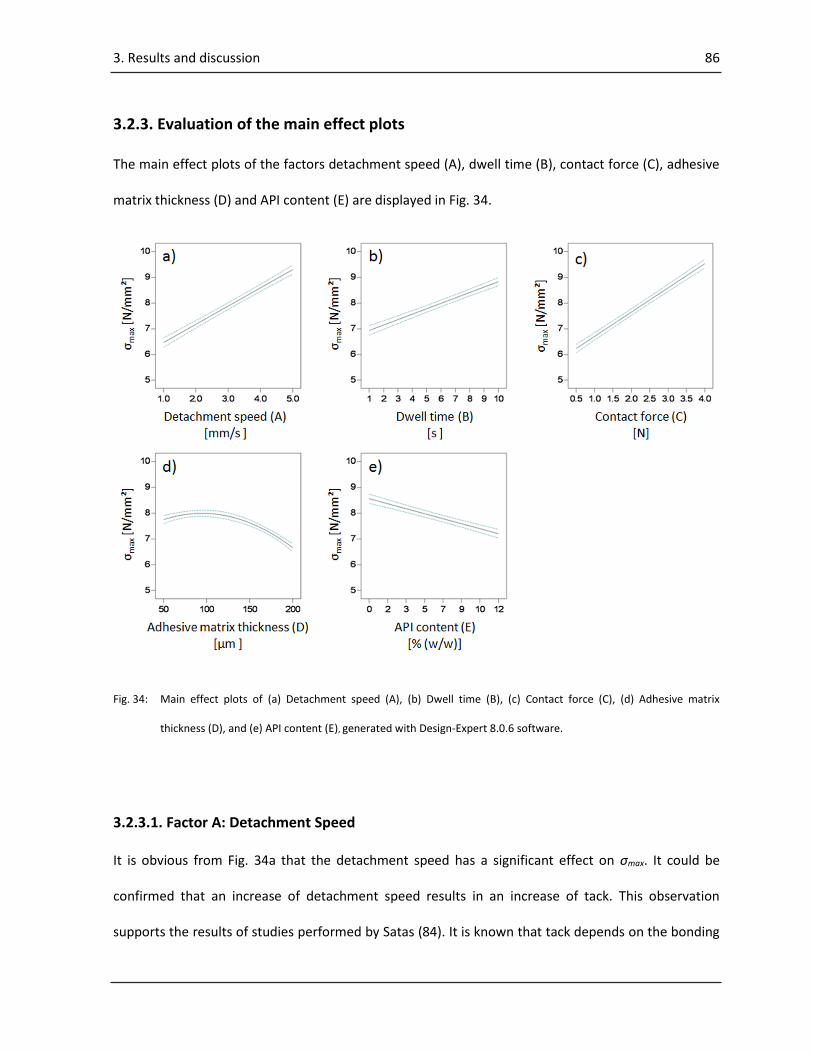
3. Results and discussion 86
3.2.3. Evaluation of the main effect plots
The main effect plots of the factors detachment speed (A), dwell time (B), contact force (C), adhesive
matrix thickness (D) and API content (E) are displayed in Fig. 34.
Fig. 34: Main effect plots of (a) Detachment speed (A), (b) Dwell time (B), (c) Contact force (C), (d) Adhesive matrix
thickness (D), and (e) API content (E), generated with Design-Expert 8.0.6 software.
3.2.3.1. Factor A: Detachment Speed
It is obvious from Fig. 34a that the detachment speed has a significant effect on σmax. It could be
confirmed that an increase of detachment speed results in an increase of tack. This observation
supports the results of studies performed by Satas (84). It is known that tack depends on the bonding

3. Results and discussion 87
and debonding process between the probe and the adhesive and thus on the storage modulus G’
(37). The larger G’ the higher the tack, provided that the Dahlquist criterion of G’ < 105 Pa is met
(107). However, moduli of PSAs are not intrinsic material characteristics. They depend on the
experimental parameters used, such as strain rate represented by the detachment speed (37). The
detachment speed is proportional to the strain rate �̇� which can be transformed into the respective
frequency :
𝑣
ℎ= �̇� =̂ 𝜔 Eq. 6
With the results of the rheological experiments it could be confirmed that the PSA undergoes a so
called strain hardening (positive ΔG) at the debonding step with increasing detachment speed (Fig.
33).
3.2.3.2. Factor B: Dwell time
The dwell time has a positive effect on the response σmax as shown In Fig. 34b. As found by Sherriff et
al. (85), tack is also a function of wetting. Good wetting requires a sufficient fluidity of the adhesive
on the one hand, and enough time to spread on the contact area on the other hand (37). Therefore,
Dahlquist connected tack to the creep compliance J(t) which is a function of time (190).
An alternative approach to explain the effect of the dwell time involves the apparent modulus Ea.
Assuming, that the initial contact area between the adhesive and the probe at zero force is negligible,
the contact area Ac is a function of the apparent modulus Ea, the contact force Fc and the fitting
parameter according to Tordjeman et al. (135) as follows:
𝐴𝑐 ≈ 𝛽𝐹𝑐
𝐸𝑎 Eq. 7
3. Results and discussion 88
The value of the fitting parameter depends on the applied force and the apparent modulus. Ea
represents the counteraction between the thickness h and the roughness ⟨𝑎⟩ of the adhesive:
𝐸𝑎 = 𝐸 (1 +⟨𝑎⟩2
2ℎ2 ) Eq. 8
According to Mezger (191), the tensile modulus E is directly proportional to the shear modulus G. As
observed in Fig. 33, G measured as G* in oscillatory shear decreases with decreasing frequencies (i.e.
increasing dwell time). From these facts it may be concluded that, if the dwell time is prolonged, Ea
decreases and the resulting contact area Ac increases.
The further explanation for the positive effect of the dwell time on σmax is given by Creton et al. (107):
A longer dwell time may increase the degree of relaxation of the adhesive at the start of the
debonding phase. An adhesive with a relaxed polymer structure will show a higher tack than a non-
relaxed adhesive.
In summary, it can be postulated that all three effects, namely creep compliance, apparent modulus
and degree of relaxation contribute to an increase of tack with prolonged dwell time. These results
confirm earlier studies also performed within the time frame of 1 to 10 s by Zosel (134), Satas (190)
and Duncan et al. (109).
3.2.3.3. Factor C: Contact force
The applied contact force has a significant effect on the tack: With increasing contact force, σmax
increases (Fig. 34c). At high contact forces spreading and wetting are more pronounced resulting
from the relationship between the contact area Ac and the contact force Fc (Eq. 7). These results
confirm the observations by Satas (190) and Duncan (109).

3. Results and discussion 89
3.2.3.4. Factor D: Adhesive matrix thickness
The obtained data of the probe tack test demonstrate that σmax is related to the square of the
adhesive matrix thickness, with lowest values at 200 µm and a maximum at around 100 µm (Fig. 34d).
There are four relevant parameters affected by the adhesive matrix thickness which influence the
response σmax: Strain rate, contact area, solvent residuals, and oriented polymer fraction.
With increasing film thickness h a decrease of the strain rate �̇� at the debonding stage will result
according to Eq. 6. As already discussed in chapter 3.2.3.1, σmax depends on strain rate and an
increasing film thickness will cause a negative effect on the tack. This effect is most pronounced with
thin films as the strain rate decreases non-linearly with increasing adhesive matrix thickness (Eq. 6,
Fig. 35).
With increasing adhesive matrix thickness, an increase of the contact area Ac by a decrease of the
apparent modulus Ea will occur according Eqs. 7 and 8. For viscoelastic polymers, it has additionally to
be considered that the modulus E will decrease with decreasing strain rate �̇� according to the
decrease of G* in Fig. 33 and chapter 3.2.3.1. A higher contact area Ac will result in a higher σmax (Fig.
35). This effect is more pronounced with thin films as the contact area Ac decreases non-linearly with
decreasing adhesive matrix thickness h according to Eqs. 7 and 8.
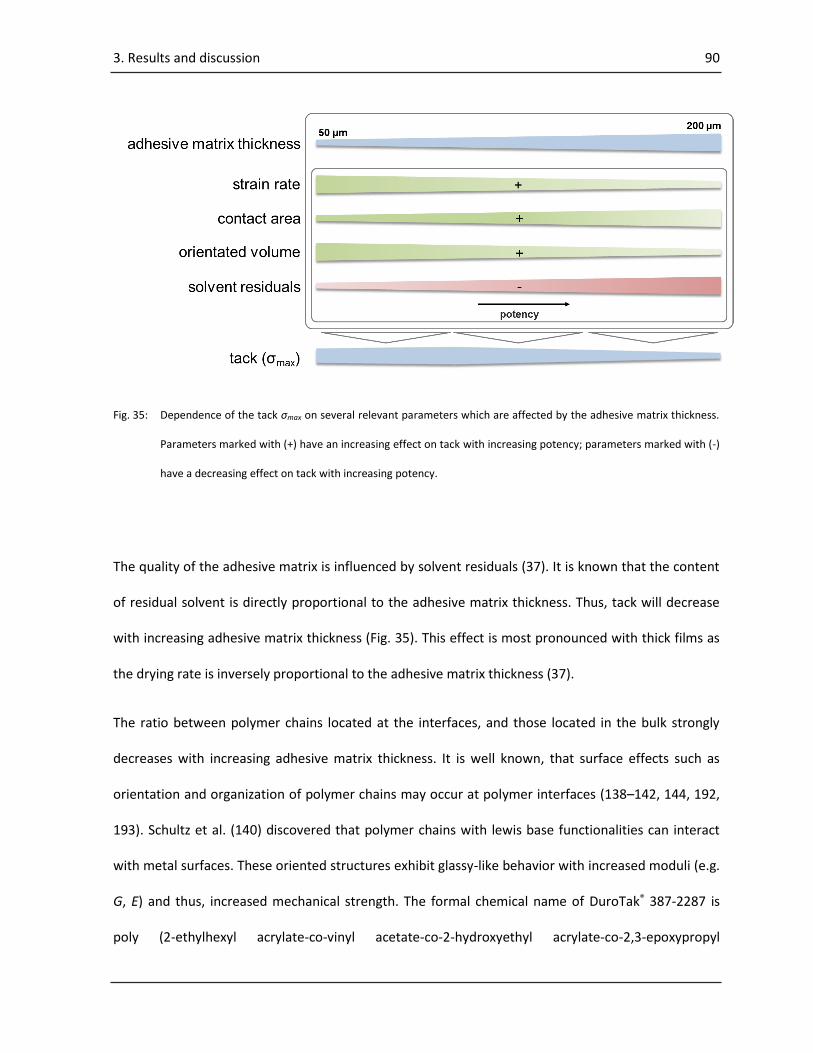
3. Results and discussion 90
Fig. 35: Dependence of the tack σmax on several relevant parameters which are affected by the adhesive matrix thickness.
Parameters marked with (+) have an increasing effect on tack with increasing potency; parameters marked with (-)
have a decreasing effect on tack with increasing potency.
The quality of the adhesive matrix is influenced by solvent residuals (37). It is known that the content
of residual solvent is directly proportional to the adhesive matrix thickness. Thus, tack will decrease
with increasing adhesive matrix thickness (Fig. 35). This effect is most pronounced with thick films as
the drying rate is inversely proportional to the adhesive matrix thickness (37).
The ratio between polymer chains located at the interfaces, and those located in the bulk strongly
decreases with increasing adhesive matrix thickness. It is well known, that surface effects such as
orientation and organization of polymer chains may occur at polymer interfaces (138–142, 144, 192,
193). Schultz et al. (140) discovered that polymer chains with lewis base functionalities can interact
with metal surfaces. These oriented structures exhibit glassy-like behavior with increased moduli (e.g.
G, E) and thus, increased mechanical strength. The formal chemical name of DuroTak® 387-2287 is
poly (2-ethylhexyl acrylate-co-vinyl acetate-co-2-hydroxyethyl acrylate-co-2,3-epoxypropyl
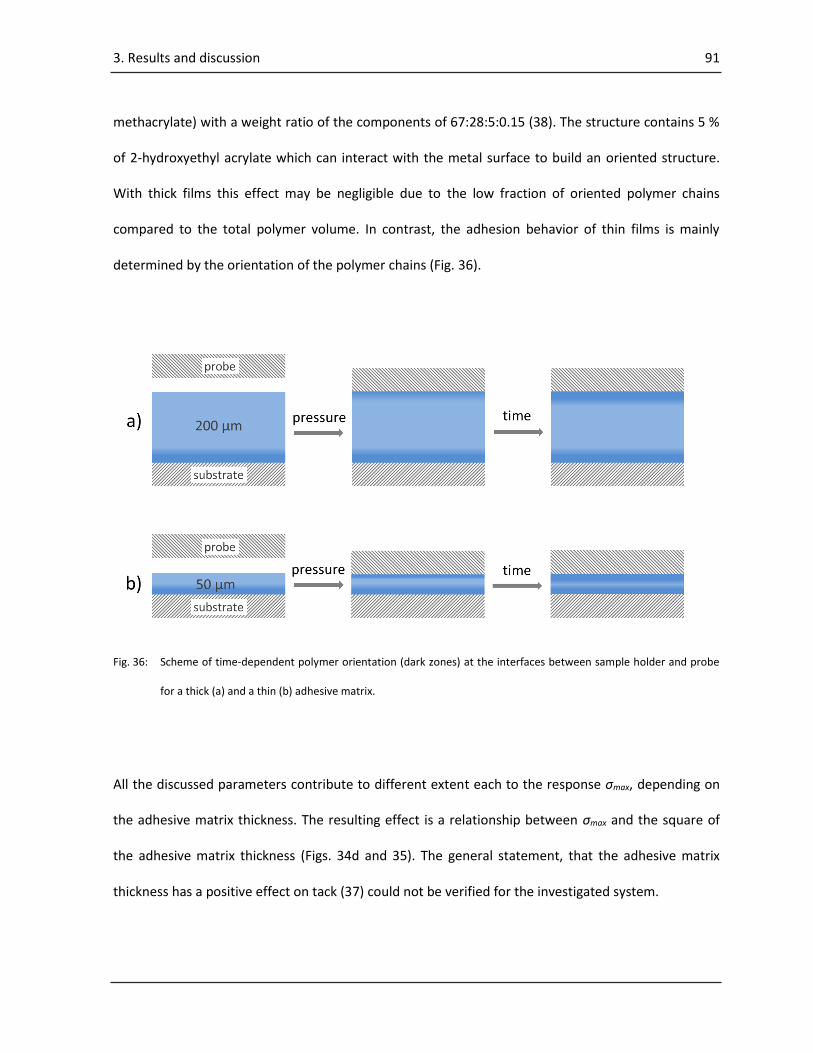
3. Results and discussion 91
methacrylate) with a weight ratio of the components of 67:28:5:0.15 (38). The structure contains 5 %
of 2-hydroxyethyl acrylate which can interact with the metal surface to build an oriented structure.
With thick films this effect may be negligible due to the low fraction of oriented polymer chains
compared to the total polymer volume. In contrast, the adhesion behavior of thin films is mainly
determined by the orientation of the polymer chains (Fig. 36).
Fig. 36: Scheme of time-dependent polymer orientation (dark zones) at the interfaces between sample holder and probe
for a thick (a) and a thin (b) adhesive matrix.
All the discussed parameters contribute to different extent each to the response σmax, depending on
the adhesive matrix thickness. The resulting effect is a relationship between σmax and the square of
the adhesive matrix thickness (Figs. 34d and 35). The general statement, that the adhesive matrix
thickness has a positive effect on tack (37) could not be verified for the investigated system.

3. Results and discussion 92
3.2.3.5. Factor E: API Content
The ibuprofen content has a negative effect on σmax, with an increasing API content leading to a linear
decrease of σmax (Fig. 34e). A decrease of tack caused by an API has been observed earlier (186, 188),
and explained by a plasticizing effect of the API.
The results of the probe tack test could also be confirmed by rheological measurements (Fig. 33). The
shear modulus G* decreases at all investigated frequencies with increasing amount of ibuprofen,
which is a known evidence for plasticization (26, 84).
3.2.4. Interaction plots
The response surface plots of the interactions BD, CD and DE are displayed in Fig. 37.
Fig. 37: Response surface plots of the probe tack test experiments with σmax in dependence of (a) Dwell time (B) and
adhesive matrix thickness (D), (b) Contact force (C) and adhesive matrix thickness (D), (c) Adhesive matrix thickness
(D) and API content (E), generated with Design-Expert 8.0.6 software.
3. Results and discussion 93
3.2.4.1. Interaction between Factors B and D
From the results of the ANOVA the two factors dwell time and adhesive matrix thickness were
identified to interact (Table 6). The response surface plot in Fig. 37a shows an effect of the dwell time
on σmax that is dependent on the adhesive matrix thickness.
As shown earlier (Fig. 35), for thin adhesive matrices the most relevant parameters effecting σmax are
strain rate, contact area and oriented polymer volume. The strain rate is independent of the dwell
time and will therefore not be considered as a relevant parameter.
The contact area Ac increases by decreasing the storage modulus (chapter 3.2.3.4). This effect occurs
regardless of the adhesive matrix thickness. Therefore, this parameter may not be responsible for the
more pronounced increase of σmax observed with thin adhesive matrices in dependence of the dwell
time (Fig. 37a).
Hence, the oriented polymer fraction (Fig. 36) is the only parameter which explains the interaction. A
longer contact time with the metal surface causes a further orientation of the polymer, because
orientation is a time-dependent process (140). As shown in Fig. 36, this orientation is more prominent
in thin than in thick adhesive matrices as the fraction of oriented polymer chains in thin adhesive
matrices is higher than in thick films. Thus, the mechanical strength of thin adhesive matrices is
increased by orientation of the polymer chains, resulting in an increase of tack.
3.2.4.2. Interaction between Factors C and D
From the data displayed in Fig. 37b an interaction of the adhesive matrix thickness and the contact
force becomes apparent. The contact force has a higher impact on σmax at thin adhesive matrices than
3. Results and discussion 94
at thick films. This result is somehow unexpected, because from Eqs. 7 and 8 it can be expected that
the increase of the contact area Ac is more pronounced with thick films than with thin films.
As discussed before, the most important parameters influencing the tack of thin adhesive matrices
are the contact area Ac and the oriented polymer fraction. Again, the mechanical strength of thin
adhesive matrices appears to be higher than that of thicker films. If the quantity of adhesive bonds is
increased, tack of the thinner films will increase in a stronger manner than tack of thicker films.
In addition, another parameter should be discussed here. Part of the energy applied by force to the
adhesive matrix dissipates during deformation. During viscoelastic deformation all plastic
deformation energy dissipates and as a consequence load transmission is decreased by damping.
Therefore, for thicker adhesive matrices the applied force at the contact surface to the probe is
reduced. In conclusion, with increasing contact force, the increase of tack of a thicker adhesive matrix
is less pronounced than that of a thinner adhesive matrix due to its higher ability to dissipate energy
via plastic deformation.
3.2.4.3. Interaction between Factors D and E
If ibuprofen is added to an adhesive matrix, a decrease of σmax is observed as discussed in section
3.2.3.5. This behavior is consistent with previous studies (133) as its mechanism is related to
plasticization. As only OFAT experiments were performed in those studies it has not been taken into
account that there could also be an interaction of plasticization (e.g. API content) with other factors.
The results displayed in Fig. 37c reveal that there is a significant interaction between API content and
adhesive matrix thickness. As expected, ibuprofen acts as plasticizer in thick adhesive matrices
accompanied by a significant decrease of tack with increasing ibuprofen content. For thin adhesive

3. Results and discussion 95
matrices the decrease of tack is less pronounced and non-significant at any investigated ibuprofen
concentration. It may therefore be noted that the plasticizing effect decreases with decreasing
adhesive matrix thickness.
The reason for this interaction can neither be explained by the different strain rates applied at
debonding nor by any other information gathered from the rheological experiments. Therefore, one
may conclude that tack should be decreased independent of the adhesive matrix thickness. However,
with the performed rheological experiments no interfacial effects could have been investigated
because the samples had to be at least 1200 µm thick to allow measurements with an appropriate
resolution of the rheometer. This leads to the conclusion that orientation of polymer chains may also
be responsible for the absence of a plasticizing effect of ibuprofen in thin adhesive matrices. A
polymer with oriented chains can exhibit a pseudo-glassy behavior (138–140, 142) causing an
increased robustness to plasticizing because above the glass transition temperature plasticizers have
a less pronounced effect on the modulus G (178).
In summary, the interaction between the factors adhesive matrix thickness and API content may be
explained by the oriented fraction of polymer chains at the interface and their resistance to
plasticization.
3.2.5. Interpretation of the data
Generally, all observed effects can be traced back to the relationship between stress and strain:
𝐹𝑚𝑎𝑥
𝐴𝑐= 𝜎𝑚𝑎𝑥 = 𝐸 ∙ 𝜀
⇔ 𝐹𝑚𝑎𝑥 = 𝐸 ∙ 𝜀 ∙ 𝐴𝑐 Eq. 9
3. Results and discussion 96
Where Fmax is defined as the maximum force at break and ε is the strain; Ac is the contact area at the
interface and can be related to the quantity of adhesion bonds; E is the tensile modulus and can be
related to the quality of the adhesion bonds. It has to be considered that both Ac and E depend on the
PSA properties as well as on the test conditions.
When contact is made at the bonding step, a contact area Ac is formed. Ac depends on wetting: The
higher the wettability the higher Ac. Wetting is a function of the viscoelastic bulk properties of the
adhesive as well as of the interfacial characteristics between substrate and adhesive. As described in
chapter 3.2.3.2, Ac is proportional to the contact force and inversely proportional to the apparent
modulus Ea (Eq. 7). Ea itself is proportional to E and inversely proportional to the adhesive matrix
thickness h (Eq. 8). Therefore, good wetting requires a low Ea (i.e. a low E), a high contact force and a
high adhesive matrix thickness.
At the debonding a high tensile modulus E results in high values of σmax. As discussed previously, E is
directly proportional to G and for viscoelastic polymers both moduli are strain rate-dependent.
Furthermore, E is affected by physicochemical parameters such as plasticizing e.g. caused by solvent
residuals or by an API. E also depends on physical factors such as oriented polymer fraction which
itself is a function of time and adhesive matrix thickness.
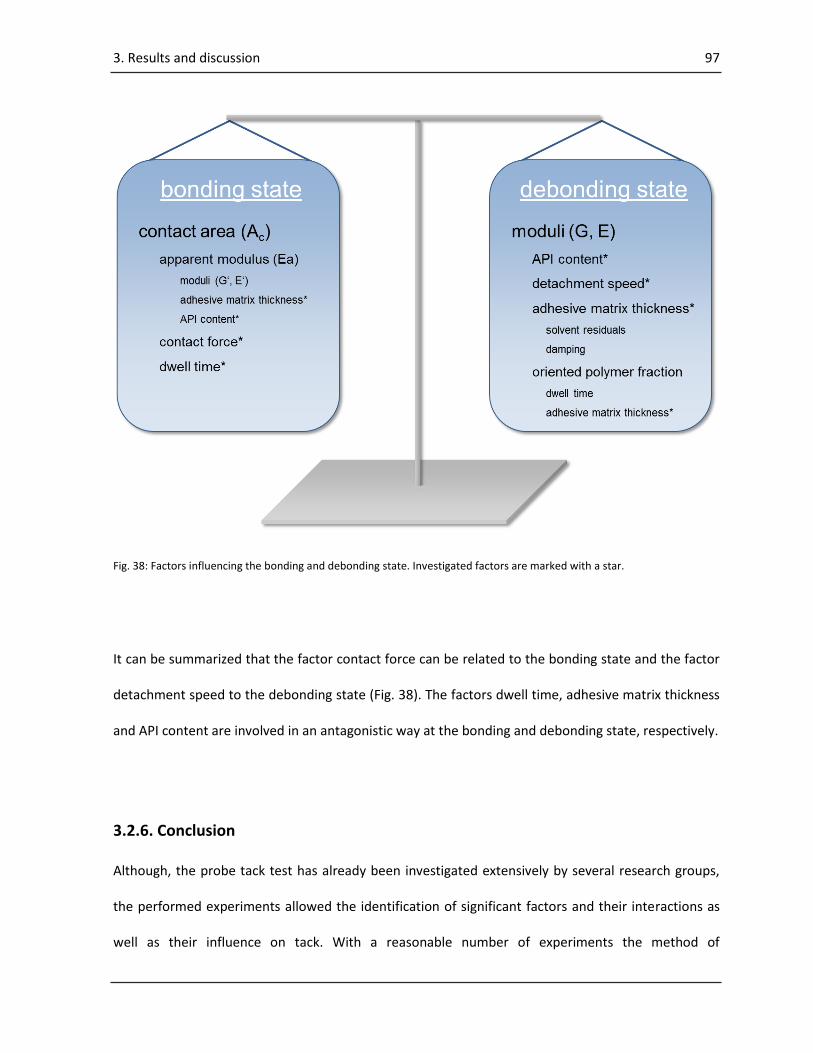
3. Results and discussion 97
Fig. 38: Factors influencing the bonding and debonding state. Investigated factors are marked with a star.
It can be summarized that the factor contact force can be related to the bonding state and the factor
detachment speed to the debonding state (Fig. 38). The factors dwell time, adhesive matrix thickness
and API content are involved in an antagonistic way at the bonding and debonding state, respectively.
3.2.6. Conclusion
Although, the probe tack test has already been investigated extensively by several research groups,
the performed experiments allowed the identification of significant factors and their interactions as
well as their influence on tack. With a reasonable number of experiments the method of

3. Results and discussion 98
experimental design for a measurement system analysis could clearly prove its superiority over the
OFAT methodology which would not allow detecting interactions between the investigated factors.
All identified significant factors have to be monitored carefully with respect to their interactions.
Furthermore, the general assumption that tack increases with an increase of adhesive matrix
thickness needs to be reconsidered. It was found that tack increases with decreasing adhesive matrix
thickness. An explanation for this observation was found to be the orientation of polymer chains. In
terms of pressure sensitive adhesion this phenomenon should be investigated in more detail. For
such experiments alternative methods such as atomic force microscopy or dielectric spectroscopy
may be used.
The obtained results can also serve as a framework for future work with intelligent polymers where
the orientation of polymer chains may be used to control the release rate of a drug.
3. Results and discussion 99
3.3. Results and discussions of “Formulation development of a multiple
polymer adhesive patch”4
The aim of the third study was to evaluate the statistical method of “Mixture Design” for the early
stage development of a multiple polymer adhesive patch. For this purpose, blends of silicon adhesive,
acrylic adhesive, oleyl alcohol as a surfactant and ibuprofen as a model drug were used.
4 This chapter has been published as shown in Table 10, p. 141.
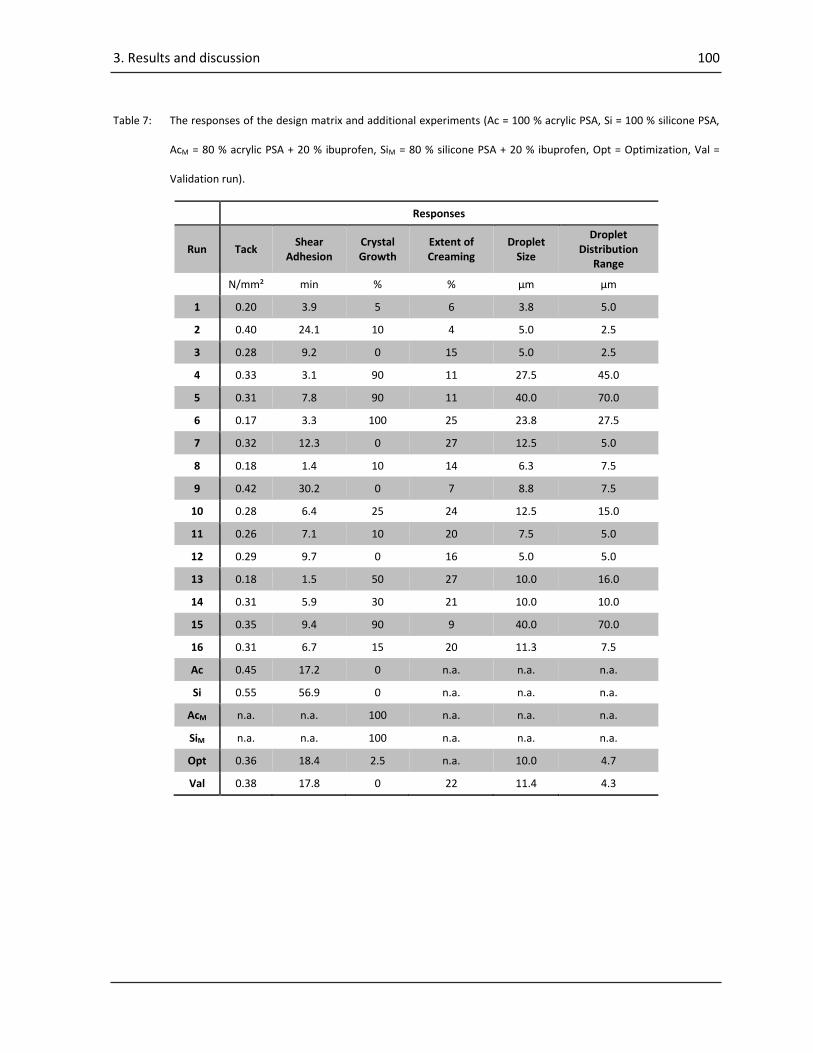
3. Results and discussion 100
Table 7: The responses of the design matrix and additional experiments (Ac = 100 % acrylic PSA, Si = 100 % silicone PSA,
AcM = 80 % acrylic PSA + 20 % ibuprofen, SiM = 80 % silicone PSA + 20 % ibuprofen, Opt = Optimization, Val =
Validation run).
Responses
Run Tack Shear
Adhesion Crystal Growth
Extent of Creaming
Droplet Size
Droplet Distribution
Range
N/mm² min % % µm µm
1 0.20 3.9 5 6 3.8 5.0
2 0.40 24.1 10 4 5.0 2.5
3 0.28 9.2 0 15 5.0 2.5
4 0.33 3.1 90 11 27.5 45.0
5 0.31 7.8 90 11 40.0 70.0
6 0.17 3.3 100 25 23.8 27.5
7 0.32 12.3 0 27 12.5 5.0
8 0.18 1.4 10 14 6.3 7.5
9 0.42 30.2 0 7 8.8 7.5
10 0.28 6.4 25 24 12.5 15.0
11 0.26 7.1 10 20 7.5 5.0
12 0.29 9.7 0 16 5.0 5.0
13 0.18 1.5 50 27 10.0 16.0
14 0.31 5.9 30 21 10.0 10.0
15 0.35 9.4 90 9 40.0 70.0
16 0.31 6.7 15 20 11.3 7.5
Ac 0.45 17.2 0 n.a. n.a. n.a.
Si 0.55 56.9 0 n.a. n.a. n.a.
AcM n.a. n.a. 100 n.a. n.a. n.a.
SiM n.a. n.a. 100 n.a. n.a. n.a.
Opt 0.36 18.4 2.5 n.a. 10.0 4.7
Val 0.38 17.8 0 22 11.4 4.3
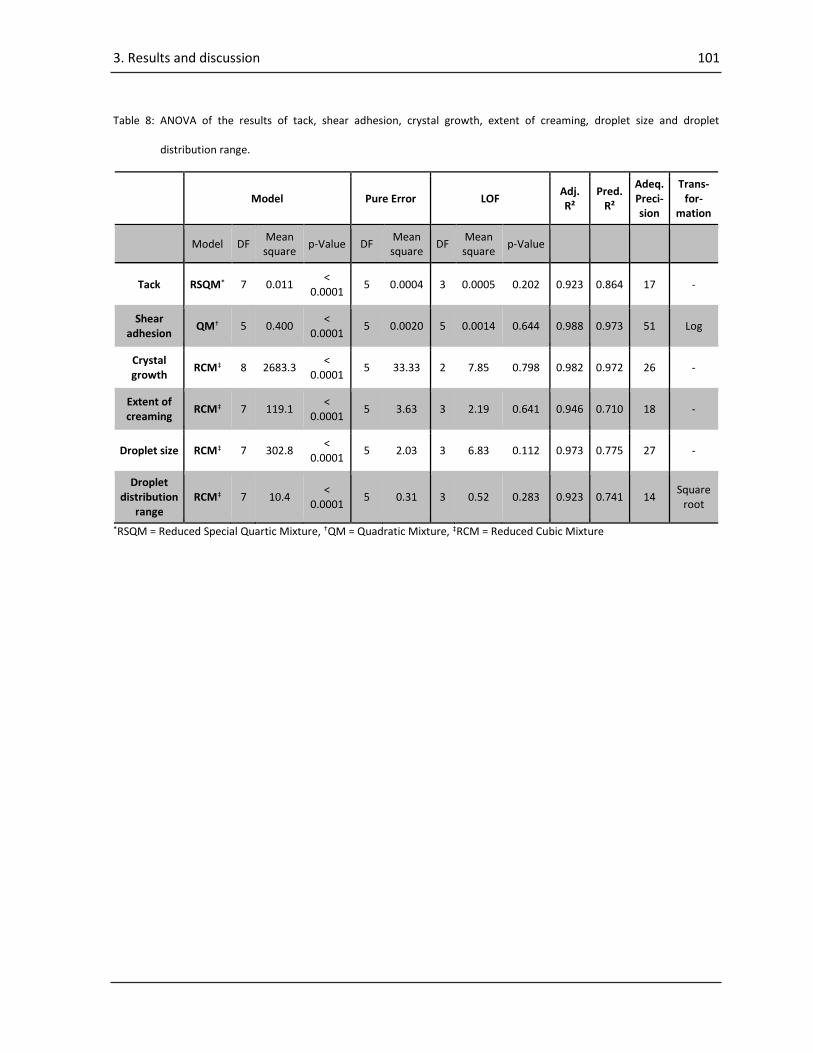
3. Results and discussion 101
Table 8: ANOVA of the results of tack, shear adhesion, crystal growth, extent of creaming, droplet size and droplet
distribution range.
Model Pure Error LOF Adj. R²
Pred. R²
Adeq. Preci-sion
Trans-for-
mation
Model DF Mean square
p-Value DF Mean square
DF Mean square
p-Value
Tack RSQM* 7 0.011 <
0.0001 5 0.0004 3 0.0005 0.202 0.923 0.864 17 -
Shear adhesion
QM† 5 0.400 <
0.0001 5 0.0020 5 0.0014 0.644 0.988 0.973 51 Log
Crystal growth
RCM‡ 8 2683.3 <
0.0001 5 33.33 2 7.85 0.798 0.982 0.972 26 -
Extent of creaming
RCM‡ 7 119.1 <
0.0001 5 3.63 3 2.19 0.641 0.946 0.710 18 -
Droplet size RCM‡ 7 302.8 <
0.0001 5 2.03 3 6.83 0.112 0.973 0.775 27 -
Droplet distribution
range RCM‡ 7 10.4
< 0.0001
5 0.31 3 0.52 0.283 0.923 0.741 14 Square
root
*RSQM = Reduced Special Quartic Mixture, †QM = Quadratic Mixture, ‡RCM = Reduced Cubic Mixture

3. Results and discussion 102
3.3.1. Tack
For an adhesive of a transdermal patch it is important to adhere immediately when it is brought in
contact with the skin. From the results displayed in Table 7, a ‘‘reduced special quartic mixture’’
(RSQM) model as the highest order polynomial was developed (Table 8). After reversed reduction of
the model, the predicted R2 of 0.864 was in good agreement with the adjusted R2 of 0.922. The
evaluation of the model by an ANOVA showed that the model with a p-value below 0.0001 was highly
significant. Moreover, the variation of the data around the fitted model, the LOF, was found to be
non-significant with p = 0.2017 and a good signal-to-noise ratio was confirmed by an ‘‘adequate
precision’’ of 16. Following the scheme of Fig. 21, a ‘‘Box-Cox’’ Plot was utilized to evaluate the data
for transformation. For the response tack the ‘‘Box-Cox’’ plot indicated that no transformation of the
data was required. In the next step, the ‘‘normal probability plot of the studentized residuals’’ was
investigated and showed normal distribution of the data confirmed by a linear relationship between
the normal probability and the internally studentized residuals (Fig. 39a).
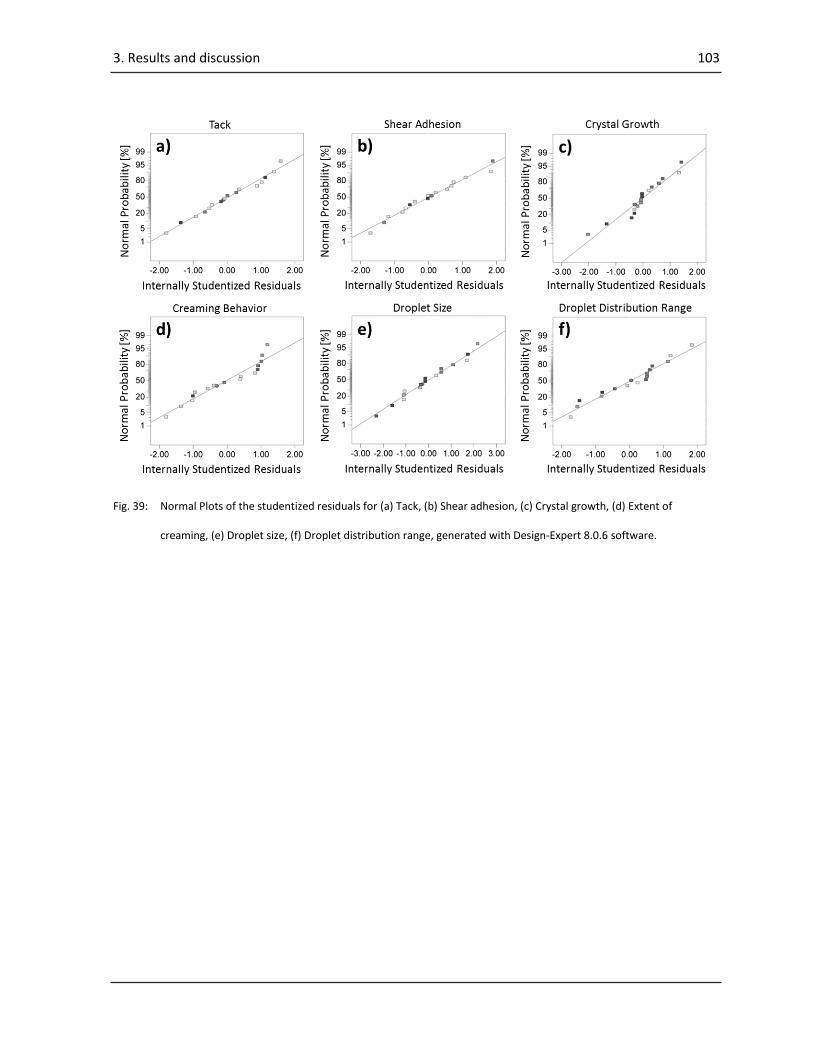
3. Results and discussion 103
Fig. 39: Normal Plots of the studentized residuals for (a) Tack, (b) Shear adhesion, (c) Crystal growth, (d) Extent of
creaming, (e) Droplet size, (f) Droplet distribution range, generated with Design-Expert 8.0.6 software.
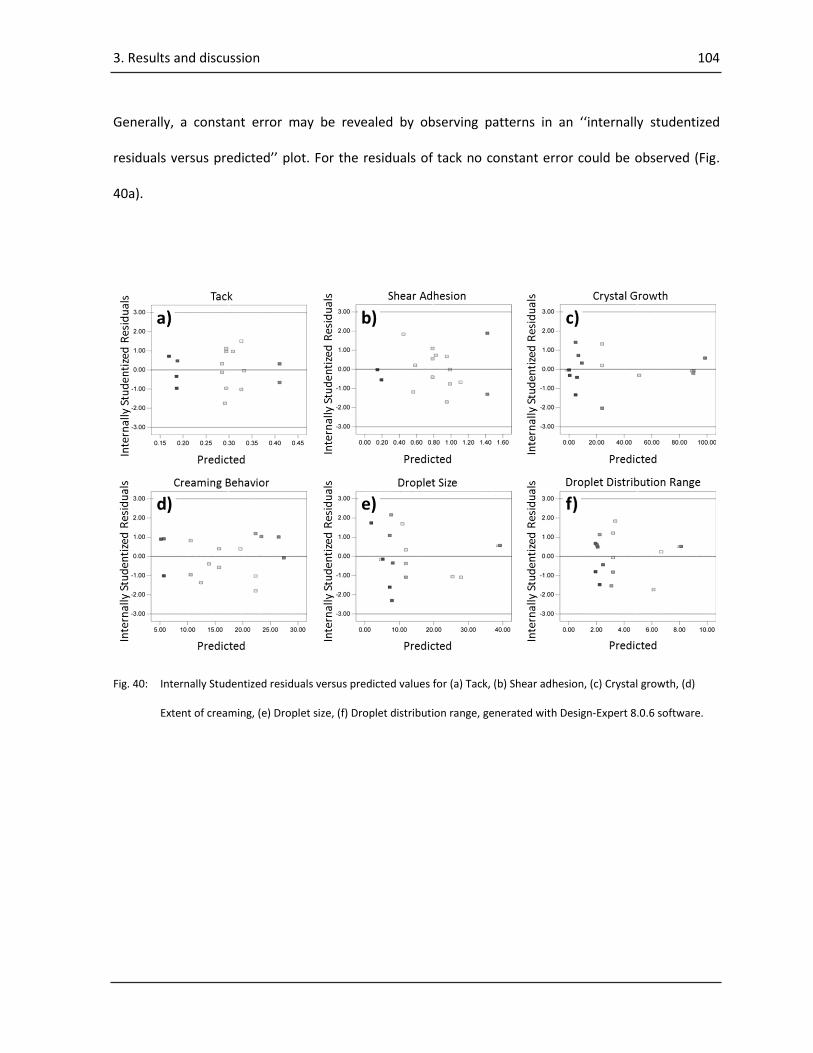
3. Results and discussion 104
Generally, a constant error may be revealed by observing patterns in an ‘‘internally studentized
residuals versus predicted’’ plot. For the residuals of tack no constant error could be observed (Fig.
40a).
Fig. 40: Internally Studentized residuals versus predicted values for (a) Tack, (b) Shear adhesion, (c) Crystal growth, (d)
Extent of creaming, (e) Droplet size, (f) Droplet distribution range, generated with Design-Expert 8.0.6 software.
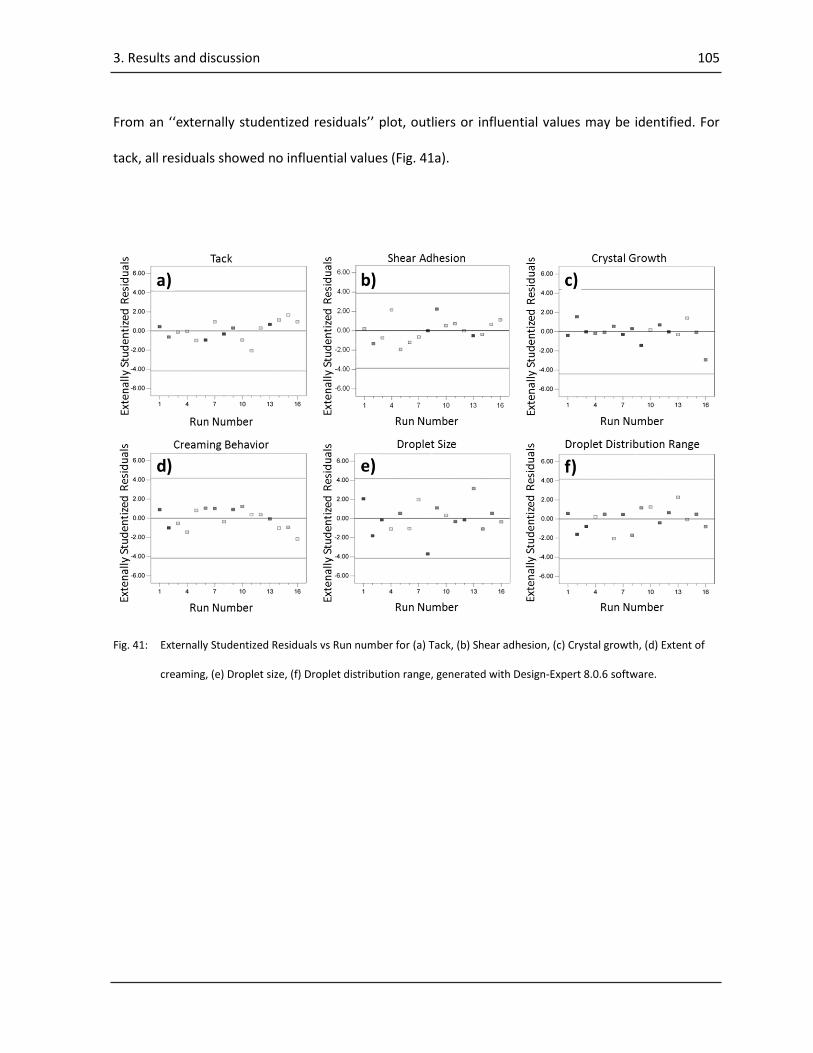
3. Results and discussion 105
From an ‘‘externally studentized residuals’’ plot, outliers or influential values may be identified. For
tack, all residuals showed no influential values (Fig. 41a).
Fig. 41: Externally Studentized Residuals vs Run number for (a) Tack, (b) Shear adhesion, (c) Crystal growth, (d) Extent of
creaming, (e) Droplet size, (f) Droplet distribution range, generated with Design-Expert 8.0.6 software.
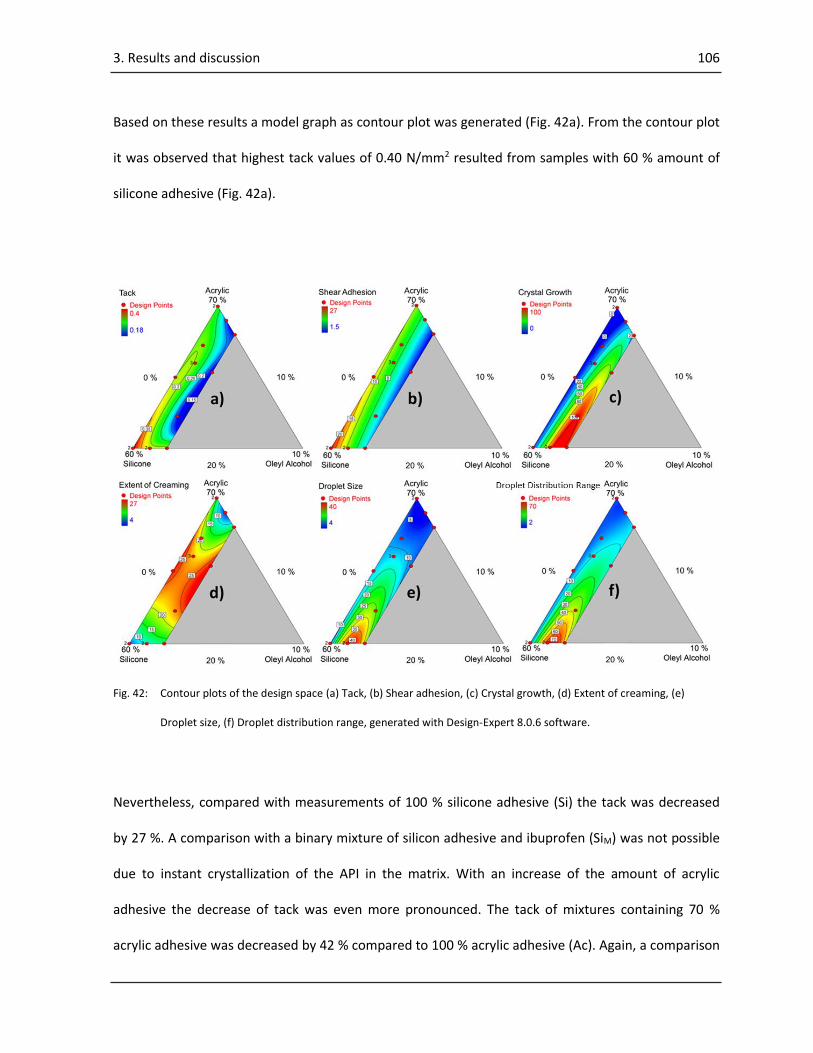
3. Results and discussion 106
Based on these results a model graph as contour plot was generated (Fig. 42a). From the contour plot
it was observed that highest tack values of 0.40 N/mm2 resulted from samples with 60 % amount of
silicone adhesive (Fig. 42a).
Fig. 42: Contour plots of the design space (a) Tack, (b) Shear adhesion, (c) Crystal growth, (d) Extent of creaming, (e)
Droplet size, (f) Droplet distribution range, generated with Design-Expert 8.0.6 software.
Nevertheless, compared with measurements of 100 % silicone adhesive (Si) the tack was decreased
by 27 %. A comparison with a binary mixture of silicon adhesive and ibuprofen (SiM) was not possible
due to instant crystallization of the API in the matrix. With an increase of the amount of acrylic
adhesive the decrease of tack was even more pronounced. The tack of mixtures containing 70 %
acrylic adhesive was decreased by 42 % compared to 100 % acrylic adhesive (Ac). Again, a comparison
3. Results and discussion 107
with a binary mixture of acrylic adhesive and ibuprofen (AcM) was not possible because of
crystallization of ibuprofen. From these observations it can be concluded that the decrease of tack is
caused by ibuprofen as well as by the interaction of the two adhesives. A decrease of tack by the
addition of small molecules is described in the literature (186, 188, 194). In particular, the decrease of
tack by ibuprofen in an acrylic adhesive was previously investigated (133) and could be explained by a
plasticizing effect of the API. The decrease of tack by interaction of the two adhesives may be
explained by the macroscopic structure of the matrices. If an acrylic and a silicon adhesive are mixed
together, they form a matrix with two phases (Fig. 43d). As for complex mixtures of crosslinked acrylic
copolymers, silicone adhesives and interfacial active substances, the Bancroft rule as well as the HLB
concept is not applicable. Stenert (195) assumes that the polymer with the smaller portion is forming
the dispersed phase. If a force is applied vertically to the matrix and pulled away as it happens during
the tack test, only the coherent phase can contribute to the resistance to this force. Compared to the
plain adhesive matrix the resistance to the tack probe is reduced (Fig. 43b and e). Turning the focus
on the addition of oleyl alcohol, a decrease of tack could be observed for all ratios with increasing
amounts of oleyl alcohol (Fig. 42a). It is assumed that oleyl alcohol reduces the tack because of a
plasticizing effect on the adhesive as observed in previous studies (196). Mixtures with increased
amounts of silicone adhesive were less sensitive to the addition of oleyl alcohol than the acrylic
adhesive.
3.3.2. Shear adhesion
Shear adhesion is critical for the long-term wear of transdermal patches. Low shear adhesion can
result in sticking of the patch to the packaging material by cold flow of the adhesive. Furthermore,
dark rings around the periphery of the patch caused by low shear adhesion are critical not only with
3. Results and discussion 108
regard to the appearance (18). Moreover, dosing may be influenced by the altered area covered by
the patch (105). The obtained shear adhesion values are displayed in Table 7. As recommended by
the ‘‘Box-Cox’’ plot, a log transformation of the data was performed (Table 8). A highly significant
‘‘quadratic mixture’’ (QM) model with a p-value of 0.0001 was obtained from the data (Table 8). The
predicted R2 of 0.973 appeared to be very close to the adjusted R2 of 0.988. The LOF test was non-
significant and the ‘‘adequate precision’’ showed a very good signal-to-noise ratio. Diagnostics
revealed normality of residuals (Fig. 39b) and no constant error in the ‘‘internally studentized
residuals versus predicted’’ plot (Fig. 40b). Moreover, no outliers or influential values could be
revealed by the ‘‘externally studentized residuals’’ plot (Fig. 41b). From the contour plot shown in Fig.
42b it was obvious that high silicon adhesive contents corresponded to high shear adhesion values.
Compared to plain silicon adhesive, the shear adhesion value was reduced by 53 %. Also, with
increasing amounts of acrylic adhesive a decrease of shear adhesion could be observed. For mixtures
with increasing amounts of oleyl alcohol an exponential decrease was detected. These results showed
that mixtures of a silicone and an acrylic adhesive, as well as the addition of ibuprofen or oleyl alcohol
to these mixtures resulted in reduced shear adhesion values. Again, the macroscopic view may be
helpful to understand the observed results. As discussed for tack, the matrix comprises a coherent
and a dispersed phase (Fig. 43a and d).
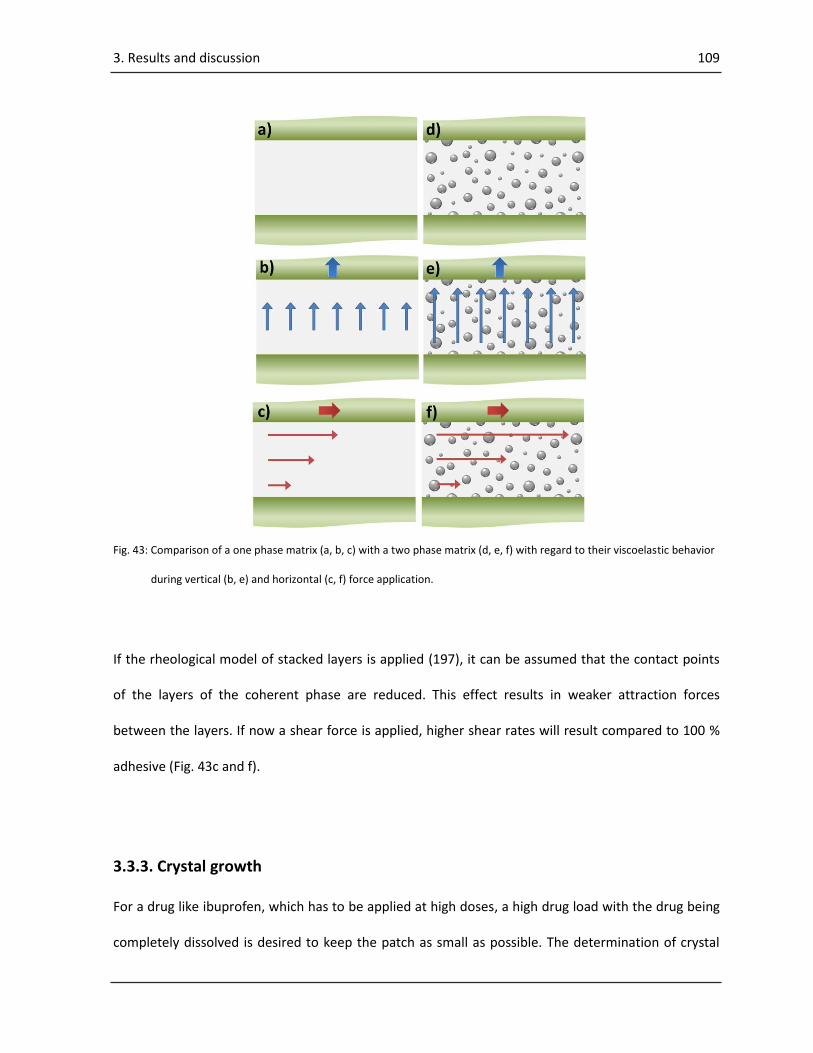
3. Results and discussion 109
Fig. 43: Comparison of a one phase matrix (a, b, c) with a two phase matrix (d, e, f) with regard to their viscoelastic behavior
during vertical (b, e) and horizontal (c, f) force application.
If the rheological model of stacked layers is applied (197), it can be assumed that the contact points
of the layers of the coherent phase are reduced. This effect results in weaker attraction forces
between the layers. If now a shear force is applied, higher shear rates will result compared to 100 %
adhesive (Fig. 43c and f).
3.3.3. Crystal growth
For a drug like ibuprofen, which has to be applied at high doses, a high drug load with the drug being
completely dissolved is desired to keep the patch as small as possible. The determination of crystal
3. Results and discussion 110
growth after 24 h in oversaturated systems may serve as an estimate of the induction time of
crystallization, which correlates with the drug concentration in the supersaturated system (198).
Under the condition of a constant drug load, a decreased drug solubility of ibuprofen in the matrices
is accompanied by an enhanced progress of crystallization. From the results of the ANOVA, a highly
significant ‘‘reduced cubic mixture’’ (RCM) model was evolved after reversed reduction of the model
terms to fit the response of crystal growth (Table 8). The model showed a predicted R2 of 0.972 and
an adjusted R2 of 0.982. Both, the non-significant LOF test and an ‘‘adequate precision’’ of 26
confirmed the reliability of the model. The diagnostics indicated normality of the data and no
constant error, outliers or influential values (Figs. 39c, 40c, and 41c). The crystal growth determined
in binary mixtures of plain acrylic adhesive or silicone adhesive with ibuprofen was determined to be
100 % (Table 7). As already described in sections ‘‘Tack’’ and ‘‘Shear adhesion’’, ibuprofen crystallized
instantly during the drying step of the matrices. In contrast to these observations, ternary mixtures of
acrylic adhesive, silicone adhesive and ibuprofen exhibited decreased crystal growth (Fig. 42c, Table
7). It is remarkable that the adhesives showed a synergistic effect on the reduction of crystallization.
With quaternary mixtures containing oleyl alcohol, a low crystallization tendency was observed at
increased acrylic adhesive contents with up to 5 % oleyl alcohol (Fig. 42c). In general, oleyl alcohol
shows an enhancing effect on the induction of crystallization. Highest values were observed with
lower levels of acrylic adhesive accompanied by high levels of oleyl alcohol. These effects will be
discussed in detail together with the response ‘‘droplet size’’ in the section ‘‘droplet distribution
range’’.
3. Results and discussion 111
3.3.4. Extent of creaming
The extent of creaming of the wet mixes gives information on their physical stability during
processing. A low extent of creaming is desired to prevent phase segregation during manufacturing of
the transdermal patch. The highly significant RCM model with a predicted R2 of 0.710 and an adjusted
R2 of 0.946 was obtained by the ANOVA (Table 8). The validity of the model was confirmed by a non-
significant LOF test and a good signal-to-noise ratio. Diagnostics showed normality and no irregular
variation of the residuals (Figs. 39d, 40d, and 41d). The derived response surface displayed as contour
plot showed a saddle-like structure, where lowest values for creaming were obtained at highest
adhesive concentrations (Fig. 42d). The most pronounced phase separation was observed with equal
proportions of the adhesives.
3.3.5. Droplet size
With regard to the performance and the appearance of the transdermal patch, a small droplet size is
desired to prevent coalescence of the two phases and as shown later to achieve a reduced
crystallization of ibuprofen. A RCM model was found to be highly significant for the droplet size (Table
8). The ‘‘LOF’’ test was non-significant, and the values showed a good ‘‘adequate precision’’. The
adjusted R2 of 0.973 was found to be in reasonable agreement with the predicted R2 of 0.775. The
diagnostics showed good results (Figs. 39e, 40e, and 41e) and a contour plot was derived from the
data (Fig. 42e). Smallest droplets were observed for ternary mixtures of silicone adhesive, acrylic
adhesive and ibuprofen at any ratio as well as for quaternary mixtures with acrylic adhesive amounts
above 60 % and oleyl alcohol at all investigated ratios (Fig. 42e). Largest droplets occurred at low
amounts of acrylic adhesive and high amounts of oleyl alcohol with a maximum at 6 % oleyl alcohol.
Interestingly, the maximum is located in the same region as observed for the crystal growth.
3. Results and discussion 112
Crystallization inhibition in an emulsion is a known phenomenon, where two mechanisms contribute
to this effect. First, heterogeneous crystallization starts with a nucleation which itself is triggered by
an impurity (200). In a bulk liquid, the probability for incorporation of a nucleus is high. If the droplet
size is decreased accompanied by an increase of the number of droplets, the probability to
incorporate a nucleus into a single drop is reduced. Hence, heterogeneous crystallization is decreased
in a two-phase system. Second, an increase in the interface by a reduction of the droplet size results
in a positive interface free energy and thus in a destabilization of an arising nucleus (198). This effect
results in an interfacial stabilization of supersaturated two-phase systems. For the investigated
samples it was observed that a large droplet size corresponds to an increased crystallization of
ibuprofen.
3.3.6. Droplet distribution range
To achieve a maximum stability of the two-phase matrices and to prevent coalescence by Ostwald
ripening a narrow droplet distribution range is desired. Based on the results obtained by the ‘‘Box-
Cox’’ plot a square root transformation of the data was performed. A RCM model with an adjusted R2
of 0.923 and a predicted R2 of 0.741 was derived by the ANOVA (Table 8). Furthermore, the ANOVA
showed a high significance of the model, no LOF and a good signal-to-noise ratio. Diagnostics showed
normality and no exceptional variation of the residuals (Figs. 39f, 40f, and 41f). As observed
previously for the droplet size, the smallest droplet distribution ranges were observed for ternary
mixtures of the adhesives containing ibuprofen as well as for mixtures with increased amounts of
acrylic adhesive and oleyl alcohol. High droplet distribution ranges were obtained at low amounts of
acrylic adhesive and high amounts of oleyl alcohol with a maximum at 6 % oleyl alcohol. The response
surface of the droplet distribution range correlates well with the response surface of the droplet size.
3. Results and discussion 113
3.3.7. Multi response optimization and validation
With a numerical optimization a combination of component levels that satisfy the requirements
placed on each of the responses is searched. Although the mixture design was performed as a starting
point for further experiments, a numerical optimization was carried out to validate the predictive
accuracy of the models. The components of silicon adhesive, acrylic adhesive and oleyl alcohol were
not adjusted to a specific set-point. For the responses tack and shear the requirement was set to
maximum to achieve values close to those of the plain adhesives. Crystal growth, droplet size and
droplet distribution range were selected to be minimized, whereas crystal growth was limited to a
maximum of 10 %. The extent of creaming was not set to any limit because it is thought not to be
controlled by formulation but by homogenization. The highest desirability was found to be 0.773 for a
mixture of 31 % acrylic adhesive, 49 % silicone adhesive, 0 % oleyl alcohol and 20 % ibuprofen (Table
4). A validation sample with the recommended fractions derived from the multi response
optimization was prepared and analyzed as described for the design runs. The responses were found
to be in good agreement with the predicted values (Table 7).
3.3.8. Interpretation of the data
In summary, oleyl alcohol neither improves the miscibility of the polymers by reduction of the
polymeric interface energy nor the solubility of ibuprofen in the mixtures. Therefore, the addition of
oleyl alcohol should be reconsidered. In contrast to the mixtures at the periphery of the design space,
wet mixes with equal fractions of polymer tend to be less stable. Furthermore, it could be shown that
crystal growth of ibuprofen correlates well with droplet size and droplet distribution range of the
multiple polymer adhesive systems, where lowest values for crystallization were found with mixtures
containing small droplets.
3. Results and discussion 114
3.3.9. Conclusion
It can be concluded that the presented data give information on the critical spots of the ‘‘mixture
design’’ and where the design needs to be improved. One possibility of improvement may be an
augmentation of the design to extended constraints of the adhesives and to different surfactants.
Preferably, these surfactants should be polymers with polar and apolar functionalities that could
interact with the immiscible polymers. As so called compatibilizers polyvinylpyrrolidone (PVP) or
Soluplus® may be used (96). Moreover, process variables, such as mixing speed or viscosity of the wet
mix as well as responses for performance indication, such as drug release may be added preferably in
a combined design. The development of a design space for a transdermal patch via ‘‘mixture design’’
in the early stage of formulation development provides valuable information on the product as well
as on the interactions of the components with an acceptable number of experiments.
3. Results and discussion 115
3.4. Final discussion
It may be summarized that the development of a method to manufacture patches as well as patch
samples for various analytical methods could successfully be established. With this method, samples
with good and reproducible quality could be prepared, whereas the loss of material was kept to a
minimum.
The results of the first study demonstrated clearly the relevance of rheometrical measurements for
the development of transdermal patches. DMA/DMTA showed excellent reproducibility and could
significantly detect the interaction between the API and the PSA with a comparatively low
preparatory effort after the development of the method. Properties such as viscoelasticity, as well as
its time and temperature dependence may be detected easily by rheometry compared to the
standard test methods of the tape industry. As a result of the excellent reproducibility and the low
limit of detection of DMA/DMTA, the phenomenon of antiplasticization could be detected. Because
antiplasticization depends on many factors such as temperature, stress, strain, mechanical history,
and API concentration the term “antiplasticizing space” was introduced. As it is likely that most
polymer/API blends exhibit an antiplasticizing space it should also be considered for solid dispersions
or coatings of other pharmaceutical dosage forms. The “antiplasticizing space” might be a critical
factor of processing, stability as well as in-vivo behavior of API/polymer blends in transdermal and
non-transdermal drug delivery. Moreover, the requirement of incorporation of viscoelastic data into
the dossier for new drug product applications was recently included in the draft “Guideline on quality
of transdermal patches” (11), which underlines the importance of DMA/DMTA for transdermal patch
development.
Variation of an analytical result may be caused by alteration of the manufacturing process of the
sample. However, it has to be emphasized that the variation of the result may also be caused by

3. Results and discussion 116
changes in the sensitivity or linearity of the analytical method itself. Only if both processes are well
understood, the cause of the variation may be identified. In the second study it was shown in an
exemplary manner that analytical measurement systems can be thoroughly investigated by a QbD
approach. The concept of the presented study is also of great interest in the field of analytical method
development as recently a joint working group from the pharmaceutical industry published a
comparable QbD approach for the evaluation of a chromatography method (201).
Orientation of polymer chains of the PSA as observed in this study might be of rather low importance
for most transdermal patches but it might have the potential in innovative drug delivery systems. In
particular, this phenomenon could be used to design intelligent drug controlling membranes, the
permeability of which may be adjusted by temperature, pH, electrochemical potential or ionic
concentration in the environment of the site of action or by an external trigger.
The data from the third study showed in an exemplary manner how the method of “Mixture Design”
delivers detailed information on the product with minimal use of resources. By performing a
reasonable number of experiments, the interaction of the components of the adhesive matrix as well
as their influence on the performance of the transdermal patch could be investigated. Of particular
interest is the fact that this method can be applied in the field of transdermal patch development as
well as in other areas dealing with formulation development using a quality by design approach. The
observed inhibition of crystallization of an API in a multiphase system such as an emulsion by
decreasing the droplet size may also be used in other drug delivery systems. As an example solid
dispersions are used to increase the solubility of poorly soluble APIs and have the advantage to be
stable over a longer period of time. A further increase of API solubility might be achieved by
combining solid dispersions with the observed effect of crystallization inhibition. A solid

3. Results and discussion 117
microemulsion is expected to have improved solubility characteristics for an API compared to
traditional solid dispersion systems.
Finally, it can be concluded that the challenge to develop and evaluate methods for transdermal
patch development with higher quality and deeper understanding of the drug product could
successfully be met.

118
4. References
4. References 119
4. References
[1] Zaffaroni, A.
Drug-delivery system.
Patent US3854480 A (1974)
[2] Prausnitz, M.R., Langer, R.
Transdermal drug delivery.
Nat Biotechnol 26(11): 1261–1268 (2008)
[3] Wokovich, A.M., Prodduturi, S., Doub, W.H., Hussain, A.S., Buhse, L.F.
Transdermal drug delivery system (TDDS) adhesion as a critical safety, efficacy and quality
attribute.
Eur J Pharm Biopharm 64(1): 1–8 (2006)
[4] Food and Drug Administration Center for Drug Evaluation and Research (CDER) Center for
Biologics Evaluation and Research (CBER)
Approved Drug Products with Therapeutic Equivalence Evaluations.
34th ed., U.S. Department of Health and Human Services, Washington, D.C. (2014)
[5] Jacques, C.
Transdermal Patch Delivery Technologies Will Create New Blockbuster Drugs.
Assessed from: http://www.luxresearchinc.com (2014)
[6] Cilurzo, F., Gennari, C.G.M., Minghetti, P.
Adhesive properties: a critical issue in transdermal patch development.
Expert Opin Drug Deliv 9(1): 33–45 (2012)
[7] Gupta, H., Babu, R.J.
Transdermal Delivery: Product and Patent Update.
Recent Patents on Drug Delivery & Formulation 7(3): 184–205 (2013)
[8] Allhenn, D.
Innovative Arzneiformen.
1st ed., Wiss. Verl.-Ges., Stuttgart (2010)
[9] Naik, A., Kalia, Y.N., Guy, R.H.
Transdermal drug delivery: overcoming the skin's barrier function.
Pharm Sci Technol Today 3(9): 318–326 (2000)
[10] Council of Europe
European Pharmacopoeia.
7th ed., Council of Europe, Strasbourg (2010)
[11] Quality Working Party
Guideline on quality of transdermal patches.
Draft, European Medicines Agency, London (2012)
4. References 120
[12] Michael Horstmann
Transdermal Therapeutic Systems: Current technologies of chemically and physically
enhanced diffusive delivery.
Skin Forum 2011, Frankfurt/Main (2011)
[13] Choy, Y., Prausnitz, M.
The Rule of Five for Non-Oral Routes of Drug Delivery: Ophthalmic, Inhalation and
Transdermal.
Pharm Res 28(5): 943-948 (2011)
[14] Wille, J.J.
Skin delivery systems: Transdermals, dermatologicals, and cosmetic actives.
1st ed., Blackwell Pub., Ames, Iowa (2006)
[15] Gregoire, S., Ribaud, C., Benech, F., Meunier, J.R., Garrigues-Mazert, A., Guy, R.H.
Prediction of chemical absorption into and through the skin from cosmetic and
dermatological formulations.
Br. J. Dermatol. 160(1): 80–91 (2009)
[16] Cantor, A., Wirtanen, D.
Novel Acrylate Adhesives for Transdermal Drug Delivery.
Pharmaceutical Technology 02(01):28–38 (2002)
[17] Sateesh Kandavilli, V.N.R.P.
Polymers in Transdermal Drug Delivery Systems.
Pharmaceutical Technology 02(05): 62–80 (2002)
[18] Venkatraman, S., Gale, R.
Skin adhesives and skin adhesion: 1. Transdermal drug delivery systems.
Biomaterials 19(13): 1119–1136 (1998)
[19] Brooke, L., Herrmann, C.
Cannabinoid Patch and Method for Cannabis Transdermal Delivery.
Patent US6113940 A (2000)
[20] Van Buskirk GA et al.
Scale-up of adhesive transdermal drug delivery systems.
Pharm Res 14(7): 848–852 (1997)
[21] Sharad K. Govil, L.J.W.
Adhesive mixture for transdermal delivery of highly plasticizing drugs - Patent application.
Patent 20090041832 (2009)
[22] Potts, R.O., Guy, R.H.
Predicting Skin Permeability.
Pharm Res 9(5): 663-669 (1992)

4. References 121
[23] Prausnitz, M.R., Mitragotri, S., Langer, R.
Current status and future potential of transdermal drug delivery.
Nat Rev Drug Discov 3(2): 115–124 (2004)
[24] Güngör, S., Erdal, M.S., Özsoy, Y.
Plasticizers in Transdermal Drug Delivery Systems.
In: Recent Advances in Plasticizers, 1st ed. (Luqman M., ed): p. 91–112, InTech, Croatia (2012)
[25] Takayasu, T., Kakubari, I., Shinkai, N., Kawakami, J., Nakajima, N., Uruno, A.
Patch.
Patent US6211425 B1 (2001)
[26] Dillard, D.A., Pocius, A.V.
Adhesion Science and Engineering, Vol I: The Mechanics of Adhesion.
1st ed., New York, NY, Elsevier (2003)
[27] Taub, M.B., Dauskardt, R.H.
Adhesion of pressure sensitive adhesives with applications in transdermal drug delivery.
Mater. Res. Soc. Symp. Proc. 662(Biomaterials for Drug Delivery and Tissue Engineering):
NN4.9/1-NN4.9/6 (2001)
[28] Mayan, R.
Verbesserte Freisetzung von lbuprofen aus Heißschmelzklebemassen durch Zusatz von
pharmazeutischen Hilfsstoffen.
Patent DE 19834496 A 1 (2000)
[29] Foreman, P.B.
Acrylic Adhesives.
In: Technology of pressure-sensitive adhesives and products, 1st ed. (Benedek I., Feldstein
M.M., eds): p. 5-1 to 5-60, CRC Press - Taylor & Francis Group, Boca Raton, FL (2009)
[30] Lambert, R., Lu, W., Liao, J.
Amphetamine transdermal compositions with acrylic block copolymer.
Patent US20140271865 A1 (2014)
[31] Liao, J., Liu, P., Dinh, S.
Transdermal methylphenidate compositions with acrylic block copolymers.
Patent US20140276483 A1 (2014)
[32] Ullmann, F., Elvers, B., Hawkins, S., Schulz, G.
Ullmann's encyclopedia of industrial chemistry.
5th ed., VCH, Cambridge (1992)
[33] Haddock, T.H.
Pressure sensitive adhesive.
Patent EP 0 130 080 A1 (1985)
4. References 122
[34] Pocius AV, Dillard DA, Chaudhury MK, editors
Adhesion science and engineering: The Mechanics of Adhesion.
1st ed., Amsterdam ;, Boston, Elsevier (2002)
[35] Bonnet, M.
Kunststoffe in der Ingenieuranwendung: Verstehen und zuverlässig auswählen.
1st ed., Vieweg + Teubner, Wiesbaden (2009)
[36] Creton, C.
Pressure-Sensitive Adhesives: An Introductory Course.
MRS Bulletin June 2003: 434–439 (2003)
[37] Benedek, I.
Pressure-sensitive adhesives and applications: Rheology of Pressure Sensitive Adhesives.
2nd ed., Dekker, New York, NY (2004)
[38] Rote Liste Service GmbH
Rote Liste 2007: Arzneimittelverzeichnis für Deutschland (einschließlich EU-Zulassungen und
bestimmter Medizinprodukte)
1st ed., Rote Liste Service, Frankfurt/Main (2007)
[39] Lin, S.B., Durfee, L.D., Knott, A.A., Schalau II, G.K.
Silicone Pressure-Sensitive Adhesives.
In: Technology of pressure-sensitive adhesives and products, 1st ed. (Benedek I., Feldstein
M.M., eds): p. 6-1 to 6-26, CRC Press - Taylor & Francis Group, Boca Raton, FL (2009)
[40] Tan, H.S., Pfister, W.R.
Pressure-sensitive adhesives for transdermal drug delivery systems.
Pharm Sci Technol Today 2(2): 60–69 (1999)
[41] Merrill, D.
Process for the production of a bodied silicone resin without the use of a catalyst.
Patent US4056492 A (1977)
[42] Barnes, K., Gathman, S., Plante, D., Stark-Kasley, L.
Architectural coating compositions containing silicone resins.
Patent WO2006113183 A1 (2006)
[43] Clark, H.
Room temperature curing silicone.
Patent US2934519 A (1960)
[44] Metevia, V., Woodard, J.
Transdermal drug delivery device with amine-resistant silicone adhesive and method for
making such a device.
Patent EP0180377 A2 (1986)
4. References 123
[45] Woodard, J., Metevia, V.
Transdermal drug delivery devices with amine- resistant silicone adhesives.
Patent CA1253074 A1 (1989)
[46] Briquet, F., Colas, A., Thomas, X.
Silikone in der Medizin.
Assessed from: http://www.dowcorning.com (2014)
[47] Liu, Y., Paul, C., Ouyang, J., Foreman, P., Sridhar, L., Shah, S.
Silicone Acrylic Hybrid Polymer-Based Adhesives.
Patent US20120095159 A1 (2012)
[48] Lauterback, T., Muller, W., Schacht, D., Wolff, H.
Silicone transdermal patch.
Patent US20030026830 A1 (2003)
[49] Pfister, W., Wilson, J.
Silicone pressure sensitive adhesive compositons for transdermal drug delivery devices and
related medical devices.
Patent US5232702 A (1993)
[50] Pfister, W., Wilson, J.
Silicone pressure sensitive adhesive compositions for transdermal drug delivery devices and
related medical devices.
Patent EP0524776 B1 (1995)
[51] Kydonieus, A., Rossi, T., ARNOLD, C., Banga, A., SACHDEVA, V.
Transdermal hormone delivery.
Patent WO2013112806 A2 (2013)
[52] Radloff, D., Wasner, M.
Skin-friendly plasters for the transdermal administration of non-steroidal antirheumatic
agents.
Patent EP1120115 B1 (2007)
[53] Wang, K., Osborne, J., Hunt, J., Nelson, M.
Polyisobutylene adhesives for transdermal devices.
Patent EP0525105 A1 (1993)
[54] Wang, K., Osborne, J., Hunt, J., Nelson, M.
Drug delivery patches having mixture of high and low molecular weight polymers as adhesives
which dissolve active agents, free of plasticizers and tackifiers.
Patent US5508038 A (1996)
[55] Audett, J., Beste, R., Farinas, K., Putnam, W.
Polyisobutylene Adhesives Containing High Tg Tackifier for Transdermal Devices.
Patent WO1996022083 A1 (1996)
4. References 124
[56] Enscore, D., Gale, R.
Matrix composition for transdermal therapeutic system.
Patent CA1217139 A1 (1987)
[57] Jona, J., Audett, J., Singh, N.
Transdermal patch and method for administering 17-deacetyl norgestimate alone or in
combination with an estrogen.
Patent US006071531A (2000)
[58] Venkateshwaran, S., Fikstad, D., Ebert, C.
Pressure sensitive adhesive matrix patches for transdermal delivery of salts of pharmaceutical
agents.
Patent US5985317 A (1999)
[59] Robbins, W.
Transdermal therapeutic device and method with capsaicin and capsaicin analogs.
Patent WO1999030560 A1 (1999)
[60] Santus, G., Kim, A., Francoeur, M., Bremer, U.
Transdermal patch.
Patent US5658587 A (1997)
[61] Robbins, W.
Transdermal therapeutic device and method with capsaicin and capsaicin analogs.
Patent CA2314326 C (2008)
[62] Enscore, D.
Non-sensitizing transdermal clonidine patch.
Patent WO2013072763 A2 (2013)
[63] Enscore, D.
Transdermal propranolol patch for treatment of malignant melanoma.
Patent US20140294920 A1 (2014)
[64] Bondi, J., Loper, A., Cohen, E.
Transdermal system for timolol.
Patent US4752478 A (1988)
[65] Audett, J., Bailey, S.
Transdermal delivery of basic drugs using nonpolar adhesive systems and acidic solubilizing
agents.
Patent US5879701 A (1999)
[66] 3M
Drug Delivery Systems: Transdermal Components.
Assessed from: http://solutions.3m.com (2014)
4. References 125
[67] Enscore, D.
Transdermal propranolol patch for treatment of malignant melanoma.
Patent WO2013072762 A2 (2013)
[68] Yeh, S., Patel, N., Milstone, J.
Transdermal nicotine delivery system.
Patent US5230896 A (1993)
[69] Cupo, F., Lebo, D., Lee, J., Ryoo, J., Toigo, O.
Transdermal antiemesis delivery system, method and composition therefor.
Patent WO2006028863 A1 (2006)
[70] Chaudhuri, K.R.
Crystallisation within transdermal rotigotine patch: is there cause for concern?
Expert Opin Drug Deliv 5(11): 1169–1171 (2008)
[71] Foreman, P.
Drug Solubility in Acrylic-Rubber Graft Copolymers: New Opportunities and Directions.
Annual Meeting Controlled Release Society, Copenhagen (2009)
[72] Wu, C., McGinity, J.W.
Influence of ibuprofen as a solid-state plasticizer in Eudragit® RS 30 D on the physicochemical
properties of coated beads.
AAPS PharmSciTech 2(4): 35–43 (2001)
[73] Ranade, V.V.
Drug Delivery Systems. 6. Transdermal Drug Delivery.
J Clin Pharmacol 31(5): 401–418 (1991)
[74] Mehdizadeh, A., Ghahremani, M.H., Rouini, M.R., Toliyat, T.
Effects of pressure sensitive adhesives and chemical permeation enhancers on the
permeability of fentanyl through excised rat skin.
Acta Pharm 56(2): 219–229 (2006)
[75] Passoni, G., Casetta, P., Stefanelli, P.
Adhesive transdermal formulations of diclofenac sodium.
Patent CA2471798 A1 (2003)
[76] Govil, S., Rudnic, E., Sterner, D.
Transdermal nitroglycerin patch with penetration enhancers.
Patent US5262165 A (1993)
[77] Scarbrough, C., Scarbrough, S., Shubrook, J.
Transdermal delivery of metformin.
Patent US20120283332 A1 (2012)
[78] Sharma, K., Roy, S., Roos, E.
Transdermal administration of buprenorphine.
Patent US5069909 A (1991)
4. References 126
[79] Zeltman, J.
Transdermal patch and method for delivery of vitamin b12.
Patent EP2124907 A2 (2009)
[80] Williams, A.C., Barry, B.W.
Penetration enhancers.
Breaking the Skin Barrier 56(5): 603–618 (2004)
[81] Gale, R.
Methods for transdermal drug administration.
Patent US6348210 B1 (2002)
[82] Kelly, B., Jacob, C.H., Costantino, C.
Micromechanisms of Tack of Soft Adhesives Based on Styrenic Block Copolymers.
Macromol Mater Eng 287(3): 163–179 (2002)
[83] Tse, M.F.
Studies of triblock copolymer-tackifying resin interactions by viscoelasticity and adhesive
performance.
J Adhes Sci Technol 3(1): 551–570 (1989)
[84] Satas, D.
Handbook of pressure sensitive adhesive technology.
3rd ed., Satas & Associates, Warwick RI (1999)
[85] Sherriff, M., Knibbs, R.W., Langley, P.G.
Mechanism for the action of tackifying resins in pressure-sensitive adhesives.
J Appl Polym Sci 17(11): 3423–3438 (1973)
[86] Wypych, G.
Handbook of plasticizers.
2nd ed., ChemTec Pub., Toronto (2012)
[87] Douroumis, D.
Hot-melt extrusion: Pharmaceutical applications.
1st ed., Wiley, Chichester, West Sussex (2012)
[88] Burton, S., Tata, S.
Transdermal patch.
Patent US5948433 A (1999)
[89] Wypych, G.
Handbook of plasticizers.
1st ed., ChemTec Pub., Toronto (2004)
[90] Lin, S.-Y., Lee, C.-J., Lin, Y.-Y.
The Effect of Plasticizers on Compatibility, Mechanical Properties, and Adhesion Strength of
Drug-Free Eudragit E Films.
Pharm Res 8(9): 1137–1143 (1991)
4. References 127
[91] Cilurzo, F., Minghetti, P., Pagani, S., Casiraghi, A., Montanari, L.
Design and Characterization of an Adhesive Matrix Based on a Poly(Ethyl Acrylate, Methyl
Methacrylate)
AAPS PharmSciTech 9(3): 748–754 (2008)
[92] Elgindy, N., Samy, W.
Evaluation of the mechanical properties and drug release of crosslinked Eudragit films
containing metronidazole.
Int J Pharm 376(1–2): 1–6 (2009)
[93] Taghizadeh, S.M., Lahootifard, F.
Transdermal Excipients Effect on Adhesion Strength of a Pressure Sensitive Adhesive.
Iran Polym J (12 (3)): 243–248 (2003)
[94] Aitken‐Nichol, C., Zhang, F., McGinity, J.W.
Hot Melt Extrusion of Acrylic Films.
Pharm Res 13(5): 804–808 (1996)
[95] Müller-Buschbaum, P., Ittner, T., Maurer, E., Körstgens, V., Petry, W.
Pressure-Sensitive Adhesive Blend Films for Low-Tack Applications.
Macromol Mater Eng 292(7): 825–834 (2007)
[96] Nič, M., Jirát, J., Košata, B., Jenkins, A., McNaught, A.
IUPAC Compendium of Chemical Terminology.
1st ed., IUPAC, Research Triagle Park, NC (2009)
[97] Everett, D.H.
Manual of Symbols and Terminology for Physicochemical Quantities and Units, Appendix II:
Definitions, Terminology and Symbols in Colloid and Surface Chemistry.
Pure Appl Chem 31(4) (1972)
[98] Zhao, H., Park, D.-W., Kim, S.-K., Lee, C.-H., Kim, D.-D.
The effects of pressure-sensitive adhesives and solubilizers on the skin permeation of
testosterone from a matrix-type transdermal delivery system.
Drug Dev Ind Pharm 28(9): 1125–1131 (2002)
[99] Ash, I., Ash, M.
Handbook of fillers, extenders, and diluents.
2nd ed., Synapse Information Resources, Endicott, NY (2007)
[100] Gattefossé
Labrasol® Caprylocaproyl macrogol-8 glycerides EP.
Assessed from: http://www.gattefosse.com/ (2014)
[101] Nierle, J., Gaede, C.
Hybrid system for solubilizing pharmaceutically active substances in polymer matrices.
Patent WO2003080035 A1 (2003)
4. References 128
[102] Haralambopoulos, C.
Adhesive matrix type transdermal patch and method of manufacturing same.
Patent US5965154 A (1999)
[103] Fenton, J.
Maximizing Yield in Transdermal Manufacturing.
Assessed from: http://www.drug-dev.com/ (2013)
[104] Minghetti, P., Cilurzo, F., Casiraghi, A.
Measuring Adhesive Performance in Transdermal Delivery Systems.
American Journal of Drug Delivery 2(3) (2004)
[105] Gutschke, E., Bracht, S., Nagel, S., Weitschies, W.
Adhesion testing of transdermal matrix patches with a probe tack test--in vitro and in vivo
evaluation.
Eur J Pharm Biopharm 75(3): 399–404 (2010)
[106] Pizzi, A., Mittal, K.L.
Handbook of adhesive technology.
2nd ed., M. Dekker, New York (2003)
[107] Creton, C., Fabre, P.
Tack.
In: Adhesion Science and Engineering, Vol I: The Mechanics of Adhesion, D.A. Dillard and A.V.
Pocius eds. Elsevier. pp. 535-576, 1st ed. (D.A. Dillard and A.V. Pocius, ed): p. 535–76, Elsevier,
New York, NY (2003)
[108] Creton, C.P.E., Editors, G.
Materials Science of Adhesives: How to Bond Things Together.
MRS Bulletin June 2003: 419–423 (2003)
[109] Duncan, B., Abbott, S., Roberts, R.
Measurement Good Practice Guide No. 26: Adhesive Tack, National Physical Laboratory
Assessed from: http://www.adhesivestoolkit.com (2013)
[110] Pressure Sensitive Tape Council
Test methods for pressure sensitive adhesive tapes: Peel Adhesion of Pressure Sensitive Tape.
15 ed., PSTC, Northbrook (2007)
[111] Tsukatani, T., Hatano, Y., Mizumachi, H.
Bonding and Debonding Processes in Tack of Pressure-Sensitive Adhesives.
J Adhes 31(1): 59–71 (1989)
[112] Scasso, A., Stefano, F.
Transdermal delivery device for the administration of fentanyl.
Patent WO2003097008 A2 (2003)
4. References 129
[113] Serizawa, H.
Transdermal formulations of geranylgeranylacetone.
Patent US20130273138 A1 (2013)
[114] Creton, C., Shull, K.R.
Probe Tack.
In: Applications of pressure-sensitive products, 1st ed. (Benedek I., Feldstein M.M., eds): p. 6-
1 to 6-26, CRC Press - Taylor & Francis Group, Boca Raton (2009)
[115] Kim, H., Lim, D., Park, Y.
Peel Resistance.
In: Applications of pressure-sensitive products, 1st ed. (Benedek I., Feldstein M.M., eds): p. 7-
1 to 7-34, CRC Press - Taylor & Francis Group, Boca Raton (2009)
[116] Derail, C., Allal, A., Marin, G., Tordjeman, P.
Relationship Between Viscoelastic and Peeling Properties of Model Adhesives. Part 2. The
Interfacial Fracture Domains.
J Adhes 68(3-4): 203–228 (1998)
[117] Kaelble, D.H.
Peel Adhesion: Influence of Surface Energies and Adhesive Rheology.
J Adhes 1(2): 102–123 (1969)
[118] Pesika, N.S. et al.
Peel-Zone Model of Tape Peeling Based on the Gecko Adhesive System.
J Adhes 83(4): 383–401 (2007)
[119] Renvoise, J., Burlot, D., Marin, G., Derail, C.
Adherence performances of pressure sensitive adhesives on a model viscoelastic synthetic
film: A tool for the understanding of adhesion on the human skin.
Int J Pharm 368(1-2): 83–88 (2009)
[120] Wokovich, A.M. et al.
Evaluation of substrates for 90 degrees peel adhesion - A collaborative study. I. Medical tapes.
J. Biomed. Mater. Res. Part B 87B(1): 105–113 (2008)
[121] Pressure Sensitive Tape Council
Test methods for pressure sensitive adhesive tapes: Shear Adhesion of Pressure Sensitive
Tape.
15 ed., PSTC, Northbrook (2007)
[122] Antonov, S.V., Kulichikhin, V.G.
Shear Resistance.
In: Applications of pressure-sensitive products, 1st ed. (Benedek I., Feldstein M.M., eds): p. 8-
1 to 8-18, CRC Press - Taylor & Francis Group, Boca Raton (2009)
4. References 130
[123] Chang, E.P.
Viscoelastic Properties of Pressure-Sensitive Adhesives.
J Adhes 60(1-4): 233–248 (1997)
[124] Zosel, A.
Shear Strength of Pressure Sensitive Adhesives and its Correlation to Mechanical Properties.
J Adhes 44(1-2): 1–16 (1994)
[125] Herzog, B., Gardner, D.J., Lopez-Anido, R., Goodell, B.
Glass-transition temperature based on dynamic mechanical thermal analysis techniques as an
indicator of the adhesive performance of vinyl ester resin.
J Appl Polym Sci 97(6): 2221–2229 (2005)
[126] Menard, K.P.
Dynamic mechanical analysis: A practical introduction.
2nd ed., CRC Press - Taylor & Francis Group, Boca Raton, FL (2008)
[127] Chang, E.P.
Viscoelastic Windows of Pressure-Sensitive Adhesives.
J Adhes 34(1-4): 189–200 (1991)
[128] Dale, W.C., Paster, M.D., Haynes, J.K.
Mechanical Properties of Acrylic Pressure Sensitive Adhesives and Their Relationships to
Industry Standard Testing.
J Adhes 31(1): 1–20 (1989)
[129] Brummer, R., Hetzel, F., Kimmerl, C., Lenuck, V., Kenndoff, J.W., Knieler, R.
DMA zu Überwachung der Fertigung.
Adhäsion - kleben u. dichten 3(42): 26–29 (1998)
[130] Derail, C., Marin, G.
Role of Viscoelastic Behavior of Pressure-Sensitive Adhesives in the Course of Bonding and
Debonding Processes.
In: Applications of pressure-sensitive products, 1st ed. (Benedek I., Feldstein M.M., eds): p. 4-
1 to 4-26, CRC Press - Taylor & Francis Group, Boca Raton (2009)
[131] Chang, E.
Viscoelastic Properties and Windows of Pressure-Sensitive Adhesives.
In: Applications of pressure-sensitive products, 1st ed. (Benedek I., Feldstein M.M., eds): p. 5-
1 to 5-22, CRC Press - Taylor & Francis Group, Boca Raton (2009)
[132] Ho, K.Y., Dodou, K.
Rheological studies on pressure-sensitive silicone adhesives and drug-in-adhesive layers as a
means to characterise adhesive performance.
Int J Pharm 333(1-2): 24–33 (2007)
4. References 131
[133] Michaelis, M., Brummer, R., Leopold, C.S.
Plasticization and antiplasticization of an acrylic pressure sensitive adhesive by ibuprofen and
their effect on the adhesion properties.
Eur J Pharm Biopharm 86(2): 234–243 (2014)
[134] Zosel, A.
Adhesion and tack of polymers: Influence of mechanical properties and surface tensions.
Colloid Polym. Sci. 263(7): 541–553 (1985)
[135] Tordjeman, P., Papon, E., Villenave, J.-J.
Squeeze elastic deformation and contact area of a rubber adhesive.
J Chem Phys 113(23): 10712–10716 (2000)
[136] Gay, C., Leibler, L.
Theory of Tackiness.
Phys Rev Lett 82(5): 936 (1999)
[137] Zosel, A.
The effect of bond formation on the tack of polymers.
J Adhes Sci Technol 11(11): 1447–1457 (1997)
[138] Asloun, E.M., Nardin, M., Schultz, J.
Stress transfer in single-fibre composites: effect of adhesion, elastic modulus of fibre and
matrix, and polymer chain mobility.
J Mater Sci 24(5): 1835-1844 (1989)
[139] Lee, L.-H.
Molecular Bonding and Adhesion at Polymer-Metal Interphases.
J Adhes 46(1-4): 15–38 (1994)
[140] Schultz, J.
Effect of Orientation and Organization of Polymers at Interfaces on Adhesive Strength.
J Adhes 37(1-3): 73–81 (1992)
[141] Wu, S.
Polymer interface and adhesion.
8th ed., Dekker, New York (1982)
[142] Habenicht, G.
Kleben.
6.th ed., Springer, Berlin Heidelberg (2009)
[143] Dahlquist, C.A.
The Theory of Adhesion.
In: Coatings technology handbook, 3rd ed. (Tracton A.A., ed): p. 5-1 to 5-9, CRC Press - Taylor
& Francis Group, Boca Raton (2006)
4. References 132
[144] Ma, W., Vodungbo, B., Nilles, K., Theato, P., Lüning, J.
Surface and bulk ordering in thin films of a symmetrical diblock copolymer.
J Polym Sci B Polym Phys 51(17): 1282–1287 (2013)
[145] Hefer, A.W.
Adhesion in Bitumen-Aggregate Systems and Quantification of the Effects of Water on the
Adhesive Bond.
Dissertation, Texas, Texas A&M University (2004)
[146] R. Brummer, F.H.C.H.
Correlation of Polymer Properties with Dynamic Mechanical Measurements.
Appl Rheol 7: 173–178 (1997)
[147] Foreman, P., Eaton, P., Shah, S.
Rubber-Acrylic Hybrid Pressure Sensitive Adhesives, National Starch and Chemical Company.
Assessed from: http://www.pstc.org (2013)
[148] Coughlin, C.S., Mauritz, K.A., Storey, R.F.
A general free volume based theory for the diffusion of large molecules in amorphous
polymers above Tg. 4. Polymer-penetrant interactions.
Macromolecules 24(7): 1526–1534 (1991)
[149] Palzer, S., Zürcher, U.
Kinetik unerwünschter Agglomerationsprozesse bei der Lagerung und Verarbeitung amorpher
Lebensmittelpulver.
Chemie Ingenieur Technik 76(10): 1594–1599 (2004)
[150] Wilkes, C.E., Summers, J.W., Daniels, C.A., Berard, M.T.
PVC handbook.
1st ed., Hanser, Munich, Cincinnati (2005)
[151] Stark, W.
Investigation of the curing behaviour of carbon fibre epoxy prepreg by Dynamic Mechanical
Analysis DMA.
Polym Test 32(2): 231–239 (2013)
[152] Crowley, M.M. et al.
The influence of guaifenesin and ketoprofen on the properties of hot-melt extruded
polyethylene oxide films.
Eur J Pharm Sci 22(5): 409–418 (2004)
[153] Jackson, W.J., Caldwell, J.R.
Antiplasticization. III. Characteristics and properties of antiplasticizable polymers.
J Appl Polym Sci 11(2): 227–244 (1967)
[154] Mitchell, B.S.
An introduction to materials engineering and science: For chemical and materials engineers.
1st ed., John Wiley, Hoboken (NJ) (2004)
4. References 133
[155] Wu, C., McGinity, J.W.
Non-traditional plasticization of polymeric films.
Int J Pharm 177(1): 15–27 (1999)
[156] Arzhakov, M.S., Arzhakov, S.A., Gustov, V.V., Kevdina, I.B., Shantarovich, V.P.
Physical and Mechanical Behavior of Polymer Glasses. V. Structural Plasticization.
Int J Polym Mater 47(2-3): 149–167 (2000)
[157] Siepmann, F., Le Brun, V., Siepmann, J.
Drugs acting as plasticizers in polymeric systems: A quantitative treatment.
J Control Release 115(3): 298–306 (2006)
[158] Jenquin, M.R., Liebowitz, S.M., Sarabia, R.E., McGinity, J.W.
Physical and chemical factors influencing the release of drugs from acrylic resin films.
J Pharm Sci 79(9): 811–816 (1990)
[159] Jackson, W.J., Caldwell, J.R.
Antiplasticization. II. Characteristics of antiplasticizers.
J Appl Polym Sci 11(2): 211–226 (1967)
[160] Anderson, S.L., Grulke, E.A., DeLassus, P.T., Smith, P.B., Kocher, C.W., Landes, B.G.
A Model for Antiplasticization in Polystyrene.
Macromolecules 28(8): 2944–2954 (1995)
[161] Lee, J.S., Leisen, J., Choudhury, R.P., Kriegel, R.M., Beckham, H.W., Koros, W.J.
Antiplasticization-based enhancement of poly(ethylene terephthalate) barrier properties.
Polymer 53(1): 213–222 (2012)
[162] Lin, S.-Y., Lee, C.-J., Lin, Y.-Y.
Drug-polymer interaction affecting the mechanical properties, adhesion strength and release
kinetics of piroxicam-loaded Eudragit E films plasticized with different plasticizers.
J Control Release 33(3): 375–381 (1995)
[163] Anderson, M.J., Whitcomb, P.J.
DOE simplified: Practical tools for effective experimentation.
2nd ed., CRC Press - Taylor & Francis Group, Boca Raton, Fla (2007)
[164] Kleppmann, W.
Versuchsplanung: Produkte und Prozesse optimieren.
8th ed., Hanser, Munich (2013)
[165] Siebertz, K., Bebber, D.T.v., Hochkirchen, T.
Statistische Versuchsplanung: Design of Experiments (DOE)
1st ed., Springer, Heidelberg, Dordrecht (2010)
[166] Yu, L.X.
Pharmaceutical quality by design: product and process development, understanding, and
control.
Pharm Res 25(4): 781–791 (2008)
4. References 134
[167] International Conference on Harmonisation of Technical Requirements for Registration of
Pharmaceuticals for Human Use (ICH)
Guidance for Industry Q8(R2) Pharmaceutical Development.
2nd ed., U.S. Department of Health and Human Services, Washington, D.C (2009)
[168] Burghaus, R., Mogk, G., Mrziglod, T., Hübl, P.
Method and system for the automatic design of experiments.
Patent US7079965 B2 (2006)
[169] Keller, P.A.
Six sigma demystified.
2nd ed., McGraw-Hill, New York (2011)
[170] Keller, P.A.
Statistical process control demystified.
1st ed., McGraw-Hill, New York (2011)
[171] Cornell, J.
Experiments with mixtures: designs, models, and the analysis of mixture data.
3rd ed., Wiley, New York (2002)
[172] Anderson, M.J., Whitcomb, P.J.
RSM simplified: Optimizing processes using response surface methods for design of
experiments.
1st ed., CRC Press - Taylor & Francis Group, Boca Raton, Fla (2005)
[173] Belavendram, N.
Quality by design.
1st ed., Prentice Hall, London, New York (1995)
[174] Vikström, E., Björk, R., Rydén, P.
Methods and apparatus for automated predictive design space estimation.
Patent US20130218529 A1 (2013)
[175] Wikström, E., Sundström, H., Nordahl, T.
Methods and apparatus for automated predictive design space estimation.
Patent US8412356 B2 (2013)
[176] Göndör, V., Koczor, Z.
Improvement of the Measurement System Analysis Using Experimental Design, Budapest,
Hungary, Óbuda University (2010)
[177] Lampert, A., Seiberth, J., Haefeli, W.E., Seidling, H.M.
A systematic review of medication administration errors with transdermal patches.
Expert Opin Drug Saf 13(8): 1101–1114 (2014)
[178] George Wypych, editor
Handbook of plasticizers.
1st ed., Norwich, William Andrew Publishing (2004)
4. References 135
[179] Xiao, C. et al.
Positronium Annihilation Lifetime and Dynamic Mechanical Studies of γ-Relaxation in BPA-PC
and TMBPA-PC Plasticized by TOP.
Macromolecules 32(23): 7913–7920 (1999)
[180] Mascia, L.
Antiplasticization of poly (vinyl chloride) in relation to thermal ageing and non-linear
viscoelastic behaviour.
Polymer 19(3): 325–328 (1978)
[181] Soong, S.Y., Cohen, R.E., Boyce, M.C., Chen, W.
The effects of thermomechanical history and strain rate on antiplasticization of PVC.
Polymer 49(6): 1440–1443 (2008)
[182] Bing, Y., Chris, M., Eli, M.P.
Explanation of tackifier effect on the viscoelastic properties of polyolefin-based pressure
sensitive adhesives.
J Appl Polym Sci 99(5): 2408–2413 (2006)
[183] Mascia, L., Margetts, G.
Viscoelasticity and plasticity aspects of antiplasticization phenomena: Strain rate and
temperature effects.
J of Macromolecular Sc, Part B 26(2): 237–256 (1987)
[184] Lunter, D.J., Daniels, R.
New film forming emulsions containing Eudragit® NE and/or RS 30D for sustained dermal
delivery of nonivamide.
Eur J Pharm Biopharm 82(2): 291–298 (2012)
[185] Michelle, R.J., Stephen, M.L., Rafael, E.S., James, W.M.
Physical and chemical factors influencing the release of drugs from acrylic resin films.
J. Pharm. Sci. 79(9): 811–816 (1990)
[186] Taghizadeh, S.M., Soroushnia, A., Mirzadeh, H., Barikani, M.
Preparation and In Vitro Evaluation of a New Fentanyl Patch Based on Acrylic/Silicone
Pressure-Sensitive Adhesive Blends.
Drug Dev Ind Pharm 35(4): 487–498 (2009)
[187] Trenor, S.R., Suggs, A.E., Love, B.J.
Influence of penetration enhancers on the thermomechanical properties and peel strength of
a poly(isobutylene) pressure sensitive adhesive.
J Mater Sci Lett 21(17): 1321–1323 (2002)
[188] Gullick, D.R., Pugh, W.J., Ingram, M.J., Cox, P.A., Moss, G.P.
Formulation and characterization of a captopril ethyl ester drug-in-adhesive-type patch for
percutaneous absorption.
Drug Dev Ind Pharm 36(8): 926–932 (2010)
4. References 136
[189] Minghetti, P., Cilurzo, F., Casiraghi, A., Montanari, L.
The effect of thickness and water content on the adhesive properties of methacrylic patches.
Acta Technologiae et Legis Medicamenti 11(2): 81–92 (2000)
[190] Satas, D.
Handbook of pressure sensitive adhesive technology.
2nd ed., Van Nostrand Reinhold, New York (1989)
[191] Mezger, T.
The Rheology Handbook: For Users of Rotational and Oscillatory Rheometers.
2nd ed., Vincentz Network, Hannover (2006)
[192] Chalykh, A.E., Shcherbina, A.A.
Transition Zones in Adhesive Joints.
In: Applications of pressure-sensitive products, 1st ed. (Benedek I., Feldstein M.M., eds): p. 3-
1 to 3-32, CRC Press - Taylor & Francis Group, Boca Raton (2009)
[193] Tracton AA, editor
Coatings Technology Handbook.
3rd ed., CRC Press - Taylor & Francis Group, Boca Raton (2005)
[194] Govil, S., Weimann, L.
Adhesive mixture for transdermal delivery of highly plasticizing drugs.
Patent US20020150613 A1 (2002)
[195] Stenert, M.
Entwicklung binärer und ternärer Polymerblends auf der Basis von Polymethylmethacrylat,
Poly(n-butylacrylat), Polystyrol und deren Diblockcopolymeren.
Dissertation, Universität GH Essen, Essen, (2000)
[196] Hille, T.
Transdermal absorption of active substances from subcooled melts.
Patent US 6344211 B1 (2002)
[197] Mezger, T.
Das Rheologie-Handbuch: Für Anwender von Rotations- und Oszillations-Rheometern.
2nd ed., Vincentz Network, Hannover (2006)
[198] Yoreo, J.J. de, Vekilov, P.G.
Principles of Crystal Nucleation and Growth.
In: Biomineralization: Principles of crystal nucleation and growth (Dove P., Yoreo J. de, Weiner
S., eds): p. 57–93, Mineralogical Society of America, Washington, DC (2003)
[199] Sonoda, K., Furuzono, T., Walsh, D., Sato, K., Tanaka, J.
Influence of emulsion on crystal growth of hydroxyapatite.
Solid State Ionics 151(1–4): 321–327 (2002)
4. References 137
[200] McClements, D.J.
Crystals and crystallization in oil-in-water emulsions: Implications for emulsion-based delivery
systems.
Adv Colloid Interface Sci 174(174): 1–30 (2012)
[201] Barnett, K. et al.
Using Quality by Design to Develop Robust Chromatographic Methods.
Pharmaceutical Technology 14(11): 48–64 (2014)

5. Appendix 138
5. Appendix

5. Appendix 139
5.1 Appendix – Curriculum Vitae
Entfällt aus datenschutzrechtlichen Gründen.
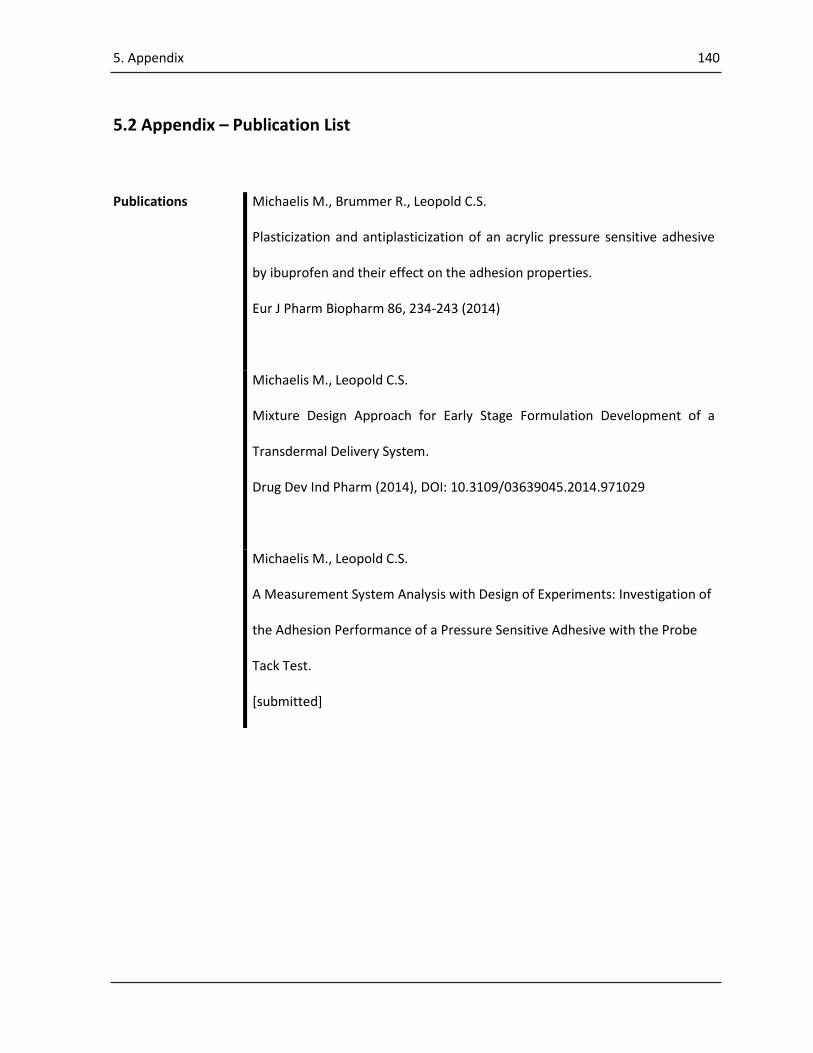
5. Appendix 140
5.2 Appendix – Publication List
Publications Michaelis M., Brummer R., Leopold C.S.
Plasticization and antiplasticization of an acrylic pressure sensitive adhesive
by ibuprofen and their effect on the adhesion properties.
Eur J Pharm Biopharm 86, 234-243 (2014)
Michaelis M., Leopold C.S.
Mixture Design Approach for Early Stage Formulation Development of a
Transdermal Delivery System.
Drug Dev Ind Pharm (2014), DOI: 10.3109/03639045.2014.971029
Michaelis M., Leopold C.S.
A Measurement System Analysis with Design of Experiments: Investigation of
the Adhesion Performance of a Pressure Sensitive Adhesive with the Probe
Tack Test.
[submitted]
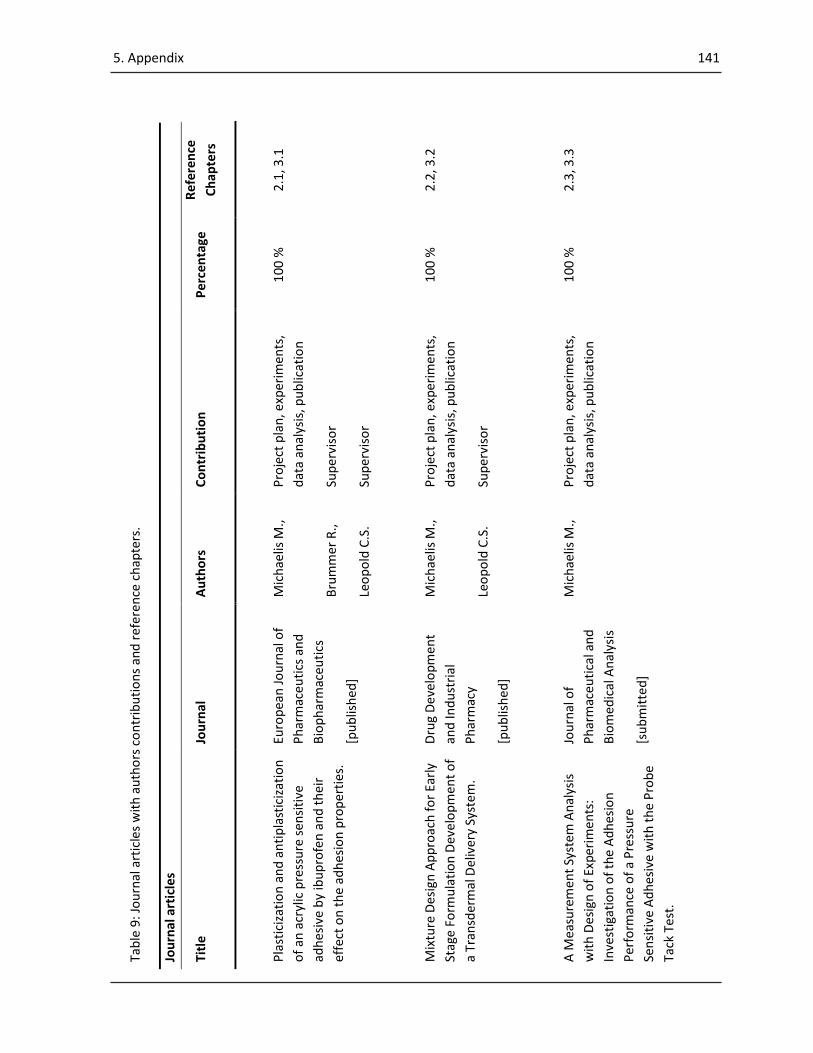
5. Appendix 141
Ta
ble
9:
Jou
rnal
art
icle
s w
ith
au
tho
rs c
on
trib
uti
on
s an
d r
efer
ence
ch
apte
rs.
Jou
rnal
art
icle
s
Titl
e Jo
urn
al
Au
tho
rs
Co
ntr
ibu
tio
n
Pe
rcen
tage
R
efe
ren
ce
Ch
apte
rs
Pla
stic
izat
ion
an
d a
nti
pla
stic
izat
ion
of
an a
cryl
ic p
ress
ure
sen
siti
ve
adh
esiv
e b
y ib
up
rofe
n a
nd
th
eir
effe
ct o
n t
he
adh
esio
n p
rop
erti
es.
Euro
pea
n J
ou
rnal
of
Ph
arm
aceu
tics
an
d
Bio
ph
arm
aceu
tics
[pu
blis
hed
]
Mic
hae
lis M
.,
Pro
ject
pla
n, e
xper
imen
ts,
dat
a an
alys
is, p
ub
licat
ion
100
%
2.1
, 3.1
Bru
mm
er R
., Su
per
viso
r
Leo
po
ld C
.S.
Sup
ervi
sor
Mix
ture
Des
ign
Ap
pro
ach
fo
r Ea
rly
Stag
e Fo
rmu
lati
on
Dev
elo
pm
ent
of
a Tr
ansd
erm
al D
eliv
ery
Syst
em
.
Dru
g D
evel
op
men
t
and
Ind
ust
rial
Ph
arm
acy
[pu
blis
hed
]
Mic
hae
lis M
.,
Pro
ject
pla
n, e
xper
imen
ts,
dat
a an
alys
is, p
ub
licat
ion
100
%
2.2
, 3.2
Leo
po
ld C
.S.
Sup
ervi
sor
A M
easu
rem
ent
Syst
em A
nal
ysis
wit
h D
esig
n o
f Ex
per
imen
ts:
Inve
stig
atio
n o
f th
e A
dh
esio
n
Per
form
ance
of
a P
ress
ure
Sen
siti
ve A
dh
esiv
e w
ith
th
e P
rob
e
Tack
Te
st.
Jou
rnal
of
Ph
arm
aceu
tica
l an
d
Bio
med
ical
An
alys
is
[su
bm
itte
d]
Mic
hae
lis M
.,
Pro
ject
pla
n, e
xper
imen
ts,
dat
a an
alys
is, p
ub
licat
ion
100
%
2.3
, 3.3
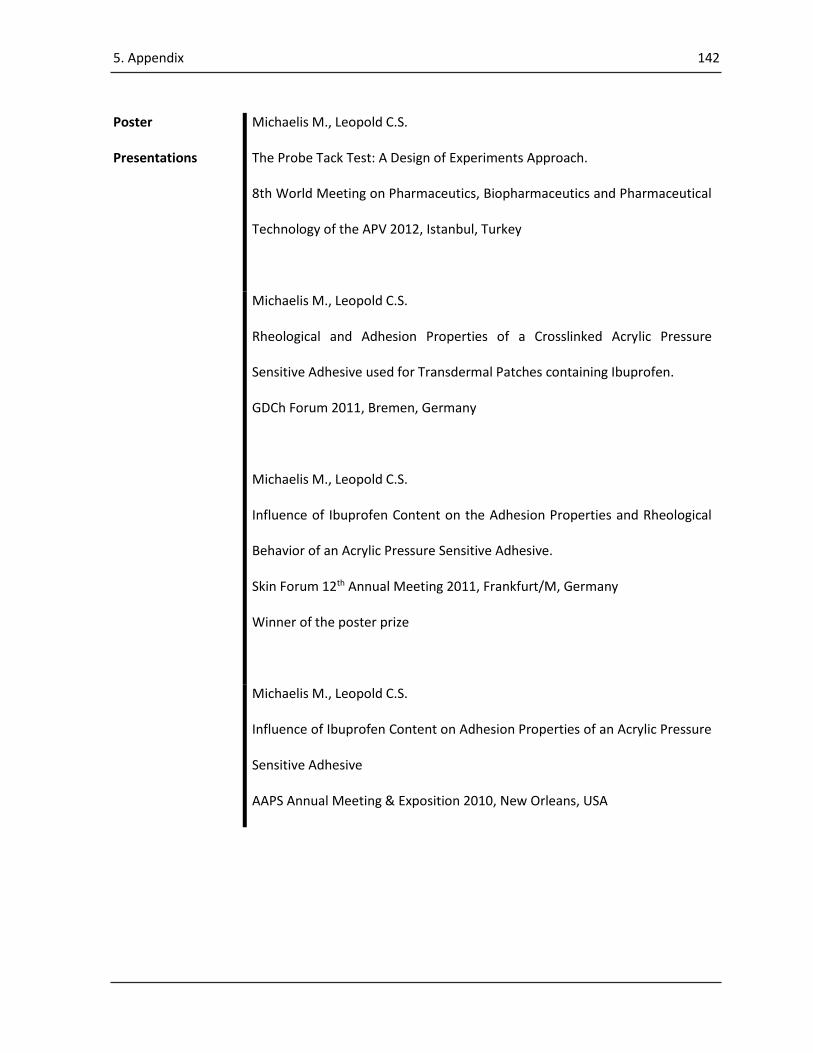
5. Appendix 142
Poster
Presentations
Michaelis M., Leopold C.S.
The Probe Tack Test: A Design of Experiments Approach.
8th World Meeting on Pharmaceutics, Biopharmaceutics and Pharmaceutical
Technology of the APV 2012, Istanbul, Turkey
Michaelis M., Leopold C.S.
Rheological and Adhesion Properties of a Crosslinked Acrylic Pressure
Sensitive Adhesive used for Transdermal Patches containing Ibuprofen.
GDCh Forum 2011, Bremen, Germany
Michaelis M., Leopold C.S.
Influence of Ibuprofen Content on the Adhesion Properties and Rheological
Behavior of an Acrylic Pressure Sensitive Adhesive.
Skin Forum 12th Annual Meeting 2011, Frankfurt/M, Germany
Winner of the poster prize
Michaelis M., Leopold C.S.
Influence of Ibuprofen Content on Adhesion Properties of an Acrylic Pressure
Sensitive Adhesive
AAPS Annual Meeting & Exposition 2010, New Orleans, USA
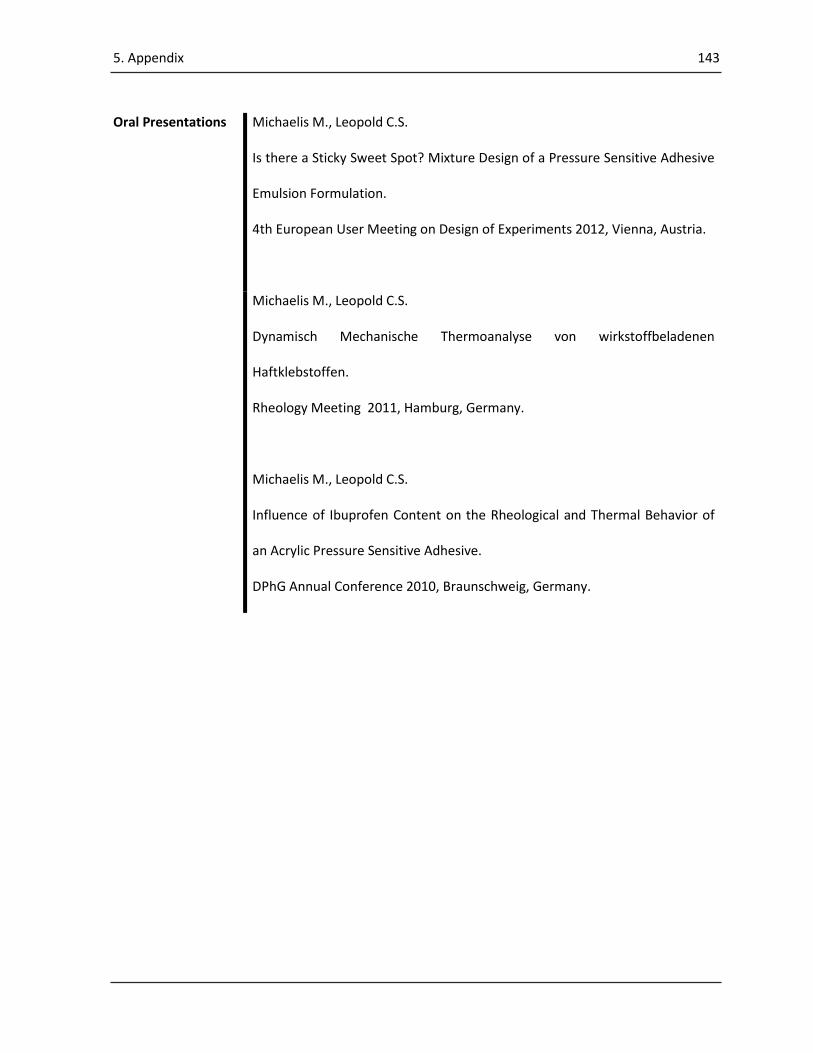
5. Appendix 143
Oral Presentations Michaelis M., Leopold C.S.
Is there a Sticky Sweet Spot? Mixture Design of a Pressure Sensitive Adhesive
Emulsion Formulation.
4th European User Meeting on Design of Experiments 2012, Vienna, Austria.
Michaelis M., Leopold C.S.
Dynamisch Mechanische Thermoanalyse von wirkstoffbeladenen
Haftklebstoffen.
Rheology Meeting 2011, Hamburg, Germany.
Michaelis M., Leopold C.S.
Influence of Ibuprofen Content on the Rheological and Thermal Behavior of
an Acrylic Pressure Sensitive Adhesive.
DPhG Annual Conference 2010, Braunschweig, Germany.
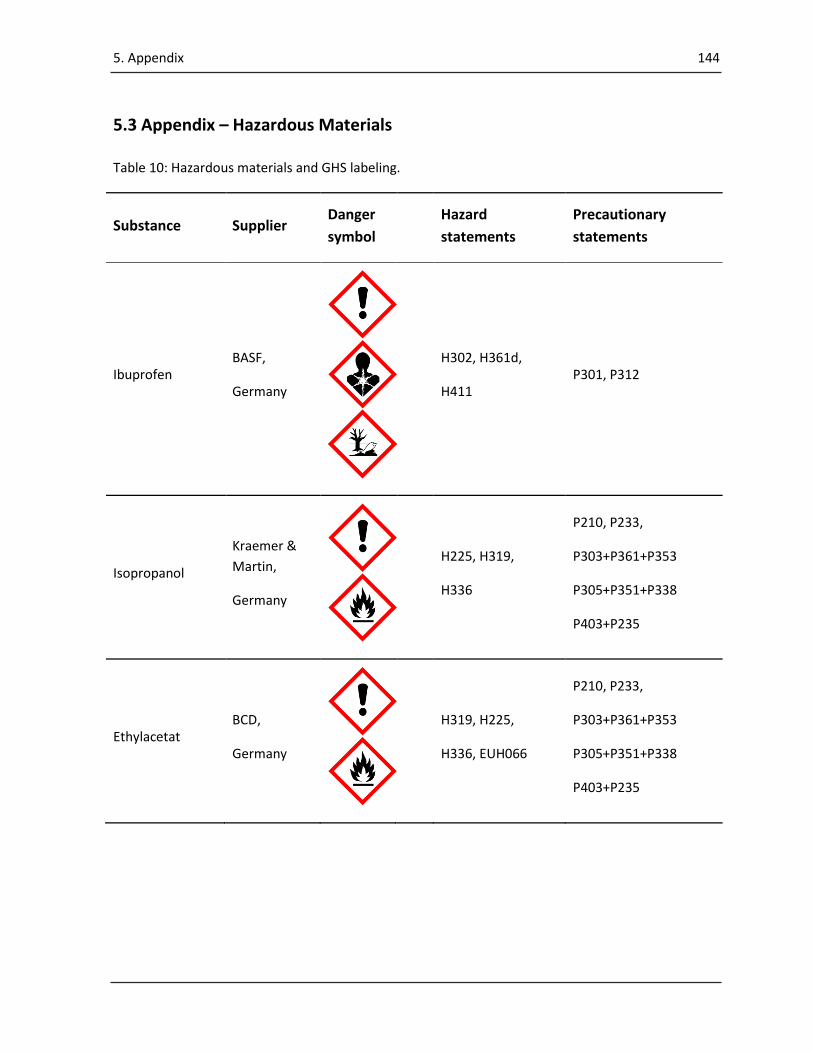
5. Appendix 144
5.3 Appendix – Hazardous Materials
Table 10: Hazardous materials and GHS labeling.
Substance Supplier Danger
symbol
Hazard
statements
Precautionary
statements
Ibuprofen BASF,
Germany
H302, H361d,
H411 P301, P312
Isopropanol
Kraemer &
Martin,
Germany
H225, H319,
H336
P210, P233,
P303+P361+P353
P305+P351+P338
P403+P235
Ethylacetat BCD,
Germany
H319, H225,
H336, EUH066
P210, P233,
P303+P361+P353
P305+P351+P338
P403+P235

5. Appendix 145
Substance Supplier Danger
symbol
Hazard
statements
Precautionary
statements
DURO-TAK
387-2287
Henkel,
GB
H319, H225,
H336, H351,
EUH066
P210, P261, P280,
P308 + P313,
P370 + P378
DURO-TAK
87-4287
Henkel,
GB
H319, H225,
H336, H351,
EUH066
P210, P261, P280,
P308 + P313,
P370 + P378
6. Eidesstattliche Versicherung 146
6. Eidesstattliche Versicherung
Hiermit versichere ich an Eides statt, die vorliegende Arbeit selbstständig und ohne fremde Hilfe
sowie nur mit den angegebenen Hilfsmitteln und Quellen erstellt zu haben. Ich versichere zudem,
keinen weiteren Promotionsversuch an einer anderen Einrichtung unternommen zu haben.
Hamburg, den
__________________________
Marc Michaelis